UNITED STATES
SECURITIES AND EXCHANGE COMMISSION
Washington, D.C. 20549
|
CERTIFIED SHAREHOLDER REPORT OF REGISTERED MANAGEMENT INVESTMENT
COMPANIES
Investment Company Act file number 811-21779
--------
|
JOHN HANCOCK FUNDS II
---------------------------------------------------------
(Exact name of registrant as specified in charter)
|
601 CONGRESS STREET, BOSTON, MA 02210-2805
-------------------------------------------------------------
(Address of principal executive offices) (Zip code)
|
GORDON M. SHONE, 601 CONGRESS STREET, BOSTON, MA 02210-2805
------------------------------------------------------------------------------------------
(Name and address of agent for service)
|
Registrant's telephone number, including area code: (617) 663-3000
--------------
Date of fiscal year end: 8/31
------
Date of reporting period: 2/28/06
-------
ITEM 1. REPORTS TO STOCKHOLDERS.
|
The Registrant prepared six semi annual reports to shareholders for the period ended February 28, 2006. The first report applies to 48 of the Registrant’s portfolios, the second report applies to Lifestyle Aggressive Portfolio, the third report applies to Lifestyle Balanced Portfolio, the fourth report applies to Lifestyle Conservative Portfolio, the fifth report applies to Lifestyle Growth Portfolio, and the sixth report applies to Lifestyle Moderate Portfolio.
John Hancock Funds II
President’s Message
|
February 28, 2006
To our shareholders:
After producing modest returns in 2005, the stock market started off strong in the first two months of 2006. The major indexes all advanced and produced two-month returns that were already half as much as the market’s returns for all of 2005. For example, the Standard & Poor’s 500 Index returned 2.93% through February 2006, versus 4.91% last year in total. Investors were encouraged by solid corporate earnings, a slower-growing economy and stable inflation, which suggested the Federal Reserve could be coming close to the end of their 18-month campaign of rising interest rates.
Although a solid yearly beginning has typically augured well for the rest of the year, it is anyone’s guess where the market will end 2006, especially given the wild cards of interest rate moves and record-high energy prices and their impact on corporate profits and the economy.
One thing we do know, however, is that the stock market’s pattern is one of extremes. Consider the last 10 years. From 1995 through 1999, we saw double-digit returns in excess of 20% per year, only to have 2000 through 2002 produce ever-increasing negative results, followed by another 20%-plus up year in 2004 and a less than 5% advance in 2005. Since 1926, the market, as measured by the Standard & Poor’s 500 Index, has produced average annual results of 10.4% . However, that “normal” return is rarely produced in any given year. In fact, calendar-year returns of 8% to 12% have occurred only five times in the 80 years since 1926.
Although the past in no way predicts the future, we have learned at least one lesson from history: Expect highs and lows in the short term, but always invest for the long term. Equally important: Work with your financial professional to maintain a diversified portfolio, spread out among not only different asset classes —stocks, bonds and cash — but also among various investment styles. It’s the best way we know of to benefit from, and weather, the market’s extremes.
Sincerely,

Keith F. Hartstein
President and Chief Executive Officer
|
John Hancock Funds II
Semiannual Report — Table of Contents
|
| Sector Weightings | 4 |
| Understanding Your Fund’s Expenses | 10 |
| Statements of Assets and Liabilities | 27 |
| Statements of Operations | 39 |
| Statements of Changes in Net Assets | 51 |
| Financial Highlights | 59 |
| Portfolio of Investments (See below for each Fund’s page #) | 107 |
| Notes to Financial Statements | 317 |
| Evaluation of Advisory and Subadivsory Agreements by the Board of Trustees | 344 |
| Appendix A | 346 |
| | Portfolio of | | Portfolio of |
| Portfolio | Investments | Portfolio | Investments |
| 500 Index Fund | 107 | Mid Cap Stock Fund | 214 |
| Active Bond Fund | 113 | Mid Cap Value Fund | 216 |
| All Cap Growth Fund | 127 | Natural Resources Fund | 218 |
| All Cap Value Fund | 129 | Quantitative Mid Cap Fund | 219 |
| Blue Chip Growth Fund | 131 | Quantitative Value Fund | 220 |
| Capital Appreciation Fund | 134 | Real Estate Securities Fund | 222 |
| Core Bond Fund | 135 | Real Return Bond Fund | 223 |
| Core Equity Fund | 142 | Small Cap Fund | 224 |
| Emerging Growth Fund | 143 | Small Cap Index Fund | 225 |
| Emerging Small Company Fund | 145 | Small Cap Opportunities Fund | 245 |
| Equity-Income Fund | 147 | Small Company Fund | 247 |
| Fundamental Value Fund | 150 | Small Company Growth Fund | 251 |
| Global Bond Fund | 151 | Small Company Value Fund | 254 |
| High Yield Fund | 156 | Special Value Fund | 256 |
| International Equity Index Fund | 168 | Spectrum Income Fund | 259 |
| International Opportunities Fund | 183 | Strategic Bond Fund | 285 |
| International Small Cap Fund | 184 | Strategic Value Fund | 295 |
| International Stock Fund | 186 | Total Return Fund | 296 |
| International Value Fund | 191 | U.S. Global Leaders Growth Fund | 299 |
| Investment Quality Bond Fund | 192 | U.S. Government Securities Fund | 300 |
| Large Cap Fund | 204 | U.S. High Yield Bond Fund | 301 |
| Large Cap Value Fund | 205 | U.S. Multi Sector Fund | 306 |
| Mid Cap Core Fund | 207 | Value & Restructuring Fund | 312 |
| Mid Cap Index Fund | 209 | Vista Fund | 314 |
3
John Hancock Funds II
Sector Weightings
|
| 500 Index Fund | |
|
| Sector Weighting | % of Total |
| Basic Materials | 2.65 |
| Communications | 9.77 |
| Consumer, Cyclical | 7.94 |
| Consumer, Non-cyclical | 19.69 |
| Energy | 8.74 |
| Finance and Insurance | 2.82 |
| Financial | 19.07 |
| Government | 4.83 |
| Industrial | 10.53 |
| Mortgage Securities | 0.42 |
| Technology | 10.30 |
| Utilities | 3.11 |
| Other Assets & Liabilities | 0.13 |
| Total | 100.00 |
| |
| Active Bond Fund | |
|
| Sector Weighting | % of Total |
| Asset Backed Securities | 1.91 |
| Basic Materials | 0.45 |
| Communications | 3.35 |
| Consumer, Cyclical | 1.34 |
| Consumer, Non-cyclical | 1.86 |
| Diversified | 0.21 |
| Energy | 1.99 |
| Financial | 8.48 |
| Government | 30.49 |
| Industrial | 1.07 |
| Mortgage Securities | 44.85 |
| Other Services (except | |
| Public Administration)* | 16.97 |
| Short-Term Securities | 21.39 |
| Technology | 0.02 |
| Utilities | 2.67 |
| Other Assets & Liabilities | –37.05 |
| Total | 100.00 |
| |
| All Cap Growth Fund | |
|
| Sector Weighting | % of Total |
| Basic Materials | 3.26 |
| Communications | 13.15 |
| Consumer, Cyclical | 10.60 |
| Consumer, Non-cyclical | 21.00 |
| Energy | 6.94 |
| Financial | 11.60 |
| Industrial | 13.13 |
| Other Services (except | |
| Public Administration)* | 2.96 |
| Short-Term Securities | 2.35 |
| Technology | 18.14 |
| Other Assets & Liabilities | –3.13 |
| Total | 100.00 |
| All Cap Value Fund | |
|
| Sector Weighting | % of Total |
| Basic Materials | 8.05 |
| Communications | 8.74 |
| Consumer, Cyclical | 10.77 |
| Consumer, Non-cyclical | 16.28 |
| Energy | 6.10 |
| Financial | 10.40 |
| Industrial | 27.52 |
| Other Services (except | |
| Public Administration)* | 10.77 |
| Short-Term Securities | 3.34 |
| Technology | 6.01 |
| Utilities | 2.59 |
| Other Assets & Liabilities | –10.57 |
| Total | 100.00 |
| |
| Blue Chip Growth Fund | |
|
| Sector Weighting | % of Total |
| Basic Materials | 1.80 |
| Communications | 12.30 |
| Consumer, Cyclical | 10.78 |
| Consumer, Non-cyclical | 21.99 |
| Energy | 6.51 |
| Financial | 21.24 |
| Industrial | 9.14 |
| Other Services (except | |
| Public Administration)* | 5.93 |
| Short-Term Securities | 0.88 |
| Technology | 15.17 |
| Other Assets & Liabilities | –5.74 |
| Total | 100.00 |
| |
| Capital Appreciation Fund | |
|
| Sector Weighting | % of Total |
| Communications | 16.95 |
| Consumer, Cyclical | 13.06 |
| Consumer, Non-cyclical | 26.33 |
| Energy | 5.33 |
| Financial | 14.06 |
| Industrial | 3.50 |
| Other Services (except | |
| Public Administration)* | 0.78 |
| Short-Term Securities | 1.63 |
| Technology | 19.60 |
| Other Assets & Liabilities | –1.24 |
| Total | 100.00 |
| Core Bond Fund | |
|
| Sector Weighting | % of Total |
| Asset Backed Securities | 12.14 |
| Basic Materials | 0.23 |
| Communications | 3.31 |
| Consumer, Cyclical | 0.31 |
| Consumer, Non-cyclical | 0.97 |
| Energy | 1.61 |
| Financial | 7.78 |
| Government | 24.47 |
| Industrial | 0.22 |
| Mortgage Securities | 57.74 |
| Short-Term Securities | 4.54 |
| Technology | 0.15 |
| Utilities | 1.22 |
| Other Assets & Liabilities | –14.69 |
| Total | 100.00 |
| |
| Core Equity Fund | |
|
| Sector Weighting | % of Total |
| Communications | 35.15 |
| Consumer, Cyclical | 9.84 |
| Consumer, Non-cyclical | 15.22 |
| Financial | 14.17 |
| Industrial | 10.28 |
| Short-Term Securities | 0.96 |
| Technology | 9.59 |
| Utilities | 4.45 |
| Other Assets & Liabilities | 0.34 |
| Total | 100.00 |
| |
| Emerging Growth Fund | |
|
| Sector Weighting | % of Total |
| Basic Materials | 0.73 |
| Communications | 10.09 |
| Consumer, Cyclical | 17.36 |
| Consumer, Non-cyclical | 19.65 |
| Energy | 9.66 |
| Finance and Insurance | 3.44 |
| Financial | 8.11 |
| Government | 1.76 |
| Industrial | 12.64 |
| Other Services (except | |
| Public Administration)* | 41.30 |
| Technology | 16.10 |
| Utilities | 0.78 |
| Other Assets & Liabilities | –41.62 |
| Total | 100.00 |
4
John Hancock Funds II
Sector Weightings
|
| Emerging Small Company Fund |
|
| Sector Weighting | % of Total |
| Basic Materials | 3.44 |
| Communications | 8.08 |
| Consumer, Cyclical | 11.75 |
| Consumer, Non-cyclical | 20.77 |
| Energy | 8.20 |
| Financial | 12.16 |
| Industrial | 17.07 |
| Short-Term Securities | 1.54 |
| Technology | 15.76 |
| Other Assets & Liabilities | 1.23 |
| Total | 100.00 |
| |
| Equity-Income Fund | |
|
| Sector Weighting | % of Total |
| Basic Materials | 4.62 |
| Communications | 16.84 |
| Consumer, Cyclical | 5.80 |
| Consumer, Non-cyclical | 18.48 |
| Energy | 8.50 |
| Financial | 17.88 |
| Industrial | 13.71 |
| Mortgage Securities | 0.48 |
| Other Services (except | |
| Public Administration)* | 10.52 |
| Short-Term Securities | 4.82 |
| Technology | 4.95 |
| Utilities | 4.20 |
| Other Assets & Liabilities | –10.80 |
| Total | 100.00 |
| |
| Fundamental Value Fund | |
|
| Sector Weighting | % of Total |
| Asset Backed Securities | 1.52 |
| Basic Materials | 0.43 |
| Communications | 6.58 |
| Consumer, Cyclical | 8.05 |
| Consumer, Non-cyclical | 16.21 |
| Diversified | 0.41 |
| Energy | 10.71 |
| Financial | 43.71 |
| Industrial | 8.64 |
| Other Services (except | |
| Public Administration)* | 11.95 |
| Technology | 3.66 |
| Other Assets & Liabilities | –11.87 |
| Total | 100.00 |
| Global Bond Fund | |
|
| Sector Weighting | % of Total |
| Asset Backed Securities | 18.87 |
| Basic Materials | 0.19 |
| Communications | 0.60 |
| Consumer, Cyclical | 7.92 |
| Consumer, Non-cyclical | 0.22 |
| Energy | 0.02 |
| Financial | 13.42 |
| Government | 33.02 |
| Industrial | 1.75 |
| Mortgage Securities | 32.05 |
| Other Services (except | |
| Public Administration)* | 2.76 |
| Short-Term Securities | 6.59 |
| Technology | 2.96 |
| Utilities | 0.78 |
| Other Assets & Liabilities | –21.15 |
| Total | 100.00 |
| |
| High Yield Fund | |
|
| Sector Weighting | % of Total |
| Asset Backed Securities | 0.00 |
| Basic Materials | 7.47 |
| Communications | 15.61 |
| Consumer, Cyclical | 15.56 |
| Consumer, Non-cyclical | 12.66 |
| Diversified | 0.62 |
| Energy | 8.94 |
| Finance and Insurance | 0.02 |
| Financial | 14.08 |
| Government | 10.35 |
| Industrial | 7.89 |
| Other Services (except | |
| Public Administration)* | 22.92 |
| Retail Trade | 0.17 |
| Technology | 1.41 |
| Utilities | 4.43 |
| Other Assets & Liabilities | –22.13 |
| Total | 100.00 |
| International Equity Index Fund |
|
| Sector Weighting | % of Total |
| Basic Materials | 8.03 |
| Communications | 9.95 |
| Consumer, Cyclical | 9.34 |
| Consumer, Non-cyclical | 13.15 |
| Diversified | 0.71 |
| Energy | 9.44 |
| Financial | 27.31 |
| Funds | 0.35 |
| Industrial | 10.22 |
| Other Services (except | |
| Public Administration)* | 12.84 |
| Short-Term Securities | 3.56 |
| Technology | 2.46 |
| Utilities | 4.93 |
| Other Assets & Liabilities | –12.29 |
| Total | 100.00 |
| |
| International Opportunities Fund |
|
| Sector Weighting | % of Total |
| Basic Materials | 4.90 |
| Communications | 10.62 |
| Consumer, Cyclical | 20.34 |
| Consumer, Non-cyclical | 10.36 |
| Diversified | 1.50 |
| Energy | 7.24 |
| Financial | 21.26 |
| Industrial | 17.73 |
| Other Services (except | |
| Public Administration)* | 11.06 |
| Short-Term Securities | 2.33 |
| Technology | 2.02 |
| Utilities | 2.59 |
| Other Assets & Liabilities | –11.95 |
| Total | 100.00 |
| |
| International Small Cap Fund |
|
| Sector Weighting | % of Total |
| Basic Materials | 6.01 |
| Communications | 4.26 |
| Consumer, Cyclical | 16.80 |
| Consumer, Non-cyclical | 17.74 |
| Diversified | 2.64 |
| Energy | 3.56 |
| Financial | 9.00 |
| Industrial | 23.42 |
| Other Services (except | |
| Public Administration)* | 4.29 |
| Short-Term Securities | 7.09 |
| Technology | 4.37 |
| Utilities | 2.38 |
| Other Assets & Liabilities | –1.56 |
| Total | 100.00 |
5
John Hancock Funds II
Sector Weightings
|
| International Stock Fund | |
|
| Sector Weighting | % of Total |
| Basic Materials | 6.71 |
| Communications | 4.52 |
| Consumer, Cyclical | 15.96 |
| Consumer, Non-cyclical | 16.31 |
| Diversified | 0.49 |
| Energy | 11.15 |
| Financial | 25.01 |
| Government | 0.44 |
| Industrial | 8.39 |
| Other Services (except | |
| Public Administration)* | 16.79 |
| Short-Term Securities | 4.37 |
| Technology | 0.88 |
| Utilities | 5.47 |
| Other Assets & Liabilities | –16.49 |
| Total | 100.00 |
| |
| International Value Fund | |
|
| Sector Weighting | % of Total |
| Basic Materials | 6.84 |
| Communications | 20.70 |
| Consumer, Cyclical | 6.99 |
| Consumer, Non-cyclical | 11.80 |
| Diversified | 1.16 |
| Energy | 6.72 |
| Financial | 19.07 |
| Government | 0.07 |
| Industrial | 13.94 |
| Other Services (except | |
| Public Administration)* | 15.74 |
| Short-Term Securities | 5.02 |
| Technology | 4.49 |
| Utilities | 2.34 |
| Other Assets & Liabilities | –14.88 |
| Total | 100.00 |
| |
| Investment Quality Bond Fund |
|
| Sector Weighting | % of Total |
| Asset Backed Securities | 7.82 |
| Basic Materials | 1.75 |
| Communications | 5.69 |
| Consumer, Cyclical | 3.26 |
| Consumer, Non-cyclical | 15.80 |
| Diversified | 0.16 |
| Energy | 1.96 |
| Financial | 19.63 |
| Government | 19.70 |
| Industrial | 1.24 |
| Mortgage Securities | 18.90 |
| Technology | 0.12 |
| Utilities | 3.12 |
| Other Assets & Liabilities | 0.85 |
| Total | 100.00 |
| Large Cap Fund | |
|
| Sector Weighting | % of Total |
| Communications | 10.60 |
| Consumer, Cyclical | 7.75 |
| Consumer, Non-cyclical | 21.94 |
| Energy | 4.34 |
| Financial | 24.68 |
| Government | 0.19 |
| Industrial | 11.71 |
| Other Services (except | |
| Public Administration)* | 1.25 |
| Short-Term Securities | 2.87 |
| Technology | 10.01 |
| Utilities | 5.85 |
| Other Assets & Liabilities | –1.19 |
| Total | 100.00 |
| |
| Large Cap Value Fund | |
|
| Sector Weighting | % of Total |
| Basic Materials | 3.46 |
| Communications | 5.13 |
| Consumer, Cyclical | 6.07 |
| Consumer, Non-cyclical | 13.34 |
| Energy | 23.27 |
| Financial | 28.05 |
| Industrial | 9.97 |
| Other Services (except | |
| Public Administration)* | 3.84 |
| Short-Term Securities | 0.18 |
| Technology | 8.98 |
| Utilities | 1.44 |
| Other Assets & Liabilities | –3.73 |
| Total | 100.00 |
| |
| Mid Cap Core Fund | |
|
| Sector Weighting | % of Total |
| Basic Materials | 7.04 |
| Communications | 3.79 |
| Consumer, Cyclical | 8.57 |
| Consumer, Non-cyclical | 19.12 |
| Diversified | 1.00 |
| Energy | 4.91 |
| Financial | 10.17 |
| Industrial | 14.66 |
| Other Services (except | |
| Public Administration)* | 14.50 |
| Short-Term Securities | 19.12 |
| Technology | 10.27 |
| Utilities | 1.48 |
| Other Assets & Liabilities | –14.63 |
| Total | 100.00 |
| Mid Cap Index Fund | |
|
| Sector Weighting | % of Total |
| Basic Materials | 3.19 |
| Communications | 4.43 |
| Consumer, Cyclical | 13.69 |
| Consumer, Non-cyclical | 16.44 |
| Diversified | 0.37 |
| Energy | 9.58 |
| Financial | 20.08 |
| Government | 3.51 |
| Industrial | 12.82 |
| Technology | 9.98 |
| Utilities | 5.84 |
| Other Assets & Liabilities | 0.07 |
| Total | 100.00 |
| |
| Mid Cap Stock Fund | |
|
| Sector Weighting | % of Total |
| Basic Materials | 1.08 |
| Communications | 8.69 |
| Consumer, Cyclical | 22.18 |
| Consumer, Non-cyclical | 22.34 |
| Diversified | 2.22 |
| Energy | 5.90 |
| Financial | 15.59 |
| Industrial | 7.27 |
| Other Services (except | |
| Public Administration)* | 30.80 |
| Technology | 14.89 |
| Other Assets & Liabilities | –30.96 |
| Total | 100.00 |
| |
| Mid Cap Value Fund | |
|
| Sector Weighting | % of Total |
| Basic Materials | 11.41 |
| Communications | 16.90 |
| Consumer, Cyclical | 14.08 |
| Consumer, Non-cyclical | 12.48 |
| Energy | 5.40 |
| Financial | 12.38 |
| Industrial | 11.68 |
| Other Services (except | |
| Public Administration)* | 30.21 |
| Short-Term Securities | 5.08 |
| Technology | 3.04 |
| Utilities | 7.57 |
| Other Assets & Liabilities | –30.23 |
| Total | 100.00 |
6
John Hancock Funds II
Sector Weightings
|
| Natural Resources Fund | |
|
| Sector Weighting | % of Total |
| Basic Materials | 33.20 |
| Energy | 63.54 |
| Financial | 3.10 |
| Other Services (except | |
| Public Administration)* | 12.20 |
| Other Assets & Liabilities | –12.04 |
| Total | 100.00 |
| |
| Quantitative Mid Cap Fund | |
|
| Sector Weighting | % of Total |
| Basic Materials | 2.71 |
| Communications | 7.85 |
| Consumer, Cyclical | 15.09 |
| Consumer, Non-cyclical | 17.63 |
| Energy | 9.78 |
| Finance and Insurance | 2.26 |
| Financial | 14.91 |
| Funds | 2.27 |
| Industrial | 15.58 |
| Other Services (except | |
| Public Administration)* | 20.23 |
| Technology | 8.82 |
| Utilities | 3.34 |
| Other Assets & Liabilities | –20.47 |
| Total | 100.00 |
| |
| Quantitative Value Fund | |
|
| Sector Weighting | % of Total |
| Basic Materials | 2.01 |
| Communications | 7.54 |
| Consumer, Cyclical | 6.74 |
| Consumer, Non-cyclical | 12.83 |
| Energy | 15.88 |
| Finance and Insurance | 0.90 |
| Financial | 35.60 |
| Government | 0.87 |
| Industrial | 5.86 |
| Mortgage Securities | 1.54 |
| Other Services (except | |
| Public Administration)* | 16.05 |
| Technology | 6.18 |
| Utilities | 4.64 |
| Other Assets & Liabilities | –16.64 |
| Total | 100.00 |
| |
| Real Estate Securities Fund | |
|
| Sector Weighting | % of Total |
| Consumer, Cyclical | 3.80 |
| Financial | 95.06 |
| Other Services (except | |
| Public Administration)* | 6.90 |
| Short-Term Securities | 1.07 |
| Other Assets & Liabilities | –6.83 |
| Total | 100.00 |
| Real Return Bond Fund | |
|
| Sector Weighting | % of Total |
| Asset Backed Securities | 0.11 |
| Basic Materials | 0.16 |
| Consumer, Cyclical | 0.02 |
| Energy | 0.09 |
| Financial | 1.12 |
| Government | 100.27 |
| Mortgage Securities | 4.43 |
| Other Services (except | |
| Public Administration)* | 50.74 |
| Short-Term Securities | 2.09 |
| Other Assets & Liabilities | –59.03 |
| Total | 100.00 |
| |
| Small Cap Fund | |
|
| Sector Weighting | % of Total |
| Basic Materials | 4.23 |
| Communications | 11.09 |
| Consumer, Cyclical | 14.46 |
| Consumer, Non-cyclical | 17.99 |
| Energy | 7.71 |
| Financial | 14.33 |
| Industrial | 16.31 |
| Other Services (except | |
| Public Administration)* | 44.04 |
| Short-Term Securities | 3.02 |
| Technology | 9.16 |
| Utilities | 1.64 |
| Other Assets & Liabilities | –43.98 |
| Total | 100.00 |
| |
| Small Cap Index Fund | |
|
| Sector Weighting | % of Total |
| Basic Materials | 3.63 |
| Communications | 8.79 |
| Consumer, Cyclical | 12.05 |
| Consumer, Non-cyclical | 18.03 |
| Diversified | 0.19 |
| Energy | 5.75 |
| Finance and Insurance | 3.11 |
| Financial | 19.32 |
| Government | 2.52 |
| Industrial | 13.94 |
| Mortgage Securities | 0.02 |
| Retail Trade | 0.04 |
| Technology | 10.22 |
| Utilities | 2.34 |
| Other Assets & Liabilities | 0.05 |
| Total | 100.00 |
| Small Cap Opportunities Fund |
|
| Sector Weighting | % of Total |
| Basic Materials | 2.99 |
| Communications | 2.26 |
| Consumer, Cyclical | 21.64 |
| Consumer, Non-cyclical | 6.84 |
| Energy | 8.64 |
| Financial | 25.32 |
| Industrial | 19.98 |
| Other Services (except | |
| Public Administration)* | 50.80 |
| Short-Term Securities | 5.10 |
| Technology | 5.64 |
| Utilities | 0.98 |
| Other Assets & Liabilities | –50.19 |
| Total | 100.00 |
| |
| Small Company Fund | |
|
| Sector Weighting | % of Total |
| Basic Materials | 5.18 |
| Communications | 4.66 |
| Consumer, Cyclical | 18.97 |
| Consumer, Non-cyclical | 17.70 |
| Energy | 5.29 |
| Financial | 13.78 |
| Industrial | 23.05 |
| Manufacturing | 0.23 |
| Other Services (except | |
| Public Administration)* | 40.79 |
| Short-Term Securities | 0.44 |
| Technology | 7.41 |
| Utilities | 3.49 |
| Other Assets & Liabilities | –40.99 |
| Total | 100.00 |
| |
| Small Company Growth Fund |
|
| Sector Weighting | % of Total |
| Basic Materials | 1.71 |
| Communications | 8.23 |
| Consumer, Cyclical | 15.69 |
| Consumer, Non-cyclical | 25.23 |
| Energy | 8.70 |
| Financial | 6.86 |
| Industrial | 16.77 |
| Short-Term Securities | 1.52 |
| Technology | 15.30 |
| Utilities | 0.24 |
| Other Assets & Liabilities | –0.25 |
| Total | 100.00 |
7
John Hancock Funds II
Sector Weightings
| Small Company Value Fund | |
|
| Sector Weighting | % of Total |
| Basic Materials | 7.46 |
| Communications | 3.50 |
| Consumer, Cyclical | 10.43 |
| Consumer, Non-cyclical | 12.84 |
| Energy | 8.76 |
| Financial | 19.56 |
| Funds | 0.85 |
| Industrial | 24.95 |
| Other Services (except | |
| Public Administration)* | 35.86 |
| Short-Term Securities | 3.91 |
| Technology | 4.52 |
| Utilities | 3.14 |
| Other Assets & Liabilities | –35.78 |
| Total | 100.00 |
| |
| Special Value Fund | |
|
| Sector Weighting | % of Total |
| Basic Materials | 5.07 |
| Communications | 1.22 |
| Consumer, Cyclical | 11.11 |
| Consumer, Non-cyclical | 10.77 |
| Energy | 4.25 |
| Financial | 24.20 |
| Funds | 6.07 |
| Industrial | 22.88 |
| Other Services (except | |
| Public Administration)* | 35.73 |
| Short-Term Securities | 10.01 |
| Technology | 7.96 |
| Utilities | 1.10 |
| Other Assets & Liabilities | –40.37 |
| Total | 100.00 |
| |
| Spectrum Income Fund | |
|
| Sector Weighting | % of Total |
| Asset Backed Securities | 1.35 |
| Basic Materials | 1.96 |
| Communications | 7.93 |
| Consumer, Cyclical | 4.61 |
| Consumer, Non-cyclical | 6.66 |
| Diversified | 0.28 |
| Energy | 4.84 |
| Financial | 8.97 |
| Government | 19.53 |
| Industrial | 5.21 |
| Mortgage Securities | 23.94 |
| Short-Term Securities | 9.67 |
| Technology | 1.85 |
| Utilities | 3.09 |
| Other Assets & Liabilities | 0.11 |
| Total | 100.00 |
| Strategic Bond Fund | |
|
| Sector Weighting | % of Total |
| Asset Backed Securities | 4.29 |
| Basic Materials | 1.22 |
| Communications | 5.97 |
| Consumer, Cyclical | 3.07 |
| Consumer, Non-cyclical | 3.52 |
| Diversified | 0.46 |
| Energy | 2.85 |
| Financial | 48.32 |
| Government | 20.82 |
| Industrial | 2.34 |
| Mortgage Securities | 37.72 |
| Other Services (except | |
| Public Administration)* | 19.73 |
| Retail Trade | 0.04 |
| Short-Term Securities | 2.67 |
| Technology | 0.35 |
| Utilities | 1.67 |
| Other Assets & Liabilities | –55.04 |
| Total | 100.00 |
| |
| Strategic Value Fund | |
|
| Sector Weighting | % of Total |
| Basic Materials | 3.99 |
| Communications | 24.90 |
| Consumer, Cyclical | 10.33 |
| Consumer, Non-cyclical | 12.62 |
| Energy | 9.69 |
| Financial | 23.54 |
| Industrial | 9.21 |
| Other Services (except | |
| Public Administration)* | 4.68 |
| Technology | 6.50 |
| Other Assets & Liabilities | –5.46 |
| Total | 100.00 |
| |
| Total Return Fund | |
|
| Sector Weighting | % of Total |
| Asset Backed Securities | 9.49 |
| Basic Materials | 2.72 |
| Communications | 0.15 |
| Consumer, Cyclical | 5.86 |
| Consumer, Non-cyclical | 0.41 |
| Energy | 0.08 |
| Financial | 12.18 |
| Funds | 2.69 |
| Government | 16.34 |
| Industrial | 3.56 |
| Mortgage Securities | 67.80 |
| Other Services (except | |
| Public Administration)* | 0.02 |
| Short-Term Securities | 12.35 |
| Technology | 0.24 |
| Utilities | 0.71 |
| Other Assets & Liabilities | –34.60 |
| Total | 100.00 |
| U.S. Global Leaders Growth Fund |
|
| Sector Weighting | % of Total |
| Communications | 3.89 |
| Consumer, Cyclical | 19.61 |
| Consumer, Non-cyclical | 41.41 |
| Financial | 7.36 |
| Industrial | 8.15 |
| Short-Term Securities | 3.05 |
| Technology | 18.66 |
| Other Assets & Liabilities | –2.13 |
| Total | 100.00 |
| |
| U.S. Government Securities Fund |
|
| Sector Weighting | % of Total |
| Financial | 15.67 |
| Government | 61.98 |
| Mortgage Securities | 76.11 |
| Short-Term Securities | 12.96 |
| Other Assets & Liabilities | –66.72 |
| Total | 100.00 |
| |
| U.S. High Yield Bond Fund | |
|
| Sector Weighting | % of Total |
| Basic Materials | 2.53 |
| Communications | 21.91 |
| Consumer, Cyclical | 16.94 |
| Consumer, Non-cyclical | 11.99 |
| Energy | 9.98 |
| Financial | 18.97 |
| Government | 0.28 |
| Industrial | 7.92 |
| Other Services (except | |
| Public Administration)* | 13.01 |
| Short-Term Securities | 6.62 |
| Technology | 2.56 |
| Utilities | 1.11 |
| Other Assets & Liabilities | –13.82 |
| Total | 100.00 |
| |
| U.S. Multi Sector Fund | |
|
| Sector Weighting | % of Total |
| Basic Materials | 0.17 |
| Communications | 7.39 |
| Consumer, Cyclical | 22.29 |
| Consumer, Non-cyclical | 30.20 |
| Energy | 4.44 |
| Financial | 11.72 |
| Government | 0.26 |
| Industrial | 5.50 |
| Mortgage Securities | 2.07 |
| Short-Term Securities | 4.96 |
| Technology | 9.88 |
| Utilities | 0.98 |
| Other Assets & Liabilities | 0.14 |
| Total | 100.00 |
8
John Hancock Funds II
Sector Weightings
|
| Value & Restructuring Fund | |
|
| Sector Weighting | % of Total |
| Basic Materials | 5.46 |
| Communications | 13.76 |
| Consumer, Cyclical | 10.70 |
| Consumer, Non-cyclical | 13.33 |
| Energy | 17.95 |
| Finance and Insurance | 0.19 |
| Financial | 20.79 |
| Industrial | 13.95 |
| Short-Term Securities | 0.95 |
| Technology | 0.49 |
| Utilities | 2.34 |
| Other Assets & Liabilities | 0.09 |
| Total | 100.00 |
| |
| Vista Fund | |
|
| Sector Weighting | % of Total |
| Basic Materials | 5.53 |
| Communications | 15.81 |
| Consumer, Cyclical | 6.23 |
| Consumer, Non-cyclical | 14.47 |
| Energy | 9.78 |
| Financial | 11.52 |
| Industrial | 25.10 |
| Other Services (except | |
| Public Administration)* | 21.96 |
| Short-Term Securities | 2.89 |
| Technology | 10.34 |
| Other Assets & Liabilities | –23.63 |
| Total | 100.00 |
*Includes investment in the Navigator Securities Lending Prime Portfolio using cash held as collateral for the Securities Lending program.
Percentages are based on net assets as of 2-28-06.
9
John Hancock Funds II
Understanding Your Fund’s Expenses
|
As a John Hancock Funds II mutual fund investor, you pay ongoing expenses, such as management fees, distribution fees (12b-1) and other expenses. Using the information below, you can estimate how these expenses affect your investment and compare them with the expenses of other funds. This example is intended to help you understand your ongoing costs (in dollars) of investing in each Fund and to compare these costs with the ongoing costs of investing in other mutual funds.
Actual Expenses
The first table for each Fund shows the actual account values and actual Fund expenses you would have paid on a $1,000 investment in the Fund held from inception through Feburary 28, 2006. It also shows how much a $1,000 investment would be at the close of the period, assuming actual Fund returns and expenses. To estimate the expenses that you paid over the period, simply divide your account value by $1,000 (for example, an $8,600 account value divided by $1,000 = 8.6) and multiply the result by the number in the “Expenses Paid During Period” row as shown below for your Classes.
Hypothetical Example for Comparison Purposes
The second table for each Fund provides information about hypothetical account values and hypothetical expenses based on the Fund’s actual expense ratios and an assumed rate of return of 5% per year before expenses, which is not each Fund’s actual return. The hypothetical account values and expenses may not be used to estimate the actual ending account balance or expenses you paid on your investment for the period. You may use this information to compare the ongoing costs of investing in each Fund and other funds. To do so, compare this 5% hypothetical example with the 5% hypothetical examples that appear in the shareholder reports of the other funds.
Please note that the expenses shown in the tables are meant to highlight your ongoing costs only and do not reflect any transactional costs. Therefore, the second table for each Fund is useful in comparing ongoing costs only and will not help you determine the relative total costs of owning different Funds. In addition, if these transactional costs were included, your costs would have been higher.
| 500 Index | | |
|
| Actual Fund Return | | Class NAV |
| Beginning Account Value 10/29/2005 | | $1,000.00 |
| Ending Account Value 2/28/2006 | | 1,074.10 |
| Expenses Paid During Period* | | 1.76 |
|
| Hypothetical 5% Fund Return | | Class NAV |
| Beginning Account Value 10/29/2005 | | $1,000.00 |
| Ending Account Value 2/28/2006 | | 1,015.10 |
| Expenses Paid During Period* | | 1.71 |
|
| Annualized Expense Ratios | | Class NAV |
| | | 0.50% |
| Active Bond | | |
|
| Actual Fund Return | Class 1# | Class NAV# |
| Beginning Account Value 10/15/2005 and 10/27/2005 | $1,000.00 | $1,000.00 |
| Ending Account Value 2/28/2006 | 1,012.40 | 1,015.00 |
| Expenses Paid During Period* | 2.82 | 2.42 |
|
| Hypothetical 5% Fund Return | Class 1# | Class NAV# |
| Beginning Account Value 10/15/2005 and 10/27/2005 | $1,000.00 | $1,000.00 |
| Ending Account Value 2/28/2006 | 1,016.00 | 1,014.60 |
| Expenses Paid During Period* | 2.82 | 2.42 |
|
| Annualized Expense Ratios | Class 1# | Class NAV# |
| | 0.75% | 0.70% |
| # Class 1 and Class NAV shares began operations on 10/15/2005 and 10/27/2005, respectively. | | |
10
John Hancock Funds II
Understanding Your Fund’s Expenses
|
| All Cap Growth | | |
|
| Actual Fund Return | Class 1 | Class NAV |
| Beginning Account Value 10/15/2005 | $1,000.00 | $1,000.00 |
| Ending Account Value 2/28/2006 | 1,111.50 | 1,112.10 |
| Expenses Paid During Period* | 4.01 | 3.80 |
|
| Hypothetical 5% Fund Return | Class 1 | Class NAV |
| Beginning Account Value 10/15/2005 | $1,000.00 | $1,000.00 |
| Ending Account Value 2/28/2006 | 1,015.00 | 1,015.20 |
| Expenses Paid During Period* | 3.83 | 3.63 |
|
| Annualized Expense Ratios | Class 1 | Class NAV |
| | 1.01% | 0.96% |
| All Cap Value | | |
|
| Actual Fund Return | Class 1 | Class NAV |
| Beginning Account Value 10/15/2005 | $1,000.00 | $1,000.00 |
| Ending Account Value 2/28/2006 | 1,118.10 | 1,118.60 |
| Expenses Paid During Period* | 3.71 | 3.50 |
|
| Hypothetical 5% Fund Return | Class 1 | Class NAV |
| Beginning Account Value 10/15/2005 | $1,000.00 | $1,000.00 |
| Ending Account Value 2/28/2006 | 1,015.30 | 1,015.50 |
| Expenses Paid During Period* | 3.53 | 3.33 |
|
| Annualized Expense Ratios | Class 1 | Class NAV |
| | 0.94% | 0.89% |
| Blue Chip Growth | | |
|
| Actual Fund Return | Class 1 | Class NAV |
| Beginning Account Value 10/15/2005 | $1,000.00 | $1,000.00 |
| Ending Account Value 2/28/2006 | 1,095.80 | 1,096.00 |
| Expenses Paid During Period* | 3.46 | 3.35 |
|
| Hypothetical 5% Fund Return | Class 1 | Class NAV |
| Beginning Account Value 10/15/2005 | $1,000.00 | $1,000.00 |
| Ending Account Value 2/28/2006 | 1,015.50 | 1,015.60 |
| Expenses Paid During Period* | 3.33 | 3.22 |
|
| Annualized Expense Ratios | Class 1 | Class NAV |
| | 0.89% | 0.84% |
11
John Hancock Funds II
Understanding Your Fund’s Expenses
|
| Capital Appreciation | | |
|
| Actual Fund Return | Class 1 | Class NAV |
| Beginning Account Value 10/15/2005 | $1,000.00 | $1,000.00 |
| Ending Account Value 2/28/2006 | 1,102.20 | 1,103.30 |
| Expenses Paid During Period* | 3.68 | 3.47 |
|
| Hypothetical 5% Fund Return | Class 1 | Class NAV |
| Beginning Account Value 10/15/2005 | $1,000.00 | $1,000.00 |
| Ending Account Value 2/28/2006 | 1,015.30 | 1,015.50 |
| Expenses Paid During Period* | 3.53 | 3.33 |
|
| Annualized Expense Ratios | Class 1 | Class NAV |
| | 0.93% | 0.88% |
| Core Bond | | |
|
| Actual Fund Return | Class 1 | Class NAV |
| Beginning Account Value 10/15/2005 | $1,000.00 | $1,000.00 |
| Ending Account Value 2/28/2006 | 1,012.60 | 1,012.80 |
| Expenses Paid During Period* | 3.22 | 3.12 |
|
| Hypothetical 5% Fund Return | Class 1 | Class NAV |
| Beginning Account Value 10/15/2005 | $1,000.00 | $1,000.00 |
| Ending Account Value 2/28/2006 | 1,015.50 | 1,015.70 |
| Expenses Paid During Period* | 3.33 | 3.12 |
|
| Annualized Expense Ratios | Class 1 | Class NAV |
| | 0.88% | 0.83% |
| Core Equity | | |
|
| Actual Fund Return | Class 1 | Class NAV |
| Beginning Account Value 10/15/2005 | $1,000.00 | $1,000.00 |
| Ending Account Value 2/28/2006 | 1,084.30 | 1,085.00 |
| Expenses Paid During Period* | 3.44 | 3.23 |
|
| Hypothetical 5% Fund Return | Class 1 | Class NAV |
| Beginning Account Value 10/15/2005 | $1,000.00 | $1,000.00 |
| Ending Account Value 2/28/2006 | 1,015.50 | 1,015.70 |
| Expenses Paid During Period* | 3.33 | 3.12 |
|
| Annualized Expense Ratios | Class 1 | Class NAV |
| | 0.88% | 0.83% |
12
John Hancock Funds II
Understanding Your Fund’s Expenses
|
| Emerging Growth | | |
|
| Actual Fund Return | Class 1 | Class NAV |
| Beginning Account Value 10/15/2005 | $1,000.00 | $1,000.00 |
| Ending Account Value 2/28/2006 | 1,174.90 | 1,174.90 |
| Expenses Paid During Period* | 3.81 | 3.59 |
|
| Hypothetical 5% Fund Return | Class 1 | Class NAV |
| Beginning Account Value 10/15/2005 | $1,000.00 | $1,000.00 |
| Ending Account Value 2/28/2006 | 1,015.30 | 1,015.50 |
| Expenses Paid During Period* | 3.53 | 3.33 |
|
| Annualized Expense Ratios | Class 1 | Class NAV |
| | 0.92% | 0.87% |
| Emerging Small Company | | |
|
| Actual Fund Return | Class 1 | |
| Beginning Account Value 10/15/2005 | $1,000.00 | |
| Ending Account Value 2/28/2006 | 1,168.60 | |
| Expenses Paid During Period* | 4.77 | |
|
| Hypothetical 5% Fund Return | Class 1 | |
| Beginning Account Value 10/15/2005 | $1,000.00 | |
| Ending Account Value 2/28/2006 | 1,014.40 | |
| Expenses Paid During Period* | 4.43 | |
|
| Annualized Expense Ratios | Class 1 | |
| | 1.18% | |
| Equity-Income | | |
|
| Actual Fund Return | Class 1 | Class NAV |
| Beginning Account Value 10/15/2005 | $1,000.00 | $1,000.00 |
| Ending Account Value 2/28/2006 | 1,090.70 | 1,090.90 |
| Expenses Paid During Period* | 3.45 | 3.35 |
|
| Hypothetical 5% Fund Return | Class 1 | Class NAV |
| Beginning Account Value 10/15/2005 | $1,000.00 | $1,000.00 |
| Ending Account Value 2/28/2006 | 1,015.50 | 1,015.60 |
| Expenses Paid During Period* | 3.33 | 3.22 |
|
| Annualized Expense Ratios | Class 1 | Class NAV |
| | 0.89% | 0.84% |
13
John Hancock Funds II
Understanding Your Fund’s Expenses
|
| Fundamental Value | | |
|
| Actual Fund Return | Class 1 | Class NAV |
| Beginning Account Value 10/15/2005 | $1,000.00 | $1,000.00 |
| Ending Account Value 2/28/2006 | 1,071.30 | 1,071.60 |
| Expenses Paid During Period* | 3.42 | 3.21 |
|
| Hypothetical 5% Fund Return | Class 1 | Class NAV |
| Beginning Account Value 10/15/2005 | $1,000.00 | $1,000.00 |
| Ending Account Value 2/28/2006 | 1,015.50 | 1,015.70 |
| Expenses Paid During Period* | 3.33 | 3.12 |
|
| Annualized Expense Ratios | Class 1 | Class NAV |
| | 0.87% | 0.82% |
| Global Bond | | |
|
| Actual Fund Return | Class 1 | Class NAV |
| Beginning Account Value 10/15/2005 | $1,000.00 | $1,000.00 |
| Ending Account Value 2/28/2006 | 992.80 | 993.60 |
| Expenses Paid During Period* | 3.19 | 2.99 |
|
| Hypothetical 5% Fund Return | Class 1 | Class NAV |
| Beginning Account Value 10/15/2005 | $1,000.00 | $1,000.00 |
| Ending Account Value 2/28/2006 | 1,015.60 | 1,015.80 |
| Expenses Paid During Period* | 3.22 | 3.02 |
|
| Annualized Expense Ratios | Class 1 | Class NAV |
| | 0.85% | 0.80% |
| High Yield | | |
|
| Actual Fund Return | Class 1 | Class NAV |
| Beginning Account Value 10/15/2005 | $1,000.00 | $1,000.00 |
| Ending Account Value 2/28/2006 | 1,045.70 | 1,045.00 |
| Expenses Paid During Period* | 2.97 | 2.76 |
|
| Hypothetical 5% Fund Return | Class 1 | Class NAV |
| Beginning Account Value 10/15/2005 | $1,000.00 | $1,000.00 |
| Ending Account Value 2/28/2006 | 1,015.90 | 1,016.10 |
| Expenses Paid During Period* | 2.92 | 2.72 |
|
| Annualized Expense Ratios | Class 1 | Class NAV |
| | 0.78% | 0.73% |
14
John Hancock Funds II
Understanding Your Fund’s Expenses
|
| International Equity Index | | |
|
| Actual Fund Return | | Class NAV |
| Beginning Account Value 10/29/2005 | | $1,000.00 |
| Ending Account Value 2/28/2006 | | 1,145.90 |
| Expenses Paid During Period* | | 2.15 |
|
| Hypothetical 5% Fund Return | | Class NAV |
| Beginning Account Value 10/29/2005 | | $1,000.00 |
| Ending Account Value 2/28/2006 | | 1,014.80 |
| Expenses Paid During Period* | | 2.01 |
|
| Annualized Expense Ratios | | Class NAV |
| | | 0.59% |
| International Opportunities | | |
|
| Actual Fund Return | Class 1 | Class NAV |
| Beginning Account Value 10/15/2005 | $1,000.00 | $1,000.00 |
| Ending Account Value 2/28/2006 | 1,193.10 | 1,193.90 |
| Expenses Paid During Period* | 4.61 | 4.39 |
|
| Hypothetical 5% Fund Return | Class 1 | Class NAV |
| Beginning Account Value 10/15/2005 | $1,000.00 | $1,000.00 |
| Ending Account Value 2/28/2006 | 1,014.60 | 1,014.80 |
| Expenses Paid During Period* | 4.23 | 4.03 |
|
| Annualized Expense Ratios | Class 1 | Class NAV |
| | 1.11% | 1.06% |
| International Small Cap | | |
|
| Actual Fund Return | Class 1 | Class NAV |
| Beginning Account Value 10/15/2005 | $1,000.00 | $1,000.00 |
| Ending Account Value 2/28/2006 | 1,107.60 | 1,109.20 |
| Expenses Paid During Period* | 4.64 | 4.43 |
|
| Hypothetical 5% Fund Return | Class 1 | Class NAV |
| Beginning Account Value 10/15/2005 | $1,000.00 | $1,000.00 |
| Ending Account Value 2/28/2006 | 1,014.40 | 1,014.60 |
| Expenses Paid During Period* | 4.43 | 4.23 |
|
| Annualized Expense Ratios | Class 1 | Class NAV |
| | 1.17% | 1.12% |
15
John Hancock Funds II
Understanding Your Fund’s Expenses
|
| International Stock | | |
|
| Actual Fund Return | Class 1 | Class NAV |
| Beginning Account Value 10/15/2005 | $1,000.00 | $1,000.00 |
| Ending Account Value 2/28/2006 | 1,132.30 | 1,133.80 |
| Expenses Paid During Period* | 4.37 | 4.16 |
|
| Hypothetical 5% Fund Return | Class 1 | Class NAV |
| Beginning Account Value 10/15/2005 | $1,000.00 | $1,000.00 |
| Ending Account Value 2/28/2006 | 1,014.70 | 1,014.90 |
| Expenses Paid During Period* | 4.13 | 3.93 |
|
| Annualized Expense Ratios | Class 1 | Class NAV |
| | 1.09% | 1.04% |
| International Value | | |
|
| Actual Fund Return | Class 1 | Class NAV |
| Beginning Account Value 10/15/2005 | $1,000.00 | $1,000.00 |
| Ending Account Value 2/28/2006 | 1,091.10 | 1,091.50 |
| Expenses Paid During Period* | 3.97 | 3.76 |
|
| Hypothetical 5% Fund Return | Class 1 | Class NAV |
| Beginning Account Value 10/15/2005 | $1,000.00 | $1,000.00 |
| Ending Account Value 2/28/2006 | 1,015.00 | 1,015.20 |
| Expenses Paid During Period* | 3.83 | 3.63 |
|
| Annualized Expense Ratios | Class 1 | Class NAV |
| | 1.00% | 0.95% |
| Investment Quality Bond | | |
|
| Actual Fund Return | Class 1 | Class NAV |
| Beginning Account Value 10/15/2005 | $1,000.00 | $1,000.00 |
| Ending Account Value 2/28/2006 | 1,013.70 | 1,013.80 |
| Expenses Paid During Period* | 3.12 | 2.92 |
|
| Hypothetical 5% Fund Return | Class 1 | Class NAV |
| Beginning Account Value 10/15/2005 | $1,000.00 | $1,000.00 |
| Ending Account Value 2/28/2006 | 1,015.70 | 1,015.90 |
| Expenses Paid During Period* | 3.12 | 2.92 |
|
| Annualized Expense Ratios | Class 1 | Class NAV |
| | 0.83% | 0.78% |
16
John Hancock Funds II
Understanding Your Fund’s Expenses
|
| Large Cap | | |
|
| Actual Fund Return | Class 1 | Class NAV |
| Beginning Account Value 10/15/2005 | $1,000.00 | $1,000.00 |
| Ending Account Value 2/28/2006 | 1,091.50 | 1,091.20 |
| Expenses Paid During Period* | 3.76 | 3.56 |
|
| Hypothetical 5% Fund Return | Class 1 | Class NAV |
| Beginning Account Value 10/15/2005 | $1,000.00 | $1,000.00 |
| Ending Account Value 2/28/2006 | 1,015.20 | 1,015.40 |
| Expenses Paid During Period* | 3.63 | 3.43 |
|
| Annualized Expense Ratios | Class 1 | Class NAV |
| | 0.95% | 0.90% |
| Large Cap Value | | |
|
| Actual Fund Return | Class 1 | Class NAV |
| Beginning Account Value 10/15/2005 | $1,000.00 | $1,000.00 |
| Ending Account Value 2/28/2006 | 1,103.70 | 1,104.20 |
| Expenses Paid During Period* | 3.79 | 3.58 |
|
| Hypothetical 5% Fund Return | Class 1 | Class NAV |
| Beginning Account Value 10/15/2005 | $1,000.00 | $1,000.00 |
| Ending Account Value 2/28/2006 | 1,015.20 | 1,015.40 |
| Expenses Paid During Period* | 3.63 | 3.43 |
|
| Annualized Expense Ratios | Class 1 | Class NAV |
| | 0.96% | 0.91% |
| Mid Cap Core | | |
|
| Actual Fund Return | Class 1 | Class NAV |
| Beginning Account Value 10/15/2005 | $1,000.00 | $1,000.00 |
| Ending Account Value 2/28/2006 | 1,104.90 | 1,105.10 |
| Expenses Paid During Period* | 3.89 | 3.68 |
|
| Hypothetical 5% Fund Return | Class 1 | Class NAV |
| Beginning Account Value 10/15/2005 | $1,000.00 | $1,000.00 |
| Ending Account Value 2/28/2006 | 1,015.10 | 1,015.30 |
| Expenses Paid During Period* | 3.73 | 3.53 |
|
| Annualized Expense Ratios | Class 1 | Class NAV |
| | 0.99% | 0.94% |
17
John Hancock Funds II
Understanding Your Fund’s Expenses
|
| Mid Cap Index | | |
|
| Actual Fund Return | | Class NAV |
| Beginning Account Value 10/29/2005 | | $1,000.00 |
| Ending Account Value 2/28/2006 | | 1,123.50 |
| Expenses Paid During Period* | | 2.02 |
|
| Hypothetical 5% Fund Return | | Class NAV |
| Beginning Account Value 10/29/2005 | | $1,000.00 |
| Ending Account Value 2/28/2006 | | 1,014.90 |
| Expenses Paid During Period* | | 1.91 |
|
| Annualized Expense Ratios | | Class NAV |
| | | 0.55% |
| Mid Cap Stock | | |
|
| Actual Fund Return | Class 1 | Class NAV |
| Beginning Account Value 10/15/2005 | $1,000.00 | $1,000.00 |
| Ending Account Value 2/28/2006 | 1,181.00 | 1,181.70 |
| Expenses Paid During Period* | 3.93 | 3.71 |
|
| Hypothetical 5% Fund Return | Class 1 | Class NAV |
| Beginning Account Value 10/15/2005 | $1,000.00 | $1,000.00 |
| Ending Account Value 2/28/2006 | 1,015.20 | 1,015.40 |
| Expenses Paid During Period* | 3.63 | 3.43 |
|
| Annualized Expense Ratios | Class 1 | Class NAV |
| | 0.95% | 0.90% |
| Mid Cap Value | | |
|
| Actual Fund Return | Class 1 | Class NAV |
| Beginning Account Value 10/15/2005 | $1,000.00 | $1,000.00 |
| Ending Account Value 2/28/2006 | 1,086.40 | 1,086.60 |
| Expenses Paid During Period* | 3.76 | 3.65 |
|
| Hypothetical 5% Fund Return | Class 1 | Class NAV |
| Beginning Account Value 10/15/2005 | $1,000.00 | $1,000.00 |
| Ending Account Value 2/28/2006 | 1,015.20 | 1,015.30 |
| Expenses Paid During Period* | 3.63 | 3.53 |
|
| Annualized Expense Ratios | Class 1 | Class NAV |
| | 0.97% | 0.92% |
18
John Hancock Funds II
Understanding Your Fund’s Expenses
|
| Natural Resources | | |
|
| Actual Fund Return | Class 1 | Class NAV |
| Beginning Account Value 10/15/2005 | $1,000.00 | $1,000.00 |
| Ending Account Value 2/28/2006 | 1,160.10 | 1,160.40 |
| Expenses Paid During Period* | 4.54 | 4.43 |
|
| Hypothetical 5% Fund Return | Class 1 | Class NAV |
| Beginning Account Value 10/15/2005 | $1,000.00 | $1,000.00 |
| Ending Account Value 2/28/2006 | 1,014.60 | 1,014.70 |
| Expenses Paid During Period* | 4.23 | 4.13 |
|
| Annualized Expense Ratios | Class 1 | Class NAV |
| | 1.13% | 1.08% |
| Quantitative Mid Cap | | |
|
| Actual Fund Return | Class 1# | Class NAV# |
| Beginning Account Value 10/15/2005 and 10/27/2005 | $1,000.00 | $1,000.00 |
| Ending Account Value 2/28/2006 | 1,140.80 | 1,143.50 |
| Expenses Paid During Period* | 3.43 | 2.89 |
|
| Hypothetical 5% Fund Return | Class 1# | Class NAV# |
| Beginning Account Value 10/15/2005 and 10/27/2005 | $1,000.00 | $1,000.00 |
| Ending Account Value 2/28/2006 | 1,015.60 | 1,014.30 |
| Expenses Paid During Period* | 3.22 | 2.72 |
|
| Annualized Expense Ratios | Class 1# | Class NAV# |
| | 0.84% | 0.79% |
| # Class 1 and Class NAV shares began operations on 10/15/2005 and 10/27/2005, respectively. | | |
Quantitative Value | | |
|
| Actual Fund Return | Class 1 | Class NAV |
| Beginning Account Value 10/15/2005 | $1,000.00 | $1,000.00 |
| Ending Account Value 2/28/2006 | 1,122.80 | 1,122.80 |
| Expenses Paid During Period* | 3.18 | 2.97 |
|
| Hypothetical 5% Fund Return | Class 1 | Class NAV |
| Beginning Account Value 10/15/2005 | $1,000.00 | $1,000.00 |
| Ending Account Value 2/28/2006 | 1,015.80 | 1,016.00 |
| Expenses Paid During Period* | 3.02 | 2.82 |
|
| Annualized Expense Ratios | Class 1 | Class NAV |
| | 0.80% | 0.75% |
19
John Hancock Funds II
Understanding Your Fund’s Expenses
|
| Real Estate Securities | | |
|
| Actual Fund Return | Class 1 | Class NAV |
| Beginning Account Value 10/15/2005 | $1,000.00 | $1,000.00 |
| Ending Account Value 2/28/2006 | 1,172.30 | 1,172.70 |
| Expenses Paid During Period* | 3.26 | 3.04 |
|
| Hypothetical 5% Fund Return | Class 1 | Class NAV |
| Beginning Account Value 10/15/2005 | $1,000.00 | $1,000.00 |
| Ending Account Value 2/28/2006 | 1,015.80 | 1,016.00 |
| Expenses Paid During Period* | 3.02 | 2.82 |
|
| Annualized Expense Ratios | Class 1 | Class NAV |
| | 0.79% | 0.74% |
| Real Return Bond | | |
|
| Actual Fund Return | Class 1 | Class NAV |
| Beginning Account Value 10/15/2005 | $1,000.00 | $1,000.00 |
| Ending Account Value 2/28/2006 | 1,008.70 | 1,008.80 |
| Expenses Paid During Period* | 3.01 | 2.81 |
|
| Hypothetical 5% Fund Return | Class 1 | Class NAV |
| Beginning Account Value 10/15/2005 | $1,000.00 | $1,000.00 |
| Ending Account Value 2/28/2006 | 1,015.80 | 1,016.00 |
| Expenses Paid During Period* | 3.02 | 2.82 |
|
| Annualized Expense Ratios | Class 1 | Class NAV |
| | 0.80% | 0.75% |
| Small Cap | | |
|
| Actual Fund Return | Class 1 | Class NAV |
| Beginning Account Value 10/15/2005 | $1,000.00 | $1,000.00 |
| Ending Account Value 2/28/2006 | 1,122.80 | 1,123.40 |
| Expenses Paid During Period* | 3.82 | 3.61 |
|
| Hypothetical 5% Fund Return | Class 1 | Class NAV |
| Beginning Account Value 10/15/2005 | $1,000.00 | $1,000.00 |
| Ending Account Value 2/28/2006 | 1,015.20 | 1,015.40 |
| Expenses Paid During Period* | 3.63 | 3.43 |
|
| Annualized Expense Ratios | Class 1 | Class NAV |
| | 0.95% | 0.90% |
20
John Hancock Funds II
Understanding Your Fund’s Expenses
|
| Small Cap Index | | |
|
| Actual Fund Return | | Class NAV |
| Beginning Account Value 10/29/2005 | | $1,000.00 |
| Ending Account Value 2/28/2006 | | 1,149.70 |
| Expenses Paid During Period* | | 2.04 |
|
| Hypothetical 5% Fund Return | | Class NAV |
| Beginning Account Value 10/29/2005 | | $1,000.00 |
| Ending Account Value 2/28/2006 | | 1,014.90 |
| Expenses Paid During Period* | | 1.91 |
|
| Annualized Expense Ratios | | Class NAV |
| | | 0.55% |
| Small Cap Opportunities | | |
|
| Actual Fund Return | Class 1 | Class NAV |
| Beginning Account Value 10/15/2005 | $1,000.00 | $1,000.00 |
| Ending Account Value 2/28/2006 | 1,132.10 | 1,132.40 |
| Expenses Paid During Period* | 4.37 | 4.16 |
|
| Hypothetical 5% Fund Return | Class 1 | Class NAV |
| Beginning Account Value 10/15/2005 | $1,000.00 | $1,000.00 |
| Ending Account Value 2/28/2006 | 1,014.70 | 1,014.90 |
| Expenses Paid During Period* | 4.13 | 3.93 |
|
| Annualized Expense Ratios | Class 1 | Class NAV |
| | 1.09% | 1.04% |
| Small Company | | |
|
| Actual Fund Return | Class 1 | Class NAV |
| Beginning Account Value 10/15/2005 | $1,000.00 | $1,000.00 |
| Ending Account Value 2/28/2006 | 1,123.40 | 1,124.00 |
| Expenses Paid During Period* | 5.41 | 5.20 |
|
| Hypothetical 5% Fund Return | Class 1 | Class NAV |
| Beginning Account Value 10/15/2005 | $1,000.00 | $1,000.00 |
| Ending Account Value 2/28/2006 | 1,013.70 | 1,013.90 |
| Expenses Paid During Period* | 5.13 | 4.93 |
|
| Annualized Expense Ratios | Class 1 | Class NAV |
| | 1.36% | 1.31% |
21
John Hancock Funds II
Understanding Your Fund’s Expenses
|
| Small Company Growth | | |
|
| Actual Fund Return | | Class NAV |
| Beginning Account Value 10/29/2005 | | $1,000.00 |
| Ending Account Value 2/28/2006 | | 1,140.00 |
| Expenses Paid During Period* | | 4.07 |
|
| Hypothetical 5% Fund Return | | Class NAV |
| Beginning Account Value 10/29/2005 | | $1,000.00 |
| Ending Account Value 2/28/2006 | | 1,013.60 |
| Expenses Paid During Period* | | 3.83 |
|
| Annualized Expense Ratios | | Class NAV |
| | | 1.09% |
| Small Company Value | | |
|
| Actual Fund Return | Class 1 | Class NAV |
| Beginning Account Value 10/15/2005 | $1,000.00 | $1,000.00 |
| Ending Account Value 2/28/2006 | 1,148.80 | 1,149.10 |
| Expenses Paid During Period* | 4.41 | 4.19 |
|
| Hypothetical 5% Fund Return | Class 1 | Class NAV |
| Beginning Account Value 10/15/2005 | $1,000.00 | $1,000.00 |
| Ending Account Value 2/28/2006 | 1,014.70 | 1,014.90 |
| Expenses Paid During Period* | 4.13 | 3.93 |
|
| Annualized Expense Ratios | Class 1 | Class NAV |
| | 1.10% | 1.05% |
| Special Value | | |
|
| Actual Fund Return | Class 1 | Class NAV |
| Beginning Account Value 10/15/2005 | $1,000.00 | $1,000.00 |
| Ending Account Value 2/28/2006 | 1,112.50 | 1,113.40 |
| Expenses Paid During Period* | 4.44 | 4.23 |
|
| Hypothetical 5% Fund Return | Class 1 | Class NAV |
| Beginning Account Value 10/15/2005 | $1,000.00 | $1,000.00 |
| Ending Account Value 2/28/2006 | 1,014.60 | 1,014.80 |
| Expenses Paid During Period* | 4.23 | 4.03 |
|
| Annualized Expense Ratios | Class 1 | Class NAV |
| | 1.12% | 1.07% |
22
John Hancock Funds II
Understanding Your Fund’s Expenses
|
| Spectrum Income | | |
|
| Actual Fund Return | | Class NAV |
| Beginning Account Value 10/29/2005 | | $1,000.00 |
| Ending Account Value 2/28/2006 | | 1,031.90 |
| Expenses Paid During Period* | | 3.25 |
|
| Hypothetical 5% Fund Return | | Class NAV |
| Beginning Account Value 10/29/2005 | | $1,000.00 |
| Ending Account Value 2/28/2006 | | 1,014.20 |
| Expenses Paid During Period* | | 3.22 |
|
| Annualized Expense Ratios | | Class NAV |
| | | 0.93% |
| Strategic Bond | | |
|
| Actual Fund Return | Class 1 | Class NAV |
| Beginning Account Value 10/15/2005 | $1,000.00 | $1,000.00 |
| Ending Account Value 2/28/2006 | 1,023.30 | 1,023.40 |
| Expenses Paid During Period* | 3.03 | 2.93 |
|
| Hypothetical 5% Fund Return | Class 1 | Class NAV |
| Beginning Account Value 10/15/2005 | $1,000.00 | $1,000.00 |
| Ending Account Value 2/28/2006 | 1,015.80 | 1,015.90 |
| Expenses Paid During Period* | 3.02 | 2.92 |
|
| Annualized Expense Ratios | Class 1 | Class NAV |
| | 0.81% | 0.76% |
| Strategic Value | | |
|
| Actual Fund Return | Class 1 | Class NAV |
| Beginning Account Value 10/15/2005 | $1,000.00 | $1,000.00 |
| Ending Account Value 2/28/2006 | 1,062.80 | 1,063.20 |
| Expenses Paid During Period* | 3.71 | 3.51 |
|
| Hypothetical 5% Fund Return | Class 1 | Class NAV |
| Beginning Account Value 10/15/2005 | $1,000.00 | $1,000.00 |
| Ending Account Value 2/28/2006 | 1,015.20 | 1,015.40 |
| Expenses Paid During Period* | 3.63 | 3.43 |
|
| Annualized Expense Ratios | Class 1 | Class NAV |
| | 0.96% | 0.91% |
23
John Hancock Funds II
Understanding Your Fund’s Expenses
|
| Total Return | | |
|
| Actual Fund Return | Class 1 | Class NAV |
| Beginning Account Value 10/15/2005 | $1,000.00 | $1,000.00 |
| Ending Account Value 2/28/2006 | 1,014.00 | 1,014.10 |
| Expenses Paid During Period* | 3.12 | 2.92 |
|
| Hypothetical 5% Fund Return | Class 1 | Class NAV |
| Beginning Account Value 10/15/2005 | $1,000.00 | $1,000.00 |
| Ending Account Value 2/28/2006 | 1,015.70 | 1,015.90 |
| Expenses Paid During Period* | 3.12 | 2.92 |
|
| Annualized Expense Ratios | Class 1 | Class NAV |
| | 0.83% | 0.78% |
| U.S. Global Leaders Growth | | |
|
| Actual Fund Return | Class 1 | Class NAV |
| Beginning Account Value 10/15/2005 | $1,000.00 | $1,000.00 |
| Ending Account Value 2/28/2006 | 1,045.00 | 1,045.10 |
| Expenses Paid During Period* | 3.07 | 2.86 |
|
| Hypothetical 5% Fund Return | Class 1 | Class NAV |
| Beginning Account Value 10/15/2005 | $1,000.00 | $1,000.00 |
| Ending Account Value 2/28/2006 | 1,015.80 | 1,016.00 |
| Expenses Paid During Period* | 3.02 | 2.82 |
|
| Annualized Expense Ratios | Class 1 | Class NAV |
| | 0.79% | 0.74% |
| U.S. Government Securities | | |
|
| Actual Fund Return | Class 1 | Class NAV |
| Beginning Account Value 10/15/2005 | $1,000.00 | $1,000.00 |
| Ending Account Value 2/28/2006 | 1,013.70 | 1,013.80 |
| Expenses Paid During Period* | 2.92 | 2.72 |
|
| Hypothetical 5% Fund Return | Class 1 | Class NAV |
| Beginning Account Value 10/15/2005 | $1,000.00 | $1,000.00 |
| Ending Account Value 2/28/2006 | 1,015.90 | 1,016.10 |
| Expenses Paid During Period* | 2.92 | 2.72 |
|
| Annualized Expense Ratios | Class 1 | Class NAV |
| | 0.77% | 0.72% |
24
John Hancock Funds II
Understanding Your Fund’s Expenses
|
| U.S. High Yield Bond | | |
|
| Actual Fund Return | Class 1 | Class NAV |
| Beginning Account Value 10/15/2005 | $1,000.00 | $1,000.00 |
| Ending Account Value 2/28/2006 | 1,041.40 | 1,041.50 |
| Expenses Paid During Period* | 3.27 | 3.06 |
|
| Hypothetical 5% Fund Return | Class 1 | Class NAV |
| Beginning Account Value 10/15/2005 | $1,000.00 | $1,000.00 |
| Ending Account Value 2/28/2006 | 1,015.60 | 1,015.80 |
| Expenses Paid During Period* | 3.22 | 3.02 |
|
| Annualized Expense Ratios | Class 1 | Class NAV |
| | 0.86% | 0.81% |
| U.S. Multi Sector | | |
|
| Actual Fund Return | | Class NAV |
| Beginning Account Value 10/29/2005 | | $1,000.00 |
| Ending Account Value 2/28/2006 | | 1,065.50 |
| Expenses Paid During Period* | | 2.99 |
|
| Hypothetical 5% Fund Return | | Class NAV |
| Beginning Account Value 10/29/2005 | | $1,000.00 |
| Ending Account Value 2/28/2006 | | 1,014.50 |
| Expenses Paid During Period* | | 2.92 |
|
| Annualized Expense Ratios | | Class NAV |
| | | 0.82% |
| Value & Restructuring | | |
|
| Actual Fund Return | | Class NAV |
| Beginning Account Value 10/29/2005 | | $1,000.00 |
| Ending Account Value 2/28/2006 | | 1,120.70 |
| Expenses Paid During Period* | | 3.29 |
|
| Hypothetical 5% Fund Return | | Class NAV |
| Beginning Account Value 10/29/2005 | | $1,000.00 |
| Ending Account Value 2/28/2006 | | 1,014.30 |
| Expenses Paid During Period* | | 3.12 |
|
| Annualized Expense Ratios | | Class NAV |
| | | 0.90% |
25
John Hancock Funds II
Understanding Your Fund’s Expenses
|
| Vista | |
|
| Actual Fund Return | Class NAV |
| Beginning Account Value 10/29/2005 | $1,000.00 |
| Ending Account Value 2/28/2006 | 1,128.00 |
| Expenses Paid During Period* | 3.62 |
|
| Hypothetical 5% Fund Return | Class NAV |
| Beginning Account Value 10/29/2005 | $1,000.00 |
| Ending Account Value 2/28/2006 | 1,014.00 |
| Expenses Paid During Period* | 3.42 |
|
| Annualized Expense Ratios | Class NAV |
| | 0.99% |
* Expenses are equal to the Fund’s annualized expenses ratio for each respective class, multiplied by the average account value over the period, multiplied by [number of days since inception/365] (to reflect the one-half year period).
26
John Hancock Funds II
Statements of Assets and Liabilities — February 28, 2006 (Unaudited)
|
| Assets | 500 Index | Active Bond | All Cap Growth | All Cap Value |
|
| Investments, at value | $283,237,231 | $394,960,261 | $140,548,992 | $184,535,246 |
| Securities loaned, at value (Note 2) | — | 62,669,745 | 4,153,432 | 20,071,291 |
| Repurchase agreements, at value | — | 84,637,000 | 3,367,000 | 6,367,000 |
| Cash | 13,672 | — | 47 | 260 |
| Foreign currency, at value | — | 482 | — | — |
| Receivable for investments sold | — | 20,245,463 | — | 629,366 |
| Receivable for shares sold | 59,080 | 68,849 | 191,685 | 377,805 |
| Dividends and interest receivable | 517,663 | 2,971,898 | 122,916 | 372,764 |
| Other assets | 1,138 | 1,063 | 566 | 655 |
| Total assets | 283,828,784 | 565,554,761 | 148,384,638 | 212,354,387 |
| |
| Liabilities | | | | |
|
| Due to custodian | — | 889,202 | — | — |
| Payable for investments purchased | — | 19,375,260 | 518,445 | 969,774 |
| Payable for delayed delivery securities purchased | — | 85,534,399 | — | — |
| Payable upon return of securities loaned | — | 63,952,895 | 4,252,196 | 20,547,958 |
| Payable for futures variation margin | 197,200 | — | — | — |
| Payable to affiliates | | | | |
| Fund administration expenses | 5,114 | 7,662 | 2,683 | 3,461 |
| Other payables and accrued expenses | 24,106 | 118,259 | 37,476 | 34,417 |
| Total liabilities | 226,420 | 169,877,677 | 4,810,800 | 21,555,610 |
| |
| Net assets | | | | |
|
| Capital paid-in | 266,118,200 | 392,669,241 | 130,103,194 | 172,228,738 |
| Accumulated undistributed net realized gain (loss) on investments, | | | | |
| futures contracts, and foreign currency transactions | 116,173 | 208,280 | 1,133,999 | 3,138,085 |
| Unrealized appreciation (depreciation) on investments, futures contracts, | | | | |
| and translation of assets and liabilities in foreign currencies | 16,613,450 | 101,564 | 12,347,248 | 15,138,950 |
| Undistributed net investment income (loss) | 754,541 | 2,697,999 | (10,603) | 293,004 |
| Net assets | $283,602,364 | $395,677,084 | $143,573,838 | $190,798,777 |
| Investments, including repurchase agreements, at cost | $266,735,054 | $542,165,602 | $135,722,316 | $195,834,587 |
| Foreign currency, at cost | — | $484 | — | — |
| |
| Net asset value per share | | | | |
|
| Based on net asset values and shares outstanding — The Funds have an unlimited number of shares authorized with no par value. | | |
| 500 Index | | NAV per share | | |
| Class NAV ($283,602,364 ÷ 25,628,350 shares) | | $11.07 | | |
| Active Bond | | | | |
| Class 1 ($35,844,798 ÷ 3,705,596 shares) | | $9.67 | | |
| Class NAV ($359,832,286 ÷ 37,215,779 shares) | | $9.67 | | |
| All Cap Growth | | | | |
| Class 1 ($35,465,188 ÷ 2,059,341 shares) | | $17.22 | | |
| Class NAV ($108,108,650 ÷ 6,272,289 shares) | | $17.24 | | |
| All Cap Value | | | | |
| Class 1 ($18,176,375 ÷ 1,176,664 shares) | | $15.45 | | |
| Class NAV ($172,622,402 ÷ 11,205,142 shares) | | $15.41 | | |
The accompanying notes are an integral part of the financial statements. 27
John Hancock Funds II
Statements of Assets and Liabilities — February 28, 2006 (Unaudited)
|
| | Blue Chip | Capital | | |
| Assets | Growth | Appreciation | Core Bond | Core Equity |
|
| Investments, at value | $1,151,559,769 | $301,240,926 | $194,678,426 | $495,017,768 |
| Securities loaned, at value (Note 2) | 67,063,189 | 2,293,149 | — | — |
| Repurchase agreements, at value | 3,996,000 | — | 8,031,000 | 4,831,000 |
| Cash | 179 | 541 | 215,362 | 1,746 |
| Receivable for investments sold | 6,802,008 | 19,190 | 8,496,407 | 763,624 |
| Receivable for delayed delivery securities sold | — | — | 46,858,322 | — |
| Receivable for shares sold | 1,905,141 | 569,100 | 92,027 | 1,841,722 |
| Dividends and interest receivable | 1,305,806 | 269,510 | 1,252,788 | 215,791 |
| Other assets | 3,721 | 898 | 551 | 1,589 |
| Total assets | 1,232,635,813 | 304,393,314 | 259,624,883 | 502,673,240 |
| |
| Liabilities | | | | |
|
| Payable for investments purchased | 7,642,045 | 2,176,751 | 4,534,497 | 1,033,135 |
| Payable for delayed delivery securities purchased | — | — | 78,255,607 | — |
| Payable upon return of securities loaned | 68,562,354 | 2,341,825 | — | — |
| Payable to affiliates | | | | |
| Fund administration expenses | 17,777 | 5,305 | 3,220 | 8,604 |
| Other payables and accrued expenses | 152,242 | 41,124 | 80,928 | 64,149 |
| Total liabilities | 76,374,418 | 4,565,005 | 82,874,252 | 1,105,888 |
| |
| Net assets | | | | |
|
| Capital paid-in | 1,071,569,311 | 277,993,252 | 175,673,149 | 467,673,907 |
| Accumulated undistributed net realized gain (loss) on investments, | | | | |
| futures contracts, and foreign currency transactions and | | | | |
| forward foreign currency contracts | (227,356) | 2,183,406 | 258,429 | 913,764 |
| Unrealized appreciation (depreciation) on investments, | | | | |
| and translation of assets and liabilities in foreign currencies | 82,211,943 | 19,512,575 | (222,228) | 33,181,404 |
| Undistributed net investment income (loss) | 2,707,497 | 139,076 | 1,041,281 | (201,723) |
| Net assets | $1,156,261,395 | $299,828,309 | $176,750,631 | $501,567,352 |
| Investments, including repurchase agreements, at cost | $1,140,407,448 | $284,021,500 | $202,931,654 | $466,667,364 |
| |
| Net asset value per share | | | | |
|
| Based on net asset values and shares outstanding — The Funds have an unlimited number of shares authorized with no par value. | | |
| Blue Chip Growth | | NAV per share | | |
| Class 1 ($127,446,679 ÷ 7,041,011 shares) | | $18.10 | | |
| Class NAV ($1,028,814,716 ÷ 56,903,484 shares) | | $18.08 | | |
| Capital Appreciation | | | | |
| Class 1 ($18,047,338 ÷ 1,779,677 shares) | | $10.14 | | |
| Class NAV ($281,780,971 ÷ 27,770,920 shares) | | $10.15 | | |
| Core Bond | | | | |
| Class 1 ($385,766 ÷ 30,674 shares) | | $12.58 | | |
| Class NAV ($176,364,865 ÷ 14,031,755 shares) | | $12.57 | | |
| Core Equity | | | | |
| Class 1 ($8,413,077 ÷ 563,701 shares) | | $14.92 | | |
| Class NAV ($493,154,275 ÷ 33,013,765 shares) | | $14.94 | | |
The accompanying notes are an integral part of the financial statements. 28
John Hancock Funds II
Statements of Assets and Liabilities — February 28, 2006 (Unaudited)
|
| | | Emerging | | |
| Assets | Emerging Growth | Small Company | Equity-Income | Fundamental Value |
|
| Investments, at value | $165,751,480 | $55,701,238 | $854,292,124 | $657,755,603 |
| Securities loaned, at value (Note 2) | 65,899,564 | — | 87,442,964 | 76,724,965 |
| Repurchase agreements, at value | — | 883,000 | 2,499,000 | — |
| Cash | 9,014 | 665 | 111 | 336 |
| Foreign currency, at value | — | — | 53,958 | 58 |
| Receivable for investments sold | 563,835 | 938,883 | 717,991 | — |
| Receivable for shares sold | 26,978 | 35,482 | 773,248 | 509,365 |
| Dividends and interest receivable | 10,246 | 10,830 | 2,107,312 | 627,283 |
| Other assets | 869 | 216 | 2,901 | 2,032 |
| Total assets | 232,261,986 | 57,570,314 | 947,889,609 | 735,619,642 |
| |
| Liabilities | | | | |
|
| Payable for investments purchased | 1,084,536 | 236,146 | 5,966,084 | 430,168 |
| Payable for shares repurchased | — | — | — | 60,727 |
| Payable upon return of securities loaned | 67,564,512 | — | 89,633,044 | 78,446,424 |
| Payable to affiliates | | | | |
| Fund administration expenses | 3,202 | 1,935 | 13,567 | 11,517 |
| Other payables and accrued expenses | 27,631 | 40,487 | 112,301 | 97,124 |
| Total liabilities | 68,679,881 | 278,568 | 95,724,996 | 79,045,960 |
| |
| Net assets | | | | |
|
| Capital paid-in | 139,455,661 | 49,097,929 | 791,112,683 | 625,561,970 |
| Accumulated undistributed net realized gain (loss) on investments, | | | | |
| futures contracts, and foreign currency transactions | 2,946,777 | 1,258,520 | 2,426,949 | (159,033) |
| Unrealized appreciation (depreciation) on investments, | | | | |
| and translation of assets and liabilities in foreign currencies | 21,450,303 | 7,044,365 | 56,199,803 | 30,556,095 |
| Undistributed net investment income (loss) | (270,636) | (109,068) | 2,425,178 | 614,650 |
| Net assets | $163,582,105 | $57,291,746 | $852,164,613 | $656,573,682 |
| Investments, including repurchase agreements, at cost | $210,200,741 | $49,539,873 | $888,032,892 | $703,924,829 |
| Foreign currency, at cost | — | — | $55,266 | $58 |
| |
| Net asset value per share | | | | |
|
| Based on net asset values and shares outstanding — The Funds have an unlimited number of shares authorized with no par value. | | |
| Emerging Growth | | NAV per share | | |
| Class 1 ($119,259,657 ÷ 6,208,013 shares) | | $19.21 | | |
| Class NAV ($44,322,448 ÷ 2,307,728 shares) | | $19.21 | | |
| Emerging Small Company | | | | |
| Class 1 ($57,291,746 ÷ 1,740,320 shares) | | $32.92 | | |
| Equity-Income | | | | |
| Class 1 ($167,690,257 ÷ 9,627,011 shares) | | $17.42 | | |
| Class NAV ($684,474,356 ÷ 39,346,126 shares) | | $17.40 | | |
| Fundamental Value | | | | |
| Class 1 ($55,955,844 ÷ 3,650,258 shares) | | $15.33 | | |
| Class NAV ($600,617,838 ÷ 39,259,530 shares) | | $15.30 | | |
The accompanying notes are an integral part of the financial statements. 29
John Hancock Funds II
Statements of Assets and Liabilities — February 28, 2006 (Unaudited)
|
| | | | International | International |
| Assets | Global Bond | High Yield | Equity Index | Opportunities |
|
| Investments, at value | $623,847,794 | $1,340,839,226 | $187,680,280 | $428,407,918 |
| Securities loaned, at value (Note 2) | 13,513,896 | 331,498,919 | 22,972,433 | 46,210,367 |
| Repurchase agreements, at value | 13,069,000 | 130,892,000 | — | 10,088,000 |
| Cash | — | — | — | 116 |
| Foreign currency, at value | 4,151,774 | 7,544 | 174,837 | — |
| Receivable for investments sold | — | 2,793,034 | — | 890,302 |
| Receivable for delayed delivery securities sold | 5,313,328 | — | — | — |
| Receivable for shares sold | 76,246 | 197,265 | 28,151 | 90,724 |
| Receivable for forward foreign currency exchange contracts (Note 2) | 4,343,776 | — | 82,306 | — |
| Dividends and interest receivable | 4,281,005 | 27,636,748 | 303,082 | 115,156 |
| Receivable for swap contracts | 121,449 | — | — | — |
| Unrealized appreciation of swap contracts (Note 2) | 3,045,458 | — | — | — |
| Receivable for futures variation margin | 999,498 | — | 462,457 | — |
| Other assets | 1,696 | 4,221 | 735 | 1,406 |
| Total assets | 672,764,920 | 1,833,868,957 | 211,704,281 | 485,803,989 |
| |
| Liabilities | | | | |
|
| Due to custodian | 2,600,923 | 45,902 | — | 430,336 |
| Payable for investments purchased | 8,697,688 | 16,085,215 | — | 4,366,474 |
| Payable for delayed delivery securities purchased | 107,837,918 | 2,462,625 | — | — |
| Payable upon return of securities loaned | 13,793,450 | 338,457,704 | 24,089,643 | 47,889,360 |
| Payable for options written, at value (Note 2) | 511,694 | — | — | — |
| Payable for swap contracts | 2,243,302 | — | — | — |
| Payable for forward foreign currency exchange contracts (Note 2) | 68,633 | — | 2,091 | — |
| Payable to affiliates | | | | |
| Fund administration expenses | 10,050 | 26,567 | 3,312 | 3,067 |
| Other payables and accrued expenses | 132,526 | 256,606 | 18,849 | 163,135 |
| Total liabilities | 135,896,184 | 357,334,619 | 24,113,895 | 52,852,372 |
| |
| Net assets | | | | |
|
| Capital paid-in | 540,772,677 | 1,435,091,397 | 166,171,938 | 378,264,610 |
| Accumulated undistributed net realized gain (loss) on investments, | | | | |
| futures contracts, options written, interest rate swaps, and foreign | | | | |
| currency transactions | (12,090,900) | 1,795,339 | 1,131,931 | 15,584,004 |
| Unrealized appreciation (depreciation) on investments, futures contracts, | | | | |
| options written, interest rate swaps and translation of assets and | | | | |
| liabilities in foreign currencies | 5,290,779 | 21,239,899 | 21,710,430 | 58,177,071 |
| Undistributed net investment income (loss) | 2,896,180 | 18,407,703 | (1,423,913) | (19,074,068) |
| Net assets | $536,868,736 | $1,476,534,338 | $187,590,386 | $432,951,617 |
| Investments, including repurchase agreements, at cost | $652,316,059 | $1,781,989,097 | $189,181,011 | $426,522,691 |
| Foreign currency, at cost | $4,106,069 | $7,533 | $173,689 | — |
| Premiums received on written options | $1,302,370 | — | — | — |
| |
| Net asset value per share | | | | |
|
| Based on net asset values and shares outstanding — The Funds have an unlimited number of shares authorized with no par value. | | |
| Global Bond | | NAV per share | | |
| Class 1 ($37,574,683 ÷ 2,614,095 shares) | | $14.37 | | |
| Class NAV ($499,294,053 ÷ 34,827,460 shares) | | $14.34 | | |
| High Yield | | | | |
| Class 1 ($39,091,458 ÷ 3,749,766 shares) | | $10.43 | | |
| Class NAV ($1,437,442,880 ÷ 138,430,687 shares) | | $10.38 | | |
| International Equity Index | | | | |
| Class NAV ($187,590,386 ÷ 10,626,160 shares) | | $17.65 | | |
| International Opportunities | | | | |
| Class 1 ($2,718,686 ÷ 174,320 shares) | | $15.60 | | |
| Class NAV ($430,232,931 ÷ 27,536,796 shares) | | $15.62 | | |
The accompanying notes are an integral part of the financial statements. 30
John Hancock Funds II
Statements of Assets and Liabilities — February 28, 2006 (Unaudited)
|
| | International | International | International | Investment |
| Assets | Small Cap | Stock | Value | Quality Bond |
|
| Investments, at value | $502,774,040 | $920,479,300 | $954,021,650 | $103,054,191 |
| Securities loaned, at value (Note 2) | 22,735,901 | 152,846,814 | 150,628,179 | — |
| Repurchase agreements, at value | 39,435,000 | 41,880,000 | 50,495,000 | 13,918,000 |
| Cash | 635 | 966 | 60,620 | — |
| Foreign currency, at value | 9,749,371 | 1,435,737 | 8,546,516 | — |
| Receivable for investments sold | 5,522,725 | 38,073 | 633,103 | — |
| Receivable for shares sold | 123,557 | 221,510 | 441,526 | 70,709 |
| Receivable for forward foreign currency exchange contracts (Note 2) | — | 1,157,591 | — | — |
| Dividends and interest receivable | 594,754 | 1,752,751 | 1,539,162 | 1,256,666 |
| Receivable due from adviser | — | — | 26,157 | — |
| Other assets | 40,663 | 2,952 | 3,182 | 429 |
| Total assets | 580,976,646 | 1,119,815,694 | 1,166,395,095 | 118,299,995 |
| |
| Liabilities | | | | |
|
| Due to custodian | — | — | — | 50,552 |
| Capital gains withholding tax | 146,381 | — | — | — |
| Payable for investments purchased | 363,774 | — | 2,092,958 | 133,844 |
| Payable for delayed delivery securities purchased | — | — | — | 4,975 |
| Payable for shares repurchased | — | — | — | 54,295 |
| Payable upon return of securities loaned | 23,860,955 | 160,743,448 | 158,239,011 | — |
| Payable for futures variation margin | — | 402,898 | — | 16,500 |
| Payable for forward foreign currency exchange contracts (Note 2) | — | 873,501 | — | — |
| Payable to affiliates | | | | |
| Fund administration expenses | 6,466 | 17,347 | 15,926 | 2,418 |
| Other payables and accrued expenses | 332,302 | 448,461 | 486,507 | 68,372 |
| Total liabilities | 24,709,878 | 162,485,655 | 160,834,402 | 330,956 |
| |
| Net assets | | | | |
|
| Capital paid-in | 496,473,014 | 859,121,360 | 913,732,348 | 117,274,724 |
| Accumulated undistributed net realized gain (loss) on investments, | | | | |
| futures contracts, and foreign currency transactions | 7,184,561 | 14,491,615 | 14,317,672 | (64,993) |
| Unrealized appreciation (depreciation) on investments,a futures contracts, | | | | |
| and translation of assets and liabilities in foreign currencies | 53,770,097 | 101,191,689 | 74,584,385 | (22,193) |
| Undistributed net investment income (loss) | (1,160,904) | (17,474,625) | 2,926,288 | 781,501 |
| Net assets | $556,266,768 | $957,330,039 | $1,005,560,693 | $117,969,039 |
| Investments, including repurchase agreements, at cost | $510,897,239 | $1,016,535,465 | $1,080,520,847 | $116,976,376 |
| Foreign currency, at cost | $9,907,340 | $1,426,390 | $8,587,630 | — |
| |
| Net asset value per share | | | | |
|
| Based on net asset values and shares outstanding — The Funds have an unlimited number of shares authorized with no par value. | | |
| International Small Cap | | NAV per share | | |
| Class 1 ($33,527,066 ÷ 1,640,718 shares) | | $20.43 | | |
| Class NAV ($522,739,702 ÷ 25,599,083 shares) | | $20.42 | | |
| International Stock | | | | |
| Class 1 ($31,333,022 ÷ 2,369,108 shares) | | $13.23 | | |
| Class NAV ($925,997,017 ÷ 70,081,495 shares) | | $13.21 | | |
| International Value | | | | |
| Class 1 ($113,767,464 ÷ 6,883,851 shares) | | $16.53 | | |
| Class NAV ($891,793,229 ÷ 54,070,694 shares) | | $16.49 | | |
| Investment Quality Bond | | | | |
| Class 1 ($33,212,149 ÷ 2,791,259 shares) | | $11.90 | | |
| Class NAV ($84,756,890 ÷ 7,128,815 shares) | | $11.89 | | |
| |
| a Net of deferred foreign withholding taxes of $146,381 for International Small Cap. | | | |
The accompanying notes are an integral part of the financial statements. 31
John Hancock Funds II
Statements of Assets and Liabilities — February 28, 2006 (Unaudited)
|
| Assets | Large Cap | Large Cap Value | Mid Cap Core | Mid Cap Index |
|
| Investments, at value | $165,134,837 | $159,169,924 | $289,207,575 | $63,725,509 |
| Securities loaned, at value (Note 2) | 2,080,777 | 5,984,498 | 50,440,068 | — |
| Repurchase agreements, at value | 4,876,000 | 280,000 | 68,025,000 | — |
| Cash | 172 | 414 | 911 | 9,058 |
| Foreign currency, at value | — | — | 231 | — |
| Receivable for investments sold | 193,151 | 3,186,377 | 189,693 | — |
| Receivable for shares sold | 63,427 | 103,600 | 59,448 | 12,630 |
| Dividends and interest receivable | 254,340 | 238,731 | 306,257 | 73,343 |
| Other assets | 477 | 500 | 957 | 258 |
| Total assets | 172,603,181 | 168,964,044 | 408,230,140 | 63,820,798 |
| |
| Liabilities | | | | |
|
| Payable for investments purchased | 345,583 | 3,329,370 | 937,172 | — |
| Payable upon return of securities loaned | 2,128,439 | 6,127,940 | 51,567,685 | — |
| Payable for futures variation margin | 29,000 | — | — | 39,600 |
| Payable to affiliates | | | | |
| Fund administration expenses | 3,021 | 2,816 | 6,334 | 1,146 |
| Other payables and accrued expenses | 26,258 | 25,174 | 68,516 | 12,766 |
| Total liabilities | 2,532,301 | 9,485,300 | 52,579,707 | 53,512 |
| |
| Net assets | | | | |
|
| Capital paid-in | 158,913,270 | 145,947,350 | 325,329,292 | 57,027,105 |
| Accumulated undistributed net realized gain (loss) on investments, | | | | |
| futures contracts, and foreign currency transactions | 1,072,261 | 2,147,928 | 11,778,838 | 233,010 |
| Unrealized appreciation (depreciation) on investments, futures contracts, | | | | |
| and translation of assets and liabilities in foreign currencies | 9,776,342 | 11,215,178 | 18,167,851 | 6,393,553 |
| Undistributed net investment income (loss) | 309,007 | 168,288 | 374,452 | 113,618 |
| Net assets | $170,070,880 | $159,478,744 | $355,650,433 | $63,767,286 |
| Investments, including repurchase agreements, at cost | $162,310,497 | $154,219,244 | $389,504,792 | $57,400,829 |
| Foreign currency, at cost | — | — | $231 | — |
| |
| Net asset value per share | | | | |
|
| Based on net asset values and shares outstanding — The Funds have an unlimited number of shares authorized with no par value. | | |
| Large Cap | | NAV per share | | |
| Class 1 ($1,522,094 ÷ 105,252 shares) | | $14.46 | | |
| Class NAV ($168,548,786 ÷ 11,660,890 shares) | | $14.45 | | |
| Large Cap Value | | | | |
| Class 1 ($13,010,303 ÷ 581,529 shares) | | $22.37 | | |
| Class NAV ($146,468,441 ÷ 6,538,350 shares) | | $22.40 | | |
| Mid Cap Core | | | | |
| Class 1 ($8,485,561 ÷ 483,441 shares) | | $17.55 | | |
| Class NAV ($347,164,872 ÷ 19,779,081 shares) | | $17.55 | | |
| Mid Cap Index | | | | |
| Class NAV ($63,767,286 ÷ 3,373,518 shares) | | $18.90 | | |
The accompanying notes are an integral part of the financial statements. 32
John Hancock Funds II
Statements of Assets and Liabilities — February 28, 2006 (Unaudited)
|
| | | | | Quantitative |
| Assets | Mid Cap Stock | Mid Cap Value | Natural Resources | Mid Cap |
|
| Investments, at value | $267,883,741 | $207,921,013 | $653,713,329 | $189,413,858 |
| Securities loaned, at value (Note 2) | 83,159,941 | 63,810,791 | 80,304,638 | 37,219,029 |
| Repurchase agreements, at value | 11,179,000 | 11,032,000 | 20,420,000 | — |
| Cash | 227 | 240 | 730 | 2,105 |
| Receivable for investments sold | 1,566,778 | 74,343 | — | 12,032,180 |
| Receivable for shares sold | 160,106 | 267,993 | 261,107 | 480,885 |
| Dividends and interest receivable | 76,646 | 246,358 | 1,048,715 | 94,043 |
| Other assets | 980 | 779 | 2,250 | 712 |
| Total assets | 364,027,419 | 283,353,517 | 755,750,769 | 239,242,812 |
| |
| Liabilities | | | | |
|
| Payable for investments purchased | 2,192,282 | 583,095 | — | 13,022,452 |
| Payable upon return of securities loaned | 85,194,265 | 65,600,494 | 82,182,802 | 38,058,720 |
| Payable to affiliates | | | | |
| Fund administration expenses | 3,785 | 4,030 | 14,120 | 3,468 |
| Other payables and accrued expenses | 44,034 | 42,918 | 160,799 | 28,740 |
| Total liabilities | 87,434,366 | 66,230,537 | 82,357,721 | 51,113,380 |
| |
| Net assets | | | | |
|
| Capital paid-in | 236,883,495 | 201,796,465 | 575,534,016 | 166,439,231 |
| Accumulated undistributed net realized gain (loss) on investments, | | | | |
| futures contracts, and foreign currency transactions | 11,807,231 | 3,115,924 | 10,722,016 | 1,892,168 |
| Unrealized appreciation (depreciation) on investments, | | | | |
| and translation of assets and liabilities in foreign currencies | 28,089,100 | 12,083,701 | 86,457,565 | 19,787,865 |
| Undistributed net investment income (loss) | (186,773) | 126,890 | 679,451 | 10,168 |
| Net assets | $276,593,053 | $217,122,980 | $673,393,048 | $188,129,432 |
| Investments, including repurchase agreements, at cost | $334,133,582 | $270,680,103 | $667,980,608 | $206,845,022 |
| |
| Net asset value per share | | | | |
|
| Based on net asset values and shares outstanding — The Funds have an unlimited number of shares authorized with no par value. | |
| Mid Cap Stock | | NAV per share | | |
| Class 1 ($105,252,598 ÷ 6,436,389 shares) | | $16.35 | | |
| Class NAV ($171,340,455 ÷ 10,468,423 shares) | | $16.37 | | |
| Mid Cap Value | | | | |
| Class 1 ($87,001,095 ÷ 4,545,945 shares) | | $19.14 | | |
| Class NAV ($130,121,885 ÷ 6,807,250 shares) | | $19.12 | | |
| Natural Resources | | | | |
| Class 1 ($58,231,459 ÷ 1,750,647 shares) | | $33.26 | | |
| Class NAV ($615,161,589 ÷ 18,558,040 shares) | | $33.15 | | |
| Quantitative Mid Cap | | | | |
| Class 1 ($143,917,802 ÷ 9,316,595 shares) | | $15.45 | | |
| Class NAV ($44,211,630 ÷ 2,862,961 shares) | | $15.44 | | |
The accompanying notes are an integral part of the financial statements. 33
John Hancock Funds II
Statements of Assets and Liabilities — February 28, 2006 (Unaudited)
|
| | Quantitative | Real Estate | | |
| Assets | Value | Securities | Real Return Bond | Small Cap |
|
| Investments, at value | $348,453,886 | $695,974,010 | $675,758,438 | $205,174,257 |
| Securities loaned, at value (Note 2) | 54,005,024 | 47,412,541 | 312,130,477 | 89,987,734 |
| Repurchase agreements, at value | — | 7,519,000 | 10,340,000 | 6,329,000 |
| Cash | 9,985 | 30 | 2,041 | 72 |
| Foreign currency, at value | — | — | 9,314 | — |
| Receivable for investments sold | — | 5,543,966 | — | 389,364 |
| Receivable for delayed delivery securities sold | — | — | 3,262,230 | — |
| Receivable for shares sold | 615,396 | 450,255 | 192,975 | 51,170 |
| Dividends and interest receivable | 848,426 | 661,904 | 2,955,689 | 93,349 |
| Unrealized appreciation of swap contracts (Note 2) | — | — | 37,833 | — |
| Other assets | 1,312 | 2,239 | 1,741 | 661 |
| Total assets | 403,934,029 | 757,563,945 | 1,004,690,738 | 302,025,607 |
| |
| Liabilities | | | | |
|
| Payable for investments purchased | 3,343,584 | 6,070,061 | 296,580 | 383,411 |
| Payable for delayed delivery securities purchased | — | — | 58,022,989 | — |
| Payable for shares repurchased | 109,214 | — | — | — |
| Payable upon return of securities loaned | 55,387,811 | 48,505,156 | 318,498,126 | 92,214,294 |
| Payable for options written, at value (Note 2) | — | — | 10,281 | — |
| Payable for futures variation margin | — | — | 55,144 | — |
| Payable for forward foreign currency exchange contracts (Note 2) | — | — | 6,948 | — |
| Payable to affiliates | | | | |
| Fund administration expenses | 6,326 | 12,891 | 12,433 | 2,957 |
| Other payables and accrued expenses | 44,949 | 84,011 | 84,866 | 27,771 |
| Total liabilities | 58,891,884 | 54,672,119 | 376,987,367 | 92,628,433 |
| |
| Net assets | | | | |
|
| Capital paid-in | 310,673,494 | 613,099,974 | 625,086,493 | 185,093,365 |
| Accumulated undistributed net realized gain (loss) on investments, | | | | |
| futures contracts, options written, interest rate swaps, and foreign | | | | |
| currency transactions | 13,549,665 | 3,259,539 | (543,978) | 297,643 |
| Unrealized appreciation (depreciation) on investments, futures contracts, | | | | |
| options written, interest rate swaps and translation of assets and | | | | |
| liabilities in foreign currencies | 19,752,467 | 82,187,933 | 4,877,831 | 24,278,473 |
| Undistributed net investment income (loss) | 1,066,519 | 4,344,380 | (1,716,975) | (272,307) |
| Net assets | $345,042,145 | $702,891,826 | $627,703,371 | $209,397,174 |
| Investments, including repurchase agreements, at cost | $382,706,443 | $668,717,618 | $992,609,664 | $277,212,518 |
| Foreign currency, at cost | — | — | $9,244 | — |
| Premiums received on written options | — | — | $47,522 | — |
| |
| Net asset value per share | | | | |
|
| Based on net asset values and shares outstanding — The Funds have an unlimited number of shares authorized with no par value. | | |
| Quantitative Value | | NAV per share | | |
| Class 1 ($85,442,178 ÷ 5,422,900 shares) | | $15.76 | | |
| Class NAV ($259,599,967 ÷ 16,475,680 shares) | | $15.76 | | |
| Real Estate Securities | | | | |
| Class 1 ($143,356,545 ÷ 5,349,278 shares) | | $26.80 | | |
| Class NAV ($559,535,281 ÷ 20,910,733 shares) | | $26.76 | | |
| Real Return Bond | | | | |
| Class 1 ($15,245,756 ÷ 1,128,144 shares) | | $13.51 | | |
| Class NAV ($612,457,615 ÷ 45,625,259 shares) | | $13.42 | | |
| Small Cap | | | | |
| Class 1 ($408,820 ÷ 26,770 shares) | | $15.27 | | |
| Class NAV ($208,988,354 ÷ 13,667,379 shares) | | $15.29 | | |
The accompanying notes are an integral part of the financial statements. 34
John Hancock Funds II
Statements of Assets and Liabilities — February 28, 2006 (Unaudited)
|
| | | Small Cap | | Small |
| Assets | Small Cap Index | Opportunities | Small Company | Company Growth |
|
| Investments, at value | $64,207,526 | $250,487,302 | $85,426,727 | $63,483,773 |
| Securities loaned, at value (Note 2) | — | 130,104,006 | 33,784,081 | — |
| Repurchase agreements, at value | — | 13,380,000 | 375,000 | 980,000 |
| Cash | 14,738 | 983 | 451 | 235 |
| Receivable for investments sold | — | 1,933,864 | 1,824,303 | 268,151 |
| Receivable for shares sold | 14,092 | 99,035 | 176,372 | 12,693 |
| Dividends and interest receivable | 55,907 | 108,685 | 41,319 | 3,669 |
| Other assets | 259 | 806 | 243 | 231 |
| Total assets | 64,292,522 | 396,114,681 | 121,628,496 | 64,748,752 |
| |
| Liabilities | | | | |
|
| Payable for investments purchased | — | 496,904 | 2,151,432 | 425,879 |
| Payable upon return of securities loaned | — | 133,253,392 | 34,585,798 | — |
| Payable for futures variation margin | 39,600 | — | — | — |
| Payable to affiliates | | | | |
| Fund administration expenses | 1,146 | 4,644 | 1,483 | 1,006 |
| Other payables and accrued expenses | 12,744 | 35,750 | 69,958 | 16,085 |
| Total liabilities | 53,490 | 133,790,690 | 36,808,671 | 442,970 |
| |
| Net assets | | | | |
|
| Capital paid-in | 56,037,681 | 233,346,987 | 75,562,848 | 56,548,324 |
| Accumulated undistributed net realized gain (loss) on investments, | | | | |
| and foreign currency transactions | 58,754 | 1,380,665 | 1,465,036 | 766,095 |
| Unrealized appreciation (depreciation) on investments, | | | | |
| and futures contracts | 8,043,393 | 27,180,837 | 7,889,829 | 7,151,980 |
| Undistributed net investment income (loss) | 99,204 | 415,502 | (97,888) | (160,617) |
| Net assets | $64,239,032 | $262,323,991 | $84,819,825 | $64,305,782 |
| Investments, including repurchase agreements, at cost | $56,308,945 | $366,790,471 | $111,695,979 | $57,311,793 |
| |
| Net asset value per share | | | | |
|
| Based on net asset values and shares outstanding — The Funds have an unlimited number of shares authorized with no par value. | | |
| Small Cap Index | | NAV per share | | |
| Class NAV ($64,239,032 ÷ 3,982,225 shares) | | $16.13 | | |
| Small Cap Opportunities | | | | |
| Class 1 ($27,076,668 ÷ 1,121,995 shares) | | $24.13 | | |
| Class NAV ($235,247,323 ÷ 9,793,524 shares) | | $24.02 | | |
| Small Company | | | | |
| Class 1 ($6,535,654 ÷ 383,901 shares) | | $17.02 | | |
| Class NAV ($78,284,171 ÷ 4,593,434 shares) | | $17.04 | | |
| Small Company Growth | | | | |
| Class NAV ($64,305,782 ÷ 5,640,644 shares) | | $11.40 | | |
The accompanying notes are an integral part of the financial statements. 35
John Hancock Funds II
Statements of Assets and Liabilities — February 28, 2006 (Unaudited)
|
| Assets | Small Company Value | Special Value | Spectrum Income | Strategic Bond |
|
| Investments, at value | $353,757,281 | $106,429,577 | $612,840,366 | $547,952,204 |
| Securities loaned, at value (Note 2) | 124,033,044 | 38,867,372 | — | 98,455,905 |
| Repurchase agreements, at value | 3,178,000 | 11,157,000 | 33,553,000 | 143,073,000 |
| Cash | 522 | 436 | — | — |
| Foreign currency, at value | — | — | 3,079,179 | — |
| Receivable for investments sold | 416,287 | 124,965 | 5,196,471 | 516,247 |
| Receivable for delayed delivery securities sold | — | — | 2,967,003 | — |
| Receivable for shares sold | 203,904 | 22,632 | 337,039 | 72,524 |
| Receivable for forward foreign currency exchange contracts (Note 2) | — | — | 296,628 | — |
| Dividends and interest receivable | 219,199 | 75,487 | 5,997,108 | 4,521,325 |
| Receivable for futures variation margin | — | — | 8,517 | 10,938 |
| Other assets | 1,240 | 295 | 2,265 | 133,140 |
| Total assets | 481,809,477 | 156,677,764 | 664,277,576 | 794,735,283 |
| |
| Liabilities | | | | |
|
| Due to custodian | — | — | 160,619 | 19,848 |
| Payable for investments purchased | 493,358 | 5,363,120 | 10,094,860 | 1,412,781 |
| Payable for delayed delivery securities purchased | — | — | 6,402,979 | 183,483,647 |
| Payable upon return of securities loaned | 127,033,163 | 39,827,991 | — | 100,471,016 |
| Payable for forward foreign currency exchange contracts (Note 2) | — | — | 131,851 | — |
| Payable to affiliates | | | | |
| Fund administration expenses | 6,130 | 1,973 | 10,294 | 9,427 |
| Other payables and accrued expenses | 46,910 | 23,879 | 385,031 | 111,476 |
| Total liabilities | 127,579,561 | 45,216,963 | 17,185,634 | 285,508,195 |
| |
| Net assets | | | | |
|
| Capital paid-in | 310,563,234 | 101,525,199 | 632,202,851 | 502,011,613 |
| Accumulated undistributed net realized gain (loss) on investments, | | | | |
| futures contracts, and foreign currency transactions | 1,194,462 | 86,092 | 237,527 | 718,226 |
| Unrealized appreciation (depreciation) on investments, futures | | | | |
| contracts, and translation of assets and liabilities | | | | |
| in foreign currencies | 42,397,287 | 9,815,284 | 10,861,028 | 2,769,539 |
| Undistributed net investment income (loss) | 74,933 | 34,226 | 3,790,536 | 3,727,710 |
| Net assets | $354,229,916 | $111,460,801 | $647,091,942 | $509,227,088 |
| Investments, including repurchase agreements, at cost | $438,571,038 | $146,638,665 | $635,696,586 | $786,693,645 |
| Foreign currency, at cost | — | — | $3,077,169 | — |
| |
| Net asset value per share | | | | |
|
| Based on net asset values and shares outstanding — The Funds have an unlimited number of shares authorized with no par value. | | |
| Small Company Value | | NAV per share | | |
| Class 1 ($144,060,322 ÷ 5,957,108 shares) | | $24.18 | | |
| Class NAV ($210,169,594 ÷ 8,702,757 shares) | | $24.15 | | |
| Special Value | | | | |
| Class 1 ($2,967,473 ÷ 143,042 shares) | | $20.75 | | |
| Class NAV ($108,493,328 ÷ 5,226,560 shares) | | $20.76 | | |
| Spectrum Income | | | | |
| Class NAV ($647,091,942 ÷ 63,126,657 shares) | | $10.25 | | |
| Strategic Bond | | | | |
| Class 1 ($39,297,009 ÷ 3,269,381 shares) | | $12.02 | | |
| Class NAV ($469,930,079 ÷ 39,151,205 shares) | | $12.00 | | |
The accompanying notes are an integral part of the financial statements. 36
John Hancock Funds II
Statements of Assets and Liabilities — February 28, 2006 (Unaudited)
|
| | | | U.S. Global | U.S. Government |
| Assets | Strategic Value | Total Return | Leaders Growth | Securities |
|
| Investments, at value | $136,646,100 | $1,375,806,776 | $420,562,252 | $291,086,313 |
| Securities loaned, at value (Note 2) | 6,056,133 | — | — | — |
| Repurchase agreements, at value | — | 33,543,000 | 12,926,000 | 30,188,000 |
| Cash | 650 | 79,396 | 445 | — |
| Foreign currency, at value | — | 14,912,957 | — | — |
| Receivable for investments sold | 1,600,268 | — | 3,106,617 | — |
| Receivable for delayed delivery securities sold | — | 22,652,781 | — | — |
| Receivable for shares sold | 45,531 | 161,984 | 61,929 | 88,198 |
| Receivable for forward foreign currency exchange contracts (Note 2) | — | 721,014 | — | — |
| Dividends and interest receivable | 52,106 | 3,658,939 | 392,632 | 713,207 |
| Receivable for futures variation margin | — | 737,284 | — | — |
| Other assets | 409 | 3,162 | 1,037 | 766 |
| Total assets | 144,401,197 | 1,452,277,293 | 437,050,912 | 322,076,484 |
| |
| Liabilities | | | | |
|
| Due to custodian | — | — | — | 118,227 |
| Payable for investments purchased | 2,725,264 | 15,899,359 | 12,561,459 | — |
| Payable for delayed delivery securities purchased | — | 387,640,469 | — | 129,162,573 |
| Payable for shares repurchased | — | — | 5,285 | 18,230 |
| Payable upon return of securities loaned | 6,331,582 | — | — | — |
| Payable for options written, at value (Note 2) | — | 1,174,331 | — | — |
| Unrealized depreciation of swap contracts (Note 2) | — | 190,777 | — | — |
| Payable for futures variation margin | — | — | — | 19,281 |
| Payable for forward foreign currency exchange contracts (Note 2) | — | 99,472 | — | — |
| Payable to affiliates | | | | |
| Fund administration expenses | 2,447 | 18,466 | 5,005 | 4,010 |
| Other payables and accrued expenses | 23,116 | 173,785 | 46,420 | 56,429 |
| Total liabilities | 9,082,409 | 405,196,659 | 12,618,169 | 129,378,750 |
| |
| Net assets | | | | |
|
| Capital paid-in | 128,219,920 | 1,037,780,356 | 420,300,310 | 191,273,101 |
| Accumulated undistributed net realized gain (loss) on investments, | | | | |
| futures contracts, options written, interest rate swaps, and foreign | | | | |
| currency transactions | 16,043 | 3,367,238 | 267,667 | (129,163) |
| Unrealized appreciation (depreciation) on investments, futures contracts, | | | | |
| options written, interest rate swaps and translation of assets and | | | | |
| liabilities in foreign currencies | 6,957,003 | (341,539) | 3,541,736 | 213,177 |
| Undistributed net investment income (loss) | 125,822 | 6,274,579 | 323,030 | 1,340,619 |
| Net assets | $135,318,788 | $1,047,080,634 | $424,432,743 | $192,697,734 |
| Investments, including repurchase agreements, at cost | $135,745,230 | $1,407,936,256 | $429,946,516 | $321,061,591 |
| Foreign currency, at cost | — | $14,912,957 | — | — |
| Premiums received on written options | — | $1,121,248 | — | — |
| |
| Net asset value per share | | | | |
|
| Based on net asset values and shares outstanding — The Funds have an unlimited number of shares authorized with no par value. | | |
| Strategic Value | | NAV per share | | |
| Class 1 ($13,184,733 ÷ 1,207,746 shares) | | $10.92 | | |
| Class NAV ($122,134,055 ÷ 11,227,968 shares) | | $10.88 | | |
| Total Return | | | | |
| Class 1 ($112,052,323 ÷ 8,123,665 shares) | | $13.79 | | |
| Class NAV ($935,028,311 ÷ 67,930,903 shares) | | $13.76 | | |
| U.S. Global Leaders Growth | | | | |
| Class 1 ($23,400,443 ÷ 1,752,057 shares) | | $13.36 | | |
| Class NAV ($401,032,300 ÷ 30,001,576 shares) | | $13.37 | | |
| U.S. Government Securities | | | | |
| Class 1 ($46,536,876 ÷ 3,414,462 shares) | | $13.63 | | |
| Class NAV ($146,160,858 ÷ 10,747,111 shares) | | $13.60 | | |
The accompanying notes are an integral part of the financial statements. 37
John Hancock Funds II
Statements of Assets and Liabilities — February 28, 2006 (Unaudited)
|
| | U.S. High | | Value & | |
| Assets | Yield Bond | U.S. Multi Sector | Restructuring | Vista |
|
| Investments, at value | $157,455,065 | $1,030,400,448 | $174,630,565 | $108,394,353 |
| Securities loaned, at value (Note 2) | 21,245,630 | — | — | 23,446,851 |
| Repurchase agreements, at value | 11,028,000 | 53,815,000 | 1,678,000 | 3,159,000 |
| Cash | 697 | 721 | 489 | 721 |
| Foreign currency, at value | — | — | 23,884 | — |
| Receivable for investments sold | 1,666,460 | — | 29 | 3,003,822 |
| Receivable for shares sold | 115,146 | 578,587 | 110,288 | 22,362 |
| Dividends and interest receivable | 2,923,488 | 1,384,850 | 330,176 | 59,875 |
| Other assets | 518 | 3,784 | 636 | 380 |
| Total assets | 194,435,004 | 1,086,183,390 | 176,774,067 | 138,087,364 |
| |
| Liabilities | | | | |
|
| Due to custodian | — | — | — | 859,543 |
| Payable for investments purchased | 3,774,872 | — | 275,911 | 4,008,673 |
| Payable for delayed delivery securities purchased | 2,240,324 | — | — | — |
| Payable upon return of securities loaned | 21,693,548 | — | — | 23,978,603 |
| Payable for options written, at value (Note 2) | — | — | 3,730 | — |
| Payable for futures variation margin | — | 287,100 | — | — |
| Payable for forward foreign currency exchange contracts (Note 2) | — | — | — | 14,074 |
| Payable to affiliates | | | | |
| Fund administration expenses | 3,014 | 17,230 | 2,805 | 1,686 |
| Other payables and accrued expenses | 35,549 | 175,927 | 26,198 | 26,942 |
| Total liabilities | 27,747,307 | 480,257 | 308,644 | 28,889,521 |
| |
| Net assets | | | | |
|
| Capital paid-in | 162,724,079 | 1,024,502,348 | 158,095,661 | 97,277,527 |
| Accumulated undistributed net realized gain (loss) on investments, | | | | |
| futures contracts, options written, and foreign currency transactions | 72,199 | 10,439,313 | 597,630 | (1,702,489) |
| Unrealized appreciation (depreciation) on investments, futures | | | | |
| contracts, options written, and translation of assets and | | | | |
| liabilities in foreign currencies | 2,168,739 | 49,217,740 | 17,370,405 | 13,439,726 |
| Undistributed net investment income (loss) | 1,722,680 | 1,543,732 | 401,727 | 183,079 |
| Net assets | $166,687,697 | $1,085,703,133 | $176,465,423 | $109,197,843 |
| Investments, including repurchase agreements, at cost | $187,559,956 | $1,035,294,786 | $159,007,699 | $121,547,295 |
| Foreign currency, at cost | — | — | $23,927 | — |
| Premiums received on written options | — | — | $73,250 | — |
| |
| Net asset value per share | | | | |
|
| Based on net asset values and shares outstanding — The Funds have an unlimited number of shares authorized with no par value. | | |
| U.S. High Yield Bond | | NAV per share | | |
| Class 1 ($590,906 ÷ 45,139 shares) | | $13.09 | | |
| Class NAV ($166,096,791 ÷ 12,690,588 shares) | | $13.09 | | |
| U.S. Multi Sector | | | | |
| Class NAV ($1,085,703,133 ÷ 102,021,815 shares) | | $10.64 | | |
| Value & Restructuring | | | | |
| Class NAV ($176,465,423 ÷ 15,781,505 shares) | | $11.18 | | |
| Vista | | | | |
| Class NAV ($109,197,843 ÷ 9,679,275 shares) | | $11.28 | | |
The accompanying notes are an integral part of the financial statements. 38
John Hancock Funds II
Statements of Operations — for the period ended February 28, 2006 (Unaudited)
|
| Investment income | 500 Indexb | Active Bonda | All Cap Growtha | All Cap Valuea |
|
| Dividends | $1,872,244 | — | $480,757 | $1,107,495 |
| Interest | 169,564 | $6,015,657 | 58,100 | 59,535 |
| Less foreign taxes withheld | — | (864) | (1,352) | (11,104) |
| Total investment income | 2,041,808 | 6,014,793 | 537,505 | 1,155,926 |
| |
| Expenses | | | | |
|
| Investment management fees (Note 3) | 405,329 | 751,333 | 434,298 | 522,175 |
| Class 1 distribution and service fees (Note 3) | — | 6,833 | 6,616 | 3,370 |
| Fund administration fees (Note 3) | 5,119 | 7,671 | 2,696 | 3,474 |
| Audit and legal fees | 7,015 | 9,669 | 6,514 | 6,784 |
| Custodian fees | 4,268 | 84,634 | 23,368 | 17,018 |
| Trustees’ fees (Note 3) | 1,102 | 1,647 | 578 | 746 |
| Registration and filing fees | 14,818 | 22,205 | 7,806 | 10,058 |
| Miscellaneous | 1,896 | 6,460 | 1,008 | 1,217 |
| Total expenses | 439,547 | 890,452 | 482,884 | 564,842 |
| Net investment income (loss) | 1,602,261 | 5,124,341 | 54,621 | 591,084 |
| |
| Realized and unrealized gain (loss) | | | | |
|
| Net realized gain (loss) on | | | | |
| Investments (Note 5) | 198,150 | 208,469 | 1,135,418 | 3,138,085 |
| Futures contracts | (81,977) | — | — | — |
| Foreign currency transactions | — | (189) | (1,419) | — |
| Change in net unrealized appreciation (depreciation) of | | | | |
| Investments | 16,502,177 | 101,404 | 12,347,108 | 15,138,950 |
| Futures contracts | 111,273 | — | — | — |
| Translation of assets and liabilities in foreign currencies | — | 160 | 140 | — |
| Net realized and unrealized gain (loss) | 16,729,623 | 309,844 | 13,481,247 | 18,277,035 |
| |
| Increase (decrease) in net assets from operations | $18,331,884 | $5,434,185 | $13,535,868 | $18,868,119 |
a Period from 10-15-05 (commencement of operations) to 2-28-06.
b Period from 10-29-05 (commencement of operations) to 2-28-06.
The accompanying notes are an integral part of the financial statements. 39
John Hancock Funds II
Statements of Operations — for the period ended February 28, 2006 (Unaudited)
|
| Investment income | Blue Chip Growtha | Capital Appreciationa | Core Bonda | Core Equitya |
|
| Dividends | $6,608,959 | $884,279 | — | $1,105,694 |
| Interest | 185,698 | 122,541 | $2,659,392 | 52,203 |
| Less foreign taxes withheld | (19,324) | (26,565) | (228) | — |
| Total investment income | 6,775,333 | 980,255 | 2,659,164 | 1,157,897 |
| |
| Expenses | | | | |
|
| Investment management fees (Note 3) | 3,025,819 | 789,347 | 382,400 | 1,281,495 |
| Class 1 distribution and service fees (Note 3) | 23,675 | 3,005 | 29 | 1,466 |
| Fund administration fees (Note 3) | 17,829 | 5,317 | 3,229 | 8,627 |
| Audit and legal fees | 11,775 | 7,425 | 8,125 | 8,576 |
| Custodian fees | 74,250 | 17,254 | 58,042 | 28,984 |
| Trustees’ fees (Note 3) | 3,828 | 1,141 | 693 | 1,852 |
| Registration and filing fees | 63,049 | 15,392 | 9,349 | 24,972 |
| Miscellaneous | 10,263 | 2,298 | 12,599 | 3,648 |
| Total expenses | 3,230,488 | 841,179 | 474,466 | 1,359,620 |
| Less expense reductions (Note 3) | (57,625) | — | — | — |
| Net expenses | 3,172,863 | 841,179 | 474,466 | 1,359,620 |
| Net investment income (loss) | 3,602,470 | 139,076 | 2,184,698 | (201,723) |
| |
| Realized and unrealized gain (loss) | | | | |
|
| Net realized gain (loss) on | | | | |
| Investments | (366,521) | 2,146,283 | 258,429 | 902,392 |
| Foreign currency transactions | 139,165 | 37,123 | — | 11,372 |
| Change in net unrealized appreciation (depreciation) of | | | | |
| Investments | 82,211,510 | 19,512,575 | (222,228) | 33,181,404 |
| Translation of assets and liabilities in foreign currencies | 433 | — | — | — |
| Net realized and unrealized gain (loss) | 81,984,587 | 21,695,981 | 36,201 | 34,095,168 |
| |
| Increase (decrease) in net assets from operations | $85,587,057 | $21,835,057 | $2,220,899 | $33,893,445 |
a Period from 10-15-05 (commencement of operations) to 2-28-06.
The accompanying notes are an integral part of the financial statements. 40
John Hancock Funds II
Statements of Operations — for the period ended February 28, 2006 (Unaudited)
|
| | | Emerging | | |
| Investment income | Emerging Growtha | Small Companya | Equity-Incomea | Fundamental Valuea |
|
| Dividends | $178,972 | $124,640 | $7,235,816 | $2,556,478 |
| Interest | 106,225 | 9,717 | 592,276 | 1,155,411 |
| Less foreign taxes withheld | — | (284) | (36,128) | (17,910) |
| Total investment income | 285,197 | 134,073 | 7,791,964 | 3,693,979 |
| |
| Expenses | | | | |
|
| Investment management fees (Note 3) | 490,881 | 219,584 | 2,263,552 | 1,620,307 |
| Class 1 distribution and service fees (Note 3) | 23,735 | 10,262 | 30,667 | 9,794 |
| Fund administration fees (Note 3) | 3,229 | 1,945 | 13,616 | 11,548 |
| Audit and legal fees | 7,060 | 6,253 | 10,310 | 9,590 |
| Custodian fees | 11,147 | 8,255 | 52,652 | 51,941 |
| Trustees’ fees (Note 3) | 693 | 417 | 2,924 | 2,479 |
| Registration and filing fees | 9,347 | 5,632 | 47,258 | 33,429 |
| Miscellaneous | 9,741 | 764 | 8,318 | 3,928 |
| Total expenses | 555,833 | 253,112 | 2,429,297 | 1,743,016 |
| Less expense reductions (Note 3) | — | (9,971) | (46,376) | — |
| Net expenses | 555,833 | 243,141 | 2,382,921 | 1,743,016 |
| Net investment income (loss) | (270,636) | (109,068) | 5,409,043 | 1,950,963 |
| |
| Realized and unrealized gain (loss) | | | | |
|
| Net realized gain (loss) on | | | | |
| Investments | 3,589,393 | 1,258,520 | 2,414,784 | (87,831) |
| Futures contracts | (642,616) | — | — | — |
| Foreign currency transactions | — | — | 12,165 | (71,202) |
| Change in net unrealized appreciation (depreciation) of | | | | |
| Investments | 21,450,303 | 7,044,365 | 56,201,196 | 30,555,739 |
| Translation of assets and liabilities in foreign currencies | — | — | (1,393) | 356 |
| Net realized and unrealized gain (loss) | 24,397,080 | 8,302,885 | 58,626,752 | 30,397,062 |
| |
| Increase (decrease) in net assets from operations | $24,126,444 | $8,193,817 | $64,035,795 | $32,348,025 |
a Period from 10-15-05 (commencement of operations) to 2-28-06.
The accompanying notes are an integral part of the financial statements. 41
John Hancock Funds II
Statements of Operations — for the period ended February 28, 2006 (Unaudited)
|
| | | | International | International |
| Investment income | Global Bonda | High Yielda | Equity Indexb | Opportunitiesa |
|
| Dividends | — | $44,364 | $941,148 | $899,604 |
| Interest | $7,326,092 | 38,788,890 | 102,609 | 155,500 |
| Securities lending | — | 118,424 | — | — |
| Less foreign taxes withheld | (518) | (34,336) | (50,817) | (65,874) |
| Total investment income | 7,325,574 | 38,917,342 | 992,940 | 989,230 |
| |
| Expenses | | | | |
|
| Investment management fees (Note 3) | 1,219,505 | 3,097,348 | 307,956 | 1,267,294 |
| Class 1 distribution and service fees (Note 3) | 7,233 | 7,180 | — | 238 |
| Fund administration fees (Note 3) | 10,079 | 26,620 | 3,315 | 3,083 |
| Audit and legal fees | 12,295 | 16,727 | 6,387 | 7,010 |
| Custodian fees | 89,194 | 157,327 | 4,268 | 134,672 |
| Trustees’ fees (Note 3) | 2,164 | 5,715 | 713 | 662 |
| Registration and filing fees | 29,177 | 77,061 | 9,596 | 22,852 |
| Miscellaneous | 31,555 | 8,733 | 3,937 | 3,187 |
| Total expenses | 1,401,202 | 3,396,711 | 336,172 | 1,438,998 |
| Net investment income (loss) | 5,924,372 | 35,520,631 | 656,768 | (449,768) |
| |
| Realized and unrealized gain (loss) | | | | |
|
| Net realized gain (loss) on | | | | |
| Investments (Note 5) | 1,367,801 | 1,786,719 | 375,892 | 15,730,799 |
| Futures contracts | (921,484) | — | 612,895 | — |
| Options written | (37,969) | — | — | — |
| Interest rate swap contracts | (3,140,233) | — | — | — |
| Foreign currency transactions | (9,359,015) | 8,620 | 143,144 | (146,795) |
| Change in net unrealized appreciation (depreciation) of | | | | |
| Investments | (1,885,369) | 21,241,048 | 21,471,702 | 58,183,594 |
| Futures contracts | (1,138,927) | — | 156,209 | — |
| Options written | 790,676 | — | — | — |
| Interest rate swap contracts | 3,045,458 | — | — | — |
| Translation of assets and liabilities in foreign currencies | 4,478,941 | (1,149) | 82,519 | (6,523) |
| Net realized and unrealized gain (loss) | (6,800,121) | 23,035,238 | 22,842,361 | 73,761,075 |
| |
| Increase (decrease) in net assets from operations | ($875,749) | $58,555,869 | $23,499,129 | $73,311,307 |
a Period from 10-15-05 (commencement of operations) to 2-28-06.
b Period from 10-29-05 (commencement of operations) to 2-28-06.
The accompanying notes are an integral part of the financial statements. 42
John Hancock Funds II
Statements of Operations — for the period ended February 28, 2006 (Unaudited)
|
| | International | International | International | Investment |
| Investment income | Small Capa | Stocka | Valuea | Quality Bonda |
|
| Dividends | $1,716,951 | $5,534,898 | $8,935,204 | — |
| Interest | 333,390 | 355,292 | 560,846 | $2,065,617 |
| Less foreign taxes withheld | (160,754) | (238,104) | (213,973) | (2,229) |
| Total investment income | 1,889,587 | 5,652,086 | 9,282,077 | 2,063,388 |
| |
| Expenses | | | | |
|
| Investment management fees (Note 3) | 1,598,544 | 2,681,259 | 2,652,098 | 241,393 |
| Class 1 distribution and service fees (Note 3) | 5,974 | 5,235 | 20,125 | 6,070 |
| Fund administration fees (Note 3) | 6,487 | 17,378 | 15,974 | 2,427 |
| Audit and legal fees | 8,193 | 9,397 | 11,647 | 8,098 |
| Custodian fees | 293,992 | 387,160 | 419,869 | 52,857 |
| Trustees’ fees (Note 3) | 1,394 | 2,137 | 3,431 | 520 |
| Registration and filing fees | 29,061 | 50,307 | 54,500 | 7,024 |
| Miscellaneous | 24,419 | 4,617 | 5,996 | 1,660 |
| Total expenses | 1,968,064 | 3,157,490 | 3,183,640 | 320,049 |
| Less expense reductions (Note 3) | — | — | (56,339) | — |
| Net expenses | 1,968,064 | 3,157,490 | 3,127,301 | 320,049 |
| Net investment income (loss) | (78,477) | 2,494,596 | 6,154,776 | 1,743,339 |
| |
| Realized and unrealized gain (loss) | | | | |
|
| Net realized gain (loss) on | | | | |
| Investments | 7,036,304 | 11,672,906 | 13,440,226 | (17,195) |
| Futures contracts | — | 2,285,067 | — | (47,798) |
| Foreign currency transactions | 148,257 | 715,261 | 877,446 | — |
| Change in net unrealized appreciation (depreciation) of | | | | |
| Investmentsc | 53,901,321 | 98,670,649 | 74,623,982 | (4,185) |
| Futures contracts | — | 2,181,263 | — | (18,008) |
| Translation of assets and liabilities in foreign currencies | (131,224) | 339,777 | (39,597) | — |
| Net realized and unrealized gain (loss) | 60,954,658 | 115,864,923 | 88,902,057 | (87,186) |
| |
| Increase (decrease) in net assets from operations | $60,876,181 | $118,359,519 | $95,056,833 | $1,656,153 |
a Period from 10-15-05 (commencement of operations) to 2-28-06.
c Net of $146,381 in deferred foreign withholding taxes for International Small Cap.
The accompanying notes are an integral part of the financial statements. 43
John Hancock Funds II
Statements of Operations — for the period ended February 28, 2006 (Unaudited)
|
| Investment income | Large Capa | Large Cap Valuea | Mid Cap Corea | Mid Cap Indexb |
|
| Dividends | $950,874 | $940,999 | $1,177,722 | $281,210 |
| Interest | 52,623 | 15,817 | 625,203 | 39,900 |
| Less foreign taxes withheld | — | — | (1,358) | — |
| Total investment income | 1,003,497 | 956,816 | 1,801,567 | 321,110 |
| |
| Expenses | | | | |
|
| Investment management fees (Note 3) | 450,418 | 433,985 | 965,849 | 96,393 |
| Class 1 distribution and service fees (Note 3) | 170 | 2,192 | 1,488 | — |
| Fund administration fees (Note 3) | 3,027 | 2,824 | 6,344 | 1,147 |
| Audit and legal fees | 6,628 | 6,558 | 7,782 | 5,634 |
| Custodian fees | 10,232 | 9,923 | 40,980 | 4,268 |
| Trustees’ fees (Note 3) | 651 | 606 | 1,361 | 248 |
| Registration and filing fees | 8,764 | 8,175 | 18,364 | 3,323 |
| Miscellaneous | 1,161 | 7,023 | 2,433 | 427 |
| Total expenses | 481,051 | 471,286 | 1,044,601 | 111,440 |
| Less expense reductions (Note 3) | — | — | — | (2,885) |
| Net expenses | 481,051 | 471,286 | 1,044,601 | 108,555 |
| Net investment income (loss) | 522,446 | 485,530 | 756,966 | 212,555 |
| |
| Realized and unrealized gain (loss) | | | | |
|
| Net realized gain (loss) on | | | | |
| Investments | 1,015,106 | 2,147,928 | 11,747,318 | 233,010 |
| Futures contracts | 57,155 | — | — | — |
| Foreign currency transactions | — | — | 31,520 | — |
| Change in net unrealized appreciation (depreciation) of | | | | |
| Investments | 9,781,117 | 11,215,178 | 18,167,851 | 6,324,680 |
| Futures contracts | (4,775) | — | — | 68,873 |
| Net realized and unrealized gain (loss) | 10,848,603 | 13,363,106 | 29,946,689 | 6,626,563 |
| |
| Increase (decrease) in net assets from operations | $11,371,049 | $13,848,636 | $30,703,655 | $6,839,118 |
a Period from 10-15-05 (commencement of operations) to 2-28-06.
b Period from 10-29-05 (commencement of operations) to 2-28-06.
The accompanying notes are an integral part of the financial statements. 44
John Hancock Funds II
Statements of Operations — for the period ended February 28, 2006 (Unaudited)
|
| | | | | Quantitative |
| Investment income | Mid Cap Stocka | Mid Cap Valuea | Natural Resourcesa | Mid Capa |
|
| Dividends | $426,782 | $1,052,025 | $3,472,981 | $506,562 |
| Interest | 224,425 | 85,663 | 546,880 | 61,085 |
| Securities lending | — | — | 2,412 | — |
| Less foreign taxes withheld | (500) | (1,161) | (131,635) | — |
| Total investment income | 650,707 | 1,136,527 | 3,890,638 | 567,647 |
| |
| Expenses | | | | |
|
| Investment management fees (Note 3) | 760,684 | 621,545 | 2,278,055 | 470,526 |
| Class 1 distribution and service fees (Note 3) | 17,806 | 15,666 | 9,395 | 25,046 |
| Fund administration fees (Note 3) | 3,803 | 4,046 | 14,150 | 3,484 |
| Audit and legal fees | 6,898 | 6,983 | 10,496 | 6,787 |
| Custodian fees | 25,645 | 23,602 | 106,454 | 11,403 |
| Trustees’ fees (Note 3) | 818 | 869 | 3,036 | 748 |
| Registration and filing fees | 11,009 | 11,713 | 40,962 | 10,088 |
| Miscellaneous | 2,262 | 1,695 | 6,460 | 1,753 |
| Total expenses | 828,925 | 686,119 | 2,469,008 | 529,835 |
| Net investment income (loss) | (178,218) | 450,408 | 1,421,630 | 37,812 |
| |
| Realized and unrealized gain (loss) on | | | | |
|
| Net realized gain (loss) | | | | |
| Investments (Note 5) | 12,102,077 | 3,179,407 | 6,310,056 | 1,954,122 |
| Futures contracts | — | — | 4,274,760 | — |
| Foreign currency transactions | 2,439 | — | 137,200 | — |
| Change in net unrealized appreciation (depreciation) of | | | | |
| Investments | 28,089,100 | 12,083,701 | 86,457,359 | 19,787,865 |
| Translation of assets and liabilities in foreign currencies | — | — | 206 | — |
| Net realized and unrealized gain (loss) | 40,193,616 | 15,263,108 | 97,179,581 | 21,741,987 |
| |
| Increase (decrease) in net assets from operations | $40,015,398 | $15,713,516 | $98,601,211 | $21,779,799 |
a Period from 10-15-05 (commencement of operations) to 2-28-06.
The accompanying notes are an integral part of the financial statements. 45
John Hancock Funds II
Statements of Operations — for the period ended February 28, 2006 (Unaudited)
|
| | Quantitative | Real Estate | | |
| Investment income | Valuea | Securitiesa | Real Return Bonda | Small Capa |
|
| Dividends | $3,083,007 | $10,036,882 | — | $278,514 |
| Interest | 67,483 | 108,830 | $5,085,428 | 52,686 |
| Total investment income | 3,150,490 | 10,145,712 | 5,085,428 | 331,200 |
| |
| Expenses | | | | |
|
| Investment management fees (Note 3) | 818,835 | 1,599,892 | 1,388,218 | 571,205 |
| Class 1 distribution and service fees (Note 3) | 17,419 | 25,266 | 2,807 | 35 |
| Fund administration fees (Note 3) | 6,355 | 12,927 | 12,456 | 2,965 |
| Audit and legal fees | 7,785 | 10,070 | 12,583 | 6,607 |
| Custodian fees | 17,915 | 34,132 | 33,584 | 12,065 |
| Trustees’ fees (Note 3) | 1,365 | 2,776 | 2,673 | 637 |
| Registration and filing fees | 18,398 | 37,420 | 36,059 | 8,586 |
| Miscellaneous | 6,280 | 4,319 | 9,980 | 1,407 |
| Total expenses | 894,352 | 1,726,802 | 1,498,360 | 603,507 |
| Net investment income (loss) | 2,256,138 | 8,418,910 | 3,587,068 | (272,307) |
| |
| Realized and unrealized gain (loss) | | | | |
|
| Net realized gain (loss) on | | | | |
| Investments | 13,594,334 | 4,015,011 | (879,736) | 297,643 |
| Futures contracts | — | — | 348,609 | — |
| Options written | — | — | 161,688 | — |
| Interest rate swap contracts | — | — | (2,630) | — |
| Foreign currency transactions | — | — | (27,565) | — |
| Change in net unrealized appreciation (depreciation) of | | | | |
| Investments | 19,752,467 | 82,187,933 | 5,619,251 | 24,278,473 |
| Futures contracts | — | — | (809,597) | — |
| Options written | — | — | 37,241 | — |
| Interest rate swap contracts | — | — | 37,833 | — |
| Translation of assets and liabilities in foreign currencies | — | — | (6,897) | — |
| Net realized and unrealized gain (loss) | 33,346,801 | 86,202,944 | 4,478,197 | 24,576,116 |
| |
| Increase (decrease) in net assets from operations | $35,602,939 | $94,621,854 | $8,065,265 | $24,303,809 |
a Period from 10-15-05 (commencement of operations) to 2-28-06.
The accompanying notes are an integral part of the financial statements. 46
John Hancock Funds II
Statements of Operations — for the period ended February 28, 2006 (Unaudited)
|
| | | Small Cap | | Small Company |
| Investment income | Small Cap Indexb | Opportunitiesa | Small Companya | Growthb |
|
| Dividends | $253,817 | $1,722,831 | $245,252 | $36,119 |
| Interest | 41,304 | 85,751 | 9,448 | 19,686 |
| Less foreign taxes withheld | (159) | (3,229) | (215) | — |
| Total investment income | 294,962 | 1,805,353 | 254,485 | 55,805 |
| |
| Expenses | | | | |
|
| Investment management fees (Note 3) | 96,838 | 830,976 | 279,094 | 198,962 |
| Class 1 distribution and service fees (Note 3) | — | 4,570 | 975 | — |
| Fund administration fees (Note 3) | 1,147 | 4,657 | 1,486 | 1,006 |
| Audit and legal fees | 5,634 | 7,195 | 6,093 | 5,197 |
| Custodian fees | 4,268 | 14,206 | 59,263 | 7,746 |
| Trustees’ fees (Note 3) | 248 | 1,000 | 319 | 216 |
| Registration and filing fees | 3,323 | 13,480 | 4,301 | 2,912 |
| Miscellaneous | 479 | 1,931 | 842 | 383 |
| Total expenses | 111,937 | 878,015 | 352,373 | 216,422 |
| Less expense reductions (Note 3) | (2,851) | — | — | — |
| Net expenses | 109,086 | 878,015 | 352,373 | 216,422 |
| Net investment income (loss) | 185,876 | 927,338 | (97,888) | (160,617) |
| |
| Realized and unrealized gain (loss) | | | | |
|
| Net realized gain (loss) on | | | | |
| Investments | 58,754 | 1,417,733 | 1,465,036 | 766,095 |
| Foreign currency transactions | — | (119) | — | — |
| Change in net unrealized appreciation (depreciation) of | | | | |
| Investments | 7,898,581 | 27,180,837 | 7,889,829 | 7,151,980 |
| Futures contracts | 144,812 | — | — | — |
| Net realized and unrealized gain (loss) | 8,102,147 | 28,598,451 | 9,354,865 | 7,918,075 |
| |
| Increase (decrease) in net assets from operations | $8,288,023 | $29,525,789 | $9,256,977 | $7,757,458 |
a Period from 10-15-05 (commencement of operations) to 2-28-06.
b Period from 10-29-05 (commencement of operations) to 2-28-06.
The accompanying notes are an integral part of the financial statements. 47
John Hancock Funds II
Statements of Operations — for the period ended February 28, 2006 (Unaudited)
|
| Investment income | Small Company Valuea | Special Valuea | Spectrum Incomeb | Strategic Bonda |
|
| Dividends | $1,820,741 | $412,351 | $1,063,702 | $1,805 |
| Interest | 178,697 | 76,408 | 8,586,494 | 9,024,805 |
| Securities lending | — | — | — | 17,106 |
| Less foreign taxes withheld | — | — | (19,003) | (5,412) |
| Total investment income | 1,999,438 | 488,759 | 9,631,193 | 9,038,304 |
| |
| Expenses | | | | |
|
| Investment management fees (Note 3) | 1,200,993 | 345,944 | 1,476,455 | 1,138,634 |
| Class 1 distribution and service fees (Note 3) | 25,353 | 475 | — | 7,176 |
| Fund administration fees (Note 3) | 6,153 | 1,976 | 10,315 | 9,458 |
| Audit and legal fees | 7,715 | 6,262 | 9,893 | 10,542 |
| Custodian fees | 20,434 | 11,460 | 335,115 | 71,938 |
| Trustees’ fees (Note 3) | 1,322 | 424 | 2,214 | 2,030 |
| Registration and filing fees | 17,810 | 5,720 | 37,649 | 27,378 |
| Miscellaneous | 4,539 | 612 | 5,027 | 3,357 |
| Total expenses | 1,284,319 | 372,873 | 1,876,668 | 1,270,513 |
| Less expense reductions (Note 3) | (34,174) | — | (25,222) | — |
| Net expenses | 1,250,145 | 372,873 | 1,851,446 | 1,270,513 |
| Net investment income (loss) | 749,293 | 115,886 | 7,779,747 | 7,767,791 |
| |
| Realized and unrealized gain (loss) | | | | |
|
| Net realized gain (loss) on | | | | |
| Investments | 1,194,462 | 86,092 | 343,392 | 774,073 |
| Futures contracts | — | — | (8,612) | 62,895 |
| Foreign currency transactions | — | — | (97,253) | 6,091 |
| Change in net unrealized appreciation (depreciation) of | | | | |
| Investments | 42,397,287 | 9,815,284 | 10,696,780 | 2,787,464 |
| Futures contracts | — | — | 9,917 | (17,905) |
| Translation of assets and liabilities in foreign currencies | — | — | 154,331 | (20) |
| Net realized and unrealized gain (loss) | 43,591,749 | 9,901,376 | 11,098,555 | 3,612,598 |
| |
| Increase (decrease) in net assets from operations | $44,341,042 | $10,017,262 | $18,878,302 | $11,380,389 |
a Period from 10-15-05 (commencement of operations) to 2-28-06.
b Period from 10-29-05 (commencement of operations) to 2-28-06.
The accompanying notes are an integral part of the financial statements. 48
John Hancock Funds II
Statements of Operations — for the period ended February 28, 2006 (Unaudited)
|
| | | | U.S. Global | U.S. Government |
| Investment income | Strategic Valuea | Total Returna | Leaders Growtha | Securitiesa |
|
| Dividends | $676,775 | — | $1,399,943 | — |
| Interest | 48,048 | $15,392,051 | 80,188 | $3,081,881 |
| Total investment income | 724,823 | 15,392,051 | 1,480,131 | 3,081,881 |
| |
| Expenses | | | | |
|
| Investment management fees (Note 3) | 368,671 | 2,355,692 | 889,697 | 427,700 |
| Class 1 distribution and service fees (Note 3) | 2,395 | 20,715 | 4,459 | 8,846 |
| Fund administration fees (Note 3) | 2,453 | 18,509 | 5,021 | 4,028 |
| Audit and legal fees | 6,428 | 14,759 | 7,322 | 6,976 |
| Custodian fees | 9,104 | 101,801 | 17,341 | 37,315 |
| Trustees’ fees (Note 3) | 527 | 3,974 | 1,078 | 864 |
| Registration and filing fees | 7,102 | 53,582 | 20,927 | 11,658 |
| Miscellaneous | 803 | 66,514 | 1,850 | 1,213 |
| Total expenses | 397,483 | 2,635,546 | 947,695 | 498,600 |
| Net investment income (loss) | 327,340 | 12,756,505 | 532,436 | 2,583,281 |
| |
| Realized and unrealized gain (loss) | | | | |
|
| Net realized gain (loss) on | | | | |
| Investments | 16,043 | 2,787,116 | 267,667 | (79,290) |
| Futures contracts | — | (885,326) | — | 10,152 |
| Options written | — | 281,388 | — | — |
| Interest rate swap contracts | — | 66,937 | — | — |
| Foreign currency transactions | — | 1,117,123 | — | — |
| Change in net unrealized appreciation (depreciation) of | | | | |
| Investments | 6,957,003 | 1,413,520 | 3,541,736 | 212,722 |
| Futures contracts | — | (2,132,741) | — | 455 |
| Options written | — | (53,083) | — | — |
| Interest rate swap contracts | — | (190,777) | — | — |
| Translation of assets and liabilities in foreign currencies | — | 621,542 | — | — |
| Net realized and unrealized gain (loss) | 6,973,046 | 3,025,699 | 3,809,403 | 144,039 |
| |
| Increase (decrease) in net assets from operations | $7,300,386 | $15,782,204 | $4,341,839 | $2,727,320 |
a Period from 10-15-05 (commencement of operations) to 2-28-06.
The accompanying notes are an integral part of the financial statements. 49
John Hancock Funds II
Statements of Operations — for the period ended February 28, 2006 (Unaudited)
|
| | U.S. High | | Value & | |
| Investment income | Yield Bonda | U.S. Multi Sectorb | Restructuringb | Vistab |
|
| Dividends | — | $5,246,483 | $1,288,525 | $494,496 |
| Interest | $4,212,838 | 454,152 | 32,963 | 19,815 |
| Less foreign taxes withheld | (6,286) | — | (15,308) | (347) |
| Total investment income | 4,206,552 | 5,700,635 | 1,306,180 | 513,964 |
| |
| Expenses | | | | |
|
| Investment management fees (Note 3) | 396,824 | 2,536,446 | 468,299 | 301,353 |
| Class 1 distribution and service fees (Note 3) | 48 | — | — | — |
| Fund administration fees (Note 3) | 3,022 | 17,266 | 2,811 | 1,689 |
| Audit and legal fees | 8,053 | 12,309 | 5,824 | 5,434 |
| Custodian fees | 18,188 | 96,777 | 11,591 | 16,230 |
| Trustees’ fees (Note 3) | 648 | 3,708 | 604 | 362 |
| Registration and filing fees | 8,749 | 62,863 | 8,139 | 4,891 |
| Miscellaneous | 1,037 | 6,407 | 1,067 | 926 |
| Total expenses | 436,569 | 2,735,776 | 498,335 | 330,885 |
| Net investment income (loss) | 3,769,983 | 2,964,859 | 807,845 | 183,079 |
| |
| Realized and unrealized gain (loss) | | | | |
|
| Net realized gain (loss) on | | | | |
| Investments | 72,199 | 9,028,067 | 508,353 | (1,667,564) |
| Futures contracts | — | 1,427,988 | — | — |
| Options written | — | — | 71,901 | — |
| Foreign currency transactions | — | (16,742) | 17,376 | (34,925) |
| Change in net unrealized appreciation (depreciation) of | | | | |
| Investments | 2,168,739 | 48,920,662 | 17,300,866 | 13,452,909 |
| Futures contracts | — | 297,078 | — | — |
| Options written | — | — | 69,520 | — |
| Translation of assets and liabilities in foreign currencies | — | — | 19 | (13,183) |
| Net realized and unrealized gain (loss) | 2,240,938 | 59,657,053 | 17,968,035 | 11,737,237 |
| |
| Increase (decrease) in net assets from operations | $6,010,921 | $62,621,912 | $18,775,880 | $11,920,316 |
a Period from 10-15-05 (commencement of operations) to 2-28-06.
b Period from 10-29-05 (commencement of operations) to 2-28-06.
The accompanying notes are an integral part of the financial statements. 50
John Hancock Funds II
Statements of Changes in Net Assets
|
| | 500 Index | Active Bond | All Cap Growth |
| | Period ended | Period ended | Period ended |
| | 2-28-06b | 2-28-06a | 2-28-06a |
| Increase (decrease) in net assets | (Unaudited) | (Unaudited) | (Unaudited) |
|
| From operations | | | |
| Net investment income (loss) | $1,602,261 | $5,124,341 | $54,621 |
| Net realized gain (loss) | 116,173 | 208,280 | 1,133,999 |
| Change in net unrealized appreciation (depreciation) | 16,613,450 | 101,564 | 12,347,248 |
| Increase (decrease) in net assets resulting from operations | 18,331,884 | 5,434,185 | 13,535,868 |
| Distributions to shareholders | | | |
| From net investment income | | | |
| Class 1 | — | (223,338) | (15,666) |
| Class NAV | (847,720) | (2,203,004) | (49,558) |
| | (847,720) | (2,426,342) | (65,224) |
| From Fund share transactions | 266,118,200 | 392,669,241 | 130,103,194 |
| |
| Net assets | | | |
|
| Beginning of period | — | — | — |
| End of period | $283,602,364 | $395,677,084 | $143,573,838 |
| Undistributed net investment income (loss) | $754,541 | $2,697,999 | ($10,603) |
| |
| | All Cap Value | Blue Chip Growth | Capital Appreciation |
| | Period ended | Period ended | Period ended |
| | 2-28-06a | 2-28-06a | 2-28-06a |
| Increase (decrease) in net assets | (Unaudited) | (Unaudited) | (Unaudited) |
|
| From operations | | | |
| Net investment income (loss) | $591,084 | $3,602,470 | $139,076 |
| Net realized gain (loss) | 3,138,085 | (227,356) | 2,183,406 |
| Change in net unrealized appreciation (depreciation) | 15,138,950 | 82,211,943 | 19,512,575 |
| Increase (decrease) in net assets resulting from operations | 18,868,119 | 85,587,057 | 21,835,057 |
| Distributions to shareholders | | | |
| From net investment income | | | |
| Class 1 | (29,388) | (96,099) | — |
| Class NAV | (268,692) | (798,874) | — |
| | (298,080) | (894,973) | — |
| From Fund share transactions | 172,228,738 | 1,071,569,311 | 277,993,252 |
| |
| Net assets | | | |
|
| Beginning of period | — | — | — |
| End of period | $190,798,777 | $1,156,261,395 | $299,828,309 |
| Undistributed net investment income (loss) | $293,004 | $2,707,497 | $139,076 |
a Period from 10-15-05 (commencement of operations) to 2-28-06.
b Period from 10-29-05 (commencement of operations) to 2-28-06.
The accompanying notes are an integral part of the financial statements. 51
John Hancock Funds II
Statements of Changes in Net Assets
|
| | Core Bond | Core Equity | Emerging Growth |
| | Period ended | Period ended | Period ended |
| | 2-28-06a | 2-28-06a | 2-28-06a |
| Increase (decrease) in net assets | (Unaudited) | (Unaudited) | (Unaudited) |
|
| From operations | | | |
| Net investment income (loss) | $2,184,698 | ($201,723) | ($270,636) |
| Net realized gain (loss) | 258,429 | 913,764 | 2,946,777 |
| Change in net unrealized appreciation (depreciation) | (222,228) | 33,181,404 | 21,450,303 |
| Increase (decrease) in net assets resulting from operations | 2,220,899 | 33,893,445 | 24,126,444 |
| Distributions to shareholders | | | |
| From net investment income | | | |
| Class 1 | (911) | — | — |
| Class NAV | (1,142,506) | — | — |
| | (1,143,417) | — | — |
| From Fund share transactions | 175,673,149 | 467,673,907 | 139,455,661 |
| |
| Net assets | | | |
|
| Beginning of period | — | — | — |
| End of period | $176,750,631 | $501,567,352 | $163,582,105 |
| Undistributed net investment income (loss) | $1,041,281 | ($201,723) | ($270,636) |
| |
| | Emerging Small Company | Equity-Income | Fundamental Value |
| | Period ended | Period ended | Period ended |
| | 2-28-06a | 2-28-06a | 2-28-06a |
| Increase (decrease) in net assets | (Unaudited) | (Unaudited) | (Unaudited) |
|
| From operations | | | |
| Net investment income (loss) | ($109,068) | $5,409,043 | $1,950,963 |
| Net realized gain (loss) | 1,258,520 | 2,426,949 | (159,033) |
| Change in net unrealized appreciation (depreciation) | 7,044,365 | 56,199,803 | 30,556,095 |
| Increase (decrease) in net assets resulting from operations | 8,193,817 | 64,035,795 | 32,348,025 |
| Distributions to shareholders | | | |
| From net investment income | | | |
| Class 1 | — | (612,671) | (109,544) |
| Class NAV | — | (2,371,194) | (1,226,769) |
| | — | (2,983,865) | (1,336,313) |
| From Fund share transactions | 49,097,929 | 791,112,683 | 625,561,970 |
| |
| Net assets | | | |
|
| Beginning of period | — | — | — |
| End of period | $57,291,746 | $852,164,613 | $656,573,682 |
| Undistributed net investment income (loss) | ($109,068) | $2,425,178 | $614,650 |
a Period from 10-15-05 (commencement of operations) to 2-28-06.
The accompanying notes are an integral part of the financial statements. 52
John Hancock Funds II
Statements of Changes in Net Assets
|
| | Global Bond | High Yield | International Equity Index |
| | Period ended | Period ended | Period ended |
| | 2-28-06a | 2-28-06a | 2-28-06b |
| Increase (decrease) in net assets | (Unaudited) | (Unaudited) | (Unaudited) |
|
| From operations | | | |
| Net investment income (loss) | $5,924,372 | $35,520,631 | $656,768 |
| Net realized gain (loss) | (12,090,900) | 1,795,339 | 1,131,931 |
| Change in net unrealized appreciation (depreciation) | 5,290,779 | 21,239,899 | 21,710,430 |
| Increase (decrease) in net assets resulting from operations | (875,749) | 58,555,869 | 23,499,129 |
| Distributions to shareholders | | | |
| From net investment income | | | |
| Class 1 | (227,540) | (473,790) | — |
| Class NAV | (2,800,652) | (16,639,138) | (2,080,681) |
| | (3,028,192) | (17,112,928) | (2,080,681) |
| From Fund share transactions | 540,772,677 | 1,435,091,397 | 166,171,938 |
| |
| Net assets | | | |
|
| Beginning of period | — | — | — |
| End of period | $536,868,736 | $1,476,534,338 | $187,590,386 |
| Undistributed net investment income (loss) | $2,896,180 | $18,407,703 | ($1,423,913) |
| |
| International Opportunities | International Small Cap | International Stock |
| | Period ended | Period ended | Period ended |
| | 2-28-06a | 2-28-06a | 2-28-06a |
| Increase (decrease) in net assets | (Unaudited) | (Unaudited) | (Unaudited) |
|
| From operations | | | |
| Net investment income (loss) | ($449,768) | ($78,477) | $2,494,596 |
| Net realized gain (loss) | 15,584,004 | 7,184,561 | 14,673,234 |
| Change in net unrealized appreciation (depreciation) | 58,177,071 | 53,770,097 | 101,191,689 |
| Increase (decrease) in net assets resulting from operations | 73,311,307 | 60,876,181 | 118,359,519 |
| Distributions to shareholders | | | |
| From net investment income | | | |
| Class 1 | (42,136) | (59,757) | (619,551) |
| Class NAV | (18,582,164) | (1,022,670) | (19,349,670) |
| From net realized gain | | | |
| Class 1 | — | — | (5,707) |
| Class NAV | — | — | (175,912) |
| | (18,624,300) | (1,082,427) | (20,150,840) |
| From Fund share transactions | 378,264,610 | 496,473,014 | 859,121,360 |
| |
| Net assets | | | |
|
| Beginning of period | — | — | — |
| End of period | $432,951,617 | $556,266,768 | $957,330,039 |
| Undistributed net investment income (loss) | ($19,074,068) | ($1,160,904) | ($17,474,625) |
a Period from 10-15-05 (commencement of operations) to 2-28-06.
b Period from 10-29-05 (commencement of operations) to 2-28-06.
The accompanying notes are an integral part of the financial statements. 53
John Hancock Funds II
Statements of Changes in Net Assets
|
| | International Value | Investment Quality Bond | Large Cap |
| | Period ended | Period ended | Period ended |
| | 2-28-06a | 2-28-06a | 2-28-06a |
| Increase (decrease) in net assets | (Unaudited) | (Unaudited) | (Unaudited) |
|
| From operations | | | |
| Net investment income (loss) | $6,154,776 | $1,743,339 | $522,446 |
| Net realized gain (loss) | 14,317,672 | (64,993) | 1,072,261 |
| Change in net unrealized appreciation (depreciation) | 74,584,385 | (22,193) | 9,776,342 |
| Increase (decrease) in net assets resulting from operations | 95,056,833 | 1,656,153 | 11,371,049 |
| Distributions to shareholders | | | |
| From net investment income | | | |
| Class 1 | (353,039) | (272,643) | (1,427) |
| Class NAV | (2,875,449) | (689,195) | (212,012) |
| | (3,228,488) | (961,838) | (213,439) |
| From Fund share transactions | 913,732,348 | 117,274,724 | 158,913,270 |
| |
| Net assets | | | |
|
| Beginning of period | — | — | — |
| End of period | $1,005,560,693 | $117,969,039 | $170,070,880 |
| Undistributed net investment income (loss) | $2,926,288 | $781,501 | $309,007 |
| |
| | Large Cap Value | Mid Cap Core | Mid Cap Index |
| | Period ended | Period ended | Period ended |
| | 2-28-06a | 2-28-06a | 2-28-06b |
| Increase (decrease) in net assets | (Unaudited) | (Unaudited) | (Unaudited) |
|
| From operations | | | |
| Net investment income (loss) | $485,530 | $756,966 | $212,555 |
| Net realized gain (loss) | 2,147,928 | 11,778,838 | 233,010 |
| Change in net unrealized appreciation (depreciation) | 11,215,178 | 18,167,851 | 6,393,553 |
| Increase (decrease) in net assets resulting from operations | 13,848,636 | 30,703,655 | 6,839,118 |
| Distributions to shareholders | | | |
| From net investment income | | | |
| Class 1 | (24,236) | (8,276) | — |
| Class NAV | (293,006) | (374,238) | (98,937) |
| | (317,242) | (382,514) | (98,937) |
| From Fund share transactions | 145,947,350 | 325,329,292 | 57,027,105 |
| |
| Net assets | | | |
|
| Beginning of period | — | — | — |
| End of period | $159,478,744 | $355,650,433 | $63,767,286 |
| Undistributed net investment income (loss) | $168,288 | $374,452 | $113,618 |
a Period from 10-15-05 (commencement of operations) to 2-28-06.
b Period from 10-29-05 (commencement of operations) to 2-28-06.
The accompanying notes are an integral part of the financial statements. 54
John Hancock Funds II
Statements of Changes in Net Assets
|
| | Mid Cap Stock | Mid Cap Value | Natural Resources |
| | Period ended | Period ended | Period ended |
| | 2-28-06a | 2-28-06a | 2-28-06a |
| Increase (decrease) in net assets | (Unaudited) | (Unaudited) | (Unaudited) |
|
| From operations | | | |
| Net investment income (loss) | ($178,218) | $450,408 | $1,421,630 |
| Net realized gain (loss) | 12,104,516 | 3,179,407 | 10,722,016 |
| Change in net unrealized appreciation (depreciation) | 28,089,100 | 12,083,701 | 86,457,565 |
| Increase (decrease) in net assets resulting from operations | 40,015,398 | 15,713,516 | 98,601,211 |
| Distributions to shareholders | | | |
| From net investment income | | | |
| Class 1 | — | (129,841) | (51,094) |
| Class NAV | (8,555) | (193,677) | (691,085) |
| From net realized gain | | | |
| Class 1 | (110,835) | (26,179) | — |
| Class NAV | (186,450) | (37,304) | — |
| | (305,840) | (387,001) | (742,179) |
| From Fund share transactions | 236,883,495 | 201,796,465 | 575,534,016 |
| |
| Net assets | | | |
|
| Beginning of period | — | — | — |
| End of period | $276,593,053 | $217,122,980 | $673,393,048 |
| Undistributed net investment income (loss) | ($186,773) | $126,890 | $679,451 |
| |
| | Quantitative Mid Cap | Quantitative Value | Real Estate Securities |
| | Period ended | Period ended | Period ended |
| | 2-28-06a | 2-28-06a | 2-28-06a |
| Increase (decrease) in net assets | (Unaudited) | (Unaudited) | (Unaudited) |
|
| From operations | | | |
| Net investment income (loss) | $37,812 | $2,256,138 | $8,418,910 |
| Net realized gain (loss) | 1,954,122 | 13,594,334 | 4,015,011 |
| Change in net unrealized appreciation (depreciation) | 19,787,865 | 19,752,467 | 82,187,933 |
| Increase (decrease) in net assets resulting from operations | 21,779,799 | 35,602,939 | 94,621,854 |
| Distributions to shareholders | | | |
| From net investment income | | | |
| Class 1 | (19,537) | (305,249) | (836,666) |
| Class NAV | (8,107) | (884,369) | (3,237,863) |
| From net realized gain | | | |
| Class 1 | (47,665) | (11,547) | (156,926) |
| Class NAV | (14,289) | (33,123) | (598,547) |
| | (89,598) | (1,234,288) | (4,830,002) |
| From Fund share transactions | 166,439,231 | 310,673,494 | 613,099,974 |
| |
| Net assets | | | |
|
| Beginning of period | — | — | — |
| End of period | $188,129,432 | $345,042,145 | $702,891,826 |
| Undistributed net investment income (loss) | $10,168 | $1,066,519 | $4,344,380 |
a Period from 10-15-05 (commencement of operations) to 2-28-06.
The accompanying notes are an integral part of the financial statements. 55
John Hancock Funds II
Statements of Changes in Net Assets
|
| | Real Return Bond | Small Cap | Small Cap Index |
| | Period ended | Period ended | Period ended |
| | 2-28-06a | 2-28-06a | 2-28-06b |
| Increase (decrease) in net assets | (Unaudited) | (Unaudited) | (Unaudited) |
|
| From operations | | | |
| Net investment income (loss) | $3,587,068 | ($272,307) | $185,876 |
| Net realized gain (loss) | (399,634) | 297,643 | 58,754 |
| Change in net unrealized appreciation (depreciation) | 4,877,831 | 24,278,473 | 8,043,393 |
| Increase (decrease) in net assets resulting from operations | 8,065,265 | 24,303,809 | 8,288,023 |
| Distributions to shareholders | | | |
| From net investment income | | | |
| Class 1 | (136,421) | — | — |
| Class NAV | (5,167,622) | — | (86,672) |
| From net realized gain | | | |
| Class 1 | (3,746) | — | — |
| Class NAV | (140,598) | — | — |
| | (5,448,387) | — | (86,672) |
| From Fund share transactions | 625,086,493 | 185,093,365 | 56,037,681 |
| |
| Net assets | | | |
|
| Beginning of period | — | — | — |
| End of period | $627,703,371 | $209,397,174 | $64,239,032 |
| Undistributed net investment income (loss) | ($1,716,975) | ($272,307) | $99,204 |
| |
| | Small Cap Opportunities | Small Company | Small Company Growth |
| | Period ended | Period ended | Period ended |
| | 2-28-06a | 2-28-06a | 2-28-06b |
| Increase (decrease) in net assets | (Unaudited) | (Unaudited) | (Unaudited) |
|
| From operations | | | |
| Net investment income (loss) | $927,338 | ($97,888) | ($160,617) |
| Net realized gain (loss) | 1,417,614 | 1,465,036 | 766,095 |
| Change in net unrealized appreciation (depreciation) | 27,180,837 | 7,889,829 | 7,151,980 |
| Increase (decrease) in net assets resulting from operations | 29,525,789 | 9,256,977 | 7,757,458 |
| Distributions to shareholders | | | |
| From net investment income | | | |
| Class 1 | (48,845) | — | — |
| Class NAV | (462,991) | — | — |
| From net realized gain | | | |
| Class 1 | (3,697) | — | — |
| Class NAV | (33,252) | — | — |
| | (548,785) | — | — |
| From Fund share transactions | 233,346,987 | 75,562,848 | 56,548,324 |
| |
| Net assets | | | |
|
| Beginning of period | — | — | — |
| End of period | $262,323,991 | $84,819,825 | $64,305,782 |
| Undistributed net investment income (loss) | $415,502 | ($97,888) | ($160,617) |
a Period from 10-15-05 (commencement of operations) to 2-28-06.
b Period from 10-29-05 (commencement of operations) to 2-28-06.
The accompanying notes are an integral part of the financial statements. 56
John Hancock Funds II
Statements of Changes in Net Assets
|
| | Small Company Value | Special Value | Spectrum Income |
| | Period ended | Period ended | Period ended |
| | 2-28-06a | 2-28-06a | 2-28-06b |
| Increase (decrease) in net assets | (Unaudited) | (Unaudited) | (Unaudited) |
|
| From operations | | | |
| Net investment income (loss) | $749,293 | $115,886 | $7,779,747 |
| Net realized gain (loss) | 1,194,462 | 86,092 | 237,527 |
| Change in net unrealized appreciation (depreciation) | 42,397,287 | 9,815,284 | 10,861,028 |
| Increase (decrease) in net assets resulting from operations | 44,341,042 | 10,017,262 | 18,878,302 |
| Distributions to shareholders | | | |
| From net investment income | | | |
| Class 1 | (272,671) | (1,203) | — |
| Class NAV | (401,689) | (80,457) | (3,989,211) |
| | (674,360) | (81,660) | (3,989,211) |
| From Fund share transactions | 310,563,234 | 101,525,199 | 632,202,851 |
| |
| Net assets | | | |
|
| Beginning of period | — | — | — |
| End of period | $354,229,916 | $111,460,801 | $647,091,942 |
| Undistributed net investment income (loss) | $74,933 | $34,226 | $3,790,536 |
| |
| | Strategic Bond | Strategic Value | Total Return |
| | Period ended | Period ended | Period ended |
| | 2-28-06a | 2-28-06a | 2-28-06a |
| Increase (decrease) in net assets | (Unaudited) | (Unaudited) | (Unaudited) |
|
| From operations | | | |
| Net investment income (loss) | $7,767,791 | $327,340 | $12,756,505 |
| Net realized gain (loss) | 843,059 | 16,043 | 3,367,238 |
| Change in net unrealized appreciation (depreciation) | 2,769,539 | 6,957,003 | (341,539) |
| Increase (decrease) in net assets resulting from operations | 11,380,389 | 7,300,386 | 15,782,204 |
| Distributions to shareholders | | | |
| From net investment income | | | |
| Class 1 | (322,248) | (18,908) | (721,705) |
| Class NAV | (3,717,833) | (182,610) | (5,760,221) |
| From net realized gain | | | |
| Class 1 | (10,065) | — | — |
| Class NAV | (114,768) | — | — |
| | (4,164,914) | (201,518) | (6,481,926) |
| From Fund share transactions | 502,011,613 | 128,219,920 | 1,037,780,356 |
| |
| Net assets | | | |
|
| Beginning of period | — | — | — |
| End of period | $509,227,088 | $135,318,788 | $1,047,080,634 |
| Undistributed net investment income (loss) | $3,727,710 | $125,822 | $6,274,579 |
a Period from 10-15-05 (commencement of operations) to 2-28-06.
b Period from 10-29-05 (commencement of operations) to 2-28-06.
The accompanying notes are an integral part of the financial statements. 57
John Hancock Funds II
Statements of Changes in Net Assets
|
| U.S. Global Leaders Growth | U.S. Government Securities | U.S. High Yield Bond |
| | Period ended | Period ended | Period ended |
| | 2-28-06a | 2-28-06a | 2-28-06a |
| Increase (decrease) in net assets | (Unaudited) | (Unaudited) | (Unaudited) |
|
| From operations | | | |
| Net investment income (loss) | $532,436 | $2,583,281 | $3,769,983 |
| Net realized gain (loss) | 267,667 | (69,138) | 72,199 |
| Change in net unrealized appreciation (depreciation) | 3,541,736 | 213,177 | 2,168,739 |
| Increase (decrease) in net assets resulting from operations | 4,341,839 | 2,727,320 | 6,010,921 |
| Distributions to shareholders | | | |
| From net investment income | | | |
| Class 1 | (10,881) | (313,345) | (1,743) |
| Class NAV | (198,525) | (929,318) | (2,045,560) |
| From net realized gain | | | |
| Class 1 | — | (15,290) | — |
| Class NAV | — | (44,734) | — |
| | (209,406) | (1,302,687) | (2,047,303) |
| From Fund share transactions | 420,300,310 | 191,273,101 | 162,724,079 |
| |
| Net assets | | | |
|
| Beginning of period | — | — | — |
| End of period | $424,432,743 | $192,697,734 | $166,687,697 |
| Undistributed net investment income (loss) | $323,030 | $1,340,619 | $1,722,680 |
| |
| | U.S. Multi Sector | Value & Restructuring | Vista |
| | Period ended | Period ended | Period ended |
| | 2-28-06b | 2-28-06b | 2-28-06b |
| Increase (decrease) in net assets | (Unaudited) | (Unaudited) | (Unaudited) |
|
| From operations | | | |
| Net investment income (loss) | $2,964,859 | $807,845 | $183,079 |
| Net realized gain (loss) | 10,439,313 | 597,630 | (1,702,489) |
| Change in net unrealized appreciation (depreciation) | 49,217,740 | 17,370,405 | 13,439,726 |
| Increase (decrease) in net assets resulting from operations | 62,621,912 | 18,775,880 | 11,920,316 |
| Distributions to shareholders | | | |
| From net investment income | | | |
| Class 1 | — | — | — |
| Class NAV | (1,421,127) | (406,118) | — |
| | (1,421,127) | (406,118) | — |
| From Fund share transactions | 1,024,502,348 | 158,095,661 | 97,277,527 |
| |
| Net assets | | | |
|
| Beginning of period | — | — | — |
| End of period | $1,085,703,133 | $176,465,423 | $109,197,843 |
| Undistributed net investment income (loss) | $1,543,732 | $401,727 | $183,079 |
a Period from 10-15-05 (commencement of operations) to 2-28-06.
b Period from 10-29-05 (commencement of operations) to 2-28-06.
The accompanying notes are an integral part of the financial statements. 58
John Hancock Funds II
Financial Highlights (For a share outstanding throughout the period)
|
500 Index
| | Class NAV | |
| Period ended | | 2-28-06a,b |
|
| Per share operating performance | | |
|
| Net asset value, beginning of period | | $10.34 |
| Net investment income (loss)h | | 0.07 |
| Net realized and unrealized gain (loss) on investments | | 0.70 |
| Total from investment operations | | 0.77 |
| Less distributions | | |
| From net investment income | | (0.04) |
| | | (0.04) |
| Net asset value, end of period | | $11.07 |
| Total return (%)k | | 7.41m |
| Ratios and supplemental data | | |
|
| Net assets, end of period (in millions) | | $284 |
| Ratio of net expenses to average net assets (%) | | 0.50r |
| Ratio of net investment income (loss) to | | |
| average net assets (%) | | 1.83r |
| Portfolio turnover (%) | | 1m |
a Class NAV shares began operations on 10-29-05.
b Unaudited.
h Based on the average of the shares outstanding.
k Assumes dividend reinvestment.
m Not annualized.
r Annualized.
|
The accompanying notes are an integral part of the financial statements. 59
John Hancock Funds II
Financial Highlights (For a share outstanding throughout the period)
|
Active Bond
| | Class 1 | | Class NAV | |
| Period ended | | 2-28-06a,b | | 2-28-06a,b |
|
| Per share operating performance | | | | |
|
| Net asset value, beginning of period | | $9.61 | | $9.59 |
| Net investment income (loss)h | | 0.15 | | 0.13 |
| Net realized and unrealized gain (loss) on investments | | (0.03) | | 0.01 |
| Total from investment operations | | 0.12 | | 0.14 |
| Less distributions | | | | |
| From net investment income | | (0.06) | | (0.06) |
| | | (0.06) | | (0.06) |
| Net asset value, end of period | | $9.67 | | $9.67 |
| Total return (%)k | | 1.24m | | 1.50m |
| Ratios and supplemental data | | | | |
|
| Net assets, end of period (in millions) | | $36 | | $360 |
| Ratio of net expenses to average net assets (%) | | 0.75r | | 0.70r |
| Ratio of net investment income (loss) to | | | | |
| average net assets (%) | | 4.05r | | 4.09r |
| Portfolio turnover (%) | | 179m | | 179m |
a Class 1 and Class NAV shares began operations on 10-15-05 and 10-27-05, respectively.
b Unaudited.
h Based on the average of the shares outstanding.
k Assumes dividend reinvestment.
m Not annualized.
r Annualized.
|
The accompanying notes are an integral part of the financial statements. 60
John Hancock Funds II
Financial Highlights (For a share outstanding throughout the period)
|
All Cap Growth
| | Class 1 | | Class NAV | |
| Period ended | | 2-28-06a,b | | 2-28-06a,b |
|
| Per share operating performance | | | | |
|
| Net asset value, beginning of period | | $15.50 | | $15.51 |
| Net investment income (loss)h | | —j | | 0.01 |
| Net realized and unrealized gain (loss) on investments | | 1.73 | | 1.73 |
| Total from investment operations | | 1.73 | | 1.74 |
| Less distributions | | | | |
| From net investment income | | (0.01) | | (0.01) |
| | | (0.01) | | (0.01) |
| Net asset value, end of period | | $17.22 | | $17.24 |
| Total return (%)k | | 11.15m | | 11.21m |
| Ratios and supplemental data | | | | |
|
| Net assets, end of period (in millions) | | $35 | | $108 |
| Ratio of net expenses to average net assets (%) | | 1.01r | | 0.96r |
| Ratio of net investment income (loss) to | | | | |
| average net assets (%) | | 0.07r | | 0.12r |
| Portfolio turnover (%) | | 44m | | 44m |
a Class 1 and Class NAV shares began operations on 10-15-05
b Unaudited.
h Based on the average of the shares outstanding.
j Less than $0.01 per share.
k Assumes dividend reinvestment.
m Not annualized.
r Annualized.
|
The accompanying notes are an integral part of the financial statements. 61
John Hancock Funds II
Financial Highlights (For a share outstanding throughout the period)
|
All Cap Value
| | Class 1 | | Class NAV | |
| Period ended | | 2-28-06a,b | | 2-28-06a,b |
|
| Per share operating performance | | | | |
|
| Net asset value, beginning of period | | $13.84 | | $13.80 |
| Net investment income (loss)h | | 0.05 | | 0.05 |
| Net realized and unrealized gain (loss) on investments | | 1.58 | | 1.59 |
| Total from investment operations | | 1.63 | | 1.64 |
| Less distributions | | | | |
| From net investment income | | (0.02) | | (0.03) |
| | | (0.02) | | (0.03) |
| Net asset value, end of period | | $15.45 | | $15.41 |
| Total return (%)k | | 11.81l,m | | 11.86l,m |
| Ratios and supplemental data | | | | |
|
| Net assets, end of period (in millions) | | $18 | | $173 |
| Ratio of net expenses to average net assets (%) | | 0.94r | | 0.89r |
| Ratio of net investment income (loss) to | | | | |
| average net assets (%) | | 0.82r | | 0.95r |
| Portfolio turnover (%) | | 19m | | 19m |
a Class 1 and Class NAV shares began operations on 10-15-05.
b Unaudited.
h Based on the average of the shares outstanding.
k Assumes dividend reinvestment.
l The Adviser/Subadviser voluntarily reimbursed Class 1 and Class NAV $46,991 and $410,290, respectively, for a potential lost investment opportunity. Excluding these reimbursements,
the total return would have been 11.52% for Class 1 and 11.57% for Class NAV.
m Not annualized.
r Annualized.
|
The accompanying notes are an integral part of the financial statements. 62
John Hancock Funds II
Financial Highlights (For a share outstanding throughout the period)
|
Blue Chip Growth
| | Class 1 | | Class NAV | |
| Period ended | | 2-28-06a,b | | 2-28-06a,b |
|
| Per share operating performance | | | | |
|
| Net asset value, beginning of period | | $16.53 | | $16.51 |
| Net investment income (loss)h | | 0.05 | | 0.07 |
| Net realized and unrealized gain (loss) on investments | | 1.53 | | 1.52 |
| Total from investment operations | | 1.58 | | 1.59 |
| Less distributions | | | | |
| From net investment income | | (0.01) | | (0.02) |
| | | (0.01) | | (0.02) |
| Net asset value, end of period | | $18.10 | | $18.08 |
| Total return (%)k,l | | 9.58m | | 9.60m |
| Ratios and supplemental data | | | | |
|
| Net assets, end of period (in millions) | | $127 | | $1,029 |
| Ratio of net expenses to average net assets (%) | | 0.89r | | 0.84r |
| Ratio of gross expenses to average net assets (%)p | | 0.91r | | 0.86r |
| Ratio of net investment income (loss) to | | | | |
| average net assets (%) | | 0.80r | | 0.98r |
| Portfolio turnover (%) | | 10m | | 10m |
a Class 1 and Class NAV shares began operations on 10-15-05.
b Unaudited.
h Based on the average of the shares outstanding.
k Assumes dividend reinvestment.
l Total returns would have been lower had certain expenses not been reduced during the period shown.
m Not annualized.
p Does not take into consideration expense reductions during the period shown.
r Annualized.
|
The accompanying notes are an integral part of the financial statements. 63
John Hancock Funds II
Financial Highlights (For a share outstanding throughout the period)
|
Capital Appreciation
| | Class 1 | | Class NAV | |
| Period ended | | 2-28-06a,b | | 2-28-06a,b |
|
| Per share operating performance | | | | |
|
| Net asset value, beginning of period | | $9.20 | | $9.20 |
| Net investment income (loss)h | | —j | | 0.01 |
| Net realized and unrealized gain (loss) on investments | | 0.94 | | 0.94 |
| Total from investment operations | | 0.94 | | 0.95 |
| Net asset value, end of period | | $10.14 | | $10.15 |
| Total return (%) | | 10.22m | | 10.33m |
| Ratios and supplemental data | | | | |
|
| Net assets, end of period (in millions) | | $18 | | $282 |
| Ratio of net expenses to average net assets (%) | | 0.93r | | 0.88r |
| Ratio of net investment income (loss) to | | | | |
| average net assets (%) | | 0.06r | | 0.15r |
| Portfolio turnover (%) | | 22m | | 22m |
a Class 1 and Class NAV shares began operations on 10-15-05.
b Unaudited.
h Based on the average of the shares outstanding.
j Less than $0.01 per share.
m Not annualized.
r Annualized.
|
The accompanying notes are an integral part of the financial statements. 64
John Hancock Funds II
Financial Highlights (For a share outstanding throughout the period)
|
Core Bond
| | Class 1 | | Class NAV | |
| Period ended | | 2-28-06a,b | | 2-28-06a,b |
|
| Per share operating performance | | | | |
|
| Net asset value, beginning of period | | $12.51 | | $12.50 |
| Net investment income (loss)h | | 0.18 | | 0.18 |
| Net realized and unrealized gain (loss) on investments | | (0.02) | | (0.02) |
| Total from investment operations | | 0.16 | | 0.16 |
| Less distributions | | | | |
| From net investment income | | (0.09) | | (0.09) |
| | | (0.09) | | (0.09) |
| Net asset value, end of period | | $12.58 | | $12.57 |
| Total return (%)k | | 1.26m | | 1.28m |
| Ratios and supplemental data | | | | |
|
| Net assets, end of period (in millions) | | —g | | $176 |
| Ratio of net expenses to average net assets (%) | | 0.88r | | 0.83r |
| Ratio of net investment income (loss) to | | | | |
| average net assets (%) | | 3.90r | | 3.84r |
| Portfolio turnover (%) | | 247m | | 247m |
a Class 1 and Class NAV shares began operations on 10-15-05.
b Unaudited.
g Less than $500,000.
h Based on the average of the shares outstanding.
k Assumes dividend reinvestment.
m Not annualized.
r Annualized.
|
The accompanying notes are an integral part of the financial statements. 65
John Hancock Funds II
Financial Highlights (For a share outstanding throughout the period)
|
Core Equity
| | Class 1 | | Class NAV | |
| Period ended | | 2-28-06a,b | | 2-28-06a,b |
|
| Per share operating performance | | | | |
|
| Net asset value, beginning of period | | $13.76 | | $13.77 |
| Net investment income (loss)h | | (0.01) | | (0.01) |
| Net realized and unrealized gain (loss) on investments | | 1.17 | | 1.18 |
| Total from investment operations | | 1.16 | | 1.17 |
| Net asset value, end of period | | $14.92 | | $14.94 |
| Total return (%) | | 8.43m | | 8.50m |
| Ratios and supplemental data | | | | |
|
| Net assets, end of period (in millions) | | $8 | | $493 |
| Ratio of net expenses to average net assets (%) | | 0.88r | | 0.83r |
| Ratio of net investment income (loss) to | | | | |
| average net assets (%) | | (0.12)r | | (0.12)r |
| Portfolio turnover (%) | | 4m | | 4m |
a Class 1 and Class NAV shares began operations on 10-15-05.
b Unaudited.
h Based on the average of the shares outstanding.
m Not annualized.
r Annualized.
|
The accompanying notes are an integral part of the financial statements. 66
John Hancock Funds II
Financial Highlights (For a share outstanding throughout the period)
|
Emerging Growth
| | Class 1 | | Class NAV | |
| Period ended | | 2-28-06a,b | | 2-28-06a,b |
|
| Per share operating performance | | | | |
|
| Net asset value, beginning of period | | $16.35 | | $16.35 |
| Net investment income (loss)h | | (0.03) | | (0.03) |
| Net realized and unrealized gain (loss) on investments | | 2.89 | | 2.89 |
| Total from investment operations | | 2.86 | | 2.86 |
| Net asset value, end of period | | $19.21 | | $19.21 |
| Total return (%) | | 17.49m | | 17.49m |
| Ratios and supplemental data | | | | |
|
| Net assets, end of period (in millions) | | $119 | | $44 |
| Ratio of net expenses to average net assets (%) | | 0.92r | | 0.87r |
| Ratio of net investment income (loss) to | | | | |
| average net assets (%) | | (0.45)r | | (0.41)r |
| Portfolio turnover (%) | | 82m | | 82m |
a Class 1 and Class NAV shares began operations on 10-15-05.
b Unaudited.
h Based on the average of the shares outstanding.
m Not annualized.
r Annualized.
|
The accompanying notes are an integral part of the financial statements. 67
John Hancock Funds II
Financial Highlights (For a share outstanding throughout the period)
|
Emerging Small Company
| | Class 1 | |
| Period ended | | 2-28-06a,b |
|
| Per share operating performance | | |
|
| Net asset value, beginning of period | | $28.17 |
| Net investment income (loss)h | | (0.06) |
| Net realized and unrealized gain (loss) on investments | | 4.81 |
| Total from investment operations | | 4.75 |
| Net asset value, end of period | | $32.92 |
| Total return (%)l | | 16.86m |
| Ratios and supplemental data | | |
|
| Net assets, end of period (in millions) | | $57 |
| Ratio of net expenses to average net assets (%) | | 1.18r |
| Ratio of gross expenses to average net assets (%)p | | 1.23r |
| Ratio of net investment income (loss) to | | |
| average net assets (%) | | (0.53)r |
| Portfolio turnover (%) | | 80m |
a Class 1 shares began operations on 10-15-05.
b Unaudited.
h Based on the average of the shares outstanding.
l Total returns would have been lower had certain expenses not been reduced during the period shown.
m Not annualized.
p Does not take into consideration expense reductions during the period shown.
r Annualized.
|
The accompanying notes are an integral part of the financial statements. 68
John Hancock Funds II
Financial Highlights (For a share outstanding throughout the period)
|
Equity-Income
| | Class 1 | | Class NAV | |
| Period ended | | 2-28-06a,b | | 2-28-06a,b |
|
| Per share operating performance | | | | |
|
| Net asset value, beginning of period | | $16.03 | | $16.01 |
| Net investment income (loss)h | | 0.11 | | 0.12 |
| Net realized and unrealized gain (loss) on investments | | 1.34 | | 1.33 |
| Total from investment operations | | 1.45 | | 1.45 |
| Less distributions | | | | |
| From net investment income | | (0.06) | | (0.06) |
| | | (0.06) | | (0.06) |
| Net asset value, end of period | | $17.42 | | $17.40 |
| Total return (%)k,l | | 9.07m | | 9.09m |
| Ratios and supplemental data | | | | |
|
| Net assets, end of period (in millions) | | $168 | | $684 |
| Ratio of net expenses to average net assets (%) | | 0.89r | | 0.84r |
| Ratio of gross expenses to average net assets (%)p | | 0.91r | | 0.86r |
| Ratio of net investment income (loss) to | | | | |
| average net assets (%) | | 1.79r | | 1.97r |
| Portfolio turnover (%) | | 5m | | 5m |
a Class 1 and Class NAV shares began operations on 10-15-05.
b Unaudited.
h Based on the average of the shares outstanding.
k Assumes dividend reinvestment.
l Total returns would have been lower had certain expenses not been reduced during the period shown.
m Not annualized.
p Does not take into consideration expense reductions during the period shown.
r Annualized.
|
The accompanying notes are an integral part of the financial statements. 69
John Hancock Funds II
Financial Highlights (For a share outstanding throughout the period)
|
Fundamental Value
| | Class 1 | | Class NAV | |
| Period ended | | 2-28-06a,b | | 2-28-06a,b |
|
| Per share operating performance | | | | |
|
| Net asset value, beginning of period | | $14.34 | | $14.31 |
| Net investment income (loss)h | | 0.05 | | 0.05 |
| Net realized and unrealized gain (loss) on investments | | 0.97 | | 0.97 |
| Total from investment operations | | 1.02 | | 1.02 |
| Less distributions | | | | |
| From net investment income | | (0.03) | | (0.03) |
| | | (0.03) | | (0.03) |
| Net asset value, end of period | | $15.33 | | $15.30 |
| Total return (%)k | | 7.13m | | 7.16m |
| Ratios and supplemental data | | | | |
|
| Net assets, end of period (in millions) | | $56 | | $601 |
| Ratio of net expenses to average net assets (%) | | 0.87r | | 0.82r |
| Ratio of net investment income (loss) to | | | | |
| average net assets (%) | | 0.83r | | 0.93r |
| Portfolio turnover (%) | | 1m | | 1m |
a Class 1 and Class NAV shares began operations on 10-15-05.
b Unaudited.
h Based on the average of the shares outstanding.
k Assumes dividend reinvestment.
m Not annualized.
r Annualized.
|
The accompanying notes are an integral part of the financial statements. 70
John Hancock Funds II
Financial Highlights (For a share outstanding throughout the period)
|
Global Bond
| | Class 1 | | Class NAV | |
| Period ended | | 2-28-06a,b | | 2-28-06a,b |
|
| Per share operating performance | | | | |
|
| Net asset value, beginning of period | | $14.56 | | $14.52 |
| Net investment income (loss)h | | 0.17 | | 0.18 |
| Net realized and unrealized gain (loss) on investments | | (0.27) | | (0.27) |
| Total from investment operations | | (0.10) | | (0.09) |
| Less distributions | | | | |
| From net investment income | | (0.09) | | (0.09) |
| | | (0.09) | | (0.09) |
| Net asset value, end of period | | $14.37 | | $14.34 |
| Total return (%)k | | (0.72)m | | (0.64)m |
| Ratios and supplemental data | | | | |
|
| Net assets, end of period (in millions) | | $38 | | $499 |
| Ratio of net expenses to average net assets (%) | | 0.85r | | 0.80r |
| Ratio of net investment income (loss) to | | | | |
| average net assets (%) | | 3.21r | | 3.42r |
| Portfolio turnover (%) | | 245m | | 245m |
a Class 1 and Class NAV shares began operations on 10-15-05.
b Unaudited.
h Based on the average of the shares outstanding.
k Assumes dividend reinvestment.
m Not annualized.
r Annualized.
|
The accompanying notes are an integral part of the financial statements. 71
John Hancock Funds II
Financial Highlights (For a share outstanding throughout the period)
|
High Yield
| | Class 1 | | Class NAV | |
| Period ended | | 2-28-06a,b | | 2-28-06a,b |
|
| Per share operating performance | | | | |
|
| Net asset value, beginning of period | | $10.10 | | $10.06 |
| Net investment income (loss)h | | 0.28 | | 0.29 |
| Net realized and unrealized gain (loss) on investments | | 0.18 | | 0.16 |
| Total from investment operations | | 0.46 | | 0.45 |
| Less distributions | | | | |
| From net investment income | | (0.13) | | (0.13) |
| | | (0.13) | | (0.13) |
| Net asset value, end of period | | $10.43 | | $10.38 |
| Total return (%)k | | 4.57m | | 4.50m |
| Ratios and supplemental data | | | | |
|
| Net assets, end of period (in millions) | | $39 | | $1,437 |
| Ratio of net expenses to average net assets (%) | | 0.78r | | 0.73r |
| Ratio of net investment income (loss) to | | | | |
| average net assets (%) | | 7.31r | | 7.61r |
| Portfolio turnover (%) | | 19m | | 19m |
a Class 1 and Class NAV shares began operations on 10-15-05.
b Unaudited.
h Based on the average of the shares outstanding.
k Assumes dividend reinvestment.
m Not annualized.
r Annualized.
|
The accompanying notes are an integral part of the financial statements. 72
John Hancock Funds II
Financial Highlights (For a share outstanding throughout the period)
|
International Equity Index
| | Class NAV | |
| Period ended | | 2-28-06a,b |
|
| Per share operating performance | | |
|
| Net asset value, beginning of period | | $15.59 |
| Net investment income (loss)h | | 0.06 |
| Net realized and unrealized gain (loss) on investments | | 2.20 |
| Total from investment operations | | 2.26 |
| Less distributions | | |
| From net investment income | | (0.20) |
| | | (0.20) |
| Net asset value, end of period | | $17.65 |
| Total return (%)k | | 14.59m |
| Ratios and supplemental data | | |
|
| Net assets, end of period (in millions) | | $188 |
| Ratio of net expenses to average net assets (%) | | 0.59r |
| Ratio of net investment income (loss) to | | |
| average net assets (%) | | 1.14r |
| Portfolio turnover (%) | | 1m |
a Class NAV shares began operations on 10-29-05.
b Unaudited.
h Based on the average of the shares outstanding.
k Assumes dividend reinvestment.
m Not annualized.
r Annualized.
|
The accompanying notes are an integral part of the financial statements. 73
John Hancock Funds II
Financial Highlights (For a share outstanding throughout the period)
|
International Opportunities
| | Class 1 | | Class NAV | |
| Period ended | | 2-28-06a,b | | 2-28-06a,b |
|
| Per share operating performance | | | | |
|
| Net asset value, beginning of period | | $13.71 | | $13.72 |
| Net investment income (loss)h | | (0.03) | | (0.02) |
| Net realized and unrealized gain (loss) on investments | | 2.62 | | 2.62 |
| Total from investment operations | | 2.59 | | 2.60 |
| Less distributions | | | | |
| From net investment income | | (0.70) | | (0.70) |
| | | (0.70) | | (0.70) |
| Net asset value, end of period | | $15.60 | | $15.62 |
| Total return (%)k | | 19.31l,m | | 19.39l,m |
| Ratios and supplemental data | | | | |
|
| Net assets, end of period (in millions) | | $3 | | $430 |
| Ratio of net expenses to average net assets (%) | | 1.11r | | 1.06r |
| Ratio of net investment income (loss) to | | | | |
| average net assets (%) | | (0.57)r | | (0.33)r |
| Portfolio turnover (%) | | 50m | | 50m |
a Class 1 and Class NAV shares began operations on 10-15-05.
b Unaudited.
h Based on the average of the shares outstanding.
k Assumes dividend reinvestment.
l The Adviser/Subadviser voluntarily reimbursed Class 1 and Class NAV $11,316 and $3,937,220, respectively, for a potential lost investment opportunity. Excluding these reimbursements,
the total return would have been 18.24% for Class 1 and 18.32% for Class NAV.
m Not annualized.
r Annualized.
|
The accompanying notes are an integral part of the financial statements. 74
John Hancock Funds II
Financial Highlights (For a share outstanding throughout the period)
|
International Small Cap
| | Class 1 | | Class NAV | |
| Period ended | | 2-28-06a,b | | 2-28-06a,b |
|
| Per share operating performance | | | | |
|
| Net asset value, beginning of period | | $18.48 | | $18.45 |
| Net investment income (loss)h | | (0.01) | | -j |
| Net realized and unrealized gain (loss) on investments | | 2.00 | | 2.01 |
| Total from investment operations | | 1.99 | | 2.01 |
| Less distributions | | | | |
| From net investment income | | (0.04) | | (0.04) |
| | | (0.04) | | (0.04) |
| Net asset value, end of period | | $20.43 | | $20.42 |
| Total return (%)k | | 10.76m | | 10.92m |
| Ratios and supplemental data | | | | |
|
| Net assets, end of period (in millions) | | $34 | | $523 |
| Ratio of net expenses to average net assets (%) | | 1.17r | | 1.12r |
| Ratio of net investment income (loss) to | | | | |
| average net assets (%) | | (0.19)r | | (0.03)r |
| Portfolio turnover (%) | | 32m | | 32m |
a Class 1 and Class NAV shares began operations on 10-15-05.
b Unaudited.
h Based on the average of the shares outstanding.
j Less than $0.01 per share.
k Assumes dividend reinvestment.
m Not annualized.
r Annualized.
|
The accompanying notes are an integral part of the financial statements. 75
John Hancock Funds II
Financial Highlights (For a share outstanding throughout the period)
|
International Stock
| | Class 1 | | Class NAV | |
| Period ended | | 2-28-06a,b | | 2-28-06a,b |
|
| Per share operating performance | | | | |
|
| Net asset value, beginning of period | | $11.95 | | $11.92 |
| Net investment income (loss)h | | 0.03 | | 0.04 |
| Net realized and unrealized gain (loss) on investments | | 1.53 | | 1.54 |
| Total from investment operations | | 1.56 | | 1.58 |
| Less distributions | | | | |
| From net investment income | | (0.28) | | (0.29) |
| From net realized gain | | —j | | —j |
| | | (0.28) | | (0.29) |
| Net asset value, end of period | | $13.23 | | $13.21 |
| Total return (%)k | | 13.23m | | 13.38m |
| Ratios and supplemental data | | | | |
|
| Net assets, end of period (in millions) | | $31 | | $926 |
| Ratio of net expenses to average net assets (%) | | 1.09r | | 1.04r |
| Ratio of net investment income (loss) to | | | | |
| average net assets (%) | | 0.69r | | 0.83r |
| Portfolio turnover (%) | | 67m | | 67m |
a Class 1 and Class NAV shares began operations on 10-15-05.
b Unaudited.
h Based on the average of the shares outstanding.
j Less than $0.01 per share.
k Assumes dividend reinvestment.
m Not annualized.
r Annualized.
|
The accompanying notes are an integral part of the financial statements. 76
John Hancock Funds II
Financial Highlights (For a share outstanding throughout the period)
|
International Value
| | Class 1 | | Class NAV | |
| Period ended | | 2-28-06a,b | | 2-28-06a,b |
|
| Per share operating performance | | | | |
|
| Net asset value, beginning of period | | $15.20 | | $15.16 |
| Net investment income (loss)h | | 0.10 | | 0.11 |
| Net realized and unrealized gain (loss) on investments | | 1.28 | | 1.27 |
| Total from investment operations | | 1.38 | | 1.38 |
| Less distributions | | | | |
| From net investment income | | (0.05) | | (0.05) |
| | | (0.05) | | (0.05) |
| Net asset value, end of period | | $16.53 | | $16.49 |
| Total return (%)k,l | | 9.11m | | 9.15m |
| Ratios and supplemental data | | | | |
|
| Net assets, end of period (in millions) | | $114 | | $892 |
| Ratio of net expenses to average net assets (%) | | 1.00r | | 0.95r |
| Ratio of gross expenses to average net assets (%)p | | 1.02r | | 0.97r |
| Ratio of net investment income (loss) to | | | | |
| average net assets (%) | | 1.75r | | 1.92r |
| Portfolio turnover (%) | | 33m | | 33m |
a Class 1 and Class NAV shares began operations on 10-15-05.
b Unaudited.
h Based on the average of the shares outstanding.
k Assumes dividend reinvestment.
l Total returns would have been lower had certain expenses not been reduced during the period shown.
m Not annualized.
p Does not take into consideration expense reductions during the period shown.
r Annualized.
|
The accompanying notes are an integral part of the financial statements. 77
John Hancock Funds II
Financial Highlights (For a share outstanding throughout the period)
|
Investment Quality Bond
| | Class 1 | | Class NAV | |
| Period ended | | 2-28-06a,b | | 2-28-06a,b |
|
| Per share operating performance | | | | |
|
| Net asset value, beginning of period | | $11.84 | | $11.83 |
| Net investment income (loss)h | | 0.19 | | 0.19 |
| Net realized and unrealized gain (loss) on investments | | (0.03) | | (0.03) |
| Total from investment operations | | 0.16 | | 0.16 |
| Less distributions | | | | |
| From net investment income | | (0.10) | | (0.10) |
| | | (0.10) | | (0.10) |
| Net asset value, end of period | | $11.90 | | $11.89 |
| Total return (%)k | | 1.37m | | 1.38m |
| Ratios and supplemental data | | | | |
|
| Net assets, end of period (in millions) | | $33 | | $85 |
| Ratio of net expenses to average net assets (%) | | 0.83r | | 0.78r |
| Ratio of net investment income (loss) to | | | | |
| average net assets (%) | | 4.23r | | 4.38r |
| Portfolio turnover (%) | | 19m | | 19m |
a Class 1 and Class NAV shares began operations on 10-15-05.
b Unaudited.
h Based on the average of the shares outstanding.
k Assumes dividend reinvestment.
m Not annualized.
r Annualized.
|
The accompanying notes are an integral part of the financial statements. 78
John Hancock Funds II
Financial Highlights (For a share outstanding throughout the period)
|
Large Cap
| | Class 1 | | Class NAV | |
| Period ended | | 2-28-06a,b | | 2-28-06a,b |
|
| Per share operating performance | | | | |
|
| Net asset value, beginning of period | | $13.26 | | $13.26 |
| Net investment income (loss)h | | 0.05 | | 0.05 |
| Net realized and unrealized gain (loss) on investments | | 1.16 | | 1.16 |
| Total from investment operations | | 1.21 | | 1.21 |
| Less distributions | | | | |
| From net investment income | | (0.01) | | (0.02) |
| | | (0.01) | | (0.02) |
| Net asset value, end of period | | $14.46 | | $14.45 |
| Total return (%)k | | 9.15m | | 9.12m |
| Ratios and supplemental data | | | | |
|
| Net assets, end of period (in millions) | | $2 | | $169 |
| Ratio of net expenses to average net assets (%) | | 0.95r | | 0.90r |
| Ratio of net investment income (loss) to | | | | |
| average net assets (%) | | 0.85r | | 0.98r |
| Portfolio turnover (%) | | 11m | | 11m |
a Class 1 and Class NAV shares began operations on 10-15-05.
b Unaudited.
h Based on the average of the shares outstanding.
k Assumes dividend reinvestment.
m Not annualized.
r Annualized.
|
The accompanying notes are an integral part of the financial statements. 79
John Hancock Funds II
Financial Highlights (For a share outstanding throughout the period)
|
Large Cap Value
| | Class 1 | | Class NAV | |
| Period ended | | 2-28-06a,b | | 2-28-06a,b |
|
| Per share operating performance | | | | |
|
| Net asset value, beginning of period | | $20.31 | | $20.33 |
| Net investment income (loss)h | | 0.07 | | 0.08 |
| Net realized and unrealized gain (loss) on investments | | 2.04 | | 2.04 |
| Total from investment operations | | 2.11 | | 2.12 |
| Less distributions | | | | |
| From net investment income | | (0.05) | | (0.05) |
| | | (0.05) | | (0.05) |
| Net asset value, end of period | | $22.37 | | $22.40 |
| Total return (%)k | | 10.37m | | 10.42m |
| Ratios and supplemental data | | | | |
|
| Net assets, end of period (in millions) | | $13 | | $146 |
| Ratio of net expenses to average net assets (%) | | 0.96r | | 0.91r |
| Ratio of net investment income (loss) to | | | | |
| average net assets (%) | | 0.82r | | 0.96r |
| Portfolio turnover (%) | | 24m | | 24m |
a Class 1 and Class NAV shares began operations on 10-15-05.
b Unaudited.
h Based on the average of the shares outstanding.
k Assumes dividend reinvestment.
m Not annualized.
r Annualized.
|
The accompanying notes are an integral part of the financial statements. 80
John Hancock Funds II
Financial Highlights (For a share outstanding throughout the period)
|
Mid Cap Core
| | Class 1 | | Class NAV | |
| Period ended | | 2-28-06a,b | | 2-28-06a,b |
|
| Per share operating performance | | | | |
|
| Net asset value, beginning of period | | $15.90 | | $15.90 |
| Net investment income (loss)h | | 0.04 | | 0.04 |
| Net realized and unrealized gain (loss) on investments | | 1.63 | | 1.63 |
| Total from investment operations | | 1.67 | | 1.67 |
| Less distributions | | | | |
| From net investment income | | (0.02) | | (0.02) |
| | | (0.02) | | (0.02) |
| Net asset value, end of period | | $17.55 | | $17.55 |
| Total return (%)k | | 10.49m | | 10.51m |
| Ratios and supplemental data | | | | |
|
| Net assets, end of period (in millions) | | $8 | | $347 |
| Ratio of net expenses to average net assets (%) | | 0.99r | | 0.94r |
| Ratio of net investment income (loss) to | | | | |
| average net assets (%) | | 0.55r | | 0.69r |
| Portfolio turnover (%) | | 50m | | 50m |
a Class 1 and Class NAV shares began operations on 10-15-05.
b Unaudited.
h Based on the average of the shares outstanding.
k Assumes dividend reinvestment.
m Not annualized.
r Annualized.
|
The accompanying notes are an integral part of the financial statements. 81
John Hancock Funds II
Financial Highlights (For a share outstanding throughout the period)
|
Mid Cap Index
| | Class NAV | |
| Period ended | | 2-28-06a,b |
|
| Per share operating performance | | |
|
| Net asset value, beginning of period | | $16.85 |
| Net investment income (loss)h | | 0.07 |
| Net realized and unrealized gain (loss) on investments | | 2.01 |
| Total from investment operations | | 2.08 |
| Less distributions | | |
| From net investment income | | (0.03) |
| | | (0.03) |
| Net asset value, end of period | | $18.90 |
| Total return (%)k,l | | 12.35m |
| Ratios and supplemental data | | |
|
| Net assets, end of period (in millions) | | $64 |
| Ratio of net expenses to average net assets (%) | | 0.55r |
| Ratio of gross expenses to average net assets (%)p | | 0.56r |
| Ratio of net investment income (loss) to | | |
| average net assets (%) | | 1.07r |
| Portfolio turnover (%) | | 5m |
a Class NAV shares began operations on 10-29-05.
b Unaudited.
h Based on the average of the shares outstanding.
k Assumes dividend reinvestment.
l Total returns would have been lower had certain expenses not been reduced during the period shown.
m Not annualized.
p Does not take into consideration expense reductions during the period shown.
r Annualized.
|
The accompanying notes are an integral part of the financial statements. 82
John Hancock Funds II
Financial Highlights (For a share outstanding throughout the period)
|
Mid Cap Stock
| | Class 1 | | Class NAV | |
| Period ended | | 2-28-06a,b | | 2-28-06a,b |
|
| Per share operating performance | | | | |
|
| Net asset value, beginning of period | | $13.86 | | $13.87 |
| Net investment income (loss)h | | (0.01) | | (0.01) |
| Net realized and unrealized gain (loss) on investments | | 2.52 | | 2.53 |
| Total from investment operations | | 2.51 | | 2.52 |
| Less distributions | | | | |
| From net investment income | | — | | —j |
| From net realized gain | | (0.02) | | (0.02) |
| | | (0.02) | | (0.02) |
| Net asset value, end of period | | $16.35 | | $16.37 |
| Total return (%)k | | 18.10l,m | | 18.17l,m |
| Ratios and supplemental data | | | | |
|
| Net assets, end of period (in millions) | | $105 | | $171 |
| Ratio of net expenses to average net assets (%) | | 0.95r | | 0.90r |
| Ratio of net investment income (loss) to | | | | |
| average net assets (%) | | (0.22)r | | (0.18)r |
| Portfolio turnover (%) | | 56m | | 56m |
a Class 1 and Class NAV shares began operations on 10-15-05.
b Unaudited.
h Based on the average of the shares outstanding.
j Less than $0.01 per share.
k Assumes dividend reinvestment.
l The Adviser/Subadviser voluntarily reimbursed Class 1 and Class NAV $510,149 and $847,342, respectively, for a potential lost investment opportunity. Excluding these reimbursements,
the total return would have been 17.53% for Class 1 and 17.59% for Class NAV.
m Not annualized.
r Annualized.
|
The accompanying notes are an integral part of the financial statements. 83
John Hancock Funds II
Financial Highlights (For a share outstanding throughout the period)
|
Mid Cap Value
| | Class 1 | | Class NAV | |
| Period ended | | 2-28-06a,b | | 2-28-06a,b |
|
| Per share operating performance | | | | |
|
| Net asset value, beginning of period | | $17.65 | | $17.63 |
| Net investment income (loss)h | | 0.04 | | 0.05 |
| Net realized and unrealized gain (loss) on investments | | 1.49 | | 1.48 |
| Total from investment operations | | 1.53 | | 1.53 |
| Less distributions | | | | |
| From net investment income | | (0.03) | | (0.03) |
| From net realized gain | | (0.01) | | (0.01) |
| | | (0.04) | | (0.04) |
| Net asset value, end of period | | $19.14 | | $19.12 |
| Total return (%)k | | 8.64m | | 8.66m |
| Ratios and supplemental data | | | | |
|
| Net assets, end of period (in millions) | | $87 | | $130 |
| Ratio of net expenses to average net assets (%) | | 0.97r | | 0.92r |
| Ratio of net investment income (loss) to | | | | |
| average net assets (%) | | 0.55r | | 0.67r |
| Portfolio turnover (%) | | 13m | | 13m |
a Class 1 and Class NAV shares began operations on 10-15-05.
b Unaudited.
h Based on the average of the shares outstanding.
k Assumes dividend reinvestment.
m Not annualized.
r Annualized.
|
The accompanying notes are an integral part of the financial statements. 84
John Hancock Funds II
Financial Highlights (For a share outstanding throughout the period)
|
Natural Resources
| | Class 1 | | Class NAV | |
| Period ended | | 2-28-06a,b | | 2-28-06a,b |
|
| Per share operating performance | | | | |
|
| Net asset value, beginning of period | | $28.70 | | $28.60 |
| Net investment income (loss)h | | 0.08 | | 0.07 |
| Net realized and unrealized gain (loss) on investments | | 4.51 | | 4.52 |
| Total from investment operations | | 4.59 | | 4.59 |
| Less distributions | | | | |
| From net investment income | | (0.03) | | (0.04) |
| | | (0.03) | | (0.04) |
| Net asset value, end of period | | $33.26 | | $33.15 |
| Total return (%)k | | 16.01m | | 16.04m |
| Ratios and supplemental data | | | | |
|
| Net assets, end of period (in millions) | | $58 | | $615 |
| Ratio of net expenses to average net assets (%) | | 1.13r | | 1.08r |
| Ratio of net investment income (loss) to | | | | |
| average net assets (%) | | 0.64r | | 0.62r |
| Portfolio turnover (%) | | 64m | | 64m |
a Class 1 and Class NAV shares began operations on 10-15-05.
b Unaudited.
h Based on the average of the shares outstanding.
k Assumes dividend reinvestment.
m Not annualized.
r Annualized.
|
The accompanying notes are an integral part of the financial statements. 85
John Hancock Funds II
Financial Highlights (For a share outstanding throughout the period)
|
Quantitative Mid Cap
| | Class 1 | | Class NAV | |
| Period ended | | 2-28-06a,b | | 2-28-06a,b |
|
| Per share operating performance | | | | |
|
| Net asset value, beginning of period | | $13.55 | | $13.51 |
| Net investment income (loss)h | | —j | | 0.01 |
| Net realized and unrealized gain (loss) on investments | | 1.91 | | 1.93 |
| Total from investment operations | | 1.91 | | 1.94 |
| Less distributions | | | | |
| From net investment income | | —j | | —j |
| From net realized gain | | (0.01) | | (0.01) |
| | | (0.01) | | (0.01) |
| Net asset value, end of period | | $15.45 | | $15.44 |
| Total return (%)k | | 14.08m | | 14.35m |
| Ratios and supplemental data | | | | |
|
| Net assets, end of period (in millions) | | $144 | | $44 |
| Ratio of net expenses to average net assets (%) | | 0.84r | | 0.79r |
| Ratio of net investment income (loss) to | | | | |
| average net assets (%) | | 0.03r | | 0.16r |
| Portfolio turnover (%) | | 39m | | 39m |
a Class 1 and Class NAV shares began operations on 10-15-05 and 10-27-05, respectively.
b Unaudited.
h Based on the average of the shares outstanding.
j Less than $0.01 per share.
k Assumes dividend reinvestment.
m Not annualized.
r Annualized.
|
The accompanying notes are an integral part of the financial statements. 86
John Hancock Funds II
Financial Highlights (For a share outstanding throughout the period)
|
Quantitative Value
| | Class 1 | | Class NAV | |
| Period ended | | 2-28-06a,b | | 2-28-06a,b |
|
| Per share operating performance | | | | |
|
| Net asset value, beginning of period | | $14.09 | | $14.09 |
| Net investment income (loss)h | | 0.10 | | 0.11 |
| Net realized and unrealized gain (loss) on investments | | 1.63 | | 1.62 |
| Total from investment operations | | 1.73 | | 1.73 |
| Less distributions | | | | |
| From net investment income | | (0.06) | | (0.06) |
| From net realized gain | | —j | | —j |
| | | (0.06) | | (0.06) |
| Net asset value, end of period | | $15.76 | | $15.76 |
| Total return (%)k | | 12.28m | | 12.28m |
| Ratios and supplemental data | | | | |
|
| Net assets, end of period (in millions) | | $85 | | $260 |
| Ratio of net expenses to average net assets (%) | | 0.80r | | 0.75r |
| Ratio of net investment income (loss) to | | | | |
| average net assets (%) | | 1.75r | | 2.00r |
| Portfolio turnover (%) | | 52m | | 52m |
a Class 1 and Class NAV shares began operations on 10-15-05.
b Unaudited.
h Based on the average of the shares outstanding.
j Less than $0.01 per share.
k Assumes dividend reinvestment.
m Not annualized.
r Annualized.
|
The accompanying notes are an integral part of the financial statements. 87
John Hancock Funds II
Financial Highlights (For a share outstanding throughout the period)
|
Real Estate Securities
| | Class 1 | | Class NAV | |
| Period ended | | 2-28-06a,b | | 2-28-06a,b |
|
| Per share operating performance | | | | |
|
| Net asset value, beginning of period | | $23.03 | | $22.99 |
| Net investment income (loss)h | | 0.32 | | 0.35 |
| Net realized and unrealized gain (loss) on investments | | 3.64 | | 3.61 |
| Total from investment operations | | 3.96 | | 3.96 |
| Less distributions | | | | |
| From net investment income | | (0.16) | | (0.16) |
| From net realized gain | | (0.03) | | (0.03) |
| | | (0.19) | | (0.19) |
| Net asset value, end of period | | $26.80 | | $26.76 |
| Total return (%)k | | 17.23m | | 17.27m |
| Ratios and supplemental data | | | | |
|
| Net assets, end of period (in millions) | | $143 | | $560 |
| Ratio of net expenses to average net assets (%) | | 0.79r | | 0.74r |
| Ratio of net investment income (loss) to | | | | |
| average net assets (%) | | 3.45r | | 3.75r |
| Portfolio turnover (%) | | 24m | | 24m |
a Class 1 and Class NAV shares began operations on 10-15-05.
b Unaudited.
h Based on the average of the shares outstanding.
k Assumes dividend reinvestment.
m Not annualized.
r Annualized.
|
The accompanying notes are an integral part of the financial statements. 88
John Hancock Funds II
Financial Highlights (For a share outstanding throughout the period)
|
Real Return Bond
| | Class 1 | | Class NAV | |
| Period ended | | 2-28-06a,b | | 2-28-06a,b |
|
| Per share operating performance | | | | |
|
| Net asset value, beginning of period | | $13.52 | | $13.43 |
| Net investment income (loss)h | | 0.09 | | 0.09 |
| Net realized and unrealized gain (loss) on investments | | 0.02 | | 0.02 |
| Total from investment operations | | 0.11 | | 0.11 |
| Less distributions | | | | |
| From net investment income | | (0.12) | | (0.12) |
| From net realized gain | | —j | | —j |
| | | (0.12) | | (0.12) |
| Net asset value, end of period | | $13.51 | | $13.42 |
| Total return (%)k | | 0.87m | | 0.88m |
| Ratios and supplemental data | | | | |
|
| Net assets, end of period (in millions) | | $15 | | $612 |
| Ratio of net expenses to average net assets (%) | | 0.80r | | 0.75r |
| Ratio of net investment income (loss) to | | | | |
| average net assets (%) | | 1.80r | | 1.81r |
| Portfolio turnover (%) | | 51m | | 51m |
a Class 1 and Class NAV shares began operations on 10-15-05.
b Unaudited.
h Based on the average of the shares outstanding.
j Less than $0.01 per share.
k Assumes dividend reinvestment.
m Not annualized.
r Annualized.
|
The accompanying notes are an integral part of the financial statements. 89
John Hancock Funds II
Financial Highlights (For a share outstanding throughout the period)
|
Small Cap
| | Class 1 | | Class NAV | |
| Period ended | | 2-28-06a,b | | 2-28-06a,b |
|
| Per share operating performance | | | | |
|
| Net asset value, beginning of period | | $13.60 | | $13.61 |
| Net investment income (loss)h | | (0.02) | | (0.02) |
| Net realized and unrealized gain (loss) on investments | | 1.69 | | 1.70 |
| Total from investment operations | | 1.67 | | 1.68 |
| Net asset value, end of period | | $15.27 | | $15.29 |
| Total return (%) | | 12.28m | | 12.34m |
| Ratios and supplemental data | | | | |
|
| Net assets, end of period (in millions) | | —g | | $209 |
| Ratio of net expenses to average net assets (%) | | 0.95r | | 0.90r |
| Ratio of net investment income (loss) to | | | | |
| average net assets (%) | | (0.38)r | | (0.41)r |
| Portfolio turnover (%) | | 22m | | 22m |
a Class 1 and Class NAV shares began operations on 10-15-05.
b Unaudited.
g Less than $500,000.
h Based on the average of the shares outstanding.
m Not annualized.
r Annualized.
|
The accompanying notes are an integral part of the financial statements. 90
John Hancock Funds II
Financial Highlights (For a share outstanding throughout the period)
|
Small Cap Index
| | Class NAV | |
| Period ended | | 2-28-06a,b |
|
| Per share operating performance | | |
|
| Net asset value, beginning of period | | $14.05 |
| Net investment income (loss)h | | 0.05 |
| Net realized and unrealized gain (loss) on investments | | 2.05 |
| Total from investment operations | | 2.10 |
| Less distributions | | |
| From net investment income | | (0.02) |
| | | (0.02) |
| Net asset value, end of period | | $16.13 |
| Total return (%)k,l | | 14.97m |
| Ratios and supplemental data | | |
|
| Net assets, end of period (in millions) | | $64 |
| Ratio of net expenses to average net assets (%) | | 0.55r |
| Ratio of gross expenses to average net assets (%)p | | 0.56r |
| Ratio of net investment income (loss) to | | |
| average net assets (%) | | 0.93r |
| Portfolio turnover (%) | | 3m |
a Class NAV shares began operations on 10-29-05.
b Unaudited.
h Based on the average of the shares outstanding.
k Assumes dividend reinvestment.
l Total returns would have been lower had certain expenses not been reduced during the period shown.
m Not annualized.
p Does not take into consideration expense reductions during the period shown.
r Annualized.
|
The accompanying notes are an integral part of the financial statements. 91
John Hancock Funds II
Financial Highlights (For a share outstanding throughout the period)
|
Small Cap Opportunities
| | Class 1 | | Class NAV | |
| Period ended | | 2-28-06a,b | | 2-28-06a,b |
|
| Per share operating performance | | | | |
|
| Net asset value, beginning of period | | $21.36 | | $21.26 |
| Net investment income (loss)h | | 0.10 | | 0.09 |
| Net realized and unrealized gain (loss) on investments | | 2.72 | | 2.72 |
| Total from investment operations | | 2.82 | | 2.81 |
| Less distributions | | | | |
| From net investment income | | (0.05) | | (0.05) |
| From net realized gain | | —j | | —j |
| | | (0.05) | | (0.05) |
| Net asset value, end of period | | $24.13 | | $24.02 |
| Total return (%)k | | 13.21m | | 13.24m |
| Ratios and supplemental data | | | | |
|
| Net assets, end of period (in millions) | | $27 | | $235 |
| Ratio of net expenses to average net assets (%) | | 1.09r | | 1.04r |
| Ratio of net investment income (loss) to | | | | |
| average net assets (%) | | 1.11r | | 1.10r |
| Portfolio turnover (%) | | 19m | | 19m |
a Class 1 and Class NAV shares began operations on 10-15-05.
b Unaudited.
h Based on the average of the shares outstanding.
j Less than $0.01 per share.
k Assumes dividend reinvestment.
m Not annualized.
r Annualized.
|
The accompanying notes are an integral part of the financial statements. 92
John Hancock Funds II
Financial Highlights (For a share outstanding throughout the period)
|
Small Company
| | Class 1 | | Class NAV | |
| Period ended | | 2-28-06a,b | | 2-28-06a,b |
|
| Per share operating performance | | | | |
|
| Net asset value, beginning of period | | $15.15 | | $15.16 |
| Net investment income (loss)h | | (0.03) | | (0.02) |
| Net realized and unrealized gain (loss) on investments | | 1.90 | | 1.90 |
| Total from investment operations | | 1.87 | | 1.88 |
| Net asset value, end of period | | $17.02 | | $17.04 |
| Total return (%) | | 12.34m | | 12.40m |
| Ratios and supplemental data | | | | |
|
| Net assets, end of period (in millions) | | $7 | | $78 |
| Ratio of net expenses to average net assets (%) | | 1.36r | | 1.31r |
| Ratio of net investment income (loss) to | | | | |
| average net assets (%) | | (0.50)r | | (0.36)r |
| Portfolio turnover (%) | | 45m | | 45m |
a Class 1 and Class NAV shares began operations on 10-15-05.
b Unaudited.
h Based on the average of the shares outstanding.
m Not annualized.
r Annualized.
|
The accompanying notes are an integral part of the financial statements. 93
John Hancock Funds II
Financial Highlights (For a share outstanding throughout the period)
|
Small Company Growth
| | Class NAV | |
| Period ended | | 2-28-06a,b |
|
| Per share operating performance | | |
|
| Net asset value, beginning of period | | $10.00 |
| Net investment income (loss)h | | (0.03) |
| Net realized and unrealized gain (loss) on investments | | 1.43 |
| Total from investment operations | | 1.40 |
| Net asset value, end of period | | $11.40 |
| Total return (%) | | 14.00m |
| Ratios and supplemental data | | |
|
| Net assets, end of period (in millions) | | $64 |
| Ratio of net expenses to average net assets (%) | | 1.09r |
| Ratio of net investment income (loss) to | | |
| average net assets (%) | | (0.81)r |
| Portfolio turnover (%) | | 18m |
a Class NAV shares began operations on 10-29-05.
b Unaudited.
h Based on the average of the shares outstanding.
m Not annualized.
r Annualized.
|
The accompanying notes are an integral part of the financial statements. 94
John Hancock Funds II
Financial Highlights (For a share outstanding throughout the period)
|
Small Company Value
| | Class 1 | | Class NAV | |
| Period ended | | 2-28-06a,b | | 2-28-06a,b |
|
| Per share operating performance | | | | |
|
| Net asset value, beginning of period | | $21.09 | | $21.06 |
| Net investment income (loss)h | | 0.05 | | 0.06 |
| Net realized and unrealized gain (loss) on investments | | 3.09 | | 3.08 |
| Total from investment operations | | 3.14 | | 3.14 |
| Less distributions | | | | |
| From net investment income | | (0.05) | | (0.05) |
| | | (0.05) | | (0.05) |
| Net asset value, end of period | | $24.18 | | $24.15 |
| Total return (%)k,l | | 14.88m | | 14.91m |
| Ratios and supplemental data | | | | |
|
| Net assets, end of period (in millions) | | $144 | | $210 |
| Ratio of net expenses to average net assets (%) | | 1.10r | | 1.05r |
| Ratio of gross expenses to average net assets (%)p | | 1.13r | | 1.08r |
| Ratio of net investment income (loss) to | | | | |
| average net assets (%) | | 0.57r | | 0.69r |
| Portfolio turnover (%) | | 8m | | 8m |
a Class 1 and Class NAV shares began operations on 10-15-05.
b Unaudited.
h Based on the average of the shares outstanding.
k Assumes dividend reinvestment.
l Total returns would have been lower had certain expenses not been reduced during the period shown.
m Not annualized.
p Does not take into consideration expense reductions during the period shown.
r Annualized.
|
The accompanying notes are an integral part of the financial statements. 95
John Hancock Funds II
Financial Highlights (For a share outstanding throughout the period)
|
Special Value
| | Class 1 | | Class NAV | |
| Period ended | | 2-28-06a,b | | 2-28-06a,b |
|
| Per share operating performance | | | | |
|
| Net asset value, beginning of period | | $18.66 | | $18.66 |
| Net investment income (loss)h | | 0.01 | | 0.03 |
| Net realized and unrealized gain (loss) on investments | | 2.09 | | 2.09 |
| Total from investment operations | | 2.10 | | 2.12 |
| Less distributions | | | | |
| From net investment income | | (0.01) | | (0.02) |
| | | (0.01) | | (0.02) |
| Net asset value, end of period | | $20.75 | | $20.76 |
| Total return (%)k | | 11.25m | | 11.34m |
| Ratios and supplemental data | | | | |
|
| Net assets, end of period (in millions) | | $3 | | $108 |
| Ratio of net expenses to average net assets (%) | | 1.12r | | 1.07r |
| Ratio of net investment income (loss) to | | | | |
| average net assets (%) | | 0.17r | | 0.34r |
| Portfolio turnover (%) | | 6m | | 6m |
a Class 1 and Class NAV shares began operations on 10-15-05.
b Unaudited.
h Based on the average of the shares outstanding.
k Assumes dividend reinvestment.
m Not annualized.
r Annualized.
|
The accompanying notes are an integral part of the financial statements. 96
John Hancock Funds II
Financial Highlights (For a share outstanding throughout the period)
|
Spectrum Income
| | Class NAV | |
| Period ended | | 2-28-06a,b |
|
| Per share operating performance | | |
|
| Net asset value, beginning of period | | $10.00 |
| Net investment income (loss)h | | 0.13 |
| Net realized and unrealized gain (loss) on investments | | 0.19 |
| Total from investment operations | | 0.32 |
| Less distributions | | |
| From net investment income | | (0.07) |
| | | (0.07) |
| Net asset value, end of period | | $10.25 |
| Total return (%)k,l | | 3.19m |
| Ratios and supplemental data | | |
|
| Net assets, end of period (in millions) | | $647 |
| Ratio of net expenses to average net assets (%) | | 0.93r |
| Ratio of gross expenses to average net assets (%)p | | 0.94r |
| Ratio of net investment income (loss) to | | |
| average net assets (%) | | 3.91r |
| Portfolio turnover (%) | | 59m |
a Class NAV shares began operations on 10-29-05.
b Unaudited.
h Based on the average of the shares outstanding.
k Assumes dividend reinvestment.
l Total returns would have been lower had certain expenses not been reduced during the period shown.
m Not annualized.
p Does not take into consideration expense reductions during the period shown.
r Annualized.
|
The accompanying notes are an integral part of the financial statements. 97
John Hancock Funds II
Financial Highlights (For a share outstanding throughout the period)
|
Strategic Bond
| | Class 1 | | Class NAV | |
| Period ended | | 2-28-06a,b | | 2-28-06a,b |
|
| Per share operating performance | | | | |
|
| Net asset value, beginning of period | | $11.85 | | $11.83 |
| Net investment income (loss)h | | 0.20 | | 0.21 |
| Net realized and unrealized gain (loss) on investments | | 0.07 | | 0.06 |
| Total from investment operations | | 0.27 | | 0.27 |
| Less distributions | | | | |
| From net investment income | | (0.10) | | (0.10) |
| From net realized gain | | —j | | —j |
| | | (0.10) | | (0.10) |
| Net asset value, end of period | | $12.02 | | $12.00 |
| Total return (%)k | | 2.33m | | 2.34m |
| Ratios and supplemental data | | | | |
|
| Net assets, end of period (in millions) | | $39 | | $470 |
| Ratio of net expenses to average net assets (%) | | 0.81r | | 0.76r |
| Ratio of net investment income (loss) to | | | | |
| average net assets (%) | | 4.53r | | 4.66r |
| Portfolio turnover (%) | | 46m | | 46m |
a Class 1 and Class NAV shares began operations on 10-15-05.
b Unaudited.
h Based on the average of the shares outstanding.
j Less than $0.01 per share.
k Assumes dividend reinvestment.
m Not annualized.
r Annualized.
|
The accompanying notes are an integral part of the financial statements. 98
John Hancock Funds II
Financial Highlights (For a share outstanding throughout the period)
|
Strategic Value
| | Class 1 | | Class NAV | |
| Period ended | | 2-28-06a,b | | 2-28-06a,b |
|
| Per share operating performance | | | | |
|
| Net asset value, beginning of period | | $10.29 | | $10.25 |
| Net investment income (loss)h | | 0.02 | | 0.03 |
| Net realized and unrealized gain (loss) on investments | | 0.63 | | 0.62 |
| Total from investment operations | | 0.65 | | 0.65 |
| Less distributions | | | | |
| From net investment income | | (0.02) | | (0.02) |
| | | (0.02) | | (0.02) |
| Net asset value, end of period | | $10.92 | | $10.88 |
| Total return (%)k | | 6.28m | | 6.32m |
| Ratios and supplemental data | | | | |
|
| Net assets, end of period (in millions) | | $13 | | $122 |
| Ratio of net expenses to average net assets (%) | | 0.96r | | 0.91r |
| Ratio of net investment income (loss) to | | | | |
| average net assets (%) | | 0.61r | | 0.77r |
| Portfolio turnover (%) | | 15m | | 15m |
a Class 1 and Class NAV shares began operations on 10-15-05.
b Unaudited.
h Based on the average of the shares outstanding.
k Assumes dividend reinvestment.
m Not annualized.
r Annualized.
|
The accompanying notes are an integral part of the financial statements. 99
John Hancock Funds II
Financial Highlights (For a share outstanding throughout the period)
|
Total Return
| | Class 1 | | Class NAV | |
| Period ended | | 2-28-06a,b | | 2-28-06a,b |
|
| Per share operating performance | | | | |
|
| Net asset value, beginning of period | | $13.70 | | $13.67 |
| Net investment income (loss)h | | 0.19 | | 0.19 |
| Net realized and unrealized gain (loss) on investments | | (0.01) | | (0.01) |
| Total from investment operations | | 0.18 | | 0.18 |
| Less distributions | | | | |
| From net investment income | | (0.09) | | (0.09) |
| | | (0.09) | | (0.09) |
| Net asset value, end of period | | $13.79 | | $13.76 |
| Total return (%)k | | 1.32m | | 1.33m |
| Ratios and supplemental data | | | | |
|
| Net assets, end of period (in millions) | | $112 | | $935 |
| Ratio of net expenses to average net assets (%) | | 0.83r | | 0.78r |
| Ratio of net investment income (loss) to | | | | |
| average net assets (%) | | 3.66r | | 3.81r |
| Portfolio turnover (%) | | 237m | | 237m |
a Class 1 and Class NAV shares began operations on 10-15-05.
b Unaudited.
h Based on the average of the shares outstanding.
k Assumes dividend reinvestment.
m Not annualized.
r Annualized.
|
The accompanying notes are an integral part of the financial statements. 100
John Hancock Funds II
Financial Highlights (For a share outstanding throughout the period)
|
U.S. Global Leaders Growth
| | Class 1 | | Class NAV | |
| Period ended | | 2-28-06a,b | | 2-28-06a,b |
|
| Per share operating performance | | | | |
|
| Net asset value, beginning of period | | $12.79 | | $12.80 |
| Net investment income (loss)h | | 0.02 | | 0.02 |
| Net realized and unrealized gain (loss) on investments | | 0.56 | | 0.56 |
| Total from investment operations | | 0.58 | | 0.58 |
| Less distributions | | | | |
| From net investment income | | (0.01) | | (0.01) |
| | | (0.01) | | (0.01) |
| Net asset value, end of period | | $13.36 | | $13.37 |
| Total return (%)k | | 4.50m | | 4.51m |
| Ratios and supplemental data | | | | |
|
| Net assets, end of period (in millions) | | $23 | | $401 |
| Ratio of net expenses to average net assets (%) | | 0.79r | | 0.74r |
| Ratio of net investment income (loss) to | | | | |
| average net assets (%) | | 0.35r | | 0.42r |
| Portfolio turnover (%) | | 3m | | 3m |
a Class 1 and Class NAV shares began operations on 10-15-05.
b Unaudited.
h Based on the average of the shares outstanding.
k Assumes dividend reinvestment.
m Not annualized.
r Annualized.
|
The accompanying notes are an integral part of the financial statements. 101
John Hancock Funds II
Financial Highlights (For a share outstanding throughout the period)
|
U.S. Government Securities
| | Class 1 | | Class NAV | |
| Period ended | | 2-28-06a,b | | 2-28-06a,b |
|
| Per share operating performance | | | | |
|
| Net asset value, beginning of period | | $13.54 | | $13.51 |
| Net investment income (loss)h | | 0.19 | | 0.19 |
| Net realized and unrealized gain (loss) on investments | | (0.01) | | (0.01) |
| Total from investment operations | | 0.18 | | 0.18 |
| Less distributions | | | | |
| From net investment income | | (0.09) | | (0.09) |
| From net realized gain | | —j | | —j |
| | | (0.09) | | (0.09) |
| Net asset value, end of period | | $13.63 | | $13.60 |
| Total return (%)k | | 1.37m | | 1.38m |
| Ratios and supplemental data | | | | |
|
| Net assets, end of period (in millions) | | $47 | | $146 |
| Ratio of net expenses to average net assets (%) | | 0.77r | | 0.72r |
| Ratio of net investment income (loss) to | | | | |
| average net assets (%) | | 3.75r | | 3.84r |
| Portfolio turnover (%) | | 74m | | 74m |
a Class 1 and Class NAV shares began operations on 10-15-05.
b Unaudited.
h Based on the average of the shares outstanding.
j Less than $0.01 per share.
k Assumes dividend reinvestment.
m Not annualized.
r Annualized.
|
The accompanying notes are an integral part of the financial statements. 102
John Hancock Funds II
Financial Highlights (For a share outstanding throughout the period)
|
U.S. High Yield Bond
| | Class 1 | | Class NAV | |
| Period ended | | 2-28-06a,b | | 2-28-06a,b |
|
| Per share operating performance | | | | |
|
| Net asset value, beginning of period | | $12.74 | | $12.74 |
| Net investment income (loss)h | | 0.35 | | 0.34 |
| Net realized and unrealized gain (loss) on investments | | 0.17 | | 0.18 |
| Total from investment operations | | 0.52 | | 0.52 |
| Less distributions | | | | |
| From net investment income | | (0.17) | | (0.17) |
| | | (0.17) | | (0.17) |
| Net asset value, end of period | | $13.09 | | $13.09 |
| Total return (%)k | | 4.14m | | 4.15m |
| Ratios and supplemental data | | | | |
|
| Net assets, end of period (in millions) | | $1 | | $166 |
| Ratio of net expenses to average net assets (%) | | 0.86r | | 0.81r |
| Ratio of net investment income (loss) to | | | | |
| average net assets (%) | | 7.26r | | 7.03r |
| Portfolio turnover (%) | | 24m | | 24m |
a Class 1 and Class NAV shares began operations on 10-15-05.
b Unaudited.
h Based on the average of the shares outstanding.
k Assumes dividend reinvestment.
m Not annualized.
r Annualized.
|
The accompanying notes are an integral part of the financial statements. 103
John Hancock Funds II
Financial Highlights (For a share outstanding throughout the period)
|
U.S. Multi Sector
| | Class NAV | |
| Period ended | | 2-28-06a,b |
|
| Per share operating performance | | |
|
| Net asset value, beginning of period | | $10.00 |
| Net investment income (loss)h | | 0.03 |
| Net realized and unrealized gain (loss) on investments | | 0.62 |
| Total from investment operations | | 0.65 |
| Less distributions | | |
| From net investment income | | (0.01) |
| | | (0.01) |
| Net asset value, end of period | | $10.64 |
| Total return (%)k | | 6.55m |
| Ratios and supplemental data | | |
|
| Net assets, end of period (in millions) | | $1,086 |
| Ratio of net expenses to average net assets (%) | | 0.82r |
| Ratio of net investment income (loss) to | | |
| average net assets (%) | | 0.89r |
| Portfolio turnover (%) | | 87m |
a Class NAV shares began operations on 10-29-05.
b Unaudited.
h Based on the average of the shares outstanding.
k Assumes dividend reinvestment.
m Not annualized.
r Annualized.
|
The accompanying notes are an integral part of the financial statements. 104
John Hancock Funds II
Financial Highlights (For a share outstanding throughout the period)
|
Value & Restructuring
| | Class NAV | |
| Period ended | | 2-28-06a,b |
|
| Per share operating performance | | |
|
| Net asset value, beginning of period | | $10.00 |
| Net investment income (loss)h | | 0.05 |
| Net realized and unrealized gain (loss) on investments | | 1.16 |
| Total from investment operations | | 1.21 |
| Less distributions | | |
| From net investment income | | (0.03) |
| | | (0.03) |
| Net asset value, end of period | | $11.18 |
| Total return (%)k | | 12.07m |
| Ratios and supplemental data | | |
|
| Net assets, end of period (in millions) | | $176 |
| Ratio of net expenses to average net assets (%) | | 0.90r |
| Ratio of net investment income (loss) to | | |
| average net assets (%) | | 1.47r |
| Portfolio turnover (%) | | 6m |
a Class NAV shares began operations on 10-29-05.
b Unaudited.
h Based on the average of the shares outstanding.
k Assumes dividend reinvestment.
m Not annualized.
r Annualized.
|
The accompanying notes are an integral part of the financial statements. 105
John Hancock Funds II
Financial Highlights (For a share outstanding throughout the period)
|
Vista
| | Class NAV | |
| Period ended | | 2-28-06a,b |
|
| Per share operating performance | | |
|
| Net asset value, beginning of period | | $10.00 |
| Net investment income (loss)h | | 0.02 |
| Net realized and unrealized gain (loss) on investments | | 1.26 |
| Total from investment operations | | 1.28 |
| Net asset value, end of period | | $11.28 |
| Total return (%) | | 12.80m |
| Ratios and supplemental data | | |
|
| Net assets, end of period (in millions) | | $109 |
| Ratio of net expenses to average net assets (%) | | 0.99r |
| Ratio of net investment income (loss) to | | |
| average net assets (%) | | 0.55r |
| Portfolio turnover (%) | | 79m |
a Class NAV shares began operations on 10-29-05.
b Unaudited.
h Based on the average of the shares outstanding.
m Not annualized.
r Annualized.
|
The accompanying notes are an integral part of the financial statements. 106
John Hancock Funds II
Portfolio of investments — February 28, 2006 (Unaudited)
(showing percentage of total net assets)
|
| 500 Index Fund | | | |
| | Shares or | | |
| | Principal | | |
| | Amount | | Value |
|
|
| |
| COMMON STOCKS - 92.22% | | | |
| Advertising - 0.20% | | | |
| Monster Worldwide, Inc. * | 2,785 | $ | 136,354 |
| Omnicom Group, Inc. | 4,079 | | 325,586 |
| The Interpublic Group of Companies, Inc. * | 9,740 | | 100,906 |
|
|
| | | | 562,846 |
| Aerospace - 1.89% | | | |
| Boeing Company | 18,262 | | 1,327,465 |
| General Dynamics Corp. | 4,554 | | 561,372 |
| Goodrich Corp. | 2,781 | | 116,357 |
| Lockheed Martin Corp. | 8,089 | | 589,445 |
| Northrop Grumman Corp. | 8,038 | | 515,236 |
| Raytheon Company | 10,106 | | 438,600 |
| Rockwell Collins, Inc. | 3,908 | | 207,710 |
| Textron, Inc. | 2,995 | | 263,890 |
| United Technologies Corp. | 23,044 | | 1,348,074 |
|
|
| | | | 5,368,149 |
| Agriculture - 0.35% | | | |
| Archer-Daniels-Midland Company | 14,776 | | 468,695 |
| Monsanto Company | 6,074 | | 509,487 |
|
|
| | | | 978,182 |
| Air Travel - 0.09% | | | |
| Southwest Airlines Company | 15,781 | | 264,647 |
Aluminum - 0.20% | | | |
| Alcoa, Inc. | 19,686 | | 577,194 |
Apparel & Textiles - 0.38% | | | |
| Cintas Corp. | 3,116 | | 128,036 |
| Coach, Inc. * | 8,598 | | 307,121 |
| Jones Apparel Group, Inc. | 2,643 | | 76,436 |
| Liz Claiborne, Inc. | 2,413 | | 86,940 |
| NIKE, Inc., Class B | 4,300 | | 373,154 |
| VF Corp. | 2,012 | | 110,258 |
|
|
| | | | 1,081,945 |
| Auto Parts - 0.22% | | | |
| AutoZone, Inc. * | 1,249 | | 120,753 |
| Dana Corp. | 3,402 | | 5,988 |
| Genuine Parts Company | 3,925 | | 174,741 |
| Johnson Controls, Inc. | 4,366 | | 311,165 |
|
|
| | | | 612,647 |
| Auto Services - 0.03% | | | |
| AutoNation, Inc. * | 4,096 | | 85,647 |
Automobiles - 0.30% | | | |
| Ford Motor Company | 42,024 | | 334,931 |
| General Motors Corp. | 12,793 | | 259,826 |
| PACCAR, Inc. | 3,830 | | 267,602 |
|
|
| | | | 862,359 |
| Banking - 5.74% | | | |
| AmSouth Bancorp. | 7,885 | | 218,809 |
| Bank of America Corp. | 105,075 | | 4,817,689 |
| Bank of New York Company, Inc. | 17,424 | | 596,598 |
| BB&T Corp. | 12,268 | | 484,954 |
| 500 Index Fund (continued) | | | |
| | Shares or | | |
| | Principal | | |
| | Amount | | Value |
|
|
| |
| COMMON STOCKS (continued) | | | |
| Banking (continued) | | | |
| Comerica, Inc. | 3,739 | $ | 214,319 |
| Compass Bancshares, Inc. | 2,817 | | 141,639 |
| Fifth Third Bancorp. | 12,552 | | 485,135 |
| First Horizon National Corp. | 2,850 | | 111,463 |
| Golden West Financial Corp. | 5,765 | | 409,488 |
| Huntington Bancshares, Inc. | 5,162 | | 124,146 |
| KeyCorp | 9,225 | | 343,816 |
| M&T Bank Corp. | 1,805 | | 202,882 |
| Marshall & Ilsley Corp. | 4,732 | | 208,208 |
| National City Corp. | 12,468 | | 433,886 |
| North Fork Bancorporation, Inc. | 10,761 | | 274,836 |
| Northern Trust Corp. | 4,197 | | 221,266 |
| Regions Financial Corp. | 10,359 | | 360,286 |
| Sovereign Bancorp, Inc. | 8,080 | | 168,306 |
| SunTrust Banks, Inc. | 8,176 | | 591,697 |
| US Bancorp | 41,090 | | 1,270,092 |
| Wachovia Corp. | 35,143 | | 1,970,468 |
| Wells Fargo Company | 37,830 | | 2,428,686 |
| Zions Bancorp. | 2,362 | | 194,912 |
|
|
| | | | 16,273,581 |
| Biotechnology - 1.20% | | | |
| Amgen, Inc. * | 27,923 | | 2,107,907 |
| Applera Corp. | 4,251 | | 120,176 |
| Biogen Idec, Inc. * | 7,678 | | 362,785 |
| Chiron Corp. * | 2,474 | | 112,988 |
| Genzyme Corp. * | 5,842 | | 405,084 |
| MedImmune, Inc. * | 5,566 | | 203,103 |
| Millipore Corp. * | 1,178 | | 81,671 |
|
|
| | | | 3,393,714 |
| Broadcasting - 0.65% | | | |
| CBS Corp., Class B | 17,480 | | 427,561 |
| Clear Channel Communications, Inc. | 12,228 | | 346,052 |
| News Corp. | 55,047 | | 896,165 |
| Univision Communications, Inc., Class A * | 5,058 | | 169,190 |
|
|
| | | | 1,838,968 |
| Building Materials & Construction - 0.16% | | | |
| American Standard Companies, Inc. | 4,136 | | 163,703 |
| Masco Corp. | 9,587 | | 299,018 |
|
|
| | | | 462,721 |
| Business Services - 1.55% | | | |
| Affiliated Computer Services, Inc., Class A * | 2,812 | | 176,931 |
| Automatic Data Processing, Inc. | 13,044 | | 602,502 |
| Cendant Corp. | 23,174 | | 385,152 |
| Computer Sciences Corp. * | 4,185 | | 227,413 |
| Convergys Corp. * | 3,167 | | 55,011 |
| Electronic Data Systems Corp. | 11,798 | | 315,007 |
| Equifax, Inc. | 2,938 | | 107,648 |
| First Data Corp. | 17,285 | | 780,072 |
| Fluor Corp. | 1,964 | | 169,493 |
| H & R Block, Inc. | 7,412 | | 165,288 |
| Moody's Corp. | 5,613 | | 376,071 |
The accompanying notes are an integral part of the financial statements. 107
John Hancock Funds II
Portfolio of investments — February 28, 2006 (Unaudited)
(showing percentage of total net assets)
|
| 500 Index Fund (continued) | | | |
| | Shares or | | |
| | Principal | | |
| | Amount | | Value |
|
|
| |
| COMMON STOCKS (continued) | | | |
| Business Services (continued) | | | |
| NCR Corp. * | 4,153 | $ | 166,494 |
| Paychex, Inc. | 7,545 | | 302,177 |
| Pitney Bowes, Inc. | 5,161 | | 220,581 |
| R.R. Donnelley & Sons Company | 4,916 | | 165,472 |
| Robert Half International, Inc. | 3,853 | | 138,400 |
| Unisys Corp. * | 7,720 | | 51,570 |
| |
|
| | | | 4,405,282 |
| Cable and Television - 1.35% | | | |
| Comcast Corp., Class A * | 49,124 | | 1,317,997 |
| Time Warner, Inc. | 105,479 | | 1,825,841 |
| Viacom, Inc. * | 17,480 | | 698,501 |
| |
|
| | | | 3,842,339 |
| Cellular Communications - 0.43% | | | |
| Motorola, Inc. | 56,348 | | 1,205,847 |
Chemicals - 1.17% | | | |
| Air Products & Chemicals, Inc. | 5,020 | | 322,083 |
| Ashland, Inc. | 1,624 | | 105,998 |
| Dow Chemical Company | 21,833 | | 939,474 |
| E.I. Du Pont De Nemours & Company | 20,798 | | 836,912 |
| Eastman Chemical Company | 1,843 | | 90,915 |
| Engelhard Corp. | 2,713 | | 107,842 |
| Hercules, Inc. * | 2,551 | | 30,229 |
| PPG Industries, Inc. | 3,779 | | 229,121 |
| Praxair, Inc. | 7,291 | | 393,568 |
| Rohm & Haas Company | 3,258 | | 162,086 |
| Sigma-Aldrich Corp. | 1,521 | | 97,968 |
| |
|
| | | | 3,316,196 |
| Colleges & Universities - 0.06% | | | |
| Apollo Group, Inc., Class A * | 3,292 | | 162,559 |
Commercial Services - 0.01% | | | |
| Live Nation, Inc. * | 1,528 | | 27,275 |
Computers & Business Equipment - 4.41% | | | |
| Apple Computer, Inc. * | 19,065 | | 1,306,715 |
| Cisco Systems, Inc. * | 138,959 | | 2,812,530 |
| Dell, Inc. * | 53,242 | | 1,544,018 |
| EMC Corp. * | 54,083 | | 758,244 |
| Gateway, Inc. * | 5,993 | | 14,144 |
| Hewlett-Packard Company | 64,813 | | 2,126,515 |
| International Business Machines Corp. | 35,732 | | 2,867,136 |
| Lexmark International, Inc. * | 2,625 | | 123,611 |
| Network Appliance, Inc. * | 8,418 | | 279,141 |
| Parametric Technology Corp. * | 2,464 | | 37,502 |
| Sun Microsystems, Inc. * | 77,238 | | 322,082 |
| Xerox Corp. * | 21,727 | | 323,732 |
| |
|
| | | | 12,515,370 |
| Construction & Mining Equipment - 0.12% | | | |
| National Oilwell, Inc. * | 3,943 | | 240,050 |
| Rowan Companies, Inc. * | 2,473 | | 99,538 |
| |
|
| | | | 339,588 |
| 500 Index Fund (continued) | | | |
| | Shares or | | |
| | Principal | | |
| | Amount | | Value |
|
|
| |
| COMMON STOCKS (continued) | | | |
| Construction Materials - 0.13% | | | |
| Louisiana-Pacific Corp. | 2,393 | $ | 68,033 |
| Sherwin-Williams Company | 2,540 | | 115,697 |
| Vulcan Materials Company | 2,304 | | 182,016 |
| |
|
| | | | 365,746 |
| Containers & Glass - 0.12% | | | |
| Ball Corp. | 2,354 | | 100,281 |
| Bemis Company, Inc. | 2,382 | | 71,412 |
| Pactiv Corp. * | 3,241 | | 74,316 |
| Sealed Air Corp. * | 1,841 | | 104,716 |
| |
|
| | | | 350,725 |
| Cosmetics & Toiletries - 2.24% | | | |
| Alberto Culver Company, Class B | 1,708 | | 78,004 |
| Avon Products, Inc. | 10,370 | | 299,174 |
| Colgate-Palmolive Company | 11,720 | | 638,506 |
| Estee Lauder Companies, Inc., Class A | 2,725 | | 101,970 |
| International Flavors & Fragrances, Inc. | 1,828 | | 63,304 |
| Kimberly-Clark Corp. | 10,569 | | 625,473 |
| Procter & Gamble Company | 75,825 | | 4,544,192 |
| |
|
| | | | 6,350,623 |
| Crude Petroleum & Natural Gas - 2.59% | | | |
| Amerada Hess Corp. | 1,810 | | 250,341 |
| Apache Corp. | 7,449 | | 498,487 |
| Burlington Resources, Inc. | 8,552 | | 771,219 |
| ChevronTexaco Corp. | 50,787 | | 2,868,450 |
| Devon Energy Corp. | 10,051 | | 589,290 |
| EOG Resources, Inc. | 5,465 | | 368,341 |
| Marathon Oil Corp. | 8,291 | | 585,345 |
| Occidental Petroleum Corp. | 9,094 | | 832,465 |
| Sunoco, Inc. | 3,079 | | 228,154 |
| XTO Energy, Inc. | 8,216 | | 344,168 |
| |
|
| | | | 7,336,260 |
| Domestic Oil - 0.06% | | | |
| Murphy Oil Corp. | 3,735 | | 175,059 |
Drugs & Health Care - 0.53% | | | |
| Wyeth | 30,365 | | 1,512,177 |
Electrical Equipment - 3.21% | | | |
| American Power Conversion Corp. | 3,888 | | 79,432 |
| Cooper Industries, Ltd., Class A | 2,073 | | 173,510 |
| Emerson Electric Company | 9,294 | | 760,342 |
| General Electric Company | 239,032 | | 7,856,982 |
| Molex, Inc. | 3,247 | | 103,352 |
| Symbol Technologies, Inc. | 5,678 | | 65,978 |
| Tektronix, Inc. | 1,886 | | 58,089 |
| |
|
| | | | 9,097,685 |
| Electrical Utilities - 2.51% | | | |
| Allegheny Energy, Inc. * | 3,684 | | 131,740 |
| Ameren Corp. | 4,621 | | 234,146 |
| American Electric Power Company, Inc. | 8,906 | | 325,069 |
| CenterPoint Energy, Inc. | 7,015 | | 90,985 |
| Cinergy Corp. | 4,512 | | 198,889 |
The accompanying notes are an integral part of the financial statements. 108
John Hancock Funds II
Portfolio of investments — February 28, 2006 (Unaudited)
(showing percentage of total net assets)
|
| 500 Index Fund (continued) | | | |
| | Shares or | | |
| | Principal | | |
| | Amount | | Value |
|
|
| |
| COMMON STOCKS (continued) | | | |
| Electrical Utilities (continued) | | | |
| CMS Energy Corp. * | 4,979 | $ | 70,104 |
| Consolidated Edison, Inc. | 5,542 | | 254,211 |
| Constellation Energy Group, Inc. | 4,038 | | 237,192 |
| Dominion Resources, Inc. | 7,856 | | 589,986 |
| DTE Energy Company | 4,023 | | 174,196 |
| Edison International | 7,371 | | 326,978 |
| Entergy Corp. | 4,694 | | 340,362 |
| Exelon Corp. | 15,094 | | 862,018 |
| FirstEnergy Corp. | 7,462 | | 381,159 |
| FPL Group, Inc. | 8,933 | | 374,561 |
| PG&E Corp. | 7,762 | | 295,344 |
| Pinnacle West Capital Corp. | 2,240 | | 91,952 |
| PPL Corp. | 8,600 | | 273,480 |
| Public Service Enterprise Group, Inc. | 5,671 | | 393,511 |
| TECO Energy, Inc. | 4,708 | | 80,318 |
| The AES Corp. * | 14,776 | | 255,625 |
| The Southern Company | 16,774 | | 570,819 |
| TXU Corp. | 10,923 | | 572,256 |
|
|
| | | | 7,124,901 |
| Electronics - 0.40% | | | |
| Agilent Technologies, Inc. * | 9,300 | | 334,800 |
| Harman International Industries, Inc. | 1,490 | | 164,422 |
| Jabil Circuit, Inc. * | 3,936 | | 148,978 |
| L-3 Communications Holdings, Inc. | 2,718 | | 225,893 |
| Sanmina-SCI Corp. * | 11,891 | | 45,899 |
| Solectron Corp. * | 20,668 | | 74,611 |
| Thermo Electron Corp. * | 3,669 | | 127,021 |
|
|
| | | | 1,121,624 |
| Energy - 0.46% | | | |
| Duke Energy Corp. | 20,984 | | 595,946 |
| Progress Energy, Inc. | 5,693 | | 252,655 |
| Sempra Energy | 5,816 | | 278,237 |
| Xcel Energy, Inc. | 9,114 | | 169,156 |
|
|
| | | | 1,295,994 |
| Financial Services - 7.97% | | | |
| Ameriprise Financial, Inc. | 5,565 | | 253,096 |
| Bear Stearns Companies, Inc. | 2,563 | | 344,570 |
| Capital One Financial Corp. | 6,776 | | 593,578 |
| Charles Schwab Corp. | 23,337 | | 378,293 |
| CIT Group, Inc. | 4,519 | | 242,987 |
| Citigroup, Inc. | 114,446 | | 5,306,861 |
| Countrywide Financial Corp. | 13,510 | | 465,825 |
| E*TRADE Financial Corp. * | 9,254 | | 236,717 |
| Federal Home Loan Mortgage Corp. | 15,632 | | 1,053,441 |
| Federal National Mortgage Association | 21,896 | | 1,197,273 |
| Federated Investors, Inc., Class B | 1,916 | | 74,513 |
| Fiserv, Inc. * | 4,174 | | 173,221 |
| Franklin Resources, Inc. | 3,358 | | 344,799 |
| Goldman Sachs Group, Inc. | 10,198 | | 1,440,875 |
| Janus Capital Group, Inc. | 4,880 | | 107,018 |
| JPMorgan Chase & Company | 79,157 | | 3,256,519 |
| 500 Index Fund (continued) | | | |
| | Shares or | | |
| | Principal | | |
| | Amount | | Value |
|
|
| |
| COMMON STOCKS (continued) | | | |
| Financial Services (continued) | | | |
| Lehman Brothers Holdings, Inc. | 6,061 | $ | 884,603 |
| Mellon Financial Corp. | 9,459 | | 341,375 |
| Merrill Lynch & Company, Inc. | 20,789 | | 1,605,119 |
| Morgan Stanley | 24,385 | | 1,454,809 |
| PNC Financial Services Group, Inc. | 6,611 | | 465,084 |
| SLM Corp. | 9,441 | | 532,567 |
| State Street Corp. (c) | 7,418 | | 463,477 |
| Synovus Financial Corp. | 7,065 | | 200,293 |
| T. Rowe Price Group, Inc. | 2,957 | | 227,038 |
| Washington Mutual, Inc. | 22,322 | | 953,149 |
|
|
| | | | 22,597,100 |
| Food & Beverages - 2.62% | | | |
| Campbell Soup Company | 4,210 | | 131,057 |
| Coca-Cola Enterprises, Inc. | 6,856 | | 134,720 |
| ConAgra Foods, Inc. | 11,739 | | 246,871 |
| Constellation Brands, Inc., Class A * | 4,451 | | 117,239 |
| General Mills, Inc. | 8,037 | | 395,822 |
| H.J. Heinz Company | 7,571 | | 286,714 |
| Hershey Foods Corp. | 4,097 | | 209,562 |
| Kellogg Company | 5,810 | | 257,441 |
| McCormick & Company, Inc. | 3,028 | | 99,409 |
| Pepsi Bottling Group, Inc. | 3,102 | | 91,075 |
| PepsiCo, Inc. | 37,535 | | 2,218,694 |
| Sara Lee Corp. | 17,183 | | 303,624 |
| Starbucks Corp. * | 17,385 | | 631,423 |
| The Coca-Cola Company | 46,826 | | 1,965,287 |
| Tyson Foods, Inc., Class A | 5,694 | | 77,040 |
| William Wrigley Jr. Company | 4,059 | | 257,909 |
|
|
| | | | 7,423,887 |
| Forest Products - 0.13% | | | |
| Weyerhaeuser Company | 5,503 | | 375,800 |
Furniture & Fixtures - 0.03% | | | |
| Leggett & Platt, Inc. | 4,162 | | 97,724 |
Gas & Pipeline Utilities - 0.39% | | | |
| Dynegy, Inc., Class A * | 6,816 | | 36,875 |
| El Paso Corp. | 14,916 | | 195,101 |
| KeySpan Corp. | 3,944 | | 160,718 |
| Kinder Morgan, Inc. | 2,381 | | 220,909 |
| Nicor, Inc. | 999 | | 42,887 |
| NiSource, Inc. | 6,167 | | 126,608 |
| Peoples Energy Corp. | 863 | | 31,681 |
| Williams Companies, Inc. | 12,963 | | 279,612 |
|
|
| | | | 1,094,391 |
| Healthcare Products - 3.16% | | | |
| Bausch & Lomb, Inc. | 1,216 | | 84,159 |
| Baxter International, Inc. | 14,108 | | 533,988 |
| Becton, Dickinson & Company | 5,702 | | 364,073 |
| Biomet, Inc. | 5,635 | | 205,114 |
| Boston Scientific Corp. * | 13,348 | | 325,958 |
| C.R. Bard, Inc. | 2,372 | | 155,342 |
The accompanying notes are an integral part of the financial statements. 109
John Hancock Funds II
Portfolio of investments — February 28, 2006 (Unaudited)
(showing percentage of total net assets)
|
500 Index Fund (continued)
| | Shares or | | |
| | Principal | | |
| | Amount | | Value |
|
|
| |
| COMMON STOCKS (continued) | | | |
| Healthcare Products (continued) | | | |
| Fisher Scientific International, Inc. * | 2,774 | $ | 189,076 |
| Guidant Corp. | 7,506 | | 576,160 |
| Johnson & Johnson | 67,300 | | 3,879,845 |
| Medtronic, Inc. | 27,364 | | 1,476,288 |
| Patterson Companies, Inc. * | 3,128 | | 112,733 |
| St. Jude Medical, Inc. * | 8,293 | | 378,161 |
| Stryker Corp. | 6,596 | | 304,867 |
| Zimmer Holdings, Inc. * | 5,605 | | 387,754 |
|
|
| | | | 8,973,518 |
| Healthcare Services - 2.14% | | | |
| Cardinal Health, Inc. | 9,688 | | 703,349 |
| Coventry Health Care, Inc. * | 3,675 | | 219,103 |
| Express Scripts, Inc. * | 3,295 | | 287,555 |
| HCA, Inc. | 9,590 | | 459,361 |
| Humana, Inc. * | 3,683 | | 190,300 |
| IMS Health, Inc. | 5,242 | | 126,332 |
| Laboratory Corp. of America Holdings * | 3,007 | | 174,737 |
| McKesson Corp. | 6,960 | | 376,745 |
| Medco Health Solutions, Inc. * | 6,958 | | 387,700 |
| Quest Diagnostics, Inc. | 3,749 | | 198,210 |
| UnitedHealth Group, Inc. | 30,885 | | 1,798,433 |
| Wellpoint, Inc. * | 14,918 | | 1,145,553 |
|
|
| | | | 6,067,378 |
| Holdings Companies/Conglomerates - 0.10% | | | |
| Loews Corp. | 3,067 | | 282,961 |
Homebuilders - 0.32% | | | |
| Centex Corp. | 2,890 | | 195,393 |
| D.R. Horton, Inc. | 6,158 | | 210,049 |
| KB Home | 1,771 | | 118,710 |
| Lennar Corp., Class A | 3,107 | | 185,985 |
| Pulte Homes, Inc. | 4,853 | | 186,404 |
|
|
| | | | 896,541 |
| Hotels & Restaurants - 0.93% | | | |
| Darden Restaurants, Inc. | 2,962 | | 124,226 |
| Harrah's Entertainment, Inc. | 4,158 | | 299,043 |
| Hilton Hotels Corp. | 7,421 | | 179,588 |
| Marriott International, Inc., Class A | 3,724 | | 254,722 |
| McDonald's Corp. | 28,472 | | 993,958 |
| Starwood Hotels & Resorts Worldwide, Inc. | 4,960 | | 314,960 |
| Wendy's International, Inc. | 2,630 | | 152,277 |
| Yum! Brands, Inc. | 6,404 | | 305,471 |
|
|
| | | | 2,624,245 |
| Household Appliances - 0.11% | | | |
| Black & Decker Corp. | 1,774 | | 151,819 |
| Maytag Corp. | 1,813 | | 31,184 |
| Whirlpool Corp. | 1,526 | | 137,019 |
|
|
| | | | 320,022 |
| Household Products - 0.22% | | | |
| Fortune Brands, Inc. | 3,305 | | 256,303 |
| Newell Rubbermaid, Inc. | 6,232 | | 154,990 |
| 500 Index Fund (continued) | | | |
| | Shares or | | |
| | Principal | | |
| | Amount | | Value |
|
|
| |
| COMMON STOCKS (continued) | | | |
| Household Products (continued) | | | |
| The Clorox Company | 3,409 | $ | 207,778 |
|
|
| | | | 619,071 |
| Industrial Machinery - 1.00% | | | |
| Caterpillar, Inc. | 15,388 | | 1,124,555 |
| Cummins, Inc. | 1,059 | | 114,668 |
| Deere & Company | 5,456 | | 416,129 |
| Dover Corp. | 4,585 | | 219,805 |
| Ingersoll-Rand Company, Class A | 7,484 | | 307,068 |
| ITT Industries, Inc. | 4,178 | | 219,345 |
| Pall Corp. | 2,818 | | 82,906 |
| Parker-Hannifin Corp. | 2,709 | | 211,763 |
| W.W. Grainger, Inc. | 1,720 | | 127,349 |
|
|
| | | | 2,823,588 |
| Insurance - 4.77% | | | |
| ACE, Ltd. | 7,292 | | 406,383 |
| Aetna, Inc. | 12,940 | | 659,940 |
| AFLAC, Inc. | 11,320 | | 523,550 |
| Allstate Corp. | 14,674 | | 803,842 |
| Ambac Financial Group, Inc. | 2,380 | | 178,857 |
| American International Group, Inc. | 58,719 | | 3,896,593 |
| Aon Corp. | 7,239 | | 286,737 |
| Chubb Corp. | 4,522 | | 432,981 |
| CIGNA Corp. | 2,845 | | 349,224 |
| Cincinnati Financial Corp. | 3,952 | | 175,311 |
| Genworth Financial, Inc. | 8,520 | | 271,106 |
| Hartford Financial Services Group, Inc. | 6,795 | | 559,772 |
| Jefferson-Pilot Corp. | 3,032 | | 182,678 |
| Lincoln National Corp. | 3,919 | | 222,482 |
| Marsh & McLennan Companies, Inc. | 12,322 | | 380,873 |
| MBIA, Inc. | 3,033 | | 178,158 |
| MetLife, Inc. | 17,131 | | 858,606 |
| MGIC Investment Corp. | 2,053 | | 130,879 |
| Principal Financial Group, Inc. | 6,338 | | 308,787 |
| Progressive Corp. | 4,462 | | 479,442 |
| Prudential Financial, Inc. | 11,424 | | 880,105 |
| SAFECO Corp. | 2,795 | | 143,970 |
| St. Paul Travelers Companies, Inc. | 15,665 | | 673,282 |
| Torchmark, Inc. | 2,348 | | 128,365 |
| UnumProvident Corp. | 6,742 | | 139,492 |
| XL Capital, Ltd., Class A | 3,945 | | 266,485 |
|
|
| | | | 13,517,900 |
| International Oil - 1.24% | | | |
| Anadarko Petroleum Corp. | 5,366 | | 532,093 |
| ConocoPhillips | 31,390 | | 1,913,534 |
| Kerr-McGee Corp. | 2,624 | | 256,365 |
| Nabors Industries, Ltd. * | 3,575 | | 235,771 |
| Noble Corp. | 3,097 | | 228,899 |
| Weatherford International, Ltd. * | 7,864 | | 339,096 |
|
|
| | | | 3,505,758 |
| Internet Retail - 0.46% | | | |
| Amazon.com, Inc. * | 6,939 | | 260,143 |
The accompanying notes are an integral part of the financial statements. 110
John Hancock Funds II
Portfolio of investments — February 28, 2006 (Unaudited)
(showing percentage of total net assets)
|
| 500 Index Fund (continued) | | | |
| | Shares or | | |
| | Principal | | |
| | Amount | | Value |
|
|
| |
| COMMON STOCKS (continued) | | | |
| Internet Retail (continued) | | | |
| eBay, Inc. * | 25,855 | $ | 1,035,751 |
|
|
| | | | 1,295,894 |
| Internet Service Provider - 0.32% | | | |
| Yahoo!, Inc. * | 28,565 | | 915,794 |
Internet Software - 0.19% | | | |
| Symantec Corp. * | 24,466 | | 413,231 |
| VeriSign, Inc. * | 5,800 | | 137,228 |
|
|
| | | | 550,459 |
| Leisure Time - 0.86% | | | |
| Brunswick Corp. | 2,182 | | 85,600 |
| Carnival Corp. | 9,801 | | 506,221 |
| Electronic Arts, Inc. * | 6,800 | | 353,396 |
| International Game Technology, Inc. | 7,623 | | 272,675 |
| Walt Disney Company | 43,517 | | 1,218,041 |
|
|
| | | | 2,435,933 |
| Life Sciences - 0.06% | | | |
| PerkinElmer, Inc. | 2,959 | | 70,395 |
| Waters Corp. * | 2,504 | | 106,996 |
|
|
| | | | 177,391 |
| Liquor - 0.33% | | | |
| Anheuser-Busch Companies, Inc. | 17,563 | | 729,567 |
| Brown Forman Corp., Class B | 1,879 | | 132,206 |
| Molson Coors Brewing Company, Class B | 1,277 | | 80,132 |
|
|
| | | | 941,905 |
| Manufacturing - 1.73% | | | |
| 3M Company | 17,191 | | 1,265,086 |
| Danaher Corp. | 5,367 | | 325,133 |
| Eaton Corp. | 3,348 | | 233,255 |
| Harley-Davidson, Inc. | 6,212 | | 326,192 |
| Honeywell International, Inc. | 19,065 | | 780,712 |
| Illinois Tool Works, Inc. | 4,632 | | 397,611 |
| Rockwell Automation, Inc. | 4,052 | | 276,225 |
| Snap-on, Inc. | 1,311 | | 51,024 |
| Stanley Works | 1,646 | | 82,530 |
| Tyco International, Ltd. | 45,540 | | 1,174,476 |
|
|
| | | | 4,912,244 |
| Medical-Hospitals - 0.10% | | | |
| Health Management Associates, Inc., Class A | 5,592 | | 119,054 |
| Manor Care, Inc. | 1,790 | | 74,016 |
| Tenet Healthcare Corp. * | 10,619 | | 83,784 |
|
|
| | | | 276,854 |
| Mining - 0.37% | | | |
| Freeport-McMoran Copper & Gold, Inc., | | | |
| Class B | 4,164 | | 210,823 |
| Newmont Mining Corp. | 10,107 | | 534,863 |
| Phelps Dodge Corp. | 2,297 | | 316,986 |
|
|
| | | | 1,062,672 |
| Newspapers - 0.09% | | | |
| Dow Jones & Company, Inc. | 1,335 | | 54,268 |
| 500 Index Fund (continued) | | | |
| | Shares or | | |
| | Principal | | |
| | Amount | | Value |
|
|
| |
| COMMON STOCKS (continued) | | | |
| Newspapers (continued) | | | |
| E.W. Scripps Company, Class A | 1,925 | $ | 92,554 |
| Knight-Ridder, Inc. | 1,570 | | 94,231 |
|
|
| | | | 241,053 |
| Office Furnishings & Supplies - 0.16% | | | |
| Avery Dennison Corp. | 2,499 | | 149,940 |
| Office Depot, Inc. * | 6,987 | | 249,296 |
| OfficeMax, Inc. | 1,602 | | 46,987 |
|
|
| | | | 446,223 |
| Paper - 0.26% | | | |
| International Paper Company | 11,096 | | 363,616 |
| MeadWestvaco Corp. | 4,105 | | 114,201 |
| Plum Creek Timber Company, Inc. | 4,164 | | 154,693 |
| Temple-Inland, Inc. | 2,539 | | 108,339 |
|
|
| | | | 740,849 |
| Petroleum Services - 4.49% | | | |
| Baker Hughes, Inc. | 7,733 | | 525,612 |
| BJ Services Company | 7,292 | | 228,313 |
| Exxon Mobil Corp. | 140,765 | | 8,357,218 |
| Halliburton Company | 11,602 | | 788,936 |
| Schlumberger, Ltd. | 13,327 | | 1,532,605 |
| Transocean, Inc. * | 7,467 | | 553,902 |
| Valero Energy Corp. | 13,950 | | 750,370 |
|
|
| | | | 12,736,956 |
| Pharmaceuticals - 4.64% | | | |
| Abbott Laboratories | 35,092 | | 1,550,365 |
| Allergan, Inc. | 2,977 | | 322,290 |
| AmerisourceBergen Corp. | 4,718 | | 216,981 |
| Bristol-Myers Squibb Company | 44,261 | | 1,022,429 |
| Caremark Rx, Inc. * | 10,175 | | 506,206 |
| Eli Lilly & Company | 25,713 | | 1,430,157 |
| Forest Laboratories, Inc. * | 7,642 | | 350,768 |
| Gilead Sciences, Inc. * | 10,359 | | 645,055 |
| Hospira, Inc. * | 3,639 | | 144,468 |
| King Pharmaceuticals, Inc. * | 5,470 | | 88,887 |
| Merck & Company, Inc. | 49,467 | | 1,724,420 |
| Mylan Laboratories, Inc. | 4,945 | | 113,735 |
| Pfizer, Inc. | 166,758 | | 4,367,392 |
| Schering-Plough Corp. | 33,433 | | 618,511 |
| Watson Pharmaceuticals, Inc. * | 2,294 | | 68,774 |
|
|
| | | | 13,170,438 |
| Photography - 0.06% | | | |
| Eastman Kodak Company | 6,497 | | 182,241 |
Publishing - 0.39% | | | |
| Gannett Company, Inc. | 5,427 | | 337,343 |
| McGraw-Hill Companies, Inc. | 8,481 | | 450,256 |
| Meredith Corp. | 948 | | 52,225 |
| The New York Times Company, Class A | 3,282 | | 92,618 |
| Tribune Company | 5,923 | | 181,244 |
|
|
| | | | 1,113,686 |
The accompanying notes are an integral part of the financial statements. 111
John Hancock Funds II
Portfolio of investments — February 28, 2006 (Unaudited)
(showing percentage of total net assets)
|
| 500 Index Fund (continued) | | | |
| | Shares or | | |
| | Principal | | |
| | Amount | | Value |
|
|
| |
| COMMON STOCKS (continued) | | | |
| Railroads & Equipment - 0.68% | | | |
| Burlington Northern Santa Fe Corp. | 8,448 | $ | 664,351 |
| CSX Corp. | 4,914 | | 272,137 |
| Norfolk Southern Corp. | 9,194 | | 470,549 |
| Union Pacific Corp. | 5,994 | | 530,769 |
|
|
| | | | 1,937,806 |
| Real Estate - 0.68% | | | |
| Apartment Investment & Management | | | |
| Company, Class A, REIT | 2,165 | | 95,931 |
| Archstone-Smith Trust, REIT | 4,796 | | 227,330 |
| Equity Office Properties Trust, REIT | 9,189 | | 288,994 |
| Equity Residential, REIT | 6,519 | | 295,180 |
| ProLogis, REIT | 5,508 | | 289,280 |
| Public Storage, Inc., REIT | 1,870 | | 145,898 |
| Simon Property Group, Inc., REIT | 4,218 | | 349,968 |
| Vornado Realty Trust, REIT | 2,671 | | 237,692 |
|
|
| | | | 1,930,273 |
| Retail Grocery - 0.53% | | | |
| Albertsons, Inc. | 8,343 | | 212,246 |
| Safeway, Inc. | 10,164 | | 247,087 |
| SUPERVALU, Inc. | 3,081 | | 97,359 |
| Sysco Corp. | 14,033 | | 422,253 |
| The Kroger Company * | 16,398 | | 328,616 |
| Whole Foods Market, Inc. | 3,102 | | 198,156 |
|
|
| | | | 1,505,717 |
| Retail Trade - 4.56% | | | |
| Bed Bath & Beyond, Inc. * | 6,716 | | 242,045 |
| Best Buy Company, Inc. | 9,246 | | 497,990 |
| Big Lots, Inc. * | 2,578 | | 32,766 |
| Circuit City Stores, Inc. | 3,543 | | 85,138 |
| Costco Wholesale Corp. | 10,680 | | 547,670 |
| CVS Corp. | 18,419 | | 521,810 |
| Dillard's, Inc., Class A | 1,394 | | 34,390 |
| Dollar General Corp. | 7,163 | | 124,780 |
| Family Dollar Stores, Inc. | 3,512 | | 90,329 |
| Federated Department Stores, Inc. | 6,158 | | 437,464 |
| Gap, Inc. | 12,984 | | 240,723 |
| Home Depot, Inc. | 48,056 | | 2,025,560 |
| J.C. Penney Company, Inc. | 5,254 | | 308,095 |
| Kohl's Corp. * | 7,799 | | 375,210 |
| Limited Brands, Inc. | 7,878 | | 186,472 |
| Lowe's Companies, Inc. | 17,689 | | 1,206,036 |
| Nordstrom, Inc. | 4,945 | | 187,910 |
| RadioShack Corp. | 3,046 | | 59,549 |
| Sears Holdings Corp. * | 2,258 | | 271,976 |
| Staples, Inc. | 16,546 | | 406,039 |
| Target Corp. | 19,889 | | 1,081,962 |
| The TJX Companies, Inc. | 10,422 | | 255,235 |
| Tiffany & Co. | 3,218 | | 119,484 |
| Walgreen Company | 22,896 | | 1,027,115 |
| Wal-Mart Stores, Inc. | 56,513 | | 2,563,430 |
|
|
| | | | 12,929,178 |
| 500 Index Fund (continued) | | | |
| | Shares or | | |
| | Principal | | |
| | Amount | | Value |
|
|
| |
| COMMON STOCKS (continued) | | | |
| Sanitary Services - 0.22% | | | |
| Allied Waste Industries, Inc. * | 4,938 | $ | 52,886 |
| Ecolab, Inc. | 4,170 | | 150,912 |
| Waste Management, Inc. | 12,484 | | 415,218 |
|
|
| | | | 619,016 |
| Semiconductors - 2.85% | | | |
| Advanced Micro Devices, Inc. * | 9,141 | | 353,483 |
| Altera Corp. * | 8,200 | | 164,328 |
| Analog Devices, Inc. | 8,299 | | 316,524 |
| Applied Materials, Inc. | 36,705 | | 673,170 |
| Applied Micro Circuits Corp. * | 6,759 | | 24,400 |
| Broadcom Corp., Class A * | 9,813 | | 442,468 |
| Freescale Semiconductor, Inc., Class B * | 9,284 | | 251,039 |
| Intel Corp. | 136,390 | | 2,809,634 |
| KLA-Tencor Corp. | 4,466 | | 233,259 |
| Linear Technology Corp. | 6,895 | | 254,150 |
| LSI Logic Corp. * | 8,861 | | 86,395 |
| Maxim Integrated Products, Inc. | 7,416 | | 289,891 |
| Micron Technology, Inc. * | 13,980 | | 216,830 |
| National Semiconductor Corp. | 7,775 | | 218,089 |
| Novellus Systems, Inc. * | 3,017 | | 80,644 |
| NVIDIA Corp. * | 3,872 | | 182,487 |
| PMC-Sierra, Inc. * | 4,145 | | 42,320 |
| QLogic Corp. * | 1,820 | | 74,875 |
| Teradyne, Inc. * | 4,454 | | 74,783 |
| Texas Instruments, Inc. | 36,604 | | 1,092,629 |
| Xilinx, Inc. | 7,884 | | 215,076 |
|
|
| | | | 8,096,474 |
| Software - 2.90% | | | |
| Adobe Systems, Inc. | 13,601 | | 525,271 |
| Autodesk, Inc. * | 5,221 | | 196,571 |
| BMC Software, Inc. * | 4,893 | | 107,010 |
| CA, Inc. | 10,381 | | 281,948 |
| Citrix Systems, Inc. * | 3,989 | | 129,084 |
| Compuware Corp. * | 8,765 | | 71,961 |
| Intuit, Inc. * | 4,003 | | 194,466 |
| Microsoft Corp. | 207,095 | | 5,570,855 |
| Novell, Inc. * | 8,642 | | 82,185 |
| Oracle Corp. * | 85,079 | | 1,056,681 |
|
|
| | | | 8,216,032 |
| Steel - 0.19% | | | |
| Allegheny Technologies, Inc. | 1,924 | | 97,181 |
| Nucor Corp. | 3,520 | | 302,896 |
| United States Steel Corp. | 2,565 | | 139,793 |
|
|
| | | | 539,870 |
| Telecommunications Equipment & | | | |
| Services - 1.29% | | | |
| ADC Telecommunications, Inc. * | 2,636 | | 66,744 |
| Andrew Corp. * | 3,675 | | 49,833 |
| Avaya, Inc. * | 9,474 | | 105,351 |
| Ciena Corp. * | 13,075 | | 52,562 |
| Citizens Communications Company | 7,554 | | 100,846 |
The accompanying notes are an integral part of the financial statements. 112
John Hancock Funds II
Portfolio of investments — February 28, 2006 (Unaudited)
(showing percentage of total net assets)
|
| 500 Index Fund (continued) | | | | |
| | | Shares or | | |
| | | Principal | | |
| | | Amount | | Value |
| |
|
| COMMON STOCKS (continued) | | | | |
| Telecommunications Equipment & | | | | |
| Services (continued) | | | | |
| Comverse Technology, Inc. * | | 4,570 | $ | 131,433 |
| Corning, Inc. * | | 34,476 | | 841,559 |
| JDS Uniphase Corp. * | | 37,381 | | 113,638 |
| Lucent Technologies, Inc. * | | 100,553 | | 281,548 |
| QUALCOMM, Inc. | | 37,195 | | 1,755,976 |
| Tellabs, Inc. * | | 10,145 | | 149,030 |
| |
|
| | | | | 3,648,520 |
| Telephone - 2.98% | | | | |
| ALLTEL Corp. | | 8,662 | | 547,005 |
| AT&T Corp. | | 88,372 | | 2,438,183 |
| BellSouth Corp. | | 41,368 | | 1,306,401 |
| CenturyTel, Inc. | | 2,963 | | 106,609 |
| Qwest Communications International, Inc. * | | 34,924 | | 220,720 |
| Sprint Corp. | | 66,837 | | 1,606,093 |
| Verizon Communications, Inc. | | 66,115 | | 2,228,076 |
| |
|
| | | | | 8,453,087 |
| Tires & Rubber - 0.03% | | | | |
| Cooper Tire & Rubber Company | | 1,387 | | 20,666 |
| Goodyear Tire & Rubber Company * | | 3,991 | | 57,191 |
| |
|
| | | | | 77,857 |
| Tobacco - 1.32% | | | | |
| Altria Group, Inc. | | 47,108 | | 3,387,065 |
| Reynolds American, Inc. | | 1,934 | | 205,294 |
| UST, Inc. | | 3,700 | | 143,856 |
| |
|
| | | | | 3,736,215 |
| Toys, Amusements & Sporting Goods - 0.08% | | | | |
| Hasbro, Inc. | | 4,035 | | 81,870 |
| Mattel, Inc. | | 9,135 | | 153,925 |
| |
|
| | | | | 235,795 |
| Travel Services - 0.56% | | | | |
| American Express Company | | 28,090 | | 1,513,489 |
| Sabre Holdings Corp. | | 2,969 | | 71,642 |
| |
|
| | | | | 1,585,131 |
| Trucking & Freight - 0.95% | | | | |
| Fedex Corp. | | 6,855 | | 735,130 |
| Navistar International Corp. * | | 1,396 | | 40,973 |
| Ryder Systems, Inc. | | 1,452 | | 64,382 |
| United Parcel Service, Inc., Class B | | 24,965 | | 1,865,135 |
| |
|
| | | | | 2,705,620 |
|
| TOTAL COMMON STOCKS (Cost $245,042,740) | | | $ | 261,544,917 |
|
| |
| SHORT TERM INVESTMENTS - 7.65% | | | | |
| Federal Home Loan Bank Discount Note | | | | |
| zero coupon due 03/15/2006 | $ | 4,000,000 | $ | 3,993,156 |
| Federal Home Loan Mortgage Corp. Discount Notes | | | | |
| zero coupon due 03/07/2006 to | | | | |
| 03/21/2006 | | 7,240,000 | | 7,225,735 |
| Federal National Mortgage Association Discount | | | | |
| Notes | | | | |
| zero coupon due 03/01/2006 | | 1,380,000 | | 1,380,000 |
| 500 Index Fund (continued) | | | | |
| | | Shares or | | |
| | Principal | | |
| | Amount | | Value |
| |
|
| |
| SHORT TERM INVESTMENTS (continued) | | | | |
| Rabobank USA Finance Corp. | | | | |
| 4.56% due 03/01/2006 | $ | 8,000,000 | $ | 8,000,000 |
| United States Treasury Bills | | | | |
| 4.31% due 04/20/2006 **** | | 300,000 | | 298,204 |
| 4.335% due 04/20/2006 **** | | 400,000 | | 397,650 |
| 4.375% due 04/20/2006 **** | | 400,000 | | 397,569 |
|
| TOTAL SHORT TERM INVESTMENTS | | | | |
| (Cost $21,692,314) | | | $ | 21,692,314 |
|
| Total Investments (500 Index Fund) | | | | |
| (Cost $266,735,054) - 99.87% | | | $ | 283,237,231 |
| Other Assets in Excess of Liabilities - 0.13% | | | | 365,133 |
| |
|
| TOTAL NET ASSETS - 100.00% | | | $ | 283,602,364 |
| |
|
| |
| |
| Active Bond Fund | | | | |
| | | Shares or | | |
| | | Principal | | |
| | | Amount | | Value |
| |
|
| |
| PREFERRED STOCKS - 0.07% | | | | |
| Agriculture - 0.07% | | | | |
| Ocean Spray Cranberries, Inc. * | | 3,200 | $ | 263,800 |
|
| TOTAL PREFERRED STOCKS (Cost $262,400) | | | $ | 263,800 |
|
| |
| U.S. TREASURY OBLIGATIONS - 23.29% | | | | |
| Treasury Inflation Protected | | | | |
| Securities (d) - 0.46% | | | | |
| 3.50% due 01/15/2011 | $ | 1,634,396 | | 1,755,124 |
| 3.875% due 04/15/2029 (a) | | 39,517 | | 53,990 |
| |
|
| | | | | 1,809,114 |
| U.S. Treasury Bonds - 2.34% | | | | |
| 4.50% due 02/15/2036 | | 1,410,000 | | 1,410,000 |
| 5.375% due 02/15/2031 | | 191,000 | | 212,614 |
| 5.375% due 02/15/2031 (a) | | 1,175,000 | | 1,307,968 |
| 6.875% due 08/15/2025 | | 1,595,000 | | 2,035,245 |
| 8.75% due 08/15/2020 (a) | | 3,040,000 | | 4,316,919 |
| |
|
| | | | | 9,282,746 |
| U.S. Treasury Notes - 20.49% | | | | |
| 3.25% due 08/15/2007 (a) | | 12,588,000 | | 12,330,336 |
| 4.25% due 10/15/2010 to 11/15/2013 | | 6,230,000 | | 6,096,718 |
| 4.375% due 01/31/2008 (a) | | 14,520,000 | | 14,436,060 |
| 4.50% due 02/28/2011 to 02/15/2016 | | 30,479,000 | | 30,306,433 |
| 4.50% due 02/15/2009 to 02/15/2016 (a) | | 17,985,000 | | 17,905,183 |
| |
|
| | | | | 81,074,730 |
|
| TOTAL U.S. TREASURY OBLIGATIONS | | | | |
| (Cost $92,179,503) | | | $ | 92,166,590 |
|
| |
| U.S. GOVERNMENT AGENCY OBLIGATIONS - 39.65% | | |
| Federal Home Loan Bank - 0.50% | | | | |
| 2.50% due 04/11/2006 | | 135,000 | | 134,654 |
| 3.75% due 08/15/2007 | | 75,000 | | 73,768 |
| 5.00% due 05/03/2010 | | 35,000 | | 34,642 |
| 5.02% due 11/07/2008 | | 1,590,000 | | 1,583,869 |
The accompanying notes are an integral part of the financial statements. 113
John Hancock Funds II
Portfolio of investments — February 28, 2006 (Unaudited)
(showing percentage of total net assets)
|
| Active Bond Fund (continued) | | | |
| | | Shares or | | |
| | | Principal | | |
| | | Amount | | Value |
|
|
| |
| U.S. GOVERNMENT AGENCY | | | | |
| OBLIGATIONS (continued) | | | | |
| Federal Home Loan Bank (continued) | | | | |
| 5.80% due 09/02/2008 | $ | 135,000 | $ | 137,383 |
|
|
| | | | | 1,964,316 |
| Federal Home Loan Mortgage Corp. - 2.17% | | | |
| 3.625% due 09/15/2008 | | 118,000 | | 114,393 |
| 3.952% due 06/01/2034 | | 167,840 | | 163,238 |
| 4.75% due 10/17/2008 | | 2,875,000 | | 2,847,187 |
| 4.90% due 11/03/2008 | | 105,000 | | 104,273 |
| 5.00% due 10/18/2010 to 03/01/2018 | | 1,358,130 | | 1,345,581 |
| 5.10% due 11/14/2008 | | 440,000 | | 438,967 |
| 5.168% due 11/01/2035 | | 1,163,055 | | 1,146,299 |
| 5.287% due 12/01/2035 | | 1,110,000 | | 1,092,181 |
| 5.30% due 11/17/2010 | | 90,000 | | 89,627 |
| 5.50% due 07/15/2006 to 01/01/2034 | | 88,078 | | 87,548 |
| 5.875% due 03/21/2011 | | 81,000 | | 83,650 |
| 6.00% due 04/01/2016 to 12/01/2035 | | 1,086,970 | | 1,098,303 |
|
|
| | | | | 8,611,247 |
| Federal National Mortgage | | | | |
| Association - 36.86% | | | | |
| 2.50% due 06/15/2008 | | 3,039,000 | | 2,882,027 |
| 3.25% due 08/15/2008 | | 39,000 | | 37,511 |
| 3.765% due 07/01/2033 (b) | | 8,002 | | 7,839 |
| 4.25% due 09/15/2007 | | 5,600,000 | | 5,545,081 |
| 4.25% due 07/15/2007 (a) | | 43,000 | | 42,615 |
| 4.375% due 03/15/2013 (a) | | 20,000 | | 19,347 |
| 4.50% due 08/01/2020 to 10/01/2035 | | 4,564,562 | | 4,403,084 |
| 4.50% TBA ** | | 6,000,000 | | 5,827,500 |
| 4.75% due 08/25/2008 to 08/02/2010 | | 2,110,000 | | 2,090,828 |
| 5.00% due 11/14/2008 to 10/01/2035 | | 12,924,948 | | 12,686,992 |
| 5.00% TBA ** | | 30,000,000 | | 29,214,060 |
| 5.125% due 12/15/2008 | | 195,000 | | 194,450 |
| 5.50% due 03/15/2011 to 01/01/2036 | | 22,611,807 | | 22,598,938 |
| 5.50% TBA ** | | 30,000,000 | | 29,718,750 |
| 6.00% due 05/15/2008 to 10/01/2035 | | 13,448,564 | | 13,625,328 |
| 6.00% TBA ** | | 11,000,000 | | 11,099,682 |
| 6.25% due 05/15/2029 | | 157,000 | | 185,062 |
| 6.50% due 06/01/2031 to 01/01/2034 | | 155,292 | | 159,518 |
| 6.625% due 09/15/2009 | | 5,046,000 | | 5,319,145 |
| 7.00% due 09/01/2010 to 10/25/2041 | | 160,945 | | 166,206 |
| 7.50% due 09/01/2029 to 08/01/2031 | | 10,610 | | 11,111 |
|
|
| | | | | 145,835,074 |
| Government National Mortgage | | | | |
| Association - 0.09% | | | | |
| 5.00% due 04/15/2035 | | 138,495 | | 136,385 |
| 5.50% due 03/15/2035 | | 147,003 | | 147,444 |
| 6.00% due 03/15/2033 to 06/15/2033 | | 67,798 | | 69,248 |
| 6.50% due 09/15/2028 to 08/15/2031 | | 11,953 | | 12,478 |
| 7.00% due 04/15/2029 | | 3,727 | | 3,895 |
| 8.00% due 10/15/2026 | | 3,543 | | 3,798 |
|
|
| | | | | 373,248 |
| Active Bond Fund (continued) | | | |
| | | | Shares or | |
| | | | Principal | |
| | | | Amount | Value |
| |
|
| |
| U.S. GOVERNMENT AGENCY | | | | |
| OBLIGATIONS (continued) | | | | |
| The Financing Corp. - 0.03% | | | | |
| 10.35% due 08/03/2018 | | $ | 75,000 | $ | 111,637 |
|
| TOTAL U.S. GOVERNMENT AGENCY OBLIGATIONS | |
| (Cost $156,584,390) | | | | $ | 156,895,522 |
|
| |
| FOREIGN GOVERNMENT OBLIGATIONS - 0.21% | |
| Argentina - 0.02% | | | | |
| Republic of Argentina | | | | |
| 0.63%, Step up to 1.18% on | | | | |
| 03/31/2009 due 12/31/2038 (b) | | ARS | 177,218 | 31,363 |
| .34% due 12/15/2035 (b) | | | 393,449 | 7,993 |
| 5.83% due 12/31/2033 (b) | | | 77,403 | 33,075 |
|
|
| | | | | 72,431 |
| Canada - 0.03% | | | | |
| Government of Canada | | | | |
| 5.50% due 06/01/2010 | | CAD | 5,000 | 4,637 |
| Province of Ontario | | | | |
| 4.50% due 03/08/2015 | | | 125,000 | 110,573 |
|
|
| | | | | 115,210 |
| Chile - 0.06% | | | | |
| Republic of Chile | | | | |
| 5.06% due 01/28/2008 (b) | | $ | 223,000 | 224,115 |
| Colombia - 0.01% | | | | |
| Republic of Colombia | | | | |
| 10.00% due 01/23/2012 | | | 20,000 | 24,350 |
| 11.75% due 03/01/2010 | | COP | 16,000,000 | 8,239 |
|
|
| | | | | 32,589 |
| Hungary - 0.00% | | | | |
| Republic of Hungary | | | | |
| 6.50% due 08/24/2006 | | HUF | 590,000 | 2,779 |
Japan - 0.01% | | | | |
| Government of Japan | | | | |
| 0.90% due 12/22/2008 | | JPY | 550,000 | 4,779 |
| 1.50% due 09/20/2014 | | | 1,350,000 | 11,643 |
| 1.80% due 03/22/2010 | | | 2,650,000 | 23,642 |
|
|
| | | | | 40,064 |
| Mexico - 0.07% | | | | |
| Government of Mexico | | | | |
| 8.00% due 12/07/2023 | | MXN | 238,900 | 22,611 |
| 8.00% due 12/19/2013 | | | 167,800 | 16,184 |
| 9.875% due 02/01/2010 | | $ | 205,000 | 238,005 |
|
|
| | | | | 276,800 |
| Panama - 0.00% | | | | |
| Republic of Panama | | | | |
| 8.875% due 09/30/2027 | | | 6,000 | 7,515 |
| 9.375% due 07/23/2012 | | | 2,000 | 2,360 |
|
|
| | | | | 9,875 |
| Peru - 0.00% | | | | |
| Republic of Peru | | | | |
| 9.125% due 02/21/2012 | | | 3,000 | 3,465 |
| 9.875% due 02/06/2015 | | | 2,000 | 2,490 |
|
|
| | | | | 5,955 |
The accompanying notes are an integral part of the financial statements. 114
John Hancock Funds II
Portfolio of investments — February 28, 2006 (Unaudited)
(showing percentage of total net assets)
|
| Active Bond Fund (continued) | | |
| | | Shares or | |
| | | Principal | |
| | | Amount | Value |
|
|
| |
| FOREIGN GOVERNMENT OBLIGATIONS | | |
| (continued) | | | |
| Philippines - 0.00% | | | |
| Republic of Philippines | | | |
| 9.125% due 02/22/2010 | EUR | 2,000 | $ | 2,730 |
| 10.625% due 03/16/2025 | $ | 1,000 | 1,297 |
|
|
| | | | 4,027 |
| Sweden - 0.00% | | | |
| Kingdom of Sweden | | | |
| 5.00% due 01/28/2009 | SEK | 30,000 | 4,007 |
| 5.25% due 03/15/2011 | | 30,000 | 4,152 |
|
|
| | | | 8,159 |
| Turkey - 0.01% | | | |
| Republic of Turkey | | | |
| 20.00% due 10/17/2007 | TRY | 23,700 | 21,106 |
|
| TOTAL FOREIGN GOVERNMENT OBLIGATIONS | |
| (Cost $794,963) | | | $ | 813,110 |
|
| |
| COMMON STOCKS - 0.16% | | | |
| Domestic Oil - 0.16% | | | |
| Enterprise Products Operating LP | | | |
| 6.375% due 02/01/2013 | $ | 595,000 | 618,992 |
|
| TOTAL COMMON STOCKS (Cost $617,521) | | $ | 618,992 |
|
| |
| CORPORATE BONDS - 21.10% | | | |
| Aerospace - 0.01% | | | |
| Systems 2001 Asset Trust LLC | | | |
| 6.664% due 09/15/2013 | | 45,333 | 48,086 |
Air Travel - 0.00% | | | |
| Delta Air Lines, Inc. | | | |
| 3.312% due 01/25/2008 (b) | | 2,384 | 2,387 |
| 8.00% due 12/15/2007 | | 4,000 | 890 |
|
|
| | | | 3,277 |
| Apparel & Textiles - 0.22% | | | |
| Mohawk Industries, Inc. | | | |
| 6.125% due 01/15/2016 | | 850,000 | 858,387 |
Auto Parts - 0.00% | | | |
| Delphi Trust II | | | |
| 6.197% due 11/15/2033 (b) | | 2,000 | 510 |
Auto Services - 0.13% | | | |
| Erac USA Finance Company | | | |
| 5.90% due 11/15/2015 | | 250,000 | 253,645 |
| 6.70% due 06/01/2034 | | 205,000 | 216,078 |
| 7.95% due 12/15/2009 | | 40,000 | 43,353 |
|
|
| | | | 513,076 |
| Automobiles - 0.06% | | | |
| DaimlerChrysler NA Holding Corp. | | | |
| 4.05% due 06/04/2008 | | 234,000 | 227,175 |
| DaimlerChrysler North America Holding | | | |
| 5.38% due 05/24/2006 (b) | | 26,000 | 26,022 |
|
|
| | | | 253,197 |
| Banking - 1.12% | | | |
| Allied Irish Banks PLC | | | |
| 7.50% due 12/29/2049 (b) | EUR | 1,000 | 1,389 |
| Active Bond Fund (continued) | | |
| | | Shares or | |
| | | Principal | |
| | | Amount | Value |
|
|
| |
| CORPORATE BONDS (continued) | | | |
| Banking (continued) | | | |
| Banco Santander Chile | | | |
| 4.81% due 12/09/2009 (b) | $ | 18,000 | $ | 18,022 |
| 5.375% due 12/09/2014 | | 5,000 | 4,930 |
| Bank of Ireland | | | |
| 6.45% due 02/10/2010 | EUR | 1,000 | 1,322 |
| Capital One Financial Corp. | | | |
| 7.25% due 05/01/2006 | $ | 13,000 | 13,049 |
| Chuo Mitsui Trust & Banking Company | | | |
| 5.506% due 04/15/2049 (b) | | 350,000 | 339,245 |
| Colonial Bank NA | | | |
| 6.375% due 12/01/2015 | | 356,000 | 363,718 |
| HBOS PLC | | | |
| 3.125% due 01/12/2007 | | 17,000 | 16,726 |
| 5.375% due 11/29/2049 (b) | | 22,000 | 21,725 |
| 6.413% due 09/29/2049 (b) | | 450,000 | 451,516 |
| Independence Community Bank Corp. | | | |
| 3.75% due 04/01/2014 (b) | | 5,000 | 4,766 |
| NB Capital Trust IV | | | |
| 8.25% due 04/15/2027 | | 50,000 | 53,307 |
| Rabobank Capital Funding II | | | |
| 5.26% due 12/29/2049 (b) | | 520,000 | 509,347 |
| RBS Capital Trust IV | | | |
| 5.327% due 09/29/2049 (b) | | 18,000 | 18,180 |
| Royal Bank of Scotland Group PLC | | | |
| 7.648% due 08/31/2049 (b) | | 550,000 | 658,975 |
| Sovereign Capital Trust I | | | |
| 9.00% due 04/01/2027 | | 370,000 | 396,282 |
| TuranAlem Finance BV | | | |
| 7.875% due 06/02/2010 | | 12,000 | 12,550 |
| Wachovia Capital Trust II | | | |
| 5.10% due 01/15/2027 (b) | | 385,000 | 370,296 |
| Wachovia Capital Trust III | | | |
| 5.80% due 08/29/2049 (b) | | 700,000 | 696,041 |
| Washington Mutual, Inc. | | | |
| 4.20% due 01/15/2010 | | 222,000 | 213,698 |
| 4.801% due 03/22/2012 (b) | | 7,000 | 6,980 |
| 5.625% due 01/15/2007 | | 32,000 | 32,095 |
| Wells Fargo Company | | | |
| 3.50% due 04/04/2008 (a) | | 219,000 | 212,287 |
|
|
| | | | 4,416,446 |
| Broadcasting - 0.28% | | | |
| Clear Channel Communications, Inc. | | | |
| 5.50% due 09/15/2014 | | 245,000 | 231,482 |
| 6.00% due 11/01/2006 | | 9,000 | 9,036 |
| 7.65% due 09/15/2010 | | 214,000 | 227,123 |
| Liberty Media Corp. | | | |
| 5.991% due 09/17/2006 (b) | | 32,000 | 32,145 |
| 8.25% due 02/01/2030 (a) | | 32,000 | 32,139 |
| News America Holdings, Inc. | | | |
| 6.75% due 01/09/2038 | | 2,000 | 2,117 |
| 7.75% due 12/01/2045 | | 9,000 | 10,437 |
| 8.25% due 08/10/2018 | | 325,000 | 385,825 |
| XM Satellite Radio Holdings, Inc. | | | |
| 12.00% due 06/15/2010 | | 150,000 | 167,625 |
|
|
| | | | 1,097,929 |
The accompanying notes are an integral part of the financial statements. 115
John Hancock Funds II
Portfolio of investments — February 28, 2006 (Unaudited)
(showing percentage of total net assets)
|
| Active Bond Fund (continued) | | |
| | | Shares or | |
| | | Principal | |
| | | Amount | Value |
|
|
| |
| CORPORATE BONDS (continued) | | | |
| Building Materials & Construction - 0.21% | | |
| Hughes Supply, Inc. | | | |
| 5.50% due 10/15/2014 | $ | 600,000 | $ | 606,935 |
| Votorantim Overseas IV | | | |
| 7.75% due 06/24/2020 | | 200,000 | 220,000 |
| WCI Communities, Inc. | | | |
| 6.625% due 03/15/2015 | | 8,000 | 7,020 |
|
|
| | | | 833,955 |
| Business Services - 0.00% | | | |
| Electronic Data Systems Corp. | | | |
| 7.125% due 10/15/2009 | | 2,000 | 2,116 |
Cable and Television - 0.70% | | | |
| BSKYB Finance UK PLC | | | |
| 6.50% due 10/15/2035 | | 260,000 | 260,078 |
| Comcast Corp. | | | |
| 5.90% due 03/15/2016 | | 240,000 | 239,669 |
| 6.45% due 03/15/2037 | | 240,000 | 238,558 |
| 6.50% due 11/15/2035 | | 530,000 | 537,153 |
| Comcast Corp., Class A | | | |
| 5.30% due 01/15/2014 | | 219,000 | 212,993 |
| 7.05% due 03/15/2033 | | 11,000 | 11,843 |
| Cox Communications, Inc. | | | |
| 4.625% due 01/15/2010 | | 22,000 | 21,192 |
| 5.039% due 12/14/2007 (b) | | 160,000 | 161,049 |
| 5.45% due 12/15/2014 | | 218,000 | 211,474 |
| 6.75% due 03/15/2011 | | 209,000 | 216,626 |
| 7.75% due 11/01/2010 | | 207,000 | 222,819 |
| Quebecor Media Inc. | | | |
| 7.75% due 03/15/2016 | | 50,000 | 51,250 |
| TCI Communications, Inc. | | | |
| 9.80% due 02/01/2012 | | 255,000 | 304,086 |
| Time Warner Companies, Inc. | | | |
| 7.57% due 02/01/2024 | | 34,000 | 38,058 |
| Time Warner, Inc. | | | |
| 6.15% due 05/01/2007 | | 13,000 | 13,134 |
| 7.625% due 04/15/2031 | | 9,000 | 10,236 |
|
|
| | | | 2,750,218 |
| Cellular Communications - 0.35% | | | |
| America Movil S.A. de CV | | | |
| 5.75% due 01/15/2015 | | 245,000 | 245,537 |
| American Tower Corp. | | | |
| 7.50% due 05/01/2012 | | 12,000 | 12,660 |
| AT&T Wireless Services, Inc. | | | |
| 7.875% due 03/01/2011 | | 211,000 | 233,974 |
| 8.75% due 03/01/2031 | | 209,000 | 277,355 |
| Cingular Wireless Services, Inc. | | | |
| 8.125% due 05/01/2012 | | 200,000 | 229,155 |
| Nextel Communications, Inc. | | | |
| 7.375% due 08/01/2015 | | 2,000 | 2,115 |
| Nextel Communications, Inc., Series F | | | |
| 5.95% due 03/15/2014 | | 345,000 | 346,776 |
| Rogers Wireless, Inc. | | | |
| 9.625% due 05/01/2011 | | 8,000 | 9,260 |
| Active Bond Fund (continued) | | |
| | | Shares or | |
| | | Principal | |
| | | Amount | Value |
|
|
| |
| CORPORATE BONDS (continued) | | | |
| Cellular Communications (continued) | | | |
| Verizon Wireless Capital LLC | | | |
| 5.375% due 12/15/2006 | $ | 22,000 | $ | 22,042 |
|
|
| | | | 1,378,874 |
| Chemicals - 0.22% | | | |
| Cytec Industries, Inc. | | | |
| 6.00% due 10/01/2015 (a) | | 450,000 | 437,231 |
| 6.75% due 03/15/2008 | | 13,000 | 13,248 |
| ICI Wilmington, Inc. | | | |
| 4.375% due 12/01/2008 | | 218,000 | 210,986 |
| Lyondell Chemical Company | | | |
| 10.875% due 05/01/2009 | | 25,000 | 25,500 |
| Nova Chemicals Ltd. | | | |
| 7.875% due 09/15/2025 | | 195,000 | 194,513 |
|
|
| | | | 881,478 |
| Commercial Services - 0.02% | | | |
| Cendant Corp. | | | |
| 6.25% due 01/15/2008 (a) | | 34,000 | 34,424 |
| 6.25% due 03/15/2010 | | 9,000 | 9,231 |
| 6.875% due 08/15/2006 | | 11,000 | 11,071 |
| 7.375% due 01/15/2013 | | 2,000 | 2,201 |
|
|
| | | | 56,927 |
| Computers & Business Equipment - 0.02% | | |
| Agilysys, Inc. | | | |
| 9.50% due 08/01/2006 | | 85,000 | 85,786 |
Construction & Mining Equipment - 0.10% | | |
| Kennametal, Inc. | | | |
| 7.20% due 06/15/2012 | | 365,000 | 393,591 |
Containers & Glass - 0.11% | | | |
| BWAY Corp. | | | |
| 10.00% due 10/15/2010 | | 195,000 | 205,725 |
| Stone Container Corp. | | | |
| 9.75% due 02/01/2011 | | 215,000 | 220,106 |
|
|
| | | | 425,831 |
| Crude Petroleum & Natural Gas - 0.01% | | |
| Chesapeake Energy Corp. | | | |
| 7.00% due 08/15/2014 | | 18,000 | 18,675 |
| Premcor Refining Group, Inc. | | | |
| 7.50% due 06/15/2015 | | 4,000 | 4,266 |
|
|
| | | | 22,941 |
| Domestic Oil - 0.12% | | | |
| Amerada Hess Corp. | | | |
| 7.30% due 08/15/2031 | | 212,000 | 248,961 |
| Devon Financing Corp., ULC | | | |
| 6.875% due 09/30/2011 | | 205,000 | 220,381 |
| Union Oil Company of California | | | |
| 7.50% due 02/15/2029 | | 7,000 | 8,876 |
|
|
| | | | 478,218 |
| Drugs & Health Care - 0.20% | | | |
| Allegiance Corp. | | | |
| 7.00% due 10/15/2026 | | 205,000 | 225,696 |
| Wyeth | | | |
| 4.375% due 03/01/2008 | | 210,000 | 206,718 |
The accompanying notes are an integral part of the financial statements. 116
John Hancock Funds II
Portfolio of investments — February 28, 2006 (Unaudited)
(showing percentage of total net assets)
|
| Active Bond Fund (continued) | | |
| | | Shares or | |
| | | Principal | |
| | | Amount | Value |
| |
|
| |
| CORPORATE BONDS (continued) | | | |
| Drugs & Health Care (continued) | | | |
| Wyeth (continued) | | | |
| 5.50% due 02/15/2016 | $ | 340,000 | $ | 342,060 |
|
|
| | | | 774,474 |
| Electrical Equipment - 0.28% | | | |
| Ametek, Inc. | | | |
| 7.20% due 07/15/2008 | | 90,000 | 93,080 |
| General Electric Company | | | |
| 5.00% due 02/01/2013 | | 1,037,000 | 1,026,310 |
|
|
| | | | 1,119,390 |
| Electrical Utilities - 2.29% | | | |
| AES Eastern Energy LP, Series 99-A | | | |
| 9.00% due 01/02/2017 | | 408,979 | 462,146 |
| AES Gener SA | | | |
| 7.50% due 03/25/2014 | | 218,000 | 226,283 |
| American Electric Power Company, Inc. | | | |
| 5.25% due 06/01/2015 | | 210,000 | 206,261 |
| Appalachian Power Company | | | |
| 5.80% due 10/01/2035 | | 39,000 | 38,151 |
| Arizona Public Service Company | | | |
| 5.50% due 09/01/2035 | | 222,000 | 205,956 |
| 5.80% due 06/30/2014 | | 140,000 | 141,117 |
| Beaver Valley Funding Corp. | | | |
| 9.00% due 06/01/2017 | | 395,000 | 455,008 |
| CenterPoint Energy Houston Electric LLC, Series K2 | | |
| 6.95% due 03/15/2033 | | 10,000 | 11,474 |
| CenterPoint Energy Resources Corp. | | | |
| 7.875% due 04/01/2013 | | 235,000 | 266,798 |
| CSFB (Empresa Electrica Guacolda SA) | | | |
| 8.625% due 04/30/2013 | | 202,500 | 224,994 |
| Dominion Resources, Inc. | | | |
| 5.70% due 09/17/2012 (a) | | 207,000 | 208,711 |
| Empresa Nacional De Electricidad | | | |
| 8.35% due 08/01/2013 | | 220,000 | 249,325 |
| 8.50% due 04/01/2009 | | 8,000 | 8,644 |
| Enersis SA | | | |
| 7.375% due 01/15/2014 | | 12,000 | 12,830 |
| Entergy (Waterford 3 Funding) | | | |
| 8.09% due 01/02/2017 | | 59,950 | 63,092 |
| Entergy Gulf States, Inc. | | | |
| 5.70% due 06/01/2015 | | 175,000 | 170,725 |
| FirstEnergy Corp. | | | |
| 6.45% due 11/15/2011 | | 209,000 | 218,571 |
| 7.375% due 11/15/2031 | | 226,000 | 263,550 |
| HQI Transelec Chile SA | | | |
| 7.875% due 04/15/2011 | | 325,000 | 355,043 |
| Indiantown Cogeneration LP, Series A-9 | | | |
| 9.26% due 12/15/2010 | | 110,322 | 118,058 |
| Ipalco Enterprises, Inc. | | | |
| 8.625% due 11/14/2011 | | 285,000 | 315,638 |
| Kansas Gas & Electric | | | |
| 5.647% due 03/29/2021 | | 230,000 | 225,786 |
| Nevada Power Company | | | |
| 5.95% due 03/15/2016 | | 160,000 | 160,751 |
| Pacific Gas & Electric Company | | | |
| 4.20% due 03/01/2011 | | 246,000 | 233,939 |
| Active Bond Fund (continued) | | |
| | | Shares or | |
| | | Principal | |
| | | Amount | Value |
|
|
| |
| CORPORATE BONDS (continued) | | | |
| Electrical Utilities (continued) | | | |
| Pacific Gas & Electric Company (continued) | | |
| 4.80% due 03/01/2014 | $ | 212,000 | $ | 204,669 |
| 6.05% due 03/01/2034 | | 834,000 | 863,044 |
| Pepco Holdings, Inc. | | | |
| 6.45% due 08/15/2012 | | 290,000 | 304,027 |
| PPL Energy Supply LLC, Series A | | | |
| 6.40% due 11/01/2011 | | 365,000 | 381,103 |
| PSEG Power LLC | | | |
| 5.00% due 04/01/2014 | | 214,000 | 205,913 |
| 6.875% due 04/15/2006 | | 16,000 | 16,032 |
| 8.625% due 04/15/2031 | | 214,000 | 284,435 |
| Scottish Power PLC | | | |
| 4.91% due 03/15/2010 | | 225,000 | 221,438 |
| System Energy Resources, Inc. | | | |
| 5.129% due 01/15/2014 | | 302,721 | 289,402 |
| Texas-New Mexico Power Company | | | |
| 6.125% due 06/01/2008 | | 440,000 | 444,711 |
| TransAlta Corp. | | | |
| 5.75% due 12/15/2013 | | 355,000 | 357,465 |
| TXU Corp., Series R | | | |
| 6.55% due 11/15/2034 (a) | | 678,000 | 643,012 |
| United Energy Distribution Property, Ltd. | | | |
| 4.70% due 04/15/2011 | | 6,000 | 5,853 |
|
|
| | | | 9,063,955 |
| Electronics - 0.00% | | | |
| Jabil Circuit, Inc. | | | |
| 5.875% due 07/15/2010 | | 17,000 | 17,158 |
Energy - 1.01% | | | |
| Duke Capital LLC | | | |
| 6.75% due 02/15/2032 | | 511,000 | 557,537 |
| Enterprise Products Operating LP | | | |
| 4.95% due 06/01/2010 | | 210,000 | 205,352 |
| Enterprise Products Operating LP, Series B | | | |
| 5.00% due 03/01/2015 | | 211,000 | 200,290 |
| 6.875% due 03/01/2033 | | 209,000 | 224,215 |
| Kansas City Power & Light Company, Series B | | |
| 6.00% due 03/15/2007 | | 11,000 | 11,086 |
| KN Capital Trust I, Series B | | | |
| 8.56% due 04/15/2027 | | 125,000 | 133,031 |
| Nexen, Inc. | | | |
| 5.875% due 03/10/2035 | | 212,000 | 209,610 |
| Northern Border Pipeline Company | | | |
| 6.25% due 05/01/2007 | | 12,000 | 12,113 |
| NRG Energy, Inc. | | | |
| 7.25% due 02/01/2014 | | 230,000 | 235,750 |
| Pioneer Natural Resources Company | | | |
| 5.875% due 07/15/2016 | | 207,000 | 199,338 |
| Progress Energy, Inc. | | | |
| 5.625% due 01/15/2016 | | 110,000 | 109,810 |
| 6.75% due 03/01/2006 | | 15,000 | 15,000 |
| 7.00% due 10/30/2031 | | 826,000 | 926,688 |
| Salton Sea Funding Corp. | | | |
| 7.84% due 05/30/2010 | | 176,816 | 182,458 |
| Salton Sea Funding Corp., Series E | | | |
| 8.30% due 05/30/2011 | | 182,860 | 195,480 |
The accompanying notes are an integral part of the financial statements. 117
John Hancock Funds II
Portfolio of investments — February 28, 2006 (Unaudited)
(showing percentage of total net assets)
|
| Active Bond Fund (continued) | | |
| | | Shares or | |
| | | Principal | |
| | | Amount | Value |
|
|
| |
| CORPORATE BONDS (continued) | | | |
| Energy (continued) | | | |
| Sempra Energy | | | |
| 4.75% due 05/15/2009 | $ | 208,000 | $ | 204,107 |
| Talisman Energy, Inc. | | | |
| 5.85% due 02/01/2037 | | 160,000 | 159,604 |
| TXU Energy Company, LLC | | | |
| 7.00% due 03/15/2013 | | 217,000 | 230,612 |
|
|
| | | | 4,012,081 |
| Financial Services - 3.53% | | | |
| American General Finance Corp., Series MTNI | | |
| 4.875% due 07/15/2012 | | 535,000 | 518,182 |
| Astoria Depositor Corp. | | | |
| 8.144% due 05/01/2021 | | 500,000 | 529,625 |
| AXA Financial, Inc. | | | |
| 7.75% due 08/01/2010 | | 210,000 | 230,042 |
| Bank of New York Institutional Capital Trust A | | |
| 7.78% due 12/01/2026 | | 60,000 | 63,263 |
| Bear Stearns Companies, Inc. | | | |
| 5.70% due 11/15/2014 (a) | | 219,000 | 223,192 |
| Bosphorus Financial Services Ltd | | | |
| 6.549% due 02/15/2012 (b) | | 275,000 | 276,477 |
| Caterpillar Financial Services Corp. | | | |
| 4.50% due 06/15/2009 (a) | | 210,000 | 206,041 |
| CIT Group, Inc., Series MTN | | | |
| 4.99% due 05/18/2007 (b) | | 8,000 | 8,022 |
| Citigroup, Inc. | | | |
| 5.00% due 09/15/2014 | | 218,000 | 213,328 |
| 5.625% due 08/27/2012 | | 219,000 | 223,579 |
| CNOOC Finance 2003 Ltd. | | | |
| 5.50% due 05/21/2033 | | 10,000 | 9,400 |
| Corporacion Andina de Fomento | | | |
| 6.875% due 03/15/2012 | | 20,000 | 21,575 |
| Credit Suisse First Boston USA, Inc. | | | |
| 4.625% due 01/15/2008 (a) | | 208,000 | 206,337 |
| 6.50% due 01/15/2012 | | 209,000 | 220,986 |
| Dresdner Bank-New York | | | |
| 7.25% due 09/15/2015 | | 211,000 | 238,458 |
| ERP Operating LP | | | |
| 4.75% due 06/15/2009 | | 13,000 | 12,779 |
| ESI Tractebel Acquisition Corp., Series B | | | |
| 7.99% due 12/30/2011 | | 415,000 | 434,022 |
| FleetBoston Financial Corp. | | | |
| 4.875% due 12/01/2006 | | 14,000 | 13,972 |
| Ford Motor Credit Company | | | |
| 5.70% due 11/16/2006 (b) | | 695,000 | 688,070 |
| Fund American Companies, Inc. | | | |
| 5.875% due 05/15/2013 | | 214,000 | 213,317 |
| General Electric Capital Corp. | | | |
| 5.45% due 01/15/2013 | | 261,000 | 264,596 |
| General Motors Acceptance Corp. | | | |
| 6.75% due 12/01/2014 | | 155,000 | 136,933 |
| 6.875% due 09/15/2011 | | 232,000 | 207,727 |
| 7.75% due 01/19/2010 (a) | | 42,000 | 39,583 |
| 8.00% due 11/01/2031 (a) | | 504,000 | 460,272 |
| General Motors Acceptance Corp., Series MTN | | |
| 5.52% due 04/13/2006 (b) | | 70,000 | 69,790 |
| Active Bond Fund (continued) | | |
| | | Shares or | |
| | | Principal | |
| | | Amount | Value |
|
|
| |
| CORPORATE BONDS (continued) | | | |
| Financial Services (continued) | | | |
| General Motors Acceptance Corp., Series MTN | | |
| (continued) | | | |
| 5.645% due 05/18/2006 (b) | $ | 45,000 | $ | 44,760 |
| Glencore Funding LLC | | | |
| 6.00% due 04/15/2014 | | 170,000 | 162,166 |
| Household Finance Corp. | | | |
| 6.375% due 10/15/2011 | | 200,000 | 209,322 |
| 6.40% due 06/17/2008 | | 237,000 | 243,214 |
| HSBC Finance Capital Trust IX | | | |
| 5.911% due 11/30/2035 (b) | | 300,000 | 301,600 |
| HSBC Finance Corp. | | | |
| 4.625% due 01/15/2008 | | 213,000 | 211,226 |
| 6.75% due 05/15/2011 | | 520,000 | 552,619 |
| HVB Funding Trust III | | | |
| 9.00% due 10/22/2031 | | 10,000 | 13,447 |
| International Lease Finance Corp. | | | |
| 3.50% due 04/01/2009 | | 213,000 | 201,763 |
| 4.55% due 10/15/2009 | | 7,000 | 6,839 |
| 4.75% due 07/01/2009 | | 30,000 | 29,450 |
| 5.00% due 04/15/2010 | | 211,000 | 208,451 |
| 5.875% due 05/01/2013 | | 215,000 | 219,511 |
| International Lease Finance Corp., Series MTNP | | |
| 5.00% due 01/15/2010 (b) | | 13,000 | 13,066 |
| Jefferies Group, Inc. | | | |
| 6.25% due 01/15/2036 | | 300,000 | 297,977 |
| John Deere Capital Corp., Series MTND | | | |
| 4.125% due 01/15/2010 | | 39,000 | 37,554 |
| JP Morgan Chase & Company | | | |
| 6.75% due 02/01/2011 (a) | | 218,000 | 231,580 |
| JPMorgan Chase & Company | | | |
| 5.35% due 03/01/2007 | | 9,000 | 9,017 |
| Lehman Brothers Holdings, Inc., Series MTN | | |
| 4.25% due 01/27/2010 | | 285,000 | 275,355 |
| MBNA Capital, Series B | | | |
| 5.48% due 02/01/2027 (b) | | 23,000 | 22,632 |
| Metallurg Holdings, Inc. | | | |
| 10.50% due 10/01/2010 | | 150,000 | 148,500 |
| Midland Funding II, Series B | | | |
| 13.25% due 07/23/2006 | | 509,438 | 521,727 |
| Mizuho Financial Group (Cayman), Ltd. | | | |
| 8.375% due 12/29/2049 | | 420,000 | 451,500 |
| Morgan Stanley | | | |
| 4.25% due 05/15/2010 (a) | | 232,000 | 222,877 |
| NiSource Finance Corp. | | | |
| 6.15% due 03/01/2013 (a) | | 219,000 | 226,661 |
| 7.875% due 11/15/2010 | | 216,000 | 236,859 |
| Noble Group Ltd. | | | |
| 6.625% due 03/17/2015 | | 250,000 | 228,811 |
| Nuveen Investments, Inc., Class A | | | |
| 5.50% due 09/15/2015 | | 29,000 | 28,328 |
| Popular North America, Inc. | | | |
| 4.70% due 06/30/2009 | | 12,000 | 11,726 |
| Popular North America, Inc., Series MTNE | | |
| 6.125% due 10/15/2006 | | 14,000 | 14,070 |
| Reliastar Financial Corp. | | | |
| 6.50% due 11/15/2008 | | 14,000 | 14,408 |
The accompanying notes are an integral part of the financial statements. 118
John Hancock Funds II
Portfolio of investments — February 28, 2006 (Unaudited)
(showing percentage of total net assets)
|
| Active Bond Fund (continued) | | |
| | | Shares or | |
| | | Principal | |
| | | Amount | Value |
|
|
| |
| CORPORATE BONDS (continued) | | | |
| Financial Services (continued) | | | |
| Residential Capital Corp. | | | |
| 6.875% due 06/30/2015 (a) | $ | 241,000 | $ | 252,883 |
| Skandinaviska Enskilda Banken AB | | | |
| 5.471% due 03/29/2049 (b) | | 400,000 | 391,726 |
| SLM Corp., Series MTNA | | | |
| 5.00% due 04/15/2015 | | 27,000 | 26,073 |
| St. George Funding Company LLC | | | |
| zero coupon, Step up to 8.985% on | | | |
| 06/30/2017 due 12/31/2049 | | 270,000 | 289,797 |
| State Street Institutional Capital A | | | |
| 7.94% due 12/30/2026 (c) | | 160,000 | 168,834 |
| The Goldman Sachs Group, Inc. | | | |
| 5.125% due 01/15/2015 | | 247,000 | 241,290 |
| 5.25% due 04/01/2013 | | 224,000 | 222,443 |
| 5.35% due 01/15/2016 | | 335,000 | 331,466 |
| Trinity Industries Leasing Companies | | | |
| 7.755% due 02/15/2009 | | 310,089 | 316,290 |
| Waddell & Reed Financial, Inc. | | | |
| 5.60% due 01/15/2011 | | 400,000 | 396,560 |
| Westfield Capital Corp, Ltd. | | | |
| 4.375% due 11/15/2010 | | 214,000 | 205,235 |
|
|
| | | | 13,969,181 |
| |
| Food & Beverages - 0.58% | | | |
| Ahold Lease USA, Inc., Series A-1 | | | |
| 7.82% due 01/02/2020 | | 465,809 | 498,415 |
| American Seafoods Group LLC | | | |
| 10.125% due 04/15/2010 | | 315,000 | 333,113 |
| ASG Consolidated LLC/ASG Finance, Inc. | | | |
| zero coupon, Step up to 11.5% on | | | |
| 11/01/2008 due 11/01/2011 | | 45,000 | 36,112 |
| Corn Products International, Inc. | | | |
| 8.45% due 08/15/2009 | | 350,000 | 381,105 |
| Kellogg Company, Series B | | | |
| 6.60% due 04/01/2011 | | 209,000 | 220,740 |
| Kraft Foods, Inc. | | | |
| 5.625% due 11/01/2011 | | 219,000 | 221,747 |
| Nabisco, Inc. | | | |
| 7.05% due 07/15/2007 | | 8,000 | 8,172 |
| 7.55% due 06/15/2015 (a) | | 229,000 | 264,550 |
| Panamerican Beverages, Inc. | | | |
| 7.25% due 07/01/2009 | | 95,000 | 99,750 |
| Smithfield Foods., Inc. | | | |
| 7.00% due 08/01/2011 | | 18,000 | 18,225 |
| Tate & Lyle International Finance PLC | | | |
| 5.00% due 11/15/2014 | | 208,000 | 195,425 |
|
|
| | | | 2,277,354 |
| |
| Forest Products - 0.00% | | | |
| Weyerhaeuser Company | | | |
| 6.125% due 03/15/2007 | | 5,000 | 5,029 |
Gas & Pipeline Utilities - 0.62% | | | |
| Atlas Pipeline Partners LP | | | |
| 8.125% due 12/15/2015 | | 75,000 | 78,000 |
| Dynegy-Roseton Danskammer | | | |
| 7.67% due 11/08/2016 | | 225,000 | 231,029 |
| Active Bond Fund (continued) | | | |
| | | Shares or | |
| | | Principal | |
| | | Amount | Value |
|
|
| |
| CORPORATE BONDS (continued) | | | |
| Gas & Pipeline Utilities (continued) | | | |
| Energy Transfer Partners LP | | | |
| 5.95% due 02/01/2015 | $ | 365,000 | $ | 366,479 |
| Kinder Morgan Energy Partners LP | | | |
| 5.80% due 03/15/2035 | | 208,000 | 198,737 |
| 7.30% due 08/15/2033 | | 212,000 | 242,256 |
| Kinder Morgan Finance Company ULC | | | |
| 6.40% due 01/05/2036 | | 965,000 | 995,404 |
| Magellan Midstream Partners LP | | | |
| 6.45% due 06/01/2014 | | 305,000 | 321,899 |
| Michigan Consolidated Gas Company | | | |
| 5.70% due 03/15/2033 | | 14,000 | 13,796 |
|
|
| | | | 2,447,600 |
| |
| Healthcare Services - 0.30% | | | |
| Coventry Health Care, Inc. | | | |
| 5.875% due 01/15/2012 | | 225,000 | 224,719 |
| UnitedHealth Group, Inc. | | | |
| 5.375% due 03/15/2016 | | 240,000 | 240,271 |
| 5.80% due 03/15/2036 | | 160,000 | 160,450 |
| WellPoint, Inc. | | | |
| 3.50% due 09/01/2007 | | 14,000 | 13,625 |
| 3.75% due 12/14/2007 | | 10,000 | 9,752 |
| 5.00% due 12/15/2014 | | 208,000 | 202,225 |
| 5.25% due 01/15/2016 | | 320,000 | 315,618 |
|
|
| | | | 1,166,660 |
| |
| Holdings Companies/Conglomerates - 0.00% | | |
| SPI Electricity & Gas Australia Holdings Party Ltd. | | |
| 6.15% due 11/15/2013 | | 16,000 | 16,760 |
Homebuilders - 0.05% | | | |
| Pulte Homes, Inc. | | | |
| 6.25% due 02/15/2013 | | 210,000 | 213,079 |
Hotels & Restaurants - 0.19% | | | |
| Hilton Hotels Corp. | | | |
| 8.25% due 02/15/2011 | | 9,000 | 9,815 |
| Hyatt Equities LLC | | | |
| 6.875% due 06/15/2007 | | 360,000 | 364,587 |
| Majestic Star LLC | | | |
| 9.75% due 01/15/2011 | | 125,000 | 128,438 |
| Marriott International, Inc. | | | |
| 4.625% due 06/15/2012 | | 26,000 | 24,791 |
| MTR Gaming Group, Inc., Series B | | | |
| 9.75% due 04/01/2010 | | 220,000 | 235,675 |
|
|
| | | | 763,306 |
| |
| Household Products - 0.01% | | | |
| RPM International, Inc. | | | |
| 6.25% due 12/15/2013 | | 45,000 | 45,430 |
Industrial Machinery - 0.06% | | | |
| Caterpillar, Inc. | | | |
| 7.25% due 09/15/2009 | | 213,000 | 226,891 |
Industrials - 0.28% | | | |
| Tyco International Group SA | | | |
| 6.875% due 01/15/2029 | | 1,000,000 | 1,089,577 |
The accompanying notes are an integral part of the financial statements. 119
John Hancock Funds II
Portfolio of investments — February 28, 2006 (Unaudited)
(showing percentage of total net assets)
|
| Active Bond Fund (continued) | | |
| | | Shares or | |
| | | Principal | |
| | | Amount | Value |
|
|
| |
| CORPORATE BONDS (continued) | | | |
| Insurance - 2.33% | | | |
| ACE INA Holdings, Inc. | | | |
| 5.875% due 06/15/2014 | $ | 303,000 | $ | 310,236 |
| Aetna, Inc. | | | |
| 7.375% due 03/01/2006 | | 4,000 | 4,000 |
| Allstate Corp. | | | |
| 5.55% due 05/09/2035 | | 72,000 | 71,013 |
| American International Group, Inc. | | | |
| 5.05% due 10/01/2015 | | 350,000 | 339,243 |
| AON Capital Trust A | | | |
| 8.205% due 01/01/2027 | | 820,000 | 975,363 |
| Assurant, Inc. | | | |
| 5.625% due 02/15/2014 | | 209,000 | 209,064 |
| 6.75% due 02/15/2034 | | 550,000 | 599,220 |
| Cincinnati Financial Corp. | | | |
| 6.92% due 05/15/2028 | | 960,000 | 1,077,101 |
| CNA Financial Corp. | | | |
| 5.85% due 12/15/2014 | | 333,000 | 329,113 |
| Endurance Specialty Holdings Ltd. | | | |
| 7.00% due 07/15/2034 (a) | | 73,000 | 77,594 |
| First American Corp. | | | |
| 7.55% due 04/01/2028 | | 290,000 | 325,411 |
| Hartford Financial Services Group, Inc. | | | |
| 4.625% due 07/15/2013 | | 8,000 | 7,547 |
| Liberty Mutual Group, Inc. | | | |
| 6.50% due 03/15/2035 | | 683,000 | 678,567 |
| Liberty Mutual Insurance Company | | | |
| 7.697% due 10/15/2097 | | 300,000 | 324,691 |
| Markel Corp. | | | |
| 6.80% due 02/15/2013 | | 325,000 | 338,146 |
| 7.35% due 08/15/2034 | | 300,000 | 324,745 |
| Marsh & McLennan Companies, Inc. | | | |
| 5.375% due 03/15/2007 | | 16,000 | 15,980 |
| 5.375% due 07/15/2014 (a) | | 206,000 | 201,311 |
| 5.75% due 09/15/2015 | | 238,000 | 238,340 |
| Metlife, Inc. | | | |
| 5.70% due 06/15/2035 | | 255,000 | 254,658 |
| New York Life Insurance Company | | | |
| 5.875% due 05/15/2033 | | 300,000 | 310,728 |
| Odyssey Re Holdings Corp. | | | |
| 7.65% due 11/01/2013 | | 15,000 | 15,802 |
| Ohio Casualty Corp. | | | |
| 7.30% due 06/15/2014 | | 215,000 | 228,397 |
| Phoenix Life Insurance Company | | | |
| 7.15% due 12/15/2034 | | 265,000 | 282,211 |
| Provident Financing Trust I | | | |
| 7.405% due 03/15/2038 | | 300,000 | 297,373 |
| Prudential Financial, Inc. | | | |
| 4.75% due 04/01/2014 | | 227,000 | 218,089 |
| RenaissanceRe Holdings, Ltd. | | | |
| 7.00% due 07/15/2008 | | 400,000 | 411,662 |
| The Phoenix Companies, Inc. | | | |
| 6.675% due 02/16/2008 | | 230,000 | 231,386 |
| Travelers Property Casualty Corp. | | | |
| 6.375% due 03/15/2033 | | 21,000 | 22,385 |
| URC Holdings Corp. | | | |
| 7.875% due 06/30/2006 | | 23,000 | 23,146 |
| Active Bond Fund (continued) | | |
| | | Shares or | |
| | | Principal | |
| | | Amount | Value |
|
|
| |
| CORPORATE BONDS (continued) | | | |
| Insurance (continued) | | | |
| W.R. Berkley Corp. | | | |
| 6.15% due 08/15/2019 | $ | 14,000 | $ | 13,890 |
| XL Capital, Ltd. | | | |
| 5.25% due 09/15/2014 | | 214,000 | 205,882 |
| Zurich Capital Trust I | | | |
| 8.376% due 06/01/2037 | | 245,000 | 263,085 |
|
|
| | | | 9,225,379 |
| International Oil - 0.27% | | | |
| Delek & Avner-Yam Tethys Ltd. | | | |
| 5.326% due 08/01/2013 | | 22,485 | 21,857 |
| Newfield Exploration Company | | | |
| 8.375% due 08/15/2012 | | 3,000 | 3,218 |
| Pemex Project Funding Master Trust | | | |
| 5.791% due 06/15/2010 (b) | | 18,000 | 18,540 |
| 6.125% due 08/15/2008 | | 13,000 | 13,234 |
| 9.125% due 10/13/2010 | | 280,000 | 322,000 |
| Ras Laffan Liquefied Natural Gas | | | |
| 3.437% due 09/15/2009 | | 20,115 | 19,338 |
| Ras Laffan LNG III | | | |
| 5.838% due 09/30/2027 | | 250,000 | 248,177 |
| Vintage Petroleum, Inc. | | | |
| 8.25% due 05/01/2012 | | 400,000 | 428,000 |
|
|
| | | | 1,074,364 |
| Internet Content - 0.13% | | | |
| Cisco Systems, Inc. | | | |
| 5.50% due 02/22/2016 | | 510,000 | 513,490 |
Leisure Time - 0.69% | | | |
| AMC Entertainment, Inc. | | | |
| 9.50% due 02/01/2011 | | 170,000 | 160,863 |
| Boyd Gaming Corp. | | | |
| 7.125% due 02/01/2016 | | 500,000 | 506,250 |
| Caesars Entertainment, Inc. | | | |
| 7.00% due 04/15/2013 | | 294,000 | 311,107 |
| Little Traverse Bay Bands of Odawa Indians | | |
| 10.25% due 02/15/2014 | | 210,000 | 207,375 |
| MGM Mirage, Inc. | | | |
| 6.00% due 10/01/2009 | | 16,000 | 15,920 |
| 6.375% due 12/15/2011 | | 212,000 | 212,530 |
| Mohegan Tribal Gaming Authority | | | |
| 6.375% due 07/15/2009 | | 208,000 | 209,300 |
| Time Warner, Inc. | | | |
| 7.70% due 05/01/2032 | | 864,000 | 995,033 |
| Waterford Gaming, LLC | | | |
| 8.625% due 09/15/2012 | | 105,000 | 111,169 |
|
|
| | | | 2,729,547 |
| Liquor - 0.00% | | | |
| Anheuser-Busch Companies, Inc. | | | |
| 6.50% due 02/01/2043 | | 10,000 | 11,260 |
Medical-Hospitals - 0.17% | | | |
| HCA, Inc. | | | |
| 6.375% due 01/15/2015 | | 226,000 | 225,645 |
| 6.50% due 02/15/2016 | | 200,000 | 199,311 |
| 7.875% due 02/01/2011 | | 208,000 | 222,260 |
The accompanying notes are an integral part of the financial statements. 120
John Hancock Funds II
Portfolio of investments — February 28, 2006 (Unaudited)
(showing percentage of total net assets)
|
| Active Bond Fund (continued) | | |
| | | Shares or | |
| | | Principal | |
| | | Amount | Value |
|
|
| |
| CORPORATE BONDS (continued) | | | |
| Medical-Hospitals (continued) | | | |
| Manor Care, Inc. | | | |
| 6.25% due 05/01/2013 | $ | 25,000 | $ | 25,271 |
|
|
| | | | 672,487 |
| |
| Metal & Metal Products - 0.11% | | | |
| Alcan, Inc. | | | |
| 5.00% due 06/01/2015 | | 6,000 | 5,797 |
| Inco Ltd. | | | |
| 7.75% due 05/15/2012 | | 234,000 | 259,788 |
| Vedanta Resources PLC | | | |
| 6.625% due 02/22/2010 | | 160,000 | 156,485 |
|
|
| | | | 422,070 |
| |
| Mining - 0.05% | | | |
| Corporacion Nacional del Cobre | | | |
| 5.50% due 10/15/2013 | | 209,000 | 211,096 |
Paper - 0.05% | | | |
| Norske Skogindustrier ASA | | | |
| 7.625% due 10/15/2011 | | 34,000 | 35,696 |
| Plum Creek Timberlands LP | | | |
| 5.875% due 11/15/2015 | | 165,000 | 165,285 |
|
|
| | | | 200,981 |
| |
| Petroleum Services - 0.18% | | | |
| Noram Energy Corp. | | | |
| 6.50% due 02/01/2008 | | 280,000 | 285,484 |
| Premcor Refining Group, Inc. | | | |
| 9.50% due 02/01/2013 | | 150,000 | 167,002 |
| Valero Logistics Operations LP | | | |
| 6.05% due 03/15/2013 | | 248,000 | 254,445 |
|
|
| | | | 706,931 |
| |
| Pharmaceuticals - 0.29% | | | |
| AmerisourceBergen Corp. | | | |
| 5.875% due 09/15/2015 | | 39,000 | 39,248 |
| Caremark Rx, Inc. | | | |
| 7.375% due 10/01/2006 | | 255,000 | 257,954 |
| Hospira, Inc. | | | |
| 5.90% due 06/15/2014 | | 8,000 | 8,178 |
| Medco Health Solutions, Inc. | | | |
| 7.25% due 08/15/2013 | | 270,000 | 294,382 |
| Schering Plough Corp. | | | |
| 5.55% due 12/01/2013 (b) | | 218,000 | 219,794 |
| Teva Pharmaceutical Finance LLC | | | |
| 5.55% due 02/01/2016 (a) | | 170,000 | 168,752 |
| 6.15% due 02/01/2036 | | 170,000 | 170,754 |
|
|
| | | | 1,159,062 |
| |
| Photography - 0.05% | | | |
| Sotheby's Holdings, Inc. | | | |
| 6.875% due 02/01/2009 | | 200,000 | 200,000 |
Real Estate - 1.79% | | | |
| Boston Properties, Ltd., REIT | | | |
| 6.25% due 01/15/2013 | | 215,000 | 224,186 |
| Camden Property Trust, REIT | | | |
| 5.00% due 06/15/2015 | | 216,000 | 206,247 |
| Colonial Properties Trust, REIT | | | |
| 6.25% due 06/15/2014 | | 211,000 | 216,048 |
| Active Bond Fund (continued) | | |
| | | Shares or | |
| | | Principal | |
| | | Amount | Value |
|
|
| |
| CORPORATE BONDS (continued) | | | |
| Real Estate (continued) | | | |
| Colonial Realty LP | | | |
| 5.50% due 10/01/2015 | $ | 231,000 | $ | 224,223 |
| Developers Diversified Realty Corp., REIT | | | |
| 4.625% due 08/01/2010 | | 22,000 | 21,166 |
| Duke Realty Corp., REIT | | | |
| 4.761% due 12/22/2006 (b) | | 368,000 | 368,395 |
| Health Care Property Investors, Inc., REIT | | | |
| 7.50% due 01/15/2007 | | 275,000 | 280,450 |
| Health Care Property Investors, Inc., Series MTN, | | |
| REIT | | | |
| 4.875% due 09/15/2010 (a) | | 229,000 | 222,924 |
| 5.625% due 02/28/2013 | | 520,000 | 518,371 |
| Health Care REIT, Inc. | | | |
| 6.20% due 06/01/2016 | | 520,000 | 519,921 |
| Health Care, Inc., REIT | | | |
| 6.00% due 11/15/2013 | | 215,000 | 212,669 |
| Healthcare Realty Trust, Inc., REIT | | | |
| 8.125% due 05/01/2011 | | 330,000 | 362,780 |
| Hospitality Properties Trust, REIT | | | |
| 6.75% due 02/15/2013 | | 612,000 | 644,906 |
| iStar Financial, Inc., REIT | | | |
| 6.05% due 04/15/2015 | | 20,000 | 20,320 |
| iStar Financial, Inc., Series 1, REIT | | | |
| 5.875% due 03/15/2016 | | 730,000 | 730,757 |
| Price, Inc., REIT | | | |
| 7.50% due 11/05/2006 | | 9,000 | 9,140 |
| Prologis, REIT | | | |
| 7.05% due 07/15/2006 | | 25,000 | 25,127 |
| Residential Capital Corp. | | | |
| 6.00% due 02/22/2011 (a) | | 630,000 | 625,978 |
| Rouse Company | | | |
| 3.625% due 03/15/2009 | | 645,000 | 601,088 |
| Rouse Company, REIT | | | |
| 5.375% due 11/26/2013 | | 209,000 | 198,143 |
| Simon Property Group LP, REIT | | | |
| 5.75% due 12/01/2015 | | 530,000 | 535,126 |
| Socgen Real Estate Company LLC | | | |
| 7.64% due 12/29/2049 (b) | | 264,000 | 272,679 |
| Spieker Properties LP, REIT | | | |
| 7.125% due 12/01/2006 | | 35,000 | 35,417 |
|
|
| | | | 7,076,061 |
| |
| Retail - 0.03% | | | |
| JC Penney Corp., Inc. | | | |
| 8.125% due 04/01/2027 | | 110,000 | 115,225 |
Retail Grocery - 0.06% | | | |
| Delhaize America, Inc. | | | |
| 9.00% due 04/15/2031 | | 200,000 | 238,670 |
| The Kroger Company | | | |
| 7.50% due 04/01/2031 | | 10,000 | 11,323 |
|
|
| | | | 249,993 |
| |
| Retail Trade - 0.07% | | | |
| J.C. Penney Company, Inc. | | | |
| 7.95% due 04/01/2017 | | 235,000 | 275,497 |
The accompanying notes are an integral part of the financial statements. 121
John Hancock Funds II
Portfolio of investments — February 28, 2006 (Unaudited)
(showing percentage of total net assets)
|
| Active Bond Fund (continued) | | | | |
| | | Shares or | | | |
| | | Principal | | | |
| | | Amount | | | Value |
|
|
| |
| CORPORATE BONDS (continued) | | | | | |
| Telecommunications Equipment & | | | | | |
| Services - 0.62% | | | | | |
| Citizens Communications Company | | | | | |
| 9.00% due 08/15/2031 | $ | 61,000 | | $ | 64,812 |
| Corning, Inc. | | | | | |
| 6.05% due 06/15/2015 | | 210,000 | | | 206,415 |
| Corning, Inc., Series MTN | | | | | |
| 8.30% due 04/04/2025 | | 520,000 | | | 539,348 |
| Deutsche Telekom International Finance BV | | | | |
| 6.625% due 07/11/2011 | EUR | 1,000 | | | 1,348 |
| 8.00% due 06/15/2010 | $ | 222,000 | | | 244,040 |
| 8.25% due 06/15/2030 | | 227,000 | | | 285,420 |
| France Telecom SA | | | | | |
| 8.00% due 03/01/2011 | | 20,000 | | | 22,051 |
| 8.50% due 03/01/2031 (b) | | 220,000 | | | 288,763 |
| Innova S de R.L. | | | | | |
| 9.375% due 09/19/2013 | | 215,000 | | | 238,650 |
| Intelsat, Ltd. | | | | | |
| 9.614% due 01/15/2012 (b) | | 100,000 | | | 102,000 |
| SBC Communications, Inc. | | | | | |
| 4.125% due 09/15/2009 | | 207,000 | | | 199,375 |
| 5.10% due 09/15/2014 | | 16,000 | | | 15,540 |
| 5.625% due 06/15/2016 | | 12,000 | | | 11,997 |
| Singapore Telecommunications, Ltd. | | | | | |
| 6.375% due 12/01/2011 | | 9,000 | | | 9,472 |
| Verizon Global Funding Corp. | | | | | |
| 5.85% due 09/15/2035 | | 230,000 | | | 217,163 |
| | |
|
| | | | | | 2,446,394 |
| Telephone - 1.03% | | | | | |
| AT&T Corp. | | | | | |
| 9.75%, Step down to 8.0% on 05/15/2006 | | | | |
| due 11/15/2031 (b) | | 435,000 | | | 544,283 |
| BellSouth Corp. | | | | | |
| 4.20% due 09/15/2009 | | 212,000 | | | 205,028 |
| 6.00% due 11/15/2034 | | 820,000 | | | 809,193 |
| Sprint Capital Corp. | | | | | |
| 6.125% due 11/15/2008 | | 216,000 | | | 220,778 |
| 6.375% due 05/01/2009 | | 212,000 | | | 218,150 |
| 6.875% due 11/15/2028 | | 242,000 | | | 263,693 |
| 8.375% due 03/15/2012 | | 207,000 | | | 237,806 |
| 8.75% due 03/15/2032 | | 632,000 | | | 830,150 |
| Telecom Italia Capital SA | | | | | |
| 4.00% due 01/15/2010 | | 215,000 | | | 203,383 |
| 4.00% due 11/15/2008 | | 169,000 | | | 163,192 |
| Telecomunicaciones de Puerto Rico, Inc. | | | | | |
| 6.65% due 05/15/2006 | | 75,000 | | | 75,182 |
| Verizon Communications, Inc. | | | | | |
| 5.55% due 02/15/2016 | | 300,000 | | | 297,798 |
| Verizon, New York, Inc. | | | | | |
| 6.875% due 04/01/2012 | | 15,000 | | | 15,700 |
| | |
|
| | | | | | 4,084,336 |
| Tobacco - 0.00% | | | | | |
| Altria Group, Inc. | | | | | |
| 7.00% due 11/04/2013 | | 6,000 | | | 6,518 |
| Active Bond Fund (continued) | | | | |
| | | Shares or | | | |
| | | Principal | | | |
| | | Amount | | | Value |
|
|
| |
| CORPORATE BONDS (continued) | | | | | |
| Transportation - 0.10% | | | | | |
| CMA CGM SA | | | | | |
| 7.25% due 02/01/2013 | $ | 355,000 | | $ | 359,824 |
| CSX Corp. | | | | | |
| 4.99% due 08/03/2006 (b) | | 17,000 | | | 17,018 |
| Overseas Shipholding Group, Inc. | | | | | |
| 8.25% due 03/15/2013 | | 2,000 | | | 2,132 |
| | |
|
| | | | | | 378,974 |
| |
| Utility Service - 0.00% | | | | | |
| Public Service Company of New Mexico | | | | | |
| 4.40% due 09/15/2008 | | 13,000 | | | 12,659 |
|
| TOTAL CORPORATE BONDS (Cost $83,215,775) | | | $ | 83,481,092 |
|
| |
| COLLATERALIZED MORTGAGE | | | | | |
| OBLIGATIONS - 11.94% | | | | | |
| American Home Mortgage Investment Trust, | | | | |
| Series 2005-2, Class 4A1 | | | | | |
| 5.66% due 09/25/2045 | | 4,209 | | | 4,223 |
| American Home Mortgage Investment Trust, | | | | |
| Series 2005-4, Class 5A | | | | | |
| 5.35% due 11/25/2045 | | 834,611 | | | 827,067 |
| Banc of America Commercial Mortgage, Inc., | | | | |
| Series 2004-4, Class A3 | | | | | |
| 4.128% due 07/10/2042 | | 32,284 | | | 31,227 |
| Banc of America Commercial Mortgage, Inc., | | | | |
| Series 2005-2, Class AJ | | | | | |
| 4.953% due 07/10/2043 (b) | | 50,846 | | | 49,232 |
| Banc of America Commercial Mortgage, Inc., | | | | |
| Series 2005-4, Class A5A | | | | | |
| 4.933% due 07/10/2045 | | 245,000 | | | 238,569 |
| Banc of America Commercial Mortgage, Inc., | | | | |
| Series 2005-6, Class A4 | | | | | |
| 5.182% due 09/10/2047 (b) | | 470,000 | | | 468,230 |
| Banc of America Commercial Mortgage, Inc., | | | | |
| Series 2005-6, Class H | | | | | |
| 5.182% due 09/10/2047 (b) | | 350,000 | | | 331,882 |
| Banc of America Commercial Mortgage, Inc., | | | | |
| Series 2006-1, Class AM | | | | | |
| 5.421% due 09/10/2045 | | 1,600,000 | | | 1,608,079 |
| Banc of America Commercial Mortgage, Inc., | | | | |
| Series 2006-1, Class XC | | | | | |
| 5.421% IO due 09/10/2045 | | 52,842,323 | | | 359,309 |
| Banc of America Funding Corp., Series 2006-B, | | | | |
| Class 6A1 | | | | | |
| 5.904% due 03/20/2036 (b) | | 615,000 | | | 617,282 |
| Banc of America Large Loan, | | | | | |
| Series 2005-MIB1, Class B | | | | | |
| 4.83% due 03/15/2022 (b) | | 895,000 | | | 894,719 |
| Bank of America Commercial Mortgage, Inc., | | | | |
| Series 2001-3, Class A1 | | | | | |
| 4.89% due 04/11/2037 | | 14,936 | | | 14,853 |
| Bear Stearns Adjustable Rate Mortgage Trust, | | | | |
| Series 2004-12, Class 2A1 | | | | | |
| 4.499% due 02/25/2035 (b) | | 1,989 | | | 1,945 |
| Bear Stearns Adjustable Rate Mortgage Trust, | | | | |
| Series 2005-12, Class 22A1 | | | | | |
| 5.759% due 02/25/2036 (b) | | 572,978 | | | 576,716 |
The accompanying notes are an integral part of the financial statements. 122
John Hancock Funds II
Portfolio of investments — February 28, 2006 (Unaudited)
(showing percentage of total net assets)
|
| Active Bond Fund (continued) | | | | |
| | | Shares or | | | |
| | | Principal | | | |
| | | Amount | | | Value |
|
|
| |
| COLLATERALIZED MORTGAGE | | | | | |
| OBLIGATIONS (continued) | | | | | |
| Bear Stearns Alt-A Trust, Series 2006-1, | | | | | |
| Class 23A1 | | | | | |
| 5.695% due 02/25/2036 (b) | $ | 590,000 | | $ | 592,489 |
| Bear Stearns Asset Backed Securities, Inc., | | | | | |
| Series 2003-AC4, Class A | | | | | |
| 5.00% due 09/25/2033 | | 15,210 | | | 14,773 |
| Bear Stearns Commercial Mortgage Securities, | | | | |
| Inc., Series 2004-PWR5, Class X1 | | | | | |
| 0.076% IO due 07/11/2042 | | 493,831 | | | 10,206 |
| Bear Stearns Commercial Mortgage Securities, | | | | |
| Inc., Series 2004-T16, Class X1 | | | | | |
| 0.087% IO due 02/13/2046 (b) | | 592,703 | | | 11,533 |
| Bear Stearns Commercial Mortgage Securities, | | | | |
| Series 2005-PWR8, Class AJ | | | | | |
| 4.75% due 06/11/2041 | | 47,292 | | | 44,944 |
| Bear Stearns Commercial Mortgage Securities, | | | | |
| Series 2005-T20, Class A4A | | | | | |
| 5.156% due 10/12/2042 (b) | | 260,000 | | | 258,759 |
| Chase Commercial Mortgage Securities Corp., | | | | |
| Series 2000-2, Class C | | | | | |
| 7.928% due 07/15/2032 | | 29,619 | | | 32,538 |
| Chaseflex Trust, Series 2005-2, Class 4A1 | | | | | |
| 5.00% due 05/25/2020 | | 388,216 | | | 381,222 |
| Citicorp Mortgage Securities, Inc., Series 2005-5, | | | | |
| Class 2A3 | | | | | |
| 5.00% due 08/25/2020 | | 757,398 | | | 741,885 |
| Citigroup Mortgage Loan Trust Inc., | | | | | |
| Series 2005-10, Class 1A5A | | | | | |
| 5.911% due 12/25/2035 (b) | | 568,203 | | | 570,070 |
| Citigroup Mortgage Loan Trust, Inc., Series 2005-5, | | | | |
| Class 2A3 | | | | | |
| 5.00% due 08/25/2035 | | 373,785 | | | 368,310 |
| Citigroup/Deutsche Bank Commercial Mortgage | | | | |
| Trust, Series 2005-CD1, Class C | | | | | |
| 5.225% due 09/15/2020 | | 145,000 | | | 143,621 |
| Citigroup/Deutsche Bank Commercial Mortgage | | | | |
| Trust, Series 2005-CD1, Class J | | | | | |
| 5.224% due 09/15/2020 | | 74,000 | | | 67,617 |
| Citigroup/Deutsche Bank Commercial Mortgage | | | | |
| Trust, Series 2005-CD1, Class A4 | | | | | |
| 5.224% due 09/15/2020 | | 360,000 | | | 360,273 |
| Citigroup/Deutsche Bank Commercial Mortgage, | | | | |
| Series 2006-CD2, Class AM | | | | | |
| 5.592% due 01/15/2046 | | 1,000,000 | | | 1,004,926 |
| Commercial Mortgage Acceptance Corp., | | | | | |
| Series 1999-C1, Class A1 | | | | | |
| 6.79% due 06/15/2031 | | 177 | | | 176 |
| Commercial Mortgage Pass Through Certificates, | | | | |
| Series 2006-CN2A, Class H | | | | | |
| 5.57% due 02/05/2019 (b) | | 380,000 | | | 377,610 |
| Commercial Mortgage Pass-Through Certificates, | | | | |
| Series 2003-LB1A, Class A2 | | | | | |
| 4.084% due 06/10/2038 | | 49,859 | | | 46,268 |
| Commercial Mortgage Pass-Through Certificates, | | | | |
| Series 2005-C6, Class B | | | | | |
| 5.226% due 06/10/2044 (b) | | 49,365 | | | 48,780 |
| Active Bond Fund (continued) | | | |
| | | Shares or | | |
| | | Principal | | |
| | | Amount | | Value |
| |
|
| |
| COLLATERALIZED MORTGAGE | | | | |
| OBLIGATIONS (continued) | | | | |
| Commercial Mortgage Pass-Through Certificates, | | | |
| Series 2005-C6, Class G | | | | |
| 5.459% due 06/10/2044 | $ | 25,000 | $ | 23,764 |
| Commercial Mortgage Pass-Through Certificates, | | | |
| Series 2005-C6, Class XC1 | | | | |
| 0.04% IO due 06/10/2044 | | 6,844,271 | | 46,314 |
| Commercial Mortgage Pass-Through Certificates, | | | |
| Series 2005-FL11, Class AJ | | | | |
| 4.77% due 11/15/2017 (b) | | 595,000 | | 594,670 |
| Countrywide Alternative Loan Trust, | | | | |
| Series 2004-24CB, Class 1A1 | | | | |
| 6.00% due 11/25/2034 | | 29,229 | | 29,302 |
| Countrywide Alternative Loan Trust, | | | | |
| Series 2005-J1, Class 3A1 | | | | |
| 6.50% due 08/25/2032 | | 168,411 | | 171,095 |
| Countrywide Home Loan Mortgage Pass Through | | | |
| Trust, Series 2004-HYB2, Class 4A | | | | |
| 4.555% due 07/20/2034 (b) | | 1,993,057 | | 1,959,618 |
| Countrywide Home Loans, Series 2005-6, | | | | |
| Class 2A1 | | | | |
| 5.50% due 04/25/2035 | | 322,686 | | 316,087 |
| Crown Castle Towers LLC, | | | | |
| Series 2005-1A, Class AFX | | | | |
| 4.643% due 06/15/2035 | | 305,000 | | 296,713 |
| Crown Castle Towers LLC, | | | | |
| Series 2005-1A, Class D | | | | |
| 5.612% due 06/15/2035 | | 220,000 | | 214,336 |
| CS First Boston Mortgage Securities Corp., | | | |
| Series 2001-CF2, Class A3 | | | | |
| 6.238% due 02/15/2034 | | 19,811 | | 20,108 |
| CS First Boston Mortgage Securities Corp., | | | |
| Series 2001-CKN5, Class A4 | | | | |
| 5.435% due 09/15/2034 | | 34,555 | | 34,851 |
| CS First Boston Mortgage Securities Corp., | | | |
| Series 2001-CP4, Class A4 | | | | |
| 6.18% due 12/15/2035 | | 32,087 | | 33,404 |
| CS First Boston Mortgage Securities Corp., | | | |
| Series 2002-CKN2, Class A3 | | | | |
| 6.133% due 04/15/2037 | | 19,746 | | 20,589 |
| CS First Boston Mortgage Securities Corp., | | | |
| Series 2003-25, Class 2A1 | | | | |
| 4.50% due 10/25/2018 | | 282,247 | | 271,924 |
| CS First Boston Mortgage Securities Corp., | | | |
| Series 2004-C4, Class A4 | | | | |
| 4.283% due 10/15/2039 | | 10,860 | | 10,353 |
| CS First Boston Mortgage Securities Corp., | | | |
| Series 2005-5, Class 1A1 | | | | |
| 5.00% due 07/25/2020 | | 355,199 | | 345,100 |
| CS First Boston Mortgage Securities Corp., | | | |
| Series 2005-C1, Class AX | | | | |
| 0.047% IO due 02/15/2038 (b) | | 1,192,260 | | 14,179 |
| CS First Boston Mortgage Securities Corp., | | | |
| Series 2005-C1, Class F | | | | |
| 4.821% due 02/15/2038 | | 20,000 | | 18,473 |
| CS First Boston Mortgage Securities Corp., | | | |
| Series 2005-C2, Class B | | | | |
| 5.016% due 04/15/2037 (b) | | 58,053 | | 56,019 |
The accompanying notes are an integral part of the financial statements. 123
John Hancock Funds II
Portfolio of investments — February 28, 2006 (Unaudited)
(showing percentage of total net assets)
|
| Active Bond Fund (continued) | | | |
| | | Shares or | | |
| | | Principal | | |
| | | Amount | | Value |
|
|
| |
| COLLATERALIZED MORTGAGE | | | | |
| OBLIGATIONS (continued) | | | | |
| CS First Boston Mortgage Securities Corp., | | | |
| Series 2005-C4, Class F | | | | |
| 5.392% due 08/15/2038 (b) | $ | 50,000 | $ | 48,162 |
| CS First Boston Mortgage Securities Corp., | | | |
| Series 2005-C4, Class G | | | | |
| 5.392% due 08/15/2038 (b) | | 40,000 | | 38,257 |
| Federal Home Loan Mortgage Corp., | | | | |
| Series 2003-2640, Class WA | | | | |
| 3.50% due 03/15/2033 | | 9,618 | | 9,221 |
| Federal Home Loan Mortgage Corp., | | | | |
| Series 2005-3019, Class MD | | | | |
| 4.75% due 01/15/2031 | | 2,771,255 | | 2,730,235 |
| Federal Home Loan Mortgage Corp., | | | | |
| Series 2005-3033, Class JH | | | | |
| 5.00% due 06/15/2032 | | 99,234 | | 97,650 |
| Federal Home Loan Mortgage Corp., | | | | |
| Series 2005-3046, Class BC | | | | |
| 5.00% due 08/15/2023 | | 2,905,536 | | 2,869,151 |
| Federal Home Loan Mortgage Corp., Series MTN | | | |
| 4.875% due 10/04/2010 | | 90,000 | | 89,368 |
| Federal National Mortgage Association Whole | | | |
| Loan, Series 2002-W3, Class A5 | | | | |
| 7.50% due 01/25/2028 | | 12,521 | | 13,025 |
| Federal National Mortgage Association, | | | | |
| Series 2003-18, Class EX | | | | |
| 4.00% due 06/25/2017 | | 2,318,323 | | 2,239,114 |
| Federal National Mortgage Association, | | | | |
| Series 2003-33, Class AC | | | | |
| 4.25% due 03/25/2033 | | 7,747 | | 7,442 |
| Federal National Mortgage Association, | | | | |
| Series 2003-49, Class JE | | | | |
| 3.00% due 04/25/2033 | | 53,151 | | 47,609 |
| Federal National Mortgage Association, | | | | |
| Series 2003-58, Class AD | | | | |
| 3.25% due 07/25/2033 | | 25,321 | | 23,240 |
| Federal National Mortgage Association, | | | | |
| Series 2003-63, Class PE | | | | |
| 3.50% due 07/25/2033 | | 19,100 | | 17,512 |
| FHLMC Structured Pass Through Securities, | | | |
| Series T-41, Class 3A | | | | |
| 7.50% due 07/25/2032 | | 6,428 | | 6,679 |
| First Union National Bank Commercial Mortgage | | | |
| Trust, Series 2001-C2, Class A1 | | | | |
| 6.204% due 01/12/2043 | | 33,971 | | 34,473 |
| First Union National Bank Commercial Mortgage | | | |
| Trust, Series 2002-C1, Class A1 | | | | |
| 5.585% due 02/12/2034 | | 13,136 | | 13,248 |
| GE Capital Commercial Mortgage Corp., | | | | |
| Series 2001-3, Class A2 | | | | |
| 6.07% due 06/10/2038 | | 22,214 | | 23,104 |
| GE Capital Commercial Mortgage Corp., | | | | |
| Series 2002-2A, Class A3 | | | | |
| 5.349% due 08/11/2036 | | 14,809 | | 14,899 |
| GE Capital Commercial Mortgage Corp., | | | | |
| Series 2005-C1, Class XC | | | | |
| 0.041% IO due 06/10/2048 (b) | | 1,735,796 | | 21,895 |
| Active Bond Fund (continued) | | | |
| | Shares or | | |
| | | Principal | | |
| | | Amount | | Value |
|
|
| |
| COLLATERALIZED MORTGAGE | | | | |
| OBLIGATIONS (continued) | | | | |
| GE Capital Commercial Mortgage Corp., | | | | |
| Series 2005-C2, Class C | | | | |
| 5.133% due 05/10/2043 (b) | $ | 43,737 | $ | 42,765 |
| GE Capital Commercial Mortgage Corp., | | | | |
| Series 2005-C4, Class H | | | | |
| 5.334% due 11/10/2045 (b) | | 450,000 | | 428,644 |
| Global Signal Trust, Series 2004-1A, Class D | | | |
| 5.098% due 01/15/2034 | | 450,000 | | 450,000 |
| Global Signal Trust, Series 2004-2A, Class D | | | |
| 5.093% due 12/15/2014 | | 180,000 | | 175,570 |
| Global Signal Trust, Series 2006-1, Class E | | | |
| 6.495% due 02/15/2036 | | 210,000 | | 210,000 |
| GMAC Commercial Mortgage Securities, Inc., | | | |
| Series 2001-C1, Class A1 | | | | |
| 5.988% due 04/15/2034 | | 56,839 | | 56,818 |
| GMAC Commercial Mortgage Securities, Inc., | | | |
| Series 2002-C1, Class A1 | | | | |
| 5.785% due 11/15/2039 | | 279,958 | | 282,857 |
| GMAC Commercial Mortgage Securities, Inc., | | | |
| Series 2006-C1, Class AJ | | | | |
| 5.349% due 11/10/2045 (b) | | 945,000 | | 941,751 |
| GMAC Mortgage Corp. Loan Trust, | | | | |
| Series 2006-AR1, Class 2A1 | | | | |
| 5.667% due 04/19/2036 (b) | | 605,000 | | 605,000 |
| Government National Mortgage Association, | | | |
| Series 2003-42, Class XA | | | | |
| 3.75% due 05/16/2033 | | 5,976 | | 5,611 |
| Greenwich Capital Commercial Funding Corp., | | | |
| Series 2002-C1, Class A2 | | | | |
| 4.112% due 01/11/2017 | | 45,126 | | 43,827 |
| Greenwich Capital Commercial Funding Corp., | | | |
| Series 2003-C2, Class A2 | | | | |
| 4.022% due 01/05/2036 | | 50,000 | | 48,309 |
| Greenwich Capital Commercial Funding Corp., | | | |
| Series 2005-GG5, Class A2 | | | | |
| 5.117% due 04/10/2037 | | 705,000 | | 702,073 |
| GS Mortgage Securities Corp II, Series 2005-GG4, | | | |
| Class E | | | | |
| 5.078% due 07/10/2039 (b) | | 52,919 | | 50,834 |
| GS Mortgage Securities Corp II, Series 2005-GG4, | | | |
| Class XC | | | | |
| 0.105% IO due 07/10/2039 (b) | | 2,095,108 | | 40,999 |
| GSR Mortgage Loan Trust, Series 2004-9, Class B1 | | | |
| 4.518% due 08/25/2034 (b) | | 376,056 | | 370,706 |
| GSR Mortgage Loan Trust, Series 2005-5F, | | | |
| Class 6A1 | | | | |
| 5.00% due 05/25/2020 | | 376,260 | | 366,937 |
| GSR Mortgage Loan Trust, Series 2005-8F, | | | |
| Class 6A1 | | | | |
| 4.50% due 10/25/2020 | | 404,004 | | 391,244 |
| GSR Mortgage Loan Trust, Series 2006-AR1, | | | |
| Class 3A1 | | | | |
| 5.436% due 01/25/2036 (b) | | 940,000 | | 938,617 |
| IndyMac Index Mortgage Loan Trust, | | | | |
| Series 2005-AR5, Class B1 | | | | |
| 5.431% due 05/25/2035 (b) | | 134,499 | | 135,314 |
The accompanying notes are an integral part of the financial statements. 124
John Hancock Funds II
Portfolio of investments — February 28, 2006 (Unaudited)
(showing percentage of total net assets)
|
| Active Bond Fund (continued) | | | |
| | | Shares or | | |
| | | Principal | | |
| | | Amount | | Value |
|
|
| |
| COLLATERALIZED MORTGAGE | | | | |
| OBLIGATIONS (continued) | | | | |
| JP Morgan Alternative Loan Trust | | | | |
| 6.09% due 02/01/2036 | $ | 740,000 | $ | 746,157 |
| JP Morgan Alternative Loan Trust, Series 2006-A1, | | | |
| Class 4A1 | | | | |
| 6.092% due 03/25/2036 (b) | | 740,000 | | 746,157 |
| JP Morgan Mortgage Trust, Series 2005-S3, | | | |
| Class 2A2 | | | | |
| 5.50% due 01/25/2021 | | 576,740 | | 572,484 |
| JPMorgan Chase Commercial Mortgage Securities | | | |
| Corp., Series 2002-C1, Class A3 | | | | |
| 5.376% due 07/12/2037 | | 51,734 | | 52,068 |
| JPMorgan Chase Commercial Mortgage Securities | | | |
| Corp., Series 2004-CBX, Class A2 | | | | |
| 3.89% due 01/12/2037 | | 14,809 | | 14,357 |
| JPMorgan Chase Commercial Mortgage Securities | | | |
| Corp., Series 2005-LDP2, Class E | | | | |
| 4.981% due 07/15/2042 (b) | | 30,705 | | 29,464 |
| JPMorgan Chase Commercial Mortgage Securities | | | |
| Corp., Series 2005-LDP3, Class A4B | | | | |
| 4.996% due 08/15/2042 (b) | | 515,000 | | 501,846 |
| JPMorgan Chase Commercial Mortgage Securities | | | |
| Corp., Series 2005-LDP4, Class B | | | | |
| 5.129% due 10/15/2042 (b) | | 145,000 | | 141,214 |
| JPMorgan Mortgage Trust, Series 2005-A2, | | | |
| Class 1A1 | | | | |
| 4.768% due 04/25/2035 (b) | | 4,987 | | 4,932 |
| JPMorgan Mortgage Trust, Series 2005-S2, | | | |
| Class 2A16 | | | | |
| 6.50% due 09/25/2035 | | 316,667 | | 325,097 |
| LB-UBS Commercial Mortgage Trust, | | | | |
| Series 2002-C1, Class A4 | | | | |
| 6.462% due 03/15/2031 | | 29,619 | | 31,495 |
| LB-UBS Commercial Mortgage Trust, | | | | |
| Series 2005-C1, Class XCL | | | | |
| 0.148% IO due 02/15/2040 (b) | | 746,315 | | 15,903 |
| LB-UBS Commercial Mortgage Trust, | | | | |
| Series 2005-C3, Class AJ | | | | |
| 4.843% due 07/15/2040 | | 40,874 | | 39,163 |
| LB-UBS Commercial Mortgage Trust, | | | | |
| Series 2005-C3, Class G | | | | |
| 5.111% due 07/15/2040 (b) | | 25,472 | | 24,418 |
| LB-UBS Commercial Mortgage Trust, | | | | |
| Series 2005-C5, Class A2 | | | | |
| 4.885% due 09/15/2040 | | 58,053 | | 57,292 |
| Lehman Mortgage Trust, Series 2005-1, Class 6A1 | | | |
| 5.00% due 11/25/2020 | | 527,737 | | 516,585 |
| Merrill Lynch Mortgage Trust, Series 2004-BPB1, | | | |
| Class XC | | | | |
| 0.058% IO due 09/12/2041 | | 500,000 | | 9,811 |
| Merrill Lynch Mortgage Trust, Series 2004-KEY2, | | | |
| Class A4 | | | | |
| 4.864% due 08/12/2039 (b) | | 31,988 | | 30,976 |
| Merrill Lynch Mortgage Trust, Series 2005-CIP1, | | | |
| Class XC | | | | |
| 0.041% IO due 07/12/2038 | | 5,600,000 | | 36,113 |
| Active Bond Fund (continued) | | | |
| | | Shares or | | |
| | | Principal | | |
| | | Amount | | Value |
|
|
| |
| COLLATERALIZED MORTGAGE | | | | |
| OBLIGATIONS (continued) | | | | |
| Merrill Lynch Mortgage Trust, Series 2005-CKI1, | | | |
| Class A6 | | | | |
| 5.245% due 11/12/2037 (b) | $ | 435,000 | $ | 435,370 |
| Merrill Lynch Mortgage Trust, Series 2005-LC1, | | | |
| Class G | | | | |
| 5.377% due 01/12/2044 | | 450,000 | | 427,102 |
| MLCC Mortgage Investors, Inc., Series 2004-1, | | | |
| Class 2A1 | | | | |
| 4.737% due 12/25/2034 (b) | | 1,201 | | 1,183 |
| Morgan Stanley Capital I | | | | |
| 0.05% IO due 07/15/2056 (b) | | 700,000 | | 19,758 |
| Morgan Stanley Capital I, Series 2004-T13, Class A2 | | | |
| 3.94% due 09/13/2045 | | 27,150 | | 25,913 |
| Morgan Stanley Capital I, Series 2005-HQ7, | | | |
| Class A2 | | | | |
| 5.205% due 11/14/2042 (b) | | 415,000 | | 414,142 |
| Morgan Stanley Capital I, Series 2005-HQ7, | | | |
| Class A4 | | | | |
| 5.205% due 11/14/2042 (b) | | 415,000 | | 414,495 |
| Morgan Stanley Capital I, Series 2005-IQ10, | | | |
| Class A4A | | | | |
| 5.23% due 09/15/2042 (b) | | 675,000 | | 670,871 |
| Morgan Stanley Capital I, Series 2005-T17, Class X1 | | | |
| 0.069% IO due 12/13/2041 (b) | | 1,488,345 | | 22,257 |
| Morgan Stanley Capital I, Series 2006-T21, Class X | | | |
| 0.153% IO due 10/12/2052 (b) | | 20,543,000 | | 318,634 |
| Morgan Stanley Mortgage Loan Trust, | | | | |
| Series 2006-3AR, Class 3A1 | | | | |
| 6.119% due 03/25/2036 (b) | | 820,000 | | 826,630 |
| Prime Mortgage Trust, Series 2005-2, Class 1A2 | | | |
| 5.00% due 07/25/2020 | | 893,526 | | 877,099 |
| Residential Accredit Loans, Inc., | | | | |
| Series 2005-QA12, Class NB5 | | | | |
| 6.020% due 12/25/2035 (b) | | 573,790 | | 579,259 |
| Residential Accredit Loans, Inc., Series 2006-QA1, | | | |
| Class A31 | | | | |
| 6.305% due 01/25/2036 (b) | | 799,456 | | 808,075 |
| Residential Accredit Loans, Inc., Series 2006-QO2, | | | |
| Class A2 | | | | |
| 4.875% due 02/25/2046 (b) | | 1,500,000 | | 1,500,000 |
| Salomon Brothers Mortgage Securities VII, | | | |
| Series 2000-C3, Class A2 | | | | |
| 6.592% due 12/18/2033 | | 12,045 | | 12,608 |
| Salomon Brothers Mortgage Securities VII, | | | |
| Series 2001-C1, Class A2 | | | | |
| 6.226% due 12/18/2035 | | 21,439 | | 21,632 |
| Salomon Brothers Mortgage Securities VII, | | | |
| Series 2001-C1, Class A3 | | | | |
| 6.428% due 12/18/2035 | | 24,682 | | 25,792 |
| SBA CMBS Trust, Series 2005-1A, Class A | | | |
| 5.369% due 11/15/2035 | | 200,000 | | 199,422 |
| SBA CMBS Trust, Series 2005-1A, Class B | | | |
| 5.565% due 11/15/2035 | | 200,000 | | 199,743 |
| SBA CMBS Trust, Series 2005-1A, Class C | | | |
| 5.731% due 11/15/2035 | | 397,000 | | 396,790 |
| Sequoia Mortgage Trust, Series 2005-3, Class A1 | | | |
| 4.77% due 05/20/2035 (b) | | 18,774 | | 18,770 |
The accompanying notes are an integral part of the financial statements. 125
John Hancock Funds II
Portfolio of investments — February 28, 2006 (Unaudited)
(showing percentage of total net assets)
|
| Active Bond Fund (continued) | | | |
| | | Shares or | | |
| | | Principal | | |
| | | Amount | | Value |
|
|
| |
| COLLATERALIZED MORTGAGE | | | | |
| OBLIGATIONS (continued) | | | | |
| Wachovia Bank Commercial Mortgage Trust, | | | |
| Series 2004-C10, Class A3 | | | | |
| 4.39% due 02/15/2041 | $ | 39,492 | $ | 37,758 |
| Wachovia Bank Commercial Mortgage Trust, | | | |
| Series 2005-C17, Class XC | | | | |
| 0.041% IO due 03/15/2042 (b) | | 1,003,060 | | 9,033 |
| Wachovia Bank Commercial Mortgage Trust, | | | |
| Series 2005-C19, Class A5 | | | | |
| 4.661% due 05/15/2044 | | 66,742 | | 64,212 |
| Wachovia Bank Commercial Mortgage Trust, | | | |
| Series 2005-C19, Class AJ | | | | |
| 4.793% due 05/15/2044 | | 37,517 | | 35,790 |
| Washington Mutual Alternative Mortgage | | | | |
| Pass-Through Certificates, Series 2005-6, | | | |
| Class 1CB | | | | |
| 6.50% due 08/25/2035 | | 255,143 | | 259,130 |
| Washington Mutual, Inc., Series 2005-1, Class 6A1 | | | |
| 6.50% due 03/25/2035 | | 24,947 | | 25,197 |
| Wells Fargo Mortgage Backed Securities Trust, | | | |
| Series 2004-7, Class 2A2 | | | | |
| 5.00% due 07/25/2019 | | 373,873 | | 367,330 |
| Wells Fargo Mortgage Backed Securities Trust, | | | |
| Series 2005-AR16, Class 2A1 | | | | |
| 4.945% due 10/25/2035 (b) | | 4,131,679 | | 4,100,339 |
| Wells Fargo Mortgage Backed Securities Trust, | | | |
| Series 2005-AR2, Class 3A1 | | | | |
| 4.947% due 03/25/2035 (b) | | 38,933 | | 38,800 |
|
| TOTAL COLLATERALIZED MORTGAGE OBLIGATIONS | | |
| (Cost $47,723,327) | | | $ | 47,257,058 |
|
| |
| ASSET BACKED SECURITIES - 2.21% | | | |
| Amresco Residential Securities Mortgage Loan | | | |
| Trust, Series 1998-1, Class A6 | | | | |
| 6.51% due 08/25/2027 | | 3,921 | | 3,910 |
| Argent Securities, Inc., Series 2004-W1, Class M3 | | | |
| 6.031% due 03/25/2034 (b) | | 31,593 | | 31,905 |
| Bank One Issuance Trust, Series 2003-C1, | | | | |
| Class C1 | | | | |
| 4.54% due 09/15/2010 | | 10,000 | | 9,873 |
| California Infrastructure Development PG&E-1, | | | |
| Series 1997-1, Class A7 | | | | |
| 6.42% due 09/25/2008 | | 4,994 | | 5,017 |
| Capital Trust Re CDO, Ltd., Series 2005-1A, Class B | | | |
| 5.04% due 03/20/2050 (b) | | 400,000 | | 400,406 |
| Citibank Credit Card Issuance Trust, | | | | |
| Series 2003-C3, Class C3 | | | | |
| 4.45% due 04/07/2010 | | 11,000 | | 10,826 |
| Continental Airlines Inc., Series 00-2 | | | | |
| 7.707% due 04/02/2021 | | 297,092 | | 307,664 |
| Continental Airlines Inc., Series 991A | | | | |
| 6.545% due 02/02/2019 | | 176,635 | | 178,064 |
| Countrywide Asset-Backed Certificates, | | | | |
| Series 2004-10, Class AF3 | | | | |
| 3.842% due 10/25/2030 (b) | | 37,231 | | 37,006 |
| Countrywide Asset-Backed Certificates, | | | | |
| Series 2004-12, Class 2AV2 | | | | |
| 4.861% due 09/25/2033 (b) | | 21,490 | | 21,507 |
| Active Bond Fund (continued) | | | |
| | | Shares or | | |
| | | Principal | | |
| | | Amount | | Value |
|
|
| |
| ASSET BACKED SECURITIES | | | | |
| (continued) | | | | |
| Credit-Based Asset Servicing and Securitization, | | | |
| Series 2005-CB8, Class AF2 | | | | |
| 5.303% due 12/25/2035 | $ | 1,000,000 | $ | 995,313 |
| Credit-Based Asset Servicing and Securitization, | | | |
| Series 2006-CB2, Class AF2 | | | | |
| 5.501% due 12/25/2036 | | 1,250,000 | | 1,249,963 |
| Equity One ABS, Inc., Series 2004-2, Class AV2 | | | |
| 4.831% due 07/25/2034 (b) | | 5,102 | | 5,108 |
| Home Equity Mortgage Trust, | | | | |
| Series 2005-3, Class A1 | | | | |
| 4.821% due 11/25/2035 (b) | | 54,212 | | 54,210 |
| LNR CDO Ltd., Series 2006-1A, Class 3C7 | | | |
| 4.96% due 05/25/2043 | | 700,000 | | 700,000 |
| Morgan Stanley ABS Capital I, | | | | |
| Series 2004-OP1, Class A2B | | | | |
| 4.871% due 11/25/2034 (b) | | 29,619 | | 29,648 |
| Newcastle CDO, Ltd., Series 2005-7A, Class 2FL | | | |
| 4.72% due 12/25/2050 | | 570,000 | | 570,000 |
| Onyx Acceptance Auto Trust, | | | | |
| Series 2002-C, Class A4 | | | | |
| 4.07% due 04/15/2009 | | 5,493 | | 5,493 |
| Ownit Mortgage Loan Asset Backed Certificates, | | | |
| Series 2006-1, Class AF2 | | | | |
| 5.29 due 12/25/2036 | | 1,050,000 | | 1,044,586 |
| Peco Energy Transition Trust, | | | | |
| Series 1999-A, Class A7 | | | | |
| 6.13% due 03/01/2009 | | 28,000 | | 28,530 |
| PG&E Energy Recovery Funding LLC, | | | | |
| Series 2005-1, Class A3 | | | | |
| 4.14% due 09/25/2012 | | 22,000 | | 21,404 |
| Popular ABS Mortgage Pass-Through Trust, | | | |
| Series 2005-4, Class AF3 | | | | |
| 4.982% due 09/25/2035 (b) | | 65,162 | | 64,262 |
| Popular ABS Mortgage Pass-Through Trust, | | | |
| Series 2005-6, Class A2 | | | | |
| 5.349% due 01/25/2036 (b) | | 900,000 | | 896,934 |
| Renaissance Home Equity Loan Trust, | | | | |
| Series 2004-4, Class AF2 | | | | |
| 3.856% due 02/25/2035 | | 45,000 | | 44,617 |
| Renaissance Home Equity Loan Trust, | | | | |
| Series 2005-2, Class AF3 | | | | |
| 4.499% due 08/25/2035 | | 210,000 | | 205,541 |
| Renaissance Home Equity Loan Trust, | | | | |
| Series 2005-2, Class AF4 | | | | |
| 4.934% due 08/25/2035 | | 230,000 | | 222,991 |
| Renaissance Home Equity Loan Trust, | | | | |
| Series 2005-4, Class A2 | | | | |
| 5.399% due 02/25/2036 | | 1,000,000 | | 997,212 |
| Residential Accredit Loans, Inc., | | | | |
| Series 2004-QS16, Class 1A1 | | | | |
| 5.50% due 12/25/2034 | | 32,276 | | 31,995 |
| Residential Asset Mortgage Products, Inc., | | | | |
| Series 2003-RS10, Class AI5 | | | | |
| 4.91% due 01/25/2031 | | 30,000 | | 29,813 |
| Sail Net Interest Margin Notes, Series 2005-6A, | | | |
| Class A | | | | |
| 4.75% due 07/27/2035 | | 344,384 | | 342,205 |
The accompanying notes are an integral part of the financial statements. 126
John Hancock Funds II
Portfolio of investments — February 28, 2006 (Unaudited)
(showing percentage of total net assets)
|
| Active Bond Fund (continued) | | | |
| | | Shares or | | |
| | | Principal | | |
| | | Amount | | Value |
|
|
| |
| ASSET BACKED SECURITIES | | | | |
| (continued) | | | | |
| Specialty Underwriting & Residential Finance, | | | | |
| Series 2003-BC4, Class A3B | | | | |
| 4.788% due 11/25/2034 | $ | 28,504 | $ | 28,201 |
| Specialty Underwriting & Residential Finance, | | | | |
| Series 2004-BC4, Class A2B | | | | |
| 4.891% due 10/25/2035 (b) | | 34,555 | | 34,625 |
| Structured Asset Investment Loan Trust, | | | | |
| Series 2004-8, Class A13 | | | | |
| 4.881% due 09/25/2034 (b) | | 46,106 | | 46,135 |
| Structured Asset Investment Loan Trust, | | | | |
| Series 2004-8, Class A7 | | | | |
| 4.881% due 09/25/2034 (b) | | 29,619 | | 29,643 |
| USAA Auto Owner Trust, Series 2004-3, Class A3 | | | |
| 3.16% due 02/17/2009 | | 28,000 | | 27,652 |
| Wells Fargo Home Equity Trust, | | | | |
| Series 2004-2, Class AI5 | | | | |
| 4.89% due 11/25/2028 (b) | | 49,000 | | 47,900 |
|
| TOTAL ASSET BACKED SECURITIES | | | | |
| (Cost $8,773,420) | | | $ | 8,760,159 |
|
| |
| SUPRANATIONAL OBLIGATIONS - 0.06% | | | |
| Honduras - 0.00% | | | | |
| Central American Bank for Economic Integration | | | |
| 6.75% due 04/15/2013 | | 12,000 | | 12,658 |
Venezuela - 0.06%
| | | | |
| Corporacion Andina de Fomento | | | | |
| 5.20% due 05/21/2013 | | 214,000 | | 211,238 |
|
| TOTAL SUPRANATIONAL OBLIGATIONS | | | | |
| (Cost $227,516) | | | $ | 223,896 |
|
| |
| SHORT TERM INVESTMENTS - 16.97% | | | | |
| State Street Global Advisers Funds (c) | $ | 3,196,892 | $ | 3,196,892 |
| State Street Navigator Securities Lending | | | | |
| Prime Portfolio (c) | | 63,952,895 | | 63,952,895 |
|
| TOTAL SHORT TERM INVESTMENTS | | | | |
| (Cost $67,149,787) | | | $ | 67,149,787 |
|
| |
| REPURCHASE AGREEMENTS - 21.39% | | | | |
| Repurchase Agreement with State | | | | |
| Street Corp. dated 02/28/2006 at | | | | |
| 3.20% to be repurchased at | | | | |
| $84,644,523 on 03/01/2006, | | | | |
| collateralized by $81,430,000 | | | | |
| Federal Home Loan Mortgage | | | | |
| Corporation (valued at | | | | |
| $81,430,681, including interest) | | | | |
| and by $545,000 Federal Home | | | | |
| Loan Bank (valued at $543,725, | | | | |
| including interest) and by | | | | |
| 4,620,000 Federal National | | | | |
| Mortgage Association (valued at | | | | |
| 4,359,539, including interest). (c) | $ | 84,637,000 | $ | 84,637,000 |
|
| TOTAL REPURCHASE AGREEMENTS | | | | |
| (Cost $84,637,000) | | | $ | 84,637,000 |
|
| Total Investments (Active Bond Fund) | | | |
| (Cost $542,165,602) - 137.05% | | $ | 542,267,006 |
| Liabilities in Excess of Other Assets - (37.05)% | | | (146,589,922) |
|
|
| TOTAL NET ASSETS - 100.00% | | $ | 395,677,084 |
|
|
| |
| |
| All Cap Growth Fund | | | |
| | Shares or | | |
| | Principal | | |
| | Amount | | Value |
|
|
| |
| COMMON STOCKS - 97.82% | | | |
| Aerospace - 3.62% | | | |
| Boeing Company | 21,661 | $ | 1,574,538 |
| General Dynamics Corp. | 9,190 | | 1,132,851 |
| Textron, Inc. | 28,273 | | 2,491,134 |
|
|
| | | | 5,198,523 |
| Agriculture - 0.77% | | | |
| Monsanto Company | 13,200 | | 1,107,216 |
Banking - 0.61% | | | |
| Kookmin Bank, ADR | 11,510 | | 871,882 |
Biotechnology - 1.57% | | | |
| Amgen, Inc. * | 9,670 | | 729,988 |
| Cephalon, Inc. * (a) | 10,500 | | 834,540 |
| Genentech, Inc. * | 8,113 | | 695,203 |
|
|
| | | | 2,259,731 |
| Business Services - 1.44% | | | |
| Electronic Data Systems Corp. | 26,256 | | 701,035 |
| Robert Half International, Inc. | 38,071 | | 1,367,511 |
|
|
| | | | 2,068,546 |
| Computers & Business Equipment - 6.74% | | | |
| Apple Computer, Inc. * | 52,512 | | 3,599,172 |
| Cisco Systems, Inc. * | 138,501 | | 2,803,260 |
| Dell, Inc. * | 36,759 | | 1,066,011 |
| EMC Corp. * | 157,537 | | 2,208,669 |
|
|
| | | | 9,677,112 |
| Construction & Mining Equipment - 1.07% | | | |
| National Oilwell, Inc. * | 25,273 | | 1,538,620 |
Cosmetics & Toiletries - 1.01% | | | |
| Procter & Gamble Company | 24,287 | | 1,455,520 |
Crude Petroleum & Natural Gas - 3.06% | | | |
| Apache Corp. | 14,618 | | 978,237 |
| Devon Energy Corp. | 19,491 | | 1,142,757 |
| Newfield Exploration Company * | 14,618 | | 564,986 |
| Occidental Petroleum Corp. | 18,700 | | 1,711,798 |
|
|
| | | | 4,397,778 |
| Drugs & Health Care - 0.59% | | | |
| Wyeth | 16,877 | | 840,475 |
Electrical Equipment - 1.55% | | | |
| Emerson Electric Company | 19,692 | | 1,611,003 |
| Wesco International, Inc. * | 10,785 | | 618,196 |
|
|
| | | | 2,229,199 |
| Electronics - 2.87% | | | |
| Agilent Technologies, Inc. * | 26,256 | | 945,216 |
| Garmin, Ltd. (a) | 13,128 | | 903,469 |
| Harman International Industries, Inc. | 13,128 | | 1,448,675 |
| Matsushita Electric Industrial Co., Ltd., ADR | 4,034 | | 85,158 |
The accompanying notes are an integral part of the financial statements. 127
John Hancock Funds II
Portfolio of investments — February 28, 2006 (Unaudited)
(showing percentage of total net assets)
|
| All Cap Growth Fund (continued) | | |
| | Shares or | | |
| | Principal | | |
| | Amount | | Value |
|
|
| |
| COMMON STOCKS (continued) | | | |
| Electronics (continued) | | | |
| Matsushita Electric Industrial Company, Ltd. | 34,419 | $ | 736,902 |
|
|
| | | | 4,119,420 |
| Financial Services - 6.16% | | | |
| Charles Schwab Corp. | 116,840 | | 1,893,977 |
| Chicago Merchantile Exchange Holdings, Inc. | 1,382 | | 588,179 |
| Franklin Resources, Inc. | 7,309 | | 750,488 |
| Goldman Sachs Group, Inc. | 14,441 | | 2,040,369 |
| Janus Capital Group, Inc. | 25,000 | | 548,250 |
| Merrill Lynch & Company, Inc. | 20,349 | | 1,571,146 |
| SLM Corp. | 25,600 | | 1,444,096 |
|
|
| | | | 8,836,505 |
| Food & Beverages - 1.12% | | | |
| Kellogg Company | 15,155 | | 671,518 |
| PepsiCo, Inc. | 15,754 | | 931,219 |
|
|
| | | | 1,602,737 |
| Healthcare Products - 4.72% | | | |
| Alcon, Inc. | 17,786 | | 2,048,236 |
| Johnson & Johnson | 18,000 | | 1,037,700 |
| Medtronic, Inc. | 18,000 | | 971,100 |
| St. Jude Medical, Inc. * | 26,256 | | 1,197,274 |
| Varian Medical Systems, Inc. * | 26,256 | | 1,519,697 |
|
|
| | | | 6,774,007 |
| Healthcare Services - 2.58% | | | |
| Omnicare, Inc. | 22,318 | | 1,358,050 |
| UnitedHealth Group, Inc. | 12,000 | | 698,760 |
| Wellpoint, Inc. * | 21,500 | | 1,650,985 |
|
|
| | | | 3,707,795 |
| Industrial Machinery - 1.84% | | | |
| Caterpillar, Inc. | 7,220 | | 527,638 |
| Komatsu, Ltd. | 49,230 | | 886,127 |
| Parker-Hannifin Corp. | 15,754 | | 1,231,490 |
|
|
| | | | 2,645,255 |
| Industrials - 1.80% | | | |
| ABB, Ltd. * | 134,000 | | 1,604,423 |
| Mitsui O.S.K. Lines, Ltd. | 131,440 | | 972,453 |
|
|
| | | | 2,576,876 |
| Insurance - 6.65% | | | |
| Aetna, Inc. | 65,640 | | 3,347,640 |
| Allstate Corp. | 26,256 | | 1,438,304 |
| Assurant, Inc. | 22,974 | | 1,043,020 |
| CIGNA Corp. | 18,816 | | 2,309,664 |
| Millea Holdings, Inc. | 47 | | 969,741 |
| Mitsui Sumitomo Insurance Company, Ltd. | 32,900 | | 440,238 |
|
|
| | | | 9,548,607 |
| Internet Retail - 1.48% | | | |
| eBay, Inc. * | 53,169 | | 2,129,950 |
| Internet Service Provider - 3.36% | | | |
| Google, Inc., Class A * | 7,250 | | 2,628,995 |
| Redback Networks, Inc. * (a) | 28,448 | | 539,090 |
| All Cap Growth Fund (continued) | | |
| | Shares or | | |
| | Principal | | |
| | Amount | | Value |
|
|
| |
| COMMON STOCKS (continued) | | | |
| Internet Service Provider | | | |
| (continued) | | | |
| Yahoo!, Inc. * | 51,586 | $ | 1,653,847 |
|
|
| | | | 4,821,932 |
| Leisure Time - 0.86% | | | |
| Electronic Arts, Inc. * | 23,631 | | 1,228,103 |
Manufacturing - 0.66% | | | |
| Rockwell Automation, Inc. | 13,784 | | 939,655 |
Metal & Metal Products - 1.33% | | | |
| Companhia Vale Do Rio Doce, ADR | 23,200 | | 1,077,176 |
| Precision Castparts Corp. | 15,754 | | 835,592 |
|
|
| | | | 1,912,768 |
| Mining - 2.49% | | | |
| BHP Billiton, Ltd. (a) | 20,000 | | 721,800 |
| Joy Global, Inc. | 21,005 | | 1,083,018 |
| Phelps Dodge Corp. | 7,877 | | 1,087,026 |
| Rio Tinto PLC | 14,500 | | 681,565 |
|
|
| | | | 3,573,409 |
| Office Furnishings & Supplies - 1.76% | | | |
| Office Depot, Inc. * | 70,892 | | 2,529,427 |
Petroleum Services - 2.80% | | | |
| Baker Hughes, Inc. | 18,000 | | 1,223,460 |
| ENSCO International, Inc. | 25,500 | | 1,139,595 |
| GlobalSantaFe Corp. | 16,400 | | 907,576 |
| Valero Energy Corp. | 14,000 | | 753,060 |
|
|
| | | | 4,023,691 |
| Pharmaceuticals - 6.13% | | | |
| Allergan, Inc. | 7,220 | | 781,638 |
| Caremark Rx, Inc. * | 36,759 | | 1,828,760 |
| Gilead Sciences, Inc. * | 32,311 | | 2,012,006 |
| Medicis Pharmaceutical Corp., Class A | 19,849 | | 564,506 |
| PDL BioPharma, Inc. * (a) | 26,256 | | 822,075 |
| Roche Holdings AG - CHF | 11,089 | | 1,639,777 |
| Teva Pharmaceutical Industries, Ltd., SADR | 27,288 | | 1,145,823 |
|
|
| | | | 8,794,585 |
| Railroads & Equipment - 1.47% | | | |
| Burlington Northern Santa Fe Corp. | 26,913 | | 2,116,438 |
Retail Trade - 6.31% | | | |
| AnnTaylor Stores Corp. * | 23,631 | | 857,805 |
| Best Buy Company, Inc. | 15,000 | | 807,900 |
| Chico's FAS, Inc. * | 17,723 | | 833,867 |
| Federated Department Stores, Inc. | 21,661 | | 1,538,798 |
| Home Depot, Inc. | 34,133 | | 1,438,706 |
| J.C. Penney Company, Inc. | 15,097 | | 885,288 |
| Target Corp. | 24,943 | | 1,356,899 |
| Tiffany & Co. | 36,234 | | 1,345,369 |
|
|
| | | | 9,064,632 |
| Semiconductors - 9.75% | | | |
| Analog Devices, Inc. | 72,204 | | 2,753,861 |
| ASML Holding NV * | 53,169 | | 1,099,535 |
The accompanying notes are an integral part of the financial statements. 128
John Hancock Funds II
Portfolio of investments — February 28, 2006 (Unaudited)
(showing percentage of total net assets)
|
| All Cap Growth Fund (continued) | | |
| | | Shares or | | |
| | | Principal | | |
| | | Amount | | Value |
|
|
| |
| COMMON STOCKS (continued) | | | | |
| Semiconductors (continued) | | | | |
| Freescale Semiconductor, Inc., Class B * | | 82,707 | $ | 2,236,397 |
| Integrated Device Technology, Inc. * | | 41,905 | | 622,289 |
| KLA-Tencor Corp. | | 17,067 | | 891,409 |
| Marvell Technology Group, Ltd. * | | 30,090 | | 1,842,110 |
| Microchip Technology, Inc. | | 78,770 | | 2,772,704 |
| NVIDIA Corp. * | | 17,723 | | 835,285 |
| PMC-Sierra, Inc. * (a) | | 93,089 | | 950,439 |
|
|
| | | | | 14,004,029 |
| Software - 2.26% | | | | |
| BEA Systems, Inc. * | | 45,000 | | 516,150 |
| Hyperion Solutions Corp. * | | 17,723 | | 594,607 |
| Microsoft Corp. | | 40,697 | | 1,094,749 |
| Red Hat, Inc. * | | 38,500 | | 1,034,495 |
|
|
| | | | | 3,240,001 |
| Telecommunications Equipment & | | | | |
| Services - 5.84% | | | | |
| Amdocs, Ltd. * | | 76,000 | | 2,517,120 |
| Nokia Oyj, SADR | | 105,025 | | 1,951,364 |
| QUALCOMM, Inc. | | 60,389 | | 2,850,965 |
| Tellabs, Inc. * | | 72,224 | | 1,060,971 |
|
|
| | | | | 8,380,420 |
| Telephone - 0.52% | | | | |
| Harris Corp. | | 16,410 | | 749,609 |
Travel Services - 0.52% | | | | |
| American Express Company | | 13,888 | | 748,285 |
Trucking & Freight - 0.51% | | | | |
| Oshkosh Truck Corp. | | 13,000 | | 737,490 |
|
| TOTAL COMMON STOCKS (Cost $128,103,120) | | $ | 140,450,228 |
|
| |
| SHORT TERM INVESTMENTS - 2.96% | | | | |
| State Street Navigator Securities | | | | |
| Lending Prime Portfolio (c) | $ | 4,252,196 | $ | 4,252,196 |
|
| TOTAL SHORT TERM INVESTMENTS | | | | |
| (Cost $4,252,196) | | | $ | 4,252,196 |
|
| |
| REPURCHASE AGREEMENTS - 2.35% | | | | |
| Repurchase Agreement with State | | | | |
| Street Corp. dated 02/28/2006 at | | | | |
| 4.250% to be repurchased at | | | | |
| $3,367,397 on 03/01/2006, | | | | |
| collateralized by $3,595,000 | | | | |
| Federal National Mortgage | | | | |
| Association, 3.25% due 2/15/2009 | | | | |
| (valued at $3,435,759, including | | | | |
| interest) (c) | $ | 3,367,000 | $ | 3,367,000 |
|
| TOTAL REPURCHASE AGREEMENTS | | | | |
| (Cost $3,367,000) | | | $ | 3,367,000 |
|
| Total Investments (All Cap Growth Fund) | | | | |
| (Cost $135,722,316) - 103.13% | | | $ | 148,069,424 |
| Liabilities in Excess of Other Assets - (3.13)% | | | (4,495,586) |
|
|
| TOTAL NET ASSETS - 100.00% | | | $ | 143,573,838 |
|
|
| All Cap Value Fund | | | |
| | Shares or | | |
| | Principal | | |
| | Amount | | Value |
|
|
| |
| COMMON STOCKS - 96.47% | | | |
| Advertising - 0.11% | | | |
| The Interpublic Group of Companies, Inc. * | 21,120 | $ | 218,803 |
Aerospace - 0.38% | | | |
| Moog, Inc., Class A * (a) | 12,487 | | 419,064 |
| Woodward Governor Company | 9,333 | | 300,056 |
|
|
| | | | 719,120 |
| Agriculture - 1.53% | | | |
| Archer-Daniels-Midland Company | 91,803 | | 2,911,991 |
Air Travel - 0.15% | | | |
| Frontier Airlines, Inc. * (a) | 40,052 | | 288,374 |
Apparel & Textiles - 0.93% | | | |
| Timberland Company, Class A * | 10,800 | | 378,540 |
| VF Corp. | 25,581 | | 1,401,839 |
|
|
| | | | 1,780,379 |
| Auto Parts - 1.10% | | | |
| American Axle & Manufacturing Holdings, Inc. (a) | 6,600 | | 107,052 |
| Autoliv, Inc. | 24,800 | | 1,328,040 |
| Genuine Parts Company | 14,913 | | 663,927 |
|
|
| | | | 2,099,019 |
| Automobiles - 0.10% | | | |
| Tenneco, Inc. * (a) | 8,300 | | 187,995 |
Banking - 4.76% | | | |
| Bank of America Corp. | 20,557 | | 942,539 |
| Bank of New York Company, Inc. | 57,509 | | 1,969,108 |
| Cullen Frost Bankers, Inc. (a) | 55,135 | | 3,039,041 |
| Marshall & Ilsley Corp. | 44,164 | | 1,943,216 |
| Webster Financial Corp. | 25,335 | | 1,194,545 |
|
|
| | | | 9,088,449 |
| Building Materials & Construction - 1.26% | | | |
| American Standard Companies, Inc. | 11,400 | | 451,212 |
| Hughes Supply, Inc. (a) | 42,299 | | 1,956,329 |
|
|
| | | | 2,407,541 |
| Business Services - 5.80% | | | |
| Automatic Data Processing, Inc. | 82,600 | | 3,815,294 |
| Cadence Design Systems, Inc. * | 229,730 | | 4,077,708 |
| Jacobs Engineering Group, Inc. * (a) | 7,479 | | 641,249 |
| R.R. Donnelley & Sons Company | 75,515 | | 2,541,835 |
|
|
| | | | 11,076,086 |
| Cable and Television - 0.58% | | | |
| Comcast Corp.-Special Class A * | 41,337 | | 1,105,765 |
Cellular Communications - 0.89% | | | |
| Motorola, Inc. | 79,493 | | 1,701,150 |
Chemicals - 2.45% | | | |
| Eastman Chemical Company | 30,770 | | 1,517,884 |
| Praxair, Inc. | 58,618 | | 3,164,200 |
|
|
| | | | 4,682,084 |
| Commercial Services - 0.19% | | | |
| Shaw Group, Inc. * (a) | 10,779 | | 359,480 |
The accompanying notes are an integral part of the financial statements. 129
John Hancock Funds II
Portfolio of investments — February 28, 2006 (Unaudited)
(showing percentage of total net assets)
|
| All Cap Value Fund (continued) | | | |
| | Shares or | | |
| | Principal | | |
| | Amount | | Value |
|
|
| |
| COMMON STOCKS (continued) | | | |
| Computers & Business Equipment - 0.43% | | | |
| Sun Microsystems, Inc. * | 195,900 | $ | 816,903 |
Construction Materials - 2.16% | | | |
| JLG Industries, Inc. | 4,859 | | 286,632 |
| Simpson Manufacturing, Inc. (a) | 16,819 | | 657,455 |
| Trinity Industries, Inc. (a) | 60,110 | | 3,185,830 |
|
|
| | | | 4,129,917 |
| Containers & Glass - 2.01% | | | |
| Ball Corp. | 46,331 | | 1,973,701 |
| Pactiv Corp. * | 24,695 | | 566,256 |
| Sonoco Products Company (a) | 39,300 | | 1,285,896 |
|
|
| | | | 3,825,853 |
| Cosmetics & Toiletries - 0.77% | | | |
| Procter & Gamble Company | 24,594 | | 1,473,918 |
Drugs & Health Care - 2.24% | | | |
| Wyeth | 85,791 | | 4,272,392 |
Electrical Equipment - 7.28% | | | |
| AMETEK, Inc. | 1,211 | | 51,879 |
| Anixter International, Inc. * (a) | 29,689 | | 1,358,272 |
| Cooper Industries, Ltd., Class A | 29,400 | | 2,460,780 |
| Emerson Electric Company | 34,599 | | 2,830,544 |
| General Electric Company | 169,979 | | 5,587,210 |
| Hubbell, Inc., Class B | 34,562 | | 1,606,096 |
|
|
| | | | 13,894,781 |
| Electrical Utilities - 1.57% | | | |
| Ameren Corp. (a) | 25,840 | | 1,309,313 |
| CMS Energy Corp. * | 119,860 | | 1,687,629 |
|
|
| | | | 2,996,942 |
| Electronics - 2.49% | | | |
| AVX Corp. (a) | 117,374 | | 1,943,713 |
| Rogers Corp. * (a) | 8,476 | | 415,663 |
| Vishay Intertechnology, Inc. * | 164,378 | | 2,386,769 |
|
|
| | | | 4,746,145 |
| Financial Services - 0.87% | | | |
| Citigroup, Inc. | 35,878 | | 1,663,663 |
Food & Beverages - 3.34% | | | |
| Campbell Soup Company | 20,314 | | 632,375 |
| Diageo PLC, SADR (a) | 26,700 | | 1,647,390 |
| PepsiCo, Inc. | 69,179 | | 4,089,170 |
|
|
| | | | 6,368,935 |
| Furniture & Fixtures - 0.91% | | | |
| Ethan Allen Interiors, Inc. (a) | 42,591 | | 1,733,880 |
Gas & Pipeline Utilities - 1.02% | | | |
| AGL Resources, Inc. | 13,400 | | 481,060 |
| Nicor, Inc. (a) | 13,758 | | 590,631 |
| NiSource, Inc. | 42,681 | | 876,241 |
|
|
| | | | 1,947,932 |
| Gold - 1.02% | | | |
| Barrick Gold Corp. | 71,197 | | 1,948,662 |
| All Cap Value Fund (continued) | | | |
| | Shares or | | |
| | Principal | | |
| | Amount | | Value |
|
|
| |
| COMMON STOCKS (continued) | | | |
| Hotels & Restaurants - 1.17% | | | |
| Brinker International, Inc. | 53,437 | $ | 2,225,651 |
| Industrial Machinery - 4.60% | | | |
| Deere & Company | 8,845 | | 674,608 |
| Dover Corp. | 41,000 | | 1,965,540 |
| IDEX Corp. | 16,078 | | 759,685 |
| Parker-Hannifin Corp. | 46,404 | | 3,627,401 |
| W.W. Grainger, Inc. | 23,540 | | 1,742,902 |
|
|
| | | | 8,770,136 |
| Insurance - 3.67% | | | |
| ACE, Ltd. | 17,524 | | 976,613 |
| AFLAC, Inc. | 27,662 | | 1,279,367 |
| Cincinnati Financial Corp. | 11,900 | | 527,884 |
| Everest Re Group, Ltd. | 6,700 | | 663,568 |
| Genworth Financial, Inc. | 61,696 | | 1,963,167 |
| Markel Corp. * | 3,400 | | 1,117,070 |
| SAFECO Corp. | 9,118 | | 469,668 |
|
|
| | | | 6,997,337 |
| Internet Software - 1.16% | | | |
| McAfee, Inc. * | 94,799 | | 2,205,025 |
Life Sciences - 0.20% | | | |
| Waters Corp. * | 8,800 | | 376,024 |
Manufacturing - 3.30% | | | |
| Carlisle Companies, Inc. | 33,477 | | 2,631,292 |
| Eaton Corp. | 38,990 | | 2,716,433 |
| Hexcel Corp. * (a) | 19,200 | | 413,184 |
| Honeywell International, Inc. | 13,212 | | 541,032 |
|
|
| | | | 6,301,941 |
| Metal & Metal Products - 3.27% | | | |
| Crown Holdings, Inc. * | 100,929 | | 1,847,001 |
| Quanex Corp. | 43,257 | | 2,684,962 |
| Timken Company | 59,213 | | 1,698,229 |
|
|
| | | | 6,230,192 |
| Mining - 3.14% | | | |
| Newmont Mining Corp. | 113,071 | | 5,983,717 |
Paper - 0.35% | | | |
| MeadWestvaco Corp. | 24,072 | | 669,683 |
Petroleum Services - 6.10% | | | |
| BP PLC, SADR | 5,200 | | 345,384 |
| Exxon Mobil Corp. | 142,091 | | 8,435,942 |
| Halliburton Company | 16,629 | | 1,130,772 |
| Key Energy Services, Inc. * (a) | 15,205 | | 227,315 |
| Schlumberger, Ltd. | 7,418 | | 853,070 |
| Superior Energy Services, Inc. * (a) | 24,800 | | 644,800 |
|
|
| | | | 11,637,283 |
| Pharmaceuticals - 5.70% | | | |
| GlaxoSmithKline PLC, ADR | 44,052 | | 2,238,723 |
| Mylan Laboratories, Inc. | 126,598 | | 2,911,754 |
| Novartis AG, ADR | 75,070 | | 3,997,477 |
| Pfizer, Inc. | 32,544 | | 852,327 |
The accompanying notes are an integral part of the financial statements. 130
John Hancock Funds II
Portfolio of investments — February 28, 2006 (Unaudited)
(showing percentage of total net assets)
|
| All Cap Value Fund (continued) | | | |
| | | Shares or | | |
| | | Principal | | |
| | | Amount | | Value |
|
|
| |
| COMMON STOCKS (continued) | | | | |
| Pharmaceuticals (continued) | | | | |
| Schering-Plough Corp. | | 47,104 | $ | 871,424 |
|
|
| | | | | 10,871,705 |
| Railroads & Equipment - 0.96% | | | | |
| GATX Corp. (a) | | 14,200 | | 563,740 |
| Union Pacific Corp. | | 14,324 | | 1,268,390 |
|
|
| | | | | 1,832,130 |
| Real Estate - 1.10% | | | | |
| Host Marriott Corp., REIT | | 108,002 | | 2,098,479 |
Retail Grocery - 1.38% | | | | |
| The Kroger Company * | | 131,734 | | 2,639,949 |
Retail Trade - 3.59% | | | | |
| Federated Department Stores, Inc. | | 47,957 | | 3,406,865 |
| Foot Locker, Inc. | | 53,659 | | 1,240,060 |
| Pacific Sunwear of California, Inc. * | | 23,800 | | 566,678 |
| Wal-Mart Stores, Inc. | | 35,917 | | 1,629,195 |
|
|
| | | | | 6,842,798 |
| Software - 1.45% | | | | |
| Microsoft Corp. | | 102,576 | | 2,759,294 |
Steel - 1.08% | | | | |
| Steel Dynamics, Inc. (a) | | 44,927 | | 2,066,642 |
Telecommunications Equipment & | | | | |
| Services - 1.99% | | | | |
| ADC Telecommunications, Inc. * | | 21,528 | | 545,089 |
| Avaya, Inc. * | | 89,153 | | 991,381 |
| Tellabs, Inc. * | | 154,402 | | 2,268,166 |
|
|
| | | | | 3,804,636 |
| Telephone - 3.29% | | | | |
| AT&T Corp. | | 58,000 | | 1,600,220 |
| BellSouth Corp. | | 30,700 | | 969,506 |
| Qwest Communications International, Inc. * (a) | 109,800 | | 693,936 |
| Sprint Corp. | | 43,368 | | 1,042,133 |
| Verizon Communications, Inc. | | 58,506 | | 1,971,652 |
|
|
| | | | | 6,277,447 |
| Travel Services - 0.88% | | | | |
| Sabre Holdings Corp. | | 69,855 | | 1,685,601 |
Trucking & Freight - 1.75% | | | | |
| Heartland Express, Inc. | | 47,167 | | 1,090,973 |
| Werner Enterprises, Inc. (a) | | 115,583 | | 2,245,777 |
|
|
| | | | | 3,336,750 |
|
| TOTAL COMMON STOCKS (Cost $168,919,629) | | $ | 184,058,579 |
|
| |
| SHORT TERM INVESTMENTS - 10.77% | | | |
| State Street Navigator Securities | | | | |
| Lending Prime Portfolio (c) | $ | 20,547,958 | $ | 20,547,958 |
|
| TOTAL SHORT TERM INVESTMENTS | | | | |
| (Cost $20,547,958) | | | $ | 20,547,958 |
|
| All Cap Value Fund (continued) | | |
| | | Shares or | |
| | | Principal | |
| | | Amount | Value |
|
|
| |
| REPURCHASE AGREEMENTS - 3.33% | | |
| Repurchase Agreement with State | | | |
| Street Corp. dated 02/28/2006 at | | | |
| 3.20% to be repurchased at | | | |
| $6,367,566 on 03/01/2006, | | | |
| collateralized by $6,367,000 | | | |
| Federal National Mortgage | | | |
| Association, 5.55% due | | | |
| 07/10/2028 (valued at $6,498,007, | | | |
| including interest) (c) | $ | 6,367,000 $ | 6,367,000 |
|
| TOTAL REPURCHASE AGREEMENTS | | | |
| (Cost $6,367,000) | | $ | 6,367,000 |
|
| Total Investments (All Cap Value Fund) | | | |
| (Cost $195,834,587) - 110.57% | | $ | 210,973,537 |
| Liabilities in Excess of Other Assets - (10.57)% | | (20,174,760) |
|
|
| TOTAL NET ASSETS - 100.00% | | $ | 190,798,777 |
|
|
| |
| |
| Blue Chip Growth Fund | | | |
| | | Shares or | |
| | | Principal | |
| | | Amount | Value |
|
|
| |
| COMMON STOCKS - 98.93% | | | |
| Advertising - 0.45% | | | |
| Monster Worldwide, Inc. * | | 26,400 $ | 1,292,544 |
| Omnicom Group, Inc. (a) | | 49,036 | 3,914,054 |
|
|
| | | | 5,206,598 |
| Aerospace - 1.07% | | | |
| General Dynamics Corp. | | 63,613 | 7,841,575 |
| Lockheed Martin Corp. | | 8,727 | 635,936 |
| Rockwell Collins, Inc. | | 58,801 | 3,125,273 |
| United Technologies Corp. | | 13,600 | 795,600 |
|
|
| | | | 12,398,384 |
| Agriculture - 1.10% | | | |
| Monsanto Company | | 152,148 | 12,762,174 |
Apparel & Textiles - 0.20% | | | |
| Cintas Corp. (a) | | 56,001 | 2,301,081 |
Banking - 2.69% | | | |
| Northern Trust Corp. (a) | | 192,711 | 10,159,724 |
| UBS AG - CHF | | 107,600 | 11,430,833 |
| Wells Fargo Company | | 147,854 | 9,492,227 |
|
|
| | | | 31,082,784 |
| Biotechnology - 2.72% | | | |
| Amgen, Inc. * | | 242,855 | 18,333,124 |
| Genentech, Inc. * | | 153,778 | 13,177,237 |
|
|
| | | | 31,510,361 |
| Broadcasting - 0.15% | | | |
| Grupo Televisa SA, SADR (a) | | 21,800 | 1,710,428 |
Business Services - 2.96% | | | |
| Accenture, Ltd., Class A | | 236,564 | 7,726,180 |
| Automatic Data Processing, Inc. | | 274,819 | 12,693,890 |
| ChoicePoint, Inc. * | | 35,088 | 1,557,907 |
The accompanying notes are an integral part of the financial statements. 131
John Hancock Funds II
Portfolio of investments — February 28, 2006 (Unaudited)
(showing percentage of total net assets)
|
| Blue Chip Growth Fund (continued) | | |
| | Shares or | | |
| | Principal | | |
| | Amount | | Value |
|
|
| |
| COMMON STOCKS (continued) | | | |
| Business Services (continued) | | | |
| First Data Corp. | 205,636 | $ | 9,280,353 |
| Paychex, Inc. | 73,657 | | 2,949,963 |
|
|
| | | | 34,208,293 |
| Cable and Television - 1.78% | | | |
| Rogers Communications, Inc. | 128,916 | | 5,160,507 |
| Time Warner, Inc. | 475,986 | | 8,239,318 |
| Viacom, Inc. * | 179,381 | | 7,168,065 |
|
|
| | | | 20,567,890 |
| Cellular Communications - 1.16% | | | |
| America Movil S.A. de C.V., Series L | 217,049 | | 7,538,112 |
| American Tower Corp., Class A * | 181,762 | | 5,785,484 |
| NII Holdings, Inc., Class B * | 2,200 | | 112,684 |
|
|
| | | | 13,436,280 |
| Colleges & Universities - 0.11% | | | |
| Apollo Group, Inc., Class A * | 25,903 | | 1,279,090 |
Computers & Business Equipment - 3.51% | | | |
| Cisco Systems, Inc. * | 696,482 | | 14,096,796 |
| Dell, Inc. * | 582,627 | | 16,896,183 |
| EMC Corp. * | 681,948 | | 9,560,911 |
|
|
| | | | 40,553,890 |
| Cosmetics & Toiletries - 1.51% | | | |
| Procter & Gamble Company | 292,268 | | 17,515,621 |
Domestic Oil - 0.28% | | | |
| Murphy Oil Corp. (a) | 68,842 | | 3,226,625 |
Drugs & Health Care - 0.95% | | | |
| Novartis AG - CHF | 89,500 | | 4,818,837 |
| Wyeth | 123,946 | | 6,172,511 |
|
|
| | | | 10,991,348 |
| Electrical Equipment - 3.39% | | | |
| General Electric Company | 1,191,699 | | 39,171,146 |
Electronics - 1.22% | | | |
| Garmin, Ltd. (a) | 85,000 | | 5,849,700 |
| Harman International Industries, Inc. | 59,840 | | 6,603,344 |
| Samsung Electronics Company, Ltd. - KRW | 2,400 | | 1,698,043 |
|
|
| | | | 14,151,087 |
| Financial Services - 13.24% | | | |
| Ameriprise Financial, Inc. | 73,589 | | 3,346,828 |
| Charles Schwab Corp. | 555,714 | | 9,008,124 |
| Chicago Merchantile Exchange Holdings, Inc. (a) | 3,500 | | 1,489,600 |
| Citigroup, Inc. | 516,479 | | 23,949,131 |
| E*TRADE Financial Corp. * | 324,171 | | 8,292,294 |
| Fiserv, Inc. * (a) | 34,281 | | 1,422,662 |
| Franklin Resources, Inc. | 154,035 | | 15,816,314 |
| Goldman Sachs Group, Inc. | 83,524 | | 11,801,106 |
| Legg Mason, Inc. | 118,880 | | 15,524,539 |
| Mellon Financial Corp. | 116,539 | | 4,205,893 |
| Merrill Lynch & Company, Inc. | 191,810 | | 14,809,650 |
| Morgan Stanley | 12,800 | | 763,648 |
| SLM Corp. | 230,608 | | 13,008,597 |
| Blue Chip Growth Fund (continued) | | |
| | Shares or | | |
| | Principal | | |
| | Amount | | Value |
|
|
| |
| COMMON STOCKS (continued) | | | |
| Financial Services (continued) | | | |
| State Street Corp. (a)(c) | 357,365 | $ | 22,328,165 |
| TD Ameritrade Holding Corp. * (a) | 335,226 | | 7,294,518 |
|
|
| | | | 153,061,069 |
| Food & Beverages - 1.23% | | | |
| PepsiCo, Inc. | 197,366 | | 11,666,304 |
| The Coca-Cola Company | 60,109 | | 2,522,775 |
|
|
| | | | 14,189,079 |
| Healthcare Products - 3.27% | | | |
| Alcon, Inc. | 13,200 | | 1,520,112 |
| Johnson & Johnson | 150,101 | | 8,653,323 |
| Medtronic, Inc. | 265,864 | | 14,343,363 |
| St. Jude Medical, Inc. * (a) | 163,364 | | 7,449,398 |
| Stryker Corp. | 126,521 | | 5,847,800 |
|
|
| | | | 37,813,996 |
| Healthcare Services - 6.00% | | | |
| Cardinal Health, Inc. | 81,705 | | 5,931,783 |
| Humana, Inc. * | 39,100 | | 2,020,297 |
| Quest Diagnostics, Inc. | 158,078 | | 8,357,584 |
| UnitedHealth Group, Inc. | 670,941 | | 39,068,894 |
| Wellpoint, Inc. * | 181,728 | | 13,954,893 |
|
|
| | | | 69,333,451 |
| Hotels & Restaurants - 2.17% | | | |
| Harrah's Entertainment, Inc. | 87,848 | | 6,318,028 |
| Marriott International, Inc., Class A | 87,456 | | 5,981,991 |
| McDonald's Corp. | 88,485 | | 3,089,011 |
| Wynn Resorts, Ltd. * (a) | 146,173 | | 9,713,196 |
|
|
| | | | 25,102,226 |
| Household Products - 0.17% | | | |
| Fortune Brands, Inc. (a) | 25,862 | | 2,005,598 |
Industrial Machinery - 0.52% | | | |
| Deere & Company | 79,013 | | 6,026,322 |
Insurance - 4.32% | | | |
| Aetna, Inc. | 65,952 | | 3,363,552 |
| AFLAC, Inc. | 44,289 | | 2,048,366 |
| American International Group, Inc. | 343,653 | | 22,804,813 |
| Hartford Financial Services Group, Inc. | 123,716 | | 10,191,724 |
| Marsh & McLennan Companies, Inc. (a) | 254,802 | | 7,875,930 |
| Prudential Financial, Inc. (a) | 47,400 | | 3,651,696 |
|
|
| | | | 49,936,081 |
| Internet Retail - 0.93% | | | |
| Amazon.com, Inc. * | 38,311 | | 1,436,279 |
| eBay, Inc. * | 178,465 | | 7,149,308 |
| IAC/InterActiveCorp * (a) | 74,327 | | 2,173,322 |
|
|
| | | | 10,758,909 |
| Internet Service Provider - 2.43% | | | |
| Google, Inc., Class A * | 46,034 | | 16,692,849 |
| Yahoo!, Inc. * | 356,368 | | 11,425,158 |
|
|
| | | | 28,118,007 |
The accompanying notes are an integral part of the financial statements. 132
John Hancock Funds II
Portfolio of investments — February 28, 2006 (Unaudited)
(showing percentage of total net assets)
|
| Blue Chip Growth Fund (continued) | | |
| | Shares or | | |
| | Principal | | |
| | Amount | | Value |
|
|
| |
| COMMON STOCKS (continued) | | | |
| Internet Software - 0.43% | | | |
| Juniper Networks, Inc. * | 269,379 | $ | 4,953,880 |
Leisure Time - 1.86% | | | |
| Carnival Corp. (a) | 247,249 | | 12,770,411 |
| International Game Technology, Inc. | 243,098 | | 8,695,615 |
|
|
| | | | 21,466,026 |
| Manufacturing - 3.32% | | | |
| Danaher Corp. (a) | 420,537 | | 25,476,132 |
| Honeywell International, Inc. | 209,595 | | 8,582,915 |
| Illinois Tool Works, Inc. | 50,513 | | 4,336,036 |
|
|
| | | | 38,395,083 |
| Mining - 0.41% | | | |
| BHP Billiton, Ltd. - AUD | 260,100 | | 4,685,787 |
Newspapers - 0.43% | | | |
| E.W. Scripps Company, Class A (a) | 104,450 | | 5,021,956 |
Petroleum Services - 6.23% | | | |
| Baker Hughes, Inc. (a) | 174,041 | | 11,829,567 |
| Exxon Mobil Corp. | 208,162 | | 12,358,578 |
| Schlumberger, Ltd. (a) | 195,354 | | 22,465,710 |
| Smith International, Inc. (a) | 342,428 | | 13,262,236 |
| Total SA, SADR | 49,546 | | 6,249,237 |
| Transocean, Inc. * | 79,588 | | 5,903,838 |
|
|
| | | | 72,069,166 |
| Pharmaceuticals - 4.19% | | | |
| Caremark Rx, Inc. * | 243,697 | | 12,123,926 |
| Gilead Sciences, Inc. * | 237,519 | | 14,790,308 |
| Pfizer, Inc. | 365,796 | | 9,580,197 |
| Roche Holdings AG - CHF | 21,000 | | 3,105,358 |
| Sepracor, Inc. * | 105,688 | | 6,056,979 |
| Teva Pharmaceutical Industries, Ltd., SADR (a) | 66,728 | | 2,801,909 |
|
|
| | | | 48,458,677 |
| Publishing - 0.38% | | | |
| McGraw-Hill Companies, Inc. (a) | 82,448 | | 4,377,164 |
Railroads & Equipment - 0.02% | | | |
| Union Pacific Corp. | 2,806 | | 248,471 |
Retail Grocery - 0.48% | | | |
| Sysco Corp. | 183,005 | | 5,506,620 |
Retail Trade - 5.98% | | | |
| Best Buy Company, Inc. (a) | 90,310 | | 4,864,097 |
| CVS Corp. | 151,298 | | 4,286,272 |
| Home Depot, Inc. | 394,252 | | 16,617,722 |
| Kohl's Corp. * | 257,570 | | 12,391,693 |
| Target Corp. | 262,878 | | 14,300,563 |
| Wal-Mart Stores, Inc. | 367,836 | | 16,685,041 |
|
|
| | | | 69,145,388 |
| Semiconductors - 5.91% | | | |
| Analog Devices, Inc. (a) | 253,357 | | 9,663,036 |
| Applied Materials, Inc. | 163,500 | | 2,998,590 |
| Intel Corp. | 378,708 | | 7,801,385 |
| Linear Technology Corp. | 180,910 | | 6,668,342 |
| Blue Chip Growth Fund (continued) | | |
| | | Shares or | | |
| | | Principal | | |
| | | Amount | | Value |
| |
|
| |
| COMMON STOCKS (continued) | | | | |
| Semiconductors (continued) | | | | |
| Marvell Technology Group, Ltd. * (a) | | 131,695 | $ | 8,062,368 |
| Maxim Integrated Products, Inc. | | 374,228 | | 14,628,572 |
| Texas Instruments, Inc. | | 255,082 | | 7,614,198 |
| Xilinx, Inc. | | 397,775 | | 10,851,302 |
|
|
| | | | | 68,287,793 |
| Software - 4.81% | | | | |
| Adobe Systems, Inc. | | 154,125 | | 5,952,307 |
| Intuit, Inc. * (a) | | 89,289 | | 4,337,660 |
| Microsoft Corp. | | 1,339,360 | | 36,028,784 |
| Oracle Corp. * | | 745,838 | | 9,263,308 |
|
|
| | | | | 55,582,059 |
| Steel - 0.29% | | | | |
| Nucor Corp. | | 39,510 | | 3,399,836 |
Telecommunications Equipment & | | | | |
| Services - 2.94% | | | | |
| Corning, Inc. * | | 356,085 | | 8,692,035 |
| Nokia Oyj, SADR | | 504,172 | | 9,367,516 |
| QUALCOMM, Inc. | | 193,323 | | 9,126,779 |
| Telefonaktiebolaget LM Ericsson, SADR | | 26,800 | | 913,880 |
| Telus Corp., Non Voting Shares | | 151,482 | | 5,886,590 |
|
|
| | | | | 33,986,800 |
| Travel Services - 1.41% | | | | |
| American Express Company | | 302,648 | | 16,306,674 |
Trucking & Freight - 0.31% | | | | |
| United Parcel Service, Inc., Class B | | 47,478 | | 3,547,081 |
|
| TOTAL COMMON STOCKS (Cost $1,061,644,768) | | $ 1,143,856,279 |
|
| |
| SHORT TERM INVESTMENTS - 6.47% | | | | |
| State Street Navigator Securities | | | | |
| Lending Prime Portfolio (c) | $ | 68,562,353 | $ | 68,562,353 |
| T. Rowe Price Reserve Investment Fund (c) | | 6,204,326 | | 6,204,326 |
|
| TOTAL SHORT TERM INVESTMENTS | | | | |
| (Cost $74,766,680) | | | $ | 74,766,679 |
|
| |
| REPURCHASE AGREEMENTS - 0.34% | | | | |
| Repurchase Agreement with State | | | | |
| Street Corp. dated 02/28/2006 at | | | | |
| 3.20% to be repurchased at | | | | |
| $3,996,355 on 03/01/2006, | | | | |
| collateralized by $4,100,000 U.S. | | | | |
| Treasury Bond, 4.50% due | | | | |
| 02/15/2036 (valued at | | | | |
| $4,079,500, including interest) (c) | $ | 3,996,000 | $ | 3,996,000 |
|
| TOTAL REPURCHASE AGREEMENTS | | | | |
| (Cost $3,996,000) | | | $ | 3,996,000 |
|
| Total Investments (Blue Chip Growth Fund) | | | | |
| (Cost $1,140,407,448) - 105.74% | | | $ 1,222,618,958 |
| Liabilities in Excess of Other Assets - (5.74)% | | | (66,357,563) |
|
|
| TOTAL NET ASSETS - 100.00% | | | $ 1,156,261,395 |
|
|
The accompanying notes are an integral part of the financial statements. 133
John Hancock Funds II
Portfolio of investments — February 28, 2006 (Unaudited)
(showing percentage of total net assets)
|
| Capital Appreciation Fund | | | |
| | Shares or | | |
| | Principal | | |
| | Amount | | Value |
|
|
| |
| COMMON STOCKS - 98.83% | | | |
| Advertising - 0.81% | | | |
| Getty Images, Inc. * (a) | 29,900 | $ | 2,422,797 |
Apparel & Textiles - 3.11% | | | |
| Coach, Inc. * | 126,156 | | 4,506,292 |
| NIKE, Inc., Class B | 55,646 | | 4,828,960 |
| |
|
| | | | 9,335,252 |
| Banking - 1.82% | | | |
| UBS AG | 51,300 | | 5,449,599 |
Biotechnology - 4.72% | | | |
| Amgen, Inc. * | 108,225 | | 8,169,905 |
| Genentech, Inc. * | 69,831 | | 5,983,819 |
| |
|
| | | | 14,153,724 |
| Computers & Business Equipment - 3.23% | | | |
| Apple Computer, Inc. * | 64,256 | | 4,404,106 |
| Cisco Systems, Inc. * | 260,830 | | 5,279,199 |
| |
|
| | | | 9,683,305 |
| Cosmetics & Toiletries - 3.07% | | | |
| Procter & Gamble Company | 153,784 | | 9,216,275 |
Crude Petroleum & Natural Gas - 1.18% | | | |
| Occidental Petroleum Corp. | 38,700 | | 3,542,598 |
Electrical Equipment - 2.23% | | | |
| General Electric Company | 203,588 | | 6,691,938 |
Electronics - 1.27% | | | |
| Agilent Technologies, Inc. * | 105,559 | | 3,800,124 |
Financial Services - 6.56% | | | |
| Charles Schwab Corp. | 353,331 | | 5,727,495 |
| Goldman Sachs Group, Inc. | 30,510 | | 4,310,758 |
| JPMorgan Chase & Company | 77,370 | | 3,183,002 |
| Legg Mason, Inc. | 3,800 | | 496,242 |
| Merrill Lynch & Company, Inc. | 76,982 | | 5,943,780 |
| |
|
| | | | 19,661,277 |
| Food & Beverages - 1.66% | | | |
| PepsiCo, Inc. | 84,335 | | 4,985,042 |
Healthcare Products - 3.60% | | | |
| Alcon, Inc. | 54,419 | | 6,266,892 |
| St. Jude Medical, Inc. * | 99,474 | | 4,536,015 |
| |
|
| | | | 10,802,907 |
| Healthcare Services - 2.94% | | | |
| UnitedHealth Group, Inc. | 85,130 | | 4,957,120 |
| Wellpoint, Inc. * | 50,208 | | 3,855,472 |
| |
|
| | | | 8,812,592 |
| Hotels & Restaurants - 2.24% | | | |
| Marriott International, Inc., Class A | 65,900 | | 4,507,560 |
| The Cheesecake Factory, Inc. * | 61,200 | | 2,212,992 |
| |
|
| | | | 6,720,552 |
| Insurance - 3.15% | | | |
| American International Group, Inc. | 106,208 | | 7,047,963 |
| CIGNA Corp. | 19,600 | | 2,405,900 |
| |
|
| | �� | | 9,453,863 |
| Capital Appreciation Fund (continued) | | |
| | Shares or | | |
| | Principal | | |
| | Amount | | Value |
|
|
| |
| COMMON STOCKS (continued) | | | |
| Internet Retail - 3.28% | | | |
| eBay, Inc. * | 245,135 | $ | 9,820,108 |
Internet Service Provider - 6.33% | | | |
| Google, Inc., Class A * | 33,793 | | 12,254,018 |
| Yahoo!, Inc. * | 209,692 | | 6,722,725 |
|
|
| | | | 18,976,743 |
| Leisure Time - 3.42% | | | |
| Electronic Arts, Inc. * | 91,908 | | 4,776,459 |
| Walt Disney Company | 195,100 | | 5,460,849 |
|
|
| | | | 10,237,308 |
| Petroleum Services - 4.15% | | | |
| Schlumberger, Ltd. | 75,297 | | 8,659,155 |
| Suncor Energy, Inc. | 50,752 | | 3,793,712 |
|
|
| | | | 12,452,867 |
| Pharmaceuticals - 8.66% | | | |
| Caremark Rx, Inc. * | 89,689 | | 4,462,028 |
| Gilead Sciences, Inc. * | 100,386 | | 6,251,036 |
| Novartis AG, ADR | 106,976 | | 5,696,472 |
| Roche Holdings, Ltd., SADR | 81,911 | | 6,054,411 |
| Sanofi-Aventis, ADR | 82,173 | | 3,503,035 |
|
|
| | | | 25,966,982 |
| Retail Grocery - 1.67% | | | |
| Whole Foods Market, Inc. | 78,334 | | 5,003,976 |
Retail Trade - 7.70% | | | |
| Chico's FAS, Inc. * | 113,851 | | 5,356,689 |
| Federated Department Stores, Inc. | 63,845 | | 4,535,549 |
| Lowe's Companies, Inc. | 64,476 | | 4,395,974 |
| Target Corp. | 96,593 | | 5,254,659 |
| Urban Outfitters, Inc. * | 39,400 | | 1,107,140 |
| Williams-Sonoma, Inc. * | 60,380 | | 2,444,786 |
|
|
| | | | 23,094,797 |
| Semiconductors - 9.33% | | | |
| Broadcom Corp., Class A * | 164,650 | | 7,424,068 |
| Marvell Technology Group, Ltd. * | 123,025 | | 7,531,590 |
| Maxim Integrated Products, Inc. | 176,119 | | 6,884,492 |
| Texas Instruments, Inc. | 205,050 | | 6,120,743 |
|
|
| | | | 27,960,893 |
| Software - 7.21% | | | |
| Adobe Systems, Inc. | 195,515 | | 7,550,789 |
| Microsoft Corp. | 269,441 | | 7,247,963 |
| NAVTEQ Corp. * | 33,900 | | 1,569,909 |
| SAP AG, SADR | 102,688 | | 5,247,357 |
|
|
| | | | 21,616,018 |
| Telecommunications Equipment & | | | |
| Services - 2.95% | | | |
| Nokia Oyj, SADR | 204,931 | | 3,807,618 |
| QUALCOMM, Inc. | 106,800 | | 5,042,028 |
|
|
| | | | 8,849,646 |
The accompanying notes are an integral part of the financial statements. 134
John Hancock Funds II
Portfolio of investments — February 28, 2006 (Unaudited)
(showing percentage of total net assets)
|
| Capital Appreciation Fund (continued) | | |
| | | Shares or | | |
| | | Principal | | |
| | | Amount | | Value |
| |
|
| |
| COMMON STOCKS (continued) | | | | |
| Travel Services - 2.54% | | | | |
| American Express Company | | 141,074 | $ | 7,601,067 |
|
| TOTAL COMMON STOCKS (Cost $276,799,675) | | $ | 296,312,250 |
|
| |
| SHORT TERM INVESTMENTS - 2.41% | | | |
| Citigroup Funding, Inc. | | | | |
| 4.46% due 03/01/2006 | $ | 4,880,000 | $ | 4,880,000 |
| State Street Navigator Securities Lending | | | | |
| Prime Portfolio (c) | | 2,341,825 | | 2,341,825 |
|
| TOTAL SHORT TERM INVESTMENTS | | | | |
| (Cost $7,221,825) | | | $ | 7,221,825 |
|
| Total Investments (Capital Appreciation Fund) | | | |
| (Cost $284,021,500) - 101.24% | | | $ | 303,534,075 |
| Liabilities in Excess of Other Assets - (1.24)% | | | (3,705,766) |
|
|
| TOTAL NET ASSETS - 100.00% | | | $ | 299,828,309 |
|
|
| |
| |
| Core Bond Fund | | | | |
| | | Shares or | | |
| | | Principal | | |
| | | Amount | | Value |
|
|
| |
| PREFERRED STOCKS - 0.12% | | | | |
| Banking - 0.12% | | | | |
| UOB Cayman Ltd. * (b) | | 200,000 | $ | 202,761 |
|
| TOTAL PREFERRED STOCKS (Cost $201,748) | | $ | 202,761 |
|
| |
| U.S. TREASURY OBLIGATIONS - 17.45% | | | |
| U.S. Treasury Bonds - 7.04% | | | | |
| 4.125% due 08/15/2010 *** | $ | 1,714,000 | | 1,679,653 |
| 5.375% due 02/15/2031 | | 277,000 | | 308,347 |
| 6.00% due 02/15/2026 *** | | 3,248,000 | | 3,796,353 |
| 6.25% due 08/15/2023 to 05/15/2030 *** | 5,586,000 | | 6,660,007 |
|
|
| | | | | 12,444,360 |
| U.S. Treasury Notes - 10.41% | | | | |
| 4.00% due 02/15/2015 *** | | 1,955,000 | | 1,870,079 |
| 4.125% due 05/15/2015 | | 913,000 | | 881,366 |
| 4.25% due 01/15/2011 | | 2,284,000 | | 2,249,027 |
| 4.25% due 08/15/2015 *** | | 1,093,000 | | 1,064,736 |
| 4.375% due 12/31/2007 to 01/31/2008 | | 2,303,000 | | 2,289,743 |
| 4.50% due 02/15/2009 to 02/15/2016 | | 1,627,000 | | 1,620,223 |
| 4.50% due 11/15/2010 to 11/15/2015 *** | 8,467,000 | | 8,399,315 |
| 4.625% due 02/29/2008 | | 18,000 | | 17,982 |
|
|
| | | | | 18,392,471 |
|
| TOTAL U.S. TREASURY OBLIGATIONS | | | |
| (Cost $30,881,590) | | | $ | 30,836,831 |
|
| |
| U.S. GOVERNMENT AGENCY OBLIGATIONS - 43.92% | | |
| Federal Home Loan Bank - 1.88% | | | | |
| 5.46% due 11/30/2015 | | 3,325,324 | | 3,319,568 |
Federal Home Loan Mortgage Corp. - 35.01% | | | |
| 0.99% due 07/01/2034 | | 1,025,000 | | 1,048,873 |
| 3.50% due 05/15/2026 | | 229,898 | | 223,790 |
| Core Bond Fund (continued) | | | |
| | | Shares or | | |
| | | Principal | | |
| | | Amount | | Value |
|
|
| |
| U.S. GOVERNMENT AGENCY | | | | |
| OBLIGATIONS (continued) | | | | |
| Federal Home Loan Mortgage Corp. | | | | |
| (continued) | | | | |
| 3.57% due 06/15/2029 | $ | 961,963 | $ | 931,034 |
| 3.90% due 01/15/2023 | | 2,188,582 | | 2,116,671 |
| 4.00% due 09/15/2017 to 04/15/2025 | | 1,246,796 | | 1,211,399 |
| 4.125% due 07/12/2010 | | 1,574,000 | | 1,524,713 |
| 4.50% due 05/15/2024 to 12/01/2099 | | 8,482,589 | | 8,111,727 |
| 4.933% due 11/01/2035 | | 659,000 | | 650,052 |
| 5.00% due 05/15/2022 to 12/01/2035 | | 3,806,038 | | 3,710,879 |
| 5.00% TBA ** | | 3,836,000 | | 3,713,727 |
| 5.50% due 04/01/2017 to 03/15/2035 | | 6,362,473 | | 6,370,190 |
| 6.00% due 03/01/2025 to 03/01/2036 | | 6,018,058 | | 6,096,832 |
| 6.50% due 01/01/2036 | | 2,347,710 | | 2,402,390 |
| 6.50% TBA ** | | 18,306,000 | | 18,706,444 |
| 6.625% due 09/15/2009 *** | | 4,801,000 | | 5,059,294 |
|
|
| | | | | 61,878,015 |
| Federal National Mortgage | | | | |
| Association - 6.15% | | | | |
| 4.50% due 08/01/2033 to 09/01/2035 | | 2,578,700 | | 2,433,156 |
| 5.004% due 12/01/2035 | | 388,823 | | 385,505 |
| 5.035% due 12/01/2035 | | 264,260 | | 262,120 |
| 5.09% due 11/30/2035 | | 108,000 | | 106,958 |
| 5.21% due 11/30/2035 | | 99,000 | | 99,514 |
| 5.327% due 12/01/2035 | | 263,428 | | 262,058 |
| 5.67% due 03/01/2009 | | 433,973 | | 438,185 |
| 6.00% due 05/15/2011 *** | | 2,715,000 | | 2,841,383 |
| 6.00% TBA ** | | 3,973,000 | | 4,041,520 |
|
|
| | | | | 10,870,399 |
| Government National Mortgage | | | | |
| Association - 0.88% | | | | |
| 4.07% due 01/15/2021 | | 195,000 | | 189,150 |
| 6.00% due 12/01/2099 | | 1,357,000 | | 1,377,461 |
|
|
| | | | | 1,566,611 |
|
| TOTAL U.S. GOVERNMENT AGENCY OBLIGATIONS | | |
| (Cost $77,691,122) | | | $ | 77,634,593 |
|
| |
| FOREIGN GOVERNMENT OBLIGATIONS - 0.53% | | |
| Mexico - 0.34% | | | | |
| Government of Mexico | | | | |
| 5.875% due 01/15/2014 | | 314,000 | | 321,850 |
| 6.75% due 09/27/2034 | | 250,000 | | 279,375 |
|
|
| | | | | 601,225 |
| Russia - 0.19% | | | | |
| Russian Federation | | | | |
| 5.00% due 03/31/2030 | | 295,000 | | 332,613 |
|
| TOTAL FOREIGN GOVERNMENT OBLIGATIONS | | |
| (Cost $923,807) | | | $ | 933,838 |
|
| |
| CORPORATE BONDS - 15.68% | | | | |
| Automobiles - 0.23% | | | | |
| DaimlerChrysler NA Holding Corp. | | | | |
| 6.50% due 11/15/2013 | | 195,000 | | 201,560 |
The accompanying notes are an integral part of the financial statements. 135
John Hancock Funds II
Portfolio of investments — February 28, 2006 (Unaudited)
(showing percentage of total net assets)
|
| Core Bond Fund (continued) | | | |
| | | Shares or | | |
| | | Principal | | |
| | | Amount | | Value |
|
|
| |
| CORPORATE BONDS (continued) | | | | |
| Automobiles (continued) | | | | |
| DaimlerChrysler NA Holding Corp. (continued) | | | |
| 8.50% due 01/18/2031 | $ | 171,000 | $ | 208,480 |
| |
|
| | | | | 410,040 |
| |
| Banking - 0.49% | | | | |
| BAC Capital Trust VI | | | | |
| 5.625% due 03/08/2035 | | 234,000 | | 230,107 |
| PNC Funding Corp. | | | | |
| 5.25% due 11/15/2015 | | 259,000 | | 255,554 |
| Wachovia Capital Trust III | | | | |
| 5.80% due 08/29/2049 (b) | | 265,000 | | 263,501 |
| Wachovia Corp. | | | | |
| 5.50% due 08/01/2035 | | 123,000 | | 118,655 |
| |
|
| | | | | 867,817 |
| |
| Broadcasting - 0.31% | | | | |
| CBS Corp. | | | | |
| 5.625% due 08/15/2012 | | 145,000 | | 145,177 |
| Clear Channel Communications, Inc. | | | | |
| 5.50% due 09/15/2014 | | 135,000 | | 127,551 |
| News America, Inc. | | | | |
| 6.40% due 12/15/2035 | | 275,000 | | 276,726 |
| |
|
| | | | | 549,454 |
| |
| Cable and Television - 0.23% | | | | |
| Comcast Corp. | | | | |
| 5.65% due 06/15/2035 | | 166,000 | | 151,908 |
| 5.90% due 03/15/2016 | | 110,000 | | 109,848 |
| Cox Communications, Inc. | | | | |
| 7.125% due 10/01/2012 | | 130,000 | | 138,759 |
| |
|
| | | | | 400,515 |
| |
| Cellular Communications - 0.55% | | | | |
| America Movil SA de CV | | | | |
| 6.375% due 03/01/2035 | | 244,000 | | 246,846 |
| AT&T Broadband Corp. | | | | |
| 8.375% due 03/15/2013 | | 217,000 | | 248,796 |
| Cingular Wireless Services, Inc. | | | | |
| 8.125% due 05/01/2012 | | 130,000 | | 148,951 |
| Verizon Wireless Capital LLC | | | | |
| 5.375% due 12/15/2006 | | 330,000 | | 330,626 |
| |
|
| | | | | 975,219 |
| |
| Crude Petroleum & Natural Gas - 0.11% | | | | |
| Canadian Natural Resources, Ltd. | | | | |
| 5.85% due 02/01/2035 | | 78,000 | | 78,572 |
| EnCana Corp. | | | | |
| 6.50% due 08/15/2034 | | 106,000 | | 118,399 |
| |
|
| | | | | 196,971 |
| |
| Domestic Oil - 0.16% | | | | |
| Amerada Hess Corp. | | | | |
| 7.125% due 03/15/2033 | | 94,000 | | 108,336 |
| ConocoPhillips | | | | |
| 5.90% due 10/15/2032 | | 160,000 | | 169,808 |
| |
|
| | | | | 278,144 |
| |
| Drugs & Health Care - 0.27% | | | | |
| Wyeth | | | | |
| 5.50% due 02/15/2016 | | 475,000 | | 477,878 |
| Core Bond Fund (continued) | | | |
| | | Shares or | | |
| | | Principal | | |
| | | Amount | | Value |
|
|
| |
| CORPORATE BONDS (continued) | | | | |
| Electrical Utilities - 1.22% | | | | |
| American Electric Power Company, Inc., Series C | | | |
| 5.375% due 03/15/2010 | $ | 185,000 | $ | 184,956 |
| Dominion Resources, Inc. | | | | |
| 5.95% due 06/15/2035 | | 121,000 | | 117,607 |
| Empresa Nacional de Electricidad S.A. | | | | |
| 8.625% due 08/01/2015 | | 130,000 | | 152,547 |
| FirstEnergy Corp. | | | | |
| 7.375% due 11/15/2031 | | 95,000 | | 110,784 |
| Kansas Gas & Electric | | | | |
| 5.647% due 03/29/2021 | | 264,000 | | 259,164 |
| Nevada Power Company | | | | |
| 5.95% due 03/15/2016 | | 180,000 | | 180,845 |
| Pacific Gas & Electric Company | | | | |
| 6.05% due 03/01/2034 | | 67,000 | | 69,333 |
| Progress Energy, Inc. | | | | |
| 6.85% due 04/15/2012 | | 510,000 | | 544,576 |
| PSEG Power LLC | | | | |
| 8.625% due 04/15/2031 | | 173,000 | | 229,941 |
| Public Service Company of Colorado | | | | |
| 7.875% due 10/01/2012 | | 262,000 | | 301,440 |
| |
|
| | | | | 2,151,193 |
| Financial Services - 4.86% | | | | |
| AMBAC Financial Group, Inc. | | | | |
| 5.95% due 12/05/2035 | | 80,000 | | 81,340 |
| American General Finance Corp. | | | | |
| 3.875% due 10/01/2009 | | 360,000 | | 343,552 |
| Capital One Bank | | | | |
| 4.875% due 05/15/2008 | | 245,000 | | 242,936 |
| Capital One Financial Corp. | | | | |
| 8.75% due 02/01/2007 | | 400,000 | | 412,150 |
| CIT Group, Inc., Series MTN | | | | |
| 4.75% due 08/15/2008 | | 219,000 | | 216,914 |
| Citigroup, Inc. | | | | |
| 5.00% due 09/15/2014 | | 467,000 | | 456,991 |
| 5.125% due 02/14/2011 | | 395,000 | | 394,020 |
| Credit Suisse First Boston USA, Inc. | | | | |
| 4.875% due 08/15/2010 | | 290,000 | | 286,137 |
| General Electric Capital Corp. | | | | |
| 4.875% due 03/04/2015 | | 168,000 | | 163,993 |
| General Electric Capital Corp., Series MTNA | | | |
| 3.75% due 12/15/2009 | | 406,000 | | 386,798 |
| General Electric Capital Corp., Series A, MTN | | | |
| 6.00% due 06/15/2012 | | 383,000 | | 398,879 |
| HSBC Finance Corp. | | | | |
| 4.75% due 04/15/2010 | | 972,000 | | 953,013 |
| 5.00% due 06/30/2015 | | 200,000 | | 192,671 |
| JP Morgan Chase & Company | | | | |
| 6.75% due 02/01/2011 | | 339,000 | | 360,118 |
| JP Morgan Chase Capital XV | | | | |
| 5.875% due 03/15/2035 | | 154,000 | | 152,262 |
| Lazard Group, LLC | | | | |
| 7.125% due 05/15/2015 | | 615,000 | | 647,746 |
| Merrill Lynch & Company, Inc., Series MTNC | | | |
| 4.25% due 02/08/2010 | | 530,000 | | 513,084 |
| Morgan Stanley | | | | |
| 4.00% due 01/15/2010 | | 737,000 | | 704,924 |
The accompanying notes are an integral part of the financial statements. 136
John Hancock Funds II
Portfolio of investments — February 28, 2006 (Unaudited)
(showing percentage of total net assets)
|
| Core Bond Fund (continued) | | | | |
| | | Shares or | | |
| | | Principal | | |
| | | Amount | | Value |
|
|
| |
| CORPORATE BONDS (continued) | | | | |
| Financial Services (continued) | | | | |
| Morgan Stanley (continued) | | | | |
| 5.375% due 10/15/2015 | $ | 325,000 | $ | 322,782 |
| Residential Capital Corp. | | | | |
| 6.125% due 11/21/2008 | | 450,000 | | 449,329 |
| The Goldman Sachs Group, Inc. | | | | |
| 5.125% due 01/15/2015 | | 438,000 | | 427,874 |
| 6.125% due 02/15/2033 | | 90,000 | | 94,216 |
| Washington Mutual Bank | | | | |
| 5.125% due 01/15/2015 | | 250,000 | | 242,492 |
| Washington Mutual, Inc. | | | | |
| 4.00% due 01/15/2009 | | 147,000 | | 142,282 |
| |
|
| | | | | 8,586,503 |
| Food & Beverages - 0.17% | | | | |
| Kraft Foods, Inc. | | | | |
| 5.625% due 11/01/2011 | | 183,000 | | 185,295 |
| 6.50% due 11/01/2031 | | 108,000 | | 118,325 |
| |
|
| | | | | 303,620 |
| Gas & Pipeline Utilities - 0.90% | | | | |
| Duke Capital LLC | | | | |
| 7.50% due 10/01/2009 | | 306,000 | | 325,060 |
| 8.00% due 10/01/2019 | | 200,000 | | 236,353 |
| Energy Transfer Partners LP | | | | |
| 5.65% due 08/01/2012 | | 491,000 | | 487,442 |
| Kinder Morgan Finance Company ULC | | | | |
| 5.35% due 01/05/2011 | | 135,000 | | 134,134 |
| 6.40% due 01/05/2036 | | 140,000 | | 144,411 |
| Kinder Morgan, Inc. | | | | |
| 6.50% due 09/01/2012 | | 95,000 | | 99,944 |
| Magellan Midstream Partners LP | | | | |
| 5.65% due 10/15/2016 | | 169,000 | | 168,322 |
| |
|
| | | | | 1,595,666 |
| Healthcare Services - 0.19% | | | | |
| WellPoint, Inc. | | | | |
| 5.00% due 01/15/2011 | | 65,000 | | 64,168 |
| 5.25% due 01/15/2016 | | 195,000 | | 192,330 |
| 5.85% due 01/15/2036 | | 80,000 | | 79,992 |
| |
|
| | | | | 336,490 |
| Insurance - 1.15% | | | | |
| Aegon Funding Corp. | | | | |
| 5.75% due 12/15/2020 | | 100,000 | | 100,844 |
| American International Group, Inc. | | | | |
| 4.70% due 10/01/2010 | | 568,000 | | 554,654 |
| 5.05% due 10/01/2015 | | 155,000 | | 150,236 |
| CNA Financial Corp. | | | | |
| 5.85% due 12/15/2014 | | 200,000 | | 197,666 |
| 6.95% due 01/15/2018 | | 65,000 | | 68,548 |
| Coventry Health Care, Inc. | | | | |
| 6.125% due 01/15/2015 | | 190,000 | | 191,900 |
| GE Global Insurance Holding Corp. | | | | |
| 7.00% due 02/15/2026 | | 80,000 | | 91,890 |
| Liberty Mutual Insurance Company | | | | |
| 7.875% due 10/15/2026 | | 85,000 | | 99,669 |
| Marsh & McLennan Companies, Inc. | | | | |
| 5.15% due 09/15/2010 | | 109,000 | | 107,489 |
| Core Bond Fund (continued) | | | |
| | | Shares or | |
| | | Principal | |
| | | Amount | Value |
|
|
| |
| CORPORATE BONDS (continued) | | | |
| Insurance (continued) | | | |
| Metlife, Inc. | | | |
| 5.70% due 06/15/2035 | $ | 170,000 $ | 169,772 |
| UnumProvident Finance Company, PLC | | | |
| 6.85% due 11/15/2015 | | 125,000 | 129,946 |
| XL Capital Ltd. | | | |
| 6.375% due 11/15/2024 | | 170,000 | 175,345 |
|
|
| | | | 2,037,959 |
| |
| International Oil - 0.16% | | | |
| Pemex Project Funding Master Trust | | | |
| 6.625% due 06/15/2035 | | 70,000 | 73,045 |
| 7.375% due 12/15/2014 | | 74,000 | 82,325 |
| Petro-Canada | | | |
| 5.95% due 05/15/2035 | | 130,000 | 131,668 |
|
|
| | | | 287,038 |
| |
| Internet Content - 0.15% | | | |
| Cisco Systems, Inc. | | | |
| 5.50% due 02/22/2016 | | 270,000 | 271,848 |
Leisure Time - 0.27% | | | |
| Time Warner Entertainment Company, LP | | | |
| 8.375% due 07/15/2033 | | 91,000 | 109,243 |
| Time Warner, Inc. | | | |
| 7.70% due 05/01/2032 | | 325,000 | 374,289 |
|
|
| | | | 483,532 |
| |
| Manufacturing - 0.10% | | | |
| Tyco International Group SA | | | |
| 6.375% due 10/15/2011 | | 169,000 | 175,122 |
Metal & Metal Products - 0.10% | | | |
| CODELCO, Inc. | | | |
| 5.625% due 09/21/2035 | | 182,000 | 181,941 |
Mining - 0.04% | | | |
| Vale Overseas Ltd. | | | |
| 8.25% due 01/17/2034 | | 55,000 | 66,963 |
Paper - 0.09% | | | |
| Celulosa Arauco y Constitucion SA | | | |
| 5.625% due 04/20/2015 | | 155,000 | 152,473 |
Petroleum Services - 0.27% | | | |
| Halliburton Company | | | |
| 5.50% due 10/15/2010 | | 147,000 | 148,720 |
| 8.75% due 02/15/2021 | | 258,000 | 334,917 |
|
|
| | | | 483,637 |
| |
| Pharmaceuticals - 0.17% | | | |
| Teva Pharmaceutical Finance LLC | | | |
| 5.55% due 02/01/2016 | | 95,000 | 94,302 |
| 6.15% due 02/01/2036 | | 200,000 | 200,888 |
|
|
| | | | 295,190 |
| |
| Real Estate - 1.28% | | | |
| Developers Diversified Realty Corp., REIT | | | |
| 5.375% due 10/15/2012 | | 291,000 | 286,782 |
| Health Care REIT, Inc. | | | |
| 6.20% due 06/01/2016 | | 310,000 | 309,953 |
| ProLogis REIT | | | |
| 5.25% due 11/15/2010 | | 205,000 | 203,780 |
The accompanying notes are an integral part of the financial statements. 137
John Hancock Funds II
Portfolio of investments — February 28, 2006 (Unaudited)
(showing percentage of total net assets)
|
| Core Bond Fund (continued) | | | |
| | | Shares or | | |
| | | Principal | | |
| | | Amount | | Value |
| |
|
| |
| CORPORATE BONDS (continued) | | | | |
| Real Estate (continued) | | | | |
| Residential Capital Corp. | | | | |
| 6.00% due 02/22/2011 | $ | 915,000 | $ | 909,158 |
| Simon Property Group LP, REIT | | | | |
| 4.60% due 06/15/2010 | | 147,000 | | 142,759 |
| 5.375% due 06/01/2011 | | 405,000 | | 403,004 |
| |
|
| | | | | 2,255,436 |
| |
| Retail Grocery - 0.06% | | | | |
| Delhaize America, Inc. | | | | |
| 9.00% due 04/15/2031 | | 90,000 | | 107,401 |
Retail Trade - 0.08% | | | | |
| Wal-Mart Stores, Inc. | | | | |
| 5.25% due 09/01/2035 | | 144,000 | | 138,775 |
Software - 0.15% | | | | |
| Oracle Corp. | | | | |
| 5.00% due 01/15/2011 | | 270,000 | | 266,546 |
Telecommunications Equipment & | | | | |
| Services - 0.49% | | | | |
| France Telecom SA | | | | |
| 7.20% due 03/01/2006 | | 382,000 | | 382,000 |
| SBC Communications, Inc. | | | | |
| 6.15% due 09/15/2034 | | 265,000 | | 264,038 |
| Verizon Global Funding Corp. | | | | |
| 5.85% due 09/15/2035 | | 224,000 | | 211,498 |
| |
|
| | | | | 857,536 |
| |
| Telephone - 1.31% | | | | |
| AT&T Corp. | | | | |
| 9.05%, Step down to 7.3% on 05/15/2006 | | | |
| due 11/15/2011 (b) | | 110,000 | | 120,496 |
| British Telecommunications PLC | | | | |
| 8.875% due 12/15/2030 | | 154,000 | | 203,459 |
| Sprint Capital Corp. | | | | |
| 6.00% due 01/15/2007 | | 509,000 | | 512,481 |
| 6.125% due 11/15/2008 | | 291,000 | | 297,437 |
| 7.625% due 01/30/2011 | | 147,000 | | 160,723 |
| 8.75% due 03/15/2032 *** | | 150,000 | | 197,030 |
| Telecom Italia Capital | | | | |
| 4.875% due 10/01/2010 | | 218,000 | | 211,591 |
| Telecom Italia Capital SA | | | | |
| 5.25% due 11/15/2013 | | 281,000 | | 271,367 |
| Telefonos de Mexico SA de CV | | | | |
| 5.50% due 01/27/2015 | | 139,000 | | 136,910 |
| Verizon Communications, Inc. | | | | |
| 5.35% due 02/15/2011 | | 200,000 | | 199,899 |
| |
|
| | | | | 2,311,393 |
| |
| Transportation - 0.12% | | | | |
| Norfolk Southern Corp. | | | | |
| 7.05% due 05/01/2037 | | 183,000 | | 217,675 |
|
| TOTAL CORPORATE BONDS (Cost $27,687,416) | | $ | 27,719,975 |
| | |
|
| Core Bond Fund (continued) | | | |
| | | Shares or | | |
| | | Principal | | |
| | | Amount | | Value |
|
|
| |
| MUNICIPAL BONDS - 0.19% | | | | |
| Texas - 0.19% | | | | |
| Brazos Texas Higher Education Authority, Inc. | | | |
| 5.03% due 12/01/2041 | $ | 331,000 | $ | 331,000 |
|
| TOTAL MUNICIPAL BONDS (Cost $330,933) | | $ | 331,000 |
|
| |
| COLLATERALIZED MORTGAGE | | | | |
| OBLIGATIONS - 16.51% | | | | |
| Bear Stearns Commercial Mortgage Securities Inc., | | | |
| Series 2005-PW10, Class AAB | | | | |
| 5.382% due 12/11/2040 | | 323,000 | | 324,169 |
| Bear Stearns Commercial Mortgage Securities, | | | |
| Inc., Series 2005-PWR8, Class AAB | | | | |
| 4.581% due 06/11/2041 | | 610,000 | | 585,018 |
| Citigroup/Deutsche Bank Commercial Mortgage, | | | |
| Series 2006-CD2, Class AAB | | | | |
| 5.575% due 01/15/2046 | | 667,000 | | 670,307 |
| Commercial Mortgage Pass Through Certificates, | | | |
| Series 1999-1, Class E | | | | |
| 7.0932% due 05/15/2032 (b) | | 274,000 | | 285,824 |
| Commercial Mortgage Pass Through Certificates, | | | |
| Series 2000-C1, Class C | | | | |
| 7.706% due 08/15/2033 | | 74,000 | | 80,389 |
| Countrywide Alternative Loan Trust, Series | | | |
| 2005-J4, Class 2A1B | | | | |
| 4.7006% due 07/25/2035 (b) | | 176,251 | | 176,178 |
| Credit Suisse First Boston Mortgage Securities | | | |
| Corp., Series 2005-C6, Class B | | | | |
| 5.23% due 12/15/2040 (b) | | 259,000 | | 254,100 |
| CS First Boston Mortgage Securities Corp., Series | | | |
| 2002-CKS4, Class A2 | | | | |
| 5.183% due 11/15/2036 | | 431,000 | | 429,067 |
| CS First Boston Mortgage Securities Corp., Series | | | |
| 2003-C4, Class A4 | | | | |
| 5.14% due 08/15/2036 (b) | | 589,000 | | 582,610 |
| CS First Boston Mortgage Securities Corp., Series | | | |
| 2004-C2, Class A2 | | | | |
| 5.416% due 05/15/2036 (b) | | 856,000 | | 857,641 |
| CS First Boston Mortgage Securities Corp., | | | |
| Series 2001-CP4, Class A4 | | | | |
| 6.18% due 12/15/2035 | | 393,000 | | 409,125 |
| Federal National Mortgage Association, | | | | |
| Series 2002-M3, Class B | | | | |
| 4.37% due 09/25/2010 | | 163,108 | | 158,788 |
| Federal National Mortgage Association, | | | | |
| Series 2003-63, Class QP | | | | |
| 3.50% due 10/25/2031 | | 1,052,009 | | 977,934 |
| Federal National Mortgage Association, | | | | |
| Series 2003-76, Class DE | | | | |
| 4.00% due 09/25/2031 *** | | 1,409,634 | | 1,330,901 |
| Federal National Mortgage Association, | | | | |
| Series 2003-81, Class NX | | | | |
| 3.50% due 10/25/2013 | | 631,594 | | 616,768 |
| Federal National Mortgage Association, | | | | |
| Series 2003-84, Class PG | | | | |
| 5.00% due 03/25/2032 | | 358,000 | | 346,807 |
| Federal National Mortgage Association, | | | | |
| Series 2003-92, Class KQ | | | | |
| 3.50% due 06/25/2023 | | 679,000 | | 662,616 |
The accompanying notes are an integral part of the financial statements. 138
John Hancock Funds II
Portfolio of investments — February 28, 2006 (Unaudited)
(showing percentage of total net assets)
|
| Core Bond Fund (continued) | | | |
| | | Shares or | | |
| | | Principal | | |
| | | Amount | | Value |
| |
|
| |
| COLLATERALIZED MORTGAGE | | | | |
| OBLIGATIONS (continued) | | | | |
| Federal National Mortgage Association, | | | | |
| Series 2004-7, Class JK | | | | |
| 4.00% due 02/25/2019 | $ | 159,000 | $ | 144,034 |
| Federal National Mortgage Association, | | | | |
| Series 2005-45, Class BA | | | | |
| 4.50% due 11/25/2014 | | 1,607,000 | | 1,592,514 |
| Federal National Mortgage Association, | | | | |
| Series 2005-51, Class KC | | | | |
| 4.50% due 01/25/2025 | | 1,472,052 | | 1,449,400 |
| Federal National Mortgage Association, | | | | |
| Series 2005-65, Class WG | | | | |
| 4.50% due 08/25/2026 | | 1,138,374 | | 1,123,174 |
| Federal National Mortgage Association, | | | | |
| Series 2005-69, Class JM | | | | |
| 4.50% due 08/25/2025 | | 562,000 | | 518,237 |
| Federal National Mortgage Association, | | | | |
| Series 2005-77, Class BX | | | | |
| 4.50% due 07/25/2028 | | 3,256,784 | | 3,208,155 |
| First Union National Bank Commercial Mortgage, | | | |
| Series 2001-C3, Class A3 | | | | |
| 6.423% due 08/15/2033 | | 214,000 | | 224,750 |
| First Union National Bank Commercial Mortgage, | | | |
| Series 2001-C4, Class B | | | | |
| 6.417% due 12/12/2033 | | 188,000 | | 198,560 |
| GE Capital Commercial Mortgage Corp., | | | | |
| Series 2001-3, Class A2 | | | | |
| 6.07% due 06/10/2038 | | 393,000 | | 408,755 |
| GE Capital Commercial Mortgage Corp., | | | | |
| Series 2002-2A, Class A3 | | | | |
| 5.349% due 08/11/2036 | | 391,000 | | 393,383 |
| General Electric Capital Commercial Mortgage | | | |
| Corp., Series 2005-C3, Class A2 | | | | |
| 4.853% due 07/10/2045 | | 347,000 | | 342,407 |
| GMAC Commercial Mortgage Securities Inc., Series | | | |
| 2006-C1, Class B | | | | |
| 5.429% due 11/10/2045 (b) | | 264,000 | | 263,123 |
| GMAC Commercial Mortgage Securities, Inc., | | | |
| Series 2002-C2, Class A3 | | | | |
| 5.713% due 10/15/2038 | | 132,000 | | 135,407 |
| GMAC Commercial Mortgage Securities, Inc., | | | |
| Series 2003-C3, Class A4 | | | | |
| 5.023% due 04/10/2040 | | 741,000 | | 727,187 |
| GMAC Commercial Mortgage Securities, Inc., | | | |
| Series 2004-C1, Class A1 | | | | |
| 3.118% due 03/10/2038 | | 299,392 | | 289,842 |
| Government National Mortgage Association, | | | |
| Series 2006-3, Class A | | | | |
| 4.212% due 01/16/2028 | | 123,000 | | 119,471 |
| Greenwich Capital Commercial Funding Corp, | | | |
| Series 2005-GG5, Class AAB | | | | |
| 5.19% due 04/10/2037 (b) | | 118,000 | | 117,167 |
| GS Mortgage Securities Corp II, Series 1998-GLII, | | | |
| Class A2 | | | | |
| 6.562% due 04/13/2031 | | 728,000 | | 745,578 |
| GS Mortgage Securities Corp. II, Series 1998-C1, | | | |
| Class B | | | | |
| 6.97% due 10/18/2030 | | 109,000 | | 113,343 |
| Core Bond Fund (continued) | | | |
| | | Shares or | | |
| | | Principal | | |
| | | Amount | | Value |
| |
|
| |
| COLLATERALIZED MORTGAGE | | | | |
| OBLIGATIONS (continued) | | | | |
| JP Morgan Chase Commercial Mortgage Securities | | | |
| Corp., Series 2005-CB11, Class A4 | | | | |
| 5.335% due 08/12/2037 (b) | $ | 674,000 | $ | 673,655 |
| JP Morgan Chase Commercial Mortgage Securities | | | |
| Corp., Series 2005-CB11, Class ASB | | | | |
| 5.201% due 08/12/2037 (b) | | 79,000 | | 78,703 |
| JP Morgan Chase Commercial Mortgage Securities | | | |
| Corp., Series 2005-LDP5, Class A4 | | | | |
| 5.1793% due 12/15/2044 (b) | | 136,000 | | 135,682 |
| JP Morgan Chase Commercial Mortgage Securities | | | |
| Corp., Series 2005-LDP5, Class B | | | | |
| 5.3343% due 12/15/2044 (b) | | 90,000 | | 89,812 |
| JP Morgan Chase Commercial Mortgage Securities | | | |
| Corp., Series 2004-C3, Class A1 | | | | |
| 3.765% due 01/15/2042 | | 1,052,191 | | 1,024,206 |
| LB Commercial Conduit Mortgage Trust, Series | | | |
| 1999-C2, Class A1 | | | | |
| 7.105% due 10/15/2032 | | 242,092 | | 244,056 |
| LB-UBS Commercial Mortgage Trust, Series | | | |
| 2003-C7, Class A4 | | | | |
| 4.931% due 09/15/2035 (b) | | 801,000 | | 783,731 |
| LB-UBS Commercial Mortgage Trust, Series | | | |
| 2005-C3, Class A2 | | | | |
| 4.553% due 07/15/2030 | | 683,000 | | 666,897 |
| Merrill Lynch Mortgage Trust, Series 2005-CKI1, | | | |
| Class ASB | | | | |
| 5.2446% due 11/12/2037 (b) | | 334,000 | | 334,194 |
| Merrill Lynch Mortgage Trust, Series 2005-LC1, | | | |
| Class A4 | | | | |
| 5.291% due 01/12/2044 (b) | | 258,000 | | 257,738 |
| Morgan Stanley Capital I, Series 2004-HQ4, Class | | | |
| A2 | | | | |
| 3.92% due 04/14/2040 | | 284,000 | | 276,940 |
| Morgan Stanley Capital I, Series 2006-T21, Class A2 | | | |
| 5.09% due 10/12/2052 | | 264,000 | | 262,804 |
| Specialty Underwriting & Residential Finance, | | | |
| Series 2005-BC4, Class A2A | | | | |
| 4.6906% due 09/25/2036 (b) | | 318,275 | | 318,324 |
| Wachovia Bank Commercial Mortgage Trust, | | | |
| Series 2005-C21, Class A4 | | | | |
| 5.1949% due 10/15/2044 (b) | | 196,814 | | 196,406 |
| Wachovia Bank Commercial Mortgage Trust, | | | |
| Series 2006-C23, Class A4 | | | | |
| 5.437% due 01/15/2045 | | 1,360,000 | | 1,366,790 |
| Wachovia Bank Commercial Mortgage Trust, | | | |
| Series 2003-C6, Class A3 | | | | |
| 4.957% due 08/15/2035 | | 248,000 | | 244,299 |
| Wachovia Bank Commercial Mortgage Trust, | | | |
| Series 2003-C8, Class A3 | | | | |
| 4.445% due 11/15/2035 | | 186,000 | | 179,769 |
| Wachovia Bank Commercial Mortgage Trust, | | | |
| Series 2005-C17, Class A4 | | | | |
| 5.083% due 03/15/2042 (b) | | 356,000 | | 349,978 |
| Wachovia Bank Commercial Mortgage Trust, | | | |
| Series 2005-C19, Class APB | | | | |
| 4.621% due 05/15/2044 | | 301,000 | | 288,902 |
The accompanying notes are an integral part of the financial statements. 139
John Hancock Funds II
Portfolio of investments — February 28, 2006 (Unaudited)
(showing percentage of total net assets)
|
| Core Bond Fund (continued) | | | |
| | | Shares or | | |
| | | Principal | | |
| | | Amount | | Value |
|
|
| |
| COLLATERALIZED MORTGAGE | | | | |
| OBLIGATIONS (continued) | | | | |
| Wachovia Bank Commercial Mortgage Trust, | | | |
| Series 2005-C20, Class A7 | | | | |
| 5.118% due 07/15/2042 (b) | $ | 278,000 | $ | 273,823 |
| Washington Mutual Asset Securities Corp., Series | | | |
| 2005-C1A, Class AJ | | | | |
| 5.19% due 05/25/2036 (b) | | 269,000 | | 267,195 |
|
| TOTAL COLLATERALIZED MORTGAGE OBLIGATIONS | | |
| (Cost $29,304,846) | | | $ | 29,176,633 |
|
| |
| ASSET BACKED SECURITIES - 12.02% | | | |
| Advanta Business Card Master Trust, | | | | |
| Series 2005-A4, Class A4 | | | | |
| 4.75% due 01/20/2011 | | 128,000 | | 127,347 |
| AmeriCredit Automobile Receivables Trust, Series | | | |
| 2005-DA, Class A2 | | | | |
| 4.747% due 11/06/2008 | | 218,000 | | 217,811 |
| AmeriCredit Automobile Receivables Trust, Series | | | |
| 2006-1, Class A3 | | | | |
| 5.11% due 10/06/2010 | | 231,000 | | 230,985 |
| AmeriCredit Automobile Receivables Trust, | | | |
| Series 2003-DM, Class A4 | | | | |
| 2.84% due 08/06/2010 | | 536,000 | | 527,820 |
| Ameriquest Mortgage Securities Inc., Series | | | |
| 2004-R12, Class A3 | | | | |
| 4.6588% due 01/25/2035 | | 362,335 | | 362,671 |
| Atlantic City Electric Transition Funding LLC, Series | | | |
| 2003-1, Class A1 | | | | |
| 2.89% due 07/20/2011 | | 396,001 | | 381,960 |
| BMW Vehicle Owner Trust, | | | | |
| Series 2003-A, Class A4 | | | | |
| 2.53% due 02/25/2008 | | 972,297 | | 965,441 |
| Cabela's Master Credit Card Trust, Series | | | | |
| 2005-1A, Class A1 | | | | |
| 4.97% due 10/15/2013 | | 350,000 | | 349,752 |
| Capital Auto Receivables Asset Trust, Series | | | |
| 2004-1, Class A3 | | | | |
| 2.00% due 11/15/2007 | | 222,684 | | 220,227 |
| Capital Auto Receivables Asset Trust, Series | | | |
| 2006-1, Class A3 | | | | |
| 5.03% due 10/15/2009 | | 265,000 | | 265,083 |
| Capital One Master Trust, Series 2001-3A, Class A | | | |
| 5.45% due 03/16/2009 | | 604,000 | | 605,166 |
| Capital One Multi-Asset Execution Trust, Series | | | |
| 2005-A3, Class A3 | | | | |
| 4.05% due 03/15/2013 | | 116,000 | | 111,875 |
| Capital One Prime Auto Receivables Trust, Series | | | |
| 2006-1, Class A3 | | | | |
| 5.04% due 09/15/2010 | | 342,000 | | 341,945 |
| Carrington Mortgage Loan Trust, Series 2005-NC3, | | | |
| Class A1B | | | | |
| 4.7406% due 06/25/2035 (b) | | 325,000 | | 325,029 |
| Chase Manhattan Auto Owner | | | | |
| Trust, Series 2003-A, Class A4 | | | | |
| 2.06% due 12/15/2009 | | 610,814 | | 597,220 |
| Citibank Credit Card Issuance Trust, Series | | | |
| 2000-A3, Class A3 | | | | |
| 6.875% due 11/16/2009 | | 380,000 | | 391,505 |
| Core Bond Fund (continued) | | | |
| | | Shares or | | |
| | | Principal | | |
| | | Amount | | Value |
|
|
| |
| ASSET BACKED SECURITIES | | | | |
| (continued) | | | | |
| Citibank Credit Card Issuance Trust, Series | | | |
| 2004-A1, Class A1 | | | | |
| 2.55% due 01/20/2009 | $ | 264,000 | $ | 258,336 |
| Citibank Credit Card Issuance Trust, Series | | | |
| 2005-B1, Class B1 | | | | |
| 4.40% due 09/15/2010 | | 256,000 | | 251,184 |
| Comed Transitional Funding Trust, Series 1998-1, | | | |
| Class A6 | | | | |
| 5.63% due 06/25/2009 | | 300,713 | | 301,887 |
| Comed Transitional Funding Trust, Series 1998-1, | | | |
| Class A7 | | | | |
| 5.74% due 12/25/2010 | | 62,000 | | 62,845 |
| Countrywide Asset-Backed Certificates, Series | | | | |
| 2005-17, Class 1AF2 | | | | |
| 5.363% due 05/25/2036 (b) | | 130,000 | | 129,492 |
| Countrywide Asset-Backed Certificates, Series | | | |
| 2005-12, Class 1A1 | | | | |
| 4.7306% due 02/25/2036 (b) | | 201,861 | | 201,864 |
| Countrywide Asset-Backed Certificates, Series | | | |
| 2005-BC4, Class 2A1 | | | | |
| 4.7006% due 08/25/2035 (b) | | 148,622 | | 148,639 |
| Encore Credit Receivables Trust, Series 2005-3, | | | |
| Class 2A1 | | | | |
| 4.7006% due 10/25/2035 (b) | | 347,405 | | 316,575 |
| Ford Credit Auto Owner Trust, | | | | |
| Series 2005-A, Class A2 | | | | |
| 3.08% due 07/15/2007 | | 141,856 | | 141,568 |
| Ford Credit Auto Owner Trust, | | | | |
| Series 2005-A, Class A3 | | | | |
| 3.48% due 11/15/2008 | | 446,000 | | 440,633 |
| Ford Credit Auto Owner Trust, | | | | |
| Series 2005-B, Class A3 | | | | |
| 4.17% due 01/15/2009 | | 333,000 | | 330,075 |
| Ford Credit Auto Owner Trust, Series 2006-A, | | | |
| Class A4 | | | | |
| 5.08% due 12/15/2010 | | 558,000 | | 558,872 |
| Franklin Auto Trust, Series 2005-1, Class A2 | | | |
| 4.84% due 09/22/2008 | | 90,000 | | 89,845 |
| Harley-Davidson Motorcycle Trust, Series 2003-1, | | | |
| Class A2 | | | | |
| 2.63% due 11/15/2010 | | 147,593 | | 144,285 |
| Honda Auto Receivables Owner Trust, Series | | | |
| 2004-2, Class A3 | | | | |
| 3.30% due 06/16/2008 | | 727,000 | | 720,430 |
| Household Automotive Trust, | | | | |
| Series 2005-3, Class A2 | | | | |
| 4.70% due 01/27/2009 | | 191,000 | | 190,719 |
| Hyundai Auto Receivables Trust, Series 2005-A, | | | |
| Class A4 | | | | |
| 4.18% due 02/15/2012 | | 275,000 | | 267,138 |
| Illinois Power Special Purpose Trust, Series | | | |
| 1998-1, Class A6 | | | | |
| 5.54% due 06/25/2009 | | 116,079 | | 116,482 |
| JP Morgan Mortgage Acquisition Corp, Series | | | |
| 2005-OPT2, Class A3 | | | | |
| 4.8206% due 12/25/2035 (b) | | 325,000 | | 325,251 |
The accompanying notes are an integral part of the financial statements. 140
John Hancock Funds II
Portfolio of investments — February 28, 2006 (Unaudited)
(showing percentage of total net assets)
|
| Core Bond Fund (continued) | | | |
| | | Shares or | | |
| | | Principal | | |
| | | Amount | | Value |
|
|
| |
| ASSET BACKED SECURITIES | | | | |
| (continued) | | | | |
| M.A.S.Transactions Asset Backed Securities | | | |
| Trust, Series 2004-FRE1, Class A2 | | | | |
| 4.9206% due 07/25/2034 (b) | $ | 195,074 | $ | 195,458 |
| M.A.S.Transactions Asset Backed Securities | | | |
| Trust, Series 2004-OPT2, Class A2 | | | | |
| 4.9306% due 09/25/2034 (b) | | 77,121 | | 77,257 |
| M.A.S.Transactions Asset Backed Securities | | | |
| Trust, Series 2005-AB1, Class A1B | | | | |
| 5.143% due 11/25/2035 (b) | | 263,477 | | 261,913 |
| MBNA Credit Card Master Note Trust, Series | | | |
| 2005-A1, Class A1 | | | | |
| 4.20% due 09/15/2010 | | 380,000 | | 374,242 |
| MBNA Credit Card Master Note Trust, Series | | | |
| 2006-A1, Class A1 | | | | |
| 4.90% due 07/15/2011 | | 398,000 | | 397,130 |
| MBNA Credit Card Master Note Trust, | | | | |
| Series 2001-A1, Class A | | | | |
| 5.75% due 10/15/2008 | | 413,000 | | 414,060 |
| Merrill Lynch Mortgage Investors Inc., Series | | | |
| 2005-SD1, Class A1 | | | | |
| 4.7606% due 05/25/2046 (b) | | 270,620 | | 270,632 |
| Morgan Stanley ABS Capital I, Series 2005-HE2, | | | |
| Class A3B | | | | |
| 4.8006% due 01/25/2035 (b) | | 651,000 | | 651,434 |
| Morgan Stanley ABS Capital I, Series 2006-NC1, | | | |
| Class A1 | | | | |
| 4.6606% due 12/25/2035 (b) | | 259,174 | | 259,174 |
| Morgan Stanley ABS Capital I, | | | | |
| Series 2004-WMC2, Class A2 | | | | |
| 4.9406% due 07/25/2034 (b) | | 358,592 | | 358,578 |
| Nissan Auto Lease Trust, Series 2005-A, Class A2 | | | |
| 4.61% due 01/15/2008 | | 191,000 | | 190,314 |
| Nissan Auto Receivables Owner Trust, Series | | | |
| 2006-A, Class A4 | | | | |
| 4.73% due 07/15/2011 | | 132,000 | | 131,002 |
| Nissan Auto Receivables Owner Trust, | | | | |
| Series 2005-B, Class A2 | | | | |
| 3.75% due 09/17/2007 | | 146,936 | | 146,573 |
| Northstar Education Finance, Inc., | | | | |
| Series 2005-1, Class A5 | | | | |
| 3.98% due 10/28/2045 | | 207,000 | | 207,000 |
| Novastar Home Equity Loan, | | | | |
| Series 2005-2, Class A2B | | | | |
| 4.7306% due 10/25/2035 (b) | | 348,000 | | 348,024 |
| Option One Mortgage Loan Trust, Series 2006-1, | | | |
| Class 2A1 | | | | |
| 4.6506% due 01/25/2036 (b) | | 320,098 | | 320,048 |
| Ownit Mortgage Loan Asset-Backed Certificates, | | | |
| Series 2006-1, Class AF1 | | | | |
| 5.424% due 12/25/2036 | | 170,185 | | 169,281 |
| Peco Energy Transition Trust, | | | | |
| Series 1999-A, Class A6 | | | | |
| 6.05% due 03/01/2009 | | 292,195 | | 293,829 |
| Peco Energy Transition Trust, | | | | |
| Series 2001-A, Class A1 | | | | |
| 6.52% due 12/31/2010 | | 168,000 | | 177,162 |
| Core Bond Fund (continued) | | | |
| | | Shares or | | |
| | | Principal | | |
| | | Amount | | Value |
| |
|
| |
| ASSET BACKED SECURITIES | | | | |
| (continued) | | | | |
| PG&E Energy Recovery Funding LLC, Series | | | |
| 2005-1, Class A4 | | | | |
| 4.37% due 06/25/2014 | $ | 132,000 | $ | 127,809 |
| PG&E Energy Recovery Funding LLC, Series | | | |
| 2005-2, Class A1 | | | | |
| 4.85% due 06/25/2011 | | 484,000 | | 482,536 |
| PG&E Energy Recovery Funding LLC, Series | | | |
| 2005-2, Class A3 | | | | |
| 5.12% due 12/25/2014 | | 233,000 | | 233,566 |
| PG&E Energy Recovery Funding LLC, | | | | |
| Series 2005-1, Class A2 | | | | |
| 3.87% due 06/25/2011 | | 293,000 | | 287,016 |
| SLM Student Loan Trust, Series 2003-11, Class A5 | | | |
| 2.99% due 12/15/2022 | | 432,000 | | 425,459 |
| SLM Student Loan Trust, Series 2004-1, Class A2 | | | |
| 4.7629% due 07/25/2018 (b) | | 282,000 | | 283,004 |
| SLM Student Loan Trust, Series 2005-7, Class A3 | | | |
| 4.41% due 12/31/2010 | | 219,000 | | 216,319 |
| SLM Student Loan Trust, Series 2005-8, Class A4 | | | |
| 4.25% due 01/25/2028 | | 630,000 | | 618,269 |
| Specialty Underwriting & Residential Finance, | | | |
| Series 2005-BC1, Class A1B | | | | |
| 4.8106% due 12/25/2035 (b) | | 353,000 | | 353,138 |
| Structured Asset Investment Loan Trust, Series | | | |
| 2005-11, Class A4 | | | | |
| 4.6706% due 01/25/2036 (b) | | 333,302 | | 333,302 |
| Structured Asset Investment Loan Trust, Series | | | |
| 2005-11, Class A6 | | | | |
| 4.8006% due 01/25/2036 (b) | | 285,000 | | 285,134 |
| Structured Asset Investment Loan Trust, | | | | |
| Series 2005-5, Class A2 | | | | |
| 4.6706% due 06/25/2035 (b) | | 163,952 | | 163,960 |
| Triad Auto Receivables Owner Trust, Series | | | |
| 2006-A, Class A3 | | | | |
| 4.77% due 01/12/2011 | | 330,000 | | 327,473 |
| USAA Auto Owner Trust, Series 2005-3, Class A2 | | | |
| 4.52% due 06/16/2008 | | 184,000 | | 183,253 |
| Wachovia Auto Owner Trust, | | | | |
| Series 2005-B, Class A2 | | | | |
| 4.82% due 02/20/2009 | | 321,000 | | 320,398 |
| WFS Financial Owner Trust, | | | | |
| Series 2005-3, Class A4 | | | | |
| 4.39% due 05/17/2013 | | 358,000 | | 351,771 |
|
| TOTAL ASSET BACKED SECURITIES | | | | |
| (Cost $21,289,872) | | | $ | 21,253,475 |
|
| |
| SHORT TERM INVESTMENTS - 3.73% | | | |
| Federal Home Loan Mortgage Corp. Discount Notes | | | |
| 4.74% due 01/18/2007 | $ | 6,882,000 | $ | 6,589,320 |
|
| TOTAL SHORT TERM INVESTMENTS | | | | |
| (Cost $6,589,320) | | | $ | 6,589,320 |
|
The accompanying notes are an integral part of the financial statements. 141
John Hancock Funds II
Portfolio of investments — February 28, 2006 (Unaudited)
(showing percentage of total net assets)
|
| Core Bond Fund (continued) | | | |
| | | Shares or | | |
| | | Principal | | |
| | | Amount | | Value |
|
|
| |
| REPURCHASE AGREEMENTS - 4.54% | | | |
| Repurchase Agreement with State | | | | |
| Street Corp. dated 02/28/2006 at | | | | |
| 3.20% to be repurchased at | | | | |
| $8,031,714 on 03/01/2006, | | | | |
| collateralized by $8,665,000 | | | | |
| Federal National Mortgage | | | | |
| Association 5.57% due | | | | |
| 06/30/2028 (valued at $8,196,327, | | | | |
| including interest) (c)*** | $ | 8,031,000 | $ | 8,031,000 |
|
| TOTAL REPURCHASE AGREEMENTS | | | | |
| (Cost $8,031,000) | | | $ | 8,031,000 |
|
| Total Investments (Core Bond Fund) | | | | |
| (Cost $202,931,654) - 114.69% | | | $ | 202,709,426 |
| Liabilities in Excess of Other Assets - (14.69)% | | | (25,958,795) |
| |
|
| TOTAL NET ASSETS - 100.00% | | | $ | 176,750,631 |
| |
|
| |
| |
| Core Equity Fund | | | | |
| | | Shares or | | |
| | | Principal | | |
| | | Amount | | Value |
|
|
| |
| COMMON STOCKS - 98.70% | | | | |
| Advertising - 1.85% | | | | |
| WPP Group PLC | | 797,800 | $ | 9,270,106 |
Building Materials & Construction - 0.58% | | | |
| Masco Corp. | | 93,214 | | 2,907,345 |
Cable and Television - 4.07%
| | | | |
| DIRECTV Group, Inc. * | | 716,802 | | 11,296,799 |
| Time Warner, Inc. | | 525,600 | | 9,098,136 |
| |
|
| | | | | 20,394,935 |
| Computers & Business Equipment - 6.84% | | | |
| Cisco Systems, Inc. * | | 298,400 | | 6,039,616 |
| Dell, Inc. * | | 267,700 | | 7,763,300 |
| Hewlett-Packard Company | | 192,600 | | 6,319,206 |
| International Business Machines Corp. | | 74,900 | | 6,009,976 |
| Seagate Technology, Inc. * | | 307,426 | | 8,168,309 |
| |
|
| | | | | 34,300,407 |
| Electrical Utilities - 4.45% | | | | |
| The AES Corp. * | | 1,289,100 | | 22,301,430 |
| Financial Services - 10.75% | | | | |
| Capital One Financial Corp. | | 111,000 | | 9,723,600 |
| Citigroup, Inc. | | 261,500 | | 12,125,755 |
| Countrywide Financial Corp. | | 368,100 | | 12,692,088 |
| JPMorgan Chase & Company | | 470,600 | | 19,360,484 |
| |
|
| | | | | 53,901,927 |
| Healthcare Services - 10.26% | | | | |
| Health Net, Inc. * | | 250,344 | | 12,003,995 |
| McKesson Corp. | | 245,600 | | 13,294,328 |
| UnitedHealth Group, Inc. | | 449,200 | | 26,156,916 |
| |
|
| | | | | 51,455,239 |
| Core Equity Fund (continued) | | | | |
| | Shares or | | | |
| | Principal | | | |
| | Amount | | | Value |
| |
| |
| |
| COMMON STOCKS (continued) | | | | |
| Homebuilders - 4.93% | | | | |
| Beazer Homes USA, Inc. | 50,108 | | $ | 3,179,353 |
| Centex Corp. | 129,410 | | | 8,749,410 |
| Pulte Homes, Inc. | 242,600 | | | 9,318,266 |
| Ryland Group, Inc. | 49,908 | | | 3,481,083 |
|
| |
| | | | | 24,728,112 |
| Insurance - 6.89% | | | | |
| Aetna, Inc. | 341,300 | | | 17,406,300 |
| MGIC Investment Corp. | 127,900 | | | 8,153,625 |
| St. Paul Travelers Companies, Inc. | 209,900 | | | 9,021,502 |
|
| |
| | | | | 34,581,427 |
| Internet Retail - 11.87% | | | | |
| Amazon.com, Inc. * | 581,400 | | | 21,796,686 |
| eBay, Inc. * | 387,900 | | | 15,539,274 |
| Expedia, Inc. * | 480,000 | | | 9,105,600 |
| IAC/InterActiveCorp * | 448,100 | | | 13,102,444 |
|
| |
| | | | | 59,544,004 |
| Internet Service Provider - 6.17% | | | | |
| Google, Inc., Class A * | 51,800 | | | 18,783,716 |
| Yahoo!, Inc. * | 379,500 | | | 12,166,770 |
|
| |
| | | | | 30,950,486 |
| Leisure Time - 2.08% | | | | |
| Electronic Arts, Inc. * | 200,700 | | | 10,430,379 |
| Manufacturing - 4.63% | | | | |
| Tyco International, Ltd. | 900,400 | | | 23,221,316 |
| Pharmaceuticals - 1.49% | | | | |
| Pfizer, Inc. | 285,785 | | | 7,484,709 |
| Photography - 3.21% | | | | |
| Eastman Kodak Company | 573,848 | | | 16,096,436 |
| Retail Trade - 4.91% | | | | |
| Home Depot, Inc. | 248,300 | | | 10,465,845 |
| Sears Holdings Corp. * | 117,700 | | | 14,176,965 |
|
| |
| | | | | 24,642,810 |
| Sanitary Services - 1.87% | | | | |
| Waste Management, Inc. | 281,400 | | | 9,359,364 |
| Software - 1.87% | | | | |
| CA, Inc. | 139,300 | | | 3,783,388 |
| Intuit, Inc. * | 115,500 | | | 5,610,990 |
|
| |
| | | | | 9,394,378 |
| Telephone - 9.98% | | | | |
| Qwest Communications International, Inc. * | 2,784,500 | | | 17,598,040 |
| Sprint Corp. | 1,350,600 | | | 32,454,918 |
|
| |
| | | | | 50,052,958 |
| |
| TOTAL COMMON STOCKS (Cost $461,836,364) | | | $ | 495,017,768 |
| |
The accompanying notes are an integral part of the financial statements. 142
John Hancock Funds II
Portfolio of investments — February 28, 2006 (Unaudited)
(showing percentage of total net assets)
|
| Core Equity Fund (continued) | | | |
| | | Shares or | | |
| | | Principal | | |
| | | Amount | | Value |
|
|
| |
| REPURCHASE AGREEMENTS - 0.96% | | | |
| Repurchase Agreement with State | | | | |
| Street Corp. dated 02/28/2006 at | | | | |
| 3.20% to be repurchased at | | | | |
| $4,831,429 on 03/01/2006, | | | | |
| collateralized by $5,005,000 | | | | |
| Federal Home Loan Bank, 6.00% | | | | |
| due 11/15/2024 (valued at | | | | |
| $4,929,925 including interest) (c) | $ | 4,831,000 | $ | 4,831,000 |
|
| TOTAL REPURCHASE AGREEMENTS | | | | |
| (Cost $4,831,000) | | | $ | 4,831,000 |
|
| Total Investments (Core Equity Fund) | | | | |
| (Cost $466,667,364) - 99.66% | | | $ | 499,848,768 |
| Other Assets in Excess of Liabilities - 0.34% | | | 1,718,584 |
| |
|
| TOTAL NET ASSETS - 100.00% | | | $ | 501,567,352 |
| |
|
| |
| |
| Emerging Growth Fund | | | | |
| | | Shares or | | |
| | | Principal | | |
| | | Amount | | Value |
|
|
| |
| COMMON STOCKS - 95.11% | | | | |
| Advertising - 2.33% | | | | |
| ValueClick, Inc. * (a) | | 100,484 | $ | 1,759,475 |
| Ventiv Health, Inc. * | | 73,781 | | 2,055,539 |
| |
|
| | | | | 3,815,014 |
| Aerospace - 0.95% | | | | |
| Teledyne Technologies, Inc. * | | 46,883 | | 1,553,234 |
Apparel & Textiles - 3.35% | | | | |
| Guess, Inc. * (a) | | 56,215 | | 2,034,421 |
| Phillips - Van Heusen Corp. (a) | | 56,008 | | 1,988,284 |
| The Gymboree Corp. * (a) | | 63,500 | | 1,451,610 |
| |
|
| | | | | 5,474,315 |
| Banking - 3.36% | | | | |
| BankAtlantic Bancorp, Inc., Class A (a) | | 90,225 | | 1,231,571 |
| First Community Bancorp. | | 25,665 | | 1,532,714 |
| First Midwest Bancorp, Inc. (a) | | 32,598 | | 1,096,271 |
| Republic Bancorp, Inc. (a) | | 86,422 | | 1,048,299 |
| Wintrust Financial Corp. (a) | | 11,115 | | 585,538 |
| |
|
| | | | | 5,494,393 |
| Biotechnology - 4.79% | | | | |
| Applera Corp. - Celera Genomics Group * (a) | 94,307 | | 1,083,587 |
| Arena Pharmaceuticals, Inc. * (a) | | 19,531 | | 345,894 |
| Cephalon, Inc. * (a) | | 10,740 | | 853,615 |
| Charles River Laboratories International, Inc. * | 23,479 | | 1,135,210 |
| deCODE genetics, Inc. * (a) | | 96,663 | | 910,566 |
| Intermune, Inc. * (a) | | 53,151 | | 1,013,058 |
| Myriad Genetics, Inc. * (a) | | 55,706 | | 1,430,530 |
| Neurocrine Biosciences, Inc. * (a) | | 16,165 | | 1,060,586 |
| |
|
| | | | | 7,833,046 |
| Business Services - 4.27% | | | | |
| Euronet Worldwide, Inc. * (a) | | 33,404 | | 1,171,144 |
| Labor Ready, Inc. * | | 84,491 | | 2,075,944 |
| Emerging Growth Fund (continued) | | |
| | Shares or | | |
| | Principal | | |
| | Amount | | Value |
|
|
| |
| COMMON STOCKS (continued) | | | |
| Business Services (continued) | | | |
| Navigant Consulting Company * (a) | 62,704 | $ | 1,222,101 |
| TALX Corp. (a) | 48,804 | | 1,559,776 |
| West Corp. * | 21,855 | | 951,348 |
| |
|
| | | | 6,980,313 |
| Cellular Communications - 2.85% | | | |
| Brightpoint, Inc. * | 58,575 | | 1,657,087 |
| Leap Wireless International, Inc. * (a) | 33,838 | | 1,424,918 |
| UbiquiTel, Inc. * (a) | 161,405 | | 1,576,927 |
| |
|
| | | | 4,658,932 |
| Chemicals - 0.73% | | | |
| Cytec Industries, Inc. (a) | 22,375 | | 1,193,483 |
Commercial Services - 1.48% | | | |
| Chemed Corp. (a) | 27,297 | | 1,513,345 |
| TNS, Inc. * (a) | 56,268 | | 905,915 |
| |
|
| | | | 2,419,260 |
| Computers & Business Equipment - 3.45% | | | |
| Blue Coat Systems, Inc. * (a) | 59,210 | | 1,257,028 |
| FileNET Corp. * (a) | 55,360 | | 1,424,966 |
| Komag, Inc. * (a) | 33,621 | | 1,574,808 |
| Parametric Technology Corp. * | 91,457 | | 1,391,979 |
| |
|
| | | | 5,648,781 |
| Construction Materials - 1.24% | | | |
| Applied Industrial Technologies, Inc. (a) | 47,522 | | 2,032,991 |
Crude Petroleum & Natural Gas - 1.05% | | | |
| Swift Energy Company * (a) | 44,410 | | 1,721,332 |
Domestic Oil - 3.62% | | | |
| Berry Petroleum Company, Class A (a) | 22,820 | | 1,541,491 |
| Giant Industries, Inc. * (a) | 21,770 | | 1,267,014 |
| KCS Energy, Inc. * (a) | 73,951 | | 1,745,244 |
| Oil States International, Inc. * (a) | 39,665 | | 1,369,632 |
| |
|
| | | | 5,923,381 |
| Drugs & Health Care - 0.79% | | | |
| Cell Genesys, Inc. * | 87,169 | | 613,670 |
| DOV Pharmaceutical, Inc. * (a) | 35,520 | | 683,760 |
| |
|
| | | | 1,297,430 |
| Educational Services - 0.63% | | | |
| Education Management Corp. * | 27,228 | | 1,023,773 |
Electrical Equipment - 4.40% | | | |
| Encore Wire Corp. * (a) | 64,050 | | 1,997,719 |
| Greatbatch, Inc. * (a) | 43,581 | | 963,576 |
| Watsco, Inc. (a) | 24,184 | | 1,683,690 |
| Wesco International, Inc. * (a) | 44,418 | | 2,546,040 |
| |
|
| | | | 7,191,025 |
| Electrical Utilities - 0.77% | | | |
| Pike Electric Corp. * | 66,600 | | 1,268,730 |
Electronics - 1.60% | | | |
| Thomas & Betts Corp. * (a) | 41,751 | | 2,054,149 |
| TTM Technologies, Inc. * | 43,420 | | 560,552 |
| |
|
| | | | 2,614,701 |
The accompanying notes are an integral part of the financial statements. 143
John Hancock Funds II
Portfolio of investments — February 28, 2006 (Unaudited)
(showing percentage of total net assets)
|
| Emerging Growth Fund (continued) | |
| | Shares or | |
| | Principal | |
| | Amount | Value |
|
|
| |
| COMMON STOCKS (continued) | | |
| Financial Services - 0.88% | | |
| Raymond James Financial, Inc. (a) | 33,682 | $ | 1,447,652 |
Healthcare Products - 3.00% | | |
| DJ Orthopedics, Inc. * (a) | 50,037 | 1,745,291 |
| Haemonetics Corp. * | 29,716 | 1,539,289 |
| ICU Medical, Inc. * | 8,911 | 312,776 |
| Respironics, Inc. * | 36,009 | 1,309,287 |
|
|
| | | 4,906,643 |
| Healthcare Services - 2.58% | | |
| American Retirement Corp. * (a) | 84,910 | 2,285,777 |
| Sierra Health Services, Inc. * | 46,264 | 1,928,746 |
|
|
| | | 4,214,523 |
| Hotels & Restaurants - 1.18% | | |
| Choice Hotels, Inc. (a) | 18,332 | 816,324 |
| Sonic Corp. * | 35,418 | 1,119,563 |
|
|
| | | 1,935,887 |
| Household Products - 1.13% | | |
| Central Garden & Pet Company * (a) | 19,329 | 1,050,724 |
| Tempur-Pedic International, Inc. * (a) | 67,975 | 802,105 |
|
|
| | | 1,852,829 |
| Industrial Machinery - 1.68% | | |
| Ceradyne, Inc. * (a) | 18,985 | 1,155,807 |
| NATCO Group, Inc. * (a) | 64,140 | 1,589,389 |
|
|
| | | 2,745,196 |
| Insurance - 2.54% | | |
| American Physicians Capital, Inc. * (a) | 35,139 | 1,732,001 |
| HCC Insurance Holdings, Inc. | 38,966 | 1,254,316 |
| Scottish Re Group, Ltd. (a) | 47,100 | 1,177,500 |
|
|
| | | 4,163,817 |
| Internet Content - 0.80% | | |
| Jupitermedia Corp. * (a) | 88,748 | 1,317,020 |
Internet Service Provider - 0.82% | | |
| Avocent Corp. * | 40,003 | 1,336,500 |
Internet Software - 1.52% | | |
| F5 Networks, Inc. * | 21,945 | 1,488,310 |
| WebEx Communications, Inc. * (a) | 35,635 | 993,504 |
|
|
| | | 2,481,814 |
| Leisure Time - 2.53% | | |
| Penn National Gaming, Inc. * | 38,773 | 1,344,648 |
| SCP Pool Corp. (a) | 29,513 | 1,282,930 |
| Shuffle Master, Inc. * (a) | 57,754 | 1,509,112 |
|
|
| | | 4,136,690 |
| Life Sciences - 1.05% | | |
| PerkinElmer, Inc. | 72,513 | 1,725,084 |
Medical-Hospitals - 1.13% | | |
| Cepheid, Inc. * (a) | 97,586 | 893,888 |
| Lifepoint Hospitals, Inc. * | 30,801 | 956,679 |
|
|
| | | 1,850,567 |
| Emerging Growth Fund (continued) | | |
| | Shares or | | |
| | Principal | | |
| | Amount | | Value |
|
|
| |
| COMMON STOCKS (continued) | | | |
| Metal & Metal Products - 2.64% | | | |
| Commercial Metals Company (a) | 30,863 | $ | 1,397,785 |
| Crown Holdings, Inc. * | 75,742 | | 1,386,079 |
| Matthews International Corp., Class A | 41,156 | | 1,528,534 |
|
|
| | | | 4,312,398 |
| Petroleum Services - 4.61% | | | |
| Core Laboratories NV * (a) | 38,557 | | 1,767,839 |
| Grey Wolf, Inc. * (a) | 238,347 | | 1,654,128 |
| McDermott International, Inc. * (a) | 40,097 | | 2,067,000 |
| W-H Energy Services, Inc. * | 52,132 | | 2,059,214 |
|
|
| | | | 7,548,181 |
| Pharmaceuticals - 1.88% | | | |
| First Horizon Pharmaceutical Corp. * (a) | 56,051 | | 1,150,166 |
| Medicis Pharmaceutical Corp., Class A | 23,814 | | 677,270 |
| PDL BioPharma, Inc. * (a) | 13,410 | | 419,867 |
| Salix Pharmaceuticals, Ltd. * (a) | 52,585 | | 828,740 |
|
|
| | | | 3,076,043 |
| Railroads & Equipment - 0.65% | | | |
| Genesee & Wyoming, Inc., Class A * | 23,107 | | 1,057,145 |
Real Estate - 1.32% | | | |
| Equity Inns, Inc., REIT (a) | 139,363 | | 2,157,339 |
Retail Trade - 6.22% | | | |
| AnnTaylor Stores Corp. * | 21,260 | | 771,738 |
| Coldwater Creek, Inc. * (a) | 67,642 | | 1,519,916 |
| Hibbett Sporting Goods, Inc. * | 44,588 | | 1,430,383 |
| Pantry, Inc. * (a) | 38,827 | | 2,297,393 |
| Payless ShoeSource, Inc. * (a) | 54,966 | | 1,302,694 |
| Stein Mart, Inc. | 64,528 | | 1,076,327 |
| The Men's Wearhouse, Inc. * (a) | 56,562 | | 1,771,522 |
|
|
| | | | 10,169,973 |
| Semiconductors - 7.85% | | | |
| ATMI, Inc. * (a) | 42,605 | | 1,279,428 |
| Brooks Automation, Inc. * | 49,068 | | 769,877 |
| Emulex Corp. * (a) | 79,527 | | 1,415,581 |
| LSI Logic Corp. * | 153,958 | | 1,501,091 |
| Microsemi Corp. * (a) | 49,244 | | 1,514,253 |
| MIPS Technologies, Inc., Class A * | 102,221 | | 858,656 |
| MKS Instruments, Inc. * (a) | 87,665 | | 1,960,189 |
| ON Semiconductor Corp. * (a) | 355,399 | | 2,342,080 |
| Semtech Corp. * | 34,940 | | 656,173 |
| Skyworks Solutions, Inc. * (a) | 102,342 | | 538,319 |
|
|
| | | | 12,835,647 |
| Software - 4.61% | | | |
| Advent Software, Inc. * (a) | 44,050 | | 1,224,590 |
| ANSYS, Inc. * (a) | 36,533 | | 1,732,395 |
| Hyperion Solutions Corp. * | 29,878 | | 1,002,407 |
| Progress Software Corp. * | 62,824 | | 1,834,460 |
| Transaction Systems Architects, Inc., Class A * | 52,533 | | 1,752,501 |
|
|
| | | | 7,546,353 |
The accompanying notes are an integral part of the financial statements. 144
John Hancock Funds II
Portfolio of investments — February 28, 2006 (Unaudited)
(showing percentage of total net assets)
|
| Emerging Growth Fund (continued) | |
| | | Shares or | |
| | | Principal | |
| | | Amount | Value |
| |
|
| |
| COMMON STOCKS (continued) | | | |
| Telecommunications Equipment & | | | |
| Services - 1.43% | | | |
| ADTRAN, Inc. (a) | | 47,970 | $ | 1,320,134 |
| ECI Telecom, Ltd. ADR * | | 117,394 | 1,023,676 |
|
|
| | | | 2,343,810 |
| Trucking & Freight - 1.40% | | | |
| Old Dominion Freight Lines, Inc. * (a) | | 45,246 | 1,192,685 |
| Plains All American Pipeline LP (a) | | 24,408 | 1,093,722 |
|
|
| | | | 2,286,407 |
|
| TOTAL COMMON STOCKS (Cost $134,141,349) | | $ | 155,591,652 |
|
| |
| SHORT TERM INVESTMENTS - 46.50% | | |
| Federal Home Loan Bank Discount Notes | | | |
| zero coupon due 03/17/2006 | $ | 1,500,000 | $ | 1,497,070 |
| Federal Home Loan Mortgage Corp. Discount Notes | | |
| zero coupon due 03/14/2006 | | 1,380,000 | 1,377,810 |
| Rabobank USA Finance Corp. | | | |
| 4.56% due 03/01/2006 | | 5,620,000 | 5,620,000 |
| State Street Navigator Securities Lending | | | |
| Prime Portfolio (c) | | 67,564,512 | 67,564,512 |
|
| TOTAL SHORT TERM INVESTMENTS | | | |
| (Cost $76,059,392) | | | $ | 76,059,392 |
|
| Total Investments (Emerging Growth Fund) | | |
| (Cost $210,200,741) - 141.61% | | | $ | 231,651,044 |
Liabilities in Excess of Other Assets - (41.61)% | | (68,068,939) |
|
|
| TOTAL NET ASSETS - 100.00% | | | $ | 163,582,105 |
|
|
| |
| |
| Emerging Small Company Fund | | |
| | | Shares or | |
| | | Principal | |
| | | Amount | Value |
| |
|
| |
| COMMON STOCKS - 97.23% | | | |
| Advertising - 1.73% | | | |
| Marchex, Inc., Class B * | | 27,135 | $ | 595,342 |
| ValueClick, Inc. * | | 22,725 | 397,915 |
|
|
| | | | 993,257 |
| Aerospace - 2.05% | | | |
| ARGON ST, Inc. * | | 19,700 | 585,287 |
| K&F Industries Holdings, Inc. * | | 17,000 | 263,160 |
| Orbital Sciences Corp., Class A * | | 21,228 | 323,302 |
|
|
| | | | 1,171,749 |
| Air Travel - 1.16% | | | |
| JetBlue Airways Corp. * | | 26,300 | 299,820 |
| Republic Airways Holdings, Inc. * | | 25,851 | 362,431 |
|
|
| | | | 662,251 |
| Automobiles - 0.38% | | | |
| Tenneco, Inc. * | | 9,700 | 219,705 |
| Banking - 3.75% | | | |
| Doral Financial Corp. | | 13,201 | 147,323 |
| East West Bancorp, Inc. | | 9,516 | 358,658 |
| Emerging Small Company Fund (continued) | |
| | Shares or | | |
| | Principal | | |
| | Amount | | Value |
|
|
| |
| COMMON STOCKS (continued) | | | |
| Banking (continued) | | | |
| First State Bancorporation | 16,733 | $ | 432,046 |
| Franklin Bank Corp. * | 9,487 | | 161,849 |
| Greater Bay Bancorp | 9,610 | | 258,509 |
| Hancock Holding Company | 6,068 | | 270,936 |
| Signature Bank * | 6,825 | | 221,130 |
| UCBH Holdings, Inc. | 16,500 | | 295,350 |
| |
|
| | | | 2,145,801 |
| Biotechnology - 4.12% | | | |
| Coley Pharmaceutical Group, Inc. * | 32,467 | | 487,005 |
| Digene Corp. * | 11,484 | | 476,127 |
| Panacos Pharmaceuticals, Inc. * | 12,901 | | 93,919 |
| Serologicals Corp. * | 18,085 | | 437,476 |
| Telik, Inc. * | 24,113 | | 533,379 |
| Trimeris, Inc. * | 26,455 | | 331,746 |
| |
|
| | | | 2,359,652 |
| Broadcasting - 0.06% | | | |
| Entravision Communications Corp., Class A * | 4,835 | | 35,924 |
Building Materials & Construction - 0.78% | | | |
| Beacon Roofing Supply, Inc. * | 11,400 | | 447,564 |
Business Services - 5.76% | | | |
| BearingPoint, Inc. * | 50,790 | | 452,539 |
| CDI Corp. | 23,604 | | 578,062 |
| Global Cash Access, Inc. * | 15,286 | | 258,333 |
| Global Payments, Inc. | 11,918 | | 620,451 |
| Jackson Hewitt Tax Service, Inc. | 9,976 | | 283,318 |
| LECG Corp. * | 14,923 | | 241,305 |
| MAXIMUS, Inc. | 9,274 | | 338,594 |
| Optimal Group, Inc. * | 1,200 | | 22,152 |
| Quest Software, Inc. * | 34,668 | | 505,113 |
| |
|
| | | | 3,299,867 |
| Chemicals - 3.44% | | | |
| Cabot Corp. | 13,826 | | 511,838 |
| FMC Corp. * | 10,270 | | 624,519 |
| Minerals Technologies, Inc. | 8,294 | | 443,978 |
| Westlake Chemical Corp. | 11,459 | | 393,273 |
| |
|
| | | | 1,973,608 |
| Commercial Services - 0.36% | | | |
| TNS, Inc. * | 12,747 | | 205,227 |
Computers & Business Equipment - 4.77% | | | |
| FileNET Corp. * | 20,998 | | 540,488 |
| Ixia * | 25,400 | | 306,324 |
| Micros Systems, Inc. * | 10,287 | | 445,324 |
| National Instruments Corp. | 16,919 | | 549,022 |
| Trident Microsystems, Inc. * | 16,200 | | 452,628 |
| Witness Systems, Inc. * | 18,800 | | 440,484 |
| |
|
| | | | 2,734,270 |
| Construction Materials - 0.28% | | | |
| Clarcor, Inc. | 4,728 | | 160,043 |
The accompanying notes are an integral part of the financial statements. 145
John Hancock Funds II
Portfolio of investments — February 28, 2006 (Unaudited)
(showing percentage of total net assets)
|
| Emerging Small Company Fund (continued) | |
| | Shares or | | |
| | Principal | | |
| | Amount | | Value |
|
|
| |
| COMMON STOCKS (continued) | | | |
| Crude Petroleum & Natural Gas - 0.61% | | | |
| Western Refining, Inc. * | 21,400 | $ | 347,536 |
Domestic Oil - 2.43% | | | |
| Denbury Resources, Inc. * | 22,958 | | 650,859 |
| Oil States International, Inc. * | 21,487 | | 741,946 |
| |
|
| | | | 1,392,805 |
| Drugs & Health Care - 1.82% | | | |
| DOV Pharmaceutical, Inc. * | 14,600 | | 281,050 |
| Impax Laboratories, Inc. * | 26,121 | | 292,555 |
| Parexel International Corp. * | 18,364 | | 470,486 |
| |
|
| | | | 1,044,091 |
| Educational Services - 0.96% | | | |
| Lincoln Educational Services Corp. * | 14,484 | | 239,565 |
| Strayer Education, Inc. | 3,200 | | 308,256 |
| |
|
| | | | 547,821 |
| Electrical Equipment - 5.11% | | | |
| FLIR Systems, Inc. * | 32,627 | | 843,082 |
| Greatbatch, Inc. * | 21,354 | | 472,137 |
| Sirf Technology Holdings, Inc. * | 14,000 | | 524,020 |
| Tektronix, Inc. | 19,114 | | 588,711 |
| Varian, Inc. * | 12,470 | | 497,553 |
| |
|
| | | | 2,925,503 |
| Electronics - 1.91% | | | |
| Electro Scientific Industries, Inc. * | 17,426 | | 434,953 |
| Trimble Navigation, Ltd. * | 16,079 | | 657,792 |
| |
|
| | | | 1,092,745 |
| Energy - 0.96% | | | |
| Headwaters, Inc. * | 14,759 | | 547,854 |
Financial Services - 4.29% | | | |
| Advance America Cash Advance Centers, | | | |
| Inc. | 18,274 | | 254,191 |
| Capitalsource, Inc. * | 28,529 | | 702,099 |
| Financial Federal Corp. | 18,179 | | 507,726 |
| GFI Group, Inc. * | 6,439 | | 386,726 |
| National Financial Partners Corp. | 10,352 | | 609,215 |
| |
|
| | | | 2,459,957 |
| Gas & Pipeline Utilities - 0.27% | | | |
| Bill Barrett Corp. * | 4,610 | | 152,683 |
Healthcare Products - 3.60% | | | |
| American Medical Systems Holdings, Inc. * | 21,630 | | 468,722 |
| Merit Medical Systems, Inc. * | 22,754 | | 324,244 |
| Molecular Devices Corp. * | 11,694 | | 372,220 |
| STERIS Corp. | 14,567 | | 360,825 |
| Symmetry Medical, Inc. * | 3,948 | | 81,802 |
| The Medicines Company * | 22,307 | | 454,840 |
| |
|
| | | | 2,062,653 |
| Healthcare Services - 2.23% | | | |
| Sierra Health Services, Inc. * | 13,148 | | 548,140 |
| Symbion, Inc. * | 10,731 | | 253,037 |
| Emerging Small Company Fund (continued) | |
| | Shares or | |
| | Principal | |
| | Amount | Value |
|
|
| |
| COMMON STOCKS (continued) | | |
| Healthcare Services (continued) | | |
| United Surgical Partners International, Inc. * | 13,604 $ | 478,181 |
|
|
| | | 1,279,358 |
| Hotels & Restaurants - 3.12% | | |
| BJ's Restaurants, Inc. * | 8,915 | 226,352 |
| Four Seasons Hotels, Inc. | 3,863 | 218,878 |
| Orient Express Hotels, Ltd. | 16,931 | 590,553 |
| P.F. Chang's China Bistro, Inc. * | 6,835 | 330,404 |
| Panera Bread Company, Class A * | 5,963 | 422,538 |
|
|
| | | 1,788,725 |
| Industrial Machinery - 2.81% | | |
| Flowserve Corp. * | 16,367 | 841,264 |
| FMC Technologies, Inc. * | 5,580 | 261,814 |
| Manitowoc, Inc. | 6,605 | 509,047 |
|
|
| | | 1,612,125 |
| Insurance - 0.54% | | |
| Aspen Insurance Holdings, Ltd. | 1,805 | 41,894 |
| Max Re Capital, Ltd. | 10,989 | 268,242 |
|
|
| | | 310,136 |
| Internet Content - 0.63% | | |
| RightNow Technologies, Inc. * | 21,733 | 358,377 |
Internet Retail - 0.41% | | |
| Ariba, Inc. * | 23,000 | 234,600 |
Internet Service Provider - 1.36% | | |
| Avocent Corp. * | 10,498 | 350,738 |
| Entrust, Inc. * | 115,293 | 426,584 |
|
|
| | | 777,322 |
| Internet Software - 0.76% | | |
| Sapient Corp. * | 58,144 | 436,080 |
Investment Companies - 0.59% | | |
| Ares Cap Corp. | 19,637 | 340,506 |
Leisure Time - 1.93% | | |
| Gaylord Entertainment Company * | 8,953 | 399,751 |
| Penn National Gaming, Inc. * | 20,372 | 706,501 |
|
|
| | | 1,106,252 |
| Manufacturing - 1.17% | | |
| Coherent, Inc. * | 11,839 | 384,294 |
| Mettler-Toledo International, Inc. * | 4,709 | 285,177 |
|
|
| | | 669,471 |
| Medical-Hospitals - 2.43% | | |
| Psychiatric Solutions, Inc. * | 16,812 | 555,301 |
| RehabCare Group, Inc. * | 11,057 | 223,130 |
| VCA Antech, Inc. * | 21,882 | 611,602 |
|
|
| | | 1,390,033 |
| Mining - 0.46% | | |
| Alpha Natural Resources, Inc. * | 12,390 | 264,774 |
Mobile Homes - 0.65% | | |
| Winnebago Industries, Inc. | 11,606 | 372,785 |
The accompanying notes are an integral part of the financial statements. 146
John Hancock Funds II
Portfolio of investments — February 28, 2006 (Unaudited)
(showing percentage of total net assets)
|
| Emerging Small Company Fund (continued) | |
| | Shares or | | |
| | Principal | | |
| | Amount | | Value |
|
|
| |
| COMMON STOCKS (continued) | | | |
| Petroleum Services - 3.02% | | | |
| Cal Dive International, Inc. * | 25,012 | $ | 880,672 |
| Superior Energy Services, Inc. * | 32,659 | | 849,134 |
| |
|
| | | | 1,729,806 |
| Pharmaceuticals - 1.70% | | | |
| Adams Respiratory Therapeutics, Inc. * | 10,000 | | 375,100 |
| Angiotech Pharmaceuticals, Inc. * | 30,410 | | 472,267 |
| Penwest Pharmaceuticals Company * | 5,400 | | 125,550 |
| |
|
| | | | 972,917 |
| Real Estate - 3.42% | | | |
| Felcor Lodging Trust, Inc., REIT | 14,700 | | 291,795 |
| Innkeepers USA Trust, REIT | 24,119 | | 422,806 |
| Jones Lang Lasalle, Inc. | 7,584 | | 513,285 |
| LaSalle Hotel Properties, REIT | 8,400 | | 335,580 |
| MeriStar Hospitality Corp., REIT * | 38,647 | | 398,451 |
| |
|
| | | | 1,961,917 |
| Retail Trade - 2.72% | | | |
| Cost Plus, Inc. * | 14,458 | | 277,449 |
| Hot Topic, Inc. * | 20,818 | | 274,381 |
| Regis Corp. | 6,458 | | 247,212 |
| Tractor Supply Company * | 8,033 | | 507,525 |
| Tuesday Morning Corp. | 11,325 | | 249,264 |
| |
|
| | | | 1,555,831 |
| Sanitary Services - 0.56% | | | |
| Waste Connections, Inc. * | 8,706 | | 318,988 |
Semiconductors - 8.92% | | | |
| Actel Corp. * | 25,648 | | 374,204 |
| FormFactor, Inc. * | 14,422 | | 531,306 |
| Microsemi Corp. * | 21,777 | | 669,643 |
| Microtune, Inc. * | 47,952 | | 258,941 |
| Netlogic Microsystems, Inc * | 5,100 | | 180,285 |
| Power Integrations, Inc. * | 24,469 | | 607,565 |
| Semtech Corp. * | 30,951 | | 581,260 |
| Silicon Laboratories, Inc. * | 20,498 | | 983,494 |
| Varian Semiconductor Equipment | | | |
| Associates, Inc. * | 19,229 | | 906,840 |
| ZILOG, Inc. * | 8,197 | | 18,525 |
| |
|
| | | | 5,112,063 |
| Software - 0.64% | | | |
| THQ, Inc. * | 15,287 | | 366,888 |
Telecommunications Equipment & | | | |
| Services - 2.60% | | | |
| Arris Group, Inc. * | 29,559 | | 375,104 |
| Essex Corp. * | 20,253 | | 455,693 |
| Viasat, Inc. * | 24,544 | | 659,006 |
| |
|
| | | | 1,489,803 |
| Trucking & Freight - 3.96% | | | |
| Forward Air Corp. | 19,054 | | 676,036 |
| Knight Transportation, Inc. | 33,681 | | 666,547 |
| Landstar Systems, Inc. | 7,430 | | 346,164 |
| Oshkosh Truck Corp. | 5,105 | | 289,606 |
| Emerging Small Company Fund (continued) | |
| | | Shares or | |
| | | Principal | |
| | | Amount | Value |
|
|
| |
| COMMON STOCKS (continued) | | | |
| Trucking & Freight (continued) | | | |
| Wabash National Corp. | | 14,600 | $ | 291,562 |
|
|
| | | | 2,269,915 |
|
| TOTAL COMMON STOCKS (Cost $48,656,873) | | $ | 55,701,238 |
|
| |
| REPURCHASE AGREEMENTS - 1.54% | | |
| Repurchase Agreement with State | | | |
| Street Corp. dated 02/28/2006 at | | | |
| 3.20% to be repurchased at | | | |
| $883,079 on 3/01/2006, | | | |
| collateralized by $915,000 Federal | | | |
| Home Loan Bank, 6.00% due | | | |
| 11/15/2024 (valued at $901,275, | | | |
| including interest) (c) | $ | 883,000 | $ | 883,000 |
|
| TOTAL REPURCHASE AGREEMENTS | | | |
| (Cost $883,000) | | | $ | 883,000 |
|
| Total Investments (Emerging Small Company Fund) | |
| (Cost $49,539,873) - 98.77% | | | $ | 56,584,238 |
| Other Assets in Excess of Liabilities - 1.23% | | 707,508 |
| |
|
| TOTAL NET ASSETS - 100.00% | | | $ | 57,291,746 |
|
|
| |
| |
| Equity-Income Fund | | | |
| | | Shares or | |
| | | Principal | |
| | | Amount | Value |
|
|
| |
| COMMON STOCKS - 95.18% | | | |
| Aerospace - 1.76% | | | |
| Lockheed Martin Corp. | | 104,300 | $ | 7,600,341 |
| Raytheon Company | | 171,500 | 7,443,100 |
|
|
| | | | 15,043,441 |
| Aluminum - 0.64% | | | |
| Alcoa, Inc. | | 187,100 | 5,485,772 |
Auto Parts - 0.62% | | | |
| Genuine Parts Company (a) | | 119,750 | 5,331,270 |
Automobiles - 0.18% | | | |
| Ford Motor Company (a) | | 194,500 | 1,550,165 |
Banking - 4.47% | | | |
| Bank of America Corp. | | 143,146 | 6,563,244 |
| Bank of Ireland | | 195,100 | 3,477,196 |
| Fifth Third Bancorp. (a) | | 241,462 | 9,332,506 |
| Mercantile Bankshares Corp. | | 75,225 | 2,873,595 |
| National City Corp. (a) | | 94,300 | 3,281,640 |
| Northern Trust Corp. | | 54,900 | 2,894,328 |
| SunTrust Banks, Inc. | | 88,000 | 6,368,560 |
| Wells Fargo Company | | 51,200 | 3,287,040 |
|
|
| | | | 38,078,109 |
| Biotechnology - 0.60% | | | |
| MedImmune, Inc. * | | 139,700 | 5,097,653 |
| Broadcasting - 0.61% | | | |
| CBS Corp., Class B | | 211,200 | 5,165,952 |
The accompanying notes are an integral part of the financial statements. 147
John Hancock Funds II
Portfolio of investments — February 28, 2006 (Unaudited)
(showing percentage of total net assets)
|
| Equity-Income Fund (continued) | | | |
| | Shares or | | |
| | Principal | | |
| | Amount | | Value |
|
|
| |
| COMMON STOCKS (continued) | | | |
| Business Services - 0.26% | | | |
| Cendant Corp. | 132,200 | $ | 2,197,164 |
Cable and Television - 3.55% | | | |
| Cablevision Systems New York Group, | | | |
| Class A * (a) | 76,700 | | 2,013,375 |
| Comcast Corp., Class A * | 295,061 | | 7,916,487 |
| EchoStar Communications Corp., Class A * (a) | 105,300 | | 3,092,661 |
| Time Warner, Inc. (a) | 611,900 | | 10,591,989 |
| Viacom, Inc. * | 166,300 | | 6,645,348 |
|
|
| | | | 30,259,860 |
| Cellular Communications - 0.63% | | | |
| Motorola, Inc. | 251,800 | | 5,388,520 |
Chemicals - 1.32% | | | |
| Chemtura Corp. | 149,624 | | 1,657,834 |
| E.I. Du Pont De Nemours & Company | 196,000 | | 7,887,040 |
| Hercules, Inc. * (a) | 146,700 | | 1,738,395 |
|
|
| | | | 11,283,269 |
| Computers & Business Equipment - 2.84% | | | |
| Cisco Systems, Inc. * | 306,000 | | 6,193,440 |
| Hewlett-Packard Company | 237,299 | | 7,785,780 |
| International Business Machines Corp. | 128,000 | | 10,270,720 |
|
|
| | | | 24,249,940 |
| Construction Materials - 0.63% | | | |
| Vulcan Materials Company (a) | 68,100 | | 5,379,900 |
Cosmetics & Toiletries - 3.31% | | | |
| Avon Products, Inc. (a) | 224,100 | | 6,465,285 |
| Colgate-Palmolive Company | 192,000 | | 10,460,160 |
| International Flavors & Fragrances, Inc. (a) | 171,700 | | 5,945,971 |
| Kimberly-Clark Corp. | 89,700 | | 5,308,446 |
|
|
| | | | 28,179,862 |
| Crude Petroleum & Natural Gas - 2.76% | | | |
| Amerada Hess Corp. | 67,600 | | 9,349,756 |
| ChevronTexaco Corp. | 250,360 | | 14,140,333 |
|
|
| | | | 23,490,089 |
| Domestic Oil - 0.27% | | | |
| Murphy Oil Corp. | 49,600 | | 2,324,752 |
Drugs & Health Care - 1.15% | | | |
| Wyeth | 197,200 | | 9,820,560 |
Electrical Equipment - 3.48% | | | |
| Cooper Industries, Ltd., Class A (a) | 81,900 | | 6,855,030 |
| General Electric Company | 693,900 | | 22,808,493 |
|
|
| | | | 29,663,523 |
| Electrical Utilities - 1.07% | | | |
| FirstEnergy Corp. (a) | 99,175 | | 5,065,859 |
| Pinnacle West Capital Corp. | 60,300 | | 2,475,315 |
| TECO Energy, Inc. | 94,900 | | 1,618,994 |
|
|
| | | | 9,160,168 |
| Electronics - 0.70% | | | |
| Sony Corp. | 124,200 | | 5,929,348 |
| Equity-Income Fund (continued) | | | |
| | Shares or | | |
| | Principal | | |
| | Amount | | Value |
|
|
| |
| COMMON STOCKS (continued) | | | |
| Energy - 2.27% | | | |
| Duke Energy Corp. (a) | 287,100 | $ | 8,153,640 |
| Progress Energy, Inc. | 142,600 | | 6,328,588 |
| Xcel Energy, Inc. (a) | 260,700 | | 4,838,592 |
|
|
| | | | 19,320,820 |
| Financial Services - 7.96% | | | |
| Charles Schwab Corp. | 540,400 | | 8,759,884 |
| Citigroup, Inc. | 96,996 | | 4,497,704 |
| Federal National Mortgage Association | 75,000 | | 4,101,000 |
| Janus Capital Group, Inc. | 28,500 | | 625,005 |
| JPMorgan Chase & Company | 483,914 | | 19,908,222 |
| Mellon Financial Corp. | 256,000 | | 9,239,040 |
| Morgan Stanley | 196,100 | | 11,699,326 |
| State Street Corp. (a)(c) | 143,900 | | 8,990,872 |
|
|
| | | | 67,821,053 |
| Food & Beverages - 3.49% | | | |
| Campbell Soup Company | 196,000 | | 6,101,480 |
| General Mills, Inc. (a) | 150,300 | | 7,402,275 |
| H.J. Heinz Company | 69,600 | | 2,635,752 |
| McCormick & Company, Inc. (a) | 106,200 | | 3,486,546 |
| The Coca-Cola Company | 240,800 | | 10,106,376 |
|
|
| | | | 29,732,429 |
| Gas & Pipeline Utilities - 0.86% | | | |
| NiSource, Inc. (a) | 358,000 | | 7,349,740 |
Healthcare Products - 2.04% | | | |
| Baxter International, Inc. | 122,300 | | 4,629,055 |
| Boston Scientific Corp. * | 179,300 | | 4,378,506 |
| Johnson & Johnson | 145,100 | | 8,365,015 |
|
|
| | | | 17,372,576 |
| Hotels & Restaurants - 0.54% | | | |
| McDonald's Corp. | 131,200 | | 4,580,192 |
Household Products - 1.50% | | | |
| Fortune Brands, Inc. | 63,900 | | 4,955,445 |
| Newell Rubbermaid, Inc. (a) | 314,200 | | 7,814,154 |
|
|
| | | | 12,769,599 |
| Industrial Machinery - 1.84% | | | |
| Deere & Company | 137,100 | | 10,456,617 |
| Pall Corp. (a) | 177,000 | | 5,207,340 |
|
|
| | | | 15,663,957 |
| Insurance - 5.52% | | | |
| American International Group, Inc. | 102,365 | | 6,792,941 |
| Chubb Corp. | 42,700 | | 4,088,525 |
| Lincoln National Corp. (a) | 128,098 | | 7,272,124 |
| Marsh & McLennan Companies, Inc. | 444,200 | | 13,730,222 |
| SAFECO Corp. | 53,800 | | 2,771,238 |
| St. Paul Travelers Companies, Inc. | 154,049 | | 6,621,026 |
| UnumProvident Corp. (a) | 276,900 | | 5,729,061 |
|
|
| | | | 47,005,137 |
| International Oil - 2.20% | | | |
| Anadarko Petroleum Corp. | 69,500 | | 6,891,620 |
The accompanying notes are an integral part of the financial statements. 148
John Hancock Funds II
Portfolio of investments — February 28, 2006 (Unaudited)
(showing percentage of total net assets)
|
| Equity-Income Fund (continued) | | |
| | Shares or | |
| | Principal | |
| | Amount | Value |
|
|
| |
| COMMON STOCKS (continued) | | |
| International Oil (continued) | | |
| Royal Dutch Shell PLC, ADR | 196,100 | $ | 11,860,128 |
|
|
| | | 18,751,748 |
| Leisure Time - 0.91% | | |
| Walt Disney Company | 276,700 | 7,744,833 |
Liquor - 1.21% | | |
| Anheuser-Busch Companies, Inc. | 247,600 | 10,285,304 |
Manufacturing - 2.11% | | |
| Eaton Corp. | 46,700 | 3,253,589 |
| Honeywell International, Inc. (a) | 283,700 | 11,617,515 |
| Tyco International, Ltd. | 120,700 | 3,112,853 |
|
|
| | | 17,983,957 |
| Newspapers - 1.37% | | |
| Dow Jones & Company, Inc. (a) | 170,000 | 6,910,500 |
| Knight-Ridder, Inc. (a) | 79,500 | 4,771,590 |
|
|
| | | 11,682,090 |
| Office Furnishings & Supplies - 0.84% | | |
| Avery Dennison Corp. | 119,500 | 7,170,000 |
Paper - 1.95% | | |
| International Paper Company | 395,925 | 12,974,462 |
| MeadWestvaco Corp. (a) | 131,200 | 3,649,984 |
|
|
| | | 16,624,446 |
| Petroleum Services - 3.27% | | |
| BP PLC, SADR (a) | 112,192 | 7,451,793 |
| Exxon Mobil Corp. | 248,224 | 14,737,059 |
| Schlumberger, Ltd. | 49,100 | 5,646,500 |
|
|
| | | 27,835,352 |
| Pharmaceuticals - 5.05% | | |
| Abbott Laboratories | 147,400 | 6,512,132 |
| Bristol-Myers Squibb Company | 239,400 | 5,530,140 |
| Eli Lilly & Company (a) | 76,100 | 4,232,682 |
| Merck & Company, Inc. | 348,900 | 12,162,654 |
| Pfizer, Inc. | 392,800 | 10,287,432 |
| Schering-Plough Corp. | 232,900 | 4,308,650 |
|
|
| | | 43,033,690 |
| Photography - 0.75% | | |
| Eastman Kodak Company (a) | 229,100 | 6,426,255 |
Publishing - 2.08% | | |
| The New York Times Company, Class A (a) | 315,100 | 8,892,122 |
| Tribune Company (a) | 289,300 | 8,852,580 |
|
|
| | | 17,744,702 |
| Railroads & Equipment - 2.32% | | |
| Norfolk Southern Corp. | 117,400 | 6,008,532 |
| Union Pacific Corp. | 155,000 | 13,725,250 |
|
|
| | | 19,733,782 |
| Real Estate - 0.42% | | |
| Simon Property Group, Inc., REIT (a) | 43,200 | 3,584,304 |
Retail Grocery - 0.26% | | |
| Sysco Corp. | 73,000 | 2,196,570 |
| Equity-Income Fund (continued) | | | |
| | | Shares or | | |
| | | Principal | | |
| | | Amount | | Value |
| |
|
| |
| COMMON STOCKS (continued) | | | | |
| Retail Trade - 2.03% | | | | |
| Home Depot, Inc. | | 106,700 | $ | 4,497,405 |
| RadioShack Corp. | | 153,500 | | 3,000,925 |
| Wal-Mart Stores, Inc. | | 215,300 | | 9,766,008 |
|
|
| | | | | 17,264,338 |
| Sanitary Services - 0.82% | | | | |
| Waste Management, Inc. | | 209,722 | | 6,975,354 |
Semiconductors - 1.56% | | | | |
| Analog Devices, Inc. | | 147,100 | | 5,610,394 |
| Intel Corp. | | 191,500 | | 3,944,900 |
| Texas Instruments, Inc. | | 125,000 | | 3,731,250 |
|
|
| | | | | 13,286,544 |
| Software - 1.27% | | | | |
| Microsoft Corp. | | 403,100 | | 10,843,390 |
Telecommunications Equipment & | | | | |
| Services - 1.35% | | | | |
| Lucent Technologies, Inc. * (a) | | 595,500 | | 1,667,400 |
| Nokia Oyj, SADR | | 352,500 | | 6,549,450 |
| Telus Corp., Non Voting Shares | | 51,200 | | 1,989,632 |
| Telus Corp. | | 33,000 | | 1,296,511 |
|
|
| | | | | 11,502,993 |
| Telephone - 5.33% | | | | |
| ALLTEL Corp. | | 132,700 | | 8,380,005 |
| AT&T Corp. | | 470,773 | | 12,988,627 |
| Qwest Communications International, Inc. * (a) | 1,240,800 | | 7,841,856 |
| Sprint Corp. | | 353,300 | | 8,489,799 |
| Verizon Communications, Inc. | | 228,252 | | 7,692,092 |
|
|
| | | | | 45,392,379 |
| Tobacco - 0.39% | | | | |
| UST, Inc. (a) | | 86,700 | | 3,370,896 |
Toys, Amusements & Sporting Goods - 0.82% | | | |
| Mattel, Inc. | | 414,000 | | 6,975,900 |
|
| TOTAL COMMON STOCKS (Cost $754,856,822) | | $ | 811,103,647 |
|
| |
| CORPORATE BONDS - 0.28% | | | | |
| Telecommunications Equipment & | | | | |
| Services - 0.28% | | | | |
| Lucent Technologies, Inc. | | | | |
| 8.00% due 08/01/2031 (a) | $ | 2,366,000 | | 2,398,864 |
|
| TOTAL CORPORATE BONDS (Cost $2,444,494) | | $ | 2,398,864 |
|
| |
| SHORT TERM INVESTMENTS - 15.05% | | | |
| State Street Navigator Securities | | | | |
| Lending Prime Portfolio (c) | $ | 89,633,044 | $ | 89,633,044 |
| T. Rowe Price Reserve Investment Fund (c) | | 38,599,533 | | 38,599,533 |
|
| TOTAL SHORT TERM INVESTMENTS | | | | |
| (Cost $128,232,576) | | | $ | 128,232,577 |
|
The accompanying notes are an integral part of the financial statements. 149
John Hancock Funds II
Portfolio of investments — February 28, 2006 (Unaudited)
(showing percentage of total net assets)
|
| Equity-Income Fund (continued) | | |
| | | Shares or | |
| | | Principal | |
| | | Amount | Value |
| |
|
| |
| REPURCHASE AGREEMENTS - 0.29% | | |
| Repurchase Agreement with State | | | |
| Street Corp. dated 02/28/2006 at | | | |
| 3.20% to be repurchased at | | | |
| $2,499,222 on 03/01/2006, | | | |
| collateralized by $2,575,000 | | | |
| Federal National Mortgage | | | |
| Association, 5.7% due 03/27/2023 | | | |
| (valued at $2,549,250, including | | | |
| interest) (c) | $ | 2,499,000 | $ | 2,499,000 |
|
| TOTAL REPURCHASE AGREEMENTS | | | |
| (Cost $2,499,000) | | | $ | 2,499,000 |
|
| Total Investments (Equity-Income Fund) | | |
| (Cost $888,032,892) - 110.80% | | | $ | 944,234,088 |
| Liabilities in Excess of Other Assets - (10.80)% | | (92,069,475) |
|
|
| TOTAL NET ASSETS - 100.00% | | | $ | 852,164,613 |
|
|
| |
| |
| Fundamental Value Fund | | | |
| | | Shares or | |
| | | Principal | |
| | | Amount | Value |
| |
|
| |
| COMMON STOCKS - 94.75% | | | |
| Advertising - 0.25% | | | |
| WPP Group PLC-Sponsored ADR (a) | | 28,451 | $ | 1,649,873 |
Banking - 7.68% | | | |
| Commerce Bancorp, Inc. (a) | | 104,800 | 3,476,216 |
| Fifth Third Bancorp. (a) | | 119,929 | 4,635,256 |
| Golden West Financial Corp. (a) | | 312,999 | 22,232,319 |
| Lloyds TSB Group PLC-Sponsored ADR (a) | 119,881 | 4,693,341 |
| Wells Fargo Company | | 240,133 | 15,416,539 |
|
|
| | | | 50,453,671 |
| Broadcasting - 0.96% | | | |
| Liberty Media Corp., Series A * | | 391,700 | 3,227,608 |
| News Corp. (a) | | 186,900 | 3,042,732 |
|
|
| | | | 6,270,340 |
| Business Services - 4.35% | | | |
| Dun & Bradstreet Corp. * | | 17,095 | 1,243,490 |
| H & R Block, Inc. (a) | | 332,323 | 7,410,803 |
| Iron Mountain, Inc. * (a) | | 228,742 | 9,996,026 |
| Moody's Corp. | | 147,801 | 9,902,667 |
|
|
| | | | 28,552,986 |
| Cable and Television - 2.54% | | | |
| Comcast Corp.-Special Class A * (a) | | 622,557 | 16,653,400 |
Computers & Business Equipment - 2.03% | | |
| Dell, Inc. * | | 193,900 | 5,623,100 |
| Hewlett-Packard Company | | 119,384 | 3,916,989 |
| Lexmark International, Inc. * (a) | | 80,957 | 3,812,265 |
|
|
| | | | 13,352,354 |
| Construction Materials - 1.59% | | | |
| Martin Marietta Materials, Inc. (a) | | 59,479 | 5,799,203 |
| Vulcan Materials Company (a) | | 58,670 | 4,634,930 |
|
|
| | | | 10,434,133 |
| Fundamental Value Fund (continued) | | |
| | Shares or | | |
| | Principal | | |
| | Amount | | Value |
|
|
| |
| COMMON STOCKS (continued) | | | |
| Containers & Glass - 2.21% | | | |
| Sealed Air Corp. * (a) | 254,904 | $ | 14,498,940 |
| Cosmetics & Toiletries - 0.80% | | | |
| Avon Products, Inc. | 181,912 | | 5,248,161 |
Crude Petroleum & Natural Gas - 6.54% | | | |
| Devon Energy Corp. | 241,409 | | 14,153,810 |
| EOG Resources, Inc. (a) | 205,788 | | 13,870,111 |
| Occidental Petroleum Corp. | 163,091 | | 14,929,350 |
|
|
| | | | 42,953,271 |
| Financial Services - 10.83% | | | |
| Ameriprise Financial, Inc. | 159,913 | | 7,272,843 |
| Citigroup, Inc. | 304,319 | | 14,111,272 |
| HSBC Holdings PLC | 1,040,772 | | 17,779,490 |
| JPMorgan Chase & Company | 647,682 | | 26,645,637 |
| Morgan Stanley | 66,975 | | 3,995,729 |
| State Street Corp. (c) | 20,775 | | 1,298,022 |
|
|
| | | | 71,102,993 |
| Food & Beverages - 1.77% | | | |
| Diageo PLC, SADR (a) | 117,581 | | 7,254,748 |
| Hershey Foods Corp. (a) | 84,883 | | 4,341,765 |
|
|
| | | | 11,596,513 |
| Healthcare Services - 2.89% | | | |
| Cardinal Health, Inc. (a) | 103,152 | | 7,488,835 |
| HCA, Inc. (a) | 239,851 | | 11,488,863 |
|
|
| | | | 18,977,698 |
| Holdings Companies/Conglomerates - 5.24% | | | |
| Berkshire Hathaway, Inc., Class A * | 232 | | 20,137,600 |
| China Merchants Holdings | | | |
| International Company, Ltd. | 949,253 | | 2,703,867 |
| Loews Corp. | 125,637 | | 11,591,269 |
|
|
| | | | 34,432,736 |
| Household Products - 0.17% | | | |
| Hunter Douglas NV | 18,840 | | 1,134,235 |
Industrials - 0.27% | | | |
| Cosco Pacific, Ltd. | 825,415 | | 1,739,407 |
Insurance - 10.62% | | | |
| American International Group, Inc. | 449,143 | | 29,805,129 |
| Aon Corp. (a) | 136,908 | | 5,422,926 |
| Chubb Corp. | 18,352 | | 1,757,204 |
| Markel Corp. * | 1,247 | | 409,702 |
| Marsh & McLennan Companies, Inc. | 149,348 | | 4,616,347 |
| Principal Financial Group, Inc. | 41,542 | | 2,023,926 |
| Progressive Corp. (a) | 165,699 | | 17,804,357 |
| Sun Life Financial, Inc. | 26,071 | | 1,137,217 |
| Transatlantic Holdings, Inc. (a) | 110,012 | | 6,726,134 |
|
|
| | | | 69,702,942 |
| International Oil - 3.30% | | | |
| ConocoPhillips | 355,850 | | 21,692,616 |
Internet Retail - 0.35% | | | |
| Expedia, Inc. * (a) | 47,077 | | 893,051 |
The accompanying notes are an integral part of the financial statements. 150
John Hancock Funds II
Portfolio of investments — February 28, 2006 (Unaudited)
(showing percentage of total net assets)
|
| Fundamental Value Fund (continued) | |
| | Shares or | |
| | Principal | |
| | Amount | Value |
|
|
| |
| COMMON STOCKS (continued) | | |
| Internet Retail (continued) | | |
| IAC/InterActiveCorp * (a) | 47,077 | $ | 1,376,531 |
|
|
| | | 2,269,582 |
| Liquor - 0.73% | | |
| Heineken Holding NV | 138,125 | 4,808,237 |
Manufacturing - 5.72% | | |
| Harley-Davidson, Inc. (a) | 217,732 | 11,433,107 |
| Tyco International, Ltd. | 1,013,988 | 26,150,751 |
|
|
| | | 37,583,858 |
| Mining - 0.44% | | |
| BHP Billiton PLC | 85,117 | 1,433,152 |
| Rio Tinto PLC | 30,200 | 1,419,537 |
|
|
| | | 2,852,689 |
| Petroleum Services - 0.87% | | |
| Transocean, Inc. * | 76,575 | 5,680,334 |
Pharmaceuticals - 1.11% | | |
| Caremark Rx, Inc. * | 147,071 | 7,316,782 |
Publishing - 1.24% | | |
| Gannett Company, Inc. | 31,418 | 1,952,943 |
| Lagardere S.C.A. | 80,087 | 6,196,371 |
|
|
| | | 8,149,314 |
| Real Estate - 1.40% | | |
| CenterPoint Properties Corp., REIT (a) | 184,098 | 9,177,285 |
Retail Trade - 6.13% | | |
| Costco Wholesale Corp. | 533,248 | 27,344,958 |
| Wal-Mart Stores, Inc. | 284,595 | 12,909,229 |
|
|
| | | 40,254,187 |
| Software - 1.43% | | |
| Microsoft Corp. | 350,026 | 9,415,699 |
Telecommunications Equipment & | | |
| Services - 1.25% | | |
| Nokia Oyj, SADR | 85,286 | 1,584,614 |
| NTL, Inc. * | 20,490 | 1,349,266 |
| SK Telecom Company, Ltd., ADR | 116,639 | 2,816,832 |
| Telewest Global, Inc. * (a) | 102,966 | 2,455,739 |
|
|
| | | 8,206,451 |
| Tobacco - 4.48% | | |
| Altria Group, Inc. | 409,203 | 29,421,696 |
Travel Services - 4.70% | | |
| American Express Company | 572,165 | 30,828,250 |
Trucking & Freight - 0.86% | | |
| Kuehne & Nagel International AG | 6,550 | 1,978,112 |
| United Parcel Service, Inc., Class B | 49,142 | 3,671,399 |
|
|
| | | 5,649,511 |
|
| TOTAL COMMON STOCKS (Cost $591,504,405) | | $ | 622,060,144 |
| |
|
| Fundamental Value Fund (continued) | |
| | | Shares or | |
| | | Principal | |
| | | Amount | Value |
|
|
| |
| ASSET BACKED SECURITIES - 1.52% | | |
| GCO Education Loan Funding Trust, Series | | |
| 2005-1, Class A6AR | | | |
| zero coupon due 03/25/2042 (b) | $ | 10,000,000 | $ | 10,000,000 |
|
| TOTAL ASSET BACKED SECURITIES | | |
| (Cost $10,000,000) | | | $ | 10,000,000 |
|
| |
| SHORT TERM INVESTMENTS - 15.60% | | |
| Rabobank USA Financial Corp. | | | |
| 4.56% due 03/01/2006 | $ | 23,974,000 | $ | 23,974,000 |
| State Street Navigator Securities Lending | | |
| Prime Portfolio (c) | | 78,446,424 | 78,446,424 |
|
| TOTAL SHORT TERM INVESTMENTS | | |
| (Cost $102,420,424) | | | $ | 102,420,424 |
|
| Total Investments (Fundamental Value Fund) | | |
| (Cost $703,924,829) - 111.87% | | | $ | 734,480,568 |
| Liabilities in Excess of Other Assets - (11.87)% | | (77,906,886) |
|
|
| TOTAL NET ASSETS - 100.00% | | | $ | 656,573,682 |
|
|
| |
| |
| Global Bond Fund | | | |
| | | Shares or | |
| | | Principal | |
| | | Amount | Value |
|
|
| |
| U.S. TREASURY OBLIGATIONS - 1.57% | | |
| Treasury Inflation Protected | | | |
| Securities (d) - 0.07% | | | |
| 2.00% due 01/15/2026 (a)*** | $ | 396,676 | $ | 399,000 |
| U.S. Treasury Bonds - 1.37% | | | |
| 7.875% due 02/15/2021 (a)*** | | 5,500,000 | 7,351,526 |
| U.S. Treasury Notes - 0.13% | | | |
| 4.25% due 08/15/2013 to | | | |
| 11/15/2014 (a)*** | | 700,000 | 682,570 |
|
| TOTAL U.S. TREASURY OBLIGATIONS | | |
| (Cost $8,415,899) | | | $ | 8,433,096 |
|
| |
| U.S. GOVERNMENT AGENCY OBLIGATIONS - 13.96% | |
| Federal National Mortgage | | | |
| Association - 13.96% | | | |
| 4.678% due 10/01/2044 (b)*** | | 2,497,692 | 2,510,341 |
| 5.020% due 11/01/2035 (b)*** | | 1,960,962 | 2,019,416 |
| 5.50% due 04/01/2034 to 02/01/2036 *** | 47,213,637 | 46,861,923 |
| 5.50% TBA ** | | 23,800,000 | 23,577,408 |
|
|
| | | | 74,969,088 |
|
| |
| TOTAL U.S. GOVERNMENT AGENCY OBLIGATIONS | |
| (Cost $74,876,610) | | | $ | 74,969,088 |
|
| |
| FOREIGN GOVERNMENT OBLIGATIONS - 27.28% | |
| France - 3.33% | | | |
| Government of France | | | |
| 5.50% due 04/25/2010 | EUR | 13,800,000 | 17,884,504 |
Germany - 14.47% | | | |
| Federal Republic of Germany | | | |
| 4.25% due 01/04/2014 *** | | 4,800,000 | 6,038,058 |
The accompanying notes are an integral part of the financial statements. 151
John Hancock Funds II
Portfolio of investments — February 28, 2006 (Unaudited)
(showing percentage of total net assets)
|
| Global Bond Fund (continued) | | |
| | | Shares or | |
| | | Principal | |
| | | Amount | Value |
|
|
| |
| FOREIGN GOVERNMENT OBLIGATIONS | | |
| (continued) | | | |
| Germany (continued) | | | |
| Federal Republic of Germany (continued) | | | |
| 5.00% due 01/04/2012 *** | EUR | 5,100,000 | $ | 6,609,490 |
| 5.25% due 07/04/2010 *** | | 13,400,000 | 17,248,985 |
| 5.50% due 01/04/2031 | | 18,200,000 | 27,850,835 |
| 6.50% due 07/04/2027 *** | | 11,900,000 | 19,921,418 |
|
|
| | | | 77,668,786 |
| |
| Netherlands - 4.26% | | | |
| Kingdom of Netherlands | | | |
| zero coupon due 04/28/2006 *** | | 16,000,000 | 18,999,047 |
| 3.75% due 07/15/2014 *** | | 3,200,000 | 3,894,892 |
|
|
| | | | 22,893,939 |
| |
| United Kingdom - 5.22% | | | |
| Government of United Kingdom | | | |
| 4.75% due 06/07/2010 | GBP | 15,700,000 | 28,011,117 |
|
| TOTAL FOREIGN GOVERNMENT OBLIGATIONS | |
| (Cost $147,778,790) | | | $ | 146,458,346 |
|
| |
| CORPORATE BONDS - 6.48% | | | |
| Japan - 0.13% | | | |
| Bank of Tokyo-Mitsubishi UFJ Ltd., Series EMTN | | |
| 3.50% due 12/16/2015 (b)*** | EUR | 600,000 | 705,680 |
Luxembourg - 0.11% | | | |
| VTB Capital SA for Vneshtorgbank, Series 144A | | |
| 5.25% due 09/21/2007 (b)*** | $ | 600,000 | 600,150 |
Netherlands - 0.46% | | | |
| Rabobank Nederland | | | |
| 4.64% due 01/15/2009 (b)*** | | 2,500,000 | 2,498,900 |
| Spain - 0.47% | | | |
| Santander US Debt SA Unipersonal, Series 144A | | |
| 4.77% due 02/06/2009 (b) | | 2,500,000 | 2,499,090 |
United Kingdom - 0.22% | | | |
| Royal Bank of Scotland Group PLC, Series 144A | | |
| 4.50% due 12/21/2007 (b)*** | | 1,200,000 | 1,199,944 |
United States - 5.09% | | | |
| Atlantic & Western Re, Ltd., Series A | | | |
| 10.5194% due 01/09/2007 (b) | | 1,200,000 | 1,200,000 |
| Bear Stearns Company, Inc. | | | |
| 4.8975% due 01/31/2011 (b)*** | | 2,800,000 | 2,800,848 |
| BellSouth Corp. | | | |
| 4.258% due 04/26/2006 (b)*** | | 400,000 | 399,577 |
| Cisco Systems, Inc. | | | |
| 4.85% due 02/20/2009 (a)(b)*** | | 2,600,000 | 2,601,973 |
| CIT Group, Inc., Series MTN | | | |
| 4.84% due 02/21/2008 (b)*** | | 1,100,000 | 1,099,723 |
| Citigroup, Inc. | | | |
| 4.5594% due 12/26/2008 (b)*** | | 1,500,000 | 1,499,488 |
| 4.7075% due 01/30/2009 (b)*** | | 3,000,000 | 2,998,581 |
| CMS Energy Corp. | | | |
| 7.50% due 01/15/2009 (a)*** | | 800,000 | 826,000 |
| 8.90% due 07/15/2008 *** | | 400,000 | 427,000 |
| 9.875% due 10/15/2007 *** | | 1,340,000 | 1,433,800 |
| Global Bond Fund (continued) | | |
| | | Shares or | |
| | | Principal | |
| | | Amount | Value |
| |
|
| |
| CORPORATE BONDS (continued) | | | |
| United States (continued) | | | |
| DaimlerChrysler NA Holding Corp., Series D, MTN | | |
| 4.96% due 09/10/2007 (b)*** | $ | 1,500,000 | $ | 1,504,480 |
| Dominion Resources, Inc., Series D | | | |
| 4.819% due 09/28/2007 (b)*** | | 1,500,000 | 1,500,860 |
| El Paso Corp. | | | |
| 7.625% due 08/16/2007 *** | | 100,000 | 102,125 |
| General Electric Capital Corp., Series MTN | | |
| 4.671% due 01/20/2010 (b)*** | | 2,600,000 | 2,598,638 |
| Genworth Global Funding Trusts | | | |
| 4.641% due 02/10/2009 (b)*** | | 2,600,000 | 2,599,405 |
| HCA, Inc. | | | |
| 7.125% due 06/01/2006 *** | | 1,200,000 | 1,205,239 |
| Koch Forest Products, Inc. | | | |
| 6.88% due 12/20/2012 | | 1,000,000 | 1,000,000 |
| MCI, Inc. | | | |
| 7.688% due 05/01/2009 *** | | 200,000 | 206,000 |
| Oracle Corp and Ozark Holding, Inc. | | | |
| 4.81% due 01/13/2009 (b)*** | | 1,300,000 | 1,299,870 |
|
|
| | | | 27,303,607 |
|
| |
| TOTAL CORPORATE BONDS (Cost $34,825,045) | | $ | 34,807,371 |
|
| |
| COLLATERALIZED MORTGAGE | | | |
| OBLIGATIONS - 18.08% | | | |
| Ireland - 0.28% | | | |
| Paris Residential Funding PLC, Series 1X, Class A | | |
| 2.51% due 07/25/2011 (b)*** | EUR | 1,254,163 | 1,497,542 |
Netherlands - 1.40% | | | |
| Atomium Mortgage Finance BV, | | | |
| Series 2003-I , Class A | | | |
| 2.314% due 07/01/2034 (b)*** | | 1,328,575 | 1,587,344 |
| Delphinus BV, Series 2001-II, Class A1 | | | |
| 2.74% due 11/28/2031 (b)*** | | 2,000,000 | 2,400,989 |
| Delphinus BV, Series 2003-I, Class A1 | | | |
| 2.41% due 04/25/2093 (b)*** | | 1,000,000 | 1,199,302 |
| Dutch Mortgage Portfolio Loans, BV, | | | |
| Series III, Class A | | | |
| 2.854% due 11/20/2035 (b)*** | | 1,932,249 | 2,317,351 |
|
|
| | | | 7,504,986 |
| |
| United States - 16.40% | | | |
| American Home Mortgage Investment Trust, | | |
| Series 2004-3, Class 5A | | | |
| 4.29% due 10/25/2034 (b)*** | $ | 1,024,520 | 1,000,334 |
| Banc of America Commercial Mortgage, Inc., | | |
| Series 2002-2 , Class A2 | | | |
| 4.772% due 07/11/2043 *** | | 2,500,000 | 2,469,565 |
| Banc of America Funding Corp., | | | |
| Series 2006-A, Class 1A1 | | | |
| 4.6271% due 02/20/2036 (b)*** | | 2,500,000 | 2,458,484 |
| Banc of America Mortgage Securities, | | | |
| Series 2004-4, Class 1A9 | | | |
| 5.00% due 05/25/2034 *** | | 2,202,688 | 2,143,404 |
| Bear Stearns Adjustable Rate Mortgage Trust, | | |
| Series 2005-9, Class A1 | | | |
| 4.625% due 10/25/2035 (b)*** | | 4,355,711 | 4,252,311 |
The accompanying notes are an integral part of the financial statements. 152
John Hancock Funds II
Portfolio of investments — February 28, 2006 (Unaudited)
(showing percentage of total net assets)
|
| Global Bond Fund (continued) | | |
| | | Shares or | |
| | | Principal | |
| | | Amount | Value |
| |
|
| |
| COLLATERALIZED MORTGAGE | | | |
| OBLIGATIONS (continued) | | | |
| United States (continued) | | | |
| Bella Vista Mortgage Trust, | | | |
| Series 2005-2, Class 2A1 | | | |
| 4.82% due 05/20/2045 (b)*** | $ | 2,732,934 | $ | 2,753,058 |
| Citigroup Mortgage Loan Trust, Inc., | | | |
| Series 2005-11, Class 1A1 | | | |
| 4.90% due 12/25/2035 (b)*** | | 883,558 | 883,971 |
| Citigroup Mortgage Loan Trust, Inc., | | | |
| Series 2005-11, Class A2A | | | |
| 4.70% due 12/25/2035 *** | | 3,032,863 | 3,006,903 |
| Commercial Mortgage Pass Through | | | |
| Certificates, Series 2006-CN2A, Class A2FL | | |
| 1.00% due 02/05/2019 (b)*** | | 2,600,000 | 2,600,000 |
| Countrywide Alternative Loan Trust, | | | |
| Series 2005-11CB, Class 2A8 | | | |
| 4.50% due 06/25/2035 *** | | 2,562,828 | 2,523,452 |
| Countrywide Alternative Loan Trust, | | | |
| Series 2005-81, Class A1 | | | |
| 4.8606% due 02/25/2037 (b)*** | | 6,284,677 | 5,943,848 |
| Countrywide Alternative Loan Trust, | | | |
| Series 2006-OA1, Class 2A1 | | | |
| 4.80% due 02/25/2036 (b)*** | | 2,600,000 | 2,600,000 |
| Countrywide Home Loan Mortgage | | | |
| Pass Through Trust, Series 2005-HYB9 , Class 5A1 | |
| 5.25% due 02/20/2036 (b)*** | | 1,084,456 | 1,074,535 |
| Countrywide Home Loan Mortgage | | | |
| Pass Through Trust, Series 2005-R2, Class 1AF1 | | |
| 4.9206% due 06/25/2035 (b)*** | | 257,016 | 257,950 |
| Countrywide Home Loans, | | | |
| Series 2004-12, Class 14A2 | | | |
| 4.8606% due 08/25/2034 (b)*** | | 634,777 | 635,320 |
| Countrywide Home Loans, | | | |
| Series 2004-25, Class 1A1 | | | |
| 4.9106% due 02/25/2035 (b)*** | | 954,522 | 957,294 |
| Countrywide Home Loans, | | | |
| Series 2004-25, Class 2A1 | | | |
| 4.9206% due 02/25/2035 (b)*** | | 1,051,813 | 1,053,736 |
| Countrywide Home Loans, | | | |
| Series 2005-HYB9, Class 3A2A | | | |
| 5.25% due 02/20/2036 *** | | 1,076,937 | 1,066,874 |
| CS First Boston Mortgage Securities Corp., | | |
| Series 2005-CN2A, Class A1S | | | |
| 4.79% due 11/15/2019 (b)*** | | 649,989 | 649,943 |
| Federal Home Loan Mortgage Corp., Series | | |
| 2004-2770, Class YW | | | |
| 4.00% due 06/15/2022 | | 2,612,158 | 2,575,056 |
| Federal Home Loan Mortgage Corp., Series | | |
| 2004-2895, Class F | | | |
| 4.92% due 06/15/2031 (b)*** | | 975,484 | 974,478 |
| Federal Home Loan Mortgage Corp., Series 2844, | | |
| Class PR | | | |
| 5.00% due 09/15/2017 *** | | 673,428 | 671,559 |
| Federal Home Loan Mortgage Corp., Series T-63, | | |
| Class 1A1 | | | |
| 4.678% due 02/25/2045 (b)*** | | 938,914 | 947,521 |
| Global Bond Fund (continued) | | |
| | | Shares or | |
| | | Principal | |
| | | Amount | Value |
|
|
| |
| COLLATERALIZED MORTGAGE | | | |
| OBLIGATIONS (continued) | | | |
| United States (continued) | | | |
| Federal National Mortgage Association | | | |
| Grantor Trust, Series 2005-T3, Class A1A | | |
| 4.6206% due 07/25/2035 (b)*** | $ | 796,063 | $ | 796,143 |
| Federal National Mortgage Association | | | |
| Grantor Trust, Series 2005-T4, Class A1B | | |
| 4.6706% due 09/25/2035 (b)*** | | 1,200,000 | 1,200,473 |
| Federal National Mortgage Association, | | | |
| Series 2003-W6, Class F | | | |
| 4.9306% due 09/25/2042 (b)*** | | 1,251,250 | 1,258,477 |
| Federal National Mortgage Association, | | | |
| Series 2004-W2, Class 5AF | | | |
| 4.9306% due 03/25/2044 (b)*** | | 1,118,395 | 1,119,681 |
| Federal National Mortgage Association, | | | |
| Series 2005-120, Class NF | | | |
| 4.6806% due 01/25/2021 (b)*** | | 1,387,658 | 1,382,707 |
| Federal National Mortgage Association, | | | |
| Series 2006-15, Class FC | | | |
| 4.567% due 03/25/2036 (b)*** | | 2,600,000 | 2,600,000 |
| Federal National Mortgage Association, | | | |
| Series 2006-5, Class 3A2 | | | |
| 4.6893% due 05/25/2035 (b)*** | | 1,200,000 | 1,180,875 |
| First Republic Mortgage Loan Trust, | | | |
| Series 2001-FRB1, Class A | | | |
| 4.92% due 11/15/2031 (b)*** | | 884,828 | 888,070 |
| GMAC Mortgage Corp Loan Trust, | | | |
| Series 2004-J4, Class A1 | | | |
| 5.50% due 09/25/2034 *** | | 1,435,438 | 1,423,199 |
| GS Mortgage Securities Corp., | | | |
| Series 2003-1, Class A2 | | | |
| 5.2806% due 01/25/2032 (b)*** | | 1,128,363 | 1,139,537 |
| Harborview Mortgage Loan Trust, | | | |
| Series 2006-1, Class 2A1A | | | |
| 4.81% due 03/19/2037 (b)*** | | 2,500,000 | 2,500,000 |
| LB-UBS Commercial Mortgage Trust, | | | |
| Series 2003-C1, Class A2 | | | |
| 3.323% due 03/15/2027 *** | | 4,420,000 | 4,270,852 |
| Mellon Residential Funding Corp., | | | |
| Series 2000-TBC3, Class A1 | | | |
| 5.01% due 12/15/2030 (b)*** | | 2,040,272 | 2,040,815 |
| Merrill Lynch Mortgage Trust, | | | |
| Series 2004-BPC1, Class A1 | | | |
| 3.585% due 09/12/2041 *** | | 1,145,492 | 1,115,047 |
| MLCC Mortgage Investors, Inc., | | | |
| Series 2003-C, Class A1 | | | |
| 4.9106% due 06/25/2028 (b)*** | | 2,283,591 | 2,291,074 |
| Sequoia Mortgage Trust, Series 5, Class A | | | |
| 4.92% due 10/19/2026 (b)*** | | 719,977 | 721,993 |
| Structured Adjustable Rate Mortgage Loan Trust, | | |
| Series 2004-1, Class 4A2 | | | |
| 4.58% due 02/25/2034 (b)*** | | 2,021,814 | 1,998,761 |
| Structured Adjustable Rate Mortgage Loan Trust, | | |
| Series 2004-19, Class 2A1 | | | |
| 5.288% due 01/25/2035 (b)*** | | 3,352,276 | 3,356,466 |
| Wachovia Bank Commercial Mortgage Trust, | | |
| Series 2005-C16, Class A1 | | | |
| 4.061% due 10/15/2041 *** | | 2,404,472 | 2,355,033 |
The accompanying notes are an integral part of the financial statements. 153
John Hancock Funds II
Portfolio of investments — February 28, 2006 (Unaudited)
(showing percentage of total net assets)
|
| Global Bond Fund (continued) | | |
| | | Shares or | |
| | | Principal | |
| | | Amount | Value |
| |
|
| |
| COLLATERALIZED MORTGAGE | | | |
| OBLIGATIONS (continued) | | | |
| United States (continued) | | | |
| Washington Mutual Mortgage Securities Corp., | | |
| Series 2003-R1, Class A1 | | | |
| 4.8506% due 12/25/2027 (b)*** | $ | 1,882,507 | $ | 1,881,881 |
| Washington Mutual Mortgage Securities Corp., | | |
| Series 2005-AR13, Class A1A1 | | | |
| 4.8706% due 10/25/2045 (b)*** | | 580,462 | 583,140 |
| Washington Mutual Mortgage Securities Corp., | | |
| Series 2005-AR2, Class 2A1A | | | |
| 4.8906% due 01/25/2045 (b)*** | | 1,185,726 | 1,190,887 |
| Washington Mutual Mortgage Securities Corp., | | |
| Series 2005-AR6, Class 2A1A | | | |
| 4.8106% due 04/25/2045 (b)*** | | 2,002,729 | 2,006,079 |
| Washington Mutual Mortgage Securities Corp., | | |
| Series 2006-AR3, Class A1A | | | |
| 4.618% due 02/25/2046 (b)*** | | 2,600,000 | 2,600,000 |
| Wells Fargo Mortgage Backed Securities Trust, | | |
| Series 2006-AR2, Class 2A1 | | | |
| 4.95% due 03/25/2036 (b)*** | | 2,700,000 | 2,673,633 |
|
|
| | | | 88,074,419 |
|
| |
| TOTAL COLLATERALIZED MORTGAGE OBLIGATIONS | |
| (Cost $97,592,424) | | | $ | 97,076,947 |
|
| |
| ASSET BACKED SECURITIES - 18.87% | | |
| United States - 18.87% | | | |
| AAA Trust, Series 2005-2, Class A1 | | | |
| 4.705% due 11/26/2035 (b)*** | | 2,417,033 | 2,420,231 |
| ACE Securities Corp., Series 2006-HE1, Class A2A | | |
| 4.64% due 02/25/2036 (b)*** | | 2,600,000 | 2,600,000 |
| ACE Securities Corp., Series 2006-NC1, Class A2A | | |
| 4.6506% due 12/25/2035 (b)*** | | 2,500,000 | 2,499,610 |
| ACE Securities Corp., Series 2006-NC1, Class A2B | | |
| 4.7306% due 12/25/2035 (b)*** | | 2,500,000 | 2,500,390 |
| Argent Securities, Inc., Series 2005-W4, Class A2A | | |
| 4.7206% due 02/25/2036 (b)*** | | 3,200,909 | 3,202,411 |
| Carrington Mortgage Loan Trust, | | | |
| Series 2005-NC3, Class A1A | | | |
| 4.6606% due 06/25/2035 (b)*** | | 1,352,866 | 1,352,816 |
| Countrywide Asset-Backed Certificates, | | | |
| Series 2005-4, Class 3AV1 | | | |
| 4.6606% due 10/25/2035 (b)*** | | 1,356,746 | 1,356,898 |
| Countrywide Asset-Backed Certificates, | | | |
| Series 2006-1, Class AF1 | | | |
| 4.71% due 02/25/2036 (b)*** | | 2,700,000 | 2,700,845 |
| Countrywide Asset-Backed Certificates, | | | |
| Series 2006-3, Class 2A1 | | | |
| 4.64% due 02/25/2036 (b)*** | | 2,800,000 | 2,800,000 |
| FBR Securitization Trust, | | | |
| Series 2005-5, Class AV21 | | | |
| 4.7006% due 11/25/2035 (b)*** | | 1,017,489 | 1,017,531 |
| First NLC Trust, Series 2005-3, Class AV1 | | | |
| 4.6906% due 12/25/2035 (b)*** | | 836,814 | 836,831 |
| First NLC Trust, Series 2005-4, Class A1 | | | |
| 4.7006% due 02/25/2036 (b)*** | | 494,732 | 494,887 |
| Global Bond Fund (continued) | | |
| | | Shares or | |
| | | Principal | |
| | | Amount | Value |
|
|
| |
| ASSET BACKED SECURITIES | | | |
| (continued) | | | |
| United States (continued) | | | |
| GE-WMC Mortgage Securities LLC, | | | |
| Series 2005-2, Class A2A | | | |
| 4.6806% due 12/25/2035 (b)*** | $ | 373,991 | $ | 373,582 |
| GSAMP Trust, Series 2006-NC1, Class A1 | | | |
| 4.641% due 02/25/2036 (b)*** | | 2,600,000 | 2,600,000 |
| GSAMP Trust, Series 2006-S1, Class A2A | | | |
| 4.6706% due 11/25/2035 (b)*** | | 2,800,000 | 2,800,437 |
| GSAMP Trust, Series 2006-SD1, Class A1 | | | |
| 4.7006% due 12/25/2035 (b)*** | | 2,556,956 | 2,557,355 |
| GSR Mortgage Loan Trust, | | | |
| Series 2005-HEL1, Class A2A | | | |
| 4.6806% due 11/25/2030 (b)*** | | 2,426,656 | 2,426,656 |
| Home Equity Asset Trust, Series 2005-8, Class 2A1 | | |
| 4.6906% due 02/25/2036 (b)*** | | 1,028,857 | 1,029,061 |
| Home Equity Mortgage Trust, | | | |
| Series 2006-1, Class A1A1 | | | |
| 4.661% due 04/25/2036 (b)*** | | 2,600,000 | 2,600,000 |
| JP Morgan Mortgage Acquisition Corp., | | | |
| Series 2006-FRE1, Class A2 | | | |
| 4.6506% due 05/25/2035 (b)*** | | 2,500,000 | 2,499,610 |
| Long Beach Mortgage Loan Trust, | | | |
| Series 2005-3, Class 2A1 | | | |
| 4.7006% due 09/25/2035 (b)*** | | 159,243 | 159,267 |
| Long Beach Mortgage Loan Trust, | | | |
| Series 2006-2, Class 2A1 | | | |
| 4.64% due 03/25/2036 (b) | | 2,700,000 | 2,700,000 |
| Long Beach Mortgage Loan Trust, | | | |
| Series 2006-WL1, Class 2A1 | | | |
| 4.67% due 01/25/2036 (b)*** | | 4,100,000 | 4,102,056 |
| Mastr Asset Backed Securities Trust, | | | |
| Series 2005-NC2, Class A1 | | | |
| 4.69% due 11/25/2035 (b)*** | | 2,595,242 | 2,595,348 |
| Mastr Asset Backed Securities Trust, | | | |
| Series 2006-HE1, Class A1 | | | |
| 4.66% due 01/25/2036 (b)*** | | 2,700,000 | 2,700,000 |
| Mastr Asset Backed Securities Trust, | | | |
| Series 2006-NC1, Class A1 | | | |
| 4.65125% due 01/25/2036 (b)*** | | 2,700,000 | 2,700,000 |
| MBNA Credit Card Master Note Trust, | | | |
| Series 2001-A1, Class A | | | |
| 5.75% due 10/15/2008 *** | | 1,950,000 | 1,955,007 |
| Metris Master Trust, Series 2001-2, Class A | | |
| 4.89% due 11/20/2009 (b)*** | | 4,100,000 | 4,102,362 |
| Morgan Stanley Capital I, | | | |
| Series 2004-HE9, Class A3A | | | |
| 2.24% due 11/25/2034 (b) | | 5,300,000 | 5,300,000 |
| Nelnet Student Loan Trust, Series 2006-1, Class A1 | | |
| 4.75% due 08/23/2011 (b)*** | | 2,600,000 | 2,599,594 |
| New Century Home Equity Loan Trust, | | | |
| Series 2005-B, Class A2A | | | |
| 4.7006% due 10/25/2035 (b)*** | | 1,424,019 | 1,424,239 |
| Nomura Asset Acceptance Corp., | | | |
| Series 2006-S1, Class A1 | | | |
| 4.72% due 01/25/2036 (b)*** | | 900,000 | 900,000 |
The accompanying notes are an integral part of the financial statements. 154
John Hancock Funds II
Portfolio of investments — February 28, 2006 (Unaudited)
(showing percentage of total net assets)
|
| Global Bond Fund (continued) | | |
| | | Shares or | |
| | | Principal | |
| | | Amount | Value |
| |
|
| |
| ASSET BACKED SECURITIES | | | |
| (continued) | | | |
| United States (continued) | | | |
| Park Place Securities, Inc., | | | |
| Series 2004-WWF1, Class A1A | | | |
| 4.7506% due 02/25/2035 (b)*** | $ | 1,008,426 | $ | 1,008,487 |
| Park Place Securities, Inc., | | | |
| Series 2005-WHQ4, Class A2A | | | |
| 4.6906% due 09/25/2035 (b)*** | | 1,514,400 | 1,514,614 |
| Popular ABS Mortgage Pass-Through Trust, | | |
| Series 2005-4, Class AV1 | | | |
| 4.6906% due 09/25/2035 (b)*** | | 1,330,841 | 1,330,632 |
| Residential Asset Mortgage Products, Inc., | | | |
| Series 2006-NC1, Class A1 | | | |
| 4.6606% due 01/25/2036 (b)*** | | 2,500,000 | 2,499,220 |
| Residential Asset Mortgage Products, Inc., | | | |
| Series 2006-NC2, Class A1 | | | |
| 4.64% due 02/25/2036 (b) | | 5,300,000 | 5,300,000 |
| Residential Asset Securities Corp., | | | |
| Series 2005-EMX1, Class AI1 | | | |
| 4.6806% due 03/25/2035 (b)*** | | 1,392,467 | 1,392,629 |
| Residential Asset Securities Corp., | | | |
| Series 2005-KS12, Class A1 | | | |
| 4.6706% due 01/25/2036 (b)*** | | 693,372 | 693,480 |
| Residential Asset Securities Corp., | | | |
| Series 2006-EMX1, Class A1 | | | |
| 4.6606% due 01/25/2036 (b)*** | | 2,500,000 | 2,500,000 |
| Residential Asset Securities Corp., | | | |
| Series 2006-KS2, Class A1 | | | |
| 4.64% due 03/25/2036 (b)*** | | 1,100,000 | 1,099,828 |
| Securitized Asset Backed Receivables LLC Trust, | | |
| Series 2005-FR4, Class A2A | | | |
| 4.7006% due 01/25/2036 (b)*** | | 1,562,751 | 1,562,920 |
| SLM Student Loan Trust, Series 2003-11, Class A2 | | |
| 4.5413% due 03/15/2013 (b)*** | | 1,940,572 | 1,940,370 |
| Soundview Home Equity Loan Trust, | | | |
| Series 2005-A, Class A | | | |
| 4.7506% due 04/25/2035 (b)*** | | 759,764 | 759,917 |
| Soundview Home Equity Loan Trust, | | | |
| Series 2005-B, Class A1 | | | |
| 4.6906% due 05/25/2035 (b)*** | | 352,425 | 352,397 |
| Specialty Underwriting & Residential Finance, | | |
| Series 2006-BC1, Class A2A | | | |
| 4.65% due 12/25/2036 (b)*** | | 2,700,000 | 2,701,557 |
| Structured Asset Investment Loan Trust, | | | |
| Series 2005-6, Class A7 | | | |
| 4.6706% due 07/25/2035 (b)*** | | 1,271,270 | 1,271,461 |
| Structured Asset Securities Corp., | | | |
| Series 2005-S7, Class A1 | | | |
| 4.7106% due 12/25/2035 (b)*** | | 3,308,591 | 3,308,468 |
| Structured Asset Securities Corp., | | | |
| Series 2005-WF1, Class A1 | | | |
| 4.6706% due 02/25/2035 (b)*** | | 172,166 | 172,171 |
|
|
| | | | 101,315,175 |
|
| |
| TOTAL ASSET BACKED SECURITIES | | | |
| (Cost $101,310,934) | | | $ | 101,315,175 |
|
| Global Bond Fund (continued) | | | |
| | | Shares or | | |
| | | Principal | | |
| | | Amount | | Value |
|
|
| |
| OPTIONS - 0.19% | | | | |
| United States - 0.19% | | | | |
| Chicago Mercantile Exchange American Purchase | | | |
| Call on Eurodollar | | | | |
| Expiration 03/13/2006 at $95.25 * | | 1,225,000 | $ | 3,062 |
| Chicago Mercantile Exchange American Purchase | | | |
| Put on Eurodollar | | | | |
| Expiration 12/18/2006 at $92.50 * | | 137,500 | | 344 |
| Chicago Mercantile Exchange American Purchase | | | |
| Put on Eurodollar Futures | | | | |
| Expiration 09/18/2006 at $92.75 * | | 812,500 | | 2,031 |
| Chicago Mercentile Exchange American Purchase | | | |
| Put on Eurodollar | | | | |
| Expiration 03/13/2006 at $95.125 * | | 500,000 | | 10,000 |
| Eurodollar Futures | | | | |
| Expiration 06/19/2006 at $0.00 * | | 1,290,000 | | 77,400 |
| Expiration 06/19/2006 at $0.00 * | | 1,042,500 | | 135,525 |
| Interest Rate Swap | | | | |
| Expiration 06/16/2006 at $3.45 * | | 3,000,000 | | 25,511 |
| Expiration 06/12/2006 at $4.10 * | | 4,900,000 | | 152,296 |
| Expiration 04/28/2006 at $5.50 * | | 10,000,000 | | 0 |
| Over The Counter European Style Call | | | | |
| Expiration 08/08/2006 at $4.75 * | | 143,300,000 | | 427,894 |
| Expiration 12/22/2006 at $4.80 * | | 18,200,000 | | 126,126 |
| Over The Counter European Style Put | | | | |
| Expiration 03/06/2006 at $5.50 * | | 97,000,000 | | 0 |
| Expiration 04/05/2006 at $5.50 * | | 22,000,000 | | 0 |
| Expiration 05/26/2006 at $115.00 * | | 1,000,000 | | 20,217 |
| United States Treasury Notes 10yrs Futures | | | |
| Expiration 05/26/2006 at $101.00 * | | 718,000 | | 11,219 |
| United States Treasury Notes 5yrs Futures | | | | |
| Expiration 05/26/2006 at $101.00 * | | 1,850,000 | | 28,906 |
|
|
| | | | | 1,020,531 |
|
| TOTAL OPTIONS (Cost $1,346,383) | | | $ | 1,020,531 |
|
| |
| SHORT TERM INVESTMENTS - 32.28% | | | |
| Bank of Ireland | | | | |
| 4.605% due 05/09/2006 *** | $ | 14,200,000 | $ | 14,074,667 |
| Barclays U.S. Funding LLC | | | | |
| 4.675% due 05/22/2006 *** | | 2,900,000 | | 2,869,119 |
| CBA (Delaware) Finance, Inc. | | | | |
| 4.50% due 03/14/2006 *** | | 14,600,000 | | 14,576,275 |
| Danske Corp. | | | | |
| 4.49% due 04/24/2006 *** | | 11,500,000 | | 11,422,547 |
| 4.51% due 04/26/2006 *** | | 1,900,000 | | 1,886,670 |
| Dexia Delaware LLC | | | | |
| 4.50% due 03/10/2006 *** | | 9,000,000 | | 8,989,875 |
| Federal National Mortgage Association | | | | |
| Discount Notes | | | | |
| zero coupon due 03/15/2006 *** | | 2,900,000 | | 2,895,134 |
| HBOS PLC Treasury | | | | |
| 4.67% due 05/23/2006 *** | | 5,100,000 | | 5,045,089 |
| ING US Funding LLC | | | | |
| 4.50% due 03/16/2006 *** | | 14,600,000 | | 14,572,625 |
| Ixis Corp. | | | | |
| 4.60% due 05/04/2006 *** | | 14,200,000 | | 14,083,875 |
| National Australia Funding (Delaware), Inc. | | | |
| 4.50% due 03/16/2006 *** | | 14,600,000 | | 14,572,625 |
The accompanying notes are an integral part of the financial statements. 155
John Hancock Funds II
Portfolio of investments — February 28, 2006 (Unaudited)
(showing percentage of total net assets)
|
| Global Bond Fund (continued) | | |
| | | Shares or | |
| | | Principal | |
| | | Amount | Value |
|
|
| |
| SHORT TERM INVESTMENTS (continued) | | |
| Societe Generale North America, Inc. | | | |
| 4.34% due 03/06/2006 | $ | 1,700,000 | $ | 1,698,975 |
| 4.34% due 03/06/2006 *** | | 7,700,000 | 7,695,359 |
| 4.43% due 04/20/2006 *** | | 700,000 | 695,693 |
| State Street Navigator Securities Lending | | | |
| Prime Portfolio (c) | | 13,793,450 | 13,793,450 |
| Swedbank (Foreningssparbanken AB) | | | |
| 4.405% due 03/28/2006 *** | | 600,000 | 598,018 |
| 4.605% due 05/09/2006 *** | | 14,200,000 | 14,074,667 |
| UBS Finance (Delaware) LLC | | | |
| 4.22% due 03/02/2006 *** | | 8,500,000 | 8,499,004 |
| 4.48% due 04/20/2006 *** | | 1,400,000 | 1,391,289 |
| 4.66% due 05/22/2006 *** | | 500,000 | 494,693 |
| United States Treasury Bills | | | |
| zero coupon due 03/16/2006 *** **** | | 4,915,000 | 4,906,458 |
| Westpac Trust Securities NZ, Ltd. | | | |
| 4.66% due 05/22/2006 *** | | 14,600,000 | 14,445,029 |
|
| TOTAL SHORT TERM INVESTMENTS | | | |
| (Cost $173,100,974) | | | $ | 173,281,136 |
|
| |
| REPURCHASE AGREEMENTS - 2.44% | | | |
| Repurchase Agreement with State | | | |
| Street Corp. dated 02/28/2006 at | | | |
| 3.20% to be repurchased at | | | |
| $13,070,162 on 03/01/2006, | | | |
| collateralized by $13,520,000 | | | |
| Federal Home Loan Bank, 4.25% | | | |
| due 03/17/2010 (valued at | | | |
| $13,334,100, including interest) (c)*** | $ | 13,069,000 | $ | 13,069,000 |
|
| TOTAL REPURCHASE AGREEMENTS | | | |
| (Cost $13,069,000) | | | $ | 13,069,000 |
|
| Total Investments (Global Bond Fund) | | | |
| (Cost $652,316,059) - 121.15% | | | $ | 650,430,690 |
| Liabilities in Excess of Other Assets - (21.15)% | | (113,561,954) |
|
|
| TOTAL NET ASSETS - 100.00% | | | $ | 536,868,736 |
|
|
| |
| |
| High Yield Fund | | | |
| | | Shares or | |
| | | Principal | |
| | | Amount | Value |
|
|
| |
| COMMON STOCKS - 1.03% | | | |
| Broadcasting - 0.17% | | | |
| Liberty Global, Inc., Class A * | | 62,079 | $ | 1,260,824 |
| Liberty Global, Inc., Series C * (a) | | 62,079 | 1,204,333 |
|
|
| | | | 2,465,157 |
| Cellular Communications - 0.32% | | | |
| American Tower Corp., Class A * (a) | | 148,992 | 4,742,415 |
Electrical Utilities - 0.01% | | | |
| Mirant Corp. * | | 4,534 | 111,537 |
Household Products - 0.17% | | | |
| Home Interiors * | | 9,260,656 | 2,500,377 |
| High Yield Fund (continued) | | |
| | | Shares or | |
| | | Principal | |
| | | Amount | Value |
| |
|
| |
| COMMON STOCKS (continued) | | | |
| Internet Content - 0.00% | | | |
| Globix Corp. * (a) | | 15,039 | $ | 27,822 |
Telecommunications Equipment & | | | |
| Services - 0.36% | | | |
| NTL, Inc. * (a) | | 42,175 | 2,777,224 |
| Telewest Global, Inc. * (a) | | 105,478 | 2,515,650 |
|
|
| | | | 5,292,874 |
| Telephone - 0.00% | | | |
| XO Communications, Inc. * (a) | | 821 | 1,872 |
|
| TOTAL COMMON STOCKS (Cost $13,945,938) | | $ | 15,142,054 |
|
| |
| PREFERRED STOCKS - 0.09% | | | |
| Auto Parts - 0.02% | | | |
| Delphi Trust I * (a) | | 54,282 | 314,835 |
Broadcasting - 0.07% | | | |
| Spanish Broadcasting System, Series B * | | 1,000 | 1,080,000 |
Telecommunications Equipment & | | | |
| Services - 0.00% | | | |
| McLeodUSA, Inc., Class A * | | 2,985 | 30 |
| Song Networks Holding AB * | | 4,951 | 0 |
|
|
| | | | 30 |
|
| TOTAL PREFERRED STOCKS (Cost $1,488,911) | | $ | 1,394,865 |
|
| |
| WARRANTS - 0.04% | | | |
| Cellular Communications - 0.02% | | | |
| American Tower Escrow Corp. | | | |
| (Expiration date 08/01/2008; strike | | | |
| price 0.01) * | | 537 | 240,700 |
Government of Mexico - 0.02% | | | |
| Government of Mexico | | | |
| (Expiration Date 10/10/2006; strike | | | |
| price $25.00) * | | 22,500 | 101,250 |
| (Expiration date 09/01/2006; strike | | | |
| price $35.00) * | | 17,400 | 125,280 |
| (Expiration date 11/09/2006; strike | | | |
| price $22.50) * | | 28,000 | 92,400 |
|
|
| | | | 318,930 |
|
| TOTAL WARRANTS (Cost $387,910) | | | $ | 559,630 |
|
| |
| FOREIGN GOVERNMENT OBLIGATIONS - 10.33% | |
| Argentina - 0.60% | | | |
| Republic of Argentina | | | |
| zero coupon, Step up to 2.5% on | | | |
| 03/31/2009 due 12/31/2038 (a) | $ | 575,000 | 230,575 |
| zero coupon due 12/15/2035 (b) | EUR | 1,225,000 | 108,799 |
| .34% due 12/15/2035 (b) | ARS | 12,240,355 | 248,673 |
| 4.50% due 12/15/2035 (a)(b) | $ | 575,000 | 43,700 |
| 4.889% due 08/03/2012 (b) | | 1,984,238 | 1,628,067 |
| 5.83% due 12/31/2033 (b) | ARS | 5,868,661 | 2,507,770 |
| 7.00% due 03/18/2049 | EUR | 6,100,000,000 | 1,179,682 |
| 7.00% due 03/18/2004 ^ | | 625,000 | 240,293 |
| 7.50% due 05/23/2049 | | 935,172 | 412,045 |
The accompanying notes are an integral part of the financial statements. 156
John Hancock Funds II
Portfolio of investments — February 28, 2006 (Unaudited)
(showing percentage of total net assets)
|
| High Yield Fund (continued) | | | |
| | | Shares or | | |
| | | Principal | | |
| | | Amount | | Value |
|
|
| |
| FOREIGN GOVERNMENT OBLIGATIONS | | | |
| (continued) | | | | |
| Argentina (continued) | | | | |
| Republic of Argentina (continued) | | | | |
| 7.625 due 08/11/2007 | EUR | 505,000,000 | $ | 96,777 |
| 8.00% due 02/26/2008 | | 304,137 | | 118,055 |
| 8.00% due 10/30/2009 | | 175,000,000 | | 32,938 |
| 8.125% due 04/21/2008 | | 625,000 | | 239,547 |
| 8.125% due 10/04/2049 | | 375,000 | | 139,079 |
| 8.50% due 02/23/2049 | | 425,000 | | 85,099 |
| 9.00% due 05/26/2009 | | 100,000 | | 37,374 |
| 9.00% due 06/20/2049 | | 600,000 | | 228,070 |
| 9.25% due 10/21/2049 | | 225,000 | | 83,233 |
| 9.50% due 03/04/2049 | | 456,000 | | 180,264 |
| 9.75% due 11/26/2049 | | 425,000 | | 156,306 |
| 11.75% due 05/20/2011 | | 2,425,000 | | 473,739 |
| 11.75% due 11/13/2026 | | 1,800,000 | | 341,767 |
|
|
| | | | | 8,811,852 |
| Brazil - 2.43% | | | | |
| Federative Republic of Brazil | | | | |
| 5.1875% due 04/15/2009 (a)(b) | $ | 1,507,692 | | 1,503,923 |
| 5.1875% due 04/15/2009 (b) | | 3,402,000 | | 3,402,000 |
| 5.25% due 04/15/2009 (b) | | 1,853,100 | | 1,851,988 |
| 5.25% due 04/15/2012 (b) | | 4,453,729 | | 4,453,729 |
| 7.875% due 03/07/2015 (a) | | 2,685,000 | | 3,001,830 |
| 8.00% due 01/15/2018 (a) | | 8,610,000 | | 9,638,895 |
| 8.25% due 01/20/2034 (a) | | 5,850,000 | | 6,961,500 |
| 8.75% due 02/04/2025 | | 1,395,000 | | 1,684,463 |
| 10.50% due 07/14/2014 (a) | | 225,000 | | 289,687 |
| 12.25% due 03/06/2030 | | 1,875,000 | | 3,046,875 |
|
|
| | | | | 35,834,890 |
| Bulgaria - 0.16% | | | | |
| Republic of Bulgaria | | | | |
| 8.25% due 01/15/2015 (a) | | 1,925,000 | | 2,311,733 |
China - 0.03% | | | | |
| People's Republic of China | | | | |
| 4.75% due 10/29/2013 | | 525,000 | | 513,863 |
Colombia - 0.45% | | | | |
| Republic of Colombia | | | | |
| 8.125% due 05/21/2024 (a) | | 500,000 | | 584,500 |
| 10.375% due 01/28/2033 (a) | | 2,030,000 | | 2,958,725 |
| 10.75% due 01/15/2013 (a) | | 1,700,000 | | 2,176,000 |
| 11.75% due 02/25/2020 | | 575,000 | | 861,062 |
|
|
| | | | | 6,580,287 |
| Costa Rica - 0.01% | | | | |
| Republic of Costa Rica | | | | |
| 6.548% due 03/20/2014 | | 25,000 | | 25,337 |
| 8.05% due 01/31/2013 | | 175,000 | | 191,713 |
|
|
| | | | | 217,050 |
| Ecuador - 0.15% | | | | |
| Republic of Ecuador | | | | |
| zero coupon, Step up to 10% on | | | | |
| 08/15/2006 due 08/15/2030 (b) | | 1,675,000 | | 1,658,250 |
| High Yield Fund (continued) | | |
| | | Shares or | |
| | | Principal | |
| | | Amount | Value |
|
|
| |
| FOREIGN GOVERNMENT OBLIGATIONS | | |
| (continued) | | | |
| Ecuador (continued) | | | |
| Republic of Ecuador, Series REGS (continued) | | |
| 9.375% due 12/15/2015 | $ | 600,000 | $ | 628,998 |
|
|
| | | | 2,287,248 |
| El Salvador - 0.11% | | | |
| Republic of El Salvador | | | |
| 7.75% due 01/24/2023 | | 975,000 | 1,101,750 |
| 8.25% due 04/10/2032 | | 390,000 | 457,275 |
|
|
| | | | 1,559,025 |
| Mexico - 1.89% | | | |
| Government of Mexico | | | |
| 5.875% due 01/15/2014 | | 4,900,000 | 5,022,500 |
| 6.375% due 01/16/2013 | | 7,465,000 | 7,860,645 |
| 6.625% due 03/03/2015 | | 3,375,000 | 3,653,438 |
| 8.00% due 09/24/2022 | | 3,925,000 | 4,857,187 |
| 8.125% due 12/30/2019 | | 800,000 | 990,000 |
| 8.30% due 08/15/2031 | | 525,000 | 687,750 |
| 8.375% due 01/14/2011 | | 500,000 | 564,500 |
| 10.375% due 02/17/2009 | | 1,075,000 | 1,225,500 |
| 11.375% due 09/15/2016 | | 2,075,000 | 3,046,100 |
|
|
| | | | 27,907,620 |
| Panama - 0.20% | | | |
| Republic of Panama | | | |
| 9.375% due 04/01/2029 | | 2,150,000 | 2,816,500 |
| 9.625% due 02/08/2011 | | 150,000 | 175,500 |
|
|
| | | | 2,992,000 |
| Peru - 0.60% | | | |
| Republic of Peru | | | |
| 5.00% Step up to 6.89% on 03/07/2007 | | | |
| due 03/07/2017 (b) | | 3,300,500 | 3,242,741 |
| 5.00% Step up to 6.94% on 03/07/2007 | | | |
| due 03/07/2017 (b) | | 465,500 | 455,026 |
| 7.35% due 07/21/2025 | | 1,053,000 | 1,113,548 |
| 8.375% due 05/03/2016 (a) | | 290,000 | 336,400 |
| 8.75% due 11/21/2033 (a) | | 2,300,000 | 2,817,500 |
| 9.125% due 02/21/2012 | | 425,000 | 490,875 |
| 9.875% due 02/06/2015 | | 275,000 | 342,375 |
|
|
| | | | 8,798,465 |
| Philippines - 0.58% | | | |
| Republic of Philippines | | | |
| 8.00% due 01/15/2016 (a) | | 750,000 | 805,313 |
| 8.25% due 01/15/2014 (a) | | 700,000 | 757,750 |
| 8.875% due 03/17/2015 | | 375,000 | 424,687 |
| 9.375% due 01/18/2017 | | 300,000 | 349,125 |
| 9.50% due 02/02/2030 (a) | | 1,900,000 | 2,275,250 |
| 10.625% due 03/16/2025 (a) | | 3,050,000 | 3,957,375 |
|
|
| | | | 8,569,500 |
| Poland - 0.12% | | | |
| Republic of Poland | | | |
| 5.25% due 01/15/2014 (a) | | 1,775,000 | 1,785,650 |
The accompanying notes are an integral part of the financial statements. 157
John Hancock Funds II
Portfolio of investments — February 28, 2006 (Unaudited)
(showing percentage of total net assets)
|
| High Yield Fund (continued) | | |
| | | Shares or | |
| | | Principal | |
| | | Amount | Value |
|
|
| |
| FOREIGN GOVERNMENT OBLIGATIONS | | |
| (continued) | | | |
| Russia - 1.31% | | | |
| Russian Federation | | | |
| 5.00% due 03/31/2030 | $ | 10,550,000 | $ | 11,915,170 |
| 8.25% due 03/31/2010 | | 1,045,000 | 1,105,296 |
| 11.00% due 07/24/2018 | | 2,150,000 | 3,184,365 |
| 12.75% due 06/24/2028 | | 1,680,000 | 3,110,016 |
|
|
| | | | 19,314,847 |
| South Africa - 0.13% | | | |
| Republic of South Africa | | | |
| 6.50% due 06/02/2014 | | 1,075,000 | 1,159,656 |
| 9.125% due 05/19/2009 | | 675,000 | 750,938 |
|
|
| | | | 1,910,594 |
| Turkey - 0.90% | | | |
| Republic of Turkey | | | |
| 7.00% due 06/05/2020 (a) | | 1,750,000 | 1,817,813 |
| 7.25% due 03/15/2015 | | 2,400,000 | 2,565,000 |
| 7.375% due 02/05/2025 | | 3,350,000 | 3,576,125 |
| 9.50% due 01/15/2014 (a) | | 2,025,000 | 2,435,063 |
| 11.00% due 01/14/2013 | | 300,000 | 384,375 |
| 11.75% due 06/15/2010 | | 450,000 | 549,000 |
| 11.875% due 01/15/2030 (a) | | 1,225,000 | 1,938,562 |
|
|
| | | | 13,265,938 |
| Ukraine - 0.09% | | | |
| Republic of Ukraine | | | |
| 7.65% due 06/11/2013 (a) | | 1,306,000 | 1,404,995 |
Uruguay - 0.07% | | | |
| Republic of Uruguay | | | |
| 7.25% due 02/15/2011 | | 650,000 | 682,500 |
| 7.50% due 03/15/2015 | | 325,000 | 344,500 |
|
|
| | | | 1,027,000 |
| Venezuela - 0.50% | | | |
| Republic of Venezuela | | | |
| zero coupon due 04/15/2020 | | 305,000 | 96,075 |
| 5.375% due 08/07/2010 | | 375,000 | 366,562 |
| 6.75% due 03/31/2020 | | 250,000 | 250,313 |
| 7.65% due 04/21/2025 (a) | | 2,675,000 | 2,915,750 |
| 10.75% due 09/19/2013 | | 3,000,000 | 3,780,000 |
|
|
| | | | 7,408,700 |
|
| TOTAL FOREIGN GOVERNMENT OBLIGATIONS | |
| (Cost $144,856,731) | | | $ | 152,501,257 |
|
| |
| CORPORATE BONDS - 78.85% | | | |
| Advertising - 1.57% | | | |
| Lamar Media Corp. | | | |
| 6.625% due 08/15/2015 | | 3,375,000 | 3,412,969 |
| R H Donnelley Finance Corp. | | | |
| 8.875% due 01/15/2016 | | 7,900,000 | 8,235,750 |
| RH Donnelley Corp. | | | |
| 6.875% due 01/15/2013 | | 1,650,000 | 1,551,000 |
| 6.875% due 01/15/2013 | | 3,200,000 | 3,008,000 |
| RH Donnelley Finance Corp., Series I | | | |
| 10.875% due 12/15/2012 | | 2,300,000 | 2,587,500 |
| High Yield Fund (continued) | | | |
| | | Shares or | |
| | | Principal | |
| | | Amount | Value |
|
|
| |
| CORPORATE BONDS (continued) | | | |
| Advertising (continued) | | | |
| Vertis, Inc. | | | |
| 9.75% due 04/01/2009 | $ | 4,225,000 | $ | 4,372,875 |
|
|
| | | | 23,168,094 |
| Aerospace - 1.04% | | | |
| Alliant Techsystems, Inc. | | | |
| 8.50% due 05/15/2011 | | 1,850,000 | 1,935,562 |
| Argo-Tech Corp. | | | |
| 9.25% due 06/01/2011 | | 1,625,000 | 1,722,500 |
| DRS Technologies, Inc. | | | |
| 6.875% due 11/01/2013 (a) | | 4,925,000 | 4,912,687 |
| Sequa Corp. | | | |
| 9.00% due 08/01/2009 (a) | | 2,800,000 | 3,017,000 |
| Sequa Corp., Series B | | | |
| 8.875% due 04/01/2008 | | 3,575,000 | 3,744,813 |
|
|
| | | | 15,332,562 |
| Agriculture - 0.89% | | | |
| Case New Holland, Inc. | | | |
| 7.125% due 03/01/2014 | | 4,575,000 | 4,586,437 |
| 9.25% due 08/01/2011 | | 1,825,000 | 1,957,312 |
| Hines Nurseries, Inc. | | | |
| 10.25% due 10/01/2011 | | 450,000 | 449,438 |
| IOWA Select Farms, LP | | | |
| 6.50% due 12/01/2012 | | 1,550,000 | 1,550,000 |
| UAP Holding Corp. | | | |
| zero coupon, Step up to 10.75% on | | | |
| 01/15/2008 due 07/15/2012 | | 4,575,000 | 4,083,188 |
| United Agri Products, Inc. | | | |
| 8.25% due 12/15/2011 | | 525,000 | 553,875 |
|
|
| | | | 13,180,250 |
| Air Travel - 0.07% | | | |
| Continental Airlines, Inc. | | | |
| 6.541% due 09/15/2008 | | 620,945 | 583,840 |
| 6.80% due 07/02/2007 | | 557,573 | 524,693 |
|
|
| | | | 1,108,533 |
| Aluminum - 0.27% | | | |
| IMCO Recycling, Inc. | | | |
| 10.375% due 10/15/2010 | | 3,575,000 | 3,932,500 |
Amusement & Theme Parks - 0.30% | | | |
| Six Flags, Inc. | | | |
| 9.625% due 06/01/2014 | | 3,325,000 | 3,374,875 |
| 9.75% due 04/15/2013 | | 1,000,000 | 1,022,500 |
|
|
| | | | 4,397,375 |
| Apparel & Textiles - 1.15% | | | |
| Collins & Aikman Floorcoverings, Inc. | | | |
| 9.75% due 02/15/2010 | | 3,225,000 | 3,047,625 |
| Levi Strauss & Company | | | |
| 7.73% due 04/01/2012 | | 1,075,000 | 1,109,937 |
| 9.75% due 01/15/2015 | | 3,650,000 | 3,887,250 |
| 12.25% due 12/15/2012 | | 2,550,000 | 2,913,375 |
| Oxford Industries, Inc. | | | |
| 8.875% due 06/01/2011 | | 1,925,000 | 1,982,750 |
| Quiksilver, Inc. | | | |
| 6.875% due 04/15/2015 (a) | | 2,743,000 | 2,646,995 |
The accompanying notes are an integral part of the financial statements. 158
John Hancock Funds II
Portfolio of investments — February 28, 2006 (Unaudited)
(showing percentage of total net assets)
|
| High Yield Fund (continued) | | | |
| | | Shares or | |
| | | Principal | |
| | | Amount | Value |
|
|
| |
| CORPORATE BONDS (continued) | | | |
| Apparel & Textiles (continued) | | | |
| Tommy Hilfiger USA, Inc. | | | |
| 6.85% due 06/01/2008 | $ | 1,300,000 | $ | 1,339,000 |
|
|
| | | | 16,926,932 |
| Auto Parts - 1.00% | | | |
| CSK Auto, Inc. | | | |
| 7.00% due 01/15/2014 | | 3,825,000 | 3,595,500 |
| Keystone Automotive Operations | | | |
| 9.75% due 11/01/2013 | | 3,400,000 | 2,966,500 |
| Rexnord Corp. | | | |
| 10.125% due 12/15/2012 | | 750,000 | 825,000 |
| Tenneco Automotive, Inc. | | | |
| 8.625% due 11/15/2014 (a) | | 3,300,000 | 3,283,500 |
| 10.25% due 07/15/2013 | | 1,100,000 | 1,218,250 |
| TRW Automotive, Inc. | | | |
| 9.375% due 02/15/2013 | | 2,575,000 | 2,793,875 |
| 11.00% due 02/15/2013 (a) | | 125,000 | 140,312 |
|
|
| | | | 14,822,937 |
| Automobiles - 2.94% | | | |
| Ford Motor Company | | | |
| 6.625% due 10/01/2028 | | 1,050,000 | 703,500 |
| 7.45% due 07/16/2031 (a) | | 36,325,000 | 25,790,750 |
| 8.90% due 01/15/2032 | | 1,425,000 | 1,097,250 |
| General Motors Corp. | | | |
| 8.25% due 07/15/2023 (a) | | 2,425,000 | 1,667,188 |
| 8.375% due 07/15/2033 (a) | | 17,475,000 | 12,319,875 |
| Hertz Corp., Class A | | | |
| 8.875% due 01/01/2014 | | 1,700,000 | 1,776,500 |
|
|
| | | | 43,355,063 |
| Broadcasting - 2.22% | | | |
| CanWest Media, Inc. | | | |
| 8.00% due 09/15/2012 | | 6,054,009 | 6,205,359 |
| Charter Communications Holdings | | | |
| zero coupon, Step up to 11.75% on | | | |
| 05/15/2006 due 05/15/2014 | | 5,900,000 | 3,068,000 |
| zero coupon, Step up to 12.125% on | | | |
| 01/15/2007 due 01/15/2015 (a) | | 525,000 | 241,500 |
| 9.92% due 04/01/2014 | | 175,000 | 91,000 |
| 11.00% due 10/01/2015 | | 13,975,000 | 11,756,469 |
| Charter Communications Operating LLC | | | |
| 8.00% due 04/30/2012 | | 75,000 | 75,562 |
| 8.375% due 04/30/2014 | | 1,525,000 | 1,536,438 |
| CSC Holdings, Inc. | | | |
| 7.00% due 04/15/2012 | | 2,550,000 | 2,467,125 |
| 7.25% due 07/15/2008 | | 550,000 | 556,875 |
| 7.625% due 07/15/2018 | | 300,000 | 292,125 |
| 8.125% due 08/15/2009 (a) | | 2,575,000 | 2,655,469 |
| CSC Holdings, Inc., Series B | | | |
| 7.625% due 04/01/2011 | | 700,000 | 705,250 |
| 8.125% due 07/15/2009 | | 50,000 | 51,562 |
| Emmis Communications Corp. | | | |
| 10.3663% due 06/15/2012 (a)(b) | | 848,571 | 848,571 |
| Liberty Media Corp. | | | |
| 5.70% due 05/15/2013 (a) | | 50,000 | 46,831 |
| 7.875% due 07/15/2009 (a) | | 25,000 | 26,313 |
| High Yield Fund (continued) | | |
| | | Shares or | |
| | | Principal | |
| | | Amount | Value |
| |
|
| |
| CORPORATE BONDS (continued) | | | |
| Broadcasting (continued) | | | |
| Liberty Media Corp. (continued) | | | |
| 8.25% due 02/01/2030 | $ | 25,000 | $ | 25,109 |
| Radio One, Inc. | | | |
| 6.375% due 02/15/2013 (a) | | 843,000 | 809,280 |
| 8.875% due 07/01/2011 | | 900,000 | 945,000 |
| Salem Communications Holding Corp. | | | |
| 9.00% due 07/01/2011 | | 350,000 | 367,500 |
|
|
| | | | 32,771,338 |
| Building Materials & Construction - 0.46% | | |
| Associated Materials, Inc. | | | |
| zero coupon, Step up to 11.25% on | | | |
| 03/01/2009 due 03/01/2014 (a) | | 2,525,000 | 1,338,250 |
| Brand Services, Inc. | | | |
| 12.00% due 10/15/2012 | | 1,175,000 | 1,248,437 |
| NTK Holdings, Inc. | | | |
| zero coupon, Step up to 10.75% on | | | |
| 03/01/14 due 03/01/2014 | | 2,725,000 | 1,907,500 |
| Texas Industries, Inc. | | | |
| 7.25% due 07/15/2013 | | 2,175,000 | 2,251,125 |
|
|
| | | | 6,745,312 |
| Business Services - 2.09% | | | |
| Allied Security Escrow Corp. | | | |
| 11.375% due 07/15/2011 | | 375,000 | 352,500 |
| Buhrmann US, Inc. | | | |
| 7.875% due 03/01/2015 | | 2,625,000 | 2,618,437 |
| Cardtronics, Inc. | | | |
| 9.25% due 08/15/2013 | | 575,000 | 572,125 |
| CB Richard Ellis Services, Inc. | | | |
| 11.25% due 06/15/2011 | | 500,000 | 533,750 |
| Conveo Corp. | | | |
| 7.875% due 12/01/2013 (a) | | 3,325,000 | 3,291,750 |
| Interep National Radio Sales, Inc., Series B, Class A | | |
| 10.00% due 07/01/2008 (a) | | 1,475,000 | 1,255,594 |
| Invensys PLC | | | |
| 9.875% due 03/15/2011 (a) | | 3,600,000 | 3,726,000 |
| Iron Mountain, Inc. | | | |
| 6.625% due 01/01/2016 | | 100,000 | 94,250 |
| 7.75% due 01/15/2015 | | 7,350,000 | 7,441,875 |
| 8.625% due 04/01/2013 | | 2,275,000 | 2,371,688 |
| SunGard Data Systems, Inc. | | | |
| 9.125% due 08/15/2013 (a) | | 1,600,000 | 1,702,000 |
| Universal Compression, Inc. | | | |
| 7.25% due 05/15/2010 (a) | | 775,000 | 802,125 |
| Xerox Capital Trust I | | | |
| 8.00% due 02/01/2027 | | 5,690,000 | 5,889,150 |
| Xerox Corp. | | | |
| 7.20% due 04/01/2016 (a) | | 50,000 | 53,250 |
| 9.75% due 01/15/2009 | | 100,000 | 109,750 |
|
|
| | | | 30,814,244 |
| Cable and Television - 3.35% | | | |
| Atlantic Broadband Finance LLC | | | |
| 9.375% due 01/15/2014 | | 2,700,000 | 2,511,000 |
| CCO Holdings LLC | | | |
| 8.75% due 11/15/2013 | | 575,000 | 560,625 |
The accompanying notes are an integral part of the financial statements. 159
John Hancock Funds II
Portfolio of investments — February 28, 2006 (Unaudited)
(showing percentage of total net assets)
|
| High Yield Fund (continued) | | | | |
| | | Shares or | | |
| | | Principal | | |
| | | Amount | | Value |
|
|
| |
| CORPORATE BONDS (continued) | | | | |
| Cable and Television (continued) | | | | |
| DirecTV Holdings LLC | | | | |
| 6.375% due 06/15/2015 | $ | 7,850,000 | $ | 7,820,562 |
| 8.375% due 03/15/2013 | | 1,625,000 | | 1,742,812 |
| Echostar DBS Corp. | | | | |
| 6.375% due 10/01/2011 | | 100,000 | | 97,750 |
| 6.625% due 10/01/2014 | | 10,075,000 | | 9,797,937 |
| 7.125% due 02/01/2016 | | 2,525,000 | | 2,499,750 |
| Insight Communications, Inc. | | | | |
| zero coupon, Step up to 12.25% on | | | | |
| 02/15/2006 due 02/15/2011 (a) | | 100,000 | | 106,250 |
| Lodgenet Entertainment Corp. | | | | |
| 9.50% due 06/15/2013 | | 2,625,000 | | 2,835,000 |
| Mediacom Broadband LLC | | | | |
| 8.50% due 10/15/2015 | | 375,000 | | 360,000 |
| 11.00% due 07/15/2013 (a) | | 1,575,000 | | 1,685,250 |
| Mediacom LLC/Mediacom Capital Corp. | | | | |
| 9.50% due 01/15/2013 | | 2,925,000 | | 2,925,000 |
| Rainbow National Services LLC | | | | |
| 8.75% due 09/01/2012 | | 1,375,000 | | 1,481,562 |
| 10.375% due 09/01/2014 (a) | | 3,000,000 | | 3,393,750 |
| Renaissance Media Group, LLC | | | | |
| 10.00% due 04/15/2008 | | 50,000 | | 50,063 |
| Rogers Cable, Inc. | | | | |
| 6.25% due 06/15/2013 | | 225,000 | | 223,594 |
| 8.75% due 05/01/2032 | | 750,000 | | 890,625 |
| Shaw Communications, Inc. | | | | |
| 8.25% due 04/11/2010 (a) | | 25,000 | | 26,813 |
| Sinclair Broadcast Group, Inc. | | | | |
| 8.00% due 03/15/2012 | | 4,700,000 | | 4,799,875 |
| 8.75% due 12/15/2011 | | 550,000 | | 578,188 |
| Videotron Ltee | | | | |
| 6.375% due 12/15/2015 | | 1,375,000 | | 1,361,250 |
| Young Broadcasting, Inc. | | | | |
| 8.75% due 01/15/2014 (a) | | 50,000 | | 42,000 |
| 10.00% due 03/01/2011 (a) | | 4,125,000 | | 3,686,719 |
|
|
| | | | | 49,476,375 |
| Cellular Communications - 2.69% | | | | |
| American Tower Corp. | | | | |
| 5.00% due 02/15/2010 | | 600,000 | | 593,250 |
| 7.25% due 12/01/2011 | | 75,000 | | 78,750 |
| 7.50% due 05/01/2012 | | 3,400,000 | | 3,587,000 |
| Centennial Communications Corp. | | | | |
| 8.125% due 02/01/2014 (a) | | 1,525,000 | | 1,555,500 |
| 10.125% due 06/15/2013 | | 3,950,000 | | 4,325,250 |
| 10.25% due 01/01/2013 (b) | | 1,200,000 | | 1,239,000 |
| 10.75% due 12/15/2008 | | 125,000 | | 127,656 |
| Dobson Cellular Systems, Inc. | | | | |
| 8.375% due 11/01/2011 (a) | | 600,000 | | 636,000 |
| Nextel Communications, Inc. | | | | |
| 6.875% due 10/31/2013 | | 900,000 | | 942,210 |
| 7.375% due 08/01/2015 | | 13,500,000 | | 14,277,249 |
| Rogers Wireless, Inc. | | | | |
| 7.50% due 03/15/2015 | | 2,725,000 | | 2,956,625 |
| 9.625% due 05/01/2011 | | 100,000 | | 115,750 |
| High Yield Fund (continued) | | |
| | | Shares or | |
| | | Principal | |
| | | Amount | Value |
|
|
| |
| CORPORATE BONDS (continued) | | | |
| Cellular Communications (continued) | | | |
| SBA Communications Corp. | | | |
| 8.50% due 12/01/2012 | $ | 1,600,000 | $ | 1,760,000 |
| SBA Telecommunication / | | | |
| SBA Communications Corp. | | | |
| zero coupon, Step up to 9.75% on | | | |
| 12/15/2007 due 12/15/2011 | | 2,475,000 | 2,345,063 |
| UbiquiTel Operating Company | | | |
| 9.875% due 03/01/2011 | | 4,025,000 | 4,427,500 |
| US Unwired, Inc., Series B | | | |
| 10.00% due 06/15/2012 (a) | | 700,000 | 791,000 |
|
|
| | | | 39,757,803 |
| Chemicals - 3.89% | | | |
| Airgas, Inc. | | | |
| 9.125% due 10/01/2011 (a) | | 1,075,000 | 1,143,531 |
| Equistar Chemicals LP | | | |
| 10.125% due 09/01/2008 (a) | | 500,000 | 537,500 |
| 10.625% due 05/01/2011 | | 3,300,000 | 3,588,750 |
| Ethyl Corp. | | | |
| 8.875% due 05/01/2010 | | 3,325,000 | 3,474,625 |
| FMC Corp. | | | |
| 7.00% due 05/15/2008 | | 575,000 | 590,304 |
| 7.75% due 07/01/2011 | | 1,225,000 | 1,292,484 |
| Hercules, Inc. | | | |
| 6.75% due 10/15/2029 | | 2,775,000 | 2,719,500 |
| Huntsman ICI Chemicals | | | |
| 10.125% due 07/01/2009 (a) | | 2,275,000 | 2,331,875 |
| 10.125% due 07/01/2009 | EUR | 125,000 | 154,979 |
| Huntsman International LLC | | | |
| 7.375% due 01/01/2015 (a) | $ | 1,325,000 | 1,344,875 |
| 9.875% due 03/01/2009 | | 1,050,000 | 1,099,875 |
| IMC Global, Inc. | | | |
| 7.30% due 01/15/2028 | | 25,000 | 24,000 |
| 10.875% due 08/01/2013 (a) | | 875,000 | 1,006,250 |
| Innophos, Inc. | | | |
| 8.875% due 08/15/2014 | | 3,475,000 | 3,579,250 |
| JohnsonDiversey, Inc., Series B | | | |
| 9.625% due 05/15/2012 | | 25,000 | 25,625 |
| Lyondell Chemical Company | | | |
| 9.50% due 12/15/2008 (a) | | 839,000 | 876,755 |
| 11.125% due 07/15/2012 | | 375,000 | 414,375 |
| Lyondell Chemical Company, Series A | | | |
| 9.625% due 05/01/2007 | | 425,000 | 439,875 |
| Methanex Corp. | | | |
| 8.75% due 08/15/2012 (a) | | 1,200,000 | 1,323,000 |
| Millennium America, Inc. | | | |
| 9.25% due 06/15/2008 | | 4,325,000 | 4,443,937 |
| Nalco Company | | | |
| 7.75% due 11/15/2011 | | 50,000 | 50,875 |
| 8.875% due 11/15/2013 (a) | | 5,800,000 | 6,075,500 |
| Nova Chemicals Corp | | | |
| 6.50% due 01/15/2012 (a) | | 9,315,000 | 8,965,688 |
| OM Group, Inc. | | | |
| 9.25% due 12/15/2011 | | 1,550,000 | 1,550,000 |
| PQ Corp. | | | |
| 7.50% due 02/15/2013 | | 1,200,000 | 1,152,000 |
The accompanying notes are an integral part of the financial statements. 160
John Hancock Funds II
Portfolio of investments — February 28, 2006 (Unaudited)
(showing percentage of total net assets)
|
| High Yield Fund (continued) | | |
| | | Shares or | |
| | | Principal | |
| | | Amount | Value |
|
|
| |
| CORPORATE BONDS (continued) | | | |
| Chemicals (continued) | | | |
| Rhodia SA | | | |
| 7.625% due 06/01/2010 | $ | 725,000 | $ | 737,688 |
| 8.875% due 06/01/2011 (a) | | 4,150,000 | 4,305,625 |
| 10.25% due 06/01/2010 | | 875,000 | 984,375 |
| Westlake Chemical Corp. | | | |
| 6.625% due 01/15/2016 (a) | | 3,150,000 | 3,146,063 |
|
|
| | | | 57,379,179 |
| Coal - 0.28% | | | |
| Massey Energy Company | | | |
| 6.625% due 11/15/2010 (a) | | 2,925,000 | 2,990,813 |
| 6.875% due 12/15/2013 (a) | | 1,200,000 | 1,197,000 |
|
|
| | | | 4,187,813 |
| Commercial Services - 0.36% | | | |
| DynCorp International LLC, Series B | | | |
| 9.50% due 02/15/2013 | | 5,100,000 | 5,278,500 |
Computers & Business Equipment - 0.33% | | |
| Seagate Technology Holdings | | | |
| 8.00% due 05/15/2009 | | 3,825,000 | 3,978,000 |
| Unisys Corp. | | | |
| 8.00% due 10/15/2012 | | 875,000 | 853,125 |
|
|
| | | | 4,831,125 |
| Construction & Mining Equipment - 0.23% | | |
| Terex Corp. | | | |
| 7.375% due 01/15/2014 | | 1,100,000 | 1,133,000 |
| 10.375% due 04/01/2011 | | 2,100,000 | 2,215,500 |
|
|
| | | | 3,348,500 |
| Construction Materials - 0.17% | | | |
| Nortek, Inc. | | | |
| 8.50% due 09/01/2014 | | 2,575,000 | 2,568,563 |
Containers & Glass - 1.62% | | | |
| Graphic Packaging International Corp. | | | |
| 8.50% due 08/15/2011 (a) | | 2,550,000 | 2,562,750 |
| 9.50% due 08/15/2013 (a) | | 3,450,000 | 3,277,500 |
| Owens-Brockway Glass Container, Inc. | | | |
| 6.75% due 12/01/2014 (a) | | 1,053,000 | 1,031,940 |
| 7.75% due 05/15/2011 | | 3,350,000 | 3,517,500 |
| 8.25% due 05/15/2013 | | 550,000 | 573,375 |
| 8.75% due 11/15/2012 | | 250,000 | 268,750 |
| Owens-Illinois, Inc., Series 2008 | | | |
| 7.35% due 05/15/2008 (a) | | 200,000 | 202,500 |
| Owens-Illinois, Inc., Series 2010 | | | |
| 7.50% due 05/15/2010 (a) | | 850,000 | 860,625 |
| Pliant Corp. | | | |
| 11.125% due 09/01/2009 ^ | | 750,000 | 690,000 |
| 11.625% due 06/15/2009 ^ | | 978,765 | 1,066,854 |
| 12.75% due 06/15/2010 ^ | | 1,000,000 | 245,000 |
| 13.00% due 06/01/2010 ^ | | 125,000 | 30,625 |
| Radnor Holdings Corp. | | | |
| 11.00% due 03/15/2010 | | 2,350,000 | 1,786,000 |
| Stone Container Corp. | | | |
| 8.375% due 07/01/2012 (a) | | 3,675,000 | 3,601,500 |
| 9.75% due 02/01/2011 | | 1,925,000 | 1,970,719 |
| High Yield Fund (continued) | | | |
| | | Shares or | |
| | | Principal | |
| | | Amount | Value |
|
|
| |
| CORPORATE BONDS (continued) | | | |
| Containers & Glass (continued) | | | |
| Stone Container Finance | | | |
| 7.375% due 07/15/2014 (a) | $ | 25,000 | $ | 23,187 |
| Tekni Plex, Inc., Series B | | | |
| 12.75% due 06/15/2010 | | 2,650,000 | 1,550,250 |
| Tekni-Plex, Inc. | | | |
| 8.75% due 11/15/2013 | | 725,000 | 665,188 |
|
|
| | | | 23,924,263 |
| Correctional Facilities - 0.43% | | | |
| Corrections Corporation of America | | | |
| 6.25% due 03/15/2013 | | 5,575,000 | 5,533,187 |
| 6.75% due 01/31/2014 | | 750,000 | 763,125 |
|
|
| | | | 6,296,312 |
| Cosmetics & Toiletries - 0.70% | | | |
| Del Laboratories, Inc. | | | |
| 8.00% due 02/01/2012 (a) | | 2,125,000 | 1,750,469 |
| 9.68% due 11/01/2011 (b) | | 1,625,000 | 1,657,500 |
| Jafra Cosmetics International, Inc. | | | |
| 10.75% due 05/15/2011 | | 1,800,000�� | 1,959,750 |
| Playtex Products, Inc. | | | |
| 9.375% due 06/01/2011 | | 4,600,000 | 4,818,500 |
| Spectrum Brands, Inc. | | | |
| 7.375% due 02/01/2015 | | 257,000 | 221,662 |
|
|
| | | | 10,407,881 |
| Crude Petroleum & Natural Gas - 0.63% | | | |
| Chesapeake Energy Corp. | | | |
| 6.25% due 01/15/2018 | | 3,225,000 | 3,220,969 |
| 6.625% due 01/15/2016 | | 1,375,000 | 1,395,625 |
| 6.875% due 01/15/2016 | | 1,400,000 | 1,435,000 |
| 7.00% due 08/15/2014 | | 425,000 | 440,937 |
| Kerr-McGee Corp. | | | |
| 6.875% due 09/15/2011 | | 1,200,000 | 1,266,604 |
| Plains Exploration & Production Company | | | |
| 8.75% due 07/01/2012 | | 1,500,000 | 1,612,500 |
|
|
| | | | 9,371,635 |
| Domestic Oil - 2.15% | | | |
| Amerada Hess Corp. | | | |
| 7.30% due 08/15/2031 | | 50,000 | 58,717 |
| Exco Resources, Inc. | | | |
| 7.25% due 01/15/2011 | | 5,650,000 | 5,763,000 |
| Forest Oil Corp. | | | |
| 8.00% due 06/15/2008 | | 550,000 | 574,062 |
| 8.00% due 12/15/2011 | | 2,800,000 | 3,052,000 |
| Magnum Hunter Resources, Inc. | | | |
| 9.60% due 03/15/2012 | | 4,800,000 | 5,184,000 |
| Stone Energy Corp. | | | |
| 6.75% due 12/15/2014 | | 4,075,000 | 3,891,625 |
| 8.25% due 12/15/2011 (a) | | 1,725,000 | 1,750,875 |
| Swift Energy Company | | | |
| 7.625% due 07/15/2011 | | 1,550,000 | 1,596,500 |
| 9.375% due 05/01/2012 | | 3,175,000 | 3,413,125 |
| Whiting Petroleum Corp. | | | |
| 7.00% due 02/01/2014 | | 1,165,000 | 1,167,913 |
| 7.25% due 05/01/2012 | | 5,185,000 | 5,249,813 |
|
|
| | | | 31,701,630 |
The accompanying notes are an integral part of the financial statements. 161
John Hancock Funds II
Portfolio of investments — February 28, 2006 (Unaudited)
(showing percentage of total net assets)
|
| High Yield Fund (continued) | | | | |
| | | Shares or | | |
| | | Principal | | |
| | | Amount | | Value |
|
|
| |
| CORPORATE BONDS (continued) | | | | |
| Drugs & Health Care - 1.00% | | | | |
| General Nutrition Centers, Inc. | | | | |
| 8.50% due 12/01/2010 | $ | 1,125,000 | $ | 1,054,687 |
| Rite Aid Corp. | | | | |
| 6.125% due 12/15/2008 (a) | | 1,500,000 | | 1,443,750 |
| 7.125% due 01/15/2007 | | 525,000 | | 528,938 |
| 7.50% due 01/15/2015 | | 625,000 | | 602,344 |
| 8.125% due 05/01/2010 (a) | | 2,375,000 | | 2,422,500 |
| 9.50% due 02/15/2011 | | 75,000 | | 78,750 |
| The Jean Coutu Group (PJC), Inc. | | | | |
| 8.50% due 08/01/2014 (a) | | 4,925,000 | | 4,703,375 |
| Warner Chilcott Corp. | | | | |
| 8.75% due 02/01/2015 | | 3,550,000 | | 3,487,875 |
| WH Holdings/WH Capital Corp. | | | | |
| 9.50% due 04/01/2011 | | 425,000 | | 459,000 |
|
|
| | | | | 14,781,219 |
| Electrical Utilities - 3.34% | | | | |
| AES Corp. | | | | |
| 7.75% due 03/01/2014 | | 2,750,000 | | 2,904,688 |
| 8.75% due 06/15/2008 (a) | | 850,000 | | 889,312 |
| 8.75% due 05/15/2013 | | 100,000 | | 108,375 |
| 8.875% due 02/15/2011 (a) | | 1,675,000 | | 1,813,187 |
| 9.00% due 05/15/2015 | | 125,000 | | 136,250 |
| 9.375% due 09/15/2010 | | 5,000,000 | | 5,487,500 |
| 9.50% due 06/01/2009 (a) | | 1,175,000 | | 1,276,344 |
| Allegheny Energy Supply Company LLC | | | | |
| 8.25 due 04/15/2012 | | 1,950,000 | | 2,142,563 |
| Calpine Corp. | | | | |
| 8.50% due 07/15/2010 (a) | | 2,950,000 | | 2,743,500 |
| 8.75% due 07/15/2013 (a) | | 1,850,000 | | 1,720,500 |
| Calpine Generating Company LLC | | | | |
| 13.2163% due 04/01/2011 (b) | | 3,050,000 | | 3,324,500 |
| CenterPoint Energy Resources Corp. | | | | |
| 7.875% due 04/01/2013 | | 50,000 | | 56,766 |
| CMS Energy Corp. | | | | |
| 8.50% due 04/15/2011 (a) | | 50,000 | | 54,500 |
| Edison Mission Energy | | | | |
| 7.73% due 06/15/2009 | | 2,700,000 | | 2,787,750 |
| 9.875% due 04/15/2011 | | 3,729,000 | | 4,297,673 |
| 10.00% due 08/15/2008 | | 2,024,000 | | 2,206,160 |
| FirstEnergy Corp. | | | | |
| 7.375% due 11/15/2031 | | 25,000 | | 29,154 |
| Mirant Americas Generation LLC | | | | |
| 8.30% due 05/01/2011 ^ | | 6,204,000 | | 6,490,935 |
| 8.50% due 10/01/2021 ^ | | 407,000 | | 418,701 |
| Nevada Power Company | | | | |
| 5.875% due 01/15/2015 | | 25,000 | | 25,046 |
| 9.00% due 08/15/2013 | | 25,000 | | 27,644 |
| Reliant Energy, Inc. | | | | |
| 6.75% due 12/15/2014 | | 2,075,000 | | 1,875,281 |
| 9.25% due 07/15/2010 | | 2,425,000 | | 2,464,406 |
| 9.50% due 07/15/2013 (a) | | 5,800,000 | | 5,916,000 |
| TXU Corp., Series P | | | | |
| 5.55% due 11/15/2014 | | 50,000 | | 47,618 |
| TXU Corp., Series Q | | | | |
| 6.50% due 11/15/2024 | | 50,000 | | 47,673 |
| High Yield Fund (continued) | | |
| | | Shares or | |
| | | Principal | |
| | | Amount | Value |
|
|
| |
| CORPORATE BONDS (continued) | | | |
| Electrical Utilities (continued) | | | |
| TXU Corp., Series R | | | |
| 6.55% due 11/15/2034 (a) | $ | 25,000 | $ | 23,710 |
|
|
| | | | 49,315,736 |
| Electronics - 1.07% | | | |
| L-3 Communications Corp. | | | |
| 6.125% due 07/15/2013 | | 25,000 | 24,625 |
| 7.625% due 06/15/2012 | | 2,575,000 | 2,697,312 |
| L-3 Communications Corp., Series B | | | |
| 6.375% due 10/15/2015 | | 8,173,000 | 8,152,568 |
| Motors & Gears, Inc., Series D | | | |
| 10.75% due 11/15/2006 | | 1,650,000 | 1,612,875 |
| Muzak, LLC/Muzak Finance Corp. | | | |
| 9.875% due 03/15/2009 | | 1,250,000 | 731,250 |
| 10.00% due 02/15/2009 (a) | | 2,950,000 | 2,570,188 |
|
|
| | | | 15,788,818 |
| Energy - 1.48% | | | |
| Chesapeake Energy Corp. | | | |
| 7.50% due 06/15/2014 (a) | | 5,125,000 | 5,458,125 |
| El Paso Energy | | | |
| 7.375% due 12/15/2012 (a) | | 225,000 | 233,437 |
| Inergy, L.P. | | | |
| 6.875% due 12/15/2014 | | 3,150,000 | 3,000,375 |
| NRG Energy, Inc. | | | |
| 7.25% due 02/01/2014 | | 2,350,000 | 2,408,750 |
| 7.375% due 02/01/2016 | | 10,300,000 | 10,609,000 |
| Peabody Energy Corp. | | | |
| 6.875% due 03/15/2013 (a) | | 50,000 | 51,375 |
| TECO Energy, Inc. | | | |
| 7.20% due 05/01/2011 (a) | | 50,000 | 52,875 |
|
|
| | | | 21,813,937 |
| Financial Services - 6.27% | | | |
| Alamosa Delaware, Inc. | | | |
| 8.50% due 01/31/2012 | | 450,000 | 486,000 |
| 11.00% due 07/31/2010 (a) | | 1,575,000 | 1,756,125 |
| 12.00% due 07/31/2009 (a) | | 1,400,000 | 1,515,500 |
| Arch Western Finance LLC | | | |
| 6.75% due 07/01/2013 | | 75,000 | 75,187 |
| BCP Crystal Holdings Corp. | | | |
| 9.625% due 06/15/2014 | | 3,850,000 | 4,307,187 |
| CB Richard Ellis Services, Inc. | | | |
| 9.75% due 05/15/2010 | | 675,000 | 732,375 |
| Chukchansi Economic Development Authority | | |
| 8.00% due 11/15/2013 | | 3,075,000 | 3,167,250 |
| Ford Motor Credit Company | | | |
| 4.95% due 01/15/2008 | | 1,350,000 | 1,243,660 |
| 6.625% due 06/16/2008 (a) | | 14,600,000 | 13,592,571 |
| 7.875% due 06/15/2010 | | 925,000 | 855,502 |
| General Motors Acceptance Corp. | | | |
| 8.00% due 11/01/2031 (a) | | 23,750,000 | 21,689,402 |
| Global Cash Access LLC | | | |
| 8.75% due 03/15/2012 | | 4,250,000 | 4,563,438 |
| Hexion US Finance Corp/Hexion Nova Scotia | | |
| Finance ULC | | | |
| 9.00% due 07/15/2014 | | 6,175,000 | 6,352,531 |
The accompanying notes are an integral part of the financial statements. 162
John Hancock Funds II
Portfolio of investments — February 28, 2006 (Unaudited)
(showing percentage of total net assets)
|
| High Yield Fund (continued) | | |
| | | Shares or | |
| | | Principal | |
| | | Amount | Value |
|
|
| |
| CORPORATE BONDS (continued) | | | |
| Financial Services (continued) | | | |
| iPCS, Inc. | | | |
| 11.50% due 05/01/2012 | $ | 1,275,000 | $ | 1,463,063 |
| JSG Funding PLC | | | |
| 9.625% due 10/01/2012 | | 2,925,000 | 3,063,938 |
| 10.125% due 10/01/2012 | EUR | 475,000 | 622,898 |
| Nell AF SARL | | | |
| 8.375% due 08/15/2015 (a) | $ | 2,925,000 | 2,939,625 |
| Nexstar Finance Holdings LLC | | | |
| zero coupon, Step up to 11.375% on | | | |
| 04/01/2008 due 04/01/2013 | | 1,525,000 | 1,210,469 |
| Nexstar Finance, Inc. | | | |
| 7.00% due 01/15/2014 (a) | | 300,000 | 281,250 |
| Sensus Metering Systems, Inc. | | | |
| 8.625% due 12/15/2013 | | 2,050,000 | 1,962,875 |
| TRAINS HY-2005-1 | | | |
| 7.651% due 06/15/2015 (b) | | 17,996,829 | 18,469,246 |
| Ucar Finance, Inc. | | | |
| 10.25% due 02/15/2012 (a) | | 600,000 | 639,000 |
| Yell Finance BV | | | |
| zero coupon, Step up to 13.5% on | | | |
| 08/01/2006 due 08/01/2011 | | 1,500,000 | 1,550,625 |
|
|
| | | | 92,539,717 |
| Food & Beverages - 1.38% | | | |
| Ahold Finance USA, Inc. | | | |
| 6.875% due 05/01/2029 | | 25,000 | 23,062 |
| 8.25% due 07/15/2010 | | 1,400,000 | 1,498,000 |
| Ahold Lease USA, Inc., Series A-1 | | | |
| 7.82% due 01/02/2020 | | 1,142,127 | 1,222,076 |
| Ahold Lease USA, Inc., Series A-2 | | | |
| 8.62% due 01/02/2025 | | 250,000 | 275,947 |
| Constellation Brands, Inc. | | | |
| 8.125% due 01/15/2012 (a) | | 75,000 | 78,562 |
| Del Monte Corp. | | | |
| 8.625% due 12/15/2012 (a) | | 3,075,000 | 3,274,875 |
| Doane Pet Care Company | | | |
| 10.625% due 11/15/2015 | | 1,400,000 | 1,480,500 |
| 10.75% due 03/01/2010 | | 1,100,000 | 1,183,875 |
| Dole Food, Inc. | | | |
| 7.25% due 06/15/2010 | | 3,175,000 | 3,055,938 |
| 8.625% due 05/01/2009 | | 1,700,000 | 1,721,250 |
| 8.75% due 07/15/2013 | | 425,000 | 425,000 |
| 8.875% due 03/15/2011 | | 1,050,000 | 1,059,188 |
| Pinnacle Foods Holding Corp. | | | |
| 8.25% due 12/01/2013 (a) | | 4,100,000 | 4,018,000 |
| Swift & Company | | | |
| 10.125% due 10/01/2009 (a) | | 1,050,000 | 1,077,563 |
|
|
| | | | 20,393,836 |
| Furniture & Fixtures - 0.49% | | | |
| Norcraft Companies LP | | | |
| 9.00% due 11/01/2011 | | 2,025,000 | 2,093,344 |
| Norcraft Holdings LP | | | |
| zero coupon, Step up to 9.75% on | | | |
| 09/01/2008 due 09/01/2012 | | 250,000 | 179,375 |
| High Yield Fund (continued) | | | |
| | | Shares or | |
| | | Principal | |
| | | Amount | Value |
|
|
| |
| CORPORATE BONDS (continued) | | | |
| Furniture & Fixtures (continued) | | | |
| Sealy Mattress Company | | | |
| 8.25% due 06/15/2014 (a) | $ | 4,775,000 | $ | 4,989,875 |
|
|
| | | | 7,262,594 |
| Gas & Pipeline Utilities - 3.47% | | | |
| Atlas Pipeline Partners LP | | | |
| 8.125% due 12/15/2015 | | 2,950,000 | 3,068,000 |
| Dynegy Holdings, Inc. | | | |
| 6.875% due 04/01/2011 (a) | | 925,000 | 922,687 |
| 7.625% due 10/15/2026 | | 2,700,000 | 2,632,500 |
| 9.875% due 07/15/2010 | | 3,350,000 | 3,659,875 |
| 10.125% due 07/15/2013 | | 2,000,000 | 2,250,000 |
| El Paso Corp. | | | |
| 7.75% due 01/15/2032 (a) | | 3,725,000 | 3,957,813 |
| 7.80% due 08/01/2031 | | 5,825,000 | 6,174,500 |
| 7.875% due 06/15/2012 | | 5,675,000 | 6,015,500 |
| El Paso Natural Gas Company, Series A | | | |
| 7.625% due 08/01/2010 | | 25,000 | 26,307 |
| El Paso Production Holding Company | | | |
| 7.75% due 06/01/2013 | | 125,000 | 131,875 |
| Holly Energy Partners LP | | | |
| 6.25% due 03/01/2015 | | 3,225,000 | 3,104,063 |
| Northwest Pipeline Corp. | | | |
| 8.125% due 03/01/2010 | | 75,000 | 79,406 |
| Targa Resources, Inc. | | | |
| 8.50% due 11/01/2013 | | 4,175,000 | 4,425,500 |
| Transcontinental Gas Pipe Line Corp. | | | |
| 8.875% due 07/15/2012 | | 150,000 | 172,875 |
| Williams Companies, Inc. | | | |
| 7.125% due 09/01/2011 | | 50,000 | 52,375 |
| 7.625% due 07/15/2019 (a) | | 3,050,000 | 3,355,000 |
| 7.875% due 09/01/2021 (a) | | 4,500,000 | 5,028,750 |
| 8.125% due 03/15/2012 (a) | | 125,000 | 136,875 |
| 8.75% due 03/15/2032 | | 4,975,000 | 6,019,750 |
|
|
| | | | 51,213,651 |
| Healthcare Products - 0.42% | | | |
| Accellent, Inc. | | | |
| 10.50% due 12/01/2013 | | 4,910,000 | 5,155,500 |
| Riddell Bell Holdings, Inc. | | | |
| 8.375% due 10/01/2012 (a) | | 525,000 | 506,625 |
| Sybron Dental Specialties, Inc. | | | |
| 8.125% due 06/15/2012 | | 575,000 | 606,625 |
|
|
| | | | 6,268,750 |
| Healthcare Services - 2.36% | | | |
| Ameripath, Inc. | | | |
| 10.50% due 04/01/2013 | | 4,100,000 | 4,325,500 |
| DaVita, Inc. | | | |
| 7.25% due 03/15/2015 (a) | | 6,125,000 | 6,247,500 |
| Extendicare Health Services, Inc. | | | |
| 6.875% due 05/01/2014 (a) | | 3,200,000 | 3,320,000 |
| 9.50% due 07/01/2010 | | 1,575,000 | 1,663,594 |
| Insight Health Services Corp. | | | |
| 9.875% due 11/01/2011 (a) | | 550,000 | 305,250 |
| National Mentor, Inc. | | | |
| 9.625% due 12/01/2012 | | 1,975,000 | 2,103,375 |
The accompanying notes are an integral part of the financial statements. 163
John Hancock Funds II
Portfolio of investments — February 28, 2006 (Unaudited)
(showing percentage of total net assets)
|
| High Yield Fund (continued) | | |
| | | Shares or | |
| | | Principal | |
| | | Amount | Value |
|
|
| |
| CORPORATE BONDS (continued) | | | |
| Healthcare Services (continued) | | | |
| Psychiatric Solutions, Inc. | | | |
| 7.75% due 07/15/2015 | $ | 4,225,000 | $ | 4,362,312 |
| 10.625% due 06/15/2013 | | 1,275,000 | 1,432,781 |
| Tenet Healthcare Corp. | | | |
| 9.25% due 02/01/2015 | | 1,200,000 | 1,203,000 |
| Vanguard Health Holding Company II LLC | | | |
| 9.00% due 10/01/2014 (a) | | 7,275,000 | 7,584,188 |
| Vanguard Health Holding Company, Inc. LLC | | |
| zero coupon, Step up to 11.25% on | | | |
| 10/01/2009 due 10/01/2015 (a) | | 3,175,000 | 2,349,500 |
|
|
| | | | 34,897,000 |
| Homebuilders - 0.02% | | | |
| Beazer Homes USA, Inc. | | | |
| 8.625% due 05/15/2011 (a) | | 50,000 | 52,375 |
| D.R. Horton, Inc. | | | |
| 5.625% due 01/15/2016 | | 50,000 | 47,554 |
| KB Home | | | |
| 8.625% due 12/15/2008 | | 25,000 | 26,431 |
| Meritage Homes Corp. | | | |
| 7.00% due 05/01/2014 | | 25,000 | 23,594 |
| Ryland Group, Inc. | | | |
| 9.125% due 06/15/2011 | | 25,000 | 26,316 |
| Schuler Homes, Inc. | | | |
| 10.50% due 07/15/2011 | | 25,000 | 26,719 |
| Standard Pacific Corp. | | | |
| 6.50% due 10/01/2008 | | 50,000 | 49,562 |
| Toll Brothers, Inc. | | | |
| 8.25% due 02/01/2011 | | 25,000 | 26,049 |
|
|
| | | | 278,600 |
| Hotels & Restaurants - 2.19% | | | |
| Buffets, Inc. | | | |
| 11.25% due 07/15/2010 | | 625,000 | 650,000 |
| CCM Merger, Inc. | | | |
| 8.00% due 08/01/2013 | | 2,750,000 | 2,736,250 |
| Chumash Casino & Resort Enterprise | | | |
| 9.26% due 07/15/2010 | | 925,000 | 975,875 |
| Friendly Ice Cream Corp. | | | |
| 8.375% due 06/15/2012 (a) | | 1,650,000 | 1,542,750 |
| Gaylord Entertainment Company | | | |
| 6.75% due 11/15/2014 | | 3,800,000 | 3,752,500 |
| Hilton Hotels Corp. | | | |
| 7.625% due 12/01/2012 (a) | | 5,350,000 | 5,782,622 |
| HMH Properties, Inc., Series B | | | |
| 7.875% due 08/01/2008 | | 250,000 | 251,562 |
| Inn of the Mountain Gods Resort & Casino | | | |
| 12.00% due 11/15/2010 (a) | | 2,725,000 | 2,878,281 |
| Park Place Entertainment Corp. | | | |
| 7.875% due 03/15/2010 | | 525,000 | 559,781 |
| 8.125% due 05/15/2011 (a) | | 2,250,000 | 2,469,375 |
| 8.875% due 09/15/2008 | | 2,525,000 | 2,723,844 |
| 9.375% due 02/15/2007 | | 700,000 | 725,375 |
| Sbarro, Inc. | | | |
| 11.00% due 09/15/2009 (a) | | 2,825,000 | 2,888,563 |
| Starwood Hotels & Resorts Worldwide, Inc. | | | |
| 7.375% due 05/01/2007 | | 175,000 | 178,500 |
| High Yield Fund (continued) | | | |
| | | Shares or | |
| | | Principal | |
| | | Amount | Value |
|
|
| |
| CORPORATE BONDS (continued) | | | |
| Hotels & Restaurants (continued) | | | |
| Starwood Hotels & Resorts Worldwide, Inc. | | | |
| (continued) | | | |
| 7.875% due 05/01/2012 | $ | 1,625,000 | $ | 1,783,438 |
| Turning Stone Casino Resort | | | |
| 9.125% due 12/15/2010 | | 2,125,000 | 2,210,000 |
| Vicorp Restaurants, Inc. | | | |
| 10.50% due 04/15/2011 (a) | | 300,000 | 282,000 |
|
|
| | | | 32,390,716 |
| Household Appliances - 0.02% | | | |
| Applica, Inc. | | | |
| 10.00% due 07/31/2008 | | 385,000 | 373,450 |
Household Products - 0.46% | | | |
| Resolution Performance Products, Inc. | | | |
| 8.00% due 12/15/2009 | | 1,375,000 | 1,416,250 |
| 9.50% due 04/15/2010 (a) | | 1,125,000 | 1,164,375 |
| 13.50% due 11/15/2010 (a) | | 3,450,000 | 3,691,500 |
| Simmons Bedding Company | | | |
| 7.875% due 01/15/2014 (a) | | 400,000 | 384,000 |
| 10.00% due 12/15/2014 (a) | | 225,000 | 135,000 |
|
|
| | | | 6,791,125 |
| Industrial Machinery - 0.44% | | | |
| Dresser Rand Group, Inc. | | | |
| 7.375% due 11/01/2014 | | 4,375,000 | 4,550,000 |
| Grant Prideco, Inc. | | | |
| 6.125% due 08/15/2015 (a) | | 1,250,000 | 1,259,375 |
| NMHG Holding Company | | | |
| 10.00% due 05/15/2009 | | 700,000 | 738,500 |
|
|
| | | | 6,547,875 |
| Industrials - 0.44% | | | |
| Dynegy Holdings, Inc. | | | |
| 7.125% due 05/15/2018 | | 6,650,000 | 6,483,750 |
International Oil - 0.49% | | | |
| Newfield Exploration Company | | | |
| 6.625% due 09/01/2014 (a) | | 25,000 | 25,812 |
| 8.375% due 08/15/2012 | | 25,000 | 26,812 |
| Pemex Project Funding Master Trust | | | |
| 9.125% due 10/13/2010 | | 250,000 | 287,500 |
| Pogo Producing Co. | | | |
| 6.875% due 10/01/2017 | | 1,725,000 | 1,737,938 |
| 8.25% due 04/15/2011 (a) | | 925,000 | 964,313 |
| Vintage Petroleum, Inc. | | | |
| 7.875% due 05/15/2011 | | 3,325,000 | 3,469,568 |
| 8.25% due 05/01/2012 | | 700,000 | 749,000 |
|
|
| | | | 7,260,943 |
| Internet Content - 0.00% | | | |
| PSINet, Inc. | | | |
| 11.00% due 08/01/2009 ^ | | 193,291 | 121 |
| PSINet, Inc., Series B | | | |
| 10.00% due 02/15/2005 ^ | | 494,555 | 309 |
|
|
| | | | 430 |
| Leisure Time - 5.29% | | | |
| AMC Entertainment, Inc. | | | |
| 11.00% due 02/01/2016 | | 3,900,000 | 3,924,375 |
The accompanying notes are an integral part of the financial statements. 164
John Hancock Funds II
Portfolio of investments — February 28, 2006 (Unaudited)
(showing percentage of total net assets)
|
| High Yield Fund (continued) | | | | |
| | | Shares or | | |
| | | Principal | | |
| | | Amount | | Value |
|
|
| |
| CORPORATE BONDS (continued) | | | | |
| Leisure Time (continued) | | | | |
| AMC Entertainment, Inc., Series B | | | | |
| 8.625% due 08/15/2012 | $ | 25,000 | $ | 26,062 |
| AMF Bowling Worldwide, Inc. | | | | |
| 10.00% due 03/01/2010 | | 625,000 | | 639,062 |
| Boyd Gaming Corp. | | | | |
| 6.75% due 04/15/2014 (a) | | 5,900,000 | | 5,885,250 |
| 7.75% due 12/15/2012 (a) | | 25,000 | | 26,156 |
| Caesars Entertainment, Inc. | | | | |
| 7.00% due 04/15/2013 | | 2,475,000 | | 2,619,015 |
| Choctaw Resort Development Enterprise | | | | |
| 7.25% due 11/15/2019 | | 675,000 | | 688,500 |
| Cinemark, Inc. | | | | |
| zero coupon, Step up to 9.75% on | | | | |
| 03/15/2009 due 03/15/2014 | | 7,350,000 | | 5,475,750 |
| Herbst Gaming, Inc. | | | | |
| 7.00% due 11/15/2014 | | 3,750,000 | | 3,750,000 |
| 8.125% due 06/01/2012 | | 800,000 | | 834,000 |
| Isle Capri Casinos, Inc. | | | | |
| 7.00% due 03/01/2014 (a) | | 3,925,000 | | 3,925,000 |
| Kerzner International Ltd. | | | | |
| 6.75% due 10/01/2015 | | 4,625,000 | | 4,590,312 |
| Las Vegas Sands Corp. | | | | |
| 6.375% due 02/15/2015 (a) | | 4,050,000 | | 3,928,500 |
| Mandalay Resort Group | | | | |
| 9.375% due 02/15/2010 (a) | | 125,000 | | 137,188 |
| MGM Mirage, Inc. | | | | |
| 5.875% due 02/27/2014 (a) | | 1,100,000 | | 1,060,125 |
| 6.625% due 07/15/2015 (a) | | 1,550,000 | | 1,555,813 |
| 6.75% due 09/01/2012 (a) | | 4,100,000 | | 4,166,625 |
| 7.25% due 08/01/2017 | | 825,000 | | 860,063 |
| 8.375% due 02/01/2011 (a) | | 2,800,000 | | 3,003,000 |
| 9.75% due 06/01/2007 | | 1,500,000 | | 1,571,250 |
| Mohegan Tribal Gaming Authority | | | | |
| 6.875% due 02/15/2015 | | 2,625,000 | | 2,654,531 |
| 7.125% due 08/15/2014 | | 3,300,000 | | 3,399,000 |
| Penn National Gaming, Inc. | | | | |
| 6.75% due 03/01/2015 (a) | | 5,200,000 | | 5,226,000 |
| 6.875% due 12/01/2011 | | 825,000 | | 841,500 |
| Pinnacle Entertainment, Inc. | | | | |
| 8.25% due 03/15/2012 | | 2,550,000 | | 2,652,000 |
| 8.75% due 10/01/2013 (a) | | 3,050,000 | | 3,263,500 |
| Seneca Gaming Corp. | | | | |
| 7.25% due 05/01/2012 | | 1,825,000 | | 1,852,375 |
| Station Casinos, Inc. | | | | |
| 6.50% due 02/01/2014 (a) | | 500,000 | | 500,000 |
| 6.625% due 03/15/2018 | | 2,475,000 | | 2,468,813 |
| 6.875% due 03/01/2016 (a) | | 6,450,000 | | 6,562,875 |
|
|
| | | | | 78,086,640 |
| Manufacturing - 0.49% | | | | |
| Blount, Inc. | | | | |
| 8.875% due 08/01/2012 (a) | | 350,000 | | 367,500 |
| KI Holdings, Inc. | | | | |
| zero coupon, Step up to 9.875% on | | | | |
| 11/15/2009 due 11/15/2014 | | 725,000 | | 514,750 |
| High Yield Fund (continued) | | | |
| | | Shares or | |
| | | Principal | |
| | | Amount | Value |
|
|
| |
| CORPORATE BONDS (continued) | | | |
| Manufacturing (continued) | | | |
| Koppers, Inc. | | | |
| 9.875% due 10/15/2013 | $ | 3,750,000 | $ | 4,050,000 |
| Park-Ohio Industries, Inc. | | | |
| 8.375% due 11/15/2014 | | 1,750,000 | 1,575,000 |
| Trinity Industries, Inc. | | | |
| 6.50% due 03/15/2014 | | 800,000 | 802,000 |
|
|
| | | | 7,309,250 |
| Medical-Hospitals - 2.11% | | | |
| Genesis Healthcare Corp. | | | |
| 8.00% due 10/15/2013 | | 2,400,000 | 2,526,000 |
| HCA, Inc. | | | |
| 5.50% due 12/01/2009 (a) | | 25,000 | 24,599 |
| 6.30% due 10/01/2012 (a) | | 150,000 | 149,457 |
| 6.375% due 01/15/2015 | | 3,875,000 | 3,868,920 |
| 7.05% due 12/01/2027 | | 2,350,000 | 2,247,462 |
| 7.50% due 12/15/2023 | | 3,050,000 | 3,092,374 |
| 7.69% due 06/15/2025 | | 925,000 | 956,316 |
| 8.36% due 04/15/2024 | | 150,000 | 162,071 |
| 8.75% due 09/01/2010 | | 600,000 | 659,933 |
| IASIS Healthcare LLC | | | |
| 8.75% due 06/15/2014 | | 5,500,000 | 5,582,500 |
| Tenet Healthcare Corp. | | | |
| 6.875% due 11/15/2031 | | 1,400,000 | 1,141,000 |
| 7.375% due 02/01/2013 (a) | | 5,125,000 | 4,702,187 |
| 9.875% due 07/01/2014 (a) | | 2,600,000 | 2,645,500 |
| Triad Hospitals, Inc. | | | |
| 7.00% due 05/15/2012 (a) | | 75,000 | 76,500 |
| 7.00% due 11/15/2013 (a) | | 3,250,000 | 3,278,438 |
|
|
| | | | 31,113,257 |
| Metal & Metal Products - 0.81% | | | |
| Codelco, Inc. | | | |
| 5.50% due 10/15/2013 | | 575,000 | 581,469 |
| Mueller Group, Inc. | | | |
| 10.00% due 05/01/2012 | | 2,350,000 | 2,573,250 |
| Mueller Holdings, Inc. | | | |
| zero coupon, Step up to 14.75% on | | | |
| 04/15/2009 due 04/15/2014 | | 1,825,000 | 1,478,250 |
| Novelis, Inc. | | | |
| 7.25% due 02/15/2015 (a) | | 6,275,000 | 6,086,750 |
| Wolverine Tube, Inc. | | | |
| 7.375% due 08/01/2008 | | 1,600,000 | 1,248,000 |
|
|
| | | | 11,967,719 |
| Office Furnishings & Supplies - 0.48% | | | |
| IKON Office Solutions, Inc. | | | |
| 7.75% due 09/15/2015 | | 2,100,000 | 2,121,000 |
| Interface, Inc. | | | |
| 9.50% due 02/01/2014 | | 3,075,000 | 3,151,875 |
| 10.375% due 02/01/2010 | | 1,075,000 | 1,174,438 |
| Tempur-Pedic/Tempur Products | | | |
| 10.25% due 08/15/2010 | | 600,000 | 642,000 |
|
|
| | | | 7,089,313 |
| Paper - 2.26% | | | |
| Abitibi-Consolidated, Inc. | | | |
| 7.50% due 04/01/2028 | | 25,000 | 20,375 |
The accompanying notes are an integral part of the financial statements. 165
John Hancock Funds II
Portfolio of investments — February 28, 2006 (Unaudited)
(showing percentage of total net assets)
|
| High Yield Fund (continued) | | | |
| | | Shares or | |
| | | Principal | |
| | | Amount | Value |
|
|
| |
| CORPORATE BONDS (continued) | | | |
| Paper (continued) | | | |
| Abitibi-Consolidated, Inc. (continued) | | | |
| 7.75% due 06/15/2011 | $ | 1,150,000 | $ | 1,085,312 |
| 8.375% due 04/01/2015 (a) | | 4,280,000 | 4,044,600 |
| 8.55% due 08/01/2010 | | 450,000 | 444,375 |
| 8.85% due 08/01/2030 (a) | | 4,070,000 | 3,576,512 |
| Appleton Papers, Inc. | | | |
| 8.125% due 06/15/2011 | | 1,525,000 | 1,528,813 |
| Appleton Papers, Inc., Series B | | | |
| 9.75% due 06/15/2014 | | 2,700,000 | 2,598,750 |
| Boise Cascade LLC | | | |
| 7.125% due 10/15/2014 (a) | | 3,825,000 | 3,633,750 |
| Bowater Canada Finance Corp. | | | |
| 7.95% due 11/15/2011 | | 75,000 | 73,500 |
| Bowater, Inc. | | | |
| 6.50% due 06/15/2013 (a) | | 1,275,000 | 1,160,250 |
| 9.50% due 10/15/2012 | | 1,725,000 | 1,794,000 |
| Buckeye Technologies, Inc. | | | |
| 8.00% due 10/15/2010 | | 1,200,000 | 1,173,000 |
| 8.50% due 10/01/2013 | | 1,270,000 | 1,292,225 |
| 9.25% due 09/15/2008 | | 1,400,000 | 1,400,000 |
| Jefferson Smurfit Corp. | | | |
| 8.25% due 10/01/2012 (a) | | 3,578,000 | 3,497,495 |
| Newark Group, Inc. | | | |
| 9.75% due 03/15/2014 | | 2,150,000 | 1,870,500 |
| Norske Skog Canada, Ltd. | | | |
| 7.375% due 03/01/2014 | | 600,000 | 552,000 |
| 8.625% due 06/15/2011 (a) | | 2,975,000 | 2,945,250 |
| Smurfit Capital Funding PLC | | | |
| 7.50% due 11/20/2025 | | 750,000 | 690,000 |
|
|
| | | | 33,380,707 |
| Petroleum Services - 0.63% | | | |
| Chaparral Energy, Inc. | | | |
| 8.50% due 12/01/2015 (a) | | 5,150,000 | 5,446,125 |
| Hanover Compressor Company | | | |
| zero coupon due 03/31/2007 | | 675,000 | 621,000 |
| 8.625% due 12/15/2010 | | 1,150,000 | 1,214,688 |
| 9.00% due 06/01/2014 | | 1,225,000 | 1,335,250 |
| Hanover Equipment Trust | | | |
| 8.75% due 09/01/2011 | | 525,000 | 553,875 |
| Premcor Refining Group, Inc. | | | |
| 6.75% due 02/01/2011 | | 25,000 | 26,269 |
| 9.50% due 02/01/2013 | | 50,000 | 55,667 |
| Pride International, Inc. | | | |
| 7.375% due 07/15/2014 | | 75,000 | 80,063 |
|
|
| | | | 9,332,937 |
| Pharmaceuticals - 0.57% | | | |
| Omnicare, Inc. | | | |
| 6.875% due 12/15/2015 | | 2,900,000 | 2,958,000 |
| Valeant Pharmaceuticals International | | | |
| 7.00% due 12/15/2011 | | 5,525,000 | 5,414,500 |
|
|
| | | | 8,372,500 |
| Plastics - 0.24% | | | |
| Berry Plastics Corp. | | | |
| 10.75% due 07/15/2012 | | 3,325,000 | 3,615,937 |
| High Yield Fund (continued) | | |
| | | Shares or | |
| | | Principal | |
| | | Amount | Value |
| |
|
| |
| CORPORATE BONDS (continued) | | | |
| Publishing - 1.76% | | | |
| Block Communications, Inc. | | | |
| 8.25% due 12/15/2015 | $ | 3,050,000 | $ | 3,019,500 |
| Cadmus Communications Corp. | | | |
| 8.375% due 06/15/2014 | | 1,850,000 | 1,877,750 |
| CBD Media Holdings, LLC | | | |
| 9.25% due 07/15/2012 | | 2,625,000 | 2,674,219 |
| CBD Media, Inc. | | | |
| 8.625% due 06/01/2011 | | 1,750,000 | 1,778,437 |
| Dex Media East LLC | | | |
| 9.875% due 11/15/2009 | | 900,000 | 965,250 |
| 12.125% due 11/15/2012 | | 575,000 | 663,406 |
| Dex Media West LLC | | | |
| 8.50% due 08/15/2010 (a) | | 50,000 | 53,000 |
| 9.875% due 08/15/2013 | | 1,700,000 | 1,882,750 |
| Dex Media, Inc. | | | |
| zero coupon, Step up to 9.00% on | | | |
| 11/15/2008 due 11/15/2013 (a) | | 4,975,000 | 4,179,000 |
| zero coupon, Step up to 9.00% on | | | |
| 11/15/2008 due 11/15/2013 (a) | | 3,425,000 | 2,877,000 |
| 8.00% due 11/15/2013 | | 25,000 | 25,875 |
| Houghton Mifflin Company | | | |
| zero coupon, Step up to 11.50% on | | | |
| 10/15/2008 due 10/15/2013 (a) | | 2,900,000 | 2,407,000 |
| 8.25% due 02/01/2011 | | 50,000 | 52,250 |
| Mail-Well I Corp. | | | |
| 9.625% due 03/15/2012 | | 2,100,000 | 2,257,500 |
| Yell Finance BV | | | |
| 10.75% due 08/01/2011 | | 1,125,000 | 1,231,875 |
|
|
| | | | 25,944,812 |
| Real Estate - 1.73% | | | |
| Felcor Lodging LP, REIT | | | |
| 9.00% due 06/01/2011 | | 3,925,000 | 4,337,125 |
| Host Marriott LP, REIT | | | |
| 6.375% due 03/15/2015 | | 2,125,000 | 2,119,687 |
| 7.125% due 11/01/2013 (a) | | 5,550,000 | 5,730,375 |
| 9.50% due 01/15/2007 | | 1,475,000 | 1,521,094 |
| Meristar Hospitality Corp., REIT | | | |
| 9.00% due 01/15/2008 (a) | | 1,050,000 | 1,113,000 |
| 9.125% due 01/15/2011 | | 3,625,000 | 4,205,000 |
| Meristar Hospitality Operating Partnership LP, REIT | | |
| 10.50% due 06/15/2009 (a) | | 425,000 | 452,094 |
| Omega Healthcare Investors, Inc., REIT | | | |
| 7.00% due 01/15/2016 | | 5,600,000 | 5,614,000 |
| 7.00% due 04/01/2014 | | 500,000 | 506,875 |
|
|
| | | | 25,599,250 |
| Retail - 0.46% | | | |
| Carrols Corp. | | | |
| 9.00% due 01/15/2013 (a) | | 700,000 | 708,750 |
| Eye Care Centers of America | | | |
| 10.75% due 02/15/2015 | | 2,100,000 | 2,052,750 |
| Harry & David Operations, Inc. | | | |
| 9.00% due 03/01/2013 | | 2,225,000 | 2,158,250 |
| Leslie's Poolmart | | | |
| 7.75% due 02/01/2013 | | 1,850,000 | 1,877,750 |
|
|
| | | | 6,797,500 |
The accompanying notes are an integral part of the financial statements. 166
John Hancock Funds II
Portfolio of investments — February 28, 2006 (Unaudited)
(showing percentage of total net assets)
|
| High Yield Fund (continued) | | | |
| | | Shares or | |
| | | Principal | |
| | | Amount | Value |
|
|
| |
| CORPORATE BONDS (continued) | | | |
| Retail Grocery - 0.03% | | | |
| CA FM Lease Trust | | | |
| 8.50% due 07/15/2017 | $ | 377,277 | $ | 409,086 |
Retail Trade - 0.56% | | | |
| Finlay Fine Jewelry Corp. | | | |
| 8.375% due 06/01/2012 | | 1,775,000 | 1,579,750 |
| FTD, Inc. | | | |
| 7.75% due 02/15/2014 (a) | | 1,425,000 | 1,403,625 |
| Jean Coutu Group, Inc. | | | |
| 7.625% due 08/01/2012 | | 925,000 | 925,000 |
| Jo-Ann Stores, Inc. | | | |
| 7.50% due 03/01/2012 (a) | | 750,000 | 630,000 |
| Neiman Marcus Group, Inc. | | | |
| 10.375% due 10/15/2015 (a) | | 1,950,000 | 2,052,375 |
| PETCO Animal Supplies, Inc. | | | |
| 10.75% due 11/01/2011 | | 100,000 | 107,750 |
| Saks, Inc. | | | |
| 9.875% due 10/01/2011 | | 1,375,000 | 1,512,500 |
|
|
| | | | 8,211,000 |
| Sanitary Services - 0.78% | | | |
| Allied Waste North America, Inc. | | | |
| 7.25% due 03/15/2015 | | 3,000,000 | 3,045,000 |
| 7.875% due 04/15/2013 (a) | | 325,000 | 338,000 |
| 8.50% due 12/01/2008 | | 950,000 | 1,001,063 |
| Allied Waste North America, Inc., Series B | | | |
| 7.375% due 04/15/2014 (a) | | 2,700,000 | 2,652,750 |
| 8.875% due 04/01/2008 | | 50,000 | 52,562 |
| 9.25% due 09/01/2012 | | 4,025,000 | 4,367,125 |
|
|
| | | | 11,456,500 |
| Semiconductors - 0.41% | | | |
| Amkor Technology, Inc. | | | |
| 7.125% due 03/15/2011 | | 2,125,000 | 1,997,500 |
| 7.75% due 05/15/2013 (a) | | 75,000 | 71,062 |
| 9.25% due 02/15/2008 | | 1,900,000 | 1,928,500 |
| 10.50% due 05/01/2009 (a) | | 2,100,000 | 2,089,500 |
|
|
| | | | 6,086,562 |
| Steel - 0.41% | | | |
| IPSCO, Inc. | | | |
| 8.75% due 06/01/2013 | | 2,500,000 | 2,731,250 |
| RathGibson, Inc. | | | |
| 11.25% due 02/15/2014 | | 3,200,000 | 3,240,000 |
| United States Steel LLC | | | |
| 10.75% due 08/01/2008 | | 25,000 | 27,625 |
|
|
| | | | 5,998,875 |
| Telecommunications Equipment & | | | |
| Services - 2.39% | | | |
| Citizens Communications Company | | | |
| 9.25% due 05/15/2011 | | 100,000 | 110,750 |
| Insight Midwest LP | | | |
| 9.75% due 10/01/2009 | | 1,400,000 | 1,445,500 |
| 10.50% due 11/01/2010 | | 2,650,000 | 2,792,438 |
| Intelsat, Ltd. | | | |
| 9.614% due 01/15/2012 (b) | | 1,625,000 | 1,657,500 |
| Lucent Technologies, Inc. | | | |
| 6.45% due 03/15/2029 (a) | | 12,975,000 | 10,947,656 |
| High Yield Fund (continued) | | | |
| | | Shares or | | |
| | | Principal | | |
| | | Amount | | Value |
| |
|
| |
| CORPORATE BONDS (continued) | | | | |
| Telecommunications Equipment & | | | | |
| Services (continued) | | | | |
| Panamsat Corp. | | | | |
| 9.00% due 08/15/2014 (a) | $ | 1,425,000 | $ | 1,503,375 |
| United States West Communications, Inc. | | | | |
| 6.875% due 09/15/2033 | | 15,086,000 | | 14,482,560 |
| World Access, Inc. | | | | |
| 13.25% due 01/15/2049 ^ | | 1,500,000 | | 75,000 |
| Zeus Special Subsidiary, Ltd. | | | | |
| zero coupon, Step up to 9.25% on | | | | |
| 02/01/2010 due 02/01/2015 (a) | | 3,275,000 | | 2,243,375 |
|
|
| | | | | 35,258,154 |
| |
| Telephone - 1.00% | | | | |
| NTL Cable PLC | | | | |
| 8.75% due 04/15/2014 | | 2,725,000 | | 2,779,500 |
| Qwest Communications International, Inc. | | | | |
| 7.25% due 02/15/2011 | | 25,000 | | 25,531 |
| 7.50% due 02/15/2014 (a) | | 1,196,000 | | 1,228,890 |
| Qwest Communications International, Inc., Series B | | | |
| 7.50% due 02/15/2014 (a) | | 4,333,000 | | 4,452,157 |
| Qwest Corp. | | | | |
| 7.50% due 06/15/2023 (a) | | 1,885,000 | | 1,913,275 |
| 8.875% due 03/15/2012 (a) | | 3,150,000 | | 3,528,000 |
| Telefonos de Mexico SA de CV | | | | |
| 8.75% due 01/31/2016 | MXN | 9,000,000 | | 860,349 |
|
|
| | | | | 14,787,702 |
| |
| Transportation - 0.27% | | | | |
| OMI Corp. | | | | |
| 7.625% due 12/01/2013 (a) | $ | 3,850,000 | | 3,946,250 |
|
| TOTAL CORPORATE BONDS (Cost $1,151,928,226) | $ | 1,164,250,817 |
|
| |
| ASSET BACKED SECURITIES - 0.00% | | | |
| First Consumers Master Trust, | | | | |
| Series 2001-A, Class A | | | | |
| 4.88% due 09/15/2008 (b) | | 31,858 | | 31,818 |
|
| TOTAL ASSET BACKED SECURITIES | | | | |
| (Cost $31,677) | | | $ | 31,818 |
|
| |
| SHORT TERM INVESTMENTS - 22.92% | | | |
| State Street Navigator Securities | | | | |
| Lending Prime Portfolio (c) | $ | 338,457,704 | $ | 338,457,704 |
|
| TOTAL SHORT TERM INVESTMENTS | | | | |
| (Cost $338,457,704) | | | $ | 338,457,704 |
|
| |
| REPURCHASE AGREEMENTS - 8.87% | | | |
| Bank of America Repurchase | | | | |
| Agreement dated 02/28/2006 at | | | | |
| 4.47% to be repurchased at | | | | |
| $50,006,208 on 03/01/2006, | | | | |
| collateralized by $51,065,000 | | | | |
| FHLMC, 5.395% due 02/28/2011 | | | | |
| (valued at $52,021,192, including | | | | |
| interest) | $ | 50,000,000 | $ | 50,000,000 |
The accompanying notes are an integral part of the financial statements. 167
John Hancock Funds II
Portfolio of investments — February 28, 2006 (Unaudited)
(showing percentage of total net assets)
|
| High Yield Fund (continued) | | | |
| | | Shares or | | |
| | | Principal | | |
| | | Amount | | Value |
|
|
| |
| REPURCHASE AGREEMENTS (continued) | | | |
| Greenwich Capital Repurchase | | | | |
| Agreement dated 02/28/2006 at | | | | |
| 4.55% to be repurchased at | | | | |
| $80,902,224 on 03/01/2006, | | | | |
| collateralized by $6,310,000 | | | | |
| FNMAs 6.21% due 08/06/2038 | | | | |
| (valued at $7,548,338 including | | | | |
| interest) and 75,000,000 FNMAs | | | | |
| 5% due 07/25/2008 (valued at | | | | |
| $75,000,000 including interest) | $ | 80,892,000 | $ | 80,892,000 |
|
| TOTAL REPURCHASE AGREEMENTS | | | | |
| (Cost $130,892,000) | | | $ | 130,892,000 |
|
| Total Investments (High Yield Fund) | | | | |
| (Cost $1,781,989,097) - 122.13% | | | $ | 1,803,230,145 |
| Liabilities in Excess of Other Assets - (22.13)% | | | (326,695,807) |
| |
| TOTAL NET ASSETS - 100.00% | | | $ | 1,476,534,338 |
| |
|
| |
| |
| International Equity Index Fund | | | |
| | | Shares or | | |
| | | Principal | | |
| | | Amount | | Value |
| |
|
| |
| COMMON STOCKS - 95.73% | | | | |
| Argentina - 0.02% | | | | |
| Petrobras Energia | | | | |
| Participaciones SA, ADR, B Shares * (a) | 1,508 | $ | 18,171 |
| Siderar SA, Class A Shares, ADR | | 173 | | 11,874 |
| Telecom Argentina SA, ADR, B Shares * (a) | 1,322 | | 16,644 |
|
|
| | | | | 46,689 |
| Australia - 4.18% | | | | |
| Alinta, Ltd. (a) | | 3,321 | | 27,435 |
| Alumina, Ltd. | | 16,468 | | 84,904 |
| Amcor, Ltd. (a) | | 12,358 | | 68,305 |
| AMP, Ltd. | | 25,934 | | 165,691 |
| Ansell, Ltd. (a) | | 1,910 | | 15,608 |
| APN News & Media, Ltd. (a) | | 3,859 | | 13,618 |
| Aristocrat Leisure, Ltd. (a) | | 4,090 | | 36,613 |
| Australia and New Zealand Bank Group, Ltd. | 25,591 | | 488,977 |
| Australia Gas & Light Company, Ltd. (a) | | 6,456 | | 91,847 |
| Australian Stock Exchange, Ltd. (a) | | 1,358 | | 32,748 |
| Axa Asia Pacific Holdings, Ltd. (a) | | 12,726 | | 55,307 |
| Babcock & Brown, Ltd. | | 1,984 | | 25,543 |
| BHP Billiton, Ltd. - AUD (a) | | 50,149 | | 903,451 |
| Billabong International, Ltd. (a) | | 1,774 | | 20,454 |
| Bluescope Steel, Ltd. (a) | | 10,432 | | 51,150 |
| Boral, Ltd. | | 8,438 | | 55,101 |
| Brambles Industries, Ltd. (a) | | 13,639 | | 101,831 |
| Caltex Australia, Ltd. | | 1,785 | | 22,808 |
| Centro Properties Group, Ltd. | | 11,714 | | 59,176 |
| CFS Gandel Retail Trust, New Shares * | | 571 | | 810 |
| CFS Gandel Retail Trust | | 19,973 | | 28,934 |
| Challenger Financial Services Group, Ltd. (a) | 5,297 | | 15,308 |
| Coca-Cola Amatil, Ltd. | | 6,892 | | 36,096 |
| International Equity Index Fund (continued) | |
| | Shares or | | |
| | Principal | | |
| | Amount | | Value |
|
|
| |
| COMMON STOCKS (continued) | | | |
| Australia (continued) | | | |
| Cochlear, Ltd. | 718 | $ | 26,137 |
| Coles Myer, Ltd. | 16,708 | | 121,890 |
| Commonwealth Bank of Australia, Ltd. (a) | 17,932 | | 597,478 |
| Commonwealth Property Office Fund, Ltd. | 20,278 | | 20,337 |
| Computershare, Ltd. (a) | 5,108 | | 25,690 |
| CSL, Ltd. (a) | 2,676 | | 104,768 |
| CSR, Ltd. | 12,034 | | 34,151 |
| DB RREEF Trust | 35,689 | | 37,384 |
| DCA Group, Ltd. (a) | 5,313 | | 13,854 |
| Downer EDI, Ltd. (a) | 3,649 | | 21,280 |
| Foster's Group, Ltd. | 27,979 | | 113,074 |
| Futuris Corp., Ltd. | 7,014 | | 12,297 |
| General Property Trust | 25,657 | | 79,101 |
| Harvey Norman Holding, Ltd. | 6,991 | | 18,178 |
| Iluka Resources, Ltd. (a) | 3,079 | | 16,332 |
| ING Industrial Fund | 9,945 | | 16,919 |
| Investa Property Group, Ltd. | 22,834 | | 34,096 |
| James Hardie Industries, Ltd. | 6,806 | | 44,899 |
| John Fairfax Holdings, Ltd. | 12,219 | | 36,038 |
| Leighton Holdings, Ltd. | 1,802 | | 24,391 |
| Lend Lease Corp. | 5,221 | | 51,703 |
| Lion Nathan, Ltd. | 3,884 | | 23,083 |
| Macquarie Airports, Ltd. (a) | 8,499 | | 20,394 |
| Macquarie Bank, Ltd. | 3,262 | | 155,651 |
| Macquarie Communications | | | |
| Infrastructure Group, Ltd. | 4,557 | | 19,195 |
| Macquarie Goodman Group, Ltd. | 17,441 | | 65,433 |
| Macquarie Infrastructure Group, Ltd. | 34,164 | | 88,831 |
| Mayne Nickless, Ltd. | 8,434 | | 20,990 |
| Mayne Pharma, Ltd. * (a) | 8,434 | | 17,356 |
| Mirvac Group, Ltd. | 11,503 | | 35,977 |
| Multiplex Group, Ltd. (a) | 8,302 | | 19,489 |
| National Australia Bank, Ltd. | 22,056 | | 601,017 |
| Newcrest Mining, Ltd. | 4,647 | | 73,188 |
| NRMA Insurance Group, Ltd. (a) | 22,436 | | 89,839 |
| OneSteel, Ltd. (a) | 7,453 | | 21,372 |
| Orica, Ltd. | 4,489 | | 76,669 |
| Origin Energy, Ltd. (a) | 11,149 | | 57,150 |
| Pacific Brands, Ltd. | 6,649 | | 11,213 |
| PaperlinX, Ltd. | 5,898 | | 14,898 |
| Patrick Corp., Ltd. | 8,634 | | 43,937 |
| Perpetual Trust of Australia, Ltd. (a) | 606 | | 30,613 |
| Publishing & Broadcasting, Ltd. | 1,779 | | 22,520 |
| Qantas Airways, Ltd., ADR | 12,292 | | 37,440 |
| QBE Insurance Group, Ltd. (a) | 10,752 | | 165,345 |
| Rinker Group, Ltd. | 13,114 | | 174,291 |
| Rio Tinto, Ltd. (a) | 3,952 | | 209,039 |
| Santos, Ltd. | 8,360 | | 70,304 |
| SFE Corporation, Ltd. (a) | 1,772 | | 16,837 |
| Sonic Healthcare, Ltd. (a) | 3,462 | | 39,942 |
| Stockland Company, Ltd. | 18,236 | | 91,175 |
| Stockland Trust Group, Ltd. | 580 | | 2,777 |
The accompanying notes are an integral part of the financial statements. 168
John Hancock Funds II
Portfolio of investments — February 28, 2006 (Unaudited)
(showing percentage of total net assets)
|
| International Equity Index Fund (continued) | |
| | Shares or | | |
| | Principal | | |
| | Amount | | Value |
|
|
| |
| COMMON STOCKS (continued) | | | |
| Australia (continued) | | | |
| Suncorp-Metway, Ltd. (a) | 7,642 | $ | 116,156 |
| TABCORP Holdings, Ltd. (a) | 7,371 | | 83,179 |
| Telstra Corp., Ltd. (a) | 29,718 | | 84,998 |
| Toll Holdings, Ltd. (a) | 3,273 | | 28,400 |
| Transurban Group, Ltd. | 11,519 | | 61,102 |
| UNiTAB, Ltd. (a) | 1,586 | | 16,224 |
| Wesfarmers, Ltd. (a) | 5,248 | | 142,694 |
| Westfield Group * | 656 | | 8,306 |
| Westfield Group | 20,804 | | 275,104 |
| Westpac Banking Corp., Ltd. | 25,443 | | 446,267 |
| Woodside Petroleum, Ltd. | 6,498 | | 195,460 |
| Woolworths, Ltd. | 15,850 | | 216,659 |
| |
|
| | | | 7,842,226 |
Austria - 0.37% | | | |
| Andritz AG | 133 | | 17,205 |
| Bohler Uddeholm AG | 149 | | 27,959 |
| Erste Bank der Oesterreichischen | | | |
| Sparkassen AG | 2,424 | | 147,378 |
| Flughafen Wien AG | 153 | | 12,341 |
| Immofinanz Immobiien Anlage AG * | 4,905 | | 50,055 |
| Mayr-Melnhof Karton AG | 61 | | 8,977 |
| Meinl European Land, Ltd. * | 1,403 | | 25,841 |
| Oesterreichische Elektrizitaets AG, Class A | 113 | | 52,538 |
| OMV AG | 2,411 | | 149,606 |
| RHI AG * | 302 | | 8,616 |
| Telekom Austria AG | 5,114 | | 116,812 |
| Voestalpine AG | 289 | | 33,699 |
| Wienerberger Baustoffindustrie AG | 921 | | 42,700 |
|
|
| | | | 693,727 |
Belgium - 0.98% | | | |
| Agfa Gevaert NV | 1,277 | | 25,454 |
| Barco NV | 148 | | 12,421 |
| Bekaert SA | 190 | | 19,514 |
| Belgacom SA | 2,298 | | 69,146 |
| Cofinimmo SA | 78 | | 12,358 |
| Colruyt SA | 226 | | 32,574 |
| Compagnie Maritime Belge SA | 231 | | 7,485 |
| Delhaize Group | 998 | | 66,627 |
| Dexia | 7,691 | | 191,078 |
| Euronav NV | 243 | | 7,060 |
| Fortis Group SA | 16,444 | | 586,151 |
| Groupe Bruxelles Lambert SA | 975 | | 107,110 |
| Interbrew | 2,563 | | 118,522 |
| KBC Bancassurance Holding NV | 2,576 | | 269,018 |
| Mobistar SA | 404 | | 28,392 |
| Omega Pharma SA | 261 | | 14,129 |
| SA D'Ieteren Trading NV | 37 | | 11,107 |
| Solvay SA | 894 | | 98,958 |
| Suez SA | 1,452 | | 53,188 |
| UCB SA | 1,238 | | 58,666 |
| International Equity Index Fund (continued) | |
| | Shares or | | |
| | Principal | | |
| | Amount | | Value |
|
|
| |
| COMMON STOCKS (continued) | | | |
| Belgium (continued) | | | |
| Union Miniere SA | 344 | $ | 48,925 |
|
|
| | | | 1,837,883 |
Bermuda - 0.24% | | | |
| Brilliance China Automotive Holdings, Ltd. * | 32,000 | | 5,568 |
| Cheung Kong Infrastructure Holdings, Ltd. | 6,000 | | 18,830 |
| Cosco Pacific, Ltd. | 16,000 | | 33,717 |
| Credicorp Ltd, ADR | 967 | | 28,942 |
| Digital China Holdings, Ltd. | 5,000 | | 1,772 |
| Esprit Holdings, Ltd. | 13,500 | | 103,790 |
| Frontline, Ltd. | 750 | | 28,780 |
| Giordano International, Ltd. | 20,000 | | 10,633 |
| Johnson Electronic Holdings, Ltd. | 19,000 | | 18,489 |
| Kerry Properties, Ltd. | 6,500 | | 20,944 |
| Li & Fung, Ltd. | 24,000 | | 48,720 |
| Noble Group, Ltd. (a) | 12,000 | | 9,030 |
| Orient Overseas International, Ltd. | 3,000 | | 11,136 |
| Shangri-La Asia, Ltd. | 14,000 | | 22,465 |
| Smartone Telecommunications Holdings, Ltd. | 4,000 | | 4,511 |
| South China Morning Post, Ltd. | 12,000 | | 4,485 |
| Texwinca Holdings, Ltd. | 8,000 | | 6,290 |
| TPV Technology, Ltd. | 16,000 | | 17,632 |
| Weatherford International, Ltd. * | 710 | | 30,615 |
| Yue Yuen Industrial Holdings, Ltd. | 6,500 | | 20,232 |
|
|
| | | | 446,581 |
Brazil - 1.57% | | | |
| Aracruz Celulose SA, ADR (a) | 845 | | 41,532 |
| Brasil Telecom Participacoes SA, ADR (a) | 905 | | 35,974 |
| Centrais Eletricas Brasileiras SA, ADR, B | | | |
| Shares (a) | 2,071 | | 22,621 |
| Centrais Eletricas Brasileiras SA, ADR | 3,447 | | 36,310 |
| CIA Brasileira De Distribuicao Grupo Pao de | | | |
| Acucar, ADR (a) | 436 | | 18,530 |
| CIA de Bebidas das Americas, ADR, PFD | | | |
| Shares | 4,766 | | 202,269 |
| CIA de Bebidas das Americas, ADR | 900 | | 32,130 |
| CIA Energetica De Minas Gerais, ADR (a) | 1,976 | | 102,673 |
| Companhia Siderurgica Nacional SA, ADR (a) | 3,126 | | 92,123 |
| Companhia Vale Do Rio Doce, ADR | 6,194 | | 287,588 |
| Companhia Vale Do Rio Doce, SADR | 8,786 | | 357,590 |
| Contax Participacoes SA, ADR * | 4,934 | | 6,885 |
| Empresa Brasileira de Aeronautica SA, ADR | 1,575 | | 62,606 |
| Gerdau SA, ADR (a) | 4,161 | | 94,912 |
| Petroleo Brasileiro SA, ADR, Petro | 8,318 | | 665,191 |
| Petroleo Brasileiro SA, ADR * | 5,997 | | 524,977 |
| Tele Centro Oeste Celular Participacoes SA, | | | |
| ADR (a) | 1,166 | | 17,152 |
| Tele Norte Leste Participacoes SA, ADR | 5,457 | | 101,118 |
| Telesp Celular Participacoes SA, ADR * (a) | 4,580 | | 22,671 |
| Unibanco - Uniao De Bancos Brasileiros SA, | | | |
| ADR | 1,717 | | 151,010 |
| Usinas Siderurgicas de Minas Gerais SA, ADR (a) | 1,567 | | 51,365 |
The accompanying notes are an integral part of the financial statements. 169
John Hancock Funds II
Portfolio of investments — February 28, 2006 (Unaudited)
(showing percentage of total net assets)
|
| International Equity Index Fund (continued) | |
| | Shares or | | |
| | Principal | | |
| | Amount | | Value |
|
|
| |
| COMMON STOCKS (continued) | | | |
| Brazil (continued) | | | |
| Votorantim Celulose e Papel SA, SADR | 1,189 | $ | 17,550 |
|
|
| | | | 2,944,777 |
Canada - 6.07% | | | |
| Aber Diamond Corp. | 700 | | 26,388 |
| Abitibi Consolidated, Inc. | 5,300 | | 18,443 |
| Agnico-Eagle Mines, Ltd. | 1,300 | | 33,163 |
| Agrium, Inc. | 1,800 | | 44,763 |
| Alcan Aluminum, Ltd. USD | 5,200 | | 226,643 |
| Algoma Steel, Inc. * | 500 | | 13,225 |
| Aliant, Inc. | 600 | | 14,483 |
| Angiotech Pharmaceuticals, Inc. * | 1,100 | | 17,022 |
| ATI Technologies, Inc. * | 3,400 | | 54,047 |
| Bank Nova Scotia Halifax | 13,900 | | 582,627 |
| Bank of Montreal | 6,900 | | 418,184 |
| Barrick Gold Corp. | 11,908 | | 324,906 |
| BCE, Inc. | 4,100 | | 99,510 |
| Biovail Corp. * | 1,800 | | 45,237 |
| Bombardier, Inc. * | 19,100 | | 49,009 |
| Brookfield Asset Management, Inc. | 3,300 | | 180,804 |
| Brookfield Properties Corp. | 1,800 | | 52,877 |
| CAE, Inc. | 3,300 | | 27,374 |
| Cameco Corp. | 4,800 | | 178,207 |
| Canadian Imperial Bank of Commerce | 4,700 | | 330,198 |
| Canadian National Railway Company | 7,800 | | 364,640 |
| Canadian Natural Resources, Ltd. | 7,400 | | 403,749 |
| Canadian Pacific Railway, Ltd. | 2,300 | | 117,627 |
| Canadian Tire Corp., Ltd. | 1,100 | | 64,279 |
| Canfor Corp. * | 1,200 | | 14,236 |
| Celestica, Inc. * | 2,500 | | 27,065 |
| CGI Group, Inc. * | 3,800 | | 28,483 |
| CI Financial Inc., ADR | 2,100 | | 51,670 |
| Cognos, Inc. * | 1,200 | | 46,049 |
| Cott Corp. * | 800 | | 9,772 |
| Domtar, Inc. | 2,600 | | 14,051 |
| Enbridge, Inc. | 4,700 | | 147,856 |
| EnCana Corp. - CAD | 12,200 | | 503,866 |
| Fairfax Financial Holdings, Ltd. | 300 | | 43,036 |
| Fairmont Hotels & Resorts, Inc. | 1,000 | | 44,218 |
| Falconbridge, Ltd. | 4,200 | | 135,633 |
| Finning International, Inc. | 1,200 | | 39,554 |
| Four Seasons Hotels, Inc. | 300 | | 16,982 |
| George Weston, Ltd. | 700 | | 53,607 |
| Gildan Activewear, Inc. * | 800 | | 39,895 |
| Glamis Gold, Ltd. * | 1,700 | | 46,220 |
| Goldcorp, Inc. - New | 4,500 | | 114,477 |
| Great-West Lifeco, Inc. | 3,600 | | 92,373 |
| Hudson's Bay Company | 800 | | 10,685 |
| Husky Energy, Inc. | 1,700 | | 103,912 |
| IGM Financial, Inc. | 1,600 | | 65,097 |
| Imperial Oil, Ltd. | 1,700 | | 163,726 |
| Inco, Ltd. | 2,700 | | 130,634 |
| International Equity Index Fund (continued) | |
| | Shares or | | |
| | Principal | | |
| | Amount | | Value |
|
|
| |
| COMMON STOCKS (continued) | | | |
| Canada (continued) | | | |
| Intrawest Corp. | 600 | $ | 19,081 |
| Ipsco, Inc. | 700 | | 67,355 |
| Ivanhoe Mines, Ltd. * | 2,900 | | 23,190 |
| Jean Coutu Group, Inc. | 1,900 | | 22,172 |
| Kinross Gold Corp. * | 4,600 | | 42,402 |
| Loblaw Companies, Ltd. | 1,500 | | 75,923 |
| Magna International, Inc. | 1,500 | | 111,709 |
| Manulife Financial Corp. | 11,100 | | 708,040 |
| MDS, Inc. | 1,900 | | 38,401 |
| Meridian Gold, Inc. * | 1,300 | | 32,786 |
| Methanex Corp. | 1,600 | | 31,719 |
| MI Developments, Inc. | 600 | | 20,399 |
| National Bank of Canada | 2,400 | | 136,661 |
| Nexen, Inc. | 3,700 | | 193,193 |
| Nortel Networks Corp. * | 59,400 | | 171,728 |
| Nova Chemicals Corp. | 1,100 | | 35,774 |
| Novelis, Inc. | 1,000 | | 18,251 |
| Onex Corp. | 1,600 | | 28,344 |
| Open Text Corp. * | 600 | | 10,450 |
| Petro-Canada | 7,200 | | 329,378 |
| Potash Corp. of Saskatchewan, Inc. | 1,500 | | 143,660 |
| Power Corporation Of Canada | 4,300 | | 118,647 |
| Power Financial Corp. | 3,300 | | 96,709 |
| Precision Drilling Trust, ADR | 1,700 | | 53,076 |
| QLT, Inc. * | 1,300 | | 9,253 |
| Quebecor World, Inc. | 1,200 | | 12,179 |
| Research In Motion, Ltd. * | 2,200 | | 155,469 |
| Rogers Communications, Inc. | 2,800 | | 111,951 |
| RONA, Inc. * | 1,500 | | 28,286 |
| Royal Bank of Canada | 9,000 | | 751,002 |
| Saputo, Inc. | 600 | | 17,626 |
| Shaw Communications, Inc. | 2,600 | | 67,970 |
| Shell Canada, Ltd. | 2,800 | | 93,989 |
| Shoppers Drug Mart Corp. | 2,600 | | 101,350 |
| SNC-Lavalin Group, Inc. | 700 | | 58,208 |
| Sun Life Financial, Inc. | 8,200 | | 358,480 |
| Suncor Energy, Inc. | 6,400 | | 478,032 |
| Talisman Energy, Inc. | 5,100 | | 267,593 |
| Teck Cominco, Ltd. | 2,800 | | 174,815 |
| Telus Corp. - Non Voting Shares | 2,300 | | 89,332 |
| Telus Corp. | 800 | | 31,431 |
| Thomson Corp. | 3,100 | | 118,443 |
| TransAlta Corp. | 2,600 | | 54,993 |
| Trans-Canada Corp. | 6,800 | | 209,079 |
| TSX Group, Inc. | 900 | | 38,120 |
|
|
| | | | 11,387,151 |
Cayman Islands - 0.05% | | | |
| ASM Pacific Technology, Ltd. | 2,500 | | 14,000 |
| China Resources Land, Ltd. | 10,000 | | 5,381 |
| Hutchison Telecommunications | | | |
| International, Ltd. * | 19,000 | | 29,386 |
| Kingboard Chemical Holdings, Ltd. | 8,000 | | 25,314 |
The accompanying notes are an integral part of the financial statements. 170
John Hancock Funds II
Portfolio of investments — February 28, 2006 (Unaudited)
(showing percentage of total net assets)
|
| International Equity Index Fund (continued) | |
| | Shares or | | |
| | Principal | | |
| | Amount | | Value |
|
|
| |
| COMMON STOCKS (continued) | | | |
| Cayman Islands (continued) | | | |
| Solomon Systech International, Ltd. | 24,000 | $ | 11,291 |
|
|
| | | | 85,372 |
Chile - 0.23% | | | |
| Banco Santander Chile SA, ADR | 1,528 | | 72,565 |
| CIA Cervecerias Unidas SA, ADR | 257 | | 6,990 |
| Compania de Telecomunicaciones de Chile | | | |
| SA, ADR (a) | 4,429 | | 38,089 |
| Distribucion y Servicio D&S SA, ADR (a) | 553 | | 11,364 |
| Embotelladora Andina SA, ADR, Series A | 516 | | 7,032 |
| Embotelladora Andina SA, ADR, Series B | 582 | | 8,614 |
| Empresa Nacional de Electricidad SA, ADR | 3,697 | | 116,825 |
| Enersis SA, ADR | 8,835 | | 108,406 |
| Sociedad Quimica y Minera de | | | |
| Chile SA, ADR, B Shares (a) | 410 | | 50,102 |
| Vina Concha Y Toro S.A., ADR (a) | 514 | | 14,649 |
|
|
| | | | 434,636 |
China - 0.70% | | | |
| Air China, Ltd. * | 38,000 | | 13,714 |
| Aluminum Corp. of China, Ltd. | 38,000 | | 38,937 |
| Angang New Steel Co., Ltd. Class H | 12,000 | | 9,744 |
| AviChina Industry & Technology Co., Ltd. * | 20,000 | | 1,547 |
| Bank of Communications Co., Ltd., H Shares * | 88,000 | | 53,591 |
| Beijing Capital International Airport Co., Ltd., | | | |
| Class H | 16,000 | | 9,074 |
| Beijing Datang Power Generation Company, | | | |
| Ltd., Class H | 22,000 | | 15,737 |
| BYD Company, Ltd., H Shares | 2,000 | | 3,995 |
| Chaoda Modern Agriculture Holdings, Ltd. | 22,000 | | 13,185 |
| China Construction Bank * | 374,500 | | 174,973 |
| China Life Insurance Company, Ltd. * | 102,000 | | 115,689 |
| China Mengniu Dairy Co., Ltd. | 14,000 | | 14,435 |
| China Overseas Land & Investment, Ltd. | 50,000 | | 27,227 |
| China Petroleum & Chemical Corp., Class H | 254,000 | | 153,048 |
| China Shipping Container Lines Co., Ltd. | 33,000 | | 11,590 |
| China Shipping Development Company, Ltd., | | | |
| Class H | 20,000 | | 16,111 |
| China Telecom Corp., Ltd. | 200,000 | | 73,466 |
| China Travel International Investment Hong | | | |
| Kong, Ltd. | 34,000 | | 9,312 |
| COSCO Holdings * | 25,000 | | 12,244 |
| Guangdong Investment, Ltd. | 36,000 | | 16,472 |
| Guangshen Railway Company, Ltd., Class H | 18,000 | | 6,728 |
| Huadian Power International Corp., Ltd., | | | |
| Class H * | 18,000 | | 4,872 |
| Huaneng Power International, Inc., Class H | 46,000 | | 30,830 |
| Jiangsu Expressway, Ltd. | 20,000 | | 12,889 |
| Jiangxi Copper Co., Ltd., Class H | 22,000 | | 13,043 |
| Lenovo Group, Ltd. | 52,000 | | 21,447 |
| Maanshan Iron & Steel Co., Ltd., Class H | 28,000 | | 9,834 |
| PetroChina Company, Ltd., Class H | 288,000 | | 282,109 |
| PICC Property & Casualty Co., Ltd., Class H | 38,000 | | 12,979 |
| Qingling Motors Co. | 10,000 | | 1,663 |
| International Equity Index Fund (continued) | |
| | Shares or | | |
| | Principal | | |
| | Amount | | Value |
|
|
| |
| COMMON STOCKS (continued) | | | |
| China (continued) | | | |
| Shanghai Electric Group Co., Ltd. * | 44,000 | $ | 19,565 |
| Shanghai Forte Land Co. | 12,000 | | 5,181 |
| Shenzhen Expressway Co. Ltd. | 10,000 | | 3,931 |
| Sinopec Shanghai Petrochemical | | | |
| Company, Ltd., H Shares | 36,000 | | 20,416 |
| Sinopec Yizheng Chemical Fibre Co., Ltd. | 18,000 | | 4,814 |
| Sinotrans, Ltd., Class H | 20,000 | | 8,507 |
| Tsingtao Brewery Company, Ltd., Series H | 4,000 | | 5,259 |
| Weichai Power Co., Ltd. | 2,000 | | 3,261 |
| Yanzhou Coal Mining Company, Ltd., Class H | 30,000 | | 24,553 |
| Zhejiang Expressway Company, Ltd., Class H | 20,000 | | 14,178 |
| Zijin Mining Group, Ltd. | 20,000 | | 11,922 |
| ZTE Corp., Class H | 2,200 | | 8,223 |
|
|
| | | | 1,310,295 |
Colombia - 0.04% | | | |
| BanColombia SA, ADR (a) | 2,203 | | 72,280 |
Denmark - 0.54% | | | |
| A P Moller- Maersk AS | 17 | | 155,938 |
| AS Det Ostasiatiske Kompagni | 275 | | 27,511 |
| Bang & Olufsen AS - B Series (a) | 150 | | 17,858 |
| Carlsberg AS, B Shares | 500 | | 31,322 |
| Coloplast AS | 352 | | 23,513 |
| Dampskibsselskabet Torm AS (a) | 200 | | 9,732 |
| Danisco AS | 700 | | 51,346 |
| Danske Bank AS | 6,200 | | 221,195 |
| DSV AS | 300 | | 40,319 |
| FLS Industries AS, B Shares | 400 | | 12,561 |
| GN Store Nord AS | 3,000 | | 40,031 |
| H. Lundbeck AS | 800 | | 16,492 |
| NKT Holdings AS | 300 | | 15,197 |
| Novo Nordisk AS | 3,400 | | 199,949 |
| Novozymes AS, B Shares | 750 | | 44,945 |
| Topdanmark AS * | 300 | | 30,395 |
| Vestas Wind Systems AS | 2,400 | | 50,339 |
| William Demant Holdings AS * | 400 | | 23,300 |
|
|
| | | | 1,011,943 |
Finland - 1.18% | | | |
| Amer Group Oyj | 950 | | 19,876 |
| Asko Oyj (a) | 800 | | 20,934 |
| Cargotec Corp. Oyj * (a) | 507 | | 20,550 |
| Elisa Oyj, A Shares | 2,250 | | 45,439 |
| Fortum Corp. Oyj | 6,200 | | 150,044 |
| KCI Konecranes Oyj | 200 | | 12,589 |
| Kesko Oyj | 900 | | 28,293 |
| Kone Corp. Oyj (a) | 1,012 | | 41,864 |
| Metra Oyj, B Shares | 800 | | 29,184 |
| Metso Oyj | 1,500 | | 55,256 |
| Neste Oil Oyj * | 1,712 | | 52,432 |
| Nokia AB - Oyj | 61,950 | | 1,159,502 |
| Nokian Renkaat Oyj | 1,360 | | 21,645 |
| Orion Oyj, Series B (a) | 1,000 | | 21,554 |
The accompanying notes are an integral part of the financial statements. 171
John Hancock Funds II
Portfolio of investments — February 28, 2006 (Unaudited)
(showing percentage of total net assets)
|
| International Equity Index Fund (continued) | |
| | Shares or | | |
| | Principal | | |
| | Amount | | Value |
|
|
| |
| COMMON STOCKS (continued) | | | |
| Finland (continued) | | | |
| Outokumpu Oyj | 1,400 | $ | 25,419 |
| Rautaruukki Oyj | 1,200 | | 40,471 |
| Sampo Oyj, A Shares | 5,600 | | 112,291 |
| Stora Enso Oyj, R Shares | 8,500 | | 121,397 |
| TietoEnator Oyj (a) | 1,060 | | 38,138 |
| UPM-Kymmene Oyj | 7,300 | | 154,908 |
| YIT-Yhtyma Oyj | 900 | | 45,707 |
|
|
| | | | 2,217,493 |
France - 7.32% | | | |
| Accor SA (a) | 2,747 | | 165,036 |
| Air France KLM (a) | 1,603 | | 37,072 |
| Alcatel SA * (a) | 17,316 | | 233,016 |
| Alstom RGPT * | 1,563 | | 133,642 |
| Atos Origin SA * | 888 | | 61,863 |
| Autoroutes du Sud de la France | 764 | | 46,128 |
| AXA Group | 20,919 | | 738,378 |
| BNP Paribas SA | 10,967 | | 1,014,118 |
| Bouygues SA (a) | 2,794 | | 146,599 |
| Business Objects SA * | 891 | | 32,935 |
| Caisse Nationale du Credit Agricole | 8,204 | | 299,542 |
| Cap Gemini SA * | 1,800 | | 88,850 |
| Carrefour SA | 7,814 | | 387,661 |
| Casino Guich Perrachon SA (a) | 494 | | 30,767 |
| CNP Assurances SA | 458 | | 43,851 |
| Compagnie De Saint Gobain SA | 4,365 | | 291,093 |
| Compagnie Generale des Etablissements | | | |
| Michelin, Class B | 2,040 | | 124,383 |
| Dassault Systemes SA | 750 | | 41,799 |
| Essilor International SA | 1,403 | | 120,797 |
| European Aeronautic Defence & | | | |
| Space Company | 3,410 | | 125,046 |
| France Telecom SA | 23,637 | | 513,706 |
| Gecina SA | 123 | | 15,365 |
| Groupe Danone SA | 3,296 | | 380,731 |
| Hermes International SA | 317 | | 79,200 |
| Imerys SA | 420 | | 35,836 |
| Klepierre SA | 305 | | 35,159 |
| Lafarge SA | 2,469 | | 258,005 |
| Lagardere S.C.A. (a) | 1,709 | | 132,083 |
| L'Air Liquide SA | 1,513 | | 298,372 |
| L'Oreal SA | 4,113 | | 363,676 |
| LVMH Moet Hennessy SA | 3,403 | | 309,002 |
| Neopost SA | 421 | | 42,088 |
| PagesJaunes Groupe SA | 1,659 | | 44,353 |
| Pernod-Ricard SA (a) | 986 | | 168,613 |
| Peugeot SA | 2,214 | | 129,007 |
| Pinault-Printemps-Redoute SA | 946 | | 108,937 |
| Publicis Groupe SA | 1,809 | | 69,001 |
| Renault Regie Nationale SA (a) | 2,581 | | 247,886 |
| Safran SA | 2,206 | | 56,113 |
| Sanofi-Aventis (a) | 14,554 | | 1,237,485 |
| Schneider Electric SA | 3,145 | | 321,155 |
| International Equity Index Fund (continued) | |
| | Shares or | | |
| | Principal | | |
| | Amount | | Value |
|
|
| |
| COMMON STOCKS (continued) | | | |
| France (continued) | | | |
| SCOR | 10,889 | $ | 26,194 |
| Societe BIC SA | 412 | | 25,096 |
| Societe des Autoroutes du Nord et | | | |
| de l'Est de la France * | 303 | | 20,928 |
| Societe Des Autoroutes Paris-Rhin-Rhone | 448 | | 5,927 |
| Societe Generale | 4,924 | | 697,203 |
| Societe Television Francaise 1 | 1,562 | | 47,024 |
| Sodexho Alliance (a) | 1,262 | | 53,697 |
| STMicroelectronics NV | 8,852 | | 150,379 |
| Suez SA Strip VVPR * | 1,452 | | 17 |
| Suez SA | 12,469 | | 458,679 |
| Technip SA | 1,146 | | 68,850 |
| Thales SA | 1,023 | | 46,574 |
| Thomson SA (a) | 3,434 | | 58,969 |
| Total SA (a) | 7,847 | | 1,971,721 |
| Unibail | 651 | | 106,596 |
| Valeo SA | 922 | | 36,881 |
| Veolia Environnement SA | 4,817 | | 251,310 |
| Vinci SA | 2,337 | | 215,685 |
| Vivendi Universal SA | 15,034 | | 455,640 |
| Zodiac SA | 504 | | 31,600 |
|
|
| | | | 13,737,319 |
Germany - 5.43% | | | |
| Adidas-Salomon AG | 630 | | 122,965 |
| Allianz AG | 5,306 | | 854,928 |
| Altana AG | 951 | | 51,005 |
| BASF AG | 7,586 | | 571,065 |
| Bayer AG | 9,318 | | 374,675 |
| Beiersdorf AG | 228 | | 30,933 |
| Celesio AG | 518 | | 48,013 |
| Commerzbank AG | 6,826 | | 248,073 |
| Continental AG | 1,875 | | 191,574 |
| DaimlerChrysler AG (a) | 12,868 | | 712,045 |
| Deutsche Bank AG | 6,965 | | 766,252 |
| Deutsche Boerse AG | 1,443 | | 181,297 |
| Deutsche Lufthansa AG | 3,101 | | 51,146 |
| Deutsche Post AG | 8,725 | | 227,484 |
| Deutsche Post AG-Reg * | 1,000 | | 25,508 |
| Deutsche Telekom AG | 38,508 | | 606,712 |
| Douglas Holding AG | 450 | | 20,638 |
| E.ON AG | 8,785 | | 971,078 |
| Epcos AG * | 663 | | 8,994 |
| Fresenius Medical Care AG | 829 | | 88,982 |
| Heidelberger Druckmaschinen AG | 698 | | 29,952 |
| Hochtief AG | 806 | | 43,219 |
| Hypo Real Estate Holding AG | 1,767 | | 116,070 |
| Infineon Technologies AG * | 8,606 | | 79,266 |
| IVG Immobilien AG | 943 | | 24,385 |
| Karstadt Quelle AG | 857 | | 20,947 |
| Linde AG | 1,131 | | 89,434 |
| MAN AG | 1,909 | | 120,127 |
| Merck & Company AG | 657 | | 65,673 |
The accompanying notes are an integral part of the financial statements. 172
John Hancock Funds II
Portfolio of investments — February 28, 2006 (Unaudited)
(showing percentage of total net assets)
|
| International Equity Index Fund (continued) | |
| | Shares or | | |
| | Principal | | |
| | Amount | | Value |
|
|
| |
| COMMON STOCKS (continued) | | | |
| Germany (continued) | | | |
| Metro AG | 1,975 | $ | 104,844 |
| MLP AG | 822 | | 18,487 |
| Muenchener Rueckversicherungs- | | | |
| Gesellschaft AG | 2,605 | | 352,617 |
| Premiere AG * | 611 | | 10,208 |
| ProSieben Sat.1 Media AG | 1,111 | | 26,111 |
| Puma AG | 224 | | 80,447 |
| Qiagen AG * | 1,899 | | 28,706 |
| RWE AG | 5,928 | | 506,919 |
| SAP AG | 3,119 | | 634,866 |
| Schering AG | 2,364 | | 169,688 |
| Siemens AG | 11,310 | | 1,036,327 |
| Suedzucker AG | 898 | | 23,734 |
| Thyssen Krupp AG | 5,196 | | 131,393 |
| Tui AG | 3,051 | | 60,124 |
| Volkswagen AG | 3,201 | | 223,445 |
| Wincor Nixdorf AG | 213 | | 27,121 |
|
|
| | | | 10,177,477 |
Greece - 0.55% | | | |
| Alpha Bank SA | 3,940 | | 150,118 |
| Athens Stock Exchange S.A. (ASE) | 610 | | 9,119 |
| Bank of Piraeus SA | 2,450 | | 74,071 |
| Coca Cola Hell Bottling | 1,530 | | 45,600 |
| Commercial Bank of Greece SA * | 1,140 | | 40,554 |
| Cosmote Mobile Communications SA | 1,900 | | 40,817 |
| Duty Free Shops | 240 | | 4,486 |
| EFG Eurobank Ergas SA | 2,680 | | 106,712 |
| Folli-Follie SA | 220 | | 6,494 |
| Germanos SA | 750 | | 15,683 |
| Greek Organization of Football Prognostics | 3,180 | | 120,858 |
| Hellenic Petroleum SA | 1,410 | | 19,667 |
| Hellenic Technodomiki Tev SA | 1,270 | | 10,992 |
| Hellenic Telecommunications Organization SA * | 3,500 | | 74,688 |
| Hyatt Regency Hotel SA | 550 | | 7,317 |
| Intracom SA | 1,130 | | 8,325 |
| National Bank Of Greece SA | 3,775 | | 195,046 |
| Public Power Corp. | 1,490 | | 33,323 |
| Techniki Olympiaki SA | 1,050 | | 6,609 |
| Titan Cement Company SA | 820 | | 39,103 |
| Viohalco SA | 1,450 | | 16,042 |
|
|
| | | | 1,025,624 |
Hong Kong - 1.57% | | | |
| Anhui Conch Cement Company, Ltd., Series H | 6,000 | | 8,623 |
| Bank of East Asia, Ltd. | 20,200 | | 69,644 |
| Beijing Enterprises Holdings, Ltd. | 4,000 | | 7,965 |
| BOC Hong Kong Holdings, Ltd. | 52,000 | | 104,889 |
| Cathay Pacific Airways, Ltd. | 15,000 | | 27,840 |
| Cheung Kong Holdings, Ltd. | 21,000 | | 221,944 |
| China Eastern Airlines Corp., Ltd. | 20,000 | | 3,351 |
| China Everbright, Ltd. * | 10,000 | | 5,349 |
| International Equity Index Fund (continued) | |
| | Shares or | | |
| | Principal | | |
| | Amount | | Value |
|
|
| |
| COMMON STOCKS (continued) | | | |
| Hong Kong (continued) | | | |
| China Merchants Holdings | | | |
| International Company, Ltd. | 16,000 | $ | 45,575 |
| China Mobile, Ltd. | 74,500 | | 364,401 |
| China Pharmaceutical Group, Ltd. * | 10,000 | | 1,843 |
| China Resource Power Holdings, Ltd. | 16,000 | | 10,620 |
| China Resources Enterprises, Ltd. | 16,000 | | 35,367 |
| China Southern Airlines Co., Ltd. * | 16,000 | | 4,743 |
| Citic Pacific, Ltd. | 17,000 | | 50,833 |
| CLP Holdings, Ltd. | 25,500 | | 145,926 |
| CNOOC, Ltd. | 187,000 | | 157,868 |
| Cofco International, Ltd. | 8,000 | | 4,253 |
| Denway Motors, Ltd. | 76,000 | | 30,121 |
| Global Bio-Chem Technology Group Company | 20,000 | | 11,342 |
| Gome Electrical Appliances Holdings, Ltd. | 8,000 | | 7,630 |
| Guangzhou Investment Company, Ltd. | 42,000 | | 7,254 |
| Hang Lung Properties, Ltd. | 26,000 | | 46,915 |
| Hang Seng Bank, Ltd. | 10,700 | | 143,288 |
| Henderson Land Development Company, Ltd. | 10,000 | | 53,682 |
| Hong Kong & China Gas Company, Ltd. | 51,000 | | 122,263 |
| Hong Kong Electric Holdings, Ltd. | 19,500 | | 89,851 |
| Hong Kong Exchange & Clearing, Ltd. | 14,000 | | 71,997 |
| Hopewell Holdings, Ltd. | 9,000 | | 25,288 |
| Hutchison Whampoa, Ltd. | 30,000 | | 286,517 |
| Hysan Development Company, Ltd. | 8,000 | | 19,539 |
| Li Ning Co., Ltd. | 7,000 | | 6,000 |
| Link, REIT * | 29,500 | | 64,447 |
| MTR Corp. | 19,000 | | 43,345 |
| New World Development Company, Ltd. | 32,575 | | 52,481 |
| PCCW, Ltd. | 53,000 | | 36,546 |
| Ping An Insurance Group Company of China, | | | |
| Ltd. | 16,000 | | 37,223 |
| Semiconductor Manufacturing | | | |
| International Corp. * | 114,000 | | 16,750 |
| Shanghai Industrial Holdings, Ltd. | 6,000 | | 12,914 |
| Shenzhen Investment, Ltd. | 14,000 | | 2,400 |
| Sino Land Company, Ltd. | 20,276 | | 30,576 |
| Sun Hung Kai Properties, Ltd. | 18,000 | | 188,266 |
| Swire Pacific, Ltd., Class A | 13,000 | | 124,744 |
| TCL International Holdings, Ltd. | 18,000 | | 2,668 |
| Techtronic Industries Company, Ltd. | 15,500 | | 26,970 |
| Television Broadcasting Company, Ltd. | 4,000 | | 22,504 |
| Travelsky Technology, Ltd. | 4,000 | | 3,918 |
| Weiqiao Textile Company, Ltd. | 4,500 | | 7,250 |
| Wharf Holdings, Ltd. | 17,000 | | 63,103 |
| Wing Hang Bank, Ltd. | 2,500 | | 19,285 |
|
|
| | | | 2,948,111 |
| India - 0.78% | | | |
| Bajaj Auto, Ltd., ADR | 717 | | 42,088 |
| Dr Reddy's Laboratories, Ltd., ADR | 1,473 | | 42,378 |
| Grasim Industries, Ltd., ADR | 999 | | 38,961 |
| ICICI Bank, Ltd., SADR | 7,679 | | 235,822 |
| Infosys Technologies, Ltd., ADR | 5,107 | | 361,575 |
The accompanying notes are an integral part of the financial statements. 173
John Hancock Funds II
Portfolio of investments — February 28, 2006 (Unaudited)
(showing percentage of total net assets)
|
| International Equity Index Fund (continued) | |
| | Shares or | | |
| | Principal | | |
| | Amount | | Value |
|
|
| |
| COMMON STOCKS (continued) | | | |
| India (continued) | | | |
| Larsen & Toubro, Ltd., ADR | 394 | $ | 21,285 |
| Ranbaxy Laboratories, Ltd., ADR | 4,173 | | 39,769 |
| Reliance Industries, Ltd., GDR | 9,876 | | 315,044 |
| Satyam Computer Services, Ltd., ADR | 3,622 | | 149,045 |
| State Bank of India, Ltd., ADR (a) | 640 | | 30,720 |
| Tata Motors, Ltd., ADR (a) | 5,069 | | 92,915 |
| Videsh Sanchar Nigam, Ltd., ADR (a) | 698 | | 11,280 |
| Wipro, Ltd., ADR (a) | 5,847 | | 81,215 |
|
|
| | | | 1,462,097 |
| Indonesia - 0.19% | | | |
| PT Telekomunikiasi Indonesia, ADR | 13,500 | | 351,675 |
| Ireland - 0.70% | | | |
| Allied Irish Banks PLC - Dublin | 12,402 | | 296,144 |
| Bank of Ireland | 13,768 | | 245,382 |
| C&C Group PLC | 3,967 | | 26,484 |
| CRH PLC | 7,606 | | 248,993 |
| DCC PLC | 1,159 | | 26,391 |
| Depfa Bank PLC | 4,781 | | 79,396 |
| Eircom Group PLC - Dublin | 11,472 | | 30,225 |
| Elan Corp. - Dublin * | 5,676 | | 75,719 |
| Fyffes PLC - Dublin | 4,132 | | 10,345 |
| Grafton Group PLC | 3,146 | | 38,630 |
| Greencore Group PLC - Dublin | 2,050 | | 8,407 |
| Iaws Group PLC, ADR | 1,528 | | 25,502 |
| Independent News & Media PLC - Dublin | 8,061 | | 25,658 |
| Irish Life & Permanent PLC - Dublin | 3,852 | | 84,909 |
| Kerry Group PLC | 1,876 | | 41,509 |
| Kingspan Group PLC - Dublin | 1,550 | | 22,396 |
| Paddy Power PLC | 593 | | 9,367 |
| Ryanair Holdings PLC, SADR * (a) | 420 | | 22,298 |
|
|
| | | | 1,317,755 |
| Israel - 0.43% | | | |
| Aladdin Knowledge Systems ADR * (a) | 979 | | 19,844 |
| Alvarion, Ltd., ADR * (a) | 10,017 | | 93,559 |
| Audio Codes, Ltd., ADR * (a) | 2,831 | | 32,500 |
| Check Point Software Technologies, Ltd., ADR * | 15,898 | | 337,991 |
| ECI Telecom, Ltd. ADR * | 3,196 | | 27,869 |
| Given Imaging Corp. ADR * | 2,814 | | 64,835 |
| Lipman Electronic Engineering, Ltd. ADR * | 1,761 | | 43,197 |
| M-Systems Flash Disk Pioneers, Ltd. ADR * (a) | 2,758 | | 74,466 |
| Orbotech, Ltd. ADR * | 2,403 | | 57,263 |
| RADWARE, Ltd. ADR * (a) | 962 | | 19,173 |
| Syneron Medical, Ltd. ADR * (a) | 1,159 | | 31,757 |
|
|
| | | | 802,454 |
| Italy - 3.06% | | | |
| Alleanza Assicuraz SpA | 5,893 | | 72,993 |
| Assicurazioni Generali SpA | 13,419 | | 481,363 |
| Autogrill SpA | 1,430 | | 20,986 |
| Autostrade SpA | 3,966 | | 101,275 |
| Banca Fideuram SpA | 3,673 | | 22,288 |
| Banca Intesa SpA - Non convertible | 13,022 | | 71,683 |
| International Equity Index Fund (continued) | |
| | Shares or | | |
| | Principal | | |
| | Amount | | Value |
|
|
| |
| COMMON STOCKS (continued) | | | |
| Italy (continued) | | | |
| Banca Intesa SpA | 46,280 | $ | 273,656 |
| Banca Monte dei Paschi Siena SpA | 15,334 | | 79,337 |
| Banca Naz Del Lavoro SpA * (a) | 14,806 | | 51,453 |
| Banca Popolare di Milano SpA | 5,514 | | 69,745 |
| Banche Popolari Unite SpA | 4,763 | | 119,697 |
| Banco Popolare Di Verona e Novara SpA | 5,137 | | 123,278 |
| BCA Antonveneta SpA | 1,219 | | 38,409 |
| Benetton Group SpA | 794 | | 10,128 |
| Bulgari SpA | 1,857 | | 22,050 |
| Capitalia SpA | 23,243 | | 175,676 |
| Enel SpA | 60,342 | | 501,399 |
| Eni SpA | 36,425 | | 1,040,440 |
| Fiat SpA * (a) | 6,708 | | 72,612 |
| Finmeccanica SpA | 4,105 | | 89,899 |
| Gruppo Editoriale L'Espresso SpA | 2,164 | | 11,112 |
| Italcementi SpA | 885 | | 18,126 |
| Lottomatica SpA * (a) | 389 | | 15,535 |
| Luxottica Group SpA | 1,919 | | 53,968 |
| Mediaset SpA | 11,436 | | 134,698 |
| Mediobanca SpA | 6,765 | | 141,539 |
| Mediolanum SpA (a) | 3,782 | | 31,245 |
| Mondadori (Arnoldo) Editore SpA | 1,458 | | 13,792 |
| Pirelli & Company SpA | 41,559 | | 39,289 |
| San Paolo-IMI SpA | 15,626 | | 275,888 |
| Seat Pagine Gialle SpA * | 60,043 | | 29,491 |
| Snam Rete Gas SpA | 14,057 | | 61,753 |
| T.E.R.N.A SpA | 16,879 | | 44,420 |
| Telecom Italia Media SpA * | 14,331 | | 7,278 |
| Telecom Italia SpA | 150,037 | | 402,897 |
| Telecom Italia SpA-RNC | 84,903 | | 195,248 |
| Tiscali SpA * | 2,947 | | 8,687 |
| UniCredito Italiano SpA (a) | 112,666 | | 819,991 |
|
|
| | | | 5,743,324 |
| Japan - 20.22% | | | |
| Acom Company, Ltd. (a) | 960 | | 58,580 |
| Aderans Company, Ltd. (a) | 800 | | 22,015 |
| Advantest Corp. | 1,000 | | 113,922 |
| AEON Company, Ltd. | 9,300 | | 221,750 |
| AEON Credit Service Company, Ltd. | 1,200 | | 34,151 |
| Aiful Corp. | 850 | | 56,589 |
| Aisin Seiki Company | 2,500 | | 88,668 |
| Ajinomoto Company, Inc. | 8,000 | | 84,779 |
| Alfresa Holdings Corp. (a) | 300 | | 17,357 |
| All Nippon Airways Company, Ltd. | 8,000 | | 29,126 |
| Alps Electric Company (a) | 2,300 | | 35,971 |
| Amada Company, Ltd. | 5,000 | | 47,261 |
| Amano Corp. | 1,400 | | 25,186 |
| Anritsu Corp. | 2,000 | | 11,469 |
| Aoyama Trading Company, Ltd. | 800 | | 24,613 |
| Ariake Japan Company, Ltd. | 400 | | 11,144 |
| Asahi Breweries, Ltd. | 5,100 | | 68,561 |
The accompanying notes are an integral part of the financial statements. 174
John Hancock Funds II
Portfolio of investments — February 28, 2006 (Unaudited)
(showing percentage of total net assets)
|
| International Equity Index Fund (continued) | |
| | Shares or | | |
| | Principal | | |
| | Amount | | Value |
|
|
| |
| COMMON STOCKS (continued) | | | |
| Japan (continued) | | | |
| Asahi Glass Company, Ltd. (a) | 15,000 | $ | 211,520 |
| Asahi Kasei Corp. | 18,000 | | 118,913 |
| ASATSU-DK, Inc. | 500 | | 17,819 |
| Astellas Pharmaceuticals, Inc. | 7,700 | | 296,128 |
| Autobacs Seven Company, Ltd. | 400 | | 20,101 |
| Bank of Fukuoka, Ltd. (a) | 7,000 | | 59,345 |
| Bank of Kyoto, Ltd. (a) | 3,000 | | 35,023 |
| Bank of Yokohama, Ltd. * | 16,000 | | 129,630 |
| Benesse Corp. | 900 | | 30,843 |
| Bridgestone Corp. | 9,000 | | 175,369 |
| Canon Sales Company, Inc. | 1,000 | | 21,323 |
| Canon, Inc. | 10,500 | | 656,866 |
| Casio Computer Company, Ltd. (a) | 2,900 | | 46,842 |
| Central Glass Company, Ltd. (a) | 4,000 | | 22,391 |
| Central Japan Railway Company, Ltd. | 22 | | 214,340 |
| Chiba Bank, Ltd. | 10,000 | | 84,095 |
| Chiyoda Corp. * (a) | 2,000 | | 48,372 |
| Chubu Electric Power Company, Inc. | 8,300 | | 218,477 |
| Chugai Pharmaceutical Company, Ltd. | 3,700 | | 67,511 |
| Circle K Sunkus Company, Ltd. (a) | 600 | | 13,871 |
| Citizen Watch Company, Ltd. (a) | 4,800 | | 42,745 |
| Coca-Cola West Japan Company, Ltd. (a) | 1,000 | | 23,759 |
| COMSYS Holdings Corp. | 2,000 | | 27,844 |
| Credit Saison Company, Ltd. | 2,100 | | 99,068 |
| CSK Corp. | 900 | | 41,073 |
| Dai Nippon Printing Company, Ltd. | 9,000 | | 158,448 |
| Daicel Chemical Industries, Ltd. | 4,000 | | 32,237 |
| Daido Steel Company, Ltd. | 5,000 | | 43,971 |
| Daiichi Sankyo Company, Ltd. * (a) | 9,300 | | 189,958 |
| Daikin Industries, Ltd. | 3,200 | | 106,110 |
| Daimaru, Inc. | 3,000 | | 40,407 |
| Dainippon Ink & Chemicals, Inc. | 9,000 | | 36,535 |
| Dainippon Screen | | | |
| Manufacturing Company, Ltd. | 3,000 | | 27,921 |
| Daito Trust Construction Company, Ltd. | 1,000 | | 46,577 |
| Daiwa House Industry Company, Ltd. | 7,000 | | 112,050 |
| Daiwa Securities Group, Inc. | 18,000 | | 215,366 |
| Denki Kagaku Kogyo Kabushiki Kaisha | 6,000 | | 25,229 |
| Denso Corp. | 7,500 | | 274,335 |
| Dentsu, Inc. | 24 | | 80,198 |
| Dowa Mining Company, Ltd. | 4,000 | | 44,270 |
| E Trade Securities Corp. (a) | 18 | | 41,689 |
| E-Access, Ltd. * | 32 | | 24,039 |
| East Japan Railway Company, Ltd. | 48 | | 339,663 |
| Ebara Corp. | 4,000 | | 24,921 |
| Eisai Company, Ltd. | 3,600 | | 166,447 |
| Electric Power Development Company, Ltd. | 2,160 | | 68,671 |
| Elpida Memory, Inc. * | 500 | | 18,246 |
| Familymart Company, Ltd. (a) | 900 | | 28,074 |
| Fanuc, Ltd. | 2,500 | | 211,520 |
| Fast Retailing Company, Ltd. | 700 | | 60,781 |
| Fuji Electric Holdings | 7,000 | | 32,843 |
| International Equity Index Fund (continued) | |
| | Shares or | | |
| | Principal | | |
| | Amount | | Value |
|
|
| |
| COMMON STOCKS (continued) | | | |
| Japan (continued) | | | |
| Fuji Photo Film Company, Ltd. (a) | 6,800 | $ | 217,930 |
| Fuji Software ABC, Inc. | 800 | | 22,631 |
| Fuji Television Network, Inc. | 7 | | 16,870 |
| Fujikura, Ltd. | 4,000 | | 44,714 |
| Fujitsu, Ltd. | 25,000 | | 200,196 |
| Furukawa Electric Company, Ltd. | 8,000 | | 62,969 |
| Glory, Ltd. | 800 | | 17,845 |
| Goodwill Group, Inc. | 33 | | 23,634 |
| Gunma Bank | 5,000 | | 37,262 |
| Gunze, Ltd. | 3,000 | | 19,127 |
| Hakuhodo DY Holdings, Inc. (a) | 300 | | 24,177 |
| Hankyu Department Stores (a) | 2,000 | | 17,605 |
| Hikari Tsushin, Inc. * | 300 | | 20,767 |
| Hino Motors, Ltd. (a) | 4,000 | | 25,263 |
| Hirose Electric Company, Ltd. | 400 | | 54,081 |
| Hitachi Cable, Ltd. (a) | 5,000 | | 28,160 |
| Hitachi Capital Corp. | 700 | | 13,311 |
| Hitachi Chemical, Ltd. | 1,400 | | 38,886 |
| Hitachi Construction Machinery Co., Ltd. (a) | 1,300 | | 32,219 |
| Hitachi Software Engineering Co., Ltd. | 600 | | 11,076 |
| Hitachi, Ltd. (a) | 45,000 | | 315,742 |
| Hokkaido Electric Power Company, Inc. | 2,300 | | 53,564 |
| Hokugin Financial Group, Inc. (a) | 15,000 | | 64,738 |
| Honda Motor Company, Ltd. | 11,000 | | 648,662 |
| House Food Corp. | 1,000 | | 15,349 |
| Hoya Corp. | 6,100 | | 241,894 |
| Ibiden Company, Ltd. (a) | 1,900 | | 89,633 |
| Index Corp. (a) | 20 | | 36,407 |
| Inpex Corp. | 5 | | 47,859 |
| Isetan Company, Ltd. | 2,400 | | 43,586 |
| Ishihara Sangyo | 6,000 | | 11,845 |
| Ishikawajima Harima Heavy Industries | | | |
| Company, Ltd. * | 15,000 | | 45,893 |
| ITO EN, Ltd. (a) | 800 | | 24,682 |
| Itochu Corp. | 22,000 | | 183,693 |
| Itochu Techno-Science Corp. | 400 | | 15,452 |
| JAFCO Company, Ltd. | 400 | | 27,485 |
| Japan Airlines System Corp. | 9,000 | | 23,921 |
| Japan Prime Realty Investment Corp. | 6 | | 18,357 |
| Japan Real Estate Investment Corp. | 4 | | 35,552 |
| Japan Retail Fund | 3 | | 23,331 |
| Japan Tobacco, Inc. | 13 | | 222,203 |
| JFE Holdings, Inc (a) | 7,900 | | 291,667 |
| JGC Corp. (a) | 3,000 | | 64,097 |
| Joyo Bank, Ltd. | 9,000 | | 57,610 |
| JS Group Corporation | 3,900 | | 75,993 |
| JSR Corp. | 2,400 | | 70,763 |
| Kajima Corp. (a) | 12,000 | | 70,353 |
| Kaken Pharmaceutical Company, Ltd. | 2,000 | | 16,409 |
| Kamigumi Company, Ltd. | 3,000 | | 22,870 |
| Kaneka Corp. | 4,000 | | 52,406 |
| Kansai Electric Power Company, Ltd. | 10,900 | | 251,982 |
The accompanying notes are an integral part of the financial statements. 175
John Hancock Funds II
Portfolio of investments — February 28, 2006 (Unaudited)
(showing percentage of total net assets)
|
| International Equity Index Fund (continued) | |
| | Shares or | | |
| | Principal | | |
| | Amount | | Value |
|
|
| |
| COMMON STOCKS (continued) | | | |
| Japan (continued) | | | |
| Kansai Paint Company, Ltd. | 3,000 | $ | 25,664 |
| Kao Corp. | 7,000 | | 189,043 |
| Katokichi Company, Ltd. | 3,100 | | 21,168 |
| Kawasaki Heavy Industries, Ltd. (a) | 16,000 | | 55,106 |
| Kawasaki Kisen Kaisha, Ltd. (a) | 6,000 | | 37,433 |
| KDDI Corp. | 36 | | 184,292 |
| Keihin Electric Express Railway Company, Ltd. | 6,000 | | 49,739 |
| (a) | | | |
| Keio Electric Railway Company, Ltd. | 7,000 | | 43,013 |
| Keisei Electric Railway Company, Ltd. (a) | 3,000 | | 19,332 |
| Keyence Corp. | 500 | | 136,954 |
| Kikkoman Corp. | 2,000 | | 19,520 |
| Kinden Corp. | 2,000 | | 18,768 |
| Kintetsu Corp. (a) | 20,000 | | 77,087 |
| Kirin Brewery Company, Ltd. | 12,000 | | 157,730 |
| Kobe Steel Company, Ltd. (a) | 38,000 | | 144,842 |
| Kokuyo Company, Ltd. | 1,100 | | 16,329 |
| Komatsu, Ltd. | 13,000 | | 231,647 |
| Komori Corp. | 1,000 | | 20,981 |
| Konami Corp. | 1,200 | | 29,587 |
| Konica Minolta Holdings, Inc. | 6,000 | | 74,865 |
| Kose Corp. | 400 | | 16,306 |
| Koyo Seiko Company, Ltd. | 2,800 | | 53,124 |
| Kubota Corp. | 14,000 | | 137,595 |
| Kuraray Company, Ltd. | 5,000 | | 59,824 |
| Kurita Water Industries, Ltd. (a) | 1,500 | | 32,049 |
| Kyocera Corp. | 2,300 | | 204,427 |
| Kyowa Hakko Kogyo Company, Ltd. | 4,000 | | 30,220 |
| Kyushu Electric Power | 5,500 | | 131,613 |
| Lawson, Inc. (a) | 800 | | 29,741 |
| LeoPalace21 Corp. | 1,600 | | 57,568 |
| Mabuchi Motor Company, Ltd. | 400 | | 20,408 |
| Makita Corp. | 1,500 | | 43,586 |
| Marubeni Corp. | 18,000 | | 89,377 |
| Marui Company, Ltd. | 4,200 | | 79,685 |
| Matsui Securities Company, Ltd. | 1,500 | | 20,716 |
| Matsumotokiyoshi Company, Ltd. (a) | 500 | | 13,759 |
| Matsushita Electric Industrial Company, Ltd. (a) | 29,000 | | 614,648 |
| Matsushita Electric Works, Ltd. | 4,000 | | 46,594 |
| Mediceo Holdings Company, Ltd. (a) | 2,000 | | 32,630 |
| Meiji Dairies Corp. | 3,000 | | 16,152 |
| Meiji Seika Kaisha, Ltd. | 4,000 | | 20,374 |
| Meitec Corp. | 500 | | 17,093 |
| Millea Holdings, Inc. | 21 | | 428,937 |
| Minebea Company, Ltd. (a) | 5,000 | | 30,126 |
| Mitsubishi Chemical Holdings Corp, ADR * | 15,500 | | 93,787 |
| Mitsubishi Corp. | 16,600 | | 385,881 |
| Mitsubishi Electric Corp. | 27,000 | | 215,751 |
| Mitsubishi Estate Company, Ltd. | 16,000 | | 337,065 |
| Mitsubishi Gas & Chemicals Company, Inc. | 5,000 | | 59,012 |
| Mitsubishi Heavy Industries, Ltd. | 43,000 | | 202,119 |
| Mitsubishi Logistc Corp. (a) | 2,000 | | 31,245 |
| International Equity Index Fund (continued) | |
| | Shares or | | |
| | Principal | | |
| | Amount | | Value |
|
|
| |
| COMMON STOCKS (continued) | | | |
| Japan (continued) | | | |
| Mitsubishi Materials Corp. | 13,000 | $ | 67,661 |
| Mitsubishi Rayon Company, Ltd. | 7,000 | | 56,414 |
| Mitsubishi Securities Company, Ltd. (a) | 4,000 | | 58,627 |
| Mitsubishi UFJ Financial Group, Inc. | 102 | | 1,525,509 |
| Mitsui & Company, Ltd. (a) | 20,000 | | 273,481 |
| Mitsui Chemicals, Inc. (a) | 8,000 | | 63,858 |
| Mitsui Engineering & Shipbuilding | | | |
| Company, Ltd. (a) | 10,000 | | 31,450 |
| Mitsui Fudosan Company, Ltd. | 11,000 | | 228,442 |
| Mitsui Mining & Smelting Company, Ltd. | 8,000 | | 54,354 |
| Mitsui O.S.K. Lines, Ltd. | 16,000 | | 117,186 |
| Mitsui Sumitomo Insurance Company, Ltd. | 17,000 | | 225,194 |
| Mitsui Trust Holdings, Inc. | 7,000 | | 102,777 |
| Mitsukoshi, Ltd. (a) | 6,000 | | 34,100 |
| Mitsumi Electric Company, Ltd. | 1,900 | | 23,464 |
| Mizuho Financial Group, Inc. | 135 | | 1,079,906 |
| Murata Manufacturing Company, Ltd. | 2,900 | | 180,429 |
| Namco Bandai Holdings, Inc. * | 2,800 | | 34,411 |
| NEC Corp. | 27,000 | | 166,370 |
| NEC Electronics Corp. | 500 | | 16,708 |
| Net One Systems Company, Ltd. | 7 | | 14,059 |
| NGK Insulators, Ltd. | 4,000 | | 54,081 |
| NGK Spark Plug Company, Ltd. | 3,000 | | 68,327 |
| NHK Spring Company, Ltd. (a) | 2,000 | | 23,742 |
| Nichii Gakkan Company, Ltd. | 400 | | 8,615 |
| Nichirei Corp. | 3,000 | | 13,717 |
| Nidec Corp. (a) | 1,500 | | 119,220 |
| Nikko Cordial Corp. | 11,500 | | 183,001 |
| Nikon Corp. (a) | 4,000 | | 68,199 |
| Nintendo Company, Ltd. | 1,400 | | 206,512 |
| Nippon Building Fund, Inc. (a) | 5 | | 47,859 |
| Nippon Electric Glass Company, Ltd. | 3,000 | | 72,686 |
| Nippon Express Company, Ltd. | 11,000 | | 58,380 |
| Nippon Kayaku Company, Ltd. (a) | 2,000 | | 16,631 |
| Nippon Light Metal Company, Ltd. (a) | 6,000 | | 16,870 |
| Nippon Meat Packers, Inc. | 2,000 | | 19,742 |
| Nippon Mining Holdings, Inc. | 10,000 | | 74,438 |
| Nippon Oil Corp. | 18,000 | | 135,834 |
| Nippon Paper Group, Inc. | 13 | | 59,773 |
| Nippon Sheet Glass Company, Ltd. (a) | 5,000 | | 21,024 |
| Nippon Shokubai Company, Ltd. | 2,000 | | 22,733 |
| Nippon Steel Corp. (a) | 86,000 | | 343,235 |
| Nippon Telegraph & Telephone Corp. | 73 | | 315,682 |
| Nippon Yusen Kabushiki Kaisha (a) | 14,000 | | 91,172 |
| Nippon Zeon Company | 2,000 | | 25,177 |
| Nishimatsu Construction Company, Ltd. (a) | 3,000 | | 12,691 |
| Nishi-Nippon City Bank, Ltd. * (a) | 6,000 | | 30,767 |
| Nissan Chemical Industries, Ltd. | 2,000 | | 32,972 |
| Nissan Motor Company, Ltd. | 31,800 | | 364,174 |
| Nisshin Seifun Group, Inc. | 2,500 | | 25,297 |
| Nisshin Steel Company | 11,000 | | 36,852 |
| Nisshinbo Industries, Inc. | 2,000 | | 20,904 |
The accompanying notes are an integral part of the financial statements. 176
John Hancock Funds II
Portfolio of investments — February 28, 2006 (Unaudited)
(showing percentage of total net assets)
|
| International Equity Index Fund (continued) | |
| | Shares or | | |
| | Principal | | |
| | Amount | | Value |
|
|
| |
| COMMON STOCKS (continued) | | | |
| Japan (continued) | | | |
| Nissin Food Products Company, Ltd. | 1,200 | $ | 36,407 |
| Nitori Company, Ltd. | 500 | | 24,442 |
| Nitto Denko Corp. | 2,300 | | 197,744 |
| NOK Corp. | 1,400 | | 40,920 |
| Nomura Real Estate Office Fund, Inc. | 3 | | 24,100 |
| Nomura Research Institute, Ltd. | 300 | | 34,151 |
| Nomura Securities Company, Ltd. | 24,800 | | 475,822 |
| NSK, Ltd. | 6,000 | | 45,996 |
| NTN Corp. | 5,000 | | 37,005 |
| NTT Data Corp. | 17 | | 78,891 |
| NTT DoCoMo, Inc. | 239 | | 355,405 |
| NTT Urban Development Corp. | 3 | | 23,818 |
| Obayashi Corp. | 8,000 | | 59,619 |
| OBIC Co., Ltd. | 100 | | 19,742 |
| Odakyu Electric Railway Company (a) | 8,000 | | 48,885 |
| Oji Paper Company, Ltd. | 11,000 | | 75,771 |
| Oki Electric Industry Company, Ltd. (a) | 7,000 | | 22,434 |
| Okumura Corp. | 3,000 | | 16,101 |
| Olympus Optical Company, Ltd. (a) | 3,000 | | 86,403 |
| Omron Corp. | 2,800 | | 77,532 |
| Onward Kashiyama Company, Ltd. (a) | 2,000 | | 33,860 |
| Oracle Corp. - Japan | 400 | | 18,562 |
| Oriental Land Company, Ltd. | 700 | | 40,920 |
| Orix Corp. | 1,200 | | 318,947 |
| Osaka Gas Company, Ltd. | 27,000 | | 102,683 |
| Pioneer Electronic Corp. | 2,100 | | 32,897 |
| Promise Company, Ltd. (a) | 1,150 | | 69,092 |
| Q.P. Corp. | 2,400 | | 22,767 |
| Rakuten, Inc. (a) | 55 | | 47,475 |
| Resona Holdings, Inc. * (a) | 65 | | 230,536 |
| Ricoh Company, Ltd. | 10,000 | | 185,027 |
| Rinnai Corp. | 900 | | 26,075 |
| Rohm Company, Ltd. | 1,500 | | 144,090 |
| Ryohin Keikaku Company, Ltd. (a) | 300 | | 22,537 |
| Sanken Electric Company | 2,000 | | 29,980 |
| SANKYO Co., Ltd. | 700 | | 42,654 |
| Santen Pharmaceutical Co., Ltd. | 1,000 | | 23,075 |
| Sanwa Shutter Corp. (a) | 2,000 | | 13,213 |
| Sanyo Electric Company, Ltd. * (a) | 21,000 | | 50,790 |
| Sapporo Holdings (a) | 4,000 | | 20,682 |
| SBI Holdings, Inc. (a) | 73 | | 38,805 |
| Secom Company, Ltd. | 3,000 | | 148,705 |
| Sega Sammy Holdings, Inc. | 1,900 | | 77,617 |
| Seiko Epson Corp. | 1,400 | | 33,262 |
| Seino Transportation Co., Ltd. (a) | 2,000 | | 19,434 |
| Sekisui Chemical Company, Ltd. | 6,000 | | 48,252 |
| Sekisui House, Ltd. | 7,000 | | 106,187 |
| Seven & I Holdings Co., Ltd. | 11,300 | | 461,618 |
| SFCG Company, Ltd. | 80 | | 16,675 |
| Sharp Corp. | 14,000 | | 247,671 |
| Shimachu Company, Ltd. | 600 | | 17,588 |
| Shimamura Company, Ltd. | 300 | | 33,997 |
| International Equity Index Fund (continued) | |
| | Shares or | | |
| | Principal | | |
| | Amount | | Value |
|
|
| |
| COMMON STOCKS (continued) | | | |
| Japan (continued) | | | |
| Shimano, Inc. | 1,000 | $ | 28,630 |
| Shimizu Corp. | 8,000 | | 56,200 |
| Shin-Etsu Chemical Company, Ltd. | 5,500 | | 292,838 |
| Shinko Securities Company, Ltd. * (a) | 7,000 | | 36,313 |
| Shinsei Bank, Ltd. | 13,000 | | 87,215 |
| Shionogi & Co., Ltd. | 4,000 | | 54,901 |
| Shiseido Company, Ltd. (a) | 5,000 | | 87,813 |
| Shizuoka Bank, Ltd. | 8,000 | | 78,284 |
| Showa Denko K.K. | 14,000 | | 60,183 |
| Showa Shell Sekiyu K.K. | 2,300 | | 25,966 |
| Skylark Company, Ltd. (a) | 1,100 | | 17,100 |
| SMC Corp. | 700 | | 99,009 |
| SOFTBANK Corp. (a) | 10,200 | | 313,819 |
| Sojitz Holdings Corp. * (a) | 5,200 | | 28,620 |
| Sompo Japan Insurance, Inc. | 12,000 | | 174,241 |
| Sony Corp. | 13,900 | | 656,926 |
| Stanley Electric Corp. | 2,000 | | 38,458 |
| Sumitomo Bakelite Company, Ltd. | 2,000 | | 17,075 |
| Sumitomo Chemical Company, Ltd. | 20,000 | | 155,542 |
| Sumitomo Corp. | 15,000 | | 203,828 |
| Sumitomo Electric Industries, Ltd. (a) | 10,200 | | 153,597 |
| Sumitomo Heavy Industries, Ltd. | 7,000 | | 62,815 |
| Sumitomo Light Metal Industries, Ltd. | 57,000 | | 253,799 |
| Sumitomo Metal Mining Co., Ltd. (a) | 7,000 | | 93,265 |
| Sumitomo Mitsui Financial Group, Inc. | 82 | | 897,016 |
| Sumitomo Osaka Cement Company, Ltd. | 5,000 | | 15,640 |
| Sumitomo Realty & | | | |
| Development Company, Ltd. | 5,000 | | 116,657 |
| Sumitomo Rubber Industries, Inc. | 2,000 | | 24,169 |
| Sumitomo Trust & Banking Company, Ltd. | 17,000 | | 173,327 |
| Suruga Bank, Ltd. | 3,000 | | 38,843 |
| Suzuken Company, Ltd. | 800 | | 23,656 |
| T&D Holdings, Inc. | 3,250 | | 243,590 |
| Taiheiyo Cement Corp. (a) | 11,000 | | 47,381 |
| Taisei Corp. | 12,000 | | 58,046 |
| Taisho Pharmaceuticals Company, Ltd. | 2,000 | | 42,219 |
| Taiyo Nippon Sanso Corp. | 4,000 | | 27,861 |
| Taiyo Yuden Company, Ltd. | 2,000 | | 30,459 |
| Takara Holdings (a) | 2,000 | | 11,999 |
| Takashimaya Company, Ltd. (a) | 4,000 | | 58,115 |
| Takeda Pharmaceutical Company, Ltd. | 12,500 | | 694,384 |
| Takefuji Corp. (a) | 1,460 | | 93,332 |
| Tanabe Seiyaku Co., Ltd. | 3,000 | | 32,972 |
| TDK Corp. | 1,600 | | 111,580 |
| Teijin, Ltd. (a) | 11,000 | | 74,173 |
| Teikoku Oil Company, Ltd. (a) | 3,000 | | 40,535 |
| Terumo Corp. | 2,200 | | 66,934 |
| The 77th Bank, Ltd. | 4,000 | | 30,083 |
| THK Company, Ltd. | 1,400 | | 39,484 |
| TIS, Inc. | 900 | | 23,921 |
| Tobu Railway Company, Ltd. (a) | 10,000 | | 50,167 |
| Toda Corp. | 3,000 | | 15,306 |
The accompanying notes are an integral part of the financial statements. 177
John Hancock Funds II
Portfolio of investments — February 28, 2006 (Unaudited)
(showing percentage of total net assets)
|
| International Equity Index Fund (continued) | |
| | Shares or | | |
| | Principal | | |
| | Amount | | Value |
|
|
| |
| COMMON STOCKS (continued) | | | |
| Japan (continued) | | | |
| Toho Company, Ltd. (a) | 1,900 | $ | 35,480 |
| Tohoku Electric Power Company, Ltd. | 5,700 | | 128,117 |
| Tokuyama Corp. | 3,000 | | 44,765 |
| Tokyo Broadcasting Company, Ltd. | 500 | | 14,785 |
| Tokyo Electric Power Company, Ltd. | 16,100 | | 432,048 |
| Tokyo Electron, Ltd. | 2,200 | | 147,218 |
| Tokyo Gas Company, Ltd. | 30,000 | | 136,655 |
| Tokyo Steel Manufacturing Co., Ltd. | 1,500 | | 28,908 |
| Tokyo Style Company, Ltd. | 2,000 | | 22,716 |
| Tokyo Tatemono Company, Ltd. | 3,000 | | 29,074 |
| Tokyu Corp. | 12,000 | | 74,968 |
| Tokyu Land Corp. (a) | 5,000 | | 43,885 |
| TonenGeneral Sekiyu K.K. | 4,000 | | 39,586 |
| Toppan Printing Company, Ltd. | 8,000 | | 101,735 |
| Toray Industries, Inc. | 18,000 | | 138,603 |
| Toshiba Corp. | 41,000 | | 233,364 |
| Tosoh Corp. | 6,000 | | 31,587 |
| Toto, Ltd. (a) | 4,000 | | 33,706 |
| Toyo Seikan Kaisha, Ltd. | 2,200 | | 37,792 |
| Toyo Suisan Kaisha, Ltd. * | 1,000 | | 14,486 |
| Toyobo Company, Ltd. | 9,000 | | 27,921 |
| Toyoda Gosei Co., Ltd. | 900 | | 19,152 |
| Toyota Industries Corp. (a) | 2,600 | | 103,991 |
| Toyota Motor Corp. | 40,400 | | 2,157,933 |
| Toyota Tsusho Corp. (a) | 2,000 | | 46,321 |
| Trend Micro, Inc. (a) | 1,500 | | 46,150 |
| Ube Industries, Ltd. (a) | 11,000 | | 32,433 |
| UNI Charm Corp. | 600 | | 29,690 |
| Uniden Corp. | 1,000 | | 15,041 |
| UNY Company, Ltd. | 2,000 | | 30,339 |
| Ushio, Inc. | 1,500 | | 36,663 |
| USS Company., Ltd. | 320 | | 20,976 |
| Wacoal Corp. | 1,000 | | 13,665 |
| West Japan Railway Company, Ltd. | 23 | | 92,778 |
| Yahoo Japan Corp. | 100 | | 117,938 |
| Yakult Honsha Company, Ltd. (a) | 1,400 | | 32,185 |
| Yamada Denki Company, Ltd. | 1,000 | | 107,341 |
| Yamaha Corp. | 2,300 | | 39,411 |
| Yamaha Motor Company, Ltd. | 2,500 | | 57,474 |
| Yamato Transport Company, Ltd. (a) | 5,000 | | 95,291 |
| Yamazaki Baking Company, Ltd. | 3,000 | | 24,075 |
| Yaskawa Electric Corp. * | 3,000 | | 32,818 |
| Yokogawa Electric Corp. (a) | 2,700 | | 49,611 |
|
|
| | | | 37,930,678 |
Korea - 0.03% | | | |
| LG.Philips LCD Co Ltd, ADR * (a) | 2,320 | | 51,458 |
Luxembourg - 0.20% | | | |
| Arcelor SA (a) | 7,171 | | 262,109 |
| Tenaris SA, ADR | 700 | | 112,105 |
|
|
| | | | 374,214 |
| International Equity Index Fund (continued) | |
| | Shares or | | |
| | Principal | | |
| | Amount | | Value |
|
|
| |
| COMMON STOCKS (continued) | | | |
| Mexico - 0.80% | | | |
| America Movil S.A. de C.V., Series L | 20,600 | $ | 715,438 |
| Cemex SA de C.V., SADR | 4,979 | | 307,503 |
| Grupo Televisa SA, SADR | 2,100 | | 164,766 |
| Telefonos de Mexico SA de CV, Class L, | | | |
| SADR | 14,000 | | 313,460 |
|
|
| | | | 1,501,167 |
Netherlands - 4.37% | | | |
| ABN AMRO Holdings NV | 25,024 | | 729,401 |
| Aegon NV | 19,937 | | 329,185 |
| Akzo Nobel NV | 3,776 | | 191,766 |
| ASML Holding NV * | 6,744 | | 139,974 |
| Buhrmann NV | 1,539 | | 25,851 |
| Corio NV | 533 | | 35,043 |
| DSM NV | 2,154 | | 89,619 |
| Euronext NV | 1,116 | | 69,981 |
| Getronics NV (a) | 1,602 | | 21,772 |
| Hagemeyer NV * (a) | 6,817 | | 27,469 |
| Heineken NV | 3,417 | | 128,725 |
| IHC Caland NV | 495 | | 48,803 |
| ING Groep NV | 26,236 | | 986,171 |
| Koninklijke (Royal) KPN NV | 29,494 | | 305,200 |
| Koninklijke (Royal) Philips Electronics NV | 18,442 | | 600,647 |
| Koninklijke Ahold NV * | 21,603 | | 176,157 |
| Oce-Van Der Grinten NV | 1,037 | | 17,951 |
| Randstad Holdings NV | 611 | | 34,220 |
| Reed Elsevier NV | 9,792 | | 132,378 |
| Rodamco Europe NV | 644 | | 59,040 |
| Royal Dutch Shell PLC, A Shares | 56,716 | | 1,711,465 |
| Royal Dutch Shell PLC, B Shares | 38,614 | | 1,218,151 |
| Royal Numico NV * | 2,423 | | 104,942 |
| TNT Post Group NV | 5,828 | | 189,746 |
| Unilever NV | 8,011 | | 556,306 |
| Vedior NV | 2,201 | | 41,589 |
| VNU NV | 3,363 | | 108,970 |
| Wereldhave NV | 274 | | 29,202 |
| Wolters Kluwer NV | 4,113 | | 90,319 |
|
|
| | | | 8,200,043 |
New Zealand - 0.15% | | | |
| Auckland International Airport, Ltd. | 15,760 | | 19,550 |
| Contact Energy, Ltd. | 4,646 | | 22,159 |
| Fisher & Paykel Appliances Holdings, Ltd. | 4,059 | | 10,555 |
| Fisher & Paykel Healthcare Corp. | 7,769 | | 19,481 |
| Fletcher Building, Ltd. | 7,464 | | 39,016 |
| Kiwi Income Property Trust | 11,787 | | 9,930 |
| Sky City Entertainment Group, Ltd. | 6,728 | | 22,315 |
| Sky Network Television, Ltd. * | 3,143 | | 13,177 |
| Telecom Corp. of New Zealand, Ltd. (a) | 31,895 | | 111,923 |
| Tower, Ltd. * | 4,007 | | 5,688 |
| Vector, Ltd. * | 3,493 | | 5,978 |
| Warehouse Group, Ltd. | 1,921 | | 4,893 |
The accompanying notes are an integral part of the financial statements. 178
John Hancock Funds II
Portfolio of investments — February 28, 2006 (Unaudited)
(showing percentage of total net assets)
|
| International Equity Index Fund (continued) | |
| | Shares or | | |
| | Principal | | |
| | Amount | | Value |
|
|
| |
| COMMON STOCKS (continued) | | | |
| New Zealand (continued) | | | |
| Waste Management Corp. | 1,401 | $ | 5,994 |
|
|
| | | | 290,659 |
Norway - 0.61% | | | |
| Den Norske Bank ASA | 9,600 | | 116,631 |
| Norsk Hydro ASA | 2,040 | | 238,320 |
| Norske Skogindustrier ASA | 2,300 | | 34,417 |
| Orkla ASA (a) | 2,750 | | 119,990 |
| Petroleum Geo-Services ASA * | 753 | | 29,564 |
| Prosafe ASA (a) | 450 | | 22,335 |
| Schibsted ASA | 700 | | 19,290 |
| Smedvig ASA, A shares | 600 | | 18,179 |
| Statoil ASA | 9,400 | | 239,544 |
| Stolt Offshore SA * | 2,756 | | 36,852 |
| Stolt-Nielsen SA | 600 | | 18,757 |
| Storebrand ASA | 3,200 | | 35,440 |
| Tandberg ASA (a) | 1,800 | | 13,934 |
| Tandberg Television ASA * | 1,000 | | 17,779 |
| Telenor ASA | 11,200 | | 121,135 |
| Tomra Systems ASA (a) | 2,400 | | 19,113 |
| Yara International ASA (a) | 3,000 | | 45,670 |
|
|
| | | | 1,146,950 |
Peru - 0.02% | | | |
| Compania de Minas Buenaventura SA, ADR | 1,366 | | 35,817 |
| Portugal - 0.22% | | | |
| Banco BPI, SA | 3,999 | | 21,596 |
| Banco Comercial dos Acores, SA | 25,707 | | 76,310 |
| Banco Espirito Santo, SA | 1,381 | | 22,753 |
| Brisa Auto Estrada, SA | 4,341 | | 38,244 |
| Cimpor-Cimentos De Portugal, SA | 2,652 | | 16,219 |
| Electricidade De Portugal, SA | 24,048 | | 84,000 |
| Jeronimo Martins, SGPS, SA | 497 | | 8,088 |
| Portugal Telecom, SGPS, SA | 9,973 | | 115,326 |
| PT Multimedia.com, SGPS, SA | 1,032 | | 12,512 |
| Sonae Industria SGPS SA/New * | 802 | | 7,056 |
| Sonae, SGPS, SA | 11,838 | | 18,346 |
|
|
| | | | 420,450 |
Russia - 0.85% | | | |
| Gazprom, ADR (a) | 1,110 | | 93,906 |
| JSC MMC Norilsk Nickel, ADR | 1,170 | | 104,130 |
| Lukoil Oil Company, ADR | 8,012 | | 640,159 |
| Mechel Steel Group, ADR (a) | 433 | | 12,206 |
| Mobile Telesystems, ADR | 1,565 | | 56,450 |
| RAO Unified Energy System, ADR | 1,290 | | 89,010 |
| Rostelecom, ADR (a) | 981 | | 19,728 |
| Sberbank of Russian Federation, ADR | 600 | | 92,700 |
| Sibirtelecom, ADR (a) | 71 | | 5,055 |
| Surgutneftegaz, ADR for PFD Shares (a) | 1,096 | | 126,588 |
| Surgutneftegaz, ADR | 2,239 | | 163,223 |
| Tatneft, ADR (a) | 1,020 | | 116,025 |
| UralsvyAzinform, ADR | 669 | | 5,499 |
| VolgaTelecom, ADR (a) | 612 | | 5,337 |
| International Equity Index Fund (continued) | |
| | Shares or | | |
| | Principal | | |
| | Amount | | Value |
|
|
| |
| COMMON STOCKS (continued) | | | |
| Russia (continued) | | | |
| Vympel Communicatii, ADR * (a) | 1,449 | $ | 63,756 |
| Wimm-Bill-Dann Foods OJSC, ADR * | 211 | | 4,937 |
|
|
| | | | 1,598,709 |
Singapore - 0.69% | | | |
| Allgreen Properties, Ltd. | 6,000 | | 5,070 |
| Ascendas Real Estate | 12,000 | | 15,987 |
| CapitaLand, Ltd. | 15,000 | | 38,856 |
| CapitaMall Trust | 12,000 | | 17,245 |
| Chartered Semiconductor Manufacturing, Ltd. * | 13,000 | | 10,824 |
| (a) | | | |
| City Developments, Ltd. | 7,000 | | 41,015 |
| ComfortDelGro Corp., Ltd. | 25,000 | | 25,442 |
| Cosco Corp. Singapore, Ltd. | 10,000 | | 7,339 |
| Creative Technology, Ltd. (a) | 700 | | 5,483 |
| Datacraft Asia, Ltd. * | 3,000 | | 3,480 |
| DBS Group Holdings, Ltd. | 16,000 | | 161,840 |
| Fraser & Neave, Ltd. (a) | 3,000 | | 35,341 |
| Haw Par Corp., Ltd. | 1,000 | | 3,516 |
| Jardine Cycle and Carriage, Ltd. | 2,000 | | 12,705 |
| Keppel Corp., Ltd. (a) | 8,000 | | 69,078 |
| Keppel Land, Ltd. | 5,000 | | 13,631 |
| Neptune Orient Lines, Ltd. | 7,000 | | 10,880 |
| Olam International, Ltd. | 8,000 | | 9,079 |
| Oversea-Chinese Banking Corp., Ltd. | 36,000 | | 150,985 |
| OverSeas Union Enterprises, Ltd. | 1,000 | | 7,340 |
| Parkway Holdings, Ltd. | 8,000 | | 12,089 |
| SembCorp Industries, Ltd. * | 12,000 | | 23,092 |
| SembCorp Logistics, Ltd. | 4,000 | | 4,268 |
| SembCorp Marine, Ltd. (a) | 7,000 | | 12,650 |
| Singapore Airlines, Ltd. | 8,000 | | 73,026 |
| Singapore Exchange, Ltd. (a) | 10,000 | | 23,561 |
| Singapore Land, Ltd. | 2,000 | | 7,525 |
| Singapore Petroleum Co., Ltd. | 2,000 | | 6,229 |
| Singapore Post, Ltd. | 18,000 | | 13,433 |
| Singapore Press Holdings, Ltd. | 22,000 | | 60,246 |
| Singapore Technologies Engineering, Ltd. | 19,000 | | 35,625 |
| Singapore Telecommunications, Ltd. | 95,000 | | 152,928 |
| SMRT Corporation, Ltd. | 8,000 | | 5,428 |
| ST Assembly Test Services, Ltd. * | 17,000 | | 11,953 |
| Suntec Real Estate Investment Trust * | 11,000 | | 8,073 |
| United Overseas Bank, Ltd. | 16,000 | | 148,025 |
| United Overseas Land, Ltd. | 7,000 | | 11,527 |
| Venture Corp., Ltd. | 3,000 | | 24,239 |
| Want Want Holdings ADR | 5,000 | | 6,300 |
| Wing Tai Holdings, Ltd. | 6,000 | | 5,551 |
|
|
| | | | 1,290,904 |
South Korea - 2.53% | | | |
| Kookmin Bank, ADR | 23,304 | | 1,765,278 |
| Korea Electric Power Corp., ADR | 34,936 | | 775,929 |
| KT Corp., Sponsored ADR | 19,441 | | 396,985 |
| POSCO, ADR | 20,857 | | 1,218,883 |
The accompanying notes are an integral part of the financial statements. 179
John Hancock Funds II
Portfolio of investments — February 28, 2006 (Unaudited)
(showing percentage of total net assets)
|
| International Equity Index Fund (continued) | |
| | Shares or | | |
| | Principal | | |
| | Amount | | Value |
|
|
| |
| COMMON STOCKS (continued) | | | |
| South Korea (continued) | | | |
| SK Telecom Company, Ltd., ADR | 24,387 | $ | 588,946 |
|
|
| | | | 4,746,021 |
| Spain - 3.09% | | | |
| Abertis Infrastructuras SA (a) | 3,030 | | 78,529 |
| Acciona SA (a) | 412 | | 57,466 |
| Acerinox SA | 2,436 | | 37,375 |
| ACS Actividades SA | 3,453 | | 128,846 |
| Aguas De Barcelona SA-Class A | 770 | | 21,297 |
| Altadis SA, Series A | 3,934 | | 165,085 |
| Antena 3 de Television SA | 1,028 | | 27,292 |
| Banco Bilbao Vizcaya Argentaria SA | 47,461 | | 966,397 |
| Banco Popular Espanol SA | 11,836 | | 158,741 |
| Banco Santander Central Hispano SA | 83,131 | | 1,214,031 |
| Cintra Concesiones de Infraestructuras de | | | |
| Transporte SA (a) | 2,598 | | 34,503 |
| Corporacion Mapfre SA | 1,421 | | 27,393 |
| Ebro Puleva SA (a) | 1,119 | | 20,384 |
| Endesa SA | 13,371 | | 448,239 |
| Fomento de Construcciones SA | 663 | | 45,092 |
| Gamesa Corporation Tecno SA | 2,482 | | 42,993 |
| Gas Natural SDG SA (a) | 2,522 | | 76,819 |
| Grupo Ferrovial SA | 904 | | 67,734 |
| Iberdrola SA | 11,393 | | 359,520 |
| Iberia Lineas Aereas de Espana SA | 6,235 | | 17,765 |
| Indra Sistemas SA | 1,809 | | 36,015 |
| Industria de Diseno Textil SA | 3,055 | | 109,734 |
| Inmobiliaria Colonial SA | 407 | | 26,152 |
| Metrovacesa SA | 806 | | 60,054 |
| NH Hoteles SA | 1,027 | | 16,590 |
| Promotora de Informaciones SA (a) | 1,013 | | 18,767 |
| Repsol SA | 12,854 | | 359,192 |
| Sacyr Vallehermoso SA (a) | 1,452 | | 40,852 |
| Sociedad General de Aguas de Barcelona SA * | 7 | | 186 |
| Sogecable SA * (a) | 530 | | 21,312 |
| Telefonica Publicidad e Informacion SA (a) | 2,148 | | 22,637 |
| Telefonica SA | 62,426 | | 963,009 |
| Union Fenosa SA | 2,982 | | 111,982 |
| Zeltia SA * | 2,097 | | 14,550 |
|
|
| | | | 5,796,533 |
Sweden - 1.87% | | | |
| Alfa Laval AB | 1,300 | | 32,829 |
| Assa Abloy AB, Series B | 4,200 | | 71,328 |
| Atlas Copco AB, Series A * | 4,700 | | 115,724 |
| Atlas Copco AB, Series B * | 3,000 | | 68,184 |
| Axfood AB | 400 | | 10,329 |
| Billerud Aktibolag AB (a) | 700 | | 9,988 |
| Capio AB * | 1,000 | | 17,299 |
| Castellum AB | 500 | | 20,929 |
| D. Carnegie & Company AB | 600 | | 10,152 |
| Electrolux AB, Series B | 4,000 | | 110,610 |
| Elekta AB, Series B | 1,144 | | 16,901 |
| International Equity Index Fund (continued) | |
| | Shares or | | |
| | Principal | | |
| | Amount | | Value |
|
|
| |
| COMMON STOCKS (continued) | | | |
| Sweden (continued) | | | |
| Eniro AB | 2,500 | $ | 27,700 |
| Ericsson LM, Series B | 208,000 | | 709,118 |
| Fabege AB | 1,000 | | 19,824 |
| Gambro AB- A shares * | 2,500 | | 25,490 |
| Gambro AB- B shares * | 1,500 | | 15,436 |
| Getinge AB, Series B | 2,400 | | 34,698 |
| Hennes & Mauritz AB, Series B | 6,700 | | 244,069 |
| Hoganas AG, B Shares (a) | 400 | | 8,460 |
| Holmen AB, Series B | 700 | | 27,135 |
| Kungsleden AB | 670 | | 23,434 |
| Lundin Petroleum AB, Series A * | 2,190 | | 24,196 |
| Modern Time Group AB, Series B * | 750 | | 34,755 |
| Nordea Bank AB | 30,500 | | 344,678 |
| OMX AB * | 1,000 | | 17,046 |
| Oriflame Cosmetics AB | 400 | | 13,006 |
| Sandvik AB | 2,800 | | 150,612 |
| SAS AB * (a) | 1,000 | | 13,195 |
| Scania AB, Series B | 1,300 | | 54,333 |
| Securitas AB, B Shares | 4,200 | | 77,162 |
| Skandinaviska Enskilda Banken AB, Series A | 6,600 | | 145,839 |
| Skanska AB, Series B | 5,500 | | 88,545 |
| SKF AB, Series B * | 5,600 | | 81,316 |
| SSAB Svenskt Stal AB, Series A | 800 | | 35,961 |
| SSAB Svenskt Stal AB, Series B | 400 | | 16,895 |
| Svenska Cellulosa AB, Series B | 2,700 | | 113,186 |
| Svenska Handelsbanken AB, Series A | 7,300 | | 189,881 |
| Swedish Match AB | 4,500 | | 60,230 |
| Tele2 AB, Series B * | 4,540 | | 49,013 |
| Telelogic AB * | 3,000 | | 7,311 |
| Teliasonera AB | 26,000 | | 138,541 |
| Trelleborg AB, Series B | 1,000 | | 20,834 |
| Volvo AB, Series A | 1,300 | | 55,071 |
| Volvo AB, Series B | 3,100 | | 135,239 |
| Wihlborgs Fastigheter AB * | 218 | | 6,014 |
| WM Data AB, Series B | 4,000 | | 11,768 |
|
|
| | | | 3,504,264 |
Switzerland - 5.48% | | | |
| ABB, Ltd. * | 27,342 | | 326,729 |
| Adecco SA | 1,845 | | 101,108 |
| Ciba Specialty Chemicals Holding AG (a) | 969 | | 59,888 |
| Clariant AG * (a) | 3,042 | | 46,423 |
| Compagnie Financiere | | | |
| Richemont AG, Series A | 6,875 | | 299,052 |
| Credit Suisse Group AG (a) | 16,940 | | 937,359 |
| Geberit AG | 52 | | 47,138 |
| Givaudan AG (a) | 96 | | 68,648 |
| Holcim, Ltd. (a) | 2,568 | | 202,104 |
| Kudelski SA (a) | 465 | | 13,095 |
| Kuehne & Nagel International AG | 158 | | 47,622 |
| Kuoni Reisen Holding AG, Series B * | 38 | | 16,226 |
| Logitech International SA, REG * | 1,076 | | 43,406 |
| Lonza Group AG | 500 | | 32,405 |
The accompanying notes are an integral part of the financial statements. 180
John Hancock Funds II
Portfolio of investments — February 28, 2006 (Unaudited)
(showing percentage of total net assets)
|
| International Equity Index Fund (continued) | |
| | Shares or | | |
| | Principal | | |
| | Amount | | Value |
|
|
| |
| COMMON STOCKS (continued) | | | |
| Switzerland (continued) | | | |
| Micronas Semiconductor Holding AG * | 429 | $ | 13,796 |
| Nestle SA (a) | 5,626 | | 1,651,825 |
| Nobel Biocare Holding AG, Series BR | 327 | | 72,925 |
| Novartis AG - CHF (a) | 32,516 | | 1,747,271 |
| Phonak Holding AG | 562 | | 27,120 |
| PSP Swiss Property AG * | 496 | | 23,406 |
| Rieter Holdings AG | 59 | | 22,857 |
| Roche Holdings AG - CHF | 9,797 | | 1,445,870 |
| Schindler Holding AG | 68 | | 32,193 |
| Serono AG, Series B (a) | 71 | | 49,987 |
| SIG Holding AG, REG | 82 | | 18,162 |
| Societe Generale de Surveillance Holdings AG | 57 | | 52,582 |
| Straumann Holding AG | 103 | | 24,244 |
| Sulzer AG | 48 | | 29,976 |
| Swatch Group AG, BR shares (a) | 474 | | 76,845 |
| Swatch Group AG (a) | 725 | | 23,839 |
| Swiss Reinsurance Company AG | 4,459 | | 317,158 |
| Swisscom AG (a) | 302 | | 90,623 |
| Syngenta AG * | 1,493 | | 210,455 |
| Synthes AG | 650 | | 71,035 |
| UBS AG - CHF | 14,412 | | 1,528,036 |
| Unaxis Holding AG * | 75 | | 15,713 |
| Valora Holding AG * | 47 | | 9,542 |
| Zurich Financial Services AG * | 2,014 | | 475,203 |
|
|
| | | | 10,271,866 |
Turkey - 0.28% | | | |
| Turkcell Iletisim Hizmetleri AS - ADR | 29,553 | | 531,658 |
United Kingdom - 17.73% | | | |
| 3I Group PLC | 7,645 | | 126,164 |
| Aegis Group PLC | 14,805 | | 34,411 |
| Aggreko PLC | 3,369 | | 17,600 |
| Alliance Unichem PLC | 3,342 | | 51,452 |
| AMEC PLC | 4,399 | | 30,693 |
| Amvescap PLC | 10,579 | | 100,167 |
| Anglo American PLC | 19,747 | | 738,177 |
| ARM Holdings PLC | 17,849 | | 43,133 |
| Arriva PLC | 2,581 | | 27,375 |
| Associated British Ports Holdings PLC | 4,010 | | 43,554 |
| AstraZeneca Group PLC | 22,364 | | 1,035,672 |
| Aviva PLC | 33,216 | | 460,592 |
| BAA PLC | 15,417 | | 216,761 |
| BAE Systems PLC | 45,600 | | 336,594 |
| Barclays PLC | 90,482 | | 1,063,055 |
| Barratt Developments PLC | 3,191 | | 57,932 |
| BBA Group PLC | 5,996 | | 28,215 |
| Bellway PLC | 1,491 | | 30,711 |
| Berkeley Group Holdings PLC * | 1,438 | | 28,154 |
| BG Group PLC | 49,545 | | 581,223 |
| BHP Billiton PLC | 34,436 | | 581,000 |
| BICC PLC | 5,613 | | 36,968 |
| BOC Group PLC | 7,101 | | 188,447 |
| International Equity Index Fund (continued) | |
| | Shares or | | |
| | Principal | | |
| | Amount | | Value |
|
|
| |
| COMMON STOCKS (continued) | | | |
| United Kingdom (continued) | | | |
| Boots Group PLC * | 6,420 | $ | 80,053 |
| Bovis Homes Group PLC | 1,572 | | 22,075 |
| BP PLC | 292,405 | | 3,237,556 |
| Brambles Industries, Ltd. | 9,578 | | 69,395 |
| Britannic Group PLC | 2,625 | | 30,771 |
| British Airways PLC * | 7,158 | | 41,357 |
| British American Tobacco Australasia, Ltd. | 22,256 | | 531,568 |
| British Land Company PLC | 7,369 | | 156,706 |
| British Sky Broadcasting Group PLC | 17,580 | | 156,028 |
| Brixton PLC | 3,378 | | 27,636 |
| BT Group PLC | 118,879 | | 429,870 |
| Bunzl PLC | 4,661 | | 52,345 |
| Burberry Group PLC | 6,126 | | 49,364 |
| Cable & Wireless PLC | 31,660 | | 59,398 |
| Cadbury Schweppes PLC | 29,471 | | 300,410 |
| Capita Group PLC | 8,776 | | 73,263 |
| Carnival PLC | 2,431 | | 133,642 |
| Cattles PLC | 4,346 | | 26,504 |
| Centrica PLC | 53,064 | | 270,918 |
| Close Brothers Group PLC | 1,721 | | 31,290 |
| Cobham PLC | 14,816 | | 44,266 |
| Compass Group PLC | 31,035 | | 118,496 |
| Cookson Group PLC * | 2,504 | | 20,816 |
| Corus Group PLC | 58,766 | | 74,362 |
| Daily Mail and General Trust PLC | 3,979 | | 45,455 |
| Davis Service Group PLC | 2,234 | | 19,356 |
| De La Rue PLC | 2,192 | | 21,419 |
| Diageo PLC | 41,342 | | 636,484 |
| Dixons Group PLC | 24,881 | | 75,212 |
| E D & F Manitoba Treasury Management PLC | 4,266 | | 173,266 |
| Electrocomponents PLC | 5,754 | | 29,175 |
| EMAP PLC | 3,405 | | 56,880 |
| EMI Group PLC | 10,439 | | 45,040 |
| Enterprise Inns PLC | 4,620 | | 72,792 |
| First Choice Holidays PLC | 5,931 | | 23,531 |
| FirstGroup PLC | 5,205 | | 38,398 |
| FKI PLC | 7,697 | | 16,436 |
| Friends Provident Ethical Investment Trust PLC | 27,325 | | 99,288 |
| Gallaher Group PLC | 9,323 | | 144,844 |
| George Wimpey PLC | 5,191 | | 50,451 |
| GKN PLC | 9,488 | | 56,653 |
| GlaxoSmithKline PLC | 81,556 | | 2,072,603 |
| Great Portland Estates PLC | 2,148 | | 17,479 |
| Group 4 Securicor PLC | 15,050 | | 47,081 |
| GUS PLC | 12,316 | | 227,275 |
| Hammerson PLC | 4,139 | | 82,926 |
| Hanson PLC | 10,421 | | 127,562 |
| Hays PLC | 21,760 | | 56,600 |
| HBOS PLC | 54,545 | | 1,018,056 |
| Hilton Group PLC | 22,761 | | 147,608 |
| HMV Group PLC | 5,340 | | 17,386 |
| HSBC Holdings PLC | 157,881 | | 2,702,594 |
The accompanying notes are an integral part of the financial statements. 181
John Hancock Funds II
Portfolio of investments — February 28, 2006 (Unaudited)
(showing percentage of total net assets)
|
| International Equity Index Fund (continued) | |
| | Shares or | | |
| | Principal | | |
| | Amount | | Value |
|
|
| |
| COMMON STOCKS (continued) | | | |
| United Kingdom (continued) | | | |
| ICAP PLC | 6,396 | $ | 49,966 |
| IMI PLC | 4,614 | | 42,410 |
| Imperial Chemical Industries PLC | 17,227 | | 101,501 |
| Imperial Tobacco Group PLC | 10,252 | | 309,004 |
| Inchcape PLC | 980 | | 41,526 |
| InterContinental Hotels Group PLC | 5,849 | | 90,152 |
| International Power PLC | 21,315 | | 107,044 |
| Intertek Group PLC | 2,049 | | 27,008 |
| Invensys PLC * | 75,187 | | 27,749 |
| iSOFT Group PLC | 2,867 | | 9,372 |
| ITV PLC | 58,700 | | 111,933 |
| J Sainsbury PLC | 19,655 | | 110,625 |
| Johnson Matthey PLC | 2,901 | | 72,908 |
| Kesa Electricals PLC | 7,001 | | 32,729 |
| Kingfisher PLC | 33,493 | | 134,356 |
| Land Securities Group PLC | 6,682 | | 216,198 |
| Legal & General Group PLC | 92,885 | | 212,626 |
| Liberty International PLC | 3,190 | | 62,175 |
| Lloyds TSB Group PLC | 78,529 | | 764,251 |
| Logicacmg PLC | 14,891 | | 52,603 |
| London Stock Exchange PLC | 3,365 | | 50,564 |
| Marconi Corp. * | 2,760 | | 19,136 |
| Marks & Spencer Group, PLC | 23,635 | | 215,376 |
| Meggitt PLC | 5,685 | | 37,293 |
| MFI Furniture Group PLC | 7,862 | | 12,677 |
| Misys PLC | 6,402 | | 26,441 |
| Mitchells & Butler PLC | 6,744 | | 46,966 |
| National Express Group PLC | 1,814 | | 28,326 |
| National Grid PLC ADR | 38,173 | | 402,531 |
| Next Group PLC | 3,422 | | 99,233 |
| Old Mutual PLC | 76,838 | | 253,542 |
| Pearson PLC | 11,419 | | 142,287 |
| Persimmon PLC | 4,027 | | 98,801 |
| Pilkington PLC | 13,822 | | 39,353 |
| Premier Farnell PLC | 4,798 | | 17,265 |
| Provident Financial PLC | 3,375 | | 35,708 |
| Prudential Corp. PLC | 33,785 | | 358,041 |
| Punch Taverns PLC | 3,342 | | 50,248 |
| Rank Group PLC | 8,254 | | 37,789 |
| Reckitt Benckiser PLC | 8,839 | | 315,349 |
| Reed Elsevier PLC | 18,301 | | 165,643 |
| Rentokil Initial PLC | 23,930 | | 66,134 |
| Reuters Group PLC | 20,273 | | 135,392 |
| Rexam PLC | 7,295 | | 65,002 |
| Rio Tinto PLC | 14,886 | | 701,140 |
| Rolls-Royce Group PLC * | 22,421 | | 172,888 |
| Royal & Sun Alliance PLC | 38,574 | | 88,131 |
| Royal Bank of Scotland Group PLC | 44,527 | | 1,493,899 |
| SAB Miller PLC | 12,805 | | 255,202 |
| Schroders PLC | 1,643 | | 33,221 |
| Scottish & Newcastle PLC | 10,050 | | 90,477 |
| Scottish & Southern Energy PLC | 12,317 | | 248,724 |
| International Equity Index Fund (continued) |
| | Shares or | | |
| | Principal | | |
| | Amount | | Value |
|
|
| |
| COMMON STOCKS (continued) | | | |
| United Kingdom (continued) | | | |
| Scottish Power PLC | 26,531 | $ | 272,307 |
| Serco Group PLC | 6,126 | | 37,386 |
| Severn Trent PLC | 5,031 | | 102,036 |
| Signet Group PLC | 22,947 | | 41,640 |
| Slough Estates PLC | 5,590 | | 59,879 |
| Smith & Nephew PLC | 13,427 | | 119,877 |
| Smiths Group PLC | 8,043 | | 132,732 |
| SSL International PLC | 2,505 | | 14,385 |
| Stagecoach Group PLC | 11,308 | | 22,308 |
| Tate & Lyle PLC | 6,435 | | 67,630 |
| Taylor Woodrow PLC | 7,526 | | 55,024 |
| Tesco PLC | 110,102 | | 654,039 |
| The Peninsular & Oriental Steam | | | |
| Navigation Company, PLC | 9,920 | | 89,917 |
| The Sage Group PLC | 16,972 | | 82,698 |
| Tomkins PLC | 10,221 | | 59,818 |
| Travis Perkins PLC | 1,535 | | 40,035 |
| Trinity Mirror PLC | 3,850 | | 39,076 |
| Unilever PLC | 38,810 | | 400,722 |
| United Business Media PLC | 3,661 | | 43,205 |
| United Utilities PLC | 12,405 | | 148,905 |
| Vodafone Group PLC | 883,149 | | 1,691,813 |
| Whitbread PLC | 3,381 | | 62,956 |
| William Hill PLC | 5,213 | | 53,276 |
| Wolseley PLC | 8,448 | | 210,237 |
| WPP Group PLC | 17,084 | | 198,915 |
| Yell Group PLC | 10,205 | | 99,585 |
| Yorkshire Water PLC | 4,966 | | 69,516 |
|
|
| | | | 33,266,821 |
| United States - 0.38% | | | |
| iShares MSCI Malaysia Index Fund (a) | 89,109 | | 654,060 |
| Southern Copper Corp. (a) | 700 | | 55,755 |
|
|
| | | | 709,815 |
| Venezuela - 0.01% | | | |
| CIA Anonima Nacional Telefonos de | | | |
| Venezuela, ADR | 1,107 | | 19,173 |
|
| TOTAL COMMON STOCKS (Cost $158,174,081) | | $ | 179,584,089 |
|
| |
| PREFERRED STOCKS - 0.16% | | | |
| Germany - 0.16% | | | |
| Henkel KGaA-Vorzug, Non-Voting (a) | 804 | | 88,432 |
| Porsche AG, Non Voting | 107 | | 89,953 |
| RWE AG, Non Voting | 528 | | 41,469 |
| Volkswagen AG, Non-Voting | 1,425 | | 73,324 |
|
|
| | | | 293,178 |
|
| TOTAL PREFERRED STOCKS (Cost $232,191) | | $ | 293,178 |
|
| |
The accompanying notes are an integral part of the financial statements. 182
John Hancock Funds II
Portfolio of investments — February 28, 2006 (Unaudited)
(showing percentage of total net assets)
|
| International Equity Index Fund (continued) |
| | | Shares or | | |
| | | Principal | | |
| | | Amount | | Value |
|
|
| |
| RIGHTS - 0.00% | | | | |
| Austria - 0.00% | | | | |
| Meinl European Land, Ltd. | | 1,403 | $ | 83 |
|
| TOTAL RIGHTS (Cost $0) | | | $ | 83 |
|
| |
| OPTIONS - 0.00% | | | | |
| Switzerland - 0.00% | | | | |
| Syngenta AG | | | | |
| Expiration 05/23/2006 at $178.43 | | 1,493 | | 1,841 |
|
| TOTAL OPTIONS (Cost $1,217) | | | $ | 1,841 |
|
| |
| SHORT TERM INVESTMENTS - 16.40% | | | |
| AIM Short-Term Investment Trust, STIC Prime | | | |
| Portfolio, Institutional Class | | | | |
| 4.48% due 01/01/2050 | $ | 6,683,879 | $ | 6,683,879 |
| State Street Navigator Securities Lending | | | | |
| Prime Portfolio | | 24,089,643 | | 24,089,643 |
|
| TOTAL SHORT TERM INVESTMENTS | | | | |
| (Cost $30,773,522) | | | $ | 30,773,522 |
|
| Total Investments (International Equity Index Fund) | | |
| (Cost $189,181,011) - 112.29% | | | $ | 210,652,713 |
| Liabilities in Excess of Other Assets - (12.29)% | | | (23,062,327) |
|
|
| TOTAL NET ASSETS - 100.00% | | | $ | 187,590,386 |
|
|
| |
| |
| International Opportunities Fund | | | |
| | | Shares or | | |
| | | Principal | | |
| | | Amount | | Value |
|
|
| |
| COMMON STOCKS - 98.56% | | | | |
| Australia - 1.54% | | | | |
| CSL, Ltd. (a) | | 170,815 | $ | 6,687,550 |
| Austria - 2.14% | | | | |
| Erste Bank der Oesterreichischen | | | | |
| Sparkassen AG - New * | | 37,287 | | 2,228,807 |
| Erste Bank der Oesterreichischen | | | | |
| Sparkassen AG | | 115,492 | | 7,021,870 |
|
|
| | | | | 9,250,677 |
| Bermuda - 2.73% | | | | |
| Esprit Holdings, Ltd. | | 770,000 | | 5,919,870 |
| Shangri-La Asia, Ltd. | | 3,673,778 | | 5,895,129 |
|
|
| | | | | 11,814,999 |
| Brazil - 5.23% | | | | |
| Companhia Vale Do Rio Doce, ADR | | 97,834 | | 4,542,433 |
| Gafisa SA * | | 118,483 | | 1,375,174 |
| Petroleo Brasileiro SA, ADR * | | 101,297 | | 8,867,540 |
| Unibanco - Uniao De Bancos Brasileiros SA, | | | |
| ADR | | 89,453 | | 7,867,391 |
|
|
| | | | | 22,652,538 |
| Canada - 9.10% | | | | |
| Canadian National Railway Company | | 139,045 | | 13,118,896 |
| Shoppers Drug Mart Corp. | | 335,430 | | 13,075,286 |
| International Opportunities Fund (continued) |
| | Shares or | | |
| | Principal | | |
| | Amount | | Value |
|
|
| |
| COMMON STOCKS (continued) | | | |
| Canada (continued) | | | |
| Talisman Energy, Inc. | 251,550 | $ | 13,198,638 |
|
|
| | | | 39,392,820 |
| China - 1.06% | | | |
| CNOOC, Ltd., SADR (a) | 51,734 | | 4,287,714 |
| Shanghai Electric Group Co., Ltd. * | 661,523 | | 294,154 |
|
|
| | | | 4,581,868 |
| France - 8.70% | | | |
| JC Decaux SA * | 173,790 | | 4,356,486 |
| LVMH Moet Hennessy SA | 71,398 | | 6,483,139 |
| Vallourec | 11,565 | | 9,041,485 |
| Veolia Environnement SA | 214,643 | | 11,198,230 |
| Vinci SA | 71,468 | | 6,595,880 |
|
|
| | | | 37,675,220 |
| Germany - 8.34% | | | |
| Continental AG | 171,898 | | 17,563,267 |
| Hypo Real Estate Holding AG | 195,541 | | 12,844,597 |
| Metro AG (a) | 107,371 | | 5,699,842 |
|
|
| | | | 36,107,706 |
| India - 1.78% | | | |
| ICICI Bank, Ltd., SADR (a) | 250,700 | | 7,698,997 |
| Ireland - 1.05% | | | |
| Anglo Irish Bank Corp. PLC | 9,507 | | 155,839 |
| Anglo Irish Bank Corp. PLC | 267,597 | | 4,389,652 |
|
|
| | | | 4,545,491 |
| Japan - 18.27% | | | |
| Advantest Corp. | 45,300 | | 5,160,656 |
| Credit Saison Company, Ltd. | 85,676 | | 4,041,800 |
| Fanuc, Ltd. | 50,838 | | 4,301,304 |
| LeoPalace21 Corp. | 164,850 | | 5,931,268 |
| Misawa Homes Holdings, Inc. * | 75,500 | | 3,910,174 |
| Mitsubishi UFJ Financial Group, Inc. | 707 | | 10,573,870 |
| Murata Manufacturing Company, Ltd. | 66,469 | | 4,135,491 |
| Nippon Electric Glass Company, Ltd. (a) | 295,305 | | 7,154,847 |
| Sega Sammy Holdings, Inc. | 172,318 | | 7,039,390 |
| Seiyu, Ltd. * (a) | 1,816,000 | | 3,895,526 |
| Sumitomo Realty & | | | |
| Development Company, Ltd. (a) | 275,958 | | 6,438,462 |
| Toyota Motor Corp. | 206,135 | | 11,010,531 |
| Yamada Denki Company, Ltd. | 51,228 | | 5,498,871 |
|
|
| | | | 79,092,190 |
| Mexico - 9.72% | | | |
| America Movil S.A. de C.V., Series L | 531,840 | | 18,470,803 |
| Cemex SA de C.V., SADR (a) | 284,056 | | 17,543,299 |
| Grupo Televisa SA, SADR | 77,206 | | 6,057,583 |
|
|
| | | | 42,071,685 |
| Norway - 1.15% | | | |
| Stolt Offshore SA * (a) | 374,491 | | 5,007,454 |
| Singapore - 1.50% | | | |
| CapitaLand, Ltd. | 2,502,587 | | 6,482,786 |
The accompanying notes are an integral part of the financial statements. 183
John Hancock Funds II
Portfolio of investments — February 28, 2006 (Unaudited)
(showing percentage of total net assets)
|
| International Opportunities Fund (continued) |
| | | Shares or | | |
| | | Principal | | |
| | | Amount | | Value |
|
|
| |
| COMMON STOCKS (continued) | | | | |
| South Korea - 2.02% | | | | |
| Samsung Electronics Company, Ltd., GDR | | 24,686 | $ | 8,732,672 |
Sweden - 3.95% | | | | |
| Telefonaktiebolaget LM Ericsson, SADR (a) | | 501,725 | | 17,108,822 |
| Switzerland - 12.52% | | | | |
| ABB, Ltd. | | 788,469 | | 9,421,989 |
| Lonza Group AG | | 171,521 | | 11,116,300 |
| Roche Holdings AG - CHF (a) | | 88,951 | | 13,127,649 |
| Syngenta AG * | | 39,198 | | 5,525,720 |
| UBS AG - CHF | | 141,539 | | 15,006,713 |
|
|
| | | | | 54,198,371 |
| United Kingdom - 7.76% | | | | |
| Carphone Warehouse | | 946,838 | | 4,509,589 |
| Diageo PLC | | 538,152 | | 8,283,412 |
| Enterprise Inns PLC | | 618,624 | | 9,746,957 |
| Reckitt Benckiser PLC | | 310,176 | | 11,066,142 |
|
|
| | | | | 33,606,100 |
|
| TOTAL COMMON STOCKS (Cost $368,526,517) | | $ | 426,707,946 |
|
| |
| OPTIONS - 0.00% | | | | |
| Switzerland - 0.00% | | | | |
| Syngenta AG | | | | |
| Expiration 05/23/2006 at $178.43 | | 17,014 | | 20,979 |
|
| TOTAL OPTIONS (Cost $18,814) | | | $ | 20,979 |
|
| |
| SHORT TERM INVESTMENTS - 11.06% | | | | |
| State Street Navigator Securities | | | | |
| Lending Prime Portfolio (c) | $ | 47,889,360 | $ | 47,889,360 |
|
| TOTAL SHORT TERM INVESTMENTS | | | | |
| (Cost $47,889,360) | | | $ | 47,889,360 |
|
| |
| REPURCHASE AGREEMENTS - 2.33% | | | | |
| Repurchase Agreement with State | | | | |
| Street Corp. dated 02/28/2006 at | | | | |
| 3.20% to be repurchased at | | | | |
| $10,088,897 on 03/01/2006, | | | | |
| collateralized by $10,395,000 | | | | |
| Federal National Mortgage | | | | |
| Association, 5.70% due | | | | |
| 03/27/2023 (valued at | | | | |
| $10,291,050, including interest) (c) | $ | 10,088,000 | $ | 10,088,000 |
|
| TOTAL REPURCHASE AGREEMENTS | | | | |
| (Cost $10,088,000) | | | $ | 10,088,000 |
|
| Total Investments (International Opportunities Fund) | | |
| (Cost $426,522,691) - 111.95% | | | $ | 484,706,285 |
| Liabilities in Excess of Other Assets - (11.95)% | | | (51,754,668) |
|
|
| TOTAL NET ASSETS - 100.00% | | | $ | 432,951,617 |
|
|
| The portfolio had the following five top industry concentrations as of | |
| February 28, 2006 (as a percentage of total net assets): | | |
| Banking | 12.69% | | |
| Real Estate | 7.64% | | |
| International Oil | 6.09% | | |
| Electronics | 5.67% | | |
| Construction Materials | 4.96% | | |
| |
| |
| International Small Cap Fund | | | |
| | Shares or | | |
| | Principal | | |
| | Amount | | Value |
|
|
| |
| COMMON STOCKS - 89.59% | | | |
| Australia - 3.84% | | | |
| Billabong International, Ltd. (a) | 475,751 | $ | 5,485,318 |
| Downer EDI, Ltd. (a) | 1,462,885 | | 8,531,203 |
| PaperlinX, Ltd. (a) | 2,903,662 | | 7,334,245 |
|
|
| | | | 21,350,766 |
| Austria - 0.70% | | | |
| Wienerberger Baustoffindustrie AG | 84,077 | | 3,898,036 |
Belgium - 0.98% | | | |
| Barco NV | 64,930 | | 5,449,401 |
Bermuda - 4.71% | | | |
| Axis Capital Holdings, Ltd. | 16,740 | | 518,270 |
| Giordano International, Ltd. | 10,964,073 | | 5,829,173 |
| Ngai Lik Industrial Holding, Ltd. | 18,284,513 | | 2,757,276 |
| People's Food Holdings, Ltd. | 12,758,529 | | 9,049,439 |
| Texwinca Holdings, Ltd. | 6,320,868 | | 4,969,556 |
| Yue Yuen Industrial Holdings, Ltd. | 980,955 | | 3,053,355 |
|
|
| | | | 26,177,069 |
| Brazil - 1.34% | | | |
| Aracruz Celulose SA, ADR (a) | 92,153 | | 4,529,320 |
| Companhia de Saneamento de Minas Gerais * | 244,500 | | 2,907,006 |
|
|
| | | | 7,436,326 |
| Canada - 10.24% | | | |
| CAE, Inc. | 1,165,926 | | 9,671,653 |
| Domtar, Inc. | 812,410 | | 4,390,441 |
| Dorel Industries, Inc. * | 59,900 | | 1,771,735 |
| Legacy Hotels Real Estate Investment, REIT | 853,311 | | 6,171,133 |
| Linamar Corp. | 440,974 | | 5,134,363 |
| MDS, Inc. | 442,022 | | 8,933,661 |
| North West Company | 304,894 | | 9,913,074 |
| Open Text Corp. * | 429,942 | | 7,488,093 |
| Quebecor World, Inc. | 340,891 | | 3,459,834 |
|
|
| | | | 56,933,987 |
| Cayman Islands - 0.17% | | | |
| TCL Communication Technology Holdings, Ltd. * | 25,070,192 | | 967,919 |
| China - 0.50% | | | |
| BYD Company, Ltd., H Shares | 1,398,825 | | 2,794,513 |
Denmark - 1.97% | | | |
| Vestas Wind Systems AS | 522,919 | | 10,967,962 |
Finland - 4.29% | | | |
| Amer Group Oyj (a) | 395,207 | | 8,268,609 |
| Huhtamaki Oyj | 363,043 | | 6,730,064 |
The accompanying notes are an integral part of the financial statements. 184
John Hancock Funds II
Portfolio of investments — February 28, 2006 (Unaudited)
(showing percentage of total net assets)
|
| International Small Cap Fund (continued) | | |
| | Shares or | | |
| | Principal | | |
| | Amount | | Value |
|
|
| |
| COMMON STOCKS (continued) | | | |
| Finland (continued) | | | |
| KCI Konecranes Oyj | 22,121 | $ | 1,392,417 |
| Metso Oyj | 202,807 | | 7,470,886 |
|
|
| | | | 23,861,976 |
Germany - 2.28% | | | |
| Jenoptik AG * (a) | 605,913 | | 5,143,053 |
| Vossloh AG | 145,284 | | 7,561,922 |
|
|
| | | | 12,704,975 |
Hong Kong - 7.61% | | | |
| Asia Satellite Telecom Holdings | 1,208,720 | | 2,068,866 |
| China Oilfield Services Ltd., H shares | 10,929,059 | | 5,634,480 |
| China Pharmaceutical Group, Ltd. * | 8,402,384 | | 1,546,299 |
| China Resource Power Holdings, Ltd. | 7,210,558 | | 4,778,935 |
| Chitaly Holdings, Ltd. | 3,608,729 | | 1,837,225 |
| Dah Sing Financial Group | 658,659 | | 4,602,730 |
| Fountain Set Holdings, Ltd. | 11,063,436 | | 4,912,065 |
| Hopewell Holdings, Ltd. | 1,046,357 | | 2,935,563 |
| Hung Hing Printing | 1,740,216 | | 1,153,361 |
| Lerado Group Holdings | 12,649,682 | | 929,320 |
| TCL International Holdings, Ltd. | 21,841,942 | | 3,237,428 |
| Techtronic Industries Company, Ltd. | 1,041,707 | | 1,809,816 |
| Travelsky Technology, Ltd. | 3,576,058 | | 3,497,624 |
| Weiqiao Textile Company, Ltd. | 2,111,723 | | 3,402,186 |
|
|
| | | | 42,345,898 |
Indonesia - 0.74% | | | |
| Astra International Tbk PT | 2,406,756 | | 2,568,604 |
| PT Indonesian Satellite Corp. | 2,656,868 | | 1,519,037 |
|
|
| | | | 4,087,641 |
Israel - 0.28% | | | |
| Orbotech, Ltd. ADR * | 64,956 | | 1,547,902 |
Japan - 4.87% | | | |
| Japan Airport Terminal Company, Ltd. | 67,951 | | 612,668 |
| Meitec Corp. | 233,693 | | 7,988,812 |
| Nichii Gakkan Company, Ltd. | 204,600 | | 4,406,387 |
| Sohgo Security Services Company, Ltd. | 636,913 | | 10,309,476 |
| Tokyo Individualized Educational Institute, Inc. | 312,520 | | 3,797,991 |
|
|
| | | | 27,115,334 |
Luxembourg - 0.53% | | | |
| Thiel Logistik AG * | 718,107 | | 2,962,075 |
Netherlands - 8.45% | | | |
| Aalberts Industries NV | 115,902 | | 8,267,237 |
| Draka Holdings * | 465,354 | | 8,299,761 |
| IHC Caland NV | 45,789 | | 4,520,622 |
| Imtech NV | 105,688 | | 4,427,317 |
| Oce-Van Der Grinten NV | 154,668 | | 2,681,011 |
| OPG Groep NV | 117,546 | | 10,243,827 |
| Pyaterochka Holding NV, GDR-USD * | 31,845 | | 507,674 |
| Pyaterochka Holding NV-GBP * | 108,308 | | 1,727,735 |
| Vedior NV | 334,878 | | 6,336,470 |
|
|
| | | | 47,011,654 |
| International Small Cap Fund (continued) | | |
| | Shares or | | |
| | Principal | | |
| | Amount | | Value |
|
|
| |
| COMMON STOCKS (continued) | | | |
| Norway - 0.85% | | | |
| Prosafe ASA (a) | 95,777 | $ | 4,753,729 |
| Singapore - 2.69% | | | |
| Bio-Treat Technology, Ltd. | 3,535,000 | | 2,507,324 |
| Huan Hsin Holdings, Ltd. | 3,335,298 | | 1,100,555 |
| Osim International | 3,166,116 | | 3,534,505 |
| Venture Corp., Ltd. | 897,138 | | 7,248,594 |
| Want Want Holdings ADR | 456,000 | | 574,560 |
|
|
| | | | 14,965,538 |
South Korea - 4.56% | | | |
| Daeduck Electronics Company, Ltd. | 260,000 | | 2,254,583 |
| Daegu Bank | 497,100 | | 7,781,586 |
| Halla Climate Control | 693,940 | | 6,610,654 |
| Pusan Bank | 599,610 | | 7,996,858 |
| Sindo Ricoh Co., Ltd. | 16,400 | | 747,374 |
|
|
| | | | 25,391,055 |
Spain - 0.33% | | | |
| Sol Melia SA (a) | 121,394 | | 1,806,103 |
Sweden - 1.58% | | | |
| D. Carnegie & Company AB | 520,855 | | 8,812,780 |
Switzerland - 4.27% | | | |
| Gurit Heberlein | 4,599 | | 4,787,520 |
| Kuoni Reisen Holding AG, Series B * | 7,529 | | 3,221,177 |
| SIG Holding AG, REG | 20,270 | | 4,498,433 |
| Verwaltungs-und Privat-Bank AG | 44,784 | | 8,299,342 |
| Vontobel Holdings AG | 74,285 | | 2,940,241 |
|
|
| | | | 23,746,713 |
Taiwan - 5.31% | | | |
| Acbel Polytech, Inc. | 5,000,000 | | 2,291,273 |
| D-Link Corp. | 7,571,000 | | 8,604,223 |
| Fu Sheng Industrial Company, Ltd. | 4,733,000 | | 5,740,405 |
| Giant Manufacturing Company, Ltd. | 850,000 | | 1,584,033 |
| KYE System Corp. | 2,993,000 | | 2,432,226 |
| Taiwan Fu Hsing | 2,680,000 | | 2,881,993 |
| Taiwan Green Point Enterprises Company, | | | |
| Ltd. | 2,330,000 | | 6,007,778 |
|
|
| | | | 29,541,931 |
Thailand - 2.90% | | | |
| BEC World, Public Company, Ltd. | 8,847,832 | | 2,918,732 |
| Glow Energy PCL | 8,275,316 | | 5,554,969 |
| Total Access Communication PCL * | 2,184,570 | | 7,645,995 |
|
|
| | | | 16,119,696 |
United Kingdom - 10.86% | | | |
| Bodycote International | 2,235,233 | | 10,233,461 |
| Burberry Group PLC | 590,028 | | 4,754,490 |
| Cambridge Antibody Technology Group PLC * | 470,950 | | 6,393,892 |
| DS Smith PLC | 1,768,810 | | 5,533,414 |
| DX Services PLC | 1,640,500 | | 8,764,796 |
| Electrocomponents PLC | 121,262 | | 614,841 |
| Game Group PLC | 7,375,357 | | 10,369,672 |
| Homeserve PLC | 73,642 | | 2,030,676 |
The accompanying notes are an integral part of the financial statements. 185
John Hancock Funds II
Portfolio of investments — February 28, 2006 (Unaudited)
(showing percentage of total net assets)
|
| International Small Cap Fund (continued) | | |
| | | Shares or | | |
| | | Principal | | |
| | | Amount | | Value |
|
|
| |
| COMMON STOCKS (continued) | | | | |
| United Kingdom (continued) | | | | |
| John Wood Group PLC | | 1,167,204 | $ | 4,871,945 |
| Yule Catto & Company PLC | | 1,440,948 | | 6,837,606 |
|
|
| | | | | 60,404,793 |
| United States - 2.74% | | | | |
| CAE, Inc. | | 95,766 | | 797,731 |
| GSI Group, Inc. * | | 564,982 | | 7,446,463 |
| Quebecor World, Inc. | | 146,526 | | 1,485,773 |
| Steiner Leisure, Ltd. * | | 129,086 | | 5,502,936 |
|
|
| | | | | 15,232,903 |
|
| TOTAL COMMON STOCKS (Cost $444,845,212) | | $ | 498,388,675 |
|
| |
| PREFERRED STOCKS - 0.59% | | | | |
| Germany - 0.59% | | | | |
| Hugo Boss AG | | 82,176 | | 3,260,311 |
|
| TOTAL PREFERRED STOCKS (Cost $2,756,072) | | $ | 3,260,311 |
|
| |
| SHORT TERM INVESTMENTS - 4.29% | | | | |
| State Street Navigator Securities | | | | |
| Lending Prime Portfolio (c) | $ | 23,860,955 | $ | 23,860,955 |
|
| TOTAL SHORT TERM INVESTMENTS | | | | |
| (Cost $23,860,955) | | | $ | 23,860,955 |
|
| |
| REPURCHASE AGREEMENTS - 7.09% | | | | |
| Repurchase Agreement with State | | | | |
| Street Corp. dated 02/28/2006 at | | | | |
| 3.20% to be repurchased at | | | | |
| $39,438,505 on 03/01/2006, | | | | |
| collateralized by $40,225,000 | | | | |
| Federal Home Loan Bank, 5.125% | | | | |
| due 08/15/2019 (valued at | | | | |
| $40,225,000 including interest) (c) | $ | 39,435,000 | $ | 39,435,000 |
|
| TOTAL REPURCHASE AGREEMENTS | | | | |
| (Cost $39,435,000) | | | $ | 39,435,000 |
|
| Total Investments (International Small Cap Fund) | | | |
| (Cost $510,897,239) - 101.56% | | | $ | 564,944,941 |
| Liabilities in Excess of Other Assets - (1.56)% | | | (8,678,173) |
|
|
| TOTAL NET ASSETS - 100.00% | | | $ | 556,266,768 |
|
|
The portfolio had the following five top industry concentrations as of February 28, 2006 (as a percentage of total net assets):
| Electrical Equipment | 5.82% |
| Apparel & Textiles | 4.81% |
| Business Services | 4.43% |
| Banking | 4.33% |
| Paper | 4.12% |
| International Stock Fund | | | |
| | Shares or | | |
| | Principal | | |
| | Amount | | Value |
|
|
| |
| COMMON STOCKS - 94.42% | | | |
| Australia - 2.50% | | | |
| Amcor, Ltd. (a) | 194,168 | $ | 1,073,201 |
| Australia and New Zealand Bank Group, Ltd. | 137,169 | | 2,620,942 |
| BHP Billiton, Ltd. - AUD (a) | 84,814 | | 1,527,952 |
| Commonwealth Bank of Australia, Ltd. (a) | 76,718 | | 2,556,172 |
| Foster's Group, Ltd. (a) | 195,843 | | 791,475 |
| Investa Property Group, Ltd. | 450,500 | | 672,700 |
| Macquarie Bank, Ltd. | 32,286 | | 1,540,574 |
| Mirvac Group, Ltd. | 313,474 | | 980,424 |
| National Australia Bank, Ltd. (a) | 105,072 | | 2,863,167 |
| Qantas Airways, Ltd., ADR | 300,772 | | 916,119 |
| Rinker Group, Ltd. | 95,241 | | 1,265,799 |
| Santos, Ltd. | 156,693 | | 1,317,730 |
| Stockland Company, Ltd. (a) | 134,706 | | 673,492 |
| Telstra Corp., Ltd. (a) | 837,186 | | 2,394,490 |
| Woodside Petroleum, Ltd. | 42,669 | | 1,283,485 |
| Woolworths, Ltd. | 109,048 | | 1,490,617 |
|
|
| | | | 23,968,339 |
| Austria - 0.75% | | | |
| Bohler Uddeholm AG | 3,561 | | 668,201 |
| Oesterreichische Elektrizitaets AG, Class A | 1,300 | | 604,420 |
| OMV AG | 48,930 | | 3,036,174 |
| Telekom Austria AG | 62,855 | | 1,435,708 |
| Voestalpine AG | 11,972 | | 1,395,985 |
|
|
| | | | 7,140,488 |
| Belgium - 0.90% | | | |
| Colruyt SA | 2,958 | | 426,339 |
| Delhaize Group | 14,345 | | 957,677 |
| Dexia | 92,571 | | 2,299,870 |
| Fortis Group SA | 100,973 | | 3,599,210 |
| UCB SA | 28,326 | | 1,342,311 |
|
|
| | | | 8,625,407 |
| Bermuda - 0.10% | | | |
| Frontline, Ltd. | 7,613 | | 292,135 |
| Noble Group, Ltd. (a) | 41,361 | | 31,123 |
| Yue Yuen Industrial Holdings, Ltd. | 197,718 | | 615,424 |
|
|
| | | | 938,682 |
| Canada - 2.70% | | | |
| BCE, Inc. | 47,091 | | 1,142,929 |
| Canadian Imperial Bank of Commerce | 40,870 | | 2,871,315 |
| Canadian Natural Resources, Ltd. | 137,437 | | 7,498,650 |
| EnCana Corp. - CAD | 42,397 | | 1,751,018 |
| Magna International, Inc. | 11,800 | | 878,779 |
| National Bank of Canada | 30,965 | | 1,763,209 |
| Nexen, Inc. | 35,339 | | 1,845,205 |
| Petro-Canada | 103,967 | | 4,756,171 |
| Royal Bank of Canada | 39,837 | | 3,324,184 |
|
|
| | | | 25,831,460 |
| Denmark - 0.46% | | | |
| A P Moller- Maersk AS | 121 | | 1,090,578 |
| A P Moller- Maersk AS | 189 | | 1,733,668 |
The accompanying notes are an integral part of the financial statements. 186
John Hancock Funds II
Portfolio of investments — February 28, 2006 (Unaudited)
(showing percentage of total net assets)
|
| International Stock Fund (continued) | | |
| | Shares or | | |
| | Principal | | |
| | Amount | | Value |
|
|
| |
| COMMON STOCKS (continued) | | | |
| Denmark (continued) | | | |
| Danske Bank AS | 25,519 | $ | 910,431 |
| DSV AS | 5,378 | | 722,785 |
|
|
| | | | 4,457,462 |
Finland - 3.43% | | | |
| Amer Group Oyj | 24,700 | | 516,779 |
| Elcoteq SE | 14,700 | | 324,556 |
| Fortum Corp. Oyj | 150,889 | | 3,651,609 |
| Kesko Oyj | 39,767 | | 1,250,154 |
| Metra Oyj, B Shares | 17,037 | | 621,506 |
| Metso Oyj | 56,817 | | 2,092,992 |
| Neste Oil Oyj * | 30,400 | | 931,040 |
| Nokia AB - Oyj | 666,785 | | 12,480,046 |
| OKO Bank - A | 33,400 | | 563,024 |
| Orion Oyj, Series B (a) | 17,900 | | 385,818 |
| Outokumpu Oyj | 91,904 | | 1,668,649 |
| Rautaruukki Oyj | 80,009 | | 2,698,376 |
| Sampo Oyj, A Shares | 205,358 | | 4,117,829 |
| YIT-Yhtyma Oyj | 30,758 | | 1,562,062 |
|
|
| | | | 32,864,440 |
France - 8.18% | | | |
| Alstom RGPT * | 23,378 | | 1,998,901 |
| Assurances Generales de France (a) | 6,994 | | 725,859 |
| AXA Group | 61,285 | | 2,163,176 |
| BNP Paribas SA (a) | 142,012 | | 13,131,850 |
| Business Objects SA * | 26,000 | | 961,069 |
| Cap Gemini SA * | 20,252 | | 999,659 |
| Carrefour SA (a) | 34,688 | | 1,720,909 |
| Casino Guich Perrachon SA (a) | 15,471 | | 963,562 |
| Christian Dior SA | 6,300 | | 583,686 |
| Compagnie De Saint Gobain SA | 37,387 | | 2,493,263 |
| Compagnie Generale des Etablissements | | | |
| Michelin, Class B (a) | 20,853 | | 1,271,446 |
| L'Oreal SA (a) | 25,951 | | 2,294,616 |
| LVMH Moet Hennessy SA | 27,910 | | 2,534,306 |
| Peugeot SA (a) | 78,172 | | 4,554,974 |
| Pinault-Printemps-Redoute SA | 6,543 | | 753,465 |
| Publicis Groupe SA | 31,267 | | 1,192,621 |
| Renault Regie Nationale SA (a) | 57,732 | | 5,544,730 |
| Sanofi-Aventis (a) | 53,495 | | 4,548,527 |
| Schneider Electric SA | 14,096 | | 1,439,426 |
| Societe Generale | 30,923 | | 4,378,475 |
| Total SA (a) | 87,936 | | 22,095,741 |
| Vallourec (a) | 1,800 | | 1,407,235 |
| Zodiac SA | 9,454 | | 592,752 |
|
|
| | | | 78,350,248 |
Germany - 7.61% | | | |
| Adidas-Salomon AG | 3,091 | | 603,308 |
| Allianz AG | 36,074 | | 5,812,414 |
| Altana AG (a) | 29,210 | | 1,566,617 |
| Bayer AG | 14,513 | | 583,565 |
| Bayerische Motoren Werke (BMW) AG | 87,703 | | 4,210,115 |
| International Stock Fund (continued) | | |
| | Shares or | | |
| | Principal | | |
| | Amount | | Value |
|
|
| |
| COMMON STOCKS (continued) | | | |
| Germany (continued) | | | |
| Commerzbank AG | 94,221 | $ | 3,424,210 |
| DaimlerChrysler AG (a) | 87,303 | | 4,830,874 |
| Deutsche Bank AG | 41,333 | | 4,547,235 |
| Deutsche Boerse AG | 23,493 | | 2,951,642 |
| Deutsche Post AG | 17,500 | | 456,272 |
| Deutsche Postbank AG | 11,678 | | 824,492 |
| E.ON AG | 79,021 | | 8,734,842 |
| Fresenius AG | 7,981 | | 1,276,249 |
| Henkel KGaA | 5,400 | | 551,025 |
| Hochtief AG (a) | 25,863 | | 1,386,799 |
| Karstadt Quelle AG (a) | 24,188 | | 591,213 |
| MAN AG | 34,858 | | 2,193,499 |
| Merck & Company AG | 8,230 | | 822,664 |
| Muenchener Rueckversicherungs- | | | |
| Gesellschaft AG | 45,893 | | 6,212,143 |
| RWE AG | 14,385 | | 1,230,101 |
| Salzgitter AG | 26,553 | | 1,816,875 |
| Schering AG | 36,545 | | 2,623,209 |
| Suedzucker AG | 41,389 | | 1,093,899 |
| Thyssen Krupp AG | 193,019 | | 4,880,930 |
| Tui AG | 91,763 | | 1,808,304 |
| Volkswagen AG (a) | 112,530 | | 7,855,141 |
|
|
| | | | 72,887,637 |
Hong Kong - 0.50% | | | |
| Cheung Kong Holdings, Ltd. | 165,011 | | 1,743,965 |
| CLP Holdings, Ltd. | 224,904 | | 1,287,037 |
| Hong Kong Electric Holdings, Ltd. | 254,854 | | 1,174,299 |
| MTR Corp. | 203,500 | | 464,246 |
| Sino Land Company, Ltd. | 58,029 | | 87,507 |
|
|
| | | | 4,757,054 |
Ireland - 0.73% | | | |
| Bank of Ireland | 34,623 | | 617,073 |
| CRH PLC | 90,356 | | 2,957,933 |
| DCC PLC | 30,072 | | 684,741 |
| Depfa Bank PLC | 116,677 | | 1,937,613 |
| Kerry Group PLC | 34,358 | | 760,215 |
|
|
| | | | 6,957,575 |
Italy - 2.95% | | | |
| Banca Monte dei Paschi Siena SpA | 359,993 | | 1,862,578 |
| Benetton Group SpA | 48,523 | | 618,959 |
| Capitalia SpA | 150,741 | | 1,139,335 |
| Eni SpA | 635,534 | | 18,153,330 |
| ERG SpA | 35,600 | | 837,776 |
| Fiat SpA - RNC * | 39,512 | | 376,363 |
| Fiat SpA * (a) | 171,000 | | 1,851,027 |
| Fondiaria-Sai SpA | 20,600 | | 613,957 |
| Impregilo SpA * (a) | 173,107 | | 741,898 |
| Italcementi SpA | 36,738 | | 523,814 |
| San Paolo-IMI SpA | 83,869 | | 1,480,769 |
|
|
| | | | 28,199,806 |
The accompanying notes are an integral part of the financial statements. 187
John Hancock Funds II
Portfolio of investments — February 28, 2006 (Unaudited)
(showing percentage of total net assets)
|
| International Stock Fund (continued) | | |
| | Shares or | | |
| | Principal | | |
| | Amount | | Value |
|
|
| |
| COMMON STOCKS (continued) | | | |
| Japan - 25.39% | | | |
| Aderans Company, Ltd. (a) | 12,565 | $ | 345,776 |
| AEON Company, Ltd. | 75,989 | | 1,811,888 |
| Aioi Insurance Company, Ltd. * (a) | 45,076 | | 332,455 |
| Alps Electric Company (a) | 42,346 | | 662,277 |
| Amada Company, Ltd. | 100,487 | | 949,820 |
| Asics Corp. | 54,000 | | 514,109 |
| Chiyoda Corp. * (a) | 49,992 | | 1,209,103 |
| Chubu Electric Power Company, Inc. | 159,999 | | 4,211,575 |
| Chugoku Electric Power Company, Inc. * | 26,600 | | 571,737 |
| Cosmo Oil Company Ltd. * (a) | 141,000 | | 712,169 |
| Daido Steel Company, Ltd. | 135,040 | | 1,187,557 |
| Daiei Inc. * (a) | 60,858 | | 1,685,152 |
| Daiichi Sankyo Company, Ltd. * (a) | 50,631 | | 1,034,168 |
| Daikyo, Inc. * (a) | 244,888 | | 1,299,678 |
| Dainippon Screen | | | |
| Manufacturing Company, Ltd. (a) | 28,603 | | 266,205 |
| Daito Trust Construction Company, Ltd. | 18,615 | | 867,034 |
| Daiwa Securities Group, Inc. | 136,000 | | 1,627,209 |
| Eisai Company, Ltd. | 55,380 | | 2,560,512 |
| Fanuc, Ltd. | 24,814 | | 2,099,464 |
| Fuji Electric Holdings | 153,000 | | 717,861 |
| Fuji Heavy Industries Ltd. * (a) | 333,116 | | 1,793,546 |
| Haseko Corp. * (a) | 764,847 | | 2,673,464 |
| Hirose Electric Company, Ltd. | 4,222 | | 570,823 |
| Hitachi Chemical, Ltd. | 6,337 | | 176,013 |
| Hokkaido Electric Power Company, Inc. | 39,499 | | 919,876 |
| Honda Motor Company, Ltd. | 232,506 | | 13,710,704 |
| Hoya Corp. | 73,224 | | 2,903,675 |
| Ibiden Company, Ltd. (a) | 42,436 | | 2,001,935 |
| Inpex Corp. | 115 | | 1,100,759 |
| Isetan Company, Ltd. (a) | 48,403 | | 879,038 |
| Ishikawajima Harima Heavy Industries | | | |
| Company, Ltd. * (a) | 462,769 | | 1,415,871 |
| Isuzu Motors, Ltd. * (a) | 432,542 | | 1,497,131 |
| Itochu Corp. | 572,047 | | 4,776,423 |
| JAFCO Company, Ltd. | 13,100 | | 900,127 |
| Japan Tobacco, Inc. | 79 | | 1,350,310 |
| JGC Corp. (a) | 40,375 | | 862,639 |
| JSR Corp. | 28,939 | | 853,256 |
| Kansai Electric Power Company, Ltd. | 106,500 | | 2,462,030 |
| Kao Corp. | 93,050 | | 2,512,928 |
| Kawasaki Heavy Industries, Ltd. (a) | 439,438 | | 1,513,489 |
| Kawasaki Kisen Kaisha, Ltd. (a) | 83,000 | | 517,818 |
| Keisei Electric Railway Company, Ltd. (a) | 99,458 | | 640,896 |
| Kenedix, Inc. | 224 | | 1,049,072 |
| Kobe Steel Company, Ltd. (a) | 592,744 | | 2,259,324 |
| Komatsu, Ltd. | 176,949 | | 3,153,049 |
| Konami Corp. (a) | 50,223 | | 1,238,297 |
| Kubota Corp. (a) | 71,000 | | 697,803 |
| Kyushu Electric Power | 85,880 | | 2,055,070 |
| LeoPalace21 Corp. | 21,790 | | 784,000 |
| Marubeni Corp. | 525,824 | | 2,610,917 |
| International Stock Fund (continued) | | |
| | Shares or | | |
| | Principal | | |
| | Amount | | Value |
|
|
| |
| COMMON STOCKS (continued) | | | |
| Japan (continued) | | | |
| Marui Company, Ltd. | 58,510 | $ | 1,110,094 |
| Matsushita Electric Industrial Company, Ltd. (a) | 77,021 | | 1,632,440 |
| Matsushita Electric Works, Ltd. | 52,000 | | 605,725 |
| Mazda Motor Corp. * (a) | 395,488 | | 2,251,044 |
| Mediceo Holdings Company, Ltd. (a) | 34,700 | | 566,124 |
| Mitsubishi Corp. | 384,595 | | 8,940,237 |
| Mitsubishi Estate Company, Ltd. | 80,404 | | 1,693,835 |
| Mitsubishi Heavy Industries, Ltd. | 194,000 | | 911,887 |
| Mitsubishi Materials Corp. | 265,130 | | 1,379,916 |
| Mitsubishi Motors Corp. * (a) | 984,188 | | 2,035,495 |
| Mitsubishi Rayon Company, Ltd. | 171,920 | | 1,385,526 |
| Mitsubishi UFJ Financial Group, Inc. | 294 | | 4,397,055 |
| Mitsui & Company, Ltd. (a) | 158,560 | | 2,168,154 |
| Mitsui Sumitomo Insurance Company, Ltd. | 42,050 | | 557,024 |
| Mitsui Trust Holdings, Inc. | 309,553 | | 4,545,008 |
| Mizuho Financial Group, Inc. | 635 | | 5,079,560 |
| NGK Insulators, Ltd. (a) | 25,169 | | 340,290 |
| NGK Spark Plug Company, Ltd. | 52,000 | | 1,184,342 |
| Nikko Cordial Corp. | 54,000 | | 859,310 |
| Nikon Corp. (a) | 68,227 | | 1,163,257 |
| Nintendo Company, Ltd. | 9,500 | | 1,401,332 |
| Nippon Electric Glass Company, Ltd. (a) | 31,231 | | 756,686 |
| Nippon Mining Holdings, Inc. (a) | 75,868 | | 564,746 |
| Nippon Steel Corp. (a) | 373,831 | | 1,492,000 |
| Nippon Telegraph & Telephone Corp. | 960 | | 4,151,435 |
| Nippon Yusen Kabushiki Kaisha (a) | 61,000 | | 397,248 |
| Nippon Zeon Company | 16,462 | | 207,234 |
| Nissan Chemical Industries, Ltd. | 66,992 | | 1,104,413 |
| Nissan Motor Company, Ltd. | 835,400 | | 9,567,000 |
| Nitto Denko Corp. | 27,199 | | 2,338,446 |
| Nomura Research Institute, Ltd. (a) | 8,634 | | 982,863 |
| Nomura Securities Company, Ltd. | 72,600 | | 1,392,931 |
| NTT Data Corp. | 172 | | 798,187 |
| NTT DoCoMo, Inc. | 1,438 | | 2,138,379 |
| Orient Corp. * (a) | 230,000 | | 817,707 |
| Orix Corp. | 13,927 | | 3,701,643 |
| Osaka Gas Company, Ltd. (a) | 598,120 | | 2,274,704 |
| Resona Holdings, Inc. * (a) | 1,462 | | 5,185,277 |
| Ricoh Company, Ltd. | 84,000 | | 1,554,224 |
| Sanken Electric Company (a) | 4,732 | | 70,933 |
| Sapporo Hokuyo Holdings, Inc. * | 4 | | 43,073 |
| Secom Company, Ltd. (a) | 20,202 | | 1,001,380 |
| Seven & I Holdings Co., Ltd. | 30,000 | | 1,225,535 |
| Shimamura Company, Ltd. (a) | 4,400 | | 498,623 |
| Shimizu Corp. (a) | 147,715 | | 1,037,703 |
| Shinko Electric Industries Company, Ltd. * | 13,289 | | 978,985 |
| Shinko Securities Company, Ltd. * (a) | 196,000 | | 1,016,767 |
| Showa Shell Sekiyu K.K. | 52,000 | | 587,060 |
| SMC Corp. | 9,996 | | 1,413,842 |
| SOFTBANK Corp. (a) | 45,300 | | 1,393,725 |
| Sompo Japan Insurance, Inc. | 42,140 | | 611,877 |
| Sumitomo Corp. | 181,596 | | 2,467,629 |
The accompanying notes are an integral part of the financial statements. 188
John Hancock Funds II
Portfolio of investments — February 28, 2006 (Unaudited)
(showing percentage of total net assets)
|
| International Stock Fund (continued) | | |
| | Shares or | | |
| | Principal | | |
| | Amount | | Value |
|
|
| |
| COMMON STOCKS (continued) | | | |
| Japan (continued) | | | |
| Sumitomo Heavy Industries, Ltd. | 69,686 | $ | 625,333 |
| Sumitomo Light Metal Industries, Ltd. | 217,000 | | 548,944 |
| Sumitomo Light Metal Industries, Ltd. | 1,219,334 | | 5,429,213 |
| Sumitomo Trust & Banking Company, Ltd. (a) | 121,448 | | 1,238,247 |
| Taiheiyo Cement Corp. (a) | 236,097 | | 1,016,945 |
| Taisho Pharmaceuticals Company, Ltd. | 43,790 | | 924,375 |
| Takashimaya Company, Ltd. (a) | 57,436 | | 834,468 |
| Takeda Pharmaceutical Company, Ltd. | 357,789 | | 19,875,445 |
| THK Company, Ltd. | 29,308 | | 826,564 |
| Tohoku Electric Power Company, Ltd. | 76,800 | | 1,726,209 |
| Tokuyama Corp. | 17,079 | | 254,849 |
| Tokyo Electric Power Company, Ltd. | 50,039 | | 1,342,811 |
| Tokyo Gas Company, Ltd. (a) | 466,397 | | 2,124,513 |
| Tokyo Seimitsu Company, Ltd. (a) | 14,401 | | 844,293 |
| Tokyu Land Corp. (a) | 158,516 | | 1,391,298 |
| TonenGeneral Sekiyu K.K. (a) | 118,133 | | 1,169,113 |
| Toyo Tire & Rubber Company, Ltd. * | 53,812 | | 252,941 |
| Toyota Industries Corp. (a) | 17,900 | | 715,938 |
| Toyota Motor Corp. | 214,800 | | 11,473,365 |
| Ube Industries, Ltd. (a) | 440,282 | | 1,298,155 |
| UFJ NICOS Company, Ltd. * (a) | 121,548 | | 1,171,746 |
| UNI Charm Corp. (a) | 4,495 | | 222,426 |
| Urban Corp. * (a) | 109,955 | | 1,616,292 |
| Yakult Honsha Company, Ltd. (a) | 35,744 | | 821,735 |
| Yamada Denki Company, Ltd. | 20,720 | | 2,224,108 |
| Yamaha Corp. (a) | 50,310 | | 862,075 |
| Yamaha Motor Company, Ltd. | 29,800 | | 685,086 |
| Yaskawa Electric Corp. * (a) | 94,696 | | 1,035,901 |
|
|
| | | | 243,078,330 |
Luxembourg - 0.48% | | | |
| Arcelor SA (a) | 125,961 | | 4,604,039 |
Netherlands - 8.59% | | | |
| ABN AMRO Holdings NV | 633,196 | | 18,481,983 |
| Aegon NV | 467,066 | | 7,722,529 |
| Akzo Nobel NV | 38,171 | | 1,941,220 |
| Buhrmann NV | 66,030 | | 1,110,667 |
| Corio NV | 2,469 | | 162,554 |
| CSM NV | 31,180 | | 932,800 |
| DSM NV | 34,013 | | 1,417,105 |
| Heineken Holding NV | 27,851 | | 970,857 |
| Heineken NV | 76,772 | | 2,896,153 |
| ING Groep NV | 605,796 | | 22,802,470 |
| Koninklijke Ahold NV * | 145,136 | | 1,185,121 |
| Oce-Van Der Grinten NV | 37,046 | | 642,154 |
| Reed Elsevier NV | 48,651 | | 658,622 |
| Royal Dutch Shell PLC, A Shares | 477,295 | | 14,442,421 |
| Royal Dutch Shell PLC, B Shares | 112,603 | | 3,552,274 |
| Stork N.V. | 12,001 | | 685,394 |
| TNT Post Group NV | 31,505 | | 1,027,147 |
| Unilever NV | 13,374 | | 930,012 |
| International Stock Fund (continued) | | |
| | Shares or | | |
| | Principal | | |
| | Amount | | Value |
|
|
| |
| COMMON STOCKS (continued) | | | |
| Netherlands (continued) | | | |
| Wereldhave NV | 6,158 | $ | 657,217 |
|
|
| | | | 82,218,700 |
Norway - 0.74% | | | |
| Norsk Hydro ASA (a) | 29,931 | | 3,496,643 |
| Orkla ASA (a) | 16,785 | | 732,378 |
| Statoil ASA | 93,518 | | 2,383,154 |
| Stolt Offshore SA * | 38,600 | | 516,134 |
|
|
| | | | 7,128,309 |
Singapore - 1.19% | | | |
| Ascendas Real Estate | 333,000 | | 443,630 |
| CapitaLand, Ltd. | 242,203 | | 627,411 |
| Cosco Corp. Singapore, Ltd. | 908,600 | | 666,873 |
| DBS Group Holdings, Ltd. | 325,231 | | 3,289,720 |
| Keppel Corp., Ltd. (a) | 108,072 | | 933,178 |
| Keppel Land, Ltd. | 234,538 | | 639,379 |
| Neptune Orient Lines, Ltd. | 389,488 | | 605,366 |
| SembCorp Industries, Ltd. * | 396,802 | | 763,575 |
| SembCorp Marine, Ltd. (a) | 111,267 | | 201,074 |
| Singapore Technologies Engineering, Ltd. | 189,683 | | 355,652 |
| Singapore Telecommunications, Ltd. | 824,578 | | 1,327,381 |
| StarHub Ltd. | 533,290 | | 720,329 |
| United Overseas Bank, Ltd. | 87,668 | | 811,065 |
|
|
| | | | 11,384,633 |
Spain - 1.73% | | | |
| Acciona SA (a) | 7,860 | | 1,096,324 |
| ACS Actividades SA | 26,705 | | 996,478 |
| Fomento de Construcciones SA | 14,015 | | 953,190 |
| Gas Natural SDG SA (a) | 39,326 | | 1,197,847 |
| Iberdrola SA (a) | 166,046 | | 5,239,780 |
| Metrovacesa SA | 11,300 | | 841,956 |
| Repsol SA | 210,295 | | 5,876,480 |
| Sacyr Vallehermoso SA (a) | 12,378 | | 348,252 |
|
|
| | | | 16,550,307 |
Sweden - 0.88% | | | |
| Atlas Copco AB, Series A * | 30,800 | | 758,362 |
| Electrolux AB, Series B | 85,873 | | 2,374,608 |
| Hennes & Mauritz AB, Series B | 47,562 | | 1,732,596 |
| Old Mutual PLC * | 31,958 | | 104,727 |
| Svenska Cellulosa AB, Series B | 34,994 | | 1,466,976 |
| Tele2 AB, Series B * (a) | 184,420 | | 1,990,973 |
|
|
| | | | 8,428,242 |
Switzerland - 4.44% | | | |
| ABB, Ltd. * | 242,202 | | 2,899,959 |
| Compagnie Financiere | | | |
| Richemont AG, Series A | 14,816 | | 645,746 |
| Credit Suisse Group AG (a) | 58,075 | | 3,219,869 |
| Nestle SA (a) | 23,642 | | 6,955,120 |
| Roche Holdings AG - CHF (a) | 95,792 | | 14,165,162 |
| Serono AG, Series B (a) | 1,449 | | 1,022,174 |
| Swiss Life Holding * (a) | 1,440 | | 267,299 |
The accompanying notes are an integral part of the financial statements. 189
John Hancock Funds II
Portfolio of investments — February 28, 2006 (Unaudited)
(showing percentage of total net assets)
|
| International Stock Fund (continued) | | |
| | Shares or | | |
| | Principal | | |
| | Amount | | Value |
|
|
| |
| COMMON STOCKS (continued) | | | |
| Switzerland (continued) | | | |
| Swiss Reinsurance Company AG | 23,511 | $ | 1,675,579 |
| Zurich Financial Services AG * | 49,142 | | 11,617,937 |
|
|
| | | | 42,468,845 |
United Kingdom - 20.17% | | | |
| Alliance & Leicester PLC | 94,733 | | 1,779,799 |
| Anglo American PLC | 99,354 | | 3,714,025 |
| Arriva PLC | 69,991 | | 742,355 |
| AstraZeneca Group PLC | 393,959 | | 18,244,150 |
| Aviva PLC | 235,548 | | 3,266,242 |
| BAE Systems PLC | 197,831 | | 1,460,278 |
| Barclays PLC | 155,290 | | 1,824,471 |
| Barratt Developments PLC | 160,270 | | 2,909,676 |
| BBA Group PLC | 189,201 | | 890,317 |
| Berkeley Group Holdings PLC * | 22,065 | | 431,997 |
| BG Group PLC | 210,098 | | 2,464,706 |
| BHP Billiton PLC | 94,336 | | 1,591,625 |
| Boots Group PLC (a) | 166,799 | | 2,079,878 |
| BP PLC | 500,418 | | 5,540,711 |
| British American Tobacco Australasia, Ltd. | 179,441 | | 4,285,812 |
| BT Group PLC | 2,144,056 | | 7,752,968 |
| Cable & Wireless PLC | 695,286 | | 1,304,438 |
| Cadbury Schweppes PLC | 299,513 | | 3,053,062 |
| Cairn Energy PLC * | 24,900 | | 844,595 |
| Centrica PLC | 979,323 | | 4,999,932 |
| Cobham PLC | 440,656 | | 1,316,560 |
| Compass Group PLC | 383,363 | | 1,463,733 |
| Dixons Group PLC | 775,589 | | 2,344,510 |
| E D & F Manitoba Treasury Management PLC | 17,860 | | 725,393 |
| Gallaher Group PLC | 134,071 | | 2,082,951 |
| George Wimpey PLC | 286,428 | | 2,783,765 |
| GlaxoSmithKline PLC | 1,162,151 | | 29,534,040 |
| GUS PLC | 181,289 | | 3,345,436 |
| Hanson PLC | 136,952 | | 1,676,415 |
| HBOS PLC | 632,505 | | 11,805,394 |
| Hilton Group PLC | 124,262 | | 805,855 |
| IMI PLC | 106,304 | | 977,110 |
| Imperial Chemical Industries PLC | 170,725 | | 1,005,907 |
| Imperial Tobacco Group PLC | 224,085 | | 6,754,122 |
| J Sainsbury PLC | 371,910 | | 2,093,240 |
| Johnson Matthey PLC | 33,103 | | 831,946 |
| Kingfisher PLC | 502,919 | | 2,017,441 |
| Lloyds TSB Group PLC | 633,100 | | 6,161,381 |
| Next Group PLC | 100,613 | | 2,917,629 |
| Northern Rock | 40,447 | | 801,129 |
| Rank Group PLC | 149,952 | | 686,518 |
| Rio Tinto PLC | 295,930 | | 13,938,492 |
| Rolls-Royce Group PLC * | 143,100 | | 1,103,440 |
| Royal & Sun Alliance PLC | 1,150,888 | | 2,629,471 |
| Royal Bank of Scotland Group PLC | 256,774 | | 8,614,875 |
| Scottish & Newcastle PLC | 129,258 | | 1,163,674 |
| Scottish & Southern Energy PLC | 123,886 | | 2,501,694 |
| International Stock Fund (continued) | | |
| | | Shares or | | |
| | | Principal | | |
| | | Amount | | Value |
| |
|
| |
| COMMON STOCKS (continued) | | | | |
| United Kingdom (continued) | | | | |
| Scottish Power PLC | | 286,650 | $ | 2,942,096 |
| Taylor Woodrow PLC | | 377,312 | | 2,758,582 |
| The Sage Group PLC | | 212,533 | | 1,035,595 |
| Unilever PLC | | 107,625 | | 1,111,253 |
| United Utilities PLC | | 91,326 | | 1,096,244 |
| Vodafone Group PLC | | 1,080,516 | | 2,069,902 |
| Wolseley PLC | | 32,268 | | 803,022 |
|
|
| | | | | 193,079,852 |
|
| TOTAL COMMON STOCKS (Cost $806,052,008) | | $ | 903,919,855 |
|
| |
| PREFERRED STOCKS - 0.47% | | | | |
| Germany - 0.30% | | | | |
| Bayerische Motoren Werke (BMW) AG | | 10,400 | | 447,513 |
| Fresenius Medical Care AG, Non-Voting (a) | | 7,600 | | 761,770 |
| Henkel KGaA-Vorzug, Non-Voting (a) | | 8,530 | | 938,222 |
| Volkswagen AG, Non-Voting | | 13,410 | | 690,014 |
|
|
| | | | | 2,837,519 |
| Italy - 0.17% | | | | |
| IFI-Istituto Finanziario Industriale SPA * | | 24,500 | | 460,021 |
| Unipol SpA | | 452,055 | | 1,184,270 |
|
|
| | | | | 1,644,291 |
|
| TOTAL PREFERRED STOCKS (Cost $3,679,494) | | $ | 4,481,810 |
|
| |
| SHORT TERM INVESTMENTS - 17.23% | | | | |
| State Street Navigator Securities | | | | |
| Lending Prime Portfolio (c) | $ | 160,743,448 | $ | 160,743,448 |
| United States Treasury Bills | | | | |
| zero coupon due 08/24/2006 | | 4,275,000 | | 4,181,001 |
|
| TOTAL SHORT TERM INVESTMENTS | | | | |
| (Cost $164,923,963) | | | $ | 164,924,449 |
|
| |
| REPURCHASE AGREEMENTS - 4.37% | | | | |
| Repurchase Agreement with State | | | | |
| Street Corp. dated 02/28/2006 at | | | | |
| 3.20% to be repurchased at | | | | |
| $41,883,723 on 03/01/2006, | | | | |
| collateralized by $42,615,000 | | | | |
| Federal Home Loan Mortgage, | | | | |
| 5.25% due 10/19/2015 (valued at | | | | |
| $42,721,538, including interest) (c) | $ | 41,880,000 | $ | 41,880,000 |
|
| TOTAL REPURCHASE AGREEMENTS | | | | |
| (Cost $41,880,000) | | | $ | 41,880,000 |
|
| Total Investments (International Stock Fund) | | | |
| (Cost $1,016,535,465) - 116.49% | | | $ | 1,115,206,114 |
| Liabilities in Excess of Other Assets - (16.49)% | | | (157,876,075) |
|
|
| TOTAL NET ASSETS - 100.00% | | | $ | 957,330,039 |
|
|
The accompanying notes are an integral part of the financial statements. 190
John Hancock Funds II
Portfolio of investments — February 28, 2006 (Unaudited)
(showing percentage of total net assets)
|
The portfolio had the following five top industry concentrations as of February 28, 2006 (as a percentage of total net assets):
| Banking | 10.67% |
| Pharmaceuticals | 7.79% |
| Automobiles | 7.59% |
| Insurance | 7.47% |
| International Oil | 5.52% |
| International Value Fund | | |
| | Shares or | |
| | Principal | |
| | Amount | Value |
|
|
| |
| COMMON STOCKS - 94.05% | | |
| Australia - 2.26% | | |
| National Australia Bank, Ltd. (a) | 593,674 $ | 16,177,364 |
| Qantas Airways, Ltd., ADR | 2,155,521 | 6,565,481 |
|
|
| | | 22,742,845 |
Belgium - 1.36% | | |
| Agfa Gevaert NV (a) | 686,120 | 13,676,251 |
Bermuda - 0.90% | | |
| ACE, Ltd. | 162,056 | 9,031,381 |
Brazil - 0.33% | | |
| Tele Norte Leste Participacoes SA, ADR | 176,579 | 3,272,009 |
Canada - 1.13% | | |
| Domtar, Inc. | 1,139,444 | 6,157,804 |
| Quebecor World, Inc. | 512,900 | 5,205,619 |
|
|
| | | 11,363,423 |
Cayman Islands - 0.39% | | |
| XL Capital, Ltd., Class A | 58,833 | 3,974,169 |
China - 1.26% | | |
| China Telecom Corp., Ltd. | 34,394,086 | 12,633,965 |
Denmark - 1.97% | | |
| Vestas Wind Systems AS (a) | 944,327 | 19,806,782 |
Finland - 2.49% | | |
| Stora Enso Oyj, R Shares - EUR | 761,820 | 10,880,275 |
| UPM-Kymmene Oyj | 668,231 | 14,180,036 |
|
|
| | | 25,060,311 |
France - 6.02% | | |
| AXA Group (a) | 390,996 | 13,800,980 |
| France Telecom SA | 766,171 | 16,651,294 |
| Sanofi-Aventis (a) | 193,869 | 16,484,129 |
| Total SA (a) | 53,933 | 13,551,783 |
|
|
| | | 60,488,186 |
Germany - 6.64% | | |
| BASF AG | 42,673 | 3,212,373 |
| Bayerische Motoren Werke (BMW) AG | 191,764 | 9,205,482 |
| Deutsche Post AG | 580,171 | 15,126,623 |
| E.ON AG | 70,929 | 7,840,367 |
| Muenchener Rueckversicherungs- | | |
| Gesellschaft AG | 111,316 | 15,067,895 |
| Siemens AG | 178,399 | 16,346,573 |
|
|
| | | 66,799,313 |
| International Value Fund (continued) | | |
| | Shares or | | |
| | Principal | | |
| | Amount | | Value |
|
|
| |
| COMMON STOCKS (continued) | | | |
| Hong Kong - 2.11% | | | |
| Cheung Kong Holdings, Ltd. | 902,444 | $ | 9,537,733 |
| Hutchison Whampoa, Ltd. | 1,224,620 | | 11,695,818 |
|
|
| | | | 21,233,551 |
| Israel - 1.14% | | | |
| Check Point Software Technologies, Ltd., ADR * | 540,250 | | 11,485,715 |
Italy - 2.22% | | | |
| Eni SpA | 413,067 | | 11,798,805 |
| UniCredito Italiano SpA (a) | 1,447,644 | | 10,536,058 |
|
|
| | | | 22,334,863 |
Japan - 5.91% | | | |
| Hitachi, Ltd. (a) | 1,066,353 | | 7,482,051 |
| KDDI Corp. | 1,924 | | 9,849,369 |
| Konica Minolta Holdings, Inc. | 909,462 | | 11,347,859 |
| Nippon Telegraph & Telephone Corp. | 1,005 | | 4,346,033 |
| Sony Corp. | 364,814 | | 17,241,424 |
| Takeda Pharmaceutical Company, Ltd. | 165,186 | | 9,176,205 |
|
|
| | | | 59,442,941 |
Mexico - 0.88% | | | |
| Telefonos de Mexico SA de CV, Class L, ADR | 395,305 | | 8,850,879 |
Netherlands - 7.76% | | | |
| Akzo Nobel NV | 241,946 | | 12,304,376 |
| ING Groep NV | 415,722 | | 15,647,988 |
| Koninklijke (Royal) Philips Electronics NV | 485,036 | | 15,819,261 |
| Reed Elsevier NV | 1,227,665 | | 16,619,749 |
| Royal Dutch Shell PLC, B Shares | 352,313 | | 11,114,377 |
| VNU NV | 200,651�� | | 6,510,619 |
|
|
| | | | 78,016,370 |
Norway - 3.13% | | | |
| Norske Skogindustrier ASA (a) | 767,124 | | 11,479,298 |
| Telenor ASA (a) | 1,847,081 | | 19,977,319 |
|
|
| | | | 31,456,617 |
Portugal - 1.50% | | | |
| Portugal Telecom, SGPS, SA | 1,304,106 | | 15,080,486 |
Singapore - 1.40% | | | |
| Venture Corp., Ltd. | 1,742,840 | | 14,081,601 |
South Africa - 0.59% | | | |
| Sappi, Ltd. | 466,015 | | 5,905,337 |
South Korea - 4.54% | | | |
| Kookmin Bank, ADR | 101,261 | | 7,670,521 |
| KT Corp., Sponsored ADR | 181,994 | | 3,716,318 |
| POSCO, ADR | 71,643 | | 4,186,817 |
| Samsung Electronics Company, Ltd., GDR | 57,800 | | 20,446,750 |
| Samsung Electronics Company, Ltd.-London, | | | |
| GDR | 64 | | 22,640 |
| SK Telecom Company, Ltd., ADR | 399,323 | | 9,643,650 |
|
|
| | | | 45,686,696 |
Spain - 5.05% | | | |
| Banco Santander Central Hispano SA (a) | 353,905 | | 5,167,070 |
| Gamesa Corporation Tecno SA (a) | 994,280 | | 17,218,522 |
The accompanying notes are an integral part of the financial statements. 191
John Hancock Funds II
Portfolio of investments — February 28, 2006 (Unaudited)
(showing percentage of total net assets)
|
| International Value Fund (continued) | | |
| | Shares or | | |
| | Principal | | |
| | Amount | | Value |
|
|
| |
| COMMON STOCKS (continued) | | | |
| Spain (continued) | | | |
| Iberdrola SA (a) | 140,164 | $ | 4,421,931 |
| Repsol SA (a) | 529,894 | | 14,803,628 |
| Telefonica SA - EUR | 594,085 | | 9,162,298 |
| Telefonica SA - USD (a) | 113 | | 5,221 |
|
|
| | | | 50,778,670 |
Sweden - 1.71% | | | |
| Nordea Bank AB | 546,686 | | 6,178,062 |
| Nordic Baltic Holding AB-EUR | 168,311 | | 1,902,180 |
| Nordic Baltic Holding-DKK | 71,187 | | 804,858 |
| Securitas AB, B Shares | 424,458 | | 7,798,103 |
| Stora Enso Oyj, R Shares - SEK | 33,746 | | 479,365 |
|
|
| | | | 17,162,568 |
Switzerland - 3.07% | | | |
| Nestle SA (a) | 41,277 | | 12,143,072 |
| Swiss Reinsurance Company AG | 171,853 | | 12,247,598 |
| UBS AG - CHF (a) | 60,694 | | 6,447,797 |
|
|
| | | | 30,838,467 |
Taiwan - 5.70% | | | |
| Chunghwa Telecom Company, Ltd., ADR (a) | 478,379 | | 8,963,359 |
| Compal Electronics, Inc., GDR | 550,762 | | 2,626,310 |
| Compal Electronics, Inc. | 6,134,000 | | 5,696,825 |
| Lite-On Technology Corp. | 1,214,240 | | 16,321,959 |
| Mega Financial Holding Company, Ltd. | 31,432,000 | | 23,718,349 |
|
|
| | | | 57,326,802 |
United Kingdom - 22.59% | | | |
| Amvescap PLC | 382,002 | | 3,616,970 |
| BAE Systems PLC | 610,443 | | 4,505,950 |
| Boots Group PLC (a) | 907,312 | | 11,313,606 |
| BP PLC | 1,468,532 | | 16,259,829 |
| British Sky Broadcasting Group PLC | 1,900,376 | | 16,866,420 |
| Cadbury Schweppes PLC | 592,160 | | 6,036,137 |
| Centrica PLC | 2,211,102 | | 11,288,777 |
| Compass Group PLC | 6,806,407 | | 25,987,811 |
| GlaxoSmithKline PLC | 482,985 | | 12,274,221 |
| Group 4 Securicor PLC | 2,184,000 | | 6,831,051 |
| Morrison W Supermarket | 3,649,277 | | 13,676,906 |
| Old Mutual PLC | 1,987,022 | | 6,556,539 |
| Pearson PLC | 1,154,676 | | 14,387,932 |
| Reed Elsevier PLC | 89,874 | | 813,455 |
| Rentokil Initial PLC | 3,336,007 | | 9,219,547 |
| Royal Bank of Scotland Group PLC | 706,882 | | 23,716,186 |
| Shire PLC | 518,674 | | 8,122,022 |
| Smiths Group PLC | 291,113 | | 4,804,179 |
| Unilever PLC | 1,135,670 | | 11,726,058 |
| Vodafone Group PLC | 10,012,007 | | 19,179,604 |
|
|
| | | | 227,183,200 |
|
| TOTAL COMMON STOCKS (Cost $871,082,503) | | $ | 945,713,398 |
| |
|
| International Value Fund (continued) | | |
| | | Shares or | | |
| | | Principal | | |
| | | Amount | | Value |
|
|
| |
| FOREIGN GOVERNMENT OBLIGATIONS - 0.07% | | |
| Australia - 0.07% | | | | |
| New South Wales Treasury Corp. | | | | |
| 6.50% due 05/01/2006 | AUD | 937,000 | $ | 697,420 |
|
| TOTAL FOREIGN GOVERNMENT OBLIGATIONS | | |
| (Cost $704,333) | | | $ | 697,420 |
|
| |
| SHORT TERM INVESTMENTS - 15.74% | | | |
| State Street Navigator Securities | | | | |
| Lending Prime Portfolio (c) | $ | 158,239,011 | $ | 158,239,011 |
|
| TOTAL SHORT TERM INVESTMENTS | | | |
| (Cost $158,239,011) | | | $ | 158,239,011 |
|
| |
| REPURCHASE AGREEMENTS - 5.02% | | | |
| Repurchase Agreement with State | | | | |
| Street Corp. dated 02/28/2006 at | | | | |
| 3.20% to be repurchased at | | | | |
| $50,499,488 on 03/01/2006, | | | | |
| collateralized by $51,445,000 | | | | |
| Federal Home Loan Mortgage | | | | |
| Company, 5.625% due 02/22/2016 | | | | |
| (valued at $51,509,306, including | | | | |
| interest) (c) | $ | 50,495,000 | $ | 50,495,000 |
|
| TOTAL REPURCHASE AGREEMENTS | | | |
| (Cost $50,495,000) | | | $ | 50,495,000 |
|
| Total Investments (International Value Fund) | | | |
| (Cost $1,080,520,847) - 114.88% | | | $ 1,155,144,829 |
| Liabilities in Excess of Other Assets - (14.88)% | | | (149,584,136) |
|
|
| TOTAL NET ASSETS - 100.00% | | | $ 1,005,560,693 |
|
|
The portfolio had the following five top industry concentrations as of February 28, 2006 (as a percentage of total net assets):
| Telecommunications Equipment & Services | 10.29% |
| Electronics | 7.70% |
| Banking | 7.63% |
| Insurance | 7.59% |
| Food & Beverages | 5.56% |
| Investment Quality Bond Fund | | |
| | | Shares or | |
| | | Principal | |
| | | Amount | Value |
|
|
| |
| U.S. TREASURY OBLIGATIONS - 15.51% | | |
| Treasury Inflation Protected | | | |
| Securities (d) - 4.18% | | | |
| 1.875% due 07/15/2013 | $ | 3,858,012 | $ | 3,833,448 |
| 2.00% due 07/15/2014 | | 1,097,454 | 1,098,869 |
|
|
| | | | 4,932,317 |
| U.S. Treasury Bonds - 9.45% | | | |
| 6.25% due 08/15/2023 | | 2,000,000 | 2,364,844 |
| 7.875% due 02/15/2021 | | 2,339,000 | 3,126,403 |
| 8.125% due 08/15/2019 **** | | 885,000 | 1,184,310 |
| 8.75% due 08/15/2020 | | 1,535,000 | 2,179,760 |
The accompanying notes are an integral part of the financial statements. 192
John Hancock Funds II
Portfolio of investments — February 28, 2006 (Unaudited)
(showing percentage of total net assets)
|
| Investment Quality Bond Fund (continued) | |
| | | Shares or | | |
| | | Principal | | |
| | | Amount | | Value |
|
|
| |
| U.S. TREASURY OBLIGATIONS | | | | |
| (continued) | | | | |
| U.S. Treasury Bonds (continued) | | | | |
| 8.875% due 08/15/2017 to 02/15/2019 | $ | 1,655,000 | $ | 2,288,581 |
|
|
| | | | | 11,143,898 |
| U.S. Treasury Notes - 1.88% | | | | |
| 3.375% due 02/28/2007 | | 2,250,000 | | 2,220,293 |
|
| TOTAL U.S. TREASURY OBLIGATIONS | �� | | |
| (Cost $18,152,406) | | | $ | 18,296,508 |
|
| |
| U.S. GOVERNMENT AGENCY OBLIGATIONS - 14.57% | | |
| Federal Home Loan Bank - 1.82% | | | | |
| 5.80% due 09/02/2008 | | 2,105,000 | | 2,142,164 |
| Federal Home Loan Mortgage Corp. - 2.80% | | | |
| 4.00% due 11/15/2019 | | 135,265 | | 123,573 |
| 5.00% due 03/01/2019 to 12/01/2019 | | 975,898 | | 963,875 |
| 6.30% due 03/15/2023 | | 9,824 | | 9,875 |
| 6.50% due 04/01/2029 to 08/01/2034 | | 41,958 | | 42,945 |
| 6.625% due 09/15/2009 | | 2,030,000 | | 2,139,214 |
| 7.50% due 06/01/2010 to 05/01/2028 | | 16,026 | | 16,768 |
|
|
| | | | | 3,296,250 |
Federal National Mortgage | | | | |
| Association - 9.42% | | | | |
| 3.125% due 12/15/2007 | | 541,000 | | 524,643 |
| 4.682% due 05/01/2013 | | 217,701 | | 211,500 |
| 4.874% due 02/01/2013 | | 389,399 | | 382,038 |
| 5.00% due 03/01/2019 to 06/01/2019 | | 1,908,754 | | 1,885,228 |
| 5.25% due 04/15/2007 | | 676,000 | | 678,148 |
| 5.393% due 09/01/2014 | | 2,950,414 | | 2,981,083 |
| 5.50% due 08/01/2035 to 11/01/2035 | | 1,480,894 | | 1,467,678 |
| 5.636% due 12/01/2011 | | 227,773 | | 231,218 |
| 5.885% due 11/01/2011 | | 240,066 | | 245,865 |
| 6.051% due 03/01/2012 to 05/01/2012 | | 323,482 | | 334,433 |
| 6.085% due 10/01/2011 | | 158,543 | | 163,402 |
| 6.27% due 11/01/2007 | | 201,903 | | 203,416 |
| 6.28% due 04/01/2011 | | 135,265 | | 140,807 |
| 6.34% due 01/01/2008 | | 33,604 | | 33,934 |
| 6.43% due 01/01/2008 | | 38,731 | | 39,162 |
| 6.44% due 02/01/2011 | | 474,621 | | 497,806 |
| 6.46% due 06/01/2009 | | 186,837 | | 191,733 |
| 6.50% due 09/01/2031 | | 177 | | 182 |
| 6.625% due 09/15/2009 | | 850,000 | | 896,011 |
| 6.80% due 10/01/2007 | | 5,303 | | 5,363 |
| 7.00% due 06/01/2029 | | 631 | | 654 |
|
|
| | | | | 11,114,304 |
Government National Mortgage | | | | |
| Association - 0.46% | | | | |
| 6.00% due 08/15/2008 to 04/15/2035 | | 141,231 | | 144,212 |
| 6.50% due 06/15/2028 to 08/15/2034 | | 86,744 | | 90,522 |
| 7.00% due 04/15/2023 to 03/15/2029 | | 292,494 | | 305,505 |
| 8.00% due 07/15/2030 to 10/15/2030 | | 4,258 | | 4,561 |
|
|
| | | | | 544,800 |
| Investment Quality Bond Fund (continued) | |
| | | Shares or | |
| | | Principal | |
| | | Amount | Value |
|
|
| |
| U.S. GOVERNMENT AGENCY | | | |
| OBLIGATIONS (continued) | | | |
| Housing & Urban Development - 0.07% | | | |
| 7.498% due 08/01/2011 | $ | 81,000 | $ | 87,270 |
|
| TOTAL U.S. GOVERNMENT AGENCY OBLIGATIONS | |
| (Cost $17,297,681) | | | $ | 17,184,788 |
|
| |
| FOREIGN GOVERNMENT OBLIGATIONS - 0.32% | |
| Argentina - 0.05% | | | |
| Republic of Argentina | | | |
| 4.889% due 08/03/2012 (b) | | 71,000 | 58,255 |
South Africa - 0.13% | | | |
| Republic of South Africa | | | |
| 7.375% due 04/25/2012 | | 143,000 | 158,194 |
Trinidad and Tobago - 0.14% | | | |
| Republic of Trinidad & Tobago | | | |
| 9.75% due 07/01/2020 | | 117,000 | 163,299 |
|
| TOTAL FOREIGN GOVERNMENT OBLIGATIONS | |
| (Cost $375,015) | | | $ | 379,748 |
|
| |
| CORPORATE BONDS - 40.93% | | | |
| Aerospace - 0.21% | | | |
| Argo-Tech Corp. | | | |
| 9.25% due 06/01/2011 | | 5,000 | 5,300 |
| DRS Technologies, Inc. | | | |
| 6.625% due 02/01/2016 | | 5,000 | 5,025 |
| 7.625% due 02/01/2018 | | 5,000 | 5,137 |
| Moog, Inc. | | | |
| 6.25% due 01/15/2015 | | 1,000 | 990 |
| Northrop Grumman Corp. | | | |
| 7.875% due 03/01/2026 | | 15,000 | 18,821 |
| Raytheon Company | | | |
| 4.85% due 01/15/2011 | | 208,000 | 203,886 |
| Sequa Corp. | | | |
| 9.00% due 08/01/2009 | | 6,000 | 6,465 |
|
|
| | | | 245,624 |
| |
| Agriculture - 0.42% | | | |
| Archer-Daniels-Midland Company | | | |
| 6.75% due 12/15/2027 | | 135,000 | 153,275 |
| Bunge Limited Finance Corp. | | | |
| 5.10% due 07/15/2015 | | 79,000 | 75,315 |
| Case New Holland, Inc. | | | |
| 7.125% due 03/01/2014 | | 10,000 | 10,025 |
| 9.25% due 08/01/2011 | | 12,000 | 12,870 |
| Monsanto Company | | | |
| 5.50% due 08/15/2025 | | 135,000 | 129,095 |
| 5.50% due 07/30/2035 | | 125,000 | 118,769 |
|
|
| | | | 499,349 |
| |
| Air Travel - 0.57% | | | |
| American Airlines | | | |
| 3.857% due 07/09/2010 | | 26,148 | 25,004 |
| Continental Airlines, Inc., Series 974A | | | |
| 6.90% due 01/02/2018 | | 136,549 | 137,956 |
| Continental Airlines, Inc., Series 981A | | | |
| 6.648% due 09/15/2017 | | 310,429 | 309,270 |
The accompanying notes are an integral part of the financial statements. 193
John Hancock Funds II
Portfolio of investments — February 28, 2006 (Unaudited)
(showing percentage of total net assets)
|
| Investment Quality Bond Fund (continued) | |
| | | Shares or | |
| | | Principal | |
| | | Amount | Value |
|
|
| |
| CORPORATE BONDS (continued) | | | |
| Air Travel (continued) | | | |
| Continental Airlines, Inc., Series ERJ1 | | | |
| 9.798% due 04/01/2021 | $ | 14,764 | $ | 14,985 |
| Delta Air Lines, Inc., Series 2002-1 | | | |
| 6.718% due 07/02/2024 | | 104,487 | 106,497 |
| Southwest Airlines Company | | | |
| 5.25% due 10/01/2014 | | 84,000 | 81,212 |
|
|
| | | | 674,924 |
| Aluminum - 0.37% | | | |
| Alcan Aluminum, Ltd. | | | |
| 6.125% due 12/15/2033 | | 27,000 | 27,822 |
| 6.45% due 03/15/2011 | | 159,000 | 166,405 |
| Alcoa, Inc. | | | |
| 6.75% due 01/15/2028 | | 208,000 | 237,071 |
|
|
| | | | 431,298 |
| Auto Parts - 0.02% | | | |
| ArvinMeritor, Inc. | | | |
| 8.75% due 03/01/2012 | | 8,000 | 7,840 |
| Tenneco Automotive, Inc. | | | |
| 10.25% due 07/15/2013 | | 1,000 | 1,107 |
| TRW Automotive, Inc. | | | |
| 11.00% due 02/15/2013 | | 2,000 | 2,245 |
| United Rentals North America, Inc. | | | |
| 6.50% due 02/15/2012 | | 10,000 | 9,987 |
| Visteon Corp. | | | |
| 7.00% due 03/10/2014 | | 3,000 | 2,228 |
|
|
| | | | 23,407 |
| Automobiles - 0.55% | | | |
| Chrysler Corp. | | | |
| 7.45% due 02/01/2097 | | 135,000 | 141,233 |
| DaimlerChrysler NA Holding Corp. | | | |
| 4.75% due 01/15/2008 | | 305,000 | 301,282 |
| 8.50% due 01/18/2031 | | 150,000 | 182,877 |
| Ford Motor Company | | | |
| 7.45% due 07/16/2031 | | 10,000 | 7,100 |
| General Motors Corp. | | | |
| 8.375% due 07/15/2033 | | 4,000 | 2,820 |
| Hertz Corp., Class A | | | |
| 8.875% due 01/01/2014 | | 5,000 | 5,225 |
| 10.50% due 01/01/2016 | | 5,000 | 5,388 |
|
|
| | | | 645,925 |
| Banking - 4.50% | | | |
| American Express Centurion Bank | | | |
| 4.375% due 07/30/2009 | | 250,000 | 243,990 |
| Bank of America Corp. | | | |
| 4.375% due 12/01/2010 | | 436,000 | 421,660 |
| 7.40% due 01/15/2011 | | 402,000 | 438,442 |
| Bayerische Landesbank Girozentrale | | | |
| 5.65% due 02/01/2009 | | 27,000 | 27,458 |
| BB & T Corp. | | | |
| 4.90% due 06/30/2017 | | 192,000 | 184,296 |
| Chase Manhattan Corp. | | | |
| 7.00% due 11/15/2009 | | 135,000 | 142,777 |
| Chevy Chase Bank | | | |
| 6.875% due 12/01/2013 | | 5,000 | 5,150 |
| Investment Quality Bond Fund (continued) | |
| | | Shares or | |
| | | Principal | |
| | | Amount | Value |
|
|
| |
| CORPORATE BONDS (continued) | | | |
| Banking (continued) | | | |
| China Development Bank | | | |
| 5.00% due 10/15/2015 | $ | 175,000 | $ | 170,470 |
| Citicorp | | | |
| 6.375% due 11/15/2008 | | 231,000 | 238,404 |
| First Republic Bank of San Francisco | | | |
| 7.75% due 09/15/2012 | | 111,000 | 122,100 |
| First Union National Bank | | | |
| 7.80% due 08/18/2010 | | 350,000 | 385,376 |
| Frost National Bank | | | |
| 6.875% due 08/01/2011 | | 135,000 | 144,207 |
| HBOS PLC, MTN | | | |
| 6.00% due 11/01/2033 | | 210,000 | 222,431 |
| Huntington National Bank | | | |
| 4.90% due 01/15/2014 | | 250,000 | 240,959 |
| National Australia Bank Ltd. | | | |
| 8.60% due 05/19/2010 | | 23,000 | 25,808 |
| National City Corp. | | | |
| 6.875% due 05/15/2019 | | 260,000 | 291,791 |
| NBD Bancorp | | | |
| 8.25% due 11/01/2024 | | 270,000 | 340,921 |
| Regions Financial Corp. | | | |
| 7.00% due 03/01/2011 | | 12,000 | 12,972 |
| Republic New York Corp. | | | |
| 9.50% due 04/15/2014 | | 135,000 | 169,427 |
| Royal Bank of Scotland Group PLC | | | |
| 6.40% due 04/01/2009 | | 696,000 | 722,982 |
| Sovereign Bancorp, Inc. | | | |
| 4.80% due 09/01/2010 | | 30,000 | 29,138 |
| VTB Capital SA | | | |
| 6.25% due 07/02/2035 | | 150,000 | 154,875 |
| Wachovia Corp. | | | |
| 5.50% due 08/01/2035 | | 250,000 | 241,168 |
| Wells Fargo Bank NA | | | |
| 7.55% due 06/21/2010 | | 300,000 | 328,021 |
|
|
| | | | 5,304,823 |
Broadcasting - 1.03% | | | |
| CanWest Media, Inc. | | | |
| 8.00% due 09/15/2012 | | 10,000 | 10,250 |
| Chancellor Media Corp. | | | |
| 8.00% due 11/01/2008 | | 54,000 | 57,099 |
| Clear Channel Communications, Inc. | | | |
| 7.65% due 09/15/2010 | | 216,000 | 229,246 |
| Comcast Cable Communications | | | |
| 8.50% due 05/01/2027 | | 189,000 | 230,678 |
| CSC Holdings, Inc. | | | |
| 7.625% due 07/15/2018 | | 11,000 | 10,711 |
| Emmis Communications Corp. | | | |
| 10.3663% due 06/15/2012 (b) | | 2,057 | 2,057 |
| Liberty Media Corp. | | | |
| 5.70% due 05/15/2013 | | 4,000 | 3,747 |
| 7.875% due 07/15/2009 | | 9,000 | 9,473 |
| 8.25% due 02/01/2030 | | 2,000 | 2,009 |
| News America Holdings, Inc. | | | |
| 7.75% due 01/20/2024 | | 328,000 | 368,500 |
The accompanying notes are an integral part of the financial statements. 194
John Hancock Funds II
Portfolio of investments — February 28, 2006 (Unaudited)
(showing percentage of total net assets)
|
| Investment Quality Bond Fund (continued) | |
| | | Shares or | |
| | | Principal | |
| | | Amount | Value |
|
|
| |
| CORPORATE BONDS (continued) | | | |
| Broadcasting (continued) | | | |
| Viacom, Inc. | | | |
| 7.875% due 07/30/2030 | $ | 250,000 | $ | 287,702 |
|
|
| | | | 1,211,472 |
Building Materials & Construction - 0.60% | | |
| American Standard, Inc. | | | |
| 7.375% due 02/01/2008 | | 135,000 | 139,530 |
| Lowe's Companies, Inc. | | | |
| 6.50% due 03/15/2029 | | 273,000 | 307,969 |
| Masco Corp. | | | |
| 5.75% due 10/15/2008 | | 94,000 | 94,840 |
| SCL Terminal Aereo Santiago SA | | | |
| 6.95% due 07/01/2012 | | 156,946 | 159,976 |
|
|
| | | | 702,315 |
Business Services - 0.22% | | | |
| FedEx Corp., Series 981A | | | |
| 6.72% due 01/15/2022 | | 158,971 | 171,657 |
| GTECH Holdings Corp. | | | |
| 4.75% due 10/15/2010 | | 45,000 | 44,448 |
| Invensys PLC | | | |
| 9.875% due 03/15/2011 | | 9,000 | 9,315 |
| SunGard Data Systems, Inc. | | | |
| 9.125% due 08/15/2013 | | 13,000 | 13,829 |
| 10.25% due 08/15/2015 | | 4,000 | 4,195 |
| Xerox Corp. | | | |
| 7.20% due 04/01/2016 | | 15,000 | 15,975 |
|
|
| | | | 259,419 |
Cable and Television - 0.99% | | | |
| Cablevision Systems Corp., Series B | | | |
| 8.00% due 04/15/2012 | | 13,000 | 12,772 |
| Comcast Corp. | | | |
| 5.85% due 11/15/2015 | | 350,000 | 351,326 |
| 6.50% due 11/15/2035 | | 175,000 | 177,362 |
| Cox Communications, Inc. | | | |
| 7.125% due 10/01/2012 | | 208,000 | 222,014 |
| Cox Enterprises, Inc. | | | |
| 4.375% due 05/01/2008 | | 64,000 | 62,256 |
| Echostar DBS Corp. | | | |
| 6.375% due 10/01/2011 | | 6,000 | 5,865 |
| LIN Television Corp. | | | |
| 6.50% due 05/15/2013 | | 5,000 | 4,744 |
| LIN Television Corp., Series B | | | |
| 6.50% due 05/15/2013 | | 2,000 | 1,897 |
| Mediacom Broadband LLC | | | |
| 8.50% due 10/15/2015 | | 2,000 | 1,920 |
| 11.00% due 07/15/2013 | | 4,000 | 4,280 |
| Mediacom LLC/Mediacom Capital Corp. | | | |
| 7.875% due 02/15/2011 | | 5,000 | 4,769 |
| 9.50% due 01/15/2013 | | 4,000 | 4,000 |
| Quebecor Media Inc. | | | |
| 7.75% due 03/15/2016 | | 10,000 | 10,250 |
| Rogers Cable, Inc. | | | |
| 6.25% due 06/15/2013 | | 10,000 | 9,938 |
| Shaw Communications, Inc. | | | |
| 8.25% due 04/11/2010 | | 4,000 | 4,290 |
| Investment Quality Bond Fund (continued) | |
| | | Shares or | |
| | | Principal | |
| | | Amount | Value |
|
|
| |
| CORPORATE BONDS (continued) | | | |
| Cable and Television (continued) | | | |
| Sinclair Broadcast Group, Inc. | | | |
| 8.00% due 03/15/2012 | $ | 6,000 | $ | 6,128 |
| TCI Communications, Inc. | | | |
| 8.75% due 08/01/2015 | | 183,000 | 218,505 |
| Time Warner, Inc. | | | |
| 7.25% due 10/15/2017 | | 60,000 | 65,588 |
|
|
| | | | 1,167,904 |
Cellular Communications - 0.70% | | | |
| American Cellular Corp. | | | |
| 10.00% due 08/01/2011 | | 6,000 | 6,525 |
| AT&T Wireless Services, Inc. | | | |
| 7.875% due 03/01/2011 | | 94,000 | 104,235 |
| 8.75% due 03/01/2031 | | 217,000 | 287,971 |
| Cingular Wireless LLC | | | |
| 7.125% due 12/15/2031 | | 67,000 | 76,365 |
| Cingular Wireless Services, Inc. | | | |
| 8.125% due 05/01/2012 | | 56,000 | 64,163 |
| Dobson Cellular Systems, Inc. | | | |
| 8.375% due 11/01/2011 | | 15,000 | 15,900 |
| Nextel Communications, Inc. | | | |
| 7.375% due 08/01/2015 | | 7,000 | 7,403 |
| Rogers Wireless, Inc. | | | |
| 9.625% due 05/01/2011 | | 27,000 | 31,253 |
| Vodafone Group PLC | | | |
| 7.75% due 02/15/2010 | | 211,000 | 228,878 |
|
|
| | | | 822,693 |
Chemicals - 0.36% | | | |
| Cytec Industries, Inc. | | | |
| 4.60% due 07/01/2013 | | 135,000 | 122,128 |
| Dow Chemical Company | | | |
| 5.75% due 12/15/2008 | | 54,000 | 54,869 |
| 6.00% due 10/01/2012 | | 154,000 | 160,398 |
| Equistar Chemicals LP | | | |
| 10.625% due 05/01/2011 | | 8,000 | 8,700 |
| IMC Global, Inc. | | | |
| 7.30% due 01/15/2028 | | 3,000 | 2,880 |
| IMC Global, Inc., Series B | | | |
| 10.875% due 06/01/2008 | | 43,000 | 47,623 |
| 11.25% due 06/01/2011 | | 4,000 | 4,290 |
| Lyondell Chemical Company, Series A | | | |
| 9.625% due 05/01/2007 | | 9,000 | 9,315 |
| Methanex Corp. | | | |
| 8.75% due 08/15/2012 | | 4,000 | 4,410 |
| Millennium America, Inc. | | | |
| 9.25% due 06/15/2008 | | 4,000 | 4,110 |
| Nalco Company | | | |
| 7.75% due 11/15/2011 | | 4,000 | 4,070 |
|
|
| | | | 422,793 |
Coal - 0.00% | | | |
| Massey Energy Company | | | |
| 6.625% due 11/15/2010 | | 2,000 | 2,045 |
| Computers & Business Equipment - 0.07% | | |
| Computer Sciences Corp. | | | |
| 7.375% due 06/15/2011 | | 19,000 | 20,046 |
The accompanying notes are an integral part of the financial statements. 195
John Hancock Funds II
Portfolio of investments — February 28, 2006 (Unaudited)
(showing percentage of total net assets)
|
| Investment Quality Bond Fund (continued) | |
| | | Shares or | |
| | | Principal | |
| | | Amount | Value |
|
|
| |
| CORPORATE BONDS (continued) | | | |
| Computers & Business Equipment | | | |
| (continued) | | | |
| Hewlett Packard Company | | | |
| 6.50% due 07/01/2012 | $ | 54,000 | $ | 57,690 |
|
|
| | | | 77,736 |
| |
| Containers & Glass - 0.03% | | | |
| Crown Holdings, Inc. | | | |
| 7.625% due 11/15/2013 | | 5,000 | 5,212 |
| 7.75% due 11/15/2015 | | 5,000 | 5,212 |
| Owens-Brockway Glass Container, Inc. | | | |
| 8.25% due 05/15/2013 | | 16,000 | 16,680 |
| Stone Container Corp. | | | |
| 9.25% due 02/01/2008 | | 10,000 | 10,413 |
|
|
| | | | 37,517 |
| |
| Correctional Facilities - 0.00% | | | |
| Corrections Corporation of America | | | |
| 6.25% due 03/15/2013 | | 2,000 | 1,985 |
Cosmetics & Toiletries - 0.01% | | | |
| Spectrum Brands, Inc. | | | |
| 7.375% due 02/01/2015 | | 10,000 | 8,625 |
Crude Petroleum & Natural Gas - 0.19% | | | |
| Burlington Resources Finance Company | | | |
| 7.40% due 12/01/2031 | | 159,000 | 199,545 |
| Chesapeake Energy Corp. | | | |
| 6.50% due 08/15/2017 | | 10,000 | 10,063 |
| 6.625% due 01/15/2016 | | 12,000 | 12,180 |
| 7.50% due 09/15/2013 | | 3,000 | 3,191 |
| Premcor Refining Group, Inc. | | | |
| 6.75% due 05/01/2014 | | 4,000 | 4,197 |
|
|
| | | | 229,176 |
| |
| Domestic Oil - 0.55% | | | |
| Amerada Hess Corp. | | | |
| 7.30% due 08/15/2031 | | 2,000 | 2,349 |
| Delta Petroleum Corp. | | | |
| 7.00% due 04/01/2015 | | 10,000 | 9,650 |
| Devon Financing Corp., ULC | | | |
| 6.875% due 09/30/2011 | | 305,000 | 327,884 |
| Exco Resources, Inc. | | | |
| 7.25% due 01/15/2011 | | 4,000 | 4,080 |
| Magnum Hunter Resources, Inc. | | | |
| 9.60% due 03/15/2012 | | 2,000 | 2,160 |
| Motiva Enterprises LLC | | | |
| 5.20% due 09/15/2012 | | 148,000 | 147,585 |
| Valero Energy Corp. | | | |
| 8.75% due 06/15/2030 | | 112,000 | 149,856 |
| Whiting Petroleum Corp. | | | |
| 7.00% due 02/01/2014 | | 3,000 | 3,007 |
| 7.25% due 05/01/2013 | | 3,000 | 3,037 |
|
|
| | | | 649,608 |
| |
| Drugs & Health Care - 0.04% | | | |
| Allegiance Corp. | | | |
| 7.00% due 10/15/2026 | | 13,000 | 14,312 |
| Biovail Corp. | | | |
| 7.875% due 04/01/2010 | | 10,000 | 10,300 |
| Investment Quality Bond Fund (continued) | |
| | | Shares or | |
| | | Principal | |
| | | Amount | Value |
|
|
| |
| CORPORATE BONDS (continued) | | | |
| Drugs & Health Care (continued) | | | |
| Rite Aid Corp. | | | |
| 8.125% due 05/01/2010 | $ | 18,000 | $ | 18,360 |
|
|
| | | | 42,972 |
| |
| Electrical Equipment - 0.29% | | | |
| Exelon Generation Company LLC | | | |
| 5.35% due 01/15/2014 | | 187,000 | 185,015 |
| Nisource Finance Corp. | | | |
| 3.20% due 11/01/2006 | | 81,000 | 79,925 |
| Northern States Power-Minnesota | | | |
| 6.50% due 03/01/2028 | | 67,000 | 74,964 |
|
|
| | | | 339,904 |
| |
| Electrical Utilities - 2.66% | | | |
| AES Corp. | | | |
| 9.00% due 05/15/2015 | | 14,000 | 15,260 |
| Alabama Power Company | | | |
| 5.875% due 12/01/2022 | | 63,000 | 65,508 |
| American Electric Power, Inc., Series A | | | |
| 6.125% due 05/15/2006 | | 113,000 | 113,217 |
| Arizona Public Service Company | | | |
| 6.375% due 10/15/2011 | | 135,000 | 139,966 |
| Avista Corp. | | | |
| 9.75% due 06/01/2008 | | 17,000 | 18,351 |
| Carolina Power & Light Company | | | |
| 6.50% due 07/15/2012 | | 371,000 | 392,772 |
| CMS Energy Corp. | | | |
| 8.50% due 04/15/2011 | | 4,000 | 4,360 |
| Commonwealth Edison Company | | | |
| 6.15% due 03/15/2012 | | 92,000 | 95,286 |
| Duke Energy Corp. | | | |
| 5.375% due 01/01/2009 | | 135,000 | 134,685 |
| Florida Power & Light Company | | | |
| 5.85% due 02/01/2033 | | 31,000 | 32,038 |
| Georgia Power Company | | | |
| 5.25% due 12/15/2015 | | 150,000 | 149,115 |
| Midwest Generation LLC | | | |
| 8.75% due 05/01/2034 | | 6,000 | 6,555 |
| Nevada Power Company | | | |
| 9.00% due 08/15/2013 | | 3,000 | 3,317 |
| 10.875% due 10/15/2009 | | 9,000 | 9,745 |
| New York State Electric & Gas Corp. | | | |
| 5.75% due 05/01/2023 | | 74,000 | 73,143 |
| NSTAR | | | |
| 8.00% due 02/15/2010 | | 270,000 | 295,654 |
| Ohio Edison Company | | | |
| 4.00% due 05/01/2008 | | 312,000 | 303,715 |
| Old Dominion Electric Coop. | | | |
| 6.25% due 06/01/2011 | | 141,000 | 147,672 |
| Oncor Electric Delivery Company | | | |
| 6.375% due 05/01/2012 | | 158,000 | 165,153 |
| Pacificorp Australia LLC | | | |
| 6.15% due 01/15/2008 | | 111,000 | 112,862 |
| Pacificorp Secured MTN | | | |
| 6.375% due 05/15/2008 | | 135,000 | 138,195 |
| PSEG Power LLC | | | |
| 8.625% due 04/15/2031 | | 154,000 | 204,687 |
The accompanying notes are an integral part of the financial statements. 196
John Hancock Funds II
Portfolio of investments — February 28, 2006 (Unaudited)
(showing percentage of total net assets)
|
| Investment Quality Bond Fund (continued) | |
| | | Shares or | |
| | | Principal | |
| | | Amount | Value |
|
|
| |
| CORPORATE BONDS (continued) | | | |
| Electrical Utilities (continued) | | | |
| Puget Sound Energy, Inc. | | | |
| 7.00% due 03/09/2029 | $ | 54,000 | $ | 62,763 |
| Reliant Energy, Inc. | | | |
| 6.75% due 12/15/2014 | | 15,000 | 13,556 |
| Southern California Edison Company | | | |
| 6.00% due 01/15/2034 | | 201,000 | 210,596 |
| TXU Corp., Series O | | | |
| 4.80% due 11/15/2009 | | 74,000 | 71,105 |
| TXU Corp., Series P | | | |
| 5.55% due 11/15/2014 | | 21,000 | 20,000 |
| Wisconsin Electric Power Company | | | |
| 6.50% due 06/01/2028 | | 94,000 | 103,947 |
| Wisconsin Energy Corp. | | | |
| 6.20% due 04/01/2033 | | 33,000 | 34,526 |
|
|
| | | | 3,137,749 |
| |
| Electronics - 0.00% | | | |
| Sanmina-SCI Corp. | | | |
| 6.75% due 03/01/2013 | | 1,000 | 965 |
Energy - 0.34% | | | |
| Alliant Energy Resources, Inc. | | | |
| 9.75% due 01/15/2013 | | 60,000 | 73,408 |
| Aquila, Inc. | | | |
| 9.95 due 02/01/2011 | | 10,000 | 11,125 |
| Midamerican Funding LLC | | | |
| 6.75% due 03/01/2011 | | 260,000 | 275,650 |
| Mirant North America LLC | | | |
| 7.375% due 12/31/2013 | | 10,000 | 10,262 |
| NRG Energy, Inc. | | | |
| 7.25% due 02/01/2014 | | 5,000 | 5,125 |
| 7.375% due 02/01/2016 | | 15,000 | 15,450 |
| Peabody Energy Corp. | | | |
| 6.875% due 03/15/2013 | | 11,000 | 11,303 |
| TECO Energy, Inc. | | | |
| 6.75% due 05/01/2015 | | 2,000 | 2,100 |
|
|
| | | | 404,423 |
| |
| Financial Services - 7.81% | | | |
| Aiful Corp. | | | |
| 5.00% due 08/10/2010 | | 100,000 | 97,741 |
| AMBAC Financial Group, Inc. | | | |
| 5.95% due 12/05/2035 | | 185,000 | 188,099 |
| American Financial Group, Inc. | | | |
| 7.125% due 04/15/2009 | | 245,000 | 257,382 |
| American General Finance Corp. | | | |
| 5.375% due 10/01/2012 | | 154,000 | 153,247 |
| Amerus Capital I | | | |
| 8.85% due 02/01/2027 | | 101,000 | 106,385 |
| Arch Western Finance LLC | | | |
| 6.75% due 07/01/2013 | | 16,000 | 16,040 |
| Associates Corp. of North America | | | |
| 8.55% due 07/15/2009 | | 81,000 | 89,271 |
| Beneficial Corp. | | | |
| 8.40% due 05/15/2008 | | 47,000 | 50,052 |
| CB Richard Ellis Services, Inc. | | | |
| 9.75% due 05/15/2010 | | 1,000 | 1,085 |
| Investment Quality Bond Fund (continued) | |
| | | Shares or | |
| | | Principal | |
| | | Amount | Value |
|
|
| |
| CORPORATE BONDS (continued) | | | |
| Financial Services (continued) | | | |
| CIT Group, Inc. | | | |
| 5.00% due 02/01/2015 | $ | 175,000 | $ | 168,951 |
| Citigroup, Inc. | | | |
| 4.875% due 05/07/2015 | | 586,000 | 566,112 |
| Credit Suisse First Boston USA, Inc. | | | |
| 6.125% due 11/15/2011 | | 325,000 | 337,555 |
| E*TRADE Financial Corp. | | | |
| 7.375% due 09/15/2013 | | 2,000 | 2,065 |
| 8.00% due 06/15/2011 | | 3,000 | 3,157 |
| Equitable Companies, Inc. | | | |
| 7.00% due 04/01/2028 | | 235,000 | 272,729 |
| Erac USA Finance Company | | | |
| 8.00% due 01/15/2011 | | 534,000 | 589,394 |
| Farmers Exchange Capital | | | |
| 7.05% due 07/15/2028 | | 250,000 | 262,619 |
| Fidelity National Title Group, Inc. | | | |
| 7.30% due 08/15/2011 | | 81,000 | 83,825 |
| Ford Motor Credit Company | | | |
| 7.00% due 10/01/2013 | | 6,000 | 5,273 |
| General Electric Capital Corp. | | | |
| 6.125% due 02/22/2011 | | 67,000 | 69,663 |
| General Electric Capital Corp., MTN | | | |
| 6.75% due 03/15/2032 | | 634,000 | 742,001 |
| General Motors Acceptance Corp. | | | |
| 6.875% due 09/15/2011 | | 135,000 | 120,875 |
| 8.00% due 11/01/2031 | | 20,000 | 18,265 |
| Goldman Sachs Group, Inc. | | | |
| 6.875% due 01/15/2011 | | 108,000 | 115,227 |
| Hartford Financial Services Group, Inc. | | | |
| 7.90% due 06/15/2010 | | 27,000 | 29,665 |
| Household Finance Corp. | | | |
| 6.375% due 11/27/2012 | | 410,000 | 431,445 |
| 7.00% due 05/15/2012 | | 283,000 | 306,314 |
| International Lease Finance Corp. | | | |
| 5.75% due 10/15/2006 | | 94,000 | 94,252 |
| 5.875% due 05/01/2013 | | 150,000 | 153,147 |
| John Deere Capital Corp. | | | |
| 7.00% due 03/15/2012 | | 104,000 | 113,352 |
| JP Morgan Chase Capital XV | | | |
| 5.875% due 03/15/2035 | | 467,000 | 461,729 |
| JSG Funding PLC | | | |
| 9.625% due 10/01/2012 | | 2,000 | 2,095 |
| Lehman Brothers Holdings, Inc. | | | |
| 4.375% due 11/30/2010 | | 117,000 | 113,192 |
| Mizuho Financial Group Cayma | | | |
| 5.79% due 04/15/2014 | | 246,000 | 251,249 |
| Morgan Stanley | | | |
| 4.75% due 04/01/2014 | | 401,000 | 382,409 |
| 6.75% due 04/15/2011 | | 106,000 | 112,898 |
| Morgan Stanley Dean Witter | | | |
| 6.60% due 04/01/2012 | | 135,000 | 143,353 |
| Nationwide Financial Services, Inc. | | | |
| 6.25% due 11/15/2011 | | 196,000 | 203,776 |
| Pemex Finance, Ltd. | | | |
| 8.875% due 11/15/2010 | | 162,000 | 178,343 |
The accompanying notes are an integral part of the financial statements. 197
John Hancock Funds II
Portfolio of investments — February 28, 2006 (Unaudited)
(showing percentage of total net assets)
|
| Investment Quality Bond Fund (continued) | |
| | | Shares or | |
| | | Principal | |
| | | Amount | Value |
|
|
| |
| CORPORATE BONDS (continued) | | | |
| Financial Services (continued) | | | |
| Sun Canada Financial Company | | | |
| 7.25% due 12/15/2015 | $ | 229,000 | $ | 251,567 |
| Sunamerica, Inc. | | | |
| 8.125% due 04/28/2023 | | 135,000 | 172,398 |
| The Goldman Sachs Group, Inc. | | | |
| 6.125% due 02/15/2033 | | 304,000 | 318,241 |
| TIAA Global Markets | | | |
| 4.125% due 11/15/2007 | | 200,000 | 196,526 |
| UFJ Finance Aruba AEC | | | |
| 6.75% due 07/15/2013 | | 111,000 | 119,546 |
| United States Bancorp Oregon | | | |
| 7.50% due 06/01/2026 | | 700,000 | 854,244 |
| Western Financial Bank | | | |
| 9.625% due 05/15/2012 | | 8,000 | 8,980 |
|
|
| | | | 9,215,734 |
| Food & Beverages - 1.49% | | | |
| Ameriqual Group LLC | | | |
| 9.00% due 04/01/2012 | | 2,000 | 2,100 |
| Cia Brasileira de Bebidas | | | |
| 8.75% due 09/15/2013 | | 371,000 | 434,626 |
| General Mills, Inc. | | | |
| 6.00% due 02/15/2012 | | 86,000 | 88,861 |
| Kraft Foods, Inc. | | | |
| 5.625% due 11/01/2011 | | 160,000 | 162,007 |
| 6.50% due 11/01/2031 | | 266,000 | 291,430 |
| Molson Coors Capital Financial | | | |
| 4.85% due 09/22/2010 | | 117,000 | 114,568 |
| Pepsi Bottling Group, Inc., Series B | | | |
| 7.00% due 03/01/2029 | | 142,000 | 168,562 |
| Tricon Global Restaurants, Inc. | | | |
| 7.65% due 05/15/2008 | | 147,000 | 153,975 |
| Tyson Foods, Inc. | | | |
| 8.25% due 10/01/2011 | | 312,000 | 342,519 |
|
|
| | | | 1,758,648 |
| Forest Products - 0.31% | | | |
| Weyerhaeuser Company | | | |
| 6.75% due 03/15/2012 | | 308,000 | 325,538 |
| 7.95% due 03/15/2025 | | 40,000 | 46,137 |
|
|
| | | | 371,675 |
| Gas & Pipeline Utilities - 0.65% | | | |
| Duke Energy Field Services | | | |
| 5.75% due 11/15/2006 | | 33,000 | 33,106 |
| El Paso Production Holding Company | | | |
| 7.75% due 06/01/2013 | | 10,000 | 10,550 |
| Kinder Morgan Energy Partners | | | |
| 7.125% due 03/15/2012 | | 208,000 | 225,487 |
| National Gas Company | | | |
| 6.05% due 01/15/2036 | | 250,000 | 248,712 |
| Northern Border Partners, LP | | | |
| 7.10% due 03/15/2011 | | 135,000 | 144,437 |
| Praxair, Inc. | | | |
| 6.50% due 03/01/2008 | | 81,000 | 82,937 |
| Tennessee Gas Pipeline Company | | | |
| 8.375% due 06/15/2032 | | 5,000 | 6,023 |
| Investment Quality Bond Fund (continued) | |
| | | Shares or | |
| | | Principal | |
| | | Amount | Value |
|
|
| |
| CORPORATE BONDS (continued) | | | |
| Gas & Pipeline Utilities (continued) | | | |
| Williams Companies, Inc. | | | |
| 7.125% due 09/01/2011 | $ | 13,000 | $ | 13,618 |
| 7.875% due 09/01/2021 | | 1,000 | 1,118 |
| 8.125% due 03/15/2012 | | 1,000 | 1,095 |
|
|
| | | | 767,083 |
| Healthcare Products - 0.01% | | | |
| CDRV Investors, Inc. | | | |
| zero coupon, Step up to 9.625% on | | | |
| 01/01/2010 due 01/01/2015 | | 13,000 | 8,905 |
Healthcare Services - 0.28% | | | |
| DaVita, Inc. | | | |
| 6.625% due 03/15/2013 | | 2,000 | 2,030 |
| 7.25% due 03/15/2015 | | 2,000 | 2,040 |
| Healthsouth Corp. | | | |
| 7.625% due 06/01/2012 | | 2,000 | 2,195 |
| 8.375% due 10/01/2011 | | 13,000 | 14,625 |
| Quest Diagnostics, Inc. | | | |
| 5.45% due 11/01/2015 | | 125,000 | 124,526 |
| WellPoint, Inc. | | | |
| 5.00% due 01/15/2011 | | 185,000 | 182,632 |
|
|
| | | | 328,048 |
| Homebuilders - 0.61% | | | |
| Beazer Homes USA, Inc. | | | |
| 8.625% due 05/15/2011 | | 12,000 | 12,570 |
| Centex Corp. | | | |
| 7.875% due 02/01/2011 | | 260,000 | 282,289 |
| D.R. Horton, Inc. | | | |
| 7.875% due 08/15/2011 | | 150,000 | 162,723 |
| 9.75% due 09/15/2010 | | 14,000 | 15,925 |
| KB Home | | | |
| 6.25% due 06/15/2015 | | 5,000 | 4,747 |
| Pulte Homes, Inc. | | | |
| 7.875% due 08/01/2011 | | 100,000 | 108,866 |
| 8.125% due 03/01/2011 | | 125,000 | 136,429 |
|
|
| | | | 723,549 |
| Hotels & Restaurants - 0.26% | | | |
| Aztar Corp. | | | |
| 9.00% due 08/15/2011 | | 4,000 | 4,225 |
| CCM Merger, Inc. | | | |
| 8.00% due 08/01/2013 | | 6,000 | 5,970 |
| Majestic Star LLC | | | |
| 9.75% due 01/15/2011 | | 15,000 | 15,413 |
| Marriott International, Inc. | | | |
| 4.625% due 06/15/2012 | | 228,000 | 217,401 |
| Park Place Entertainment Corp. | | | |
| 8.125% due 05/15/2011 | | 24,000 | 26,340 |
| Riviera Holdings Corp. | | | |
| 11.00% due 06/15/2010 | | 10,000 | 10,750 |
| Wendy's International, Inc. | | | |
| 7.00% due 12/15/2025 | | 24,000 | 24,176 |
|
|
| | | | 304,275 |
Household Products - 0.33% | | | |
| Procter & Gamble, Series A | | | |
| 9.36% due 01/01/2021 | | 300,000 | 387,171 |
The accompanying notes are an integral part of the financial statements. 198
John Hancock Funds II
Portfolio of investments — February 28, 2006 (Unaudited)
(showing percentage of total net assets)
|
| Investment Quality Bond Fund (continued) | |
| | | Shares or | |
| | | Principal | |
| | | Amount | Value |
|
|
| |
| CORPORATE BONDS (continued) | | | |
| Industrial Machinery - 0.01% | | | |
| The Manitowoc Company, Inc. | | | |
| 10.50% due 08/01/2012 | $ | 7,000 | $ | 7,753 |
| Industrials - 0.02% | | | |
| Dynegy Holdings, Inc. | | | |
| 7.125% due 05/15/2018 | | 15,000 | 14,625 |
| Goodman Global Holding Company, Inc. | | | |
| 7.875% due 12/15/2012 | | 10,000 | 9,775 |
|
|
| | | | 24,400 |
| |
| Insurance - 4.69% | | | |
| AAG Holding Company, Inc. | | | |
| 6.875% due 06/01/2008 | | 231,000 | 237,541 |
| ACE Capital Trust II | | | |
| 9.70% due 04/01/2030 | | 198,000 | 274,964 |
| AIG SunAmerica Global Financing X | | | |
| 6.90% due 03/15/2032 | | 100,000 | 115,725 |
| Allstate Corp. | | | |
| 5.55% due 05/09/2035 | | 294,000 | 289,970 |
| Cigna Corp. | | | |
| 7.875% due 05/15/2027 | | 11,000 | 13,286 |
| Dai Ichi Mutual Life Insurance Company | | | |
| 5.73% due 03/17/2014 | | 200,000 | 201,183 |
| Equitable Life Assurance Society | | | |
| 7.70% due 12/01/2015 | | 250,000 | 290,272 |
| Everest Reinsurance Holdings, Inc. | | | |
| 8.75% due 03/15/2010 | | 394,000 | 440,607 |
| Florida Windstorm Underwriting Association, | | |
| Series 1999 | | | |
| 7.125% due 02/25/2019 | | 503,000 | 568,623 |
| Jackson National Life Insurance Company | | | |
| 8.15% due 03/15/2027 | | 377,000 | 472,749 |
| Liberty Mutual Insurance Company | | | |
| 7.697% due 10/15/2097 | | 429,000 | 464,308 |
| Metlife, Inc. | | | |
| 5.375% due 12/15/2012 | | 150,000 | 151,092 |
| 5.70% due 06/15/2035 | | 208,000 | 207,722 |
| Nationwide Mutual Insurance Company | | | |
| 8.25% due 12/01/2031 | | 260,000 | 323,746 |
| New York Life Insurance Company | | | |
| 5.875% due 05/15/2033 | | 100,000 | 103,576 |
| Ohio National Life Insurance Company | | | |
| 8.50% due 05/15/2026 | | 155,000 | 187,438 |
| Premium Asset Trust | | | |
| 4.125% due 03/12/2009 | | 87,000 | 83,261 |
| Principal Life Global Funding I | | | |
| 6.125% due 10/15/2033 | | 108,000 | 115,438 |
| Prudential Financial | | | |
| 7.65% due 07/01/2007 | | 200,000 | 206,337 |
| Reinsurance Group of America, Inc. | | | |
| 6.75% due 12/15/2011 | | 135,000 | 142,014 |
| Safeco Corp. | | | |
| 4.875% due 02/01/2010 | | 132,000 | 129,959 |
| 7.25% due 09/01/2012 | | 18,000 | 19,777 |
| The St. Paul Companies, Inc. | | | |
| 5.50% due 12/01/2015 | | 55,000 | 54,983 |
| Investment Quality Bond Fund (continued) | |
| | | Shares or | |
| | | Principal | |
| | | Amount | Value |
|
|
| |
| CORPORATE BONDS (continued) | | | |
| Insurance (continued) | | | |
| The St. Paul Companies, Inc. | | | |
| 5.75% due 03/15/2007 | $ | 127,000 | $ | 126,917 |
| WR Berkley Corp. | | | |
| 5.125% due 09/30/2010 | | 54,000 | 53,180 |
| 5.60% due 05/15/2015 | | 263,000 | 259,081 |
|
|
| | | | 5,533,749 |
| International Oil - 0.30% | | | |
| Canadian Natural Resources, Ltd. | | | |
| 6.45% due 06/30/2033 | | 37,000 | 39,968 |
| Kerr-McGee Corp. | | | |
| 7.125% due 10/15/2027 | | 15,000 | 15,976 |
| Pemex Project Funding Master Trust | | | |
| 9.125% due 10/13/2010 | | 260,000 | 299,000 |
|
|
| | | | 354,944 |
| Internet Retail - 0.23% | | | |
| InterActive Corp. | | | |
| 7.00% due 01/15/2013 | | 260,000 | 268,514 |
Investment Companies - 0.14% | | | |
| Canadian Oil Sands | | | |
| 7.90% due 09/01/2021 | | 135,000 | 163,926 |
Leisure Time - 0.47% | | | |
| AMC Entertainment, Inc. | | | |
| 11.00% due 02/01/2016 | | 15,000 | 15,094 |
| Mandalay Resort Group | | | |
| 10.25% due 08/01/2007 | | 7,000 | 7,429 |
| MGM Mirage, Inc. | | | |
| 6.00% due 10/01/2009 | | 20,000 | 19,900 |
| Movie Gallery, Inc. | | | |
| 11.00% due 05/01/2012 | | 2,000 | 1,315 |
| Seneca Gaming Corp. | | | |
| 7.25% due 05/01/2012 | | 1,000 | 1,015 |
| Station Casinos, Inc. | | | |
| 6.00% due 04/01/2012 | | 5,000 | 5,000 |
| 6.625% due 03/15/2018 | | 5,000 | 4,988 |
| 6.875% due 03/01/2016 | | 1,000 | 1,017 |
| Time Warner, Inc. | | | |
| 7.70% due 05/01/2032 | | 427,000 | 491,758 |
| Wynn Las Vegas LLC | | | |
| 6.625% due 12/01/2014 | | 9,000 | 8,865 |
|
|
| | | | 556,381 |
| Life Sciences - 0.00% | | | |
| Fisher Scientific International, Inc. | | | |
| 6.125% due 07/01/2015 | | 4,000 | 4,005 |
| 6.75% due 08/15/2014 | | 1,000 | 1,043 |
|
|
| | | | 5,048 |
| Manufacturing - 0.29% | | | |
| Clarke American Corp. | | | |
| 11.75% due 12/15/2013 | | 5,000 | 5,012 |
| Koppers, Inc. | | | |
| 9.875% due 10/15/2013 | | 2,000 | 2,160 |
| Tyco International Group SA | | | |
| 6.75% due 02/15/2011 | | 325,000 | 340,951 |
|
|
| | | | 348,123 |
The accompanying notes are an integral part of the financial statements. 199
John Hancock Funds II
Portfolio of investments — February 28, 2006 (Unaudited)
(showing percentage of total net assets)
|
| Investment Quality Bond Fund (continued) | |
| | | Shares or | |
| | | Principal | |
| | | Amount | Value |
|
|
| |
| CORPORATE BONDS (continued) | | | |
| Medical-Hospitals - 0.20% | | | |
| HCA, Inc. | | | |
| 6.375% due 01/15/2015 | $ | 5,000 | $ | 4,992 |
| 7.875% due 02/01/2011 | | 20,000 | 21,371 |
| Laboratory Corp. of America Holdings | | | |
| 5.625% due 12/15/2015 | | 200,000 | 201,102 |
| Triad Hospitals, Inc. | | | |
| 7.00% due 05/15/2012 | | 4,000 | 4,080 |
|
|
| | | | 231,545 |
| |
| Metal & Metal Products - 0.16% | | | |
| Hawk Corp. | | | |
| 8.75% due 11/01/2014 | | 2,000 | 2,020 |
| Inco, Ltd. | | | |
| 5.70% due 10/15/2015 | | 33,000 | 32,518 |
| Novelis, Inc. | | | |
| 7.25% due 02/15/2015 | | 3,000 | 2,910 |
| Vale Overseas, Ltd. | | | |
| 6.25% due 01/11/2016 | | 150,000 | 153,600 |
|
|
| | | | 191,048 |
| |
| Mining - 0.18% | | | |
| Corporacion Nacional Del Cobre de Chile - | | | |
| CODELCO | | | |
| 6.375% due 11/30/2012 | | 200,000 | 212,488 |
Newspapers - 0.11% | | | |
| News America Holdings, Inc. | | | |
| 9.25% due 02/01/2013 | | 109,000 | 130,188 |
Office Furnishings & Supplies - 0.00% | | | |
| IKON Office Solutions, Inc. | | | |
| 7.75% due 09/15/2015 | | 5,000 | 5,050 |
Paper - 0.18% | | | |
| Abitibi-Consolidated, Inc. | | | |
| 8.55% due 08/01/2010 | | 9,000 | 8,887 |
| Bowater Canada Finance Corp. | | | |
| 7.95% due 11/15/2011 | | 16,000 | 15,680 |
| Georgia-Pacific Corp. | | | |
| 8.00% due 01/15/2024 | | 7,000 | 7,000 |
| Longview Fibre Company | | | |
| 10.00% due 01/15/2009 | | 2,000 | 2,100 |
| Norske Skog Canada, Ltd. | | | |
| 8.625% due 06/15/2011 | | 5,000 | 4,950 |
| Temple-Inland, Inc. | | | |
| 6.625% due 01/15/2018 | | 125,000 | 130,081 |
| Willamette Industries, Inc. | | | |
| 7.00% due 02/01/2018 | | 40,000 | 42,044 |
|
|
| | | | 210,742 |
| |
| Petroleum Services - 0.52% | | | |
| Baker Hughes, Inc. | | | |
| 6.875% due 01/15/2029 | | 27,000 | 31,756 |
| Halliburton Company | | | |
| 5.50% due 10/15/2010 | | 192,000 | 194,247 |
| Hornbeck Offshore Services, Inc. | | | |
| 6.125% due 12/01/2014 | | 3,000 | 2,977 |
| Noram Energy Corp. | | | |
| 6.50% due 02/01/2008 | | 263,000 | 268,151 |
| Investment Quality Bond Fund (continued) | |
| | | Shares or | |
| | | Principal | |
| | | Amount | Value |
|
|
| |
| CORPORATE BONDS (continued) | | | |
| Petroleum Services (continued) | | | |
| Petroleum Export, Ltd. | | | |
| 5.265% due 06/15/2011 | $ | 119,000 | $ | 116,915 |
| Pride International, Inc. | | | |
| 7.375% due 07/15/2014 | | 5,000 | 5,338 |
|
|
| | | | 619,384 |
| Pharmaceuticals - 0.42% | | | |
| AmerisourceBergen Corp. | | | |
| 5.625% due 09/15/2012 | | 3,000 | 2,984 |
| 5.875% due 09/15/2015 | | 3,000 | 3,019 |
| Athena Neurosciences, Inc. | | | |
| 7.25% due 02/21/2008 | | 3,000 | 2,917 |
| Mylan Laboratories Inc. | | | |
| 6.375% due 08/15/2015 | | 4,000 | 4,045 |
| Omnicare, Inc. | | | |
| 6.75% due 12/15/2013 | | 5,000 | 5,088 |
| 6.875% due 12/15/2015 | | 5,000 | 5,100 |
| Schering Plough Corp. | | | |
| 5.55% due 12/01/2013 (b) | | 85,000 | 85,700 |
| 6.75% due 12/01/2033 (b) | | 344,000 | 388,408 |
|
|
| | | | 497,261 |
| Publishing - 0.11% | | | |
| Dex Media East LLC | | | |
| 12.125% due 11/15/2012 | | 4,000 | 4,615 |
| Dex Media, Inc. | | | |
| zero coupon, Step up to 9.00% on | | | |
| 11/15/2008 due 11/15/2013 | | 7,000 | 5,880 |
| 8.00% due 11/15/2013 | | 15,000 | 15,525 |
| E.W. Scripps Company | | | |
| 6.625% due 10/15/2007 | | 67,000 | 68,066 |
| Scholastic Corp. | | | |
| 5.00% due 04/15/2013 | | 35,000 | 31,448 |
|
|
| | | | 125,534 |
| Railroads & Equipment - 0.15% | | | |
| Canadian National Railway Company | | | |
| 7.375% due 10/15/2031 | | 142,000 | 178,177 |
| Greenbrier Companies, Inc. | | | |
| 8.375% due 05/15/2015 | | 2,000 | 2,100 |
|
|
| | | | 180,277 |
| Real Estate - 2.78% | | | |
| AMB Property LP, REIT | | | |
| 5.45% due 12/01/2010 | | 80,000 | 79,914 |
| 7.50% due 06/30/2018 | | 106,000 | 119,205 |
| Developers Diversified Realty Corp., REIT | | | |
| 5.375% due 10/15/2012 | | 228,000 | 224,695 |
| Duke Realty Corp. LP, REIT | | | |
| 5.25% due 01/15/2010 | | 275,000 | 272,814 |
| EOP Operating LP, REIT | | | |
| 4.65% due 10/01/2010 | | 50,000 | 48,196 |
| ERP Operating LP, REIT | | | |
| 5.125% due 03/15/2016 | | 201,000 | 194,989 |
| 5.375% due 08/01/2016 | | 125,000 | 123,785 |
| Federal Realty Investment Trust, REIT | | | |
| 5.65% due 06/01/2016 | | 55,000 | 54,867 |
The accompanying notes are an integral part of the financial statements. 200
John Hancock Funds II
Portfolio of investments — February 28, 2006 (Unaudited)
(showing percentage of total net assets)
|
| Investment Quality Bond Fund (continued) | |
| | | Shares or | |
| | | Principal | |
| | | Amount | Value |
|
|
| |
| CORPORATE BONDS (continued) | | | |
| Real Estate (continued) | | | |
| Health Care Property Investors, Inc., REIT | | | |
| 6.00% due 03/01/2015 | $ | 75,000 | $ | 75,827 |
| 7.072 due 06/08/2015 (b) | | 67,000 | 72,599 |
| Healthcare Realty Trust, Inc., REIT | | | |
| 8.125% due 05/01/2011 | | 377,000 | 414,449 |
| Host Marriott LP, REIT | | | |
| 9.50% due 01/15/2007 | | 16,000 | 16,500 |
| Kimco Realty Corp. - REIT | | | |
| 5.584% due 11/23/2015 | | 125,000 | 124,356 |
| Liberty Property LP, REIT | | | |
| 7.25% due 03/15/2011 | | 377,000 | 405,168 |
| Prologis, REIT | | | |
| 5.625% due 11/15/2015 | | 175,000 | 174,973 |
| Realty Income Corp., REIT | | | |
| 5.375% due 09/15/2017 | | 135,000 | 130,001 |
| Regency Centers LP, REIT | | | |
| 7.95% due 01/15/2011 | | 169,000 | 186,223 |
| Simon Property Group LP, REIT | | | |
| 5.10% due 06/15/2015 | | 129,000 | 124,583 |
| 5.75% due 12/01/2015 | | 225,000 | 227,176 |
| Spieker Properties LP, REIT | | | |
| 7.25% due 05/01/2009 | | 60,000 | 63,608 |
| United Dominion Realty Trust, Inc., REIT | | | |
| 5.25% due 01/15/2016 | | 142,000 | 136,016 |
| Ventas Realty LP, REIT | | | |
| 6.75% due 06/01/2010 | | 2,000 | 2,043 |
| 7.125% due 06/01/2015 | | 3,000 | 3,142 |
|
|
| | | | 3,275,129 |
| Retail - 0.31% | | | |
| CVS Lease Pass Through | | | |
| 5.88% due 01/10/2028 | | 364,524 | 362,355 |
Retail Grocery - 0.17% | | | |
| Delhaize America, Inc. | | | |
| 9.00% due 04/15/2031 | | 2,000 | 2,386 |
| Kroger Co. | | | |
| 6.75% due 04/15/2012 | | 179,000 | 188,401 |
| Pathmark Stores, Inc. | | | |
| 8.75% due 02/01/2012 | | 8,000 | 7,600 |
|
|
| | | | 198,387 |
| Retail Trade - 0.61% | | | |
| Federated Department Stores, Inc. | | | |
| 6.90% due 04/01/2029 | | 156,000 | 170,312 |
| Fortune Brands, Inc. | | | |
| 5.125% due 01/15/2011 | | 170,000 | 167,939 |
| GSC Holdings Corp. | | | |
| 8.00% due 10/01/2012 | | 8,000 | 7,980 |
| Lazy Days RV Center, Inc. | | | |
| 11.75% due 05/15/2012 | | 9,000 | 9,180 |
| Neff Corp. | | | |
| 11.25% due 06/15/2012 | | 5,000 | 5,425 |
| Target Corp. | | | |
| 6.35% due 01/15/2011 | | 142,000 | 149,463 |
| Wal-Mart Stores, Inc. | | | |
| 4.125% due 02/15/2011 | | 218,000 | 208,828 |
|
|
| | | | 719,127 |
| Investment Quality Bond Fund (continued) | |
| | | Shares or | |
| | | Principal | |
| | | Amount | Value |
|
|
| |
| CORPORATE BONDS (continued) | | | |
| Sanitary Services - 0.02% | | | |
| Allied Waste North America, Inc. | | | |
| 8.50% due 12/01/2008 | $ | 22,000 | $ | 23,182 |
Semiconductors - 0.01% | | | |
| Amkor Technology, Inc. | | | |
| 7.125% due 03/15/2011 | | 6,000 | 5,640 |
| 7.75% due 05/15/2013 | | 5,000 | 4,737 |
| MagnaChip Semiconductor SA | | | |
| 6.875% due 12/15/2011 | | 2,000 | 1,973 |
| 8.00% due 12/15/2014 | | 3,000 | 2,895 |
|
|
| | | | 15,245 |
| |
| Software - 0.00% | | | |
| Activant Solutions, Inc. | | | |
| 10.53% due 04/01/2010 (b) | | 5,000 | 5,125 |
Steel - 0.01% | | | |
| United States Steel LLC | | | |
| 10.75% due 08/01/2008 | | 9,000 | 9,945 |
Telecommunications Equipment & | | | |
| Services - 0.78% | | | |
| Bellsouth Corp. | | | |
| 4.75% due 11/15/2012 | | 302,000 | 292,266 |
| Citizens Communications Company | | | |
| 9.25% due 05/15/2011 | | 12,000 | 13,290 |
| France Telecom SA | | | |
| 8.00% due 03/01/2011 | | 267,000 | 294,381 |
| GCI, Inc. | | | |
| 7.25% due 02/15/2014 | | 15,000 | 14,737 |
| Insight Midwest LP | | | |
| 10.50% due 11/01/2010 | | 12,000 | 12,645 |
| Insight Midwest LP/ Insight Capital, Inc. | | | |
| 9.75% due 10/01/2009 | | 4,000 | 4,130 |
| Intelsat Bermuda, Ltd. | | | |
| 8.625% due 01/15/2015 | | 2,000 | 2,075 |
| Intelsat, Ltd. | | | |
| 8.25% due 01/15/2013 | | 17,000 | 17,382 |
| Lucent Technologies, Inc. | | | |
| 6.45% due 03/15/2029 | | 2,000 | 1,688 |
| Panamsat Corp. | | | |
| 9.00% due 08/15/2014 | | 1,000 | 1,055 |
| Singapore Telecommunications, Ltd. | | | |
| 7.375% due 12/01/2031 | | 208,000 | 254,487 |
| Syniverse Technologies Inc., Series B | | | |
| 7.75% due 08/15/2013 | | 6,000 | 6,015 |
| United States West Communications, Inc. | | | |
| 6.875% due 09/15/2033 | | 3,000 | 2,880 |
|
|
| | | | 917,031 |
| |
| Telephone - 1.34% | | | |
| Alltel Corp. | | | |
| 7.875% due 07/01/2032 | | 40,000 | 50,002 |
| Ameritech Capital Funding Corp. | | | |
| 6.45% due 01/15/2018 | | 148,000 | 149,872 |
| AT&T Corp. | | | |
| 9.05%, Step down to 7.3% on 05/15/2006 | | |
| due 11/15/2011 (b) | | 9,000 | 9,859 |
The accompanying notes are an integral part of the financial statements. 201
John Hancock Funds II
Portfolio of investments — February 28, 2006 (Unaudited)
(showing percentage of total net assets)
|
| Investment Quality Bond Fund (continued) | |
| | | Shares or | |
| | | Principal | |
| | | Amount | Value |
| |
|
| |
| CORPORATE BONDS (continued) | | | |
| Telephone (continued) | | | |
| AT&T Corp. (continued) | | | |
| 9.75%, Step down to 8.0% on | | | |
| 05/15/2006 due 11/15/2031 (b) | $ | 2,000 | $ | 2,502 |
| British Telecommunications PLC | | | |
| 8.375% due 12/15/2010 | | 156,000 | 175,448 |
| Qwest Capital Funding, Inc. | | | |
| 7.25% due 02/15/2011 | | 5,000 | 5,088 |
| Qwest Communications International, Inc. | | | |
| 7.25% due 02/15/2011 | | 13,000 | 13,276 |
| Sprint Capital Corp. | | | |
| 6.875% due 11/15/2028 | | 402,000 | 438,035 |
| Telecom Italia Capital SA | | | |
| 6.00% due 09/30/2034 | | 409,000 | 386,769 |
| Verizon Communications, Inc. | | | |
| 8.75% due 11/01/2021 | | 285,000 | 349,397 |
|
|
| | | | 1,580,248 |
| |
| Tobacco - 0.25% | | | |
| Alliance One International, Inc. | | | |
| 11.00% due 05/15/2012 | | 2,000 | 1,875 |
| Altria Group, Inc. | | | |
| 7.00% due 11/04/2013 | | 269,000 | 292,201 |
| RJ Reynolds Tobacco Holdings, Inc. | | | |
| 7.30% due 07/15/2015 | | 6,000 | 6,217 |
|
|
| | | | 300,293 |
| |
| Trucking & Freight - 0.00% | | | |
| Navistar International Corp. | | | |
| 6.25% due 03/01/2012 | | 2,000 | 2,015 |
|
| TOTAL CORPORATE BONDS (Cost $48,241,849) | | $ | 48,284,176 |
|
| |
| MUNICIPAL BONDS - 0.97% | | | |
| Arizona - 0.12% | | | |
| Phoenix Arizona Civic Improvement Corp. | | | |
| 6.30% due 07/01/2008 | | 135,000 | 138,582 |
California - 0.44% | | | |
| Los Angeles County California Pension, Series A | | |
| 8.62% due 06/30/2006 | | 200,000 | 202,408 |
| San Bernardino County California, Series A | | |
| 5.15% due 08/01/2011 | | 120,000 | 119,771 |
| Southern California Public Power Authority Project, | | |
| Series B | | | |
| 6.93% due 05/15/2017 | | 175,000 | 201,591 |
|
|
| | | | 523,770 |
| |
| Florida - 0.14% | | | |
| Miami Beach Florida Redevelopment Agency Tax | | |
| Increment Revenue | | | |
| 8.95% due 12/01/2022 | | 135,000 | 160,932 |
Indiana - 0.01% | | | |
| Indiana Bond Bank Revenue | | | |
| 5.02% due 01/15/2016 | | 15,000 | 14,770 |
Maryland - 0.03% | | | |
| Maryland State Transportation Authority, Ltd. | | |
| 5.84% due 07/01/2011 | | 40,000 | 41,441 |
| Investment Quality Bond Fund (continued) | |
| | | Shares or | |
| | | Principal | |
| | | Amount | Value |
| |
|
| |
| MUNICIPAL BONDS (continued) | | | |
| Michigan - 0.16% | | | |
| Detroit Michigan Downtown Development Authority | | |
| 6.20% due 07/01/2008 | $ | 180,000 | $ | 184,383 |
New Jersey - 0.02% | | | |
| Jersey City New Jersey Municipal Utilities Authority | | |
| 4.55% due 05/15/2012 | | 20,000 | 19,348 |
New York - 0.05% | | | |
| Sales Tax Asset Receivable Corp., Series B | | |
| 4.25% due 10/15/2011 | | 65,000 | 62,206 |
|
| TOTAL MUNICIPAL BONDS (Cost $1,161,312) | | $ | 1,145,432 |
|
| |
| COLLATERALIZED MORTGAGE | | | |
| OBLIGATIONS - 7.24% | | | |
| Asset Securitization Corp., | | | |
| Series 1997-D5, Class A1B | | | |
| 6.66% due 02/14/2043 | | 98,820 | 99,663 |
| Asset Securitization Corp., | | | |
| Series 1997-D5, Class A1D | | | |
| 6.85% due 02/14/2043 | | 500,000 | 528,897 |
| Banc of America Commercial Mortgage, Inc., | | |
| Series 2002-PB2 Class A4 | | | |
| 6.186% due 06/11/2035 | | 405,797 | 423,798 |
| Bear Stearns Commercial Mortgage Securities, | | |
| Inc., Series 2003-T12, Class A4 | | | |
| 4.68% due 08/13/2039 | | 405,797 | 390,315 |
| Chase Commercial Mortgage Securities Corp., | | |
| Series 1998-1, Class A2 | | | |
| 6.56% due 05/18/2030 | | 438,210 | 447,681 |
| Chase Commercial Mortgage Securities Corp., | | |
| Series 1998-2, Class A2 | | | |
| 6.39% due 11/18/2030 | | 322,685 | 331,460 |
| Citigroup/Deutsche Bank Commercial Mortgage | | |
| Trust, Series 2005-CD1, Class A4 | | | |
| 5.224% due 09/15/2020 | | 500,000 | 500,380 |
| Commercial Mortgage Asset Trust, Series | | | |
| 1999-C1, Class A3 | | | |
| 6.64% due 01/17/2032 | | 405,797 | 421,131 |
| Commercial Mortgage Pass Through Certificates, | | |
| Series 2005-C6, Class A5A | | | |
| 5.116% due 06/10/2044 (b) | | 500,000 | 493,471 |
| CS First Boston Mortgage Securities Corp, Series | | |
| 2003-C3, Class A5 | | | |
| 3.936% due 05/15/2038 | | 500,000 | 460,334 |
| First Union - Chase Commercial Mortgage, | | |
| Series 1999-C2, Class A2 | | | |
| 6.645% due 06/15/2031 | | 384,658 | 397,952 |
| General Electric Capital Assurance Company, | | |
| Series 2003-1, Class A5 | | | |
| 5.7426% due 05/12/2035 | | 89,275 | 92,368 |
| Government National Mortgage Association, | | |
| Series 2005-74, Class HA | | | |
| 7.50% due 09/16/2035 | | 58,235 | 61,183 |
| Government National Mortgage Association, | | |
| Series 2005-74, Class HB | | | |
| 7.50% due 09/16/2035 | | 40,222 | 41,956 |
The accompanying notes are an integral part of the financial statements. 202
John Hancock Funds II
Portfolio of investments — February 28, 2006 (Unaudited)
(showing percentage of total net assets)
|
| Investment Quality Bond Fund (continued) | |
| | | Shares or | |
| | | Principal | |
| | | Amount | Value |
|
|
| |
| COLLATERALIZED MORTGAGE | | | |
| OBLIGATIONS (continued) | | | |
| Government National Mortgage Association, | | |
| Series 2005-74, Class HC | | | |
| 7.50% due 09/16/2035 | $ | 28,577 | $ | 30,024 |
| Greenwich Capital Commercial Funding Corp., | | |
| Series 2005-GG5, Class A5 | | | |
| 5.224% due 04/10/2037 (b) | | 500,000 | 497,386 |
| JP Morgan Chase Commercial Mortgage | | | |
| Securities Corp., Series 2005-LDP4, Class A4 | | |
| 4.918% due 10/15/2042 (b) | | 500,000 | 485,737 |
| LB-UBS Commercial Mortgage Trust, | | | |
| Series 2001-C7, Class A3 | | | |
| 5.642% due 12/15/2025 | | 349,312 | 352,577 |
| LB-UBS Commercial Mortgage Trust, | | | |
| Series 2002-C1, Class A4 | | | |
| 6.462% due 03/15/2031 | | 202,898 | 215,746 |
| Merrill Lynch Mortgage Trust, Series 2005-CIP1, | | |
| Class A4 | | | |
| 5.047% due 07/12/2038 (b) | | 500,000 | 490,801 |
| Morgan Stanley Capital I, Inc., Series 1998-WF2, | | |
| Class A2 | | | |
| 6.54% due 07/15/2030 | | 148,953 | 152,394 |
| Morgan Stanley Capital I, Inc., Series 1999-WF1, | | |
| Class A2 | | | |
| 6.21% due 11/15/2031 | | 390,298 | 397,958 |
| Morgan Stanley Dean Witter Capital I, Series | | |
| 2001-TOP5, Class A4 | | | |
| 6.39% due 10/15/2035 | | 270,531 | 284,502 |
| Morgan Stanley Dean Witter Capital I, | | | |
| Series 2001, Class A4 | | | |
| 6.39% due 07/15/2033 | | 113,623 | 119,210 |
| Morgan Stanley Dean Witter | | | |
| Capital I, Series 2002-TOP7, Class A2 | | | |
| 5.98% due 01/15/2039 | | 40,579 | 42,105 |
| Nomura Asset Securities Corp., | | | |
| Series 1998-D6, Class A1B | | | |
| 6.59% due 03/15/2030 | | 385,507 | 396,044 |
| Prudential Commercial Mortgage Trust, | | | |
| Series 2003-PWR1, Class A2 | | | |
| 4.493% due 02/11/2036 | | 405,797 | 387,467 |
|
| TOTAL COLLATERALIZED MORTGAGE OBLIGATIONS | |
| (Cost $8,579,035) | | | $ | 8,542,540 |
|
| |
| ASSET BACKED SECURITIES - 7.81% | | |
| Advanta Business Card Master Trust, | | | |
| Series 2005-A4, Class A4 | | | |
| 4.75% due 01/20/2011 | | 370,000 | 368,112 |
| AESOP Funding II LLC, Series 2003-4, Class A | | |
| 2.86% due 08/20/2009 | | 235,000 | 223,715 |
| AmeriCredit Automobile Receivables Trust, | | |
| Series 2005-AX, Class A4 | | | |
| 3.93% due 10/06/2011 | | 700,000 | 685,235 |
| Bank One Auto Securitization Trust, | | | |
| Series 2003-1, Class A4 | | | |
| 2.43% due 03/22/2010 | | 602,000 | 587,982 |
| Capital One Multi-Asset Execution Trust, | | | |
| Series 2003-A4, Class A4 | | | |
| 3.65% due 07/15/2011 | | 415,000 | 401,766 |
| Investment Quality Bond Fund (continued) | |
| | | Shares or | |
| | | Principal | |
| | | Amount | Value |
|
|
| |
| ASSET BACKED SECURITIES | | | |
| (continued) | | | |
| Carmax Auto Owner Trust, | | | |
| Series 2004-2, Class A4 | | | |
| 3.46% due 09/15/2011 | $ | 405,000 | $ | 392,571 |
| Chase Manhattan Auto Owner Trust, | | | |
| Series 2005-B, Class A4 | | | |
| 4.88% due 06/15/2012 | | 700,000 | 697,624 |
| Ford Credit Auto Owner Trust, Series 2005-C, | | |
| Class A4 | | | |
| 4.36% due 06/15/2010 | | 279,000 | 273,740 |
| Harley-Davidson Motorcycle Trust, | | | |
| Series 2005-1, Class A2 | | | |
| 3.76% due 12/17/2012 | | 405,000 | 396,258 |
| Honda Auto Receivables Owner Trust, | | | |
| Series 2005-1, Class A4 | | | |
| 3.82% due 05/21/2010 | | 606,000 | 590,142 |
| M&I Auto Loan Trust, Series 2005-1, Class A4 | | |
| 4.86% due 03/21/2011 | | 700,000 | 696,711 |
| Massachusetts RRB Special Purpose Trust, | | |
| Series 1999-1, Class A5 | | | |
| 7.03% due 03/15/2012 | | 600,000 | 632,480 |
| Massachusetts RRB Special Purpose Trust, | | |
| Series 2001-1, Class A | | | |
| 6.53% due 06/01/2015 | | 97,156 | 102,120 |
| MBNA Credit Card Master Note Trust, | | | |
| Series 2001-A1, Class A | | | |
| 5.75% due 10/15/2008 | | 270,000 | 270,693 |
| Peco Energy Transition Trust, | | | |
| Series 2001-A, Class A1 | | | |
| 6.52% due 12/31/2010 | | 33,000 | 34,800 |
| Providian Gateway Master Trust, | | | |
| Series 2004-DA, Class A | | | |
| 3.35% due 09/15/2011 | | 405,000 | 394,071 |
| USAA Auto Owner Trust, Series 2004-1, Class A4 | | |
| 2.67% due 10/15/2010 | | 112,000 | 108,960 |
| USAA Auto Owner Trust, Series 2005-4, Class A4 | | |
| 4.89% due 08/15/2012 | | 700,000 | 697,589 |
| Wachovia Auto Owner Trust, | | | |
| Series 2005-B, Class A5 | | | |
| 4.93% due 11/20/2012 | | 700,000 | 698,688 |
| WFS Financial Owner Trust, | | | |
| Series 2005-2, Class A4 | | | |
| 4.39% due 11/19/2012 | | 290,000 | 286,577 |
| World Omni Auto Receivables Trust, | | | |
| Series 2005-A, Class A4 | | | |
| 3.82% due 11/12/2011 | | 700,000 | 681,165 |
|
| TOTAL ASSET BACKED SECURITIES | | | |
| (Cost $9,251,078) | | | $ | 9,220,999 |
|
The accompanying notes are an integral part of the financial statements. 203
John Hancock Funds II
Portfolio of investments — February 28, 2006 (Unaudited)
(showing percentage of total net assets)
|
| Investment Quality Bond Fund (continued) | |
| | | Shares or | |
| | | Principal | |
| | | Amount | Value |
|
|
| |
| REPURCHASE AGREEMENTS - 11.80% | | |
| Bank of America Repurchase | | | |
| Agreement dated 02/28/2006 at | | | |
| 4.50% to be repurchased at | | | |
| $13,919,740 on 03/01/2006, | | | |
| collaterized by $14,395,000 | | | |
| U.S.Treasury Bills, 0% due | | | |
| 06/15/2006 (valued at | | | |
| $14,202,039 including interest) (c) | $ | 13,918,000 | $ | 13,918,000 |
|
| TOTAL REPURCHASE AGREEMENTS | | | |
| (Cost $13,918,000) | | | $ | 13,918,000 |
|
| Total Investments (Investment Quality Bond Fund) | |
| (Cost $116,976,376) - 99.15% | | | $ | 116,972,191 |
| Other Assets in Excess of Liabilities - 0.85% | | 996,848 |
|
|
| TOTAL NET ASSETS - 100.00% | | | $ | 117,969,039 |
|
|
| |
| |
| Large Cap Fund | | | |
| | | Shares or | |
| | | Principal | |
| | | Amount | Value |
|
|
| |
| COMMON STOCKS - 96.88% | | | |
| Advertising - 1.96% | | | |
| Omnicom Group, Inc. | | 41,775 $ | 3,334,481 |
Aerospace - 2.80% | | | |
| Lockheed Martin Corp. | | 36,488 | 2,658,881 |
| Northrop Grumman Corp. | | 32,865 | 2,106,646 |
|
|
| | | | 4,765,527 |
Auto Parts - 2.18% | | | |
| BorgWarner, Inc. | | 17,569 | 979,823 |
| Johnson Controls, Inc. | | 38,227 | 2,724,438 |
|
|
| | | | 3,704,261 |
Banking - 4.75% | | | |
| Fifth Third Bancorp. | | 79,195 | 3,060,887 |
| Wells Fargo Company | | 78,239 | 5,022,944 |
|
|
| | | | 8,083,831 |
Biotechnology - 2.40% | | | |
| Cephalon, Inc. * (a) | | 19,003 | 1,510,358 |
| Genzyme Corp. * | | 37,102 | 2,572,653 |
|
|
| | | | 4,083,011 |
Broadcasting - 0.74% | | | |
| Clear Channel Communications, Inc. | | 16,358 | 462,931 |
| Univision Communications, Inc., Class A * | 23,755 | 794,605 |
|
|
| | | | 1,257,536 |
Building Materials & Construction - 1.96% | | |
| Masco Corp. | | 106,578 | 3,324,168 |
| Business Services - 2.15% | | | |
| Accenture, Ltd., Class A | | 47,870 | 1,563,434 |
| Cendant Corp. | | 69,914 | 1,161,971 |
| R.H. Donnelley Corp. * | | 15,324 | 934,764 |
|
|
| | | | 3,660,169 |
| Large Cap Fund (continued) | | | |
| | Shares or | | |
| | Principal | | |
| | Amount | | Value |
|
|
| |
| COMMON STOCKS (continued) | | | |
| Cable and Television - 1.02% | | | |
| DIRECTV Group, Inc. * | 109,609 | $ | 1,727,438 |
Computers & Business Equipment - 1.11% | | | |
| Dell, Inc. * | 65,000 | | 1,885,000 |
Crude Petroleum & Natural Gas - 1.70% | | | |
| Marathon Oil Corp. | 40,869 | | 2,885,351 |
Drugs & Health Care - 3.42% | | | |
| Wyeth | 116,818 | | 5,817,536 |
Electrical Utilities - 4.22% | | | |
| American Electric Power Company, Inc. | 39,643 | | 1,446,970 |
| Exelon Corp. | 80,413 | | 4,592,386 |
| Northeast Utilities | 20,600 | | 404,172 |
| Pepco Holdings, Inc. | 30,981 | | 736,418 |
|
|
| | | | 7,179,946 |
| Energy - 1.06% | | | |
| Sempra Energy | 37,614 | | 1,799,454 |
Financial Services - 15.61% | | | |
| Citigroup, Inc. | 156,034 | | 7,235,297 |
| Federal Home Loan Mortgage Corp. | 53,545 | | 3,608,397 |
| JPMorgan Chase & Company | 99,699 | | 4,101,617 |
| Mellon Financial Corp. | 99,432 | | 3,588,501 |
| Morgan Stanley | 93,713 | | 5,590,918 |
| PNC Financial Services Group, Inc. | 34,504 | | 2,427,356 |
|
|
| | | | 26,552,086 |
| Gas & Pipeline Utilities - 0.57% | | | |
| NiSource, Inc. | 47,298 | | 971,028 |
Healthcare Products - 3.38% | | | |
| Johnson & Johnson | 61,608 | | 3,551,701 |
| Medtronic, Inc. | 20,334 | | 1,097,020 |
| Zimmer Holdings, Inc. * | 15,784 | | 1,091,937 |
|
|
| | | | 5,740,658 |
| Healthcare Services - 5.40% | | | |
| Healthsouth Corp. * (a) | 116,889 | | 570,418 |
| Medco Health Solutions, Inc. * | 38,250 | | 2,131,290 |
| UnitedHealth Group, Inc. | 69,543 | | 4,049,489 |
| Wellpoint, Inc. * | 31,739 | | 2,437,238 |
|
|
| | | | 9,188,435 |
| Insurance - 4.31% | | | |
| Allstate Corp. | 25,600 | | 1,402,368 |
| American International Group, Inc. | 62,768 | | 4,165,285 |
| Hartford Financial Services Group, Inc. | 21,438 | | 1,766,062 |
|
|
| | | | 7,333,715 |
| Internet Retail - 1.21% | | | |
| Expedia, Inc. * | 108,601 | | 2,060,161 |
Internet Software - 0.97% | | | |
| Symantec Corp. * | 97,588 | | 1,648,261 |
Leisure Time - 1.30% | | | |
| Carnival Corp. | 42,899 | | 2,215,733 |
The accompanying notes are an integral part of the financial statements. 204
John Hancock Funds II
Portfolio of investments — February 28, 2006 (Unaudited)
(showing percentage of total net assets)
|
| Large Cap Fund (continued) | | | |
| | | Shares or | | |
| | | Principal | | |
| | | Amount | | Value |
|
|
| |
| COMMON STOCKS (continued) | | | | |
| Life Sciences - 0.89% | | | | |
| Waters Corp. * | | 35,445 | $ | 1,514,565 |
Liquor - 0.68% | | | | |
| Anheuser-Busch Companies, Inc. | | 27,800 | | 1,154,812 |
Manufacturing - 3.44% | | | | |
| Harley-Davidson, Inc. | | 28,700 | | 1,507,037 |
| Illinois Tool Works, Inc. | | 37,124 | | 3,186,724 |
| Mettler-Toledo International, Inc. * | | 19,055 | | 1,153,971 |
|
|
| | | | | 5,847,732 |
| Petroleum Services - 2.64% | | | | |
| Baker Hughes, Inc. | | 15,428 | | 1,048,641 |
| Exxon Mobil Corp. | | 26,169 | | 1,553,654 |
| GlobalSantaFe Corp. | | 34,200 | | 1,892,628 |
|
|
| | | | | 4,494,923 |
| Pharmaceuticals - 3.74% | | | | |
| Allergan, Inc. | | 34,063 | | 3,687,660 |
| Bristol-Myers Squibb Company | | 49,899 | | 1,152,667 |
| Caremark Rx, Inc. * | | 30,413 | | 1,513,047 |
|
|
| | | | | 6,353,374 |
| Railroads & Equipment - 1.93% | | | | |
| Burlington Northern Santa Fe Corp. | | 41,750 | | 3,283,220 |
Retail Grocery - 1.33% | | | | |
| The Kroger Company * | | 112,598 | | 2,256,464 |
Retail Trade - 3.38% | | | | |
| Costco Wholesale Corp. | | 73,290 | | 3,758,311 |
| Kohl's Corp. * | | 41,405 | | 1,991,995 |
|
|
| | | | | 5,750,306 |
| Semiconductors - 2.67% | | | | |
| Analog Devices, Inc. | | 43,300 | | 1,651,462 |
| Intel Corp. | | 90,900 | | 1,872,540 |
| Xilinx, Inc. | | 37,491 | | 1,022,754 |
|
|
| | | | | 4,546,756 |
| Software - 6.22% | | | | |
| Mercury Interactive Corp. * | | 37,024 | | 1,314,352 |
| Microsoft Corp. | | 237,289 | | 6,383,074 |
| Oracle Corp. * | | 232,585 | | 2,888,706 |
|
|
| | | | | 10,586,132 |
| Telephone - 4.16% | | | | |
| AT&T Corp. | | 78,974 | | 2,178,892 |
| Sprint Corp. | | 203,627 | | 4,893,157 |
|
|
| | | | | 7,072,049 |
| Trucking & Freight - 1.58% | | | | |
| Fedex Corp. | | 24,983 | | 2,679,177 |
|
| TOTAL COMMON STOCKS (Cost $154,976,179) | | $ | 164,757,296 |
|
| |
| SHORT TERM INVESTMENTS - 1.44% | | | |
| State Street Navigator Securities | | | | |
| Lending Prime Portfolio (c) | $ | 2,128,439 | $ | 2,128,439 |
| United States Treasury Bill | | | | |
| 4.245% due 07/06/2006 | | 175,000 | | 172,379 |
| Large Cap Fund (continued) | | | |
| | | Shares or | |
| | | Principal | |
| | | Amount | Value |
|
|
| |
| SHORT TERM INVESTMENTS (continued) | | |
| United States Treasury Bill (continued) | | | |
| 4.43% due 07/06/2006 **** | $ | 160,000 | $ | 157,500 |
|
| TOTAL SHORT TERM INVESTMENTS | | | |
| (Cost $2,458,318) | | $ | 2,458,318 |
|
| |
| REPURCHASE AGREEMENTS - 2.87% | | | |
| Repurchase Agreement with State | | | |
| Street Corp. dated 02/28/2006 at | | | |
| 3.20% to be repurchased at | | | |
| $4,876433 on 03/01/2006, | | | |
| collateralized by $4,965,000 | | | |
| Federal Home Loan Mortgage | | | |
| Corp., 5.25% due 10/19/2015 | | | |
| (valued at $4,977,413, including | | | |
| interest) (c) | $ | 4,876,000 | $ | 4,876,000 |
|
| TOTAL REPURCHASE AGREEMENTS | | | |
| (Cost $4,876,000) | | $ | 4,876,000 |
|
| Total Investments (Large Cap Fund) | | | |
| (Cost $162,310,497) - 101.19% | | $ | 172,091,614 |
| Liabilities in Excess of Other Assets - (1.19)% | | (2,020,734) |
|
|
| TOTAL NET ASSETS - 100.00% | | $ | 170,070,880 |
|
|
| |
| |
| Large Cap Value Fund | | | |
| | | Shares or | |
| | | Principal | |
| | | Amount | Value |
|
|
| |
| COMMON STOCKS - 99.72% | | | |
| Aerospace - 2.92% | | | |
| Lockheed Martin Corp. | | 6,520 $ | 475,112 |
| Northrop Grumman Corp. | | 34,000 | 2,179,400 |
| Raytheon Company | | 46,000 | 1,996,400 |
|
|
| | | | 4,650,912 |
| Agriculture - 0.82% | | | |
| Archer-Daniels-Midland Company | | 41,000 | 1,300,520 |
Apparel & Textiles - 0.44% | | | |
| Polo Ralph Lauren Corp., Class A | | 12,000 | 695,520 |
Auto Services - 0.35% | | | |
| AutoNation, Inc. * | | 27,000 | 564,570 |
Automobiles - 0.16% | | | |
| Ford Motor Company (a) | | 31,720 | 252,808 |
Banking - 2.30% | | | |
| Bank of America Corp. | | 45,000 | 2,063,250 |
| Comerica, Inc. | | 28,000 | 1,604,960 |
|
|
| | | | 3,668,210 |
| Business Services - 1.98% | | | |
| Cadence Design Systems, Inc. * | | 51,000 | 905,250 |
| Computer Sciences Corp. * | | 33,000 | 1,793,220 |
| NCR Corp. * | | 11,454 | 459,191 |
|
|
| | | | 3,157,661 |
| Cellular Communications - 1.15% | | | |
| Motorola, Inc. | | 86,000 | 1,840,400 |
The accompanying notes are an integral part of the financial statements. 205
John Hancock Funds II
Portfolio of investments — February 28, 2006 (Unaudited)
(showing percentage of total net assets)
|
| Large Cap Value Fund (continued) | | |
| | Shares or | | |
| | Principal | | |
| | Amount | | Value |
|
|
| |
| COMMON STOCKS (continued) | | | |
| Chemicals - 0.31% | | | |
| Eastman Chemical Company | 9,868 | $ | 486,788 |
Computers & Business Equipment - 2.97% | | | |
| Apple Computer, Inc. * | 8,282 | | 567,648 |
| Hewlett-Packard Company | 122,000 | | 4,002,820 |
| Sybase, Inc. * | 7,577 | | 161,618 |
|
|
| | | | 4,732,086 |
Crude Petroleum & Natural Gas - 9.29% | | | |
| Amerada Hess Corp. | 13,000 | | 1,798,030 |
| Apache Corp. | 30,000 | | 2,007,600 |
| Burlington Resources, Inc. | 12,000 | | 1,082,160 |
| ChevronTexaco Corp. | 23,000 | | 1,299,040 |
| Devon Energy Corp. | 37,000 | | 2,169,310 |
| Marathon Oil Corp. | 32,000 | | 2,259,200 |
| Occidental Petroleum Corp. | 28,000 | | 2,563,120 |
| Sunoco, Inc. | 22,000 | | 1,630,200 |
|
|
| | | | 14,808,660 |
Electrical Utilities - 1.44% | | | |
| Edison International | 41,000 | | 1,818,760 |
| TXU Corp. | 9,162 | | 479,997 |
|
|
| | | | 2,298,757 |
Electronics - 4.23% | | | |
| Agilent Technologies, Inc. * | 25,000 | | 900,000 |
| Sanmina-SCI Corp. * | 380,000 | | 1,466,800 |
| Solectron Corp. * | 437,000 | | 1,577,570 |
| Synopsys, Inc. * | 72,000 | | 1,574,640 |
| Teleflex, Inc. | 19,000 | | 1,228,350 |
|
|
| | | | 6,747,360 |
Financial Services - 13.23% | | | |
| CIT Group, Inc. | 33,000 | | 1,774,410 |
| Citigroup, Inc. | 62,000 | | 2,874,940 |
| Countrywide Financial Corp. | 54,000 | | 1,861,920 |
| E*TRADE Financial Corp. * | 53,000 | | 1,355,740 |
| Goldman Sachs Group, Inc. | 20,000 | | 2,825,800 |
| JPMorgan Chase & Company | 115,000 | | 4,731,100 |
| Lehman Brothers Holdings, Inc. | 18,000 | | 2,627,100 |
| Morgan Stanley | 51,000 | | 3,042,660 |
|
|
| | | | 21,093,670 |
Funeral Services - 0.47% | | | |
| Service Corp. International | 94,000 | | 747,300 |
Healthcare Products - 0.15% | | | |
| Becton, Dickinson & Company | 3,876 | | 247,483 |
Healthcare Services - 4.12% | | | |
| Cardinal Health, Inc. | 26,000 | | 1,887,600 |
| HCA, Inc. | 7,225 | | 346,078 |
| Humana, Inc. * | 31,000 | | 1,601,770 |
| McKesson Corp. | 10,926 | | 591,424 |
| Wellpoint, Inc. * | 28,000 | | 2,150,120 |
|
|
| | | | 6,576,992 |
| Large Cap Value Fund (continued) | | |
| | Shares or | | |
| | Principal | | |
| | Amount | | Value |
|
|
| |
| COMMON STOCKS (continued) | | | |
| Homebuilders - 0.76% | | | |
| Beazer Homes USA, Inc. (a) | 13,000 | $ | 824,850 |
| Ryland Group, Inc. | 5,639 | | 393,320 |
|
|
| | | | 1,218,170 |
Industrial Machinery - 1.02% | | | |
| Cummins, Inc. (a) | 15,000 | | 1,624,200 |
Insurance - 13.68% | | | |
| Aetna, Inc. | 36,000 | | 1,836,000 |
| American Financial Group, Inc. | 1,586 | | 65,661 |
| Aon Corp. | 7,000 | | 277,270 |
| Chubb Corp. | 6,520 | | 624,290 |
| CIGNA Corp. | 16,000 | | 1,964,000 |
| Hartford Financial Services Group, Inc. | 23,000 | | 1,894,740 |
| Lincoln National Corp. | 32,000 | | 1,816,640 |
| MetLife, Inc. | 13,569 | | 680,078 |
| MGIC Investment Corp. | 28,000 | | 1,785,000 |
| PMI Group, Inc. | 39,000 | | 1,688,700 |
| Principal Financial Group, Inc. | 36,000 | | 1,753,920 |
| Prudential Financial, Inc. | 33,000 | | 2,542,320 |
| SAFECO Corp. | 28,000 | | 1,442,280 |
| St. Paul Travelers Companies, Inc. | 46,000 | | 1,977,080 |
| UnumProvident Corp. | 71,000 | | 1,468,990 |
|
|
| | | | 21,816,969 |
International Oil - 4.71% | | | |
| Anadarko Petroleum Corp. | 22,000 | | 2,181,520 |
| ConocoPhillips | 57,000 | | 3,474,720 |
| Kerr-McGee Corp. | 19,000 | | 1,856,300 |
|
|
| | | | 7,512,540 |
Internet Software - 1.16% | | | |
| Checkfree Corp. * | 30,000 | | 1,483,800 |
| McAfee, Inc. * | 15,507 | | 360,693 |
|
|
| | | | 1,844,493 |
| Leisure Time - 1.67% | | | |
| Walt Disney Company | 95,000 | | 2,659,050 |
| Manufacturing - 1.40% | | | |
| Rockwell Automation, Inc. | 8,282 | | 564,584 |
| SPX Corp. | 34,000 | | 1,674,500 |
|
|
| | | | 2,239,084 |
Metal & Metal Products - 0.07% | | | |
| Precision Castparts Corp. | 2,114 | | 112,127 |
Mining - 0.95% | | | |
| Phelps Dodge Corp. | 11,000 | | 1,518,000 |
Paper - 0.96% | | | |
| MeadWestvaco Corp. | 55,000 | | 1,530,100 |
Petroleum Services - 9.28% | | | |
| Exxon Mobil Corp. | 184,000 | | 10,924,080 |
| Tesoro Petroleum Corp. (a) | 24,000 | | 1,449,840 |
| Valero Energy Corp. | 45,000 | | 2,420,550 |
|
|
| | | | 14,794,470 |
The accompanying notes are an integral part of the financial statements. 206
John Hancock Funds II
Portfolio of investments — February 28, 2006 (Unaudited)
(showing percentage of total net assets)
|
| Large Cap Value Fund (continued) | | |
| | | Shares or | | |
| | | Principal | | |
| | | Amount | | Value |
|
|
| |
| COMMON STOCKS (continued) | | | | |
| Pharmaceuticals - 5.04% | | | | |
| AmerisourceBergen Corp. | | 14,450 | $ | 664,555 |
| Caremark Rx, Inc. * | | 10,926 | | 543,569 |
| Merck & Company, Inc. | | 88,000 | | 3,067,680 |
| Pfizer, Inc. | | 85,469 | | 2,238,433 |
| Watson Pharmaceuticals, Inc. * | | 51,000 | | 1,528,980 |
|
|
| | | | | 8,043,217 |
Publishing - 0.51% | | | | |
| American Greetings Corp., Class A | | 39,000 | | 818,220 |
Railroads & Equipment - 1.32% | | | | |
| Norfolk Southern Corp. | | 41,000 | | 2,098,380 |
Retail Grocery - 1.07% | | | | |
| Safeway, Inc. | | 70,000 | | 1,701,700 |
Retail Trade - 2.44% | | | | |
| Circuit City Stores, Inc. | | 67,000 | | 1,610,010 |
| J.C. Penney Company, Inc. | | 31,000 | | 1,817,840 |
| Nordstrom, Inc. | | 12,159 | | 462,042 |
|
|
| | | | | 3,889,892 |
Semiconductors - 0.44% | | | | |
| Advanced Micro Devices, Inc. * | | 16,000 | | 618,720 |
| Intersil Corp., Class A | | 3,172 | | 89,894 |
|
|
| | | | | 708,614 |
Software - 2.60% | | | | |
| Autodesk, Inc. * | | 7,930 | | 298,565 |
| BMC Software, Inc. * | | 12,335 | | 269,766 |
| CA, Inc. | | 16,000 | | 434,560 |
| Compuware Corp. * | | 175,000 | | 1,436,750 |
| Novell, Inc. * | | 179,800 | | 1,709,898 |
|
|
| | | | | 4,149,539 |
Steel - 1.24% | | | | |
| Nucor Corp. | | 23,000 | | 1,979,150 |
Telephone - 1.15% | | | | |
| Qwest Communications International, Inc. * (a) | 290,000 | | 1,832,800 |
Toys, Amusements & Sporting Goods - 0.95% | | | |
| Hasbro, Inc. | | 75,000 | | 1,521,750 |
Travel Services - 0.97% | | | | |
| Sabre Holdings Corp. | | 64,000 | | 1,544,320 |
|
| TOTAL COMMON STOCKS (Cost $147,811,304) | | $ | 159,026,482 |
|
| |
| SHORT TERM INVESTMENTS - 3.84% | | | |
| State Street Navigator Securities | | | | |
| Lending Prime Portfolio (c) | $ | 6,127,940 | $ | 6,127,940 |
|
| TOTAL SHORT TERM INVESTMENTS | | | | |
| (Cost $6,127,940) | | | $ | 6,127,940 |
|
| Large Cap Value Fund (continued) | | |
| | | Shares or | | |
| | | Principal | | |
| | | Amount | | Value |
|
|
| |
| REPURCHASE AGREEMENTS - 0.17% | | | |
| Repurchase Agreement with State | | | | |
| Street Corp. dated 02/28/2006 at | | | | |
| 3.20% to be repurchased at | | | | |
| $280,025 on 03/01/2006, | | | | |
| collateralized by $305,000 Federal | | | | |
| National Mortgage Association, | | | | |
| 5.5% due 7/14/2028 (valued at | | | | |
| $286,362 including interest) (c) | $ | 280,000 | $ | 280,000 |
|
| TOTAL REPURCHASE AGREEMENTS | | | | |
| (Cost $280,000) | | | $ | 280,000 |
|
| Total Investments (Large Cap Value Fund) | | | |
| (Cost $154,219,244) - 103.73% | | | $ | 165,434,422 |
| Liabilities in Excess of Other Assets - (3.73)% | | | (5,955,678) |
|
|
| TOTAL NET ASSETS - 100.00% | | | $ | 159,478,744 |
|
|
| |
| |
| Mid Cap Core Fund | | | | |
| | | Shares or | | |
| | | Principal | | |
| | | Amount | | Value |
|
|
| |
| COMMON STOCKS - 81.00% | | | | |
| Auto Parts - 1.04% | | | | |
| Genuine Parts Company | | 82,707 | $ | 3,682,116 |
Banking - 3.29% | | | | |
| Investors Financial Services Corp. (a) | | 78,136 | | 3,524,715 |
| Marshall & Ilsley Corp. (a) | | 68,681 | | 3,021,964 |
| North Fork Bancorporation, Inc. (a) | | 131,555 | | 3,359,915 |
| SVB Financial Group * | | 35,039 | | 1,786,638 |
|
|
| | | | | 11,693,232 |
| Broadcasting - 1.46% | | | | |
| Belo Corp., Class A | | 245,283 | | 5,209,811 |
Building Materials & Construction - 1.56% | | | |
| Masco Corp. | | 178,058 | | 5,553,629 |
Business Services - 8.12% | | | | |
| Cadence Design Systems, Inc. * | | 210,012 | | 3,727,713 |
| Fair Isaac Corp. (a) | | 76,716 | | 3,269,636 |
| H & R Block, Inc. | | 288,879 | | 6,442,001 |
| Pitney Bowes, Inc. | | 79,631 | | 3,403,429 |
| Rentokil Initial PLC | | 1,796,420 | | 4,954,540 |
| Reynolds & Reynolds Company, Class A | | 141,484 | | 3,919,107 |
| The ServiceMaster Company (a) | | 252,342 | | 3,159,322 |
|
|
| | | | | 28,875,748 |
| Chemicals - 4.38% | | | | |
| Rohm & Haas Company (a) | | 95,171 | | 4,734,757 |
| Sigma-Aldrich Corp. (a) | | 111,583 | | 7,187,061 |
| Techne Corp. * (a) | | 61,726 | | 3,670,845 |
|
|
| | | | | 15,592,663 |
| Coal - 0.68% | | | | |
| Massey Energy Company (a) | | 65,496 | | 2,436,451 |
Colleges & Universities - 0.41% | | | | |
| Apollo Group, Inc., Class A * | | 29,600 | | 1,461,648 |
The accompanying notes are an integral part of the financial statements. 207
John Hancock Funds II
Portfolio of investments — February 28, 2006 (Unaudited)
(showing percentage of total net assets)
|
| Mid Cap Core Fund (continued) | | | |
| | Shares or | | |
| | Principal | | |
| | Amount | | Value |
|
|
| |
| COMMON STOCKS (continued) | | | |
| Computers & Business Equipment - 3.50% | | | |
| GTECH Holdings Corp. | 129,430 | $ | 4,320,373 |
| Xerox Corp. * | 545,549 | | 8,128,680 |
|
|
| | | | 12,449,053 |
| Construction Materials - 1.07% | | | |
| Sherwin-Williams Company (a) | 83,224 | | 3,790,853 |
Containers & Glass - 2.08% | | | |
| Ball Corp. | 85,085 | | 3,624,621 |
| Pactiv Corp. * | 164,238 | | 3,765,977 |
|
|
| | | | 7,390,598 |
| Cosmetics & Toiletries - 5.16% | | | |
| Avon Products, Inc. | 190,349 | | 5,491,568 |
| Estee Lauder Companies, Inc., Class A (a) | 191,588 | | 7,169,223 |
| International Flavors & Fragrances, Inc. | 164,457 | | 5,695,146 |
|
|
| | | | 18,355,937 |
| Crude Petroleum & Natural Gas - 1.05% | | | |
| Newfield Exploration Company * | 51,109 | | 1,975,363 |
| Sunoco, Inc. | 23,864 | | 1,768,322 |
|
|
| | | | 3,743,685 |
| Drugs & Health Care - 0.51% | | | |
| ImClone Systems, Inc. * (a) | 47,600 | | 1,827,364 |
Electrical Utilities - 1.18% | | | |
| Wisconsin Energy Corp. | 102,932 | | 4,206,831 |
Food & Beverages - 1.94% | | | |
| Cadbury Schweppes PLC | 676,967 | | 6,886,528 |
Funeral Services - 1.51% | | | |
| Service Corp. International | 676,660 | | 5,379,447 |
Gas & Pipeline Utilities - 0.97% | | | |
| UGI Corp. | 47,674 | | 1,070,281 |
| Williams Companies, Inc. | 110,036 | | 2,373,477 |
|
|
| | | | 3,443,758 |
| Healthcare Products - 1.01% | | | |
| Biomet, Inc. | 98,489 | | 3,585,000 |
Holdings Companies/Conglomerates - 1.00% | | | |
| Groupe Bruxelles Lambert SA | 32,356 | | 3,554,519 |
Hotels & Restaurants - 0.97% | | | |
| Outback Steakhouse, Inc. (a) | 82,697 | | 3,457,562 |
Industrial Machinery - 5.86% | | | |
| Briggs & Stratton Corp. (a) | 157,926 | | 5,603,214 |
| Dover Corp. | 94,320 | | 4,521,701 |
| FMC Technologies, Inc. * | 69,743 | | 3,272,342 |
| Pall Corp. | 182,386 | | 5,365,796 |
| Parker-Hannifin Corp. (a) | 26,760 | | 2,091,829 |
|
|
| | | | 20,854,882 |
| Insurance - 6.88% | | | |
| ACE, Ltd. | 95,258 | | 5,308,728 |
| Axis Capital Holdings, Ltd. (a) | 142,168 | | 4,401,521 |
| Genworth Financial, Inc. | 108,547 | | 3,453,966 |
| Marsh & McLennan Companies, Inc. | 155,015 | | 4,791,514 |
| Mid Cap Core Fund (continued) | | |
| | Shares or | |
| | Principal | |
| | Amount | Value |
|
|
| |
| COMMON STOCKS (continued) | | |
| Insurance (continued) | | |
| Montpelier Re Holdings, Ltd. (a) | 90,088 $ | 1,553,117 |
| XL Capital, Ltd., Class A (a) | 73,285 | 4,950,402 |
|
|
| | | 24,459,248 |
| International Oil - 0.71% | | |
| Noble Corp. | 33,932 | 2,507,914 |
Life Sciences - 3.29% | | |
| PerkinElmer, Inc. | 254,103 | 6,045,110 |
| Waters Corp. * | 132,516 | 5,662,409 |
|
|
| | | 11,707,519 |
| Liquor - 2.08% | | |
| Heineken NV | 196,635 | 7,407,619 |
Manufacturing - 1.64% | | |
| Mettler-Toledo International, Inc. * | 96,428 | 5,839,680 |
Petroleum Services - 0.88% | | |
| Smith International, Inc. | 80,585 | 3,121,057 |
Pharmaceuticals - 1.64% | | |
| Forest Laboratories, Inc. * | 127,190 | 5,838,021 |
Pollution Control - 1.14% | | |
| Republic Services, Inc. | 104,117 | 4,047,028 |
Publishing - 1.20% | | |
| McGraw-Hill Companies, Inc. | 80,328 | 4,264,613 |
Retail Grocery - 1.33% | | |
| The Kroger Company * | 236,864 | 4,746,755 |
Retail Trade - 3.47% | | |
| 99 Cents Only Stores * (a) | 180,363 | 2,052,531 |
| Bed Bath & Beyond, Inc. * | 99,324 | 3,579,637 |
| Gap, Inc. | 103,719 | 1,922,950 |
| Kohl's Corp. * | 58,061 | 2,793,315 |
| Tuesday Morning Corp. (a) | 90,288 | 1,987,239 |
|
|
| | | 12,335,672 |
| Semiconductors - 2.99% | | |
| Analog Devices, Inc. | 136,952 | 5,223,349 |
| Microchip Technology, Inc. (a) | 56,135 | 1,975,952 |
| Xilinx, Inc. | 125,380 | 3,420,367 |
|
|
| | | 10,619,668 |
| Software - 0.97% | | |
| CA, Inc. (a) | 127,649 | 3,466,947 |
Steel - 1.02% | | |
| Tenaris SA, ADR (a) | 22,578 | 3,615,867 |
Telecommunications Equipment & | | |
| Services - 1.13% | | |
| SK Telecom Company, Ltd., ADR | 165,705 | 4,001,776 |
Toys, Amusements & Sporting Goods - 0.65% | | |
| Nintendo Company, Ltd. | 15,487 | 2,307,641 |
Travel Services - 1.23% | | |
| Sabre Holdings Corp. | 180,755 | 4,361,618 |
|
| TOTAL COMMON STOCKS (Cost $269,912,107) | | | $ | 288,079,958 |
|
The accompanying notes are an integral part of the financial statements. 208
John Hancock Funds II
Portfolio of investments — February 28, 2006 (Unaudited)
(showing percentage of total net assets)
|
| Mid Cap Core Fund (continued) | | | |
| | | Shares or | | |
| | | Principal | | |
| | | Amount | | Value |
| |
|
| |
| SHORT TERM INVESTMENTS - 14.50% | | | | |
| State Street Navigator Securities | | | | |
| Lending Prime Portfolio (c) | $ | 51,567,685 | $ | 51,567,685 |
|
| TOTAL SHORT TERM INVESTMENTS | | | | |
| (Cost $51,567,685) | | | $ | 51,567,685 |
|
| |
| REPURCHASE AGREEMENTS - 19.13% | | | | |
| Repurchase Agreement with State | | | | |
| Street Corp. dated 02/28/2006 at | | | | |
| 4.25% to be repurchased at | | | | |
| $68,033,031 on 03/01/2006, | | | | |
| collateralized by $42,060,000 | | | | |
| Federal Home Loan Bank, zero | | | | |
| coupon due 9/17/2010 and | | | | |
| $27,725,000 Federal National | | | | |
| Mortgage Association, 4.25% due | | | | |
| 5/15/2009 (valued at $69,389,554, | | | | |
| including interest) (c) | $ | 68,025,000 | $ | 68,025,000 |
|
| TOTAL REPURCHASE AGREEMENTS | | | | |
| (Cost $68,025,000) | | | $ | 68,025,000 |
|
| Total Investments (Mid Cap Core Fund) | | | | |
| (Cost $389,504,792) - 114.63% | | | $ | 407,672,643 |
| Liabilities in Excess of Other Assets - (14.63)% | | | (52,022,210) |
|
|
| TOTAL NET ASSETS - 100.00% | | | $ | 355,650,433 |
|
|
| |
| |
| Mid Cap Index Fund | | | | |
| | | Shares or | | |
| | | Principal | | |
| | | Amount | | Value |
| |
|
| |
| COMMON STOCKS - 93.29% | | | | |
| Aerospace - 0.44% | | | | |
| Alliant Techsystems, Inc. * | | 1,916 | $ | 146,421 |
| DRS Technologies, Inc. | | 2,035 | | 107,387 |
| Sequa Corp., Class A * | | 335 | | 28,445 |
|
|
| | | | | 282,253 |
| Air Travel - 0.34% | | | | |
| Airtran Holdings, Inc. * | | 4,590 | | 81,610 |
| Alaska Air Group, Inc. * | | 1,443 | | 46,248 |
| JetBlue Airways Corp. * | | 7,885 | | 89,889 |
|
|
| | | | | 217,747 |
| Apparel & Textiles - 0.82% | | | | |
| Mohawk Industries, Inc. * | | 2,762 | | 238,941 |
| Polo Ralph Lauren Corp., Class A | | 3,178 | | 184,197 |
| Timberland Company, Class A * | | 2,868 | | 100,523 |
|
|
| | | | | 523,661 |
| Auto Parts - 1.13% | | | | |
| Arvinmeritor, Inc. | | 3,675 | | 61,519 |
| BorgWarner, Inc. | | 2,980 | | 166,195 |
| Federal Signal Corp. | | 2,514 | | 45,026 |
| Gentex Corp. | | 8,122 | | 135,313 |
| Lear Corp. | | 3,511 | | 73,239 |
| Modine Manufacturing Company | | 1,801 | | 50,518 |
| Mid Cap Index Fund (continued) | | | |
| | Shares or | | |
| | Principal | | |
| | Amount | | Value |
|
|
| |
| COMMON STOCKS (continued) | | | |
| Auto Parts (continued) | | | |
| O'Reilly Automotive, Inc. * | 5,858 | $ | 191,674 |
|
|
| | | | 723,484 |
| Auto Services - 0.33% | | | |
| ADESA, Inc. | 4,682 | | 117,050 |
| Copart, Inc. * | 3,642 | | 94,109 |
|
|
| | | | 211,159 |
| Banking - 4.95% | | | |
| Associated Banc-Corp. | 7,133 | | 245,875 |
| Astoria Financial Corp. | 4,617 | | 132,369 |
| Bank of Hawaii Corp. | 2,682 | | 143,219 |
| Cathay General Bancorp, Inc. | 2,622 | | 93,422 |
| City National Corp. | 2,173 | | 165,061 |
| Colonial Bancgroup, Inc. | 8,060 | | 202,387 |
| Commerce Bancorp, Inc. | 9,077 | | 301,084 |
| Cullen Frost Bankers, Inc. | 2,467 | | 135,981 |
| FirstMerit Corp. | 4,345 | | 107,495 |
| Greater Bay Bancorp | 2,638 | | 70,962 |
| Independence Community Bank Corp. | 3,858 | | 158,101 |
| Investors Financial Services Corp. | 3,397 | | 153,239 |
| Mercantile Bankshares Corp. | 6,435 | | 245,817 |
| New York Community Bancorp, Inc. | 12,379 | | 208,834 |
| SVB Financial Group * | 1,855 | | 94,586 |
| TCF Financial Corp. | 5,942 | | 150,689 |
| Texas Regional Bancshares, Inc., Class A | 2,156 | | 66,577 |
| Washington Federal, Inc. | 4,545 | | 107,535 |
| Webster Financial Corp. | 2,813 | | 132,633 |
| Westamerica Bancorporation | 1,678 | | 91,015 |
| Wilmington Trust Corp. | 3,545 | | 151,761 |
|
|
| | | | 3,158,642 |
| Biotechnology - 1.52% | | | |
| Affymetrix, Inc. * | 3,468 | | 123,149 |
| Cephalon, Inc. * | 3,036 | | 241,301 |
| Charles River Laboratories International, Inc. * | 3,780 | | 182,763 |
| Invitrogen Corp. * | 2,763 | | 195,979 |
| Martek Biosciences Corp. * | 1,658 | | 56,505 |
| Millennium Pharmaceuticals, Inc. * | 16,227 | | 170,059 |
|
|
| | | | 969,756 |
| Broadcasting - 0.36% | | | |
| Belo Corp., Class A | 4,948 | | 105,096 |
| Emmis Communications Corp., Class A * | 1,927 | | 31,545 |
| Entercom Communications Corp. * | 1,993 | | 56,143 |
| Westwood One, Inc. | 3,429 | | 38,233 |
|
|
| | | | 231,017 |
| Building Materials & Construction - 0.24% | | | |
| Dycom Industries, Inc. * | 2,099 | | 44,814 |
| RPM International, Inc. | 6,154 | | 111,018 |
|
|
| | | | 155,832 |
| Business Services - 5.37% | | | |
| Acxiom Corp. | 3,959 | | 102,459 |
| Alliance Data Systems Corp. * | 3,583 | | 155,001 |
The accompanying notes are an integral part of the financial statements. 209
John Hancock Funds II
Portfolio of investments — February 28, 2006 (Unaudited)
(showing percentage of total net assets)
|
| Mid Cap Index Fund (continued) | | | |
| | Shares or | | |
| | Principal | | |
| | Amount | | Value |
|
|
| |
| COMMON STOCKS (continued) | | | |
| Business Services (continued) | | | |
| Banta Corp. | 1,253 | $ | 61,034 |
| Brinks Company | 3,070 | | 150,338 |
| Cadence Design Systems, Inc. * | 14,829 | | 263,215 |
| Catalina Marketing Corp. | 2,058 | | 45,646 |
| Ceridian Corp. * | 7,593 | | 196,355 |
| ChoicePoint, Inc. * | 4,688 | | 208,147 |
| Corporate Executive Board Company | 2,066 | | 206,600 |
| CSG Systems International, Inc. * | 2,541 | | 55,851 |
| Deluxe Corp. | 2,650 | | 65,640 |
| DST Systems, Inc. * | 3,294 | | 185,222 |
| Dun & Bradstreet Corp. * | 3,470 | | 252,408 |
| Fair Isaac Corp. | 3,417 | | 145,632 |
| Gartner Group, Inc., Class A * | 3,026 | | 42,606 |
| Harte-Hanks, Inc. | 2,968 | | 83,134 |
| Jacobs Engineering Group, Inc. * | 3,041 | | 260,735 |
| Kelly Services, Inc., Class A | 1,010 | | 27,260 |
| Korn/Ferry International * | 2,203 | | 46,373 |
| Manpower, Inc. | 4,565 | | 244,867 |
| MPS Group, Inc. * | 5,287 | | 80,045 |
| Navigant Consulting Company * | 2,640 | | 51,454 |
| Reynolds & Reynolds Company, Class A | 2,673 | | 74,042 |
| Rollins, Inc. | 1,535 | | 29,733 |
| Sotheby's Holdings, Inc., Class A * | 2,343 | | 49,484 |
| SRA International, Inc., Class A * | 1,943 | | 67,072 |
| Tech Data Corp. * | 2,951 | | 122,555 |
| The BISYS Group, Inc. * | 6,315 | | 89,105 |
| Wind River Systems, Inc. * | 3,907 | | 60,441 |
|
|
| | | | 3,422,454 |
Cellular Communications - 0.42% | | | |
| RF Micro Devices, Inc. * | 9,882 | | 66,506 |
| Telephone & Data Systems, Inc. | 5,364 | | 200,614 |
|
|
| | | | 267,120 |
Chemicals - 2.63% | | | |
| Airgas, Inc. | 3,502 | | 127,438 |
| Albemarle Corp. | 1,998 | | 84,815 |
| Cabot Corp. | 3,242 | | 120,019 |
| Cabot Microelectronics Corp. * | 1,270 | | 43,332 |
| Chemtura Corp. | 12,539 | | 138,932 |
| Cytec Industries, Inc. | 2,073 | | 110,574 |
| Ferro Corp. | 2,190 | | 43,975 |
| FMC Corp. * | 1,985 | | 120,708 |
| Lubrizol Corp. | 3,555 | | 153,789 |
| Lyondell Chemical Company | 10,712 | | 224,095 |
| Minerals Technologies, Inc. | 1,050 | | 56,207 |
| Olin Corp. | 3,749 | | 78,766 |
| Techne Corp. * | 2,032 | | 120,843 |
| The Scotts Company, Class A | 2,359 | | 112,973 |
| Valspar Corp. | 5,293 | | 139,894 |
|
|
| | | | 1,676,360 |
Coal - 1.47% | | | |
| Arch Coal, Inc. | 3,722 | | 272,115 |
| Mid Cap Index Fund (continued) | | | |
| | Shares or | | |
| | Principal | | |
| | Amount | | Value |
|
|
| |
| COMMON STOCKS (continued) | | | |
| Coal (continued) | | | |
| Peabody Energy Corp. | 13,746 | $ | 663,520 |
|
|
| | | | 935,635 |
Colleges & Universities - 0.67% | | | |
| Career Education Corp. * | 5,121 | | 168,173 |
| Corinthian Colleges, Inc. * | 4,778 | | 61,923 |
| DeVry, Inc. * | 3,060 | | 71,849 |
| ITT Educational Services, Inc. * | 1,985 | | 123,070 |
|
|
| | | | 425,015 |
Computers & Business Equipment - 3.86% | | | |
| 3Com Corp. * | 20,227 | | 94,056 |
| Anteon International Corp. * | 1,710 | | 94,546 |
| CDW Corp. | 3,282 | | 186,615 |
| Cognizant Technology Solutions Corp., | | | |
| Class A * | 7,223 | | 416,117 |
| Diebold, Inc. | 3,624 | | 144,960 |
| GTECH Holdings Corp. | 6,538 | | 218,238 |
| Henry, Jack & Associates, Inc. | 3,911 | | 86,081 |
| Ingram Micro, Inc., Class A * | 6,059 | | 119,847 |
| National Instruments Corp. | 2,896 | | 93,975 |
| Plexus Corp. * | 2,277 | | 76,416 |
| Sandisk Corp. * | 9,624 | | 580,712 |
| Sybase, Inc. * | 4,762 | | 101,573 |
| Western Digital Corp. * | 11,275 | | 250,869 |
|
|
| | | | 2,464,005 |
Construction Materials - 0.68% | | | |
| Granite Construction, Inc. | 1,722 | | 79,815 |
| Martin Marietta Materials, Inc. | 2,423 | | 236,242 |
| Trinity Industries, Inc. | 2,279 | | 120,787 |
|
|
| | | | 436,844 |
Containers & Glass - 0.46% | | | |
| Longview Fibre Company | 2,670 | | 50,249 |
| Packaging Corp. of America | 3,278 | | 74,771 |
| Sonoco Products Company | 5,180 | | 169,490 |
|
|
| | | | 294,510 |
| Crude Petroleum & Natural Gas - 2.22%�� | | | |
| Helmerich & Payne, Inc. | 2,719 | | 178,829 |
| Newfield Exploration Company * | 6,651 | | 257,061 |
| Patterson-UTI Energy, Inc. | 9,032 | | 248,831 |
| Pioneer Natural Resources Company | 6,718 | | 282,761 |
| Plains Exploration & Production Company * | 4,098 | | 166,993 |
| Pogo Producing Company | 3,131 | | 156,112 |
| Quicksilver Resources, Inc. * | 3,494 | | 126,902 |
|
|
| | | | 1,417,489 |
Domestic Oil - 1.09% | | | |
| Denbury Resources, Inc. * | 5,988 | | 169,760 |
| Forest Oil Corp. * | 2,856 | | 141,800 |
| Noble Energy, Inc. | 9,144 | | 384,414 |
|
|
| | | | 695,974 |
Drugs & Health Care - 0.63% | | | |
| Hillenbrand Industries, Inc. | 3,194 | | 162,383 |
The accompanying notes are an integral part of the financial statements. 210
John Hancock Funds II
Portfolio of investments — February 28, 2006 (Unaudited)
(showing percentage of total net assets)
|
| Mid Cap Index Fund (continued) | | | |
| | Shares or | | |
| | Principal | | |
| | Amount | | Value |
|
|
| |
| COMMON STOCKS (continued) | | | |
| Drugs & Health Care (continued) | | | |
| Intuitive Surgical, Inc. * | 1,854 | $ | 167,231 |
| Perrigo Company | 4,346 | | 69,058 |
|
|
| | | | 398,672 |
Educational Services - 0.42% | | | |
| Education Management Corp. * | 3,496 | | 131,449 |
| Laureate Education, Inc. * | 2,601 | | 134,680 |
|
|
| | | | 266,129 |
Electrical Equipment - 0.58% | | | |
| AMETEK, Inc. | 3,669 | | 157,180 |
| Hubbell, Inc., Class B | 3,172 | | 147,403 |
| Varian, Inc. * | 1,627 | | 64,917 |
|
|
| | | | 369,500 |
Electrical Utilities - 3.76% | | | |
| Alliant Corp. | 6,107 | | 202,142 |
| Black Hills Corp. | 1,732 | | 59,875 |
| DPL, Inc. | 6,666 | | 179,449 |
| Duquesne Light Holdings, Inc. | 4,076 | | 70,719 |
| Great Plains Energy, Inc. | 3,904 | | 110,874 |
| Hawaiian Electric Industries, Inc. | 4,232 | | 113,121 |
| IDACORP, Inc. | 2,212 | | 72,863 |
| Northeast Utilities | 7,844 | | 153,899 |
| NSTAR | 5,583 | | 163,917 |
| OGE Energy Corp. | 4,734 | | 136,102 |
| Pepco Holdings, Inc. | 9,887 | | 235,014 |
| PNM Resources, Inc. | 3,594 | | 88,951 |
| Puget Energy, Inc. | 6,035 | | 130,115 |
| Quanta Services, Inc. * | 6,168 | | 84,440 |
| Sierra Pacific Resources * | 9,588 | | 136,533 |
| Westar Energy, Inc. | 4,534 | | 97,572 |
| Wisconsin Energy Corp. | 6,115 | | 249,920 |
| WPS Resources Corp. | 2,091 | | 109,882 |
|
|
| | | | 2,395,388 |
Electronics - 2.43% | | | |
| Amphenol Corp., Class A | 4,646 | | 233,369 |
| Arrow Electronics, Inc. * | 6,250 | | 217,437 |
| Avnet, Inc. * | 7,627 | | 191,667 |
| Imation Corp. | 1,793 | | 78,623 |
| Kemet Corp. * | 4,532 | | 40,380 |
| Mentor Graphics Corp. * | 4,139 | | 46,481 |
| Synopsys, Inc. * | 7,543 | | 164,965 |
| Teleflex, Inc. | 2,117 | | 136,864 |
| Thomas & Betts Corp. * | 2,768 | | 136,186 |
| Vishay Intertechnology, Inc. * | 9,624 | | 139,740 |
| Zebra Technologies Corp., Class A * | 3,677 | | 162,303 |
|
|
| | | | 1,548,015 |
Energy - 1.59% | | | |
| Energy East Corp. | 7,720 | | 193,463 |
| Hanover Compressor Company * | 4,800 | | 73,344 |
| MDU Resources Group, Inc. | 6,265 | | 220,841 |
| SCANA Corp. | 5,984 | | 244,028 |
| Mid Cap Index Fund (continued) | | | |
| | Shares or | | |
| | Principal | | |
| | Amount | | Value |
|
|
| |
| COMMON STOCKS (continued) | | | |
| Energy (continued) | | | |
| Southwestern Energy Company * | 8,713 | $ | 279,600 |
|
|
| | | | 1,011,276 |
Financial Services - 4.00% | | | |
| A.G. Edwards, Inc. | 4,009 | | 179,202 |
| Americredit Corp. * | 7,204 | | 212,518 |
| Eaton Vance Corp. | 6,823 | | 192,272 |
| Fidelity National Information Services Inc * | 3,247 | | 128,744 |
| IndyMac Bancorp, Inc. | 3,355 | | 130,241 |
| Jefferies Group, Inc. | 2,581 | | 147,220 |
| Legg Mason, Inc. | 6,368 | | 831,597 |
| Leucadia National Corp. | 4,294 | | 232,949 |
| Moneygram International, Inc. | 4,452 | | 127,639 |
| Raymond James Financial, Inc. | 2,974 | | 127,823 |
| SEI Investment Company | 3,320 | | 138,743 |
| Waddell & Reed Financial, Inc., Class A | 4,377 | | 101,940 |
|
|
| | | | 2,550,888 |
Food & Beverages - 1.36% | | | |
| Bob Evans Farms, Inc. | 1,872 | | 54,606 |
| Dean Foods Company * | 7,036 | | 263,639 |
| Hormel Foods Corp. | 3,815 | | 131,350 |
| PepsiAmericas, Inc. | 3,213 | | 76,855 |
| Sensient Technologies Corp. | 2,460 | | 44,083 |
| Smithfield Foods, Inc. * | 5,168 | | 136,590 |
| The J.M. Smucker Company | 3,051 | | 120,576 |
| Tootsie Roll Industries, Inc. | 1,315 | | 37,162 |
|
|
| | | | 864,861 |
Forest Products - 0.27% | | | |
| Rayonier, Inc. | 3,965 | | 170,892 |
Furniture & Fixtures - 0.10% | | | |
| Furniture Brands International, Inc. | 2,658 | | 65,706 |
Gas & Pipeline Utilities - 2.20% | | | |
| AGL Resources, Inc. | 4,059 | | 145,718 |
| Aquila, Inc. * | 19,518 | | 76,120 |
| Equitable Resources, Inc. | 6,318 | | 229,722 |
| National Fuel Gas Company | 4,415 | | 142,958 |
| ONEOK, Inc. | 5,100 | | 156,009 |
| Questar Corp. | 4,458 | | 326,549 |
| Vectren Corp. | 3,977 | | 104,834 |
| Western Gas Resources, Inc. | 3,003 | | 142,072 |
| WGL Holdings, Inc. | 2,545 | | 78,386 |
|
|
| | | | 1,402,368 |
| Healthcare Products - 2.92% | | | |
| Advanced Medical Optics, Inc. * | 3,487 | | 155,102 |
| Beckman Coulter, Inc. | 3,248 | | 175,230 |
| Cytyc Corp. * | 5,956 | | 171,711 |
| DENTSPLY International, Inc. | 4,110 | | 234,229 |
| Edwards Lifesciences Corp. * | 3,122 | | 129,095 |
| Gen-Probe, Inc. * | 2,657 | | 132,744 |
| Henry Schein, Inc. * | 4,556 | | 212,537 |
| INAMED Corp. * | 1,900 | | 168,017 |
The accompanying notes are an integral part of the financial statements. 211
John Hancock Funds II
Portfolio of investments — February 28, 2006 (Unaudited)
(showing percentage of total net assets)
|
| Mid Cap Index Fund (continued) | | | |
| | Shares or | | |
| | Principal | | |
| | Amount | | Value |
|
|
| |
| COMMON STOCKS (continued) | | | |
| Healthcare Products (continued) | | | |
| STERIS Corp. | 3,573 | $ | 88,503 |
| Varian Medical Systems, Inc. * | 6,876 | | 397,983 |
|
|
| | | | 1,865,151 |
Healthcare Services - 2.02% | | | |
| Apria Healthcare Group, Inc. * | 2,591 | | 59,567 |
| Covance, Inc. * | 3,270 | | 184,591 |
| Health Net, Inc. * | 5,985 | | 286,981 |
| Lincare Holdings, Inc. * | 5,083 | | 207,895 |
| Omnicare, Inc. | 6,241 | | 379,765 |
| Renal Care Group, Inc. * | 3,572 | | 170,420 |
|
|
| | | | 1,289,219 |
Homebuilders - 1.10% | | | |
| Beazer Homes USA, Inc. | 2,153 | | 136,608 |
| Hovnanian Enterprises, Inc., Class A * | 1,872 | | 86,318 |
| M.D.C. Holdings, Inc. | 1,714 | | 105,051 |
| Ryland Group, Inc. | 2,444 | | 170,469 |
| Toll Brothers, Inc. * | 6,185 | | 200,146 |
|
|
| | | | 698,592 |
Hotels & Restaurants - 1.37% | | | |
| Applebee's International, Inc. | 3,987 | | 92,259 |
| Boyd Gaming Corp. | 2,285 | | 99,923 |
| Brinker International, Inc. | 4,495 | | 187,217 |
| CBRL Group, Inc. | 2,444 | | 108,587 |
| Outback Steakhouse, Inc. | 3,434 | | 143,575 |
| Ruby Tuesday, Inc. | 3,272 | | 93,416 |
| The Cheesecake Factory, Inc. * | 4,105 | | 148,437 |
|
|
| | | | 873,414 |
Household Products - 0.62% | | | |
| Blyth, Inc. | 1,393 | | 31,036 |
| Church & Dwight, Inc. | 3,362 | | 116,090 |
| Energizer Holdings, Inc. * | 3,414 | | 186,507 |
| Tupperware Corp. | 2,792 | | 59,162 |
|
|
| | | | 392,795 |
Industrial Machinery - 2.09% | | | |
| AGCO Corp. * | 4,731 | | 92,491 |
| Cooper Cameron Corp. * | 5,928 | | 240,084 |
| Donaldson Company, Inc. | 3,567 | | 123,632 |
| Flowserve Corp. * | 2,889 | | 148,495 |
| FMC Technologies, Inc. * | 3,599 | | 168,865 |
| Graco, Inc. | 3,583 | | 149,304 |
| Grant Prideco, Inc. * | 6,721 | | 271,999 |
| Kennametal, Inc. | 2,015 | | 117,837 |
| Tecumseh Products Company, Class A | 966 | | 21,841 |
|
|
| | | | 1,334,548 |
Industrials - 0.88% | | | |
| Crane Company | 2,607 | | 100,344 |
| Fastenal Company | 6,474 | | 284,273 |
| Harsco Corp. | 2,182 | | 174,080 |
|
|
| | | | 558,697 |
| Mid Cap Index Fund (continued) | | | |
| | Shares or | | |
| | Principal | | |
| | Amount | | Value |
|
|
| |
| COMMON STOCKS (continued) | | | |
Insurance - 5.45% | | | |
| American Financial Group, Inc. | 2,432 | $ | 100,685 |
| Amerus Group Company | 2,020 | | 121,705 |
| Arthur J. Gallagher & Company | 4,976 | | 146,742 |
| Brown & Brown, Inc. | 5,813 | | 181,773 |
| Everest Re Group, Ltd. | 3,234 | | 320,295 |
| Fidelity National Financial, Inc. | 9,070 | | 342,483 |
| First American Corp. | 5,003 | | 210,926 |
| Hanover Insurance Group, Inc. | 2,807 | | 135,999 |
| HCC Insurance Holdings, Inc. | 5,530 | | 178,011 |
| Horace Mann Educators Corp. | 2,246 | | 41,888 |
| Mercury General Corp. | 1,855 | | 103,695 |
| Ohio Casualty Corp. | 3,325 | | 101,778 |
| Old Republic International Corp. | 11,971 | | 254,863 |
| PMI Group, Inc. | 4,681 | | 202,687 |
| Protective Life Corp. | 3,643 | | 177,596 |
| Radian Group, Inc. | 4,340 | | 246,295 |
| Stancorp Financial Group, Inc. | 2,853 | | 154,347 |
| Unitrin, Inc. | 2,376 | | 114,880 |
| W.R. Berkley Corp. | 5,862 | | 339,351 |
|
|
| | | | 3,475,999 |
Internet Service Provider - 0.13% | | | |
| Avocent Corp. * | 2,557 | | 85,429 |
Internet Software - 0.99% | | | |
| Checkfree Corp. * | 4,739 | | 234,391 |
| F5 Networks, Inc. * | 2,061 | | 139,777 |
| McAfee, Inc. * | 8,769 | | 203,967 |
| RSA Security, Inc. * | 3,710 | | 54,463 |
|
|
| | | | 632,598 |
Leisure Time - 0.23% | | | |
| Callaway Golf Company | 3,437 | | 56,676 |
| International Speedway Corp., Class A | 1,840 | | 87,143 |
|
|
| | | | 143,819 |
Life Sciences - 0.29% | | | |
| Pharmaceutical Product Development, Inc. * | 2,625 | | 182,674 |
Manufacturing - 1.10% | | | |
| Carlisle Companies, Inc. | 1,594 | | 125,289 |
| Lancaster Colony Corp. | 1,331 | | 53,426 |
| Mine Safety Appliances Company | 1,378 | | 54,913 |
| Nordson Corp. | 1,707 | | 85,214 |
| Pentair, Inc. | 5,289 | | 212,353 |
| SPX Corp. | 3,440 | | 169,420 |
|
|
| | | | 700,615 |
Medical-Hospitals - 1.14% | | | |
| Community Health Systems, Inc. * | 4,627 | | 175,456 |
| Lifepoint Hospitals, Inc. * | 2,984 | | 92,683 |
| Triad Hospitals, Inc. * | 4,502 | | 193,856 |
| Universal Health Services, Inc., Class B | 2,853 | | 143,306 |
| VCA Antech, Inc. * | 4,319 | | 120,716 |
|
|
| | | | 726,017 |
The accompanying notes are an integral part of the financial statements. 212
John Hancock Funds II
Portfolio of investments — February 28, 2006 (Unaudited)
(showing percentage of total net assets)
|
| Mid Cap Index Fund (continued) | | | |
| | Shares or | | |
| | Principal | | |
| | Amount | | Value |
|
|
| |
| COMMON STOCKS (continued) | | | |
| Metal & Metal Products - 0.77% | | | |
| Precision Castparts Corp. | 6,945 | $ | 368,363 |
| Timken Company | 4,349 | | 124,729 |
|
|
| | | | 493,092 |
Mining - 0.51% | | | |
| Joy Global, Inc. | 6,352 | | 327,509 |
Mobile Homes - 0.13% | | | |
| Thor Industries, Inc. | 1,807 | | 85,290 |
Newspapers - 0.49% | | | |
| Lee Enterprises, Inc. | 2,377 | | 83,076 |
| Washington Post Company, Class B | 306 | | 230,189 |
|
|
| | | | 313,265 |
Office Furnishings & Supplies - 0.43% | | | |
| Herman Miller, Inc. | 3,609 | | 108,956 |
| HNI Corp. | 2,863 | | 166,884 |
|
|
| | | | 275,840 |
Paper - 0.27% | | | |
| Bowater, Inc. | 2,923 | | 76,057 |
| P.H. Glatfelter Company | 2,303 | | 37,861 |
| Potlatch Corp. * | 1,526 | | 55,607 |
|
|
| | | | 169,525 |
Petroleum Services - 1.86% | | | |
| ENSCO International, Inc. | 8,011 | | 358,012 |
| Pride International, Inc. * | 8,282 | | 256,494 |
| Smith International, Inc. | 10,474 | | 405,658 |
| Tidewater, Inc. | 3,162 | | 165,214 |
|
|
| | | | 1,185,378 |
Pharmaceuticals - 1.95% | | | |
| Barr Pharmaceuticals, Inc. * | 5,624 | | 377,820 |
| Par Pharmaceutical Companies, Inc. * | 1,790 | | 53,235 |
| PDL BioPharma, Inc. * | 5,898 | | 184,666 |
| Sepracor, Inc. * | 5,545 | | 317,784 |
| Valeant Pharmaceuticals International | 4,842 | | 86,285 |
| Vertex Pharmaceuticals, Inc. * | 5,181 | | 224,026 |
|
|
| | | | 1,243,816 |
Pollution Control - 0.61% | | | |
| Republic Services, Inc. | 6,381 | | 248,029 |
| Stericycle, Inc. * | 2,306 | | 139,398 |
|
|
| | | | 387,427 |
Publishing - 0.53% | | | |
| American Greetings Corp., Class A | 3,435 | | 72,066 |
| Media General, Inc., Class A | 1,257 | | 62,976 |
| Readers Digest Association, Inc., Class A | 5,150 | | 78,228 |
| Scholastic Corp. * | 1,864 | | 54,839 |
| Valassis Communications, Inc. * | 2,487 | | 68,517 |
|
|
| | | | 336,626 |
Railroads & Equipment - 0.16% | | | |
| GATX Corp. | 2,645 | | 105,007 |
Real Estate - 3.32% | | | |
| AMB Property Corp., REIT | 4,467 | | 239,655 |
| Mid Cap Index Fund (continued) | | | |
| | Shares or | | |
| | Principal | | |
| | Amount | | Value |
|
|
| |
| COMMON STOCKS (continued) | | | |
| Real Estate (continued) | | | |
| Developers Diversified Realty Corp., REIT | 5,690 | $ | 285,581 |
| Highwoods Properties, Inc., REIT | 2,824 | | 91,357 |
| Hospitality Properties Trust, REIT | 3,759 | | 167,276 |
| Liberty Property Trust, REIT | 4,612 | | 206,525 |
| Mack-California Realty Corp., REIT | 3,235 | | 145,252 |
| New Plan Realty Trust, Inc., REIT | 5,448 | | 136,472 |
| Regency Centers Corp., REIT | 3,548 | | 228,846 |
| The Macerich Company, REIT | 3,628 | | 261,397 |
| United Dominion Realty Trust, Inc., REIT | 7,171 | | 191,824 |
| Weingarten Realty Investors, REIT | 4,201 | | 165,435 |
|
|
| | | | 2,119,620 |
| Retail Grocery - 0.07% | | | |
| Ruddick Corp. | 1,819 | | 43,983 |
Retail Trade - 6.82% | | | |
| 99 Cents Only Stores * | 2,508 | | 28,541 |
| Abercrombie & Fitch Company, Class A | 4,581 | | 308,393 |
| Advance Auto Parts, Inc. * | 5,654 | | 233,793 |
| Aeropostale, Inc. * | 2,841 | | 81,508 |
| American Eagle Outfitters, Inc. | 6,876 | | 174,925 |
| AnnTaylor Stores Corp. * | 3,800 | | 137,940 |
| Barnes & Noble, Inc. | 2,751 | | 118,486 |
| BJ's Wholesale Club, Inc. * | 3,535 | | 111,918 |
| Borders Group, Inc. | 3,490 | | 84,214 |
| CarMax, Inc. * | 5,472 | | 171,930 |
| Chico's FAS, Inc. * | 9,460 | | 445,093 |
| Claire's Stores, Inc. | 5,194 | | 166,416 |
| Dollar Tree Stores, Inc. * | 5,561 | | 152,483 |
| Foot Locker, Inc. | 8,157 | | 188,508 |
| GameStop Corp., Class A * | 2,986 | | 119,530 |
| Michael's Stores, Inc. | 6,987 | | 224,283 |
| MSC Industrial Direct Company, Inc., Class A | 2,820 | | 133,583 |
| Pacific Sunwear of California, Inc. * | 3,877 | | 92,311 |
| Payless ShoeSource, Inc. * | 3,586 | | 84,988 |
| PETsMART, Inc. | 7,338 | | 190,495 |
| Pier 1 Imports, Inc. | 4,532 | | 47,722 |
| Regis Corp. | 2,366 | | 90,570 |
| Rent-A-Center, Inc. * | 3,710 | | 86,591 |
| Ross Stores, Inc. | 7,555 | | 213,958 |
| Saks, Inc. * | 7,265 | | 137,309 |
| United Rentals, Inc. * | 3,499 | | 114,067 |
| Urban Outfitters, Inc. * | 5,768 | | 162,081 |
| Williams-Sonoma, Inc. * | 6,033 | | 244,276 |
|
|
| | | | 4,345,912 |
| Sanitary Services - 0.30% | | | |
| Aqua America, Inc. | 6,726 | | 193,305 |
Semiconductors - 3.60% | | | |
| Atmel Corp. * | 22,228 | | 101,137 |
| Credence Systems Corp. * | 5,197 | | 45,006 |
| Cree, Inc. * | 3,967 | | 118,812 |
| Cypress Semiconductor Corp. * | 7,075 | | 125,652 |
| Fairchild Semiconductor International, Inc. * | 6,278 | | 109,112 |
The accompanying notes are an integral part of the financial statements. 213
John Hancock Funds II
Portfolio of investments — February 28, 2006 (Unaudited)
(showing percentage of total net assets)
|
| Mid Cap Index Fund (continued) | | | |
| | Shares or | | |
| | Principal | | |
| | Amount | | Value |
|
|
| |
| COMMON STOCKS (continued) | | | |
| Semiconductors (continued) | | | |
| Integrated Device Technology, Inc. * | 10,435 | $ | 154,960 |
| International Rectifier Corp. * | 3,700 | | 137,270 |
| Intersil Corp., Class A | 8,075 | | 228,846 |
| Lam Research Corp. * | 7,108 | | 306,355 |
| Lattice Semiconductor Corp. * | 5,939 | | 27,022 |
| MEMC Electronic Materials, Inc. * | 8,633 | | 289,119 |
| Micrel, Inc. * | 3,411 | | 47,652 |
| Microchip Technology, Inc. | 10,986 | | 386,707 |
| Semtech Corp. * | 3,808 | | 71,514 |
| Silicon Laboratories, Inc. * | 2,343 | | 112,417 |
| Triquint Semiconductor, Inc. * | 7,318 | | 34,687 |
|
|
| | | | 2,296,268 |
Software - 0.56% | | | |
| Activision, Inc. * | 14,306 | | 178,825 |
| Advent Software, Inc. * | 841 | | 23,380 |
| Macrovision Corp. * | 2,661 | | 53,779 |
| McDATA Corp., Class A * | 7,996 | | 35,342 |
| Transaction Systems Architects, Inc., Class A * | 1,943 | | 64,818 |
|
|
| | | | 356,144 |
Steel - 0.26% | | | |
| Steel Dynamics, Inc. | 2,005 | | 92,230 |
| Worthington Industries, Inc. | 3,734 | | 73,186 |
|
|
| | | | 165,416 |
Telecommunications Equipment & | | | |
| Services - 0.79% | | | |
| ADTRAN, Inc. | 3,540 | | 97,421 |
| Commscope, Inc. * | 2,875 | | 68,971 |
| Newport Corp. * | 2,088 | | 37,041 |
| Plantronics, Inc. | 2,477 | | 85,605 |
| Polycom, Inc. * | 4,917 | | 95,488 |
| Powerwave Technologies, Inc. * | 5,781 | | 84,865 |
| UTStarcom, Inc. * | 5,494 | | 34,338 |
|
|
| | | | 503,729 |
Telephone - 0.58% | | | |
| Cincinnati Bell, Inc. * | 12,867 | | 52,626 |
| Harris Corp. | 6,992 | | 319,395 |
|
|
| | | | 372,021 |
Tires & Rubber - 0.04% | | | |
| Bandag, Inc. | 612 | | 26,175 |
Tobacco - 0.09% | | | |
| Universal Corp. | 1,344 | | 54,661 |
Transportation - 1.61% | | | |
| Alexander & Baldwin, Inc. | 2,294 | | 111,787 |
| C.H. Robinson Worldwide, Inc. | 8,934 | | 400,422 |
| Expeditors International of Washington, Inc. | 5,574 | | 433,601 |
| Overseas Shipholding Group, Inc. | 1,546 | | 78,181 |
|
|
| | | | 1,023,991 |
| Trucking & Freight - 0.87% | | | |
| CNF, Inc. | 2,728 | | 136,891 |
| J.B. Hunt Transport Services, Inc. | 6,467 | | 153,009 |
| Mid Cap Index Fund (continued) | | |
| | | Shares or | |
| | | Principal | |
| | | Amount | Value |
| |
|
| |
| COMMON STOCKS (continued) | | | |
| Trucking & Freight (continued) | | | |
| Swift Transportation, Inc. * | | 2,740 | $ | 65,322 |
| Werner Enterprises, Inc. | | 2,697 | 52,403 |
| YRC Worldwide, Inc. * | | 3,036 | 145,242 |
|
|
| | | | 552,867 |
|
| TOTAL COMMON STOCKS (Cost $53,164,406) | | $ | 59,489,086 |
|
| |
| SHORT TERM INVESTMENTS - 6.64% | | |
| Federal Home Loan Mortgage Corp. Discount Notes | | |
| zero coupon due 03/07/2006 to | | | |
| 03/21/2006 | $ | 2,040,000 | $ | 2,037,618 |
| Rabobank USA Financial Corp. | | | |
| 4.56% due 03/01/2006 | | 2,000,000 | 2,000,000 |
| United States Treasury Bills | | | |
| zero coupon due 04/20/2006 | | 200,000 | 198,805 |
|
| TOTAL SHORT TERM INVESTMENTS | | | |
| (Cost $4,236,423) | | | $ | 4,236,423 |
|
| Total Investments (Mid Cap Index Fund) | | |
| (Cost $57,400,829) - 99.93% | | | $ | 63,725,509 |
| Other Assets in Excess of Liabilities - 0.07% | | 41,777 |
|
|
| TOTAL NET ASSETS - 100.00% | | | $ | 63,767,286 |
|
|
| |
| |
| Mid Cap Stock Fund | | | |
| | | Shares or | |
| | | Principal | |
| | | Amount | Value |
| |
|
| |
| COMMON STOCKS - 96.12% | | | |
| Aerospace - 3.17% | | | |
| Alliant Techsystems, Inc. * | | 56,515 $ | 4,318,876 |
| Rockwell Collins, Inc. | | 83,592 | 4,442,915 |
|
|
| | | | 8,761,791 |
Air Travel - 4.58% | | | |
| Gol Linhas Aereas Inteligentes SA, ADR (a) | 92,440 | 3,032,032 |
| JetBlue Airways Corp. * (a) | | 280,150 | 3,193,710 |
| Ryanair Holdings PLC, SADR * (a) | | 66,501 | 3,530,538 |
| Southwest Airlines Company (a) | | 172,825 | 2,898,275 |
|
|
| | | | 12,654,555 |
Apparel & Textiles - 0.66% | | | |
| Geox SpA | | 148,000 | 1,817,313 |
Biotechnology - 3.35% | | | |
| Applera Corp. | | 74,881 | 2,116,886 |
| Cephalon, Inc. * (a) | | 54,477 | 4,329,832 |
| ICOS Corp. * (a) | | 43,912 | 1,059,596 |
| Millennium Pharmaceuticals, Inc. * | | 167,483 | 1,755,222 |
|
|
| | | | 9,261,536 |
Broadcasting - 1.87% | | | |
| Sirius Satellite Radio, Inc. * (a) | | 587,175 | 3,000,464 |
| Univision Communications, Inc., Class A * | 5,000 | 167,250 |
| XM Satellite Radio Holdings, Inc., Class A * (a) | 90,275 | 1,994,175 |
|
|
| | | | 5,161,889 |
The accompanying notes are an integral part of the financial statements. 214
John Hancock Funds II
Portfolio of investments — February 28, 2006 (Unaudited)
(showing percentage of total net assets)
|
| Mid Cap Stock Fund (continued) | | | |
| | Shares or | | |
| | Principal | | |
| | Amount | | Value |
|
|
| |
| COMMON STOCKS (continued) | | | |
| Business Services - 4.63% | | | |
| Corporate Executive Board Company | 21,815 | $ | 2,181,500 |
| DST Systems, Inc. * (a) | 50,800 | | 2,856,484 |
| Equifax, Inc. (a) | 95,700 | | 3,506,448 |
| Resources Connection, Inc. * (a) | 154,800 | | 4,260,096 |
|
|
| | | | 12,804,528 |
Cellular Communications - 2.33% | | | |
| American Tower Corp., Class A * | 128,649 | | 4,094,898 |
| Crown Castle International Corp. * | 74,820 | | 2,345,607 |
|
|
| | | | 6,440,505 |
Commercial Services - 1.37% | | | |
| Live Nation, Inc. * | 212,300 | | 3,789,555 |
Computers & Business Equipment - 3.11% | | | |
| Cognizant Technology Solutions Corp., | | | |
| Class A * | 67,467 | | 3,886,774 |
| Network Appliance, Inc. * (a) | 142,400 | | 4,721,984 |
|
|
| | | | 8,608,758 |
Containers & Glass - 1.41% | | | |
| Jarden Corp. * (a) | 129,668 | | 3,888,743 |
Crude Petroleum & Natural Gas - 1.88% | | | |
| Chesapeake Energy Corp. (a) | 89,028 | | 2,643,241 |
| EOG Resources, Inc. (a) | 37,986 | | 2,560,257 |
|
|
| | | | 5,203,498 |
Drugs & Health Care - 1.83% | | | |
| CV Therapeutics, Inc. * (a) | 52,000 | | 1,399,320 |
| Shionogi & Co., Ltd. | 263,347 | | 3,651,187 |
|
|
| | | | 5,050,507 |
Electrical Equipment - 1.08% | | | |
| Tektronix, Inc. | 97,046 | | 2,989,017 |
Energy - 1.64% | | | |
| Q-Cells AG * | 15,692 | | 1,594,041 |
| Suntech Power Holdings Co., Ltd., ADR * (a) | 78,600 | | 2,952,216 |
|
|
| | | | 4,546,257 |
Financial Services - 10.37% | | | |
| Blackrock, Inc., Class A | 4,800 | | 682,080 |
| E*TRADE Financial Corp. * | 170,395 | | 4,358,704 |
| Eaton Vance Corp. | 77,644 | | 2,188,008 |
| Julius Baer Holding, Ltd. | 35,851 | | 3,084,075 |
| Melco International Development | 1,871,038 | | 2,845,612 |
| Nasdaq Stock Market, Inc. * (a) | 101,216 | | 4,100,260 |
| Nuveen Investments, Class A (a) | 79,200 | | 3,815,064 |
| State Street Corp. (c) | 73,776 | | 4,609,524 |
| TD Ameritrade Holding Corp. * | 137,600 | | 2,994,176 |
|
|
| | | | 28,677,503 |
Healthcare Products - 2.09% | | | |
| Boston Scientific Corp. * | 65,900 | | 1,609,278 |
| Kyphon, Inc. * (a) | 73,800 | | 2,635,398 |
| The Medicines Company * (a) | 75,839 | | 1,546,357 |
|
|
| | | | 5,791,033 |
| Mid Cap Stock Fund (continued) | | | |
| | Shares or | | |
| | Principal | | |
| | Amount | | Value |
|
|
| |
| COMMON STOCKS (continued) | | | |
| Healthcare Services - 3.61% | | | |
| Covance, Inc. * | 71,735 | $ | 4,049,441 |
| Coventry Health Care, Inc. * | 42,700 | | 2,545,774 |
| IMS Health, Inc. (a) | 140,600 | | 3,388,460 |
|
|
| | | | 9,983,675 |
Homebuilders - 4.04% | | | |
| Centex Corp. (a) | 37,300 | | 2,521,853 |
| D.R. Horton, Inc. (a) | 76,941 | | 2,624,457 |
| Standard Pacific Corp. | 83,929 | | 2,757,068 |
| Walter Industries, Inc. (a) | 49,900 | | 3,284,917 |
|
|
| | | | 11,188,295 |
Hotels & Restaurants - 4.11% | | | |
| Harrah's Entertainment, Inc. (a) | 46,075 | | 3,313,714 |
| Panera Bread Company, Class A * (a) | 42,800 | | 3,032,808 |
| Starwood Hotels & Resorts Worldwide, Inc. | 78,943 | | 5,012,880 |
|
|
| | | | 11,359,402 |
International Oil - 0.83% | | | |
| Nabors Industries, Ltd. * (a) | 34,800 | | 2,295,060 |
Internet Content - 0.78% | | | |
| NetFlix, Inc. * | 81,000 | | 2,171,610 |
Internet Service Provider - 0.50% | | | |
| Salesforce.Com, Inc. * (a) | 40,069 | | 1,396,405 |
Leisure Time - 1.55% | | | |
| DreamWorks Animation SKG, Class A * (a) | 100,239 | | 2,706,453 |
| Las Vegas Sands Corp. * (a) | 29,749 | | 1,587,109 |
|
|
| | | | 4,293,562 |
Life Sciences - 1.47% | | | |
| Pharmaceutical Product Development, Inc. * | 58,610 | | 4,078,670 |
Manufacturing - 1.07% | | | |
| Roper Industries, Inc. | 65,500 | | 2,952,085 |
Medical-Hospitals - 1.27% | | | |
| Manor Care, Inc. (a) | 84,645 | | 3,500,071 |
Metal & Metal Products - 1.08% | | | |
| Cameco Corp. | 80,752 | | 2,997,514 |
Petroleum Services - 1.54% | | | |
| BJ Services Company | 59,684 | | 1,868,706 |
| GlobalSantaFe Corp. (a) | 43,302 | | 2,396,333 |
|
|
| | | | 4,265,039 |
| Pharmaceuticals - 4.34% | | | |
| Alkermes, Inc. * (a) | 81,601 | | 2,073,481 |
| Amylin Pharmaceuticals, Inc. * (a) | 82,967 | | 3,599,109 |
| Elan Corp. PLC, ADR * (a) | 94,500 | | 1,200,150 |
| Forest Laboratories, Inc. * | 64,762 | | 2,972,576 |
| Vertex Pharmaceuticals, Inc. * (a) | 49,776 | | 2,152,314 |
|
|
| | | | 11,997,630 |
| Pollution Control - 1.19% | | | |
| Stericycle, Inc. * (a) | 54,304 | | 3,282,677 |
Real Estate - 2.21% | | | |
| Host Marriott Corp., REIT (a) | 154,125 | | 2,994,649 |
The accompanying notes are an integral part of the financial statements. 215
John Hancock Funds II
Portfolio of investments — February 28, 2006 (Unaudited)
(showing percentage of total net assets)
|
| Mid Cap Stock Fund (continued) | | | |
| | | Shares or | | |
| | | Principal | | |
| | | Amount | | Value |
| |
|
| |
| COMMON STOCKS (continued) | | | | |
| Real Estate (continued) | | | | |
| Kimco Realty Corp., REIT (a) | | 86,451 | $ | 3,106,184 |
|
|
| | | | | 6,100,833 |
Retail Trade - 8.44% | | | | |
| Abercrombie & Fitch Company, Class A (a) | | 86,639 | | 5,832,538 |
| Advance Auto Parts, Inc. * | | 49,274 | | 2,037,480 |
| Kohl's Corp. * | | 93,600 | | 4,503,096 |
| New York & Co., Inc. * (a) | | 157,300 | | 2,653,651 |
| Tiffany & Co. | | 104,307 | | 3,872,919 |
| Williams-Sonoma, Inc. * (a) | | 109,707 | | 4,442,036 |
|
|
| | | | | 23,341,720 |
Semiconductors - 1.35% | | | | |
| Altera Corp. * | | 173,600 | | 3,478,944 |
| International Rectifier Corp. * | | 6,900 | | 255,990 |
|
|
| | | | | 3,734,934 |
Software - 7.66% | | | | |
| Activision, Inc. * | | 251,400 | | 3,142,500 |
| Adobe Systems, Inc. (a) | | 90,500 | | 3,495,110 |
| Cognos, Inc. * (a) | | 93,811 | | 3,588,271 |
| Red Hat, Inc. * (a) | | 96,410 | | 2,590,537 |
| THQ, Inc. * | | 156,084 | | 3,746,016 |
| VeriFone Holdings, Inc. * (a) | | 175,494 | | 4,633,041 |
|
|
| | | | | 21,195,475 |
Telecommunications Equipment & | | | | |
| Services - 3.71% | | | | |
| Comverse Technology, Inc. * (a) | | 130,803 | | 3,761,894 |
| Polycom, Inc. * (a) | | 145,900 | | 2,833,378 |
| Tellabs, Inc. * (a) | | 250,000 | | 3,672,500 |
|
|
| | | | | 10,267,772 |
|
| TOTAL COMMON STOCKS (Cost $237,760,317) | | $ | 265,849,417 |
|
| |
| SHORT TERM INVESTMENTS - 30.80% | | | | |
| State Street Navigator Securities | | | | |
| Lending Prime Portfolio (c) | $ | 85,194,265 | $ | 85,194,265 |
|
| TOTAL SHORT TERM INVESTMENTS | | | | |
| (Cost $85,194,265) | | | $ | 85,194,265 |
|
| |
| REPURCHASE AGREEMENTS - 4.04% | | | | |
| Repurchase Agreement with Bank of | | | | |
| America dated 02/28/2006 at | | | | |
| 4.50% to be repurchased at | | | | |
| $11,180,397 on 03/01/2006, | | | | |
| collaterized by $11,565,000 U.S. | | | | |
| Treasury Bills, zero coupon due | | | | |
| 06/15/2006 (valued at | | | | |
| $11,409,974 including interest) (c) | $ | 11,179,000 | $ | 11,179,000 |
|
| TOTAL REPURCHASE AGREEMENTS | | | | |
| (Cost $11,179,000) | | | $ | 11,179,000 |
|
| Total Investments (Mid Cap Stock Fund) | | | | |
| (Cost $334,133,582) - 130.96% | | | $ | 362,222,682 |
| Liabilities in Excess of Other Assets - (30.96)% | | | (85,629,629) |
|
|
| TOTAL NET ASSETS - 100.00% | | | $ | 276,593,053 |
|
|
| Mid Cap Value Fund | | |
| | Shares or | |
| | Principal | |
| | Amount | Value |
|
|
| |
| COMMON STOCKS - 94.94% | | |
| Advertising - 1.95% | | |
| The Interpublic Group of Companies, Inc. * (a) | 408,906 $ | 4,236,266 |
| Agriculture - 3.59% | | |
| Monsanto Company | 49,598 | 4,160,280 |
| Mosaic Company * (a) | 228,429 | 3,632,021 |
|
|
| | | 7,792,301 |
| Apparel & Textiles - 0.08% | | |
| Tommy Hilfiger Corp. * (a) | 10,193 | 168,694 |
Auto Parts - 2.18% | | |
| Dana Corp. (a) | 247,154 | 434,991 |
| Genuine Parts Company | 96,593 | 4,300,320 |
|
|
| | | 4,735,311 |
Broadcasting - 2.30% | | |
| Clear Channel Communications, Inc. | 114,900 | 3,251,670 |
| Westwood One, Inc. | 155,853 | 1,737,761 |
|
|
| | | 4,989,431 |
Business Services - 5.88% | | |
| Cadence Design Systems, Inc. * (a) | 241,129 | 4,280,040 |
| R.H. Donnelley Corp. * | 63,753 | 3,888,933 |
| R.R. Donnelley & Sons Company (a) | 136,276 | 4,587,050 |
|
|
| | | 12,756,023 |
| Chemicals - 3.57% | | |
| Chemtura Corp. (a) | 254,231 | 2,816,880 |
| Eastman Chemical Company | 100,062 | 4,936,058 |
|
|
| | | 7,752,938 |
Computers & Business Equipment - 1.07% | | |
| Sybase, Inc. * (a) | 108,856 | 2,321,899 |
Containers & Glass - 4.42% | | |
| Ball Corp. | 103,922 | 4,427,077 |
| Pactiv Corp. * | 225,473 | 5,170,096 |
|
|
| | | 9,597,173 |
Crude Petroleum & Natural Gas - 1.64% | | |
| EOG Resources, Inc. | 52,915 | 3,566,471 |
Electrical Equipment - 1.53% | | |
| Hubbell, Inc., Class B (a) | 71,637 | 3,328,971 |
Electrical Utilities - 5.48% | | |
| Ameren Corp. (a) | 79,242 | 4,015,192 |
| CMS Energy Corp. * (a) | 239,423 | 3,371,076 |
| Northeast Utilities (a) | 165,021 | 3,237,712 |
| Puget Energy, Inc. (a) | 59,557 | 1,284,049 |
|
|
| | | 11,908,029 |
Food & Beverages - 0.40% | | |
| ConAgra Foods, Inc. (a) | 41,400 | 870,642 |
Gas & Pipeline Utilities - 2.08% | | |
| NiSource, Inc. | 158,751 | 3,259,158 |
| Southwest Gas Corp. (a) | 44,245 | 1,261,867 |
|
|
| | | 4,521,025 |
The accompanying notes are an integral part of the financial statements. 216
John Hancock Funds II
Portfolio of investments — February 28, 2006 (Unaudited)
(showing percentage of total net assets)
|
| Mid Cap Value Fund (continued) | | | |
| | Shares or | | |
| | Principal | | |
| | Amount | | Value |
|
|
| |
| COMMON STOCKS (continued) | | | |
| Healthcare Products - 1.40% | | | |
| Bausch & Lomb, Inc. | 43,845 | $ | 3,034,513 |
Hotels & Restaurants - 2.21% | | | |
| Brinker International, Inc. (a) | 93,132 | | 3,878,948 |
| Yum! Brands, Inc. | 19,282 | | 919,751 |
|
|
| | | | 4,798,699 |
Household Products - 1.82% | | | |
| Newell Rubbermaid, Inc. (a) | 96,879 | | 2,409,381 |
| Tupperware Corp. (a) | 72,761 | | 1,541,805 |
|
|
| | | | 3,951,186 |
Industrial Machinery - 3.96% | | | |
| CNH Global NV | 52,908 | | 1,336,985 |
| Cummins, Inc. (a) | 34,217 | | 3,705,017 |
| W.W. Grainger, Inc. | 47,888 | | 3,545,628 |
|
|
| | | | 8,587,630 |
Insurance - 11.75% | | | |
| ACE, Ltd. | 40,263 | | 2,243,857 |
| Aetna, Inc. | 44,528 | | 2,270,928 |
| Conseco, Inc. * (a) | 133,563 | | 3,317,705 |
| Everest Re Group, Ltd. | 27,970 | | 2,770,149 |
| Genworth Financial, Inc. | 77,817 | | 2,476,137 |
| PartnerRe, Ltd. (a) | 59,715 | | 3,619,326 |
| PMI Group, Inc. (a) | 55,154 | | 2,388,168 |
| SAFECO Corp. | 51,200 | | 2,637,312 |
| XL Capital, Ltd., Class A (a) | 56,186 | | 3,795,364 |
|
|
| | | | 25,518,946 |
Internet Software - 1.58% | | | |
| McAfee, Inc. * | 147,154 | | 3,422,802 |
Manufacturing - 1.67% | | | |
| Snap-on, Inc. | 92,934 | | 3,616,991 |
Metal & Metal Products - 1.74% | | | |
| Timken Company (a) | 131,444 | | 3,769,814 |
Mining - 1.31% | | | |
| Potash Corp. of Saskatchewan, Inc. | 29,739 | | 2,847,509 |
Office Furnishings & Supplies - 1.23% | | | |
| OfficeMax, Inc. (a) | 91,345 | | 2,679,149 |
Paper - 2.94% | | | |
| Bowater, Inc. (a) | 96,165 | | 2,502,213 |
| MeadWestvaco Corp. | 139,379 | | 3,877,524 |
|
|
| | | | 6,379,737 |
Petroleum Services - 3.75% | | | |
| GlobalSantaFe Corp. | 77,066 | | 4,264,833 |
| Halliburton Company | 57,143 | | 3,885,724 |
|
|
| | | | 8,150,557 |
Pharmaceuticals - 3.76% | | | |
| King Pharmaceuticals, Inc. * | 228,429 | | 3,711,971 |
| Mylan Laboratories, Inc. (a) | 193,888 | | 4,459,424 |
|
|
| | | | 8,171,395 |
| Mid Cap Value Fund (continued) | | | |
| | | Shares or | | |
| | | Principal | | |
| | | Amount | | Value |
| |
|
| |
| COMMON STOCKS (continued) | | | | |
| Publishing - 0.97% | | | | |
| American Greetings Corp., Class A (a) | | 100,774 | $ | 2,114,239 |
Real Estate - 1.68% | | | | |
| Host Marriott Corp., REIT (a) | | 187,322 | | 3,639,667 |
Retail Grocery - 2.08% | | | | |
| Safeway, Inc. | | 95,373 | | 2,318,518 |
| The Kroger Company * | | 109,300 | | 2,190,372 |
|
|
| | | | | 4,508,890 |
| Retail Trade - 3.21% | | | | |
| Federated Department Stores, Inc. | | 47,683 | | 3,387,400 |
| Foot Locker, Inc. | | 154,926 | | 3,580,340 |
|
|
| | | | | 6,967,740 |
| Telecommunications Equipment & | | | | |
| Services - 6.14% | | | | |
| ADC Telecommunications, Inc. * (a) | | 120,449 | | 3,049,769 |
| Avaya, Inc. * (a) | | 270,644 | | 3,009,561 |
| JDS Uniphase Corp. * (a) | | 910,700 | | 2,768,528 |
| PanAmSat Holding Corp. | | 61,543 | | 1,545,345 |
| Tellabs, Inc. * (a) | | 202,111 | | 2,969,010 |
|
|
| | | | | 13,342,213 |
| Telephone - 3.14% | | | | |
| CenturyTel, Inc. (a) | | 70,153 | | 2,524,105 |
| Qwest Communications International, Inc. * (a) | | 679,500 | | 4,294,440 |
|
|
| | | | | 6,818,545 |
| Travel Services - 2.43% | | | | |
| Sabre Holdings Corp. | | 218,231 | | 5,265,914 |
|
| TOTAL COMMON STOCKS (Cost $194,047,609) | | $ | 206,131,310 |
|
| |
| SHORT TERM INVESTMENTS - 30.21% | | | | |
| State Street Navigator Securities | | | | |
| Lending Prime Portfolio (c) | $ | 65,600,494 | $ | 65,600,494 |
|
| TOTAL SHORT TERM INVESTMENTS | | | | |
| (Cost $65,600,494) | | | $ | 65,600,494 |
|
| |
| REPURCHASE AGREEMENTS - 5.08% | | | | |
| Repurchase Agreement with State | | | | |
| Street Corp. dated 02/28/2006 at | | | | |
| 3.20% to be repurchased at | | | | |
| $11,032,981 on 03/01/2006, | | | | |
| collateralized by $11,090,000 | | | | |
| Federal National Mortgage | | | | |
| Association, 5.5% due 07/14/2028 | | | | |
| (valued at $11,257,315, including | | | | |
| interest) (c) | $ | 11,032,000 | $ | 11,032,000 |
|
| TOTAL REPURCHASE AGREEMENTS | | | | |
| (Cost $11,032,000) | | | $ | 11,032,000 |
|
| Total Investments (Mid Cap Value Fund) | | | | |
| (Cost $270,680,103) - 130.23% | | | $ | 282,763,804 |
| Liabilities in Excess of Other Assets - (30.23)% | | | (65,640,824) |
|
|
| TOTAL NET ASSETS - 100.00% | | | $ | 217,122,980 |
|
|
The accompanying notes are an integral part of the financial statements. 217
John Hancock Funds II
Portfolio of investments — February 28, 2006 (Unaudited)
(showing percentage of total net assets)
|
| Natural Resources Fund | | | |
| | Shares or | | |
| | Principal | | |
| | Amount | | Value |
|
|
| |
| COMMON STOCKS - 96.54% | | | |
Aluminum - 1.57% | | | |
| Alcoa, Inc. | 361,225 | $ | 10,591,117 |
Coal - 1.78% | | | |
| CONSOL Energy, Inc. | 101,043 | | 6,468,773 |
| Massey Energy Company (a) | 148,423 | | 5,521,336 |
|
|
| | | | 11,990,109 |
Crude Petroleum & Natural Gas - 8.95% | | | |
| Burlington Resources, Inc. | 105,266 | | 9,492,888 |
| EOG Resources, Inc. | 290,269 | | 19,564,131 |
| Newfield Exploration Company * (a) | 157,352 | | 6,081,655 |
| Surgutneftegaz, ADR (a) | 106,445 | | 7,759,840 |
| XTO Energy, Inc. | 414,786 | | 17,375,385 |
|
|
| | | | 60,273,899 |
Domestic Oil - 6.26% | | | |
| Noble Energy, Inc. | 160,764 | | 6,758,519 |
| Suncor Energy, Inc. | 278,507 | | 20,802,368 |
| Western Oil Sands, Inc. * | 536,311 | | 14,609,526 |
|
|
| | | | 42,170,413 |
Gas & Pipeline Utilities - 1.89% | | | |
| Equitable Resources, Inc. (a) | 153,960 | | 5,597,986 |
| Western Gas Resources, Inc. (a) | 150,448 | | 7,117,695 |
|
|
| | | | 12,715,681 |
Gold - 1.91% | | | |
| Barrick Gold Corp. | 193,456 | | 5,294,891 |
| Gold Fields, Ltd. | 345,943 | | 7,577,606 |
|
|
| | | | 12,872,497 |
International Oil - 23.89% | | | |
| Canadian Natural Resources, Ltd. | 750,633 | | 40,955,011 |
| China Petroleum and Chemical Corp. ADR (a) | 124,465 | | 7,383,264 |
| ConocoPhillips | 157,417 | | 9,596,140 |
| EnCana Corp. - CAD | 572,954 | | 23,663,302 |
| Lukoil Oil Company, ADR (a) | 197,027 | | 15,742,457 |
| Petroleo Brasileiro SA, ADR * | 194,749 | | 17,048,328 |
| Royal Dutch Shell PLC, ADR | 150,469 | | 9,100,365 |
| Royal Dutch Shell PLC-ADR, Class B shares | 115,349 | | 7,270,448 |
| Talisman Energy, Inc. | 574,066 | | 30,120,809 |
|
|
| | | | 160,880,124 |
Metal & Metal Products - 13.80% | | | |
| Alumina, Ltd. | 1,559,292 | | 8,039,283 |
| Cameco Corp. | 228,322 | | 8,475,313 |
| Companhia Siderurgica Nacional SA, ADR (a) | 356,697 | | 10,511,861 |
| Companhia Vale Do Rio Doce, ADR | 231,689 | | 10,757,320 |
| Companhia Vale Do Rio Doce, SADR | 734,826 | | 29,907,418 |
| Inco, Ltd. (a) | 218,179 | | 10,542,409 |
| Vedanta Resources PLC | 848,879 | | 14,672,604 |
|
|
| | | | 92,906,208 |
Mining - 10.65% | | | |
| Aluminum Corp. China, Ltd. ADR (a) | 113,272 | | 11,654,556 |
| Anglo American PLC | 186,803 | | 6,968,770 |
| Anglo Platinum, Ltd. | 206,968 | | 16,538,769 |
| Natural Resources Fund (continued) | | |
| | | Shares or | | |
| | | Principal | | |
| | | Amount | | Value |
| |
|
| |
| COMMON STOCKS (continued) | | | | |
| Mining (continued) | | | | |
| Freeport-McMoran Copper & Gold, Inc., | | | | |
| Class B (a) | | 203,830 | $ | 10,319,913 |
| Impala Platinum Holdings, Ltd. | | 56,884 | | 9,691,102 |
| Xstrata PLC | | 566,001 | | 16,528,605 |
|
|
| | | | | 71,701,715 |
Paper - 3.15% | | | | |
| Abitibi Consolidated, Inc. | | 1,228,619 | | 4,287,880 |
| Domtar, Inc. | | 141,380 | | 764,049 |
| International Paper Company | | 493,665 | | 16,177,402 |
|
|
| | | �� | | 21,229,331 |
Petroleum Services - 20.77% | | | | |
| BP PLC, SADR | | 341,927 | | 22,710,791 |
| Exxon Mobil Corp. | | 478,405 | | 28,402,905 |
| GlobalSantaFe Corp. | | 116,623 | | 6,453,917 |
| Halliburton Company | | 140,451 | | 9,550,668 |
| Petro-Canada | | 237,831 | | 10,880,037 |
| Repsol YPF SA, SADR | | 182,276 | | 5,105,551 |
| Total SA, SADR (a) | | 152,881 | | 19,282,881 |
| Transocean, Inc. * | | 97,385 | | 7,224,019 |
| Valero Energy Corp. | | 561,766 | | 30,217,393 |
|
|
| | | | | 139,828,162 |
Steel - 1.92% | | | | |
| Mittal Steel Company, NV (a) | | 389,425 | | 12,897,756 |
|
| TOTAL COMMON STOCKS (Cost $563,792,568) | | $ | 650,057,012 |
|
| |
| PREFERRED STOCKS - 0.20% | | | | |
| Mining - 0.20% | | | | |
| Anglo American Platinum Corp., Ltd.- ZAR * | 42,800 | | 1,340,278 |
|
| TOTAL PREFERRED STOCKS (Cost $1,196,524) | | $ | 1,340,278 |
|
| |
| WARRANTS - 0.07% | | | | |
| Financial Services - 0.07% | | | | |
| Goldman Sachs International | | | | |
| (Expiration date 06/30/2006; strike | | | | |
| price $0.0001) | | 17,100 | | 437,875 |
|
| TOTAL WARRANTS (Cost $388,714) | | | $ | 437,875 |
|
| |
| SHORT TERM INVESTMENTS - 12.20% | | | |
| State Street Navigator Securities | | | | |
| Lending Prime Portfolio (c) | $ | 82,182,802 | $ | 82,182,802 |
|
| TOTAL SHORT TERM INVESTMENTS | | | | |
| (Cost $82,182,802) | | | $ | 82,182,802 |
|
The accompanying notes are an integral part of the financial statements. 218
John Hancock Funds II
Portfolio of investments — February 28, 2006 (Unaudited)
(showing percentage of total net assets)
|
| Natural Resources Fund (continued) | | |
| | | Shares or | | |
| | | Principal | | |
| | | Amount | | Value |
|
|
| |
| REPURCHASE AGREEMENTS - 3.03% | | | |
| Repurchase Agreement with Bank of | | | | |
| America dated 02/28/2006 at | | | | |
| 4.50% to be repurchased at | | | | |
| $20,422,553 on 03/01/2006, | | | | |
| collaterized by $21,120,000 U.S. | | | | |
| Treasury Bills, 4.51% due | | | | |
| 06/15/2006 (valued at | | | | |
| $20,836,892, including interest) (c) | $ | 20,420,000 | $ | 20,420,000 |
|
| TOTAL REPURCHASE AGREEMENTS | | | | |
| (Cost $20,420,000) | | | $ | 20,420,000 |
|
| Total Investments (Natural Resources Fund) | | | |
| (Cost $667,980,608) - 112.04% | | | $ | 754,437,967 |
| Liabilities in Excess of Other Assets - (12.04)% | | | (81,044,919) |
|
|
| TOTAL NET ASSETS - 100.00% | | | $ | 673,393,048 |
|
|
| |
| |
| Quantitative Mid Cap Fund | | | |
| | | Shares or | | |
| | | Principal | | |
| | | Amount | | Value |
|
|
| |
| COMMON STOCKS - 97.97% | | | | |
| Advertising - 1.13% | | | | |
| Getty Images, Inc. * (a) | | 26,324 | $ | 2,133,034 |
Apparel & Textiles - 3.36% | | | | |
| Carter's, Inc. * (a) | | 43,481 | | 2,782,349 |
| Coach, Inc. * | | 98,841 | | 3,530,601 |
|
|
| | | | | 6,312,950 |
Auto Parts - 0.94% | | | | |
| O'Reilly Automotive, Inc. * | | 54,300 | | 1,776,696 |
Banking - 4.61% | | | | |
| Colonial Bancgroup, Inc. (a) | | 45,800 | | 1,150,038 |
| Corus Bankshares, Inc. (a) | | 22,792 | | 1,368,659 |
| Cullen Frost Bankers, Inc. (a) | | 40,800 | | 2,248,896 |
| Zions Bancorp. | | 47,240 | | 3,898,245 |
|
|
| | | | | 8,665,838 |
Broadcasting - 0.50% | | | | |
| Grupo Televisa SA, SADR | | 12,100 | | 949,366 |
Building Materials & Construction - 0.28% | | | |
| Lennox International, Inc. | | 16,300 | | 524,045 |
Business Services - 7.45% | | | | |
| Alliance Data Systems Corp. * | | 37,750 | | 1,633,065 |
| Corporate Executive Board Company | | 44,455 | | 4,445,500 |
| Global Payments, Inc. | | 84,848 | | 4,417,187 |
| MPS Group, Inc. * | | 108,800 | | 1,647,232 |
| URS Corp. * | | 43,200 | | 1,883,088 |
|
|
| | | | | 14,026,072 |
Cellular Communications - 0.81% | | | | |
| American Tower Corp., Class A * | | 47,800 | | 1,521,474 |
Chemicals - 3.03% | | | | |
| Airgas, Inc. | | 107,061 | | 3,895,950 |
| Quantitative Mid Cap Fund (continued) | |
| | Shares or | |
| | Principal | |
| | Amount | Value |
|
|
| |
| COMMON STOCKS (continued) | | |
| Chemicals (continued) | | |
| Techne Corp. * | 30,300 $ | 1,801,941 |
|
|
| | | 5,697,891 |
Commercial Services - 0.99% | | |
| CB Richard Ellis Group, Inc. * | 27,100 | 1,861,228 |
Computers & Business Equipment - 1.81% | | |
| Cognizant Technology Solutions Corp., | | |
| Class A * | 58,979 | 3,397,780 |
Containers & Glass - 0.98% | | |
| Silgan Holdings, Inc. (a) | 46,659 | 1,839,298 |
Crude Petroleum & Natural Gas - 3.68% | | |
| Chesapeake Energy Corp. (a) | 79,749 | 2,367,748 |
| Patterson-UTI Energy, Inc. | 86,550 | 2,384,452 |
| XTO Energy, Inc. | 52,074 | 2,181,380 |
|
|
| | | 6,933,580 |
Domestic Oil - 1.84% | | |
| Oil States International, Inc. * (a) | 59,700 | 2,061,441 |
| St. Mary Land & Exploration Company (a) | 36,300 | 1,393,557 |
|
|
| | | 3,454,998 |
Drugs & Health Care - 0.96% | | |
| Intuitive Surgical, Inc. * (a) | 20,000 | 1,804,000 |
Electrical Equipment - 2.76% | | |
| AMETEK, Inc. | 86,242 | 3,694,607 |
| Anixter International, Inc. * (a) | 32,900 | 1,505,175 |
|
|
| | | 5,199,782 |
Electrical Utilities - 1.35% | | |
| DPL, Inc. | 51,900 | 1,397,148 |
| Sierra Pacific Resources * | 80,200 | 1,142,048 |
|
|
| | | 2,539,196 |
| Electronics - 2.62% | | |
| Amphenol Corp., Class A | 30,371 | 1,525,535 |
| Jabil Circuit, Inc. * | 46,623 | 1,764,681 |
| Thomas & Betts Corp. * | 33,200 | 1,633,440 |
|
|
| | | 4,923,656 |
Financial Services - 5.32% | | |
| Affiliated Managers Group, Inc. * (a) | 41,850 | 4,119,296 |
| AllianceBernstein Holding LP * (a) | 29,109 | 1,870,835 |
| American Capital Strategies, Ltd. (a) | 47,300 | 1,688,610 |
| CIT Group, Inc. | 19,152 | 1,029,803 |
| Nelnet, Inc., Class A * (a) | 31,200 | 1,293,240 |
|
|
| | | 10,001,784 |
Food & Beverages - 2.93% | | |
| Constellation Brands, Inc., Class A * | 109,886 | 2,894,397 |
| Fomento Economico Mexicano SA de CV, | | |
| SADR | 13,600 | 1,183,064 |
| Hormel Foods Corp. | 41,510 | 1,429,190 |
|
|
| | | 5,506,651 |
| Forest Products - 0.64% | | |
| Rayonier, Inc. | 27,800 | 1,198,180 |
The accompanying notes are an integral part of the financial statements. 219
John Hancock Funds II
Portfolio of investments — February 28, 2006 (Unaudited)
(showing percentage of total net assets)
|
| Quantitative Mid Cap Fund (continued) | | |
| | Shares or | | |
| | Principal | | |
| | Amount | | Value |
|
|
| |
| COMMON STOCKS (continued) | | | |
| Gas & Pipeline Utilities - 3.07% | | | |
| Magellan Midstream Partners LP (a) | 55,653 | $ | 1,752,513 |
| Questar Corp. | 54,962 | | 4,025,966 |
|
|
| | | | 5,778,479 |
Healthcare Services - 3.57% | | | |
| Express Scripts, Inc. * | 13,491 | | 1,177,359 |
| Humana, Inc. * | 44,795 | | 2,314,558 |
| Omnicare, Inc. (a) | 29,200 | | 1,776,820 |
| Sierra Health Services, Inc. * | 34,858 | | 1,453,230 |
|
|
| | | | 6,721,967 |
Hotels & Restaurants - 2.16% | | | |
| Choice Hotels, Inc. (a) | 36,500 | | 1,625,345 |
| Darden Restaurants, Inc. | 58,200 | | 2,440,908 |
|
|
| | | | 4,066,253 |
Household Appliances - 0.99% | | | |
| Black & Decker Corp. | 21,856 | | 1,870,436 |
Industrial Machinery - 1.81% | | | |
| IDEX Corp. | 71,934 | | 3,398,881 |
Industrials - 1.66% | | | |
| Harsco Corp. | 39,066 | | 3,116,685 |
Insurance - 4.00% | | | |
| American Financial Group, Inc. | 63,400 | | 2,624,760 |
| PMI Group, Inc. | 45,557 | | 1,972,618 |
| W.R. Berkley Corp. | 50,665 | | 2,932,997 |
|
|
| | | | 7,530,375 |
Internet Software - 1.30% | | | |
| F5 Networks, Inc. * | 35,980 | | 2,440,164 |
Leisure Time - 4.50% | | | |
| International Speedway Corp., Class A | 30,479 | | 1,443,485 |
| Penn National Gaming, Inc. * | 54,076 | | 1,875,356 |
| Scientific Games Corp., Class A * (a) | 76,910 | | 2,351,908 |
| SCP Pool Corp. (a) | 64,404 | | 2,799,642 |
|
|
| | | | 8,470,391 |
| Life Sciences - 0.87% | | | |
| Pharmaceutical Product Development, Inc. * | 23,600 | | 1,642,324 |
Medical-Hospitals - 1.06% | | | |
| Community Health Systems, Inc. * | 52,729 | | 1,999,484 |
Mining - 0.91% | | | |
| Joy Global, Inc. | 33,200 | | 1,711,792 |
Mutual Funds - 2.27% | | | |
| Midcap SPDR Trust Series 1 * (a) | 30,200 | | 4,267,864 |
Petroleum Services - 1.18% | | | |
| Cal Dive International, Inc. * (a) | 63,332 | | 2,229,920 |
Pharmaceuticals - 3.17% | | | |
| Barr Pharmaceuticals, Inc. * (a) | 42,100 | | 2,828,278 |
| Celgene Corp. * | 48,078 | | 1,826,964 |
| PDL BioPharma, Inc. * (a) | 41,700 | | 1,305,627 |
|
|
| | | | 5,960,869 |
| Quantitative Mid Cap Fund (continued) | |
| | | Shares or | |
| | | Principal | |
| | | Amount | Value |
| |
|
| |
| COMMON STOCKS (continued) | | | |
| Pollution Control - 1.92% | | | |
| Republic Services, Inc. | | 93,000 $ | 3,614,910 |
Retail Trade - 4.12% | | | |
| Barnes & Noble, Inc. | | 36,700 | 1,580,669 |
| Chico's FAS, Inc. * (a) | | 108,121 | 5,087,093 |
| Payless ShoeSource, Inc. * (a) | | 45,800 | 1,085,460 |
|
|
| | | | 7,753,222 |
Sanitary Services - 1.99% | | | |
| Aqua America, Inc. (a) | | 130,081 | 3,738,528 |
Semiconductors - 3.49% | | | |
| Intersil Corp., Class A | | 63,200 | 1,791,088 |
| Marvell Technology Group, Ltd. * | | 49,763 | 3,046,491 |
| Microsemi Corp. * | | 56,349 | 1,732,732 |
|
|
| | | | 6,570,311 |
Software - 1.91% | | | |
| Activision, Inc. * | | 83,333 | 1,041,662 |
| Red Hat, Inc. * | | 43,200 | 1,160,784 |
| Websense, Inc. * | | 22,400 | 1,384,544 |
|
|
| | | | 3,586,990 |
Telecommunications Equipment & | | | |
| Services - 1.43% | | | |
| Comverse Technology, Inc. * | | 93,527 | 2,689,836 |
Telephone - 1.14% | | | |
| Harris Corp. | | 46,972 | 2,145,681 |
Transportation - 1.46% | | | |
| UTI Worldwide, Inc. (a) | | 26,200 | 2,741,306 |
|
| TOTAL COMMON STOCKS (Cost $164,526,302) | | $ | 184,314,167 |
|
| |
| SHORT TERM INVESTMENTS - 22.50% | | |
| Rabobank USA Finance Corp. | | | |
| 4.56% due 03/01/2006 | $ | 4,260,000 | $ | 4,260,000 |
| State Street Navigator Securities Lending | | | |
| Prime Portfolio (c) | | 38,058,720 | 38,058,720 |
|
| TOTAL SHORT TERM INVESTMENTS | | | |
| (Cost $42,318,720) | | $ | 42,318,720 |
|
| Total Investments (Quantitative Mid Cap Fund) | | |
| (Cost $206,845,022) - 120.47% | | $ | 226,632,887 |
| Liabilities in Excess of Other Assets - (20.47)% | | (38,503,455) |
|
|
| TOTAL NET ASSETS - 100.00% | | $ | 188,129,432 |
|
|
| |
| |
| Quantitative Value Fund | | | |
| | | Shares or | |
| | | Principal | |
| | | Amount | Value |
| |
|
| |
| COMMON STOCKS - 98.82% | | | |
| Aerospace - 1.42% | | | |
| Northrop Grumman Corp. | | 76,400 | $ | 4,897,240 |
| Apparel & Textiles - 0.52% | | | |
| Coach, Inc. * | | 49,700 | 1,775,284 |
The accompanying notes are an integral part of the financial statements. 220
John Hancock Funds II
Portfolio of investments — February 28, 2006 (Unaudited)
(showing percentage of total net assets)
|
| Quantitative Value Fund (continued) | | |
| | Shares or | | |
| | Principal | | |
| | Amount | | Value |
|
|
| |
| COMMON STOCKS (continued) | | | |
| Banking - 10.93% | | | |
| Bank of America Corp. | 284,000 | $ | 13,021,400 |
| KeyCorp (a) | 178,900 | | 6,667,603 |
| US Bancorp | 234,500 | | 7,248,395 |
| Wachovia Corp. | 192,000 | | 10,765,440 |
|
|
| | | | 37,702,838 |
Business Services - 2.19% | | | |
| Accenture, Ltd., Class A | 41,500 | | 1,355,390 |
| Alliance Data Systems Corp. * (a) | 76,200 | | 3,296,412 |
| Fair Isaac Corp. (a) | 48,800 | | 2,079,856 |
| Pitney Bowes, Inc. | 19,600 | | 837,704 |
|
|
| | | | 7,569,362 |
Chemicals - 1.20% | | | |
| Dow Chemical Company | 51,800 | | 2,228,954 |
| Lyondell Chemical Company (a) | 91,500 | | 1,914,180 |
|
|
| | | | 4,143,134 |
Coal - 0.84% | | | |
| CONSOL Energy, Inc. | 45,500 | | 2,912,910 |
Computers & Business Equipment - 1.76% | | | |
| Apple Computer, Inc. * | 21,800 | | 1,494,172 |
| EMC Corp. * | 165,800 | | 2,324,516 |
| Network Appliance, Inc. * (a) | 67,700 | | 2,244,932 |
|
|
| | | | 6,063,620 |
Construction Materials - 0.42% | | | |
| Sherwin-Williams Company (a) | 31,900 | | 1,453,045 |
Crude Petroleum & Natural Gas - 4.56% | | | |
| ChevronTexaco Corp. | 129,500 | | 7,314,160 |
| Patterson-UTI Energy, Inc. | 190,900 | | 5,259,295 |
| Pogo Producing Company (a) | 63,600 | | 3,171,096 |
|
|
| | | | 15,744,551 |
Electrical Equipment - 0.43% | | | |
| General Electric Company | 45,300 | | 1,489,011 |
Electrical Utilities - 2.50% | | | |
| TXU Corp. | 164,800 | | 8,633,872 |
Energy - 2.14% | | | |
| Energen Corp. | 109,600 | | 3,916,008 |
| Sempra Energy | 72,600 | | 3,473,184 |
|
|
| | | | 7,389,192 |
Financial Services - 15.82% | | | |
| American Capital Strategies, Ltd. (a) | 131,300 | | 4,687,410 |
| Bear Stearns Companies, Inc. | 51,500 | | 6,923,660 |
| Citigroup, Inc. | 250,300 | | 11,606,411 |
| Countrywide Financial Corp. | 174,949 | | 6,032,241 |
| Federal National Mortgage Association | 97,380 | | 5,324,738 |
| Goldman Sachs Group, Inc. | 51,300 | | 7,248,177 |
| JPMorgan Chase & Company | 37,400 | | 1,538,636 |
| Lehman Brothers Holdings, Inc. | 25,400 | | 3,707,130 |
| Morgan Stanley | 125,900 | | 7,511,194 |
|
|
| | | | 54,579,597 |
| Quantitative Value Fund (continued) | | |
| | Shares or | | |
| | Principal | | |
| | Amount | | Value |
|
|
| |
| COMMON STOCKS (continued) | | | |
| Food & Beverages - 4.51% | | | |
| Constellation Brands, Inc., Class A * (a) | 171,100 | $ | 4,506,774 |
| Hershey Foods Corp. | 58,500 | | 2,992,275 |
| Pepsi Bottling Group, Inc. | 107,700 | | 3,162,072 |
| PepsiCo, Inc. | 83,000 | | 4,906,130 |
|
|
| | | | 15,567,251 |
Gas & Pipeline Utilities - 2.11% | | | |
| Western Gas Resources, Inc. (a) | 153,800 | | 7,276,278 |
Healthcare Products - 1.50% | | | |
| Johnson & Johnson | 41,300 | | 2,380,945 |
| Varian Medical Systems, Inc. * (a) | 48,400 | | 2,801,392 |
|
|
| | | | 5,182,337 |
Homebuilders - 0.79% | | | |
| Meritage Homes Corp. * (a) | 46,700 | | 2,733,351 |
Hotels & Restaurants - 2.87% | | | |
| Hilton Hotels Corp. | 66,900 | | 1,618,980 |
| McDonald's Corp. | 237,400 | | 8,287,634 |
|
|
| | | | 9,906,614 |
Industrial Machinery - 1.57% | | | |
| Ingersoll-Rand Company, Class A | 132,000 | | 5,415,960 |
Industrials - 1.28% | | | |
| Fastenal Company (a) | 100,400 | | 4,408,564 |
Insurance - 7.25% | | | |
| American Financial Group, Inc. (a) | 74,600 | | 3,088,440 |
| CNA Financial Corp. * (a) | 72,600 | | 2,244,792 |
| Endurance Specialty Holdings, Ltd. (a) | 144,300 | | 4,545,450 |
| PartnerRe, Ltd. (a) | 42,600 | | 2,581,986 |
| Principal Financial Group, Inc. | 76,800 | | 3,741,696 |
| Reinsurance Group of America, Inc. | 69,200 | | 3,199,116 |
| RenaissanceRe Holdings, Ltd. (a) | 125,700 | | 5,599,935 |
|
|
| | | | 25,001,415 |
International Oil - 3.91% | | | |
| Anadarko Petroleum Corp. | 8,400 | | 832,944 |
| ConocoPhillips | 184,600 | | 11,253,216 |
| Nabors Industries, Ltd. * (a) | 21,500 | | 1,417,925 |
|
|
| | | | 13,504,085 |
Internet Service Provider - 0.62% | | | |
| Google, Inc., Class A * | 5,914 | | 2,144,535 |
Leisure Time - 0.52% | | | |
| International Speedway Corp., Class A (a) | 37,495 | | 1,775,763 |
Metal & Metal Products - 0.39% | | | |
| Southern Copper Corp. (a) | 16,800 | | 1,338,120 |
Mining - 0.51% | | | |
| Alliance Resource Partners LP (a) | 47,500 | | 1,753,225 |
Petroleum Services - 3.94% | | | |
| Exxon Mobil Corp. | 229,100 | | 13,601,667 |
Pharmaceuticals - 4.13% | | | |
| Caremark Rx, Inc. * | 75,500 | | 3,756,125 |
| Eli Lilly & Company | 66,900 | | 3,720,978 |
The accompanying notes are an integral part of the financial statements. 221
John Hancock Funds II
Portfolio of investments — February 28, 2006 (Unaudited)
(showing percentage of total net assets)
|
| Quantitative Value Fund (continued) | | |
| | | Shares or | | |
| | | Principal | | |
| | | Amount | | Value |
| |
|
| |
| COMMON STOCKS (continued) | | | | |
| Pharmaceuticals (continued) | | | | |
| Pfizer, Inc. | | 174,823 | $ | 4,578,614 |
| Teva Pharmaceutical Industries, Ltd., SADR | 52,000 | | 2,183,480 |
|
|
| | | | | 14,239,197 |
Publishing - 1.96% | | | | |
| Gannett Company, Inc. | | 34,000 | | 2,113,440 |
| Meredith Corp. (a) | | 84,500 | | 4,655,105 |
|
|
| | | | | 6,768,545 |
Real Estate - 3.15% | | | | |
| CBL & Associates Properties, Inc., REIT (a) | 78,200 | | 3,331,320 |
| Hospitality Properties Trust, REIT (a) | | 71,200 | | 3,168,400 |
| Simon Property Group, Inc., REIT | | 52,800 | | 4,380,816 |
|
|
| | | | | 10,880,536 |
Retail Trade - 0.77% | | | | |
| Bed Bath & Beyond, Inc. * | | 37,200 | | 1,340,688 |
| Dollar Tree Stores, Inc. * | | 47,400 | | 1,299,708 |
|
|
| | | | | 2,640,396 |
Semiconductors - 3.32% | | | | |
| Applied Micro Circuits Corp. * (a) | | 281,500 | | 1,016,215 |
| Atmel Corp. * (a) | | 486,900 | | 2,215,395 |
| Conexant Systems, Inc. * (a) | | 530,600 | | 1,581,188 |
| Marvell Technology Group, Ltd. * | | 53,200 | | 3,256,904 |
| National Semiconductor Corp. | | 60,900 | | 1,708,245 |
| Taiwan Semiconductor | | | | |
| Manufacturing Company, Ltd., SADR (a) | 173,200 | | 1,685,236 |
|
|
| | | | | 11,463,183 |
Software - 0.25% | | | | |
| Citrix Systems, Inc. * | | 27,000 | | 873,720 |
Telecommunications Equipment & | | | | |
| Services - 0.28% | | | | |
| Ciena Corp. * | | 240,800 | | 968,016 |
Telephone - 4.68% | | | | |
| AT&T Corp. | | 261,496 | | 7,214,675 |
| BellSouth Corp. | | 127,200 | | 4,016,976 |
| CenturyTel, Inc. (a) | | 136,500 | | 4,911,270 |
|
|
| | | | | 16,142,921 |
Tobacco - 1.34% | | | | |
| Altria Group, Inc. | | 64,400 | | 4,630,360 |
Transportation - 1.65% | | | | |
| Laidlaw International, Inc. | | 206,000 | | 5,685,600 |
Trucking & Freight - 0.79% | | | | |
| YRC Worldwide, Inc. * (a) | | 57,100 | | 2,731,664 |
|
| TOTAL COMMON STOCKS (Cost $321,234,492) | | $ | 340,986,959 |
|
| |
| SHORT TERM INVESTMENTS - 17.82% | | | |
| Federal Home Loan Bank Discount Notes | | | | |
| zero coupon. due 03/17/2006 | $ | 3,000,000 | $ | 2,994,140 |
| Rabobank USA Finance Corp. | | | | |
| 4.56% due 03/01/2006 | | 3,090,000 | | 3,090,000 |
| Quantitative Value Fund (continued) | | |
| | | Shares or | | |
| | | Principal | | |
| | | Amount | | Value |
|
|
| |
| SHORT TERM INVESTMENTS (continued) | | | |
| State Street Navigator Securities | | | | |
| Lending Prime Portfolio (c) | $ | 55,387,811 | $ | 55,387,811 |
|
| TOTAL SHORT TERM INVESTMENTS | | | | |
| (Cost $61,471,951) | | | $ | 61,471,951 |
|
| Total Investments (Quantitative Value Fund) | | | |
| (Cost $382,706,443) - 116.64% | | | $ | 402,458,910 |
| Liabilities in Excess of Other Assets - (16.64)% | | | (57,416,765) |
|
|
| TOTAL NET ASSETS - 100.00% | | | $ | 345,042,145 |
|
|
| |
| |
| Real Estate Securities Fund | | | |
| | | Shares or | | |
| | | Principal | | |
| | | Amount | | Value |
|
|
| |
| COMMON STOCKS - 98.86% | | | | |
| Hotels & Restaurants - 3.80% | | | | |
| Hilton Hotels Corp. (a) | | 268,348 | $ | 6,494,022 |
| Starwood Hotels & Resorts Worldwide, Inc. (a) | 317,984 | | 20,191,984 |
|
|
| | | | | 26,686,006 |
Real Estate - 95.06% | | | | |
| AMB Property Corp., REIT (a) | | 361,300 | | 19,383,745 |
| American Land Lease, Inc., REIT | | 54,201 | | 1,446,083 |
| Apartment Investment & Management | | | | |
| Company, Class A, REIT (a) | | 437,003 | | 19,363,603 |
| Archstone-Smith Trust, REIT | | 669,970 | | 31,756,578 |
| Avalon Bay Communities, Inc., REIT (a) | | 317,674 | | 32,720,422 |
| BioMed Realty Trust, Inc., REIT (a) | | 187,800 | | 5,198,304 |
| Boston Properties, Inc., REIT (a) | | 425,082 | | 35,991,693 |
| Brandywine Realty Trust, REIT (a) | | 91,457 | | 2,686,092 |
| BRE Properties, Inc., Class A, REIT | | 123,600 | | 6,720,132 |
| Camden Property Trust, REIT (a) | | 94,648 | | 6,232,571 |
| CarrAmerica Realty Corp., REIT (a) | | 98,100 | | 4,067,226 |
| Corporate Office Properties Trust, REIT (a) | 148,271 | | 6,156,212 |
| Digital Realty Trust, Inc., REIT (a) | | 125,898 | | 3,476,044 |
| Duke Realty Corp., REIT (a) | | 377,250 | | 13,241,475 |
| Entertainment Properties Trust, REIT (a) | | 100,283 | | 4,146,702 |
| Equity Lifestyle Properties, Inc., REIT | | 140,571 | | 6,703,831 |
| Equity Office Properties Trust, REIT | | 1,202,174 | | 37,808,372 |
| Equity One, Inc., REIT | | 287,153 | | 6,460,942 |
| Equity Residential, REIT (a) | | 618,420 | | 28,002,057 |
| Essex Property Trust, Inc., REIT (a) | | 81,444 | | 8,115,894 |
| Federal Realty Investment Trust, REIT (a) | | 225,416 | | 15,709,241 |
| Felcor Lodging Trust, Inc., REIT | | 757,800 | | 15,042,330 |
| General Growth Properties, Inc., REIT (a) | | 523,384 | | 26,373,320 |
| Highwoods Properties, Inc., REIT (a) | | 159,390 | | 5,156,266 |
| Host Marriott Corp., REIT (a) | | 1,165,192 | | 22,639,680 |
| Inland Real Estate Corp., REIT (a) | | 352,033 | | 5,417,788 |
| Kilroy Realty Corp., REIT (a) | | 86,800 | | 6,494,376 |
| LaSalle Hotel Properties, REIT (a) | | 150,722 | | 6,021,344 |
| Lexington Corporate Property Trust, REIT | | 201,574 | | 4,297,558 |
| Liberty Property Trust, REIT | | 211,728 | | 9,481,180 |
| LTC Properties, Inc., REIT (a) | | 97,591 | | 2,159,689 |
The accompanying notes are an integral part of the financial statements. 222
John Hancock Funds II
Portfolio of investments — February 28, 2006 (Unaudited)
(showing percentage of total net assets)
|
| Real Estate Securities Fund (continued) | | |
| | | Shares or | | |
| | | Principal | | |
| | | Amount | | Value |
| |
|
| |
| COMMON STOCKS (continued) | | | | |
| Real Estate (continued) | | | | |
| Mack-California Realty Corp., REIT (a) | | 177,087 | $ | 7,951,206 |
| Nationwide Health Properties, Inc., REIT | | 173,744 | | 3,912,715 |
| Pan Pacific Retail Properties, Inc., REIT | | 196,241 | | 13,581,840 |
| ProLogis, REIT | | 507,052 | | 26,630,371 |
| PS Business Parks, Inc., REIT | | 79,700 | | 4,239,243 |
| Public Storage, Inc., REIT | | 354,830 | | 27,683,837 |
| Reckson Associates Realty Corp., REIT (a) | | 253,800 | | 10,380,420 |
| Regency Centers Corp., REIT (a) | | 154,200 | | 9,945,900 |
| Senior Housing Properties Trust, REIT (a) | | 261,373 | | 4,686,418 |
| Simon Property Group, Inc., REIT (a) | | 712,763 | | 59,137,946 |
| Sovran Self Storage, Inc., REIT | | 92,352 | | 4,802,304 |
| Taubman Centers, Inc., REIT (a) | | 225,881 | | 8,976,511 |
| The Macerich Company, REIT | | 336,144 | | 24,219,175 |
| U-Store-It Trust, REIT (a) | | 132,995 | | 2,961,799 |
| Ventas, Inc., REIT (a) | | 587,116 | | 18,200,596 |
| Vornado Realty Trust, REIT | | 430,089 | | 38,273,620 |
| Washington REIT (a) | | 123,900 | | 4,140,738 |
|
|
| | | | | 668,195,389 |
|
| TOTAL COMMON STOCKS (Cost $612,693,462) | | $ | 694,881,395 |
|
| |
| SHORT TERM INVESTMENTS - 6.90% | | | | |
| State Street Navigator Securities | | | | |
| Lending Prime Portfolio (c) | $ | 48,505,156 | $ | 48,505,156 |
|
| TOTAL SHORT TERM INVESTMENTS | | | | |
| (Cost $48,505,156) | | | $ | 48,505,156 |
|
| |
| REPURCHASE AGREEMENTS - 1.07% | | | | |
| Repurchase Agreement with State | | | | |
| Street Corp. dated 02/28/2006 at | | | | |
| 3.20% to be repurchased at | | | | |
| $7,519,668 on 03/01/2006, | | | | |
| collateralized by $7,790,000 | | | | |
| Federal Home Loan Bank, 6% due | | | | |
| 11/15/2024 (valued at $7,673,150, | | | | |
| including interest) (c) | $ | 7,519,000 | $ | 7,519,000 |
|
| TOTAL REPURCHASE AGREEMENTS | | | | |
| (Cost $7,519,000) | | | $ | 7,519,000 |
|
| Total Investments (Real Estate Securities Fund) | | | |
| (Cost $668,717,618) - 106.83% | | | $ | 750,905,551 |
| Liabilities in Excess of Other Assets - (6.83)% | | | (48,013,725) |
|
|
| TOTAL NET ASSETS - 100.00% | | | $ | 702,891,826 |
|
|
| |
| |
| Real Return Bond Fund | | | | |
| | | Shares or | | |
| | | Principal | | |
| | | Amount | | Value |
| |
|
| |
| U.S. TREASURY OBLIGATIONS - 99.45% | | | | |
| Treasury Inflation Protected | | | | |
| Securities (d) - 99.05% | | | | |
| 0.875% due 04/15/2010 (a)*** | $ | 82,805,909 | $ | 79,386,936 |
| Real Return Bond Fund (continued) | |
| | | Shares or | |
| | | Principal | |
| | | Amount | Value |
|
|
| |
| U.S. TREASURY OBLIGATIONS | | | |
| (continued) | | | |
| Treasury Inflation Protected | | | |
| Securities (d) (continued) | | | |
| 1.875% due 07/15/2013 to | | | |
| 07/15/2015 (a)*** | $ | 123,563,628 | $ | 122,596,689 |
| 2.00% due 07/15/2014 to | | | |
| 01/15/2026 (a)*** | | 120,994,052 | 121,236,889 |
| 2.375% due 01/15/2025 (a)*** | | 66,619,960 | 70,809,756 |
| 3.00% due 07/15/2012 (a)*** | | 19,704,780 | 20,947,107 |
| 3.375% due 01/15/2007 | | 8,115,640 | 8,248,469 |
| 3.50% due 01/15/2011 (a)*** | | 39,581,850 | 42,505,642 |
| 3.625% due 01/15/2008 (a)*** | | 51,806,945 | 53,640,445 |
| 3.875% due 04/15/2029 (a)*** | | 74,472,060 | 101,747,452 |
| 3.875% due 01/15/2009 *** | | 600,085 | 634,895 |
|
|
| | | | 621,754,280 |
| U.S. Treasury Bonds - 0.40% | | | |
| 4.50% due 02/15/2036 | | 2,500,000 | 2,498,632 |
|
| TOTAL U.S. TREASURY OBLIGATIONS | | | |
| (Cost $619,302,372) | | | $ | 624,252,912 |
|
| |
| U.S. GOVERNMENT AGENCY OBLIGATIONS - 4.66% | |
| Federal National Mortgage | | | |
| Association - 3.88% | | | |
| 4.678% due 10/01/2044 (b)*** | | 312,212 | 313,793 |
| 5.50% due 03/01/2034 to 09/01/2035 *** | 12,084,401 | 11,979,547 |
| 5.50% TBA ** | | 12,200,000 | 12,083,562 |
|
|
| | | | 24,376,902 |
| Small Business Administration - 0.78% | | | |
| 4.88% due 11/01/2024 *** | | 3,283,837 | 3,214,621 |
| 4.504% due 02/01/2014 *** | | 1,715,520 | 1,660,015 |
|
|
| | | | 4,874,636 |
|
| TOTAL U.S. GOVERNMENT AGENCY OBLIGATIONS | |
| (Cost $28,686,190) | | | $ | 29,251,538 |
|
| |
| FOREIGN GOVERNMENT OBLIGATIONS - 0.38% | |
| Canada - 0.08% | | | |
| Government of Canada | | | |
| 3.00% due 12/01/2036 *** | CAD | 418,092 | 506,417 |
Russia - 0.30% | | | |
| Russian Federation | | | |
| 5.00% due 03/31/2030 *** | $ | 1,300,000 | 1,468,220 |
| 8.25% due 03/31/2010 *** | | 400,000 | 423,080 |
|
|
| | | | 1,891,300 |
|
| TOTAL FOREIGN GOVERNMENT OBLIGATIONS | |
| (Cost $2,315,065) | | | $ | 2,397,717 |
|
| |
| CORPORATE BONDS - 1.37% | | | |
| Banking - 0.03% | | | |
| Resona Bank, Ltd. | | | |
| 5.85% due 09/29/2049 (b)*** | | 200,000 | 198,533 |
Crude Petroleum & Natural Gas - 0.07% | | | |
| Pemex Project Funding Master Trust | | | |
| 9.25% due 03/30/2018 *** | | 350,000 | 446,250 |
The accompanying notes are an integral part of the financial statements. 223
John Hancock Funds II
Portfolio of investments — February 28, 2006 (Unaudited)
(showing percentage of total net assets)
|
| Real Return Bond Fund (continued) | | |
| | | Shares or | | |
| | | Principal | | |
| | | Amount | | Value |
|
|
| |
| CORPORATE BONDS (continued) | | | | |
| Financial Services - 1.09% | | | | |
| Citigroup, Inc. | | | | |
| 4.7075% due 01/30/2009 (b)*** | $ | 600,000 | $ | 599,716 |
| General Electric Capital Corp., Series MTN | | | | |
| 4.52% due 12/12/2008 (b)*** | | 500,000 | | 499,908 |
| General Motors Acceptance Corp. | | | | |
| 4.50% due 07/15/2006 (a)*** | | 5,300,000 | | 5,220,383 |
| Rabobank Nederland | | | | |
| 4.64% due 01/15/2009 (b)*** | | 500,000 | | 499,780 |
|
|
| | | | | 6,819,787 |
| |
| Gas & Pipeline Utilities - 0.02% | | | | |
| El Paso Corp. | | | | |
| 7.625% due 08/16/2007 *** | | 100,000 | | 102,125 |
Paper - 0.16% | | | | |
| Koch Forest Products, Inc. | | | | |
| 6.88% due 12/20/2012 | | 1,000,000 | | 1,000,000 |
|
| TOTAL CORPORATE BONDS (Cost $8,548,193) | | $ | 8,566,695 |
|
| |
| COLLATERALIZED MORTGAGE | | | | |
| OBLIGATIONS - 0.03% | | | | |
| Citigroup Mortgage Loan Trust, Inc., | | | | |
| Series 2005-11, Class 1A1 | | | | |
| 4.90% due 12/25/2035 (b)*** | | 196,346 | | 196,438 |
|
| TOTAL COLLATERALIZED MORTGAGE OBLIGATIONS | | |
| (Cost $195,273) | | | $ | 196,438 |
|
| |
| ASSET BACKED SECURITIES - 0.11% | | | | |
| Merrill Lynch Mortgage Investors, Inc., Series | | | |
| 2006-WMC1, Class A2A | | | | |
| 4.66% due 01/25/2037 (b)*** | | 500,000 | | 499,922 |
| Soundview Home Equity Loan Trust, Series | | | | |
| 2006-1, Class A1 | | | | |
| 4.65% due 02/25/2036 (b)*** | | 200,000 | | 199,969 |
|
| TOTAL ASSET BACKED SECURITIES | | | | |
| (Cost $700,000) | | | $ | 699,891 |
|
| |
| SHORT TERM INVESTMENTS - 51.38% | | | |
| Danske Corp. | | | | |
| 4.71% due 06/02/2006 *** | $ | 2,800,000 | $ | 2,765,931 |
| Government of France | | | | |
| zero coupon due 03/23/2006 *** | EUR | 260,000 | | 309,526 |
| State Street Navigator Securities | | | | |
| Lending Prime Portfolio (c) | $ | 318,498,126 | | 318,498,126 |
| UBS Finance (Delaware) LLC | | | | |
| 4.44% due 04/28/2006 | | 14,967 | | 14,860 |
| 4.66% due 05/22/2006 *** | | 100,000 | | 98,938 |
| United States Treasury Bills | | | | |
| zero coupon due 06/01/2006 | | 300,000 | | 296,580 |
| zero coupon due 03/02/2006 to | | | | |
| 03/16/2006 *** **** | | 510,000 | | 509,781 |
| zero coupon due 03/02/2006 to | | | | |
| 03/16/2006 **** | | 30,000 | | 29,982 |
|
| TOTAL SHORT TERM INVESTMENTS | | | | |
| (Cost $322,522,571) | | | $ | 322,523,724 |
|
| Real Return Bond Fund (continued) | |
| | | Shares or | |
| | | Principal | |
| | | Amount | Value |
|
|
| |
| REPURCHASE AGREEMENTS - 1.65% | | |
| Repurchase Agreement with State | | | |
| Street Corp. dated 02/28/2006 at | | | |
| 3.20% to be repurchased at | | | |
| $10,340,919 on 03/01/2006, | | | |
| collateralized by $10,420,000, | | | |
| Federal National Mortgage | | | |
| Assocation, 1.00% due 2/23/2007 | | | |
| (valued at $10,550,250, including | | | |
| interest) (c)*** | $ | 10,340,000 | $ | 10,340,000 |
|
| TOTAL REPURCHASE AGREEMENTS | | | |
| (Cost $10,340,000) | | | $ | 10,340,000 |
|
| Total Investments (Real Return Bond Fund) | | |
| (Cost $992,609,664) - 159.03% | | | $ | 998,228,915 |
| Liabilities in Excess of Other Assets - (59.03)% | | (370,525,544) |
|
|
| TOTAL NET ASSETS - 100.00% | | | $ | 627,703,371 |
|
|
| |
| |
| Small Cap Fund | | | |
| | | Shares or | |
| | | Principal | |
| | | Amount | Value |
|
|
| |
| COMMON STOCKS - 96.92% | | | |
| Advertising - 1.56% | | | |
| Ventiv Health, Inc. * (a) | | 116,900 $ | 3,256,834 |
Apparel & Textiles - 4.05% | | | |
| Hartmarx Corp. * (a) | | 245,800 | 2,131,086 |
| Warnaco Group, Inc. * (a) | | 273,700 | 6,352,577 |
|
|
| | | | 8,483,663 |
| Auto Parts - 3.44% | | | |
| LKQ Corp. * (a) | | 327,000 | 7,200,540 |
Banking - 7.70% | | | |
| Boston Private Financial Holdings, Inc. (a) | | 161,200 | 4,934,332 |
| First Community Bancorp. (a) | | 66,100 | 3,947,492 |
| Placer Sierra Bancshares (a) | | 195,600 | 5,140,368 |
| Tierone Corp. (a) | | 63,500 | 2,095,500 |
|
|
| | | | 16,117,692 |
| Business Services - 3.51% | | | |
| Escala Group, Inc. * (a) | | 185,800 | 4,617,130 |
| Infocrossing, Inc. * (a) | | 233,100 | 2,741,256 |
|
|
| | | | 7,358,386 |
| Chemicals - 4.23% | | | |
| Arch Chemicals, Inc. (a) | | 113,500 | 3,202,970 |
| Cytec Industries, Inc. (a) | | 106,100 | 5,659,374 |
|
|
| | | | 8,862,344 |
| Coal - 1.68% | | | |
| James River Coal Company * (a) | | 97,100 | 3,510,165 |
Computers & Business Equipment - 1.37% | | |
| Parametric Technology Corp. * | | 188,960 | 2,875,971 |
Construction Materials - 1.95% | | | |
| Clarcor, Inc. (a) | | 120,800 | 4,089,080 |
The accompanying notes are an integral part of the financial statements. 224
John Hancock Funds II
Portfolio of investments — February 28, 2006 (Unaudited)
(showing percentage of total net assets)
|
| Small Cap Fund (continued) | | |
| | Shares or | |
| | Principal | |
| | Amount | Value |
|
|
| |
| COMMON STOCKS (continued) | | |
| Cosmetics & Toiletries - 4.01% | | |
| Intermediate Parfums, Inc. (a) | 267,500 $ | 4,681,250 |
| Playtex Products, Inc. * | 353,700 | 3,713,850 |
|
|
| | | 8,395,100 |
Crude Petroleum & Natural Gas - 2.12% | | |
| Petroquest Energy, Inc. * (a) | 474,900 | 4,440,315 |
Domestic Oil - 1.57% | | |
| Forest Oil Corp. * | 66,300 | 3,291,795 |
Electrical Equipment - 2.98% | | |
| Encore Wire Corp. * (a) | 107,100 | 3,340,449 |
| Excel Technology, Inc. * (a) | 97,100 | 2,899,406 |
|
|
| | | 6,239,855 |
Electronics - 6.28% | | |
| Daktronics, Inc. (a) | 166,400 | 5,897,216 |
| Trimble Navigation, Ltd. * | 177,100 | 7,245,161 |
|
|
| | | 13,142,377 |
Gas & Pipeline Utilities - 2.08% | | |
| Dresser-Rand Group, Inc. * (a) | 172,400 | 4,359,996 |
Healthcare Products - 7.91% | | |
| Cantel Medical Corp. * (a) | 235,200 | 4,026,624 |
| Hologic, Inc. * (a) | 105,300 | 5,036,499 |
| Inverness Medical Innovations, Inc. * (a) | 166,700 | 4,415,883 |
| Kensey Nash Corp. * (a) | 126,100 | 3,086,928 |
|
|
| | | 16,565,934 |
Healthcare Services - 1.08% | | |
| Healthspring, Inc. * | 7,500 | 177,000 |
| Radiation Therapy Services, Inc. * (a) | 73,200 | 2,078,148 |
|
|
| | | 2,255,148 |
Industrial Machinery - 3.02% | | |
| Presstek, Inc. * (a) | 202,100 | 2,560,607 |
| Watts Industries, Inc., Class A (a) | 105,200 | 3,764,056 |
|
|
| | | 6,324,663 |
Insurance - 6.63% | | |
| James River Group, Inc. * (a) | 37,100 | 890,400 |
| National Interstate Corp. * (a) | 104,600 | 2,229,026 |
| Philadelphia Consolidated Holding Corp. * (a) | 56,000 | 5,992,000 |
| Scottish Re Group, Ltd. (a) | 190,900 | 4,772,500 |
|
|
| | | 13,883,926 |
Internet Service Provider - 3.14% | | |
| Avocent Corp. * (a) | 196,900 | 6,578,429 |
Internet Software - 1.71% | | |
| Lionbridge Technologies, Inc. * (a) | 500,300 | 3,582,148 |
Leisure Time - 3.09% | | |
| Gaylord Entertainment Company * (a) | 145,100 | 6,478,715 |
Medical-Hospitals - 1.41% | | |
| Lifepoint Hospitals, Inc. * (a) | 95,200 | 2,956,912 |
Petroleum Services - 0.26% | | |
| Hercules Offshore, Inc. * (a) | 17,700 | 538,080 |
| Small Cap Fund (continued) | | | | |
| | | Shares or | | |
| | | Principal | | |
| | | Amount | | Value |
| |
|
| |
| COMMON STOCKS (continued) | | | | |
| Pharmaceuticals - 1.38% | | | | |
| Prestige Brands Holdings, Inc. * (a) | | 258,000 | $ | 2,884,440 |
Publishing - 1.90% | | | | |
| Courier Corp. (a) | | 100,600 | | 3,970,682 |
Railroads & Equipment - 2.08% | | | | |
| Genesee & Wyoming, Inc., Class A * (a) | | 95,000 | | 4,346,250 |
Retail Trade - 3.88% | | | | |
| Build A Bear Workshop, Inc. * (a) | | 135,800 | | 3,928,694 |
| Cost Plus, Inc. * (a) | | 218,300 | | 4,189,177 |
|
|
| | | | | 8,117,871 |
| Sanitary Services - 1.64% | | | | |
| Aqua America, Inc. (a) | | 119,800 | | 3,443,052 |
Software - 9.26% | | | | |
| Emageon, Inc. * (a) | | 119,700 | | 2,100,735 |
| Hyperion Solutions Corp. * (a) | | 102,300 | | 3,432,165 |
| Parametric Technology Corp. * (a) | | 0 | | 0 |
| Secure Computing Corp. * (a) | | 481,500 | | 5,826,150 |
| Take-Two Interactive Software, Inc. * (a) | | 210,600 | | 3,281,148 |
| Transaction Systems Architects, Inc., Class A * | | 142,600 | | 4,757,136 |
|
|
| | | | | 19,397,334 |
|
| TOTAL COMMON STOCKS (Cost $178,669,224) | | $ | 202,947,697 |
|
| |
| SHORT TERM INVESTMENTS - 44.04% | | | | |
| State Street Navigator Securities | | | | |
| Lending Prime Portfolio (c) | $ | 92,214,294 | $ | 92,214,294 |
|
| TOTAL SHORT TERM INVESTMENTS | | | | |
| (Cost $92,214,294) | | | $ | 92,214,294 |
|
| |
| REPURCHASE AGREEMENTS - 3.02% | | | | |
| Repurchase Agreement with State | | | | |
| Street Corp. dated 02/28/2006 at | | | | |
| 3.20% to be repurchased at | | | | |
| $6,329,563 on 03/01/2006, | | | | |
| collateralized by $6,540,000 | | | | |
| Federal Home Loan Bank, 4.00% | | | | |
| due 03/10/2008 (valued at | | | | |
| $6,548,250, including interest) (c) | $ | 6,329,000 | $ | 6,329,000 |
|
| TOTAL REPURCHASE AGREEMENTS | | | | |
| (Cost $6,329,000) | | | $ | 6,329,000 |
|
| Total Investments (Small Cap Fund) | | | | |
| (Cost $277,212,518) - 143.98% | | | $ | 301,490,991 |
| Liabilities in Excess of Other Assets - (43.98)% | | | (92,093,817) |
|
|
| TOTAL NET ASSETS - 100.00% | | | $ | 209,397,174 |
|
|
| |
| |
| Small Cap Index Fund | | | | |
| | | Shares or | | |
| | | Principal | | |
| | | Amount | | Value |
| |
|
| |
| COMMON STOCKS - 94.32% | | | | |
| Advertising - 0.31% | | | | |
| aQuantive, Inc. * | | 2,625 | $ | 69,799 |
The accompanying notes are an integral part of the financial statements. 225
John Hancock Funds II
Portfolio of investments — February 28, 2006 (Unaudited)
(showing percentage of total net assets)
|
| Small Cap Index Fund (continued) | | |
| | Shares or | | |
| | Principal | | |
| | Amount | | Value |
|
|
| |
| COMMON STOCKS (continued) | | | |
| Advertising (continued) | | | |
| Marchex, Inc., Class B * | 959 | $ | 21,040 |
| ValueClick, Inc. * | 4,066 | | 71,196 |
| Ventiv Health, Inc. * | 1,264 | | 35,215 |
|
|
| | | | 197,250 |
Aerospace - 1.38% | | | |
| AAR Corp. * | 1,526 | | 38,623 |
| ARGON ST, Inc. * | 444 | | 13,191 |
| Armor Holdings, Inc. * | 1,599 | | 93,909 |
| Aviall, Inc. * | 1,550 | | 59,133 |
| BE Aerospace, Inc. * | 2,677 | | 64,221 |
| Curtiss Wright Corp. | 995 | | 61,531 |
| DRS Technologies, Inc. | 1,761 | | 92,928 |
| EDO Corp. | 778 | | 22,663 |
| Esterline Technologies Corp. * | 1,166 | | 48,552 |
| GenCorp, Inc. * | 2,568 | | 49,434 |
| HEICO Corp. | 1,112 | | 32,715 |
| Herley Industries, Inc. * | 715 | | 13,449 |
| Innovative Solutions & Support, Inc. * | 677 | | 9,553 |
| Integral Systems, Inc. | 612 | | 17,142 |
| K&F Industries Holdings, Inc. * | 797 | | 12,338 |
| Moog, Inc., Class A * | 1,574 | | 52,823 |
| MTC Technologies, Inc. * | 496 | | 13,685 |
| Orbital Sciences Corp., Class A * | 2,618 | | 39,872 |
| Sequa Corp., Class A * | 301 | | 25,558 |
| Teledyne Technologies, Inc. * | 1,552 | | 51,418 |
| Triumph Group, Inc. * | 750 | | 31,388 |
| Woodward Governor Company | 1,383 | | 44,463 |
|
|
| | | | 888,589 |
Agriculture - 0.13% | | | |
| Delta & Pine Land Company | 1,736 | | 43,938 |
| Tejon Ranch Company * | 420 | | 19,908 |
| The Andersons, Inc. | 351 | | 19,744 |
|
|
| | | | 83,590 |
Air Freight - 0.06% | | | |
| ABX Air, Inc. * | 2,861 | | 22,945 |
| ExpressJet Holdings, Inc. * | 2,158 | | 16,228 |
|
|
| | | | 39,173 |
Air Travel - 0.52% | | | |
| Airtran Holdings, Inc. * | 4,068 | | 72,329 |
| Alaska Air Group, Inc. * | 1,279 | | 40,992 |
| Continental Airlines, Inc., Class B * | 3,903 | | 90,940 |
| Frontier Airlines, Inc. * | 1,759 | | 12,665 |
| Mesa Air Group, Inc. * | 1,510 | | 17,244 |
| Republic Airways Holdings, Inc. * | 758 | | 10,627 |
| SkyWest, Inc. | 2,688 | | 77,871 |
| World Air Holdings, Inc. * | 1,176 | | 10,196 |
|
|
| | | | 332,864 |
Aluminum - 0.16% | | | |
| Aleris International Inc. * | 1,443 | | 61,803 |
| Small Cap Index Fund (continued) | | |
| | Shares or | | |
| | Principal | | |
| | Amount | | Value |
|
|
| |
| COMMON STOCKS (continued) | | | |
| Aluminum (continued) | | | |
| Century Aluminum Company * | 1,086 | $ | 38,651 |
|
|
| | | | 100,454 |
Amusement & Theme Parks - 0.02% | | | |
| Great Wolf Resorts, Inc. * | 1,286 | | 13,284 |
Apparel & Textiles - 1.23% | | | |
| Brown Shoe, Inc. | 866 | | 41,308 |
| Carter's, Inc. * | 857 | | 54,839 |
| Cherokee, Inc. | 426 | | 16,418 |
| Deckers Outdoor Corp. * | 511 | | 17,323 |
| dELiA*s, Inc. * | 971 | | 8,652 |
| Dixie Group, Inc. * | 628 | | 10,287 |
| G & K Services, Class A | 939 | | 36,715 |
| Guess, Inc. * | 755 | | 27,323 |
| Hartmarx Corp. * | 1,357 | | 11,765 |
| Interface, Inc., Class A * | 2,226 | | 24,664 |
| Joseph A. Bank Clothiers, Inc. * | 801 | | 35,744 |
| Kellwood Company | 1,331 | | 34,260 |
| K-Swiss, Inc., Class A | 1,198 | | 34,958 |
| Maidenform Brands, Inc. * | 681 | | 6,592 |
| Movado Group, Inc. | 958 | | 20,884 |
| Oakley, Inc. | 1,171 | | 17,823 |
| Oxford Industries, Inc. | 667 | | 30,535 |
| Perry Ellis International, Inc. * | 545 | | 11,995 |
| Phillips - Van Heusen Corp. | 1,536 | | 54,528 |
| Russell Corp. | 1,606 | | 22,934 |
| Skechers United States of America, Inc., | | | |
| Class A * | 1,107 | | 23,468 |
| Stage Stores, Inc. | 1,310 | | 38,200 |
| Stride Rite Corp. | 1,867 | | 25,951 |
| The Gymboree Corp. * | 1,479 | | 33,810 |
| Under Armour, Inc. * | 452 | | 12,742 |
| Unifirst Corp. | 470 | | 15,750 |
| Warnaco Group, Inc. * | 2,191 | | 50,853 |
| Wellman, Inc. | 1,631 | | 10,243 |
| Wolverine World Wide, Inc. | 2,734 | | 60,312 |
|
|
| | | | 790,876 |
Auto Parts - 0.71% | | | |
| Accuride Corp. * | 559 | | 6,328 |
| Aftermarket Technology Corp. * | 1,050 | | 22,785 |
| American Axle & Manufacturing Holdings, Inc. | 1,979 | | 32,099 |
| Arvinmeritor, Inc. | 3,290 | | 55,075 |
| Commercial Vehicle Group, Inc. * | 717 | | 13,121 |
| CSK Auto Corp. * | 2,182 | | 34,716 |
| Federal Signal Corp. | 2,325 | | 41,641 |
| Hayes Lemmerz International, Inc. * | 1,923 | | 6,019 |
| Keystone Automotive Industries, Inc. * | 770 | | 34,034 |
| LKQ Corp. * | 1,344 | | 29,595 |
| Modine Manufacturing Company | 1,617 | | 45,357 |
| Noble International, Ltd. | 660 | | 10,131 |
| Pep Boys - Manny, Moe & Jack | 2,626 | | 41,228 |
| Standard Motor Products, Inc., Class A | 804 | | 8,530 |
The accompanying notes are an integral part of the financial statements. 226
John Hancock Funds II
Portfolio of investments — February 28, 2006 (Unaudited)
(showing percentage of total net assets)
|
| Small Cap Index Fund (continued) | | |
| | Shares or | | |
| | Principal | | |
| | Amount | | Value |
|
|
| |
| COMMON STOCKS (continued) | | | |
| Auto Parts (continued) | | | |
| Strattec Security Corp. * | 234 | $ | 9,468 |
| Superior Industries International, Inc. | 1,057 | | 22,778 |
| Titan International, Inc. | 759 | | 13,161 |
| Visteon Corp. * | 6,061 | | 28,244 |
|
|
| | | | 454,310 |
Auto Services - 0.14% | | | |
| Dollar Thrifty Automotive Group, Inc. * | 1,185 | | 47,850 |
| Lithia Motors, Inc., Class A | 762 | | 24,415 |
| Midas, Inc. * | 831 | | 15,822 |
|
|
| | | | 88,087 |
Automobiles - 0.26% | | | |
| Americas Car Mart, Inc. * | 548 | | 10,094 |
| Monaco Coach Corp. | 1,267 | | 18,131 |
| Monro Muffler Brake, Inc. | 545 | | 19,718 |
| Rush Enterprises, Inc., Class A * | 1,064 | | 19,684 |
| Tenneco, Inc. * | 2,057 | | 46,591 |
| United Auto Group, Inc. | 1,251 | | 54,093 |
|
|
| | | | 168,311 |
Banking - 8.62% | | | |
| 1st Source Corp. | 620 | | 16,523 |
| Alabama National BanCorp | 664 | | 46,194 |
| Amcore Financial, Inc. | 1,024 | | 30,628 |
| Americanwest BanCorp * | 665 | | 16,824 |
| Ameris Bancorp | 780 | | 17,940 |
| Ames National Corp. | 487 | | 11,995 |
| Anchor BanCorp Wisconsin, Inc. | 1,115 | | 33,952 |
| Arrow Financial Corp. | 667 | | 17,882 |
| BancorpSouth, Inc. | 3,617 | | 86,880 |
| Bank Granite Corp. | 842 | | 16,503 |
| Bank Mutual Corp. | 2,832 | | 32,115 |
| Bank of the Ozarks, Inc. | 595 | | 21,158 |
| BankAtlantic Bancorp, Inc., Class A | 2,092 | | 28,556 |
| BankFinancial Corp. * | 1,358 | | 21,592 |
| BankUnited Financial Corp., Class A | 1,268 | | 35,428 |
| Banner Corp. | 614 | | 19,648 |
| Berkshire Hill Bancorp, Inc. | 491 | | 16,228 |
| BFC Financial Corp. * | 1,445 | | 8,684 |
| Boston Private Financial Holdings, Inc. | 1,341 | | 41,048 |
| Brookline Bancorp, Inc. | 3,012 | | 45,210 |
| Camden National Corp. | 456 | | 15,221 |
| Capital City Bank Group, Inc. | 608 | | 21,231 |
| Capital Corp of the West | 508 | | 17,089 |
| Capital Crossing Bank * | 369 | | 11,841 |
| Capitol Bancorp, Ltd. | 639 | | 27,694 |
| Cardinal Financial Corp. | 1,385 | | 17,035 |
| Cascade Bancorp | 925 | | 24,059 |
| Cathay General Bancorp, Inc. | 2,130 | | 75,892 |
| Centennial Bank Holdings Inc * | 2,237 | | 26,665 |
| Center Financial Corp. | 585 | | 13,554 |
| Central Pacific Financial Corp. | 1,449 | | 53,613 |
| Chemical Financial Corp. | 1,238 | | 39,851 |
| Small Cap Index Fund (continued) | | |
| | Shares or | | |
| | Principal | | |
| | Amount | | Value |
|
|
| |
| COMMON STOCKS (continued) | | | |
| Banking (continued) | | | |
| Chittenden Corp. | 2,175 | $ | 62,618 |
| Citizens & Northern Corp. | 493 | | 12,562 |
| Citizens Banking Corp. | 2,049 | | 54,258 |
| City Bank Lynnwood WA | 483 | | 20,441 |
| Coastal Financial Corp. | 1,014 | | 13,415 |
| CoBiz, Inc. | 831 | | 15,831 |
| Columbia Banking System, Inc. | 818 | | 27,428 |
| Community Bank Systems, Inc. | 1,462 | | 31,682 |
| Community Banks, Inc. | 1,085 | | 30,217 |
| Community Trust Bancorp, Inc. | 771 | | 24,456 |
| Corus Bankshares, Inc. | 869 | | 52,183 |
| CVB Financial Corp. | 2,828 | | 47,256 |
| Digital Insight Corp. * | 1,631 | | 53,905 |
| Dime Community Bancorp, Inc. | 1,359 | | 18,591 |
| Doral Financial Corp. | 4,012 | | 44,774 |
| Enterprise Financial Services Corp. | 511 | | 13,639 |
| F.N.B. Corp. | 2,725 | | 44,935 |
| Fidelity Bankshares, Inc. | 1,081 | | 34,516 |
| Financial Institutions, Inc. | 325 | | 6,214 |
| First BanCorp Puerto Rico | 3,199 | | 40,499 |
| First Bancorp. | 743 | | 16,517 |
| First Charter Corp. | 1,468 | | 35,981 |
| First Citizens Bancshares, Inc. | 274 | | 51,282 |
| First Commonwealth Financial Corp. | 3,392 | | 45,860 |
| First Community Bancorp. | 636 | | 37,982 |
| First Community Bancshares, Inc. | 568 | | 18,528 |
| First Defiance Financial Corp. | 463 | | 12,774 |
| First Financial BanCorp | 1,697 | | 28,696 |
| First Financial Bankshares, Inc. | 901 | | 32,959 |
| First Financial Corp. | 733 | | 21,037 |
| First Financial Holdings, Inc. | 696 | | 22,495 |
| First Indiana Corp. | 705 | | 19,451 |
| First Merchants Corp. | 977 | | 25,168 |
| First Midwest Bancorp, Inc. | 2,146 | | 72,170 |
| First Niagara Financial Group, Inc. | 5,413 | | 76,269 |
| First Place Financial Corp. | 819 | | 19,566 |
| First Republic Bank | 1,023 | | 37,125 |
| First State Bancorporation | 828 | | 21,379 |
| FirstFed Financial Corp. * | 787 | | 47,228 |
| Flagstar Bancorp, Inc. | 1,635 | | 25,261 |
| Flushing Financial Corp. | 1,093 | | 18,122 |
| Franklin Bank Corp. * | 1,073 | | 18,305 |
| Frontier Financial Corp. | 1,192 | | 38,406 |
| GB&T Bancshares, Inc. | 753 | | 15,700 |
| Glacier Bancorp, Inc. | 1,506 | | 47,499 |
| Gold Banc Corp., Inc. | 1,933 | | 35,355 |
| Great Southern Bancorp, Inc. | 577 | | 16,254 |
| Greater Bay Bancorp | 2,413 | | 64,910 |
| Greenhill & Company, Inc. | 557 | | 36,372 |
| Hancock Holding Company | 1,264 | | 56,438 |
| Hanmi Financial Corp. | 1,891 | | 33,943 |
| Harleysville National Corp. | 1,349 | | 29,880 |
The accompanying notes are an integral part of the financial statements. 227
John Hancock Funds II
Portfolio of investments — February 28, 2006 (Unaudited)
(showing percentage of total net assets)
|
| Small Cap Index Fund (continued) | | |
| | Shares or | | |
| | Principal | | |
| | Amount | | Value |
|
|
| |
| COMMON STOCKS (continued) | | | |
| Banking (continued) | | | |
| Heritage Commerce Corp. | 717 | $ | 16,469 |
| Horizon Financial Corp. | 686 | | 16,649 |
| IBERIABANK Corp. | 489 | | 28,245 |
| Independent Bank Corp. - MA | 799 | | 24,210 |
| Independent Bank Corp. - MI | 1,113 | | 30,018 |
| Integra Bank Corp. | 866 | | 18,697 |
| Interchange Financial Services Corp. | 1,028 | | 19,563 |
| Irwin Financial Corp. | 893 | | 17,896 |
| KNBT Bancorp, Inc. | 1,637 | | 25,897 |
| Lakeland Bancorp, Inc. | 1,096 | | 17,076 |
| Lakeland Financial Corp. | 405 | | 17,739 |
| Macatawa Bank Corp. | 535 | | 19,554 |
| MAF Bancorp, Inc. | 1,531 | | 65,619 |
| Main Street Banks, Inc. | 784 | | 20,259 |
| MainSource Financial Group, Inc. | 778 | | 14,222 |
| MB Financial, Inc. | 1,074 | | 39,480 |
| MBT Financial Corp. | 887 | | 14,902 |
| Mercantile Bankcorp. | 440 | | 17,085 |
| Mid-State Bancshares | 1,123 | | 32,309 |
| Midwest Banc Holdings, Inc. | 696 | | 17,887 |
| Nara Bancorp, Inc. | 960 | | 16,771 |
| National Penn Bancshares, Inc. | 2,120 | | 44,350 |
| Netbank, Inc. | 2,331 | | 17,366 |
| Newalliance Bancshares, Inc. | 5,346 | | 75,860 |
| Northern Empire Bancshares * | 486 | | 12,378 |
| Northwest Bancorp, Inc. | 959 | | 21,788 |
| Old National Bancorp | 3,222 | | 68,467 |
| Old Second Bancorp, Inc. | 733 | | 23,397 |
| Omega Financial Corp. | 706 | | 22,959 |
| Oriental Financial Group, Inc. | 1,064 | | 15,173 |
| Pacific Capital Bancorp | 2,150 | | 76,820 |
| Park National Corp. | 578 | | 60,632 |
| Partners Trust Financial Group, Inc. | 2,446 | | 28,814 |
| Peapack Gladstone Financial Corp. | 558 | | 15,764 |
| Pennfed Financial Services, Inc. | 575 | | 10,684 |
| Peoples Bancorp, Inc. | 561 | | 16,527 |
| PFF Bancorp, Inc. | 945 | | 29,701 |
| PremierWest Bancorp | 796 | | 14,169 |
| PrivateBancorp, Inc. | 810 | | 30,723 |
| Prosperity Bancshares, Inc. | 1,026 | | 29,610 |
| Provident Bankshares Corp. | 1,568 | | 57,028 |
| Provident Financial Services, Inc. | 3,415 | | 63,519 |
| Provident New York Bancorp | 2,037 | | 24,281 |
| R & G Financial Corp., Class B | 1,374 | | 16,199 |
| Renasant Corp. | 602 | | 20,751 |
| Republic Bancorp, Inc. | 3,724 | | 45,172 |
| S & T Bancorp, Inc. | 1,304 | | 47,518 |
| S.Y. Bancorp, Inc. | 744 | | 18,436 |
| Sandy Spring Bancorp, Inc. | 768 | | 27,241 |
| SCBT Financial Corp. | 548 | | 19,180 |
| Seacoast Banking Corp. of Florida | 695 | | 18,723 |
| Security Bank Corp. | 617 | | 14,210 |
| Small Cap Index Fund (continued) | | |
| | Shares or | | |
| | Principal | | |
| | Amount | | Value |
|
|
| |
| COMMON STOCKS (continued) | | | |
| Banking (continued) | | | |
| Signature Bank * | 564 | $ | 18,274 |
| Simmons First National Corp., Class A | 766 | | 21,808 |
| Southwest Bancorp, Inc. | 742 | | 16,242 |
| State Bancorp, Inc. | 675 | | 10,712 |
| Sterling Bancorp | 1,031 | | 20,971 |
| Sterling Bancshares, Inc. | 2,197 | | 39,151 |
| Sterling Financial Corp., Pennsylvania | 1,287 | | 26,551 |
| Sterling Financial Corp., Washington | 1,642 | | 47,519 |
| Suffolk Bancorp | 577 | | 19,797 |
| Summit Bankshares, Inc. | 741 | | 13,553 |
| Susquehanna Bancshares, Inc. | 2,216 | | 53,428 |
| SVB Financial Group * | 1,653 | | 84,286 |
| TD Banknorth, Inc. | 2,582 | | 79,349 |
| Texas Capital Bancshares, Inc. * | 1,100 | | 23,738 |
| Texas Regional Bancshares, Inc., Class A | 1,950 | | 60,216 |
| Tierone Corp. | 914 | | 30,162 |
| Tompkins Trustco, Inc. | 371 | | 17,315 |
| Trico Bancshares | 677 | | 17,521 |
| TrustCo Bank Corp. | 3,656 | | 45,956 |
| Trustmark Corp. | 2,216 | | 66,812 |
| U.S.B. Holding Company, Inc. | 629 | | 13,813 |
| UCBH Holdings, Inc. | 4,311 | | 77,167 |
| Umpqua Holdings Corp. | 2,119 | | 57,065 |
| Union Bankshares Corp. | 476 | | 21,472 |
| United Bankshares, Inc. | 1,764 | | 66,097 |
| United Community Banks, Inc. | 1,534 | | 41,955 |
| Univest Corp. of Pennsylvania | 616 | | 15,074 |
| Unizan Financial Corp. | 1,122 | | 30,631 |
| Vineyard National Bancorp Company | 470 | | 14,100 |
| Virginia Commerce Bancorp, Inc. * | 550 | | 19,965 |
| Virginia Financial Group, Inc. | 459 | | 18,360 |
| W Holding Company, Inc. | 5,079 | | 40,835 |
| Washington Trust Bancorp, Inc. | 654 | | 17,769 |
| Wesbanco, Inc. | 1,114 | | 35,370 |
| West Bank Corp. | 1,000 | | 18,600 |
| West Coast Bancorp. | 798 | | 21,538 |
| Westamerica Bancorporation | 1,547 | | 83,909 |
| Western Sierra Bancorp * | 439 | | 18,890 |
| Wilshire Bancorp, Inc. | 831 | | 15,997 |
| Wintrust Financial Corp. | 1,118 | | 58,896 |
| Yardville National Bancorp | 517 | | 18,586 |
|
|
| | | | 5,534,502 |
Biotechnology - 1.95% | | | |
| Aastrom Biosciences, Inc. * | 4,960 | | 8,482 |
| Applera Corp. - Celera Genomics Group * | 3,479 | | 39,974 |
| Arena Pharmaceuticals, Inc. * | 1,717 | | 30,408 |
| Arqule, Inc. * | 1,604 | | 8,630 |
| Bio Reference Labs, Inc. * | 550 | | 9,466 |
| Bio-Rad Laboratories, Inc., Class A * | 827 | | 47,395 |
| Cell Therapeutics, Inc. * | 3,524 | | 6,801 |
| Cotherix, Inc. * | 643 | | 7,407 |
The accompanying notes are an integral part of the financial statements. 228
John Hancock Funds II
Portfolio of investments — February 28, 2006 (Unaudited)
(showing percentage of total net assets)
|
| Small Cap Index Fund (continued) | | |
| | Shares or | | |
| | Principal | | |
| | Amount | | Value |
|
|
| |
| COMMON STOCKS (continued) | | | |
| Biotechnology (continued) | | | |
| deCODE genetics, Inc. * | 2,615 | $ | 24,633 |
| Digene Corp. * | 715 | | 29,644 |
| Discovery Laboratories, Inc. * | 2,630 | | 19,962 |
| Exelixis, Inc. * | 3,969 | | 43,103 |
| Genitope Corp. * | 1,222 | | 11,132 |
| Geron Corp. * | 3,014 | | 27,005 |
| Human Genome Sciences, Inc. * | 6,138 | | 76,848 |
| ICOS Corp. * | 3,013 | | 72,704 |
| Integra LifeSciences Holdings Corp. * | 980 | | 39,043 |
| Intermune, Inc. * | 1,215 | | 23,158 |
| Keryx Biopharmaceuticals, Inc. * | 1,317 | | 22,468 |
| Lexicon Genetics, Inc. * | 3,176 | | 13,022 |
| Martek Biosciences Corp. * | 1,480 | | 50,438 |
| Medarex, Inc. * | 5,248 | | 77,461 |
| MGI Pharma, Inc. * | 3,626 | | 63,926 |
| Momenta Pharmaceuticals, Inc. * | 442 | | 10,537 |
| Monogram Biosciences, Inc. * | 6,036 | | 12,012 |
| Myogen, Inc. * | 971 | | 36,801 |
| Myriad Genetics, Inc. * | 1,733 | | 44,503 |
| Nabi Biopharmaceuticals * | 2,795 | | 11,487 |
| Nektar Therapeutics * | 4,014 | | 83,933 |
| Neurocrine Biosciences, Inc. * | 1,722 | | 112,980 |
| Orchid Cellmark, Inc. * | 1,278 | | 8,550 |
| PRA International * | 540 | | 14,229 |
| Progenics Pharmaceuticals, Inc. * | 960 | | 28,320 |
| Serologicals Corp. * | 1,638 | | 39,623 |
| StemCells, Inc. * | 2,993 | | 10,865 |
| Tanox, Inc. * | 1,174 | | 22,400 |
| Telik, Inc. * | 2,473 | | 54,703 |
| Trimeris, Inc. * | 879 | | 11,023 |
|
|
| | | | 1,255,076 |
Broadcasting - 0.53% | | | |
| Citadel Broadcasting Corp. | 2,070 | | 23,060 |
| Cox Radio, Inc., Class A * | 1,831 | | 25,323 |
| Cumulus Media, Inc., Class A * | 2,521 | | 29,244 |
| Emmis Communications Corp., Class A * | 1,525 | | 24,964 |
| Entercom Communications Corp. * | 1,676 | | 47,213 |
| Entravision Communications Corp., Class A * | 3,683 | | 27,365 |
| Gray Television, Inc. | 2,118 | | 17,833 |
| Journal Communications, Inc. | 1,367 | | 16,828 |
| Mediacom Communications Corp., Class A * | 3,010 | | 16,976 |
| Radio One, Inc., Class D * | 3,915 | | 32,651 |
| Regent Communications, Inc. * | 1,998 | | 9,131 |
| Saga Communications, Inc., Class A * | 1,029 | | 9,745 |
| Salem Communications Corp., Class A * | 636 | | 8,891 |
| Sinclair Broadcast Group, Inc., Class A | 2,231 | | 16,041 |
| Spanish Broadcasting System, Inc., Class A * | 1,961 | | 11,001 |
| World Wrestling Entertainment, Inc., Class A | 1,095 | | 16,370 |
| WorldSpace, Inc. * | 633 | | 7,336 |
|
|
| | | | 339,972 |
| Small Cap Index Fund (continued) | | |
| | Shares or | | |
| | Principal | | |
| | Amount | | Value |
|
|
| |
| COMMON STOCKS (continued) | | | |
| Building Materials & Construction - 1.30% | | | |
| Apogee Enterprises, Inc. | 1,377 | $ | 23,808 |
| Beacon Roofing Supply, Inc. * | 792 | | 31,094 |
| Builders FirstSource, Inc. * | 588 | | 13,942 |
| Corrections Corp. of America * | 1,831 | | 78,751�� |
| Dycom Industries, Inc. * | 2,302 | | 49,148 |
| Eagle Materials, Inc. | 2,565 | | 138,844 |
| ElkCorp. | 955 | | 34,476 |
| Griffon Corp. * | 1,376 | | 32,364 |
| Hughes Supply, Inc. | 3,081 | | 142,496 |
| Infrasource Services, Inc. * | 645 | | 11,526 |
| Interline Brands, Inc. * | 625 | | 14,531 |
| Lennox International, Inc. | 2,355 | | 75,713 |
| Levitt Corp., Class A | 808 | | 18,794 |
| LSI Industries, Inc. | 992 | | 15,416 |
| NCI Building Systems, Inc. * | 977 | | 56,353 |
| Perini Corp. * | 929 | | 28,232 |
| Trex Company, Inc. * | 570 | | 14,814 |
| WCI Commmunities, Inc. * | 1,626 | | 41,040 |
| Williams Scotsman International Inc * | 531 | | 11,857 |
|
|
| | | | 833,199 |
Business Services - 4.56% | | | |
| ABM Industries, Inc. | 1,900 | | 35,055 |
| Acxiom Corp. | 4,114 | | 106,470 |
| Administaff, Inc. | 927 | | 43,986 |
| ADVO, Inc. | 1,494 | | 48,032 |
| AMERCO, Inc. * | 484 | | 42,999 |
| Arbitron, Inc. | 1,491 | | 58,447 |
| Banta Corp. | 1,151 | | 56,065 |
| BearingPoint, Inc. * | 8,608 | | 76,697 |
| Black Box Corp. | 797 | | 38,081 |
| Bowne & Company, Inc. | 1,634 | | 24,330 |
| Bright Horizons Family Solutions, Inc. * | 1,292 | | 43,295 |
| Catalina Marketing Corp. | 2,343 | | 51,968 |
| CDI Corp. | 612 | | 14,988 |
| Central Parking Corp. | 982 | | 16,007 |
| Clark, Inc. | 838 | | 8,849 |
| Coinstar, Inc. * | 1,215 | | 31,347 |
| Compucredit Corp. * | 946 | | 35,759 |
| COMSYS IT Partners, Inc. * | 676 | | 7,889 |
| CoStar Group, Inc. * | 782 | | 40,359 |
| CRA International, Inc. * | 537 | | 25,105 |
| CSG Systems International, Inc. * | 2,369 | | 52,071 |
| DiamondCluster International, Inc., Class A * | 1,466 | | 14,323 |
| eFunds Corp. * | 2,132 | | 57,735 |
| Electro Rent Corp. * | 946 | | 14,095 |
| Ennis Business Forms, Inc. | 1,277 | | 25,182 |
| Euronet Worldwide, Inc. * | 1,480 | | 51,889 |
| Exponent, Inc. * | 467 | | 14,851 |
| FactSet Research Systems, Inc. | 1,598 | | 62,562 |
| Forrester Research, Inc. * | 657 | | 14,855 |
| FTI Consulting, Inc. * | 1,817 | | 50,767 |
The accompanying notes are an integral part of the financial statements. 229
John Hancock Funds II
Portfolio of investments — February 28, 2006 (Unaudited)
(showing percentage of total net assets)
|
| Small Cap Index Fund (continued) | | |
| | Shares or | | |
| | Principal | | |
| | Amount | | Value |
|
|
| |
| COMMON STOCKS (continued) | | | |
| Business Services (continued) | | | |
| Gartner Group, Inc., Class A * | 2,626 | $ | 36,974 |
| Geo Group, Inc. * | 532 | | 12,023 |
| Gevity HR, Inc. | 1,308 | | 32,935 |
| Global Cash Access, Inc. * | 609 | | 10,292 |
| GSI Commerce, Inc. * | 1,544 | | 24,627 |
| Healthcare Services Group, Inc. | 1,295 | | 23,906 |
| Heidrick & Struggles International, Inc. * | 939 | | 34,743 |
| Hudson Highland Group, Inc. * | 1,145 | | 18,996 |
| Huron Consulting Group, Inc. * | 347 | | 9,522 |
| Infocrossing, Inc. * | 1,081 | | 12,713 |
| Informatica Corp. * | 4,100 | | 65,682 |
| Insight Enterprises, Inc. * | 2,308 | | 49,691 |
| Intervoice Brite, Inc. * | 1,843 | | 15,794 |
| Jackson Hewitt Tax Service, Inc. | 1,776 | | 50,438 |
| John H. Harland Company | 1,284 | | 46,468 |
| Kanbay International, Inc. * | 1,198 | | 20,342 |
| Kelly Services, Inc., Class A | 899 | | 24,264 |
| Kforce, Inc. * | 1,590 | | 19,255 |
| Korn/Ferry International * | 1,621 | | 34,122 |
| Labor Ready, Inc. * | 2,500 | | 61,425 |
| LECG Corp. * | 741 | | 11,982 |
| MAXIMUS, Inc. | 905 | | 33,042 |
| McGrath Rentcorp | 995 | | 27,382 |
| MPS Group, Inc. * | 4,832 | | 73,156 |
| Navigant Consulting Company * | 2,312 | | 45,061 |
| NCO Group, Inc. * | 1,543 | | 34,671 |
| Paxar Corp. * | 1,665 | | 31,935 |
| Perot Systems Corp., Class A * | 3,815 | | 57,645 |
| PHH Corp. * | 2,445 | | 69,903 |
| Pre-Paid Legal Services, Inc. | 466 | | 16,827 |
| Quest Software, Inc. * | 3,016 | | 43,943 |
| Rent-Way, Inc. * | 1,437 | | 9,728 |
| Resource America, Inc. | 832 | | 13,661 |
| Resources Connection, Inc. * | 2,230 | | 61,370 |
| Rollins, Inc. | 1,389 | | 26,905 |
| Scansource, Inc. * | 603 | | 35,040 |
| Seachange International, Inc. * | 1,327 | | 11,956 |
| SFBC International, Inc. * | 867 | | 20,461 |
| Sirva, Inc. * | 1,145 | | 9,160 |
| Sonicwall, Inc. * | 2,565 | | 17,211 |
| Sotheby's Holdings, Inc., Class A * | 1,750 | | 36,960 |
| Source Interlink Companies * | 1,598 | | 17,178 |
| SOURCECORP, Inc. * | 776 | | 19,866 |
| Spherion Corp. * | 2,947 | | 29,411 |
| StarTek, Inc. | 631 | | 12,431 |
| TALX Corp. | 1,342 | | 42,890 |
| Teletech Holdings, Inc. * | 1,700 | | 20,995 |
| TETRA Technologies, Inc. * | 2,464 | | 43,884 |
| Triple Crown Media, Inc. * | 211 | | 1,414 |
| Tyler Technologies, Inc. * | 1,798 | | 17,818 |
| URS Corp. * | 1,897 | | 82,690 |
| Viad Corp. | 1,080 | | 34,571 |
| Small Cap Index Fund (continued) | | |
| | Shares or | | |
| | Principal | | |
| | Amount | | Value |
|
|
| |
| COMMON STOCKS (continued) | | | |
| Business Services (continued) | | | |
| Viisage Technology, Inc. * | 654 | $ | 12,021 |
| Volt Information Sciences, Inc. * | 423 | | 10,122 |
| Watson Wyatt & Company Holdings | 1,575 | | 48,132 |
| Wind River Systems, Inc. * | 3,369 | | 52,118 |
| Wireless Facilities, Inc. * | 2,726 | | 12,267 |
| Zhone Technologies, Inc. * | 5,359 | | 13,076 |
|
|
| | | | 2,927,153 |
Cable and Television - 0.18% | | | |
| Charter Communications, Inc., Class A * | 17,231 | | 19,816 |
| Lin TV Corp. * | 1,377 | | 12,847 |
| LodgeNet Entertainment Corp. * | 924 | | 13,158 |
| Superior Essex, Inc. * | 897 | | 23,474 |
| Time Warner Telecom, Inc., Class A * | 2,404 | | 30,363 |
| TiVo, Inc. * | 2,748 | | 15,251 |
|
|
| | | | 114,909 |
Cellular Communications - 0.40% | | | |
| Brightpoint, Inc. * | 1,908 | | 53,977 |
| Dobson Communications Corp., Class A * | 6,489 | | 46,980 |
| Novatel Wireless, Inc * | 1,382 | | 11,277 |
| RF Micro Devices, Inc. * | 8,789 | | 59,150 |
| Syniverse Holdings, Inc. * | 840 | | 12,012 |
| UbiquiTel, Inc. * | 3,611 | | 35,280 |
| USA Mobility, Inc. * | 1,269 | | 36,573 |
|
|
| | | | 255,249 |
Chemicals - 1.37% | | | |
| A. Schulman, Inc. | 1,468 | | 34,395 |
| Albany Molecular Research, Inc. * | 1,144 | | 11,543 |
| American Vanguard Corp. | 545 | | 15,647 |
| Arch Chemicals, Inc. | 1,137 | | 32,086 |
| Balchem Corp. | 664 | | 14,256 |
| Cabot Microelectronics Corp. * | 1,166 | | 39,784 |
| Calgon Carbon Corp. | 1,834 | | 14,269 |
| Cambrex Corp. | 1,276 | | 23,632 |
| CF Industries Holdings, Inc. | 1,955 | | 34,447 |
| Ferro Corp. | 1,976 | | 39,678 |
| Georgia Gulf Corp. | 1,604 | | 46,035 |
| Glenayre Technologies, Inc. * | 3,297 | | 12,858 |
| H.B. Fuller Company | 1,329 | | 53,957 |
| Hercules, Inc. * | 5,336 | | 63,232 |
| Innospec Inc | 736 | | 17,149 |
| MacDermid, Inc. | 1,451 | | 42,688 |
| Minerals Technologies, Inc. | 941 | | 50,372 |
| Newmarket Corp. * | 848 | | 29,231 |
| Olin Corp. | 3,342 | | 70,215 |
| OM Group, Inc. * | 1,360 | | 28,846 |
| Pioneer Companies, Inc. * | 578 | | 17,409 |
| Polyone Corp. * | 4,394 | | 38,360 |
| Rockwood Holdings, Inc. * | 961 | | 22,007 |
| Terra Industries, Inc. * | 4,383 | | 31,075 |
| Tronox, Inc. | 664 | | 10,159 |
| UAP Holding Corp. | 1,583 | | 34,446 |
The accompanying notes are an integral part of the financial statements. 230
John Hancock Funds II
Portfolio of investments — February 28, 2006 (Unaudited)
(showing percentage of total net assets)
|
| Small Cap Index Fund (continued) | | |
| | Shares or | | |
| | Principal | | |
| | Amount | | Value |
|
|
| |
| COMMON STOCKS (continued) | | | |
| Chemicals (continued) | | | |
| W. R. Grace & Company * | 3,179 | $ | 32,267 |
| Westlake Chemical Corp. | 625 | | 21,450 |
|
|
| | | | 881,493 |
Coal - 0.10% | | | |
| Foundation Coal Holdings, Inc. | 1,111 | | 44,440 |
| James River Coal Company * | 620 | | 22,413 |
|
|
| | | | 66,853 |
Colleges & Universities - 0.19% | | | |
| Corinthian Colleges, Inc. * | 4,310 | | 55,857 |
| DeVry, Inc. * | 2,735 | | 64,218 |
|
|
| | | | 120,075 |
Commercial Services - 0.60% | | | |
| CBIZ, Inc. * | 3,039 | | 22,063 |
| Cenveo, Inc. * | 2,332 | | 32,858 |
| Chemed Corp. | 1,194 | | 66,195 |
| Color Kinetics, Inc. * | 678 | | 11,845 |
| First Advantage Corp., Class A * | 278 | | 6,622 |
| Morningstar, Inc. * | 407 | | 17,350 |
| Odyssey Marine Exploration, Inc. * | 2,033 | | 7,624 |
| Providence Service Corp. * | 502 | | 15,477 |
| Shaw Group, Inc. * | 3,606 | | 120,260 |
| TNS, Inc. * | 530 | | 8,533 |
| Vertrue, Inc. * | 393 | | 17,315 |
| Waste Services, Inc. * | 3,159 | | 10,804 |
| Wright Express Corp. * | 1,904 | | 45,772 |
|
|
| | | | 382,718 |
Computers & Business Equipment - 3.03% | | | |
| 3Com Corp. * | 18,034 | | 83,858 |
| 3D Systems Corp. * | 612 | | 11,628 |
| ADE Corp. * | 495 | | 16,375 |
| Advanced Digital Information Corp. * | 3,045 | | 26,370 |
| Agilysys, Inc. | 1,448 | | 20,692 |
| Anteon International Corp. * | 1,297 | | 71,711 |
| Applied Films Corp. * | 751 | | 14,427 |
| Benchmark Electronics, Inc. * | 1,923 | | 67,728 |
| Blue Coat Systems, Inc. * | 494 | | 10,488 |
| Brocade Communications Systems, Inc. * | 12,675 | | 66,797 |
| Cogent, Inc. * | 1,120 | | 26,051 |
| Digi International, Inc. * | 1,186 | | 12,892 |
| Dot Hill Systems Corp. * | 2,151 | | 14,541 |
| Echelon Corp. * | 1,484 | | 12,020 |
| Electronics for Imaging, Inc. * | 2,523 | | 67,667 |
| Extreme Networks, Inc. * | 5,787 | | 26,794 |
| Falconstor Software, Inc. * | 1,264 | | 11,755 |
| FileNET Corp. * | 1,939 | | 49,910 |
| Foundry Networks, Inc. * | 5,721 | | 80,323 |
| Gateway, Inc. * | 12,189 | | 28,766 |
| Henry, Jack & Associates, Inc. | 3,393 | | 74,680 |
| Hypercom Corp. * | 2,582 | | 19,856 |
| IHS, Inc., Class A * | 480 | | 12,067 |
| InPhonic, Inc. * | 799 | | 4,490 |
| Small Cap Index Fund (continued) | |
| | Shares or | |
| | Principal | |
| | Amount | Value |
|
|
| |
| COMMON STOCKS (continued) | | |
| Computers & Business Equipment | | |
| (continued) | | |
| Intergraph Corp. * | 1,307 $ | 47,392 |
| Intermec, Inc. * | 2,289 | 70,226 |
| Ixia * | 1,554 | 18,741 |
| Komag, Inc. * | 1,354 | 63,421 |
| Kronos, Inc. * | 1,500 | 61,515 |
| Lexar Media, Inc. * | 3,783 | 25,346 |
| Maxtor Corp. * | 11,933 | 114,557 |
| Merge Technologies, Inc. * | 894 | 17,281 |
| Micros Systems, Inc. * | 1,775 | 76,840 |
| Mobility Electronics, Inc. * | 1,318 | 12,429 |
| MTS Systems Corp. | 934 | 36,912 |
| Ness Technologies, Inc. * | 977 | 10,962 |
| Netscout Systems, Inc. * | 1,301 | 8,795 |
| Palm, Inc. * | 1,957 | 80,824 |
| Parametric Technology Corp. * | 5,103 | 77,665 |
| Phoenix Technology, Ltd. * | 1,382 | 9,577 |
| Plexus Corp. * | 2,036 | 68,328 |
| Quantum Corp. * | 8,752 | 31,245 |
| Radiant Systems, Inc. * | 1,167 | 16,665 |
| RadiSys Corp. * | 983 | 17,930 |
| Rimage Corp. * | 504 | 10,977 |
| SI International, Inc. * | 490 | 15,954 |
| Silicon Storage Technology, Inc. * | 4,178 | 18,884 |
| Sonic Solutions * | 1,161 | 21,072 |
| Standard Microsystems Corp. * | 981 | 31,902 |
| Stratasys, Inc. * | 534 | 14,669 |
| Sykes Enterprises, Inc. * | 1,234 | 16,437 |
| Synaptics, Inc. * | 1,050 | 24,664 |
| Trident Microsystems, Inc. * | 2,357 | 65,855 |
| Witness Systems, Inc. * | 1,299 | 30,435 |
|
|
| | | 1,949,386 |
Construction & Mining Equipment - 0.47% | | |
| A.S.V., Inc. * | 847 | 27,256 |
| Astec Industries, Inc. * | 749 | 26,904 |
| Bucyrus International, Inc., Class A | 954 | 60,083 |
| Carbo Ceramics, Inc. | 927 | 50,753 |
| Dril-Quip, Inc. * | 337 | 17,120 |
| Gulf Islands Fabrication, Inc. | 529 | 12,024 |
| Kaman Corp., Class A | 1,063 | 24,141 |
| Layne Christensen Company * | 501 | 13,973 |
| Washington Group International, Inc. * | 1,210 | 70,628 |
|
|
| | | 302,882 |
Construction Materials - 1.17% | | |
| Ameron International Corp. | 428 | 25,423 |
| Applied Industrial Technologies, Inc. | 1,426 | 61,004 |
| Clarcor, Inc. | 2,419 | 81,883 |
| Comfort Systems USA, Inc. | 1,965 | 21,595 |
| EMCOR Group, Inc. * | 1,438 | 62,683 |
| Granite Construction, Inc. | 1,624 | 75,272 |
| JLG Industries, Inc. | 2,360 | 139,216 |
The accompanying notes are an integral part of the financial statements. 231
John Hancock Funds II
Portfolio of investments — February 28, 2006 (Unaudited)
(showing percentage of total net assets)
|
| Small Cap Index Fund (continued) | | |
| | Shares or | | |
| | Principal | | |
| | Amount | | Value |
|
|
| |
| COMMON STOCKS (continued) | | | |
| Construction Materials (continued) | | | |
| Regal-Beloit Corp. | 1,157 | $ | 46,558 |
| Simpson Manufacturing, Inc. | 1,696 | | 66,297 |
| Standex International Corp. | 685 | | 21,831 |
| Trinity Industries, Inc. | 1,922 | | 101,866 |
| Universal Forest Products, Inc. | 738 | | 45,631 |
|
|
| | | | 749,259 |
Containers & Glass - 0.43% | | | |
| Graphic Packaging Corp. * | 3,160 | | 8,216 |
| Greif, Inc., Class A | 723 | | 41,869 |
| Jarden Corp. * | 3,042 | | 91,229 |
| Longview Fibre Company | 2,385 | | 44,886 |
| Mobile Mini, Inc. * | 710 | | 38,681 |
| Silgan Holdings, Inc. | 1,043 | | 41,115 |
| TAL International Group Inc. * | 373 | | 7,960 |
|
|
| | | | 273,956 |
Cosmetics & Toiletries - 0.28% | | | |
| Chattem, Inc. * | 849 | | 33,103 |
| Elizabeth Arden, Inc. * | 1,247 | | 30,427 |
| Nature's Sunshine Products, Inc. | 589 | | 9,995 |
| Nu Skin Enterprises, Inc., Class A | 2,655 | | 48,002 |
| Parlux Fragrances, Inc. * | 325 | | 11,242 |
| Playtex Products, Inc. * | 1,950 | | 20,475 |
| Revlon, Inc., Class A * | 7,015 | | 23,711 |
|
|
| | | | 176,955 |
Crude Petroleum & Natural Gas - 1.00% | | | |
| Bois d'Arc Energy, Inc. * | 644 | | 9,660 |
| Cabot Oil & Gas Corp., Class A | 2,281 | | 103,238 |
| Cascade Natural Gas Corp. | 839 | | 16,444 |
| Cimarex Energy Company * | 3,774 | | 160,999 |
| Edge Petroleum Corp. * | 833 | | 23,274 |
| Endeavour International Corp. * | 2,845 | | 8,763 |
| FX Energy, Inc. * | 1,714 | | 9,478 |
| Gasco Energy, Inc. * | 3,083 | | 17,604 |
| Goodrich Petroleum Corp. * | 505 | | 12,211 |
| Harvest Natural Resources, Inc. * | 1,819 | | 16,389 |
| Hydril * | 902 | | 60,741 |
| Parallel Petroleum Corp. * | 1,640 | | 27,896 |
| Penn Virginia Corp. | 876 | | 54,181 |
| Petroquest Energy, Inc. * | 1,953 | | 18,261 |
| Swift Energy Company * | 1,323 | | 51,279 |
| Toreador Resources Corp. * | 686 | | 20,559 |
| Tri-Valley Corp. * | 1,166 | | 9,608 |
| W&T Offshore, Inc. | 578 | | 22,490 |
|
|
| | | | 643,075 |
Domestic Oil - 1.82% | | | |
| Atlas America, Inc. * | 579 | | 38,787 |
| Berry Petroleum Company, Class A | 808 | | 54,580 |
| Brigham Exploration Company * | 1,250 | | 10,712 |
| Carrizo Oil & Gas, Inc. * | 946 | | 22,032 |
| Comstock Resources, Inc. * | 1,912 | | 53,727 |
| Delta Petroleum Corp. * | 1,535 | | 29,948 |
| Small Cap Index Fund (continued) | | |
| | Shares or | | |
| | Principal | | |
| | Amount | | Value |
|
|
| |
| COMMON STOCKS (continued) | | | |
| Domestic Oil (continued) | | | |
| Encore Aquisition Company * | 2,313 | $ | 70,870 |
| Energy Partners, Ltd. * | 1,574 | | 36,186 |
| Frontier Oil Corp. | 2,558 | | 118,308 |
| Giant Industries, Inc. * | 680 | | 39,576 |
| Holly Corp. | 960 | | 57,312 |
| Houston Exploration Company * | 1,333 | | 77,101 |
| KCS Energy, Inc. * | 2,322 | | 54,799 |
| McMoran Exploration Company * | 1,017 | | 17,991 |
| Meridian Resource Corp. * | 4,159 | | 17,634 |
| Oil States International, Inc. * | 1,910 | | 65,952 |
| Remington Oil Gas Corp. * | 1,100 | | 46,090 |
| St. Mary Land & Exploration Company | 2,667 | | 102,386 |
| Stone Energy Corp. * | 1,114 | | 46,120 |
| Syntroleum Corp. * | 1,867 | | 16,467 |
| TETRA Technologies, Inc. * | 1,610 | | 60,536 |
| Warren Resources, Inc. * | 1,035 | | 15,142 |
| Whiting Petroleum Corp. * | 1,536 | | 62,362 |
| Williams Clayton Energy, Inc. * | 295 | | 12,824 |
| World Fuel Services Corp. | 1,279 | | 38,754 |
|
|
| | | | 1,166,196 |
Drugs & Health Care - 2.34% | | | |
| 1 800 Contacts * | 520 | | 7,025 |
| Abaxis, Inc. * | 996 | | 21,902 |
| Abiomed, Inc. * | 1,039 | | 10,806 |
| Acadia Pharmaceuticals, Inc. * | 872 | | 13,054 |
| Alpharma, Inc., Class A | 1,858 | | 56,204 |
| Antigenics, Inc. * | 1,515 | | 9,257 |
| Ariad Pharmaceuticals, Inc. * | 2,908 | | 19,513 |
| Arrow International, Inc. | 1,012 | | 31,311 |
| Beverly Enterprises, Inc. * | 5,140 | | 63,530 |
| Bioenvision, Inc. * | 1,988 | | 16,739 |
| Biomarin Pharmaceutical, Inc. * | 3,501 | | 45,793 |
| Candela Corp. * | 1,138 | | 21,793 |
| Cell Genesys, Inc. * | 2,268 | | 15,967 |
| CNS, Inc. | 690 | | 14,345 |
| Conmed Corp. * | 1,405 | | 27,201 |
| Conor Medsystems, Inc. * | 406 | | 10,454 |
| Curagen Corp. * | 2,329 | | 11,622 |
| Curis, Inc. * | 2,489 | | 6,222 |
| CV Therapeutics, Inc. * | 2,049 | | 55,139 |
| Datascope Corp. | 589 | | 22,470 |
| Dendreon Corp. * | 2,829 | | 13,777 |
| Diversa Corp. * | 1,260 | | 9,967 |
| DOV Pharmaceutical, Inc. * | 1,111 | | 21,387 |
| Durect Corp., Inc. * | 1,889 | | 10,748 |
| Enzo Biochem, Inc. * | 1,334 | | 17,569 |
| Enzon Pharmaceuticals, Inc. * | 2,150 | | 14,534 |
| Gentiva Health Services, Inc. * | 1,174 | | 19,559 |
| Healthextras, Inc. * | 1,006 | | 31,146 |
| I-Flow Corp. * | 992 | | 13,620 |
| Illumina, Inc. * | 1,713 | | 43,562 |
The accompanying notes are an integral part of the financial statements. 232
John Hancock Funds II
Portfolio of investments — February 28, 2006 (Unaudited)
(showing percentage of total net assets)
|
| Small Cap Index Fund (continued) | |
| | Shares or | |
| | Principal | |
| | Amount | Value |
|
|
| |
| COMMON STOCKS (continued) | | |
| Drugs & Health Care (continued) | | |
| Immucor Corp. * | 2,133 | $ | 63,606 |
| Immunogen, Inc. * | 2,065 | 9,437 |
| Intuitive Surgical, Inc. * | 1,623 | 146,395 |
| Invacare Corp. | 1,443 | 45,180 |
| K-V Pharmaceutical Company, Class A * | 1,716 | 39,416 |
| Landauer, Inc. | 448 | 20,608 |
| Luminex Corp. * | 1,296 | 18,144 |
| Mannatech, Inc. | 788 | 10,551 |
| Matria Healthcare, Inc. * | 976 | 42,231 |
| Maxygen, Inc. * | 1,293 | 10,060 |
| Mentor Corp. | 1,498 | 64,474 |
| Meridian Bioscience, Inc. | 885 | 19,727 |
| Molina Healthcare, Inc. * | 537 | 15,256 |
| Nanogen, Inc. * | 2,510 | 6,325 |
| NeoPharm, Inc. * | 874 | 8,845 |
| Neurogen Corp. * | 1,228 | 8,277 |
| New River Pharmaceuticals, Inc. * | 574 | 17,553 |
| Northfield Laboratories, Inc. * | 1,154 | 12,082 |
| Option Care, Inc. | 1,097 | 15,380 |
| OraSure Technologies, Inc. * | 2,154 | 20,506 |
| Parexel International Corp. * | 1,267 | 32,461 |
| Perrigo Company | 3,992 | 63,433 |
| Res-Care, Inc. * | 1,014 | 18,546 |
| Savient Pharmaceuticals, Inc. * | 3,051 | 15,774 |
| Seattle Genetics, Inc. * | 1,383 | 7,302 |
| Vital Signs, Inc. | 287 | 14,654 |
| West Pharmaceutical Services, Inc. | 1,472 | 47,531 |
| Zymogenetics, Inc. * | 1,456 | 32,236 |
|
|
| | | 1,502,206 |
Educational Services - 0.22% | | |
| eCollege.com * | 876 | 18,072 |
| Educate, Inc. * | 910 | 7,835 |
| Leapfrog Enterprises, Inc., Class A * | 1,552 | 18,081 |
| Strayer Education, Inc. | 694 | 66,853 |
| Universal Technical Institute, Inc. * | 1,032 | 31,796 |
|
|
| | | 142,637 |
Electrical Equipment - 1.50% | | |
| A.O. Smith Corp. | 779 | 36,068 |
| American Science & Engineering, Inc. * | 390 | 29,675 |
| Anaren, Inc. * | 907 | 15,582 |
| Anixter International, Inc. * | 1,466 | 67,069 |
| Artesyn Technologies, Inc. * | 1,828 | 19,925 |
| Audiovox Corp., Class A * | 854 | 10,906 |
| Baldor Electric Company | 1,594 | 51,406 |
| C & D Technologies, Inc. | 1,326 | 11,324 |
| Cohu, Inc. | 1,036 | 21,880 |
| DTS, Inc. * | 882 | 16,273 |
| Encore Wire Corp. * | 779 | 24,297 |
| Excel Technology, Inc. * | 618 | 18,453 |
| General Cable Corp. * | 1,884 | 50,868 |
| Genlyte Group, Inc. * | 1,129 | 69,863 |
| Small Cap Index Fund (continued) | | |
| | Shares or | | |
| | Principal | | |
| | Amount | | Value |
|
|
| |
| COMMON STOCKS (continued) | | | |
| Electrical Equipment (continued) | | | |
| Global Power Equipment Group, Inc. * | 1,836 | $ | 9,290 |
| Greatbatch, Inc. * | 1,034 | | 22,862 |
| Littelfuse, Inc. * | 1,089 | | 31,298 |
| Methode Electronics, Inc., Class A | 1,791 | | 21,976 |
| Metrologic Instruments, Inc. * | 583 | | 13,065 |
| Plug Power, Inc. * | 2,455 | | 12,496 |
| Power-One, Inc. * | 3,567 | | 20,225 |
| Sirf Technology Holdings, Inc. * | 1,633 | | 61,123 |
| Ultralife Batteries, Inc. * | 780 | | 9,711 |
| Universal Electronics, Inc. * | 786 | | 14,117 |
| Varian, Inc. * | 1,500 | | 59,850 |
| Vicor Corp. | 914 | | 18,179 |
| W.H. Brady Company, Class A | 1,923 | | 71,113 |
| Watsco, Inc. | 994 | | 69,202 |
| Wesco International, Inc. * | 1,480 | | 84,834 |
|
|
| | | | 962,930 |
Electrical Utilities - 1.42% | | | |
| Allete, Inc. | 1,190 | | 55,537 |
| Avista Corp. | 2,316 | | 45,394 |
| Black Hills Corp. | 1,527 | | 52,788 |
| Central Vermont Public Service Corp. | 746 | | 15,972 |
| CH Energy Group, Inc. | 760 | | 37,316 |
| Cleco Corp. | 2,368 | | 53,256 |
| Connecticut Water Service, Inc. | 606 | | 15,368 |
| Duquesne Light Holdings, Inc. | 3,642 | | 63,189 |
| El Paso Electric Company * | 2,279 | | 46,606 |
| Empire District Electric Company | 1,282 | | 28,358 |
| IDACORP, Inc. | 1,973 | | 64,991 |
| ITC Holdings Corp. | 601 | | 15,662 |
| MGE Energy, Inc. | 992 | | 33,252 |
| NorthWestern Corp. | 1,689 | | 54,774 |
| Otter Tail Corp. | 1,389 | | 43,267 |
| Pike Electric Corp. * | 647 | | 12,325 |
| Quanta Services, Inc. * | 5,463 | | 74,788 |
| Sierra Pacific Resources * | 8,167 | | 116,298 |
| UIL Holding Corp. | 696 | | 35,670 |
| Unisource Energy Corp. | 1,626 | | 49,447 |
|
|
| | | | 914,258 |
Electronics - 1.81% | | | |
| Adaptec, Inc. * | 5,332 | | 33,378 |
| Analogic Corp. | 663 | | 35,769 |
| Ansoft Corp. * | 339 | | 13,279 |
| August Technology Corp. * | 937 | | 9,417 |
| Bel Fuse, Inc., Class B | 573 | | 18,972 |
| Belden CDT, Inc. | 2,029 | | 52,308 |
| Bell Microproducts, Inc. * | 1,506 | | 9,051 |
| Checkpoint Systems, Inc. * | 1,772 | | 50,608 |
| CTS Corp. | 1,763 | | 21,773 |
| Cubic Corp. | 792 | | 17,123 |
| Daktronics, Inc. | 737 | | 26,119 |
| Electro Scientific Industries, Inc. * | 1,345 | | 33,571 |
The accompanying notes are an integral part of the financial statements. 233
John Hancock Funds II
Portfolio of investments — February 28, 2006 (Unaudited)
(showing percentage of total net assets)
|
| Small Cap Index Fund (continued) | |
| | Shares or | |
| | Principal | |
| | Amount | Value |
|
|
| |
| COMMON STOCKS (continued) | | |
| Electronics (continued) | | |
| Enersys * | 2,190 | $ | 29,740 |
| Fargo Electronics, Inc. * | 653 | 12,361 |
| FEI Company * | 1,143 | 22,872 |
| Franklin Electric, Inc. | 1,055 | 47,317 |
| Hutchinson Technology, Inc. * | 1,200 | 33,012 |
| Identix, Inc. * | 4,329 | 35,368 |
| II-VI, Inc. * | 1,121 | 20,391 |
| Imation Corp. | 1,552 | 68,055 |
| Integrated Silicon Solution, Inc. * | 1,806 | 11,414 |
| Itron, Inc. * | 1,094 | 65,049 |
| Keithley Instruments, Inc. | 684 | 10,315 |
| Kemet Corp. * | 4,089 | 36,433 |
| LaBarge, Inc. * | 544 | 9,107 |
| LeCroy Corp. * | 651 | 9,635 |
| LoJack Corp. * | 815 | 18,541 |
| Measurement Specialties, Inc. * | 608 | 14,847 |
| Medis Technologies, Ltd. * | 730 | 13,870 |
| Mentor Graphics Corp. * | 3,736 | 41,955 |
| Mercury Computer Systems, Inc. * | 1,039 | 17,912 |
| Multi-Fineline Electronix, Inc. * | 377 | 21,466 |
| OSI Systems, Inc. * | 757 | 15,708 |
| Park Electrochemical Corp. | 954 | 27,542 |
| Photon Dynamics, Inc. * | 825 | 17,482 |
| Portalplayer, Inc. * | 722 | 18,238 |
| Rogers Corp. * | 799 | 39,183 |
| Supertex, Inc. * | 475 | 15,993 |
| Sycamore Networks, Inc. * | 8,305 | 38,784 |
| Taser International, Inc. * | 2,922 | 27,934 |
| Technitrol, Inc. | 1,927 | 42,163 |
| TTM Technologies, Inc. * | 2,000 | 25,820 |
| Universal Display Corp. * | 1,154 | 16,387 |
| X-Rite, Inc. | 1,137 | 14,497 |
|
|
| | | 1,160,759 |
Energy - 0.69% | | |
| Alon USA Energy, Inc. * | 508 | 9,881 |
| Covanta Holding Corp. * | 5,089 | 88,294 |
| Evergreen Solar, Inc. * | 1,862 | 29,029 |
| Fuelcell Energy, Inc. * | 2,281 | 25,387 |
| Hanover Compressor Company * | 4,255 | 65,016 |
| Headwaters, Inc. * | 1,938 | 71,939 |
| KFx, Inc. * | 2,780 | 58,046 |
| New Jersey Resources Corp. | 1,286 | 57,870 |
| Pioneer Drilling Company * | 938 | 13,498 |
| Quantum Fuel Systems Technologies | | |
| Worldwide, Inc. * | 2,314 | 10,482 |
| SunPower Corp, Class A. * | 334 | 14,663 |
|
|
| | | 444,105 |
Financial Services - 2.76% | | |
| Accredited Home Lenders Holding Company * | 833 | 44,407 |
| Ace Cash Express, Inc. * | 590 | 14,532 |
| Small Cap Index Fund (continued) | |
| | Shares or | |
| | Principal | |
| | Amount | Value |
|
|
| |
| COMMON STOCKS (continued) | | |
| Financial Services (continued) | | |
| Advance America Cash Advance Centers, | | |
| Inc. | 3,235 | $ | 44,999 |
| Advanta Corp., Class B | 920 | 32,264 |
| Archipelago Holdings, Inc. * | 1,379 | 88,808 |
| Asset Acceptance Capital Corp. * | 440 | 8,796 |
| Asta Funding, Inc. | 512 | 17,828 |
| Bankrate, Inc. * | 454 | 16,412 |
| Calamos Asset Management, Inc. | 1,110 | 42,591 |
| Charter Municipal Mortgage Acceptance | | |
| Company, SBI | 1,963 | 43,323 |
| City Holding Company | 889 | 32,369 |
| Collegiate Funding Services * | 776 | 15,512 |
| Commercial Capital Bancorp, Inc. | 2,113 | 30,279 |
| Delphi Financial Group, Inc. | 1,333 | 69,423 |
| Encore Capital Group, Inc. * | 724 | 12,482 |
| Federal Agricultural Mortgage Corp., Class C | 570 | 17,020 |
| Financial Federal Corp. | 1,265 | 35,318 |
| Fremont General Corp. | 3,038 | 72,061 |
| Fulton Financial Corp. | 830 | 14,608 |
| GFI Group, Inc. * | 285 | 17,117 |
| Harbor Florida Bancshares, Inc. | 1,008 | 38,314 |
| Heartland Payment Systems, Inc. * | 268 | 5,909 |
| Intercontinental Exchange Inc. * | 702 | 38,435 |
| International Securities Exchange, Inc. * | 560 | 23,638 |
| Investment Technology Group, Inc. * | 1,859 | 84,547 |
| Investors Bancorp Inc. * | 1,559 | 19,410 |
| Investors Real Estate Trust, SBI | 2,400 | 22,704 |
| Ipayment, Inc. * | 599 | 25,595 |
| ITLA Capital Corp. * | 336 | 15,550 |
| Knight Capital Group, Inc. * | 5,088 | 64,058 |
| LaBranche & Company, Inc. * | 2,550 | 36,083 |
| MarketAxess Holdings, Inc. * | 1,159 | 15,241 |
| Moneygram International, Inc. | 4,044 | 115,942 |
| Nasdaq Stock Market, Inc. * | 2,093 | 84,787 |
| National Financial Partners Corp. | 1,662 | 97,809 |
| NBT Bancorp, Inc. | 1,562 | 35,739 |
| Ocwen Financial Corp. * | 1,778 | 17,460 |
| optionsXpress Holdings, Inc. | 1,003 | 30,872 |
| Piper Jaffray Companies, Inc. * | 984 | 48,885 |
| Portfolio Recovery Associates, Inc. * | 753 | 36,829 |
| Sanders Morris Harris Group, Inc. | 729 | 11,649 |
| Stifel Financial Corp. * | 428 | 16,405 |
| SWS Group, Inc. | 849 | 20,690 |
| UMB Financial Corp. | 712 | 48,160 |
| United Community Financial Corp. | 1,566 | 19,168 |
| Waddell & Reed Financial, Inc., Class A | 3,605 | 83,960 |
| World Acceptance Corp. * | 930 | 23,975 |
| WSFS Financial Corp. | 321 | 19,353 |
|
|
| | | 1,771,316 |
Food & Beverages - 1.37% | | |
| Bob Evans Farms, Inc. | 1,670 | 48,714 |
| Buffalo Wild Wings, Inc. * | 384 | 14,565 |
The accompanying notes are an integral part of the financial statements. 234
John Hancock Funds II
Portfolio of investments — February 28, 2006 (Unaudited)
(showing percentage of total net assets)
|
| Small Cap Index Fund (continued) | | |
| | Shares or | | |
| | Principal | | |
| | Amount | | Value |
|
|
| |
| COMMON STOCKS (continued) | | | |
| Food & Beverages (continued) | | | |
| Chiquita Brands International, Inc. | 1,961 | $ | 33,768 |
| Coca-Cola Bottling Company | 296 | | 13,388 |
| Corn Products International, Inc. | 3,512 | | 94,684 |
| Denny's Corp. * | 4,376 | | 19,473 |
| Domino's Pizza, Inc. | 1,495 | | 38,123 |
| Fisher Communications, Inc. * | 354 | | 15,151 |
| Flowers Foods, Inc. | 2,353 | | 64,708 |
| Gold Kist, Inc. * | 2,456 | | 32,591 |
| Green Medium Term Note Coffee, Inc. * | 243 | | 9,965 |
| Hain Celestial Group, Inc. * | 1,410 | | 32,909 |
| Hansen Natural Corp. * | 695 | | 64,871 |
| J & J Snack Foods Corp. | 648 | | 22,000 |
| John B. Sanfilippo & Son, Inc. * | 458 | | 6,687 |
| Lance, Inc. | 1,496 | | 32,523 |
| Nuco2, Inc. * | 560 | | 16,772 |
| Peets Coffee & Tea, Inc. * | 678 | | 20,299 |
| Performance Food Group Company * | 1,772 | | 52,044 |
| Ralcorp Holdings, Inc. * | 1,406 | | 54,300 |
| Ruth's Chris Steak House, Inc. * | 671 | | 14,440 |
| Sanderson Farms, Inc. | 864 | | 20,149 |
| Seabord Corp. | 16 | | 23,904 |
| Sensient Technologies Corp. | 2,284 | | 40,929 |
| Spartan Stores, Inc. | 1,084 | | 12,780 |
| The Steak & Shake Company * | 1,343 | | 24,483 |
| Tootsie Roll Industries, Inc. | 1,197 | | 33,827 |
| USANA Health Sciences, Inc. * | 491 | | 21,187 |
|
|
| | | | 879,234 |
Forest Products - 0.06% | | | |
| Caraustar Industries, Inc. * | 1,451 | | 14,757 |
| Deltic Timber Corp. | 504 | | 26,339 |
|
|
| | | | 41,096 |
Funeral Services - 0.09% | | | |
| Alderwoods Group, Inc. * | 1,922 | | 32,828 |
| Stewart Enterprises, Inc., Class A | 5,035 | | 25,527 |
|
|
| | | | 58,355 |
Furniture & Fixtures - 0.35% | | | |
| American Woodmark Corp. | 553 | | 18,802 |
| Ethan Allen Interiors, Inc. | 1,629 | | 66,317 |
| Furniture Brands International, Inc. | 2,273 | | 56,189 |
| Hooker Furniture Corp. | 609 | | 9,360 |
| Kimball International, Inc., Class B | 1,229 | | 17,415 |
| La-Z-Boy, Inc. | 2,472 | | 39,428 |
| Stanley Furniture Company, Inc. | 684 | | 17,442 |
|
|
| | | | 224,953 |
Gas & Pipeline Utilities - 1.17% | | | |
| American States Water Company | 829 | | 28,592 |
| Aquila, Inc. * | 17,495 | | 68,230 |
| Bill Barrett Corp. * | 607 | | 20,104 |
| California Water Service Group | 827 | | 36,189 |
| Crosstex Energy, Inc. | 302 | | 24,030 |
| Global Industries, Ltd. * | 3,908 | | 49,671 |
| Small Cap Index Fund (continued) | | |
| | Shares or | | |
| | Principal | | |
| | Amount | | Value |
|
|
| |
| COMMON STOCKS (continued) | | | |
| Gas & Pipeline Utilities (continued) | | | |
| Maverick Tube Corp. * | 1,996 | $ | 92,874 |
| Middlesex Water Company | 702 | | 13,549 |
| Nicor, Inc. | 1,986 | | 85,259 |
| Northwest Natural Gas Company | 1,303 | | 44,615 |
| Peoples Energy Corp. | 1,733 | | 63,618 |
| South Jersey Industries, Inc. | 1,330 | | 38,038 |
| Southwest Gas Corp. | 1,779 | | 50,737 |
| Southwest Water Company | 1,144 | | 20,672 |
| The Laclede Group, Inc. | 1,019 | | 34,330 |
| Transmontaigne, Inc. * | 2,066 | | 15,578 |
| WGL Holdings, Inc. | 2,230 | | 68,684 |
|
|
| | | | 754,770 |
Gold - 0.04% | | | |
| Royal Gold, Inc. | 869 | | 27,313 |
Healthcare Products - 2.38% | | | |
| Align Technology, Inc. * | 2,959 | | 24,145 |
| American Medical Systems Holdings, Inc. * | 3,255 | | 70,536 |
| Arthrocare Corp. * | 1,143 | | 51,629 |
| Aspect Medical Systems, Inc. * | 777 | | 20,816 |
| Biosite, Inc. * | 802 | | 43,372 |
| Bruker BioSciences Corp. * | 1,958 | | 8,752 |
| Caliper Life Sciences, Inc. * | 1,462 | | 9,693 |
| Cantel Medical Corp. * | 564 | | 9,656 |
| Computer Programs & Systems, Inc. | 398 | | 18,292 |
| Cyberonics, Inc. * | 1,009 | | 27,414 |
| Cypress Biosciences, Inc. * | 1,518 | | 9,078 |
| Diagnostic Products Corp. | 1,070 | | 49,380 |
| DJ Orthopedics, Inc. * | 1,032 | | 35,996 |
| Encore Medical Corp. * | 2,065 | | 12,307 |
| Foxhollow Technologies, Inc. * | 657 | | 17,450 |
| Haemonetics Corp. * | 1,208 | | 62,574 |
| Health Tronics, Inc. * | 1,671 | | 12,148 |
| Hologic, Inc. * | 2,039 | | 97,525 |
| ICU Medical, Inc. * | 680 | | 23,868 |
| Intralase Corp. * | 646 | | 11,970 |
| Inverness Medical Innovations, Inc. * | 967 | | 25,616 |
| Kensey Nash Corp. * | 494 | | 12,093 |
| Kyphon, Inc. * | 1,363 | | 48,673 |
| LCA-Vision, Inc. | 960 | | 41,856 |
| LifeCell Corp. * | 1,514 | | 33,399 |
| Lifeline Systems, Inc. * | 620 | | 29,562 |
| Mannkind Corp. * | 1,210 | | 20,921 |
| Merit Medical Systems, Inc. * | 1,324 | | 18,867 |
| Molecular Devices Corp. * | 837 | | 26,642 |
| Nuvasive, Inc. * | 767 | | 14,182 |
| Owens & Minor, Inc. | 1,866 | | 59,507 |
| Polymedica Corp. | 1,145 | | 46,304 |
| PSS World Medical, Inc. * | 3,050 | | 52,704 |
| Somanetics Corp. * | 505 | | 12,787 |
| SonoSite, Inc. * | 748 | | 30,189 |
| STERIS Corp. | 3,223 | | 79,834 |
The accompanying notes are an integral part of the financial statements. 235
John Hancock Funds II
Portfolio of investments — February 28, 2006 (Unaudited)
(showing percentage of total net assets)
|
| Small Cap Index Fund (continued) | | |
| | Shares or | | |
| | Principal | | |
| | Amount | | Value |
|
|
| |
| COMMON STOCKS (continued) | | | |
| Healthcare Products (continued) | | | |
| SurModics, Inc. * | 721 | $ | 27,946 |
| Sybron Dental Specialties, Inc. * | 1,871 | | 71,584 |
| Symmetry Medical, Inc. * | 400 | | 8,288 |
| The Medicines Company * | 2,340 | | 47,713 |
| Thermogenesis Corp. * | 2,347 | | 9,365 |
| Thoratec Corp. * | 2,288 | | 46,035 |
| Tripath Imaging, Inc. * | 1,531 | | 9,906 |
| Ventana Medical Systems, Inc. * | 1,479 | | 53,643 |
| Viasys Healthcare, Inc. * | 1,468 | | 42,836 |
| Wright Medical Group, Inc. * | 1,402 | | 27,101 |
| Zoll Medical Corp. * | 525 | | 13,781 |
|
|
| | | | 1,527,935 |
Healthcare Services - 1.48% | | | |
| Allied Healthcare International, Inc. * | 1,584 | | 7,667 |
| Amedisys, Inc. * | 740 | | 23,813 |
| America Service Group, Inc. * | 580 | | 10,469 |
| American Dental Partners, Inc. * | 638 | | 8,313 |
| American Retirement Corp. * | 1,334 | | 35,911 |
| AMN Healthcare Services, Inc. * | 601 | | 12,465 |
| Apria Healthcare Group, Inc. * | 2,301 | | 52,900 |
| Barrier Therapeutics, Inc. * | 782 | | 7,906 |
| Brookdale Senior Living, Inc. | 317 | | 10,496 |
| CorVel Corp. * | 360 | | 7,020 |
| Cross Country Healthcare, Inc. * | 1,558 | | 28,527 |
| Eclipsys Corp. * | 1,820 | | 46,810 |
| Genesis HealthCare Corp. * | 937 | | 37,246 |
| Healthways Inc * | 1,559 | | 67,894 |
| Hooper Holmes, Inc. | 3,576 | | 10,156 |
| Horizon Health Corp. * | 539 | | 12,435 |
| Intermagnetics General Corp. * | 1,997 | | 58,737 |
| Kindred Healthcare, Inc. * | 1,335 | | 28,863 |
| Magellan Health Services, Inc. * | 1,298 | | 49,571 |
| National Healthcare Corp. | 337 | | 13,665 |
| Nitromed, Inc. * | 784 | | 9,212 |
| Odyssey Healthcare, Inc. * | 1,647 | | 30,996 |
| PainCare Holdings, Inc. * | 2,283 | | 6,986 |
| Pediatrix Medical Group, Inc. * | 1,076 | | 101,553 |
| Per-Se Technologies, Inc. * | 1,465 | | 37,006 |
| Phase Forward, Inc. * | 1,085 | | 10,785 |
| Radiation Therapy Services, Inc. * | 529 | | 15,018 |
| Symbion, Inc. * | 848 | | 19,996 |
| The Advisory Board Company * | 908 | | 49,005 |
| United Surgical Partners International, Inc. * | 2,037 | | 71,601 |
| US Physical Therapy, Inc. * | 678 | | 13,051 |
| Vistacare, Inc. * | 589 | | 7,981 |
| WebMD Health Corp. * | 298 | | 11,074 |
| Wellcare Health Plans, Inc. * | 875 | | 34,081 |
|
|
| | | | 949,209 |
Holdings Companies/Conglomerates - 0.04% | | | |
| United Industrial Corp. | 481 | | 24,849 |
| Small Cap Index Fund (continued) | | |
| | Shares or | | |
| | Principal | | |
| | Amount | | Value |
|
|
| |
| COMMON STOCKS (continued) | | | |
| Homebuilders - 0.33% | | | |
| Champion Enterprises, Inc. * | 3,576 | $ | 55,500 |
| Palm Harbor Homes, Inc. * | 509 | | 10,664 |
| Schottenstein Homes, Inc. | 585 | | 24,640 |
| Walter Industries, Inc. | 1,695 | | 111,582 |
| William Lyon Homes, Inc. * | 115 | | 9,786 |
|
|
| | | | 212,172 |
Hotels & Restaurants - 1.37% | | | |
| AFC Enterprises, Inc. * | 1,027 | | 15,960 |
| Ameristar Casinos, Inc. | 1,173 | | 25,912 |
| Aztar Corp. * | 1,652 | | 49,857 |
| BJ's Restaurants, Inc. * | 709 | | 18,002 |
| California Pizza Kitchen, Inc. * | 919 | | 27,625 |
| CEC Entertainment, Inc. * | 1,632 | | 53,138 |
| CKE Restaurants, Inc. | 2,783 | | 47,339 |
| Dave & Buster's, Inc. * | 783 | | 14,094 |
| IHOP Corp. | 892 | | 45,403 |
| Jack In the Box, Inc. * | 1,697 | | 67,880 |
| Krispy Kreme Doughnuts, Inc. * | 2,687 | | 18,137 |
| Landry's Restaurants, Inc. | 771 | | 23,801 |
| Lodgian, Inc. * | 1,317 | | 16,515 |
| Lone Star Steakhouse & Saloon, Inc. | 860 | | 23,186 |
| Luby's Cafeterias, Inc. * | 1,118 | | 16,669 |
| Magna Entertainment Corp., Class A * | 1,908 | | 12,803 |
| Marcus Corp. | 1,000 | | 16,430 |
| McCormick & Schmick's Seafood | | | |
| Restaurants, Inc. * | 409 | | 9,583 |
| MTR Gaming Group, Inc. * | 1,233 | | 12,293 |
| O'Charley's, Inc. * | 1,117 | | 19,838 |
| P.F. Chang's China Bistro, Inc. * | 1,221 | | 59,023 |
| Papa Johns International, Inc. * | 1,028 | | 33,821 |
| RARE Hospitality International, Inc. * | 1,602 | | 51,264 |
| Red Robin Gourmet Burgers, Inc. * | 668 | | 26,713 |
| Ruby Tuesday, Inc. | 2,988 | | 85,307 |
| Ryan's Restaurant Group, Inc. * | 2,035 | | 26,882 |
| Texas Roadhouse, Inc., Class A * | 1,990 | | 30,566 |
| Triarc Companies, Inc. | 2,071 | | 32,308 |
|
|
| | | | 880,349 |
Household Appliances - 0.29% | | | |
| Bassett Furniture Industries, Inc. | 677 | | 13,059 |
| Consolidated Tomoka Land Company | 283 | | 18,395 |
| Drew Industries, Inc. * | 738 | | 23,948 |
| Jacuzzi Brands, Inc. * | 3,646 | | 35,658 |
| Libbey, Inc. | 794 | | 7,035 |
| Lifetime Brands, Inc. | 390 | | 8,806 |
| Maytag Corp. | 3,747 | | 64,449 |
| Technical Olympic USA, Inc. | 749 | | 15,864 |
|
|
| | | | 187,214 |
Household Products - 0.41% | | | |
| Blyth, Inc. | 1,278 | | 28,474 |
| Central Garden & Pet Company * | 916 | | 49,794 |
The accompanying notes are an integral part of the financial statements. 236
John Hancock Funds II
Portfolio of investments — February 28, 2006 (Unaudited)
(showing percentage of total net assets)
|
| Small Cap Index Fund (continued) | | |
| | Shares or | | |
| | Principal | | |
| | Amount | | Value |
|
|
| |
| COMMON STOCKS (continued) | | | |
| Household Products (continued) | | | |
| Martha Stewart Living | | | |
| Omnimedia, Inc., Class A * | 1,060 | $ | 18,338 |
| Select Comfort Corp. * | 1,701 | | 62,172 |
| Tupperware Corp. | 2,491 | | 52,784 |
| TurboChef Technologies, Inc. * | 623 | | 8,286 |
| Water Pik Technology, Inc. * | 704 | | 19,395 |
| WD-40 Company | 878 | | 26,805 |
|
|
| | | | 266,048 |
Industrial Machinery - 2.22% | | | |
| Actuant Corp., Class A | 1,259 | | 69,371 |
| AGCO Corp. * | 4,159 | | 81,308 |
| Albany International Corp., Class A | 1,347 | | 50,068 |
| Badger Meter, Inc. | 312 | | 16,673 |
| Briggs & Stratton Corp. | 2,401 | | 85,187 |
| Cascade Corp. | 575 | | 29,819 |
| Ceradyne, Inc. * | 1,149 | | 69,951 |
| Circor International, Inc. | 794 | | 21,914 |
| Cognex Corp. | 1,926 | | 52,984 |
| Dionex Corp. * | 960 | | 52,675 |
| Energy Conversion Devices, Inc. * | 945 | | 44,273 |
| EnPro Industries, Inc. * | 997 | | 32,672 |
| Flowserve Corp. * | 2,575 | | 132,355 |
| Gardner Denver, Inc. * | 1,182 | | 72,528 |
| Gehl Company * | 579 | | 19,159 |
| Gorman Rupp Company | 546 | | 12,432 |
| Kadant, Inc. * | 777 | | 14,678 |
| Kennametal, Inc. | 1,756 | | 102,691 |
| Lindsay Manufacturing Company | 639 | | 15,656 |
| Lufkin Industries, Inc. | 666 | | 34,472 |
| Manitowoc, Inc. | 1,393 | | 107,359 |
| Middleby Corp. * | 251 | | 23,770 |
| NACCO Industries, Inc., Class A | 241 | | 33,451 |
| Presstek, Inc. * | 1,452 | | 18,397 |
| Robbins & Myers, Inc. | 655 | | 13,742 |
| Rofin Sinar Technologies, Inc. * | 722 | | 38,035 |
| Stewart & Stevenson Services, Inc. | 1,374 | | 47,334 |
| Tecumseh Products Company, Class A | 809 | | 18,291 |
| Tennant Company | 396 | | 18,493 |
| Tredegar Industries, Inc. | 1,389 | | 22,919 |
| Valmont Industries, Inc. | 826 | | 30,042 |
| Watts Industries, Inc., Class A | 1,196 | | 42,793 |
|
|
| | | | 1,425,492 |
Industrials - 0.31% | | | |
| Brookfield Homes Corp. | 688 | | 34,200 |
| Clean Harbors, Inc. * | 751 | | 24,768 |
| Crane Company | 2,416 | | 92,992 |
| GrafTech International, Ltd. * | 4,689 | | 23,914 |
| Intevac, Inc. * | 1,050 | | 23,027 |
|
|
| | | | 198,901 |
Insurance - 2.03% | | | |
| 21st Century Insurance Group | 1,611 | | 26,098 |
| Small Cap Index Fund (continued) | | |
| | Shares or | | |
| | Principal | | |
| | Amount | | Value |
|
|
| |
| COMMON STOCKS (continued) | | | |
| Insurance (continued) | | | |
| Alfa Corp. | 1,629 | $ | 26,194 |
| American Equity Investment Life Holding | | | |
| Company | 1,659 | | 22,214 |
| American Physicians Capital, Inc. * | 391 | | 19,272 |
| Argonaut Group, Inc. * | 1,350 | | 49,302 |
| Bristol West Holdings, Inc. | 892 | | 16,538 |
| Ceres Group, Inc. * | 2,081 | | 11,258 |
| Citizens, Inc. Class A * | 1,996 | | 10,619 |
| CNA Surety Corp. * | 834 | | 14,495 |
| Crawford & Company, Class B | 1,347 | | 8,163 |
| Direct General Corp. | 805 | | 12,872 |
| Donegal Group, Inc. | 558 | | 13,643 |
| FBL Financial Group, Inc., Class A | 683 | | 23,372 |
| First Acceptance Corp. * | 965 | | 11,821 |
| FPIC Insurance Group, Inc. * | 524 | | 18,413 |
| Harleysville Group, Inc. | 686 | | 18,062 |
| Hilb, Rogal and Hamilton Company | 1,519 | | 58,709 |
| Horace Mann Educators Corp. | 2,071 | | 38,624 |
| Infinity Property & Casualty Corp. | 1,004 | | 39,819 |
| KMG America Corp. * | 1,202 | | 12,621 |
| LandAmerica Financial Group, Inc. | 852 | | 56,828 |
| Midland Company | 539 | | 18,148 |
| National Western Life Insurance Company, | | | |
| Class A * | 111 | | 24,760 |
| Navigators Group, Inc. * | 470 | | 22,043 |
| Ohio Casualty Corp. | 2,960 | | 90,606 |
| Phoenix Companies, Inc. | 4,501 | | 64,589 |
| PICO Holdings, Inc. * | 430 | | 14,521 |
| PMA Capital Corp., Class A * | 1,682 | | 16,181 |
| Presidential Life Corp. | 1,050 | | 23,006 |
| ProAssurance Corp. * | 1,340 | | 68,729 |
| RLI Corp. | 1,087 | | 57,307 |
| Safety Insurance Group, Inc. | 601 | | 25,981 |
| Selective Insurance Group, Inc. | 1,352 | | 73,306 |
| State Auto Financial Corp. | 705 | | 22,969 |
| Stewart Information Services Corp. | 816 | | 38,311 |
| Tower Group, Inc. | 863 | | 15,612 |
| Triad Guaranty, Inc. * | 460 | | 20,879 |
| U.S.I. Holdings Corp. * | 2,184 | | 31,319 |
| UICI | 1,661 | | 60,942 |
| United Fire & Casualty Company | 824 | | 29,491 |
| Universal American Financial Corp. * | 1,267 | | 19,195 |
| Zenith National Insurance Corp. | 1,142 | | 58,813 |
|
|
| | | | 1,305,645 |
International Oil - 0.27% | | | |
| ATP Oil & Gas Corp. * | 861 | | 32,072 |
| Callon Petroleum Company * | 686 | | 12,128 |
| Cheniere Energy, Inc. * | 2,250 | | 89,213 |
| Parker Drilling Company * | 4,544 | | 42,032 |
|
|
| | | | 175,445 |
The accompanying notes are an integral part of the financial statements. 237
John Hancock Funds II
Portfolio of investments — February 28, 2006 (Unaudited)
(showing percentage of total net assets)
|
| Small Cap Index Fund (continued) | | |
| | Shares or | | |
| | Principal | | |
| | Amount | | Value |
|
|
| |
| COMMON STOCKS (continued) | | | |
| Internet Content - 0.71% | | | |
| Alloy Inc. * | 485 | $ | 6,387 |
| AMICAS, Inc. * | 2,375 | | 11,661 |
| Applied Digital Solutions, Inc. * | 3,130 | | 8,451 |
| Audible, Inc. * | 1,160 | | 11,751 |
| Autobytel, Inc. * | 2,185 | | 10,204 |
| CMGI, Inc. * | 22,582 | | 32,970 |
| CNET Networks, Inc. * | 6,010 | | 83,178 |
| Digitas, Inc. * | 4,188 | | 59,176 |
| Harris Interactive, Inc. * | 2,588 | | 14,545 |
| InfoSpace, Inc. * | 1,449 | | 34,935 |
| Internet Cap Group, Inc. * | 1,836 | | 16,708 |
| iVillage, Inc. * | 2,247 | | 18,313 |
| Jupitermedia Corp. * | 958 | | 14,217 |
| NetFlix, Inc. * | 1,721 | | 46,140 |
| Netratings, Inc. * | 689 | | 8,978 |
| ProQuest Company * | 1,207 | | 25,709 |
| RightNow Technologies, Inc. * | 538 | | 8,872 |
| Schawk, Inc., Class A | 623 | | 15,482 |
| Sohu.com, Inc. * | 1,176 | | 24,731 |
| WebSideStory, Inc. * | 451 | | 7,067 |
|
|
| | | | 459,475 |
Internet Retail - 0.37% | | | |
| 1-800-Flowers.com, Inc. * | 1,448 | | 9,238 |
| Ariba, Inc. * | 3,145 | | 32,079 |
| Blue Nile, Inc. * | 714 | | 23,826 |
| Drugstore.com, Inc. * | 3,373 | | 8,500 |
| HomeStore, Inc. * | 6,927 | | 43,086 |
| Navarre Corp. * | 1,353 | | 5,182 |
| Nutri/System, Inc. * | 1,136 | | 48,814 |
| Overstock.com, Inc. * | 505 | | 11,363 |
| Priceline.com, Inc. * | 1,183 | | 29,043 |
| Stamps.com, Inc. * | 777 | | 25,027 |
|
|
| | | | 236,158 |
Internet Service Provider - 0.46% | | | |
| Avocent Corp. * | 2,337 | | 78,079 |
| C-COR.net Corp. * | 2,326 | | 16,515 |
| Earthlink, Inc. * | 5,548 | | 55,036 |
| Entrust, Inc. * | 3,073 | | 11,370 |
| eSPEED, Inc., Class A * | 1,136 | | 9,440 |
| Online Resources Corp. * | 1,067 | | 13,551 |
| Redback Networks, Inc. * | 1,969 | | 37,312 |
| Terremark Worldwide, Inc. * | 1,428 | | 7,683 |
| TriZetto Group, Inc. * | 2,016 | | 33,788 |
| United Online, Inc. | 2,860 | | 34,349 |
|
|
| | | | 297,123 |
Internet Software - 1.07% | | | |
| Agile Software Corp. * | 2,635 | | 18,287 |
| Click Commerce, Inc. * | 407 | | 10,265 |
| Cybersource Corp. * | 1,409 | | 11,779 |
| Digital River, Inc. * | 1,605 | | 60,412 |
| eResearch Technology, Inc. * | 2,406 | | 35,392 |
| Small Cap Index Fund (continued) | | |
| | Shares or | | |
| | Principal | | |
| | Amount | | Value |
|
|
| |
| COMMON STOCKS (continued) | | | |
| Internet Software (continued) | | | |
| Internet Security Systems, Inc. * | 1,822 | $ | 42,471 |
| Interwoven, Inc. * | 2,011 | | 17,496 |
| Keynote Systems, Inc. * | 949 | | 10,676 |
| Lionbridge Technologies, Inc. * | 2,229 | | 15,960 |
| MatrixOne, Inc. * | 2,555 | | 15,509 |
| NIC, Inc. * | 1,654 | | 9,941 |
| Openwave Systems, Inc. * | 3,289 | | 65,287 |
| RealNetworks, Inc. * | 5,373 | | 42,232 |
| RSA Security, Inc. * | 3,372 | | 49,501 |
| S1 Corp. * | 3,427 | | 14,119 |
| Safenet, Inc. * | 1,158 | | 28,857 |
| Sapient Corp. * | 3,850 | | 28,875 |
| Stellent, Inc. * | 1,251 | | 13,698 |
| SupportSoft, Inc. * | 2,219 | | 9,164 |
| TIBCO Software, Inc. * | 10,130 | | 87,827 |
| VASCO Data Security International, Inc. * | 1,155 | | 11,538 |
| Vignette Corp. * | 1,406 | | 22,637 |
| WebEx Communications, Inc. * | 1,554 | | 43,326 |
| WebMethods, Inc. * | 2,601 | | 19,351 |
|
|
| | | | 684,600 |
Investment Companies - 0.34% | | | |
| Apollo Investment Corp. | 2,895 | | 54,397 |
| Ares Cap Corp. | 1,507 | | 26,131 |
| Capital Southwest Corp. | 156 | | 15,031 |
| GAMCO Investors, Inc. | 389 | | 17,501 |
| Gladstone Capital Corp. | 715 | | 14,636 |
| Gladstone Investment Corp. | 901 | | 13,578 |
| Harris & Harris Group, Inc. * | 934 | | 12,348 |
| MCG Capital Corp. | 2,360 | | 36,108 |
| NGP Capital Resources Company | 1,006 | | 14,044 |
| Technology Investment Capital Corp. | 816 | | 12,444 |
|
|
| | | | 216,218 |
Leisure Time - 1.27% | | | |
| 4Kids Entertainment, Inc. * | 721 | | 12,257 |
| Alliance Gaming Corp. * | 2,447 | | 36,216 |
| Arctic Cat, Inc. | 722 | | 17,328 |
| Blockbuster, Inc., Class A | 8,995 | | 34,811 |
| Bluegreen Corp. * | 998 | | 15,838 |
| Callaway Golf Company | 3,591 | | 59,216 |
| Carmike Cinemas, Inc. | 620 | | 14,768 |
| Churchill Downs, Inc. | 404 | | 16,188 |
| Gaylord Entertainment Company * | 1,892 | | 84,478 |
| Handleman Company | 1,069 | | 10,508 |
| Isle of Capri Casinos, Inc. * | 720 | | 21,823 |
| K2, Inc. * | 2,294 | | 26,152 |
| Life Time Fitness, Inc. * | 1,109 | | 46,534 |
| Mikohn Gaming Corp. * | 1,695 | | 13,458 |
| Monarch Casino & Resort, Inc. * | 505 | | 13,539 |
| Movie Gallery, Inc. | 1,232 | | 3,930 |
| Multimedia Games, Inc. * | 1,365 | | 14,455 |
| Pinnacle Entertainment, Inc. * | 1,938 | | 54,361 |
The accompanying notes are an integral part of the financial statements. 238
John Hancock Funds II
Portfolio of investments — February 28, 2006 (Unaudited)
(showing percentage of total net assets)
|
| Small Cap Index Fund (continued) | | |
| | Shares or | | |
| | Principal | | |
| | Amount | | Value |
|
|
| |
| COMMON STOCKS (continued) | | | |
| Leisure Time (continued) | | | |
| RC2 Corp. * | 858 | $ | 30,914 |
| Riviera Holdings Corp. * | 446 | | 7,158 |
| Shuffle Master, Inc. * | 1,697 | | 44,343 |
| Six Flags, Inc. * | 4,365 | | 46,051 |
| Speedway Motorsports, Inc. | 740 | | 26,529 |
| Steinway Musical Instruments, Inc. * | 439 | | 14,465 |
| Sturm Ruger & Company, Inc. | 1,166 | | 8,395 |
| Sunterra Corp. * | 1,001 | | 15,015 |
| The Nautilus Group, Inc. | 1,578 | | 25,958 |
| Topps, Inc. | 1,845 | | 14,908 |
| Vail Resorts, Inc. * | 1,458 | | 48,172 |
| West Marine, Inc. * | 690 | | 8,880 |
| WMS Industries, Inc. * | 1,019 | | 29,602 |
|
|
| | | | 816,250 |
Life Sciences - 0.17% | | | |
| American Ecology Corp. | 617 | | 11,735 |
| Incyte Corp. * | 3,969 | | 23,338 |
| Ionatron, Inc. * | 1,136 | | 13,019 |
| Senomyx, Inc. * | 1,074 | | 17,463 |
| Symyx Technologies, Inc. * | 1,552 | | 45,008 |
|
|
| | | | 110,563 |
Liquor - 0.07% | | | |
| Boston Beer Company, Inc. * | 549 | | 14,675 |
| Central European Distribution Corp. * | 790 | | 33,109 |
|
|
| | | | 47,784 |
Manufacturing - 0.86% | | | |
| Acuity Brands, Inc. | 2,064 | | 81,507 |
| Barnes Group, Inc. | 826 | | 31,702 |
| Blout International, Inc. * | 1,439 | | 23,513 |
| Coherent, Inc. * | 1,438 | | 46,677 |
| ESCO Technologies, Inc. * | 1,190 | | 60,428 |
| Hexcel Corp. * | 2,784 | | 59,912 |
| Kaydon Corp. | 1,372 | | 49,392 |
| Lancaster Colony Corp. | 1,228 | | 49,292 |
| Mine Safety Appliances Company | 1,352 | | 53,877 |
| Nordson Corp. | 1,190 | | 59,405 |
| Raven Industries, Inc. | 752 | | 26,531 |
| Reddy Ice Holdings, Inc. | 563 | | 11,373 |
|
|
| | | | 553,609 |
Medical-Hospitals - 0.56% | | | |
| AmSurg Corp. * | 1,421 | | 31,134 |
| Centene Corp. * | 1,991 | | 54,454 |
| Cepheid, Inc. * | 2,057 | | 18,842 |
| ev3, Inc. * | 480 | | 7,997 |
| IRIS International, Inc. * | 797 | | 18,116 |
| Laserscope, Inc. * | 945 | | 20,667 |
| Neurometrix, Inc. * | 280 | | 10,057 |
| Palomar Medical Technologies, Inc. * | 808 | | 25,816 |
| Psychiatric Solutions, Inc. * | 2,404 | | 79,404 |
| RehabCare Group, Inc. * | 839 | | 16,931 |
| Sunrise Senior Living, Inc. * | 1,541 | | 54,644 |
| Small Cap Index Fund (continued) | | |
| | Shares or | | |
| | Principal | | |
| | Amount | | Value |
|
|
| |
| COMMON STOCKS (continued) | | | |
| Medical-Hospitals (continued) | | | |
| Vital Images, Inc. * | 631 | $ | 20,949 |
|
|
| | | | 359,011 |
Metal & Metal Products - 0.90% | | | |
| A. M. Castle & Company | 547 | | 15,491 |
| Commercial Metals Company | 2,787 | | 126,223 |
| Dynamic Materials Corp. | 287 | | 9,385 |
| Earle M. Jorgensen Company * | 921 | | 12,894 |
| Gibraltar Industries, Inc. | 1,150 | | 29,337 |
| Matthews International Corp., Class A | 1,511 | | 56,119 |
| Metal Management, Inc. | 1,021 | | 28,802 |
| Mueller Industries, Inc. | 1,727 | | 57,008 |
| NN, Inc. | 1,150 | | 14,191 |
| Quanex Corp. | 1,156 | | 71,753 |
| Reliance Steel & Aluminum Company | 1,323 | | 109,002 |
| Sun Hydraulics, Inc. | 354 | | 8,050 |
| Titanium Metals Corp. * | 1,048 | | 42,989 |
|
|
| | | | 581,244 |
Mining - 0.75% | | | |
| Alpha Natural Resources, Inc. * | 1,377 | | 29,427 |
| AMCOL International Corp. | 1,046 | | 28,880 |
| Brush Wellman, Inc. * | 970 | | 16,888 |
| Charles & Colvard, Ltd. | 746 | | 10,462 |
| Cleveland-Cliffs, Inc. | 1,015 | | 87,341 |
| Coeur d'Alene Mines Corp. * | 11,133 | | 61,677 |
| Compass Minerals International, Inc. | 977 | | 24,376 |
| Hecla Mining Company * | 5,518 | | 27,480 |
| Lincoln Electric Holding, Inc. | 1,684 | | 77,733 |
| RTI International Metals, Inc. * | 1,042 | | 43,816 |
| Stillwater Mining Company * | 1,939 | | 25,226 |
| USEC, Inc. | 4,038 | | 50,233 |
|
|
| | | | 483,539 |
Mobile Homes - 0.28% | | | |
| Coachmen Industries, Inc. | 794 | | 9,369 |
| Fleetwood Enterprises, Inc. * | 2,623 | | 29,640 |
| Skyline Corp. | 395 | | 15,847 |
| Thor Industries, Inc. | 1,598 | | 75,426 |
| Winnebago Industries, Inc. | 1,559 | | 50,075 |
|
|
| | | | 180,357 |
Newspapers - 0.04% | | | |
| Journal Register Company | 2,028 | | 26,080 |
Office Furnishings & Supplies - 0.31% | | | |
| Global Imaging Systems, Inc. * | 1,112 | | 40,143 |
| IKON Office Solutions, Inc. | 5,319 | | 69,945 |
| The Standard Register Company | 859 | | 14,105 |
| United Stationers, Inc. * | 1,499 | | 74,200 |
|
|
| | | | 198,393 |
Paper - 0.40% | | | |
| Bowater, Inc. | 2,594 | | 67,496 |
| Buckeye Technologies, Inc. * | 1,556 | | 13,708 |
| Chesapeake Corp. | 971 | | 12,808 |
The accompanying notes are an integral part of the financial statements. 239
John Hancock Funds II
Portfolio of investments — February 28, 2006 (Unaudited)
(showing percentage of total net assets)
|
| Small Cap Index Fund (continued) | | |
| | Shares or | | |
| | Principal | | |
| | Amount | | Value |
|
|
| |
| COMMON STOCKS (continued) | | | |
| Paper (continued) | | | |
| Mercer International, Inc. * | 1,538 | $ | 14,042 |
| Neenah Paper, Inc. | 743 | | 22,743 |
| P.H. Glatfelter Company | 2,109 | | 34,672 |
| Potlatch Corp. * | 1,330 | | 48,465 |
| Rock-Tenn Company, Class A | 1,428 | | 18,735 |
| Wausau-Mosinee Paper Corp. | 2,081 | | 27,053 |
|
|
| | | | 259,722 |
Petroleum Services - 1.52% | | | |
| Atwood Oceanics, Inc. * | 626 | | 56,453 |
| Bronco Drilling Company, Inc. * | 253 | | 6,125 |
| Cal Dive International, Inc. * | 3,638 | | 128,094 |
| Grey Wolf, Inc. * | 8,992 | | 62,404 |
| Gulfmark Offshore, Inc. * | 745 | | 20,428 |
| Hercules Offshore, Inc. * | 359 | | 10,914 |
| Hornbeck Offshore Services, Inc. * | 751 | | 24,152 |
| Input/Output, Inc. * | 3,295 | | 24,910 |
| Lone Star Technologies, Inc. * | 1,406 | | 69,878 |
| Newpark Resources, Inc. * | 3,978 | | 29,676 |
| Oceaneering International, Inc. * | 1,221 | | 67,326 |
| PetroHawk Energy Corp. * | 2,390 | | 30,186 |
| Petroleum Development Corp. * | 802 | | 34,494 |
| RPC, Inc. | 1,078 | | 22,843 |
| SEACOR SMIT, Inc. * | 842 | | 61,441 |
| Superior Energy Services, Inc. * | 3,661 | | 95,186 |
| TODCO * | 2,216 | | 74,280 |
| Universal Compression Holdings, Inc. * | 850 | | 37,188 |
| Veritas DGC, Inc. * | 1,596 | | 67,239 |
| W-H Energy Services, Inc. * | 1,330 | | 52,535 |
|
|
| | | | 975,752 |
Pharmaceuticals - 2.57% | | | |
| Abgenix, Inc. * | 4,225 | | 93,964 |
| Adams Respiratory Therapeutics, Inc. * | 386 | | 14,479 |
| Adolor Corp. * | 1,910 | | 52,468 |
| Alexion Pharmaceuticals, Inc. * | 1,451 | | 54,529 |
| Alkermes, Inc. * | 4,263 | | 108,323 |
| Amylin Pharmaceuticals, Inc. * | 5,148 | | 223,320 |
| Andrx Corp. * | 3,439 | | 67,404 |
| Array BioPharma, Inc. * | 1,646 | | 14,896 |
| Atherogenics, Inc. * | 1,807 | | 29,129 |
| AVANIR Pharmaceuticals * | 1,328 | | 22,762 |
| Bentley Pharmaceuticals, Inc. * | 909 | | 16,198 |
| BioScrip, Inc. * | 1,852 | | 13,279 |
| Connetics Corp. * | 1,679 | | 26,663 |
| Cubist Pharmaceuticals, Inc. * | 2,514 | | 55,585 |
| Dusa Pharmaceuticals, Inc. * | 894 | | 6,481 |
| Encysive Pharmaceuticals, Inc. * | 2,761 | | 25,125 |
| First Horizon Pharmaceutical Corp. * | 1,329 | | 27,271 |
| Hi-Tech Pharmacal Company, Inc. * | 393 | | 9,684 |
| Idenix Pharmaceuticals, Inc. * | 594 | | 12,159 |
| Inspire Pharmaceuticals, Inc. * | 2,040 | | 10,302 |
| Isis Pharmaceuticals, Inc. * | 3,343 | | 26,878 |
| Small Cap Index Fund (continued) | | |
| | Shares or | | |
| | Principal | | |
| | Amount | | Value |
|
|
| |
| COMMON STOCKS (continued) | | | |
| Pharmaceuticals (continued) | | | |
| Medicis Pharmaceutical Corp., Class A | 2,546 | $ | 72,408 |
| Nastech Pharmaceutical Company, Inc. * | 1,032 | | 21,651 |
| Noven Pharmaceuticals, Inc. * | 1,159 | | 17,466 |
| NPS Pharmaceuticals, Inc. * | 2,128 | | 32,643 |
| Nuvelo, Inc. * | 2,054 | | 35,206 |
| Onyx Pharmaceuticals, Inc. * | 1,849 | | 52,696 |
| Pain Therapeutics, Inc. * | 1,446 | | 15,602 |
| Par Pharmaceutical Companies, Inc. * | 1,617 | | 48,090 |
| Penwest Pharmaceuticals Company * | 1,064 | | 24,738 |
| Pharmion Corp. * | 1,176 | | 19,428 |
| Pozen, Inc. * | 1,187 | | 20,630 |
| Prestige Brands Holdings, Inc. * | 1,348 | | 15,071 |
| Regeneron Pharmaceuticals, Inc. * | 1,658 | | 27,141 |
| Renovis, Inc. * | 1,010 | | 21,877 |
| Rigel Pharmaceuticals, Inc. * | 1,129 | | 10,725 |
| Salix Pharmaceuticals, Ltd. * | 2,149 | | 33,868 |
| Supergen, Inc. * | 2,486 | | 12,654 |
| United Therapeutics Corp. * | 1,061 | | 65,400 |
| Vertex Pharmaceuticals, Inc. * | 4,451 | | 192,461 |
|
|
| | | | 1,650,654 |
Plastics - 0.06% | | | |
| Spartech Corp. | 1,531 | | 37,050 |
Pollution Control - 0.02% | | | |
| Duratek, Inc. * | 722 | | 15,826 |
Publishing - 0.60% | | | |
| Consolidated Graphics, Inc. * | 536 | | 27,374 |
| Courier Corp. | 502 | | 19,814 |
| Gemstar-TV Guide International, Inc. * | 11,672 | | 35,249 |
| Hollinger International, Inc., Class A | 2,828 | | 26,300 |
| Media General, Inc., Class A | 993 | �� | 49,749 |
| Playboy Enterprises, Inc., Class B * | 1,076 | | 14,913 |
| PRIMEDIA, Inc. * | 7,144 | | 16,145 |
| Readers Digest Association, Inc., Class A | 4,666 | | 70,877 |
| Scholastic Corp. * | 1,522 | | 44,777 |
| Thomas Nelson, Inc. | 614 | | 17,960 |
| Valassis Communications, Inc. * | 2,343 | | 64,550 |
|
|
| | | | 387,708 |
Railroads & Equipment - 0.61% | | | |
| Florida East Coast Indiana, Inc. | 1,547 | | 78,649 |
| GATX Corp. | 2,052 | | 81,464 |
| Genesee & Wyoming, Inc., Class A * | 1,129 | | 51,652 |
| Kansas City Southern * | 3,829 | | 88,718 |
| RailAmerica, Inc. * | 1,923 | | 19,038 |
| Wabtec Corp. | 2,206 | | 72,864 |
|
|
| | | | 392,385 |
Real Estate - 5.95% | | | |
| Aames Investment Corp., REIT | 2,072 | | 11,935 |
| Acadia Realty Trust, REIT | 1,386 | | 30,395 |
| Affordable Residential Communities, REIT | 1,277 | | 12,080 |
| Agree Realty Corp., REIT | 620 | | 19,350 |
The accompanying notes are an integral part of the financial statements. 240
John Hancock Funds II
Portfolio of investments — February 28, 2006 (Unaudited)
(showing percentage of total net assets)
|
| Small Cap Index Fund (continued) | | |
| | Shares or | | |
| | Principal | | |
| | Amount | | Value |
|
|
| |
| COMMON STOCKS (continued) | | | |
| Real Estate (continued) | | | |
| Alexander's, Inc., REIT * | 95 | $ | 22,562 |
| Alexandria Real Estate Equities, Inc., REIT | 988 | | 86,964 |
| American Campus Communities, Inc., REIT | 870 | | 21,924 |
| American Home Mortgage Investment Corp., | | | |
| REIT | 1,920 | | 54,720 |
| Anthracite Capital, Inc., REIT | 2,570 | | 27,550 |
| Anworth Mortgage Asset Corp., REIT | 2,343 | | 17,596 |
| Arbor Realty Trust, Inc. - REIT | 652 | | 17,154 |
| Ashford Hospitality Trust, Inc., REIT | 1,772 | | 22,132 |
| Avatar Holdings, Inc., REIT * | 301 | | 16,805 |
| Bedford Property Investments, Inc., REIT | 788 | | 21,134 |
| BioMed Realty Trust, Inc., REIT | 2,103 | | 58,211 |
| Boykin Lodging Company, REIT * | 973 | | 12,435 |
| Brandywine Realty Trust, REIT | 3,992 | | 117,245 |
| California Coastal Communities, Inc. * | 412 | | 15,858 |
| Capital Lease Funding, Inc., REIT | 1,437 | | 15,577 |
| Capital Trust, Inc., REIT | 634 | | 21,429 |
| Cedar Shopping Centers, Inc., REIT | 1,086 | | 16,518 |
| CentraCore Properties Trust, REIT | 647 | | 17,482 |
| Colonial Properties Trust, REIT | 1,798 | | 86,933 |
| Columbia Equity Trust, Inc., REIT | 967 | | 16,710 |
| Commercial Net Lease Realty, REIT | 2,464 | | 56,056 |
| Corporate Office Properties Trust, REIT | 1,367 | | 56,758 |
| Cousins Properties, Inc., REIT | 1,835 | | 56,279 |
| Deerfield Triarc Capital Corp., REIT | 1,189 | | 15,528 |
| DiamondRock Hospitality Company | 1,314 | | 16,859 |
| Digital Realty Trust, Inc., REIT | 343 | | 9,470 |
| EastGroup Properties, Inc., REIT | 1,026 | | 47,145 |
| ECC Capital Corp., REIT | 2,897 | | 4,664 |
| Education Realty Trust, Inc., REIT | 1,224 | | 16,524 |
| Entertainment Properties Trust, REIT | 1,205 | | 49,827 |
| Equity Inns, Inc., REIT | 2,558 | | 39,598 |
| Equity Lifestyle Properties, Inc., REIT | 924 | | 44,066 |
| Equity One, Inc., REIT | 1,709 | | 38,452 |
| Extra Space Storage, Inc., REIT | 1,813 | | 27,195 |
| Felcor Lodging Trust, Inc., REIT | 2,330 | | 46,251 |
| Fieldstone Investment Corp., REIT | 2,337 | | 27,670 |
| First Industrial Realty Trust, Inc., REIT | 1,967 | | 75,887 |
| First Potomac Realty Trust, REIT | 863 | | 25,579 |
| Getty Realty Corp., REIT | 860 | | 24,381 |
| Glenborough Realty Trust, Inc., REIT | 1,501 | | 29,044 |
| Glimcher Realty Trust, REIT | 1,736 | | 46,316 |
| GMH Communities Trust, REIT | 1,581 | | 26,276 |
| Government Properties Trust, Inc., REIT | 1,139 | | 9,727 |
| Gramercy Captial Corp., REIT | 688 | | 18,067 |
| Heritage Property Investment Trust, REIT | 1,244 | | 47,720 |
| Hersha Hospitality Trust, REIT | 1,404 | | 13,296 |
| Highland Hospitality Corp., REIT | 2,437 | | 30,024 |
| Highwoods Properties, Inc., REIT | 2,466 | | 79,775 |
| Home Properties, Inc., REIT | 1,457 | | 71,918 |
| Homebanc Corp., Georgia, REIT | 2,818 | | 24,517 |
| Impac Mortgage Holdings, Inc., REIT | 3,521 | | 29,260 |
| Small Cap Index Fund (continued) | | |
| | Shares or | | |
| | Principal | | |
| | Amount | | Value |
|
|
| |
| COMMON STOCKS (continued) | | | |
| Real Estate (continued) | | | |
| Inland Real Estate Corp., REIT | 3,219 | $ | 49,540 |
| Innkeepers USA Trust, REIT | 2,046 | | 35,866 |
| Jer Investors Trust, Inc., REIT | 427 | | 7,464 |
| Jones Lang Lasalle, Inc. | 1,602 | | 108,423 |
| Kilroy Realty Corp., REIT | 1,344 | | 100,558 |
| Kite Realty Group Trust, REIT | 1,171 | | 17,717 |
| LaSalle Hotel Properties, REIT | 1,418 | | 56,649 |
| Lexington Corporate Property Trust, REIT | 2,424 | | 51,680 |
| LTC Properties, Inc., REIT | 1,155 | | 25,560 |
| Luminent Mortgage Capital, Inc., REIT | 2,023 | | 15,334 |
| Maguire Properties, Inc., REIT | 1,625 | | 54,990 |
| MeriStar Hospitality Corp., REIT * | 4,107 | | 42,343 |
| MFA Mortgage Investments, Inc., REIT | 3,903 | | 23,106 |
| Mid-America Apartment Communities, Inc., | | | |
| REIT | 913 | | 49,576 |
| MortgageIT Holdings, Inc., REIT | 1,193 | | 13,898 |
| National Health Investments, Inc., REIT | 1,109 | | 29,522 |
| Nationwide Health Properties, Inc., REIT | 3,105 | | 69,925 |
| Newcastle Investment Corp., REIT | 2,067 | | 49,443 |
| Newkirk Realty Trust Inc., REIT * | 631 | | 10,841 |
| NorthStar Realty Finance Corp., REIT | 1,197 | | 12,233 |
| Novastar Financial, Inc., REIT | 1,224 | | 37,516 |
| Omega Healthcare Investors, REIT | 2,421 | | 31,328 |
| Opteum, Inc. * | 1,239 | | 10,792 |
| Parkway Properties, Inc., REIT | 674 | | 29,683 |
| Pennsylvania Real Estate | | | |
| Investment Trust, REIT | 1,698 | | 68,599 |
| Post Properties, Inc., REIT | 1,840 | | 81,696 |
| PS Business Parks, Inc., REIT | 810 | | 43,084 |
| RAIT Investment Trust, REIT | 1,267 | | 34,589 |
| Ramco-Gershenson Properties Trust, REIT | 779 | | 22,638 |
| Redwood Trust, Inc., REIT | 916 | | 37,977 |
| Saul Centers, Inc., REIT | 582 | | 22,576 |
| Saxon Capital, Inc., REIT | 2,392 | | 23,800 |
| Senior Housing Properties Trust, REIT | 2,757 | | 49,433 |
| Sizeler Property Investors, Inc., REIT | 1,095 | | 15,878 |
| Sovran Self Storage, Inc., REIT | 757 | | 39,364 |
| Spirit Finance Corp., REIT | 3,164 | | 38,126 |
| Strategic Hotel Cap, Inc., REIT | 1,951 | | 42,142 |
| Sun Communities, Inc., REIT | 810 | | 28,042 |
| Sunstone Hotel Investors, Inc., REIT | 1,250 | | 36,700 |
| Tanger Factory Outlet Centers, Inc., REIT | 1,317 | | 42,539 |
| Tarragon Realty Investments, Inc. * | 536 | | 10,361 |
| Taubman Centers, Inc., REIT | 2,380 | | 94,581 |
| Town & Country Trust, SBI, REIT | 920 | | 37,067 |
| Trammell Crow Company * | 1,652 | | 53,657 |
| Trustreet Properties, Inc., REIT | 2,824 | | 40,948 |
| Universal Health Realty Income Trust, REIT | 623 | | 21,961 |
| Urstadt Biddle Properties, Inc., REIT | 1,153 | | 19,624 |
| U-Store-It Trust, REIT | 1,489 | | 33,160 |
| Washington REIT | 1,993 | | 66,606 |
The accompanying notes are an integral part of the financial statements. 241
John Hancock Funds II
Portfolio of investments — February 28, 2006 (Unaudited)
(showing percentage of total net assets)
|
| Small Cap Index Fund (continued) | | |
| | Shares or | | |
| | Principal | | |
| | Amount | | Value |
|
|
| |
| COMMON STOCKS (continued) | | | |
| Real Estate (continued) | | | |
| Winston Hotels, Inc., REIT | 1,497 | $ | 15,389 |
|
|
| | | | 3,819,352 |
Retail Grocery - 0.39% | | | |
| Ingles Markets, Inc. | 746 | | 12,317 |
| Nash-Finch Company | 630 | | 19,530 |
| Pathmark Stores, Inc. * | 2,403 | | 24,174 |
| Ruddick Corp. | 1,609 | | 38,906 |
| Smart & Final, Inc. * | 703 | | 10,615 |
| The Great Atlantic & Pacific Tea Company, Inc. * | 803 | | 25,905 |
| United Natural Foods, Inc. * | 1,936 | | 64,391 |
| Weis Markets, Inc. | 661 | | 29,520 |
| Wild Oats Markets, Inc. * | 1,411 | | 25,327 |
|
|
| | | | 250,685 |
Retail Trade - 4.01% | | | |
| 99 Cents Only Stores * | 2,059 | | 23,431 |
| A.C. Moore Arts & Crafts, Inc. * | 747 | | 13,446 |
| Aaron Rents, Inc., Class B | 1,875 | | 49,125 |
| Aeropostale, Inc. * | 2,606 | | 74,766 |
| Asbury Automotive Group, Inc. * | 652 | | 12,486 |
| Big 5 Sporting Goods Corp. | 1,012 | | 22,051 |
| Big Lots, Inc. * | 5,319 | | 67,604 |
| Build A Bear Workshop, Inc. * | 484 | | 14,002 |
| Building Materials Holding Corp. | 649 | | 43,678 |
| Burlington Coat Factory Warehouse Corp. | 774 | | 34,861 |
| Cabela's, Inc. * | 1,498 | | 28,327 |
| Cache, Inc. * | 664 | | 11,540 |
| Casey's General Stores, Inc. | 2,346 | | 61,536 |
| Cash America International, Inc. | 1,394 | | 37,359 |
| Casual Male Retail Group, Inc. * | 1,449 | | 13,200 |
| Cato Corp., Class A | 1,484 | | 30,971 |
| Charlotte Russe Holding, Inc. * | 743 | | 13,523 |
| Charming Shoppes, Inc. * | 5,609 | | 75,105 |
| Childrens Place Retail Stores, Inc. * | 985 | | 45,970 |
| Christopher & Banks Corp. | 1,730 | | 37,939 |
| Citi Trends, Inc. * | 218 | | 9,385 |
| Coldwater Creek, Inc. * | 2,500 | | 56,175 |
| Cost Plus, Inc. * | 1,085 | | 20,821 |
| DSW Inc., Class A * | 583 | | 16,662 |
| Finish Line, Inc. | 1,997 | | 33,430 |
| First Cash Financial Services * | 1,270 | | 22,123 |
| Fossil, Inc. * | 2,286 | | 38,908 |
| Fred's, Inc., Class A | 1,909 | | 26,669 |
| FTD Group, Inc. * | 741 | | 6,936 |
| GameStop Corp., Class A * | 2,545 | | 101,876 |
| Genesco, Inc. * | 1,067 | | 43,320 |
| Group 1 Automotive, Inc. * | 996 | | 38,127 |
| Guitar Center, Inc. * | 1,221 | | 63,199 |
| Haverty Furniture Companies, Inc. | 1,058 | | 15,077 |
| Hibbett Sporting Goods, Inc. * | 1,693 | | 54,311 |
| Hot Topic, Inc. * | 2,138 | | 28,179 |
| J. Jill Group, Inc. * | 984 | | 23,252 |
| Small Cap Index Fund (continued) | | |
| | Shares or | | |
| | Principal | | |
| | Amount | | Value |
|
|
| |
| COMMON STOCKS (continued) | | | |
| Retail Trade (continued) | | | |
| Jo Ann Stores, Inc. * | 1,126 | $ | 14,976 |
| Kenneth Cole Productions, Inc., Class A | 469 | | 12,902 |
| Longs Drug Stores Corp. | 1,430 | | 54,869 |
| Marinemax, Inc. * | 656 | | 20,244 |
| NBTY, Inc. * | 2,613 | | 57,225 |
| New York & Co., Inc. * | 647 | | 10,915 |
| Pacific Sunwear of California, Inc. * | 3,524 | | 83,906 |
| Pantry, Inc. * | 807 | | 47,750 |
| Payless ShoeSource, Inc. * | 3,129 | | 74,157 |
| PETCO Animal Supplies, Inc. * | 2,737 | | 53,262 |
| Pier 1 Imports, Inc. | 4,073 | | 42,889 |
| Regis Corp. | 2,107 | | 80,656 |
| Restoration Hardware, Inc. * | 1,549 | | 8,334 |
| Retail Ventures, Inc. * | 845 | | 11,205 |
| School Specialty, Inc. * | 1,086 | | 37,880 |
| Shoe Carnival, Inc. * | 406 | | 9,123 |
| Sonic Automotive, Inc. | 1,391 | | 36,848 |
| Sports Authority, Inc. * | 1,230 | | 45,006 |
| Stein Mart, Inc. | 1,241 | | 20,700 |
| Steven Madden, Ltd. * | 664 | | 21,281 |
| Talbots, Inc. | 1,075 | | 28,660 |
| The Buckle, Inc. | 381 | | 14,573 |
| The Dress Barn, Inc. * | 1,005 | | 43,396 |
| The Wet Seal, Inc., Class A * | 2,749 | | 14,597 |
| The Yankee Candle, Inc. | 2,153 | | 62,523 |
| Too, Inc. * | 1,617 | | 49,205 |
| Tractor Supply Company * | 1,533 | | 96,855 |
| Transport World Entertainment Corp. * | 1,041 | | 6,246 |
| Tuesday Morning Corp. | 1,245 | | 27,402 |
| United Rentals, Inc. * | 3,143 | | 102,462 |
| ValueVision Media, Inc., Class A * | 1,358 | | 17,260 |
| Zale Corp. * | 2,364 | | 61,582 |
|
|
| | | | 2,578,259 |
Sanitary Services - 0.24% | | | |
| Casella Waste Systems, Inc., Class A * | 1,005 | | 14,221 |
| Darling International, Inc. * | 3,447 | | 15,098 |
| Flanders Corp. * | 723 | | 7,917 |
| Insituform Technologies, Inc., Class A * | 1,300 | | 34,983 |
| Waste Connections, Inc. * | 2,154 | | 78,922 |
|
|
| | | | 151,141 |
Semiconductors - 4.18% | | | |
| Actel Corp. * | 1,273 | | 18,573 |
| Advanced Analogic Technologies, Inc. * | 549 | | 6,555 |
| Advanced Energy Industries, Inc. * | 1,328 | | 19,017 |
| American Superconductor Corp. * | 1,595 | | 16,078 |
| Amis Holdings, Inc. * | 2,101 | | 18,111 |
| Amkor Technology, Inc. * | 4,730 | | 42,002 |
| Applied Micro Circuits Corp. * | 14,483 | | 52,284 |
| Asyst Technologies, Inc. * | 2,449 | | 23,902 |
| Atmel Corp. * | 19,627 | | 89,303 |
| ATMI, Inc. * | 1,735 | | 52,102 |
The accompanying notes are an integral part of the financial statements. 242
John Hancock Funds II
Portfolio of investments — February 28, 2006 (Unaudited)
(showing percentage of total net assets)
|
| Small Cap Index Fund (continued) | | |
| | Shares or | | |
| | Principal | | |
| | Amount | | Value |
|
|
| |
| COMMON STOCKS (continued) | | | |
| Semiconductors (continued) | | | |
| Axcelis Technologies, Inc. * | 4,814 | $ | 33,265 |
| Brooks Automation, Inc. * | 3,534 | | 55,448 |
| Cirrus Logic, Inc. * | 4,020 | | 30,512 |
| Conexant Systems, Inc. * | 22,082 | | 65,804 |
| Credence Systems Corp. * | 4,205 | | 36,415 |
| Cymer, Inc. * | 1,682 | | 75,656 |
| Cypress Semiconductor Corp. * | 6,148 | | 109,188 |
| Diodes, Inc. * | 699 | | 26,408 |
| DSP Group, Inc. * | 1,331 | | 35,804 |
| Emcore Corp. * | 1,872 | | 14,508 |
| Emulex Corp. * | 3,884 | | 69,135 |
| Entegris, Inc. * | 5,569 | | 58,252 |
| Exar Corp. * | 1,690 | | 21,040 |
| Fairchild Semiconductor International, Inc. * | 5,530 | | 96,111 |
| FormFactor, Inc. * | 1,591 | | 58,612 |
| Genesis Microchip, Inc. * | 1,569 | | 33,734 |
| Integrated Device Technology, Inc. * | 9,070 | | 134,690 |
| International Displayworks, Inc. * | 1,602 | | 10,605 |
| IXYS Corp. * | 1,219 | | 13,043 |
| Kopin Corp. * | 3,372 | | 14,668 |
| Kulicke & Soffa Industries, Inc. * | 2,487 | | 27,854 |
| Lattice Semiconductor Corp. * | 5,423 | | 24,675 |
| LTX Corp. * | 3,009 | | 17,031 |
| Mattson Technology, Inc. * | 2,050 | | 24,764 |
| Micrel, Inc. * | 2,914 | | 40,709 |
| Microsemi Corp. * | 2,863 | | 88,037 |
| Microtune, Inc. * | 2,561 | | 13,829 |
| MIPS Technologies, Inc., Class A * | 2,099 | | 17,632 |
| MKS Instruments, Inc. * | 1,541 | | 34,457 |
| Netlogic Microsystems, Inc * | 506 | | 17,887 |
| OmniVision Technologies, Inc. * | 2,660 | | 67,830 |
| ON Semiconductor Corp. * | 6,787 | | 44,726 |
| Pericom Semiconductor Corp. * | 1,501 | | 13,524 |
| Photronics, Inc. * | 1,886 | | 33,137 |
| Pixelworks, Inc. * | 2,283 | | 10,296 |
| PLX Technology, Inc. * | 1,175 | | 14,194 |
| PMC-Sierra, Inc. * | 8,442 | | 86,193 |
| Power Integrations, Inc. * | 1,402 | | 34,812 |
| Rambus, Inc. * | 4,666 | | 144,879 |
| Rudolph Technologies, Inc. * | 700 | | 11,536 |
| Semitool, Inc. * | 983 | | 12,415 |
| Semtech Corp. * | 3,424 | | 64,303 |
| Sigmatel, Inc. * | 1,696 | | 18,232 |
| Silicon Image, Inc. * | 3,737 | | 40,808 |
| Silicon Laboratories, Inc. * | 1,982 | | 95,096 |
| Skyworks Solutions, Inc. * | 7,381 | | 38,824 |
| Tessera Technologies, Inc. * | 2,072 | | 64,709 |
| TranSwitch Corp. * | 5,351 | | 9,097 |
| Triquint Semiconductor, Inc. * | 6,586 | | 31,218 |
| Ultratech, Inc. * | 1,150 | | 22,989 |
| Varian Semiconductor Equipment | | | |
| Associates, Inc. * | 1,692 | | 79,795 |
| Small Cap Index Fund (continued) | | |
| | Shares or | | |
| | Principal | | |
| | Amount | | Value |
|
|
| |
| COMMON STOCKS (continued) | | | |
| Semiconductors (continued) | | | |
| Veeco Instruments, Inc. * | 1,275 | $ | 25,615 |
| Vitesse Semiconductor Corp. * | 10,369 | | 32,662 |
| Volterra Semiconductor Corp. * | 760 | | 13,232 |
| Zoran Corp. * | 2,028 | | 40,114 |
|
|
| | | | 2,687,936 |
Shipbuilding - 0.02% | | | |
| Maritrans, Inc. | 447 | | 10,174 |
Software - 2.30% | | | |
| Advent Software, Inc. * | 1,026 | | 28,523 |
| Allscripts Healthcare Solution, Inc. * | 1,588 | | 29,775 |
| Altiris, Inc. * | 1,069 | | 21,177 |
| American Reprographics Company * | 666 | | 19,114 |
| ANSYS, Inc. * | 1,490 | | 70,656 |
| AsiaInfo Holdings, Inc. * | 1,819 | | 7,931 |
| Aspen Technology, Inc. * | 2,175 | | 26,057 |
| Blackboard, Inc. * | 841 | | 24,229 |
| Borland Software Corp. * | 3,829 | | 20,332 |
| Bottomline Technologies, Inc. * | 765 | | 9,387 |
| Catapult Communications Corp. * | 502 | | 6,983 |
| CIBER, Inc. * | 2,585 | | 14,967 |
| Concur Technologies, Inc. * | 1,414 | | 21,436 |
| Covansys Corp. * | 1,480 | | 22,170 |
| Dendrite International, Inc. * | 2,023 | | 26,906 |
| Emageon, Inc. * | 750 | | 13,163 |
| Epicor Software Corp. * | 2,525 | | 31,361 |
| EPIQ Systems, Inc. * | 696 | | 15,291 |
| Equinix, Inc. * | 730 | | 38,281 |
| Faro Technologies, Inc. * | 562 | | 8,986 |
| InfoUSA, Inc. * | 1,599 | | 18,788 |
| Intermediate Telephone, Inc. | 1,020 | | 20,023 |
| iPass, Inc. * | 2,679 | | 19,771 |
| JDA Software Group, Inc. * | 1,403 | | 19,263 |
| Keane, Inc. * | 2,188 | | 25,687 |
| Lawson Software, Inc. * | 3,004 | | 23,882 |
| Macrovision Corp. * | 2,390 | | 48,302 |
| Magma Design Automation, Inc. * | 1,724 | | 14,861 |
| Manhattan Associates, Inc. * | 1,335 | | 28,129 |
| Mantech International Corp. * | 749 | | 21,047 |
| MapInfo Corp. * | 1,068 | | 14,407 |
| McDATA Corp., Class A * | 7,349 | | 32,483 |
| MicroStrategy, Inc. * | 650 | | 59,592 |
| Midway Games, Inc. * | 840 | | 8,324 |
| Monolithic Power Systems, Inc. * | 859 | | 14,646 |
| MRO Software, Inc. * | 998 | | 14,711 |
| NetIQ Corp. * | 2,105 | | 23,787 |
| Nuance Communications, Inc. * | 5,402 | | 57,801 |
| Open Solutions, Inc. * | 955 | | 25,928 |
| Opsware, Inc. * | 3,614 | | 28,442 |
| Packeteer, Inc. * | 1,617 | | 19,339 |
| PDF Solutions, Inc. * | 919 | | 15,522 |
| Progress Software Corp. * | 1,778 | | 51,918 |
The accompanying notes are an integral part of the financial statements. 243
John Hancock Funds II
Portfolio of investments — February 28, 2006 (Unaudited)
(showing percentage of total net assets)
|
| Small Cap Index Fund (continued) | | |
| | Shares or | | |
| | Principal | | |
| | Amount | | Value |
|
|
| |
| COMMON STOCKS (continued) | | | |
| Software (continued) | | | |
| Quality Systems, Inc. * | 352 | $ | 24,365 |
| Secure Computing Corp. * | 2,283 | | 27,624 |
| Serena Software, Inc. * | 1,335 | | 31,907 |
| SPSS, Inc. * | 871 | | 28,429 |
| THQ, Inc. * | 2,899 | | 69,576 |
| Tradestation Group, Inc. * | 1,017 | | 16,150 |
| Transaction Systems Architects, Inc., Class A * | 1,783 | | 59,481 |
| Ulticom, Inc. * | 652 | | 7,289 |
| Ultimate Software Group, Inc. * | 1,156 | | 27,050 |
| VeriFone Holdings, Inc. * | 1,176 | | 31,046 |
| Verint Systems, Inc. * | 627 | | 22,716 |
| Websense, Inc. * | 1,119 | | 69,165 |
|
|
| | | | 1,478,176 |
Steel - 0.96% | | | |
| Alaska Steel Holding Corp. * | 5,180 | | 57,498 |
| Carpenter Technology Corp. | 1,138 | | 95,125 |
| Chaparral Steel Company * | 1,076 | | 49,292 |
| NS Group, Inc. * | 1,039 | | 42,381 |
| Oregon Steel Mills, Inc. * | 1,653 | | 62,616 |
| Roanoke Electric Steel Corp. | 597 | | 16,686 |
| Ryerson Tull, Inc. | 1,181 | | 29,808 |
| Schnitzer Steel Industries, Inc. | 1,026 | | 31,909 |
| Steel Dynamics, Inc. | 1,875 | | 86,250 |
| Steel Technologies, Inc. | 553 | | 15,257 |
| Texas Industries, Inc. | 1,060 | | 64,300 |
| Worthington Industries, Inc. | 3,210 | | 62,916 |
|
|
| | | | 614,038 |
Telecommunications Equipment & | | | |
| Services - 2.77% | | | |
| ADTRAN, Inc. | 3,055 | | 84,074 |
| Aeroflex, Inc. * | 3,527 | | 45,851 |
| Airspan Networks, Inc. * | 1,998 | | 12,288 |
| Applied Signal Technology, Inc. | 602 | | 14,111 |
| Arris Group, Inc. * | 4,861 | | 61,686 |
| Atheros Communications, Inc. * | 1,643 | | 33,813 |
| Broadwing Corp. * | 3,109 | | 27,857 |
| Ciena Corp. * | 26,856 | | 107,961 |
| Commonwealth Telephone Enterprises, Inc. | 1,021 | | 32,958 |
| Commscope, Inc. * | 2,547 | | 61,103 |
| Comtech Telecommunications Corp. * | 1,011 | | 31,675 |
| Consolidated Communications Holdings, Inc. | 812 | | 11,563 |
| CT Communications, Inc. | 1,096 | | 14,511 |
| Ditech Communications Corp. * | 1,579 | | 16,279 |
| Essex Corp. * | 833 | | 18,742 |
| Fairpoint Communications, Inc. | 1,387 | | 19,515 |
| Finisar Corp. * | 9,720 | | 27,022 |
| General Communication, Inc. * | 2,713 | | 30,521 |
| GlobeTel Communications Corp. * | 3,341 | | 9,856 |
| Golden Telecom, Inc. | 1,018 | | 30,520 |
| Harmonic, Inc. * | 3,504 | | 20,218 |
| InterDigital Communication Corp. * | 2,526 | | 65,044 |
| Small Cap Index Fund (continued) | |
| | Shares or | |
| | Principal | |
| | Amount | Value |
|
|
| |
| COMMON STOCKS (continued) | | |
| Telecommunications Equipment & | | |
| Services (continued) | | |
| Intrado, Inc. * | 871 $ | 22,350 |
| Iowa Telecommunications Services, Inc. | 1,109 | 19,629 |
| J2 Global Communications, Inc. * | 1,091 | 47,568 |
| Level 3 Communications, Inc. * | 32,689 | 111,143 |
| Mastec, Inc. * | 1,312 | 16,990 |
| MRV Communications, Inc. * | 5,255 | 15,397 |
| NETGEAR, Inc. * | 1,501 | 25,757 |
| NeuStar, Inc., Class A * | 1,136 | 32,717 |
| Newport Corp. * | 1,777 | 31,524 |
| Oplink Communications, Inc. * | 771 | 12,606 |
| Plantronics, Inc. | 2,291 | 79,177 |
| Polycom, Inc. * | 4,571 | 88,769 |
| Powerwave Technologies, Inc. * | 5,110 | 75,015 |
| Premiere Global Services, Inc. * | 3,435 | 28,201 |
| Price Communications Corp. * | 2,179 | 36,498 |
| RCN Corp. * | 1,086 | 27,150 |
| SBA Communications Corp. * | 3,874 | 87,126 |
| Shenandoah Telecommunications Company | 351 | 15,293 |
| Sonus Networks, Inc. * | 11,652 | 56,512 |
| Spectralink Corp. | 978 | 12,098 |
| SureWest Communications | 739 | 18,682 |
| Symmetricom, Inc. * | 2,237 | 20,066 |
| Tekelec, Inc. * | 2,657 | 35,630 |
| Telkonet, Inc. * | 1,825 | 7,373 |
| Terayon Communication Systems, Inc. * | 3,810 | 10,211 |
| UTStarcom, Inc. * | 4,778 | 29,862 |
| Viasat, Inc. * | 1,024 | 27,494 |
| Westell Technologies, Inc., Class A * | 2,683 | 12,744 |
|
|
| | | 1,780,750 |
Telephone - 0.21% | | |
| Centennial Communications Corp., Class A * | 1,045 | 7,931 |
| Cincinnati Bell, Inc. * | 11,682 | 47,779 |
| IDT Corp. * | 2,745 | 32,638 |
| North Pittsburgh Systems, Inc. | 849 | 17,269 |
| TALK America Holdings, Inc. * | 1,479 | 12,616 |
| Valor Communications Group, Inc. | 1,425 | 17,599 |
|
|
| | | 135,832 |
Tires & Rubber - 0.14% | | |
| Bandag, Inc. | 560 | 23,951 |
| Cooper Tire & Rubber Company | 2,977 | 44,358 |
| Myers Indiana, Inc. | 1,307 | 20,912 |
|
|
| | | 89,221 |
Tobacco - 0.18% | | |
| Alliance One International, Inc. | 4,333 | 19,282 |
| Schweitzer Mauduit International, Inc. | 777 | 19,969 |
| Universal Corp. | 1,220 | 49,617 |
| Vector Group, Ltd. | 1,301 | 24,212 |
|
|
| | | 113,080 |
Toys, Amusements & Sporting Goods - 0.06% | | |
| Jakks Pacific, Inc. * | 1,212 | 30,082 |
The accompanying notes are an integral part of the financial statements. 244
John Hancock Funds II
Portfolio of investments — February 28, 2006 (Unaudited)
(showing percentage of total net assets)
|
| Small Cap Index Fund (continued) | | |
| | | Shares or | | |
| | | Principal | | |
| | | Amount | | Value |
|
|
| |
| COMMON STOCKS (continued) | | | | |
| Toys, Amusements & Sporting Goods | | | | |
| (continued) | | | | |
| Russ Berrie & Company, Inc. | | 630 | $ | 8,562 |
|
|
| | | | | 38,644 |
Transportation - 0.37% | | | | |
| Bristow Group, Inc * | | 1,107 | | 33,055 |
| Dynamex, Inc. * | | 681 | | 13,838 |
| Frozen Food Express Industries, Inc. * | | 918 | | 10,704 |
| Kirby Corp. * | | 1,032 | | 63,261 |
| Marten Transport, Ltd. * | | 822 | | 19,226 |
| Pacer International, Inc. | | 1,802 | | 57,394 |
| SCS Transportation, Inc. * | | 798 | | 21,570 |
| U. S. Xpress Enterprises, Inc., Class A * | | 562 | | 9,588 |
| USA Truck, Inc. * | | 235 | | 6,916 |
|
|
| | | | | 235,552 |
Travel Services - 0.05% | | | | |
| Ambassadors Group, Inc. | | 833 | | 20,150 |
| Pegasus Solutions, Inc. * | | 1,142 | | 10,552 |
|
|
| | | | | 30,702 |
Trucking & Freight - 0.65% | | | | |
| Arkansas Best Corp. | | 1,200 | | 49,872 |
| EGL, Inc. * | | 1,527 | | 61,767 |
| Forward Air Corp. | | 1,542 | | 54,710 |
| Heartland Express, Inc. | | 2,183 | | 50,493 |
| Hub Group, Inc., Class A * | | 930 | | 38,781 |
| Knight Transportation, Inc. | | 2,685 | | 53,136 |
| Old Dominion Freight Lines, Inc. * | | 1,354 | | 35,692 |
| Wabash National Corp. | | 1,487 | | 29,695 |
| Werner Enterprises, Inc. | | 2,405 | | 46,729 |
|
|
| | | | | 420,875 |
Utility Service - 0.03% | | | | |
| SJW Corp. | | 386 | | 19,817 |
|
| TOTAL COMMON STOCKS (Cost $52,692,462) | | $ | 60,590,622 |
|
| |
| RIGHTS - 0.00% | | | | |
| Cosmetics & Toiletries - 0.00% | | | | |
| Revlon, Inc. (Expiration date 03/20/2006) * | 7,015 | | 421 |
|
| TOTAL RIGHTS (Cost $0) | | | $ | 421 |
|
| |
| SHORT TERM INVESTMENTS - 5.63% | | | |
| Federal Home Loan Mortgage Corp. Discount Notes | | | |
| zero coupon due 03/07/2006 to | | | | |
| 03/21/2006 | $ | 1,420,000 | $ | 1,417,678 |
| Rabobank USA Finance Corp. | | | | |
| 4.56% due 03/01/2006 | | 2,000,000 | | 2,000,000 |
| United States Treasury Bills | | | | |
| zero coupon due 04/20/2006 | | 200,000 | | 198,805 |
|
| TOTAL SHORT TERM INVESTMENTS | | | | |
| (Cost $3,616,483) | | | $ | 3,616,483 |
|
| Total Investments (Small Cap Index Fund) | | |
| (Cost $56,308,945) - 99.95% | | $ | 64,207,526 |
| Other Assets in Excess of Liabilities - 0.05% | | 31,506 |
|
|
| TOTAL NET ASSETS - 100.00% | | $ | 64,239,032 |
|
|
| |
| |
| Small Cap Opportunities Fund | | |
| | Shares or | |
| | Principal | |
| | Amount | Value |
|
|
| |
| COMMON STOCKS - 94.29% | | |
| Aerospace - 0.56% | | |
| Alliant Techsystems, Inc. * (a) | 19,180 $ | 1,465,736 |
Air Freight - 0.28% | | |
| ExpressJet Holdings, Inc. * | 97,724 | 734,884 |
Aluminum - 0.97% | | |
| Century Aluminum Company * (a) | 71,308 | 2,537,852 |
Apparel & Textiles - 0.72% | | |
| Wolverine World Wide, Inc. (a) | 85,614 | 1,888,645 |
Auto Parts - 3.67% | | |
| American Axle & Manufacturing Holdings, Inc. (a) | 69,557 | 1,128,214 |
| BorgWarner, Inc. (a) | 89,310 | 4,980,819 |
| Commercial Vehicle Group, Inc. * (a) | 121,712 | 2,227,330 |
| Noble International, Ltd. (a) | 84,702 | 1,300,176 |
|
|
| | | 9,636,539 |
Auto Services - 0.90% | | |
| Lithia Motors, Inc., Class A (a) | 57,756 | 1,850,502 |
| Spartan Motors, Inc. (a) | 46,271 | 496,488 |
|
|
| | | 2,346,990 |
Automobiles - 1.78% | | |
| Rush Enterprises, Inc., Class A * (a) | 19,628 | 363,118 |
| United Auto Group, Inc. (a) | 99,807 | 4,315,655 |
|
|
| | | 4,678,773 |
Banking - 0.85% | | |
| Bank of the Ozarks, Inc. (a) | 34,745 | 1,235,532 |
| Cathay General Bancorp, Inc. (a) | 28,124 | 1,002,058 |
|
|
| | | 2,237,590 |
Building Materials & Construction - 2.17% | | |
| Builders FirstSource, Inc. * (a) | 178,649 | 4,235,768 |
| Eagle Materials, Inc. (a) | 26,640 | 1,442,023 |
|
|
| | | 5,677,791 |
| Business Services - 0.82% | | |
| Exponent, Inc. * (a) | 14,400 | 457,920 |
| SRA International, Inc., Class A * (a) | 49,300 | 1,701,836 |
|
|
| | | 2,159,756 |
Computers & Business Equipment - 3.63% | | |
| CACI International, Inc., Class A * (a) | 46,892 | 2,826,181 |
| Digi International, Inc. * (a) | 239,402 | 2,602,299 |
| Komag, Inc. * (a) | 25,100 | 1,175,684 |
| Sonic Solutions * (a) | 161,105 | 2,924,056 |
|
|
| | | 9,528,220 |
Construction & Mining Equipment - 1.33% | | |
| Pason Systems, Inc. | 122,836 | 3,486,470 |
Construction Materials - 1.02% | | |
| Universal Forest Products, Inc. (a) | 43,218 | 2,672,169 |
The accompanying notes are an integral part of the financial statements. 245
John Hancock Funds II
Portfolio of investments — February 28, 2006 (Unaudited)
(showing percentage of total net assets)
|
| Small Cap Opportunities Fund (continued) | |
| | Shares or | | |
| | Principal | | |
| | Amount | | Value |
|
|
| |
| COMMON STOCKS (continued) | | | |
| Crude Petroleum & Natural Gas - 1.49% | | | |
| Cimarex Energy Company * (a) | 42,000 | $ | 1,791,720 |
| Unit Corp. * | 39,531 | | 2,101,863 |
|
|
| | | | 3,893,583 |
Domestic Oil - 2.24% | | | |
| Brigham Exploration Company * (a) | 189,257 | | 1,621,933 |
| Oil States International, Inc. * (a) | 75,176 | | 2,595,827 |
| TETRA Technologies, Inc. * (a) | 44,180 | | 1,661,168 |
|
|
| | | | 5,878,928 |
Drugs & Health Care - 0.56% | | | |
| Qiagen NV * (a) | 98,000 | | 1,461,180 |
Electrical Equipment - 2.32% | | | |
| AMETEK, Inc. (a) | 100,195 | | 4,292,354 |
| FLIR Systems, Inc. * (a) | 69,000 | | 1,782,960 |
|
|
| | | | 6,075,314 |
| Electrical Utilities - 0.42% | | | |
| Allete, Inc. (a) | 23,841 | | 1,112,659 |
Electronics - 0.65% | | | |
| TTM Technologies, Inc. * (a) | 132,632 | | 1,712,279 |
Energy - 2.75% | | | |
| Headwaters, Inc. * (a) | 57,418 | | 2,131,356 |
| New Jersey Resources Corp. (a) | 32,445 | | 1,460,025 |
| Southwestern Energy Company * (a) | 113,046 | | 3,627,646 |
|
|
| | | | 7,219,027 |
Financial Services - 6.04% | | | |
| Accredited Home Lenders Holding Company * (a) | 80,640 | | 4,298,918 |
| Ace Cash Express, Inc. * (a) | 108,776 | | 2,679,153 |
| Affiliated Managers Group, Inc. * (a) | 50,820 | | 5,002,213 |
| Asset Acceptance Capital Corp. * (a) | 15,710 | | 314,043 |
| Commercial Capital Bancorp, Inc. (a) | 165,380 | | 2,369,895 |
| Harbor Florida Bancshares, Inc. (a) | 31,300 | | 1,189,713 |
|
|
| | | | 15,853,935 |
Healthcare Products - 3.40% | | | |
| American Medical Systems Holdings, Inc. * (a) | 53,600 | | 1,161,512 |
| Merit Medical Systems, Inc. * (a) | 106,302 | | 1,514,804 |
| Orthofix International NV * | 59,356 | | 2,463,274 |
| Polymedica Corp. (a) | 63,616 | | 2,572,631 |
| Respironics, Inc. * (a) | 33,376 | | 1,213,551 |
|
|
| | | | 8,925,772 |
| Homebuilders - 4.16% | | | |
| Beazer Homes USA, Inc. (a) | 14,400 | | 913,680 |
| Comstock Homebuilding Companies, Inc. * (a) | 89,342 | | 835,348 |
| Meritage Homes Corp. * (a) | 62,100 | | 3,634,713 |
| Ryland Group, Inc. (a) | 79,212 | | 5,525,037 |
|
|
| | | | 10,908,778 |
| Household Appliances - 1.70% | | | |
| Drew Industries, Inc. * (a) | 54,544 | | 1,769,953 |
| Technical Olympic USA, Inc. (a) | 126,586 | | 2,681,091 |
|
|
| | | | 4,451,044 |
| Small Cap Opportunities Fund (continued) | |
| | Shares or | | |
| | Principal | | |
| | Amount | | Value |
|
|
| |
| COMMON STOCKS (continued) | | | |
| Household Products - 0.70% | | | |
| Tempur-Pedic International, Inc. * (a) | 155,248 | $ | 1,831,926 |
| Industrial Machinery - 5.56% | | | |
| Actuant Corp., Class A (a) | 53,557 | | 2,950,991 |
| Ceradyne, Inc. * (a) | 62,212 | | 3,787,467 |
| FMC Technologies, Inc. * (a) | 30,983 | | 1,453,722 |
| Graco, Inc. (a) | 52,004 | | 2,167,007 |
| Middleby Corp. * | 27,556 | | 2,609,553 |
| Rush Enterprises, Inc., Class B * | 94,165 | | 1,626,229 |
|
|
| | | | 14,594,969 |
| Insurance - 3.15% | | | |
| American Equity Investment Life Holding | | | |
| Company (a) | 28,400 | | 380,276 |
| Aspen Insurance Holdings, Ltd. (a) | 98,810 | | 2,293,380 |
| Assured Guaranty, Ltd. (a) | 49,753 | | 1,313,479 |
| Hub International, Ltd. | 40,723 | | 1,164,678 |
| Max Re Capital, Ltd. (a) | 22,300 | | 544,343 |
| Scottish Re Group, Ltd. (a) | 51,882 | | 1,297,050 |
| Triad Guaranty, Inc. * (a) | 28,143 | | 1,277,411 |
|
|
| | | | 8,270,617 |
| Internet Content - 0.89% | | | |
| Schawk, Inc., Class A (a) | 93,800 | | 2,330,930 |
Internet Service Provider - 0.53% | | | |
| Tom Online, Inc., ADR * (a) | 62,600 | | 1,395,980 |
Leisure Time - 0.88% | | | |
| Penn National Gaming, Inc. * (a) | 66,449 | | 2,304,451 |
Manufacturing - 2.48% | | | |
| AptarGroup, Inc. | 19,368 | | 1,027,473 |
| Carlisle Companies, Inc. (a) | 42,155 | | 3,313,383 |
| Raven Industries, Inc. (a) | 61,526 | | 2,170,637 |
|
|
| | | | 6,511,493 |
Medical-Hospitals - 0.62% | | | |
| VCA Antech, Inc. * (a) | 58,068 | | 1,623,001 |
Metal & Metal Products - 1.14% | | | |
| Quanex Corp. (a) | 26,700 | | 1,657,269 |
| Reliance Steel & Aluminum Company (a) | 16,192 | | 1,334,059 |
|
|
| | | | 2,991,328 |
| Mining - 1.51% | | | |
| AMCOL International Corp. (a) | 143,810 | | 3,970,594 |
Mobile Homes - 2.49% | | | |
| Thor Industries, Inc. (a) | 83,178 | | 3,926,001 |
| Winnebago Industries, Inc. (a) | 80,673 | | 2,591,217 |
|
|
| | | | 6,517,218 |
| Petroleum Services - 0.84% | | | |
| Core Laboratories NV * (a) | 47,966 | | 2,199,241 |
Railroads & Equipment - 1.78% | | | |
| Genesee & Wyoming, Inc., Class A * | 101,982 | | 4,665,677 |
Real Estate - 16.28% | | | |
| Aames Investment Corp., REIT (a) | 345,147 | | 1,988,047 |
The accompanying notes are an integral part of the financial statements. 246
John Hancock Funds II
Portfolio of investments — February 28, 2006 (Unaudited)
(showing percentage of total net assets)
|
| Small Cap Opportunities Fund (continued) | |
| | Shares or | | |
| | Principal | | |
| | Amount | | Value |
|
|
| |
| COMMON STOCKS (continued) | | | |
| Real Estate (continued) | | | |
| American Home Mortgage Investment Corp., | | | |
| REIT (a) | 185,643 | $ | 5,290,825 |
| Anthracite Capital, Inc., REIT (a) | 105,856 | | 1,134,776 |
| Ashford Hospitality Trust, Inc., REIT (a) | 226,189 | | 2,825,101 |
| CentraCore Properties Trust, REIT (a) | 16,966 | | 458,421 |
| Corporate Office Properties Trust, REIT (a) | 40,447 | | 1,679,359 |
| Equity One, Inc., REIT (a) | 107,273 | | 2,413,643 |
| First Potomac Realty Trust, REIT (a) | 29,000 | | 859,560 |
| Gramercy Captial Corp., REIT (a) | 46,004 | | 1,208,065 |
| Jer Investors Trust, Inc., REIT (a) | 167,548 | | 2,928,739 |
| KKR Financial Corp., REIT | 200,237 | | 4,579,420 |
| LaSalle Hotel Properties, REIT (a) | 84,280 | | 3,366,986 |
| Luminent Mortgage Capital, Inc., REIT (a) | 72,611 | | 550,391 |
| MortgageIT Holdings, Inc., REIT (a) | 86,700 | | 1,010,055 |
| New Century Financial Corp., REIT (a) | 49,802 | | 1,929,828 |
| Newcastle Investment Corp., REIT (a) | 156,765 | | 3,749,819 |
| RAIT Investment Trust, REIT (a) | 107,043 | | 2,922,274 |
| Redwood Trust, Inc., REIT | 56,046 | | 2,323,667 |
| Saxon Capital, Inc., REIT (a) | 80,000 | | 796,000 |
| SL Green Realty Corp., REIT | 7,911 | | 687,545 |
|
|
| | | | 42,702,521 |
Retail Grocery - 0.62% | | | |
| Ruddick Corp. (a) | 44,471 | | 1,075,309 |
| United Natural Foods, Inc. * (a) | 16,845 | | 560,264 |
|
|
| | | | 1,635,573 |
Retail Trade - 2.56% | | | |
| Cabela's, Inc. * (a) | 100,740 | | 1,904,994 |
| First Cash Financial Services * (a) | 104,372 | | 1,818,160 |
| Guitar Center, Inc. * (a) | 35,397 | | 1,832,149 |
| Ritchie Brothers Auctioneers, Inc. | 24,510 | | 1,169,862 |
|
|
| | | | 6,725,165 |
Semiconductors - 1.58% | | | |
| Diodes, Inc. * (a) | 109,996 | | 4,155,649 |
Software - 0.30% | | | |
| Websense, Inc. * (a) | 12,817 | | 792,219 |
Steel - 0.49% | | | |
| NS Group, Inc. * (a) | 31,300 | | 1,276,727 |
Telecommunications Equipment & | | | |
| Services - 1.43% | | | |
| J2 Global Communications, Inc. * (a) | 40,800 | | 1,778,880 |
| NETGEAR, Inc. * (a) | 114,348 | | 1,962,212 |
|
|
| | | | 3,741,092 |
Trucking & Freight - 4.03% | | | |
| Landstar Systems, Inc. | 27,268 | | 1,270,416 |
| Old Dominion Freight Lines, Inc. * (a) | 122,187 | | 3,220,849 |
| Oshkosh Truck Corp. (a) | 106,934 | | 6,066,366 |
|
|
| | | | 10,557,631 |
|
| TOTAL COMMON STOCKS (Cost $220,157,079) | | $ | 247,337,916 |
|
| |
| Small Cap Opportunities Fund (continued) | |
| | | Shares or | | |
| | | Principal | | |
| | | Amount | | Value |
|
|
| |
| SHORT TERM INVESTMENTS - 50.80% | | | | |
| State Street Navigator Securities | | | | |
| Lending Prime Portfolio (c) | $ | 133,253,392 | $ | 133,253,392 |
|
| TOTAL SHORT TERM INVESTMENTS | | | | |
| (Cost $133,253,392) | | | $ | 133,253,392 |
|
| |
| REPURCHASE AGREEMENTS - 5.10% | | | | |
| Repurchase Agreement with State | | | | |
| Street Corp. dated 02/28/2006 at | | | | |
| 3.20% to be repurchased at | | | | |
| $13,381,189 on 03/01/2006, | | | | |
| collateralized by $14,485,000 | | | | |
| Federal National Mortgage | | | | |
| Association, 5.55% due | | | | |
| 07/10/2028 (valued at | | | | |
| $13,650,997 including interest) (c) | $ | 13,380,000 | $ | 13,380,000 |
|
| TOTAL REPURCHASE AGREEMENTS | | | | |
| (Cost $13,380,000) | | | $ | 13,380,000 |
|
| Total Investments (Small Cap Opportunities Fund) | | |
| (Cost $366,790,471) - 150.19% | | | $ | 393,971,308 |
| Liabilities in Excess of Other Assets - (50.19)% | | | (131,647,317) |
|
|
| TOTAL NET ASSETS - 100.00% | | | $ | 262,323,991 |
|
|
| |
| |
| Small Company Fund | | | | |
| | | Shares or | | |
| | | Principal | | |
| | | Amount | | Value |
|
|
| |
| COMMON STOCKS - 99.77% | | | | |
| Aerospace - 0.67% | | | | |
| Alliant Techsystems, Inc. * | | 6,590 | $ | 503,608 |
| Teledyne Technologies, Inc. * | | 1,938 | | 64,206 |
|
|
| | | | | 567,814 |
Air Travel - 0.37% | | | | |
| Frontier Airlines, Inc. * (a) | | 4,054 | | 29,189 |
| Mesa Air Group, Inc. * (a) | | 3,607 | | 41,192 |
| SkyWest, Inc. (a) | | 8,420 | | 243,927 |
|
|
| | | | | 314,308 |
Apparel & Textiles - 1.33% | | | | |
| Brown Shoe, Inc. (a) | | 7,400 | | 352,980 |
| DHB Industries, Inc. * (a) | | 15,300 | | 71,145 |
| Guess, Inc. * (a) | | 19,000 | | 687,610 |
| Phillips - Van Heusen Corp. | | 500 | | 17,750 |
|
|
| | | | | 1,129,485 |
Auto Parts - 0.84% | | | | |
| Accuride Corp. * | | 4,618 | | 52,276 |
| Aftermarket Technology Corp. * | | 819 | | 17,772 |
| Arvinmeritor, Inc. | | 2,720 | | 45,533 |
| Commercial Vehicle Group, Inc. * | | 2,322 | | 42,493 |
| TRW Automotive Holdings Corp. * (a) | | 21,740 | | 556,544 |
|
|
| | | | | 714,618 |
| Banking - 5.34% | | | | |
| Anchor BanCorp Wisconsin, Inc. (a) | | 500 | | 15,225 |
| Astoria Financial Corp. | | 3,800 | | 108,946 |
The accompanying notes are an integral part of the financial statements. 247
John Hancock Funds II
Portfolio of investments — February 28, 2006 (Unaudited)
(showing percentage of total net assets)
|
| Small Company Fund (continued) | | |
| | Shares or | | |
| | Principal | | |
| | Amount | | Value |
|
|
| |
| COMMON STOCKS (continued) | | | |
| Banking (continued) | | | |
| BancFirst Corp. | 1,176 | $ | 99,490 |
| Bank of Hawaii Corp. | 16,965 | | 905,931 |
| Capital Crossing Bank * (a) | 490 | | 15,724 |
| Center Financial Corp. (a) | 3,676 | | 85,173 |
| City National Corp. | 7,977 | | 605,933 |
| Commerce Bancshares, Inc. (a) | 5,672 | | 292,392 |
| Community Trust Bancorp, Inc. (a) | 488 | | 15,479 |
| Corus Bankshares, Inc. (a) | 13,017 | | 781,671 |
| Cullen Frost Bankers, Inc. (a) | 3,197 | | 176,219 |
| Downey Financial Corp. (a) | 17,537 | | 1,114,476 |
| First Citizens Bancshares, Inc. (a) | 650 | | 121,654 |
| First Indiana Corp. | 1,250 | | 34,487 |
| First Regional Bancorp * (a) | 676 | | 56,581 |
| Old Second Bancorp, Inc. (a) | 1,419 | | 45,294 |
| Wilmington Trust Corp. | 1,312 | | 56,167 |
|
|
| | | | 4,530,842 |
Biotechnology - 0.33% | | | |
| Bio-Rad Laboratories, Inc., Class A * | 298 | | 17,078 |
| Millipore Corp. * (a) | 977 | | 67,736 |
| PRA International * | 7,531 | | 198,442 |
|
|
| | | | 283,256 |
Broadcasting - 0.22% | | | |
| New Frontier Media, Inc. * (a) | 2,300 | | 16,399 |
| Sinclair Broadcast Group, Inc., Class A (a) | 23,137 | | 166,355 |
|
|
| | | | 182,754 |
Building Materials & Construction - 1.06% | | | |
| BlueLinx Holdings, Inc. (a) | 2,819 | | 44,766 |
| Lennox International, Inc. | 26,500 | | 851,975 |
|
|
| | | | 896,741 |
Business Services - 5.83% | | | |
| Acxiom Corp. | 10,860 | | 281,057 |
| Arbinet-Thexchange. Inc. * (a) | 4,900 | | 31,164 |
| Dun & Bradstreet Corp. * | 439 | | 31,933 |
| Escala Group, Inc. * (a) | 10,650 | | 264,652 |
| Ezcorp, Inc., Class A * | 2,722 | | 58,877 |
| Global Payments, Inc. | 28,003 | | 1,457,836 |
| John H. Harland Company | 19,583 | | 708,709 |
| Kendle International, Inc. * | 5,675 | | 180,181 |
| R.H. Donnelley Corp. * | 9,805 | | 598,105 |
| Sotheby's Holdings, Inc., Class A * | 20,685 | | 436,867 |
| Spherion Corp. * | 14,600 | | 145,708 |
| Tech Data Corp. * | 13,509 | | 561,029 |
| Teletech Holdings, Inc. * | 15,000 | | 185,250 |
|
|
| | | | 4,941,368 |
Cable and Television - 0.05% | | | |
| LodgeNet Entertainment Corp. * | 2,997 | | 42,677 |
Cellular Communications - 0.19% | | | |
| Brightpoint, Inc. * | 2,291 | | 64,812 |
| Tessco Technologies, Inc. * | 5,373 | | 99,401 |
|
|
| | | | 164,213 |
| Small Company Fund (continued) | | |
| | Shares or | | |
| | Principal | | |
| | Amount | | Value |
|
|
| |
| COMMON STOCKS (continued) | | | |
Chemicals - 2.27% | | | |
| A. Schulman, Inc. | 887 | $ | 20,782 |
| Albany Molecular Research, Inc. * (a) | 1,616 | | 16,306 |
| Celanese Corp., Series A | 14,020 | | 300,028 |
| Eastman Chemical Company | 4,000 | | 197,320 |
| Glenayre Technologies, Inc. * (a) | 17,800 | | 69,420 |
| Olin Corp. (a) | 17,620 | | 370,196 |
| Pioneer Companies, Inc. * (a) | 7,788 | | 234,575 |
| Terra Industries, Inc. * (a) | 65,127 | | 461,750 |
| UAP Holding Corp. (a) | 11,900 | | 258,944 |
|
|
| | | | 1,929,321 |
| Coal - 0.09% | | | |
| Massey Energy Company | 2,000 | | 74,400 |
Commercial Services - 0.30% | | | |
| Vertrue, Inc. * (a) | 5,699 | | 251,098 |
Computers & Business Equipment - 4.74% | | | |
| Agilysys, Inc. | 27,458 | | 392,375 |
| CalAmp Corp. * | 11,688 | | 117,464 |
| Electronics for Imaging, Inc. * | 2,600 | | 69,732 |
| Gerber Scientific, Inc. * (a) | 7,643 | | 79,411 |
| Intergraph Corp. * (a) | 16,753 | | 607,464 |
| Komag, Inc. * (a) | 23,911 | | 1,119,991 |
| Lasercard Corp. * (a) | 2,681 | | 48,982 |
| MTS Systems Corp. | 10,081 | | 398,401 |
| Plexus Corp. * | 28,000 | | 939,680 |
| Sybase, Inc. * | 651 | | 13,886 |
| Sykes Enterprises, Inc. * (a) | 17,460 | | 232,567 |
|
|
| | | | 4,019,953 |
| Construction & Mining Equipment - 0.04% | | | |
| Kaman Corp., Class A | 1,614 | | 36,654 |
Construction Materials - 5.39% | | | |
| Applied Industrial Technologies, Inc. | 22,828 | | 976,582 |
| Columbus McKinnon Corp. * | 3,900 | | 104,910 |
| JLG Industries, Inc. | 20,138 | | 1,187,941 |
| Louisiana-Pacific Corp. | 16,833 | | 478,562 |
| Universal Forest Products, Inc. | 6,300 | | 389,529 |
| USG Corp. * (a) | 16,933 | | 1,430,500 |
|
|
| | | | 4,568,024 |
| Containers & Glass - 1.14% | | | |
| Greif, Inc., Class A (a) | 7,610 | | 440,695 |
| Silgan Holdings, Inc. | 13,248 | | 522,236 |
|
|
| | | | 962,931 |
| Cosmetics & Toiletries - 0.48% | | | |
| Playtex Products, Inc. * | 38,600 | | 405,300 |
Crude Petroleum & Natural Gas - 0.77% | | | |
| Harvest Natural Resources, Inc. * (a) | 29,394 | | 264,840 |
| Penn Virginia Corp. | 300 | | 18,555 |
| Pogo Producing Company | 5,332 | | 265,853 |
| Swift Energy Company * | 2,596 | | 100,621 |
|
|
| | | | 649,869 |
The accompanying notes are an integral part of the financial statements. 248
John Hancock Funds II
Portfolio of investments — February 28, 2006 (Unaudited)
(showing percentage of total net assets)
|
| Small Company Fund (continued) | | |
| | Shares or | | |
| | Principal | | |
| | Amount | | Value |
|
|
| |
| COMMON STOCKS (continued) | | | |
| Domestic Oil - 1.59% | | | |
| Frontier Oil Corp. (a) | 22,642 | $ | 1,047,193 |
| Giant Industries, Inc. * (a) | 4,731 | | 275,344 |
| St. Mary Land & Exploration Company | 639 | | 24,531 |
|
|
| | | | 1,347,068 |
Drugs & Health Care - 1.74% | | | |
| Alliance Imaging, Inc. * (a) | 9,640 | | 56,683 |
| Alpharma, Inc., Class A | 32,024 | | 968,726 |
| Candela Corp. * | 6,700 | | 128,305 |
| CNS, Inc. (a) | 5,732 | | 119,168 |
| Nutraceutical International Corp. * | 8,093 | | 116,297 |
| Vital Signs, Inc. | 1,322 | | 67,501 |
| West Pharmaceutical Services, Inc. | 710 | | 22,926 |
|
|
| | | | 1,479,606 |
Electrical Equipment - 1.61% | | | |
| A.O. Smith Corp. (a) | 22,667 | | 1,049,482 |
| American Science & Engineering, Inc. * (a) | 600 | | 45,654 |
| Ampex Corp. * | 982 | | 19,984 |
| Greatbatch, Inc. * (a) | 688 | | 15,212 |
| Lamson & Sessions Company * (a) | 8,350 | | 197,143 |
| Watsco, Inc. (a) | 600 | | 41,772 |
|
|
| | | | 1,369,247 |
Electrical Utilities - 0.51% | | | |
| Allegheny Energy, Inc. * | 9,250 | | 330,780 |
| Pepco Holdings, Inc. (a) | 4,100 | | 97,457 |
|
|
| | | | 428,237 |
Electronics - 3.77% | | | |
| Ansoft Corp. * | 1,584 | | 62,045 |
| Arrow Electronics, Inc. * (a) | 28,117 | | 978,191 |
| Avnet, Inc. * | 15,334 | | 385,343 |
| AVX Corp. (a) | 11,348 | | 187,923 |
| Imation Corp. | 1,405 | | 61,609 |
| Itron, Inc. * (a) | 2,369 | | 140,861 |
| LoJack Corp. * | 2,590 | | 58,923 |
| Multi-Fineline Electronix, Inc. * (a) | 6,620 | | 376,943 |
| Teleflex, Inc. | 13,102 | | 847,044 |
| Zygo Corp. * | 5,989 | | 102,951 |
|
|
| | | | 3,201,833 |
Energy - 1.30% | | | |
| Energen Corp. | 30,936 | | 1,105,343 |
Financial Services - 1.99% | | | |
| Americredit Corp. * | 12,412 | | 366,154 |
| Calamos Asset Management, Inc. (a) | 1,188 | | 45,584 |
| City Holding Company (a) | 2,913 | | 106,062 |
| Nelnet, Inc., Class A * | 1,100 | | 45,595 |
| Raymond James Financial, Inc. | 12,171 | | 523,110 |
| Stifel Financial Corp. * (a) | 1,700 | | 65,161 |
| Taylor Capital Group, Inc. (a) | 866 | | 32,691 |
| Westcorp, Inc. | 7,018 | | 504,243 |
|
|
| | | | 1,688,600 |
| Small Company Fund (continued) | | |
| | Shares or | | |
| | Principal | | |
| | Amount | | Value |
|
|
| |
| COMMON STOCKS (continued) | | | |
Food & Beverages - 2.61% | | | |
| Chiquita Brands International, Inc. (a) | 15,085 | $ | 259,764 |
| Del Monte Foods Company | 26,543 | | 288,788 |
| Domino's Pizza, Inc. | 30,636 | | 781,218 |
| Gold Kist, Inc. * | 2,310 | | 30,654 |
| Hansen Natural Corp. * (a) | 200 | | 18,668 |
| M & F Worldwide Corp. * (a) | 7,776 | | 128,304 |
| PepsiAmericas, Inc. | 3,642 | | 87,116 |
| Seabord Corp. (a) | 377 | | 563,238 |
| Spartan Stores, Inc. (a) | 4,900 | | 57,771 |
|
|
| | | | 2,215,521 |
Forest Products - 0.27% | | | |
| Rayonier, Inc. (a) | 5,400 | | 232,740 |
Funeral Services - 0.12% | | | |
| Alderwoods Group, Inc. * (a) | 6,183 | | 105,606 |
Gas & Pipeline Utilities - 1.69% | | | |
| Nicor, Inc. (a) | 20,710 | | 889,080 |
| UGI Corp. | 24,079 | | 540,574 |
|
|
| | | | 1,429,654 |
Healthcare Products - 4.29% | | | |
| Cantel Medical Corp. * | 800 | | 13,696 |
| Cutera, Inc. * (a) | 11,736 | | 317,928 |
| Dade Behring Holdings, Inc. | 22,715 | | 828,643 |
| DENTSPLY International, Inc. | 2,272 | | 129,481 |
| Edwards Lifesciences Corp. * | 6,570 | | 271,670 |
| Haemonetics Corp. * (a) | 14,333 | | 742,450 |
| Health Tronics, Inc. * (a) | 4,090 | | 29,734 |
| Henry Schein, Inc. * | 400 | | 18,660 |
| Hologic, Inc. * | 2,266 | | 108,383 |
| ICU Medical, Inc. * (a) | 7,587 | | 266,304 |
| IDEXX Laboratories, Inc. * (a) | 400 | | 31,432 |
| Kinetic Concepts, Inc. * | 1,314 | | 48,749 |
| Molecular Devices Corp. * (a) | 700 | | 22,281 |
| PetMed Express, Inc. * (a) | 12,245 | | 228,859 |
| PSS World Medical, Inc. * (a) | 4,800 | | 82,944 |
| Respironics, Inc. * | 2,350 | | 85,446 |
| SurModics, Inc. * (a) | 9,486 | | 367,677 |
| Sybron Dental Specialties, Inc. * (a) | 702 | | 26,859 |
| Zoll Medical Corp. * | 657 | | 17,246 |
|
|
| | | | 3,638,442 |
Healthcare Services - 2.78% | | | |
| Genesis HealthCare Corp. * (a) | 6,381 | | 253,645 |
| Magellan Health Services, Inc. * (a) | 19,203 | | 733,362 |
| Odyssey Healthcare, Inc. * (a) | 1,500 | | 28,230 |
| Pediatrix Medical Group, Inc. * (a) | 300 | | 28,314 |
| Per-Se Technologies, Inc. * (a) | 3,615 | | 91,315 |
| Sierra Health Services, Inc. * | 29,300 | | 1,221,517 |
|
|
| | | | 2,356,383 |
Holdings Companies/Conglomerates - 0.02% | | | |
| United Industrial Corp. (a) | 400 | | 20,664 |
The accompanying notes are an integral part of the financial statements. 249
John Hancock Funds II
Portfolio of investments — February 28, 2006 (Unaudited)
(showing percentage of total net assets)
|
| Small Company Fund (continued) | | |
| | Shares or | | |
| | Principal | | |
| | Amount | | Value |
|
|
| |
| COMMON STOCKS (continued) | | | |
| Homebuilders - 1.65% | | | |
| NVR, Inc. * (a) | 1,858 | $ | 1,399,074 |
Hotels & Restaurants - 1.29% | | | |
| Luby's Cafeterias, Inc. * (a) | 13,387 | | 199,600 |
| Main Street Restaurant Group, Inc. * (a) | 8,386 | | 46,123 |
| Papa Johns International, Inc. * (a) | 25,818 | | 849,412 |
|
|
| | | | 1,095,135 |
Industrial Machinery - 1.58% | | | |
| Cummins, Inc. (a) | 10,009 | | 1,083,775 |
| Flow International Corp. * (a) | 9,936 | | 129,863 |
| Mitcham Industries Inc * (a) | 7,455 | | 124,871 |
|
|
| | | | 1,338,509 |
Industrials - 0.45% | | | |
| Clean Harbors, Inc. * (a) | 11,528 | | 380,193�� |
Insurance - 4.32% | | | |
| American Financial Group, Inc. | 4,870 | | 201,618 |
| Conseco, Inc. * | 17,603 | | 437,259 |
| First American Corp. | 7,655 | | 322,735 |
| FPIC Insurance Group, Inc. * (a) | 400 | | 14,056 |
| LandAmerica Financial Group, Inc. (a) | 16,319 | | 1,088,477 |
| Philadelphia Consolidated Holding Corp. * | 563 | | 60,241 |
| Protective Life Corp. | 7,211 | | 351,536 |
| Safety Insurance Group, Inc. (a) | 5,626 | | 243,212 |
| Selective Insurance Group, Inc. (a) | 2,761 | | 149,701 |
| Zenith National Insurance Corp. (a) | 15,434 | | 794,851 |
|
|
| | | | 3,663,686 |
International Oil - 0.54% | | | |
| Callon Petroleum Company * (a) | 12,800 | | 226,304 |
| Parker Drilling Company * (a) | 24,900 | | 230,325 |
|
|
| | | | 456,629 |
Internet Service Provider - 1.66% | | | |
| Earthlink, Inc. * | 86,389 | | 856,979 |
| TriZetto Group, Inc. * (a) | 11,409 | | 191,215 |
| United Online, Inc. (a) | 29,923 | | 359,375 |
|
|
| | | | 1,407,569 |
Leisure Time - 1.25% | | | |
| Bluegreen Corp. * (a) | 5,749 | | 91,237 |
| DreamWorks Animation SKG, Class A * | 30,178 | | 814,806 |
| Handleman Company (a) | 1,200 | | 11,796 |
| Steinway Musical Instruments, Inc. * | 4,232 | | 139,444 |
|
|
| | | | 1,057,283 |
Manufacturing - 1.23% | | | |
| Acuity Brands, Inc. | 700 | | 27,643 |
| Blout International, Inc. * (a) | 21,000 | | 343,140 |
| Mettler-Toledo International, Inc. * | 11,068 | | 670,278 |
|
|
| | | | 1,041,061 |
Medical-Hospitals - 0.16% | | | |
| Air Methods Corp * (a) | 1,600 | | 37,936 |
| Community Health Systems, Inc. * | 2,465 | | 93,473 |
|
|
| | | | 131,409 |
| Small Company Fund (continued) | | |
| | Shares or | | |
| | Principal | | |
| | Amount | | Value |
|
|
| |
| COMMON STOCKS (continued) | | | |
| Metal & Metal Products - 3.68% | | | |
| Commercial Metals Company | 4,260 | $ | 192,935 |
| Metal Management, Inc. | 18,114 | | 510,996 |
| Quanex Corp. | 16,037 | | 995,417 |
| Reliance Steel & Aluminum Company (a) | 16,713 | | 1,376,984 |
| Shiloh Industries, Inc * | 3,016 | | 49,161 |
|
|
| | | | 3,125,493 |
Mining - 0.33% | | | |
| Cleveland-Cliffs, Inc. (a) | 3,246 | | 279,318 |
Office Furnishings & Supplies - 0.02% | | | |
| CompX International, Inc. (a) | 1,227 | | 20,908 |
Petroleum Services - 3.50% | | | |
| McDermott International, Inc. * | 22,023 | | 1,135,286 |
| SEACOR SMIT, Inc. * (a) | 3,590 | | 261,962 |
| Tesoro Petroleum Corp. (a) | 7,258 | | 438,456 |
| Veritas DGC, Inc. * (a) | 26,961 | | 1,135,867 |
|
|
| | | | 2,971,571 |
Pharmaceuticals - 2.41% | | | |
| Alkermes, Inc. * (a) | 44,374 | | 1,127,544 |
| King Pharmaceuticals, Inc. * | 46,173 | | 750,311 |
| United Therapeutics Corp. * (a) | 500 | | 30,820 |
| ViroPharma, Inc. * (a) | 6,800 | | 131,580 |
|
|
| | | | 2,040,255 |
Publishing - 0.58% | | | |
| Consolidated Graphics, Inc. * | 3,830 | | 195,598 |
| John Wiley & Sons, Inc Class A | 500 | | 18,825 |
| Playboy Enterprises, Inc., Class B * (a) | 6,900 | | 95,634 |
| Scholastic Corp. * | 6,096 | | 179,344 |
|
|
| | | | 489,401 |
| Railroads & Equipment - 0.33% | | | |
| Kansas City Southern * (a) | 11,934 | | 276,511 |
| Real Estate - 2.13% | | | |
| Boykin Lodging Company, REIT * | 6,336 | | 80,974 |
| CBL & Associates Properties, Inc., REIT | 20,393 | | 868,742 |
| Innkeepers USA Trust, REIT | 9,310 | | 163,204 |
| MeriStar Hospitality Corp., REIT * (a) | 18,436 | | 190,075 |
| Mission West Properties, Inc., REIT (a) | 8,196 | | 87,697 |
| PS Business Parks, Inc., REIT | 2,000 | | 106,380 |
| Saul Centers, Inc., REIT (a) | 1,200 | | 46,548 |
| Tanger Factory Outlet Centers, Inc., REIT | 2,700 | | 87,210 |
| Taubman Centers, Inc., REIT | 4,363 | | 173,386 |
|
|
| | | | 1,804,216 |
Retail Trade - 7.97% | | | |
| Barnes & Noble, Inc. | 20,224 | | 871,048 |
| Blair Corp. | 1,700 | | 70,125 |
| Bon-Ton Stores, Inc. (a) | 2,400 | | 65,328 |
| Building Materials Holding Corp. (a) | 13,609 | | 915,886 |
| Burlington Coat Factory Warehouse Corp. (a) | 400 | | 18,016 |
| Genesco, Inc. * (a) | 8,035 | | 326,221 |
| Longs Drug Stores Corp. (a) | 21,238 | | 814,902 |
| Pantry, Inc. * (a) | 15,219 | | 900,508 |
The accompanying notes are an integral part of the financial statements.
John Hancock Funds II
Portfolio of investments — February 28, 2006 (Unaudited)
(showing percentage of total net assets)
|
| Small Company Fund (continued) | | |
| | Shares or | | |
| | Principal | | |
| | Amount | | Value |
|
|
| |
| COMMON STOCKS (continued) | | | |
| Retail Trade (continued) | | | |
| Payless ShoeSource, Inc. * | 36,314 | $ | 860,642 |
| Sonic Automotive, Inc. (a) | 28,300 | | 749,667 |
| Sportsman's Guide, Inc. * | 826 | | 20,890 |
| Steven Madden, Ltd. * (a) | 3,985 | | 127,719 |
| The Dress Barn, Inc. * (a) | 23,625 | | 1,020,127 |
|
|
| | | | 6,761,079 |
Semiconductors - 0.70% | | | |
| Cymer, Inc. * (a) | 4,513 | | 202,995 |
| Netlogic Microsystems, Inc * (a) | 1,370 | | 48,429 |
| OmniVision Technologies, Inc. * (a) | 6,981 | | 178,016 |
| ON Semiconductor Corp. * (a) | 25,121 | | 165,547 |
|
|
| | | | 594,987 |
Software - 1.21% | | | |
| Actuate Corp. * (a) | 9,700 | | 37,636 |
| Aspen Technology, Inc. * (a) | 9,415 | | 112,792 |
| DucoCorp, Inc. * | 2,500 | | 19,437 |
| Novell, Inc. * | 72,600 | | 690,426 |
| SPSS, Inc. * | 5,100 | | 166,464 |
|
|
| | | | 1,026,755 |
Steel - 0.16% | | | |
| Chaparral Steel Company * (a) | 1,837 | | 84,153 |
| Novamerican Stee, Inc * | 800 | | 32,128 |
| Olympic Steel, Inc. (a) | 784 | | 20,666 |
|
|
| | | | 136,947 |
Telecommunications Equipment & | | | |
| Services - 0.64% | | | |
| ADTRAN, Inc. | 7,718 | | 212,400 |
| Iowa Telecommunications Services, Inc. (a) | 1,200 | | 21,240 |
| Premiere Global Services, Inc. * | 38,030 | | 312,226 |
|
|
| | | | 545,866 |
Telephone - 0.66% | | | |
| CenturyTel, Inc. (a) | 9,671 | | 347,963 |
| TALK America Holdings, Inc. * (a) | 22,840 | | 194,825 |
| Valor Communications Group, Inc. (a) | 1,686 | | 20,822 |
|
|
| | | | 563,610 |
Tires & Rubber - 0.89% | | | |
| Goodyear Tire & Rubber Company * (a) | 52,785 | | 756,409 |
Tobacco - 1.02% | | | |
| Loews Corp. - Carolina Group (a) | 18,304 | | 869,257 |
Toys, Amusements & Sporting Goods - 1.49% | | | |
| Hasbro, Inc. | 12,754 | | 258,779 |
| Jakks Pacific, Inc. * (a) | 40,400 | | 1,002,728 |
|
|
| | | | 1,261,507 |
Transportation - 0.59% | | | |
| Bristow Group, Inc * (a) | 679 | | 20,275 |
| Kirby Corp. * | 3,197 | | 195,976 |
| Laidlaw International, Inc. | 10,273 | | 283,535 |
|
|
| | | | 499,786 |
| Small Company Fund (continued) | | |
| | | Shares or | | |
| | | Principal | | |
| | | Amount | | Value |
|
|
| |
| COMMON STOCKS (continued) | | | | |
| Travel Services - 0.02% | | | | |
| Ambassadors Group, Inc. | | 600 | $ | 14,514 |
| Trucking & Freight - 1.57% | | | | |
| Arkansas Best Corp. | | 3,353 | | 139,351 |
| EGL, Inc. * | | 3,000 | | 121,350 |
| Forward Air Corp. (a) | | 4,365 | | 154,870 |
| Heartland Express, Inc. | | 8,330 | | 192,673 |
| Knight Transportation, Inc. (a) | | 11,394 | | 225,487 |
| Landstar Systems, Inc. | | 8,502 | | 396,108 |
| Navistar International Corp. * | | 500 | | 14,675 |
| Old Dominion Freight Lines, Inc. * (a) | | 3,300 | | 86,988 |
|
|
| | | | | 1,331,502 |
|
| TOTAL COMMON STOCKS (Cost $76,735,181) | | $ | 84,625,010 |
|
| |
| SHORT TERM INVESTMENTS - 40.78% | | | | |
| State Street Navigator Securities | | | | |
| Lending Prime Portfolio (c) | $ | 34,585,798 | $ | 34,585,798 |
|
| TOTAL SHORT TERM INVESTMENTS | | | | |
| (Cost $34,585,798) | | | $ | 34,585,798 |
|
| |
| REPURCHASE AGREEMENTS - 0.44% | | | | |
| Repurchase Agreement with State | | | | |
| Street Corp. dated 02/28/2006 at | | | | |
| 3.20% to be repurchased at | | | | |
| $375,033 on 03/01/2006, | | | | |
| collateralized by $410,000 FNMA | | | | |
| 5.50% due 7/14/2028 (valued at | | | | |
| $384,946 including interest) (c) | $ | 375,000 | $ | 375,000 |
|
| TOTAL REPURCHASE AGREEMENTS | | | | |
| (Cost $375,000) | | | $ | 375,000 |
|
| Total Investments (Small Company Fund) | | | | |
| (Cost $111,695,979) - 140.99% | | | $ | 119,585,808 |
| Liabilities in Excess of Other Assets - (40.99)% | | | (34,765,983) |
|
|
| TOTAL NET ASSETS - 100.00% | | | $ | 84,819,825 |
|
|
| |
| |
| Small Company Growth Fund | | | |
| | | Shares or | | |
| | | Principal | | |
| | | Amount | | Value |
|
|
| |
| COMMON STOCKS - 98.72% | | | | |
| Advertising - 0.62% | | | | |
| ValueClick, Inc. * | | 22,690 | $ | 397,302 |
Apparel & Textiles - 2.70% | | | | |
| Joseph A. Bank Clothiers, Inc. * | | 17,473 | | 779,448 |
| Warnaco Group, Inc. * | | 21,627 | | 501,963 |
| Wolverine World Wide, Inc. | | 20,653 | | 455,605 |
|
|
| | | | | 1,737,016 |
| Banking - 2.82% | | | | |
| East West Bancorp, Inc. | | 12,014 | | 452,808 |
| PrivateBancorp, Inc. | | 7,593 | | 288,002 |
| SVB Financial Group * | | 9,891 | | 504,342 |
The accompanying notes are an integral part of the financial statements. 251
John Hancock Funds II
Portfolio of investments — February 28, 2006 (Unaudited)
(showing percentage of total net assets)
|
| Small Company Growth Fund (continued) | | |
| | Shares or | | |
| | Principal | | |
| | Amount | | Value |
|
|
| |
| COMMON STOCKS (continued) | | | |
| Banking (continued) | | | |
| Texas Capital Bancshares, Inc. * | 12,866 | $ | 277,648 |
| Texas Regional Bancshares, Inc., Class A | 9,344 | | 288,543 |
|
|
| | | | 1,811,343 |
Biotechnology - 3.64% | | | |
| Integra LifeSciences Holdings Corp. * | 15,324 | | 610,508 |
| MGI Pharma, Inc. * | 18,727 | | 330,157 |
| Millipore Corp. * | 7,769 | | 538,625 |
| Myriad Genetics, Inc. * | 16,543 | | 424,824 |
| Nektar Therapeutics * | 20,857 | | 436,120 |
|
|
| | | | 2,340,234 |
Building Materials & Construction - 1.49% | | | |
| Eagle Materials, Inc. | 17,700 | | 958,101 |
Business Services - 5.54% | | | |
| Corporate Executive Board Company | 6,472 | | 647,200 |
| CoStar Group, Inc. * | 10,608 | | 547,479 |
| Euronet Worldwide, Inc. * | 19,677 | | 689,876 |
| Global Payments, Inc. | 10,970 | | 571,098 |
| Jackson Hewitt Tax Service, Inc. | 79 | | 2,243 |
| Korn/Ferry International * | 26,282 | | 553,236 |
| MPS Group, Inc. * | 36,298 | | 549,552 |
|
|
| | | | 3,560,684 |
Chemicals - 1.04% | | | |
| Rockwood Holdings, Inc. * | 15,841 | | 362,759 |
| The Scotts Company, Class A | 6,384 | | 305,730 |
|
|
| | | | 668,489 |
Computers & Business Equipment - 2.15% | | | |
| Blue Coat Systems, Inc. * | 7,255 | | 154,024 |
| Kronos, Inc. * | 11,166 | | 457,918 |
| Merge Technologies, Inc. * | 16,395 | | 316,915 |
| Micros Systems, Inc. * | 10,515 | | 455,194 |
|
|
| | | | 1,384,051 |
Construction Materials - 1.59% | | | |
| JLG Industries, Inc. | 11,442 | | 674,964 |
| Regal-Beloit Corp. | 8,567 | | 344,736 |
|
|
| | | | 1,019,700 |
Crude Petroleum & Natural Gas - 1.70% | | | |
| Hydril * | 7,200 | | 484,848 |
| Unit Corp. * | 11,429 | | 607,680 |
|
|
| | | | 1,092,528 |
Domestic Oil - 2.07% | | | |
| Encore Aquisition Company * | 17,830 | | 546,311 |
| Range Resources Corp. | 19,220 | | 459,935 |
| Whiting Petroleum Corp. * | 7,988 | | 324,313 |
|
|
| | | | 1,330,559 |
Drugs & Health Care - 1.45% | | | |
| Immucor Corp. * | 13,866 | | 413,484 |
| Mentor Corp. | 12,077 | | 519,794 |
|
|
| | | | 933,278 |
| Small Company Growth Fund (continued) | | |
| | Shares or | | |
| | Principal | | |
| | Amount | | Value |
|
|
| |
| COMMON STOCKS (continued) | | | |
| Electrical Equipment - 2.77% | | | |
| FLIR Systems, Inc. * | 21,309 | $ | 550,625 |
| Varian, Inc. * | 14,467 | | 577,233 |
| Wesco International, Inc. * | 11,349 | | 650,525 |
|
|
| | | | 1,778,383 |
Electrical Utilities - 0.24% | | | |
| Pike Electric Corp. * | 8,180 | | 155,829 |
Electronics - 3.08% | | | |
| Mercury Computer Systems, Inc. * | 18,577 | | 320,267 |
| Orbotech, Ltd. ADR * | 12,796 | | 304,929 |
| Thomas & Betts Corp. * | 14,459 | | 711,383 |
| Trimble Navigation, Ltd. * | 15,669 | | 641,019 |
|
|
| | | | 1,977,598 |
Financial Services - 1.96% | | | |
| Affiliated Managers Group, Inc. * | 6,824 | | 671,686 |
| Jefferies Group, Inc. | 10,284 | | 586,600 |
|
|
| | | | 1,258,286 |
Healthcare Products - 5.06% | | | |
| American Medical Systems Holdings, Inc. * | 26,807 | | 580,908 |
| Cyberonics, Inc. * | 16,181 | | 439,638 |
| Gen-Probe, Inc. * | 13,084 | | 653,676 |
| Nuvasive, Inc. * | 30,121 | | 556,937 |
| ResMed, Inc. * | 13,753 | | 558,234 |
| Wright Medical Group, Inc. * | 23,887 | | 461,736 |
|
|
| | | | 3,251,129 |
Healthcare Services - 3.74% | | | |
| Cerner Corp. * | 12,604 | | 524,704 |
| Pediatrix Medical Group, Inc. * | 7,464 | | 704,452 |
| Per-Se Technologies, Inc. * | 22,629 | | 571,609 |
| The Advisory Board Company * | 11,182 | | 603,493 |
|
|
| | | | 2,404,258 |
| Holdings Companies/Conglomerates - 1.24% | | | |
| United Industrial Corp. | 15,450 | | 798,147 |
Hotels & Restaurants - 3.69% | | | |
| Applebee's International, Inc. | 13,562 | | 313,825 |
| Choice Hotels, Inc. | 10,365 | | 461,553 |
| Jack In the Box, Inc. * | 15,096 | | 603,840 |
| P.F. Chang's China Bistro, Inc. * | 12,172 | | 588,395 |
| RARE Hospitality International, Inc. * | 12,761 | | 408,352 |
|
|
| | | | 2,375,965 |
Household Appliances - 0.76% | | | |
| The Toro Company | 10,548 | | 486,579 |
Household Products - 1.43% | | | |
| Church & Dwight, Inc. | 13,048 | | 450,547 |
| Tempur-Pedic International, Inc. * | 39,831 | | 470,006 |
|
|
| | | | 920,553 |
Industrial Machinery - 2.22% | | | |
| Actuant Corp., Class A | 8,913 | | 491,106 |
| Ceradyne, Inc. * | 5,994 | | 364,915 |
The accompanying notes are an integral part of the financial statements. 252
John Hancock Funds II
Portfolio of investments — February 28, 2006 (Unaudited)
(showing percentage of total net assets)
|
| Small Company Growth Fund (continued) | | |
| | Shares or | | |
| | Principal | | |
| | Amount | | Value |
|
|
| |
| COMMON STOCKS (continued) | | | |
| Industrial Machinery (continued) | | | |
| FMC Technologies, Inc. * | 12,124 | $ | 568,858 |
|
|
| | | | 1,424,879 |
Insurance - 1.64% | | | |
| HCC Insurance Holdings, Inc. | 16,047 | | 516,553 |
| ProAssurance Corp. * | 10,429 | | 534,903 |
|
|
| | | | 1,051,456 |
Internet Content - 0.80% | | | |
| Digitas, Inc. * | 36,477 | | 515,420 |
Internet Software - 1.93% | | | |
| F5 Networks, Inc. * | 7,579 | | 514,008 |
| Safenet, Inc. * | 13,872 | | 345,690 |
| Sapient Corp. * | 50,458 | | 378,435 |
|
|
| | | | 1,238,133 |
Leisure Time - 0.73% | | | |
| RC2 Corp. * | 13,097 | | 471,885 |
Manufacturing - 0.47% | | | |
| Blout International, Inc. * | 18,560 | | 303,270 |
Medical-Hospitals - 2.17% | | | |
| AmSurg Corp. * | 14,316 | | 313,663 |
| Lifepoint Hospitals, Inc. * | 14,682 | | 456,023 |
| VCA Antech, Inc. * | 22,443 | | 627,282 |
|
|
| | | | 1,396,968 |
Mining - 0.81% | | | |
| Lincoln Electric Holding, Inc. | 11,320 | | 522,531 |
Petroleum Services - 4.05% | | | |
| Atwood Oceanics, Inc. * | 5,439 | | 490,489 |
| Core Laboratories NV * | 15,947 | | 731,170 |
| Grey Wolf, Inc. * | 59,286 | | 411,445 |
| Superior Energy Services, Inc. * | 19,601 | | 509,626 |
| Veritas DGC, Inc. * | 10,986 | | 462,840 |
|
|
| | | | 2,605,570 |
| Pharmaceuticals - 3.67% | | | |
| Alkermes, Inc. * | 20,379 | | 517,830 |
| Amylin Pharmaceuticals, Inc. * | 8,450 | | 366,561 |
| Encysive Pharmaceuticals, Inc. * | 29,599 | | 269,351 |
| First Horizon Pharmaceutical Corp. * | 22,747 | | 466,768 |
| NPS Pharmaceuticals, Inc. * | 15,287 | | 234,503 |
| United Therapeutics Corp. * | 8,214 | | 506,311 |
|
|
| | | | 2,361,324 |
Pollution Control - 1.02% | | | |
| Stericycle, Inc. * | 10,901 | | 658,966 |
Real Estate - 0.45% | | | |
| BioMed Realty Trust, Inc., REIT | 10,502 | | 290,695 |
Retail Grocery - 0.87% | | | |
| United Natural Foods, Inc. * | 16,873 | | 561,196 |
Retail Trade - 5.36% | | | |
| BJ's Wholesale Club, Inc. * | 15,358 | | 486,234 |
| Charlotte Russe Holding, Inc. * | 14,264 | | 259,605 |
| Small Company Growth Fund (continued) | | |
| | Shares or | | |
| | Principal | | |
| | Amount | | Value |
|
|
| |
| COMMON STOCKS (continued) | | | |
| Retail Trade (continued) | | | |
| Childrens Place Retail Stores, Inc. * | 11,840 | $ | 552,573 |
| Coldwater Creek, Inc. * | 23,263 | | 522,720 |
| Dicks Sporting Goods, Inc. * | 13,032 | | 493,913 |
| Guitar Center, Inc. * | 8,033 | | 415,788 |
| New York & Co., Inc. * | 11,616 | | 195,962 |
| Regis Corp. | 13,637 | | 522,024 |
|
|
| | | | 3,448,819 |
| Semiconductors - 6.49% | | | |
| Cirrus Logic, Inc. * | 47,614 | | 361,390 |
| Emulex Corp. * | 22,684 | | 403,775 |
| FormFactor, Inc. * | 20,400 | | 751,536 |
| Genesis Microchip, Inc. * | 14,418 | | 309,987 |
| Microsemi Corp. * | 29,495 | | 906,971 |
| Power Integrations, Inc. * | 18,041 | | 447,958 |
| Tessera Technologies, Inc. * | 17,226 | | 537,968 |
| Varian Semiconductor Equipment | | | |
| Associates, Inc. * | 9,659 | | 455,519 |
|
|
| | | | 4,175,104 |
Software - 4.30% | | | |
| Allscripts Healthcare Solution, Inc. * | 20,630 | | 386,813 |
| ANSYS, Inc. * | 10,912 | | 517,447 |
| Avid Technology, Inc. * | 8,247 | | 386,289 |
| Blackboard, Inc. * | 18,929 | | 545,344 |
| Epicor Software Corp. * | 33,742 | | 419,076 |
| MicroStrategy, Inc. * | 5,568 | | 510,474 |
|
|
| | | | 2,765,443 |
| Steel - 1.14% | | | |
| Carpenter Technology Corp. | 8,777 | | 733,670 |
Telecommunications Equipment & | | | |
| Services - 4.64% | | | |
| Aeroflex, Inc. * | 40,115 | | 521,495 |
| NETGEAR, Inc. * | 26,776 | | 459,476 |
| NeuStar, Inc., Class A * | 14,117 | | 406,569 |
| NICE Systems, Ltd. * | 6,484 | | 337,557 |
| Polycom, Inc. * | 27,423 | | 532,555 |
| SBA Communications Corp. * | 32,410 | | 728,901 |
|
|
| | | | 2,986,553 |
Toys, Amusements & Sporting Goods - 0.70% | | | |
| Marvel Entertainment, Inc. * | 24,320 | | 450,406 |
Transportation - 0.75% | | | |
| Kirby Corp. * | 7,824 | | 479,611 |
Trucking & Freight - 3.73% | | | |
| Forward Air Corp. | 11,644 | | 413,129 |
| Heartland Express, Inc. | 17,583 | | 406,695 |
| Knight Transportation, Inc. | 23,498 | | 465,026 |
| Old Dominion Freight Lines, Inc. * | 20,411 | | 538,034 |
| Swift Transportation, Inc. * | 24,286 | | 578,978 |
|
|
| | | | 2,401,862 |
|
| TOTAL COMMON STOCKS (Cost $56,331,793) | | $ | 63,483,773 |
|
| |
The accompanying notes are an integral part of the financial statements. 253
John Hancock Funds II
Portfolio of investments — February 28, 2006 (Unaudited)
(showing percentage of total net assets)
|
| Small Company Growth Fund (continued) | |
| | | Shares or | |
| | | Principal | |
| | | Amount | Value |
|
|
| |
| REPURCHASE AGREEMENTS - 1.53% | | |
| Repurchase Agreement with State | | | |
| Street Corp. dated 02/28/2006 at | | | |
| 4.25% to be repurchased at | | | |
| $980,116 on 03/01/2006, | | | |
| collateralized by $1,050,000 | | | |
| Federal National Mortgage | | | |
| Association, 3.25% due 2/15/2009 | | | |
| (valued at $1,003,490, including | | | |
| interest) (c) | $ | 980,000 | $ | 980,000 |
|
| TOTAL REPURCHASE AGREEMENTS | | | |
| (Cost $980,000) | | | $ | 980,000 |
|
| Total Investments (Small Company Growth Fund) | | |
| (Cost $57,311,793) - 100.25% | | | $ | 64,463,773 |
| Liabilities in Excess of Other Assets - (0.25)% | | (157,991) |
|
|
| TOTAL NET ASSETS - 100.00% | | | $ | 64,305,782 |
|
|
| |
| |
| Small Company Value Fund | | |
| | | Shares or | |
| | | Principal | |
| | | Amount | Value |
| |
|
| |
| COMMON STOCKS - 96.01% | | | |
| Aerospace - 1.15% | | | |
| EDO Corp. (a) | | 52,700 | $ | 1,535,151 |
| Woodward Governor Company | | 78,600 | 2,526,990 |
|
|
| | | | 4,062,141 |
Apparel & Textiles - 0.90% | | | |
| Culp, Inc. * (a) | | 40,000 | 198,000 |
| G & K Services, Class A (a) | | 76,100 | 2,975,510 |
|
|
| | | | 3,173,510 |
Auto Parts - 0.23% | | | |
| Accuride Corp. * (a) | | 71,000 | 803,720 |
Auto Services - 1.05% | | | |
| Dollar Thrifty Automotive Group, Inc. * (a) | 92,000 | 3,714,960 |
Banking - 6.74% | | | |
| Boston Private Financial Holdings, Inc. (a) | | 39,700 | 1,215,217 |
| East West Bancorp, Inc. (a) | | 138,000 | 5,201,220 |
| First Republic Bank (a) | | 141,500 | 5,135,035 |
| Netbank, Inc. (a) | | 126,000 | 938,700 |
| SVB Financial Group * (a) | | 109,000 | 5,557,910 |
| Texas Regional Bancshares, Inc., Class A (a) | 188,200 | 5,811,616 |
|
|
| | | | 23,859,698 |
| Biotechnology - 1.53% | | | |
| Exelixis, Inc. * (a) | | 137,700 | 1,495,422 |
| Lexicon Genetics, Inc. * (a) | | 150,000 | 615,000 |
| Myriad Genetics, Inc. * (a) | | 129,600 | 3,328,128 |
|
|
| | | | 5,438,550 |
| Broadcasting - 0.29% | | | |
| Saga Communications, Inc., Class A * (a) | | 109,400 | 1,036,018 |
Building Materials & Construction - 0.35% | | |
| ElkCorp. (a) | | 34,200 | 1,234,620 |
| Small Company Value Fund (continued) | | |
| | Shares or | | |
| | Principal | | |
| | Amount | | Value |
|
|
| |
| COMMON STOCKS (continued) | | | |
| Business Services - 4.28% | | | |
| Electro Rent Corp. * (a) | 119,500 | $ | 1,780,550 |
| FTI Consulting, Inc. * (a) | 99,300 | | 2,774,442 |
| McGrath Rentcorp (a) | 142,600 | | 3,924,352 |
| MPS Group, Inc. * (a) | 253,400 | | 3,836,476 |
| StarTek, Inc. (a) | 89,700 | | 1,767,090 |
| Wireless Facilities, Inc. * (a) | 243,700 | | 1,096,650 |
|
|
| | | | 15,179,560 |
| Chemicals - 2.57% | | | |
| Airgas, Inc. (a) | 106,100 | | 3,860,979 |
| Arch Chemicals, Inc. (a) | 89,500 | | 2,525,690 |
| MacDermid, Inc. (a) | 93,000 | | 2,736,060 |
|
|
| | | | 9,122,729 |
| Commercial Services - 0.22% | | | |
| Live Nation, Inc. * | 44,700 | | 797,895 |
Construction & Mining Equipment - 0.65% | | | |
| Carbo Ceramics, Inc. (a) | 42,200 | | 2,310,450 |
Construction Materials - 4.39% | | | |
| Ameron International Corp. (a) | 39,500 | | 2,346,300 |
| Florida Rock Industries, Inc. (a) | 83,337 | | 4,801,045 |
| JLG Industries, Inc. (a) | 142,700 | | 8,417,873 |
|
|
| | | | 15,565,218 |
| Crude Petroleum & Natural Gas - 1.48% | | | |
| Penn Virginia Corp. (a) | 84,700 | | 5,238,695 |
Domestic Oil - 3.74% | | | |
| Forest Oil Corp. * (a) | 97,000 | | 4,816,050 |
| TETRA Technologies, Inc. * (a) | 133,500 | | 5,019,600 |
| Union Drilling, Inc. * (a) | 27,600 | | 346,380 |
| Whiting Petroleum Corp. * (a) | 75,400 | | 3,061,240 |
|
|
| | | | 13,243,270 |
Drugs & Health Care - 1.99% | | | |
| Arrow International, Inc. (a) | 59,200 | | 1,831,648 |
| Diversa Corp. * (a) | 165,000 | | 1,305,150 |
| Landauer, Inc. (a) | 35,200 | | 1,619,200 |
| West Pharmaceutical Services, Inc. (a) | 71,500 | | 2,308,735 |
|
|
| | | | 7,064,733 |
Electrical Equipment - 1.90% | | | |
| C & D Technologies, Inc. (a) | 104,000 | | 888,160 |
| Genlyte Group, Inc. * (a) | 48,300 | | 2,988,804 |
| Littelfuse, Inc. * (a) | 73,444 | | 2,110,780 |
| Methode Electronics, Inc., Class A (a) | 61,800 | | 758,286 |
|
|
| | | | 6,746,030 |
Electrical Utilities - 2.25% | | | |
| Black Hills Corp. (a) | 72,600 | | 2,509,782 |
| Cleco Corp. | 88,400 | | 1,988,116 |
| El Paso Electric Company * (a) | 95,000 | | 1,942,750 |
| Otter Tail Corp. (a) | 37,300 | | 1,161,895 |
| Pike Electric Corp. * (a) | 19,100 | | 363,855 |
|
|
| | | | 7,966,398 |
The accompanying notes are an integral part of the financial statements. 254
John Hancock Funds II
Portfolio of investments — February 28, 2006 (Unaudited)
(showing percentage of total net assets)
|
| Small Company Value Fund (continued) | | |
| | Shares or | | |
| | Principal | | |
| | Amount | | Value |
|
|
| |
| COMMON STOCKS (continued) | | | |
| Electronics - 2.39% | | | |
| Analogic Corp. (a) | 22,200 | $ | 1,197,690 |
| Belden CDT, Inc. (a) | 102,450 | | 2,641,161 |
| Franklin Electric, Inc. (a) | 103,000 | | 4,619,550 |
|
|
| | | | 8,458,401 |
Financial Services - 0.39% | | | |
| American Capital Strategies, Ltd. (a) | 38,500 | | 1,374,450 |
Food & Beverages - 0.18% | | | |
| Centerplate, Inc. (a) | 50,600 | | 656,788 |
Forest Products - 0.87% | | | |
| Deltic Timber Corp. (a) | 58,800 | | 3,072,888 |
Furniture & Fixtures - 0.69% | | | |
| Stanley Furniture Company, Inc. (a) | 95,400 | | 2,432,700 |
Gas & Pipeline Utilities - 1.08% | | | |
| Southwest Gas Corp. (a) | 57,300 | | 1,634,196 |
| Valley National Gases, Inc. | 32,200 | | 697,130 |
| Vectren Corp. (a) | 57,100 | | 1,505,156 |
|
|
| | | | 3,836,482 |
| Gold - 0.70% | | | |
| Meridian Gold, Inc. * (a) | 97,400 | | 2,468,116 |
Healthcare Products - 1.26% | | | |
| Owens & Minor, Inc. (a) | 140,000 | | 4,464,600 |
Hotels & Restaurants - 1.58% | | | |
| RARE Hospitality International, Inc. * (a) | 130,250 | | 4,168,000 |
| Ruby Tuesday, Inc. (a) | 50,000 | | 1,427,500 |
|
|
| | | | 5,595,500 |
Industrial Machinery - 1.13% | | | |
| IDEX Corp. (a) | 84,450 | | 3,990,262 |
Insurance - 4.41% | | | |
| Markel Corp. * (a) | 9,200 | | 3,022,660 |
| Max Re Capital, Ltd. | 105,000 | | 2,563,050 |
| Midland Company (a) | 67,600 | | 2,276,092 |
| ProAssurance Corp. * | 118,600 | | 6,082,994 |
| Scottish Re Group, Ltd. (a) | 45,800 | | 1,145,000 |
| Triad Guaranty, Inc. * | 11,899 | | 540,096 |
|
|
| | | | 15,629,892 |
Internet Software - 0.59% | | | |
| RSA Security, Inc. * (a) | 143,300 | | 2,103,644 |
Investment Companies - 1.61% | | | |
| Allied Capital Corp. (a) | 90,800 | | 2,664,072 |
| First Financial Fund, Inc. (a) | 166,198 | | 2,690,746 |
| Hercules Technology Growth Capital, Inc. | 33,000 | | 356,400 |
|
|
| | | | 5,711,218 |
Leisure Time - 1.30% | | | |
| SCP Pool Corp. (a) | 106,000 | | 4,607,820 |
Life Sciences - 0.58% | | | |
| Symyx Technologies, Inc. * (a) | 71,000 | | 2,059,000 |
Manufacturing - 2.18% | | | |
| AptarGroup, Inc. | 68,400 | | 3,628,620 |
| Small Company Value Fund (continued) | | |
| | Shares or | | |
| | Principal | | |
| | Amount | | Value |
|
|
| |
| COMMON STOCKS (continued) | | | |
| Manufacturing (continued) | | | |
| Nordson Corp. | 82,000 | $ | 4,093,440 |
|
|
| | | | 7,722,060 |
Metal & Metal Products - 2.94% | | | |
| Gibraltar Industries, Inc. (a) | 123,100 | | 3,140,281 |
| Matthews International Corp., Class A (a) | 124,000 | | 4,605,360 |
| Metal Management, Inc. (a) | 94,200 | | 2,657,382 |
|
|
| | | | 10,403,023 |
Mobile Homes - 1.03% | | | |
| Skyline Corp. (a) | 47,000 | | 1,885,640 |
| Winnebago Industries, Inc. (a) | 55,500 | | 1,782,660 |
|
|
| | | | 3,668,300 |
Mutual Funds - 0.85% | | | |
| iShares Russell 2000 Index Fund (a) | 17,500 | | 1,270,150 |
| iShares Russell 2000 Value Index Fund (a) | 24,400 | | 1,740,696 |
|
|
| | | | 3,010,846 |
Newspapers - 0.39% | | | |
| Journal Register Company (a) | 106,500 | | 1,369,590 |
Paper - 0.66% | | | |
| Chesapeake Corp. (a) | 33,800 | | 445,822 |
| Wausau-Mosinee Paper Corp. (a) | 145,600 | | 1,892,800 |
|
|
| | | | 2,338,622 |
Petroleum Services - 2.89% | | | |
| Atwood Oceanics, Inc. * (a) | 29,200 | | 2,633,256 |
| Lone Star Technologies, Inc. * (a) | 40,300 | | 2,002,910 |
| TODCO * (a) | 98,800 | | 3,311,776 |
| W-H Energy Services, Inc. * (a) | 57,900 | | 2,287,050 |
|
|
| | | | 10,234,992 |
Pharmaceuticals - 0.11% | | | |
| Pharmion Corp. * | 22,800 | | 376,656 |
Publishing - 0.09% | | | |
| Courier Corp. (a) | 7,700 | | 303,919 |
Railroads & Equipment - 1.09% | | | |
| Genesee & Wyoming, Inc., Class A * | 84,500 | | 3,865,875 |
Real Estate - 6.67% | | | |
| Bedford Property Investments, Inc., REIT (a) | 71,000 | | 1,904,220 |
| Columbia Equity Trust, Inc., REIT (a) | 54,000 | | 933,120 |
| First Potomac Realty Trust, REIT | 92,200 | | 2,732,808 |
| Glenborough Realty Trust, Inc., REIT (a) | 56,000 | | 1,083,600 |
| Innkeepers USA Trust, REIT | 82,100 | | 1,439,213 |
| Kilroy Realty Corp., REIT (a) | 89,500 | | 6,696,390 |
| LaSalle Hotel Properties, REIT | 89,000 | | 3,555,550 |
| Strategic Hotel Cap, Inc., REIT (a) | 138,900 | | 3,000,240 |
| Washington REIT (a) | 68,500 | | 2,289,270 |
|
|
| | | | 23,634,411 |
Retail Grocery - 0.71% | | | |
| Nash-Finch Company (a) | 40,100 | | 1,243,100 |
| Wild Oats Markets, Inc. * (a) | 70,800 | | 1,270,860 |
|
|
| | | | 2,513,960 |
The accompanying notes are an integral part of the financial statements. 255
John Hancock Funds II
Portfolio of investments — February 28, 2006 (Unaudited)
(showing percentage of total net assets)
|
| Small Company Value Fund (continued) | | |
| | | Shares or | | |
| | | Principal | | |
| | | Amount | | Value |
| |
|
| |
| COMMON STOCKS (continued) | | | | |
| Retail Trade - 5.45% | | | | |
| Aaron Rents, Inc., Class A | | 5,350 | $ | 131,075 |
| Aaron Rents, Inc., Class B (a) | | 237,400 | | 6,219,880 |
| Casey's General Stores, Inc. (a) | | 122,600 | | 3,215,798 |
| CSS Industries, Inc. (a) | | 69,000 | | 2,125,200 |
| Fred's, Inc., Class A (a) | | 101,400 | | 1,416,558 |
| Hancock Fabrics, Inc. (a) | | 93,100 | | 386,365 |
| Haverty Furniture Companies, Inc. (a) | | 157,000 | | 2,237,250 |
| Stein Mart, Inc. (a) | | 215,000 | | 3,586,200 |
|
|
| | | | | 19,318,326 |
Sanitary Services - 2.49% | | | | |
| Casella Waste Systems, Inc., Class A * (a) | | 162,900 | | 2,305,035 |
| Insituform Technologies, Inc., Class A * (a) | 133,100 | | 3,581,721 |
| Synagro Technologies, Inc. (a) | | 99,900 | | 477,522 |
| Waste Connections, Inc. * (a) | | 66,700 | | 2,443,888 |
|
|
| | | | | 8,808,166 |
Semiconductors - 2.26% | | | | |
| ATMI, Inc. * (a) | | 62,100 | | 1,864,863 |
| Brooks Automation, Inc. * (a) | | 255,798 | | 4,013,471 |
| Entegris, Inc. * (a) | | 204,137 | | 2,135,273 |
|
|
| | | | | 8,013,607 |
Software - 3.38% | | | | |
| Packeteer, Inc. * (a) | | 136,200 | | 1,628,952 |
| Progress Software Corp. * (a) | | 110,000 | | 3,212,000 |
| SPSS, Inc. * (a) | | 96,400 | | 3,146,496 |
| Websense, Inc. * (a) | | 64,300 | | 3,974,383 |
|
|
| | | | | 11,961,831 |
Steel - 1.32% | | | | |
| Carpenter Technology Corp. (a) | | 56,000 | | 4,681,040 |
Telecommunications Equipment & | | | | |
| Services - 0.45% | | | | |
| Premiere Global Services, Inc. * (a) | | 192,600 | | 1,581,246 |
Tires & Rubber - 0.41% | | | | |
| Myers Indiana, Inc. (a) | | 89,800 | | 1,436,800 |
Tobacco - 0.14% | | | | |
| Alliance One International, Inc. (a) | | 108,000 | | 480,600 |
Transportation - 3.58% | | | | |
| Kirby Corp. * (a) | | 77,000 | | 4,720,100 |
| Macquarie Infrastructure Company Trust (a) | 73,300 | | 2,536,180 |
| UTI Worldwide, Inc. (a) | | 51,900 | | 5,430,297 |
|
|
| | | | | 12,686,577 |
Trucking & Freight - 2.45% | | | | |
| Landstar Systems, Inc. (a) | | 186,000 | | 8,665,740 |
|
| TOTAL COMMON STOCKS (Cost $297,698,856) | | $ | 340,096,143 |
|
| |
| SHORT TERM INVESTMENTS - 38.87% | | | |
| State Street Navigator Securities | | | | |
| Lending Prime Portfolio (c) | $ | 127,033,163 | $ | 127,033,163 |
| Small Company Value Fund (continued) | | |
| | | Shares or | | |
| | | Principal | | |
| | | Amount | | Value |
|
|
| |
| SHORT TERM INVESTMENTS (continued) | | | |
| T. Rowe Price Reserve Investment | | | | |
| Fund (c) | $ | 10,661,019 | $ | 10,661,019 |
|
| TOTAL SHORT TERM INVESTMENTS | | | | |
| (Cost $137,694,182) | | | $ | 137,694,182 |
|
| |
| REPURCHASE AGREEMENTS - 0.90% | | | | |
| Repurchase Agreement with State | | | | |
| Street Corp. dated 02/28/2006 at | | | | |
| 3.20% to be repurchased at | | | | |
| $3,178,282 on 03/01/2006, | | | | |
| collateralized by $3,315,000 | | | | |
| Federal Home Loan Bank, 3.625% | | | | |
| due 11/14/2008 (valued at | | | | |
| $3,244,556, including interest) (c) | $ | 3,178,000 | $ | 3,178,000 |
|
| TOTAL REPURCHASE AGREEMENTS | | | | |
| (Cost $3,178,000) | | | $ | 3,178,000 |
|
| Total Investments (Small Company Value Fund) | | | |
| (Cost $438,571,038) - 135.78% | | | $ | 480,968,325 |
| Liabilities in Excess of Other Assets - (35.78)% | | | (126,738,409) |
|
|
| TOTAL NET ASSETS - 100.00% | | | $ | 354,229,916 |
|
|
| |
| |
| Special Value Fund | | | | |
| | | Shares or | | |
| | | Principal | | |
| | | Amount | | Value |
|
|
| |
| COMMON STOCKS - 94.53% | | | | |
| Aerospace - 2.52% | | | | |
| DRS Technologies, Inc. (a) | | 18,612 | $ | 982,155 |
| HEICO Corp., Class A | | 34,201 | | 889,568 |
| Orbital Sciences Corp., Class A * (a) | | 61,505 | | 936,721 |
|
|
| | | | | 2,808,444 |
| Air Travel - 0.92% | | | | |
| Airtran Holdings, Inc. * (a) | | 31,500 | | 560,070 |
| SkyWest, Inc. (a) | | 16,153 | | 467,952 |
|
|
| | | | | 1,028,022 |
Apparel & Textiles - 0.98% | | | | |
| Timberland Company, Class A * | | 31,104 | | 1,090,195 |
Auto Parts - 0.78% | | | | |
| Lear Corp. (a) | | 41,478 | | 865,231 |
Banking - 11.42% | | | | |
| Amcore Financial, Inc. (a) | | 26,052 | | 779,215 |
| BancTrust Financial Group, Inc. (a) | | 17,451 | | 384,969 |
| Cascade Financial Corp. | | 5,869 | | 107,109 |
| Central Pacific Financial Corp. (a) | | 29,633 | | 1,096,421 |
| City Bank Lynnwood WA (a) | | 3,693 | | 156,288 |
| Cullen Frost Bankers, Inc. (a) | | 17,580 | | 969,010 |
| First Charter Corp. (a) | | 35,197 | | 862,678 |
| First Security Group, Inc. (a) | | 58,191 | | 621,480 |
| First State Bancorporation (a) | | 36,475 | | 941,784 |
| IBERIABANK Corp. (a) | | 6,852 | | 395,772 |
| Investors Financial Services Corp. (a) | | 12,500 | | 563,875 |
The accompanying notes are an integral part of the financial statements. 256
John Hancock Funds II
Portfolio of investments — February 28, 2006 (Unaudited)
(showing percentage of total net assets)
|
| Special Value Fund (continued) | | | |
| | Shares or | | |
| | Principal | | |
| | Amount | | Value |
|
|
| |
| COMMON STOCKS (continued) | | | |
| Banking (continued) | | | |
| Midwest Banc Holdings, Inc. (a) | 37,410 | $ | 961,437 |
| Pacific Capital Bancorp (a) | 32,098 | | 1,146,862 |
| Sterling Bancorp (a) | 18,402 | | 374,297 |
| Tompkins Trustco, Inc. (a) | 5,797 | | 270,546 |
| UCBH Holdings, Inc. (a) | 73,100 | | 1,308,490 |
| Umpqua Holdings Corp. (a) | 42,525 | | 1,145,198 |
| Webster Financial Corp. (a) | 13,653 | | 643,739 |
|
|
| | | | 12,729,170 |
Business Services - 5.30% | | | |
| Black Box Corp. | 21,244 | | 1,015,038 |
| John H. Harland Company | 17,847 | | 645,883 |
| Korn/Ferry International * (a) | 9,463 | | 199,196 |
| Labor Ready, Inc. * | 49,964 | | 1,227,615 |
| Perot Systems Corp., Class A * (a) | 73,454 | | 1,109,890 |
| Tech Data Corp. * | 13,409 | | 556,876 |
| Watson Wyatt & Company Holdings (a) | 37,773 | | 1,154,343 |
|
|
| | | | 5,908,841 |
Chemicals - 2.86% | | | |
| Cabot Microelectronics Corp. * (a) | 16,510 | | 563,321 |
| Georgia Gulf Corp. (a) | 22,300 | | 640,010 |
| Lyondell Chemical Company | 19,774 | | 413,672 |
| Olin Corp. (a) | 34,102 | | 716,483 |
| OM Group, Inc. * (a) | 40,200 | | 852,642 |
|
|
| | | | 3,186,128 |
Computers & Business Equipment - 0.27% | | | |
| Rimage Corp. * (a) | 13,890 | | 302,524 |
Construction & Mining Equipment - 1.17% | | | |
| National Oilwell, Inc. * | 21,467 | | 1,306,911 |
Construction Materials - 1.60% | | | |
| EMCOR Group, Inc. * | 29,634 | | 1,291,746 |
| Patrick Industries, Inc. * | 47,053 | | 494,057 |
|
|
| | | | 1,785,803 |
Containers & Glass - 1.32% | | | |
| Smurfit-Stone Container Corp. * | 112,535 | | 1,476,459 |
Cosmetics & Toiletries - 1.25% | | | |
| Steiner Leisure, Ltd. * (a) | 32,668 | | 1,392,637 |
Crude Petroleum & Natural Gas - 1.63% | | | |
| Newfield Exploration Company * | 9,484 | | 366,557 |
| Western Refining, Inc. | 20,600 | | 334,544 |
| XTO Energy, Inc. | 26,668 | | 1,117,122 |
|
|
| | | | 1,818,223 |
Domestic Oil - 1.19% | | | |
| Denbury Resources, Inc. * (a) | 46,830 | | 1,327,631 |
Educational Services - 0.67% | | | |
| Leapfrog Enterprises, Inc., Class A * | 64,357 | | 749,759 |
Electrical Equipment - 1.12% | | | |
| Tektronix, Inc. | 40,667 | | 1,252,544 |
Electrical Utilities - 0.20% | | | |
| MGE Energy, Inc. (a) | 6,705 | | 224,752 |
| Special Value Fund (continued) | | | |
| | Shares or | | |
| | Principal | | |
| | Amount | | Value |
|
|
| |
| COMMON STOCKS (continued) | | | |
| Electronics - 2.59% | | | |
| ATI Technologies, Inc. * (a) | 58,455 | $ | 928,265 |
| Bel Fuse, Inc., Class B (a) | 9,056 | | 299,844 |
| Mercury Computer Systems, Inc. * (a) | 55,015 | | 948,459 |
| Woodhead Industries, Inc. (a) | 48,780 | | 707,310 |
|
|
| | | | 2,883,878 |
Energy - 0.46% | | | |
| New Jersey Resources Corp. | 11,502 | | 517,590 |
Financial Services - 2.10% | | | |
| Financial Federal Corp. (a) | 24,716 | | 690,304 |
| Portfolio Recovery Associates, Inc. * (a) | 32,858 | | 1,607,085 |
| Thomas Weisel Partners Group Inc * (a) | 1,900 | | 40,603 |
|
|
| | | | 2,337,992 |
Food & Beverages - 1.41% | | | |
| Del Monte Foods Company | 133,761 | | 1,455,320 |
| Pilgrims Pride Corp. | 4,800 | | 110,688 |
|
|
| | | | 1,566,008 |
Furniture & Fixtures - 0.72% | | | |
| Furniture Brands International, Inc. (a) | 32,669 | | 807,578 |
Gas & Pipeline Utilities - 0.44% | | | |
| Northwest Natural Gas Company (a) | 14,289 | | 489,255 |
| Healthcare Services - 3.39% | | | |
| AMERIGROUP Corp. * (a) | 31,940 | | 683,197 |
| Apria Healthcare Group, Inc. * | 31,581 | | 726,047 |
| Cross Country Healthcare, Inc. * (a) | 55,505 | | 1,016,296 |
| MedQuist, Inc. * | 36,465 | | 510,510 |
| National Dentex Corp. * | 41,837 | | 836,740 |
|
|
| | | | 3,772,790 |
Hotels & Restaurants - 1.00% | | | |
| O'Charley's, Inc. * (a) | 62,891 | | 1,116,944 |
Industrial Machinery - 4.37% | | | |
| Albany International Corp., Class A (a) | 30,483 | | 1,133,053 |
| IDEX Corp. | 30,262 | | 1,429,880 |
| Kennametal, Inc. | 18,187 | | 1,063,576 |
| Sauer-Danfoss, Inc. (a) | 57,981 | | 1,243,692 |
|
|
| | | | 4,870,201 |
| Industrials - 2.44% | | | |
| Crane Company | 37,484 | | 1,442,759 |
| Harsco Corp. | 15,977 | | 1,274,645 |
|
|
| | | | 2,717,404 |
Insurance - 5.73% | | | |
| CNA Surety Corp. * (a) | 42,226 | | 733,888 |
| EMC Insurance Group, Inc. (a) | 44,800 | | 1,098,496 |
| Midland Company | 29,242 | | 984,578 |
| PMI Group, Inc. | 32,233 | | 1,395,689 |
| RLI Corp. (a) | 15,885 | | 837,457 |
| Triad Guaranty, Inc. * | 29,424 | | 1,335,556 |
|
|
| | | | 6,385,664 |
Internet Software - 0.31% | | | |
| McAfee, Inc. * | 14,762 | | 343,364 |
The accompanying notes are an integral part of the financial statements. 257
John Hancock Funds II
Portfolio of investments — February 28, 2006 (Unaudited)
(showing percentage of total net assets)
|
| Special Value Fund (continued) | | | |
| | Shares or | | |
| | Principal | | |
| | Amount | | Value |
|
|
| |
| COMMON STOCKS (continued) | | | |
| Leisure Time - 0.41% | | | |
| K2, Inc. * (a) | 40,132 | $ | 457,505 |
Manufacturing - 5.17% | | | |
| AptarGroup, Inc. | 18,627 | | 988,162 |
| Kaydon Corp. (a) | 34,627 | | 1,246,572 |
| Pentair, Inc. | 36,940 | | 1,483,141 |
| Roper Industries, Inc. | 30,668 | | 1,382,207 |
| Snap-on, Inc. | 17,055 | | 663,781 |
|
|
| | | | 5,763,863 |
Medical-Hospitals - 0.76% | | | |
| RehabCare Group, Inc. * | 42,167 | | 850,930 |
Metal & Metal Products - 2.70% | | | |
| Gibraltar Industries, Inc. | 43,919 | | 1,120,374 |
| Mueller Industries, Inc. | 23,102 | | 762,597 |
| Timken Company | 39,239 | | 1,125,374 |
|
|
| | | | 3,008,345 |
Mutual Funds - 6.07% | | | |
| iShares Nasdaq Biotechnology Index Fund * (a) | 13,950 | | 1,173,334 |
| iShares Russell 2000 Value Index Fund (a) | 78,323 | | 5,587,563 |
|
|
| | | | 6,760,897 |
Office Furnishings & Supplies - 1.85% | | | |
| IKON Office Solutions, Inc. (a) | 69,984 | | 920,290 |
| United Stationers, Inc. * | 23,071 | | 1,142,014 |
|
|
| | | | 2,062,304 |
Paper - 0.39% | | | |
| Pope & Talbot, Inc. (a) | 57,064 | | 431,975 |
Petroleum Services - 0.26% | | | |
| Superior Well Services, Inc. * (a) | 11,765 | | 288,831 |
Pharmaceuticals - 1.07% | | | |
| Bentley Pharmaceuticals, Inc. * (a) | 67,083 | | 1,195,419 |
Railroads & Equipment - 1.05% | | | |
| Wabtec Corp. (a) | 35,479 | | 1,171,871 |
Real Estate - 4.95% | | | |
| American Land Lease, Inc., REIT | 16,898 | | 450,839 |
| Cousins Properties, Inc., REIT (a) | 28,947 | | 887,804 |
| Duke Realty Corp., REIT | 12,109 | | 425,026 |
| Equity One, Inc., REIT | 24,429 | | 549,652 |
| Host Marriott Corp., REIT | 38,595 | | 749,901 |
| LaSalle Hotel Properties, REIT | 23,620 | | 943,619 |
| Liberty Property Trust, REIT | 10,696 | | 478,967 |
| Pan Pacific Retail Properties, Inc., REIT | 14,937 | | 1,033,790 |
|
|
| | | | 5,519,598 |
Retail Trade - 2.80% | | | |
| Cato Corp., Class A (a) | 60,568 | | 1,264,054 |
| Deb Shops, Inc. (a) | 15,825 | | 500,861 |
| Dillard's, Inc., Class A (a) | 28,271 | | 697,446 |
| The Buckle, Inc. (a) | 17,077 | | 653,195 |
|
|
| | | | 3,115,556 |
Semiconductors - 1.62% | | | |
| Exar Corp. * (a) | 49,883 | | 621,043 |
| Special Value Fund (continued) | | | |
| | | Shares or | | |
| | | Principal | | |
| | | Amount | | Value |
|
|
| |
| COMMON STOCKS (continued) | | | | |
| Semiconductors (continued) | | | | |
| Varian Semiconductor Equipment | | | | |
| Associates, Inc. * | | 25,043 | $ | 1,181,028 |
|
|
| | | | | 1,802,071 |
| |
Software - 2.06% | | | | |
| Dendrite International, Inc. * (a) | | 37,137 | | 493,922 |
| EPIQ Systems, Inc. * (a) | | 39,317 | | 863,794 |
| NetIQ Corp. * (a) | | 82,909 | | 936,872 |
|
|
| | | | | 2,294,588 |
| |
Tires & Rubber - 1.01% | | | | |
| Cooper Tire & Rubber Company (a) | | 75,690 | | 1,127,781 |
Transportation - 0.91% | | | | |
| Kirby Corp. * | | 16,569 | | 1,015,680 |
Travel Services - 0.29% | | | | |
| Pegasus Solutions, Inc. * (a) | | 35,001 | | 323,409 |
Trucking & Freight - 1.00% | | | | |
| Arkansas Best Corp. | | 26,803 | | 1,113,933 |
|
| TOTAL COMMON STOCKS (Cost $95,547,403) | | $ | 105,366,498 |
|
| |
| CORPORATE BONDS - 0.09% | | | | |
| Metal & Metal Products - 0.09% | | | | |
| Mueller Industries, Inc. | | | | |
| 6.00% due 11/01/2014 (a) | $ | 109,000 | | 102,460 |
|
| TOTAL CORPORATE BONDS (Cost $106,271) | | $ | 102,460 |
|
| |
| SHORT TERM INVESTMENTS - 35.74% | | | | |
| State Street Navigator Securities | | | | |
| Lending Prime Portfolio (c) | $ | 39,827,991 | $ | 39,827,991 |
|
| TOTAL SHORT TERM INVESTMENTS | | | | |
| (Cost $39,827,991) | | | $ | 39,827,991 |
|
| |
| REPURCHASE AGREEMENTS - 10.01% | | | | |
| Repurchase Agreement with State | | | | |
| Street Corp. dated 02/28/2006 at | | | | |
| 3.20% to be repurchased at | | | | |
| $11,157,992 on 03/01/2006, | | | | |
| collateralized by $12,035,000 | | | | |
| FNMA, 5.57% due 06/30/2028 | | | | |
| (valued at $11,384,051, including | | | | |
| interest) (c) | $ | 11,157,000 | $ | 11,157,000 |
|
| TOTAL REPURCHASE AGREEMENTS | | | | |
| (Cost $11,157,000) | | | $ | 11,157,000 |
|
| Total Investments (Special Value Fund) | | | | |
| (Cost $146,638,665) - 140.37% | | | $ | 156,453,949 |
| Liabilities in Excess of Other Assets - (40.37)% | | | (44,993,148) |
|
|
| TOTAL NET ASSETS - 100.00% | | | $ | 111,460,801 |
|
|
The accompanying notes are an integral part of the financial statements. 258
John Hancock Funds II
Portfolio of investments — February 28, 2006 (Unaudited)
(showing percentage of total net assets)
|
| Spectrum Income Fund | | | |
| | Shares or | | |
| | Principal | | |
| | Amount | | Value |
|
|
| |
| COMMON STOCKS - 17.82% | | | |
| Aerospace - 0.31% | | | |
| Lockheed Martin Corp. | 14,100 | $ | 1,027,467 |
| Raytheon Company | 22,900 | | 993,860 |
|
|
| | | | 2,021,327 |
Aluminum - 0.11% | | | |
| Alcoa, Inc. | 24,500 | | 718,340 |
Auto Parts - 0.11% | | | |
| Genuine Parts Company | 16,200 | | 721,224 |
Automobiles - 0.04% | | | |
| Ford Motor Company | 33,100 | | 263,807 |
Banking - 0.85% | | | |
| AmSouth Bancorp. | 390 | | 10,822 |
| Bank of America Corp. | 19,160 | | 878,486 |
| Bank of Ireland - London | 4,000 | | 71,243 |
| Bank of Ireland | 26,000 | | 463,388 |
| BB&T Corp. | 300 | | 11,859 |
| Citizens Banking Corp. | 300 | | 7,944 |
| Comerica, Inc. | 180 | | 10,318 |
| Fifth Third Bancorp. | 33,900 | | 1,310,235 |
| Mercantile Bankshares Corp. | 11,400 | | 435,480 |
| National City Corp. | 13,070 | | 454,836 |
| Northern Trust Corp. | 6,600 | | 347,952 |
| Regions Financial Corp. | 660 | | 22,955 |
| SunTrust Banks, Inc. | 12,900 | | 933,573 |
| US Bancorp | 2,530 | | 78,202 |
| Wells Fargo Company | 7,400 | | 475,080 |
|
|
| | | | 5,512,373 |
Biotechnology - 0.11% | | | |
| MedImmune, Inc. * | 19,200 | | 700,608 |
Broadcasting - 0.11% | | | |
| CBS Corp., Class B | 29,450 | | 720,347 |
Business Services - 0.05% | | | |
| Cendant Corp. | 17,800 | | 295,836 |
Cable and Television - 0.68% | | | |
| Cablevision Systems New York Group, | | | |
| Class A * | 10,300 | | 270,375 |
| Comcast Corp., Class A * | 39,600 | | 1,062,468 |
| EchoStar Communications Corp., Class A * | 14,400 | | 422,928 |
| Rogers Communications, Inc. | 5,875 | | 235,176 |
| Time Warner, Inc. | 85,100 | | 1,473,081 |
| Viacom, Inc. * | 23,850 | | 953,046 |
|
|
| | | | 4,417,074 |
Cellular Communications - 0.15% | | | |
| Motorola, Inc. | 33,400 | | 714,760 |
| Nextel Partners, Inc., Class A * | 9,850 | | 276,391 |
|
|
| | | | 991,151 |
Chemicals - 0.25% | | | |
| Chemtura Corp. | 19,300 | | 213,844 |
| E.I. Du Pont De Nemours & Company | 29,590 | | 1,190,702 |
| Spectrum Income Fund (continued) | | |
| | Shares or | | |
| | Principal | | |
| | Amount | | Value |
|
|
| |
| COMMON STOCKS (continued) | | | |
| Chemicals (continued) | | | |
| Hercules, Inc. * | 19,200 | $ | 227,520 |
|
|
| | | | 1,632,066 |
Computers & Business Equipment - 0.52% | | | |
| Cisco Systems, Inc. * | 44,200 | | 894,608 |
| Hewlett-Packard Company | 31,000 | | 1,017,110 |
| International Business Machines Corp. | 18,100 | | 1,452,344 |
|
|
| | | | 3,364,062 |
Construction Materials - 0.12% | | | |
| Vulcan Materials Company | 9,500 | | 750,500 |
Cosmetics & Toiletries - 0.60% | | | |
| Avon Products, Inc. | 29,900 | | 862,615 |
| Colgate-Palmolive Company | 26,600 | | 1,449,168 |
| International Flavors & Fragrances, Inc. | 24,500 | | 848,435 |
| Kimberly-Clark Corp. | 11,900 | | 704,242 |
|
|
| | | | 3,864,460 |
Crude Petroleum & Natural Gas - 0.52% | | | |
| Amerada Hess Corp. | 9,260 | | 1,280,751 |
| ChevronTexaco Corp. | 37,050 | | 2,092,584 |
|
|
| | | | 3,373,335 |
Domestic Oil - 0.05% | | | |
| Murphy Oil Corp. | 7,200 | | 337,464 |
Drugs & Health Care - 0.21% | | | |
| Wyeth | 27,000 | | 1,344,600 |
Electrical Equipment - 0.64% | | | |
| Cooper Industries, Ltd., Class A | 11,100 | | 929,070 |
| General Electric Company | 97,300 | | 3,198,251 |
|
|
| | | | 4,127,321 |
Electrical Utilities - 0.20% | | | |
| FirstEnergy Corp. | 14,640 | | 747,811 |
| Pinnacle West Capital Corp. | 8,400 | | 344,820 |
| TECO Energy, Inc. | 11,900 | | 203,014 |
|
|
| | | | 1,295,645 |
Electronics - 0.13% | | | |
| Sony Corp. | 18,000 | | 859,326 |
Energy - 0.43% | | | |
| Duke Energy Corp. | 44,740 | | 1,270,616 |
| Progress Energy, Inc. | 18,700 | | 829,906 |
| Xcel Energy, Inc. | 36,030 | | 668,717 |
|
|
| | | | 2,769,239 |
Financial Services - 1.47% | | | |
| Charles Schwab Corp. | 77,100 | | 1,249,791 |
| Citigroup, Inc. | 12,840 | | 595,391 |
| Federal National Mortgage Association | 11,000 | | 601,480 |
| Janus Capital Group, Inc. | 2,700 | | 59,211 |
| JPMorgan Chase & Company | 67,930 | | 2,794,640 |
| Mellon Financial Corp. | 37,200 | | 1,342,548 |
| Morgan Stanley | 27,100 | | 1,616,786 |
| State Street Corp. (c) | 19,500 | | 1,218,360 |
The accompanying notes are an integral part of the financial statements. 259
John Hancock Funds II
Portfolio of investments — February 28, 2006 (Unaudited)
(showing percentage of total net assets)
|
| Spectrum Income Fund (continued) | | |
| | Shares or | | |
| | Principal | | |
| | Amount | | Value |
|
|
| |
| COMMON STOCKS (continued) | | | |
| Financial Services (continued) | | | |
| Washington Mutual, Inc. | 240 | $ | 10,248 |
|
|
| | | | 9,488,455 |
Food & Beverages - 0.64% | | | |
| Campbell Soup Company | 26,900 | | 837,397 |
| General Mills, Inc. | 21,300 | | 1,049,025 |
| H.J. Heinz Company | 9,700 | | 367,339 |
| McCormick & Company, Inc. | 15,000 | | 492,450 |
| The Coca-Cola Company | 33,700 | | 1,414,389 |
|
|
| | | | 4,160,600 |
Gas & Pipeline Utilities - 0.20% | | | |
| NiSource, Inc. | 53,660 | | 1,101,640 |
| Williams Companies, Inc. | 9,695 | | 209,121 |
|
|
| | | | 1,310,761 |
Healthcare Products - 0.38% | | | |
| Baxter International, Inc. | 17,500 | | 662,375 |
| Boston Scientific Corp. * | 23,800 | | 581,196 |
| Johnson & Johnson | 21,000 | | 1,210,650 |
|
|
| | | | 2,454,221 |
Hotels & Restaurants - 0.09% | | | |
| McDonald's Corp. | 16,600 | | 579,506 |
Household Products - 0.28% | | | |
| Fortune Brands, Inc. | 8,900 | | 690,195 |
| Newell Rubbermaid, Inc. | 45,900 | | 1,141,533 |
|
|
| | | | 1,831,728 |
Industrial Machinery - 0.33% | | | |
| Deere & Company | 18,500 | | 1,410,995 |
| Pall Corp. | 24,500 | | 720,790 |
|
|
| | | | 2,131,785 |
Insurance - 1.02% | | | |
| American International Group, Inc. | 14,100 | | 935,676 |
| Chubb Corp. | 5,500 | | 526,625 |
| Lincoln National Corp. | 18,700 | | 1,061,599 |
| Marsh & McLennan Companies, Inc. | 61,900 | | 1,913,329 |
| SAFECO Corp. | 7,300 | | 376,023 |
| St. Paul Travelers Companies, Inc. | 22,800 | | 979,944 |
| UnumProvident Corp. | 37,800 | | 782,082 |
|
|
| | | | 6,575,278 |
International Oil - 0.40% | | | |
| Anadarko Petroleum Corp. | 9,400 | | 932,104 |
| Royal Dutch Shell PLC, ADR | 27,720 | | 1,676,506 |
|
|
| | | | 2,608,610 |
Leisure Time - 0.16% | | | |
| Walt Disney Company | 37,800 | | 1,058,022 |
Liquor - 0.21% | | | |
| Anheuser-Busch Companies, Inc. | 33,300 | | 1,383,282 |
| Manufacturing - 0.41% | | | |
| Eaton Corp. | 7,300 | | 508,591 |
| Honeywell International, Inc. | 41,200 | | 1,687,140 |
| Spectrum Income Fund (continued) | | |
| | Shares or | | |
| | Principal | | |
| | Amount | | Value |
|
|
| |
| COMMON STOCKS (continued) | | | |
| Manufacturing (continued) | | | |
| Tyco International, Ltd. | 17,100 | $ | 441,009 |
|
|
| | | | 2,636,740 |
Newspapers - 0.26% | | | |
| Dow Jones & Company, Inc. | 24,600 | | 999,990 |
| Knight-Ridder, Inc. | 11,400 | | 684,228 |
|
|
| | | | 1,684,218 |
Office Furnishings & Supplies - 0.16% | | | |
| Avery Dennison Corp. | 17,100 | | 1,026,000 |
Paper - 0.37% | | | |
| International Paper Company | 58,070 | | 1,902,954 |
| MeadWestvaco Corp. | 17,920 | | 498,534 |
|
|
| | | | 2,401,488 |
Petroleum Services - 0.60% | | | |
| BP PLC, SADR | 15,600 | | 1,036,152 |
| Exxon Mobil Corp. | 34,700 | | 2,060,139 |
| Schlumberger, Ltd. | 6,900 | | 793,500 |
|
|
| | | | 3,889,791 |
Pharmaceuticals - 0.96% | | | |
| Abbott Laboratories | 21,800 | | 963,124 |
| Bristol-Myers Squibb Company | 33,600 | | 776,160 |
| Eli Lilly & Company | 11,400 | | 634,068 |
| Merck & Company, Inc. | 50,140 | | 1,747,880 |
| Pfizer, Inc. | 56,715 | | 1,485,366 |
| Schering-Plough Corp. | 32,900 | | 608,650 |
|
|
| | | | 6,215,248 |
Photography - 0.15% | | | |
| Eastman Kodak Company | 33,600 | | 942,480 |
| Publishing - 0.39% | | | |
| The New York Times Company, Class A | 45,400 | | 1,281,188 |
| Tribune Company | 40,800 | | 1,248,480 |
|
|
| | | | 2,529,668 |
Railroads & Equipment - 0.42% | | | |
| Norfolk Southern Corp. | 16,500 | | 844,470 |
| Union Pacific Corp. | 21,400 | | 1,894,970 |
|
|
| | | | 2,739,440 |
Real Estate - 0.09% | | | |
| Equity Residential, REIT | 300 | | 13,584 |
| Simon Property Group, Inc., REIT | 5,600 | | 464,632 |
| Weingarten Realty Investors, REIT | 2,585 | | 101,797 |
|
|
| | | | 580,013 |
| Retail Grocery - 0.04% | | | |
| Sysco Corp. | 9,500 | | 285,855 |
Retail Trade - 0.38% | | | |
| Home Depot, Inc. | 14,900 | | 628,035 |
| RadioShack Corp. | 18,900 | | 369,495 |
| Wal-Mart Stores, Inc. | 31,400 | | 1,424,304 |
|
|
| | | | 2,421,834 |
Sanitary Services - 0.17% | | | |
| Synagro Technologies, Inc. | 26,900 | | 128,582 |
The accompanying notes are an integral part of the financial statements. 260
John Hancock Funds II
Portfolio of investments — February 28, 2006 (Unaudited)
(showing percentage of total net assets)
|
| Spectrum Income Fund (continued) | | |
| | | Shares or | | |
| | | Principal | | |
| | | Amount | | Value |
|
|
| |
| COMMON STOCKS (continued) | | | | |
| Sanitary Services (continued) | | | | |
| Waste Management, Inc. | | 30,000 | $ | 997,800 |
|
|
| | | | | 1,126,382 |
Semiconductors - 0.29% | | | | |
| Analog Devices, Inc. | | 21,800 | | 831,452 |
| Intel Corp. | | 27,100 | | 558,260 |
| Texas Instruments, Inc. | | 16,500 | | 492,525 |
|
|
| | | | | 1,882,237 |
Software - 0.24% | | | | |
| Microsoft Corp. | | 56,600 | | 1,522,540 |
lecommunications Equipment & | | | | |
| Services - 0.31% | | | | |
| Lucent Technologies, Inc. * | | 104,600 | | 292,880 |
| Nokia Oyj, SADR | | 49,300 | | 915,994 |
| Telus Corp., Non Voting Shares | | 15,205 | | 590,866 |
| Telus Corp. | | 4,300 | | 168,940 |
|
|
| | | | | 1,968,680 |
Telephone - 0.98% | | | | |
| ALLTEL Corp. | | 17,600 | | 1,111,440 |
| AT&T Corp. | | 68,235 | | 1,882,604 |
| Qwest Communications International, Inc. * | 172,900 | | 1,092,728 |
| Sprint Corp. | | 48,700 | | 1,170,261 |
| Verizon Communications, Inc. | | 31,100 | | 1,048,070 |
|
|
| | | | | 6,305,103 |
Tobacco - 0.08% | | | | |
| UST, Inc. | | 12,820 | | 498,441 |
Toys, Amusements & Sporting Goods - 0.15% | | | |
| Mattel, Inc. | | 58,100 | | 978,985 |
|
| TOTAL COMMON STOCKS (Cost $107,743,249) | | $ | 115,297,496 |
|
| |
| PREFERRED STOCKS - 0.14% | | | | |
| Broadcasting - 0.05% | | | | |
| Spanish Broadcasting System, Series B * | | 300 | | 324,000 |
Energy - 0.02% | | | | |
| NRG Energy, Inc. * | | 100 | | 121,175 |
Telecommunications Equipment & | | | | |
| Services - 0.07% | | | | |
| Lucent Technologies Capital Trust I * | | 475 | | 457,781 |
|
| TOTAL PREFERRED STOCKS (Cost $924,484) | | $ | 902,956 |
|
| |
| U.S. TREASURY OBLIGATIONS - 6.92% | | | |
| Treasury Inflation Protected | | | | |
| Securities (d) - 0.92% | | | | |
| 0.875% due 04/15/2010 | $ | 1,626,899 | | 1,559,726 |
| 1.875% due 07/15/2013 | | 267,958 | | 266,251 |
| 2.00% due 07/15/2014 to 01/15/2026 | | 1,878,225 | | 1,881,236 |
| 2.375% due 01/15/2025 | | 780,129 | | 829,193 |
| 3.375% due 01/15/2007 | | 621,255 | | 631,423 |
| 3.50% due 01/15/2011 | | 93,879 | | 100,813 |
| 3.625% due 01/15/2008 | | 700,649 | | 725,446 |
|
|
| | | | | 5,994,088 |
| Spectrum Income Fund (continued) | | |
| | | Shares or | | |
| | | Principal | | |
| | | Amount | | Value |
|
|
| |
| U.S. TREASURY OBLIGATIONS | | | | |
| (continued) | | | | |
| U.S. Treasury Bonds - 3.04% | | | | |
| 4.50% due 02/15/2036 | $ | 200,000 | $ | 199,891 |
| 5.375% due 02/15/2031 | | 2,320,000 | | 2,582,541 |
| 5.50% due 08/15/2028 | | 290,000 | | 323,327 |
| 6.00% due 02/15/2026 | | 1,316,000 | | 1,538,178 |
| 6.125% due 08/15/2029 | | 437,000 | | 527,592 |
| 6.25% due 08/15/2023 to 05/15/2030 | | 3,028,000 | | 3,644,266 |
| 6.375% due 08/15/2027 | | 55,000 | | 67,500 |
| 6.50% due 11/15/2026 | | 800,000 | | 990,594 |
| 7.125% due 02/15/2023 | | 1,411,000 | | 1,805,915 |
| 7.50% due 11/15/2016 | | 980,000 | | 1,213,477 |
| 7.625% due 02/15/2025 | | 1,706,000 | | 2,327,757 |
| 7.875% due 02/15/2021 | | 631,000 | | 843,420 |
| 8.00% due 11/15/2021 | | 270,000 | | 367,854 |
| 8.50% due 02/15/2020 | | 880,000 | | 1,218,525 |
| 8.875% due 02/15/2019 | | 1,450,000 | | 2,033,342 |
|
|
| | | | | 19,684,179 |
| U.S. Treasury Notes - 2.86% | | | | |
| zero coupon due 05/26/2006 | | 38,000 | | 9,500 |
| 2.50% due 05/31/2006 | | 3,000,000 | | 2,984,064 |
| 3.125% due 01/31/2007 | | 216,000 | | 212,912 |
| 3.50% due 05/31/2007 | | 235,000 | | 231,530 |
| 3.50% due 11/15/2006 *** | | 1,000,000 | | 991,406 |
| 3.875% due 02/15/2013 | | 130,000 | | 124,328 |
| 4.00% due 03/15/2010 to 02/15/2015 | | 995,000 | | 965,020 |
| 4.125% due 05/15/2015 | | 1,350,000 | | 1,303,225 |
| 4.25% due 08/15/2013 to 11/15/2014 | | 5,140,000 | | 5,016,432 |
| 4.75% due 05/15/2014 | | 2,025,000 | | 2,043,271 |
| 4.875% due 02/15/2012 | | 2,845,000 | | 2,883,342 |
| 5.00% due 08/15/2011 | | 850,000 | | 866,037 |
| 5.75% due 08/15/2010 | | 820,000 | | 857,124 |
|
|
| | | | | 18,488,191 |
| U.S. Treasury Strips - 0.10% | | | | |
| zero coupon due 05/15/2020 | | 1,250,000 | | 640,747 |
|
| TOTAL U.S. TREASURY OBLIGATIONS | | | | |
| (Cost $44,302,259) | | | $ | 44,807,205 |
|
| |
| U.S. GOVERNMENT AGENCY OBLIGATIONS - 20.98% | | |
| Federal Farm Credit Bank - 0.10% | | | | |
| 1.875% due 01/16/2007 | | 640,000 | | 623,410 |
| Federal Home Loan Bank - 0.18% | | | | |
| 3.00% due 04/15/2009 | | 600,000 | | 566,762 |
| 5.25% due 06/18/2014 | | 590,000 | | 603,734 |
|
|
| | | | | 1,170,496 |
| Federal Home Loan Mortgage Corp. - 2.67% | | | |
| 2.75% due 03/15/2008 | | 650,000 | | 623,055 |
| 4.00% due 12/15/2009 | | 425,000 | | 411,919 |
| 4.50% due 10/01/2007 to 09/01/2035 | | 2,080,550 | | 1,995,045 |
| 4.522% due 09/01/2032 | | 72,456 | | 72,048 |
| 4.545% due 09/01/2035 | | 346,079 | | 336,957 |
| 4.72% due 08/01/2035 | | 503,095 | | 490,864 |
| 5.00% due 01/01/2009 to 11/01/2035 | | 7,297,757 | | 7,115,183 |
The accompanying notes are an integral part of the financial statements. 261
John Hancock Funds II
Portfolio of investments — February 28, 2006 (Unaudited)
(showing percentage of total net assets)
|
| Spectrum Income Fund (continued) | | |
| | | Shares or | | |
| | | Principal | | |
| | | Amount | | Value |
|
|
| |
| U.S. GOVERNMENT AGENCY | | | | |
| OBLIGATIONS (continued) | | | | |
| Federal Home Loan Mortgage Corp. | | | | |
| (continued) | | | | |
| 5.055% due 11/01/2035 | $ | 275,948 | $ | 272,102 |
| 5.125% due 07/15/2012 | | 1,960,000 | | 1,979,237 |
| 5.428% due 01/01/2036 | | 138,979 | | 138,377 |
| 5.50% due 03/01/2018 to 04/01/2029 | | 1,741,419 | | 1,748,953 |
| 6.00% due 11/01/2011 to 12/01/2033 | | 338,618 | | 343,696 |
| 6.50% due 05/01/2017 to 01/01/2036 | | 1,583,721 | | 1,621,210 |
| 7.00% due 02/01/2024 to 06/01/2032 | | 93,898 | | 97,121 |
| 7.50% due 05/01/2024 to 06/01/2024 | | 6,366 | | 6,684 |
| 10.50% due 05/01/2019 | | 1,161 | | 1,196 |
|
|
| | | | | 17,253,647 |
Federal National Mortgage | | | | |
| Association - 5.71% | | | | |
| 2.50% due 06/15/2006 | | 215,000 | | 213,554 |
| 3.25% due 08/15/2008 | | 325,000 | | 312,595 |
| 3.55% due 11/15/2007 | | 1,100,000 | | 1,075,197 |
| 3.825% due 10/01/2033 | | 228,389 | | 222,727 |
| 4.026% due 07/01/2027 | | 2,683 | | 2,680 |
| 4.25% due 07/15/2007 | | 780,000 | | 773,007 |
| 4.375% due 09/15/2012 | | 410,000 | | 398,540 |
| 4.50% due 05/01/2018 to 07/01/2035 | | 4,052,180 | | 3,914,517 |
| 4.5955% due 02/17/2009 (b) | | 260,000 | | 255,759 |
| 4.625% due 10/15/2014 | | 780,000 | | 766,571 |
| 4.694% due 09/01/2035 | | 606,215 | | 591,626 |
| 5.00% due 01/01/2009 to 09/01/2035 | | 2,194,257 | | 2,155,766 |
| 5.319% due 12/01/2035 | | 233,757 | | 232,308 |
| 5.376% due 12/01/2035 | | 290,925 | | 289,840 |
| 5.455% due 01/01/2019 | | 2,229 | | 2,244 |
| 5.50% due 07/01/2013 to 12/01/2034 | | 11,320,905 | | 11,280,498 |
| 5.544% due 12/01/2035 | | 453,859 | | 452,984 |
| 5.685% due 12/01/2035 | | 149,580 | | 150,111 |
| 5.715% due 01/01/2036 | | 1,024,558 | | 1,031,168 |
| 5.75% due 02/15/2008 | | 580,000 | | 589,056 |
| 6.00% due 04/01/2014 to 01/01/2036 | | 8,735,938 | | 8,833,038 |
| 6.50% due 06/01/2013 to 07/01/2032 | | 1,310,782 | | 1,344,815 |
| 7.00% due 12/01/2029 to 02/01/2030 | | 3,766 | | 3,902 |
| 7.125% due 06/15/2010 to 01/15/2030 | | 1,840,000 | | 2,090,154 |
|
|
| | | | | 36,982,657 |
Government National Mortgage | | | | |
| Association - 12.32% | | | | |
| 4.00% due 09/15/2018 | | 886,778 | | 847,665 |
| 4.50% due 09/15/2018 to 11/15/2035 | | 3,690,206 | | 3,535,859 |
| 5.00% due 02/15/2018 to 12/01/2099 | | 19,994,742 | | 19,686,707 |
| 5.50% due 01/15/2018 to 08/15/2035 | | 17,560,205 | | 17,616,032 |
| 5.50% TBA ** | | 3,095,076 | | 3,101,761 |
| 6.00% due 05/15/2013 to 12/01/2099 | | 15,294,617 | | 15,592,396 |
| 6.00% TBA ** | | 4,573,012 | | 4,659,051 |
| 6.50% due 07/15/2009 to 12/01/2099 | | 8,374,642 | | 8,690,211 |
| 6.50% TBA ** | | 1,065,443 | | 1,100,567 |
| 6.75% due 02/15/2041 | | 318,284 | | 328,501 |
| 7.00% due 09/15/2012 to 12/15/2034 | | 2,849,490 | | 2,974,299 |
| 7.50% due 09/15/2012 to 06/15/2032 | | 589,226 | | 619,767 |
| Spectrum Income Fund (continued) | | |
| | | Shares or | | |
| | | Principal | | |
| | | Amount | | Value |
|
|
| |
| U.S. GOVERNMENT AGENCY | | | | |
| OBLIGATIONS (continued) | | | | |
| Government National Mortgage | | | | |
| Association (continued) | | | | |
| 8.00% due 08/15/2007 to 06/20/2029 | $ | 459,934 | $ | 492,032 |
| 8.50% due 07/15/2008 to 02/15/2027 | | 122,614 | | 131,896 |
| 9.00% due 03/15/2009 to 05/15/2024 | | 73,585 | | 79,321 |
| 9.25% due 10/15/2016 to 12/15/2019 | | 8,183 | | 8,904 |
| 9.50% due 06/15/2009 to 12/15/2024 | | 22,734 | | 24,739 |
| 9.75% due 09/15/2016 to 02/15/2021 | | 5,553 | | 6,082 |
| 10.00% due 02/15/2016 to 03/15/2026 | | 91,317 | | 100,845 |
| 10.25% due 05/15/2020 to 11/15/2020 | | 4,908 | | 5,421 |
| 10.50% due 09/15/2015 to 07/15/2019 | | 11,250 | | 12,486 |
| 11.00% due 12/15/2009 to 07/20/2020 | | 44,149 | | 47,898 |
| 11.50% due 03/15/2010 to 11/15/2019 | | 22,927 | | 25,107 |
| 11.75% due 08/15/2013 | | 1,724 | | 1,928 |
| 12.00% due 10/15/2010 to 06/15/2015 | | 19,409 | | 21,733 |
| 12.25% due 03/15/2014 to 07/20/2015 | | 1,662 | | 1,823 |
| 12.50% due 04/15/2010 to 07/15/2015 | | 7,869 | | 8,638 |
| 12.75% due 12/20/2013 to 12/20/2014 | | 1,870 | | 2,057 |
| 13.00% due 01/15/2011 to 09/20/2015 | | 6,533 | | 7,253 |
| 13.50% due 05/15/2010 to 01/15/2015 | | 4,655 | | 5,194 |
|
|
| | | | | 79,736,173 |
|
| TOTAL U.S. GOVERNMENT AGENCY OBLIGATIONS | | |
| (Cost $135,528,263) | | | $ | 135,766,383 |
|
| |
| FOREIGN GOVERNMENT OBLIGATIONS - 10.58% | | |
| Argentina - 0.19% | | | | |
| Republic of Argentina | | | | |
| zero coupon, Step up to 2.5% on | | | | |
| 03/31/2009 due 12/31/2038 | | 225,000 | | 90,225 |
| 0.63%, Step up to 1.18% on | | | | |
| 03/31/2009 due 12/31/2038 (b) | ARS | 700,000 | | 123,881 |
| .34% due 12/15/2035 (b) | | 1,466,445 | | 29,792 |
| 4.50% due 12/15/2035 (b) | $ | 425,000 | | 32,300 |
| 4.889% due 08/03/2012 (b) | | 825,000 | | 676,912 |
| City of Buenos Aires | | | | |
| 7.875% due 04/11/2011 | | 300,000 | | 301,410 |
|
|
| | | | | 1,254,520 |
Australia - 0.23% | | | | |
| Commonwealth of Australia | | | | |
| 8.00% due 03/01/2008 | AUD | 170,000 | | 132,302 |
| Queensland Treasury Corp., Series 15G | | | | |
| 6.00% due 10/14/2015 | | 1,790,000 | | 1,385,758 |
|
|
| | | | | 1,518,060 |
Austria - 0.23% | | | | |
| Republic of Austria | | | | |
| 5.50% due 01/15/2010 | EUR | 568,000 | | 732,395 |
| 5.875% due 07/15/2006 | | 546,000 | | 658,319 |
| 6.25% due 07/15/2027 | | 49,000 | | 79,819 |
|
|
| | | | | 1,470,533 |
Belgium - 0.27% | | | | |
| Kingdom of Belgium | | | | |
| 4.25% due 09/28/2013 | | 484,000 | | 608,026 |
| 5.00% due 03/28/2035 | | 260,000 | | 376,578 |
The accompanying notes are an integral part of the financial statements. 262
John Hancock Funds II
Portfolio of investments — February 28, 2006 (Unaudited)
(showing percentage of total net assets)
|
| Spectrum Income Fund (continued) | | |
| | | Shares or | | |
| | | Principal | | |
| | | Amount | | Value |
|
|
| |
| FOREIGN GOVERNMENT OBLIGATIONS | | | |
| (continued) | | | | |
| Belgium (continued) | | | | |
| Kingdom of Belgium (continued) | | | | |
| 6.25% due 03/28/2007 | EUR | 246,000 | $ | 303,464 |
| 7.00% due 05/15/2006 | | 394,000 | | 473,749 |
|
|
| | | | | 1,761,817 |
Brazil - 0.52% | | | | |
| Federative Republic of Brazil | | | | |
| 6.00% due 05/15/2009 | BRL | 535,000 | | 238,434 |
| 6.00% due 08/15/2010 | | 130,000 | | 54,555 |
| 6.00% due 05/15/2045 | | 150,000 | | 90,631 |
| 6.00% due 08/15/2024 | | 145,000 | | 90,749 |
| 7.875% due 03/07/2015 | $ | 50,000 | | 55,900 |
| 8.00% due 01/15/2018 | | 795,000 | | 890,003 |
| 8.75% due 02/04/2025 | | 375,000 | | 452,813 |
| 8.875% due 10/14/2019 | | 150,000 | | 180,750 |
| 10.125% due 05/15/2027 | | 425,000 | | 583,312 |
| 11.00% due 08/17/2040 | | 275,000 | | 364,788 |
| 12.50% due 01/05/2016 | BRL | 350,000 | | 172,399 |
| 14.50% due 10/15/2009 | $ | 150,000 | | 195,375 |
|
|
| | | | | 3,369,709 |
Canada - 0.54% | | | | |
| Government of Canada | | | | |
| 4.00% due 09/01/2010 | CAD | 1,975,000 | | 1,730,121 |
| 5.00% due 06/01/2014 | | 645,000 | | 600,473 |
| 5.75% due 06/01/2033 | | 195,000 | | 215,511 |
| Province of British Columbia | | | | |
| 5.70% due 06/18/2029 | | 190,000 | | 193,392 |
| Province of Ontario | | | | |
| 5.00% due 03/08/2014 | | 367,000 | | 336,160 |
| Province of Quebec | | | | |
| 9.375% due 01/16/2023 | | 186,000 | | 250,389 |
| Province of Ontario | | | | |
| 6.375% due 10/12/2010 | NZD | 220,000 | | 143,967 |
|
|
| | | | | 3,470,013 |
Colombia - 0.06% | | | | |
| Republic of Colombia | | | | |
| 10.75% due 01/15/2013 | $ | 165,000 | | 211,200 |
| 11.75% due 02/25/2020 | | 100,000 | | 149,750 |
|
|
| | | | | 360,950 |
Denmark - 0.10% | | | | |
| Kingdom of Denmark | | | | |
| 5.00% due 11/15/2013 | DKK | 1,077,000 | | 190,124 |
| 7.00% due 11/10/2024 | | 364,000 | | 83,415 |
| 8.00% due 03/15/2006 | | 2,330,000 | | 372,943 |
|
|
| | | | | 646,482 |
Finland - 0.03% | | | | |
| Republic of Finland | | | | |
| 5.00% due 07/04/2007 | EUR | 136,000 | | 166,569 |
France - 0.68% | | | | |
| Government of France | | | | |
| 2.25% due 03/12/2006 | | 910,000 | | 1,084,744 |
| 4.00% due 10/25/2014 | | 655,000 | | 811,426 |
| 5.00% due 10/25/2016 | | 227,000 | | 305,629 |
| Spectrum Income Fund (continued) | |
| | | Shares or | |
| | | Principal | |
| | | Amount | Value |
|
|
| |
| FOREIGN GOVERNMENT OBLIGATIONS | | |
| (continued) | | | |
| France (continued) | | | |
| Government of France (continued) | | | |
| 5.50% due 04/25/2029 | EUR | 637,000 | $ | 965,500 |
| 5.75% due 10/25/2032 | | 767,000 | 1,218,976 |
|
|
| | | | 4,386,275 |
Germany - 1.61% | | | |
| Federal Republic of Germany | | | |
| 2.00% due 03/10/2006 | | 910,000 | 1,084,733 |
| 3.25% due 07/04/2015 | | 1,874,000 | 2,195,016 |
| 4.25% due 01/04/2014 | | 672,000 | 845,328 |
| 4.50% due 01/04/2013 | | 1,900,000 | 2,415,538 |
| 4.75% due 07/04/2028 | | 264,000 | 362,063 |
| 4.75% due 07/04/2034 | | 625,000 | 876,520 |
| 5.50% due 01/04/2031 | | 679,000 | 1,039,050 |
| 6.00% due 07/04/2007 | | 1,308,000 | 1,620,869 |
|
|
| | | | 10,439,117 |
Greece - 0.01% | | | |
| Republic of Greece | | | |
| 4.60% due 05/20/2013 | | 70,000 | 88,943 |
| Indonesia - 0.12% | | | |
| Republic of Indonesia | | | |
| 7.50% due 01/15/2016 | $ | 425,000 | 442,000 |
| 7.50% due 01/15/2016 | | 100,000 | 104,750 |
| 8.50% due 10/12/2035 | | 175,000 | 198,625 |
|
|
| | | | 745,375 |
Iraq - 0.08% | | | |
| Republic of Iraq, Series REGS | | | |
| 5.80% due 01/15/2028 | | 750,000 | 535,312 |
Ireland - 0.06% | | | |
| Republic of Ireland | | | |
| 4.00% due 04/18/2010 | EUR | 96,000 | 117,807 |
| 5.00% due 04/18/2013 | | 185,000 | 242,889 |
|
|
| | | | 360,696 |
Israel - 0.19% | | | |
| Israel Government Bond - Shahar, Series 2682 | | |
| 7.50% due 03/31/2014 | ILS | 5,135,000 | 1,242,296 |
Italy - 0.78% | | | |
| Republic of Italy | | | |
| 4.25% due 08/01/2014 | EUR | 427,000 | 532,996 |
| 4.75% due 03/15/2006 | | 1,900,000 | 2,266,744 |
| 5.00% due 10/15/2007 | | 332,000 | 407,598 |
| 6.00% due 11/01/2007 | | 1,025,000 | 1,279,692 |
| 6.00% due 05/01/2031 | | 271,000 | 423,727 |
| 7.25% due 11/01/2026 | | 75,000 | 130,594 |
| Lottomatica SpA/pre-Newgames SpA merger | | |
| 4.80% due 12/22/2008 | | 30,000 | 36,451 |
|
|
| | | | 5,077,802 |
Jamaica - 0.10% | | | |
| Government of Jamaica | | | |
| 9.00% due 06/02/2015 | $ | 215,000 | 230,050 |
| 10.625% due 06/20/2017 | | 350,000 | 407,750 |
|
|
| | | | 637,800 |
The accompanying notes are an integral part of the financial statements. 263
John Hancock Funds II
Portfolio of investments — February 28, 2006 (Unaudited)
(showing percentage of total net assets)
|
| Spectrum Income Fund (continued) | | |
| | | Shares or | | |
| | | Principal | | |
| | | Amount | | Value |
|
|
| |
| FOREIGN GOVERNMENT OBLIGATIONS | | | |
| (continued) | | | | |
| Japan - 1.58% | | | | |
| Government of Japan | | | | |
| 0.50% due 06/20/2008 | JPY | 352,150,000 | $ | 3,036,063 |
| 0.80% due 09/20/2010 | | 146,800,000 | | 1,253,746 |
| 0.80% due 12/10/2015 | | 83,000,000 | | 719,138 |
| 1.00% due 12/20/2012 | | 114,850,000 | | 968,889 |
| 1.10% due 09/20/2012 | | 67,450,000 | | 573,984 |
| 1.30% due 12/20/2013 | | 138,400,000 | | 1,180,192 |
| 1.50% due 03/20/2015 | | 89,400,000 | | 768,943 |
| 1.90% due 03/20/2025 | | 90,500,000 | | 772,758 |
| 2.00% due 06/20/2022 | | 55,200,000 | | 486,000 |
| 2.00% due 12/20/2033 | | 36,600,000 | | 301,272 |
| 2.20% due 06/22/2020 | | 18,000,000 | | 163,625 |
|
|
| | | | | 10,224,610 |
| Lebanon - 0.04% | | | | |
| Republic of Lebanon | | | | |
| 8.50% due 01/19/2016 | $ | 245,000 | | 263,987 |
Malaysia - 0.03% | | | | |
| Malaysia Government Bond, Series 4/05 | | | | |
| 3.756% due 04/28/2011 | MYR | 781,000 | | 210,082 |
Mexico - 0.83% | | | | |
| Government of Mexico | | | | |
| 4.625% due 10/08/2008 | $ | 415,000 | | 410,020 |
| 6.375% due 01/16/2013 | | 190,000 | | 200,070 |
| 6.625% due 03/03/2015 | | 295,000 | | 319,338 |
| 7.50% due 04/08/2033 | | 65,000 | | 78,975 |
| 8.00% due 12/24/2008 | MXN | 1,175,000 | | 113,593 |
| 8.00% due 12/28/2006 | | 1,750,000 | | 168,428 |
| 8.00% due 12/19/2013 | | 4,600,000 | | 443,650 |
| 8.125% due 12/30/2019 | $ | 285,000 | | 352,687 |
| 9.00% due 12/22/2011 | MXN | 29,800,000 | | 3,013,179 |
| 9.50% due 12/18/2014 | | 2,424,000 | | 254,930 |
|
|
| | | | | 5,354,870 |
| Netherlands - 0.07% | | | | |
| Kingdom of Netherlands | | | | |
| 5.00% due 07/15/2011 | EUR | 188,000 | | 242,704 |
| 5.50% due 01/15/2028 | | 137,000 | | 205,735 |
|
|
| | | | | 448,439 |
Panama - 0.03% | | | | |
| Republic of Panama | | | | |
| 6.70% due 01/26/2036 | $ | 163,000 | | 165,445 |
Peru - 0.05% | | | | |
| Republic of Peru | | | | |
| 8.375% due 05/03/2016 | | 275,000 | | 319,000 |
Philippines - 0.11% | | | | |
| Republic of Philippines | | | | |
| 9.50% due 02/02/2030 | | 200,000 | | 239,500 |
| 9.875% due 01/15/2019 | | 200,000 | | 241,000 |
| 10.625% due 03/16/2025 | | 175,000 | | 227,062 |
|
|
| | | | | 707,562 |
| Spectrum Income Fund (continued) | |
| | | Shares or | |
| | | Principal | |
| | | Amount | Value |
|
|
| |
| FOREIGN GOVERNMENT OBLIGATIONS | | |
| (continued) | | | |
| Poland - 0.06% | | | |
| Republic of Poland, Series 0509 | | | |
| 6.00% due 05/24/2009 | PLN | 1,220,000 $ | 404,196 |
Portugal - 0.18% | | | |
| Republic of Portugal | | | |
| 3.00% due 07/17/2006 | EUR | 849,000 | 1,013,440 |
| 5.15% due 06/15/2011 | | 118,000 | 152,485 |
|
|
| | | | 1,165,925 |
| |
Russia - 0.20% | | | |
| Russian Federation | | | |
| 5.00% due 03/31/2030 | $ | 1,150,000 | 1,298,810 |
Serbia - 0.19% | | | |
| Republic of Serbia | | | |
| zero coupon, Step up to 6.75% on | | | |
| 11/01/2009 due 11/01/2024 | | 1,324,000 | 1,220,728 |
South Africa - 0.14% | | | |
| Republic of South Africa | | | |
| 6.50% due 06/02/2014 | | 365,000 | 393,744 |
| Republic of South Africa, Series R153 | | | |
| 13.00% due 08/31/2010 | ZAR | 2,486,000 | 491,658 |
|
|
| | | | 885,402 |
| |
Spain - 0.24% | | | |
| Kingdom of Spain | | | |
| 4.00% due 01/31/2010 | EUR | 46,000 | 56,397 |
| 5.75% due 07/30/2032 | | 127,000 | 201,569 |
| 6.00% due 01/31/2008 | | 1,037,000 | 1,303,435 |
|
|
| | | | 1,561,401 |
| |
Sweden - 0.10% | | | |
| Kingdom of Sweden | | | |
| 5.00% due 01/28/2009 | SEK | 5,000,000 | 667,828 |
Turkey - 0.39% | | | |
| Republic of Turkey | | | |
| 7.375% due 02/05/2025 | $ | 265,000 | 282,888 |
| 15.00% due 02/10/2010 | TRY | 605,000 | 507,927 |
| 20.00% due 10/17/2007 | | 1,200,000 | 1,068,656 |
| Republic of Turkey | | | |
| 6.875% due 03/17/2036 | $ | 625,000 | 634,375 |
|
|
| | | | 2,493,846 |
| |
Ukraine - 0.02% | | | |
| Republic of Ukraine | | | |
| 7.65% due 06/11/2013 | | 100,000 | 107,580 |
United Kingdom - 0.30% | | | |
| Government of United Kingdom | | | |
| 4.25% due 06/07/2032 | GBP | 1,050,000 | 1,948,960 |
Uruguay - 0.03% | | | |
| Republic of Uruguay | | | |
| 9.25% due 05/17/2017 | $ | 150,000 | 178,125 |
Venezuela - 0.11% | | | |
| Republic of Venezuela | | | |
| 7.65% due 04/21/2025 | | 130,000 | 141,700 |
| 9.25% due 09/15/2027 | | 225,000 | 289,125 |
The accompanying notes are an integral part of the financial statements. 264
John Hancock Funds II
Portfolio of investments — February 28, 2006 (Unaudited)
(showing percentage of total net assets)
|
| Spectrum Income Fund (continued) | |
| | | Shares or | |
| | | Principal | |
| | | Amount | Value |
|
|
| |
| FOREIGN GOVERNMENT OBLIGATIONS | | |
| (continued) | | | |
| Venezuela (continued) | | | |
| Republic of Venezuela (continued) | | | |
| 13.625% due 08/15/2018 | $ | 200,000 | $ | 311,000 |
|
|
| | | | 741,825 |
Vietnam - 0.08% | | | |
| Socialist Republic of Vietnam | | | |
| 6.875% due 01/15/2016 | | 525,000 | 542,996 |
|
| TOTAL FOREIGN GOVERNMENT OBLIGATIONS | |
| (Cost $67,446,842) | | $ | 68,443,886 |
|
| |
| CORPORATE BONDS - 27.46% | | | |
| Advertising - 0.39% | | | |
| Advanstar Communications, Inc. | | | |
| 10.75% due 08/15/2010 | | 200,000 | 219,000 |
| 12.00% due 02/15/2011 | | 175,000 | 183,750 |
| Advanstar Communications, Inc., Series B | | | |
| 15.00% due 10/15/2011 | | 200,000 | 209,500 |
| Lamar Advertising Company | | | |
| 2.875% due 12/31/2010 | | 275,000 | 311,105 |
| R H Donnelley Finance Corp. | | | |
| 8.875% due 01/15/2016 | | 1,175,000 | 1,224,937 |
| 10.875% due 12/15/2012 | | 350,000 | 393,750 |
|
|
| | | | 2,542,042 |
Aerospace - 0.33% | | | |
| Aviall, Inc. | | | |
| 7.625% due 07/01/2011 | | 225,000 | 232,312 |
| BE Aerospace, Inc. | | | |
| 8.50% due 10/01/2010 | | 75,000 | 80,625 |
| BE Aerospace, Inc., Series B | | | |
| 8.875% due 05/01/2011 | | 250,000 | 261,875 |
| Boeing Company | | | |
| 8.75% due 08/15/2021 | | 55,000 | 74,295 |
| GenCorp, Inc. | | | |
| 9.50% due 08/15/2013 | | 550,000 | 596,750 |
| Moog, Inc. | | | |
| 6.25% due 01/15/2015 | | 225,000 | 222,750 |
| Northrop Grumman Corp. | | | |
| 7.125% due 02/15/2011 | | 50,000 | 53,806 |
| 7.75% due 03/01/2016 | | 35,000 | 41,317 |
| Rolls-Royce Group PLC, EMTN | | | |
| 4.50% due 03/16/2011 | EUR | 26,000 | 32,127 |
| Sequa Corp. | | | |
| 9.00% due 08/01/2009 | $ | 25,000 | 26,937 |
| TransDigm, Inc. | | | |
| 8.375% due 07/15/2011 | | 150,000 | 156,750 |
| United Technologies Corp. | | | |
| 5.40% due 05/01/2035 | | 190,000 | 189,385 |
| Vought Aircraft Industries, Inc. | | | |
| 8.00% due 07/15/2011 | | 200,000 | 187,500 |
|
|
| | | | 2,156,429 |
Agriculture - 0.21% | | | |
| Bunge, Ltd. | | | |
| 4.375% due 12/15/2008 | | 365,000 | 355,791 |
| Spectrum Income Fund (continued) | |
| | | Shares or | |
| | | Principal | |
| | | Amount | Value |
|
|
| |
| CORPORATE BONDS (continued) | | | |
| Agriculture (continued) | | | |
| Cargill, Inc. | | | |
| 6.25% due 05/01/2006 | $ | 140,000 | $ | 140,310 |
| Case New Holland, Inc. | | | |
| 9.25% due 08/01/2011 | | 325,000 | 348,563 |
| Phosphate Resource Partners LP | | | |
| 7.00% due 02/15/2008 | | 100,000 | 96,500 |
| Terra Capital, Inc. | | | |
| 11.50% due 06/01/2010 | | 150,000 | 167,250 |
| United Agri Products, Inc. | | | |
| 8.25% due 12/15/2011 | | 225,000 | 237,375 |
|
|
| | | | 1,345,789 |
| |
Air Travel - 0.01% | | | |
| Air Jamaica, Ltd., Series REGS | | | |
| 9.375% due 07/08/2015 | | 75,000 | 78,469 |
Aluminum - 0.05% | | | |
| Alcoa, Inc. | | | |
| 4.25% due 08/15/2007 | | 55,000 | 54,290 |
| Century Aluminum Company | | | |
| 7.50% due 08/15/2014 | | 250,000 | 260,000 |
|
|
| | | | 314,290 |
| |
Amusement & Theme Parks - 0.06% | | | |
| Universal City Development Partners | | | |
| 11.75% due 04/01/2010 | | 375,000 | 417,656 |
Apparel & Textiles - 0.29% | | | |
| Broder Brothers, Series B | | | |
| 11.25% due 10/15/2010 | | 225,000 | 224,437 |
| Collins & Aikman Floorcoverings, Inc. | | | |
| 9.75% due 02/15/2010 | | 250,000 | 236,250 |
| INVISTA | | | |
| 9.25% due 05/01/2012 | | 925,000 | 982,813 |
| Jones Apparel Group, Inc. | | | |
| 7.875% due 06/15/2006 | | 55,000 | 55,295 |
| Quiksilver, Inc. | | | |
| 6.875% due 04/15/2015 | | 50,000 | 48,250 |
| Rafaella Apparel Group, Inc. | | | |
| 11.25% due 06/15/2011 | | 300,000 | 298,500 |
|
|
| | | | 1,845,545 |
| |
Auto Parts - 0.17% | | | |
| Accuride Corp. | | | |
| 8.50% due 02/01/2015 | | 250,000 | 248,750 |
| Autocam Corp. | | | |
| 10.875% due 06/15/2014 | | 150,000 | 102,375 |
| Commercial Vehicle Group Inc | | | |
| 8.00% due 07/01/2013 | | 50,000 | 49,750 |
| Rexnord Corp. | | | |
| 10.125% due 12/15/2012 | | 525,000 | 577,500 |
| Visteon Corp. | | | |
| 7.00% due 03/10/2014 | | 175,000 | 129,938 |
|
|
| | | | 1,108,313 |
| |
Auto Services - 0.04% | | | |
| Adesa, Inc. | | | |
| 7.625% due 06/15/2012 | | 250,000 | 253,750 |
The accompanying notes are an integral part of the financial statements. 265
John Hancock Funds II
Portfolio of investments — February 28, 2006 (Unaudited)
(showing percentage of total net assets)
|
| Spectrum Income Fund (continued) | |
| | | Shares or | |
| | | Principal | |
| | | Amount | Value |
|
|
| |
| CORPORATE BONDS (continued) | | | |
| Automobiles - 0.36% | | | |
| DaimlerChrysler NA Holding Corp. | | | |
| 4.05% due 06/04/2008 | $ | 60,000 $ | 58,250 |
| 4.75% due 01/15/2008 | | 110,000 | 108,659 |
| 6.50% due 11/15/2013 | | 230,000 | 237,737 |
| 7.30% due 01/15/2012 | | 40,000 | 42,908 |
| 8.50% due 01/18/2031 | | 60,000 | 73,151 |
| DaimlerChrysler NA Holding Corp., Series D, MTN | | |
| 4.96% due 09/10/2007 (b) | | 70,000 | 70,209 |
| ERAC USA Finance Company | | | |
| 5.60% due 05/01/2015 | | 240,000 | 238,306 |
| Hertz Corp., Class A | | | |
| 8.875% due 01/01/2014 | | 675,000 | 705,375 |
| 10.50% due 01/01/2016 | | 725,000 | 781,187 |
|
|
| | | | 2,315,782 |
Banking - 1.41% | | | |
| Australia & New Zealand Banking Group, | | | |
| Ltd., EMTN | | | |
| 4.45% due 02/05/2015 (b) | EUR | 39,000 | 48,063 |
| BAC Capital Trust VI | | | |
| 5.625% due 03/08/2035 | $ | 335,000 | 329,427 |
| Banca Intesa SpA, EMTN | | | |
| 5.85% due 05/08/2014 (b) | EUR | 52,000 | 66,333 |
| Banca Monte dei Paschi di Siena SpA, EMTN | | |
| 4.50% due 09/24/2015 (b) | | 60,000 | 73,726 |
| Bank Nederlandse Gemeenten, EMTN | | | |
| 4.00% due 07/15/2014 | | 45,000 | 55,170 |
| Bank of America Corp. | | | |
| 5.25% due 02/01/2007 | $ | 150,000 | 150,211 |
| Bank of Ireland | | | |
| 6.45% due 02/10/2010 | EUR | 49,000 | 64,758 |
| Bank One Corp. | | | |
| 5.25% due 01/30/2013 | $ | 200,000 | 198,724 |
| Banknorth Capital Trust I, Series B | | | |
| 10.52% due 05/01/2027 | | 25,000 | 27,490 |
| Banque du Liban, Series ECD | | | |
| 10.00% due 04/25/2015 | | 300,000 | 353,250 |
| Barclays Bank PLC, EMTN | | | |
| 5.75% due 03/08/2011 | EUR | 36,000 | 47,161 |
| BB&T Corp. | | | |
| 6.50% due 08/01/2011 | $ | 290,000 | 307,869 |
| BNP Paribas, EMTN | | | |
| 5.25% due 12/17/2012 | EUR | 36,000 | 46,971 |
| Colonial Bank, N.A. | | | |
| 9.375% due 06/01/2011 | $ | 185,000 | 212,773 |
| Credit Suisse Group Finance Guernsey, Ltd. | | | |
| 6.375% due 06/07/2013 | EUR | 51,000 | 71,027 |
| Deutsche Bank AG | | | |
| 5.125% due 01/31/2013 | | 52,000 | 67,120 |
| European Investment Bank | | | |
| 6.75% due 11/17/2008 | NZD | 215,000 | 143,412 |
| Greenpoint Capital Trust I | | | |
| 9.10% due 06/01/2027 | $ | 25,000 | 27,081 |
| HBOS PLC | | | |
| 3.125% due 01/12/2007 | | 170,000 | 167,258 |
| Spectrum Income Fund (continued) | |
| | | Shares or | |
| | | Principal | |
| | | Amount | Value |
|
|
| |
| CORPORATE BONDS (continued) | | | |
| Banking (continued) | | | |
| HBOS PLC, EMTN | | | |
| 4.375% due 10/30/2019 (b) | EUR | 54,000 $ | 66,829 |
| HBOS PLC, MTN | | | |
| 6.00% due 11/01/2033 | $ | 170,000 | 180,063 |
| HSBC Bank PLC | | | |
| 7.625% due 06/15/2006 | | 95,000 | 95,680 |
| HSBC Bank PLC, EMTN | | | |
| 4.25% due 03/18/2016 (b) | EUR | 61,000 | 74,848 |
| HSBC Holdings PLC, Series 2018 | | | |
| 9.875% due 04/08/2018 | GBP | 40,000 | 90,799 |
| Hudson United Bancorp | | | |
| 8.20% due 09/15/2006 | $ | 20,000 | 20,287 |
| Huntington National Bank, BKNT | | | |
| 4.375% due 01/15/2010 | | 220,000 | 213,154 |
| Independence Community Bank Corp. | | | |
| 3.75% due 04/01/2014 (b) | | 15,000 | 14,298 |
| ING Bank NV, EMTN | | | |
| 5.50% due 01/04/2012 | EUR | 36,000 | 47,030 |
| Islandsbanki HF | | | |
| 4.76% due 10/15/2008 (b) | $ | 200,000 | 200,092 |
| Keybank NA | | | |
| 5.80% due 07/01/2014 | | 40,000 | 41,104 |
| Keybank NA, Series BKNT | | | |
| 4.412% due 03/18/2008 | | 55,000 | 54,477 |
| KeyCorp, MTN, Series G | | | |
| 4.70% due 05/21/2009 | | 45,000 | 44,444 |
| KfW Bankengruppe, EMTN | | | |
| 4.75% due 12/07/2010 | GBP | 524,000 | 926,621 |
| Kreditanstalt fuer Wiederaufbau | | | |
| 6.375% due 02/17/2015 | NZD | 1,415,000 | 1,414,012 |
| Kreditanstalt fuer Wiederaufbau, EMTN | | | |
| 6.50% due 11/15/2011 | | 530,000 | 351,612 |
| Kreditanstalt fuer Wiederaufbau, Series EXCH | | |
| 5.50% due 12/07/2015 | GBP | 140,000 | 264,859 |
| Landwirtschaftliche Rentenbank, Series 7 | | | |
| 3.75% due 06/15/2009 | $ | 110,000 | 106,087 |
| Marshall & Ilsley Bank, BKNT | | | |
| 3.80% due 02/08/2008 | | 110,000 | 107,397 |
| 4.125% due 09/04/2007 | | 50,000 | 49,296 |
| Nordea Bank Finland PLC, EMTN | | | |
| 5.75% due 03/26/2014 (b) | EUR | 52,000 | 65,997 |
| Northern Rock PLC, EMTN | | | |
| 5.75% due 02/28/2017 | GBP | 49,000 | 89,259 |
| Northern Trust Company, BKNT | | | |
| 4.60% due 02/01/2013 | $ | 120,000 | 116,149 |
| Rabobank Nederland, EMTN | | | |
| 3.125% due 07/19/2010 | EUR | 75,000 | 88,363 |
| Regions Bank, BKNT | | | |
| 2.90% due 12/15/2006 | $ | 120,000 | 118,045 |
| Royal Bank of Scotland PLC, EMTN | | | |
| zero coupon, Step up to 6.935% on | | | |
| 09/08/2014 due 06/29/2049 (b) | GBP | 49,000 | 91,819 |
| Sanpaolo IMI SpA, EMTN | | | |
| 3.75% due 06/09/2015 (b) | EUR | 64,000 | 76,711 |
| Standard Chartered Bank, EMTN | | | |
| 3.625% due 02/03/2017 (b) | | 64,000 | 75,710 |
The accompanying notes are an integral part of the financial statements. 266
John Hancock Funds II
Portfolio of investments — February 28, 2006 (Unaudited)
(showing percentage of total net assets)
|
| Spectrum Income Fund (continued) | |
| | | Shares or | |
| | | Principal | |
| | | Amount | Value |
|
|
| |
| CORPORATE BONDS (continued) | | | |
| Banking (continued) | | | |
| Sumitomo Mitsui Banking Corp. | | | |
| 5.625% due 07/29/2049 (b) | $ | 200,000 | $ | 197,629 |
| Suncorp-Metway, Ltd. | | | |
| 4.625% due 06/15/2013 | | 30,000 | 28,629 |
| Svensk Exportkredit AB | | | |
| 2.875% due 01/26/2007 | | 130,000 | 127,899 |
| Svenska Handelsbanken, EMTN | | | |
| 6.125% due 03/29/2049 (b) | GBP | 49,000 | 88,786 |
| US Bancorp, MTN, Series P | | | |
| 4.50% due 07/29/2010 | $ | 190,000 | 185,131 |
| Wachovia Corp. | | | |
| 4.66% due 07/20/2007 (b) | | 65,000 | 65,079 |
| 5.50% due 08/01/2035 | | 110,000 | 106,114 |
| 6.40% due 04/01/2008 | | 90,000 | 92,359 |
| Webster Capital Trust II, Series B | | | |
| 10.00% due 04/01/2027 | | 35,000 | 37,980 |
| Webster Financial Corp. | | | |
| 5.125% due 04/15/2014 | | 200,000 | 194,366 |
| Wells Fargo & Company | | | |
| 4.20% due 01/15/2010 | | 205,000 | 198,264 |
| 4.5638% due 03/23/2007 (b) | | 230,000 | 230,184 |
| Westpac Banking Corp. | | | |
| 2.875% due 06/25/2008 | EUR | 21,000 | 24,831 |
|
|
| | | | 9,120,117 |
| Biotechnology - 0.07% | | | |
| Amgen, Inc. | | | |
| 4.00% due 11/18/2009 | $ | 130,000 | 125,073 |
| Genentech, Inc. | | | |
| 4.40% due 07/15/2010 | | 125,000 | 121,606 |
| 4.75% due 07/15/2015 | | 205,000 | 197,627 |
|
|
| | | | 444,306 |
| Broadcasting - 0.64% | | | |
| Allbritton Communications Company | | | |
| 7.75% due 12/15/2012 | | 350,000 | 352,187 |
| CanWest Media, Inc. | | | |
| 8.00% due 09/15/2012 | | 425,000 | 435,625 |
| Charter Communications Operating LLC | | | |
| 8.00% due 04/30/2012 | | 775,000 | 780,813 |
| CSC Holdings, Inc. | | | |
| 7.25% due 07/15/2008 | | 425,000 | 430,313 |
| Fisher Communications, Inc. | | | |
| 8.625% due 09/15/2014 | | 225,000 | 236,531 |
| Gray Television, Inc. | | | |
| 9.25% due 12/15/2011 | | 375,000 | 398,906 |
| Liberty Media Corp. | | | |
| 5.991% due 09/17/2006 (b) | | 35,000 | 35,159 |
| News America, Inc. | | | |
| 6.20% due 12/15/2034 | | 370,000 | 366,038 |
| 6.40% due 12/15/2035 | | 220,000 | 221,381 |
| 7.375% due 10/17/2008 | | 125,000 | 130,760 |
| Sirius Satellite Radio, Inc. | | | |
| 9.625% due 08/01/2013 | | 250,000 | 245,000 |
| Viacom, Inc. | | | |
| 5.625% due 05/01/2007 | | 190,000 | 190,299 |
| Spectrum Income Fund (continued) | |
| | | Shares or | |
| | | Principal | |
| | | Amount | Value |
|
|
| |
| CORPORATE BONDS (continued) | | | |
| Broadcasting (continued) | | | |
| Vivendi Universal SA | | | |
| 3.875% due 02/15/2012 | EUR | 27,000 | $ | 31,985 |
| XM Satellite Radio Holdings, Inc. | | | |
| 12.00% due 06/15/2010 | $ | 175,000 | 195,563 |
| 14 due 12/31/2009 | | 100,000 | 107,250 |
|
|
| | | | 4,157,810 |
Building Materials & Construction - 0.22% | | |
| Ainsworth Lumber Company, Ltd. | | | |
| 7.25% due 10/01/2012 | | 75,000 | 70,125 |
| Brand Services, Inc. | | | |
| 12.00% due 10/15/2012 | | 350,000 | 371,875 |
| Building Materials Corporation of America | | | |
| 7.75% due 08/01/2014 | | 350,000 | 346,500 |
| CRH America, Inc. | | | |
| 6.40% due 10/15/2033 | | 65,000 | 69,029 |
| Dycom Industries, Inc. | | | |
| 8.125% due 10/15/2015 | | 200,000 | 208,000 |
| Texas Industries, Inc. | | | |
| 7.25% due 07/15/2013 | | 375,000 | 388,125 |
|
|
| | | | 1,453,654 |
Buildings - 0.05% | | | |
| D.R. Horton, Inc. | | | |
| 4.875% due 01/15/2010 | | 280,000 | 270,833 |
| 5.625% due 09/15/2014 | | 40,000 | 38,296 |
|
|
| | | | 309,129 |
Business Services - 0.69% | | | |
| Affinity Group, Inc. | | | |
| 9.00% due 02/15/2012 | | 350,000 | 350,000 |
| 10.875% due 02/15/2012 | | 105,438 | 99,111 |
| FTI Consulting, Inc. | | | |
| 7.625% due 06/15/2013 | | 250,000 | 261,875 |
| GTECH Holdings Corp. | | | |
| 4.50% due 12/01/2009 | | 250,000 | 245,935 |
| 4.75% due 10/15/2010 | | 30,000 | 29,632 |
| Insurance Auto Auctions, Inc. | | | |
| 11.00% due 04/01/2013 | | 250,000 | 260,625 |
| Invensys PLC | | | |
| 9.875% due 03/15/2011 | | 275,000 | 284,625 |
| Nebraska Book Company, Inc. | | | |
| 8.625% due 03/15/2012 | | 350,000 | 329,000 |
| Quintiles Transnational Corp. | | | |
| 10.00% due 10/01/2013 | | 275,000 | 305,250 |
| SunGard Data Systems, Inc. | | | |
| 9.125% due 08/15/2013 | | 1,073,000 | 1,141,404 |
| 10.25% due 08/15/2015 | | 438,000 | 459,353 |
| Universal Compression, Inc. | | | |
| 7.25% due 05/15/2010 | | 275,000 | 284,625 |
| Xerox Corp. | | | |
| 6.875% due 08/15/2011 | | 175,000 | 180,906 |
| 7.20% due 04/01/2016 | | 75,000 | 79,875 |
| 7.625% due 06/15/2013 | | 125,000 | 132,656 |
|
|
| | | | 4,444,872 |
The accompanying notes are an integral part of the financial statements. 267
John Hancock Funds II
Portfolio of investments — February 28, 2006 (Unaudited)
(showing percentage of total net assets)
|
| Spectrum Income Fund (continued) | | |
| | | Shares or | | |
| | | Principal | | |
| | | Amount | | Value |
|
|
| |
| CORPORATE BONDS (continued) | | | | |
| Cable and Television - 0.77% | | | | |
| Comcast Cable Communications, Inc. | | | | |
| 6.75% due 01/30/2011 | $ | 80,000 | $ | 83,962 |
| 8.375% due 05/01/2007 | | 120,000 | | 124,234 |
| Comcast Corp. | | | | |
| 4.95% due 06/15/2016 | | 425,000 | | 397,057 |
| 5.65% due 06/15/2035 | | 75,000 | | 68,633 |
| 6.50% due 11/15/2035 | | 105,000 | | 106,417 |
| Cox Communications, Inc. | | | | |
| 7.75% due 11/01/2010 | | 430,000 | | 462,861 |
| Cox Enterprises, Inc. | | | | |
| 4.375% due 05/01/2008 | | 135,000 | | 131,322 |
| DirecTV Holdings LLC | | | | |
| 6.375% due 06/15/2015 | | 500,000 | | 498,125 |
| 8.375% due 03/15/2013 | | 50,000 | | 53,625 |
| EchoStar Communications Corp. | | | | |
| 5.75% due 05/15/2008 | | 150,000 | | 147,375 |
| Echostar DBS Corp. | | | | |
| 5.75% due 10/01/2008 | | 15,000 | | 14,812 |
| 6.625% due 10/01/2014 | | 425,000 | | 413,313 |
| Mediacom Broadband LLC | | | | |
| 8.50% due 10/15/2015 | | 100,000 | | 96,000 |
| 11.00% due 07/15/2013 | | 150,000 | | 160,500 |
| Rainbow National Services LLC | | | | |
| 8.75% due 09/01/2012 | | 100,000 | | 107,750 |
| Rogers Cable, Inc. | | | | |
| 5.50% due 03/15/2014 | | 160,000 | | 151,800 |
| 6.75% due 03/15/2015 | | 250,000 | | 255,625 |
| Shaw Communications, Inc. | | | | |
| 7.40% due 10/17/2007 | CAD | 45,000 | | 41,064 |
| Sinclair Broadcast Group, Inc. | | | | |
| 8.00% due 03/15/2012 | $ | 450,000 | | 459,563 |
| 8.75% due 12/15/2011 | | 25,000 | | 26,281 |
| Time Warner Entertainment Company LP | | | | |
| 7.25% due 09/01/2008 | | 475,000 | | 494,555 |
| 8.375% due 03/15/2023 | | 246,000 | | 289,503 |
| Videotron Ltee | | | | |
| 6.375% due 12/15/2015 | | 100,000 | | 99,000 |
| 6.875% due 01/15/2014 | | 315,000 | | 322,088 |
|
|
| | | | | 5,005,465 |
Cellular Communications - 1.13% | | | | |
| America Movil SA de CV | | | | |
| 6.375% due 03/01/2035 | | 245,000 | | 247,858 |
| American Cellular Corp. | | | | |
| 10.00% due 08/01/2011 | | 200,000 | | 217,500 |
| American Tower Corp. | | | | |
| 3.00% due 08/15/2012 | | 100,000 | | 164,875 |
| 7.125% due 10/15/2012 | | 250,000 | | 261,875 |
| 7.25% due 12/01/2011 | | 50,000 | | 52,500 |
| 7.50% due 05/01/2012 | | 50,000 | | 52,750 |
| AT&T Broadband Corp. | | | | |
| 8.375% due 03/15/2013 | | 320,000 | | 366,889 |
| AT&T Wireless Services, Inc. | | | | |
| 7.875% due 03/01/2011 | | 120,000 | | 133,066 |
| 8.75% due 03/01/2031 | | 170,000 | | 225,600 |
| Spectrum Income Fund (continued) | |
| | | Shares or | |
| | | Principal | |
| | | Amount | Value |
|
|
| |
| CORPORATE BONDS (continued) | | | |
| Cellular Communications (continued) | | | |
| Centennial Communications Corp. | | | |
| 8.125% due 02/01/2014 | $ | 25,000 | $ | 25,500 |
| 10.00% due 01/01/2013 | | 75,000 | 78,000 |
| 10.125% due 06/15/2013 | | 125,000 | 136,875 |
| Cingular Wireless Services, Inc. | | | |
| 8.125% due 05/01/2012 | | 10,000 | 11,458 |
| Digicel, Ltd. | | | |
| 9.25% due 09/01/2012 | | 250,000 | 262,500 |
| Dobson Cellular Systems, Inc. | | | |
| 9.875% due 11/01/2012 | | 225,000 | 245,812 |
| Dobson Communications Corp. | | | |
| 8.875% due 10/01/2013 | | 200,000 | 201,500 |
| Horizon PCS, Inc. | | | |
| 11.375% due 07/15/2012 | | 125,000 | 143,750 |
| IWO Holdings, Inc. | | | |
| zero coupon, Step up to 10.75% on | | | |
| 01/15/2010 due 01/15/2015 | | 125,000 | 92,500 |
| mmO2 PLC, EMTN | | | |
| 6.375% due 01/25/2007 | EUR | 33,000 | 40,481 |
| Motorola, Inc. | | | |
| 7.50% due 05/15/2025 | $ | 80,000 | 95,542 |
| Nextel Communications, Inc. | | | |
| 6.875% due 10/31/2013 | | 1,290,000 | 1,350,501 |
| 7.375% due 08/01/2015 | | 180,000 | 190,363 |
| Nextel Partners, Inc. | | | |
| 8.125% due 07/01/2011 | | 200,000 | 212,000 |
| Rogers Wireless, Inc. | | | |
| 7.50% due 03/15/2015 | | 50,000 | 54,250 |
| 7.6163% due 12/15/2010 (b) | | 100,000 | 103,500 |
| 8.00% due 12/15/2012 | | 975,000 | 1,040,813 |
| 9.625% due 05/01/2011 | | 200,000 | 231,500 |
| Rural Cellular Corp. | | | |
| 9.875% due 02/01/2010 | | 150,000 | 160,500 |
| 10.43% due 11/01/2012 (b) | | 100,000 | 103,000 |
| UbiquiTel Operating Company | | | |
| 9.875% due 03/01/2011 | | 300,000 | 330,000 |
| US Unwired, Inc., Series B | | | |
| 10.00% due 06/15/2012 | | 250,000 | 282,500 |
| Verizon Wireless Capital LLC | | | |
| 5.375% due 12/15/2006 | | 165,000 | 165,313 |
|
|
| | | | 7,281,071 |
Chemicals - 0.45% | | | |
| Arco Chemical Company | | | |
| 10.25% due 11/01/2010 | | 100,000 | 110,000 |
| Chemtura Corp. | | | |
| 9.875% due 08/01/2012 | | 50,000 | 56,375 |
| Compass Minerals International, Inc., Series B | | |
| zero coupon, Step up to 12.00% on | | | |
| 06/01/2008 due 06/01/2013 | | 475,000 | 422,750 |
| Crystal US Holdings 3 LLC/Crystal US Sub 3 Corp., | | |
| Series A | | | |
| zero coupon, Step up to 10.00% on | | | |
| 10/01/2009 due 10/01/2014 | | 225,000 | 176,062 |
The accompanying notes are an integral part of the financial statements. 268
John Hancock Funds II
Portfolio of investments — February 28, 2006 (Unaudited)
(showing percentage of total net assets)
|
| Spectrum Income Fund (continued) | |
| | | Shares or | |
| | | Principal | |
| | | Amount | Value |
|
|
| |
| CORPORATE BONDS (continued) | | | |
| Chemicals (continued) | | | |
| Crystal US Holdings 3 LLC/Crystal US Sub 3 Corp., | | |
| Series B | | | |
| zero coupon, Step up to 10.50% on | | | |
| 10/01/2009 due 10/01/2014 | $ | 275,000 | $ | 213,812 |
| Dow Chemical Company | | | |
| 6.125% due 02/01/2011 | | 120,000 | 124,487 |
| Dow Chemical Company, EMTN | | | |
| 4.375% due 06/25/2010 | EUR | 38,000 | 46,429 |
| Equistar Chemicals LP | | | |
| 8.75% due 02/15/2009 | $ | 25,000 | 25,937 |
| Hercules, Inc. | | | |
| 6.75% due 10/15/2029 | | 75,000 | 73,500 |
| Huntsman LLC | | | |
| 11.625% due 10/15/2010 | | 150,000 | 171,000 |
| IMC Global, Inc. | | | |
| 10.875% due 08/01/2013 | | 25,000 | 28,750 |
| IMC Global, Inc., Series B | | | |
| 10.875% due 06/01/2008 | | 50,000 | 55,375 |
| 11.25% due 06/01/2011 | | 25,000 | 26,813 |
| Lubrizol Corp. | | | |
| 4.625% due 10/01/2009 | | 60,000 | 58,409 |
| Lyondell Chemical Company | | | |
| 9.50% due 12/15/2008 | | 59,000 | 61,655 |
| 10.50% due 06/01/2013 | | 325,000 | 363,188 |
| 11.125% due 07/15/2012 | | 100,000 | 110,500 |
| Lyondell Chemical Company, Series A | | | |
| 9.625% due 05/01/2007 | | 100,000 | 103,500 |
| Praxair, Inc. | | | |
| 4.75% due 07/15/2007 | | 85,000 | 84,693 |
| Rhodia SA | | | |
| 10.25% due 06/01/2010 | | 292,000 | 328,500 |
| Rockwood Specialties Group, Inc. | | | |
| 10.625% due 05/15/2011 | | 225,000 | 247,500 |
|
|
| | | | 2,889,235 |
Coal - 0.20% | | | |
| Alpha Natural Resources LLC | | | |
| 10.00% due 06/01/2012 | | 225,000 | 247,500 |
| Foundation PA Coal Company | | | |
| 7.25% due 08/01/2014 | | 400,000 | 410,000 |
| James River Coal Company | | | |
| 9.375% due 06/01/2012 | | 250,000 | 260,625 |
| Massey Energy Company | | | |
| 6.625% due 11/15/2010 | | 50,000 | 51,125 |
| 6.875% due 12/15/2013 | | 350,000 | 349,125 |
|
|
| | | | 1,318,375 |
Commercial Services - 0.11% | | | |
| Brickman Group, Ltd., Series B | | | |
| 11.75% due 12/15/2009 | | 450,000 | 495,000 |
| Mac-Gray Corp. | | | |
| 7.625% due 08/15/2015 | | 225,000 | 230,625 |
|
|
| | | | 725,625 |
Computers & Business Equipment - 0.13% | | |
| Cisco Systems, Inc. | | | |
| 5.25% due 02/22/2011 | | 290,000 | 290,496 |
| Spectrum Income Fund (continued) | |
| | | Shares or | |
| | | Principal | |
| | | Amount | Value |
|
|
| |
| CORPORATE BONDS (continued) | | | |
| Computers & Business Equipment | | | |
| (continued) | | | |
| International Business Machines Corp., MTN | | |
| 2.375% due 11/01/2006 | $ | 120,000 | $ | 117,948 |
| 3.80% due 02/01/2008 | | 180,000 | 175,779�� |
| Unisys Corp. | | | |
| 7.875% due 04/01/2008 | | 175,000 | 173,906 |
| 8.00% due 10/15/2012 | | 75,000 | 73,125 |
|
|
| | | | 831,254 |
Construction & Mining Equipment - 0.05% | | |
| JLG Industries, Inc. | | | |
| 8.375% due 06/15/2012 | | 200,000 | 211,500 |
| Terex Corp. | | | |
| 7.375% due 01/15/2014 | | 100,000 | 103,000 |
|
|
| | | | 314,500 |
Containers & Glass - 0.51% | | | |
| AEP Industries, Inc. | | | |
| 7.875% due 03/15/2013 | | 250,000 | 250,000 |
| Ball Corp. | | | |
| 6.875% due 12/15/2012 | | 575,000 | 585,062 |
| BWAY Corp. | | | |
| 10.00% due 10/15/2010 | | 225,000 | 237,375 |
| Graphic Packaging International Corp. | | | |
| 8.50% due 08/15/2011 | | 125,000 | 125,625 |
| 9.50% due 08/15/2013 | | 75,000 | 71,250 |
| Greif, Inc. | | | |
| 8.875% due 08/01/2012 | | 100,000 | 106,250 |
| Owens-Brockway Glass Container, Inc. | | | |
| 7.75% due 05/15/2011 | | 100,000 | 105,000 |
| 8.25% due 05/15/2013 | | 425,000 | 443,062 |
| 8.75% due 11/15/2012 | | 255,000 | 274,125 |
| 8.875% due 02/15/2009 | | 350,000 | 364,437 |
| Owens-Illinois, Inc., Series 2008 | | | |
| 7.35% due 05/15/2008 | | 75,000 | 75,938 |
| Plastipak Holdings, Inc. | | | |
| 8.50% due 12/15/2015 | | 125,000 | 129,063 |
| Sealed Air Corp. | | | |
| 5.375% due 04/15/2008 | | 230,000 | 229,282 |
| Silgan Holdings, Inc. | | | |
| 6.75% due 11/15/2013 | | 125,000 | 124,063 |
| Stone Container Corp. | | | |
| 9.75% due 02/01/2011 | | 75,000 | 76,781 |
| Stone Container Finance | | | |
| 7.375% due 07/15/2014 | | 125,000 | 115,938 |
|
|
| | | | 3,313,251 |
Cosmetics & Toiletries - 0.09% | | | |
| Chattem, Inc. | | | |
| 7.00% due 03/01/2014 | | 350,000 | 351,750 |
| Spectrum Brands, Inc. | | | |
| 7.375% due 02/01/2015 | | 250,000 | 215,625 |
| 8.50% due 10/01/2013 | | 50,000 | 45,625 |
|
|
| | | | 613,000 |
Crude Petroleum & Natural Gas - 0.74% | | | |
| Amerada Hess Corp. | | | |
| 7.375% due 10/01/2009 | | 75,000 | 80,009 |
The accompanying notes are an integral part of the financial statements. 269
John Hancock Funds II
Portfolio of investments — February 28, 2006 (Unaudited)
(showing percentage of total net assets)
|
| Spectrum Income Fund (continued) | | |
| | | Shares or | | |
| | | Principal | | |
| | | Amount | | Value |
|
|
| |
| CORPORATE BONDS (continued) | | | | |
| Crude Petroleum & Natural Gas | | | | |
| (continued) | | | | |
| Amerada Hess Corp. (continued) | | | | |
| 7.875% due 10/01/2029 | $ | 220,000 | $ | 269,429 |
| Atlantic Richfield Corp. | | | | |
| 9.125% due 03/01/2011 | | 105,000 | | 122,923 |
| Chesapeake Energy Corp. | | | | |
| 6.375% due 06/15/2015 | | 450,000 | | 450,000 |
| 6.50% due 08/15/2017 | | 175,000 | | 176,094 |
| 6.50% due 08/15/2017 | | 125,000 | | 125,781 |
| 6.625% due 01/15/2016 | | 375,000 | | 380,625 |
| 7.00% due 08/15/2014 | | 155,000 | | 160,812 |
| Compton Petroleum Finance Corp. | | | | |
| 7.625% due 12/01/2013 | | 450,000 | | 460,125 |
| Denbury Resources, Inc. | | | | |
| 7.50% due 04/01/2013 | | 400,000 | | 416,000 |
| 7.50% due 12/15/2015 | | 100,000 | | 104,750 |
| EnCana Corp. | | | | |
| 4.60% due 08/15/2009 | | 190,000 | | 186,431 |
| 6.50% due 08/15/2034 | | 45,000 | | 50,264 |
| EnCana Holdings Finance Corp. | | | | |
| 5.80% due 05/01/2014 | | 200,000 | | 206,714 |
| Encore Acquisition Company | | | | |
| 7.25% due 12/01/2017 | | 350,000 | | 356,125 |
| Hilcorp Energy I LP | | | | |
| 7.75% due 11/01/2015 | | 200,000 | | 202,500 |
| 10.50% due 09/01/2010 | | 375,000 | | 416,250 |
| Plains Exploration & Production Company | | | | |
| 8.75% due 07/01/2012 | | 275,000 | | 295,625 |
| Sempra Energy | | | | |
| 5.24% due 05/21/2008 (b) | | 180,000 | | 180,402 |
| Transocean, Inc. | | | | |
| 7.50% due 04/15/2031 | | 110,000 | | 137,815 |
|
|
| | | | | 4,778,674 |
Domestic Oil - 0.63% | | | | |
| AmeriGas Partners LP | | | | |
| 7.25% due 05/20/2015 | | 800,000 | | 812,000 |
| ConocoPhillips | | | | |
| 5.90% due 10/15/2032 | | 180,000 | | 191,035 |
| Devon Energy Corp. | | | | |
| 2.75% due 08/01/2006 | | 100,000 | | 98,955 |
| Devon Financing Corp., ULC | | | | |
| 6.875% due 09/30/2011 | | 270,000 | | 290,258 |
| 7.875% due 09/30/2031 | | 185,000 | | 235,542 |
| Diamond Offshore Drilling, Inc. | | | | |
| 4.875% due 07/01/2015 | | 140,000 | | 135,355 |
| 5.15% due 09/01/2014 | | 195,000 | | 193,019 |
| Forest Oil Corp. | | | | |
| 8.00% due 12/15/2011 | | 100,000 | | 109,000 |
| Magnum Hunter Resources, Inc. | | | | |
| 9.60% due 03/15/2012 | | 75,000 | | 81,000 |
| Range Resources Corp. | | | | |
| 6.375% due 03/15/2015 | | 600,000 | | 604,500 |
| 7.375% due 07/15/2013 | | 25,000 | | 26,188 |
| Stone Energy Corp. | | | | |
| 8.25% due 12/15/2011 | | 175,000 | | 177,625 |
| Spectrum Income Fund (continued) | |
| | | Shares or | |
| | | Principal | |
| | | Amount | Value |
|
|
| |
| CORPORATE BONDS (continued) | | | |
| Domestic Oil (continued) | | | |
| Swift Energy Company | | | |
| 7.625% due 07/15/2011 | $ | 200,000 | $ | 206,000 |
| 9.375% due 05/01/2012 | | 25,000 | 26,875 |
| Valero Energy Corp. | | | |
| 3.50% due 04/01/2009 | | 240,000 | 228,114 |
| 4.75% due 04/01/2014 | | 65,000 | 62,116 |
| Whiting Petroleum Corp. | | | |
| 7.00% due 02/01/2014 | | 280,000 | 280,700 |
| 7.25% due 05/01/2013 | | 300,000 | 303,750 |
|
|
| | | | 4,062,032 |
Drugs & Health Care - 0.06% | | | |
| Biovail Corp. | | | |
| 7.875% due 04/01/2010 | | 200,000 | 206,000 |
| Warner Chilcott Corp. | | | |
| 8.75% due 02/01/2015 | | 200,000 | 196,500 |
|
|
| | | | 402,500 |
Educational Services - 0.07% | | | |
| AAC Group Holding Corp. | | | |
| zero coupon, Step up to 10.25% on | | | |
| 10/01/2008 due 10/01/2012 | | 200,000 | 149,750 |
| American Achievement Corp. | | | |
| 8.25% due 04/01/2012 | | 275,000 | 281,531 |
|
|
| | | | 431,281 |
Electrical Equipment - 0.10% | | | |
| Exelon Generation Company LLC | | | |
| 5.35% due 01/15/2014 | | 220,000 | 217,665 |
| General Cable Corp. | | | |
| 9.50% due 11/15/2010 | | 200,000 | 215,000 |
| Telex Communications Holdings, Inc. | | | |
| 11.50% due 10/15/2008 | | 225,000 | 240,750 |
|
|
| | | | 673,415 |
Electrical Utilities - 1.43% | | | |
| AES Corp. | | | |
| 7.75% due 03/01/2014 | | 135,000 | 142,594 |
| 8.875% due 02/15/2011 | | 275,000 | 297,687 |
| 9.00% due 05/15/2015 | | 830,000 | 904,700 |
| 9.375% due 09/15/2010 | | 300,000 | 329,250 |
| Alabama Power Company | | | |
| 4.99% due 08/25/2009 (b) | | 160,000 | 160,507 |
| Alabama Power Company, Series CC | | | |
| 3.50% due 11/15/2007 | | 150,000 | 146,026 |
| Allegheny Energy Supply Company LLC | | | |
| 7.80% due 03/15/2011 | | 50,000 | 53,375 |
| 8.25 due 04/15/2012 | | 50,000 | 54,937 |
| Appalachian Power Company | | | |
| 4.8506% due 06/29/2007 (b) | | 70,000 | 70,178 |
| Arizona Public Service Company | | | |
| 4.65% due 05/15/2015 | | 45,000 | 41,689 |
| Black Hills Corp. | | | |
| 6.50% due 05/15/2013 | | 235,000 | 238,365 |
| CE Electric UK Funding Company | | | |
| 6.995% due 12/30/2007 | | 200,000 | 203,666 |
| Centerpoint Energy, Inc., Series B | | | |
| 5.875% due 06/01/2008 | | 110,000 | 110,983 |
The accompanying notes are an integral part of the financial statements. 270
John Hancock Funds II
Portfolio of investments — February 28, 2006 (Unaudited)
(showing percentage of total net assets)
|
| Spectrum Income Fund (continued) | |
| | | Shares or | |
| | | Principal | |
| | | Amount | Value |
|
|
| |
| CORPORATE BONDS (continued) | | | |
| Electrical Utilities (continued) | | | |
| Centerpoint Energy, Inc., Series B (continued) | | |
| 7.25% due 09/01/2010 | $ | 205,000 | $ | 218,184 |
| CMS Energy Corp. | | | |
| 8.50% due 04/15/2011 | | 50,000 | 54,500 |
| 9.875% due 10/15/2007 | | 475,000 | 508,250 |
| Consumers Energy Company | | | |
| 5.65% due 04/15/2020 | | 65,000 | 63,532 |
| Dominion Resources, Inc. | | | |
| 4.125% due 02/15/2008 | | 65,000 | 63,585 |
| Edison SpA, EMTN | | | |
| 5.125% due 12/10/2010 | EUR | 30,000 | 37,978 |
| El Paso Electric Company | | | |
| 6.00% due 05/15/2035 | $ | 245,000 | 243,072 |
| Elia System Operator SA | | | |
| 4.75% due 05/13/2014 | EUR | 51,000 | 64,618 |
| Enbw International Finance BV, EMTN | | | |
| 5.875% due 02/28/2012 | | 36,000 | 47,926 |
| Energy East Corp. | | | |
| 5.75% due 11/15/2006 | $ | 125,000 | 125,444 |
| Entergy Louisiana LLC | | | |
| 5.83% due 11/01/2010 | | 35,000 | 34,889 |
| FirstEnergy Corp. | | | |
| 6.45% due 11/15/2011 | | 305,000 | 318,967 |
| FirstEnergy Corp., Series A | | | |
| 5.50% due 11/15/2006 | | 70,000 | 70,130 |
| Midwest Generation LLC | | | |
| 8.75% due 05/01/2034 | | 425,000 | 464,312 |
| Mirant Americas Generation LLC | | | |
| 8.30% due 05/01/2011 ^ | | 525,000 | 549,281 |
| Mission Energy Holding Co. | | | |
| 13.50% due 07/15/2008 | | 100,000 | 115,250 |
| National Grid PLC, EMTN | | | |
| 5.00% due 07/02/2018 | EUR | 22,000 | 27,488 |
| National Power Corp. | | | |
| 9.0238% due 08/23/2011 (b) | $ | 200,000 | 219,497 |
| Nevada Power Company | | | |
| 5.875% due 01/15/2015 | | 45,000 | 45,082 |
| Pacific Gas & Electric Company | | | |
| 6.05% due 03/01/2034 | | 235,000 | 243,184 |
| Pepco Holdings, Inc. | | | |
| 5.50% due 08/15/2007 | | 110,000 | 110,278 |
| Pinnacle West Capital Corp. | | | |
| 6.40% due 04/01/2006 | | 250,000 | 250,380 |
| PPL Capital Funding, Inc. | | | |
| 4.33% due 03/01/2009 | | 285,000 | 274,853 |
| PSEG Power LLC | | | |
| 6.875% due 04/15/2006 | | 115,000 | 115,231 |
| RWE Finance BV, EMTN | | | |
| 5.375% due 04/18/2008 | EUR | 33,000 | 40,989 |
| 6.375% due 06/03/2013 | GBP | 49,000 | 93,665 |
| San Diego Gas & Electric Company | | | |
| 5.35% due 05/15/2035 | $ | 60,000 | 58,043 |
| Scottish Power UK PLC | | | |
| 8.375% due 02/20/2017 | GBP | 39,000 | 87,770 |
| Sierra Pacific Resources | | | |
| 8.625% due 03/15/2014 | $ | 800,000 | 873,067 |
| Spectrum Income Fund (continued) | |
| | | Shares or | |
| | | Principal | |
| | | Amount | Value |
|
|
| |
| CORPORATE BONDS (continued) | | | |
| Electrical Utilities (continued) | | | |
| Southern California Edison Company | | | |
| 4.65% due 04/01/2015 | $ | 55,000 | $ | 52,383 |
| Tri-State Generation & Transmission Association | | |
| 6.04% due 01/31/2018 | | 110,000 | 110,797 |
| TXU Corp., Series O | | | |
| 4.80% due 11/15/2009 | | 60,000 | 57,653 |
| Vattenfall Treasury AB, EMTN | | | |
| 6.00% due 04/03/2009 | EUR | 35,000 | 44,784 |
| Virginia Electric and Power Company | | | |
| 4.50% due 12/15/2010 | $ | 35,000 | 33,684 |
| 6.00% due 01/15/2036 | | 310,000 | 310,961 |
| Westar Energy, Inc. | | | |
| 5.10% due 07/15/2020 | | 185,000 | 173,560 |
| Western Power Distribution Holdings, Ltd. | | | |
| 6.875% due 12/15/2007 | | 160,000 | 162,045 |
| Wisconsin Electric Power Company | | | |
| 3.50% due 12/01/2007 | | 120,000 | 116,606 |
|
|
| | | | 9,235,875 |
Electronics - 0.08% | | | |
| Celestica, Inc. | | | |
| 7.875% due 07/01/2011 | | 250,000 | 255,000 |
| L-3 Communications Corp., Series B | | | |
| 6.375% due 10/15/2015 | | 275,000 | 274,313 |
|
|
| | | | 529,313 |
Energy - 0.76% | | | |
| Duke Capital Corp. | | | |
| 4.302% due 05/18/2006 | | 260,000 | 259,537 |
| Duke Capital LLC | | | |
| 6.25% due 02/15/2013 | | 170,000 | 176,311 |
| Duke Capital LLC, Series B | | | |
| 6.75% due 07/15/2018 | | 90,000 | 96,559 |
| Enterprise Products Operating LP | | | |
| 4.95% due 06/01/2010 | | 175,000 | 171,127 |
| Enterprise Products Operating LP, Series B | | | |
| 4.00% due 10/15/2007 | | 80,000 | 78,203 |
| 5.60% due 10/15/2014 | | 120,000 | 119,103 |
| Ferrellgas Partners LP | | | |
| 8.75% due 06/15/2012 | | 250,000 | 253,125 |
| Mirant North America LLC | | | |
| 7.375% due 12/31/2013 | | 1,275,000 | 1,308,469 |
| Niagara Mohawk Power Corp., Series G | | | |
| 7.75% due 10/01/2008 | | 50,000 | 52,836 |
| NRG Energy, Inc. | | | |
| 7.25% due 02/01/2014 | | 400,000 | 410,000 |
| 7.375% due 02/01/2016 | | 1,155,000 | 1,189,650 |
| Orion Power Holdings, Inc. | | | |
| 12.00% due 05/01/2010 | | 350,000 | 400,750 |
| Peabody Energy Corp. | | | |
| 6.875% due 03/15/2013 | | 200,000 | 205,500 |
| Progress Energy, Inc. | | | |
| 6.75% due 03/01/2006 | | 130,000 | 130,000 |
| TXU Energy Company LLC | | | |
| 6.125% due 03/15/2008 | | 45,000 | 45,521 |
The accompanying notes are an integral part of the financial statements. 271
John Hancock Funds II
Portfolio of investments — February 28, 2006 (Unaudited)
(showing percentage of total net assets)
|
| Spectrum Income Fund (continued) | |
| | | Shares or | |
| | | Principal | |
| | | Amount | Value |
| |
|
| |
| CORPORATE BONDS (continued) | | | |
| Energy (continued) | | | |
| Xcel Energy, Inc. | | | |
| 7.00% due 12/01/2010 | $ | 30,000 | $ | 31,942 |
|
|
| | | | 4,928,633 |
Financial Services - 3.03% | | | |
| AIG SunAmerica Global Financing XII | | | |
| 5.30% due 05/30/2007 | | 75,000 | 75,047 |
| Alamosa Delaware, Inc. | | | |
| 11.00% due 07/31/2010 | | 425,000 | 473,875 |
| Altria Finance Cayman Islands, Ltd. | | | |
| 5.625% due 06/24/2008 | EUR | 61,000 | 75,994 |
| American Express Credit Corp. | | | |
| 5.30% due 12/02/2015 | $ | 50,000 | 50,126 |
| American Express Credit Corp., EMTN | | | |
| 3.625% due 10/13/2009 | EUR | 55,000 | 65,904 |
| American General Finance Corp., Series I, MTN | | |
| 5.40% due 12/01/2015 | $ | 250,000 | 247,312 |
| American Honda Finance Corp., MTN | | | |
| 2.875% due 04/03/2006 | | 95,000 | 94,839 |
| Arch Western Finance LLC | | | |
| 6.75% due 07/01/2013 | | 275,000 | 275,687 |
| Aries Vermogensverwaltung GmbH, Series REGS | | |
| 9.60% due 10/25/2014 | | 560,000 | 720,384 |
| BCP Crystal Holdings Corp. | | | |
| 9.625% due 06/15/2014 | | 500,000 | 559,375 |
| Boeing Capital Corp., MTN, Series X | | | |
| 6.35% due 11/15/2007 | | 160,000 | 163,024 |
| Capital One Bank | | | |
| 5.125% due 02/15/2014 | | 220,000 | 215,519 |
| 6.50% due 06/13/2013 | | 330,000 | 348,907 |
| Capital One Financial Corp. | | | |
| 4.738% due 05/17/2007 | | 160,000 | 158,865 |
| Caterpillar Financial Services Corp., MTN, Series F | | |
| 4.50% due 09/01/2008 | | 140,000 | 137,860 |
| Chukchansi Economic Development Authority | | |
| 4.469% due 11/15/2012 | | 150,000 | 153,750 |
| CIT Group, Inc. | | | |
| 5.00% due 02/01/2015 | | 350,000 | 337,902 |
| 5.50% due 11/30/2007 | | 65,000 | 65,294 |
| CIT Group, Inc., GMTN | | | |
| 4.25% due 09/22/2011 | EUR | 50,000 | 60,803 |
| CIT Group, Inc., MTN | | | |
| 4.8988% due 08/15/2008 (b) | $ | 115,000 | 115,123 |
| Citigroup, Inc. | | | |
| 3.875% due 05/21/2010 | EUR | 65,000 | 78,796 |
| 5.30% due 01/07/2016 | $ | 285,000 | 284,588 |
| 5.75% due 05/10/2006 | | 130,000 | 130,209 |
| Countrywide Home Loans, Inc., MTN | | | |
| 4.125% due 09/15/2009 | | 480,000 | 461,003 |
| Dollar Financial Group, Inc. | | | |
| 9.75% due 11/15/2011 | | 200,000 | 210,500 |
| E*TRADE Financial Corp. | | | |
| 8.00% due 06/15/2011 | | 500,000 | 526,250 |
| Erac USA Finance Co. | | | |
| 6.75% due 05/15/2007 | | 150,000 | 151,363 |
| Spectrum Income Fund (continued) | | |
| | | Shares or | | |
| | | Principal | | |
| | | Amount | | Value |
|
|
| |
| CORPORATE BONDS (continued) | | | | |
| Financial Services (continued) | | | | |
| Ford Motor Credit Company | | | | |
| 5.45% due 03/21/2007 (b) | $ | 50,000 | $ | 49,240 |
| 5.625% due 06/06/2006 | EUR | 42,000 | | 50,153 |
| 5.70% due 11/16/2006 (b) | $ | 110,000 | | 108,903 |
| 5.80% due 01/12/2009 | | 330,000 | | 296,507 |
| 6.17% due 01/15/2010 (b) | | 100,000 | | 90,083 |
| 6.50% due 01/25/2007 | | 60,000 | | 59,269 |
| 7.00% due 10/01/2013 | | 115,000 | | 101,065 |
| 7.375% due 10/28/2009 | | 2,175,000 | | 2,009,093 |
| Franklin Resources, Inc. | | | | |
| 3.70% due 04/15/2008 | | 60,000 | | 58,218 |
| Fund American Companies, Inc. | | | | |
| 5.875% due 05/15/2013 | | 205,000 | | 204,345 |
| GE Capital UK Funding, EMTN | | | | |
| 5.625% due 12/12/2014 | GBP | 49,000 | | 90,878 |
| General Electric Capital Corp. | | | | |
| 6.125% due 02/22/2011 | $ | 220,000 | | 228,744 |
| General Electric Capital Corp., EMTN | | | | |
| 5.125% due 06/20/2007 | EUR | 52,000 | | 63,551 |
| General Electric Capital Corp., Series A, MTN | | | |
| 5.00% due 06/15/2007 | $ | 130,000 | | 129,833 |
| 6.00% due 06/15/2012 | | 260,000 | | 270,779 |
| General Motors Acceptance Corp. | | | | |
| 5.55% due 07/16/2007 (b) | | 180,000 | | 171,485 |
| 5.625% due 05/15/2009 | | 360,000 | | 325,981 |
| 6.00% due 10/16/2006 | EUR | 63,000 | | 74,525 |
| 6.75% due 12/01/2014 | $ | 600,000 | | 530,063 |
| 6.875% due 08/28/2012 | | 325,000 | | 289,574 |
| 7.75% due 01/19/2010 | | 625,000 | | 589,037 |
| GIE Suez Alliance, EMTN | | | | |
| 5.125% due 06/24/2015 | EUR | 47,000 | | 61,403 |
| Global Cash Access LLC | | | | |
| 8.75% due 03/15/2012 | $ | 325,000 | | 348,969 |
| Goldman Sachs Capital, Inc. | | | | |
| 6.345% due 02/15/2034 | | 510,000 | | 531,582 |
| Goldman Sachs Group, Inc. | | | | |
| 4.25% due 08/04/2010 | EUR | 48,000 | | 58,836 |
| 4.655% due 07/02/2007 (b) | $ | 65,000 | | 65,102 |
| HSBC Finance Corp. | | | | |
| 5.00% due 06/30/2015 | | 230,000 | | 221,572 |
| 5.75% due 01/30/2007 | | 95,000 | | 95,534 |
| HSBC USA, Inc. | | | | |
| 4.625% due 04/01/2014 | | 100,000 | | 95,192 |
| International Lease Finance Corp. | | | | |
| 3.75% due 08/01/2007 | | 160,000 | | 156,737 |
| 5.125% due 11/01/2010 | | 110,000 | | 108,746 |
| 6.375% due 03/15/2009 | | 90,000 | | 92,598 |
| International Lease Finance Corp., EMTN | | | | |
| 4.125% due 10/09/2008 | EUR | 45,000 | | 54,508 |
| iPCS, Inc. | | | | |
| 11.50% due 05/01/2012 | $ | 125,000 | | 143,437 |
| Jefferies Group, Inc. | | | | |
| 6.25% due 01/15/2036 | | 260,000 | | 258,247 |
| John Deere Capital Corp. | | | | |
| 3.90% due 01/15/2008 | | 85,000 | | 83,190 |
The accompanying notes are an integral part of the financial statements. 272
John Hancock Funds II
Portfolio of investments — February 28, 2006 (Unaudited)
(showing percentage of total net assets)
|
| Spectrum Income Fund (continued) | |
| | | Shares or | |
| | | Principal | |
| | | Amount | Value |
|
|
| |
| CORPORATE BONDS (continued) | | | |
| Financial Services (continued) | | | |
| John Deere Capital Corp. (continued) | | | |
| 7.00% due 03/15/2012 | $ | 200,000 | $ | 217,984 |
| JPMorgan Chase & Company | | | |
| 3.125% due 12/11/2006 | | 125,000 | 123,164 |
| JPMorgan Chase & Company, EMTN | | | |
| 4.25% due 06/09/2011 | EUR | 39,000 | 47,995 |
| JSG Funding PLC | | | |
| 7.75% due 04/01/2015 | $ | 275,000 | 250,250 |
| 9.625% due 10/01/2012 | | 225,000 | 235,688 |
| Legg Mason, Inc. | | | |
| 6.75% due 07/02/2008 | | 165,000 | 170,427 |
| Lehman Brothers Holdings, Inc. | | | |
| 3.50% due 08/07/2008 | | 290,000 | 279,008 |
| Mangrove Bay Pass Through Trust | | | |
| 6.102% due 07/15/2033 (b) | | 200,000 | 196,064 |
| MBNA America Bank NA, EMTN | | | |
| 4.625% due 08/03/2009 | | 300,000 | 295,373 |
| MBNA Europe Funding Plc, EMTN | | | |
| 4.50% due 01/23/2009 | EUR | 33,000 | 40,498 |
| Mellon Funding Corp. | | | |
| 6.375% due 11/08/2011 | GBP | 49,000 | 92,652 |
| Merrill Lynch & Company, Inc. | | | |
| 7.00% due 03/15/2006 | $ | 5,000 | 5,003 |
| Merrill Lynch & Company, Inc., EMTN | | | |
| 4.625% due 10/02/2013 | EUR | 48,000 | 60,068 |
| Merrill Lynch & Company, Inc., Series CPI | | | |
| 4.33% due 03/02/2009 (b) | $ | 150,000 | 146,522 |
| Merrill Lynch & Company, Inc., Series MTNC | | |
| 4.25% due 02/08/2010 | | 200,000 | 193,617 |
| Morgan Stanley | | | |
| 6.10% due 04/15/2006 | | 75,000 | 75,111 |
| National Rural Utilities Cooperative Finance Corp. | | |
| 3.875% due 02/15/2008 | | 200,000 | 195,271 |
| Nationwide Building Society, EMTN | | | |
| 3.375% due 08/17/2015 (b) | EUR | 55,000 | 64,954 |
| Nell AF SARL | | | |
| 8.375% due 08/15/2015 | $ | 400,000 | 402,000 |
| 8.375% due 08/15/2015 | EUR | 50,000 | 61,992 |
| Nisource Finance Corp. | | | |
| 5.3438% due 11/23/2009 (b) | $ | 140,000 | 140,472 |
| Nissan Motor Acceptance Corp. | | | |
| 4.625% due 03/08/2010 | | 120,000 | 116,265 |
| Residential Capital Corp. | | | |
| 6.125% due 11/21/2008 | | 251,000 | 250,626 |
| SLM Corp., MTN | | | |
| 5.625% due 08/01/2033 | | 45,000 | 44,419 |
| SLM Corp., MTN, Series A | | | |
| 4.8229% due 01/26/2009 (b) | | 220,000 | 220,463 |
| SLM Corp., Series CPI | | | |
| 4.30% due 04/01/2009 (b) | | 365,000 | 355,116 |
| Stripes Acquisition LLC | | | |
| 10.625% due 12/15/2013 | | 200,000 | 209,000 |
| Sun Life Canada US Capital Trust | | | |
| 8.526% due 05/29/2049 | | 270,000 | 289,110 |
| The Bear Stearns Companies, Inc. | | | |
| 4.00% due 01/31/2008 | | 150,000 | 146,987 |
| Spectrum Income Fund (continued) | |
| | | Shares or | |
| | | Principal | |
| | | Amount | Value |
|
|
| |
| CORPORATE BONDS (continued) | | | |
| Financial Services (continued) | | | |
| Toyota Motor Credit Corp. | | | |
| 2.875% due 08/01/2008 | $ | 235,000 | $ | 223,432 |
| UBS AG | | | |
| 4.50% due 09/16/2019 | EUR | 62,000 | 78,063 |
|
|
| | | | 19,632,872 |
| |
Food & Beverages - 0.49% | | | |
| B&G Foods Holding Corp. | | | |
| 8.00% due 10/01/2011 | $ | 500,000 | 512,500 |
| Birds Eye Foods, Inc. | | | |
| 11.875% due 11/01/2008 | | 75,000 | 76,500 |
| Cott Beverages USA, Inc. | | | |
| 8.00% due 12/15/2011 | | 265,000 | 272,287 |
| Del Monte Corp. | | | |
| 8.625% due 12/15/2012 | | 325,000 | 346,125 |
| Dole Food, Inc. | | | |
| 8.625% due 05/01/2009 | | 125,000 | 126,563 |
| 8.875% due 03/15/2011 | | 150,000 | 151,313 |
| General Mills, Inc. | | | |
| 6.449% due 10/15/2006 | | 150,000 | 151,184 |
| Kraft Foods, Inc. | | | |
| 4.625% due 11/01/2006 | | 105,000 | 104,644 |
| 5.625% due 11/01/2011 | | 180,000 | 182,258 |
| Le*Nature's, Inc. | | | |
| 10.00% due 06/15/2013 | | 200,000 | 210,000 |
| McCormick & Company, Inc. | | | |
| 5.20% due 12/15/2015 | | 430,000 | 426,650 |
| McCormick & Company, Inc., MTN | | | |
| 3.35% due 04/15/2009 | | 110,000 | 105,494 |
| Panamerican Beverages, Inc. | | | |
| 7.25% due 07/01/2009 | | 35,000 | 36,750 |
| PepsiAmericas, Inc. | | | |
| 4.875% due 01/15/2015 | | 55,000 | 53,659 |
| Pierre Foods, Inc. | | | |
| 9.875% due 07/15/2012 | | 100,000 | 103,750 |
| The Wornick Company | | | |
| 10.875% due 07/15/2011 | | 200,000 | 208,500 |
| Tricon Global Restaurants, Inc. | | | |
| 7.65% due 05/15/2008 | | 60,000 | 62,847 |
| William Wrigley Jr. Company | | | |
| 4.65% due 07/15/2015 | | 60,000 | 57,789 |
|
|
| | | | 3,188,813 |
| |
Forest Products - 0.02% | | | |
| Weyerhaeuser Company | | | |
| 7.375% due 03/15/2032 | | 115,000 | 129,269 |
Furniture & Fixtures - 0.10% | | | |
| Norcraft Companies LP | | | |
| 9.00% due 11/01/2011 | | 225,000 | 232,594 |
| Norcraft Holdings LP | | | |
| zero coupon, Step up to 9.75% on | | | |
| 09/01/2008 due 09/01/2012 | | 175,000 | 125,562 |
| Sealy Mattress Company | | | |
| 8.25% due 06/15/2014 | | 300,000 | 313,500 |
|
|
| | | | 671,656 |
The accompanying notes are an integral part of the financial statements. 273
John Hancock Funds II
Portfolio of investments — February 28, 2006 (Unaudited)
(showing percentage of total net assets)
|
| Spectrum Income Fund (continued) | |
| | | Shares or | |
| | | Principal | |
| | | Amount | Value |
|
|
| |
| CORPORATE BONDS (continued) | | | |
| Gas & Pipeline Utilities - 0.88% | | | |
| ANR Pipeline Company | | | |
| 8.875% due 03/15/2010 | $ | 110,000 | $ | 117,543 |
| Aquila Canada Finance Corp. | | | |
| 7.75% due 06/15/2011 | | 200,000 | 206,500 |
| Atlas Pipeline Partners LP | | | |
| 8.125% due 12/15/2015 | | 100,000 | 104,000 |
| Atmos Energy Corp. | | | |
| 4.00% due 10/15/2009 | | 230,000 | 219,087 |
| 5.95% due 10/15/2034 | | 40,000 | 39,687 |
| Boardwalk Pipelines LLC | | | |
| 5.50% due 02/01/2017 | | 90,000 | 88,547 |
| Colorado Interstate Gas Company | | | |
| 5.95% due 03/15/2015 | | 300,000 | 295,941 |
| 6.80% due 11/15/2015 | | 400,000 | 418,824 |
| Copano Energy LLC | | | |
| 8.125% due 03/01/2016 | | 250,000 | 260,000 |
| Dynegy Holdings, Inc. | | | |
| 9.875% due 07/15/2010 | | 525,000 | 573,562 |
| 10.125% due 07/15/2013 | | 450,000 | 506,250 |
| El Paso Natural Gas Company, Series A | | | |
| 7.625% due 08/01/2010 | | 15,000 | 15,784 |
| El Paso Production Holding Company | | | |
| 7.75% due 06/01/2013 | | 125,000 | 131,875 |
| Kinder Morgan Finance Company ULC | | | |
| 5.35% due 01/05/2011 | | 130,000 | 129,166 |
| 5.70% due 01/05/2016 | | 340,000 | 340,046 |
| National Gas Company | | | |
| 6.05% due 01/15/2036 | | 105,000 | 104,459 |
| Panhandle Eastern Pipe Line Company | | | |
| 4.80% due 08/15/2008 | | 155,000 | 152,672 |
| Panhandle Eastern Pipe Line Company, Series B | | |
| 2.75% due 03/15/2007 | | 130,000 | 126,563 |
| Piedmont Natural Gas Company | | | |
| 6.00% due 12/19/2033 | | 15,000 | 15,709 |
| Roseton/Danskammer, Series A | | | |
| 7.27% due 11/08/2010 | | 200,000 | 203,208 |
| Southern Natural Gas Company | | | |
| 8.875% due 03/15/2010 | | 460,000 | 492,026 |
| Sunoco, Inc. | | | |
| 4.875% due 10/15/2014 | | 30,000 | 28,825 |
| Williams Companies, Inc. | | | |
| 7.625% due 07/15/2019 | | 50,000 | 55,000 |
| 7.75% due 06/15/2031 | | 100,000 | 110,375 |
| 8.125% due 03/15/2012 | | 700,000 | 766,500 |
| 8.75% due 03/15/2032 | | 25,000 | 30,250 |
| Williams Companies, Inc., Series A | | | |
| 7.50% due 01/15/2031 | | 125,000 | 134,688 |
|
|
| | | | 5,667,087 |
Gold - 0.02% | | | |
| Newmont Mining Corp. | | | |
| 5.875% due 04/01/2035 | | 130,000 | 127,884 |
Healthcare Products - 0.16% | | | |
| CDRV Investors, Inc. | | | |
| zero coupon, Step up to 9.625% on | | | |
| 01/01/2010 due 01/01/2015 | | 175,000 | 119,875 |
| Spectrum Income Fund (continued) | |
| | | Shares or | |
| | | Principal | |
| | | Amount | Value |
|
|
| |
| CORPORATE BONDS (continued) | | | |
| Healthcare Products (continued) | | | |
| Fresenius Medical Care Capital Trust | | | |
| 7.875% due 02/01/2008 | $ | 280 | $ | 289,800 |
| 7.875% due 06/15/2011 | | 25,000 | 26,500 |
| Medtronic, Inc., Series B | | | |
| 4.375% due 09/15/2010 | | 145,000 | 140,790 |
| 4.75% due 09/15/2015 | | 330,000 | 317,024 |
| VWR International, Inc. | | | |
| 6.875% due 04/15/2012 | | 50,000 | 49,750 |
| 8.00% due 04/15/2014 | | 100,000 | 100,000 |
|
|
| | | | 1,043,739 |
Healthcare Services - 0.30% | | | |
| Concentra Operating Corp. | | | |
| 9.125% due 06/01/2012 | | 200,000 | 208,500 |
| 9.50% due 08/15/2010 | | 75,000 | 78,188 |
| DaVita, Inc. | | | |
| 6.625% due 03/15/2013 | | 150,000 | 152,250 |
| 7.25% due 03/15/2015 | | 325,000 | 331,500 |
| Team Health, Inc. | | | |
| 11.25% due 12/01/2013 | | 225,000 | 232,875 |
| UnitedHealth Group Inc | | | |
| 5.25% due 03/15/2011 | | 235,000 | 235,408 |
| US Oncology, Inc. | | | |
| 9.00% due 08/15/2012 | | 150,000 | 160,500 |
| 10.75% due 08/15/2014 | | 75,000 | 82,875 |
| Vanguard Health Holding Company II LLC | | | |
| 9.00% due 10/01/2014 | | 150,000 | 156,375 |
| WellPoint, Inc. | | | |
| 4.25% due 12/15/2009 | | 40,000 | 38,568 |
| 5.00% due 01/15/2011 | | 280,000 | 276,416 |
|
|
| | | | 1,953,455 |
Holdings Companies/Conglomerates - 0.24% | | |
| Hutchison Whampoa Finance, Ltd. | | | |
| 5.875% due 07/08/2013 | EUR | 42,000 | 55,445 |
| 6.95% due 08/01/2007 | $ | 100,000 | 102,395 |
| Leucadia National Corp. | | | |
| 7.00% due 08/15/2013 | | 415,000 | 419,150 |
| Marquee Holdings, Inc. | | | |
| zero coupon, Step up to 12.00% on | | | |
| 08/15/2009 due 08/15/2014 | | 125,000 | 76,406 |
| Visant Corp. | | | |
| 7.625% due 10/01/2012 | | 425,000 | 431,375 |
| Visant Holding Corp. | | | |
| zero coupon, Step up to 10.25% on | | | |
| 12/01/2008 due 12/01/2013 | | 575,000 | 439,156 |
|
|
| | | | 1,523,927 |
Homebuilders - 0.21% | | | |
| Centex Corp. | | | |
| 4.55% due 11/01/2010 | | 75,000 | 71,714 |
| 5.45% due 08/15/2012 | | 260,000 | 255,352 |
| KB Home | | | |
| 6.25% due 06/15/2015 | | 35,000 | 33,232 |
| Lennar Corp. | | | |
| 5.125% due 10/01/2010 | | 20,000 | 19,525 |
The accompanying notes are an integral part of the financial statements. 274
John Hancock Funds II
Portfolio of investments — February 28, 2006 (Unaudited)
(showing percentage of total net assets)
|
| Spectrum Income Fund (continued) | |
| | | Shares or | |
| | | Principal | |
| | | Amount | Value |
|
|
| |
| CORPORATE BONDS (continued) | | | |
| Homebuilders (continued) | | | |
| Lennar Corp., Series B | | | |
| 5.2469% due 03/19/2009 (b) | $ | 70,000 | $ | 70,062 |
| 5.60% due 05/31/2015 | | 205,000 | 197,580 |
| MDC Holdings, Inc., MTN | | | |
| 5.375% due 12/15/2014 | | 60,000 | 55,606 |
| NVR, Inc. | | | |
| 5.00% due 06/15/2010 | | 115,000 | 111,206 |
| Pulte Homes, Inc. | | | |
| 4.875% due 07/15/2009 | | 70,000 | 68,186 |
| 7.875% due 08/01/2011 | | 240,000 | 261,278 |
| Ryland Group, Inc. | | | |
| 5.375% due 01/15/2015 | | 20,000 | 18,670 |
| WCI Communities, Inc. | | | |
| 9.125% due 05/01/2012 | | 200,000 | 202,000 |
|
|
| | | | 1,364,411 |
| |
Hotels & Restaurants - 0.43% | | | |
| American Casino & Entertainment Properties LLC | | |
| 7.85% due 02/01/2012 | | 400,000 | 409,000 |
| CCM Merger, Inc. | | | |
| 8.00% due 08/01/2013 | | 150,000 | 149,250 |
| Harrah's Operating Company, Inc. | | | |
| 5.50% due 07/01/2010 | | 295,000 | 293,855 |
| 7.50% due 01/15/2009 | | 110,000 | 115,642 |
| HMH Properties, Inc., Series B | | | |
| 7.875% due 08/01/2008 | | 25,000 | 25,156 |
| Landry's Restaurants, Inc., Series B | | | |
| 7.50% due 12/15/2014 | | 300,000 | 290,250 |
| Majestic Holding Company LLC | | | |
| zero coupon, Step up to 12.5% on | | | |
| 10/15/2008 due 10/15/2011 | | 125,000 | 87,500 |
| Majestic Star Casino LLC | | | |
| 9.50% due 10/15/2010 | | 75,000 | 80,250 |
| O'Charleys, Inc. | | | |
| 9.00% due 11/01/2013 | | 250,000 | 256,875 |
| Poster Financial Group, Inc. | | | |
| 8.75% due 12/01/2011 | | 300,000 | 315,000 |
| Real Mex Restaurants, Inc. | | | |
| 10.00% due 04/01/2010 | | 165,000 | 178,612 |
| Resorts International Hotel and Casino, Inc. | | | |
| 11.50% due 03/15/2009 | | 25,000 | 27,563 |
| The Restaurant Company | | | |
| 10.00% due 10/01/2013 | | 275,000 | 264,000 |
| Yum! Brands, Inc. | | | |
| 7.70% due 07/01/2012 | | 250,000 | 276,828 |
|
|
| | | | 2,769,781 |
| |
Household Appliances - 0.02% | | | |
| Gregg Appliances, Inc. | | | |
| 9.00% due 02/01/2013 | | 150,000 | 141,750 |
Household Products - 0.13% | | | |
| Church & Dwight Company, Inc. | | | |
| 6.00% due 12/15/2012 | | 275,000 | 273,625 |
| Clorox Company | | | |
| 4.6138% due 12/14/2007 (b) | | 80,000 | 80,163 |
| Resolution Performance Products, Inc. | | | |
| 9.50% due 04/15/2010 | | 225,000 | 232,875 |
| Spectrum Income Fund (continued) | |
| | | Shares or | |
| | | Principal | |
| | | Amount | Value |
|
|
| |
| CORPORATE BONDS (continued) | | | |
| Household Products (continued) | | | |
| Simmons Bedding Company | | | |
| 7.875% due 01/15/2014 | $ | 100,000 | $ | 96,000 |
| 10.00% due 12/15/2014 | | 250,000 | 150,000 |
|
|
| | | | 832,663 |
| |
| Industrial Machinery - 0.16% | | | |
| Columbus McKinnon Corp. | | | |
| 8.875% due 11/01/2013 | | 250,000 | 263,125 |
| Dresser Rand Group, Inc. | | | |
| 7.375% due 11/01/2014 | | 454,000 | 472,160 |
| Grant Prideco, Inc. | | | |
| 6.125% due 08/15/2015 | | 300,000 | 302,250 |
|
|
| | | | 1,037,535 |
| |
| Insurance - 0.59% | | | |
| ACE INA Holdings, Inc. | | | |
| 5.875% due 06/15/2014 | | 150,000 | 153,582 |
| Allstate Financial Global Funding | | | |
| 5.25% due 02/01/2007 | | 300,000 | 299,734 |
| Allstate Life Funding LLC, EMTN | | | |
| 6.375% due 01/17/2011 | GBP | 49,000 | 91,463 |
| ASIF II, EMTN | | | |
| 5.625% due 02/01/2012 | | 49,000 | 89,416 |
| Cigna Corp. | | | |
| 7.40% due 05/15/2007 | $ | 80,000 | 81,797 |
| Cincinnati Financial Corp. | | | |
| 6.92% due 05/15/2028 | | 150,000 | 168,297 |
| Genworth Financial, Inc. | | | |
| 5.75% due 06/15/2014 | | 180,000 | 184,275 |
| Highmark, Inc. | | | |
| 6.80% due 08/15/2013 | | 225,000 | 240,472 |
| ING Security Life Institutional Funding | | | |
| 2.70% due 02/15/2007 | | 195,000 | 189,770 |
| Jefferson-Pilot Capital Trust A | | | |
| 8.14% due 01/15/2046 | | 120,000 | 126,749 |
| Marsh & McLennan Companies, Inc. | | | |
| 3.625% due 02/15/2008 | | 45,000 | 43,502 |
| MassMutual Global Funding II | | | |
| 3.25% due 06/15/2007 | | 140,000 | 136,181 |
| Monumental Global Funding, Ltd., EMTN | | | |
| 5.375% due 03/13/2009 | EUR | 39,000 | 49,034 |
| Nationwide Financial Services, Inc. | | | |
| 5.90% due 07/01/2012 | $ | 200,000 | 205,919 |
| Nationwide Mutual Insurance Company | | | |
| 6.60% due 04/15/2034 | | 135,000 | 137,423 |
| New York Life Global Funding | | | |
| 4.625% due 08/16/2010 | | 235,000 | 229,796 |
| NLV Financial Corp. | | | |
| 7.50% due 08/15/2033 | | 160,000 | 175,867 |
| Ohio National Financial Services, Inc. | | | |
| 6.35% due 04/01/2013 | | 15,000 | 15,756 |
| Pacific Life Funding LLC | | | |
| 5.50% due 05/14/2009 | EUR | 39,000 | 49,265 |
| Pacific Life Funding LLC, EMTN | | | |
| 5.125% due 01/20/2015 | GBP | 49,000 | 87,666 |
| Principal Financial Global Funding LLC, EMTN | | |
| 4.50% due 01/22/2009 | EUR | 39,000 | 47,639 |
The accompanying notes are an integral part of the financial statements. 275
John Hancock Funds II
Portfolio of investments — February 28, 2006 (Unaudited)
(showing percentage of total net assets)
|
| Spectrum Income Fund (continued) | |
| | | Shares or | |
| | | Principal | |
| | | Amount | Value |
|
|
| |
| CORPORATE BONDS (continued) | | | |
| Insurance (continued) | | | |
| Principal Life Global Funding I | | | |
| 5.25% due 01/15/2013 | $ | 190,000 | $ | 189,758 |
| Principal Life Income Funding Trusts | | | |
| 5.20% due 11/15/2010 | | 40,000 | 39,924 |
| Prudential Funding LLC, MTN | | | |
| 6.60% due 05/15/2008 | | 150,000 | 154,305 |
| RLI Corp. | | | |
| 5.95% due 01/15/2014 | | 35,000 | 34,424 |
| Security Benefit Life Insurance Company | | | |
| 7.45% due 10/01/2033 | | 95,000 | 109,794 |
| The St. Paul Companies, Inc. | | | |
| 5.75% due 03/15/2007 | | 55,000 | 54,964 |
| Transamerica Capital II | | | |
| 7.65% due 12/01/2026 | | 135,000 | 156,663 |
| Transatlantic Holdings, Inc. | | | |
| 5.75% due 12/14/2015 | | 170,000 | 170,993 |
| Travelers Insurance Company Institutional | | | |
| Funding, Ltd. | | | |
| 5.75% due 12/06/2011 | GBP | 49,000 | 89,837 |
| Travelers Property Casualty Corp. | | | |
| 3.75% due 03/15/2008 | $ | 40,000 | 38,998 |
|
|
| | | | 3,843,263 |
International Oil - 0.56% | | | |
| Canadian Natural Resources, Ltd. | | | |
| 6.45% due 06/30/2033 | | 75,000 | 81,017 |
| Newfield Exploration Company | | | |
| 6.625% due 09/01/2014 | | 35,000 | 36,137 |
| OAO Gazprom, Series REGS | | | |
| 9.625% due 03/01/2013 | | 590,000 | 713,133 |
| Ocean Rig Norway AS | | | |
| 8.375% due 07/01/2013 | | 200,000 | 216,000 |
| Pemex Project Funding Master Trust | | | |
| 5.75% due 12/15/2015 | | 350,000 | 349,475 |
| 5.791% due 06/15/2010 (b) | | 395,000 | 406,850 |
| 6.625% due 06/15/2035 | | 230,000 | 240,005 |
| 6.625% due 06/15/2035 | | 335,000 | 349,573 |
| 7.75% due 09/28/2049 | | 345,000 | 360,180 |
| Pemex Project Funding Master Trust, Series regs | | |
| 6.625% due 06/15/2035 | | 200,000 | 208,700 |
| Petro-Canada | | | |
| 5.95% due 05/15/2035 | | 265,000 | 268,401 |
| PF Export Receivables Master Trust | | | |
| 6.436% due 06/01/2015 | | 76,658 | 75,780 |
| Repsol International Finance BV, EMTN | | | |
| 4.625% due 10/08/2014 | EUR | 35,000 | 43,081 |
| YPF SA, MTN, Series C | | | |
| 10.00% due 11/02/2028 | $ | 220,000 | 261,800 |
|
|
| | | | 3,610,132 |
Investment Companies - 0.01% | | | |
| BES Finance, Ltd., EMTN | | | |
| 6.25% due 05/17/2011 | EUR | 36,000 | 47,823 |
Leisure Time - 1.20% | | | |
| AMC Entertainment, Inc. | | | |
| 8.00% due 03/01/2014 | $ | 300,000 | 261,000 |
| 11.00% due 02/01/2016 | | 300,000 | 301,875 |
| Spectrum Income Fund (continued) | |
| | | Shares or | |
| | | Principal | |
| | | Amount | Value |
|
|
| |
| CORPORATE BONDS (continued) | | | |
| Leisure Time (continued) | | | |
| AMF Bowling Worldwide, Inc. | | | |
| 10.00% due 03/01/2010 | $ | 200,000 | $ | 204,500 |
| Boyd Gaming Corp. | | | |
| 6.75% due 04/15/2014 | | 225,000 | 224,437 |
| 7.75% due 12/15/2012 | | 175,000 | 183,094 |
| 8.75% due 04/15/2012 | | 125,000 | 133,750 |
| Cinemark, Inc. | | | |
| zero coupon, Step up to 9.75% on | | | |
| 03/15/2009 due 03/15/2014 | | 725,000 | 540,125 |
| 9.00% due 02/01/2013 | | 250,000 | 264,375 |
| Herbst Gaming, Inc. | | | |
| 7.00% due 11/15/2014 | | 375,000 | 375,000 |
| 8.125% due 06/01/2012 | | 75,000 | 78,187 |
| International Speedway Corp. | | | |
| 4.20% due 04/15/2009 | | 90,000 | 86,960 |
| Little Traverse Bay Bands of Odawa Indians | | |
| 10.25% due 02/15/2014 | | 175,000 | 172,812 |
| Mandalay Resort Group | | | |
| 10.25% due 08/01/2007 | | 175,000 | 185,719 |
| MGM Mirage, Inc. | | | |
| 6.00% due 10/01/2009 | | 305,000 | 303,475 |
| 6.75% due 09/01/2012 | | 15,000 | 15,244 |
| 8.50% due 09/15/2010 | | 450,000 | 487,687 |
| 9.75% due 06/01/2007 | | 300,000 | 314,250 |
| Mohegan Tribal Gaming Authority | | | |
| 6.875% due 02/15/2015 | | 175,000 | 176,969 |
| Movie Gallery, Inc. | | | |
| 11.00% due 05/01/2012 | | 300,000 | 197,250 |
| Penn National Gaming, Inc. | | | |
| 6.75% due 03/01/2015 | | 450,000 | 452,250 |
| Pinnacle Entertainment, Inc. | | | |
| 8.25% due 03/15/2012 | | 200,000 | 208,000 |
| Royal Caribbean Cruises, Ltd. | | | |
| 8.00% due 05/15/2010 | | 90,000 | 97,341 |
| Speedway Motorsports, Inc. | | | |
| 6.75% due 06/01/2013 | | 310,000 | 314,650 |
| Station Casinos, Inc. | | | |
| 6.00% due 04/01/2012 | | 140,000 | 140,000 |
| 6.50% due 02/01/2014 | | 200,000 | 200,000 |
| 6.875% due 03/01/2016 | | 655,000 | 666,462 |
| Town Sports International, Inc. | | | |
| 9.625% due 04/15/2011 | | 75,000 | 78,563 |
| Trump Entertainment Resorts, Inc. | | | |
| 8.50% due 06/01/2015 | | 325,000 | 324,188 |
| Warner Music Group | | | |
| 7.375% due 04/15/2014 | | 275,000 | 275,688 |
| Worldspan LP/WS Financing Corp. | | | |
| 10.9988% due 02/15/2011 (b) | | 350,000 | 308,000 |
| Wynn Las Vegas LLC | | | |
| 6.625% due 12/01/2014 | | 175,000 | 172,375 |
|
|
| | | | 7,744,226 |
Life Sciences - 0.07% | | | |
| Fisher Scientific International, Inc. | | | |
| 6.125% due 07/01/2015 | | 425,000 | 425,531 |
The accompanying notes are an integral part of the financial statements. 276
John Hancock Funds II
Portfolio of investments — February 28, 2006 (Unaudited)
(showing percentage of total net assets)
|
| Spectrum Income Fund (continued) | |
| | | Shares or | |
| | | Principal | |
| | | Amount | Value |
|
|
| |
| CORPORATE BONDS (continued) | | | |
| Manufacturing - 0.19% | | | |
| Aearo Company | | | |
| 8.25% due 04/15/2012 | $ | 250,000 | $ | 273,750 |
| Koppers, Inc. | | | |
| 9.875% due 10/15/2013 | | 375,000 | 405,000 |
| Tyco International Group SA | | | |
| 5.80% due 08/01/2006 | | 135,000 | 135,282 |
| 6.375% due 10/15/2011 | | 390,000 | 404,127 |
| Tyco International Group SA, EMTN | | | |
| 5.50% due 11/19/2008 | EUR | 10,000 | 12,398 |
|
|
| | | | 1,230,557 |
Medical-Hospitals - 0.55% | | | |
| Community Health Systems, Inc. | | | |
| 6.50% due 12/15/2012 | $ | 200,000 | 198,000 |
| CRC Health Corp. | | | |
| 10.75% due 02/01/2016 | | 225,000 | 232,312 |
| Genesis Healthcare Corp. | | | |
| 8.00% due 10/15/2013 | | 400,000 | 421,000 |
| HCA, Inc. | | | |
| 6.375% due 01/15/2015 | | 500,000 | 499,215 |
| 6.50% due 02/15/2016 | | 325,000 | 323,881 |
| 8.75% due 09/01/2010 | | 650,000 | 714,927 |
| Tenet Healthcare Corp. | | | |
| 6.375% due 12/01/2011 | | 350,000 | 315,875 |
| 6.50% due 06/01/2012 | | 125,000 | 112,813 |
| Triad Hospitals, Inc. | | | |
| 7.00% due 05/15/2012 | | 75,000 | 76,500 |
| 7.00% due 11/15/2013 | | 625,000 | 630,469 |
|
|
| | | | 3,524,992 |
Metal & Metal Products - 0.32% | | | |
| Earle M. Jorgensen Company | | | |
| 9.75% due 06/01/2012 | | 450,000 | 488,250 |
| Falconbridge, Ltd. | | | |
| 6.20% due 06/15/2035 | | 135,000 | 132,008 |
| Gibraltar Industries, Inc. | | | |
| 8.00% due 12/01/2015 | | 425,000 | 428,187 |
| Hawk Corp. | | | |
| 8.75% due 11/01/2014 | | 156,000 | 157,560 |
| Metals USA, Inc. | | | |
| 11.125% due 12/01/2015 | | 100,000 | 107,500 |
| Mobile Mini, Inc. | | | |
| 9.50% due 07/01/2013 | | 190,000 | 208,525 |
| Neenah Foundary Company | | | |
| 11.00% due 09/30/2010 | | 150,000 | 166,500 |
| Novelis, Inc. | | | |
| 7.25% due 02/15/2015 | | 325,000 | 315,250 |
| Rio Tinto Finance PLC, EMTN | | | |
| 5.125% due 05/10/2007 | EUR | 27,000 | 32,933 |
| Vale Overseas, Ltd. | | | |
| 6.25% due 01/11/2016 | $ | 60,000 | 61,440 |
|
|
| | | | 2,098,153 |
Mining - 0.04% | | | |
| Barrick Gold Finance Company | | | |
| 4.875% due 11/15/2014 | | 30,000 | 28,930 |
| Placer Dome, Inc. | | | |
| 6.375% due 03/01/2033 | | 15,000 | 15,733 |
| Spectrum Income Fund (continued) | |
| | | Shares or | |
| | | Principal | |
| | | Amount | Value |
|
|
| |
| CORPORATE BONDS (continued) | | | |
| Mining (continued) | | | |
| Placer Dome, Inc. (continued) | | | |
| 6.45% due 10/15/2035 | $ | 25,000 | $ | 26,594 |
| Rio Tinto Finance USA, Ltd. | | | �� |
| 2.625% due 09/30/2008 | | 140,000 | 131,461 |
| Teck Cominco, Ltd. | | | |
| 5.375% due 10/01/2015 | | 75,000 | 73,612 |
|
|
| | | | 276,330 |
Newspapers - 0.01% | | | |
| E.W. Scripps Company | | | |
| 4.30% due 06/30/2010 | | 50,000 | 47,863 |
Office Furnishings & Supplies - 0.11% | | | |
| ACCO Brands Corp. | | | |
| 7.625% due 08/15/2015 | | 200,000 | 185,500 |
| IKON Office Solutions, Inc. | | | |
| 7.75% due 09/15/2015 | | 175,000 | 176,750 |
| Interface, Inc. | | | |
| 9.50% due 02/01/2014 | | 25,000 | 25,625 |
| 10.375% due 02/01/2010 | | 300,000 | 327,750 |
|
|
| | | | 715,625 |
Paper - 0.29% | | | |
| Abitibi-Consolidated, Inc. | | | |
| 5.25% due 06/20/2008 | | 75,000 | 70,969 |
| 6.95% due 12/15/2006 | | 10,000 | 10,087 |
| 8.55% due 08/01/2010 | | 50,000 | 49,375 |
| Boise Cascade LLC | | | |
| 7.125% due 10/15/2014 | | 335,000 | 318,250 |
| Celulosa Arauco y Constitucion SA | | | |
| 5.125% due 07/09/2013 | | 80,000 | 76,952 |
| 8.625% due 08/15/2010 | | 220,000 | 245,691 |
| Jefferson Smurfit Corp. | | | |
| 8.25% due 10/01/2012 | | 200,000 | 195,500 |
| Longview Fibre Company | | | |
| 10.00% due 01/15/2009 | | 375,000 | 393,750 |
| NewPage Corp. | | | |
| 10.00% due 05/01/2012 | | 25,000 | 26,125 |
| 10.93% due 05/01/2012 (b) | | 175,000 | 183,750 |
| 12.00% due 05/01/2013 | | 125,000 | 128,125 |
| Norske Skog Canada, Ltd. | | | |
| 7.375% due 03/01/2014 | | 200,000 | 184,000 |
|
|
| | | | 1,882,574 |
Petroleum Services - 0.26% | | | |
| Allis-Chalmers Energy, Inc. | | | |
| 9.00% due 01/15/2014 | | 150,000 | 150,000 |
| BP Canada Finance Company | | | |
| 3.375% due 10/31/2007 | | 60,000 | 58,415 |
| Chaparral Energy, Inc. | | | |
| 8.50% due 12/01/2015 | | 325,000 | 343,687 |
| Halliburton Company | | | |
| 5.50% due 10/15/2010 | | 335,000 | 338,920 |
| Hanover Compressor Company | | | |
| 9.00% due 06/01/2014 | | 100,000 | 109,000 |
| Hanover Equipment Trust | | | |
| 8.75% due 09/01/2011 | | 275,000 | 290,125 |
The accompanying notes are an integral part of the financial statements. 277
John Hancock Funds II
Portfolio of investments — February 28, 2006 (Unaudited)
(showing percentage of total net assets)
|
| Spectrum Income Fund (continued) | |
| | | Shares or | |
| | | Principal | |
| | | Amount | Value |
|
|
| |
| CORPORATE BONDS (continued) | | | |
| Petroleum Services (continued) | | | |
| Premcor Refining Group, Inc. | | | |
| 6.75% due 02/01/2011 | $ | 120,000 | $ | 126,093 |
| Pride International, Inc. | | | |
| 7.375% due 07/15/2014 | | 225,000 | 240,188 |
|
|
| | | | 1,656,428 |
Pharmaceuticals - 0.22% | | | |
| Abbott Laboratories | | | |
| 5.625% due 07/01/2006 | | 90,000 | 90,217 |
| AmerisourceBergen Corp. | | | |
| 5.625% due 09/15/2012 | | 250,000 | 248,696 |
| Aventis SA, EMTN | | | |
| 4.25% due 09/15/2010 | EUR | 65,000 | 79,718 |
| Hospira, Inc. | | | |
| 4.95% due 06/15/2009 | $ | 80,000 | 79,057 |
| Merck & Company, Inc. | | | |
| 2.50% due 03/30/2007 | | 100,000 | 97,258 |
| Mylan Laboratories, Inc. | | | |
| 5.75% due 08/15/2010 | | 150,000 | 149,625 |
| Omnicare, Inc. | | | |
| 6.75% due 12/15/2013 | | 350,000 | 356,125 |
| 6.875% due 12/15/2015 | | 125,000 | 127,500 |
| Teva Pharmaceutical Finance LLC | | | |
| 5.55% due 02/01/2016 | | 180,000 | 178,678 |
|
|
| | | | 1,406,874 |
Photography - 0.08% | | | |
| Eastman Kodak Company | | | |
| 7.25% due 11/15/2013 | | 540,000 | 530,675 |
Plastics - 0.08% | | | |
| Covalence Specialty Materials Corp. | | | |
| 10.25% due 03/01/2016 | | 500,000 | 518,125 |
Pollution Control - 0.03% | | | |
| Aleris International, Inc. | | | |
| 9.00% due 11/15/2014 | | 200,000 | 211,000 |
Publishing - 0.32% | | | |
| Dex Media East LLC | | | |
| 9.875% due 11/15/2009 | | 150,000 | 160,875 |
| 12.125% due 11/15/2012 | | 250,000 | 288,437 |
| Dex Media West LLC | | | |
| 8.50% due 08/15/2010 | | 25,000 | 26,500 |
| 9.875% due 08/15/2013 | | 225,000 | 249,188 |
| Haights Cross Operating Company | | | |
| 11.75% due 08/15/2011 | | 225,000 | 234,844 |
| Houghton Mifflin Company | | | |
| 8.25% due 02/01/2011 | | 200,000 | 209,000 |
| Mail-Well I Corp. | | | |
| 9.625% due 03/15/2012 | | 275,000 | 295,625 |
| Medianews Group, Inc. | | | |
| 6.375% due 04/01/2014 | | 75,000 | 67,875 |
| 6.875% due 10/01/2013 | | 300,000 | 279,750 |
| Morris Publishing Group LLC | | | |
| 7.00% due 08/01/2013 | | 300,000 | 281,250 |
|
|
| | | | 2,093,344 |
| Spectrum Income Fund (continued) | |
| | | Shares or | |
| | | Principal | |
| | | Amount | Value |
|
|
| |
| CORPORATE BONDS (continued) | | | |
| Railroads & Equipment - 0.11% | | | |
| Canadian National Railway Company | | | |
| 6.25% due 08/01/2034 | $ | 285,000 | $ | 316,100 |
| Norfolk Southern Corp. | | | |
| 5.59% due 05/17/2025 | | 30,000 | 29,912 |
| 6.00% due 04/30/2008 | | 240,000 | 243,589 |
| 7.25% due 02/15/2031 | | 35,000 | 42,283 |
| Union Pacific Corp. | | | |
| 5.75% due 10/15/2007 | | 85,000 | 85,759 |
|
|
| | | | 717,643 |
| Real Estate - 0.41% | | | |
| Archstone-Smith Operating Trust, REIT | | | |
| 5.25% due 05/01/2015 | | 180,000 | 176,522 |
| 5.625% due 08/15/2014 | | 15,000 | 15,148 |
| Arden Realty LP, REIT | | | |
| 5.20% due 09/01/2011 | | 60,000 | 60,255 |
| AvalonBay Communities, Inc., REIT | | | |
| 4.95% due 03/15/2013 | | 60,000 | 58,101 |
| BF Saul, REIT | | | |
| 7.50% due 03/01/2014 | | 150,000 | 153,750 |
| Camden Property Trust, REIT | | | |
| 4.375% due 01/15/2010 | | 90,000 | 86,997 |
| Developers Diversified Realty Corp., REIT | | | |
| 3.875% due 01/30/2009 | | 170,000 | 162,289 |
| Felcor Lodging LP, REIT | | | |
| 8.83% due 06/01/2011 (b) | | 225,000 | 234,000 |
| 9.00% due 06/01/2011 | | 75,000 | 82,875 |
| Host Marriott LP, REIT | | | |
| 6.375% due 03/15/2015 | | 75,000 | 74,812 |
| 7.125% due 11/01/2013 | | 150,000 | 154,875 |
| Host Marriott LP, Series M, REIT | | | |
| 7.00% due 08/15/2012 | | 100,000 | 102,000 |
| iStar Financial, Inc. | | | |
| 5.80% due 03/15/2011 | | 60,000 | 60,516 |
| iStar Financial, Inc., REIT | | | |
| 6.05% due 04/15/2015 | | 45,000 | 45,721 |
| iStar Financial, Inc., Series B, REIT | | | |
| 4.875% due 01/15/2009 | | 90,000 | 88,627 |
| 5.125% due 04/01/2011 | | 190,000 | 185,790 |
| Kimco Realty Corp., MTN, REIT | | | |
| 4.904% due 02/18/2015 | | 60,000 | 57,263 |
| Meristar Hospitality Corp., REIT | | | |
| 9.00% due 01/15/2008 | | 100,000 | 106,000 |
| 9.125% due 01/15/2011 | | 150,000 | 174,000 |
| Simon Property Group LP, REIT | | | |
| 3.75% due 01/30/2009 | | 180,000 | 172,336 |
| 5.375% due 06/01/2011 | | 55,000 | 54,729 |
| Ventas Realty LP, REIT | | | |
| 6.75% due 06/01/2010 | | 130,000 | 132,763 |
| Ventas Realty LP/Ventas Capital Corp. | | | |
| 6.50% due 06/01/2016 | | 150,000 | 150,750 |
| Vornado Realty LP, REIT | | | |
| 4.50% due 08/15/2009 | | 80,000 | 77,367 |
|
|
| | | | 2,667,486 |
The accompanying notes are an integral part of the financial statements. 278
John Hancock Funds II
Portfolio of investments — February 28, 2006 (Unaudited)
(showing percentage of total net assets)
|
| Spectrum Income Fund (continued) | |
| | | Shares or | |
| | | Principal | |
| | | Amount | Value |
|
|
| |
| CORPORATE BONDS (continued) | | | |
| Retail - 0.14% | | | |
| JC Penney Company, Inc. | | | |
| 7.375% due 08/15/2008 | $ | 100,000 | $ | 104,374 |
| Leslie's Poolmart | | | |
| 7.75% due 02/01/2013 | | 350,000 | 355,250 |
| NationsRent, Inc. | | | |
| 9.50% due 10/15/2010 | | 200,000 | 219,250 |
| Sunstate Equipment Company LLC | | | |
| 10.50% due 04/01/2013 | | 225,000 | 234,000 |
|
|
| | | | 912,874 |
Retail Grocery - 0.19% | | | |
| Couche-Tard US LP | | | |
| 7.50% due 12/15/2013 | | 375,000 | 390,937 |
| Delhaize America, Inc. | | | |
| 8.125% due 04/15/2011 | | 45,000 | 48,906 |
| Pathmark Stores, Inc. | | | |
| 8.75% due 02/01/2012 | | 175,000 | 166,250 |
| Safeway, Inc. | | | |
| 4.125% due 11/01/2008 | | 65,000 | 62,698 |
| Sysco Corp. | | | |
| 5.375% due 09/21/2035 | | 100,000 | 97,328 |
| The Kroger Company | | | |
| 7.80% due 08/15/2007 | | 110,000 | 113,563 |
| 8.05% due 02/01/2010 | | 300,000 | 325,377 |
|
|
| | | | 1,205,059 |
Retail Trade - 0.45% | | | |
| Fortune Brands, Inc. | | | |
| 5.125% due 01/15/2011 | | 210,000 | 207,453 |
| FTD, Inc. | | | |
| 7.75% due 02/15/2014 | | 400,000 | 394,000 |
| GSC Holdings Corp. | | | |
| 8.00% due 10/01/2012 | | 1,000,000 | 997,500 |
| Home Depot, Inc. | | | |
| 3.75% due 09/15/2009 | | 115,000 | 110,092 |
| Jean Coutu Group, Inc. | | | |
| 7.625% due 08/01/2012 | | 275,000 | 275,000 |
| Target Corp. | | | |
| 7.50% due 07/15/2006 | | 55,000 | 55,521 |
| The Pantry, Inc. | | | |
| 7.75% due 02/15/2014 | | 375,000 | 382,500 |
| Wal-Mart Stores, Inc. | | | |
| 4.75% due 01/29/2013 | GBP | 49,000 | 86,230 |
| 5.25% due 09/01/2035 | $ | 235,000 | 226,473 |
| 6.875% due 08/10/2009 | | 155,000 | 163,873 |
|
|
| | | | 2,898,642 |
Sanitary Services - 0.34% | | | |
| Allied Waste North America, Inc. | | | |
| 7.875% due 04/15/2013 | | 185,000 | 192,400 |
| 8.50% due 12/01/2008 | | 225,000 | 237,094 |
| Allied Waste North America, Inc., Series B | | | |
| 8.875% due 04/01/2008 | | 680,000 | 714,850 |
| 9.25% due 09/01/2012 | | 175,000 | 189,875 |
| Casella Waste Systems, Inc. | | | |
| 9.75% due 02/01/2013 | | 750,000 | 800,625 |
| Oakmont Asset Trust | | | |
| 4.514% due 12/22/2008 | | 20,000 | 19,424 |
| Spectrum Income Fund (continued) | |
| | | Shares or | |
| | | Principal | |
| | | Amount | Value |
|
|
| |
| CORPORATE BONDS (continued) | | | |
| Sanitary Services (continued) | | | |
| Waste Management, Inc. | | | |
| 7.375% due 05/15/2029 | $ | 15,000 | $ | 17,397 |
|
|
| | | | 2,171,665 |
Semiconductors - 0.34% | | | |
| Flextronics International, Ltd. | | | |
| 6.25% due 11/15/2014 | | 250,000 | 248,750 |
| Freescale Semiconductor, Inc. | | | |
| 6.875% due 07/15/2011 | | 435,000 | 447,506 |
| 7.125% due 07/15/2014 | | 475,000 | 501,719 |
| Intel Corp. | | | |
| 2.95% due 12/15/2035 | | 250,000 | 220,938 |
| Spansion LLC | | | |
| 11.25% due 01/15/2016 | | 175,000 | 168,875 |
| STATS ChipPAC, Ltd. | | | |
| 6.75% due 11/15/2011 | | 100,000 | 98,000 |
| 7.50% due 07/19/2010 | | 500,000 | 510,000 |
|
|
| | | | 2,195,788 |
Software - 0.22% | | | |
| Activant Solutions, Inc. | | | |
| 10.53% due 04/01/2010 (b) | | 100,000 | 102,500 |
| 10.53% due 04/01/2010 (b) | | 200,000 | 205,000 |
| Oracle Corp. | | | |
| 5.00% due 01/15/2011 | | 730,000 | 720,662 |
| SS&C Technologies, Inc. | | | |
| 11.75% due 12/01/2013 | | 100,000 | 105,000 |
| UGS Corp. | | | |
| 10.00% due 06/01/2012 | | 275,000 | 301,469 |
|
|
| | | | 1,434,631 |
Steel - 0.04% | | | |
| Gerdau Ameristeel Corp. | | | |
| 10.375% due 07/15/2011 | | 225,000 | 247,219 |
Telecommunications Equipment & | | | |
| Services - 0.70% | | | |
| Canadian Satellite Radio Holdings, Inc. | | | |
| 12.75% due 02/15/2014 | | 175,000 | 178,500 |
| Deutsche Telekom International Finance BV | | |
| 3.875% due 07/22/2008 | | 85,000 | 82,625 |
| 6.625% due 07/11/2011 | EUR | 60,000 | 80,873 |
| 7.50% due 05/29/2007 | | 26,000 | 32,585 |
| Eircom Funding | | | |
| 8.25% due 08/15/2013 | $ | 300,000 | 320,625 |
| France Telecom SA | | | |
| 7.20% due 03/01/2006 | | 130,000 | 130,000 |
| 8.00% due 03/01/2011 | | 120,000 | 132,306 |
| France Telecom SA, EMTN | | | |
| 7.00% due 12/23/2009 | EUR | 40,000 | 53,285 |
| 8.125% due 01/28/2033 | | 10,000 | 16,824 |
| Insight Midwest LP | | | |
| 9.75% due 10/01/2009 | $ | 100,000 | 103,250 |
| Intelsat, Ltd. | | | |
| 9.614% due 01/15/2012 (b) | | 400,000 | 408,000 |
| Lucent Technologies, Inc. | | | |
| 8.00% due 08/01/2031 | | 236,000 | 239,278 |
The accompanying notes are an integral part of the financial statements. 279
John Hancock Funds II
Portfolio of investments — February 28, 2006 (Unaudited)
(showing percentage of total net assets)
|
| Spectrum Income Fund (continued) | |
| | | Shares or | |
| | | Principal | |
| | | Amount | Value |
|
|
| |
| CORPORATE BONDS (continued) | | | |
| Telecommunications Equipment & | | | |
| Services (continued) | | | |
| Panamsat Corp. | | | |
| 9.00% due 08/15/2014 | $ | 300,000 | $ | 316,500 |
| Panamsat Holding Corp. | | | |
| zero coupon, Step up to 10.375% on | | | |
| 11/01/2009 due 11/01/2014 | | 25,000 | 17,781 |
| SBC Communications, Inc. | | | |
| 5.10% due 09/15/2014 | | 80,000 | 77,699 |
| Syniverse Technologies Inc., Series B | | | |
| 7.75% due 08/15/2013 | | 225,000 | 225,563 |
| Telefonica Europe BV | | | |
| 7.75% due 09/15/2010 | | 200,000 | 217,242 |
| Telus Corp. | | | |
| 7.50% due 06/01/2007 | | 200,000 | 205,295 |
| 8.00% due 06/01/2011 | | 170,000 | 189,678 |
| Time Warner Telecom, Inc. | | | |
| 10.125% due 02/01/2011 | | 425,000 | 446,250 |
| Verizon Global Funding Corp. | | | |
| 6.125% due 06/15/2007 | | 110,000 | 111,313 |
| 7.25% due 12/01/2010 | | 65,000 | 69,992 |
| 7.75% due 12/01/2030 | | 285,000 | 333,735 |
| Wind Acquisition Finance SA | | | |
| 10.75% due 12/01/2015 | | 450,000 | 481,500 |
| Zeus Special Subsidiary, Ltd. | | | |
| zero coupon, Step up to 9.25% on | | | |
| 02/01/2010 due 02/01/2015 | | 100,000 | 68,500 |
|
|
| | | | 4,539,199 |
Telephone - 0.59% | | | |
| AT&T Corp. | | | |
| 9.05%, Step down to 7.3% on 05/15/2006 | | |
| due 11/15/2011 (b) | | 50,000 | 54,771 |
| AT&T, Inc. | | | |
| 4.9506% due 11/14/2008 (b) | | 100,000 | 100,183 |
| 5.30% due 11/15/2010 | | 340,000 | 338,980 |
| BellSouth Corp. | | | |
| 4.8738% due 11/15/2007 (b) | | 110,000 | 110,131 |
| MCI, Inc. | | | |
| 7.688% due 05/01/2009 | | 275,000 | 283,250 |
| Qwest Corp. | | | |
| 7.741% due 06/15/2013 (b) | | 125,000 | 136,563 |
| 7.875% due 09/01/2011 | | 350,000 | 374,500 |
| 8.875% due 03/15/2012 | | 200,000 | 224,000 |
| Sprint Capital Corp. | | | |
| 6.875% due 11/15/2028 | | 440,000 | 479,441 |
| 7.625% due 01/30/2011 | | 295,000 | 322,539 |
| Telecom Italia Capital SA | | | |
| 4.00% due 01/15/2010 | | 150,000 | 141,895 |
| 5.25% due 11/15/2013 | | 285,000 | 275,230 |
| 6.00% due 09/30/2034 | | 120,000 | 113,477 |
| Telecom Italia Finance SA, EMTN | | | |
| 5.875% due 01/24/2008 | EUR | 14,000 | 17,451 |
| 6.875% due 01/24/2013 | | 52,000 | 71,582 |
| 7.75% due 01/24/2033 | | 11,000 | 16,944 |
| Telefonica Europe BV, Series EMTN | | | |
| 5.125% due 02/14/2013 | | 30,000 | 37,470 |
| Spectrum Income Fund (continued) | |
| | | Shares or | |
| | | Principal | |
| | | Amount | Value |
| |
|
| |
| CORPORATE BONDS (continued) | | | |
| Telephone (continued) | | | |
| Telefonos de Mexico SA de CV | | | |
| 4.50% due 11/19/2008 | $ | 120,000 | $ | 117,555 |
| 4.75% due 01/27/2010 | | 155,000 | 151,539 |
| 5.50% due 01/27/2015 | | 150,000 | 147,745 |
| US LEC Corp. | | | |
| 12.7163% due 10/01/2009 (b) | | 300,000 | 325,875 |
|
|
| | | | 3,841,121 |
Tobacco - 0.10% | | | |
| Altria Group, Inc. | | | |
| 7.20% due 02/01/2007 | | 130,000 | 131,579 |
| BAT International Finance PLC, EMTN | | | |
| 5.125% due 07/09/2013 | EUR | 61,000 | 77,154 |
| Imperial Tobacco Finance PLC, EMTN | | | |
| 6.875% due 06/13/2012 | GBP | 49,000 | 93,485 |
| RJ Reynolds Tobacco Holdings, Inc. | | | |
| 6.50% due 07/15/2010 | $ | 345,000 | 346,725 |
|
|
| | | | 648,943 |
Toys, Amusements & Sporting Goods - 0.06% | | |
| K2, Inc. | | | |
| 7.375% due 07/01/2014 | | 410,000 | 413,075 |
Transportation - 0.30% | | | |
| Bombardier, Inc. | | | |
| 6.30% due 05/01/2014 | | 375,000 | 338,437 |
| 6.75% due 05/01/2012 | | 875,000 | 826,875 |
| CHC Helicopter Corp. | | | |
| 7.375% due 05/01/2014 | | 450,000 | 459,563 |
| Grupo Transportacion Ferroviaria Mexicana, S.A. | | |
| de C.V. | | | |
| 9.375% due 05/01/2012 | | 125,000 | 137,656 |
| Petroleum Helicopters, Series B | | | |
| 9.375% due 05/01/2009 | | 150,000 | 157,875 |
|
|
| | | | 1,920,406 |
Utility Service - 0.05% | | | |
| Public Service Company of New Mexico | | | |
| 4.40% due 09/15/2008 | | 210,000 | 204,489 |
| Veolia Environnement, EMTN | | | |
| 4.875% due 05/28/2013 | EUR | 50,000 | 63,078 |
| 5.875% due 02/01/2012 | | 30,000 | 39,749 |
|
|
| | | | 307,316 |
|
| TOTAL CORPORATE BONDS (Cost $176,090,530) | | $ | 177,710,876 |
|
| |
| CONVERTIBLE BONDS - 0.09% | | | |
Insurance - 0.00% | | | |
| Fortis Insurance NV | | | |
| 7.75% due 01/26/2008 | $ | 25,000 | 30,750 |
Internet Retail - 0.05% | | | |
| Amazon.com, Inc. | | | |
| 4.75% due 02/01/2009 | | 350,000 | 335,125 |
The accompanying notes are an integral part of the financial statements. 280
John Hancock Funds II
Portfolio of investments — February 28, 2006 (Unaudited)
(showing percentage of total net assets)
|
| Spectrum Income Fund (continued) | |
| | | Shares or | |
| | | Principal | |
| | | Amount | Value |
| |
|
| |
| CONVERTIBLE BONDS (continued) | | | |
| Telecommunications Equipment & | | | |
| Services - 0.04% | | | |
| Juniper Networks, Inc. | | | |
| zero coupon due 06/15/2008 | $ | 225,000 | $ | 239,906 |
|
| TOTAL CONVERTIBLE BONDS (Cost $604,906) | | $ | 605,781 |
|
| |
| MUNICIPAL BONDS - 0.25% | | | |
| California - 0.07% | | | |
| California State Public Works Board | | | |
| 5.00% due 01/01/2021 | | 225,000 | 238,615 |
| State of California | | | |
| 5.25% due 04/01/2034 | | 100,000 | 106,924 |
| 5.50% due 11/01/2033 | | 100,000 | 110,294 |
|
|
| | | | 455,833 |
| |
District of Columbia - 0.04% | | | |
| District of Columbia, Series A | | | |
| 5.00% due 06/01/2016 | | 260,000 | 277,545 |
Georgia - 0.07% | | | |
| Atlanta Georgia Airport Passenger FAC Charge | | |
| Revenue | | | |
| 5.00% due 01/01/2033 | | 420,000 | 438,279 |
Kansas - 0.02% | | | |
| Kansas Development Finance Authority | | | |
| 5.501% due 05/01/2034 | | 120,000 | 123,817 |
Nevada - 0.04% | | | |
| Clark County Nevada School District | | | |
| 5.00% due 06/15/2018 | | 220,000 | 235,976 |
Oregon - 0.01% | | | |
| State of Oregon | | | |
| 5.892% due 06/01/2027 | | 60,000 | 63,792 |
|
| TOTAL MUNICIPAL BONDS (Cost $1,566,255) | | $ | 1,595,242 |
|
| |
| COLLATERALIZED MORTGAGE | | | |
| OBLIGATIONS - 4.25% | | | |
| Banc of America Commercial Mortgage, Inc., | | |
| Series 2003-1, Class A1 | | | |
| 3.878% due 09/11/2036 | | 90,479 | 86,676 |
| Banc of America Commercial Mortgage, Inc., | | |
| Series 2003-1, Class A2 | | | |
| 4.648% due 09/11/2036 | | 796,000 | 768,252 |
| Banc of America Commercial Mortgage, Inc., | | |
| Series 2004-6, Class A1 | | | |
| 3.801% due 12/10/2042 | | 150,433 | 146,861 |
| Banc of America Mortgage Securities, | | | |
| Series 2003-L, Class 2A2 | | | |
| 4.2639% due 01/25/2034 (b) | | 582,232 | 569,819 |
| Banc of America Mortgage Securities, | | | |
| Series 2004-A, Class 2A2 | | | |
| 4.1192% due 02/25/2034 (b) | | 321,702 | 314,039 |
| Banc of America Mortgage Securities, | | | |
| Series 2004-D, Class 2A2 | | | |
| 4.199% due 05/25/2034 (b) | | 142,144 | 138,223 |
| Banc of America Mortgage Securities, | | | |
| Series 2004-H, Class 2A2 | | | |
| 4.7607% due 09/25/2034 (b) | | 334,323 | 328,765 |
| Spectrum Income Fund (continued) | |
| | | Shares or | |
| | | Principal | |
| | | Amount | Value |
|
|
| |
| COLLATERALIZED MORTGAGE | | | |
| OBLIGATIONS (continued) | | | |
| Banc of America Mortgage Securities, | | | |
| Series 2004-I, Class 3A2 | | | |
| 4.9332% due 10/25/2034 (b) | $ | 160,060 | $ | 157,377 |
| Banc of America Mortgage Securities, | | | |
| Series 2005-J, Class 2A1 | | | |
| 5.1068% due 11/25/2035 (b) | | 550,205 | 544,779 |
| Bear Stearns Commercial Mortgage | | | |
| Securities, Series 1998-C1, Class A2 | | | |
| 6.44% due 06/16/2030 | | 600,000 | 613,877 |
| Bear Stearns Commercial Mortgage | | | |
| Securities, Series 2002-TOP8, Class A2 | | | |
| 4.83% due 08/15/2038 | | 320,000 | 312,765 |
| Bear Stearns Commercial Mortgage | | | |
| Securities, Series 2004-PWR6, Class A1 | | | |
| 3.688% due 11/11/2041 | | 116,919 | 114,403 |
| Bear Stearns Commercial Mortgage | | | |
| Securities, Series 2005-PW10, Class A1 | | | |
| 5.085% due 12/11/2040 | | 1,007,623 | 1,005,301 |
| Bear Stearns Commercial Mortgage | | | |
| Securities, Series 2005-PWR8, Class A4 | | | |
| 4.674% due 06/11/2041 | | 578,000 | 551,567 |
| Bear Stearns Commercial Mortgage | | | |
| Securities, Series 2005-PWR9, Class A1 | | | |
| 4.498% due 09/15/2042 | | 155,352 | 152,710 |
| Bear Stearns Commercial Mortgage | | | |
| Securities, Series 2005-PWR9, Class AAB | | |
| 4.804% due 09/11/2042 | | 462,000 | 449,483 |
| Bear Stearns Commercial Mortgage | | | |
| Securities, Series 2005-T18, Class A1 | | | |
| 4.274% due 02/13/2042 (b) | | 543,189 | 531,918 |
| Bear Stearns Commercial Mortgage | | | |
| Securities, Series 2005-T20, Class A1 | | | |
| 4.94% due 10/12/2042 | | 43,367 | 43,104 |
| Citigroup Commercial Mortgage | | | |
| Trust, Series 2004-C2, Class A1 | | | |
| 3.787% due 10/15/2041 | | 106,419 | 103,885 |
| Citigroup Mortgage Loan Trust, Inc. | | | |
| 4.70% due 02/25/2036 | | 945,000 | 926,322 |
| Commercial Mortgage Pass Through | | | |
| Certificates, Series 2005-LP5, Class A1 | | | |
| 4.235% due 05/10/2043 | | 508,639 | 499,440 |
| CS First Boston Mortgage Securities Corp., | | |
| Series 2005-C1, Class A2 | | | |
| 4.609% due 02/15/2038 | | 149,000 | 145,640 |
| DLJ Commercial Mortgage Corp., | | | |
| Series 1999-CG2,Class A1B | | | |
| 7.30% due 06/10/2032 | | 629,000 | 666,639 |
| Federal Home Loan Mortgage Corp. Stated Final, | | |
| Series 2004-SF4, Class B | | | |
| 2.37% due 12/15/2009 | | 113,819 | 110,104 |
| Federal Home Loan Mortgage Corp. Stated Final, | | |
| Series 2004-SF4, Class C | | | |
| 3.32% due 12/15/2011 | | 64,000 | 60,395 |
| Federal Home Loan Mortgage Corp. Strips, Series | | |
| 1998-199, Class PO | | | |
| zero coupon PO due 08/01/2028 | | 13,985 | 11,414 |
The accompanying notes are an integral part of the financial statements. 281
John Hancock Funds II
Portfolio of investments — February 28, 2006 (Unaudited)
(showing percentage of total net assets)
|
| Spectrum Income Fund (continued) | |
| | | Shares or | |
| | | Principal | |
| | | Amount | Value |
|
|
| |
| COLLATERALIZED MORTGAGE | | | |
| OBLIGATIONS (continued) | | | |
| Federal Home Loan Mortgage Corp., Series | | | |
| 1993-1633, Class PL | | | |
| 6.50% due 03/15/2023 | $ | 139,425 | $ | 139,744 |
| Federal Home Loan Mortgage Corp., Series | | | |
| 1994-1671, Class G | | | |
| 6.50% due 08/15/2023 | | 13,887 | 13,920 |
| Federal Home Loan Mortgage Corp., Series | | | |
| 2003-2586, Class NJ | | | |
| 4.50% due 08/15/2016 | | 440,460 | 431,445 |
| Federal Home Loan Mortgage Corp., Series | | | |
| 2003-2614, Class IH | | | |
| 4.50% IO due 05/15/2016 | | 267,000 | 35,640 |
| Federal Home Loan Mortgage Corp., Series | | | |
| 2003-2627, Class IE | | | |
| 4.50% IO due 04/15/2018 | | 103,756 | 11,239 |
| Federal Home Loan Mortgage Corp., Series | | | |
| 2003-2631, Class KI | | | |
| 4.50% IO due 01/15/2015 | | 306,447 | 20,661 |
| Federal Home Loan Mortgage Corp., Series | | | |
| 2003-2631, Class LI | | | |
| 4.50% IO due 06/15/2011 | | 126,035 | 4,260 |
| Federal Home Loan Mortgage Corp., Series | | | |
| 2003-2631, Class MV | | | |
| 4.00% due 01/15/2022 | | 191,000 | 188,665 |
| Federal Home Loan Mortgage Corp., Series | | | |
| 2003-2631, Class PC | | | |
| 4.50% due 03/15/2016 | | 1,224,000 | 1,195,725 |
| Federal Home Loan Mortgage Corp., Series | | | |
| 2003-2681, Class PC | | | |
| 5.00% due 01/15/2019 | | 255,000 | 253,030 |
| Federal Home Loan Mortgage Corp., Series | | | |
| 2003-2686, Class JG | | | |
| 5.50% due 04/15/2028 | | 847,000 | 844,590 |
| Federal Home Loan Mortgage Corp., Series | | | |
| 2003-41, Class YV | | | |
| 5.50% due 04/25/2014 | | 317,344 | 318,249 |
| Federal Home Loan Mortgage Corp., Series | | | |
| 2004-2844, Class PQ | | | |
| 5.00% due 05/15/2023 | | 149,000 | 148,431 |
| Federal Home Loan Mortgage Corp., Series | | | |
| 2004-2872, Class YB | | | |
| 5.00% due 06/15/2023 | | 318,000 | 316,232 |
| Federal Home Loan Mortgage Corp., Series | | | |
| 2004-2882, Class YB | | | |
| 5.00% due 10/15/2027 | | 814,000 | 801,532 |
| Federal Home Loan Mortgage Corp., Series | | | |
| 2004-2890, Class PB | | | |
| 5.00% due 11/15/2027 | | 798,000 | 785,775 |
| Federal Home Loan Mortgage Corp., Series | | | |
| 2005-2934, Class NB | | | |
| 5.00% due 01/15/2028 | | 106,000 | 104,302 |
| Federal Home Loan Mortgage Corp., Series | | | |
| 2005-46, Class CN | | | |
| 5.00% due 01/25/2020 | | 313,000 | 309,757 |
| Federal National Mortgage Association Interest | | |
| Strip, Series 2002-319, Class 2 | | | |
| 6.50% IO due 02/01/2032 | | 54,234 | 12,272 |
| Spectrum Income Fund (continued) | |
| | | Shares or | |
| | | Principal | |
| | | Amount | Value |
| |
|
| |
| COLLATERALIZED MORTGAGE | | | |
| OBLIGATIONS (continued) | | | |
| Federal National Mortgage Association, Series | | |
| 1993-8, Class L | | | |
| 9.00% due 01/25/2008 | $ | 8,077 | $ | 8,252 |
| Federal National Mortgage Association, Series | | |
| 2002-43, Class A | | | |
| 6.00% due 06/25/2016 | | 1,664 | 1,664 |
| Federal National Mortgage Association, Series | | |
| 2002-74, Class PJ | | | |
| 5.00% due 03/25/2015 | | 615,000 | 612,131 |
| Federal National Mortgage Association, Series | | |
| 2003-40, Class NI | | | |
| 5.50% IO due 11/25/2028 | | 119,518 | 8,610 |
| Federal National Mortgage Association, Series | | |
| 2003-92, Class NM | | | |
| 3.50% due 04/25/2013 | | 494,000 | 482,364 |
| Federal National Mortgage Association, Series | | |
| 2004-21, Class AC | | | |
| 4.00% due 05/25/2016 | | 106,000 | 103,047 |
| GE Capital Commercial | | | |
| Mortgage Corp., Series 2001-1, Class A2 | | |
| 6.531% due 05/15/2033 | | 440,000 | 463,707 |
| GE Capital Commercial | | | |
| Mortgage Corp., Series 2005-C4, Class A1 | | |
| 5.082% due 11/10/2045 | | 564,004 | 563,498 |
| Government National Mortgage Association, Series | | |
| 1997-16, Class PL | | | |
| 6.50% due 10/20/2027 | | 322,000 | 331,214 |
| Government National Mortgage Association, Series | | |
| 1998-12, Class Z | | | |
| 6.50% due 05/20/2028 | | 70,651 | 71,738 |
| Government National Mortgage Association, Series | | |
| 1998-6, Class EA | | | |
| zero coupon PO due 03/16/2028 | | 51,572 | 44,474 |
| Government National Mortgage Association, Series | | |
| 1999-15, Class PB | | | |
| 5.00% due 08/16/2028 | | 39,046 | 38,957 |
| Government National Mortgage Association, Series | | |
| 2001-48, Class PC | | | |
| 6.50% due 10/20/2031 | | 473,300 | 482,546 |
| Government National Mortgage Association, Series | | |
| 2003-3, Class LM | | | |
| 5.50% due 02/20/2032 | | 401,000 | 400,260 |
| Government National Mortgage Association, Series | | |
| 2003-49, Class A | | | |
| 2.212% due 10/16/2017 | | 113,522 | 106,550 |
| Government National Mortgage Association, Series | | |
| 2003-49, Class C | | | |
| 4.485% due 10/16/2033 (b) | | 67,000 | 62,733 |
| Government National Mortgage Association, Series | | |
| 2003-70, Class TD | | | |
| 5.50% due 10/20/2030 | | 908,000 | 907,174 |
| Government National Mortgage Association, Series | | |
| 2003-73, Class B | | | |
| 5.064% due 09/16/2026 (b) | | 432,000 | 427,516 |
| Government National Mortgage Association, Series | | |
| 2004-103, Class A | | | |
| 3.878% due 12/16/2019 | | 128,742 | 125,342 |
The accompanying notes are an integral part of the financial statements. 282
John Hancock Funds II
Portfolio of investments — February 28, 2006 (Unaudited)
(showing percentage of total net assets)
|
| Spectrum Income Fund (continued) | |
| | | Shares or | |
| | | Principal | |
| | | Amount | Value |
| |
|
| |
| COLLATERALIZED MORTGAGE | | | |
| OBLIGATIONS (continued) | | | |
| Government National Mortgage Association, Series | | |
| 2004-23, Class B | | | |
| 2.946% due 03/16/2019 | $ | 529,000 | $ | 502,605 |
| Government National Mortgage Association, Series | | |
| 2004-43, Class D | | | |
| 4.994% due 03/16/2030 (b) | | 56,000 | 54,770 |
| Government National Mortgage Association, Series | | |
| 2004-44, Class PC | | | |
| 5.50% due 05/20/2031 | | 928,000 | 935,656 |
| Greenwich Capital Commercial Funding Corp., | | |
| Series 2004-GG1, Class A2 | | | |
| 3.835% due 06/10/2036 | | 460,431 | 450,855 |
| Greenwich Capital Commercial Funding Corp., | | |
| Series 2005-GG3, Class AAB | | | |
| 4.619% due 08/10/2042 (b) | | 146,000 | 141,476 |
| GS Mortgage Securities Corp II, | | | |
| Series 2004-GG2, Class A2 | | | |
| 4.293% due 08/01/2038 | | 236,000 | 231,654 |
| JP Morgan Chase Commercial Mortgage | | | |
| Securities Corp., Series 2001-CIB2, Class A2 | | |
| 6.244% due 04/15/2035 | | 243,220 | 247,105 |
| JP Morgan Chase Commercial Mortgage | | | |
| Securities Corp., Series 2001-CIBC, Class A3 | | |
| 6.26% due 03/15/2033 | | 283,000 | 294,782 |
| JP Morgan Chase Commercial Mortgage | | | |
| Securities Corp., Series 2005-LDP4, Class A1 | | |
| 4.613% due 10/15/2042 | | 45,111 | 44,524 |
| JP Morgan Chase Commercial Mortgage | | | |
| Securities Corp., Series 2005-LDP4, Class ASB | | |
| 4.824% due 10/15/2042 (b) | | 621,000 | 605,798 |
| LB-UBS Commercial Mortgage Trust, Series | | |
| 2006-C1, Class A1 | | | |
| 5.018% due 02/15/2031 | | 262,096 | 261,717 |
| LB-UBS Commercial Mortgage Trust, Series | | |
| 2006-C1, Class A4 | | | |
| 5.156% due 02/15/2031 | | 842,500 | 835,523 |
| LB-UBS Commercial Mortgage | | | |
| Trust, Series 2003-C8, Class A1 | | | |
| 3.636% due 11/15/2027 | | 875,513 | 851,024 |
| LB-UBS Commercial Mortgage | | | |
| Trust, Series 2004-C2, Class A2 | | | |
| 3.246% due 03/15/2029 | | 233,000 | 220,995 |
| LB-UBS Commercial Mortgage | | | |
| Trust, Series 2004-C4, Class A2 | | | |
| 4.567% due 06/15/2029 (b) | | 457,000 | 449,571 |
| LB-UBS Commercial Mortgage | | | |
| Trust, Series 2005-C1, Class A4 | | | |
| 4.742% due 02/15/2030 | | 133,000 | 127,936 |
| Morgan Stanley Dean Witter | | | |
| Capita I, Series 2002-TOP7, Class A1 | | | |
| 5.38% due 01/15/2039 | | 70,939 | 71,357 |
| Morgan Stanley Dean Witter | | | |
| Capital I, Series 2002-TOP7, Class A2 | | | |
| 5.98% due 01/15/2039 | | 366,000 | 379,765 |
| Vendee Mortgage Trust, Series 1996-3, Class 4 | | |
| 9.6047% due 03/15/2025 (b) | | 20,030 | 21,388 |
| Spectrum Income Fund (continued) | |
| | | Shares or | |
| | | Principal | |
| | | Amount | Value |
| |
|
| |
| COLLATERALIZED MORTGAGE | | | |
| OBLIGATIONS (continued) | | | |
| Washington Mutual, Inc., Series 2004-AR1, Class A | | |
| 4.229% due 03/25/2034 (b) | $ | 250,186 | $ | 243,971 |
|
| TOTAL COLLATERALIZED MORTGAGE OBLIGATIONS | |
| (Cost $27,621,148) | | | $ | 27,503,476 |
|
| |
| ASSET BACKED SECURITIES - 1.35% | | |
| Bank One Auto Securitization Trust, | | | |
| Series 2003-1, Class A3 | | | |
| 1.82% due 09/20/2007 | | 50,518 | 50,303 |
| BankBoston Home Equity Loan Trust, | | | |
| Series 1998-2, Class A6 | | | |
| 6.64% due 12/25/2028 | | 71,976 | 72,903 |
| Capital Auto Receivables Asset | | | |
| Trust, Series 2004-1, Class A4 | | | |
| 2.64% due 11/17/2008 | | 191,000 | 185,571 |
| Capital Auto Receivables Asset | | | |
| Trust, Series 2004-1, Class CTFS | | | |
| 2.84% due 09/15/2010 | | 149,000 | 144,465 |
| Capital One Multi-Asset Execution | | | |
| Trust, Series 2004-A8, Class A8 | | | |
| 4.70% due 08/15/2014 (b) | | 999,000 | 1,002,809 |
| Capital One Multi-Asset Execution | | | |
| Trust, Series 2005-A7, Class A7 | | | |
| 4.70% due 06/15/2015 | | 468,000 | 459,491 |
| Capital One Prime Auto Receivables Trust, Series | | |
| 2006-1, Class A4 | | | |
| 5.01% due 11/15/2011 | | 260,000 | 259,964 |
| Chase Funding Mortgage Loan Asset-Backed | | |
| Certificates, Series 2002-2, Class 1M1 | | | |
| 5.599% due 09/25/2031 | | 37,932 | 37,728 |
| Chase Funding Mortgage Loan Asset-Backed | | |
| Certificates, Series 2002-4, Class 2A1 | | | |
| 4.9506% due 10/25/2032 (b) | | 21,613 | 21,706 |
| Chase Funding Mortgage Loan Asset-Backed | | |
| Certificates, Series 2003-3, Class 1A6 | | | |
| 3.717% due 10/25/2014 | | 250,000 | 236,005 |
| Chase Issuance Trust, Series 2005-A7, Class A7 | | |
| 4.55% due 03/15/2013 | | 511,000 | 500,945 |
| Chase Manhattan Auto Owner | | | |
| Trust, Series 2003-A, Class A4 | | | |
| 2.06% due 12/15/2009 | | 344,736 | 337,064 |
| Citibank Credit Card Issuance | | | |
| Trust, Series 2001-A6, Class A6 | | | |
| 5.65% due 06/16/2008 | | 149,000 | 149,410 |
| CNH Equipment Trust, Series 2003-B, Class A4B | | |
| 3.38% due 02/15/2011 | | 250,000 | 244,389 |
| Credit-Based Asset Servicing and | | | |
| Securitization, Series 2005-CB5, Class AF2 | | |
| 4.831% due 08/25/2035 | | 293,000 | 288,164 |
| GE Equipment Small Ticket LLC, Series 2005-1A, | | |
| Class A4 | | | |
| 4.51% due 12/22/2014 | | 337,000 | 331,097 |
| GS Auto Loan Trust, Series 2004-1, Class A3 | | |
| 2.13% due 11/15/2007 | | 32,612 | 32,349 |
| Harley-Davidson Motorcycle | | | |
| Trust, Series 2003-3, Class A2 | | | |
| 2.76% due 05/15/2011 | | 91,894 | 90,463 |
The accompanying notes are an integral part of the financial statements. 283
John Hancock Funds II
Portfolio of investments — February 28, 2006 (Unaudited)
(showing percentage of total net assets)
|
| Spectrum Income Fund (continued) | |
| | | Shares or | |
| | | Principal | |
| | | Amount | Value |
|
|
| |
| ASSET BACKED SECURITIES | | | |
| (continued) | | | |
| Harley-Davidson Motorcycle | | | |
| Trust, Series 2003-4, Class A2 | | | |
| 2.69% due 04/15/2011 | $ | 97,000 | $ | 94,150 |
| Hertz Vehicle Financing LLC, | | | |
| Series 2004-1A, Class A2 | | | |
| 2.38% due 05/25/2008 | | 265,000 | 257,926 |
| Honda Auto Receivables Owner | | | |
| Trust, Series 2003-5, Class A4 | | | |
| 2.96% due 04/20/2009 | | 194,000 | 189,361 |
| Household Affinity Credit Card Master Note | | |
| Trust I, Series 2003-1, Class A | | | |
| 4.69% due 02/15/2010 (b) | | 106,000 | 106,232 |
| Hyundai Auto Receivables | | | |
| Trust, Series 2003-A, Class A4 | | | |
| 3.02% due 10/15/2010 | | 150,000 | 145,981 |
| John Deere Owner Trust, Series 2003-A, Class A3 | | |
| 1.79% due 04/15/2007 | | 3,634 | 3,628 |
| John Deere Owner Trust, Series 2005-A, Class A4 | | |
| 4.16% due 05/15/2012 | | 50,000 | 48,837 |
| M&I Auto Loan Trust, Series 2005-1, Class A4 | | |
| 4.86% due 03/21/2011 | | 140,000 | 139,342 |
| MBNA Credit Card Master Note | | | |
| Trust, Series 2005-A6, Class A6 | | | |
| 4.50% due 01/15/2013 | | 247,000 | 244,390 |
| MBNA Master Credit Card Trust | | | |
| USA, Series 2000-D, Class A | | | |
| 4.77% due 09/15/2009 (b) | | 225,000 | 225,486 |
| Navistar Financial Corp. Owner | | | |
| Trust, Series 2003-B, Class A3 | | | |
| 4.77% due 04/15/2008 (b) | | 136,562 | 136,696 |
| New Century Home Equity Loan | | | |
| Trust, Series 2005-A, Class A6 | | | |
| 4.954% due 08/25/2035 | | 555,000 | 534,044 |
| New Century Home Equity Loan | | | |
| Trust, Series 2005-A, Class M2 | | | |
| 5.344% due 08/25/2035 | | 215,000 | 207,744 |
| Nissan Auto Receivables Owner | | | |
| Trust, Series 2004-A, Class A4 | | | |
| 2.76% due 07/15/2009 | | 191,000 | 185,082 |
| Onyx Acceptance Owner | | | |
| Trust, Series 2005-A, ClassA4 | | | |
| 3.91% due 09/15/2011 | | 250,000 | 243,977 |
| Peco Energy Transition Trust, | | | |
| Series 2001-A, Class A1 | | | |
| 6.52% due 12/31/2010 | | 447,000 | 471,377 |
| PP&L Transition Bond Company LLC, | | | |
| Series 1999-1, Class A8 | | | |
| 7.15% due 06/25/2009 | | 111,000 | 115,931 |
| PSE&G Transition Funding LLC, Series 2001-1, | | |
| Class A6 | | | |
| 6.61% due 06/15/2015 | | 131,000 | 141,698 |
| Reliant Energy Transport Bond | | | |
| Company, Series 2001-1, Class A4 | | | |
| 5.63% due 09/15/2015 | | 334,000 | 342,890 |
| Residential Asset Mortgage | | | |
| Products, Inc., Series 2003-RZ2, Class A1 | | |
| 3.60% due 04/25/2033 | | 44,668 | 43,240 |
| Spectrum Income Fund (continued) | |
| | | Shares or | |
| | | Principal | |
| | | Amount | Value |
|
|
| |
| ASSET BACKED SECURITIES | | | |
| (continued) | | | |
| Residential Asset Mortgage | | | |
| Products, Inc., Series 2004-RZ3, Class AI2 | | |
| 3.42% due 10/25/2027 (b) | $ | 62,809 | $ | 62,343 |
| Sovereign Bank Home Equity Loan | | | |
| Trust, Series 2000-1, Class A6 | | | |
| 7.25% due 02/25/2015 | | 8,988 | 9,151 |
| USAA Auto Owner Trust, Series 2005-2, Class A4 | | |
| 4.17% due 02/15/2011 | | 150,000 | 146,533 |
| WFS Financial Owner Trust, Series 2004-1, Class | | |
| A4 | | | |
| 2.81% due 08/22/2011 | | 213,000 | 206,181 |
|
| TOTAL ASSET BACKED SECURITIES | | | |
| (Cost $8,773,212) | | | $ | 8,747,046 |
|
| |
| SUPRANATIONAL OBLIGATIONS - 0.38% | | |
| Supranational - 0.38% | | | |
| Eurofima, EMTN | | | |
| 6.50% due 08/22/2011 | AUD | 555,000 | 428,515 |
| European Investment Bank, Series EMTN | | | |
| 6.00% due 07/15/2009 | NZD | 835,000 | 543,258 |
| 6.50% due 09/10/2014 | | 2,200,000 | 1,456,323 |
|
|
| | | | 2,428,096 |
|
| |
| TOTAL SUPRANATIONAL OBLIGATIONS | | |
| (Cost $2,510,515) | | | $ | 2,428,096 |
|
| |
| SHORT TERM INVESTMENTS - 4.49% | | |
| T. Rowe Price Reserve Investment | | | |
| Fund (c) | $ | 29,031,923 | $ | 29,031,923 |
|
| TOTAL SHORT TERM INVESTMENTS | | | |
| (Cost $29,031,923) | | | $ | 29,031,923 |
|
| |
| REPURCHASE AGREEMENTS - 5.18% | | |
| Repurchase Agreement with State | | | |
| Street Corp. dated 02/28/2006 at | | | |
| 3.20% to be repurchased at | | | |
| $33,555,982 on 03/01/2006, | | | |
| collateralized by $26,615,000 U.S. | | | |
| Treasury Bond 7.25% due | | | |
| 08/15/2022 (valued at | | | |
| $34,227,981, including interest) (c) | $ | 33,553,000 | $ | 33,553,000 |
|
| TOTAL REPURCHASE AGREEMENTS | | | |
| (Cost $33,553,000) | | | $ | 33,553,000 |
|
| Total Investments (Spectrum Income Fund) | | |
| (Cost $635,696,586) - 99.89% | | | $ | 646,393,366 |
| Other Assets in Excess of Liabilities - 0.11% | | 698,576 |
|
|
| TOTAL NET ASSETS - 100.00% | | | $ | 647,091,942 |
|
|
The accompanying notes are an integral part of the financial statements. 284
John Hancock Funds II
Portfolio of investments — February 28, 2006 (Unaudited)
(showing percentage of total net assets)
|
| Strategic Bond Fund | | | | |
| | | Shares or | | |
| | | Principal | | |
| | | Amount | | Value |
|
|
| |
| COMMON STOCKS - 0.29% | | | | |
| Broadcasting - 0.06% | | | | |
| Liberty Global, Inc., Class A * | | 7,685 | $ | 156,082 |
| Liberty Global, Inc., Series C * | | 7,685 | | 149,089 |
|
|
| | | | | 305,171 |
Cellular Communications - 0.15% | | | | |
| American Tower Corp., Class A * | | 23,747 | | 755,867 |
Household Products - 0.03% | | | | |
| Home Interiors * | | 674,617 | | 182,147 |
Telecommunications Equipment & | | | | |
| Services - 0.05% | | | | |
| Telewest Global, Inc. * | | 10,197 | | 243,199 |
|
| TOTAL COMMON STOCKS (Cost $1,342,339) | | $ | 1,486,384 |
|
| |
| WARRANTS - 0.01% | | | | |
| Government of Mexico - 0.01% | | | | |
| Government of Mexico | | | | |
| (Expiration Date 10/10/2006; strike | | | | |
| price $25.00) | | 5,000 | | 22,500 |
|
| TOTAL WARRANTS (Cost $12,500) | | | $ | 22,500 |
|
| |
| U.S. TREASURY OBLIGATIONS - 15.69% | | | |
| U.S. Treasury Bonds - 2.39% | | | | |
| 4.125% due 08/15/2010 (a) | $ | 5,000,000 | | 4,899,805 |
| 4.25% due 08/15/2014 (a) | | 1,275,000 | | 1,242,777 |
| 5.25% due 11/15/2028 to 02/15/2029 (a) | 3,250,000 | | 3,514,456 |
| 5.50% due 08/15/2028 (a) | | 1,375,000 | | 1,533,018 |
| 6.125% due 08/15/2029 (a)**** | | 800,000 | | 965,844 |
|
|
| | | | | 12,155,900 |
U.S. Treasury Notes - 13.30% | | | | |
| 3.625% due 01/15/2010 (a) | | 5,150,000 | | 4,965,527 |
| 3.875% due 05/15/2010 (a) | | 8,300,000 | | 8,058,785 |
| 4.00% due 03/15/2010 to 02/15/2014 (a) | 32,450,000 | | 31,643,761 |
| 4.25% due 11/15/2014 to 08/15/2015 (a) | 14,575,000 | | 14,198,507 |
| 5.00% due 02/15/2011 (a) | | 8,700,000 | | 8,853,607 |
|
|
| | | | | 67,720,187 |
|
| TOTAL U.S. TREASURY OBLIGATIONS | | | |
| (Cost $80,343,587) | | | $ | 79,876,087 |
|
| |
| U.S. GOVERNMENT AGENCY OBLIGATIONS - 36.38% | | |
| Federal Home Loan Mortgage Corp. - 5.64% | | | |
| 5.00% TBA ** | | 29,650,000 | | 28,723,437 |
| 8.00% due 05/01/2010 | | 12,175 | | 12,645 |
| 8.50% due 05/01/2008 | | 7,968 | | 8,190 |
|
|
| | | | | 28,744,272 |
Federal National Mortgage | | | | |
| Association - 30.73% | | | | |
| 4.00% TBA ** | | 13,300,000 | | 12,639,150 |
| 4.50% TBA ** | | 10,700,000 | | 10,071,375 |
| 5.00% TBA ** | | 42,450,000 | | 41,229,563 |
| 5.50% TBA ** | | 77,000,000 | | 76,278,125 |
| 6.00% TBA ** | | 9,600,000 | | 9,686,995 |
| 6.50% due 10/01/2032 | | 895,805 | | 919,042 |
| Strategic Bond Fund (continued) | | |
| | | Shares or | |
| | | Principal | |
| | | Amount | Value |
| |
|
| |
| U.S. GOVERNMENT AGENCY | | | |
| OBLIGATIONS (continued) | | | |
| Federal National Mortgage | | | |
| Association (continued) | | | |
| 6.50% TBA ** | $ | 5,300,000 | $ | 5,425,875 |
| 7.50% due 07/01/2030 to 02/01/2031 | | 71,961 | 75,332 |
| 8.00% due 07/01/2027 to 08/01/2027 | | 73,890 | 78,901 |
| 8.80% due 01/25/2019 | | 67,639 | 71,376 |
| 10.40% due 04/25/2019 | | 24,623 | 26,480 |
|
|
| | | | 156,502,214 |
Government National Mortgage | | | |
| Association - 0.01% | | | |
| 7.50% due 04/15/2022 to 02/15/2028 | | 26,812 | 28,230 |
|
| TOTAL U.S. GOVERNMENT AGENCY OBLIGATIONS | |
| (Cost $184,379,029) | | | $ | 185,274,716 |
|
| |
OREIGN GOVERNMENT OBLIGATIONS - 5.13% | |
| Argentina - 0.17% | | | |
| Republic of Argentina, Series PGDP | | | |
| .34% due 12/15/2035 (b) | ARS | 2,818,991 | 57,270 |
| 4.50% due 12/15/2035 (a)(b) | $ | 1,105,896 | 84,048 |
| 5.83% due 12/31/2033 (b) | ARS | 1,009,091 | 431,200 |
| 8.28% due 12/31/2033 (a) | $ | 296,963 | 297,261 |
|
|
| | | | 869,779 |
Brazil - 1.17% | | | |
| Federative Republic of Brazil | | | |
| 5.25% due 04/15/2012 (b) | | 1,298,495 | 1,298,495 |
| 7.875% due 03/07/2015 (a) | | 225,000 | 251,550 |
| 8.00% due 01/15/2018 (a) | | 2,350,000 | 2,630,825 |
| 8.75% due 02/04/2025 | | 1,475,000 | 1,781,062 |
|
|
| | | | 5,961,932 |
Bulgaria - 0.04% | | | |
| Republic of Bulgaria | | | |
| 8.25% due 01/15/2015 | | 175,000 | 210,158 |
Canada - 0.34% | | | |
| Province of Quebec Canada | | | |
| 4.60% due 05/26/2015 (a) | | 1,800,000 | 1,742,371 |
Colombia - 0.29% | | | |
| Republic of Colombia | | | |
| 8.125% due 05/21/2024 (a) | | 550,000 | 642,950 |
| 10.00% due 01/23/2012 | | 250,000 | 304,375 |
| 10.75% due 01/15/2013 (a) | | 425,000 | 544,000 |
|
|
| | | | 1,491,325 |
Ecuador - 0.08% | | | |
| Republic of Ecuador | | | |
| zero coupon, Step up to 10% on | | | |
| 08/15/2006 due 08/15/2030 (b) | | 425,000 | 420,750 |
Italy - 0.17% | | | |
| Republic of Italy | | | |
| 5.804% due 10/25/2032 | | 800,000 | 874,460 |
Mexico - 0.91% | | | |
| Government of Mexico | | | |
| 5.875% due 01/15/2014 | | 1,225,000 | 1,255,625 |
| 6.375% due 01/16/2013 | | 1,875,000 | 1,974,375 |
The accompanying notes are an integral part of the financial statements. 285
John Hancock Funds II
Portfolio of investments — February 28, 2006 (Unaudited)
(showing percentage of total net assets)
|
| Strategic Bond Fund (continued) | | |
| | | Shares or | |
| | | Principal | |
| | | Amount | Value |
| |
|
| |
| FOREIGN GOVERNMENT OBLIGATIONS | | |
| (continued) | | | |
| Mexico (continued) | | | |
| Government of Mexico (continued) | | | |
| 8.125% due 12/30/2019 | $ | 800,000 | $ | 990,000 |
| 10.375% due 02/17/2009 | | 350,000 | 399,000 |
|
|
| | | | 4,619,000 |
Panama - 0.18% | | | |
| Republic of Panama | | | |
| 6.70% due 01/26/2036 | | 359,000 | 364,385 |
| 7.25% due 03/15/2015 | | 500,000 | 537,500 |
|
|
| | | | 901,885 |
Peru - 0.19% | | | |
| Republic of Peru | | | |
| 5.00% Step up to 6.89% on 03/07/2007 | | | |
| due 03/07/2017 (b) | | 328,000 | 322,260 |
| 5.00% Step up to 6.94% on 03/07/2007 | | | |
| due 03/07/2017 (b) | | 245,000 | 239,487 |
| 8.75% due 11/21/2033 | | 125,000 | 153,125 |
| 9.875% due 02/06/2015 | | 200,000 | 249,000 |
|
|
| | | | 963,872 |
Philippines - 0.39% | | | |
| Republic of Philippines | | | |
| 8.375% due 03/12/2009 | | 225,000 | 240,188 |
| 8.875% due 03/17/2015 (a) | | 350,000 | 396,375 |
| 9.50% due 02/02/2030 (a) | | 200,000 | 239,500 |
| 9.875% due 01/15/2019 | | 500,000 | 602,500 |
| 10.625% due 03/16/2025 | | 375,000 | 486,562 |
|
|
| | | | 1,965,125 |
Poland - 0.10% | | | |
| Republic of Poland | | | |
| 5.25% due 01/15/2014 (a) | | 500,000 | 503,000 |
| Russia - 0.35% | | | |
| Russian Federation | | | |
| 8.25% due 03/31/2010 | | 475,000 | 502,407 |
| 11.00% due 07/24/2018 | | 875,000 | 1,295,963 |
|
|
| | | | 1,798,370 |
South Africa - 0.06% | | | |
| Republic of South Africa | | | |
| 6.50% due 06/02/2014 | | 275,000 | 296,656 |
Turkey - 0.37% | | | |
| Republic of Turkey | | | |
| 7.375% due 02/05/2025 | | 975,000 | 1,040,813 |
| 9.00% due 06/30/2011 (a) | | 550,000 | 627,000 |
| 11.50% due 01/23/2012 | | 175,000 | 222,687 |
|
|
| | | | 1,890,500 |
Ukraine - 0.04% | | | |
| Republic of Ukraine | | | |
| 6.875% due 03/04/2011 (a) | | 200,000 | 204,560 |
Venezuela - 0.28% | | | |
| Republic of Venezuela | | | |
| 9.375% due 01/13/2034 | | 400,000 | 518,400 |
| Strategic Bond Fund (continued) | | |
| | | Shares or | |
| | | Principal | |
| | | Amount | Value |
| |
|
| |
| FOREIGN GOVERNMENT OBLIGATIONS | | |
| (continued) | | | |
| Venezuela (continued) | | | |
| Republic of Venezuela (continued) | | | |
| 10.75% due 09/19/2013 | $ | 725,000 | $ | 913,500 |
|
|
| | | | 1,431,900 |
|
| |
| TOTAL FOREIGN GOVERNMENT OBLIGATIONS | |
| (Cost $24,957,706) | | | $ | 26,145,643 |
|
| |
| CORPORATE BONDS - 29.85% | | | |
| Advertising - 0.31% | | | |
| Lamar Media Corp. | | | |
| 6.625% due 08/15/2015 | | 150,000 | 151,688 |
| R H Donnelley Finance Corp. | | | |
| 8.875% due 01/15/2016 | | 500,000 | 521,250 |
| RH Donnelley Corp. | | | |
| 6.875% due 01/15/2013 | | 100,000 | 94,000 |
| 6.875% due 01/15/2013 | | 175,000 | 164,500 |
| RH Donnelley Finance Corp., Series I | | | |
| 10.875% due 12/15/2012 | | 300,000 | 337,500 |
| Vertis, Inc. | | | |
| 9.75% due 04/01/2009 | | 300,000 | 310,500 |
|
|
| | | | 1,579,438 |
| |
Aerospace - 0.43% | | | |
| Alliant Techsystems, Inc. | | | |
| 8.50% due 05/15/2011 | | 200,000 | 209,250 |
| Argo-Tech Corp. | | | |
| 9.25% due 06/01/2011 | | 225,000 | 238,500 |
| DRS Technologies, Inc. | | | |
| 6.875% due 11/01/2013 | | 400,000 | 399,000 |
| 7.625% due 02/01/2018 | | 25,000 | 25,687 |
| Goodrich Corp. | | | |
| 7.50% due 04/15/2008 | | 550,000 | 572,763 |
| Moog, Inc. | | | |
| 6.25% due 01/15/2015 | | 250,000 | 247,500 |
| Sequa Corp. | | | |
| 9.00% due 08/01/2009 | | 475,000 | 511,813 |
|
|
| | | | 2,204,513 |
| |
Agriculture - 0.14% | | | |
| Case New Holland, Inc. | | | |
| 7.125% due 03/01/2014 | | 225,000 | 225,562 |
| Pilgrim's Pride Corp. | | | |
| 9.25% due 11/15/2013 | | 200,000 | 209,500 |
| UAP Holding Corp. | | | |
| zero coupon, Step up to 10.75% on | | | |
| 01/15/2008 due 07/15/2012 | | 75,000 | 66,938 |
| United Agri Products, Inc. | | | |
| 8.25% due 12/15/2011 | | 175,000 | 184,625 |
|
|
| | | | 686,625 |
| |
Air Travel - 0.01% | | | |
| Continental Airlines, Inc. | | | |
| 6.541% due 09/15/2008 | | 46,339 | 43,570 |
Aluminum - 0.04% | | | |
| IMCO Recycling, Inc. | | | |
| 10.375% due 10/15/2010 | | 200,000 | 220,000 |
The accompanying notes are an integral part of the financial statements. 286
John Hancock Funds II
Portfolio of investments — February 28, 2006 (Unaudited)
(showing percentage of total net assets)
|
| Strategic Bond Fund (continued) | | |
| | | Shares or | |
| | | Principal | |
| | | Amount | Value |
| |
|
| |
| CORPORATE BONDS (continued) | | | |
| Amusement & Theme Parks - 0.04% | | | |
| Six Flags, Inc. | | | |
| 9.625% due 06/01/2014 | $ | 125,000 | $ | 126,875 |
| 9.75% due 04/15/2013 | | 75,000 | 76,688 |
|
|
| | | | 203,563 |
Apparel & Textiles - 0.18% | | | |
| Collins & Aikman Floorcoverings, Inc. | | | |
| 9.75% due 02/15/2010 | | 250,000 | 236,250 |
| Levi Strauss & Company | | | |
| 7.73% due 04/01/2012 | | 75,000 | 77,438 |
| 9.75% due 01/15/2015 | | 175,000 | 186,375 |
| 12.25% due 12/15/2012 | | 225,000 | 257,062 |
| Quiksilver, Inc. | | | |
| 6.875% due 04/15/2015 (a) | | 186,000 | 179,490 |
|
|
| | | | 936,615 |
Auto Parts - 0.12% | | | |
| Keystone Automotive Operations | | | |
| 9.75% due 11/01/2013 | | 150,000 | 130,875 |
| Tenneco Automotive, Inc. | | | |
| 8.625% due 11/15/2014 (a) | | 250,000 | 248,750 |
| TRW Automotive, Inc. | | | |
| 9.375% due 02/15/2013 | | 200,000 | 217,000 |
|
|
| | | | 596,625 |
Automobiles - 0.65% | | | |
| DaimlerChrysler NA Holding Corp. | | | |
| 4.05% due 06/04/2008 | | 1,650,000 | 1,601,873 |
| Ford Motor Company | | | |
| 6.625% due 10/01/2028 | | 150,000 | 100,500 |
| 7.45% due 07/16/2031 (a) | | 1,325,000 | 940,750 |
| 8.90% due 01/15/2032 | | 100,000 | 77,000 |
| General Motors Corp. | | | |
| 8.25% due 07/15/2023 (a) | | 100,000 | 68,750 |
| 8.375% due 07/15/2033 (a) | | 625,000 | 440,625 |
| Hertz Corp., Class A | | | |
| 8.875% due 01/01/2014 | | 100,000 | 104,500 |
|
|
| | | | 3,333,998 |
Banking - 1.19% | | | |
| Bank of America Corp. | | | |
| 7.40% due 01/15/2011 | | 2,100,000 | 2,290,369 |
| Capital One Bank | | | |
| 5.75% due 09/15/2010 | | 1,250,000 | 1,270,598 |
| Standard Chartered Bank | | | |
| 8.00% due 05/30/2031 | | 1,945,000 | 2,489,709 |
|
|
| | | | 6,050,676 |
Broadcasting - 0.93% | | | |
| CanWest Media, Inc. | | | |
| 8.00% due 09/15/2012 | | 400,000 | 410,000 |
| Charter Communications Holdings | | | |
| zero coupon, Step up to 11.75% on | | | |
| 05/15/2006 due 05/15/2014 | | 625,000 | 325,000 |
| zero coupon, Step up to 12.125% on | | | |
| 01/15/2007 due 01/15/2015 | | 75,000 | 34,500 |
| 11.00% due 10/01/2015 | | 400,000 | 336,500 |
| Charter Communications I Holdings LLC | | | |
| 10.00% due 05/15/2014 | | 75,000 | 39,000 |
| Strategic Bond Fund (continued) | | |
| | | Shares or | |
| | | Principal | |
| | | Amount | Value |
| |
|
| |
| CORPORATE BONDS (continued) | | | |
| Broadcasting (continued) | | | |
| Charter Communications I Holdings LLC (continued) | | |
| 13.5 due 01/15/2014 | $ | 125,000 | $ | 81,250 |
| Charter Communications Operating LLC | | | |
| 8.375% due 04/30/2014 | | 225,000 | 226,687 |
| CSC Holdings, Inc. | | | |
| 7.00% due 04/15/2012 | | 250,000 | 241,875 |
| 7.625% due 07/15/2018 | | 25,000 | 24,344 |
| 8.125% due 08/15/2009 | | 325,000 | 335,156 |
| CSC Holdings, Inc., Series B | | | |
| 7.625% due 04/01/2011 (a) | | 125,000 | 125,937 |
| 8.125% due 07/15/2009 | | 25,000 | 25,781 |
| Emmis Communications Corp. | | | |
| 10.3663% due 06/15/2012 (b) | | 51,429 | 51,429 |
| News America, Inc. | | | |
| 5.30% due 12/15/2014 (a) | | 1,975,000 | 1,943,359 |
| Radio One, Inc. | | | |
| 6.375% due 02/15/2013 | | 225,000 | 216,000 |
| 8.875% due 07/01/2011 | | 200,000 | 210,000 |
| Salem Communications Corp. | | | |
| 7.75% due 12/15/2010 | | 100,000 | 102,625 |
|
|
| | | | 4,729,443 |
Building Materials & Construction - 0.09% | | |
| Associated Materials, Inc. | | | |
| zero coupon, Step up to 11.25% on | | | |
| 03/01/2009 due 03/01/2014 | | 575,000 | 304,750 |
| Brand Services, Inc. | | | |
| 12.00% due 10/15/2012 | | 125,000 | 132,812 |
|
|
| | | | 437,562 |
Business Services - 0.35% | | | |
| Allied Security Escrow Corp. | | | |
| 11.375% due 07/15/2011 | | 200,000 | 188,000 |
| Conveo Corp. | | | |
| 7.875% due 12/01/2013 (a) | | 175,000 | 173,250 |
| Interep National Radio Sales, Inc., Series B, Class A | | |
| 10.00% due 07/01/2008 (a) | | 125,000 | 106,406 |
| Invensys PLC | | | |
| 9.875% due 03/15/2011 (a) | | 175,000 | 181,125 |
| Iron Mountain, Inc. | | | |
| 7.75% due 01/15/2015 | | 175,000 | 177,188 |
| 8.25% due 07/01/2011 | | 125,000 | 126,875 |
| 8.625% due 04/01/2013 | | 300,000 | 312,750 |
| SunGard Data Systems, Inc. | | | |
| 9.125% due 08/15/2013 | | 100,000 | 106,375 |
| Xerox Capital Trust I | | | |
| 8.00% due 02/01/2027 | | 400,000 | 414,000 |
|
|
| | | | 1,785,969 |
Cable and Television - 1.14% | | | |
| Atlantic Broadband Finance LLC | | | |
| 9.375% due 01/15/2014 | | 300,000 | 279,000 |
| CCO Holdings LLC | | | |
| 8.75% due 11/15/2013 | | 250,000 | 243,750 |
| DirecTV Holdings LLC | | | |
| 6.375% due 06/15/2015 | | 375,000 | 373,594 |
| 8.375% due 03/15/2013 | | 175,000 | 187,687 |
The accompanying notes are an integral part of the financial statements. 287
John Hancock Funds II
Portfolio of investments — February 28, 2006 (Unaudited)
(showing percentage of total net assets)
|
| Strategic Bond Fund (continued) | | |
| | | Shares or | |
| | | Principal | |
| | | Amount | Value |
| |
|
| |
| CORPORATE BONDS (continued) | | | |
| Cable and Television (continued) | | | |
| Echostar DBS Corp. | | | |
| 6.625% due 10/01/2014 | $ | 825,000 | $ | 802,312 |
| 7.125% due 02/01/2016 | | 50,000 | 49,500 |
| Lodgenet Entertainment Corp. | | | |
| 9.50% due 06/15/2013 | | 250,000 | 270,000 |
| Mediacom Broadband LLC | | | |
| 8.50% due 10/15/2015 | | 75,000 | 72,000 |
| 11.00% due 07/15/2013 | | 150,000 | 160,500 |
| Mediacom LLC/Mediacom Capital Corp. | | | |
| 9.50% due 01/15/2013 | | 125,000 | 125,000 |
| Rainbow National Services LLC | | | |
| 10.375% due 09/01/2014 | | 25,000 | 28,281 |
| Rogers Cable, Inc. | | | |
| 6.25% due 06/15/2013 | | 25,000 | 24,844 |
| 8.75% due 05/01/2032 | | 350,000 | 415,625 |
| Sinclair Broadcast Group, Inc. | | | |
| 8.00% due 03/15/2012 | | 300,000 | 306,375 |
| 8.75% due 12/15/2011 | | 75,000 | 78,844 |
| Time Warner, Inc. | | | |
| 7.625% due 04/15/2031 | | 1,725,000 | 1,961,849 |
| Videotron Ltee | | | |
| 6.375% due 12/15/2015 | | 200,000 | 198,000 |
| Young Broadcasting, Inc. | | | |
| 10.00% due 03/01/2011 (a) | | 250,000 | 223,438 |
|
|
| | | | 5,800,599 |
| Cellular Communications - 1.13% | | | |
| American Tower Corp. | | | |
| 7.125% due 10/15/2012 | | 250,000 | 261,875 |
| 7.50% due 05/01/2012 (a) | | 25,000 | 26,375 |
| AT&T Broadband Corp. | | | |
| 8.375% due 03/15/2013 | | 1,425,000 | 1,633,802 |
| AT&T Wireless Services, Inc. | | | |
| 8.75% due 03/01/2031 | | 1,175,000 | 1,559,292 |
| Centennial Communications Corp. | | | |
| 8.125% due 02/01/2014 (a) | | 300,000 | 306,000 |
| 10.00% due 01/01/2013 (a) | | 125,000 | 130,000 |
| Dobson Cellular Systems, Inc. | | | |
| 8.375% due 11/01/2011 | | 100,000 | 106,000 |
| Nextel Communications, Inc. | | | |
| 6.875% due 10/31/2013 | | 200,000 | 209,380 |
| 7.375% due 08/01/2015 | | 750,000 | 793,180 |
| SBA Communications Corp. | | | |
| 8.50% due 12/01/2012 | | 75,000 | 82,500 |
| SBA Telecommunication / | | | |
| SBA Communications Corp. | | | |
| zero coupon, Step up to 9.75% on | | | |
| 12/15/2007 due 12/15/2011 | | 175,000 | 165,813 |
| UbiquiTel Operating Company | | | |
| 9.875% due 03/01/2011 | | 250,000 | 275,000 |
| US Unwired, Inc., Series B | | | |
| 10.00% due 06/15/2012 (a) | | 200,000 | 226,000 |
|
|
| | | | 5,775,217 |
Chemicals - 0.56% | | | |
| Arco Chemical Company | | | |
| 9.80% due 02/01/2020 | | 75,000 | 82,500 |
| Strategic Bond Fund (continued) | | |
| | | Shares or | |
| | | Principal | |
| | | Amount | Value |
| |
|
| |
| CORPORATE BONDS (continued) | | | |
| Chemicals (continued) | | | |
| Equistar Chemicals LP | | | |
| 10.625% due 05/01/2011 | $ | 200,000 | $ | 217,500 |
| Ethyl Corp. | | | |
| 8.875% due 05/01/2010 | | 200,000 | 209,000 |
| Huntsman ICI Chemicals | | | |
| 10.125% due 07/01/2009 (a) | | 50,000 | 51,250 |
| Huntsman International LLC | | | |
| 9.875% due 03/01/2009 | | 200,000 | 209,500 |
| IMC Global, Inc. | | | |
| 10.875% due 08/01/2013 | | 25,000 | 28,750 |
| Lyondell Chemical Company | | | |
| 11.125% due 07/15/2012 | | 225,000 | 248,625 |
| Methanex Corp. | | | |
| 8.75% due 08/15/2012 (a) | | 200,000 | 220,500 |
| Millennium America, Inc. | | | |
| 9.25% due 06/15/2008 | | 400,000 | 411,000 |
| Nalco Company | | | |
| 8.875% due 11/15/2013 (a) | | 175,000 | 183,312 |
| Nova Chemicals Corp | | | |
| 6.50% due 01/15/2012 | | 125,000 | 120,313 |
| PQ Corp. | | | |
| 7.50% due 02/15/2013 | | 400,000 | 384,000 |
| Rhodia SA | | | |
| 7.625% due 06/01/2010 | | 300,000 | 305,250 |
| Westlake Chemical Corp. | | | |
| 6.625% due 01/15/2016 | | 200,000 | 199,750 |
|
|
| | | | 2,871,250 |
| |
Coal - 0.04% | | | |
| Massey Energy Company | | | |
| 6.625% due 11/15/2010 | | 200,000 | 204,500 |
Computers & Business Equipment - 0.10% | | |
| Seagate Technology Holdings | | | |
| 8.00% due 05/15/2009 | | 200,000 | 208,000 |
| Unisys Corp. | | | |
| 8.00% due 10/15/2012 | | 300,000 | 292,500 |
|
|
| | | | 500,500 |
| |
Construction & Mining Equipment - 0.07% | | |
| Terex Corp. | | | |
| 7.375% due 01/15/2014 | | 100,000 | 103,000 |
| 10.375% due 04/01/2011 | | 225,000 | 237,375 |
|
|
| | | | 340,375 |
| |
Construction Materials - 0.02% | | | |
| Nortek, Inc. | | | |
| 8.50% due 09/01/2014 | | 125,000 | 124,688 |
Containers & Glass - 0.28% | | | |
| Graphic Packaging International Corp. | | | |
| 8.50% due 08/15/2011 | | 400,000 | 402,000 |
| Owens-Brockway Glass Container, Inc. | | | |
| 7.75% due 05/15/2011 | | 200,000 | 210,000 |
| 8.25% due 05/15/2013 | | 50,000 | 52,125 |
| Owens-Illinois, Inc., Series 2008 | | | |
| 7.35% due 05/15/2008 (a) | | 325,000 | 329,062 |
| Pliant Corp. | | | |
| 12.75% due 06/15/2010 ^ | | 75,000 | 18,375 |
The accompanying notes are an integral part of the financial statements. 288
John Hancock Funds II
Portfolio of investments — February 28, 2006 (Unaudited)
(showing percentage of total net assets)
|
| Strategic Bond Fund (continued) | | |
| | | Shares or | |
| | | Principal | |
| | | Amount | Value |
| |
|
| |
| CORPORATE BONDS (continued) | | | |
| Containers & Glass (continued) | | | |
| Radnor Holdings Corp. | | | |
| 11.00% due 03/15/2010 | $ | 125,000 | $ | 95,000 |
| Stone Container Corp. | | | |
| 8.375% due 07/01/2012 | | 100,000 | 98,000 |
| Tekni-Plex, Inc. | | | |
| 8.75% due 11/15/2013 | | 225,000 | 206,438 |
|
|
| | | | 1,411,000 |
Correctional Facilities - 0.08% | | | |
| Corrections Corporation of America | | | |
| 6.25% due 03/15/2013 | | 150,000 | 148,875 |
| 6.75% due 01/31/2014 | | 275,000 | 279,812 |
|
|
| | | | 428,687 |
Cosmetics & Toiletries - 0.09% | | | |
| Del Laboratories, Inc. | | | |
| 8.00% due 02/01/2012 (a) | | 200,000 | 164,750 |
| 9.68% due 11/01/2011 (b) | | 50,000 | 51,000 |
| Jafra Cosmetics International, Inc. | | | |
| 10.75% due 05/15/2011 | | 150,000 | 163,312 |
| Spectrum Brands, Inc. | | | |
| 7.375% due 02/01/2015 | | 87,000 | 75,038 |
|
|
| | | | 454,100 |
Crude Petroleum & Natural Gas - 0.81% | | | |
| Burlington Resources Finance Company | | | |
| 5.60% due 12/01/2006 | | 1,325,000 | 1,328,876 |
| Chesapeake Energy Corp. | | | |
| 6.25% due 01/15/2018 | | 325,000 | 324,594 |
| 6.625% due 01/15/2016 | | 275,000 | 279,125 |
| 7.00% due 08/15/2014 | | 200,000 | 207,500 |
| EnCana Holdings Finance Corp. | | | |
| 5.80% due 05/01/2014 | | 1,675,000 | 1,731,226 |
| Plains Exploration & Production Company | | | |
| 7.125% due 06/15/2014 (a) | | 250,000 | 260,625 |
|
|
| | | | 4,131,946 |
Domestic Oil - 1.02% | | | |
| Devon Financing Corp., ULC | | | |
| 6.875% due 09/30/2011 | | 1,550,000 | 1,666,293 |
| Exco Resources, Inc. | | | |
| 7.25% due 01/15/2011 | | 400,000 | 408,000 |
| Forest Oil Corp. | | | |
| 8.00% due 12/15/2011 | | 325,000 | 354,250 |
| Magnum Hunter Resources, Inc. | | | |
| 9.60% due 03/15/2012 | | 250,000 | 270,000 |
| Stone Energy Corp. | | | |
| 8.25% due 12/15/2011 | | 400,000 | 406,000 |
| Swift Energy Company | | | |
| 7.625% due 07/15/2011 | | 400,000 | 412,000 |
| Valero Energy Corp. | | | |
| 4.75% due 06/15/2013 (a) | | 1,375,000 | 1,322,458 |
| Whiting Petroleum Corp. | | | |
| 7.00% due 02/01/2014 (a) | | 200,000 | 200,500 |
| 7.25% due 05/01/2013 | | 175,000 | 177,188 |
|
|
| | | | 5,216,689 |
| Strategic Bond Fund (continued) | | |
| | | Shares or | |
| | | Principal | |
| | | Amount | Value |
| |
|
| |
| CORPORATE BONDS (continued) | | | |
| Drugs & Health Care - 0.50% | | | |
| Humana, Inc. | | | |
| 6.30% due 08/01/2018 | $ | 1,675,000 | $ | 1,748,266 |
| Rite Aid Corp. | | | |
| 6.125% due 12/15/2008 (a) | | 100,000 | 96,250 |
| 7.50% due 01/15/2015 | | 250,000 | 240,938 |
| 8.125% due 05/01/2010 | | 75,000 | 76,500 |
| The Jean Coutu Group (PJC), Inc. | | | |
| 8.50% due 08/01/2014 (a) | | 400,000 | 382,000 |
|
|
| | | | 2,543,954 |
Electrical Utilities - 1.06% | | | |
| AES Corp. | | | |
| 7.75% due 03/01/2014 | | 225,000 | 237,656 |
| 8.875% due 02/15/2011 (a) | | 225,000 | 243,563 |
| 9.375% due 09/15/2010 | | 350,000 | 384,125 |
| Appalachian Power Company | | | |
| 5.95% due 05/15/2033 | | 1,500,000 | 1,498,437 |
| Calpine Corp. | | | |
| 8.50% due 07/15/2010 (a) | | 300,000 | 279,000 |
| 8.75% due 07/15/2013 (a) | | 50,000 | 46,500 |
| Calpine Generating Company LLC | | | |
| 13.2163% due 04/01/2011 (b) | | 200,000 | 218,000 |
| Edison Mission Energy | | | |
| 9.875% due 04/15/2011 | | 444,000 | 511,710 |
| Entergy Gulf States | | | |
| 6.20% due 07/01/2033 | | 725,000 | 700,808 |
| Mirant Americas Generation LLC | | | |
| 8.30% due 05/01/2011 ^ | | 395,000 | 413,269 |
| Reliant Energy, Inc. | | | |
| 6.75% due 12/15/2014 | | 425,000 | 384,094 |
| 9.25% due 07/15/2010 | | 125,000 | 127,031 |
| 9.50% due 07/15/2013 (a) | | 350,000 | 357,000 |
|
|
| | | | 5,401,193 |
Electronics - 0.18% | | | |
| L-3 Communications Corp. | | | |
| 7.625% due 06/15/2012 | | 550,000 | 576,125 |
| Motors & Gears, Inc., Series D | | | |
| 10.75% due 11/15/2006 | | 200,000 | 195,500 |
| Muzak, LLC/Muzak Finance Corp. | | | |
| 9.875% due 03/15/2009 | | 250,000 | 146,250 |
|
|
| | | | 917,875 |
Energy - 0.54% | | | |
| Duke Energy Company | | | |
| 4.20% due 10/01/2008 | | 1,225,000 | 1,192,252 |
| El Paso Energy | | | |
| 7.375% due 12/15/2012 (a) | | 475,000 | 492,813 |
| Inergy, L.P. | | | |
| 6.875% due 12/15/2014 | | 200,000 | 190,500 |
| NRG Energy, Inc. | | | |
| 7.25% due 02/01/2014 | | 150,000 | 153,750 |
| 7.375% due 02/01/2016 | | 700,000 | 721,000 |
|
|
| | | | 2,750,315 |
Financial Services - 7.12% | | | |
| Alamosa Delaware, Inc. | | | |
| 11.00% due 07/31/2010 | | 225,000 | 250,875 |
The accompanying notes are an integral part of the financial statements. 289
John Hancock Funds II
Portfolio of investments — February 28, 2006 (Unaudited)
(showing percentage of total net assets)
|
| Strategic Bond Fund (continued) | | |
| | | Shares or | |
| | | Principal | |
| | | Amount | Value |
| |
|
| |
| CORPORATE BONDS (continued) | | | |
| Financial Services (continued) | | | |
| BCP Crystal Holdings Corp. | | | |
| 9.625% due 06/15/2014 | $ | 250,000 | $ | 279,687 |
| Chukchansi Economic Development Authority | | |
| 8.00% due 11/15/2013 | | 200,000 | 206,000 |
| CIT Group, Inc. | | | |
| 7.75% due 04/02/2012 | | 1,775,000 | 1,983,862 |
| Corporacion Andina de Fomento | | | |
| 6.875% due 03/15/2012 | | 1,346,000 | 1,451,989 |
| Countrywide Home Loan | | | |
| 4.00% due 03/22/2011 (a) | | 3,100,000 | 2,899,470 |
| Diageo Finance BV | | | |
| 5.30% due 10/28/2015 | | 2,925,000 | 2,910,281 |
| Ford Motor Credit Company | | | |
| 4.95% due 01/15/2008 | | 875,000 | 806,076 |
| 6.625% due 06/16/2008 | | 250,000 | 232,749 |
| 7.875% due 06/15/2010 | | 1,875,000 | 1,734,126 |
| General Motors Acceptance Corp. | | | |
| 6.75% due 12/01/2014 | | 675,000 | 596,321 |
| 6.875% due 09/15/2011 (a) | | 1,600,000 | 1,432,598 |
| 7.25% due 03/02/2011 | | 25,000 | 22,842 |
| 8.00% due 11/01/2031 (a) | | 175,000 | 159,817 |
| Global Cash Access LLC | | | |
| 8.75% due 03/15/2012 | | 250,000 | 268,438 |
| Hexion US Finance Corp/Hexion Nova Scotia | | |
| Finance ULC | | | |
| 9.00% due 07/15/2014 | | 425,000 | 437,219 |
| HSBC Finance Capital Trust IX | | | |
| 5.911% due 11/30/2035 (b) | | 2,850,000 | 2,865,199 |
| International Lease Finance Corp. | | | |
| 5.875% due 05/01/2013 (a) | | 2,575,000 | 2,629,029 |
| iPCS, Inc. | | | |
| 11.50% due 05/01/2012 | | 250,000 | 286,875 |
| J.P. Morgan Chase & Company | | | |
| 6.625% due 03/15/2012 (a) | | 1,750,000 | 1,862,835 |
| JSG Funding PLC | | | |
| 9.625% due 10/01/2012 | | 125,000 | 130,938 |
| Lehman Brothers Holdings, Inc. | | | |
| 4.50% due 07/26/2010 | | 2,975,000 | 2,891,051 |
| MBNA Corp, Series MTN | | | |
| 6.25% due 01/17/2007 (a) | | 563,000 | 568,355 |
| Morgan Stanley | | | |
| 4.75% due 04/01/2014 | | 2,650,000 | 2,527,141 |
| Nell AF SARL | | | |
| 8.375% due 08/15/2015 (a) | | 197,000 | 197,985 |
| Sensus Metering Systems, Inc. | | | |
| 8.625% due 12/15/2013 | | 300,000 | 287,250 |
| TRAINS HY-2005-1 | | | |
| 7.651% due 06/15/2015 (b) | | 6,094,268 | 6,254,243 |
| Yell Finance BV | | | |
| zero coupon, Step up to 13.5% on | | | |
| 08/01/2006 due 08/01/2011 | | 75,000 | 77,531 |
|
|
| | | | 36,250,782 |
Food & Beverages - 0.20% | | | |
| Ahold Lease USA, Inc., Series A-1 | | | |
| 7.82% due 01/02/2020 | | 67,184 | 71,887 |
| Strategic Bond Fund (continued) | | |
| | | Shares or | |
| | | Principal | |
| | | Amount | Value |
| |
|
| |
| CORPORATE BONDS (continued) | | | |
| Food & Beverages (continued) | | | |
| Del Monte Corp. | | | |
| 8.625% due 12/15/2012 | $ | 200,000 | $ | 213,000 |
| Doane Pet Care Company | | | |
| 10.75% due 03/01/2010 | | 50,000 | 53,812 |
| Dole Food, Inc. | | | |
| 7.25% due 06/15/2010 | | 325,000 | 312,813 |
| 8.875% due 03/15/2011 | | 125,000 | 126,094 |
| Pinnacle Foods Holding Corp. | | | |
| 8.25% due 12/01/2013 | | 250,000 | 245,000 |
|
|
| | | | 1,022,606 |
Furniture & Fixtures - 0.07% | | | |
| Sealy Mattress Company | | | |
| 8.25% due 06/15/2014 (a) | | 350,000 | 365,750 |
Gas & Pipeline Utilities - 0.76% | | | |
| Atlas Pipeline Partners LP | | | |
| 8.125% due 12/15/2015 | | 200,000 | 208,000 |
| Dynegy Holdings, Inc. | | | |
| 6.875% due 04/01/2011 (a) | | 150,000 | 149,625 |
| 9.875% due 07/15/2010 | | 575,000 | 628,187 |
| 10.125% due 07/15/2013 | | 50,000 | 56,250 |
| El Paso Corp. | | | |
| 7.75% due 01/15/2032 (a) | | 250,000 | 265,625 |
| 7.875% due 06/15/2012 | | 500,000 | 530,000 |
| Targa Resources, Inc. | | | |
| 8.50% due 11/01/2013 | | 175,000 | 185,500 |
| United Utilities PLC | | | |
| 4.55% due 06/19/2018 | | 950,000 | 846,788 |
| Williams Companies, Inc. | | | |
| 7.625% due 07/15/2019 | | 25,000 | 27,500 |
| 7.875% due 09/01/2021 | | 375,000 | 419,063 |
| 8.75% due 03/15/2032 | | 450,000 | 544,500 |
|
|
| | | | 3,861,038 |
Healthcare Products - 0.05% | | | |
| Accellent, Inc. | | | |
| 10.50% due 12/01/2013 | | 250,000 | 262,500 |
Healthcare Services - 0.70% | | | |
| Ameripath, Inc. | | | |
| 10.50% due 04/01/2013 | | 275,000 | 290,125 |
| DaVita, Inc. | | | |
| 7.25% due 03/15/2015 (a) | | 400,000 | 408,000 |
| Extendicare Health Services, Inc. | | | |
| 6.875% due 05/01/2014 | | 25,000 | 25,937 |
| 9.50% due 07/01/2010 | | 200,000 | 211,250 |
| National Mentor, Inc. | | | |
| 9.625% due 12/01/2012 | | 275,000 | 292,875 |
| Quest Diagnostics, Inc. | | | |
| 5.45% due 11/01/2015 | | 1,500,000 | 1,494,315 |
| Tenet Healthcare Corp. | | | |
| 9.25% due 02/01/2015 | | 200,000 | 200,500 |
| Vanguard Health Holding Company II LLC | | | |
| 9.00% due 10/01/2014 | | 475,000 | 495,188 |
The accompanying notes are an integral part of the financial statements. 290
John Hancock Funds II
Portfolio of investments — February 28, 2006 (Unaudited)
(showing percentage of total net assets)
|
| Strategic Bond Fund (continued) | | |
| | | Shares or | |
| | | Principal | |
| | | Amount | Value |
| |
|
| |
| CORPORATE BONDS (continued) | | | |
| Healthcare Services (continued) | | | |
| Vanguard Health Holding Company, Inc. LLC | | |
| zero coupon, Step up to 11.25% on | | | |
| 10/01/2009 due 10/01/2015 | $ | 200,000 | $ | 148,000 |
|
|
| | | | 3,566,190 |
| |
Holdings Companies/Conglomerates - 0.01% | | |
| ERP Operating LP | | | |
| 5.25% due 09/15/2014 | | 25,000 | 24,717 |
Hotels & Restaurants - 0.36% | | | |
| CCM Merger, Inc. | | | |
| 8.00% due 08/01/2013 | | 175,000 | 174,125 |
| Gaylord Entertainment Company | | | |
| 6.75% due 11/15/2014 | | 300,000 | 296,250 |
| Hilton Hotels Corp. | | | |
| 7.625% due 12/01/2012 (a) | | 250,000 | 270,216 |
| Park Place Entertainment Corp. | | | |
| 9.375% due 02/15/2007 | | 250,000 | 259,062 |
| Sbarro, Inc. | | | |
| 11.00% due 09/15/2009 | | 300,000 | 306,750 |
| Starwood Hotels & Resorts Worldwide, Inc. | | |
| 7.875% due 05/01/2012 | | 175,000 | 192,063 |
| Turning Stone Casino Resort | | | |
| 9.125% due 12/15/2010 | | 300,000 | 312,000 |
|
|
| | | | 1,810,466 |
| |
| Household Appliances - 0.01% | | | |
| Applica, Inc. | | | |
| 10.00% due 07/31/2008 | | 25,000 | 24,250 |
Household Products - 0.11% | | | |
| Resolution Performance Products, Inc. | | | |
| 8.00% due 12/15/2009 | | 150,000 | 154,500 |
| 13.50% due 11/15/2010 | | 250,000 | 267,500 |
| Simmons Bedding Company | | | |
| 7.875% due 01/15/2014 (a) | | 150,000 | 144,000 |
|
|
| | | | 566,000 |
| |
Industrial Machinery - 0.16% | | | |
| Dresser Rand Group, Inc. | | | |
| 7.375% due 11/01/2014 | | 300,000 | 312,000 |
| Grant Prideco, Inc. | | | |
| 6.125% due 08/15/2015 | | 75,000 | 75,562 |
| NMHG Holding Company | | | |
| 10.00% due 05/15/2009 | | 400,000 | 422,000 |
|
|
| | | | 809,562 |
| |
International Oil - 0.21% | | | |
| OAO Gazprom, Series REGS | | | |
| 9.625% due 03/01/2013 | | 150,000 | 181,305 |
| Pemex Project Funding Master Trust | | | |
| 5.75% due 12/15/2015 | | 300,000 | 299,550 |
| 6.625% due 06/15/2035 | | 150,000 | 156,525 |
| Pogo Producing Co. | | | |
| 6.875% due 10/01/2017 | | 200,000 | 201,500 |
| Vintage Petroleum, Inc. | | | |
| 7.875% due 05/15/2011 (a) | | 225,000 | 234,783 |
|
|
| | | | 1,073,663 |
| Strategic Bond Fund (continued) | | |
| | | Shares or | |
| | | Principal | |
| | | Amount | Value |
| |
|
| |
| CORPORATE BONDS (continued) | | | |
| Leisure Time - 1.02% | | | |
| AMC Entertainment, Inc. | | | |
| 11.00% due 02/01/2016 | $ | 250,000 | $ | 251,562 |
| AMF Bowling Worldwide, Inc. | | | |
| 10.00% due 03/01/2010 | | 250,000 | 255,625 |
| Boyd Gaming Corp. | | | |
| 6.75% due 04/15/2014 (a) | | 400,000 | 399,000 |
| Caesars Entertainment, Inc. | | | |
| 7.00% due 04/15/2013 | | 250,000 | 264,547 |
| Choctaw Resort Development Enterprise | | | |
| 7.25% due 11/15/2019 | | 250,000 | 255,000 |
| Cinemark, Inc. | | | |
| zero coupon, Step up to 9.75% on | | | |
| 03/15/2009 due 03/15/2014 | | 350,000 | 260,750 |
| Herbst Gaming, Inc. | | | |
| 8.125% due 06/01/2012 | | 250,000 | 260,625 |
| Isle Capri Casinos, Inc. | | | |
| 7.00% due 03/01/2014 | | 350,000 | 350,000 |
| Kerzner International Ltd. | | | |
| 6.75% due 10/01/2015 | | 300,000 | 297,750 |
| Las Vegas Sands Corp. | | | |
| 6.375% due 02/15/2015 | | 250,000 | 242,500 |
| MGM Mirage, Inc. | | | |
| 6.625% due 07/15/2015 (a) | | 150,000 | 150,562 |
| 6.75% due 09/01/2012 (a) | | 475,000 | 482,719 |
| Mohegan Tribal Gaming Authority | | | |
| 6.875% due 02/15/2015 | | 150,000 | 151,688 |
| 7.125% due 08/15/2014 | | 150,000 | 154,500 |
| Penn National Gaming, Inc. | | | |
| 6.75% due 03/01/2015 | | 300,000 | 301,500 |
| 6.875% due 12/01/2011 | | 100,000 | 102,000 |
| Pinnacle Entertainment, Inc. | | | |
| 8.25% due 03/15/2012 | | 400,000 | 416,000 |
| Station Casinos, Inc. | | | |
| 6.50% due 02/01/2014 | | 400,000 | 400,000 |
| 6.875% due 03/01/2016 | | 175,000 | 178,063 |
|
|
| | | | 5,174,391 |
Manufacturing - 0.49% | | | |
| Blount, Inc. | | | |
| 8.875% due 08/01/2012 | | 150,000 | 157,500 |
| KI Holdings, Inc. | | | |
| zero coupon, Step up to 9.875% on | | | |
| 11/15/2009 due 11/15/2014 | | 450,000 | 319,500 |
| Park-Ohio Industries, Inc. | | | |
| 8.375% due 11/15/2014 | | 175,000 | 157,500 |
| Trinity Industries, Inc. | | | |
| 6.50% due 03/15/2014 | | 250,000 | 250,625 |
| Tyco International Group SA | | | |
| 6.125% due 11/01/2008 | | 1,600,000 | 1,626,850 |
|
|
| | | | 2,511,975 |
Medical-Hospitals - 0.47% | | | |
| Community Health Systems, Inc. | | | |
| 6.50% due 12/15/2012 (a) | | 300,000 | 297,000 |
| Genesis Healthcare Corp. | | | |
| 8.00% due 10/15/2013 | | 175,000 | 184,187 |
The accompanying notes are an integral part of the financial statements. 291
John Hancock Funds II
Portfolio of investments — February 28, 2006 (Unaudited)
(showing percentage of total net assets)
|
| Strategic Bond Fund (continued) | | |
| | | Shares or | |
| | | Principal | |
| | | Amount | Value |
| |
|
| |
| CORPORATE BONDS (continued) | | | |
| Medical-Hospitals (continued) | | | |
| HCA, Inc. | | | |
| 6.375% due 01/15/2015 (a) | $ | 575,000 | $ | 574,098 |
| 7.05% due 12/01/2027 | | 75,000 | 71,728 |
| 7.50% due 12/15/2023 | | 25,000 | 25,347 |
| 7.69% due 06/15/2025 | | 25,000 | 25,846 |
| IASIS Healthcare LLC | | | |
| 8.75% due 06/15/2014 | | 375,000 | 380,625 |
| Tenet Healthcare Corp. | | | |
| 6.875% due 11/15/2031 | | 125,000 | 101,875 |
| 7.375% due 02/01/2013 | | 125,000 | 114,688 |
| 9.875% due 07/01/2014 (a) | | 225,000 | 228,938 |
| Triad Hospitals, Inc. | | | |
| 7.00% due 11/15/2013 | | 400,000 | 403,500 |
|
|
| | | | 2,407,832 |
Metal & Metal Products - 0.13% | | | |
| Mueller Group, Inc. | | | |
| 10.00% due 05/01/2012 | | 200,000 | 219,000 |
| Mueller Holdings, Inc. | | | |
| zero coupon, Step up to 14.75% on | | | |
| 04/15/2009 due 04/15/2014 | | 60,000 | 48,600 |
| Novelis, Inc. | | | |
| 7.25% due 02/15/2015 (a) | | 425,000 | 412,250 |
|
|
| | | | 679,850 |
Office Furnishings & Supplies - 0.12% | | | |
| IKON Office Solutions, Inc. | | | |
| 7.75% due 09/15/2015 | | 150,000 | 151,500 |
| Interface, Inc. | | | |
| 9.50% due 02/01/2014 | | 100,000 | 102,500 |
| 10.375% due 02/01/2010 | | 150,000 | 163,875 |
| Tempur-Pedic/Tempur Products | | | |
| 10.25% due 08/15/2010 | | 175,000 | 187,250 |
|
|
| | | | 605,125 |
Paper - 0.59% | | | |
| Abitibi-Consolidated, Inc. | | | |
| 7.75% due 06/15/2011 | | 75,000 | 70,781 |
| 8.375% due 04/01/2015 (a) | | 340,000 | 321,300 |
| 8.55% due 08/01/2010 | | 50,000 | 49,375 |
| 8.85% due 08/01/2030 | | 210,000 | 184,537 |
| Appleton Papers, Inc., Series B | | | |
| 9.75% due 06/15/2014 | | 225,000 | 216,563 |
| Boise Cascade LLC | | | |
| 7.125% due 10/15/2014 | | 350,000 | 332,500 |
| Bowater Canada Finance Corp. | | | |
| 7.95% due 11/15/2011 | | 175,000 | 171,500 |
| Bowater, Inc. | | | |
| 6.50% due 06/15/2013 (a) | | 100,000 | 91,000 |
| Buckeye Technologies, Inc. | | | |
| 8.00% due 10/15/2010 | | 200,000 | 195,500 |
| 8.50% due 10/01/2013 | | 100,000 | 101,750 |
| 9.25% due 09/15/2008 | | 100,000 | 100,000 |
| Jefferson Smurfit Corp. | | | |
| 8.25% due 10/01/2012 (a) | | 534,000 | 521,985 |
| Newark Group, Inc. | | | |
| 9.75% due 03/15/2014 | | 225,000 | 195,750 |
| Strategic Bond Fund (continued) | | |
| | | Shares or | |
| | | Principal | |
| | | Amount | Value |
| |
|
| |
| CORPORATE BONDS (continued) | | | |
| Paper (continued) | | | |
| Norske Skog Canada, Ltd. | | | |
| 8.625% due 06/15/2011 | $ | 250,000 | $ | 247,500 |
| Smurfit Capital Funding PLC | | | |
| 7.50% due 11/20/2025 | | 200,000 | 184,000 |
|
|
| | | | 2,984,041 |
| |
Petroleum Services - 0.34% | | | |
| Chaparral Energy, Inc. | | | |
| 8.50% due 12/01/2015 | | 350,000 | 370,125 |
| Gaz Capital for Gazprom, Series REGS | | | |
| 8.625% due 04/28/2034 | | 800,000 | 1,036,000 |
| Hanover Compressor Company | | | |
| zero coupon due 03/31/2007 | | 225,000 | 207,000 |
| Hanover Equipment Trust | | | |
| 8.75% due 09/01/2011 | | 100,000 | 105,500 |
|
|
| | | | 1,718,625 |
| |
Pharmaceuticals - 0.54% | | | |
| Omnicare, Inc. | | | |
| 6.875% due 12/15/2015 | | 200,000 | 204,000 |
| Valeant Pharmaceuticals International | | | |
| 7.00% due 12/15/2011 | | 425,000 | 416,500 |
| Wyeth | | | |
| 5.50% due 03/15/2013 | | 2,100,000 | 2,120,973 |
|
|
| | | | 2,741,473 |
| |
Plastics - 0.06% | | | |
| Berry Plastics Corp. | | | |
| 10.75% due 07/15/2012 | | 300,000 | 326,250 |
Pollution Control - 0.00% | | | |
| Safety-Kleen Services, Inc. | | | |
| 9.25% due 06/01/2008 ^ | | 175,000 | 875 |
Publishing - 0.32% | | | |
| Block Communications, Inc. | | | |
| 8.25% due 12/15/2015 | | 200,000 | 198,000 |
| Cadmus Communications Corp. | | | |
| 8.375% due 06/15/2014 | | 250,000 | 253,750 |
| CBD Media Holdings, LLC | | | |
| 9.25% due 07/15/2012 | | 250,000 | 254,687 |
| Dex Media East LLC | | | |
| 12.125% due 11/15/2012 | | 125,000 | 144,219 |
| Dex Media West LLC | | | |
| 8.50% due 08/15/2010 | | 150,000 | 159,000 |
| 9.875% due 08/15/2013 | | 75,000 | 83,063 |
| Dex Media, Inc. | | | |
| zero coupon, Step up to 9.00% on | | | |
| 11/15/2008 due 11/15/2013 | | 100,000 | 84,000 |
| zero coupon, Step up to 9.00% on | | | |
| 11/15/2008 due 11/15/2013 | | 200,000 | 168,000 |
| Houghton Mifflin Company | | | |
| zero coupon, Step up to 11.50% on | | | |
| 10/15/2008 due 10/15/2013 (a) | | 150,000 | 124,500 |
| Mail-Well I Corp. | | | |
| 9.625% due 03/15/2012 | | 125,000 | 134,375 |
|
|
| | | | 1,603,594 |
The accompanying notes are an integral part of the financial statements. 292
John Hancock Funds II
Portfolio of investments — February 28, 2006 (Unaudited)
(showing percentage of total net assets)
|
| Strategic Bond Fund (continued) | | |
| | | Shares or | |
| | | Principal | |
| | | Amount | Value |
| |
|
| |
| CORPORATE BONDS (continued) | | | |
| Real Estate - 0.88% | | | |
| Boston Properties, Ltd., REIT | | | |
| 6.25% due 01/15/2013 | $ | 1,175,000 | $ | 1,225,200 |
| Felcor Lodging LP, REIT | | | |
| 9.00% due 06/01/2011 | | 300,000 | 331,500 |
| Host Marriott LP, REIT | | | |
| 6.375% due 03/15/2015 (a) | | 200,000 | 199,500 |
| 7.125% due 11/01/2013 | | 500,000 | 516,250 |
| iStar Financial, Inc., REIT | | | |
| 5.15% due 03/01/2012 | | 1,550,000 | 1,511,050 |
| Meristar Hospitality Corp., REIT | | | |
| 9.125% due 01/15/2011 | | 150,000 | 174,000 |
| Meristar Hospitality Operating Partnership LP, REIT | | |
| 10.50% due 06/15/2009 (a) | | 125,000 | 132,969 |
| Omega Healthcare Investors, Inc., REIT | | | |
| 7.00% due 01/15/2016 | | 400,000 | 401,000 |
|
|
| | | | 4,491,469 |
Retail - 0.06% | | | |
| Carrols Corp. | | | |
| 9.00% due 01/15/2013 (a) | | 175,000 | 177,187 |
| Leslie's Poolmart | | | |
| 7.75% due 02/01/2013 (a) | | 150,000 | 152,250 |
|
|
| | | | 329,437 |
Retail Grocery - 0.24% | | | |
| Safeway, Inc. | | | |
| 7.25% due 02/01/2031 (a) | | 1,100,000 | 1,202,480 |
Retail Trade - 0.34% | | | |
| Finlay Fine Jewelry Corp. | | | |
| 8.375% due 06/01/2012 | | 125,000 | 111,250 |
| FTD, Inc. | | | |
| 7.75% due 02/15/2014 | | 225,000 | 221,625 |
| Limited Brands, Inc. | | | |
| 6.95% due 03/01/2033 (a) | | 1,075,000 | 1,100,186 |
| Neiman Marcus Group, Inc. | | | |
| 10.375% due 10/15/2015 (a) | | 125,000 | 131,562 |
| PETCO Animal Supplies, Inc. | | | |
| 10.75% due 11/01/2011 | | 175,000 | 188,563 |
|
|
| | | | 1,753,186 |
Sanitary Services - 0.15% | | | |
| Allied Waste North America, Inc. | | | |
| 7.25% due 03/15/2015 | | 250,000 | 253,750 |
| 8.50% due 12/01/2008 | | 125,000 | 131,719 |
| Allied Waste North America, Inc., Series B | | | |
| 7.375% due 04/15/2014 (a) | | 250,000 | 245,625 |
| 9.25% due 09/01/2012 | | 125,000 | 135,625 |
|
|
| | | | 766,719 |
Semiconductors - 0.12% | | | |
| Amkor Technology, Inc. | | | |
| 7.75% due 05/15/2013 (a) | | 150,000 | 142,125 |
| 9.25% due 02/15/2008 | | 300,000 | 304,500 |
| 10.50% due 05/01/2009 (a) | | 175,000 | 174,125 |
|
|
| | | | 620,750 |
| Strategic Bond Fund (continued) | | |
| | | Shares or | |
| | | Principal | |
| | | Amount | Value |
| |
|
| |
| CORPORATE BONDS (continued) | | | |
| Telecommunications Equipment & | | | |
| Services - 0.46% | | | |
| Insight Midwest LP | | | |
| 10.50% due 11/01/2010 | $ | 225,000 | $ | 237,093 |
| Intelsat, Ltd. | | | |
| 9.614% due 01/15/2012 (b) | | 100,000 | 102,000 |
| Lucent Technologies, Inc. | | | |
| 6.45% due 03/15/2029 | | 825,000 | 696,094 |
| Panamsat Corp. | | | |
| 9.00% due 08/15/2014 | | 75,000 | 79,125 |
| United States West Communications, Inc. | | | |
| 6.875% due 09/15/2033 | | 1,147,000 | 1,101,120 |
| Zeus Special Subsidiary, Ltd. | | | |
| zero coupon, Step up to 9.25% on | | | |
| 02/01/2010 due 02/01/2015 | | 175,000 | 119,875 |
|
|
| | | | 2,335,307 |
| |
Telephone - 1.43% | | | |
| Qwest Communications International, Inc. | | | |
| 7.50% due 02/15/2014 (a) | | 87,000 | 89,393 |
| Qwest Communications International, Inc., Series B | | |
| 7.50% due 02/15/2014 (a) | | 306,000 | 314,415 |
| Qwest Corp. | | | |
| 7.50% due 06/15/2023 (a) | | 85,000 | 86,275 |
| 8.875% due 03/15/2012 | | 125,000 | 140,000 |
| Sprint Capital Corp. | | | |
| 8.375% due 03/15/2012 | | 1,700,000 | 1,952,999 |
| Telecom Italia Capital SA | | | |
| 5.25% due 10/01/2015 | | 2,050,000 | 1,958,215 |
| Telefonos de Mexico SA de CV | | | |
| 8.75% due 01/31/2016 | MXN | 2,000,000 | 191,189 |
| Verizon Florida, Inc., Series F | | | |
| 6.125% due 01/15/2013 (a) | $ | 2,500,000 | 2,524,570 |
|
|
| | | | 7,257,056 |
| |
Transportation - 0.23% | | | |
| Horizon Lines LLC | | | |
| 9.00% due 11/01/2012 | | 122,000 | 129,015 |
| Union Pacific Corp. | | | |
| 3.625% due 06/01/2010 | | 1,100,000 | 1,028,636 |
|
|
| | | | 1,157,651 |
|
| |
| TOTAL CORPORATE BONDS (Cost $150,884,789) | $ | 151,987,095 |
|
| |
| COLLATERALIZED MORTGAGE | | | |
| OBLIGATIONS - 1.33% | | | |
| Commercial Mortgage Asset Trust, | | | |
| Series 1999-C1, Class C | | | |
| 7.35% due 01/17/2032 | | 525,000 | 590,128 |
| Commercial Mortgage Pass-Through Certificates, | | |
| Series 2001-J2A, Class A1 | | | |
| 5.447% due 07/16/2034 | | 613,835 | 617,323 |
| Commercial Mortgage Pass-Through Certificates, | | |
| Series 2003-FL9, Class E | | | |
| 5.57% due 11/15/2015 (b) | | 245,254 | 245,446 |
| First Boston Mortgage Securities Corp. STRIP, | | |
| Series D, IO | | | |
| 10.965% due 05/25/2017 | | 28,975 | 8,118 |
The accompanying notes are an integral part of the financial statements. 293
John Hancock Funds II
Portfolio of investments — February 28, 2006 (Unaudited)
(showing percentage of total net assets)
|
| Strategic Bond Fund (continued) | | |
| | | Shares or | |
| | | Principal | |
| | | Amount | Value |
| |
|
| |
| COLLATERALIZED MORTGAGE | | | |
| OBLIGATIONS (continued) | | | |
| First Union National Bank Commercial Mortgage, | | |
| Series 2000-C1 | | | |
| 0.5265% IO due 05/17/2032 (b) | $ | 24,261,606 | $ | 639,257 |
| Green Tree Financial Corp., | | | |
| Series 1997-6, Class A8 | | | |
| 7.07% due 01/15/2029 | | 1,320,791 | 1,356,789 |
| Merit Securities Corp., Series 11PA, Class B2 | | |
| 5.88% due 09/28/2032 (b) | | 1,578,924 | 1,541,240 |
| Structured Asset Mortgage Investments Inc., | | |
| Series 2005-AR3, Class 2A1 | | | |
| 5.6435% due 08/25/2035 (b) | | 1,745,084 | 1,787,026 |
|
| TOTAL COLLATERALIZED MORTGAGE OBLIGATIONS | |
| (Cost $6,818,037) | | | $ | 6,785,327 |
|
| |
| ASSET BACKED SECURITIES - 1.62% | | |
| Ameriquest Mortgage Securities, Inc., | | | |
| Series 2004-R11, Class M5 | | | |
| 5.7806% due 11/25/2034 (b) | | 575,000 | 584,933 |
| Amortizing Residential Corp. Trust, | | | |
| Series 2002-BC6, Class M2 | | | |
| 5.7806% due 08/25/2032 (b) | | 689,067 | 692,290 |
| Asset Backed Securities Corp., | | | |
| Series 2003-HE2, Class M2 | | | |
| 6.47% due 04/15/2033 (b) | | 790,000 | 795,037 |
| Bear Stearns Asset Backed Securities NIM, | | |
| Series 2003-HE1N, Class N1 | | | |
| 6.50% due 08/25/2005 | | 713 | 713 |
| Bear Stearns Asset Backed Securities NIM, | | |
| Series 2004-FR1N, Class A1 | | | |
| 5.00% due 05/25/2034 | | 45,024 | 44,881 |
| Bear Stearns Asset Backed Securities NIM, | | |
| Series 2004-HE6N, Class A1 | | | |
| 5.25% due 08/25/2034 | | 67,632 | 67,442 |
| Countrywide Asset-Backed Certificates, | | | |
| Series 2004-5, Class M4 | | | |
| 5.8306% due 06/25/2034 (b) | | 750,000 | 760,283 |
| Countrywide Asset-Backed Certificates, | | �� | |
| Series 2004-5N, Class N1 | | | |
| 5.50% due 10/25/2035 | | 80,215 | 80,047 |
| Merrill Lynch Mortgage Investors, Inc. Series | | |
| 2005-WM1N, Class N1 | | | |
| 5.00% due 09/25/2035 | | 357,788 | 354,749 |
| Metris Master Trust, Series 2001-2, Class B | | |
| 5.65% due 11/20/2009 (b) | | 900,000 | 900,874 |
| Mid State Trust, Series 6, Class A1 | | | |
| 7.34% due 07/01/2035 | | 1,309,740 | 1,362,735 |
| Novastar Home Equity Loan, Series 2005-2, Class | | |
| M11 | | | |
| 7.5806% due 10/25/2035 (b) | | 700,000 | 609,982 |
| Novastar Home Equity Loan, | | | |
| Series 2003-4, Class M2 | | | |
| 6.2056% due 02/25/2034 (b) | | 250,000 | 253,869 |
| Novastar Home Equity Loan, | | | |
| Series 2004-1, Class M4 | | | |
| 5.5556% due 06/25/2034 (b) | | 575,000 | 577,569 |
| Strategic Bond Fund (continued) | | | |
| | | Shares or | | |
| | | Principal | | |
| | | Amount | | Value |
| |
|
| |
| ASSET BACKED SECURITIES | | | | |
| (continued) | | | | |
| Option One Mortgage Loan Trust, Series 2004-2, | | | |
| Class M7 | | | | |
| 8.0806% due 05/25/2034 (b) | $ | 550,000 | $ | 531,539 |
| Residential Asset Securities Corp., | | | | |
| Series 2002-KS2, Class MII2 | | | | |
| 5.6806% due 04/25/2032 (b) | | 172,442 | | 172,526 |
| Sail Net Interest Margin Notes, Series 2004-11A, | | | |
| Class A2 | | | | |
| 4.75% due 01/27/2035 | | 120,368 | | 119,666 |
| Sail Net Interest Margin Notes, Series 2004-2A, | | | | |
| Class A | | | | |
| 5.50% due 03/27/2034 | | 57,144 | | 56,927 |
| Sail Net Interest Margin Notes, Series 2004-4A, | | | | |
| Class A | | | | |
| 5.00% due 04/27/2034 | | 24,858 | | 24,847 |
| Sail Net Interest Margin Notes, Series 2004-BN2A, | | | |
| Class A | | | | |
| 5.00% due 12/27/2034 | | 264,061 | | 263,344 |
|
| TOTAL ASSET BACKED SECURITIES | | | | |
| (Cost $8,306,554) | | | $ | 8,254,253 |
|
| |
| SHORT TERM INVESTMENTS - 36.64% | | | | |
| Atomium Funding Corp. | | | | |
| 4.54% due 03/13/2006 *** | $ | 13,600,000 | $ | 13,579,418 |
| DaimlerChrysler North America Holding Corp. | | | | |
| 4.65% due 03/13/2006 *** | | 6,800,000 | | 6,789,460 |
| Ebury Finance Ltd | | | | |
| 4.54% due 03/13/2006 *** | | 13,600,000 | | 13,579,419 |
| Four Winds Funding Corp. | | | | |
| 4.57% due 03/13/2006 *** | | 6,800,000 | | 6,789,641 |
| Giro Balanced Funding Corp. | | | | |
| 4.54% due 03/13/2006 *** | | 13,600,000 | | 13,579,419 |
| Mica Funding LLC | | | | |
| 4.54% due 03/13/2006 *** | | 4,636,000 | | 4,628,984 |
| Morrigan TRR Funding LLC | | | | |
| 4.57% due 03/13/2006 *** | | 13,600,000 | | 13,579,283 |
| Ormond Quay Funding LLC | | | | |
| 4.53% due 03/13/2006 *** | | 13,600,000 | | 13,579,464 |
| State Street Navigator Securities Lending | | | | |
| Prime Portfolio (c) | | 100,471,016 | | 100,471,016 |
|
| TOTAL SHORT TERM INVESTMENTS | | | | |
| (Cost $186,576,104) | | | $ | 186,576,104 |
|
| |
| REPURCHASE AGREEMENTS - 28.10% | | | | |
| Greenwich Capital Repurchase | | | | |
| Agreement dated 02/28/2006 at | | | | |
| 4.55% to be repurchased at | | | | |
| $63,080,972 on 03/01/2006, | | | | |
| collateralized by $50,000,000 | | | | |
| Federal Home Loan Mortgage | | | | |
| Corp., 4.375% due 11/16/2007 | | | | |
| (valued at $50,312,500, including | | | | |
| interest) and $11,745,000 Federal | | | | |
| National Mortgage Association, | | | | |
| 6.21% due 08/06/2038 (valued at | | | | |
| $14,049,956 including interest) *** | $ | 63,073,000 | $ | 63,073,000 |
The accompanying notes are an integral part of the financial statements. 294
John Hancock Funds II
Portfolio of investments — February 28, 2006 (Unaudited)
(showing percentage of total net assets)
|
| Strategic Bond Fund (continued) | | |
| | | Shares or | |
| | | Principal | |
| | | Amount | Value |
|
|
| |
| REPURCHASE AGREEMENTS (continued) | | |
| Repurchase Agreement with Bank of | | | |
| America dated 02/28/2006 at | | | |
| 4.47% to be repurchased at | | | |
| $80,009,933 on 03/01/2006, | | | |
| collateralized by $81,705,000 | | | |
| Federal Home Loan Mortgage | | | |
| Corp., 5.395% due 02/28/2011 | | | |
| (valued at $81,602,869, including | | | |
| interest) (c)*** | $ | 80,000,000 | $ | 80,000,000 |
|
| TOTAL REPURCHASE AGREEMENTS | | | |
| (Cost $143,073,000) | | | $ | 143,073,000 |
|
| Total Investments (Strategic Bond Fund) | | |
| (Cost $786,693,645) - 155.04% | | | $ | 789,481,109 |
| Liabilities in Excess of Other Assets - (55.04)% | | (280,254,021) |
|
|
| TOTAL NET ASSETS - 100.00% | | | $ | 509,227,088 |
|
|
| |
| |
| Strategic Value Fund | | | |
| | | Shares or | |
| | | Principal | |
| | | Amount | Value |
| |
|
| |
| COMMON STOCKS - 98.16% | | | |
Banking - 4.12% | | | |
| Bank of America Corp. | | 121,581 $ | 5,574,489 |
Broadcasting - 2.07% | | | |
| CBS Corp., Class B | | 114,333 | 2,796,585 |
Building Materials & Construction - 3.12% | | |
| Masco Corp. | | 135,559 | 4,228,085 |
Computers & Business Equipment - 2.32% | | |
| Sun Microsystems, Inc. * | | 751,258 | 3,132,746 |
Containers & Glass - 2.73% | | | |
| Owens-Illinois, Inc. * | | 197,399 | 3,699,257 |
Cosmetics & Toiletries - 1.33% | | | |
| Estee Lauder Companies, Inc., Class A | | 47,981 | 1,795,449 |
Crude Petroleum & Natural Gas - 3.55% | | |
| Apache Corp. | | 24,360 | 1,630,171 |
| Devon Energy Corp. | | 54,094 | 3,171,531 |
|
|
| | | | 4,801,702 |
| |
| Drugs & Health Care - 4.44% | | | |
| Wyeth | | 120,640 | 6,007,872 |
Financial Services - 14.40% | | | |
| JPMorgan Chase & Company | | 158,116 | 6,504,892 |
| Mellon Financial Corp. | | 138,377 | 4,994,026 |
| Merrill Lynch & Company, Inc. | | 36,062 | 2,784,347 |
| PNC Financial Services Group, Inc. | | 74,034 | 5,208,292 |
|
|
| | | | 19,491,557 |
| |
| Industrial Machinery - 1.13% | | | |
| Cooper Cameron Corp. * | | 37,742 | 1,528,551 |
Insurance - 5.02% | | | |
| Allstate Corp. | | 60,135 | 3,294,195 |
| Strategic Value Fund (continued) | | |
| | Shares or | |
| | Principal | |
| | Amount | Value |
|
|
| |
| COMMON STOCKS (continued) | | |
| Insurance (continued) | | |
| Conseco, Inc. * | 140,691 | $ | 3,494,765 |
|
|
| | | 6,788,960 |
| International Oil - 2.20% | | |
| Noble Corp. | 40,325 | 2,980,421 |
Internet Software - 4.67% | | |
| Symantec Corp. * | 374,364 | 6,323,008 |
Leisure Time - 4.11% | | |
| International Game Technology, Inc. | 25,212 | 901,833 |
| Walt Disney Company | 166,507 | 4,660,531 |
|
|
| | | 5,562,364 |
Liquor - 0.51% | | |
| Molson Coors Brewing Company, Class B (a) | 11,093 | 696,086 |
Manufacturing - 3.35% | | |
| Tyco International, Ltd. | 175,673 | 4,530,607 |
Medical-Hospitals - 2.19% | | |
| Tenet Healthcare Corp. * | 374,832 | 2,957,424 |
Newspapers - 1.47% | | |
| Knight-Ridder, Inc. | 33,255 | 1,995,965 |
Office Furnishings & Supplies - 1.83% | | |
| OfficeMax, Inc. | 84,375 | 2,474,719 |
Paper - 1.38% | | |
| Bowater, Inc. | 71,685 | 1,865,244 |
Petroleum Services - 2.81% | | |
| GlobalSantaFe Corp. | 68,682 | 3,800,862 |
Pharmaceuticals - 4.16% | | |
| Merck & Company, Inc. | 161,377 | 5,625,602 |
Publishing - 0.14% | | |
| The New York Times Company, Class A (a) | 6,660 | 187,945 |
Retail Trade - 6.29% | | |
| Family Dollar Stores, Inc. | 106,523 | 2,739,772 |
| Gap, Inc. | 196,758 | 3,647,893 |
| Wal-Mart Stores, Inc. | 46,800 | 2,122,848 |
|
|
| | | 8,510,513 |
Software - 4.18% | | |
| Compuware Corp. * | 341,065 | 2,800,143 |
| Oracle Corp. * | 230,371 | 2,861,208 |
|
|
| | | 5,661,351 |
Telecommunications Equipment & | | |
| Services - 3.91% | | |
| Nortel Networks Corp. * (a) | 1,851,289 | 5,294,686 |
Telephone - 9.18% | | |
| Sprint Corp. | 236,252 | 5,677,136 |
| Verizon Communications, Inc. | 200,250 | 6,748,425 |
|
|
| | | 12,425,561 |
| Toys, Amusements & Sporting Goods - 1.55% | | |
| Mattel, Inc. | 124,216 | 2,093,040 |
|
| TOTAL COMMON STOCKS (Cost $125,873,648) | | $ | 132,830,651 |
| |
|
The accompanying notes are an integral part of the financial statements. 295
John Hancock Funds II
Portfolio of investments — February 28, 2006 (Unaudited)
(showing percentage of total net assets)
|
| Strategic Value Fund (continued) | | | |
| | | Shares or | | |
| | | Principal | | |
| | | Amount | | Value |
| |
|
| |
| SHORT TERM INVESTMENTS - 7.30% | | | |
| Jupiter Security Corp. | | | | |
| zero coupon due 03/01/2006 | $ | 3,540,000 | $ | 3,540,000 |
| State Street Navigator Securities Lending | | | | |
| Prime Portfolio (c) | | 6,331,582 | | 6,331,582 |
|
| TOTAL SHORT TERM INVESTMENTS | | | | |
| (Cost $9,871,582) | | | $ | 9,871,582 |
|
| Total Investments (Strategic Value Fund) | | | |
| (Cost $135,745,230) - 105.46% | | | $ | 142,702,233 |
| Liabilities in Excess of Other Assets - (5.46)% | | | (7,383,445) |
|
|
| TOTAL NET ASSETS - 100.00% | | | $ | 135,318,788 |
|
|
| |
| |
| Total Return Fund | | | | |
| | | Shares or | | |
| | | Principal | | |
| | | Amount | | Value |
|
|
| |
| U.S. TREASURY OBLIGATIONS - 2.12% | | | |
| Treasury Inflation Protected | | | | |
| Securities (d) - 0.60% | | | | |
| 2.00% due 01/15/2026 *** | $ | 3,470,915 | $ | 3,491,251 |
| 2.375% due 01/15/2025 *** | | 1,983,980 | | 2,108,754 |
| 3.625% due 04/15/2028 *** | | 486,776 | | 635,965 |
|
|
| | | | | 6,235,970 |
U.S. Treasury Bonds - 1.52% | | | | |
| 4.50% due 02/15/2036 | | 13,700,000 | | 13,692,506 |
| 5.25% due 11/15/2028 to 02/15/2029 *** | 2,100,000 | | 2,271,122 |
|
|
| | | | | 15,963,628 |
|
| TOTAL U.S. TREASURY OBLIGATIONS | | | |
| (Cost $22,057,312) | | | $ | 22,199,598 |
|
| |
| U.S. GOVERNMENT AGENCY OBLIGATIONS - 56.20% | | |
| Federal National Mortgage | | | | |
| Association - 56.20% | | | | |
| 3.719% due 07/01/2034 *** | | 1,054,802 | | 1,041,347 |
| 4.39% due 11/01/2034 (b)*** | | 2,202,664 | | 2,178,684 |
| 4.396% due 03/01/2035 (b)*** | | 987,885 | | 974,467 |
| 4.460% due 01/01/2035 *** | | 871,723 | | 857,749 |
| 4.526% due 05/01/2035 (b)*** | | 2,336,464 | | 2,310,249 |
| 4.84% due 06/01/2035 *** | | 2,414,409 | | 2,384,513 |
| 5.020% due 11/01/2035 (b)*** | | 1,666,818 | | 1,716,504 |
| 5.50% due 11/01/2035 (b) | | 361,802 | | 358,573 |
| 5.50% due 06/01/2035 (b)*** | | 1,127,095 | | 1,117,037 |
| 5.50% due 12/01/2034 to 12/01/2035 *** | 209,759,024 | | 208,000,820 |
| 5.50% TBA ** | | 371,000,000 | | 367,508,125 |
| | | | | 588,448,068 |
|
| TOTAL U.S. GOVERNMENT AGENCY OBLIGATIONS | | |
| (Cost $586,346,880) | | | $ | 588,448,068 |
|
| Total Return Fund (continued) | | |
| | | Shares or | |
| | | Principal | |
| | | Amount | Value |
|
|
| |
| FOREIGN GOVERNMENT OBLIGATIONS - 1.13% | |
| Brazil - 1.13% | | | |
| Federative Republic of Brazil | | | |
| 8.00% due 01/15/2018 *** | $ | 10,600,000 | $ | 11,866,700 |
|
| TOTAL FOREIGN GOVERNMENT OBLIGATIONS | |
| (Cost $10,753,700) | | | $ | 11,866,700 |
|
| |
| CORPORATE BONDS - 8.09% | | | |
| Automobiles - 0.95% | | | |
| DaimlerChrysler NA Holding Corp. | | | |
| 4.70% due 03/07/2007 (b)*** | | 10,000,000 | 10,005,180 |
Banking - 2.09% | | | |
| BNP Paribas | | | |
| 5.186% due 06/29/2049 (b)*** | | 6,000,000 | 5,759,166 |
| HSBC Bank USA | | | |
| 4.57% due 09/21/2007 (b)*** | | 5,000,000 | 5,008,360 |
| Royal Bank of Scotland Group PLC | | | |
| 7.648% due 08/31/2049 (b)*** | | 5,000,000 | 5,990,680 |
| Sumitomo Mitsui Banking Corp. | | | |
| 5.625% due 07/29/2049 (b)*** | | 5,200,000 | 5,138,349 |
|
|
| | | | 21,896,555 |
| |
Electrical Utilities - 0.29% | | | |
| FirstEnergy Corp., Series A | | | |
| 5.50% due 11/15/2006 *** | | 3,000,000 | 3,005,568 |
Financial Services - 3.88% | | | |
| American Express Credit Corp. | | | |
| 4.59% due 12/12/2007 (b)*** | | 2,100,000 | 2,100,145 |
| Atlantic & Western Re, Ltd., Series A | | | |
| 10.5194% due 01/09/2007 (b) | | 250,000 | 250,000 |
| Bear Stearns Companies, Inc. | | | |
| 4.81% due 04/29/2008 (b)*** | | 5,300,000 | 5,310,171 |
| CIT Group, Inc. | | | |
| 4.5669% due 12/19/2007 (b)*** | | 5,000,000 | 5,000,555 |
| Citigroup, Inc. | | | |
| 4.5594% due 12/26/2008 (b)*** | | 1,400,000 | 1,399,523 |
| 4.73% due 05/02/2008 (b)*** | | 5,000,000 | 5,001,885 |
| Goldman Sachs Group, Inc., Series MTN | | | |
| 4.81% due 11/10/2008 (b)*** | | 3,000,000 | 3,000,570 |
| Goldman Sachs Group, Inc., Series MTNB | | | |
| 4.5913% due 12/22/2008 (b)*** | | 2,800,000 | 2,799,720 |
| John Deere Capital Corp., Series MTND | | | |
| 4.5994% due 06/28/2006 (b)*** | | 700,000 | 700,170 |
| Lehman Brothers Holdings, Inc., Series MTN | | |
| 4.71% due 12/23/2010 (b)*** | | 10,000,000 | 10,008,900 |
| Morgan Stanley, Series GMTN | | | |
| 4.825% due 02/09/2009 (b)*** | | 5,100,000 | 5,098,184 |
|
|
| | | | 40,669,823 |
| |
International Oil - 0.08% | | | |
| Pemex Project Funding Master Trust | | | |
| 5.75% due 12/15/2015 *** | | 800,000 | 798,800 |
Software - 0.24% | | | |
| Oracle Corp and Ozark Holding, Inc. | | | |
| 4.81% due 01/13/2009 (b)*** | | 2,500,000 | 2,499,750 |
The accompanying notes are an integral part of the financial statements. 296
John Hancock Funds II
Portfolio of investments — February 28, 2006 (Unaudited)
(showing percentage of total net assets)
|
| Total Return Fund (continued) | | |
| | | Shares or | |
| | | Principal | |
| | | Amount | Value |
| |
|
| |
| CORPORATE BONDS (continued) | | | |
| Telephone - 0.15% | | | |
| BellSouth Corp. | | | |
| 4.258% due 04/26/2006 (b)*** | $ | 1,600,000 | $ | 1,598,307 |
| Tobacco - 0.41% | | | |
| Philip Morris Companies, Inc. | | | |
| 7.75% due 01/15/2027 *** | | 3,600,000 | 4,267,955 |
|
| TOTAL CORPORATE BONDS (Cost $84,517,336) | | $ | 84,741,938 |
|
| |
| MUNICIPAL BONDS - 1.57% | | | |
Iowa - 0.12% | | | |
| Tobacco Settlement Authority of Iowa, Series A | | |
| 6.50% due 06/01/2023 *** | | 1,200,000 | 1,208,916 |
Nevada - 0.01% | | | |
| Truckee Meadows Water Authority | | | |
| 5.00% due 07/01/2036 *** | | 67,000 | 77,233 |
Pennsylvania - 0.44% | | | |
| Pennsylvania Higher Educational Facilties Authority | | |
| 4.75% due 07/15/2035 *** | | 4,500,000 | 4,588,425 |
Texas - 0.53% | | | |
| Eagle Mountain & Saginaw Independent School | | |
| District/TX | | | |
| 4.75% due 08/15/2033 *** | | 5,500,000 | 5,570,950 |
Virginia - 0.04% | | | |
| Tobacco Settlement Financing Corp. | | | |
| 5.625% due 06/01/2037 *** | | 400,000 | 410,260 |
Washington - 0.14% | | | |
| Grant County Public Utility District No 2 Priest Rapids | |
| 5.00% due 01/01/2030 *** | | 1,400,000 | 1,473,206 |
Wisconsin - 0.29% | | | |
| Badger Tobacco Asset Securitization Corp. | | |
| 6.125% due 06/01/2027 *** | | 2,900,000 | 3,075,624 |
|
| TOTAL MUNICIPAL BONDS (Cost $16,209,245) | | $ | 16,404,614 |
|
| |
| COLLATERALIZED MORTGAGE | | | |
| OBLIGATIONS - 11.59% | | | |
| American Home Mortgage Investment Trust, Series | | |
| 2004-4, Class 4A | | | |
| 4.39% due 02/25/2045 *** | | 503,298 | 490,962 |
| Citigroup Mortgage Loan Trust, Inc., | | | |
| Series 2005-11, Class 1A1 | | | |
| 4.90% due 12/25/2035 (b)*** | | 2,061,636 | 2,062,599 |
| Citigroup Mortgage Loan Trust, Inc., | | | |
| Series 2005-11, Class A2A | | | |
| 4.70% due 12/25/2035 *** | | 684,840 | 678,978 |
| Countrywide Alternative Loan Trust, | | | |
| Series 2005-81, Class A1 | | | |
| 4.8606% due 02/25/2037 (b)*** | | 9,768,718 | 9,238,944 |
| Countrywide Home Loans, | | | |
| Series 2005-HYB9, Class 3A2A | | | |
| 5.25% due 02/20/2036 *** | | 873,213 | 865,054 |
| CS First Boston Mortgage Securities Corp., Series | | |
| 2005-C6, Class A1 | | | |
| 4.938% due 12/15/2040 *** | | 1,670,911 | 1,660,940 |
| Total Return Fund (continued) | | |
| | | Shares or | |
| | | Principal | |
| | | Amount | Value |
| |
|
| |
| COLLATERALIZED MORTGAGE | | | |
| OBLIGATIONS (continued) | | | |
| Federal Home Loan Mortgage Corp., Series 2637, | | |
| Class F | | | |
| 4.97% due 06/15/2018 (b)*** | $ | 550,713 | $ | 551,188 |
| Federal Home Loan Mortgage Corp., Series 2844, | | |
| Class PR | | | |
| 5.00% due 09/15/2017 *** | | 3,710,340 | 3,700,039 |
| Federal Home Loan Mortgage Corp., Series 3036, | | |
| Class NA | | | |
| 5.00% due 07/15/2024 *** | | 4,600,000 | 4,571,694 |
| Federal Home Loan Mortgage Corp., Series T-63, | | |
| Class 1A1 | | | |
| 4.678% due 02/25/2045 (b)*** | | 580,952 | 586,277 |
| Federal National Mortgage Association, Series | | |
| 2005-33, Class QA | | | |
| 5.00% due 06/25/2027 *** | | 3,830,214 | 3,803,584 |
| Federal National Mortgage Association, | | | |
| Series 2003-W6, Class F | | | |
| 4.9306% due 09/25/2042 (b)*** | | 3,385,736 | 3,405,290 |
| Federal National Mortgage Association, | | | |
| Series 2005-120, Class NF | | | |
| 4.6806% due 01/25/2021 (b)*** | | 46,139,418 | 45,974,784 |
| Federal National Mortgage Association, | | | |
| Series 2006-5, Class 3A2 | | | |
| 4.6893% due 05/25/2035 (b)*** | | 500,000 | 492,031 |
| GE Capital Commercial Mortgage Corp., Series | | |
| 2002-3A, Class A1 | | | |
| 4.229% due 12/10/2037 *** | | 7,445,520 | 7,262,237 |
| Government National Mortgage Association, Series | | |
| 2003-4, Class LA | | | |
| 4.00% due 07/16/2027 *** | | 881,908 | 871,062 |
| LB-UBS Commercial Mortgage Trust, Series | | |
| 2005-C7, Class A1 | | | |
| 4.99% due 11/15/2030 *** | | 2,095,006 | 2,086,945 |
| Mellon Residential Funding Corp., | | | |
| Series 2000-TBC3, Class A1 | | | |
| 5.01% due 12/15/2030 (b)*** | | 9,169,020 | 9,171,457 |
| Structured Asset Mortgage Investments, Inc., | | |
| Series 2005-AR8, Class A1A | | | |
| 4.8606% due 02/25/2036 (b)*** | | 998,359 | 997,536 |
| Structured Asset Securities Corp., Series | | | |
| 2005-AR1, Class A3 | | | |
| 4.6806% due 09/25/2035 (b)*** | | 8,386,526 | 8,386,211 |
| Washington Mutual, Inc., Series 2001-7, Class A | | |
| 4.674% due 05/25/2041 (b)*** | | 1,241,560 | 1,245,998 |
| Washington Mutual, Inc., Series 2005-AR19, Class | | |
| A1A1 | | | |
| 4.8506% due 12/25/2045 (b)*** | | 9,869,476 | 9,886,825 |
| Wells Fargo Mortgage Backed Securities Trust, | | |
| Series 2006-AR2, Class 2A1 | | | |
| 4.95% due 03/25/2036 (b)*** | | 3,400,000 | 3,366,797 |
|
| TOTAL COLLATERALIZED MORTGAGE OBLIGATIONS | |
| (Cost $122,058,931) | | | $ | 121,357,432 |
|
| |
| ASSET BACKED SECURITIES - 9.49% | | |
| American Express Credit Account Master Trust, | | |
| Series 2001-2, Class A | | | |
| 5.53% due 10/15/2008 (b)*** | | 12,244,000 | 12,244,000 |
The accompanying notes are an integral part of the financial statements. 297
John Hancock Funds II
Portfolio of investments — February 28, 2006 (Unaudited)
(showing percentage of total net assets)
|
| Total Return Fund (continued) | | |
| | | Shares or | |
| | | Principal | |
| | | Amount | Value |
| |
|
| |
| ASSET BACKED SECURITIES | | | |
| (continued) | | | |
| Argent Securities, Inc., Series 2005-W4, Class A2A | | |
| 4.7206% due 02/25/2036 (b)*** | $ | 5,658,067 | $ | 5,660,721 |
| First NLC Trust, Series 2005-3, Class AV1 | | | |
| 4.6906% due 12/25/2035 (b)*** | | 1,391,740 | 1,391,769 |
| Fremont Home Loan Trust, 2005-E, Class 2A1 | | |
| 4.6706% due 01/25/2036 (b)*** | | 2,070,876 | 2,070,869 |
| GE-WMC Mortgage Securities LLC, | | | |
| Series 2005-2, Class A2A | | | |
| 4.6806% due 12/25/2035 (b)*** | | 34,096,119 | 34,058,818 |
| GSR Mortgage Loan Trust, | | | |
| Series 2005-HEL1, Class A2A | | | |
| 4.6806% due 11/25/2030 (b)*** | | 2,083,649 | 2,083,649 |
| Home Equity Mortgage Trust, Series 2005-HF1, | | |
| Class A2A | | | |
| 4.6906% due 02/25/2036 (b)*** | | 1,940,105 | 1,940,163 |
| Indymac Residential Asset Backed Trust, | | | |
| Series 2005-D, Class AII1 | | | |
| 4.6806% due 03/25/2036 (b)*** | | 2,016,295 | 2,016,610 |
| Merrill Lynch Mortgage Investors, Inc., Series | | |
| 2005-SL1, Class A | | | |
| 4.7806% due 06/25/2035 (b)*** | | 8,781,278 | 8,782,879 |
| Metris Master Trust, Series 2001-2, Class A | | |
| 4.89% due 11/20/2009 (b)*** | | 1,600,000 | 1,600,922 |
| Morgan Stanley ABS Capital I, Series 2004-OP1, | | |
| Class A2A | | | |
| 4.83% due 11/25/2034 (b)*** | | 1,428,646 | 1,428,657 |
| Nissan Auto Lease Trust, Series 2004-A, Class A3 | | |
| 2.90% due 08/15/2007 *** | | 933,525 | 927,056 |
| Option One Mortgage Loan Trust, Series 2005-4, | | |
| Class A2 | | | |
| 4.6806% due 11/25/2035 (b)*** | | 4,448,675 | 4,449,411 |
| SLM Student Loan Trust, Series 2003-11, Class A2 | | |
| 4.5413% due 03/15/2013 (b)*** | | 867,064 | 866,974 |
| SLM Student Loan Trust, Series 2004-8, Class A2 | | |
| 4.6429% due 07/25/2013 (b)*** | | 2,023,308 | 2,023,688 |
| SLM Student Loan Trust, Series 2005-1, Class A1 | | |
| 4.6329% due 01/26/2015 (b)*** | | 2,312,635 | 2,309,667 |
| SLM Student Loan Trust, Series 2005-2, Class A2 | | |
| 4.6329% due 01/25/2013 (b)*** | | 8,376,206 | 8,372,671 |
| Soundview Home Equity Loan Trust, | | | |
| Series 2005-B, Class A1 | | | |
| 4.6906% due 05/25/2035 (b)*** | | 560,889 | 560,845 |
| Structured Asset Securities Corp., | | | |
| Series 2005-S7, Class A1 | | | |
| 4.7106% due 12/25/2035 (b)*** | | 3,918,069 | 3,917,922 |
| Wachovia Auto Owner Trust, | | | |
| Series 2005-B, Class A2 | | | |
| 4.82% due 02/20/2009 *** | | 2,700,000 | 2,694,937 |
|
| TOTAL ASSET BACKED SECURITIES | | | |
| (Cost $99,475,005) | | | $ | 99,402,228 |
|
| |
| OPTIONS - 0.02% | | | |
| Call Options - 0.02% | | | |
| Chicago Mercantile Exchange American Purchase | | |
| Call on Eurodollar | | | |
| Expiration 03/13/2006 at $95.25 * | | 315,000 | 788 |
| Total Return Fund (continued) | | | |
| | | Shares or | | |
| | | Principal | | |
| | | Amount | | Value |
|
|
| |
| OPTIONS (continued) | | | | |
| Call Options (continued) | | | | |
| Over The Counter European Style Call | | | | |
| Expiration 08/07/2006 at $4.50 * | | 25,000,000 | $ | 5,250 |
| Expiration 12/22/2006 at $4.80 * | | 29,000,000 | | 200,970 |
|
|
| | | | | 207,008 |
| Put Options - 0.00% | | | | |
| Chicago Mercantile Exchange American Purchase | | | |
| Put on Eurodollar | | | | |
| Expiration 12/18/2006 at $92.00 * | | 2,650,000 | | 6,625 |
| Expiration 09/18/2006 at $92.50 * | | 2,290,000 | | 5,725 |
| Expiration 12/18/2006 at $92.75 * | | 635,000 | | 1,587 |
| Expiration 06/19/2006 at $93.00 * | | 200,000 | | 500 |
| Expiration 06/19/2006 at $93.50 * | | 1,550,000 | | 3,875 |
| Expiration 06/19/2006 at $94.00 * | | 600,000 | | 1,500 |
| Expiration 12/18/2006 at $95.25 * | | 1,737,500 | | 4,344 |
|
|
| | | | | 24,156 |
|
| TOTAL OPTIONS (Cost $294,789) | | | $ | 231,164 |
|
| |
| SHORT TERM INVESTMENTS - 41.18% | | | |
| Bank of Ireland | | | | |
| 4.68% due 05/23/2006 *** | $ | 28,500,000 | $ | 28,192,485 |
| Barclays Bank PLC NY | | | | |
| 4.485% due 01/29/2007 *** | | 10,200,000 | | 10,198,474 |
| Barclays U.S. Funding LLC | | | | |
| 4.645% due 05/15/2006 *** | | 20,400,000 | | 20,202,587 |
| Cox Communications, Inc. | | | | |
| 3.00% due 07/17/2006 *** | | 2,000,000 | | 2,000,000 |
| Danske Corp. | | | | |
| 4.51% due 03/27/2006 *** | | 28,500,000 | | 28,407,169 |
| 4.515% due 04/26/2006 *** | | 500,000 | | 496,488 |
| 4.70% due 06/01/2006 *** | | 2,300,000 | | 2,272,374 |
| DNB NORBank ASA | | | | |
| 4.255% due 03/08/2006 *** | | 2,800,000 | | 2,797,683 |
| Florida Power Corp. | | | | |
| 4.63% due 04/28/2006 *** | | 4,500,000 | | 4,466,433 |
| Fortis Funding LLC | | | | |
| 4.50% due 03/01/2006 *** | | 28,500,000 | | 28,500,000 |
| Government of France | | | | |
| zero coupon due 05/24/2006 to | | | | |
| 07/20/2006 *** | EUR | 6,370,000 | | 7,534,845 |
| Federal Republic of Germany | | | | |
| zero coupon due 05/17/2006 to | | | | |
| 06/14/2006 *** | | 69,920,000 | | 82,915,266 |
| Government of France | | | | |
| zero coupon due 03/23/2006 *** | | 3,530,000 | | 4,202,264 |
| Ixis Corp. | | | | |
| 4.60% due 05/04/2006 *** | $ | 27,200,000 | | 26,977,564 |
| 4.66% due 05/22/2006 *** | | 3,500,000 | | 3,462,849 |
| 4.69% due 06/05/2006 *** | | 700,000 | | 691,245 |
| Spain Letras del Tesoro | | | | |
| zero coupon due 06/23/2006 **** | EUR | 14,490,000 | | 17,142,491 |
| Rabobank USA Financial Corp. | | | | |
| 4.55% due 03/01/2006 *** | $ | 28,700,000 | | 28,700,000 |
| Sanpaola Imi US Financial Company | | | | |
| 4.665% due 05/23/2006 *** | | 28,500,000 | | 28,193,471 |
The accompanying notes are an integral part of the financial statements. 298
John Hancock Funds II
Portfolio of investments — February 28, 2006 (Unaudited)
(showing percentage of total net assets)
|
| Total Return Fund (continued) | | | |
| | | Shares or | | |
| | | Principal | | |
| | | Amount | | Value |
|
|
| |
| SHORT TERM INVESTMENTS (continued) | | | |
| Societe Generale North America, Inc. | | | | |
| 4.495% due 03/03/2006 *** | $ | 13,100,000 | $ | 13,096,729 |
| Swedish Housing Finance Corp., Statens | | | | |
| Bostadsfinansieringsaktiebolag | | | | |
| 4.34% due 03/06/2006 *** | | 26,200,000 | | 26,184,207 |
| Total SA | | | | |
| 4.55% due 03/01/2006 *** | | 24,200,000 | | 24,200,000 |
| UBS Finance (Delaware) LLC | | | | |
| 4.43% due 04/10/2006 *** | | 10,300,000 | | 10,249,301 |
| 4.48% due 05/10/2006 *** | | 2,200,000 | | 2,180,836 |
| 4.505% due 04/24/2006 *** | | 3,500,000 | | 3,476,349 |
| 4.55% due 03/01/2006 *** | | 300,000 | | 300,000 |
| 4.66% due 05/22/2006 *** | | 8,300,000 | | 8,211,900 |
| 4.67% due 05/23/2006 *** | | 7,100,000 | | 7,023,555 |
| United States Treasury Bills | | | | |
| zero coupon due 06/01/2006 | | 2,235,000 | | 2,209,520 |
| zero coupon due 03/02/2006 to | | | | |
| 03/16/2006 *** **** | | 5,965,000 | | 5,960,084 |
| zero coupon due 03/16/2006 **** | | 710,000 | | 708,865 |
|
| TOTAL SHORT TERM INVESTMENTS | | | | |
| (Cost $432,680,058) | | | $ | 431,155,034 |
|
| |
| REPURCHASE AGREEMENTS - 3.21% | | | | |
| Repurchase Agreement with State | | | | |
| Street Corp. dated 02/28/2006 at | | | | |
| 3.20% to be repurchased at | | | | |
| $33,545,982 on 03/01/2006, | | | | |
| collateralized by $34,205,000, U.S. | | | | |
| Treasury Notes, 2.00 % due | | | | |
| 05/15/2006 (valued at | | | | |
| $34,216,356, including interest) (c)*** | $ | 33,543,000 | $ | 33,543,000 |
|
| TOTAL REPURCHASE AGREEMENTS | | | | |
| (Cost $33,543,000) | | | $ | 33,543,000 |
|
| Total Investments (Total Return Fund) | | | | |
| (Cost $1,407,936,256) - 134.60% | | | $ 1,409,349,776 |
| Liabilities in Excess of Other Assets - (34.60)% | | | (362,269,142) |
|
|
| TOTAL NET ASSETS - 100.00% | | | $ 1,047,080,634 |
|
|
| |
| |
| U.S. Global Leaders Growth Fund | | |
| | | Shares or | | |
| | | Principal | | |
| | | Amount | | Value |
|
|
| |
| COMMON STOCKS - 99.09% | | | | |
| Biotechnology - 9.45% | | | | |
| Amgen, Inc. * | | 281,740 | $ | 21,268,553 |
| Genzyme Corp. * | | 271,707 | | 18,840,163 |
|
|
| | | | | 40,108,716 |
| Business Services - 5.04% | | | | |
| Automatic Data Processing, Inc. | | 462,848 | | 21,378,949 |
| Computers & Business Equipment - 4.93% | | | | |
| Dell, Inc. * | | 722,270 | | 20,945,830 |
| Cosmetics & Toiletries - 8.34% | | | | |
| Colgate-Palmolive Company | | 277,167 | | 15,100,058 |
| U.S. Global Leaders Growth Fund (continued) |
| | | Shares or | | |
| | | Principal | | |
| | | Amount | | Value |
| |
|
| |
| COMMON STOCKS (continued) | | | | |
| Cosmetics & Toiletries (continued) | | | | |
| Procter & Gamble Company | | 338,360 | $ | 20,277,915 |
|
|
| | | | | 35,377,973 |
Electrical Equipment - 3.92% | | | | |
| General Electric Company | | 505,799 | | 16,625,613 |
Financial Services - 3.55% | | | | |
| State Street Corp. (c) | | 241,164 | | 15,067,927 |
Food & Beverages - 10.11% | | | | |
| Starbucks Corp. * | | 374,712 | | 13,609,540 |
| The Coca-Cola Company | | 400,625 | | 16,814,231 |
| William Wrigley Jr. Company | | 196,416 | | 12,480,273 |
|
|
| | | | | 42,904,044 |
Healthcare Products - 9.30% | | | | |
| Johnson & Johnson | | 322,844 | | 18,611,957 |
| Medtronic, Inc. | | 386,882 | | 20,872,284 |
|
|
| | | | | 39,484,241 |
| Insurance - 3.81% | | | | |
| American International Group, Inc. | | 243,914 | | 16,186,133 |
| Internet Retail - 3.89% | | | | |
| eBay, Inc. * | | 411,897 | | 16,500,594 |
| Leisure Time - 3.19% | | | | |
| Electronic Arts, Inc. * | | 260,796 | | 13,553,568 |
| Pharmaceuticals - 3.95% | | | | |
| Teva Pharmaceutical Industries, Ltd., SADR | 399,173 | | 16,761,274 |
| Retail Grocery - 3.48% | | | | |
| Sysco Corp. | | 491,043 | | 14,775,484 |
| Retail Trade - 16.40% | | | | |
| Costco Wholesale Corp. | | 276,719 | | 14,190,150 |
| Home Depot, Inc. | | 404,143 | | 17,034,628 |
| Staples, Inc. | | 1,197,921 | | 29,396,981 |
| Wal-Mart Stores, Inc. | | 198,214 | | 8,990,987 |
|
|
| | | | | 69,612,746 |
| Software - 5.50% | | | | |
| Microsoft Corp. | | 867,206 | | 23,327,841 |
| Trucking & Freight - 4.23% | | | | |
| United Parcel Service, Inc., Class B | | 240,280 | | 17,951,319 |
|
| TOTAL COMMON STOCKS (Cost $417,020,516) | | $ | 420,562,252 |
|
| |
| REPURCHASE AGREEMENTS - 3.04% | | | |
| Repurchase Agreement with State | | | | |
| Street Corp. dated 02/28/2006 at | | | | |
| 3.20% to be repurchased at | | | | |
| $12,927,149 on 03/01/2006, | | | | |
| collateralized by $13,390,000 | | | | |
| Federal Home Loan Bank, 6.00% | | | | |
| due 11/15/2024 (valued at | | | | |
| $13,189,150 including interest) (c) | $ | 12,926,000 | $ | 12,926,000 |
|
| TOTAL REPURCHASE AGREEMENTS | | | | |
| (Cost $12,926,000) | | | $ | 12,926,000 |
|
The accompanying notes are an integral part of the financial statements. 299
John Hancock Funds II
Portfolio of investments — February 28, 2006 (Unaudited)
(showing percentage of total net assets)
|
| Total Investments (U.S. Global Leaders Growth Fund) | | |
| (Cost $429,946,516) - 102.13% | | | $ | 433,488,252 |
| Liabilities in Excess of Other Assets - (2.13)% | | | (9,055,509) |
|
|
| TOTAL NET ASSETS - 100.00% | | | $ | 424,432,743 |
|
|
| |
| |
| U.S. Government Securities Fund | | | |
| | | Shares or | | |
| | | Principal | | |
| | | Amount | | Value |
| |
|
| |
| U.S. TREASURY OBLIGATIONS - 16.25% | | | |
| U.S. Treasury Bonds - 0.08% | | | | |
| 6.625% due 02/15/2027 **** | $ | 128,000 | $ | 160,940 |
| U.S. Treasury Notes - 16.17% | | | | |
| 3.375% due 10/15/2009 | | 2,574,000 | | 2,465,511 |
| 3.375% due 11/15/2008 **** | | 926,000 | | 896,013 |
| 3.50% due 05/31/2007 *** | | 10,171,000 | | 10,020,815 |
| 4.00% due 02/15/2014 to 02/15/2015 | | 5,516,000 | | 5,283,521 |
| 4.00% due 04/15/2010 *** | | 5,278,000 | | 5,151,207 |
| 4.25% due 08/15/2015 | | 2,445,000 | | 2,381,775 |
| 4.50% due 11/15/2015 | | 5,000,000 | | 4,964,060 |
|
|
| | | | | 31,162,902 |
|
| TOTAL U.S. TREASURY OBLIGATIONS | | | |
| (Cost $31,522,739) | | | $ | 31,323,842 |
|
| |
| U.S. GOVERNMENT AGENCY OBLIGATIONS - 77.25% | | |
| Federal Home Loan Bank - 1.13% | | | | |
| 5.80% due 09/02/2008 | | 2,145,000 | | 2,182,870 |
| Federal Home Loan Mortgage Corp. - 20.52% | | | |
| 5.00% due 08/01/2033 | | 1,797,457 | | 1,748,311 |
| 5.00% TBA ** | | 21,000,000 | | 20,343,750 |
| 5.50% TBA ** | | 15,500,000 | | 15,364,375 |
| 6.00% due 10/01/2010 to 12/01/2028 | | 622,350 | | 630,440 |
| 6.50% due 07/01/2006 to 12/01/2010 | | 52,498 | | 53,181 |
| 7.00% due 02/01/2011 to 06/01/2032 | | 934,340 | | 965,431 |
| 7.50% due 05/01/2007 | | 7,569 | | 7,680 |
| 8.25% due 07/01/2006 | | 48 | | 48 |
| 9.00% due 10/01/2017 | | 16,452 | | 17,053 |
| 9.50% due 08/01/2020 | | 30,282 | | 33,276 |
| 11.75% due 12/01/2013 | | 1,903 | | 2,111 |
| 12.00% due 07/01/2020 | | 10,913 | | 11,864 |
|
|
| | | | | 39,546,608 |
| Federal National Mortgage | | | | |
| Association - 55.10% | | | | |
| 4.5955% due 02/17/2009 (b) | | 1,544,000 | | 1,518,817 |
| 5.00% TBA ** | | 40,000,000 | | 38,850,000 |
| 5.50% due 04/01/2018 to 05/01/2018 | | 2,327,500 | | 2,339,353 |
| 5.50% TBA ** | | 33,000,000 | | 32,731,875 |
| 6.00% due 02/01/2017 | | 1,453,412 | | 1,482,147 |
| 6.00% TBA ** | | 17,000,000 | | 17,154,054 |
| 6.50% due 02/01/2026 to 07/01/2032 | | 2,193,955 | | 2,266,675 |
| 6.50% TBA ** | | 5,000,000 | | 5,118,750 |
| 6.527% due 05/25/2030 (b) | | 1,158,293 | | 1,183,644 |
| 7.00% due 07/01/2022 to 01/01/2034 | | 1,105,052 | | 1,144,058 |
| 7.50% due 09/01/2029 to 02/01/2031 | | 182,693 | | 191,352 |
| 8.00% due 06/01/2017 to 03/01/2033 | | 483,594 | | 516,211 |
| 8.25% due 09/01/2008 | | 1,694 | | 1,729 |
| 8.50% due 02/01/2009 | | 772 | | 794 |
| 8.50% due 08/01/2019 *** | | 212,368 | | 228,144 |
| U.S. Government Securities Fund (continued) |
| | | Shares or | | |
| | | Principal | | |
| | | Amount | | Value |
|
|
| |
| U.S. GOVERNMENT AGENCY | | | | |
| OBLIGATIONS (continued) | | | | |
| Federal National Mortgage | | | | |
| Association (continued) | | | | |
| 8.75% due 08/01/2009 to 10/01/2011 | $ | 37,803 | $ | 38,790 |
| 9.00% due 05/01/2021 | | 8,588 | | 9,313 |
| 11.50% due 09/15/2013 to 09/01/2019 | | 40,983 | | 44,753 |
| 11.75% due 12/01/2015 | | 11,776 | | 12,874 |
| 12.00% due 01/01/2013 to 04/20/2016 | | 101,115 | | 114,087 |
| 12.50% due 01/01/2013 to 09/20/2015 | | 47,504 | | 52,037 |
| 13.50% due 11/15/2014 | | 27,574 | | 30,657 |
|
|
| | | | | 106,164,949 |
| Government National Mortgage | | | | |
| Association - 0.50% | | | | |
| 6.50% due 02/15/2034 to 09/15/2034 | | 470,941 | | 490,834 |
| 7.50% due 03/15/2026 to 12/15/2027 | | 232,491 | | 244,724 |
| 8.50% due 06/15/2025 | | 204,465 | | 222,259 |
| 11.00% due 09/15/2015 | | 695 | | 756 |
|
|
| | | | | 958,573 |
| |
| U.S. GOVERNMENT AGENCY OBLIGATIONS - 77.25% | | |
| Federal Home Loan Mortgage Corp. | | | | |
| 4.50% due 04/15/2032 | | 240,246 | | 217,062 |
| 5.50% due 01/15/2023 | | 4,277,114 | | 152,026 |
| Federal National Mortgage Association, | | | | |
| Series 2003-W14, Class 2A | | | | |
| 5.0219% due 01/25/2043 (b) | | 1,119,059 | | 1,134,835 |
|
| TOTAL U.S. GOVERNMENT AGENCY OBLIGATIONS | | |
| (Cost $148,458,001) | | | $ | 148,853,000 |
|
| |
| SHORT TERM INVESTMENTS - 57.56% | | | | |
| Federal Home Loan Bank Discount Notes | | | | |
| zero coupon due 03/08/2006 | $ | 25,000,000 | $ | 24,978,611 |
| United States Treasury Bills | | | | |
| 4.23% due 03/09/2006 *** | | 71,000,000 | | 70,932,629 |
| 4.245% due 03/02/2006 *** | | 15,000,000 | | 14,998,231 |
|
| TOTAL SHORT TERM INVESTMENTS | | | | |
| (Cost $110,892,851) | | | $ | 110,909,471 |
|
| |
| REPURCHASE AGREEMENTS - 15.66% | | | | |
| Greenwich Capital Repurchase | | | | |
| Agreement dated 02/28/2006 at | | | | |
| 4.55% to be repurchased at | | | | |
| $30,191,815 on 03/01/2006, | | | | |
| collateralized by $30,770,000 | | | | |
| Federal National Mortgage | | | | |
| Association, 4.75% due | | | | |
| 12/15/2010 (valued at | | | | |
| $30,842,609, including interest) (c)*** | $ | 30,188,000 | $ | 30,188,000 |
|
| TOTAL REPURCHASE AGREEMENTS | | | | |
| (Cost $30,188,000) | | | $ | 30,188,000 |
|
| Total Investments (U.S. Government Securities Fund) | | |
| (Cost $321,061,591) - 166.72% | | | $ | 321,274,313 |
| Liabilities in Excess of Other Assets - (66.72)% | | | (128,576,579) |
|
|
| TOTAL NET ASSETS - 100.00% | | | $ | 192,697,734 |
|
|
The accompanying notes are an integral part of the financial statements. 300
John Hancock Funds II
Portfolio of investments — February 28, 2006 (Unaudited)
(showing percentage of total net assets)
|
| U.S. High Yield Bond Fund | | | |
| | | Shares or | |
| | | Principal | |
| | | Amount | Value |
|
|
| |
| CORPORATE BONDS - 94.19% | | | |
| Advertising - 1.59% | | | |
| R H Donnelley Finance Corp. | | | |
| 8.875% due 01/15/2016 | $ | 780,000 | $ | 813,150 |
| Sheridan Group, Inc. | | | |
| 10.25% due 08/15/2011 | | 1,180,000 | 1,222,775 |
| Vertis, Inc. | | | |
| 9.75% due 04/01/2009 | | 600,000 | 621,000 |
|
|
| | | | 2,656,925 |
| |
| Aerospace - 0.38% | | | |
| Sequa Corp., Series B | | | |
| 8.875% due 04/01/2008 | | 600,000 | 628,500 |
Aluminum - 0.07% | | | |
| IMCO Recycling, Inc. | | | |
| 10.375% due 10/15/2010 | | 100,000 | 110,000 |
Apparel & Textiles - 0.47% | | | |
| Levi Strauss & Company | | | |
| 12.25% due 12/15/2012 | | 600,000 | 685,500 |
| Phillips-Van Heusen | | | |
| 7.25% due 02/15/2011 | | 100,000 | 102,750 |
|
|
| | | | 788,250 |
| |
| Auto Parts - 1.12% | | | |
| ArvinMeritor, Inc. | | | |
| 8.75% due 03/01/2012 | | 130,000 | 127,400 |
| Federal-Mogul Corp. | | | |
| 7.375% due 01/15/2006 ^ | | 300,000 | 115,500 |
| 7.50% due 01/15/2009 ^ | | 300,000 | 115,500 |
| IAP Worldwide Services, Inc. | | | |
| 12.625% due 06/22/2013 (b)(f) | | 500,000 | 508,750 |
| Lear Corp., Series B | | | |
| 5.75% due 08/01/2014 | | 145,000 | 113,462 |
| 8.11% due 05/15/2009 (a) | | 130,000 | 114,725 |
| Meritor Automotive, Inc. | | | |
| 6.80% due 02/15/2009 | | 130,000 | 127,400 |
| TRW Automotive, Inc. | | | |
| 9.375% due 02/15/2013 | | 600,000 | 651,000 |
|
|
| | | | 1,873,737 |
| |
| Automobiles - 2.26% | | | |
| Asbury Automotive Group, Inc. | | | |
| 9.00% due 06/15/2012 | | 900,000 | 927,000 |
| Ford Motor Company | | | |
| 7.45% due 07/16/2031 (a) | | 1,375,000 | 976,250 |
| General Motors Corp. | | | |
| 8.375% due 07/15/2033 (a) | | 910,000 | 641,550 |
| Hertz Corp., Class A | | | |
| 8.875% due 01/01/2014 | | 415,000 | 433,675 |
| 10.50% due 01/01/2016 (a) | | 170,000 | 183,175 |
| Sonic Automotive, Inc., Series B | | | |
| 8.625% due 08/15/2013 | | 600,000 | 601,500 |
|
|
| | | | 3,763,150 |
| |
| Banking - 1.22% | | | |
| Bombardier Capital, Inc., MTN | | | |
| 6.125% due 06/29/2006 | | 800,000 | 799,000 |
| Capital One Financial Corp. | | | |
| 7.25% due 05/01/2006 | | 300,000 | 301,121 |
| U.S. High Yield Bond Fund (continued) | |
| | | Shares or | |
| | | Principal | |
| | | Amount | Value |
|
|
| |
| CORPORATE BONDS (continued) | | | |
| Banking (continued) | | | |
| Chevy Chase Bank | | | |
| 6.875% due 12/01/2013 | $ | 900,000 | $ | 927,000 |
|
|
| | | | 2,027,121 |
Broadcasting - 2.99% | | | |
| Charter Communications Operating LLC | | | |
| 8.00% due 04/30/2012 | | 700,000 | 705,250 |
| 8.375% due 04/30/2014 | | 2,600,000 | 2,619,500 |
| CSC Holdings, Inc. | | | |
| 7.25% due 07/15/2008 | | 600,000 | 607,500 |
| Fisher Communications, Inc. | | | |
| 8.625% due 09/15/2014 | | 1,000,000 | 1,051,250 |
|
|
| | | | 4,983,500 |
Building Materials & Construction - 1.17% | | |
| Ainsworth Lumber Company, Ltd. | | | |
| 7.25% due 10/01/2012 | | 600,000 | 561,000 |
| Masonite International | | | |
| 6.21% due 04/06/2013 (b)(f) | | 997,487 | 977,667 |
| Panolam Industries International, Inc. | | | |
| 10.75% due 10/01/2013 | | 435,000 | 417,600 |
|
|
| | | | 1,956,267 |
Business Services - 2.62% | | | |
| Affinity Group, Inc. | | | |
| 9.00% due 02/15/2012 | | 300,000 | 300,000 |
| CCC Information Services Group | | | |
| 7.07% due 02/13/2013 (b)(f) | | 500,000 | 500,000 |
| Cornell Companies, Inc. | | | |
| 10.75% due 07/01/2012 | | 600,000 | 634,500 |
| SunGard Data Systems, Inc. | | | |
| 3.75% due 01/15/2009 | | 125,000 | 116,250 |
| 4.875% due 01/15/2014 | | 600,000 | 534,000 |
| 9.125% due 08/15/2013 | | 1,000,000 | 1,063,750 |
| 10.25% due 08/15/2015 | | 675,000 | 707,906 |
| Williams Scotsman International, Inc. | | | |
| 8.50% due 10/01/2015 | | 500,000 | 515,000 |
|
|
| | | | 4,371,406 |
Cable and Television - 3.89% | | | |
| CCO Holdings LLC | | | |
| 8.6163% due 12/15/2010 (b) | | 600,000 | 600,000 |
| 8.75% due 11/15/2013 | | 600,000 | 585,000 |
| CSC Holdings, Inc. | | | |
| 7.875% due 12/15/2007 | | 1,200,000 | 1,230,000 |
| DirecTV Holdings LLC | | | |
| 6.375% due 06/15/2015 | | 2,400,000 | 2,391,000 |
| EchoStar DBS Corp. | | | |
| 7.125% due 02/01/2016 | | 1,250,000 | 1,237,500 |
| Videotron Ltee | | | |
| 6.875% due 01/15/2014 | | 425,000 | 434,562 |
|
|
| | | | 6,478,062 |
| Cellular Communications - 4.72% | | | |
| Centennial Communications Corp. | | | |
| 10.00% due 01/01/2013 (a) | | 370,000 | 384,800 |
| Dobson Cellular Systems, Inc. | | | |
| 8.375% due 11/01/2011 | | 600,000 | 636,000 |
| 9.43% due 11/01/2011 (b) | | 600,000 | 624,000 |
The accompanying notes are an integral part of the financial statements. 301
John Hancock Funds II
Portfolio of investments — February 28, 2006 (Unaudited)
(showing percentage of total net assets)
|
| U.S. High Yield Bond Fund (continued) | |
| | | Shares or | |
| | | Principal | |
| | | Amount | Value |
|
|
| |
| CORPORATE BONDS (continued) | | | |
| Cellular Communications (continued) | | | |
| Dobson Cellular Systems, Inc. (continued) | | | |
| 9.875% due 11/01/2012 (a) | $ | 600,000 | $ | 655,500 |
| Dobson Communications Corp. | | | |
| 8.875% due 10/01/2013 | | 2,100,000 | 2,115,750 |
| Nextel Communications, Inc. | | | |
| 6.875% due 10/31/2013 | | 600,000 | 628,140 |
| 7.375% due 08/01/2015 | | 600,000 | 634,544 |
| Rural Cellular Corp. | | | |
| 8.25% due 03/15/2012 | | 1,100,000 | 1,155,000 |
| 9.875% due 02/01/2010 | | 550,000 | 588,500 |
| UbiquiTel Operating Company | | | |
| 9.875% due 03/01/2011 | | 400,000 | 440,000 |
|
|
| | | | 7,862,234 |
Chemicals - 0.57% | | | |
| Equistar Chemicals LP | | | |
| 10.125% due 09/01/2008 | | 205,000 | 220,375 |
| Lyondell Chemical Company, Series A | | | |
| 9.625% due 05/01/2007 | | 395,000 | 408,825 |
| Nova Chemicals Corp. | | | |
| 7.561% due 11/15/2013 (b) | | 310,000 | 316,200 |
|
|
| | | | 945,400 |
Coal - 0.94% | | | |
| James River Coal Company | | | |
| 9.375% due 06/01/2012 | | 625,000 | 651,563 |
| Massey Energy Company | | | |
| 6.875% due 12/15/2013 | | 920,000 | 917,700 |
|
|
| | | | 1,569,263 |
Commercial Services - 0.37% | | | |
| Mac-Gray Corp. | | | |
| 7.625% due 08/15/2015 | | 600,000 | 615,000 |
Containers & Glass - 1.88% | | | |
| Crown Cork & Seal Company, Inc. | | | |
| 8.00% due 04/15/2023 | | 800,000 | 780,000 |
| Crown Holdings, Inc. | | | |
| 7.75% due 11/15/2015 | | 475,000 | 495,188 |
| Graham Packaging Company | | | |
| 8.50% due 10/15/2012 | | 600,000 | 611,250 |
| Owens-Brockway Glass Container, Inc. | | | |
| 8.25% due 05/15/2013 | | 1,200,000 | 1,251,000 |
|
|
| | | | 3,137,438 |
Correctional Facilities - 0.56% | | | |
| Corrections Corporation of America | | | |
| 6.25% due 03/15/2013 | | 600,000 | 595,500 |
| 6.75% due 01/31/2014 | | 335,000 | 340,863 |
|
|
| | | | 936,363 |
Crude Petroleum & Natural Gas - 2.42% | | | |
| AmeriGas Partners LP | | | |
| 7.125% due 05/20/2016 | | 770,000 | 773,850 |
| Chesapeake Energy Corp. | | | |
| 6.625% due 01/15/2016 | | 600,000 | 609,000 |
| 6.875% due 01/15/2016 | | 600,000 | 615,000 |
| 6.875% due 11/15/2020 | | 125,000 | 128,437 |
| 7.50% due 09/15/2013 (a) | | 600,000 | 638,250 |
| U.S. High Yield Bond Fund (continued) | |
| | | Shares or | |
| | | Principal | |
| | | Amount | Value |
|
|
| |
| CORPORATE BONDS (continued) | | | |
| Crude Petroleum & Natural Gas | | | |
| (continued) | | | |
| Encore Acquisition Company | | | |
| 6.00% due 07/15/2015 | $ | 365,000 | $ | 346,750 |
| Hanover Equipment Trust, Series A | | | |
| 8.50% due 09/01/2008 | | 441,000 | 455,333 |
| Tesoro Corp. | | | |
| 6.625% due 11/01/2015 | | 470,000 | 473,525 |
|
|
| | | | 4,040,145 |
| Domestic Oil - 0.68% | | | |
| Eagle Rock Energy | | | |
| 2.00% due 12/01/2012 (b)(f) | | 375,000 | 376,875 |
| Petroleum Geo-Services | | | |
| 7.00% due 12/15/2012 (b)(f) | | 750,000 | 759,375 |
|
|
| | | | 1,136,250 |
Electrical Utilities - 0.40% | | | |
| Nevada Power Company | | | |
| 5.95% due 03/15/2016 | | 250,000 | 251,174 |
| Tenaska Alabama Partners LP | | | |
| 7.00% due 06/30/2021 | | 397,314 | 410,114 |
|
|
| | | | 661,288 |
Electronics - 1.04% | | | |
| Communications & Power Industries, Inc. | | | |
| 8.00% due 02/01/2012 | | 1,100,000 | 1,130,250 |
| L-3 Communications Corp., Series B | | | |
| 6.375% due 10/15/2015 | | 600,000 | 598,500 |
|
|
| | | | 1,728,750 |
Energy - 1.39% | | | |
| NRG Energy, Inc. | | | |
| 6.57% due 01/31/2013 (b)(f) | | 1,500,000 | 1,512,195 |
| 7.25% due 02/01/2014 | | 225,000 | 230,625 |
| 7.375% due 02/01/2016 | | 550,000 | 566,500 |
|
|
| | | | 2,309,320 |
Financial Services - 13.12% | | | |
| Alamosa Delaware, Inc. | | | |
| 8.50% due 01/31/2012 | | 2,330,000 | 2,516,400 |
| Ameritrade Holding Corp. | | | |
| 6.04% due 12/31/2012 (b)(f) | | 2,000,000 | 2,012,180 |
| Ashton Woods USA | | | |
| 9.50% due 10/01/2015 | | 500,000 | 470,000 |
| Chukchansi Economic Development Authority | | |
| 4.469% due 11/15/2012 | | 125,000 | 128,125 |
| 8.00% due 11/15/2013 | | 120,000 | 123,600 |
| Consolidated Communications Holdings | | | |
| 9.75% due 04/01/2012 | | 96,000 | 102,600 |
| Dow Jones CDX HY, Series 5-T1 | | | |
| 8.75% due 12/29/2010 | | 6,471,630 | 6,617,242 |
| Dow Jones CDX NA HY, Series 5-T2 | | | |
| 7.25% due 12/29/2010 | | 500,000 | 494,062 |
| Ford Motor Credit Company | | | |
| 7.00% due 10/01/2013 (a) | | 1,775,000 | 1,559,921 |
| 7.25% due 10/25/2011 | | 430,000 | 384,564 |
| General Motors Acceptance Corp. | | | |
| 6.75% due 12/01/2014 (a) | | 800,000 | 706,750 |
| 6.875% due 08/28/2012 | | 200,000 | 178,199 |
The accompanying notes are an integral part of the financial statements. 302
John Hancock Funds II
Portfolio of investments — February 28, 2006 (Unaudited)
(showing percentage of total net assets)
|
| U.S. High Yield Bond Fund (continued) | |
| | | Shares or | |
| | | Principal | |
| | | Amount | Value |
|
|
| |
| CORPORATE BONDS (continued) | | | |
| Financial Services (continued) | | | |
| General Motors Acceptance Corp. (continued) | | |
| 8.00% due 11/01/2031 (a) | $ | 2,410,000 | $ | 2,200,904 |
| H&E Equipment Finance Corp. | | | |
| 11.125% due 06/15/2012 | | 425,000 | 473,344 |
| Linsco Private Ledger Holding | | | |
| 7.736% due 06/27/2013 (b)(f) | | 1,750,000 | 1,747,813 |
| Markwest Energy Partners LP | | | |
| 6.875% due 11/01/2014 | | 300,000 | 282,000 |
| Penhall International, Corp. | | | |
| 11.20% due 11/01/2010 (b)(f) | | 500,000 | 505,000 |
| Stripes Acquisition LLC | | | |
| 10.625% due 12/15/2013 | | 160,000 | 167,200 |
| Thornburg Mortgage, Inc. | | | |
| 8.00% due 05/15/2013 | | 700,000 | 691,250 |
| Wolf Hollow, 1st Lien LP | | | |
| 6.635% due 06/19/2012 (b)(f) | | 500,000 | 504,375 |
|
|
| | | | 21,865,529 |
Food & Beverages - 1.74% | | | |
| American Seafoods Group LLC | | | |
| 10.125% due 04/15/2010 | | 275,000 | 290,812 |
| B&G Foods Holding Corp. | | | |
| 8.00% due 10/01/2011 (a) | | 600,000 | 615,000 |
| Del Monte Corp. | | | |
| 8.625% due 12/15/2012 (a) | | 600,000 | 639,000 |
| Doane Pet Care Company | | | |
| 10.75% due 03/01/2010 | | 200,000 | 215,250 |
| Dole Food, Inc. | | | |
| 7.25% due 06/15/2010 | | 600,000 | 577,500 |
| Mrs. Fields Famous Brands LLC | | | |
| 11.50% due 03/15/2011 | | 300,000 | 248,250 |
| Pierre Foods, Inc. | | | |
| 9.875% due 07/15/2012 (a) | | 300,000 | 311,250 |
|
|
| | | | 2,897,062 |
Funeral Services - 0.64% | | | |
| Service Corp. International | | | |
| 6.50% due 03/15/2008 | | 600,000 | 606,000 |
| 7.00% due 06/15/2017 | | 425,000 | 434,031 |
| 7.70% due 04/15/2009 (a) | | 25,000 | 26,250 |
|
|
| | | | 1,066,281 |
Gas & Pipeline Utilities - 4.70% | | | |
| Colorado Interstate Gas Company | | | |
| 6.80% due 11/15/2015 | | 375,000 | 392,647 |
| El Paso Corp. | | | |
| 6.75% due 05/15/2009 | | 300,000 | 302,100 |
| 7.42% due 02/15/2037 | | 250,000 | 252,187 |
| 7.625% due 08/16/2007 | | 200,000 | 204,250 |
| 7.75% due 01/15/2032 (a) | | 1,075,000 | 1,142,188 |
| 7.875% due 06/15/2012 | | 1,900,000 | 2,014,000 |
| Pacific Energy Partners LP | | | |
| 6.25% due 09/15/2015 (a) | | 300,000 | 298,500 |
| Targa Resources, Inc. | | | |
| 6.34% due 08/31/2012 (b)(f) | | 478,639 | 483,426 |
| Transmontaigne, Inc. | | | |
| 9.125% due 06/01/2010 | | 600,000 | 616,500 |
| U.S. High Yield Bond Fund (continued) | |
| | | Shares or | |
| | | Principal | |
| | | Amount | Value |
|
|
| |
| CORPORATE BONDS (continued) | | | |
| Gas & Pipeline Utilities (continued) | | | |
| Williams Companies, Inc. | | | |
| 6.375% due 10/01/2010 | $ | 500,000 | $ | 501,250 |
| 6.5363% due 10/01/2010 (b) | | 400,000 | 408,000 |
| 8.75% due 03/15/2032 | | 1,000,000 | 1,210,000 |
|
|
| | | | 7,825,048 |
| |
Healthcare Services - 2.05% | | | |
| Healthsouth Corp. | | | |
| 7.375% due 10/01/2006 | | 1,400,000 | 1,414,000 |
| Matria Healthcare, Inc., Tranche B | | | |
| 8.75% due 01/19/2007 (b)(f) | | 320,513 | 323,718 |
| Matria Healthcare, Inc., Tranche C | | | |
| 8.75% due 01/19/2012 (b)(f) | | 679,487 | 679,487 |
| QTC Management | | | |
| 7.09% due 11/10/2012 (b)(f) | | 1,000,000 | 1,005,000 |
|
|
| | | | 3,422,205 |
| |
Holdings Companies/Conglomerates - 0.60% | | |
| Central Garden & Pet Company | | | |
| 6.175% due 05/14/2009 (b)(f) | | 1,000,000 | 1,000,000 |
Homebuilders - 0.28% | | | |
| Quality Home Brands | | | |
| 11.53% due 11/04/2012 (b)(f) | | 470,000 | 471,763 |
Hotels & Restaurants - 3.85% | | | |
| Buffets, Inc. | | | |
| 11.25% due 07/15/2010 | | 1,225,000 | 1,274,000 |
| CCM Merger, Inc. | | | |
| 8.00% due 08/01/2013 | | 100,000 | 99,500 |
| Denny's Corp. | | | |
| 10.00% due 10/01/2012 | | 1,500,000 | 1,567,500 |
| Friendly Ice Cream Corp. | | | |
| 8.375% due 06/15/2012 (a) | | 280,000 | 261,800 |
| Hilton Hotels Corp. | | | |
| 6.045% due 02/22/2011 (b)(f) | | 410,000 | 410,000 |
| HMH Properties, Inc., Series B | | | |
| 7.875% due 08/01/2008 | | 1,100,000 | 1,106,875 |
| MGM MIrage, Inc. | | | |
| 6.50% due 07/31/2009 | | 100,000 | 101,000 |
| O'Charleys, Inc. | | | |
| 9.00% due 11/01/2013 | | 1,350,000 | 1,387,125 |
| Real Mex Restaurants, Inc. | | | |
| 10.00% due 04/01/2010 | | 200,000 | 216,500 |
|
|
| | | | 6,424,300 |
| |
Household Appliances - 0.46% | | | |
| ALH Finance LLC | | | |
| 8.50% due 01/15/2013 (a) | | 600,000 | 579,000 |
| Fedders North America, Inc. | | | |
| 9.875% due 03/01/2014 | | 300,000 | 186,000 |
|
|
| | | | 765,000 |
| |
Housing & Urban Development - 0.19% | | | |
| Beazer Homes USA, Inc. | | | |
| 8.375% due 04/15/2012 | | 300,000 | 312,000 |
Industrial Machinery - 0.69% | | | |
| Columbus McKinnon Corp. | | | |
| 8.875% due 11/01/2013 | | 200,000 | 210,500 |
The accompanying notes are an integral part of the financial statements. 303
John Hancock Funds II
Portfolio of investments — February 28, 2006 (Unaudited)
(showing percentage of total net assets)
|
| U.S. High Yield Bond Fund (continued) | |
| | | Shares or | |
| | | Principal | |
| | | Amount | Value |
|
|
| |
| CORPORATE BONDS (continued) | | | |
| Industrial Machinery (continued) | | | |
| Columbus McKinnon Corp. (continued) | | | |
| 10.00% due 08/01/2010 | $ | 195,000 | $ | 214,744 |
| JLG Industries, Inc. | | | |
| 8.25% due 05/01/2008 | | 700,000 | 731,500 |
|
|
| | | | 1,156,744 |
Internet Content - 0.23% | | | |
| Global eXchange Services, Inc. | | | |
| 9.08% due 07/29/2011 (b)(f) | | 380,000 | 374,300 |
Leisure Time - 7.07% | | | |
| AMC Entertainment, Inc., Series B | | | |
| 8.625% due 08/15/2012 (a) | | 1,050,000 | 1,094,625 |
| Aztar Corp. | | | |
| 7.875% due 06/15/2014 (a) | | 400,000 | 416,000 |
| Bombardier Recreational Products, Inc. | | | |
| 8.375% due 12/15/2013 | | 1,100,000 | 1,155,000 |
| Hard Rock Hotel, Inc. | | | |
| 8.875% due 06/01/2013 | | 200,000 | 217,250 |
| Majestic Star Casino LLC | | | |
| 9.50% due 10/15/2010 (a) | | 595,000 | 636,650 |
| MGM Mirage, Inc. | | | |
| 6.00% due 10/01/2009 (a) | | 700,000 | 696,500 |
| 6.625% due 07/15/2015 (a) | | 550,000 | 552,062 |
| 8.50% due 09/15/2010 (a) | | 600,000 | 650,250 |
| Mohegan Tribal Gaming Authority | | | |
| 6.125% due 02/15/2013 (a) | | 500,000 | 495,625 |
| Penn National Gaming, Inc. | | | |
| 6.875% due 12/01/2011 | | 600,000 | 612,000 |
| River Rock Entertainment Authority | | | |
| 9.75% due 11/01/2011 | | 600,000 | 649,500 |
| San Pasqual Casino Development Group | | | |
| 8.00% due 09/15/2013 | | 500,000 | 510,000 |
| Speedway Motorsports, Inc. | | | |
| 6.75% due 06/01/2013 | | 900,000 | 913,500 |
| Station Casinos, Inc. | | | |
| 6.00% due 04/01/2012 | | 800,000 | 800,000 |
| 6.625% due 03/15/2018 | | 800,000 | 798,000 |
| 6.875% due 03/01/2016 (a) | | 300,000 | 305,250 |
| Wynn Las Vegas LLC | | | |
| 6.625% due 12/01/2014 (a) | | 1,300,000 | 1,280,500 |
|
|
| | | | 11,782,712 |
Medical-Hospitals - 2.09% | | | |
| HCA, Inc. | | | |
| 5.50% due 12/01/2009 | | 300,000 | 295,192 |
| 6.75% due 07/15/2013 | | 300,000 | 305,585 |
| 7.875% due 02/01/2011 | | 1,900,000 | 2,030,258 |
| Skilled Healthcare Group, Inc. | | | |
| 11.00% due 01/15/2014 | | 825,000 | 860,063 |
|
|
| | | | 3,491,098 |
Metal & Metal Products - 0.28% | | | |
| USEC, Inc. | | | |
| 6.75% due 01/20/2009 | | 490,000 | 474,075 |
Office Furnishings & Supplies - 0.30% | | | |
| IKON Office Solutions, Inc. | | | |
| 7.75% due 09/15/2015 | | 500,000 | 505,000 |
| U.S. High Yield Bond Fund (continued) | |
| | | Shares or | |
| | | Principal | |
| | | Amount | Value |
|
|
| |
| CORPORATE BONDS (continued) | | | |
| Paper - 1.68% | | | |
| Abitibi-Consolidated, Inc. | | | |
| 6.95% due 04/01/2008 | $ | 1,293,000 $ | 1,271,989 |
| Buckeye Technologies, Inc. | | | |
| 8.00% due 10/15/2010 | | 300,000 | 293,250 |
| Domtar, Inc. | | | |
| 7.125% due 08/15/2015 (a) | | 600,000 | 502,500 |
| Neenah Paper, Inc. | | | |
| 7.375% due 11/15/2014 | | 800,000 | 728,000 |
|
|
| | | | 2,795,739 |
| Petroleum Services - 0.11% | | | |
| Chaparral Energy, Inc. | | | |
| 8.50% due 12/01/2015 | | 170,000 | 179,775 |
Pharmaceuticals - 0.62% | | | |
| AmerisourceBergen Corp. | | | |
| 5.875% due 09/15/2015 | | 405,000 | 407,572 |
| Mylan Laboratories, Inc. | | | |
| 5.75% due 08/15/2010 | | 200,000 | 199,500 |
| Omnicare, Inc. | | | |
| 6.875% due 12/15/2015 (a) | | 420,000 | 428,400 |
|
|
| | | | 1,035,472 |
Publishing - 2.16% | | | |
| American Media Operations, Inc. | | | |
| 8.875% due 01/15/2011 | | 330,000 | 280,500 |
| Dex Media East LLC | | | |
| 12.125% due 11/15/2012 | | 300,000 | 346,125 |
| Houghton Mifflin Company | | | |
| 8.25% due 02/01/2011 | | 800,000 | 836,000 |
| 9.875% due 02/01/2013 (a) | | 600,000 | 654,000 |
| Medianews Group, Inc. | | | |
| 6.875% due 10/01/2013 | | 400,000 | 373,000 |
| Primedia, Inc. | | | |
| 8.00% due 05/15/2013 | | 600,000 | 537,000 |
| 8.875% due 05/15/2011 | | 600,000 | 577,500 |
|
|
| | | | 3,604,125 |
Railroads & Equipment - 0.63% | | | |
| Greenbrier Companies, Inc. | | | |
| 8.375% due 05/15/2015 | | 200,000 | 210,000 |
| 8.375% due 05/15/2015 | | 800,000 | 840,000 |
|
|
| | | | 1,050,000 |
Real Estate - 3.32% | | | |
| BF Saul, REIT | | | |
| 7.50% due 03/01/2014 | | 1,800,000 | 1,845,000 |
| Capital Automotive REIT | | | |
| 6.12% due 12/16/2010 (b)(f) | | 720,000 | 723,002 |
| Felcor Suites LP, REIT | | | |
| 7.625% due 10/01/2007 | | 1,420,000 | 1,455,500 |
| Host Marriott LP, Series M, REIT | | | |
| 7.00% due 08/15/2012 | | 1,100,000 | 1,122,000 |
| Kimball Hill Homes, Inc. | | | |
| 10.50% due 12/15/2012 | | 410,000 | 393,600 |
|
|
| | | | 5,539,102 |
The accompanying notes are an integral part of the financial statements. 304
John Hancock Funds II
Portfolio of investments — February 28, 2006 (Unaudited)
(showing percentage of total net assets)
|
| U.S. High Yield Bond Fund (continued) | |
| | | Shares or | |
| | | Principal | |
| | | Amount | Value |
|
|
| |
| CORPORATE BONDS (continued) | | | |
| Retail - 2.60% | | | |
| Ferrellgas Escrow LLC | | | |
| 6.75% due 05/01/2014 | $ | 500,000 | $ | 487,500 |
| NationsRent, Inc. | | | |
| 9.50% due 10/15/2010 | | 700,000 | 767,375 |
| 9.50% due 05/01/2015 (a) | | 285,000 | 307,800 |
| PEP Boys - Manny, Moe & Jack | | | |
| 7.50% due 12/15/2014 (a) | | 800,000 | 726,000 |
| Sunstate Equipment Company LLC | | | |
| 10.50% due 04/01/2013 | | 300,000 | 312,000 |
| Toys R Us, Inc. | | | |
| 7.307% due 12/01/2008 | | 1,750,000 | 1,737,610 |
|
|
| | | | 4,338,285 |
Retail Grocery - 0.37% | | | |
| Couche-Tard US LP | | | |
| 7.50% due 12/15/2013 | | 300,000 | 312,750 |
| Stater Brothers Holdings, Inc. | | | |
| 8.125% due 06/15/2012 (a) | | 300,000 | 303,000 |
|
|
| | | | 615,750 |
Retail Trade - 1.25% | | | |
| Neff Corp. | | | |
| 11.25% due 06/15/2012 | | 585,000 | 634,725 |
| Payless Shoesource, Inc. | | | |
| 8.25% due 08/01/2013 | | 1,100,000 | 1,157,750 |
| Suburban Propane Partners LP | | | |
| 6.875% due 12/15/2013 | | 300,000 | 289,500 |
|
|
| | | | 2,081,975 |
Sanitary Services - 1.27% | | | |
| Allied Waste North America, Inc. | | | |
| 6.50% due 11/15/2010 | | 800,000 | 796,000 |
| 7.25% due 03/15/2015 | | 200,000 | 203,000 |
| 7.875% due 04/15/2013 | | 800,000 | 832,000 |
| Allied Waste North America, Inc., Series B | | | |
| 5.75% due 02/15/2011 | | 300,000 | 287,250 |
|
|
| | | | 2,118,250 |
Semiconductors - 0.80% | | | |
| Avago Technologies Financial Services | | | |
| 10.125% due 12/01/2013 | | 675,000 | 717,187 |
| 11.875% due 12/01/2015 | | 585,000 | 618,638 |
|
|
| | | | 1,335,825 |
Telecommunications Equipment & | | | |
| Services - 2.53% | | | |
| Citizens Communications Company | | | |
| 7.625% due 08/15/2008 | | 1,100,000 | 1,145,375 |
| Hawaiian Telcom Communications, Inc. | | | |
| 12.50% due 05/01/2015 (a) | | 590,000 | 559,025 |
| Intelsat Ltd. | | | |
| 5.25% due 11/01/2008 | | 1,700,000 | 1,606,500 |
| Panamsat Corp. | | | |
| 9.00% due 08/15/2014 | | 700,000 | 738,500 |
| Time Warner Telecom Holdings, Inc. | | | |
| 9.25% due 02/15/2014 | | 150,000 | 161,813 |
|
|
| | | | 4,211,213 |
| U.S. High Yield Bond Fund (continued) | | |
| | | Shares or | | |
| | | Principal | | |
| | | Amount | | Value |
| |
|
| |
| CORPORATE BONDS (continued) | | | | |
| Telephone - 4.60% | | | | |
| Cincinnati Bell, Inc. | | | | |
| 7.00% due 02/15/2015 (a) | $ | 530,000 | $ | 529,337 |
| 7.25% due 07/15/2013 | | 600,000 | | 620,250 |
| GTE Hawaiian Telephone Company, Series B | | | | |
| 7.375% due 09/01/2006 | | 600,000 | | 600,000 |
| Qwest Corp. | | | | |
| 7.625% due 06/15/2015 | | 300,000 | | 321,750 |
| 7.875% due 09/01/2011 | | 600,000 | | 642,000 |
| 8.875% due 03/15/2012 | | 2,700,000 | | 3,024,000 |
| Valor Telecommunications Enterprise | | | | |
| 7.75% due 02/15/2015 | | 1,850,000 | | 1,926,313 |
|
|
| | | | | 7,663,650 |
| |
| Tobacco - 0.42% | | | | |
| RJ Reynolds Tobacco Holdings, Inc. | | | | |
| 6.50% due 07/15/2010 | | 700,000 | | 703,500 |
Transportation - 0.79% | | | | |
| Bombardier, Inc. | | | | |
| 6.75% due 05/01/2012 (a) | | 1,400,000 | | 1,323,000 |
|
| TOTAL CORPORATE BONDS (Cost $154,838,408) | | $ | 157,007,147 |
|
| |
| SHORT TERM INVESTMENTS - 13.01% | | | | |
| State Street Navigator Securities | | | | |
| Lending Prime Portfolio (c) | $ | 21,693,548 | $ | 21,693,548 |
|
| TOTAL SHORT TERM INVESTMENTS | | | | |
| (Cost $21,693,548) | | | $ | 21,693,548 |
|
| |
| REPURCHASE AGREEMENTS - 6.62% | | | | |
| Repurchase Agreement with State | | | | |
| Street Corp. dated 02/28/2006 at | | | | |
| 3.20% to be repurchased at | | | | |
| $11,028,980 on 03/01/2006, | | | | |
| collateralized by $11,940,000 | | | | |
| Federal National Mortgage | | | | |
| Association, 5.55% due | | | | |
| 07/10/2028 (valued at | | | | |
| $11,262,531 including interest) (c) | $ | 11,028,000 | $ | 11,028,000 |
|
| TOTAL REPURCHASE AGREEMENTS | | | | |
| (Cost $11,028,000) | | | $ | 11,028,000 |
|
| Total Investments (U.S. High Yield Bond Fund) | | | |
| (Cost $187,559,956) - 113.82% | | | $ | 189,728,695 |
| Liabilities in Excess of Other Assets - (13.82)% | | | (23,040,998) |
|
|
| TOTAL NET ASSETS - 100.00% | | | $ | 166,687,697 |
|
|
| |
| |
| U.S. Multi Sector Fund | | | | |
| | | Shares or | | |
| | | Principal | | |
| | | Amount | | Value |
| |
|
| |
| COMMON STOCKS - 94.65% | | | | |
| Advertising - 0.14% | | | | |
| Omnicom Group, Inc. | | 19,100 | $ | 1,524,562 |
Aerospace - 1.20% | | | | |
| Boeing Company | | 19,400 | | 1,410,186 |
The accompanying notes are an integral part of the financial statements. 305
John Hancock Funds II
Portfolio of investments — February 28, 2006 (Unaudited)
(showing percentage of total net assets)
|
| U.S. Multi Sector Fund (continued) | | |
| | Shares or | | |
| | Principal | | |
| | Amount | | Value |
|
|
| |
| COMMON STOCKS (continued) | | | |
| Aerospace (continued) | | | |
| General Dynamics Corp. | 18,100 | $ | 2,231,187 |
| Goodrich Corp. | 30,700 | | 1,284,488 |
| Lockheed Martin Corp. | 50,500 | | 3,679,935 |
| Rockwell Collins, Inc. | 21,400 | | 1,137,410 |
| Teledyne Technologies, Inc. * | 7,200 | | 238,536 |
| United Technologies Corp. | 51,400 | | 3,006,900 |
|
|
| | | | 12,988,642 |
Agriculture - 0.21% | | | |
| Archer-Daniels-Midland Company | 71,500 | | 2,267,980 |
| The Andersons, Inc. | 900 | | 50,625 |
|
|
| | | | 2,318,605 |
Air Freight - 0.02% | | | |
| ExpressJet Holdings, Inc. * | 30,800 | | 231,616 |
Air Travel - 0.08% | | | |
| Alaska Air Group, Inc. * | 8,700 | | 278,835 |
| SkyWest, Inc. | 20,900 | | 605,473 |
|
|
| | | | 884,308 |
Apparel & Textiles - 0.77% | | | |
| Brown Shoe, Inc. | 2,800 | | 133,560 |
| Coach, Inc. * | 5,700 | | 203,604 |
| Columbia Sportswear Company * | 2,000 | | 100,720 |
| Jones Apparel Group, Inc. | 49,500 | | 1,431,540 |
| K-Swiss, Inc., Class A | 14,800 | | 431,864 |
| Liz Claiborne, Inc. | 33,600 | | 1,210,608 |
| Mohawk Industries, Inc. * | 32,300 | | 2,794,273 |
| Oakley, Inc. | 28,900 | | 439,858 |
| Oxford Industries, Inc. | 2,300 | | 105,294 |
| Quiksilver, Inc. * | 11,300 | | 163,850 |
| Stride Rite Corp. | 7,700 | | 107,030 |
| Timberland Company, Class A * | 18,600 | | 651,930 |
| VF Corp. | 10,700 | | 586,360 |
| Weyco Group, Inc. | 2,000 | | 38,580 |
|
|
| | | | 8,399,071 |
Auto Parts - 0.82% | | | |
| American Axle & Manufacturing Holdings, Inc. | 10,300 | | 167,066 |
| AutoZone, Inc. * | 32,900 | | 3,180,772 |
| CSK Auto Corp. * | 13,900 | | 221,149 |
| Genuine Parts Company | 67,400 | | 3,000,648 |
| Johnson Controls, Inc. | 7,600 | | 541,652 |
| Keystone Automotive Industries, Inc. * | 2,400 | | 106,080 |
| Lear Corp. | 12,400 | | 258,664 |
| O'Reilly Automotive, Inc. * | 35,600 | | 1,164,832 |
| TRW Automotive Holdings Corp. * | 9,900 | | 253,440 |
|
|
| | | | 8,894,303 |
Auto Services - 0.34% | | | |
| AutoNation, Inc. * | 164,800 | | 3,445,968 |
| Dollar Thrifty Automotive Group, Inc. * | 3,800 | | 153,444 |
| Lithia Motors, Inc., Class A | 3,700 | | 118,548 |
|
|
| | | | 3,717,960 |
| U.S. Multi Sector Fund (continued) | | |
| | Shares or | | |
| | Principal | | |
| | Amount | | Value |
|
|
| |
| COMMON STOCKS (continued) | | | |
| Automobiles - 0.68% | | | |
| Ford Motor Company | 423,100 | $ | 3,372,107 |
| General Motors Corp. | 59,900 | | 1,216,569 |
| PACCAR, Inc. | 36,800 | | 2,571,216 |
| United Auto Group, Inc. | 5,200 | | 224,848 |
|
|
| | | | 7,384,740 |
Banking - 0.38% | | | |
| Anchor BanCorp Wisconsin, Inc. | 2,800 | | 85,260 |
| BancFirst Corp. | 100 | | 8,460 |
| BB&T Corp. | 12,700 | | 502,031 |
| Comerica, Inc. | 9,000 | | 515,880 |
| First Indiana Corp. | 5,000 | | 137,950 |
| Macatawa Bank Corp. | 900 | | 32,895 |
| National City Corp. | 50,200 | | 1,746,960 |
| Northern Trust Corp. | 15,400 | | 811,888 |
| Park National Corp. | 100 | | 10,490 |
| Republic Bancorp, Inc., Class A | 400 | | 8,000 |
| Wilmington Trust Corp. | 6,200 | | 265,422 |
|
|
| | | | 4,125,236 |
Biotechnology - 0.94% | | | |
| Applera Corp. | 19,900 | | 562,573 |
| Genentech, Inc. * | 111,000 | | 9,511,590 |
| Millipore Corp. * | 1,500 | | 103,995 |
|
|
| | | | 10,178,158 |
Broadcasting - 0.01% | | | |
| Sinclair Broadcast Group, Inc., Class A | 7,900 | | 56,801 |
Building Materials & Construction - 0.51% | | | |
| American Standard Companies, Inc. | 72,500 | | 2,869,550 |
| Eagle Materials, Inc. | 9,600 | | 519,648 |
| Lennox International, Inc. | 17,900 | | 575,485 |
| LSI Industries, Inc. | 11,100 | | 172,494 |
| Masco Corp. | 44,000 | | 1,372,360 |
|
|
| | | | 5,509,537 |
Business Services - 1.87% | | | |
| Administaff, Inc. | 7,000 | | 332,150 |
| Affiliated Computer Services, Inc., Class A * | 49,500 | | 3,114,540 |
| Cadence Design Systems, Inc. * | 5,900 | | 104,725 |
| Catalina Marketing Corp. | 6,100 | | 135,298 |
| CDI Corp. | 2,500 | | 61,225 |
| Compucredit Corp. * | 21,700 | | 820,260 |
| CSG Systems International, Inc. * | 7,600 | | 167,048 |
| Deluxe Corp. | 11,800 | | 292,286 |
| DST Systems, Inc. * | 3,400 | | 191,182 |
| Equifax, Inc. | 32,900 | | 1,205,456 |
| FactSet Research Systems, Inc. | 14,100 | | 552,015 |
| Fair Isaac Corp. | 17,000 | | 724,540 |
| First Data Corp. | 54,100 | | 2,441,533 |
| Forrester Research, Inc. * | 3,200 | | 72,352 |
| H & R Block, Inc. | 16,100 | | 359,030 |
| Hudson Highland Group, Inc. * | 10,500 | | 174,195 |
| Jacobs Engineering Group, Inc. * | 12,300 | | 1,054,602 |
The accompanying notes are an integral part of the financial statements. 306
John Hancock Funds II
Portfolio of investments — February 28, 2006 (Unaudited)
(showing percentage of total net assets)
|
| U.S. Multi Sector Fund (continued) | | |
| | Shares or | | |
| | Principal | | |
| | Amount | | Value |
|
|
| |
| COMMON STOCKS (continued) | | | |
| Business Services (continued) | | | |
| Lightbridge, Inc. * | 10,600 | $ | 103,986 |
| MAXIMUS, Inc. | 5,800 | | 211,758 |
| Moody's Corp. | 29,600 | | 1,983,200 |
| NCR Corp. * | 9,300 | | 372,837 |
| Paychex, Inc. | 8,100 | | 324,405 |
| Pitney Bowes, Inc. | 91,600 | | 3,914,984 |
| Pre-Paid Legal Services, Inc. | 10,800 | | 389,988 |
| Robert Half International, Inc. | 5,400 | | 193,968 |
| SOURCECORP, Inc. * | 3,300 | | 84,480 |
| Syntel, Inc. | 600 | | 10,200 |
| Tech Data Corp. * | 21,700 | | 901,201 |
|
|
| | | | 20,293,444 |
Cable and Television - 0.01% | | | |
| Time Warner Telecom, Inc., Class A * | 9,800 | | 123,774 |
Cellular Communications - 0.49% | | | |
| Brightpoint, Inc. * | 33,600 | | 950,544 |
| Motorola, Inc. | 205,100 | | 4,389,140 |
|
|
| | | | 5,339,684 |
Chemicals - 0.12% | | | |
| Air Products & Chemicals, Inc. | 19,700 | | 1,263,952 |
Colleges & Universities - 0.08% | | | |
| Apollo Group, Inc., Class A * | 1,200 | | 59,256 |
| ITT Educational Services, Inc. * | 13,400 | | 830,800 |
|
|
| | | | 890,056 |
Commercial Services - 0.01% | | | |
| Cenveo, Inc. * | 6,700 | | 94,403 |
| Vertrue, Inc. * | 1,000 | | 44,060 |
|
|
| | | | 138,463 |
Computers & Business Equipment - 4.44% | | | |
| Apple Computer, Inc. * | 4,800 | | 328,992 |
| CDW Corp. | 8,300 | | 471,938 |
| Dell, Inc. * | 669,500 | | 19,415,500 |
| Diebold, Inc. | 32,200 | | 1,288,000 |
| Hewlett-Packard Company | 708,500 | | 23,245,885 |
| Ingram Micro, Inc., Class A * | 52,800 | | 1,044,384 |
| Lexmark International, Inc. * | 22,600 | | 1,064,234 |
| MTS Systems Corp. | 2,500 | | 98,800 |
| Rimage Corp. * | 2,500 | | 54,450 |
| Sybase, Inc. * | 23,200 | | 494,856 |
| Sykes Enterprises, Inc. * | 14,900 | | 198,468 |
| Western Digital Corp. * | 21,700 | | 482,825 |
|
|
| | | | 48,188,332 |
Construction & Mining Equipment - 0.02% | | | |
| Kaman Corp., Class A | 8,100 | | 183,951 |
Construction Materials - 0.54% | | | |
| EMCOR Group, Inc. * | 9,400 | | 409,746 |
| Florida Rock Industries, Inc. | 18,100 | | 1,042,741 |
| Granite Construction, Inc. | 6,100 | | 282,735 |
| Lafarge Corp. | 400 | | 33,148 |
| Martin Marietta Materials, Inc. | 20,600 | | 2,008,500 |
| U.S. Multi Sector Fund (continued) | | |
| | Shares or | | |
| | Principal | | |
| | Amount | | Value |
|
|
| |
| COMMON STOCKS (continued) | | | |
| Construction Materials (continued) | | | |
| Simpson Manufacturing, Inc. | 9,100 | $ | 355,719 |
| Universal Forest Products, Inc. | 7,500 | | 463,725 |
| USG Corp. * | 12,500 | | 1,056,000 |
| Vulcan Materials Company | 2,800 | | 221,200 |
|
|
| | | | 5,873,514 |
Containers & Glass - 0.07% | | | |
| Greif, Inc., Class A | 5,200 | | 301,132 |
| Owens-Illinois, Inc. * | 24,400 | | 457,256 |
|
|
| | | | 758,388 |
| Cosmetics & Toiletries - 0.29% | | | |
| Colgate-Palmolive Company | 49,400 | | 2,691,312 |
| Nature's Sunshine Products, Inc. | 7,600 | | 128,972 |
| Playtex Products, Inc. * | 29,400 | | 308,700 |
|
|
| | | | 3,128,984 |
Crude Petroleum & Natural Gas - 1.99% | | | |
| Amerada Hess Corp. | 7,400 | | 1,023,494 |
| Apache Corp. | 14,600 | | 977,032 |
| Burlington Resources, Inc. | 55,000 | | 4,959,900 |
| Devon Energy Corp. | 70,200 | | 4,115,826 |
| Helmerich & Payne, Inc. | 3,100 | | 203,887 |
| Marathon Oil Corp. | 46,000 | | 3,247,600 |
| Occidental Petroleum Corp. | 37,500 | | 3,432,750 |
| Pogo Producing Company | 9,400 | | 468,684 |
| Sunoco, Inc. | 42,400 | | 3,141,840 |
|
|
| | | | 21,571,013 |
Domestic Oil - 0.06% | | | |
| Houston Exploration Company * | 2,000 | | 115,680 |
| McMoran Exploration Company * | 4,800 | | 84,912 |
| St. Mary Land & Exploration Company | 11,900 | | 456,841 |
|
|
| | | | 657,433 |
Drugs & Health Care - 1.03% | | | |
| Meridian Bioscience, Inc. | 12,300 | | 274,167 |
| Vital Signs, Inc. | 300 | | 15,318 |
| Wyeth | 217,800 | | 10,846,440 |
|
|
| | | | 11,135,925 |
Electrical Equipment - 0.31% | | | |
| American Power Conversion Corp. | 53,200 | | 1,086,876 |
| Cohu, Inc. | 4,000 | | 84,480 |
| Emerson Electric Company | 11,900 | | 973,539 |
| Genlyte Group, Inc. * | 11,500 | | 711,620 |
| Watsco, Inc. | 7,700 | | 536,074 |
|
|
| | | | 3,392,589 |
Electrical Utilities - 0.98% | | | |
| Allete, Inc. | 3,600 | | 168,012 |
| Black Hills Corp. | 7,300 | | 252,361 |
| CenterPoint Energy, Inc. | 45,200 | | 586,244 |
| CMS Energy Corp. * | 7,000 | | 98,560 |
| Constellation Energy Group, Inc. | 8,800 | | 516,912 |
| Edison International | 30,100 | | 1,335,236 |
| Exelon Corp. | 58,700 | | 3,352,357 |
The accompanying notes are an integral part of the financial statements. 307
John Hancock Funds II
Portfolio of investments — February 28, 2006 (Unaudited)
(showing percentage of total net assets)
|
| U.S. Multi Sector Fund (continued) | | |
| | Shares or | | |
| | Principal | | |
| | Amount | | Value |
|
|
| |
| COMMON STOCKS (continued) | | | |
| Electrical Utilities (continued) | | | |
| FirstEnergy Corp. | 29,500 | $ | 1,506,860 |
| The AES Corp. * | 120,100 | | 2,077,730 |
| TXU Corp. | 14,000 | | 733,460 |
|
|
| | | | 10,627,732 |
Electronics - 0.48% | | | |
| Agilent Technologies, Inc. * | 24,100 | | 867,600 |
| Amphenol Corp., Class A | 13,300 | | 668,059 |
| Arrow Electronics, Inc. * | 9,100 | | 316,589 |
| Avnet, Inc. * | 46,600 | | 1,171,058 |
| Bell Microproducts, Inc. * | 5,200 | | 31,252 |
| Imation Corp. | 7,300 | | 320,105 |
| Jabil Circuit, Inc. * | 11,000 | | 416,350 |
| Synopsys, Inc. * | 44,000 | | 962,280 |
| Teleflex, Inc. | 7,600 | | 491,340 |
|
|
| | | | 5,244,633 |
Financial Services - 5.28% | | | |
| A.G. Edwards, Inc. | 19,000 | | 849,300 |
| Asset Acceptance Capital Corp. * | 2,200 | | 43,978 |
| Charles Schwab Corp. | 206,200 | | 3,342,502 |
| Citigroup, Inc. | 54,300 | | 2,517,891 |
| Countrywide Financial Corp. | 2,600 | | 89,648 |
| E*TRADE Financial Corp. * | 19,400 | | 496,252 |
| Federal Home Loan Mortgage Corp. | 42,700 | | 2,877,553 |
| Federal National Mortgage Association | 410,500 | | 22,446,140 |
| Federated Investors, Inc., Class B | 3,800 | | 147,782 |
| Fiserv, Inc. * | 39,600 | | 1,643,400 |
| Franklin Resources, Inc. | 29,900 | | 3,070,132 |
| Investment Technology Group, Inc. * | 7,400 | | 336,552 |
| ITLA Capital Corp. * | 1,300 | | 60,164 |
| Legg Mason, Inc. | 15,600 | | 2,037,204 |
| Lehman Brothers Holdings, Inc. | 18,100 | | 2,641,695 |
| Nelnet, Inc., Class A * | 2,500 | | 103,625 |
| PNC Financial Services Group, Inc. | 20,600 | | 1,449,210 |
| State Street Corp. (c) | 30,000 | | 1,874,400 |
| Student Loan Corp. | 2,900 | | 636,521 |
| Taylor Capital Group, Inc. | 800 | | 30,200 |
| TD Ameritrade Holding Corp. * | 53,300 | | 1,159,808 |
| United Panam Financial Corp. * | 2,600 | | 69,940 |
| Washington Mutual, Inc. | 213,100 | | 9,099,370 |
| Westcorp, Inc. | 4,700 | | 337,695 |
|
|
| | | | 57,360,962 |
Food & Beverages - 2.55% | | | |
| Chiquita Brands International, Inc. | 18,000 | | 309,960 |
| Dean Foods Company * | 29,800 | | 1,116,606 |
| Flowers Foods, Inc. | 11,400 | | 313,500 |
| General Mills, Inc. | 2,400 | | 118,200 |
| Hormel Foods Corp. | 2,600 | | 89,518 |
| Kraft Foods, Inc., Class A | 72,000 | | 2,166,480 |
| National Beverage Corp. * | 400 | | 3,456 |
| Pepsi Bottling Group, Inc. | 15,200 | | 446,272 |
| PepsiCo, Inc. | 48,300 | | 2,855,013 |
| U.S. Multi Sector Fund (continued) | | |
| | Shares or | | |
| | Principal | | |
| | Amount | | Value |
|
|
| |
| COMMON STOCKS (continued) | | | |
| Food & Beverages (continued) | | | |
| Performance Food Group Company * | 12,500 | $ | 367,125 |
| Sanderson Farms, Inc. | 11,800 | | 275,176 |
| Sara Lee Corp. | 113,400 | | 2,003,778 |
| Sensient Technologies Corp. | 6,700 | | 120,064 |
| Starbucks Corp. * | 140,900 | | 5,117,488 |
| The Coca-Cola Company | 265,000 | | 11,122,050 |
| Tyson Foods, Inc., Class A | 85,400 | | 1,155,462 |
| USANA Health Sciences, Inc. * | 3,600 | | 155,340 |
|
|
| | | | 27,735,488 |
Furniture & Fixtures - 0.02% | | | |
| Furniture Brands International, Inc. | 4,700 | | 116,184 |
| La-Z-Boy, Inc. | 6,900 | | 110,055 |
|
|
| | | | 226,239 |
Gas & Pipeline Utilities - 0.18% | | | |
| Kinder Morgan, Inc. | 9,100 | | 844,298 |
| Questar Corp. | 15,700 | | 1,150,025 |
|
|
| | | | 1,994,323 |
Healthcare Products - 4.28% | | | |
| Baxter International, Inc. | 2,800 | | 105,980 |
| C.R. Bard, Inc. | 5,000 | | 327,450 |
| Computer Programs & Systems, Inc. | 7,400 | | 340,104 |
| Johnson & Johnson | 770,200 | | 44,402,030 |
| Medtronic, Inc. | 12,500 | | 674,375 |
| Owens & Minor, Inc. | 13,400 | | 427,326 |
| Patterson Companies, Inc. * | 2,300 | | 82,892 |
| St. Jude Medical, Inc. * | 2,100 | | 95,760 |
|
|
| | | | 46,455,917 |
Healthcare Services - 8.20% | | | |
| AMERIGROUP Corp. * | 16,600 | | 355,074 |
| AMN Healthcare Services, Inc. * | 3,400 | | 70,516 |
| Cardinal Health, Inc. | 146,100 | | 10,606,860 |
| Express Scripts, Inc. * | 89,300 | | 7,793,211 |
| HCA, Inc. | 17,100 | | 819,090 |
| Health Net, Inc. * | 43,100 | | 2,066,645 |
| Humana, Inc. * | 49,900 | | 2,578,333 |
| Kindred Healthcare, Inc. * | 4,200 | | 90,804 |
| Lincare Holdings, Inc. * | 62,500 | | 2,556,250 |
| McKesson Corp. | 265,100 | | 14,349,863 |
| Medco Health Solutions, Inc. * | 1,800 | | 100,296 |
| National Healthcare Corp. | 700 | | 28,385 |
| Omnicare, Inc. | 2,100 | | 127,785 |
| Quest Diagnostics, Inc. | 15,000 | | 793,050 |
| UnitedHealth Group, Inc. | 740,700 | | 43,130,961 |
| Weight Watchers International, Inc. * | 33,600 | | 1,762,992 |
| Wellpoint, Inc. * | 23,626 | | 1,814,241 |
|
|
| | | | 89,044,356 |
Holdings Companies/Conglomerates - 0.23% | | | |
| Loews Corp. | 27,500 | | 2,537,150 |
Homebuilders - 2.03% | | | |
| Centex Corp. | 40,400 | | 2,731,444 |
The accompanying notes are an integral part of the financial statements. 308
John Hancock Funds II
Portfolio of investments — February 28, 2006 (Unaudited)
(showing percentage of total net assets)
|
| U.S. Multi Sector Fund (continued) | | |
| | Shares or | | |
| | Principal | | |
| | Amount | | Value |
|
|
| |
| COMMON STOCKS (continued) | | | |
| Homebuilders (continued) | | | |
| D.R. Horton, Inc. | 13,800 | $ | 470,718 |
| Hovnanian Enterprises, Inc., Class A * | 1,900 | | 87,609 |
| KB Home | 69,900 | | 4,685,397 |
| Lennar Corp., Class A | 31,500 | | 1,885,590 |
| M.D.C. Holdings, Inc. | 28,000 | | 1,716,120 |
| NVR, Inc. * | 3,600 | | 2,710,800 |
| Pulte Homes, Inc. | 95,900 | | 3,683,519 |
| Ryland Group, Inc. | 42,400 | | 2,957,400 |
| Schottenstein Homes, Inc. | 10,700 | | 450,684 |
| Standard Pacific Corp. | 12,000 | | 394,200 |
| William Lyon Homes, Inc. * | 3,000 | | 255,300 |
|
|
| | | | 22,028,781 |
Hotels & Restaurants - 1.99% | | | |
| Ameristar Casinos, Inc. | 1,100 | | 24,299 |
| Applebee's International, Inc. | 53,600 | | 1,240,304 |
| Brinker International, Inc. | 32,700 | | 1,361,955 |
| CBRL Group, Inc. | 27,800 | | 1,235,154 |
| Darden Restaurants, Inc. | 93,000 | | 3,900,420 |
| Jack In the Box, Inc. * | 16,000 | | 640,000 |
| Marriott International, Inc., Class A | 36,700 | | 2,510,280 |
| McDonald's Corp. | 95,100 | | 3,319,941 |
| Papa Johns International, Inc. * | 35,500 | | 1,167,950 |
| Ryan's Restaurant Group, Inc. * | 14,600 | | 192,866 |
| Sonic Corp. * | 19,800 | | 625,878 |
| Wendy's International, Inc. | 51,400 | | 2,976,060 |
| Yum! Brands, Inc. | 49,700 | | 2,370,690 |
|
|
| | | | 21,565,797 |
Household Appliances - 0.55% | | | |
| Black & Decker Corp. | 10,000 | | 855,800 |
| Whirlpool Corp. | 56,900 | | 5,109,051 |
|
|
| | | | 5,964,851 |
Household Products - 0.45% | | | |
| Blyth, Inc. | 18,300 | | 407,724 |
| Energizer Holdings, Inc. * | 9,300 | | 508,059 |
| Fortune Brands, Inc. | 12,400 | | 961,620 |
| Newell Rubbermaid, Inc. | 102,500 | | 2,549,175 |
| Tupperware Corp. | 20,200 | | 428,038 |
|
|
| | | | 4,854,616 |
Industrial Machinery - 0.77% | | | |
| Badger Meter, Inc. | 300 | | 16,032 |
| Caterpillar, Inc. | 54,900 | | 4,012,092 |
| Circor International, Inc. | 400 | | 11,040 |
| Flowserve Corp. * | 11,400 | | 585,960 |
| ITT Industries, Inc. | 15,600 | | 819,000 |
| NACCO Industries, Inc., Class A | 2,300 | | 319,240 |
| Terex Corp. * | 1,400 | | 110,810 |
| W.W. Grainger, Inc. | 34,100 | | 2,524,764 |
|
|
| | | | 8,398,938 |
Industrials - 0.01% | | | |
| Lawson Products, Inc. | 2,700 | | 95,553 |
| U.S. Multi Sector Fund (continued) | | |
| | Shares or | | |
| | Principal | | |
| | Amount | | Value |
|
|
| |
| COMMON STOCKS (continued) | | | |
| Insurance - 7.99% | | | |
| 21st Century Insurance Group | 1,900 | $ | 30,780 |
| Aetna, Inc. | 11,400 | | 581,400 |
| AFLAC, Inc. | 206,000 | | 9,527,500 |
| Allstate Corp. | 71,700 | | 3,927,726 |
| Ambac Financial Group, Inc. | 40,100 | | 3,013,515 |
| American Financial Group, Inc. | 7,800 | | 322,920 |
| American International Group, Inc. | 101,100 | | 6,708,996 |
| Amerus Group Company | 13,500 | | 813,375 |
| Aon Corp. | 59,300 | | 2,348,873 |
| Brown & Brown, Inc. | 26,600 | | 831,782 |
| Chubb Corp. | 39,500 | | 3,782,125 |
| CIGNA Corp. | 52,800 | | 6,481,200 |
| Commerce Group, Inc. | 6,900 | | 372,669 |
| Conseco, Inc. * | 38,500 | | 956,340 |
| Erie Indemnity Company, Class A | 7,000 | | 371,490 |
| Fidelity National Financial, Inc. | 60,700 | | 2,292,032 |
| First American Corp. | 43,700 | | 1,842,392 |
| Great American Financial Resources, Inc. | 700 | | 13,846 |
| Hanover Insurance Group, Inc. | 16,600 | | 804,270 |
| Hartford Financial Services Group, Inc. | 18,400 | | 1,515,792 |
| HCC Insurance Holdings, Inc. | 21,000 | | 675,990 |
| Jefferson-Pilot Corp. | 35,500 | | 2,138,875 |
| LandAmerica Financial Group, Inc. | 10,900 | | 727,030 |
| Lincoln National Corp. | 29,600 | | 1,680,392 |
| Marsh & McLennan Companies, Inc. | 27,800 | | 859,298 |
| MBIA, Inc. | 25,900 | | 1,521,366 |
| MetLife, Inc. | 36,500 | | 1,829,380 |
| MGIC Investment Corp. | 38,700 | | 2,467,125 |
| National Western Life Insurance Company, | | | |
| Class A * | 900 | | 200,754 |
| Old Republic International Corp. | 115,975 | | 2,469,108 |
| PMI Group, Inc. | 21,300 | | 922,290 |
| Presidential Life Corp. | 4,200 | | 92,022 |
| Principal Financial Group, Inc. | 13,100 | | 638,232 |
| Progressive Corp. | 69,100 | | 7,424,795 |
| Protective Life Corp. | 14,700 | | 716,625 |
| Prudential Financial, Inc. | 34,400 | | 2,650,176 |
| Radian Group, Inc. | 12,600 | | 715,050 |
| Safety Insurance Group, Inc. | 2,000 | | 86,460 |
| St. Paul Travelers Companies, Inc. | 95,600 | | 4,108,888 |
| Stancorp Financial Group, Inc. | 23,400 | | 1,265,940 |
| State Auto Financial Corp. | 1,200 | | 39,096 |
| Stewart Information Services Corp. | 8,700 | | 408,465 |
| Torchmark, Inc. | 49,300 | | 2,695,231 |
| Transatlantic Holdings, Inc. | 6,000 | | 366,840 |
| Triad Guaranty, Inc. * | 2,400 | | 108,936 |
| United Fire & Casualty Company | 7,500 | | 268,425 |
| Universal American Financial Corp. * | 26,000 | | 393,900 |
| UnumProvident Corp. | 94,400 | | 1,953,136 |
| W.R. Berkley Corp. | 10,700 | | 619,423 |
| Zenith National Insurance Corp. | 3,100 | | 159,650 |
|
|
| | | | 86,741,921 |
The accompanying notes are an integral part of the financial statements. 309
John Hancock Funds II
Portfolio of investments — February 28, 2006 (Unaudited)
(showing percentage of total net assets)
|
| U.S. Multi Sector Fund (continued) | | |
| | Shares or | | |
| | Principal | | |
| | Amount | | Value |
|
|
| |
| COMMON STOCKS (continued) | | | |
| International Oil - 1.48% | | | |
| Anadarko Petroleum Corp. | 77,700 | $ | 7,704,732 |
| ConocoPhillips | 136,900 | | 8,345,424 |
|
|
| | | | 16,050,156 |
Internet Content - 0.00% | | | |
| Schawk, Inc., Class A | 1,500 | | 37,275 |
Internet Service Provider - 0.34% | | | |
| Earthlink, Inc. * | 8,800 | | 87,296 |
| Google, Inc., Class A * | 9,800 | | 3,553,676 |
|
|
| | | | 3,640,972 |
Leisure Time - 0.18% | | | |
| Bluegreen Corp. * | 4,600 | | 73,002 |
| MGM Mirage, Inc. * | 23,300 | | 861,401 |
| Polaris Industries, Inc. | 16,600 | | 830,830 |
| SCP Pool Corp. | 3,300 | | 143,451 |
|
|
| | | | 1,908,684 |
Life Sciences - 0.06% | | | |
| Pharmaceutical Product Development, Inc. * | 10,100 | | 702,859 |
Liquor - 0.09% | | | |
| Brown Forman Corp., Class B | 14,300 | | 1,006,148 |
Manufacturing - 0.79% | | | |
| AptarGroup, Inc. | 500 | | 26,525 |
| Barnes Group, Inc. | 3,200 | | 122,816 |
| Harley-Davidson, Inc. | 144,600 | | 7,592,946 |
| Rockwell Automation, Inc. | 700 | | 47,719 |
| SPX Corp. | 16,200 | | 797,850 |
|
|
| | | | 8,587,856 |
Medical-Hospitals - 0.02% | | | |
| Health Management Associates, Inc., Class A | 600 | | 12,774 |
| Universal Health Services, Inc., Class B | 3,000 | | 150,690 |
|
|
| | | | 163,464 |
Metal & Metal Products - 0.07% | | | |
| Crown Holdings, Inc. * | 3,800 | | 69,540 |
| Quanex Corp. | 3,500 | | 217,245 |
| Reliance Steel & Aluminum Company | 5,700 | | 469,623 |
|
|
| | | | 756,408 |
Mining - 0.02% | | | |
| Lincoln Electric Holding, Inc. | 4,900 | | 226,184 |
Mobile Homes - 0.11% | | | |
| Thor Industries, Inc. | 17,000 | | 802,400 |
| Winnebago Industries, Inc. | 11,500 | | 369,380 |
|
|
| | | | 1,171,780 |
Office Furnishings & Supplies - 0.44% | | | |
| Herman Miller, Inc. | 9,200 | | 277,748 |
| HNI Corp. | 9,700 | | 565,413 |
| Office Depot, Inc. * | 105,400 | | 3,760,672 |
| The Standard Register Company | 7,600 | | 124,792 |
|
|
| | | | 4,728,625 |
Petroleum Services - 0.73% | | | |
| Baker Hughes, Inc. | 11,800 | | 802,046 |
| U.S. Multi Sector Fund (continued) | | |
| | Shares or | | |
| | Principal | | |
| | Amount | | Value |
|
|
| |
| COMMON STOCKS (continued) | | | |
| Petroleum Services (continued) | | | |
| BJ Services Company | 5,400 | $ | 169,074 |
| Exxon Mobil Corp. | 105,600 | | 6,269,472 |
| Halliburton Company | 10,600 | | 720,800 |
|
|
| | | | 7,961,392 |
Pharmaceuticals - 6.77% | | | |
| Abbott Laboratories | 183,300 | | 8,098,194 |
| Allergan, Inc. | 9,700 | | 1,050,122 |
| AmerisourceBergen Corp. | 99,600 | | 4,580,604 |
| Barr Pharmaceuticals, Inc. * | 25,900 | | 1,739,962 |
| Forest Laboratories, Inc. * | 116,300 | | 5,338,170 |
| Merck & Company, Inc. | 492,600 | | 17,172,036 |
| Pfizer, Inc. | 1,353,200 | | 35,440,308 |
| Watson Pharmaceuticals, Inc. * | 3,600 | | 107,928 |
|
|
| | | | 73,527,324 |
Photography - 0.32% | | | |
| Eastman Kodak Company | 124,600 | | 3,495,030 |
| Publishing - 0.09% | | | |
| Gannett Company, Inc. | 12,600 | | 783,216 |
| Valassis Communications, Inc. * | 6,000 | | 165,300 |
|
|
| | | | 948,516 |
Railroads & Equipment - 0.51% | | | |
| Burlington Northern Santa Fe Corp. | 39,800 | | 3,129,872 |
| CSX Corp. | 8,100 | | 448,578 |
| Union Pacific Corp. | 21,500 | | 1,903,825 |
| Wabtec Corp. | 3,200 | | 105,696 |
|
|
| | | | 5,587,971 |
Real Estate - 0.04% | | | |
| CBL & Associates Properties, Inc., REIT | 8,900 | | 379,140 |
Retail Grocery - 2.46% | | | |
| Albertsons, Inc. | 97,200 | | 2,472,768 |
| Ingles Markets, Inc. | 7,000 | | 115,570 |
| Nash-Finch Company | 16,200 | | 502,200 |
| Ruddick Corp. | 10,400 | | 251,472 |
| Safeway, Inc. | 260,200 | | 6,325,462 |
| SUPERVALU, Inc. | 108,700 | | 3,434,920 |
| Sysco Corp. | 120,600 | | 3,628,854 |
| The Kroger Company * | 481,100 | | 9,641,244 |
| Weis Markets, Inc. | 500 | | 22,330 |
| Whole Foods Market, Inc. | 5,100 | | 325,788 |
|
|
| | | | 26,720,608 |
Retail Trade - 12.33% | | | |
| Abercrombie & Fitch Company, Class A | 47,200 | | 3,177,504 |
| Advance Auto Parts, Inc. * | 19,700 | | 814,595 |
| Barnes & Noble, Inc. | 6,900 | | 297,183 |
| Bed Bath & Beyond, Inc. * | 163,300 | | 5,885,332 |
| Best Buy Company, Inc. | 21,100 | | 1,136,446 |
| BJ's Wholesale Club, Inc. * | 28,300 | | 895,978 |
| Bon-Ton Stores, Inc. | 2,300 | | 62,606 |
| Burlington Coat Factory Warehouse Corp. | 6,800 | | 306,272 |
| Casey's General Stores, Inc. | 7,700 | | 201,971 |
The accompanying notes are an integral part of the financial statements. 310
John Hancock Funds II
Portfolio of investments — February 28, 2006 (Unaudited)
(showing percentage of total net assets)
|
| U.S. Multi Sector Fund (continued) | | |
| | Shares or | | |
| | Principal | | |
| | Amount | | Value |
|
|
| |
| COMMON STOCKS (continued) | | | |
| Retail Trade (continued) | | | |
| Cato Corp., Class A | 17,700 | $ | 369,399 |
| Charlotte Russe Holding, Inc. * | 6,500 | | 118,300 |
| Chico's FAS, Inc. * | 35,000 | | 1,646,750 |
| Claire's Stores, Inc. | 9,700 | | 310,788 |
| Costco Wholesale Corp. | 35,100 | | 1,799,928 |
| Dollar General Corp. | 143,900 | | 2,506,738 |
| Dollar Tree Stores, Inc. * | 4,800 | | 131,616 |
| Family Dollar Stores, Inc. | 41,700 | | 1,072,524 |
| Federated Department Stores, Inc. | 10,800 | | 767,232 |
| Fossil, Inc. * | 14,200 | | 241,684 |
| Hibbett Sporting Goods, Inc. * | 6,800 | | 218,144 |
| Home Depot, Inc. | 1,169,700 | | 49,302,855 |
| Hot Topic, Inc. * | 32,900 | | 433,622 |
| Longs Drug Stores Corp. | 22,400 | | 859,488 |
| Lowe's Companies, Inc. | 482,600 | | 32,903,668 |
| Nordstrom, Inc. | 49,400 | | 1,877,200 |
| Pacific Sunwear of California, Inc. * | 3,800 | | 90,478 |
| Pantry, Inc. * | 10,300 | | 609,451 |
| Payless ShoeSource, Inc. * | 16,100 | | 381,570 |
| Retail Ventures, Inc. * | 5,500 | | 72,930 |
| Ross Stores, Inc. | 58,700 | | 1,662,384 |
| Sonic Automotive, Inc. | 13,400 | | 354,966 |
| Staples, Inc. | 30,500 | | 748,470 |
| Steven Madden, Ltd. | 6,600 | | 211,530 |
| Talbots, Inc. | 16,900 | | 450,554 |
| The Buckle, Inc. | 4,100 | | 156,825 |
| The Men's Wearhouse, Inc. * | 34,500 | | 1,080,540 |
| The TJX Companies, Inc. | 79,400 | | 1,944,506 |
| Tiffany & Co. | 15,500 | | 575,515 |
| Too, Inc. * | 2,600 | | 79,118 |
| United Rentals, Inc. * | 12,700 | | 414,020 |
| Walgreen Company | 327,200 | | 14,678,192 |
| Wal-Mart Stores, Inc. | 66,100 | | 2,998,296 |
|
|
| | | | 133,847,168 |
Semiconductors - 3.10% | | | |
| Applied Materials, Inc. | 47,100 | | 863,814 |
| Broadcom Corp., Class A * | 12,450 | | 561,370 |
| Emulex Corp. * | 24,600 | | 437,880 |
| Intel Corp. | 907,700 | | 18,698,620 |
| International Rectifier Corp. * | 5,500 | | 204,050 |
| Micrel, Inc. * | 28,900 | | 403,733 |
| Microchip Technology, Inc. | 11,100 | | 390,720 |
| National Semiconductor Corp. | 48,400 | | 1,357,620 |
| NVIDIA Corp. * | 13,700 | | 645,681 |
| QLogic Corp. * | 38,400 | | 1,579,776 |
| Silicon Laboratories, Inc. * | 2,000 | | 95,960 |
| Texas Instruments, Inc. | 282,200 | | 8,423,670 |
|
|
| | | | 33,662,894 |
Shipbuilding - 0.00% | | | |
| Maritrans, Inc. | 1,700 | | 38,692 |
| U.S. Multi Sector Fund (continued) | | |
| | Shares or | | |
| | Principal | | |
| | Amount | | Value |
|
|
| |
| COMMON STOCKS (continued) | | | |
| Software - 1.10% | | | |
| Adobe Systems, Inc. | 122,300 | $ | 4,723,226 |
| BEA Systems, Inc. * | 77,200 | | 885,484 |
| BMC Software, Inc. * | 18,400 | | 402,408 |
| Citrix Systems, Inc. * | 26,600 | | 860,776 |
| Compuware Corp. * | 12,600 | | 103,446 |
| Intuit, Inc. * | 25,200 | | 1,224,216 |
| JDA Software Group, Inc. * | 7,700 | | 105,721 |
| Mantech International Corp. * | 3,500 | | 98,350 |
| MRO Software, Inc. * | 1,800 | | 26,532 |
| Neoware Systems, Inc. * | 5,400 | | 132,462 |
| Oracle Corp. * | 241,600 | | 3,000,672 |
| THQ, Inc. * | 9,200 | | 220,800 |
| Transaction Systems Architects, Inc., Class A * | 5,300 | | 176,808 |
|
|
| | | | 11,960,901 |
Telecommunications Equipment & | | | |
| Services - 0.72% | | | |
| ADTRAN, Inc. | 12,800 | | 352,256 |
| Corning, Inc. * | 171,200 | | 4,178,992 |
| Intrado, Inc. * | 3,500 | | 89,810 |
| QUALCOMM, Inc. | 67,000 | | 3,163,070 |
|
|
| | | | 7,784,128 |
Telephone - 5.68% | | | |
| ALLTEL Corp. | 130,700 | | 8,253,705 |
| AT&T Corp. | 668,900 | | 18,454,951 |
| BellSouth Corp. | 75,800 | | 2,393,764 |
| CenturyTel, Inc. | 28,200 | | 1,014,636 |
| Harris Corp. | 16,200 | | 740,016 |
| TALK America Holdings, Inc. * | 3,800 | | 32,414 |
| Verizon Communications, Inc. | 913,300 | | 30,778,210 |
|
|
| | | | 61,667,696 |
Tires & Rubber - 0.04% | | | |
| Goodyear Tire & Rubber Company * | 30,000 | | 429,900 |
Tobacco - 2.93% | | | |
| Altria Group, Inc. | 416,800 | | 29,967,920 |
| Universal Corp. | 10,200 | | 414,834 |
| UST, Inc. | 35,600 | | 1,384,128 |
|
|
| | | | 31,766,882 |
| Toys, Amusements & Sporting Goods - 0.04% | | | |
| Mattel, Inc. | 24,900 | | 419,565 |
Transportation - 0.46% | | | |
| C.H. Robinson Worldwide, Inc. | 46,900 | | 2,102,058 |
| Expeditors International of Washington, Inc. | 27,800 | | 2,162,562 |
| Laidlaw International, Inc. | 9,700 | | 267,720 |
| Pacer International, Inc. | 14,200 | | 452,270 |
|
|
| | | | 4,984,610 |
Trucking & Freight - 0.31% | | | |
| Fedex Corp. | 22,600 | | 2,423,624 |
| Oshkosh Truck Corp. | 5,200 | | 294,996 |
The accompanying notes are an integral part of the financial statements. 311
John Hancock Funds II
Portfolio of investments — February 28, 2006 (Unaudited)
(showing percentage of total net assets)
|
| U.S. Multi Sector Fund (continued) | |
| | | Shares or | |
| | | Principal | |
| | | Amount | Value |
| |
|
| |
| COMMON STOCKS (continued) | | | |
| Trucking & Freight (continued) | | | |
| Swift Transportation, Inc. * | | 29,200 | $ | 696,128 |
|
|
| | | | 3,414,748 |
|
| TOTAL COMMON STOCKS (Cost $978,686,523) | | $ | 1,027,607,874 |
|
| |
| SHORT TERM INVESTMENTS - 0.26% | | | |
| United States Treasury Bills | | | |
| 3.81% due 03/23/2006 **** | $ | 2,800,000 | $ | 2,792,574 |
|
| TOTAL SHORT TERM INVESTMENTS | | | |
| (Cost $2,793,263) | | | $ | 2,792,574 |
|
| |
| REPURCHASE AGREEMENTS - 4.95% | | | |
| Repurchase Agreement with State | | | |
| Street Corp. dated 02/28/2006 at | | | |
| 3.20% to be repurchased at | | | |
| $53,819,784 on 03/01/2006, | | | |
| collateralized by $54,755,000 | | | |
| Federal Home Loan Mortgage, | | | |
| 5.25% due 10/19/2015 (valued at | | | |
| $54,891,888, including interest) (c) | $ | 53,815,000 | $ | 53,815,000 |
|
| TOTAL REPURCHASE AGREEMENTS | | | |
| (Cost $53,815,000) | | | $ | 53,815,000 |
|
| Total Investments (U.S. Multi Sector Fund) | | | |
| (Cost $1,035,294,786) - 99.86% | | | $ | 1,084,215,448 |
| Other Assets in Excess of Liabilities - 0.14% | | | 1,487,685 |
|
|
| TOTAL NET ASSETS - 100.00% | | | $ | 1,085,703,133 |
| |
|
| |
| |
| Value & Restructuring Fund | | | |
| | | Shares or | |
| | | Principal | |
| | | Amount | Value |
| |
|
| |
| COMMON STOCKS - 97.95% | | | |
| Advertising - 0.51% | | | |
| The Interpublic Group of Companies, Inc. * | | 86,421 | $ | 895,322 |
Aerospace - 2.63% | | | |
| Empresa Brasileira de Aeronautica SA, ADR | | 59,714 | 2,373,632 |
| United Technologies Corp. | | 38,766 | 2,267,811 |
|
|
| | | | 4,641,443 |
Air Travel - 1.70% | | | |
| Copa Holdings SA, Class A * | | 8,973 | 206,828 |
| Gol Linhas Aereas Inteligentes SA, ADR | | 85,174 | 2,793,707 |
|
|
| | | | 3,000,535 |
Banking - 0.52% | | | |
| Doral Financial Corp. | | 81,418 | 908,625 |
Broadcasting - 3.37% | | | |
| CBS Corp., Class B | | 62,865 | 1,537,678 |
| Liberty Media Corp., Series A * | | 88,418 | 728,564 |
| XM Satellite Radio Holdings, Inc., Class A * | | 166,465 | 3,677,212 |
|
|
| | | | 5,943,454 |
Building Materials & Construction - 0.78% | | | |
| Eagle Materials, Inc., Class B | | 25,602 | 1,374,571 |
| Value & Restructuring Fund (continued) | |
| | Shares or | |
| | Principal | |
| | Amount | Value |
|
|
| |
| COMMON STOCKS (continued) | | |
| Business Services - 1.47% | | |
| Cendant Corp. | 96,100 $ | 1,597,182 |
| Deluxe Corp. | 39,895 | 988,199 |
|
|
| | | 2,585,381 |
Cable and Television - 0.90% | | |
| EchoStar Communications Corp., Class A * | 54,065 | 1,587,889 |
Cellular Communications - 3.05% | | |
| America Movil S.A. de C.V., Series L | 155,175 | 5,389,228 |
Chemicals - 4.01% | | |
| Celanese Corp., Series A | 84,162 | 1,801,067 |
| CF Industries Holdings, Inc. | 58,971 | 1,039,069 |
| Lanxess AG * | 38,404 | 1,330,005 |
| PPG Industries, Inc. | 35,268 | 2,138,299 |
| Tronox, Inc. | 50,708 | 775,832 |
|
|
| | | 7,084,272 |
Coal - 3.50% | | |
| CONSOL Energy, Inc. | 64,533 | 4,131,403 |
| Foundation Coal Holdings, Inc. | 43,751 | 1,750,040 |
| International Coal Group, Inc. * | 35,231 | 301,225 |
|
|
| | | 6,182,668 |
Computers & Business Equipment - 0.49% | | |
| International Business Machines Corp. | 10,860 | 871,406 |
Construction Materials - 1.79% | | |
| Lafarge Corp. | 38,173 | 3,163,397 |
Cosmetics & Toiletries - 0.82% | | |
| Avon Products, Inc. | 49,861 | 1,438,490 |
Crude Petroleum & Natural Gas - 6.20% | | |
| Burlington Resources, Inc. | 49,068 | 4,424,952 |
| CNX Gas Corp. * | 6,750 | 145,395 |
| Devon Energy Corp. | 67,684 | 3,968,313 |
| Mariner Energy LLC * | 37,240 | 763,420 |
| W&T Offshore, Inc. | 41,895 | 1,630,135 |
|
|
| | | 10,932,215 |
Domestic Oil - 1.41% | | |
| Noble Energy, Inc. | 59,124 | 2,485,573 |
Drugs & Health Care - 0.57% | | |
| Wyeth | 20,120 | 1,001,976 |
Electrical Utilities - 1.71% | | |
| CenterPoint Energy, Inc. | 32,931 | 427,115 |
| Enel SpA | 144,443 | 1,200,218 |
| Public Service Enterprise Group, Inc. | 20,149 | 1,398,139 |
|
|
| | | 3,025,472 |
Electronics - 1.88% | | |
| Harman International Industries, Inc. | 30,000 | 3,310,500 |
Energy - 1.51% | | |
| Duke Energy Corp. | 38,806 | 1,102,090 |
| Rosetta Resources, Inc. * | 86,842 | 1,563,156 |
|
|
| | | 2,665,246 |
The accompanying notes are an integral part of the financial statements. 312
John Hancock Funds II
Portfolio of investments — February 28, 2006 (Unaudited)
(showing percentage of total net assets)
|
| Value & Restructuring Fund (continued) | | |
| | Shares or | | |
| | Principal | | |
| | Amount | | Value |
|
|
| |
| COMMON STOCKS (continued) | | | |
| Financial Services - 11.16% | | | |
| Amvescap PLC | 80,906 | $ | 1,542,068 |
| CIT Group, Inc. | 23,474 | | 1,262,197 |
| Citigroup, Inc. | 58,191 | | 2,698,317 |
| Federal Home Loan Mortgage Corp. | 35,618 | | 2,400,297 |
| Friedman, Billings, Ramsey Group, Inc. | 79,038 | | 787,218 |
| JPMorgan Chase & Company | 53,636 | | 2,206,585 |
| Lehman Brothers Holdings, Inc. | 20,041 | | 2,924,984 |
| Morgan Stanley | 48,858 | | 2,914,868 |
| PNC Financial Services Group, Inc. | 24,826 | | 1,746,509 |
| Washington Mutual, Inc. | 28,398 | | 1,212,595 |
|
|
| | | | 19,695,638 |
Food & Beverages - 2.98% | | | |
| ConAgra Foods, Inc. | 57,439 | | 1,207,942 |
| Dean Foods Company * | 71,502 | | 2,679,180 |
| Kraft Foods, Inc., Class A | 30,190 | | 908,417 |
| Vintage Wine Trust, Inc. | 46,550 | | 465,500 |
|
|
| | | | 5,261,039 |
Furniture & Fixtures - 0.76% | | | |
| Leggett & Platt, Inc. | 57,056 | | 1,339,675 |
Healthcare Products - 1.33% | | | |
| Baxter International, Inc. | 62,200 | | 2,354,270 |
Healthcare Services - 1.08% | | | |
| HCA, Inc. | 39,904 | | 1,911,402 |
Holdings Companies/Conglomerates - 1.16% | | | |
| Loews Corp. | 22,257 | | 2,053,431 |
Homebuilders - 2.97% | | | |
| Centex Corp. | 77,607 | | 5,247,009 |
Hotels & Restaurants - 0.25% | | | |
| Morgans Hotel Group Co. * | 22,740 | | 443,430 |
Household Appliances - 2.96% | | | |
| Black & Decker Corp. | 60,990 | | 5,219,524 |
Household Products - 1.09% | | | |
| Newell Rubbermaid, Inc. | 77,533 | | 1,928,246 |
Industrial Machinery - 0.75% | | | |
| AGCO Corp. * | 67,347 | | 1,316,634 |
Insurance - 4.54% | | | |
| ACE, Ltd. | 52,637 | | 2,933,460 |
| Marsh & McLennan Companies, Inc. | 50,745 | | 1,568,528 |
| MetLife, Inc. | 44,469 | | 2,228,786 |
| People's Choice * | 60,727 | | 333,999 |
| Primus Guaranty, Ltd. * | 75,243 | | 940,537 |
|
|
| | | | 8,005,310 |
International Oil - 4.01% | | | |
| ConocoPhillips | 41,042 | | 2,501,920 |
| Petroleo Brasileiro SA, ADR * | 52,281 | | 4,576,679 |
|
|
| | | | 7,078,599 |
Investment Companies - 1.27% | | | |
| Apollo Investment Corp. | 55,562 | | 1,044,010 |
| Value & Restructuring Fund (continued) | |
| | Shares or | |
| | Principal | |
| | Amount | Value |
|
|
| |
| COMMON STOCKS (continued) | | |
| Investment Companies (continued) | | |
| MCG Capital Corp. | 78,231 | $ | 1,196,934 |
|
|
| | | 2,240,944 |
| Manufacturing - 1.04% | | |
| Tyco International, Ltd. | 71,201 | 1,836,274 |
Metal & Metal Products - 1.18% | | |
| Southern Copper Corp. | 26,115 | 2,080,060 |
Mining - 0.58% | | |
| Alpha Natural Resources, Inc. * | 47,492 | 1,014,904 |
Petroleum Services - 1.37% | | |
| PetroHawk Energy Corp. * | 40,200 | 507,726 |
| TODCO * | 56,741 | 1,901,958 |
|
|
| | | 2,409,684 |
Pharmaceuticals - 1.77% | | |
| AmerisourceBergen Corp. | 54,862 | 2,523,103 |
| Bristol-Myers Squibb Company | 26,360 | 608,916 |
|
|
| | | 3,132,019 |
| Railroads & Equipment - 1.74% | | |
| Union Pacific Corp. | 34,663 | 3,069,409 |
Real Estate - 2.07% | | |
| DiamondRock Hospitality Company | 79,718 | 1,022,782 |
| Fieldstone Investment Corp., REIT | 43,449 | 514,436 |
| Host Marriott Corp., REIT | 48,115 | 934,874 |
| Saxon Capital, Inc., REIT | 22,726 | 226,124 |
| Taberna Realty Finance Trust, REIT | 10,654 | 141,166 |
| Ventas, Inc., REIT | 26,079 | 808,449 |
|
|
| | | 3,647,831 |
Retail Trade - 4.01% | | |
| The TJX Companies, Inc. | 77,488 | 1,897,681 |
| United Rentals, Inc. * | 105,552 | 3,440,995 |
| Zale Corp. * | 66,720 | 1,738,056 |
|
|
| | | 7,076,732 |
Telecommunications Equipment & | | |
| Services - 1.72% | | |
| Nokia Oyj, SADR | 87,671 | 1,628,927 |
| Plantronics, Inc. | 40,845 | 1,411,603 |
|
|
| | | 3,040,530 |
| Telephone - 4.21% | | |
| Harris Corp. | 107,037 | 4,889,450 |
| Sprint Corp. | 73,990 | 1,777,980 |
| Valor Communications Group, Inc. | 61,837 | 763,687 |
|
|
| | | 7,431,117 |
Tobacco - 1.63% | | |
| Loews Corp. - Carolina Group | 60,456 | 2,871,055 |
Transportation - 0.47% | | |
| Aries Maritime Transport, Ltd. | 16,428 | 231,799 |
| Arlington Tankers, Ltd. | 26,326 | 601,549 |
|
|
| | | 833,348 |
The accompanying notes are an integral part of the financial statements. 313
John Hancock Funds II
Portfolio of investments — February 28, 2006 (Unaudited)
(showing percentage of total net assets)
|
| Value & Restructuring Fund (continued) | |
| | | Shares or | |
| | | Principal | |
| | | Amount | Value |
| |
|
| |
| COMMON STOCKS (continued) | | | |
| Trucking & Freight - 1.03% | | | |
| Ryder Systems, Inc. | | 41,042 | $ | 1,819,802 |
|
| TOTAL COMMON STOCKS (Cost $155,589,335) | | $ | 172,845,579 |
|
| |
| PREFERRED STOCKS - 1.01% | | | |
| Chemicals - 0.27% | | | |
| Celanese Corp. * | | 15,516 | 471,299 |
| Financial Services - 0.74% | | | |
| Ford Motor Company Capital Trust II * | | 43,356 | 1,313,687 |
|
| TOTAL PREFERRED STOCKS (Cost $1,740,364) | | $ | 1,784,986 |
|
| |
| REPURCHASE AGREEMENTS - 0.95% | | |
| Repurchase Agreement with State | | | |
| Street Corp. dated 02/28/2006 at | | | |
| 3.20% to be repurchased at | | | |
| $1,678,149 on 03/01/2006, | | | |
| collateralized by $1,740,000 | | | |
| Federal Home Loan Bank, 6.00% | | | |
| due 11/15/2024 (valued at | | | |
| $1,713,900, including interest) (c) | $ | 1,678,000 | $ | 1,678,000 |
|
| TOTAL REPURCHASE AGREEMENTS | | | |
| (Cost $1,678,000) | | | $ | 1,678,000 |
|
| Total Investments (Value & Restructuring Fund) | | |
| (Cost $159,007,699) - 99.91% | | | $ | 176,308,565 |
| Other Assets in Excess of Liabilities - 0.09% | | 156,858 |
|
|
| TOTAL NET ASSETS - 100.00% | | | $ | 176,465,423 |
|
|
| |
| |
| Vista Fund | | | |
| | | Shares or | |
| | | Principal | |
| | | Amount | Value |
|
|
| |
| COMMON STOCKS - 98.78% | | | |
| Aerospace - 1.28% | | | |
| BE Aerospace, Inc. * (a) | | 58,300 $ | 1,398,617 |
Agriculture - 0.83% | | | |
| Archer-Daniels-Midland Company | | 28,434 | 901,927 |
Banking - 0.52% | | | |
| Unibanco - Uniao De Bancos Brasileiros SA, | | |
| ADR | | 6,400 | 562,880 |
Broadcasting - 0.22% | | | |
| Grupo Televisa SA, SADR | | 3,070 | 240,872 |
Business Services - 0.80% | | | |
| Jacobs Engineering Group, Inc. * | | 10,145 | 869,832 |
Cellular Communications - 13.52% | | | |
| America Movil S.A. de C.V., Series L | | 113,022 | 3,925,254 |
| American Tower Corp., Class A * | | 103,612 | 3,297,970 |
| Crown Castle International Corp. * | | 71,900 | 2,254,065 |
| NII Holdings, Inc., Class B * | | 103,200 | 5,285,904 |
|
|
| | | | 14,763,193 |
| Vista Fund (continued) | | | |
| | Shares or | | |
| | Principal | | |
| | Amount | | Value |
|
|
| |
| COMMON STOCKS (continued) | | | |
| Coal - 1.04% | | | |
| Peabody Energy Corp. | 23,492 | $ | 1,133,959 |
Commercial Services - 2.22% | | | |
| Mitsui Fudosan Company, Ltd. | 51,000 | | 1,069,884 |
| Shaw Group, Inc. * (a) | 40,500 | | 1,350,675 |
|
|
| | | | 2,420,559 |
Computers & Business Equipment - 2.04% | | | |
| Apple Computer, Inc. * | 27,800 | | 1,905,412 |
| Electronics for Imaging, Inc. * | 2,536 | | 68,015 |
| Rackable Systems, Inc. * | 6,578 | | 259,371 |
|
|
| | | | 2,232,798 |
Construction & Mining Equipment - 2.08% | | | |
| National Oilwell, Inc. * | 37,281 | | 2,269,667 |
Construction Materials - 5.05% | | | |
| Cemex SA de C.V., SADR | 29,961 | | 1,850,391 |
| EMCOR Group, Inc. * | 13,400 | | 584,106 |
| JLG Industries, Inc. (a) | 33,100 | | 1,952,569 |
| Martin Marietta Materials, Inc. | 11,600 | | 1,131,000 |
|
|
| | | | 5,518,066 |
Crude Petroleum & Natural Gas - 1.01% | | | |
| Helmerich & Payne, Inc. | 16,838 | | 1,107,435 |
Electrical Equipment - 2.27% | | | |
| General Cable Corp. * (a) | 20,500 | | 553,500 |
| Watsco, Inc. (a) | 11,200 | | 779,744 |
| Wesco International, Inc. * | 19,942 | | 1,143,075 |
|
|
| | | | 2,476,319 |
Electrical Utilities - 1.63% | | | |
| Quanta Services, Inc. * (a) | 129,620 | | 1,774,498 |
Electronics - 1.59% | | | |
| Agilent Technologies, Inc. * | 32,732 | | 1,178,352 |
| ATI Technologies, Inc. * (a) | 11,121 | | 176,602 |
| Vishay Intertechnology, Inc. * | 26,225 | | 380,787 |
|
|
| | | | 1,735,741 |
Energy - 2.57% | | | |
| Evergreen Solar, Inc. * | 17,851 | | 278,297 |
| Southwestern Energy Company * | 72,342 | | 2,321,455 |
| SunPower Corp, Class A. * | 4,802 | | 210,808 |
|
|
| | | | 2,810,560 |
Financial Services - 9.09% | | | |
| Affiliated Managers Group, Inc. * (a) | 14,400 | | 1,417,392 |
| AllianceBernstein Holding LP * | 9,200 | | 591,284 |
| E*TRADE Financial Corp. * | 75,993 | | 1,943,901 |
| Investment Technology Group, Inc. * | 33,792 | | 1,536,860 |
| Janus Capital Group, Inc. | 73,800 | | 1,618,434 |
| Jefferies Group, Inc. (a) | 10,000 | | 570,400 |
| Nasdaq Stock Market, Inc. * (a) | 27,217 | | 1,102,561 |
| TD Ameritrade Holding Corp. * | 52,553 | | 1,143,553 |
|
|
| | | | 9,924,385 |
Healthcare Products - 1.67% | | | |
| Hologic, Inc. * | 15,346 | | 733,999 |
The accompanying notes are an integral part of the financial statements. 314
John Hancock Funds II
Portfolio of investments — February 28, 2006 (Unaudited)
(showing percentage of total net assets)
|
| Vista Fund (continued) | | |
| | Shares or | |
| | Principal | |
| | Amount | Value |
|
|
| |
| COMMON STOCKS (continued) | | |
| Healthcare Products (continued) | | |
| Varian Medical Systems, Inc. * | 18,800 | $ | 1,088,144 |
|
|
| | | 1,822,143 |
Healthcare Services - 5.09% | | |
| Express Scripts, Inc. * | 22,435 | 1,957,903 |
| Humana, Inc. * | 40,627 | 2,099,197 |
| Omnicare, Inc. (a) | 24,711 | 1,503,664 |
|
|
| | | 5,560,764 |
Industrial Machinery - 4.71% | | |
| Alstom RGPT * | 6,700 | 573,496 |
| Daifuku Co Ltd * | 30,000 | 562,006 |
| Gardner Denver, Inc. * | 8,800 | 539,968 |
| Manitowoc, Inc. (a) | 30,648 | 2,362,041 |
| Terex Corp. * | 14,000 | 1,108,100 |
|
|
| | | 5,145,611 |
Industrials - 4.65% | | |
| ABB, Ltd. * | 99,800 | 1,194,936 |
| Foster Wheeler, Ltd. * (a) | 80,928 | 3,884,544 |
|
|
| | | 5,079,480 |
Insurance - 2.26% | | |
| Aetna, Inc. | 27,202 | 1,387,302 |
| Aon Corp. | 13,300 | 526,813 |
| W.R. Berkley Corp. | 9,600 | 555,744 |
|
|
| | | 2,469,859 |
International Oil - 0.99% | | |
| ATP Oil & Gas Corp. * (a) | 13,800 | 514,050 |
| Weatherford International, Ltd. * | 13,100 | 564,872 |
|
|
| | | 1,078,922 |
Internet Retail - 0.54% | | |
| Nutri/System, Inc. * (a) | 13,600 | 584,392 |
| Leisure Time - 1.91% | | |
| International Game Technology, Inc. | 30,200 | 1,080,254 |
| Tokyu Land Corp. | 114,000 | 1,010,731 |
|
|
| | | 2,090,985 |
Life Sciences - 2.00% | | |
| Pharmaceutical Product Development, Inc. * | 31,357 | 2,182,134 |
Medical-Hospitals - 0.53% | | |
| Psychiatric Solutions, Inc. * (a) | 17,400 | 574,722 |
Metal & Metal Products - 3.66% | | |
| Precision Castparts Corp. | 38,445 | 2,039,123 |
| Titanium Metals Corp. * (a) | 47,816 | 1,961,412 |
|
|
| | | 4,000,535 |
Petroleum Services - 5.12% | | |
| Diamond Offshore Drilling, Inc. (a) | 29,500 | 2,283,005 |
| McDermott International, Inc. * | 64,200 | 3,309,510 |
|
|
| | | 5,592,515 |
Pharmaceuticals - 0.48% | | |
| Forest Laboratories, Inc. * | 11,500 | 527,850 |
| Vista Fund (continued) | | | | |
| | | Shares or | | |
| | | Principal | | |
| | | Amount | | Value |
|
|
| |
| COMMON STOCKS (continued) | | | | |
| Retail Trade - 3.48% | | | | |
| Abercrombie & Fitch Company, Class A | | 16,300 | $ | 1,097,316 |
| Chico's FAS, Inc. * | | 23,889 | | 1,123,977 |
| Circuit City Stores, Inc. | | 43,200 | | 1,038,096 |
| Yamada Denki Company, Ltd. | | 5,000 | | 542,151 |
|
|
| | | | | 3,801,540 |
Semiconductors - 8.16% | | | | |
| Advanced Micro Devices, Inc. * | | 65,705 | | 2,540,812 |
| Brooks Automation, Inc. * | | 32,900 | | 516,201 |
| Cymer, Inc. * | | 13,000 | | 584,740 |
| Diodes, Inc. * (a) | | 14,800 | | 559,144 |
| Intersil Corp., Class A | | 43,200 | | 1,224,288 |
| Lam Research Corp. * | | 12,400 | | 534,440 |
| Marvell Technology Group, Ltd. * | | 17,600 | | 1,077,472 |
| MEMC Electronic Materials, Inc. * | | 19,000 | | 636,310 |
| Microsemi Corp. * | | 18,934 | | 582,220 |
| OmniVision Technologies, Inc. * (a) | | 25,537 | | 651,194 |
|
|
| | | | | 8,906,821 |
Software - 0.51% | | | | |
| Satyam Computer Services, Ltd., ADR (a) | | 13,600 | | 559,640 |
Steel - 3.73% | | | | |
| Allegheny Technologies, Inc. | | 36,378 | | 1,837,453 |
| Oregon Steel Mills, Inc. * (a) | | 59,000 | | 2,234,920 |
|
|
| | | | | 4,072,373 |
Telecommunications Equipment & | | | | |
| Services - 1.53% | | | | |
| SBA Communications Corp. * (a) | | 74,300 | | 1,671,007 |
|
| TOTAL COMMON STOCKS (Cost $94,409,692) | | $ | 107,862,601 |
|
| |
| SHORT TERM INVESTMENTS - 21.96% | | | | |
| State Street Navigator Securities | | | | |
| Lending Prime Portfolio (c) | $ | 23,978,603 | $ | 23,978,603 |
|
| TOTAL SHORT TERM INVESTMENTS | | | | |
| (Cost $23,978,603) | | | $ | 23,978,603 |
|
| |
| REPURCHASE AGREEMENTS - 2.89% | | | | |
| Repurchase Agreement with State | | | | |
| Street Corp. dated 02/28/2006 at | | | | |
| 3.20% to be repurchased at | | | | |
| $3,159,281 on 03/01/2006, | | | | |
| collateralized by $3,420,000 | | | | |
| Federal National Mortgage | | | | |
| Association, 5.55% due | | | | |
| 07/10/2028 (valued at $3,223,087 | | | | |
| including interest) (c) | $ | 3,159,000 | $ | 3,159,000 |
|
| TOTAL REPURCHASE AGREEMENTS | | | | |
| (Cost $3,159,000) | | | $ | 3,159,000 |
|
| Total Investments (Vista Fund) | | | | |
| (Cost $121,547,295) - 123.63% | | | $ | 135,000,204 |
| Liabilities in Excess of Other Assets - (23.63)% | | | (25,802,361) |
|
|
| TOTAL NET ASSETS - 100.00% | | | $ | 109,197,843 |
|
|
The accompanying notes are an integral part of the financial statements. 315
John Hancock Funds II
Portfolio of investments — February 28, 2006 (Unaudited)
(showing percentage of total net assets)
| Footnotes |
| Percentages are stated as a percent of net assets. |
| |
| Key to Currency Abbreviations |
| ARS | - Argentine Peso |
| AUD | - Australian Dollar |
| BRL | - Brazilian Real |
| CAD | - Canadian Dollar |
| CHF | - Swiss Franc |
| COP | - Colombian Peso |
| CZK | - Czech Koruna |
| DKK | - Danish Krone |
| EUR | - European Currency |
| FIM | - Finnish Markka |
| FRF | - French Franc |
| DEM | - German Deutsche Mark |
| GBP | - British Pound |
| GRD | - Greek Drachma |
| HKD | - Hong Kong Dollar |
| HUF | - Hungarian Forint |
| IDR | - Indonesian Rupiah |
| ILS | - Israeli Shekel |
| INR | - Indian Rupee |
| ITL | - Italian Lira |
| IEP | - Irish Punt |
| JPY | - Japanese Yen |
| KRW | - South Korean Won |
| MXN | - Mexican Peso |
| MYR | - Malaysian Ringgit |
| NLG | - Netherlands Guilder |
| NZD | - New Zealand Dollar |
| NOK | - Norweigan Krone |
| PHP | - Philippines Peso |
| PLN | - Polish Zloty |
| SEK | - Swedish Krona |
| SGD | - Singapore Dollar |
| THB | - Thai Baht |
| TRY | - Turkish Lira |
| TWD | - Taiwan Dollar |
| USD | - US Dollar |
| ZAR | - South African Rand |
| Key to Security Abbreviations and Legend |
| ADR | - American Depositary Receipts |
| ADS | - American Depositary Shares |
| BKNT | - Bank Note |
| CDO | - Collateralized Debt Obligation |
| ESOP | - Employee Stock Ownership Program |
| EMTN | - European Medium Term Note |
| EWCO | - European Written Call Option |
| GDR | - Global Depositary Receipts |
| GMTN | - Global Medium Term Note |
| GTD | - Guaranteed |
| IO | - Interest Only (Carries notional principal amount) |
| MTN | - Medium Term Note |
| NIM | - Net Interest Margin |
| OTC | - Over The Counter |
| PCL | - Public Company Limited |
| PIK | - Paid In Kind |
| PO | - Principal Only |
| REIT | - Real Estate Investment Trust |
| REMIC | - Real Estate Mortgage Investment Conduit |
| SBI | - Shares Beneficial Interest |
| SADR | - Sponsored American Depositary Receipts |
| SPDR | - Standard & Poor's Depositary Receipts |
| TBA | - To Be Announced |
| TIPS | - Treasury Inflation Protected Security |
| |
| ^ | Non-Income producing, issuer is in bankruptcy and is in default of |
| | interest payments |
| * | Non-Income Producing |
| (a) | All or a portion of this security was out on loan |
| (b) | Floating Rate Note |
| (c) | Investment is an affiliate of the Trust's subadvisor or custodian bank |
| (d) | Principal amount of security is adjusted for inflation |
| (e) | Security Fair Valued on February 28, 2006 |
| (f) | Term Loan |
| ** | Purchased on a forward commitment (Note 2) |
| *** | At February 28, 2006, all or a portion of this security was pledged to |
| | cover forward commitments purchased. |
| **** | At February 28, 2006, all or a portion of this security was pledged to |
| | cover margin requirements for open futures contracts. |
The accompanying notes are an integral part of the financial statements. 316
John Hancock Funds II
Notes to Financial Statements (Unaudited)
|
1. ORGANIZATION The John Hancock Funds II (the “Trust”) is organized as a Massachusetts business trust and is registered under the Investment Company Act of 1940, as amended, as a no-load, open-end management investment company. It is a series company, which means that it has several funds, each with a stated investment objective that it pursues through separate investment policies.
The Trust currently consists of 53 separate investment funds (the “Funds”), 48 of which are presented herein.
| 500 Index | International Small Cap | Small Cap Index |
| Active Bond | International Stock | Small Cap Opportunities |
| All Cap Growth | International Value | Small Company |
| All Cap Value | Investment Quality Bond | Small Company Growth |
| Blue Chip Growth | Large Cap | Small Company Value |
| Capital Appreciation | Large Cap Value | Special Value |
| Core Bond | Mid Cap Core | Spectrum Income |
| Core Equity | Mid Cap Index | Strategic Bond |
| Emerging Growth | Mid Cap Stock | Strategic Value |
| Emerging Small Company | Mid Cap Value | Total Return |
| Equity-Income | Natural Resources | U.S. Global Leaders Growth |
| Fundamental Value | Quantitative Mid Cap | U.S. Government Securities |
| Global Bond | Quantitative Value | U.S. High Yield Bond |
| High Yield | Real Estate Securities | U.S. Multi Sector |
| International Equity Index | Real Return Bond | Value & Restructuring |
| International Opportunities | Small Cap | Vista |
Each of the Funds, with the exception of Core Equity, Global Bond, Natural Resources, Real Estate Securities, Real Return Bond, U.S. Global Leaders Growth, and U.S. Multi Sector, is diversified for purposes of the Investment Company Act of 1940, as amended.
Class 1 shares are sold only to certain exempt separate accounts of John Hancock Life Insurance Company (U.S.A.) and John Hancock Life Insurance Company of New York that fund exempt group annuity contracts issued by those insurance companies to qualified retirement plans. Class NAV shares are sold to the Lifestyle Portfolios, which are other funds of the Trust, and to certain institutional investors. John Hancock New York is a wholly owned subsidiary of John Hancock USA. John Hancock USA, John Hancock New York, JHVLICO and JHLICO are indirect wholly owned subsidiaries of The Manufacturers Life Insurance Company (“Manulife”), which in turn is a wholly owned subsidiary of Manulife Financial Corporation, a publicly traded company. Manulife Financial Corporation and its subsidiaries are known collectively as “Manulife Financial.”
The Funds offer two classes of shares. Class 1 shares are offered for all Funds with the exception of 500 Index, International Equity Index, Mid Cap Index, Small Cap Index, Small Company Growth, Spectrum Income, U.S. Multi Sector, Value & Restructuring, and Vista and Class NAV shares are offered for all Funds with the exception of Emerging Small Company. The Trustees have authorized the issuance of multiple classes of shares of the Fund, including classes designated as Class 1 and Class NAV shares. The shares of each class represent an interest in the same portfolio of investments of the Fund, and have equal rights as to voting, redemptions, dividends and liquidation, except that certain expenses, subject to the approval of the Trustees, may be applied differently to each class of shares in accordance with current regulations of the Securities and Exchange Commission and the Internal Revenue Service. Shareholders of a class that bears distribution and service expenses under the terms of a distribution plan have exclusive voting rights to that distribution plan.
2. SIGNIFICANT ACCOUNTING POLICIES In the preparation of the financial statements, the Funds follow the policies described below. The preparation of financial statements in conformity with accounting principles generally accepted in the United States of America requires management to make estimates and assumptions that affect the reported amounts of assets and liabilities at the date of the financial statements and the reported amounts of income and expenses during the reporting period. Actual results may differ from these estimates.
Security Valuation The net asset value of the shares of each Fund is determined daily as of the close of the New York Stock Exchange, normally at 4:00 P.M. Eastern Time. Short-term debt instruments with remaining maturities of 60 days or less are valued at amortized cost, and thereafter assume a constant amortization to maturity of any discount or premium, which approximates market value. Investments in State Street Navigator Securities Lending Prime Portfolio are valued at their net asset value each business day. All other securities held by the Funds are valued at the last sale price or official closing price (closing bid price or last evaluated quote if no sale has occurred) as of the close of business on a principal securities exchange (domestic or foreign) or, lacking any sales, at the closing bid price. Securities traded only in the over-the-counter market are valued at the last bid price quoted by brokers making markets in the securities at the close of trading. Securities for which there are no such quotations, principally debt securities, are valued based on the valuation provided by an independent pricing service, which utilizes both dealer-supplied and electronic data processing techniques. Other assets and securities for which no such quotations are readily available are valued at their fair value as determined in good faith under consistently applied procedures established by and under the general supervision of the Board of Trustees. Generally, trading in non-U.S. securities is substantially completed each day at various times prior to the close of trading on the New York Stock Exchange. The values of such securities used in computing the net asset value of a Fund’s shares are generally determined as of such times. Occasionally, significant events that affect the values of such securities may occur between the times at which such values are generally determined and the close of the New York Stock Exchange. In such events, these securities will then be valued at their fair value as determined in good faith under consistently applied procedures established by and under the general supervision of the Board of Trustees.
In deciding whether to make a fair value adjustment to the price of a security, the Trustees or their designee may review a variety of factors, including, developments in foreign markets, the performance of U.S. securities markets and the performance of instruments trading in U.S. markets that represent foreign securities and baskets of foreign securities. The Funds may also fair value securities in other situations, for example, when a particular foreign market is closed, but the Fund is calculating the net asset value. In view of these factors, it is likely that Funds investing significant amounts of assets in securities in foreign markets will be fair valued more frequently than Funds investing significant amounts of assets in frequently traded, U.S. exchange listed securities of large capitalization U.S. issuers.
For purposes of determining when fair value adjustments may be appropriate with respect to Funds that invest in securities in foreign markets that close prior to the New York Stock Exchange, the Funds will, on an ongoing basis, monitor for “significant market events.” A “significant market event” may be a certain percentage change in the value of an index or of certain Exchange Traded Funds that track foreign markets in which Funds have significant investments. If a significant market event occurs due to a change in the value of the index or of Exchange Traded Funds, the pricing for all Funds that invest in foreign markets that have closed prior to the New York Stock Exchange will promptly be reviewed and potential adjustments to the net asset value of such Funds will be recommended to the Trust’s Pricing Committee where applicable.
317
John Hancock Funds II
Notes to Financial Statements (Unaudited)
|
SIGNIFICANT ACCOUNTING POLICIES, CONTINUED
Fair value pricing of securities is intended to help ensure that the net asset value of a Fund’s shares reflects the value of the Fund’s securities as of the close of the New York Stock Exchange (as opposed to a value which is no longer accurate as of such close), thus limiting the opportunity for aggressive traders to purchase shares of a Fund at deflated prices, reflecting stale security valuations, and to promptly sell such shares at a gain. However, a security’s valuation may differ depending on the method used for determining value and no assurance can be given that fair value pricing of securities will successfully eliminate all potential opportunities for such trading gains.
Repurchase Agreements Each Fund may enter into repurchase agreements. When a Fund enters into a repurchase agreement through its custodian, it receives delivery of securities, the amount of which at the time of purchase and each subsequent business day is required to be maintained at such a level that the market value is generally at least 102% of the repurchase amount. Each Fund will take constructive receipt of all securities underlying the repurchase agreements it has entered into until such agreements expire. If the seller defaults, a Fund would suffer a loss to the extent that proceeds from the sale of underlying securities were less than the repurchase amount. Each Fund may enter into repurchase agreements maturing within seven days with domestic dealers, banks or other financial institutions deemed to be credit-worthy by John Hancock Investment Management Services, LLC (the “Adviser”). Collateral for certain tri-party repurchase agreements is held at the custodian bank in a segregated account for the benefit of the Fund and the counterparty.
Foreign Currency Transactions The accounting records of the Funds are maintained in U.S. dollars. Foreign currency amounts are translated into U.S. dollars on the following basis:
(i) market value of securities, other assets and other liabilities at the current rate of exchange at period end of such currencies against U.S. dollars; and
(ii) purchases and sales of securities, income and expenses at the rate of exchange quoted on the respective dates of such transactions.
|
Net realized gains and losses on foreign currency transactions represent net gains and losses from sales and maturities of foreign currency contracts, disposition of foreign currencies, the difference between the amount of net investment income accrued and the U.S. dollar amount actually received, and gains and losses between trade and settlement date on purchases and sales of securities. The effects of changes in foreign currency exchange rates on investments in securities are included with the net realized and unrealized gain or loss on investment securities.
Certain Funds may be subject to capital gains and repatriation taxes imposed by certain countries in which they invest. Such taxes are generally based upon income and/or capital gains earned or repatriated. Taxes are accrued based upon net investment income, net realized gains and net unrealized appreciation.
Investing in securities of foreign companies and foreign governments involves special risks and consideration not typically associated with investing in securities of domestic companies and the U. S. Government. These risks include revaluation of currencies and future adverse political and economic developments. Moreover, securities of foreign companies and foreign governments and their markets may be less liquid and their prices more volatile than those of the United States.
Security Transactions and Related Investment Income Investment security transactions are accounted for on a trade date basis. Interest income is accrued as earned. Dividend income is recorded on the ex-dividend date. Foreign dividends are recorded on the ex-date or as soon after the ex-date that the Fund becomes aware of such dividends, net of all taxes. Original issue discounts are accreted for financial and tax reporting purposes. Discounts/premiums are accreted/amortized for financial reporting purposes. Non-cash dividends are recorded at the fair market value of the securities received. Debt obligations may be placed in a non-accrual status and related interest income may be reduced by ceasing current accruals and writing off interest receivables when the collection of all or a portion of interest has become doubtful, based upon consistently applied procedures.
Inflation indexed securities are fixed-income securities whose principal value is periodically adjusted according to the rate of inflation. Interest is accrued based upon the principal value, which is adjusted for inflation. Principal of inflation index protected securities is increased or decreased by the rate of change in the Consumer Price Index. Interest income includes accretion of discounts and amortization of premiums as well as accretion or amortization of principal of inflation index protected securities.
From time to time, certain of the Funds may invest in Real Estate Investment Trusts (“REITs”) and as a result, will estimate the components of distributions from these securities. Distributions from REITs received in excess of income are recorded as a reduction of cost of investments and/or as a realized gain.
Multi-class Operations All income, expenses (except for class-specific expenses) and realized and unrealized gains (losses) are allocated to each class of shares based upon the relative net assets of each class. Dividends to shareholders from net investment income are determined at a class level and distributions from capital gains are determined at a Fund level.
Expense Allocation Expenses not directly attributable to a particular Fund are allocated based on the relative share of net assets of each Fund at the time the expense was incurred. Class-specific expenses, such as Distribution (Rule 12b-1) fees, are accrued daily and charged directly to the respective share classes.
Purchased and Written Options All Funds may purchase and sell put and call options on securities (whether or not it holds the securities in its Fund), securities indices, currencies and futures contracts.
When a Fund writes a put or call option, an amount equal to the premium received by the Fund is recorded as a liability and is subsequently “marked-to-market” to reflect the current market value of the option written. If an option expires or if the Fund enters into an offsetting purchase option, the Fund realizes a gain (or loss if the cost of an offsetting purchase option exceeds the premium received when the option was written). If a written call option is exercised, the Fund realizes a gain or loss from the sale of the underlying security with the proceeds of the sale increased by the premium originally received. If a written put option is exercised, the amount of the premium originally received reduces the cost of the security that the Fund purchases upon exercise of the option.
When a Fund purchases a put or call option, the premium paid by the Fund is included in the Portfolio of Investments and subsequently “marked-to-market” to reflect the current market value of the option. If the purchased option expires, the Fund realizes a loss for the cost of the option. If a Fund enters into a closing sale transaction, the Fund realizes a gain or loss, depending on whether proceeds from the closing sale transaction are greater or less than the original cost of the option. If a Fund exercises a call option, the cost of the securities acquired by exercising the call is increased by the premium paid to buy the call. If a Fund exercises a put option, it realizes a gain or loss from the sale of the underlying security and the proceeds from such sale are decreased by the premium originally paid.
318
John Hancock Funds II
Notes to Financial Statements (Unaudited)
|
SIGNIFICANT ACCOUNTING POLICIES, CONTINUED
The Funds may use options to manage exposure to fluctuations in currency values. Writing puts and buying calls may increase the Fund’s exposure to the underlying instrument. Buying puts and writing calls may decrease the Fund’s exposure to the underlying instrument. Losses may arise from changes in the value of the underlying instruments, if there is an illiquid secondary market for the contracts or if the counterparties do not perform under the terms of the contract.
Written options for the period ended February 28, 2006 were as follows:
| | Number of Contracts | Premiums Received |
|
| Global Bond | | |
| Outstanding, beginning of period | — | — |
| Options written | 88,701,711 | $1,346,557 |
| Option closed | (1,200,000) | (12,706) |
| Options expired | (88) | (31,481) |
| Outstanding, end of period | 87,501,623 | $1,302,370 |
|
| |
| Real Return Bond | | |
| Outstanding, beginning of period | — | — |
| Options written | 766 | $208,271 |
| Options expired | (542) | (160,749) |
| Outstanding, end of period | 224 | $47,522 |
|
| |
| Total Return | | |
| Outstanding, beginning of period | — | — |
| Options written | 28,902,098 | $1,403,704 |
| Options expired | (2,700,904) | (282,456) |
| Outstanding, end of period | 26,201,194 | $1,121,248 |
|
| |
| Value & Restructuring | | |
| Outstanding, beginning of period | — | — |
| Options written | 656 | $429,163 |
| Option closed | (328) | (285,945) |
| Options exercised | (138) | (69,968) |
| Outstanding, end of period | 190 | $73,250 |
The following is a summary of open written options outstanding at February 28, 2006:
| Fund | Name of Issuer | Number of Contracts | Exercise Price | Expiration Date | Value |
|
| Global Bond | Calls | | | | |
|
| | Eurodollar Midcurve 1 Year Futures | 490 | $95.50 | Mar 2006 | ($3,063) |
| | Eurodollar Midcurve 1 Year Futures | 516 | 95.25 | Jun 2006 | (106,425) |
| | Interest Rate Swap 3 Month LIBOR | 62,000,000 | 4.78 | Aug 2006 | (185,132) |
| | Swap Option 3 Month LIBOR | 7,800,000 | 4.85 | Dec 2006 | (57,977) |
|
| | | 69,801,006 | | | ($352,597) |
| |
| | Puts | | | | |
|
| | Eurodollar Midcurve 1 Year Futures | 200 | $94.875 | Mar 2006 | ($5,000) |
| | Interest Rate Swap 3 Month LIBOR | 1,200,000 | 4.50 | Mar 2006 | (23) |
| | Japanese Yen | 2,500,000 | 112.00 | May 2006 | (22,977) |
| | Interest Rate Swap 3 Month LIBOR | 9,800,000 | 5.35 | Jun 2006 | (65,072) |
| | Eurodollar Midcurve 1 Year Futures | 417 | 94.75 | Jun 2006 | (49,519) |
| | Interest Rate Swap 3 Month LIBOR | 4,200,000 | 5.20 | Jun 2006 | (16,506) |
|
| | | 17,700,617 | | | ($159,097) |
| |
| Real Return Bond | Calls | | | | |
|
| | U.S.Treasury Notes Futures | 99 | $110.00 | Mar 2006 | ($1,547) |
| | U.S.Treasury Notes Futures | 13 | 110.00 | May 2006 | (2,437) |
|
| | | 112 | | | ($3,984) |
| |
| | Puts | | | | |
|
| | U.S.Treasury Notes Futures | 99 | $106.00 | Mar 2006 | — |
| | U.S.Treasury Notes Futures | 13 | 107.00 | May 2006 | ($6,297) |
|
| | | 112 | | | ($6,297) |
319
John Hancock Funds II
Notes to Financial Statements (Unaudited)
|
| SIGNIFICANT ACCOUNTING POLICIES, CONTINUED | | | | |
| Fund | Name of Issuer | Number of Contracts | Exercise Price | Expiration Date | Value |
|
| Total Return | Calls | | | | |
|
| | Eurodollar Midcurve 1 Year Futures | 126 | $95.50 | Mar 2006 | ($788) |
| | Eurodollar Futures | 38 | 95.50 | Sep 2006 | (1,900) |
| | U.S.Treasury Notes 10 Year Futures | 40 | 110.00 | May 2006 | (6,875) |
| | Swap Option 3 Month LIBOR | 12,000,000 | 4.85 | Dec 2006 | (89,196) |
| | Swap Option 3 Month LIBOR | 11,000,000 | 4.53 | Aug 2006 | (10,505) |
|
| | | 23,000,204 | | | ($109,264) |
| |
| | Puts | | | | |
|
| | Eurodollar Futures | 47 | $95.00 | Dec 2006 | ($30,256) |
| | Eurodollar Futures | 421 | 95.25 | Dec 2006 | (447,313) |
| | Eurodollar Futures | 70 | 95.25 | Dec 2006 | (74,375) |
| | Eurodollar Futures | 50 | 95.00 | Sep 2006 | (27,812) |
| | Eurodollar Futures | 34 | 95.50 | Dec 2006 | (52,700) |
| | Eurodollar Futures | 40 | 95.25 | Mar 2007 | (41,250) |
| | Eurodollar Futures | 260 | 95.25 | Sep 2006 | (269,750) |
| | Eurodollar Futures | 38 | 95.50 | Sep 2006 | (60,325) |
| | Eurodollar Futures | 30 | 95.25 | Dec 2006 | (31,875) |
| | Japanese Yen | 3,200,000 | 112.00 | May 2006 | (29,411) |
|
| | | 3,200,990 | | | ($1,065,067) |
| |
| Value & Restructuring | Calls | | | | |
|
| | Todco | 51 | $45.00 | Mar 2006 | ($255) |
| | Devon Energy Corp. | 139 | 70.00 | Apr 2006 | (3,475) |
|
| | | 190 | | | ($3,730) |
Securities Lending All Funds may lend securities in amounts up to 33 1/3% of each Fund’s total non-cash assets to brokers, dealers and other financial institutions, provided such loans are callable at any time and are at all times fully secured by cash, cash equivalents or securities issued or guaranteed by the U.S. Government or its agencies or instrumentalities and marked to market to the value of the loaned securities on a daily basis. The Funds may bear the risk of delay in recovery of, or even of loss of rights in, the securities loaned should the borrower of the securities fail financially. Consequently, loans of Fund securities will only be made to firms deemed by the subadvisers to be creditworthy. The Funds receive compensation for lending their securities either in the form of fees or by retaining a portion of interest on the investment of any cash received as collateral. Cash collateral is invested in the State Street Navigator Securities Lending Prime Portfolio.
All collateral received will be in an amount equal to at least 100% of the market value of the loaned securities and is intended to be maintained at that level during the period of the loan. The market value of the loaned securities is determined at the close of business of the Fund and any additional required collateral is delivered to the Fund the next business day. During the loan period, the Fund continues to retain rights of ownership, including dividends and interest of the loaned securities. At February 28, 2006 the values of securities loaned and of cash collateral were as follows:
| Fund | Value of Securities Loaned | Value of Cash Collateral |
|
| Active Bond | $62,669,745 | $63,952,895 |
| All Cap Growth | 4,153,432 | 4,252,196 |
| All Cap Value | 20,071,291 | 20,547,958 |
| Blue Chip Growth | 67,063,189 | 68,562,354 |
| Capital Appreciation | 2,293,149 | 2,341,825 |
| Emerging Growth | 65,899,564 | 67,564,512 |
| Equity-Income | 87,442,964 | 89,633,044 |
| Fundamental Value | 76,724,965 | 78,446,424 |
| Global Bond | 13,513,896 | 13,793,450 |
| High Yield | 331,498,919 | 338,457,704 |
| International Equity Index | 22,972,433 | 24,089,643 |
| International Opportunities | 46,210,367 | 47,889,360 |
| International Small Cap | 22,735,901 | 23,860,955 |
| International Stock | 152,846,814 | 160,743,448 |
| International Value | 150,628,179 | 158,239,011 |
| Large Cap | 2,080,777 | 2,128,439 |
| Large Cap Value | 5,984,498 | 6,127,940 |
| Mid Cap Core | 50,440,068 | 51,567,685 |
| Mid Cap Stock | 83,159,941 | 85,194,265 |
| Mid Cap Value | 63,810,791 | 65,600,494 |
| Natural Resources | 80,304,638 | 82,182,802 |
| Quantitative Mid Cap | 37,219,029 | 38,058,720 |
| Quantitative Value | 54,005,024 | 55,387,811 |
320
John Hancock Funds II
Notes to Financial Statements (Unaudited)
|
| SIGNIFICANT ACCOUNTING POLICIES, CONTINUED | |
| |
| Fund | Value of Securities Loaned | Value of Cash Collateral |
|
| Real Estate Securities | $47,412,541 | $48,505,156 |
| Real Return Bond | 312,130,477 | 318,498,126 |
| Small Cap | 89,987,734 | 92,214,294 |
| Small Cap Opportunities | 130,104,006 | 133,253,392 |
| Small Company | 33,784,081 | 34,585,798 |
| Small Company Value | 124,033,044 | 127,033,163 |
| Special Value | 38,867,372 | 39,827,991 |
| Strategic Bond | 98,455,905 | 100,471,016 |
| Strategic Value | 6,056,133 | 6,331,582 |
| U.S. High Yield Bond | 21,245,630 | 21,693,548 |
| Vista | 23,446,851 | 23,978,603 |
Dollar Rolls All Funds may enter into mortgage dollar rolls in which they sell debt securities for delivery currently and simultaneously contract to repurchase similar, but not identical, securities at the same price or a lower price on an agreed upon date. The Funds receive compensation as consideration for entering into the commitment to repurchase. The compensation is the difference between the current sale price and the forward price for the future purchase (often referred to as the “drop”) as well as by the interest earned on the cash proceeds of the initial sale. A Fund may also be compensated by the receipt of a commitment fee. As the holder, the counter-party receives all principal and interest payments, including prepayments, made with respect to the similar security. Dollar rolls may be renewed with a new sale and repurchase price with a cash settlement made at renewal without physical delivery of the securities subject to the contract.
Futures All Funds may purchase and sell financial futures contracts and options on those contracts. The Funds invest in contracts based on financial instruments such as U.S. Treasury Bonds or Notes on securities indices such as the S&P 500 Index, in order to hedge against a decline in the value of securities owned by the Funds.
Upon entering into futures contracts, a Fund is required to deposit with a broker an amount, termed the initial margin, which typically represents a certain percentage of the purchase price indicated in the futures contract. Payments to and from the broker, known as variation margin, are required to be made on a daily basis as the price of the futures contract fluctuates, making the long or short positions in the contract more or less valuable. If the position is closed out by taking an opposite position prior to the settlement date of the futures contract, a final determination of variation margin is made, cash is required to be paid to or released by the broker, and the Fund realizes a gain or loss.
When a Fund sells a futures contract based on a financial instrument, the Fund becomes obligated to deliver that kind of instrument at an agreed upon date for a specified price. The Fund realizes a gain or loss depending on whether the price of an offsetting purchase is less or more than the price of the initial sale or on whether the price of an offsetting sale is more or less than the price of the initial purchase. The Fund could be exposed to risks if it could not close out futures positions because of an illiquid secondary market or the inability of counterparties to meet the terms of their contracts. Futures contracts are valued at the quoted daily settlement prices established by the exchange on which they trade.
The following is a summary of open futures contracts at February 28, 2006:
| Fund | Open Contracts | Number of Contracts | Position | Expiration Date | Appreciation (Depreciation) |
|
| 500 Index | S&P 500 Index | | 68 | Long | Mar 2006 | $111,273 |
|
| | | | | | | $111,273 |
| |
| Global Bond | Eurodollar | | 503 | Long | Sep 2006 | ($337,588) |
| | 10-Year German Euro-BUND | | 257 | Long | Mar 2006 | (181,538) |
| | Japan 10-Year Government Bonds | 68 | Long | Mar 2006 | (518,237) |
| | U.S. 10-Year Treasury Notes | | 755 | Long | Jun 2006 | 107,438 |
| | 5-Year German Euro-BOBL | | 181 | Long | Mar 2006 | (178,706) |
| | U.S. 5-Year Treasury Notes | | 1,850 | Long | Jun 2006 | (30,296) |
| | Euribor | | 257 | Long | May 2006 | — |
| | Euribor | | 158 | Long | May 2006 | — |
|
| | | | | | | ($1,138,927) |
| |
| International Equity Index | JSE Shares Index | | 95 | Long | Mar 2006 | $173,439 |
| | MSCI Taiwan Index | | 124 | Long | Mar 2006 | (17,230) |
|
| | | | | | | $156,209 |
| |
| International Stock | TOPIX Index | | 196 | Long | Mar 2006 | $908,627 |
| | CAC 40 10 Euro Index | | 19 | Long | Mar 2006 | (12,133) |
| | DAX Index | | 147 | Long | Mar 2006 | 1,785,517 |
| | S&P/MIB 30 Index | | 32 | Long | Mar 2006 | 471,930 |
| | IBEX 35 Index | | 3 | Long | Mar 2006 | 139 |
| | Hang Seng Stock Index | | 2 | Long | Mar 2006 | (93) |
| | OMX 30 Stockholm Stock Index | 19 | Long | Mar 2006 | (3,050) |
| | FTSE 100 Index | | 43 | Short | Mar 2006 | 13,383 |
| | SPI 200 Index | | 184 | Short | Mar 2006 | (89,735) |
| | S&P/Toronto Stock Exchange 60 Index | 184 | Short | Mar 2006 | (893,322) |
|
| | | | | | | $2,181,263 |
321
John Hancock Funds II
Notes to Financial Statements (Unaudited)
|
SIGNIFICANT ACCOUNTING POLICIES, CONTINUED
| Fund | Open Contracts | Number of Contracts | Position | Expiration Date | Appreciation (Depreciation) |
|
| Investment Quality Bond | U.S. 10-Year Treasury Notes | 44 | Short | Jun 2006 | ($18,008) |
|
| | | | | | ($18,008) |
| |
| Large Cap | S&P 500 Index | 10 | Long | Mar 2006 | ($4,775) |
|
| | | | | | ($4,775) |
| |
| Mid Cap Index | S&P Mid Cap 400 Index | 11 | Long | Mar 2006 | $68,873 |
|
| | | | | | $68,873 |
| |
| Real Return Bond | Eurodollar | 249 | Long | Sep 2007 | ($125,113) |
| | Eurodollar | 249 | Long | Mar 2007 | ($174,538) |
| | Eurodollar | 108 | Long | Dec 2007 | ($64,700) |
| | Eurodollar | 249 | Long | Jun 2007 | ($149,538) |
| | Eurodollar | 141 | Long | Dec 2006 | ($111,662) |
| | U.S. 10-Year Treasury Notes | 37 | Long | Jun 2006 | $12,141 |
| | U.S. Treasury Bonds | 328 | Short | Jun 2006 | ($192,187) |
| | U.S. 5-Year Treasury Notes | 32 | Short | Jun 2006 | ($4,000) |
|
| | | | | | ($809,597) |
| |
| Small Cap Index | Russell 2000 Index | 9 | Long | Mar 2006 | $144,812 |
|
| | | | | | $144,812 |
| |
| Spectrum Income | U.K. Treasury Bonds | 5 | Short | Jun 2006 | $3,851 |
| | U.S. 2-Year Treasury Notes | 5 | Short | Mar 2006 | 4,453 |
| | U.S. 2-Year Treasury Notes | 12 | Short | Jun 2006 | (48) |
| | U.S. 10-Year Treasury Notes | 9 | Short | Jun 2006 | (2,368) |
| | U.S. Treasury Bonds | 3 | Short | Jun 2006 | (727) |
| | U.S. 10-Year Treasury Notes | 10 | Long | Jun 2006 | 2,851 |
| | U.S. Treasury Bonds | 8 | Long | Jun 2006 | 1,905 |
|
| | | | | | $9,917 |
| |
| Strategic Bond | U.S. 10-Year Treasury Notes | 35 | Long | Mar 2006 | ($17,905) |
|
| | | | | | ($17,905) |
| |
| Total Return | Eurodollar | 979 | Long | Sep 2007 | ($353,279) |
| | Eurodollar | 1,249 | Long | Mar 2007 | (658,175) |
| | Eurodollar | 427 | Long | Dec 2007 | (205,950) |
| | Eurodollar | 1,253 | Long | Jun 2007 | (507,812) |
| | Eurodollar | 827 | Long | Dec 2007 | (514,050) |
| | U.S. Treasury Bonds | 82 | Long | Mar 2006 | 19,218 |
| | U.S. 5-Year Treasury Notes | 263 | Long | Jun 2006 | (20,548) |
| | 5-Year Euro - BOBL | 100 | Short | Mar 2006 | 107,855 |
|
| | | | | | ($2,132,741) |
| |
| U.S. Government Securities | U.S. 5-Year Treasury Notes | 22 | Long | Mar 2006 | ($15,036) |
| | U.S. 2-Year Treasury Notes | 32 | Long | Mar 2006 | (22,975) |
| | U.S. 10-Year Treasury Notes | 92 | Short | Mar 2006 | 38,466 |
|
| | | | | | $455 |
| |
| U.S. Multi Sector | S&P 500 Index | 99 | Long | Mar 2006 | $297,078 |
|
| | | | | | $297,078 |
Swap Contracts All Funds may enter into interest rate swaps. Interest rate swaps involve the exchange of commitments to pay or receive interest of one instrument for that of another instrument (for example, an exchange of floating rate payments for fixed rate payments with respect to a notional principal amount). The Funds settle accrued net receivable or payable balances under the swap contracts on a periodic basis. Accrued interest receivable or payable on the swap contracts is recorded as realized gain or loss. The Funds record changes in the value of the swaps as unrealized gains or losses on swap contracts.
322
John Hancock Funds II
Notes to Financial Statements (Unaudited)
|
SIGNIFICANT ACCOUNTING POLICIES, CONTINUED
Swap contracts are subject to risks related to the counterparty’s ability to perform under the contract, and may decline in value if the counterparty’s creditworthiness deteriorates. The risks may arise from unanticipated movement in interest rates. The Funds may also suffer losses if it is unable to terminate outstanding swap contracts or reduce its exposure through offsetting transactions.
The Funds had the following interest rate swap contracts open at February 28, 2006:
| | Notional | | Payments Made | Payments Received | Termination | Appreciation |
| Fund | Amount | Currency | by Portfolio | by Portfolio | Date | (Depreciation) |
|
| Global Bond | | | | | | |
| | 6,000,000 | NZD | Fixed 6.50% | 3 Month BBR | Feb 2008 | $4,011 |
| | 36,900,000 | GBP | 6 Month BBA LIBOR | Fixed 5.00% | Sep 2010 | 848,198 |
| | 10,000,000 | GBP | 6 Month BBA LIBOR | Fixed 5.00% | Sep 2010 | 229,864 |
| | 7,100,000 | GBP | 6 Month BBA LIBOR | Fixed 5.00% | Sep 2010 | 159,186 |
| | 4,000,000 | GBP | 6 Month BBA LIBOR | Fixed 5.00% | Sep 2010 | 89,682 |
| | 96,700,000 | USD | Fixed 5.00% | 3 Month LIBOR | Jun 2011 | 314,051 |
| | 71,100,000 | USD | Fixed 5.00% | 3 Month LIBOR | Jun 2011 | 230,910 |
| | 18,500,000 | EUR | Fixed 4.00% | 6 Month EURIBOR | Dec 2014 | (636,639) |
| | 9,700,000 | EUR | Fixed 4.00% | 6 Month EURIBOR | Dec 2014 | (277,830) |
| | 200,000 | CAD | Fixed 5.50% | 3 Month CBK | Dec 2014 | (5,692) |
| | 7,100,000 | USD | Fixed 5.00% | 3 Month LIBOR | Jun 2016 | 41,900 |
| | 3,400,000 | USD | Fixed 5.00% | 3 Month LIBOR | Jun 2016 | 20,065 |
| | 12,100,000 | USD | Fixed 5.00% | 3 Month LIBOR | Jun 2016 | 71,407 |
| | 1,500,000 | GBP | Fixed 4.00% | 6 Month BBA LIBOR | Dec 2025 | (10,583) |
| | 1,100,000 | GBP | Fixed 4.00% | 6 Month BBA LIBOR | Dec 2025 | (7,761) |
| | 2,700,000 | GBP | Fixed 5.00% | 6 Month BBA LIBOR | Jun 2034 | (524,340) |
| | 2,600,000 | GBP | Fixed 5.00% | 6 Month BBA LIBOR | Jun 2034 | (504,920) |
| | 1,800,000 | GBP | Fixed 5.00% | 6 Month BBA LIBOR | Jun 2034 | (213,793) |
| | 2,200,000 | EUR | 6 Month EURIBOR | Fixed 6.00% | Jun 2034 | 466,082 |
| | 1,100,000 | EUR | 6 Month EURIBOR | Fixed 6.00% | Jun 2034 | 233,895 |
| | 1,500,000 | EUR | 6 Month EURIBOR | Fixed 6.00% | Jun 2034 | 314,721 |
| | 10,500,000 | EUR | 6 Month BBA LIBOR | Fixed 6.00% | Jun 2034 | 2,203,044 |
|
| | | | | | | $3,045,458 |
| |
| Real Return Bond | | | | | | |
| | 2,200,000 | EUR | FRCPXTOB | Fixed 2.04% | Feb 2011 | ($4,929) |
| | 3,100,000 | USD | Fixed 5.00% | 3 Month LIBOR | Jun 2013 | 13,256 |
| | 5,500,000 | EUR | FRCPXTOB | Fixed 2.1375% | Jan 2016 | — |
| | 5,000,000 | USD | Fixed 5.00% | 3 Month LIBOR | Jun 2016 | 29,506 |
|
| | | | | | | $37,833 |
| |
| Total Return | | | | | | |
| | 20,400,000 | USD | 3 Month LIBOR | Fixed 5.00% | Jun 2008 | ($43,202) |
| | 20,000,000 | USD | 3 Month LIBOR | Fixed 5.00% | Jun 2011 | (64,954) |
| | 1,300,000 | USD | 3 Month LIBOR | Fixed 5.00% | Dec 2035 | (9,564) |
| | 400,000 | GBP | Fixed 4.00% | 6 Month BBA LIBOR | Dec 2035 | (15,386) |
| | 2,700,000 | USD | 3 Month LIBOR | Fixed 5.00% | Jun 2036 | (35,389) |
| | 1,700,000 | USD | 3 Month LIBOR | Fixed 5.00% | Jun 2036 | (22,282) |
|
| | | | | | | ($190,777) |
| BBA — British Bankers Association |
| BBR — Bank Bill Rate |
| CBK — Canadian Bank Rate |
| FRCPXTOB — French CPI Ex Tobacco Daily Reference Index |
| |
| Currency symbols are defined as follows: |
| |
| CAD | Canadian Dollar |
| EUR | Euro |
| GBP | Pound Sterling |
| NZD | New Zealand Dollar |
323
John Hancock Funds II
Notes to Financial Statements (Unaudited)
|
SIGNIFICANT ACCOUNTING POLICIES, CONTINUED
Forward Foreign Currency Contracts All Funds, with the exception of U.S. Government Securities, may purchase and sell forward foreign currency contracts in order to hedge a specific transaction or Fund position. Forward foreign currency contracts are valued at forward foreign currency exchange rates and marked to market daily. Net realized gains (losses) on foreign currency and forward foreign currency contracts shown in the Statements of Operations include net gains or losses realized by a Fund on contracts that have matured.
The net U.S. dollar value of foreign currency underlying all contractual commitments held at the end of the period, the resulting net unrealized appreciation (depreciation) and related net receivable or payable amount are determined using forward foreign currency exchange rates supplied by a quotation service. The Funds could be exposed to risks in excess of amounts recognized on the Statements of Assets and Liabilities if the counterparties to the contracts are unable to meet the terms of their contracts or if the value of the forward foreign currency contract changes unfavorably.
At February 28, 2006 certain Funds entered into forward foreign currency contracts, which contractually obligate the Funds to deliver currencies at future dates. Open forward foreign currency contracts at February 28, 2006 were as follows:
| | | Principal Amount | Settlement | Appreciation |
| Fund | Currency | Covered by Contract | Date | (Depreciation) |
|
| Global Bond | Buys | | | |
|
| | Australian Dollar | 3,515,000 | Mar 2006 | ($11,844) |
| | Danish Kroner | 27,028,000 | Mar 2006 | 37,580 |
| | Swedish Krona | 26,619,000 | Mar 2006 | 57,901 |
| | Swedish Krona | 7,000,000 | Mar 2006 | (33,770) |
| | Australian Dollar | 1,866,000 | Mar 2006 | 4,321 |
| | Australian Dollar | 1,866,000 | Mar 2006 | 7,400 |
| | Australian Dollar | 704,000 | Mar 2006 | 2,359 |
| | Japanese Yen | 18,533,640,000 | Mar 2006 | 3,123,863 |
| | Japanese Yen | 80,000,000 | Mar 2006 | 13,456 |
| | Japanese Yen | 554,395,300 | Mar 2006 | 95,144 |
| | Japanese Yen | 65,879,000 | Mar 2006 | 9,082 |
| | Japanese Yen | 43,000,000 | Mar 2006 | 26 |
| | Japanese Yen | 400,135,000 | Mar 2006 | 56,324 |
| | Pound Sterling | 740,210 | Mar 2006 | (28) |
| | Australian Dollar | 2,751,000 | Mar 2006 | 4,331 |
| | Euro | 700,000 | Mar 2006 | (954) |
| | Euro | 365,000 | Mar 2006 | 157 |
| | Euro | 96,110,000 | Mar 2006 | 460,823 |
| | Japanese Yen | 40,000,000 | Mar 2006 | 4,160 |
| | Canadian Dollar | 12,544,000 | Mar 2006 | 129,921 |
| | Pound Sterling | 17,942,000 | Mar 2006 | 246,715 |
| | Polish Zloty | 758,000 | May 2006 | 1,302 |
| | Brazilian Real | 1,130,000 | Jul 2006 | 24,896 |
| | Chilean Peso | 112,100,000 | Jul 2006 | 4,814 |
| | Peruvian Nouveau Sol | 1,726,000 | Aug 2006 | (1,108) |
| | Indian Rupee | 7,958,000 | Aug 2006 | 490 |
| | New Taiwan Dollar | 23,926,000 | Aug 2006 | (2,829) |
| | Singapore Dollar | 401,000 | Aug 2006 | 1,350 |
| | South African Rand | 379,000 | Aug 2006 | (641) |
| | South Korean Won | 1,446,869,000 | Aug 2006 | (5,103) |
| | Mexican Peso | 3,030,000 | Aug 2006 | 1,074 |
|
| | | | | $4,231,212 |
| |
| |
| | Sells | | | |
|
| | New Zealand Dollar | 1,381,680 | Mar 2006 | $24,653 |
| | New Zealand Dollar | 1,378,601 | Mar 2006 | 20,770 |
| | Japanese Yen | 1,725,161 | Mar 2006 | (4,704) |
| | Euro | 884,019 | Mar 2006 | 659 |
| | Pound Sterling | 102,974 | Mar 2006 | (516) |
| | Pound Sterling | 273,667 | Mar 2006 | (1,724) |
| | Euro | 314,616 | Apr 2006 | 4,793 |
|
| | | | | $43,931 |
324
John Hancock Funds II
Notes to Financial Statements (Unaudited)
|
SIGNIFICANT ACCOUNTING POLICIES, CONTINUED
| | | Principal Amount | Settlement | Appreciation |
| Fund | Currency | Covered by Contract | Date | (Depreciation) |
|
| International Equity Index | Buys | | | |
|
| | South African Rand | 13,955,000 | Mar 2006 | $82,306 |
| | South African Rand | 495,000 | Mar 2006 | (2,091) |
|
| | | | | $80,215 |
| |
| |
| International Stock | Buys | | | |
|
| | Danish Kroner | 1,606,840 | May 2006 | $247 |
| | Japanese Yen | 780,850,000 | May 2006 | 153,843 |
| | Japanese Yen | 780,850,000 | May 2006 | 156,584 |
| | Japanese Yen | 780,850,000 | May 2006 | 148,064 |
| | Japanese Yen | 1,096,689,650 | May 2006 | 214,566 |
| | Japanese Yen | 780,850,000 | May 2006 | 142,532 |
| | Japanese Yen | 780,850,000 | May 2006 | 135,069 |
| | Japanese Yen | 780,850,000 | May 2006 | 129,320 |
| | Norwegian Krone | 21,747,312 | May 2006 | 15,315 |
| | Norwegian Krone | 21,747,312 | May 2006 | 17,902 |
| | Norwegian Krone | 21,747,312 | May 2006 | 9,345 |
| | Norwegian Krone | 21,747,312 | May 2006 | (1,674) |
| | Norwegian Krone | 21,747,312 | May 2006 | 8,777 |
| | Norwegian Krone | 21,747,312 | May 2006 | 2,783 |
| | Norwegian Krone | 21,747,312 | May 2006 | 1,518 |
| | Swedish Krona | 40,878,257 | May 2006 | (19,240) |
| | Swedish Krona | 40,878,257 | May 2006 | (16,984) |
| | Swedish Krona | 71,242,277 | May 2006 | (136,808) |
| | Swedish Krona | 40,878,257 | May 2006 | (49,333) |
| | Swedish Krona | 40,878,257 | May 2006 | (16,233) |
| | Swedish Krona | 40,878,257 | May 2006 | (41,165) |
| | Swedish Krona | 40,878,257 | May 2006 | (41,350) |
|
| | | | | $813,078 |
| |
| |
| | Sells | | | |
|
| | Australian Dollar | 3,248,542 | May 2006 | ($30,412) |
| | Australian Dollar | 3,259,494 | May 2006 | (19,460) |
| | Australian Dollar | 3,261,634 | May 2006 | (17,320) |
| | Australian Dollar | 3,257,416 | May 2006 | (21,538) |
| | Canadian Dollar | 2,330,654 | May 2006 | (37,407) |
| | Canadian Dollar | 2,334,592 | May 2006 | (33,469) |
| | Danish Kroner | 2,691,615 | May 2006 | (13,239) |
| | Danish Kroner | 2,705,248 | May 2006 | 394 |
| | Euro | 3,571,766 | May 2006 | (12,616) |
| | Euro | 3,587,727 | May 2006 | 3,345 |
| | Hong Kong Dollar | 1,977,310 | May 2006 | 155 |
| | Hong Kong Dollar | 1,977,450 | May 2006 | 295 |
| | Pound Sterling | 5,855,067 | May 2006 | (59,343) |
| | Pound Sterling | 5,849,480 | May 2006 | (64,931) |
| | Pound Sterling | 5,857,951 | May 2006 | (56,460) |
| | Pound Sterling | 5,874,465 | May 2006 | (39,946) |
| | Pound Sterling | 5,857,618 | May 2006 | (56,793) |
| | Pound Sterling | 10,463,422 | May 2006 | (27,905) |
| | Pound Sterling | 5,872,073 | May 2006 | (42,338) |
|
| | | | | ($528,988) |
325
John Hancock Funds II
Notes to Financial Statements (Unaudited)
|
SIGNIFICANT ACCOUNTING POLICIES, CONTINUED
| | | Principal Amount | Settlement | Appreciation |
| Fund | Currency | Covered by Contract | Date | (Depreciation) |
|
| Real Return Bond | Sells | | | |
|
| | Canadian Dollar | 477,889 | Mar 2006 | ($5,696) |
| | Euro | 307,924 | Mar 2006 | (1,252) |
|
| | | | | ($6,948) |
| |
| |
| Spectrum Income | Buys | | | |
|
| | Australian Dollar | 47,439 | May 2006 | $185 |
| | Canadian Dollar | 1,870,311 | May 2006 | 21,322 |
| | Czech Koruna | 2,797,000 | May 2006 | 56 |
| | Danish Kroner | 470,487 | May 2006 | (40) |
| | Hungarian Forint | 28,340,000 | May 2006 | (1,198) |
| | Indian Rupee | 15,201,600 | May 2006 | 399 |
| | Israeli Shekel | 3,924,276 | May 2006 | 4,249 |
| | Japanese Yen | 1,566,710,067 | May 2006 | 120,849 |
| | New Taiwan Dollar | 5,740,000 | May 2006 | (1,059) |
| | Norwegian Krone | 930,000 | May 2006 | 1,333 |
| | Polish Zloty | 489,218 | May 2006 | 1,382 |
| | Pound Sterling | 1,201,334 | May 2006 | 7,079 |
| | South African Rand | 175,042 | May 2006 | 250 |
| | South Korean Won | 1,319,458,500 | May 2006 | 3,566 |
| | Swedish Krona | 11,113,085 | May 2006 | (19,186) |
| | Euro | 1,524,283 | May 2006 | (9,295) |
| | Philippine Peso | 18,041,580 | Jul 2006 | 6,791 |
| | Yuan Renminbi | 5,099,277 | Oct 2006 | 1,104 |
|
| | | | | $137,787 |
| |
| |
| | Sells | | | |
|
| | Australian Dollar | 1,509,477 | Mar 2006 | ($5,492) |
| | New Zealand Dollar | 1,481,705 | Mar 2006 | 57,405 |
| | Mexican Peso | 1,474,155 | Mar 2006 | (4,853) |
| | New Zealand Dollar | 293,767 | Apr 2006 | 6,086 |
| | Australian Dollar | 202,056 | May 2006 | (36) |
| | Canadian Dollar | 2,473,915 | May 2006 | (81) |
| | Danish Kroner | 250,000 | May 2006 | 5,016 |
| | Euro | 3,761,348 | May 2006 | 8,871 |
| | Israeli Shekel | 663,872 | May 2006 | (2,776) |
| | Japanese Yen | 3,530,805 | May 2006 | (63,202) |
| | Mexican Peso | 2,138,323 | May 2006 | (16,049) |
| | New Taiwan Dollar | 178,040 | May 2006 | (147) |
| | New Zealand Dollar | 1,977,452 | May 2006 | 41,981 |
| | Polish Zloty | 149,910 | May 2006 | 1,157 |
| | Pound Sterling | 545,585 | May 2006 | (445) |
| | South African Rand | 122,781 | May 2006 | 1,578 |
| | Yuan Renminbi | 652,081 | Oct 2006 | (2,023) |
|
| | | | | $26,990 |
326
John Hancock Funds II
Notes to Financial Statements (Unaudited)
|
| SIGNIFICANT ACCOUNTING POLICIES, CONTINUED | | |
| |
| | | Principal Amount | Settlement | Appreciation |
| Fund | Currency | Covered by Contract | Date | (Depreciation) |
|
| Total Return | Buys | | | |
|
| | Japanese Yen | 1,070,132,000 | Mar 2006 | $147,534 |
| | Pound Sterling | 2,196,000 | Mar 2006 | 30,197 |
| | Japanese Yen | 76,071,000 | May 2006 | 14,827 |
|
| | | | | $192,558 |
| |
| |
| | Sells | | | |
|
| | Euro | 24,474,634 | Mar 2006 | ($99,472) |
| | Euro | 79,754,508 | Mar 2006 | 223,386 |
| | Euro | 10,498,128 | Apr 2006 | 305,070 |
|
| | | | | $428,984 |
| |
| |
| Vista | Sells | | | |
|
| | Euro | 126,616 | Mar 2006 | ($471) |
| | Euro | 151,785 | Mar 2006 | (592) |
| | Japanese Yen | 1,595,213 | Mar 2006 | (12,006) |
| | Swiss Franc | 592,652 | Mar 2006 | (1,005) |
|
| | | | | ($14,074) |
Forward Commitments All Funds may purchase or sell debt securities on a when issued or forward delivery basis, which means that the obligations will be delivered to the Funds at a future date, which may be a month or more after the date of commitment. The price of the underlying securities and the date when the securities will be delivered and paid for are fixed at the time the transaction is negotiated.
The Fund may receive compensation for interest forgone in the purchase of forward delivery securities. With respect to purchase commitments, each Fund identifies securities as segregated in its records with a value at least equal to the amount of the commitment. Losses may arise due to changes in the value of the underlying securities or if the counterparty does not perform under the contract, or if the issuer does not issue the securities due to political, economic, or other factors. The value of the securities underlying a forward commitment to purchase securities, and the subsequent fluctuations in their value, are taken into account when determining the Fund’s net asset value starting on the day the Fund agrees to purchase the securities. The market values of the securities purchased on a forward delivery basis are identified in the Portfolio of Investments.
Federal Income Taxes Each Fund qualifies as a “regulated investment company” by complying with the applicable provisions of the Internal Revenue Code and will not be subject to federal income tax on taxable income that is distributed to shareholders. Therefore, no federal income tax provision is required.
Distribution of Income and Gains The Funds record distributions to shareholders from net investment income and net realized gains, if any, on the ex-dividend date. Distributions paid by the Funds with respect to each class of shares are calculated in the same manner, at the same time and are in the same amount, except for the effect of expenses that may be applied differently to each class. Such distributions, on a tax basis, are determined in conformity with income tax regulations, which may differ from accounting principles generally accepted in the United States of America. Distributions in excess of tax basis earnings and profits, if any, are reported in each Fund’s financial statements as a return of capital.
Capital Accounts The Funds report the undistributed net investment income and accumulated undistributed net realized gain (loss) accounts on a basis approximating amounts available for future tax distributions (or to offset future taxable realized gains when a capital loss carryforward is available). Accordingly, each Fund may periodically make reclassifications among certain capital accounts without affecting its net asset value.
3. INVESTMENT ADVISORY AND OTHER AGREEMENTS
Advisory Fees The Trust has entered into an Investment Advisory Agreement with the Adviser. The Adviser is responsible for managing the corporate and business affairs of the Trust and for selecting and compensating subadvisers to handle the investment and reinvestment of the assets of each Fund, subject to the supervision of the Board of Trustees. Under the Advisory Agreement each Fund pays a monthly management fee to the Adviser equivalent, on an annual basis, to the sum of the listed below rates, expressed as percentages of the Aggregate Net Assets of each Fund. Aggregate Net Assets include the net assets of the Fund and, in most cases, the net assets of one or more other funds, for the period during which the subadviser to the Fund also serves as the subadviser to the other fund(s).
500 Index: 0.470% - first $500 million; and 0.460% - excess over $500 million.
(Aggregate Net Assets include the net assets of the Fund and 500 Index, a series of John Hancock Trust (“JHT”))
Active Bond: 0.600% - at all asset levels
(Aggregate Net Assets include the net assets of the Fund)
All Cap Growth: 0.900% - first $500 million; and 0.850% - excess over $500 million. Effective January 1, 2006, the Adviser voluntarily reduced the advisory fees as follows: 0.850% - first $500 million, 0.825% - next $500 million; and 0.800% - excess over $1 billion.
(Aggregate Net Assets include the net assets of the Fund)
327
John Hancock Funds II
Notes to Financial Statements (Unaudited)
|
INVESTMENT ADVISORY AND OTHER AGREEMENTS, CONTINUED
All Cap Value: 0.850% - first $250 million; 0.800% - next $250 million; and 0.750% - excess over $500 million.
(Aggregate Net Assets include the net assets of the Fund and All Cap Value, a series of JHT)
Blue Chip Growth: 0.825% - first $1 billion; and 0.800% - excess over $1 billion.
(Aggregate Net Assets include the net assets of the Fund and Blue Chip Growth, a series of JHT)
Capital Appreciation: 0.850% - first $300 million; and 0.800% - excess over $300 million.
(Aggregate Net Assets include the net assets of the Fund and Capital Appreciation, a series of JHT)
Core Bond: 0.690% - first $200 million; 0.640% - next $200 million; and 0.600% - excess over $400 million.
(Aggregate Net Assets include the net assets of the Fund and Core Bond, a series of JHT)
Core Equity: 0.850% - first $350 million; and 0.750% - excess over $350 million.
(Aggregate Net Assets include the net assets of the Fund and Core Equity, a series of JHT)
Emerging Growth: 0.800% - at all asset levels.
(Aggregate Net Assets include the net assets of the Fund and Emerging Growth, a series of JHT)
Emerging Small Company: 1.000% - first $500 million; 0.970% - next $500 million; and 0.950% - excess over $1 billion.
(Aggregate Net Assets include the net assets of the Fund and Emerging Small Company, a series of JHT)
Equity-Income: 0.825% - first $1 billion; and 0.800% - excess over $1 billion.
(Aggregate Net Assets include the net assets of the Fund and Equity-Income, a series of JHT)
Fundamental Value: 0.850% - first $50 million; 0.800% - next $450 million; and 0.750% - excess over $500 million.
(Aggregate Net Assets include the net assets of the Fund and Fundamental Value, a series of JHT)
Global Bond: 0.700% - at all asset levels.
(Aggregate Net Assets include the net assets of the Fund)
High Yield: 0.725% - first $500 million; and 0.650% - excess over $500 million.
(Aggregate Net Assets include the net assets of the Fund and High Yield, a series of JHT)
International Equity Index: 0.550% - first $100 million; and 0.530% - excess over $100 million.
(Aggregate Net Assets include the net assets of the Fund and International Equity Index A, a series of JHT)
International Opportunities: 1.000% - first $250 million; 0.950% - next $250 million; and 0.900% -excess over $500 million.
Effective January 1, 2006, the Adviser voluntarily reduced the advisory fees as follows:
0.900% - first $750 million, 0.850% - next $750 million; and 0.800% - excess over $1.5 billion.
(Aggregate Net Assets include the net assets of the Fund and International Opportunities, a series of JHT)
International Small Cap: 1.050% - first $200 million; 0.950% - next $300 million; and 0.850% - excess over $500 million.
(Aggregate Net Assets include the net assets of the Fund and International Small Cap, a series of JHT)
International Stock: 0.920% - first $100 million; 0.895% - next $900 million; and 0.880% - excess over $1 billion.
(Aggregate Net Assets include the net assets of the Fund and International Stock, a series of JHT)
International Value: 0.950% - first $200 million; 0.850% - next $300 million; and 0.800% - excess over $500 million.
(Aggregate Net Assets include the net assets of the Fund, International Value, a series of JHT and Global, a series of JHT)
Investment Quality Bond: 0.600% - first $500 million; and 0.550% - excess over $500 million.
(Aggregate Net Assets include the net assets of the Fund and Investment Quality Bond, a series of JHT)
Large Cap: 0.850% - first $250 million; 0.800% - next $250 million; and 0.750% - excess over $500 million.
(Aggregate Net Assets include the net assets of the Fund and Large Cap, a series of JHT)
Large Cap Value: 0.850% - first $300 million; 0.825% - next $200 million; and 0.800% - excess over $500 million.
(Aggregate Net Assets include the net assets of the Fund and Large Cap Value, a series of JHT)
Mid Cap Core: 0.950% - first $10 million; 0.900% - next $40 million; 0.875% - next $150 million; 0.850% - next $300 million; and 0.825% - excess over $500 million.
(Aggregate Net Assets include the net assets of the Fund)
Mid Cap Index: 0.490% - first $250 million; 0.480% - next $250 million; and 0.460% - excess over $500 million.
(Aggregate Net Assets include the net assets of the Fund and Mid Cap Index, a series of JHT)
Mid Cap Stock: 0.875% - first $200 million; 0.850% - next $300 million; and 0.825% - excess over $500 million.
(Aggregate Net Assets include the net assets of the Fund and Mid Cap Stock, a series of JHT)
Mid Cap Value: 0.900% - first $200 million; 0.850% - next $300 million; and 0.825% - excess over $500 million.
(Aggregate Net Assets include the net assets of the Fund and Mid Cap Value, a series of JHT)
328
|
John Hancock Funds II
Notes to Financial Statements (Unaudited)
|
INVESTMENT ADVISORY AND OTHER AGREEMENTS, CONTINUED
Natural Resources: 1.050% - first $50 million; and 1.000% - excess over $50 million.
(Aggregate Net Assets include the net assets of the Fund and Natural Resources, a series of JHT)
Quantitative Mid Cap: 0.750% - first $200 million; and 0.650% - excess over $200 million.
(Aggregate Net Assets include the net assets of the Fund and Quantitative Mid Cap, a series of JHT)
Quantitative Value: 0.700% - first $500 million; 0.650% - next $500 million; and 0.600% - excess over $1 billion.
(Aggregate Net Assets include the net assets of the Fund and Quantitative Value, a series of JHT)
Real Estate Securities: 0.700% - at all asset levels.
(Aggregate Net Assets include the net assets of the Fund and Real Estate Securities, a series of JHT)
Real Return Bond: 0.700% - at all asset levels.
(Aggregate Net Assets include the net assets of the Fund)
Small Cap: 0.850% - at all asset levels.
(Aggregate Net Assets include the net assets of the Fund and Small Cap, a series of JHT)
Small Cap Index: 0.490% - first $250 million; 0.480% - next $250 million; and 0.460% - excess over $500 million.
(Aggregate Net Assets include the net assets of the Fund and Small Cap Index, a series of JHT)
Small Cap Opportunities: 1.000% - first $500 million; and 0.950% - excess over $500 million.
(Aggregate Net Assets include the net assets of the Fund and Small Cap Opportunities, a series of JHT)
Small Company: 1.050% - first $125 million; and 1.000% - excess over $125 million.
(Aggregate Net Assets include the net assets of the Fund and Small Company, a series of JHT)
Small Company Growth: 1.050% - first $250 million; and 1.000% - excess over $250 million.
(Aggregate Net Assets include the net assets of the Fund. However, the applicable rate is 1.000% of all net assets of the Fund when the aggregate net assets of the following exceed $1 billion: the
Fund, All Cap Growth Fund and Mid Cap Core Fund of John Hancock Funds II, and Small Company Growth, All Cap Growth and Mid Cap Core of JHT.)
Small Company Value: 1.050% - first $500 million; and 1.000% - excess over $500 million.
(Aggregate Net Assets include the net assets of the Fund and Small Company Value, a series of JHT)
Special Value: 1.000% - first $500 million; and 0.950% - excess over $500 million.
(Aggregate Net Assets include the net assets of the Fund and Special Value, a series of JHT)
Spectrum Income: 0.800% - first $250 million; and 0.725% - excess over $250 million.
(Aggregate Net Assets include the net assets of the Fund and Spectrum Income, a series of JHT)
Strategic Bond: 0.725% - first $500 million; and 0.650% - excess over $500 million.
(Aggregate Net Assets include the net assets of the Fund and Strategic Bond, a series of JHT)
Strategic Value: 0.850% - first $300 million; 0.825% - next $300 million; 0.800% - next $300 million; 0.775% - next $600 million; and 0.700% - excess over $1.5 billion.
(Aggregate Net Assets include the net assets of the Fund and Strategic Value, a series of JHT)
Total Return: 0.700% - at all asset levels.
(Aggregate Net Assets include the net assets of the Fund)
U.S. Global Leaders Growth: 0.7125% - first $500 million; and 0.675% - excess over $500 million.
(Aggregate Net Assets include the net assets of the Fund and U.S. Global Leaders Growth, a series of JHT)
U.S. Government Securities: 0.650% - first $500 million; and 0.550% - excess over $500 million.
(Aggregate Net Assets include the net assets of the Fund and U.S. Government Securities, a series of JHT)
U.S. High Yield Bond: 0.750% - first $200 million; and 0.720% - excess over $200 million.
(Aggregate Net Assets include the net assets of the Fund and U.S. High Yield Bond, a series of JHT)
U.S. Multi Sector: 0.780% - first $500 million; 0.760% - next $500 million; 0.750% - next $1.5 billion; and 0.740% - excess over $2.5 billion.
(Aggregate Net Assets include the net assets of the Fund and U.S. Multi Sector, a series of JHT)
Value & Restructuring: 0.850% - first $500 million; and 0.800% - excess over $500 million.
(Aggregate Net Assets include the net assets of the Fund and Value & Restructuring, a series of JHT)
Vista: 0.900% - first $250 million; 0.850% - next $250 million; 0.825% - next $500 million; and 0.800% - excess over $1 billion.
(Aggregate Net Assets include the net assets of the Fund and Vista, a series of JHT)
|
329
John Hancock Funds II
Notes to Financial Statements (Unaudited)
|
INVESTMENT ADVISORY AND OTHER AGREEMENTS, CONTINUED
Expense Reimbursement The Adviser agreed to voluntarily reduce its advisory fee or reimburse each Fund if the total of all expenses (excluding taxes, portfolio brokerage commissions, interest, litigation and indemnification expenses, extraordinary expenses not incurred in the ordinary course of the Funds’ business, advisory fees, Rule 12b-1 fees, and fees under any agreements or plans of the Funds dealing with services for shareholders and others with beneficial interests in shares of the Funds) exceed the following:
- 0.05% of average daily net assets of 500 Index and International Equity Index;
- 0.75% of average daily net assets of Global Bond, International Opportunities, International Small Cap, International Stock, International Value, Mid Cap Index and Small Cap Index;
- 0.06% of average daily net assets of Emerging Small Company; and
- 0.50% of average daily net assets in the case of all other Funds.
|
In addition, the Adviser voluntarily agreed to waive a portion of its advisory fee for Blue Chip Growth, Emerging Small Company, Equity-Income, International Value, Mid Cap Index, Small Cap Index, Small Company Value and Spectrum Income in the amount of $57,625, $9,971, $46,376, $56,339, $2,885, $2,851, $34,174 and $25,222, respectively.
The Adviser reserves the right to terminate this limitation at any time.
Administration Fees The Funds have an agreement with the Adviser that requires the Funds to reimburse the Adviser for all expenses associated with providing the administrative, financial, accounting and recordkeeping services of the Funds, including the preparation of all tax returns, annual, semi-annual and periodic reports to shareholders and the preparation of all regulatory reports.
Distribution Plan The Trust has a Distribution Agreement with John Hancock Funds, LLC (“JH Funds”), a wholly owned subsidiary of the Adviser. The Funds have adopted a Distribution Plan with respect to Class 1, pursuant to Rule 12b-1 under the Investment Company Act of 1940, to reimburse JH Funds for the services it provides as distributor of shares of the Funds. Accordingly, the Funds make monthly payments to JH Funds at an annual rate not to exceed 0.05% of average daily net asset value of Class 1. A maximum of 0.25% of such payments may be service fees, as defined by the Conduct Rules of the National Association of Securities Dealers. Under the Conduct Rules, curtailment of a portion of the Fund’s 12b-1 payments could occur under certain circumstances.
Trustees’ Fees The Trust compensates each Trustee who is not an employee of the Adviser or its affiliates. Total Trustees’ expenses are allocated to each Fund based on its average daily net asset value.
4. GUARANTEES AND INDEMNIFICATIONS Under the Trust’s organizational documents, its Officers and Trustees are indemnified against certain liability arising out of the performance of their duties to the Trust. Additionally, in the normal course of business, the Trust enters into contracts with service providers that contain general indemnification clauses. The Trust’s maximum exposure under these arrangements is unknown, as this would involve future claims that may be made against the Trust that have not yet occurred. However, based on experience, the Trust believes the risk of loss to be remote.
5. TRANSACTIONS WITH AFFILIATES In accordance with the provisions of Rule 17a-7 under the Investment Company Act of 1940, the following Funds purchased securities from other investment companies managed by the Adviser:
| Fund | Securities | Fund | Securities |
|
| Active Bond | $30,301,592 | Large Cap Value | $51,521,227 |
| All Cap Growth | 98,798,769 | Mid Cap Core | 38,570,448 |
| All Cap Value | 86,922,640 | Mid Cap Stock | 124,413,857 |
| Blue Chip Growth | 316,533,066 | Mid Cap Value | 110,022,338 |
| Capital Appreciation | 73,055,233 | Natural Resources | 175,862,266 |
| Core Bond | 54,735,339 | Quantitative Mid Cap | 119,725,249 |
| Core Equity | 137,955,468 | Quantitative Value | 218,234,113 |
| Emerging Growth | 220,368,575 | Real Estate Securities | 231,747,990 |
| Emerging Small Company | 80,407,901 | Real Return Bond | 30,716,184 |
| Equity-Income | 314,487,283 | Small Cap | 52,695,271 |
| Fundamental Value | 181,255,872 | Small Cap Opportunities | 72,118,864 |
| Global Bond | 144,533,513 | Small Company | 17,136,629 |
| High Yield | 243,144,865 | Small Company Value | 164,993,124 |
| International Opportunities | 84,657,804 | Special Value | 11,223,102 |
| International Small Cap | 93,201,858 | Strategic Bond | 106,952,521 |
| International Stock | 160,507,420 | Strategic Value | 35,432,428 |
| International Value | 279,045,705 | Total Return | 214,557,112 |
| Investment Quality Bond | 59,092,020 | U.S. Global Leaders Growth | 100,184,303 |
| Large Cap | 30,397,391 | U.S. Government Securities | 33,508,063 |
| | | U.S. High Yield Bond | 41,274,193 |
The trades were executed at the last sale price at the end of the day on October 14, 2005. All transactions were executed in accordance with Rule 17a-7 policies and procedures approved by the Board of Trustees on September 23, 2005.
Effective October 28, 2005, approximately $12 billion of assets held in separate accounts of John Hancock Life Insurance Company (USA) and invested in certain unaffiliated mutual funds were transferred into the Funds of John Hancock Funds II. All costs associated with the transfer of these assets were borne by the Adviser. In addition, the Adviser or the sub-adviser to the following Funds made payments to the Funds during the period: All Cap Value in the amount of $457,281 effective December 20, 2005; International Opportunities in the amount of $3,948,536 effective December 30, 2005; and Mid Cap Stock in the amount of $1,357,491 effective January 27, 2006. These payments were made to reimburse the Funds for any lost investment opportunity that may have resulted from the timing of the investment of these assets that was effective October 28, 2005.
330
John Hancock Funds II
Notes to Financial Statements (Unaudited)
|
6. LINE OF CREDIT The Funds have entered into an agreement which enables them to participate, with other funds managed by the Adviser, in a $100 million unsecured committed line of credit with State Street Corporation. Borrowings will be made primarily to temporarily finance the repurchase of capital shares. They may also be used to temporarily finance purchase or sale of securities. Interest is charged to each participating Fund based on its borrowings at a rate per annum equal to the Federal Funds rate plus 0.50% per annum. In addition, a commitment fee of 0.07% per annum, payable at the end of each calendar quarter, based on the average daily-unused portion of the line of credit, is charged to each participating Fund on a prorated basis based on average net assets. For the period ended February 28, 2006 there were no borrowings under the line of credit.
7. CAPITAL SHARES Share activities for the Funds for period ended February 28, 2006 were as follows:
| 500 Index | Period ended 2-28-06c |
| | Shares | Amount |
|
| Class NAV shares | | |
| Sold | 25,551,074 | $265,270,480 |
| Distributions reinvested | 77,276 | 847,720 |
|
| Net increase (decrease) | 25,628,350 | $266,118,200 |
| c Period from 10-29-05 (commencement of operations) to 2-28-06. | | |
| |
| Active Bond | Period ended 2-28-06d |
| | Shares | Amount |
|
| Class 1 shares | | |
| Sold | 3,970,452 | $38,159,068 |
| Distributions reinvested | 23,216 | 223,338 |
| Repurchased | (288,072) | (2,774,277) |
| Net increase (decrease) | 3,705,596 | $35,608,129 |
|
| Class NAV shares | | |
| Sold | 37,081,989 | $355,777,385 |
| Distributions reinvested | 229,241 | 2,203,004 |
| Repurchased | (95,451) | (919,277) |
| Net increase (decrease) | 37,215,779 | $357,061,112 |
|
| Net increase (decrease) | 40,921,375 | $392,669,241 |
| d Class 1 and Class NAV shares began operations on 10-15-05 and 10-27-05, respectively. | | |
| |
| All Cap Growth | Period ended 2-28-06a |
| | Shares | Amount |
|
| Class 1 shares | | |
| Sold | 2,192,414 | $34,056,844 |
| Distributions reinvested | 923 | 15,666 |
| Repurchased | (133,996) | (2,251,755) |
| Net increase (decrease) | 2,059,341 | $31,820,755 |
|
| Class NAV shares | | |
| Sold | 6,269,370 | $98,232,881 |
| Distributions reinvested | 2,919 | 49,558 |
| Net increase (decrease) | 6,272,289 | $98,282,439 |
|
| Net increase (decrease) | 8,331,630 | $130,103,194 |
| a Period from 10-15-05 (commencement of operations) to 2-28-06. | | |
| |
| All Cap Value | Period ended 2-28-06a |
| | Shares | Amount |
|
| Class 1 shares | | |
| Sold | 1,311,006 | $18,246,267 |
| Distributions reinvested | 1,978 | 29,388 |
| Repurchased | (136,320) | (2,038,128) |
| Net increase (decrease) | 1,176,664 | $16,237,527 |
|
| Class NAV shares | | |
| Sold | 11,187,012 | $155,722,519 |
| Distributions reinvested | 18,130 | 268,692 |
| Net increase (decrease) | 11,205,142 | $155,991,211 |
|
| Net increase (decrease) | 12,381,806 | $172,228,738 |
| a Period from 10-15-05 (commencement of operations) to 2-28-06. | | |
331
John Hancock Funds II
Notes to Financial Statements (Unaudited)
|
CAPITAL SHARES, CONTINUED
| Blue Chip Growth | Period ended 2-28-06a |
| | Shares | Amount |
|
| Class 1 shares | | |
| Sold | 7,414,455 | $122,806,494 |
| Distributions reinvested | 5,306 | 96,099 |
| Repurchased | (378,750) | (6,669,464) |
| Net increase (decrease) | 7,041,011 | $116,233,129 |
|
| Class NAV shares | | |
| Sold | 57,027,957 | $957,502,698 |
| Distributions reinvested | 44,161 | 798,874 |
| Repurchased | (168,634) | (2,965,390) |
| Net increase (decrease) | 56,903,484 | $955,336,182 |
|
| Net increase (decrease) | 63,944,495 | $1,071,569,311 |
| a Period from 10-15-05 (commencement of operations) to 2-28-06. | | |
| |
| Capital Appreciation | Period ended 2-28-06a |
| | Shares | Amount |
|
| Class 1 shares | | |
| Sold | 1,889,634 | $17,826,844 |
| Repurchased | (109,957) | (1,092,625) |
| Net increase (decrease) | 1,779,677 | $16,734,219 |
|
| Class NAV shares | | |
| Sold | 28,009,122 | $263,611,365 |
| Repurchased | (238,202) | (2,352,332) |
| Net increase (decrease) | 27,770,920 | $261,259,033 |
|
| Net increase (decrease) | 29,550,597 | $277,993,252 |
| a Period from 10-15-05 (commencement of operations) to 2-28-06. | | |
| |
| Core Bond | Period ended 2-28-06a |
| | Shares | Amount |
|
| Class 1 shares | | |
| Sold | 31,671 | $397,007 |
| Distributions reinvested | 73 | 911 |
| Repurchased | (1,070) | (13,407) |
| Net increase (decrease) | 30,674 | $384,511 |
|
| Class NAV shares | | |
| Sold | 13,942,345 | $174,171,997 |
| Distributions reinvested | 91,474 | 1,142,506 |
| Repurchased | (2,064) | (25,865) |
| Net increase (decrease) | 14,031,755 | $175,288,638 |
|
| Net increase (decrease) | 14,062,429 | $175,673,149 |
| a Period from 10-15-05 (commencement of operations) to 2-28-06. | | |
| |
| Core Equity | Period ended 2-28-06a |
| | Shares | Amount |
|
| Class 1 shares | | |
| Sold | 592,824 | $8,280,474 |
| Repurchased | (29,123) | (432,690) |
| Net increase (decrease) | 563,701 | $7,847,784 |
|
| Class NAV shares | | |
| Sold | 33,622,792 | $468,998,544 |
| Repurchased | (609,027) | (9,172,421) |
| Net increase (decrease) | 33,013,765 | $459,826,123 |
|
| Net increase (decrease) | 33,577,466 | $467,673,907 |
| a Period from 10-15-05 (commencement of operations) to 2-28-06. | | |
| |
| Emerging Growth | Period ended 2-28-06a |
| | Shares | Amount |
|
| Class 1 shares | | |
| Sold | 13,751,629 | $225,491,011 |
| Repurchased | (7,543,616) | (123,852,338) |
| Net increase (decrease) | 6,208,013 | $101,638,673 |
|
| Class NAV shares | | |
| Sold | 2,347,198 | $38,509,694 |
| Repurchased | (39,470) | (692,706) |
| Net increase (decrease) | 2,307,728 | $37,816,988 |
|
| Net increase (decrease) | 8,515,741 | $139,455,661 |
a Period from 10-15-05 (commencement of operations) to 2-28-06.
332
John Hancock Funds II
Notes to Financial Statements (Unaudited)
|
CAPITAL SHARES, CONTINUED
| Emerging Small Company | Period ended 2-28-06a |
| | Shares | Amount |
|
| Class 1 shares | | |
| Sold | 1,877,330 | $53,048,601 |
| Repurchased | (137,010) | (4,191,066) |
| Net increase (decrease) | 1,740,320 | $48,857,535 |
|
| Class NAV shares | | |
| Sold | 1,100,027 | $30,997,159 |
| Repurchased | (1,100,027) | (30,756,765) |
| Net increase (decrease) | — | $240,394 |
|
| Net increase (decrease) | 1,740,320 | $49,097,929 |
| a Period from 10-15-05 (commencement of operations) to 2-28-06. | | |
| |
| Equity-Income | Period ended 2-28-06a |
| | Shares | Amount |
|
| Class 1 shares | | |
| Sold | 9,977,103 | $160,199,580 |
| Distributions reinvested | 35,892 | 612,671 |
| Repurchased | (385,984) | (6,535,370) |
| Net increase (decrease) | 9,627,011 | $154,276,881 |
|
| Class NAV shares | | |
| Sold | 39,227,744 | $634,810,505 |
| Distributions reinvested | 139,155 | 2,371,194 |
| Repurchased | (20,773) | (345,897) |
| Net increase (decrease) | 39,346,126 | $636,835,802 |
|
| Net increase (decrease) | 48,973,137 | $791,112,683 |
| a Period from 10-15-05 (commencement of operations) to 2-28-06. | | |
| |
| Fundamental Value | Period ended 2-28-06a |
| | Shares | Amount |
|
| Class 1 shares | | |
| Sold | 3,749,428 | $54,162,473 |
| Distributions reinvested | 7,132 | 109,544 |
| Repurchased | (106,302) | (1,609,378) |
| Net increase (decrease) | 3,650,258 | $52,662,639 |
|
| Class NAV shares | | |
| Sold | 39,187,550 | $571,792,504 |
| Distributions reinvested | 80,076 | 1,226,769 |
| Repurchased | (8,096) | (119,942) |
| Net increase (decrease) | 39,259,530 | $572,899,331 |
|
| Net increase (decrease) | 42,909,788 | $625,561,970 |
| a Period from 10-15-05 (commencement of operations) to 2-28-06. | | |
| |
| Global Bond | Period ended 2-28-06a |
| | Shares | Amount |
|
| Class 1 shares | | |
| Sold | 2,917,693 | $42,461,405 |
| Distributions reinvested | 15,790 | 227,540 |
| Repurchased | (319,388) | (4,594,895) |
| Net increase (decrease) | 2,614,095 | $38,094,050 |
|
| Class NAV shares | | |
| Sold | 34,705,083 | $500,913,673 |
| Distributions reinvested | 194,896 | 2,800,652 |
| Repurchased | (72,519) | (1,035,698) |
| Net increase (decrease) | 34,827,460 | $502,678,627 |
|
| Net increase (decrease) | 37,441,555 | $540,772,677 |
| a Period from 10-15-05 (commencement of operations) to 2-28-06. | | |
333
John Hancock Funds II
Notes to Financial Statements (Unaudited)
|
CAPITAL SHARES, CONTINUED
| High Yield | Period ended 2-28-06a |
| | Shares | Amount |
|
| Class 1 shares | | |
| Sold | 4,027,104 | $40,706,893 |
| Distributions reinvested | 46,771 | 473,790 |
| Repurchased | (324,109) | (3,311,113) |
| Net increase (decrease) | 3,749,766 | $37,869,570 |
|
| Class NAV shares | | |
| Sold | 137,053,082 | $1,383,334,948 |
| Distributions reinvested | 1,649,072 | 16,639,138 |
| Repurchased | (271,467) | (2,752,259) |
| Net increase (decrease) | 138,430,687 | $1,397,221,827 |
|
| Net increase (decrease) | 142,180,453 | $1,435,091,397 |
| a Period from 10-15-05 (commencement of operations) to 2-28-06. | | |
| |
| International Equity Index | Period ended 2-28-06c |
| | Shares | Amount |
|
| Class NAV shares | | |
| Sold | 10,576,953 | $165,389,497 |
| Distributions reinvested | 125,191 | 2,080,681 |
| Repurchased | (75,984) | (1,298,240) |
|
| Net increase (decrease) | 10,626,160 | $166,171,938 |
| c Period from 10-29-05 (commencement of operations) to 2-28-06. | | |
| |
| International Opportunities | Period ended 2-28-06a |
| | Shares | Amount |
|
| Class 1 shares | | |
| Sold | 180,963 | $2,678,695 |
| Distributions reinvested | 2,942 | 42,136 |
| Repurchased | (9,585) | (140,939) |
| Net increase (decrease) | 174,320 | $2,579,892 |
|
| Class NAV shares | | |
| Sold | 26,997,359 | $368,225,318 |
| Distributions reinvested | 1,294,924 | 18,582,164 |
| Repurchased | (755,487) | (11,122,764) |
| Net increase (decrease) | 27,536,796 | $375,684,718 |
|
| Net increase (decrease) | 27,711,116 | $378,264,610 |
| a Period from 10-15-05 (commencement of operations) to 2-28-06. | | |
| |
| International Small Cap | Period ended 2-28-06a |
| | Shares | Amount |
|
| Class 1 shares | | |
| Sold | 1,859,493 | $34,462,298 |
| Distributions reinvested | 3,177 | 59,757 |
| Repurchased | (221,952) | (4,201,511) |
| Net increase (decrease) | 1,640,718 | $30,320,544 |
|
| Class NAV shares | | |
| Sold | 25,567,040 | $465,549,831 |
| Distributions reinvested | 54,397 | 1,022,670 |
| Repurchased | (22,354) | (420,031) |
| Net increase (decrease) | 25,599,083 | $466,152,470 |
|
| Net increase (decrease) | 27,239,801 | $496,473,014 |
| a Period from 10-15-05 (commencement of operations) to 2-28-06. | | |
334
John Hancock Funds II
Notes to Financial Statements (Unaudited)
|
| CAPITAL SHARES, CONTINUED | | |
| |
| International Stock | Period ended 2-28-06a |
| | Shares | Amount |
|
| Class 1 shares | | |
| Sold | 2,469,327 | $29,772,930 |
| Distributions reinvested | 49,782 | 625,258 |
| Repurchased | (150,001) | (1,864,976) |
| Net increase (decrease) | 2,369,108 | $28,533,212 |
|
| Class NAV shares | | |
| Sold | 69,853,987 | $827,718,211 |
| Distributions reinvested | 1,555,823 | 19,525,582 |
| Repurchased | (1,328,315) | (16,655,645) |
| Net increase (decrease) | 70,081,495 | $830,588,148 |
|
| Net increase (decrease) | 72,450,603 | $859,121,360 |
| a Period from 10-15-05 (commencement of operations) to 2-28-06. | | |
| |
| International Value | Period ended 2-28-06a |
| | Shares | Amount |
|
| Class 1 shares | | |
| Sold | 7,140,855 | $108,735,984 |
| Distributions reinvested | 22,472 | 353,039 |
| Repurchased | (279,476) | (4,355,438) |
| Net increase (decrease) | 6,883,851 | $104,733,585 |
|
| Class NAV shares | | |
| Sold | 54,049,335 | $808,713,637 |
| Distributions reinvested | 183,500 | 2,875,449 |
| Repurchased | (162,141) | (2,590,323) |
| Net increase (decrease) | 54,070,694 | $808,998,763 |
|
| Net increase (decrease) | 60,954,545 | $913,732,348 |
| a Period from 10-15-05 (commencement of operations) to 2-28-06. | | |
| |
| Investment Quality Bond | Period ended 2-28-06a |
| | Shares | Amount |
|
| Class 1 shares | | |
| Sold | 2,970,755 | $35,178,481 |
| Distributions reinvested | 23,086 | 272,643 |
| Repurchased | (202,582) | (2,399,494) |
| Net increase (decrease) | 2,791,259 | $33,051,630 |
|
| Class NAV shares | | |
| Sold | 7,105,998 | $83,955,627 |
| Distributions reinvested | 58,406 | 689,195 |
| Repurchased | (35,589) | (421,728) |
| Net increase (decrease) | 7,128,815 | $84,223,094 |
|
| Net increase (decrease) | 9,920,074 | $117,274,724 |
| a Period from 10-15-05 (commencement of operations) to 2-28-06. | | |
| |
| Large Cap | Period ended 2-28-06a |
| | Shares | Amount |
|
| Class 1 shares | | |
| Sold | 214,285 | $3,030,651 |
| Distributions reinvested | 100 | 1,427 |
| Repurchased | (109,133) | (1,549,401) |
| Net increase (decrease) | 105,252 | $1,482,677 |
|
| Class NAV shares | | |
| Sold | 11,646,054 | $157,218,581 |
| Distributions reinvested | 14,836 | 212,012 |
| Net increase (decrease) | 11,660,890 | $157,430,593 |
|
| Net increase (decrease) | 11,766,142 | $158,913,270 |
a Period from 10-15-05 (commencement of operations) to 2-28-06.
335
John Hancock Funds II
Notes to Financial Statements (Unaudited)
|
| CAPITAL SHARES, CONTINUED | | |
| |
| Large Cap Value | Period ended 2-28-06a |
| | Shares | Amount |
|
| Class 1 shares | | |
| Sold | 638,932 | $13,176,257 |
| Distributions reinvested | 1,106 | 24,236 |
| Repurchased | (58,509) | (1,266,182) |
| Net increase (decrease) | 581,529 | $11,934,311 |
|
| Class NAV shares | | |
| Sold | 6,525,001 | $133,720,033 |
| Distributions reinvested | 13,349 | 293,006 |
| Net increase (decrease) | 6,538,350 | $134,013,039 |
|
| Net increase (decrease) | 7,119,879 | $145,947,350 |
| a Period from 10-15-05 (commencement of operations) to 2-28-06. | | |
| |
| Mid Cap Core | Period ended 2-28-06a |
| | Shares | Amount |
|
| Class 1 shares | | |
| Sold | 506,151 | $8,110,447 |
| Distributions reinvested | 480 | 8,276 |
| Repurchased | (23,190) | (393,620) |
| Net increase (decrease) | 483,441 | $7,725,103 |
|
| Class NAV shares | | |
| Sold | 19,757,361 | $317,229,951 |
| Distributions reinvested | 21,720 | 374,238 |
| Net increase (decrease) | 19,779,081 | $317,604,189 |
|
| Net increase (decrease) | 20,262,522 | $325,329,292 |
| a Period from 10-15-05 (commencement of operations) to 2-28-06. | | |
| |
| Mid Cap Index | Period ended 2-28-06c |
| | Shares | Amount |
|
| Class NAV shares | | |
| Sold | 3,368,106 | $56,928,168 |
| Distributions reinvested | 5,412 | 98,937 |
|
| Net increase (decrease) | 3,373,518 | $57,027,105 |
| c Period from 10-29-05 (commencement of operations) to 2-28-06. | | |
| |
| Mid Cap Stock | Period ended 2-28-06a |
| | Shares | Amount |
|
| Class 1 shares | | |
| Sold | 6,591,155 | $92,347,833 |
| Distributions reinvested | 7,197 | 110,835 |
| Repurchased | (161,963) | (2,449,457) |
| Net increase (decrease) | 6,436,389 | $90,009,211 |
|
| Class NAV shares | | |
| Sold | 10,468,630 | $146,872,717 |
| Distributions reinvested | 12,654 | 195,005 |
| Repurchased | (12,861) | (193,438) |
| Net increase (decrease) | 10,468,423 | $146,874,284 |
|
| Net increase (decrease) | 16,904,812 | $236,883,495 |
| a Period from 10-15-05 (commencement of operations) to 2-28-06. | | |
| |
| Mid Cap Value | Period ended 2-28-06a |
| | Shares | Amount |
|
| Class 1 shares | | |
| Sold | 4,672,309 | $82,834,932 |
| Distributions reinvested | 8,173 | 156,020 |
| Repurchased | (134,537) | (2,515,334) |
| Net increase (decrease) | 4,545,945 | $80,475,618 |
|
| Class NAV shares | | |
| Sold | 6,795,131 | $121,089,866 |
| Distributions reinvested | 12,119 | 230,981 |
| Net increase (decrease) | 6,807,250 | $121,320,847 |
|
| Net increase (decrease) | 11,353,195 | $201,796,465 |
a Period from 10-15-05 (commencement of operations) to 2-28-06.
336
John Hancock Funds II
Notes to Financial Statements (Unaudited)
|
| CAPITAL SHARES, CONTINUED | | |
| |
| Natural Resources | Period ended 2-28-06a |
| | Shares | Amount |
|
| Class 1 shares | | |
| Sold | 1,929,288 | $57,166,298 |
| Distributions reinvested | 1,596 | 51,094 |
| Repurchased | (180,237) | (5,618,896) |
| Net increase (decrease) | 1,750,647 | $51,598,496 |
|
| Class NAV shares | | |
| Sold | 23,578,533 | $674,582,319 |
| Distributions reinvested | 21,664 | 691,085 |
| Repurchased | (5,042,157) | (151,337,884) |
| Net increase (decrease) | 18,558,040 | $523,935,520 |
|
| Net increase (decrease) | 20,308,687 | $575,534,016 |
| a Period from 10-15-05 (commencement of operations) to 2-28-06. | | |
| |
| Quantitative Mid Cap | Period ended 2-28-06d |
| | Shares | Amount |
|
| Class 1 shares | | |
| Sold | 9,656,852 | $131,826,789 |
| Distributions reinvested | 4,513 | 67,202 |
| Repurchased | (344,770) | (5,036,014) |
| Net increase (decrease) | 9,316,595 | $126,857,977 |
|
| Class NAV shares | | |
| Sold | 2,861,457 | $39,558,858 |
| Distributions reinvested | 1,504 | 22,396 |
| Net increase (decrease) | 2,862,961 | $39,581,254 |
|
| Net increase (decrease) | 12,179,556 | $166,439,231 |
| d Class 1 and Class NAV shares began operations on 10-15-05 and 10-27-05, respectively. | | |
| |
| Quantitative Value | Period ended 2-28-06a |
| | Shares | Amount |
|
| Class 1 shares | | |
| Sold | 11,590,966 | $163,560,152 |
| Distributions reinvested | 20,598 | 316,796 |
| Repurchased | (6,188,664) | (88,334,912) |
| Net increase (decrease) | 5,422,900 | $75,542,036 |
|
| Class NAV shares | | |
| Sold | 16,426,174 | $234,366,703 |
| Distributions reinvested | 59,655 | 917,492 |
| Repurchased | (10,149) | (152,737) |
| Net increase (decrease) | 16,475,680 | $235,131,458 |
|
| Net increase (decrease) | 21,898,580 | $310,673,494 |
| a Period from 10-15-05 (commencement of operations) to 2-28-06. | | |
| |
| Real Estate Securities | Period ended 2-28-06a |
| | Shares | Amount |
|
| Class 1 shares | | |
| Sold | 5,705,744 | $131,901,365 |
| Distributions reinvested | 39,680 | 993,592 |
| Repurchased | (396,146) | (9,760,392) |
| Net increase (decrease) | 5,349,278 | $123,134,565 |
|
| Class NAV shares | | |
| Sold | 21,295,969 | $499,822,797 |
| Distributions reinvested | 153,456 | 3,836,410 |
| Repurchased | (538,692) | (13,693,798) |
| Net increase (decrease) | 20,910,733 | $489,965,409 |
|
| Net increase (decrease) | 26,260,011 | $613,099,974 |
a Period from 10-15-05 (commencement of operations) to 2-28-06.
337
John Hancock Funds II
Notes to Financial Statements (Unaudited)
|
CAPITAL SHARES, CONTINUED
| Real Return Bond | Period ended 2-28-06a |
| | Shares | Amount |
|
| Class 1 shares | | |
| Sold | 1,227,291 | $16,581,583 |
| Distributions reinvested | 10,547 | 140,167 |
| Repurchased | (109,694) | (1,476,615) |
| Net increase (decrease) | 1,128,144 | $15,245,135 |
|
| Class NAV shares | | |
| Sold | 45,256,032 | $604,972,631 |
| Distributions reinvested | 402,138 | 5,308,220 |
| Repurchased | (32,911) | (439,493) |
| Net increase (decrease) | 45,625,259 | $609,841,358 |
|
| Net increase (decrease) | 46,753,403 | $625,086,493 |
| a Period from 10-15-05 (commencement of operations) to 2-28-06. | | |
| |
| Small Cap | Period ended 2-28-06a |
| | Shares | Amount |
|
| Class 1 shares | | |
| Sold | 32,179 | $472,306 |
| Repurchased | (5,409) | (78,191) |
| Net increase (decrease) | 26,770 | $394,115 |
|
| Class NAV shares | | |
| Sold | 13,696,604 | $185,137,581 |
| Repurchased | (29,225) | (438,331) |
| Net increase (decrease) | 13,667,379 | $184,699,250 |
|
| Net increase (decrease) | 13,694,149 | $185,093,365 |
| a Period from 10-15-05 (commencement of operations) to 2-28-06. | | |
| |
| Small Cap Index | Period ended 2-28-06c |
| | Shares | Amount |
|
| Class NAV shares | | |
| Sold | 3,976,538 | $55,951,009 |
| Distributions reinvested | 5,687 | 86,672 |
|
| Net increase (decrease) | 3,982,225 | $56,037,681 |
| c Period from 10-29-05 (commencement of operations) to 2-28-06. | | |
| |
| Small Cap Opportunities | Period ended 2-28-06a |
| | Shares | Amount |
|
| Class 1 shares | | |
| Sold | 1,179,618 | $25,458,533 |
| Distributions reinvested | 2,275 | 52,542 |
| Repurchased | (59,898) | (1,360,841) |
| Net increase (decrease) | 1,121,995 | $24,150,234 |
|
| Class NAV shares | | |
| Sold | 9,771,939 | $208,700,510 |
| Distributions reinvested | 21,585 | 496,243 |
| Net increase (decrease) | 9,793,524 | $209,196,753 |
|
| Net increase (decrease) | 10,915,519 | $233,346,987 |
| a Period from 10-15-05 (commencement of operations) to 2-28-06. | | |
| |
| Small Company | Period ended 2-28-06a |
| | Shares | Amount |
|
| Class 1 shares | | |
| Sold | 402,945 | $6,256,229 |
| Repurchased | (19,044) | (314,389) |
| Net increase (decrease) | 383,901 | $5,941,840 |
|
| Class NAV shares | | |
| Sold | 4,651,307 | $70,603,715 |
| Repurchased | (57,873) | (982,707) |
| Net increase (decrease) | 4,593,434 | $69,621,008 |
|
| Net increase (decrease) | 4,977,335 | $75,562,848 |
a Period from 10-15-05 (commencement of operations) to 2-28-06.
338
John Hancock Funds II
Notes to Financial Statements (Unaudited)
|
CAPITAL SHARES, CONTINUED
| Small Company Growth | Period ended 2-28-06b |
| | Shares | Amount |
|
| Class NAV shares | | |
| Sold | 5,640,644 | $56,548,324 |
|
| Net increase (decrease) | 5,640,644 | $56,548,324 |
| b Period from 10-29-05 (commencement of operations) to 2-28-06. | | |
| |
| Small Company Value | Period ended 2-28-06a |
| | Shares | Amount |
|
| Class 1 shares | | |
| Sold | 6,170,136 | $130,498,511 |
| Distributions reinvested | 11,964 | 272,671 |
| Repurchased | (224,992) | (5,130,855) |
| Net increase (decrease) | 5,957,108 | $125,640,327 |
|
| Class NAV shares | | |
| Sold | 8,696,355 | $184,783,636 |
| Distributions reinvested | 17,657 | 401,689 |
| Repurchased | (11,255) | (262,418) |
| Net increase (decrease) | 8,702,757 | $184,922,907 |
|
| Net increase (decrease) | 14,659,865 | $310,563,234 |
| a Period from 10-15-05 (commencement of operations) to 2-28-06. | | |
| |
| Special Value | Period ended 2-28-06a |
| | Shares | Amount |
|
| Class 1 shares | | |
| Sold | 150,708 | $2,865,794 |
| Distributions reinvested | 60 | 1,203 |
| Repurchased | (7,726) | (157,108) |
| Net increase (decrease) | 143,042 | $2,709,889 |
|
| Class NAV shares | | |
| Sold | 5,222,567 | $98,734,853 |
| Distributions reinvested | 3,993 | 80,457 |
| Net increase (decrease) | 5,226,560 | $98,815,310 |
|
| Net increase (decrease) | 5,369,602 | $101,525,199 |
| a Period from 10-15-05 (commencement of operations) to 2-28-06. | | |
| |
| Spectrum Income | Period ended 2-28-06b |
| | Shares | Amount |
|
| Class NAV shares | | |
| Sold | 62,773,651 | $628,631,793 |
| Distributions reinvested | 394,581 | 3,989,211 |
| Repurchased | (41,575) | (418,153) |
|
| Net increase (decrease) | 63,126,657 | $632,202,851 |
| b Period from 10-29-05 (commencement of operations) to 2-28-06. | | |
| |
| Strategic Bond | Period ended 2-28-06a |
| | Shares | Amount |
|
| Class 1 shares | | |
| Sold | 3,418,684 | $40,526,323 |
| Distributions reinvested | 28,020 | 332,313 |
| Repurchased | (177,323) | (2,108,853) |
| Net increase (decrease) | 3,269,381 | $38,749,783 |
|
| Class NAV shares | | |
| Sold | 38,868,749 | $459,918,793 |
| Distributions reinvested | 323,699 | 3,832,601 |
| Repurchased | (41,243) | (489,564) |
| Net increase (decrease) | 39,151,205 | $463,261,830 |
|
| Net increase (decrease) | 42,420,586 | $502,011,613 |
a Period from 10-15-05 (commencement of operations) to 2-28-06.
339
John Hancock Funds II
Notes to Financial Statements (Unaudited)
|
CAPITAL SHARES, CONTINUED
| Strategic Value | Period ended 2-28-06a |
| | Shares | Amount |
|
| Class 1 shares | | |
| Sold | 1,297,525 | $13,420,984 |
| Distributions reinvested | 1,752 | 18,908 |
| Repurchased | (91,531) | (986,034) |
| Net increase (decrease) | 1,207,746 | $12,453,858 |
|
| Class NAV shares | | |
| Sold | 11,210,981 | $115,583,452 |
| Distributions reinvested | 16,987 | 182,610 |
| Net increase (decrease) | 11,227,968 | $115,766,062 |
|
| Net increase (decrease) | 12,435,714 | $128,219,920 |
| a Period from 10-15-05 (commencement of operations) to 2-28-06. | | |
| |
| Total Return | Period ended 2-28-06a |
| | Shares | Amount |
|
| Class 1 shares | | |
| Sold | 8,374,816 | $114,755,432 |
| Distributions reinvested | 52,640 | 721,705 |
| Repurchased | (303,791) | (4,171,129) |
| Net increase (decrease) | 8,123,665 | $111,306,008 |
|
| Class NAV shares | | |
| Sold | 67,687,909 | $923,152,829 |
| Distributions reinvested | 421,069 | 5,760,221 |
| Repurchased | (178,075) | (2,438,702) |
| Net increase (decrease) | 67,930,903 | $926,474,348 |
|
| Net increase (decrease) | 76,054,568 | $1,037,780,356 |
| a Period from 10-15-05 (commencement of operations) to 2-28-06. | | |
| |
| U.S. Global Leaders Growth | Period ended 2-28-06a |
| | Shares | Amount |
|
| Class 1 shares | | |
| Sold | 1,853,602 | $23,746,090 |
| Distributions reinvested | 798 | 10,881 |
| Repurchased | (102,343) | (1,369,496) |
| Net increase (decrease) | 1,752,057 | $22,387,475 |
|
| Class NAV shares | | |
| Sold | 29,987,022 | $397,714,310 |
| Distributions reinvested | 14,554 | 198,525 |
| Net increase (decrease) | 30,001,576 | $397,912,835 |
|
| Net increase (decrease) | 31,753,633 | $420,300,310 |
| a Period from 10-15-05 (commencement of operations) to 2-28-06. | | |
| |
| U.S. Government Securities | Period ended 2-28-06a |
| | Shares | Amount |
|
| Class 1 shares | | |
| Sold | 3,705,330 | $50,171,864 |
| Distributions reinvested | 24,343 | 328,635 |
| Repurchased | (315,211) | (4,266,743) |
| Net increase (decrease) | 3,414,462 | $46,233,756 |
|
| Class NAV shares | | |
| Sold | 10,772,472 | $145,384,289 |
| Distributions reinvested | 72,313 | 974,052 |
| Repurchased | (97,674) | (1,318,996) |
| Net increase (decrease) | 10,747,111 | $145,039,345 |
|
| Net increase (decrease) | 14,161,573 | $191,273,101 |
a Period from 10-15-05 (commencement of operations) to 2-28-06.
340
John Hancock Funds II
Notes to Financial Statements (Unaudited)
|
| CAPITAL SHARES, CONTINUED | | |
| |
| U.S. High Yield Bond | Period ended 2-28-06a |
| | Shares | Amount |
|
| Class 1 shares | | |
| Sold | 58,080 | $748,606 |
| Distributions reinvested | 136 | 1,743 |
| Repurchased | (13,077) | (169,098) |
| Net increase (decrease) | 45,139 | $581,251 |
|
| Class NAV shares | | |
| Sold | 12,530,528 | $160,097,268 |
| Distributions reinvested | 160,060 | 2,045,560 |
| Net increase (decrease) | 12,690,588 | $162,142,828 |
|
| Net increase (decrease) | 12,735,727 | $162,724,079 |
| a Period from 10-15-05 (commencement of operations) to 2-28-06. | | |
| |
| U.S. Multi Sector | Period ended 2-28-06b |
| | Shares | Amount |
|
| Class NAV shares | | |
| Sold | 101,914,226 | $1,023,363,825 |
| Distributions reinvested | 134,960 | 1,421,127 |
| Repurchased | (27,371) | (282,604) |
|
| Net increase (decrease) | 102,021,815 | $1,024,502,348 |
| b Period from 10-29-05 (commencement of operations) to 2-28-06. | | |
| |
| Value & Restructuring | Period ended 2-28-06b |
| | Shares | Amount |
|
| Class NAV shares | | |
| Sold | 15,977,733 | $160,240,003 |
| Distributions reinvested | 37,778 | 406,118 |
| Repurchased | (234,006) | (2,550,460) |
|
| Net increase (decrease) | 15,781,505 | $158,095,661 |
| b Period from 10-29-05 (commencement of operations) to 2-28-06. | | |
| |
| Vista | Period ended 2-28-06b |
| | Shares | Amount |
|
| Class NAV shares | | |
| Sold | 9,679,275 | $97,277,527 |
|
| Net increase (decrease) | 9,679,275 | $97,277,527 |
b Period from 10-29-05 (commencement of operations) to 2-28-06.
341
John Hancock Funds II
Notes to Financial Statements (Unaudited)
|
8. INVESTMENT TRANSACTIONS The following summarizes the securities transactions (except for short-term investments) for the Funds for the period ended February 28, 2006:
| | | Purchases | Sales and Maturities |
| FUND | U.S. Government | Other Issuers | U.S. Government | Other Issuers |
| 500 Index | — | $247,680,387 | — | $2,835,796 |
| Active Bond | $810,032,344 | 167,774,561 | $562,577,099 | 23,468,413 |
| All Cap Growth | — | 183,505,036 | — | 56,537,334 |
| All Cap Value | — | 199,296,460 | — | 33,057,634 |
| Blue Chip Growth | — | 1,171,093,062 | — | 109,081,833 |
| Capital Appreciation | — | 335,591,057 | — | 60,939,005 |
| Core Bond | 455,938,110 | 170,592,222 | 391,994,178 | 46,437,092 |
| Core Equity | — | 479,813,534 | — | 18,832,942 |
| Emerging Growth | 5,940,288 | 250,186,282 | 2,995,623 | 119,626,049 |
| Emerging Small Company | — | 90,631,865 | — | 43,233,512 |
| Equity-Income | — | 789,826,652 | — | 34,940,120 |
| Fundamental Value | — | 596,411,827 | — | 4,805,980 |
| Global Bond | 559,770,071 | 859,654,814 | 527,245,514 | 427,377,621 |
| High Yield | — | 1,557,107,271 | — | 244,167,880 |
| International Equity Index | — | 159,645,637 | — | 1,605,066 |
| International Opportunities | — | 524,943,554 | — | 168,180,486 |
| International Small Cap | — | 590,290,658 | — | 149,725,678 |
| International Stock | 7,660,655 | 1,362,979,094 | — | 568,297,623 |
| International Value | — | 1,141,836,488 | — | 283,479,438 |
| Investment Quality Bond | 51,209,484 | 70,775,041 | 16,354,703 | 2,461,688 |
| Large Cap | — | 170,607,708 | — | 16,646,635 |
| Large Cap Value | — | 181,600,992 | — | 35,937,616 |
| Mid Cap Core | — | 396,238,526 | — | 138,073,736 |
| Mid Cap Index | — | 55,796,765 | — | 2,865,369 |
| Mid Cap Stock | — | 353,785,748 | — | 126,770,017 |
| Mid Cap Value | — | 215,127,324 | — | 24,259,122 |
| Natural Resources | — | 970,544,551 | — | 411,476,800 |
| Quantitative Mid Cap | — | 228,846,620 | — | 66,274,439 |
| Quantitative Value | — | 474,732,153 | — | 167,092,008 |
| Real Estate Securities | — | 763,848,199 | — | 155,169,748 |
| Real Return Bond | 874,490,638 | 92,727,574 | 257,534,344 | 48,892,331 |
| Small Cap | — | 219,552,792 | — | 41,181,212 |
| Small Cap Index | — | 54,502,436 | — | 1,868,727 |
| Small Cap Opportunities | — | 263,014,162 | — | 44,274,816 |
| Small Company | — | 110,607,896 | — | 35,337,751 |
| Small Company Growth | — | 65,953,794 | — | 10,388,095 |
| Small Company Value | — | 322,622,223 | — | 26,117,829 |
| Special Value | — | 101,464,774 | — | 5,897,273 |
| Spectrum Income | 273,969,917 | 628,276,486 | 158,845,607 | 163,083,033 |
| Strategic Bond | 396,075,435 | 259,647,130 | 172,204,998 | 30,248,311 |
| Strategic Value | — | 142,418,169 | — | 16,560,563 |
| Total Return | 2,232,888,492 | 467,406,934 | 1,741,686,238 | 19,965,549 |
| U.S. Global Leaders Growth | — | 426,017,954 | — | 9,265,106 |
| U.S. Government Securities | 311,038,922 | — | 130,765,150 | — |
| U.S. High Yield Bond | — | 189,956,086 | — | 35,157,886 |
| U.S. Multi Sector | — | 1,803,995,729 | — | 831,576,382 |
| Value & Restructuring | — | 166,956,655 | — | 10,135,309 |
| Vista | — | 171,133,999 | — | 75,056,743 |
342
John Hancock Funds II
Notes to Financial Statements (Unaudited)
|
INVESTMENT TRANSACTIONS, CONTINUED
At February 28, 2006, the aggregate cost of investments was the same for federal income tax and financial statement purposes. The net unrealized appreciation/ (depreciation) of investment securities for federal income tax purposes is as follows:
| | Gross Unrealized | Gross Unrealized | Net Unrealized |
| Fund | Appreciation | (Depreciation) | Appreciation/(Depreciation) |
| 500 Index | $19,774,881 | ($3,272,704) | $16,502,177 |
| Active Bond | 1,313,399 | (1,211,995) | 101,404 |
| All Cap Growth | 13,734,434 | (1,387,326) | 12,347,108 |
| All Cap Value | 16,678,490 | (1,539,540) | 15,138,950 |
| Blue Chip Growth | 92,655,143 | (10,443,633) | 82,211,510 |
| Capital Appreciation | 22,144,011 | (2,631,436) | 19,512,575 |
| Core Bond | 376,778 | (599,006) | (222,228) |
| Core Equity | 38,789,681 | (5,608,277) | 33,181,404 |
| Emerging Growth | 24,970,081 | (3,519,778) | 21,450,303 |
| Emerging Small Company | 7,926,578 | (882,213) | 7,044,365 |
| Equity-Income | 63,123,307 | (6,922,111) | 56,201,196 |
| Fundamental Value | 37,586,831 | (7,031,092) | 30,555,739 |
| Global Bond | 873,022 | (2,758,391) | (1,885,369) |
| High Yield | 32,858,517 | (11,617,469) | 21,241,048 |
| International Equity Index | 23,905,601 | (2,433,899) | 21,471,702 |
| International Opportunities | 61,137,057 | (2,953,463) | 58,183,594 |
| International Small Cap | 65,212,511 | (11,164,809) | 54,047,702 |
| International Stock | 108,099,709 | (9,429,060) | 98,670,649 |
| International Value | 91,332,561 | (16,708,579) | 74,623,982 |
| Investment Quality Bond | 588,122 | (592,307) | (4,185) |
| Large Cap | 11,769,847 | (1,988,730) | 9,781,117 |
| Large Cap Value | 12,532,558 | (1,317,380) | 11,215,178 |
| Mid Cap Core | 20,618,471 | (2,450,620) | 18,167,851 |
| Mid Cap Index | 7,212,656 | (887,976) | 6,324,680 |
| Mid Cap Stock | 33,251,019 | (5,161,919) | 28,089,100 |
| Mid Cap Value | 17,355,761 | (5,272,060) | 12,083,701 |
| Natural Resources | 93,694,769 | (7,237,410) | 86,457,359 |
| Quantitative Mid Cap | 21,871,689 | (2,083,824) | 19,787,865 |
| Quantitative Value | 24,299,321 | (4,546,854) | 19,752,467 |
| Real Estate Securities | 82,480,571 | (292,638) | 82,187,933 |
| Real Return Bond | 6,061,466 | (442,215) | 5,619,251 |
| Small Cap | 28,572,464 | (4,293,991) | 24,278,473 |
| Small Cap Index | 9,004,320 | (1,105,739) | 7,898,581 |
| Small Cap Opportunities | 31,863,923 | (4,683,086) | 27,180,837 |
| Small Company | 9,458,642 | (1,568,813) | 7,889,829 |
| Small Company Growth | 8,273,178 | (1,121,198) | 7,151,980 |
| Small Company Value | 47,201,962 | (4,804,675) | 42,397,287 |
| Special Value | 11,419,164 | (1,603,880) | 9,815,284 |
| Spectrum Income | 13,803,688 | (3,106,908) | 10,696,780 |
| Strategic Bond | 4,511,525 | (1,724,061) | 2,787,464 |
| Strategic Value | 10,328,824 | (3,371,821) | 6,957,003 |
| Total Return | 4,193,531 | (2,780,011) | 1,413,520 |
| U.S. Global Leaders Growth | 13,307,661 | (9,765,925) | 3,541,736 |
| U.S. Government Securities | 663,492 | (450,770) | 212,722 |
| U.S. High Yield Bond | 2,845,431 | (676,692) | 2,168,739 |
| U.S. Multi Sector | 66,600,182 | (17,679,520) | 48,920,662 |
| Value & Restructuring | 20,260,336 | (2,959,470) | 17,300,866 |
| Vista | 14,345,761 | (892,852) | 13,452,909 |
343
John Hancock Funds II
Evaluation of Advisory and Subadvisory Agreements by the Board of Trustees (Unaudited)
|
This section describes the evaluation by the Board of Trustees of the Advisory Agreement and each of the Subadvisory Agreements.
EVALUATION BY THE BOARD OF TRUSTEES
The Board, including the Independent Trustees, is responsible for selecting the Trust’s investment adviser, John Hancock Investment Management Services, LLC (the “Adviser” or “JHIMS”), approving the Adviser’s selection of subadvisers for each series of the Trust (the “Funds”) and approving the Trust’s advisory and subadvisory agreements, their periodic continuation and any amendments. Consistent with SEC rules, the Board will regularly evaluate the Trust’s advisory and subadvisory arrangements, including consideration of the six factors listed below. The Board may also consider other factors (including conditions and trends prevailing generally in the economy, the securities markets and the industry) and does not treat any single factor as determinative, and each Trustee may attribute different weights to different factors. The Board is furnished with an analysis of its fiduciary obligations in connection with its evaluation and, throughout the evaluation process, the Board is assisted by counsel for the Trust and the Independent Trustees are also separately assisted by independent legal counsel. The six factors to be regularly considered by the Board are:
1. the nature, extent and quality of the services to be provided by the Adviser to the Trust and by the subadvisers to the Funds;
2. the investment performance of the Funds and their subadvisers;
3. the extent to which economies of scale would be realized as a Fund grows;
4. whether fee levels reflect these economies of scale for the benefit of Trust shareholders;
5. the costs of the services to be provided and the profits to be realized by the Adviser and its affiliates from the Adviser’s relationship with the Trust; and
6. comparative services rendered and comparative advisory and subadvisory fee rates.
The Board believes that information relating to all six factors is relevant to its evaluation of the Trust’s advisory agreement. With respect to its evaluation of subadvisory agreements, the Board believes that, in view of the Trust’s “manager-of-managers” advisory structure: factors (1), (2) and (6) are of primary relevance; factors (3) and (4) generally are less signifi-cant to the Trustees’ considerations because subadvisory fees are paid to subadvisers by the Adviser and not directly by the Funds, and issues pertaining to economies of scale are considered in connection with the approval of the advisory fees that are paid directly by the Funds; and with respect to those subadvisers that are not affiliated with the Adviser, because the Board relies on the ability of the Adviser to negotiate the subadvisory fees at arms-length, factor (5) generally is also less signifi-cant to the Trustees’ considerations except in those circumstances in which such attention may be warranted because the comparative fee information considered in connection with factor (6) indicates that the subadvisory fees will materially exceed those normally charged under comparable circumstances.
In evaluating subadvisory arrangements, the Board also considers other material business relationships that unaffiliated subadvisers and their affiliates have with the Adviser or its affiliates, including the involvement by certain affiliates of certain subadvisers in the distribution of financial products, including shares of the Trust, offered by the Adviser and other affiliates of the Adviser (“Material Relationships”).
APPROVAL OF ADVISORY AGREEMENT
At its meeting on September 21, 2005, the Board, including all the Independent Trustees, approved the Advisory Agreement between the Trust and JHIMS with respect to each of the Funds.
In approving the Advisory Agreement, and with reference to the six factors that it considers, the Board:
1 (a) considered the high value to the Trust of JHIMS’s long relationship with investment companies within the same fund complex as the Trust, the skills and competency which JHIMS has demonstrated in managing the affairs and subadvisory relationships of these other investment companies, JHIMS’s ability to oversee and monitor the subadvisers’ investment performance and compliance programs and the qualifications of JHIMS’ personnel,
(b) considered JHIMS’s compliance policies and procedures and its responsiveness to regulatory changes and mutual fund industry developments, and
(c) considered JHIMS’s administrative capabilities, including its ability to supervise the other service providers for the Funds and concluded that JHIMS may reasonably be expected to ably perform its services under the Advisory Agreement;
2 reviewed the investment performance of comparably managed funds of each of the Funds; the comparative performance of their respective benchmarks and comparable funds (i.e., funds having approximately the same investment objective); and JHIMS’ analysis of such performance and its plans and recommendations regarding the Trust’s subadvisory arrangements generally and with respect to particular Funds; and concluded that each of the comparably managed funds has generally performed well or within a range that the Board deemed competitive except as discussed in Appendix A, and that JHIMS may reasonably be expected to ably monitor the performance of the Funds and each of their subadvisers;
3 & 4 reviewed the Trust’s advisory fee structure and the incorporation therein of any subadvisory fee breakpoints in the advisory fees charged and concluded (a) that to the extent that Funds have sub-advisory fees with breakpoints, those breakpoints are reflected as breakpoints in the advisory fees for Funds, (b) that all Funds with a subadviser that is not affiliated with the Adviser have subadvisory fees which are the product of arms-length negotiations between the Adviser and the subadviser and which in many, but not all, cases contain breakpoints, and (c) that, although economies of scale cannot be measured with precision, these arrangements permit shareholders of Funds with advisory fee breakpoints to benefit from economies of scale if those Funds grow;
5 (a) reviewed the financial statements of JHIMS and John Hancock Life Insurance Company (U.S.A.) (“JHLICO (U.S.A.)”) and considered an analysis presented by JHIMS regarding the estimated net profitability to JHIMS of the advisory fee structure;
(b) reviewed the profitability of the JHIMS’ relationship with the Funds in terms of the total amount of annual advisory fees it is estimated to receive with respect to the Funds and whether JHIMS has the financial ability to provide a high level of services to the Funds,
(c) considered that JHIMS will derive reputational and other indirect benefits from providing advisory services to the Funds, and
344
John Hancock Funds II
Evaluation of Advisory and Subadvisory Agreements by the Board of Trustees (Unaudited) — continued
|
APPROVAL OF ADVISORY AGREEMENT, CONTINUED
(d) noted that JHIMS will pay the subadvisory fees out of the advisory fees JHIMS receives from the Funds and concluded that the advisory fees to be paid by the Trust with respect to the Funds are not unreasonable in light of such information; and
6 reviewed comparative information with respect to the proposed advisory fee rates and concluded that the Trust’s anticipated advisory fees are within the range of those incurred by other comparable funds and that the Trust’s advisory structure is thus competitive within the industry. In considering the proposed advisory fee rates, the Board took into account the high level of services expected to be provided to the Funds and the other factors considered.
Additional information that the Board considered for a particular Fund is set forth in Appendix A.
APPROVAL OF SUBADVISORY AGREEMENTS
At its meeting on September 21, 2005, the Board, including all the Independent Trustees, approved the Subadvisory Agreements.
In making its determination with reference to these respective factors, the Board reviewed:
(1) information relating to each subadviser’s business, which may include information such as: business performance, representative clients, assets under management, financial stability, personnel and, if applicable, past subadvisory services to affiliated funds of the Trust;
(2) the investment performance of comparatively managed funds of the Fund and comparative performance information relating to the comparatively managed fund’s benchmark and comparable funds;
(3) the proposed subadvisory fee for each Fund and comparative fee information; and
(4) information relating to the nature and scope of Material Relationships and their significance to the Trust’s adviser and unaffiliated subadvisers.
The Board’s decision to approve each Subadvisory Agreement was based on a number of determinations, including the following:
1 The Subadviser has extensive experience and demonstrated skills as a manager;
2 Although not without variation, the current and historical performance of the comparably managed funds of Subadviser to the Funds generally has been within the range of the current and historical performance of comparable funds and the comparably managed funds’ respective benchmarks;
3 With respect to each subadviser that is not affiliated with the Adviser, the subadvisory fees are a product of arms-length negotiation between the Adviser and the subadviser and generally are within the range of industry norms; and
4 The Material Relationships consist of arrangements in which unaffiliated subadvisers or their affiliates provide advisory, distribution or management services in connection with financial products sponsored by the Trust’s adviser or its affiliates, which may include other registered investment companies, a 529 education savings plan, managed separate accounts and exempt group annuity contracts sold to qualified plans, and which in no case contained elements that would cause the Board to conclude that approval of the subadvisory agreement with the subadviser would be inappropriate. See (5) below for information relating to the business arrangement between the Trust’s Adviser and Grantham, Mayo, Van Otterloo & Co. LLC (“GMO”).
5 As a part of the overall business arrangement between the Adviser and GMO under which the Adviser has obtained exclusive rights to certain GMO investment management services for up to five years, the Adviser has agreed that under certain circumstances it (and not the Trust or the particular Fund) will pay GMO a specified amount (ranging from $1 to $12 million) if the Subadvisory Agreement with respect to any of the following Funds to be subadvised by GMO is terminated within a five year period from the date of its effectiveness: U.S. Core Fund, Active Value Fund, Intrinsic Value Fund, Growth Fund, International Core Fund, International Growth Fund, Global Fund, Value Opportunities Fund and Growth Opportunities Fund.
The Adviser has also agreed that, subject to its fiduciary duties as an investment adviser to each of these Funds and its shareholders, it will not recommend to the Board of Trustees to terminate the Subadvisory Agreement with respect to any of the Funds or to reduce any of the fees payable thereunder to GMO for a five year period from the date of effectiveness of the agreement. Substantially similar agreements (with varying amounts to be paid upon termination) also apply with respect to certain other John Hancock funds that are or will be advised by the Adviser and subadvised by GMO. The Trust is not a party to any of these arrangements, and they are not binding upon the Trust, the Trust Funds subadvised by GMO or the Board of Trustees. However, these arrangements present certain conflicts of interest because the Adviser has a financial incentive to support the continuation of GMO Subadvisory Agreements for as long as the termination provisions described above remain in effect. In approving the Advisory Agreement and the Sub-advisory Agreement with respect to each of the Funds subadvised by GMO, the Board of Trustees, including the Independent Trustees, was aware of and considered these potential conflicts of interest, including any financial obligations of the Adviser to GMO.
The Board concluded that, notwithstanding the potential conflicts of interest, approval of the Advisory Agreement and the Subadvisory Agreements with GMO is in the best interests of shareholders and contract owners in view of (i) the Adviser's fiduciary duty and the Board's fiduciary duty and ability to monitor potential conflicts, (ii) the benefits to shareholders and contract owners generally expected from the exclusive rights to certain GMO investment management services obtained by the Adviser for the benefit of certain Funds of the Trust and other John Hancock funds and (iii) the benefits to such Funds of the Trust expected from the subadvisory services of GMO.
Additional information that the Board considered for a particular fund is set forth in Appendix A.
345
John Hancock Funds II
Appendix A
|
| | Performance of Comparable | | |
| Fund | Funds as of June 30, 2005 | Estimated Fees and Expenses | Comments |
|
| 500 Index | Performance of the 500 Index | Subadvisory fees for this Fund are | The Board noted that performance of |
| | Trust of John Hancock Trust | lower than its peer group median. | the comparable fund is within the |
| (MFC Global Investment | (“JHT”) has lagged its benchmark | | expected tracking error guidelines |
| Management (U.S.A.) Limited) | index over the one, three and five | Advisory fees for this Fund are | gross of fees over all available time |
| | year periods. | higher than its peer group median. | periods, and the relatively small range |
| | | | among the funds in its peer group. |
| | Performance of this Fund has | Total expenses for this Fund are | |
| | lagged its peer group average over | higher than its peer group median. | |
| | the one and five year periods. | | |
| |
| | Performance of this Fund has | | |
| | outperformed its peer group | | |
| | average over the five year period. | | |
|
| Active Bond | Performance of the Active Bond | Subadvisory fees for this Fund are | |
| | Trust of JHT has lagged its | lower than the peer group median. | |
| (Declaration Management & | benchmark index over the five | | |
| Research LLC) | year period. | Advisory fees for this Fund are | |
| | | higher than the peer group median. | |
| (John Hancock Advisers) | Performance of this Fund has | | |
| | outperformed its benchmark index | Total expenses for this Fund are | |
| | over the one and three year periods. | lower than the peer group median. | |
| |
| | Performance of this Fund has | | |
| | outperformed its peer group | | |
| | average over the one, three and | | |
| | five year periods. | | |
|
| All Cap Growth | Performance of the All Cap Growth | Subadvisory fees for this Fund are | The Board noted that AIM announced |
| | Trust of JHT has lagged its | higher than the peer group median. | a manager change on September 16, |
| (A I M Capital | benchmark index over the one | | 2005 with respect to the comparable |
| Management, Inc.) | and three year periods. | Advisory fees for this Fund are | fund and this Fund and that JHIMS |
| | | higher than the peer group median. | will provide a report at the next |
| | Performance of this Fund has | | Board meeting. |
| | outperformed its benchmark index | Total expenses for this Fund are | |
| | over the five year period. | lower than the peer group median. | |
| |
| | Performance of this Fund has | | |
| | lagged its peer group average over | | |
| | the one, three and five year periods. | | |
|
| All Cap Value | Performance of the All Cap Value | Subadvisory fees for this Fund are | |
| | Trust of JHT has lagged its | higher than the peer group median. | |
| (Lord, Abbett & Co.) | benchmark index over the one and | | |
| | three year periods. | Advisory fees for this Fund are | |
| | | higher than the peer group median. | |
| | Performance of this Fund has | | |
| | lagged its peer group average over | Total expenses for this Fund are | |
| | the one year period. | lower than the peer group median. | |
| |
| | Performance of this Fund has | | |
| | outperformed its peer group | | |
| | average over the three year period. | | |
|
346
John Hancock Funds II
Appendix A — continued
|
| | Performance of Comparable | | |
| Fund | Funds as of June 30, 2005 | Estimated Fees and Expenses | Comments |
|
| Blue Chip Growth | Performance of the Blue Chip | Subadvisory fees for this Fund are | The Board noted that this Fund should |
| | Growth Trust of JHT has lagged its | higher than the peer group median. | be closely monitored since the |
| (T. Rowe Price Associates, Inc.) | benchmark index over the one, | | performance of the comparable fund |
| | three and five year periods. | Advisory fees for this Fund are | had lagged its benchmark for certain |
| | | higher than the peer group median. | time periods. |
| | Performance of this Fund has | | |
| | outperformed its peer group | Total expenses for this Fund are | |
| | average over the one, three and | lower than the peer group median. | |
| | five year periods. | | |
|
| Capital Appreciation | Performance of the Capital | Subadvisory fees for this Fund are | |
| | Appreciation Trust of JHT has | higher than the peer group median. | |
| (Jennison Associates LLC) | lagged its benchmark index over | | |
| | the three year period. | Advisory fees for this Fund are | |
| | | higher than the peer group median. | |
| | Performance of this Fund has | | |
| | outperformed its benchmark index | Total expenses for this Fund are | |
| | over the one year period. | lower than the peer group median. | |
| |
| | Performance of this Fund has | | |
| | outperformed its peer group | | |
| | average over the one and three | | |
| | year periods. | | |
|
| Core Bond | Performance of the Wells Capital | Subadvisory fees for this Fund are | |
| | Core Bond retail fund has | lower than the peer group median. | |
| (Wells Capital | outperformed its benchmark | | |
| Management, Inc.) | index in the one, three and five | Advisory fees for this Fund are | |
| | year periods. | higher than the peer group median. | |
| |
| | Performance of this Fund has | Total expenses for this Fund are | |
| | outperformed its peer group | higher than the peer group median. | |
| | average in the one, three and five | | |
| | year periods. | | |
|
| Core Equity | Performance of the Core Equity | Subadvisory fees for this Fund are | |
| | Trust of JHT has outperformed its | higher than the peer group median. | |
| (Legg Mason Funds | benchmark index over the one | | |
| Management, Inc.) | year period. | Advisory fees for this Fund are | |
| | | higher than the peer group median. | |
| | Performance of this Fund has | | |
| | outperformed its peer group | Total expenses for this Fund are | |
| | average over the one year period. | lower than the peer group median. | |
|
| Emerging Growth | Performance of the Emerging | Subadvisory fees for this Fund are | |
| | Growth Trust of JHT has lagged its | lower than the peer group median. | |
| (MFC Global Investment | benchmark index over the one | | |
| Management (U.S.A.) Limited) | year period. | Advisory fees for this Fund are | |
| | | lower than the peer group median. | |
| | Performance of this Fund has | | |
| | lagged its peer group average over | Total expenses for this Fund are | |
| | the one year period. | lower than the peer group median. | |
|
347
John Hancock Funds II
Appendix A — continued
|
| | Performance of Comparable | | |
| Fund | Funds as of June 30, 2005 | Estimated Fees and Expenses | Comments |
|
| Emerging Small Company | Performance of the Emerging | Subadvisory fees for this Fund are | The Board noted that JHIMS will be |
| | Small Company Trust of JHT has | higher than the peer group median. | meeting with the manager for an |
| (Franklin Advisers, Inc.) | lagged its benchmark index over | | update in the 4th quarter and will |
| | the one, three and five year periods. | Advisory fees for this Fund are | provide a report at the next Board |
| | | higher than the peer group median. | meeting. |
| | Performance of this Fund has | | |
| | lagged its peer group average over | Total expenses for this Fund are | |
| | the one, three and five year periods. | lower than the peer group median. | |
|
| Equity-Income | Performance of the Equity-Income | Subadvisory fees for this Fund are | |
| | Trust of JHT has lagged its | higher than the peer group median. | |
| (T. Rowe Price Associates, Inc.) | benchmark index over the one | | |
| | and three year periods. | Advisory fees for this Fund are | |
| | | higher than the peer group median. | |
| | Performance of this Fund has | | |
| | outperformed its benchmark | Total expenses for this Fund are | |
| | index over the five year period. | lower than the peer group median. | |
| |
| | Performance of this Fund has | | |
| | lagged its peer group average over | | |
| | the one year period. | | |
| |
| | Performance of this Fund has | | |
| | outperformed its peer group | | |
| | average over the three and five | | |
| | year periods. | | |
|
| Fundamental Value | Performance of the Fundamental | Subadvisory fees for this Fund are | |
| | Value Trust of JHT has | equal to the peer group median. | |
| (Davis Selected Advisers, L.P.) | outperformed its benchmark | | |
| | index over the one and three | Advisory fees for this Fund are | |
| | year periods. | higher than the peer group median. | |
| |
| | Performance of this Fund has | Total expenses for this Fund are | |
| | outperformed its peer group | lower than the peer group median. | |
| | average over the one and three | | |
| | year periods. | | |
|
| Global Bond | Performance of the Global Bond | Subadvisory fees for this Fund are | |
| | Trust of JHT has lagged its | higher than the peer group median. | |
| (Pacific Investment | benchmark index over the one | | |
| Management Company) | year period. | Advisory fees for this Fund are | |
| | | higher than the peer group median. | |
| | Performance of this Fund has | | |
| | outperformed its benchmark | Total expenses for this Fund are | |
| | index over the three and five | lower than the peer group median. | |
| | year periods. | | |
| |
| | Performance of this Fund has | | |
| | lagged its peer group average over | | |
| | the one year period. | | |
| |
| | Performance of this Fund has | | |
| | outperformed its peer group | | |
| | average over the three and five | | |
| | year periods. | | |
|
348
John Hancock Funds II
Appendix A — continued
|
| | Performance of Comparable | | |
| Fund | Funds as of June 30, 2005 | Estimated Fees and Expenses | Comments |
|
| High Yield | Performance of the High Yield | Subadvisory fees for this Fund are | The Board noted that SBAM assumed |
| | Trust of JHT has lagged its | lower than the peer group median. | subadvisory responsibilities for the |
| (Salomon Brothers | benchmark index over the three | | comparable fund in May 2003 and |
| Asset Management, Inc.) | and five year periods. | Advisory fees for this Fund are | that performance has exceeded the |
| (“SBAM”) | | higher than the peer group median. | peer group average and benchmark |
| | Performance of this Fund has | | index over the one year time period |
| | outperformed its benchmark | Total expenses for this Fund are | ended June 30, 2005. |
| | index over the one year period. | lower than the peer group median. | |
| |
| | Performance of this Fund has | | |
| | lagged its peer group average over | | |
| | the three and five year periods. | | |
| |
| | Performance of this Fund has | | |
| | outperformed its peer group | | |
| | average over the one year period. | | |
|
| International Equity Index | Performance of the International | Subadvisory fees for this Fund are | The Board noted that performance of |
| | Equity-Index Trust of JHT has | higher than its peer group median. | the comparable fund is within the |
| (SSgA Funds | lagged its benchmark index over | | expected tracking error guidelines |
| Management, Inc.) | the one, three and five year periods. | Advisory fees for this Fund are | gross of fees. The Board further noted |
| | | higher than its peer group median. | the manager change effective |
| | Performance of this Fund has | | March 25, 2004. |
| | outperformed its peer group | Total expenses for this Fund are | |
| | average over the one, three and | higher than its peer group median. | |
| | five year periods. | | |
|
| International Opportunities | Performance of the Marsico | Subadvisory fees for this Fund are | |
| | International Opportunities retail | higher than the peer group median. | |
| (Marsico Capital | fund has lagged behind its | | |
| Management, LLC) | benchmark index over the one | Advisory fees for this Fund are | |
| | and three year periods. | higher than the peer group median. | |
| |
| | Performance of this Fund has | Total expenses for this Fund are | |
| | underperformed its peer group | lower than the peer group median. | |
| | average over the one year period. | | |
| |
| | Performance of this Fund has | | |
| | outperformed its peer group | | |
| | average over the three year period. | | |
|
| International Small Cap | Performance of the International | Subadvisory fees for this Fund are | The Board noted that Templeton |
| | Small Cap Trust of JHT has lagged | lower than the peer group median. | assumed management responsibilities |
| (Templeton Investment | its benchmark index over the one, | | for the comparable fund in May 2003. |
| Counsel, Inc.) | three and five year periods. | Advisory fees for this Fund are | Although relative returns have lagged |
| | | lower than the peer group median. | the benchmark index and peer group |
| | Performance of this Fund has | | average, this Fund is within 2 basis |
| | lagged its peer group average over | Total expenses for this Fund are | points of the peer group average since |
| | the one, three and five year periods. | lower than the peer group median. | new management took over in |
| | | | May 2003. |
|
349
John Hancock Funds II
Appendix A — continued
|
| | Performance of Comparable | | |
| Fund | Funds as of June 30, 2005 | Estimated Fees and Expenses | Comments |
|
| International Stock | Performance of the International | Subadvisory fees for this Fund are | The Board noted the subadvisor to the |
| | Stock Trust of JHT has lagged its | higher than the peer group median. | comparable fund was changed to |
| (Grantham, Mayo, Van | benchmark index over the one, | | GMO on August 1, 2005. |
| Otterloo & Co., LLC) (“GMO”) | three and five year periods. | Advisory fees for this Fund are | |
| | | lower than the peer group median. | |
| | Performance of this Fund has | | |
| | lagged its peer group average over | Total expenses for this Fund are | |
| | the three year period. | higher than the peer group median. | |
| |
| | Performance of this Fund has | | |
| | outperformed its peer group | | |
| | average over the one and five | | |
| | year periods. | | |
|
| International Value | Performance of the International | Subadvisory fees for this Fund are | |
| | Value Trust of JHT has | lower than the peer group median. | |
| (Templeton Investment | outperformed its benchmark | | |
| Counsel, Inc.) | index over the one, three and five | Advisory fees for this Fund are | |
| | year periods. | lower than the peer group median. | |
| |
| | Performance of this Fund has | Total expenses for this Fund are | |
| | lagged its peer group average over | lower than the peer group median. | |
| | the five year period. | | |
| |
| | Performance of this Fund has | | |
| | outperformed its peer group | | |
| | average over the one and three | | |
| | year periods. | | |
|
| Investment Quality Bond | Performance of the Investment | Subadvisory fees for this Fund are | The Board noted that this Fund |
| | Quality Bond Trust of JHT has | lower than the peer group median. | should be closely monitored since the |
| (Wellington Management | lagged its benchmark index over | | performance of the comparable fund |
| Company, LLP) | the five year period. | Advisory fees for this Fund are | was below its peer group and had |
| | | higher than the peer group median. | lagged its benchmark over the five |
| | Performance of this Fund has out- | | year period. |
| | performed its benchmark index | Total expenses for this Fund are | |
| | over the one and three year periods. | lower than the peer group median. | |
| |
| | Performance of this Fund has | | |
| | lagged its peer group average over | | |
| | the one, three and five year periods. | | |
|
| Large Cap | Performance of the UBS Large Cap | Subadvisory fees for this Fund are | |
| | retail fund has outperformed its | higher than the peer group median. | |
| (UBS Global | benchmark index over the one, | | |
| Asset Management) | three and five year periods. | Advisory fees for this Fund are | |
| | | higher than the peer group median. | |
| | Performance of this Fund has | | |
| | outperformed its peer group | Total expenses for this Fund are | |
| | average over the one, three and | lower than the peer group median. | |
| | five year periods. | | |
|
| Large Cap Value | Performance of the Large Cap | Subadvisory fees for this Fund are | |
| | Value Trust of JHT has | higher than the peer group median. | |
| (Fund Asset Management, L.P. | outperformed its benchmark | | |
| (Mercury Advisors) | index over the one year period. | Advisory fees for this Fund are | |
| | | higher than the peer group median. | |
| | Performance of this Fund has | | |
| | outperformed its peer group | Total expenses for this Fund are | |
| | average over the one year period. | lower than the peer group median. | |
|
350
John Hancock Funds II
Appendix A — continued
|
| | Performance of Comparable | | |
| Fund | Funds as of June 30, 2005 | Estimated Fees and Expenses | Comments |
|
| Mid Cap Core | Performance of the Mid Cap Core | Subadvisory fees for this Fund are | The Board noted that this Fund |
| | Trust of JHT has lagged its | higher than the peer group median. | should be closely monitored since the |
| (A I M Capital | benchmark index over the one | | performance of the comparable fund |
| Management, Inc.) | year period. | Advisory fees for this Fund are | was below benchmark and peer group |
| | | higher than the peer group median. | over the one year period. |
| | Performance of this Fund has | | |
| | lagged its peer group average | Total expenses for this Fund are | |
| | over the one year period. | lower than the peer group median. | |
|
| Mid Cap Index | Performance of the Mid Cap | Subadvisory fees for this Fund are | The Board noted that performance is |
| | Index Trust of JHT has lagged its | lower than its peer group median. | within the expected tracking error |
| (MFC Global Investment | benchmark index over the one, | | guidelines gross of fees over all |
| Management (U.S.A.) Limited) | three and five year periods. | Advisory fees for this Fund are | available time periods, and also noted |
| | | higher than its peer group median. | the relatively small range among the |
| | Performance of this Fund has | | peer group. |
| | lagged its peer group average over | Total expenses for this Fund are | |
| | the three year period. | higher than its peer group median. | |
| |
| | Performance of this Fund has | | |
| | outperformed its peer group | | |
| | average over the one and five | | |
| | year periods. | | |
|
| Mid Cap Stock | Performance of the Mid Cap | Subadvisory fees for this Fund are | |
| | Stock Trust of JHT has lagged its | lower than the peer group median. | |
| (Wellington Management | benchmark index over the one | | |
| Company, LLP) | year period. | Advisory fees for this Fund are | |
| | | higher than the peer group median. | |
| | Performance of this Fund has | | |
| | outperformed its benchmark | Total expenses for this Fund are | |
| | index over the three and five | lower than the peer group median. | |
| | year periods. | | |
| |
| | Performance of this Fund has | | |
| | outperformed its peer group | | |
| | average over the one, three and | | |
| | five year periods. | | |
|
| Mid Cap Value | Performance of the Mid Cap | Subadvisory fees for this Fund are | |
| | Value Trust of JHT has lagged its | higher than the peer group median. | |
| (Lord, Abbett & Co.) | benchmark index over the one | | |
| | and three year periods. | Advisory fees for this Fund are | |
| | | higher than the peer group median. | |
| | Performance of this Fund has | | |
| | outperformed its peer group | Total expenses for this Fund are | |
| | average over the one and three | lower than the peer group median. | |
| | year periods. | | |
|
| Natural Resources | Performance of the Natural | Subadvisory fees for this Fund are | |
| | Resources Trust of JHT has | higher than the peer group median. | |
| (Wellington Management | outperformed its benchmark | | |
| Company, LLP) | index over the one year period. | Advisory fees for this Fund are | |
| | | higher than the peer group median. | |
| | Performance of this Fund has | | |
| | outperformed its peer group | Total expenses for this Fund are | |
| | average over the one year period. | lower than the peer group median. | |
|
351
John Hancock Funds II
Appendix A — continued
|
| | Performance of Comparable | | |
| Fund | Funds as of June 30, 2005 | Estimated Fees and Expenses | Comments |
|
| Quantitative Mid Cap | Performance of the Quantitative | Subadvisory fees for this Fund are | |
| | Mid Cap Trust of JHT has | lower than the peer group median. | |
| (MFC Global Investment | outperformed its benchmark | | |
| Management (U.S.A.) Limited) | index over the one and three | Advisory fees for this Fund are | |
| | year periods. | lower than the peer group median. | |
| |
| | Performance of this Fund has | Total expenses for this Fund are | |
| | outperformed its peer group | lower than the peer group median. | |
| | average over the one and three | | |
| | year periods. | | |
|
| Quantitative Value | Performance of the Quantitative | Subadvisory fees for this Fund are | |
| | Value Trust of JHT has | higher than the peer group median. | |
| (MFC Global Investment | outperformed its benchmark | | |
| Management (U.S.A.) Limited) | index over the one year period. | Advisory fees for this Fund are | |
| | | lower than the peer group median. | |
| | Performance of this Fund has | | |
| | outperformed its peer group | Total expenses for this Fund are | |
| | average over the one year period. | lower than the peer group median. | |
|
| Real Estate Securities | Performance of the Real Estate | Subadvisory fees for this Fund are | The Board noted the comparable |
| | Securities Trust of JHT has lagged | lower than the peer group median. | fund’s change in subadviser in 2002 |
| (Deutsche Asset | its benchmark index over the | | and that this Fund’s longer term |
| Management, Inc.) | five year period. | Advisory fees for this Fund are | performance reflects the performance |
| | | lower than the peer group median. | of the previous subadviser. |
| | Performance of this Fund has | | |
| | outperformed its benchmark | Total expenses for this Fund are | |
| | index over the one and three | lower than the peer group median. | |
| | year periods. | | |
| |
| | Performance of this Fund has | | |
| | lagged its peer group average over | | |
| | the five year period. | | |
| |
| | Performance of this Fund has | | |
| | outperformed its peer group | | |
| | average over the one and three | | |
| | year periods. | | |
|
| Real Return Bond | Performance of the Real Return | Subadvisory fees for this Fund are | |
| | Bond Trust of JHT has lagged its | higher than the peer group median. | |
| (Pacific Investment | benchmark index over the one | | |
| Management Company) | year period. | Advisory fees for this Fund are | |
| | | higher than its peer group median. | |
| | Performance of this Fund has | | |
| | outperformed its peer group | Total expenses for this Fund are | |
| | average over the one year period. | higher than the peer group median. | |
|
352
John Hancock Funds II
Appendix A — continued
|
| | Performance of Comparable | | |
| Fund | Funds as of June 30, 2005 | Estimated Fees and Expenses | Comments |
|
| Small Cap | Performance of the Independence | Subadvisory fees for this Fund are | |
| | Small Cap retail fund has | higher than the peer group median. | |
| (Independence | outperformed its benchmark | | |
| Investment LLC) | index over the one and five | Advisory fees for this Fund are | |
| | year periods. | higher than the peer group median. | |
| |
| | Performance of this Fund has | Total expenses for this Fund are | |
| | lagged behind its benchmark | higher than the peer group median. | |
| | index over the three year period. | | |
| |
| | Performance of this Fund has | | |
| | outperformed its peer group | | |
| | average over the one and five | | |
| | year periods. | | |
| |
| | Performance of this Fund has | | |
| | lagged behind its peer group | | |
| | average over the three year period. | | |
|
| Small Cap Index | Performance of the Small Cap | Subadvisory fees for this Fund are | The Board noted that performance is |
| | Index Trust of JHT has lagged its | lower than its peer group median. | within the expected tracking error |
| (MFC Global Investment | benchmark index over the one, | | guidelines gross of fees over all |
| Management (U.S.A.) Limited) | three and five year periods. | Advisory fees for this Fund are | available time periods. |
| | | higher than its peer group median. | |
| | Performance of this Fund has | | |
| | lagged its peer group average over | Total expenses for this Fund are | |
| | the one, three and five year periods. | higher than its peer group median. | |
|
| Small Cap Opportunities | Performance of the Small Cap | Subadvisory fees for this Fund are | |
| | Opportunities Trust of JHT has | higher than the peer group median. | |
| (Munder Capital Management) | outperformed its benchmark index | | |
| | over the one year period. | Advisory fees for this Fund are | |
| | | higher than the peer group median. | |
| | Performance of this Fund has | | |
| | outperformed its peer group | Total expenses for this Fund are | |
| | average over the one year period. | lower than the peer group median. | |
|
| Small Company | Performance of the Small | Subadvisory fees for this Fund are | |
| | Company Trust of JHT has | higher than the peer group median. | |
| (American Century | outperformed its benchmark | | |
| Investment Management, Inc.) | index over the one year period. | Advisory fees for this Fund are | |
| | | higher than the peer group median. | |
| | Performance of this Fund has | | |
| | outperformed its peer group | Total expenses for this Fund are | |
| | average over the one year period. | higher than the peer group median. | |
|
| Small Company Growth | Performance of the AIM Small | Subadvisory fees for this Fund are | |
| | Company Growth retail fund has | higher than the peer group median. | |
| (A I M Capital | outperformed its benchmark | | |
| Management, Inc.) | index over the one year period. | Advisory fees for this Fund are | |
| | | higher than the peer group median. | |
| | Performance for this Fund has | | |
| | lagged behind its benchmark | Total expenses for this Fund are | |
| | index over the three and five | higher than the peer group median. | |
| | year periods. | | |
| |
| | Performance for this Fund has | | |
| | lagged behind its peer group | | |
| | average over the one, three and | | |
| | five year periods. | | |
|
353
John Hancock Funds II
Appendix A — continued
|
| | Performance of Comparable | | |
| Fund | Funds as of June 30, 2005 | Estimated Fees and Expenses | Comments |
|
| Small Company Value | Performance of the Small | Subadvisory fees for this Fund are | The Board noted that T. Rowe Price |
| | Company Trust of JHT has | higher than the peer group median. | assumed management responsibilities |
| (T. Rowe Price Associates, Inc.) | lagged its benchmark index | | in May 2001. Although relative returns |
| | over the one, three and five | Advisory fees for this Fund are | have lagged the benchmark index and |
| | year periods. | higher than the peer group median. | peer group average, the Fund is within |
| | | | the range of the peer group average for |
| | Performance of this Fund has | Total expenses for this Fund are | the last four years and the manager’s |
| | lagged its peer group average | lower than the peer group median. | longer term composite (eight years) |
| | over the one, three and five | | is strong. |
| | year periods. | | |
|
| Special Value | Performance of the Special Value | Subadvisory fees for this Fund are | The Board took into account |
| | Trust of JHT has lagged its | higher than the peer group median. | management’s discussion of the |
| (Salomon Brothers | benchmark index over the one | | factors that contributed to the |
| Asset Management, Inc.) | year period. | Advisory fees for this Fund are | comparable fund’s performance, |
| | | higher than the peer group median. | including the effect of current |
| | Performance of this Fund has | | market conditions. |
| | lagged its peer group average over | Total expenses for this Fund are | |
| | the one year period. | higher than the peer group median. | |
|
| Spectrum Income | Performance of the T. Rowe Price | Subadvisory fees for this Fund are | |
| | Spectrum Income retail fund has | higher than the peer group median. | |
| (T. Rowe Price Associates, Inc.) | outperformed its benchmark index | | |
| | in the one and three year periods. | Advisory fees for this Fund are | |
| | | higher than the peer group median. | |
| | Performance of this Fund has | | |
| | lagged behind its benchmark | Total expenses for this Fund are | |
| | index over the five year periods. | lower than the peer group median. | |
| |
| | Performance of this Fund has | | |
| | lagged behind its peer group | | |
| | average over the one, and three | | |
| | year periods. | | |
| |
| | Performance of this Fund has | | |
| | outperformed its peer group | | |
| | average over the five year period. | | |
|
| Strategic Bond | Performance of the Strategic Bond | Subadvisory fees for this Fund are | |
| | Trust of JHT has outperformed its | lower than the peer group median. | |
| (Salomon Brothers | benchmark index over the one, | | |
| Asset Management, Inc.) | three and five year periods. | Advisory fees for this Fund are | |
| | | higher than the peer group median. | |
| | Performance of this Fund has | | |
| | lagged its peer group average over | Total expenses for this Fund are | |
| | the one and three year periods. | lower than the peer group median. | |
| |
| | Performance of this Fund has | | |
| | outperformed its peer group | | |
| | average over the five year period. | | |
|
| Strategic Value | Performance of the Strategic | Subadvisory fees for this Fund are | |
| | Value Trust of JHT has lagged its | higher than the peer group median. | |
| (Massachusetts Financial | benchmark index over the one | | |
| Services Company) | and three year periods. | Advisory fees for this Fund are | |
| | | higher than the peer group median. | |
| | Performance of this Fund has | | |
| | outperformed its peer group | Total expenses for this Fund are | |
| | average over the one and three | lower than the peer group median. | |
| | year periods. | | |
|
354
John Hancock Funds II
Appendix A — continued
|
| | Performance of Comparable | | |
| Fund | Funds as of June 30, 2005 | Estimated Fees and Expenses | Comments |
|
| Total Return | Performance of the Total Return | Subadvisory fees for this Fund are | |
| | Trust of JHT has outperformed | equal to the peer group median. | |
| (Pacific Investment | its benchmark index over the one, | | |
| Management Company) | three and five year periods. | Advisory fees for this Fund are | |
| | | higher than the peer group median. | |
| | Performance of this Fund has | | |
| | outperformed its peer group | Total expenses for this Fund are | |
| | average over the one, three and | higher than the peer group median. | |
| | five year periods. | | |
|
| U.S. Global Leaders Growth | Performance of the U.S. Global | Subadvisory fees for this Fund are | The Board took into account |
| | Leaders Growth Trust of JHT has | lower than the peer group median. | management’s discussion of the |
| (Sustainable Growth | lagged its benchmark index over | | comparable fund’s performance, |
| Advisers, L.P.) | the one year period. | Advisory fees for this Fund are | including the effect of current market |
| | | lower than the peer group median. | conditions on the fund’s performance. |
| | Performance of this Fund has | | |
| | lagged its peer group average over | Total expenses for this Fund are | |
| | the one year period. | higher than the peer group median. | |
|
| U.S. Government Securities | Performance of the U.S. | Subadvisory fees for this Fund are | |
| | Government Securities Trust of | higher than the peer group median. | |
| (Salomon Brothers | JHT has lagged its benchmark | | |
| Asset Management, Inc.) | index over the three and five | Advisory fees for this Fund are | |
| | year periods. | higher than the peer group median. | |
| |
| | Performance of this Fund has | Total expenses for this Fund are | |
| | outperformed its benchmark | lower than the peer group median. | |
| | index over the one year period. | | |
| |
| | Performance of this Fund has | | |
| | outperformed its peer group | | |
| | average over the one, three and | | |
| | five year periods. | | |
|
| U.S. High Yield Bond | Performance of the Wells Capital | Subadvisory fees for this Fund are | |
| | U.S. High Yield Bond retail fund | lower than the peer group median. | |
| (Wells Capital | has lagged behind its benchmark | | |
| Management, Inc.) | index over the one and three | Advisory fees for this Fund are | |
| | year periods. | higher than the peer group median. | |
| |
| | Performance of this Fund has | Total expenses for this Fund are | |
| | outperformed its benchmark | higher than the peer group median. | |
| | index over the five year period. | | |
| |
| | Performance of this Fund has | | |
| | lagged behind its peer group | | |
| | average over the one and three | | |
| | year periods. | | |
| |
| | Performance of this Fund has | | |
| | outperformed its peer group | | |
| | average over the five year period. | | |
|
355
John Hancock Funds II
Appendix A — continued
|
| | Performance of Comparable | | |
| Fund | Funds as of June 30, 2005 | Estimated Fees and Expenses | Comments |
|
| U.S. Multi Sector | Performance of the GMO Retail | Subadvisory fees for this Fund are | |
| | U.S. Multi Sector fund has | higher than the peer group median. | |
| (Grantham, Mayo, Van | outperformed its benchmark | | |
| Otterloo & Co., LLC) | index over the one, three and | Advisory fees for this Fund are | |
| | five year periods. | higher than the peer group median. | |
| |
| | Performance of this Fund has | Total expenses for this Fund are | |
| | outperformed its peer group | lower than the peer group median. | |
| | average over the one, three and | | |
| | five year periods. | | |
|
| Value & Restructuring | Performance of the UST Value & | Subadvisory fees for this Fund are | |
| | Restructuring retail fund has | higher than the peer group median. | |
| (UST Advisers, Inc.) | outperformed its benchmark | | |
| | index over the one, three and five | Advisory fees for this Fund are | |
| | year periods. | higher than the peer group median. | |
| |
| | Performance of this Fund has | Total expenses for this Fund are | |
| | outperformed its peer group | lower than the peer group median. | |
| | average over the one, three and | | |
| | five year periods. | | |
|
| Vista | Performance of the American | Subadvisory fees for this Fund are | |
| | Century Vista retail fund has | higher than the peer group median. | |
| (American Century | lagged behind its benchmark | | |
| Investment Management, Inc.) | index over the one and three | Advisory fees for this Fund are | |
| | year period. | higher than the peer group median. | |
| |
| | Performance of this Fund has | Total expenses for this Fund are | |
| | outperformed behind its | higher than the peer group median. | |
| | benchmark index over the five | | |
| | year period. | | |
| |
| | Performance of this Fund has | | |
| | lagged behind its peer group | | |
| | average over the one year period. | | |
| |
| | Performance of this Fund has | | |
| | outperformed its peer group | | |
| | average over the three and five | | |
| | year periods. | | |
|
The Statement of Additional Information, a separate document with supplemental information not contained in the Prospectus, includes additional information on the Board of Trustees and can be obtained without charge by calling 1-800-344-1029 or on the Securities and Exchange Commission (“SEC”) Web site at www.sec.gov.
PROXY VOTING POLICY From time to time, mutual funds are required to vote proxies related to the securities held by the Funds. Each of the John Hancock Funds II Funds vote proxies according to the Trust’s proxy voting policies and procedures approved by the Board of Trustees. A description of the Trust’s proxy voting policies and procedures and the proxy results are available without charge, upon request, by calling 1-800-344-1029 or on the SEC Web site at www.sec.gov.
QUARTERLY PORTFOLIO DISCLOSURE The fund files a complete schedule of portfolio holdings with the Securities and Exchange Commission for the first and third quarters of each fiscal year on Form N-Q. The fund’s Form N-Q is available electronically on the SEC’s Web site (www.sec.gov); hard copies may be reviewed and copied at the SEC’s Public Reference Room, 450 Fifth St., N.W., Washington, DC 20549. For more information on the Public Reference Room, call 1-800-SEC-0330.
356


| Table of contents |
|
| Your fund at a glance |
| page 1 |
|
| Managers’ report |
| page 2 |
|
| A look at performance |
| page 6 |
|
| Growth of $10,000 |
| page 7 |
|
| Your expenses |
| page 8 |
|
| Fund’s investments |
| page 10 |
|
| Financial statements |
| page 12 |
|
| For more information |
| page 33 |
|
To Our Shareholders,
After producing modest returns in 2005, the stock market started off strong in the first two months of 2006. The major indexes all advanced and produced two-month returns that were already half as much as the market’s returns for all of 2005. For example, the Standard & Poor’s 500 Index returned 2.93% through February 2006, versus 4.91% last year in total. Investors were encouraged solid corporate earnings, a slower-growing economy and stable inflation, which suggested the Federal Reserve could be coming close to the end of their 18-month campaign of rising interest rates
Although a solid yearly beginning has typically augured well for the rest of the year, it is anyone’s guess where the market will end 2006, especially given the wild cards of interest rate moves and record-high energy prices and their impact on corporate profits and the economy.
One thing we do know, however, is that the stock market’s pattern is one of extremes. Consider the last 10 years. From 1995 through 1999, we saw double-digit returns in excess of 20% per year, only to have 2000 through 2002 produce ever-increasing negative results, followed by another 20%-plus up year in 2004 and a less than 5% advance in 2005. Since 1926, the market, as measured the Standard & Poor’s 500 Index, has produced average annual results of 10.4% . However, that “normal” return is rarely produced in any given year. In fact, calendar-year returns of 8% to 12% have occurred only five times in the 80 years since 1926.
Although the past in no way predicts the future, we have learned least one lesson from history: Expect highs and lows in the short term, but always invest for the long term. Equally important: Work with your financial professional to maintain a diversified portfolio, spread out among not only different asset classes — stocks, bonds and cash — but also among various investment styles. It’s the best way we know of to benefit from, and weather, the market’s extremes
Sincerely,

Keith F. Hartstein,
President and Chief Executive Officer
|
This commentary reflects the CEO’s views as of February 28, 2006. They are subject to change at any time.
YOUR FUND
AT A GLANCE
The portfolio seeks
long-term growth
of capital. Current
income is not a
consideration. To
pursue this goal,
the portfolio, which
is a fund-of-funds,
normally invests
100% of its assets
in underlying
funds which
invest primarily in
equity securities.
|
Since inceptiona
* Equities performed quite well during the reporting period. Oil price
volatility has not diminished the underlying support that equities have
received from strong corporate earnings and solid economic growth.
* All the underlying funds produced positive results during the
reporting period and the Lifestyle Aggressive Portfolio outperformed
the S&P 500 index.
* The Portfolio benefited most from allocations to funds that
invest in small- and mid-cap stocks, as well as funds that invest in
non-U.S. equities.
|
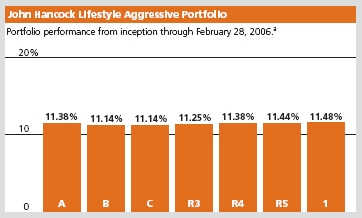
Total returns for the Portfolio are at net asset value with all distributions reinvested. These returns do not reflect the deduction of the maximum sales charge, which would reduce the performance shown above.
a Class A, Class B, Class C, Class R3, Class R4 and Class R5 began operations on 10-18-05 and Class 1 began operation on 10-15-05.
| Asset Allocation | |
| Equity | % of Total |
| U.S. Large Cap | 38.00 |
| International | 24.00 |
| U.S. Small Cap | 14.00 |
| U.S. Mid Cap | 13.00 |
| International Small Cap | 6.00 |
| Natural Resources | 5.00 |
As a percentage of the Portfolio’s net assets on February 28, 2006.
1
FROM THE MANAGEMENT TEAM OF MFC GLOBAL INVESTMENT MANAGEMENT
JOHN HANCOCK
Lifestyle
Aggressive Portfolio
|
For the reporting period of October 18, 2005 through February 28, 2006, all major equity indexes posted positive results, while bonds advanced modestly. The dominant influence of energy on the economy and on business profitability kept equity and oil prices locked in contrary motion: equities fell in December and January as oil prices firmed, and rallied in October, November and February as oil prices declined. Oil price volatility has not diminished the underlying support that equities have received from strong corporate earnings and solid economic growth.
“For the reporting period of
October 18, 2005 through
February 28, 2006, all major
equity indexes posted positive
results while bonds advanced
modestly.”
|
U.S. small-cap stocks were the best performers over the reporting period, followed by mid-cap stocks. Large-cap stocks continued to trail, which is consistent with the last two years of unremarkable performance. Small- and mid-cap growth stocks beat their value counterparts, while value stocks outperformed in the large-cap area. International stocks produced strong results during this period, outperforming U.S. equities by approximately 6%. This performance was bolstered by strong results in Japan and Germany.
Performance results
From inception October 18, 2005 (for Class I inception is October 15, 2005) through February 28, 2006, John Hancock Lifestyle Aggressive Portfolio’s Class A, Class B, Class C, Class R3, Class R4, Class R5 and Class I shares posted total returns of 11.38%, 11.14%, 11.14%, 11.25%, 11.38%, 11.44% and 11.48%, respectively, at net asset value. That compared with the 8.42% return of the Portfolio’s benchmark Standard & Poor’s 500 Index.
2
Performance explanation
This portfolio outperformed its benchmark since inception. Performance was aided by non-traditional asset classes such as natural resources and international small-cap stocks. Resilient oil prices and strengthening industrial and precious metals lifted the Wellington-managed Natural Resources Fund to a strong gain in the period. Though volatile as individual portfolios, International Small Cap Fund (+10.92%, Templeton) and Natural Resources Fund (+16.04%) provided excellent returns. The risks inherent in these asset classes, which have small allocations in this Lifestyle Aggressive Portfolio, are diffused by the Portfolio’s broad diversification.
Allocations to traditional equity asset classes also added value, particularly the exposure to non-U.S. funds and small- and mid-cap funds. International Opportunities Fund (+19.39%, Marsico), a growth-oriented fund, led the way on the non-U.S. side. In the mid- and small-cap portion of the portfolio, Mid Cap Stock Fund (+18.17%, Wellington) and Small Company Value Fund (+14.91%, T. Rowe Price) were top performers.
“Performance was aided by
non-traditional asset classes
such as natural resources and
international small-cap stocks.”
|
In the U.S. large-cap portion of the portfolio, U.S. Multi-Sector Fund (GMO) was the main detractor from performance. This was due in large part to the fund’s positioning in higher-quality names. The fund’s management team continues to believe that low-quality stocks are extremely overvalued and that high-quality equities represent the best opportunity within the U.S. Other funds in the large-cap space helped to offset this fund’s poor relative results, leading to a positive relative return from the overall large-cap allocation. Solid results were generated by two growth funds, All Cap Growth Fund (AIM) and Capital Appreciation Fund (Jennison), and a value fund, Quantitative Value Fund (MFC). Both growth funds had excellent stock selection in the technology sector, and Capital Appreciation Fund also benefited from its energy positions. All Cap Growth Fund was able to achieve favorable results across most of the sectors in which the strategy invested.3
Positioning and outlook
Lifestyle Aggressive Portfolio is well diversified across a wide range of asset classes and investment styles, including non-traditional asset classes. The Portfolio has a 30% allocation to non-U.S. equity funds, including a 6% allocation to non-U.S. small-cap funds. Other notable equity allocations include a 27% allocation to mid-and small-cap funds and a 5% position in the Natural Resources Fund (Wellington). No major changes were made during this short time period outside of the regular rebalancing process.
“We believe that the long-awaited
shift in favor of higher-quality
stocks will occur sooner rather
than later, and we are well
positioned for this impending
change...”
|
We believe that the long-awaited shift in favor of higher-quality stocks will occur sooner rather than later, and we are well positioned for this impending change within our large-cap allocations. We remain vigilant in our evaluation of the areas that have experienced excellent relative and absolute gains recently, including natural resources and small- and mid-cap stocks. In our view, valuations in these areas are not as attractive as they were three years ago. In many cases, however, the fundamentals remain strong. As always, we will make adjustments to further enhance the risk-reward profile of the Portfolio as opportunities arise.
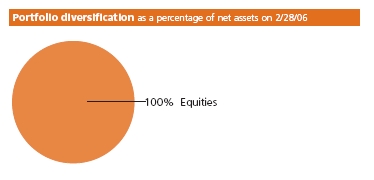
4
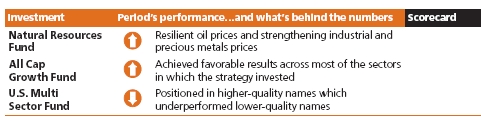
This commentary reflects the views of the portfolio managers through the end of the Portfolio’s period discussed in this report. The managers’ statements reflect their own opinions. As such, they are in no way guarantees of future events and are not intended to be used as investment advice or a recommendation regarding any specific security. They are also subject to change at any time as market and other conditions warrant.
International investing involves special risks such as political, economic and currency risks and differences in accounting standards and financial reporting. See the prospectus for the risks of investing in small-cap stocks. See the prospectus for the risks of investing in high-yield bonds.
5
A LOOK AT
PERFORMANCE
For the period ending
February 28, 2006
|
With maximum sales charge (POP)
| | Cumulative total returns | |
| | Since inceptiona | |
| |
| Class A | 5.84% | |
| |
| Class B | 6.14 | |
| |
| Class C | 10.14 | |
| |
| Class R3b | 11.25 | |
| |
| Class R4b | 11.38 | |
| |
| Class R5b | 11.44 | |
| |
| Class 1b | 11.48 | |
| |
Performance figures assume all distributions are reinvested. Returns with maximum sales charge reflect a sales charge on Class A shares of 5%, and the applicable contingent deferred sales charge (CDSC) on Class B and Class C shares. The Class B shares’ CDSC declines annually between years 1–6 according to the following schedule: 5, 4, 3, 3, 2, 1%. No sales charge will be assessed after the sixth year. Class C shares held for less than one year are subject to a 1% CDSC. Sales charge is not applicable for Class R3, Class R4, Class R5 and Class 1 shares.
The returns reflect past results and should not be considered indicative of future performance. The return and principal value of an investment will fluctuate so that shares, when redeemed, may be worth more or less than their original cost. Due to market volatility, the Fund’s current performance may be higher or lower than the performance shown. For performance data current to the most recent month-end, please call 1-800-225-5291 or visit the Fund’s Web site at www.jhfunds.com.
The performance table above and the chart on the next page do not reflect the deduction of taxes that a shareholder would pay on fund distributions or the redemption of fund shares.
The Fund’s performance results reflect any applicable expense reductions, without which the expenses would increase and results would have been less favorable.
Since inception performance is calculated with an opening price (prior day’s close) on inception date.
a Class A, Class B, Class C, Class R3, Class R4 and Class R5 shares began operations on 10-18-05 and Class 1 shares began operation on 10-15-05.
b For certain types of investors as described in the Fund’s Class R3, Class R4, Class R5 and Class 1 share prospectuses.
6
This chart shows what happened to a hypothetical $10,000 investment in Class A shares for the period indicated. For comparison, we’ve shown the same investment in the Standard & Poor’s 500 Index.
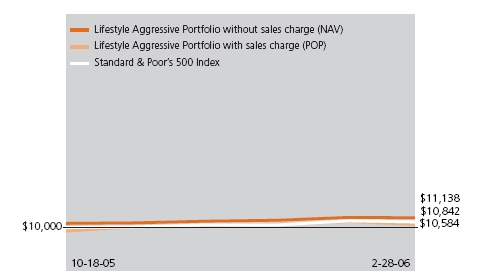
| | Class B | Class C | Class R3a | Class R4a | Class R5a | Class 1a |
| Period beginning | 10-18-05 | 10-18-05 | 10-18-05 | 10-18-05 | 10-18-05 | 10-15-05 |
|
| Without | | | | | | |
| sales charge | $11,114 | $11,114 | $11,125 | $11,138 | $11,144 | $11,148 |
|
| With maximum | | | | | | |
| sales charge | 10,614 | 11,014 | 11,125 | 11,138 | 11,144 | 11,148 |
|
| Index | 10,842 | 10,842 | 10,842 | 10,842 | 10,842 | 10,874 |
|
Assuming all distributions were reinvested for the period indicated, the table above shows the value of a $10,000 investment in the Fund’s Class B, Class C, Class R3, Class R4, Class R5 and Class 1 shares, respectively, as of February 28, 2006. Performance of the classes will vary based on the difference in sales charges paid by shareholders investing in the different classes and the fee structure of those classes.
Standard & Poor’s 500 Index is an unmanaged index that includes 500 widely traded common stocks.
It is not possible to invest directly in an index. Index figures do not reflect sales charges and would be lower if they did.
a For certain types of investors as described in the Fund’s Class R3, Class R4, Class R5 and Class 1 share prospectuses.
7
These examples are intended to help you understand your ongoing
operating expenses.
Understanding fund expenses
As a shareholder of the Fund, you incur two types of costs:
* Transaction costs which include sales charges (loads) on
purchases or redemptions (varies by share class), minimum
account fee charge, etc.
* Ongoing operating expenses including management fees,
distribution and service fees (if applicable) and other fund expenses.
|
In addition to the operating expenses which the Fund bears directly, the Fund indirectly bears a pro rata share of the operating expenses of the underlying funds in which the Fund invests. Because the underlying funds have varied operating expenses and transaction costs and the Fund may own different proportions of the underlying funds at different times, the amount of expenses incurred indirectly by the Fund will vary. If these indirect expenses were included, your expenses paid during the period would have been higher.
We are going to present only your ongoing operating expenses here.
Actual expenses/actual returns
This example is intended to provide information about your fund’s actual ongoing operating expenses, and is based on your fund’s actual return. It assumes an account value of $1,000.00 on inception date with the same investment held until February 28, 2006.
| Account value | | Expenses paid |
| $1,000.00 | Ending value | during period |
| on inception date | on 2-28-06 | ended 2-28-06a |
|
| Class Ab | $1,113.80 | $2.33 |
| Class Bb | 1,111.40 | 5.07 |
| Class Cb | 1,111.40 | 5.07 |
| Class R3b | 1,112.50 | 2.75 |
| Class R4b | 1,113.80 | 1.80 |
| Class R5b | 1,114.40 | 0.85 |
| Class 1b | 1,114.80 | 0.53 |
Together with the value of your account, you may use this information to estimate the operating expenses that you paid over
8
the period. Simply divide your account value at February 28, 2006 by $1,000.00, then multiply it by the “expenses paid” for your share class from the table above. For example, for an account value of $8,600.00, the operating expenses should be calculated as follows:
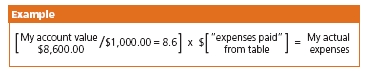
Hypothetical example for comparison purposes
This table allows you to compare your fund’s ongoing operating expenses with those of any other fund. It provides an example of the Fund’s hypothetical account values and hypothetical expenses based on each class’s actual expense ratio and an assumed 5% annual return before expenses (which is not your fund’s actual return). It assumes an account value of $1,000.00 on inception date with the same investment held until February 28, 2006. Look in any other fund shareholder report to find its hypothetical example and you will be able to compare these expenses.
| Account value | | Expenses paid |
| $1,000.00 | Ending value | during period |
| on inception date | on 2-28-06 | ended 2-28-06a |
|
| Class Ab | $1,016.20 | $2.22 |
| Class Bb | 1,013.60 | 4.83 |
| Class Cb | 1,013.60 | 4.83 |
| Class R3b | 1,015.80 | 2.62 |
| Class R4b | 1,016.70 | 1.71 |
| Class R5b | 1,017.60 | 0.81 |
| Class 1b | 1,018.30 | 0.50 |
Remember, these examples do not include any transaction costs, such as sales charges; therefore, these examples will not help you to determine the relative total costs of owning different funds. If transaction costs were included, your expenses would have been higher. See the prospectus for details regarding transaction costs.
a Expenses are equal to the Fund's annualized expense ratio of 0.60%, 1.32%, 1.32%, 0.72%, 0.47%, 0.23% and 0.12% for Class A, Class B, Class C, Class R3, Class R4, Class R5 and Class 1, respectively,
multiplied by the average account value over the period, multiplied by number of days in the inception period /365 or 366 (to reflect the one-half year period). b Class A, Class B, Class C, Class R3, Class R4 and Class R5 shares began operations on 10-18-05 and Class 1 shares began operation on 10-15-05.
9
F I N A N C I A L S TAT E M E N T S
FUND’S
INVESTMENTS
Securities owned
by the Fund on
February 28, 2006
(unaudited)
|
Lifestyle Aggressive Fund portfolio of investments, showing all
underlying funds.| Issuer | Shares | Value |
|
| Investment Companies 100.01% | | $2,221,823,210 |
| (Cost $2,019,206,817) | | |
| John Hancock Funds II | | |
|
| All Cap Growth Fund Class NAV | 2,564,041 | $44,204,071 |
|
| All Cap Value Fund Class NAV | 2,868,535 | 44,204,118 |
|
| Blue Chip Growth Fund Class NAV | 6,131,567 | 110,858,731 |
|
| Capital Appreciation Fund Class NAV | 8,733,052 | 88,640,473 |
|
| Core Equity Fund Class NAV | 4,445,937 | 66,422,304 |
|
| Emerging Growth Fund Class NAV | 2,307,728 | 44,331,451 |
|
| Equity-Income Fund Class NAV | 3,820,467 | 66,476,125 |
|
| Fundamental Value Fund Class NAV | 5,798,296 | 88,713,923 |
|
| International Equity Index Fund Class NAV | 5,048,563 | 89,157,627 |
|
| International Opportunities Fund Class NAV | 5,731,507 | 89,526,141 |
|
| International Small Cap Fund Class NAV | 6,580,600 | 134,375,853 |
|
| International Stock Fund Class NAV | 13,583,032 | 179,431,848 |
|
| International Value Fund Class NAV | 10,778,670 | 177,740,267 |
|
| Large Cap Fund Class NAV | 3,059,106 | 44,204,087 |
|
| Large Cap Value Fund Class NAV | 981,511 | 21,985,845 |
|
| Mid Cap Core Fund Class NAV | 5,063,174 | 88,858,705 |
|
| Mid Cap Stock Fund Class NAV | 2,715,175 | 44,447,416 |
|
| Mid Cap Value Fund Class NAV | 3,473,969 | 66,422,283 |
|
| Natural Resources Fund Class NAV | 3,344,149 | 110,858,547 |
|
| Quantitative Mid Cap Fund Class NAV | 2,862,961 | 44,204,118 |
|
| Quantitative Value Fund Class NAV | 4,214,613 | 66,422,303 |
|
| Small Cap Fund Class NAV | 4,356,284 | 66,607,581 |
|
| Small Cap Opportunities Fund Class NAV | 1,843,461 | 44,279,941 |
|
| Small Company Fund Class NAV | 2,594,139 | 44,204,122 |
|
| Small Company Value Fund Class NAV | 2,763,020 | 66,726,932 |
|
| Special Value Fund Class NAV | 2,134,533 | 44,312,913 |
|
| U.S. Global Leaders Growth Fund Class NAV | 1,653,118 | 22,102,189 |
See notes to
financial statements.
|
10
F I N A N C I A L S TAT E M E N T S
| Issuer | Shares | Value |
| John Hancock Funds II — continued | | |
|
| U.S. Multi Sector Fund Class NAV | 16,700,672 | $177,695,147 |
|
| Vista Fund Class NAV | 3,936,893 | 44,408,149 |
|
| Total investments 100.01% | | $2,221,823,210 |
|
| Liabilities in excess of other assets (0.01)% | | ($169,353) |
|
| Total net assets 100.00% | | $2,221,653,857 |
| Percentages are stated as a percent of net assets of the Fund. | | |
See notes to
financial statements.
|
11
F I N A N C I A L S TAT E M E N T S
ASSETS AND
LIABILITIES
February 28, 2006
(unaudited)
This Statement
of Assets and
Liabilities is the
Fund’s balance
sheet. It shows
the value of
what the Fund
owns, is due
and owes. You’ll
also find the net
asset value and
the maximum
offering price
per share.
|
|
| Assets | |
| Investments in affiliated funds, at value | |
| (cost $2,019,206,817) | $2,221,823,210 |
| Receivable for shares sold | 1,847,154 |
| Receivable from affiliates | 72,222 |
| Other assets | 3,697 |
| Total assets | 2,223,746,283 |
|
| Liabilities | |
| Due to custodian | 150,866 |
| Payable for investments purchased | 1,675,177 |
| Payable to affiliates | |
| Fund administration fees | 39,687 |
| Transfer agent fees | 3,394 |
| Other payables and accrued expenses | 223,302 |
| Total liabilities | 2,092,426 |
|
| Net assets | |
| Capital paid-in | 2,018,095,506 |
| Accumulated net realized gain on investments | 1,621,650 |
| Net unrealized appreciation on investments | 202,616,393 |
| Distributions in excess of net investment income | (679,692) |
| Net assets | $2,221,653,857 |
|
| Net asset value per share | |
| Based on net asset values and shares outstanding — | |
| the Funds have an unlimited number of shares | |
| authorized with no par value | |
| Class A ($11,778,200 ÷ 841,487 shares) | $14.00 |
| Class B ($3,023,713 ÷ 216,107 shares) | $13.99 |
| Class C ($5,498,195 ÷ 392,875 shares) | $13.99 |
| Class R3 ($145,837 ÷ 10,422 shares) | $13.99 |
| Class R4 ($143,498 ÷ 10,251 shares) | $14.00 |
| Class R5 ($171,686 ÷ 12,260 shares) | $14.00 |
| Class 1 ($2,200,892,728 ÷ 157,523,142 shares) | $13.97 |
|
| Maximum offering price per share | |
| Class Aa ($14.00 ÷ 95%) | $14.74 |
a On single retail sales of less than $50,000. On sales of $50,000 or more and on group sales the offering price is reduced.
See notes to
financial statements.
|
12
F I N A N C I A L S TAT E M E N T S
OPERATIONS
For the period ended
February 28, 2006a
(unaudited)
This Statement
of Operations
summarizes the
Fund’s investment
income earned and
expenses incurred
in operating the
Fund. It also shows
net gains (losses)
for the period
stated.
|
|
| Investment income | |
| Income distributions received from affiliated underlying funds | $11,032,304 |
| Total investment income | 11,032,304 |
|
| Expenses | |
| Investment management fees (Note III) | 294,085 |
| Distribution and service fees (Note III) | 359,171 |
| Transfer agent fees (Note III) | 3,607 |
| Blue sky fees (Note III) | 33,084 |
| Printing and postage fees (Note III) | 41,606 |
| Fund administration fees (Note III) | 39,755 |
| Audit and legal fees | 19,398 |
| Custodian fees | 4,268 |
| Trustees’ fees (Note III) | 9,988 |
| Registration and filing fees | 115,085 |
| Miscellaneous | 7,827 |
| Total expenses | 927,874 |
| Less expense reductions (Note III) | (72,432) |
| Net expenses | 855,442 |
| Net investment income | 10,176,862 |
|
| Realized and unrealized gain | |
| Net realized gain on investments | 1,493,229 |
| Capital gain distributions received from | |
| affiliated underlying funds | 128,421 |
| Change in net unrealized appreciation of investments | 202,616,393 |
| Net realized and unrealized gain | 204,238,043 |
| Increase in net assets from operations | $214,414,905 |
aPeriod from 10-15-05 (commencement of operations) to 2-28-06.
See notes to
financial statements.
|
13
F I N A N C I A L S TAT E M E N T S
CHANGES IN
NET ASSETS
These Statements
of Changes in Net
Assets show how
the value of the
Fund’s net assets
has changed since
the inception of
the Fund. The
difference reflects
earnings less
expenses, any
investment
gains and losses,
distributions, if
any, paid to
shareholders and
the net of Fund
share transactions.
|
| | Period |
| | ended |
| | 2-28-06a |
|
| Increase (decrease) in net assets | |
| From operations | |
| Net investment income | $10,176,862 |
| Net realized gain | 1,621,650 |
| Change in net unrealized appreciation | 202,616,393 |
| Increase in net assets resulting | |
| from operations | 214,414,905 |
| Distributions to shareholders | |
| From net investment income | |
| Class A | (10,791) |
| Class B | (2,807) |
| Class C | (4,862) |
| Class R3 | (460) |
| Class R4 | (512) |
| Class R5 | (565) |
| Class 1 | (10,836,557) |
| | (10,856,554) |
| From Fund share transactions | 2,018,095,506 |
|
| Net assets | |
| End of period | $2,221,653,857 |
| Distributions in excess of net investment income | ($679,692) |
a Class A, Class B, Class C, Class R3, Class R4 and Class R5 shares began operations on 10-18-05 and Class 1 shares began operation on 10-15-05. Unaudited.
See notes to
financial statements.
|
14
F I N A N C I A L H I G H L I G H T S
CLASS A SHARES
The Financial Highlights show how the Fund’s net asset value for a
share has changed since the commencement of operations of the Fund.
| Period ended | 2-28-06a |
|
| Per share operating performance | |
| Net asset value, | |
| beginning of period | $12.63 |
| Net investment incomeh | —j |
| Net realized and unrealized | |
| gain on investments | 1.43 |
| Total from | |
| investment operations | 1.43 |
| Less distributions | |
| From net investment income | (0.06) |
| | (0.06) |
| Net asset value, end of period | $14.00 |
| Total returnk,l (%) | 11.38m |
|
| Ratios and supplemental data | |
| Net assets, end of period | |
| (in millions) | $12 |
| Ratio of net expenses | |
| to average net assetsq (%) | 0.60r |
| Ratio of gross expenses | |
| to average net assetsp,q (%) | 2.41r |
| Ratio of net investment income | |
| to average net assetsv (%) | 0.04r |
| Portfolio turnover (%) | 2m |
See notes to
financial statements.
|
15
F I N A N C I A L H I G H L I G H T S
CLASS B SHARES
| Period ended | 2-28-06a |
|
| Per share operating performance | |
| Net asset value, | |
| beginning of period | $12.63 |
| Net investment lossh | (0.01) |
| Net realized and unrealized | |
| gain on investments | 1.41 |
| Total from | |
| investment operations | 1.40 |
| Less distributions | |
| From net investment income | (0.04) |
| | (0.04) |
| Net asset value, end of period | $13.99 |
| Total returnk,l (%) | 11.14m |
|
| Ratios and supplemental data | |
| Net assets, end of period | |
| (in millions) | $3 |
| Ratio of net expenses | |
| to average net assetsq (%) | 1.32r |
| Ratio of gross expenses | |
| to average net assetsp,q (%) | 4.41r |
| Ratio of net investment loss | |
| to average net assetsv (%) | (0.17)r |
| Portfolio turnover (%) | 2m |
See notes to
financial statements.
|
16
F I N A N C I A L H I G H L I G H T S
| CLASS C SHARES | |
| |
| Period ended | 2-28-06a |
|
| Per share operating performance | |
| Net asset value, | |
| beginning of period | $12.63 |
| Net investment lossh | (0.01) |
| Net realized and unrealized | |
| gain on investments | 1.42 |
| Total from | |
| investment operations | 1.41 |
| Less distributions | |
| From net investment income | (0.05) |
| | (0.05) |
| Net asset value, end of period | $13.99 |
| Total returnk,l (%) | 11.14m |
|
| Ratios and supplemental data | |
| Net assets, end of period | |
| (in millions) | $5 |
| Ratio of net expenses | |
| to average net assetsq (%) | 1.32r |
| Ratio of gross expenses | |
| to average net assetsp,q (%) | 3.81r |
| Ratio of net investment loss | |
| to average net assetsv (%) | (0.17)r |
| Portfolio turnover (%) | 2m |
See notes to
financial statements.
|
17
F I N A N C I A L H I G H L I G H T S
CLASS R3 SHARES
| Period ended | 2-28-06a |
|
| Per share operating performance | |
| Net asset value, | |
| beginning of period | $12.63 |
| Net investment incomeh | 0.03 |
| Net realized and unrealized | |
| gain on investments | 1.39 |
| Total from | |
| investment operations | 1.42 |
| Less distributions | |
| From net investment income | (0.06) |
| | (0.06) |
| Net asset value, end of period | $13.99 |
| Total returnk,l (%) | 11.25m |
|
| Ratios and supplemental data | |
| Net assets, end of period | |
| (in millions) | —i |
| Ratio of net expenses | |
| to average net assetsq (%) | 0.72r |
| Ratio of gross expenses | |
| to average net assetsp,q (%) | 16.57r |
| Ratio of net investment income | |
| to average net assetsv (%) | 0.70r |
| Portfolio turnover (%) | 2m |
See notes to
financial statements.
|
18
F I N A N C I A L H I G H L I G H T S
CLASS R4 SHARES
| Period ended | 2-28-06a |
|
| Per share operating performance | |
| Net asset value, | |
| beginning of period | $12.63 |
| Net investment incomeh | 0.04 |
| Net realized and unrealized | |
| gain on investments | 1.39 |
| Total from | |
| investment operations | 1.43 |
| Less distributions | |
| From net investment income | (0.06) |
| | (0.06) |
| Net asset value, end of period | $14.00 |
| Total returnk,l (%) | 11.38m |
|
| Ratios and supplemental data | |
| Net assets, end of period | |
| (in millions) | —i |
| Ratio of net expenses | |
| to average net assetsq (%) | 0.47r |
| Ratio of gross expenses | |
| to average net assetsp,q (%) | 15.78r |
| Ratio of net investment income | |
| to average net assetsv (%) | 0.89r |
| Portfolio turnover (%) | 2m |
See notes to
financial statements.
|
19
F I N A N C I A L H I G H L I G H T S
CLASS R5 SHARES
| Period ended | 2-28-06a |
|
| Per share operating performance | |
| Net asset value, | |
| beginning of period | $12.63 |
| Net investment incomeh | 0.06 |
| Net realized and unrealized | |
| gain on investments | 1.38 |
| Total from | |
| investment operations | 1.44 |
| Less distributions | |
| From net investment income | (0.07) |
| | (0.07) |
| Net asset value, end of period | $14.00 |
| Total returnk,l (%) | 11.44m |
|
| Ratios and supplemental data | |
| Net assets, end of period | |
| (in millions) | —i |
| Ratio of net expenses | |
| to average net assetsq (%) | 0.23r |
| Ratio of gross expenses | |
| to average net assetsp,q (%) | 16.26r |
| Ratio of net investment income | |
| to average net assetsv (%) | 1.21r |
| Portfolio turnover (%) | 2m |
See notes to
financial statements.
|
20
F I N A N C I A L H I G H L I G H T S
CLASS 1 SHARES
| Period ended | 2-28-06a |
|
| Per share operating performance | |
| Net asset value, | |
| beginning of period | $12.60 |
| Net investment incomeh | 0.07 |
| Net realized and unrealized | |
| gain on investments | 1.37 |
| Total from | |
| investment operations | 1.44 |
| Less distributions | |
| From net investment income | (0.07) |
| | (0.07) |
| Net asset value, end of period | $13.97 |
| Total returnk (%) | 11.48m |
|
| Ratios and supplemental data | |
| Net assets, end of period | |
| (in millions) | $2,201 |
| Ratio of net expenses | |
| to average net assetsq (%) | 0.12r |
| Ratio of net investment income | |
| to average net assetsv (%) | 1.48r |
| Portfolio turnover (%) | 2m |
a Class A, Class B, Class C, Class R3, Class R4 and Class R5 shares began operations on 10-18-05 and Class 1
shares began operation on 10-15-05. Unaudited.
h Based on the average of the shares outstanding.
i Less than $500,000.
j Less than $0.01 per share.
k Assumes dividend reinvestment and does not reflect the effect of sales charges.
l Total returns would have been lower had certain expenses not been reduced during the period shown.
m Not annualized.
p Does not take into consideration expense reductions during the period shown.
q Does not include expenses of the investment companies in which the Fund invests.
r Annualized.
v Recognition of net investment income by the Fund is affected by the timing of the declaration of dividends by
the underlying investment companies in which the Fund invests.
|
See notes to
financial statements.
|
21
NOTES TO
STATEMENTS
Unaudited
|
I. Organization
The John Hancock Lifestyle Aggressive Portfolio (the “Fund”) is a non-diversified series of John Hancock Funds II (the “Trust”), an open-end management investment company registered under the Investment Company Act of 1940, as amended.
The Fund operates as a “fund of funds”, which invests in shares of mutual funds (“underlying funds”) managed by affiliates of John Hancock Investment Management Services, LLC (the “Adviser”). The Adviser is a wholly owned subsidiary of Manulife Financial Corporation (“MFC”). Each underlying fund’s accounting policies are outlined in the underlying fund’s shareholder report, available without charge by calling 1-800-344-1029 or on the Securities and Exchange Commission (“SEC”) Internet site at www.sec.gov, File # 811-21779, CIK 0001331971.
The Trustees have authorized the issuance of multiple classes of shares of the Fund, including classes designated as Class A, Class B, Class C, Class R3, Class R4, Class R5, and Class 1 shares. The shares of each class represent an interest in the same portfolio of investments of the Fund, and have equal rights as to voting, redemptions, dividends and liquidation, except that certain expenses, subject to the approval of the Trustees, may be applied differently to each class of shares in accordance with current regulations of the Securities and Exchange Commission and the Internal Revenue Service. Shareholders of a class that bears distribution and service expenses under the terms of a distribution plan have exclusive voting rights to that distribution plan.
At February 28, 2006 John Hancock USA, an indirect subsidiary of MFC, owned 7,937 Class R3, Class R4 and Class R5 shares of beneficial interest of the Fund.
II. Significant
accounting policies
In the preparation of the financial statements, the Fund follows the policies described below. The preparation of financial statements in conformity with accounting principles generally accepted in the United States of America requires management to make estimates and assumptions that affect the reported amounts of assets and liabilities at the date of the financial statements and the reported amounts of income and expenses during the reporting period. Actual results may differ from these estimates.
Securities valuation
The net asset value of the shares of the Fund is determined daily as of the close of the New York Stock Exchange, normally at 4:00 P.M. Eastern Time. Investments in underlying funds are valued at their respective net asset values each business day, or at fair value as determined in good faith in accordance with procedures approved by the Trustees.
22
Securities in the underlying fund’s portfolios are valued in accordance with their respective valuation polices, as outlined in the underlying funds’ financial statements. Short-term debt investments that have a remaining maturity of 60 days or less are valued at amortized cost.
Repurchase agreements
The Fund may enter into repurchase agreements. When a Fund enters into a repurchase agreement through its custodian, it receives delivery of securities, the amount of which at the time of purchase and each subsequent business day is required to be maintained at such a level that the market value is generally at least 102% of the repurchase amount. The Fund will take constructive receipt of all securities underlying the repurchase agreements it has entered into until such agreements expire. If the seller defaults, a Fund would suffer a loss to the extent that proceeds from the sale of underlying securities were less than the repurchase amount. The Fund may enter into repurchase agreements maturing within seven days with domestic dealers, banks or other financial institutions deemed to be creditworthy by the Adviser. Collateral for certain tri-party repurchase agreements is held at the custodian bank in a segregated account for the benefit of the Fund and the counterparty.
Security transactions and
related investment income
Investment security transactions are accounted for on a trade date basis. Interest income is accrued as earned. Dividend income on investment securities is recorded on the ex-dividend date.
Multi-class operations
All income, expenses (except for class-specific expenses) and realized and unrealized gains (losses) are allocated to each class of shares based upon the relative net assets of each class. Dividends to shareholders from net investment income are determined at a class level and distributions from capital gains are determined at a Fund level.
Expense allocation
Expenses not directly attributable to a particular Fund or class of shares are allocated based on the relative share of net assets of the Fund at the time the expense was incurred. Class-specific expenses, such as transfer agency fees, blue sky fees, printing and postage fees and distribution and service fees, are accrued daily and charged directly to the respective share classes. Expenses in the Fund’s Statements of Operations reflect the expenses of the Fund and do not include any indirect expenses related to the underlying funds. Because the underlying funds have varied expense levels and the Fund may own different proportions of the underlying funds at different times, the amount of fees and expenses incurred indirectly by the Fund will vary.
Federal income taxes
The Fund qualifies as a “regulated investment company” by complying with the applicable provisions of the Internal Revenue Code and will not be subject to federal income tax on taxable income that is distributed to shareholders. Therefore, no federal income tax provision is required.
Distribution of
income and gains
The Fund records distributions to shareholders from net investment income and net realized gains, if any, on the ex-dividend date. Distributions paid by the Fund with respect to each class of shares are calculated in the same manner, at the same time and are in the same amount, except for the effect of expenses that may be applied differently to each class. Such distributions, on a tax basis, are determined in conformity with income tax regulations, which may differ from accounting principles generally accepted in the United States of America. Distributions in excess of tax basis earnings and profits, if any, are reported in the Fund’s financial statements as a return of capital.
Capital accounts
The Fund reports the undistributed net investment income and accumulated undistributed net realized
23
gain (loss) accounts on a basis approximating amounts available for future tax distributions (or to offset future taxable realized gains when a capital loss carryforward is available). Accordingly, the Fund may periodically make reclassifi-cations among certain capital accounts, without affecting its net asset value.
III. Investment
advisory and
other agreements
Advisory fees
The Trust has entered into an Investment Advisory Agreement with the Adviser. The Adviser is responsible for managing the corporate and business affairs of the Trust and for selecting and compensating subadvisers to handle the investment and reinvestment of the assets of the Fund, subject to the supervision of the Board of Trustees. Under the Advisory Agreement the Fund pays a monthly management fee to the Adviser equivalent, on an annual basis, to the sum of: (a) 0.05% of the first $7,500,000,000 of the Fund’s aggregate daily net assets and (b) 0.04% of the Fund’s aggregate daily net assets in excess of $7,500,000,000. Aggregate net assets include the net assets of the five Lifestyle Portfolios of the Trust (the Lifestyle Aggressive, the Lifestyle Balanced, the Lifestyle Conservative, the Lifestyle Growth and the Lifestyle Moderate) and the five Lifestyle Portfolios of John Hancock Trust (the Lifestyle Aggressive 1000, the Lifestyle Growth 820, the Lifestyle Balanced 640, the Lifestyle Moderate 460 and the Lifestyle Conservative 280). The Fund is not responsible for payment of the subadvisory fees.
Expense reimbursements
The Adviser has contractually agreed to waive advisory fees or reimburse Fund’s expenses for Class A, Class B, Class C, Class R3, Class R4 and Class R5 shares to the extent that blue sky fees and printing and postage expenses attributable to each class exceed 0.09% of the average annual net assets attributable to the classes, at least until November 1, 2006. Accordingly, the expense reductions related to this expense limitation amounted to $24,895, $11,940, $15,712, $6,540, $6,589 and $6,546 for Class A, Class B, Class C, Class R3, Class R4, and Class R5, respectively, for the period ended February 28, 2006. The Adviser reserves the right to terminate this limitation in the future.
Administration fees
The Fund has an agreement with the Adviser that requires the Fund to reimburse the Adviser for all expenses associated with providing the administrative, financial, accounting and recordkeeping services of the Fund, including the preparation of all tax returns, annual, semiannual and periodic reports to shareholders and the preparation of all regulatory reports.
Distribution plans
The Trust has a Distribution Agreement with John Hancock Funds, LLC (“JH Funds”), a wholly-owned subsidiary of the Adviser. The Fund has adopted Distribution Plans with respect to Class A, Class B, Class C, Class R3, Class R4 and Class 1, pursuant to Rule 12b-1 under the Investment Company Act of 1940, to reimburse JH Funds for the services it provides as distributor of shares of the Fund. Accordingly, the Fund makes monthly payments to JH Funds at an annual rate not to exceed 0.30%, 1.00%, 1.00%, 0.50%, 0.25%, and 0.05% of average daily net asset value of Class A, Class B, Class C, Class R3, Class R4 and Class 1, respectively. A maximum of 0.25% of such payments may be service fees, as defined by the Conduct Rules of the National Association of Securities Dealers. Under the Conduct Rules, curtailment of a portion of the Fund’s 12b-1 payments could occur under certain circumstances.
The Fund has also adopted a Service Plan with respect to Class R3, Class R4 and Class R5 shares (the “Service Plan”). Under the Service Plan, the Fund pays up to 0.15%, 0.10% and 0.05% of average daily net assets of
24
Class R3, Class R4 and Class R5 shares, respectively, for certain other services. There were no servicing fees during the period ended February 28, 2006.
Sales charges
Class A shares are assessed up-front sales charges. During the period ended February 28, 2006, JH Funds received net up-front sales charges of $197,071 with regard to sales of Class A shares. Of this amount, $32,125 was retained and used for printing prospectuses, advertising, sales literature and other purposes, $162,736 was paid as sales commissions to unrelated broker-dealers and $2,210 was paid as sales commissions to sales personnel of Signator Investors, Inc. (“Signator Investors”), a related broker-dealer, an indirect subsidiary of MFC.
Class B shares that are redeemed within six years of purchase are subject to a contingent deferred sales charge (“CDSC”) at declining rates, beginning at 5.00% of the lesser of the current market value at the time of redemption or the original purchase cost of the shares being redeemed. Class C shares that are redeemed within one year of purchase are subject to a CDSC at a rate of 1.00% of the lesser of the current market value at the time of redemption or the original purchase cost of the shares being redeemed. Proceeds from the CDSCs are paid to JH Funds and are used, in whole or in part, to defray its expenses for providing distribution-related services to the Fund in connection with the sale of Class B and Class C shares. During the period ended February 28, 2006, CDSCs received by JH Funds amounted to $8 for Class B shares and $193 for Class C shares.
Transfer agent fees
The Fund has a Transfer Agency Agreement with John Hancock Signature Services, Inc. (“Signature Services”), an indirect subsidiary of MFC. For Class A, Class B, Class C, Class R3, Class R4 and Class R5 shares, the Fund pays a monthly transfer agent fee at an annual rate of 0.05% of each class’s average daily net assets, plus a fee based on the number of shareholder accounts and reimbursement for certain out-of-pocket expenses. Expenses not directly attributable to a particular class of shares are aggregated and allocated to each class on the basis of its relative net asset value.
Signature Services has agreed to limit the transfer agent fees so that such fees do not exceed 0.20% annually of Class A, Class B, Class C, Class R3, Class R4 and Class R5 share average daily net assets. This agreement is effective until December 31, 2006. Signature Services reserves the right to terminate this limitation in the future.
In addition, Signature Service has voluntarily agreed to further limit transfer agent fees for Class R3, Class R4 and Class R5 shares so that such fees do not exceed 0.05% annually of each class’s average daily net assets. Accordingly, the transfer agent fees reductions amounted to $69, $72 and $69 for Class R3, Class R4 and Class R5 shares, respectively, during the period ended February 28, 2006. Signature Services reserves the right to terminate this limitation at any time.
25
Expenses under the agreements described above for the period ended February 28, 2006, were as follows:
| | Distribution | Transfer | | Printing and |
| Share Class | fees | agent | Blue sky | postage |
|
| Class A | $4,124 | $1,803 | $5,514 | $20,722 |
| Class B | 3,858 | 587 | 5,514 | 6,807 |
| Class C | 6,309 | 937 | 5,514 | 10,821 |
| Class R3 | 205 | 92 | 5,514 | 1,067 |
| Class R4 | 107 | 96 | 5,514 | 1,117 |
| Class R5 | N/A | 92 | 5,514 | 1,072 |
| Class 1 | 344,568 | — | — | — |
| Total | $359,171 | $3,607 | $33,084 | $41,606 |
Trustees’ fees
The Trust compensates each Trustee who is not an employee of the Adviser or its affiliates. Total Trustees’ expenses are allocated based on each fund’s average daily net asset value.
IV. Guarantees and indemnifications
Under the Trust’s organizational documents, its Officers and Trustees are indemnified against certain liability arising out of the performance of their duties to the Trust. Additionally, in the normal course of business, the Trust enters into contracts with service providers that contain general indemnification clauses. The Trust’s maximum exposure under these arrangements is unknown, as this would involve future claims that may be made against the Trust that have not yet occurred. However, based on experience, the Trust believes the risk of loss to be remote.
26
V. Capital shares
Share activities for the Fund for the period ended February 28, 2006 were as follows:
| | Period ended 2-28-06a | |
| | Shares | Amount |
|
| Class A shares | | |
| Sold | 846,179 | $11,660,716 |
| Distributions reinvested | 739 | 9,867 |
| Repurchased | (5,431) | (75,472) |
| Net increase | 841,487 | $11,595,111 |
|
|
| Class B shares | | |
| Sold | 219,075 | $3,000,126 |
| Distributions reinvested | 161 | 2,152 |
| Repurchased | (3,129) | (43,026) |
| Net increase | 216,107 | $2,959,252 |
|
|
| Class C shares | | |
| Sold | 395,100 | $5,424,411 |
| Distributions reinvested | 283 | 3,787 |
| Repurchased | (2,508) | (34,514) |
| Net increase | 392,875 | $5,393,684 |
|
|
| Class R3 shares | | |
| Sold | 10,422 | $134,888 |
| Net increase | 10,422 | $134,888 |
|
|
| Class R4 shares | | |
| Sold | 10,251 | $132,394 |
| Net increase | 10,251 | $132,394 |
|
|
| Class R5 shares | | |
| Sold | 12,443 | $163,064 |
| Repurchased | (183) | (2,585) |
| Net increase | 12,260 | $160,479 |
|
|
| Class 1 shares | | |
| Sold | 157,730,313 | $2,000,550,607 |
| Distributions reinvested | 812,945 | 10,836,557 |
| Repurchased | (1,020,116) | (13,667,466) |
| Net increase | 157,523,142 | $1,997,719,698 |
|
| Net increase | 159,006,544 | $2,018,095,506 |
a Class A, Class B, Class C, Class R3, Class R4 and Class R5 shares began operations on 10-18-05 and Class 1 shares began operation on 10-15-05.
27
VI. Investment transactions
Purchases and proceeds from sales or maturities of securities, other than short-term securities and obligations of the U.S. government, during the period ended February 28, 2006, aggregated $2,068,688,086 and $50,974,498, respectively.
The cost of investments owned on February 28, 2006, including short-term investments, for federal income tax purposes, was $2,019,206,817. Gross unrealized appreciation and depreciation of investments aggregated $203,063,618 and $447,225, respectively, resulting in net unrealized appreciation of $202,616,393. The difference between book basis and tax basis net unrealized appreciation of investments is attributable primarily to the tax deferral of losses on certain sales of securities.
VII. Investment
in affiliated
underlying funds
The Fund invests primarily in the underlying funds that are managed by affiliates of the Adviser. The Fund does not invest in the underlying funds for the purpose of exercising management or control.
A summary of the Fund’s transactions in the securities of affiliated issuers in which the Fund’s holdings represent 5% or more of the outstanding voting securities of the issuer, during the period ended February 28, 2006 is set forth below.
| Affiliate — | Shares | Shares | Ending Share | | Ending |
| Class NAV | Purchased | Sold | Amount | Proceeds | Value |
|
| All Cap Growth | 2,564,122 | 81 | 2,564,041 | $40,528,071 | $44,204,071 |
| All Cap Value | 2,868,620 | 85 | 2,868,535 | 40,093,361 | 44,204,118 |
| Blue Chip Growth | 6,132,074 | 507 | 6,131,567 | 103,207,032 | 110,858,731 |
| Capital Appreciation | 8,781,471 | 48,419 | 8,733,052 | 82,660,321 | 88,640,473 |
| Core Equity | 4,537,577 | 91,640 | 4,445,937 | 62,084,338 | 66,422,304 |
| Emerging Growth | 2,347,460 | 39,732 | 2,307,728 | 37,816,989 | 44,331,451 |
| Equity-Income | 3,821,321 | 854 | 3,820,467 | 61,955,762 | 66,476,125 |
| Fundamental Value | 5,799,691 | 1,395 | 5,798,296 | 84,678,142 | 88,713,923 |
| International Equity Index | 5,048,680 | 117 | 5,048,563 | 79,064,552 | 89,157,627 |
| International | | | | | |
| Opportunities | 5,916,437 | 184,930 | 5,731,507 | 78,293,098 | 89,526,141 |
| International Small Cap | 6,606,531 | 25,931 | 6,580,600 | 119,821,085 | 134,375,853 |
| International Stock | 13,863,368 | 280,336 | 13,583,032 | 161,304,993 | 179,431,848 |
| International Value | 10,808,960 | 30,290 | 10,778,670 | 161,498,801 | 177,740,267 |
| Large Cap | 3,059,186 | 80 | 3,059,106 | 41,388,042 | 44,204,087 |
| Large Cap Value | 982,121 | 610 | 981,511 | 20,143,367 | 21,985,845 |
| Mid Cap Core | 5,063,254 | 80 | 5,063,174 | 81,399,081 | 88,858,705 |
| Mid Cap Stock | 2,730,140 | 14,965 | 2,715,175 | 38,117,378 | 44,447,416 |
| Mid Cap Value | 3,474,367 | 398 | 3,473,969 | 62,025,037 | 66,422,283 |
| Natural Resources | 4,100,214 | 756,065 | 3,344,149 | 94,855,489 | 110,858,547 |
| Quantitative Mid Cap | 2,863,021 | 60 | 2,862,961 | 39,581,254 | 44,204,118 |
| Quantitative Value | 4,214,712 | 99 | 4,214,613 | 60,402,829 | 66,422,303 |
| Small Cap | 4,363,003 | 6,719 | 4,356,284 | 58,863,037 | 66,607,581 |
| Small Cap Opportunities | 1,843,827 | 366 | 1,843,461 | 39,445,858 | 44,279,941 |
| Small Company | 2,598,898 | 4,759 | 2,594,139 | 39,394,484 | 44,204,122 |
| Small Company Value | 2,766,707 | 3,687 | 2,763,020 | 58,857,386 | 66,726,932 |
| Special Value | 2,134,901 | 368 | 2,134,533 | 40,343,023 | 44,312,913 |
| U.S. Global | | | | | |
| Leaders Growth | 2,483,627 | 830,509 | 1,653,118 | 22,308,569 | 22,102,189 |
| U.S. Multi Sector | 16,701,277 | 605 | 16,700,672 | 167,908,430 | 177,695,147 |
| Vista | 3,936,995 | 102 | 3,936,893 | 39,618,327 | 44,408,149 |
28
Evaluation of Advisory and Subadvisory Agreement by the Board
of Trustees (unaudited)
This section describes the evaluation by the Board of Trustees of the Advisory Agreement and each of the Subadvisory Agreements.
Evaluation by the Board of Trustees
The Board, including the Independent Trustees, is responsible for selecting the Trust’s investment adviser, John Hancock Investment Management Services, LLC (the “Adviser” or “JHIMS”), approving the Adviser’s selection of subadvisers for each series of the Trust (the “Funds”) and approving the Trust’s advisory and subadvisory agreements, their periodic continuation and any amendments. Consistent with SEC rules, the Board will regularly evaluate the Trust’s advisory and subadvisory arrangements, including consideration of the six factors listed below. The Board may also consider other factors (including conditions and trends prevailing generally in the economy, the securities markets and the industry) and does not treat any single factor as determinative, and each Trustee may attribute different weights to different factors. The Board is furnished with an analysis of its fiduciary obligations in connection with its evaluation and, throughout the evaluation process, the Board is assisted by counsel for the Trust and the Independent Trustees are also separately assisted by independent legal counsel. The six factors to be regularly considered by the Board are:
1. the nature, extent and quality of the services to be provided by the Adviser to the Trust and by the subadvisers to the Funds;
2. the investment performance of the Funds and their subadvisers;
3. the extent to which economies of scale would be realized as a Fund grows;
4. whether fee levels reflect these economies of scale for the benefit of Trust shareholders;
5. the costs of the services to be provided and the profits to be realized by the Adviser and its affiliates from the Adviser’s relationship with the Trust; and
6. comparative services rendered and comparative advisory and subadvisory fee rates.
The Board believes that information relating to all six factors is relevant to its evaluation of the Trust’s advisory agreement. With respect to its evaluation of subadvisory agreements, the Board believes that, in view of the Trust’s “manager-of-managers” advisory structure: factors (1), (2) and (6) are of primary relevance; factors (3) and (4) generally are less significant to the Trustees’ considerations because subad-visory fees are paid to subadvisers by the Adviser and not directly by the Funds, and issues pertaining to economies of scale are considered in connection with the approval of the advisory fees that are paid directly by the Funds; and with respect to those subadvisers that are not affiliated with the Adviser, because the Board relies on the ability of the Adviser to negotiate the subadvisory fees at arms-length, factor (5) generally is also less significant to the Trustees’ considerations except in those circumstances in which such attention may be warranted because the comparative fee information considered in connection with factor (6) indicates that the subadvisory fees will materially exceed those normally charged under comparable circumstances.
29
In evaluating subadvisory arrangements, the Board also considers other material business relationships that unaffiliated subadvisers and their affiliates have with the Adviser or its affiliates, including the involvement by certain affiliates of certain subadvisers in the distribution of financial products, including shares of the Trust, offered by the Adviser and other affiliates of the Adviser (“Material Relationships”).
Approval of Advisory Agreement
At its meeting on September 21, 2005, the Board, including all the Independent Trustees, approved the Advisory Agreement between the Trust and JHIMS with respect to each of the Funds.
In approving the Advisory Agreement, and with reference to the six factors that it considers, the Board:
1(a) considered the high value to the Trust of JHIMS’s long relationship with investment companies within the same fund complex as the Trust, the skills and competency which JHIMS has demonstrated in managing the affairs and subadvisory relationships of these other investment companies, JHIMS’s ability to oversee and monitor the subadvis-ers’ investment performance and compliance programs and the qualifications of JHIMS’ personnel,
(b) considered JHIMS’s compliance policies and procedures and its responsiveness to regulatory changes and mutual fund industry developments, and
(c) considered JHIMS’s administrative capabilities, including its ability to supervise the other service providers for the Funds and concluded that JHIMS may reasonably be expected to ably perform its services under the Advisory Agreement;
2 reviewed the investment performance of comparably managed funds of each of the Funds; the comparative performance of their respective benchmarks and comparable funds (i.e., funds having approximately the same investment objective); and JHIMS’ analysis of such performance and its plans and recommendations regarding the Trust’s subadvisory arrangements generally and with respect to particular Funds; and concluded that each of the comparably managed funds has generally performed well or within a range that the Board deemed competitive except as discussed in Appendix A, and that JHIMS may reasonably be expected to ably monitor the performance of the Funds and each of their subadvisers;
3 & 4 reviewed the Trust’s advisory fee structure and the incorporation therein of any subadvisory fee breakpoints in the advisory fees charged and concluded (a) that to the extent that Funds have subadvisory fees with breakpoints, those breakpoints are reflected as breakpoints in the advisory fees for Funds, (b) that all Funds with a subadviser that is not affiliated with the Adviser have subadvisory fees which are the product of arms-length negotiations between the Adviser and the subadviser and which in many, but not all, cases contain breakpoints, and (c) that, although economies of scale cannot be measured with precision, these arrangements permit shareholders of Funds with advisory fee breakpoints to benefit from economies of scale if those Funds grow;
5 (a) reviewed the financial statements of JHIMS and John Hancock Life Insurance Company (U.S.A.) (“JHLICO (U.S.A.)”) and considered an analysis presented by JHIMS
30
regarding the estimated net profitability to JHIMS of the advisory fee structure;
(b) reviewed the profitability of the JHIMS’ relationship with the Funds in terms of the total amount of annual advisory fees it is estimated to receive with respect to the Funds and whether JHIMS has the financial ability to provide a high level of services to the Funds,
(c) considered that JHIMS will derive reputational and other indirect benefits from providing advisory services to the Funds, and
(d) noted that JHIMS will pay the sub-advisory fees out of the advisory fees JHIMS receives from the Funds and concluded that the advisory fees to be paid by the Trust with respect to the Funds are not unreasonable in light of such information; and
6 reviewed comparative information with respect to the proposed advisory fee rates and concluded that the Trust’s anticipated advisory fees are within the range of those incurred by other comparable funds and that the Trust’s advisory structure is thus competitive within the industry. In considering the proposed advisory fee rates, the Board took into account the high level of services expected to be provided to the Funds and the other factors considered.
Additional information that the Board considered for a particular Fund is set forth in Appendix A.
Approval of Subadvisory Agreements
At its meeting on September 21, 2005, the Board, including all the Independent Trustees, approved the Subadvisory Agreements.
In making its determination with reference to these respective factors, the Board reviewed:
1 information relating to each subad-viser’s business, which may include information such as: business performance, representative clients, assets under management, financial stability, personnel and, if applicable, past sub-advisory services to affiliated funds of the Trust;
2 the investment performance of comparatively managed funds of the Fund and comparative performance information relating to the comparatively managed fund’s benchmark and comparable funds;
3 the proposed subadvisory fee for each Fund and comparative fee information; and
4 information relating to the nature and scope of Material Relationships and their significance to the Trust’s adviser and unaffiliated subadvisers.
The Board’s decision to approve each Subadvisory Agreement was based on a number of determinations, including the following:
1 The Subadviser has extensive experience and demonstrated skills as a manager;
2 Although not without variation, the current and historical performance of the comparably managed funds of Subadviser to the Funds generally has been within the range of the current and historical performance of comparable funds and the comparably managed funds’ respective benchmarks;
3 With respect to each subadviser that is not affiliated with the Adviser, the subadvisory fees are a product of arms-length negotiation between the
31
Adviser and the subadviser and generally are within the range of industry norms; and
4 The Material Relationships consist of arrangements in which unaffiliated subadvisers or their affiliates provide advisory, distribution or management services in connection with financial products sponsored by the Trust’s adviser or its affiliates, which may include other registered investment companies, a 529 education savings plan, managed separate accounts and exempt group annuity contracts sold to qualified plans, and which in no case contained elements that would cause the Board to conclude that approval of the subadvisory agreement with the subadviser would be inappropriate.
Additional information that the Board considered for a particular fund is set forth below.
| | Performance of | |
| | Comparable Funds | Estimated Fees |
| Fund | as of June 30, 2005 | and Expenses |
|
| Lifestyle Aggressive | Performance of the | Advisory fees for this Fund |
| | Lifestyle Aggressive | are lower than its peer |
| (MFC Global | 1000 Trust of JHT has | group median. |
| Investment | outperformed its | |
| Management (U.S.A.) | benchmark index over | Total expenses for this |
| Limited | the one, three and five | Fund are higher than its |
| | year periods. | peer group median. |
|
32
For more information
The Portfolio’s proxy voting policies, procedures and records are available without charge, upon request:
| By phone | On the Fund’s Web site | On the SEC’s Web site |
| 1-800-225-5291 | www.jhfunds.com/proxy | www.sec.gov |
|
| Trustees | Gordon M. Shone | Principal distributor |
| James M. Oates, Chairman* | Vice President and Treasurer | John Hancock Funds, LLC |
| Charles L. Bardelis * | Betsy A. Seel | 601 Congress Street |
| James R. Boyle† | Assistant Vice President, | Boston, MA 02210-2805 |
| Peter S. Burgess * | Secretary and | |
| Elizabeth G. Cook | Chief Legal Officer | Custodian |
| William H. Cunningham | George Boyd | State Street Bank & Trust Co. |
| Charles L. Ladner * | Senior Counsel, Assistant | 225 Franklin Street |
| Hassell H. McClellan | Vice President and | Boston, MA 02110 |
| *Members of the Audit Committee | Assistant Secretary | |
| †Non-Independent Trustee | Francis V. Knox, Jr. | Transfer agent |
| Vice President and Chief | John Hancock Signature |
| Officers | Compliance Officer | Services, Inc. |
| Keith F. Hartstein | | 1 John Hancock Way, |
| President | Investment adviser | Suite 1000 |
| John G. Vrysen | John Hancock Investment | Boston, MA 02217-1000 |
| Executive Vice President and | Management Services, LLC | |
| Chief Financial Officer | 601 Congress Street | Legal counsel |
| Boston, MA 02210-2805 | Kirkpatrick & Lockhart |
| | Nicholson Graham LLP |
| | | 1 Lincoln Street |
| | | Boston, MA 02111 |
The Portfolio’s investment objective, risks, charges and expenses are included in the prospectus and should be considered carefully before investing. For a prospectus, call your financial professional, call John Hancock Funds at 1-800-225-5291, or visit the Portfolio’s Web site at www.jhfunds.com. Please read the prospectus carefully before investing or sending money.
| How to contact us | |
|
| |
| Internet | www.jhfunds.com | |
|
| |
| Mail | Regular mail: | Express mail: |
| | John Hancock | John Hancock |
| | Signature Services, Inc. | Signature Services, Inc. |
| | 1 John Hancock Way, Suite 1000 | Mutual Fund Image Operations |
| | Boston, MA 02217-1000 | 380 Stuart Street |
| | | Boston, MA 02116 |
|
| Phone | Customer service representatives | 1-800-225-5291 |
| | 24-hour automated information | 1-800-338-8080 |
| | TDD line | 1-800-554-6713 |
A listing of month-end portfolio holdings is available on our Web site, www.jhfunds.com. A more detailed portfolio holdings summary is available on a quarterly basis 60 days after the fiscal quarter on our Web site or upon request by calling 1-800-225-5291, or on the Securities and Exchange Commission’s Web site, www.sec.gov.
33


| Table of contents |
|
| Your fund at a glance |
| page 1 |
|
| Managers’ report |
| page 2 |
|
| A look at performance |
| page 6 |
|
| Growth of $10,000 |
| page 7 |
|
| Your expenses |
| page 8 |
|
| Fund’s investments |
| page 10 |
|
| Financial statements |
| page 12 |
|
| For more information |
| page 33 |
|
After producing modest returns in 2005, the stock market started off strong in the first two months of 2006. The major indexes all advanced and produced two-month returns that were already half as much as the market’s returns for all of 2005. For example, the Standard & Poor’s 500 Index returned 2.93% through February 2006, versus 4.91% last year in total. Investors were encouraged by solid corporate earnings, a slower-growing economy and stable inflation, which suggested the Federal Reserve could be coming close to the end of their 18-month campaign of rising interest rates.
Although a solid yearly beginning has typically augured well for the rest of the year, it is anyone’s guess where the market will end 2006, especially given the wild cards of interest rate moves and record-high energy prices and their impact on corporate profits and the economy.
One thing we do know, however, is that the stock market’s pattern is one of extremes. Consider the last 10 years. From 1995 through 1999, we saw double-digit returns in excess of 20% per year, only to have 2000 through 2002 produce ever-increasing negative results, followed by another 20%-plus up year in 2004 and a less than 5% advance in 2005. Since 1926, the market, as measured by the Standard & Poor’s 500 Index, has produced average annual results of 10.4% . However, that “normal” return is rarely produced in any given year. In fact, calendar-year returns of 8% to 12% have occurred only five times in the 80 years since 1926.
Although the past in no way predicts the future, we have learned at least one lesson from history: Expect highs and lows in the short term, but always invest for the long term. Equally important: Work with your financial professional to maintain a diversified portfolio, spread out among not only different asset classes — stocks, bonds and cash — but also among various investment styles. It’s the best way we know of to benefit from, and weather, the market’s extremes.

Keith F. Hartstein,
President and Chief Executive Officer
|
This commentary reflects the CEO’s views as of February 28, 2006. They are subject to change at any time.
The Portfolio seeks a
balance between a
high level of current
income and growth
of capital, with a
greater emphasis on
growth of capital.
To pursue this goal,
the Portfolio, which
is a fund of funds,
normally invests
approximately 40%
of its assets in
underlying funds
which invest
primarily in fixed-
income securities
and approximately
60% of its assets
in underlying
funds which
invest primarily in
equity securities.
|
Since inceptiona
* Equities performed quite well during the reporting period while most U.S. fixed income segments were only modestly positive.
* All but one of the underlying funds produced positive results during the reporting period and the Lifestyle Balanced Portfolio outperformed the S&P 500 Index.
* The equity portion of the Portfolio benefited most from allocations to funds that invest in small- and mid-cap stocks as well as funds that invest in non-U.S. equities, while the fixed income portion benefited most from funds that invest in high yield bonds.
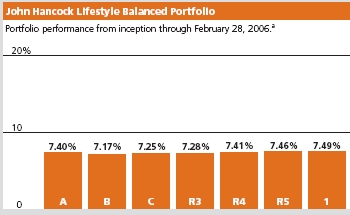
Total returns for the Portfolio are at net asset value with all distributions reinvested.
These returns do not reflect the deduction of the maximum sales charge, which would
reduce the performance shown above.
a Class A, Class B, Class C, Class R3, Class R4 and Class R5 began operations on 10-18-05
and Class 1 began operation on 10-15-05.
| Asset Allocation | | | | |
| Equity | | % of Total | Fixed Income | % of Total |
| U.S. Large Cap | | 36.00 | High Yield Bond | 14.00 |
| International | | 10.00 | Intermediate Term Bond | 9.00 |
| Real Estate | | 5.00 | Multi-Sector Bond | 8.00 |
| Natural Resources | | 4.00 | Treasury Inflation | |
| U.S. Small Cap | | 3.00 | Protected Securities | 5.00 |
| International Small Cap | 2.00 | Global Bond | 3.00 |
| U.S. Mid Cap | | 1.00 | | |
As a percentage of the Portfolio’s net assets on February 28, 2006.
1
FROM THE MANAGEMENT TEAM OF MFC GLOBAL INVESTMENT MANAGEMENT
|
Lifestyle
Balanced Portfolio
|
For the reporting period of October 18, 2005 through February 28, 2006, all major equity indexes posted positive results, while bonds advanced modestly. The dominant influence of energy on the economy and on business profitability kept equity and oil prices locked in contrary motion: equities fell in December and January as oil prices firmed, and rallied in October, November and February as oil prices declined. Oil price volatility has not diminished the underlying support that equities have received from strong corporate earnings and solid economic growth.
U.S. small-cap stocks were the best performers over the reporting period followed by mid-cap stocks. Large-cap stocks continued to trail, which is consistent with the last two years of unremarkable performance. Small- and mid-cap growth stocks beat their value counterparts, while value stocks outperformed in the large-cap area. International stocks produced strong results during this period, outperforming U.S. equities by approximately 6%. This performance was bolstered by strong results in Japan and Germany.
“For the reporting period
of October 18, 2005 through
February 28, 2006, all
major equity indexes posted
positive results, while bonds
advanced modestly.”
|
While equities performed quite well during the reporting period, most U.S. fixed-income segments were only modestly positive. One exception came from high yield issues, which significantly outperformed other fixed-income areas as investors searched for yield. In terms of non-U.S. fixed-income, hedged strategies outperformed unhedged portfolios due to the strengthening of the U.S. dollar against most currencies, namely the Euro, Yen and Sterling.
Performance results
From inception October 18, 2005 (for Class I inception is October 15, 2005) through February 28, 2006, John Hancock Lifestyle Balanced Portfolio’s Class A, Class B, Class C, Class R3,
2
Class R4, Class R5 and Class I shares posted total returns of 7.40%, 7.17%, 7.25%, 7.28%, 7.41%, 7.46% and 7.49%, respectively, at net asset value. That compared with the 5.62% return of the Portfolio’s benchmark index — a 60/40 blend of the Standard & Poor’s 500 Index and the Lehman Brothers Aggregate Bond Index.
Performance explanation
This portfolio outperformed its benchmark since inception. Both the equity and fixed-income components of the portfolio contributed to the positive outcome. Performance of the equity portion was aided by non-traditional asset classes such as natural resources, international small-cap stocks and Real Estate Investment Trusts (REITs). Resilient oil prices and strengthening industrial and precious metals lifted the Wellington-managed Natural Resources Fund (+16.04%) to a strong gain in the period. Real Estate Securities Fund (+17.27%, Deutsche Asset Management) also delivered excellent gains as REITs continued to outperform the S&P 500 Index for the sixth straight year. Though volatile as individual portfolios, International Small Cap Fund (+10.92%, Templeton), Natural Resources Fund and Real Estate Securities Fund provided excellent returns. The risks inherent in these asset classes, which have small allocations in Lifestyle Balanced Portfolio, are diffused by the Portfolio’s broad diversification.
“Both the equity and fixed-income
components of the portfolio
contributed to the positive
outcome.”
|
Allocations to traditional equity asset classes also added value, particularly the exposure to non-U.S. funds and small- and mid-cap funds. International Opportunities Fund (+19.39%, Marsico), a growth-oriented fund, led the way on the non-U.S. side. In the mid- and small-cap portions of the Portfolio, Mid-Cap Stock Fund (+18.17%, Wellington) and Small Company Value Fund (+14.91%, T. Rowe Price) were top performers.
In the U.S. large-cap portion of the Portfolio, U.S. Multi-Sector Fund (GMO) was the main detractor from performance. This was due in large part to the fund’s positioning in higher-quality names. The fund’s management team continues to believe that low-quality stocks are extremely overvalued and that high-quality equities represent the best opportunity within the U.S.
3
The best relative results in the fixed-income portion of the portfolio were generated by high yield funds. Although spreads have become historically tight in relation to other fixed-income options, investors have continued to flock to high yield bonds in an effort to capture any incremental yield over traditional fixed-income vehicles. Allocations to multi-sector bond funds also added value. These funds are designed to outperform the broad fixed-income market with a similar amount of risk by allocating across a wide range of sectors, including emerging-market debt, high yield and non-U.S. sovereign debt. Over the current reporting period, Spectrum Income Fund (+3.19%, T. Rowe Price) benefited from allocations to high yield and emerging-market debt.
The main detractor from performance within fixed-income was Global Bond Fund (-0.71%, PIMCO). Because the strategy does not hedge the underlying currency of its foreign bond holdings, the rallying U.S. dollar hurt performance. While global bonds detracted from results during this period, allocations to non-traditional fixed-income asset classes such as global bonds and TIPS help to diversify Lifestyle Balanced Portfolio over the long term.
“Lifestyle Balanced Portfolio is
well diversified across a wide
range of asset classes and
investment styles, including
non-traditional asset classes.”
|
Positioning and outlook
Lifestyle Balanced Portfolio is well diversified across a wide range of asset classes and investment styles, including non-traditional asset classes. The Portfolio has a 12% weighting in non-U.S. equity funds, including a 2% position dedicated to non-U.S. small caps.
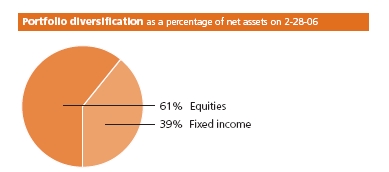
4
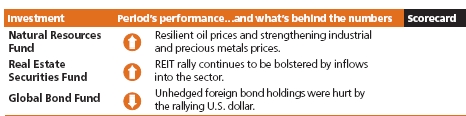
Other notable equity allocations include a 4% position in the Natural Resources Fund (Wellington) and a 5% position in Real Estate Securities Fund (Deutsche Asset Management). On the fixed-income front, the Portfolio has meaningful stakes in high-yield funds (13%), a 3% position in Global Bond Fund (PIMCO) and a 5% position in Real Return Fund (PIMCO). No major changes were made during this short time period outside of the regular rebalancing process.
We believe that the long-awaited shift in favor of higher-quality stocks will occur sooner rather than later, and we are well positioned for this impending change within our large-cap allocations. We remain vigilant in our evaluation of the areas that have experienced excellent relative and absolute gains recently, including real estate, natural resources, high yield and small- and mid-cap stocks. In our view, valuations in these areas are not as attractive as they were three years ago (for example, high-yield spreads over treasuries have tightened significantly and cash-flow multiples for REIT securities have been higher than historical averages). In many cases, however, the fundamentals remain strong. As always, we will make adjustments to further enhance the risk-reward profile of the Portfolio as opportunities arise.
This commentary reflects the views of the portfolio managers through the end of the Portfolio’s period discussed in this report. The managers’ statements reflect their own opinions. As such, they are in no way guarantees of future events and are not intended to be used as investment advice or a recommendation regarding any specific security. They are also subject to change at any time as market and other conditions warrant.
International investing involves special risks such as political, economic and currency risks and differences in accounting standards and financial reporting. See the prospectus for the risks of investing in small-cap stocks. See the prospectus for the risks of investing in high-yield bonds.
5
For the period ending
February 28, 2006
|
With maximum sales charge (POP)
|
| | Cumulative total returns |
| | Since inceptiona |
|
| Class A | 2.05% |
|
| Class B | 2.17 |
|
| Class C | 6.25 |
|
| Class R3b | 7.28 |
|
| Class R4b | 7.41 |
|
| Class R5b | 7.46 |
|
| Class 1b | 7.49 |
|
Performance figures assume all distributions are reinvested. Returns with maximum sales charge reflect a sales charge on Class A shares of 5%, and the applicable contingent deferred sales charge (CDSC) on Class B and Class C shares. The Class B shares’ CDSC declines annually between years 1–6 according to the following schedule: 5, 4, 3, 3, 2, 1%. No sales charge will be assessed after the sixth year. Class C shares held for less than one year are subject to a 1% CDSC. Sales charge is not applicable for Class R3, Class R4, Class R5 and Class 1 shares.
The returns reflect past results and should not be considered indicative of future performance. The return and principal value of an investment will fluctuate so that shares, when redeemed, may be worth more or less than their original cost. Due to market volatility, the Fund’s current performance may be higher or lower than the performance shown. For performance data current to the most recent month-end, please call 1-800-225-5291 or visit the Fund’s Web site at www.jhfunds.com.
The performance table above and the chart on the next page do not reflect the deduction of taxes that a shareholder would pay on fund distributions or the redemption of fund shares.
The Fund’s performance results reflect any applicable expense reductions, without which the expenses would increase and results would have been less favorable.
Since inception performance is calculated with an opening price (prior day’s close) on the inception date.
a Class A, Class B, Class C, Class R3, Class R4 and Class R5 shares began operation on 10-18-05 and Class 1 shares began operation on 10-15-05.
b For certain types of investors as described in the Fund’s Class R3, Class R4, Class R5 and Class 1 share prospectuses.
6
This chart shows what happened to a hypothetical $10,000 investment in Class A shares
for the period indicated. For comparison, we’ve shown the same investment in a blended index.
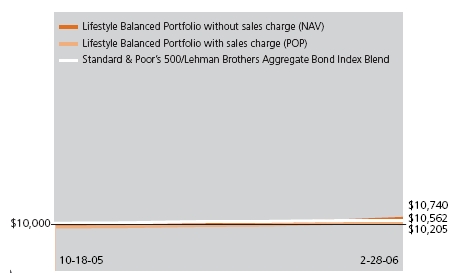
| | Class B | Class C | Class R3a | Class R4a | Class R5a | Class 1a |
| Period beginning | 10-18-05 | 10-18-05 | 10-18-05 | 10-18-05 | 10-18-05 | 10-15-05 |
|
| |
| |
| Without | | | | | | |
| sales charge | $10,717 | $10,725 | $10,728 | $10,741 | $10,746 | $10,749 |
|
| With maximum | | | | | | |
| sales charge | 10,217 | 10,625 | 10,728 | 10,741 | 10,746 | 10,749 |
|
| Index | 10,562 | 10,562 | 10,562 | 10,562 | 10,562 | 10,583 |
|
Assuming all distributions were reinvested for the period indicated, the table above shows the value of a $10,000 investment in the Fund’s Class B, Class C, Class R3, Class R4, Class R5 and Class 1 shares, respectively, as of February 28, 2006. Performance of the classes will vary based on the difference in sales charges paid by shareholders investing in the different classes and the fee structure of those classes.
A blended index is used combining 60% of the Standard & Poor’s 500 Index, an unmanaged index that includes 500 widely traded common stocks, and 40% of the Lehman Brothers Aggregate Bond Index, an unmanaged index of dollar-denominated and nonconvertible investment-grade debt issues.
It is not possible to invest directly in an index. Index figures do not reflect sales charges and would be lower if they did.
a For certain types of investors as described in the Fund’s Class R3, Class R4, Class R5 and Class 1 share prospectuses.
7
These examples are intended to help you understand your ongoing operating expenses.
Understanding fund expenses
As a shareholder of the Fund, you incur two types of costs:
* Transaction costs which include sales charges (loads) on purchases or redemptions (varies by share class), minimum account fee charge, etc.
* Ongoing operating expenses including management fees, distribution and service fees (if applicable) and other fund expenses.
In addition to the operating expenses which the Fund bears directly, the Fund indirectly bears a pro rata share of the operating expenses of the underlying funds in which the Fund invests. Because the underlying funds have varied operating expenses and transaction costs and the Fund may own different proportions of the underlying funds at different times, the amount of expenses incurred indirectly by the Fund will vary. If these indirect expenses were included, your expenses paid during the period would have been higher.
We are going to present only your ongoing operating expenses here.
Actual expenses/actual returns
This example is intended to provide information about your fund’s actual ongoing operating expenses, and is based on your fund’s actual return. It assumes an account value of $1,000.00 on inception date, with the same investment held until February 28, 2006.
| Account value | | Expenses paid |
| $1,000.00 | Ending value | during period |
| on inception date | on 2-28-06 | ended 2-28-06a |
|
| Class Ab | $1,074.00 | $2.39 |
| Class Bb | 1,071.70 | 5.08 |
| Class Cb | 1,072.50 | 4.97 |
| Class R3b | 1,072.80 | 2.69 |
| Class R4b | 1,074.10 | 1.76 |
| Class R5b | 1,074.60 | 0.83 |
| Class 1b | 1,074.90 | 0.52 |
Together with the value of your account, you may use this information to estimate the operating expenses that you paid over
8
the period. Simply divide your account value at February 28, 2006 by $1,000.00, then multiply it by the “expenses paid” for your share class from the table above. For example, for an account value of $8,600.00, the operating expenses should be calculated as follows:

Hypothetical example for comparison purposes
This table allows you to compare your fund’s ongoing operating expenses with those of any other fund. It provides an example of the Fund’s hypothetical account values and hypothetical expenses based on each class’s actual expense ratio and an assumed 5% annual return before expenses (which is not your fund’s actual return). It assumes an account value of $1,000.00 on inception date, with the same investment held until February 28, 2006. Look in any other fund shareholder report to find its hypothetical example and you will be able to compare these expenses.
| Account value | | Expenses paid |
| $1,000.00 | Ending value | during period |
| on inception date | on 2-28-06 | ended 2-28-06a |
|
| Class Ab | $1,016.10 | $2.32 |
| Class Bb | 1,013.50 | 4.93 |
| Class Cb | 1,013.60 | 4.83 |
| Class R3b | 1,015.80 | 2.62 |
| Class R4b | 1,016.70 | 1.71 |
| Class R5b | 1,017.60 | 0.81 |
| Class 1b | 1,018.30 | 0.50 |
Remember, these examples do not include any transaction costs, such as sales charges; therefore, these examples will not help you to determine the relative total costs of owning different funds. If transaction costs were included, your expenses would have been higher. See the prospectus for details regarding transaction costs.
a Expenses are equal to the Fund’s annualized expense ratio of 0.62%, 1.34%, 1.32%, 0.72%, 0.46%, 0.22% and 0.12% for Class A, Class B, Class C, Class R3, Class R4, Class R5 and Class 1, respectively, multiplied by the average account value over the period, multiplied by number of days in the inception period /365 or 366 (to reflect the one-half year period).
b Class A, Class B, Class C, Class R3, Class R4 and Class R5 shares began operations on 10-18-05 and Class 1 shares began operation on 10-15-05.
9
F I N A N C I A L S TAT E M E N T S
|
Securities owned
by the Fund on
February 28, 2006
(unaudited)
|
Lifestyle Balanced Fund portfolio of investments, showing all underlying funds.
| Issuer | Shares | Value |
|
| Investment Companies 100.01% | | $6,146,991,790 |
| (Cost $5,794,023,720) | | |
| John Hancock Funds II | | |
|
| 500 Index Fund Class NAV | 10,981,181 | $121,561,677 |
|
| Active Bond Fund Class NAV | 12,645,237 | 122,279,441 |
|
| Blue Chip Growth Fund Class NAV | 27,119,853 | 490,326,946 |
|
| Core Bond Fund Class NAV | 9,730,960 | 122,318,171 |
|
| Core Equity Fund Class NAV | 12,247,494 | 182,977,562 |
|
| Equity-Income Fund Class NAV | 17,581,464 | 305,917,478 |
|
| Fundamental Value Fund Class NAV | 11,959,322 | 182,977,622 |
|
| Global Bond Fund Class NAV | 12,894,828 | 184,782,892 |
|
| High Yield Fund Class NAV | 71,299,636 | 740,090,223 |
|
| International Opportunities Fund Class NAV | 8,172,317 | 127,651,585 |
|
| International Small Cap Fund Class NAV | 6,107,139 | 124,707,770 |
|
| International Stock Fund Class NAV | 18,770,090 | 247,952,889 |
|
| International Value Fund Class NAV | 14,838,955 | 244,694,362 |
|
| Large Cap Fund Class NAV | 4,176,667 | 60,352,837 |
|
| Large Cap Value Fund Class NAV | 2,712,684 | 60,764,127 |
|
| Mid Cap Stock Fund Class NAV | 3,790,913 | 62,057,251 |
|
| Natural Resources Fund Class NAV | 7,407,859 | 245,570,520 |
|
| Real Estate Securities Fund Class NAV | 11,586,528 | 310,055,480 |
|
| Real Return Bond Fund Class NAV | 22,977,302 | 308,355,391 |
|
| Small Cap Fund Class NAV | 4,002,307 | 61,195,267 |
|
| Small Cap Opportunities Fund Class NAV | 2,558,706 | 61,460,113 |
|
| Small Company Value Fund Class NAV | 2,553,164 | 61,658,900 |
|
| Spectrum Income Fund Class NAV | 29,972,249 | 307,215,548 |
|
| Strategic Bond Fund Class NAV | 15,336,968 | 184,043,611 |
|
| Strategic Value Fund Class NAV | 11,227,968 | 122,160,295 |
|
| Total Return Fund Class NAV | 22,358,830 | 307,881,082 |
|
| U.S. Global Leaders Growth Fund Class NAV | 13,775,462 | 184,177,926 |
See notes to
financial statements.
|
10
F I N A N C I A L S TAT E M E N T S
|
| Issuer | | Shares | Value |
| John Hancock Funds II — continued | | | |
|
| U.S. High Yield Bond Fund Class NAV | | 9,336,428 | $122,213,844 |
|
| U.S. Multi Sector Fund Class NAV | | 34,528,877 | 367,387,254 |
|
| Value & Restructuring Fund Class NAV | | 10,930,566 | 122,203,726 |
|
| |
| Total investments 100.01% | | | $6,146,991,790 |
|
| |
| Liabilities in excess of other assets (0.01)% | | | ($499,371) |
|
| |
| Total net assets 100.00% | | | $6,146,492,419 |
Percentages are stated as a percent of net assets of the Fund.
See notes to
financial statements.
|
11
F I N A N C I A L S TAT E M E N T S
|
February 28, 2006
(unaudited)
|
This Statement
of Assets and
Liabilities is the
Fund’s balance
sheet. It shows
the value of
what the Fund
owns, is due
and owes. You’ll
also find the net
asset value and
the maximum
offering price
per share.
|
| Assets | |
| Investments in affiliated funds, at value | |
| (cost $5,794,023,720) | $6,146,991,790 |
| Receivable for shares sold | 4,323,595 |
| Receivable from affiliates | 143,769 |
| Other assets | 10,641 |
| Total assets | 6,151,469,795 |
|
| Liabilities | |
| Due to custodian | 912,125 |
| Payable for investments purchased | 3,382,566 |
| Payable for shares repurchased | 10,256 |
| Payable to affiliates | |
| Fund administration fees | 112,291 |
| Transfer agent fees | 9,637 |
| Other payables and accrued expenses | 550,501 |
| Total liabilities | 4,977,376 |
|
| Net assets | |
| Capital paid-in | 5,791,976,018 |
| Accumulated net realized gain on investments | 3,262,804 |
| Net unrealized appreciation on investments | 352,968,070 |
| Distributions in excess of net investment income | (1,714,473) |
| Net assets | $6,146,492,419 |
|
| Net asset value per share | |
| Based on net asset values and shares outstanding — | |
| the Fund has an unlimited number of shares | |
| authorized with no par value | |
| Class A ($22,132,341 ÷ 1,553,094 shares) | $14.25 |
| Class B ($6,270,359 ÷ 440,338 shares) | $14.24 |
| Class C ($19,151,610 ÷ 1,344,079 shares) | $14.25 |
| Class R3 ($182,623 ÷ 12,823 shares) | $14.24 |
| Class R4 ($237,308 ÷ 16,655 shares) | $14.25 |
| Class R5 ($1,101,457 ÷ 77,295 shares) | $14.25 |
| Class 1 ($6,097,416,721 ÷ 429,037,669 shares) | $14.21 |
|
| Maximum offering price per share | |
| Class Aa ($14.25 ÷ 95%) | $15.00 |
a On single retail sales of less than $50,000. On sales of $50,000 or more and on group sales the offering price is reduced.
See notes to
financial statements.
|
12
F I N A N C I A L S TAT E M E N T S
|
For the period ended
February 28, 2006a
(unaudited)
|
This Statement
of Operations
summarizes the
Fund’s investment
income earned and
expenses incurred
in operating the
Fund. It also shows
net gains (losses) for
the period stated.
|
| Investment income | |
| Income distributions received from affiliated underlying funds | $37,784,866 |
| Total investment income | 37,784,866 |
|
| Expenses | |
| Investment management fees (Note III) | 828,332 |
| Distribution and service fees (Note III) | 1,012,116 |
| Transfer agent fees (Note III) | 10,080 |
| Blue sky fees (Note III) | 33,084 |
| Printing and postage fees (Note III) | 117,104 |
| Fund administration fees (Note III) | 112,507 |
| Audit and legal fees | 42,332 |
| Custodian fees | 4,268 |
| Trustees’ fees (Note III) | 29,239 |
| Registration and filing fees | 325,691 |
| Miscellaneous | 21,480 |
| Total expenses | 2,536,233 |
| Less expense reductions (Note III) | (144,136) |
| Net expenses | 2,392,097 |
| Net investment income | 35,392,769 |
|
| Realized and unrealized gain | |
| Net realized gain on investments | 4,108,332 |
| Capital gain distributions received | |
| from affiliated underlying funds | 569,605 |
| Change in net unrealized appreciation of investments | 352,968,070 |
| Net realized and unrealized gain | 357,646,007 |
| Increase in net assets from operations | $393,038,776 |
a Period from 10-15-05 (commencement of operations) to 2-28-06.
See notes to
financial statements.
|
13
F I N A N C I A L S TAT E M E N T S
|
These Statements
of Changes in Net
Assets show how
the value of the
Fund’s net assets
has changed since
the inception of
the Fund. The
difference reflects
earnings less
expenses, any
investment
gains and losses,
distributions, if
any, paid to
shareholders and
the net of Fund
share transactions.
|
| | Period |
| | ended |
| | 2-28-06a |
|
| Increase (decrease) in net assets | |
| From operations | |
| Net investment income | $35,392,769 |
| Net realized gain | 4,677,937 |
| Change in net unrealized appreciation | 352,968,070 |
| Increase in net assets resulting | |
| from operations | 393,038,776 |
| Distributions to shareholders | |
| From net investment income | |
| Class A | (40,713) |
| Class B | (10,958) |
| Class C | (23,406) |
| Class R3 | (568) |
| Class R4 | (619) |
| Class R5 | (3,176) |
| Class 1 | (37,027,802) |
| From net realized gain | |
| Class A | (1,728) |
| Class B | (612) |
| Class C | (1,299) |
| Class R3 | (26) |
| Class R4 | (26) |
| Class R5 | (123) |
| Class 1 | (1,411,319) |
| | (38,522,375) |
From Fund share transactions | 5,791,976,018 |
|
| Net assets | |
| End of period | $6,146,492,419 |
| Distributions in excess of net investment income | ($1,714,473) |
a Class A, Class B, Class C, Class R3, Class R4 and Class R5 shares began operations on 10-18-05 and Class 1 shares began operation on 10-15-05. Unaudited.
See notes to
financial statements.
|
14
F I N A N C I A L H I G H L I G H T S
|
CLASS A SHARES
The Financial Highlights show how the Fund’s net asset value for a share has changed since the commencement of operations of the Fund.
| Period ended | 2-28-06a |
|
| Per share operating performance | |
| Net asset value, | |
| beginning of period | $13.35 |
| Net investment incomeh | 0.04 |
| Net realized and unrealized | |
| gain on investments | 0.94 |
| Total from | |
| investment operations | 0.98 |
| Less distributions | |
| From net investment income | (0.08) |
| From net realized gain | —j |
| | (0.08) |
| Net asset value, end of period | $14.25 |
| Total returnk,l (%) | 7.40m |
|
| Ratios and supplemental data | |
| Net assets, end of period | |
| (in millions) | $22 |
| Ratio of net expenses | |
| to average net assetsq (%) | 0.62r |
| Ratio of gross expenses | |
| to average net assetsp,q (%) | 2.49r |
| Ratio of net investment income | |
| to average net assetsv (%) | 0.82r |
| Portfolio turnover (%) | 3m |
See notes to
financial statements.
|
15
F I N A N C I A L H I G H L I G H T S
|
| CLASS B SHARES | |
| |
| |
| |
| |
| Period ended | 2-28-06a |
|
| Per share operating performance | |
| Net asset value, | |
| beginning of period | $13.35 |
| Net investment incomeh | 0.01 |
| Net realized and unrealized | |
| gain on investments | 0.94 |
| Total from | |
| investment operations | 0.95 |
| Less distributions | |
| From net investment income | (0.06) |
| From net realized gain | —j |
| | (0.06) |
| Net asset value, end of period | $14.24 |
| Total returnk,l (%) | 7.17m |
|
| Ratios and supplemental data | |
| Net assets, end of period | |
| (in millions) | $6 |
| Ratio of net expenses | |
| to average net assetsq (%) | 1.34r |
| Ratio of gross expenses | |
| to average net assetsp,q (%) | 3.81r |
| Ratio of net investment income | |
| to average net assetsv (%) | 0.18 r |
| Portfolio turnover (%) | 3m |
See notes to
financial statements.
|
16
F I N A N C I A L H I G H L I G H T S
|
CLASS C SHARES
| Period ended | 2-28-06a |
|
| Per share operating performance | |
| Net asset value, | |
| beginning of period | $13.35 |
| Net investment lossh | (0.01) |
| Net realized and unrealized | |
| gain on investments | 0.97 |
| Total from | |
| investment operations | 0.96 |
| Less distributions | |
| From net investment income | (0.06) |
| From net realized gain | —j |
| | (0.06) |
| Net asset value, end of period | $14.25 |
| Total returnk,l (%) | 7.25m |
|
| Ratios and supplemental data | |
| Net assets, end of period | |
| (in millions) | $19 |
| Ratio of net expenses | |
| to average net assetsq (%) | 1.32r |
| Ratio of gross expenses | |
| to average net assetsp,q (%) | 3.15r |
| Ratio of net investment loss | |
| to average net assetsv (%) | (0.11)r |
| Portfolio turnover (%) | 3m |
See notes to
financial statements.
|
17
F I N A N C I A L H I G H L I G H T S
|
| Period ended | 2-28-06a |
|
| Per share operating performance | |
| Net asset value, | |
| beginning of period | $13.35 |
| Net investment incomeh | 0.05 |
| Net realized and unrealized | |
| gain on investments | 0.92 |
| Total from | |
| investment operations | 0.97 |
| Less distributions | |
| From net investment income | (0.08) |
| From net realized gain | —j |
| | (0.08) |
| Net asset value, end of period | $14.24 |
| Total returnk,l (%) | 7.28m |
|
| Ratios and supplemental data | |
| Net assets, end of period | |
| (in millions) | —i |
| Ratio of net expenses | |
| to average net assetsq (%) | 0.72r |
| Ratio of gross expenses | |
| to average net assetsp,q (%) | 15.96r |
| Ratio of net investment income | |
| to average net assetsv (%) | 0.92r |
| Portfolio turnover (%) | 3m |
See notes to
financial statements.
|
18
F I N A N C I A L H I G H L I G H T S
|
| Period ended | 2-28-06a |
|
| Per share operating performance | |
| Net asset value, | |
| beginning of period | $13.35 |
| Net investment incomeh | 0.05 |
| Net realized and unrealized | |
| gain on investments | 0.93 |
| Total from | |
| investment operations | 0.98 |
| Less distributions | |
| From net investment income | (0.08) |
| From net realized gain | —j |
| | (0.08) |
| Net asset value, end of period | $14.25 |
| Total returnk,l (%) | 7.41m |
|
| Ratios and supplemental data | |
| Net assets, end of period | |
| (in millions) | —i |
| Ratio of net expenses | |
| to average net assetsq (%) | 0.46r |
| Ratio of gross expenses | |
| to average net assetsp,q (%) | 13.33r |
| Ratio of net investment income | |
| to average net assetsv (%) | 0.89r |
| Portfolio turnover (%) | 3m |
See notes to
financial statements.
|
19
F I N A N C I A L H I G H L I G H T S
|
| Period ended | 2-28-06a |
|
| Per share operating performance | |
| Net asset value, | |
| beginning of period | $13.35 |
| Net investment incomeh | 0.01 |
| Net realized and unrealized | |
| gain on investments | 0.98 |
| Total from | |
| investment operations | 0.99 |
| Less distributions | |
| From net investment income | (0.09) |
| From net realized gain | —j |
| | (0.09) |
| Net asset value, end of period | $14.25 |
| Total returnk,l (%) | 7.46m |
|
| Ratios and supplemental data | |
| Net assets, end of period | |
| (in millions) | $1 |
| Ratio of net expenses | |
| to average net assetsq (%) | 0.22r |
| Ratio of gross expenses | |
| to average net assetsp,q (%) | 4.75r |
| Ratio of net investment income | |
| to average net assetsv (%) | 0.26r |
| Portfolio turnover (%) | 3m |
See notes to
financial statements.
|
20
F I N A N C I A L H I G H L I G H T S
|
| Period ended | 2-28-06a |
|
| Per share operating performance | |
| Net asset value, | |
| beginning of period | $13.31 |
| Net investment incomeh | 0.09 |
| Net realized and unrealized | |
| gain on investments | 0.90 |
| Total from | |
| investment operations | 0.99 |
| Less distributions | |
| From net investment income | (0.09) |
| From net realized gain | —j |
| | (0.09) |
| Net asset value, end of period | $14.21 |
| Total returnk,l (%) | 7.49m |
|
| Ratios and supplemental data | |
| Net assets, end of period | |
| (in millions) | $6,097 |
| Ratio of net expenses | |
| to average net assetsq (%) | 0.12r |
| Ratio of net investment income | |
| to average net assetsv (%) | 1.82r |
| Portfolio turnover (%) | 3m |
a Class A, Class B, Class C, Class R3, Class R4 and Class R5 shares began operations on 10-18-05 and Class 1 shares began operation on 10-15-05. Unaudited.
h Based on the average of the shares outstanding.
i Less than $500,000.
j Less than $0.01 per share.
k Assumes dividend reinvestment and does not reflect the effect of sales charges.
l Total returns would have been lower had certain expenses not been reduced during the period shown.
m Not annualized.
p Does not take into consideration expense reductions during the period shown.
q Does not include expenses of the investment companies in which the Fund invests.
r Annualized.
v Recognition of net investment income by the Fund is affected by the timing of the declaration of dividends by the underlying investment companies in which the Fund invests.
See notes to
financial statements.
|
21
I. Organization
The John Hancock Lifestyle Balanced Portfolio (the “Fund”) is a non-diversified series of John Hancock Funds II (the “Trust”), an open-end management investment company registered under the Investment Company Act of 1940, as amended.
The Fund operates as a “fund of funds”, which invests in shares of mutual funds (“underlying funds”) managed by affiliates of John Hancock Investment Management Services, LLC (the “Adviser”). The Adviser is a wholly owned subsidiary of Manulife Financial Corporation (“MFC”). Each underlying fund’s accounting policies are outlined in the underlying fund’s shareholder report, available without charge by calling 1-800-344-1029 or on the Securities and Exchange Commission (“SEC”) Internet site at www.sec.gov, File # 811-21779, CIK 0001331971.
The Trustees have authorized the issuance of multiple classes of shares of the Fund, including classes designated as Class A, Class B, Class C, Class R3, Class R4, Class R5, and Class 1 shares. The shares of each class represent an interest in the same portfolio of investments of the Fund, and have equal rights as to voting, redemptions, dividends and liquidation, except that certain expenses, subject to the approval of the Trustees, may be applied differently to each class of shares in accordance with current regulations of the Securities and Exchange Commission and the Internal Revenue Service. Shareholders of a class that bears distribution and service expenses under the terms of a distribution plan have exclusive voting rights to that distribution plan.
At February 28, 2006 John Hancock USA, an indirect subsidiary of MFC, owned 7,513 Class R3, Class R4 and Class R5 shares of beneficial interest of the Fund.
II. Significant accounting policies
In the preparation of the financial statements, the Fund follows the policies described below. The preparation of financial statements in conformity with accounting principles generally accepted in the United States of America requires management to make estimates and assumptions that affect the reported amounts of assets and liabilities at the date of the financial statements and the reported amounts of income and expenses during the reporting period. Actual results may differ from these estimates.
Securities valuation
The net asset value of the shares of the Fund is determined daily as of the close of the New York Stock Exchange, normally at 4:00 P.M. Eastern Time. Investments in underlying funds are valued at their respective net asset values each business day, or at fair value as determined in good faith in accordance with procedures approved by the Trustees.
22
Securities in the underlying funds’ portfolios are valued in accordance with their respective valuation polices, as outlined in the underlying funds’ financial statements. Short-term debt investments that have a remaining maturity of 60 days or less are valued at amortized cost.
Repurchase agreements
The Fund may enter into repurchase agreements. When a Fund enters into a repurchase agreement through its custodian, it receives delivery of securities, the amount of which at the time of purchase and each subsequent business day is required to be maintained at such a level that the market value is generally at least 102% of the repurchase amount. The Fund will take constructive receipt of all securities underlying the repurchase agreements it has entered into until such agreements expire. If the seller defaults, a Fund would suffer a loss to the extent that proceeds from the sale of underlying securities were less than the repurchase amount. The Fund may enter into repurchase agreements maturing within seven days with domestic dealers, banks or other financial institutions deemed to be creditworthy by the Adviser. Collateral for certain tri-party repurchase agreements is held at the custodian bank in a segregated account for the benefit of the Fund and the counterparty.
Security transactions and related investment income
Investment security transactions are accounted for on a trade date basis. Interest income is accrued as earned. Dividend income on investment securities is recorded on the ex-dividend date.
Multi-class operations
All income, expenses (except for class-specific expenses) and realized and unrealized gains (losses) are allocated to each class of shares based upon the relative net assets of each class. Dividends to shareholders from net investment income are determined at a class level and distributions from capital gains are determined at a Fund level.
Expense allocation
Expenses not directly attributable to a particular Fund or class of shares are allocated based on the relative share of net assets of the Fund at the time the expense was incurred. Class-specific expenses, such as transfer agency fees, blue sky fees, printing and postage fees and distribution and service fees, are accrued daily and charged directly to the respective share classes. Expenses in the Fund’s Statements of Operations reflect the expenses of the Fund and do not include any indirect expenses related to the underlying funds. Because the underlying funds have varied expense levels and the Fund may own different proportions of the underlying funds at different times, the amount of fees and expenses incurred indirectly by the Fund will vary.
Federal income taxes
The Fund qualifies as a “regulated investment company” by complying with the applicable provisions of the Internal Revenue Code and will not be subject to federal income tax on taxable income that is distributed to shareholders. Therefore, no federal income tax provision is required.
Distribution of income and gains
The Fund records distributions to shareholders from net investment income and net realized gains, if any, on the ex-dividend date. Distributions paid by the Fund with respect to each class of shares are calculated in the same manner, at the same time and are in the same amount, except for the effect of expenses that may be applied differently to each class. Such distributions, on a tax basis, are determined in conformity with income tax regulations, which may differ from accounting principles generally accepted in the United States of America. Distributions in excess of tax basis earnings and profits, if any, are reported in the Fund’s financial statements as a return of capital.
Capital accounts
The Fund reports the undistributed net investment income and accumulated undistributed net realized
23
gain (loss) accounts on a basis approximating amounts available for future tax distributions (or to offset future taxable realized gains when a capital loss carryforward is available). Accordingly, the Fund may periodically make reclassifications among certain capital accounts, without affecting its net asset value.
III. Investment advisory and other agreements
Advisory fees
The Trust has entered into an Investment Advisory Agreement with the Adviser. The Adviser is responsible for managing the corporate and business affairs of the Trust and for selecting and compensating subadvisers to handle the investment and reinvestment of the assets of the Fund, subject to the supervision of the Board of Trustees. Under the Advisory Agreement the Fund pays a monthly management fee to the Adviser equivalent, on an annual basis, to the sum of: (a) 0.05% of the first $7,500,000,000 of the Fund’s aggregate daily net assets and (b) 0.04% of the Fund’s aggregate daily net assets in excess of $7,500,000,000. Aggregate net assets include the net assets of the five Lifestyle Portfolios of the Trust (the Lifestyle Aggressive, the Lifestyle Balanced, the Lifestyle Conservative, the Lifestyle Growth and the Lifestyle Moderate) and the five Lifestyle Portfolios of John Hancock Trust (the Lifestyle Aggressive 1000, the Lifestyle Growth 820, the Lifestyle Balanced 640, the Lifestyle Moderate 460 and the Lifestyle Conservative 280). The Fund is not responsible for payment of the subadvisory fees.
Expense reimbursements
The Adviser has contractually agreed to waive advisory fees or reimburse Fund’s expenses for Class A, Class B, Class C, Class R3, Class R4 and Class R5 shares to the extent that blue sky fees and printing and postage expenses attributable to each class exceed 0.09% of the average annual net assets attributable to the classes, at least until November 1, 2006. Accordingly, the expense reductions related to this expense limitation amounted to $55,346, $22,834, $42,377, $6,519, $6,652 and $9,967 for Class A, Class B, Class C, Class R3, Class R4 and Class R5, respectively, for the period ended February 28, 2006. The Adviser reserves the right to terminate this limitation in the future.
Administration fees
The Fund has an agreement with the Adviser that requires the Fund to reimburse the Adviser for all expenses associated with providing the administrative, financial, accounting and recordkeeping services of the Fund, including the preparation of all tax returns, annual, semiannual and periodic reports to shareholders and the preparation of all regulatory reports.
Distribution plans
The Trust has a Distribution Agreement with John Hancock Funds, LLC (“JH Funds”), a wholly-owned subsidiary of the Adviser. The Fund has adopted Distribution Plans with respect to Class A, Class B, Class C, Class R3, Class R4 and Class 1, pursuant to Rule 12b-1 under the Investment Company Act of 1940, to reimburse JH Funds for the services it provides as distributor of shares of the Fund. Accordingly, the Fund makes monthly payments to JH Funds at an annual rate not to exceed 0.30%, 1.00%, 1.00%, 0.50%, 0.25%, and 0.05% of average daily net asset value of Class A, Class B, Class C, Class R3, Class R4 and Class 1, respectively. A maximum of 0.25% of such payments may be service fees, as defined by the Conduct Rules of the National Association of Securities Dealers. Under the Conduct Rules, curtailment of a portion of the Fund’s 12b-1 payments could occur under certain circumstances.
The Fund has also adopted a Service Plan with respect to Class R3, Class R4 and Class R5 shares (the “Service Plan”). Under the Service Plan, the Fund pays up to 0.15%, 0.10% and 0.05% of average daily net assets of Class R3, Class R4 and
24
Class R5 shares, respectively, for certain other services. There were no servicing fees during the period ended February 28, 2006.
Sales charges
Class A shares are assessed up-front sales charges. During the period ended February 28, 2006, JH Funds received net up-front sales charges of $421,226 with regard to sales of Class A shares. Of this amount, $69,415 was retained and used for printing prospectuses, advertising, sales literature and other purposes, $339,947 was paid as sales commissions to unrelated broker-dealers and $11,864 was paid as sales commissions to sales personnel of Signator Investors, Inc. (“Signator Investors”), a related broker-dealer, an indirect subsidiary of MFC.
Class B shares that are redeemed within six years of purchase are subject to a contingent deferred sales charge (“CDSC”) at declining rates, beginning at 5.00% of the lesser of the current market value at the time of redemption or the original purchase cost of the shares being redeemed. Class C shares that are redeemed within one year of purchase are subject to a CDSC at a rate of 1.00% of the lesser of the current market value at the time of redemption or the original purchase cost of the shares being redeemed. Proceeds from the CDSCs are paid to JH Funds and are used, in whole or in part, to defray its expenses for providing distribution-related services to the Fund in connection with the sale of Class B and Class C shares. During the period ended February 28, 2006, CDSCs received by JH Funds amounted to $249 for Class B shares and $846 for Class C shares.
Transfer agent fees
The Fund has a Transfer Agency Agreement with John Hancock Signature Services, Inc. (“Signature Services”), an indirect subsidiary of MFC. For Class A, Class B, Class C, Class R3, Class R4 and Class R5 shares, the Fund pays a monthly transfer agent fee at an annual rate of 0.05% of each class’s average daily net assets, plus a fee based on the number of shareholder accounts and reimbursement for certain out-of-pocket expenses. Expenses not directly attributable to a particular class of shares are aggregated and allocated to each class on the basis of its relative net asset value.
Signature Services has agreed to limit the transfer agent fees so that such fees do not exceed 0.20% annually of Class A, Class B, Class C, Class R3, Class R4 and Class R5 share average daily net assets. This agreement is effective until December 31, 2006. Signature Services reserves the right to terminate this limitation in the future. In addition, Signature Service has voluntarily agreed to further limit transfer agent fees for Class R3, Class R4 and Class R5 shares so that such fees do not exceed 0.05% annually of each class’s average daily net assets. Accordingly, the transfer agent fees reductions amounted to $66, $75 and $300 for Class R3, Class R4 and Class R5 shares, respectively, during the period ended February 28, 2006. Signature Services reserves the right to terminate this limitation at any time.
25
Expenses under the agreements described above for the period ended February 28, 2006, were as follows:
| | Distribution | Transfer | | Printing and |
| Share Class | fees | agent | Blue sky | postage |
|
| Class A | $8,875 | $4,543 | $5,514 | $52,776 |
| Class B | 9,239 | 1,564 | 5,514 | 18,247 |
| Class C | 23,143 | 3,385 | 5,514 | 39,163 |
| Class R3 | 212 | 88 | 5,514 | 1,046 |
| Class R4 | 129 | 100 | 5,514 | 1,187 |
| Class R5 | N/A | 400 | 5,514 | 4,685 |
| Class 1 | 970,518 | — | — | — |
| Total | $1,012,116 | $10,080 | $33,084 | $117,104 |
Trustees’ fees
The Trust compensates each Trustee who is not an employee of the Adviser or its affiliates. Total Trustees’ expenses are allocated based on each fund’s average daily net asset value.
IV. Guarantees and indemnifications
Under the Trust’s organizational documents, its Officers and Trustees are indemnified against certain liability arising out of the performance of their duties to the Trust. Additionally, in the normal course of business, the Trust enters into contracts with service providers that contain general indemnification clauses. The Trust’s maximum exposure under these arrangements is unknown, as this would involve future claims that may be made against the Trust that have not yet occurred. However, based on experience, the Trust believes the risk of loss to be remote.
26
V. Capital shares
Share activities for the Fund for the period ended February 28, 2006 were as follows:
| | | Period ended 2-28-06a | |
| | Shares | Amount |
|
| Class A shares | | |
| Sold | 1,576,547 | $22,134,082 |
| Distributions reinvested | 2,565 | 35,470 |
| Repurchased | (26,018) | (368,040) |
| Net increase | 1,553,094 | $21,801,512 |
|
| |
| Class B shares | | |
| Sold | 445,759 | $6,236,513 |
| Distributions reinvested | 743 | 10,287 |
| Repurchased | (6,164) | (86,821) |
| Net increase | 440,338 | $6,159,979 |
|
| |
| Class C shares | | |
| Sold | 1,355,817 | $19,084,356 |
| Distributions reinvested | 1,410 | 19,531 |
| Repurchased | (13,148) | (186,531) |
| Net increase | 1,344,079 | $18,917,356 |
|
| |
| Class R3 shares | | |
| Sold | 12,823 | $175,456 |
| Net increase | 12,823 | $175,456 |
|
| |
| Class R4 shares | | |
| Sold | 17,773 | $245,899 |
| Repurchased | (1,118) | (15,954) |
| Net increase | 16,655 | $229,945 |
|
| |
| Class R5 shares | | |
| Sold | 77,988 | $1,081,539 |
| Distributions reinvested | 188 | 2,602 |
| Repurchased | (881) | (12,436) |
| Net increase | 77,295 | $1,071,705 |
|
| |
| Class 1 shares | | |
| Sold | 427,038,807 | $5,716,214,876 |
| Distributions reinvested | 2,789,486 | 38,439,121 |
| Repurchased | (790,624) | (11,033,932) |
| Net increase | 429,037,669 | $5,743,620,065 |
|
| |
| Net increase | 432,481,953 | $5,791,976,018 |
a Class A, Class B, Class C, Class R3, Class R4 and Class R5 shares began operations on 10-18-05 and Class 1 shares began operation on 10-15-05.
27
VI. Investment transactions
Purchases and proceeds from sales or maturities of securities, other than short-term securities and obligations of the U.S. government, during the period ended February 28, 2006, aggregated $5,966,790,545 and $176,875,158, respectively.
The cost of investments owned on February 28, 2006, including short-term investments, for federal income tax purposes, was $5,794,023,720. Gross unrealized appreciation and depreciation of investments aggregated $354,380,405 and $1,412,335, respectively, resulting in net unrealized appreciation of $352,968,070. The difference between book basis and tax basis net unrealized appreciation of investments is attributable primarily to the tax deferral of losses on certain sales of securities.
VII. Investment in affiliated underlying funds
The Fund invests primarily in the underlying funds “that are managed by affili-ates of the Adviser. The Fund does not invest in the underlying funds for the purpose of exercising management or control. A summary of the Fund’s transactions in the securities of affiliated issuers in which the Fund’s holdings represent 5% or more of the outstanding voting securities of the issuer, during the period ended February 28, 2006 is set forth below.
| Affiliate ��� | Shares | Shares | Ending Share | | Ending |
| Class NAV | Purchased | Sold | Amount | Proceeds | Value |
|
| 500 Index | 10,981,302 | 121 | 10,981,181 | $114,002,555 | $121,561,677 |
| Active Bond | 12,645,270 | 33 | 12,645,237 | 121,344,145 | 122,279,441 |
| Blue Chip Growth | 27,130,636 | 10,783 | 27,119,853 | 455,514,782 | 490,326,946 |
| Core Bond | 9,730,984 | 24 | 9,730,960 | 121,540,607 | 122,318,171 |
| Core Equity | 12,321,889 | 74,395 | 12,247,494 | 170,506,485 | 182,977,562 |
| Equity-Income | 17,582,525 | 1,061 | 17,581,464 | 284,425,211 | 305,917,478 |
| Fundamental Value | 11,959,434 | 112 | 11,959,322 | 174,665,661 | 182,977,622 |
| Global Bond | 12,896,092 | 1,264 | 12,894,828 | 186,195,346 | 184,782,892 |
| High Yield | 71,317,824 | 18,188 | 71,299,636 | 719,635,887 | 740,090,223 |
| International | | | | | |
| Opportunities | 8,213,967 | 41,650 | 8,172,317 | 111,520,251 | 127,651,585 |
| International Small Cap | 6,107,270 | 131 | 6,107,139 | 111,202,971 | 124,707,770 |
| International Stock | 18,770,594 | 504 | 18,770,090 | 222,345,072 | 247,952,889 |
| International Value | 14,839,542 | 587 | 14,838,955 | 222,001,366 | 244,694,362 |
| Large Cap | 4,177,136 | 469 | 4,176,667 | 56,107,926 | 60,352,837 |
| Large Cap Value | 2,712,710 | 26 | 2,712,684 | 55,657,368 | 60,764,127 |
| Mid Cap Stock | 3,790,944 | 31 | 3,790,913 | 53,319,697 | 62,057,251 |
| Natural Resources | 9,423,753 | 2,015,894 | 7,407,859 | 208,966,667 | 245,570,520 |
| Real Estate Securities | 11,760,257 | 173,729 | 11,586,528 | 271,672,226 | 310,055,480 |
| Real Return Bond | 22,977,364 | 62 | 22,977,302 | 307,124,167 | 308,355,391 |
| Small Cap | 4,002,883 | 576 | 4,002,307 | 54,163,025 | 61,195,267 |
| Small Cap | | | | | |
| Opportunities | 2,559,048 | 342 | 2,558,706 | 54,596,076 | 61,460,113 |
| Small Company Value | 2,553,237 | 73 | 2,553,164 | 54,339,190 | 61,658,900 |
| Spectrum Income | 29,972,328 | 79 | 29,972,249 | 300,217,317 | 307,215,548 |
| Strategic Bond | 15,339,030 | 2,062 | 15,336,968 | 181,504,335 | 184,043,611 |
| Strategic Value | 11,228,139 | 171 | 11,227,968 | 115,766,062 | 122,160,295 |
| Total Return | 22,358,893 | 63 | 22,358,830 | 305,014,039 | 307,881,082 |
| U.S. Global | | | | | |
| Leaders Growth | 13,776,063 | 601 | 13,775,462 | 182,397,418 | 184,177,926 |
| U.S. High Yield Bond | 9,336,452 | 24 | 9,336,428 | 119,351,976 | 122,213,844 |
| U.S. Multi Sector | 34,529,513 | 636 | 34,528,877 | 346,584,014 | 367,387,254 |
| Value & Restructuring | 10,930,744 | 178 | 10,930,566 | 109,651,547 | 122,203,726 |
28
Evaluation of Advisory and Subadvisory Agreement by the Board of Trustees (unaudited)
This section describes the evaluation by the Board of Trustees of the Advisory Agreement and each of the Subadvisory Agreements.
Evaluation by the Board of Trustees
The Board, including the Independent Trustees, is responsible for selecting the Trust’s investment adviser, John Hancock Investment Management Services, LLC (the “Adviser” or “JHIMS”), approving the Adviser’s selection of subadvisers for each series of the Trust (the “Funds”) and approving the Trust’s advisory and subadvisory agreements, their periodic continuation and any amendments. Consistent with SEC rules, the Board will regularly evaluate the Trust’s advisory and subadvisory arrangements, including consideration of the six factors listed below. The Board may also consider other factors (including conditions and trends prevailing generally in the economy, the securities markets and the industry) and does not treat any single factor as determinative, and each Trustee may attribute different weights to different factors. The Board is furnished with an analysis of its fiduciary obligations in connection with its evaluation and, throughout the evaluation process, the Board is assisted by counsel for the Trust and the Independent Trustees are also separately assisted by independent legal counsel. The six factors to be regularly considered by the Board are:
1. the nature, extent and quality of the services to be provided by the Adviser to the Trust and by the subadvisers to the Funds;
2. the investment performance of the Funds and their subadvisers;
3. the extent to which economies of scale would be realized as a Fund grows;
4. whether fee levels reflect these economies of scale for the benefit of Trust shareholders;
5. the costs of the services to be provided and the profits to be realized by the Adviser and its affiliates from the Adviser’s relationship with the Trust; and
6. comparative services rendered and comparative advisory and subadvisory fee rates.
The Board believes that information relating to all six factors is relevant to its evaluation of the Trust’s advisory agreement. With respect to its evaluation of subadvisory agreements, the Board believes that, in view of the Trust’s “manager-of-managers” advisory structure: factors (1), (2) and (6) are of primary relevance; factors (3) and (4) generally are less significant to the Trustees’ considerations because subad-visory fees are paid to subadvisers by the Adviser and not directly by the Funds, and issues pertaining to economies of scale are considered in connection with the approval of the advisory fees that are paid directly by the Funds; and with respect to those subadvisers that are not affiliated with the Adviser, because the Board relies on the ability of the Adviser to negotiate the subadvisory fees at arms-length, factor (5) generally is also less significant to the Trustees’ considerations except in those circumstances in which such attention may be warranted because the comparative fee information considered in connection with factor (6) indicates that the subadvisory fees will materially exceed those normally charged under comparable circumstances.
29
In evaluating subadvisory arrangements, the Board also considers other material business relationships that unaffiliated subadvisers and their affili-ates have with the Adviser or its affiliates, including the involvement by certain affiliates of certain subadvisers in the distribution of financial products, including shares of the Trust, offered by the Adviser and other affiliates of the Adviser (“Material Relationships”).
Approval of Advisory Agreement
At its meeting on September 21, 2005, the Board, including all the Independent Trustees, approved the Advisory Agreement between the Trust and JHIMS with respect to each of the Funds.
In approving the Advisory Agreement, and with reference to the six factors that it considers, the Board:
1(a) considered the high value to the Trust of JHIMS’s long relationship with investment companies within the same fund complex as the Trust, the skills and competency which JHIMS has demonstrated in managing the affairs and subadvisory relationships of these other investment companies, JHIMS’s ability to oversee and monitor the subadvis-ers’ investment performance and compliance programs and the qualifications of JHIMS’ personnel,
(b) considered JHIMS’s compliance policies and procedures and its responsiveness to regulatory changes and mutual fund industry developments, and
(c) considered JHIMS’s administrative capabilities, including its ability to supervise the other service providers for the Funds and concluded that JHIMS may reasonably be expected to ably perform its services under the Advisory Agreement;
2 reviewed the investment performance of comparably managed funds of each of the Funds; the comparative performance of their respective benchmarks and comparable funds (i.e., funds having approximately the same investment objective); and JHIMS’ analysis of such performance and its plans and recommendations regarding the Trust’s subadvisory arrangements generally and with respect to particular Funds; and concluded that each of the comparably managed funds has generally performed well or within a range that the Board deemed competitive except as discussed in Appendix A, and that JHIMS may reasonably be expected to ably monitor the performance of the Funds and each of their subadvisers;
3 & 4 reviewed the Trust’s advisory fee structure and the incorporation therein of any subadvisory fee breakpoints in the advisory fees charged and concluded (a) that to the extent that Funds have subad-visory fees with breakpoints, those breakpoints are reflected as breakpoints in the advisory fees for Funds, (b) that all Funds with a subadviser that is not affiliated with the Adviser have subadvisory fees which are the product of arms-length negotiations between the Adviser and the subadviser and which in many, but not all, cases contain breakpoints, and (c) that, although economies of scale cannot be measured with precision, these arrangements permit shareholders of Funds with advisory fee breakpoints to benefit from economies of scale if those Funds grow;
5 (a) reviewed the financial statements of JHIMS and John Hancock Life Insurance Company (U.S.A.) (“JHLICO (U.S.A.)”) and considered an analysis presented by JHIMS
30
regarding the estimated net profitability to JHIMS of the advisory fee structure;
(b) reviewed the profitability of the JHIMS’ relationship with the Funds in terms of the total amount of annual advisory fees it is estimated to receive with respect to the Funds and whether JHIMS has the financial ability to provide a high level of services to the Funds,
(c) considered that JHIMS will derive reputational and other indirect benefits from providing advisory services to the Funds, and
(d) noted that JHIMS will pay the sub-advisory fees out of the advisory fees JHIMS receives from the Funds and concluded that the advisory fees to be paid by the Trust with respect to the Funds are not unreasonable in light of such information; and
6 reviewed comparative information with respect to the proposed advisory fee rates and concluded that the Trust’s anticipated advisory fees are within the range of those incurred by other comparable funds and that the Trust’s advisory structure is thus competitive within the industry. In considering the proposed advisory fee rates, the Board took into account the high level of services expected to be provided to the Funds and the other factors considered.
Additional information that the Board considered for a particular Fund is set forth in Appendix A.
Approval of Subadvisory Agreements
At its meeting on September 21, 2005, the Board, including all the Independent Trustees, approved the Subadvisory Agreements.
In making its determination with reference to these respective factors, the Board reviewed:
1 information relating to each subad-viser’s business, which may include information such as: business performance, representative clients, assets under management, financial stability, personnel and, if applicable, past sub-advisory services to affiliated funds of the Trust;
2 the investment performance of comparatively managed funds of the Fund and comparative performance information relating to the comparatively managed fund’s benchmark and comparable funds;
3 the proposed subadvisory fee for each Fund and comparative fee information; and
4 information relating to the nature and scope of Material Relationships and their significance to the Trust’s adviser and unaffiliated subadvisers.
The Board’s decision to approve each Subadvisory Agreement was based on a number of determinations, including the following:
1 The Subadviser has extensive experience and demonstrated skills as a manager;
2 Although not without variation, the current and historical performance of the comparably managed funds of Subadviser to the Funds generally has been within the range of the current and historical performance of comparable funds and the comparably managed funds’ respective benchmarks;
3 With respect to each subadviser that is not affiliated with the Adviser, the subadvisory fees are a product of arms-length negotiation between the
31
Adviser and the subadviser and generally are within the range of industry norms; and
4 The Material Relationships consist of arrangements in which unaffiliated subadvisers or their affiliates provide advisory, distribution or management services in connection with financial products sponsored by the Trust’s adviser or its affiliates, which may include other registered investment companies, a 529 education savings plan, managed separate accounts and exempt group annuity contracts sold to qualified plans, and which in no case contained elements that would cause the Board to conclude that approval of the subadvisory agreement with the subadviser would be inappropriate.
Additional information that the Board considered for a particular fund is set forth below.
| | Performance of | |
| | Comparable Funds | Estimated Fees |
| Fund | as of June 30, 2005 | and Expenses |
|
| Lifestyle Balanced | Performance of the | Advisory fees for this Fund |
| | Lifestyle Balanced 820 | are lower than its peer |
| (MFC Global | Trust of JHT has | group median. |
| Investment | outperformed its | |
| Management (U.S.A.) | benchmark index over | Total expenses for this |
| Limited | the one, three and five | Fund are higher than its |
| | year periods. | peer group median. |
|
32
For more information
The Portfolio’s proxy voting policies, procedures and records are available without charge, upon request:
| By phone | On the Fund’s Web site | On the SEC’s Web site |
| 1-800-225-5291 | www.jhfunds.com/proxy | www.sec.gov |
|
| Trustees | Gordon M. Shone | Principal distributor |
| James M. Oates, Chairman* | Vice President and Treasurer | John Hancock Funds, LLC |
| Charles L. Bardelis * | Betsy A. Seel | 601 Congress Street |
| James R. Boyle† | Assistant Vice President, | Boston, MA 02210-2805 |
| Peter S. Burgess * | Secretary and | |
| Elizabeth G. Cook | Chief Legal Officer | Custodian |
| William H. Cunningham | | State Street Bank & Trust Co. |
| Charles L. Ladner * | George Boyd | 225 Franklin Street |
| Hassell H. McClellan | Senior Counsel, Assistant | Boston, MA 02110 |
| *Members of the Audit Committee | Vice President and | |
| †Non-Independent Trustee | Assistant Secretary | Transfer agent |
| | John Hancock Signature |
| Francis V. Knox, Jr. | Services, Inc. |
| Officers | Vice President and Chief | 1 John Hancock Way, |
| Keith F. Hartstein | Compliance Officer | Suite 1000 |
| President | | Boston, MA 02217-1000 |
| Investment adviser | |
| John G. Vrysen | John Hancock Investment | Legal counsel |
| Executive Vice President and | Management Services, LLC | Kirkpatrick & Lockhart |
| Chief Financial Officer | 601 Congress Street | Nicholson Graham LLP |
| | Boston, MA 02210-2805 | 1 Lincoln Street |
| | | Boston, MA 02111 |
The Portfolio’s investment objective, risks, charges and expenses are included in the prospectus and should be considered carefully before investing. For a prospectus, call your financial professional, call John Hancock Funds at 1-800-225-5291, or visit the Portfolio’s Web site at www.jhfunds.com. Please read the prospectus carefully before investing or sending money.
| How to contact us | |
|
| |
| Internet | www.jhfunds.com | |
|
| |
| Mail | Regular mail: | Express mail: |
| | John Hancock | John Hancock |
| | Signature Services, Inc. | Signature Services, Inc. |
| | 1 John Hancock Way, Suite 1000 | Mutual Fund Image Operations |
| | Boston, MA 02217-1000 | 380 Stuart Street |
| | | Boston, MA 02116 |
|
| |
| Phone | Customer service representatives | 1-800-225-5291 |
| | 24-hour automated information | 1-800-338-8080 |
| | TDD line | 1-800-554-6713 |
A listing of month-end portfolio holdings is available on our Web site, www.jhfunds.com. A more detailed portfolio holdings summary is available on a quarterly basis 60 days after the fiscal quarter on our Web site or upon request by calling 1-800-225-5291, or on the Securities and Exchange Commission’s Web site, www.sec.gov.
33


| Table of contents |
|
| Your fund at a glance |
| page 1 |
|
| Managers’ report |
| page 2 |
|
| A look at performance |
| page 6 |
|
| Growth of $10,000 |
| page 7 |
|
| Your expenses |
| page 8 |
|
| Fund’s investments |
| page 10 |
|
| Financial statements |
| page 11 |
|
| For more information |
| page 33 |
|
To Our Shareholders,
After producing modest returns in 2005, the stock market started off strong in the first two months of 2006. The major indexes all advanced and produced two-month returns that were already half as much as the market’s returns for all of 2005. For example, the Standard & Poor’s 500 Index returned 2.93% through February 2006, versus 4.91% last year in total. Investors were encouraged by solid corporate earnings, a slower-growing economy and stable inflation, which suggested the Federal Reserve could be coming close to the end of their 18-month campaign of rising interest rates.
Although a solid yearly beginning has typically augured well for the rest of the year, it is anyone’s guess where the market will end 2006, especially given the wild cards of interest rate moves and record-high energy prices and their impact on corporate profits and the economy.
One thing we do know, however, is that the stock market’s pattern is one of extremes. Consider the last 10 years. From 1995 through 1999, we saw double-digit returns in excess of 20% per year, only to have 2000 through 2002 produce ever-increasing negative results, followed by another 20%-plus up year in 2004 and a less than 5% advance in 2005. Since 1926, the market, as measured by the Standard & Poor’s 500 Index, has produced average annual results of 10.4% . However, that “normal” return is rarely produced in any given year. In fact, calendar-year returns of 8% to 12% have occurred only five times in the 80 years since 1926.
Although the past in no way predicts the future, we have learned at least one lesson from history: Expect highs and lows in the short term, but always invest for the long term. Equally important: Work with your financial professional to maintain a diversified portfolio, spread out among not only different asset classes — stocks, bonds and cash — but also among various investment styles. It’s the best way we know of to benefit from, and weather, the market’s extremes.
Sincerely,

Keith F. Hartstein,
President and Chief Executive Officer
|
This commentary reflects the CEO’s views as of February 28, 2006. They are subject to change at any time.
YOUR FUND
AT A GLANCE
The Portfolio seeks a
balance between a
high level of current
income and growth
of capital, with a
greater emphasis
on income. To
pursue this goal,
the Portfolio, which
is a fund of funds,
normally invests
approximately
80% of its assets
in underlying
funds which invest
primarily in fixed-
income securities
and approximately
20% of its assets
in underlying
funds which invest
primarily in equity
securities.
|
Since inceptiona
* U.S. fixed income segments were only modestly positive during the
reporting period but equities performed quite well.
* All but one of the underlying funds produced positive results during the
reporting period, and the Lifestyle Conservative Portfolio outperformed
the index.
* The equity portion of the Portfolio benefited most from allocations to
funds that invest in small- and mid-cap stocks as well as funds that
invest in non-U.S. equities, while the fixed-income portion benefited
most from funds that invest in high yield bonds.
|

Total returns for the Portfolio are at net asset value with all distributions reinvested. These returns do not reflect the deduction of the maximum sales charge, which would reduce the performance shown above.
a Class A, Class B, Class C, Class R3, Class R4 and Class R5 began operations on 10-18-05 and Class 1 began operation on 10-15-05.
| Asset Allocation | | | |
| Equity | % of Total | Fixed Income | % of Total |
U.S. Large Cap | 10.00 | Intermediate Term Bond | 28.00 |
| International | 5.00 | Multi-Sector Bond | 16.00 |
| Real Estate | 5.00 | Short-Term Bond | 11.00 |
| | | Global Bond | 8.00 |
| | | High Yield Bond | 8.00 |
| | | Long-Term Bond | 5.00 |
| | | Treasury Inflation | |
| | | Protected Securities | 4.00 |
As a percentage of the Portfolio’s net assets on February 28, 2006.
1
FROM THE MANAGEMENT TEAM OF MFC GLOBAL INVESTMENT MANAGEMENT
JOHN HANCOCK
Lifestyle
Conservative Portfolio
|
For the reporting period of October 18, 2005 through February 28, 2006, all major equity indexes posted positive results, while bonds advanced modestly. The dominant influence of energy on the economy and on business profitability kept equity and oil prices locked in contrary motion: Equities fell in December and January as oil prices firmed, and rallied in October, November and February as oil prices declined. Oil price volatility has not diminished the underlying support that equities have received from strong corporate earnings and solid economic growth.
“For the reporting period of
October 18, 2005 through
February 28, 2006, all major
equity indexes posted positive
results, while bonds advanced
modestly.”
|
U.S. small-cap stocks were the best performers over the reporting period followed by mid-cap stocks. Large-cap stocks continued to trail, which is consistent with the last two years of unremarkable performance. Small-and mid-cap growth stocks beat their value counterparts, while value stocks outperformed in the large-cap area. International stocks produced strong results during this period, outperforming U.S. equities by approximately 6%. This performance was bolstered by strong results in Japan and Germany.
While equities performed quite well during the reporting period, most U.S. fixed-income segments were only modestly positive. One exception came from high-yield issues, which significantly outperformed other fixed-income areas as investors searched for yield. In terms of non-U.S. fixed-income, hedged strategies outperformed unhedged portfolios due to the strengthening of the U.S. dollar against most currencies, namely the Euro, Yen and Sterling.
Performance results
From inception October 18, 2005 (for Class I inception is October 15, 2005) through February 28, 2006, John Hancock Lifestyle Conservative Portfolio’s Class A, Class B, Class C, Class R3,
2
Class R4, Class R5 and Class I shares posted total returns of 3.52%, 3.28%, 3.21%, 3.38%, 3.51%, 3.56% and 3.66%, respectively, at net asset value. That compared with the 2.85% return of the Portfolio’s benchmark index — a 20/80 blend of the Standard & Poor’s 500 Index and the Lehman Brothers Aggregate Bond Index.
Performance explanation
This Portfolio outperformed its benchmark since inception. Both the equity and fixed-income components of the Portfolio contributed to the positive outcome. Performance of the equity portion was aided by Real Estate Securities Fund (+17.27%, Deutsche Asset Management), which delivered excellent gains as REITs continued to outperform the S&P 500 Index for the sixth straight year. While real estate can be volatile as an individual investment, the risks inherent in this asset class are diffused by the broad diversification of Lifestyle Conservative Portfolio.
“Allocations to traditional equity
asset classes also added value,
particularly the exposure to
non-U.S. funds.”
|
Allocations to traditional equity asset classes also added value, particularly the exposure to non-U.S. funds. International Stock (+13.38%, GMO), a value-oriented fund, led the way on the non-U.S. side. Domestically, the large-cap portion of the portfolio delivered a slight positive contribution. U.S. Multi Sector (GMO) Fund was the main detractor from performance. This was due in large part to the fund’s positioning in higher-quality names. The fund’s management team continues to believe that low quality stocks are extremely overvalued and that high-quality equities represent the best opportunity within the U.S. The negative relative result from U.S. Multi Sector Fund was offset by other managers in the space, particularly by the solid return from Value and Restructuring Fund (12.07%, Excelsior).
The best relative results in the fixed-income portion of the Portfolio were generated by high yield funds. Although spreads have become historically tight in relation to other fixed-income options, investors have continued to flock to high yield bonds in an effort to capture any incremental yield over traditional fixed-income asset classes. Allocations to multi-sector bond funds also added value. These funds are designed to outperform the broad
3
fixed-income market with a similar amount of risk by allocating across a wide range of sectors, including emerging-market debt, high yield and non-U.S. sovereign debt. Over the current reporting period, Spectrum Income Fund (+3.19%, T. Rowe Price) benefited from allocations to high yield and emerging-market debt.
“Lifestyle Conservative Portfolio
is well diversified across a
wide range of asset classes and
investment styles, including
non-traditional asset classes.”
|
The main detractor from performance within fixed income was Global Bond (–0.71%, PIMCO). Because the strategy does not hedge the underlying currency of its foreign bond holdings, the rallying U.S. dollar hurt performance. While global bonds detracted from results during this period, allocations to non-traditional fixed-income asset classes such as global bonds and TIPS help to diversify Lifestyle Conservative Portfolio over the long term.
Positioning and outlook
Lifestyle Conservative Portfolio is well diversified across a wide range of asset classes and investment styles, including non-traditional asset classes. The Portfolio has a 5% weighting in non-U.S. equity funds and a 5% position in the Real Estate Securities Fund (Deutsche Asset Management). On the fixed-income front, the portfolio has meaningful stake in high yield funds (8%), an 8% position in Global Bond Fund (PIMCO) and a 4% position in Real Return Bond Fund (PIMCO). No major changes were made during this short time period outside of the regular rebalancing process.
Portfolio diversification as a percentage of net assets on 2-28-06
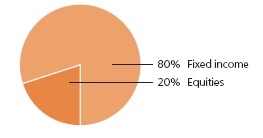
4
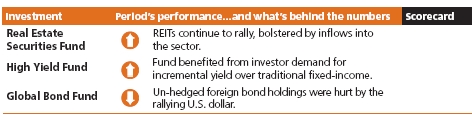
We believe that the long-awaited shift in favor of higher-quality stocks will occur sooner rather than later, and we are well positioned for this impending change within our large-cap allocations. We remain vigilant in our evaluation of the areas that have experienced excellent relative and absolute gains recently, including real estate, natural resources and high yield. In our view, valuations in these areas are not as attractive as they were three years ago (for example, high yield spreads over treasuries have tightened significantly, and cash flow multiples for REIT securities have been higher than historical averages). In many cases, however, the fundamentals remain strong. As always, we will make adjustments to further enhance the risk-reward profile of the Portfolio as opportunities arise.
This commentary reflects the views of the portfolio managers through the end of the Portfolio’s period discussed in this report. The managers’ statements reflect their own opinions. As such, they are in no way guarantees of future events and are not intended to be used as investment advice or a recommendation regarding any specific security. They are also subject to change at any time as market and other conditions warrant.
International investing involves special risks such as political, economic and currency risks and differences in accounting standards and financial reporting. See the prospectus for the risks of investing in small-cap stocks. See the prospectus for the risks of investing in high-yield bonds.
5
A LOOK AT
PERFORMANCE
For the period ending
February 28, 2006
|
| With maximum sales charge (POP) | | |
| |
| | Cumulative total returns | |
| | Since inceptiona | |
| |
| Class A | –1.64% | |
| |
| Class B | –1.72 | |
| |
| Class C | 2.21 | |
| |
| Class R3b | 3.38 | |
| |
| Class R4b | 3.51 | |
| |
| Class R5b | 3.56 | |
| |
| Class 1b | 3.66 | |
| |
Performance figures assume all distributions are reinvested. Returns with maximum sales charge reflect a sales charge on Class A shares of 5%, and the applicable contingent deferred sales charge (CDSC) on Class B and Class C shares. The Class B shares’ CDSC declines annually between years 1–6 according to the following schedule: 5, 4, 3, 3, 2, 1%. No sales charge will be assessed after the sixth year. Class C shares held for less than one year are subject to a 1% CDSC. Sales charge is not applicable for Class R3, Class R4, Class R5 and Class 1 shares.
The returns reflect past results and should not be considered indicative of future performance. The return and principal value of an investment will fluctuate so that shares, when redeemed, may be worth more or less than their original cost. Due to market volatility, the Fund’s current performance may be higher or lower than the performance shown. For performance data current to the most recent month-end, please call 1-800-225-5291 or visit the Fund’s Web site at www.jhfunds.com.
The performance table above and the chart on the next page do not reflect the deduction of taxes that a shareholder would pay on fund distributions or the redemption of fund shares.
The Fund’s performance results reflect any applicable expense reductions, without which the expenses would increase and results would have been less favorable.
Since inception performance is calculated with an opening price (prior day’s close) on the inception date.
a Class A, Class B, Class C, Class R3, Class R4 and Class R5 shares began operations on 10-18-05 and Class 1 shares began operation on 10-15-05.
b For certain types of investors as described in the Fund’s Class R3, Class R4, Class R5 and Class 1 share prospectuses.
6
This chart shows what happened to a hypothetical $10,000 investment in Class A shares for the period indicated. For comparison, we’ve shown the same investment in a blended index.
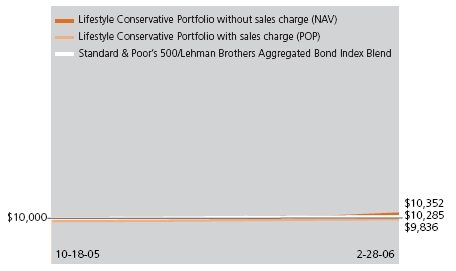
| | Class B | Class C | Class R31 | Class R41 | Class R51 | Class 11 |
| Period beginning | 10-18-05 | 10-18-05 | 10-18-05 | 10-18-05 | 10-18-05 | 10-15-05 |
|
| Without | | | | | | |
| sales charge | $10,328 | $10,321 | $10,338 | $10,351 | $10,356 | $10,366 |
|
| With maximum | | | | | | |
| sales charge | 9,828 | 10,221 | 10,338 | 10,351 | 10,356 | 10,366 |
|
| Index | 10,285 | 10,285 | 10,285 | 10,285 | 10,285 | 10,294 |
|
Assuming all distributions were reinvested for the period indicated, the table above shows the value of a $10,000 investment in the Fund’s Class B, Class C, Class R3, Class R4, Class R5 and Class 1 shares, respectively, as of February 28, 2006. Performance of the classes will vary based on the difference in sales charges paid by shareholders investing in the different classes and the fee structure of those classes.
A blended index is used combining 20% of the Standard & Poor’s 500 Index, an unmanaged index that includes 500 widely traded common stocks, and 80% of the Lehman Brothers Aggregate Bond Index, an unmanaged index of dollar-denominated and nonconvertible investment-grade debt issues.
It is not possible to invest directly in an index. Index figures do not reflect sales charges and would be lower if they did.
1 For certain types of investors as described in the Fund’s Class R3, Class R4, Class R5 and Class 1 share prospectuses.
7
These examples are intended to help you understand your ongoing operating expenses.
Understanding fund expenses
As a shareholder of the Fund, you incur two types of costs:
* Transaction costs which include sales charges (loads) on
purchases or redemptions (varies by share class), minimum
account fee charge, etc.
* Ongoing operating expenses including management fees,
distribution and service fees (if applicable) and other fund expenses.
|
In addition to the operating expenses which the Fund bears directly, the Fund indirectly bears a pro rata share of the operating expenses of the underlying funds in which the Fund invests. Because the underlying funds have varied operating expenses and transaction costs and the Fund may own different proportions of the underlying funds at different times, the amount of expenses incurred indirectly by the Fund will vary. If these indirect expenses were included, your expenses paid during the period would have been higher.
We are going to present only your ongoing operating expenses here.
Actual expenses/actual returns
This example is intended to provide information about your fund’s actual ongoing operating expenses, and is based on your fund’s actual return. It assumes an account value of $1,000.00 on inception date, with the same investment held until February 28, 2006.
| Account value | | Expenses paid |
| $1,000.00 | Ending value | during period |
| on inception date | on 2-28-06 | ended 2-28-06a |
|
| Class Ab | $1,035.20 | $2.34 |
| Class Bb | 1,032.80 | 5.08 |
| Class Cb | 1,032.10 | 4.88 |
| Class R3b | 1,033.80 | 2.75 |
| Class R4b | 1,035.10 | 1.83 |
| Class R5b | 1,035.60 | 0.81 |
| Class 1b | 1,036.60 | 0.51 |
Together with the value of your account, you may use this information to estimate the operating expenses that you paid over
8
the period. Simply divide your account value at February 28, 2006 by $1,000.00, then multiply it by the “expenses paid” for your share class from the table above. For example, for an account value of $8,600.00, the operating expenses should be calculated as follows:

Hypothetical example for comparison purposes
This table allows you to compare your fund’s ongoing operating expenses with those of any other fund. It provides an example of the Fund’s hypothetical account values and hypothetical expenses based on each class’s actual expense ratio and an assumed 5% annual return before expenses (which is not your fund’s actual return). It assumes an account value of $1,000.00 on inception date, with the same investment held until February 28, 2006. Look in any other fund shareholder report to find its hypothetical example and you will be able to compare these expenses.
| Account value | | Expenses paid |
| $1,000.00 | Ending value | during period |
| on inception date | on 2-28-06 | ended 2-28-06a |
|
| Class Ab | $1,016.10 | $2.32 |
| Class Bb | 1,013.40 | 5.03 |
| Class Cb | 1,013.60 | 4.83 |
| Class R3b | 1,015.70 | 2.72 |
| Class R4b | 1,016.60 | 1.81 |
| Class R5b | 1,017.60 | 0.81 |
| Class 1b | 1,018.30 | 0.50 |
Remember, these examples do not include any transaction costs, such as sales charges; therefore, these examples will not help you to determine the relative total costs of owning different funds. If transaction costs were included, your expenses would have been higher. See the prospectus for details regarding transaction costs.
a Expenses are equal to the Fund’s annualized expense ratio of 0.62%, 1.35%,
1.32%, 0.73%, 0.48%, 0.23% and 0.12% for Class A, Class B, Class C, Class R3,
Class R4, Class R5 and Class 1, respectively, multiplied by the average account value
over the period, multiplied by the number of days in the inception period /365 or
366 (to reflect the one-half year period).
b Class A, Class B, Class C, Class R3, Class R4 and Class R5 shares began operations on
10-18-05 and Class 1 shares began operation on 10-15-05.
|
9
F I N A N C I A L S TAT E M E N T S
FUND’S
INVESTMENTS
Securities owned
by the Fund on
February 28, 2006
(unaudited)
|
Lifestyle Conservative Fund portfolio of investments, showing all underlying funds.
| Issuer | Shares | Value |
|
| Investment Companies 100.01% | | $1,022,222,840 |
| (Cost $994,509,853) | | |
| John Hancock Funds II | | |
|
| Active Bond Fund Class NAV | 10,572,744 | $102,238,435 |
|
| Blue Chip Growth Fund Class NAV | 1,129,759 | 20,426,042 |
|
| Core Bond Fund Class NAV | 1,622,159 | 20,390,543 |
|
| Equity-Income Fund Class NAV | 1,173,766 | 20,423,523 |
|
| Fundamental Value Fund Class NAV | 1,332,422 | 20,386,054 |
|
| Global Bond Fund Class NAV | 5,729,008 | 82,096,685 |
|
| High Yield Fund Class NAV | 6,889,604 | 71,514,086 |
|
| International Stock Fund Class NAV | 1,550,231 | 20,478,549 |
|
| International Value Fund Class NAV | 1,856,206 | 30,608,836 |
|
| Investment Quality Bond Fund Class NAV | 4,296,986 | 51,091,161 |
|
| Real Estate Securities Fund Class NAV | 1,907,845 | 51,053,924 |
|
| Real Return Bond Fund Class NAV | 3,046,777 | 40,887,746 |
|
| Spectrum Income Fund Class NAV | 8,969,923 | 91,941,706 |
|
| Strategic Bond Fund Class NAV | 5,958,405 | 71,500,857 |
|
| Total Return Fund Class NAV | 11,886,315 | 163,674,552 |
|
| U.S. Government Securities Fund Class NAV | 8,271,343 | 112,490,265 |
|
| U.S. High Yield Bond Fund Class NAV | 781,931 | 10,235,482 |
|
| U.S. Multi Sector Fund Class NAV | 1,917,119 | 20,398,143 |
|
| Value & Restructuring Fund Class NAV | 1,823,457 | 20,386,251 |
|
| Total investments 100.01% | | $1,022,222,840 |
|
| Liabilities in excess of other assets (0.01)% | | ($98,130) |
|
| Total net assets 100.00% | | $1,022,124,710 |
| |
| Percentages are stated as a percent of net assets of the Fund. | | |
See notes to
financial statements.
|
10
F I N A N C I A L S TAT E M E N T S
ASSETS AND
LIABILITIES
February 28, 2006
(unaudited)
This Statement
of Assets and
Liabilities is the
Fund’s balance
sheet. It shows
the value of
what the Fund
owns, is due
and owes. You’ll
also find the net
asset value and
the maximum
offering price
per share.
|
| Assets | |
| Investments in affiliated funds, at value | |
| (cost $994,509,853) | $1,022,222,840 |
| Receivable for investments sold | 69 |
| Receivable for shares sold | 628,334 |
| Receivable from affiliates | 51,014 |
| Total assets | 1,022,902,257 |
|
| Liabilities | |
| Due to custodian | 917 |
| Payable for investments purchased | 624,776 |
| Payable to affiliates | |
| Fund administration fees | 19,499 |
| Transfer agent fees | 1,397 |
| Other payables and accrued expenses | 130,958 |
| Total liabilities | 777,547 |
|
| Net assets | |
| Capital paid-in | 993,559,243 |
| Accumulated net realized gain on investments | 837,185 |
| Net unrealized appreciation on investments | 27,712,987 |
| Accumulated net investment income | 15,295 |
| Net assets | $1,022,124,710 |
|
| Net asset value per share | |
| Based on net asset values and shares outstanding — | |
| the Fund has an unlimited number of shares | |
| authorized with no par value | |
| Class A ($4,138,640 ÷ 305,716 shares) | $13.54 |
| Class B ($955,248 ÷ 70,586 shares) | $13.53 |
| Class C ($1,394,639 ÷ 103,127 shares) | $13.52 |
| Class R3 ($102,848 ÷ 7,601 shares) | $13.53 |
| Class R4 ($105,194 ÷ 7,771 shares) | $13.54 |
| Class R5 ($231,278 ÷ 17,075 shares) | $13.54 |
| Class 1 ($1,015,196,863 ÷ 74,994,214 shares) | $13.54 |
|
| Maximum offering price per share | |
| Class Aa ($13.54 ÷ 95%) | $14.25 |
a On single retail sales of less than $50,000. On sales of $50,000 or more and on group sales the offering price is reduced.
See notes to
financial statements.
|
11
F I N A N C I A L S TAT E M E N T S
OPERATIONS
For the period ended
February 28, 2006a
(unaudited)
This Statement
of Operations
summarizes the
Fund’s investment
income earned and
expenses incurred
in operating the
Fund. It also shows
net gains (losses) for
the period stated.
|
| Investment income | |
| Income distributions received from affiliated underlying funds | $7,037,529 |
| Total investment income | 7,037,529 |
|
| Expenses | |
| Investment management fees (Note III) | 142,609 |
| Distribution and service fees (Note III) | 172,052 |
| Transfer agent fees (Note III) | 1,627 |
| Blue sky fees (Note III) | 33,084 |
| Printing and postage fees (Note III) | 19,752 |
| Fund administration fees (Note III) | 19,537 |
| Audit and legal fees | 10,007 |
| Custodian fees | 4,268 |
| Trustees’ fees (Note III) | 6,994 |
| Registration and filing fees | 56,556 |
| Miscellaneous | 5,709 |
| Total expenses | 472,195 |
| Less expense reductions (Note III) | (51,242) |
| Net expenses | 420,953 |
| Net investment income | 6,616,576 |
|
| Realized and unrealized gain | |
| Net realized gain on investments | 713,820 |
| Capital gain distributions received from affiliated | |
| underlying funds | 123,365 |
| Change in net unrealized appreciation of investments | 27,712,987 |
| Net realized and unrealized gain | 28,550,172 |
| Increase in net assets from operations | $35,166,748 |
| |
| a Period from 10-15-05 (commencement of operations) to 2-28-06. | |
See notes to
financial statements.
|
12
F I N A N C I A L S TAT E M E N T S
CHANGES IN
NET ASSETS
These Statements
of Changes in Net
Assets show how
the value of the
Fund’s net assets
has changed
during the last
two periods. The
difference reflects
earnings less
expenses, any
investment
gains and losses,
distributions, if
any, paid to
shareholders and
the net of Fund
share transactions.
|
| | Period |
| | ended |
| | 2-28-06a |
|
| |
| Increase (decrease) in net assets | |
| From operations | |
| Net investment income | $6,616,576 |
| Net realized gain | 837,185 |
| Change in net unrealized appreciation | 27,712,987 |
| Increase in net assets resulting | |
| from operations | 35,166,748 |
| Distributions to shareholders | |
| From net investment income | |
| Class A | (7,612) |
| Class B | (1,428) |
| Class C | (1,179) |
| Class R3 | (559) |
| Class R4 | (610) |
| Class R5 | (881) |
| Class 1 | (6,589,012) |
| | (6,601,281) |
| From Fund share transactions | 993,559,243 |
|
| Net assets | |
| End of period | $1,022,124,710 |
| Accumulated net investment income | $15,295 |
| |
| a Class A, Class B, Class C, Class R3, Class R4 and Class R5 shares began operations on |
| 10-18-05 and Class 1 shares began operation on 10-15-05. Unaudited. |
See notes to
financial statements.
|
13
F I N A N C I A L H I G H L I G H T S
CLASS A SHARESThe Financial Highlights show how the Fund’s net asset value for a
share has changed since the commencement of operations of the Fund.
| Period ended | 2-28-06a |
|
| Per share operating performance | |
| Net asset value, | |
| beginning of period | $13.16 |
| Net investment incomeh | 0.05 |
| Net realized and unrealized | |
| gain on investments | 0.41 |
| Total from | |
| investment operations | 0.46 |
| Less distributions | |
| From net investment income | (0.08) |
| | (0.08) |
| Net asset value, end of period | $13.54 |
| Total returnk,l (%) | 3.52m |
|
| Ratios and supplemental data | |
| Net assets, end of period | |
| (in millions) | $4 |
| Ratio of net expenses | |
| to average net assetsq (%) | 0.62r |
| Ratio of gross expenses | |
| to average net assetsp,q (%) | 3.26r |
| Ratio of net investment income | |
| to average net assetsv (%) | 0.96r |
| Portfolio turnover (%) | 3m |
See notes to
financial statements.
|
14
F I N A N C I A L H I G H L I G H T S
| CLASS B SHARES | |
| |
| Period ended | 2-28-06a |
|
| Per share operating performance | |
| Net asset value, | |
| beginning of period | $13.16 |
| Net investment incomeh | 0.01 |
| Net realized and unrealized | |
| gain on investments | 0.42 |
| Total from | |
| investment operations | 0.43 |
| Less distributions | |
| From net investment income | (0.06) |
| | (0.06) |
| Net asset value, end of period | $13.53 |
| Total returnk,l (%) | 3.28m |
|
| Ratios and supplemental data | |
| Net assets, end of period | |
| (in millions) | $1 |
| Ratio of net expenses | |
| to average net assetsq (%) | 1.35r |
| Ratio of gross expenses | |
| to average net assetsp,q (%) | 7.60r |
| Ratio of net investment income | |
| to average net assetsv (%) | 0.18r |
| Portfolio turnover (%) | 3m |
See notes to
financial statements.
|
15
| F I N A N C I A L H I G H L I G H T S | |
| |
| CLASS C SHARES | |
| |
| Period ended | 2-28-06a |
|
| Per share operating performance | |
| Net asset value, | |
| beginning of period | $13.16 |
| Net investment lossh | (0.01) |
| Net realized and unrealized | |
| gain on investments | 0.43 |
| Total from | |
| investment operations | 0.42 |
| Less distributions | |
| From net investment income | (0.06) |
| | (0.06) |
| Net asset value, end of period | $13.52 |
| Total returnk,l (%) | 3.21m |
|
| Ratios and supplemental data | |
| Net assets, end of period | |
| (in millions) | $1 |
| Ratio of net expenses | |
| to average net assetsq (%) | 1.32r |
| Ratio of gross expenses | |
| to average net assetsp,q (%) | 6.23r |
| Ratio of net investment loss | |
| to average net assetsv (%) | (0.26)r |
| Portfolio turnover (%) | 3m |
See notes to
financial statements.
|
16
F I N A N C I A L H I G H L I G H T S
| CLASS R3 SHARES | |
| |
| Period ended | 2-28-06a |
|
| Per share operating performance | |
| Net asset value, | |
| beginning of period | $13.16 |
| Net investment incomeh | 0.06 |
| Net realized and unrealized | |
| gain on investments | 0.38 |
| Total from | |
| investment operations | 0.44 |
| Less distributions | |
| From net investment income | (0.07) |
| | (0.07) |
| Net asset value, end of period | $13.53 |
| Total returnk,l (%) | 3.38m |
|
| Ratios and supplemental data | |
| Net assets, end of period | |
| (in millions) | —i |
| Ratio of net expenses | |
| to average net assetsq (%) | 0.73r |
| Ratio of gross expenses | |
| to average net assetsp,q (%) | 18.18r |
| Ratio of net investment income | |
| to average net assetsv (%) | 1.24r |
| Portfolio turnover (%) | 3m |
See notes to
financial statements.
|
17
F I N A N C I A L H I G H L I G H T S
| CLASS R4 SHARES | |
| |
| Period ended | 2-28-06a |
|
| Per share operating performance | |
| Net asset value, | |
| beginning of period | $13.16 |
| Net investment incomeh | 0.07 |
| Net realized and unrealized | |
| gain on investments | 0.39 |
| Total from | |
| investment operations | 0.46 |
| Less distributions | |
| From net investment income | (0.08) |
| | (0.08) |
| Net asset value, end of period | $13.54 |
| Total returnk,l (%) | 3.51m |
|
| Ratios and supplemental data | |
| Net assets, end of period | |
| (in millions) | —i |
| Ratio of net expenses | |
| to average net assetsq (%) | 0.48r |
| Ratio of gross expenses | |
| to average net assetsp,q (%) | 17.90r |
| Ratio of net investment income | |
| to average net assetsv (%) | 1.48r |
| Portfolio turnover (%) | 3m |
See notes to
financial statements.
|
18
F I N A N C I A L H I G H L I G H T S
| CLASS R5 SHARES | |
| |
| Period ended | 2-28-06a |
|
| Per share operating performance | |
| Net asset value, | |
| beginning of period | $13.16 |
| Net investment incomeh | 0.05 |
| Net realized and unrealized | |
| gain on investments | 0.42 |
| Total from | |
| investment operations | 0.47 |
| Less distributions | |
| From net investment income | (0.09) |
| | (0.09) |
| Net asset value, end of period | $13.54 |
| Total returnk,l (%) | 3.56m |
|
| Ratios and supplemental data | |
| Net assets, end of period | |
| (in millions) | —i |
| Ratio of net expenses | |
| to average net assetsq (%) | 0.23r |
| Ratio of gross expenses | |
| to average net assetsp,q (%) | 11.59r |
| Ratio of net investment income | |
| to average net assetsv (%) | 1.10r |
| Portfolio turnover (%) | 3m |
See notes to
financial statements.
|
19
F I N A N C I A L H I G H L I G H T S
| CLASS 1 SHARES | |
| |
| Period ended | 2-28-06a |
|
| Per share operating performance | |
| Net asset value, | |
| beginning of period | $13.15 |
| Net investment incomeh | 0.10 |
| Net realized and unrealized | |
| gain on investments | 0.38 |
| Total from | |
| investment operations | 0.48 |
| Less distributions | |
| From net investment income | (0.09) |
| | (0.09) |
| Net asset value, end of period | $13.54 |
| Total returnk (%) | 3.66m |
|
| Ratios and supplemental data | |
| Net assets, end of period | |
| (in millions) | $1,015 |
| Ratio of net expenses | |
| to average net assetsq (%) | 0.12r |
| Ratio of net investment income | |
| to average net assetsv (%) | 1.98r |
| Portfolio turnover (%) | 3m |
a Class A, Class B, Class C, Class R3, Class R4 and Class R5 shares began operations on 10-18-05 and Class 1
shares began operation on 10-15-05. Unaudited.
h Based on the average of the shares outstanding.
i Less than $500,000.
k Assumes dividend reinvestment and does not reflect the effect of sales charges.
l Total returns would have been lower had certain expenses not been reduced during the period shown.
m Not annualized.
p Does not take into consideration expense reductions during the period shown.
q Does not include expenses of the investment companies in which the Fund invests.
r Annualized.
v Recognition of net investment income by the Fund is affected by the timing of the declaration of dividends by
the underlying investment companies in which the Fund invests.
|
See notes to
financial statements.
|
20
UnauditedI. Organization
The John Hancock Lifestyle Conservative Portfolio (the “Fund”) is a non-diversified series of John Hancock Funds II (the “Trust”), an open-end management investment company registered under the Investment Company Act of 1940, as amended.
The Fund operates as a “fund of funds”, which invests in shares of mutual funds (“underlying funds”) managed by affiliates of John Hancock Investment Management Services, LLC (the “Adviser”). The Adviser is a wholly owned subsidiary of Manulife Financial Corporation (“MFC”). Each underlying fund’s accounting policies are outlined in the underlying fund’s shareholder report, available without charge by calling 1-800-344-1029 or on the Securities and Exchange Commission (“SEC”) Internet site at www.sec.gov, File # 811-21779, CIK 0001331971.
The Trustees have authorized the issuance of multiple classes of shares of the Fund, including classes designated as Class A, Class B, Class C, Class R3, Class R4, Class R5, and Class 1 shares. The shares of each class represent an interest in the same portfolio of investments of the Fund, and have equal rights as to voting, redemptions, dividends and liquidation, except that certain expenses, subject to the approval of the Trustees, may be applied differently to each class of shares in accordance with current regulations of the Securities and Exchange Commission and the Internal Revenue Service. Shareholders of a class that bears distribution and service expenses under the terms of a distribution plan have exclusive voting rights to that distribution plan.
At February 28, 2006 John Hancock USA, an indirect subsidiary of MFC, owned 7,605 Class B, Class C, Class R3, Class R4 and Class R5 shares of beneficial interest of the Fund.
II. Significant
accounting policies
In the preparation of the financial statements, the Fund follows the policies described below. The preparation of financial statements in conformity with accounting principles generally accepted in the United States of America requires management to make estimates and assumptions that affect the reported amounts of assets and liabilities at the date of the financial statements and the reported amounts of income and expenses during the reporting period. Actual results may differ from these estimates.
Securities valuation
The net asset value of the shares of the Fund is determined daily as of the close of the New York Stock Exchange, normally at 4:00 P.M. Eastern Time. Investments in underlying funds are valued at their respective net asset values each business day, or at fair value as determined in good faith in accordance with procedures
21
approved by the Trustees. Securities in the underlying funds’ portfolios are valued in accordance with their respective valuation polices, as outlined in the underlying funds’ financial statements. Short-term debt investments that have a remaining maturity of 60 days or less are valued at amortized cost.
Repurchase agreements
The Fund may enter into repurchase agreements. When a Fund enters into a repurchase agreement through its custodian, it receives delivery of securities, the amount of which at the time of purchase and each subsequent business day is required to be maintained at such a level that the market value is generally at least 102% of the repurchase amount. The Fund will take constructive receipt of all securities underlying the repurchase agreements it has entered into until such agreements expire. If the seller defaults, a Fund would suffer a loss to the extent that proceeds from the sale of underlying securities were less than the repurchase amount. The Fund may enter into repurchase agreements maturing within seven days with domestic dealers, banks or other financial institutions deemed to be creditworthy by the Adviser. Collateral for certain tri-party repurchase agreements is held at the custodian bank in a segregated account for the benefit of the Fund and the counterparty.
Security transactions and related investment income
Investment security transactions are accounted for on a trade date basis. Interest income is accrued as earned. Dividend income on investment securities is recorded on the ex-dividend date.
Multi-class operations
All income, expenses (except for class-specific expenses) and realized and unrealized gains (losses) are allocated to each class of shares based upon the relative net assets of each class. Dividends to shareholders from net investment income are determined at a class level and distributions from capital gains are determined at a Fund level.
Expense allocation
Expenses not directly attributable to a particular Fund or class of shares are allocated based on the relative share of net assets of the Fund at the time the expense was incurred. Class-specific expenses, such as transfer agency fees, blue sky fees, printing and postage fees and distribution and service fees, are accrued daily and charged directly to the respective share classes. Expenses in the Fund’s Statements of Operations reflect the expenses of the Fund and do not include any indirect expenses related to the underlying funds. Because the underlying funds have varied expense levels and the Fund may own different proportions of the underlying funds at different times, the amount of fees and expenses incurred indirectly by the Fund will vary.
Federal income taxes
The Fund qualifies as a “regulated investment company” by complying with the applicable provisions of the Internal Revenue Code and will not be subject to federal income tax on taxable income that is distributed to shareholders. Therefore, no federal income tax provision is required.
Distribution of income and gains
The Fund records distributions to shareholders from net investment income and net realized gains, if any, on the ex-dividend date. Distributions paid by the Fund with respect to each class of shares are calculated in the same manner, at the same time and are in the same amount, except for the effect of expenses that may be applied differently to each class. Such distributions, on a tax basis, are determined in conformity with income tax regulations, which may differ from accounting principles generally accepted in the United States of America. Distributions in excess of tax basis earnings and profits, if any, are reported in the Fund’s financial statements as a return of capital.
Capital accounts
The Fund reports the undistributed net investment income and accumulated
22
undistributed net realized gain (loss) accounts on a basis approximating amounts available for future tax distributions (or to offset future taxable realized gains when a capital loss carryforward is available). Accordingly, the Fund may periodically make reclassifications among certain capital accounts, without affecting its net asset value.
III. Investment advisory and other agreements
Advisory Fees
The Trust has entered into an Investment Advisory Agreement with the Adviser. The Adviser is responsible for managing the corporate and business affairs of the Trust and for selecting and compensating subadvisers to handle the investment and reinvestment of the assets of the Fund, subject to the supervision of the Board of Trustees. Under the Advisory Agreement the Fund pays a monthly management fee to the Adviser equivalent, on an annual basis, to the sum of: (a) 0.05% of the first $7,500,000,000 of the Fund’s aggregate daily net assets and (b) 0.04% of the Fund’s aggregate daily net assets in excess of $7,500,000,000. Aggregate net assets include the net assets of the five Lifestyle Portfolios of the Trust (the Lifestyle Aggressive, the Lifestyle Balanced, the Lifestyle Conservative, the Lifestyle Growth and the Lifestyle Moderate) and the five Lifestyle Portfolios of John Hancock Trust (the Lifestyle Aggressive 1000, the Lifestyle Growth 820, the Lifestyle Balanced 640, the Lifestyle Moderate 460 and the Lifestyle Conservative 280). The Fund is not responsible for payment of the subadvisory fees.
Expense reimbursements
The Adviser has contractually agreed to waive advisory fees or reimburse Fund’s expenses for Class A, Class B, Class C, Class R3, Class R4 and Class R5 shares to the extent that blue sky fees and printing and postage expenses attributable to each class exceed 0.09% of the average annual net assets attributable to the classes, at least until November 1, 2006. Accordingly, the expense reductions related to this expense limitation amounted to $14,716, $8,012, $8,320, $6,501, $6,501 and $6,964 for Class A, Class B, Class C, Class R3, Class R4 and Class R5, respectively, for the period ended February 28, 2006. The Adviser reserves the right to terminate this limitation in the future.
Administration fees
The Fund has an agreement with the Adviser that requires the Fund to reimburse the Adviser for all expenses associated with providing the administrative, financial, accounting and recordkeeping services of the Fund, including the preparation of all tax returns, annual, semiannual and periodic reports to shareholders and the preparation of all regulatory reports.
Distribution plans
The Trust has a Distribution Agreement with John Hancock Funds, LLC (“JH Funds”), a wholly-owned subsidiary of the Adviser. The Fund has adopted Distribution Plans with respect to Class A, Class B, Class C, Class R3, Class R4 and Class 1, pursuant to Rule 12b-1 under the Investment Company Act of 1940, to reimburse JH Funds for the services it provides as distributor of shares of the Fund. Accordingly, the Fund makes monthly payments to JH Funds at an annual rate not to exceed 0.30%, 1.00%, 1.00%, 0.50%, 0.25%, and 0.05% of average daily net asset value of Class A, Class B, Class C, Class R3, Class R4 and Class 1, respectively. A maximum of 0.25% of such payments may be service fees, as defined by the Conduct Rules of the National Association of Securities Dealers. Under the Conduct Rules, curtailment of a portion of the Fund’s 12b-1 payments could occur under certain circumstances.
The Fund has also adopted a Service Plan with respect to Class R3, Class R4 and Class R5 shares (the “Service Plan”). Under the Service Plan, the Fund pays up to 0.15%, 0.10% and 0.05% of average daily net assets of Class R3, Class R4 and
23
Class R5 shares, respectively, for certain other services. There were no servicing fees during the period ended February 28, 2006.
Sales charges
Class A shares are assessed up-front sales charges. During the period ended February 28, 2006, JH Funds received net up-front sales charges of $33,671 with regard to sales of Class A shares. Of this amount, $5,758 was retained and used for printing prospectuses, advertising, sales literature and other purposes, $27,913 was paid as sales commissions to unrelated broker-dealers and none was paid as sales commissions to sales personnel of Signator Investors, Inc. (“Signator Investors”), a related broker-dealer, an indirect subsidiary of MFC.
Class B shares that are redeemed within six years of purchase are subject to a contingent deferred sales charge (“CDSC”) at declining rates, beginning at 5.00% of the lesser of the current market value at the time of redemption or the original purchase cost of the shares being redeemed. Class C shares that are redeemed within one year of purchase are subject to a CDSC at a rate of 1.00% of the lesser of the current market value at the time of redemption or the original purchase cost of the shares being redeemed. Proceeds from the CDSCs are paid to JH Funds and are used, in whole or in part, to defray its expenses for providing distribution-related services to the Fund in connection with the sale of Class B and Class C shares. During the period ended February 28, 2006, JH Funds received no CDSCs with regard to Class B and Class C shares.
Transfer agent fees
The Fund has a Transfer Agency Agreement with John Hancock Signature Services, Inc. (“Signature Services”), an indirect subsidiary of MFC. For Class A, Class B, Class C, Class R3, Class R4 and Class R5 shares, the Fund pays a monthly transfer agent fee at an annual rate of 0.05% of each class’s average daily net assets, plus a fee based on the number of shareholder accounts and reimbursement for certain out-of-pocket expenses. Expenses not directly attributable to a particular class of shares are aggregated and allocated to each class on the basis of its relative net asset value.
Signature Services has agreed to limit the transfer agent fees so that such fees do not exceed 0.20% annually of Class A, Class B, Class C, Class R3, Class R4 and Class R5 share average daily net assets. This agreement is effective until December 31, 2006. Signature Services reserves the right to terminate this limitation in the future. In addition, Signature Service has voluntarily agreed to further limit transfer agent fees for Class R3, Class R4 and Class R5 shares so that such fees do not exceed 0.05% annually of each class’s average daily net assets. Accordingly, the transfer agent fees reductions amounted to $66, $66 and $96 for Class R3, Class R4 and Class R5 shares, respectively, during the period ended February 28, 2006. Signature Services reserves the right to terminate this limitation at any time.
24
| Expenses under the agreements described above for the period ended February 28, 2006, |
| were as follows: | | | | |
| | Distribution | Transfer | | Printing and |
| Share Class | fees | agent | Blue sky | postage |
|
| Class A | $1,673 | $840 | $5,514 | $9,756 |
| Class B | 1,278 | 226 | 5,514 | 2,626 |
| Class C | 1,691 | 257 | 5,514 | 2,968 |
| Class R3 | 185 | 88 | 5,514 | 1,023 |
| Class R4 | 93 | 88 | 5,514 | 1,024 |
| Class R5 | N/A | 128 | 5,514 | 1,513 |
| Class 1 | 167,132 | — | — | 842 |
| Total | $172,052 | $1,627 | $33,084 | $19,752 |
Trustees’ fees
The Trust compensates each Trustee who is not an employee of the Adviser or its affiliates. Total Trustees’ expenses are allocated based on each fund’s average daily net asset value.
IV. Guarantees and indemnifications
Under the Trust’s organizational documents, its Officers and Trustees are indemnified against certain liability arising out of the performance of their duties to the Trust. Additionally, in the normal course of business, the Trust enters into contracts with service providers that contain general indemnification clauses. The Trust’s maximum exposure under these arrangements is unknown, as this would involve future claims that may be made against the Trust that have not yet occurred. However, based on experience, the Trust believes the risk of loss to be remote.
25
V. Capital shares
Share activities for the Fund for the period ended February 28, 2006 were as follows:
| | Period ended 2-28-06a |
| | Shares | Amount |
|
| Class A shares | | |
| Sold | 316,474 | $4,244,663 |
| Distributions reinvested | 447 | 5,951 |
| Repurchased | (11,205) | (150,902) |
| Net increase | 305,716 | $4,099,712 |
|
| |
| Class B shares | | |
| Sold | 70,626 | $946,714 |
| Distributions reinvested | 61 | 813 |
| Repurchased | (101) | (1,363) |
| Net increase | 70,586 | $946,164 |
|
| |
| Class C shares | | |
| Sold | 103,089 | $1,383,102 |
| Distributions reinvested | 38 | 509 |
| Net increase | 103,127 | $1,383,611 |
|
| |
| Class R3 shares | | |
| Sold | 7,601 | $100,033 |
| Net increase | 7,601 | $100,033 |
|
| |
| Class R4 shares | | |
| Sold | 7,771 | $102,335 |
| Net increase | 7,771 | $102,335 |
|
| |
| Class R5 shares | | |
| Sold | 17,149 | $227,303 |
| Distributions reinvested | 17 | 220 |
| Repurchased | (91) | (1,214) |
| Net increase | 17,075 | $226,309 |
|
| |
| Class 1 shares | | |
| Sold | 76,466,007 | $1,006,365,462 |
| Distributions reinvested | 495,787 | 6,589,012 |
| Repurchased | (1,967,580) | (26,253,395) |
| Net increase | 74,994,214 | $986,701,079 |
|
| Net increase | 75,506,090 | $993,559,243 |
| |
| a Class A, Class B, Class C, Class R3, Class R4 and Class R5 shares began operations on 10-18-05 and Class 1 |
| shares began operation on 10-15-05, respectively. | | |
26
VI. Investment transactions
Purchases and proceeds from sales or maturities of securities, other than short-term securities and obligations of the U.S. government, during the period ended February 28, 2006, aggregated $1,020,872,798 and $27,076,764, respectively.
The cost of investment owned on February 28, 2006, including short-term investments, for federal income tax purposes, was $994,509,853. Gross unrealized appreciation and depreciation of investments aggregated $28,288,811 and $575,824, respectively, resulting in net unrealized appreciation of $27,712,987. The difference between book basis and tax basis net unrealized appreciation of investments is attributable primarily to the tax deferral of losses on certain sales of securities.
VII. Investment in affiliated underlying funds
The Fund invests primarily in the underlying funds that are managed by affiliates of the Adviser. The Fund does not invest in the underlying funds for the purpose of exercising management or control.
A summary of the Fund’s transactions in the securities of affiliated issuers in which the Fund’s holdings represent 5% or more of the outstanding voting securities of the issuer, during the period ended February 28, 2006 is set forth below.
| Affiliate — | Shares | Shares | Ending | Share | Ending |
| Class NAV | Purchased | Sold | Amount | Proceeds | Value |
|
| Active Bond | 10,672,833 | 100,089 | 10,572,744 | $101,419,894 | $102,238,435 |
| Blue Chip Growth | 1,205,409 | 75,650 | 1,129,759 | 18,859,655 | 20,426,042 |
| Core Bond | 1,627,571 | 5,412 | 1,622,159 | 20,256,318 | 20,390,543 |
| Equity-Income | 1,227,535 | 53,769 | 1,173,766 | 18,883,935 | 20,423,523 |
| Fundamental Value | 1,380,181 | 47,759 | 1,332,422 | 19,303,749 | 20,386,054 |
| Global Bond | 5,802,792 | 73,784 | 5,729,008 | 82,689,689 | 82,096,685 |
| High Yield | 7,037,847 | 148,243 | 6,889,604 | 69,470,846 | 71,514,086 |
| International Stock | 1,715,414 | 165,183 | 1,550,231 | 18,243,244 | 20,478,549 |
| International Value | 1,987,545 | 131,339 | 1,856,206 | 27,603,782 | 30,608,836 |
| Investment | | | | | |
| Quality Bond | 4,347,846 | 50,860 | 4,296,986 | 50,769,094 | 51,091,161 |
| Real Estate Securities | 2,172,441 | 264,596 | 1,907,845 | 44,379,048 | 51,053,924 |
| Real Return Bond | 3,087,109 | 40,332 | 3,046,777 | 40,737,775 | 40,887,746 |
| Spectrum Income | 9,041,559 | 71,636 | 8,969,923 | 89,753,792 | 91,941,706 |
| Strategic Bond | 6,034,726 | 76,321 | 5,958,405 | 70,476,037 | 71,500,857 |
| Total Return | 12,048,269 | 161,954 | 11,886,315 | 162,042,679 | 163,674,552 |
| U.S. Government | | | | | |
| Securities | 8,398,013 | 126,670 | 8,271,343 | 111,577,484 | 112,490,265 |
| U.S. High Yield Bond | 782,329 | 398 | 781,931 | 9,995,076 | 10,235,482 |
| U.S. Multi Sector | 1,997,150 | 80,031 | 1,917,119 | 19,175,891 | 20,398,143 |
| Value & Restructuring | 2,008,215 | 184,758 | 1,823,457 | 18,158,048 | 20,386,251 |
27
Evaluation of Advisory and Subadvisory Agreement by the Board of Trustees (unaudited)
This section describes the evaluation by the Board of Trustees of the Advisory Agreement and each of the Subadvisory Agreements.
Evaluation by the Board of Trustees
The Board, including the Independent Trustees, is responsible for selecting the Trust’s investment adviser, John Hancock Investment Management Services, LLC (the “Adviser” or “JHIMS”), approving the Adviser’s selection of subadvisers for each series of the Trust (the “Funds”) and approving the Trust’s advisory and subadvisory agreements, their periodic continuation and any amendments. Consistent with SEC rules, the Board will regularly evaluate the Trust’s advisory and subadvisory arrangements, including consideration of the six factors listed below. The Board may also consider other factors (including conditions and trends prevailing generally in the economy, the securities markets and the industry) and does not treat any single factor as determinative, and each Trustee may attribute different weights to different factors. The Board is furnished with an analysis of its fiduciary obligations in connection with its evaluation and, throughout the evaluation process, the Board is assisted by counsel for the Trust and the Independent Trustees are also separately assisted by independent legal counsel. The six factors to be regularly considered by the Board are:
1. the nature, extent and quality of the services to be provided by the Adviser to the Trust and by the subadvisers to the Funds;
2. the investment performance of the Funds and their subadvisers;
3. the extent to which economies of scale would be realized as a Fund grows;
4. whether fee levels reflect these economies of scale for the benefit of Trust shareholders;
5. the costs of the services to be provided and the profits to be realized by the Adviser and its affiliates from the Adviser’s relationship with the Trust; and
6. comparative services rendered and comparative advisory and subadvisory fee rates.
The Board believes that information relating to all six factors is relevant to its evaluation of the Trust’s advisory agreement. With respect to its evaluation of subadvisory agreements, the Board believes that, in view of the Trust’s “manager-of-managers” advisory structure: factors (1), (2) and (6) are of primary relevance; factors (3) and (4) generally are less significant to the Trustees’ considerations because subad-visory fees are paid to subadvisers by the Adviser and not directly by the Funds, and issues pertaining to economies of scale are considered in connection with the approval of the advisory fees that are paid directly by the Funds; and with respect to those subadvisers that are not affiliated with the Adviser, because the Board relies on the ability of the Adviser to negotiate the subadvisory fees at arms-length, factor (5) generally is also less significant to the Trustees’ considerations except in those circumstances in which such attention may be warranted because the comparative fee information considered in connection with factor (6) indicates that the subadvisory fees will materially exceed those normally charged under comparable circumstances.
28
In evaluating subadvisory arrangements, the Board also considers other material business relationships that unaffiliated subadvisers and their affili-ates have with the Adviser or its affiliates, including the involvement by certain affiliates of certain subadvisers in the distribution of financial products, including shares of the Trust, offered by the Adviser and other affiliates of the Adviser (“Material Relationships”).
Approval of Advisory Agreement
At its meeting on September 21, 2005, the Board, including all the Independent Trustees, approved the Advisory Agreement between the Trust and JHIMS with respect to each of the Funds.
In approving the Advisory Agreement, and with reference to the six factors that it considers, the Board:
1(a) considered the high value to the Trust of JHIMS’s long relationship with investment companies within the same fund complex as the Trust, the skills and competency which JHIMS has demonstrated in managing the affairs and subadvisory relationships of these other investment companies, JHIMS’s ability to oversee and monitor the subadvis-ers’ investment performance and compliance programs and the qualifications of JHIMS’ personnel,
(b) considered JHIMS’s compliance policies and procedures and its responsiveness to regulatory changes and mutual fund industry developments, and
(c) considered JHIMS’s administrative capabilities, including its ability to supervise the other service providers for the Funds and concluded that JHIMS may reasonably be expected to ably perform its services under the Advisory Agreement;
2 reviewed the investment performance of comparably managed funds of each of the Funds; the comparative performance of their respective benchmarks and comparable funds (i.e., funds having approximately the same investment objective); and JHIMS’ analysis of such performance and its plans and recommendations regarding the Trust’s subadvisory arrangements generally and with respect to particular Funds; and concluded that each of the comparably managed funds has generally performed well or within a range that the Board deemed competitive except as discussed in Appendix A, and that JHIMS may reasonably be expected to ably monitor the performance of the Funds and each of their subadvisers;
3 & 4 reviewed the Trust’s advisory fee structure and the incorporation therein of any subadvisory fee breakpoints in the advisory fees charged and concluded (a) that to the extent that Funds have subad-visory fees with breakpoints, those breakpoints are reflected as breakpoints in the advisory fees for Funds, (b) that all Funds with a subadviser that is not affiliated with the Adviser have subadvisory fees which are the product of arms-length negotiations between the Adviser and the subadviser and which in many, but not all, cases contain breakpoints, and (c) that, although economies of scale cannot be measured with precision, these arrangements permit shareholders of Funds with advisory fee breakpoints to benefit from economies of scale if those Funds grow;
5 (a) reviewed the financial statements of JHIMS and John Hancock Life Insurance Company (U.S.A.) (“JHLICO (U.S.A.)”) and considered an analysis presented by JHIMS
29
regarding the estimated net profitability to JHIMS of the advisory fee structure;
(b) reviewed the profitability of the JHIMS’ relationship with the Funds in terms of the total amount of annual advisory fees it is estimated to receive with respect to the Funds and whether JHIMS has the financial ability to provide a high level of services to the Funds,
(c) considered that JHIMS will derive reputational and other indirect benefits from providing advisory services to the Funds, and
(d) noted that JHIMS will pay the sub-advisory fees out of the advisory fees JHIMS receives from the Funds and concluded that the advisory fees to be paid by the Trust with respect to the Funds are not unreasonable in light of such information; and
6 reviewed comparative information with respect to the proposed advisory fee rates and concluded that the Trust’s anticipated advisory fees are within the range of those incurred by other comparable funds and that the Trust’s advisory structure is thus competitive within the industry. In considering the proposed advisory fee rates, the Board took into account the high level of services expected to be provided to the Funds and the other factors considered.
Additional information that the Board considered for a particular Fund is set forth in Appendix A.
Approval of Subadvisory Agreements
At its meeting on September 21, 2005, the Board, including all the Independent Trustees, approved the Subadvisory Agreements.
In making its determination with reference to these respective factors, the Board reviewed:
1 information relating to each subad-viser’s business, which may include information such as: business performance, representative clients, assets under management, financial stability, personnel and, if applicable, past sub-advisory services to affiliated funds of the Trust;
2 the investment performance of comparatively managed funds of the Fund and comparative performance information relating to the comparatively managed fund’s benchmark and comparable funds;
3 the proposed subadvisory fee for each Fund and comparative fee information; and
4 information relating to the nature and scope of Material Relationships and their significance to the Trust’s adviser and unaffiliated subadvisers.
The Board’s decision to approve each Subadvisory Agreement was based on a number of determinations, including the following:
1 The Subadviser has extensive experience and demonstrated skills as a manager;
2 Although not without variation, the current and historical performance of the comparably managed funds of Subadviser to the Funds generally has been within the range of the current and historical performance of comparable funds and the comparably managed funds’ respective benchmarks;
3 With respect to each subadviser that is not affiliated with the Adviser, the subadvisory fees are a product of arms-length negotiation between the
30
Adviser and the subadviser and generally are within the range of industry norms; and
4 The Material Relationships consist of arrangements in which unaffiliated subadvisers or their affiliates provide advisory, distribution or management services in connection with financial products sponsored by the Trust’s adviser or its affiliates, which may include other registered investment companies, a 529 education savings plan, managed separate accounts and exempt group annuity contracts sold to qualified plans, and which in no case contained elements that would cause the Board to conclude that approval of the subadvisory agreement with the subadviser would be inappropriate.
Additional information that the Board considered for a particular fund is set forth below.
| | Performance of | |
| | Comparable Funds | Estimated Fees |
| Fund | as of June 30, 2005 | and Expenses |
|
| Lifestyle Conservative | Performance of the | Advisory fees for this Fund |
| | Lifestyle Conservative | are lower than its peer |
| (MFC Global | 280 Trust of JHT has | group median. |
| Investment | outperformed its | |
| Management | benchmark index over | Total expenses for this |
| (U.S.A.) Limited | the one, three and five | Fund are higher than its |
| | year periods. | peer group median. |
|
31
|
| Equity | Balanced Fund |
| | Classic Value Fund |
| | Core Equity Fund |
| | Focused Equity Fund |
| | Growth Trends Fund |
| | Large Cap Equity Fund |
| | Large Cap Select Fund |
| | Mid Cap Equity Fund |
| | Mid Cap Growth Fund |
| | Multi Cap Growth Fund |
| | Small Cap Fund |
| | Small Cap Equity Fund |
| | Small Cap Intrinsic Value Fund |
| | Sovereign Investors Fund |
| | U.S. Global Leaders Growth Fund
|
|
| Asset Allocation and | Allocation Growth + Value Portfolio |
| Lifestyle Portfolios | Allocation Core Portfolio |
| | Lifestyle Aggressive Portfolio |
| | Lifestyle Growth Portfolio |
| | Lifestyle Balanced Portfolio |
| | Lifestyle Moderate Portfolio |
| | Lifestyle Conservative Portfolio
|
|
| Sector | Financial Industries Fund |
| | Health Sciences Fund |
| | Real Estate Fund |
| | Regional Bank Fund |
| | Technology Fund |
| | Technology Leaders Fund
|
|
| International | Greater China Opportunities Fund |
| | International Fund |
| | International Classic Value Fund
|
|
| Income | Bond Fund |
| | Government Income Fund |
| | High Yield Fund |
| | Investment Grade Bond Fund |
| | Strategic Income Fund
|
|
| Tax-Free Income | California Tax-Free Income Fund |
| | High Yield Municipal Bond Fund |
| | Massachusetts Tax-Free Income Fund |
| | New York Tax-Free Income Fund |
| | Tax-Free Bond Fund
|
|
| Money Market | Money Market Fund |
| | U.S. Government Cash Reserve |
|
For more complete information on any John Hancock Fund and a prospectus, which includes charges and expenses, call your financial professional, or John Hancock Funds at 1-800-225-5291. Please read the prospectus carefully before investing or sending money.
32
For more information
The Portfolio’s proxy voting policies, procedures and records are available without charge, upon request:
| By phone | On the Fund’s Web site | On the SEC’s Web site |
| 1-800-225-5291 | www.jhfunds.com/proxy | www.sec.gov |
|
| Trustees | Gordon M. Shone | Principal distributor |
| James M. Oates, Chairman* | Vice President and Treasurer | John Hancock Funds, LLC |
| Charles L. Bardelis * | Betsy A. Seel | 601 Congress Street |
| James R. Boyle† | Assistant Vice President, | Boston, MA 02210-2805 |
| Peter S. Burgess * | Secretary and | |
| Elizabeth G. Cook | Chief Legal Officer | Custodian |
| William H. Cunningham | George Boyd | State Street Bank & Trust Co. |
| Charles L. Ladner * | Senior Counsel, Assistant | 225 Franklin Street |
| Hassell H. McClellan | Vice President and | Boston, MA 02110 |
| *Members of the Audit Committee | Assistant Secretary | |
| †Non-Independent Trustee | Francis V. Knox, Jr. | Transfer agent |
| Vice President and Chief | John Hancock Signature |
| Officers | Compliance Officer | Services, Inc. |
| Keith F. Hartstein | | 1 John Hancock Way, |
| President | Investment adviser | Suite 1000 |
| John G. Vrysen | John Hancock Investment | Boston, MA 02217-1000 |
| Executive Vice President and | Management Services, LLC | |
| Chief Financial Officer | 601 Congress Street | Legal counsel |
| Boston, MA 02210-2805 | Kirkpatrick & Lockhart |
| | Nicholson Graham LLP |
| | | 1 Lincoln Street |
| | | Boston, MA 02111 |
The Portfolio’s investment objective, risks, charges and expenses are included in the prospectus and should be considered carefully before investing. For a prospectus, call your financial professional, call John Hancock Funds at 1-800-225-5291, or visit the Portfolio’s Web site at www.jhfunds.com. Please read the prospectus carefully before investing or sending money.
| How to contact us | |
|
| Internet | www.jhfunds.com | |
|
| |
| Mail | Regular mail: | Express mail: |
| | John Hancock | John Hancock |
| | Signature Services, Inc. | Signature Services, Inc. |
| | 1 John Hancock Way, Suite 1000 | Mutual Fund Image Operations |
| | Boston, MA 02217-1000 | 380 Stuart Street |
| | | Boston, MA 02116 |
|
| Phone | Customer service representatives | 1-800-225-5291 |
| | 24-hour automated information | 1-800-338-8080 |
| | TDD line | 1-800-554-6713 |
A listing of month-end portfolio holdings is available on our Web site, www.jhfunds.com. A more detailed portfolio holdings summary is available on a quarterly basis 60 days after the fiscal quarter on our Web site or upon request by calling 1-800-225-5291, or on the Securities and Exchange Commission’s Web site, www.sec.gov.
33


| Table of contents |
|
| Your fund at a glance |
| page 1 |
|
| Managers’ report |
| page 2 |
|
| A look at performance |
| page 6 |
|
| Growth of $10,000 |
| page 7 |
|
| Your expenses |
| page 8 |
|
| Fund’s investments |
| page 10 |
|
| Financial statements |
| page 12 |
|
| For more information |
| page 37 |
|
To Our Shareholders,
After producing modest returns in 2005, the stock market started off strong in the first two months of 2006. The major indexes all advanced and produced two-month returns that were already half as much as the market’s returns for all of 2005. For example, the Standard & Poor’s 500 Index returned 2.93% through February 2006, versus 4.91% last year in total. Investors were encouraged by solid corporate earnings, a slower-growing economy and stable inflation, which suggested the Federal Reserve could be coming close to the end of their 18-month campaign of rising interest rates.
Although a solid yearly beginning has typically augured well for the rest of the year, it is anyone’s guess where the market will end 2006, especially given the wild cards of interest rate moves and record-high energy prices and their impact on corporate profits and the economy.
One thing we do know, however, is that the stock market’s pattern is one of extremes. Consider the last 10 years. From 1995 through 1999, we saw double-digit returns in excess of 20% per year, only to have 2000 through 2002 produce ever-increasing negative results, followed by another 20%-plus up year in 2004 and a less than 5% advance in 2005. Since 1926, the market, as measured by the Standard & Poor’s 500 Index, has produced average annual results of 10.4% . However, that “normal” return is rarely produced in any given year. In fact, calendar-year returns of 8% to 12% have occurred only five times in the 80 years since 1926.
Although the past in no way predicts the future, we have learned at least one lesson from history: Expect highs and lows in the short term, but always invest for the long term. Equally important: Work with your financial professional to maintain a diversified portfolio, spread out among not only different asset classes — stocks, bonds and cash — but also among various investment styles. It’s the best way we know of to benefit from, and weather, the market’s extremes.
Sincerely,

Keith F. Hartstein,
President and Chief Executive Officer
This commentary reflects the CEO’s views as of February 28, 2006. They are subject to change at any time.
YOUR FUND
AT A GLANCE
The Portfolio seeks
long-term growth
of capital. Current
income is also a
consideration. To
pursue this goal,
the Portfolio, which
is a fund of funds,
normally invests
approximately
20% of its assets
in underlying
funds which invest
primarily in fixed-
income securities
and approximately
80% of its assets in
underlying funds
which invest
primarily in equity
securities.
Since inceptiona
* Equities performed quite well during the reporting period, while most U.S. fixed income segments were only modestly positive.
* All but one of the underlying funds produced positive results and the Lifestyle Growth Portfolio outperformed the index.
* The equity portion of the Portfolio benefited most from allocations to funds that invest in small- and mid-cap stocks as well as funds that invest in non-U.S. equities, while the fixed-income portion benefited most from funds that invest in high yield bonds.

Total returns for the Portfolio are at net asset value with all distributions reinvested. These returns do not reflect the deduction of the maximum sales charge, which would reduce the performance shown above.
a Class A, Class B, Class C, Class R3, Class R4 and Class R5 began operations on 10-18-05 and Class 1 began operation on 10-15-05.
| Asset Allocation | | | |
| Equity | % of Total | | Fixed Income | % of Total |
| U.S. Large Cap | 39.00 | High Yield Bond | 7.00 |
| International | 16.00 | Intermediate Term Bond | 4.00 |
| U.S. Mid Cap | 8.00 | Multi-Sector Bond | 4.00 |
| U.S. Small Cap | 7.00 | Treasury Inflation | |
| International Small Cap | 4.00 | Protected Securities | 3.00 |
| Natural Resources | 4.00 | Global Bond | 2.00 |
| Real Estate | 2.00 | | |
As a percentage of the Portfolio’s net assets on February 28, 2006.
1
FROM THE MANAGEMENT TEAM OF MFC GLOBAL INVESTMENT MANAGEMENT
MANAGERS’
REPORT
JOHN HANCOCK
Lifestyle
Growth Portfolio
For the reporting period of October 18, 2005 through February 28, 2006, all major equity indexes posted positive results, while bonds advanced modestly. The dominant influence of energy on the economy and on business profitability kept equity and oil prices locked in contrary motion: Equities fell in December and January as oil prices firmed, and rallied in October, November and February as oil prices declined. Oil price volatility has not diminished the underlying support that equities have received from strong corporate earnings and solid economic growth.
U.S. small-cap stocks were the best performers over the reporting period followed by mid-cap stocks. Large-cap stocks continued to trail, which is consistent with the last two years of unremarkable performance. Small- and mid-cap growth stocks beat their value counterparts while value stocks outperformed in the large-cap area. International stocks produced strong results during this period, outperforming U.S. equities by approximately 6%. This performance was bolstered by strong results in Japan and Germany.
“For the reporting period of
October 18, 2005 through
February 28, 2006, all major
equity indexes posted positive
results, while bonds advanced
modestly.”
While equities performed quite well during the reporting period, most U.S. fixed-income segments were only modestly positive. One exception came from high yield issues, which significantly outperformed other fixed-income areas as investors searched for yield. In terms of non-U.S. fixed income, hedged strategies outperformed unhedged portfolios due to the strengthening of the U.S. dollar against most currencies, namely the Euro, Yen and Sterling.
Performance results
From inception October 18, 2005 (for Class I inception is October 15, 2005) through February 28, 2006, John Hancock Lifestyle Growth Portfolio’s Class A, Class B, Class C, Class R3,
2
Class R4, Class R5 and Class I shares posted total returns of 9.12%, 8.89%, 8.89%, 9.00%, 9.13%, 9.19% and 9.22%, respectively, at net asset value. That compared with the 7.01% return of the Portfolio’s benchmark index — a 80/20 blend of the Standard & Poor’s 500 Index and the Lehman Brothers Aggregate Bond Index.
Performance explanation
This Portfolio outperformed its benchmark since inception. Both the equity and fixed-income components of the Portfolio contributed to the positive outcome. Performance of the equity portion was aided by non-traditional asset classes such as natural resources, international small-cap stocks and Real Estate Investment Trusts (REITs). Resilient oil prices and strengthening industrial and precious metals lifted the Wellington-managed Natural Resources Fund (+16.04%) to a strong gain in the period. Real Estate Securities (+17.27%, Deutsche Asset Management) also delivered excellent gains as REITs continued to outperform the S&P 500 for the sixth straight year. Though volatile as individual portfolios, International Small Cap Fund (+10.92%, Templeton), Natural Resources Fund, and Real Estate Securities Fund provided excellent returns. The risks inherent in these asset classes, which have small allocations in Lifestyle Growth Portfolio, are diffused by the portfolio’s broad diversification.
“Both the equity and fixed-income
components of the Portfolio
contributed to the positive
outcome.”
Allocations to traditional equity asset classes also added value, particularly the exposure to non-U.S. funds and small- and mid-cap funds. International Opportunities Fund (+19.39%, Marsico), a growth-oriented fund, led the way on the non-U.S. side. In the mid- and small-cap portion of the Portfolio, Mid-Cap Stock Fund (+18.17%, Wellington) and Small Company Value Fund (+14.91%, T. Rowe Price) were top performers.
In the U.S. large-cap portion of the portfolio, U.S. Multi-Sector Fund (GMO) was the main detractor from performance. This was due in large part to the fund’s positioning in higher-quality names. The fund’s management team continues to believe that low-quality stocks are extremely overvalued and that high-quality equities represent the best opportunity within the U.S.
3
The best relative results in the fixed-income portion of the Portfolio were generated by high yield funds. Although spreads have become historically tight in relation to other fixed-income options, investors have continued to flock to high yield bonds in an effort to capture any incremental yield over traditional fixed-income asset classes. Allocations to multi-sector bond funds also added value. These funds are designed to outperform the broad fixed-income market with a similar amount of risk by allocating across a wide range of sectors, including emerging-market debt, high yield and non-U.S. sovereign debt. Over the current reporting period, Spectrum Income Fund (+3.19%, T. Rowe Price) benefited from allocations to high yield and emerging-market debt.
The main detractor from performance within fixed income was Global Bond Fund (-0.71%, PIMCO). Because the strategy does not hedge the underlying currency of its foreign bond holdings, the rallying U.S dollar hurt performance. While global bonds detracted from results during this period, allocations to non-traditional fixed-income asset classes such as global bonds and TIPS help to diversify Lifestyle Growth Portfolio over the long term.
“We believe that the long-awaited
shift in favor of higher quality
stocks will occur sooner
rather than later, and we are
well positioned.”
Positioning and outlook
Lifestyle Growth Portfolio is well diversified across a wide range of asset classes and investment styles, including non-traditional asset classes. The Portfolio has a 20% weighting in non-US equity funds, including a 4% position dedicated to non-US small cap. Other

4
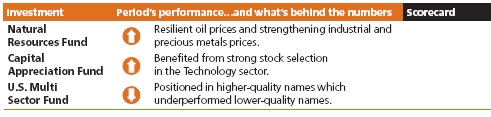
notable equity allocations include a 4% position in the Natural Resources Fund (Wellington) and a 2% position in Real Estate Securities Fund (Deutsche Asset Management). On the fixed-income front, the Portfolio has a meaningful stake (7%) in high yield funds, a 2% position in Global Bond Fund (PIMCO) and a 3% position in Real Return Fund (PIMCO). No major changes were made during this short time period outside of the regular rebalancing process.
We believe that the long-awaited shift in favor of higher-quality stocks will occur sooner rather than later, and we are well positioned for this impending change within our large-cap allocations. We remain vigilant in our evaluation of the areas that have experienced excellent relative and absolute gains recently, including real estate, natural resources, high yield and small- and mid-cap stocks. In our view, valuations in these areas are not as attractive as they were three years ago (for example, high yield spreads over treasuries have tightened significantly and cash-flow multiples for REIT securities have been higher than historical averages). In many cases, however, the fundamentals remain strong. As always, we will make adjustments to further enhance the risk-reward profile of the Portfolio as opportunities arise.
This commentary reflects the views of the portfolio managers through the end of the Portfolio’s period discussed in this report. The managers’ statements reflect their own opinions. As such, they are in no way guarantees of future events and are not intended to be used as investment advice or a recommendation regarding any specific security. They are also subject to change at any time as market and other conditions warrant.
International investing involves special risks such as political, economic and currency risks and differences in accounting standards and financial reporting. See the prospectus for the risks of investing in small-cap stocks. See the prospectus for the risks of investing in high-yield bonds.
5
A LOOK AT
PERFORMANCE
For the period ending
February 28, 2006
With maximum sales charge (POP)
| | Cumulative total returns |
| | Since inceptiona |
|
| Class A | 3.68% |
|
| Class B | 3.89 |
|
| Class C | 7.89 |
|
| Class R3b | 9.00 |
|
| Class R4b | 9.13 |
|
| Class R5b | 9.19 |
|
| Class 1b | 9.22 |
|
Performance figures assume all distributions are reinvested. Returns with maximum sales charge reflect a sales charge on Class A shares of 5%, and the applicable contingent deferred sales charge (CDSC) on Class B and Class C shares. The Class B shares’ CDSC declines annually between years 1–6 according to the following schedule: 5, 4, 3, 3, 2, 1%. No sales charge will be assessed after the sixth year. Class C shares held for less than one year are subject to a 1% CDSC. Sales charge is not applicable for Class R3, Class R4, Class R5 and Class 1 shares.
The returns reflect past results and should not be considered indicative of future performance. The return and principal value of an investment will fluctuate so that shares, when redeemed, may be worth more or less than their original cost. Due to market volatility, the Fund’s current performance may be higher or lower than the performance shown. For performance data current to the most recent month-end, please call 1-800-225-5291 or visit the Fund’s Web site at www.jhfunds.com.
The performance table above and the chart on the next page do not reflect the deduction of taxes that a shareholder would pay on fund distributions or the redemption of fund shares.
The Fund’s performance results reflect any applicable expense reductions, without which the expenses would increase and results would have been less favorable.
Since inception performance is calculated with an opening (prior day’s close) on the inception date.
a Class A, Class B, Class C, Class R3, Class R4 and Class R5 shares began operations on 10-18-05 and Class 1 shares began operation on 10-15-05.
b For certain types of investors as described in the Fund’s Class R3, Class R4, Class R5 and Class 1 share prospectuses.
6
GROWTH OF
$10,000
This chart shows what happened to a hypothetical $10,000 invest-
ment in Class A shares for the period indicated. For comparison,
we’ve shown the same investment in a blended index.

| | Class B | Class C | Class R3a | Class R4a | Class R5a | Class 1a |
| Period beginning | 10-18-05 | 10-18-05 | 10-18-05 | 10-18-05 | 10-18-05 | 10-15-05 |
|
| |
| |
| Without | | | | | | |
| sales charge | $10,889 | $10,889 | $10,900 | $10,913 | $10,919 | $10,922 |
|
| |
| With maximum | | | | | | |
| sales charge | 10,389 | 10,789 | 10,900 | 10,913 | 10,919 | 10,922 |
|
| |
| Index | 10,701 | 10,701 | 10,701 | 10,701 | 10,701 | 10,727 |
|
Assuming all distributions were reinvested for the period indicated, the table above shows the value of a $10,000 investment in the Fund’s Class B, Class C, Class R3, Class R4, Class R5 and Class 1 shares, respectively, as of February 28, 2006. Performance of the classes will vary based on the difference in sales charges paid by shareholders investing in the different classes and the fee structure of those classes.
A blended index is used combining 80% of the Standard & Poor’s 500 Index, an unmanaged index that includes 500 widely traded common stocks, and 20% of the Lehman Brothers Aggregate Bond Index, an unmanaged index of dollar-denominated and nonconvertible investment-grade debt issues.
It is not possible to invest directly in an index. Index figures do not reflect sales charges and would be lower if they did.
a For certain types of investors as described in the Fund’s Class R3, Class R4, Class R5 and Class 1 share prospectuses.
7
YOUR
EXPENSES
These examples are intended to help you understand your ongoing
operating expenses.
Understanding fund expenses
As a shareholder of the Fund, you incur two types of costs:
* Transaction costs which include sales charges (loads) on purchases or redemptions (varies by share class), minimum account fee charge, etc.
* Ongoing operating expenses including management fees, distribution and service fees (if applicable) and other fund expenses.
In addition to the operating expenses which the Fund bears directly, the Fund indirectly bears a pro rata share of the operating expenses of the underlying funds in which the Fund invests. Because the underlying funds have varied operating expenses and transaction costs and the Fund may own different proportions of the underlying funds at different times, the amount of expenses incurred indirectly by the Fund will vary. If these indirect expenses were included, your expenses paid during the period would have been higher.
We are going to present only your ongoing operating expenses here.
Actual expenses/actual returns
This example is intended to provide information about your fund’s actual ongoing operating expenses, and is based on your fund’s actual return. It assumes an account value of $1,000.00 on inception date with the same investment held until February 28, 2006.
| Account value | | Expenses paid |
| $1,000.00 | Ending value | during period |
| on inception date | on 2-28-06 | ended 2-28-06a |
|
| Class Ab | $1,091.20 | $2.30 |
| Class Bb | 1,088.90 | 5.01 |
| Class Cb | 1,088.90 | 5.01 |
| Class R3b | 1,090.00 | 2.72 |
| Class R4b | 1,091.30 | 1.78 |
| Class R5b | 1,091.90 | 0.84 |
| Class 1b | 1,092.20 | 0.52 |
Together with the value of your account, you may use this information to estimate the operating expenses that you paid over
8
the period. Simply divide your account value at February 28, 2006 by $1,000.00, then multiply it by the “expenses paid” for your share class from the table above. For example, for an account value of $8,600.00, the operating expenses should be calculated as follows:
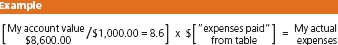
Hypothetical example for comparison purposes
This table allows you to compare your fund’s ongoing operating expenses with those of any other fund. It provides an example of the Fund’s hypothetical account values and hypothetical expenses based on each class’s actual expense ratio and an assumed 5% annual return before expenses (which is not your fund’s actual return). It assumes an account value of $1,000.00 on inception date with the same investment held until February 28, 2006. Look in any other fund shareholder report to find its hypothetical example and you will be able to compare these expenses.
| Account value | | Expenses paid |
| $1,000.00 | Ending value | during period |
| on inception date | on 2-28-06 | ended 2-28-06a |
|
| Class Ab | $1,016.20 | $2.22 |
| Class Bb | 1,013.60 | 4.83 |
| Class Cb | 1,013.60 | 4.83 |
| Class R3b | 1,015.80 | 2.62 |
| Class R4b | 1,016.70 | 1.71 |
| Class R5b | 1,017.60 | 0.81 |
| Class 1b | 1,018.30 | 0.50 |
Remember, these examples do not include any transaction costs, such as sales charges; therefore, these examples will not help you to determine the relative total costs of owning different funds. If transaction costs were included, your expenses would have been higher. See the prospectus for details regarding transaction costs.
a Expenses are equal to the Fund’s annualized expense ratio of 0.61%, 1.32%, 1.31%, 0.72%, 0.47% 0.22% and 0.12% for Class A, Class B, Class C, Class R3, Class R4, Class R5 and Class 1, respectively, multiplied by the average account value over the period, multiplied by the number of days in the inception period /365 or 366 (to reflect the one-half year period).
b Class A, Class B, Class C, Class R3, Class R4 and Class R5 shares began operations on 10-18-05 and Class 1 shares began operation on 10-15-05.
9
F I N A N C I A L S TAT E M E N T S
FUND’S
INVESTMENTS
Securities owned
by the Fund on
February 28, 2006
(unaudited)
Lifestyle Growth Fund portfolio of investments, showing
all underlying funds.
| Issuer | Shares | Value |
|
| Total investments 100.01% | | $6,476,733,289 |
|
| (Cost $6,007,700,997) | | |
| John Hancock Funds II | | |
|
| 500 Index Fund Class NAV | 11,605,597 | $128,473,962 |
|
| All Cap Growth Fund Class NAV | 3,708,247 | 63,930,186 |
|
| All Cap Value Fund Class NAV | 8,336,607 | 128,467,114 |
|
| Blue Chip Growth Fund Class NAV | 17,852,271 | 322,769,055 |
|
| Capital Appreciation Fund Class NAV | 19,037,868 | 193,234,361 |
|
| Core Equity Fund Class NAV | 12,934,032 | 193,234,441 |
|
| Equity-Income Fund Class NAV | 14,831,807 | 258,073,445 |
|
| Fundamental Value Fund Class NAV | 16,862,860 | 258,001,761 |
|
| Global Bond Fund Class NAV | 9,095,095 | 130,332,705 |
|
| High Yield Fund Class NAV | 43,935,488 | 456,050,365 |
|
| International Equity Index Fund Class NAV | 3,661,405 | 64,660,417 |
|
| International Opportunities Fund Class NAV | 12,538,804 | 195,856,116 |
|
| International Small Cap Fund Class NAV | 12,911,345 | 263,649,662 |
|
| International Stock Fund Class NAV | 29,718,573 | 392,582,344 |
|
| International Value Fund Class NAV | 23,528,815 | 387,990,153 |
|
| Large Cap Fund Class NAV | 4,425,117 | 63,942,938 |
|
| Large Cap Value Fund Class NAV | 2,844,155 | 63,709,075 |
|
| Mid Cap Core Fund Class NAV | 14,715,907 | 258,264,161 |
|
| Mid Cap Index Fund Class NAV | 3,373,518 | 63,759,489 |
|
| Mid Cap Stock Fund Class NAV | 3,962,335 | 64,863,420 |
|
| Mid Cap Value Fund Class NAV | 3,333,281 | 63,732,338 |
|
| Natural Resources Fund Class NAV | 7,806,032 | 258,769,955 |
|
| Quantitative Value Fund Class NAV | 12,261,067 | 193,234,411 |
|
| Real Estate Securities Fund Class NAV | 4,874,389 | 130,438,639 |
|
| Real Return Bond Fund Class NAV | 14,570,360 | 195,534,225 |
|
| Small Cap Fund Class NAV | 4,196,225 | 64,160,276 |
|
| Small Cap Index Fund Class NAV | 3,982,225 | 64,233,292 |
See notes to financial statements.
10
F I N A N C I A L S TAT E M E N T S
| Issuer | Shares | Value |
| John Hancock Funds II — continued | | |
|
| Small Cap Opportunities Fund Class NAV | 5,391,357 | $129,500,393 |
|
| Small Company Growth Fund Class NAV | 5,640,544 | 64,302,200 |
|
| Small Company Value Fund Class NAV | 2,676,832 | 64,645,495 |
|
| Special Value Fund Class NAV | 3,092,026 | 64,190,462 |
|
| Spectrum Income Fund Class NAV | 12,645,071 | 129,611,983 |
|
| Strategic Bond Fund Class NAV | 10,818,858 | 129,826,297 |
|
| Total Return Fund Class NAV | 18,923,426 | 260,575,577 |
|
| U.S. Global Leaders Growth Fund Class NAV | 14,572,996 | 194,840,951 |
|
| U.S. Multi Sector Fund Class NAV | 42,529,952 | 452,518,684 |
|
| Vista Fund Class NAV | 5,742,282 | 64,772,941 |
|
|
| Total investments 100.01% | | $6,476,733,289 |
|
| |
| Liabilities in excess of other assets (0.01)% | | ($464,048) |
|
| |
| Total net assets 100.00% | | $6,476,269,241 |
|
Percentages are stated as a percent of net assets of the Fund.
See notes to financial statements.
11
ASSETS AND
LIABILITIES
February 28, 2006
(unaudited)
This Statement of Assets and Liabilities is the Fund’s balance sheet. It shows the value of what the Fund owns, is due and owes. You’ll also find the net asset value and the maximum offering price per share.
|
| Assets | |
|
| Investments in affiliated funds, at value | |
| (cost $6,007,700,997) | $6,476,733,289 |
| Receivable for shares sold | 4,219,827 |
| Receivable from affiliates | 156,217 |
| Other assets | 13,137 |
| Total assets | 6,481,122,470 |
|
| Liabilities | |
|
| Due to custodian | 929,151 |
| Payable for investments purchased | 3,216,488 |
| Payable for shares repurchased | 1,000 |
| Payable to affiliates | |
| Fund administration fees | 117,539 |
| Transfer agent fees | 10,872 |
| Other payables and accrued expenses | 578,179 |
| Total liabilities | 4,853,229 |
|
| Net assets | |
|
| Capital paid-in | 6,005,083,287 |
| Accumulated net realized gain on investments | 4,306,052 |
| Net unrealized appreciation on investments | 469,032,292 |
| Distributions in excess of net investment income | (2,152,390) |
| Net assets | $6,476,269,241 |
|
| Net asset value per share | |
|
| Based on net asset values and shares outstanding — | |
| the Fund has an unlimited number of shares | |
| authorized with no par value | |
| Class A ($32,729,320 ÷ 2,259,294 shares) | $14.49 |
| Class B ($6,414,210 ÷ 442,905 shares) | $14.48 |
| Class C ($21,056,396 ÷ 1,454,110 shares) | $14.48 |
| Class R3 ($194,149 ÷ 13,405 shares) | $14.48 |
| Class R4 ($135,389 ÷ 9,346 shares) | $14.49 |
| Class R5 ($1,154,774 ÷ 79,689 shares) | $14.49 |
| Class 1 ($6,414,585,003 ÷ 443,904,454 shares) | $14.45 |
|
| Maximum offering price per share | |
|
| Class Aa ($14.49 ÷ 95%) | $15.25 |
a On single retail sales of less than $50,000. On sales of $50,000 or more and on group sales the offering price is reduced.
See notes to financial statements.
12
F I N A N C I A L S TAT E M E N T S
OPERATIONS
For the period ended
February 28, 2006a
(unaudited)
This Statement of Operations summarizes the Fund’s investment income earned and expenses incurred in operating the Fund. It also shows net gains (losses) for the period stated.
|
| Investment income | |
|
| Income distributions received from affiliated underlying funds | $36,013,276 |
| Total investment income | 36,013,276 |
|
| Expenses | |
|
| Investment management fees (Note III) | 868,020 |
| Distribution and service fees (Note III) | 1,061,403 |
| Transfer agent fees (Note III) | 11,276 |
| Blue sky fees (Note III) | 33,084 |
| Printing and postage fees (Note III) | 130,761 |
| Fund administration fees (Note III) | 117,756 |
| Audit and legal fees | 44,157 |
| Custodian fees | 4,268 |
| Trustees’ fees (Note III) | 26,217 |
| Registration and filing fees | 340,886 |
| Interest | 6,204 |
| Miscellaneous | 15,320 |
| Total expenses | 2,659,352 |
| Less expense reductions (Note III) | (156,419) |
| Net expenses | 2,502,933 |
| Net investment income | 33,510,343 |
|
| Realized and unrealized gain | |
|
| Net realized gain on investments | 3,886,191 |
| Capital gain distributions received from affiliated | |
| underlying funds | 419,861 |
| Change in net unrealized appreciation of investments | 469,032,292 |
| Net realized and unrealized gain | 473,338,344 |
| Increase in net assets from operations | $506,848,687 |
a Period from 10-15-05 (commencement of operations) to 2-28-06.
See notes to financial statements.
13
F I N A N C I A L S TAT E M E N T S
CHANGES IN
NET ASSETS
These Statements of Changes in Net Assets show how the value of the Fund’s net assets has changed since the inception of the Fund. The difference reflects earnings less expenses, any investment gains and losses, distributions, if any, paid to shareholders and the net of Fund share transactions.
Period
ended
2-28-06a
|
| Increase (decrease) in net assets | |
|
| From operations | |
| Net investment income | $33,510,343 |
| Net realized gain | 4,306,052 |
| Change in net unrealized appreciation | 469,032,292 |
| Increase in net assets resulting | |
| from operations | 506,848,687 |
| Distributions to shareholders | |
| From net investment income | |
| Class A | (46,836) |
| Class B | (6,890) |
| Class C | (19,011) |
| Class R3 | (519) |
| Class R4 | (571) |
| Class R5 | (2,527) |
| Class 1 | (35,586,379) |
| | (35,662,733) |
| From Fund share transactions | 6,005,083,287 |
|
| Net assets | |
|
| End of period | $6,476,269,241 |
| Distributions in excess of | |
| net investment income | ($2,152,390) |
a Class A, Class B, Class C, Class R3, Class R4 and Class R5 shares began operations on 10-18-05 and Class 1 shares began operation on 10-15-05. Unaudited.
See notes to financial statements.
14
F I N A N C I A L H I G H L I G H T S
FINANCIAL
HIGHLIGHTS
CLASS A SHARES
The Financial Highlights show how the Fund’s net asset value for a
share has changed since the commencement of operations of the Fund.
Period ended
|
| Per share operating performance | |
|
| Net asset value, | |
| beginning of period | $13.35 |
| Net investment incomeh | 0.03 |
| Net realized and unrealized | |
| gain on investments | 1.18 |
| Total from | |
| investment operations | 1.21 |
| Less distributions | |
| From net investment income | (0.07) |
| | (0.07) |
| Net asset value, end of period | $14.49 |
| Total returnk,l (%) | 9.12m |
|
| Ratios and supplemental data | |
|
| Net assets, end of period | |
| (in millions) | $33 |
| Ratio of net expenses | |
| to average net assetsq (%) | 0.61r |
| Ratio of gross expenses | |
| to average net assetsp,q (%) | 2.34r |
| Ratio of net investment income | |
| to average net assetsv (%) | 0.56r |
| Portfolio turnover (%) | 3m |
See notes to financial statements.
15
F I N A N C I A L H I G H L I G H T S
CLASS B SHARES
| Period ended | 2-28-06a |
|
| Per share operating performance | |
|
| Net asset value, | |
| beginning of period | $13.35 |
| Net investment lossh | (0.01) |
| Net realized and unrealized | |
| gain on investments | 1.20 |
| Total from | |
| investment operations | 1.19 |
| Less distributions | |
| From net investment income | (0.06) |
| | (0.06) |
| Net asset value, end of period | $14.48 |
| Total returnk,l (%) | 8.89m |
|
| Ratios and supplemental data | |
|
| Net assets, end of period | |
| (in millions) | $6 |
| Ratio of net expenses | |
| to average net assetsq (%) | 1.32r |
| Ratio of gross expenses | |
| to average net assetsp,q (%) | 3.70r |
| Ratio of net investment loss | |
| to average net assetsv (%) | (0.16)r |
| Portfolio turnover (%) | 3m |
See notes to financial statements.
16
F I N A N C I A L H I G H L I G H T S
CLASS C SHARES
| Period ended | 2-28-06a |
|
| Per share operating performance | |
|
| Net asset value, | |
| beginning of period | $13.35 |
| Net investment lossh | (0.02) |
| Net realized and unrealized | |
| gain on investments | 1.21 |
| Total from | |
| investment operations | 1.19 |
| Less distributions | |
| From net investment income | (0.06) |
| | (0.06) |
| Net asset value, end of period | $14.48 |
| Total returnk,l (%) | 8.89 m |
|
| Ratios and supplemental data | |
|
| Net assets, end of period | |
| (in millions) | $21 |
| Ratio of net expenses | |
| to average net assetsq (%) | 1.31r |
| Ratio of gross expenses | |
| to average net assetsp,q (%) | 3.11r |
| Ratio of net investment loss | |
| to average net assetsv (%) | (0.33)r |
| Portfolio turnover (%) | 3m |
See notes to financial statements.
17
F I N A N C I A L H I G H L I G H T S
CLASS R3 SHARES
| Period ended | 2-28-06a |
|
| Per share operating performance | |
|
| Net asset value, | |
| beginning of period | $13.35 |
| Net investment incomeh | 0.04 |
| Net realized and unrealized | |
| gain on investments | 1.16 |
| Total from | |
| investment operations | 1.20 |
| Less distributions | |
| From net investment income | (0.07) |
| | (0.07) |
| Net asset value, end of period | $14.48 |
| Total returnk,l (%) | 9.00m |
|
| Ratios and supplemental data | |
|
| Net assets, end of period | |
| (in millions) | —i |
| Ratio of net expenses | |
| to average net assetsq (%) | 0.72r |
| Ratio of gross expenses | |
| to average net assetsp,q (%) | 15.62r |
| Ratio of net investment income | |
| to average net assetsv (%) | 0.75r |
| Portfolio turnover (%) | 3m |
See notes to financial statements.
18
F I N A N C I A L H I G H L I G H T S
CLASS R4 SHARES
| Period ended | 2-28-06a |
|
| Per share operating performance | |
|
| Net asset value, | |
| beginning of period | $13.35 |
| Net investment incomeh | 0.06 |
| Net realized and unrealized | |
| gain on investments | 1.16 |
| Total from | |
| investment operations | 1.22 |
| Less distributions | |
| From net investment income | (0.08) |
| | (0.08) |
| Net asset value, end of period | $14.49 |
| Total returnk,l (%) | 9.13m |
|
| Ratios and supplemental data | |
|
| Net assets, end of period | |
| (in millions) | —i |
| Ratio of net expenses | |
| to average net assetsq (%) | 0.47r |
| Ratio of gross expenses | |
| to average net assetsp,q (%) | 16.72r |
| Ratio of net investment income | |
| to average net assetsv (%) | 1.12r |
| Portfolio turnover (%) | 3m |
See notes to financial statements.
19
F I N A N C I A L H I G H L I G H T S
CLASS R5 SHARES
| Period ended | 2-28-06a |
|
| Per share operating performance | |
|
| Net asset value, | |
| beginning of period | $13.35 |
| Net investment incomeh | 0.01 |
| Net realized and unrealized | |
| gain on investments | 1.21 |
| Total from | |
| investment operations | 1.22 |
| Less distributions | |
| From net investment income | (0.08) |
| | (0.08) |
| Net asset value, end of period | $14.49 |
| Total returnk,l (%) | 9.19m |
|
| Ratios and supplemental data | |
|
| Net assets, end of period | |
| (in millions) | $1 |
| Ratio of net expenses | |
| to average net assetsq (%) | 0.22r |
| Ratio of gross expenses | |
| to average net assetsp,q (%) | 4.94r |
| Ratio of net investment income | |
| to average net assetsv (%) | 0.15r |
| Portfolio turnover (%) | 3m |
See notes to financial statements.
20
F I N A N C I A L H I G H L I G H T S
CLASS 1 SHARES
| Period ended | 2-28-06 a |
|
| Per share operating performance | |
|
| Net asset value, | |
| beginning of period | $13.31 |
| Net investment incomeh | 0.09 |
| Net realized and unrealized | |
| gain on investments | 1.13 |
| Total from | |
| investment operations | 1.22 |
| Less distributions | |
| From net investment income | (0.08) |
| | (0.08) |
| Net asset value, end of period | $14.45 |
| Total returnk (%) | 9.22m |
|
| Ratios and supplemental data | |
|
| Net assets, end of period | |
| (in millions) | $6,415 |
| Ratio of net expenses | |
| to average net assetsq (%) | 0.12r |
| Ratio of net investment income | |
| (loss) to average net assetsv (%) | 1.65r |
| Portfolio turnover (%) | 3m |
a Class A, Class B, Class C, Class R3, Class R4 and Class R5 shares began operations on 10-18-05 and Class 1 shares
began operation on 10-15-05. Unaudited
.
h Based on the average of the shares outstanding.
i Less than $500,000.
k Assumes dividend reinvestment and does not reflect the effect of sales charges.
l Total returns would have been lower had certain expenses not been reduced during the period shown.
m Not annualized.
p Does not take into consideration expense reductions during the period shown.
q Does not include expenses of the investment companies in which the Fund invests.
r Annualized.
v Recognition of net investment income by the Fund is affected by the timing of the declaration of dividends by
the underlying investment companies in which the Fund invests.
See notes to financial statements.
21
NOTES TO
STATEMENTS
Unaudited
I. Organization
The John Hancock Lifestyle Growth Portfolio (the “Fund”) is a non-diversified series of John Hancock Funds II (the “Trust”), an open-end management investment company registered under the Investment Company Act of 1940, as amended.
The Fund operates as a “fund of funds”, which invests in shares of mutual funds (“underlying funds”) managed by affiliates of John Hancock Investment Management Services, LLC (the “Adviser”). The Adviser is a wholly owned subsidiary of Manulife Financial Corporation (“MFC”). Each underlying fund’s accounting policies are outlined in the underlying fund’s shareholder report, available without charge by calling 1-800-344-1029 or on the Securities and Exchange Commission (“SEC”) Internet site at www.sec.gov, File # 811-21779, CIK 0001331971.
The Trustees have authorized the issuance of multiple classes of shares of the Fund, including classes designated as Class A, Class B, Class C, Class R3, Class R4, Class R5, and Class 1 shares. The shares of each class represent an interest in the same portfolio of investments of the Fund, and have equal rights as to voting, redemptions, dividends and liquidation, except that certain expenses, subject to the approval of the Trustees, may be applied differently to each class of shares in accordance with current regulations of the Securities and Exchange Commission and the Internal Revenue Service. Shareholders of a class that bears distribution and service expenses under the terms of a distribution plan have exclusive voting rights to that distribution plan.
At February 28, 2006 John Hancock USA, an indirect subsidiary of MFC, owned 7,513 Class R3, Class R4 and Class R5 shares of beneficial interest of the Fund.
II. Significant accounting policies
In the preparation of the financial statements, the Fund follows the policies described below. The preparation of financial statements in conformity with accounting principles generally accepted in the United States of America requires management to make estimates and assumptions that affect the reported amounts of assets and liabilities at the date of the financial statements and the reported amounts of income and expenses during the reporting period. Actual results may differ from these estimates.
Securities valuation
The net asset value of the shares of the Fund is determined daily as of the close of the New York Stock Exchange, normally at 4:00 P.M. Eastern Time. Investments in underlying funds are valued at their respective net asset values each business day, or at fair value as determined in good faith in accordance with procedures approved by the Trustees.
22
Securities in the underlying funds’ portfolios are valued in accordance with their respective valuation polices, as outlined in the underlying funds’ financial statements. Short-term debt investments that have a remaining maturity of 60 days or less are valued at amortized cost.
Repurchase agreements
The Fund may enter into repurchase agreements. When a Fund enters into a repurchase agreement through its custodian, it receives delivery of securities, the amount of which at the time of purchase and each subsequent business day is required to be maintained at such a level that the market value is generally at least 102% of the repurchase amount. The Fund will take constructive receipt of all securities underlying the repurchase agreements it has entered into until such agreements expire. If the seller defaults, a Fund would suffer a loss to the extent that proceeds from the sale of underlying securities were less than the repurchase amount. The Fund may enter into repurchase agreements maturing within seven days with domestic dealers, banks or other financial institutions deemed to be creditworthy by the Adviser. Collateral for certain tri-party repurchase agreements is held at the custodian bank in a segregated account for the benefit of the Fund and the counterparty.
Security transactions and related investment income
Investment security transactions are accounted for on a trade date basis. Interest income is accrued as earned. Dividend income on investment securities is recorded on the ex-dividend date.
Multi-class operations
All income, expenses (except for class-specific expenses) and realized and unrealized gains (losses) are allocated to each class of shares based upon the relative net assets of each class. Dividends to shareholders from net investment income are determined at a class level and distributions from capital gains are determined at a Fund level.
Expense allocation
Expenses not directly attributable to a particular Fund or class of shares are allocated based on the relative share of net assets of the Fund at the time the expense was incurred. Class-specific expenses, such as transfer agency fees, blue sky fees, printing and postage fees and distribution and service fees, are accrued daily and charged directly to the respective share classes. Expenses in the Fund’s Statements of Operations reflect the expenses of the Fund and do not include any indirect expenses related to the underlying funds. Because the underlying funds have varied expense levels and the Fund may own different proportions of the underlying funds at different times, the amount of fees and expenses incurred indirectly by the Fund will vary.
Federal income taxes
The Fund qualifies as a “regulated investment company” by complying with the applicable provisions of the Internal Revenue Code and will not be subject to federal income tax on taxable income that is distributed to shareholders. Therefore, no federal income tax provision is required.
Distribution of income and gains
The Fund records distributions to shareholders from net investment income and net realized gains, if any, on the ex-dividend date. Distributions paid by the Fund with respect to each class of shares are calculated in the same manner, at the same time and are in the same amount, except for the effect of expenses that may be applied differently to each class. Such distributions, on a tax basis, are determined in conformity with income tax regulations, which may differ from accounting principles generally accepted in the United States of America. Distributions in excess of tax basis earnings and profits, if any, are reported in the Fund’s financial statements as a return of capital.
Capital accounts
The Fund reports the undistributed net investment income and accumulated undistributed net realized
23
gain (loss) accounts on a basis approximating amounts available for future tax distributions (or to offset future taxable realized gains when a capital loss carryforward is available). Accordingly, the Fund may periodically make reclassifications among certain capital accounts, without affecting its net asset value.
III. Investment advisory and other agreements
Advisory fees
The Trust has entered into an Investment Advisory Agreement with the Adviser. The Adviser is responsible for managing the corporate and business affairs of the Trust and for selecting and compensating subadvisers to handle the investment and reinvestment of the assets of the Fund, subject to the supervision of the Board of Trustees. Under the Advisory Agreement the Fund pays a monthly management fee to the Adviser equivalent, on an annual basis, to the sum of: (a) 0.05% of the first $7,500,000,000 of the Fund’s aggregate daily net assets and (b) 0.04% of the Fund’s aggregate daily net assets in excess of $7,500,000,000. Aggregate net assets include the net assets of the five Lifestyle Portfolios of the Trust (the Lifestyle Aggressive, the Lifestyle Balanced, the Lifestyle Conservative, the Lifestyle Growth and the Lifestyle Moderate) and the five Lifestyle Portfolios of John Hancock Trust (the Lifestyle Aggressive 1000, the Lifestyle Growth 820, the Lifestyle Balanced 640, the Lifestyle Moderate 460 and the Lifestyle Conservative 280). The Fund is not responsible for payment of the subadvisory fees.
Expense reimbursements
The Adviser has contractually agreed to waive advisory fees or reimburse Fund’s expenses for Class A, Class B, Class C, Class R3, Class R4 and Class R5 shares to the extent that blue sky fees and printing and postage expenses attributable to each class exceed 0.09% of the average annual net assets attributable to the classes, at least until November 1, 2006. Accordingly, the expense reductions related to this expense limitation amounted to $71,690, $19,086, $42,741, $6,527, $6,548 and $9,425 for Class A, Class B, Class C, Class R3, Class R4 and Class R5, respectively, for the period ended February 28, 2006. The Adviser reserves the right to terminate this limitation in the future.
Administration fees
The Fund has an agreement with the Adviser that requires the Fund to reimburse the Adviser for all expenses associated with providing the administrative, financial, accounting and recordkeeping services of the Fund, including the preparation of all tax returns, annual, semiannual and periodic reports to shareholders and the preparation of all regulatory reports.
Distribution plans
The Trust has a Distribution Agreement with John Hancock Funds, LLC (“JH Funds”), a wholly-owned subsidiary of the Adviser. The Fund has adopted Distribution Plans with respect to Class A, Class B, Class C, Class R3, Class R4 and Class 1, pursuant to Rule 12b-1 under the Investment Company Act of 1940, to reimburse JH Funds for the services it provides as distributor of shares of the Fund. Accordingly, the Fund makes monthly payments to JH Funds at an annual rate not to exceed 0.30%, 1.00%, 1.00%, 0.50%, 0.25%, and 0.05% of average daily net asset value of Class A, Class B, Class C, Class R3, Class R4 and Class 1, respectively. A maximum of 0.25% of such payments may be service fees, as defined by the Conduct Rules of the National Association of Securities Dealers. Under the Conduct Rules, curtailment of a portion of the Fund’s 12b-1 payments could occur under certain circumstances.
The Fund has also adopted a Service Plan with respect to Class R3, Class R4 and Class R5 shares (the “Service Plan”). Under the Service Plan, the Fund pays up to 0.15%, 0.10% and 0.05% of average daily net assets of Class R3, Class R4 and Class R5 shares, respectively,
24
for certain other services. There were no servicing fees during the period ended February 28, 2006.
Sales charges
Class A shares are assessed up-front sales charges. During the period ended February 28, 2006, JH Funds received net up-front sales charges of $606,012 with regard to sales of Class A shares. Of this amount, $99,425 was retained and used for printing prospectuses, advertising, sales literature and other purposes, $498,237 was paid as sales commissions to unrelated broker-dealers and $8,350 was paid as sales commissions to sales personnel of Signator Investors, Inc. (“Signator Investors”), a related broker-dealer, an indirect subsidiary of MFC.
Class B shares that are redeemed within six years of purchase are subject to a contingent deferred sales charge (“CDSC”) at declining rates, beginning at 5.00% of the lesser of the current market value at the time of redemption or the original purchase cost of the shares being redeemed. Class C shares that are redeemed within one year of purchase are subject to a CDSC at a rate of 1.00% of the lesser of the current market value at the time of redemption or the original purchase cost of the shares being redeemed. Proceeds from the CDSCs are paid to JH Funds and are used, in whole or in part, to defray its expenses for providing distribution-related services to the Fund in connection with the sale of Class B and Class C shares. During the period ended February 28, 2006, CDSCs received by JH Funds amounted to $330 for Class B shares and $488 for Class C shares.
Transfer agent fees
The Fund has a Transfer Agency Agreement with John Hancock Signature Services, Inc. (“Signature Services”), an indirect subsidiary of MFC. For Class A, Class B, Class C, Class R3, Class R4 and Class R5 shares, the Fund pays a monthly transfer agent fee at an annual rate of 0.05% of each class’s average daily net assets, plus a fee based on the number of shareholder accounts and reimbursement for certain out-of-pocket expenses. Expenses not directly attributable to a particular class of shares are aggregated and allocated to each class on the basis of its relative net asset value.
Signature Services has agreed to limit the transfer agent fees so that such fees do not exceed 0.20% annually of Class A, Class B, Class C, Class R3, Class R4 and Class R5 share average daily net assets. This agreement is effective until December 31, 2006. Signature Services reserves the right to terminate this limitation in the future. In addition, Signature Service has voluntarily agreed to further limit transfer agent fees for Class R3, Class R4 and Class R5 shares so that such fees do not exceed 0.05% annually of each class’s average daily net assets. Accordingly, the transfer agent fees reductions amounted to $69, $69 and $264 for Class R3, Class R4 and Class R5 shares, respectively, during the period ended February 28, 2006. Signature Services reserves the right to terminate this limitation at any time.
25
Expenses under the agreements described above for the period ended February 28, 2006, were as follows:
| | Distribution | Transfer | | Printing and |
| Share Class | fees | agent | Blue sky | postage |
|
| Class A | $12,499 | $6,071 | $5,514 | $70,307 |
| Class B | 8,031 | 1,238 | 5,514 | 14,370 |
| Class C | 23,821 | 3,431 | 5,514 | 39,586 |
| Class R3 | 218 | 92 | 5,514 | 1,056 |
| Class R4 | 100 | 92 | 5,514 | 1,073 |
| Class R5 | N/A | 352 | 5,514 | 4,121 |
| Class 1 | 1,016,734 | — | — | 248 |
| Total | $1,061,403 | $11,276 | $33,084 | $130,761 |
Trustees’ fees
The Trust compensates each Trustee who is not an employee of the Adviser or its affiliates. Total Trustees’ expenses are allocated based on each fund’s average daily net asset value.
IV. Guarantees and Indemnifications
Under the Trust’s organizational documents, its Officers and Trustees are indemnified against certain liability arising out of the performance of their duties to the Trust. Additionally, in the normal course of business, the Trust enters into contracts with service providers that contain general indemnification clauses. The Trust’s maximum exposure under these arrangements is unknown, as this would involve future claims that may be made against the Trust that have not yet occurred. However, based on experience, the Trust believes the risk of loss to be remote.
26
V. Capital shares
Share activities for the Fund for the period ended February 28, 2006 were as follows:
| | Period ended 2-28-06 a |
| | Shares | Amount |
|
| Class A shares | | |
|
| Sold | 2,287,854 | $32,632,382 |
| Distributions reinvested | 3,180 | 44,453 |
| Repurchased | (31,740) | (454,113) |
| Net increase | 2,259,294 | $32,222,722 |
|
| Class B shares | | |
|
| Sold | 448,775 | $6,390,226 |
| Distributions reinvested | 435 | 6,092 |
| Repurchased | (6,305) | (90,318) |
| Net increase | 442,905 | $6,306,000 |
|
| Class C shares | | |
|
| Sold | 1,460,635 | $20,858,902 |
| Distributions reinvested | 1,181 | 16,531 |
| Repurchased | (7,706) | (110,140) |
| Net increase | 1,454,110 | $20,765,293 |
|
| Class R3 shares | | |
|
| Sold | 13,405 | $185,180 |
| Net increase | 13,405 | $185,180 |
|
| Class R4 shares | | |
|
| Sold | 9,346 | $126,802 |
| Net increase | 9,346 | $126,802 |
|
| Class R5 shares | | |
|
| Sold | 81,858 | $1,150,887 |
| Distributions reinvested | 136 | 1,904 |
| Repurchased | (2,305) | (32,516) |
| Net increase | 79,689 | $1,120,275 |
|
| Class 1 shares | | |
|
| Sold | 443,752,147 | $5,942,380,950 |
| Distributions reinvested | 2,554,658 | 35,586,379 |
| Repurchased | (2,402,351) | (33,610,314) |
| Net increase | 443,904,454 | $5,944,357,015 |
|
| Net increase | 448,163,203 | $6,005,083,287 |
|
a Class A, Class B, Class C, Class R3, Class R4 and Class R5 share began operations on 10-18-05 and Class 1 shares began operation on 10-15-05.
27
VI. Investment transactions
Purchases and proceeds from sales or maturities of securities, other than short-term securities and obligations of the U.S. government, during the period ended February 28, 2006, aggregated $6,167,356,076 and $163,541,270, respectively.
The cost of investments owned on February 28, 2006, including short-term investments, for federal income tax purposes, was $6,007,700,997. Gross unrealized appreciation and depreciation of investments aggregated $469,847,833 and $815,541, respectively, resulting in net unrealized appreciation of $469,032,292. The difference between book basis and tax basis net unrealized appreciation of investments is attributable primarily to the tax deferral of losses on certain sales of securities.
VII. Investment in affiliated underlying funds
The Fund invests primarily in the underlying funds that are managed by affiliates of the Adviser. The Fund does not invest in the underlying funds for the purpose of exercising management or control.
A summary of the Fund’s transactions in the securities of affiliated issuers in which the Fund’s holdings represent 5% or more of the outstanding voting securities of the issuer, during the period ended February 28, 2006 is set forth below.
28
| Affiliate — | Shares | Shares | Ending Share | | Ending |
| Class NAV | Purchased | Sold | Amount | Proceeds | Value |
|
| 500 Index | 11,605,597 | — | 11,605,597 | $120,595,521 | $128,473,962 |
| All Cap Growth | 3,708,635 | 388 | 3,708,247 | 58,267,896 | 63,930,186 |
| All Cap Value | 8,337,047 | 440 | 8,336,607 | 116,146,450 | 128,467,114 |
| Blue Chip Growth | 17,935,324 | 83,053 | 17,852,271 | 299,619,614 | 322,769,055 |
| Capital Appreciation | 19,229,802 | 191,934 | 19,037,868 | 179,070,961 | 193,234,361 |
| Core Equity | 13,270,674 | 336,642 | 12,934,032 | 180,240,005 | 193,234,441 |
| Equity-Income | 14,832,195 | 388 | 14,831,807 | 240,245,218 | 258,073,445 |
| Fundamental Value | 16,863,718 | 858 | 16,862,860 | 246,032,425 | 258,001,761 |
| Global Bond | 9,095,095 | — | 9,095,095 | 131,148,246 | 130,332,705 |
| High Yield | 44,043,515 | 108,027 | 43,935,488 | 443,581,615 | 456,050,365 |
| International | | | | | |
| Equity Index | 3,661,405 | — | 3,661,405 | 57,267,787 | 64,660,417 |
| International | | | | | |
| Opportunities | 12,990,574 | 451,770 | 12,538,804 | 171,036,554 | 195,856,116 |
| International | | | | | |
| Small Cap | 12,911,357 | 12 | 12,911,345 | 235,091,812 | 263,649,662 |
| International Stock | 30,223,007 | 504,434 | 29,718,573 | 352,342,785 | 392,582,344 |
| International Value | 23,529,247 | 432 | 23,528,815 | 351,925,064 | 387,990,153 |
| Large Cap | 4,425,117 | — | 4,425,117 | 59,934,624 | 63,942,938 |
| Large Cap Value | 2,844,448 | 293 | 2,844,155 | 58,253,019 | 63,709,075 |
| Mid Cap Core | 14,715,907 | — | 14,715,907 | 236,205,100 | 258,264,161 |
| Mid Cap Index | 3,373,518 | — | 3,373,518 | 57,027,102 | 63,759,489 |
| Mid Cap Stock | 3,962,767 | 432 | 3,962,335 | 55,437,206 | 64,863,420 |
| Mid Cap Value | 3,333,620 | 339 | 3,333,281 | 59,295,808 | 63,732,338 |
| Natural Resources | 10,088,789 | 2,282,757 | 7,806,032 | 220,113,351 | 258,769,955 |
| Quantitative Value | 12,272,405 | 11,338 | 12,261,067 | 174,968,423 | 193,234,411 |
| Real Estate Securities | 4,910,555 | 36,166 | 4,874,389 | 114,500,935 | 130,438,639 |
| Real Return Bond | 14,570,370 | 10 | 14,570,360 | 194,725,740 | 195,534,225 |
| Small Cap | 4,196,661 | 436 | 4,196,225 | 56,761,395 | 64,160,276 |
| Small Cap Index | 3,982,225 | — | 3,982,225 | 56,037,677 | 64,233,292 |
| Small Cap Opportunities | 5,391,360 | 3 | 5,391,357 | 115,154,815 | 129,500,393 |
| Small Company Growth | 5,640,544 | — | 5,640,544 | 56,547,320 | 64,302,200 |
| Small Company Value | 2,677,407 | 575 | 2,676,832 | 56,663,056 | 64,645,495 |
| Special Value | 3,092,026 | — | 3,092,026 | 58,472,284 | 64,190,462 |
| Spectrum Income | 12,645,071 | — | 12,645,071 | 126,697,264 | 129,611,983 |
| Strategic Bond | 10,819,362 | 504 | 10,818,858 | 128,030,738 | 129,826,297 |
| Total Return | 18,923,433 | 7 | 18,923,426 | 258,071,320 | 260,575,577 |
| U.S. Global | | | | | |
| Leaders Growth | 14,573,018 | 22 | 14,572,996 | 193,362,305 | 194,840,951 |
| U.S. Multi Sector | 42,529,964 | 12 | 42,529,952 | 427,136,525 | 452,518,684 |
| Vista | 5,742,293 | 11 | 5,742,282 | 57,658,198 | 64,772,941 |
29
Evaluation of Advisory and Subadvisory Agreement by the Board of Trustees (unaudited)
This section describes the evaluation by the Board of Trustees of the Advisory Agreement and each of the Subadvisory Agreements.
Evaluation by the Board of Trustees
The Board, including the Independent Trustees, is responsible for selecting the Trust’s investment adviser, John Hancock Investment Management Services, LLC (the “Adviser” or “JHIMS”), approving the Adviser’s selection of subadvisers for each series of the Trust (the “Funds”) and approving the Trust’s advisory and subadvisory agreements, their periodic continuation and any amendments. Consistent with SEC rules, the Board will regularly evaluate the Trust’s advisory and subadvisory arrangements, including consideration of the six factors listed below. The Board may also consider other factors (including conditions and trends prevailing generally in the economy, the securities markets and the industry) and does not treat any single factor as determinative, and each Trustee may attribute different weights to different factors. The Board is furnished with an analysis of its fiduciary obligations in connection with its evaluation and, throughout the evaluation process, the Board is assisted by counsel for the Trust and the Independent Trustees are also separately assisted by independent legal counsel. The six factors to be regularly considered by the Board are:
1. the nature, extent and quality of the services to be provided by the Adviser to the Trust and by the subadvisers to the Funds;
2. the investment performance of the Funds and their subadvisers;
3. the extent to which economies of scale would be realized as a Fund grows;
4. whether fee levels reflect these economies of scale for the benefit of Trust shareholders;
5. the costs of the services to be provided and the profits to be realized by the Adviser and its affiliates from the Adviser’s relationship with the Trust; and
6. comparative services rendered and comparative advisory and subadvisory fee rates.
The Board believes that information relating to all six factors is relevant to its evaluation of the Trust’s advisory agreement. With respect to its evaluation of subadvisory agreements, the Board believes that, in view of the Trust’s “manager-of-managers” advisory structure: factors (1), (2) and (6) are of primary relevance; factors (3) and (4) generally are less significant to the Trustees’ considerations because subad-visory fees are paid to subadvisers by the Adviser and not directly by the Funds, and issues pertaining to economies of scale are considered in connection with the approval of the advisory fees that are paid directly by the Funds; and with respect to those subadvisers that are not affiliated with the Adviser, because the Board relies on the ability of the Adviser to negotiate the subadvisory fees at arms-length, factor (5) generally is also less significant to the Trustees’ considerations except in those circumstances in which such attention may be warranted because the comparative fee information considered in connection with factor (6) indicates that the subadvisory fees will materially exceed those normally charged under comparable circumstances.
30
In evaluating subadvisory arrangements, the Board also considers other material business relationships that unaffiliated subadvisers and their affili-ates have with the Adviser or its affiliates, including the involvement by certain affiliates of certain subadvisers in the distribution of financial products, including shares of the Trust, offered by the Adviser and other affiliates of the Adviser (“Material Relationships”).
Approval of Advisory Agreement
At its meeting on September 21, 2005, the Board, including all the Independent Trustees, approved the Advisory Agreement between the Trust and JHIMS with respect to each of the Funds.
In approving the Advisory Agreement, and with reference to the six factors that it considers, the Board:
1(a) considered the high value to the Trust of JHIMS’s long relationship with investment companies within the same fund complex as the Trust, the skills and competency which JHIMS has demonstrated in managing the affairs and subadvisory relationships of these other investment companies, JHIMS’s ability to oversee and monitor the subadvis-ers’ investment performance and compliance programs and the qualifications of JHIMS’ personnel,
(b) considered JHIMS’s compliance policies and procedures and its responsiveness to regulatory changes and mutual fund industry developments, and
(c) considered JHIMS’s administrative capabilities, including its ability to supervise the other service providers for the Funds and concluded that JHIMS may reasonably be expected to ably perform its services under the Advisory Agreement;
2 reviewed the investment performance of comparably managed funds of each of the Funds; the comparative performance of their respective benchmarks and comparable funds (i.e., funds having approximately the same investment objective); and JHIMS’ analysis of such performance and its plans and recommendations regarding the Trust’s subadvisory arrangements generally and with respect to particular Funds; and concluded that each of the comparably managed funds has generally performed well or within a range that the Board deemed competitive except as discussed in Appendix A, and that JHIMS may reasonably be expected to ably monitor the performance of the Funds and each of their subadvisers;
3 & 4 reviewed the Trust’s advisory fee structure and the incorporation therein of any subadvisory fee breakpoints in the advisory fees charged and concluded (a) that to the extent that Funds have subad-visory fees with breakpoints, those breakpoints are reflected as breakpoints in the advisory fees for Funds, (b) that all Funds with a subadviser that is not affiliated with the Adviser have subadvisory fees which are the product of arms-length negotiations between the Adviser and the subadviser and which in many, but not all, cases contain breakpoints, and (c) that, although economies of scale cannot be measured with precision, these arrangements permit shareholders of Funds with advisory fee breakpoints to benefit from economies of scale if those Funds grow;
5 (a) reviewed the financial statements of JHIMS and John Hancock Life Insurance Company (U.S.A.) (“JHLICO (U.S.A.)”) and considered an analysis presented by JHIMS
31
regarding the estimated net profitability to JHIMS of the advisory fee structure;
(b) reviewed the profitability of the JHIMS’ relationship with the Funds in terms of the total amount of annual advisory fees it is estimated to receive with respect to the Funds and whether JHIMS has the financial ability to provide a high level of services to the Funds,
(c) considered that JHIMS will derive reputational and other indirect benefits from providing advisory services to the Funds, and
(d) noted that JHIMS will pay the sub-advisory fees out of the advisory fees JHIMS receives from the Funds and concluded that the advisory fees to be paid by the Trust with respect to the Funds are not unreasonable in light of such information; and
6 reviewed comparative information with respect to the proposed advisory fee rates and concluded that the Trust’s anticipated advisory fees are within the range of those incurred by other comparable funds and that the Trust’s advisory structure is thus competitive within the industry. In considering the proposed advisory fee rates, the Board took into account the high level of services expected to be provided to the Funds and the other factors considered.
Additional information that the Board considered for a particular Fund is set forth in Appendix A.
Approval of Subadvisory Agreements
At its meeting on September 21, 2005, the Board, including all the Independent Trustees, approved the Subadvisory Agreements.
In making its determination with reference to these respective factors, the Board reviewed:
1 information relating to each subad-viser’s business, which may include information such as: business performance, representative clients, assets under management, financial stability, personnel and, if applicable, past sub-advisory services to affiliated funds of the Trust;
2 the investment performance of comparatively managed funds of the Fund and comparative performance information relating to the comparatively managed fund’s benchmark and comparable funds;
3 the proposed subadvisory fee for each Fund and comparative fee information; and
4 information relating to the nature and scope of Material Relationships and their significance to the Trust’s adviser and unaffiliated subadvisers.
The Board’s decision to approve each Subadvisory Agreement was based on a number of determinations, including the following:
1 The Subadviser has extensive experience and demonstrated skills as a manager;
2 Although not without variation, the current and historical performance of the comparably managed funds of Subadviser to the Funds generally has been within the range of the current and historical performance of comparable funds and the comparably managed funds’ respective benchmarks;
3 With respect to each subadviser that is not affiliated with the Adviser, the subadvisory fees are a product of arms-length negotiation between the
32
Adviser and the subadviser and generally are within the range of industry norms; and
4 The Material Relationships consist of arrangements in which unaffiliated subadvisers or their affiliates provide advisory, distribution or management services in connection with financial products sponsored by the Trust’s adviser or its affiliates, which may include other registered investment companies, a 529 education savings plan, managed separate accounts and exempt group annuity contracts sold to qualified plans, and which in no case contained elements that would cause the Board to conclude that approval of the subadvisory agreement with the subadviser would be inappropriate.
Additional information that the Board considered for a particular fund is set forth below.
| | Performance of | |
| | Comparable Funds | Estimated Fees |
| Fund | as of June 30, 2005 | and Expenses |
|
| Lifestyle Growth | Performance of the | Advisory fees for this Fund |
| | Lifestyle Growth 820 | are lower than its peer |
| (MFC Global | Trust of JHT has | group median. |
| Investment | outperformed its | |
| Management | benchmark index over | Total expenses for this |
| (U.S.A.) Limited | the one, three and five | Fund are higher than its |
| | year periods. | peer group median. |
|
33
OUR FAMILY OF FUNDS
|
| Equity | Balanced Fund |
| | Classic Value Fund |
| | Core Equity Fund |
| | Focused Equity Fund |
| | Growth Trends Fund |
| | Large Cap Equity Fund |
| | Large Cap Select Fund |
| | Mid Cap Equity Fund |
| | Mid Cap Growth Fund |
| | Multi Cap Growth Fund |
| | Small Cap Fund |
| | Small Cap Equity Fund |
| | Small Cap Intrinsic Value Fund |
| | Sovereign Investors Fund |
| | U.S. Global Leaders Growth Fund |
|
| Asset Allocation and | Allocation Growth + Value Portfolio |
| Lifestyle Portfolios | Allocation Core Portfolio |
| | Lifestyle Aggressive Portfolio |
| | Lifestyle Growth Portfolio |
| | Lifestyle Balanced Portfolio |
| | Lifestyle Moderate Portfolio |
| | Lifestyle Conservative Portfolio |
|
| Sector | Financial Industries Fund |
| | Health Sciences Fund |
| | Real Estate Fund |
| | Regional Bank Fund |
| | Technology Fund |
| | Technology Leaders Fund |
|
| International | Greater China Opportunities Fund |
| | International Fund |
| | International Classic Value Fund |
|
| Income | Bond Fund |
| | Government Income Fund |
| | High Yield Fund |
| | Investment Grade Bond Fund |
| | Strategic Income Fund |
|
| Tax-Free Income | California Tax-Free Income Fund |
| | High Yield Municipal Bond Fund |
| | Massachusetts Tax-Free Income Fund |
| | New York Tax-Free Income Fund |
| | Tax-Free Bond Fund |
|
| Money Market | Money Market Fund |
| | U.S. Government Cash Reserve |
|
For more complete information on any John Hancock Fund and a prospectus, which includes charges and expenses, call your financial professional, or John Hancock Funds at 1-800-225-5291. Please read the prospectus carefully before investing or sending money.
34
ELECTRONIC
DELIVERY
Now available from
John Hancock Funds
Instead of sending annual and semiannual reports and prospectuses through the U.S. mail, we’ll notify you by e-mail when these documents are available for online viewing.
How does electronic delivery benefit you?
* No more waiting for the mail to arrive; you’ll receive an e-mail notification as soon as the document is ready for online viewing.
* Reduces the amount of paper mail you receive from John Hancock Funds.
* Reduces costs associated with printing and mailing.
Sign up for electronic delivery today at
www.jhfunds.com/edelivery
35
OUR WEB SITE
A wealth of information —
www.jhfunds.com
| View the latest information for your account. |
|
| Transfer money from one account to another. |
|
| Get current quotes for major market indexes. |
|
| Use our online calculators to help you with your |
| financial goals. |
|
| Get up-to-date commentary from John Hancock |
| Funds investment experts. |
|
| Access forms, applications and tax information. |
|
36
For more information
The Portfolio’s proxy voting policies, procedures and records are available without charge, upon request:
| By phone | On the Fund’s Web site | On the SEC’s Web site |
| 1-800-225-5291 | www.jhfunds.com/proxy | www.sec.gov |
|
| |
| |
| Trustees | Gordon M. Shone | Principal distributor |
| James M. Oates, Chairman* | Vice President and Treasurer | John Hancock Funds, LLC |
| Charles L. Bardelis * | Betsy A. Seel | 601 Congress Street |
| James R. Boyle† | Assistant Vice President, | Boston, MA 02210-2805 |
| Peter S. Burgess * | Secretary and | |
| Elizabeth G. Cook | Chief Legal Officer | Custodian |
| William H. Cunningham | George Boyd | State Street Bank & Trust Co. |
| Charles L. Ladner * | Senior Counsel, Assistant | 225 Franklin Street |
| Hassell H. McClellan | Vice President and | Boston, MA 02110 |
| *Members of the Audit Committee | Assistant Secretary | |
| †Non-Independent Trustee | Francis V. Knox, Jr. | Transfer agent |
| Vice President and Chief | John Hancock Signature |
| Compliance Officer | Services, Inc. |
| | | 1 John Hancock Way, |
| Officers | | Suite 1000 |
| Keith F. Hartstein | | Boston, MA 02217-1000 |
| President | Investment adviser | |
| John G. Vrysen | John Hancock Investment | Legal counsel |
| Executive Vice President and | Management Services, LLC | Kirkpatrick & Lockhart |
| Chief Financial Officer | 601 Congress Street | Nicholson Graham LLP |
| | Boston, MA 02210-2805 | 1 Lincoln Street |
| | | Boston, MA 02111 |
The Portfolio’s investment objective, risks, charges and expenses are included in the prospectus and should be considered carefully before investing. For a prospectus, call your financial professional, call John Hancock Funds at 1-800-225-5291, or visit the Portfolio’s Web site at www.jhfunds.com. Please read the prospectus carefully before investing or sending money.
| How to contact us | |
|
| Internet | www.jhfunds.com | |
|
| Mail | Regular mail: | Express mail: |
| | John Hancock | John Hancock |
| | Signature Services, Inc. | Signature Services, Inc. |
| | 1 John Hancock Way, Suite 1000 | Mutual Fund Image Operations |
| | Boston, MA 02217-1000 | 380 Stuart Street |
| | | Boston, MA 02116 |
|
| |
| Phone | Customer service representatives | 1-800-225-5291 |
| | 24-hour automated information | 1-800-338-8080 |
| | TDD line | 1-800-554-6713 |
A listing of month-end portfolio holdings is available on our Web site, www.jhfunds.com. A more detailed portfolio holdings summary is available on a quarterly basis 60 days after the fiscal quarter on our Web site or upon request by calling 1-800-225-5291, or on the Securities and Exchange Commission’s Web site, www.sec.gov.
37


| Table of contents |
|
| Your fund at a glance |
| page 1 |
|
| Managers’ report |
| page 2 |
|
| A look at performance |
| page 6 |
|
| Growth of $10,000 |
| page 7 |
|
| Your expenses |
| page 8 |
|
| Funds investments |
| page 10 |
|
| Financial statements |
| page 12 |
|
| For more information |
| page 33 |
|
After producing modest returns in 2005, the stock market started off strong in the first two months of 2006. The major indexes all advanced and produced two-month returns that were already half as much as the market’s returns for all of 2005. For example, the Standard & Poor’s 500 Index returned 2.93% through February 2006, versus 4.91% last year in total. Investors were encouraged by solid corporate earnings, a slower-growing economy and stable inflation, which suggested the Federal Reserve could be coming close to the end of their 18-month campaign of rising interest rates.
Although a solid yearly beginning has typically augured well for the rest of the year, it is anyone’s guess where the market will end 2006, especially given the wild cards of interest rate moves and record-high energy prices and their impact on corporate profits and the economy.
One thing we do know, however, is that the stock market’s pattern is one of extremes. Consider the last 10 years. From 1995 through 1999, we saw double-digit returns in excess of 20% per year, only to have 2000 through 2002 produce ever-increasing negative results, followed by another 20%-plus up year in 2004 and a less than 5% advance in 2005. Since 1926, the market, as measured by the Standard & Poor’s 500 Index, has produced average annual results of 10.4% . However, that “normal” return is rarely produced in any given year. In fact, calendar-year returns of 8% to 12% have occurred only five times in the 80 years since 1926.
Although the past in no way predicts the future, we have learned at least one lesson from history: Expect highs and lows in the short term, but always invest for the long term. Equally important: Work with your financial professional to maintain a diversified portfolio, spread out among not only different asset classes — stocks, bonds and cash — but also among various investment styles. It’s the best way we know of to benefit from, and weather, the market’s extremes.
Sincerely,

Keith F. Hartstein,
President and Chief Executive Officer
|
This commentary reflects the CEO’s views as of February 28, 2006. They are subject to change at any time.
The Portfolio seeks a
balance between a
high level of current
income and growth
of capital with a
greater emphasis
on income. To
pursue this goal,
the Portfolio, which
is a fund-of-funds,
normally invests
approximately 60%
of its assets in
underlying funds,
which invest
primarily in fixed
income securities
and approximately
40% of its assets
in underlying
funds, which
invest primarily
in equity securities.
|
Since inceptiona
* U.S. fixed income segments were only modestly positive during the reporting period, but equities performed quite well.
* All but one of the underlying funds produced positive results during the reporting period and the Lifestyle Moderate Portfolio outperformed the index.
* The equity portion of the Portfolio benefited most from allocations to funds that invest in non-U.S. equities, while the fixed income portion benefited most from funds that invest in high yield bonds.
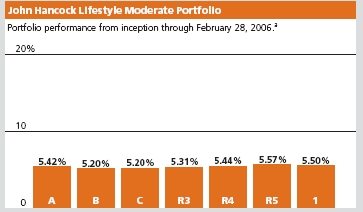
Total returns for the Portfolio are at net asset value with all distributions reinvested.
These returns do not reflect the deduction of the maximum sales charge, which would
reduce the performance shown above.
a Class A, Class B, Class C, Class R3, Class R4 and Class R5 began operations on
10-18-05 and Class 1 began operation on 10-15-05.
| Asset Allocation | | | |
| Equity | % of Total | Fixed Income | % of Total |
| U.S. Large Cap | 21.00 | Intermediate Term Bond | 22.00 |
| International | 11.00 | High Yield Bond | 12.00 |
| Real Estate | 4.00 | Multi-Sector Bond | 12.00 |
| U.S. Mid Cap | 4.00 | Global Bond | 6.00 |
| | | Treasury Inflation | |
| | | Protected Securities | 4.00 |
| | | Long Term Bond | 2.00 |
| | | Short Term Bond | 2.00 |
As a percentage of the Portfolio’s net assets on February 28, 2006.
1
FROM THE MANAGEMENT TEAM OF MFC GLOBAL INVESTMENT MANAGEMENT
JOHN HANCOCK
Lifestyle
Moderate Portfolio
|
For the reporting period of October 18, 2005 through February 28, 2006, all major equity indexes posted positive results, while bonds advanced modestly. The dominant influence of energy on the economy and on business profitability kept equity and oil prices locked in contrary motion: equities fell in December and January as oil prices firmed, and rallied in October, November and February as oil prices declined. Oil price volatility has not diminished the underlying support that equities have received from strong corporate earnings and solid economic growth.
U.S. small-cap stocks were the best performers over the reporting period followed by mid-cap stocks. Large-cap stocks continued to trail, which is consistent with the last two years of unremarkable performance. Small- and mid-cap growth stocks beat their value counterparts, while value stocks outperformed in the large-cap area. International stocks produced strong results during this period, outperforming U.S. equities by approximately 6%. This performance was bolstered by strong results in Japan and Germany.
“For the reporting period
of October 18, 2005 through
February 28, 2006, all
major equity indexes posted
positive results, while bonds
advanced modestly.”
|
While equities performed quite well during the reporting period, most U.S. fixed-income segments were only modestly positive. One exception came from high yield issues, which significantly outperformed other fixed-income areas as investors searched for yield. In terms of non-U.S. fixed-income, hedged strategies outperformed unhedged portfolios due to the strengthening of the U.S. dollar against most currencies, namely the Euro, Yen and Sterling.
Performance results
From inception October 18, 2005 (for Class 1 inception is October 15, 2005) through February 28, 2006, John Hancock Lifestyle Moderate Portfolio’s Class A, Class B, Class C, Class R3,
2
Class R4, Class R5 and Class I shares posted total returns of 5.42%, 5.20%, 5.20%, 5.31%, 5.44%, 5.57% and 5.50%, respectively, at net asset value. That compared with the 4.23% return of the Portfolio’s benchmark index — a 40/60 blend of the Standard & Poor’s 500 Index and the Lehman Brothers Aggregate Bond Index.
Performance explanation
This Portfolio outperformed its benchmark since inception. Both the equity and fixed-income components of the Portfolio contributed to the positive outcome. Performance of the equity portion was aided by Real Estate Securities Fund (+17.27%, Deutsche Asset Management), which delivered excellent gains as Real Estate Investment Trusts (REITs) continued to outperform the S&P 500 for the sixth straight year. While real estate can be volatile as an individual investment, the risks inherent in this asset class are diffused by the broad diversification of the Lifestyle Moderate Portfolio.
Allocations to traditional equity asset classes also added value, particularly the exposure to non-U.S. funds and small-cap funds. International Opportunities Fund (+19.39%, Marsico), a growth-oriented fund, led the way on the non-U.S. side. In the small-cap portion of the portfolio, Small Company Fund (+18.17%, American Century) and Small Company Value Fund (+14.91%, T. Rowe Price), were top performers.
“Both the equity and fixed-income
components of the portfolio
contributed to the positive
outcome.”
|
In the U.S. large-cap portion of the Portfolio, U.S. Multi-Sector Fund (GMO) was the main detractor from performance. This was due in large part to the fund’s positioning in higher-quality names. The fund’s management team continues to believe that low-quality stocks are extremely overvalued and that high-quality equities represent the best opportunity within the U.S.
The best relative results in the fixed-income portion of the Portfolio were generated by high yield funds. Although spreads have become historically tight in relation to other fixed-income options, investors have continued to flock to high-yield bonds in an effort to capture any incremental yield over traditional fixed-income vehicles. Allocations to multi-sector bond funds also added value. These
3
funds are designed to outperform the broad fixed-income market with a similar amount of risk by allocating across a wide range of sectors, including emerging-market debt, high yield and non-U.S. sovereign debt. Over the current reporting period, Spectrum Income Fund (+3.19%, T. Rowe Price) benefited from allocations to high yield and emerging-market debt.
The main detractor from performance within fixed-income was Global Bond Fund (-0.71%, PIMCO). Because the strategy does not hedge the underlying currency of its foreign bond holdings, the rallying U.S dollar hurt performance. While global bonds detracted from results during this period, allocations to non-traditional fixed-income asset classes such as global bonds and TIPS help to diversify Lifestyle Moderate Portfolio over the long term.
“Lifestyle Moderate Portfolio is
well diversified across a wide
range of asset classes and
investment styles, including
non-traditional asset classes.”
|
Positioning and outlook
Lifestyle Moderate Portfolio is well diversified across a wide range of asset classes and investment styles, including non-traditional asset classes. The Portfolio has an 11% weighting in non-U.S. equity funds and a 4% position in the Real Estate Securities Fund (Deutsche Asset Management). On the fixed-income front, the Portfolio has a meaningful stake in high yield funds (12%), a 6% position in Global Bond Fund (PIMCO) and a 5% position in Real Return Fund (PIMCO). No major changes were made during this short time period outside of the regular rebalancing process.
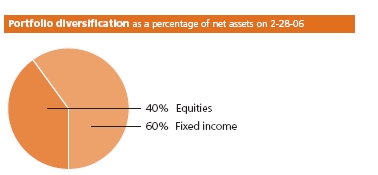
4

We believe that the long-awaited shift in favor of higher-quality stocks will occur sooner rather than later, and we are well positioned for this impending change within our large-cap allocations. We remain vigilant in our evaluation of the areas that have experienced excellent relative and absolute gains recently, including real estate, natural resources, high yield and small- and mid-cap stocks. In our view, valuations in these areas are not as attractive as they were three years ago (for example, high yield spreads over treasuries have tightened significantly and cash-flow multiples for REIT securities have been higher than historical averages). In many cases, however, the fundamentals remain strong. As always, we will make adjustments to further enhance the risk-reward profile of the Portfolio as opportunities arise.
This commentary reflects the views of the portfolio managers through the end of the Portfolio’s period discussed in this report. The managers’ statements reflect their own opinions. As such, they are in no way guarantees of future events and are not intended to be used as investment advice or a recommendation regarding any specific security. They are also subject to change at any time as market and other conditions warrant.
International investing involves special risks such as political, economic and currency risks and differences in accounting standards and financial reporting. See the prospectus for the risks of investing in small-cap stocks. See the prospectus for the risks of investing in high-yield bonds.
5
For the period ending
February 28, 2006
|
With maximum sales charge (POP)
|
| | Cumulative total returns |
| | Since inceptiona |
|
| Class A | 0.16% |
|
| Class B | 0.20 |
|
| Class C | 4.20 |
|
| Class R3b | 5.31 |
|
| Class R4b | 5.44 |
|
| Class R5b | 5.57 |
|
| Class 1b | 5.50 |
|
Performance figures assume all distributions are reinvested. Returns with maximum sales charge reflect a sales charge on Class A shares of 5%, and the applicable contingent deferred sales charge (CDSC) on Class B and Class C shares. The Class B shares’ CDSC declines annually between years 1–6 according to the following schedule: 5, 4, 3, 3, 2, 1%. No sales charge will be assessed after the sixth year. Class C shares held for less than one year are subject to a 1% CDSC. Sales charge is not applicable for Class R3, Class R4, Class R5 and Class 1 shares.
The returns reflect past results and should not be considered indicative of future performance. The return and principal value of an investment will fluctuate so that shares, when redeemed, may be worth more or less than their original cost. Due to market volatility, the Fund’s current performance may be higher or lower than the performance shown. For performance data current to the most recent month-end, please call 1-800-225-5291 or visit the Fund’s Web site at www.jhfunds.com.
The performance table above and the chart on the next page do not reflect the deduction of taxes that a shareholder would pay on fund distributions or the redemption of fund shares.
The Fund’s performance results reflect any applicable expense reductions, without which the expenses would increase and results would have been less favorable.
Since inception performance is calculated with an opening price (prior day’s close) on the inception date.
a Class A, Class B, Class C, Class R3, Class R4 and Class R5 shares began operations on 10-18-05 and Class 1 shares began operation on 10-15-05.
b For certain types of investors as described in the Fund’s Class R3, Class R4, Class R5 and Class 1 share prospectuses.
6
This chart shows what happened to a hypothetical $10,000 investment in Class A shares for the period indicated. For comparison, we’ve shown the same investment in a blended index.
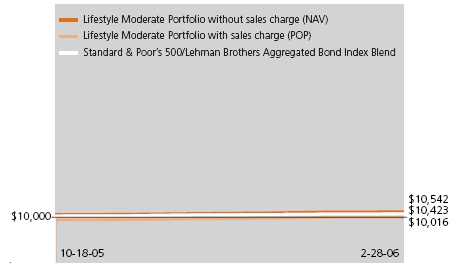
| Class B | Class C | Class R31 | Class R41 | Class R51 | Class 11 |
| Period beginning | 10-18-05 | 10-18-05 | 10-18-05 | 10-18-05 | 10-18-05 | 10-15-05 |
|
| |
| |
| Without | | | | | | |
| sales charge | $10,520 | $10,520 | $10,531 | $10,544 | $10,557 | $10,550 |
|
| |
| With maximum | | | | | | |
| sales charge | 10,020 | 10,420 | 10,531 | 10,544 | 10,557 | 10,550 |
|
| |
| Index | 10,423 | 10,423 | 10,423 | 10,423 | 10,423 | 10,438 |
|
Assuming all distributions were reinvested for the period indicated, the table above shows the value of a $10,000 investment in the Fund’s Class B, Class C, Class R3, Class R4, Class R5 and Class 1 shares, respectively, as of February 28, 2006. Performance of the classes will vary based on the difference in sales charges paid by shareholders investing in the different classes and the fee structure of those classes.
A blended index is used when combining 40% of the Standard & Poor’s 500 Index, an unmanaged index that includes 500 widely traded common stocks, and 60% of the Lehman Brothers Aggregate Bond Index, an unmanaged index of dollar-denominated and nonconvertible investment-grade debt issues.
It is not possible to invest directly in an index. Index figures do not reflect sales charges and would be lower if they did.
1 For certain types of investors as described in the Fund’s Class R3, Class R4, Class R5 and Class 1 share prospectuses.
7
These examples are intended to help you understand your ongoing operating expenses.
Understanding fund expenses
As a shareholder of the Fund, you incur two types of costs:
* Transaction costs which include sales charges (loads) on purchases or redemptions (varies by share class), minimum account fee charge, etc.
* Ongoing operating expenses including management fees, distribution and service fees (if applicable) and other fund expenses.
In addition to the operating expenses which the Fund bears directly, the Fund indirectly bears a pro rata share of the operating expenses of the underlying funds in which the Fund invests. Because the underlying funds have varied operating expenses and transaction costs and the Fund may own different proportions of the underlying funds at different times, the amount of expenses incurred indirectly by the Fund will vary. If these indirect expenses were included, your expenses paid during the period would have been higher.
We are going to present only your ongoing operating expenses here.
Actual expenses/actual returns
This example is intended to provide information about your fund’s actual ongoing operating expenses, and is based on your fund’s actual return. It assumes an account value of $1,000.00 on inception date, with the same investment held until February 28, 2006.
| Account value | | Expenses paid |
| $1,000.00 | Ending value | during period |
| on inception date | on 2-28-06 | ended 2-28-06a |
|
| Class Ab | $1,054.20 | $2.26 |
| Class Bb | 1,052.00 | 4.92 |
| Class Cb | 1,052.00 | 5.03 |
| Class R3b | 1,053.10 | 2.77 |
| Class R4b | 1,054.40 | 1.85 |
| Class R5b | 1,055.70 | 0.82 |
| Class 1b | 1,055.00 | 0.51 |
Together with the value of your account, you may use this information to estimate the operating expenses that you paid over
8
the period. Simply divide your account value at February 28, 2006 by $1,000.00, then multiply it by the “expenses paid” for your share class from the table above. For example, for an account value of $8,600.00, the operating expenses should be calculated as follows:

Hypothetical example for comparison purposes
This table allows you to compare your fund’s ongoing operating expenses with those of any other fund. It provides an example of the Fund’s hypothetical account values and hypothetical expenses based on each class’s actual expense ratio and an assumed 5% annual return before expenses (which is not your fund’s actual return). It assumes an account value of $1,000.00 on inception date, with the same investment held until February 28, 2006. Look in any other fund shareholder report to find its hypothetical example and you will be able to compare these expenses.
| Account value | | Expenses paid |
| $1,000.00 | Ending value | during period |
| on inception date | on 2-28-06 | ended 2-28-06a |
|
| Class Ab | $1,016.20 | $2.22 |
| Class Bb | 1,013.60 | 4.83 |
| Class Cb | 1,013.50 | 4.93 |
| Class R3b | 1,015.70 | 2.72 |
| Class R4b | 1,016.60 | 1.81 |
| Class R5b | 1,017.60 | 0.81 |
| Class 1b | 1,018.30 | 0.50 |
Remember, these examples do not include any transaction costs, such as sales charges; therefore, these examples will not help you to determine the relative total costs of owning different funds. If transaction costs were included, your expenses would have been higher. See the prospectus for details regarding transaction costs.
a Expenses are equal to the Fund’s annualized expense ratio of 0.61%, 1.32%, 1.33%, 0.73%, 0.48%, 0.22% and 0.12% for Class A, Class B, Class C, Class R3, Class R4, Class R5 and Class 1, respectively, multiplied by the average account value over the period, multiplied by number of days since inception /365 or 366 (to reflect the one-half year period).
b Class A, Class B, Class C, Class R3, Class R4 and Class R5 shares began operations on 10-18-05 and Class 1 shares began operation on 10-15-05.
9
F I N A N C I A L S TAT E M E N T S
|
Securities owned
by the Fund on
February 28, 2006
(unaudited)
|
Lifestyle Moderate Fund portfolio of investments, showing all
underlying funds.
| Issuer | Shares | Value |
|
| Investment Companies 100.01% | | $1,692,148,929 |
| (Cost $1,619,749,654) | | |
| John Hancock Funds II | | |
|
| 500 Index Fund Class NAV | 3,041,572 | $33,670,198 |
|
| Active Bond Fund Class NAV | 13,997,798 | 135,358,708 |
|
| Blue Chip Growth Fund Class NAV | 4,670,034 | 84,434,208 |
|
| Core Bond Fund Class NAV | 2,678,635 | 33,670,446 |
|
| Core Equity Fund Class NAV | 3,386,301 | 50,591,341 |
|
| Equity-Income Fund Class NAV | 1,938,622 | 33,732,016 |
|
| Fundamental Value Fund Class NAV | 3,306,630 | 50,591,443 |
|
| Global Bond Fund Class NAV | 7,108,529 | 101,865,221 |
|
| High Yield Fund Class NAV | 16,305,961 | 169,255,873 |
|
| International Equity Index Fund Class NAV | 1,916,192 | 33,839,943 |
|
| International Opportunities Fund Class NAV | 1,094,170 | 17,090,928 |
|
| International Stock Fund Class NAV | 6,459,572 | 85,330,948 |
|
| International Value Fund Class NAV | 3,068,050 | 50,592,147 |
|
| Investment Quality Bond Fund Class NAV | 2,831,829 | 33,670,447 |
|
| Real Estate Securities Fund Class NAV | 2,541,972 | 68,023,180 |
|
| Real Return Bond Fund Class NAV | 5,030,821 | 67,513,622 |
|
| Small Cap Fund Class NAV | 1,112,564 | 17,011,097 |
|
| Small Company Fund Class NAV | 1,999,295 | 34,067,987 |
|
| Small Company Value Fund Class NAV | 709,741 | 17,140,244 |
|
| Spectrum Income Fund Class NAV | 11,539,314 | 118,277,966 |
|
| Strategic Bond Fund Class NAV | 7,036,975 | 84,443,701 |
|
| Total Return Fund Class NAV | 14,762,334 | 203,277,335 |
|
| U.S. Government Securities Fund Class NAV | 2,475,768 | 33,670,451 |
|
| U.S. High Yield Bond Fund Class NAV | 2,572,228 | 33,670,466 |
See notes to
financial statements.
|
10
F I N A N C I A L S TAT E M E N T S
|
| Issuer | Shares | Value |
| John Hancock Funds II – continued | | |
|
| U.S. Multi Sector Fund Class NAV | 6,345,195 | $67,512,877 |
|
| Value & Restructuring Fund Class NAV | 3,027,383 | 33,846,136 |
|
| |
| Total investments 100.01% | | $1,692,148,929 |
|
| |
| Liabilities in excess of other assets (0.01)% | | ($139,396) |
|
| Total net assets 100.00% | | $1,692,009,533 |
Percentages are stated as a percent of net assets of the Fund.
|
See notes to
financial statements.
|
11
F I N A N C I A L S TAT E M E N T S
|
February 28, 2006
(unaudited)
|
This Statement
of Assets and
Liabilities is the
Fund’s balance
sheet. It shows
the value of
what the Fund
owns, is due
and owes. You’ll
also find the net
asset value and
the maximum
offering price
per share.
|
| Assets | |
| Investments in affiliated funds, at value | |
| (cost $1,619,749,654) | $1,692,148,929 |
| Receivable for investments sold | 213 |
| Receivable for shares sold | 1,427,117 |
| Receivable from affiliates | 60,558 |
| Other assets | 3,299 |
| Total assets | 1,693,640,116 |
|
| Liabilities | |
| Due to custodian | 39,335 |
| Payable for investments purchased | 1,382,892 |
| Payable for shares repurchased | 165 |
| Payable to affiliates | |
| Fund administration fees | 31,471 |
| Transfer agent fees | 2,208 |
| Other payables and accrued expenses | 174,512 |
| Total liabilities | 1,630,583 |
|
| Net assets | |
| Capital paid-in | 1,618,785,880 |
| Accumulated net realized gain on investments | 1,351,135 |
| Net unrealized appreciation on investments | 72,399,275 |
| Distributions in excess of net investment income | (526,757) |
| Net assets | $1,692,009,533 |
|
| Net asset value per share | |
| Based on net asset values and shares outstanding — | |
| the Fund has an unlimited number of shares | |
| authorized with no par value | |
| Class A ($5,727,908 ÷ 422,763 shares) | $13.55 |
| Class B ($1,629,029 ÷ 120,315 shares) | $13.54 |
| Class C ($3,654,723 ÷ 269,906 shares) | $13.54 |
| Class R3 ($104,657 ÷ 7,728 shares) | $13.54 |
| Class R4 ($107,410 ÷ 7,928 shares) | $13.55 |
| Class R5 ($503,368 ÷ 37,129 shares) | $13.56 |
| Class 1 ($1,680,282,438 ÷ 124,066,106 shares) | $13.54 |
|
| Maximum offering price per share | |
| Class Aa ($13.55 ÷ 95%) | $14.26 |
a On single retail sales of less than $50,000. On sales of $50,000 or more and on group sales the offering price is reduced.
See notes to
financial statements.
|
12
F I N A N C I A L S TAT E M E N T S
|
For the period ended
February 28, 2006a
(unaudited)
|
This Statement
of Operations
summarizes the
Fund’s investment
income earned and
expenses incurred
in operating the
Fund. It also shows
net gains (losses) for
the period stated.
|
| Investment income | |
| Income distributions received from affiliated underlying funds | $11,931,752 |
| Total investment income | 11,931,752 |
|
| Expenses | |
| Investment management fees (Note III) | 231,199 |
| Distribution and service fees (Note III) | 280,506 |
| Transfer agent fees (Note III) | 2,501 |
| Blue sky fees (Note III) | 33,084 |
| Printing and postage fees (Note III) | 29,192 |
| Fund administration fees (Note III) | 31,533 |
| Audit and legal fees | 11,639 |
| Custodian fees | 4,268 |
| Trustees’ fees (Note III) | 5,203 |
| Registration and filing fees | 91,282 |
| Miscellaneous | 5,527 |
| Total expenses | 725,934 |
| Less expense reductions (Note III) | (60,849) |
| Net expenses | 665,085 |
| Net investment income | 11,266,667 |
|
| Realized and unrealized gain | |
| Net realized gain on investments | 1,213,409 |
| Capital gain distributions received from affiliated | |
| underlying funds | 137,726 |
| Change in net unrealized appreciation of investments | 72,399,275 |
| Net realized and unrealized gain | 73,750,410 |
| Increase in net assets from operations | $85,017,077 |
aPeriod from 10-15-05 (commencement of operations) to 2-28-06.
See notes to
financial statements.
|
13
F I N A N C I A L S TAT E M E N T S
|
These Statements
of Changes in Net
Assets show how
the value of the
Fund’s net assets
has changed since
the inception of
the Fund. The
difference reflects
earnings less
expenses, any
investment
gains and losses,
distributions, if
any, paid to
shareholders and
the net of Fund
share transactions.
|
| | Period |
| | ended |
| | 2-28-06a |
|
| |
| Increase (decrease) in net assets | |
| From operations | |
| Net investment income | $11,266,667 |
| Net realized gain | 1,351,135 |
| Change in net unrealized appreciation | 72,399,275 |
| Increase in net assets resulting | |
| from operations | 85,017,077 |
| Distributions to shareholders | |
| From net investment income | |
| Class A | (9,583) |
| Class B | (2,422) |
| Class C | (6,068) |
| Class R3 | (653) |
| Class R4 | (704) |
| Class R5 | (1,434) |
| Class 1 | (11,772,560) |
| | (11,793,424) |
| From Fund share transactions | 1,618,785,880 |
|
| |
| Net assets | |
| End of period | $1,692,009,533 |
| Distributions in excess of net investment income | ($526,757) |
a Class A, Class B, Class C, Class R3, Class R4 and Class R5 shares began operations on 10-18-05 and Class 1 shares began operation on 10-15-05. Unaudited.
See notes to
financial statements.
|
14
F I N A N C I A L�� H I G H L I G H T S
|
CLASS A SHARES
The Financial Highlights show how the Fund’s net asset value for a
share has changed since the commencement of operations of the Fund.
| Period ended | 2-28-06a |
|
| Per share operating performance | |
| Net asset value, | |
| beginning of period | $12.94 |
| Net investment incomeh | 0.04 |
| Net realized and unrealized | |
| gain on investments | 0.66 |
| Total from | |
| investment operations | 0.70 |
| Less distributions | |
| From net investment income | (0.09) |
| | (0.09) |
| Net asset value, end of period | $13.55 |
| Total returnk,l (%) | 5.42m |
|
| Ratios and supplemental data | |
| Net assets, end of period | |
| (in millions) | $6 |
| Ratio of net expenses | |
| to average net assetsq (%) | 0.61r |
| Ratio of gross expenses | |
| to average net assetsp,q (%) | 3.03r |
| Ratio of net investment income | |
| to average net assetsv (%) | 0.89r |
| Portfolio turnover (%) | 3m |
See notes to
financial statements.
|
15
F I N A N C I A L H I G H L I G H T S
|
| Period ended | 2-28-06a |
|
| Per share operating performance | |
| Net asset value, | |
| beginning of period | $12.94 |
| Net investment incomeh | —j |
| Net realized and unrealized | |
| gain on investments | 0.67 |
| Total from | |
| investment operations | 0.67 |
| Less distributions | |
| From net investment income | (0.07) |
| | (0.07) |
| Net asset value, end of period | $13.54 |
| Total returnk,l (%) | 5.20m |
|
| Ratios and supplemental data | |
| Net assets, end of period | |
| (in millions) | $2 |
| Ratio of net expenses | |
| to average net assetsq (%) | 1.32r |
| Ratio of gross expenses | |
| to average net assetsp,q (%) | 5.46r |
| Ratio of net investment income | |
| to average net assetsv (%) | 0.06r |
| Portfolio turnover (%) | 3m |
See notes to
financial statements.
|
16
F I N A N C I A L H I G H L I G H T S
|
| Period ended | 2-28-06 a |
|
| Per share operating performance | |
| Net asset value, | |
| beginning of period | $12.94 |
| Net investment incomeh | 0.01 |
| Net realized and unrealized | |
| gain on investments | 0.66 |
| Total from | |
| investment operations | 0.67 |
| Less distributions | |
| From net investment income | (0.07) |
| | (0.07) |
| Net asset value, end of period | $13.54 |
| Total returnk,l (%) | 5.20m |
|
| Ratios and supplemental data | |
| Net assets, end of period | |
| (in millions) | $4 |
| Ratio of net expenses | |
| to average net assetsq (%) | 1.33r |
| Ratio of gross expenses | |
| to average net assetsp,q (%) | 4.19r |
| Ratio of net investment income | |
| to average net assetsv (%) | 0.18r |
| Portfolio turnover (%) | 3m |
See notes to
financial statements.
|
17
F I N A N C I A L H I G H L I G H T S
|
| Period ended | 2-28-06a |
|
| Per share operating performance | |
| Net asset value, | |
| beginning of period | $12.94 |
| Net investment incomeh | 0.06 |
| Net realized and unrealized | |
| gain on investments | 0.62 |
| Total from | |
| investment operations | 0.68 |
| Less distributions | |
| From net investment income | (0.08) |
| | (0.08) |
| Net asset value, end of period | $13.54 |
| Total returnk,l (%) | 5.31m |
|
| Ratios and supplemental data | |
| Net assets, end of period | |
| (in millions) | —i |
| Ratio of net expenses | |
| to average net assetsq (%) | 0.73r |
| Ratio of gross expenses | |
| to average net assetsp,q (%) | 17.99r |
| Ratio of net investment income | |
| to average net assetsv (%) | 1.33r |
| Portfolio turnover (%) | 3m |
See notes to
financial statements.
|
18
F I N A N C I A L H I G H L I G H T S
|
| Period ended | 2-28-06a |
|
| Per share operating performance | |
| Net asset value, | |
| beginning of period | $12.94 |
| Net investment incomeh | 0.08 |
| Net realized and unrealized | |
| gain on investments | 0.62 |
| Total from | |
| investment operations | 0.70 |
| Less distributions | |
| From net investment income | (0.09) |
| | (0.09) |
| Net asset value, end of period | $13.55 |
| Total returnk,l (%) | 5.44m |
|
| Ratios and supplemental data | |
| Net assets, end of period | |
| (in millions) | —i |
| Ratio of net expenses | |
| to average net assetsq (%) | 0.48r |
| Ratio of gross expenses | |
| to average net assetsp,q (%) | 17.71r |
| Ratio of net investment income | |
| to average net assetsv (%) | 1.58r |
| Portfolio turnover (%) | 3m |
See notes to
financial statements.
|
19
F I N A N C I A L H I G H L I G H T S
|
| Period ended | 2-28-06a |
|
| Per share operating performance | |
| Net asset value, | |
| beginning of period | $12.94 |
| Net investment incomeh | 0.03 |
| Net realized and unrealized | |
| gain on investments | 0.69 |
| Total from | |
| investment operations | 0.72 |
| Less distributions | |
| From net investment income | (0.10) |
| | (0.10) |
| Net asset value, end of period | $13.56 |
| Total returnk,l (%) | 5.57m |
|
| Ratios and supplemental data | |
| Net assets, end of period | |
| (in millions) | $1 |
| Ratio of net expenses | |
| to average net assetsq (%) | 0.22r |
| Ratio of gross expenses | |
| to average net assetsp,q (%) | 7.38r |
| Ratio of net investment income | |
| to average net assetsv (%) | 0.71r |
| Portfolio turnover (%) | 3m |
See notes to
financial statements.
|
20
F I N A N C I A L H I G H L I G H T S
|
| Period ended | 2-28-06 a |
|
| Per share operating performance | |
| Net asset value, | |
| beginning of period | $12.93 |
| Net investment incomeh | 0.10 |
| Net realized and unrealized | |
| gain on investments | 0.61 |
| Total from | |
| investment operations | 0.71 |
| Less distributions | |
| From net investment income | (0.10) |
| | (0.10) |
| Net asset value, end of period | $13.54 |
| Total returnk (%) | 5.50m |
|
| Ratios and supplemental data | |
| Net assets, end of period | |
| (in millions) | $1,680 |
| Ratio of net expenses | |
| to average net assetsq (%) | 0.12r |
| Ratio of net investment income | |
| to average net assetsv (%) | 2.08r |
| Portfolio turnover (%) | 3m |
| a | Class A, Class B, Class C, Class R3, Class R4 and Class R5 shares began operations on 10-18-05 and Class 1 |
| | shares began operation on 10-15-05. Unaudited. |
| h | Based on the average of the shares outstanding. |
| i | Less than $500,000. |
| j | Less than $0.01 per share. |
| k | Assumes dividend reinvestment and does not reflect the effect of sales charges. |
| l | Total returns would have been lower had certain expenses not been reduced during the period shown. |
| m Not annualized. |
| p | Does not take into consideration expense reductions during the period shown. |
| q | Does not include expenses of the investment companies in which the Fund invests. |
| r | Annualized. |
| v | Recognition of net investment income by the Fund is affected by the timing of the declaration of dividends by |
| | the underlying investment companies in which the Fund invests. |
See notes to
financial statements.
|
21
Unaudited
I. Organization
The John Hancock Lifestyle Moderate Portfolio (the “Fund”) is a non-diversified series of John Hancock Funds II (the “Trust”), an open-end management investment company registered under the Investment Company Act of 1940, as amended.
The Fund operates as a “fund of funds”, which invests in shares of mutual funds (“underlying funds”) managed by affiliates of John Hancock Investment Management Services, LLC (the “Adviser”). The Adviser is a wholly owned subsidiary of Manulife Financial Corporation (“MFC”). Each underlying fund’s accounting policies are outlined in the underlying fund’s shareholder report, available without charge by calling 1-800-344-1029 or on the Securities and Exchange Commission (“SEC”) Internet site at www.sec.gov, File # 811-21779, CIK 0001331971.
The Trustees have authorized the issuance of multiple classes of shares of the Fund, including classes designated as Class A, Class B, Class C, Class R3, Class R4, Class R5, and Class 1 shares. The shares of each class represent an interest in the same portfolio of investments of the Fund, and have equal rights as to voting, redemptions, dividends and liquidation, except that certain expenses, subject to the approval of the Trustees, may be applied differently to each class of shares in accordance with current regulations of the Securities and Exchange Commission and the Internal Revenue Service. Shareholders of a class that bears distribution and service expenses under the terms of a distribution plan have exclusive voting rights to that distribution plan.
At February 28, 2006 John Hancock USA, an indirect subsidiary of MFC, owned 7,734 Class B, Class R3, Class R4 and Class R5 shares of beneficial interest of the Fund.
II. Significant accounting policies
In the preparation of the financial statements, the Fund follows the policies described below. The preparation of financial statements in conformity with accounting principles generally accepted in the United States of America requires management to make estimates and assumptions that affect the reported amounts of assets and liabilities at the date of the financial statements and the reported amounts of income and expenses during the reporting period. Actual results may differ from these estimates.
Securities valuation
The net asset value of the shares of the Fund is determined daily as of the close of the New York Stock Exchange, normally at 4:00 P.M. Eastern Time. Investments in underlying funds are valued at their respective net asset values each business day, or at fair value as determined in good faith in accordance with procedures approved by the Trustees.
22
Securities in the underlying funds’ portfolios are valued in accordance with their respective valuation polices, as outlined in the underlying funds’ financial statements. Short-term debt investments that have a remaining maturity of 60 days or less are valued at amortized cost.
Repurchase agreements
The Fund may enter into repurchase agreements. When a Fund enters into a repurchase agreement through its custodian, it receives delivery of securities, the amount of which at the time of purchase and each subsequent business day is required to be maintained at such a level that the market value is generally at least 102% of the repurchase amount. The Fund will take constructive receipt of all securities underlying the repurchase agreements it has entered into until such agreements expire. If the seller defaults, a Fund would suffer a loss to the extent that proceeds from the sale of underlying securities were less than the repurchase amount. The Fund may enter into repurchase agreements maturing within seven days with domestic dealers, banks or other financial institutions deemed to be creditworthy by the Adviser. Collateral for certain tri-party repurchase agreements is held at the custodian bank in a segregated account for the benefit of the Fund and the counterparty.
Security transactions and related investment income
Investment security transactions are accounted for on a trade date basis. Interest income is accrued as earned. Dividend income on investment securities is recorded on the ex-dividend date.
Multi-class operations
All income, expenses (except for class-specific expenses) and realized and unrealized gains (losses) are allocated to each class of shares based upon the relative net assets of each class. Dividends to shareholders from net investment income are determined at a class level and distributions from capital gains are determined at a Fund level.
Expense allocation
Expenses not directly attributable to a particular Fund or class of shares are allocated based on the relative share of net assets of the Fund at the time the expense was incurred. Class-specific expenses, such as transfer agency fees, blue sky fees, printing and postage fees and distribution and service fees, are accrued daily and charged directly to the respective share classes. Expenses in the Fund’s Statements of Operations reflect the expenses of the Fund and do not include any indirect expenses related to the underlying funds. Because the underlying funds have varied expense levels and the Fund may own different proportions of the underlying funds at different times, the amount of fees and expenses incurred indirectly by the Fund will vary.
Federal income taxes
The Fund qualifies as a “regulated investment company” by complying with the applicable provisions of the Internal Revenue Code and will not be subject to federal income tax on taxable income that is distributed to shareholders. Therefore, no federal income tax provision is required.
Distribution of income and gains
The Fund records distributions to shareholders from net investment income and net realized gains, if any, on the ex-dividend date. Distributions paid by the Fund with respect to each class of shares are calculated in the same manner, at the same time and are in the same amount, except for the effect of expenses that may be applied differently to each class. Such distributions, on a tax basis, are determined in conformity with income tax regulations, which may differ from accounting principles generally accepted in the United States of America. Distributions in excess of tax basis earnings and profits, if any, are reported in the Fund’s financial statements as a return of capital.
23
Capital accounts
The Fund reports the undistributed net investment income and accumulated undistributed net realized gain (loss) accounts on a basis approximating amounts available for future tax distributions (or to offset future taxable realized gains when a capital loss carryfor-ward is available). Accordingly, the Fund may periodically make reclassifi-cations among certain capital accounts, without affecting its net asset value.
III. Investment advisory and other agreements
Advisory fees
The Trust has entered into an Investment Advisory Agreement with the Adviser. The Adviser is responsible for managing the corporate and business affairs of the Trust and for selecting and compensating subadvisers to handle the investment and reinvestment of the assets of the Fund, subject to the supervision of the Board of Trustees. Under the Advisory Agreement the Fund pays a monthly management fee to the Adviser equivalent, on an annual basis, to the sum of: (a) 0.05% of the first $7,500,000,000 of the Fund’s aggregate daily net assets and (b) 0.04% of the Fund’s aggregate daily net assets in excess of $7,500,000,000. Aggregate net assets include the net assets of the five Lifestyle Portfolios of the Trust (the Lifestyle Aggressive, the Lifestyle Balanced, the Lifestyle Conservative, the Lifestyle Growth and the Lifestyle Moderate) and the five Lifestyle Portfolios of John Hancock Trust (the Lifestyle Aggressive 1000, the Lifestyle Growth 820, the Lifestyle Balanced 640, the Lifestyle Moderate 460 and the Lifestyle Conservative 280). The Fund is not responsible for payment of the subadvisory fees.
Expense reimbursements
The Adviser has contractually agreed to waive advisory fees or reimburse Fund’s expenses for Class A, Class B, Class C, Class R3, Class R4 and Class R5 shares to the extent that blue sky fees and printing and postage expenses attributable to each class exceed 0.09% of the average annual net assets attributable to the classes, at least until November 1, 2006. Accordingly, the expense reductions related to this expense limitation amounted to $15,965, $9,380, $14,314, $6,511, $6,512 and $7,876 for Class A, Class B, Class C, Class R3, Class R4 and Class R5 shares, respectively, for the period ended February 28, 2006. The Adviser reserves the right to terminate this limitation in the future.
Administration fees
The Fund has an agreement with the Adviser that requires the Fund to reimburse the Adviser for all expenses associated with providing the administrative, financial, accounting and recordkeeping services of the Fund, including the preparation of all tax returns, annual, semiannual and periodic reports to shareholders and the preparation of all regulatory reports.
Distribution plans
The Trust has a Distribution Agreement with John Hancock Funds, LLC (“JH Funds”), a wholly-owned subsidiary of the Adviser. The Fund has adopted Distribution Plans with respect to Class A, Class B, Class C, Class R3, Class R4 and Class 1, pursuant to Rule 12b-1 under the Investment Company Act of 1940, to reimburse JH Funds for the services it provides as distributor of shares of the Fund. Accordingly, the Fund makes monthly payments to JH Funds at an annual rate not to exceed 0.30%, 1.00%, 1.00%, 0.50%, 0.25%, and 0.05% of average daily net asset value of Class A, Class B, Class C, Class R3, Class R4 and Class 1, respectively. A maximum of 0.25% of such payments may be service fees, as defined by the Conduct Rules of the National Association of Securities Dealers. Under the Conduct Rules, curtailment
24
of a portion of the Fund’s 12b-1 payments could occur under certain circumstances.
The Fund has also adopted a Service Plan with respect to Class R3, Class R4 and Class R5 shares (the “Service Plan”). Under the Service Plan, the Fund pays up to 0.15%, 0.10% and 0.05% of average daily net assets of Class R3, Class R4 and Class R5 shares, respectively, for certain other services. There were no servicing fees during the period ended February 28, 2006.
Sales charges
Class A shares are assessed up-front sales charges. During the period ended February 28, 2006, JH Funds received net up-front sales charges of $105,962 with regard to sales of Class A shares. Of this amount, $17,785 was retained and used for printing prospectuses, advertising, sales literature and other purposes, $84,953 was paid as sales commissions to unrelated broker-dealers and $3,224 was paid as sales commissions to sales personnel of Signator Investors, Inc. (“Signator Investors”), a related broker-dealer, an indirect subsidiary of MFC.
Class B shares that are redeemed within six years of purchase are subject to a contingent deferred sales charge (“CDSC”) at declining rates, beginning at 5.00% of the lesser of the current market value at the time of redemption or the original purchase cost of the shares being redeemed. Class C shares that are redeemed within one year of purchase are subject to a CDSC at a rate of 1.00% of the lesser of the current market value at the time of redemption or the original purchase cost of the shares being redeemed. Proceeds from the CDSCs are paid to JH Funds and are used, in whole or in part, to defray its expenses for providing distribution-related services to the Fund in connection with the sale of Class B and Class C shares. During the period ended February 28, 2006, CDSCs received by JH Funds amounted to $111 for Class B shares and $31 for Class C shares.
Transfer agent fees
The Fund has a Transfer Agency Agreement with John Hancock Signature Services, Inc. (“Signature Services”), an indirect subsidiary of MFC. For Class A, Class B, Class C, Class R3, Class R4 and Class R5 shares, the Fund pays a monthly transfer agent fee at an annual rate of 0.05% of each class’s average daily net assets, plus a fee based on the number of shareholder accounts and reimbursement for certain out-of-pocket expenses. Expenses not directly attributable to a particular class of shares are aggregated and allocated to each class on the basis of its relative net asset value.
Signature Services has agreed to limit the transfer agent fees so that such fees do not exceed 0.20% annually of Class A, Class B, Class C, Class R3, Class R4 and Class R5 share average daily net assets. This agreement is effective until December 31, 2006. Signature Services reserves the right to terminate this limitation in the future. In addition, Signature Service has voluntarily agreed to further limit transfer agent fees for Class R3, Class R4 and Class R5 shares so that such fees do not exceed 0.05% annually of each class’s average daily net assets. Accordingly, the transfer agent fees reductions amounted to $66, $66 and $159 for Class R3, Class R4 and Class R5 shares, respectively, during the period ended February 28, 2006. Signature Services reserves the right to terminate this limitation at any time.
25
Expenses under the agreements described above for the period ended February 28, 2006, were as follows:
| | Distribution | Transfer | | Printing and |
| Share Class | fees | agent | Blue sky | postage |
|
| Class A | $1,980 | $962 | $5,514 | $11,105 |
| Class B | 2,263 | 352 | 5,514 | 4,089 |
| Class C | 5,000 | 799 | 5,514 | 9,293 |
| Class R3 | 187 | 88 | 5,514 | 1,034 |
| Class R4 | 94 | 88 | 5,514 | 1,035 |
| Class R5 | N/A | 212 | 5,514 | 2,477 |
| Class 1 | 270,982 | — | — | 159 |
| Total | $280,506 | $2,501 | $33,084 | $29,192 |
Trustees’ fees
The Trust compensates each Trustee who is not an employee of the Adviser or its affiliates. Total Trustees’ expenses are allocated based on each fund’s average daily net asset value.
IV. Guarantees and indemnifications
Under the Trust’s organizational documents, its Officers and Trustees are indemnified against certain liability arising out of the performance of their duties to the Trust. Additionally, in the normal course of business, the Trust enters into contracts with service providers that contain general indemnification clauses. The Trust’s maximum exposure under these arrangements is unknown, as this would involve future claims that may be made against the Trust that have not yet occurred. However, based on experience, the Trust believes the risk of loss to be remote.
26
V. Capital shares
Share activities for the Fund for the period ended February 28, 2006 were as follows:
| | | Period ended 2-28-06a | |
| | Shares | Amount |
|
| Class A shares | | |
| Sold | 424,140 | $5,685,096 |
| Distributions reinvested | 619 | 8,199 |
| Repurchased | (1,996) | (26,871) |
| Net increase | 422,763 | $5,666,424 |
|
| |
| Class B shares | | |
| Sold | 126,066 | $1,686,357 |
| Distributions reinvested | 100 | 1,326 |
| Repurchased | (5,851) | (78,522) |
| Net increase | 120,315 | $1,609,161 |
|
| |
| Class C shares | | |
| Sold | 269,816 | $3,609,472 |
| Distributions reinvested | 370 | 4,904 |
| Repurchased | (280) | (3,766) |
| Net increase | 269,906 | $3,610,610 |
|
| |
| Class R3 shares | | |
| Sold | 7,728 | $100,000 |
| Net increase | 7,728 | $100,000 |
|
| |
| Class R4 shares | | |
| Sold | 7,928 | $102,708 |
| Net increase | 7,928 | $102,708 |
|
| |
| Class R5 shares | | |
| Sold | 37,291 | $493,469 |
| Distributions reinvested | 51 | 680 |
| Repurchased | (213) | (2,839) |
| Net increase | 37,129 | $491,310 |
|
| |
| Class 1 shares | | |
| Sold | 124,779,209 | $1,616,805,883 |
| Distributions reinvested | 890,511 | 11,772,560 |
| Repurchased | (1,603,614) | (21,372,776) |
| Net increase | 124,066,106 | $1,607,205,667 |
|
| Net increase | 124,931,875 | $1,618,785,880 |
a Class A, Class B, Class C, Class R3, Class R4 and Class R5 shares began operations on 10-18-05 and Class 1 shares began operation on10-15-05.
27
VI.Investment transactions
Purchases and proceeds from sales or maturities of securities, other than short-term securities and obligations of the U.S. government, during the period ended February 28, 2006, aggregated $1,665,544,509 and $47,008,263, respectively.
The cost of investment owned on February 28, 2006, including short-term investments, for federal income tax purposes, was $1,619,749,654. Gross unrealized appreciation and depreciation of investments aggregated $73,173,594 and $774,319, respectively, resulting in net unrealized appreciation of $72,399,275. The difference between book basis and tax basis net unrealized appreciation of investments is attributable primarily to the tax deferral of losses on certain sales of securities.
VII. Investment in affiliated underlying funds
The Fund invests primarily in the underlying funds that are managed by affili-ates of the Adviser. The Fund does not invest in the underlying funds for the purpose of exercising management or control.
A summary of the Fund’s transactions in the securities of affiliated issuers in which the Fund’s holdings represent 5% or more of the outstanding voting securities of the issuer, during the period ended February 28, 2006 is set forth below.
| Affiliate — | Shares | Shares | Ending Share | | Ending |
| Class NAV | Purchased | Sold | Amount | Proceeds | Value |
|
| 500 Index | 3,043,119 | 1,547 | 3,041,572 | $31,520,122 | $33,670,198 |
| Active Bond | 14,019,607 | 21,809 | 13,997,798 | 134,296,857 | 135,358,708 |
| Blue Chip Growth | 4,747,229 | 77,195 | 4,670,034 | 78,135,089 | 84,434,208 |
| Core Bond | 2,678,730 | 95 | 2,678,635 | 33,453,791 | 33,670,446 |
| Core Equity | 3,532,669 | 146,368 | 3,386,301 | 46,995,290 | 50,591,341 |
| Equity-Income | 1,938,689 | 67 | 1,938,622 | 31,325,676 | 33,732,016 |
| Fundamental Value | 3,306,735 | 105 | 3,306,630 | 48,219,352 | 50,591,443 |
| Global Bond | 7,133,322 | 24,793 | 7,108,529 | 102,645,352 | 101,865,221 |
| High Yield | 16,414,973 | 109,012 | 16,305,961 | 164,533,493 | 169,255,873 |
| International | | | | | |
| Equity Index | 1,996,893 | 80,701 | 1,916,192 | 29,839,603 | 33,839,943 |
| International | | | | | |
| Opportunities | 1,182,874 | 88,704 | 1,094,170 | 14,834,823 | 17,090,928 |
| International Stock | 6,907,567 | 447,995 | 6,459,572 | 76,352,077 | 85,330,948 |
| International Value | 3,134,085 | 66,035 | 3,068,050 | 45,969,771 | 50,592,147 |
| Investment Quality Bond | 2,832,430 | 601 | 2,831,829 | 33,453,999 | 33,670,447 |
| Real Estate Securities | 2,657,671 | 115,699 | 2,541,972 | 59,413,198 | 68,023,180 |
| Real Return Bond | 5,040,200 | 9,379 | 5,030,821 | 67,253,684 | 67,513,622 |
| Small Cap | 1,147,524 | 34,960 | 1,112,564 | 14,911,790 | 17,011,097 |
| Small Company | 2,057,573 | 58,278 | 1,999,295 | 30,226,524 | 34,067,987 |
| Small Company Value | 721,056 | 11,315 | 709,741 | 15,063,271 | 17,140,244 |
| Spectrum Income | 11,553,026 | 13,712 | 11,539,314 | 115,533,476 | 118,277,966 |
| Strategic Bond | 7,043,443 | 6,468 | 7,036,975 | 83,250,657 | 84,443,701 |
| Total Return | 14,836,478 | 74,144 | 14,762,334 | 201,346,320 | 203,277,335 |
| U.S. Government | | | | | |
| Securities | 2,797,295 | 321,527 | 2,475,768 | 33,461,861 | 33,670,451 |
| U.S. High Yield Bond | 2,572,319 | 91 | 2,572,228 | 32,869,992 | 33,670,466 |
| U.S. Multi Sector | 6,345,371 | 176 | 6,345,195 | 63,597,486 | 67,512,877 |
| Value & Restructuring | 3,092,492 | 65,109 | 3,027,383 | 30,285,064 | 33,846,136 |
28
Evaluation of Advisory and Subadvisory Agreement by the Board of Trustees (unaudited)
This section describes the evaluation by the Board of Trustees of the Advisory Agreement and each of the Subadvisory Agreements.
Evaluation by the Board of Trustees
The Board, including the Independent Trustees, is responsible for selecting the Trust’s investment adviser, John Hancock Investment Management Services, LLC (the “Adviser” or “JHIMS”), approving the Adviser’s selection of subadvisers for each series of the Trust (the “Funds”) and approving the Trust’s advisory and subadvisory agreements, their periodic continuation and any amendments. Consistent with SEC rules, the Board will regularly evaluate the Trust’s advisory and subadvisory arrangements, including consideration of the six factors listed below. The Board may also consider other factors (including conditions and trends prevailing generally in the economy, the securities markets and the industry) and does not treat any single factor as determinative, and each Trustee may attribute different weights to different factors. The Board is furnished with an analysis of its fiduciary obligations in connection with its evaluation and, throughout the evaluation process, the Board is assisted by counsel for the Trust and the Independent Trustees are also separately assisted by independent legal counsel. The six factors to be regularly considered by the Board are:
1. the nature, extent and quality of the services to be provided by the Adviser to the Trust and by the subadvisers to the Funds;
2. the investment performance of the Funds and their subadvisers;
3. the extent to which economies of scale would be realized as a Fund grows;
4. whether fee levels reflect these economies of scale for the benefit of Trust shareholders;
5. the costs of the services to be provided and the profits to be realized by the Adviser and its affiliates from the Adviser’s relationship with the Trust; and
6. comparative services rendered and comparative advisory and subadvisory fee rates.
The Board believes that information relating to all six factors is relevant to its evaluation of the Trust’s advisory agreement. With respect to its evaluation of subadvisory agreements, the Board believes that, in view of the Trust’s “manager-of-managers” advisory structure: factors (1), (2) and (6) are of primary relevance; factors (3) and (4) generally are less significant to the Trustees’ considerations because subad-visory fees are paid to subadvisers by the Adviser and not directly by the Funds, and issues pertaining to economies of scale are considered in connection with the approval of the advisory fees that are paid directly by the Funds; and with respect to those subadvisers that are not affiliated with the Adviser, because the Board relies on the ability of the Adviser to negotiate the subadvisory fees at arms-length, factor (5) generally is also less significant to the Trustees’ considerations except in those circumstances in which such attention may be warranted because the comparative fee information considered in connection with factor (6) indicates that the subadvisory fees will materially exceed those normally charged under comparable circumstances.
29
In evaluating subadvisory arrangements, the Board also considers other material business relationships that unaffiliated subadvisers and their affili-ates have with the Adviser or its affiliates, including the involvement by certain affiliates of certain subadvisers in the distribution of financial products, including shares of the Trust, offered by the Adviser and other affiliates of the Adviser (“Material Relationships”).
Approval of Advisory Agreement
At its meeting on September 21, 2005, the Board, including all the Independent Trustees, approved the Advisory Agreement between the Trust and JHIMS with respect to each of the Funds.
In approving the Advisory Agreement, and with reference to the six factors that it considers, the Board:
1(a) considered the high value to the Trust of JHIMS’s long relationship with investment companies within the same fund complex as the Trust, the skills and competency which JHIMS has demonstrated in managing the affairs and subadvisory relationships of these other investment companies, JHIMS’s ability to oversee and monitor the subadvis-ers’ investment performance and compliance programs and the qualifications of JHIMS’ personnel,
(b) considered JHIMS’s compliance policies and procedures and its responsiveness to regulatory changes and mutual fund industry developments, and
(c) considered JHIMS’s administrative capabilities, including its ability to supervise the other service providers for the Funds and concluded that JHIMS may reasonably be expected to ably perform its services under the Advisory Agreement;
2 reviewed the investment performance of comparably managed funds of each of the Funds; the comparative performance of their respective benchmarks and comparable funds (i.e., funds having approximately the same investment objective); and JHIMS’ analysis of such performance and its plans and recommendations regarding the Trust’s subadvisory arrangements generally and with respect to particular Funds; and concluded that each of the comparably managed funds has generally performed well or within a range that the Board deemed competitive except as discussed in Appendix A, and that JHIMS may reasonably be expected to ably monitor the performance of the Funds and each of their subadvisers;
3 & 4 reviewed the Trust’s advisory fee structure and the incorporation therein of any subadvisory fee breakpoints in the advisory fees charged and concluded (a) that to the extent that Funds have subad-visory fees with breakpoints, those breakpoints are reflected as breakpoints in the advisory fees for Funds, (b) that all Funds with a subadviser that is not affiliated with the Adviser have subadvisory fees which are the product of arms-length negotiations between the Adviser and the subadviser and which in many, but not all, cases contain breakpoints, and (c) that, although economies of scale cannot be measured with precision, these arrangements permit shareholders of Funds with advisory fee breakpoints to benefit from economies of scale if those Funds grow;
5 (a) reviewed the financial statements of JHIMS and John Hancock Life Insurance Company (U.S.A.) (“JHLICO (U.S.A.)”) and considered an analysis presented by JHIMS
30
regarding the estimated net profitability to JHIMS of the advisory fee structure;
(b) reviewed the profitability of the JHIMS’ relationship with the Funds in terms of the total amount of annual advisory fees it is estimated to receive with respect to the Funds and whether JHIMS has the financial ability to provide a high level of services to the Funds,
(c) considered that JHIMS will derive reputational and other indirect benefits from providing advisory services to the Funds, and
(d) noted that JHIMS will pay the sub-advisory fees out of the advisory fees JHIMS receives from the Funds and concluded that the advisory fees to be paid by the Trust with respect to the Funds are not unreasonable in light of such information; and
6 reviewed comparative information with respect to the proposed advisory fee rates and concluded that the Trust’s anticipated advisory fees are within the range of those incurred by other comparable funds and that the Trust’s advisory structure is thus competitive within the industry. In considering the proposed advisory fee rates, the Board took into account the high level of services expected to be provided to the Funds and the other factors considered.
Additional information that the Board considered for a particular Fund is set forth in Appendix A.
Approval of Subadvisory Agreements
At its meeting on September 21, 2005, the Board, including all the Independent Trustees, approved the Subadvisory Agreements.
In making its determination with reference to these respective factors, the Board reviewed:
1 information relating to each subad-viser’s business, which may include information such as: business performance, representative clients, assets under management, financial stability, personnel and, if applicable, past sub-advisory services to affiliated funds of the Trust;
2 the investment performance of comparatively managed funds of the Fund and comparative performance information relating to the comparatively managed fund’s benchmark and comparable funds;
3 the proposed subadvisory fee for each Fund and comparative fee information; and
4 information relating to the nature and scope of Material Relationships and their significance to the Trust’s adviser and unaffiliated subadvisers.
The Board’s decision to approve each Subadvisory Agreement was based on a number of determinations, including the following:
1 The Subadviser has extensive experience and demonstrated skills as a manager;
2 Although not without variation, the current and historical performance of the comparably managed funds of Subadviser to the Funds generally has been within the range of the current and historical performance of comparable funds and the comparably managed funds’ respective benchmarks;
3 With respect to each subadviser that is not affiliated with the Adviser, the subadvisory fees are a product of arms-length negotiation between the
31
Adviser and the subadviser and generally are within the range of industry norms; and
4 The Material Relationships consist of arrangements in which unaffiliated subadvisers or their affiliates provide advisory, distribution or management services in connection with financial products sponsored by the Trust’s adviser or its affiliates, which may include other registered investment companies, a 529 education savings plan, managed separate accounts and exempt group annuity contracts sold to qualified plans, and which in no case contained elements that would cause the Board to conclude that approval of the subadvisory agreement with the subadviser would be inappropriate.
Additional information that the Board considered for a particular fund is set forth below.
| | Performance of | |
| | Comparable Funds | Estimated Fees |
| Fund | as of June 30, 2005 | and Expenses |
|
| Lifestyle Moderate | Performance of the | Advisory fees for this Fund |
| | Lifestyle Moderate 460 | are lower than its peer |
| (MFC Global | Trust of JHT has | group median. |
| Investment | outperformed its | |
| Management | benchmark index over | Total expenses for this |
| (U.S.A.) Limited | the one, three and five | Fund are higher than its |
| | year periods. | peer group median. |
|
32
The Portfolio’s proxy voting policies, procedures and records are available without charge, upon request:
| By phone | On the Fund’s Web site | On the SEC’s Web site |
| 1-800-225-5291 | www.jhfunds.com/proxy | www.sec.gov |
|
| |
| |
| Trustees | Gordon M. Shone | Principal distributor |
| James M. Oates, Chairman* | Vice President and Treasurer | John Hancock Funds, LLC |
| Charles L. Bardelis * | Betsy A. Seel | 601 Congress Street |
| James R. Boyle† | Assistant Vice President, | Boston, MA 02210-2805 |
| Peter S. Burgess * | Secretary and | |
| Elizabeth G. Cook | Chief Legal Officer | Custodian |
| William H. Cunningham | George Boyd | State Street Bank & Trust Co. |
| Charles L. Ladner * | Senior Counsel, Assistant | 225 Franklin Street |
| Hassell H. McClellan | Vice President and | Boston, MA 02110 |
| *Members of the Audit Committee | Assistant Secretary | |
| †Non-Independent Trustee | Francis V. Knox, Jr. | Transfer agent |
| | Vice President and Chief | John Hancock Signature |
| Officers | Compliance Officer | Services, Inc. |
| Keith F. Hartstein | | 1 John Hancock Way, |
| President | Investment adviser | Suite 1000 |
| John G. Vrysen | John Hancock Investment | Boston, MA 02217-1000 |
| Executive Vice President and | Management Services, LLC | |
| Chief Financial Officer | 601 Congress Street | Legal counsel |
| Boston, MA 02210-2805 | Kirkpatrick & Lockhart |
| | Nicholson Graham LLP |
| | | 1 Lincoln Street |
| | | Boston, MA 02111 |
The Portfolio’s investment objective, risks, charges and expenses are included in the prospectus and should be considered carefully before investing. For a prospectus, call your financial professional, call John Hancock Funds at 1-800-225-5291, or visit the Portfolio’s Web site at www.jhfunds.com. Please read the prospectus carefully before investing or sending money.
| How to contact us | |
|
| |
| Internet | www.jhfunds.com | |
|
| Mail | Regular mail: | Express mail: |
| | John Hancock | John Hancock |
| | Signature Services, Inc. | Signature Services, Inc. |
| | 1 John Hancock Way, Suite 1000 | Mutual Fund Image Operations |
| | Boston, MA 02217-1000 | 380 Stuart Street |
| | | Boston, MA 02116 |
|
| Phone | Customer service representatives | 1-800-225-5291 |
| | 24-hour automated information | 1-800-338-8080 |
| | TDD line | 1-800-554-6713 |
A listing of month-end portfolio holdings is available on our Web site, www.jhfunds.com. A more detailed portfolio holdings summary is available on a quarterly basis 60 days after the fiscal quarter on our Web site or upon request by calling 1-800-225-5291, or on the Securities and Exchange Commission’s Web site, www.sec.gov.
33

(a) Not Applicable
(b) Not Applicable
(c) Not Applicable
(d) Not Applicable
(e) Not Applicable
(f) Not Applicable
|
ITEM 3. AUDIT COMMITTEE FINANCIAL EXPERT.
Not Applicable
ITEM 4. PRINCIPAL ACCOUNTANT FEES AND SERVICES.
(a) Not Applicable
(b) Not Applicable
(c) Not Applicable
(d) Not Applicable
(e) Not Applicable
(f) Not Applicable
(g) Not Applicable
(h) Not Applicable
|
ITEM 5. AUDIT COMMITTEE OF LISTED REGISTRANTS
Not Applicable
ITEM 6. SCHEDULE OF INVESTMENTS.
Included with Item 1.
ITEM 7. DISCLOSURE OF PROXY VOTING POLICIES AND PROCEDURES FOR CLOSED-END
MANAGEMENT INVESTMENT COMPANIES.
Not Applicable
ITEM 8. PORTFOLIO MANAGERS OF CLOSED-END MANAGEMENT INVESTMENT COMPANIES.
Not Applicable
ITEM 9. PURCHASE OF EQUITY SECURITIES BY CLOSED-END MANAGEMENT INVESTMENT
COMPANIES AND AFFILIATED PURCHASES.
Not Applicable
ITEM 10. SUBMISSION OF MATTERS TO VOTE OF SECURITY HOLDERS.
Not Applicable
ITEM 11. CONTROLS AND PROCEDURES.
|
(a) Based upon their evaluation of the registrant's disclosure controls and procedures as conducted within 90 days of the filing date of this Form N-CSR, the registrant's principal executive officer and principal financial officer have concluded that those disclosure controls and procedures provide reasonable assurance that the material information required to be disclosed by the registrant on this report is recorded, processed, summarized and reported within the time periods specified in the Securities and Exchange Commission's rules and forms.
(b) There was no change in the registrant's internal control over financial reporting (as defined in Rule 30a-3(d) under the Investment Company Act of 1940) that occurred during the second fiscal quarter of the period covered by this report that has materially affected, or is reasonably likely to materially affect, the registrant's internal control over financial reporting.
ITEM 12. EXHIBITS.
(A) NOT APPLICABLE
(B)(1) CERTIFICATIONS PURSUANT TO SECTION 302 OF THE SARBANES-OXLEY ACT OF 2002 OF KEITH F. HARTSTEIN, PRESIDENT (CHIEF EXECUTIVE OFFICER) AND JOHN G. VRYSEN, CHIEF FINANCIAL OFFICER
(B)(2) CERTIFICATIONS PURSUANT TO SECTION 906 OF THE SARBANES-OXLEY ACT OF 2002 OF KEITH F. HARTSTEIN, PRESIDENT (CHIEF EXECUTIVE OFFICER) AND JOHN G. VRYSEN, CHIEF FINANCIAL OFFICER
SIGNATURES
Pursuant to the requirements of the Securities Exchange Act of 1934 and the Investment Company Act of 1940, the registrant has duly caused this report to be signed on its behalf by the undersigned, thereunto duly authorized.
John Hancock Funds II
/s/ Keith F. Hartstein
President and
Chief Executive Officer
|
Date: May 8, 2006Pursuant to the requirements of the Securities Exchange Act of 1934 and the Investment Company Act of 1940, this report has been signed below by the following persons on behalf of the registrant and in the capacities and on the dates indicated.
/s/ Keith F. Hartstein
President and
Chief Executive Officer
Date: May 8, 2006
/s/ John G. Vrysen
Chief Financial Officer
Date: May 8, 2006
|