UNITED STATES
SECURITIES AND EXCHANGE COMMISSION
Washington, D.C. 20549
FORM N-CSR
CERTIFIED SHAREHOLDER REPORT OF REGISTERED MANAGEMENT INVESTMENT COMPANIES
Investment Company Act file number 811-21779
JOHN HANCOCK FUNDS II
---------------------------------------------------------
(Exact name of registrant as specified in charter)
601 CONGRESS STREET, BOSTON, MA 02210-2805
-------------------------------------------------------------
(Address of principal executive offices) (Zip code)
GORDON M. SHONE, 601 CONGRESS STREET, BOSTON, MA 02210-2805
------------------------------------------------------------------------------------------
(Name and address of agent for service)
Registrant's telephone number, including area code: (617) 663-3000
--------------
Date of fiscal year end: 8/31
------
Date of reporting period: 8/31/06
-------
ITEM 1. REPORTS TO STOCKHOLDERS.
The first report applies to Lifestyle Aggressive Portfolio, the second report applies to Lifestyle Balanced Portfolio, the third report applies to Lifestyle Conservative Portfolio, the fourth report applies to Lifestyle Growth Portfolio, the fifth report applies to Lifestyle Moderate Portfolio and the sixth report applies to 56 of the Registrant’s portfolios


CEO corner
| TABLE OF CONTENTS |
|
| |
| Managers' report |
| page 2 |
|
| |
| A look at performance |
| page 6 |
|
| |
| Your expenses |
| page 8 |
|
| |
| Portfolio’s investments |
| page 10 |
|
| |
| Financial statements |
| page 12 |
|
| |
| Trustees and officers |
| page 31 |
|
| |
| For more information |
| page 36 |
|
To Our Shareholders,
The future has arrived at John Hancock Funds.
We have always been firm believers in the powerful role the Internet can play in providing fund information to our shareholders and prospective investors. Recently, we launched a redesigned, completely overhauled Web site that is more visually pleasing, easier to navigate and, most importantly, provides more fund information and learning tools without overwhelming the user.
Not long after we embarked on this major project, a study was released by the Investment Company Institute, the mutual fund industry’s main trade group, which found that an overwhelming majority of shareholders consider the Internet the “wave of the future” for accessing fund information.
Our new site sports fresher and faster ways to access account information. New innovations allow investors to view funds by risk level, track the performance of the John Hancock funds of their choice or sort funds by Morningstar, Inc.’s star ratings. Investors who own a John Hancock fund through a qualified retirement plan and don’t pay sales charges when making a purchase have the option of sorting by a “Load Waived” Morningstar Rating, thereby creating an apples-to-apples comparison with no-load funds that may also be available in their retirement plan.
The new site also has more educational tools and interactive modules to educate and assist investors with their financial goals, from college savings to retirement planning. A new “I want to…” feature allows investors to check performance, invest more money, update personal information or download prospectuses and forms quickly and easily.
In another of our ongoing efforts to provide our shareholders with top-notch service, we also redesigned our shareholder reports, as you may have noticed with this report. We hope the larger size, more colorful cover and redesigned presentation of the commentary and data tables will draw you in and make them easier to read.
After you’ve read your shareholder report, we encourage you to visit our new Web site — www.jhfunds.com — and take a tour. It’s easy, fast and fun and allows you to be in control of what you see and do. In short, it’s the wave of the future!
Sincerely,

Keith F. Hartstein,
President and Chief Executive Officer
This commentary reflects the CEO’s views as of August 31, 2006. They are subject to change at any time.
Your portfolio at a glance
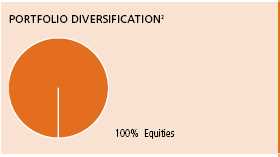
The Portfolio seeks long-term growth of capital. Current income is not a consideration. To pursue this goal, the Portfolio, which is a fund-of-funds, normally invests 100% of its assets in underlying funds that invest primarily in equity securities.
Since inception*
► Across all asset classes, financial markets gained ground during the period, with nearly all of the Portfolio’s underlying funds performing positively.
► The Portfolio’s allocation to international and natural resources funds was a big positive, while U.S. large-cap growth and core funds lagged the S&P 500 Index.
► While there were relatively few management changes to the Portfolio, we did add a new international small-cap stock fund to broaden our exposure to that asset class.
| Target Asset Allocation | |
| Equity | % of Total |
|
| U.S. Large Cap | 38.0 |
|
| International | 24.0 |
|
| U.S. Small Cap | 14.0 |
|
| U.S. Mid Cap | 13.0 |
|
| International Small Cap | 6.0 |
|
| Natural Resources | 5.0 |
|
1
Managers’ report
John Hancock
Lifestyle Aggressive Portfolio
The Portfolio’s broad diversification across multiple asset classes and fund managers was very valuable during a volatile market environment. Just about every investment type ended the reporting period in positive territory for the period beginning October 15, 2005 (the Portfolio’s inception date), through August 31, 2006.
The broad U.S. equity market turned in a respectable performance during the reporting period, as the S&P 500 Index gained 11.44% . These results came despite a sharp May/June downturn, which resulted from worries about slowing corporate earnings, fears of rising inflation and the expectation for further rate hikes from the U.S. Federal Reserve. However, strong rallies both early and late in the period helped overcome prior losses and gave stocks some much-needed upward momentum.
Continuing the trend of the past several years, large-capitalization U.S. stocks again lagged their mid-cap counterparts, which in turn underperformed small caps — although the performance gap between large and small stocks finally began to narrow during the period. Once again, one trend that remained the same across all U.S. market-capitalization ranges: value stocks continued to outshine growth stocks, despite several brief periods during which growth took the lead.
SCORECARD
| INVESTMENT | | PERIOD’S PERFORMANCE... AND WHAT’S BEHIND THE NUMBERS |
| Natural Resources | ▲ | Continued to benefit from steadily rising commodity prices. |
| (Wellington) | | |
| International | ▲ | Strong international stock performance and favorable currency |
| Opportunities (Marsico) | | movements added to results. |
| U.S. Multi-Sector | ▼ | Emphasis on certain higher-quality, large-cap growth stocks |
| (GMO) | | detracted from performance. |
2
From the MFC Global Investment Management (U.S.A.), LLC’s Portfolio Management Team
“One big reason for the
Portfolio’s solid relative
performance was our large
weighting in international
equities, approximately 30%
of assets.”
International stocks were particularly strong performers during the period, as indicated by the 23.02% return of the MSCI EAFE Index. Equities abroad benefited from continued relative weakness in the U.S. dollar and greater uncertainty about the direction of interest rates in the United States. Another asset class that did very well was natural resources, which was helped by continued economic expansion boosting demand for commodities, coupled with relatively tight supplies. Energy stocks did particularly well, as oil prices rose further. Excellent supply/demand fundamentals also helped companies in the metals and mining and the paper and forest products industries.
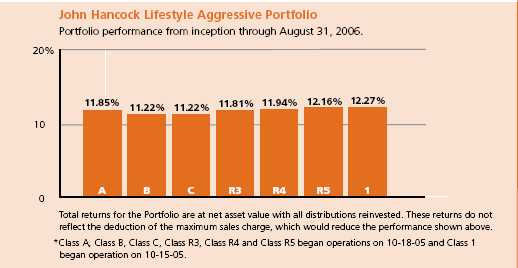
Performance results
John Hancock Lifestyle Aggressive Portfolio’s Class A, Class B, Class C, Class R3, Class R4 and Class R5, which began operations on October 18, 2005, producd total returns of 11.85%, 11.22%, 11.22%, 11.81%, 11.94% and 12.16%, respectively, at net asset value through August 31, 2006. Class 1 shares returned 12.27% at net asset value since beginning operation October 15, 2005. In comparison, the Portfolio’s benchmark, the S&P 500 Index, returned 11.44% and Morningstar’s average large blend fund returned 11.41% .1 Keep in mind that your net asset value return will be different from the Portfolio’s performance if you were not invested in the Portfolio for the entire period and did not reinvest all distributions. Please see pages six and seven for historical performance information.
Lifestyle Aggressive Portfolio
3
International gains
One big reason for the Portfolio’s solid relative performance was our large weighting in international equities, approximately 30% of assets. Particularly strong results came from International Core (+22.19%, GMO), one of our two largest allocations at 8% of the Portfolio at period end. Another big help was our position in International Opportunities (+23.51%, Marsico), in which we held a 4% stake.
In addition, we benefited significantly from our exposure to the natural resources asset class through a 5% position in Natural Resources (+24.62%, Wellington). The Portfolio’s overweighting in natural resources has declined somewhat relative to our benchmark, as these stocks have performed well and grown to occupy a larger portion of the index.
On the Portfolio’s domestic equity side, we were most helped by a number of our large-cap value-oriented investments. For example, Quantitative Value (+17.98%, MFC Global Investment Management (U.S.A.), LLC) enjoyed very strong results, while Large Cap Value (+13.43%, Mercury) and Equity Income (+13.54%, T. Rowe Price) also generated solid gains. By contrast, the Portfolio’s large-cap core and growth-oriented investments tended to lag in a market environment that continued to favor value and small-cap stocks. Capital Appreciation, managed by Jennison, turned in a modestly positive return of 2.72%, while the GMO-managed U.S. Multi-Sector — at 8% our other largest weighting — gained 4.25% . Core Equity (+3.63%, Legg Mason) also failed to keep pace with the S&P 500 Index.
Broader small-cap exposure
We initiated relatively few meaningful asset allocation shifts during the period. In May, we did establish a new position in a new international small-cap fund, International Small Company, managed by Dimensional Fund Advisors (DFA). This fund was added to complement our existing holdings in International Small Cap, managed by Templeton. The DFA offering provides us with two important benefits — added exposure to the smaller end of the international small-cap spectrum, and enough capacity to maintain our desired exposure to this important asset class.
Lifestyle Aggressive Portfolio
4
Outlook
We have maintained the Portfolio’s relatively neutral weighting in international markets. On the positive side, there are some good pockets of growth around the world, particularly in Japan. However, higher valuations in many markets along with the potential for rising interest rates are some reasons to be cautious.
“On the Portfolio’s domestic equity
side, we were most helped by a
number of our large-cap value-
oriented investments.”
We believe the stage may be set for high-quality, large-cap stocks to finally take the lead over their mid- and small-cap counterparts. We have positioned the Portfolio to benefit from such a scenario, maintaining a slight overweight in funds that own high-quality, large-cap stocks, such as T. Rowe Price’s Blue Chip Growth. Added exposure to this group comes from funds such as U.S. Multi Sector, whose management team also has prepared for a high-quality large-cap shift and has tilted its portfolio accordingly. Although we are expecting large caps to take the lead, we can’t predict when such a reversal will take place. If, however, investors continue their preference for higher-risk, lower-quality asset classes, we believe our broadly diversified Portfolio can help capture these performance gains while effectively managing volatility for our shareholders.
This commentary reflects the views of the portfolio managers through the end of the Portfolio’s period discussed in this report. The managers’ statements reflect their own opinions. As such, they are in no way guarantees of future events and are not intended to be used as investment advice or a recommendation regarding any specific security. They are also subject to change at any time as market and other conditions warrant.
International investing involves special risks such as political, economic and currency risks and differences in accounting standards and financial reporting. See the prospectus for the risks of investing in small-cap stocks. See the prospectus for the risks of investing in high-yield bonds.
1 Figures from Morningstar, Inc. include reinvested dividends and do not take into account sales charges. Actual load-adjusted performance is lower.
2 As a percentage of net assets on August 31, 2006.
Lifestyle Aggressive Portfolio
5
A look at performance
| For the period ending August 31, 2006 | |
| |
| | | Cumulative total returns |
| | | with maximum sales charge (POP) |
|
| | Inception | Since |
| Class | date | Inceptiona |
|
| A | 10-18-05 | 6.30% |
|
| B | 10-18-05 | 6.22 |
|
| C | 10-18-05 | 10.22 |
|
| R3b | 10-18-05 | 11.81 |
|
| R4b | 10-18-05 | 11.94 |
|
| R5b | 10-18-05 | 12.16 |
|
| 1b | 10-15-05 | 12.27 |
|
Performance figures assume all distributions are reinvested. Returns with maximum sales charge reflect a sales charge on Class A shares of 5%, and the applicable contingent deferred sales charge (CDSC) on Class B and Class C shares. The Class B shares’ CDSC declines annually between years 1–6 according to the following schedule: 5, 4, 3, 3, 2, 1%. No sales charge will be assessed after the sixth year. Class C shares held for less than one year are subject to a 1% CDSC. Sales charge is not applicable for Class R3, Class R4, Class R5 and Class 1 shares.
The returns reflect past results and should not be considered indicative of future performance. The return and principal value of an investment will fluctuate so that shares, when redeemed, may be worth more or less than their original cost. Due to market volatility, the Portfolio’s current performance may be higher or lower than the performance shown. For performance data current to the most recent month-end, please call 1-800-225-5291 or visit the Portfolio’s Web site at www.jhfunds.com.
The performance table above and the chart on the next page do not reflect the deduction of taxes that a shareholder would pay on fund distributions or the redemption of fund shares.
The Portfolio’s performance results reflect any applicable expense reductions, without which the expenses would increase and results would have been less favorable.
Since inception performance is calculated with an opening price (prior day’s close) on inception date.
a Class A, Class B, Class C, Class R3, Class R4 and Class R5 shares began operations on 10-18-05 and Class 1 shares began operation on 10-15-05.
b For certain types of investors as described in the Portfolio’s Class R3, Class R4, Class R5 and Class 1 share prospectuses.
Lifestyle Aggressive Portfolio
6
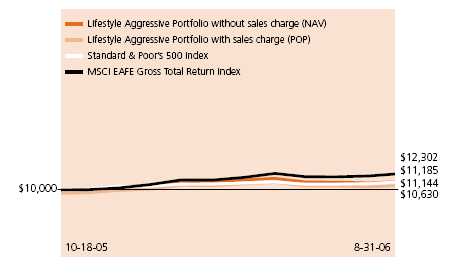
Growth of $10,000
This chart shows what happened to a hypothetical $10,000 investment in Class A shares for the period indicated. For comparison, we’ve shown the same investment in two separate indexes.
| | | Without sales | With maximum | | |
| Class | Period beginning | charge | sales charge | Index 1 | Index 2 |
|
| B1 | 10-18-05 | $11,122 | $10,622 | $11,144 | $12,302 |
|
| C1 | 10-18-05 | 11,122 | 11,022 | 11,144 | 12,302 |
|
| R31,3 | 10-18-05 | 11,181 | 11,181 | 11,144 | 12,302 |
|
| R41,3 | 10-18-05 | 11,194 | 11,194 | 11,144 | 12,302 |
|
| R51,3 | 10-18-05 | 11,216 | 11,216 | 11,144 | 12,302 |
|
| 12,3 | 10-15-05 | 11,227 | 11,227 | 11,177 | 11,944 |
|
Assuming all distributions were reinvested for the period indicated, the table above shows the value of a $10,000 investment in the Portfolio’s Class B, Class C, Class R3, Class R4, Class R5 and Class 1 shares, respectively, as of August 31, 2006. Performance of the classes will vary based on the difference in sales charges paid by shareholders investing in the different classes and the fee structure of those classes.
Index 1 — Standard & Poor’s 500 Index is an unmanaged index that includes 500 widely traded common stocks.
Index 2 — MSCI EAFE Gross Total Return Index (Europe, Australasia, Far East) is a free float-adjusted market capitalization index that is designed to measure developed market equity performance, excluding the U.S. & Canada. As of June 2006 the MSCI EAFE Index consisted of the following 21 developed market country indices: Australia, Belgium, Denmark, Finland, France, Germany, Greece, Hong Kong, Ireland, Italy, Japan, the Netherlands, New Zealand, Norway, Portugal, Singapore, Spain, Sweden, Switzerland and the United Kingdom.
It is not possible to invest directly in an index. Index figures do not reflect sales charges and would be lower if they did.
1 Index 2 figure from 10/31/05.
2 Index 2 figure from 9/30/05.
3 For certain types of investors as described in the Portfolio’s Class R3, Class R4, Class R5 and Class 1 share prospectuses.
7
Lifestyle Aggressive Portfolio
Your expenses
These examples are intended to help you understand your ongoing operating expenses.
Understanding portfolio expenses
As a shareholder of the Portfolio, you incur two types of costs:
■ Transaction costs which include sales charges (loads) on purchases or redemptions (varies by share class), minimum account fee charge, etc.
■ Ongoing operating expenses including management fees, distribution and service fees (if applicable) and other Portfolio expenses.
In addition to the operating expenses which the Portfolio bears directly, the Portfolio indirectly bears a pro rata share of the operating expenses of the underlying funds in which the Portfolio invests. Because the underlying funds have varied operating expenses and transaction costs and the Portfolio may own different proportions of the underlying funds at different times, the amount of expenses incurred indirectly by the Portfolio will vary. If these indirect expenses were included, your expenses paid during the period would have been higher.
We are going to present only your ongoing operating expenses here.
Actual expenses/actual returns
This example is intended to provide information about your portfolio’s actual ongoing operating expenses, and is based on your portfolio’s actual return. It assumes an account value of $1,000.00 on March 1, 2006, with the same investment held until August 31, 2006.
| | Account value | Ending value | Expenses paid during period |
| | on 3-1-06 | on 8-31-06 | ended 8-31-06 a |
|
| Class A | $1,000.00 | $1,004.30 | $3.28 |
|
| Class B | 1,000.00 | 1,000.70 | 6.81 |
|
| Class C | 1,000.00 | 1,000.70 | 6.81 |
|
| Class R3 | 1,000.00 | 1,005.00 | 3.44 |
|
| Class R4 | 1,000.00 | 1,005.00 | 2.48 |
|
| Class R5 | 1,000.00 | 1,006.40 | 0.96 |
|
| Class 1 | 1,000.00 | 1,007.20 | 0.56 |
|
8
Lifestyle Aggressive Portfolio
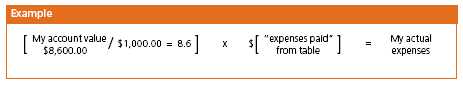
Together with the value of your account, you may use this information to estimate the operating expenses that you paid over the period. Simply divide your account value at August 31, 2006 by $1,000.00, then multiply it by the “expenses paid” for your share class from the table above. For example, for an account value of $8,600.00, the operating expenses should be calculated as follows:
Hypothetical example for comparison purposes
This table allows you to compare your portfolio’s ongoing operating expenses with those of any other fund. It provides an example of the Portfolio’s hypothetical account values and hypothetical expenses based on each class’s actual expense ratio and an assumed 5% annual return before expenses (which is not your portfolio’s actual return). It assumes an account value of $1,000.00 on March 1, 2006, with the same investment held until August 31, 2006. Look in any other fund shareholder report to find its hypothetical example and you will be able to compare these expenses.
| | Account value | Ending value | Expenses paid during period |
| | on 3-1-06 | on 8-31-06 | ended 8-31-06 a |
|
| Class A | $1,000.00 | $1,021.93 | $3.31 |
|
| Class B | 1,000.00 | 1,018.40 | 6.87 |
|
| Class C | 1,000.00 | 1,018.40 | 6.87 |
|
| Class R3 | 1,000.00 | 1,021.78 | 3.47 |
|
| Class R4 | 1,000.00 | 1,022.74 | 2.50 |
|
| Class R5 | 1,000.00 | 1,024.25 | 0.97 |
|
| Class 1 | 1,000.00 | 1,024.65 | 0.56 |
|
Remember, these examples do not include any transaction costs, such as sales charges; therefore, these examples will not help you to determine the relative total costs of owning different funds. If transaction costs were included, your expenses would have been higher. See the prospectus for details regarding transaction costs.
a Expenses are equal to the Portfolio's annualized expense ratio of 0.65%, 1.35%, 1.35%, 0.68%, 0.49%, 0.19% and 0.11% for Class A, Class B, Class C, Class R3, Class R4, Class R5 and Class 1, respectively, multiplied by the average account value over the period, multiplied by the number of days in the period /365 or 366 (to reflect the one-half year period). The expense ratios do not include fees and expenses incurred by the Portfolio from the underlying funds.
Lifestyle Aggressive Portfolio
9
F I N A N C I A L S T A T E M E N T SPortfolio’s investments
Securities owned by the Portfolio on 8-31-06
Portfolio of investments, showing all underlying funds.
| Issuer | Shares | Value |
|
| Investment companies 99.97% | | $2,493,325,747 |
| (Cost $2,332,750,384) | | |
| John Hancock Funds II | | |
|
| All Cap Growth Fund Class NAV | 3,022,333 | $49,717,383 |
|
| All Cap Value Fund Class NAV | 3,136,053 | 49,549,643 |
|
| Blue Chip Growth Fund Class NAV | 6,985,892 | 124,348,875 |
|
| Capital Appreciation Fund Class NAV | 10,532,521 | 99,532,325 |
|
| Core Equity Fund Class NAV | 5,286,718 | 75,441,459 |
|
| Emerging Growth Fund Class NAV | 2,789,800 | 51,164,930 |
|
| Equity-Income Fund Class NAV | 2,736,026 | 49,549,424 |
|
| Fundamental Value Fund Class NAV | 6,280,209 | 99,415,710 |
|
| International Equity Index Fund Class NAV | 6,555,210 | 124,352,333 |
|
| International Opportunities Fund Class NAV | 6,182,381 | 99,907,280 |
|
| International Small Cap Fund Class NAV | 3,557,189 | 74,523,111 |
|
| International Small Company Fund Class NAV | 7,989,553 | 74,542,530 |
|
| International Value Fund Class NAV | 9,755,233 | 174,423,566 |
|
| Large Cap Fund Class NAV | 3,379,099 | 49,571,376 |
|
| Large Cap Value Fund Class NAV | 1,069,803 | 24,616,172 |
|
| Mid Cap Core Fund Class NAV | 4,327,223 | 74,687,869 |
|
| Mid Cap Index Fund Class NAV | 1,361,218 | 25,005,575 |
|
| Mid Cap Stock Fund Class NAV | 3,170,730 | 50,192,653 |
|
| Mid Cap Value Equity Fund Class NAV | 2,578,332 | 24,880,903 |
|
| Mid Cap Value Fund Class NAV | 2,635,211 | 49,700,071 |
|
| Natural Resources Fund Class NAV | 3,492,935 | 124,348,487 |
|
| Quantitative Mid Cap Fund Class NAV | 3,479,128 | 49,821,116 |
|
| Quantitative Value Fund Class NAV | 4,497,753 | 74,482,795 |
|
| Small Cap Fund Class NAV | 5,402,799 | 75,855,305 |
|
| Small Cap Index Fund Class NAV | 3,174,474 | 50,632,853 |
|
| Small Company Fund Class NAV | 3,224,770 | 49,790,455 |
|
| Small Company Value Fund Class NAV | 3,199,392 | 75,601,641 |
|
| Special Value Fund Class NAV | 2,441,971 | 50,109,240 |
|
| U.S. Global Leaders Growth Fund Class NAV | 1,958,976 | 24,839,817 |
|
| U.S. Multi Sector Fund Class NAV | 19,130,584 | 199,149,379 |
|
| Value & Restructuring Fund Class NAV | 2,239,676 | 24,815,609 |
|
| Vista Fund Class NAV | 4,636,102 | 49,606,288 |
See notes to financial statements
Lifestyle Aggressive Portfolio
10
F I N A N C I A L S T A T E M E N T S
| Issuer | Shares | Value |
|
| John Hancock Funds III | | |
|
| International Core Fund Class NAV | 5,057,125 | $199,149,574 |
|
| Total investments 99.97% | | $2,493,325,747 |
|
| Other assets in excess of liabilities 0.03% | | $631,006 |
|
| Total net assets 100.00% | | $2,493,956,753 |
| | | |
| Percentages are stated as a percent of net assets of the Portfolio. | | |
See notes to financial statements
Lifestyle Aggressive Portfolio
11
F I N A N C I A L S T A T E M E N T SFinancial statements
Statement of assets and liabilities 8-31-06
This Statement of Assets and Liabilities is the Portfolio’s balance sheet. It shows the value of what the Portfolio owns, is due and owes. You’ll also find the net asset value and the maximum offering price per share.
| Assets | |
|
| Investments in affiliated funds, at value (cost $2,332,750,384) | $2,493,325,747 |
| Receivable for fund shares sold | 2,917,687 |
| Other assets | 7,767 |
| Total assets | 2,496,251,201 |
|
| Liabilities | |
|
| Payable for investments purchased | 1,954,062 |
| Payable for fund shares repurchased | 68,176 |
| Payable to affiliates | |
| Fund administration fees | 46,274 |
| Transfer agent fees | 36,857 |
| Trustees’ fees | 515 |
| Due to adviser | 22,540 |
| Other payables and accrued expenses | 166,024 |
| Total liabilities | 2,294,448 |
|
| Net assets | |
|
| Capital paid-in | 2,274,094,924 |
| Accumulated net realized gain on investments | 54,811,392 |
| Net unrealized appreciation on investments | 160,575,363 |
| Accumulated net investment income | 4,475,074 |
| Net assets | $2,493,956,753 |
|
| Net asset value per share | |
|
| Based on net asset values and shares outstanding | |
| — the Portfolio has an unlimited number of shares authorized with no par value | |
| Class A ($35,037,913 ÷ 2,492,440 shares) | $14.06 |
| Class B ($8,453,392 ÷ 603,673 shares) | $14.00 |
| Class C ($25,269,023 ÷ 1,804,306 shares) | $14.00 |
| Class R3 ($1,087,135 ÷ 77,333 shares) | $14.06 |
| Class R4 ($1,579,009 ÷ 112,222 shares) | $14.07 |
| Class R5 ($468,879 ÷ 33,274 shares) | $14.09 |
| Class 1 ($2,422,061,402 ÷ 172,137,524 shares) | $14.07 |
|
| Maximum offering price per share | |
|
| Class A1 ($14.06 ÷ 95%) | $14.80 |
1 On single retail sales of less than $50,000. On sales of $50,000 or more and on group sales the offering price is reduced.
See notes to financial statements
Lifestyle Aggressive Portfolio
12
F I N A N C I A L S T A T E M E N T SStatement of operations For the period ended 8-31-06a
This Statement of Operations summarizes the Portfolio’s investment income earned and expenses incurred in operating the Portfolio. It also shows net gains (losses) for the period stated.
| Investment income | |
|
| Income distributions received from affiliated underlying funds | 11,032,304 |
| Total investment income | 11,032,304 |
|
| Expenses | |
|
| Investment management fees (Note 3) | 793,633 |
| Distribution and service fees (Note 3) | 1,087,115 |
| Transfer agent fees (Note 3) | 52,221 |
| Blue sky fees (Note 3) | 99,466 |
| Printing and postage fees (Note 3) | 51,472 |
| Fund administration fees (Note 3) | 166,487 |
| Audit and legal fees | 85,026 |
| Custodian fees | 10,944 |
| Trustees’ fees (Note 3) | 21,991 |
| Registration and filing fees | 70,700 |
| Miscellaneous | 17,551 |
| Total expenses | 2,456,606 |
| Less expense reductions (Note 3) | (122,636) |
| Net expenses | 2,333,970 |
| Net investment income | 8,698,334 |
| |
| Realized and unrealized gain | |
|
| Net realized gain on investments | 54,792,008 |
| Capital gain distributions received from affiliated underlying funds | 6,427,198 |
| Change in net unrealized appreciation of investments | 160,575,363 |
| Net realized and unrealized gain | 221,794,569 |
| Increase in net assets from operations | $230,492,903 |
a Period from 10-15-06 (commencement of operatons) to 8-31-06.
See notes to financial statements
Lifestyle Aggressive Portfolio
13
F I N A N C I A L S T A T E M E N T SStatement of changes in net assets
This Statement of Changes in Net Assets shows how the value of the Portfolio’s net assets has changed during the period. It reflects earnings less expenses, any investment gains and losses, distributions, if any, paid to shareholders and the net of Portfolio share transactions.
| | Period |
| | ended a |
| | 8-31-06 |
|
| Increase (decrease) in net assets | |
|
| From operations | |
| Net investment income | $8,698,334 |
| Net realized gain | 61,219,206 |
| Change in net unrealized appreciation | 160,575,363 |
| Increase in net assets resulting from operations | 230,492,903 |
| Distributions to shareholders | |
| From net investment income | |
| Class A | (10,791) |
| Class B | (2,807) |
| Class C | (4,862) |
| Class R3 | (460) |
| Class R4 | (513) |
| Class R5 | (565) |
| Class 1 | (10,836,557) |
| | (10,856,555) |
| From Fund share transactions | 2,274,320,405 |
|
| Net assets | |
|
| End of period | $2,493,956,753 |
| Accumulated net investment income | $4,475,074 |
a Period from 10-15-05 (commencement of operations) to 8-31-06.
See notes to financial statements
Lifestyle Aggressive Portfolio
14
F I N A N C I A L S T A T E M E N T SFinancial highlights
The Financial highlights show how the Portfolio’s net asset value for a share has changed since the beginning of the period.
| CLASS A SHARES | |
| |
| Period ended | 8-31-06a |
|
| Per share operating performance | |
| |
| Net asset value, beginning of period | $12.63 |
| Net investment loss h,v | (0.07) |
| Net realized and unrealized | |
| gain on investments | 1.56 |
| Total from investment operations | 1.49 |
| Less distributions | |
| From net investment income | (0.06) |
| | (0.06) |
| Net asset value, end of period | $14.06 |
| Total return k,l (%) | 11.85 m |
|
| Ratios and supplemental data | |
|
| Net assets, end of period | |
| (in millions) | $35 |
| Ratio of net expenses | |
| to average net assets q (%) | 0.65 r |
| Ratio of gross expenses | |
| to average net assets p,q (%) | 0.84 r |
| Ratio of net investment loss | |
| to average net assets v (%) | (0.59) r |
| Portfolio turnover (%) | 23 m |
See notes to financial statements
Lifestyle Aggressive Portfolio
15
F I N A N C I A L S T A T E M E N T SFinancial highlights
| CLASS B SHARES | |
| |
| Period ended | 8-31-06a |
|
| Per share operating performance | |
|
| Net asset value, beginning of period | $12.63 |
| Net investment loss h,v | (0.15) |
| Net realized and unrealized | |
| gain on investments | 1.56 |
| Total from investment operations | 1.41 |
| Less distributions | |
| From net investment income | (0.04) |
| | (0.04) |
| Net asset value, end of period | $14.00 |
| Total return k,l (%) | 11.22m |
|
| Ratios and supplemental data | |
|
| Net assets, end of period | |
| (in millions) | $8 |
| Ratio of net expenses | |
| to average net assets q (%) | 1.34r |
| Ratio of gross expenses | |
| to average net assets p,q (%) | 2.00r |
| Ratio of net investment loss | |
| to average net assets v (%) | (1.23)r |
| Portfolio turnover (%) | 23m |
See notes to financial statements
Lifestyle Aggressive Portfolio
16
F I N A N C I A L S T A T E M E N T SFinancial highlights
| CLASS C SHARES | |
| |
| Period ended | 8-31-06a |
|
| Per share operating performance | |
|
| Net asset value, beginning of period | $12.63 |
| Net investment loss h,v | (0.15) |
| Net realized and unrealized | |
| gain on investments | 1.57 |
| Total from investment operations | 1.42 |
| Less distributions | |
| From net investment income | (0.05) |
| | (0.05) |
| Net asset value, end of period | $14.00 |
| Total return k,l (%) | 11.22m |
|
| Ratios and supplemental data | |
|
| Net assets, end of period | |
| (in millions) | $25 |
| Ratio of net expenses | |
| to average net assets q (%) | 1.34r |
| Ratio of gross expenses | |
| to average net assets p,q (%) | 1.60r |
| Ratio of net investment loss | |
| to average net assets v (%) | (1.27)r |
| Portfolio turnover (%) | 23m |
See notes to financial statements
Lifestyle Aggressive Portfolio
17
F I N A N C I A L S T A T E M E N T S
| Financial highlights | |
| |
| |
| |
| |
| CLASS R3 SHARES | |
| |
| Period ended | 8-31-06a |
|
| Per share operating performance | |
|
| Net asset value, beginning of period | $12.63 |
| Net investment loss h,v | (0.05) |
| Net realized and unrealized | |
| gain on investments | 1.54 |
| Total from investment operations | 1.49 |
| Less distributions | |
| From net investment income | (0.06) |
| | (0.06) |
| Net asset value, end of period | $14.06 |
| Total return k,l (%) | 11.81m |
|
| Ratios and supplemental data | |
|
| Net assets, end of period | |
| (in millions) | $1 |
| Ratio of net expenses | |
| to average net assets q (%) | 0.69r |
| Ratio of gross expenses | |
| to average net assets p,q (%) | 8.07r |
| Ratio of net investment loss | |
| to average net assets v (%) | (0.47)r |
| Portfolio turnover (%) | 23m |
See notes to financial statements
Lifestyle Aggressive Portfolio
18
F I N A N C I A L S T A T E M E N T SFinancial highlights
| CLASS R4 SHARES | |
| |
| Period ended | 8-31-06a |
|
| Per share operating performance | |
|
| Net asset value, beginning of period | $12.63 |
| Net investment loss h,v | (0.05) |
| Net realized and unrealized | |
| gain on investments | 1.55 |
| Total from investment operations | 1.50 |
| Less distributions | |
| From net investment income | (0.06) |
| | (0.06) |
| Net asset value, end of period | $14.07 |
| Total return k,l (%) | 11.94m |
|
| Ratios and supplemental data | |
|
| Net assets, end of period | |
| (in millions) | $2 |
| Ratio of net expenses | |
| to average net assets q (%) | 0.49r |
| Ratio of gross expenses | |
| to average net assets p,q (%) | 4.08r |
| Ratio of net investment loss | |
| to average net assets v (%) | (0.38)r |
| Portfolio turnover (%) | 23m |
See notes to financial statements
Lifestyle Aggressive Portfolio
19
F I N A N C I A L S T A T E M E N T SFinancial highlights
| CLASS R5 SHARES | |
| |
| Period ended | 8-31-06a |
|
| Per share operating performance | |
|
| Net asset value, beginning of period | $12.63 |
| Net investment income h,v | 0.01 |
| Net realized and unrealized | |
| gain on investments | 1.52 |
| Total from investment operations | 1.53 |
| Less distributions | |
| From net investment income | (0.07) |
| | (0.07) |
| Net asset value, end of period | $14.09 |
| Total return k,l (%) | 12.16m |
|
| Ratios and supplemental data | |
|
| Net assets, end of period | |
| (in millions) | $—i |
| Ratio of net expenses | |
| to average net assets q (%) | 0.20r |
| Ratio of gross expenses | |
| to average net assets p,q (%) | 8.26r |
| Ratio of net investment income | |
| to average net assets v (%) | 0.05r |
| Portfolio turnover (%) | 23m |
See notes to financial statements
Lifestyle Aggressive Portfolio
20
F I N A N C I A L S T A T E M E N T SFinancial highlights
| CLASS 1 SHARES | |
| |
| Period ended | 8-31-06a |
|
| Per share operating performance | |
|
| Net asset value, beginning of period | $12.60 |
| Net investment income h,v | 0.06 |
| Net realized and unrealized | |
| gain on investments | 1.48 |
| Total from investment operations | 1.54 |
| Less distributions | |
| From net investment income | (0.07) |
| | (0.07) |
| Net asset value, end of period | $14.07 |
| Total return k (%) | 12.27m |
|
| Ratios and supplemental data | |
|
| Net assets, end of period | |
| (in millions) | $2,422 |
| Ratio of net expenses | |
| to average net assets q (%) | 0.11r |
| Ratio of net investment income | |
| to average net assets v (%) | 0.48r |
| Portfolio turnover (%) | 23m |
a Class A, Class B, Class C, Class R3, Class R4 and Class R5 shares began operations on 10-18-05, and Class 1 shares began operation on 10-15-05.
h Based on the average of the shares outstanding.
i Less than $500,000.
k Assumes dividend reinvestment and does not reflect the effect of sales charges.
l Total returns would have been lower had certain expenses not been reduced during the period shown.
m Not annualized.
p Does not take into consideration expense reductions during the period shown.
q Does not include expenses of the investment companies in which the Portfolio invests.
r Annualized.
v Recognition of net investment income by the Portfolio is affected by the timing of the declaration of dividends by the underlying investment companies in which the Portfolio invests.
See notes to financial statements
Lifestyle Aggressive Portfolio
21
Notes to financial statements
1. Organization
The John Hancock Lifestyle Aggressive Portfolio (the “Portfolio”) is a newly organized non-diversified series of John Hancock Funds II (the “Trust”). The Trust was established as a Massachusetts business trust on June 28, 2005. The Trust is registered under the Investment Company Act of 1940, as amended (the “1940 Act”), as an open-end investment management company.
The Portfolio operates as a “fund of funds”, investing in Class NAV shares of underlying funds of the Trust and John Hancock Funds III and in other permitted investments.
John Hancock Investment Management Services, LLC (the “Adviser”), a Delaware limited liability company controlled by John Hancock Life Insurance Company (U.S.A.) (“John Hancock USA”) serves as investment adviser for the Trust and John Hancock Funds, LLC (the “Distributor”), an affiliate of the Adviser, serves as principal underwriter. John Hancock Life Insurance Company of New York (“John Hancock New York”) is a wholly owned subsidiary of John Hancock USA. John Hancock USA and John Hancock New York are indirect wholly owned subsidiaries of The Manufactures Life Insurance Company (“Manulife”), which in turn is a wholly owned subsidiary of Manulife Financial Corporation (“MFC”), a publicly traded company. MFC and its subsidiaries are known collectively as “Manulife Financial.”
The Portfolio commenced operations after certain separate accounts of John Hancock USA redeemed their interests in portfolios of John Hancock Trust and certain unaffiliated mutual funds of approximately $350 million at the close of business on October 14, 2005, with additional redemption proceeds of approximately $1.5 billion received on October 28, 2005, and invested such proceeds in Class 1 shares of the Portfolio, which in turn invested the proceeds in underlying funds of the Trust.
The Board of Trustees has authorized the issuance of multiple classes of shares of the Portfolio, including classes designated as Class A, Class B, Class C, Class R3, Class R4, Class R5 and Class 1 shares.
Class A, B, and C shares are open to all retail investors. Class 1 shares are sold only to certain exempt separate accounts of John Hancock USA and John Hancock New York. Class R3, R4 and R5 shares are available only to certain retirement plans.
The shares of each class represent an interest in the same portfolio of investments of the Portfolio, and have equal rights as to voting, redemptions, dividends and liquidation, except that certain expenses, subject to the approval of the Trustees, may be applied differently to each class of shares in accordance with current regulations of the SEC and the Internal Revenue Service. Shareholders of a class that bears distribution and service expenses under the terms of a distribution plan have exclusive voting rights to that distribution plan. Class B shares will convert to Class A shares eight years after purchase.
2. Significant accounting policies
In the preparation of the financial statements, the Portfolio follows the policies described below. The preparation of financial statements in conformity with accounting principles generally accepted in the United States of America requires management to make estimates and assumptions that affect the reported amounts of assets and liabilities at the date of the financial statements and the reported amounts of income and expenses during the reporting period. Actual results may differ from these estimates.
Lifestyle Aggressive Portfolio
22
Securities valuation
The net asset value of the shares of the Portfolio is determined daily as of the close of the New York Stock Exchange, normally at 4:00 p.m. Eastern Time. Investments in underlying funds are valued at their respective net asset values each business day, or at fair value as determined in good faith in accordance with procedures approved by the Trustees. Securities in the underlying funds’ portfolios are valued in accordance with their respective valuation polices, as outlined in the underlying funds’ financial statements. Short-term debt investments that have a remaining maturity of 60 days or less are valued at amortized cost.
Security transactions and related investment income
Investment security transactions in the underlying funds are accounted for on a trade date plus one basis for daily net asset value calculations. However, for financial reporting purposes, investment transactions are reported on trade date. Interest income is accrued as earned. Dividend income and capital gain distributions are recorded on the ex-dividend date.
Gains and losses on securities sold are determined on the basis of specific identi-fied cost for both financial and federal income tax reporting purposes.
Multi-class operations
All income, expenses (except for class-specific expenses) and realized and unrealized gains (losses) are allocated to each class of shares based upon the relative net assets of each class. Dividends to shareholders from net investment income are determined at a class level and distributions from capital gains are determined at a Portfolio level.
Expense allocation
Expenses not directly attributable to a particular Portfolio or class of shares are allocated based on the relative share of net assets of the Portfolio at the time the expense was incurred. Class-specific expenses, such as transfer agency fees, blue sky fees, printing and postage fees and distribution and service fees, are accrued daily and charged directly to the respective share classes. Expenses in the Portfolio’s Statement of Operations reflect the expenses of the Portfolio and do not include any indirect expenses related to the underlying funds. Because the underlying funds have varied expense levels and the Portfolio may own different proportions of the underlying funds at different times, the amount of fees and expenses incurred indirectly by the Portfolio will vary.
Federal income taxes
The Portfolio qualifies as a “regulated investment company” by complying with the applicable provisions of the Internal Revenue Code and will not be subject to federal income tax on taxable income that is distributed to shareholders. Therefore, no federal income tax provision is required.
New accounting pronouncement
In June 2006, Financial Accounting Standards Board (FASB) Interpretation No. 48, Accounting for Uncertainty in Income Taxes (the “Interpretation”) was issued and is effective for fiscal years beginning after December 15, 2006 and is to be applied to all open tax years as of the effective date. This Interpretation prescribes a minimum threshold for financial statement recognition of the benefit of a tax position taken or expected to be taken in a tax return, and requires certain expanded disclosures. Management is currently evaluating the application of the Interpretation to the Portfolio and has not at this time quantified the impact, if any, resulting from the adoption of this Interpretation on the Portfolio’s financial statements.
In September 2006, FASB Standard No. 157, Fair Value Measurements (“FAS 157”) was issued, and is effective for fiscal years beginning after November 15, 2007. FAS 157 defines fair value, establishing a framework for measuring fair value and expands disclosure about fair value measurements. Management is currently evaluating the application of FAS 157 to the Portfolio, and its impact, if any, resulting from the adoption of FAS 157 on the Portfolio’s financial statements.
Distribution of income and gains
The Portfolio records distributions to shareholders from net investment income and net realized gains, if any, on the ex-dividend date.
Lifestyle Aggressive Portfolio
23
During the period ended August 31, 2006, the tax character of distributions paid was as follows: ordinary income $10,856,555. Distributions paid by the Portfolio with respect to each class of shares are calculated in the same manner, at the same time and are in the same amount, except for the effect of expenses that may be applied differently to each class. Such distributions, on a tax basis, are determined in conformity with income tax regulations, which may differ from accounting principles generally accepted in the United States of America. Distributions in excess of tax basis earnings and profits, if any, are reported in the Portfolio’s financial statements as a return of capital. As of August 31, 2006, the components of distributable earnings on a tax basis included $59,267,085 of undistributed ordinary income and $19,381 of undistributed long-term gain.
Capital accounts
The Portfolio reports the undistributed net investment income and accumulated undistributed net realized gain (loss) accounts on a basis approximating amounts available for future tax distributions (or to offset future taxable realized gains when a capital loss carry-forward is available). Accordingly, the Portfolio may periodically make reclassifications among certain capital accounts, without affecting its net asset value.
3. Investment advisory and
other agreements
Advisory fees
The Trust has entered into an Investment Advisory Agreement with the Adviser. The Adviser is responsible for managing the corporate and business affairs of the Trust and for selecting and compensating subadvisers to handle the investment and reinvestment of the assets of the Portfolio, subject to the supervision of the Board of Trustees. Under the Advisory Agreement, the Portfolio pays a monthly management fee to the Adviser equivalent, on an annual basis, to its pro rata portion of the sum of: (a) 0.05% of the first $7,500,000,000 of the aggregate daily net assets and (b) 0.04% of the aggregate daily net assets in excess of $7,500,000,000 of the five Lifestyle Portfolios of the Trust (Lifestyle Aggressive, Lifestyle Growth, Lifestyle Balanced, Lifestyle Moderate and Lifestyle Conservative) and the five Lifestyle Portfolios of John Hancock Trust (Lifestyle Aggressive, Lifestyle Growth, Lifestyle Balanced, Lifestyle Moderate and Lifestyle Co nservative). The Portfolio is not responsible for payment of the subadvisory fees.
Expense reimbursements
The Adviser has contractually agreed to waive advisory fees or reimburse the Portfolio’s expenses for Class A, Class B, Class C, Class R3, Class R4 and Class R5 shares to the extent that blue sky fees and printing and postage expenses attributable to each class exceed 0.09% of the average annual net assets attributable to the classes, at least until November 1, 2006, and may thereafter be terminated by the Adviser at any time. Accordingly, the expense reductions related to this expense limitation amounted to $24,863, $22,518, $21,975, $17,405, $17,026 and $17,584 for Class A, Class B, Class C, Class R3, Class R4 and Class R5, respectively, for the period ended August 31, 2006.
Administration fees
The Portfolio has an agreement with the Adviser that requires the Portfolio to reimburse the Adviser for all expenses associated with providing the administrative, financial, accounting and recordkeeping services of the Portfolio, including the preparation of all tax returns, annual, semiannual and periodic reports to shareholders and the preparation of all regulatory reports.
Distribution plans
The Trust has a Distribution Agreement with the Distributor. The Portfolio has adopted Distribution Plans with respect to Class A, Class B, Class C, Class R3, Class R4 and Class 1, pursuant to Rule 12b-1 under the 1940 Act, to reimburse the Distributor for the services it provides as distributor of shares of the Portfolio. Accordingly, the Portfolio makes monthly payments to the Distributor at an annual rate not to exceed 0.30%, 1.00%, 1.00%, 0.50%, 0.25% and 0.05% of the
Lifestyle Aggressive Portfolio
24
average daily net assets of Class A, Class B, Class C, Class R3, Class R4 and Class 1, respectively. A maximum of 0.25% of such payments may be service fees, as defined by the Conduct Rules of the National Association of Securities Dealers. Under the Conduct Rules, curtailment of a portion of the Portfolio’s 12b-1 payments could occur under certain circumstances.
The Portfolio has also adopted a Service Plan with respect to Class R3, Class R4 and Class R5 shares (the “Service Plan”). Under the Service Plan, the Portfolio pays up to 0.15%, 0.10% and 0.05% of the average daily net assets of Class R3, Class R4 and Class R5 shares, respectively, for certain other services.
Sales charges
Class A shares are assessed up-front sales charges of up to 5% of the net asset value of such shares. During the period ended August 31, 2006, the Portfolio was informed that the Distributor received net up-front sales charges of $800,789 with regard to sales of Class A shares. Of this amount, $128,706 was retained and used for printing prospectuses, advertising, sales literature and other purposes, $664,228 was paid as sales commissions to unrelated broker-dealers and $7,855 was paid as sales commissions to sales personnel of Signator Investors, Inc. (“Signator Investors”), a related broker-dealer, an indirect subsidiary of MFC.
Class B shares that are redeemed within six years of purchase are subject to a contingent deferred sales charge (“CDSC”) at declining rates, beginning at 5.00% of the lesser of the current market value at the time of redemption or the original purchase cost of the shares being redeemed. Class C shares that are redeemed within one year of purchase are subject to a CDSC at a rate of 1.00% of the lesser of the current market value at the time of redemption or the original purchase cost of the shares being redeemed.
Proceeds from the CDSCs are paid to the Distributor and are used, in whole or in part, to defray its expenses for providing distribution-related services to the Portfolio in connection with the sale of Class B and Class C shares. During the period ended August 31, 2006, the Portfolio was informed that CDSCs received by the Distributor amounted to $5,977 for Class B shares and $3,815 for Class C shares.
Transfer agent fees
The Portfolio has a Transfer Agency Agreement with John Hancock Signature Services, Inc. (“Signature Services”), an indirect subsidiary of MFC. For Class A, Class B, Class C, Class R3, Class R4 and Class R5 shares, the Portfolio pays a monthly transfer agent fee at an annual rate of 0.05% of each class’s average daily net assets, plus a fee based on the number of shareholder accounts and reimbursement for certain out-of-pocket expenses. Expenses not directly attributable to a particular class of shares are aggregated and allocated to each class on the basis of its relative net asset value.
Signature Services has agreed to limit the transfer agent fees so that such fees do not exceed 0.20% annually of each of Class A, Class B, Class C, Class R3, Class R4 and Class R5 share average daily net assets. This agreement is effective until December 31, 2006. Signature Services reserves the right to terminate this limitation in the future. In addition, Signature Services has voluntarily agreed to further limit transfer agent fees for Class R3, Class R4 and Class R5 shares so that such fees do not exceed 0.05% annually of each class’s average daily net assets. Accordingly, the transfer agent fees reductions amounted to $304, $638 and $323 for Class R3, Class R4 and Class R5 shares, respectively, during the period ended August 31, 2006. Signature Services reserves the right to terminate this limitation at any time.
Lifestyle Aggressive Portfolio
25
Expenses under the agreements described above for the period ended August 31, 2006, were as follows:
| | Distribution and | Transfer | | Printing and |
| Share Class | service fees | agent | Blue sky | postage |
|
| |
| Class A | $39,384 | $26,457 | $17,638 | $19,040 |
| Class B | 34,257 | 6,917 | 16,149 | 9,452 |
| Class C | 84,676 | 17,156 | 17,423 | 12,174 |
| Class R3 | 1,226 | 397 | 15,925 | 1,698 |
| Class R4 | 1,455 | 877 | 15,925 | 1,550 |
| Class R5 | 7 | 417 | 16,406 | 1,379 |
| Class 1 | 926,110 | — | — | 6,179 |
| Total | $1,087,115 | $52,221 | $99,466 | $51,472 |
Trustees’ fees
The Trust compensates each Trustee who is not an employee of the Adviser or its affiliates. Total Trustees’ expenses are allocated based on each portfolio’s average daily net asset value.
4. Guarantees and Indemnifications
Under the Trust’s organizational documents, its Officers and Trustees are indemnified against certain liability arising out of the performance of their duties to the Trust. Additionally, in the normal course of business, the Trust enters into contracts with service providers that contain general indemnification clauses. The Trust’s maximum exposure under these arrangements is unknown, as this would involve future claims that may be made against the Trust that have not yet occurred. However, based on experience, the Trust believes the risk of loss to be remote.
5. Capital shares
Share activities for the Portfolio for the period ended August 31, 2006 were as follows:
| | Period ended 8-31-06a |
| | Shares | Amount |
|
| Class A shares | | |
| |
| Sold | 2,656,426 | $37,105,900 |
| Distributions reinvested | 739 | 9,867 |
| Repurchased | (164,725) | (2,284,281) |
| Net increase | 2,492,440 | $34,831,486 |
|
| |
| Class B shares | | |
| |
| Sold | 641,314 | $8,963,149 |
| Distributions reinvested | 161 | 2,152 |
| Repurchased | (37,802) | (520,561) |
| Net increase | 603,673 | $8,444,740 |
|
| |
| |
| Class C shares | | |
| |
| Sold | 1,853,043 | $25,877,041 |
| Distributions reinvested | 283 | 3,786 |
| Repurchased | (49,020) | (685,074) |
| Net increase | 1,804,306 | $25,195,753 |
Lifestyle Aggressive Portfolio
26
| | Period ended 8-31-06a |
| | Shares | Amount |
|
| Class R3 shares | | |
| |
| Sold | 78,517 | $1,063,860 |
| Repurchased | (1,184) | (16,116) |
| Net increase | 77,333 | $1,047,744 |
|
| |
| Class R4 shares | | |
| |
| Sold | 125,577 | $1,762,808 |
| Repurchased | (13,355) | (183,449) |
| Net increase | 112,222 | $1,579,359 |
|
| |
| Class R5 shares | | |
| |
| Sold | 38,324 | $533,868 |
| Repurchased | (5,050) | (73,349) |
| Net increase | 33,274 | $460,519 |
|
| |
| Class 1 shares | | |
| |
| Sold | 173,760,521 | $2,225,676,778 |
| Distributions reinvested | 812,945 | 10,836,557 |
| Repurchased | (2,435,942) | (33,752,531) |
| Net increase | 172,137,524 | $2,202,760,804 |
|
| |
| Net increase | 177,260,772 | $2,274,320,405 |
a Class A, Class B, Class C, Class R3, Class R4 and Class R5 shares began operations on 10-18-05, and Class 1 shares began operation on 10-15-05.
6. Investment transactions
Purchases and sales of the underlying funds during the period ended August 31, 2006, aggregated $2,782,373,375 and $504,414,999, respectively.
The cost of investments owned on August 31, 2006, including short-term investments, for federal income tax purposes, was $2,332,750,384. Gross unrealized appreciation and depreciation of investments aggregated $173,885,053 and $13,309,690, respectively, resulting in net unrealized appreciation of $160,575,363.
7. Investment in affiliated underlying funds
The Portfolio invests primarily in the underlying funds that are managed by affiliates of the Adviser. The Portfolio does not invest in the underlying funds for the purpose of exercising management or control.
A summary of the Portfolio’s transactions in the securities of affiliated issuers in which the Portfolio’s holdings represent 5% or more of the outstanding voting securities of the issuer, during the period ended August 31, 2006 is set forth below.
Lifestyle Aggressive Portfolio
27
| Affiliate — | Shares | Shares | Ending Share | | Ending |
| Class NAV | Purchased | Sold | Amount | Proceeds | Value |
|
| All Cap Growth | 3,022,915 | 582 | 3,022,333 | $9,704 | $49,717,383 |
| All Cap Value | 3,136,588 | 535 | 3,136,053 | 8,328 | 49,549,643 |
| Blue Chip Growth | 6,993,440 | 7,548 | 6,985,892 | 132,497 | 124,348,875 |
| Capital Appreciation | 10,634,630 | 102,109 | 10,532,521 | 980,546 | 99,532,325 |
| Core Equity | 5,379,463 | 92,745 | 5,286,718 | 1,395,241 | 75,441,459 |
| Emerging Growth | 2,849,165 | 59,365 | 2,789,800 | 1,092,545 | 51,164,930 |
| Emerging Small Company | 252,226 | 252,226 | — | 7,052,232 | — |
| Equity-Income | 4,051,280 | 1,315,254 | 2,736,026 | 23,659,779 | 49,549,424 |
| Fundamental Value | 6,326,518 | 46,309 | 6,280,209 | 730,650 | 99,415,710 |
| International Core * | 5,057,125 | — | 5,057,125 | — | 199,149,574 |
| International Equity Index | 6,643,725 | 88,515 | 6,555,210 | 1,653,856 | 124,352,333 |
| International | | | | | |
| Opportunities | 6,500,950 | 318,569 | 6,182,381 | 4,890,687 | 99,907,280 |
| International Small Cap | 6,972,659 | 3,415,470 | 3,557,189 | 74,920,265 | 74,523,111 |
| International Small Company | 8,003,632 | 14,079 | 7,989,553 | 130,062 | 74,542,530 |
| International Stock | 15,376,049 | 15,376,049 | — | 210,898,404 | — |
| International Value | 11,382,320 | 1,627,087 | 9,755,233 | 28,832,080 | 174,423,566 |
| Large Cap | 3,379,943 | 844 | 3,379,099 | 12,124 | 49,571,376 |
| Large Cap Value | 1,070,611 | 808 | 1,069,803 | 17,033 | 24,616,172 |
| Mid Cap Core | 5,625,095 | 1,297,872 | 4,327,223 | 23,244,140 | 74,687,869 |
| Mid Cap Index | 1,361,298 | 80 | 1,361,218 | 1,452 | 25,005,575 |
| Mid Cap Stock | 3,186,155 | 15,425 | 3,170,730 | 231,280 | 50,192,653 |
| Mid Cap Value Equity | 2,578,534 | 202 | 2,578,332 | 1,916 | 24,880,903 |
| Mid Cap Value | 3,849,395 | 1,214,184 | 2,635,211 | 23,542,159 | 49,700,071 |
| Natural Resources | 4,622,763 | 1,129,828 | 3,492,935 | 36,288,093 | 124,348,487 |
| Quantitative Mid Cap | 3,479,631 | 503 | 3,479,128 | 7,484 | 49,821,116 |
| Quantitative Value | 4,584,366 | 86,613 | 4,497,753 | 1,426,897 | 74,482,795 |
| Small Cap | 5,465,472 | 62,673 | 5,402,799 | 976,051 | 75,855,305 |
| Small Cap Index | 3,174,671 | 197 | 3,174,474 | 3,049 | 50,632,853 |
| Small Cap Opportunities | 1,890,213 | 1,890,213 | — | 48,025,547 | — |
| Small Company | 3,230,032 | 5,262 | 3,224,770 | 81,705 | 49,790,455 |
| Small Company Value | 3,243,700 | 44,308 | 3,199,392 | 1,106,036 | 75,601,641 |
| Special Value | 2,461,043 | 19,072 | 2,441,971 | 406,574 | 50,109,240 |
| U.S. Global Leaders | | | | | |
| Growth | 2,789,786 | 830,810 | 1,958,976 | 10,875,171 | 24,839,817 |
| U.S. Multi Sector | 19,227,030 | 96,446 | 19,130,584 | 986,469 | 199,149,379 |
| Value & Restructuring | 2,239,885 | 209 | 2,239,676 | 2,274 | 24,815,609 |
| Vista | 4,703,770 | 67,668 | 4,636,102 | 792,670 | 49,606,288 |
*Represents the Portfolio’s investment in John Hancock Funds III International Core Fund
8. Reclassification of accounts
During the period ended August 31, 2006, the Portfolio reclassified amounts to reflect a decrease in accumulated net realized gain on investments of $6,407,814, an increase in accumulated net investment income of $6,633,295 and a decrease in capital paid-in of $225,481. This represents the amounts necessary to report these balances on a tax basis, excluding certain temporary differences, as of August 31, 2006. Additional adjustments may be needed in subsequent reporting periods. These reclassifications, which have no impact on the net asset value of the Portfolio, are primarily attributable to certain differences in the computation of distributable income and capital gains under federal tax rules versus accounting principles generally accepted in the United States of America and book and tax differences in accounting for non-deductible organizational costs. The calculation of net investment income per share in the Portfolio’s Financial Highlights excludes these adjustments.
Lifestyle Aggressive Portfolio
28
Auditors’ report
Report of Independent Registered Public Accounting Firm
To the Board of Trustees of John Hancock Funds II and Shareholders of John Hancock Lifestyle Aggressive Portfolio:
In our opinion, the accompanying statement of assets and liabilities, including the schedule of securities owned, and the related statements of operations and of changes in net assets and the financial highlights present fairly, in all material respects, the financial position of John Hancock Lifestyle Aggressive Portfolio (the “Portfolio”) at August 31, 2006, and the results of its operations, the changes in its net assets, and the financial highlights for the period October 15, 2005 (commencement of operations) through August 31, 2006, in conformity with accounting principles generally accepted in the United States of America. These financial statements and financial highlights (hereafter referred to as “financial statements”) are the responsibility of the Portfolio’s management; our responsibility is to express an opinion on these financial statements based on our audit. We conducted our audit of these financial statements in accordance with the standards of the Public Company Accounting Oversight Board (United States). Those standards require that we plan and perform the audit to obtain reasonable assurance about whether the financial statements are free of material misstatement. An audit includes examining, on a test basis, evidence supporting the amounts and disclosures in the financial statements, assessing the accounting principles used and significant estimates made by management, and evaluating the overall financial statement presentation. We believe that our audit, which included confirmation of securities at August 31, 2006, by correspondence with the transfer agent, provides a reasonable basis for our opinion.
PricewaterhouseCoopers LLP
Boston, Massachusetts
October 26, 2006
29
Tax information
Unaudited
For federal income tax purposes, the following information is furnished with respect to the distributions of the Portfolio, if any, paid during its taxable year ended August 31, 2006.
With respect to the ordinary dividends paid by the Portfolio for the fiscal period ended August 31, 2006, 24.82% of the dividends qualify for the corporate dividends-received deduction.
The Portfolio hereby designates the maximum amount allowable of its net taxable income as qualified diviend income as provided in the Jobs and Growth Tax Relief Reconciliation Act of 2003. This amount will be reflected on Form 1099-DIV for the calendar year 2006.
Shareholders will be mailed a 2006 U.S. Treasury Department Form 1099-DIV in January 2007. This will reflect the total of all distributions that are taxable for calendar year 2006.
30
Trustees and Officers
This chart provides information about the Trustees and Officers who oversee your John Hancock fund. Officers elected by the Trustees manage the day-to-day operations of the Portfolio and execute policies formulated by the Trustees.
| Independent Trustees | | |
| |
| Name, age | | Number of |
| Position(s) held with Portfolio | Trustee of | John Hancock |
| Principal occupation(s) and other | Portfolio | funds overseen |
| directorships during past 5 years | since1 | by Trustee |
|
| Charles L. Bardelis, Born: 1941 | 2005 | 209 |
|
| President and Executive Officer, Island Commuter Corp. (Marine Transport). | | |
| Trustee of John Hancock Trust (since 1988) and John Hancock Funds III (since 2005). | |
|
| |
| Peter S. Burgess, Born: 1942 | 2005 | 209 |
|
| Consultant (financial, accounting and auditing matters (since 1999); | | |
| Certified Public Accountant; Partner, Arthur Andersen (prior to 1999). | | |
| Director of the following publicly traded companies: PMA Capital Corporation | | |
| (since 2004) and Lincoln Educational Services Corporation (since 2004). | | |
| Trustee of John Hancock Trust (since 2005), John Hancock Funds III (since 2005). | |
|
| |
| Elizabeth G. Cook, Born: 1937 | 2005 | 209 |
|
| Expressive Arts Therapist, Massachusetts General Hospital (September 2001 | | |
| to present); Expressive Arts Therapist, Dana Farber Cancer Institute | | |
| (September 2000 to January 2004); President, The Advertising Club of Greater Boston. | |
| Trustee of John Hancock Trust (since 2005) and John Hancock Funds III (since 2005). | |
|
| |
| William H. Cunningham, Born: 1944 | 2005 | 160 |
|
| Former Chancellor, University of Texas System and former President of the | | |
| University of Texas, Austin, Texas; Chairman and CEO, IBT Technologies | | |
| (until 2001); Director of the following: Hire.com (until 2004), STC Broadcasting, | |
| Inc. and Sunrise Television Corp. (until 2001), Symtx, Inc. (electronic manufacturing) | |
| (since 2001), Adorno/Rogers Technology, Inc. (until 2004), Pinnacle Foods | | |
| Corporation (until 2003), rateGenius (until 2003), Lincoln National Corporation | |
| (insurance) (since 2006), Jefferson-Pilot Corporation (diversified life insurance | | |
| company) (until 2006), New Century Equity Holdings (formerly Billing Concepts) | |
| (until 2001), eCertain (until 2001), ClassMap.com (until 2001), Agile Ventures | | |
| (until 2001), AskRed.com (until 2001), Southwest Airlines, Introgen and Viasystems | |
| Group, Inc. (electronic manufacturer) (until 2003); Advisory Director, Interactive | |
| Bridge, Inc. (college fundraising) (until 2001); Advisory Director, Q Investments | | |
| (until 2003); Advisory Director, JP Morgan Chase Bank (formerly Texas Commerce | |
| Bank - Austin), LIN Television (since 2002), WilTel Communications (until 2003) | |
| and Hayes Lemmerz International, Inc. (diversified automotive parts supply | | |
| company) (since 2003). Trustee of John Hancock Funds (since 2005) and | | |
| John Hancock Funds III (since 2005). | | |
31
| Independent Trustees (continued) | | |
| |
| Name, age | | Number of |
| Position(s) held with Portfolio | Trustee of | John Hancock |
| Principal occupation(s) and other | Portfolio | funds overseen |
| directorships during past 5 years | since1 | by Trustee |
|
| Charles L. Ladner, Born: 1938 | 2005 | 160 |
|
| Chairman and Trustee, Dunwoody Village, Inc. (retirement services) (until 2003); | |
| Senior Vice President and Chief Financial Officer, UGI Corporation (public utility | |
| holding company) (retired 1998); Vice President and Director for AmeriGas, Inc. | |
| (retired 1998); Director of AmeriGas Partners, L.P. (until 1997)(gas distribution); | |
| Director, EnergyNorth, Inc. (until 1995); Director, Parks and History Association | |
| (since 2007). Trustee of John Hancock Funds (since 2004) and John Hancock | | |
| Funds III (since 2005). | | |
|
| |
| Hassell H. McClellan, Born: 1945 | 2005 | 209 |
|
| Associate Professor, The Wallace E. Carroll School of Management, Boston College. | |
| Trustee of John Hancock Trust (since 2005), John Hancock Funds III (since 2005). | |
|
| |
| James. M. Oates, Born: 1946 | 2005 | 209 |
|
| Managing Director, Wydown Group (financial consulting firm)(since 1994); | | |
| Chairman, Emerson Investment Management, Inc. (since 2000); Chairman, | | |
| Hudson Castle Group, Inc. (formerly IBEX Capital Markets, Inc.) (financial services | |
| company) (since 1997). Director of the following publicly traded companies: | | |
| Stifel Financial (since 1996); Investor Financial Services Corporation (since 1995); | |
| and Connecticut River Bancorp, Director (since 1998). Director, Phoenix Mutual | |
| Funds (since 1988; overseeing 20 portfolios). Trustee of John Hancock Trust | | |
| (since 2004) and John Hancock Funds III (since 2005). | | |
1 Because the Trust does not hold regular annual shareholders meetings, each Trustee holds office for an indefinite term until his/her successor is duly elected and qualified or until he/she dies, retires, resigns, is removed or becomes disqualified.
32
| Non-Independent Trustee3 | | |
| |
| Name, age | | Number of |
| Position(s) held with Portfolio | Trustee of | John Hancock |
| Principal occupation(s) and other | Portfolio | funds overseen |
| directorships during past 5 years | since1 | by Trustee |
|
| James R. Boyle, Born: 1959 | 2005 | 262 |
|
| Chairman and Director, John Hancock Advisers, LLC (the “Adviser”), The Berkeley Financial Group, LLC |
| (“The Berkeley Group”) (holding company) and John Hancock Funds, LLC (since 2005); President, John |
| Hancock Annuities; Executive Vice President, John Hancock Life Insurance Company (since June, 2004); |
| President U.S. Annuities; Senior Vice President, The Manufacturers Life Insurance Company (U.S.A) (prior |
| to 2004). | | |
| |
| |
| Principal officers who are not Trustees | | |
| |
| Name, age | | |
| Position(s) held with Portfolio | | Officer of |
| Principal occupation(s) and | | Portfolio |
| directorships during past 5 years | | since |
|
| Keith Hartstein2, Born: 1956 | | 2005 |
|
| President and Chief Executive Officer | | |
| Senior Vice President, Manulife Financial Corporation (since 2004); Director, President and Chief |
| Executive Officer, the Adviser and The Berkeley Group, John Hancock Funds, LLC (since 2005); |
| Director, MFC Global Investment Management (U.S.), LLC (“MFC Global (U.S.)”) (since 2005); |
| Director, John Hancock Signature Services, Inc. (since 2005); President and Chief Executive |
| Officer, John Hancock Investment Management Services, LLC (since 2006); President and Chief |
| Executive Officer, John Hancock Funds, John Hancock Funds II, John Hancock Funds III, John |
| Hancock Trust,; Director, Chairman and President, NM Capital Management, Inc. (since 2005); |
| Chairman, Investment Company Institute Sales Force Marketing Committee (since 2003); |
| Director, President and Chief Executive Officer, MFC Global (U.S.) (2005-2006); Executive Vice |
| President, John Hancock Funds, LLC (until 2005). | | |
|
| |
| John Vrysen2, Born: 1955 | | 2005 |
|
| Chief Financial Officer | | |
| Director, Executive Vice President and Chief Financial Officer, the Adviser, The Berkeley Group and |
| John Hancock Funds, LLC (since 2005); Executive Vice President and Chief Financial Officer, John |
| Hancock Investment Management Services, LLC (since 2005), Vice President and Chief Financial |
| Officer, MFC Global (U.S.) (since 2005); Director, John Hancock Signature Services, Inc. (since |
| 2005); Chief Financial Officer, John Hancock Funds, John Hancock Funds II, John Hancock Funds III, |
| John Hancock Trust (since 2005); Vice President and General Manager, Fixed Annuities, U.S. Wealth |
| Management (until 2005); Vice President, Operations Manulife Wood Logan (2000-2004). |
|
| |
| Francis V. Knox2, Jr., Born: 1947 | | 2005 |
|
| Vice President and Chief Compliance Officer, John Hancock Investment Management Services, |
| LLC, the Adviser and MFC Global (U.S.) (since 2005); Chief Compliance Officer, John Hancock |
| Funds, John Hancock Funds II, John Hancock Funds III and John Hancock Trust (since 2005); Vice |
| President and Assistant Treasurer, Fidelity Group of Funds (until 2004); Vice President and Ethics |
| & Compliance Officer, Fidelity Investments (until 2001). | | |
33
| Principal officers who are not Trustees (continued) | |
| |
| Name, age | |
| Position(s) held with Portfolio | Officer of |
| Principal occupation(s) and | Portfolio |
| directorships during past 5 years | since |
|
| Gordon Shone2, Born: 1956 | 2005 |
|
| Treasurer, John Hancock Funds (since 2006); John Hancock Funds II, John Hancock Funds III and John |
| Hancock Trust (since 2005); Vice President and Chief Financial Officer, John Hancock Trust (2003-2005); |
| Senior Vice President, John Hancock Life Insurance Company (U.S.A.) (since 2001); Vice President, John |
| Hancock Investment Management Services, Inc. and John Hancock Advisers, LLC (since 2006), The |
| Manufacturers Life Insurance Company (U.S.A.) (1998 to 2000). | |
|
| |
| Thomas M. Kinzler2, Born: 1955 | 2006 |
|
| Vice President and Counsel for John Hancock Life Insurance Company (U.S.A.) (since 2006); |
| Secretary and Chief Legal Officer, John Hancock Funds, John Hancock Funds II, John Hancock |
| Funds III and John Hancock Trust (since 2006); Vice President and Associate General Counsel for |
| Massachusetts Mutual Life Insurance Company (1999-2006); Secretary and Chief Legal Counsel |
| for MML Series Investment Fund (2000-2006); Secretary and Chief Legal Counsel for MassMutual |
| Institutional Funds (2000-2004); Secretary and Chief Legal Counsel for MassMutual Select Funds |
| and MassMutual Premier Funds (2004-2006). | |
1 Because the Trust does not hold regular annual shareholders meetings, each Trustee holds office for an indefinite term until his successor is duly elected and qualified or until he dies, retires, resigns, is removed or becomes disqualified.
2Affiliated with the investment adviser.
3 Non-Independent Trustee: holds positions with the Fund’s investment adviser, underwriter, and/ or certain other affiliates.
34
For more information
The Portfolio’s proxy voting policies, procedures and records are available without charge, upon request:
| By phone | On the Portfolio’s Web site | On the SEC’s Web site |
| 1-800-225-5291 | www.jhfunds.com/proxy | www.sec.gov |
|
| |
| Investment adviser | Custodian | Legal counsel |
| John Hancock Investment | State Street Bank & Trust Co. | Kirkpatrick & Lockhart |
| Management Services, LLC | 2 Avenue de Lafayette | Nicholson Graham LLP |
| 601 Congress Street | Boston, MA 02111 | 1 Lincoln Street |
| Boston, MA 02210-2805 | | Boston, MA 02111 |
| | Transfer agent | |
| Principal distributor | John Hancock Signature | Independent registered |
| John Hancock Funds, LLC | Services, Inc. | public accounting firm |
| 601 Congress Street | 1 John Hancock Way, | PricewaterhouseCoopers LLP |
| Boston, MA 02210-2805 | Suite 1000 | 125 High Street |
| | Boston, MA 02217-1000 | Boston, MA 02110 |
Each underlying fund’s accounting policies are outlined in the underlying fund’s shareholder report, available without charge by calling 1-800-344-1029 or on the Securities and Exchange Commission (“SEC”) Web site at www.sec.gov, File # 811-21779, CIK 0001331971.
The Portfolio’s investment objective, risks, charges and expenses are included in the prospectus and should be considered carefully before investing. For a prospectus, call your financial professional, call John Hancock Funds at 1-800-225-5291 or visit the Portfolio’s Web site at www.jhfunds.com. Please read the prospectus carefully before investing or sending money.
| How to contact us | |
|
| |
| Internet | www.jhfunds.com | |
|
| |
| Mail | Regular mail: | Express mail: |
| | John Hancock | John Hancock |
| | Signature Services, Inc. | Signature Services, Inc. |
| | 1 John Hancock Way, Suite 1000 | Mutual Fund Image Operations |
| | Boston, MA 02217-1000 | 380 Stuart Street |
| | | Boston, MA 02116 |
| Phone | Customer service representatives | 1-888-225-5291 |
| | 24-hour automated information | 1-800-338-8080 |
| | TDD line | 1-800-554-6713 |
A listing of month-end portfolio holdings is available on our Web site, www.jhfunds.com. A more detailed portfolio holdings summary is available on a quarterly basis 60 days after the fiscal quarter on our Web site or upon request by calling 1-800-225-5291, or on the Securities and Exchange Commission’s Web site, www.sec.gov.
36
J O H N H A N C O C K F A M I L Y O F F U N D S
| EQUITY | INTERNATIONAL |
| Balanced Fund | Greater China Opportunities Fund |
| Classic Value Fund | International Classic Value Fund |
| Classic Value Fund II | International Core Fund |
| Core Equity Fund | International Fund |
| Focused Equity Fund | International Growth Fund |
| Growth Fund | |
| Growth Opportunities Fund | INCOME |
| Growth Trends Fund | Bond Fund |
| Intrinsic Value Fund | Government Income Fund |
| Large Cap Equity Fund | High Yield Fund |
| Large Cap Select Fund | Investment Grade Bond Fund |
| Mid Cap Equity Fund | Strategic Income Fund |
| Mid Cap Growth Fund | |
| Multi Cap Growth Fund | TAX-FREE INCOME |
| Small Cap Equity Fund | California Tax-Free Income Fund |
| Small Cap Fund | High Yield Municipal Bond Fund |
| Small Cap Intrinsic Value Fund | Massachusetts Tax-Free Income Fund |
| Sovereign Investors Fund | New York Tax-Free Income Fund |
| U.S. Core Fund | Tax-Free Bond Fund |
| U.S. Global Leaders Growth Fund | |
| Value Opportunities Fund | MONEY MARKET |
| | Money Market Fund |
| ASSET ALLOCATION & LIFESTYLE | U.S. Government Cash Reserve |
| Allocation Core Portfolio | |
| Allocation Growth + Value Portfolio | CLOSED-END |
| Lifestyle Aggressive Portfolio | Bank & Thrift Opportunity |
| Lifestyle Balanced Portfolio | Financial Trends |
| Lifestyle Conservative Portfolio | Income Securities |
| Lifestyle Growth Portfolio | Investors Trust |
| Lifestyle Moderate Portfolio | Patriot Global Dividend |
| | Patriot Preferred Dividend |
| SECTOR | Patriot Premium Dividend I |
| Financial Industries Fund | Patriot Premium Dividend II |
| Health Sciences Fund | Patriot Select Dividend |
| Real Estate Fund | Preferred Income |
| Regional Bank Fund | Preferred Income II |
| Technology Fund | Preferred Income III |
| Technology Leaders Fund | Tax-Advantaged Dividend |
For more complete information on any John Hancock Fund and a prospectus, which includes charges and expenses, call your financial professional, or John Hancock Funds at 1-800-225-5291. Please read the prospectus carefully before investing or sending money.

1-800-225-5291
1-800-554-6713 (TDD)
1-800-338-8080 EASI-Line
www.jhfunds.com
Now available: electronic delivery
www.jhfunds.com/edelivery
This report is for the information of the shareholders of John Hancock Lifestyle Agressive Portfolio.
9600A 8/06
10/06


| TABLE OF CONTENTS |
|
| Managers' report |
| page 2 |
|
| A look at performance |
| page 6 |
|
| Your expenses |
| page 8 |
|
| Portfolio’s investments |
| page 10 |
|
| Financial statements |
| page 12 |
|
| Trustees and officers |
| page 33 |
|
| For more information |
| page 40 |
|
CEO corner
To Our Shareholders,
The future has arrived at John Hancock Funds.
We have always been firm believers in the powerful role the Internet can play in providing fund information to our shareholders and prospective investors. Recently, we launched a redesigned, completely overhauled Web site that is more visually pleasing, easier to navigate and, most importantly, provides more fund information and learning tools without overwhelming the user.
Not long after we embarked on this major project, a study was released by the Investment Company Institute, the mutual fund industry’s main trade group, which found that an overwhelming majority of shareholders consider the Internet the “wave of the future” for accessing fund information.
Our new site sports fresher and faster ways to access account information. New innovations allow investors to view funds by risk level, track the performance of the John Hancock funds of their choice or sort funds by Morningstar, Inc.’s star ratings. Investors who own a John Hancock fund through a qualified retirement plan and don’t pay sales charges when making a purchase have the option of sorting by a “Load Waived” Morningstar Rating, thereby creating an apples-to-apples comparison with no-load funds that may also be available in their retirement plan.
The new site also has more educational tools and interactive modules to educate and assist investors with their financial goals, from college savings to retirement planning. A new “I want to…” feature allows investors to check performance, invest more money, update personal information or download prospectuses and forms quickly and easily.
In another of our ongoing efforts to provide our shareholders with top-notch service, we also redesigned our shareholder reports, as you may have noticed with this report. We hope the larger size, more colorful cover and redesigned presentation of the commentary and data tables will draw you in and make them easier to read.
After you’ve read your shareholder report, we encourage you to visit our new Web site — www.jhfunds.com — and take a tour. It’s easy, fast and fun and allows you to be in control of what you see and do. In short, it’s the wave of the future!
Sincerely,

Keith F. Hartstein,
President and Chief Executive Officer |
This commentary reflects the CEO’s views as of August 31, 2006. They are subject to change
at any time. |
Your portfolio at a glance
The Portfolio seeks a balance between a high level of current income and growth of capital, with greater emphasis on growth of capital. To pursue this goal, the Portfolio, which is a fund-of-funds, normally invests approximately 40% of its assets in underlying funds that invest primarily in fixed-income securities and approximately 60% of its assets in underlying funds that invest primarily in equity securities.
Since inception*
► Across all asset classes, financial markets gained ground during the period, with nearly
all of the Portfolio’s underlying funds performing positively.
► The Portfolio’s allocation to international and natural resources funds was a big
positive, while U.S. large-cap growth and core funds lagged the S&P 500 Index.
► We initiated several allocation shifts to increase the Portfolio’s diversification, establishing
new positions in the high-yield bond and global real estate securities asset classes. |
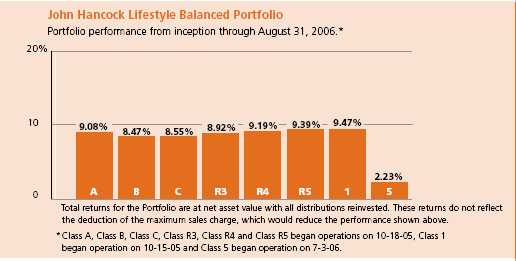
| Target asset allocation | | | | |
| Equity | % of Total | | Fixed Income | % of Total |
|
| U.S. Large Cap | 36.0 | | High Yield Bond | 13.0 |
|
| International | 10.0 | | Intermediate Term Bond | 9.0 |
|
| Real Estate | 5.0 | | Multi-Sector Bond | 9.0 |
|
| Natural Resources | 4.0 | | Treasury Inflation Protected Securities | 5.0 |
|
| U.S. Small Cap | 3.0 | | Global Bond | 3.0 |
|
| International Small Cap | 2.0 | | | |
| | |
| U.S. Mid Cap | 1.0 | | | |
| | |
1
Managers’ report
John Hancock
Lifestyle Balanced Portfolio |
The Portfolio’s broad diversification across multiple asset classes and fund managers was very valuable during a volatile market environment. Just about every investment type ended the reporting period in positive territory for the period beginning October 15, 2005 (the Portfolio’s inception date), through August 31, 2006.
The broad U.S. equity market turned in a respectable performance during the reporting period, as the S&P 500 Index gained 11.44% . These results came despite a sharp May/June downturn, which resulted from worries about slowing corporate earnings, fears of rising inflation and the expectation for further rate hikes from the U.S. Federal Reserve. Large-capitalization U.S. stocks again lagged their mid-cap counterparts, which in turn underperformed small caps — although the performance gap between large and small stocks finally began to narrow during the period. Once again, one trend that remained the same across all U.S. market-capitalization ranges: value stocks continued to outshine growth stocks, despite several brief periods during which growth took the lead.
International stocks were particularly strong performers during the period, as indicated by the 23.02% return of the MSCI EAFE Index. Equities abroad benefited from continued relative weakness in the U.S. dollar and greater uncertainty about the direction of interest rates in the United States. Another asset class that did very well was natural resources, which was helped by continued economic expansion, boosting
SCORECARD
| INVESTMENT | | PERIOD’S PERFORMANCE. . . AND WHAT’S BEHIND THE NUMBERS |
| |
| International Core (GMO) | ▲ | Strong international stock performance and favorable currency |
| | | movements added to results. |
| Non-traditional | ▲ | The Portfolio benefited greatly from our investments in |
| asset classes | | natural resources and real estate securities funds. |
| U.S. Multi-Sector (GMO) | ▼ | Emphasis on certain higher-quality large-cap growth stocks detracted |
| | | from performance. |
2
From The MFC Global Investment Management (U.S.A.), LLC’s
Portfolio Management Team |
demand for commodities, coupled with relatively tight supplies. Real estate securities also gained ground, helped by continued strong fundamentals and investors’ demand for yield.
Fixed-income securities — which make up approximately 40% of the Portfolio’s assets — generally gained ground but produced mediocre results, with the broad bond market returning 3.33%, as measured by the Lehman Brothers Aggregate Bond Index. A steady stream of interest rate increases from the Federal Reserve Board weighed on bonds’ results. On August 31, 2006, the federal funds rate stood at 5.25%, up from 3.75% the previous October. Once again, the strongest performers in the fixed-income market were lower-rated, higher-yielding bonds, which benefited as credit spreads — the difference in yield among bonds of various credit quality — continued to narrow.
“Particularly strong results came
from the Portfolio’s international
investments...” |
Performance results
John Hancock Lifestyle Balanced Portfolio’s Class A, Class B, Class C, Class R3, Class R4 and Class R5, which began operations on October 18, 2005, producd total returns of 9.08%, 8.47%, 8.55%, 8.92%, 9.19% and 9.39%, respectively, at net asset value through August 31, 2006. Class 1 shares returned 9.47% at net asset value since beginning operation October 15, 2005 and Class 5 shares returned 2.23% at net asset value since beginning operation July 3, 2006. In comparison, the Portfolio’s benchmark, the 60% S&P 500/40% Lehman Brothers Aggregate Bond combined index, returned 7.34%, and Morningstar’s average moderate allocation fund returned 9.42% .1 Keep in mind that your net asset value return will be different from the Portfolio’s performance if you were not invested in the Portfolio for the entire period and did not reinvest all distributions. Please see pages six and seven f or historical performance information.
Lifestyle Balanced Portfolio
3
International gains
Particularly strong results came from the Portfolio’s international investments, with International Core (+22.19%, GMO) and International Opportunities (+23.51%, Marsico) performing especially well. In addition, we benefited significantly from our exposure to the natural resources asset class through a 4% position in Natural Resources (+24.62%, Wellington). The Portfolio’s weighting in natural resources has declined somewhat relative to our benchmark, as these stocks have performed well and grown to occupy a larger portion of the index.
On the Portfolio’s domestic equity side, we were most helped by a number of our large-cap value-oriented investments. For example, Fundamental Value (+10.87%, Davis) enjoyed very strong results, while Equity Income (+13.54%, T. Rowe Price) also generated solid gains. By contrast, the Portfolio’s large-cap core and growth-oriented investments tended to lag in a market environment that continued to favor value and small-cap stocks. The GMO-managed U.S. Multi-Sector — at 6% our third-largest weighting — gained 4.25% . Core Equity (+3.63%, Legg Mason) also failed to keep pace with the S&P 500.
Portfolio changes
In the fixed-income portion of the Portfolio, we sought to further diversify our high-yield bond exposure. We reduced our exposure to the High Yield fund, which was formerly managed by Salomon Brothers Asset Management and is now managed by Western Asset Management. We reallocated part of these assets to a new fund, High Income, managed by MFC Global Investment Management (U.S.), LLC. We also added to our weighting in U.S. High Yield Bond, managed by Wells Capital Management.
Within the real estate asset class, we increased diversification by adding exposure to non-U.S. real estate securities. Because the real estate market outside the United States is less well developed, we believe it offers greater inefficiency and therefore greater return potential. We established a new allocation to Global Real Estate, managed by Deutsche Asset Management. At period end, the Portfolio maintained a 5% overall allocation to real estate securities.
Lifestyle Balanced Portfolio
4
Outlook
We believe the stage may be set for high-quality large-cap stocks to finally take the lead over their mid- and small-cap counterparts. Accordingly, we have positioned the Portfolio to benefit from such a potential scenario, maintaining a slight overweight in funds that own high-quality, large-cap stocks. If, however, investors continue their preference for higher-risk, lower-quality asset classes, we believe our broadly diversified Portfolio can help capture these performance gains while effectively managing volatility for our shareholders.
“On the Portfolio’s domestic equity side,
we were most helped by a number
of our large-cap value-oriented
investments.” |
On the fixed-income side of the Portfolio, bonds have encountered some difficulty, although our exposure to the strong-performing high yield category helped make up for some of the sluggish results turned in by investment-grade offerings. This is a great example of why diversification works. When certain types of investments are performing poorly, others may help pick up the slack — improving results and reducing volatility at the same time. These important diversification benefits are one of the prime advantages provided by the Portfolio — and a key reason why we believe it can be an important component of a balanced investor’s portfolio.
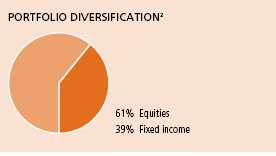
This commentary reflects the views of the portfolio managers through the end of the Portfolio’s period discussed in this report. The managers’ statements reflect their own opinions. As such, they are in no way guarantees of future events and are not intended to be used as investment advice or a recommendation regarding any specific security. They are also subject to change at any time as market and other conditions warrant.
International investing involves special risks such as political, economic and currency risks and differences in accounting standards and financial reporting. See the prospectus for the risks of investing in small-cap stocks. See the prospectus for the risks of investing in high-yield bonds.
1 Figures from Morningstar, Inc. include reinvested dividends and do not take into account sales charges. Actual load-adjusted performance is lower.
2 As a percentage of net assets on August 31, 2006.
Lifestyle Balanced Portfolio
5
A look at performance
| For the period ending August 31, 2006 | |
| |
| | | Cumulative total returns |
| | | with maximum sales charge (POP) |
| | |
| | Inception | Since |
| Class | date | inceptiona |
|
| A | 10-18-05 | 3.65% |
|
| B | 10-18-05 | 3.47 |
|
| C | 10-18-05 | 7.55 |
|
| R3 b | 10-18-05 | 8.92 |
|
| R4 b | 10-18-05 | 9.19 |
|
| R5 b | 10-18-05 | 9.39 |
|
| 1 b | 10-15-05 | 9.47 |
|
| 5 b | 7-3-06 | 2.23 |
|
Performance figures assume all distributions are reinvested. Returns with maximum sales charge reflect a sales charge on Class A shares of 5%, and the applicable contingent deferred sales charge (CDSC) on Class B and Class C shares. The Class B shares’ CDSC declines annually between years 1–6 according to the following schedule: 5, 4, 3, 3, 2, 1%. No sales charge will be assessed after the sixth year. Class C shares held for less than one year are subject to a 1% CDSC. Sales charge is not applicable for Class R3, Class R4, Class R5, Class 1 and Class 5 shares.
The returns reflect past results and should not be considered indicative of future performance. The return and principal value of an investment will fluctuate so that shares, when redeemed, may be worth more or less than their original cost. Due to market volatility, the Portfolio’s current performance may be higher or lower than the performance shown. For performance data current to the most recent month-end, please call 1-800-225-5291 or visit the Portfolio’s Web site at www.jhfunds.com.
The performance table above and the chart on the next page do not reflect the deduction of taxes that a shareholder would pay on fund distributions or the redemption of fund shares.
The Portfolio’s performance results reflect any applicable expense reductions, without which the expenses would increase and results would have been less favorable.
Since inception performance is calculated with an opening price (prior day’s close) on the inception date.
a Class A, Class B, Class C, Class R3, Class R4 and Class R5 shares began operations on 10-18-05, Class 1 shares began operation on 10-15-05 and Class 5 shares began operation on 7-3-06.
b For certain types of investors as described in the Portfolio’s Class R3, Class R4, Class R5, Class 1 and Class 5 share prospectuses.
Lifestyle Balanced Portfolio
6
Growth of $10,000
This chart shows what happened to a hypothetical $10,000 investment in Class A shares for the period indicated. For comparison, we’ve shown the same investment in a blended index.
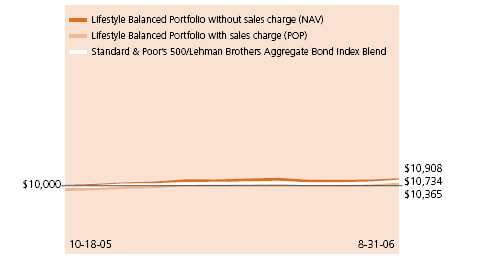
| Class | Period beginning | Without sales charge | With maximum sales charge | Index |
|
| B 2 | 10-18-05 | $10,847 | $10,347 | $10,734 |
|
| C 2 | 10-18-05 | 10,855 | 10,755 | 10,734 |
|
| R3 1,2 | 10-18-05 | 10,892 | 10,892 | 10,734 |
|
| R4 1,2 | 10-18-05 | 10,919 | 10,919 | 10,734 |
|
| R5 1,2 | 10-18-05 | 10,939 | 10,939 | 10,734 |
|
| 1 1,3 | 10-15-05 | 10,947 | 10,947 | 10,393 |
|
| 5 1,4 | 7-03-06 | 10,223 | 10,223 | 10,297 |
|
Assuming all distributions were reinvested for the period indicated, the table above shows the value of a $10,000 investment in the Portfolio’s Class B, Class C, Class R3, Class R4, Class R5, Class 1 and Class 5 shares, respectively, as of August 31, 2006. Performance of the classes will vary based on the difference in sales charges paid by shareholders investing in the different classes and the fee structure of those classes.
A blended index is used combining 60% of the Standard & Poor’s 500 Index, an unmanaged index that includes 500 widely traded common stocks, and 40% of the Lehman Brothers Aggregate Bond Index, an unmanaged index of dollar-denominated and nonconvertible investment-grade debt issues.
It is not possible to invest directly in an index. Index figures do not reflect sales charges and would be lower if they did.
1 For certain types of investors as described in the Portfolio’s Class R3, Class R4, Class R5, Class 1 and Class 5 share prospectuses.
2 Index figure from 10-31-05. 3 Index figure from 9-30-05. 4 Index figure from 6-30-06.
Lifestyle Balanced Portfolio
7
Your expenses
These examples are intended to help you understand your ongoing operating expenses.
Understanding Portfolio expenses
As a shareholder of the Portfolio, you incur two types of costs:
▪ Transaction costs which include sales charges (loads) on purchases or redemptions
(varies by share class), minimum account fee charge, etc.
▪ Ongoing operating expenses including management fees, distribution and service
fees (if applicable) and other Portfolio expenses.
In addition to the operating expenses which the Portfolio bears directly, the Portfolio indirectly bears a pro rata share of the operating expenses of the underlying funds in which the Portfolio invests. Because the underlying funds have varied operating expenses and transaction costs and the Portfolio may own different proportions of the underlying funds at different times, the amount of expenses incurred indirectly by the Portfolio will vary. If these indirect expenses were included, your expenses paid during the period would have been higher.
We are going to present only your ongoing operating expenses here.
Actual expenses/actual returns
This example is intended to provide information about your Portfolio’s actual ongoing operating expenses, and is based on your Portfolio’s actual return. It assumes an account value of $1,000.00 on March 1, 2006, with the same investment held until August 31, 2006.
| | Account value | Ending value | Expenses paid during period |
| | on 3-1-06 | on 8-31-06 | ended 8-31-06a |
|
| Class A | $1,000.00 | $1,015.70 | $2.90 |
|
| Class B | 1,000.00 | 1,012.10 | 6.80 |
|
| Class C | 1,000.00 | 1,012.10 | 6.54 |
|
| Class R3 | 1,000.00 | 1,015.30 | 3.45 |
|
| Class R4 | 1,000.00 | 1,016.60 | 2.39 |
|
| Class R5 | 1,000.00 | 1,017.90 | 0.86 |
|
| Class 1 | 1,000.00 | 1,018.40 | 0.56 |
|
| Class 5b | 1,000.00 | 1,022.30 | 0.02 |
|
Lifestyle Balanced Portfolio
8
Together with the value of your account, you may use this information to estimate the operating expenses that you paid over the period. Simply divide your account value at August 31, 2006 by $1,000.00, then multiply it by the “expenses paid” for your share class from the table above. For example, for an account value of $8,600.00, the operating expenses should be calculated as follows:
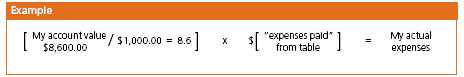
Hypothetical example for comparison purposes
This table allows you to compare your Portfolio’s ongoing operating expenses with those of any other fund. It provides an example of the Portfolio’s hypothetical account values and hypothetical expenses based on each class’s actual expense ratio and an assumed 5% annual return before expenses (which is not your Portfolio’s actual return). It assumes an account value of $1,000.00 on March 1, 2006, with the same investment held until August 31, 2006. Look in any other fund shareholder report to find its hypothetical example and you will be able to compare these expenses.
| | Account value | Ending value | Expenses paid during period |
| | on 3-1-06 | on 8-31-06 | ended 8-31-06a |
|
| Class A | $1,000.00 | $1,022.33 | $2.91 |
|
| Class B | 1,000.00 | 1,018.45 | 6.82 |
|
| Class C | 1,000.00 | 1,018.70 | 6.56 |
|
| Class R3 | 1,000.00 | 1,021.78 | 3.47 |
|
| Class R4 | 1,000.00 | 1,022.84 | 2.40 |
|
| Class R5 | 1,000.00 | 1,024.35 | 0.87 |
|
| Class 1 | 1,000.00 | 1,024.65 | 0.56 |
|
| Class 5b | 1,000.00 | 1,008.20 | 0.02 |
|
Remember, these examples do not include any transaction costs, such as sales charges; therefore, these examples will not help you to determine the relative total costs of owning different funds. If transaction costs were included, your expenses would have been higher. See the prospectus for details regarding transaction costs.
a Expenses are equal to the Portfolio's annualized expense ratio of 0.57%, 1.34%, 1.29%, 0.68%, 0.47%, 0.17%, 0.11% and 0.01% for Class A, Class B, Class C, Class R3, Class R4, Class R5, Class 1 and Class 5, respectively, multiplied by the average account value over the period, multiplied by the number of days in the period /365 or 366 (to reflect the one-half year period). The expense ratios do not include fees and expenses incurred by the Portfolio from the underlying funds.
b Class 5 shares began operation on 7-3-06.
Lifestyle Balanced Portfolio
9
F I N A N C I A L S T A T E M E N T S
Portfolio’s investments
Securities owned by the Portfolio on 8-31-06
Portfolio of investments, showing all underlying funds. |
| Issuer | Shares | Value |
|
| Investment Companies 99.97% | | $6,927,396,432 |
|
| (Cost $6,631,187,391) | | |
John Hancock Funds II | | |
|
| Active Bond Fund Class NAV | 14,348,698 | $137,747,499 |
|
| All Cap Core Fund Class NAV | 13,949,346 | 138,377,511 |
|
| Blue Chip Growth Fund Class NAV | 31,187,742 | 555,141,800 |
|
| Core Bond Fund Class NAV | 11,009,165 | 137,724,650 |
|
| Core Equity Fund Class NAV | 14,775,230 | 210,842,537 |
|
| Equity-Income Fund Class NAV | 11,450,490 | 207,368,378 |
|
| Fundamental Value Fund Class NAV | 13,044,559 | 206,495,371 |
|
| Global Bond Fund Class NAV | 13,973,572 | 206,669,135 |
|
| Global Real Estate Fund Class NAV | 20,365,152 | 209,761,062 |
|
| High Income Fund Class NAV | 13,960,804 | 137,793,132 |
|
| High Yield Fund Class NAV | 61,755,028 | 622,490,683 |
|
| International Opportunities Fund Class NAV | 8,635,136 | 139,543,804 |
|
| International Small Cap Fund Class NAV | 6,612,982 | 138,541,979 |
|
| International Value Fund Class NAV | 15,561,937 | 278,247,438 |
|
| Large Cap Fund Class NAV | 4,716,545 | 69,191,713 |
|
| Large Cap Value Fund Class NAV | 5,962,792 | 137,203,834 |
|
| Mid Cap Stock Fund Class NAV | 4,428,541 | 70,103,806 |
|
| Natural Resources Fund Class NAV | 7,738,262 | 275,482,140 |
|
| Quantitative Value Fund Class NAV | 4,173,449 | 69,112,316 |
|
| Real Estate Equity Fund Class NAV | 12,751,108 | 140,134,673 |
|
| Real Return Bond Fund Class NAV | 25,973,686 | 345,969,503 |
|
| Small Cap Fund Class NAV | 5,025,819 | 70,562,505 |
|
| Small Cap Opportunities Fund Class NAV | 3,014,427 | 69,753,843 |
|
| Small Company Value Fund Class NAV | 2,978,978 | 70,393,247 |
|
| Spectrum Income Fund Class NAV | 33,620,812 | 345,285,740 |
See notes to financial statements
Lifestyle Balanced Portfolio
10
F I N A N C I A L S T A T E M E N T S
| Issuer | Shares | Value |
John Hancock Funds II — continued | | |
|
| Strategic Bond Fund Class NAV | 11,694,497 | $137,644,230 |
|
| Strategic Income Fund Class NAV | 13,690,046 | 137,721,862 |
|
| Strategic Value Fund Class NAV | 12,711,120 | 138,551,204 |
|
| Total Return Fund Class NAV | 25,123,452 | 345,447,469 |
|
| U.S. Global Leaders Growth Fund Class NAV | 16,419,986 | 208,205,417 |
|
| U.S. High Yield Bond Fund Class NAV | 10,536,141 | 137,496,640 |
|
| U.S. Multi Sector Fund Class NAV | 40,079,468 | 417,227,265 |
|
| Value & Restructuring Fund Class NAV | 12,513,767 | 138,652,533 |
John Hancock Funds III | | |
|
| International Core Fund Class NAV | 7,021,623 | 276,511,513 |
|
| |
| Total investments 99.97% | | $6,927,396,432 |
|
| |
| Other assets in excess of liabilities 0.03% | | $1,754,554 |
|
| |
| Total net assets 100.00% | | $6,929,150,986 |
Percentages are stated as a percent of net assets of the Portfolio.
See notes to financial statements
Lifestyle Balanced Portfolio
11
F I N A N C I A L S T A T E M E N T S
Financial statements
Statement of assets and liabilities 8-31-06
This Statement of Assets and Liabilities is the Portfolio’s balance sheet. It shows the value
of what the Portfolio owns, is due and owes. You’ll also find the net asset value and the
maximum offering price per share. |
| Assets | |
| Investments in affiliated funds, at value (cost $6,631,187,391) | $6,927,396,432 |
| Cash | 757 |
| Receivable for fund shares sold | 4,465,161 |
| Other assets | 24,443 |
| Total assets | 6,931,886,793 |
|
| Liabilities | |
|
| Payable for investments purchased | 1,897,476 |
| Payable for fund shares repurchased | 131,436 |
| Payable to affiliates | |
| Fund administration fees | 115,694 |
| Transfer agent fees | 68,377 |
| Trustees’ fees | 1,427 |
| Due to adviser | 124,205 |
| Other payables and accrued expenses | 397,192 |
| Total liabilities | 2,735,807 |
|
| Net assets | |
|
| Capital paid-in | 6,508,086,961 |
| Accumulated net realized gain on investments | 116,596,537 |
| Net unrealized appreciation on investments | 296,209,041 |
| Accumulated net investment income | 8,258,447 |
| Net assets | $6,929,150,986 |
|
| Net asset value per share | |
|
| Based on net asset values and shares outstanding | |
| — the Portfolio has an unlimited number of shares authorized with no par value | |
| Class A ($81,185,685 ÷ 5,644,101 shares) | $14.38 |
| Class B ($20,096,137 ÷ 1,398,616 shares) | $14.37 |
| Class C ($79,060,371 ÷ 5,496,929 shares) | $14.38 |
| Class R3 ($2,708,241 ÷ 188,421 shares) | $14.37 |
| Class R4 ($7,180,835 ÷ 499,386 shares) | $14.38 |
| Class R5 ($1,422,097 ÷ 98,876 shares) | $14.38 |
| Class 1 ($6,736,347,049 ÷ 469,674,868 shares) | $14.34 |
| Class 5 ($1,150,571 ÷ 80,205 shares) | $14.35 |
|
| Maximum offering price per share | |
|
| Class A1 ($14.38 ÷ 95%) | $15.14 |
1 On single retail sales of less than $50,000. On sales of $50,000 or more and on group sales the offering price
is reduced. |
See notes to financial statements
Lifestyle Balanced Portfolio
12
F I N A N C I A L S T A T E M E N T S
Statement of operations For the period ended 8-31-06a
This Statement of Operations summarizes the Portfolio’s investment income earned and
expenses incurred in operating the Portfolio. It also shows net gains (losses) for the
period stated. |
| Investment income | |
| Income distributions received from affiliated underlying funds | $100,574,302 |
| |
| Total investment income | 100,574,302 |
|
| Expenses | |
|
| Investment management fees (Note 3) | 2,203,879 |
| Distribution and service fees (Note 3) | 3,010,082 |
| Transfer agent fees (Note 3) | 96,586 |
| Blue sky fees (Note 3) | 108,068 |
| Printing and postage fees (Note 3) | 114,386 |
| Fund administration fees (Note 3) | 452,525 |
| Audit and legal fees | 175,565 |
| Custodian fees | 12,619 |
| Trustees’ fees (Note 3) | 62,341 |
| Registration and filing fees | 197,349 |
| Miscellaneous | 49,624 |
| |
| Total expenses | 6,483,024 |
| Less expense reductions (Note 3) | (153,974) |
| |
| Net expenses | 6,329,050 |
| |
| Net investment income | 94,245,252 |
|
| Realized and unrealized gain | |
|
| Net realized gain on investments | 117,969,301 |
| Capital gain distributions received from affiliated underlying funds | 9,368,289 |
| Change in net unrealized appreciation of investments | 296,209,041 |
Net realized and unrealized gain | 423,546,631 |
Increase in net assets from operations | $517,791,883 |
a Period from 10-15-05 (commencement of operations) to 8-31-06.
See notes to financial statements
Lifestyle Balanced Portfolio
13
F I N A N C I A L S T A T E M E N T S
Statement of changes in net assets
This Statement of Changes in Net Assets shows how the value of the Portfolio’s net
assets has changed during the period. It reflects earnings less expenses, any investment
gains and losses, distributions, if any, paid to shareholders and the net of Portfolio
share transactions. |
| | Period |
| | endeda |
| | 8-31-06 |
|
| Increase (decrease) in net assets | |
|
| From operations | |
| Net investment income | $94,245,252 |
| Net realized gain | 127,337,590 |
| Change in net unrealized appreciation | 296,209,041 |
| |
| Increase in net assets resulting from operations | 517,791,883 |
| |
| Distributions to shareholders | |
| From net investment income | |
| Class A | (428,612) |
| Class B | (57,145) |
| Class C | (203,872) |
| Class R3 | (15,304) |
| Class R4 | (26,987) |
| Class R5 | (15,130) |
| Class 1 | (95,206,787) |
| Class 5 | (347) |
| From net realized gain | |
| Class A | (1,728) |
| Class B | (612) |
| Class C | (1,299) |
| Class R3 | (26) |
| Class R4 | (26) |
| Class R5 | (123) |
| Class 1 | (1,411,319) |
| | (97,369,317) |
| From Fund share transactions | 6,508,728,420 |
|
| Net assets | |
| End of period | $6,929,150,986 |
| |
| Accumulated net investment income | $8,258,447 |
a Period from 10-15-05 (commencement of operations) to 8-31-06.
See notes to financial statements
Lifestyle Balanced Portfolio
14
F I N A N C I A L S T A T E M E N T S
Financial highlights
The Financial Highlights show how the Portfolio’s net asset value for a share has changed since the beginning of the period.
| CLASS A SHARES | |
| |
| Period ended | 8-31-06a |
|
| Per share operating performance | |
|
| Net asset value, beginning of period | $13.35 |
| Net investment income h,v | 0.19 |
| Net realized and unrealized | |
| gain on investments | 1.01 |
| |
| Total from investment operations | 1.20 |
| |
| Less distributions | |
| From net investment income | (0.17) |
| From net realized gain | —j |
| | (0.17) |
| Net asset value, end of period | $14.38 |
| Total return k,l (%) | 9.08m |
|
| Ratios and supplemental data | |
|
| Net assets, end of period | |
| (in millions) | $81 |
| Ratio of net expenses to average | |
| net assets q (%) | 0.58r |
| Ratio of gross expenses to average | |
| net assets p,q (%) | 0.70r |
| Ratio of net investment income | |
| to average net assets v (%) | 1.60r |
| Portfolio turnover (%) | 23m |
See notes to financial statements
Lifestyle Balanced Portfolio
15
F I N A N C I A L S T A T E M E N T S
Financial highlights
| CLASS B SHARES | |
| |
| Period ended | 8-31-06a |
|
| Per share operating performance | |
|
| Net asset value, beginning of period | $13.35 |
| Net investment income h,v | 0.10 |
| Net realized and unrealized | |
| gain on investments | 1.02 |
| |
| Total from investment operations | 1.12 |
| |
| Less distributions | |
| From net investment income | (0.10) |
| From net realized gain | —j |
| | (0.10) |
| Net asset value, end of period | $14.37 |
| Total return k,l (%) | 8.47m |
|
| Ratios and supplemental data | |
|
| Net assets, end of period | |
| (in millions) | $20 |
| Ratio of net expenses to average | |
| net assets q (%) | 1.34r |
| Ratio of gross expenses to average | |
| net assets p,q (%) | 1.73r |
| Ratio of net investment income | |
| to average net assets v (%) | 0.84r |
| Portfolio turnover (%) | 23m |
See notes to financial statements
Lifestyle Balanced Portfolio
16
F I N A N C I A L S T A T E M E N T S
Financial highlights
| CLASS C SHARES | |
| |
| Period ended | 8-31-06a |
|
| Per share operating performance | |
|
| Net asset value, beginning of period | $13.35 |
| Net investment income h,v | 0.12 |
| Net realized and unrealized | |
| gain on investments | 1.01 |
| |
| Total from investment operations | 1.13 |
| |
| Less distributions | |
| From net investment income | (0.10) |
| From net realized gain | —j |
| | (0.10) |
| Net asset value, end of period | $14.38 |
| Total return k,l (%) | 8.55m |
|
| Ratios and supplemental data | |
|
| Net assets, end of period | |
| (in millions) | $79 |
| Ratio of net expenses to average | |
| net assets q (%) | 1.29r |
| Ratio of gross expenses to average | |
| net assets p,q (%) | 1.41r |
| Ratio of net investment income | |
| to average net assets v (%) | 0.97r |
| Portfolio turnover (%) | 23m |
See notes to financial statements
Lifestyle Balanced Portfolio
17
F I N A N C I A L S T A T E M E N T S
Financial highlights
| CLASS R3 SHARES | |
| |
| Period ended | 8-31-06a |
|
| Per share operating performance | |
|
| Net asset value, beginning of period | $13.35 |
| Net investment income h,v | 0.36 |
| Net realized and unrealized | |
| gain on investments | 0.82 |
| |
| Total from investment operations | 1.18 |
| |
| Less distributions | |
| From net investment income | (0.16) |
| From net realized gain | —j |
| | (0.16) |
| Net asset value, end of period | $14.37 |
| Total return k,l (%) | 8.92m |
|
| Ratios and supplemental data | |
|
| Net assets, end of period | |
| (in millions) | $3 |
| Ratio of net expenses to average | |
| net assets q (%) | 0.69r |
| Ratio of gross expenses to average | |
| net assets p,q (%) | 3.70r |
| Ratio of net investment income | |
| to average net assets v (%) | 3.10r |
| Portfolio turnover (%) | 23m |
See notes to financial statements
Lifestyle Balanced Portfolio
18
F I N A N C I A L S T A T E M E N T S
Financial highlights
| CLASS R4 | |
| |
| Period ended | 8-31-06a |
|
| Per share operating performance | |
|
| Net asset value, beginning of period | $13.35 |
| Net investment income h,v | 0.16 |
| Net realized and unrealized | |
| gain on investments | 1.06 |
| |
| Total from investment operations | 1.22 |
| |
| Less distributions | |
| From net investment income | (0.19) |
| From net realized gain | —j |
| | (0.19) |
| Net asset value, end of period | $14.38 |
| Total return k,l (%) | 9.19m |
|
| Ratios and supplemental data | |
|
| Net assets, end of period | |
| (in millions) | $7 |
| Ratio of net expenses to average | |
| net assets q (%) | 0.48r |
| Ratio of gross expenses to average | |
| net assets p,q (%) | 1.46r |
| Ratio of net investment income | |
| to average net assets v (%) | 1.37r |
| Portfolio turnover (%) | 23m |
See notes to financial statements
Lifestyle Balanced Portfolio
19
F I N A N C I A L S T A T E M E N T S
Financial highlights
| CLASS R5 | |
| |
| Period ended | 8-31-06a |
|
| Per share operating performance | |
|
| Net asset value, beginning of period | $13.35 |
| Net investment income h,v | 0.18 |
| Net realized and unrealized | |
| gain on investments | 1.06 |
| |
| Total from investment operations | 1.24 |
| |
| Less distributions | |
| From net investment income | (0.21) |
| From net realized gain | —j |
| | (0.21) |
| Net asset value, end of period | $14.38 |
| Total return k,l (%) | 9.39m |
|
| Ratios and supplemental data | |
|
| Net assets, end of period | |
| (in millions) | $1 |
| Ratio of net expenses to average | |
| net assets q (%) | 0.19r |
| Ratio of gross expenses to average | |
| net assets p,q (%) | 2.58r |
| Ratio of net investment income | |
| to average net assets v (%) | 1.48r |
| Portfolio turnover (%) | 23m |
See notes to financial statements
Lifestyle Balanced Portfolio
20
F I N A N C I A L S T A T E M E N T S
Financial highlights
| CLASS 1 SHARES | |
| |
| Period ended | 8-31-06a |
|
| Per share operating performance | |
|
| Net asset value, beginning of period | $13.31 |
| Net investment income h,v | 0.22 |
| Net realized and unrealized | |
| gain on investments | 1.03 |
| |
| Total from investment operations | 1.25 |
| |
| Less distributions | |
| From net investment income | (0.22) |
| From net realized gain | —j |
| | (0.22) |
| Net asset value, end of period | $14.34 |
| Total return k (%) | 9.47m |
|
| Ratios and supplemental data | |
|
| Net assets, end of period | |
| (in millions) | $6,736 |
| Ratio of net expenses to average | |
| net assets q (%) | 0.11r |
| Ratio of net investment income | |
| to average net assets v (%) | 1.81r |
| Portfolio turnover (%) | 23m |
See notes to financial statements
Lifestyle Balanced Portfolio
21
F I N A N C I A L S T A T E M E N T S
Financial highlights
| CLASS 5 SHARES | |
| |
| Period ended | 8-31-06a |
|
| Per share operating performance | |
|
| Net asset value, beginning of period | $14.17 |
| Net investment loss h,v | —j |
| Net realized and unrealized | |
| gain on investments | 0.31 |
| |
| Total from investment operations | 0.31 |
| |
| Less distributions | |
| From net investment income | (0.13) |
| | (0.13) |
| Net asset value, end of period | $14.35 |
| Total return k (%) | 2.23m |
|
| Ratios and supplemental data | |
|
| Net assets, end of period | |
| (in millions) | $1 |
| Ratio of net expenses to average | |
| net assets q (%) | 0.01r |
| Ratio of net investment loss | |
| to average net assets v (%) | (0.01)r |
| Portfolio turnover (%) | 23m |
a Class A, Class B, Class C, Class R3, Class R4 and Class R5 shares began operations on 10-18-05, Class 1 shares began operation on 10-15-05, and Class 5 shares began operation on 7-3-06.
h Based on the average of the shares outstanding.
j Less than $0.01 per share.
k Assumes dividend reinvestment and does not reflect the effect of sales charges.
l Total returns would have been lower had certain expenses not been reduced during the period shown.
m Not annualized.
p Does not take into consideration expense reductions during the period shown.
q Does not include expenses of the investment companies in which the Portfolio invests.
r Annualized.
v Recognition of net investment income by the Portfolio is affected by the timing of the declaration of dividends by the underlying investment companies in which the Portfolio invests.
See notes to financial statements
Lifestyle Balanced Portfolio
22
Notes to financial statements
1. Organization
The John Hancock Lifestyle Balanced Portfolio (the “Portfolio”) is a newly organized non-diversified series of John Hancock Funds II (the “Trust”). The Trust was established as a Massachusetts business trust on June 28, 2005. The Trust is registered under the Investment Company Act of 1940 as amended (the “1940 Act”), as an open-end investment management company.
The Portfolio operates as a “fund of funds”, investing in Class NAV shares of underlying funds of the Trust and John Hancock Funds III and in other permitted investments.
John Hancock Investment Management Services, LLC (the “Adviser”), a Delaware limited liability company controlled by John Hancock Life Insurance Company (U.S.A.) (“John Hancock USA”), serves as investment adviser for the Trust and John Hancock Funds, LLC, (the “Distributor”), an affiliate of the Adviser, serves as the principal underwriter. John Hancock Life Insurance Company of New York (“John Hancock New York”) is a wholly owned subsidiary of John Hancock USA. John Hancock USA and John Hancock New York are indirect wholly owned subsidiaries of The Manufacturers Life Insurance Company (“Manulife”), which in turn is a wholly owned subsidiary of Manulife Financial Corporation (“MFC”), a publicly traded company. MFC and its subsidiaries are known collectively as “Manulife Financial.”
The Portfolio commenced operations after certain separate accounts of John Hancock USA redeemed their interests in portfolios of John Hancock Trust and certain unaffiliated mutual funds of approximately $1.2 billion at the close of business on October 14, 2005, with additional redemption proceeds of approximately $4.2 billion received on October 28, 2005, and invested such proceeds in Class 1 shares of the Portfolio, which in turn invested the proceeds in underlying funds of the Trust.
The Board of Trustees has authorized the issuance of multiple classes of shares of the Portfolio, including classes designated as Class A, Class B, Class C, Class R3, Class R4, Class R5, Class 1 and Class 5 shares.
Class A, B, and C shares are open to all retail investors. Class 1 shares are sold only to certain exempt separate accounts of John Hancock USA and John Hancock New York. Class R3, R4 and R5 shares are available only to certain retirement plans. Class 5 shares currently are available only to the John Hancock Freedom 529 Plan.
The shares of each class represent an interest in the same portfolio of investments of the Portfolio, and have equal rights as to voting, redemptions, dividends and liquidation, except that certain expenses, subject to the approval of the Trustees, may be applied differently to each class of shares in accordance with current regulations of the SEC and the Internal Revenue Service. Shareholders of a class that bears distribution and service expenses under the terms of a distribution plan have exclusive voting rights to that distribution plan. Class B shares will convert to Class A shares eight years after purchase.
2. Significant accounting policies
In the preparation of the financial statements, the Portfolio follows the policies described below. The preparation of financial statements in conformity with accounting principles generally accepted in the United States of America requires management to make estimates and assumptions that affect the reported amounts of assets and liabilities at the date of the financial statements and the reported amounts of income and expenses during the reporting period. Actual results may differ from these estimates.
Lifestyle Balanced Portfolio
23
Securities valuation
The net asset value of the shares of the Portfolio is determined daily as of the close of the New York Stock Exchange, normally at 4:00 p.m. Eastern Time. Investments in underlying funds are valued at their respective net asset values each business day, or at fair value as determined in good faith in accordance with procedures approved by the Trustees. Securities in the underlying funds’ portfolios are valued in accordance with their respective valuation polices, as outlined in the underlying funds’ financial statements. Short-term debt investments that have a remaining maturity of 60 days or less are valued at amortized cost.
Security transactions and related
investment income
Investment security transactions in the underlying funds are accounted for on a trade date plus one basis for daily net asset value calculations. However, for financial reporting purposes, investment transactions are reported on trade date. Interest income is accrued as earned. Dividend income and captial gain distributions are recorded on the ex-dividend date.
Gains and losses on securities sold are determined on the basis of specific identified cost for both financial and federal income tax reporting purposes.
Multi-class operations
All income, expenses (except for class-specific expenses) and realized and unrealized gains (losses) are allocated to each class of shares based upon the relative net assets of each class. Dividends to shareholders from net investment income are determined at a class level and distributions from capital gains are determined at a Portfolio level.
Expense allocation
Expenses not directly attributable to a particular Portfolio or class of shares are allocated based on the relative share of net assets of the Portfolio at the time the expense was incurred. Class-specific expenses, such as transfer agency fees, blue sky fees, printing and postage fees and distribution and service fees, are accrued daily and charged directly to the respective share classes. Expenses in the Portfolio’s Statement of Operations reflect the expenses of the Portfolio and do not include any indirect expenses related to the underlying funds. Because the underlying funds have varied expense levels and the Portfolio may own different proportions of the underlying funds at different times, the amount of fees and expenses incurred indirectly by the Portfolio will vary.
Federal income taxes
The Portfolio qualifies as a “regulated investment company” by complying with the applicable provisions of the Internal Revenue Code and will not be subject to federal income tax on taxable income that is distributed to shareholders. Therefore, no federal income tax provision is required.
New accounting pronouncement
In June 2006, Financial Accounting Standards Board (FASB) Interpretation No. 48, Accounting for Uncertainty in Income Taxes (the “Interpretation”) was issued and is effective for fiscal years beginning after December 15, 2006 and is to be applied to all open tax years as of the effective date. This Interpretation prescribes a minimum threshold for financial statement recognition of the benefit of a tax position taken or expected to be taken in a tax return, and requires certain expanded disclosures. Management is currently evaluating the application of the Interpretation to the Portfolio, and has not at this time quantified the impact, if any, resulting from the adoption of this Interpretation on the Portfolio’s financial statements.
In September 2006, FASB Standard No. 157, Fair Value Measurements (“FAS 157”) was issued, and is effective for fiscal years beginning after November 15, 2007. FAS 157 defines fair value, establishing a framework for measuring fair value and expands disclosure about fair value measurements. Management is currently evaluating the application of FAS 157 to the Portfolio, and its impact, if any, resulting from the adoption of FAS 157 on the Portfolio’s financial statements.
Distribution of income and gains
The Portfolio records distributions to shareholders from net investment income and net realized gains, if any, on the ex-dividend date.
Lifestyle Balanced Portfolio
24
During the period ended August 31, 2006, the tax character of distributions paid was as follows: ordinary income $97,369,317. Distributions paid by the Portfolio with respect to each class of shares are calculated in the same manner, at the same time and are in the same amount, except for the effect of expenses that may be applied differently to each class. Such distributions, on a tax basis, are determined in conformity with income tax regulations, which may differ from accounting principles generally accepted in the United States of America. Distributions in excess of tax basis earnings and profits, if any, are reported in the Portfolio’s financial statements as a return of capital. As of August 31, 2006, the components of distributable earnings on a tax basis included $124,812,862 of undistributed ordinary income and $42,122 of undistributed long-term gain.
Capital accounts
The Portfolio reports the undistributed net investment income and accumulated undistributed net realized gain (loss) accounts on a basis approximating amounts available for future tax distributions (or to offset future taxable realized gains when a capital loss carryforward is available). Accordingly, the Portfolio may periodically make reclassifications among certain capital accounts, without affecting its net asset value.
3. Investment advisory and
other agreements
Advisory fees
The Trust has entered into an Investment Advisory Agreement with the Adviser. The Adviser is responsible for managing the corporate and business affairs of the Trust and for selecting and compensating subadvisers to handle the investment and reinvestment of the assets of the Portfolio, subject to the supervision of the Board of Trustees. Under the Advisory Agreement, the Portfolio pays a monthly management fee to the Adviser equivalent, on an annual basis, to its pro rata portion of the sum of: (a) 0.05% of the first $7,500,000,000 of the aggregate daily net assets and (b) 0.04% of the aggregate daily net assets in excess of $7,500,000,000 of the five Lifestyle Portfolios of the Trust (Lifestyle Aggressive, Lifestyle Growth, Lifestyle Balanced, Lifestyle Moderate and Lifestyle Conservative) and the five Lifestyle Portfolios of John Hancock Trust (Lifestyle Aggressive, Lifestyle Growth, Lifestyle Balanced, Lifestyle Moderate and Lifestyle Co nservative). The Portfolio is not responsible for payment of the subadvisory fees.
Expense reimbursements
The Adviser has contractually agreed to waive advisory fees or reimburse the Portfolio’s expenses for Class A, Class B, Class C, Class R3, Class R4 and Class R5 shares to the extent that blue sky fees and printing and postage expenses attributable to each class exceed 0.09% of the average annual net assets attributable to the classes, at least until November 1, 2006, and may thereafter be terminated by the Adviser at any time. Accordingly, the expense reductions related to this expense limitation amounted to $33,969, $29,026, $32,959, $18,307, $17,531 and $19,684 for Class A, Class B, Class C, Class R3, Class R4 and Class R5, respectively, for the period ended August 31, 2006.
The Adviser has contractually agreed to waive advisory fees or reimburse Portfolio expenses for Class 5 shares to the extent that total Portfolio operating expenses attributable to Class 5 exceed 0.07% of the average annual net assets attributable to Class 5. There were no expense reductions related to this expense limitation during the period ended August 31, 2006. This agreement remains in effect until June 30, 2007 and may thereafter be terminated by the Adviser at any time.
Administration fees
The Portfolio has an agreement with the Adviser that requires the Portfolio to reimburse the Adviser for all expenses associated with providing the administrative, financial, accounting and recordkeeping services of the Portfolio, including the preparation of all tax returns, annual, semiannual and periodic reports to shareholders and the preparation of all regulatory reports.
Distribution plans
The Trust has a Distribution Agreement with the Distributor. The Portfolio has adopted Distribution Plans with respect to Class A, Class B, Class C, Class R3, Class R4 and Class 1, pursuant to Rule 12b-1 under the
Lifestyle Balanced Portfolio
25
1940 Act to reimburse the Distributor for the services it provides as distributor of shares of the Portfolio. Accordingly, the Portfolio makes monthly payments to the Distributor at an annual rate not to exceed 0.30%, 1.00%, 1.00%, 0.50%, 0.25% and 0.05% of the average daily net assets of Class A, Class B, Class C, Class R3, Class R4 and Class 1, respectively. A maximum of 0.25% of such payments may be service fees, as defined by the Conduct Rules of the National Association of Securities Dealers. Under the Conduct Rules, curtailment of a portion of the Portfolio’s 12b-1 payments could occur under certain circumstances.
The Portfolio has also adopted a Service Plan with respect to Class R3, Class R4 and Class R5 shares (the “Service Plan”). Under the Service Plan, the Portfolio pays up to 0.15%, 0.10% and 0.05% of the average daily net assets of Class R3, Class R4 and Class R5 shares, respectively, for certain other services.
Sales charges
Class A shares are assessed up-front sales charges of up to 5% of the net asset value of such shares. During the period ended August 31, 2006, the Portfolio was informed that the Distributor received net up-front sales charges of $1,896,086 with regard to sales of Class A shares. Of this amount, $311,121 was retained and used for printing prospectuses, advertising, sales literature and other purposes, $1,560,918 was paid as sales commissions to unrelated broker-dealers and $24,047 was paid as sales commissions to sales personnel of Signator Investors, Inc. (“Signator Investors”), a related broker-dealer, an indirect subsidiary of MFC.
Class B shares that are redeemed within six years of purchase are subject to a contingent deferred sales charge (“CDSC”) at declining rates, beginning at 5.00% of the lesser of the current market value at the time of redemption or the original purchase cost of the shares being redeemed. Class C shares that are redeemed within one year of purchase are subject to a CDSC at a rate of 1.00% of the lesser of the current market value at the time of redemption or the original purchase cost of the shares being redeemed. Proceeds from the CDSCs are paid to the Distributor and are used, in whole or in part, to defray its expenses for providing distribution-related services to the Portfolio in connection with the sale of Class B and Class C shares. During the period ended August 31, 2006, the Portfolio was informed that CDSCs received by the Distributor amounted to $7,025 for Class B shares and $10,157 for Class C shares.
Transfer agent fees
The Portfolio has a Transfer Agency Agreement with John Hancock Signature Services, Inc. (“Signature Services”), an indirect subsidiary of MFC. For Class A, Class B, Class C, Class R3, Class R4 and Class R5 shares, the Portfolio pays a monthly transfer agent fee at an annual rate of 0.05% of each class’s average daily net assets, plus a fee based on the number of shareholder accounts and reimbursement for certain out-of-pocket expenses. Expenses not directly attributable to a particular class of shares are aggregated and allocated to each class on the basis of its relative net asset value.
Signature Services has agreed to limit the transfer agent fees so that such fees do not exceed 0.20% annually of each of Class A, Class B, Class C, Class R3, Class R4 and Class R5 share average daily net assets. This agreement is effective until December 31, 2006. Signature Services reserves the right to terminate this limitation in the future. In addition, Signature Services has voluntarily agreed to further limit transfer agent fees for Class R3, Class R4 and Class R5 shares so that such fees do not exceed 0.05% annually of each class’s average daily net assets. Accordingly, the transfer agent fees reductions amounted to $501, $1,060 and $937 for Class R3, Class R4 and Class R5 shares, respectively, during the period ended August 31, 2006. Signature Services reserves the right to terminate this limitation at any time.
Lifestyle Balanced Portfolio
26
| Expenses under the agreements described above for the period ended August 31, 2006, were as follows: |
| |
| | Distribution | Transfer | | Printing and |
| Share Class | and service fees | agent | Blue sky | postage |
|
| |
| Class A | $83,686 | $38,106 | $20,586 | $38,489 |
| Class B | 74,189 | 14,872 | 16,689 | 19,014 |
| Class C | 268,990 | 39,526 | 20,807 | 36,361 |
| Class R3 | 3,157 | 809 | 16,074 | 2,802 |
| Class R4 | 5,410 | 2,006 | 16,244 | 3,005 |
| Class R5 | 5 | 1,267 | 17,668 | 2,798 |
| Class 1 | 2,574,645 | — | — | 11,917 |
| Class 5 | — | — | — | — |
| Total | $3,010,082 | $96,586 | $108,068 | $114,386 |
Trustees’ fees
The Trust compensates each Trustee who is not an employee of the Adviser or its affiliates. Total Trustees’ expenses are allocated based on each Portfolio’s average daily net asset value.
4. Guarantees and Indemnifications
Under the Trust’s organizational documents, its Officers and Trustees are indemnified against certain liability arising out of the performance of their duties to the Trust. Additionally, in the normal course of business, the Trust enters into contracts with service providers that contain general indemnification clauses. The Trust’s maximum exposure under these arrangements is unknown, as this would involve future claims that may be made against the Trust that have not yet occurred. However, based on experience, the Trust believes the risk of loss to be remote.
5. Capital shares
Share activities for the Portfolio for the period ended August 31, 2006 were as follows:
| | | Period ended 8-31-06 a |
| | Shares | Amount |
|
| Class A shares | | |
|
| Sold | 6,009,152 | $85,302,501 |
| Distributions reinvested | 27,765 | 389,529 |
| Repurchased | (392,816) | (5,635,273) |
| Net increase | 5,644,101 | $80,056,757 |
|
| |
| Class B shares | | |
|
| Sold | 1,452,791 | $20,544,736 |
| Distributions reinvested | 3,722 | 52,170 |
| Repurchased | (57,897) | (818,019) |
| Net increase | 1,398,616 | $19,778,887 |
|
| |
| Class C shares | | |
|
| Sold | 5,676,144 | $80,561,010 |
| Distributions reinvested | 13,319 | 187,092 |
| Repurchased | (192,534) | (2,732,138) |
| Net increase | 5,496,929 | $78,015,964 |
Lifestyle Balanced Portfolio
27
| | | Period ended 8-31-06 a |
| | Shares | Amount |
|
| Class R3 shares | | |
|
| Sold | 246,488 | $3,431,004 |
| Distributions reinvested | 1,003 | 14,088 |
| Repurchased | (59,070) | (818,494) |
| Net increase | 188,421 | $2,626,598 |
|
| |
| Class R4 shares | | |
|
| Sold | 532,830 | $7,589,789 |
| Distributions reinvested | 1,821 | 25,583 |
| Repurchased | (35,265) | (504,224) |
| Net increase | 499,386 | $7,111,148 |
|
| |
| Class R5 shares | | |
|
| Sold | 102,605 | $1,431,987 |
| Distributions reinvested | 974 | 13,638 |
| Repurchased | (4,703) | (65,769) |
| Net increase | 98,876 | $1,379,856 |
|
| |
| Class 1 shares | | |
|
| Sold | 468,643,365 | $6,306,035,420 |
| Distributions reinvested | 6,945,128 | 96,618,106 |
| Repurchased | (5,913,625) | (84,025,930) |
| Net increase | 469,674,868 | $6,318,627,596 |
|
| |
| Class 5 shares | | |
|
| Sold | 80,813 | $1,140,151 |
| Distributions reinvested | 25 | 347 |
| Repurchased | (633) | (8,884) |
| Net increase | 80,205 | $1,131,614 |
|
| |
| Net increase | 483,081,402 | $6,508,728,420 |
a Class A, Class B, Class C, Class R3, Class R4 and Class R5 shares began operations on 10-18-05, Class 1 shares began operation on 10-15-05, and Class 5 shares began operation on 7-3-06.
Lifestyle Balanced Portfolio
28
6. Investment transactions
Purchases and sales of the underlying funds, during the period ended August 31, 2006, aggregated $7,937,698,651 and $1,424,480,561, respectively.
The cost of investments owned on August 31, 2006, including short-term investments, for federal income tax purposes, was $6,631,187,391. Gross unrealized appreciation and depreciation of investments aggregated $307,249,905 and $11,040,864, respectively, resulting in net unrealized appreciation of $296,209,041.
7. Investment in affiliated
underlying funds
The Portfolio invests primarily in the underlying funds that are managed by affiliates of the Adviser. The Portfolio does not invest in the underlying funds for the purpose of exercising management or control.
A summary of the Portfolio’s transactions in the securities of affiliated issuers in which the Portfolio’s holdings represent 5% or more of the outstanding voting securities of the issuer, during the period ended August 31, 2006 is set forth below.
| Affiliate — | Shares | Shares | Ending Share | | Ending |
| Class NAV | Purchased | Sold | Amount | Proceeds | Value |
|
| 500 Index | 11,314,738 | 11,314,738 | — | $128,316,617 | — |
| Active Bond | 14,355,063 | 6,365 | 14,348,698 | 60,699 | $137,747,499 |
| All Cap Core | 13,955,620 | 6,274 | 13,949,346 | 61,864 | 138,377,511 |
| All Cap Growth | 2,334,710 | 2,334,710 | — | 36,724,984 | — |
| All Cap Value | 1,749,344 | 1,749,344 | — | 24,333,378 | — |
| Blue Chip Growth | 31,487,653 | 299,911 | 31,187,742 | 5,360,615 | 555,141,800 |
| Capital Appreciation | 2,624,011 | 2,624,011 | — | 24,613,225 | — |
| Core Bond | 11,014,021 | 4,856 | 11,009,165 | 60,203 | 137,724,650 |
| Core Equity | 14,900,468 | 125,238 | 14,775,230 | 1,834,740 | 210,842,537 |
| Equity-Income | 18,646,262 | 7,195,772 | 11,450,490 | 129,449,894 | 207,368,378 |
| Fundamental Value | 13,051,080 | 6,521 | 13,044,559 | 102,603 | 206,495,371 |
| Global Bond | 14,088,637 | 115,065 | 13,973,572 | 1,678,019 | 206,669,135 |
| Global Real Estate | 20,796,111 | 430,959 | 20,365,152 | 4,347,800 | 209,761,062 |
| High Income | 13,966,765 | 5,961 | 13,960,804 | 59,174 | 137,793,132 |
| High Yield | 80,953,018 | 19,197,990 | 61,755,028 | 200,427,268 | 622,490,683 |
| International Core* | 7,021,623 | — | 7,021,623 | — | 276,511,513 |
| International Opportunities | 9,261,503 | 626,367 | 8,635,136 | 10,228,004 | 139,543,804 |
| International Small Cap | 6,844,750 | 231,768 | 6,612,982 | 5,008,979 | 138,541,979 |
| International Stock | 21,517,914 | 21,517,914 | — | 295,831,965 | — |
| International Value | 16,080,181 | 518,244 | 15,561,937 | 9,153,387 | 278,247,438 |
| Large Cap | 4,719,052 | 2,507 | 4,716,545 | 35,997 | 69,191,713 |
| Large Cap Value | 5,966,269 | 3,477 | 5,962,792 | 80,451 | 137,203,834 |
| Mid Cap Stock | 4,430,636 | 2,095 | 4,428,541 | 34,891 | 70,103,806 |
| Natural Resources | 10,983,040 | 3,244,778 | 7,738,262 | 104,659,552 | 275,482,140 |
| Quantitative Value | 5,888,730 | 1,715,281 | 4,173,449 | 24,412,287 | 69,112,316 |
| Real Estate Equity | 13,349,729 | 598,621 | 12,751,108 | 6,339,202 | 140,134,673 |
| Real Estate Securities | 12,598,713 | 12,598,713 | — | 342,300,631 | — |
| Real Return Bond | 26,133,209 | 159,523 | 25,973,686 | 2,062,517 | 345,969,503 |
| Small Cap | 5,028,298 | 2,479 | 5,025,819 | 36,877 | 70,562,505 |
| Small Cap Opportunities | 3,040,577 | 26,150 | 3,014,427 | 662,156 | 69,753,843 |
| Small Company Value | 3,002,720 | 23,742 | 2,978,978 | 599,692 | 70,393,247 |
| Spectrum Income | 33,637,189 | 16,377 | 33,620,812 | 167,599 | 345,285,740 |
| Strategic Bond | 16,944,840 | 5,250,343 | 11,694,497 | 62,425,790 | 137,644,230 |
| Strategic Income | 13,696,275 | 6,229 | 13,690,046 | 62,132 | 137,721,862 |
| Strategic Value | 12,717,074 | 5,954 | 12,711,120 | 65,626 | 138,551,204 |
| Total Return | 25,141,548 | 18,096 | 25,123,452 | 245,350 | 345,447,469 |
Lifestyle Balanced Portfolio
29
| Affiliate — | Shares | Shares | Ending Share | | Ending |
| Class NAV | Purchased | Sold | Amount | Proceeds | Value |
|
| U.S. Global | | | | | |
| Leaders Growth | 16,427,292 | 7,306 | 16,419,986 | $94,186 | $208,205,417 |
| U.S. High Yield Bond | 10,540,640 | 4,499 | 10,536,141 | 59,061 | 137,496,640 |
| U.S. Multi Sector | 40,097,561 | 18,093 | 40,079,468 | 188,647 | 417,227,265 |
| Value & Restructuring | 12,709,102 | 195,335 | 12,513,767 | 2,294,499 | 138,652,533 |
*Represents the Portfolio’s investment in John Hancock Funds III International Core Fund
8. Reclassification of accounts
During the period ended August 31, 2006, the Portfolio reclassified amounts to reflect a decrease in accumulated net realized gain on investments of $9,325,920, an increase in accumulated net investment income of $9,967,379 and a decrease in capital paid-in of $641,459. This represents the amounts necessary to report these balances on a tax basis, excluding certain temporary differences, as of August 31, 2006. Additional adjustments may be needed in subsequent reporting periods.These reclassifications, which have no impact on the net asset value of the Portfolio, are primarily attributable to certain differences in the computation of distributable income and capital gains under federal tax rules versus accounting principles generally accepted in the United States of America and book and tax differences in accounting for non-deductible organizational costs. The calculation of net investment income per share in the Portfolio’s Financial Highlights excludes these adjus tments.
Lifestyle Balanced Portfolio
30
Auditors’ report
Report of Independent Registered Public Accounting Firm |
To the Board of Trustees of John Hancock Funds II and Shareholders of John Hancock Lifestyle
Balanced Portfolio: |
In our opinion, the accompanying statement of assets and liabilities, including the schedule of securities owned, and the related statements of operations and of changes in net assets and the financial highlights present fairly, in all material respects, the financial position of John Hancock Lifestyle Balanced Portfolio (the “Portfolio”) at August 31, 2006, and the results of its operations, the changes in its net assets, and the financial highlights for the period October 15, 2005 (commencement of operations) through August 31, 2006, in conformity with accounting principles generally accepted in the United States of America. These financial statements and financial highlights (hereafter referred to as “financial statements”) are the responsibility of the Portfolio’s management; our responsibility is to express an opinion on these financial statements based on our audit. We conducted our audit of these financial statements in accordance with the standards of the Public Company Accounting Oversight Board (United States). Those standards require that we plan and perform the audit to obtain reasonable assurance about whether the financial statements are free of material misstatement. An audit includes examining, on a test basis, evidence supporting the amounts and disclosures in the financial statements, assessing the accounting principles used and significant estimates made by management, and evaluating the overall financial statement presentation. We believe that our audit, which included confirmation of securities at August 31, 2006, by correspondence with the transfer agent, provides a reasonable basis for our opinion.
PricewaterhouseCoopers LLP
Boston, Massachusetts
October 26, 2006 |
31
For federal income tax purposes, the following information is furnished with respect to the distributions of the Portfolio, if any, paid during its taxable year ended August 31, 2006.
With respect to the ordinary dividends paid by the Portfolio for the fiscal period ended August 31, 2006, 49.43% of the dividends qualify for the corporate dividends-received deduction.
The Portfolio hereby designates the maximum amount allowable of its net taxable income as qualified dividend income as provided in the Jobs and Growth Tax Relief Reconciliation Act of 2003. This amount will be reflected on Form 1099-DIV for the calendar year 2006.
Shareholders will be mailed a 2006 U.S. Treasury Department Form 1099-DIV in January 2007. This will reflect the total of all distributions that are taxable for calendar year 2006.
32
Trustees and Officers
This chart provides information about the Trustees and Officers who oversee your John
Hancock fund. Officers elected by the Trustees manage the day-to-day operations of the
Portfolio and execute policies formulated by the Trustees. |
| Independent Trustees | | |
| |
| Name, age | | Number of |
| Position(s) held with Portfolio | Trustee | John Hancock |
| Principal occupation(s) and other | of Portfolio | funds overseen |
| directorships during past 5 years | since1 | by Trustee |
|
| Charles L. Bardelis, Born: 1941 | 2005 | 209 |
|
| President and Executive Officer, Island Commuter Corp. (Marine Transport). | | |
| Trustee of John Hancock Trust (since 1988) and John Hancock Funds III (since 2005). | |
|
| |
| Peter S. Burgess, Born: 1942 | 2005 | 209 |
|
| Consultant (financial, accounting and auditing matters (since 1999); | | |
| Certified Public Accountant; Partner, Arthur Andersen (prior to 1999). | | |
| Director of the following publicly traded companies: PMA Capital Corporation | | |
| (since 2004) and Lincoln Educational Services Corporation (since 2004). | | |
| Trustee of John Hancock Trust (since 2005), John Hancock Funds III (since 2005). | |
|
| |
| Elizabeth G. Cook, Born: 1937 | 2005 | 209 |
|
| Expressive Arts Therapist, Massachusetts General Hospital (September 2001 | | |
| to present); Expressive Arts Therapist, Dana Farber Cancer Institute | | |
| (September 2000 to January 2004); President, The Advertising Club of Greater Boston. | |
| Trustee of John Hancock Trust (since 2005) and John Hancock Funds III (since 2005). | |
|
| |
| William H. Cunningham, Born: 1944 | 2005 | 160 |
|
| Former Chancellor, University of Texas System and former President of the | | |
| University of Texas, Austin, Texas; Chairman and CEO, IBT Technologies | | |
| (until 2001); Director of the following: Hire.com (until 2004), STC Broadcasting, | |
| Inc. and Sunrise Television Corp. (until 2001), Symtx, Inc. (electronic manufacturing) | |
| (since 2001), Adorno/Rogers Technology, Inc. (until 2004), Pinnacle Foods | | |
| Corporation (until 2003), rateGenius (until 2003), Lincoln National Corporation | |
| (insurance) (since 2006), Jefferson-Pilot Corporation (diversified life insurance | | |
| company) (until 2006), New Century Equity Holdings (formerly Billing Concepts) | |
| (until 2001), eCertain (until 2001), ClassMap.com (until 2001), Agile Ventures | | |
| (until 2001), AskRed.com (until 2001), Southwest Airlines, Introgen and Viasystems | |
| Group, Inc. (electronic manufacturer) (until 2003); Advisory Director, Interactive | |
| Bridge, Inc. (college fundraising) (until 2001); Advisory Director, Q Investments | | |
| (until 2003); Advisory Director, JP Morgan Chase Bank (formerly Texas Commerce | |
| Bank - Austin), LIN Television (since 2002), WilTel Communications (until 2003) | |
| and Hayes Lemmerz International, Inc. (diversified automotive parts supply | | |
| company) (since 2003). Trustee of John Hancock Funds (since 2005) and | | |
| John Hancock Funds III (since 2005). | | |
33
| Independent Trustees (continued) | | |
| |
| Name, age | | Number of |
| Position(s) held with Portfolio | Trustee | John Hancock |
| Principal occupation(s) and other | of Portfolio | funds overseen |
| directorships during past 5 years | since1 | by Trustee |
|
| Charles L. Ladner, Born: 1938 | 2005 | 160 |
|
| Chairman and Trustee, Dunwoody Village, Inc. (retirement services) (until 2003); | |
| Senior Vice President and Chief Financial Officer, UGI Corporation (public utility | |
| holding company) (retired 1998); Vice President and Director for AmeriGas, Inc. | |
| (retired 1998); Director of AmeriGas Partners, L.P. (until 1997)(gas distribution); | |
| Director, EnergyNorth, Inc. (until 1995); Director, Parks and History Association | |
| (since 2007). Trustee of John Hancock Funds (since 2004) and John Hancock | | |
| Funds III (since 2005). | | |
|
| |
| Hassell H. McClellan, Born: 1945 | 2005 | 209 |
|
| Associate Professor, The Wallace E. Carroll School of Management, Boston College. | |
| Trustee of John Hancock Trust (since 2005), John Hancock Funds III (since 2005). | |
|
| |
| James. M. Oates, Born: 1946 | 2005 | 209 |
|
| Managing Director, Wydown Group (financial consulting firm)(since 1994); | | |
| Chairman, Emerson Investment Management, Inc. (since 2000); Chairman, | | |
| Hudson Castle Group, Inc. (formerly IBEX Capital Markets, Inc.) (financial services | |
| company) (since 1997). Director of the following publicly traded companies: | | |
| Stifel Financial (since 1996); Investor Financial Services Corporation (since 1995); | |
| and Connecticut River Bancorp, Director (since 1998). Director, Phoenix Mutual | |
| Funds (since 1988; overseeing 20 portfolios). Trustee of John Hancock Trust | | |
| (since 2004) and John Hancock Funds III (since 2005). | | |
1 Because the Trust does not hold regular annual shareholders meetings, each Trustee holds office for an indefinite term until his/her successor is duly elected and qualified or until he/she dies, retires, resigns, is removed or becomes disqualified.
34
| Non-Independent Trustee3 | | |
| |
| Name, age | | Number of |
| Position(s) held with Portfolio | Trustee | John Hancock |
| Principal occupation(s) and other | of Portfolio | funds overseen |
| directorships during past 5 years | since1 | by Trustee |
|
| James R. Boyle, Born: 1959 | 2005 | 262 |
|
| Chairman and Director, John Hancock Advisers, LLC (the “Adviser”), The Berkeley Financial Group, LLC |
| (“The Berkeley Group”) (holding company) and John Hancock Funds, LLC (since 2005); President, |
| John Hancock Annuities; Executive Vice President, John Hancock Life Insurance Company | |
| (since June, 2004); President U.S. Annuities; Senior Vice President, The Manufacturers Life Insurance |
| Company (U.S.A) (prior to 2004). | | |
| |
| |
| Principal officers who are not Trustees | | |
| |
| Name, age | | |
| Position(s) held with Portfolio | | Officer |
| Principal occupation(s) and | | of Portfolio |
| directorships during past 5 years | | since |
|
| Keith Hartstein2, Born: 1956 | | 2005 |
|
| President and Chief Executive Officer | | |
| Senior Vice President, Manulife Financial Corporation (since 2004); Director, President and Chief Executive |
| Officer, the Adviser and The Berkeley Group, John Hancock Funds, LLC (since 2005); Director, MFC Global |
| Investment Management (U.S.), LLC (“MFC Global (U.S.)”) (since 2005); Director, John Hancock Signature |
| Services, Inc. (since 2005); President and Chief Executive Officer, John Hancock Investment Management |
| Services, LLC (since 2006); President and Chief Executive Officer, John Hancock Funds, John Hancock |
| Funds II, John Hancock Funds III, John Hancock Trust,; Director, Chairman and President, NM Capital |
| Management, Inc. (since 2005); Chairman, Investment Company Institute Sales Force Marketing |
| Committee (since 2003); Director, President and Chief Executive Officer, MFC Global (U.S.) (2005-2006); |
| Executive Vice President, John Hancock Funds, LLC (until 2005). | | |
|
| |
| John Vrysen2, Born: 1955 | | 2005 |
|
| Chief Financial Officer | | |
| Director, Executive Vice President and Chief Financial Officer, the Adviser, The Berkeley Group and |
| John Hancock Funds, LLC (since 2005); Executive Vice President and Chief Financial Officer, John Hancock |
| Investment Management Services, LLC (since 2005), Vice President and Chief Financial Officer, MFC |
| Global (U.S.) (since 2005); Director, John Hancock Signature Services, Inc. (since 2005); Chief Financial |
| Officer, John Hancock Funds, John Hancock Funds II, John Hancock Funds III, John Hancock Trust (since |
| 2005); Vice President and General Manager, Fixed Annuities, U.S. Wealth Management (until 2005); |
| Vice President, Operations Manulife Wood Logan (2000-2004). | | |
|
| |
| Francis V. Knox, Jr.2, Born: 1947 | | 2005 |
|
| Vice President and Chief Compliance Officer, John Hancock Investment Management Services, LLC, |
| the Adviser and MFC Global (U.S.) (since 2005); Chief Compliance Officer, John Hancock Funds, John |
| Hancock Funds II, John Hancock Funds III and John Hancock Trust (since 2005); Vice President and |
| Assistant Treasurer, Fidelity Group of Funds (until 2004); Vice President and Ethics & Compliance Officer, |
| Fidelity Investments (until 2001). | | |
35
| Principal officers who are not Trustees (continued) | |
| |
| Name, age | |
| Position(s) held with Portfolio | Officer |
| Principal occupation(s) and | of Portfolio |
| directorships during past 5 years | since |
|
| Gordon Shone2, Born: 1956 | 2005 |
|
| Treasurer, John Hancock Funds (since 2006); John Hancock Funds II, John Hancock Funds III and | |
| John Hancock Trust (since 2005); Vice President and Chief Financial Officer, John Hancock Trust | |
| (2003-2005); Senior Vice President, John Hancock Life Insurance Company (U.S.A.) (since 2001); |
| Vice President, John Hancock Investment Management Services, Inc. and John Hancock Advisers, LLC |
| (since 2006), The Manufacturers Life Insurance Company (U.S.A.) (1998 to 2000). | |
|
| |
| Thomas M. Kinzler2, Born: 1955 | 2006 |
|
| Vice President and Counsel for John Hancock Life Insurance Company (U.S.A.) (since 2006); Secretary and |
| Chief Legal Officer, John Hancock Funds, John Hancock Funds II, John Hancock Funds III and John Hancock |
| Trust (since 2006); Vice President and Associate General Counsel for Massachusetts Mutual Life Insurance |
| Company (1999-2006); Secretary and Chief Legal Counsel for MML Series Investment Fund (2000-2006); |
| Secretary and Chief Legal Counsel for MassMutual Institutional Funds (2000-2004); Secretary and Chief |
| Legal Counsel for MassMutual Select Funds and MassMutual Premier Funds (2004-2006). | |
1 Because the Trust does not hold regular annual shareholders meetings, each Trustee holds office for an indefinite term until his successor is duly elected and qualified or until he dies, retires, resigns, is removed or becomes disqualified.
2Affiliated with the investment adviser.
3Non-Independent Trustee: holds positions with the Fund’s investment adviser, underwriter, and/ or certain other affiliates.
36
For more information
The Portfolio’s proxy voting policies, procedures and records are available without charge,
upon request: |
| By phone | On the Portfolio’s Web site | On the SEC’s Web site |
| 1-800-225-5291 | www.jhfunds.com/proxy | www.sec.gov |
|
| |
| Investment adviser | Custodian | Legal counsel |
| John Hancock Investment | State Street Bank & Trust Co. | Kirkpatrick & Lockhart |
| Management Services, LLC | 2 Avenue de Lafayette | Nicholson Graham LLP |
| 601 Congress Street | Boston, MA 02111 | 1 Lincoln Street |
| Boston, MA 02210-2805 | | Boston, MA 02111 |
| | Transfer agent | |
| Principal distributor | John Hancock Signature | Independent registered |
| John Hancock Funds, LLC | Services, Inc. | public accounting firm |
| 601 Congress Street | 1 John Hancock Way, | PricewaterhouseCoopers LLP |
| Boston, MA 02210-2805 | Suite 1000 | 125 High Street |
| | Boston, MA 02217-1000 | Boston, MA 02110 |
Each underlying fund’s accounting policies are outlined in the underlying fund’s shareholder report, available without charge by calling 1-800-344-1029 or on the Securities and Exchange Commission (“SEC”) Web site at www.sec.gov, File # 811-21779, CIK 0001331971.
The Portfolio’s investment objective, risks, charges and expenses are included in the prospectus and should be considered carefully before investing. For a prospectus, call your financial professional, call John Hancock Funds at 1-800-225-5291 or visit the Portfolio’s Web site at www.jhfunds.com. Please read the prospectus carefully before investing or sending money.
| How to contact us | |
|
| |
| Internet | www.jhfunds.com | |
|
| |
| Mail | Regular mail: | Express mail: |
| | John Hancock | John Hancock |
| | Signature Services, Inc. | Signature Services, Inc. |
| | 1 John Hancock Way, Suite 1000 | Mutual Fund Imaging Operations |
| | Boston, MA 02217-1000 | 380 Stuart Street |
| | | Boston, MA 02116 |
|
| |
| Phone | Customer service representatives | 1-800-225-5291 |
| | 24-hour automated information | 1-800-338-8080 |
| | TDD line | 1-800-554-6713 |
A listing of month-end portfolio holdings is available on our Web site, www.jhfunds.com. A more detailed portfolio holdings summary is available on a quarterly basis 60 days after the fiscal quarter on our Web site or upon request by calling 1-800-225-5291, or on the Securities and Exchange Commission’s Web site, www.sec.gov.
40
J O H N H A N C O C K F A M I L Y O F F U N D S
| EQUITY | INTERNATIONAL |
| Balanced Fund | Greater China Opportunities Fund |
| Classic Value Fund | International Classic Value Fund |
| Classic Value Fund II | International Core Fund |
| Core Equity Fund | International Fund |
| Focused Equity Fund | International Growth Fund |
| Growth Fund | |
| Growth Opportunities Fund | INCOME |
| Growth Trends Fund | Bond Fund |
| Intrinsic Value Fund | Government Income Fund |
| Large Cap Equity Fund | High Yield Fund |
| Large Cap Select Fund | Investment Grade Bond Fund |
| Mid Cap Equity Fund | Strategic Income Fund |
| Mid Cap Growth Fund | |
| Multi Cap Growth Fund | TAX-FREE INCOME |
| Small Cap Equity Fund | California Tax-Free Income Fund |
| Small Cap Fund | High Yield Municipal Bond Fund |
| Small Cap Intrinsic Value Fund | Massachusetts Tax-Free Income Fund |
| Sovereign Investors Fund | New York Tax-Free Income Fund |
| U.S. Core Fund | Tax-Free Bond Fund |
| U.S. Global Leaders Growth Fund | |
| Value Opportunities Fund | MONEY MARKET |
| | Money Market Fund |
| ASSET ALLOCATION & LIFESTYLE | U.S. Government Cash Reserve |
| Allocation Core Portfolio | |
| Allocation Growth + Value Portfolio | CLOSED-END |
| Lifestyle Aggressive Portfolio | Bank & Thrift Opportunity |
| Lifestyle Balanced Portfolio | Financial Trends |
| Lifestyle Conservative Portfolio | Income Securities |
| Lifestyle Growth Portfolio | Investors Trust |
| Lifestyle Moderate Portfolio | Patriot Global Dividend |
| | Patriot Preferred Dividend |
| SECTOR | Patriot Premium Dividend I |
| Financial Industries Fund | Patriot Premium Dividend II |
| Health Sciences Fund | Patriot Select Dividend |
| Real Estate Fund | Preferred Income |
| Regional Bank Fund | Preferred Income II |
| Technology Fund | Preferred Income III |
| Technology Leaders Fund | Tax-Advantaged Dividend |
For more complete information on any John Hancock Fund and a prospectus, which includes charges and expenses, call your financial professional, or John Hancock Funds at 1-800-225-5291. Please read the prospectus carefully before investing or sending money.

1-800-225-5291
1-800-554-6713 (TDD)
1-800-338-8080 EASI-Line
www.jhfunds. com |
Now available: electronic delivery
www.jhfunds. com/edelivery |
This report is for the information of the shareholders of John Hancock Lifestyle Balanced Portfolio.


| TABLE OF CONTENTS |
|
| Managers' report |
| page 2 |
|
| A look at performance |
| page 6 |
|
| Your expenses |
| page 8 |
|
| Portfolio’s investments |
| page 10 |
|
| Financial statements |
| page 12 |
|
| Trustees and officers |
| page 31 |
|
| For more information |
| page 36 |
|
CEO corner
To Our Shareholders,
The future has arrived at John Hancock Funds.
We have always been firm believers in the powerful role the Internet can play in providing fund information to our shareholders and prospective investors. Recently, we launched a redesigned, completely overhauled Web site that is more visually pleasing, easier to navigate and, most importantly, provides more fund information and learning tools without overwhelming the user.
Not long after we embarked on this major project, a study was released by the Investment Company Institute, the mutual fund industry’s main trade group, which found that an overwhelming majority of shareholders consider the Internet the “wave of the future” for accessing fund information.
Our new site sports fresher and faster ways to access account information. New innovations allow investors to view funds by risk level, track the performance of the John Hancock funds of their choice or sort funds by Morningstar, Inc.’s star ratings. Investors who own a John Hancock fund through a qualified retirement plan and don’t pay sales charges when making a purchase have the option of sorting by a “Load Waived” Morningstar Rating, thereby creating an apples-to-apples comparison with no-load funds that may also be available in their retirement plan.
The new site also has more educational tools and interactive modules to educate and assist investors with their financial goals, from college savings to retirement planning. A new “I want to…” feature allows investors to check performance, invest more money, update personal information or download prospectuses and forms quickly and easily.
In another of our ongoing efforts to provide our shareholders with top-notch service, we also redesigned our shareholder reports, as you may have noticed with this report. We hope the larger size, more colorful cover and redesigned presentation of the commentary and data tables will draw you in and make them easier to read.
After you’ve read your shareholder report, we encourage you to visit our new Web site — www.jhfunds.com — and take a tour. It’s easy, fast and fun and allows you to be in control of what you see and do. In short, it’s the wave of the future!
Sincerely,

Keith F. Hartstein,
President and Chief Executive Officer |
This commentary reflects the CEO’s views as of August 31, 2006. They are subject to change
at any time. |
Your portfolio at a glance
The Portfolio seeks a balance between a high level of current income and growth of capital, with a greater emphasis on income. To pursue this goal, the Portfolio, which is a fund-of-funds, normally invests approximately 80% of its assets in underlying funds that invest primarily in fixed-income securities and approximately 20% of its assets in underlying funds that invest primarily in equity securities.
Since inception*
► Most fixed-income funds turned in low single-digit gains as investors continued to
worry about rising inflation and higher interest rates.
►The high yield asset class continued to provide strong performance, thanks to investors’
willingness to take on extra credit risk in exchange for higher levels of income relative
to other fixed-income investments.
► The Portfolio’s international equity and domestic large-cap value stock funds helped
boost returns for our shareholders. |
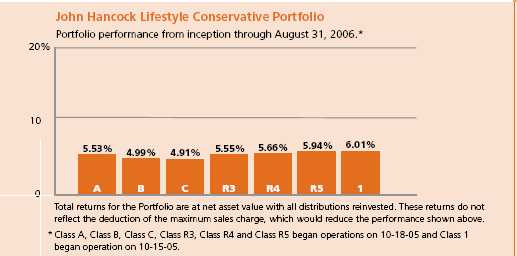
| Target asset allocation | | | | |
| Equity | % of Total | | Fixed Income | % of Total |
|
| U.S. Large Cap | 10.0 | | Long-Term Bond | 5.0 |
|
| International | 5.0 | | Intermediate-Term Bond | 28.0 |
|
| Real Estate | 5.0 | | Short-Term Bond | 11.0 |
|
| | | | Multi-Sector Bond | 16.0 |
| |
|
| | | | High Yield Bond | 8.0 |
| |
|
| | | | Global Bond | 8.0 |
| |
|
| | | | Treasury Inflation-Protected Securities | 4.0 |
| |
|
1
Managers’ report
John Hancock
Lifestyle Conservative Portfolio
The Portfolio’s broad diversification across multiple asset classes and fund managers was very valuable during a volatile market environment. Just about every investment type ended the reporting period in positive territory for the period beginning October 15, 2005 (the Portfolio’s inception date) through August 31, 2006.
Fixed-income securities — which make up approximately 80% of the Portfolio’s assets — generally gained ground but produced mediocre results, with the broad bond market returning 3.33%, as measured by the Lehman Brothers Aggregate Bond Index. A steady stream of interest rate increases from the Federal Reserve Board (the Fed) weighed on bonds’ results. Although investors had long been hoping for a pause in the Fed’s series of rate hikes — a pause that did not come until August 2006 — inflation remained higher than expected and the U.S. central bank raised rates at five of its six meetings during the period. On August 31, 2006, the federal funds rate stood at 5.25%, up from 3.75% the previous October. Once again, the strongest performers in the fixed-income market were lower-rated, higher-yielding bonds. Against a backdrop of low default rates and continued strong fundamentals from bond issuers, credit spreads — the difference in yiel d among bonds of various credit quality — continued to narrow, but ended the period at historically very tight levels.
SCORECARD
| INVESTMENT | | PERIOD’S PERFORMANCE. . . AND WHAT’S BEHIND THE NUMBERS |
| |
| High Yield (Western) | ▲ | High yield bonds continued to benefit in an environment of |
| | | narrowing credit spreads. |
| Real estate securities | ▲ | Benefited from continued fundamental strengthening and demand for |
| | | the securities’ high dividend yields. |
| U.S. Multi-Sector (GMO) | ▼ | An emphasis on certain higher-quality large-cap growth stocks |
| | | detracted from performance in an environment favoring smaller, |
| | | more-speculative names. |
Lifestyle Conservative Portfolio
22
From The MFC Global Investment Management (U.S.A.), LLC’s Portfolio
Management Team |
On the Portfolio’s equity side, results were better, as the Standard & Poor’s 500 Index returned 11.44% during the period. Large-capitalization U.S. stocks again lagged their mid-cap counterparts, which in turn underperformed small caps — although the performance gap between large and small stocks finally began to narrow during the period. Value stocks also continued to outshine growth stocks, despite several brief periods during which growth took the lead. International stocks were particularly strong performers, benefiting from continued relative weakness in the U.S. dollar and greater uncertainty about the direction of interest rates in the United States. Real estate securities also gained ground, helped by continued strong fundamentals and investors’ demand for yield.
“Diversification also helped
within the fixed-income portion
of the Portfolio...” |
Performance summary
John Hancock Lifestyle Conservative Portfolio’s Class A, Class B, Class C, Class R3, Class R4 and Class R5, which began operations on October 18, 2006, produced total returns of 5.53%, 4.99%, 4.91%, 5.55%, 5.66% and 5.94%, respectively, at net asset value through August 31, 2006. Class 1 shares returned 6.01% at net asset value since beginning operation October 15, 2005. In comparison, the Portfolio’s benchmark — a 20/80 blend of the S&P 500 Index and the Lehman Brothers Aggregate Bond Index — returned 4.84% and Morningstar’s average conservative allocation portfolio returned 6.35% .1 Keep in mind that your net asset value return will differ from the Portfolio’s performance if you were not invested in the Portfolio for the entire period and did not reinvest all distributions. See pages six and seven for historical performance information.
Benefits of diversification
During the period, we were successful in developing a portfolio of funds to outperform the overall bond market without exposing our
Lifestyle Conservative Portfolio
3
shareholders to excess levels of volatility. Much of these diversification benefits came from our approximately 20% stake in equity offerings — both domestic and international — including from our exposure to the strong-performing real estate securities market.
On the domestic equity side, for example, we were helped by a number of our large-cap value-oriented investments, such as Equity Income (+13.54%, T. Rowe Price), Value & Restructuring (+11.07%, Excelsior) and Fundamental Value (+10.87%, Davis). On the negative side, U.S. Multi-Sector, managed by GMO, was a relative laggard, gaining just 4.25% during a positive equity market environment. Our international stock investments were significant contributors, as their returns were well in excess of the overall bond market. In particular, the Fund benefited from its positions in International Core (+22.19%, GMO) and International Value (18.22%, Franklin/Templeton). In the real estate sector, our holdings in Real Estate Securities (+30.96%, Deutsche Asset Management) provided particularly strong results and we trimmed this position and reallocated to Global Real Estate.
Diversification also helped within the fixed-income portion of the Portfolio, especially with our high yield bond investments, which continued to enjoy strong gains. High Yield (+6.49%, Western) was one particularly favorable contributor to performance during the reporting period. The diversification theme also extended to individual fixed-income funds in the Portfolio, such as Spectrum Income (+5.47%, T. Rowe Price) whose managers have the flexibility to invest in multiple sectors of the bond market. At 11% of the Portfolio’s assets, Spectrum Income is one of our largest allocations. Other large Portfolio holdings generally performed in line with their benchmarks, including Total Return (+3.18%, PIMCO), at 16% of assets; U.S. Government Securities (+2.91%, Western), at 11%; and Active Bond (+2.98%, MFC Global Investment Management (U.S.) LLC/Declaration) at 10%.
Portfolio changes
To improve the Portfolio’s diversification within the high yield bond asset class, during the second quarter of 2006 we reduced our exposure to the High Yield fund, which was formerly managed by Salomon Brothers Asset Management and is now managed by Western Asset Management. For further diversification, we used the proceeds of
Lifestyle Conservative Portfolio
4
this sale to establish a new Portfolio holding, High Income, managed by MFC Global. We also added to our weighting in U.S. High Yield Bond, managed by Wells Capital Management. Meanwhile, within our multi-sector bond allocation, we trimmed our Strategic Bond (Western) holding while slightly increasing our Spectrum Income weighting and initiating a position in Strategic Income (MFC Global).
“Lifestyle Conservative Portfolio is
well diversified across a wide range
of asset classes and investment styles,
including non-traditional asset classes.” |
We also increased our diversification within the real estate asset class by adding exposure to non-U.S. real estate securities. Because the real estate market outside the United States is less well developed, we believe it offers greater inefficiency and therefore greater return potential. We established a new allocation in Global Real Estate, managed by Deutsche Asset Management.

Outlook
As interest rates have risen, bonds have encountered some difficulty. However, we note that the diversification provided by the Portfolio worked exactly as expected during the period. Although it may seem like a contradiction, maintaining a small allocation to more aggressive assets such as stocks, global bonds and real estate actually reduced risk and improved returns in a predominantly fixed-income portfolio. This is an excellent example of the power of diversification and asset allocation — and why we believe the Portfolio can be an important component of a conservative investor’s portfolio.
This commentary reflects the views of the portfolio managers through the end of the Portfolio’s period discussed in this report. The managers’ statements reflect their own opinions. As such, they are in no way guarantees of future events and are not intended to be used as investment advice or a recommendation regarding any specific security. They are also subject to change at any time as market and other conditions warrant.
International investing involves special risks such as political, economic and currency risks and differences in accounting standards and financial reporting. See the prospectus for the risks of investing in small-cap stocks. See the prospectus for the risks of investing in high-yield bonds.
1 Figures from Morningstar, Inc. include reinvested dividends and do not take into account sales charges. Actual load-adjusted performance is lower.
2 As a percentage of net assets on August 31, 2006.
Lifestyle Conservative Portfolio
5
A look at performance
| For the period ending August 31, 2006 | |
| |
| | | Cumulative total returns |
| | | with maximum sales charge (POP) |
| | |
| | Inception | Since |
| Class | date | Inceptiona |
|
| A | 10-18-05 | 0.27% |
|
| B | 10-18-05 | –0.01 |
|
| C | 10-18-05 | 3.91 |
|
| R3 b | 10-18-05 | 5.55 |
|
| R4b | 10-18-05 | 5.66 |
|
| R5b | 10-18-05 | 5.94 |
|
| 1 b | 10-15-05 | 6.01 |
|
Performance figures assume all distributions are reinvested. Returns with maximum sales charge reflect a sales charge on Class A shares of 5%, and the applicable contingent deferred sales charge (CDSC) on Class B and Class C shares. The Class B shares’ CDSC declines annually between years 1–6 according to the following schedule: 5, 4, 3, 3, 2, 1%. No sales charge will be assessed after the sixth year. Class C shares held for less than one year are subject to a 1% CDSC. Sales charge is not applicable for Class R3, Class R4, Class R5 and Class 1 shares.
The returns reflect past results and should not be considered indicative of future performance. The return and principal value of an investment will fluctuate so that shares, when redeemed, may be worth more or less than their original cost. Due to market volatility, the Portfolio’s current performance may be higher or lower than the performance shown. For performance data current to the most recent month-end, please call 1-800-225-5291 or visit the Portfolio’s Web site at www.jhfunds.com.
The performance table above and the chart on the next page do not reflect the deduction of taxes that a shareholder would pay on fund distributions or the redemption of fund shares.
The Portfolio’s performance results reflect any applicable expense reductions, without which the expenses would increase and results would have been less favorable.
Since inception performance is calculated with an opening price (prior day’s close) on the inception date.
a Class A, Class B, Class C, Class R3, Class R4 and Class R5 shares began operations on 10-18-05 and Class 1 shares began operation on 10-15-05.
b For certain types of investors as described in the Portfolio’s Class R3, Class R4, Class R5 and Class 1 share prospectuses.
Lifestyle Conservative Portfolio
6
Growth of $10,000
This chart shows what happened to a hypothetical $10,000 investment in Class A shares for the period indicated. For comparison, we’ve shown the same investment in a blended index.
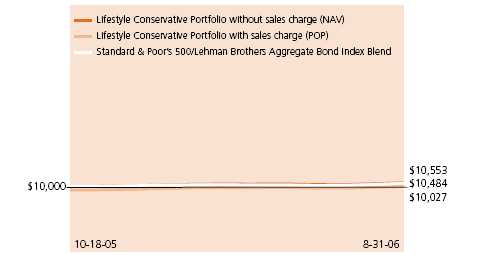
| Class | Period beginning | Without sales charge | With maximum sales charge | Index |
|
| B3 | 10-18-05 | $10,499 | $9,999 | $10,484 |
|
| C3 | 10-18-05 | 10,491 | 10,391 | 10,484 |
|
| R31,3 | 10-18-05 | 10,555 | 10,555 | 10,484 |
|
| R41,3 | 10-18-05 | 10,566 | 10,566 | 10,484 |
|
| R51,3 | 10-18-05 | 10,594 | 10,594 | 10,484 |
|
| 11,2 | 10-15-05 | 10,601 | 10,601 | 10,383 |
|
Assuming all distributions were reinvested for the period indicated, the table above shows the value of a $10,000 investment in the Portfolio’s Class B, Class C, Class R3, Class R4, Class R5 and Class 1 shares, respectively, as of August 31, 2006. Performance of the classes will vary based on the difference in sales charges paid by shareholders investing in the different classes and the fee structure of those classes.
A blended index is used combining 20% of the Standard & Poor’s 500 Index, an unmanaged index that includes 500 widely traded common stocks, and 80% of the Lehman Brothers Aggregate Bond Index, an unmanaged index of dollar-denominated and nonconvertible investment-grade debt issues.
It is not possible to invest directly in an index. Index figures do not reflect sales charges and would be lower if they did.
1 For certain types of investors as described in the Portfolio’s Class R3, Class R4, Class R5 and Class 1 share prospectuses.
2 Index figure from 9-30-05.
3 Index figure from 10-31-05.
Lifestyle Conservative Portfolio
7
Your expenses
These examples are intended to help you understand your ongoing
operating expenses. |
Understanding Portfolio expenses
As a shareholder of the Portfolio, you incur two types of costs:
▪ Transaction costs which include sales charges (loads) on purchases or redemptions
(varies by share class), minimum account fee charge, etc.
▪ Ongoing operating expenses including management fees, distribution and service
fees (if applicable) and other Portfolio expenses. |
In addition to the operating expenses which the Portfolio bears directly, the Portfolio indirectly bears a pro rata share of the operating expenses of the underlying funds in which the Portfolio invests. Because the underlying funds have varied operating expenses and transaction costs and the Portfolio may own different proportions of the underlying funds at different times, the amount of expenses incurred indirectly by the Portfolio will vary. If these indirect expenses were included, your expenses paid during the period would have been higher.
We are going to present only your ongoing operating expenses here.
Actual expenses/actual returns
This example is intended to provide information about your Portfolio’s actual ongoing operating expenses, and is based on your Portfolio’s actual return. It assumes an account value of $1,000.00 on March 1, 2006, with the same investment held until August 31, 2006.
| | Account value | Ending value | Expenses paid during period |
| | on 3-1-06 | on 8-31-06 | ended 8-31-06 a |
|
| Class A | $1,000.00 | $1,019.40 | $2.70 |
|
| Class B | 1,000.00 | 1,016.60 | 6.66 |
|
| Class C | 1,000.00 | 1,016.50 | 6.61 |
|
| Class R3 | 1,000.00 | 1,021.00 | 3.51 |
|
| Class R4 | 1,000.00 | 1,020.80 | 2.29 |
|
| Class R5 | 1,000.00 | 1,022.90 | 0.87 |
|
| Class 1 | 1,000.00 | 1,022.60 | 0.56 |
|
Together with the value of your account, you may use this information to estimate the operating expenses that you paid over the period. Simply divide your account value at
Lifestyle Conservative Portfolio
8
August 31, 2006 by $1,000.00, then multiply it by the “expenses paid” for your share class from the table above. For example, for an account value of $8,600.00, the operating expenses should be calculated as follows:

Hypothetical example for comparison purposes
This table allows you to compare your Portfolio’s ongoing operating expenses with those of any other fund. It provides an example of the Portfolio’s hypothetical account values and hypothetical expenses based on each class’s actual expense ratio and an assumed 5% annual return before expenses (which is not your Portfolio’s actual return). It assumes an account value of $1,000.00 on March 1, 2006, with the same investment held until August 31, 2006. Look in any other fund shareholder report to find its hypothetical example and you will be able to compare these expenses.
| | Account value | Ending value | Expenses paid during period |
| | on 3-1-06 | on 8-31-06 | ended 8-31-06 a |
|
| Class A | $1,000.00 | $1,022.53 | $2.70 |
|
| Class B | 1,000.00 | 1,018.60 | 6.67 |
|
| Class C | 1,000.00 | 1,018.65 | 6.61 |
|
| Class R3 | 1,000.00 | 1,021.73 | 3.52 |
|
| Class R4 | 1,000.00 | 1,022.94 | 2.29 |
|
| Class R5 | 1,000.00 | 1,024.35 | 0.87 |
|
| Class 1 | 1,000.00 | 1,024.65 | 0.56 |
|
Remember, these examples do not include any transaction costs, such as sales charges; therefore, these examples will not help you to determine the relative total costs of owning different funds. If transaction costs were included, your expenses would have been higher. See the prospectus for details regarding transaction costs.
a Expenses are equal to the Portfolio’s annualized expense ratio of 0.53%, 1.31%, 1.30%, 0.69%, 0.45%, 0.17% and 0.11% for Class A, Class B, Class C, Class R3, Class R4, Class R5 and Class 1, respectively, multiplied by the average account value over the period, multiplied by the number of days in the period /365 or 366 (to reflect the one-half year period). The expense ratios do not include fees and expenses incurred by the Portfolio from the underlying funds.
Lifestyle Conservative Portfolio
9
Portfolio’s investments
Securities owned by the Portfolio on 8-31-06
Portfolio of investments, showing all underlying funds.
| Issuer | Shares | Value |
|
| Investment companies 99.99% | | $1,122,093,692 |
| (Cost $1,097,601,204) | | |
John Hancock Funds II | | |
|
| Active Bond Fund Class NAV | 11,676,853 | $112,097,784 |
|
| Blue Chip Growth Fund Class NAV | 1,266,323 | 22,540,556 |
|
| Core Bond Fund Class NAV | 1,787,816 | 22,365,576 |
|
| Equity-Income Fund Class NAV | 1,240,334 | 22,462,455 |
|
| Fundamental Value Fund Class NAV | 1,410,630 | 22,330,275 |
|
| Global Bond Fund Class NAV | 6,061,926 | 89,655,892 |
|
| Global Real Estate Fund Class NAV | 3,307,474 | 34,066,978 |
|
| High Income Fund Class NAV | 2,267,633 | 22,381,534 |
|
| High Yield Fund Class NAV | 4,442,772 | 44,783,146 |
|
| International Value Fund Class NAV | 1,896,422 | 33,908,026 |
|
| Investment Quality Bond Fund Class NAV | 4,765,388 | 55,993,309 |
|
| Real Estate Equity Fund Class NAV | 2,072,821 | 22,780,304 |
|
| Real Return Bond Fund Class NAV | 3,368,735 | 44,871,555 |
|
| Spectrum Income Fund Class NAV | 12,007,658 | 123,318,649 |
|
| Strategic Bond Fund Class NAV | 1,900,350 | 22,367,119 |
|
| Strategic Income Fund Class NAV | 3,339,826 | 33,598,645 |
|
| Total Return Fund Class NAV | 13,052,538 | 179,472,399 |
|
| U.S. Government Securities Fund Class NAV | 9,094,286 | 123,318,512 |
|
| U.S. High Yield Bond Fund Class NAV | 1,712,137 | 22,343,387 |
|
| U.S. Multi Sector Fund Class NAV | 2,170,038 | 22,590,100 |
|
| Value & Restructuring Fund Class NAV | 2,032,200 | 22,516,772 |
Lifestyle Conservative Portfolio
10
F I N A N C I A L S T A T E M E N T S
| Issuer | Shares | Value |
| John Hancock Funds III | | |
|
| International Core Fund Class NAV | 567,057 | $22,330,719 |
|
| Total investments 99.99% | | $1,122,093,692 |
|
| Other assets in excess of liabilities 0.01% | | $151,984 |
|
| Total net assets 100.00% | | $1,122,245,676 |
Percentages are stated as a percent of net assets of the Portfolio.
See notes to financial statements
Lifestyle Conservative Portfolio
11
F I N A N C I A L S T A T E M E N T S
Financial statements
Statement of assets and liabilities 8-31-06
This Statement of Assets and Liabilities is the Portfolio’s balance sheet. It shows the value
of what the Portfolio owns, is due and owes. You’ll also find the net asset value and the
maximum offering price per share. |
| Assets | |
|
| Investments in affiliated funds, at value (cost $1,097,601,204) | $1,122,093,692 |
| Receivable for investments sold | 16,521 |
| Receivable for fund shares sold | 594,102 |
| Other assets | 3,199 |
| Total assets | 1,122,707,514 |
|
| Liabilities | |
|
| Payable for investments purchased | 323,376 |
| Payable for fund shares repurchased | 22,957 |
| Payable to affiliates | |
| Fund administration fees | 19,885 |
| Transfer agent fees | 8,061 |
| Trustees’ fees | 236 |
| Due to adviser | 1,144 |
| Other payables and accrued expenses | 86,179 |
| Total liabilities | 461,838 |
|
| Net assets | |
|
| Capital paid-in | 1,084,398,395 |
| Accumulated net realized gain on investments | 12,734,242 |
| Net unrealized appreciation on investments | 24,492,488 |
| Accumulated net investment income | 620,551 |
| Net assets | $1,122,245,676 |
|
| Net asset value per share | |
|
| Based on net asset values and shares outstanding | |
| — the Portfolio has an unlimited number of shares authorized with no par value | |
| Class A ($12,359,401 ÷ 906,463 shares) | $13.63 |
| Class B ($2,960,262 ÷ 217,223 shares) | $13.63 |
| Class C ($8,305,380 ÷ 609,807 shares) | $13.62 |
| Class R3 ($297,906 ÷ 21,827 shares) | $13.65 |
| Class R4 ($703,562 ÷ 51,572 shares) | $13.64 |
| Class R5 ($295,346 ÷ 21,635 shares) | $13.65 |
| Class 1 ($1,097,323,819 ÷ 80,478,108 shares) | $13.64 |
|
| Maximum offering price per share | |
|
| Class A1 ($13.63 ÷ 95%) | $14.35 |
1 On single retail sales of less than $50,000. On sales of $50,000 or more and on group sales the offering price is reduced.
See notes to financial statements
Lifestyle Conservative Portfolio
12
F I N A N C I A L S T A T E M E N T S
Statement of operations For the period ended 8-31-06a
This Statement of Operations summarizes the Portfolio’s investment income earned and
expenses incurred in operating the Portfolio. It also shows net gains (losses) for the
period stated. |
| Investment income | |
| Income distributions received from affiliated underlying funds | $23,080,110 |
Total investment income | 23,080,110 |
|
| Expenses | |
| Investment management fees (Note 3) | 365,900 |
| Distribution and service fees (Note 3) | 477,073 |
| Transfer agent fees (Note 3) | 11,912 |
| Blue sky fees (Note 3) | 95,830 |
| Printing and postage fees (Note 3) | 22,906 |
| Fund administration fees (Note 3) | 77,124 |
| Audit and legal fees | 58,980 |
| Custodian fees | 10,438 |
| Trustees’ fees (Note 3) | 10,734 |
| Registration and filing fees | 32,664 |
| Miscellaneous | 7,906 |
| |
| Total expenses | 1,171,467 |
| Less expense reductions (Note 3) | (108,345) |
| |
| Net expenses | 1,063,122 |
| |
| Net investment income | 22,016,988 |
|
| Realized and unrealized gain | |
|
| Net realized gain on investments | 12,725,793 |
| Capital gain distributions received from affiliated underlying funds | 838,352 |
| Change in net unrealized appreciation of investments | 24,492,488 |
| Net realized and unrealized gain | 38,056,633 |
| Increase in net assets from operations | $60,073,621 |
a Period from 10-15-05 (commencement of operations) to 8-31-06.
See notes to financial statements
Lifestyle Conservative Portfolio
13
F I N A N C I A L S T A T E M E N T S
Statement of changes in net assets
This Statement of Changes in Net Assets shows how the value of the Portfolio’s net
assets has changed during the period. It reflects earnings less expenses, any investment
gains and losses, distributions, if any, paid to shareholders and the net of Portfolio
share transactions. |
| | Period |
| | ended a |
| | 8-31-06 |
|
| Increase (decrease) in net assets | |
| |
| From operations | |
| Net investment income | $22,016,988 |
| Net realized gain | 13,564,145 |
| Change in net unrealized appreciation | 24,492,488 |
| |
| Increase in net assets resulting from operations | 60,073,621 |
| |
| Distributions to shareholders | |
| From net investment income | |
| Class A | (125,005) |
| Class B | (20,839) |
| Class C | (56,558) |
| Class R3 | (3,046) |
| Class R4 | (6,698) |
| Class R5 | (5,036) |
| Class 1 | (22,120,363) |
| | (22,337,545) |
| |
| From Fund share transactions | 1,084,509,600 |
|
| Net assets | |
| End of period | $1,122,245,676 |
| |
| Accumulated net investment income | $620,551 |
a Period from 10-15-05 (commencement of operations) to 8-31-06.
See notes to financial statements
Lifestyle Conservative Portfolio
14
F I N A N C I A L S T A T E M E N T S
Financial highlights
The Financial Highlights show how the Portfolio’s net asset value for a share has changed
since the beginning of the period. |
| CLASS A SHARES | |
| |
| Period ended | 8-31-06a |
|
| Per share operating performance | |
|
| Net asset value, beginning of period | $13.16 |
| Net investment income h,v | 0.31 |
| Net realized and unrealized | |
| gain on investments | 0.41 |
| |
| Total from investment operations | 0.72 |
| |
| Less distributions | |
| From net investment income | (0.25) |
| | (0.25) |
| Net asset value, end of period | $13.63 |
| Total return k,l (%) | 5.53m |
|
| Ratios and supplemental data | |
|
| Net assets, end of period | |
| (in millions) | $12 |
| Ratio of net expenses to average | |
| net assets q (%) | 0.57r |
| Ratio of gross expenses to average | |
| net assets p,q (%) | 1.02r |
| Ratio of net investment income | |
| to average net assets v (%) | 2.75r |
| Portfolio turnover (%) | 20m |
See notes to financial statements
Lifestyle Conservative Portfolio
15
F I N A N C I A L S T A T E M E N T S
Financial highlights
| CLASS B SHARES | |
| |
| Period ended | 8-31-06a |
|
| Per share operating performance | |
| Net asset value, beginning of period | $13.16 |
| Net investment income h,v | 0.24 |
| Net realized and unrealized | |
| gain on investments | 0.41 |
| |
| Total from investment operations | 0.65 |
| Less distributions | |
| From net investment income | (0.18) |
| | (0.18) |
| Net asset value, end of period | $13.63 |
| Total return k,l (%) | 4.99m |
|
| Ratios and supplemental data | |
|
| Net assets, end of period | |
| (in millions) | $3 |
| Ratio of net expenses to average | |
| net assets q (%) | 1.33r |
| Ratio of gross expenses to average | |
| net assets p,q (%) | 3.12r |
| Ratio of net investment income | |
| to average net assets v (%) | 2.08r |
| Portfolio turnover (%) | 20m |
See notes to financial statements
Lifestyle Conservative Portfolio
16
F I N A N C I A L S T A T E M E N T S
Financial highlights
| CLASS C SHARES | |
| |
| Period ended | 8-31-06a |
|
| Per share operating performance | |
| Net asset value, beginning of period | $13.16 |
| Net investment income h,v | 0.29 |
| Net realized and unrealized | |
| gain on investments | 0.35 |
| |
| Total from investment operations | 0.64 |
| |
| Less distributions | |
| From net investment income | (0.18) |
| | (0.18) |
| Net asset value, end of period | $13.62 |
| Total return k,l (%) | 4.91m |
|
| Ratios and supplemental data | |
|
| Net assets, end of period | |
| (in millions) | $8 |
| Ratio of net expenses to average | |
| net assets q (%) | 1.31r |
| Ratio of gross expenses to average | |
| net assets p,q (%) | 2.05r |
| Ratio of net investment income | |
| to average net assets v (%) | 2.54r |
| Portfolio turnover (%) | 20m |
See notes to financial statements
Lifestyle Conservative Portfolio
17
F I N A N C I A L S T A T E M E N T S
Financial highlights
| CLASS R3 SHARES | |
| |
| Period ended | 8-31-06a |
|
| Per share operating performance | |
|
| Net asset value, beginning of period | $13.16 |
| Net investment income h,v | 0.28 |
| Net realized and unrealized | |
| gain on investments | 0.44 |
| |
| Total from investment operations | 0.72 |
| |
| Less distributions | |
| From net investment income | (0.23) |
| | (0.23) |
| Net asset value, end of period | $13.65 |
| Total return k,l (%) | 5.55m |
|
| Ratios and supplemental data | |
|
| Net assets, end of period | |
| (in millions) | $—i |
| Ratio of net expenses to average | |
| net assets q (%) | 0.68r |
| Ratio of gross expenses to average | |
| net assets p,q (%) | 14.72r |
| Ratio of net investment income | |
| to average net assets v (%) | 2.46r |
| Portfolio turnover (%) | 20m |
See notes to financial statements
Lifestyle Conservative Portfolio
18
F I N A N C I A L S T A T E M E N T S
Financial highlights
| CLASS R4 SHARES | |
| |
| Period ended | 8-31-06a |
|
| Per share operating performance | |
|
| Net asset value, beginning of period | $13.16 |
| Net investment income h,v | 0.44 |
| Net realized and unrealized | |
| gain on investments | 0.30 |
| |
| Total from investment operations | 0.74 |
| |
| Less distributions | |
| From net investment income | (0.26) |
| | (0.26) |
| Net asset value, end of period | $13.64 |
| Total return k,l (%) | 5.66m |
|
| Ratios and supplemental data | |
|
| Net assets, end of period | |
| (in millions) | $1 |
| Ratio of net expenses to average | |
| net assets q (%) | 0.45r |
| Ratio of gross expenses to average | |
| net assets p,q (%) | 10.01r |
| Ratio of net investment income | |
| to average net assets v (%) | 3.89r |
| Portfolio turnover (%) | 20m |
See notes to financial statements
Lifestyle Conservative Portfolio
19
F I N A N C I A L S T A T E M E N T S
Financial highlights
| CLASS R5 SHARES | |
| |
| Period ended | 8-31-06a |
|
| Per share operating performance | |
|
| Net asset value, beginning of period | $13.16 |
| Net investment income h,v | 0.28 |
| Net realized and unrealized | |
| gain on investments | 0.49 |
| |
| Total from investment operations | 0.77 |
| |
| Less distributions | |
| From net investment income | (0.28) |
| | (0.28) |
| Net asset value, end of period | $13.65 |
| Total return k,l (%) | 5.94m |
|
| Ratios and supplemental data | |
|
| Net assets, end of period | |
| (in millions) | $—i |
| Ratio of net expenses to average | |
| net assets q (%) | 0.19r |
| Ratio of gross expenses to average | |
| net assets p,q (%) | 9.18r |
| Ratio of net investment income | |
| to average net assets v (%) | 2.44r |
| Portfolio turnover (%) | 20m |
See notes to financial statements
Lifestyle Conservative Portfolio
20
F I N A N C I A L S T A T E M E N T S
Financial highlights
| CLASS 1 SHARES | |
| |
| Period ended | 8-31-06a |
|
| Per share operating performance | |
|
| Net asset value, beginning of period | $13.15 |
| Net investment income h,v | 0.30 |
| Net realized and unrealized | |
| gain on investments | 0.48 |
| |
| Total from investment operations | 0.78 |
| |
| Less distributions | |
| From net investment income | (0.29) |
| | (0.29) |
| Net asset value, end of period | $13.64 |
| Total return k (%) | 6.01m |
|
| Ratios and supplemental data | |
|
| Net assets, end of period | |
| (in millions) | $1,097 |
| Ratio of net expenses to average | |
| net assets q (%) | 0.12r |
| Ratio of net investment income | |
| to average net assets v (%) | 2.54r |
| Portfolio turnover (%) | 20m |
a Class A, Class B, Class C, Class R3, Class R4 and Class R5 shares began operations on 10-18-05, and Class 1 shares began operation on 10-15-05.
h Based on the average of the shares outstanding.
i Less than $500,000.
k Assumes dividend reinvestment and does not reflect the effect of sales charges.
l Total returns would have been lower had certain expenses not been reduced during the period shown.
m Not annualized.
p Does not take into consideration expense reductions during the period shown.
q Does not include expenses of the investment companies in which the Portfolio invests.
r Annualized.
v Recognition of net investment income by the Portfolio is affected by the timing of the declaration of dividends by the underlying investment companies in which the Portfolio invests.
See notes to financial statements
Lifestyle Conservative Portfolio
21
Notes to financial statements
1. Organization
The John Hancock Lifestyle Conservative Portfolio (the “Portfolio”) is a newly organized non-diversified series of John Hancock Funds II (the “Trust”). The Trust was established as a Massachusetts business trust on June 28, 2005. The Trust is registered under the Investment Company Act of 1940, as amended (the “1940 Act”), as an open-end investment management company.
The Portfolio operates as a “fund of funds”, investing in Class NAV shares of underlying funds of the Trust and John Hancock Funds III and in other permitted investments.
John Hancock Investment Management Services, LLC (the “Adviser”), a Delaware limited liability company controlled by John Hancock Life Insurance Company (U.S.A.) (“John Hancock USA”), serves as investment adviser for the Trust and John Hancock Funds, LLC, (the “Distributor”), an affiliate of the Adviser, serves as principal underwriter. John Hancock Life Insurance Company of New York (“John Hancock New York”) is a wholly owned subsidiary of John Hancock USA. John Hancock USA and John Hancock New York are indirect wholly owned subsidiaries of The Manufacturers Life Insurance Company (“Manulife”), which in turn is a wholly owned subsidiary of Manulife Financial Corporation (“MFC”), a publicly traded company. MFC and its subsidiaries are known collectively as “Manulife Financial.”
The Portfolio commenced operations after certain separate accounts of John Hancock USA redeemed their interests in portfolios of John Hancock Trust and certain unaffiliated mutual funds of approximately $214 million at the close of business on October 14, 2005, with additional redemption proceeds of approximately $741 million received on October 28, 2005, and invested such proceeds in Class 1 shares of the Portfolio, which in turn invested the proceeds in underlying funds of the Trust.
The Board of Trustees has authorized the issuance of multiple classes of shares of the Portfolio, including classes designated as Class A, Class B, Class C, Class R3, Class R4, Class R5 and Class 1 shares. Class A, B, and C shares are open to all retail investors.
Class 1 shares are sold only to certain exempt separate accounts of John Hancock USA and John Hancock New York. Class R3, R4 and R5 shares are available only to certain retirement plans.
The shares of each class represent an interest in the same portfolio of investments of the Portfolio, and have equal rights as to voting, redemptions, dividends and liquidation, except that certain expenses, subject to the approval of the Trustees, may be applied differently to each class of shares in accordance with current regulations of the SEC and the Internal Revenue Service. Shareholders of a class that bears distribution and service expenses under the terms of a distribution plan have exclusive voting rights to that distribution plan. Class B shares will convert to Class A shares eight years after purchase.
2. Significant accounting policies
In the preparation of the financial statements, the Portfolio follows the policies described below. The preparation of financial statements in conformity with accounting principles generally accepted in the United States of America requires management to make estimates and assumptions that affect the reported amounts of assets and liabilities at the date of the financial statements and the reported amounts of income and expenses during the reporting period. Actual results may differ from these estimates.
Lifestyle Conservative Portfolio
22
Securities valuation
The net asset value of the shares of the Portfolio is determined daily as of the close of the New York Stock Exchange, normally at 4:00 p.m. Eastern Time. Investments in underlying funds are valued at their respective net asset values each business day, or at fair value as determined in good faith in accordance with procedures approved by the Trustees. Securities in the underlying funds’ portfolios are valued in accordance with their respective valuation polices, as outlined in the underlying funds’ financial statements. Short-term debt investments that have a remaining maturity of 60 days or less are valued at amortized cost.
Security transactions and related
investment income
Investment security transactions in the underlying funds are accounted for on a trade date plus one basis for daily net asset value calculations. However, for financial reporting purposes, investment transactions are reported on trade date. Interest income is accrued as earned. Dividend income and capital gain distributions are recorded on the ex-dividend date.
Gains and losses on securities sold are determined on the basis of specific identified cost for both financial and federal income tax reporting purposes.
Multi-class operations
All income, expenses (except for class-specific expenses) and realized and unrealized gains (losses) are allocated to each class of shares based upon the relative net assets of each class. Dividends to shareholders from net investment income are determined at a class level and distributions from capital gains are determined at a Portfolio level.
Expense allocation
Expenses not directly attributable to a particular Portfolio or class of shares are allocated based on the relative share of net assets of the Portfolio at the time the expense was incurred. Class-specific expenses, such as transfer agency fees, blue sky fees, printing and postage fees and distribution and service fees, are accrued daily and charged directly to the respective share classes. Expenses in the Portfolio’s Statement of Operations reflect the expenses of the Portfolio and do not include any indirect expenses related to the underlying funds. Because the underlying funds have varied expense levels and the Portfolio may own different proportions of the underlying funds at different times, the amount of fees and expenses incurred indirectly by the Portfolio will vary.
Federal income taxes
The Portfolio qualifies as a “regulated investment company” by complying with the applicable provisions of the Internal Revenue Code and will not be subject to federal income tax on taxable income that is distributed to shareholders. Therefore, no federal income tax provision is required.
New accounting pronouncement
In June 2006, Financial Accounting Standards Board (FASB) Interpretation No. 48, Accounting for Uncertainty in Income Taxes (the “Interpretation”) was issued and is effective for fiscal years beginning after December 15, 2006 and is to be applied to all open tax years as of the effective date. This Interpretation prescribes a minimum threshold for financial statement recognition of the benefit of a tax position taken or expected to be taken in a tax return, and requires certain expanded disclosures. Management is currently evaluating the application of the Interpretation to the Portfolio and has not at this time quantified the impact, if any, resulting from the adoption of this Interpretation on the Portfolio’s financial statements.
In September 2006, FASB Standard No. 157, Fair Value Measurements (“FAS 157”) was issued, and is effective for fiscal years beginning after November 15, 2007. FAS 157 defines fair value, establishing a framework for measuring fair value and expands disclosure about fair value measurements. Management is currently evaluating the application of FAS 157 to the Portfolio, and its impact, if any, resulting from the adoption of FAS 157 on the Portfolio’s financial statements.
Distribution of income and gains
The Portfolio records distributions to shareholders from net investment income and net realized gains, if any, on the ex-dividend date.
Lifestyle Conservative Portfolio
23
During the period ended August 31, 2006, the tax character of distributions paid was as follows: ordinary income $22,337,545. Distributions paid by the Portfolio with respect to each class of shares are calculated in the same manner, at the same time and are in the same amount, except for the effect of expenses that may be applied differently to each class. Such distributions, on a tax basis, are determined in conformity with income tax regulations, which may differ from accounting principles generally accepted in the United States of America. Distributions in excess of tax basis earnings and profits, if any, are reported in the Portfolio’s financial statements as a return of capital. As of August 31, 2006, the components of distributable earnings on a tax basis included $13,346,451 of undistributed ordinary income and $8,342 of undistributed long-term gain.
Capital accounts
The Portfolio reports the undistributed net investment income and accumulated undistributed net realized gain (loss) accounts on a basis approximating amounts available for future tax distributions (or to offset future taxable realized gains when a capital loss carryforward is available). Accordingly, the Portfolio may periodically make reclassifications among certain capital accounts, without affecting its net asset value.
3. Investment advisory and
other agreements |
Advisory fees
The Trust has entered into an Investment Advisory Agreement with the Adviser. The Adviser is responsible for managing the corporate and business affairs of the Trust and for selecting and compensating subadvisers to handle the investment and reinvestment of the assets of the Portfolio, subject to the supervision of the Board of Trustees. Under the Advisory Agreement, the Portfolio pays a monthly management fee to the Adviser equivalent, on an annual basis, to its pro rata portion of the sum of: (a) 0.05% of the first $7,500,000,000 of the aggregate daily net assets and (b) 0.04% of the aggregate daily net assets in excess of $7,500,000,000 of the five Lifestyle Portfolios of the Trust (Lifestyle Aggressive, Lifestyle Growth, Lifestyle Balanced, Lifestyle Moderate and Lifestyle Conservative) and the five Lifestyle Portfolios of John Hancock Trust (Lifestyle Aggressive, Lifestyle Growth, Lifestyle Balanced, Lifestyle Moderate and Lifestyle Co nservative). The Portfolio is not responsible for payment of the subadvisory fees.
Expense reimbursements
The Adviser has contractually agreed to waive advisory fees or reimburse the Portfolio’s expenses for Class A, Class B, Class C, Class R3, Class R4 and Class R5 shares to the extent that blue sky fees and printing and postage expenses attributable to each class exceed 0.09% of the average annual net assets attributable to the classes, at least until November 1, 2006, and may thereafter be terminated by the Adviser at any time. Accordingly, the expense reductions related to this expense limitation amounted to $19,988, $18,459, $17,947, $17,104, $16,789 and $17,356 for Class A, Class B, Class C, Class R3, Class R4 and Class R5, respectively, for the period ended August 31, 2006.
Administration fees
The Portfolio has an agreement with the Adviser that requires the Portfolio to reimburse the Adviser for all expenses associated with providing the administrative, financial, accounting and recordkeeping services of the Portfolio, including the preparation of all tax returns, annual, semiannual and periodic reports to shareholders and the preparation of all regulatory reports.
Distribution plans
The Trust has a Distribution Agreement with the Distributor. The Portfolio has adopted Distribution Plans with respect to Class A, Class B, Class C, Class R3, Class R4 and Class 1, pursuant to Rule 12b-1 under the 1940 Act to reimburse the Distributor for the services it provides as distributor of shares of the Portfolio. Accordingly, the Portfolio makes monthly payments to the Distributor at an annual rate not to exceed 0.30%, 1.00%, 1.00%, 0.50%, 0.25% and 0.05% of the average daily net assets of Class A, Class B, Class C,
Lifestyle Conservative Portfolio
24
Class R3, Class R4 and Class 1, respectively. A maximum of 0.25% of such payments may be service fees, as defined by the Conduct Rules of the National Association of Securities Dealers. Under the Conduct Rules, curtailment of a portion of the Portfolio’s 12b-1 payments could occur under certain circumstances.
The Portfolio has also adopted a Service Plan with respect to Class R3, Class R4 and Class R5 shares (the “Service Plan”). Under the Service Plan, the Portfolio pays up to 0.15%, 0.10% and 0.05% of the average daily net assets of Class R3, Class R4 and Class R5 shares, respectively, for certain other services.
Sales charges
Class A shares are assessed up-front sales charges of up to 5% of the net asset value of such shares. During the period ended August 31, 2006, the Portfolio was informed that the Distributor received net up-front sales charges of $203,967 with regard to sales of Class A shares. Of this amount, $37,633 was retained and used for printing prospectuses, advertising, sales literature and other purposes, $165,887 was paid as sales commissions to unrelated broker-dealers and $447 was paid as sales commissions to sales personnel of Signator Investors, Inc. (“Signator Investors”), a related broker-dealer, an indirect subsidiary of MFC.
Class B shares that are redeemed within six years of purchase are subject to a contingent deferred sales charge (“CDSC”) at declining rates, beginning at 5.00% of the lesser of the current market value at the time of redemption or the original purchase cost of the shares being redeemed. Class C shares that are redeemed within one year of purchase are subject to a CDSC at a rate of 1.00% of the lesser of the current market value at the time of redemption or the original purchase cost of the shares being redeemed. Proceeds from the CDSCs are paid to the Distributor and are used, in whole or in part, to defray its expenses for providing distribution-related services to the Portfolio in connection with the sale of Class B and Class C shares. During the period ended August 31, 2006, the Portfolio was informed that CDSCs received by the Distributor amounted to $1,755 for Class B shares and $420 for Class C shares.
Transfer agent fees
The Portfolio has a Transfer Agency Agreement with John Hancock Signature Services, Inc. (“Signature Services”), an indirect subsidiary of MFC. For Class A, Class B, Class C, Class R3, Class R4 and Class R5 shares, the Portfolio pays a monthly transfer agent fee at an annual rate of 0.05% of each class’s average daily net assets, plus a fee based on the number of shareholder accounts and reimbursement for certain out-of-pocket expenses. Expenses not directly attributable to a particular class of shares are aggregated and allocated to each class on the basis of its relative net asset value.
Signature Services has agreed to limit the transfer agent fees so that such fees do not exceed 0.20% annually of each of Class A, Class B, Class C, Class R3, Class R4 and Class R5 share average daily net assets. This agreement is effective until December 31, 2006. Signature Services reserves the right to terminate this limitation in the future. In addition, Signature Services has voluntarily agreed to further limit transfer agent fees for Class R3, Class R4 and Class R5 shares so that such fees do not exceed 0.05% annually of each class’s average daily net assets. Accordingly, the transfer agent fees reductions amounted to $166, $244 and $292 for Class R3, Class R4 and Class R5 shares, respectively, during the period ended August 31, 2006. Signature Services reserves the right to terminate this limitation at any time.
Lifestyle Conservative Portfolio
25
| Expenses under the agreements described above for the period ended August 31, 2006, were as follows: |
| |
| | Distribution | Transfer | | Printing and |
| Share Class | and service fees | agent | Blue sky | postage |
|
| |
| Class A | $13,027 | $5,061 | $16,139 | $7,758 |
| Class B | 10,235 | 1,954 | 15,948 | 3,432 |
| Class C | 24,052 | 4,006 | 16,089 | 4,023 |
| Class R3 | 621 | 211 | 15,774 | 1,441 |
| Class R4 | 460 | 319 | 15,774 | 1,176 |
| Class R5 | 1 | 361 | 16,106 | 1,429 |
| Class 1 | 428,677 | — | — | 3,647 |
| Total | $477,073 | $11,912 | $95,830 | $22,906 |
Trustees’ fees
The Trust compensates each Trustee who is not an employee of the Adviser or its affiliates. Total Trustees’ expenses are allocated based on each Portfolio’s average daily net asset value.
4. Guarantees and Indemnifications
Under the Trust’s organizational documents, its Officers and Trustees are indemnified against certain liability arising out of the performance of their duties to the Trust. Additionally, in the normal course of business, the Trust enters into contracts with service providers that contain general indemnification clauses. The Trust’s maximum exposure under these arrangements is unknown, as this would involve future claims that may be made against the Trust that have not yet occurred. However, based on experience, the Trust believes the risk of loss to be remote.
5. Capital shares
Share activities for the Portfolio for the period ended August 31, 2006 were as follows:
| | Period ended 8-31-06a |
| | Shares | Amount |
|
| Class A shares | | |
|
| Sold | 970,480 | $13,042,633 |
| Distributions reinvested | 8,061 | 106,760 |
| Repurchased | (72,078) | (970,334) |
| Net increase | 906,463 | $12,179,059 |
|
| Class B shares | | |
|
| Sold | 227,435 | $3,046,846 |
| Distributions reinvested | 1,215 | 16,097 |
| Repurchased | (11,427) | (153,081) |
| Net increase | 217,223 | $2,909,862 |
|
| Class C shares | | |
|
| Sold | 621,340 | $8,332,624 |
| Distributions reinvested | 3,508 | 46,442 |
| Repurchased | (15,041) | (203,312) |
| Net increase | 609,807 | $8,175,754 |
Lifestyle Conservative Portfolio
26
| | Period ended 8-31-06a |
| | Shares | Amount |
|
| Class R3 shares | | |
|
| Sold | 21,755 | $290,487 |
| Distributions reinvested | 96 | 1,277 |
| Repurchased | (24) | (327) |
| Net increase | 21,827 | $291,437 |
|
| |
| Class R4 shares | | |
|
| Sold | 51,727 | $693,385 |
| Distributions reinvested | 359 | 4,751 |
| Repurchased | (514) | (6,839) |
| Net increase | 51,572 | $691,297 |
|
| |
| Class R5 shares | | |
|
| Sold | 22,121 | $294,449 |
| Distributions reinvested | 219 | 2,896 |
| Repurchased | (705) | (9,504) |
| Net increase | 21,635 | $287,841 |
|
| |
| Class 1 shares | | |
|
| Sold | 82,605,957 | $1,088,806,246 |
| Distributions reinvested | 1,669,737 | 22,120,363 |
| Repurchased | (3,797,586) | (50,952,259) |
| Net increase | 80,478,108 | $1,059,974,350 |
|
| |
| Net increase | 82,306,635 | $1,084,509,600 |
a Class A, Class B, Class C, Class R3, Class R4 and Class R5 shares began operations on 10-18-05, and Class 1 shares began operation on 10-15-05.
6. Investment transactions
Purchases and sales of the underlying funds during the period ended August 31, 2006, aggregated $1,295,924,477 and $211,049,066, respectively.
The cost of investments owned on August 31, 2006, including short-term investments, for federal income tax purposes, was $1,097,601,204. Gross unrealized appreciation and depreciation of investments aggregated $25,040,986 and $548,498, respectively, resulting in net unrealized appreciation of $24,492,488.
7. Investment in affiliated
underlying funds |
The Portfolio invests primarily in the underlying funds that are managed by affiliates of the Adviser. The Portfolio does not invest in the underlying funds for the purpose of exercising management or control.
A summary of the Portfolio’s transactions in the securities of affiliated issuers in which the Portfolio’s holdings represent 5% or more of the outstanding voting securities of the issuer, during the period ended August 31, 2006 is set forth below.
Lifestyle Conservative Portfolio
27
| Affiliate — | Shares | Shares | Ending Share | | Ending |
| Class NAV | Purchased | Sold | Amount | Proceeds | Value |
|
| Active Bond | 11,802,252 | 125,399 | 11,676,853 | $1,206,024 | $112,097,784 |
| Blue Chip Growth | 1,364,197 | 97,874 | 1,266,323 | 1,737,077 | 22,540,556 |
| Core Bond | 1,793,949 | 6,133 | 1,787,816 | 76,768 | 22,365,576 |
| Equity-Income | 1,324,589 | 84,255 | 1,240,334 | 1,452,194 | 22,462,455 |
| Fundamental Value | 1,489,354 | 78,724 | 1,410,630 | 1,205,982 | 22,330,275 |
| Global Bond | 6,400,164 | 338,238 | 6,061,926 | 4,886,884 | 89,655,892 |
| Global Real Estate | 3,534,808 | 227,334 | 3,307,474 | 2,206,835 | 34,066,978 |
| High Income | 2,268,231 | 598 | 2,267,633 | 5,902 | 22,381,534 |
| High Yield | 7,625,047 | 3,182,275 | 4,442,772 | 33,212,442 | 44,783,146 |
| International Core* | 567,063 | 6 | 567,057 | 243 | 22,330,719 |
| International Stock | 2,096,544 | 2,096,544 | — | 28,695,699 | — |
| International Value | 2,306,371 | 409,949 | 1,896,422 | 6,957,524 | 33,908,026 |
| Investment Quality Bond | 4,823,671 | 58,283 | 4,765,388 | 689,386 | 55,993,309 |
| Real Estate Equity | 2,219,693 | 146,872 | 2,072,821 | 1,524,383 | 22,780,304 |
| Real Estate Securities | 2,297,538 | 2,297,538 | — | 62,052,189 | — |
| Real Return Bond | 3,421,010 | 52,275 | 3,368,735 | 695,294 | 44,871,555 |
| Spectrum Income | 12,118,904 | 111,246 | 12,007,658 | 1,128,399 | 123,318,649 |
| Strategic Bond | 6,312,683 | 4,412,333 | 1,900,350 | 52,461,152 | 22,367,119 |
| Strategic Income | 3,340,661 | 835 | 3,339,826 | 8,295 | 33,598,645 |
| Total Return | 13,287,977 | 235,439 | 13,052,538 | 3,220,507 | 179,472,399 |
| U.S. Government | | | | | |
| Securities | 9,246,831 | 152,545 | 9,094,286 | 2,059,959 | 123,318,512 |
| U.S. High Yield Bond | 1,714,291 | 2,154 | 1,712,137 | 28,000 | 22,343,387 |
| U.S. Multi Sector | 2,279,765 | 109,727 | 2,170,038 | 1,144,986 | 22,590,100 |
| Value & Restructuring | 2,427,471 | 395,271 | 2,032,200 | 4,392,942 | 22,516,772 |
*Represents the Portfolio’s investment in John Hancock Funds III International Core Fund
8. Reclassification of accounts
During the period ended August 31, 2006, the Portfolio reclassified amounts to reflect a decrease in accumulated net realized gain on investments of $829,903, an increase in accumulated net investment income of $941,108 and a decrease in capital paid-in of $111,205. This represents the amounts necessary to report these balances on a tax basis, excluding certain temporary differences, as of August 31, 2006. Additional adjustments may be needed in subsequent reporting periods.These reclassifications, which have no impact on the net asset value of the Portfolio, are primarily attributable to certain differences in the computation of distributable income and capital gains under federal tax rules versus accounting principles generally accepted in the United States of America and book and tax differences in accounting for non-deductible organizational costs. The calculation of net investment income per share in the Portfolio’s Financial Highlights excludes these adjustments.
Lifestyle Conservative Portfolio
28
Auditors’ report
Report of Independent Registered Public Accounting Firm
To the Board of Trustees of John Hancock Funds II and Shareholders of John Hancock
Lifestyle Conservative Portfolio: |
In our opinion, the accompanying statement of assets and liabilities, including the schedule of securities owned, and the related statements of operations and of changes in net assets and the financial highlights present fairly, in all material respects, the financial position of John Hancock Lifestyle Conservative Portfolio (the “Portfolio”) at August 31, 2006, and the results of its operations, the changes in its net assets, and the financial highlights for the period October 15, 2005 (commencement of operations) through August 31, 2006, in conformity with accounting principles generally accepted in the United States of America. These financial statements and financial highlights (hereafter referred to as “financial statements”) are the responsibility of the Portfolio’s management; our responsibility is to express an opinion on these financial statements based on our audit. We conducted our audit of these financial statements in accordance with the standards of the Public Company Accounting Oversight Board (United States). Those standards require that we plan and perform the audit to obtain reasonable assurance about whether the financial statements are free of material misstatement. An audit includes examining, on a test basis, evidence supporting the amounts and disclosures in the financial statements, assessing the accounting principles used and significant estimates made by management, and evaluating the overall financial statement presentation. We believe that our audit, which included confirmation of securities at August 31, 2006, by correspondence with the transfer agent, provides a reasonable basis for our opinion.
PricewaterhouseCoopers LLP
Boston, Massachusetts
October 26, 2006 |
29
For federal income tax purposes, the following information is furnished with respect to the distributions of the Portfolio, if any, paid during its taxable year ended August 31, 2006.
With respect to the ordinary dividends paid by the Portfolio for the fiscal period ended August 31, 2006, 67.19% of the dividends qualify for the corporate dividends-received deduction.
The Portfolio hereby designates the maximum amount allowable of its net taxable income as qualified dividend income as provided in the Jobs and Growth Tax Relief Reconciliation Act of 2003. This amount will be reflected on Form 1099-DIV for the calendar year 2006.
Shareholders will be mailed a 2006 U.S. Treasury Department Form 1099-DIV in January 2007. This will reflect the total of all distributions that are taxable for calendar year 2006.
Trustees and Officers
This chart provides information about the Trustees and Officers who oversee your John
Hancock fund. Officers elected by the Trustees manage the day-to-day operations of the
Portfolio and execute policies formulated by the Trustees. |
| Independent Trustees | | |
| |
| Name, age | | Number of |
| Position(s) held with Portfolio | Trustee of | John Hancock |
| Principal occupation(s) and other | Portfolio | funds overseen |
| directorships during past 5 years | since1 | by Trustee |
|
| Charles L. Bardelis, Born: 1941 | 2005 | 209 |
|
| President and Executive Officer, Island Commuter Corp. (Marine Transport). | | |
| Trustee of John Hancock Trust (since 1988) and John Hancock Funds III (since 2005). | |
|
| |
| Peter S. Burgess, Born: 1942 | 2005 | 209 |
|
| Consultant (financial, accounting and auditing matters (since 1999); | | |
| Certified Public Accountant; Partner, Arthur Andersen (prior to 1999). | | |
| Director of the following publicly traded companies: PMA Capital Corporation | | |
| (since 2004) and Lincoln Educational Services Corporation (since 2004). | | |
| Trustee of John Hancock Trust (since 2005), John Hancock Funds III (since 2005). | |
|
| |
| Elizabeth G. Cook, Born: 1937 | 2005 | 209 |
|
| Expressive Arts Therapist, Massachusetts General Hospital (September 2001 | | |
| to present); Expressive Arts Therapist, Dana Farber Cancer Institute | | |
| (September 2000 to January 2004); President, The Advertising Club of Greater Boston. | |
| Trustee of John Hancock Trust (since 2005) and John Hancock Funds III (since 2005). | |
|
| |
| William H. Cunningham, Born: 1944 | 2005 | 160 |
|
| Former Chancellor, University of Texas System and former President of the | | |
| University of Texas, Austin, Texas; Chairman and CEO, IBT Technologies | | |
| (until 2001); Director of the following: Hire.com (until 2004), STC Broadcasting, | |
| Inc. and Sunrise Television Corp. (until 2001), Symtx, Inc. (electronic manufacturing) | |
| (since 2001), Adorno/Rogers Technology, Inc. (until 2004), Pinnacle Foods | | |
| Corporation (until 2003), rateGenius (until 2003), Lincoln National Corporation | |
| (insurance) (since 2006), Jefferson-Pilot Corporation (diversified life insurance | | |
| company) (until 2006), New Century Equity Holdings (formerly Billing Concepts) | |
| (until 2001), eCertain (until 2001), ClassMap.com (until 2001), Agile Ventures | | |
| (until 2001), AskRed.com (until 2001), Southwest Airlines, Introgen and Viasystems | |
| Group, Inc. (electronic manufacturer) (until 2003); Advisory Director, Interactive | |
| Bridge, Inc. (college fundraising) (until 2001); Advisory Director, Q Investments | | |
| (until 2003); Advisory Director, JP Morgan Chase Bank (formerly Texas Commerce | |
| Bank - Austin), LIN Television (since 2002), WilTel Communications (until 2003) | |
| and Hayes Lemmerz International, Inc. (diversified automotive parts supply | | |
| company) (since 2003). Trustee of John Hancock Funds (since 2005) and | | |
| John Hancock Funds III (since 2005). | | |
31
| Independent Trustees (continued) | | |
| |
| Name, age | | Number of |
| Position(s) held with Portfolio | Trustee of | John Hancock |
| Principal occupation(s) and other | Portfolio | funds overseen |
| directorships during past 5 years | since1 | by Trustee |
|
| Charles L. Ladner, Born: 1938 | 2005 | 160 |
|
| Chairman and Trustee, Dunwoody Village, Inc. (retirement services) (until 2003); | |
| Senior Vice President and Chief Financial Officer, UGI Corporation (public utility | |
| holding company) (retired 1998); Vice President and Director for AmeriGas, Inc. | |
| (retired 1998); Director of AmeriGas Partners, L.P. (until 1997)(gas distribution); | |
| Director, EnergyNorth, Inc. (until 1995); Director, Parks and History Association | |
| (since 2007). Trustee of John Hancock Funds (since 2004) and John Hancock | | |
| Funds III (since 2005). | | |
|
| |
| Hassell H. McClellan, Born: 1945 | 2005 | 209 |
|
| Associate Professor, The Wallace E. Carroll School of Management, Boston College. | |
| Trustee of John Hancock Trust (since 2005), John Hancock Funds III (since 2005). | |
|
| |
| James. M. Oates, Born: 1946 | 2005 | 209 |
|
| Managing Director, Wydown Group (financial consulting firm)(since 1994); | | |
| Chairman, Emerson Investment Management, Inc. (since 2000); Chairman, | | |
| Hudson Castle Group, Inc. (formerly IBEX Capital Markets, Inc.) (financial services | |
| company) (since 1997). Director of the following publicly traded companies: | | |
| Stifel Financial (since 1996); Investor Financial Services Corporation (since 1995); | |
| and Connecticut River Bancorp, Director (since 1998). Director, Phoenix Mutual | |
| Funds (since 1988; overseeing 20 portfolios). Trustee of John Hancock Trust | | |
| (since 2004) and John Hancock Funds III (since 2005). | | |
1 Because the Trust does not hold regular annual shareholders meetings, each Trustee holds office for an indefinite term until his/her successor is duly elected and qualified or until he/she dies, retires, resigns, is removed or becomes disqualified.
32
| Non-Independent Trustee3 | | |
| |
| Name, age | | Number of |
| Position(s) held with Portfolio | Trustee of | John Hancock |
| Principal occupation(s) and other | Portfolio | funds overseen |
| directorships during past 5 years | since1 | by Trustee |
|
| James R. Boyle, Born: 1959 | 2005 | 262 |
|
| Chairman and Director, John Hancock Advisers, LLC (the “Adviser”), The | | |
| Berkeley Financial Group, LLC (“The Berkeley Group”) (holding company) | | |
| and John Hancock Funds, LLC (since 2005); President, John Hancock | | |
| Annuities; Executive Vice President, John Hancock Life Insurance Company | | |
| (since June, 2004); President U.S. Annuities; Senior Vice President, The | | |
| Manufacturers Life Insurance Company (U.S.A) (prior to 2004). | | |
| |
| Principal officers who are not Trustees | | |
| |
| Name, age | | |
| Position(s) held with Portfolio | | Officer of |
| Principal occupation(s) and | | Portfolio |
| directorships during past 5 years | | since |
|
| Keith Hartstein2, Born: 1956 | | 2005 |
|
| President and Chief Executive Officer | | |
| Senior Vice President, Manulife Financial Corporation (since 2004); | | |
| Director, President and Chief Executive Officer, the Adviser and The | | |
| Berkeley Group, John Hancock Funds, LLC (since 2005); Director, MFC | | |
| Global Investment Management (U.S.), LLC (“MFC Global (U.S.)”) | | |
| (since 2005); Director, John Hancock Signature Services, Inc. (since | | |
| 2005); President and Chief Executive Officer, John Hancock Investment | | |
| Management Services, LLC (since 2006); President and Chief Executive | | |
| Officer, John Hancock Funds, John Hancock Funds II, John Hancock Funds | | |
| III, John Hancock Trust,; Director, Chairman and President, NM Capital | | |
| Management, Inc. (since 2005); Chairman, Investment Company Institute | | |
| Sales Force Marketing Committee (since 2003); Director, President and | | |
| Chief Executive Officer, MFC Global (U.S.) (2005-2006); Executive Vice | | |
| President, John Hancock Funds, LLC (until 2005). | | |
|
| |
| John Vrysen2, Born: 1955 | | 2005 |
|
| Chief Financial Officer | | |
| Director, Executive Vice President and Chief Financial Officer, the Adviser, | | |
| The Berkeley Group and John Hancock Funds, LLC (since 2005); Executive | | |
| Vice President and Chief Financial Officer, John Hancock Investment | | |
| Management Services, LLC (since 2005), Vice President and Chief Financial | | |
| Officer, MFC Global (U.S.) (since 2005); Director, John Hancock Signature | | |
| Services, Inc. (since 2005); Chief Financial Officer, John Hancock Funds, | | |
| John Hancock Funds II, John Hancock Funds III, John Hancock Trust (since | | |
| 2005); Vice President and General Manager, Fixed Annuities, U.S. Wealth | | |
| Management (until 2005); Vice President, Operations Manulife Wood | | |
| Logan (2000-2004). | | |
33
| Principal officers who are not Trustees (continued) | |
| |
| Name, age | |
| Position(s) held with Portfolio | Officer of |
| Principal occupation(s) and | Portfolio |
| directorships during past 5 years | since |
|
| Francis V. Knox, Jr.2, Born: 1947 | 2005 |
|
| Vice President and Chief Compliance Officer, John Hancock Investment | |
| Management Services, LLC, the Adviser and MFC Global (U.S.) (since 2005); | |
| Chief Compliance Officer, John Hancock Funds, John Hancock Funds II, | |
| John Hancock Funds III and John Hancock Trust (since 2005); Vice President | |
| and Assistant Treasurer, Fidelity Group of Funds (until 2004); Vice President | |
| and Ethics & Compliance Officer, Fidelity Investments (until 2001). | |
|
| |
| Gordon Shone2, Born: 1956 | 2005 |
|
| Treasurer, John Hancock Funds (since 2006); John Hancock Funds II, John | |
| Hancock Funds III and John Hancock Trust (since 2005); Vice President | |
| and Chief Financial Officer, John Hancock Trust (2003-2005); Senior Vice | |
| President, John Hancock Life Insurance Company (U.S.A.) (since 2001); | |
| Vice President, John Hancock Investment Management Services, Inc. and | |
| John Hancock Advisers, LLC (since 2006), The Manufacturers Life Insurance | |
| Company (U.S.A.) (1998 to 2000). | |
|
| |
| Thomas M. Kinzler2, Born: 1955 | 2006 |
|
| Vice President and Counsel for John Hancock Life Insurance Company | |
| (U.S.A.) (since 2006); Secretary and Chief Legal Officer, John Hancock | |
| Funds, John Hancock Funds II, John Hancock Funds III and John Hancock | |
| Trust (since 2006); Vice President and Associate General Counsel for | |
| Massachusetts Mutual Life Insurance Company (1999-2006); Secretary | |
| and Chief Legal Counsel for MML Series Investment Fund (2000-2006); | |
| Secretary and Chief Legal Counsel for MassMutual Institutional Funds | |
| (2000-2004); Secretary and Chief Legal Counsel for MassMutual Select | |
| Funds and MassMutual Premier Funds (2004-2006). | |
1 Because the Trust does not hold regular annual shareholders meetings, each Trustee holds office for an indefinite term until his successor is duly elected and qualified or until he dies, retires, resigns, is removed or becomes disqualified.
2Affiliated with the investment adviser.
3 Non-Independent Trustee: holds positions with the Fund’s investment adviser, underwriter, and/ or certain other affiliates.
For more information
The Portfolio’s proxy voting policies, procedures and records are available without charge,
upon request: |
| By phone | On the Portfolio’s Web site | On the SEC’s Web site |
| 1-800-225-5291 | www.jhfunds.com/proxy | www.sec.gov |
|
| |
| Investment adviser | Custodian | Legal counsel |
| John Hancock Investment | State Street Bank & Trust Co. | Kirkpatrick & Lockhart |
| Management Services, LLC | 2 Avenue de Lafayette | Nicholson Graham LLP |
| 601 Congress Street | Boston, MA 02111 | 1 Lincoln Street |
| Boston, MA 02210-2805 | | Boston, MA 02111 |
| | Transfer agent | |
| Principal distributor | John Hancock Signature | Independent registered |
| John Hancock Funds, LLC | Services, Inc. | public accounting firm |
| 601 Congress Street | 1 John Hancock Way, | PricewaterhouseCoopers LLP |
| Boston, MA 02210-2805 | Suite 1000 | 125 High Street |
| | Boston, MA 02217-1000 | Boston, MA 02110 |
Each underlying fund’s accounting policies are outlined in the underlying fund’s shareholder report, available without charge by calling 1-800-344-1029 or on the Securities and Exchange Commission (“SEC”) Web site at www.sec.gov, File # 811-21779, CIK 0001331971.
The Portfolio’s investment objective, risks, charges and expenses are included in the prospectus and should be considered carefully before investing. For a prospectus, call your financial professional, call John Hancock Funds at 1-800-225-5291 or visit the Portfolio’s Web site at www.jhfunds.com. Please read the prospectus carefully before investing or sending money.
| How to contact us | |
|
| |
| Internet | www.jhfunds.com | |
|
| |
| Mail | Regular mail: | Express mail: |
| | John Hancock | John Hancock |
| | Signature Services, Inc. | Signature Services, Inc. |
| | 1 John Hancock Way, Suite 1000 | Mutual Fund Imaging Operations |
| | Boston, MA 02217-1000 | 380 Stuart Street |
| | | Boston, MA 02116 |
|
| |
| Phone | Customer service representatives | 1-800-225-5291 |
| | 24-hour automated information | 1-800-338-8080 |
| | TDD line | 1-800-554-6713 |
A listing of month-end portfolio holdings is available on our Web site, www.jhfunds.com. A more detailed portfolio holdings summary is available on a quarterly basis 60 days after the fiscal quarter on our Web site or upon request by calling 1-800-225-5291, or on the Securities and Exchange Commission’s Web site, www.sec.gov.
36
J O H N H A N C O C K F A M I L Y O F F U N D S
| EQUTIY | INTERNATIONAL |
| Balanced Fund | Greater China Opportunities Fund |
| Classic Value Fund | International Classic Value Fund |
| Classic Value Fund II | International Core Fund |
| Core Equity Fund | International Fund |
| Focused Equity Fund | International Growth Fund |
| Growth Fund | |
| Growth Opportunities Fund | INCOME |
| Growth Trends Fund | Bond Fund |
| Intrinsic Value Fund | Government Income Fund |
| Large Cap Equity Fund | High Yield Fund |
| Large Cap Select Fund | Investment Grade Bond Fund |
| Mid Cap Equity Fund | Strategic Income Fund |
| Mid Cap Growth Fund | |
| Multi Cap Growth Fund | TAX-FREE INCOME |
| Small Cap Equity Fund | California Tax-Free Income Fund |
| Small Cap Fund | High Yield Municipal Bond Fund |
| Small Cap Intrinsic Value Fund | Massachusetts Tax-Free Income Fund |
| Sovereign Investors Fund | New York Tax-Free Income Fund |
| U.S. Core Fund | Tax-Free Bond Fund |
| U.S. Global Leaders Growth Fund | |
| Value Opportunities Fund | MONEY MARKET |
| | Money Market Fund |
| ASSET ALLOCATION & LIFESTYLE | U.S. Government Cash Reserve |
| Allocation Core Portfolio | |
| Allocation Growth + Value Portfolio | CLOSED-END |
| Lifestyle Aggressive Portfolio | Bank & Thrift Opportunity |
| Lifestyle Balanced Portfolio | Financial Trends |
| Lifestyle Conservative Portfolio | Income Securities |
| Lifestyle Growth Portfolio | Investors Trust |
| Lifestyle Moderate Portfolio | Patriot Global Dividend |
| | Patriot Preferred Dividend |
| SECTOR | Patriot Premium Dividend I |
| Financial Industries Fund | Patriot Premium Dividend II |
| Health Sciences Fund | Patriot Select Dividend |
| Real Estate Fund | Preferred Income |
| Regional Bank Fund | Preferred Income II |
| Technology Fund | Preferred Income III |
| Technology Leaders Fund | Tax-Advantaged Dividend |
For more complete information on any John Hancock Fund and a prospectus, which includes charges and expenses, call your financial professional, or John Hancock Funds at 1-800-225-5291. Please read the prospectus carefully before investing or sending money.

1-800-225-5291
1-800-554-6713 (TDD)
1-800-338-8080 EASI-Line
www.jhfunds. com |
Now available: electronic delivery www.jhfunds. com/edelivery
This report is for the information of the shareholders of John Hancock Lifestyle Conservative Portfolio.


| TABLE OF CONTENTS |
|
| |
| Managers' report |
| page 2 |
|
| |
| A look at performance |
| page 6 |
|
| |
| Your expenses |
| page 8 |
|
| |
| Portfolio’s investments |
| page 10 |
|
| |
| Financial statements |
| page 12 |
|
| |
| Trustees and officers |
| page 33 |
|
| |
| For more information |
| page 40 |
|
CEO corner
To Our Shareholders,
The future has arrived at John Hancock Funds.
We have always been firm believers in the powerful role the Internet can play in providing fund information to our shareholders and prospective investors. Recently, we launched a redesigned, completely overhauled Web site that is more visually pleasing, easier to navigate and, most importantly, provides more fund information and learning tools without overwhelming the user.
Not long after we embarked on this major project, a study was released by the Investment Company Institute, the mutual fund industry’s main trade group, which found that an overwhelming majority of shareholders consider the Internet the “wave of the future” for accessing fund information.
Our new site sports fresher and faster ways to access account information. New innovations allow investors to view funds by risk level, track the performance of the John Hancock funds of their choice or sort funds by Morningstar, Inc.’s star ratings. Investors who own a John Hancock fund through a qualified retirement plan and don’t pay sales charges when making a purchase have the option of sorting by a “Load Waived” Morningstar Rating, thereby creating an apples-to-apples comparison with no-load funds that may also be available in their retirement plan.
The new site also has more educational tools and interactive modules to educate and assist investors with their financial goals, from college savings to retirement planning. A new “I want to…” feature allows investors to check performance, invest more money, update personal information or download prospectuses and forms quickly and easily.
In another of our ongoing efforts to provide our shareholders with top-notch service, we also redesigned our shareholder reports, as you may have noticed with this report. We hope the larger size, more colorful cover and redesigned presentation of the commentary and data tables will draw you in and make them easier to read.
After you’ve read your shareholder report, we encourage you to visit our new Web site — www.jhfunds.com — and take a tour. It’s easy, fast and fun and allows you to be in control of what you see and do. In short, it’s the wave of the future!
Sincerely,

Keith F. Hartstein,
President and Chief Executive Officer
This commentary reflects the CEO’s views as of August 31, 2006. They are subject to change at any time.
Your portfolio at a glance
The Portfolio seeks long-term growth of capital. Current income is also a consideration. To pursue this goal, the Portfolio, which is a fund-of-funds, normally invests approximately 20% of its assets in underlying funds that invest primarily in fixed-income securities and approximately 80% of its assets in underlying funds that invest primarily in equity securities.
Since inception*
► Across all asset classes, financial markets gained ground during the period, with nearly all of the Portfolio’s underlying funds performing positively.
► The Portfolio’s allocation to international, natural resources and real estate securities funds was a big positive, while U.S. large-cap growth and core funds lagged the S&P 500 Index.
► For further diversification, we add a new international small-cap stock fund to broaden our exposure to that asset class.
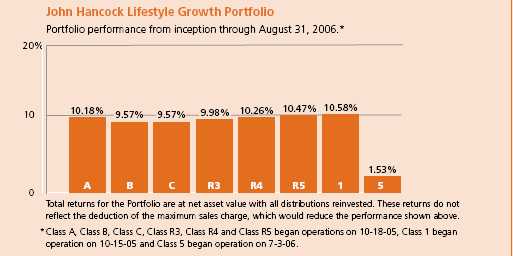
| Target asset allocation | | | | |
Equity | % of Total | Fixed Income | | % of Total |
|
| U.S. Large Cap | 39.0 | High Yield Bond | | 7.0 |
|
| International | 16.0 | Intermediate Term Bond | | 4.0 |
|
| U.S. Mid Cap | 8.0 | Multi-Sector Bond | | 4.0 |
|
| U.S. Small Cap | 7.0 | Treasury Inflation-Protected Securities | 3.0 |
|
| International Small Cap | 4.0 | Global Bond | | 2.0 |
|
| Natural Resources | 4.0 | | | |
|
| Real Estate | 2.0 | | | |
|
1
Managers’ report
John Hancock
Lifestyle Growth Portfolio
The Portfolio’s broad diversification across multiple asset classes and fund managers was very valuable during a volatile market environment. Just about every investment type ended the reporting period in positive territory for the period beginning October 15, 2005 (the Portfolio’s inception date), through August 31, 2006.
The broad U.S. equity market turned in a respectable performance during the reporting period, as the S&P 500 Index gained 11.44% . These results came despite a sharp May/June downturn, which resulted from worries about slowing corporate earnings, fears of rising inflation and the expectation for further rate hikes from the U.S. Federal Reserve. Large-capitalization U.S. stocks again lagged their mid-cap counterparts, which in turn underperformed small caps — although the performance gap between large and small stocks finally began to narrow during the period. Once again, one trend that remained the same across all U.S. market-capitalization ranges: value stocks continued to outshine growth stocks, despite several brief periods during which growth took the lead.
International stocks were particularly strong performers during the period, as indicated by the 23.02% return of the MSCI EAFE Index. Equities abroad benefited from continued relative weakness in the U.S. dollar and greater uncertainty about the direction of interest rates in the United States. Another asset class that did very well was natural
SCORECARD
| INVESTMENT | | PERIOD’S PERFORMANCE... AND WHAT’S BEHIND THE NUMBERS |
| Natural Resources | ▲ | Continued to benefit from steadily rising commodity prices. |
| (Wellington) | | |
| International | ▲ | Strong international stock performance and favorable |
| Opportunities (Marsico) | | currency movements added to results. |
| U.S. Multi-Sector (GMO) | ▼ | Emphasis on certain higher-quality large-cap growth stocks detracted |
| | | from performance. |
2
From the MFC Global Investment Management (U.S.A.), LLC’s
Portfolio Management Team
resources, which was helped by continued economic expansion boosting demand for commodities, coupled with relatively tight supplies. Real estate securities also gained ground, helped by continued strong fundamentals and investors’ demand for yield.
Fixed-income securities — which make up approximately 20% of the Portfolio’s assets — generally gained ground but produced mediocre results, with the broad bond market returning 3.33%, as measured by the Lehman Brothers Aggregate Bond Index. A steady stream of interest rate increases from the Federal Reserve Board weighed on bonds’ results. Once again, the strongest performers in the fixed-income market were lower-rated, higher-yielding bonds, which benefited as credit spreads — the difference in yield among bonds of various credit quality — continued to narrow.
“On the Portfolio’s domestic
equity side, we were most helped
by a number of our large-cap
value-oriented investments.”
Performance results
John Hancock Lifestyle Growth Portfolio’s Class A, Class B, Class C, Class R3, Class R4 and Class R5, which began operations on October 18, 2005, producd total returns of 10.18%, 9.57%, 9.57%, 9.98%, 10.26% and 10.47%, respectively, at net asset value through August 31, 2006. Class 1 shares returned 10.58% at net asset value since beginning operation October 15, 2005 and Class 5 shares returned 1.53% at net asset value since beginning operation July 3, 2006. In comparison, the Portfolio’s benchmark, the 80% S&P 500/20% Lehman Brothers Aggregate Bond combined index, returned 8.59%, and Morningstar’s average large blend fund returned 11.41% .1 Keep in mind that your net asset value return will be different from the Portfolio’s performance if you were not invested in the Portfolio for the entire period and did not reinvest all distributions. Please see pages six and seven for historical performance information.
Lifestyle Growth Portfolio
3
International gains
Particularly strong results came from the Portfolio’s international investments. International Core (+22.19%, GMO), our second-largest position at period end at 6% of assets, performed very well. Another big help was our position in International Opportunities (+23.51%, Marsico), in which we held a 4% stake. In addition, we benefited significantly from our exposure to the natural resources asset class through a 4% position in Natural Resources (+24.62%, Wellington). The Portfolio’s weighting in natural resources has declined somewhat relative to our benchmark, as these stocks have performed well and grown to occupy a larger portion of the index.
On the Portfolio’s domestic equity side, we were most helped by a number of our large-cap value-oriented investments. For example, Quantitative Value (+17.98%, MFC Global Investment Management (U.S.A.), LLC) enjoyed very strong results, while Large Cap Value (+13.43%, Mercury) and Equity Income (+13.54%, T. Rowe Price) also generated solid gains. By contrast, the Portfolio’s large-cap core and growth-oriented investments tended to lag in a market environment that continued to favor value and small-cap stocks. Capital Appreciation, managed by Jennison, turned in a modestly positive return of 2.72%, while the GMO-managed U.S. Multi-Sector — at 7% our largest weighting — gained 4.25% .. Core Equity (+3.63%, Legg Mason) also failed to keep pace with the S&P 500.
Broader small-cap exposure
We made a handful of allocation shifts during the period. In May, for example, we established a position in a new international small-cap fund, International Small Company, managed by Dimensional Fund Advisors (DFA). This fund was added to complement our existing holdings in International Small Cap, managed by Templeton. The DFA offering provides us with two important benefits — added exposure to the smaller end of the international small-cap spectrum, and enough capacity to maintain our desired exposure to this important asset class.
In the fixed-income portion of the Portfolio, we sought to further diversify our high yield bond exposure. We reduced our weighting in the High Yield fund (+6.49%), which was formerly managed by Salomon Brothers Asset Management and is now managed by Western Asset Management. We reallocated part of these assets to a new fund, High Income, managed by MFC Global and we also added to our weighting in U.S. High Yield Bond, managed by Wells Capital Management.
Lifestyle Growth Portfolio
4
We also increased diversification within the real estate asset class by adding exposure to non-U.S. real estate securities. Because the real estate market outside the United States is less well developed, we believe it offers greater inefficiency and therefore return potential. We established a new allocation to Global Real Estate, managed by Deutsche Asset Management. At period end, the Portfolio maintained a 2% overall allocation in real estate securities.
“Particularly strong results came
from the Portfolio’s international
investments.”
Outlook
We have maintained the Portfolio’s relatively neutral weighting in international markets. On the positive side, there are some good pockets of growth around the world. However, higher valuations in many markets along with the potential for rising interest rates are some reasons to be cautious.
We believe the stage may be set for high-quality, large-cap stocks to finally take the lead over their mid- and small-cap counterparts. We believe we have positioned the Portfolio to benefit from such a scenario, maintaining a slight overweight in funds that own high-quality large caps. Although we are expecting large caps to take the lead, we can’t predict when such a reversal will take place. If, however, investors continue their preference for higher-risk, lower-quality asset classes, we believe our broadly diversified Portfolio can help capture these potential performance gains while seeking to effectively manage volatility for our shareholders.
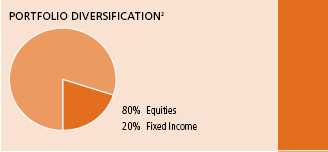
This commentary reflects the views of the portfolio managers through the end of the Portfolio’s period discussed in this report. The managers’ statements reflect their own opinions. As such, they are in no way guarantees of future events and are not intended to be used as investment advice or a recommendation regarding any specific security. They are also subject to change at any time as market and other conditions warrant.
International investing involves special risks such as political, economic and currency risks and differences in accounting standards and financial reporting. See the prospectus for the risks of investing in small-cap stocks. See the prospectus for the risks of investing in high-yield bonds.
1 Figures from Morningstar, Inc. include reinvested dividends and do not take into account sales charges. Actual load-adjusted performance is lower.
2 As a percentage of net assets on August 31, 2006.
Lifestyle Growth Portfolio
5
A look at performance
For the period ending August 31, 2006
| | | Cumulative total returns |
| | | with maximum sales charge (POP) |
| | Inception | Since |
| Class | date | Inceptiona |
|
| A | 10-18-05 | 4.69% |
|
| B | 10-18-05 | 4.57 |
|
| C | 10-18-05 | 8.57 |
|
| R3b | 10-18-05 | 9.98 |
|
| R4b | 10-18-05 | 10.26 |
|
| R5b | 10-18-05 | 10.47 |
|
| 1b | 10-15-05 | 10.58 |
|
| 5b | 7-03-06 | 1.53 |
|
Performance figures assume all distributions are reinvested. Returns with maximum sales charge reflect a sales charge on Class A shares of 5%, and the applicable contingent deferred sales charge (CDSC) on Class B and Class C shares. The Class B shares’ CDSC declines annually between years 1–6 according to the following schedule: 5, 4, 3, 3, 2, 1%. No sales charge will be assessed after the sixth year. Class C shares held for less than one year are subject to a 1% CDSC. Sales charge is not applicable for Class R3, Class R4, Class R5, Class 1 and Class 5 shares.
The returns reflect past results and should not be considered indicative of future performance. The return and principal value of an investment will fluctuate so that shares, when redeemed, may be worth more or less than their original cost. Due to market volatility, the Portfolio’s current performance may be higher or lower than the performance shown. For performance data current to the most recent month-end, please call 1-800-225-5291 or visit the Portfolio’s Web site at www.jhfunds.com.
The performance table above and the chart on the next page do not reflect the deduction of taxes that a shareholder would pay on fund distributions or the redemption of fund shares.
The Portfolio’s performance results reflect any applicable expense reductions, without which the expenses would increase and results would have been less favorable.
Since inception performance is calculated with an opening (prior day’s close) on the inception date.
a Class A, Class B, Class C, Class R3, Class R4 and Class R5 shares began operations on 10-18-05, Class 1 shares began operation on 10-15-05 and Class 5 shares began operation on 7-3-06.
b For certain types of investors as described in the Portfolio’s Class R3, Class R4, Class R5, Class 1 and Class 5 share prospectuses.
Lifestyle Growth Portfolio
6
Growth of $10,000
This chart shows what happened to a hypothetical $10,000 investment in Class A shares for the period indicated. For comparison, we’ve shown the same investment in a blended Index.
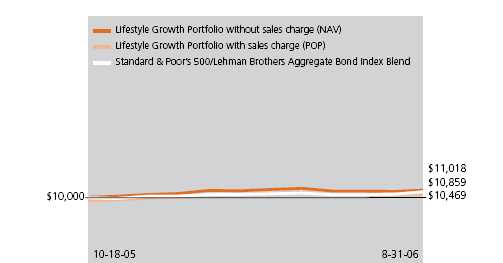
| Class | Period beginning | Without sales charge | With maximum sales charge | Index |
|
| B4 | 10-18-05 | $10,957 | $10,457 | $10,859 |
|
| C 4 | 10-18-05 | 10,957 | 10,857 | 10,859 |
|
| R31,4 | 10-18-05 | 10,998 | 10,998 | 10,859 |
|
| R41,4 | 10-18-05 | 11,026 | 11,026 | 10,859 |
|
| R51,4 | 10-18-05 | 11,047 | 11,047 | 10,859 |
|
| 11,2 | 10-15-05 | 11,058 | 11,058 | 10,697 |
|
| 51,3 | 07-03-06 | 10,153 | 10,153 | 10,299 |
|
Assuming all distributions were reinvested for the period indicated, the table above shows the value of a $10,000 investment in the Portfolio’s Class B, Class C, Class R3, Class R4, Class R5, Class 1 and Class 5 shares, respectively, as of August 31, 2006. Performance of the classes will vary based on the difference in sales charges paid by shareholders investing in the different classes and the fee structure of those classes.
A blended index is used combining 80% of the Standard & Poor’s 500 Index, an unmanaged index that includes 500 widely traded common stocks, and 20% of the Lehman Brothers Aggregate Bond Index, an unmanaged index of dollar-denominated and nonconvertible investment-grade debt issues.
It is not possible to invest directly in an index. Index figures do not reflect sales charges and would be lower if they did. 1 For certain types of investors as described in the Portfolio’s Class R3, Class R4, Class R5, Class 1 and Class 5 share prospectuses.
2 Index figure from 9-30-05.
3 Index figure from 6-30-06.
4 Index figure from 10-31-05.
Lifestyle Growth Portfolio
7
Your expenses
These examples are intended to help you understand your ongoing operating expenses.
Understanding portfolio expenses
As a shareholder of the Portfolio, you incur two types of costs:
■ Transaction costs which include sales charges (loads) on purchases or redemptions (varies by share class), minimum account fee charge, etc.
■ Ongoing operating expenses including management fees, distribution and service fees (if applicable) and other Portfolio expenses.
In addition to the operating expenses which the Portfolio bears directly, the Portfolio indirectly bears a pro rata share of the operating expenses of the underlying funds in which the Portfolio invests. Because the underlying funds have varied operating expenses and transaction costs and the Portfolio may own different proportions of the underlying funds at different times, the amount of expenses incurred indirectly by the Portfolio will vary. If these indirect expenses were included, your expenses paid during the period would have been higher.
We are going to present only your ongoing operating expenses here.
Actual expenses/actual returns
This example is intended to provide information about your portfolio’s actual ongoing operating expenses, and is based on your portfolio’s actual return. It assumes an account value of $1,000.00 on March 1, 2006, with the same investment held until August 31, 2006.
| | Account value | Ending value | Expenses paid during period |
| | on 3-1-06 | on 8-31-06 | ended 8-31-06a |
|
| Class A | $1,000.00 | $1,009.70 | $3.09 |
|
| Class B | 1,000.00 | 1,006.20 | 6.83 |
|
| Class C | 1,000.00 | 1,006.20 | 6.78 |
|
| Class R3 | 1,000.00 | 1,009.00 | 3.39 |
|
| Class R4 | 1,000.00 | 1,010.40 | 2.48 |
|
| Class R5 | 1,000.00 | 1,011.70 | 0.96 |
|
| Class 1 | 1,000.00 | 1,012.50 | 0.56 |
|
| Class 5 b | 1,000.00 | 1,015.30 | 0.03 |
|
Lifestyle Growth Portfolio
8
Together with the value of your account, you may use this information to estimate the operating expenses that you paid over the period. Simply divide your account value at August 31, 2006 by $1,000.00, then multiply it by the “expenses paid” for your share class from the table above. For example, for an account value of $8,600.00, the operating expenses should be calculated as follows:
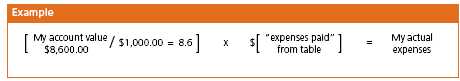
Hypothetical example for comparison purposes
This table allows you to compare your portfolio’s ongoing operating expenses with those of any other fund. It provides an example of the Portfolio’s hypothetical account values and hypothetical expenses based on each class’s actual expense ratio and an assumed 5% annual return before expenses (which is not your portfolio’s actual return). It assumes an account value of $1,000.00 on March 1, 2006, with the same investment held until August 31, 2006. Look in any other fund shareholder report to find its hypothetical example and you will be able to compare these expenses.
| | Account value | Ending value | Expenses paid during period |
| | on 3-1-06 | on 8-31-06 | ended 8-31-06a |
|
| Class A | $1,000.00 | $1,022.13 | $3.11 |
|
| Class B | 1,000.00 | 1,018.40 | 6.87 |
|
| Class C | 1,000.00 | 1,018.45 | 6.82 |
|
| Class R3 | 1,000.00 | 1,021.83 | 3.41 |
|
| Class R4 | 1,000.00 | 1,022.74 | 2.50 |
|
| Class R5 | 1,000.00 | 1,024.25 | 0.97 |
|
| Class 1 | 1,000.00 | 1,024.65 | 0.56 |
|
| Class 5 b | 1,000.00 | 1,008.19 | 0.03 |
|
Remember, these examples do not include any transaction costs, such as sales charges; therefore, these examples will not help you to determine the relative total costs of owning different funds. If transaction costs were included, your expenses would have been higher. See the prospectus for details regarding transaction costs.
a Expenses are equal to the Portfolio's annualized expense ratio of 0.61%, 1.35%, 1.34%, 0.67%, 0.49%, 0.19%, 0.11% and 0.02% for Class A, Class B, Class C, Class R3, Class R4, Class R5, Class 1 and Class 5, respectively, multiplied by the average account value over the period, multiplied by the number of days in the period /365 or 366 (to reflect the one-half year period). The expense ratios do not include fees and expenses incurred by the Portfolio from the underlying funds.
b Class 5 shares began operation on 7-3-06.
Lifestyle Growth Portfolio
9
F I N A N C I A L S T A T E M E N T S
Portfolio’s investments
Securities owned by the Portfolio on 8-31-06
Portfolio of investments, showing all underlying funds.
| Issuer | Shares | Value |
|
| Investment companies 99.97% | | $7,310,803,568 |
| (Cost $6,954,050,007) | | |
| John Hancock Funds II | | |
|
| All Cap Core Fund Class NAV | 14,681,919 | $145,644,635 |
|
| All Cap Growth Fund Class NAV | 4,441,115 | 73,056,348 |
|
| All Cap Value Fund Class NAV | 9,211,950 | 145,548,808 |
|
| Blue Chip Growth Fund Class NAV | 16,408,692 | 292,074,718 |
|
| Capital Appreciation Fund Class NAV | 30,983,896 | 292,797,818 |
|
| Core Equity Fund Class NAV | 15,550,538 | 221,906,172 |
|
| Equity-Income Fund Class NAV | 12,065,362 | 218,503,714 |
|
| Fundamental Value Fund Class NAV | 18,421,529 | 291,612,803 |
|
| Global Bond Fund Class NAV | 9,830,446 | 145,392,303 |
|
| Global Real Estate Fund Class NAV | 7,148,278 | 73,627,263 |
|
| High Income Fund Class NAV | 7,347,765 | 72,522,440 |
|
| High Yield Fund Class NAV | 36,182,183 | 364,716,402 |
|
| International Equity Index Fund Class NAV | 7,696,629 | 146,005,059 |
|
| International Opportunities Fund Class NAV | 18,186,292 | 293,890,478 |
|
| International Small Cap Fund Class NAV | 6,963,951 | 145,894,773 |
|
| International Small Company Fund Class NAV | 15,667,344 | 146,176,323 |
|
| International Value Fund Class NAV | 16,379,362 | 292,862,991 |
|
| Large Cap Fund Class NAV | 4,966,896 | 72,864,364 |
|
| Large Cap Value Fund Class NAV | 3,141,475 | 72,285,344 |
|
| Mid Cap Core Fund Class NAV | 12,729,621 | 219,713,260 |
|
| Mid Cap Index Fund Class NAV | 8,008,519 | 147,116,485 |
|
| Mid Cap Stock Fund Class NAV | 4,663,342 | 73,820,697 |
|
| Mid Cap Value Equity Fund Class NAV | 7,584,913 | 73,194,409 |
|
| Natural Resources Fund Class NAV | 8,191,364 | 291,612,553 |
|
| Quantitative Value Fund Class NAV | 13,197,327 | 218,547,736 |
|
| Real Estate Equity Fund Class NAV | 6,709,222 | 73,734,347 |
|
| Real Return Bond Fund Class NAV | 16,403,954 | 218,500,667 |
|
| Small Cap Fund Class NAV | 5,288,773 | 74,254,376 |
|
| Small Cap Index Fund Class NAV | 4,668,215 | 74,458,026 |
|
| Small Cap Opportunities Fund Class NAV | 6,348,995 | 146,915,745 |
|
| Small Company Growth Fund Class NAV | 6,665,328 | 73,918,490 |
|
| Small Company Value Fund Class NAV | 3,136,883 | 74,124,541 |
See notes to financial statements
Lifestyle Growth Portfolio
10
F I N A N C I A L S T A T E M E N T S
| Issuer | Shares | Value |
| John Hancock Funds II (continued) | | |
|
| Special Value Fund Class NAV | 3,591,654 | $73,700,746 |
|
| Spectrum Income Fund Class NAV | 14,156,989 | 145,392,276 |
|
| Strategic Bond Fund Class NAV | 6,157,718 | 72,476,340 |
|
| Strategic Income Fund Class NAV | 7,208,455 | 72,517,058 |
|
| Total Return Fund Class NAV | 21,207,881 | 291,608,367 |
|
| U.S. Global Leaders Growth Fund Class NAV | 17,289,398 | 219,229,572 |
|
| U.S. High Yield Bond Fund Class NAV | 5,547,813 | 72,398,961 |
|
| U.S. Multi Sector Fund Class NAV | 49,218,806 | 512,367,776 |
|
| Value & Restructuring Fund Class NAV | 6,588,884 | 73,004,837 |
|
| Vista Fund Class NAV | 6,819,209 | 72,965,538 |
| John Hancock Funds III | | |
|
| International Core Fund Class NAV | 11,118,538 | 437,848,009 |
|
| |
| Total investment companies 99.97% | | $7,310,803,568 |
|
| |
| Other assets in excess of liabilities 0.03% | | $1,939,429 |
|
| |
| Total net assets 100.00% | | $7,312,742,997 |
Percentages are stated as a percent of net assets of the Portfolio.
See notes to financial statements
Lifestyle Growth Portfolio
11
F I N A N C I A L S T A T E M E N T S
Financial statements
Statement of assets and liabilities 8-31-06
This Statement of Assets and Liabilities is the Portfolio’s balance sheet. It shows the value of what the Portfolio owns, is due and owes. You’ll also find the net asset value and the maximum offering price per share.
| Assets | |
| Investments in affiliated funds, at value (cost $6,954,050,007) | $7,310,803,568 |
| Receivable for fund shares sold | 9,005,920 |
| Other assets | 25,408 |
| Total assets | 7,319,834,896 |
|
| Liabilities | |
| Payable for investments purchased | 6,174,523 |
| Payable for fund shares repurchased | 124,831 |
| Payable to affiliates | |
| Fund administration fees | 123,524 |
| Transfer agent fees | 104,151 |
| Trustees’ fees | 1,507 |
| Due to advisor | 132,199 |
| Other payables and accrued expenses | 431,164 |
| Total liabilities | 7,091,899 |
|
| Net assets | |
| Capital paid-in | 6,754,160,151 |
| Accumulated net realized gain on investments | 158,942,423 |
| Net unrealized appreciation on investments | 356,753,561 |
| Accumulated net investment income | 42,886,862 |
| Net assets | $7,312,742,997 |
|
| Net asset value per share | |
| Based on net asset values and shares outstanding | |
| — the Portfolio has an unlimited number of shares authorized with no par value | |
| Class A ($103,206,294 ÷ 7,055,607 shares) | $14.63 |
| Class B ($24,126,195 ÷ 1,655,812 shares) | $14.57 |
| Class C ($93,229,755 ÷ 6,399,461 shares) | $14.57 |
| Class R3 ($2,224,344 ÷ 152,219 shares) | $14.61 |
| Class R4 ($4,600,962 ÷ 314,372 shares) | $14.64 |
| Class R5 ($1,541,424 ÷ 105,122 shares) | $14.66 |
| Class 1 ($7,080,518,761 ÷ 484,032,948 shares) | $14.63 |
| Class 5 ($3,295,262 ÷ 225,361 shares) | $14.62 |
|
| Maximum offering price per share | |
| Class Aa ($14.63 ÷ 95%) | $15.40 |
a On single retail sales of less than $50,000. On sales of $50,000 or more and on group sales the offering price is reduced.
See notes to financial statements
Lifestyle Growth Portfolio
12
F I N A N C I A L S T A T E M E N T S
Statement of operations For the period ended 8-31-06a
This Statement of Operations summarizes the Portfolio’s investment income earned and expenses incurred in operating the Portfolio. It also shows net gains (losses) for the period stated.
| Investment income | |
| Income distributions received from affiliated underlying funds | $70,403,278 |
| Total investment income | 70,403,278 |
|
| Expenses | |
| Investment management fees (Note 3) | 2,324,445 |
| Distribution and service fees (Note 3) | 3,231,975 |
| Transfer agent fees (Note 3) | 144,604 |
| Blue sky fees (Note 3) | 110,195 |
| Printing and postage fees (Note 3) | 135,707 |
| Fund administration fees (Note 3) | 477,403 |
| Audit and legal fees | 182,437 |
| Custodian fees | 12,763 |
| Trustees’ fees (Note 3) | 65,233 |
| Registration and filing fees | 206,837 |
| Miscellaneous | 53,195 |
| Total expenses | 6,944,794 |
| Less expense reductions (Note 3) | (162,750) |
| Net expenses | 6,782,044 |
| Net investment income | 63,621,234 |
|
| Realized and unrealized gain | |
| Net realized gain on investments | 158,888,831 |
| Capital gain distributions received from affiliated underlying funds | 14,311,942 |
| Change in net unrealized appreciation of investments | 356,753,561 |
| Net realized and unrealized gain | 529,954,334 |
| Increase in net assets from operations | $593,575,568 |
a Period from 10-15-05 (commencement of operations) to 8-31-06.
See notes to financial statements
Lifestyle Growth Portfolio
13
F I N A N C I A L S T A T E M E N T S
Statement of changes in net assets
This Statement of Changes in Net Assets shows how the value of the Portfolio’s net assets has changed during the period. It reflects earnings less expenses, any investment gains and losses, distributions, if any, paid to shareholders and the net of Portfolio share transactions.
| | Period ended |
| | 8-31-06a |
|
| Increase (decrease) in net assets | |
| |
| From operations | |
| Net investment income | $63,621,234 |
| Net realized gain | 173,200,773 |
| Change in net unrealized appreciation | 356,753,561 |
| Increase in net assets resulting from operations | 593,575,568 |
| Distributions to shareholders | |
| From net investment income | |
| Class A | (46,836) |
| Class B | (6,890) |
| Class C | (19,011) |
| Class R3 | (519) |
| Class R4 | (571) |
| Class R5 | (2,527) |
| Class 1 | (35,586,379) |
| | (35,662,733) |
| From Fund share transactions | 6,754,830,162 |
|
| Net assets | |
| End of period | $7,312,742,997 |
| Accumulated net investment income | $42,886,862 |
a Period from 10-15-05 (commencement of operations) to 8-31-06.
See notes to financial statements
Lifestyle Growth Portfolio
14
F I N A N C I A L S T A T E M E N T S
Financial highlights
The Financial highlights show how the Portfolio’s net asset value for a share has changed since the beginning of the period.
| CLASS A SHARES | |
| |
| Period ended | 8-31-06a |
|
| Per share operating performance | |
| Net asset value, beginning of period | $13.35 |
| Net investment income h,v | 0.07 |
| Net realized and unrealized | |
| gain on investments | 1.28 |
| Total from investment operations | 1.35 |
| Less distributions | |
| From net investment income | (0.07) |
| | (0.07) |
| Net asset value, end of period | $14.63 |
| Total return k,l (%) | 10.18m |
|
| Ratios and supplemental data | |
| Net assets, end of period | |
| (in millions) | $103 |
| Ratio of net expenses | |
| to average net assets q (%) | 0.61r |
| Ratio of gross expenses | |
| to average net assets p,q (%) | 0.72r |
| Ratio of net investment income | |
| to average net assets v (%) | 0.55r |
| Portfolio turnover (%) | 26m |
See notes to financial statements
Lifestyle Growth Portfolio
15
F I N A N C I A L S T A T E M E N T S
Financial highlights
| CLASS B SHARES | |
| |
| Period ended | 8-31-06a |
|
| Per share operating performance | |
| Net asset value, beginning of period | $13.35 |
| Net investment loss h,v | (0.02) |
| Net realized and unrealized | |
| gain on investments | 1.30 |
| Total from investment operations | 1.28 |
| Less distributions | |
| From net investment income | (0.06) |
| | (0.06) |
| Net asset value, end of period | $14.57 |
| Total return k,l (%) | 9.57m |
|
| Ratios and supplemental data | |
| Net assets, end of period | |
| (in millions) | $24 |
| Ratio of net expenses | |
| to average net assets q (%) | 1.34r |
| Ratio of gross expenses | |
| to average net assets p,q (%) | 1.69r |
| Ratio of net investment loss | |
| to average net assets v (%) | (0.19)r |
| Portfolio turnover (%) | 26m |
See notes to financial statements
Lifestyle Growth Portfolio
16
F I N A N C I A L S T A T E M E N T S
Financial highlights
| CLASS C SHARES | |
| |
| Period ended | 8-31-06a |
|
| Per share operating performance | |
| Net asset value, beginning of period | $13.35 |
| Net investment loss h,v | (0.02) |
| Net realized and unrealized | |
| gain on investments | 1.30 |
| Total from investment operations | 1.28 |
| Less distributions | |
| From net investment income | (0.06) |
| | (0.06) |
| Net asset value, end of period | $14.57 |
| Total return k,l (%) | 9.57m |
|
| Ratios and supplemental data | |
| Net assets, end of period | |
| (in millions) | $93 |
| Ratio of net expenses | |
| to average net assets q (%) | 1.33r |
| Ratio of gross expenses | |
| to average net assets p,q (%) | 1.44r |
| Ratio of net investment loss | |
| to average net assets v (%) | (0.14)r |
| Portfolio turnover (%) | 26 m |
See notes to financial statements
Lifestyle Growth Portfolio
17
F I N A N C I A L S T A T E M E N T S
Financial highlights
| CLASS R3 SHARES | |
| |
| Period ended | 8-31-06a |
|
| Per share operating performance | |
| Net asset value, beginning of period | $13.35 |
| Net investment income h,v | 0.07 |
| Net realized and unrealized | |
| gain on investments | 1.26 |
| Total from investment operations | 1.33 |
| Less distributions | |
| From net investment income | (0.07) |
| | (0.07) |
| Net asset value, end of period | $14.61 |
| Total return k,l (%) | 9.98m |
|
| Ratios and supplemental data | |
| Net assets, end of period | |
| (in millions) | $2 |
| Ratio of net expenses | |
| to average net assets q (%) | 0.68r |
| Ratio of gross expenses | |
| to average net assets p,q (%) | 5.07r |
| Ratio of net investment income | |
| to average net assets v (%) | 0.62r |
| Portfolio turnover (%) | 26m |
See notes to financial statements
Lifestyle Growth Portfolio
18
F I N A N C I A L S T A T E M E N T S
Financial highlights
| CLASS R4 SHARES | |
| |
| Period ended | 8-31-06a |
|
| Per share operating performance | |
| Net asset value, beginning of period | $13.35 |
| Net investment income h,v | 0.08 |
| Net realized and unrealized | |
| gain on investments | 1.29 |
| Total from investment operations | 1.37 |
| Less distributions | |
| From net investment income | (0.08) |
| | (0.08) |
| Net asset value, end of period | $14.64 |
| Total return k,l (%) | 10.26m |
|
| Ratios and supplemental data | |
| Net assets, end of period | |
| (in millions) | $5 |
| Ratio of net expenses | |
| to average net assets q (%) | 0.49r |
| Ratio of gross expenses | |
| to average net assets p,q (%) | 1.78r |
| Ratio of net investment income | |
| to average net assets v (%) | 0.69r |
| Portfolio turnover (%) | 26m |
See notes to financial statements
Lifestyle Growth Portfolio
19
F I N A N C I A L S T A T E M E N T S
Financial highlights
| CLASS R5 SHARES | |
| |
| Period ended | 8-31-06a |
|
| Per share operating performance | |
| Net asset value, beginning of period | $13.35 |
| Net investment income h,v | 0.09 |
| Net realized and unrealized | |
| gain on investments | 1.30 |
| Total from investment operations | 1.39 |
| Less distributions | |
| From net investment income | (0.08) |
| | (0.08) |
| Net asset value, end of period | $14.66 |
| Total return k,l (%) | 10.47m |
|
| Ratios and supplemental data | |
| Net assets, end of period | |
| (in millions) | $2 |
| Ratio of net expenses | |
| to average net assets q (%) | 0.19r |
| Ratio of gross expenses | |
| to average net assets p,q (%) | 2.52r |
| Ratio of net investment income | |
| to average net assets v (%) | 0.70r |
| Portfolio turnover (%) | 26m |
See notes to financial statements
Lifestyle Growth Portfolio
20
F I N A N C I A L S T A T E M E N T S
Financial highlights
| CLASS 1 SHARES | |
| |
| Period ended | 8-31-06a |
|
| Per share operating performance | |
| Net asset value, beginning of period | $13.31 |
| Net investment income h,v | 0.15 |
| Net realized and unrealized | |
| gain on investments | 1.25 |
| Total from investment operations | 1.40 |
| Less distributions | |
| From net investment income | (0.08) |
| | (0.08) |
| Net asset value, end of period | $14.63 |
| Total return k (%) | 10.58m |
|
| Ratios and supplemental data | |
| Net assets, end of period | |
| (in millions) | $7,081 |
| Ratio of net expenses | |
| to average net assets q (%) | 0.11r |
| Ratio of net investment income | |
| to average net assets v (%) | 1.17r |
| Portfolio turnover (%) | 26m |
See notes to financial statements
Lifestyle Growth Portfolio
21
F I N A N C I A L S T A T E M E N T S
Financial highlights
| CLASS 5 SHARES | |
| |
| Period ended | 8-31-06a |
|
| Per share operating performance | |
| Net asset value, beginning of period | $14.40 |
| Net investment loss h,v | —j |
| Net realized and unrealized | |
| gain on investments | 0.22 |
| Total from investment operations | 0.22 |
| Net asset value, end of period | $14.62 |
| Total return k (%) | 1.53m |
|
| Ratios and supplemental data | |
| Net assets, end of period | |
| (in millions) | $3 |
| Ratio of net expenses | |
| to average net assets q (%) | 0.02r |
| Ratio of net investment loss | |
| to average net assets v (%) | (0.02)r |
| Portfolio turnover (%) | 26m |
a Class A, Class B, Class C, Class R3, Class R4 and Class R5 shares began operations on 10-18-05, Class 1 shares began operation on 10-15-05, and Class 5 shares began operation on 7-3-06.
h Based on the average of the shares outstanding.
j Less than $0.01 per share.
k Assumes dividend reinvestment and does not reflect the effect of sales charges.
l Total returns would have been lower had certain expenses not been reduced during the period shown.
m Not annualized.
p Does not take into consideration expense reductions during the period shown.
q Does not include expenses of the investment companies in which the Portfolio invests.
r Annualized.
v Recognition of net investment income by the Portfolio is affected by the timing of the declaration of dividends by the underlying investment companies in which the Portfolio invests.
See notes to financial statements
Lifestyle Growth Portfolio
22
Notes to financial statements
1. Organization
The John Hancock Lifestyle Growth Portfolio (the “Portfolio”) is a newly organized non-diversified series of John Hancock Funds II (the “Trust”). The Trust was established as a Massachusetts business trust on June 28, 2005. The Trust is registered under the Investment Company Act of 1940, as amended (the “1940 Act”), as an open-end investment management company.
The Portfolio operates as a “fund of funds”, investing in Class NAV shares of underlying funds of the Trust and John Hancock Funds III and in other permitted investments.
John Hancock Investment Management Services, LLC (the “Adviser”), a Delaware limited liability company controlled by John Hancock Life Insurance Company (U.S.A.) (“John Hancock USA”), serves as investment adviser for the Trust and John Hancock Funds, LLC (the “Distributor”), an affiliate of the Adviser serves as the principal underwriter. John Hancock Life Insurance Company of New York (“John Hancock New York”) is a wholly owned subsidiary of John Hancock USA. John Hancock USA and John Hancock New York are indirect wholly owned subsidiaries of The Manufacturers Life Insurance Company (“Manulife”), which in turn is a wholly owned subsidiary of Manulife Financial Corporation (“MFC”), a publicly traded company. MFC and its subsidiaries are known collectively as “Manulife Financial.”
The Portfolio commenced operations after certain separate accounts of John Hancock USA redeemed their interests in portfolios of John Hancock Trust and certain unaffiliated mutual funds of approximately $1.2 billion at the close of business on October 14, 2005, with additional redemption proceeds of approximately $4.4 billion received on October 28, 2005, and invested such proceeds in Class 1 shares of the Portfolio, which in turn invested the proceeds in underlying funds of the Trust.
The Board of Trustees has authorized the issuance of multiple classes of shares of the Portfolio, including classes designated as Class A, Class B, Class C, Class R3, Class R4, Class R5, Class 1 and Class 5 shares. Class A, B, and C shares are open to all retail investors.
Class 1 shares are sold only to certain exempt separate accounts of John Hancock USA and John Hancock New York. Class R3, R4 and R5 shares are available only to certain retirement plans. Class 5 shares currently are available only to the John Hancock Freedom 529 Plan.
The shares of each class represent an interest in the same portfolio of investments of the Portfolio, and have equal rights as to voting, redemptions, dividends and liquidation, except that certain expenses, subject to the approval of the Trustees, may be applied differently to each class of shares in accordance with current regulations of the SEC and the Internal Revenue Service. Shareholders of a class that bears distribution and service expenses under the terms of a distribution plan have exclusive voting rights to that distribution plan. Class B shares will convert to Class A shares eight years after purchase.
2. Significant accounting policies
In the preparation of the financial statements, the Portfolio follows the policies described below. The preparation of financial statements in conformity with accounting principles generally accepted in the United States of America requires management to make estimates and assumptions that affect the reported amounts of assets and liabilities at the date of the financial statements and the reported amounts of income and expenses during the reporting period. Actual results may differ from these estimates.
Lifestyle Growth Portfolio
23
Securities valuation
The net asset value of the shares of the Portfolio is determined daily as of the close of the New York Stock Exchange, normally at 4:00 P.M. Eastern Time. Investments in underlying funds are valued at their respective net asset values each business day, or at fair value as determined in good faith in accordance with procedures approved by the Trustees. Securities in the underlying funds’ portfolios are valued in accordance with their respective valuation polices, as outlined in the underlying funds’ financial statements. Short-term debt investments that have a remaining maturity of 60 days or less are valued at amortized cost.
Security transactions and related investment income
Investment security transactions in the underlying funds are accounted for on a trade date plus one basis for daily net asset value calculations. However, for financial reporting purposes, investment transactions are reported on trade date. Interest income is accrued as earned. Dividend income and capital gain distributions are recorded on the ex-dividend date.
Gains and losses on securities sold are determined on the basis of specific identified cost for both financial and federal income tax reporting purposes.
Multi-class operations
All income, expenses (except for class-specific expenses) and realized and unrealized gains (losses) are allocated to each class of shares based upon the relative net assets of each class. Dividends to shareholders from net investment income are determined at a class level and distributions from capital gains are determined at a Portfolio level.
Expense allocation
Expenses not directly attributable to a particular Portfolio or class of shares are allocated based on the relative share of net assets of the Portfolio at the time the expense was incurred. Class-specific expenses, such as transfer agency fees, blue sky fees, printing and postage fees and distribution and service fees, are accrued daily and charged directly to the respective share classes. Expenses in the Portfolio’s Statement of Operations reflect the expenses of the Portfolio and do not include any indirect expenses related to the underlying funds. Because the underlying funds have varied expense levels and the Portfolio may own different proportions of the underlying funds at different times, the amount of fees and expenses incurred indirectly by the Portfolio will vary.
Federal income taxes
The Portfolio qualifies as a “regulated investment company” by complying with the applicable provisions of the Internal Revenue Code and will not be subject to federal income tax on taxable income that is distributed to shareholders. Therefore, no federal income tax provision is required.
New accounting pronouncement
In June 2006, Financial Accounting Standards Board (FASB) Interpretation No. 48, Accounting for Uncertainty in Income Taxes (the “Interpretation”) was issued and is effective for fiscal years beginning after December 15, 2006 and is to be applied to all open tax years as of the effective date. This Interpretation prescribes a minimum threshold for financial statement recognition of the benefit of a tax position taken or expected to be taken in a tax return, and requires certain expanded disclosures. Management is currently evaluating the application of the Interpretation to the Portfolio, and has not at this time quantified the impact, if any, resulting from the adoption of this Interpretation on the Portfolio’s financial statements.
In September 2006, FASB Standard No. 157, Fair Value Measurements (“FAS 157”) was issued, and is effective for fiscal years beginning after November 15, 2007. FAS 157 defines fair value, establishing a framework for measuring fair value and expands disclosure about fair value measurements. Management is currently evaluating the application of FAS 157 to the Portfolio, and its impact, if any, resulting from the adoption of FAS 157 on the Portfolio’s financial statements.
Lifestyle Growth Portfolio
24
Distribution of income and gains
The Portfolio records distributions to shareholders from net investment income and net realized gains, if any, on the ex-dividend date.
During the period ended August 31, 2006, the tax character of distributions paid was as follows: ordinary income $35,662,733. Distributions paid by the Portfolio with respect to each class of shares are calculated in the same manner, at the same time and are in the same amount, except for the effect of expenses that may be applied differently to each class. Such distributions, on a tax basis, are determined in conformity with income tax regulations, which may differ from accounting principles generally accepted in the United States of America. Distributions in excess of tax basis earnings and profits, if any, are reported in the Portfolio’s financial statements as a return of capital. As of August 31, 2006, the components of distributable earnings on a tax basis included $201,775,956 of undistributed ordinary income and $53,329 of undistributed long-term gain.
Capital accounts
The Portfolio reports the undistributed net investment income and accumulated undistributed net realized gain (loss) accounts on a basis approximating amounts available for future tax distributions (or to offset future taxable realized gains when a capital loss carryforward is available). Accordingly, the Portfolio may periodically make reclassifica-tions among certain capital accounts, without affecting its net asset value.
3. Investment advisory and other agreements
Advisory fees
The Trust has entered into an Investment Advisory Agreement with the Adviser. The Adviser is responsible for managing the corporate and business affairs of the Trust and for selecting and compensating subadvisers to handle the investment and reinvestment of the assets of the Portfolio, subject to the supervision of the Board of Trustees. Under the Advisory Agreement, the Portfolio pays a monthly management fee to the Adviser equivalent, on an annual basis, to its pro rata portion of the sum of: (a) 0.05% of the first $7,500,000,000 of the aggregate daily net assets and (b) 0.04% of the aggregate daily net assets in excess of $7,500,000,000 of the five Lifestyle Portfolios of the Trust (Lifestyle Aggressive, Lifestyle Growth, Lifestyle Balanced, Lifestyle Moderate and Lifestyle Conservative) and the five Lifestyle Portfolios of John Hancock Trust (Lifestyle Aggressive, Lifestyle Growth, Lifestyle Balanced, Lifestyle Moderate and Lifestyle Co nservative). The Portfolio is not responsible for payment of the subadvisory fees.
Expense reimbursements
The Adviser has contractually agreed to waive advisory fees or reimburse the Portfolio’s expenses for Class A, Class B, Class C, Class R3, Class R4 and Class R5 shares to the extent that blue sky fees and printing and postage expenses attributable to each class exceed 0.09% of the average annual net assets attributable to the classes, at least until November 1, 2006, and may thereafter be terminated by the Adviser at any time. Accordingly, the expense reductions related to this expense limitation amounted to $41,134, $30,659, $33,679, $17,776, $17,357 and $19,973 for Class A, Class B, Class C, Class R3, Class R4 and Class R5, respectively, for the period ended August 31, 2006.
The Adviser has contractually agreed to waive advisory fees or reimburse Portfolio expenses for Class 5 shares to the extent that total Portfolio operating expenses attributable to Class 5 exceed 0.07% of the average annual net assets attributable to Class 5. There were no expense reductions related to this expense limitation during the period ended August 31, 2006. This agreement remains in effect until June 30, 2007 and may thereafter be terminated by the Adviser at any time.
Administration fees
The Portfolio has an agreement with the Adviser that requires the Portfolio to reimburse the Adviser for all expenses associated with providing the administrative, financial, accounting and recordkeeping services of the Portfolio, including the preparation of all tax returns, annual, semiannual and periodic reports to shareholders and the preparation of all regulatory reports.
Lifestyle Growth Portfolio
25
Distribution plans
The Trust has a Distribution Agreement with the Distributor. The Portfolio has adopted Distribution Plans with respect to Class A, Class B, Class C, Class R3, Class R4 and Class 1, pursuant to Rule 12b-1 under the 1940 Act, to reimburse the Distributor for the services it provides as distributor of shares of the Portfolio. Accordingly, the Portfolio makes monthly payments to the Distributor at an annual rate not to exceed 0.30%, 1.00%, 1.00%, 0.50%, 0.25% and 0.05% of the average daily net assets of Class A, Class B, Class C, Class R3, Class R4 and Class 1, respectively. A maximum of 0.25% of such payments may be service fees, as defined by the Conduct Rules of the National Association of Securities Dealers. Under the Conduct Rules, curtailment of a portion of the Portfolio’s 12b-1 payments could occur under certain circumstances.
The Portfolio has also adopted a Service Plan with respect to Class R3, Class R4 and Class R5 shares (the “Service Plan”). Under the Service Plan, the Portfolio pays up to 0.15%, 0.10% and 0.05% of the average daily net assets of Class R3, Class R4 and Class R5 shares, respectively, for certain other services.
Sales charges
Class A shares are assessed up-front sales charges of up to 5% of the net asset value of such shares. During the period ended August 31, 2006, the Portfolio was informed that the Distributor received net up-front sales charges of $2,719,165 with regard to sales of Class A shares. Of this amount, $441,963 was retained and used for printing prospectuses, advertising, sales literature and other purposes, $2,258,586 was paid as sales commissions to unrelated broker-dealers and $18,616 was paid as sales commissions to sales personnel of Signator Investors, Inc. (“Signator Investors”), a related broker-dealer, an indirect subsidiary of MFC.
Class B shares that are redeemed within six years of purchase are subject to a contingent deferred sales charge (“CDSC”) at declining rates, beginning at 5.00% of the lesser of the current market value at the time of redemption or the original purchase cost of the shares being redeemed. Class C shares that are redeemed within one year of purchase are subject to a CDSC at a rate of 1.00% of the lesser of the current market value at the time of redemption or the original purchase cost of the shares being redeemed. Proceeds from the CDSCs are paid to the Distributor and are used, in whole or in part, to defray its expenses for providing distribution-related services to the Portfolio in connection with the sale of Class B and Class C shares. During the period ended August 31, 2006, the Portfolio was informed that CDSCs received by the Distributor amounted to $9,636 for Class B shares and $3,756 for Class C shares.
Transfer agent fees
The Portfolio has a Transfer Agency Agreement with John Hancock Signature Services, Inc. (“Signature Services”), an indirect subsidiary of MFC. For Class A, Class B, Class C, Class R3, Class R4 and Class R5 shares, the Portfolio pays a monthly transfer agent fee at an annual rate of 0.05% of each class’s average daily net assets, plus a fee based on the number of shareholder accounts and reimbursement for certain out-of-pocket expenses. Expenses not directly attributable to a particular class of shares are aggregated and allocated to each class on the basis of its relative net asset value.
Signature Services has agreed to limit the transfer agent fees so that such fees do not exceed 0.20% annually of each of Class A, Class B, Class C, Class R3, Class R4 and Class R5 share average daily net assets. This agreement is effective until December 31, 2006. Signature Services reserves the right to terminate this limitation in the future. In addition, Signature Services has voluntarily agreed to further limit transfer agent fees for Class R3, Class R4 and Class R5 shares so that such fees do not exceed 0.05% annually of each class’s average daily net assets. Accordingly, the transfer agent fees reductions amounted to $457, $797 and $918 for Class R3, Class R4 and Class R5 shares, respectively, during the period ended August 31, 2006. Signature Services reserves the right to terminate this limitation at any time.
Lifestyle Growth Portfolio
26
Expenses under the agreements described above for the period ended August 31, 2006, were as follows:
| | Distribution and | Transfer | | Printing and |
| Share Class | service fees | agent | Blue sky | postage |
|
| |
| Class A | $114,180 | $62,773 | $22,848 | $52,540 |
| Class B | 86,746 | 17,572 | 17,171 | 21,296 |
| Class C | 314,958 | 60,828 | 20,105 | 41,921 |
| Class R3 | 2,098 | 644 | 16,055 | 2,098 |
| Class R4 | 4,260 | 1,510 | 16,055 | 2,587 |
| Class R5 | 28 | 1,277 | 17,961 | 2,828 |
| Class 1 | 2,709,705 | — | — | 12,437 |
| Class 5 | — | — | — | — |
| Total | $3,231,975 | $144,604 | $110,195 | $135,707 |
Trustees’ fees
The Trust compensates each Trustee who is not an employee of the Adviser or its affiliates. Total Trustees’ expenses are allocated based on each portfolio’s average daily net asset value.
4. Guarantees and Indemnifications
Under the Trust’s organizational documents, its Officers and Trustees are indemnified against certain liability arising out of the performance of their duties to the Trust. Additionally, in the normal course of business, the Trust enters into contracts with service providers that contain general indemnification clauses. The Trust’s maximum exposure under these arrangements is unknown, as this would involve future claims that may be made against the Trust that have not yet occurred. However, based on experience, the Trust believes the risk of loss to be remote.
5. Capital shares
Share activities for the Portfolio for the period ended August 31, 2006 were as follows:
| | | Period ended 8-31-06a |
| | Shares | Amount |
|
| Class A shares | | |
| |
| Sold | 7,413,437 | $107,056,385 |
| Distributions reinvested | 3,180 | 44,453 |
| Repurchased | (361,010) | (5,177,905) |
| Net increase | 7,055,607 | $101,922,933 |
|
| |
| Class B shares | | |
| |
| Sold | 1,720,077 | $24,839,956 |
| Distributions reinvested | 435 | 6,092 |
| Repurchased | (64,700) | (923,569) |
| Net increase | 1,655,812 | $23,922,479 |
|
| |
| Class C shares | | |
| |
| Sold | 6,576,277 | $95,022,521 |
| Distributions reinvested | 1,182 | 16,531 |
| Repurchased | (177,998) | (2,523,827) |
| Net increase | 6,399,461 | $92,515,225 |
Lifestyle Growth Portfolio
27
| | | Period ended 8-31-06a |
| | Shares | Amount |
|
| Class R3 shares | | |
| |
| Sold | 152,570 | $2,166,010 |
| Repurchased | (351) | (5,030) |
| Net increase | 152,219 | $2,160,980 |
|
| |
| Class R4 shares | | |
| |
| Sold | 330,719 | $4,841,734 |
| Repurchased | (16,347) | (238,184) |
| Net increase | 314,372 | $4,603,550 |
|
| |
| Class R5 shares | | |
| |
| Sold | 113,625 | $1,616,476 |
| Distributions reinvested | 136 | 1,904 |
| Repurchased | (8,639) | (122,977) |
| Net increase | 105,122 | $1,495,403 |
|
| |
| Class 1 shares | | |
| |
| Sold | 486,658,311 | $6,563,462,581 |
| Distributions reinvested | 2,554,657 | 35,586,379 |
| Repurchased | (5,180,020) | (74,075,698) |
| Net increase | 484,032,948 | $6,524,973,262 |
|
| |
| Class 5 shares | | |
| |
| Sold | 225,361 | $3,236,330 |
| Net increase | 225,361 | $3,236,330 |
|
| |
| Net increase | 499,940,902 | $6,754,830,162 |
aClass A, Class B, Class C, Class R3, Class R4 and Class R5 shares began operations on 10-18-05, Class 1 shares began operation on 10-15-05, and Class 5 shares began operation on 7-3-06.
6. Investment transactions
Purchases and sales of the underlying funds during the period ended August 31, 2006, aggregated $8,524,500,996 and $1,729,339,820, respectively.
The cost of investments owned on August 31, 2006, including short-term investments, for federal income tax purposes, was $6,954,050,007. Gross unrealized appreciation and depreciation of investments aggregated $388,487,932 and $31,734,371, respectively, resulting in net unrealized appreciation of $356,753,561.
7. Investment in affiliated underlying funds
The Portfolio invests primarily in the underlying funds that are managed by affiliates of the Adviser. The Portfolio does not invest in the underlying funds for the purpose of exercising management or control.
A summary of the Portfolio’s transactions in the securities of affiliated issuers in which the Portfolio’s holdings represent 5% or more of the outstanding voting securities of the issuer, during the period ended August 31, 2006 is set forth below.
Lifestyle Growth Portfolio
28
| Affiliate — | Shares | Shares | Ending Share | | Ending |
| Class NAV | Purchased | Sold | Amount | Proceeds | Value |
|
| 500 Index | 12,089,572 | 12,089,572 | — | $137,103,780 | — |
| All Cap Core | 14,682,279 | 360 | 14,681,919 | 3,516 | $145,644,635 |
| All Cap Growth | 4,441,618 | 503 | 4,441,115 | 8,105 | 73,056,348 |
| All Cap Value | 9,212,669 | 719 | 9,211,950 | 10,557 | 145,548,808 |
| Blue Chip Growth | 20,040,836 | 3,632,144 | 16,408,692 | 66,335,476 | 292,074,718 |
| Capital Appreciation | 31,369,562 | 385,666 | 30,983,896 | 3,704,776 | 292,797,818 |
| Core Bond | 1,906,404 | 1,906,404 | — | 23,791,925 | — |
| Core Equity | 15,887,788 | 337,250 | 15,550,538 | 5,077,283 | 221,906,172 |
| Emerging Small Company | 847,802 | 847,802 | — | 23,704,534 | — |
| Equity-Income | 15,842,260 | 3,776,898 | 12,065,362 | 67,945,556 | 218,503,714 |
| Fundamental Value | 18,435,574 | 14,045 | 18,421,529 | 221,150 | 291,612,803 |
| Global Bond | 9,868,480 | 38,034 | 9,830,446 | 554,512 | 145,392,303 |
| Global Real Estate | 7,310,055 | 161,777 | 7,148,278 | 1,633,881 | 73,627,263 |
| High Income | 7,347,987 | 222 | 7,347,765 | 2,193 | 72,522,440 |
| High Yield | 49,487,268 | 13,305,085 | 36,182,183 | 138,978,920 | 364,716,402 |
| International Core * | 11,118,538 | — | 11,118,538 | — | 437,848,009 |
| International Equity Index | 7,708,246 | 11,617 | 7,696,629 | 218,015 | 146,005,059 |
| International Opportunities | 18,855,465 | 669,173 | 18,186,292 | 10,114,025 | 293,890,478 |
| International Small Cap | 13,640,102 | 6,676,151 | 6,963,951 | 146,611,771 | 145,894,773 |
| International Small Company | 15,667,855 | 511 | 15,667,344 | 4,841 | 146,176,323 |
| International Stock | 34,060,140 | 34,060,140 | — | 467,417,437 | — |
| International Value | 24,836,223 | 8,456,861 | 16,379,362 | 150,231,854 | 292,862,991 |
| Large Cap | 4,967,046 | 150 | 4,966,896 | 2,178 | 72,864,364 |
| Large Cap Value | 3,141,865 | 390 | 3,141,475 | 8,235 | 72,285,344 |
| Mid Cap Core | 16,461,476 | 3,731,855 | 12,729,621 | 66,837,266 | 219,713,260 |
| Mid Cap Index | 8,008,706 | 187 | 8,008,519 | 3,557 | 147,116,485 |
| Mid Cap Stock | 4,663,898 | 556 | 4,663,342 | 8,113 | 73,820,697 |
| Mid Cap Value Equity | 7,585,038 | 125 | 7,584,913 | 1,249 | 73,194,409 |
| Mid Cap Value | 3,495,079 | 3,495,079 | — | 67,769,033 | — |
| Natural Resources | 11,432,617 | 3,241,253 | 8,191,364 | 103,589,110 | 291,612,553 |
| Quantitative Value | 13,222,684 | 25,357 | 13,197,327 | 401,451 | 218,547,736 |
| Real Estate Equity | 7,095,201 | 385,979 | 6,709,222 | 4,152,945 | 73,734,347 |
| Real Estate Securities | 5,204,204 | 5,204,204 | — | 141,368,436 | — |
| Real Return Bond | 16,768,155 | 364,201 | 16,403,954 | 4,831,760 | 218,500,667 |
| Small Cap | 5,289,400 | 627 | 5,288,773 | 8,668 | 74,254,376 |
| Small Cap Index | 4,668,371 | 156 | 4,668,215 | 2,528 | 74,458,026 |
| Small Cap Opportunities | 6,372,833 | 23,838 | 6,348,995 | 605,478 | 146,915,745 |
| Small Company Growth | 6,665,521 | 193 | 6,665,328 | 2,237 | 73,918,490 |
| Small Company Value | 3,137,535 | 652 | 3,136,883 | 14,139 | 74,124,541 |
| Special Value | 3,591,766 | 112 | 3,591,654 | 2,347 | 73,700,746 |
| Spectrum Income | 14,158,647 | 1,658 | 14,156,989 | 16,730 | 145,392,276 |
| Strategic Bond | 11,801,069 | 5,643,351 | 6,157,718 | 67,098,154 | 72,476,340 |
| Strategic Income | 7,208,792 | 337 | 7,208,455 | 3,351 | 72,517,058 |
| Total Return | 21,489,547 | 281,666 | 21,207,881 | 3,826,406 | 291,608,367 |
| U.S. Global | | | | | |
| Leaders Growth | 17,290,244 | 846 | 17,289,398 | 10,907 | 219,229,572 |
| U.S. High Yield Bond | 7,404,354 | 1,856,541 | 5,547,813 | 23,726,652 | 72,398,961 |
| U.S. Multi Sector | 49,220,942 | 2,136 | 49,218,806 | 22,115 | 512,367,776 |
| Value & Restructuring | 6,588,998 | 114 | 6,588,884 | 1,323 | 73,004,837 |
| Vista | 6,931,735 | 112,526 | 6,819,209 | 1,351,345 | 72,965,538 |
*Represents the Portfolio’s investment in John Hancock Funds III International Core Fund
Lifestyle Growth Portfolio
29
8. Reclassification of accounts
During the period ended August 31, 2006, the Portfolio reclassified amounts to reflect a decrease in accumulated net realized gain on investments of $14,258,350, an increase in accumulated net investment income of $14,928,361 and a decrease in capital paid-in of $670,011. This represents the amounts necessary to report these balances on a tax basis, excluding certain temporary differences, as of August 31, 2006. Additional adjustments may be needed in subsequent reporting periods. These reclassifications, which have no impact on the net asset value of the Portfolio, are primarily attributable to certain differences in the computation of distributable income and capital gains under federal tax rules versus accounting principles generally accepted in the United States of America and book and tax differences in accounting for non-deductible organizational costs. The calculation of net investment income per share in the Portfolio’s Financial Highlights excludes these ad justments.
Lifestyle Growth Portfolio
30
Auditors’ report
Report of Independent Registered Public Accounting Firm
To the Board of Trustees of John Hancock Funds II and Shareholders of John Hancock Lifestyle Growth Portfolio:
In our opinion, the accompanying statement of assets and liabilities, including the schedule of securities owned, and the related statements of operations and of changes in net assets and the financial highlights present fairly, in all material respects, the financial position of John Hancock Lifestyle Growth Portfolio (the “Portfolio”) at August 31, 2006, and the results of its operations, the changes in its net assets, and the financial highlights for the period October 15, 2005 (commencement of operations) through August 31, 2006, in conformity with accounting principles generally accepted in the United States of America. These financial statements and financial highlights (hereafter referred to as “financial statements”) are the responsibility of the Portfolio’s management; our responsibility is to express an opinion on these financial statements based on our audit. We conducted our audit of these financial statements in accordance with the standards of the Public Company Accounting Oversight Board (United States). Those standards require that we plan and perform the audit to obtain reasonable assurance about whether the financial statements are free of material misstatement. An audit includes examining, on a test basis, evidence supporting the amounts and disclosures in the financial statements, assessing the accounting principles used and significant estimates made by management, and evaluating the overall financial statement presentation. We believe that our audit, which included confirmation of securities at August 31, 2006, by correspondence with the transfer agent, provides a reasonable basis for our opinion.
PricewaterhouseCoopers LLP
Boston, Massachusetts
October 26, 2006
31
Tax information
Unaudited
For federal income tax purposes, the following information is furnished with respect to the distributions of the Portfolio, if any, paid during its taxable year ended August 31, 2006.
With respect to the ordinary dividends paid by the Portfolio for the fiscal period ended August 31, 2006, 35.60% of the dividends qualify for the corporate dividends-received deduction.
The Portfolio hereby designates the maximum amount allowable of its net taxable income as quali-fied dividend income as provided in the Jobs and Growth Tax Relief Reconciliation Act of 2003. This amount will be reflected on Form 1099-DIV for the calendar year 2006.
Shareholders will be mailed a 2006 U.S. Treasury Department Form 1099-DIV in January 2007. This will reflect the total of all distributions that are taxable for calendar year 2006.
32
Trustees and Officers
This chart provides information about the Trustees and Officers who oversee your John Hancock fund. Officers elected by the Trustees manage the day-to-day operations of the Portfolio and execute policies formulated by the Trustees.
| Independent Trustees | | |
| |
| Name, age | | Number of |
| Position(s) held with Portfolio | Trustee of | John Hancock |
| Principal occupation(s) and other | Portfolio | funds overseen |
| directorships during past 5 years | since1 | by Trustee |
|
| Charles L. Bardelis, Born: 1941 | 2005 | 209 |
| President and Executive Officer, Island Commuter Corp. (Marine Transport). | | |
| Trustee of John Hancock Trust (since 1988) and John Hancock Funds III (since 2005). | |
|
| |
| Peter S. Burgess, Born: 1942 | 2005 | 209 |
| Consultant (financial, accounting and auditing matters (since 1999); | | |
| Certified Public Accountant; Partner, Arthur Andersen (prior to 1999). | | |
| Director of the following publicly traded companies: PMA Capital Corporation | | |
| (since 2004) and Lincoln Educational Services Corporation (since 2004). | | |
| Trustee of John Hancock Trust (since 2005), John Hancock Funds III (since 2005). | |
|
| |
| Elizabeth G. Cook, Born: 1937 | 2005 | 209 |
| Expressive Arts Therapist, Massachusetts General Hospital (September 2001 | | |
| to present); Expressive Arts Therapist, Dana Farber Cancer Institute | | |
| (September 2000 to January 2004); President, The Advertising Club of Greater Boston. | |
| Trustee of John Hancock Trust (since 2005) and John Hancock Funds III (since 2005). | |
|
| |
| William H. Cunningham, Born: 1944 | 2005 | 160 |
| Former Chancellor, University of Texas System and former President of the | | |
| University of Texas, Austin, Texas; Chairman and CEO, IBT Technologies | | |
| (until 2001); Director of the following: Hire.com (until 2004), STC Broadcasting, | |
| Inc. and Sunrise Television Corp. (until 2001), Symtx, Inc. (electronic manufacturing) | |
| (since 2001), Adorno/Rogers Technology, Inc. (until 2004), Pinnacle Foods | | |
| Corporation (until 2003), rateGenius (until 2003), Lincoln National Corporation | |
| (insurance) (since 2006), Jefferson-Pilot Corporation (diversified life insurance | | |
| company) (until 2006), New Century Equity Holdings (formerly Billing Concepts) | |
| (until 2001), eCertain (until 2001), ClassMap.com (until 2001), Agile Ventures | | |
| (until 2001), AskRed.com (until 2001), Southwest Airlines, Introgen and Viasystems | |
| Group, Inc. (electronic manufacturer) (until 2003); Advisory Director, Interactive | |
| Bridge, Inc. (college fundraising) (until 2001); Advisory Director, Q Investments | | |
| (until 2003); Advisory Director, JP Morgan Chase Bank (formerly Texas Commerce | |
| Bank - Austin), LIN Television (since 2002), WilTel Communications (until 2003) | |
| and Hayes Lemmerz International, Inc. (diversified automotive parts supply | | |
| company) (since 2003). Trustee of John Hancock Funds (since 2005) and | | |
| John Hancock Funds III (since 2005). | | |
33
| Independent Trustees (continued) | | |
| |
| Name, age | | Number of |
| Position(s) held with Portfolio | Trustee of | John Hancock |
| Principal occupation(s) and other | Portfolio | funds overseen |
| directorships during past 5 years | since1 | by Trustee |
|
| Charles L. Ladner, Born: 1938 | 2005 | 160 |
| Chairman and Trustee, Dunwoody Village, Inc. (retirement services) (until 2003); | |
| Senior Vice President and Chief Financial Officer, UGI Corporation (public utility | |
| holding company) (retired 1998); Vice President and Director for AmeriGas, Inc. | |
| (retired 1998); Director of AmeriGas Partners, L.P. (until 1997)(gas distribution); | |
| Director, EnergyNorth, Inc. (until 1995); Director, Parks and History Association | |
| (since 2007). Trustee of John Hancock Funds (since 2004) and John Hancock | | |
| Funds III (since 2005). | | |
|
| |
| Hassell H. McClellan, Born: 1945 | 2005 | 209 |
| Associate Professor, The Wallace E. Carroll School of Management, Boston College. | |
| Trustee of John Hancock Trust (since 2005), John Hancock Funds III (since 2005). | |
|
| |
| James. M. Oates, Born: 1946 | 2005 | 209 |
| Managing Director, Wydown Group (financial consulting firm)(since 1994); | | |
| Chairman, Emerson Investment Management, Inc. (since 2000); Chairman, | | |
| Hudson Castle Group, Inc. (formerly IBEX Capital Markets, Inc.) (financial services | |
| company) (since 1997). Director of the following publicly traded companies: | | |
| Stifel Financial (since 1996); Investor Financial Services Corporation (since 1995); | |
| and Connecticut River Bancorp, Director (since 1998). Director, Phoenix Mutual | |
| Funds (since 1988; overseeing 20 portfolios). Trustee of John Hancock Trust | | |
| (since 2004) and John Hancock Funds III (since 2005). | | |
1 Because the Trust does not hold regular annual shareholders meetings, each Trustee holds office for an indefinite term until his/her successor is duly elected and qualified or until he/she dies, retires, resigns, is removed or becomes disqualified.
34
| Non-Independent Trustee3 | | |
| |
| Name, age | | Number of |
| Position(s) held with Portfolio | Trustee of | John Hancock |
| Principal occupation(s) and other | Portfolio | funds overseen |
| directorships during past 5 years | since1 | by Trustee |
|
| James R. Boyle, Born: 1959 | 2005 | 262 |
| Chairman and Director, John Hancock Advisers, LLC (the “Adviser”), | | |
| The Berkeley Financial Group, LLC (“The Berkeley Group”) (hold- | | |
| ing company) and John Hancock Funds, LLC (since 2005); President, | | |
| John Hancock Annuities; Executive Vice President, John Hancock | | |
| Life Insurance Company (since June, 2004); President U.S. Annuities; | | |
| Senior Vice President, The Manufacturers Life Insurance Company | | |
| (U.S.A) (prior to 2004). | | |
| |
| |
| Principal officers who are not Trustees | | |
| |
| Name, age | | |
| Position(s) held with Portfolio | | Officer of |
| Principal occupation(s) and | | Portfolio |
| directorships during past 5 years | | since |
|
| Keith Hartstein2, Born: 1956 | | 2005 |
| President and Chief Executive Officer | | |
| Senior Vice President, Manulife Financial Corporation (since 2004); Director, | | |
| President and Chief Executive Officer, the Adviser and The Berkeley Group, John | |
| Hancock Funds, LLC (since 2005); Director, MFC Global Investment Management | |
| (U.S.), LLC (“MFC Global (U.S.)”) (since 2005); Director, John Hancock Signature | |
| Services, Inc. (since 2005); President and Chief Executive Officer, John Hancock | |
| Investment Management Services, LLC (since 2006); President and Chief Executive | |
| Officer, John Hancock Funds, John Hancock Funds II, John Hancock Funds III, | | |
| John Hancock Trust,; Director, Chairman and President, NM Capital Management, | |
| Inc. (since 2005); Chairman, Investment Company Institute Sales Force Marketing | |
| Committee (since 2003); Director, President and Chief Executive Officer, MFC | | |
| Global (U.S.) (2005-2006); Executive Vice President, John Hancock Funds, LLC | | |
| (until 2005). | | |
|
| |
| John Vrysen2, Born: 1955 | | 2005 |
| Chief Financial Officer | | |
| Director, Executive Vice President and Chief Financial Officer, the Adviser, The | | |
| Berkeley Group and John Hancock Funds, LLC (since 2005); Executive Vice | | |
| President and Chief Financial Officer, John Hancock Investment Management | | |
| Services, LLC (since 2005), Vice President and Chief Financial Officer, MFC | | |
| Global (U.S.) (since 2005); Director, John Hancock Signature Services, Inc. (since | |
| 2005); Chief Financial Officer, John Hancock Funds, John Hancock Funds II, John | |
| Hancock Funds III, John Hancock Trust (since 2005); Vice President and General | |
| Manager, Fixed Annuities, U.S. Wealth Management (until 2005); Vice President, | |
| Operations Manulife Wood Logan (2000-2004). | | |
35
| Principal officers who are not Trustees (continued) | |
| |
| Name, age | |
| Position(s) held with Portfolio | Officer of |
| Principal occupation(s) and | Portfolio |
| directorships during past 5 years | since |
|
| Francis V. Knox, Jr.2, Born: 1947 | 2005 |
| Vice President and Chief Compliance Officer, John Hancock Investment | |
| Management Services, LLC, the Adviser and MFC Global (U.S.) (since 2005); Chief | |
| Compliance Officer, John Hancock Funds, John Hancock Funds II, John Hancock | |
| Funds III and John Hancock Trust (since 2005); Vice President and Assistant | |
| Treasurer, Fidelity Group of Funds (until 2004); Vice President and Ethics & | |
| Compliance Officer, Fidelity Investments (until 2001). | |
|
| |
| Gordon Shone2, Born: 1956 | 2005 |
| Treasurer, John Hancock Funds (since 2006); John Hancock Funds II, John Hancock | |
| Funds III and John Hancock Trust (since 2005); Vice President and Chief Financial | |
| Officer, John Hancock Trust (2003-2005); Senior Vice President, John Hancock | |
| Life Insurance Company (U.S.A.) (since 2001); Vice President, John Hancock | |
| Investment Management Services, Inc. and John Hancock Advisers, LLC (since | |
| 2006), The Manufacturers Life Insurance Company (U.S.A.) (1998 to 2000). | |
|
| |
| Thomas M. Kinzler2, Born: 1955 | 2006 |
| Vice President and Counsel for John Hancock Life Insurance Company (U.S.A.) | |
| (since 2006); Secretary and Chief Legal Officer, John Hancock Funds, John | |
| Hancock Funds II, John Hancock Funds III and John Hancock Trust (since 2006); | |
| Vice President and Associate General Counsel for Massachusetts Mutual Life | |
| Insurance Company (1999-2006); Secretary and Chief Legal Counsel for MML | |
| Series Investment Fund (2000-2006); Secretary and Chief Legal Counsel for | |
| MassMutual Institutional Funds (2000-2004); Secretary and Chief Legal Counsel | |
| for MassMutual Select Funds and MassMutual Premier Funds (2004-2006). | |
1 Because the Trust does not hold regular annual shareholders meetings, each Trustee holds office for an indefinite term until his successor is duly elected and qualified or until he dies, retires, resigns, is removed or becomes disqualified.
2Affiliated with the investment adviser.
3 Non-Independent Trustee: holds positions with the Fund’s investment adviser, underwriter, and/ or certain other affiliates.
36
For more information
The Portfolio’s proxy voting policies, procedures and records are available without charge, upon request:
| By phone | On the Portfolio’s Web site | On the SEC’s Web site |
| 1-800-225-5291 | www.jhfunds.com/proxy | www.sec.gov |
|
| |
| Investment adviser | Custodian | Legal counsel |
| John Hancock Investment | State Street Bank & Trust Co. | Kirkpatrick & Lockhart |
| Management Services, LLC | 2 Avenue de Lafayette | Nicholson Graham LLP |
| 601 Congress Street | Boston, MA 02111 | 1 Lincoln Street |
| Boston, MA 02210-2805 | | Boston, MA 02111 |
| | Transfer agent | |
| Principal distributor | John Hancock Signature | Independent registered |
| John Hancock Funds, LLC | Services, Inc. | public accounting firm |
| 601 Congress Street | 1 John Hancock Way, | PricewaterhouseCoopers LLP |
| Boston, MA 02210-2805 | Suite 1000 | 125 High Street |
| | Boston, MA 02217-1000 | Boston, MA 02110 |
Each underlying fund’s accounting policies are outlined in the underlying fund’s shareholder report, available without charge by calling 1-800-344-1029 or on the Securities and Exchange Commission (“SEC”) Web site at www.sec.gov, File # 811-21779, CIK 0001331971.
The Portfolio’s investment objective, risks, charges and expenses are included in the prospectus and should be considered carefully before investing. For a prospectus, call your financial professional, call John Hancock Funds at 1-800-225-5291 or visit the Portfolio’s Web site at www.jhfunds.com. Please read the prospectus
carefully before investing or sending money.
| How to contact us | |
|
| |
| Internet | www.jhfunds.com | |
|
| |
| Mail | Regular mail: | Express mail: |
| | John Hancock | John Hancock |
| | Signature Services, Inc. | Signature Services, Inc. |
| | 1 John Hancock Way, Suite 1000 | Mutual Fund Image Operations |
| | Boston, MA 02217-1000 | 380 Stuart Street |
| | | Boston, MA 02116 |
| Phone | Customer service representatives | 1-888-225-5291 |
| | 24-hour automated information | 1-800-338-8080 |
| | TDD line | 1-800-554-6713 |
A listing of month-end portfolio holdings is available on our Web site, www.jhfunds.com. A more detailed portfolio holdings summary is available on a quarterly basis 60 days after the fiscal quarter on our Web site or upon request by calling 1-800-225-5291, or on the Securities and Exchange Commission’s Web site, www.sec.gov.
40
J O H N H A N C O C K F A M I L Y O F F U N D S
Equity
Balanced Fund
Classic Value Fund
Classic Value Fund II
Core Equity Fund
Focused Equity Fund
Growth Fund
Growth Opportunities Fund
Growth Trends Fund
Intrinsic Value Fund
Large Cap Equity Fund
Large Cap Select Fund
Mid Cap Equity Fund
Mid Cap Growth Fund
Multi Cap Growth Fund
Small Cap Equity Fund
Small Cap Fund
Small Cap Intrinsic Value Fund
Sovereign Investors Fund
U.S. Core Fund
U.S. Global Leaders Growth Fund
Value Opportunities Fund
ASSET ALLOCATION & LIFESTYLE
Allocation Core Portfolio
Allocation Growth + Value Portfolio
Lifestyle Aggressive Portfolio
Lifestyle Balanced Portfolio
Lifestyle Conservative Portfolio
Lifestyle Growth Portfolio
Lifestyle Moderate Portfolio
SECTOR
Financial Industries Fund
Health Sciences Fund
Real Estate Fund
Regional Bank Fund
Technology Fund
Technology Leaders Fund
INTERNATIONAL
Greater China Opportunities Fund
International Classic Value Fund
International Core Fund
International Fund
International Growth Fund
INCOME
Bond Fund
Government Income Fund
High Yield Fund
Investment Grade Bond Fund
Strategic Income Fund
TAX-FREE INCOME
California Tax-Free Income Fund
High Yield Municipal Bond Fund
Massachusetts Tax-Free Income Fund
New York Tax-Free Income Fund
Tax-Free Bond Fund
MONEY MARKET
Money Market Fund
U.S. Government Cash Reserve
CLOSED-END
Bank & Thrift Opportunity
Financial Trends
Income Securities
Investors Trust
Patriot Global Dividend
Patriot Preferred Dividend
Patriot Premium Dividend I
Patriot Premium Dividend II
Patriot Select Dividend
Preferred Income
Preferred Income II
Preferred Income III
Tax-Advantaged Dividend
For more complete information on any John Hancock Fund and a prospectus, which includes charges and expenses, call your financial professional, or John Hancock Funds at 1-800-225-5291. Please read the prospectus carefully before investing or sending money.

1-800-225-5291
1-800-554-6713 (TDD)
1-800-338-8080 EASI-Line
www.jhfunds. com
Now available: electronic delivery
www.jhfunds. com/edelivery
This report is for the information of the shareholders of John Hancock Lifestyle Growth Portfolio.
0400A 8/06
10/06


| TABLE OF CONTENTS |
|
| Managers' report |
| page 2 |
|
| A look at performance |
| page 6 |
|
| Your expenses |
| page 8 |
|
| Portfolio’s investments |
| page 10 |
|
| Financial statements |
| page 12 |
|
| Trustees and officers |
| page 33 |
|
| For more information |
| page 40 |
|
CEO corner
To Our Shareholders,
The future has arrived at John Hancock Funds.
We have always been firm believers in the powerful role the Internet can play in providing fund information to our shareholders and prospective investors. Recently, we launched a redesigned, completely overhauled Web site that is more visually pleasing, easier to navigate and, most importantly, provides more fund information and learning tools without overwhelming the user.
Not long after we embarked on this major project, a study was released by the Investment Company Institute, the mutual fund industry’s main trade group, which found that an overwhelming majority of shareholders consider the Internet the “wave of the future” for accessing fund information.
Our new site sports fresher and faster ways to access account information. New innovations allow investors to view funds by risk level, track the performance of the John Hancock funds of their choice or sort funds by Morningstar, Inc.’s star ratings. Investors who own a John Hancock fund through a qualified retirement plan and don’t pay sales charges when making a purchase have the option of sorting by a “Load Waived” Morningstar Rating, thereby creating an apples-to-apples comparison with no-load funds that may also be available in their retirement plan.
The new site also has more educational tools and interactive modules to educate and assist investors with their financial goals, from college savings to retirement planning. A new “I want to…” feature allows investors to check performance, invest more money, update personal information or download prospectuses and forms quickly and easily.
In another of our ongoing efforts to provide our shareholders with top-notch service, we also redesigned our shareholder reports, as you may have noticed with this report. We hope the larger size, more colorful cover and redesigned presentation of the commentary and data tables will draw you in and make them easier to read.
After you’ve read your shareholder report, we encourage you to visit our new Web site — www.jhfunds.com — and take a tour. It’s easy, fast and fun and allows you to be in control of what you see and do. In short, it’s the wave of the future!
Sincerely,

Keith F. Hartstein,
President and Chief Executive Officer
This commentary reflects the CEO’s views as of August 31, 2006. They are subject to change at any time.
Your portfolio at a glance
The Portfolio seeks a balance between a high level of current income and growth of capital, with a greater emphasis on income. To pursue this goal, the Portfolio, which is a fund-of-funds, normally invests approximately 60% of its assets in underlying funds that invest primarily in fixed-income securities and approximately 40% of its assets in underlying funds that invest primarily in equity securities.
Since inception*
► Most fixed-income funds turned in low single-digit gains as investors continued to worry about rising inflation and higher interest rates.
► The high yield asset class continued to provide strong performance, thanks to investors’ willingness to take on extra credit risk in exchange for higher levels of income relative to other fixed-income investments.
► The Portfolio’s international equity, domestic equity large-cap value and real estate securities funds helped boost returns for our shareholders.
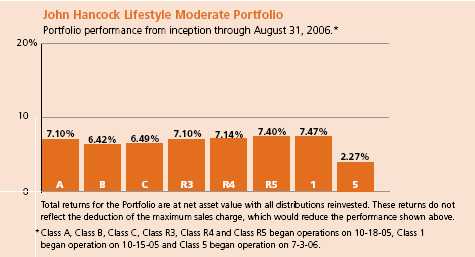
| Target asset allocation | | | | |
| | | | | |
| Equity | % of Total | | Fixed Income | % of Total |
| |
|
| U.S. Large Cap | 21.0 | | Intermediate Term Bond | 22.0 |
| |
|
| International | 11.0 | | High Yield Bond | 12.0 |
| |
|
| Real Estate | 4.0 | | Multi-Sector Bond | 12.0 |
| |
|
| U.S. Small Cap | 4.0 | | Global Bond | 6.0 |
| |
|
| | | | Treasury Inflation- Protected Securities | 4.0 |
| |
|
| | | | Long-Term Bond | 2.0 |
| |
|
| | | | Short-Term Bond | 2.0 |
| |
|
1
Managers’ report
John Hancock
Lifestyle Moderate Portfolio
The Portfolio’s broad diversification across multiple asset classes and fund managers was very valuable during a volatile market environment. Just about every investment type ended the reporting period in positive territory for the period beginning October 15, 2005 (the Portfolio’s inception date) through August 31, 2006.
Fixed-income securities — which make up approximately 60% of the Portfolio’s assets — generally gained ground but produced mediocre results, with the broad bond market returning 3.33%, as measured by the Lehman Brothers Aggregate Bond Index. A steady stream of interest rate increases from the Federal Reserve Board (the Fed) weighed on bonds’ results. On August 31, 2006, the federal funds rate stood at 5.25%, up from 3.75% the previous October. Once again, the strongest performers in the fixed-income market were lower-rated, higher-yielding bonds. Against a backdrop of low default rates and continued strong fundamentals from bond issuers, credit spreads — the difference in yield among bonds of various credit quality — continued to narrow but ended the period at historically very tight levels.
On the Portfolio’s equity side, results were better, as the Standard & Poor’s 500 Index returned 11.44% during the period. Large-capitalization U.S. stocks again lagged their mid-cap counterparts, which in turn underperformed small caps — although the performance gap between large and small stocks finally began to narrow during the period. Value stocks also continued to outshine growth stocks, despite several brief periods during
SCORECARD
| INVESTMENT | | PERIOD’S PERFORMANCE...AND WHAT’S BEHIND THE NUMBERS |
| |
| High Yield (Western) | ▲ | Continued to benefit in an environment of narrowing credit spreads. |
| Real estate securities | ▲ | Benefited from continued fundamental strengthening and demand |
| | | for the securities’ high dividend yields. |
| U.S. Multi-Sector (GMO) | ▼ | Emphasis on certain higher-quality large-cap growth stocks |
| | | detracted from performance in an environment favoring smaller, |
| | | more-speculative names. |
2
From The MFC Global Investment Management (U.S.A.) LLC’s
Portfolio Management Team
which growth took the lead. International stocks were particularly strong performers, benefiting from continued relative weakness in the U.S. dollar and greater uncertainty about the direction of interest rates in the United States.
“During the period, we were
successful in developing a
portfolio of funds to outperform
the overall bond market without
exposing our shareholders to
excess levels of volatility.”
Performance summary
John Hancock Lifestyle Moderate Portfolio’s Class A, Class B, Class C, Class R3, Class R4 and Class R5, which began operations on October 18, 2005, produced total returns of 7.10%, 6.42%, 6.49%, 7.10%, 7.14% and 7.40%, respectively, at net asset value through August 31, 2006. Class 1 shares returned 7.47% at net asset value since beginning operation October 15, 2005 and Class 5 shares returned 2.27% at net asset value since beginning operation July 3, 2006. In comparison, the Portfolio’s benchmark — a 40/60 blend of the S&P 500 Index and the Lehman Brothers Aggregate Bond Index — returned 6.09%, and Morningstar’s average moderate allocation portfolio returned 6.35% .1 Keep in mind that your net asset value return will be different from the Portfolio’s performance if you were not invested in the Portfolio for the entire period and did n ot reinvest all distributions. Please see pages six and seven for historical performance information.
Benefits of diversification
During the period, we were successful in developing a portfolio of funds to outperform the overall bond market without exposing our shareholders to excess levels of volatility. Much of these diversification benefits came from our approximately 40% stake in equity offerings — both domestic and international — including our exposure to the strong-performing real estate securities market.
Lifestyle Moderate Portfolio
3
On the domestic equity side, for example, we were helped by a number of our large-cap value-oriented investments, such as Equity Income (+13.54%, T. Rowe Price) and Fundamental Value (+10.87%, Davis). Those strong results were offset somewhat by relative weakness in Core Equity (+3.63%, Legg Mason) and U.S. Multi-Sector (4.25%, GMO), both of which trailed the S&P 500. Our international stock investments were significant contributors, as their returns were well in excess of the overall bond market. In particular, the Fund benefited from its positions in International Core (+22.19%, GMO) and International Opportunities (+23.51%, Marsico). In the real estate sector, our holdings in Real Estate Securities (+30.96%, Deutsche Asset Management) provided particularly strong results and we trimmed this position and reallocated to Global Real Estate.
Diversification also helped within the fixed-income portion of the Portfolio, especially with our high-yield bond investments, which continued to enjoy strong gains. High Yield (+6.49%, Western) was one particularly favorable contributor to performance during the reporting period. The diversification theme also extended to individual fixed-income funds in the Portfolio, such as Spectrum Income (+5.47%, T. Rowe Price), whose managers have the flexibility to invest in multiple sectors of the bond market. At 8% of the Portfolio’s assets, Spectrum Income is one of our largest allocations. Other large Portfolio holdings generally performed in line with their benchmarks, including Total Return (+3.18%, PIMCO), at 12% of assets, and Active Bond (+2.98%, MFC Global Investment Management (U.S.) LLC/Declaration), at 8%.
Portfolio changes
To improve the Portfolio’s diversification within the high yield bond asset class, during the second quarter of 2006 we reduced our exposure to the High Yield fund, which was formerly managed by Salomon Brothers Asset Management and is now managed by Western Asset Management. For further diversification, we used the proceeds of this sale to establish a new Portfolio holding, High Income, managed by MFC Global. We also added to our weighting in U.S. High Yield Bond, managed by Wells Capital Management. Meanwhile, within our multi-sector bond allocation, we trimmed our Strategic Bond (Western) holding while slightly increasing our Spectrum Income weighting and initiating a position in Strategic Income (MFC Global).
Lifestyle Moderate Portfolio
4
We also increased our diversification within the real estate asset class by adding exposure to non-U.S. real estate securities. Because the real estate market outside the United States is less well developed, we believe it offers greater inefficiency and therefore greater return potential. We established a new allocation to Global Real Estate, managed by Deutsche Asset Management.
“On the domestic equity side, for
example, we were helped
by a number of our large-cap
value-oriented investments...”
Outlook
We believe the stage may be set for high-quality, large-cap stocks to finally take the lead over their mid- and small-cap counterparts. Accordingly, we have positioned the Portfolio to benefit from such a potential scenario, maintaining a slight overweight in funds that own high-quality, large-cap stocks. If, however, investors continue their preference for higher-risk, lower-quality asset classes, we believe our broadly diversified Portfolio can help capture these performance gains while effectively managing volatility for our shareholders.
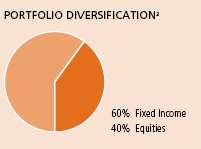
As interest rates have risen, bonds have encountered some difficulty. However, we note that the diversification provided by the Portfolio worked exactly as expected during the period. Although it may seem like a contradiction, maintaining a moderate allocation to more aggressive assets such as stocks, global bonds and real estate actually reduced risk and improved returns in a majority fixed-income portfolio. This is an excellent example of the power of diversification and asset allocation — and why we believe the Portfolio can be an important component of a moderate investor’s portfolio.
Lifestyle Moderate Portfolio
5
A look at performance
For the period ending August 31, 2006
| | | Cumulative total returns |
| | | with maximum sales charge (POP) |
| | | |
| | Inception | Since |
| Class | date | Inceptiona |
|
| A | 10-18-05 | 1.75% |
|
| B | 10-18-05 | 1.42 |
|
| C | 10-18-05 | 5.49 |
|
| R3b | 10-18-05 | 7.10 |
|
| R4b | 10-18-05 | 7.14 |
|
| R5b | 10-18-05 | 7.40 |
|
| 1b | 10-15-05 | 7.47 |
|
| 5b | 7-3-06 | 2.27 |
|
Performance figures assume all distributions are reinvested. Returns with maximum sales charge reflect a sales charge on Class A shares of 5%, and the applicable contingent deferred sales charge (CDSC) on Class B and Class C shares. The Class B shares’ CDSC declines annually between years 1–6 according to the following schedule: 5, 4, 3, 3, 2, 1%. No sales charge will be assessed after the sixth year. Class C shares held for less than one year are subject to a 1% CDSC. Sales charge is not applicable for Class R3, Class R4, Class R5, Class 1 and Class 5 shares.
The returns reflect past results and should not be considered indicative of future performance. The return and principal value of an investment will fluctuate so that shares, when redeemed, may be worth more or less than their original cost. Due to market volatility, the Portfolio’s current performance may be higher or lower than the performance shown. For performance data current to the most recent month-end, please call 1-800-225-5291 or visit the Portfolio’s Web site at www.jhfunds.com.
The performance table above and the chart on the next page do not reflect the deduction of taxes that a shareholder would pay on fund distributions or the redemption of fund shares.
The Portfolio’s performance results reflect any applicable expense reductions, without which the expenses would increase and results would have been less favorable.
Since inception performance is calculated with an opening price (prior day’s close) on the inception date.
a Class A, Class B, Class C, Class R3, Class R4 and Class R5 shares began operations on 10-18-05, Class 1 shares began operation on 10-15-05 and Class 5 shares began operation on 7-3-06.
b For certain types of investors as described in the Portfolio’s Class R3, Class R4, Class R5, Class 1 and Class 5 share prospectuses.
Lifestyle Moderate Portfolio
6
Growth of $10,000
This chart shows what happened to a hypothetical $10,000 investment in Class A shares for the period indicated. For comparison, we’ve shown the same investment in a blended index.

| Class | Period beginning | Without sales charge | With maximum sales charge | Index |
|
| B 4 | 10-18-05 | $10,642 | $10,142 | $10,609 |
|
| C 4 | 10-18-05 | 10,649 | 10,549 | 10,609 |
|
| R31,4 | 10-18-05 | 10,710 | 10,710 | 10,609 |
|
| R41,4 | 10-18-05 | 10,714 | 10,714 | 10,609 |
|
| R51,4 | 10-18-05 | 10,740 | 10,740 | 10,609 |
|
| 11,2 | 10-15-05 | 10,747 | 10,747 | 10,488 |
|
| 51,3 | 7-3-06 | 10,227 | 10,227 | 10,295 |
|
Assuming all distributions were reinvested for the period indicated, the table above shows the value of a $10,000 investment in the Portfolio’s Class B, Class C, Class R3, Class R4, Class R5, Class 1 and Class 5 shares, respectively, as of August 31, 2006. Performance of the classes will vary based on the difference in sales charges paid by shareholders investing in the different classes and the fee structure of those classes.
A blended index is used when combining 40% of the Standard & Poor’s 500 Index, an unmanaged index that includes 500 widely traded common stocks, and 60% of the Lehman Brothers Aggregate Bond Index, an unmanaged index of dollar-denominated and nonconvertible investment-grade debt issues.
It is not possible to invest directly in an index. Index figures do not reflect sales charges and would be lower if they did.
1 For certain types of investors as described in the Portfolio’s Class R3, Class R4, Class R5, Class 1 and Class 5 share prospectuses.
2 Index figure from 9-30-05.
3 Index figure from 6-30-06.
4 Index figure from 10-31-05.
Lifestyle Moderate Portfolio
7
Your expenses
These examples are intended to help you understand your ongoing operating expenses.
Understanding Portfolio expenses
As a shareholder of the Portfolio, you incur two types of costs:
■ Transaction costs which include sales charges (loads) on purchases or redemptions (varies by share class), minimum account fee charge, etc.
■ Ongoing operating expenses including management fees, distribution and service fees (if applicable) and other Portfolio expenses.
In addition to the operating expenses which the Portfolio bears directly, the Portfolio indirectly bears a pro rata share of the operating expenses of the underlying funds in which the Portfolio invests. Because the underlying funds have varied operating expenses and transaction costs and the Portfolio may own different proportions of the underlying funds at different times, the amount of expenses incurred indirectly by the Portfolio will vary. If these indirect expenses were included, your expenses paid during the period would have been higher.
We are going to present only your ongoing operating expenses here.
Actual expenses/actual returns
This example is intended to provide information about your Portfolio’s actual ongoing operating expenses, and is based on your Portfolio’s actual return. It assumes an account value of $1,000.00 on March 1, 2006, with the same investment held until August 31, 2006.
| | Account value | Ending value | Expenses paid during period |
| | on 3-1-06 | on 8-31-06 | ended 8-31-06 a |
|
| Class A | $1,000.00 | $1,015.90 | $2.90 |
|
| Class B | 1,000.00 | 1,011.60 | 6.84 |
|
| Class C | 1,000.00 | 1,012.30 | 6.54 |
|
| Class R3 | 1,000.00 | 1,017.10 | 3.46 |
|
| Class R4 | 1,000.00 | 1,016.10 | 2.49 |
|
| Class R5 | 1,000.00 | 1,017.40 | 0.92 |
|
| Class 1 | 1,000.00 | 1,018.60 | 0.56 |
|
| Class 5 b | 1,000.00 | 1,022.70 | 0.02 |
|
Together with the value of your account, you may use this information to estimate the operating expenses that you paid over the period. Simply divide your account value at
Lifestyle Moderate Portfolio
8
August 31, 2006 by $1,000.00, then multiply it by the “expenses paid” for your share class from the table above. For example, for an account value of $8,600.00, the operating expenses should be calculated as follows:
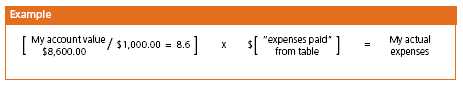
Hypothetical example for comparison purposes
This table allows you to compare your Portfolio’s ongoing operating expenses with those of any other fund. It provides an example of the Portfolio’s hypothetical account values and hypothetical expenses based on each class’s actual expense ratio and an assumed 5% annual return before expenses (which is not your Portfolio’s actual return). It assumes an account value of $1,000.00 on March 1, 2006, with the same investment held until August 31, 2006. Look in any other fund shareholder report to find its hypothetical example and you will be able to compare these expenses.
| | Account value | Ending value | Expenses paid during period |
| | on 3-1-06 | on 8-31-06 | ended 8-31-06 a |
|
| Class A | $1,000.00 | $1,022.33 | $2.91 |
|
| Class B | 1,000.00 | 1,018.40 | 6.87 |
|
| Class C | 1,000.00 | 1,018.70 | 6.56 |
|
| Class R3 | 1,000.00 | 1,021.78 | 3.47 |
|
| Class R4 | 1,000.00 | 1,022.74 | 2.50 |
|
| Class R5 | 1,000.00 | 1,024.30 | 0.92 |
|
| Class 1 | 1,000.00 | 1,024.65 | 0.56 |
|
| Class 5 b | 1,000.00 | 1,008.20 | 0.02 |
|
Remember, these examples do not include any transaction costs, such as sales charges; therefore, these examples will not help you to determine the relative total costs of owning different funds. If transaction costs were included, your expenses would have been higher. See the prospectus for details regarding transaction costs.
a Expenses are equal to the Portfolio’s annualized expense ratio of 0.57%, 1.35%, 1.29%, 0.68%, 0.49%, 0.18%, 0.11% and 0.01% for Class A, Class B, Class C, Class R3, Class R4, Class R5, Class 1 and Class 5, respectively, multiplied by the average account value over the period, multiplied by the number of days in the period /365 or 366 (to reflect the one-half year period). The expense ratios do not include fees and expenses incurred by the Portfolio from the underlying funds.
b Class 5 shares began operation on 7-3-06.
Lifestyle Moderate Portfolio
9
Portfolio’s investments
Securities owned by the Portfolio on 8-31-06
Portfolio of investments, showing all underlying funds.
| Issuer | Shares | Value |
| |
| Investment companies 99.97% | | $1,871,324,713 |
|
| (Cost $1,817,133,945) | | |
| | | |
| John Hancock Funds II | | |
|
| Active Bond Fund Class NAV | 15,570,987 | $149,481,471 |
|
| Blue Chip Growth Fund Class NAV | 5,262,463 | 93,671,836 |
|
| Core Bond Fund Class NAV | 2,973,803 | 37,202,272 |
|
| Core Equity Fund Class NAV | 5,321,191 | 75,933,397 |
|
| Equity-Income Fund Class NAV | 2,060,856 | 37,322,101 |
|
| Fundamental Value Fund Class NAV | 4,714,343 | 74,628,043 |
|
| Global Bond Fund Class NAV | 7,576,371 | 112,054,531 |
|
| Global Real Estate Fund Class NAV | 3,666,366 | 37,763,573 |
|
| High Income Fund Class NAV | 5,665,191 | 55,915,434 |
|
| High Yield Fund Class NAV | 11,116,571 | 112,055,038 |
|
| International Equity Index Fund Class NAV | 1,974,971 | 37,465,196 |
|
| International Opportunities Fund Class NAV | 1,165,892 | 18,840,809 |
|
| International Value Fund Class NAV | 3,151,314 | 56,345,489 |
|
| Investment Quality Bond Fund Class NAV | 3,166,140 | 37,202,151 |
|
| Real Estate Equity Fund Class NAV | 3,443,977 | 37,849,311 |
|
| Real Return Bond Fund Class NAV | 5,602,786 | 74,629,115 |
|
| Small Cap Fund Class NAV | 1,357,954 | 19,065,668 |
|
| Small Company Fund Class NAV | 2,434,385 | 37,586,907 |
|
| Small Company Value Fund Class NAV | 804,498 | 19,010,298 |
|
| Spectrum Income Fund Class NAV | 14,555,152 | 149,481,407 |
|
| Strategic Bond Fund Class NAV | 3,160,762 | 37,202,169 |
|
| Strategic Income Fund Class NAV | 3,699,314 | 37,215,095 |
|
| Total Return Fund Class NAV | 16,315,260 | 224,334,826 |
Lifestyle Moderate Portfolio
10
F I N A N C I A L S T A T E M E N T S
| Issuer | Shares | Value |
| | | |
| John Hancock Funds II — continued | | |
|
| U.S. Government Securities Fund Class NAV | 2,743,515 | $37,202,058 |
|
| U.S. High Yield Bond Fund Class NAV | 4,284,689 | 55,915,191 |
|
| U.S. Multi Sector Fund Class NAV | 7,213,778 | 75,095,428 |
|
| Value & Restructuring Fund Class NAV | 3,378,940 | 37,438,660 |
| | | |
| John Hancock Funds III | | |
|
| International Core Fund Class NAV | 2,372,200 | 93,417,239 |
|
| |
| Total investments 99.97% | | $1,871,324,713 |
|
| |
| Other assets in excess of liabilities 0.03% | | $542,121 |
|
| |
| Total net assets 100.00% | | $1,871,866,834 |
|
Percentages are stated as a percent of net assets of the Portfolio
See notes to financial statements
Lifestyle Moderate Portfolio
11
F I N A N C I A L S T A T E M E N T S
Financial statements
Statement of assets and liabilities 8-31-06
This Statement of Assets and Liabilities is the Portfolio’s balance sheet. It shows the value of what the Portfolio owns, is due and owes. You’ll also find the net asset value and the maximum offering price per share.
| Assets | |
|
| Investments in affiliated funds, at value (cost $1,817,133,945) | $1,871,324,713 |
| Receivable for fund shares sold | 2,776,322 |
| Other assets | 5,512 |
| Total assets | 1,874,106,547 |
| |
| Liabilities | |
|
| Payable for investments purchased | 1,994,394 |
| Payable for fund shares repurchased | 55,364 |
| Payable to affiliates | |
| Fund administration fees | 35,928 |
| Transfer agent fees | 16,409 |
| Trustees’ fees | 391 |
| Due to adviser | 9,267 |
| Other payables and accrued expenses | 127,960 |
| Total liabilities | 2,239,713 |
| |
| Net assets | |
|
| Capital paid-in | 1,785,340,876 |
| Accumulated net realized gain on investments | 29,534,707 |
| Net unrealized appreciation on investments | 54,190,768 |
| Accumulated net investment income | 2,800,483 |
| Net assets | $1,871,866,834 |
| |
| Net asset value per share | |
|
| Based on net asset values and shares outstanding | |
| — the Portfolio has an unlimited number of shares authorized with no par value | |
| Class A ($25,494,946 ÷ 1,869,382 shares) | $13.64 |
| Class B ($4,974,279 ÷ 365,228 shares) | $13.62 |
| Class C ($17,552,052 ÷ 1,287,959 shares) | $13.63 |
| Class R3 ($767,362 ÷ 56,236 shares) | $13.65 |
| Class R4 ($1,096,530 ÷ 80,450 shares) | $13.63 |
| Class R5 ($644,004 ÷ 47,199 shares) | $13.64 |
| Class 1 ($1,820,059,336 ÷ 133,544,957 shares) | $13.63 |
| Class 5 ($1,278,325 ÷ 93,854 shares) | $13.62 |
| |
| Maximum offering price per share | |
|
| Class A1 ($13.64 ÷ 95%) | $14.36 |
1 On single retail sales of less than $50,000. On sales of $50,000 or more and on group sales the offering price is reduced.
See notes to financial statements
Lifestyle Moderate Portfolio
12
F I N A N C I A L S T A T E M E N T S
Statement of operations For the period ended 8-31-06a
This Statement of Operations summarizes the Portfolio’s investment income earned and expenses incurred in operating the Portfolio. It also shows net gains (losses) for the period stated.
| Investment income | |
|
| Income distributions received from affiliated underlying funds | $33,550,119 |
| | |
| Total investment income | 33,550,119 |
| |
| Expenses | |
|
| Investment management fees (Note 3) | 603,786 |
| Distribution and service fees (Note 3) | 806,941 |
| Transfer agent fees (Note 3) | 24,255 |
| Blue sky fees (Note 3) | 98,749 |
| Printing and postage fees (Note 3) | 36,479 |
| Fund administration fees (Note 3) | 129,402 |
| Audit and legal fees | 74,078 |
| Custodian fees | 10,722 |
| Trustees’ fees (Note 3) | 17,410 |
| Registration and filing fees | 53,994 |
| Miscellaneous | 13,541 |
| | |
| Total expenses | 1,869,357 |
| Less expense reductions (Note 3) | (116,541) |
| | |
| Net expenses | 1,752,816 |
| | |
| Net investment income | 31,797,303 |
| |
| Realized and unrealized gain | |
|
| Net realized gain on Investments | 29,511,991 |
| Capital gain distributions received from affiliated underlying funds | 3,107,989 |
| Change in net unrealized appreciation of Investments | 54,190,768 |
| | |
| Net realized and unrealized gain | 86,810,748 |
| | |
| Increase in net assets from operations | $118,608,051 |
a Period from 10-15-05 (commencement of operations) to 8-31-06.
See notes to financial statements
Lifestyle Moderate Portfolio
13
F I N A N C I A L S T A T E M E N T S
Statement of changes in net assets
This Statement of Changes in Net Assets shows how the value of the Portfolio’s net assets has changed during the period. It reflects earnings less expenses, any investment gains and losses, distributions, if any, paid to shareholders and the net of Portfolio share transactions.
| | Period |
| | ended |
| | 8-31-06a |
| |
| Increase (decrease) in net assets | |
|
| From operations | |
| Net investment income | $31,797,303 |
| Net realized gain | 32,619,980 |
| Change in net unrealized appreciation | 54,190,768 |
| | |
| Increase in net assets resulting from operations | 118,608,051 |
| | |
| Distributions to shareholders | |
| From net investment income | |
| Class A | (171,868) |
| Class B | (22,967) |
| Class C | (77,475) |
| Class R3 | (6,081) |
| Class R4 | (10,781) |
| Class R5 | (8,339) |
| Class 1 | (31,963,702) |
| Class 5 | (490) |
| | (32,261,703) |
| From Fund share transactions | 1,785,520,486 |
| |
| Net assets | |
|
| End of period | $1,871,866,834 |
| | |
| Accumulated net investment income | $2,800,483 |
a Period from 10-15-05 (commencement of operations) to 8-31-06.
See notes to financial statements
Lifestyle Moderate Portfolio
14
F I N A N C I A L S T A T E M E N T S
Financial highlights
The Financial Highlights show how the Portfolio’s net asset value for a share has changed since the beginning of the period.
CLASS A SHARES
| Period ended | 8-31-06a |
| |
| Per share operating performance | |
|
| Net asset value, beginning of period | $12.94 |
| Net investment income h,v | 0.25 |
| Net realized and unrealized | |
| gain on investments | 0.66 |
| Total from investment operations | 0.91 |
| Less distributions | |
| From net investment income | (0.21) |
| | (0.21) |
| Net asset value, end of period | $13.64 |
| Total return k,l (%) | 7.10m |
| |
| Ratios and supplemental data | |
|
| Net assets, end of period | |
| (in millions) | $25 |
| Ratio of net expenses to average | |
| net assets q (%) | 0.57r |
| Ratio of gross expenses to average | |
| net assets p,q (%) | 0.83r |
| Ratio of net investment income | |
| to average net assets v (%) | 2.21r |
| Portfolio turnover (%) | 24m |
See notes to financial statements
Lifestyle Moderate Portfolio
15
F I N A N C I A L S T A T E M E N T S
Financial highlights
| CLASS B SHARES | |
| |
| Period ended | 8-31-06a |
| |
| Per share operating performance | |
|
| Net asset value, beginning of period | $12.94 |
| Net investment income h,v | 0.15 |
| Net realized and unrealized | |
| gain on investments | 0.68 |
| Total from investment operations | 0.83 |
| Less distributions | |
| From net investment income | (0.15) |
| | (0.15) |
| Net asset value, end of period | $13.62 |
| Total return k,l (%) | 6.42m |
| |
| Ratios and supplemental data | |
|
| Net assets, end of period | |
| (in millions) | $5 |
| Ratio of net expenses to average | |
| net assets q (%) | 1.34r |
| Ratio of gross expenses to average | |
| net assets p,q (%) | 2.43r |
| Ratio of net investment income | |
| to average net assets v (%) | 1.28r |
| Portfolio turnover (%) | 24m |
See notes to financial statements
Lifestyle Moderate Portfolio
16
F I N A N C I A L S T A T E M E N T S
Financial highlights
| CLASS C SHARES | |
| |
| Period ended | 8-31-06a |
| |
| Per share operating performance | |
|
| Net asset value, beginning of period | $12.94 |
| Net investment income h,v | 0.17 |
| Net realized and unrealized | |
| gain on investments | 0.67 |
| Total from investment operations | 0.84 |
| Less distributions | |
| From net investment income | (0.15) |
| | (0.15) |
| Net asset value, end of period | $13.63 |
| Total return k,l (%) | 6.49m |
| |
| Ratios and supplemental data | |
|
| Net assets, end of period | |
| (in millions) | $18 |
| Ratio of net expenses to average | |
| net assets q (%) | 1.29r |
| Ratio of gross expenses to average | |
| net assets p,q (%) | 1.67r |
| Ratio of net investment income | |
| to average net assets v (%) | 1.51r |
| Portfolio turnover (%) | 24m |
See notes to financial statements
Lifestyle Moderate Portfolio
17
F I N A N C I A L S T A T E M E N T S
Financial highlights
| CLASS R3 SHARES | |
| |
| Period ended | 8-31-06a |
| |
| Per share operating performance | |
|
| Net asset value, beginning of period | $12.94 |
| Net investment income h,v | 0.33 |
| Net realized and unrealized | |
| gain on investments | 0.58 |
| Total from investment operations | 0.91 |
| Less distributions | |
| From net investment income | (0.20) |
| | (0.20) |
| Net asset value, end of period | $13.65 |
| Total return k,l (%) | 7.10m |
| |
| Ratios and supplemental data | |
|
| Net assets, end of period | |
| (in millions) | $1 |
| Ratio of net expenses to average | |
| net assets q (%) | 0.69r |
| Ratio of gross expenses to average | |
| net assets p,q (%) | 8.44r |
| Ratio of net investment income | |
| to average net assets v (%) | 2.93r |
| Portfolio turnover (%) | 24m |
See notes to financial statements
Lifestyle Moderate Portfolio
18
F I N A N C I A L S T A T E M E N T S
Financial highlights
| CLASS R4 SHARES | |
| |
| Period ended | 8-31-06a |
| |
| Per share operating performance | |
|
| Net asset value, beginning of period | $12.94 |
| Net investment income h,v | 0.30 |
| Net realized and unrealized | |
| gain on investments | 0.62 |
| Total from investment operations | 0.92 |
| Less distributions | |
| From net investment income | (0.23) |
| | (0.23) |
| Net asset value, end of period | $13.63 |
| Total return k,l (%) | 7.14m |
| |
| Ratios and supplemental data | |
|
| Net assets, end of period | |
| (in millions) | $1 |
| Ratio of net expenses to average | |
| net assets q (%) | 0.49r |
| Ratio of gross expenses to average | |
| net assets p,q (%) | 4.65r |
| Ratio of net investment income | |
| to average net assets v (%) | 2.59r |
| Portfolio turnover (%) | 24m |
See notes to financial statements
Lifestyle Moderate Portfolio
19
F I N A N C I A L S T A T E M E N T S
Financial highlights
| CLASS R5 SHARES | |
| |
| Period ended | 8-31-06a |
| |
| Per share operating performance | |
|
| Net asset value, beginning of period | $12.94 |
| Net investment income h,v | 0.22 |
| Net realized and unrealized | |
| gain on investments | 0.73 |
| Total from investment operations | 0.95 |
| Less distributions | |
| From net investment income | (0.25) |
| | (0.25) |
| Net asset value, end of period | $13.64 |
| Total return k,l (%) | 7.40m |
| |
| Ratios and supplemental data | |
|
| Net assets, end of period | |
| (in millions) | $1 |
| Ratio of net expenses to average | |
| net assets q (%) | 0.19r |
| Ratio of gross expenses to average | |
| net assets p,q (%) | 4.86r |
| Ratio of net investment income | |
| to average net assets v (%) | 1.92r |
| Portfolio turnover (%) | 24m |
See notes to financial statements
Lifestyle Moderate Portfolio
20
F I N A N C I A L S T A T E M E N T S
Financial highlights
| CLASS 1 SHARES | |
| |
| Period ended | 8-31-06a |
| |
| Per share operating performance | |
|
| Net asset value, beginning of period | $12.93 |
| Net investment income h,v | 0.26 |
| Net realized and unrealized | |
| gain on investments | 0.70 |
| Total from investment operations | 0.96 |
| Less distributions | |
| From net investment income | (0.26) |
| | (0.26) |
| Net asset value, end of period | $13.63 |
| Total return k (%) | 7.47m |
| |
| Ratios and supplemental data | |
|
| Net assets, end of period | |
| (in millions) | $1,820 |
| Ratio of net expenses to average | |
| net assets q (%) | 0.11r |
| Ratio of net investment income | |
| to average net assets v (%) | 2.23r |
| Portfolio turnover (%) | 24m |
See notes to financial statements
Lifestyle Moderate Portfolio
21
F I N A N C I A L S T A T E M E N T S
Financial highlights
| CLASS 5 SHARES | |
| |
| Period ended | 8-31-06a |
| |
| Per share operating performance | |
|
| Net asset value, beginning of period | $13.48 |
| Net investment loss h,v | —j |
| Net realized and unrealized | |
| gain on investments | 0.30 |
| Total from investment operations | 0.30 |
| Less distributions | |
| From net investment income | (0.16) |
| | (0.16) |
| Net asset value, end of period | $13.62 |
| Total return k (%) | 2.27m |
| |
| Ratios and supplemental data | |
|
| Net assets, end of period | |
| (in millions) | $1 |
| Ratio of net expenses to average | |
| net assets q (%) | 0.01r |
| Ratio of net investment loss | |
| to average net assets v (%) | (0.01)r |
| Portfolio turnover (%) | 24m |
a Class A, Class B, Class C, Class R3, Class R4 and Class R5 shares began operations on 10-18-05, Class 1 shares began operation on 10-15-05, and Class 5 shares began operation on 7-3-06.
h Based on the average of the shares outstanding.
j Less than $0.01 per share.
k Assumes dividend reinvestment and does not reflect the effect of sales charges.
l Total returns would have been lower had certain expenses not been reduced during the period shown.
m Not annualized.
p Does not take into consideration expense reductions during the period shown.
q Does not include expenses of the investment companies in which the Portfolio invests.
r Annualized.
v Recognition of net investment income by the Portfolio is affected by the timing of the declaration of dividends by the underlying investment companies in which the Portfolio invests.
See notes to financial statements
Lifestyle Moderate Portfolio
22
Notes to financial statements
1. Organization
The John Hancock Lifestyle Moderate Portfolio (the “Portfolio”) is a newly organized non-diversified series of John Hancock Funds II (the “Trust”). The Trust was established as a Massachusetts business trust on June 28, 2005. The Trust is registered under the Investment Company Act of 1940, as amended (the “1940 Act”), as an open-end investment management company.
The Portfolio operates as a “fund of funds”, investing in Class NAV shares of underlying funds of the Trust and John Hancock Funds III and in other permitted investments.
John Hancock Investment Management Services, LLC (the “Adviser”), a Delaware limited liability company controlled by John Hancock Life Insurance Company (U.S.A.) (“John Hancock USA”), serves as investment adviser for the Trust and John Hancock Funds, LLC (the “Distributor), an affiliate of the Adviser, serves as principal underwriter. John Hancock Life Insurance Company of New York (“John Hancock New York”) is a wholly owned subsidiary of John Hancock USA. John Hancock USA and John Hancock New York are indirect wholly owned subsidiaries of The Manufacturers Life Insurance Company (“Manulife”), which in turn is a wholly owned subsidiary of Manulife Financial Corporation (“MFC”), a publicly traded company. MFC and its subsidiaries are known collectively as “Manulife Financial.”
The Portfolio commenced operations after certain separate accounts of John Hancock USA redeemed their interests in portfolios of John Hancock Trust and certain unaffiliated mutual funds of approximately $340 million at the close of business on October 14, 2005, with additional redemption proceeds of approximately $1.2 billion received on October 28, 2005, and invested such proceeds in Class 1 shares of the Portfolio, which in turn invested the proceeds in underlying funds of the Trust.
The Board of Trustees has authorized the issuance of multiple classes of shares of the Portfolio, including classes designated as Class A, Class B, Class C, Class R3, Class R4, Class R5, Class 1 and Class 5 shares.
Class A, B, and C shares are open to all retail investors. Class 1 shares are sold only to certain exempt separate accounts of John Hancock USA and John Hancock New York. Class R3, R4 and R5 shares are available only to certain retirement plans. Class 5 shares currently are available only to the John Hancock Freedom 529 Plan.
The shares of each class represent an interest in the same portfolio of investments of the Portfolio, and have equal rights as to voting, redemptions, dividends and liquidation, except that certain expenses, subject to the approval of the Trustees, may be applied differently to each class of shares in accordance with current regulations of the SEC and the Internal Revenue Service. Shareholders of a class that bears distribution and service expenses under the terms of a distribution plan have exclusive voting rights to that distribution plan. Class B shares will convert to Class A shares eight years after purchase.
2. Significant accounting policies
In the preparation of the financial statements, the Portfolio follows the policies described below. The preparation of financial statements in conformity with accounting principles generally accepted in the United States of America requires management to make estimates and assumptions that affect the reported amounts of assets and liabilities at the date of the financial statements and the reported amounts of income and expenses during the reporting period. Actual results may differ from these estimates.
Lifestyle Moderate Portfolio
23
Securities valuation
The net asset value of the shares of the Portfolio is determined daily as of the close of the New York Stock Exchange, normally at 4:00 p.m. Eastern Time. Investments in underlying funds are valued at their respective net asset values each business day, or at fair value as determined in good faith in accordance with procedures approved by the Trustees. Securities in the underlying funds’ portfolios are valued in accordance with their respective valuation polices, as outlined in the underlying funds’ financial statements. Short-term debt investments that have a remaining maturity of 60 days or less are valued at amortized cost.
Security transactions and related
investment income
Investment security transactions in the underlying funds are accounted for on a trade date plus one basis for daily net asset value calculations. However, for financial reporting purposes, investment transactions are reported on trade date. Interest income is accrued as earned. Dividend income and capital gain distributions are recorded on the ex-dividend date.
Gains and losses on securities sold are determined on the basis of specific identified cost for both financial and federal income tax reporting purposes.
Multi-class operations
All income, expenses (except for class-specific expenses) and realized and unrealized gains (losses) are allocated to each class of shares based upon the relative net assets of each class. Dividends to shareholders from net investment income are determined at a class level and distributions from capital gains are determined at a Portfolio level.
Expense allocation
Expenses not directly attributable to a particular Portfolio or class of shares are allocated based on the relative share of net assets of the Portfolio at the time the expense was incurred. Class-specific expenses, such as transfer agency fees, blue sky fees, printing and postage fees and distribution and service fees, are accrued daily and charged directly to the respective share classes. Expenses in the Portfolio’s Statement of Operations reflect the expenses of the Portfolio and do not include any indirect expenses related to the underlying funds. Because the underlying funds have varied expense levels and the Portfolio may own different proportions of the underlying funds at different times, the amount of fees and expenses incurred indirectly by the Portfolio will vary.
Federal income taxes
The Portfolio qualifies as a “regulated investment company” by complying with the applicable provisions of the Internal Revenue Code and will not be subject to federal income tax on taxable income that is distributed to shareholders. Therefore, no federal income tax provision is required.
New accounting pronouncement
In June 2006, Financial Accounting Standards Board (FASB) Interpretation No. 48, Accounting for Uncertainty in Income Taxes (the “Interpretation”) was issued and is effective for fiscal years beginning after December 15, 2006 and is to be applied to all open tax years as of the effective date. This Interpretation prescribes a minimum threshold for financial statement recognition of the benefit of a tax position taken or expected to be taken in a tax return, and requires certain expanded disclosures. Management is currently evaluating the application of the Interpretation to the Portfolio and has not at this time quantified the impact, if any, resulting from the adoption of this Interpretation on the Portfolio’s financial statements.
In September 2006, FASB Standard No. 157, Fair Value Measurements (“FAS 157”) was issued, and is effective for fiscal years beginning after November 15, 2007. FAS 157 defines fair value, establishing a framework for measuring fair value and expands disclosure about fair value measurements. Management is currently evaluating the application of FAS 157 to the Portfolio, and its impact, if any, resulting from the adoption of FAS 157 on the Portfolio’s financial statements.
Distribution of income and gains
The Portfolio records distributions to shareholders from net investment income and net realized gains, if any, on the ex-dividend date.
Lifestyle Moderate Portfolio
24
During the period ended August 31, 2006, the tax character of distributions paid was as follows: ordinary income $32,261,703. Distributions paid by the Portfolio with respect to each class of shares are calculated in the same manner, at the same time and are in the same amount, except for the effect of expenses that may be applied differently to each class. Such distributions, on a tax basis, are determined in conformity with income tax regulations, which may differ from accounting principles generally accepted in the United States of America. Distributions in excess of tax basis earnings and profits, if any, are reported in the Portfolio’s financial statements as a return of capital. As of August 31, 2006, the components of distributable earnings on a tax basis included $32,312,560 of undistributed ordinary income and $22,630 of undistributed long-term gain.
Capital accounts
The Portfolio reports the undistributed net investment income and accumulated undistributed net realized gain (loss) accounts on a basis approximating amounts available for future tax distributions (or to offset future taxable realized gains when a capital loss carryforward is available). Accordingly, the Portfolio may periodically make reclassifications among certain capital accounts, without affecting its net asset value.
3. Investment advisory and
other agreements
Advisory fees
The Trust has entered into an Investment Advisory Agreement with the Adviser. The Adviser is responsible for managing the corporate and business affairs of the Trust and for selecting and compensating subadvisers to handle the investment and reinvestment of the assets of the Portfolio, subject to the supervision of the Board of Trustees. Under the Advisory Agreement, the Portfolio pays a monthly management fee to the Adviser equivalent, on an annual basis, to its pro rata portion of the sum of: (a) 0.05% of the first $7,500,000,000 of the aggregate daily net assets and (b) 0.04% of the aggregate daily net assets in excess of $7,500,000,000 of the five Lifestyle Portfolios of the Trust (Lifestyle Aggressive, Lifestyle Growth, Lifestyle Balanced, Lifestyle Moderate and Lifestyle Conservative) and the five Lifestyle Portfolios of John Hancock Trust (Lifestyle Aggressive, Lifestyle Growth, Lifestyle Balanced, Lifestyle Moderate and Lifestyle Conse rvative). The Portfolio is not responsible for payment of the subadvisory fees.
Expense reimbursements
The Adviser has contractually agreed to waive advisory fees or reimburse the Portfolio’s expenses for Class A, Class B, Class C, Class R3, Class R4 and Class R5 shares to the extent that blue sky fees and printing and postage expenses attributable to each class exceed 0.09% of the average annual net assets attributable to the classes, at least until November 1, 2006, and may thereafter be terminated by the Adviser at any time. Accordingly, the expense reductions related to this expense limitation amounted to $21,158, $19,954, $21,099, $17,474, $17,021 and $18,272 for Class A, Class B, Class C, Class R3, Class R4 and Class R5, respectively, for the period ended August 31, 2006.
The Adviser has contractually agreed to waive advisory fees or reimburse Portfolio expenses for Class 5 shares to the extent that total Portfolio operating expenses attributable to Class 5 exceed 0.07% of the average annual net assets attributable to Class 5. There were no expense reductions related to this expense limitation during the period ended August 31, 2006. This agreement remains in effect until June 30, 2007 and may thereafter be terminated by the Adviser at any time.
Administration fees
The Portfolio has an agreement with the Adviser that requires the Portfolio to reimburse the Adviser for all expenses associated with providing the administrative, financial, accounting and recordkeeping services of the Portfolio, including the preparation of all tax returns, annual, semiannual and periodic reports to shareholders and the preparation of all regulatory reports.
Lifestyle Moderate Portfolio
25
Distribution plans
The Trust has a Distribution Agreement with the Distributor. The Portfolio has adopted Distribution Plans with respect to Class A, Class B, Class C, Class R3, Class R4 and Class 1, pursuant to Rule 12b-1 under the 1940 Act, to reimburse the Distributor for the services it provides as distributor of shares of the Portfolio. Accordingly, the Portfolio makes monthly payments to the Distributor at an annual rate not to exceed 0.30%, 1.00%, 1.00%, 0.50%, 0.25% and 0.05% of the average daily net assets of Class A, Class B, Class C, Class R3, Class R4 and Class 1, respectively. A maximum of 0.25% of such payments may be service fees, as defined by the Conduct Rules of the National Association of Securities Dealers. Under the Conduct Rules, curtailment of a portion of the Portfolio’s 12b-1 payments could occur under certain circumstances.
The Portfolio has also adopted a Service Plan with respect to Class R3, Class R4 and Class R5 shares (the “Service Plan”). Under the Service Plan, the Portfolio pays up to 0.15%, 0.10% and 0.05% of the average daily net assets of Class R3, Class R4 and Class R5 shares, respectively, for certain other services.
Sales charges
Class A shares are assessed up-front sales charges of up to 5% of the net asset value of such shares. During the period ended August 31, 2006, the Portfolio was informed that the Distributor received net up-front sales charges of $488,042 with regard to sales of Class A shares. Of this amount, $79,302 was retained and used for printing prospectuses, advertising, sales literature and other purposes, $402,557 was paid as sales commissions to unrelated broker-dealers and $6,183 was paid as sales commissions to sales personnel of Signator Investors, Inc. (“Signator Investors”), a related broker-dealer, an indirect subsidiary of MFC.
Class B shares that are redeemed within six years of purchase are subject to a contingent deferred sales charge (“CDSC”) at declining rates, beginning at 5.00% of the lesser of the current market value at the time of redemption or the original purchase cost of the shares being redeemed. Class C shares that are redeemed within one year of purchase are subject to a CDSC at a rate of 1.00% of the lesser of the current market value at the time of redemption or the original purchase cost of the shares being redeemed. Proceeds from the CDSCs are paid to the Distributor and are used, in whole or in part, to defray its expenses for providing distribution-related services to the Portfolio in connection with the sale of Class B and Class C shares. During the period ended August 31, 2006, the Portfolio was informed that CDSCs received by the Distributor amounted to $292 for Class B shares and $726 for Class C shares.
Transfer agent fees
The Portfolio has a Transfer Agency Agreement with John Hancock Signature Services, Inc. (“Signature Services”), an indirect subsidiary of MFC. For Class A, Class B, Class C, Class R3, Class R4 and Class R5 shares, the Portfolio pays a monthly transfer agent fee at an annual rate of 0.05% of each class’s average daily net assets, plus a fee based on the number of shareholder accounts and reimbursement for certain out-of-pocket expenses. Expenses not directly attributable to a particular class of shares are aggregated and allocated to each class on the basis of its relative net asset value.
Signature Services has agreed to limit the transfer agent fees so that such fees do not exceed 0.20% annually of each of Class A, Class B, Class C, Class R3, Class R4 and Class R5 share average daily net assets. This agreement is effective until December 31, 2006. Signature Services reserves the right to terminate this limitation in the future. In addition, Signature Services has voluntarily agreed to further limit transfer agent fees for Class R3, Class R4 and Class R5 shares so that such fees do not exceed 0.05% annually of each class’s average daily net assets. Accordingly, the transfer agent fees reductions amounted to $327, $615 and $621 for Class R3, Class R4 and Class R5 shares, respectively, during the period ended August 31, 2006. Signature Services reserves the right to terminate this limitation at any time.
Lifestyle Moderate Portfolio
26
Expenses under the agreements described above for the period ended August 31, 2006, were as follows:
| | Distribution | Transfer | | Printing and |
| Share Class | and service fees | agent | Blue sky | postage |
|
| |
| Class A | $24,411 | $10,212 | $16,557 | $11,925 |
| Class B | 18,261 | 3,658 | 16,196 | 5,402 |
| Class C | 55,889 | 8,369 | 17,409 | 8,720 |
| Class R3 | 1,158 | 427 | 15,925 | 1,757 |
| Class R4 | 1,256 | 817 | 15,925 | 1,481 |
| Class R5 | 2 | 772 | 16,737 | 1,903 |
| Class 1 | 705,964 | — | — | 5,291 |
| Class 5 | — | — | — | — |
| Total | $806,941 | $24,255 | $98,749 | $36,479 |
Trustees’ fees
The Trust compensates each Trustee who is not an employee of the Adviser or its affiliates. Total Trustees’ expenses are allocated based on each Portfolio’s average daily net asset value.
4. Guarantees and Indemnifications
Under the Trust’s organizational documents, its Officers and Trustees are indemnified against certain liability arising out of the performance of their duties to the Trust. Additionally, in the normal course of business, the Trust enters into contracts with service providers that contain general indemnification clauses. The Trust’s maximum exposure under these arrangements is unknown, as this would involve future claims that may be made against the Trust that have not yet occurred. However, based on experience, the Trust believes the risk of loss to be remote.
5. Capital shares
Share activities for the Portfolio for the period ended August 31, 2006 were as follows:
| | Period ended 8-31-06 a |
| | Shares | Amount |
|
| Class A shares | | |
|
| Sold | 1,906,772 | $25,643,938 |
| Distributions reinvested | 11,786 | 156,721 |
| Repurchased | (49,176) | (660,565) |
| Net increase | 1,869,382 | $25,140,094 |
| |
| Class B shares | | |
|
| Sold | 394,049 | $5,293,647 |
| Distributions reinvested | 1,374 | 18,275 |
| Repurchased | (30,195) | (405,623) |
| Net increase | 365,228 | $4,906,299 |
| |
| Class C shares | | |
|
| Sold | 1,313,617 | $17,670,307 |
| Distributions reinvested | 5,335 | 70,936 |
| Repurchased | (30,993) | (417,164) |
| Net increase | 1,287,959 | $17,324,079 |
Lifestyle Moderate Portfolio
27
| | Period ended 8-31-06 a |
| | Shares | Amount |
|
| Class R3 shares | | |
|
| Sold | 61,803 | $824,287 |
| Distributions reinvested | 339 | 4,515 |
| Repurchased | (5,906) | (79,750) |
| Net increase | 56,236 | $749,052 |
| |
| Class R4 shares | | |
|
| Sold | 81,786 | $1,104,574 |
| Distributions reinvested | 680 | 9,033 |
| Repurchased | (2,016) | (27,039) |
| Net increase | 80,450 | $1,086,568 |
|
| Class R5 shares | | |
|
| Sold | 48,649 | $647,657 |
| Distributions reinvested | 482 | 6,410 |
| Repurchased | (1,932) | (26,226) |
| Net increase | 47,199 | $627,841 |
|
| Class 1 shares | | |
|
| Sold | 134,937,718 | $1,753,494,793 |
| Distributions reinvested | 2,410,929 | 31,963,702 |
| Repurchased | (3,803,690) | (51,025,836) |
| Net increase | 133,544,957 | $1,734,432,659 |
|
| Class 5 shares | | |
|
| Sold | 93,828 | $1,253,556 |
| Distributions reinvested | 37 | 490 |
| Repurchased | (11) | (152) |
| Net increase | 93,854 | $1,253,894 |
| |
| Net increase | 137,345,265 | $1,785,520,486 |
|
a Class A, Class B, Class C, Class R3, Class R4 and Class R5 shares began operations on 10-18-05, Class 1 shares began operation on 10-15-05, and Class 5 shares began operation on 7-3-06 .
6. Investment transactions
Purchases and sales of the underlying funds during the period ended August 31, 2006, aggregated $2,196,540,459 and $408,918,505, respectively.
The cost of investments owned on August 31, 2006, including short-term investments, for federal income tax purposes, was $1,817,133,945. Gross unrealized appreciation and depreciation of investments aggregated $55,136,252 and $945,484, respectively, resulting in net unrealized appreciation of $54,190,768.
7. Investment in affiliated underlying funds
The Portfolio invests primarily in the underlying funds that are managed by affiliates of the Adviser. The Portfolio does not invest in the underlying funds for the purpose of exercising management or control.
A summary of the Portfolio’s transactions in the securities of affiliated issuers in which the Portfolio’s holdings represent 5% or more of the outstanding voting securities of the issuer, during the period ended August 31, 2006 is set forth below.
Lifestyle Moderate Portfolio
28
| Affiliate — | Shares | Shares | Ending Share | | Ending |
| Class NAV | Purchased | Sold | Amount | Proceeds | Value |
|
| 500 Index | 3,089,655 | 3,089,655 | — | $35,037,957 | — |
| Active Bond | 15,858,658 | 287,671 | 15,570,987 | 2,733,917 | $149,481,471 |
| All Cap Value | 503,231 | 503,231 | — | 6,999,944 | — |
| Blue Chip Growth | 5,383,508 | 121,045 | 5,262,463 | 2,150,429 | 93,671,836 |
| Core Bond | 2,986,459 | 12,656 | 2,973,803 | 156,371 | 37,202,272 |
| Core Equity | 5,511,368 | 190,177 | 5,321,191 | 2,822,430 | 75,933,397 |
| Equity-Income | 2,070,645 | 9,789 | 2,060,856 | 175,970 | 37,322,101 |
| Fundamental Value | 4,728,089 | 13,746 | 4,714,343 | 214,770 | 74,628,043 |
| Global Bond | 7,761,491 | 185,120 | 7,576,371 | 2,690,729 | 112,054,531 |
| Global Real Estate | 3,748,449 | 82,083 | 3,666,366 | 824,336 | 37,763,573 |
| High Income | 5,665,883 | 692 | 5,665,191 | 6,852 | 55,915,434 |
| High Yield | 17,895,000 | 6,778,429 | 11,116,571 | 70,799,045 | 112,055,038 |
| International Core* | 2,372,200 | — | 2,372,200 | — | 93,417,239 |
| International | | | | | |
| Equity Index | 2,208,675 | 233,704 | 1,974,971 | 4,249,483 | 37,465,196 |
| International Opportunities | 1,318,086 | 152,194 | 1,165,892 | 2,357,729 | 18,840,809 |
| International Stock | 8,159,849 | 8,159,849 | — | 111,811,735 | — |
| International Value | 3,404,665 | 253,351 | 3,151,314 | 4,346,029 | 56,345,489 |
| Investment | | | | | |
| Quality Bond | 3,180,337 | 14,197 | 3,166,140 | 165,519 | 37,202,151 |
| Large Cap Value | 344,547 | 344,547 | — | 7,042,538 | — |
| Real Estate Equity | 3,625,046 | 181,069 | 3,443,977 | 1,858,988 | 37,849,311 |
| Real Estate Securities | 2,818,512 | 2,818,512 | — | 76,532,112 | — |
| Real Return Bond | 5,676,884 | 74,098 | 5,602,786 | 968,317 | 74,629,115 |
| Small Cap | 1,400,539 | 42,585 | 1,357,954 | 654,632 | 19,065,668 |
| Small Company | 2,554,687 | 120,302 | 2,434,385 | 2,065,167 | 37,586,907 |
| Small Company Value | 837,191 | 32,693 | 804,498 | 813,661 | 19,010,298 |
| Spectrum Income | 14,602,734 | 47,582 | 14,555,152 | 480,643 | 149,481,407 |
| Strategic Bond | 7,510,463 | 4,349,701 | 3,160,762 | 51,717,798 | 37,202,169 |
| Strategic Income | 3,699,702 | 388 | 3,699,314 | 3,885 | 37,215,095 |
| Total Return | 16,703,568 | 388,308 | 16,315,260 | 5,266,408 | 224,334,826 |
| U.S. Global | | | | | |
| Leaders Growth | 536,019 | 536,019 | — | 7,016,491 | — |
| U.S. Government | | | | | |
| Securities | 3,071,150 | 327,635 | 2,743,515 | 4,412,627 | 37,202,058 |
| U.S. High Yield Bond | 4,289,540 | 4,851 | 4,284,689 | 62,016 | 55,915,191 |
| U.S. Multi Sector | 7,215,384 | 1,606 | 7,213,778 | 16,587 | 75,095,428 |
| Value & Restructuring | 3,595,802 | 216,862 | 3,378,940 | 2,463,390 | 37,438,660 |
*Represents the Portfolio’s investment in John Hancock Funds III International Core Fund
Lifestyle Moderate Portfolio
29
8. Reclassification of accounts
During the period ended August 31, 2006, the Portfolio reclassified amounts to reflect a decrease in accumulated net realized gain on investments of $3,085,273, an increase in accumulated net investment income of $3,264,883 and a decrease in capital paid-in of $179,610. This represents the amounts necessary to report these balances on a tax basis, excluding certain temporary differences, as of August 31, 2006. Additional adjustments may be needed in subsequent reporting periods.These reclassifications, which have no impact on the net asset value of the Portfolio, are primarily attributable to certain differences in the computation of distributable income and capital gains under federal tax rules versus accounting principles generally accepted in the United States of America and book and tax differences in accounting for non-deductible organizational costs. The calculation of net investment income per share in the Portfolio’s Financial Highlights excludes these adjustments.
Lifestyle Moderate Portfolio
30
Auditors’ report
Report of Independent Registered Public Accounting Firm
To the Board of Trustees of John Hancock Funds II and Shareholders of
John Hancock Lifestyle Moderate Portfolio:
In our opinion, the accompanying statement of assets and liabilities, including the schedule of securities owned, and the related statements of operations and of changes in net assets and the financial highlights present fairly, in all material respects, the financial position of John Hancock Lifestyle Moderate Portfolio (the “Portfolio”) at August 31, 2006, and the results of its operations, the changes in its net assets, and the financial highlights for the period October 15, 2005 (commencement of operations) through August 31, 2006, in conformity with accounting principles generally accepted in the United States of America. These financial statements and financial highlights (hereafter referred to as “financial statements”) are the responsibility of the Portfolio’s management; our responsibility is to express an opinion on these financial statements based on our audit. We conducted our audit of these financial statements in accordance with the standards of the Public Company Accounting Oversight Board (United States). Those standards require that we plan and perform the audit to obtain reasonable assurance about whether the financial statements are free of material misstatement. An audit includes examining, on a test basis, evidence supporting the amounts and disclosures in the financial statements, assessing the accounting principles used and significant estimates made by management, and evaluating the overall financial statement presentation. We believe that our audit, which included confirmation of securities at August 31, 2006, by correspondence with the transfer agent, provides a reasonable basis for our opinion.
PricewaterhouseCoopers LLP
Boston, Massachusetts
October 26, 2006
31
Tax information
Unaudited
For federal income tax purposes, the following information is furnished with respect to the distributions of the Portfolio, if any, paid during its taxable year ended August 31, 2006.
With respect to the ordinary dividends paid by the Portfolio for the fiscal period ended August 31, 2006, 56.66% of the dividends qualify for the corporate dividends-received deduction.
The Portfolio hereby designates the maximum amount allowable of its net taxable income as qualified dividend income as provided in the Jobs and Growth Tax Relief Reconciliation Act of 2003. This amount will be reflected on Form 1099-DIV for the calendar year 2006.
Shareholders will be mailed a 2006 U.S. Treasury Department Form 1099-DIV in January 2007. This will reflect the total of all distributions that are taxable for calendar year 2006.
32
Trustees and Officers
This chart provides information about the Trustees and Officers who oversee your John Hancock fund. Officers elected by the Trustees manage the day-to-day operations of the Portfolio and execute policies formulated by the Trustees.
| Independent Trustees | | |
| |
| Name, age | | Number of |
| Position(s) held with Portfolio | Trustee of | John Hancock |
| Principal occupation(s) and other | Portfolio | funds overseen |
| directorships during past 5 years | since1 | by Trustee |
| |
| Charles L. Bardelis, Born: 1941 | 2005 | 209 |
|
| President and Executive Officer, Island Commuter Corp. (Marine Transport). | | |
| Trustee of John Hancock Trust (since 1988) and John Hancock Funds III (since 2005). | |
| |
| Peter S. Burgess, Born: 1942 | 2005 | 209 |
|
| Consultant (financial, accounting and auditing matters (since 1999); | | |
| Certified Public Accountant; Partner, Arthur Andersen (prior to 1999). | | |
| Director of the following publicly traded companies: PMA Capital Corporation | | |
| (since 2004) and Lincoln Educational Services Corporation (since 2004). | | |
| Trustee of John Hancock Trust (since 2005), John Hancock Funds III (since 2005). | |
| |
| Elizabeth G. Cook, Born: 1937 | 2005 | 209 |
|
| Expressive Arts Therapist, Massachusetts General Hospital (September 2001 | | |
| to present); Expressive Arts Therapist, Dana Farber Cancer Institute | | |
| (September 2000 to January 2004); President, The Advertising Club of Greater Boston. | |
| Trustee of John Hancock Trust (since 2005) and John Hancock Funds III (since 2005). | |
| |
| William H. Cunningham, Born: 1944 | 2005 | 160 |
|
| Former Chancellor, University of Texas System and former President of the | | |
| University of Texas, Austin, Texas; Chairman and CEO, IBT Technologies | | |
| (until 2001); Director of the following: Hire.com (until 2004), STC Broadcasting, | |
| Inc. and Sunrise Television Corp. (until 2001), Symtx, Inc. (electronic manufacturing) | |
| (since 2001), Adorno/Rogers Technology, Inc. (until 2004), Pinnacle Foods | | |
| Corporation (until 2003), rateGenius (until 2003), Lincoln National Corporation | |
| (insurance) (since 2006), Jefferson-Pilot Corporation (diversified life insurance | | |
| company) (until 2006), New Century Equity Holdings (formerly Billing Concepts) | |
| (until 2001), eCertain (until 2001), ClassMap.com (until 2001), Agile Ventures | | |
| (until 2001), AskRed.com (until 2001), Southwest Airlines, Introgen and Viasystems | |
| Group, Inc. (electronic manufacturer) (until 2003); Advisory Director, Interactive | |
| Bridge, Inc. (college fundraising) (until 2001); Advisory Director, Q Investments | | |
| (until 2003); Advisory Director, JP Morgan Chase Bank (formerly Texas Commerce | |
| Bank - Austin), LIN Television (since 2002), WilTel Communications (until 2003) | |
| and Hayes Lemmerz International, Inc. (diversified automotive parts supply | | |
| company) (since 2003). Trustee of John Hancock Funds (since 2005) and | | |
| John Hancock Funds III (since 2005). | | |
33
| Independent Trustees (continued) | | |
| |
| Name, age | | Number of |
| Position(s) held with Portfolio | Trustee of | John Hancock |
| Principal occupation(s) and other | Portfolio | funds overseen |
| directorships during past 5 years | since1 | by Trustee |
| |
| Charles L. Ladner, Born: 1938 | 2005 | 160 |
|
| Chairman and Trustee, Dunwoody Village, Inc. (retirement services) (until 2003); | |
| Senior Vice President and Chief Financial Officer, UGI Corporation (public utility | |
| holding company) (retired 1998); Vice President and Director for AmeriGas, Inc. | |
| (retired 1998); Director of AmeriGas Partners, L.P. (until 1997) (gas distribution); | |
| Director, EnergyNorth, Inc. (until 1995); Director, Parks and History Association | |
| (since 2007). Trustee of John Hancock Funds (since 2004) and John Hancock | | |
| Funds III (since 2005). | | |
| |
| Hassell H. McClellan, Born: 1945 | 2005 | 209 |
|
| Associate Professor, The Wallace E. Carroll School of Management, Boston College. | |
| Trustee of John Hancock Trust (since 2005), John Hancock Funds III (since 2005). | |
| |
| James. M. Oates, Born: 1946 | 2005 | 209 |
|
| Managing Director, Wydown Group (financial consulting firm) (since 1994); | | |
| Chairman, Emerson Investment Management, Inc. (since 2000); Chairman, | | |
| Hudson Castle Group, Inc. (formerly IBEX Capital Markets, Inc.) (financial services | |
| company) (since 1997). Director of the following publicly traded companies: | | |
| Stifel Financial (since 1996); Investor Financial Services Corporation (since 1995); | |
| and Connecticut River Bancorp, Director (since 1998). Director, Phoenix Mutual | |
| Funds (since 1988; overseeing 20 portfolios). Trustee of John Hancock Trust | | |
| (since 2004) and John Hancock Funds III (since 2005). | | |
| |
| 1Because the Trust does not hold regular annual shareholders meetings, each Trustee holds office for an | |
| indefinite term until his/her successor is duly elected and qualified or until he/she dies, retires, resigns, is removed |
| or becomes disqualified. | | |
| |
| Non-Independent Trustee3 | | |
| |
| Name, age | | Number of |
| Position(s) held with Portfolio | Trustee of | John Hancock |
| Principal occupation(s) and other | Portfolio | funds overseen |
| directorships during past 5 years | since1 | by Trustee |
| |
| James R. Boyle, Born: 1959 | 2005 | 262 |
|
| Chairman and Director, John Hancock Advisers, LLC (the “Adviser”), | | |
| The Berkeley Financial Group, LLC (“The Berkeley Group”) (holding | | |
| company) and John Hancock Funds, LLC (since 2005); President, | | |
| John Hancock Annuities; Executive Vice President, John Hancock Life | | |
| Insurance Company (since June, 2004); President U.S. Annuities; Senior | | |
| Vice President, The Manufacturers Life Insurance Company (U.S.A) | | |
| (prior to 2004). | | |
34
| Principal officers who are not Trustees | |
| |
| Name, age | |
| Position(s) held with Portfolio | Officer of |
| Principal occupation(s) and | Portfolio |
| directorships during past 5 years | since |
| |
| Keith Hartstein2, Born: 1956 | 2005 |
|
| President and Chief Executive Officer | |
| Senior Vice President, Manulife Financial Corporation (since 2004); Director, | |
| President and Chief Executive Officer, the Adviser and The Berkeley Group, | |
| John Hancock Funds, LLC (since 2005); Director, MFC Global Investment | |
| Management (U.S.), LLC (“MFC Global (U.S.)”) (since 2005); Director, | |
| John Hancock Signature Services, Inc. (since 2005); President and Chief | |
| Executive Officer, John Hancock Investment Management Services, LLC | |
| (since 2006); President and Chief Executive Officer, John Hancock Funds, | |
| John Hancock Funds II, John Hancock Funds III, John Hancock Trust,; Director, | |
| Chairman and President, NM Capital Management, Inc. (since 2005); | |
| Chairman, Investment Company Institute Sales Force Marketing Committee | |
| (since 2003); Director, President and Chief Executive Officer, MFC Global (U.S.) | |
| (2005-2006); Executive Vice President, John Hancock Funds, LLC (until 2005). | |
| |
| John Vrysen2, Born: 1955 | 2005 |
|
| Chief Financial Officer | |
| Director, Executive Vice President and Chief Financial Officer, the Adviser, | |
| The Berkeley Group and John Hancock Funds, LLC (since 2005); Executive | |
| Vice President and Chief Financial Officer, John Hancock Investment | |
| Management Services, LLC (since 2005), Vice President and Chief Financial | |
| Officer, MFC Global (U.S.) (since 2005); Director, John Hancock Signature | |
| Services, Inc. (since 2005); Chief Financial Officer, John Hancock Funds, | |
| John Hancock Funds II, John Hancock Funds III, John Hancock Trust | |
| (since 2005); Vice President and General Manager, Fixed Annuities, | |
| U.S. Wealth Management (until 2005); Vice President, Operations Manulife | |
| Wood Logan (2000–2004). | |
| |
| Francis V. Knox, Jr.2, Born: 1947 | 2005 |
|
| Vice President and Chief Compliance Officer, John Hancock Investment | |
| Management Services, LLC, the Adviser and MFC Global (U.S.) (since 2005); | |
| Chief Compliance Officer, John Hancock Funds, John Hancock Funds II, | |
| John Hancock Funds III and John Hancock Trust (since 2005); Vice President | |
| and Assistant Treasurer, Fidelity Group of Funds (until 2004); Vice President | |
| and Ethics & Compliance Officer, Fidelity Investments (until 2001). | |
35
| Principal officers who are not Trustees (continued) | |
| |
| Name, age | |
| Position(s) held with Portfolio | Officer of |
| Principal occupation(s) and | Portfolio |
| directorships during past 5 years | since |
| |
| Gordon Shone2, Born: 1956 | 2005 |
|
| Treasurer, John Hancock Funds (since 2006); John Hancock Funds II, John | |
| Hancock Funds III and John Hancock Trust (since 2005); Vice President and | |
| Chief Financial Officer, John Hancock Trust (2003-2005); Senior Vice President, | |
| John Hancock Life Insurance Company (U.S.A.) (since 2001); Vice President, | |
| John Hancock Investment Management Services, Inc. and John Hancock | |
| Advisers, LLC (since 2006), The Manufacturers Life Insurance Company (U.S.A.) | |
| (1998 to 2000). | |
| |
| Thomas M. Kinzler2, Born: 1955 | 2006 |
|
| Vice President and Counsel for John Hancock Life Insurance Company (U.S.A.) | |
| (since 2006); Secretary and Chief Legal Officer, John Hancock Funds, John | |
| Hancock Funds II, John Hancock Funds III and John Hancock Trust (since 2006); | |
| Vice President and Associate General Counsel for Massachusetts Mutual Life | |
| Insurance Company (1999–2006); Secretary and Chief Legal Counsel for | |
| MML Series Investment Fund (2000–2006); Secretary and Chief Legal Counsel | |
| for MassMutual Institutional Funds (2000–2004); Secretary and Chief Legal | |
| Counsel for MassMutual Select Funds and MassMutual Premier Funds | |
| (2004–2006). | |
1 Because the Trust does not hold regular annual shareholders meetings, each Trustee holds office for an indefinite term until his successor is duly elected and qualified or until he dies, retires, resigns, is removed or becomes disqualified.
2Affiliated with the investment adviser.
3 Non-Independent Trustee: holds positions with the Fund’s investment adviser, underwriter, and/ or certain other affiliates.
36
For more information
The Portfolio’s proxy voting policies, procedures and records are available without charge, upon request:
| By phone | On the Portfolio’s Web site | On the SEC’s Web site |
| 1-800-225-5291 | www.jhfunds.com/proxy | www.sec.gov |
|
| Investment adviser | Custodian | Legal counsel |
| John Hancock Investment | State Street Bank & Trust Co. | Kirkpatrick & Lockhart |
| Management Services, LLC | 2 Avenue de Lafayette | Nicholson Graham LLP |
| 601 Congress Street | Boston, MA 02111 | 1 Lincoln Street |
| Boston, MA 02210-2805 | | Boston, MA 02111 |
| | Transfer agent | |
| Principal distributor | John Hancock Signature | Independent registered |
| John Hancock Funds, LLC | Services, Inc. | public accounting firm |
| 601 Congress Street | 1 John Hancock Way, | PricewaterhouseCoopers LLP |
| Boston, MA 02210-2805 | Suite 1000 | 125 High Street |
| | Boston, MA 02217-1000 | Boston, MA 02110 |
Each underlying fund’s accounting policies are outlined in the underlying fund’s shareholder report, available without charge by calling 1-800-344-1029 or on the Securities and Exchange Commission (“SEC”) Web site at www.sec.gov, File # 811-21779, CIK 0001331971.
The Portfolio’s investment objective, risks, charges and expenses are included in the prospectus and should be considered carefully before investing. For a prospectus, call your financial professional, call John Hancock Funds at 1-800-225-5291 or visit the Portfolio’s Web site at www.jhfunds.com. Please read the prospectus carefully before investing or sending money.
| How to contact us | |
|
| |
| Internet | www.jhfunds.com | |
|
| Mail | Regular mail: | Express mail: |
| | John Hancock | John Hancock |
| | Signature Services, Inc. | Signature Services, Inc. |
| | 1 John Hancock Way, Suite 1000 | Mutual Fund Imaging Operations |
| | Boston, MA 02217-1000 | 380 Stuart Street |
| | | Boston, MA 02116 |
|
| Phone | Customer service representatives | 1-800-225-5291 |
| | 24-hour automated information | 1-800-338-8080 |
| | TDD line | 1-800-554-6713 |
A listing of month-end portfolio holdings is available on our Web site, www.jhfunds.com. A more detailed portfolio holdings summary is available on a quarterly basis 60 days after the fiscal quarter on our Web site or upon request by calling 1-800-225-5291, or on the Securities and Exchange Commission’s Web site, www.sec.gov.
40
J O H N H A N C O C K F A M I L Y O F F U N D S
| EQUITY | INTERNATIONAL |
| Balanced Fund | Greater China Opportunities Fund |
| Classic Value Fund | International Classic Value Fund |
| Classic Value Fund II | International Core Fund |
| Core Equity Fund | International Fund |
| Focused Equity Fund | International Growth Fund |
| Growth Fund | |
| Growth Opportunities Fund | INCOME |
| Growth Trends Fund | Bond Fund |
| Intrinsic Value Fund | Government Income Fund |
| Large Cap Equity Fund | High Yield Fund |
| Large Cap Select Fund | Investment Grade Bond Fund |
| Mid Cap Equity Fund | Strategic Income Fund |
| Mid Cap Growth Fund | |
| Multi Cap Growth Fund | TAX-FREE INCOME |
| Small Cap Equity Fund | California Tax-Free Income Fund |
| Small Cap Fund | High Yield Municipal Bond Fund |
| Small Cap Intrinsic Value Fund | Massachusetts Tax-Free Income Fund |
| Sovereign Investors Fund | New York Tax-Free Income Fund |
| U.S. Core Fund | Tax-Free Bond Fund |
| U.S. Global Leaders Growth Fund | |
| Value Opportunities Fund | MONEY MARKET |
| | Money Market Fund |
| ASSET ALLOCATION & LIFESTYLE | U.S. Government Cash Reserve |
| Allocation Core Portfolio | |
| Allocation Growth + Value Portfolio | CLOSED-END |
| Lifestyle Aggressive Portfolio | Bank & Thrift Opportunity |
| Lifestyle Balanced Portfolio | Financial Trends |
| Lifestyle Conservative Portfolio | Income Securities |
| Lifestyle Growth Portfolio | Investors Trust |
| Lifestyle Moderate Portfolio | Patriot Global Dividend |
| | Patriot Preferred Dividend |
| SECTOR | Patriot Premium Dividend I |
| Financial Industries Fund | Patriot Premium Dividend II |
| Health Sciences Fund | Patriot Select Dividend |
| Real Estate Fund | Preferred Income |
| Regional Bank Fund | Preferred Income II |
| Technology Fund | Preferred Income III |
| Technology Leaders Fund | Tax-Advantaged Dividend |
For more complete information on any John Hancock Fund and a prospectus, which includes charges and expenses, call your financial professional, or John Hancock Funds at 1-800-225-5291. Please read the prospectus carefully before investing or sending money.

1-800-225-5291
1-800-554-6713 (TDD)
1-800-338-8080 EASI-Line
www.jhfunds.com
Now available: electronic delivery
www.jhfunds.com/edelivery
This report is for the information of the shareholders of John Hancock Lifestyle Moderate Portfolio.
9700A 8/06
10/06
John Hancock Funds II
President’s Message
August 31, 2006
To our shareholders,
The future has arrived at John Hancock Funds.
We have always been firm believers in the powerful role the Internet can play in providing fund information to our shareholders and prospective investors. Recently, we launched a redesigned, completely overhauled Web site that is more visually pleasing, easier to navigate and, most importantly, provides more fund information and learning tools without overwhelming the user.
Not long after we embarked on this major project, a study was released by the Investment Company Institute, the mutual fund industry’s main trade group, which found that an overwhelming majority of shareholders consider the Internet the “wave of the future” for accessing fund information.
Our new site sports fresher and faster ways to access account information. New innovations allow investors to view funds by risk level, track the performance of the John Hancock funds of their choice, or sort funds by Morningstar, Inc.’s star ratings. Investors who own a John Hancock fund through a qualified retirement plan and don’t pay sales charges when making a purchase have the option of sorting by a “Load Waived” Morningstar Rating, thereby creating an apples-to-apples comparison with no-load funds that may also be available in their retirement plan.
The new site also has more educational tools and interactive modules to educate and assist investors with their financial goals, from college savings to retirement planning. A new “I want to...” feature allows investors to check performance, invest more money, update personal information or download prospectuses and forms quickly and easily.
We encourage you to visit our new Website — www.jhfunds.com — and take a tour. It’s easy, fast and fun and allows you to be in control of what you see and do. In short, it’s the wave of the future!
Sincerely,

Keith F. Hartstein
President and Chief Executive Officer
2
John Hancock Funds II
Annual Report — Table of Contents
| Manager’s Commentary and Fund Performance (See below for each Fund’s page #) | 4 |
| Understanding Your Fund’s Expenses | 61 |
| Statements of Assets and Liabilities | 80 |
| Statements of Operations | 94 |
| Statements of Changes in Net Assets | 108 |
| Financial Highlights | 117 |
| Portfolio of Investments (See below for each Fund’s page #) | 173 |
| Notes to Financial Statements | 427 |
| Report of Independent Registered Public Accounting Firm | 464 |
| Federal Income Tax Information | 465 |
| Evaluation of Advisory and Subadvisory Agreements by the Board of Trustees | 466 |
| Appendix A | 470 |
| Trustees and Officers Information | 473 |
| Manager’s Commentary & | Portfolio of | | Manager’s Commentary & | Portfolio of |
| Fund | Portfolio Performance | Investments | Fund | Portfolio Performance | Investments |
| | | | | | |
| Absolute Return Fund | 5 | 173 | Mid Cap Stock Fund | 33 | 309 |
| Active Bond Fund | 6 | 173 | Mid Cap Value Fund | 34 | 311 |
| All Cap Core Fund | 7 | 188 | Mid Cap Value Equity Fund | 35 | 312 |
| All Cap Growth Fund | 8 | 190 | Natural Resources Fund | 36 | 315 |
| All Cap Value Fund | 9 | 192 | Quantitative All Cap Fund | 37 | 316 |
| Blue Chip Growth Fund | 10 | 194 | Quantitative Mid Cap Fund | 38 | 318 |
| Capital Appreciation Fund | 11 | 196 | Quantitative Value Fund | 39 | 320 |
| Core Bond Fund | 12 | 198 | Real Estate Equity Fund | 40 | 322 |
| Core Equity Fund | 13 | 206 | Real Estate Securities Fund | 41 | 322 |
| Emerging Growth Fund | 14 | 207 | Real Return Bond Fund | 42 | 323 |
| Emerging Small Company Fund | 15 | 209 | Small Cap Fund | 43 | 325 |
| Equity-Income Fund | 16 | 211 | Small Cap Index Fund | 44 | 326 |
| Fundamental Value Fund | 17 | 213 | Small Cap Opportunities Fund | 45 | 345 |
| Global Bond Fund | 18 | 215 | Small Company Fund | 46 | 348 |
| Global Real Estate Fund | 19 | 220 | Small Company Growth Fund | 47 | 352 |
| High Income Fund | 20 | 222 | Small Company Value Fund | 48 | 354 |
| High Yield Fund | 21 | 225 | Special Value Fund | 49 | 356 |
| International Equity Index Fund | 22 | 234 | Spectrum Income Fund | 50 | 359 |
| International Opportunities Fund | 23 | 255 | Strategic Bond Fund | 51 | 386 |
| International Small Cap Fund | 24 | 256 | Strategic Income Fund | 52 | 396 |
| International Small Company Fund | 25 | 258 | Strategic Value Fund | 53 | 400 |
| International Stock Fund | 26 | 281 | Total Return Fund | 54 | 401 |
| International Value Fund | 27 | 285 | U.S. Global Leaders Growth Fund | 55 | 405 |
| Investment Quality Bond Fund | 28 | 287 | U.S. Government Securities Fund | 56 | 406 |
| Large Cap Fund | 29 | 298 | U.S. High Yield Bond Fund | 57 | 408 |
| Large Cap Value Fund | 30 | 300 | U.S. Multi Sector Fund | 58 | 414 |
| Mid Cap Core Fund | 31 | 302 | Value & Restructuring Fund | 59 | 421 |
| Mid Cap Index Fund | 32 | 303 | Vista Fund | 60 | 423 |
3
John Hancock Funds II
Manager’s Commentary and Fund Performance
Fund Performance
In the following pages we have set forth information regarding the performance of each Fund of the John Hancock Funds II (the “trust”). There are several ways to evaluate a Fund’s historical performance. One can look at the total percentage change in value, the average annual percentage change or the growth of a hypothetical $10,000 investment. With respect to all performance information presented, it is important to understand that past performance does not guarantee future results. Return and principal fluctuate, and shares, when redeemed, may be worth more or less than their original cost. The Funds are still in their first year of operation so a full year of past performance is not available.
Performance Tables
The Performance Tables show two types of total return information: cumulative and average annual total returns. A cumulative total return is an expression of a Fund’s total change in share value in percentage terms over a set period of time — one, five and ten years (or since the Fund’s inception if less than the applicable period). An average annual total return takes the Fund’s cumulative total return for a time period greater than one year and shows what would have happened if the Fund had performed at a constant rate each year. The tables show all cumulative and average annual total returns, net of fees and expenses of the Trust, but do not reflect the insurance (separate account) expenses (including a possible contingent deferred sales charge) that invest in the Fund. If these were included, performance would be lower.
Graph — Change in Value of $10,000 Investment and Comparative Indices
The performance graph for each Fund shows the change in value of a $10,000 investment over the life or ten-year period of each Fund, whichever is shorter. Each Fund’s performance is compared with the performance of one or more broad-based securities indices as a “benchmark.” All performance information includes the reinvestment of dividends and capital gain distributions, as well as the deduction of ongoing management fees and Fund operating expenses. The benchmarks used for comparison are unmanaged and include reinvestment of dividends and capital gains distributions, if any, but do not reflect any fees or expenses. Funds that invest in multiple asset classes are compared with a customized benchmark. This benchmark is comprised of a set percentage allocation from each of the asset classes in which the Fund invests.
Portfolio Manager’s Commentary
Finally, we have provided a commentary by each portfolio manager regarding each Fund’s performance during the period ended August 31, 2006. The views expressed are those of the portfolio manager as of August 31, 2006, and are subject to change based on market and other conditions. Information about a Fund’s holdings, asset allocation or country diversification is historical and is no indication of future fund composition, which will vary. Information provided in this report should not be considered a recommendation to purchase or sell securities. The Funds are not insured by the FDIC, are not a deposit or other obligation of, or guaranteed by banks and are subject to investment risks including loss of principal amount invested. For a more detailed discussion of the risks associated with the Funds, see the Fund prospectus.
“Standard & Poor’s,” “Standard & Poor’s 500,” “S&P 500,” and “S&P MidCap 400 Index” are trademarks of The McGraw-Hill Companies, Inc. “Russell 1000,” “Russell 2000,” “Russell 3000,” and “Russell Midcap” are trademarks of Frank Russell Company. “Wilshire 5000” is a trademark of Wilshire Associates. “Morgan Stanley European Australian Far East Free”, “EAFE” and “MSCI” are trademarks of Morgan Stanley & Co. Incorporated.” “Lehman Brothers” is a registered trademark of Lehman Brothers Inc. “Lipper” is a registered trademark of Reuters S.A. None of the Trusts are sponsored, endorsed, managed, advised, sold or promoted by any of these companies, and none of these companies make any representation regarding the advisability of investing in the Trust.
4
Absolute Return Fund
Subadviser: MFC Global Investment Management (U.S.A.) Limited
Portfolio Managers: Steve Orlich and James Robertson
INVESTMENT OBJECTIVE & POLICIES - To seek maximum real return, consistent with preservation of real capital and prudent investment management.
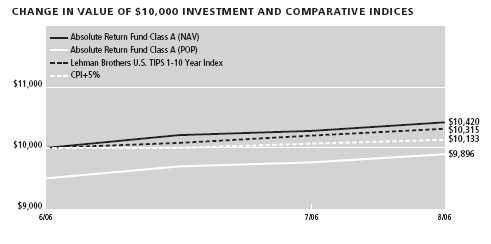
| Target Asset Allocation | % of Total |
|
| Fixed Income | |
| Multi-Sector Bond | 13.00 |
| High Yield Bond | 10.00 |
| Treasury Inflation Protected Securities | 10.00 |
| Intermediate-Term Bond | 10.00 |
| Cash | 8.00 |
| Long-Term Bond | 3.00 |
| Global Bond | 2.00 |
| Short-Term Bond | 2.00 |
| |
| Equity | |
| U. S. Large Cap | 15.00 |
| Real Estate | 9.00 |
| U.S. Small Cap | 5.00 |
| Natural Resources | 4.00 |
| International | 4.00 |
| International Small Cap | 3.00 |
| Commodities | 2.00 |
PORTFOLIO MANAGER’S COMMENTARY
Performance - Since its inception in June 2006, the Absolute Return Fund returned + 4.20%, outperforming the +3.15% return of the Lehman Brothers U.S. TIPS 1-10 Year Index and the +1.33% return of the CPI +5%.
Environment - We started the Fund with the goal of establishing a mix that would achieve the objectives of CPI+ and avoid an initial downturn in performance. To this end, we started with an underweight to the commodities market. The move in commodities had become almost parabolic and we felt it would not be prudent to go to full weight under those conditions. The market has subsequently retraced, providing us the opportunity to move to an equal weight at a more attractive level. In fixed income, the flat yield curve and Fed tightening prompted us to again underweight the asset class. We did, however, feel that the high yield market was extremely attractive. The high running yield and a credit environment that we believe will remain friendly for some time to come points to the best fixed income asset. An almost 70% yield pick-up over treasurie s was compelling. In the equity portion, we were positive, but felt a short term correction could occur. As such, we tilted away from small cap in favor of large cap. The correction materialized to a certain degree, but the portfolio was protected.
Outlook - Looking forward, we remain comfortable with our current stance. Interest rates are still not compelling but the argument in favor of high yield remains valid. The Fed appears to have halted its relentless tightening campaign, and the softening housing market is leading to a slightly lower level of GDP growth. Add in a correcting commodity market, and we expect inflation concerns to moderate, and the overall economy to continue to move forward at a reasonable clip. We remain well positioned, although we are looking at selling calls against our equity exposure to earn income and crystallize gains.
The views expressed are those of the portfolio manager as of August 31, 2006, and are subject to change based on market and other conditions.
| | Cumulative Total Return | | | | Cumulative Total Return | |
| PERFORMANCE TABLE1,4 | Without Maximum Sales Charge (NAV) | | With Maximum Sales Charge (POP) |
|
| | | | | Since | | | | Since |
| Periods Ending August 31, 2006 | 1-year | 5-year | 10-year | inception | 1-year | 5-year | 10-year | inception2 |
|
| Absolute Return Class A (began 6/26/06) | — | — | — | 4.20% | — | — | — | –1.04% |
| Absolute Return Class B (began 6/26/06) | — | — | — | 4.00% | — | — | — | –1.00% |
| Absolute Return Class C (began 6/26/06) | — | — | — | 4.00% | — | — | — | 3.00% |
| Absolute Return Class 1 (began 6/26/06) | — | — | — | 4.20% | — | — | — | 4.20% |
| Lehman Brothers U.S. TIPS 1-10 Year Index3,5,7 | — | — | — | 3.15% | — | — | — | 3.15% |
| CPI +5%3,6,7 | — | — | — | 1.33% | — | — | — | 1.33% |
1 Performance does not reflect the deduction of taxes on fund distributions or redemptions of fund shares. Past performance does not predict future performance.
2 Current subadviser has managed the fund since June 26, 2006.
3 Since inception returns for the indices may begin on the month-end closest to the actual inception date of the fund.
4 Since inception, a portion of the Absolute Return Fund expenses were reimbursed. If such expenses had not been reimbursed, returns would be lower.
5 Lehman Brothers U.S. TIPS 1-10 Year Index is an unmanaged index which consists of Inflation-Protection securities issued by the U.S. Treasury. The stocks in this index must have at least one year to final maturity, have at least $250 million par amount outstanding and be rated investment-grade (Baa3/BBB– or higher) by at least two of the following ratings agencies: Moody’s, S&P, Fitch.
6 The CPI + 5% benchmark is created by adding 5% to the annual percentage change in the Consumer Price Index. This index reflects non-seasonably adjusted returns. The Consumer Price Index (CPI) is an unmanaged index representing the rate of inflation in U.S. consumer prices as determined by the U.S. Department of Labor Statistics. There can be no guarantee that the CPI or other indices will reflect the exact level of inflation at any given time. It is not possible to invest directly in an index.
7 It is not possible to invest directly in an index. Index figures do not reflect sales charges and would be lower if they did.
5
Active Bond Fund
Subadviser: Declaration Management & Research LLC, Sovereign Asset Management LLC
Portfolio Managers: James E. Shallcross and Peter Farley
INVESTMENT OBJECTIVE & POLICIES - To seek income and capital appreciation. The Fund normally invests at least 80% of its assets in a diversified mix of debt securities and instruments.
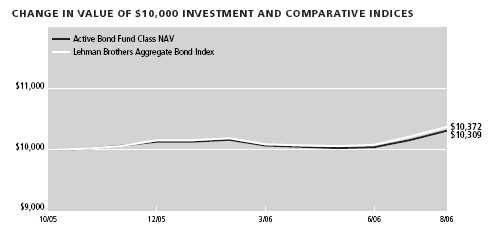
| Sector Weighting* | % of Total |
|
| Mortgage Securities | 38.98 |
| Government | 15.27 |
| Financial | 7.67 |
| Communications | 3.03 |
| Utilities | 2.40 |
| Asset Backed Securities | 2.32 |
| Energy | 1.79 |
| Consumer, Non-cyclical | 1.37 |
| Consumer, Cyclical | 1.00 |
| Industrial | 0.89 |
*Top Sectors as a percentage of market value. Does not include short-term securities and investments in the State Street Navigator Securities Lending Prime Portfolio.
PORTFOLIO MANAGER’S COMMENTARY
Performance - Since its inception in October 2005, the Active Bond Fund returned +3.09%, underperforming the +3.72% return of the LB Aggregate Bond Index.
Environment - Interest rates moved higher during the period as the Federal Reserve continued its restrictive monetary policy. The economy shifted back into momentum in the first quarter of 2006, after falling behind because of the impact of the Gulf Coast hurricanes in 2005. Inflation began to elevate, as both wages and surging energy prices raised the prospects for higher interest rates. The yield curve flattened as short-term interest rates increased by nearly a full percentage point, while long-term rates climbed 0.20% . The market was positioned for slower economic growth as indications for the Fed to pause were coming to fruition after its long series of interest rate hikes. The Fund remained short in duration against the benchmark and was positioned for a yield curve-flattening move in the market. Most fixed-income sectors performed well, with high yield and emerging mark ets leading the pack. The fund benefited from having positions in both. Mortgages also contributed to performance as commercial mortgage-backed securities outperformed on the heels of improving sector fundamentals.
Outlook - Economic growth is expected to slow as higher interest rates, a softening residential real estate market, and elevated energy prices stall consumer consumption. Inflation remains a concern for the Fed, but is expected to taper off with evidence of economic weakness. Historically, the Fed has been unable to engineer a soft landing for the economy. This time, the Fed is better positioned. However, the fallout from a weaker housing market has yet to filter through the economy. Interest rates will remain range-bound in the high 4% area as the market wrestles with inflation and slower growth. Fixed-income sectors are approaching rich levels and caution is warranted, especially in credit, as the economy transitions.
Sovereign Asset Management LLC
Environment - Early during the past year, a combination of longer and shorter-dated bonds positioned the Fund for a flatter yield curve. Portfolio duration was generally kept below the benchmark. We structured the Fund this way believing economic growth would remain above 3% and inflation pressures would mount, causing interest rates to increase. The Federal Reserve continued to tighten monetary policy, taking the federal funds rate from 3.50% to 5.25% before pausing in August. Interest rates for the U.S. Treasury market increased and the curve flattened. More recently, we shifted the maturity position to benefit from an eventual steepening. The portfolio’s largest sector weightings were in corporate bonds and mortgage-backed securities. We took a cautious approach among the more cyclical sectors within corporate bonds. Corporate spreads remained near historically tight le vels, and with the Fed removing liquidity from the financial system, we believed spreads would widen. This scenario did not play out, as high yield corporate bonds continued to outperform other sectors. In the mortgage market, we remained defensive as well, holding adjustable-rate mortgages in place of many fixed-rate 30-year mortgages. This position worked out well, as changes in prepayment rates led 30-year mortgages to underperform adjustable-rate mortgages.
Outlook - Recent indicators show the housing market weakening much faster than predicted, with many areas of the country experiencing decreasing home prices. Combined with higher energy prices and interest rates over the past year, we believe that this will have a moderating effect for the U.S. and global economies. Inflation pressures should begin to ease as growth slows. Most recently, commodity prices have started to decline. We expect the federal funds rate to ease in 2007. While the economy will likely slow and interest rates fall, we do not expect a significant widening in corporate bond spreads, as we doubt the U.S. economy will enter a recession. Likewise, there should be little negative effect on mortgage-backed security spreads.
The views expressed are those of the portfolio manager as of August 31, 2006, and are subject to change based on market and other conditions.
| PERFORMANCE TABLE1 | Average Annual Total Return | | | Cumulative Total Return | |
|
| | | | | Since | | | | Since |
| Periods Ending August 31, 2006 | 1-year | 5-year | 10-year | inception | 1-year | 5-year | 10-year | inception2 |
|
| Active Bond Class 1 (began 10/15/05) | — | — | — | — | — | — | — | 2.68% |
| Active Bond Class NAV (began 10/27/05) | — | — | — | — | — | — | — | 3.09% |
| Lehman Brothers Aggregate Bond Index (10/15/05)3,4,5 | — | — | — | — | — | — | — | 3.37% |
| Lehman Brothers Aggregate Bond Index (10/27/05)3,4,5 | — | — | — | — | — | — | — | 3.72% |
1 Performance does not reflect the deduction of taxes on fund distributions or redemptions of fund shares. Past performance does not predict future performance.
2 Current subadvisers have managed the fund since October 15, 2005.
3 Since inception returns for the indices may begin on the month-end closest to the actual inception date of the fund.
4 Lehman Brothers Aggregate Bond Index is an unmanaged index of dollar-denominated and nonconvertible investment-grade debt issues.
5 It is not possible to invest directly in an index. Index figures do not reflect sales charges and would be lower if they did.
6
All Cap Core Fund
Subadviser: Deutsche Asset Management
Portfolio Managers: Julie Abbett, Janet Campagna and Robert Wang
INVESTMENT OBJECTIVE & POLICIES - To seek to achieve long-term growth of capital by investing in stocks within all assets classes (small-, mid- and large-cap) primarily those within the Russell 3000 Index.
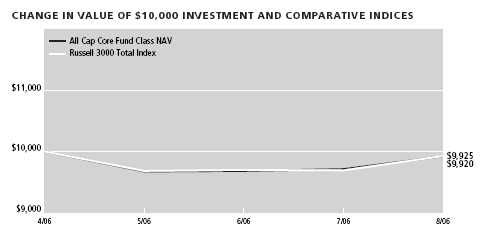
| Sector Weighting* | % of Total |
|
| Consumer, Non-cyclical | 18.94 |
| Financial | 15.69 |
| Technology | 9.85 |
| Consumer, Cyclical | 9.35 |
| Communications | 8.51 |
| Industrial | 7.99 |
| Energy | 7.96 |
| Basic Materials | 3.65 |
| Utilities | 2.92 |
*Top Sectors as a percentage of market value. Does not include short-term securities and investments in the State Street Navigator Securities Lending Prime Portfolio.
PORTFOLIO MANAGER’S COMMENTARY
Performance - Since its inception in April 2005, the All Cap Core Fund returned –0.80%, underper-forming the –0.75% return of the Russell 3000 Total Index.
Environment - The US stock market has remained choppy on worries about economic growth, energy prices and rising interest rates. In August 2006, markets responded positively to news on all three factors. Economic releases such as slightly higher jobless claims, lower new home and auto sales, as well as lower consumer confidence, supported slowing growth. In response, on August 8, the Federal Reserve paused at a 5.25% Federal Funds level; this is a change from increases over the last 18 months. The Federal Reserve noted the slowing economy outweighed inflation concerns but it left a door open for more hikes in the future.
The All Cap Core strategy outperformed its benchmark during the period. Stocks within the energy, capital goods, and retailing industry groups contributed most to relative performance. Stocks within the energy industry group returned a positive 3.86% while those in the benchmark 0.03% . The largest detractor from relative performance was the food & staples retailing industry group. Stocks within the Index in this industry group returned 4.13% versus a return of -4.58% in the portfolio.
Outlook - Over the next several quarters, US economic data should continue to show lower levels of growth than 1st quarter 2006. The Federal Reserve paused on their cycle of raising interest rates, with the economy forecast to slow to a pace at or slightly below trend. We believe this should encourage a gradual transition back to high quality stocks, and therefore our disciplined approach to portfolio management will continue to be rewarded. As the profit cycle decelerates and margin growth slows through competitive pressures, we believe owning companies with high quality earnings and strong cash flow will leave the portfolio well positioned for continued success.
The views expressed are those of the portfolio manager as of August 31, 2006, and are subject to change based on market and other conditions.
| PERFORMANCE TABLE1 | Average Annual Total Return | | | Cumulative Total Return | |
|
| | | | | Since | | | | Since |
| Periods Ended August 31, 2006 | 1-year | 5-year | 10-year | inception | 1-year | 5-year | 10-year | inception2 |
|
| All Cap Core Class NAV (began 4/28/06) | — | — | — | — | — | — | — | –0.80% |
| Russell 3000 Total Index3,4,5 | — | — | — | — | — | — | — | –0.75% |
1 Performance does not reflect the deduction of taxes on fund distributions or redemptions of fund shares. Past performance does not predict future performance.
2 Current subadviser has managed the fund since April 28, 2006.
3 Since inception returns for the indices may begin on the month-end closest to the actual inception date of the fund.
4 Russell 3000 Total Index is an unmanaged index of the 3,000 largest U.S. companies based on total market capitalization, which represents approximately 98% of the investable U.S. equity market.
5 It is not possible to invest directly in an index. Index figures do not reflect sales charges and would be lower if they did.
7
All Cap Growth Fund
Subadviser: AIM Capital Management, Inc.
Portfolio Managers: Lanny H. Sachnowitz, Kirk L. Anderson, Robert J. Lloyd and James G. Birdsall
INVESTMENT OBJECTIVE & POLICIES - To seek to achieve long-term capital appreciation by investing principally in common stocks of companies that are likely to benefit from new or innovative products, services or processes, as well as those that have experienced above-average, long-term growth in earnings and have excellent prospects for future growth.
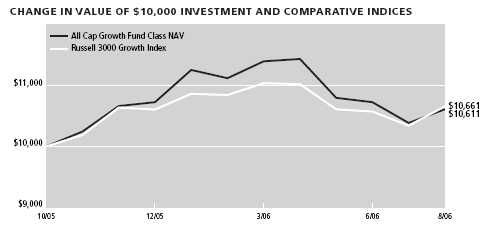
| Sector Weighting* | % of Total |
|
| Consumer, Non-cyclical | 19.06 |
| Industrial | 13.96 |
| Technology | 13.95 |
| Consumer, Cyclical | 12.85 |
| Communications | 11.37 |
| Financial | 10.48 |
| Energy | 5.46 |
| Basic Materials | 3.54 |
*Top Sectors as a percentage of market value. Does not include short-term securities and investments in the State Street Navigator Securities Lending Prime Portfolio.
PORTFOLIO MANAGER’S COMMENTARY
Performance - Since its inception in October 2005, the All Cap Growth Fund returned +6.11%, underperforming the +6.61% return of the Russell 3000 Growth Index.
Environment - Despite widespread concern about the impact of rising short-term interest rates, high energy prices, a housing bubble and the long-term economic effects of the Gulf Coast hurricanes of 2005, the equity markets generated positive returns for the fiscal year. Under new chairman Ben Bernanke, the Federal Reserve continued raising the federal funds rate, to 5.25% . Positive performance in the Russell 3000 Growth Index was broad-based, with the highest returns in the Utilities, Telecommunications and Materials sectors.
The Fund outperformed the benchmark by a wide margin in Industrials, Materials and Financials. In Industrials, the Fund had strong stock selection across several industries that benefited from global economic expansion. In Materials, we gained from stock selection and an overweight, as the sector was a top Index performer. Metals and mining stocks made key contributions, as commodity prices remained high generally, and the fund benefited from an overweight position. In Financials, our performance was driven by stock selection in insurance and commercial bank holdings and overweight positions in capital market and diversified financial services holdings.
The Fund underperformed by a wide margin versus its benchmark in the Health Care, Consumer Staples and Energy sectors. Stock selection and an overweight in the health care providers and services industry detracted from performance. In the Consumer Staples sector, stock selection and an underweight in beverages and in food and staples retailing detracted from performance. Underperformance in Energy was driven largely by an overweight position, as many Energy stocks began to fade late in the period.
Outlook - We believe growth stocks are poised to outperform. Many growth stocks continue to trade at reasonable valuations relative to value stocks, as well as to expected growth rates, and the current economic environment is favorable for the stock prices of companies that can deliver above-average earnings growth. This environment has created an opportunity to buy companies with superior growth prospects at unusually modest prices.
The portfolio is positioned to benefit from global economic growth, although we maintain significant positions in relatively defensive growth stocks as the economic cycle shows signs of maturing.
The views expressed are those of the portfolio manager as of August 31, 2006, and are subject to change based on market and other conditions.
| PERFORMANCE TABLE1 | Average Annual Total Return | | | Cumulative Total Return | |
|
| | | | | Since | | | | Since |
| Periods Ended August 31, 2006 | 1-Year | 5-Year | 10-year | inception | 1-year | 5-Year | 10-year | inception2 |
|
| All Cap Growth Class 1 (began 10/15/05) | — | — | — | — | — | — | — | 6.05% |
| All Cap Growth Class NAV (began 10/15/05) | — | — | — | — | — | — | — | 6.11% |
| Russell 3000 Growth Index3,4,5 | — | — | — | — | — | — | — | 6.61% |
1 Performance does not reflect the deduction of taxes on fund distributions or redemptions of fund shares. Past performance does not predict future performance.
2 Current subadviser has managed the fund since October 15, 2005.
3 Since inception returns for the indices may begin on the month-end closest to the actual inception date of the fund.
4 Russell 3000 Growth Index is an unmnaged index that measures the performance of those Russell 3000 Index companies with higher price-to-book ratios and higher forecasted growth values. The stocks in this index are also members of either the Russell 1000 Growth or the Russell 2000 Growth indexes.
5 It is not possible to invest directly in an index. Index figures do not reflect sales charges and would be lower if they did.
8
All Cap Value Fund
Subadviser: Lord, Abbett & Co. LLC
Portfolio Managers: David G. Builder, Robert P. Fetch, Daniel H. Frascarelli, Howard E. Hansen, Gerard E. Heffernan Jr. and Robert G. Morris
INVESTMENT OBJECTIVE & POLICIES - To seek to achieve capital appreciation, the Fund will invest primarily in equity securities of U.S. and multinational companies that Lord, Abbett & Co. LLC (Lord Abbett) believes are undervalued in all capitalization ranges. Under normal circumstances, the Fund will invest at least 50% of its net assets in equity securities of large, seasoned companies with market capitalizations of at least $5 billion at the time of purchase.
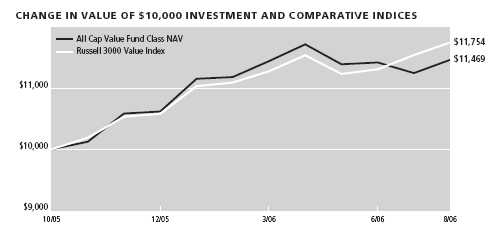
| Sector Weighting* | % of Total |
|
| Industrial | 23.20 |
| Consumer, Non-cyclical | 17.56 |
| Financial | 10.48 |
| Energy | 9.62 |
| Communications | 6.95 |
| Basic Materials | 5.89 |
| Consumer, Cyclical | 5.50 |
| Utilities | 4.47 |
| Technology | 3.36 |
*Top Sectors as a percentage of market value. Does not include short-term securities and investments in the State Street Navigator Securities Lending Prime Portfolio.
PORTFOLIO MANAGER’S COMMENTARY
Performance - Since its inception in October 2005, the All Cap Value Fund returned +14.69%, underperforming the +17.54% return of the Russell 3000 Value Index.
Environment - After outperforming the Index for the first half of the year, the portfolio underperformed significantly in July. This coincided with the market’s reaction to the perceived slowing U.S. economy, which hurt our cyclical stocks. The largest detractor from relative performance was Technology stock selection. The relative overweight within this sector also hurt performance because Technology was the portfolio’s second worst performing sector. Within Financial Services, stock selection and our relative underweight also detracted from performance. The Fund either did not own or held a relative underweight in several very strong performers in this sector. Stock selection within the Health Care sector was also a detractor, as product recalls affected one of our holdings.
A relative sector overweight within the Materials and Processing sector was the largest contributor to the portfolio’s performance versus the Russell 3000 Value Index. Within this sector, which posted the highest returns in the Index, the Fund’s average weighting was almost three times higher than the Index. Stock selection in Materials and Processing also was positive. The Other Energy sector provided our highest returns, led by strong stock selection. Lastly, the Fund’s relative overweight within the Consumer Staples sector benefited performance as cyclical stocks performed well.
Outlook - We are focused on finding companies that meet certain valuation hurdles and that have identifiable catalysts to drive their stock prices higher. We have found many such companies within the Materials and Processing and Technology sectors, which led the portfolio to a relative overweight in both of these sectors, as of the end of August. In contrast, we continue to be concerned about earnings and valuations within the Financial Services sector, which is by far the portfolio’s largest underweight. We will continue to build the portfolio from the bottom up and respond to opportunities that exist in every market environment.
The views expressed are those of the portfolio manager as of August 31, 2006, and are subject to change based on market and other conditions.
| PERFORMANCE TABLE1 | Average Annual Total Return | | | Cumulative Total Return | |
|
| | | | | Since | | | | Since |
| Periods Ended August 31, 2006 | 1-year | 5-year | 10-year | inception | 1-year | 5-year | 10-year | inception2 |
|
| All Cap Value Class 1 (began 10/15/05) | — | — | — | — | — | — | — | 14.64% |
| All Cap Value Class NAV (began 10/15/05) | — | — | — | — | — | — | — | 14.69% |
| Russell 3000 Value Index3,4,5 | — | — | — | — | — | — | — | 17.54% |
1 Performance does not reflect the deduction of taxes on fund distributions or redemptions of fund shares. Past performance does not predict future performance.
2 Current subadviser has managed the fund since October 15, 2005.
3 Since inception returns for the indices may begin on the month-end closest to the actual inception date of the fund.
4 Russell 3000 Value Index is an unmanaged index that measures the performance of those Russell 3000 companies with lower price-to-book ratios and lower forecasted growth values. The stocks in this index are also members of either the Russell 1000 Value or Russell 2000 Value indexes.
5 It is not possible to invest directly in an index. Index figures do not reflect sales charges and would be lower if they did.
9
Blue Chip Growth Fund
Subadviser: T. Rowe Price Associates, Inc.
Portfolio Manager: Larry J. Puglia
INVESTMENT OBJECTIVE & POLICIES - To seek to provide long-term growth of capital by investing at least 80% of the Fund’s total assets in the common stocks of large and medium sized blue chip growth companies as defined by T. Rowe Price Associates, Inc. These are firms that the managers believe are well established in their industries and have the potential for above-average earnings growth. Current income is a secondary objective.

| Sector Weighting* | % of Total |
|
| Consumer, Non-cyclical | 22.48 |
| Financial | 20.14 |
| Technology | 13.34 |
| Communications | 12.61 |
| Industrial | 9.69 |
| Consumer, Cyclical | 9.11 |
| Energy | 6.98 |
| Basic Materials | 1.19 |
*Top Sectors as a percentage of market value. Does not include short-term securities and investments in the State Street Navigator Securities Lending Prime Portfolio.
PORTFOLIO MANAGER’S COMMENTARY
Performance - Since its inception in October 2005, the Blue Chip Growth Fund returned +7.90%, underperforming the +11.77% return of the S&P 500 Index.
Environment - U.S. stocks rose over the past 10-plus-month period. Within the S&P 500, the materials and telecommunications services sectors posted the strongest returns: the IT and consumer discretionary sectors were weakest but generated positive returns for the period. Investors seemed pleased that the Federal Reserve refrained from raising the Fed funds target rate on August 8, and stocks rallied at the end of the period.
A significant overweight and stock selection in the information technology sector was the fund’s largest relative performance detractor. Although Google, Nokia, and Intuit were strong gainers, an overweight in Dell and semiconductor holdings Maxim Integrated Products and Marvell Technology Group detracted from the sector’s results. Currently, our largest overweights are in the semiconductors and semiconductor equipment and Internet software and services industries because we believe in the multi-year growth potential of the companies we own.
Stock selection in the health care sector was the next-largest detractor. Nevertheless, we believe in the long-term prospects for our providers and services holdings given their exceptional cash flow generation ability. The financials sector also detracted due to stock selection — although the sector was the strongest absolute contributor. We’ve maintained an overweight in capital markets because of the positive economic backdrop, healthy investment banking activity, and the ability to leverage fee-for-service business models that should generate strong free cash flow and earnings growth.
Despite our underweight allocation, the energy sector was the best relative performer thanks to oil equipment and services companies Baker Hughes, Smith International, and Schlumberger. We like the prospects for our oil services holdings as they continue to benefit from increased spending by energy producers on infrastructure, equipment, technology, and specialized services.
Outlook - We continue to anticipate solid GDP growth, modest increases in inflation and interest rates, and stable unemployment and consumer confidence for the remainder of 2006. In addition, we expect good corporate profits that could lead to increased business spending. Valuations are reasonable, particularly for large-cap growth companies generating consistent earnings and cash-flow growth. However, with a moderation in average earnings growth rates, stock selection should become increasingly important. We remain optimistic on the prospects for equities and remain vigilant in finding companies with durable long-term growth characteristics, regardless of the economic environment.
The views expressed are those of the portfolio manager as of August 31, 2006, and are subject to change based on market and other conditions.
| PERFORMANCE TABLE1,4 | Average Annual Total Return | | | Cumulative Total Return | |
|
| | | | | Since | | | | Since |
| Periods Ended August 31, 2006 | 1-year | 5-year | 10-year | inception | 1-year | 5-year | 10-year | inception2 |
|
| Blue Chip Growth Class 1 (began 10/15/05) | — | — | — | — | — | — | — | 7.88% |
| Blue Chip Growth Class NAV (began 10/15/05) | — | — | — | — | — | — | — | 7.90% |
| Standard & Poors 500 Index3,5,6 | — | — | — | — | — | — | — | 11.77% |
1 Performance does not reflect the deduction of taxes on fund distributions or redemptions of fund shares. Past performance does not predict future performance.
2 Current subadviser has managed the fund since October 15, 2005.
3 Since inception returns for the indices may begin on the month-end closest to the actual inception date of the fund.
4 Since inception, a portion of the Blue Chip Growth Fund expenses were reimbursed. If such expenses had not been reimbursed, returns would be lower.
5 Standard & Poors 500 Index is an unmanaged index that includes 500 widely traded common stocks.
6 It is not possible to invest directly in an index. Index figures do not reflect sales charges and would be lower if they did.
10
Capital Appreciation Fund
Subadviser: Jennison Associates, LLC
Portfolio Managers: Michael Del Balso, Kathleen McCarragher and Spiros Seagalas
INVESTMENT OBJECTIVE & POLICIES - To seek to achieve long-term growth of capital by investing at least 65% of the Fund’s total assets in equity-related securities of companies that exceed $1 billion in market capitalization and that Jennison Associates believes have above-average growth prospects.
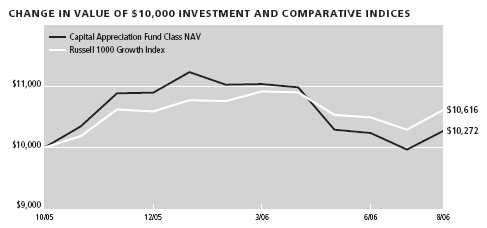
| Sector Weighting* | % of Total |
|
| Consumer, Non-cyclical | 30.80 |
| Communications | 17.92 |
| Financial | 12.52 |
| Technology | 12.28 |
| Consumer, Cyclical | 9.71 |
| Industrial | 6.96 |
| Energy | 4.08 |
*Top Sectors as a percentage of market value. Does not include short-term securities and investments in the State Street Navigator Securities Lending Prime Portfolio.
PORTFOLIO MANAGER’S COMMENTARY
Performance - Since its inception in October 2005, the Capital Appreciation Fund returned +2.72%, underperforming the +6.16% return of the Russell 1000 Growth Index.
Environment - The September quarter of 2005 was marked by a series of disruptive events, most notably Hurricanes Katrina and Rita and the London train bombings. The economic fallout from the Gulf coast storms produced real and lingering economic effects in fourth-quarter 2005, reflected most immediately in sharply higher refined products and natural gas prices. The economy rebounded strongly during first-quarter 2006, posting solid and balanced growth across almost all fronts. Higher commodity prices and inflation concerns combined with rising interest rates to produce a difficult second-quarter 2006 for many asset classes and markets. Despite these headwinds, the US economy maintained positive momentum, although growth cooled from the first quarter’s 5.6% rate to 2.5% . From May through the end of the Fund’s fiscal year in August, stocks had a difficult time as perceptions of where growth, inflation, and interest rates were headed changed rapidly. A struggle ensued between those with their hopes pinned on sustained growth worrying about the likelihood of higher interest rates and those who felt that signs of economic moderation were already foreshadowing a slowdown and that recession was now the greater risk.
The Fund underperformed the Russell 1000® Growth Index in large part because of adverse stock selection in the Information Technology sector. Stock selection detracted materially from relative performance in Consumer Discretionary as well. In Industrials, an underweight position hurt return. Stock selection in the Financials sector was a chief contributor to positive relative performance, as was an overweight allocation to Health Care.
Outlook - Economic activity is likely to moderate during the remainder of 2006, as the consumer sector confronts the effects of higher interest rates and energy prices. Weaker year-over-year sales gains are probable, but normal seasonality is likely. The tone in the corporate sector is more favorable because of sustained positive sales growth and the above-average profitability associated with the current cycle. We believe the profit outlook for companies in the Fund remains strong. Despite inflation fears and uncertainty of future monetary policy, we believe the current interest rate cycle is peaking. In our view, the economy remains durable, with growth outside the US more supportive than at any point in the current decade.
The views expressed are those of the portfolio manager as of August 31, 2006, and are subject to change based on market and other conditions.
| PERFORMANCE TABLE1 | Average Annual Total Return | | | Cumulative Total Return | |
|
| | | | | Since | | | | Since |
| Periods Ended August 31, 2006 | 1-year | 5-year | 10-year | inception | 1-year | 5-year | 10-year | inception2 |
|
| Capital Appreciation Class 1 (began 10/15/05) | — | — | — | — | — | — | — | 2.61% |
| Capital Appreciation Class NAV (began 10/15/05) | — | — | — | — | — | — | — | 2.72% |
| Russell 1000 Growth Index3,4,5 | — | — | — | — | — | — | — | 6.16% |
1 Performance does not reflect the deduction of taxes on fund distributions or redemptions of fund shares. Past performance does not predict future performance.
2 Current subadviser has managed the fund since October 15, 2005.
3 Since inception returns for the indices may begin on the month-end closest to the actual inception date of the fund.
4 Russell 1000 Growth Index is an unmanaged index composed of the Russell 1000 securities that have a greater-than-average growth orientation.
5 It is not possible to invest directly in an index. Index figures do not reflect sales charges and would be lower if they did.
11
Core Bond Fund
Subadviser: Wells Capital Management, Inc.
Portfolio Managers: William Stevens, Marie Chandoha and Thomas O'Connor
INVESTMENT OBJECTIVE & POLICIES - Seeks total return consisting of income and capital appreciation by investing in a broad range of investment-grade debt securities, including US Government obligations, corporate bonds, mortgage- and other asset-backed securities and money market instruments.
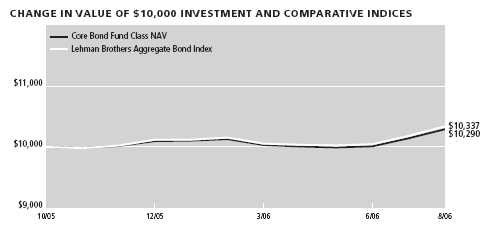
| Sector Weighting* | % of Total |
|
| Mortgage Securities | 55.80 |
| Government | 15.70 |
| Asset Backed Securities | 8.45 |
| Financial | 8.20 |
| Communications | 3.34 |
| Energy | 1.65 |
| Utilities | 1.64 |
| Consumer, Non-cyclical | 1.23 |
| Consumer, Cyclical | 0.72 |
| Industrial | 0.53 |
*Top Sectors as a percentage of market value. Does not include short-term securities and investments in the State Street Navigator Securities Lending Prime Portfolio.
PORTFOLIO MANAGER’S COMMENTARY
Performance - Since its inception in October 2005, the Core Bond Fund returned +2.90%, underperforming the +3.37% return of the LB Aggregate Bond Index.
Environment - Due to the effects of the twin hurricanes and spiking energy prices, it became evident to investors late last year that the economy was slowing. Longer-term Treasury yields moved downward until mid-January of 2006. The slowdown proved temporary, as the economy rebounded during the first quarter of 2006, sending Treasury yields upward, peaking in June. The Federal Reserve continued its tightening regime, lifting the federal funds rate from 4.00% in November 2005 to the current rate of 5.25% . Investment grade corporate bond spreads remained stable over the period and at historically tight levels, as the credit fundamentals remained positive. Mortgage spreads also remained fairly stable during the period, as volatility has been historically low.
Outlook - The Federal Reserve held rates steady at its August meeting and the market’s reaction seems to imply “the Fed is done.” The market was probably too jubilant and Treasury rates, which have dropped by close to 0.5% since early July, are biased to move up modestly from here. The rapid deceleration of all aspects of the housing sector continues to shadow the outlook for economic growth as weaker than expected housing data dominated August’s economic releases. But inflation is also edging up. The Fed could face the unsavory prospect of slower growth and higher prices. We think the Fed will leave rates unchanged for now, giving more time for economic data to reveal how much the economy is slowing and whether inflation is really an issue.
Our largest sector overweight continues to be in Commercial Mortgage-Backed Securities (CMBS). We particularly like the older CMBS issues with better underwriting. In Mortgage-Backed Securities, we have moved to more defensive positioning, adding to our holdings of 15-year mortgages. In August, we pared back our corporate positioning to neutral relative to the Lehman Brothers Aggregate Bond Index, as many of our holdings have outperformed. Given the very heavy new issue calendar in September, we believe we can add corporate bonds at more attractive levels. In all sectors, we continue to focus our efforts on finding good relative value opportunities through our bottom-up research.
The views expressed are those of the portfolio manager as of August 31, 2006, and are subject to change based on market and other conditions.
| PERFORMANCE TABLE1 | Average Annual Total Return | | | Cumulative Total Return | |
|
| | | | | Since | | | | Since |
| Periods Ending August 31, 2006 | 1-year | 5-year | 10-year | inception | 1-year | 5-year | 10-year | inception2 |
|
| Core Bond Class 1 (began 10/15/05) | — | — | — | — | — | — | — | 2.86% |
| Core Bond Class NAV (began 10/15/05) | — | — | — | — | — | — | — | 2.90% |
| Lehman Brothers Aggregate Bond Index3,4,5 | — | — | — | — | — | — | — | 3.37% |
1 Performance does not reflect the deduction of taxes on fund distributions or redemptions of fund shares. Past performance does not predict future performance.
2 Current subadviser has managed the fund since October 15, 2005.
3 Since inception returns for the indices may begin on the month-end closest to the actual inception date of the fund.
4 Lehman Brothers Aggregate Bond Index is an unmanaged index of dollar-denominated and nonconvertible investment-grade debt issues.
5 It is not possible to invest directly in an index. Index figures do not reflect sales charges and would be lower if they did.
12
Core Equity Fund
Subadviser: Legg Mason Funds Management, Inc.
Portfolio Manager: Mary Chris Gay and Bill Miller
INVESTMENT OBJECTIVE & POLICIES - To seek long term capital growth by investing, under normal market conditions, primarily in large capitalization equity securities that, in the subadviser’s opinion, offer the potential for capital growth.
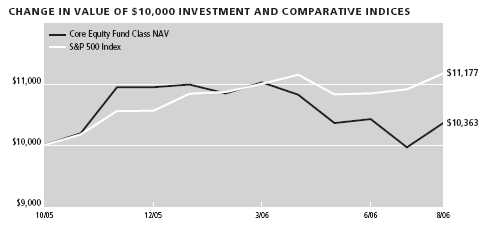
| Sector Weighting* | % of Total |
|
| Communications | 36.21 |
| Financial | 14.80 |
| Consumer, Non-cyclical | 12.11 |
| Consumer, Cyclical | 10.52 |
| Industrial | 10.13 |
| Technology | 8.45 |
| Utilities | 5.32 |
*Top Sectors as a percentage of market value. Does not include short-term securities and investments in the State Street Navigator Securities Lending Prime Portfolio.
PORTFOLIO MANAGER’S COMMENTARY
Performance - Since its inception in October 2005, the Core Equity Fund returned +3.63%, underperforming the +11.77% return of the S&P 500 Index.
Environment - The ten-month period began strongly for the U.S. equity market, which was buoyed by the moderation in oil prices that followed hurricanes Katrina and Rita and economic reports indicating robust productivity. Despite lingering concerns that new Fed Chairman Ben Bernanke would raise interest rates too far in an effort to establish his inflation-fighting credentials, the S&P 500’s total return of 4.21% in the first quarter of 2006 marked its best first quarter showing since 1999. Small-cap stocks continued their leadership as the year began, but large caps began to show relative strength in the second quarter amid simultaneous tightening efforts from the U.S. Federal Reserve, Bank of Japan, and European Central Bank. After 17 consecutive hikes, the Fed left short-term rates unchanged at its August meeting, setting the stag e for the equity markets as the historically weak fall season gets underway.
From a sector perspective, consolidation in Telecommunication, particularly the $67 billion mega-merger between AT&T and BellSouth, led the group to the strongest performance in the S&P 500. Due to its substantial overweight, it was also the top-contributing sector in the John Hancock Core Equity Trust portfolio. Energy displayed continued strength, gaining 17.4% as oil prices rose amid geopolitical tensions, a move that hindered the relative performance of the portfolio due to our absence from the sector. Versus the S&P 500 benchmark, the primary cause for portfolio underperformance was a significantly overweight position in the index-lagging Consumer Discretionary sector, which was exacerbated by the poor returns of our individual securities, especially Internet-related businesses and home-builders. In addition, a pullback from our managed care holdings detracted from our performance in Health Care.
Outlook - We believe the economy remains healthy overall, recently softening oil prices should help consumers, and the Fed will likely keep rates at their current level for the time being. While the Fed’s actions will impact equity results, we continue to see ample reason to be positive on the prospects for equities, particularly U.S. mega caps, whether the Fed stands pat in September or not. Corporate balance sheets are flush with cash, share buybacks are on the rise, earnings growth is solid, M&A and private equity activity is robust, and, most importantly, valuations for large-cap stocks are among the best they have been in many years. In short, we expect U.S. equity investors will be rewarded for staying the course in coming months.
The views expressed are those of the portfolio manager as of August 31, 2006, and are subject to change based on market and other conditions.
| PERFORMANCE TABLE1 | Average Annual Total Return | | | Cumulative Total Return | |
|
| | | | | Since | | | | Since |
| Periods Ended August 31, 2006 | 1-year | 5-year | 10-year | inception | 1-year | 5-year | 10-year | inception2 |
|
| Core Equity Class 1 (began 10/15/05) | — | — | — | — | — | — | — | 3.56% |
| Core Equity Class NAV (began 10/15/05) | — | — | — | — | — | — | — | 3.63% |
| Standard & Poors 500 Index3,4,5 | — | — | — | — | — | — | — | 11.77% |
1 Performance does not reflect the deduction of taxes on fund distributions or redemptions of fund shares. Past performance does not predict future performance.
2 Current subadviser has managed the fund since October 15, 2005.
3 Since inception returns for the indices may begin on the month-end closest to the actual inception date of the fund.
4 Standard & Poors 500 Index is an unmanaged index that includes 500 widely traded common stocks.
5 It is not possible to invest directly in an index. Index figures do not reflect sales charges and would be lower if they did.
13
Emerging Growth Fund
Subadviser: Sovereign Asset Management LLC
Portfolio Managers: Alan E. Norton and Henry E. Mehlman
INVESTMENT OBJECTIVE & POLICIES - The Fund seeks long-term capital appreciation by investing at least 80% of the Fund’s total assets in equity securities of small capitalization companies.

| Sector Weighting* | % of Total |
|
| Consumer, Non-cyclical | 23.19 |
| Technology | 14.62 |
| Industrial | 11.79 |
| Consumer, Cyclical | 9.77 |
| Financial | 8.21 |
| Communications | 6.39 |
| Energy | 5.96 |
| Funds | 1.48 |
| Basic Materials | 0.37 |
*Top Sectors as a percentage of market value. Does not include short-term securities and investments in the State Street Navigator Securities Lending Prime Portfolio.
PORTFOLIO MANAGER’S COMMENTARY
Performance - Since its inception in October 2005, the Emerging Growth Fund returned +12.17%, outperforming the +11.27% return of the Russell 2000 Growth Index.
Environment - The equity markets have been tumultuous over the past four months. Most indices reached their yearly highs in mid-May, only to give back double-digits gains and set yearly lows two months later. Most concerns centered on the extent to which the U.S. Federal Reserve would ultimately raise interest rates, and fears of Mid East unrest and global terrorism. A vigilant Fed has monitored a strong economy and rising commodity prices. The federal funds rate was raised to 5.25% in June, 2.25% higher than June 2005. The equity markets were not able to support valuations in the face of higher interest rates and rising commodity prices.
The concern shifted to the Fed possibly tightening too much; the market took on a decidedly defensive tone. The Energy and Materials sectors were strong performers before May’s high point, and then defensive strategies began to outperform. Value stocks continued to outperform growth stocks. The portfolio was positioned all year for a healthy economy. It will benefit if growth begins outperforming value and defensive strategies, which we expect.
Outlook - We believe our focus on high-quality growth names should position the Fund well for an environment where economic growth may decelerate modestly, but will not spiral into a recession. While it appears at the moment that the current Fed tightening cycle is at or near the end, we are encouraged that corporate profits remain robust, margins are healthy and unemployment is very low.
We continue to believe business investment will drive economic growth and we are encouraged by the opportunities we see in the Health Care sector, where favorable long-term demographic tailwinds exist, and new technologies and products continue to emerge that should be able to grow in any environment. Regarding consumer-dependant stocks, we feel that a lot of pessimism is reflected in current stock prices and opportunities exist to invest in high-quality consumer brands that are attractively valued. In general, the Fund is positioned to benefit from a market that ascribes a higher value for quality growth stocks with visible earnings prospects.
The views expressed are those of the portfolio manager as of August 31, 2006, and are subject to change based on market and other conditions.
| PERFORMANCE TABLE1 | Average Annual Total Return | | | Cumulative Total Return | |
|
| | | | | Since | | | | Since |
| Periods Ended August 31, 2006 | 1-year | 5-year | 10-year | inception | 1-year | 5-year | 10-year | inception2 |
|
| Emerging Growth Class 1 (began 10/15/05) | — | — | — | — | — | — | — | 12.17% |
| Emerging Growth Class NAV (began 10/15/05) | — | — | — | — | — | — | — | 12.17% |
| Russell 2000 Growth Index3,4,5 | — | — | — | — | — | — | — | 11.27% |
1 Performance does not reflect the deduction of taxes on fund distributions or redemptions of fund shares. Past performance does not predict future performance.
2 Current subadviser has managed the fund since October 15, 2005.
3 Since inception returns for the indices may begin on the month-end closest to the actual inception date of the fund.
4 Russell 2000 Growth Index is an unmanaged index that contains those securities from the Russell 2000 Index with a greater than average growth orientation.
5 It is not possible to invest directly in an index. Index figures do not reflect sales charges and would be lower if they did.
14
Emerging Small Company Fund
Subadviser: RCM Capital Management, LLC
Portfolio Managers: Thomas J. Ross
INVESTMENT OBJECTIVE & POLICIES - To seek to achieve long-term capital appreciation by primarily investing in the common stocks of small capitalization companies.
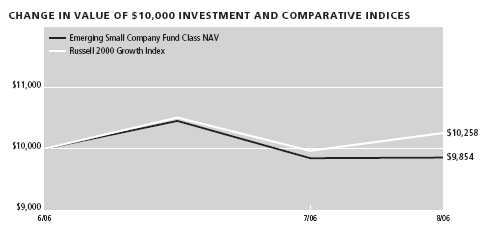
| Sector Weighting* | % of Total |
|
| Consumer, Non-cyclical | 22.93 |
| Financial | 17.30 |
| Consumer, Cyclical | 14.97 |
| Industrial | 13.32 |
| Technology | 10.28 |
| Energy | 6.25 |
| Communications | 5.77 |
| Funds | 3.35 |
| Basic Materials | 1.09 |
*Top Sectors as a percentage of market value. Does not include short-term securities and investments in the State Street Navigator Securities Lending Prime Portfolio.
PORTFOLIO MANAGER’S COMMENTARY
Performance - Since its inception in June 2006, the Emerging Small Company Fund returned –1.46%, underperforming the +2.58% return of the Russell 2000 Growth Index.
Environment - After reaching an all-time high on May 5, the Russell 2000 Index has corrected substantially. Strong gains in equities over the first four months of 2006 began to erode after the U.S. Federal Reserve’s early May policy meeting. The increasingly hawkish tone concerned investors that the Fed may raise rates too far, given a tendency to overshoot in prior cycles.
From May through August, the Russell 2000 Index lost 5.4%, while the Russell 2000 Growth Index fell by 9.2% . While all sectors in the growth index posted negative returns during this period, Consumer Staples, Financials and Energy held up the best, outperforming on a relative basis.
The decision-making process is always focused on individual stock selection over an intermediate time horizon. During the period under review, the portfolio was positioned to gain advantage in a market environment characterized by increasing volatility, profit taking, and potentially a corrective phase. For this reason, we underweighted the Technology sector and focused on companies that were positioned to benefit from increased spending in the Telecommunications and Financial sectors.
Within Health Care, we focused on companies whose businesses were biased towards services and existing medical technology products, while we underweighted biotechnology. We overweighted very high quality companies in transportations, which, despite having proven to be excellent long-term investments, corrected sharply as the market declined.
Outlook - Because we believe the Fed is at or near the end of its tightening cycle, we recently increased positions in selected Financial companies with solid growth attributes that we believe will benefit from an improving interest rate environment. We anticipate adding to selected Technology holdings while remaining cognizant of valuations. We are particularly focused on the possible peak in earnings in various Industrial names and we will take actions appropriately.
The views expressed are those of the portfolio manager as of August 31, 2006, and are subject to change based on market and other conditions.
| PERFORMANCE TABLE1,4 | Average Annual Total Return | | | Cumulative Total Return | |
|
| | | | | Since | | | | Since |
| Periods Ended August 31, 2006 | 1-year | 5-year | 10-year | inception | 1-year | 5-year | 10-year | inception2 |
|
| Emerging Small Company Class 1 (began 10/15/05) | — | — | — | — | — | — | — | 2.84% |
| Emerging Small Company Class NAV (began 6/26/06) | — | — | — | — | — | — | — | -1.46% |
| Russell 2000 Growth Index (10/15/05)3,5,6 | — | — | — | — | — | — | — | 11.27% |
| Russell 2000 Growth Index (6/26/06)3,5,6 | — | — | — | — | — | — | — | 2.58% |
1 Performance does not reflect the deduction of taxes on fund distributions or redemptions of fund shares. Past performance does not predict future performance.
2 Current subadviser has managed the fund since April 28, 2006.
3 Since inception returns for the indices may begin on the month-end closest to the actual inception date of the fund.
4 Since inception, a portion of the Emerging Small Company Fund expenses were reimbursed. If such expenses had not been reimbursed, returns would be lower.
5 Russell 2000 Growth Index is an unmanaged index that contains those securities from the Russell 2000 Index with a greater than average growth orientation.
6 It is not possible to invest directly in an index. Index figures do not reflect sales charges and would be lower if they did.
15
Equity-Income Fund
Subadviser: T. Rowe Price Associates, Inc.
Portfolio Manager: Brian C. Rogers
INVESTMENT OBJECTIVE & POLICIES - To seek to provide substantial dividend income and long-term capital appreciation by investing primarily in common stocks of well-established companies. The Fund will normally invest in companies that are paying above-average dividends. T. Rowe Price Associates, Inc. (T. Rowe Price) seeks to select stocks that appear to be undervalued or temporarily out of favor, but that have good prospects for capital appreciation and dividend growth.
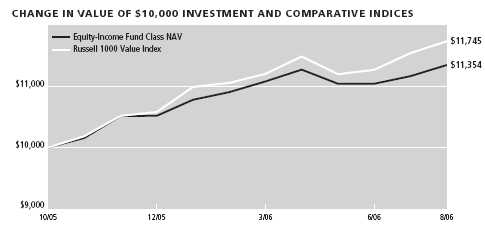
| Sector Weighting* | % of Total |
|
| Consumer, Non-cyclical | 18.48 |
| Financial | 16.54 |
| Communications | 15.31 |
| Industrial | 11.72 |
| Energy | 9.85 |
| Consumer, Cyclical | 5.46 |
| Basic Materials | 4.32 |
| Technology | 4.28 |
| Utilities | 4.12 |
| Mortgage Securities | 0.44 |
*Top Sectors as a percentage of market value. Does not include short-term securities and investments in the State Street Navigator Securities Lending Prime Portfolio.
PORTFOLIO MANAGER’S COMMENTARY
Performance - Since its inception in October 2005, the Equity-Income Fund returned +13.54%, underperforming the +17.45% return of the Russell 1000 Value Index.
Environment - All sectors of the Russell 1000 Value Index registered positive results during the period, led by telecommunication services, materials, and consumer staples. Lagging sectors included consumer discretionary, industrials and business services, and information technology.
The consumer discretionary sector was the largest detractor from relative performance due to a combination of stock selection-especially in specialty retail and media-and our large overweight in this segment. Stock selection in the consumer staples sector also weighed on relative performance, driven by weakness in our food and staples retailing and household products holdings. Information technology detracted from relative performance on stock selection in the computers and peripherals and semiconductor and semiconductor equipment industries. Technology stocks have tumbled recently, and we took advantage of the opportunity to invest in quality companies at attractive valuations.
Industrial and business services was the largest positive contributor to relative performance, aided by good stock selection, especially in commercial services and supplies and in aerospace and defense companies. Both industries benefited from a robust economy and strong business spending. The Fund’s underweight in the energy and utilities sectors also aided performance versus the benchmark. As interest rates rise, dividends of utilities stocks tend to look less attractive.
Outlook - It remains to be seen whether the Fed’s recent decision not to raise short-term rates means that interest rates have finally peaked. We don’t expect a particularly strong stock market environment until the Fed makes it clear to investors that further monetary tightening is unnecessary.
We have gradually increased the Fund’s holdings in several high-quality growth companies, since our analysis suggests that’s where the true value is at the moment. Companies falling into this category often provide good dividend yields, a history of dividend increases, and opportunistic stock repurchases. In the past, many stocks of this type have performed relatively well during periods of decelerating economic growth. While it is virtually impossible to predict short-term movements in the market, let alone long-term performance, we remain generally constructive about the environment for stocks during the next few years. We will continue to employ the discipline that has served investors well over the years, seeking out reasonably valued stocks of high-quality companies while monitoring general economic conditions.
The views expressed are those of the portfolio manager as of August 31, 2006, and are subject to change based on market and other conditions.
| PERFORMANCE TABLE1,4 | Average Annual Total Return | | | Cumulative Total Return | |
|
| | | | | Since | | | | Since |
| Periods Ended August 31, 2006 | 1-year | 5-year | 10-year | inception | 1-year | 5-year | 10-year | inception2 |
|
| Equity Income Class 1 (began 10/15/05) | — | — | — | — | — | — | — | 13.52% |
| Equity Income Class NAV (began 10/15/05) | — | — | — | — | — | — | — | 13.54% |
| Russell 1000 Value Index3,5,6 | — | — | — | — | — | — | — | 17.45% |
1 Performance does not reflect the deduction of taxes on fund distributions or redemptions of fund shares. Past performance does not predict future performance.
2 Current subadviser has managed the fund since October 15, 2005.
3 Since inception returns for the indices may begin on the month-end closest to the actual inception date of the fund.
4 Since inception, a portion of the Equity-Income Fund expenses were reimbursed. If such expenses had not been reimbursed, returns would be lower.
5 Russell 1000 Value Index is an unmanaged index containing those securities in the Russell 1000 Index with a less-than-average growth orientation.
6 It is not possible to invest directly in an index. Index figures do not reflect sales charges and would be lower if they did.
16
Fundamental Value Fund
Subadviser: Davis Selected Advisers, L.P.
Portfolio Managers: Christopher C. Davis and Kenneth C. Feinberg
INVESTMENT OBJECTIVE & POLICIES - To seek to achieve growth of capital by investing primarily in common stocks of U.S. companies with market capitalizations of at least $10 billion.
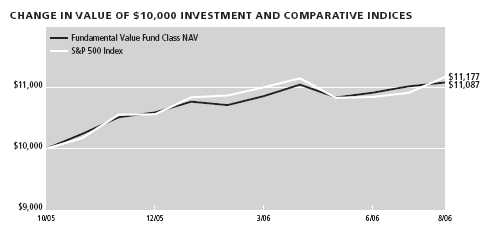
| Sector Weighting* | % of Total |
|
| Financial | 35.53 |
| Consumer, Non-cyclical | 15.73 |
| Energy | 11.24 |
| Communications | 9.55 |
| Consumer, Cyclical | 8.47 |
| Industrial | 7.75 |
| Technology | 3.39 |
| Diversified | 0.50 |
| Basic Materials | 0.40 |
*Top Sectors as a percentage of market value. Does not include short-term securities and investments in the State Street Navigator Securities Lending Prime Portfolio.
PORTFOLIO MANAGER’S COMMENTARY
Performance - Since its inception in October 2005, the Fundamental Value Fund returned +10.87%, underperforming the +11.77% return of the S&P 500 Index.
Environment - During the period ended August 31, 2006, large cap stocks, as measured by the Standard & Poor’s 500® Index, increased by 11.4% . U.S. economic activity, as measured by the gross domestic product (“GDP”), increased between 1.8% and 5.6% over the last three calendar quarters ended June 30, 2006. Interest rates, as measured by the 10-year Treasury bond, began October 2005 at about 4.2%, slowly increased, and ended August 2006 at about 4.9% .
The Fund has made substantial investments in insurance, diversified financial, and consumer staple companies. The Fund’s diversified financial holdings out-performed the Index, while holdings in the other two sectors trailed the Index, but made positive contributions to performance. Telecommunication service companies turned in the strongest performance of any sector in the Index. Our holdings in this sector did not perform as well, reducing the Fund’s overall performance. We worked to carefully invest its cash after beginning operations in October. These cash balances reduced the Fund’s relative returns as the Index turned in a strong performance over the period.
Outlook - While we believe that a ten and a half month period is too short to provide meaningful insight into a Fund’s future long-term performance, we are building a portfolio which is quite different in composition from the Standard & Poor’s 500® Index. Our investment strategy is to perform extensive research to buy durable companies at a discount to their intrinsic values and hold them for the long term.
The views expressed are those of the portfolio manager as of August 31, 2006, and are subject to change based on market and other conditions.
| PERFORMANCE TABLE1 | Average Annual Total Return | | | Cumulative Total Return | |
|
| | | | | Since | | | | Since |
| Periods Ended August 31, 2006 | 1-year | 5-year | 10-year | inception | 1-year | 5-year | 10-year | inception2 |
|
| Fundamental Value Class 1 (began 10/15/05) | — | — | — | — | — | — | — | 10.83% |
| Fundamental Value Class NAV (began 10/15/05) | — | — | — | — | — | — | — | 10.87% |
| Standard & Poors 500 Index3,4,5 | — | — | — | — | — | — | — | 11.77% |
1 Performance does not reflect the deduction of taxes on fund distributions or redemptions of fund shares. Past performance does not predict future performance.
2 Current subadviser has managed the fund since October 15, 2005.
3 Since inception returns for the indices may begin on the month-end closest to the actual inception date of the fund.
4 Standard & Poors 500 Index is an unmanaged index that includes 500 widely traded common stocks.
5 It is not possible to invest directly in an index. Index figures do not reflect sales charges and would be lower if they did.
17
Global Bond Fund
Subadviser: Pacific Investment Management Company
Portfolio Managers: Sudi Mariappa
INVESTMENT OBJECTIVE & POLICIES - To seek to achieve maximum total return, consistent with preservation of capital and prudent investment management, by investing primarily in U.S. and non-U.S. fixed income securities. The Fund will normally hold these securities on a currency unhedged basis.
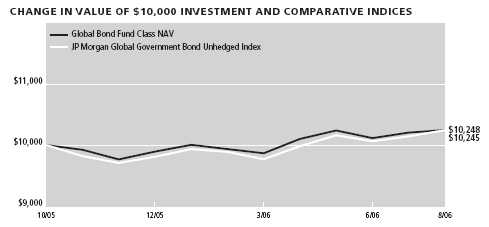
| Sector Weighting* | % of Total |
|
| Government | 37.93 |
| Mortgage Securities | 21.18 |
| Asset Backed Securities | 14.81 |
| Financial | 6.54 |
| Utilities | 2.85 |
| Communications | 0.84 |
| Industrial | 0.23 |
| Consumer, Cyclical | 0.23 |
| Energy | 0.23 |
| Technology | 0.20 |
*Top Sectors as a percentage of market value. Does not include short-term securities and investments in the State Street Navigator Securities Lending Prime Portfolio.
PORTFOLIO MANAGER’S COMMENTARY
Performance - Since its inception in October 2005, the Global Bond Fund returned +2.48%, outperforming the +2.45% return of the JPM Global Gov Bond Unhedged USD Index.
Environment - Global growth was firm through much of 2006, boosting inflation and prompting global central bank tightening. In the U.S., the Federal Reserve acknowledged that economic growth had moderated as shown by declining home sales, mortgage applications, and consumer confidence. Euroland showed strength on surging exports and a pickup in domestic consumption. Likewise, the United Kingdom defied expectations of a slowdown, as housing activity remained robust. Japan posted strong economic data, and the Bank of Japan joined the Fed and the European Central Bank (ECB) in tightening global liquidity.
Developed global bonds have been challenged in the face of monetary tightening by central banks.
Above-index duration in the U.S. hurt performance, as interest rates rose across the curve. Short-to-intermediate yield curve exposure was costly, as the yield curve flattened as the Fed continued to raise the Fed Funds rate. An underweight to Euroland duration helped relative returns, as Euroland yields increased amid stronger-than-expected economic data and ECB rate hikes. Short-term maturity exposure in the U.K. held back performance, as longer maturities outperformed, and the Bank of England surprised the market with an August rate increase. An underweight to Japanese bonds was positive, as yields rose on fears that the central bank would move away from zero interest rates, which it did in July. Emerging markets were positive, reflecting attractive yields and improving credit fundamentals. A long Euro position boosted relative returns, slightly offset by exposure to a depreciating Yen. In the U.S., an emphasis on mortgage-backed securities helped, as this sector outperformed like-duration Treasuries due to higher yields, low implied volatility, and a decreased supply.
Outlook - Our outlook for global growth remains favorable, although key risks could derail the pace of growth. While the U.S. economy has been resilient, the severity of a consumer slowdown remains a wildcard. Japan’s economic prospects remain bright with improvements in corporate investment and hiring, along with household consumption. In Euroland, the corporate sector is leading the recovery on strong exports and a pickup in capital spending, but consumers have yet to fully participate. Meanwhile, Chinese and Asian growth has been robust and should remain strong as exports, investment and spending on infrastructure boost incomes and domestic demand.
The views expressed are those of the portfolio manager as of August 31, 2006, and are subject to change based on market and other conditions.
| PERFORMANCE TABLE1 | Average Annual Total Return | | | Cumulative Total Return | |
|
| | | | | Since | | | | Since |
| Periods Ending August 31, 2006 | 1-year | 5-year | 10-year | inception | 1-year | 5-year | 10-year | inception2 |
|
| Global Bond Class 1 (began 10/15/05) | — | — | — | — | — | — | — | 2.46% |
| Global Bond Class NAV (began 10/15/05) | — | — | — | — | — | — | — | 2.48% |
| JP Morgan Global Government Bond Unhedged Index3,4,5 | — | — | — | — | — | — | — | 2.45% |
1 Performance does not reflect the deduction of taxes on fund distributions or redemptions of fund shares. Past performance does not predict future performance.
2 Current subadviser has managed the fund since October 15, 2005.
3 Since inception returns for the indices may begin on the month-end closest to the actual inception date of the fund.
4 JP Morgan Global Government Bond Unhedged Index is an unmanaged index which measures the performance of leading government bond markets based on total return in U.S. currency. By including only traded issues, the Index provides a realistic measure of market performance for international investors. It is calculated by J.P. Morgan, and reflects reinvestment of all applicable dividends, capital gains and interest.
5 It is not possible to invest directly in an index. Index figures do not reflect sales charges and would be lower if they did.
18
Global Real Estate Fund
Subadviser: Deutsche Asset Management
Portfolio Managers: John F. Robertson, John W. Vojticek, John Hammond, Danny Ekins and William Leung
INVESTMENT OBJECTIVE & POLICIES - To achieve a combination of long-term capital appreciation and current income. At least 80% of assets will be invested in equity securities of U.S. REITs, foreign entities with tax-transparent structures similar to REITs and U.S. and foreign real estate operating companies. The Fund will be invested in issuers located in at least three different countries, including the United States.

| Sector Weighting* | % of Total |
|
| Financial | 81.91 |
| Consumer, Non-cyclical | 3.72 |
| Consumer, Cyclical | 1.68 |
| Industrial | 0.60 |
*Top Sectors as a percentage of market value. Does not include short-term securities and investments in the State Street Navigator Securities Lending Prime Portfolio.
PORTFOLIO MANAGER’S COMMENTARY
Performance - Since its inception in April 2006, the Global Real Estate Fund returned +3.00%, underperforming the +7.35% return of the EPRA NAREIT Global Unhedged U.S. Index.
Environment - Global uncertainty surrounding interest rates and global economic growth impacted global real estate securities. Europe and Asia in particular sold off in May on fears that higher inflation in the U.S and elsewhere would push central banks to get aggressive with rate increases that would result in an economic slowdown. The more mature real estate markets of Australia and North America performed better than European and Asian markets even as many companies in Europe reported earnings figures that either exceeded consensus expectations or were at the top of the range. Performance in the U.S. was driven in part by merger and acquisition news, and in Australia, the REIT sector yield spread over the current Australia 10-year bond rate has helped REIT performance. Toward the end of the period investors reacted favorably to encouraging inflation reports, partly because they suggested that the US Federal Reserve’s attempt to guide the economy to a soft landing is more likely to succeed; also due to that yields on REITs will remain attractive. Australia and North America were the top performing regions posting total returns of 11.01% and 10.39% respectively while Europe, with a total return of 4.75%, and Asia, with a total return of 1.94%, lagged. Our overweight Asia and Europe combined with our underweight North America detracted form performance. Conversely, positive stock selection in each region contributed favorable to performance.
Outlook - In North America demand for real estate is high, capital flows into the sector are strong and we believe private market pricing of commercial real estate will drive performance in the public real estate sector. Even as economic growth slows, real estate fundamentals are staying strong, and we expect this growth, combined with demand for the asset class, to drive returns for REITs over the next 12 months. Upside may be limited, but downside risk is minimal. The Australian market continues to provide reasonable yields and includes companies with good earnings growth prospects. Britain still looks more attractive than mainland Europe on a discount to NAV basis. We expect higher returns in the UK over the next 12 months, partly due to the introduction of REITs as well as to favorable valuations. We still have a positive long-term view o n Asian property stocks, backed by the compelling fundamentals. In the near term, the direction of US interest rates is likely to be the main influence on Asian property stocks.
The views expressed are those of the portfolio manager as of August 31, 2006, and are subject to change based on market and other conditions.
| PERFORMANCE TABLE1 | Average Annual Total Return | | | Cumulative Total Return | |
|
| | | | | Since | | | | Since |
| Periods Ending August 31, 2006 | 1-year | 5-year | 10-year | inception | 1-year | 5-year | 10-year | inception2 |
|
| Global Real Estate Class NAV (began 4/28/06) | — | — | — | — | — | — | — | 3.00% |
| EPRA NAREIT Global Unhedged U.S. Index3,4,5 | — | — | — | — | — | — | — | 7.35% |
1 Performance does not reflect the deduction of taxes on fund distributions or redemptions of fund shares. Past performance does not predict future performance.
2 Current subadviser has managed the fund since April 28, 2006.
3 Since inception returns for the indices may begin on the month-end closest to the actual inception date of the fund.
4 EPRA NAREIT Global Unhedged U.S. Index is an unmanaged index. Designed to track the performance of listed real estate companies and REITs worldwide, the series acts as a performance measure of the overall market and is also suitable for use as the basis for investment products such as derivatives and Exchange Traded Funds (ETFs).
5 It is not possible to invest directly in an index. Index figures do not reflect sales charges and would be lower if they did.
19
High Income Fund
Subadviser: Sovereign Asset Management LLC
Portfolio Managers: Arthur N. Calavritinos
INVESTMENT OBJECTIVE & POLICIES - The Fund seeks high current income, with capital appreciation as a secondary goal, by investing primarily in U.S. and foreign high yield bonds rated BB/Ba or lower and unrated equivalents. The Fund may invest up to 20% of assets in common stock and preferreds of high yield issuers both inside and outside of the United States.
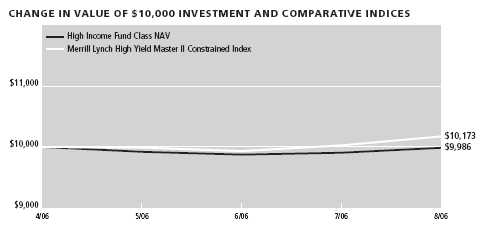
| Sector Weighting* | % of Total |
|
| Communications | 23.97 |
| Consumer, Cyclical | 22.48 |
| Industrial | 7.86 |
| Basic Materials | 7.81 |
| Consumer, Non-cyclical | 7.61 |
| Financial | 3.88 |
| Energy | 3.63 |
| Funds | 3.04 |
| Diversified | 1.80 |
| Asset Backed Securities | 0.45 |
*Top Sectors as a percentage of market value. Does not include short-term securities and investments in the State Street Navigator Securities Lending Prime Portfolio.
PORTFOLIO MANAGER’S COMMENTARY
Performance - Since its inception in April 2006, the High Income Fund returned -0.14%, underperforming the +1.73% return of the Merrill Lynch High Yield Master II Constrained Index.
Environment - From the Fund’s inception at the end of April through August 31, 2006, high-yield bonds had modest returns because of concern over slower economic growth, rising inflation and higher interest rates. Since the Fund’s inception, we have positioned the portfolio more defensively, consistent with our expectation for slower economic growth, deteriorating credit quality, and higher default rates going forward. In addition, we looked for securities that we believe have more attractive risk/reward characteristics. For example, we reduced the Fund’s position in bonds trading at or above par where we thought the upside was limited. And in terms of sector exposure, we avoided Energy, as we believe these securities are priced for perfection at a time when oil prices are far ahead of supply and demand fundamentals.
At the same time, we added bonds of larger, more established businesses in defensive areas of the economy, such as Cable and Media. In addition, we overweighted airline securities, where we believe industry restructuring signals a secular change is underway in the investment climate for these securities. However, returns in this space were limited in recent months by worry that rising energy prices will pinch profitability.
Outlook - We remain cautious about the near-term prospects for the high-yield sector. After several years of strong performance, we believe high-yield bonds remain fairly richly valued, despite a modest pull-back in the second quarter of 2006. That’s because the spread, or difference in yield, between these riskier, lower-rated securities and the highest credit quality Treasury bonds is only 2% to 3%. That puts the incremental yield offered by high-yield bonds at near historic lows. In other words, investors are not being well compensated for taking on the additional credit risk that high-yield bonds entail. In this environment, we will maintain a conservative stance and collect our coupon payments as we continue to look for opportunities that we believe offer good value with an attractive risk-reward trade-off.
The views expressed are those of the portfolio manager as of August 31, 2006, and are subject to change based on market and other conditions.
| PERFORMANCE TABLE1 | Average Annual Total Return | | | Cumulative Total Return | |
|
| | | | | Since | | | | Since |
| Periods Ending August 31, 2006 | 1-year | 5-year | 10-year | inception | 1-year | 5-year | 10-year | inception2 |
|
| High Income Class NAV (began 4/28/06) | — | — | — | — | — | — | — | –0.14% |
| Merrill Lynch High Yield Master II Constrained Index3,4,5 | — | — | — | — | — | — | — | 1.73% |
1 Performance does not reflect the deduction of taxes on fund distributions or redemptions of fund shares. Past performance does not predict future performance.
2 Current subadviser has managed the fund since April 28, 2006.
3 Since inception returns for the indices may begin on the month-end closest to the actual inception date of the fund.
4 Merrill Lynch High Yield Master II Constrained Index is an unmanaged index composed of U.S. currency high-yield bonds issued by U.S. and non-U.S. issuers.
5 It is not possible to invest directly in an index. Index figures do not reflect sales charges and would be lower if they did.
20
High Yield Fund
Subadviser: Western Asset Management Company
Portfolio Manager: Ken Leech, Steve Walsh, Mike Buchanon, T.J. Settel and Ian Edmonds
INVESTMENT OBJECTIVE & POLICIES - To seek to achieve maximum current income by investing primarily in high yield bonds issued by U.S. and foreign corporations and foreign governments and their agencies and instrumentalities. This Fund invests, under normal circumstances, at least 80% of its assets in high yield bonds and related investments.
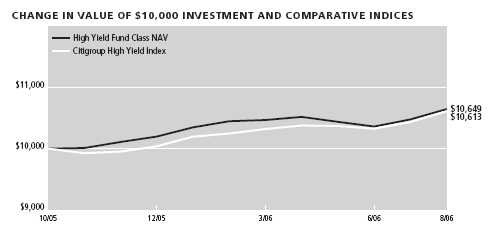
| Sector Weighting* | % of Total |
|
| Communications | 15.33 |
| Consumer, Cyclical | 14.05 |
| Energy | 8.98 |
| Government | 8.62 |
| Financial | 8.51 |
| Industrial | 7.43 |
| Consumer, Non-cyclical | 6.59 |
| Utilities | 3.18 |
| Basic Materials | 2.55 |
| Technology | 2.03 |
*Top Sectors as a percentage of market value. Does not include short-term securities and investments in the State Street Navigator Securities Lending Prime Portfolio.
PORTFOLIO MANAGER’S COMMENTARY
Performance - Since its inception in October 2005, the High Yield Fund returned +6.49%, outperforming the +6.13% return of the Citigroup High Yield Index.
Environment - Interest rates moved broadly higher across the yield curve, driven by a tighter-than-expected Federal Reserve, stronger-than-expected economy, and a modest increase in inflation expectations. Short-term rates rose much more than long-term rates, leaving the yield curve substantially flat, but mildly inverted in the short end. The Fed raised its target funds rate by 0.25% at seven of its eight meetings, exceeding market expectations. The Fed paused at its August meeting, as it adopted a wait-and-see attitude to judge the extent to which the housing slowdown would affect the rest of the economy. Ben Bernanke replaced Alan Greenspan as Fed Chairman, but he gave no indication of any significant shift in monetary policy.
The economy bounced back strongly from its weak showing in the fourth quarter of 2005, with growth of more than 5% in the first quarter, but slowed to 2.9% growth in the second quarter. Headline inflation rose to the 3.5 -4.5% range, core inflation drifted higher to the 2.5 -3.0% range. Inflation concerns were fueled by gains in gold, industrial commodity and energy prices, and a decline in the dollar against most major currencies. The economy displayed some very solid fundamentals, as corporate profits exceeded expectations, and federal and state revenues registered some of the strongest gains in real terms (adjusting for inflation) in history. Nevertheless, the housing market showed signs of a spreading slowdown, which gave rise to the widely held perception that the overall economy would likely slow enough to reduce inflation pressures and allow the Fed to end its tightening cycle.
Outlook - Our outlook calls for continued moderate growth and relatively contained inflation. We are positioned with the expectation that there will be no significant changes in key macro-economic variables, but we also have strategies in place that are designed to hedge against unexpected economic weakness and higher-than-expected inflation.
The views expressed are those of the portfolio manager as of August 31, 2006, and are subject to change based on market and other conditions.
| PERFORMANCE TABLE1 | Average Annual Total Return | | | Cumulative Total Return | |
|
| | | | | Since | | | | Since |
| Periods Ending August 31, 2006 | 1-year | 5-year | 10-year | inception | 1-year | 5-year | 10-year | inception2 |
|
| High Yield Class 1 (began 10/15/05) | — | — | — | — | — | — | — | 6.41% |
| High Yield Class NAV (began 10/15/05) | — | — | — | — | — | — | — | 6.49% |
| Citigroup High Yield Index3,4,5 | — | — | — | — | — | — | — | 6.13% |
1 Performance does not reflect the deduction of taxes on fund distributions or redemptions of fund shares. Past performance does not predict future performance.
2 Current subadviser has managed the fund since April 28, 2006.
3 Since inception returns for the indices may begin on the month-end closest to the actual inception date of the fund.
4 Citigroup High Yield Index is an unmanaged index which measures the performance of below-investment grade debt issued by corporations domiciled in the U.S. or Canada.
5 It is not possible to invest directly in an index. Index figures do not reflect sales charges and would be lower if they did.
21
International Equity Index Fund
Subadviser: SSgA Funds Management, Inc. Portfolio Managers: Jeffrey Beach and James Francis
INVESTMENT OBJECTIVE & POLICIES - To seek to track the performance of a broad-based equity index of foreign companies primarily in developed countries and, to a lesser extent, in emerging market countries. Invests, under normal market conditions, at least 80% of its assets in securities listed in the Morgan Stanley Capital International All Country World Excluding U.S. Index.
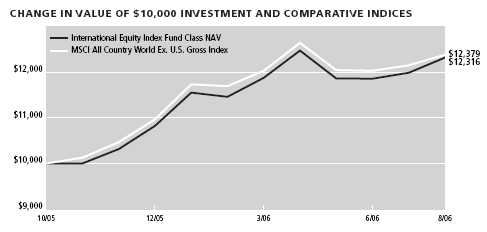
| Sector Weighting* | % of Total |
|
| Financial | 23.14 |
| Consumer, Non-cyclical | 11.74 |
| Energy | 8.42 |
| Industrial | 8.41 |
| Consumer, Cyclical | 8.03 |
| Communications | 7.06 |
| Basic Materials | 6.74 |
| Utilities | 3.98 |
| Technology | 2.65 |
| Funds | 0.83 |
*Top Sectors as a percentage of market value. Does not include short-term securities and investments in the State Street Navigator Securities Lending Prime Portfolio.
PORTFOLIO MANAGER’S COMMENTARY
Performance - Since its inception in October 2005, the International Equity Index Fund returned +23.16%, underperforming the +23.79% return of the MSCI AC World Index Ex U.S. Gross Index.
Environment - The Fund was positioned during 2006 to replicate the return of the MSCI ACWI ex U.S. Index by owning most of the stocks in the index in the same proportion. A small portion of the Fund also used futures, exchange traded funds (ETF)s, American depository receipts (ADRs) and global depository receipts (GDRs), where owning local equities was less desirable. The Fund’s broad-based diversification allowed investors to take full advantage of the double-digit equity returns achieved by most non-U.S. markets during the year.
Early in the year, solid economic news, vigorous earnings growth and retreating bond yields caused investor confidence to surge worldwide. This uptrend continued through April and into early May, as corporate profits and economic activity stayed strong against a backdrop of stable inflation. Global equity markets traveled a bumpier road during May and June. Rising commodity and energy prices led to increased inflationary concerns and higher market volatility. Central banks around the world responded by continuing to raise interest rates. As the year ended, markets rebounded as investors realized that most economies were performing well, earnings appeared resilient and the future profit picture remained bright. Exchange rates also were a positive for the Fund. The U.S. dollar strengthened early in the year but then fell significantly against most major currencies.
Outlook - The combination of healthy economic growth, benign financial conditions, and valuations that remain remarkably compelling on a relative basis, suggests that non U.S. equities should be able to maintain their advantage over U.S. shares. Seasonal tendencies that often bring market dislocations in the autumn, and a potential rebound in volatility levels from their impressive recent declines, might temporarily benefit the U.S. dollar as a safe haven. But profits in the U.S. appear more vulnerable than earnings in non-U.S. markets, and the latter remain available on broadly cheaper terms.
The views expressed are those of the portfolio manager as of August 31, 2006, and are subject to change based on market and other conditions.
| PERFORMANCE TABLE1 | Average Annual Total Return | | | Cumulative Total Return | |
|
| | | | | Since | | | | Since |
| Periods Ending August 31, 2006 | 1-year | 5-year | 10-year | inception | 1-year | 5-year | 10-year | inception2 |
|
| International Equity Index Fund Class NAV (began 10/29/05) | — | — | — | — | — | — | — | 23.16% |
| MSCI ACWI (All Country World Index) Ex U.S. Gross Index3,4,5 | — | — | — | — | — | — | — | 23.79% |
1 Performance does not reflect the deduction of taxes on fund distributions or redemptions of fund shares. Past performance does not predict future performance.
2 Current subadviser has managed the fund since October 29, 2005.
3 Since inception returns for the indices may begin on the month-end closest to the actual inception date of the fund.
4 MSCI ACWI (All Country World Index) Ex U.S. Index is a free float-adjusted market capitalization index that is designed to measure equity market performance in the global developed and emerging markets excluding U.S. As of June 2006 the MSCI ACWI consisted of the following 47 developed and emerging market country indices: Argentina, Australia, Austria, Belgium, Brazil, Canada, Chile, China, Colombia, Czech Republic, Denmark, Egypt, Finland, France, Germany, Greece, Hong Kong, Hungary, India, Indonesia, Ireland, Israel, Italy, Japan, Jordan, Korea, Malaysia, Mexico, Morocco, Netherlands, New Zealand, Norway, Pakistan, Peru, Philippines, Poland, Portugal, Russia, Singapore Free, South Africa, Spain, Sweden, Switzerland, Taiwan, Thailand, Turkey, and the United Kingdom.
5 It is not possible to invest directly in an index. Index figures do not reflect sales charges and would be lower if they did.
22
International Opportunities Fund
Subadviser: Marsico Capital Management, LLC Portfolio Manager: James G.Gendelman
INVESTMENT OBJECTIVE & POLICIES - To seek long-term growth of capital. The Fund invests, under normal market conditions, at least 65% of its assets in common stocks of foreign companies that are selected for their long-term growth potential. The Fund may invest in companies of any size throughout the world. The Fund normally invests in issuers from at least three different countries not including the U.S. The Fund may invest in common stocks of companies operating in emerging markets.
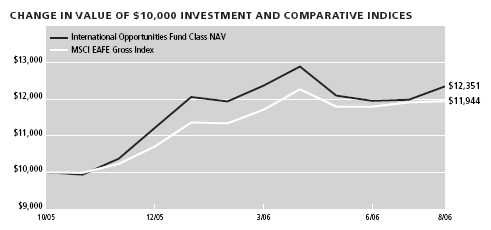
| Sector Weighting* | % of Total |
|
| Financial | 21.33 |
| Consumer, Cyclical | 16.31 |
| Consumer, Non-cyclical | 12.55 |
| Industrial | 10.44 |
| Basic Materials | 5.57 |
| Communications | 4.58 |
| Energy | 4.40 |
| Utilities | 3.04 |
| Technology | 2.31 |
| Diversified | 1.96 |
*Top Sectors as a percentage of market value. Does not include short-term securities and investments in the State Street Navigator Securities Lending Prime Portfolio.
PORTFOLIO MANAGER’S COMMENTARY
Performance - Since its inception in October 2005, the International Opportunities Fund returned +23.51%, outperforming the +19.44% return of the MSCI EAFE Gross Index.
Environment - International equities, spanning both developed and emerging markets, posted solid gains for the period. The overall strong performance masked considerable underlying volatility as international equities were saddled by concerns regarding the potential for decelerating global growth, central bank interest rate tightenings, and higher inflation expectations.
Gains in developed markets, as measured by the MSCI EAFE Index, were widespread. Telecommunications was the only Index sector to post a modest decline. The Fund benefited by having little exposure to the weak-performing sector. Stock selection within the Telecommunications sector further aided our results. During the period, the Fund maintained, on average, an overweighted posture in the Consumer Discretionary sector and it benefited from stock selection within the sector. Stock selection in Industrials was an additional area of strength. The portfolio’s underweight in Financials and Utilities presented an opportunity cost, as the sectors were among the Index’s best performing areas. Stock selection in the Materials sector was another detractor, as our Materials-related investment results lagged those of the benchmark. Currency fluctuations may at times affect the Fund’s investment results because its foreign holdin gs are denominated in foreign currencies whose value may rise or fall against the dollar. These fluctuations had a modest, negative impact on the Fund’s performance during the period.
Outlook - We believe there are a substantial number of positive factors that – all else being equal – could be expected to provide a favorable backdrop for equity prices. These include continued low interest rates globally, overall constrained inflation worldwide, solid corporate profits, and – on balance – relatively attractive international equity market valuations.
The views expressed are those of the portfolio manager as of August 31, 2006, and are subject to change based on market and other conditions.
| PERFORMANCE TABLE1 | Average Annual Total Return | | | Cumulative Total Return | |
|
| | | | | Since | | | | Since |
| Periods Ended August 31, 2006 | 1-year | 5-year | 10-year | inception | 1-year | 5-year | 10-year | inception2 |
|
| International Opportunities Class 1 (began 10/15/05) | — | — | — | — | — | — | — | 23.36% |
| International Opportunities Class NAV (began 10/15/05) | — | — | — | — | — | — | — | 23.51% |
| MSCI EAFE Gross Index3,4,5 | — | — | — | — | | | | 19.44% |
1 Performance does not reflect the deduction of taxes on fund distributions or redemptions of fund shares. Past performance does not predict future performance.
2 Current subadviser has managed the fund since October 15, 2005.
3 Since inception returns for the indices may begin on the month-end closest to the actual inception date of the fund.
4 MSCI EAFE Gross Total Return Index (Europe, Australia, Far East) is a free-float-adjusted market capitalization index that is designed to measure developed market equity performance, excluding the U.S. & Canada. As of June 2006, the MSCI EAFE Index consisted of the following 21 developed market country indices: Australia, Austria, Belgium, Denmark, Finland, France, Germany, Greece, Hong Kong, Ireland, Italy, Japan, the Netherlands, New Zealand, Norway, Portugal, Singapore, Spain, Sweden, Switzerland and the United Kingdom.
5 It is not possible to invest directly in an index. Index figures do not reflect sales charges and would be lower if they did.
23
International Small Cap Fund
Subadviser: Franklin Templeton Investment Counsel, Inc.
Portfolio Managers: Tucker Scott and Cindy L. Sweeting
INVESTMENT OBJECTIVE & POLICIES - To seek to achieve long-term capital appreciation. Under normal market conditions, at least 80% of the Fund’s net assets (plus borrowings for investment purposes) are invested in securities issued by foreign companies which have total stock market capitalizations or annual revenues of $4 billion or less (“small company securities”).
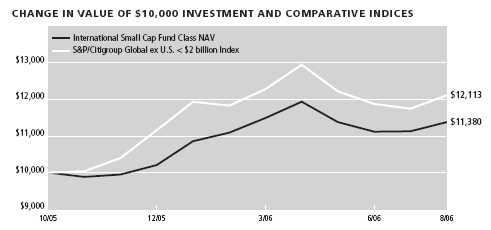
| Sector Weighting* | % of Total |
|
| Industrial | 19.05 |
| Consumer, Cyclical | 17.52 |
| Consumer, Non-cyclical | 16.77 |
| Financial | 7.56 |
| Technology | 5.04 |
| Communications | 4.94 |
| Basic Materials | 4.03 |
| Energy | 3.30 |
| Utilities | 2.71 |
| Diversified | 1.62 |
*Top Sectors as a percentage of market value. Does not include short-term securities and investments in the State Street Navigator Securities Lending Prime Portfolio.
PORTFOLIO MANAGER’S COMMENTARY
Performance - Since its inception in October 2005, the International Small Cap Fund returned +13.80%, underperforming the +21.13% return of the S&P/Citigroup Global ex US <$2 billion Index.
Environment - Global economic growth remained strong during the 12-month period. However, signs of moderation appeared toward the end of the period primarily due to three factors. First, many central banks, including those of the world’s three largest economies, continued to tighten monetary policy, thereby reducing the immense liquidity that helped fuel the current recovery. Second, oil prices remained elevated and reached a historical high during the period. Third, the U.S. housing market showed evidence of cooling.
When compared with the benchmark index, the Fund’s overweighted position and stock selection in the Netherlands benefited relative results, as did stock selection in Switzerland. By sector, the Fund’s relative performance was aided by stock selection in the energy and financials sectors. The underweighted position in Japan also helped relative performance; however, much of the positive impact was offset by stock selection among Japanese equities.
Stock selection in Hong Kong, South Korea and Canada hurt relative performance during the period. By sector, stock selection among health care stocks worked against the Fund’s results versus the index. An overweighted position and stock selection in the consumer discretionary sector negatively affected relative performance, as did an underweighted position and stock selection in the materials sector.
Outlook - The current global economic expansion — lasting just over three years by period-end — is maturing, but the timing of a potential slowing or retrenchment in growth is elusive. Robust economic growth could continue to be underpinned by ongoing high levels of liquidity (despite the tightening of monetary policy by central banks of the world’s three largest economies), productivity gains, a solid labor market, and strong, albeit expected slower, corporate profit growth. However, the negative effect of rising interest rates, expensive energy and other raw materials costs on corporate profitability, and a cooling in the U.S. housing market and consumer spending late in the period could presage a global economic slowdown. Corporate profitability and cash flow are at historically high levels; however, costs pressures are beco ming more visible.
The views expressed are those of the portfolio manager as of August 31, 2006, and are subject to change based on market and other conditions.
| PERFORMANCE TABLE1 | Average Annual Total Return | | | Cumulative Total Return | |
|
| | | | | Since | | | | Since |
| Periods Ended August 31, 2006 | 1-year | 5-year | 10-year | inception | 1-year | 5-year | 10-year | inception2 |
|
| International Small Cap Class 1 (began 10/15/05) | — | — | — | — | — | — | — | 13.58% |
| International Small Cap Class NAV (began 10/15/05) | — | — | — | — | — | — | — | 13.80% |
| S&P/Citigroup Global ex U.S. <$2 Billion Index3,4,5 | — | — | — | — | — | — | — | 21.13% |
1 Performance does not reflect the deduction of taxes on fund distributions or redemptions of fund shares. Past performance does not predict future performance.
2 Current subadviser has managed the fund since October 15, 2005.
3 Since inception returns for the indices may begin on the month-end closest to the actual inception date of the fund.
4 S&P/Citigroup Global ex U.S. <$2 Billion Index is an unmanaged index which follows an objective, free float-weighted, rules based methodology, capturing the broad investable opportunity set.
5 It is not possible to invest directly in an index. Index figures do not reflect sales charges and would be lower if they did.
24
International Small Company Fund
Subadviser: Dimensional Fund Advisors, Inc.
Portfolio Managers: Karen E. Umland
INVESTMENT OBJECTIVE & POLICIES - The Fund seeks to achieve long-term capital appreciation.
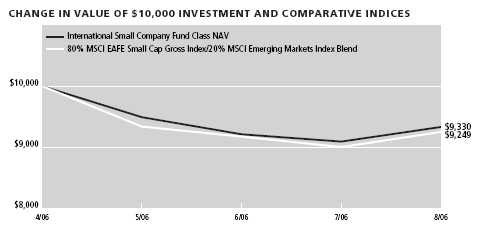
| Sector Weighting* | % of Total |
|
| Industrial | 22.27 |
| Consumer, Cyclical | 14.79 |
| Consumer, Non-cyclical | 13.64 |
| Financial | 10.65 |
| Basic Materials | 9.09 |
| Technology | 3.98 |
| Energy | 3.64 |
| Communications | 3.45 |
| Diversified | 1.62 |
| Utilities | 0.75 |
*Top Sectors as a percentage of market value. Does not include short-term securities and investments in the State Street Navigator Securities Lending Prime Portfolio.
PORTFOLIO MANAGER’S COMMENTARY
Performance - Since its inception in April 2006, the International Small Company Fund returned –6.70%, outperforming the –7.51% return of the combined Index (80% MSCI EAFE Small Cap Gross Index and 20% MSCI Emerging Markets Index Blend).
Environment - Returns in May 2006 were sharply negative across all US and international asset classes. Since then, global equity markets by and large stabilized and began recovering some of the ground lost. During the period from May to August 2006, dollar-denominated returns on international equities benefited from currency effects, as the US dollar depreciated against most major currencies except the yen. Dollar-denominated asset class returns on developed-market equities ranged from 0.8% for large cap value stocks to –7.9% for small cap stocks. Using the EAFE indices (Net Dividends) as proxies, small cap (EAFE Small) underperformed large cap (EAFE) by 7.5% .
Outlook - Between mid-May and mid-June, emerging market equities experienced a decline in value the likes of which had not been seen since 1998. Although emerging market equities performed well in July and August, those two months were not enough to offset the poor showing in May and June. Consequently, the dollar-denominated returns for emerging markets from May to August 2006, as measured by the MSCI Emerging Markets Index (Net Dividends), were -7.1% . Furthermore, the US dollar generally appreciated against emerging-market currencies, exacerbating the poor returns on emerging market equities from May to August 2006.
The views expressed are those of the portfolio manager as of August 31, 2006, and are subject to change based on market and other conditions.
| PERFORMANCE TABLE1 | Average Annual Total Return | | | Cumulative Total Return | |
|
| | | | | Since | | | | Since |
| Periods Ending August 31, 2006 | 1-year | 5-year | 10-year | inception | 1-year | 5-year | 10-year | inception2 |
|
| International Small Company Class NAV (began 4/28/06) | — | — | — | — | — | — | — | –6.70% |
| 80% MSCI EAFE Small Cap Gross Index/ | | | | | | | | |
| 20% MSCI Emerging Markets Index Blend3,4,5 | — | — | — | — | — | — | — | –7.51% |
1 Performance does not reflect the deduction of taxes on fund distributions or redemptions of fund shares. Past performance does not predict future performance.
2 Current subadviser has managed the fund since April 28, 2006.
3 Since inception returns for the indices may begin on the month-end closest to the actual inception date of the fund.
4 MSCI EAFE Small Cap Gross Index/MSCI Emerging Markets Index Blend - A blended index is used combining 80% of the MSCI EAFE(r) Small Cap Index (Europe, Australia, Far East), an unmanaged index that is a free float-adjusted market capitalization index that is designed to measure developed market equity performance, excluding the US & Canada. As of June 2006 the MSCI EAFE Index consisted of the following 21 developed market country indices: Australia, Austria, Belgium, Denmark, Finland, France, Germany, Greece, Hong Kong, Ireland, Italy, Japan, the Netherlands, New Zealand, Norway, Portugal, Singapore, Spain, Sweden, Switzerland and the United Kingdom and 20% of the MSCI Emerging Markets Index, an unmanaged index that is a free float-adjusted market capitalization index that is designed to measure equity market performance in the global emerging markets. As of June 2006 the MSCI Emerging Markets Index consisted of the following 25 emerging market country indices: Argentina, Brazil, Chile, China, Colombia, Czech Republic, Egypt, Hungary, India, Indonesia, Israel, Jordan, Korea, Malaysia, Mexico, Morocco, Pakistan, Peru, Philippines, Poland, Russia, South Africa, Taiwan, Thailand, and Turkey.
5 It is not possible to invest directly in an index. Index figures do not reflect sales charges and would be lower if they did.
25
International Stock Fund
Subadviser: Grantham, Mayo, Van Otterloo & Co. LLC
Portfolio Manager: Thomas Hancock and Anthony Hene
INVESTMENT OBJECTIVE & POLICIES - The Fund seeks high total return by typically investing in a diversified fund of equity investments from a number of developed markets outside the U.S. The subadviser evaluates and selects individual stocks, countries and currencies based on several factors which may include valuation, improving fundamentals, GDP trends, industrial competitiveness and interest rate differentials.
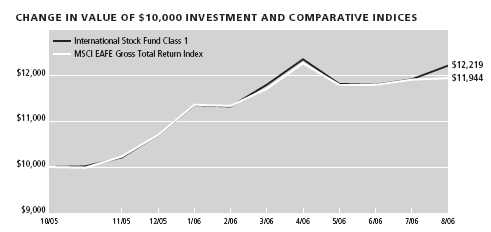
| Sector Weighting* | % of Total |
|
| Financial | 28.13 |
| Consumer, Cyclical | 16.65 |
| Consumer, Non-cyclical | 14.94 |
| Energy | 10.09 |
| Basic Materials | 8.30 |
| Industrial | 7.95 |
| Utilities | 4.78 |
| Communications | 4.77 |
| Technology | 2.10 |
| Diversified | 0.45 |
*Top Sectors as a percentage of market value. Does not include short-term securities and investments in the State Street Navigator Securities Lending Prime Portfolio.
PORTFOLIO MANAGER’S COMMENTARY
Performance - Since its inception in October 2005, the International Stock Fund returned +22.19%, outperforming the +19.44% return of the MSCI EAFE Gross Total Return Index.
Environment - Early in the period, international stocks were generally strong, aided by the surging Japanese market and declining oil prices. As time passed, reality set in as oil supply concerns intensified and oil demand remained robust, Japan lost some of its luster, Middle East tensions rose, and the ultimate extent of the U.S. interest rate hikes became more uncertain. We. have favored higher quality and more defensive companies throughout the year on valuation grounds. Despite this mix of positive and negative news, international stocks have generally performed well, with returns to U.S. investors helped by a weak U.S. dollar. In this environment, we favored more defensive stocks and higher quality companies based on their valuation characteristics. Furthermore, we favored Germany and Japan over the United Kingdom. Health Care shares we re attractive due to their higher quality and lower valuations. Energy stocks have exhibited good momentum.
Outlook - International equity markets are not particularly cheap at current prices. Attractive returns depend on solid economic fundamentals that would lead to robust earnings growth. While this is within the realm of possibility, particularly in regions where profit margins are relatively depressed, the market declines of May and June should serve as a warning for investors who have been taking on more risk in the last few years, and, up until recently, have been handsomely rewarded for it. A much more judicious approach to risk and a healthy appreciation of the merit of higher quality and more defensive names are now appropriate. We remain overweight higher quality and more defensive companies. We still favor Japan and Germany over the UK and are overweight Health Care and Energy.
The views expressed are those of the portfolio manager as of August 31, 2006, and are subject to change based on market and other conditions.
| PERFORMANCE TABLE1 | Average Annual Total Return | | | Cumulative Total Return | |
|
| | | | | Since | | | | Since |
| Periods Ended August 31, 2006 | 1-year | 5-year | 10-year | inception | 1-year | 5-year | 10-year | inception2 |
|
| International Stock Class 1 (began 10/15/05) | — | — | — | — | — | — | — | 22.19% |
| MSCI EAFE Gross Total Return Index3,4,5 | — | — | — | — | — | — | — | 19.44% |
1 Performance does not reflect the deduction of taxes on fund distributions or redemptions of fund shares. Past performance does not predict future performance.
2 Current subadviser has managed the fund since October 15, 2005.
3 Since inception returns for the indices may begin on the month-end closest to the actual inception date of the fund.
4 MSCI EAFE Gross Total Return Index (Europe, Australia, Far East) is a free-float-adjusted market capitalization index that is designed to measure developed market equity performance, excluding the U.S. & Canada. As of June 2006, the MSCI EAFE Index consisted of the following 21 developed market country indices: Australia, Austria, Belgium, Denmark, Finland, France, Germany, Greece, Hong Kong, Ireland, Italy, Japan, the Netherlands, New Zealand, Norway, Portugal, Singapore, Spain, Sweden, Switzerland and the United Kingdom.
5 It is not possible to invest directly in an index. Index figures do not reflect sales charges and would be lower if they did.
26
International Value Fund
Subadviser: Franklin Templeton Investment Counsel, Inc.
Portfolio Managers: Antonio C. Docal, Tucker Scott and Cindy L. Sweeting
INVESTMENT OBJECTIVE & POLICIES - To achieve long-term growth of capital by investing primarily in equity securities of companies located outside the United States, including those in emerging markets.

| Sector Weighting* | % of Total |
|
| Communications | 19.50 |
| Financial | 18.77 |
| Consumer, Non-cyclical | 11.53 |
| Industrial | 11.52 |
| Consumer, Cyclical | 8.18 |
| Energy | 6.67 |
| Basic Materials | 4.28 |
| Technology | 4.15 |
| Utilities | 2.09 |
| Diversified | 1.52 |
*Top Sectors as a percentage of market value. Does not include short-term securities and investments in the State Street Navigator Securities Lending Prime Portfolio.
PORTFOLIO MANAGER’S COMMENTARY
Performance - Since its inception in October 2005, the International Value Fund returned +18.35%, underperforming the +19.44% return of the MSCI EAFE Gross Index.
Environment - Global economic growth remained strong during the 12-month period. However, signs of moderation appeared toward the end of the period primarily due to three factors. First, many central banks, including those of the world’s three largest economies, continued to tighten monetary policy, thereby reducing the immense liquidity that helped fuel the current recovery. Second, oil prices remained elevated and reached a historical high during the period. Third, the U.S. housing market showed evidence of cooling.
When compared with the benchmark index, the Fund’s overweighted allocation and stock selection in the Netherlands and Norway benefited relative results, as did an underweighted position and stock selection in Japan. By sector, the Fund’s relative performance was supported by stock selection in the industrials and consumer discretionary sectors. Although the financials sector delivered the greatest contribution to the Fund’s return, the underweighted allocation versus the benchmark proved detrimental to relative performance.
Stock selection in the U.K., Germany and France hurt relative performance during the period, as did an underweighted position and stock selection in Switzerland. By sector, stock selection among energy and materials stocks worked against the Fund’s results versus the index, as did an overweighted position and stock selection in the information technology sector. Of the Fund’s stock holdings, Israeli network security software provider Check Point Software Technologies, which is not an index component, declined in value during the period and was the largest detractor from the Fund’s relative results. The amount of cash in the portfolio was also a drag on performance.
Outlook - The current global economic expansion — lasting just over three years by period-end — is maturing, but the timing of a potential slowing or retrenchment in growth is elusive. Robust economic growth could continue to be underpinned by ongoing high levels of liquidity (despite the tightening of monetary policy by central banks of the world’s three largest economies), productivity gains, a solid labor market, and strong, albeit expected slower, corporate profit growth. However, the negative effect of rising interest rates, expensive energy and other raw materials costs on corporate profitability, and a cooling in the U.S. housing market and consumer spending late in the period could presage a global economic slowdown. Corporate profitability and cash flow are at historically high levels; however, costs pressures are becoming more visible.
The views expressed are those of the portfolio manager as of August 31, 2006, and are subject to change based on market and other conditions.
| PERFORMANCE TABLE1,4 | Average Annual Total Return | | | Cumulative Total Return | |
|
| | | | | Since | | | | Since |
| Periods Ended August 31, 2006 | 1-year | 5-year | 10-year | inception | 1-year | 5-year | 10-year | inception2 |
|
| International Value Class 1 (began 10/15/05) | — | — | — | — | — | — | — | 18.22% |
| International Value Class NAV (began 10/15/05) | — | — | — | — | — | — | — | 18.35% |
| MSCI EAFE Gross Index3,5,6 | — | — | — | — | — | — | — | 19.44% |
1 Performance does not reflect the deduction of taxes on fund distributions or redemptions of fund shares. Past performance does not predict future performance.
2 Current subadviser has managed the fund since October 15, 2005.
3 Since inception returns for the indices may begin on the month-end closest to the actual inception date of the fund.
4 Since inception, a portion of the International Value Fund expenses were reimbursed. If such expenses had not been reimbursed, returns would be lower.
5 MSCI EAFE Gross Total Return Index (Europe, Australia, Far East) is a free-float-adjusted market capitalization index that is designed to measure developed market equity performance, excluding the U.S. & Canada. As of June 2006, the MSCI EAFE Index consisted of the following 21 developed market country indices: Australia, Austria, Belgium, Denmark, Finland, France, Germany, Greece, Hong Kong, Ireland, Italy, Japan, the Netherlands, New Zealand, Norway, Portugal, Singapore, Spain, Sweden, Switzerland and the United Kingdom.
6 It is not possible to invest directly in an index. Index figures do not reflect sales charges and would be lower if they did.
27
Investment Quality Bond Fund
Subadviser: Wellington Management Company, LLP
Portfolio Manager: Thomas L. Pappas
INVESTMENT OBJECTIVE & POLICIES - To seek to achieve a high level of current income consistent with the maintenance of principal and liquidity by investing, under normal market conditions, at least 80% of the Fund’s net assets in investment grade bonds. The Fund will invest primarily in corporate bonds and U.S. government bonds with intermediate to longer-term maturities.
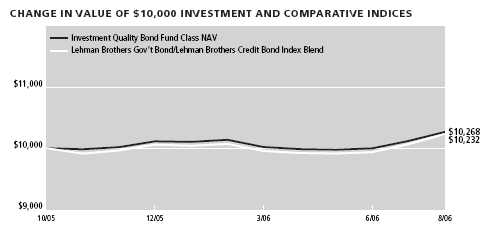
| Sector Weighting* | % of Total |
|
| Government | 20.49 |
| Mortgage Securities | 16.03 |
| Financial | 15.73 |
| Asset Backed Securities | 5.52 |
| Communications | 4.48 |
| Consumer, Non-cyclical | 3.19 |
| Consumer, Cyclical | 2.44 |
| Utilities | 2.43 |
| Basic Materials | 1.71 |
| Energy | 1.56 |
*Top Sectors as a percentage of market value. Does not include short-term securities and investments in the State Street Navigator Securities Lending Prime Portfolio.
PORTFOLIO MANAGER’S COMMENTARY
Performance - Since its inception in October 2005, the Investment Quality Bond Fund returned +2.68%, outperforming the +2.32% return of the 50% Lehman Brother Gov’t Bond/50% Lehman Bros Credit Bond Index Blend.
Environment - There was greater uncertainty about the direction of US monetary policy during the first half of 2006 due to the appointment of the new Federal Reserve Chairman. The Federal Reserve maintained measured rate increases to the Federal Funds target rate throughout the period until its last meeting during the period on August 8, 2006. The six Fed rate hikes during the period brought the federal funds rate to 5.25%, up 150 basis points. US bond yields have risen over the latter part of the period in reaction to the rate hikes and the stronger economic data.
During the period, performance was primarily driven by our shorter duration posture and our yield curve positioning as rates increased throughout the period. We were underweight the short end of the curve and overweight the 10-Year portion. Our opportunistic allocation to high yield and structured sectors, Asset Backed Securities (“ABS”) and Commercial Mortgage Backed Securities (“CMBS”), and our positive security selection within our allocation to investment-grade corporate bonds also added to the Fund’s outperformance relative to the benchmark.
Outlook - US economic growth has slowed over the period due to the slowing housing market and increasing energy prices and interest rates. As a result, we have moved from a short duration posture to neutral, balancing meager yield valuations with anticipation of further economic slowdown. Without an impetus on the immediate horizon for the curve to steepen, we are also neutral on the yield curve. We continue to underweight the government sector as Treasury yields just over 5% are not attractive. ABS and CMBS yield spreads continue to grind tighter across all sub sectors; however CMBS remains attractive on a relative value basis to corporate bonds. We continue to reduce Mortgage-Backed Securities and prefer the stability of other structured sectors, namely ABS and CMBS.
| PERFORMANCE TABLE1 | Average Annual Total Return | | | Cumulative Total Return | |
|
| | | | | Since | | | | Since |
| Periods Ending August 31, 2006 | 1-year | 5-year | 10-year | inception | 1-year | 5-year | 10-year | inception2 |
|
| Investment Quality Bond Class 1 (began 10/15/05) | — | — | — | — | — | — | — | 2.64% |
| Investment Quality Bond Class NAV (began 10/15/05) | — | — | — | — | — | — | — | 2.68% |
| Lehman Brothers Gov’t Bond/Lehman Brothers Credit | | | | | | | | |
| Bond Index Blend3,4,5 | — | — | — | — | — | — | — | 2.32% |
1 Performance does not reflect the deduction of taxes on fund distributions or redemptions of fund shares. Past performance does not predict future performance.
2 Current subadviser has managed the fund since October 15, 2005.
3 Since inception returns for the indices may begin on the month-end closest to the actual inception date of the fund.
4 Lehman Brothers Government Bond Index and Lehman Brothers Credit Bond Index Blend-A blended index is used combining 50% of the Lehman Brothers Government Bond Index which is an unmanaged index that represents securities issued by the U.S. Government (i.e. securities in the Treasury and Agency indices); and 50% Lehman Brothers Credit Bond Index, which is an unmanaged index of publicly issued U.S. corporate and specified foreign debentures and secured notes that meet the specified maturity, liquidity, and quality requirements. To qualify, bonds must be SEC registered.
5 It is not possible to invest directly in an index. Index figures do not reflect sales charges and would be lower if they did.
28
Large Cap Fund
Subadviser: UBS Global Asset Management
Portfolio Manager: Thomas J. Digenan, John C. Leonard and Thomas Cole
INVESTMENT OBJECTIVE & POLICIES - To seek to maximize total return, consisting of capital appreciation and current income by investing at least 80% of its net assets in equity securities of U.S. large capitalization companies.
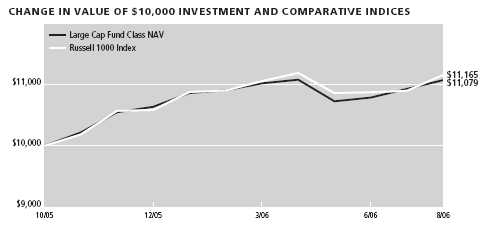
| Sector Weighting* | % of Total |
|
| Financial | 23.39 |
| Consumer, Non-cyclical | 21.54 |
| Communications | 10.40 |
| Technology | 10.21 |
| Industrial | 8.87 |
| Consumer, Cyclical | 7.76 |
| Utilities | 6.01 |
| Energy | 5.31 |
| Mortgage Securities | 1.50 |
| Government | 0.05 |
*Top Sectors as a percentage of market value. Does not include short-term securities and investments in the State Street Navigator Securities Lending Prime Portfolio.
PORTFOLIO MANAGER’S COMMENTARY
Performance - Since its inception in October 2005, the Large Cap Fund returned +10.79%, underperforming the +11.65% return of the Russell 1000 Index.
Environment - Above-average earnings growth came from the energy sector, as crude oil prices hit record highs during the reporting period. Marathon Oil, one of our select holdings in the oil industry, returned delivered strong returns over the period. Despite the recent spike in oil prices and subsequently in oil stocks, we continue to underweight this sector. Our view is that crude oil prices at current levels are not sustainable and are not supported by current fundamentals.
In our other main underweight, hardware and semiconductors, we are seeing better coordination along the semiconductor chip value chain, leading to improved inventory management. However, the semiconductor cycle should continue to be muted, and warrants less attention than in prior years.
The financials sector continues to be our top overweight, with Morgan Stanley our top holding. Our position performed solidly over the reporting period.
We maintain an overweight to the health care sector, where we are seeing meaningful changes in the competitive dynamics of large cap pharmaceutical companies. We believe the 2006 Medicare prescription drug benefit program rollout creates both significant pricing pressure and opportunities, and we would like to maintain exposure to companies with unique or non-commodity product concentrations, such as in vaccines, anti-infectives and biologics. Specialty pharmaceutical maker Allergan was one of the top contributors to portfolio returns over the period.
Outlook - Looking ahead, we believe a number of factors will determine the strength of the economy. As the Federal Reserve Board continues its efforts to fight inflation, it will be forced to strike a difficult balance between maintaining price stability and not raising short-term interest rates so high as to put the brakes on what has been a period of robust economic expansion.
Meanwhile, although a cooling housing market is an issue of potential concern, other economic indicators remain solid—job growth and corporate profitability are both stable, and we anticipate they should remain so over the months ahead. Ultimately, we believe the equity markets will reward those companies that are leaders within their industries, generate free cash flow over time on behalf of their investors, and are able to best navigate an ever-changing economic landscape. We continue to seek out those companies through extensive bottom-up research, and to position the portfolio accordingly.
The views expressed are those of the portfolio manager as of August 31, 2006, and are subject to change based on market and other conditions.
| PERFORMANCE TABLE1 | Average Annual Total Return | | | Cumulative Total Return | |
|
| | | | | Since | | | | Since |
| Periods Ended August 31, 2006 | 1-year | 5-year | 10-year | inception | 1-year | 5-year | 10-year | inception2 |
|
| Large Cap Class 1 (began 10/15/05) | — | — | — | — | — | — | — | 10.73% |
| Large Cap Class NAV (began 10/15/05) | — | — | — | — | — | — | — | 10.79% |
| Russell 1000 Index3,4,5 | — | — | — | — | — | — | — | 11.65% |
1 Performance does not reflect the deduction of taxes on fund distributions or redemptions of fund shares. Past performance does not predict future performance.
2 Current subadviser has managed the fund since October 15, 2005.
3 Since inception returns for the indices may begin on the month-end closest to the actual inception date of the fund.
4 Russell 1000 Index is an unmanaged index which measures the performance of the 1,000 largest companies in the Russell 3000 Index.
5 It is not possible to invest directly in an index. Index figures do not reflect sales charges and would be lower if they did.
29
Large Cap Value Fund
Subadviser: Mercury Advisers
Portfolio Manager: Bob Doll
INVESTMENT OBJECTIVE & POLICIES - The Fund seeks long-term growth of capital through investment primarily in a diversified portfolio of equity securities of large-cap companies located in the United States. The Fund seeks to achieve its investment objective by investing at least 80% of its net assets in common stocks of large cap companies the subadviser selects from among those that are, at the time of purchase, included in the Russell 1000 Value Index.
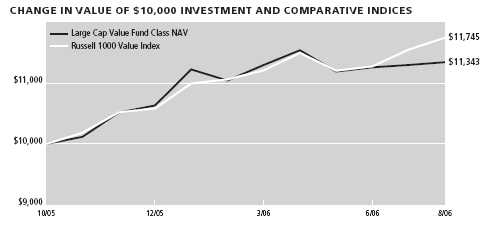
| Sector Weighting* | % of Total |
|
| Financial | 25.42 |
| Energy | 22.01 |
| Consumer, Non-cyclical | 15.94 |
| Technology | 8.18 |
| Industrial | 6.74 |
| Consumer, Cyclical | 6.34 |
| Basic Materials | 4.86 |
| Communications | 4.55 |
| Utilities | 1.75 |
*Top Sectors as a percentage of market value. Does not include short-term securities and investments in the State Street Navigator Securities Lending Prime Portfolio.
PORTFOLIO MANAGER’S COMMENTARY
Performance - Since its inception in October 2005, the Large Cap Value Fund returned +13.43%, underperforming the +17.45% return of the Russell 1000 Value Index.
Environment - Shares of large-cap value companies significantly outperformed their large-cap growth counterparts during the past 12 months. The Russell 1000 Value Index advanced 10.98% while the Russell 1000 Growth Index posted a small gain of 0.22% .
We maintained the Fund’s pro-cyclical stance during the period. Despite weakness in the U.S. equity market early in the third quarter, we retained the portfolio’s overweight in sectors that are benefiting from global economic growth, as we believe the pause will be temporary. The Federal Reserve ended its rate-tightening campaign pausing at their August meeting, although the central bank will likely continue its anti- inflation rhetoric. We expect that as fears of slowing growth overtake inflation concerns, the Fed will begin easing monetary policy in the first half of next year.
Regarding corporate earnings, we continue to believe that given the slowing economy, current earnings expectations are too high and that disappointments are likely for the next couple of quarters. We believe that the stock correction earlier this year probably saw its lows a couple of months ago. The rally in August can likely be attributed to lower oil prices and the growing perception that the Fed’s tightening has finally ended. We foresee some turbulent times ahead as growth cools and earnings disappoint, but we are sticking with our forecast for a soft economic landing. We believe that the Fed will begin easing before economic growth becomes too weak.
At period end, the Fund was overweight (versus the Russell 1000 Value Index) to Energy, Information Technology and Health Care, and was underweight to Financials, Utilities, Telecommunication Services, Consumer Staples and Consumer Discretionary sectors.
Outlook - One factor that points to stronger equity market performance going forward is that over the past few years, strong earnings growth combined with little upward movement in stocks caused stock valuations to contract significantly. These decent valuation levels should provide some protection from slowing earnings growth and may allow stock prices to move higher, but perhaps not before a growth scare related to earnings disappointments takes the market somewhat lower.
The views expressed are those of the portfolio manager as of August 31, 2006, and are subject to change based on market and other conditions.
| PERFORMANCE TABLE1 | Average Annual Total Return | | | Cumulative Total Return | |
|
| | | | | Since | | | | Since |
| Periods Ended August 31, 2006 | 1-year | 5-year | 10-year | Inception | 1-year | 5-year | 10-year | Inception2 |
|
| Large Cap Value Class 1 (began 10/15/05) | — | — | — | — | — | — | — | 13.33% |
| Large Cap Value Class NAV (began 10/15/05) | — | — | — | — | — | — | — | 13.43% |
| Russell 1000 Value Index3,4,5 | — | — | — | — | — | — | — | 17.45% |
1 Performance does not reflect the deduction of taxes on fund distributions or redemptions of fund shares. Past performance does not predict future performance.
2 Current subadviser has managed the fund since October 15, 2005.
3 Since inception returns for the indices may begin on the month-end closest to the actual inception date of the fund.
4 Russell 1000 Value Index is an unmanaged index containing those securities in the Russell 1000 Index with a less-than-average growth orientation.
5 It is not possible to invest directly in an index. Index figures do not reflect sales charges and would be lower if they did.
30
Mid Cap Core Fund
Subadviser: AIM Capital Management, Inc.
Portfolio Manager: Ronald S. Sloan
INVESTMENT OBJECTIVE & POLICIES - To achieve long-term growth of capital. The Fund seeks to achieve its objective by investing, normally, at least 80% of its assets in equity securities, including convertible securities, of mid-capitalization companies.
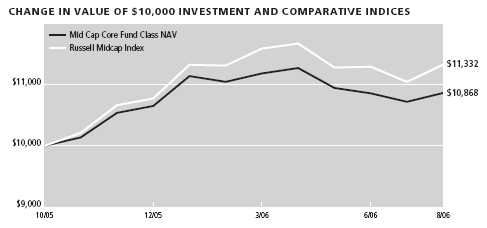
| Sector Weighting* | % of Total |
|
| Consumer, Non-cyclical | 22.25 |
| Industrial | 11.29 |
| Basic Materials | 9.19 |
| Technology | 7.92 |
| Communications | 7.24 |
| Financial | 6.52 |
| Consumer, Cyclical | 5.54 |
| Energy | 3.37 |
| Utilities | 2.83 |
| Diversified | 1.10 |
*Top Sectors as a percentage of market value. Does not include short-term securities and investments in the State Street Navigator Securities Lending Prime Portfolio.
PORTFOLIO MANAGER’S COMMENTARY
Performance - Since its inception in October 2005, the Mid Cap Core Fund returned +8.68%, underperforming the +13.32% return of the Russell Midcap Index.
Environment - Since last fall, market sentiment has been growing more cautious. The U.S. market has switched from a focus on the benefits of economic growth to a concern about the economic impact of higher interests rates and inflation.
During the period, the Federal Reserve continued its tightening policy, raising the federal funds target rate to 5.25% as Ben Bernanke settled into his role as Fed chairman. The Fed raised short-term interest rates 17 times since June 2004 before pausing in August. Although the current level of interest rates is low by historical standards, a five-fold increase in two years could affect the economy, especially industries that have benefited from low rates, such as housing-related industries. Builders now view sales conditions as poor, a major shift in just one year.
The Fund delivered strong absolute performance, largely due to investments in the Energy and Materials sectors. Relative underperformance versus the benchmark was mostly attributable to a significant underweight position in Financials as well as stock selection within Industrials.
Currently, we are focused on industry-leading companies that are less sensitive to interest rates, have flexible cash and stable growth profiles. The portfolio is well diversified across most sectors. However, it is still positioned more defensively than the Index. The only noticeable overweight is in Consumer Staples stocks. We are underweight in Financials and Consumer Discretionary stocks due to the risk of higher rates and a softening housing market. We actively took profits in Energy stocks as they became more fairly valued early in 2006, and shifted toward more compelling opportunities in Consumer Staples, Health Care, Information Technology, and specialized Industrials and Materials businesses.
Outlook - We are constructive yet cautious. Our more conservative portfolio seeks to participate well in growth cycles and preserve capital in less robust credit conditions, when earnings growth is more difficult to maintain and higher quality businesses demand a premium. We believe our emphasis on fair valuations and fundamentally sound companies will prevail.
The views expressed are those of the portfolio manager as of August 31, 2006, and are subject to change based on market and other conditions.
| PERFORMANCE TABLE1 | Average Annual Total Return | | | Cumulative Total Return | |
|
| | | | | Since | | | | Since |
| Periods Ended August 31, 2006 | 1-year | 5-year | 10-year | inception | 1-year | 5-year | 10-year | inception2 |
|
| Mid Cap Core Class 1 (began 10/15/05) | — | — | — | — | — | — | — | 8.67% |
| Mid Cap Core Class NAV (began 10/15/05) | — | — | — | — | — | — | — | 8.68% |
| Russell Midcap Index3,4,5 | — | — | — | — | — | — | — | 13.32% |
1 Performance does not reflect the deduction of taxes on fund distributions or redemptions of fund shares. Past performance does not predict future performance.
2 Current subadviser has managed the fund since October 15, 2005.
3 Since inception returns for the indices may begin on the month-end closest to the actual inception date of the fund.
4 Russell Midcap Index is an unmanaged index that measures the performance of the 800 smallest companies in the Russell 1000 index, which represents approximately 30% of the total market capitalization of the Russell 1000 Index.
5 It is not possible to invest directly in an index. Index figures do not reflect sales charges and would be lower if they did.
31
Mid Cap Index Fund
Subadviser: MFC Global Investment Management (U.S.A.) Limited
Portfolio Managers: Carson Jen and Narayan Ramani
INVESTMENT OBJECTIVE & POLICIES - To seek to approximate the aggregate total return of a mid cap U.S. domestic equity market index. Invests, under normal market conditions, at least 80% of its net assets (plus any borrowings for investment purposes) in (a) the common stocks that are included in the S&P 400 Index and (b) securities (which may or may not be included in the S&P 400 Index) that MFC Global (U.S.A.) believes as a group will behave in a manner similar to the index.

| Sector Weighting* | % of Total |
|
| Financial | 13.71 |
| Consumer, Non-cyclical | 12.96 |
| Industrial | 11.94 |
| Consumer, Cyclical | 10.93 |
| Energy | 8.68 |
| Technology | 8.01 |
| Utilities | 5.68 |
| Government | 4.41 |
| Communications | 3.73 |
| Basic Materials | 3.16 |
*Top Sectors as a percentage of market value. Does not include short-term securities and investments in the State Street Navigator Securities Lending Prime Portfolio.
PORTFOLIO MANAGER’S COMMENTARY
Performance - Since its inception in October 2005, the Mid Cap Index Fund returned +9.20%, outperforming the +8.17% return of the S&P MidCap 400 Index.
Environment - The U.S. economy seems to be slowing down, with growth in the gross domestic product (GDP) declining from a 5.6% gain in the first quarter of 2006 to just 2.5% in the second quarter. Recent data show inflation to be at an 11-year high. Core inflation has risen 2.4% in the past 12 months.
After 17 consecutive interest rate increases, the Federal Reserve paused and kept the benchmark rate at 5.25% in August. However, Board Chairman Ben Bernanke did not rule out further increases in 2006.
Job growth picked up in August and the unemployment rate approached a five-year low at 4.7%, down from 4.8% in July, and U.S. employers added 128,000 workers to their payrolls, up from a revised 121,000 in July. The Conference Board’s Consumer Confidence Index dropped to 99.6 in August from 107.0 in July. The index is at its lowest level this year.
For the period, Financials and Information Technology were the best performing sectors, returning 13.54% and 11.72%, respectively. Consumer Discretionary and Energy were the worst performers, returning –6.47% and -0.20%, respectively.
Outlook - The economy continues to grow modestly, with growth expectations around 2.6% for the second half of this year and 2.7% in 2007. In the short term, consumer spending is expected to slow down in the face of higher gasoline prices and higher interest rates. It appears that the Fed is at the end of its current tightening cycle, with fewer signs of price pressures and a cooling economy.
The views expressed are those of the portfolio manager as of August 31, 2006, and are subject to change based on market and other conditions.
| PERFORMANCE TABLE1,4 | Average Annual Total Return | | | Cumulative Total Return | |
|
| | | | | Since | | | | Since |
| Periods Ending August 31, 2006 | 1-year | 5-year | 10-year | inception | 1-year | 5-year | 10-year | inception2 |
|
| Mid Cap Index Fund Class NAV (began 10/29/05) | — | — | — | — | — | — | — | 9.20% |
| Standard & Poors MidCap 400 Index3,5,6 | — | — | — | — | — | — | — | 8.17% |
1 Performance does not reflect the deduction of taxes on fund distributions or redemptions of fund shares. Past performance does not predict future performance.
2 Current subadviser has managed the fund since October 29, 2005.
3 Since inception returns for the indices may begin on the month-end closest to the actual inception date of the fund.
4 Since inception, a portion of the Mid Cap Index Fund expenses were reimbursed. If such expenses had not been reimbursed, returns would be lower.
5 Standard & Poors MidCap 400 Index is an unmanaged index of 400 domestic stocks of medium-sized companies.
6 It is not possible to invest directly in an index. Index figures do not reflect sales charges and would be lower if they did.
32
Mid Cap Stock Fund
Subadviser: Wellington Management Company, LLP
Portfolio Manager: Michael Carmen
INVESTMENT OBJECTIVE & POLICIES - To achieve growth of capital by investing at least 80% of the Fund’s net assets in equity securities of mid-sized companies with significant capital appreciation potential.
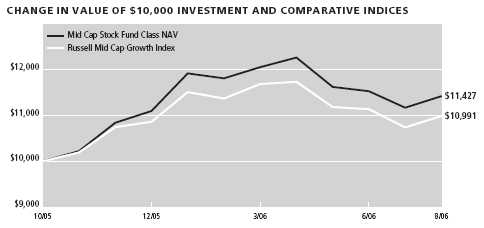
| Sector Weighting* | % of Total |
|
| Consumer, Non-cyclical | 18.19 |
| Technology | 17.48 |
| Industrial | 11.04 |
| Communications | 8.78 |
| Consumer, Cyclical | 8.63 |
| Financial | 4.79 |
| Basic Materials | 4.52 |
| Energy | 3.71 |
*Top Sectors as a percentage of market value. Does not include short-term securities and investments in the State Street Navigator Securities Lending Prime Portfolio.
PORTFOLIO MANAGER’S COMMENTARY
Performance - Since its inception in October 2005, the Mid Cap Stock Fund returned +14.27%, outperforming the +9.91% return of the Russell Mid Cap Growth Index.
Environment - Despite volatile energy prices, rising interest rates and concerns of a slowing U.S. economy, the equity markets experienced positive returns during the period. Overall, mid-cap stocks underperformed small-cap stocks and generally outperformed large-caps. However, all market capitalization segments provided strong absolute returns. Within the Index, Telecommunications was the best performing sector while Consumer Discretionary delivered the weakest returns.
The Fund outperformed its benchmark Index as a result of positive stock selection. The greatest contributors to positive relative performance from stock selection were Information Technology, Health Care and Materials. While Utilities are a small component of the Index, the portfolio’s zero weight in Utilities detracted from relative performance during the period.
Outlook - As a result of our bottom-up decision-making process, the Portfolio has the largest exposures to Industrials and Information Technology. In addition, the Portfolio continues to have no allocation to the Utilities sector. We do see the potential for rising costs, particularly from raw materials, labor and energy. However, we are confident in our ability to find companies with improving margins, growing profits and higher returns on investment.
The views expressed are those of the portfolio manager as of August 31, 2006, and are subject to change based on market and other conditions.
| PERFORMANCE TABLE1 | Average Annual Total Return | | | Cumulative Total Return | |
|
| | | | | Since | | | | Since |
| Periods Ended August 31, 2006 | 1-year | 5-year | 10-year | inception | 1-year | 5-year | 10-year | inception2 |
|
| Mid Cap Stock Class 1 (began 10/15/05) | — | — | — | — | — | — | — | 14.20% |
| Mid Cap Stock Class NAV (began 10/15/05) | — | — | — | — | — | — | — | 14.27% |
| Russell Mid Cap Growth Index3,4,5 | — | — | — | — | — | — | — | 9.91% |
1 Performance does not reflect the deduction of taxes on fund distributions or redemptions of fund shares. Past performance does not predict future performance.
2 Current subadviser has managed the fund since October 15, 2005.
3 Since inception returns for the indices may begin on the month-end closest to the actual inception date of the fund.
4 Russell Mid Cap Growth Index is an unmanaged index that contains those stocks from the Russell Mid Cap Index with a greater than average growth orientation.
5 It is not possible to invest directly in an index. Index figures do not reflect sales charges and would be lower if they did.
33
Mid Cap Value Fund
Subadviser: Lord, Abbett & Co. LLC
Portfolio Managers: Eileen K. Banko, David G. Builder, Howard Hansen and Edward K. von der Linde
INVESTMENT OBJECTIVE & POLICIES - To seek capital appreciation. The Fund invests primarily in equity securities which it believes to be undervalued in the marketplace. Under normal market conditions, at least 80% of the Fund’s net assets (plus any borrowings for investment purposes) will consist of investments in mid-sized companies, with market capitalizations of approximately $500 million to $10 billion.
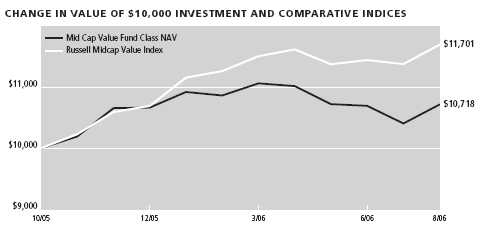
| Sector Weighting* | % of Total |
|
| Communications | 15.98 |
| Consumer, Cyclical | 12.12 |
| Consumer, Non-cyclical | 11.55 |
| Financial | 10.53 |
| Industrial | 10.38 |
| Basic Materials | 8.25 |
| Utilities | 7.67 |
| Energy | 4.35 |
| Technology | 2.87 |
*Top Sectors as a percentage of market value. Does not include short-term securities and investments in the State Street Navigator Securities Lending Prime Portfolio.
PORTFOLIO MANAGER’S COMMENTARY
Performance - Since its inception in October 2005, the Mid Cap Value Fund returned +7.18%, underperforming the +17.01% return of the Russell Midcap Value Index.
Environment - Stock selection within the Consumer Discretionary sector along with poor performance from some stocks within the Auto & Transportation and Health Care sectors were the Fund’s primary detractors.
Within the Auto & Transportation sector, shares of an auto parts supplier detracted from portfolio performance after it reported lower-than-expected quarterly earnings. The company experienced higher steel costs and production inefficiencies in its heavy truck division.
Within Health Care, performance of an eye health care company hurt portfolio returns as its shares fell following the announcement that an increase in cases of a rare eye infection could be related to the use of its contact lens solution. Annual revenue and earning estimates were lowered.
On the positive side, stock selection within the Utilities and Producer Durables sectors and a forestry holding in the Materials & Processing sector contributed to performance. Within the telecommunications industry of the Utilities sector, shares of a telecommunications services provider rose following the announcement that it was acquiring a metropolitan fiber and wide area network company.
Outlook - Despite the overall market correction during the second quarter of 2006, the market’s leadership remains dominated by short-term earnings expectations and share price momentum strategies. This is classically a late economic cycle trading pattern.
For the last 18 months, we have been turning the portfolio toward the stocks of companies that we expect will improve their profitability over the next two to four years. This longer-term focus has put us at odds with the current market preoccupation with short-term trends, and is reflected in our relative performance. We continue to execute on our investment discipline, which is grounded in the longer-term improving performance of high-quality companies. We believe our current investments will generate longer-term gains that will more than offset any near term relative underperformance.
The views expressed are those of the portfolio manager as of August 31, 2006, and are subject to change based on market and other conditions.
| PERFORMANCE TABLE1 | Average Annual Total Return | | | Cumulative Total Return | |
|
| | | | | Since | | | | Since |
| Periods Ended August 31, 2006 | 1-year | 5-year | 10-year | inception | 1-year | 5-year | 10-year | inception2 |
|
| Mid Cap Value Class 1 (began 10/15/05) | — | — | — | — | — | — | — | 7.11% |
| Mid Cap Value Class NAV (began 10/15/05) | — | — | — | — | — | — | — | 7.18% |
| Russell Midcap Value Index3,4,5 | — | — | — | — | — | — | — | 17.01% |
1 Performance does not reflect the deduction of taxes on fund distributions or redemptions of fund shares. Past performance does not predict future performance.
2 Current subadviser has managed the fund since October 15, 2005.
3 Since inception returns for the indices may begin on the month-end closest to the actual inception date of the fund.
4 Russell Midcap Value Index is an unmanaged index that measures the performance of those Russell Midcap companies with lower price-to-book ratios and lower forecasted growth values. The stocks are also members of the Russell 1000 Value Index.
5 It is not possible to invest directly in an index. Index figures do not reflect sales charges and would be lower if they did.
34
Mid Cap Value Equity Fund
Subadviser: Riversource Investments, LLC
Portfolio Managers: Stephen Shroll, Laton Spahr and Warren Spitz
INVESTMENT OBJECTIVE & POLICIES - The Fund seeks long-term growth of capital by investing at least 80% of net assets in equity securities of medium-sized companies.
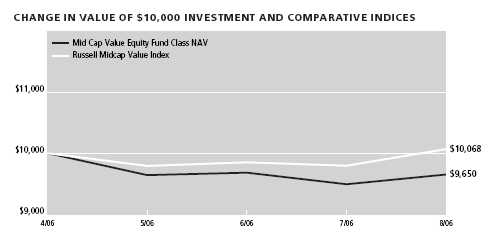
| Sector Weighting* | % of Total |
|
| Financial | 16.20 |
| Industrial | 12.77 |
| Utilities | 9.85 |
| Energy | 9.33 |
| Consumer, Cyclical | 8.30 |
| Consumer, Non-cyclical | 7.92 |
| Communications | 6.47 |
| Technology | 5.23 |
| Basic Materials | 4.95 |
*Top Sectors as a percentage of market value. Does not include short-term securities and investments in the State Street Navigator Securities Lending Prime Portfolio.
PORTFOLIO MANAGER’S COMMENTARY
Performance - Since its inception in April 2006, the Mid Cap Value Equity Fund returned –3.50%, underperforming the +0.68% return of the Russell Midcap Value Index.
Environment - The equity market was strong and accelerating in April and early May, with companies beating their estimates and multiples expanding. The Russell MidCap® Value Index, the portfolio’s benchmark index, peaked on May 10. Then, the market began responding to investors’ concerns about the strength of the economy and experienced a significant reassessment of risk across all segments. This volatile market correction was based in uncertainty stemming from rising interest rates, higher inflation and slower economic growth. Some market pundits, however, attribute the timing of the correction to an off-the-record comment by Chairman Bernanke.
In the marketplace, sectors that lagged most since we took over management of the portfolio on May 1 were technology, consumer discretionary and integrated oils. Conversely, the best performing sectors were consumer staples and utilities—historically defensive sectors.
In late August, we made changes to the portfolio so it could better adapt to the weaker economic environment. We reduced some positions in the following sectors: other energy, producer durables and basic materials, although we are still overweight in these sectors compared to the Russell MidCap® Value Index. Alternately, we increased our positions in the utilities, financials, and health care sectors. Health care and financials, although underperforming in the Russell MidCap® Value Index, were beneficial within the portfolio. Strong stock selection within these sectors benefited the portfolio’s performance.
Outlook - Over the long term, we expect to reduce some cyclical themes in the portfolio. We have invested broadly in some industries with long-term potential to outperform and continue to watch for opportunities.
Regardless of market conditions, we continue to find a wide variety of deep value, contrarian ideas and — when appropriate — incorporate the best ideas into the portfolio. Mid cap stocks have outperformed for an extended period, and we expect continued acquisition activities to buoy up the potential outperformance of the asset class. We expect the rapid slow down of residential real estate to continue and will be watchful of opportunities there, as well.
The views expressed are those of the portfolio manager as of August 31, 2006, and are subject to change based on market and other conditions.
| PERFORMANCE TABLE1 | Average Annual Total Return | | | Cumulative Total Return | |
|
| | | | | Since | | | | Since |
| Periods Ending August 31, 2006 | 1-year | 5-year | 10-year | inception | 1-year | 5-year | 10-year | inception2 |
|
| Mid Cap Value Equity Class NAV (began 4/28/06) | — | — | — | — | — | — | — | –3.50% |
| Russell Midcap Value Index3,4,5 | — | — | — | — | — | — | — | 0.68% |
1 Performance does not reflect the deduction of taxes on fund distributions or redemptions of fund shares. Past performance does not predict future performance.
2 Current subadviser has managed the fund since April 28, 2006.
3 Since inception returns for the indices may begin on the month-end closest to the actual inception date of the fund.
4 Russell Midcap Value Index is an unmanaged index that measures the performance of those Russell Midcap companies with lower price-to-book ratios and lower forecasted growth values. The stocks are also members of the Russell 1000 Value Index.
5 It is not possible to invest directly in an index. Index figures do not reflect sales charges and would be lower if they did.
35
Natural Resources Fund
Subadviser: Wellington Management Company, LLP
Portfolio Manager: James A. Bevilacqua
INVESTMENT OBJECTIVE & POLICIES - To achieve long-term total return. Under normal market conditions, the Fund will invest at least 80% of its net assets in equity and equity-related securities of natural resources-related companies worldwide. Natural resources-related companies include companies that own or develop energy, metals, forest products and other natural resources, or supply goods and services to such companies. The Fund seeks to invest in companies that are expected to benefit from rising demand for natural resources and natural resource-based products and services.

| Sector Weighting* | % of Total |
|
| Energy | 54.37 |
| Basic Materials | 32.74 |
*Top Sectors as a percentage of market value. Does not include short-term securities and investments in the State Street Navigator Securities Lending Prime Portfolio.
PORTFOLIO MANAGER’S COMMENTARY
Performance - Since its inception in October 2005, the Natural Resources Fund returned +24.62%, outperforming the +14.96% return of the Combined4 Index.
Environment - 2005 was a year of natural disasters, with hurricanes Katrina and Rita having an adverse effect on the oil & gas industry. Late in the year, the price of oil ranged in the low $60s and declined during an unusually warm winter season, but then advanced sharply to $75 in mid-April 2006, due to concerns of supply disruption. By the end of the August, oil prices declined to around $70, curbing the industry’s concerns of overly inflated prices. The price of natural gas plunged from $14 per thousand cubic feet to roughly $6. Following unfounded concerns of supply shortages, a relatively mild winter season, and consistent inventory levels, natural gas prices declined while oil prices leveled off in the high range.
Base metals experienced growth throughout the period, led by nickel, tin and copper, due to strong demand and lower inventory levels. The U.S. dollar price of an ounce of gold rose during the period, from $470 per ounce to $626 per ounce. This upward trajectory was caused by the weakened U.S. dollar, fears of inflation and slowing demand.
For the period from inception to August 31, 2006, the Fund slightly underperformed its benchmark. Industry allocation was negative, but stock selection overall was positive. In the Energy Equipment & Services industry, the Fund benefited from its underweight position, but was hurt by weak stock selection. The underweight position in the strong performing Metals & Mining industry and the overweight in the weaker performing Oil & Gas industry also contributed to the Fund’s underperformance. However, strong stock selection in both industries helped to offset the impact.
Outlook - At period end, the Fund had an underweight position relative to the benchmark in Paper & Forest Products, Energy Equipment & Services, and Metals & Mining. The Fund had an overweight position relative to the benchmark in Oil & Gas, which remains the largest bet for the portfolio. The Fund is still positioned to take advantage of the rising demand for oil, as we are overweight oil and gas companies.
The views expressed are those of the portfolio manager as of August 31, 2006, and are subject to change based on market and other conditions.
| PERFORMANCE TABLE1 | Average Annual Total Return | | | Cumulative Total Return | |
|
| | | | | Since | | | | Since |
| Periods Ended August 31, 2006 | 1-year | 5-year | 10-year | inception | 1-year | 5-year | 10-year | inception2 |
|
| Natural Resources Class 1 (began 10/15/05) | — | — | — | — | — | — | — | 24.55% |
| Natural Resources Class NAV (began 10/15/05) | — | — | — | — | — | — | — | 24.62% |
| MSCI World Energy Index, MSCI World Metals, | | | | | | | | |
| MSCI World Paper and Forest Products Index Blend3,4,5 | — | — | — | — | — | — | — | 14.96% |
1 Performance does not reflect the deduction of taxes on fund distributions or redemptions of fund shares. Past performance does not predict future performance.
2 Current subadviser has managed the fund since October 15, 2005.
3 Since inception returns for the indices may begin on the month-end closest to the actual inception date of the fund.
4 The Combined Index is comprised of 60% MSCI World Energy Index, 30% MSCI World Metals & Mining Index, and 10% MSCI World Paper & Forest Products Index.
5 It is not possible to invest directly in an index. Index figures do not reflect sales charges and would be lower if they did.
36
Quantitative All Cap Fund
Subadviser: MFC Global Investment Management (U.S.A.) Limited
Portfolio Managers: Brett Hryb and Harpreet Singh
INVESTMENT OBJECTIVE & POLICIES - To seek to achieve long-term growth of capital. The Fund seeks to achieve its objective by investing, under normal circumstances, primarily in equity securities of U.S. companies. The Fund will generally focus on equity securities of U.S. companies across the three market capitalization ranges of large, mid and small.
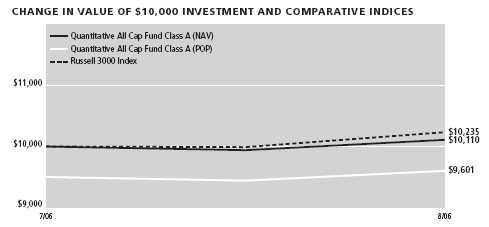
| Sector Weighting* | % of Total |
|
| Financial | 22.27 |
| Consumer, Non-cyclical | 19.03 |
| Consumer, Cyclical | 14.28 |
| Technology | 10.09 |
| Communications | 9.55 |
| Industrial | 9.09 |
| Energy | 8.20 |
| Utilities | 4.43 |
| Basic Materials | 2.70 |
| Mortgage Securities | 0.36 |
*Top Sectors as a percentage of market value. Does not include short-term securities and investments in the State Street Navigator Securities Lending Prime Portfolio.
PORTFOLIO MANAGER’S COMMENTARY
Performance - Since its inception in July 2006, the Quantitative All Cap Fund returned +1.10%, underperforming the +2.35% return of the Russell 3000 Index.
Environment - The Russell 3000 Index finished up 2.4% for July and August. The market moved higher in anticipation of a hiatus on interest rate increases, lower oil prices and in response to better-than-expected second quarter earnings results. Economic data released during the period point towards a gradual slowdown in economic growth. The biggest contributor to the slower growth is the housing sector. New and existing home sales were down double-digits from last year’s levels and home price increases declined substantially. The pace of job growth eased slightly over the last two months and second quarter economic growth came in at 2.9% .
Oil sold off, after reaching record highs of around $78 a barrel, once the conflict between Israel and Lebanon eased. Second quarter earnings results were outstanding. Nearly 70% of the companies that reported exceeded expectations. Earnings grew by 14%, marking the sixteenth consecutive quarter of double-digit earnings growth. The best performing sectors were Health Care, Power Utilities and Consumer Staples. The worst performing sectors were Industrials, Basic Materials and Consumer Discretionary. Large-cap stocks outperformed small-cap stocks.
The Fund underperformed the Russell 3000 Index during the period. Stock selection within Financial Services and Capital Goods took away from the Fund’s performance. The underperformance of small-cap stocks versus large-caps detracted from performance, as the Fund was overweight small-caps.
Outlook - We like what we see on a number of key fronts for U.S. markets. Strong earnings growth and good overall economic growth should bode well for the rest of the year and into 2007. Although interest rates and energy costs are a concern, the Fed appears poised to leave interest rates unchanged for now, while energy prices, a key cause of inflation concerns, appear to be moderating and could fall further as new supply comes on line. Market valuations still appear relatively attractive. We feel the U.S. market could return double digits by the end of the year. The Fund is focused on generating above-average returns across most economic environments while maintaining a diverse risk profile that seeks to minimize economic as well as factor risk.
The views expressed are those of the portfolio manager as of August 31, 2006, and are subject to change based on market and other conditions.
| | Cumulative Total Return | | | | Cumulative Total Return | |
| PERFORMANCE TABLE1,4 | Without Maximum Sales Charge (NAV) | | With Maximum Sales Charge (POP) |
|
| | | | | Since | | | | Since |
| Periods Ended August 31, 2006 | 1-year | 5-year | 10-year | inception | 1-year | 5-year | 10-year | inception2 |
|
| Quantitative All Cap Class A (began 7/28/06) | — | — | — | 1.10% | — | — | — | –3.99% |
| Quantitative All Cap Class B (began 7/28/06) | — | — | — | 1.10% | — | — | — | –3.90% |
| Quantitative All Cap Class C (began 7/28/06) | — | — | — | 1.10% | — | — | — | 0.10% |
| Quantitative All Cap Class I (began 7/28/06) | — | — | — | 1.20% | — | — | — | 1.20% |
| Russell 3000 Index3,5,6 | — | — | — | 2.35% | — | — | — | 2.35% |
1 Performance does not reflect the deduction of taxes on fund distributions or redemptions of fund shares. Past performance does not predict future performance.
2 Current subadviser has managed the fund since July 28, 2006.
3 Since inception returns for the indices may begin on the month-end closest to the actual inception date of the fund.
4 Since inception, a portion of the Quantitative All Cap Fund expenses were reimbursed. If such expenses had not been reimbursed, returns would be lower.
5 Russell 3000 Index is an unmanaged index of the 3,000 largest U.S. companies based on total market capitalization, which represents approximately 98% of the investable U.S. equity market.
6 It is not possible to invest directly in an index. Index figures do not reflect sales charges and would be lower if they did.
37
Quantitative Mid Cap Fund
Subadviser: MFC Global Investment Management (U.S.A.) Limited
Portfolio Managers: Rhonda Chang and Noman Ali
INVESTMENT OBJECTIVE & POLICIES - To seek to achieve long-term capital growth by investing at least 80% of the Fund’s total assets in U.S. mid cap stocks, convertible preferred stocks, convertible bonds and warrants.

| Sector Weighting* | % of Total |
|
| Financial | 14.52 |
| Consumer, Non-cyclical | 13.66 |
| Industrial | 12.10 |
| Consumer, Cyclical | 10.09 |
| Energy | 9.16 |
| Technology | 5.55 |
| Communications | 5.32 |
| Funds | 3.89 |
| Utilities | 3.74 |
| Basic Materials | 1.24 |
*Top Sectors as a percentage of market value. Does not include short-term securities and investments in the State Street Navigator Securities Lending Prime Portfolio.
PORTFOLIO MANAGER’S COMMENTARY
Performance - Since its inception in October 2005, the Quantitative Mid Cap Fund returned +4.51%, underperforming the +8.17% return of the S&P MidCap 400 Index.
Environment - This period was characterized by continued interest rate hikes by the Federal Reserve to fight inflation. Investors, concerned by the Fed’s hawkish stance and slowing economy, took profits, selling off high-growth and momentum stocks. Increased uncertainty from geopolitical tensions in the Middle East and the risk of oil supply disruptions, which kept the price of oil close to $70, further contributed to investors’ concerns. Against this backdrop, Technology and Industrials were the best performing sectors in the Index, although both sold off sharply in the second quarter of 2006. Consumer Discretionary was the worst performing sector as slowing consumer spending hurt retail stocks, due to a weak housing market and record gasoline prices. The second quarter of 2006 was the Fund’s worst period of performance, with Industrials and Technology sectors among the top detractors. In Industrials, the sell-off was led by commodities and mining-related equipment stocks due to fears of a slowing economy. Reduced earnings guidance coupled with the negative sentiment on the options backdating issue were the main factors for weakness in the Technology sector.
Outlook - We feel that the current market sell-off is a short-term correction, and that over the next 12 to 18 months the markets should move higher. There are many positives to bring stocks higher. The economy is expected to continue expanding, and inflation should remain under control. The Fed is nearing the end of its tightening policy, which has historically been good for the market. Another plus is strong corporate earnings growth. Finally, corporations have historically high cash on their balance sheets. This should fuel more share buybacks, increased dividends and more merger & acquisition activity. The latter should provide downside protection to valuations of small- and mid-cap companies, while the first two should increase shareholder returns.
Given the above scenario, we believe investors should take advantage of this downturn to add to positions that are down on profit taking. Stocks with strong earnings momentum, predictability, consistency and reasonable valuations should bounce back, because stocks with these characteristics tend to outperform over the long run.
The views expressed are those of the portfolio manager as of August 31, 2006, and are subject to change based on market and other conditions.
| PERFORMANCE TABLE1 | Average Annual Total Return | | | Cumulative Total Return | |
|
| | | | | Since | | | | Since |
| Periods Ended August 31, 2006 | 1-year | 5-year | 10-year | inception | 1-year | 5-year | 10-year | inception2 |
|
| Quantitative Mid Cap Class 1 (began 10/15/05) | — | — | — | — | — | — | — | 5.74% |
| Quantitative Mid Cap Class NAV (began 10/27/05) | — | — | — | — | — | — | — | 4.51% |
| Standard & Poors MidCap 400 Index (10/15/05)3,4,5 | — | — | — | — | — | — | — | 5.85% |
| Standard & Poors MidCap 400 Index (10/27/05)3,4,5 | — | — | — | — | — | — | — | 8.17% |
1 Performance does not reflect the deduction of taxes on fund distributions or redemptions of fund shares. Past performance does not predict future performance.
2 Current subadviser has managed the fund since October 15, 2005.
3 Since inception returns for the indices may begin on the month-end closest to the actual inception date of the fund.
4 Standard & Poors MidCap 400 Index is an unmanaged index of 400 domestic stocks of medium-sized companies.
5 It is not possible to invest directly in an index. Index figures do not reflect sales charges and would be lower if they did.
38
Quantitative Value Fund
Subadviser: MFC Global Investment Management (U.S.A.) Limited
Portfolio Managers: Brett Hryb, Chris Benson and Harpreet Singh
INVESTMENT OBJECTIVE & POLICIES - Seeks long-term capital appreciation by investing primarily in large-cap U.S. securities with the potential for long-term growth of capital. The subadviser uses both qualitative and quantitative analysis to determine the best investment values, emphasizing securities that may have been undervalued by the market.
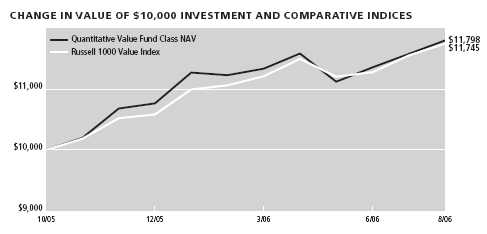
| Sector Weighting* | % of Total |
|
| Financial | 33.31 |
| Energy | 13.31 |
| Consumer, Non-cyclical | 12.54 |
| Communications | 9.76 |
| Consumer, Cyclical | 9.16 |
| Utilities | 4.60 |
| Industrial | 4.31 |
| Technology | 3.36 |
| Basic Materials | 3.05 |
| Mortgage Securities | 0.75 |
*Top Sectors as a percentage of market value. Does not include short-term securities and investments in the State Street Navigator Securities Lending Prime Portfolio.
PORTFOLIO MANAGER’S COMMENTARY
Performance - Since its inception in October 2005, the Quantitative Value Fund returned +17.98%, outperforming the +17.45% return of the Russell 1000 Value Index.
Environment - The market has been strong for value-oriented investors since last October. During that period, the Russell 1000 Value Index outperformed its Growth counterpart by more than 9%: 12.4% versus 3.2% . Growth investing has been hurt by concerns over high energy costs, inflation and the falling housing market.
Energy prices have been high for several years. Over the past year, the aftermath of Hurricane Katrina and tensions in the Middle East pushed prices into record territory. Inflation also rose, causing investor concern over a prolonged Federal Reserve monetary tightening cycle. The U.S. housing market, long a bastion of wealth for consumers, began to slow. Key coastal areas saw fairly dramatic price declines from the peak, as overall inventories of unsold homes rose meaningfully. Despite these risks, however, the U.S. economy continued to show stable growth.
The strongest sectors included classic value sectors, such as Financials, Telecommunications, Consumer Staples and Materials. The more momentum-based sectors, such as Technology and Consumer Cyclicals have underperformed by a wide margin. Although the Fund underperformed the benchmark Russell 1000 Value Total Return Index during the period, it strongly outperformed its peer group. Stock selection remains the top contributor to performance, as the Fund remains essentially sector neutral. We generated strong returns in the Financial, Information Technology, Utility and Industrials sectors. Our stock selection among Utilities was particularly strong. Stock selection in the Consumer Discretionary and Staples sectors detracted from performance.
Outlook - We like what we see on a number of key fronts. Strong earnings growth and good overall economic growth should bode well for the rest of the year and into 2007. Although interest rates and energy costs are a concern, the Fed seems ready to leave interest rates unchanged for now, while energy prices, a key cause of inflation concerns, appear to be moderating and could fall further as new supply comes on line. In addition, market valuations still appear relatively attractive. We feel the U.S. market could return double digits by the end of the year.
The views expressed are those of the portfolio manager as of August 31, 2006, and are subject to change based on market and other conditions.
| PERFORMANCE TABLE1 | Average Annual Total Return | | | Cumulative Total Return | |
|
| | | | | Since | | | | Since |
| Periods Ended August 31, 2006 | 1-year | 5-year | 10-year | inception | 1-year | 5-year | 10-year | inception2 |
|
| Quantitative Value Class 1 (began 10/15/05) | — | — | — | — | — | — | — | 17.98% |
| Quantitative Value Class NAV (began 10/15/05) | — | — | — | — | — | — | — | 17.98% |
| Russell 1000 Value Index3,4,5 | — | — | — | — | — | — | — | 17.45% |
1 Performance does not reflect the deduction of taxes on fund distributions or redemptions of fund shares. Past performance does not predict future performance.
2 Current subadviser has managed the fund since October 15, 2005.
3 Since inception returns for the indices may begin on the month-end closest to the actual inception date of the fund.
4 Russell 1000 Value Index is an unmanaged index containing those securities in the Russell 1000 Index with a less-than-average growth orientation.
5 It is not possible to invest directly in an index. Index figures do not reflect sales charges and would be lower if they did.
39
Real Estate Equity Fund
Subadviser: T. Rowe Price Associates, Inc.
Portfolio Managers: David M. Lee
INVESTMENT OBJECTIVE & POLICIES - To seek to provide long-term capital growth through a combination of appreciation and current income by investing in real estate companies, including real estate investment trusts.
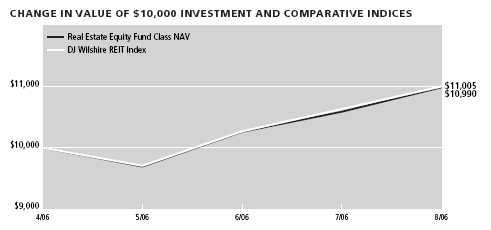
| Sector Weighting* | % of Total |
|
| Financial | 85.91 |
| Consumer, Cyclical | 1.15 |
| Basic Materials | 1.08 |
*Top Sectors as a percentage of market value. Does not include short-term securities and investments in the State Street Navigator Securities Lending Prime Portfolio.
PORTFOLIO MANAGER’S COMMENTARY
Performance - Since its inception in April 2006, the Real Estate Equity Fund returned +9.90%, underperforming the +10.05% return of the DJ Wilshire REIT Index.
Environment - In recent months, investors appear to have grown increasingly more risk-averse, wary of rising interest rates, heightened inflation fears, and the potential for slowing economic growth. Against this backdrop, the real estate sector managed to outperform the broader market, and some of the best-performing segments within real estate were industrials, office, and apartments.
The U.S. economy continued to show healthy growth, despite the continuing effects of the Federal Reserve’s restrictive monetary policy. Industrial stocks benefited from the steady GDP growth, and office stocks also performed well as non-farm payroll growth fueled demand for office space. This demand, reflected in positive net absorption, resulted in higher occupancies in several markets and increased the potential for higher rental rates.
Apartments also performed well during this period as the cost of home ownership increased with rising interest rates. In many cases, investors are assuming that the housing slowdown will lead to an increased demand for rental units, which in turn should lead to rising occupancy rates and higher rents for apartments. The rental expense component of the consumer price index has been increasing, demonstrating strength in this area.
Outlook - Our fundamental outlook remains optimistic as we expect continued job growth to have a beneficial impact on commercial real estate. However, recent slowing in the pace of job creation has emerged as another risk we are monitoring, as the impact of the Fed’s monetary tightening could slow the economy to the point that it negatively affects fundamental demand for our commercial real estate properties. Fortunately, job growth appears to remain sufficiently positive in our view, and we are optimistic that the Fed can begin to curtail its restrictive policies while maintaining a steady-growth economy.
We are projecting continued demand for commercial real estate space, and expect further gains in occupancy and market rental rates. We continue to believe that the greatest risk we face is the threat of compression in earnings multiples in the sector, since it could outweigh the fundamental benefits mentioned. That said, we cannot predict if this type of compression will occur, and we consider public market valuations to be in line with valuations in the private marketplace. In other words, we see no obvious disconnect between the valuations of the stocks in our portfolio and the valuations found in private real estate transactions. Continued demand through job growth, combined with reasonable supply, leaves us optimistic about the fundamentals that drive long-term performance in our sectors.
The views expressed are those of the portfolio manager as of August 31, 2006, and are subject to change based on market and other conditions.
| PERFORMANCE TABLE1,4 | Average Annual Total Return | | | Cumulative Total Return | |
|
| | | | | Since | | | | Since |
| Periods Ending August 31, 2006 | 1-year | 5-year | 10-year | inception | 1-year | 5-year | 10-year | inception2 |
|
| Real Estate Equity Class NAV (began 4/28/06) | — | — | — | — | — | — | — | 9.90% |
| DJ Wilshire REIT Index3,5,6 | — | — | — | — | — | — | — | 10.05% |
1 Performance does not reflect the deduction of taxes on fund distributions or redemptions of fund shares. Past performance does not predict future performance.
2 Current subadviser has managed the fund since April 28, 2006.
3 Since inception returns for the indices may begin on the month-end closest to the actual inception date of the fund.
4 Since inception, a portion of the Real Estate Equity Fund expenses were reimbursed. If such expenses had not been reimbursed, returns would be lower.
5 DJ Wilshire REIT Index is an unmanaged index consisting of actively traded real estate investment trusts.
6 It is not possible to invest directly in an index. Index figures do not reflect sales charges and would be lower if they did.
40
Real Estate Securities Fund
Subadviser: Deutsche Asset Management
Portfolio Managers: John F. Robertson, John W. Vojticek, Jerry W. Ehlinger and Asad Kazim
INVESTMENT OBJECTIVE & POLICIES - To achieve a combination of long-term capital appreciation and current income, the Fund invests, under normal market conditions, at least 80% of net assets (plus any borrowings for investment purposes) in equity securities of real estate investment trusts (“REITS”) and real estate companies. Equity securities include common stock, preferred stock and securities convertible into common stock.
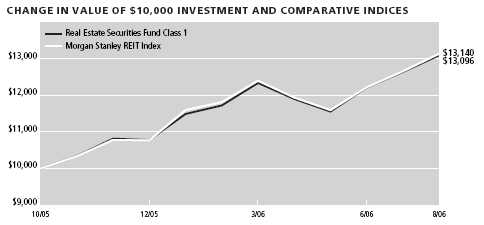
| Sector Weighting* | % of Total |
|
| Financial | 93.91 |
| Consumer, Cyclical | 2.33 |
*Top Sectors as a percentage of market value. Does not include short-term securities and investments in the State Street Navigator Securities Lending Prime Portfolio.
PORTFOLIO MANAGER’S COMMENTARY
Performance - Since its inception in October 2005, the Real Estate Securities Fund returned +30.96%, underperforming the +31.40% return of the Morgan Stanley REIT Index.
Environment - The solid performance of REITs during the fiscal year was driven by privatization and merger activity occurring at premiums; continued strong demand for high dividend yields; stability of earnings; and positive U.S. economic views. The Fund underperformed the Morgan Stanley REIT Index this year due to slightly negative stock and sector selection. From a stock selection perspective, individual holdings in hotel, office, healthcare, mall, and specialty sectors performed particularly well on a relative basis, while holdings within retail, self storage, apartment, and industrial sectors served as a drag on the portfolio. From a sector perspective, the apartment, hotels, office, self storage, and industrial sectors outperformed the benchmark and the other property types during the year, while healthcare, retail, mall, and specialty s ectors lagged. As such, relative sector performance for the Fund was helped by an overweight position in the apartment and self storage sectors and underweight position in the specialty sector. However, an overweight position in the underperforming regional mall sector and underweight position in the outperforming industrial sector detracted from performance for the year.
Outlook - Demand for real estate remains high and capital flows into the sector remain strong. We believe private market pricing of commercial real estate will continue to drive performance in the public real estate sector. Also, private equity capital has been abundant and continues to provide a floor to overall real estate valuations. We are maintaining positions in the highest quality assets in the best fundamental markets and have a slight bias toward the larger capitalization stocks in the REIT universe at this time. Even as economic growth slows, real estate fundamentals remain strong and we expect this growth combined with demand for the asset class will drive REIT returns over the next 12 months.
The views expressed are those of the portfolio manager as of August 31, 2006, and are subject to change based on market and other conditions.
| PERFORMANCE TABLE1 | Average Annual Total Return | | | Cumulative Total Return | |
|
| | | | | Since | | | | Since |
| Periods Ended August 31, 2006 | 1-year | 5-year | 10-year | inception | 1-year | 5-year | 10-year | inception2 |
|
| Real Estate Securities Class 1 (began 10/15/05) | — | — | — | — | — | — | — | 30.96% |
| Morgan Stanley REIT Index3,4,5 | — | — | — | — | — | — | — | 31.40% |
1 Performance does not reflect the deduction of taxes on fund distributions or redemptions of fund shares. Past performance does not predict future performance.
2 Current subadviser has managed the fund since October 15, 2005.
3 Since inception returns for the indices may begin on the month-end closest to the actual inception date of the fund.
4 Morgan Stanley REIT Index is an unmanaged index consisting of the most actively traded real estate investment trusts.
5 It is not possible to invest directly in an index. Index figures do not reflect sales charges and would be lower if they did.
41
Real Return Bond Fund
Subadviser: Pacific Investment Management Company
Portfolio Manager: John B. Brynjolfsson
INVESTMENT OBJECTIVE & POLICIES - To seek maximum real return, consistent with preservation of real capital and prudent investment management. The Fund seeks to achieve its objective by investing under normal circumstances, at least 80% of its net assets in inflation-indexed bonds of varying maturities issued by the U.S. and non-U.S. governments, their agencies or instrumentalities, and corporations.
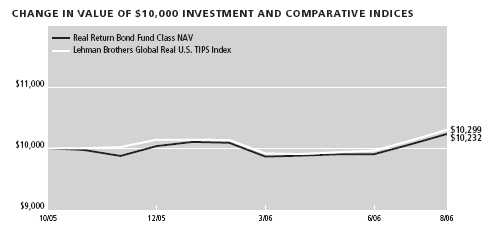
| Sector Weighting* | % of Total |
|
| Government | 92.92 |
| Mortgage Securities | 3.87 |
| Financial | 0.33 |
| Consumer, Cyclical | 0.17 |
| Communications | 0.15 |
| Basic Materials | 0.11 |
| Asset Backed Securities | 0.07 |
| Energy | 0.06 |
*Top Sectors as a percentage of market value. Does not include short-term securities and investments in the State Street Navigator Securities Lending Prime Portfolio.
PORTFOLIO MANAGER’S COMMENTARY
Performance - Since its inception in October 2005, the Real Return Bond Fund returned +2.32%, underperforming the +2.99% return of the Lehman Brothers Global Real U.S. TIPS Index.
Environment - For most of the period, the bond market was focused on the Federal Reserve’s tightening cycle. Market expectations of continued Fed tightening drove short-term rates higher and led to a significant flattening of the yield curve. The U.S. central bank raised the federal funds rate in quarter-point increments through June to 5.25% . In July, U.S. Treasury yields started to decline, based on evidence of a slowing U.S. economy. Treasury yields continued their descent in August on reports of a housing slowdown, weaker inflation and rising unemployment. The Fed kept rates unchanged in August after 17 consecutive rate hikes in two years. Ten-year real yields ended August at 2.26%, 0.29 percentage points higher for the year. The difference in yield between two- and 10-year TIPS increased from a 0.73 percentage point carry on Octobe r 14, 2005 to a 0.42 percentage point inversion by August 31, 2006.
Prudent diversification and active management protected the portfolio in a volatile market. The Fund benefited from tactical adjustments and holdings in non-Index securities, such as mortgages, corporate bonds and emerging markets bonds. Above-benchmark duration detracted from performance as interest rates rose. A flattening of the U.S. Treasury yield curve hurt the portfolio. Overall, TIPS outperformed nominal U.S. Treasuries due to strong inflation prints driven by rising energy prices. A small allocation to corporate bonds was positive as their relatively higher coupons offset the impact of rising interest rates. Exposure to mortgage-backed securities added value from coupon selection and yield advantage. Emerging market bonds helped performance as credit premiums narrowed.
Outlook - Global economic growth appears strong but vulnerable. Robust U.S. consumption, massive Chinese investment spending and positive developments in Japan and emerging economies produced growth over the last year. This expansion prompted tightening by central banks to contain mild but accelerating inflation. Major central banks are embarked on an uncertain path of interest rate hikes that could, if pursued too aggressively, derail the global expansion. Inflation expectations should ease and the nominal yield curve should revert to a positive slope, as markets anticipate Fed easing. Risk premiums and volatility should expand to more normal levels as central banks withdraw liquidity from markets.
The views expressed are those of the portfolio manager as of August 31, 2006, and are subject to change based on market and other conditions.
| PERFORMANCE TABLE1 | Average Annual Total Return | | | Cumulative Total Return | |
|
| | | | | Since | | | | Since |
| Periods Ending August 31, 2006 | 1-year | 5-year | 10-year | inception | 1-year | 5-year | 10-year | inception2 |
|
| Real Return Bond Class 1 (began 10/15/05) | — | — | — | — | — | — | — | 2.27% |
| Real Return Bond Class NAV (began 10/15/05) | — | — | — | — | — | — | — | 2.32% |
| Lehman Brothers Global Real U.S. TIPS Index3,4,5 | — | — | — | — | — | — | — | 2.99% |
1 Performance does not reflect the deduction of taxes on fund distributions or redemptions of fund shares. Past performance does not predict future performance.
2 Current subadviser has managed the fund since October 15, 2005.
3 Since inception returns for the indices may begin on the month-end closest to the actual inception date of the fund.
4 Lehman Brothers Global Real U.S. TIPS Index is an unmanaged index that consists of Inflation-Protection securities issued by the U.S. Treasury.
5 It is not possible to invest directly in an index. Index figures do not reflect sales charges and would be lower if they did.
42
Small Cap Fund
Subadviser: Independence Investment LLC
Portfolio Manager: Charles S. Glovsky
INVESTMENT OBJECTIVE & POLICIES - To seek maximum capital appreciation consistent with reasonable risk to principal. The Fund invests, under normal market conditions, at least 80% of its net assets in equity securities of small cap companies.
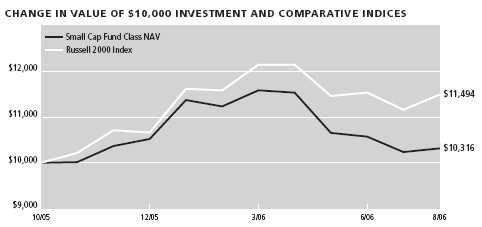
| Sector Weighting* | % of Total |
|
| Consumer, Non-cyclical | 15.92 |
| Consumer, Cyclical | 14.08 |
| Industrial | 11.68 |
| Financial | 9.98 |
| Communications | 8.76 |
| Technology | 7.15 |
| Energy | 6.96 |
| Basic Materials | 4.01 |
| Utilities | 1.26 |
*Top Sectors as a percentage of market value. Does not include short-term securities and investments in the State Street Navigator Securities Lending Prime Portfolio.
PORTFOLIO MANAGER’S COMMENTARY
Performance - Since its inception in October 2005, the Small Cap Fund returned +3.16%, underperforming the +14.94% return of the Russell 2000 Index.
Environment - Market volatility and strong economic crosscurrents characterized the markets for the 10 months since this Fund was started. Overall, demand for small-cap stocks was strong, with the Russell 2000 Index up almost 15% for the period. Significant funds flowed into the small-cap sector earlier in the period, driving small-cap share prices higher. A large amount of those funds were invested in Exchange Traded Funds, which created higher demand for the illiquid, low-quality, speculative stocks in the Index. This made it difficult for active managers to outperform the Index as those poorer quality stocks drove the Index. Our portfolio, which is focused on high-quality stocks, tends to lag in that type of environment.
Also affecting performance was sector selection, which was slightly negative during the period, and stock selection, which accounted for most of the Fund’s relative underperformance. Among the stocks that contributed positively to performance were a digital sign manufacturer that continues to benefit from growing demand for digital billboards and a wire company benefiting from growth in commercial construction and new building regulation. In addition, both a GPS company that focuses on the commercial market and an off-price retailer that recently brought in new management reported strong quarters and added to the Fund’s performance. Stocks that hurt performance included a company that was under investigation by Spanish authorities and a coal producer that has suffered from higher labor costs and missed earnings several quarters in a row.
Outlook - We expect market conditions to remain fairly stable in the coming months. The spread of inflation from Energy and Commodity sectors to the broader economy continues to be a risk, but the containment of wage inflation due to global competition and technology serves as an important counterbalance. We expect economic growth to moderate to a more sustainable pace, which should also relieve some inflationary pressure. Small-cap relative valuations remain high, but growth appears more attractive than value. We will continue to seek companies with strong growth prospects that are underappreciated by the market. We have confidence that our disciplined strategy of bottom-up, fundamentally-driven stock picking will outperform over a full market cycle.
The views expressed are those of the portfolio manager as of August 31, 2006, and are subject to change based on market and other conditions.
| PERFORMANCE TABLE1 | Average Annual Total Return | | | Cumulative Total Return | |
|
| | | | | Since | | | | Since |
| Periods Ended August 31, 2006 | 1-year | 5-year | 10-year | inception | 1-year | 5-year | 10-year | inception2 |
|
| Small Cap Class 1 (began 10/15/05) | — | — | — | — | — | — | — | 3.09% |
| Small Cap Class NAV (began 10/15/05) | — | — | — | — | — | — | — | 3.16% |
| Russell 2000 Index3,4,5 | — | — | — | — | — | — | — | 14.94% |
1 Performance does not reflect the deduction of taxes on fund distributions or redemptions of fund shares. Past performance does not predict future performance.
2 Current subadviser has managed the fund since October 15, 2005.
3 Since inception returns for the indices may begin on the month-end closest to the actual inception date of the fund.
4 Russell 2000 Index is an unmanaged index composed of 2,000 U.S. small capitalization stocks.
5 It is not possible to invest directly in an index. Index figures do not reflect sales charges and would be lower if they did.
43
Small Cap Index Fund
Subadviser: MFC Global Investment Management (U.S.A.) Limited
Portfolio Managers: Carson Jen and Narayan Ramani
INVESTMENT OBJECTIVE & POLICIES - To seek to approximate the aggregate total return of a small cap U.S. domestic equity market index. Invests, under normal market conditions, at least 80% of its net assets (plus any borrowings for investment purposes) in (a) the common stocks that are included in the Russell 2000 Index and (b) securities (which may or may not be included in the Russell 2000 Index) that MFC Global (U.S.A.) believes as a group will behave in a manner similar to the index.
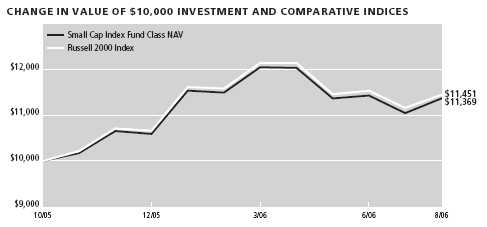
| Sector Weighting* | % of Total |
|
| Financial | 21.30 |
| Consumer, Non-cyclical | 18.50 |
| Consumer, Cyclical | 13.04 |
| Industrial | 12.59 |
| Technology | 9.54 |
| Communications | 9.26 |
| Energy | 5.17 |
| Basic Materials | 3.45 |
| Utilities | 2.92 |
| Government | 2.63 |
*Top Sectors as a percentage of market value. Does not include short-term securities and investments in the State Street Navigator Securities Lending Prime Portfolio.
PORTFOLIO MANAGER’S COMMENTARY
Performance - Since its inception in October 2005, the Small Cap Index Fund returned +13.69%, underperforming the +14.51% return of the Russell 2000 Index.
Environment - The U.S. economy seems to be slowing down, with growth in the gross domestic product (GDP) declining from a 5.6% gain in the first quarter of 2006 to just 2.5% in the second quarter. Recent data show inflation to be at an 11-year high. Core inflation has risen 2.4% in the past 12 months.
After 17 consecutive interest rate increases, the Federal Reserve paused and kept the benchmark rate at 5.25% in August. However, Board Chairman Ben Bernanke did not rule out further increases in 2006.
Job growth picked up in August and the unemployment rate approached a five-year low at 4.7%, down from 4.8% in July, and U.S. employers added 128,000 workers to their payrolls, up from a revised 121,000 in July. The Conference Board’s Consumer Confidence Index dropped to 99.6 in August from 107.0 in July. The index is at its lowest level this year.
For the year, Materials & Processing and Other were the best performing sectors, returning 19.0% and 17.7%, respectively; Other Energy and Consumer Discretionary were the worst performers, returning 2.2% and 2.6%, respectively.
Outlook - The economy continues to grow modestly, with growth expectations around 2.6% for the second half of this year and 2.7% in 2007. In the short term, consumer spending is expected to slow down in the face of higher gasoline prices and higher interest rates. It appears that the Fed is at the end of its current tightening cycle, with fewer signs of price pressures and a cooling economy.
The views expressed are those of the portfolio manager as of August 31, 2006, and are subject to change based on market and other conditions.
| PERFORMANCE TABLE1,4 | Average Annual Total Return | | | Cumulative Total Return | |
|
| | | | | Since | | | | Since |
| Periods Ending August 31, 2006 | 1-year | 5-year | 10-year | inception | 1-year | 5-year | 10-year | inception2 |
|
| Small Cap Index Fund Class NAV (began 10/29/05) | — | — | — | — | — | — | — | 13.69% |
| Russell 2000 Index3,5,6 | — | — | — | — | — | — | — | 14.51% |
1 Performance does not reflect the deduction of taxes on fund distributions or redemptions of fund shares. Past performance does not predict future performance.
2 Current subadviser has managed the fund since October 29, 2005.
3 Since inception returns for the indices may begin on the month-end closest to the actual inception date of the fund.
4 Since inception, a portion of the Small Cap Index Fund expenses were reimbursed. If such expenses had not been reimbursed, returns would be lower.
5 Russell 2000 Index is an unmanaged index composed of 2,000 U.S. small capitalization stocks.
6 It is not possible to invest directly in an index. Index figures do not reflect sales charges and would be lower if they did.
44
Small Cap Opportunities Fund
Subadviser: Munder Capital Management
Portfolio Managers: Robert E. Crosby, Julie R. Hollinshead and John P. Richardson
INVESTMENT OBJECTIVE & POLICIES - To achieve long-term capital appreciation by investing, under normal circumstances, at least 80% of its net assets in smaller-capitalization companies that the managers believe are undervalued but have stable or improving earnings records and sound finances. Small-capitalization companies generally have a market capitalization below $1.5 billion at the time of purchase.

| Sector Weighting* | % of Total |
|
| Financial | 24.56 |
| Industrial | 14.19 |
| Consumer, Cyclical | 14.16 |
| Energy | 6.69 |
| Consumer, Non-cyclical | 4.81 |
| Technology | 4.20 |
| Communications | 2.61 |
| Basic Materials | 2.37 |
| Utilities | 0.93 |
*Top Sectors as a percentage of market value. Does not include short-term securities and investments in the State Street Navigator Securities Lending Prime Portfolio.
PORTFOLIO MANAGER’S COMMENTARY
Performance - Since its inception in October 2005, the Small Cap Opportunities Fund returned +9.09%, underperforming the +18.63% return of the Russell 2000 Value Index.
Environment - The stock market rallied during the last two months of 2005, reflecting increased consumer confidence and continued good earnings growth, and the Fund participated in this rebound. Good stock selection in the Financial, Industrials, Consumer Discretionary and Utilities sectors offset weak stock selection in Information Technology.
The portfolio had good absolute returns for the first quarter of 2006, but lagged the strong performance of the Russell 2000 Value Index. The portfolio’s focus is driven by stock selection, with an emphasis on stocks with high profitability levels and below-average valuations. Unfortunately, these characteristics were not rewarded during the first quarter of the year, as more volatile stocks with low profitability and a lack of earnings were the top performers. During the second quarter, the portfolio bettered its benchmark. The period was a volatile one for small-cap stocks, with leadership changing as small-cap stocks corrected following several quarters of strong relative performance. For July and August, the largest detractors to relative performance were in the Industrials, Information Technology and Consumer Discretionary sectors. Building products, auto parts & equipment and Internet software & services stocks were the main laggards.
Overall, most of the Fund’s relative underperformance from November 2005 through August 2006 was due to the decline in our positions in home-builders and their suppliers. While we anticipated some negative investor sentiment towards these stocks, we were surprised by how quickly and dramatically performance of these stocks shifted.
The Fund remains overweighted in homebuilder and homebuilder supplier stocks. However, our exposure is smaller than six months ago. These companies are still executing well, but appear to be suffering from continued negative news flow and investor sentiment. We believe that over the next six months stock prices will better reflect the solid fundamentals of these stocks.
While we remain overweight, we have reduced reduced our exposure in mortgage companies and mortgage REITs (real estate investment trusts). Most of our mortgage REIT holdings are commercial mortgage REITs, and are not exposed to the residential side. We also reduced our residential mortgage REIT exposure, and we believe we own the best companies in the group.
The views expressed are those of the portfolio manager as of August 31, 2006, and are subject to change based on market and other conditions.
| PERFORMANCE TABLE1 | Average Annual Total Return | | | Cumulative Total Return | |
|
| | | | | Since | | | | Since |
| Periods Ended August 31, 2006 | 1-year | 5-year | 10-year | inception | 1-year | 5-year | 10-year | inception2 |
|
| Small Cap Opportunities Class 1 (began 10/15/05) | — | — | — | — | — | — | — | 9.04% |
| Small Cap Opportunities Class NAV (began 10/15/05) | — | — | — | — | — | — | — | 9.09% |
| Russell 2000 Value Index3,4,5 | — | — | — | — | — | — | — | 18.63% |
1 Performance does not reflect the deduction of taxes on fund distributions or redemptions of fund shares. Past performance does not predict future performance.
2 Current subadviser has managed the fund since October 15, 2005.
3 Since inception returns for the indices may begin on the month-end closest to the actual inception date of the fund.
4 Russell 2000 Value Index is an unmanaged index that measures the performance of those Russell 2000 companies with lower price-to-book ratios and lower forecasted growth values.
5 It is not possible to invest directly in an index. Index figures do not reflect sales charges and would be lower if they did.
45
Small Company Fund
Subadviser: American Century Investment Management, Inc.
Portfolio Managers: Matti Von Turk, William Martin and Thomas Vaiana
INVESTMENT OBJECTIVE & POLICIES - To seek to achieve long-term capital growth by investing primarily in the common stock of U.S. small companies. The Fund manages risk by broadly diversifying its investments based on the S&P SmallCap 600 Index.
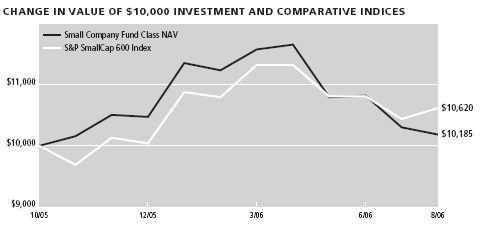
| Sector Weighting* | % of Total |
|
| Consumer, Non-cyclical | 16.01 |
| Consumer, Cyclical | 14.03 |
| Industrial | 12.64 |
| Financial | 12.35 |
| Technology | 8.34 |
| Basic Materials | 5.24 |
| Energy | 5.01 |
| Communications | 3.49 |
| Utilities | 2.51 |
*Top Sectors as a percentage of market value. Does not include short-term securities and investments in the State Street Navigator Securities Lending Prime Portfolio.
PORTFOLIO MANAGER’S COMMENTARY
Performance - Since its inception in October 2005, the Small Company Fund returned +1.85%, underperforming the +6.20% return of the S&P SmallCap 600 Index.
Environment - The U.S. stock market rallied during the reporting period. Although rising commodity prices and higher interest rates weighed on investor confidence, stocks enjoyed a boost from the healthy U.S. economy and continued strength in corporate earnings growth. Small-cap stocks posted solid gains that were in line with the broader market. Within the portfolio, the most economically-sensitive sectors — Energy, Industrials and Utilities — contributed the most to absolute performance. Information Technology stocks and consumer-oriented issues were the only segments of the portfolio to decline. The Fund underperformed its benchmark index because of disappointing stock selection in every market sector, most notably Information Technology and Financials. Stock choices among electronic equipment manufacturers and software makers de tracted the most in the Technology sector, while real estate investment trusts and commercial banks weighed on results in the Financial sector. On the positive side, stock selection proved more favorable in the Telecommunications Services sector, particularly among wireless providers, and among oil producers in the Energy sector.
Outlook - As always, we will remain true to our disciplined investment approach, building a portfolio of smaller companies that we believe provides an optimal balance between risk and expected return.
The views expressed are those of the portfolio manager as of August 31, 2006, and are subject to change based on market and other conditions.
| PERFORMANCE TABLE1 | Average Annual Total Return | | | Cumulative Total Return | |
|
| | | | | Since | | | | Since |
| Periods Ended August 31, 2006 | 1-year | 5-year | 10-year | inception | 1-year | 5-year | 10-year | inception2 |
|
| Small Company Class 1 (began 10/15/05) | — | — | — | — | — | — | — | 1.78% |
| Small Company Class NAV (began 10/15/05) | — | — | — | — | — | — | — | 1.85% |
| Standard & Poors Small Cap 600 Index3,4,5 | — | — | — | — | — | — | — | 6.20% |
1 Performance does not reflect the deduction of taxes on fund distributions or redemptions of fund shares. Past performance does not predict future performance.
2 Current subadviser has managed the fund since October 15, 2005.
3 Since inception returns for the indices may begin on the month-end closest to the actual inception date of the fund.
4 Standard & Poors Small Cap 600 Index is an unmanaged index composed of 600 U.S. small-sized companies.
5 It is not possible to invest directly in an index. Index figures do not reflect sales charges and would be lower if they did.
46
Small Company Growth Fund
Subadviser: AIM Capital Management, Inc.
Portfolio Managers: Juliet S. Ellis
INVESTMENT OBJECTIVE & POLICIES - To seek long-term growth of capital. To pursue this goal, the Fund normally invests at least 80% of its assets in securities of small-capitalization companies. The Fund considers a company to be a small-capitalization company if it has a market capitalization, at the time of purchase, no larger than the largest capitalized company included in the Russell 2000 Index during the most recent 11-month period (based on month-end data) plus the most recent data during the current month.
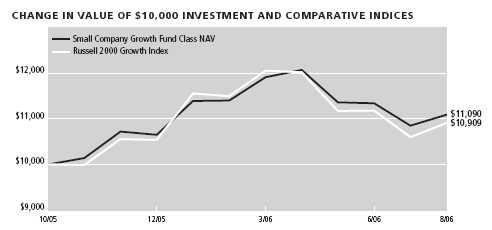
| Sector Weighting* | % of Total |
|
| Consumer, Non-cyclical | 23.70 |
| Technology | 17.32 |
| Industrial | 15.30 |
| Consumer, Cyclical | 13.84 |
| Energy | 9.31 |
| Financial | 8.71 |
| Communications | 8.20 |
| Basic Materials | 0.89 |
| Utilities | 0.78 |
*Top Sectors as a percentage of market value. Does not include short-term securities and investments in the State Street Navigator Securities Lending Prime Portfolio.
PORTFOLIO MANAGER’S COMMENTARY
Performance - Since its inception in October 2005, the Small Company Growth Fund returned +10.90%, outperforming the +9.09% return of the Russell 2000 Growth Index.
Environment - Despite widespread concern about the impact of rising short-term interest rates, high energy prices, a housing bubble and the long-term economic effects of the Gulf Coast hurricanes of 2005, the equity markets generated positive returns. Under its new chairman Ben Bernanke, the Federal Reserve continued raising the federal funds rate, to 5.25%; however, in August, the Fed paused for the first time in 2 years. Positive performance in the Russell 2000 Growth Index was broad-based, with the highest returns in the Utilities, Consumer Staples and Materials sectors.
The Fund outperformed the benchmark in Industrials, Consumer Discretionary and Energy. Outperformance in Industrials was driven by strong stock selection across several industries that benefited from global economic expansion. In the Consumer Discretionary sector, strong stock selection and an underweight position helped, as many consumer-related stocks struggled due to concerns about the impact of higher interest rates and energy prices. However, some holdings held up in this environment, including those in household durables and hotels/restaurants/leisure. The Energy sector experienced wide swings, but finished the period with gains. The Fund benefited from strong selection in energy equipment and services stocks.
The Fund underperformed its benchmark index in the Information Technology and Health Care sectors. In Information Technology, the portfolio had poor stock selection in communications equipment, computers and peripherals, and IT services stocks. In Health Care, underperformance was due largely to poor selection in biotechnology stocks and an overweight in health care technology stocks, a weak performing area.
Outlook - We believe that growth stocks are poised to outperform. Many of them continue to trade at reasonable valuations relative to value stocks, as well as to expected growth rates, and the current economic environment is favorable for the stock prices of companies that can deliver above-average earnings growth. This environment has created an opportunity to buy companies with superior growth prospects at unusually modest prices.
The fund is positioned to benefit from global economic growth, although we maintain significant positions in relatively defensive growth stocks as the economic cycle shows signs of maturing.
The views expressed are those of the portfolio manager as of August 31, 2006, and are subject to change based on market and other conditions.
| PERFORMANCE TABLE1 | Average Annual Total Return | | | Cumulative Total Return | |
|
| | | | | Since | | | | Since |
| Periods Ended August 31, 2006 | 1-year | 5-year | 10-year | inception | 1-year | 5-year | 10-year | inception2 |
|
| Small Company Growth Class NAV (began 10/29/05) | — | — | — | — | — | — | — | 10.90% |
| Russell 2000 Growth Index3,4,5 | — | — | — | — | — | — | — | 9.09% |
1 Performance does not reflect the deduction of taxes on fund distributions or redemptions of fund shares. Past performance does not predict future performance.
2 Current subadviser has managed the fund since October 29, 2005.
3 Since inception returns for the indices may begin on the month-end closest to the actual inception date of the fund.
4 Russell 2000 Growth Index is an unmanaged index that contains those securities from the Russell 2000 Index with a greater than average growth orientation.
5 It is not possible to invest directly in an index. Index figures do not reflect sales charges and would be lower if they did.
47
Small Company Value Fund
Subadviser: T. Rowe Price Associates, Inc.
Portfolio Manager: Preston G. Athey
INVESTMENT OBJECTIVE & POLICIES - To seek long-term growth of capital by investing at least 80% of its net assets in companies with market capitalizations that do not exceed the maximum market capitalization of any security in the Russell 2000 Index at the time of purchase. Portfolio securities are also selected by what T. Rowe Price believes to be undervalued companies that have good prospects for capital appreciation.
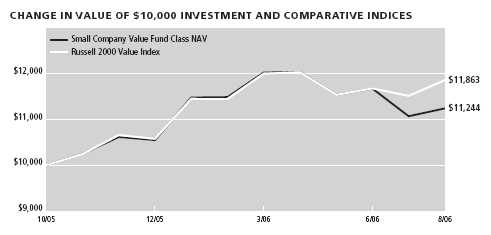
| Sector Weighting* | % of Total |
|
| Industrial | 19.07 |
| Financial | 16.43 |
| Consumer, Non-cyclical | 10.48 |
| Consumer, Cyclical | 8.51 |
| Energy | 7.65 |
| Basic Materials | 6.67 |
| Technology | 3.46 |
| Utilities | 2.95 |
| Communications | 2.65 |
| Funds | 0.57 |
*Top Sectors as a percentage of market value. Does not include short-term securities and investments in the State Street Navigator Securities Lending Prime Portfolio.
PORTFOLIO MANAGER’S COMMENTARY
Performance - Since its inception in October 2005, the Small Company Value Fund returned +12.44%, underperforming the +18.63% return of the Russell 2000 Value Index.
Environment - The Fund’s significant underweight in financials, combined with stock selection, helped relative performance as the sector was pressured by rising interest rates. Stock selection in real estate and commercial banks was the primary reason for outperformance.
Good stock selection in health care, particularly in biotechnology and health care equipment and supplies, also helped relative returns. We have marginal overweight positions in every health care industry except pharmaceuticals (where we currently have no holdings) and biotechnology (where we maintain a large overweight). While we are only slightly overweight in the health care sector as a whole, most of this overweight is concentrated in the biotechnology industry, which was helpful during the period.
Stock selection in industrials and business services was the biggest detractor from relative performance by some margin as many strong performers in recent years pulled back in response to signs of slowing economic growth. Machinery holding JLG Industries, a maker of aerial lifts and construction equipment, was a particularly large detractor. Shares were sold off despite the company’s announcement of earnings that beat estimates and offering higher guidance for future results. Stock selection in air freight and logistics also hurt. UTi Worldwide, a provider of air and ocean freight and logistics services, lowered guidance for the year due to a large information technology project and increased staffing costs and expenses related to a recent acquisition.
Stock selection in materials also detracted, although this was mitigated by the positive contribution of our large overweight position. Holdings in construction materials companies detracted due to the slowdown in the residential housing market. Florida Rock Industries, a cement and concrete company, announced earnings that came in below estimates and suffered from concern that the housing slowdown will be particularly steep in its home state. We remain overweight in all industries within materials as the sector is poised to benefit from the strong global economy.
Outlook - While we expect investor sentiment to remain negative for some time toward home-builders, restaurants, and other areas tied to the consumer, we are finding what we perceive to be bargains in these areas. In the meantime, we are optimistic that the longer-term favorable performance of our industrials and business services, energy, and materials holdings will continue as the capital goods cycle progresses and companies expand production capacity.
The views expressed are those of the portfolio manager as of August 31, 2006, and are subject to change based on market and other conditions.
| PERFORMANCE TABLE1,4 | Average Annual Total Return | | | Cumulative Total Return | |
|
| | | | | Since | | | | Since |
| Periods Ended August 31, 2006 | 1-year | 5-year | 10-year | inception | 1-year | 5-year | 10-year | inception2 |
|
| Small Company Value Class 1 (began 10/15/05) | — | — | — | — | — | — | — | 12.41% |
| Small Company Value Class NAV (began 10/15/05) | — | — | — | — | — | — | — | 12.44% |
| Russell 2000 Value Index3,5,6 | — | — | — | — | — | — | — | 18.63% |
1 Performance does not reflect the deduction of taxes on fund distributions or redemptions of fund shares. Past performance does not predict future performance.
2 Current subadviser has managed the fund since October 15, 2005.
3 Since inception returns for the indices may begin on the month-end closest to the actual inception date of the fund.
4 Since inception, a portion of the Small Company Value expenses were reimbursed. If such expenses had not been reimbursed, returns would be lower.
5 Russell 2000 Value Index is an unmanaged index that measures the performance of those Russell 2000 companies with lower price-to-book ratios and lower forecasted growth values.
6 It is not possible to invest directly in an index. Index figures do not reflect sales charges and would be lower if they did.
48
Special Value Fund
Subadviser: Salomon Brothers Asset Management Inc.
Portfolio Manager: Peter J. Hable
INVESTMENT OBJECTIVE & POLICIES - To seek to achieve long-term growth of capital by investing in the common stock and other equity securities of smaller-capitalized U.S. companies believed to be undervalued.
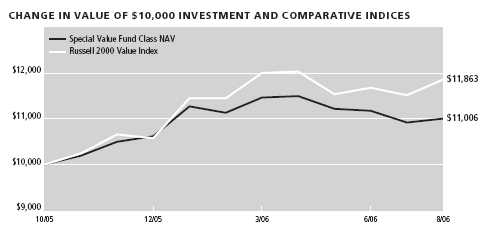
| Sector Weighting* | % of Total |
|
| Financial | 17.72 |
| Industrial | 17.04 |
| Consumer, Cyclical | 8.49 |
| Consumer, Non-cyclical | 8.43 |
| Funds | 4.62 |
| Technology | 4.23 |
| Energy | 3.66 |
| Communications | 2.86 |
| Basic Materials | 1.09 |
| Utilities | 0.98 |
*Top Sectors as a percentage of market value. Does not include short-term securities and investments in the State Street Navigator Securities Lending Prime Portfolio.
PORTFOLIO MANAGER’S COMMENTARY
Performance - Since its inception in October 2005, the Special Value Fund returned +10.06%, underperforming the +18.63% return of the Russell 2000 Value Index.
Environment - The market for small-capitalization stocks this year was characterized by speculative performance from companies with the poorest balance sheets and no earnings. This was concentrated in three sectors: Technology, Basic Materials and Health Care. Given our focus on companies with high returns on invested capital, healthy balance sheets and strong free cash flow, this speculative rally left the Fund trailing its benchmark in 2006.
With the twin taxes of rising short-term interest rates and higher energy prices slowing the economy, we positioned the portfolio defensively. The Fund was underweighted in Technology, Consumer Discretionary and Basic Materials stocks, which tend to suffer the most as the economy slows. Except for the speculative move in poor-quality Technology and Basic Materials companies mentioned above, this positioning served the Fund well.
The portfolio’s five largest sectors as of August 31, 2006, were Financials (31.23%), Industrials (25.71%), Consumer Discretionary (12.86%), Information Technology (12.40%) and Health Care (6.70%) .
Outlook - We have had a defensive stance with our Financials sector weighting. Our concern with Financials was driven by a flatter yield curve compressing net interest margins and lowering earnings for banks, increased real estate loan exposure with decreased loan loss reserves in a speculative real estate market and rich valuations for small bank stocks in general. Currently, there is an unprecedented $1 trillion-dollar inventory of unsold homes. That leads us to believe we are entering the difficult part of the credit cycle. In time, the Federal Reserve will ride to the rescue, but it may be after many small banks experience a hard landing.
The outperformance of small stocks relative to large stocks over the last six years has eliminated the valuation gap that existed between capitalizations and it has left most small-cap stocks trading at a premium. Selectively, attractive small-cap valuations have appeared as rising short-term interest rates and rising energy prices slowed the economy. As better valuations present themselves, we will move away from our defensive stance.
The views expressed are those of the portfolio manager as of August 31, 2006, and are subject to change based on market and other conditions.
| PERFORMANCE TABLE1,4 | Average Annual Total Return | | | Cumulative Total Return | |
|
| | | | | Since | | | | Since |
| Periods Ended August 31, 2006 | 1-year | 5-year | 10-year | inception | 1-year | 5-year | 10-year | inception2 |
|
| Special Value Class 1 (began 10/15/05) | — | — | — | — | — | — | — | 9.91% |
| Special Value Class NAV (began 10/15/05) | — | — | — | — | — | — | — | 10.06% |
| Russell 2000 Value Index3,4,5 | — | — | — | — | — | — | — | 18.63% |
1 Performance does not reflect the deduction of taxes on fund distributions or redemptions of fund shares. Past performance does not predict future performance.
2 Current subadviser has managed the fund since October 15, 2005.
3 Since inception returns for the indices may begin on the month-end closest to the actual inception date of the fund.
4 Russell 2000 Value Index is an unmanaged index that measures the performance of those Russell 2000 companies with lower price-to-book ratios and lower forecasted growth values.
5 It is not possible to invest directly in an index. Index figures do not reflect sales charges and would be lower if they did.
49
Spectrum Income Fund
Subadviser: T. Rowe Price Associates, Inc.
Portfolio Managers: Edmund N. Notzon, III
INVESTMENT OBJECTIVE & POLICIES - The Spectrum Income Fund seeks a high level of current income with moderate share price fluctuation. The Fund normally invests in a diversified portfolio of domestic and international government, corporate and mortgage-backed bonds. The Fund will also seek equity income through investments in dividend-paying stocks.
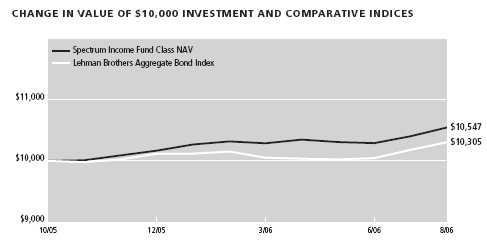
| Sector Weighting* | % of Total |
|
| Mortgage Securities | 22.22 |
| Government | 17.75 |
| Financial | 8.31 |
| Communications | 7.71 |
| Consumer, Non-cyclical | 5.62 |
| Energy | 4.71 |
| Industrial | 4.51 |
| Consumer, Cyclical | 4.16 |
| Utilities | 2.81 |
| Asset Backed Securities | 2.04 |
*Top Sectors as a percentage of market value. Does not include short-term securities and investments in the State Street Navigator Securities Lending Prime Portfolio.
PORTFOLIO MANAGER’S COMMENTARY
Performance - Since its inception in October 2005, the Spectrum Income Fund returned +5.47%, outperforming the +3.05% return of the LB Aggregate Bond Index.
Environment - All major segments of the fixed-income markets posted positive total returns for the period beginning October 31, 2005 and ending August 31, 2006, despite a rise in the general level of interest rates. The period began with the Federal Reserve raising the targeted fed funds rate an expected 0.25% to 4.00% on November 1. Five more rate hikes would follow, causing a corresponding rise in short-term rates. The three-month Treasury bill ended the period with a yield of 5.04%, according to Bloomberg, compared to a 3.88% yield on October 31. Long-term yields rose at a more-modest pace on investor confidence that the Fed would keep inflation in check. The differing yield increase between the short-term and long-term parts of the Treasury curve resulted in a rare yield curve inversion in December 2005, with two-year Treasuries yielding more than 10-year Treasuries. The yield curve flattened in early 2006 and then inverted again in the summer.
The fixed-income markets rallied strongly in August, as the Federal Reserve held the targeted fed funds rate steady after its August 8th meeting amid evidence that economic growth was moderating. The Fed’s decision to pause in its tightening campaign after seventeen consecutive quarter-point rate increases indicates that the regime of Fed Chairman Ben Bernanke is willing to set policy based on the expectation of continued inflationary pressures subsiding in the future due to the lagged cumulative effect of past monetary policy actions. The rally pushed the 10-year Treasury yield to 4.73%, its lowest level since March 2006.
The Lehman Brothers U.S. Aggregate Bond Index returned 3.59% for the period, aided by strong returns for mortgage-backed securities. Among non-index markets, both high-yield bonds and emerging-market bonds outperformed the Lehman Aggregate sectors, though investors’ risk tolerance varied sharply during the period, as rising geopolitical risk and rate uncertainty caused a sell-off of riskier assets in the latter half of the second quarter. By July, however, the increasing probability of a Fed pause led to a softening of the previous risk-averse sentiment.
Outlook - The economic expansion has continued at a somewhat milder pace and is likely to be restrained through the second half of 2006. We believe the Fund’s broad diversification will serve our shareholders well in the coming months.
The views expressed are those of the portfolio manager as of August 31, 2006, and are subject to change based on market and other conditions.
| PERFORMANCE TABLE1,4 | Average Annual Total Return | | | Cumulative Total Return | |
|
| | | | | Since | | | | Since |
| Periods Ended August 31, 2006 | 1-year | 5-year | 10-year | inception | 1-year | 5-year | 10-year | inception2 |
|
| Spectrum Income Class NAV (began 10/29/05) | — | — | — | — | — | — | — | 5.47% |
| Lehman Brothers Aggregate Bond Index3,5,6 | — | — | — | — | — | — | — | 3.05% |
1 Performance does not reflect the deduction of taxes on fund distributions or redemptions of fund shares. Past performance does not predict future performance.
2 Current subadviser has managed the fund since October 29, 2005.
3 Since inception returns for the indices may begin on the month-end closest to the actual inception date of the fund.
4 Since inception, a portion of the Spectrum Income Fund expenses were reimbursed. If such expenses had not been reimbursed, returns would be lower.
5 Lehman Brothers Aggregate Bond Index is an unmanaged index of dollar-denominated and nonconvertible investment-grade debt issues.
6 It is not possible to invest directly in an index. Index figures do not reflect sales charges and would be lower if they did.
50
Strategic Bond Fund
Subadviser: Western Asset Management Company
Portfolio Managers: Ken Leech, Steve Walsh, Keith Gardner, Matt Duda and Mike Buchanon
INVESTMENT OBJECTIVE & POLICIES - To seek to achieve a high level of total return, consistent with preservation of capital, by investing the Fund’s assets in five segments of the fixed-income market: (i) U.S. government obligations, (ii) investment-grade domestic corporate fixed-income securities, (iii) high yield corporate fixed-income securities, (iv) mortgage-backed and asset-backed securities and (v) investment-grade and high yield international fixed-income securities.
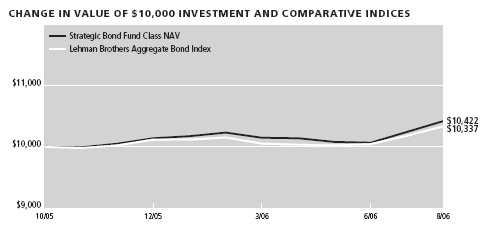
| Sector Weighting* | % of Total |
|
| Mortgage Securities | 30.95 |
| Government | 11.50 |
| Financial | 10.04 |
| Asset Backed Securities | 7.76 |
| Energy | 4.77 |
| Communications | 4.32 |
| Utilities | 4.10 |
| Industrial | 4.04 |
| Consumer, Cyclical | 2.50 |
| Consumer, Non-cyclical | 1.59 |
*Top Sectors as a percentage of market value. Does not include short-term securities and investments in the State Street Navigator Securities Lending Prime Portfolio.
PORTFOLIO MANAGER’S COMMENTARY
Performance - Since its inception in October 2005, the Strategic Bond Fund returned +4.22%, outperforming the +3.37% return of the LB Aggregate Bond Index.
Environment - Interest rates moved broadly higher across the yield curve, driven by a tighter-than-expected Federal Reserve, stronger-than-expected economy, and a modest increase in inflation expectations. Short-term rates rose much more than long-term rates, leaving the yield curve substantially flat, but mildly inverted in the short end. The Fed raised its target funds rate by 0.25% at seven of its eight meetings, exceeding market expectations. The Fed paused at its August meeting, as it adopted a wait-and-see attitude to judge the extent to which the housing slowdown would affect the rest of the economy. Ben Bernanke replaced Alan Greenspan as Fed Chairman, but he gave no indication of any significant shift in monetary policy.
The economy bounced back strongly from its weak showing in the fourth quarter of 2005, with growth of more than 5% in the first quarter, but slowed to 2.9% growth in the second quarter. Headline inflation rose to the 3.5 –4.5% range, core inflation drifted higher to the 2.5 –3.0% range. Inflation concerns were fueled by gains in gold, industrial commodity and energy prices, and a decline in the dollar against most major currencies. The economy displayed some very solid fundamentals, as corporate profits exceeded expectations, and federal and state revenues registered some of the strongest gains in real terms (adjusting for inflation) in history.
Nevertheless, the housing market showed signs of a spreading slowdown, which gave rise to the widely held perception that the overall economy would likely slow enough to reduce inflation pressures and allow the Fed to end its tightening cycle.
Outlook - Our outlook calls for continued moderate growth and relatively contained inflation. We are positioned with the expectation that there will be no significant changes in key macro-economic variables, but we also have strategies in place that are designed to hedge against unexpected economic weakness and higher-than-expected inflation.
The views expressed are those of the portfolio manager as of August 31, 2006, and are subject to change based on market and other conditions.
| PERFORMANCE TABLE1 | Average Annual Total Return | | | Cumulative Total Return | |
|
| | | | | Since | | | | Since |
| Periods Ending August 31, 2006 | 1-year | 5-year | 10-year | inception | 1-year | 5-year | 10-year | inception2 |
|
| Strategic Bond Class 1 (began 10/15/05) | — | — | — | — | — | — | — | 4.18% |
| Strategic Bond Class NAV (began 10/15/05) | — | — | — | — | — | — | — | 4.22% |
| Lehman Brothers Aggregate Bond Index3,4,5 | — | — | — | — | — | — | — | 3.37% |
1 Performance does not reflect the deduction of taxes on fund distributions or redemptions of fund shares. Past performance does not predict future performance.
2 Current subadviser has managed the fund since April 28, 2006.
3 Since inception returns for the indices may begin on the month-end closest to the actual inception date of the fund.
4 Lehman Brothers Aggregate Bond Index is an unmanaged index of dollar-denominated and nonconvertible investment-grade debt issues.
5 It is not possible to invest directly in an index. Index figures do not reflect sales charges and would be lower if they did.
51
Strategic Income Fund
Subadviser: Sovereign Asset Management LLC
Portfolio Managers: Barry Evans, Daniel Samuel Janis and John Iles
INVESTMENT OBJECTIVE & POLICIES - The Fund seeks high current income through investing, under normal market conditions, primarily in foreign government and corporate debt securities from developed and emerging markets; U.S. Government and agency securities; and U.S. high yield bonds.
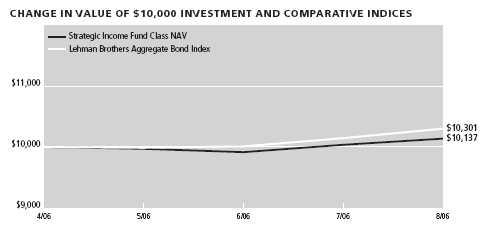
| Sector Weighting* | % of Total |
|
| Government | 49.51 |
| Financial | 5.39 |
| Funds | 5.26 |
| Mortgage Securities | 4.43 |
| Communications | 2.86 |
| Energy | 2.78 |
| Consumer, Cyclical | 2.76 |
| Basic Materials | 2.23 |
| Consumer, Non-cyclical | 2.18 |
| Industrial | 2.14 |
*Top Sectors as a percentage of market value. Does not include short-term securities and investments in the State Street Navigator Securities Lending Prime Portfolio.
PORTFOLIO MANAGER’S COMMENTARY
Performance - Since its inception in October 2005, the Strategic Income Fund returned +1.37%, underperforming the +3.01% return of the LB Aggregate Bond Index.
Environment - U.S. dollar-bloc government bonds generally posted gains during the period amid soft economic data and a growing sense that the Federal Reserve would pause in its more than two-year-long campaign to raise interest rates. European government bonds also finished higher, in part due to a reinforced sense that the Fed would pause and also to reports suggesting a slowing economy in Europe. Elsewhere, continued strong investor demand helped buoy high-yield bonds.
Since the Fund’s inception, we have worked to fully invest the assets based on our tri-sector model, targeting investments in the U.S. government, foreign and high-yield bond sectors. With the Fed continuing on a tightening path and credit spreads near historic lows, we maintained a lower-than-benchmark duration in our U.S. government allocation, and kept a reduced exposure to the U.S. high-yield sector. Bolstered by our belief that the U.S. dollar is in the midst of a multi-year decline relative to the major global currencies, we sought to add value to the portfolio via our exposure to the euro, the Canadian dollar and, to a lesser extent, the Japanese yen. We also concentrated on high-yield names with predictable cash flow that we believe can outperform in a variety of economic conditions, particularly those in the gaming, media and packaging industries.
Outlook - We’re comfortable with our emphasis on non-dollar denominated foreign government bonds, given our negative view of the U.S. dollar. We believe the American trade and current account deficits will remain large, which likely will prompt a resumption in a multi-year cyclical decline in the U.S. dollar. We are concerned that U.S. economic growth may be weaker going forward. Prior interest rate hikes, a weakening housing market and high energy prices are likely to put the brakes on the global economy at large. With yield spreads close to historic lows, we plan to maintain an underweight in high-yield and emerging market bonds. We plan to opportunistically add to our high-yield and emerging market holdings, but only when valuations warrant.
The views expressed are those of the portfolio manager as of August 31, 2006, and are subject to change based on market and other conditions.
| PERFORMANCE TABLE1 | Average Annual Total Return | | | Cumulative Total Return | |
|
| | | | | Since | | | | Since |
| Periods Ending August 31, 2006 | 1-year | 5-year | 10-year | inception | 1-year | 5-year | 10-year | inception2 |
|
| Strategic Income Class NAV (began 4/28/06) | — | — | — | — | — | — | — | 1.37% |
| Lehman Brothers Aggregate Bond Index3,4,5 | — | — | — | — | — | — | — | 3.01% |
1 Performance does not reflect the deduction of taxes on fund distributions or redemptions of fund shares. Past performance does not predict future performance.
2 Current subadviser has managed the fund since April 28, 2006.
3 Since inception returns for the indices may begin on the month-end closest to the actual inception date of the fund.
4 Lehman Brothers Aggregate Bond Index is an unmanaged index of dollar-denominated and nonconvertible investment-grade debt issues.
5 It is not possible to invest directly in an index. Index figures do not reflect sales charges and would be lower if they did.
52
Strategic Value Fund
Subadviser: MFS Investment Management
Portfolio Managers: Kenneth J. Enright and Alan Langsner
INVESTMENT OBJECTIVE & POLICIES - To seek capital appreciation. The Fund invests, under normal market conditions, at least 65% of its net assets in common stocks and related securities, such as preferred stock, convertible securities and depositary receipts, of companies which MFS believes are undervalued in the market relative to their long term potential.

| Sector Weighting* | % of Total |
|
| Communications | 20.91 |
| Financial | 18.23 |
| Consumer, Non-cyclical | 11.18 |
| Industrial | 10.94 |
| Technology | 8.06 |
| Energy | 8.04 |
| Consumer, Cyclical | 7.14 |
| Utilities | 2.96 |
| Basic Materials | 1.39 |
*Top Sectors as a percentage of market value. Does not include short-term securities and investments in the State Street Navigator Securities Lending Prime Portfolio.
PORTFOLIO MANAGER’S COMMENTARY
Performance - Since its inception in October 2005, the Strategic Value Fund returned +6.52%, underperforming the +17.45% return of the Russell 1000 Value Index.
Environment - Stock selection in the Technology, Utilities & Communications, Basic Materials and Industrial Goods & Services sectors held back performance relative to the Russell 1000 Value Index. In Technology, a telecommunications equipment maker, a security software company and a computer manufacturer detracted from relative results. In the Utilities & Communications sector, an independent power producer and a telecommunications service provider were a drag on performance. Within the Basic Materials sector, a package manufacturer and a newsprint maker hindered results. An industrial conglomerate was also among the Fund’s top relative detractors. Stocks in other sectors that hurt results included a health services provider and a home improvement products company.
Relative to the Fund’s benchmark, the Leisure sector was the top contributing sector to relative performance, bolstered by the Fund’s avoidance of a poor-performing media giant. Stock selection in the Financial Services sector also aided relative returns. Within this sector, holdings in several banking firms boosted results. Elsewhere, the fund’s positions in a pharmaceutical company, an office supply retailer, a consumer electronics retailer, an enterprise software company, and an electric power distributor helped results.
The views expressed are those of the portfolio manager as of August 31, 2006, and are subject to change based on market and other conditions.
| PERFORMANCE TABLE1 | Average Annual Total Return | | | Cumulative Total Return | |
|
| | | | | Since | | | | Since |
| Periods Ended August 31, 2006 | 1-year | 5-year | 10-year | inception | 1-year | 5-year | 10-year | inception2 |
|
| Strategic Value Class 1 (began 10/15/05) | — | — | — | — | — | — | — | 6.47% |
| Strategic Value Class NAV (began 10/15/05) | — | — | — | — | — | — | — | 6.52% |
| Russell 1000 Value Index3,4,5 | — | — | — | — | — | — | — | 17.45% |
1 Performance does not reflect the deduction of taxes on fund distributions or redemptions of fund shares. Past performance does not predict future performance.
2 Current subadviser has managed the fund since October 15, 2005.
3 Since inception returns for the indices may begin on the month-end closest to the actual inception date of the fund.
4 Russell 1000 Value Index is an unmanaged index containing those securities in the Russell 1000 Index with a less-than-average growth orientation.
5 It is not possible to invest directly in an index. Index figures do not reflect sales charges and would be lower if they did.
53
Total Return Fund
Subadviser: Pacific Investment Management Company
Portfolio Manager: William H. Gross
INVESTMENT OBJECTIVE & POLICIES - To seek to achieve maximum total return, consistent with preservation of capital and prudent investment management by investing primarily in a diversified portfolio of fixed income securities of varying maturities. The average portfolio duration will normally vary within a 3- to 6-year time frame based on PIMCO’s forecast for interest rates.

| Sector Weighting* | % of Total |
|
| Mortgage Securities | 42.44 |
| Government | 18.01 |
| Financial | 12.53 |
| Asset Backed Securities | 4.19 |
| Communications | 1.39 |
| Consumer, Cyclical | 0.68 |
| Consumer, Non-cyclical | 0.29 |
| Utilities | 0.24 |
| Energy | 0.21 |
| Technology | 0.17 |
*Top Sectors as a percentage of market value. Does not include short-term securities and investments in the State Street Navigator Securities Lending Prime Portfolio.
PORTFOLIO MANAGER’S COMMENTARY
Performance - Since its inception in October 2005, the Total Return Fund returned +3.18%, underperforming the +3.37% return of the LB Aggregate Bond Index.
Environment - For most of the period, the bond market was focused on the Federal Reserve’s tightening cycle. Market expectations of continued Fed tightening drove short-term rates higher and led to a significant flattening of the yield curve. The U.S. central bank raised the federal funds rate in quarter-point increments through June to 5.25% . In July, U.S. Treasury yields started to decline, based on evidence the U.S. economy was beginning to slow. Treasury yields continued their descent in August on reports of a housing slowdown, weaker inflation and rising unemployment. The Fed kept rates unchanged in August after 17 consecutive rate hikes since the tightening cycle began in June 2004.
The benchmark 10-year Treasury yield ended the period at 4.73%, 0.52% lower than the federal funds rate.
Broad diversification helped returns during a challenging environment. Above-index duration detracted from performance for most of the year, as interest rates rose. However, late in the period, above-index duration was a positive as interest rates fell due to weaker economic data. An overweight to shorter maturities hurt returns early in the period, but was a positive in July and August. An overweight to mortgages and coupon selection helped performance — and an underweight to corporate bonds hurt — as both sectors outperformed like-duration Treasuries. Exposure to emerging market bonds aided performance as credit premiums narrowed. Municipal securities helped returns, as they usually outperform when rates rise.
Outlook - Global economic growth appears strong but vulnerable. Robust U.S. consumption, massive Chinese investment spending and positive developments in Japan and emerging economies produced growth over the last year. This expansion prompted tightening by central banks to contain mild but accelerating inflation. Major central banks are embarked on an uncertain path of interest rate hikes that could, if pursued too aggressively, derail the global expansion. Inflation expectations should ease and the nominal yield curve should revert to a positive slope, as markets begin to anticipate Fed easing. Risk premiums and volatility should expand to more normal levels as central banks withdraw liquidity from markets.
The views expressed are those of the portfolio manager as of August 31, 2006, and are subject to change based on market and other conditions.
| PERFORMANCE TABLE1 | Average Annual Total Return | | | Cumulative Total Return | |
|
| | | | | Since | | | | Since |
| Periods Ending August 31, 2006 | 1-year | 5-year | 10-year | inception | 1-year | 5-year | 10-year | inception2 |
|
| Total Return Class 1 (began 10/15/05) | — | — | — | — | — | — | — | 3.14% |
| Total Return Class NAV (began 10/15/05) | — | — | — | — | — | — | — | 3.18% |
| Lehman Brothers Aggregate Bond Index3,4,5 | — | — | — | — | — | — | — | 3.37% |
1 Performance does not reflect the deduction of taxes on fund distributions or redemptions of fund shares. Past performance does not predict future performance.
2 Current subadviser has managed the fund since October 15, 2005.
3 Since inception returns for the indices may begin on the month-end closest to the actual inception date of the fund.
4 Lehman Brothers Aggregate Bond Index is an unmanaged index of dollar-denominated and nonconvertible investment-grade debt issues.
5 It is not possible to invest directly in an index. Index figures do not reflect sales charges and would be lower if they did.
54
U.S. Global Leaders Growth Fund
Subadviser: Sustainable Growth Advisers, LP
Portfolio Managers: George P. Fraise, Gordon M. Marchand and Robert L. Rohn
INVESTMENT OBJECTIVE & POLICIES - The Fund seeks long-term growth of capital. To pursue this goal, the Fund normally invests at least 80% of its assets in common stocks that managers regard as “U.S. Global Leaders.” The managers consider U.S. Global Leaders to typically exhibit the following characteristics: pricing flexibility, recurring revenues and global reach.
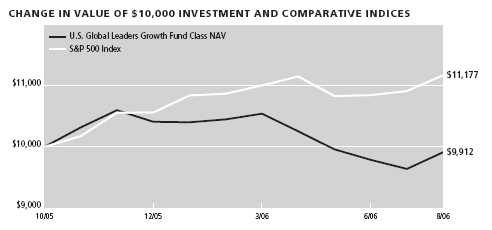
| Sector Weighting* | % of Total |
|
| Consumer, Non-cyclical | 43.49 |
| Technology | 17.19 |
| Consumer, Cyclical | 16.18 |
| Industrial | 7.75 |
| Financial | 7.37 |
| Communications | 6.31 |
*Top Sectors as a percentage of market value. Does not include short-term securities and investments in the State Street Navigator Securities Lending Prime Portfolio.
PORTFOLIO MANAGER’S COMMENTARY
Performance - Since its inception in October 2005, the U.S. Global Leaders Growth Fund returned –0.88%, underperforming the +11.77% return of the S&P 500 Index.
Environment - U.S. stocks rallied in the first half of 2006. A healthy economy and strong profit growth provided support for the market, but gains were muted by a sell-off late in the six-month period caused by higher inflation and rising interest rates. In the end, the major stock indexes posted gains of about 3%. Small-cap stocks led the market’s advance, while value shares outperformed growth-oriented issues.
The first half of 2006 was a challenging period for the Fund, which lagged the S&P 500 Index and its Morningstar peer group by a wide margin. The high-quality, large-cap growth stocks in which the portfolio invests remained out of favor: small-cap stocks outpaced large-company issues, value stocks continued to outperform growth, and lower-quality stocks posted better returns than high-quality names.
Sector allocation was also a drag on performance as investors continued to favor deep cyclical sectors, such as Energy and Utilities, which we avoid because they do not meet our investment criteria. In contrast, growth-oriented sectors that are well represented in the portfolio, such as Health Care and Information Technology, were the only market sectors to decline. The best performers in the portfolio were consumer-oriented stocks.
Outlook - Although the Fund’s recent performance has been frustrating, the long-term outlook is promising. We face an unprecedented opportunity in many high-quality, sustainable-growth companies. We believe the portfolio looks more attractive now than at any other time in its history.
If the Fund was a public company that owned each of the individual businesses, it would have more than a decade of double-digit earnings growth (twice the overall market’s growth rate), a free cash flow yield of 5%, and a lower valuation than the broader market on a cash basis. That is why we are extremely comfortable with the portfolio and very excited about its future prospects.
The views expressed are those of the portfolio manager as of August 31, 2006, and are subject to change based on market and other conditions.
| PERFORMANCE TABLE1 | Average Annual Total Return | | | Cumulative Total Return | |
|
| | | | | Since | | | | Since |
| Periods Ended August 31, 2006 | 1-year | 5-year | 10-year | inception | 1-year | 5-year | 10-year | inception2 |
|
| U.S. Global Leaders Growth Class 1 (began 10/15/05) | — | — | — | — | — | — | — | -0.97% |
| U.S. Global Leaders Growth Class NAV (began 10/15/05) | — | — | — | — | — | — | — | -0.88% |
| Standard & Poors 500 Index3,4,5 | — | — | — | — | — | — | — | 11.77% |
1 Performance does not reflect the deduction of taxes on fund distributions or redemptions of fund shares. Past performance does not predict future performance.
2 Current subadviser has managed the fund since October 15, 2005.
3 Since inception returns for the indices may begin on the month-end closest to the actual inception date of the fund.
4 Standard & Poors 500 Index is an unmanaged index that includes 500 widely traded common stocks.
5 It is not possible to invest directly in an index. Index figures do not reflect sales charges and would be lower if they did.
55
U.S. Government Securities Fund
Subadviser: Western Asset Management Company
Portfolio Manager: Ken Leech, Steve Walsh, Mark Lindbloom, Ron Mass and Fred Marki
INVESTMENT OBJECTIVE & POLICIES - To achieve a high level of current income consistent with the preservation of capital and maintenance of liquidity. The Fund invests a substantial portion of its assets in debt obligations and mortgage-backed securities issued or guaranteed by the U.S. government, its agencies or instrumentalities and derivative securities.
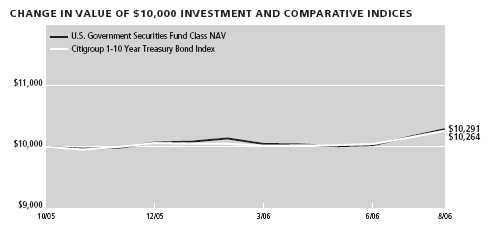
| Sector Weighting* | % of Total |
|
| Mortgage Securities | 60.97 |
| Asset Backed Securities | 12.45 |
| Government | 11.92 |
*Top Sectors as a percentage of market value. Does not include short-term securities and investments in the State Street Navigator Securities Lending Prime Portfolio.
PORTFOLIO MANAGER’S COMMENTARY
Performance - Since its inception in October 2005, the U.S. Government Securities Fund returned +2.91%, outperforming the +2.64% return of the Citigroup 1-10 Year Treasury Bond Index.
Environment - Interest rates moved broadly higher across the yield curve, driven by a tighter-than-expected Federal Reserve, stronger-than-expected economy, and a modest increase in inflation expectations. Short-term rates rose much more than long-term rates, leaving the yield curve substantially flat, but mildly inverted in the short end. The Fed raised its target funds rate by 0.25% at seven of its eight meetings, exceeding market expectations. The Fed paused at its August meeting, as it adopted a wait-and-see attitude to judge the extent to which the housing slowdown would affect the rest of the economy. Ben Bernanke replaced Alan Greenspan as Fed Chairman, but he gave no indication of any significant shift in monetary policy.
The economy bounced back strongly from its weak showing in the fourth quarter of 2005, with growth of more than 5% in the first quarter, but slowed to 2.9% growth in the second quarter. Headline inflation rose to the 3.5 –4.5% range, core inflation drifted higher to the 2.5 –3.0% range. Inflation concerns were fueled by gains in gold, industrial commodity and energy prices, and a decline in the dollar against most major currencies. The economy displayed some very solid fundamentals, as corporate profits exceeded expectations, and federal and state revenues registered some of the strongest gains in real terms (adjusting for inflation) in history.
Nevertheless, the housing market showed signs of a spreading slowdown, which gave rise to the widely held perception that the overall economy would likely slow enough to reduce inflation pressures and allow the Fed to end its tightening cycle.
Outlook - Our outlook calls for continued moderate growth and relatively contained inflation. We are positioned with the expectation that there will be no significant changes in key macro-economic variables, but we also have strategies in place that are designed to hedge against unexpected economic weakness and higher-than-expected inflation.
The views expressed are those of the portfolio manager as of August 31, 2006, and are subject to change based on market and other conditions.
| PERFORMANCE TABLE1 | Average Annual Total Return | | | Cumulative Total Return | |
|
| | | | | Since | | | | Since |
| Periods Ending August 31, 2006 | 1-year | 5-year | 10-year | inception | 1-year | 5-year | 10-year | inception2 |
|
| U.S. Government Securities Class 1 (began 10/15/05) | — | — | — | — | — | — | — | 2.87% |
| U.S. Government Securities Class NAV (began 10/15/05) | — | — | — | — | — | — | — | 2.91% |
| Citigroup 1-10 Year Treasury Bond Index3,4,5 | — | — | — | — | — | — | — | 2.64% |
1 Performance does not reflect the deduction of taxes on fund distributions or redemptions of fund shares. Past performance does not predict future performance.
2 Current subadviser has managed the fund since April 28, 2006.
3 Since inception returns for the indices may begin on the month-end closest to the actual inception date of the fund.
4 Citigroup 1-10 Year Treasury Bond Index is a broad measure of the performance of the short-term and medium-term U.S. Treasury securities.
5 It is not possible to invest directly in an index. Index figures do not reflect sales charges and would be lower if they did.
56
U.S. High Yield Bond Fund
Subadviser: Wells Capital Management, Inc.
Portfolio Managers: Roger Wittlin, Niklas Nordonfelt, Chris Lee, Sean Lynch, and Phil Susser
INVESTMENT OBJECTIVE & POLICIES - To seek total return with a high level of current income. The Fund invests, under normal market conditions, primarily in below investment-grade debt securities (sometimes referred to as “junk bonds” or high yield securities). The Fund also invests in corporate debt securities and may buy preferred and other convertible securities and bank loans.

| Sector Weighting* | % of Total |
|
| Communications | 22.16 |
| Consumer, Cyclical | 13.48 |
| Financial | 11.94 |
| Consumer, Non-cyclical | 11.38 |
| Energy | 7.92 |
| Industrial | 6.08 |
| Technology | 3.56 |
| Basic Materials | 2.75 |
| Utilities | 1.48 |
*Top Sectors as a percentage of market value. Does not include short-term securities and investments in the State Street Navigator Securities Lending Prime Portfolio.
PORTFOLIO MANAGER’S COMMENTARY
Performance - Since its inception in October 2005, the U.S. High Yield Bond Fund returned +6.58%, outperforming the +5.82% return of the Merrill Lynch US High Yield Master II Constrained Index.
Environment - Due to the effects of the twin hurricanes and spiking energy prices, it became evident to investors late last year that the economy was slowing. Longer-term Treasury yields moved downward until mid-January of 2006. The slowdown proved temporary, as the economy rebounded during the first quarter of 2006, sending Treasury yields upward, peaking in June. During this time, the Federal Reserve continued its tightening regime, lifting the federal funds rate from 4.00% in November 2005 to the current rate of 5.25% . High-yield spreads were relatively stable and historically low during the period. The credit environment has remained healthy, with lower quality bonds significantly outperforming higher quality bonds so far in 2006. With the Fed holding rates steady at its August meeting amid indications of a slowing housing market, Treasu ry yields have fallen by a half percent since early July.
Outlook - While the economy remains strong, the Fed is entering a difficult period. Growth appears to be slowing, led by a weaker housing market and lower consumer spending, yet wage-price pressures and core price inflation continue rising. The challenge for the Fed will be to combat the inflationary pressures while not squeezing liquidity and thereby exacerbating an economic slowdown. We feel the default environment will continue to be supportive of credit spreads, as corporate fundamentals remain positive. Because spreads are especially tight by historical measures, we will continue to lower risk by moving up in quality and in the capital structure.
We will continue to be mindful of opportunities that are likely to present themselves should segments of the market weaken beyond their fundamentals. The new issue market, particularly in high yield bonds, is likely to affect spreads. Should the market see large, sponsor-driven deals, such as leveraged buyouts (LBOs), high yield spreads are likely to widen. As part of our strategy and credit diligence, we will continue to be skeptical of sponsor-driven deals, whether they are LBO-related or motivated to pay outsized dividends. In addition, we are keenly monitoring the increasing amount of “covenant-lite” loans coming to market.
The views expressed are those of the portfolio manager as of August 31, 2006, and are subject to change based on market and other conditions.
| PERFORMANCE TABLE1 | Average Annual Total Return | | | Cumulative Total Return | |
|
| | | | | Since | | | | Since |
| Periods Ending August 31, 2006 | 1-year | 5-year | 10-year | inception | 1-year | 5-year | 10-year | inception2 |
|
| U.S. High Yield Bond Class Class 1 (began 10/15/05) | — | — | — | — | — | — | — | 6.55% |
| U.S. High Yield Bond Class Class NAV (began 10/15/05) | — | — | — | — | — | — | — | 6.58% |
| Merrill Lynch U.S. High Yield Master II Constrained Index3,4,5 | — | — | — | — | — | — | — | 5.82% |
1 Performance does not reflect the deduction of taxes on fund distributions or redemptions of fund shares. Past performance does not predict future performance.
2 Current subadviser has managed the fund since October 15, 2005.
3 Since inception returns for the indices may begin on the month-end closest to the actual inception date of the fund.
4 Merrill Lynch U.S. High Yield Master II Constrained Index is an unmanaged index composed of U.S. currency high-yield bonds issued by U.S. and non-U.S. issuers.
5 It is not possible to invest directly in an index. Index figures do not reflect sales charges and would be lower if they did.
57
U.S. Multi Sector Fund
Subadviser: Grantham, Mayo, Van Otterloo & Co. LLC
Portfolio Managers: Robert Soucy, Sam Wilderman and Donna Murphy
INVESTMENT OBJECTIVE & POLICIES - To seek long term capital appreciation. The Fund seeks total return greater than its benchmark. To pursue this goal, the Fund normally invests in securities in the Wilshire 5000 Stock Index, an independently maintained and published equity securities (with readily available price data) of issuers with headquarters in the U.S. The Fund normally invests at least 80% of its assets in investments tied economically to the U.S.
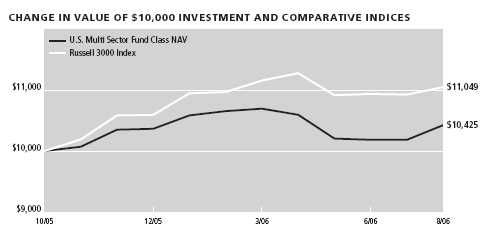
| Sector Weighting* | % of Total |
|
| Consumer, Non-cyclical | 29.13 |
| Consumer, Cyclical | 19.02 |
| Financial | 14.50 |
| Industrial | 9.00 |
| Technology | 6.58 |
| Communications | 5.97 |
| Energy | 3.31 |
| Mortgage Securities | 2.18 |
| Basic Materials | 1.09 |
| Utilities | 0.24 |
*Top Sectors as a percentage of market value. Does not include short-term securities and investments in the State Street Navigator Securities Lending Prime Portfolio.
PORTFOLIO MANAGER’S COMMENTARY
Performance - Since its inception in October 2005, the GMO U.S. Multi Sector Fund returned +4.25%, underperforming the +10.49% return of the Russell 3000 Index.
Environment - Early in the period, the U.S. witnessed a market that managed to stay afloat in spite of additional federal funds rate increases, rising health care and energy costs, and mixed reports pertaining to economic growth. During the first quarter of 2006, U.S. markets produced modest gains amid an array of uncertain economic factors. Despite another hike in the federal funds rate and the upsurge in energy and construction costs, major market indices rose during the quarter. This positive performance completely reversed itself in the second quarter, due in large part to the malaise among Technology stocks. During its roughly 10-month period since its inception, the portfolio was positioned to favor higher quality companies based on their valuation characteristics. Quality equities traditionally have traded at an 18% premium to the mark et, and now trade at a discount, which makes them the cheapest stocks relative to the market. In this environment, the portfolio favored several higher quality companies, all of which exceeded market returns. Health Care was an attractive sector to find high-quality, undervalued securities, while the Fund’s selection among retail stocks hindered overall performance.
Outlook - The majority of U.S. equity market indices posted negative returns in the second quarter of 2006, with the exception of the Dow Jones Industrial Average, which rose 0.9% . The spread between high- and low-quality stocks was considerable, although both types were down during the quarter. Although lower quality stocks once again outpaced high-quality stocks, we continue to believe that a tilt towards higher quality stocks is worthwhile for U.S. investors, as these stocks have remained cheap relative to their historical averages. Our market outlook for 2006 is for a moderate, yet sustained bear market. Investors are encouraged to focus on quality and avoid risk when possible. The portfolio remains overweight high-quality companies and defensive stocks, while maintaining an underweight position in U.S. small-/mid-cap stocks, as their va luations have remained unattractive throughout the year.
The views expressed are those of the portfolio manager as of August 31, 2006, and are subject to change based on market and other conditions.
| PERFORMANCE TABLE1 | Average Annual Total Return | | | Cumulative Total Return | |
|
| | | | | Since | | | | Since |
| Periods Ended August 31, 2006 | 1-year | 5-year | 10-year | inception | 1-year | 5-year | 10-year | inception2 |
|
| U.S. Multi Sector Class NAV (began 10/29/05) | — | — | — | — | — | — | — | 4.25% |
| Russell 3000 Index3,4,5 | — | — | — | — | — | — | — | 10.49% |
1 Performance does not reflect the deduction of taxes on fund distributions or redemptions of fund shares. Past performance does not predict future performance.
2 Current subadviser has managed the fund since October 29, 2005.
3 Since inception returns for the indices may begin on the month-end closest to the actual inception date of the fund.
4 Russell 3000 Index is an unmanaged index of the 3,000 largest U.S. companies based on total market capitalization, which represents approximately 98% of the investable U.S. equity market.
5 It is not possible to invest directly in an index. Index figures do not reflect sales charges and would be lower if they did.
58
Value & Restructuring Fund
Subadviser: United States Trust Company
Portfolio Managers: David J. Williams
INVESTMENT OBJECTIVE & POLICIES - To seek long-term capital appreciation. To pursue this goal, the Fund invests primarily (at least 65% of its assets) in common stocks of U.S. and foreign companies whose share prices, in the opinion of the subadviser, do not reflect the economic value of company assets, but where the subadviser believes restructuring efforts or industry consolidation will serve to highlight the true value of the company.
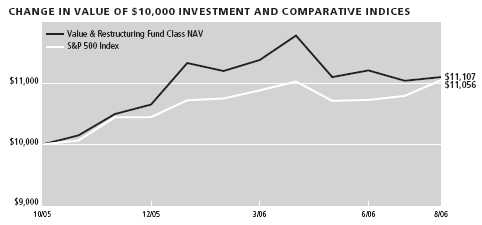
| Sector Weighting* | % of Total |
|
| Financial | 19.29 |
| Energy | 17.87 |
| Industrial | 11.12 |
| Consumer, Non-cyclical | 9.92 |
| Communications | 9.76 |
| Consumer, Cyclical | 9.07 |
| Basic Materials | 5.57 |
| Technology | 1.38 |
| Mortgage Securities | 1.25 |
| Utilities | 0.46 |
*Top Sectors as a percentage of market value. Does not include short-term securities and investments in the State Street Navigator Securities Lending Prime Portfolio.
PORTFOLIO MANAGER’S COMMENTARY
Performance - Since its inception in October 2005, the Value & Restructuring Fund returned +11.07%, outperforming the +10.56% return of the S&P 500 Index.
Environment - The best performing stocks in the portfolio during the last few months of 2005 and the first few months of 2006 were typically associated with an expanding economy. While many of these holdings were in the energy and materials sector, it was our bottom-up stock selection process focused on companies undergoing change that led to these opportunities. The portfolio advanced nicely in this period aided by restructuring success and the perceived economic tailwind. Conversely, in May and June, fear of a slowing economy turned many of these leaders into laggards and the portfolio declined. Summer months brought recovery as investors anticipated an end to Fed rate hikes and the portfolio recovered. These swings in investor sentiment provide a useful backdrop to understanding our restructuring focus and short and long term influences on portfolio results.
Cyclical influences play an obvious role in determining portfolio success and our approach tends to perform a bit better in times of expansion than during contraction. However, swings in investor sentiment play a more dominant role in our restructuring focused portfolio over the short term while over the long-term the success of our companies in successfully implementing change determines results. In exuberant times, investors expand their investment horizons and embrace change which benefits our portfolio as our companies sell at lower than average prices but display above average fundamentals. On the other hand, when investors favor defensive investments, our portfolio often trails the broader market due to the inherent uncertainty of restructuring companies and the lack of near term predictability.
The first eight months of 2006 witnessed a bit of everything as investor expectations swung widely in both directions. It is our way to make only minor portfolio adjustments due to short-term influences focusing instead on multi-year transformations underway at our portfolio holdings and the revaluation that can take place when change is successful in improving the quality and durability of company fundamentals. Portfolio turnover has been and remains low and diversification remains paramount with investments distributed among our restructuring themes such as cost-cutting, industry consolidation, break-up value and others and along the restructuring life-cycle of early, mid and late stage restructuring companies.
Outlook - Proper diversification goes a long way toward mitigating the impact of short-term market swings and emphasizing longer-term determinants of portfolio results. Along these lines there are many reasons to be optimistic. Stock prices of restructuring companies seem unusually low to us relative to underlying fundamentals and the generally benign economic backdrop. Evidence of these low prices can be found in the dramatic increase in mergers and acquisitions particularly cash deals at significant premiums, a development that has aided the portfolio nicely in the last year and one we expect to continue to boost returns. We expect stock prices to rise as investors focus on the longer-term drivers of equity returns but in periods of investor uncertainty which we will surely face, continued deal making should help steady results.
The views expressed are those of the portfolio manager as of August 31, 2006, and are subject to change based on market and other conditions.
| PERFORMANCE TABLE1 | Average Annual Total Return | | | Cumulative Total Return | |
|
| | | | | Since | | | | Since |
| Periods Ended August 31, 2006 | 1-year | 5-year | 10-year | inception | 1-year | 5-year | 10-year | inception2 |
|
| Value & Restructuring Class NAV (began 10/29/05) | — | — | — | — | — | — | — | 11.07% |
| S&P 500 Index3,4,5 | — | — | — | — | — | — | — | 10.56% |
1 Performance does not reflect the deduction of taxes on fund distributions or redemptions of fund shares. Past performance does not predict future performance.
2 Current subadviser has managed the fund since October 29, 2005.
3 Since inception returns for the indices may begin on the month-end closest to the actual inception date of the fund.
4 Standard & Poors 500 Index is an unmanaged index that includes 500 widely traded common stocks.
5 It is not possible to invest directly in an index. Index figures do not reflect sales charges and would be lower if they did.
59
Vista Fund
Subadviser: American Century Investment Management, Inc.
Portfolio Managers: Glenn A. Fogle
INVESTMENT OBJECTIVE & POLICIES - To seek long-term capital growth. To pursue this goal, the Fund normally invests in common stocks of U.S. and foreign companies that are medium-sized and smaller at the time of purchase, but the portfolio may purchase other types of securities as well. For purposes of the description of the Vista Fund, medium-sized and smaller companies are defined as companies in the Russell MidCap Growth Index which has a market cap range between $1.23 billion and $15.8 billion as of August 31, 2005.
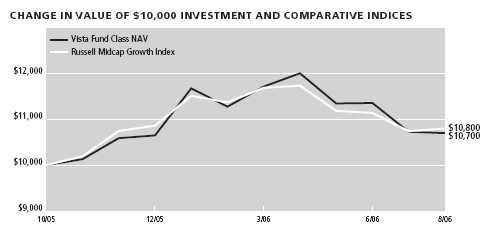
| Sector Weighting* | % of Total |
|
| Consumer, Non-cyclical | 20.58 |
| Communications | 16.28 |
| Industrial | 14.72 |
| Financial | 8.39 |
| Energy | 7.83 |
| Consumer, Cyclical | 6.12 |
| Technology | 4.53 |
| Basic Materials | 3.95 |
| Utilities | 1.73 |
*Top Sectors as a percentage of market value. Does not include short-term securities and investments in the State Street Navigator Securities Lending Prime Portfolio.
PORTFOLIO MANAGER’S COMMENTARY
Performance - Since its inception in October 2005, the Vista Fund returned +7.00%, underperforming the +8.00% return of the Russell Midcap Growth Index.
Environment - Early in the 10-month period, small- and mid-cap stocks continued outperforming large-cap stocks, as they have since the technology bubble burst in 2000. But investors increasingly steered toward large-cap stocks as the economy cooled in mid-2006. Value stocks continued their string of outperformance versus growth stocks in the period, though growth gained increasing favor as the period closed. Within the mid-cap space, for the 10-month time frame as a whole, the Russell Midcap Value Index gained 14.36%, compared with 7.82% for the Russell Midcap Growth Index.
The Fund’s overweight in Materials stocks reflected one of its key 2006 investment themes: finding areas of the market that would benefit from rising capital expenditures. The sector, which performed particularly well as commodity prices soared early in the period, led all others in contributions to the portfolio’s relative performance. An overweight stake in Industrials, centered on construction and engineering firms, produced similar results. The portfolio also benefited from an overweight in Telecommunication Services, led by investments in growing wireless providers serving the Latin American market. Recognizing the impact that high gasoline prices and rising interest rates have on consumers, we maintained an underweight stake in Consumer Discretionary stocks, which further aided relative returns.
From a relative standpoint, however, the portfolio couldn’t overcome weak security selection in Technology and Health Care stocks, which accounted for the vast majority of its underperformance. Stock selection in Technology suffered in a number of industries; in Health Care, an overweight in providers and services proved detrimental as reimbursement issues and rising costs crimped profit margins for most health insurers and provider networks.
Outlook - The Federal Reserve’s rate hike pause and at least a temporary respite from high gas prices boosted both investors’ and consumers’ confidence heading into the final months of 2006. In that climate, we will continue focusing on areas of the market and individual stocks that offer the best fits for our investment process.
The views expressed are those of the portfolio manager as of August 31, 2006, and are subject to change based on market and other conditions.
| PERFORMANCE TABLE1 | Average Annual Total Return | | | Cumulative Total Return | |
|
| | | | | Since | | | | Since |
| Periods Ended August 31, 2006 | 1-year | 5-year | 10-year | inception | 1-year | 5-year | 10-year | inception2 |
|
| Vista Class NAV (began 10/29/05) | — | — | — | — | — | — | — | 7.00% |
| Russell Midcap Growth Index3,4,5 | — | — | — | — | — | — | — | 8.00% |
1 Performance does not reflect the deduction of taxes on fund distributions or redemptions of fund shares. Past performance does not predict future performance.
2 Current subadviser has managed the fund since October 29, 2005.
3 Since inception returns for the indices may begin on the month-end closest to the actual inception date of the fund.
4 Russell Midcap Growth Index is an unmanaged index that contains those stocks from the Russell Mid Cap Index with a greater than average growth orientation.
5 It is not possible to invest directly in an index. Index figures do not reflect sales charges and would be lower if they did.
60
John Hancock Funds II
Understanding Your Fund’s Expenses
As a shareholder of John Hancock Funds II, you pay ongoing expenses, such as management fees, distribution fees (12b-1) and other expenses. Using the information below, you can estimate how these expenses affect your investment and compare them with the expenses of other funds. This example is intended to help you understand your ongoing costs (in dollars) of investing in each Fund and to compare these costs with the ongoing costs of investing in other mutual funds.
Actual Expenses
The first table for each Fund shows the actual account values and actual Fund expenses you would have paid on a $1,000 investment in the Fund held from March 1, 2006 through August 31, 2006. It also shows how much a $1,000 investment would be at the close of the period, assuming actual Fund returns and expenses. To estimate the expenses that you paid over the period, simply divide your account value by $1,000 (for example, an $8,600 account value divided by $1,000 = 8.6) and multiply the result by the number in the “Expenses Paid During Period” row as shown below for your Classes.
Hypothetical Example for Comparison Purposes
The second table for each Fund provides information about hypothetical account values and hypothetical expenses based on the Fund’s actual expense ratios and an assumed rate of return of 5% per year before expenses, which is not each Fund’s actual return. The hypothetical account values and expenses may not be used to estimate the actual ending account balance or expenses you paid on your investment for the period. You may use this information to compare the ongoing costs of investing in each Fund and other funds. To do so, compare this 5% hypothetical example with the 5% hypothetical examples that appear in the shareholder reports of the other funds.
Please note that the expenses shown in the tables are meant to highlight your ongoing costs only and do not reflect any transactional costs, such as sales charges. Therefore, the second table for each Fund is useful in comparing ongoing costs only and will not help you determine the relative total costs of owning different Funds. In addition, if these transactional costs were included, your costs would have been higher.
| Absolute Return | | | | |
|
| Actual Portfolio Return | Class A | Class B | Class C | Class 1 |
|
| Beginning Account Value 6/26/2006 | $1,000.00 | $1,000.00 | $1,000.00 | $1,000.00 |
| Ending Account Value 8/31/2006 | 1,042.00 | 1,040.00 | 1,040.00 | 1,042.00 |
| Expenses Paid During Period* | 1.03 | 2.34 | 2.34 | 0.56 |
|
| Hypothetical 5% Portfolio Return | Class A | Class B | Class C | Class 1 |
|
| Beginning Account Value 6/26/2006 | $1,000.00 | $1,000.00 | $1,000.00 | $1,000.00 |
| Ending Account Value 8/31/2006 | 1,008.17 | 1,006.88 | 1,006.88 | 1,008.63 |
| Expenses Paid During Period* | 1.01 | 2.30 | 2.30 | 0.55 |
|
| Annualized Expense Ratios | Class A | Class B | Class C | Class 1 |
|
| | 0.55% | 1.25% | 1.25% | 0.30% |
| |
| Active Bond | | | | |
|
| Actual Portfolio Return | | | Class 1 | Class NAV |
|
| Beginning Account Value 3/1/2006 | | | $1,000.00 | $1,000.00 |
| Ending Account Value 8/31/2006 | | | 1,014.30 | 1,014.60 |
| Expenses Paid During Period* | | | 3.81 | 3.55 |
|
| Hypothetical 5% Portfolio Return | | | Class 1 | Class NAV |
|
| Beginning Account Value 3/1/2006 | | | $1,000.00 | $1,000.00 |
| Ending Account Value 8/31/2006 | | | 1,021.42 | 1,021.68 |
| Expenses Paid During Period* | | | 3.82 | 3.57 |
|
| Annualized Expense Ratios | | | Class 1 | Class NAV |
|
| | | | 0.75% | 0.70% |
61
John Hancock Funds II
Understanding Your Fund’s Expenses
| All Cap Core | | |
|
| Actual Portfolio Return | | Class NAV |
|
| Beginning Account Value 4/28/2006 | | $1,000.00 |
| Ending Account Value 8/31/2006 | | 992.00 |
| Expenses Paid During Period* | | 2.89 |
|
| Hypothetical 5% Portfolio Return | | Class NAV |
|
| Beginning Account Value 4/28/2006 | | $1,000.00 |
| Ending Account Value 8/31/2006 | | 1,014.36 |
| Expenses Paid During Period* | | 2.92 |
|
| Annualized Expense Ratios | | Class NAV |
|
| | | 0.84% |
| | | |
| All Cap Growth | | |
|
| Actual Portfolio Return | Class 1 | Class NAV |
|
| Beginning Account Value 3/1/2006 | $1,000.00 | $1,000.00 |
| Ending Account Value 8/31/2006 | 954.10 | 954.20 |
| Expenses Paid During Period* | 4.88 | 4.63 |
|
| Hypothetical 5% Portfolio Return | Class 1 | Class NAV |
|
| Beginning Account Value 3/1/2006 | $1,000.00 | $1,000.00 |
| Ending Account Value 8/31/2006 | 1,020.21 | 1,020.47 |
| Expenses Paid During Period* | 5.04 | 4.79 |
|
| Annualized Expense Ratios | Class 1 | Class NAV |
|
| | 0.99% | 0.94% |
| | | |
| All Cap Value | | |
|
| Actual Portfolio Return | Class 1 | Class NAV |
|
| Beginning Account Value 3/1/2006 | $1,000.00 | $1,000.00 |
| Ending Account Value 8/31/2006 | 1,025.20 | 1,025.30 |
| Expenses Paid During Period* | 4.80 | 4.54 |
|
| Hypothetical 5% Portfolio Return | Class 1 | Class NAV |
|
| Beginning Account Value 3/1/2006 | $1,000.00 | $1,000.00 |
| Ending Account Value 8/31/2006 | 1,020.47 | 1,020.72 |
| Expenses Paid During Period* | 4.79 | 4.53 |
|
| Annualized Expense Ratios | Class 1 | Class NAV |
|
| | 0.94% | 0.89% |
62
John Hancock Funds II
Understanding Your Fund’s Expenses
| Blue Chip Growth | | |
|
| Actual Portfolio Return | Class 1 | Class NAV |
|
| Beginning Account Value 3/1/2006 | $1,000.00 | $1,000.00 |
| Ending Account Value 8/31/2006 | 984.50 | 984.50 |
| Expenses Paid During Period* | 4.40 | 4.15 |
|
| Hypothetical 5% Portfolio Return | Class 1 | Class NAV |
|
| Beginning Account Value 3/1/2006 | $1,000.00 | $1,000.00 |
| Ending Account Value 8/31/2006 | 1,020.77 | 1,021.02 |
| Expenses Paid During Period* | 4.48 | 4.23 |
|
| Annualized Expense Ratios | Class 1 | Class NAV |
|
| | 0.88% | 0.83% |
| | | |
| Capital Appreciation | | |
|
| Actual Portfolio Return | Class 1 | Class NAV |
|
| Beginning Account Value 3/1/2006 | $1,000.00 | $1,000.00 |
| Ending Account Value 8/31/2006 | 931.00 | 931.00 |
| Expenses Paid During Period* | 4.19 | 3.94 |
|
| Hypothetical 5% Portfolio Return | Class 1 | Class NAV |
|
| Beginning Account Value 3/1/2006 | $1,000.00 | $1,000.00 |
| Ending Account Value 8/31/2006 | 1,020.87 | 1,021.12 |
| Expenses Paid During Period* | 4.38 | 4.13 |
|
| Annualized Expense Ratios | Class 1 | Class NAV |
|
| | 0.86% | 0.81% |
| | | |
| Core Bond | | |
|
| Actual Portfolio Return | Class 1 | Class NAV |
|
| Beginning Account Value 3/1/2006 | $1,000.00 | $1,000.00 |
| Ending Account Value 8/31/2006 | 1,015.80 | 1,016.10 |
| Expenses Paid During Period* | 4.47 | 4.22 |
|
| Hypothetical 5% Portfolio Return | Class 1 | Class NAV |
|
| Beginning Account Value 3/1/2006 | $1,000.00 | $1,000.00 |
| Ending Account Value 8/31/2006 | 1,020.77 | 1,021.02 |
| Expenses Paid During Period* | 4.48 | 4.23 |
|
| Annualized Expense Ratios | Class 1 | Class NAV |
|
| | 0.88% | 0.83% |
63
John Hancock Funds II
Understanding Your Fund’s Expenses
| Core Equity | | |
|
| Actual Portfolio Return | Class 1 | Class NAV |
|
| Beginning Account Value 3/1/2006 | $1,000.00 | $1,000.00 |
| Ending Account Value 8/31/2006 | 955.10 | 955.20 |
| Expenses Paid During Period* | 4.34 | 4.09 |
|
| Hypothetical 5% Portfolio Return | Class 1 | Class NAV |
|
| Beginning Account Value 3/1/2006 | $1,000.00 | $1,000.00 |
| Ending Account Value 8/31/2006 | 1,020.77 | 1,021.02 |
| Expenses Paid During Period* | 4.48 | 4.23 |
|
| Annualized Expense Ratios | Class 1 | Class NAV |
|
| | 0.88% | 0.83% |
| | | |
| Emerging Growth | | |
|
| Actual Portfolio Return | Class 1 | Class NAV |
|
| Beginning Account Value 3/1/2006 | $1,000.00 | $1,000.00 |
| Ending Account Value 8/31/2006 | 954.70 | 954.70 |
| Expenses Paid During Period* | 5.03 | 4.78 |
|
| Hypothetical 5% Portfolio Return | Class 1 | Class NAV |
|
| Beginning Account Value 3/1/2006 | $1,000.00 | $1,000.00 |
| Ending Account Value 8/31/2006 | 1,020.06 | 1,020.32 |
| Expenses Paid During Period* | 5.19 | 4.94 |
|
| Annualized Expense Ratios | Class 1 | Class NAV |
|
| | 1.02% | 0.97% |
| | | |
| Emerging Small Company | | |
|
| Actual Portfolio Return | Class 1 | Class NAV # |
|
| Beginning Account Value 3/1/2006 | $1,000.00 | $1,000.00 |
| Ending Account Value 8/31/2006 | 880.00 | 985.40 |
| Expenses Paid During Period* | 5.17 | 1.94 |
|
| Hypothetical 5% Portfolio Return | Class 1 | Class NAV # |
|
| Beginning Account Value 3/1/2006 | $1,000.00 | $1,000.00 |
| Ending Account Value 8/31/2006 | 1,019.71 | 1,007.09 |
| Expenses Paid During Period* | 5.55 | 1.96 |
|
| Annualized Expense Ratios | Class 1 | Class NAV # |
|
| | 1.09% | 1.08% |
# Period from 6/26/2006 (commencement of operations) to 8/31/2006.
64
John Hancock Funds II
Understanding Your Fund’s Expenses
| Equity-Income | | |
|
| Actual Portfolio Return | Class 1 | Class NAV |
|
| Beginning Account Value 3/1/2006 | $1,000.00 | $1,000.00 |
| Ending Account Value 8/31/2006 | 1,040.80 | 1,040.80 |
| Expenses Paid During Period* | 4.53 | 4.27 |
|
| Hypothetical 5% Portfolio Return | Class 1 | Class NAV |
|
| Beginning Account Value 3/1/2006 | $1,000.00 | $1,000.00 |
| Ending Account Value 8/31/2006 | 1,020.77 | 1,021.02 |
| Expenses Paid During Period* | 4.48 | 4.23 |
|
| Annualized Expense Ratios | Class 1 | Class NAV |
|
| | 0.88% | 0.83% |
| | | |
| Fundamental Value | | |
|
| Actual Portfolio Return | Class 1 | Class NAV |
|
| Beginning Account Value 3/1/2006 | $1,000.00 | $1,000.00 |
| Ending Account Value 8/31/2006 | 1,034.60 | 1,034.60 |
| Expenses Paid During Period* | 4.41 | 4.15 |
|
| Hypothetical 5% Portfolio Return | Class 1 | Class NAV |
|
| Beginning Account Value 3/1/2006 | $1,000.00 | $1,000.00 |
| Ending Account Value 8/31/2006 | 1,020.87 | 1,021.12 |
| Expenses Paid During Period* | 4.38 | 4.13 |
|
| Annualized Expense Ratios | Class 1 | Class NAV |
|
| | 0.86% | 0.81% |
| | | |
| Global Bond | | |
|
| Actual Portfolio Return | Class 1 | Class NAV |
|
| Beginning Account Value 3/1/2006 | $1,000.00 | $1,000.00 |
| Ending Account Value 8/31/2006 | 1,032.00 | 1,031.40 |
| Expenses Paid During Period* | 4.30 | 4.04 |
|
| Hypothetical 5% Portfolio Return | Class 1 | Class NAV |
|
| Beginning Account Value 3/1/2006 | $1,000.00 | $1,000.00 |
| Ending Account Value 8/31/2006 | 1,020.97 | 1,021.22 |
| Expenses Paid During Period* | 4.28 | 4.02 |
|
| Annualized Expense Ratios | Class 1 | Class NAV |
|
| | 0.84% | 0.79% |
65
John Hancock Funds II
Understanding Your Fund’s Expenses
| Global Real Estate | | |
|
| Actual Portfolio Return | | Class NAV |
|
| Beginning Account Value 4/28/2006 | | $1,000.00 |
| Ending Account Value 8/31/2006 | | 1,030.00 |
| Expenses Paid During Period* | | 3.82 |
|
| Hypothetical 5% Portfolio Return | | Class NAV |
|
| Beginning Account Value 4/28/2006 | | $1,000.00 |
| Ending Account Value 8/31/2006 | | 1,013.50 |
| Expenses Paid During Period* | | 3.79 |
|
| Annualized Expense Ratios | | Class NAV |
|
| | | 1.09% |
| | | |
| High Income | | |
|
| Actual Portfolio Return | | Class NAV |
|
| Beginning Account Value 4/28/2006 | | $1,000.00 |
| Ending Account Value 8/31/2006 | | 998.60 |
| Expenses Paid During Period* | | 2.66 |
|
| Hypothetical 5% Portfolio Return | | Class NAV |
|
| Beginning Account Value 4/28/2006 | | $1,000.00 |
| Ending Account Value 8/31/2006 | | 1,014.60 |
| Expenses Paid During Period* | | 2.68 |
|
| Annualized Expense Ratios | | Class NAV |
|
| | | 0.77% |
| | | |
| High Yield | | |
|
| Actual Portfolio Return | Class 1 | Class NAV |
|
| Beginning Account Value 3/1/2006 | $1,000.00 | $1,000.00 |
| Ending Account Value 8/31/2006 | 1,017.70 | 1,019.00 |
| Expenses Paid During Period* | 3.87 | 3.61 |
|
| Hypothetical 5% Portfolio Return | Class 1 | Class NAV |
|
| Beginning Account Value 3/1/2006 | $1,000.00 | $1,000.00 |
| Ending Account Value 8/31/2006 | 1,021.37 | 1,021.63 |
| Expenses Paid During Period* | 3.87 | 3.62 |
|
| Annualized Expense Ratios | Class 1 | Class NAV |
|
| | 0.76% | 0.71% |
66
John Hancock Funds II
Understanding Your Fund’s Expenses
| International Equity Index | | |
|
| Actual Portfolio Return | | Class NAV |
|
| Beginning Account Value 3/1/2006 | | $1,000.00 |
| Ending Account Value 8/31/2006 | | 1,074.80 |
| Expenses Paid During Period* | | 3.01 |
|
| Hypothetical 5% Portfolio Return | | Class NAV |
|
| Beginning Account Value 3/1/2006 | | $1,000.00 |
| Ending Account Value 8/31/2006 | | 1,022.31 |
| Expenses Paid During Period* | | 2.93 |
|
| Annualized Expense Ratios | | Class NAV |
|
| | | 0.58% |
| | | |
| International Opportunities | | |
|
| Actual Portfolio Return | Class 1 | Class NAV |
|
| Beginning Account Value 3/1/2006 | $1,000.00 | $1,000.00 |
| Ending Account Value 8/31/2006 | 1,034.00 | 1,034.60 |
| Expenses Paid During Period* | 5.49 | 5.23 |
|
| Hypothetical 5% Portfolio Return | Class 1 | Class NAV |
|
| Beginning Account Value 3/1/2006 | $1,000.00 | $1,000.00 |
| Ending Account Value 8/31/2006 | 1,019.81 | 1,020.06 |
| Expenses Paid During Period* | 5.45 | 5.19 |
|
| Annualized Expense Ratios | Class 1 | Class NAV |
|
| | 1.07% | 1.02% |
| | | |
| International Small Cap | | |
|
| Actual Portfolio Return | Class 1 | Class NAV |
|
| Beginning Account Value 3/1/2006 | $1,000.00 | $1,000.00 |
| Ending Account Value 8/31/2006 | 1,025.50 | 1,026.00 |
| Expenses Paid During Period* | 6.02 | 5.77 |
|
| Hypothetical 5% Portfolio Return | Class 1 | Class NAV |
| |
| Beginning Account Value 3/1/2006 | $1,000.00 | $1,000.00 |
| Ending Account Value 8/31/2006 | 1,019.26 | 1,019.51 |
| Expenses Paid During Period* | 6.01 | 5.75 |
|
| Annualized Expense Ratios | Class 1 | Class NAV |
|
| | 1.18% | 1.13% |
67
John Hancock Funds II
Understanding Your Fund’s Expenses
| International Small Company | | |
|
| Actual Portfolio Return | | Class NAV |
|
| Beginning Account Value 4/28/2006 | | $1,000.00 |
| Ending Account Value 8/31/2006 | | 933.00 |
| Expenses Paid During Period* | | 3.80 |
|
| Hypothetical 5% Portfolio Return | | Class NAV |
|
| Beginning Account Value 4/28/2006 | | $1,000.00 |
| Ending Account Value 8/31/2006 | | 1,013.32 |
| Expenses Paid During Period* | | 3.96 |
|
| Annualized Expense Ratios | | Class NAV |
|
| | | 1.14% |
| | | |
| International Stock | | |
|
| Actual Portfolio Return | | Class 1 |
|
| Beginning Account Value 3/1/2006 | | $1,000.00 |
| Ending Account Value 8/31/2006 | | 1,079.10 |
| Expenses Paid During Period* | | 5.82 |
|
| Hypothetical 5% Portfolio Return | | Class 1 |
|
| Beginning Account Value 3/1/2006 | | $1,000.00 |
| Ending Account Value 8/31/2006 | | 1,019.61 |
| Expenses Paid During Period* | | 5.65 |
|
| Annualized Expense Ratios | | Class 1 |
|
| | | 1.11% |
| | | |
| International Value | | |
|
| Actual Portfolio Return | Class 1 | Class NAV |
|
| Beginning Account Value 3/1/2006 | $1,000.00 | $1,000.00 |
| Ending Account Value 8/31/2006 | 1,083.50 | 1,084.30 |
| Expenses Paid During Period* | 5.15 | 4.89 |
|
| Hypothetical 5% Portfolio Return | Class 1 | Class NAV |
|
| Beginning Account Value 3/1/2006 | $1,000.00 | $1,000.00 |
| Ending Account Value 8/31/2006 | 1,020.27 | 1,020.52 |
| Expenses Paid During Period* | 4.99 | 4.74 |
|
| Annualized Expense Ratios | Class 1 | Class NAV |
|
| | 0.98% | 0.93% |
68
John Hancock Funds II
Understanding Your Fund’s Expenses
| Investment Quality Bond | | |
|
| Actual Portfolio Return | Class 1 | Class NAV |
|
| Beginning Account Value 3/1/2006 | $1,000.00 | $1,000.00 |
| Ending Account Value 8/31/2006 | 1,012.60 | 1,012.80 |
| Expenses Paid During Period* | 4.31 | 4.06 |
|
| Hypothetical 5% Portfolio Return | Class 1 | Class NAV |
|
| Beginning Account Value 3/1/2006 | $1,000.00 | $1,000.00 |
| Ending Account Value 8/31/2006 | 1,020.92 | 1,021.17 |
| Expenses Paid During Period* | 4.33 | 4.08 |
|
| Annualized Expense Ratios | Class 1 | Class NAV |
|
| | 0.85% | 0.80% |
| | | |
| Large Cap | | |
|
| Actual Portfolio Return | Class 1 | Class NAV |
|
| Beginning Account Value 3/1/2006 | $1,000.00 | $1,000.00 |
| Ending Account Value 8/31/2006 | 1,014.50 | 1,015.20 |
| Expenses Paid During Period* | 4.67 | 4.42 |
|
| Hypothetical 5% Portfolio Return | Class 1 | Class NAV |
|
| Beginning Account Value 3/1/2006 | $1,000.00 | $1,000.00 |
| Ending Account Value 8/31/2006 | 1,020.57 | 1,020.82 |
| Expenses Paid During Period* | 4.69 | 4.43 |
|
| Annualized Expense Ratios | Class 1 | Class NAV |
|
| | 0.92% | 0.87% |
| | | |
| Large Cap Value | | |
|
| Actual Portfolio Return | Class 1 | Class NAV |
|
| Beginning Account Value 3/1/2006 | $1,000.00 | $1,000.00 |
| Ending Account Value 8/31/2006 | 1,026.80 | 1,027.20 |
| Expenses Paid During Period* | 4.80 | 4.55 |
|
| Hypothetical 5% Portfolio Return | Class 1 | Class NAV |
|
| Beginning Account Value 3/1/2006 | $1,000.00 | $1,000.00 |
| Ending Account Value 8/31/2006 | 1,020.47 | 1,020.72 |
| Expenses Paid During Period* | 4.79 | 4.53 |
|
| Annualized Expense Ratios | Class 1 | Class NAV |
|
| | 0.94% | 0.89% |
69
John Hancock Funds II
Understanding Your Fund’s Expenses
| Mid Cap Core | | |
|
| Actual Portfolio Return | Class 1 | Class NAV |
|
| Beginning Account Value 3/1/2006 | $1,000.00 | $1,000.00 |
| Ending Account Value 8/31/2006 | 983.50 | 983.50 |
| Expenses Paid During Period* | 4.80 | 4.55 |
|
| Hypothetical 5% Portfolio Return | Class 1 | Class NAV |
|
| Beginning Account Value 3/1/2006 | $1,000.00 | $1,000.00 |
| Ending Account Value 8/31/2006 | 1,020.37 | 1,020.62 |
| Expenses Paid During Period* | 4.89 | 4.63 |
|
| Annualized Expense Ratios | Class 1 | Class NAV |
|
| | 0.96% | 0.91% |
| | | |
| Mid Cap Index | | |
|
| Actual Portfolio Return | | Class NAV |
|
| Beginning Account Value 3/1/2006 | | $1,000.00 |
| Ending Account Value 8/31/2006 | | 972.00 |
| Expenses Paid During Period* | | 2.76 |
|
| Hypothetical 5% Portfolio Return | | Class NAV |
|
| Beginning Account Value 3/1/2006 | | $1,000.00 |
| Ending Account Value 8/31/2006 | | 1,022.41 |
| Expenses Paid During Period* | | 2.83 |
|
| Annualized Expense Ratios | | Class NAV |
|
| | | 0.56% |
| | | |
| Mid Cap Stock | | |
|
| Actual Portfolio Return | Class 1 | Class NAV |
|
| Beginning Account Value 3/1/2006 | $1,000.00 | $1,000.00 |
| Ending Account Value 8/31/2006 | 967.00 | 967.00 |
| Expenses Paid During Period* | 4.81 | 4.56 |
|
| Hypothetical 5% Portfolio Return | Class 1 | Class NAV |
|
| Beginning Account Value 3/1/2006 | $1,000.00 | $1,000.00 |
| Ending Account Value 8/31/2006 | 1,020.32 | 1,020.57 |
| Expenses Paid During Period* | 4.94 | 4.69 |
|
| Annualized Expense Ratios | Class 1 | Class NAV |
|
| | 0.97% | 0.92% |
70
John Hancock Funds II
Understanding Your Fund’s Expenses
| Mid Cap Value | | |
|
| Actual Portfolio Return | Class 1 | Class NAV |
|
| Beginning Account Value 3/1/2006 | $1,000.00 | $1,000.00 |
| Ending Account Value 8/31/2006 | 985.90 | 986.40 |
| Expenses Paid During Period* | 4.86 | 4.61 |
|
| Hypothetical 5% Portfolio Return | Class 1 | Class NAV |
|
| Beginning Account Value 3/1/2006 | $1,000.00 | $1,000.00 |
| Ending Account Value 8/31/2006 | 1,020.32 | 1,020.57 |
| Expenses Paid During Period* | 4.94 | 4.69 |
|
| Annualized Expense Ratios | Class 1 | Class NAV |
|
| | 0.97% | 0.92% |
| | | |
| Mid Cap Value Equity | | |
|
| Actual Portfolio Return | | Class NAV |
|
| Beginning Account Value 4/28/2006 | | $1,000.00 |
| Ending Account Value 8/31/2006 | | 965.00 |
| Expenses Paid During Period* | | 3.46 |
|
| Hypothetical 5% Portfolio Return | | Class NAV |
|
| Beginning Account Value 4/28/2006 | | $1,000.00 |
| Ending Account Value 8/31/2006 | | 1,013.74 |
| Expenses Paid During Period* | | 3.55 |
|
| Annualized Expense Ratios | | Class NAV |
|
| | | 1.02% |
| | | |
| Natural Resources | | |
|
| Actual Portfolio Return | Class 1 | Class NAV |
|
| Beginning Account Value 3/1/2006 | $1,000.00 | $1,000.00 |
| Ending Account Value 8/31/2006 | 1,073.70 | 1,073.90 |
| Expenses Paid During Period* | 5.80 | 5.54 |
|
| Hypothetical 5% Portfolio Return | Class 1 | Class NAV |
|
| Beginning Account Value 3/1/2006 | $1,000.00 | $1,000.00 |
| Ending Account Value 8/31/2006 | 1,019.61 | 1,019.86 |
| Expenses Paid During Period* | 5.65 | 5.40 |
|
| Annualized Expense Ratios | Class 1 | Class NAV |
|
| | 1.11% | 1.06% |
71
John Hancock Funds II
Understanding Your Fund’s Expenses
| Quantitative All Cap | | | | |
|
| Actual Portfolio Return | Class A | Class B | Class C | Class I |
|
| Beginning Account Value 7/28/2006 | $1,000.00 | $1,000.00 | $1,000.00 | $1,000.00 |
| Ending Account Value 8/31/2006 | 1,011.00 | 1,011.00 | 1,011.00 | 1,012.00 |
| Expenses Paid During Period* | 1.03 | 1.69 | 1.69 | 0.75 |
|
| Hypothetical 5% Portfolio Return | Class A | Class B | Class C | Class I |
|
| Beginning Account Value 7/28/2006 | $1,000.00 | $1,000.00 | $1,000.00 | $1,000.00 |
| Ending Account Value 8/31/2006 | 1,003.77 | 1,003.12 | 1,003.12 | 1,004.05 |
| Expenses Paid During Period* | 1.03 | 1.68 | 1.68 | 0.75 |
|
| Annualized Expense Ratios | Class A | Class B | Class C | Class I |
|
| | 1.07% | 1.75% | 1.75% | 0.78% |
| | | | | |
| Quantitative Mid Cap | �� | | | |
|
| Actual Portfolio Return | | | Class 1 | Class NAV |
|
| Beginning Account Value 3/1/2006 | | | $1,000.00 | $1,000.00 |
| Ending Account Value 8/31/2006 | | | 926.90 | 927.50 |
| Expenses Paid During Period* | | | 4.13 | 3.89 |
|
| Hypothetical 5% Portfolio Return | | | Class 1 | Class NAV |
|
| Beginning Account Value 3/1/2006 | | | $1,000.00 | $1,000.00 |
| Ending Account Value 8/31/2006 | | | 1,020.92 | 1,021.17 |
| Expenses Paid During Period* | | | 4.33 | 4.08 |
|
| Annualized Expense Ratios | | | Class 1 | Class NAV |
|
| | | | 0.85% | 0.80% |
| | | | | |
| Quantitative Value | | | | |
|
| Actual Portfolio Return | | | Class 1 | Class NAV |
|
| Beginning Account Value 3/1/2006 | | | $1,000.00 | $1,000.00 |
| Ending Account Value 8/31/2006 | | | 1,050.80 | 1,050.80 |
| Expenses Paid During Period* | | | 4.08 | 3.83 |
|
| Hypothetical 5% Portfolio Return | | | Class 1 | Class NAV |
|
| Beginning Account Value 3/1/2006 | | | $1,000.00 | $1,000.00 |
| Ending Account Value 8/31/2006 | | | 1,021.22 | 1,021.48 |
| Expenses Paid During Period* | | | 4.02 | 3.77 |
|
| Annualized Expense Ratios | | | Class 1 | Class NAV |
|
| | | | 0.79% | 0.74% |
72
John Hancock Funds II
Understanding Your Fund’s Expenses
| Real Estate Equity | | |
|
| Actual Portfolio Return | | Class NAV |
|
| Beginning Account Value 4/28/2006 | | $1,000.00 |
| Ending Account Value 8/31/2006 | | 1,099.00 |
| Expenses Paid During Period* | | 3.26 |
|
| Hypothetical 5% Portfolio Return | | Class NAV |
|
| Beginning Account Value 4/28/2006 | | $1,000.00 |
| Ending Account Value 8/31/2006 | | 1,014.15 |
| Expenses Paid During Period* | | 3.13 |
|
| Annualized Expense Ratios | | Class NAV |
|
| | | 0.90% |
| | | |
| Real Estate Securities | | |
|
| Actual Portfolio Return | | Class 1 |
|
| Beginning Account Value 3/1/2006 | | $1,000.00 |
| Ending Account Value 8/31/2006 | | 1,117.20 |
| Expenses Paid During Period* | | 4.48 |
|
| Hypothetical 5% Portfolio Return | | Class 1 |
|
| Beginning Account Value 3/1/2006 | | $1,000.00 |
| Ending Account Value 8/31/2006 | | 1,020.97 |
| Expenses Paid During Period* | | 4.28 |
|
| Annualized Expense Ratios | | Class 1 |
|
| | | 0.84% |
| | | |
| Real Return Bond | | |
|
| Actual Portfolio Return | Class 1 | Class NAV |
|
| Beginning Account Value 3/1/2006 | $1,000.00 | $1,000.00 |
| Ending Account Value 8/31/2006 | 1,014.00 | 1,014.30 |
| Expenses Paid During Period* | 4.06 | 3.81 |
|
| Hypothetical 5% Portfolio Return | Class 1 | Class NAV |
|
| Beginning Account Value 3/1/2006 | $1,000.00 | $1,000.00 |
| Ending Account Value 8/31/2006 | 1,021.17 | 1,021.42 |
| Expenses Paid During Period* | 4.08 | 3.82 |
|
| Annualized Expense Ratios | Class 1 | Class NAV |
|
| | 0.80% | 0.75% |
73
John Hancock Funds II
Understanding Your Fund’s Expenses
| Small Cap | | |
|
| Actual Portfolio Return | Class 1 | Class NAV |
|
| Beginning Account Value 3/1/2006 | $1,000.00 | $1,000.00 |
| Ending Account Value 8/31/2006 | 918.10 | 918.20 |
| Expenses Paid During Period* | 4.64 | 4.40 |
|
| Hypothetical 5% Portfolio Return | Class 1 | Class NAV |
|
| Beginning Account Value 3/1/2006 | $1,000.00 | $1,000.00 |
| Ending Account Value 8/31/2006 | 1,020.37 | 1,020.62 |
| Expenses Paid During Period* | 4.89 | 4.63 |
|
| Annualized Expense Ratios | Class 1 | Class NAV |
|
| | 0.96% | 0.91% |
| | | |
| Small Cap Index | | |
|
| Actual Portfolio Return | | Class NAV |
|
| Beginning Account Value 3/1/2006 | | $1,000.00 |
| Ending Account Value 8/31/2006 | | 988.80 |
| Expenses Paid During Period* | | 2.86 |
|
| Hypothetical 5% Portfolio Return | | Class NAV |
|
| Beginning Account Value 3/1/2006 | | $1,000.00 |
| Ending Account Value 8/31/2006 | | 1,022.33 |
| Expenses Paid During Period* | | 2.91 |
|
| Annualized Expense Ratios | | Class NAV |
|
| | | 0.57% |
| | | |
| Small Cap Opportunities | | |
|
| Actual Portfolio Return | Class 1 | Class NAV |
|
| Beginning Account Value 3/1/2006 | $1,000.00 | $1,000.00 |
| Ending Account Value 8/31/2006 | 963.10 | 963.40 |
| Expenses Paid During Period* | 5.44 | 5.20 |
|
| Hypothetical 5% Portfolio Return | Class 1 | Class NAV |
|
| Beginning Account Value 3/1/2006 | $1,000.00 | $1,000.00 |
| Ending Account Value 8/31/2006 | 1,019.66 | 1,019.91 |
| Expenses Paid During Period* | 5.60 | 5.35 |
|
| Annualized Expense Ratios | Class 1 | Class NAV |
|
| | 1.10% | 1.05% |
74
John Hancock Funds II
Understanding Your Fund’s Expenses
| Small Company | | |
|
| Actual Portfolio Return | Class 1 | Class NAV |
|
| Beginning Account Value 3/1/2006 | $1,000.00 | $1,000.00 |
| Ending Account Value 8/31/2006 | 906.00 | 906.10 |
| Expenses Paid During Period* | 6.39 | 6.15 |
|
| Hypothetical 5% Portfolio Return | Class 1 | Class NAV |
|
| Beginning Account Value 3/1/2006 | $1,000.00 | $1,000.00 |
| Ending Account Value 8/31/2006 | 1,018.50 | 1,018.75 |
| Expenses Paid During Period* | 6.77 | 6.51 |
|
| Annualized Expense Ratios | Class 1 | Class NAV |
|
| | 1.33% | 1.28% |
| | | |
| Small Company Growth | | |
|
| Actual Portfolio Return | | Class NAV |
|
| Beginning Account Value 3/1/2006 | | $1,000.00 |
| Ending Account Value 8/31/2006 | | 972.80 |
| Expenses Paid During Period* | | 5.87 |
|
| Hypothetical 5% Portfolio Return | | Class NAV |
|
| Beginning Account Value 3/1/2006 | | $1,000.00 |
| Ending Account Value 8/31/2006 | | 1,019.26 |
| Expenses Paid During Period* | | 6.01 |
|
| Annualized Expense Ratios | | Class NAV |
|
| | | 1.18% |
| | | |
| Small Company Value | | |
|
| Actual Portfolio Return | Class 1 | Class NAV |
|
| Beginning Account Value 3/1/2006 | $1,000.00 | $1,000.00 |
| Ending Account Value 8/31/2006 | 978.50 | 978.50 |
| Expenses Paid During Period* | 5.49 | 5.24 |
|
| Hypothetical 5% Portfolio Return | Class 1 | Class NAV |
|
| Beginning Account Value 3/1/2006 | $1,000.00 | $1,000.00 |
| Ending Account Value 8/31/2006 | 1,019.66 | 1,019.91 |
| Expenses Paid During Period* | 5.60 | 5.35 |
|
| Annualized Expense Ratios | Class 1 | Class NAV |
|
| | 1.10% | 1.05% |
75
John Hancock Funds II
Understanding Your Fund’s Expenses
| Special Value | | |
|
| Actual Portfolio Return | Class 1 | Class NAV |
|
| Beginning Account Value 3/1/2006 | $1,000.00 | $1,000.00 |
| Ending Account Value 8/31/2006 | 988.00 | 988.40 |
| Expenses Paid During Period* | 5.61 | 5.36 |
|
| Hypothetical 5% Portfolio Return | Class 1 | Class NAV |
|
| Beginning Account Value 3/1/2006 | $1,000.00 | $1,000.00 |
| Ending Account Value 8/31/2006 | 1,019.56 | 1,019.81 |
| Expenses Paid During Period* | 5.70 | 5.45 |
|
| Annualized Expense Ratios | Class 1 | Class NAV |
|
| | 1.12% | 1.07% |
| | | |
| Spectrum Income | | |
|
| Actual Portfolio Return | | Class NAV |
|
| Beginning Account Value 3/1/2006 | | $1,000.00 |
| Ending Account Value 8/31/2006 | | 1,022.10 |
| Expenses Paid During Period* | | 4.59 |
|
| Hypothetical 5% Portfolio Return | | Class NAV |
|
| Beginning Account Value 3/1/2006 | | $1,000.00 |
| Ending Account Value 8/31/2006 | | 1,020.67 |
| Expenses Paid During Period* | | 4.58 |
|
| Annualized Expense Ratios | | Class NAV |
|
| | | 0.90% |
| | | |
| Strategic Bond | | |
|
| Actual Portfolio Return | Class 1 | Class NAV |
|
| Beginning Account Value 3/1/2006 | $1,000.00 | $1,000.00 |
| Ending Account Value 8/31/2006 | 1,018.00 | 1,018.40 |
| Expenses Paid During Period* | 4.22 | 3.97 |
|
| Hypothetical 5% Portfolio Return | Class 1 | Class NAV |
|
| Beginning Account Value 3/1/2006 | $1,000.00 | $1,000.00 |
| Ending Account Value 8/31/2006 | 1,021.02 | 1,021.27 |
| Expenses Paid During Period* | 4.23 | 3.97 |
|
| Annualized Expense Ratios | Class 1 | Class NAV |
|
| | 0.83% | 0.78% |
76
John Hancock Funds II
Understanding Your Fund’s Expenses
| Strategic Income | | |
|
| Actual Portfolio Return | | Class NAV |
|
| Beginning Account Value 4/28/2006 | | $1,000.00 |
| Ending Account Value 8/31/2006 | | 1,013.70 |
| Expenses Paid During Period* | | 2.99 |
|
| Hypothetical 5% Portfolio Return | | Class NAV |
| |
| Beginning Account Value 4/28/2006 | | $1,000.00 |
| Ending Account Value 8/31/2006 | | 1,014.29 |
| Expenses Paid During Period* | | 2.99 |
|
| Annualized Expense Ratios | | Class NAV |
|
| | | 0.86% |
| | | |
| Strategic Value | | |
|
| Actual Portfolio Return | Class 1 | Class NAV |
|
| Beginning Account Value 3/1/2006 | $1,000.00 | $1,000.00 |
| Ending Account Value 8/31/2006 | 1,001.80 | 1,001.80 |
| Expenses Paid During Period* | 4.94 | 4.69 |
|
| Hypothetical 5% Portfolio Return | Class 1 | Class NAV |
|
| Beginning Account Value 3/1/2006 | $1,000.00 | $1,000.00 |
| Ending Account Value 8/31/2006 | 1,020.27 | 1,020.52 |
| Expenses Paid During Period* | 4.99 | 4.74 |
|
| Annualized Expense Ratios | Class 1 | Class NAV |
|
| | 0.98% | 0.93% |
| | | |
| Total Return | | |
|
| Actual Portfolio Return | Class 1 | Class NAV |
|
| Beginning Account Value 3/1/2006 | $1,000.00 | $1,000.00 |
| Ending Account Value 8/31/2006 | 1,017.90 | 1,018.20 |
| Expenses Paid During Period* | 4.12 | 3.87 |
|
| Hypothetical 5% Portfolio Return | Class 1 | Class NAV |
|
| Beginning Account Value 3/1/2006 | $1,000.00 | $1,000.00 |
| Ending Account Value 8/31/2006 | 1,021.12 | 1,021.37 |
| Expenses Paid During Period* | 4.13 | 3.87 |
|
| Annualized Expense Ratios | Class 1 | Class NAV |
|
| | 0.81% | 0.76% |
77
John Hancock Funds II
Understanding Your Fund’s Expenses
| U.S. Global Leaders Growth | | |
|
| Actual Portfolio Return | Class 1 | Class NAV |
|
| Beginning Account Value 3/1/2006 | $1,000.00 | $1,000.00 |
| Ending Account Value 8/31/2006 | 947.60 | 948.40 |
| Expenses Paid During Period* | 3.88 | 3.63 |
|
| Hypothetical 5% Portfolio Return | Class 1 | Class NAV |
|
| Beginning Account Value 3/1/2006 | $1,000.00 | $1,000.00 |
| Ending Account Value 8/31/2006 | 1,021.22 | 1,021.48 |
| Expenses Paid During Period* | 4.02 | 3.77 |
|
| Annualized Expense Ratios | Class 1 | Class NAV |
|
| | 0.79% | 0.74% |
| | | |
| U.S. Government Securities | | |
|
| Actual Portfolio Return | Class 1 | Class NAV |
|
| Beginning Account Value 3/1/2006 | $1,000.00 | $1,000.00 |
| Ending Account Value 8/31/2006 | 1,014.80 | 1,015.10 |
| Expenses Paid During Period* | 4.01 | 3.76 |
|
| Hypothetical 5% Portfolio Return | Class 1 | Class NAV |
|
| Beginning Account Value 3/1/2006 | $1,000.00 | $1,000.00 |
| Ending Account Value 8/31/2006 | 1,021.22 | 1,021.48 |
| Expenses Paid During Period* | 4.02 | 3.77 |
|
| Annualized Expense Ratios | Class 1 | Class NAV |
|
| | 0.79% | 0.74% |
| | | |
| U.S. High Yield Bond | | |
|
| Actual Portfolio Return | Class 1 | Class NAV |
|
| Beginning Account Value 3/1/2006 | $1,000.00 | $1,000.00 |
| Ending Account Value 8/31/2006 | 1,023.10 | 1,023.30 |
| Expenses Paid During Period* | 4.44 | 4.18 |
|
| Hypothetical 5% Portfolio Return | Class 1 | Class NAV |
|
| Beginning Account Value 3/1/2006 | $1,000.00 | $1,000.00 |
| Ending Account Value 8/31/2006 | 1,020.82 | 1,021.07 |
| Expenses Paid During Period* | 4.43 | 4.18 |
|
| Annualized Expense Ratios | Class 1 | Class NAV |
|
| | 0.87% | 0.82% |
78
John Hancock Funds II
Understanding Your Fund’s Expenses
| U.S. Multi Sector | |
|
| Actual Portfolio Return | Class NAV |
|
| Beginning Account Value 3/1/2006 | $1,000.00 |
| Ending Account Value 8/31/2006 | 978.40 |
| Expenses Paid During Period* | 4.04 |
|
| Hypothetical 5% Portfolio Return | Class NAV |
|
| Beginning Account Value 3/1/2006 | $1,000.00 |
| Ending Account Value 8/31/2006 | 1,021.12 |
| Expenses Paid During Period* | 4.13 |
|
| Annualized Expense Ratios | Class NAV |
|
| | 0.81% |
| | |
| Value & Restructuring | |
|
| Actual Portfolio Return | Class NAV |
|
| Beginning Account Value 3/1/2006 | $1,000.00 |
| Ending Account Value 8/31/2006 | 991.10 |
| Expenses Paid During Period* | 4.62 |
|
| Hypothetical 5% Portfolio Return | Class NAV |
|
| Beginning Account Value 3/1/2006 | $1,000.00 |
| Ending Account Value 8/31/2006 | 1,020.57 |
| Expenses Paid During Period* | 4.69 |
|
| Annualized Expense Ratios | Class NAV |
|
| | 0.92% |
| | |
| Vista | |
|
| Actual Portfolio Return | Class NAV |
|
| Beginning Account Value 3/1/2006 | $1,000.00 |
| Ending Account Value 8/31/2006 | 948.60 |
| Expenses Paid During Period* | 5.16 |
|
| Hypothetical 5% Portfolio Return | Class NAV |
|
| Beginning Account Value 3/1/2006 | $1,000.00 |
| Ending Account Value 8/31/2006 | 1,019.91 |
| Expenses Paid During Period* | 5.35 |
|
| Annualized Expense Ratios | Class NAV |
|
| | 1.05% |
* Expenses are equal to the Fund’s annualized expense ratio for each respective class, multiplied by the average account value over the period, multiplied by [number of days in most recent fiscal half-year or inception, whichever is shorter/365 or 366] (to reflect the one-half year period).
79
| John Hancock Funds II | | | | |
| |
| Statements of Assets and Liabilities — August 31, 2006 | | | |
|
| |
| |
| Assets | Absolute Return | Active Bond | All Cap Core | All Cap Growth |
|
| Investments, at value | $469,634 | $504,391,750 | $253,455,597 | $146,390,352 |
| Investments in affiliated funds, at value | 4,708,363 | — | — | — |
| Securities loaned, at value (Note 2) | — | 81,697,633 | 12,028,205 | 6,928,300 |
| Repurchase agreements, at value | — | 6,881,000 | 30,627,000 | 7,953,000 |
| Cash | 18,202 | 854,726 | 7,906 | 904 |
| Foreign currency, at value | — | 3,849 | — | 29 |
| Receivable for investments sold | — | 1,134,871 | 33,114,322 | 1,572,629 |
| Receivable for shares sold | — | 314,730 | 68,368 | 9,646 |
| Dividends and interest receivable | — | 3,288,237 | 479,790 | 142,300 |
| Receivable due from adviser | 32,257 | — | — | — |
| Other assets | — | 4,098 | 3,176 | 1,562 |
| Total assets | 5,228,456 | 598,570,894 | 329,784,364 | 162,998,722 |
| |
| Liabilities | | | | |
|
| Payable for investments purchased | — | 3,848,695 | 33,377,015 | 874,386 |
| Payable for delayed delivery securities purchased | — | 74,683,222 | — | — |
| Payable for shares repurchased | — | 7,487 | — | 3,121 |
| Payable upon return of securities loaned (Note 2) | — | 83,363,396 | 12,324,387 | 7,097,453 |
| Payable for futures variation margin | — | — | 1,415 | — |
| Payable to affiliates | | | | |
| Fund administration fees | 122 | 9,170 | 6,393 | 5,742 |
| Other payables and accrued expenses | 22,560 | 103,881 | 51,713 | 47,133 |
| Total liabilities | 22,682 | 162,015,851 | 45,760,923 | 8,027,835 |
| |
| Net assets | | | | |
|
| Capital paid-in | 4,994,565 | 435,610,733 | 285,676,890 | 148,381,582 |
| Accumulated undistributed net realized gain (loss) on investments, | | | | |
| futures contracts, foreign currency transactions and | | | | |
| forward foreign currency contracts | — | (3,319,079) | (8,213,574) | (3,002,765) |
| Unrealized appreciation (depreciation) on investments, | | | | |
| futures contracts, and translation of assets and | | | | |
| liabilities in foreign currencies | 160,534 | 670,385 | 5,270,609 | 9,501,316 |
| Undistributed net investment income (loss) | 50,675 | 3,593,004 | 1,289,516 | 90,754 |
| Net assets | $5,205,774 | $436,555,043 | $284,023,441 | $154,970,887 |
| Investments, including repurchase agreements, at cost | $5,017,463 | $592,300,056 | $291,452,968 | $151,769,476 |
| Foreign currency, at cost | — | $3,823 | — | $29 |
| |
| Net asset value per share | | | | |
|
| Based on net asset values and shares outstanding — The Funds have an unlimited number of shares authorized with no par value. | | |
| Class A | | | | |
| Net assets | $1,302,120 | — | — | — |
| Shares outstanding | 125,000 | — | — | — |
| Net asset value and redemption price (Note 3) per share | | | | |
| (net assets ÷ shares outstanding) | $10.42 | — | — | — |
| Class Ba | | | | |
| Net assets | $1,300,473 | — | — | — |
| Shares outstanding | 125,000 | — | — | — |
| Net asset value and offering price (Note 3) per share | | | | |
| (net assets ÷ shares outstanding) | $10.40 | — | — | — |
| Class Ca | | | | |
| Net assets | $1,300,473 | — | — | — |
| Shares outstanding | 125,000 | — | — | — |
| Net asset value and offering price (Note 3) per share | | | | |
| (net assets ÷ shares outstanding) | $10.40 | — | — | — |
| Class 1 | | | | |
| Net assets | $1,302,708 | $37,283,742 | — | $32,229,101 |
| Shares outstanding | 125,000 | 3,882,410 | — | 1,961,825 |
| Net asset value per share (net assets ÷ shares outstanding) | $10.42 | $9.60 | — | $16.43 |
| Class NAV | | | | |
| Net assets | — | $399,271,301 | $284,023,441 | $122,741,786 |
| Shares outstanding | — | 41,596,537 | 28,631,265 | 7,463,449 |
| Net asset value per share (net assets ÷ shares outstanding) | — | $9.60 | $9.92 | $16.45 |
| |
| Maximum offering price per share | | | | |
|
| Class A1 ($10.42 ÷ 95%) | $10.97 | — | — | — |
1 On single retail sales of less than $50,000. On sales of $50,000 or more and on group sales the offering price is reduced.
a Redemption price is equal to net asset value less any applicable contingent deferred sales charges (Note 3).
The accompanying notes are an integral part of the financial statements. 80
| John Hancock Funds II | | | | |
| |
| Statements of Assets and Liabilities — August 31, 2006 | | | |
|
| |
| Assets | All Cap Value | Blue Chip Growth | Capital Appreciation | Core Bond |
|
| Investments, at value | $204,008,294 | $1,268,309,434 | $461,535,163 | $217,232,500 |
| Securities loaned, at value (Note 2) | 16,658,524 | 47,949,100 | 18,108,656 | 18,991,238 |
| Repurchase agreements, at value | 13,275,000 | 2,041,000 | — | 1,896,000 |
| Cash | 634 | — | 496 | 417,813 |
| Receivable for investments sold | 1,005,094 | 4,625,284 | 1,923,239 | 9,727,764 |
| Receivable for delayed delivery securities sold | — | — | — | 50,661,921 |
| Receivable for shares sold | 53,321 | 462,618 | 93,061 | 38,606 |
| Dividends and interest receivable | 377,249 | 1,255,585 | 242,960 | 1,447,724 |
| Other assets | 2,019 | 12,034 | 3,138 | 1,841 |
| Total assets | 235,380,135 | 1,324,655,055 | 481,906,713 | 300,415,407 |
| |
| Liabilities | | | | |
|
| Payable for investments purchased | 2,002,877 | 2,524,969 | 2,956,393 | 21,997,053 |
| Payable for delayed delivery securities purchased | — | — | — | 60,559,772 |
| Payable for shares repurchased | 95,219 | 143,421 | 101,011 | — |
| Payable upon return of securities loaned (Note 2) | 17,067,785 | 48,982,997 | 18,532,002 | 19,381,094 |
| Payable to affiliates | | | | |
| Fund administration expenses | 4,265 | 22,293 | 7,270 | 7,910 |
| Other payables and accrued expenses | 48,188 | 130,587 | 65,168 | 79,782 |
| Total liabilities | 19,218,334 | 51,804,267 | 21,661,844 | 102,025,611 |
| |
| Net assets | | | | |
|
| Capital paid-in | 192,470,269 | 1,201,032,427 | 468,587,781 | 197,819,645 |
| Accumulated undistributed net realized gain (loss) on investments, | | | | |
| foreign currency transactions and forward foreign currency contracts | 5,826,940 | (3,928,748) | (17,467,941) | (1,956,868) |
| Unrealized appreciation (depreciation) on investments and | | | | |
| translation of assets and liabilities in foreign currencies | 16,725,292 | 70,971,019 | 8,657,847 | 869,346 |
| Undistributed net investment income (loss) | 1,139,300 | 4,776,090 | 467,182 | 1,657,673 |
| Net assets | $216,161,801 | $1,272,850,788 | $460,244,869 | $198,389,796 |
| Investments, including repurchase agreements, at cost | $217,216,526 | $1,247,331,996 | $470,985,984 | $237,250,392 |
| |
| Net asset value per share | | | | |
|
| Based on net asset values and shares outstanding — The Funds have an unlimited number of shares authorized with no par value. | |
| Class 1 | | | | |
| Net assets | $21,054,323 | $184,779,132 | $67,703,887 | $962,817 |
| Shares outstanding | 1,329,231 | 10,369,260 | 7,168,783 | 76,931 |
| Net asset value per share (net assets ÷ shares outstanding) | $15.84 | $17.82 | $9.44 | $12.52 |
| Class NAV | | | | |
| Net assets | $195,107,478 | $1,088,071,656 | $392,540,982 | $197,426,979 |
| Shares outstanding | 12,348,003 | 61,111,112 | 41,538,087 | 15,783,183 |
| Net asset value per share (net assets ÷ shares outstanding) | $15.80 | $17.80 | $9.45 | $12.51 |
The accompanying notes are an integral part of the financial statements. 81
| John Hancock Funds II | | | | |
| |
| Statements of Assets and Liabilities — August 31, 2006 | | | |
|
| |
| |
| | | | Emerging | |
| Assets | Core Equity | Emerging Growth | Small Company | Equity-Income |
|
| Investments, at value | $584,435,089 | $172,844,838 | $50,180,125 | $713,281,169 |
| Securities loaned, at value (Note 2) | — | 37,271,615 | — | 40,404,082 |
| Repurchase agreements, at value | 14,737,000 | — | 2,495,000 | 3,515,000 |
| Cash | 958 | 915 | 828 | 795 |
| Receivable for investments sold | 1,904,609 | 289,262 | 963,857 | 1,550,534 |
| Receivable for shares sold | 65,434 | 70 | — | 420,870 |
| Dividends and interest receivable | 225,727 | 37,181 | 5,824 | 2,056,152 |
| Receivable due from adviser | — | — | 61,435 | — |
| Other assets | 5,276 | 1,825 | 680 | 8,941 |
| Total assets | 601,374,093 | 210,445,706 | 53,707,749 | 761,237,543 |
| |
| Liabilities | | | | |
|
| Payable for investments purchased | 5,141,144 | 102,716 | 1,765,728 | 678,437 |
| Payable for shares repurchased | — | 295,691 | 49,466 | 276,909 |
| Payable upon return of securities loaned (Note 2) | — | 38,275,542 | — | 41,370,005 |
| Payable to affiliates | | | | |
| Fund administration expenses | 17,166 | 30,700 | 30,013 | 24,710 |
| Other payables and accrued expenses | 76,332 | 86,370 | 43,757 | 90,489 |
| Total liabilities | 5,234,642 | 38,791,019 | 1,888,964 | 42,440,550 |
| |
| Net assets | | | | |
|
| Capital paid-in | 586,021,098 | 155,912,789 | 50,734,807 | 622,841,119 |
| Accumulated undistributed net realized gain (loss) on investments, | | | | |
| futures contracts, foreign currency transactions and | | | | |
| forward foreign currency contracts | 3,447,577 | 31,090,358 | 5,058,902 | 31,315,187 |
| Unrealized appreciation (depreciation) on investments and | | | | |
| translation of assets and liabilities in foreign currencies | 6,670,679 | (15,348,460) | (3,974,924) | 56,205,455 |
| Undistributed net investment income (loss) | 97 | — | — | 8,435,232 |
| Net assets | $596,139,451 | $171,654,687 | $51,818,785 | $718,796,993 |
| Investments, including repurchase agreements, at cost | $592,501,706 | $225,464,913 | $56,650,049 | $700,994,796 |
| |
| Net asset value per share | | | | |
|
| Based on net asset values and shares outstanding — The Funds have an unlimited number of shares authorized with no par value. | | |
| Class 1 | | | | |
| Net assets | $12,113,145 | $120,481,278 | $51,720,247 | $183,451,590 |
| Shares outstanding | 850,013 | 6,568,281 | 1,785,370 | 10,119,372 |
| Net asset value per share (net assets ÷ shares outstanding) | $14.25 | $18.34 | $28.97 | $18.13 |
| Class NAV | | | | |
| Net assets | $584,026,306 | $51,173,409 | $98,538 | $535,345,403 |
| Shares outstanding | 40,933,677 | 2,789,800 | 3,401 | 29,558,876 |
| Net asset value per share (net assets ÷ shares outstanding) | $14.27 | $18.34 | $28.97 | $18.11 |
The accompanying notes are an integral part of the financial statements. 82
| John Hancock Funds II | | | | |
| |
| Statements of Assets and Liabilities — August 31, 2006 | | | |
|
| |
| Assets | Fundamental Value | Global Bond | Global Real Estate | High Income |
|
| Investments, at value | $761,694,064 | $632,977,657 | $350,030,574 | $287,672,560 |
| Securities loaned, at value (Note 2) | 22,455,397 | 9,124,648 | 41,422,785 | 59,127,174 |
| Repurchase agreements, at value | — | 11,868,000 | 4,680,000 | — |
| Cash | 595 | 384 | 74 | — |
| Foreign currency, at value | 6,382 | 12,875,304 | 891,977 | — |
| Receivable for investments sold | 728,599 | 508,414 | 3,374,344 | 1,124,025 |
| Receivable for shares sold | 1,395,888 | 915,540 | 3,692 | 95,471 |
| Receivable for forward foreign currency exchange contracts (Note 2) | — | 1,477,322 | 430,756 | — |
| Dividends and interest receivable | 1,068,234 | 3,299,547 | 360,760 | 4,781,678 |
| Receivable for swap contracts | — | 141,725 | — | — |
| Receivable for futures variation margin | — | 932,938 | — | — |
| Other assets | 6,854 | 5,586 | 3,859 | 3,322 |
| Total assets | 787,356,013 | 674,127,065 | 401,198,821 | 352,804,230 |
| |
| Liabilities | | | | |
|
| Due to custodian | — | — | — | 994,927 |
| Payable for investments purchased | 2,899,183 | 37,045,599 | 1,566,880 | 1,558,829 |
| Payable for delayed delivery securities pruchased | — | 26,846,148 | — | — |
| Payable upon return of securities loaned (Note 2) | 22,927,961 | 9,309,000 | 43,240,359 | 60,455,958 |
| Payable for options written, at value | — | 2,994,704 | — | 476,050 |
| Payable for swap contracts | — | 562,329 | — | — |
| Unrealized depreciation of swap contracts (Note 2) | — | 58,762 | — | — |
| Unrealized depreciation on forward volatility options (Note 2) | — | 31,951 | — | — |
| Payable for forward foreign currency exchange contracts (Note 2) | — | 2,136,719 | 1,048,158 | 184,378 |
| Payable to affiliates | | | | |
| Fund administration expenses | 13,421 | 13,777 | 7,964 | 6,628 |
| Other payables and accrued expenses | 91,695 | 130,139 | 110,982 | 68,225 |
| Total liabilities | 25,932,260 | 79,129,128 | 45,974,343 | 63,744,995 |
| |
| Net assets | | | | |
|
| Capital paid-in | 706,520,373 | 579,998,011 | 343,735,965 | 292,151,701 |
| Accumulated undistributed net realized gain (loss) on investments, | | | | |
| futures contracts, options written, interest rate swaps, | | | | |
| foreign currency transactions and forward foreign currency contracts | 4,881,179 | (1,979,215) | (8,654,114) | (602,478) |
| Unrealized appreciation (depreciation) on investments, | | | | |
| futures contracts, options written, interest rate swaps and | | | | |
| translation of assets and liabilities in foreign currencies | 45,751,068 | 7,486,259 | 15,126,084 | (5,980,048) |
| Undistributed net investment income (loss) | 4,271,133 | 9,492,882 | 5,016,543 | 3,490,060 |
| Net assets | $761,423,753 | $594,997,937 | $355,224,478 | $289,059,235 |
| Investments, including repurchase agreements, at cost | $738,398,686 | $648,911,321 | $380,386,125 | $352,637,235 |
| Foreign currency, at cost | $6,226 | $12,835,350 | $892,085 | — |
| Premium received on written options | — | $2,493,828 | — | $517,604 |
| |
| Net asset value per share | | | | |
|
| Based on net asset values and shares outstanding — The Funds have an unlimited number of shares authorized with no par value. | |
| Class 1 | | | | |
| Net assets | $66,919,554 | $41,070,045 | — | — |
| Shares outstanding | 4,220,517 | 2,769,848 | — | — |
| Net asset value per share (net assets ÷ shares outstanding) | $15.86 | $14.83 | — | — |
| Class NAV | | | | |
| Net assets | $694,504,199 | $553,927,892 | $355,224,478 | $289,059,235 |
| Shares outstanding | 43,877,857 | 37,449,290 | 34,487,270 | 29,282,645 |
| Net asset value per share (net assets ÷ shares outstanding) | $15.83 | $14.79 | $10.30 | $9.87 |
The accompanying notes are an integral part of the financial statements. 83
| John Hancock Funds II | | | | |
| |
| Statements of Assets and Liabilities — August 31, 2006 | | | |
|
| |
| |
| | | International | International | International |
| Assets | High Yield | Equity Index | Opportunities | Small Cap |
|
| Investments, at value | $1,123,646,335 | $307,468,597 | $555,952,487 | $361,988,214 |
| Securities loaned, at value (Note 2) | 279,406,317 | 56,232,027 | 102,487,713 | 46,558,890 |
| Repurchase agreements, at value | 33,200,000 | — | 9,470,000 | 26,833,000 |
| Cash | 408,654 | — | 637 | 162 |
| Foreign currency, at value | 544,387 | 627,297 | 107,624 | 9,566,132 |
| Receivable for investments sold | 16,719,970 | 1,647,951 | 11,007,822 | — |
| Receivable for shares sold | 748,390 | 114,112 | 141,410 | 64,217 |
| Receivable for forward foreign currency exchange contracts (Note 2) | — | 94,029 | — | — |
| Dividends and interest receivable | 23,074,909 | 677,634 | 441,907 | 1,040,507 |
| Receivable for futures variation margin | — | 1,471,057 | — | — |
| Other assets | 15,194 | 4,469 | 4,434 | 5,687 |
| Total assets | 1,477,764,156 | 368,337,173 | 679,614,034 | 446,056,809 |
| |
| Liabilities | | | | |
|
| Capital gains withholding tax | — | — | — | 242,277 |
| Payable for investments purchased | 4,223,441 | 1,436,595 | 10,822,189 | 559,756 |
| Payable for shares repurchased | 82,000 | — | — | — |
| Payable upon return of securities loaned (Note 2) | 285,165,979 | 59,053,314 | 107,481,210 | 49,186,127 |
| Payable for futures variation margin | — | 28,229 | — | — |
| Payable for forward foreign currency exchange contracts (Note 2) | — | 11,084 | — | — |
| Payable to affiliates | | | | |
| Fund administration expenses | 27,386 | 4,624 | 10,546 | 9,719 |
| Other payables and accrued expenses | 169,850 | 44,310 | 139,379 | 193,840 |
| Total liabilities | 289,668,656 | 60,578,156 | 118,453,324 | 50,191,719 |
| |
| Net assets | | | | |
|
| Capital paid-in | 1,172,248,792 | 272,434,870 | 490,996,985 | 310,729,239 |
| Accumulated undistributed net realized gain (loss) on investments, | | | | |
| futures contracts, foreign currency transactions and | | | | |
| forward foreign currency contracts | 8,020,849 | 2,605,976 | 2,598,649 | 51,813,331 |
| Unrealized appreciation (depreciation) on investments, | | | | |
| futures contracts and translation of assets and | | | | |
| liabilities in foreign currencies | (7,794,032) | 29,836,925 | 67,545,351 | 28,663,284a |
| Undistributed net investment income (loss) | 15,619,891 | 2,881,246 | 19,725 | 4,659,236 |
| Net assets | $1,188,095,500 | $307,759,017 | $561,160,710 | $395,865,090 |
| Investments, including repurchase agreements, at cost | $1,444,087,968 | $334,559,078 | $600,366,904 | $406,360,101 |
| Foreign currency, at cost | $515,353 | $625,747 | $107,320 | $9,683,288 |
| |
| Net asset value per share | | | | |
|
| Based on net asset values and shares outstanding — The Funds have an unlimited number of shares authorized with no par value. | | |
| Class 1 | | | | |
| Net assets | $43,950,157 | — | $8,942,696 | $36,951,053 |
| Shares outstanding | 4,342,243 | — | 554,477 | 1,763,618 |
| Net asset value per share (net assets ÷ shares outstanding) | $10.12 | — | $16.13 | $20.95 |
| Class NAV | | | | |
| Net assets | $1,144,145,343 | $307,759,017 | $552,218,014 | $358,914,037 |
| Shares outstanding | 113,506,841 | 16,226,810 | 34,176,390 | 17,134,122 |
| Net asset value per share (net assets ÷ shares outstanding) | $10.08 | $18.97 | $16.16 | $20.95 |
a Net of $242,277 in deferred foreign withholding taxes for International Small Cap.
The accompanying notes are an integral part of the financial statements. 84
| John Hancock Funds II | | | | |
| |
| Statements of Assets and Liabilities — August 31, 2006 | | | |
|
| |
| | International | International | International | Investment |
| Assets | Small Company | Stock | Value | Quality Bond |
|
| Investments, at value | $219,549,301 | $75,669,401 | $937,781,846 | $120,862,841 |
| Securities loaned, at value (Note 2) | 37,750,230 | 978,177 | 100,205,333 | 30,020,994 |
| Repurchase agreements, at value | 2,107,000 | 393,000 | 19,803,000 | 9,703,000 |
| Cash | 480 | 297 | 546 | 786 |
| Foreign currency, at value | 1,202,491 | 265,720 | 14,778,109 | — |
| Cash segregated for futures contracts | — | 550,000 | — | — |
| Receivable for investments sold | 145,960 | 5,238 | — | — |
| Receivable for shares sold | 27,999 | — | 201,925 | 44,685 |
| Receivable for forward foreign currency exchange contracts (Note 2) | — | 39,266 | — | — |
| Dividends and interest receivable | 205,705 | 2,795,334 | 2,726,540 | 1,333,347 |
| Receivable for futures variation margin | — | 29,861 | — | — |
| Receivable due from adviser | — | — | 13,409 | 70 |
| Other assets | 2,488 | 9,803 | 10,492 | 1,263 |
| Total assets | 260,991,654 | 80,736,097 | 1,075,521,200 | 161,966,986 |
| |
| Liabilities | | | | |
|
| Capital gains withholding tax | 1,892 | — | — | — |
| Payable for investments purchased | 290,391 | — | 182,038 | 819,364 |
| Payable for delayed delivery securities purchased | — | — | — | 2,052,548 |
| Payable for shares repurchased | — | 13,107 | — | 119,172 |
| Payable upon return of securities loaned (Note 2) | 39,707,208 | 1,028,026 | 104,966,722 | 30,637,942 |
| Payable for futures variation margin | — | 11,249 | — | 16,953 |
| Payable for forward foreign currency exchange contracts (Note 2) | — | 68,321 | — | — |
| Payable to affiliates | | | | |
| Fund administration expenses | 4,904 | 20,140 | 24,198 | 3,862 |
| Other payables and accrued expenses | 76,269 | 275,413 | 257,131 | 69,710 |
| Total liabilities | 40,080,664 | 1,416,256 | 105,430,089 | 33,719,551 |
| |
| Net assets | | | | |
|
| Capital paid-in | 234,373,406 | 62,987,912 | 791,293,144 | 128,278,583 |
| Accumulated undistributed net realized gain (loss) on investments, | | | | |
| futures contracts, foreign currency transactions and | | | | |
| forward foreign currency contracts | (7,554,175) | (208) | 49,679,104 | (366,488) |
| Unrealized appreciation (depreciation) on investments, | | | | |
| futures contracts and translation of assets and | | | | |
| liabilities in foreign currencies | (6,753,919)a | 13,665,641 | 105,464,902 | (862,651) |
| Undistributed net investment income (loss) | 845,678 | 2,666,496 | 23,653,961 | 1,197,991 |
| Net assets | $220,910,990 | $79,319,841 | $970,091,111 | $128,247,435 |
| Investments, including repurchase agreements, at cost | $266,159,932 | $63,483,062 | $952,362,733 | $161,398,588 |
| Foreign currency, at cost | $1,201,488 | $267,421 | $14,749,579 | — |
| |
| Net asset value per share | | | | |
|
| Based on net asset values and shares outstanding — The Funds have an unlimited number of shares authorized with no par value. | | |
| Class 1 | | | | |
| Net assets | — | $79,319,841 | $134,429,163 | $34,859,138 |
| Shares outstanding | — | 5,740,707 | 7,506,850 | 2,963,182 |
| Net asset value per share (net assets ÷ shares outstanding) | — | $13.82 | $17.91 | $11.76 |
| Class NAV | | | | |
| Net assets | $220,910,990 | — | $835,661,948 | $93,388,297 |
| Shares outstanding | 23,673,770 | — | 46,750,287 | 7,944,725 |
| Net asset value per share (net assets ÷ shares outstanding) | $9.33 | — | $17.88 | $11.75 |
a Net of deferred foreign withholding taxes of $1,892 for International Small Company.
The accompanying notes are an integral part of the financial statements. 85
| John Hancock Funds II | | | | |
| |
| Statements of Assets and Liabilities — August 31, 2006 | | | |
|
| |
| |
| Assets | Large Cap | Large Cap Value | Mid Cap Core | Mid Cap Index |
|
| Investments, at value | $190,136,057 | $339,005,203 | $248,261,725 | $172,177,954 |
| Securities loaned, at value (Note 2) | 6,464,141 | 14,553,765 | 19,407,625 | 30,056,185 |
| Repurchase agreements, at value | 3,326,000 | — | 53,132,000 | 541,000 |
| Cash | 684 | — | 791 | 659 |
| Foreign currency, at value | — | — | 5,675,617 | — |
| Receivable for investments sold | 481,414 | — | 3,750,244 | — |
| Receivable for shares sold | 31,029 | 371,800 | 38,237 | 16,866 |
| Dividends and interest receivable | 319,436 | 632,241 | 332,314 | 159,334 |
| Receivable for futures variation margin | — | — | — | 49,600 |
| Other assets | 1,782 | 1,683 | 3,664 | 693 |
| Total assets | 200,760,543 | 354,564,692 | 330,602,217 | 203,002,291 |
| |
| Liabilities | | | | |
|
| Due to custodian | — | 96,574 | — | — |
| Payable for investments purchased | 305,473 | — | 4,965,274 | — |
| Payable for shares repurchased | — | — | 27,487 | — |
| Payable upon return of securities loaned (Note 2) | 6,601,703 | 14,896,485 | 19,867,086 | 30,804,574 |
| Payable to affiliates | | | | |
| Fund administration expenses | 4,437 | 7,807 | 8,866 | 2,206 |
| Due to adviser | — | — | — | 1,666 |
| Other payables and accrued expenses | 45,868 | 50,057 | 62,409 | 38,352 |
| Total liabilities | 6,957,481 | 15,050,923 | 24,931,122 | 30,846,798 |
| |
| Net assets | | | | |
|
| Capital paid-in | 179,904,511 | 321,849,283 | 278,211,895 | 173,066,721 |
| Accumulated undistributed net realized gain (loss) on investments, | | | | |
| futures contracts, foreign currency transactions and | | | | |
| forward foreign currency contracts | 3,114,081 | (1,478,897) | 11,819,064 | 132,501 |
| Unrealized appreciation (depreciation) on investments, | | | | |
| futures contracts and translation of assets and | | | | |
| liabilities in foreign currencies | 9,634,421 | 17,901,225 | 13,277,221 | (1,868,848) |
| Undistributed net investment income (loss) | 1,150,049 | 1,242,158 | 2,362,915 | 825,119 |
| Net assets | $193,803,062 | $339,513,769 | $305,671,095 | $172,155,493 |
| Investments, including repurchase agreements, at cost | $190,291,777 | $335,657,743 | $307,523,543 | $204,876,370 |
| Foreign currency, at cost | — | — | $5,684,105 | — |
| |
| Net asset value per share | | | | |
|
| Based on net asset values and shares outstanding — The Funds have an unlimited number of shares authorized with no par value. | | |
| Class 1 | | | | |
| Net assets | $2,060,522 | $105,323,658 | $11,243,766 | — |
| Shares outstanding | 140,472 | 4,584,811 | 651,471 | — |
| Net asset value per share (net assets ÷ shares outstanding) | $14.67 | $22.97 | $17.26 | — |
| Class NAV | | | | |
| Net assets | $191,742,540 | $234,190,111 | $294,427,329 | $172,155,493 |
| Shares outstanding | 13,073,261 | 10,178,577 | 17,056,845 | 9,369,737 |
| Net asset value per share (net assets ÷ shares outstanding) | $14.67 | $23.01 | $17.26 | $18.37 |
The accompanying notes are an integral part of the financial statements. 86
| John Hancock Funds II | | | | |
| |
| Statements of Assets and Liabilities — August 31, 2006 | | | |
|
| |
| | | | Mid Cap | |
| Assets | Mid Cap Stock | Mid Cap Value | Value Equity | Natural Resources |
|
| Investments, at value | $291,415,707 | $137,780,116 | $99,750,567 | $733,911,348 |
| Securities loaned, at value (Note 2) | 71,681,651 | 20,377,144 | 16,791,394 | 71,298,145 |
| Repurchase agreements, at value | 12,377,000 | 5,820,000 | — | 35,462,000 |
| Cash | 97 | 939 | 25,510 | 404 |
| Foreign currency, at value | — | — | — | 486,481 |
| Receivable for investments sold | 1,548,815 | 274,977 | 2,807,672 | — |
| Receivable for shares sold | 21,740 | 15,723 | 8,605 | 3,631,256 |
| Dividends and interest receivable | 78,472 | 178,651 | 146,771 | 1,459,595 |
| Other assets | 2,883 | 2,316 | 1,102 | 7,369 |
| Total assets | 377,126,365 | 164,449,866 | 119,531,621 | 846,256,598 |
| |
| Liabilities | | | | |
|
| Due to custodian | 1,548,815 | — | — | — |
| Payable for investments purchased | 1,140,921 | 306,528 | 4,135,327 | 88,153 |
| Payable for shares repurchased | 45,023 | — | — | 206,549 |
| Payable upon return of securities loaned (Note 2) | 73,452,448 | 20,909,218 | 17,229,156 | 72,883,888 |
| Fund administration expenses | 8,351 | 4,392 | 2,206 | 14,744 |
| Other payables and accrued expenses | 61,029 | 45,085 | 41,152 | 119,213 |
| Total liabilities | 76,256,587 | 21,265,223 | 21,407,841 | 73,312,547 |
| |
| Net assets | | | | |
|
| Capital paid-in | 270,197,904 | 128,418,339 | 101,230,202 | 619,960,625 |
| Accumulated undistributed net realized gain (loss) on investments, | | | | |
| futures contracts, foreign currency transactions and | | | | |
| forward foreign currency contracts | 14,254,231 | 5,190,077 | (871,916) | 32,945,984 |
| Unrealized appreciation (depreciation) on investments and | | | | |
| translation of assets and liabilities in foreign currencies | 16,417,643 | 8,839,164 | (2,464,971) | 114,034,956 |
| Undistributed net investment income (loss) | — | 737,063 | 230,465 | 6,002,486 |
| Net assets | $300,869,778 | $143,184,643 | $98,123,780 | $772,944,051 |
| Investments, including repurchase agreements, at cost | $359,056,883 | $155,138,096 | $119,006,979 | $726,632,531 |
| Foreign currency, at cost | — | — | — | $489,746 |
| |
| Net asset value per share | | | | |
|
| Based on net asset values and shares outstanding — The Funds have an unlimited number of shares authorized with no par value. | | |
| Class 1 | | | | |
| Net assets | $106,749,566 | $93,479,668 | — | $81,381,839 |
| Shares outstanding | 6,751,092 | 4,953,645 | — | 2,278,995 |
| Net asset value per share (net assets ÷ shares outstanding) | $15.81 | $18.87 | — | $35.71 |
| Class NAV | | | | |
| Net assets | $194,120,212 | $49,704,975 | $98,123,780 | $691,562,212 |
| Shares outstanding | 12,262,613 | 2,635,211 | 10,163,245 | 19,428,491 |
| Net asset value per share (net assets ÷ shares outstanding) | $15.83 | $18.86 | $9.65 | $35.60 |
The accompanying notes are an integral part of the financial statements. 87
| John Hancock Funds II | | | | |
| |
| Statements of Assets and Liabilities — August 31, 2006 | | | |
|
| |
| |
| | Quantitative | Quantitative | Quantitative | Real |
| Assets | All Cap | Mid Cap | Value | Estate Equity |
|
| Investments, at value | $5,023,003 | $183,523,168 | $457,775,981 | $273,802,292 |
| Securities loaned, at value (Note 2) | — | 41,490,539 | 24,016,341 | 33,658,317 |
| Repurchase agreement, at value | — | — | — | 2,297,000 |
| Cash | 14,243 | 8,283 | 4,546 | 583 |
| Receivable for investments sold | 21,611 | 3,382,316 | — | — |
| Receivable for shares sold | — | 45,337 | 203,974 | 21,425 |
| Dividends and interest receivable | 7,653 | 64,182 | 773,767 | 228,569 |
| Receivable due from adviser | 23,320 | — | — | — |
| Other assets | — | 1,999 | 3,695 | 3,041 |
| Total assets | 5,089,830 | 228,515,824 | 482,778,304 | 310,011,227 |
| |
| Liabilities | | | | |
|
| Payable for investments purchased | 11,250 | 2,847,903 | — | 613,222 |
| Payable upon return of securities loaned (Note 2) | — | 42,435,825 | 24,592,740 | 34,447,109 |
| Payable to affiliates | | | | |
| Fund administration fees | 54 | 4,076 | 8,194 | 6,296 |
| Other payables and accrued expenses | 23,689 | 43,757 | 60,190 | 50,134 |
| Total liabilities | 34,993 | 45,331,561 | 24,661,124 | 35,116,761 |
| |
| Net assets | | | | |
|
| Capital paid-in | 4,997,328 | 175,790,348 | 403,894,233 | 249,457,958 |
| Accumulated undistributed net realized gain (loss) on investments | 6,261 | (2,784,557) | 20,826,320 | 1,890,278 |
| Unrealized appreciation (depreciation) on investments | 41,732 | 9,969,387 | 29,110,362 | 22,030,725 |
| Undistributed net investment income (loss) | 9,516 | 209,085 | 4,286,265 | 1,515,505 |
| Net assets | $5,054,837 | $183,184,263 | $458,117,180 | $274,894,466 |
| Investments, including repurchase agreements, at cost | $4,981,271 | $215,044,320 | $452,681,960 | $287,726,884 |
| |
| Net asset value per share | | | | |
|
| Based on net asset values and shares outstanding — The Funds have an unlimited number of shares authorized with no par value. | | |
| Class A | | | | |
| Net assets | $1,264,033 | — | — | — |
| Shares outstanding | 125,000 | — | — | — |
| Net asset value and redemption price (Note 3) per share | | | | |
| (net assets ÷ shares outstanding) | $10.11 | — | — | — |
| Class Ba | | | | |
| Net assets | $1,263,209 | — | — | — |
| Shares outstanding | 125,000 | — | — | — |
| Net asset value and offering price (Note 3) per share | | | | |
| (net assets ÷ shares outstanding) | $10.11 | — | — | — |
| Class Ca | | | | |
| Net assets | $1,263,209 | — | — | — |
| Shares outstanding | 125,000 | — | — | — |
| Net asset value and offering price (Note 3) per share | | | | |
| (net assets ÷ shares outstanding) | $10.11 | — | — | — |
| Class I | | | | |
| Net assets | $1,264,386 | — | — | — |
| Shares outstanding | 125,000 | — | — | — |
| Net asset value per share (net assets ÷ shares outstanding) | $10.12 | — | — | — |
| Class 1 | | | | |
| Net assets | — | $133,373,231 | $95,796,140 | — |
| Shares outstanding | — | 9,315,002 | 5,785,667 | — |
| Net asset value per share (net assets ÷ shares outstanding) | — | $14.32 | $16.56 | — |
| Class NAV | | | | |
| Net assets | — | $49,811,032 | $362,321,040 | $274,894,466 |
| Shares outstanding | — | 3,479,128 | 21,874,998 | 25,023,046 |
| Net asset value per share (net assets ÷ shares outstanding) | — | $14.32 | $16.56 | $10.99 |
| |
| Maximum offering price per share | | | | |
|
| Class A1 ($10.11 ÷ 95%) | $10.64 | — | — | — |
1 On single retail sales of less than $50,000. On sales of $50,000 or more and on group sales the offering price is reduced.
a Redemption price is equal to net asset value less any applicable contingent deferred sales charges (Note 3).
The accompanying notes are an integral part of the financial statements. 88
| John Hancock Funds II | | | | |
| |
| Statements of Assets and Liabilities — August 31, 2006 | | | |
|
| |
| Assets | Real Estate Securities | Real Return Bond | Small Cap | Small Cap Index |
|
| Investments, at value | $166,466,109 | $899,667,896 | $237,735,274 | $125,940,654 |
| Securities loaned, at value (Note 2) | 1,539,498 | 11,000,333 | 54,437,362 | 31,219,839 |
| Repurchase agreements, at value | 4,925,000 | 8,637,000 | 3,866,000 | — |
| Cash | 830 | 16,633 | 312 | 37,280 |
| Foreign currency, at value | — | 315,751 | — | — |
| Receivable for investments sold | 369,054 | — | 2,183,514 | 5,574 |
| Receivable for delayed delivery securities sold | — | 5,850,000 | — | — |
| Receivable for shares sold | 105,238 | 106,898 | 8,855 | 4,357 |
| Dividends and interest receivable | 118,719 | 3,908,784 | 62,775 | 79,557 |
| Receivable for swap contracts | — | 152,467 | — | — |
| Unrealized appreciation of swap contracts (Note 2) | — | 1,808,198 | — | — |
| Receivable for futures variation margin | — | 148,721 | — | — |
| Receivable due from adviser | — | — | — | 7,878 |
| Other assets | 7,367 | 6,475 | 2,183 | 697 |
| Total assets | 173,531,815 | 931,619,156 | 298,296,275 | 157,295,836 |
| |
| Liabilities | | | | |
|
| Payable for investments purchased | 1,326,937 | — | 1,732,657 | — |
| Payable for delayed delivery securities purchased | — | 217,385,149 | — | — |
| Payable upon return of securities loaned (Note 2) | 1,572,850 | 11,227,436 | 55,917,662 | 32,157,578 |
| Payable for options written, at value | — | 381,726 | — | — |
| Payable for futures variation margin | — | — | — | 2,800 |
| Payable for forward foreign currency exchange contracts (Note 2) | — | 671,182 | — | — |
| Payable for swap contracts | — | 26,201 | — | — |
| Payable to affiliates | | | | |
| Fund administration expenses | 10,683 | 12,188 | 6,215 | 2,535 |
| Other payables and accrued expenses | 59,710 | 117,868 | 48,502 | 36,485 |
| Total liabilities | 2,970,180 | 229,821,750 | 57,705,036 | 32,199,398 |
| |
| Net assets | | | | |
|
| Capital paid-in | 54,158,965 | 695,365,310 | 233,850,347 | 119,963,061 |
| Accumulated undistributed net realized gain (loss) on investments, | | | | |
| futures contracts, options written, interest rate swaps, | | | | |
| foreign currency transactions and forward foreign currency contracts | 79,575,928 | 3,166,159 | (1,290,852) | 3,381,304 |
| Unrealized appreciation (depreciation) on investments, | | | | |
| futures contracts, options written, interest rate swaps and | | | | |
| translation of assets and liabilities in foreign currencies | 32,841,754 | (73,149) | 8,031,744 | 1,215,440 |
| Undistributed net investment income (loss) | 3,984,988 | 3,339,086 | — | 536,633 |
| Net assets | $170,561,635 | $701,797,406 | $240,591,239 | $125,096,438 |
| Investments, including repurchase agreements, at cost | $140,088,853 | $919,767,932 | $288,006,892 | $156,144,205 |
| Foreign currency, at cost | — | $315,264 | — | — |
| Premium received on written options | — | $331,920 | — | — |
| |
| Net asset value per share | | | | |
|
| Based on net asset values and shares outstanding — The Funds have an unlimited number of shares authorized with no par value. | | |
| Class 1 | | | | |
| Net assets | $170,561,635 | $17,347,250 | $795,786 | — |
| Shares outstanding | 5,696,344 | 1,293,505 | 56,749 | — |
| Net asset value per share (net assets ÷ shares outstanding) | $29.94 | $13.41 | $14.02 | — |
| Class NAV | | | | |
| Net assets | — | $684,450,156 | $239,795,453 | $125,096,438 |
| Shares outstanding | — | 51,388,376 | 17,075,346 | 7,842,689 |
| Net asset value per share (net assets ÷ shares outstanding) | — | $13.32 | $14.04 | $15.95 |
The accompanying notes are an integral part of the financial statements. 89
| John Hancock Funds II | | | | |
| |
| Statements of Assets and Liabilities — August 31, 2006 | | | |
|
| |
| |
| | Small Cap | Small | Small Company | Small Company |
| Assets | Opportunities | Company | Growth | Value |
|
| Investments, at value | $233,914,732 | $93,890,854 | $72,288,345 | $386,961,652 |
| Securities loaned, at value (Note 2) | 61,872,659 | 22,846,131 | — | 93,113,462 |
| Repurchase agreements, at value | 15,996,000 | 481,000 | 1,437,000 | 3,343,000 |
| Cash | 8 | 195 | 383 | — |
| Receivable for investments sold | 596,809 | 2,090,688 | 329,312 | 397,293 |
| Receivable for shares sold | — | 10,638 | 18,424 | 13,134 |
| Dividends and interest receivable | 69,541 | 65,438 | 8,759 | 284,042 |
| Other assets | 2,775 | 910 | 686 | 3,733 |
| Total assets | 312,452,524 | 119,385,854 | 74,082,909 | 484,116,316 |
| |
| Liabilities | | | | |
|
| Payable for investments purchased | 1,785,462 | 2,483,518 | 139,210 | 469,267 |
| Payable for shares repurchased | 21,989 | 3,105 | — | 186,251 |
| Payable upon return of securities loaned (Note 2) | 63,456,325 | 23,408,260 | — | 95,479,263 |
| Payable to affiliates | | | | |
| Fund administration expenses | 6,491 | 3,237 | 2,006 | 8,738 |
| Other payables and accrued expenses | 50,732 | 62,168 | 40,898 | 57,703 |
| Total liabilities | 65,320,999 | 25,960,288 | 182,114 | 96,201,222 |
| |
| Net assets | | | | |
|
| Capital paid-in | 223,688,468 | 92,469,697 | 67,787,488 | 351,900,983 |
| Accumulated undistributed net realized gain (loss) on investments, | | | | |
| foreign currency transactions and forward foreign currency contracts | 6,716,360 | (365,945) | 1,232,409 | 3,010,994 |
| Unrealized appreciation (depreciation) on investments | 15,182,294 | 1,321,814 | 4,880,900 | 32,157,056 |
| Undistributed net investment income (loss) | 1,544,403 | — | (2) | 846,061 |
| Net assets | $247,131,525 | $93,425,566 | $73,900,795 | $387,915,094 |
| Investments, including repurchase agreements, at cost | $296,601,097 | $115,896,171 | $68,844,445 | $451,261,058 |
| |
| Net asset value per share | | | | |
|
| Based on net asset values and shares outstanding — The Funds have an unlimited number of shares authorized with no par value. | | |
| Class 1 | | | | |
| Net assets | $30,450,106 | $6,070,937 | — | $148,620,194 |
| Shares outstanding | 1,310,076 | 393,818 | — | 6,282,031 |
| Net asset value per share (net assets ÷ shares outstanding) | $23.24 | $15.42 | — | $23.66 |
| Class NAV | | | | |
| Net assets | $216,681,419 | $87,354,629 | $73,900,795 | $239,294,900 |
| Shares outstanding | 9,363,422 | 5,659,156 | 6,665,329 | 10,126,170 |
| Net asset value per share (net assets ÷ shares outstanding) | $23.14 | $15.44 | $11.09 | $23.63 |
The accompanying notes are an integral part of the financial statements. 90
| John Hancock Funds II | | | | |
| |
| Statements of Assets and Liabilities — August 31, 2006 | | | |
|
| |
| Assets | Special Value | Spectrum Income | Strategic Bond | Strategic Income |
|
| Investments, at value | $110,816,995 | $738,380,952 | $376,484,610 | $281,755,083 |
| Securities loaned, at value (Note 2) | 30,324,584 | 81,569,665 | 48,170,381 | 69,120,975 |
| Repurchase agreements, at value | 18,053,000 | 26,772,000 | 28,200,000 | — |
| Cash | 220 | 40,393 | 356,621 | 112 |
| Foreign currency, at value | — | 175,017 | — | 82,190 |
| Receivable for investments sold | 28,875 | 7,845,458 | 19,656 | 1,411,865 |
| Receivable for delayed delivery securities sold | — | — | 76,618,406 | — |
| Receivable for shares sold | 20,663 | 764,782 | 79,624 | 35,861 |
| Receivable for forward foreign currency exchange contracts (Note 2) | — | 151,173 | — | 204,021 |
| Dividends and interest receivable | 72,889 | 7,822,386 | 3,433,864 | 3,887,822 |
| Receivable for futures variation margin | — | 3,179 | — | — |
| Other assets | 1,195 | 6,832 | 5,309 | 3,226 |
| Total assets | 159,318,421 | 863,531,837 | 533,368,471 | 356,501,155 |
| |
| Liabilities | | | | |
|
| Payable for investments purchased | 496,717 | 15,917,580 | 281,060 | 1,043,534 |
| Payable for delayed delivery securities purchased | — | — | 171,479,014 | 1,302,361 |
| Payable for shares repurchased | — | — | 28,671 | — |
| Payable upon return of securities loaned (Note 2) | 31,115,018 | 83,287,899 | 49,146,472 | 70,775,414 |
| Payable for options written, at value | — | — | 247,456 | — |
| Payable for futures variation margin | — | — | 306,653 | — |
| Payable for forward foreign currency exchange contracts (Note 2) | — | 311,816 | — | 2,193,109 |
| Payable to affiliates | | | | |
| Fund administration expenses | 2,875 | 13,716 | 9,008 | 6,479 |
| Other payables and accrued expenses | 42,018 | 269,854 | 100,897 | 86,825 |
| Total liabilities | 31,656,628 | 99,800,865 | 221,599,231 | 75,407,722 |
| |
| Net assets | | | | |
|
| Capital paid-in | 118,997,783 | 745,816,154 | 311,445,518 | 278,957,842 |
| Accumulated undistributed net realized gain (loss) on investments, | | | | |
| futures contracts, options written, foreign currency transactions and | | | | |
| forward foreign currency contracts | 947,156 | (160,269) | (5,369,848) | (507,126) |
| Unrealized appreciation (depreciation) on investments, | | | | |
| futures contracts, options written and translation of assets and | | | | |
| liabilities in foreign currencies | 7,424,159 | 11,651,117 | 2,577,393 | (1,112,323) |
| Undistributed net investment income (loss) | 292,695 | 6,423,970 | 3,116,177 | 3,755,040 |
| Net assets | $127,661,793 | $763,730,972 | $311,769,240 | $281,093,433 |
| Investments, including repurchase agreements, at cost | $151,770,420 | $834,918,505 | $448,998,871 | $350,014,222 |
| Foreign currency, at cost | — | $175,092 | — | $82,189 |
| Premium received on written options | — | — | $233,474 | — |
| |
| Net asset value per share | | | | |
|
| Based on net asset values and shares outstanding — The Funds have an unlimited number of shares authorized with no par value. | | |
| Class 1 | | | | |
| Net assets | $3,862,125 | — | $41,781,486 | — |
| Shares outstanding | 188,388 | — | 3,542,433 | — |
| Net asset value per share (net assets ÷ shares outstanding) | $20.50 | — | $11.79 | — |
| Class NAV | | | | |
| Net assets | $123,799,668 | $763,730,972 | $269,987,754 | $281,093,433 |
| Shares outstanding | 6,033,625 | 74,370,852 | 22,931,151 | 27,952,938 |
| Net asset value per share (net assets ÷ shares outstanding) | $20.52 | $10.27 | $11.77 | $10.06 |
The accompanying notes are an integral part of the financial statements. 91
| John Hancock Funds II | | | | |
| |
| Statements of Assets and Liabilities — August 31, 2006 | | | |
|
| |
| |
| | | | U.S. Global | U.S. Government |
| Assets | Strategic Value | Total Return | Leaders Growth | Securities |
|
| Investments, at value | $154,192,576 | $1,428,143,449 | $472,758,114 | $302,813,146 |
| Securities loaned, at value (Note 2) | 13,033,306 | 27,645,085 | 2,766,722 | — |
| Repurchase agreements, at value | — | 46,743,000 | 5,402,000 | 52,000,000 |
| Cash | — | 60 | 482 | 347,884 |
| Foreign currency, at value | — | 1,355,922 | — | — |
| Receivable for investments sold | 1,749,803 | — | 957,718 | — |
| Receivable for delayed delivery securities sold | — | 1,955,008 | — | 42,961,195 |
| Receivable for shares sold | 33,904 | 655,454 | 130,796 | 136,619 |
| Receivable for forward foreign currency exchange contracts (Note 2) | — | 207,275 | — | — |
| Dividends and interest receivable | 300,693 | 3,334,674 | 383,645 | 585,403 |
| Receivable for swap contracts | — | 25,941 | — | — |
| Unrealized appreciation of swap contracts (Note 2) | — | 102,020 | — | — |
| Receivable for futures variation margin | — | 1,152,184 | — | 8,313 |
| Other assets | 1,409 | 10,881 | 4,260 | 2,070 |
| Total assets | 169,311,691 | 1,511,330,953 | 482,403,737 | 398,854,630 |
| |
| Liabilities | | | | |
|
| Due to custodian | 1,220,775 | — | — | — |
| Payable for investments purchased | 2,326,245 | 11,700,000 | 2,486,968 | 1,899,480 |
| Payable for delayed delivery securities purchased | — | 303,866,901 | — | 193,217,087 |
| Payable for shares repurchased | — | 57,647 | — | 98,419 |
| Payable upon return of securities loaned (Note 2) | 13,329,847 | 28,221,891 | 2,825,622 | — |
| Payable for options written, at value | — | 6,278,640 | — | — |
| Payable for futures variation margin | — | — | — | 2,578 |
| Payable for forward foreign currency exchange contracts (Note 2) | — | 1,729,083 | — | — |
| Payable to affiliates | | | | |
| Fund administration expenses | 3,477 | 20,280 | 12,877 | 3,995 |
| Other payables and accrued expenses | 43,846 | 181,819 | 64,444 | 68,302 |
| Total liabilities | 16,924,190 | 352,056,261 | 5,389,911 | 195,289,861 |
| |
| Net assets | | | | |
|
| Capital paid-in | 144,752,358 | 1,149,215,011 | 495,814,764 | 202,432,297 |
| Accumulated undistributed net realized gain (loss) on investments, | | | | |
| futures contracts, options written, interest rate swaps, | | | | |
| foreign currency transactions and forward foreign currency contracts | 2,312,021 | (430,977) | (5,771,575) | (1,303,388) |
| Unrealized appreciation (depreciation) on investments, | | | | |
| futures contracts, options written, interest rate swaps and | | | | |
| translation of assets and liabilities in foreign currencies | 4,274,310 | 468,988 | (14,622,516) | 629,379 |
| Undistributed net investment income (loss) | 1,048,812 | 10,021,670 | 1,593,153 | 1,806,481 |
| Net assets | $152,387,501 | $1,159,274,692 | $477,013,826 | $203,564,769 |
| Investments, including repurchase agreements, at cost | $162,951,572 | $1,496,888,257 | $495,549,352 | $354,172,681 |
| Foreign currency, at cost | — | $1,350,210 | — | — |
| Premium received on written options | — | $4,098,858 | — | — |
| |
| Net asset value per share | | | | |
|
| Based on net asset values and shares outstanding — The Funds have an unlimited number of shares authorized with no par value. | | |
| Class 1 | | | | |
| Net assets | $13,776,342 | $117,807,255 | $24,793,838 | $42,904,461 |
| Shares outstanding | 1,259,130 | 8,547,580 | 1,957,750 | 3,156,386 |
| Net asset value per share (net assets ÷ shares outstanding) | $10.94 | $13.78 | $12.66 | $13.59 |
| Class NAV | | | | |
| Net assets | $138,611,159 | $1,041,467,437 | $452,219,988 | $160,660,308 |
| Shares outstanding | 12,711,120 | 75,725,529 | 35,668,361 | 11,845,409 |
| Net asset value per share (net assets ÷ shares outstanding) | $10.90 | $13.75 | $12.68 | $13.56 |
The accompanying notes are an integral part of the financial statements. 92
| John Hancock Funds II | | | | |
| |
| Statements of Assets and Liabilities — August 31, 2006 | | | |
|
| |
| | U.S. High | | Value & | |
| Assets | Yield Bond | U.S. Multi Sector | Restructuring | Vista |
|
| Investments, at value | $269,178,034 | $1,167,133,786 | $292,724,205 | $116,774,839 |
| Securities loaned, at value (Note 2) | 35,968,218 | 57,531,004 | 41,400,946 | 13,612,271 |
| Repurchase agreements, at value | 17,711,000 | 56,038,000 | 6,201,000 | 8,038,000 |
| Cash | 507 | 303 | 307 | 476 |
| Cash segregated for futures contracts | — | 1,956,096 | — | — |
| Receivable for investments sold | 4,870,725 | — | — | 4,169,056 |
| Receivable for shares sold | 222,729 | 214,373 | 29,539 | 26,082 |
| Receivable for forward foreign currency exchange contracts (Note 2) | — | — | — | 1,979 |
| Dividends and interest receivable | 5,343,194 | 2,299,789 | 381,527 | 19,878 |
| Receivable for futures variation margin | — | 13,750 | — | — |
| Due from broker | — | 993,904 | — | — |
| Other assets | 1,727 | 11,496 | 1,889 | 1,163 |
| Total assets | 333,296,134 | 1,286,192,501 | 340,739,413 | 142,643,744 |
| |
| Liabilities | | | | |
|
| Due to custodian | — | — | — | 959,243 |
| Payable for investments purchased | 6,495,861 | — | 1,689,012 | 5,088,018 |
| Payable for shares repurchased | 1,398 | — | — | — |
| Payable upon return of securities loaned (Note 2) | 36,710,913 | 59,044,947 | 42,492,506 | 13,929,842 |
| Payable for forward foreign currency exchange contracts (Note 2) | — | — | — | 1,496 |
| Payable to affiliates | | | | |
| Fund administration expenses | 4,269 | 22,040 | 8,996 | 5,118 |
| Other payables and accrued expenses | 70,166 | 159,621 | 54,192 | 50,324 |
| Total liabilities | 43,282,607 | 59,226,608 | 44,244,706 | 20,034,041 |
| |
| Net assets | | | | |
|
| Capital paid-in | 287,221,622 | 1,188,817,440 | 284,218,800 | 115,833,181 |
| Accumulated undistributed net realized gain (loss) on investments, | | | | |
| futures contracts, options written, foreign currency transactions and | | | | |
| forward foreign currency contracts | (285,372) | 4,358,689 | 1,103,581 | (3,974,440) |
| Unrealized appreciation (depreciation) on investments, | | | | |
| futures contracts and translation of assets and | | | | |
| liabilities in foreign currencies | (747,561) | 26,125,188 | 9,209,793 | 10,751,445 |
| Undistributed net investment income (loss) | 3,824,838 | 7,664,576 | 1,962,533 | (483) |
| Net assets | $290,013,527 | $1,226,965,893 | $296,494,707 | $122,609,703 |
| Investments, including repurchase agreements, at cost | $323,604,813 | $1,255,571,506 | $331,116,707 | $127,673,023 |
| |
| Net asset value per share | | | | |
|
| Based on net asset values and shares outstanding — The Funds have an unlimited number of shares authorized with no par value. | | |
| Class 1 | | | | |
| Net assets | $1,814,164 | — | — | — |
| Shares outstanding | 138,976 | — | — | — |
| Net asset value per share (net assets ÷ shares outstanding) | $13.05 | — | — | — |
| Class NAV | | | | |
| Net assets | $288,199,363 | $1,226,965,893 | $296,494,707 | $122,609,703 |
| Shares outstanding | 22,080,780 | 117,812,675 | 26,753,467 | 11,455,311 |
| Net asset value per share (net assets ÷ shares outstanding) | $13.05 | $10.41 | $11.08 | $10.70 |
The accompanying notes are an integral part of the financial statements. 93
| John Hancock Funds II | | | | |
| |
| Statements of Operations — for the period ended August 31, 2006 | | |
|
| |
| |
| Investment income | Absolute Returna | Active Bondb | All Cap Corec | All Cap Growthb |
|
| Dividends | — | $10,000 | $1,545,874 | $1,167,776 |
| Interest | $3,520 | 16,552,387 | 505,346 | 175,694 |
| Securities lending | — | 107,981 | 8,336 | 21,611 |
| Income distributions received from affiliated underlying funds | 49,469 | — | — | — |
| Less foreign taxes withheld | — | (1,006) | — | (18,323) |
| Total investment income | 52,989 | 16,669,362 | 2,059,556 | 1,346,758 |
| |
| Expenses | | | | |
|
| Investment management fees (Note 3) | 1,851 | 1,993,572 | 696,524 | 1,067,591 |
| Class A distribution and service fees (Note 3) | 694 | — | — | — |
| Class B distribution and service fees (Note 3) | 2,313 | — | — | — |
| Class C distribution and service fees (Note 3) | 2,313 | — | — | — |
| Class 1 distribution and service fees (Note 3) | 115 | 15,760 | — | 15,173 |
| Fund administration fees (Note 3) | 160 | 30,692 | 10,677 | 14,312 |
| Audit and legal fees | 27,650 | 62,483 | 28,742 | 42,355 |
| Printing and postage fees | 32 | 5,314 | 1,592 | 2,919 |
| Custodian fees | 2,013 | 190,654 | 13,386 | 44,829 |
| Trustees’ fees (Note 3) | 1 | 3,938 | 692 | 1,729 |
| Registration and filing fees | 2,777 | 13,222 | 10,049 | 2,522 |
| Miscellaneous | 87 | 30,887 | 1,825 | 2,769 |
| Total expenses | 40,006 | 2,346,522 | 763,487 | 1,194,199 |
| Less expense reductions (Note 3) | (32,257) | — | — | — |
| Net expenses | 7,749 | 2,346,522 | 763,487 | 1,194,199 |
| Net investment income (loss) | 45,240 | 14,322,840 | 1,296,069 | 152,559 |
| |
| Realized and unrealized gain (loss) | | | | |
|
| Net realized gain (loss) on | | | | |
| Investments | — | (3,179,487) | (5,196,991) | (3,002,765) |
| Futures contracts | — | — | (3,023,136) | — |
| Foreign currency transactions | — | 4,013 | — | (1,144) |
| Change in net unrealized appreciation (depreciation) of | | | | |
| Investments | 160,534 | 670,327 | 4,657,834 | 9,502,176 |
| Futures contracts | — | — | 612,775 | — |
| Translation of assets and liabilities in foreign currencies | — | 58 | — | (860) |
| Net realized and unrealized gain (loss) | 160,534 | (2,505,089) | (2,949,518) | 6,497,407 |
| |
| Increase (decrease) in net assets from operations | $205,774 | $11,817,751 | ($1,653,449) | $6,649,966 |
a Period from 6-26-06 (commencement of operations) to 8-31-06.
b Period from 10-15-05 (commencement of operations) to 8-31-06.
c Period from 4-28-06 (commencement of operations) to 8-31-06.
The accompanying notes are an integral part of the financial statements. 94
| John Hancock Funds II | | | | |
| |
| Statements of Operations — for the period ended August 31, 2006 | | | |
|
| |
| | | Blue Chip | Capital | |
| Investment income | All Cap Valuea | Growtha | Appreciationa | Core Bonda |
|
| Dividends | $2,716,701 | $13,150,034 | $2,497,681 | — |
| Interest | 200,149 | 476,983 | 438,358 | 7,639,517 |
| Securities lending | 6,836 | 165,539 | 52,155 | 3,903 |
| Less foreign taxes withheld | (11,352) | (162,787) | (89,083) | (1,857) |
| Total investment income | 2,912,334 | 13,629,769 | 2,899,111 | 7,641,563 |
| |
| Expenses | | | | |
|
| Investment management fees (Note 3) | 1,361,949 | 7,797,684 | 2,309,140 | 1,009,020 |
| Class 1 distribution and service fees (Note 3) | 8,264 | 57,505 | 15,920 | 197 |
| Fund administration fees (Note 3) | 15,225 | 86,664 | 24,419 | 17,770 |
| Audit and legal fees | 43,302 | 65,591 | 45,900 | 52,200 |
| Printing and postage fees | 3,354 | 17,602 | 4,681 | 2,801 |
| Custodian fees | 35,470 | 151,219 | 42,881 | 137,254 |
| Trustees’ fees | 2,127 | 12,159 | 3,174 | 1,872 |
| Registration and filing fees | 4,274 | 37,849 | 14,031 | 5,243 |
| Miscellaneous | 3,297 | 23,686 | 10,745 | 21,720 |
| Total expenses | 1,477,262 | 8,249,959 | 2,470,891 | 1,248,077 |
| Less expense reductions (Note 3) | — | (158,836) | — | — |
| Net expenses | 1,477,262 | 8,091,123 | 2,470,891 | 1,248,077 |
| Net investment income (loss) | 1,435,072 | 5,538,646 | 428,220 | 6,393,486 |
| |
| Realized and unrealized gain (loss) | | | | |
|
| Net realized gain (loss) on | | | | |
| Investments (Note 5) | 5,826,940 | (3,928,748) | (17,467,941) | (1,818,731) |
| Foreign currency transactions | — | 112,639 | 36,980 | — |
| Change in net unrealized appreciation (depreciation) of | | | | |
| Investments | 16,725,292 | 70,967,538 | 8,657,835 | 869,346 |
| Translation of assets and liabilities in foreign currencies | — | 3,481 | 12 | — |
| Net realized and unrealized gain (loss) | 22,552,232 | 67,154,910 | (8,773,114) | (949,385) |
| |
| Increase (decrease) in net assets from operations | $23,987,304 | $72,693,556 | ($8,344,894) | $5,444,101 |
a Period from 10-15-05 (commencement of operations) to 8-31-06.
The accompanying notes are an integral part of the financial statements. 95
| John Hancock Funds II | | | | |
| |
| Statements of Operations — for the period ended August 31, 2006 | | | |
|
| |
| |
| | | Emerging | Emerging Small | |
| Investment income | Core Equitya | Growtha | Companya | Equity-Incomea |
|
| Dividends | $3,356,972 | $386,874 | $233,358 | $15,596,385 |
| Interest | 248,262 | 476,927 | 37,029 | 1,436,031 |
| Securities lending | — | 204,166 | — | 44,266 |
| Less foreign taxes withheld | — | — | (284) | (97,551) |
| Total investment income | 3,605,234 | 1,067,967 | 270,103 | 16,979,131 |
| |
| Expenses | | | | |
|
| Investment management fees (Note 3) | 3,425,926 | 1,183,968 | 492,869 | 5,312,140 |
| Class 1 distribution and service fees (Note 3) | 3,825 | 55,258 | 24,196 | 74,395 |
| Fund administration fees (Note 3) | 45,375 | 41,450 | 33,603 | 72,128 |
| Audit and legal fees | 50,482 | 56,223 | 40,705 | 58,573 |
| Printing and postage fees | 7,774 | 44,665 | 1,606 | 13,746 |
| Custodian fees | 66,660 | 29,182 | 33,968 | 103,359 |
| Trustees’ fees (Note 3) | 5,326 | 2,361 | 778 | 9,161 |
| Registration and filing fees | 16,620 | 1,959 | 688 | 14,517 |
| Miscellaneous | 8,912 | 14,937 | 1,336 | 17,745 |
| Total expenses | 3,630,900 | 1,430,003 | 629,749 | 5,675,764 |
| Less expense reductions (Note 3) | — | — | (82,214) | (108,998) |
| Net expenses | 3,630,900 | 1,430,003 | 547,535 | 5,566,766 |
| Net investment income (loss) | (25,666) | (362,036) | (277,432) | 11,412,365 |
| |
| Realized and unrealized gain (loss) | | | | |
|
| Net realized gain (loss) on | | | | |
| Investments (Note 5) | 3,465,352 | 32,077,945 | 5,329,331 | 31,298,726 |
| Futures contracts | — | (642,616) | — | — |
| Foreign currency transactions | 6,994 | — | — | 2,088 |
| Change in net unrealized appreciation (depreciation) of | | | | |
| Investments | 6,670,383 | (15,348,460) | (3,974,924) | 56,205,455 |
| Translation of assets and liabilities in foreign currencies | 296 | — | — | — |
| Net realized and unrealized gain (loss) | 10,143,025 | 16,086,869 | 1,354,407 | 87,506,269 |
| |
| Increase (decrease) in net assets from operations | $10,117,359 | $15,724,833 | $1,076,975 | $98,918,634 |
a Period from 10-15-05 (commencement of operations) to 8-31-06.
The accompanying notes are an integral part of the financial statements. 96
| John Hancock Funds II | | | |
| | | |
| Statements of Operations — for the period ended August 31, 2006 | | |
|
| |
| |
| Investment income | Fundamental Valuea | Global Bonda | Global Real Estateb | High Incomeb |
|
| Dividends | $8,463,367 | — | $3,319,177 | $427,568 |
| Interest | 1,884,463 | $19,923,339 | 123,347 | 6,629,800 |
| Securities lending | 18,469 | 2,534 | 17,432 | 68,316 |
| Less foreign taxes withheld | (62,142) | (45,201) | (323,940) | (60,706) |
| Total investment income | 10,304,157 | 19,880,672 | 3,136,016 | 7,064,978 |
| |
| Expenses | | | | |
|
| Investment management fees (Note 3) | 4,358,268 | 3,204,729 | 1,054,022 | 630,943 |
| Class 1 distribution and service fees (Note 3) | 25,295 | 17,044 | — | — |
| Fund administration fees (Note 3) | 50,116 | 43,907 | 13,254 | 11,080 |
| Audit and legal fees | 54,115 | 68,598 | 29,349 | 38,270 |
| Printing and postage fees | 10,229 | 8,642 | 1,988 | 1,650 |
| Custodian fees | 104,635 | 240,278 | 126,904 | 27,673 |
| Trustees’ fees (Note 3) | 6,915 | 5,745 | 856 | 719 |
| Registration and filing fees | 19,571 | 15,432 | 12,520 | 10,207 |
| Miscellaneous | 10,736 | 42,231 | 3,998 | 3,895 |
| Total expenses | 4,639,880 | 3,646,606 | 1,242,891 | 724,437 |
| |
| Net investment income (loss) | 5,664,277 | 16,234,066 | 1,893,125 | 6,340,541 |
| |
| Realized and unrealized gain (loss) | | | | |
|
| Net realized gain (loss) on | | | | |
| Investments | 4,881,179 | (2,207,560) | (8,966,008) | (552,367) |
| Futures contracts | — | (6,435,817) | — | — |
| Options written | — | 996,504 | — | — |
| Interest rate swap contracts | — | 1,328,766 | — | — |
| Foreign currency transactions | (63,448) | (152,556) | 3,435,312 | (1,620) |
| Change in net unrealized appreciation (depreciation) of | | | | |
| Investments | 45,750,775 | 5,058,984 | 15,747,234 | (5,837,501) |
| Futures contracts | — | 3,616,049 | — | — |
| Options written | — | (532,827) | — | 41,554 |
| Interest rate swap contracts | — | (58,762) | — | — |
| Translation of assets and liabilities in foreign currencies | 293 | (597,185) | (621,150) | (184,101) |
| Net realized and unrealized gain (loss) | 50,568,799 | 1,015,596 | 9,595,388 | (6,534,035) |
| |
| Increase (decrease) in net assets from operations | $56,233,076 | $17,249,662 | $11,488,513 | ($193,494) |
a Period from 10-15-05 (commencement of operations) to 8-31-06.
b Period from 4-28-06 (commencement of operations) to 8-31-06.
The accompanying notes are an integral part of the financial statements. 97
| John Hancock Funds II | | | | |
| |
| Statements of Operations — for the period ended August 31, 2006 | | |
|
| |
| |
| | | International | International | International |
| Investment income | High Yielda | Equity Indexb | Opportunitiesa | Small Capa |
|
| Dividends | $126,778 | $6,352,470 | $6,675,683 | $10,363,425 |
| Interest | 88,328,640 | 294,063 | 503,829 | 840,943 |
| Securities lending | 778,067 | 158,328 | 202,615 | 199,324 |
| Less foreign taxes withheld | (60,152) | (473,961) | (583,263) | (1,168,386) |
| Total investment income | 89,173,333 | 6,330,900 | 6,798,864 | 10,235,306 |
| |
| Expenses | | | | |
|
| Investment management fees (Note 3) | 7,302,813 | 1,006,407 | 3,501,613 | 3,650,938 |
| Class 1 distribution and service fees (Note 3) | 17,540 | — | 1,474 | 15,239 |
| Fund administration fees (Note 3) | 106,194 | 15,960 | 34,520 | 39,001 |
| Audit and legal fees | 80,425 | 41,867 | 49,963 | 51,894 |
| Printing and postage fees | 20,303 | 2,691 | 6,303 | 7,578 |
| Custodian fees | 301,217 | 13,515 | 356,092 | 684,294 |
| Trustees’ fees (Note 3) | 14,709 | 2,089 | 4,407 | 5,467 |
| Registration and filing fees | 34,740 | 9,369 | 15,114 | 8,805 |
| Miscellaneous | 24,144 | 3,075 | 8,047 | 38,702 |
| Total expenses | 7,902,085 | 1,094,973 | 3,977,533 | 4,501,918 |
| |
| Net investment income (loss) | 81,271,248 | 5,235,927 | 2,821,331 | 5,733,388 |
| |
| Realized and unrealized gain (loss) | | | | |
|
| Net realized gain (loss) on | | | | |
| Investments (Note 5) | 9,379,053 | 2,145,902 | 18,650,706 | 51,813,331 |
| Futures contracts | — | 460,074 | — | — |
| Foreign currency transactions | (40,075) | (274,000) | (229,471) | 4,172 |
| Change in net unrealized appreciation (depreciation) of | | | | |
| Investments | (7,835,316) | 29,141,546 | 67,543,296 | 28,777,726c |
| Futures contracts | — | 608,774 | — | — |
| Translation of assets and liabilities in foreign currencies | 41,284 | 86,605 | 2,055 | (114,442) |
| Net realized and unrealized gain (loss) | 1,544,946 | 32,168,901 | 85,966,586 | 80,480,787 |
| |
| Increase (decrease) in net assets from operations | $82,816,194 | $37,404,828 | $88,787,917 | $86,214,175 |
a Period from 10-15-05 (commencement of operations) to 8-31-06.
b Period from 10-29-05 (commencement of operations) to 8-31-06.
c Net of $242,277 in deferred foreign withholding taxes for International Small Cap.
The accompanying notes are an integral part of the financial statements. 98
| John Hancock Funds II | | | | |
| |
| Statements of Operations — for the period ended August 31, 2006 | | |
|
| |
| | International | International | International | Investment |
| Investment income | Small Companya | Stockd | Valued | Quality Bondd |
|
| Dividends | $1,747,584 | $27,244,272 | $34,053,340 | — |
| Interest | 77,125 | 1,260,117 | 1,175,015 | 5,353,505 |
| Securities lending | 37,146 | 710,004 | 660,210 | 4,245 |
| Less foreign taxes withheld | (72,224) | (2,099,182) | (2,256,320) | (1,750) |
| Total investment income | 1,789,631 | 27,115,211 | 33,632,245 | 5,356,000 |
| |
| Expenses | | | | |
|
| Investment management fees (Note 3) | 691,238 | 7,178,612 | 6,610,387 | 606,718 |
| Class 1 distribution and service fees (Note 3) | — | 15,716 | 51,118 | 14,495 |
| Fund administration fees (Note 3) | 9,592 | 72,282 | 79,742 | 10,766 |
| Audit and legal fees | 29,817 | 61,570 | 63,197 | 51,008 |
| Printing and postage fees | 1,244 | 13,368 | 15,385 | 2,192 |
| Custodian fees | 70,411 | 913,267 | 936,296 | 119,870 |
| Trustees’ fees (Note 3) | 550 | 9,595 | 10,508 | 1,367 |
| Registration and filing fees | 8,388 | 29,650 | 21,159 | 5,490 |
| Miscellaneous | 3,392 | 17,580 | 19,929 | 2,965 |
| Total expenses | 814,632 | 8,311,640 | 7,807,721 | 814,871 |
| Less expense reductions (Note 3) | — | — | (136,471) | — |
| Net expenses | 814,632 | 8,311,640 | 7,671,250 | 814,871 |
| Net investment income (loss) | 974,999 | 18,803,571 | 25,960,995 | 4,541,129 |
| |
| Realized and unrealized gain (loss) | | | | |
|
| Net realized gain (loss) on | | | | |
| Investments | (7,585,481)b | 157,552,267e | 49,679,104 | (247,736) |
| Futures contracts | — | 3,407,262 | — | (41,598) |
| Foreign currency transactions | (199,688) | 1,191,895 | 907,753 | — |
| Change in net unrealized appreciation (depreciation) of | | | | |
| Investments | (6,755,293)c | 13,557,516 | 105,427,446 | (811,753) |
| Futures contracts | — | 126,403 | — | (50,898) |
| Translation of assets and liabilities in foreign currencies | 1,374 | (18,278) | 37,456 | — |
| Net realized and unrealized gain (loss) | (14,539,088) | 175,817,065 | 156,051,759 | (1,151,985) |
| |
| Increase (decrease) in net assets from operations | ($13,564,089) | $194,620,636 | $182,012,754 | $3,389,144 |
a Period from 4-28-06 (commencement of operations) to 8-31-06.
b Net of foreign taxes of $31,306 for International Small Company.
c Net of $1,892 in deferred foreign withholding taxes for International Small Company.
d Period from 10-15-05 (commencement of operations) to 8-31-06.
e Refer to Merger of International Stock Fund footnote 1.
The accompanying notes are an integral part of the financial statements. 99
| John Hancock Funds II | | | | |
| |
| Statements of Operations — for the period ended August 31, 2006 | | |
|
| |
| |
| Investment income | Large Capa | Large Cap Valuea | Mid Cap Corea | Mid Cap Indexb |
|
| Dividends | $2,466,959 | $2,969,910 | $3,311,697 | $1,175,635 |
| Interest | 164,509 | 81,193 | 1,761,752 | 259,100 |
| Securities lending | 2,206 | 4,811 | 11,951 | 2,780 |
| Less foreign taxes withheld | — | — | (28,729) | — |
| Total investment income | 2,633,674 | 3,055,914 | 5,056,671 | 1,437,515 |
| |
| Expenses | | | | |
|
| Investment management fees (Note 3) | 1,179,335 | 1,388,690 | 2,330,858 | 407,633 |
| Class 1 distribution and service fees (Note 3) | 618 | 9,860 | 3,797 | — |
| Fund administration fees (Note 3) | 13,699 | 17,045 | 27,652 | 6,413 |
| Audit and legal fees | 42,435 | 42,565 | 46,231 | 38,989 |
| Printing and postage fees | 2,393 | 2,645 | 4,578 | 1,054 |
| Custodian fees | 21,737 | 22,020 | 66,477 | 10,148 |
| Trustees’ fees (Note 3) | 1,710 | 1,733 | 3,446 | 770 |
| Registration and filing fees | 5,305 | 10,417 | 8,823 | 5,506 |
| Miscellaneous | 3,045 | 4,210 | 6,017 | 2,191 |
| Total expenses | 1,270,277 | 1,499,185 | 2,497,879 | 472,704 |
| Less expense reductions (Note 3) | — | — | — | (1,219) |
| Net expenses | 1,270,277 | 1,499,185 | 2,497,879 | 471,485 |
| Net investment income (loss) | 1,363,397 | 1,556,729 | 2,558,792 | 966,030 |
| |
| Realized and unrealized gain (loss) | | | | |
|
| Net realized gain (loss) on | | | | |
| Investments | 2,932,504 | (1,478,897) | 11,819,064 | 806,547 |
| Futures contracts | 181,577 | — | — | (716,035) |
| Foreign currency transactions | — | — | 185,522 | — |
| Change in net unrealized appreciation (depreciation) of | | | | |
| Investments | 9,634,421 | 17,901,225 | 13,277,807 | (2,101,231) |
| Futures contracts | — | — | — | 232,383 |
| Translation of assets and liabilities in foreign currencies | — | — | (586) | — |
| Net realized and unrealized gain (loss) | 12,748,502 | 16,422,328 | 25,281,807 | (1,778,336) |
| |
| Increase (decrease) in net assets from operations | $14,111,899 | $17,979,057 | $27,840,599 | ($812,306) |
a Period from 10-15-05 (commencement of operations) to 8-31-06.
b Period from 10-29-05 (commencement of operations) to 8-31-06.
The accompanying notes are an integral part of the financial statements. 100
| John Hancock Funds II | | | | |
| |
| Statements of Operations — for the period ended August 31, 2006 | | | |
|
| |
| | Mid Cap | Mid Cap | Mid Cap | Natural |
| Investment income | Stocka | Valuea | Value Equityb | Resourcesa |
|
| Dividends | $928,914 | $2,233,833 | $514,772 | $11,835,732 |
| Interest | 536,027 | 300,008 | 49,758 | 1,188,447 |
| Securities lending | 80,684 | 10,130 | 3,863 | 456,566 |
| Less foreign taxes withheld | (18,988) | (3,393) | (1,907) | (407,464) |
| Total investment income | 1,526,637 | 2,540,578 | 566,486 | 13,073,281 |
| |
| Expenses | | | | |
|
| Investment management fees (Note 3) | 1,961,977 | 1,341,196 | 267,535 | 5,990,651 |
| Class 1 distribution and service fees (Note 3) | 44,627 | 38,297 | — | 27,442 |
| Fund administration fees (Note 3) | 24,039 | 16,600 | 3,693 | 53,977 |
| Audit and legal fees | 45,319 | 43,771 | 27,128 | 55,065 |
| Printing and postage fees | 4,758 | 3,800 | 549 | 10,674 |
| Custodian fees | 71,702 | 37,938 | 16,084 | 234,927 |
| Trustees’ fees (Note 3) | 3,035 | 2,422 | 240 | 7,417 |
| Registration and filing fees | 6,097 | 1,797 | 3,667 | 17,435 |
| Miscellaneous | 5,482 | 3,820 | 761 | 13,698 |
| Total expenses | 2,167,036 | 1,489,641 | 319,657 | 6,411,286 |
| |
| Net investment income (loss) | (640,399) | 1,050,937 | 246,829 | 6,661,995 |
| |
| Realized and unrealized gain (loss) | | | | |
|
| Net realized gain (loss) on | | | | |
| Investments (Note 5) | 15,207,277 | 5,252,528 | (888,295) | 28,671,223 |
| Futures contracts | — | — | — | 4,274,761 |
| Foreign currency transactions | (18,742) | — | 15 | 76,604 |
| Change in net unrealized appreciation (depreciation) of | | | | |
| Investments | 16,417,475 | 8,839,164 | (2,465,018) | 114,038,962 |
| Translation of assets and liabilities in foreign currencies | 168 | — | 47 | (4,006) |
| Net realized and unrealized gain (loss) | 31,606,178 | 14,091,692 | (3,353,251) | 147,057,544 |
| |
| Increase (decrease) in net assets from operations | $30,965,779 | $15,142,629 | ($3,106,422) | $153,719,539 |
a Period from 10-15-05 (commencement of operations) to 8-31-06.
b Period from 4-28-06 (commencement of operations) to 8-31-06.
The accompanying notes are an integral part of the financial statements. 101
| John Hancock Funds II | | | | |
| |
| Statements of Operations — for the period ended August 31, 2006 | | |
|
| |
| |
| | Quantitative | Quantitative | Quantitative | Real Estate |
| Investment income | All Capa | Mid Capb | Valueb | Equityc |
|
| Dividends | 9,729 | $1,350,721 | $7,669,457 | $2,738,339 |
| Interest | 3,536 | 171,349 | 194,843 | 130,659 |
| Securities lending | — | 18,066 | 50,556 | 2,714 |
| Less foreign taxes withheld | (10) | (767) | (2,832) | (3,930) |
| Total investment income | 13,255 | 1,539,369 | 7,912,024 | 2,867,782 |
| |
| Expenses | | | | |
|
| Investment management fees (Note 3) | 3,295 | 1,165,041 | 2,222,866 | 755,255 |
| Class A distribution and service fees (Note 3) | 348 | — | — | — |
| Class B distribution and service fees (Note 3) | 1,162 | — | — | — |
| Class C distribution and service fees (Note 3) | 1,162 | — | — | — |
| Class 1 distribution and service fees (Note 3) | — | 60,479 | 39,356 | — |
| Fund administration fees (Note 3) | 54 | 15,065 | 28,833 | 10,478 |
| Audit and legal fees | 22,465 | 43,409 | 47,706 | 28,706 |
| Printing and postage fees | 31 | 3,675 | 6,875 | 1,571 |
| Custodian fees | 1,013 | 21,300 | 48,166 | 12,212 |
| Trustees’ fees (Note 3) | 1 | 2,200 | 4,101 | 677 |
| Registration and filing fees | 176 | 3,268 | 8,471 | 9,309 |
| Miscellaneous | 24 | 4,763 | 12,522 | 4,908 |
| Total expenses | 29,731 | 1,319,200 | 2,418,896 | 823,116 |
| Less expense reductions (Note 3) | (23,320) | — | — | (16,911) |
| Net expenses | 6,411 | 1,319,200 | 2,418,896 | 806,205 |
| Net investment income | 6,844 | 220,169 | 5,493,128 | 2,061,577 |
| |
| Realized and unrealized gain (loss) | | | | |
|
| Net realized gain (loss) on | | | | |
| Investments | 6,261 | (2,725,612) | 20,841,210 | 1,344,206 |
| Change in net unrealized appreciation of | | | | |
| Investments | 41,732 | 9,969,387 | 29,110,362 | 22,030,725 |
| Net realized and unrealized gain | 47,993 | 7,243,775 | 49,951,572 | 23,374,931 |
| |
| Increase in net assets from operations | $54,837 | $7,463,944 | $55,444,700 | $25,436,508 |
a Period from 7-28-06 (commencement of operations) to 8-31-06.
b Period from 10-15-05 (commencement of operations) to 8-31-06
c Period from 4-28-06 (commencement of operations) to 8-31-06.
The accompanying notes are an integral part of the financial statements. 102
| John Hancock Funds II | | | |
| |
| Statements of Operations — for the period ended August 31, 2006 | | |
| |
| |
| Investment income | Real Estate Securitiesa | Real Return Bonda | Small Capa | Small Cap Indexb |
|
| Dividends | $14,621,746 | — | $621,417 | $790,818 |
| Interest | 228,107 | $29,340,391 | 178,399 | 225,363 |
| Securities lending | 12,260 | 13,990 | 338,319 | 16,423 |
| Less foreign taxes withheld | (3,481) | — | — | (341) |
| Total investment income | 14,858,632 | 29,354,381 | 1,138,135 | 1,032,263 |
| |
| Expenses | | | | |
|
| Investment management fees (Note 3) | 2,822,723 | 3,735,458 | 1,508,791 | 337,795 |
| Class 1 distribution and service fees (Note 3) | 63,532 | 6,833 | 199 | — |
| Fund administration fees (Note 3) | 38,102 | 46,528 | 17,824 | 6,532 |
| Audit and legal fees | 52,320 | 70,153 | 44,122 | 38,847 |
| Printing and postage fees | 10,075 | 9,039 | 3,143 | 963 |
| Custodian fees | 49,089 | 104,129 | 25,735 | 10,145 |
| Trustees’ fees (Note 3) | 6,220 | 6,371 | 2,173 | 740 |
| Registration and filing fees | 26,147 | 24,813 | 6,314 | 4,364 |
| Miscellaneous | 18,608 | 25,054 | 3,895 | 1,570 |
| Total expenses | 3,086,816 | 4,028,378 | 1,612,196 | 400,956 |
| Less expense reductions (Note 3) | — | — | — | (10,729) |
| Net expenses | 3,086,816 | 4,028,378 | 1,612,196 | 390,227 |
| Net investment income (loss) | 11,771,816 | 25,326,003 | (474,061) | 642,036 |
| |
| Realized and unrealized gain (loss) | | | | |
|
| Net realized gain (loss) on | | | | |
| Investments | 76,579,811 | (4,987,783) | (1,290,852) | 3,299,512 |
| Futures contracts | — | 2,251,463 | — | 62,562 |
| Options written | — | 503,409 | — | — |
| Interest rate swap contracts | — | (2,585,201) | — | — |
| Foreign currency transactions | — | (1,516,472) | — | — |
| Change in net unrealized appreciation (depreciation) of | | | | |
| Investments | 32,841,754 | (462,703) | 8,031,744 | 1,016,288 |
| Futures contracts | — | (698,331) | — | 199,152 |
| Options written | — | (49,806) | — | — |
| Interest rate swap contracts | — | 1,808,198 | — | — |
| Translation of assets and liabilities in foreign currencies | — | (670,507) | — | — |
| Net realized and unrealized gain (loss) | 109,421,565 | (6,407,733) | 6,740,892 | 4,577,514 |
| |
| Increase (decrease) in net assets from operations | $121,193,381 | $18,918,270 | $6,266,831 | $5,219,550 |
a Period from 10-15-05 (commencement of operations) to 8-31-06.
b Period from 10-29-05 (commencement of operations) to 8-31-06.
The accompanying notes are an integral part of the financial statements. 103
| John Hancock Funds II | | | | |
| |
| Statements of Operations — for the period ended August 31, 2006 | | | |
|
| |
| |
| | Small Cap | Small | Small Company | Small Company |
| Investment income | Opportunitiesa | Companya | Growthb | Valuea |
|
| Dividends | $3,976,479 | $655,539 | $104,403 | $4,169,110 |
| Interest | 273,516 | 23,887 | 72,406 | 498,122 |
| Securities lending | 105,912 | 19,661 | — | 80,852 |
| Less foreign taxes withheld | (6,487) | (215) | (49) | — |
| Total investment income | 4,349,420 | 698,872 | 176,760 | 4,748,084 |
| |
| Expenses | | | | |
|
| Investment management fees (Note 3) | 2,050,099 | 740,735 | 538,487 | 3,103,883 |
| Class 1 distribution and service fees (Note 3) | 12,006 | 2,597 | — | 62,990 |
| Fund administration fees (Note 3) | 20,850 | 7,866 | 5,665 | 29,050 |
| Audit and legal fees | 44,596 | 40,506 | 39,150 | 47,328 |
| Printing and postage fees | 3,979 | 1,210 | 842 | 6,221 |
| Custodian fees | 31,966 | 124,366 | 27,149 | 40,643 |
| Trustees’ fees (Note 3) | 2,720 | 857 | 679 | 3,950 |
| Registration and filing fees | 17,776 | 2,828 | 2,256 | 11,948 |
| Miscellaneous | 4,581 | 1,780 | 1,617 | 8,460 |
| Total expenses | 2,188,573 | 922,745 | 615,845 | 3,314,473 |
| Less expense reductions (Note 3) | — | — | — | (80,667) |
| Net expenses | 2,188,573 | 922,745 | 615,845 | 3,233,806 |
| Net investment income (loss) | 2,160,847 | (223,873) | (439,085) | 1,514,278 |
| |
| Realized and unrealized gain (loss) | | | | |
|
| Net realized gain (loss) on | | | | |
| Investments | 6,633,553 | (349,401) | 1,671,495 | 2,995,867 |
| Foreign currency transactions | (156) | — | (3) | — |
| Change in net unrealized appreciation (depreciation) of | | | | |
| Investments | 15,182,294 | 1,321,814 | 4,880,900 | 32,157,056 |
| Net realized and unrealized gain (loss) | 21,815,691 | 972,413 | 6,552,392 | 35,152,923 |
| |
| Increase (decrease) in net assets from operations | $23,976,538 | $748,540 | $6,113,307 | $36,667,201 |
a Period from 10-15-05 (commencement of operations) to 8-31-06.
b Period from 10-29-05 (commencement of operations) to 8-31-06.
The accompanying notes are an integral part of the financial statements. 104
| John Hancock Funds II | | | | |
| |
| Statements of Operations — for the period ended August 31, 2006 | | |
|
| |
| Investment income | Special Valuea | Spectrum Incomeb | Strategic Bonda | Strategic Incomec |
|
| Dividends | $1,048,002 | $2,644,133 | $2,671 | $15,991 |
| Interest | 314,193 | 25,140,578 | 19,940,540 | 4,645,244 |
| Securities lending | 56,650 | 42,961 | 99,253 | 14,209 |
| Less foreign taxes withheld | — | (35,012) | (1,023) | (36,627) |
| Total investment income | 1,418,845 | 27,792,660 | 20,041,441 | 4,638,817 |
| |
| Expenses | | | | |
|
| Investment management fees (Note 3) | 925,399 | 4,104,485 | 2,413,625 | 642,275 |
| Class 1 distribution and service fees (Note 3) | 1,342 | — | 17,194 | — |
| Fund administration fees (Note 3) | 8,882 | 50,517 | 36,765 | 10,827 |
| Audit and legal fees | 41,053 | 62,116 | 59,657 | 38,212 |
| Printing and postage fees | 1,473 | 8,510 | 8,161 | 1,613 |
| Custodian fees | 23,416 | 870,671 | 180,376 | 64,923 |
| Trustees’ fees (Note 3) | 1,092 | 6,796 | 5,420 | 702 |
| Registration and filing fees | 3,918 | 28,134 | 6,325 | 9,840 |
| Miscellaneous | 1,649 | 14,181 | 17,001 | 21,673 |
| Total expenses | 1,008,224 | 5,145,410 | 2,744,524 | 790,065 |
| Less expense reductions (Note 3) | — | (74,483) | — | — |
| Net expenses | 1,008,224 | 5,070,927 | 2,744,524 | 790,065 |
| Net investment income (loss) | 410,621 | 22,721,733 | 17,296,917 | 3,848,752 |
| |
| Realized and unrealized gain (loss) | | | | |
|
| Net realized gain (loss) on | | | | |
| Investments | 910,254 | (7,800) | (4,573,911) | (460,785) |
| Futures contracts | — | 60,265 | (585,829) | — |
| Options written | — | — | 278,216 | — |
| Foreign currency transactions | — | 584,992 | (5,869) | 1,370,260 |
| Change in net unrealized appreciation (depreciation) of | | | | |
| Investments | 7,424,159 | 11,804,112 | 3,856,120 | 861,836 |
| Futures contracts | — | (18,082) | (1,264,739) | — |
| Options written | — | — | (13,982) | — |
| Translation of assets and liabilities in foreign currencies | — | (134,913) | (6) | (1,974,159) |
| Net realized and unrealized gain (loss) | 8,334,413 | 12,288,574 | (2,310,000) | (202,848) |
| |
| Increase (decrease) in net assets from operations | $8,745,034 | $35,010,307 | $14,986,917 | $3,645,904 |
a Period from 10-15-05 (commencement of operations) to 8-31-06.
b Period from 10-29-05 (commencement of operations) to 8-31-06.
c Period from 4-28-06 (commencement of operations) to 8-31-06.
The accompanying notes are an integral part of the financial statements. 105
| John Hancock Funds II | | | | |
| |
| Statements of Operations — for the period ended August 31, 2006 | | |
|
| |
| |
| | | | U.S. Global | U.S. Government |
| Investment income | Strategic Valuea | Total Returna | Leaders Growtha | Securitiesa |
|
| Dividends | $2,190,396 | — | $4,194,238 | — |
| Interest | 120,331 | $41,945,745 | 220,338 | $7,423,824 |
| Securities lending | 3,142 | 311 | 5,160 | — |
| Less foreign taxes withheld | — | — | (14,064) | — |
| Total investment income | 2,313,869 | 41,946,056 | 4,405,672 | 7,423,824 |
| |
| Expenses | | | | |
|
| Investment management fees (Note 3) | 973,699 | 6,231,441 | 2,448,474 | 1,032,998 |
| Class 1 distribution and service fees (Note 3) | 5,768 | 49,340 | 10,226 | 19,925 |
| Fund administration fees (Note 3) | 10,975 | 78,340 | 35,135 | 15,580 |
| Audit and legal fees | 41,728 | 80,155 | 47,934 | 53,107 |
| Printing and postage fees | 2,040 | 15,628 | 5,911 | 3,917 |
| Custodian fees | 23,341 | 295,682 | 33,136 | 88,713 |
| Trustees’ fees (Note 3) | 1,408 | 10,879 | 4,031 | 2,348 |
| Registration and filing fees | 3,997 | 33,609 | 14,619 | 5,504 |
| Miscellaneous | 2,220 | 67,545 | 6,990 | 13,267 |
| Total expenses | 1,065,176 | 6,862,619 | 2,606,456 | 1,235,359 |
| |
| Net investment income (loss) | 1,248,693 | 35,083,437 | 1,799,216 | 6,188,465 |
| |
| Realized and unrealized gain (loss) | | | | |
|
| Net realized gain (loss) on | | | | |
| Investments | 2,312,021 | (26,541) | (5,771,575) | (1,112,306) |
| Futures contracts | — | (1,372,617) | — | 111,400 |
| Options written | — | 985,044 | — | — |
| Interest rate swap contracts | — | 285,222 | — | — |
| Foreign currency transactions | — | 1,419,640 | — | — |
| Change in net unrealized appreciation (depreciation) of | | | | |
| Investments | 4,274,310 | 5,643,277 | (14,622,516) | 640,465 |
| Futures contracts | — | (1,580,431) | — | (11,086) |
| Options written | — | (2,179,782) | — | — |
| Interest rate swap contracts | — | 102,020 | — | — |
| Translation of assets and liabilities in foreign currencies | — | (1,516,096) | — | — |
| Net realized and unrealized gain (loss) | 6,586,331 | 1,759,736 | (20,394,091) | (371,527) |
| |
| Increase (decrease) in net assets from operations | $7,835,024 | $36,843,173 | ($18,594,875) | $5,816,938 |
a Period from 10-15-05 (commencement of operations) to 8-31-06.
The accompanying notes are an integral part of the financial statements. 106
| John Hancock Funds II | | | | |
| |
| Statements of Operations — for the period ended August 31, 2006 | | | |
|
| |
| | U.S. High | U.S. Multi | Value & | |
| Investment income | Yield Bonda | Sectorb | Restructuringb | Vistab |
|
| Dividends | — | $15,001,116 | $3,807,276 | $708,929 |
| Interest | $13,764,385 | 1,459,617 | 167,296 | 77,663 |
| Securities lending | 46,404 | 40,452 | 36,421 | 21,795 |
| Less foreign taxes withheld | (11,278) | | (34,605) | (3,478) |
| Total investment income | 13,799,511 | 16,501,185 | 3,976,388 | 804,909 |
| |
| Expenses | | | | |
|
| Investment management fees (Note 3) | 1,287,281 | 6,923,232 | 1,514,336 | 821,661 |
| Class 1 distribution and service fees (Note 3) | 349 | | — | — |
| Fund administration fees (Note 3) | 14,022 | 83,451 | 19,535 | 11,299 |
| Audit and legal fees | 52,261 | 65,147 | 42,058 | 40,174 |
| Printing and postage fees | 2,824 | 14,118 | 2,510 | 1,416 |
| Custodian fees | 61,836 | 240,474 | 31,845 | 57,504 |
| Trustees’ fees (Note 3) | 1,825 | 11,333 | 1,933 | 1,138 |
| Registration and filing fees | 8,155 | 41,693 | 14,344 | 3,866 |
| Miscellaneous | 7,733 | 19,541 | 3,130 | 3,030 |
| Total expenses | 1,436,286 | 7,398,989 | 1,629,691 | 940,088 |
| |
| Net investment income (loss) | 12,363,225 | 9,102,196 | 2,346,697 | (135,179) |
| |
| Realized and unrealized gain (loss) | | | | |
|
| Net realized gain (loss) on | | | | |
| Investments | (96,841) | 3,873,645 | 958,144 | (3,989,289) |
| Futures contracts | — | 485,293 | — | — |
| Options written | — | — | 144,796 | — |
| Foreign currency transactions | — | (16,742) | 17,551 | (154,069) |
| Change in net unrealized appreciation (depreciation) of | | | | |
| Investments | (747,561) | 25,131,284 | 9,209,444 | 10,752,087 |
| Futures contracts | — | 993,904 | — | — |
| Translation of assets and liabilities in foreign currencies | — | — | 349 | (642) |
| Net realized and unrealized gain (loss) | (844,402) | 30,467,384 | 10,330,284 | 6,608,087 |
| |
| Increase (decrease) in net assets from operations | $11,518,823 | $39,569,580 | $12,676,981 | $6,472,908 |
a Period from 10-15-05 (commencement of operations) to 8-31-06.
b Period from 10-29-05 (commencement of operations) to 8-31-06.
The accompanying notes are an integral part of the financial statements. 107
| John Hancock Funds II | | | |
| |
| Statements of Changes in Net Assets | | | |
|
| |
| |
| | Absolute Return | Active Bond | All Cap Core |
| | Period ended | Period ended | Period ended |
| Increase (decrease) in net assets | 8-31-06a | 8-31-06b | 8-31-06c |
|
| From operations | | | |
| Net investment income (loss) | $45,240 | $14,322,840 | $1,296,069 |
| Net realized gain (loss) | — | (3,175,474) | (8,220,127) |
| Change in net unrealized appreciation (depreciation) | 160,534 | 670,385 | 5,270,609 |
| Increase (decrease) in net assets resulting from operations | 205,774 | 11,817,751 | (1,653,449) |
| Distributions to shareholders | | | |
| From net investment income | | | |
| Class A | — | — | — |
| Class B | — | — | — |
| Class C | — | — | — |
| Class 1 | — | (954,551) | — |
| Class NAV | — | (10,220,932) | — |
| | — | (11,175,483) | — |
| From Fund share transactions | 5,000,000 | 435,912,775 | 285,676,890 |
| |
| Net assets | | | |
|
| Beginning of period | — | — | — |
| End of period | $5,205,774 | $436,555,043 | $284,023,441 |
| Undistributed net investment income (loss) | $50,675 | $3,593,004 | $1,289,516 |
| |
| | All Cap Growth | All Cap Value | Blue Chip Growth |
| | Period ended | Period ended | Period ended |
| Increase (decrease) in net assets | 8-31-06 d | 8-31-06 d | 8-31-06 d |
|
| From operations | | | |
| Net investment income (loss) | $152,559 | $1,435,072 | $5,538,646 |
| Net realized gain (loss) | (3,003,909) | 5,826,940 | (3,816,109) |
| Change in net unrealized appreciation (depreciation) | 9,501,316 | 16,725,292 | 70,971,019 |
| Increase (decrease) in net assets resulting from operations | 6,649,966 | 23,987,304 | 72,693,556 |
| Distributions to shareholders | | | |
| From net investment income | | | |
| Class 1 | (15,666) | (29,388) | (96,099) |
| Class NAV | (49,558) | (268,692) | (798,874) |
| | (65,224) | (298,080) | (894,973) |
| From Fund share transactions | 148,386,145 | 192,472,577 | 1,201,052,205 |
| |
| Net assets | | | |
|
| Beginning of period | — | — | — |
| End of period | $154,970,887 | $216,161,801 | $1,272,850,788 |
| Undistributed net investment income (loss) | $90,754 | $1,139,300 | $4,776,090 |
a Period from 6-26-06 (commencement of operations) to 8-31-06.
b Class 1 and Class NAV shares began operations on 10-15-05 and 10-27-05, respectively.
c Period from 4-28-06 (commencement of operations) to 8-31-06.
d Period from 10-15-05 (commencement of operations) to 8-31-06.
The accompanying notes are an integral part of the financial statements. 108
| John Hancock Funds II | | |
| |
| Statements of Changes in Net Assets | | | |
| |
| |
| | Capital Appreciation | Core Bond | Core Equity |
| | Period ended | Period ended | Period ended |
| Increase (decrease) in net assets | 8-31-06 a | 8-31-06 a | 8-31-06 a |
|
| From operations | | | |
| Net investment income (loss) | $428,220 | $6,393,486 | ($25,666) |
| Net realized gain (loss) | (17,430,961) | (1,818,731) | 3,472,346 |
| Change in net unrealized appreciation (depreciation) | 8,657,847 | 869,346 | 6,670,679 |
| Increase (decrease) in net assets resulting from operations | (8,344,894) | 5,444,101 | 10,117,359 |
| Distributions to shareholders | | | |
| From net investment income | | | |
| Class 1 | — | (16,947) | — |
| Class NAV | — | (4,956,804) | — |
| | — | (4,973,751) | — |
| From Fund share transactions | 468,589,763 | 197,919,446 | 586,022,092 |
| |
| Net assets | | | |
|
| Beginning of period | — | — | — |
| End of period | $460,244,869 | $198,389,796 | $596,139,451 |
| Undistributed net investment income (loss) | $467,182 | $1,657,673 | $97 |
| |
| | Emerging Growth | Emerging Small Company | Equity-Income |
| | Period ended | Period ended | Period ended |
| Increase (decrease) in net assets | 8-31-06 a | 8-31-06 a | 8-31-06 a |
|
| From operations | | | |
| Net investment income (loss) | ($362,036) | ($277,432) | $11,412,365 |
| Net realized gain (loss) | 31,435,329 | 5,329,331 | 31,300,814 |
| Change in net unrealized appreciation (depreciation) | (15,348,460) | (3,974,924) | 56,205,455 |
| Increase (decrease) in net assets resulting from operations | 15,724,833 | 1,076,975 | 98,918,634 |
| Distributions to shareholders | | | |
| From net investment income | | | |
| Class 1 | — | — | (612,671) |
| Class NAV | — | — | (2,371,194) |
| | — | — | (2,983,865) |
| From Fund share transactions | 155,929,854 | 50,741,810 | 622,862,224 |
| |
| Net assets | | | |
|
| Beginning of period | — | — | — |
| End of period | $171,654,687 | $51,818,785 | $718,796,993 |
| Undistributed net investment income (loss) | — | — | $8,435,232 |
a Period from 10-15-05 (commencement of operations) to 8-31-06.
The accompanying notes are an integral part of the financial statements. 109
| John Hancock Funds II | | | |
| |
| Statements of Changes in Net Assets | | | |
|
| |
| |
| | Fundamental Value | Global Bond | Global Real Estate |
| | Period ended | Period ended | Period ended |
| Increase (decrease) in net assets | 8-31-06 a | 8-31-06 a | 8-31-06 b |
|
| From operations | | | |
| Net investment income (loss) | $5,664,277 | $16,234,066 | $1,893,125 |
| Net realized gain (loss) | 4,817,731 | (6,470,663) | (5,530,696) |
| Change in net unrealized appreciation (depreciation) | 45,751,068 | 7,486,259 | 15,126,084 |
| Increase (decrease) in net assets resulting from operations | 56,233,076 | 17,249,662 | 11,488,513 |
| Distributions to shareholders | | | |
| From net investment income | | | |
| Class 1 | (109,544) | (227,540) | — |
| Class NAV | (1,226,769) | (2,800,652) | — |
| | (1,336,313) | (3,028,192) | — |
| From Fund share transactions | 706,526,990 | 580,776,467 | 343,735,965 |
| |
| Net assets | | | |
|
| Beginning of period | — | — | — |
| End of period | $761,423,753 | $594,997,937 | $355,224,478 |
| Undistributed net investment income (loss) | $4,271,133 | $9,492,882 | $5,016,543 |
| |
| | High Income | High Yield | International Equity Index |
| | Period ended | Period ended | Period ended |
| Increase (decrease) in net assets | 8-31-06 b | 8-31-06 a | 8-31-06 c |
|
| From operations | | | |
| Net investment income (loss) | $6,340,541 | $81,271,248 | $5,235,927 |
| Net realized gain (loss) | (553,987) | 9,338,978 | 2,331,976 |
| Change in net unrealized appreciation (depreciation) | (5,980,048) | (7,794,032) | 29,836,925 |
| Increase (decrease) in net assets resulting from operations | (193,494) | 82,816,194 | 37,404,828 |
| Distributions to shareholders | | | |
| From net investment income | | | |
| Class 1 | — | (2,373,236) | — |
| Class NAV | (3,127,218) | (67,041,478) | (2,080,681) |
| | (3,127,218) | (69,414,714) | (2,080,681) |
| From Fund share transactions | 292,379,947 | 1,174,694,020 | 272,434,870 |
| |
| Net assets | | | |
|
| Beginning of period | — | — | — |
| End of period | $289,059,235 | $1,188,095,500 | $307,759,017 |
| Undistributed net investment income (loss) | $3,490,060 | $15,619,891 | $2,881,246 |
a Period from 10-15-05 (commencement of operations) to 8-31-06.
b Period from 4-28-06 (commencement of operations) to 8-31-06.
c Period from 10-29-05 (commencement of operations) to 8-31-06.
The accompanying notes are an integral part of the financial statements. 110
| John Hancock Funds II | | |
| |
| Statements of Changes in Net Assets | | | |
|
| |
| International Opportunities | International Small Cap | International Small Company |
| | Period ended | Period ended | Period ended |
| Increase (decrease) in net assets | 8-31-06 a | 8-31-06 a | 8-31-06 b |
|
| From operations | | | |
| Net investment income (loss) | $2,821,331 | $5,733,388 | $974,999 |
| Net realized gain (loss) | 18,421,235 | 51,817,503 | (7,785,169) |
| Change in net unrealized appreciation (depreciation) | 67,545,351 | 28,663,284 | (6,753,919) |
| Increase (decrease) in net assets resulting from operations | 88,787,917 | 86,214,175 | (13,564,089) |
| Distributions to shareholders | | | |
| From net investment income | | | |
| Class 1 | (42,136) | (59,757) | — |
| Class NAV | (18,582,164) | (1,022,670) | — |
| | (18,624,300) | (1,082,427) | — |
| From Fund share transactions | 490,997,093 | 310,733,342 | 234,475,079 |
| |
| Net assets | | | |
|
| Beginning of period | — | — | — |
| End of period | $561,160,710 | $395,865,090 | $220,910,990 |
| Undistributed net investment income (loss) | $19,725 | $4,659,236 | $845,678 |
| |
| | International Stock | International Value | Investment Quality Bond |
| | Period ended | Period ended | Period ended |
| Increase (decrease) in net assets | 8-31-06 a | 8-31-06 a | 8-31-06 a |
|
| From operations | | | |
| Net investment income (loss) | $18,803,571 | $25,960,995 | $4,541,129 |
| Net realized gain (loss) | 162,151,424 | 50,586,857 | (289,334) |
| Change in net unrealized appreciation (depreciation) | 13,665,641 | 105,464,902 | (862,651) |
| Increase (decrease) in net assets resulting from operations | 194,620,636 | 182,012,754 | 3,389,144 |
| Distributions to shareholders | | | |
| From net investment income | | | |
| Class 1 | (619,551) | (353,039) | (1,074,307) |
| Class NAV c | (19,349,670) | (2,875,449) | (2,811,572) |
| From net realized gain | | | |
| Class 1 | (2,530,723) | — | — |
| Class NAV c | (32,850,704) | — | — |
| | (55,350,648) | (3,228,488) | (3,885,879) |
| From Fund share transactions | (59,950,147) | 791,306,845 | 128,744,170 |
| |
| Net assets | | | |
|
| Beginning of period | — | — | — |
| End of period | $79,319,841 | $970,091,111 | $128,247,435 |
| Undistributed net investment income (loss) | $2,666,496 | $23,653,961 | $1,197,991 |
a Period from 10-15-05 (commencement of operations) to 8-31-06.
b Period from 4-28-06 (commencement of operations) to 8-31-06.
c Class NAV shares of International Stock were terminated on 8-29-06.
The accompanying notes are an integral part of the financial statements. 111
| John Hancock Funds II | | | |
| |
| Statements of Changes in Net Assets | | | |
|
| |
| |
| | Large Cap | Large Cap Value | Mid Cap Core |
| | Period ended | Period ended | Period ended |
| Increase (decrease) in net assets | 8-31-06 a | 8-31-06 a | 8-31-06 a |
|
| From operations | | | |
| Net investment income (loss) | $1,363,397 | $1,556,729 | $2,558,792 |
| Net realized gain (loss) | 3,114,081 | (1,478,897) | 12,004,586 |
| Change in net unrealized appreciation (depreciation) | 9,634,421 | 17,901,225 | 13,277,221 |
| Increase (decrease) in net assets resulting from operations | 14,111,899 | 17,979,057 | 27,840,599 |
| Distributions to shareholders | | | |
| From net investment income | | | |
| Class 1 | (1,427) | (24,236) | (8,276) |
| Class NAV | (212,012) | (293,006) | (374,238) |
| | (213,439) | (317,242) | (382,514) |
| From Fund share transactions | 179,904,602 | 321,851,954 | 278,213,010 |
| |
| Net assets | | | |
|
| Beginning of period | — | — | — |
| End of period | $193,803,062 | $339,513,769 | $305,671,095 |
| Undistributed net investment income (loss) | $1,150,049 | $1,242,158 | $2,362,915 |
| |
| | Mid Cap Index | Mid Cap Stock | Mid Cap Value |
| | Period ended | Period ended | Period ended |
| Increase (decrease) in net assets | 8-31-06 b | 8-31-06 a | 8-31-06 a |
|
| From operations | | | |
| Net investment income (loss) | $966,030 | ($640,399) | $1,050,937 |
| Net realized gain (loss) | 90,512 | 15,188,535 | 5,252,528 |
| Change in net unrealized appreciation (depreciation) | (1,868,848) | 16,417,643 | 8,839,164 |
| Increase (decrease) in net assets resulting from operations | (812,306) | 30,965,779 | 15,142,629 |
| Distributions to shareholders | | | |
| From net investment income | | | |
| Class 1 | — | — | (129,841) |
| Class NAV | (98,937) | (8,555) | (193,677) |
| From net realized gain | | | |
| Class 1 | — | (110,835) | (26,180) |
| Class NAV | — | (186,450) | (37,303) |
| | (98,937) | (305,840) | (387,001) |
| From Fund share transactions | 173,066,736 | 270,209,839 | 128,429,015 |
| |
| Net assets | | | |
|
| Beginning of period | — | — | — |
| End of period | $172,155,493 | $300,869,778 | $143,184,643 |
| Undistributed net investment income (loss) | $825,119 | — | $737,063 |
a Period from 10-15-05 (commencement of operations) to 8-31-06.
b Period from 10-29-05 (commencement of operations) to 8-31-06.
The accompanying notes are an integral part of the financial statements. 112
| John Hancock Funds II | | |
| |
| Statements of Changes in Net Assets | | | |
|
| |
| | Mid Cap Value Equity | Natural Resources | Quantitative All Cap |
| | Period ended | Period ended | Period ended |
| Increase (decrease) in net assets | 8-31-06 a | 8-31-06 b | 8-31-06 c |
|
| From operations | | | |
| Net investment income (loss) | $246,829 | $6,661,995 | $6,844 |
| Net realized gain (loss) | (888,280) | 33,022,588 | 6,261 |
| Change in net unrealized appreciation (depreciation) | (2,464,971) | 114,034,956 | 41,732 |
| Increase (decrease) in net assets resulting from operations | (3,106,422) | 153,719,539 | 54,837 |
| Distributions to shareholders | | | |
| From net investment income | | | |
| Class 1 | — | (51,094) | — |
| Class NAV | — | (691,085) | — |
| | — | (742,179) | — |
| From Fund share transactions | 101,230,202 | 619,966,691 | 5,000,000 |
| |
| Net assets | | | |
|
| Beginning of period | — | — | — |
| End of period | $98,123,780 | $772,944,051 | $5,054,837 |
| Undistributed net investment income (loss) | $230,465 | $6,002,486 | $9,516 |
| |
| | Quantitative Mid Cap | Quantitative Value | Real Estate Equity |
| | Period ended | Period ended | Period ended |
| Increase (decrease) in net assets | 8-31-06 d | 8-31-06 b | 8-31-06 a |
|
| From operations | | | |
| Net investment income (loss) | $220,169 | $5,493,128 | $2,061,577 |
| Net realized gain (loss) | (2,725,612) | 20,841,210 | 1,344,206 |
| Change in net unrealized appreciation (depreciation) | 9,969,387 | 29,110,362 | 22,030,725 |
| Increase (decrease) in net assets resulting from operations | 7,463,944 | 55,444,700 | 25,436,508 |
| Distributions to shareholders | | | |
| From net investment income | | | |
| Class 1 | (19,536) | (305,249) | — |
| Class NAV | (8,107) | (884,370) | — |
| From net realized gain | | | |
| Class 1 | (47,665) | (11,546) | — |
| Class NAV | (14,289) | (33,123) | — |
| | (89,597) | (1,234,288) | — |
| From Fund share transactions | 175,809,916 | 403,906,768 | 249,457,958 |
| |
| Net assets | | | |
|
| Beginning of period | — | — | — |
| End of period | $183,184,263 | $458,117,180 | $274,894,466 |
| Undistributed net investment income (loss) | $209,085 | $4,286,265 | $1,515,505 |
a Period from 4-28-06 (commencement of operations) to 8-31-06.
b Period from 10-15-05 (commencement of operations) to 8-31-06.
c Period from 7-28-06 (commencement of operations) to 8-31-06.
d Class 1 and Class NAV shares began operations on 10-15-05 and 10-27-05, respectively.
The accompanying notes are an integral part of the financial statements. 113
| John Hancock Funds II | | |
| |
| Statements of Changes in Net Assets | | | |
|
| |
| |
| | Real Estate Securities | Real Return Bond | Small Cap |
| | Period ended | Period ended | Period ended |
| Increase (decrease) in net assets | 8-31-06 a | 8-31-06 a | 8-31-06 a |
|
| From operations | | | |
| Net investment income (loss) | $11,771,816 | $25,326,003 | ($474,061) |
| Net realized gain (loss) | 76,579,811 | (6,334,584) | (1,290,852) |
| Change in net unrealized appreciation (depreciation) | 32,841,754 | (73,149) | 8,031,744 |
| Increase (decrease) in net assets resulting from operations | 121,193,381 | 18,918,270 | 6,266,831 |
| Distributions to shareholders | | | |
| From net investment income | | | |
| Class 1 | (836,666) | (463,414) | — |
| Class NAV b | (3,237,864) | (19,110,091) | — |
| From net realized gain | | | |
| Class 1 | (156,925) | (3,746) | — |
| Class NAV b | (598,547) | (140,598) | — |
| | (4,830,002) | (19,717,849) | — |
| From Fund share transactions | 54,198,256 | 702,596,985 | 234,324,408 |
| |
| Net assets | | | |
|
| Beginning of period | — | — | — |
| End of period | $170,561,635 | $701,797,406 | $240,591,239 |
| Undistributed net investment income (loss) | $3,984,988 | $3,339,086 | — |
| |
| | Small Cap Index | Small Cap Opportunities | Small Company |
| | Period ended | Period ended | Period ended |
| Increase (decrease) in net assets | 8-31-06 c | 8-31-06 a | 8-31-06 a |
|
| From operations | | | |
| Net investment income (loss) | $642,036 | $2,160,847 | ($223,873) |
| Net realized gain (loss) | 3,362,074 | 6,633,397 | (349,401) |
| Change in net unrealized appreciation (depreciation) | 1,215,440 | 15,182,294 | 1,321,814 |
| Increase (decrease) in net assets resulting from operations | 5,219,550 | 23,976,538 | 748,540 |
| Distributions to shareholders | | | |
| From net investment income | | | |
| Class 1 | — | (48,845) | — |
| Class NAV | (86,672) | (462,991) | — |
| From net realized gain | | | |
| Class 1 | — | (3,697) | — |
| Class NAV | — | (33,252) | — |
| | (86,672) | (548,785) | — |
| From Fund share transactions | 119,963,560 | 223,703,772 | 92,677,026 |
| |
| Net assets | | | |
|
| Beginning of period | — | — | — |
| End of period | $125,096,438 | $247,131,525 | $93,425,566 |
| Undistributed net investment income (loss) | $536,633 | $1,544,403 | — |
a Period from 10-15-05 (commencement of operations) to 8-31-06.
b Class NAV shares of Real Estate Securities Fund were terminated on 5-1-06.
c Period from 10-29-05 (commencement of operations) to 8-31-06.
The accompanying notes are an integral part of the financial statements. 114
| John Hancock Funds II | | |
| |
| Statements of Changes in Net Assets | | | |
|
| |
| | Small Company Growth | Small Company Value | Special Value |
| | Period ended | Period ended | Period ended |
| Increase (decrease) in net assets | 8-31-06 a | 8-31-06 b | 8-31-06 b |
|
| From operations | | | |
| Net investment income (loss) | ($439,085) | $1,514,278 | $410,621 |
| Net realized gain (loss) | 1,671,492 | 2,995,867 | 910,254 |
| Change in net unrealized appreciation (depreciation) | 4,880,900 | 32,157,056 | 7,424,159 |
| Increase (decrease) in net assets resulting from operations | 6,113,307 | 36,667,201 | 8,745,034 |
| Distributions to shareholders | | | |
| From net investment income | | | |
| Class 1 | — | (272,671) | (1,203) |
| Class NAV | — | (401,689) | (80,457) |
| | — | (674,360) | (81,660) |
| From Fund share transactions | 67,787,488 | 351,922,253 | 118,998,419 |
| |
| Net assets | | | |
|
| Beginning of period | — | — | — |
| End of period | $73,900,795 | $387,915,094 | $127,661,793 |
| Undistributed net investment income (loss) | ($2) | $846,061 | $292,695 |
| |
| | Spectrum Income | Strategic Bond | Strategic Income |
| | Period ended | Period ended | Period ended |
| Increase (decrease) in net assets | 8-31-06 a | 8-31-06 b | 8-31-06 c |
|
| From operations | | | |
| Net investment income (loss) | $22,721,733 | $17,296,917 | $3,848,752 |
| Net realized gain (loss) | 637,457 | (4,887,393) | 909,475 |
| Change in net unrealized appreciation (depreciation) | 11,651,117 | 2,577,393 | (1,112,323) |
| Increase (decrease) in net assets resulting from operations | 35,010,307 | 14,986,917 | 3,645,904 |
| Distributions to shareholders | | | |
| From net investment income | | | |
| Class 1 | — | (1,747,753) | — |
| Class NAV | (18,140,475) | (13,039,773) | (2,008,968) |
| From net realized gain | | | |
| Class 1 | — | (10,065) | — |
| Class NAV | — | (114,768) | — |
| | (18,140,475) | (14,912,359) | (2,008,968) |
| From Fund share transactions | 746,861,140 | 311,694,682 | 279,456,497 |
| |
| Net assets | | | |
|
| Beginning of period | — | — | — |
| End of period | $763,730,972 | $311,769,240 | $281,093,433 |
| Undistributed net investment income (loss) | $6,423,970 | $3,116,177 | $3,755,040 |
a Period from 10-29-05 (commencement of operations) to 8-31-06.
b Period from 10-15-05 (commencement of operations) to 8-31-06.
c Period from 4-28-06 (commencement of operations) to 8-31-06.
The accompanying notes are an integral part of the financial statements. 115
| John Hancock Funds II | | |
| |
| Statements of Changes in Net Assets | | | |
|
| |
| |
| | Strategic Value | Total Return | U.S. Global Leaders Growth |
| | Period ended | Period ended | Period ended |
| Increase (decrease) in net assets | 8-31-06 a | 8-31-06 a | 8-31-06 a |
|
| From operations | | | |
| Net investment income (loss) | $1,248,693 | $35,083,437 | $1,799,216 |
| Net realized gain (loss) | 2,312,021 | 1,290,748 | (5,771,575) |
| Change in net unrealized appreciation (depreciation) | 4,274,310 | 468,988 | (14,622,516) |
| Increase (decrease) in net assets resulting from operations | 7,835,024 | 36,843,173 | (18,594,875) |
| Distributions to shareholders | | | |
| From net investment income | | | |
| Class 1 | (18,908) | (2,773,005) | (10,881) |
| Class NAV | (182,609) | (24,067,715) | (198,525) |
| | (201,517) | (26,840,720) | (209,406) |
| From Fund share transactions | 144,753,994 | 1,149,272,239 | 495,818,107 |
| |
| Net assets | | | |
|
| Beginning of period | — | — | — |
| End of period | $152,387,501 | $1,159,274,692 | $477,013,826 |
| Undistributed net investment income (loss) | $1,048,812 | $10,021,670 | $1,593,153 |
| |
| U.S. Government Securities | U.S. High Yield Bond | U.S. Multi Sector |
| | Period ended | Period ended | Period ended |
| Increase (decrease) in net assets | 8-31-06 a | 8-31-06 a | 8-31-06 b |
|
| From operations | | | |
| Net investment income (loss) | $6,188,465 | $12,363,225 | $9,102,196 |
| Net realized gain (loss) | (1,000,906) | (96,841) | 4,342,196 |
| Change in net unrealized appreciation (depreciation) | 629,379 | (747,561) | 26,125,188 |
| Increase (decrease) in net assets resulting from operations | 5,816,938 | 11,518,823 | 39,569,580 |
| Distributions to shareholders | | | |
| From net investment income | | | |
| Class 1 | (1,060,319) | (38,635) | — |
| Class NAV | (3,604,130) | (9,044,306) | (1,421,127) |
| From net realized gain | | | |
| Class 1 | (15,290) | — | — |
| Class NAV | (44,735) | — | — |
| | (4,724,474) | (9,082,941) | (1,421,127) |
| From Fund share transactions | 202,472,305 | 287,577,645 | 1,188,817,440 |
| |
| Net assets | | | |
|
| Beginning of period | — | — | — |
| End of period | $203,564,769 | $290,013,527 | $1,226,965,893 |
| Undistributed net investment income (loss) | $1,806,481 | $3,824,838 | $7,664,576 |
| |
| | Value & Restructuring | Vista | |
| | Period ended | Period ended | |
| Increase (decrease) in net assets | 8-31-06 b | 8-31-06 b | |
|
| From operations | | | |
| Net investment income (loss) | $2,346,697 | ($135,179) | |
| Net realized gain (loss) | 1,120,491 | (4,143,358) | |
| Change in net unrealized appreciation (depreciation) | 9,209,793 | 10,751,445 | |
| Increase (decrease) in net assets resulting from operations | 12,676,981 | 6,472,908 | |
| Distributions to shareholders | | | |
| From net investment income | | | |
| Class NAV | (406,118) | — | |
| | (406,118) | — | |
| From Fund share transactions | 284,223,844 | 116,136,795 | |
| |
| Net assets | | | |
|
| Beginning of period | — | — | |
| End of period | $296,494,707 | $122,609,703 | |
| Undistributed net investment income (loss) | $1,962,533 | ($483) | |
a Period from 10-15-05 (commencement of operations) to 8-31-06.
b Period from 10-29-05 (commencement of operations) to 8-31-06.
The accompanying notes are an integral part of the financial statements. 116
| John Hancock Funds II | | | |
| |
| Financial Highlights (For a share outstanding throughout the period) | | |
|
| |
| |
| Absolute Return | | | |
|
|
| | Class A | | Class B | |
| Period ended | 8-31-06a | | 8-31-06a |
|
| Per share operating performance | | | |
|
| Net asset value, beginning of period | $10.00 | | $10.00 |
| Net investment income (loss)h,v | 0.10 | | 0.08 |
| Net realized and unrealized gain (loss) on investments | 0.32 | | 0.32 |
| Total from investment operations | 0.42 | | 0.40 |
| Net asset value, end of period | $10.42 | | $10.40 |
| Total returnk,l (%) | 4.20m | | 4.00m |
| | | | |
| Ratios and supplemental data | | | |
|
| Net assets, end of period (in millions) | $1 | | $1 |
| Ratio of net expenses to average net assetsq (%) | 0.55r | | 1.25r |
| Ratio of gross expenses to average net assetsp,q (%) | 4.04r | | 4.73r |
| Ratio of net investment income (loss) to | | | |
| average net assetsv (%) | 5.17r | | 4.48r |
| Portfolio turnover (%) | —m | | —m |
| | |
|
|
| Class C | | Class 1 | |
| Period ended | 8-31-06a | | 8-31-06a |
|
| Per share operating performance | | | |
|
| Net asset value, beginning of period | $10.00 | | $10.00 |
| Net investment income (loss)h,v | 0.08 | | 0.10 |
| Net realized and unrealized gain (loss) on investments | 0.32 | | 0.32 |
| Total from investment operations | 0.40 | | 0.42 |
| Net asset value, end of period | $10.40 | | $10.42 |
| Total returnk,l (%) | 4.00m | | 4.20m |
| | | | |
| Ratios and supplemental data | | | |
|
| Net assets, end of period (in millions) | $1 | | $1 |
| Ratio of net expenses to average net assetsq (%) | 1.25r | | 0.30r |
| Ratio of gross expenses to average net assetsp,q (%) | 4.73r | | 3.79r |
| Ratio of net investment income (loss) to | | | |
| average net assetsv (%) | 4.48r | | 5.42r |
| Portfolio turnover (%) | —m | | —m |
a Class A, Class B, Class C and Class 1 shares began operations on 6-26-06.
h Based on the average of the shares outstanding.
k Assumes dividend reinvestment and does not reflect the effect of sales charges.
l Total returns would have been lower had certain expenses not been reduced during the period shown.
m Not annualized.
p Does not take into consideration expense reductions during the period shown.
q Does not include expenses of the investment companies in which the Fund invests.
r Annualized.
v Recognition of net investment income by the Fund is affected by the timing of the declaration of dividends by the underlying investment companies in which the Fund invests.
The accompanying notes are an integral part of the financial statements. 117
| John Hancock Funds II | | | |
| |
| Financial Highlights (For a share outstanding throughout the period) | | |
|
| |
| |
| Active Bond | | | |
|
|
| | Class 1 | | Class NAV | |
| Period ended | 8-31-06a | | 8-31-06a |
|
| Per share operating performance | | | |
|
| Net asset value, beginning of period | $9.61 | | $9.58 |
| Net investment income (loss)h | 0.36 | | 0.35 |
| Net realized and unrealized gain (loss) on investments | (0.11) | | (0.06) |
| Total from investment operations | 0.25 | | 0.29 |
| Less distributions | | | |
| From net investment income | (0.26) | | (0.27) |
| | (0.26) | | (0.27) |
| Net asset value, end of period | $9.60 | | $9.60 |
| Total returnk (%) | 2.68m | | 3.09m |
| | | | |
| Ratios and supplemental data | | | |
|
| Net assets, end of period (in millions) | $37 | | $399 |
| Ratio of net expenses to average net assets (%) | 0.79r | | 0.70r |
| Ratio of net investment income (loss) to | | | |
| average net assets (%) | 4.27r | | 4.30r |
| Portfolio turnover (%) | 406m | | 406m |
a Class 1 and Class NAV shares began operations on 10-15-05 and 10-27-05, respectively.
h Based on the average of the shares outstanding.
k Assumes dividend reinvestment.
m Not annualized.
r Annualized.
The accompanying notes are an integral part of the financial statements. 118
| John Hancock Funds II | |
| |
| Financial Highlights (For a share outstanding throughout the period) |
|
| |
| |
| All Cap Core | |
|
|
| | Class NAV | |
| Period ended | 8-31-06a |
|
| Per share operating performance | |
|
| Net asset value, beginning of period | $10.00 |
| Net investment income (loss)h | 0.05 |
| Net realized and unrealized gain (loss) on investments | (0.13) |
| Total from investment operations | (0.08) |
| Net asset value, end of period | $9.92 |
| Total return (%) | (0.80)m |
| | |
| Ratios and supplemental data | |
|
| Net assets, end of period (in millions) | $284 |
| Ratio of net expenses to average net assets (%) | 0.84r |
| Ratio of net investment income (loss) to | |
| average net assets (%) | 1.42r |
| Portfolio turnover (%) | 86m |
a Class NAV shares began operations on 4-28-06.
h Based on the average of the shares outstanding.
m Not annualized.
r Annualized.
The accompanying notes are an integral part of the financial statements. 119
| John Hancock Funds II | | | |
| |
| Financial Highlights (For a share outstanding throughout the period) | | |
|
| |
| |
| All Cap Growth | | | |
| | Class 1 | | Class NAV | |
| Period ended | 8-31-06a | | 8-31-06a |
|
| Per share operating performance | | | |
|
| Net asset value, beginning of period | $15.50 | | $15.51 |
| Net investment income (loss)h | 0.01 | | 0.02 |
| Net realized and unrealized gain (loss) on investments | 0.93 | | 0.93 |
| Total from investment operations | 0.94 | | 0.95 |
| Less distributions | | | |
| From net investment income | (0.01) | | (0.01) |
| | (0.01) | | (0.01) |
| Net asset value, end of period | $16.43 | | $16.45 |
| Total returnk (%) | 6.05m | | 6.11m |
| Ratios and supplemental data | | | |
|
| Net assets, end of period (in millions) | $32 | | $123 |
| Ratio of net expenses to average net assets (%) | 1.00r | | 0.95r |
| Ratio of net investment income (loss) to | | | |
| average net assets (%) | 0.08r | | 0.14r |
| Portfolio turnover (%) | 106m | | 106m |
a Class 1 and Class NAV shares began operations on 10-15-05.
h Based on the average of the shares outstanding.
k Assumes dividend reinvestment.
m Not annualized.
r Annualized.
The accompanying notes are an integral part of the financial statements. 120
| John Hancock Funds II | | | |
| |
| Financial Highlights (For a share outstanding throughout the period) | | |
|
| |
| |
| All Cap Value | | | |
| | Class 1 | | Class NAV | |
| Period ended | 8-31-06a | | 8-31-06a |
|
| Per share operating performance | | | |
|
| Net asset value, beginning of period | $13.84 | | $13.80 |
| Net investment income (loss)h | 0.11 | | 0.12 |
| Net realized and unrealized gain (loss) on investments | 1.91 | | 1.91 |
| Total from investment operations | 2.02 | | 2.03 |
| Less distributions | | | |
| From net investment income | (0.02) | | (0.03) |
| | (0.02) | | (0.03) |
| Net asset value, end of period | $15.84 | | $15.80 |
| Total returnk,l (%) | 14.64m | | 14.69m |
| Ratios and supplemental data | | | |
|
| Net assets, end of period (in millions) | $21 | | $195 |
| Ratio of net expenses to average net assets (%) | 0.94r | | 0.89r |
| Ratio of net investment income (loss) to | | | |
| average net assets (%) | 0.80r | | 0.88r |
| Portfolio turnover (%) | 48m | | 48m |
a Class 1 and Class NAV shares began operations on 10-15-05.
h Based on the average of the shares outstanding.
k Assumes dividend reinvestment.
l The Adviser/Subadviser voluntarily paid Class 1 and Class NAV $46,991 and $410,290, respectively, for a potential lost investment opportunity. Excluding these payments, the total return would
have been 14.38% for Class 1 and 14.45% for Class NAV.
m Not annualized.
r Annualized.
The accompanying notes are an integral part of the financial statements. 121
| John Hancock Funds II | | | |
| |
| Financial Highlights (For a share outstanding throughout the period) | | |
|
| |
| |
| Blue Chip Growth | | | |
| | Class 1 | | Class NAV | |
| Period ended | 8-31-06a | | 8-31-06a |
|
| Per share operating performance | | | |
|
| Net asset value, beginning of period | $16.53 | | $16.51 |
| Net investment income (loss)h | 0.08 | | 0.09 |
| Net realized and unrealized gain (loss) on investments | 1.22 | | 1.22 |
| Total from investment operations | 1.30 | | 1.31 |
| Less distributions | | | |
| From net investment income | (0.01) | | (0.02) |
| | (0.01) | | (0.02) |
| Net asset value, end of period | $17.82 | | $17.80 |
| Total returnk,l (%) | 7.88m | | 7.90m |
| Ratios and supplemental data | | | |
|
| Net assets, end of period (in millions) | $185 | | $1,088 |
| Ratio of net expenses to average net assets (%) | 0.88r | | 0.83r |
| Ratio of gross expenses to average net assetsp (%) | 0.90r | | 0.85r |
| Ratio of net investment income (loss) to | | | |
| average net assets (%) | 0.51r | | 0.58r |
| Portfolio turnover (%) | 28m | | 28m |
a Class 1 and Class NAV shares began operations on 10-15-05.
h Based on the average of the shares outstanding.
k Assumes dividend reinvestment.
l Total returns would have been lower had certain expenses not been reduced during the period shown.
m Not annualized.
p Does not take into consideration expense reductions during the period shown.
r Annualized.
The accompanying notes are an integral part of the financial statements. 122
| John Hancock Funds II | | | |
| |
| Financial Highlights (For a share outstanding throughout the period) | | |
|
| |
| |
| Capital Appreciation | | | |
| | Class 1 | | Class NAV | |
| Period ended | 8-31-06a | | 8-31-06a |
|
| Per share operating performance | | | |
|
| Net asset value, beginning of period | $9.20 | | $9.20 |
| Net investment income (loss)h | 0.01 | | 0.01 |
| Net realized and unrealized gain (loss) on investments | 0.23 | | 0.24 |
| Total from investment operations | 0.24 | | 0.25 |
| Net asset value, end of period | $9.44 | | $9.45 |
| Total return (%) | 2.61m | | 2.72m |
| Ratios and supplemental data | | | |
|
| Net assets, end of period (in millions) | $68 | | $393 |
| Ratio of net expenses to average net assets (%) | 0.88r | | 0.83r |
| Ratio of net investment income (loss) to | | | |
| average net assets (%) | 0.10r | | 0.15r |
| Portfolio turnover (%) | 57m | | 57m |
a Class 1 and Class NAV shares began operations on 10-15-05.
h Based on the average of the shares outstanding.
m Not annualized.
r Annualized.
The accompanying notes are an integral part of the financial statements. 123
| John Hancock Funds II | | | |
| |
| Financial Highlights (For a share outstanding throughout the period) | | |
|
| |
| |
| Core Bond | | | |
| | Class 1 | | Class NAV | |
| Period ended | 8-31-06a | | 8-31-06a |
|
| Per share operating performance | | | |
|
| Net asset value, beginning of period | $12.51 | | $12.50 |
| Net investment income (loss)h | 0.47 | | 0.46 |
| Net realized and unrealized gain (loss) on investments | (0.12) | | (0.11) |
| Total from investment operations | 0.35 | | 0.35 |
| Less distributions | | | |
| From net investment income | (0.34) | | (0.34) |
| | (0.34) | | (0.34) |
| Net asset value, end of period | $12.52 | | $12.51 |
| Total returnk (%) | 2.86m | | 2.90m |
| Ratios and supplemental data | | | |
|
| Net assets, end of period (in millions) | $1 | | $197 |
| Ratio of net expenses to average net assets (%) | 0.88r | | 0.83r |
| Ratio of net investment income (loss) to | | | |
| average net assets (%) | 4.39r | | 4.24r |
| Portfolio turnover (%) | 436m | | 436m |
a Class 1 and Class NAV shares began operations on 10-15-05.
h Based on the average of the shares outstanding.
k Assumes dividend reinvestment.
m Not annualized.
r Annualized.
The accompanying notes are an integral part of the financial statements. 124
| John Hancock Funds II | | | |
| |
| Financial Highlights (For a share outstanding throughout the period) | | |
|
| |
| |
| Core Equity | | | |
| | Class 1 | | Class NAV | |
| Period ended | 8-31-06a | | 8-31-06a |
|
| Per share operating performance | | | |
|
| Net asset value, beginning of period | $13.76 | | $13.77 |
| Net investment income (loss)h | (0.01) | | —j |
| Net realized and unrealized gain (loss) on investments | 0.50 | | 0.50 |
| Total from investment operations | 0.49 | | 0.50 |
| Net asset value, end of period | $14.25 | | $14.27 |
| Total return (%) | 3.56m | | 3.63m |
| Ratios and supplemental data | | | |
|
| Net assets, end of period (in millions) | $12 | | $584 |
| Ratio of net expenses to average net assets (%) | 0.88r | | 0.83r |
| Ratio of net investment income (loss) to | | | |
| average net assets (%) | (0.04)r | | (0.01)r |
| Portfolio turnover (%) | 13m | | 13m |
a Class 1 and Class NAV shares began operations on 10-15-05.
h Based on the average of the shares outstanding.
j Less than $0.01 per share.
m Not annualized.
r Annualized.
The accompanying notes are an integral part of the financial statements. 125
| John Hancock Funds II | | | |
| |
| Financial Highlights (For a share outstanding throughout the period) | | |
|
| |
| |
| Emerging Growth | | | |
| | Class 1 | | Class NAV | |
| Period ended | 8-31-06a | | 8-31-06a |
|
| Per share operating performance | | | |
|
| Net asset value, beginning of period | $16.35 | | $16.35 |
| Net investment income (loss)h | (0.04) | | (0.03) |
| Net realized and unrealized gain (loss) on investments | 2.03 | | 2.02 |
| Total from investment operations | 1.99 | | 1.99 |
| Net asset value, end of period | $18.34 | | $18.34 |
| Total return (%) | 12.17m | | 12.17m |
| Ratios and supplemental data | | | |
|
| Net assets, end of period (in millions) | $120 | | $51 |
| Ratio of net expenses to average net assets (%) | 0.98r | | 0.93r |
| Ratio of net investment income (loss) to | | | |
| average net assets (%) | (0.26)r | | (0.20)r |
| Portfolio turnover (%) | 206m | | 206m |
a Class 1 and Class NAV shares began operations on 10-15-05.
h Based on the average of the shares outstanding.
m Not annualized.
r Annualized.
The accompanying notes are an integral part of the financial statements. 126
| John Hancock Funds II | | | |
| |
| Financial Highlights (For a share outstanding throughout the period) | | |
|
| |
| |
| Emerging Small Company | | | |
| | Class 1 | | Class NAV | |
| Period ended | 8-31-06a | | 8-31-06a |
|
| Per share operating performance | | | |
|
| Net asset value, beginning of period | $28.17 | | $29.40 |
| Net investment income (loss)h | (0.16) | | (0.04) |
| Net realized and unrealized gain (loss) on investments | 0.96 | | (0.39) |
| Total from investment operations | 0.80 | | (0.43) |
| Net asset value, end of period | $28.97 | | $28.97 |
| Total returnl (%) | 2.84m | | (1.46)m |
| Ratios and supplemental data | | | |
|
| Net assets, end of period (in millions) | $52 | | —n |
| Ratio of net expenses to average net assets (%) | 1.13r | | 1.08r |
| Ratio of gross expenses to average net assetsp (%) | 1.30r | | 1.76r |
| Ratio of net investment income (loss) to | | | |
| average net assets (%) | (0.57)r | | (0.71)r |
| Portfolio turnover (%) | 207m | | 207m |
a Class 1 and Class NAV shares began operations on 10-15-05 and 6-26-06, respectively.
h Based on the average of the shares outstanding.
l Total returns would have been lower had certain expenses not been reduced during the period shown.
m Not annualized.
n Less than $500,000.
p Does not take into consideration expense reductions during the period shown.
r Annualized.
The accompanying notes are an integral part of the financial statements. 127
| John Hancock Funds II | | | |
| |
| Financial Highlights (For a share outstanding throughout the period) | | |
|
| |
| |
| Equity-Income | | | |
| | Class 1 | | Class NAV | |
| Period ended | 8-31-06a | | 8-31-06a |
|
| Per share operating performance | | | |
|
| Net asset value, beginning of period | $16.03 | | $16.01 |
| Net investment income (loss)h | 0.26 | | 0.27 |
| Net realized and unrealized gain (loss) on investments | 1.90 | | 1.89 |
| Total from investment operations | 2.16 | | 2.16 |
| Less distributions | | | |
| From net investment income | (0.06) | | (0.06) |
| | (0.06) | | (0.06) |
| Net asset value, end of period | $18.13 | | $18.11 |
| Total returnk,l (%) | 13.52m | | 13.54m |
| Ratios and supplemental data | | | |
|
| Net assets, end of period (in millions) | $183 | | $535 |
| Ratio of net expenses to average net assets (%) | 0.89r | | 0.84r |
| Ratio of gross expenses to average net assetsp (%) | 0.90r | | 0.85r |
| Ratio of net investment income (loss) to | | | |
| average net assets (%) | 1.68r | | 1.75r |
| Portfolio turnover (%) | 39m | | 39m |
a Class 1 and Class NAV shares began operations on 10-15-05.
h Based on the average of the shares outstanding.
k Assumes dividend reinvestment.
l Total returns would have been lowered had certain expenses not been reduced during the period shown.
m Not annualized.
p Does not take into consideration expense reductions during the period shown.
r Annualized.
The accompanying notes are an integral part of the financial statements.
128
| John Hancock Funds II | | | |
| |
| Financial Highlights (For a share outstanding throughout the period) | | |
|
| |
| |
| Fundamental Value | | | |
| | Class 1 | | Class NAV | |
| Period ended | 8-31-06a | | 8-31-06a |
|
| Per share operating performance | | | |
|
| Net asset value, beginning of period | $14.34 | | $14.31 |
| Net investment income (loss)h | 0.13 | | 0.13 |
| Net realized and unrealized gain (loss) on investments | 1.42 | | 1.42 |
| Total from investment operations | 1.55 | | 1.55 |
| Less distributions | | | |
| From net investment income | (0.03) | | (0.03) |
| | (0.03) | | (0.03) |
| Net asset value, end of period | $15.86 | | $15.83 |
| Total returnk (%) | 10.83m | | 10.87m |
| Ratios and supplemental data | | | |
|
| Net assets, end of period (in millions) | $67 | | $695 |
| Ratio of net expenses to average net assets (%) | 0.86r | | 0.81r |
| Ratio of net investment income (loss) to | | | |
| average net assets (%) | 0.93r | | 1.00r |
| Portfolio turnover (%) | 8m | | 8m |
a Class 1 and Class NAV shares began operations on 10-15-05.
h Based on the average of the shares outstanding.
k Assumes dividend reinvestment.
m Not annualized.
r Annualized.
The accompanying notes are an integral part of the financial statements. 129
| John Hancock Funds II | | | |
| |
| Financial Highlights (For a share outstanding throughout the period) | | |
|
| |
| |
| Global Bond | | | |
| | Class 1 | | Class NAV | |
| Period ended | 8-31-06a | | 8-31-06a |
|
| Per share operating performance | | | |
|
| Net asset value, beginning of period | $14.56 | | $14.52 |
| Net investment income (loss)h | 0.44 | | 0.45 |
| Net realized and unrealized gain (loss) on investments | (0.08) | | (0.09) |
| Total from investment operations | 0.36 | | 0.36 |
| Less distributions | | | |
| From net investment income | (0.09) | | (0.09) |
| | (0.09) | | (0.09) |
| Net asset value, end of period | $14.83 | | $14.79 |
| Total returnk (%) | 2.46m | | 2.48m |
| Ratios and supplemental data | | | |
|
| Net assets, end of period (in millions) | $41 | | $554 |
| Ratio of net expenses to average net assets (%) | 0.84r | | 0.79r |
| Ratio of net investment income (loss) to | | | |
| average net assets (%) | 3.42r | | 3.56r |
| Portfolio turnover (%) | 248m | | 248m |
a Class 1 and Class NAV shares began operations on 10-15-05.
h Based on the average of the shares outstanding.
k Assumes dividend reinvestment.
m Not annualized.
r Annualized.
The accompanying notes are an integral part of the financial statements. 130
| John Hancock Funds II | |
| |
| Financial Highlights (For a share outstanding throughout the period) |
|
| |
| |
| Global Real Estate | |
| | Class NAV | |
| Period ended | 8-31-06a |
|
| Per share operating performance | |
|
| Net asset value, beginning of period | $10.00 |
| Net investment income (loss)h | 0.06 |
| Net realized and unrealized gain (loss) on investments | 0.24 |
| Total from investment operations | 0.30 |
| Net asset value, end of period | $10.30 |
| Total return (%) | 3.00m |
| Ratios and supplemental data | |
|
| Net assets, end of period (in millions) | $355 |
| Ratio of net expenses to average net assets (%) | 1.09r |
| Ratio of net investment income (loss) to | |
| average net assets (%) | 1.65r |
| Portfolio turnover (%) | 87m |
a Class NAV shares began operations on 4-28-06.
h Based on the average of the shares outstanding.
m Not annualized.
r Annualized.
The accompanying notes are an integral part of the financial statements. 131
| John Hancock Funds II | |
| |
| Financial Highlights (For a share outstanding throughout the period) |
|
| |
| |
| High Income | |
| | Class NAV | |
| Period ended | 8-31-06a |
|
| Per share operating performance | |
|
| Net asset value, beginning of period | $10.00 |
| Net investment income (loss)h | 0.23 |
| Net realized and unrealized gain (loss) on investments | (0.25) |
| Total from investment operations | (0.02) |
| Less distributions | |
| From net investment income | (0.11) |
| | (0.11) |
| Net asset value, end of period | $9.87 |
| Total returnk (%) | (0.14)m |
| Ratios and supplemental data | |
|
| Net assets, end of period (in millions) | $289 |
| Ratio of net expenses to average net assets (%) | 0.77r |
| Ratio of net investment income (loss) to | |
| average net assets (%) | 6.73r |
| Portfolio turnover (%) | 76m |
a Class NAV shares began operations on 4-28-06.
h Based on the average of the shares outstanding.
k Assumes dividend reinvestment.
m Not annualized.
r Annualized.
The accompanying notes are an integral part of the financial statements. 132
| John Hancock Funds II | | | |
| |
| Financial Highlights (For a share outstanding throughout the period) | | |
|
| |
| |
| High Yield | | | |
| | Class 1 | | Class NAV | |
| Period ended | 8-31-06a | | 8-31-06a |
|
| Per share operating performance | | | |
|
| Net asset value, beginning of period | $10.10 | | $10.06 |
| Net investment income (loss)h | 0.65 | | 0.66 |
| Net realized and unrealized gain (loss) on investments | (0.03) | | (0.03) |
| Total from investment operations | 0.62 | | 0.63 |
| Less distributions | | | |
| From net investment income | (0.60) | | (0.61) |
| | (0.60) | | (0.61) |
| Net asset value, end of period | $10.12 | | $10.08 |
| Total returnk (%) | 6.41m | | 6.49m |
| Ratios and supplemental data | | | |
|
| Net assets, end of period (in millions) | $44 | | $1,144 |
| Ratio of net expenses to average net assets (%) | 0.76r | | 0.71r |
| Ratio of net investment income (loss) to | | | |
| average net assets (%) | 7.22r | | 7.36r |
| Portfolio turnover (%) | 83m | | 83m |
a Class 1 and Class NAV shares began operations on 10-15-05.
h Based on the average of the shares outstanding.
k Assumes dividend reinvestment.
m Not annualized.
r Annualized.
The accompanying notes are an integral part of the financial statements. 133
| John Hancock Funds II | |
| |
| Financial Highlights (For a share outstanding throughout the period) |
|
| |
| |
| International Equity Index | |
| | Class NAV | |
| Period ended | 8-31-06b |
|
| Per share operating performance | |
|
| Net asset value, beginning of period | $15.59 |
| Net investment income (loss)h | 0.41 |
| Net realized and unrealized gain (loss) on investments | 3.17 |
| Total from investment operations | 3.58 |
| Less distributions | |
| From net investment income | (0.20) |
| | (0.20) |
| Net asset value, end of period | $18.97 |
| Total returnk (%) | 23.16m |
| Ratios and supplemental data | |
|
| Net assets, end of period (in millions) | $308 |
| Ratio of net expenses to average net assets (%) | 0.58r |
| Ratio of net investment income (loss) to | |
| average net assets (%) | 2.78r |
| Portfolio turnover (%) | 11m |
b Class NAV shares began operations on 10-29-05.
h Based on the average of the shares outstanding.
k Assumes dividend reinvestment.
m Not annualized.
r Annualized.
The accompanying notes are an integral part of the financial statements. 134
| John Hancock Funds II | | | |
| |
| Financial Highlights (For a share outstanding throughout the period) | | |
|
| |
| |
| International Opportunities | | | |
| | Class 1 | | Class NAV | |
| Period ended | 8-31-06a | | 8-31-06a |
|
| Per share operating performance | | | |
|
| Net asset value, beginning of period | $13.71 | | $13.72 |
| Net investment income (loss)h | 0.11 | | 0.10 |
| Net realized and unrealized gain (loss) on investments | 3.01 | | 3.04 |
| Total from investment operations | 3.12 | | 3.14 |
| Less distributions | | | |
| From net investment income | (0.70) | | (0.70) |
| | (0.70) | | (0.70) |
| Net asset value, end of period | $16.13 | | $16.16 |
| Total returnk,l (%) | 23.36m | | 23.51m |
| Ratios and supplemental data | | | |
|
| Net assets, end of period (in millions) | $9 | | $552 |
| Ratio of net expenses to average net assets (%) | 1.07r | | 1.02r |
| Ratio of net investment income (loss) to | | | |
| average net assets (%) | 0.78r | | 0.73r |
| Portfolio turnover (%) | 99m | | 99m |
a Class 1 and Class NAV shares began operations on 10-15-05.
h Based on the average of the shares outstanding.
k Assumes dividend reinvestment.
l The Adviser/Subadviser voluntarily reimbursed Class 1 and Class NAV $11,316 and $3,937,220, respectively, for a potential lost investment opportunity. Excluding these reimbursements, the total
return would have been 23.19% for Class 1 and 22.62% for Class NAV.
m Not annualized.
r Annualized.
The accompanying notes are an integral part of the financial statements. 135
| John Hancock Funds II | | | |
| |
| Financial Highlights (For a share outstanding throughout the period) | | |
|
| |
| |
| International Small Cap | | | |
| | Class 1 | | Class NAV | |
| Period ended | 8-31-06a | | 8-31-06a |
|
| Per share operating performance | | | |
|
| Net asset value, beginning of period | $18.48 | | $18.45 |
| Net investment income (loss)h | 0.27 | | 0.25 |
| Net realized and unrealized gain (loss) on investments | 2.24 | | 2.29 |
| Total from investment operations | 2.51 | | 2.54 |
| Less distributions | | | |
| From net investment income | (0.04) | | (0.04) |
| | (0.04) | | (0.04) |
| Net asset value, end of period | $20.95 | | $20.95 |
| Total returnk (%) | 13.58m | | 13.80m |
| Ratios and supplemental data | | | |
|
| Net assets, end of period (in millions) | $37 | | $359 |
| Ratio of net expenses to average net assets (%) | 1.18r | | 1.13r |
| Ratio of net investment income (loss) to | | | |
| average net assets (%) | 1.55r | | 1.43r |
| Portfolio turnover (%) | 89m | | 89m |
a Class 1 and Class NAV shares began operations on 10-15-05.
h Based on the average of the shares outstanding.
k Assumes dividend reinvestment.
m Not annualized.
r Annualized.
The accompanying notes are an integral part of the financial statements. 136
| John Hancock Funds II | |
| |
| Financial Highlights (For a share outstanding throughout the period) |
|
| |
| |
| International Small Company | |
| | Class NAV | |
| Period ended | 8-31-06a |
|
| Per share operating performance | |
|
| Net asset value, beginning of period | $10.00 |
| Net investment income (loss)h | 0.04 |
| Net realized and unrealized gain (loss) on investments | (0.71) |
| Total from investment operations | (0.67) |
| Net asset value, end of period | $9.33 |
| Total return (%) | (6.70)m |
| Ratios and supplemental data | |
|
| Net assets, end of period (in millions) | $221 |
| Ratio of net expenses to average net assets (%) | 1.14r |
| Ratio of net investment income (loss) to | |
| average net assets (%) | 1.37r |
| Portfolio turnover (%) | 57m |
a Class NAV shares began operations on 4-28-06.
h Based on the average of the shares outstanding.
m Not annualized.
r Annualized.
The accompanying notes are an integral part of the financial statements. 137
| John Hancock Funds II | |
| |
| Financial Highlights (For a share outstanding throughout the period) |
|
| |
| |
| International Stock | |
| | Class 1 | |
| Period ended | 8-31-06a |
|
| Per share operating performance | |
|
| Net asset value, beginning of period | $11.95 |
| Net investment income (loss)h | 0.28 |
| Net realized and unrealized gain (loss) on investments | 2.32 |
| Total from investment operations | 2.60 |
| Less distributions | |
| From net investment income | (0.28) |
| From net realized gain | (0.45) |
| | (0.73) |
| Net asset value, end of period | $13.82 |
| Total returnk (%) | 22.19m |
| Ratios and supplemental data | |
|
| Net assets, end of period (in millions) | $79 |
| Ratio of net expenses to average net assets (%) | 1.12r |
| Ratio of net investment income (loss) to | |
| average net assets (%) | 2.44r |
| Portfolio turnover (%) | 196m,x |
a Class 1 shares began operations on 10-15-05.
h Based on the average of the shares outstanding.
k Assumes dividend reinvestment.
m Not annualized.
r Annualized.
x Includes redemption-in-kind activity. Refer to Merger of International Stock footnote 1.
The accompanying notes are an integral part of the financial statements. 138
| John Hancock Funds II | | | |
| |
| Financial Highlights (For a share outstanding throughout the period) | | |
|
| |
| |
| International Value | | | |
| | Class 1 | | Class NAV | |
| Period ended | 8-31-06a | | 8-31-06a |
|
| Per share operating performance | | | |
|
| Net asset value, beginning of period | $15.20 | | $15.16 |
| Net investment income (loss)h | 0.46 | | 0.47 |
| Net realized and unrealized gain (loss) on investments | 2.30 | | 2.30 |
| Total from investment operations | 2.76 | | 2.77 |
| Less distributions | | | |
| From net investment income | (0.05) | | (0.05) |
| | (0.05) | | (0.05) |
| Net asset value, end of period | $17.91 | | $17.88 |
| Total returnk,l (%) | 18.22m | | 18.35m |
| Ratios and supplemental data | | | |
|
| Net assets, end of period (in millions) | $134 | | $836 |
| Ratio of net expenses to average net assets (%) | 0.99r | | 0.94r |
| Ratio of gross expenses to average net assetsp (%) | 1.01r | | 0.96r |
| Ratio of net investment income (loss) to | | | |
| average net assets (%) | 3.17r | | 3.21r |
| Portfolio turnover (%) | 59m | | 59m |
a Class 1 and Class NAV shares began operations on 10-15-05.
h Based on the average of the shares outstanding.
k Assumes dividend reinvestment.
l Total returns would have been lower had certain expenses not been reduced during the period shown.
m Not annualized.
p Does not take into consideration expense reductions during the period shown.
r Annualized.
The accompanying notes are an integral part of the financial statements. 139
| John Hancock Funds II | | | |
| |
| Financial Highlights (For a share outstanding throughout the period) | | |
|
| |
| |
| Investment Quality Bond | | | |
| | Class 1 | | Class NAV | |
| Period ended | 8-31-06a | | 8-31-06a |
|
| Per share operating performance | | | |
|
| Net asset value, beginning of period | $11.84 | | $11.83 |
| Net investment income (loss)h | 0.46 | | 0.46 |
| Net realized and unrealized gain (loss) on investments | (0.16) | | (0.16) |
| Total from investment operations | 0.30 | | 0.30 |
| Less distributions | | | |
| From net investment income | (0.38) | | (0.38) |
| | (0.38) | | (0.38) |
| Net asset value, end of period | $11.76 | | $11.75 |
| Total returnk (%) | 2.64m | | 2.68m |
| Ratios and supplemental data | | | |
|
| Net assets, end of period (in millions) | $35 | | $93 |
| Ratio of net expenses to average net assets (%) | 0.84r | | 0.79r |
| Ratio of net investment income (loss) to | | | |
| average net assets (%) | 4.42r | | 4.51r |
| Portfolio turnover (%) | 35m | | 35m |
a Class 1 and Class NAV shares began operations on 10-15-05.
h Based on the average of the shares outstanding.
k Assumes dividend reinvestment.
m Not annualized.
r Annualized.
The accompanying notes are an integral part of the financial statements. 140
| John Hancock Funds II | | | |
| |
| Financial Highlights (For a share outstanding throughout the period) | | |
|
| |
| |
| Large Cap | | | |
| | Class 1 | | Class NAV | |
| Period ended | 8-31-06a | | 8-31-06a |
|
| Per share operating performance | | | |
|
| Net asset value, beginning of period | $13.26 | | $13.26 |
| Net investment income (loss)h | 0.11 | | 0.12 |
| Net realized and unrealized gain (loss) on investments | 1.31 | | 1.31 |
| Total from investment operations | 1.42 | | 1.43 |
| Less distributions | | | |
| From net investment income | (0.01) | | (0.02) |
| | (0.01) | | (0.02) |
| Net asset value, end of period | $14.67 | | $14.67 |
| Total returnk (%) | 10.73m | | 10.79m |
| Ratios and supplemental data | | | |
|
| Net assets, end of period (in millions) | $2 | | $192 |
| Ratio of net expenses to average net assets (%) | 0.93r | | 0.88r |
| Ratio of net investment income (loss) to | | | |
| average net assets (%) | 0.86r | | 0.95r |
| Portfolio turnover (%) | 24m | | 24m |
a Class 1 and Class NAV shares began operations on 10-15-05.
h Based on the average of the shares outstanding.
k Assumes dividend reinvestment.
m Not annualized.
r Annualized.
The accompanying notes are an integral part of the financial statements. 141
| John Hancock Funds II | | | |
| |
| Financial Highlights (For a share outstanding throughout the period) | | |
|
| |
| |
| Large Cap Value | | | |
| | Class 1 | | Class NAV | |
| Period ended | 8-31-06a | | 8-31-06a |
|
| Per share operating performance | | | |
|
| Net asset value, beginning of period | $20.31 | | $20.33 |
| Net investment income (loss)h | 0.23 | | 0.17 |
| Net realized and unrealized gain (loss) on investments | 2.48 | | 2.56 |
| Total from investment operations | 2.71 | | 2.73 |
| Less distributions | | | |
| From net investment income | (0.05) | | (0.05) |
| | (0.05) | | (0.05) |
| Net asset value, end of period | $22.97 | | $23.01 |
| Total returnk (%) | 13.33m | | 13.43m |
| Ratios and supplemental data | | | |
|
| Net assets, end of period (in millions) | $105 | | $234 |
| Ratio of net expenses to average net assets (%) | 0.98r | | 0.89r |
| Ratio of net investment income (loss) to | | | |
| average net assets (%) | 1.24r | | 0.89r |
| Portfolio turnover (%) | 54m | | 54m |
a Class 1 and Class NAV shares began operations on 10-15-05.
h Based on the average of the shares outstanding.
k Assumes dividend reinvestment.
m Not annualized.
r Annualized.
The accompanying notes are an integral part of the financial statements. 142
| John Hancock Funds II | | | |
| |
| Financial Highlights (For a share outstanding throughout the period) | | |
|
| |
| |
| Mid Cap Core | | | |
| | Class 1 | | Class NAV | |
| Period ended | 8-31-06a | | 8-31-06a |
|
| Per share operating performance | | | |
|
| Net asset value, beginning of period | $15.90 | | $15.90 |
| Net investment income (loss)h | 0.13 | | 0.14 |
| Net realized and unrealized gain (loss) on investments | 1.25 | | 1.24 |
| Total from investment operations | 1.38 | | 1.38 |
| Less distributions | | | |
| From net investment income | (0.02) | | (0.02) |
| | (0.02) | | (0.02) |
| Net asset value, end of period | $17.26 | | $17.26 |
| Total returnk (%) | 8.67m | | 8.68m |
| Ratios and supplemental data | | | |
|
| Net assets, end of period (in millions) | $11 | | $294 |
| Ratio of net expenses to average net assets (%) | 0.98r | | 0.93r |
| Ratio of net investment income (loss) to | | | |
| average net assets (%) | 0.88r | | 0.95r |
| Portfolio turnover (%) | 115m | | 115m |
a Class 1 and Class NAV shares began operations on 10-15-05.
h Based on the average of the shares outstanding.
k Assumes dividend reinvestment.
m Not annualized.
r Annualized.
The accompanying notes are an integral part of the financial statements. 143
| John Hancock Funds II | |
| |
| Financial Highlights (For a share outstanding throughout the period) |
|
| |
| |
| Mid Cap Index | |
| | Class NAV | |
| Period ended | 8-31-06b |
|
| Per share operating performance | |
|
| Net asset value, beginning of period | $16.85 |
| Net investment income (loss)h | 0.17 |
| Net realized and unrealized gain (loss) on investments | 1.38 |
| Total from investment operations | 1.55 |
| Less distributions | |
| From net investment income | (0.03) |
| | (0.03) |
| Net asset value, end of period | $18.37 |
| Total returnk,l (%) | 9.20m |
| Ratios and supplemental data | |
|
| Net assets, end of period (in millions) | $172 |
| Ratio of net expenses to average net assets (%) | 0.56r |
| Ratio of gross expenses to average net assetsp (%) | 0.56r |
| Ratio of net investment income (loss) to | |
| average net assets (%) | 1.14r |
| Portfolio turnover (%) | 10m |
b Class NAV shares began operations on 10-29-05.
h Based on the average of the shares outstanding.
k Assumes dividend reinvestment.
l Total returns would have been lower had certain expenses not been reduced during the period shown.
m Not annualized.
p Does not take into consideration expense reductions during the period shown.
r Annualized.
The accompanying notes are an integral part of the financial statements. 144
| John Hancock Funds II | | | |
| |
| Financial Highlights (For a share outstanding throughout the period) | | |
|
| |
| |
| Mid Cap Stock | | | |
| | Class 1 | | Class NAV | |
| Period ended | 8-31-06a | | 8-31-06a |
|
| Per share operating performance | | | |
|
| Net asset value, beginning of period | $13.86 | | $13.87 |
| Net investment income (loss)h | (0.04) | | (0.04) |
| Net realized and unrealized gain (loss) on investments | 2.01 | | 2.02 |
| Total from investment operations | 1.97 | | 1.98 |
| Less distributions | | | |
| From net investment income | — | | —j |
| From net realized gain | (0.02) | | (0.02) |
| | (0.02) | | (0.02) |
| Net asset value, end of period | $15.81 | | $15.83 |
| Total returnk,l (%) | 14.20m | | 14.27m |
| Ratios and supplemental data | | | |
|
| Net assets, end of period (in millions) | $107 | | $194 |
| Ratio of net expenses to average net assets (%) | 0.96r | | 0.91r |
| Ratio of net investment income (loss) to | | | |
| average net assets (%) | (0.30)r | | (0.26)r |
| Portfolio turnover (%) | 104m | | 104m |
a Class 1 and Class NAV shares began operations on 10-15-05.
h Based on the average of the shares outstanding.
j Less than $0.01 per share.
k Assumes dividend reinvestment.
l The Adviser/Subadviser voluntarily paid Class 1 and Class NAV $510,149 and $847,342, respectively, for a potential lost investment opportunity. Excluding these payments, the total return would
have been 13.67% for Class 1 and 13.77% for Class NAV.
m Not annualized.
r Annualized.
The accompanying notes are an integral part of the financial statements. 145
| John Hancock Funds II | | | |
| |
| Financial Highlights (For a share outstanding throughout the period) | | |
|
| |
| |
| Mid Cap Value | | | |
| | Class 1 | | Class NAV | |
| Period ended | 8-31-06a | | 8-31-06a |
|
| Per share operating performance | | | |
|
| Net asset value, beginning of period | $17.65 | | $17.63 |
| Net investment income (loss)h | 0.11 | | 0.12 |
| Net realized and unrealized gain (loss) on investments | 1.15 | | 1.15 |
| Total from investment operations | 1.26 | | 1.27 |
| Less distributions | | | |
| From net investment income | (0.03) | | (0.03) |
| From net realized gain | (0.01) | | (0.01) |
| | (0.04) | | (0.04) |
| Net asset value, end of period | $18.87 | | $18.86 |
| Total returnk (%) | 7.11m | | 7.18m |
| Ratios and supplemental data | | | |
|
| Net assets, end of period (in millions) | $93 | | $50 |
| Ratio of net expenses to average net assets (%) | 0.97r | | 0.92r |
| Ratio of net investment income (loss) to | | | |
| average net assets (%) | 0.63r | | 0.70r |
| Portfolio turnover (%) | 74m | | 74m |
a Class 1 and Class NAV shares began operations on 10-15-05.
h Based on the average of the shares outstanding.
k Assumes dividend reinvestment.
m Not annualized.
r Annualized.
The accompanying notes are an integral part of the financial statements. 146
| John Hancock Funds II | |
| |
| Financial Highlights (For a share outstanding throughout the period) |
|
| |
| |
| Mid Cap Value Equity | |
| | Class NAV | |
| Period ended | 8-31-06a |
|
| Per share operating performance | |
|
| Net asset value, beginning of period | $10.00 |
| Net investment income (loss)h | 0.03 |
| Net realized and unrealized gain (loss) on investments | (0.38) |
| Total from investment operations | (0.35) |
| Net asset value, end of period | $9.65 |
| Total return (%) | (3.50)m |
| Ratios and supplemental data | |
|
| Net assets, end of period (in millions) | $98 |
| Ratio of net expenses to average net assets (%) | 1.02r |
| Ratio of net investment income (loss) to | |
| average net assets (%) | 0.79r |
| Portfolio turnover (%) | 24m |
a Class NAV shares began operations on 4-28-06.
h Based on the average of the shares outstanding.
m Not annualized.
r Annualized.
The accompanying notes are an integral part of the financial statements. 147
| John Hancock Funds II | | | |
| |
| Financial Highlights (For a share outstanding throughout the period) | | |
|
| |
| |
| Natural Resources | | | |
| | Class 1 | | Class NAV | |
| Period ended | 8-31-06a | | 8-31-06a |
|
| Per share operating performance | | | |
|
| Net asset value, beginning of period | $28.70 | | $28.60 |
| Net investment income (loss)h | 0.34 | | 0.33 |
| Net realized and unrealized gain (loss) on investments | 6.70 | | 6.71 |
| Total from investment operations | 7.04 | | 7.04 |
| Less distributions | | | |
| From net investment income | (0.03) | | (0.04) |
| | (0.03) | | (0.04) |
| Net asset value, end of period | $35.71 | | $35.60 |
| Total returnk (%) | 24.55m | | 24.62m |
| Ratios and supplemental data | | | |
|
| Net assets, end of period (in millions) | $81 | | $692 |
| Ratio of net expenses to average net assets (%) | 1.12r | | 1.07r |
| Ratio of net investment income (loss) to | | | |
| average net assets (%) | 1.13r | | 1.11r |
| Portfolio turnover (%) | 71m | | 71m |
a Class 1 and Class NAV shares began operations on 10-15-05.
h Based on the average of the shares outstanding.
k Assumes dividend reinvestment.
m Not annualized.
r Annualized.
The accompanying notes are an integral part of the financial statements. 148
| John Hancock Funds II | | | |
| |
| Financial Highlights (For a share outstanding throughout the period) | | |
|
| |
| |
| Quantitative All Cap | | | |
| | Class A | | Class B | |
| Period ended | 8-31-06a | | 8-31-06a |
|
| Per share operating performance | | | |
|
| Net asset value, beginning of period | $10.00 | | $10.00 |
| Net investment income (loss)h | 0.02 | | 0.01 |
| Net realized and unrealized gain (loss) on investments | 0.09 | | 0.10 |
| Total from investment operations | 0.11 | | 0.11 |
| Net asset value, end of period | $10.11 | | $10.11 |
| Total returnk (%) | 1.10l,m | | 1.10l,m |
| Ratios and supplemental data | | | |
|
| Net assets, end of period (in millions) | $1 | | $1 |
| Ratio of net expenses to average net assets (%) | 1.07r | | 1.75r |
| Ratio of gross expenses to average net assetsp (%) | 5.94r | | 6.63r |
| Ratio of net investment income (loss) to | | | |
| average net assets (%) | 1.70r | | 1.02r |
| Portfolio turnover (%) | 21m | | 21m |
|
|
| |
| | Class C | | Class I | |
| Period ended | 8-31-06a | | 8-31-06a |
|
| Per share operating performance | | | |
|
| Net asset value, beginning of period | $10.00 | | $10.00 |
| Net investment income (loss)h | 0.01 | | 0.02 |
| Net realized and unrealized gain (loss) on investments | 0.10 | | 0.10 |
| Total from investment operations | 0.11 | | 0.12 |
| Net asset value, end of period | $10.11 | | $10.12 |
| Total returnk (%) | 1.10l,m | | 1.20l,m |
| Ratios and supplemental data | | | |
|
| Net assets, end of period (in millions) | $1 | | $1 |
| Ratio of net expenses to average net assets (%) | 1.75r | | 0.78r |
| Ratio of gross expenses to average net assetsp (%) | 6.63r | | 5.66r |
| Ratio of net investment income (loss) to | | | |
| average net assets (%) | 1.02r | | 1.99r |
| Portfolio turnover (%) | 21m | | 21m |
a Class A, Class B, Class C, and Class I shares began operations on 7-28-06.
h Based on the average of the shares outstanding.
k Assumes dividend reinvestment and does not reflect the effect of sales charges.
l Total returns would have been lower had certain expenses not been reduced during the period shown.
m Not annualized.
p Does not take into consideration expense reductions during the period shown.
r Annualized.
The accompanying notes are an integral part of the financial statements. 149
| John Hancock Funds II | | | |
| |
| Financial Highlights (For a share outstanding throughout the period) | | |
|
| |
| |
| Quantitative Mid Cap | | | |
| | Class 1 | | Class NAV | |
| Period ended | 8-31-06a | | 8-31-06a |
|
| Per share operating performance | | | |
|
| Net asset value, beginning of period | $13.55 | | $13.71 |
| Net investment income (loss)h | 0.02 | | 0.03 |
| Net realized and unrealized gain (loss) on investments | 0.76 | | 0.59 |
| Total from investment operations | 0.78 | | 0.62 |
| Less distributions | | | |
| From net investment income | —j | | —j |
| From net realized gain | (0.01) | | (0.01) |
| | (0.01) | | (0.01) |
| Net asset value, end of period | $14.32 | | $14.32 |
| Total returnk (%) | 5.74m | | 4.51m |
| Ratios and supplemental data | | | |
|
| Net assets, end of period (in millions) | $133 | | $50 |
| Ratio of net expenses to average net assets (%) | 0.85r | | 0.80r |
| Ratio of net investment income (loss) to | | | |
| average net assets (%) | 0.12r | | 0.20r |
| Portfolio turnover (%) | 119m | | 119m |
a Class 1 and Class NAV shares began operations on 10-15-05 and 10-27-05, respectively.
h Based on the average of the shares outstanding.
j Less than $0.01 per share.
k Assumes dividend reinvestment.
m Not annualized.
r Annualized.
The accompanying notes are an integral part of the financial statements. 150
| John Hancock Funds II | | | |
| |
| Financial Highlights (For a share outstanding throughout the period) | | |
|
| |
| |
| Quantitative Value | | | |
| | Class 1 | | Class NAV | |
| Period ended | 8-31-06a | | 8-31-06a |
|
| Per share operating performance | | | |
|
| Net asset value, beginning of period | $14.09 | | $14.09 |
| Net investment income (loss)h | 0.22 | | 0.24 |
| Net realized and unrealized gain (loss) on investments | 2.31 | | 2.29 |
| Total from investment operations | 2.53 | | 2.53 |
| Less distributions | | | |
| From net investment income | (0.06) | | (0.06) |
| From net realized gain | —j | | —j |
| | (0.06) | | (0.06) |
| Net asset value, end of period | $16.56 | | $16.56 |
| Total returnk (%) | 17.98m | | 17.98m |
| Ratios and supplemental data | | | |
|
| Net assets, end of period (in millions) | $96 | | $362 |
| Ratio of net expenses to average net assets (%) | 0.79r | | 0.74r |
| Ratio of net investment income (loss) to | | | |
| average net assets (%) | 1.62r | | 1.73r |
| Portfolio turnover (%) | 127m | | 127m |
a Class 1 and Class NAV shares began operations on 10-15-05.
h Based on the average of the shares outstanding.
j Less than $0.01 per share.
k Assumes dividend reinvestment.
m Not annualized.
r Annualized.
The accompanying notes are an integral part of the financial statements. 151
| John Hancock Funds II | |
| |
| Financial Highlights (For a share outstanding throughout the period) |
|
| |
| |
| Real Estate Equity | |
| | Class NAV | |
| Period ended | 8-31-06a |
|
| Per share operating performance | |
|
| Net asset value, beginning of period | $10.00 |
| Net investment income (loss)h | 0.08 |
| Net realized and unrealized gain (loss) on investments | 0.91 |
| Total from investment operations | 0.99 |
| Net asset value, end of period | $10.99 |
| Total return (%)l | 9.90m |
| Ratios and supplemental data | |
|
| Net assets, end of period (in millions) | $275 |
| Ratio of net expenses to average net assets (%) | 0.90r |
| Ratio of gross expenses to average net assetsp (%) | 0.92r |
| Ratio of net investment income (loss) to | |
| average net assets (%) | 2.29r |
| Portfolio turnover (%) | 50m |
a Class NAV shares began operations on 4-28-06.
h Based on the average of the shares outstanding.
l Total returns would have been lower had certain expenses not been reduced during period shown.
m Not annualized.
p Does not take into consideration expense reductions during period shown.
r Annualized.
The accompanying notes are an integral part of the financial statements. 152
| John Hancock Funds II | |
| |
| Financial Highlights (For a share outstanding throughout the period) |
|
| |
| |
| Real Estate Securities | |
| | Class 1 | |
| Period ended | 8-31-06a |
|
| Per share operating performance | |
|
| Net asset value, beginning of period | $23.03 |
| Net investment income (loss)h | 0.64 |
| Net realized and unrealized gain (loss) on investments | 6.46 |
| Total from investment operations | 7.10 |
| Less distributions | |
| From net investment income | (0.16) |
| From net realized gain | (0.03) |
| | (0.19) |
| Net asset value, end of period | $29.94 |
| Total returnk (%) | 30.96m |
| Ratios and supplemental data | |
|
| Net assets, end of period (in millions) | $171 |
| Ratio of net expenses to average net assets (%) | 0.82r |
| Ratio of net investment income (loss) to | |
| average net assets (%) | 2.76r |
| Portfolio turnover (%) | 199m |
a Class 1 shares began operations on 10-15-05.
h Based on the average of the shares outstanding.
k Assumes dividend reinvestment.
m Not annualized.
r Annualized.
The accompanying notes are an integral part of the financial statements. 153
| John Hancock Funds II | | | |
| |
| Financial Highlights (For a share outstanding throughout the period) | | |
|
| |
| |
| Real Return Bond | | | |
| | Class 1 | | Class NAV | |
| Period ended | 8-31-06a | | 8-31-06a |
|
| Per share operating performance | | | |
|
| Net asset value, beginning of period | $13.52 | | $13.43 |
| Net investment income (loss)h | 0.53 | | 0.55 |
| Net realized and unrealized gain (loss) on investments | (0.24) | | (0.26) |
| Total from investment operations | 0.29 | | 0.29 |
| Less distributions | | | |
| From net investment income | (0.40) | | (0.40) |
| From net realized gain | —j | | —j |
| | (0.40) | | (0.40) |
| Net asset value, end of period | $13.41 | | $13.32 |
| Total returnk (%) | 2.27m | | 2.32m |
| Ratios and supplemental data | | | |
|
| Net assets, end of period (in millions) | $17 | | $684 |
| Ratio of net expenses to average net assets (%) | 0.80r | | 0.75r |
| Ratio of net investment income (loss) to | | | |
| average net assets (%) | 4.52r | | 4.75r |
| Portfolio turnover (%) | 216m | | 216m |
a Class 1 and Class NAV shares began operations on 10-15-05.
h Based on the average of the shares outstanding.
j Less than $0.01 per share.
k Assumes dividend reinvestment.
m Not annualized.
r Annualized.
The accompanying notes are an integral part of the financial statements. 154
| John Hancock Funds II | | | |
| |
| Financial Highlights (For a share outstanding throughout the period) | | |
|
| |
| |
| Small Cap | | | |
| | Class 1 | | Class NAV | |
| Period ended | 8-31-06a | | 8-31-06a |
|
| Per share operating performance | | | |
|
| Net asset value, beginning of period | $13.60 | | $13.61 |
| Net investment income (loss)h | (0.03) | | (0.03) |
| Net realized and unrealized gain (loss) on investments | 0.45 | | 0.46 |
| Total from investment operations | 0.42 | | 0.43 |
| Net asset value, end of period | $14.02 | | $14.04 |
| Total return (%) | 3.09m | | 3.16m |
| Ratios and supplemental data | | | |
|
| Net assets, end of period (in millions) | $1 | | $240 |
| Ratio of net expenses to average net assets (%) | 0.96r | | 0.91r |
| Ratio of net investment income (loss) to | | | |
| average net assets (%) | (0.27)r | | (0.27)r |
| Portfolio turnover (%) | 53m | | 53m |
a Class 1 and Class NAV shares began operations on 10-15-05.
h Based on the average of the shares outstanding.
m Not annualized.
r Annualized.
The accompanying notes are an integral part of the financial statements. 155
| John Hancock Funds II | |
| |
| Financial Highlights (For a share outstanding throughout the period) |
|
| |
| |
| Small Cap Index | |
| | Class NAV | |
| Period ended | 8-31-06a |
|
| Per share operating performance | |
|
| Net asset value, beginning of period | $14.05 |
| Net investment income (loss)h | 0.12 |
| Net realized and unrealized gain (loss) on investments | 1.80 |
| Total from investment operations | 1.92 |
| Less distributions | |
| From net investment income | (0.02) |
| | (0.02) |
| Net asset value, end of period | $15.95 |
| Total returnk,l (%) | 13.69m |
| Ratios and supplemental data | |
|
| Net assets, end of period (in millions) | $125 |
| Ratio of net expenses to average net assets (%) | 0.56r |
| Ratio of gross expenses to average net assetsp (%) | 0.58r |
| Ratio of net investment income (loss) to | |
| average net assets (%) | 0.92r |
| Portfolio turnover (%) | 40m |
a Class NAV shares began operations on 10-29-05.
h Based on the average of the shares outstanding.
k Assumes dividend reinvestment.
l Total returns would have been lower had certain expenses not been reduced during the periods shown.
m Not annualized.
p Does not take into consideration expense reductions during the period shown.
r Annualized.
The accompanying notes are an integral part of the financial statements. 156
| John Hancock Funds II | | | |
| |
| Financial Highlights (For a share outstanding throughout the period) | | |
|
| |
| |
| Small Cap Opportunities | | | |
| | Class 1 | | Class NAV | |
| Period ended | 8-31-06a | | 8-31-06a |
|
| Per share operating performance | | | |
|
| Net asset value, beginning of period | $21.36 | | $21.26 |
| Net investment income (loss)h | 0.21 | | 0.22 |
| Net realized and unrealized gain (loss) on investments | 1.72 | | 1.71 |
| Total from investment operations | 1.93 | | 1.93 |
| Less distributions | | | |
| From net investment income | (0.05) | | (0.05) |
| From net realized gain | —j | | —j |
| | (0.05) | | (0.05) |
| Net asset value, end of period | $23.24 | | $23.14 |
| Total returnk (%) | 9.04m | | 9.09m |
| Ratios and supplemental data | | | |
|
| Net assets, end of period (in millions) | $30 | | $217 |
| Ratio of net expenses to average net assets (%) | 1.10r | | 1.05r |
| Ratio of net investment income (loss) to | | | |
| average net assets (%) | 1.01r | | 1.05r |
| Portfolio turnover (%) | 59m | | 59m |
a Class 1 and Class NAV shares began operations on 10-15-05.
h Based on the average of the shares outstanding.
j Less than $0.01 per share.
k Assumes dividend reinvestment.
m Not annualized.
r Annualized.
The accompanying notes are an integral part of the financial statements. 157
| John Hancock Funds II | | | |
| |
| Financial Highlights (For a share outstanding throughout the period) | | |
|
| |
| |
| Small Company | | | |
| | Class 1 | | Class NAV | |
| Period ended | 8-31-06a | | 8-31-06a |
|
| Per share operating performance | | | |
|
| Net asset value, beginning of period | $15.15 | | $15.16 |
| Net investment income (loss)h | (0.06) | | (0.04) |
| Net realized and unrealized gain (loss) on investments | 0.33 | | 0.32 |
| Total from investment operations | 0.27 | | 0.28 |
| Net asset value, end of period | $15.42 | | $15.44 |
| Total return (%) | 1.78m | | 1.85m |
| Ratios and supplemental data | | | |
|
| Net assets, end of period (in millions) | $6 | | $87 |
| Ratio of net expenses to average net assets (%) | 1.34r | | 1.29r |
| Ratio of net investment income (loss) to | | | |
| average net assets (%) | (0.40)r | | (0.31)r |
| Portfolio turnover (%) | 110m | | 110m |
a Class 1 and Class NAV shares began operations on 10-15-05.
h Based on the average of the shares outstanding.
m Not annualized.
r Annualized.
The accompanying notes are an integral part of the financial statements. 158
| John Hancock Funds II | | |
| |
| Financial Highlights (For a share outstanding throughout the period) | |
|
| |
| |
| Small Company Growth | | |
| | Class NAV | | Class NAV |
| Period ended | 8-31-06a | |
|
| Per share operating performance | | |
|
| Net asset value, beginning of period | $10.00 | |
| Net investment income (loss)h | (0.08) | |
| Net realized and unrealized gain (loss) on investments | 1.17 | |
| Total from investment operations | 1.09 | |
| Net asset value, end of period | $11.09 | |
| Total return (%) | 10.90m | |
| Ratios and supplemental data | | |
|
| Net assets, end of period (in millions) | $74 | |
| Ratio net of expenses to average net assets (%) | 1.16r | |
| Ratio of net investment income (loss) to | | |
| average net assets (%) | (0.83)r | |
| Portfolio turnover (%) | 49m | |
a Class 1 and Class NAV shares began operations on 10-29-05.
h Based on the average of the shares outstanding.
m Not annualized.
r Annualized.
The accompanying notes are an integral part of the financial statements. 159
| John Hancock Funds II | | | |
| |
| Financial Highlights (For a share outstanding throughout the period) | | |
|
| |
| |
| Small Company Value | | | |
| | Class 1 | | Class NAV | |
| Period ended | 8-31-06a | | 8-31-06a |
|
| Per share operating performance | | | |
|
| Net asset value, beginning of period | $21.09 | | $21.06 |
| Net investment income (loss)h | 0.10 | | 0.11 |
| Net realized and unrealized gain (loss) on investments | 2.52 | | 2.51 |
| Total from investment operations | 2.62 | | 2.62 |
| Less distributions | | | |
| From net investment income | (0.05) | | (0.05) |
| | (0.05) | | (0.05) |
| Net asset value, end of period | $23.66 | | $23.63 |
| Total returnk,l (%) | 12.41m | | 12.44m |
| Ratios and supplemental data | | | |
|
| Net assets, end of period (in millions) | $149 | | $239 |
| Ratio of net expenses to average net assets (%) | 1.10r | | 1.05r |
| Ratio of gross expenses to average net assetsp (%) | 1.12r | | 1.07r |
| Ratio of net investment income (loss) to | | | |
| average net assets (%) | 0.46r | | 0.53r |
| Portfolio turnover (%) | 12m | | 12m |
a Class 1 and Class NAV shares began operations on 10-15-05.
h Based on the average of the shares outstanding.
k Assumes dividend reinvestment.
l Total returns would have been lower had certain expenses not been reduced during the period shown.
m Not annualized.
p Does not take into consideration expense reductions during the period shown.
r Annualized.
The accompanying notes are an integral part of the financial statements. 160
| John Hancock Funds II | | | |
| |
| Financial Highlights (For a share outstanding throughout the period) | | |
|
| |
| |
| Special Value | | | |
| | Class 1 | | Class NAV | |
| Period ended | 8-31-06a | | 8-31-06a |
|
| Per share operating performance | | | |
|
| Net asset value, beginning of period | $18.66 | | $18.66 |
| Net investment income (loss)h | 0.06 | | 0.08 |
| Net realized and unrealized gain (loss) on investments | 1.79 | | 1.80 |
| Total from investment operations | 1.85 | | 1.88 |
| Less distributions | | | |
| From net investment income | (0.01) | | (0.02) |
| | (0.01) | | (0.02) |
| Net asset value, end of period | $20.50 | | $20.52 |
| Total return (%)k | 9.91m | | 10.06m |
| Ratios and supplemental data | | | |
|
| Net assets, end of period (in millions) | $4 | | $124 |
| Ratio of net expenses to average net assets (%) | 1.12r | | 1.07r |
| Ratio of net investment income (loss) to | | | |
| average net assets (%) | 0.35r | | 0.44r |
| Portfolio turnover (%) | 26m | | 26m |
a Class 1 and Class NAV shares began operations on 10-15-05.
h Based on the average of the shares outstanding.
k Assumes dividend reinvestment.
m Not annualized.
r Annualized.
The accompanying notes are an integral part of the financial statements. 161
| John Hancock Funds II | |
| |
| Financial Highlights (For a share outstanding throughout the period) |
|
| |
| |
| Spectrum Income | |
| | Class NAV | |
| Period ended | 8-31-06a |
|
| Per share operating performance | |
|
| Net asset value, beginning of period | $10.00 |
| Net investment income (loss)h | 0.35 |
| Net realized and unrealized gain (loss) on investments | 0.19 |
| Total from investment operations | 0.54 |
| Less distributions | |
| From net investment income | (0.27) |
| | (0.27) |
| Net asset value, end of period | $10.27 |
| Total returnk,l (%) | 5.47m |
| Ratios and supplemental data | |
|
| Net assets, end of period (in millions) | $764 |
| Ratio of net expenses to average net assets (%) | 0.93r |
| Ratio of gross expenses to average net assetsp (%) | 0.94r |
| Ratio of net investment income (loss) to | |
| average net assets (%) | 4.15r |
| Portfolio turnover (%) | 123m |
a Class NAV shares began operations on 10-29-05.
h Based on the average of the shares outstanding.
k Assumes dividend reinvestment.
l Total returns would have been lower had certain expenses not been reduced during the periods shown.
m Not annualized.
p Does not take into consideration expense reductions during the period shown.
r Annualized.
The accompanying notes are an integral part of the financial statements. 162
| John Hancock Funds II | | | |
| |
| Financial Highlights (For a share outstanding throughout the period) | | |
|
| |
| |
| Strategic Bond | | | |
| | Class 1 | | Class NAV | |
| Period ended | 8-31-06a | | 8-31-06a |
|
| Per share operating performance | | | |
|
| Net asset value, beginning of period | $11.85 | | $11.83 |
| Net investment income (loss)h | 0.51 | | 0.51 |
| Net realized and unrealized gain (loss) on investments | (0.04) | | (0.04) |
| Total from investment operations | 0.47 | | 0.47 |
| Less distributions | | | |
| From net investment income | (0.53) | | (0.53) |
| From net realized gain | —j | | —j |
| | (0.53) | | (0.53) |
| Net asset value, end of period | $11.79 | | $11.77 |
| Total returnk (%) | 4.18m | | 4.22m |
| Ratios and supplemental data | | | |
|
| Net assets, end of period (in millions) | $42 | | $270 |
| Ratio of net expenses to average net assets (%) | 0.82r | | 0.77r |
| Ratio of net investment income (loss) to | | | |
| average net assets (%) | 4.88r | | 4.88r |
| Portfolio turnover (%) | 192m | | 192m |
a Class 1 and Class NAV shares began operations on 10-15-05.
h Based on the average of the shares outstanding.
j Less than $0.01 per share.
k Assumes dividend reinvestment.
m Not annualized.
r Annualized.
The accompanying notes are an integral part of the financial statements. 163
| John Hancock Funds II | |
| |
| Financial Highlights (For a share outstanding throughout the period) |
|
| |
| |
| Strategic Income | |
| Class NAV | |
| Period ended | 8-31-06a |
|
| Per share operating performance | |
|
| Net asset value, beginning of period | $10.00 |
| Net investment income (loss)h | 0.14 |
| Net realized and unrealized gain (loss) on investments | (0.01) |
| Total from investment operations | 0.13 |
| Less distributions | |
| From net investment income | (0.07) |
| | (0.07) |
| Net asset value, end of period | $10.06 |
| Total returnk (%) | 1.37m |
| Ratios and supplemental data | |
|
| Net assets, end of period (in millions) | $281 |
| Ratio of net expenses to average net assets (%) | 0.86r |
| Ratio of net investment income (loss) to | |
| average net assets (%) | 4.18r |
| Portfolio turnover (%) | 65m |
a Class NAV shares began operations on 4-28-06.
h Based on the average of the shares outstanding.
k Assumes dividend reinvestment.
m Not annualized.
r Annualized.
The accompanying notes are an integral part of the financial statements. 164
| John Hancock Funds II | | | |
| |
| Financial Highlights (For a share outstanding throughout the period) | | |
|
| |
| |
| Strategic Value | | | |
| | Class 1 | | Class NAV | |
| Period ended | 8-31-06a | | 8-31-06a |
|
| Per share operating performance | | | |
|
| Net asset value, beginning of period | $10.29 | | $10.25 |
| Net investment income (loss)h | 0.09 | | 0.10 |
| Net realized and unrealized gain (loss) on investments | 0.58 | | 0.57 |
| Total from investment operations | 0.67 | | 0.67 |
| Less distributions | | | |
| From net investment income | (0.02) | | (0.02) |
| | (0.02) | | (0.02) |
| Net asset value, end of period | $10.94 | | $10.90 |
| Total returnk (%) | 6.47m | | 6.52m |
| Ratios and supplemental data | | | |
|
| Net assets, end of period (in millions) | $14 | | $139 |
| Ratio of net expenses to average net assets (%) | 0.97r | | 0.92r |
| Ratio of net investment income (loss) to average net assets (%) | 0.98r | | 1.10r |
| Portfolio turnover (%) | 42m | | 42m |
a Class 1 and Class NAV shares began operations on 10-15-05.
h Based on the average of the shares outstanding.
k Assumes dividend reinvestment.
m Not annualized.
r Annualized.
The accompanying notes are an integral part of the financial statements. 165
| John Hancock Funds II | | | |
| |
| Financial Highlights (For a share outstanding throughout the period) | | |
|
| |
| |
| Total Return | | | |
| | Class 1 | | Class NAV | |
| Period ended | 8-31-06a | | 8-31-06a |
|
| Per share operating performance | | | |
|
| Net asset value, beginning of period | $13.70 | | $13.67 |
| Net investment income (loss)h | 0.46 | | 0.47 |
| Net realized and unrealized gain (loss) on investments | (0.04) | | (0.05) |
| Total from investment operations | 0.42 | | 0.42 |
| Less distributions | | | |
| From net investment income | (0.34) | | (0.34) |
| | (0.34) | | (0.34) |
| Net asset value, end of period | $13.78 | | $13.75 |
| Total returnk (%) | 3.14m | | 3.18m |
| Ratios and supplemental data | | | |
|
| Net assets, end of period (in millions) | $118 | | $1,041 |
| Ratio of net expenses to average net assets (%) | 0.82r | | 0.77r |
| Ratio of net investment income (loss) to | | | |
| average net assets (%) | 3.85r | | 3.95r |
| Portfolio turnover (%) | 398m | | 398m |
a Class 1 and Class NAV shares began operations on 10-15-05.
h Based on the average of the shares outstanding.
k Assumes dividend reinvestment.
m Not annualized.
r Annualized.
The accompanying notes are an integral part of the financial statements. 166
| John Hancock Funds II | | | |
| |
| Financial Highlights (For a share outstanding throughout the period) | | |
|
| |
| |
| U.S. Global Leaders Growth | | | |
| | Class 1 | | Class NAV | |
| Period ended | 8-31-06a | | 8-31-06a |
|
| Per share operating performance | | | |
|
| Net asset value, beginning of period | $12.79 | | $12.80 |
| Net investment income (loss)h | 0.05 | | 0.06 |
| Net realized and unrealized gain (loss) on investments | (0.17) | | (0.17) |
| Total from investment operations | (0.12) | | (0.11) |
| Less distributions | | | |
| From net investment income | (0.01) | | (0.01) |
| | (0.01) | | (0.01) |
| Net asset value, end of period | $12.66 | | $12.68 |
| Total returnk (%) | (0.97)m | | (0.88)m |
| Ratios and supplemental data | | | |
|
| Net assets, end of period (in millions) | $25 | | $452 |
| Ratio of net expenses to average net assets (%) | 0.79r | | 0.74r |
| Ratio of net investment income (loss) to | | | |
| average net assets (%) | 0.44r | | 0.52r |
| Portfolio turnover (%) | 17m | | 17m |
a Class 1 and Class NAV shares began operations on 10-15-05.
h Based on the average of the shares outstanding.
k Assumes dividend reinvestment.
m Not annualized.
r Annualized.
The accompanying notes are an integral part of the financial statements. 167
| John Hancock Funds II | | | |
| |
| Financial Highlights (For a share outstanding throughout the period) | | |
|
| |
| |
| U.S. Government Securities | | | |
| | Class 1 | | Class NAV | |
| Period ended | 8-31-06a | | 8-31-06a |
|
| Per share operating performance | | | |
|
| Net asset value, beginning of period | $13.54 | | $13.51 |
| Net investment income (loss)h | 0.44 | | 0.44 |
| Net realized and unrealized gain (loss) on investments | (0.07) | | (0.06) |
| Total from investment operations | 0.37 | | 0.38 |
| Less distributions | | | |
| From net investment income | (0.32) | | (0.33) |
| From net realized gain | —j | | —j |
| | (0.32) | | (0.33) |
| Net asset value, end of period | $13.59 | | $13.56 |
| Total return (%)k | 2.87m | | 2.91m |
| Ratios and supplemental data | | | |
|
| Net assets, end of period (in millions) | $43 | | $161 |
| Ratio of net expenses to average net assets (%) | 0.78r | | 0.73r |
| Ratio of net investment income (loss) to | | | |
| average net assets (%) | 3.67r | | 3.75r |
| Portfolio turnover (%) | 100m | | 100m |
a Class 1 and Class NAV shares began operations on 10-15-05.
h Based on the average of the shares outstanding.
j Less than $0.01 per share.
k Assumes dividend reinvestment.
m Not annualized.
r Annualized.
The accompanying notes are an integral part of the financial statements. 168
| John Hancock Funds II | | | |
| |
| Financial Highlights (For a share outstanding throughout the period) | | |
|
| |
| |
| U.S. High Yield Bond | | | |
| | Class 1 | | Class NAV | |
| Period ended | 8-31-06a | | 8-31-06a |
|
| Per share operating performance | | | |
|
| Net asset value, beginning of period | $12.74 | | $12.74 |
| Net investment income (loss)h | 0.80 | | 0.80 |
| Net realized and unrealized gain (loss) on investments | 0.02 | | 0.02 |
| Total from investment operations | 0.82 | | 0.82 |
| Less distributions | | | |
| From net investment income | (0.51) | | (0.51) |
| | (0.51) | | (0.51) |
| Net asset value, end of period | $13.05 | | $13.05 |
| Total returnk (%) | 6.55m | | 6.58m |
| Ratios and supplemental data | | | |
|
| Net assets, end of period (in millions) | $2 | | $288 |
| Ratio of net expenses to average net assets (%) | 0.87r | | 0.82r |
| Ratio of net investment income (loss) to | | | |
| average net assets (%) | 7.12r | | 7.06r |
| Portfolio turnover (%) | 108m | | 108m |
a Class 1 and Class NAV shares began operations on 10-15-05.
h Based on the average of the shares outstanding.
k Assumes dividend reinvestment.
m Not annualized.
r Annualized.
The accompanying notes are an integral part of the financial statements. 169
| John Hancock Funds II | |
| |
| Financial Highlights (For a share outstanding throughout the period) |
|
| |
| |
| U.S. Multi Sector | |
| | Class NAV | |
| Period ended | 8-31-06a |
|
| Per share operating performance | |
|
| Net asset value, beginning of period | $10.00 |
| Net investment income (loss)h | 0.09 |
| Net realized and unrealized gain (loss) on investments | 0.33 |
| Total from investment operations | 0.42 |
| Less distributions | |
| From net investment income | (0.01) |
| | (0.01) |
| Net asset value, end of period | $10.41 |
| Total returnk (%) | 4.25m |
| Ratios and supplemental data | |
|
| Net assets, end of period (in millions) | $1,227 |
| Ratio of net expenses to average net assets (%) | 0.82r |
| Ratio of net investment income (loss) to | |
| average net assets (%) | 1.01r |
| Portfolio turnover (%) | 116m |
a Class NAV shares began operations on 10-29-05.
h Based on the average of the shares outstanding.
k Assumes dividend reinvestment.
m Not annualized.
r Annualized.
The accompanying notes are an integral part of the financial statements. 170
| John Hancock Funds II | |
| |
| Financial Highlights (For a share outstanding throughout the period) |
|
| |
| |
| Value & Restructuring | |
| | Class NAV | |
| Period ended | 8-31-06a |
|
| Per share operating performance | |
|
| Net asset value, beginning of period | $10.00 |
| Net investment income (loss)h | 0.12 |
| Net realized and unrealized gain (loss) on investments | 0.99 |
| Total from investment operations | 1.11 |
| Less distributions | |
| From net investment income | (0.03) |
| | (0.03) |
| Net asset value, end of period | $11.08 |
| Total returnk (%) | 11.07m |
| Ratios and supplemental data | |
|
| Net assets, end of period (in millions) | $296 |
| Ratio of net expenses to average net assets (%) | 0.92r |
| Ratio of net investment income (loss) to | |
| average net assets (%) | 1.33r |
| Portfolio turnover (%) | 17m |
a Class NAV shares began operations on 10-29-05.
h Based on the average of the shares outstanding.
k Assumes dividend reinvestment.
m Not annualized.
r Annualized.
The accompanying notes are an integral part of the financial statements. 171
| John Hancock Funds II | |
| |
| Financial Highlights (For a share outstanding throughout the period) |
|
| |
| |
| Vista | |
| | Class NAV | |
| Period ended | 8-31-06a |
|
| Per share operating performance | |
|
| Net asset value, beginning of period | $10.00 |
| Net investment income (loss)h | (0.01) |
| Net realized and unrealized gain (loss) on investments | 0.71 |
| Total from investment operations | 0.70 |
| Net asset value, end of period | $10.70 |
| Total return (%) | 7.00m |
| Ratios and supplemental data | |
|
| Net assets, end of period (in millions) | $123 |
| Ratio of net expenses to average net assets (%) | 1.04r |
| Ratio of net investment income (loss) to | |
| average net assets (%) | (0.15)r |
| Portfolio turnover (%) | 205m |
a Class NAV shares began operations on 10-29-05.
h Based on the average of the shares outstanding.
m Not annualized.
r Annualized.
The accompanying notes are an integral part of the financial statements. 172
John Hancock Funds II
Portfolio of investments — August 31, 2006
(showing percentage of total net assets)
| Absolute Return Fund | | | | |
| | | Shares or | | |
| | | Principal | | |
| | | Amount | | Value |
|
|
| |
| INVESTMENT COMPANIES - 92.37% | | | | |
| Mutual Funds - 92.37% | | | | |
| Capital Appreciation Fund Class NAV | | 21,668 | $ | 204,767 |
| Core Bond Fund Class NAV | | 12,400 | | 155,123 |
| Emerging Small Company Fund Class NAV | 3,401 | | 98,537 |
| Equity-Income Fund Class NAV | | 5,807 | | 105,168 |
| Fundamental Value Fund Class NAV | | 6,588 | | 104,282 |
| Global Bond Fund Class NAV | | 6,974 | | 103,138 |
| High Income Fund Class NAV | | 41,253 | | 407,164 |
| High Yield Fund Class NAV | | 10,288 | | 103,699 |
| International Opportunities Fund Class NAV | 6,689 | | 108,094 |
| International Small Company Fund Class NAV | 16,873 | | 157,424 |
| International Value Fund Class NAV | | 6,020 | | 107,646 |
| Investment Quality Bond Fund Class NAV | | 13,196 | | 155,055 |
| Large Cap Fund Class NAV | | 10,722 | | 157,291 |
| Large Cap Value Fund Class NAV | | 4,507 | | 103,695 |
| Natural Resources Fund Class NAV | | 5,929 | | 211,088 |
| PowerShares DB Commodity | | | | |
| Index Tracking Fund | | 4,000 | | 100,000 |
| Quantitative Value Fund Class NAV | | 6,468 | | 107,115 |
| Real Estate Equity Fund Class NAV | | 45,918 | | 504,643 |
| Real Return Bond Fund Class NAV | | 39,215 | | 522,338 |
| Small Company Value Fund Class NAV | | 6,418 | | 151,669 |
| Spectrum Income Fund Class NAV | | 30,242 | | 310,583 |
| Strategic Bond Fund Class NAV | | 17,824 | | 209,793 |
| Strategic Income Fund Class NAV | | 15,298 | | 153,899 |
| Total Return Fund Class NAV | | 26,398 | | 362,971 |
| U.S. Government Securities Fund Class NAV | 7,609 | | 103,181 |
|
|
| | | | | 4,808,363 |
|
| TOTAL INVESTMENT COMPANIES (Cost $4,647,830) | $ | 4,808,363 |
|
| |
| SHORT TERM INVESTMENTS - 7.10% | | | |
| United States Treasury Bill | | | | |
| zero coupon due 09/28/2006 | $ | 371,000 | $ | 369,634 |
|
| TOTAL SHORT TERM INVESTMENTS | | | | |
| (Cost $369,633) | | | $ | 369,634 |
|
| Total Investments (Absolute Return Fund) | | | |
| (Cost $5,017,463) - 99.47% | | | $ | 5,177,997 |
| Other Assets in Excess of Liabilities - 0.53% | | | 27,777 |
|
|
| TOTAL NET ASSETS - 100.00% | | | $ | 5,205,774 |
|
|
| |
| |
| Active Bond Fund | | | | |
| | | Shares or | | |
| | | Principal | | |
| | | Amount | | Value |
|
|
| |
| PREFERRED STOCKS - 0.06% | | | | |
| Food & Beverages - 0.06% | | | | |
| Ocean Spray Cranberries, Inc. * | | 3,200 | $ | 254,900 |
|
| TOTAL PREFERRED STOCKS (Cost $262,400) | | $ | 254,900 |
|
| Active Bond Fund (continued) | | | |
| | | Shares or | | |
| | | Principal | | |
| | | Amount | | Value |
|
| |
| |
| U.S. TREASURY OBLIGATIONS - 17.35% | | | |
| U.S. Treasury Bonds - 2.97% | | | | |
| 4.50% due 02/15/2036 | $ | 7,868,000 | $ | 7,405,141 |
| 5.375% due 02/15/2031 (a) | | 650,000 | | 691,539 |
| 6.875% due 08/15/2025 (a) | | 2,080,000 | | 2,567,176 |
| 8.75% due 08/15/2020 (a) | | 1,663,000 | | 2,299,616 |
|
|
| | | | | 12,963,472 |
| U.S. Treasury Notes - 14.38% | | | | |
| 4.25% due 11/15/2013 (a) | | 7,620,000 | | 7,400,331 |
| 4.50% due 11/15/2015 (a) | | 1,925,000 | | 1,889,959 |
| 4.75% due 08/31/2011 | | 9,140,000 | | 9,110,010 |
| 4.875% due 08/15/2016 | | 8,480,000 | | 8,576,061 |
| 4.875% due 08/15/2009 to 07/31/2011 (a) | 17,104,000 | | 17,198,090 |
| 5.00% due 07/31/2008 (a) | | 12,020,000 | | 12,063,200 |
| 5.125% due 05/15/2016 (a) | | 6,355,000 | | 6,535,469 |
|
|
| | | | | 62,773,120 |
|
| TOTAL U.S. TREASURY OBLIGATIONS | | | |
| (Cost $75,006,322) | | | $ | 75,736,592 |
|
| |
| U.S. GOVERNMENT AGENCY OBLIGATIONS - 34.00% | | |
| Federal Home Loan Bank - 0.03% | | | | |
| 5.80% due 09/02/2008 | | 135,000 | | 136,574 |
| Federal Home Loan Mortgage Corp. - 1.42% | | | |
| 3.952% due 06/01/2034 | | 150,029 | | 145,889 |
| 4.50% due 03/01/2019 | | 1,657,130 | | 1,592,532 |
| 5.00% due 10/18/2010 (a) | | 1,330,000 | | 1,325,368 |
| 5.168% due 11/01/2035 | | 1,117,575 | | 1,090,942 |
| 5.287% due 12/01/2035 | | 1,077,095 | | 1,058,703 |
| 5.875% due 03/21/2011 (a) | | 81,000 | | 83,138 |
| 6.00% due 12/01/2035 | | 884,350 | | 886,054 |
|
|
| | | | | 6,182,626 |
| Federal National Mortgage | | | | |
| Association - 32.45% | | | | |
| 2.50% due 06/15/2008 | | 3,039,000 | | 2,904,494 |
| 3.765% due 07/01/2033 (b) | | 7,639 | | 7,538 |
| 4.375% due 03/15/2013 (a) | | 20,000 | | 19,233 |
| 4.50% TBA ** *** | | 6,000,000 | | 5,765,628 |
| 5.00% due 05/01/2018 to 04/01/2036 | | 9,217,121 | | 8,986,376 |
| 5.00% TBA ** | | 30,000,000 | | 28,840,610 |
| 5.057% due 05/01/2035 | | 5,078,666 | | 5,058,651 |
| 5.50% due 02/01/2018 to 01/01/2036 | | 11,403,068 | | 11,226,469 |
| 5.50% due 03/15/2011 (a) | | 5,086,000 | | 5,180,701 |
| 5.50% TBA ** | | 30,000,000 | | 29,437,500 |
| 5.75% due 05/01/2013 | | 755,000 | | 756,773 |
| 6.00% due 05/01/2035 to 08/01/2036 | | 17,334,858 | | 17,360,035 |
| 6.00% due 05/15/2008 (a) | | 3,548,000 | | 3,597,949 |
| 6.00% TBA ** | | 11,000,000 | | 11,010,318 |
| 6.25% due 05/15/2029 | | 157,000 | | 177,669 |
| 6.50% due 02/01/2036 to 06/01/2036 | | 5,829,437 | | 5,918,457 |
| 6.625% due 09/15/2009 (a) | | 5,046,000 | | 5,272,823 |
| 7.00% due 09/01/2010 to 10/25/2041 | | 137,184 | | 140,115 |
| 7.50% due 09/01/2029 to 08/01/2031 | | 8,664 | | 8,972 |
|
|
| | | | | 141,670,311 |
The accompanying notes are an integral part of the financial statements. 173
John Hancock Funds II
Portfolio of investments — August 31, 2006
(showing percentage of total net assets)
| Active Bond Fund (continued) | | |
| | | Shares or | |
| | | Principal | |
| | | Amount | Value |
|
|
| |
| U.S. GOVERNMENT AGENCY | | | |
| OBLIGATIONS (continued) | | | |
| Government National Mortgage | | | |
| Association - 0.08% | | | |
| 5.00% due 04/15/2035 | $ | 130,054 | $ | 126,026 |
| 5.50% due 03/15/2035 | | 125,142 | 123,970 |
| 6.00% due 03/15/2033 to 06/15/2033 | | 58,903 | 59,521 |
| 6.50% due 09/15/2028 to 08/15/2031 | | 11,220 | 11,493 |
| 7.00% due 04/15/2029 | | 3,341 | 3,448 |
| 8.00% due 10/15/2026 | | 3,324 | 3,528 |
|
|
| | | | 327,986 |
| The Financing Corp. - 0.02% | | | |
| 10.35% due 08/03/2018 | | 75,000 | 109,438 |
|
| TOTAL U.S. GOVERNMENT AGENCY OBLIGATIONS | |
| (Cost $148,030,603) | | | $ | 148,426,935 |
|
| |
| FOREIGN GOVERNMENT OBLIGATIONS - 0.16% | |
| Argentina - 0.02% | | | |
| Republic of Argentina | | | |
| zero coupon, Step up to 1.18% on | | | |
| 03/31/2009 due 12/31/2038 (b) | ARS | 177,218 | 28,354 |
| 0.275% due 12/15/2035 (b) | | 393,449 | 10,924 |
| 5.83% due 12/31/2033 (b) | | 72,870 | 29,736 |
|
|
| | | | 69,014 |
| Canada - 0.00% | | | |
| Government of Canada | | | |
| 5.50% due 06/01/2010 | CAD | 5,000 | 4,753 |
| Chile - 0.05% | | | |
| Republic of Chile | | | |
| 5.90% due 01/28/2008 (b) | $ | 223,000 | 223,781 |
| Colombia - 0.01% | | | |
| Republic of Colombia | | | |
| 10.00% due 01/23/2012 | | 20,000 | 23,280 |
| 11.75% due 03/01/2010 | COP | 16,000,000 | 7,191 |
|
|
| | | | 30,471 |
| Japan - 0.01% | | | |
| Government of Japan | | | |
| 0.90% due 12/22/2008 | JPY | 550,000 | 4,712 |
| 1.50% due 09/20/2014 | | 1,350,000 | 11,493 |
| 1.80% due 03/22/2010 | | 2,650,000 | 23,302 |
|
|
| | | | 39,507 |
| Mexico - 0.06% | | | |
| Government of Mexico | | | |
| 8.00% due 12/07/2023 | MXN | 238,900 | 20,993 |
| 8.00% due 12/19/2013 | | 167,800 | 15,268 |
| 9.875% due 02/01/2010 | $ | 205,000 | 233,495 |
|
|
| | | | 269,756 |
| Panama - 0.00% | | | |
| Republic of Panama | | | |
| 8.875% due 09/30/2027 | | 6,000 | 7,320 |
| 9.375% due 07/23/2012 | | 2,000 | 2,315 |
|
|
| | | | 9,635 |
| Active Bond Fund (continued) | | |
| | | Shares or | |
| | | Principal | |
| | | Amount | Value |
|
|
| |
| FOREIGN GOVERNMENT OBLIGATIONS | | |
| (continued) | | | |
| Peru - 0.00% | | | |
| Republic of Peru | | | |
| 9.125% due 02/21/2012 | $ | 3,000 | $ | 3,420 |
| 9.875% due 02/06/2015 | | 2,000 | 2,460 |
|
|
| | | | 5,880 |
| |
| Philippines - 0.00% | | | |
| Republic of Philippines | | | |
| 9.125% due 02/22/2010 | EUR | 2,000 | 2,872 |
| 10.625% due 03/16/2025 | $ | 1,000 | 1,311 |
|
|
| | | | 4,183 |
| |
| Sweden - 0.00% | | | |
| Kingdom of Sweden | | | |
| 5.00% due 01/28/2009 | SEK | 30,000 | 4,290 |
| 5.25% due 03/15/2011 | | 30,000 | 4,424 |
|
|
| | | | 8,714 |
| |
| Turkey - 0.01% | | | |
| Republic of Turkey | | | |
| 20.00% due 10/17/2007 | TRY | 23,700 | 17,413 |
|
| TOTAL FOREIGN GOVERNMENT OBLIGATIONS | |
| (Cost $685,492) | | | $ | 683,107 |
|
| |
| CORPORATE BONDS - 24.45% | | | |
| Aerospace - 0.01% | | | |
| Systems 2001 Asset Trust LLC | | | |
| 6.664% due 09/15/2013 | $ | 45,073 | 47,212 |
| Air Travel - 0.07% | | | |
| Continental Airlines Inc., Series 991A | | | |
| 6.545% due 02/02/2019 | | 107,963 | 109,233 |
| Continental Airlines, Inc., Series 00-2 | | | |
| 8.307% due 04/02/2018 | | 178,160 | 177,066 |
| Delta Air Lines, Inc. | | | |
| 8.00% due 12/15/2007 | | 4,000 | 950 |
|
|
| | | | 287,249 |
| |
| Amusement & Theme Parks - 0.03% | | | |
| HRP Myrtle Beach Operations LLC | | | |
| 9.8181% due 04/01/2012 (b) | | 140,000 | 139,300 |
| Auto Parts - 0.00% | | | |
| Delphi Trust II | | | |
| 6.197% due 11/15/2033 (b) | | 2,000 | 1,280 |
| Auto Services - 0.05% | | | |
| Erac USA Finance Company | | | |
| 6.70% due 06/01/2034 | | 205,000 | 211,417 |
| 7.95% due 12/15/2009 | | 10,000 | 10,713 |
|
|
| | | | 222,130 |
| |
| Automobiles - 0.14% | | | |
| DaimlerChrysler N.A. Holding Corp. | | | |
| 4.05% due 06/04/2008 | | 234,000 | 228,136 |
| 5.875% due 03/15/2011 | | 395,000 | 396,624 |
|
|
| | | | 624,760 |
| |
| Banking - 1.57% | | | |
| Allied Irish Banks PLC | | | |
| 7.50% due 12/29/2049 (b) | EUR | 1,000 | 1,446 |
The accompanying notes are an integral part of the financial statements. 174
John Hancock Funds II
Portfolio of investments — August 31, 2006
(showing percentage of total net assets)
| Active Bond Fund (continued) | | |
| | | Shares or | |
| | | Principal | |
| | | Amount | Value |
|
|
| |
| CORPORATE BONDS (continued) | | | |
| Banking (continued) | | | |
| BAC Capital Trust XI | | | |
| 6.625% due 05/23/2036 | $ | 555,000 | $ | 579,181 |
| Banco Santander Chile | | | |
| 5.375% due 12/09/2014 | | 5,000 | 4,887 |
| 5.6325% due 12/09/2009 (b) | | 18,000 | 18,090 |
| Bank of Ireland | | | |
| 6.45% due 02/10/2010 | EUR | 1,000 | 1,382 |
| BankAmerica Institutional Capital B | | | |
| 7.70% due 12/31/2026 | $ | 125,000 | 130,310 |
| BNP Paribas Capital Trust | | | |
| 9.003% due 12/29/2049 (b) | | 350,000 | 393,434 |
| Chuo Mitsui Trust & Banking Company | | | |
| 5.506% due 04/15/2049 (b) | | 350,000 | 333,276 |
| HBOS PLC | | | |
| 3.125% due 01/12/2007 | | 17,000 | 16,856 |
| 5.375% due 11/29/2049 (b) | | 22,000 | 21,444 |
| 6.413% due 09/29/2049 (b) | | 450,000 | 428,130 |
| Independence Community Bank Corp. | | | |
| 3.75% due 04/01/2014 (b) | | 5,000 | 4,790 |
| Landsbanki Islands HF | | | |
| 1.00% due 08/25/2009 (b) | | 490,000 | 489,883 |
| 6.10% due 08/25/2011 | | 295,000 | 295,580 |
| NB Capital Trust IV | | | |
| 8.25% due 04/15/2027 | | 50,000 | 52,501 |
| Rabobank Capital Funding II | | | |
| 5.26% due 12/29/2049 (b) | | 560,000 | 542,797 |
| RBS Capital Trust IV | | | |
| 6.2988% due 09/29/2049 (b) | | 18,000 | 18,065 |
| Royal Bank of Scotland Group PLC | | | |
| 7.648% due 08/31/2049 (b) | | 580,000 | 657,292 |
| Sovereign Capital Trust I | | | |
| 9.00% due 04/01/2027 | | 370,000 | 387,901 |
| TuranAlem Finance BV | | | |
| 7.875% due 06/02/2010 | | 12,000 | 12,299 |
| USB Capital IX | | | |
| 6.189% due 04/15/2042 (b) | | 520,000 | 522,175 |
| Wachovia Capital Trust II | | | |
| 6.0069% due 01/15/2027 (b) | | 385,000 | 369,140 |
| Wachovia Capital Trust III | | | |
| 5.80% due 03/15/2042 (b) | | 700,000 | 696,885 |
| Washington Mutual Bank, Series BKNT | | | |
| 6.75% due 05/20/2036 | | 400,000 | 420,656 |
| Washington Mutual, Inc. | | | |
| 4.20% due 01/15/2010 | | 222,000 | 214,168 |
| 5.7369% due 03/22/2012 (b) | | 7,000 | 6,980 |
| Wells Fargo Company | | | |
| 3.50% due 04/04/2008 (a) | | 219,000 | 213,290 |
|
|
| | | | 6,832,838 |
| Broadcasting - 0.62% | | | |
| Clear Channel Communications, Inc. | | | |
| 5.50% due 09/15/2014 (a) | | 245,000 | 226,671 |
| 6.00% due 11/01/2006 | | 9,000 | 9,004 |
| 7.65% due 09/15/2010 | | 214,000 | 225,109 |
| Liberty Media Corp. | | | |
| 6.8294% due 09/17/2006 (b) | | 32,000 | 32,011 |
| Active Bond Fund (continued) | | |
| | | Shares or | |
| | | Principal | |
| | | Amount | Value |
|
|
| |
| CORPORATE BONDS (continued) | | | |
| Broadcasting (continued) | | | |
| News America Holdings, Inc. | | | |
| 6.75% due 01/09/2038 | $ | 2,000 | $ | 2,081 |
| 7.75% due 12/01/2045 | | 9,000 | 9,881 |
| 8.25% due 08/10/2018 | | 345,000 | 403,206 |
| Viacom, Inc. | | | |
| 5.75% due 04/30/2011 | | 1,000,000 | 991,770 |
| 6.875% due 04/30/2036 | | 525,000 | 514,979 |
| XM Satellite Radio Holdings, Inc. | | | |
| 9.75% due 05/01/2014 (a) | | 330,000 | 310,200 |
|
|
| | | | 2,724,912 |
| Building Materials & Construction - 0.05% | | |
| Hanson PLC | | | |
| 6.125% due 08/15/2016 | | 200,000 | 201,977 |
| Business Services - 0.07% | | | |
| Electronic Data Systems Corp. | | | |
| 7.125% due 10/15/2009 | | 2,000 | 2,085 |
| Xerox Corp. | | | |
| 6.75% due 02/01/2017 | | 300,000 | 300,750 |
|
|
| | | | 302,835 |
| Cable and Television - 0.82% | | | |
| Comcast Corp. | | | |
| 5.90% due 03/15/2016 | | 240,000 | 237,913 |
| 6.50% due 11/15/2035 | | 530,000 | 522,570 |
| Comcast Corp., Class A | | | |
| 5.30% due 01/15/2014 | | 219,000 | 211,344 |
| 7.05% due 03/15/2033 | | 11,000 | 11,547 |
| Cox Communications, Inc. | | | |
| 4.625% due 01/15/2010 | | 22,000 | 21,313 |
| 5.45% due 12/15/2014 | | 218,000 | 207,382 |
| 6.75% due 03/15/2011 | | 209,000 | 216,715 |
| 7.125% due 10/01/2012 | | 315,000 | 333,250 |
| 7.75% due 11/01/2010 | | 207,000 | 222,710 |
| Shaw Communications, Inc. | | | |
| 8.25% due 04/11/2010 | | 275,000 | 289,094 |
| TCI Communications, Inc. | | | |
| 9.80% due 02/01/2012 (a) | | 275,000 | 323,903 |
| Time Warner Companies, Inc. | | | |
| 7.57% due 02/01/2024 | | 34,000 | 36,435 |
| Time Warner Entertainment Company LP | | | |
| 8.375% due 03/15/2023 | | 280,000 | 315,043 |
| Time Warner Entertainment Company, LP | | | |
| 8.375% due 07/15/2033 | | 535,000 | 613,540 |
| Time Warner, Inc. | | | |
| 6.15% due 05/01/2007 | | 13,000 | 13,051 |
| 7.625% due 04/15/2031 | | 9,000 | 9,746 |
|
|
| | | | 3,585,556 |
| Cellular Communications - 0.34% | | | |
| America Movil S.A. de CV | | | |
| 5.75% due 01/15/2015 | | 275,000 | 270,668 |
| American Tower Corp. | | | |
| 7.50% due 05/01/2012 (a) | | 12,000 | 12,210 |
| AT&T Wireless Services, Inc. | | | |
| 7.875% due 03/01/2011 | | 211,000 | 230,218 |
| 8.75% due 03/01/2031 | | 209,000 | 264,162 |
The accompanying notes are an integral part of the financial statements. 175
John Hancock Funds II
Portfolio of investments — August 31, 2006
(showing percentage of total net assets)
| Active Bond Fund (continued) | | |
| | | Shares or | |
| | | Principal | |
| | | Amount | Value |
|
|
| |
| CORPORATE BONDS (continued) | | | |
| Cellular Communications (continued) | | | |
| Cingular Wireless Services, Inc. | | | |
| 8.125% due 05/01/2012 | $ | 240,000 | $ | 268,708 |
| Nextel Communications, Inc. | | | |
| 7.375% due 08/01/2015 | | 2,000 | 2,058 |
| Nextel Partners, Inc. | | | |
| 8.125% due 07/01/2011 | | 405,000 | 425,250 |
| Rogers Wireless, Inc. | | | |
| 9.625% due 05/01/2011 | | 8,000 | 8,940 |
| Verizon Wireless Capital LLC | | | |
| 5.375% due 12/15/2006 | | 22,000 | 21,992 |
|
|
| | | | 1,504,206 |
| |
| Chemicals - 0.11% | | | |
| Cytec Industries, Inc. | | | |
| 6.75% due 03/15/2008 | | 13,000 | 13,156 |
| ICI Wilmington, Inc. | | | |
| 4.375% due 12/01/2008 | | 218,000 | 212,578 |
| Lyondell Chemical Company | | | |
| 10.875% due 05/01/2009 (a) | | 25,000 | 25,500 |
| Nova Chemicals Ltd. | | | |
| 7.875% due 09/15/2025 | | 265,000 | 238,169 |
|
|
| | | | 489,403 |
| |
| Computers & Business Equipment - 0.12% | | |
| Cisco Systems, Inc. | | | |
| 5.50% due 02/22/2016 | | 510,000 | 507,759 |
| Construction & Mining Equipment - 0.16% | | |
| Caterpillar, Inc. | | | |
| 6.05% due 08/15/2036 | | 305,000 | 313,988 |
| Kennametal, Inc. | | | |
| 7.20% due 06/15/2012 | | 365,000 | 385,156 |
|
|
| | | | 699,144 |
| |
| Containers & Glass - 0.07% | | | |
| BWAY Corp. | | | |
| 10.00% due 10/15/2010 | | 290,000 | 303,775 |
| Crude Petroleum & Natural Gas - 0.00% | | |
| Premcor Refining Group, Inc. | | | |
| 7.50% due 06/15/2015 | | 4,000 | 4,178 |
| Diversified Financial Services - 0.32% | | | |
| Ford Motor Credit Company | | | |
| 9.75% due 09/15/2010 | | 468,000 | 484,429 |
| Kinder Morgan Finance Company ULC | | | |
| 6.40% due 01/05/2036 | | 700,000 | 611,457 |
| Quebecor World Capital Corp. | | | |
| 8.75% due 03/15/2016 | | 115,000 | 107,525 |
| Tate & Lyle International Finance PLC | | | |
| 5.00% due 11/15/2014 | | 208,000 | 194,918 |
|
|
| | | | 1,398,329 |
| |
| Domestic Oil - 0.25% | | | |
| Devon Financing Corp., ULC | | | |
| 6.875% due 09/30/2011 (a) | | 205,000 | 217,400 |
| Enterprise Products Operating LP | | | |
| 6.375% due 02/01/2013 | | 645,000 | 658,394 |
| Active Bond Fund (continued) | | |
| | | Shares or | |
| | | Principal | |
| | | Amount | Value |
|
|
| |
| CORPORATE BONDS (continued) | | | |
| Domestic Oil (continued) | | | |
| Hess Corp. | | | |
| 7.30% due 08/15/2031 | $ | 212,000 | $ | 235,890 |
|
|
| | | | 1,111,684 |
| Drugs & Health Care - 0.10% | | | |
| Allegiance Corp. | | | |
| 7.00% due 10/15/2026 | | 205,000 | 218,785 |
| Wyeth | | | |
| 4.375% due 03/01/2008 | | 210,000 | 207,110 |
|
|
| | | | 425,895 |
| Electrical Equipment - 0.02% | | | |
| Ametek, Inc. | | | |
| 7.20% due 07/15/2008 | | 90,000 | 92,246 |
| Electrical Utilities - 2.95% | | | |
| AES Eastern Energy LP, Series 99-A | | | |
| 9.00% due 01/02/2017 | | 488,603 | 537,464 |
| AES Gener SA | | | |
| 7.50% due 03/25/2014 (a) | | 218,000 | 226,482 |
| American Electric Power Company, Inc. | | | |
| 5.25% due 06/01/2015 | | 210,000 | 202,276 |
| Appalachian Power Company | | | |
| 5.80% due 10/01/2035 | | 39,000 | 36,276 |
| Arizona Public Service Company | | | |
| 5.50% due 09/01/2035 | | 222,000 | 192,212 |
| Beaver Valley Funding Corp. | | | |
| 9.00% due 06/01/2017 | | 395,000 | 445,509 |
| CenterPoint Energy Houston Electric LLC, Series K2 | | |
| 6.95% due 03/15/2033 | | 10,000 | 11,028 |
| CenterPoint Energy Resources Corp. | | | |
| 7.875% due 04/01/2013 | | 235,000 | 259,141 |
| Constellation Energy Group Inc. | | | |
| 7.60% due 04/01/2032 | | 360,000 | 412,095 |
| CSFB (Empresa Electrica Guacolda SA) | | | |
| 8.625% due 04/30/2013 | | 197,500 | 217,372 |
| Dominion Resources, Inc. | | | |
| 5.70% due 09/17/2012 | | 207,000 | 207,382 |
| 7.50% due 06/30/2066 (b) | | 820,000 | 846,818 |
| Empresa Nacional De Electricidad | | | |
| 8.35% due 08/01/2013 | | 220,000 | 244,379 |
| 8.50% due 04/01/2009 | | 8,000 | 8,518 |
| Enersis SA | | | |
| 7.375% due 01/15/2014 | | 12,000 | 12,640 |
| Entergy (Waterford 3 Funding) | | | |
| 8.09% due 01/02/2017 | | 474,148 | 490,421 |
| Entergy Gulf States, Inc. | | | |
| 5.70% due 06/01/2015 | | 175,000 | 169,461 |
| FirstEnergy Corp. | | | |
| 6.45% due 11/15/2011 | | 209,000 | 216,763 |
| 7.375% due 11/15/2031 | | 226,000 | 255,578 |
| HQI Transelec Chile SA | | | |
| 7.875% due 04/15/2011 (a) | | 325,000 | 341,951 |
| Indiantown Cogeneration LP, Series A-9 | | | |
| 9.26% due 12/15/2010 | | 101,663 | 106,931 |
| Ipalco Enterprises, Inc. | | | |
| 8.625% due 11/14/2011 | | 285,000 | 305,662 |
The accompanying notes are an integral part of the financial statements. 176
John Hancock Funds II
Portfolio of investments — August 31, 2006
(showing percentage of total net assets)
| Active Bond Fund (continued) | | |
| | | Shares or | |
| | | Principal | |
| | | Amount | Value |
|
|
| |
| CORPORATE BONDS (continued) | | | |
| Electrical Utilities (continued) | | | |
| Monterrey Power SA De CV | | | |
| 9.625% due 11/15/2009 | $ | 157,906 | $ | 172,710 |
| National Grid PLC | | | |
| 6.30% due 08/01/2016 | | 745,000 | 763,632 |
| Nevada Power Company | | | |
| 6.50% due 05/15/2018 | | 345,000 | 352,873 |
| 6.65% due 04/01/2036 | | 530,000 | 534,220 |
| Pacific Gas & Electric Company | | | |
| 4.20% due 03/01/2011 | | 246,000 | 234,630 |
| 4.80% due 03/01/2014 | | 212,000 | 202,728 |
| 6.05% due 03/01/2034 | | 834,000 | 824,302 |
| PSEG Power LLC | | | |
| 5.00% due 04/01/2014 | | 214,000 | 202,981 |
| 8.625% due 04/15/2031 | | 214,000 | 274,245 |
| Scottish Power PLC | | | |
| 4.91% due 03/15/2010 | | 225,000 | 220,492 |
| Sierra Pacific Power Company | | | |
| 6.00% due 05/15/2016 | | 840,000 | 833,771 |
| System Energy Resources, Inc. | | | |
| 5.129% due 01/15/2014 | | 466,355 | 454,682 |
| Texas-New Mexico Power Company | | | |
| 6.125% due 06/01/2008 | | 440,000 | 441,753 |
| TransAlta Corp. | | | |
| 5.75% due 12/15/2013 | | 485,000 | 478,698 |
| TXU Corp., Series R | | | |
| 6.55% due 11/15/2034 | | 715,000 | 660,915 |
| United Energy Distribution Property, Ltd. | | | |
| 4.70% due 04/15/2011 | | 6,000 | 5,841 |
| Virginia Electric and Power Company | | | |
| 6.00% due 01/15/2036 | | 500,000 | 484,060 |
|
|
| | | | 12,888,892 |
| Electronics - 0.00% | | | |
| Jabil Circuit, Inc. | | | |
| 5.875% due 07/15/2010 | | 17,000 | 17,099 |
| Energy - 0.67% | | | |
| Duke Capital LLC | | | |
| 6.25% due 02/15/2013 (a) | | 470,000 | 476,411 |
| 6.75% due 02/15/2032 (a) | | 511,000 | 525,823 |
| Enterprise Products Operating LP | | | |
| 4.95% due 06/01/2010 | | 210,000 | 205,058 |
| Enterprise Products Operating LP, Series B | | | |
| 5.00% due 03/01/2015 (a) | | 211,000 | 196,992 |
| 6.875% due 03/01/2033 | | 209,000 | 213,503 |
| Kansas City Power & Light Company, Series B | | |
| 6.00% due 03/15/2007 | | 11,000 | 11,031 |
| KN Capital Trust I, Series B | | | |
| 8.56% due 04/15/2027 | | 125,000 | 122,500 |
| Nexen, Inc. | | | |
| 5.875% due 03/10/2035 | | 212,000 | 198,333 |
| Northern Border Pipeline Company | | | |
| 6.25% due 05/01/2007 | | 12,000 | 12,040 |
| Salton Sea Funding Corp., Series E | | | |
| 8.30% due 05/30/2011 | | 176,610 | 186,365 |
| Salton Sea Funding Corp., Series F | | | |
| 7.475% due 11/30/2018 | | 326,061 | 341,203 |
| Active Bond Fund (continued) | | |
| | | Shares or | |
| | | Principal | |
| | | Amount | Value |
|
|
| |
| CORPORATE BONDS (continued) | | | |
| Energy (continued) | | | |
| Sempra Energy | | | |
| 4.75% due 05/15/2009 | $ | 208,000 | $ | 204,751 |
| TXU Energy Company, LLC | | | |
| 7.00% due 03/15/2013 | | 217,000 | 226,420 |
|
|
| | | | 2,920,430 |
| Financial Services - 4.29% | | | |
| American Express Company | | | |
| 6.80% due 09/01/2066 | | 305,000 | 316,837 |
| American General Finance Corp., Series MTNI | | |
| 4.875% due 07/15/2012 | | 500,000 | 483,344 |
| Astoria Depositor Corp. | | | |
| 8.144% due 05/01/2021 | | 500,000 | 545,215 |
| AXA Financial, Inc. | | | |
| 7.75% due 08/01/2010 | | 210,000 | 227,205 |
| Bank of New York Institutional Capital Trust A | | |
| 7.78% due 12/01/2026 | | 60,000 | 62,568 |
| Bear Stearns Companies, Inc. | | | |
| 5.70% due 11/15/2014 | | 219,000 | 220,796 |
| Bosphorus Financial Services Ltd | | | |
| 7.205% due 02/15/2012 (b) | | 375,000 | 372,186 |
| Capital One Capital III | | | |
| 7.686% due 08/15/2036 (a) | | 610,000 | 636,767 |
| Caterpillar Financial Services Corp. | | | |
| 4.50% due 06/15/2009 | | 210,000 | 206,206 |
| CIT Group, Inc. | | | |
| 5.60% due 04/27/2011 | | 380,000 | 382,357 |
| 5.63% due 05/18/2007 (b) | | 8,000 | 8,014 |
| Citigroup, Inc. | | | |
| 5.00% due 09/15/2014 | | 218,000 | 210,922 |
| 5.625% due 08/27/2012 | | 219,000 | 221,708 |
| CNOOC Finance 2003 Ltd. | | | |
| 5.50% due 05/21/2033 | | 10,000 | 9,203 |
| Credit Suisse First Boston USA, Inc. | | | |
| 4.625% due 01/15/2008 | | 208,000 | 206,236 |
| 6.50% due 01/15/2012 | | 209,000 | 219,235 |
| Dresdner Bank-New York | | | |
| 7.25% due 09/15/2015 | | 211,000 | 234,709 |
| E*Trade Financial Corp. | | | |
| 7.375% due 09/15/2013 | | 310,000 | 313,100 |
| ERP Operating LP | | | |
| 4.75% due 06/15/2009 | | 13,000 | 12,793 |
| ESI Tractebel Acquisition Corp., Series B | | | |
| 7.99% due 12/30/2011 | | 550,000 | 569,353 |
| FleetBoston Financial Corp. | | | |
| 4.875% due 12/01/2006 | | 14,000 | 13,981 |
| Ford Motor Credit Company | | | |
| 9.875% due 08/10/2011 | | 165,000 | 172,392 |
| Fund American Companies, Inc. | | | |
| 5.875% due 05/15/2013 | | 214,000 | 210,095 |
| General Electric Capital Corp. | | | |
| 5.45% due 01/15/2013 | | 261,000 | 262,668 |
| General Motors Acceptance Corp. | | | |
| 6.75% due 12/01/2014 (a) | | 315,000 | 301,986 |
| 6.875% due 09/15/2011 | | 232,000 | 228,492 |
| 7.75% due 01/19/2010 | | 42,000 | 42,691 |
The accompanying notes are an integral part of the financial statements. 177
John Hancock Funds II
Portfolio of investments — August 31, 2006
(showing percentage of total net assets)
| Active Bond Fund (continued) | | | |
| | | Shares or | | |
| | | Principal | | |
| | | Amount | | Value |
|
|
| |
| CORPORATE BONDS (continued) | | | | |
| Financial Services (continued) | | | | |
| Goldman Sachs Group, Inc. | | | | |
| 5.25% due 04/01/2013 | $ | 224,000 | $ | 220,222 |
| Household Finance Corp. | | | | |
| 6.375% due 10/15/2011 (a) | | 200,000 | | 208,109 |
| 6.40% due 06/17/2008 | | 237,000 | | 241,326 |
| HSBC Finance Capital Trust IX | | | | |
| 5.911% due 11/30/2035 (b) | | 300,000 | | 297,447 |
| HSBC Finance Corp. | | | | |
| 4.625% due 01/15/2008 | | 213,000 | | 211,222 |
| 6.75% due 05/15/2011 | | 520,000 | | 548,969 |
| HVB Funding Trust III | | | | |
| 9.00% due 10/22/2031 | | 10,000 | | 12,620 |
| International Lease Finance Corp. | | | | |
| 3.50% due 04/01/2009 | | 213,000 | | 203,634 |
| 4.55% due 10/15/2009 | | 7,000 | | 6,838 |
| 4.75% due 07/01/2009 | | 30,000 | | 29,530 |
| 5.00% due 04/15/2010 | | 211,000 | | 207,520 |
| 5.875% due 05/01/2013 | | 215,000 | | 219,104 |
| International Lease Finance Corp., Series P | | | | |
| 5.9069% due 01/15/2010 (b) | | 13,000 | | 13,088 |
| International Lease Finance Corp., Series MTN | | | |
| 5.45% due 03/24/2011 | | 1,200,000 | | 1,201,121 |
| Jefferies Group, Inc. | | | | |
| 6.25% due 01/15/2036 | | 300,000 | | 286,052 |
| John Deere Capital Corp., Series D | | | | |
| 4.125% due 01/15/2010 | | 39,000 | | 37,628 |
| JPMorgan Chase & Company | | | | |
| 5.35% due 03/01/2007 | | 9,000 | | 8,995 |
| 6.75% due 02/01/2011 | | 218,000 | | 229,867 |
| JSG Funding PLC | | | | |
| 9.625% due 10/01/2012 | | 285,000 | | 297,469 |
| Lehman Brothers Holdings, Inc., Series N | | | | |
| 4.25% due 01/27/2010 | | 285,000 | | 275,683 |
| MBNA Capital, Series B | | | | |
| 6.2888% due 02/01/2027 (b) | | 23,000 | | 22,712 |
| Merrill Lynch & Company, Inc. | | | | |
| 6.05% due 05/16/2016 | | 340,000 | | 350,686 |
| Metallurg Holdings, Inc. | | | | |
| 10.50% due 10/01/2010 (a) | | 355,000 | | 351,450 |
| Mizuho Financial Group (Cayman), Ltd. | | | | |
| 8.375% due 12/29/2049 | | 420,000 | | 444,528 |
| Morgan Stanley | | | | |
| 4.25% due 05/15/2010 | | 232,000 | | 223,615 |
| MUFG Capital Finance 1, Ltd. | | | | |
| 6.346% due 07/29/2049 (b) | | 540,000 | | 540,544 |
| Nisource Finance Corp. | | | | |
| 5.25% due 09/15/2017 | | 640,000 | | 589,542 |
| 6.15% due 03/01/2013 | | 219,000 | | 220,509 |
| 7.875% due 11/15/2010 | | 216,000 | | 232,124 |
| Nissan Motor Acceptance Corp. | | | | |
| 5.625% due 03/14/2011 | | 370,000 | | 370,135 |
| Nuveen Investments, Inc., Class A | | | | |
| 5.50% due 09/15/2015 | | 29,000 | | 27,942 |
| Popular North America, Inc. | | | | |
| 4.70% due 06/30/2009 | | 12,000 | | 11,738 |
| Active Bond Fund (continued) | | |
| | | Shares or | |
| | | Principal | |
| | | Amount | Value |
|
|
| |
| CORPORATE BONDS (continued) | | | |
| Financial Services (continued) | | | |
| Popular North America, Inc., Series E | | | |
| 6.125% due 10/15/2006 | $ | 14,000 | $ | 14,009 |
| Reliastar Financial Corp. | | | |
| 6.50% due 11/15/2008 | | 14,000 | 14,321 |
| Residential Capital Corp. | | | |
| 6.00% due 02/22/2011 | | 630,000 | 626,583 |
| 7.3369% due 04/17/2009 (b) | | 700,000 | 703,114 |
| Skandinaviska Enskilda Banken AB | | | |
| 5.471% due 03/29/2049 (b) | | 400,000 | 377,796 |
| SLM Corp., Series A | | | |
| 5.00% due 04/15/2015 | | 27,000 | 25,718 |
| St. George Funding Company LLC | | | |
| zero coupon, Step up to 8.985% on | | | |
| 06/30/2017 due 12/31/2049 | | 495,000 | 522,582 |
| State Street Institutional Capital A | | | |
| 7.94% due 12/30/2026 (c) | | 160,000 | 167,150 |
| The Goldman Sachs Group, Inc. | | | |
| 5.125% due 01/15/2015 | | 247,000 | 238,896 |
| Trinity Industries Leasing Companies | | | |
| 7.755% due 02/15/2009 | | 310,089 | 307,763 |
| Ucar Finance, Inc. | | | |
| 10.25% due 02/15/2012 | | 270,000 | 283,500 |
| Waddell & Reed Financial, Inc. | | | |
| 5.60% due 01/15/2011 | | 400,000 | 395,263 |
| Westfield Capital Corp, Ltd. | | | |
| 4.375% due 11/15/2010 | | 214,000 | 205,444 |
|
|
| | | | 18,715,167 |
| |
| Food & Beverages - 0.34% | | | |
| ASG Consolidated LLC/ASG Finance, Inc. | | | |
| zero coupon, Step up to 11.5% on | | | |
| 11/01/2008 due 11/01/2011 | | 395,000 | 342,662 |
| Kellogg Company, Series B | | | |
| 6.60% due 04/01/2011 | | 209,000 | 219,026 |
| Kraft Foods, Inc. | | | |
| 5.625% due 11/01/2011 | | 219,000 | 220,391 |
| Nabisco, Inc. | | | |
| 7.05% due 07/15/2007 | | 8,000 | 8,074 |
| 7.55% due 06/15/2015 | | 229,000 | 259,089 |
| Panamerican Beverages, Inc. | | | |
| 7.25% due 07/01/2009 | | 95,000 | 98,040 |
| Smithfield Foods., Inc. | | | |
| 7.00% due 08/01/2011 | | 18,000 | 18,067 |
| Tyson Foods, Inc. | | | |
| 6.60% due 04/01/2016 | | 330,000 | 334,865 |
|
|
| | | | 1,500,214 |
| |
| Forest Products - 0.00% | | | |
| Weyerhaeuser Company | | | |
| 6.125% due 03/15/2007 | | 5,000 | 5,006 |
| Gas & Pipeline Utilities - 0.51% | | | |
| CenterPoint Energy Resources Corp. | | | |
| 6.15% due 05/01/2016 | | 530,000 | 536,446 |
| Dynegy-Roseton Danskammer | | | |
| 7.67% due 11/08/2016 | | 225,000 | 221,625 |
| Energy Transfer Partners LP | | | |
| 5.95% due 02/01/2015 | | 435,000 | 432,702 |
The accompanying notes are an integral part of the financial statements. 178
John Hancock Funds II
Portfolio of investments — August 31, 2006
(showing percentage of total net assets)
| Active Bond Fund (continued) | | |
| | | Shares or | |
| | | Principal | |
| | | Amount | Value |
|
|
| |
| CORPORATE BONDS (continued) | | | |
| Gas & Pipeline Utilities (continued) | | | |
| Kinder Morgan Energy Partners LP | | | |
| 5.80% due 03/15/2035 | $ | 208,000 | $ | 186,739 |
| 7.30% due 08/15/2033 | | 212,000 | 227,478 |
| Magellan Midstream Partners LP | | | |
| 6.45% due 06/01/2014 | | 340,000 | 350,856 |
| MarkWest Energy Partners LP | | | |
| 8.50% due 07/15/2016 | | 260,000 | 263,250 |
| Michigan Consolidated Gas Company | | | |
| 5.70% due 03/15/2033 | | 14,000 | 13,080 |
|
|
| | | | 2,232,176 |
| Healthcare Products - 0.09% | | | |
| Boston Scientific Corp. | | | |
| 6.40% due 06/15/2016 | | 395,000 | 399,806 |
| Healthcare Services - 0.18% | | | |
| Coventry Health Care, Inc. | | | |
| 5.875% due 01/15/2012 | | 225,000 | 222,332 |
| UnitedHealth Group, Inc. | | | |
| 5.375% due 03/15/2016 | | 240,000 | 235,358 |
| 5.80% due 03/15/2036 | | 115,000 | 111,063 |
| WellPoint, Inc. | | | |
| 3.50% due 09/01/2007 | | 14,000 | 13,685 |
| 3.75% due 12/14/2007 | | 10,000 | 9,792 |
| 5.00% due 12/15/2014 | | 208,000 | 199,408 |
|
|
| | | | 791,638 |
| Holdings Companies/Conglomerates - 0.38% | | |
| General Electric Company | | | |
| 5.00% due 02/01/2013 | | 1,037,000 | 1,017,974 |
| Siemens Financierings NV | | | |
| 6.125% due 08/17/2026 | | 600,000 | 612,989 |
| SPI Electricity & Gas Australia Holdings Party Ltd. | | |
| 6.15% due 11/15/2013 | | 16,000 | 16,532 |
|
|
| | | | 1,647,495 |
| Homebuilders - 0.05% | | | |
| Pulte Homes, Inc. | | | |
| 6.25% due 02/15/2013 | | 210,000 | 210,134 |
| Hotels & Restaurants - 0.22% | | | |
| Hilton Hotels Corp. | | | |
| 8.25% due 02/15/2011 | | 9,000 | 9,672 |
| Hyatt Equities LLC | | | |
| 6.875% due 06/15/2007 | | 185,000 | 186,255 |
| Marriott International, Inc. | | | |
| 4.625% due 06/15/2012 | | 26,000 | 24,604 |
| Starwood Hotels & Resorts Worldwide, Inc. | | | |
| 7.875% due 05/01/2012 | | 680,000 | 736,100 |
|
|
| | | | 956,631 |
| Industrial Machinery - 0.19% | | | |
| Caterpillar, Inc. | | | |
| 7.25% due 09/15/2009 | | 213,000 | 225,475 |
| Weatherford International, Ltd. | | | |
| 6.50% due 08/01/2036 | | 600,000 | 611,145 |
|
|
| | | | 836,620 |
| Active Bond Fund (continued) | | |
| | | Shares or | |
| | | Principal | |
| | | Amount | Value |
|
|
| |
| CORPORATE BONDS (continued) | | | |
| Insurance - 2.56% | | | |
| Ace INA Holdings, Inc. | | | |
| 6.70% due 05/15/2036 | $ | 420,000 | $ | 429,265 |
| Allied World Assurance Holdings Ltd. | | | |
| 7.50% due 08/01/2016 | | 855,000 | 874,994 |
| American International Group, Inc. | | | |
| 5.05% due 10/01/2015 | | 350,000 | 338,489 |
| AmerUs Group Company | | | |
| 6.583% due 05/16/2011 | | 255,000 | 264,293 |
| AON Capital Trust A | | | |
| 8.205% due 01/01/2027 | | 390,000 | 442,882 |
| Assurant, Inc. | | | |
| 5.625% due 02/15/2014 | | 209,000 | 206,473 |
| 6.75% due 02/15/2034 | | 550,000 | 568,904 |
| Cincinnati Financial Corp. | | | |
| 6.92% due 05/15/2028 | | 960,000 | 1,037,259 |
| CNA Financial Corp. | | | |
| 5.85% due 12/15/2014 | | 333,000 | 326,431 |
| 6.00% due 08/15/2011 | | 280,000 | 281,871 |
| Endurance Specialty Holdings Ltd. | | | |
| 7.00% due 07/15/2034 | | 300,000 | 284,917 |
| First American Corp. | | | |
| 7.55% due 04/01/2028 (a) | | 290,000 | 313,712 |
| Hartford Financial Services Group, Inc. | | | |
| 4.625% due 07/15/2013 | | 8,000 | 7,593 |
| Horace Mann Educators Corp. | | | |
| 6.85% due 04/15/2016 | | 230,000 | 232,882 |
| Liberty Mutual Group, Inc. | | | |
| 6.50% due 03/15/2035 | | 683,000 | 625,407 |
| 7.50% due 08/15/2036 | | 200,000 | 206,565 |
| Liberty Mutual Insurance Company | | | |
| 7.697% due 10/15/2097 | | 300,000 | 297,147 |
| Markel Corp. | | | |
| 6.80% due 02/15/2013 | | 325,000 | 334,672 |
| 7.35% due 08/15/2034 | | 325,000 | 330,890 |
| Marsh & McLennan Companies, Inc. | | | |
| 5.375% due 03/15/2007 | | 16,000 | 15,985 |
| 5.375% due 07/15/2014 | | 206,000 | 196,784 |
| 5.75% due 09/15/2015 | | 238,000 | 231,797 |
| MetLife, Inc. | | | |
| 5.70% due 06/15/2035 | | 255,000 | 242,389 |
| Odyssey Re Holdings Corp. | | | |
| 7.65% due 11/01/2013 | | 15,000 | 14,530 |
| Ohio Casualty Corp. | | | |
| 7.30% due 06/15/2014 | | 320,000 | 337,908 |
| Prudential Financial, Inc. | | | |
| 4.75% due 04/01/2014 | | 227,000 | 215,520 |
| RenaissanceRe Holdings, Ltd. | | | |
| 7.00% due 07/15/2008 | | 400,000 | 408,803 |
| Symetra Financial Corp. | | | |
| 6.125% due 04/01/2016 | | 350,000 | 350,389 |
| The Phoenix Companies, Inc. | | | |
| 6.675% due 02/16/2008 | | 230,000 | 231,432 |
| Travelers Property Casualty Corp. | | | |
| 6.375% due 03/15/2033 | | 21,000 | 21,093 |
| W.R. Berkley Corp. | | | |
| 5.125% due 09/30/2010 | | 900,000 | 886,670 |
The accompanying notes are an integral part of the financial statements. 179
John Hancock Funds II
Portfolio of investments — August 31, 2006
(showing percentage of total net assets)
| Active Bond Fund (continued) | | |
| | | Shares or | |
| | | Principal | |
| | | Amount | Value |
|
|
| |
| CORPORATE BONDS (continued) | | | |
| Insurance (continued) | | | |
| W.R. Berkley Corp. (continued) | | | |
| 6.15% due 08/15/2019 | $ | 14,000 | $ | 13,832 |
| XL Capital, Ltd. | | | |
| 5.25% due 09/15/2014 | | 214,000 | 204,810 |
| Zurich Capital Trust I | | | |
| 8.376% due 06/01/2037 | | 375,000 | 396,066 |
|
|
| | | | 11,172,654 |
| International Oil - 0.41% | | | |
| Delek & Avner-Yam Tethys Ltd. | | | |
| 5.326% due 08/01/2013 | | 20,540 | 20,006 |
| Pemex Project Funding Master Trust | | | |
| 6.125% due 08/15/2008 | | 13,000 | 13,052 |
| 6.6294% due 06/15/2010 (b) | | 18,000 | 18,414 |
| 9.125% due 10/13/2010 | | 320,000 | 356,800 |
| Pioneer Natural Resources Company | | | |
| 5.875% due 07/15/2016 | | 207,000 | 193,091 |
| 6.875% due 05/01/2018 | | 500,000 | 493,699 |
| Ras Laffan Liquefied Natural Gas | | | |
| 3.437% due 09/15/2009 | | 17,766 | 17,168 |
| Ras Laffan LNG III | | | |
| 5.838% due 09/30/2027 | | 250,000 | 243,120 |
| Vintage Petroleum, Inc. | | | |
| 8.25% due 05/01/2012 | | 400,000 | 422,000 |
|
|
| | | | 1,777,350 |
| Investment Companies - 0.17% | | | |
| Allied Capital Corp. | | | |
| 6.625% due 07/15/2011 | | 750,000 | 761,251 |
| Leisure Time - 0.60% | | | |
| AMC Entertainment, Inc. | | | |
| 9.50% due 02/01/2011 (a) | | 245,000 | 244,388 |
| Caesars Entertainment, Inc. | | | |
| 7.00% due 04/15/2013 | | 319,000 | 329,284 |
| Jacobs Entertainment, Inc. | | | |
| 9.75% due 06/15/2014 | | 180,000 | 179,775 |
| Little Traverse Bay Bands of Odawa Indians | | |
| 10.25% due 02/15/2014 | | 235,000 | 233,825 |
| Majestic Star Casino LLC | | | |
| 9.75% due 01/15/2011 | | 295,000 | 288,363 |
| MGM Mirage, Inc. | | | |
| 6.00% due 10/01/2009 | | 16,000 | 15,640 |
| 6.375% due 12/15/2011 (a) | | 212,000 | 204,050 |
| 6.75% due 04/01/2013 | | 255,000 | 246,075 |
| Mohegan Tribal Gaming Authority | | | |
| 6.375% due 07/15/2009 | | 208,000 | 205,400 |
| 8.00% due 04/01/2012 | | 150,000 | 154,687 |
| MTR Gaming Group, Inc. | | | |
| 9.00% due 06/01/2012 | | 60,000 | 60,450 |
| MTR Gaming Group, Inc., Series B | | | |
| 9.75% due 04/01/2010 | | 220,000 | 231,275 |
| Pokagon Gaming Authority | | | |
| 10.375% due 06/15/2014 | | 100,000 | 105,750 |
| Waterford Gaming, LLC | | | |
| 8.625% due 09/15/2012 | | 100,000 | 105,375 |
|
|
| | | | 2,604,337 |
| Active Bond Fund (continued) | | |
| | | Shares or | |
| | | Principal | |
| | | Amount | Value |
|
|
| |
| CORPORATE BONDS (continued) | | | |
| Liquor - 0.00% | | | |
| Anheuser-Busch Companies, Inc. | | | |
| 6.50% due 02/01/2043 | $ | 10,000 | $ | 10,751 |
| Manufacturing - 0.26% | | | |
| Tyco International Group SA | | | |
| 6.875% due 01/15/2029 | | 1,000,000 | 1,116,112 |
| Medical-Hospitals - 0.43% | | | |
| Alliance Imaging, Inc. | | | |
| 7.25% due 12/15/2012 (a) | | 275,000 | 255,750 |
| HCA, Inc. | | | |
| 6.375% due 01/15/2015 | | 226,000 | 179,670 |
| 6.50% due 02/15/2016 (a) | | 200,000 | 157,500 |
| 7.875% due 02/01/2011 | | 208,000 | 198,120 |
| Health Management Associates, Inc. | | | |
| 6.125% due 04/15/2016 | | 495,000 | 472,339 |
| HealthSouth Corp. | | | |
| 11.4181% due 06/15/2014 (a)(b) | | 230,000 | 236,325 |
| Manor Care, Inc. | | | |
| 6.25% due 05/01/2013 | | 355,000 | 356,239 |
|
|
| | | | 1,855,943 |
| |
| Metal & Metal Products - 0.10% | | | |
| Alcan, Inc. | | | |
| 5.00% due 06/01/2015 | | 6,000 | 5,694 |
| Inco Ltd. | | | |
| 7.75% due 05/15/2012 | | 234,000 | 254,524 |
| Vedanta Resources PLC | | | |
| 6.625% due 02/22/2010 (a) | | 160,000 | 157,000 |
|
|
| | | | 417,218 |
| |
| Mining - 0.09% | | | |
| Corporacion Nacional del Cobre | | | |
| 5.50% due 10/15/2013 (a) | | 209,000 | 206,679 |
| Drummond Company, Inc. | | | |
| 7.375% due 02/15/2016 | | 195,000 | 183,300 |
|
|
| | | | 389,979 |
| |
| Paper - 0.17% | | | |
| Abitibi-Consolidated, Inc. | | | |
| 6.00% due 06/20/2013 | | 195,000 | 160,875 |
| Plum Creek Timberlands LP | | | |
| 5.875% due 11/15/2015 | | 295,000 | 290,148 |
| Verso Paper Holdings LLC and Verso Paper, Inc. | | |
| 9.125% due 08/01/2014 | | 310,000 | 308,450 |
|
|
| | | | 759,473 |
| |
| Petroleum Services - 0.26% | | | |
| Enterprise Products Operating LP | | | |
| 8.375% due 08/01/2066 (b) | | 700,000 | 729,729 |
| Premcor Refining Group, Inc. | | | |
| 9.50% due 02/01/2013 | | 150,000 | 163,835 |
| Valero Logistics Operations LP | | | |
| 6.05% due 03/15/2013 | | 248,000 | 249,975 |
|
|
| | | | 1,143,539 |
| |
| Pharmaceuticals - 0.36% | | | |
| Allergan, Inc. | | | |
| 5.75% due 04/01/2016 | | 400,000 | 402,029 |
The accompanying notes are an integral part of the financial statements. 180
John Hancock Funds II
Portfolio of investments — August 31, 2006
(showing percentage of total net assets)
| Active Bond Fund (continued) | | |
| | | Shares or | |
| | | Principal | |
| | | Amount | Value |
|
|
| |
| CORPORATE BONDS (continued) | | | |
| Pharmaceuticals (continued) | | | |
| AmerisourceBergen Corp. | | | |
| 5.875% due 09/15/2015 | $ | 39,000 | $ | 37,791 |
| Caremark Rx, Inc. | | | |
| 7.375% due 10/01/2006 | | 255,000 | 255,280 |
| Hospira, Inc. | | | |
| 5.90% due 06/15/2014 | | 8,000 | 8,045 |
| Medco Health Solutions, Inc. | | | |
| 7.25% due 08/15/2013 | | 295,000 | 319,159 |
| Schering Plough Corp. | | | |
| 5.55% due 12/01/2013 | | 218,000 | 217,581 |
| Teva Pharmaceutical Finance LLC | | | |
| 5.55% due 02/01/2016 | | 170,000 | 165,134 |
| 6.15% due 02/01/2036 | | 170,000 | 160,575 |
|
|
| | | | 1,565,594 |
| Real Estate - 1.78% | | | |
| Boston Properties, Ltd., REIT | | | |
| 6.25% due 01/15/2013 | | 215,000 | 221,746 |
| Camden Property Trust, REIT | | | |
| 5.00% due 06/15/2015 | | 216,000 | 204,917 |
| Colonial Properties Trust, REIT | | | |
| 6.25% due 06/15/2014 (a) | | 211,000 | 214,353 |
| Colonial Realty LP | | | |
| 5.50% due 10/01/2015 | | 231,000 | 223,324 |
| Developers Diversified Realty Corp., REIT | | | |
| 4.625% due 08/01/2010 | | 22,000 | 21,246 |
| Duke Realty Corp., REIT | | | |
| 5.6969% due 12/22/2006 (b) | | 8,000 | 8,006 |
| Duke Realty LP | | | |
| 5.95% due 02/15/2017 | | 975,000 | 981,489 |
| Equity One, Inc., REIT | | | |
| 6.25% due 01/15/2017 | | 260,000 | 264,293 |
| Health Care Property Investors, Inc., | | | |
| Series MTN, REIT | | | |
| 4.875% due 09/15/2010 | | 229,000 | 222,513 |
| 5.625% due 02/28/2013 | | 520,000 | 509,919 |
| Health Care REIT, Inc. | | | |
| 6.00% due 11/15/2013 | | 215,000 | 212,854 |
| 6.20% due 06/01/2016 | | 540,000 | 538,860 |
| Healthcare Realty Trust, Inc., REIT | | | |
| 8.125% due 05/01/2011 | | 360,000 | 390,909 |
| Hospitality Properties Trust, REIT | | | |
| 6.75% due 02/15/2013 | | 612,000 | 639,617 |
| iStar Financial, Inc., REIT | | | |
| 6.05% due 04/15/2015 | | 20,000 | 20,065 |
| Nationwide Health Properties, Inc., REIT | | | |
| 6.50% due 07/15/2011 | | 250,000 | 254,663 |
| Price, Inc., REIT | | | |
| 7.50% due 11/05/2006 | | 9,000 | 9,024 |
| Rouse Company LP, REIT | | | |
| 6.75% due 05/01/2013 | | 420,000 | 418,155 |
| Rouse Company, REIT | | | |
| 3.625% due 03/15/2009 | | 645,000 | 608,385 |
| 5.375% due 11/26/2013 | | 209,000 | 191,296 |
| Simon Property Group LP, REIT | | | |
| 5.75% due 12/01/2015 | | 530,000 | 530,224 |
| Active Bond Fund (continued) | | |
| | | Shares or | |
| | | Principal | |
| | | Amount | Value |
|
|
| |
| CORPORATE BONDS (continued) | | | |
| Real Estate (continued) | | | |
| Socgen Real Estate Company LLC | | | |
| 7.64% due 12/29/2049 (b) | $ | 274,000 | $ | 280,112 |
| Vornado Realty, LP | | | |
| 5.60% due 02/15/2011 | | 800,000 | 799,241 |
|
|
| | | | 7,765,211 |
| Retail - 0.16% | | | |
| CVS Corp. | | | |
| 6.125% due 08/15/2016 | | 515,000 | 523,986 |
| JC Penney Corp., Inc. | | | |
| 8.125% due 04/01/2027 | | 185,000 | 190,958 |
|
|
| | | | 714,944 |
| Retail Grocery - 0.05% | | | |
| Delhaize America, Inc. | | | |
| 9.00% due 04/15/2031 | | 200,000 | 233,994 |
| Telecommunications Equipment & | | | |
| Services - 0.88% | | | |
| Citizens Communications Company | | | |
| 6.25% due 01/15/2013 | | 255,000 | 246,394 |
| 9.00% due 08/15/2031 | | 160,000 | 168,800 |
| Deutsche Telekom International Finance BV | | |
| 5.75% due 03/23/2016 (a) | | 1,000,000 | 972,734 |
| 6.625% due 07/11/2011 | EUR | 1,000 | 1,420 |
| 8.00% due 06/15/2010 | $ | 222,000 | 241,423 |
| 8.25% due 06/15/2030 (b) | | 227,000 | 273,841 |
| Embarq Corp. | | | |
| 7.082% due 06/01/2016 | | 1,250,000 | 1,275,422 |
| France Telecom SA | | | |
| 7.75 due 03/01/2011 | | 20,000 | 21,839 |
| 8.50% due 03/01/2031 (b) | | 220,000 | 280,722 |
| Intelsat Ltd. | | | |
| 10.4844% due 01/15/2012 (b) | | 100,000 | 101,500 |
| SBC Communications, Inc. | | | |
| 4.125% due 09/15/2009 | | 207,000 | 199,788 |
| 5.10% due 09/15/2014 | | 16,000 | 15,259 |
| 5.625% due 06/15/2016 | | 12,000 | 11,747 |
| Singapore Telecommunications, Ltd. | | | |
| 6.375% due 12/01/2011 | | 9,000 | 9,377 |
|
|
| | | | 3,820,266 |
| Telephone - 1.18% | | | |
| AT&T Corp. | | | |
| 8.00% due 11/15/2031 (b) | | 435,000 | 519,706 |
| AT&T, Inc. | | | |
| 6.80% due 05/15/2036 | | 400,000 | 413,604 |
| BellSouth Corp. | | | |
| 4.20% due 09/15/2009 | | 212,000 | 204,938 |
| 6.00% due 11/15/2034 (a) | | 820,000 | 752,624 |
| Sprint Capital Corp. | | | |
| 6.125% due 11/15/2008 | | 216,000 | 218,869 |
| 6.375% due 05/01/2009 | | 212,000 | 216,879 |
| 6.875% due 11/15/2028 | | 642,000 | 648,270 |
| 8.375% due 03/15/2012 | | 207,000 | 231,338 |
| 8.75% due 03/15/2032 | | 317,000 | 384,384 |
| Telecom Italia Capital SA | | | |
| 4.00% due 01/15/2010 | | 215,000 | 204,286 |
The accompanying notes are an integral part of the financial statements. 181
John Hancock Funds II
Portfolio of investments — August 31, 2006
(showing percentage of total net assets)
| Active Bond Fund (continued) | | |
| | | Shares or | |
| | | Principal | |
| | | Amount | Value |
|
|
| |
| CORPORATE BONDS (continued) | | | |
| Telephone (continued) | | | |
| Telecom Italia Capital SA (continued) | | | |
| 4.00% due 11/15/2008 | $ | 169,000 | $ | 163,758 |
| 7.20% due 07/18/2036 | | 845,000 | 882,521 |
| Verizon Communications, Inc. | | | |
| 5.55% due 02/15/2016 | | 300,000 | 292,236 |
| Verizon, New York, Inc. | | | |
| 6.875% due 04/01/2012 (a) | | 15,000 | 15,575 |
|
|
| | | | 5,148,988 |
| |
| Tobacco - 0.06% | | | |
| Altria Group, Inc. | | | |
| 7.00% due 11/04/2013 | | 6,000 | 6,527 |
| Reynolds American, Inc. | | | |
| 7.25% due 06/01/2013 | | 235,000 | 240,719 |
|
|
| | | | 247,246 |
| |
| Transportation - 0.10% | | | |
| CMA CGM SA | | | |
| 7.25% due 02/01/2013 | | 455,000 | 429,975 |
| Overseas Shipholding Group, Inc. | | | |
| 8.25% due 03/15/2013 | | 2,000 | 2,060 |
|
|
| | | | 432,035 |
| |
| Travel Services - 0.04% | | | |
| TDS Investor Corp. | | | |
| 9.875% due 09/01/2014 | | 165,000 | 161,700 |
| Utility Service - 0.00% | | | |
| Public Service Company of New Mexico | | | |
| 4.40% due 09/15/2008 | | 13,000 | 12,718 |
|
| TOTAL CORPORATE BONDS (Cost $107,597,740) | | $ | 106,739,279 |
|
| |
| COLLATERALIZED MORTGAGE | | | |
| OBLIGATIONS - 19.38% | | | |
| American Home Mortgage Investment Trust, | | |
| Series 2004-4, Class 5A | | | |
| 4.44% due 02/25/2045 | | 1,069,708 | 1,045,539 |
| Banc of America Commercial Mortgage, Inc., | | |
| Series 2004-4, Class A3 | | | |
| 4.128% due 07/10/2042 | | 32,284 | 31,332 |
| Banc of America Commercial Mortgage, Inc., | | |
| Series 2005-2, Class AJ | | | |
| 4.953% due 07/10/2043 (b) | | 50,846 | 48,866 |
| Banc of America Commercial Mortgage, Inc., | | |
| Series 2005-4, Class A5A | | | |
| 4.933% due 07/10/2045 | | 245,000 | 235,830 |
| Banc of America Commercial Mortgage, Inc., | | |
| Series 2005-6, Class A4 | | | |
| 5.3539% due 09/10/2047 (b) | | 470,000 | 463,009 |
| Banc of America Commercial Mortgage, Inc., | | |
| Series 2005-6, Class H | | | |
| 5.3539% due 09/10/2047 (b) | | 350,000 | 333,481 |
| Banc of America Commercial Mortgage, Inc., | | |
| Series 2006-1, Class AM | | | |
| 5.421% due 09/10/2045 (b) | | 1,600,000 | 1,585,897 |
| Banc of America Commercial Mortgage, Inc., | | |
| Series 2006-1, Class XC | | | |
| 5.421% due 09/10/2045 (b) | | 52,752,102 | 381,398 |
| Active Bond Fund (continued) | | |
| | | Shares or | |
| | | Principal | |
| | | Amount | Value |
|
|
| |
| COLLATERALIZED MORTGAGE | | | |
| OBLIGATIONS (continued) | | | |
| Banc of America Commercial Mortgage, Inc., | | |
| Series 2006-2, Class A3 | | | |
| 5.9024% due 05/10/2045 (b) | $ | 1,365,000 | $ | 1,392,049 |
| Banc of America Commercial Mortgage, Inc., | | |
| Series 2006-3, Class A4 | | | |
| 5.889% due 07/10/2044 | | 775,000 | 797,460 |
| Banc of America Commercial Mortgage, Inc., | | |
| Series 2006-4, Class A3A | | | |
| 5.60% due 08/10/2013 | | 750,000 | 753,756 |
| Banc of America Commercial Mortgage, Inc., | | |
| Series 2006-4, Class XC | | | |
| 1.00% due 07/10/2046 | | 63,999,741 | 789,981 |
| Banc of America Funding Corp., Series 2006-B, | | |
| Class 6A1 | | | |
| 5.9003% due 03/20/2036 (b) | | 588,959 | 591,291 |
| Banc of America Funding Corp., Series 2006-D, | | |
| Class 6B1 | | | |
| 5.9793% due 05/20/2036 (b) | | 324,879 | 324,474 |
| Banc of America Large Loan, | | | |
| Series 2005-MIB1, Class B | | | |
| 5.59% due 03/15/2022 (b) | | 895,000 | 895,561 |
| Banc of America Large Loan, Series 2006-LAQ, | | |
| Class H | | | |
| 6.0481% due 02/09/2021 (b) | | 525,000 | 526,980 |
| Bank of America Commercial Mortgage, Inc., | | |
| Series 2001-3, Class A1 | | | |
| 4.89% due 04/11/2037 | | 11,140 | 11,063 |
| Bear Stearns Alt-A Trust, Series 2005-3, Class B2 | | |
| 5.3298% due 04/25/2035 (b) | | 194,551 | 192,868 |
| Bear Stearns Alt-A Trust, Series 2006-1, Class 23A1 | | |
| 5.6447% due 02/25/2036 (b) | | 532,832 | 531,711 |
| Bear Stearns Alt-A Trust, Series 2006-3, Class 34A1 | | |
| 6.2201% due 05/25/2036 (b) | | 644,107 | 650,386 |
| Bear Stearns Asset Backed Securities, Inc., Series | | |
| 2003-AC4, Class A | | | |
| 5.00% due 09/25/2033 | | 13,351 | 13,080 |
| Bear Stearns Commercial Mortgage Securities, | | |
| Inc., Series 2004-PWR5, Class X1 | | | |
| 0.076% IO due 07/11/2042 (b) | | 489,672 | 10,227 |
| Bear Stearns Commercial Mortgage Securities, | | |
| Inc., Series 2004-T16, Class X1 | | | |
| 0.1769% IO due 02/13/2046 (b) | | 589,452 | 11,501 |
| Bear Stearns Commercial Mortgage Securities, | | |
| Series 2005-PWR8, Class AJ | | | |
| 4.75% due 06/11/2041 | | 47,292 | 44,667 |
| Bear Stearns Commercial Mortgage Securities, | | |
| Series 2005-T20, Class A4A | | | |
| 5.3028% due 10/12/2042 (b) | | 260,000 | 255,787 |
| Bear Stearns Commercial Mortgage Securities, | | |
| Series 2006-BBA7, Class G | | | |
| 5.77% due 03/15/2019 (b) | | 700,000 | 699,996 |
| Bear Stearns Commercial Mortgage Securities, | | |
| Series 2002-TOP8, Class A2 | | | |
| 4.83% due 08/15/2038 | | 870,000 | 846,804 |
| Chase Commercial Mortgage Securities Corp., | | |
| Series 2000-2, Class C | | | |
| 7.928% due 07/15/2032 | | 29,619 | 32,282 |
The accompanying notes are an integral part of the financial statements. 182
John Hancock Funds II
Portfolio of investments — August 31, 2006
(showing percentage of total net assets)
| Active Bond Fund (continued) | | |
| | | Shares or | |
| | | Principal | |
| | | Amount | Value |
|
|
| |
| COLLATERALIZED MORTGAGE | | | |
| OBLIGATIONS (continued) | | | |
| Chaseflex Trust, Series 2005-2, Class 4A1 | | | |
| 5.00% due 05/25/2020 | $ | 363,450 | $ | 353,115 |
| Citigroup Commercial Mortgage Trust, | | | |
| Series 2006-C4, Class A3 | | | |
| 5.9111% due 03/15/2049 (b) | | 575,000 | 588,903 |
| Citigroup Mortgage Loan Trust, Inc., | | | |
| Series 2005-10, Class 1A5A | | | |
| 5.8871% due 12/25/2035 (b) | | 505,110 | 506,224 |
| Citigroup Mortgage Loan Trust, Inc., Series 2005-5, | | |
| Class 2A3 | | | |
| 5.00% due 08/25/2035 | | 343,673 | 334,759 |
| Citigroup Mortgage Loan Trust, Inc., | | | |
| Series 2006-AR1, Class 1A1 | | | |
| 4.90% due 10/25/2035 (b) | | 1,387,242 | 1,369,806 |
| Citigroup Mortgage Loan Trust, Inc., | | | |
| Series 2006-WF2, Class A2C | | | |
| 5.852% due 05/25/2036 | | 2,000,000 | 2,009,316 |
| Citigroup/Deutsche Bank Commercial Mortgage | | |
| Trust, Series 2005-CD1, Class C | | | |
| 5.3997% due 07/15/2044 (b) | | 190,000 | 186,298 |
| Citigroup/Deutsche Bank Commercial | | | |
| Mortgage Trust, Series 2005-CD1, Class A4 | | |
| 5.3997% due 07/15/2044 (b) | | 360,000 | 355,671 |
| Citigroup/Deutsche Bank Commercial Mortgage, | | |
| Series 2006-CD2, Class AM | | | |
| 5.5915% due 01/15/2046 (b) | | 1,000,000 | 998,035 |
| Citigroup/Deutsche Bank Commercial Mortgage, | | |
| Series 2006-CD2, Class X | | | |
| 0.1294% IO due 01/15/2046 (b) | | 110,577,392 | 647,829 |
| Commercial Mortgage Pass-Through Certificates, | | |
| Series 2005-C6, Class XC1 | | | |
| 0.04% IO due 06/10/2044 (b) | | 6,827,298 | 46,611 |
| Commercial Mortgage Pass-Through Certificates, | | |
| Series 2006-C7, Class A3 | | | |
| 5.9003% due 06/10/2046 (b) | | 540,000 | 551,288 |
| Commercial Mortgage Pass-Through Certificates, | | |
| Series 2006-CN2A, Class H | | | |
| 5.7556% due 02/05/2019 (b) | | 380,000 | 379,483 |
| Commercial Mortgage, Series 2003-LB1A, Class A2 | | |
| 4.084% due 06/10/2038 | | 49,859 | 46,280 |
| Commercial Mortgage, Series 2005-C6, Class B | | |
| 5.3994% due 06/10/2044 (b) | | 49,365 | 48,415 |
| Commercial Mortgage, Series 2005-C6, Class G | | |
| 5.459% due 06/10/2044 | | 25,000 | 23,886 |
| Commercial Mortgage, Series 2005-FL11, Class AJ | | |
| 5.53% due 11/15/2017 (b) | | 595,000 | 595,182 |
| Countrywide Alternative Loan Trust, | | | |
| Series 2004-24CB, Class 1A1 | | | |
| 6.00% due 11/25/2034 | | 269,906 | 268,388 |
| Countrywide Alternative Loan Trust, | | | |
| Series 2005-2, Class 1A1 | | | |
| 5.1009% due 03/25/2035 (b) | | 1,998,417 | 1,992,681 |
| Countrywide Alternative Loan Trust, | | | |
| Series 2005-J1, Class 3A1 | | | |
| 6.50% due 08/25/2032 | | 153,724 | 154,829 |
| Active Bond Fund (continued) | | |
| | | Shares or | |
| | | Principal | |
| | | Amount | Value |
|
|
| |
| COLLATERALIZED MORTGAGE | | | |
| OBLIGATIONS (continued) | | | |
| Countrywide Alternative Loan Trust, | | | |
| Series 2006-11CB, Class 3A1 | | | |
| 6.50% due 05/25/2036 | $ | 933,143 | $ | 939,308 |
| Countrywide Home Loan Mortgage Pass Through | | |
| Trust, Series 2004-HYB2, Class 4A | | | |
| 4.5341% due 07/20/2034 (b) | | 1,693,565 | 1,669,882 |
| Countrywide Home Loan Trust, Series 2005-HYB5 | | |
| 4.9162% due 09/20/2035 (b) | | 786,932 | 776,439 |
| Countrywide Home Loan Trust, Series 2005-HYB6, | | |
| Class 1A1 | | | |
| 5.0516% due 10/20/2035 (b) | | 1,302,810 | 1,295,344 |
| Countrywide Home Loans, Series 2005-6, Class 2A1 | | |
| 5.50% due 04/25/2035 | | 300,910 | 291,130 |
| Credit Suisse Mortgage Capital Certificates, | | |
| Series 2006-TFLA, Class B | | | |
| 5.56% due 04/15/2021 (b) | | 870,000 | 870,268 |
| Crown Castle Towers LLC, | | | |
| Series 2005-1A, Class AFX | | | |
| 4.643% due 06/15/2035 | | 305,000 | 298,179 |
| Crown Castle Towers LLC, Series 2005-1A, Class D | | |
| 5.612% due 06/15/2035 | | 511,000 | 509,356 |
| CS First Boston Mortgage Securities Corp., | | |
| Series 2001-CF2, Class A3 | | | |
| 6.238% due 02/15/2034 | | 17,860 | 18,000 |
| CS First Boston Mortgage Securities Corp., | | |
| Series 2001-CKN5, Class A4 | | | |
| 5.435% due 09/15/2034 | | 34,555 | 34,726 |
| CS First Boston Mortgage Securities Corp., | | |
| Series 2001-CP4, Class A4 | | | |
| 6.18% due 12/15/2035 | | 32,087 | 33,207 |
| CS First Boston Mortgage Securities Corp., | | |
| Series 2002-CKN2, Class A3 | | | |
| 6.133% due 04/15/2037 | | 19,746 | 20,483 |
| CS First Boston Mortgage Securities Corp., | | |
| Series 2004-C4, Class A4 | | | |
| 4.283% due 10/15/2039 | | 10,860 | 10,358 |
| CS First Boston Mortgage Securities Corp., | | |
| Series 2005-C1, Class AX | | | |
| 0.1002% IO due 02/15/2038 (b) | | 1,186,173 | 14,080 |
| CS First Boston Mortgage Securities Corp., | | |
| Series 2005-C1, Class F | | | |
| 4.821% due 02/15/2038 | | 20,000 | 18,609 |
| CS First Boston Mortgage Securities Corp., | | |
| Series 2005-C2, Class B | | | |
| 5.016% due 04/15/2037 (b) | | 58,053 | 55,891 |
| CS First Boston Mortgage Securities Corp., | | |
| Series 2005-C4, Class F | | | |
| 5.5716% due 08/15/2038 (b) | | 50,000 | 48,378 |
| CS First Boston Mortgage Securities Corp., | | |
| Series 2005-C4, Class G | | | |
| 5.5716% due 08/15/2038 (b) | | 40,000 | 38,439 |
| Federal Home Loan Mortgage Corp., Series 24989, | | |
| Class PE | | | |
| 6.00% due 08/15/2032 | | 405,000 | 409,718 |
| Federal Home Loan Mortgage Corp., | | | |
| Series 2003-2640, Class WA | | | |
| 3.50% due 03/15/2033 | | 107,642 | 103,235 |
The accompanying notes are an integral part of the financial statements. 183
John Hancock Funds II
Portfolio of investments — August 31, 2006
(showing percentage of total net assets)
| Active Bond Fund (continued) | | |
| | | Shares or | |
| | | Principal | |
| | | Amount | Value |
|
|
| |
| COLLATERALIZED MORTGAGE | | | |
| OBLIGATIONS (continued) | | | |
| Federal Home Loan Mortgage Corp., | | | |
| Series 2005-3019, Class MD | | | |
| 4.75% due 01/15/2031 | $ | 2,518,412 | $ | 2,481,590 |
| Federal Home Loan Mortgage Corp., | | | |
| Series 2006-3153, Class NE | | | |
| 5.50% due 05/15/2034 | | 795,000 | 778,254 |
| Federal Home Loan Mortgage Corp., | | | |
| Series 2006-3154, Class PM | | | |
| 5.50% due 05/15/2034 | | 680,000 | 663,624 |
| Federal Home Loan Mortgage Corp., | | | |
| Series 2006-3184, Class PD | | | |
| 5.50% due 07/15/2034 | | 2,320,000 | 2,273,948 |
| Federal National Mortgage Association Whole | | |
| Loan, Series 2002-W3, Class A5 | | | |
| 7.50% due 01/25/2028 | | 10,664 | 11,047 |
| Federal National Mortgage Association, | | | |
| Series 2003-18, Class EX | | | |
| 4.00% due 06/25/2017 | | 2,093,910 | 2,015,108 |
| Federal National Mortgage Association, | | | |
| Series 2003-33, Class AC | | | |
| 4.25% due 03/25/2033 | | 93,077 | 88,725 |
| Federal National Mortgage Association, | | | |
| Series 2003-49, Class JE | | | |
| 3.00% due 04/25/2033 | | 413,591 | 365,681 |
| Federal National Mortgage Association, | | | |
| Series 2003-58, Class AD | | | |
| 3.25% due 07/25/2033 | | 270,184 | 245,112 |
| Federal National Mortgage Association, | | | |
| Series 2003-63, Class PE | | | |
| 3.50% due 07/25/2033 | | 214,652 | 193,865 |
| Federal National Mortgage Association, | | | |
| Series 2006-57, Class PD | | | |
| 5.50% due 01/25/2035 | | 885,000 | 863,722 |
| Federal National Mortgage Association, | | | |
| Series 2006-64, Class PC | | | |
| 5.50% due 10/25/2034 | | 690,000 | 673,332 |
| Federal National Mortgage Association, | | | |
| Series 2006-65, Class HE | | | |
| 5.50% due 02/25/2035 | | 995,000 | 969,387 |
| Federal National Mortgage Association, | | | |
| Series 2006-67, Class PD | | | |
| 5.50% due 12/25/2034 | | 720,000 | 702,620 |
| FHLMC Structured Pass Through Securities, | | |
| Series T-41, Class 3A | | | |
| 7.50% due 07/25/2032 | | 5,513 | 5,706 |
| First Horizon Alternative Mortgage Securities, | | |
| Series 2004-AA2, Class 2A1 | | | |
| 5.0044% due 08/25/2034 (b) | | 1,760,693 | 1,747,201 |
| First Horizon Alternative Mortgage Securities, | | |
| Series 2004-AA5, Class B1 | | | |
| 5.2331% due 12/25/2034 (b) | | 152,507 | 150,657 |
| First Horizon Alternative Mortgage Securities, | | |
| Series 2006-AA2, Class B1 | | | |
| 6.239% due 05/25/2036 (b) | | 199,901 | 201,763 |
| First Union National Bank Commercial Mortgage | | |
| Trust, Series 2001-C2, Class A1 | | | |
| 6.204% due 01/12/2043 | | 30,385 | 30,664 |
| Active Bond Fund (continued) | | |
| | | Shares or | |
| | | Principal | |
| | | Amount | Value |
|
|
| |
| COLLATERALIZED MORTGAGE | | | |
| OBLIGATIONS (continued) | | | |
| First Union National Bank Commercial Mortgage | | |
| Trust, Series 2002-C1, Class A1 | | | |
| 5.585% due 02/12/2034 | $ | 12,385 | $ | 12,455 |
| GE Capital Commercial Mortgage Corp., | | | |
| Series 2001-3, Class A2 | | | |
| 6.07% due 06/10/2038 | | 22,214 | 22,980 |
| GE Capital Commercial Mortgage Corp., | | | |
| Series 2002-2A, Class A3 | | | |
| 5.349% due 08/11/2036 | | 14,809 | 14,818 |
| GE Capital Commercial Mortgage Corp., | | | |
| Series 2005-C1, Class XC | | | |
| 0.0939% IO due 06/10/2048 (b) | | 1,728,308 | 22,590 |
| GE Capital Commercial Mortgage Corp., | | | |
| Series 2005-C2, Class C | | | |
| 5.133% due 05/10/2043 (b) | | 43,737 | 42,488 |
| GE Capital Commercial Mortgage Corp., | | | |
| Series 2005-C4, Class H | | | |
| 5.5114% due 11/10/2045 (b) | | 450,000 | 430,610 |
| Global Signal Trust, Series 2004-2A, Class D | | |
| 5.093% due 12/15/2014 | | 295,000 | 290,969 |
| Global Signal Trust, Series 2006-1, Class E | | |
| 6.495% due 02/15/2036 | | 367,000 | 371,257 |
| GMAC Commercial Mortgage Securities, Inc., | | |
| Series 2001-C1, Class A1 | | | |
| 5.988% due 04/15/2034 | | 38,878 | 38,889 |
| GMAC Commercial Mortgage Securities, Inc., | | |
| Series 2002-C1, Class A1 | | | |
| 5.785% due 11/15/2039 | | 244,333 | 246,513 |
| GMAC Commercial Mortgage Securities, Inc., | | |
| Series 2006-C1, Class AJ | | | |
| 5.349% due 11/10/2045 (b) | | 945,000 | 927,097 |
| GMAC Mortgage Corp. Loan Trust, | | | |
| Series 2006-AR1, Class 2A1 | | | |
| 5.6532% due 04/19/2036 (b) | | 347,899 | 347,408 |
| Government National Mortgage Association, | | |
| Series 2003-42, Class XA | | | |
| 3.75% due 05/16/2033 | | 5,152 | 4,797 |
| Greenwich Capital Commercial Funding Corp., | | |
| Series 2002-C1, Class A2 | | | |
| 4.112% due 01/11/2017 | | 43,890 | 42,762 |
| Greenwich Capital Commercial Funding Corp., | | |
| Series 2003-C2, Class A2 | | | |
| 4.022% due 01/05/2036 | | 50,000 | 48,550 |
| Greenwich Capital Commercial Funding Corp., | | |
| Series 2005-GG5, Class A2 | | | |
| 5.117% due 04/10/2037 | | 705,000 | 701,052 |
| Greenwich Capital Commercial Funding Corp., | | |
| Series 2006-GG7, Class A4 | | | |
| 6.1101% due 07/10/2038 (b) | | 735,000 | 762,402 |
| GS Mortgage Securities Corp. II, Series 2005-GG4, | | |
| Class E | | | |
| 5.078% due 07/10/2039 (b) | | 52,919 | 50,645 |
| GS Mortgage Securities Corp. II, Series 2005-GG4, | | |
| Class XC | | | |
| 0.1089% IO due 07/10/2039 (b) | | 2,091,132 | 41,349 |
The accompanying notes are an integral part of the financial statements. 184
John Hancock Funds II
Portfolio of investments — August 31, 2006
(showing percentage of total net assets)
| Active Bond Fund (continued) | | |
| | | Shares or | |
| | | Principal | |
| | | Amount | Value |
|
|
| |
| COLLATERALIZED MORTGAGE | | | |
| OBLIGATIONS (continued) | | | |
| GS Mortgage Securities Corp. II, Series 2006-GG6, | | |
| Class AM | | | |
| 5.622% due 04/10/2038 (b) | $ | 1,350,000 | $ | 1,360,777 |
| GSR Mortgage Loan Trust, Series 2004-14, | | |
| Class 3A2 | | | |
| 4.58% due 12/25/2034 (b) | | 1,483,643 | 1,465,967 |
| GSR Mortgage Loan Trust, Series 2004-9, Class B1 | | |
| 4.5716% due 08/25/2034 (b) | | 374,731 | 367,525 |
| GSR Mortgage Loan Trust, Series 2006-AR1, | | |
| Class 3A1 | | | |
| 5.4193% due 01/25/2036 (b) | | 895,946 | 887,851 |
| Harborview NIM Corp., Series 2006-BU1, Class N1 | | |
| 5.93% due 02/20/2046 | | 366,073 | 366,101 |
| IndyMac Index Mortgage Loan Trust, | | | |
| Series 2004-AR13, Class B1 | | | |
| 5.296% due 01/25/2035 | | 269,174 | 268,307 |
| IndyMac Index Mortgage Loan Trust, | | | |
| Series 2005-AR5, Class B1 | | | |
| 5.399% due 05/25/2035 (b) | | 134,409 | 135,851 |
| IndyMac Index Mortgage Loan Trust, | | | |
| Series 2006-AR19, Class 1B1 | | | |
| 6.4484% due 08/25/2036 (b) | | 299,491 | 299,246 |
| JP Morgan Chase Commercial Mortgage Securities | | |
| Corp., Series 2006-LDP7, Class A4 | | | |
| 6.0658% due 04/15/2045 (b) | | 490,000 | 507,258 |
| JPMorgan Chase Commercial Mortgage Securities | | |
| Corp., Series 2002-C1, Class A3 | | | |
| 5.376% due 07/12/2037 | | 51,734 | 51,846 |
| JPMorgan Chase Commercial Mortgage Securities | | |
| Corp., Series 2004-CBX, Class A2 | | | |
| 3.89% due 01/12/2037 | | 14,809 | 14,422 |
| JPMorgan Chase Commercial Mortgage Securities | | |
| Corp., Series 2005-LDP3, Class A4B | | | |
| 4.996% due 08/15/2042 (b) | | 515,000 | 496,566 |
| JPMorgan Chase Commercial Mortgage Securities | | |
| Corp., Series 2005-LDP4, Class B | | | |
| 5.129% due 10/15/2042 (b) | | 145,000 | 140,524 |
| JPMorgan Chase Commercial Mortgage Securities | | |
| Corp., Series 2006-LDP6, Class X1 | | | |
| 0.0400% IO due 04/15/2043 (b) | | 82,143,403 | 439,755 |
| JPMorgan Mortgage Trust, Series 2005-S2, | | |
| Class 2A16 | | | |
| 6.50% due 09/25/2035 | | 281,153 | 285,665 |
| JPMorgan Mortgage Trust, Series 2005-S3, | | |
| Class 2A2 | | | |
| 5.50% due 01/25/2021 | | 571,361 | 565,290 |
| LB-UBS Commercial Mortgage Trust, | | | |
| Series 2002-C1,Class A4 | | | |
| 6.462% due 03/15/2031 | | 29,619 | 31,183 |
| LB-UBS Commercial Mortgage Trust, | | | |
| Series 2005-C1, Class XCL | | | |
| 0.1548% IO due 02/15/2040 (b) | | 743,616 | 15,888 |
| LB-UBS Commercial Mortgage Trust, | | | |
| Series 2005-C3, Class AJ | | | |
| 4.843% due 07/15/2040 | | 40,874 | 38,969 |
| Active Bond Fund (continued) | | |
| | | Shares or | |
| | | Principal | |
| | | Amount | Value |
|
|
| |
| COLLATERALIZED MORTGAGE | | | |
| OBLIGATIONS (continued) | | | |
| LB-UBS Commercial Mortgage Trust, | | | |
| Series 2005-C3, Class G | | | |
| 5.111% due 07/15/2040 (b) | $ | 25,472 | $ | 24,411 |
| LB-UBS Commercial Mortgage Trust, | | | |
| Series 2005-C5, Class A2 | | | |
| 4.885% due 09/15/2040 | | 58,053 | 57,404 |
| LB-UBS Commercial Mortgage Trust, | | | |
| Series 2006-C4, Class A4 | | | |
| 6.0977% due 06/15/2038 (b) | | 575,000 | 593,751 |
| Mastr Adjustable Rate Mortgages Trust, | | | |
| Series 2004-13, Class 2A1 | | | |
| 3.817% due 04/21/2034 (b) | | 1,962,460 | 1,909,427 |
| Mastr Adjustable Rate Mortgages Trust, | | | |
| Series 2004-8, Class 5A1 | | | |
| 4.664% due 08/25/2034 (b) | | 1,029,143 | 1,014,603 |
| Mastr Adjustable Rate Mortgages Trust, | | | |
| Series 2005-2, Class 2A1 | | | |
| 5.1333% due 03/25/2035 (b) | | 2,227,021 | 2,217,889 |
| Mastr Adjustable Rate Mortgages Trust, | | | |
| Series 2006-2, Class 4A1 | | | |
| 4.9891% due 02/25/2036 (b) | | 755,390 | 745,151 |
| Merrill Lynch Mortgage Trust, Series 2006-C2, | | |
| Class X | | | |
| 5.87% IO due 08/12/2026 | | 15,784,187 | 495,000 |
| Merrill Lynch Mortgage Trust, Series 2004-BPB1, | | |
| Class XC | | | |
| 0.058% IO due 09/12/2041 | | 491,045 | 9,733 |
| Merrill Lynch Mortgage Trust, | | | |
| Series 2004-KEY2, Class A4 | | | |
| 4.864% due 08/12/2039 (b) | | 31,988 | 30,654 |
| Merrill Lynch Mortgage Trust, Series 2005-CIP1, | | |
| Class XC | | | |
| 0.041% IO due 07/12/2038 | | 5,570,641 | 36,220 |
| Merrill Lynch Mortgage Trust, Series 2005-CKI1, | | |
| Class A6 | | | |
| 5.4172% due 11/12/2037 (b) | | 435,000 | 430,079 |
| Merrill Lynch Mortgage Trust, Series 2006-C1, | | |
| Class AM | | | |
| 5.8442% due 05/12/2039 (b) | | 1,000,000 | 1,016,880 |
| Merrill Lynch/Countrywide Commercial Mortgage | | |
| Trust, Series 2006-2, Class A4 | | | |
| 6.105% due 06/12/2046 (b) | | 785,000 | 813,602 |
| Morgan Stanley Capital I, Series 2004-T13, Class A2 | | |
| 3.94% due 09/13/2045 | | 27,150 | 26,090 |
| Morgan Stanley Capital I, Series 2005-HQ7, | | |
| Class A2 | | | |
| 5.3752% due 11/14/2042 (b) | | 415,000 | 412,193 |
| Morgan Stanley Capital I, Series 2005-HQ7, | | |
| Class A4 | | | |
| 5.3752% due 11/14/2042 (b) | | 415,000 | 409,355 |
| Morgan Stanley Capital I, Series 2005-IQ10, | | |
| Class A4A | | | |
| 5.23% due 09/15/2042 (b) | | 675,000 | 663,282 |
| Morgan Stanley Capital I, Series 2005-IQ9, Class X1 | | |
| 0.123% IO due 07/15/2056 (b) | | 690,081 | 19,983 |
| Morgan Stanley Capital I, Series 2005-T17, Class X1 | | |
| 0.1012% IO due 12/13/2041 (b) | | 1,482,541 | 22,458 |
The accompanying notes are an integral part of the financial statements. 185
John Hancock Funds II
Portfolio of investments — August 31, 2006
(showing percentage of total net assets)
| Active Bond Fund (continued) | | |
| | | Shares or | |
| | | Principal | |
| | | Amount | Value |
|
|
| |
| COLLATERALIZED MORTGAGE | | | |
| OBLIGATIONS (continued) | | | |
| Morgan Stanley Capital I, Series 2006-HQ8, Class X | | |
| 0.1081% IO due 03/12/2044 (b) | $ | 113,000,000 | $ | 582,594 |
| Morgan Stanley Capital I, Series 2006-HQ9, Class X | | |
| 0.395% IO due 07/20/2044 (b) | | 53,857,143 | 1,001,312 |
| Morgan Stanley Capital I, Series 2006-T21, Class X | | |
| 0.2748% IO due 10/12/2052 (b) | | 20,476,520 | 291,921 |
| Morgan Stanley Capital I, Series 2006-T23, Class A4 | | |
| 5.983% due 08/12/2041 | | 455,000 | 469,483 |
| Nomura Asset Acceptance Corp., | | | |
| Series 2006-AF1, Class CB1 | | | |
| 6.539% due 06/25/2036 (b) | | 304,943 | 311,440 |
| Nomura Asset Acceptance Corp., | | | |
| Series 2006-AF2, Class 4A | | | |
| 6.7384% due 08/25/2036 (b) | | 675,400 | 685,109 |
| Provident Funding Mortgage Loan Trust, | | | |
| Series 2005-1, Class B1 | | | |
| 4.3636% due 05/25/2035 (b) | | 317,694 | 309,381 |
| Residential Accredit Loans, Inc., | | | |
| Series 2005-QA12, Class NB5 | | | |
| 5.9897% due 12/25/2035 (b) | | 512,035 | 518,170 |
| Residential Accredit Loans, Inc., Series 2006-QA1, | | |
| Class A31 | | | |
| 6.2832% due 01/25/2036 (b) | | 20,091 | 20,327 |
| Residential Asset Securitization Trust, | | | |
| Series 2006-A7CB, Class 2A1 | | | |
| 6.50% due 07/25/2036 | | 724,439 | 729,327 |
| Salomon Brothers Mortgage Securities VII, | | |
| Series 2000-C3, Class A2 | | | |
| 6.592% due 12/18/2033 | | 12,045 | 12,553 |
| Salomon Brothers Mortgage Securities VII, | | |
| Series 2001-C1, Class A2 | | | |
| 6.226% due 12/18/2035 | | 7,796 | 7,836 |
| Salomon Brothers Mortgage Securities VII, | | |
| Series 2001-C1, Class A3 | | | |
| 6.428% due 12/18/2035 | | 24,682 | 25,661 |
| SBA CMBS Trust, Series 2005-1A, Class A | | |
| 5.369% due 11/15/2035 | | 200,000 | 199,736 |
| SBA CMBS Trust, Series 2005-1A, Class B | | |
| 5.565% due 11/15/2035 | | 200,000 | 200,336 |
| SBA CMBS Trust, Series 2005-1A, Class C | | |
| 5.731% due 11/15/2035 | | 397,000 | 398,104 |
| SBA CMBS Trust, Series 2005-1A, Class D | | |
| 6.219% due 11/15/2035 | | 100,000 | 100,790 |
| SBA CMBS Trust, Series 2005-1A, Class E | | |
| 6.706% due 11/15/2035 | | 110,000 | 111,868 |
| Sequoia Mortgage Trust, Series 2005-3, Class A1 | | |
| 5.525% due 05/20/2035 (b) | | 13,032 | 13,036 |
| Wachovia Bank Commercial Mortgage Trust, | | |
| Series 2006-C27, Class XC | | | |
| 0.061% IO due 07/15/2045 (b) | | 51,503,486 | 508,499 |
| Wachovia Bank Commercial Mortgage Trust, | | |
| Series 2004-C10, Class A3 | | | |
| 4.39% due 02/15/2041 | | 39,492 | 37,855 |
| Wachovia Bank Commercial Mortgage Trust, | | |
| Series 2005-C17, Class XC | | | |
| 0.0635% IO due 03/15/2042 (b) | | 998,401 | 9,141 |
| Active Bond Fund (continued) | | |
| | | Shares or | |
| | | Principal | |
| | | Amount | Value |
|
|
| |
| COLLATERALIZED MORTGAGE | | | |
| OBLIGATIONS (continued) | | | |
| Wachovia Bank Commercial Mortgage Trust, | | |
| Series 2005-C19, Class A5 | | | |
| 4.661% due 05/15/2044 | $ | 66,742 | $ | 64,252 |
| Wachovia Bank Commercial Mortgage Trust, | | |
| Series 2005-C19, Class AJ | | | |
| 4.793% due 05/15/2044 | | 37,517 | 35,538 |
| Wachovia Bank Commercial Mortgage Trust, | | |
| Series 2006-C24, Class XC | | | |
| 0.0476% IO due 03/15/2045 (b) | | 158,190,235 | 871,154 |
| Washington Mutual Alternative Mortgage | | | |
| Pass-Through Certificates, Series 2006-7, Class | | |
| A3 | | | |
| 6.081% due 09/25/2036 | | 1,350,000 | 1,344,938 |
| Washington Mutual Alternative Mortgage | | | |
| Pass-Through Certificates, Series 2005-6, | | |
| Class 1CB | | | |
| 6.50% due 08/25/2035 | | 365,388 | 367,900 |
| Washington Mutual, Inc., Series 2005-1, Class 6A1 | | |
| 6.50% due 03/25/2035 | | 20,715 | 20,882 |
| Washington Mutual, Inc., Series 2005-AR12, | | |
| Class 1A8 | | | |
| 4.8398% due 10/25/2035 (b) | | 1,436,978 | 1,416,797 |
| Wells Fargo Mortgage Backed Securities Trust, | | |
| Series 2004-7, Class 2A2 | | | |
| 5.00% due 07/25/2019 | | 351,225 | 342,335 |
| Wells Fargo Mortgage Backed Securities Trust, | | |
| Series 2005-AR16, Class 2A1 | | | |
| 4.9454% due 10/25/2035 (b) | | 3,637,682 | 3,617,094 |
|
| TOTAL COLLATERALIZED MORTGAGE OBLIGATIONS | |
| (Cost $84,484,596) | | | $ | 84,603,467 |
|
| |
| ASSET BACKED SECURITIES - 3.04% | | |
| Amresco Residential Securities Mortgage Loan | | |
| Trust, Series 1998-1, Class A6 | | | |
| 6.51% due 08/25/2027 | | 3,043 | 3,049 |
| Argent Securities, Inc., Series 2004-W1, Class M3 | | |
| 6.7744% due 03/25/2034 (b) | | 31,593 | 31,941 |
| California Infrastructure Development PG&E-1, | | |
| Series 1997-1, Class A7 | | | |
| 6.42% due 09/25/2008 | | 1,076 | 1,077 |
| Capital Trust Re CDO, Ltd., Series 2005-1A, Class B | | |
| 5.795% due 03/20/2050 (b) | | 400,000 | 400,422 |
| Countrywide Asset-Backed Certificates, | | | |
| Series 2004-10, Class AF3 | | | |
| 3.842% due 10/25/2030 (b) | | 17,620 | 17,482 |
| Countrywide Asset-Backed Certificates, | | | |
| Series 2004-12, Class 2AV2 | | | |
| 5.6044% due 09/25/2033 (b) | | 9,073 | 9,078 |
| Credit-Based Asset Servicing and Securitization, | | |
| Series 2006-MH1, Class B1 | | | |
| 6.25% due 09/25/2036 | | 460,000 | 408,510 |
| Credit-Based Asset Servicing and Securitization, | | |
| Series 2005-CB8, Class AF2 | | | |
| 5.303% due 12/25/2035 | | 1,000,000 | 993,438 |
| Credit-Based Asset Servicing and Securitization, | | |
| Series 2006-CB2, Class AF2 | | | |
| 5.501% due 12/25/2036 | | 1,250,000 | 1,245,704 |
The accompanying notes are an integral part of the financial statements. 186
John Hancock Funds II
Portfolio of investments — August 31, 2006
(showing percentage of total net assets)
| Active Bond Fund (continued) | | |
| | | Shares or | |
| | | Principal | |
| | | Amount | Value |
|
|
| |
| ASSET BACKED SECURITIES | | | |
| (continued) | | | |
| DB Master Finance LLC, Series 2006-1, Class-A2 | | |
| 5.779% due 06/20/2031 | $ | 1,205,000 | $ | 1,218,970 |
| DB Master Finance LLC, Series 2006-1, Class-M1 | | |
| 8.285% due 06/20/2031 | | 125,000 | 127,249 |
| Equity One ABS, Inc., Series 2004-2, Class AV2 | | |
| 5.5744% due 07/25/2034 (b) | | 1,874 | 1,877 |
| GSAA Home Equity Trust, Series 2006-10, | | |
| Class AF3 | | | |
| 5.9846% due 06/25/2036 (b) | | 1,000,000 | 1,009,375 |
| Home Equity Asset Trust, Series 2006-3N, Class A | | |
| 5.50% due 08/27/2036 | | 924,829 | 918,502 |
| Home Equity Mortgage Trust, | | | |
| Series 2005-3, Class A1 | | | |
| 5.5644% due 11/25/2035 (b) | | 32,358 | 32,375 |
| LNR CDO Ltd, Series 2006-1A, Class BFL | | |
| 5.8781% due 05/28/2043 (b) | | 700,000 | 700,000 |
| Morgan Stanley ABS Capital I, | | | |
| Series 2004-OP1, Class A2B | | | |
| 5.6144% due 11/25/2034 (b) | | 13,932 | 13,941 |
| Newcastle CDO, Ltd., Series 2005-7A, Class 2FL | | |
| 4.72% due 12/25/2050 | | 570,000 | 570,228 |
| N-Star Real Estate CDO, Ltd. | | | |
| 5.7044% due 06/22/2051 (b) | | 900,000 | 900,000 |
| Ownit Mortgage Loan, Series 2006-1, Class AF2 | | |
| 5.29 due 12/25/2036 | | 1,050,000 | 1,043,110 |
| Ownit Mortgage Loan, Series 2006-2, Class A2B | | |
| 5.6329 due 01/25/2037 (b) | | 1,000,000 | 1,000,313 |
| Popular ABS Mortgage Pass-Through Trust, | | |
| Series 2005-4, Class AF3 | | | |
| 4.982% due 09/25/2035 (b) | | 65,162 | 64,451 |
| Popular ABS Mortgage Pass-Through Trust, | | |
| Series 2005-6, Class A2 | | | |
| 5.35% due 01/25/2036 (b) | | 900,000 | 897,059 |
| Renaissance Home Equity Loan Trust, | | | |
| Series 2005-2, Class AF3 | | | |
| 4.499% due 08/25/2035 | | 210,000 | 206,514 |
| Renaissance Home Equity Loan Trust, | | | |
| Series 2005-2, Class AF4 | | | |
| 4.934% due 08/25/2035 | | 230,000 | 225,169 |
| Renaissance Home Equity Loan Trust, | | | |
| Series 2005-4, Class A2 | | | |
| 5.399% due 02/25/2036 | | 1,000,000 | 994,060 |
| Residential Accredit Loans, Inc., | | | |
| Series 2004-QS16, Class 1A1 | | | |
| 5.50% due 12/25/2034 | | 27,019 | 26,769 |
| Sail Net Interest Margin Notes, Series 2005-6A, | | |
| Class A | | | |
| 4.75% due 07/27/2035 | | 94,404 | 94,048 |
| Specialty Underwriting & Residential Finance, | | |
| Series 2003-BC4, Class A3B | | | |
| 4.788% due 11/25/2034 | | 23,608 | 23,377 |
| Specialty Underwriting & Residential Finance, | | |
| Series 2004-BC4, Class A2B | | | |
| 5.6344% due 10/25/2035 (b) | | 25,684 | 25,728 |
| Structured Asset Investment Loan Trust, | | | |
| Series 2004-8, Class A13 | | | |
| 5.6244% due 09/25/2034 (b) | | 2,836 | 2,836 |
| Active Bond Fund (continued) | | |
| | | Shares or | |
| | | Principal | |
| | | Amount | Value |
|
|
| |
| ASSET BACKED SECURITIES | | | |
| (continued) | | | |
| Structured Asset Investment Loan Trust, | | | |
| Series 2004-8, Class A7 | | | |
| 5.6244% due 09/25/2034 (b) | $ | 8,095 | $ | 8,098 |
| Wells Fargo Home Equity Trust, | | | |
| Series 2004-2, Class AI5 | | | |
| 4.89% due 11/25/2028 (b) | | 49,000 | 47,819 |
|
| TOTAL ASSET BACKED SECURITIES | | | |
| (Cost $13,259,441) | | | $ | 13,262,569 |
|
| |
| SUPRANATIONAL OBLIGATIONS - 0.05% | | |
| Honduras - 0.00% | | | |
| Central American Bank for Economic Integration | | |
| 6.75% due 04/15/2013 | | 12,000 | 12,497 |
| Venezuela - 0.05% | | | |
| Corporacion Andina de Fomento | | | |
| 5.20% due 05/21/2013 | | 214,000 | 208,421 |
| Corporacion Andina de Fomento, Series EXCH | | | |
| 6.875% due 03/15/2012 | | 20,000 | 21,117 |
|
|
| | | | 229,538 |
|
| |
| TOTAL SUPRANATIONAL OBLIGATIONS | | | |
| (Cost $249,239) | | | $ | 242,035 |
|
| |
| SHORT TERM INVESTMENTS - 35.77% | | | |
| Federal National Mortgage Association | | | |
| Discount Notes | | | |
| zero coupon due 09/13/2006 to | | | |
| 09/18/2006 | $ | 71,000,000 | $ | 70,872,311 |
| State Street Global Advisers Funds (c) | | 1,904,792 | 1,904,792 |
| State Street Navigator Securities Lending | | | |
| Prime Portfolio (c) | | 83,363,396 | 83,363,396 |
|
| TOTAL SHORT TERM INVESTMENTS | | | |
| (Cost $155,843,223) | | | $ | 156,140,499 |
|
| |
| REPURCHASE AGREEMENTS - 1.57% | | | |
| Repurchase Agreement with State | | | |
| Street Corp. dated 08/31/2006 at | | | |
| 3.95% to be repurchased at | | | |
| $6,881,755 on 9/1/2006, | | | |
| collateralized by $7,210,000 | | | |
| Federal National Mortgage | | | |
| Association, 4.25% due | | | |
| 08/15/2010 (valued at $7,020,738, | | | |
| including interest) (c) | $ | 6,881,000 | $ | 6,881,000 |
|
| TOTAL REPURCHASE AGREEMENTS | | | |
| (Cost $6,881,000) | | | $ | 6,881,000 |
|
| Total Investments (Active Bond Fund) | | | |
| (Cost $592,300,056) - 135.83% | | | $ | 592,970,383 |
| Liabilities in Excess of Other Assets - (35.83)% | | (156,415,340) |
|
|
| TOTAL NET ASSETS - 100.00% | | | $ | 436,555,043 |
|
|
The accompanying notes are an integral part of the financial statements. 187
John Hancock Funds II
Portfolio of investments — August 31, 2006
(showing percentage of total net assets)
| All Cap Core Fund | | | |
| | Shares or | | |
| | Principal | | |
| | Amount | | Value |
|
|
| |
| COMMON STOCKS - 88.47% | | | |
| Aerospace - 3.22% | | | |
| Boeing Company | 56,400 | $ | 4,224,360 |
| Lockheed Martin Corp. | 50,500 | | 4,171,300 |
| Raytheon Company | 16,000 | | 755,360 |
|
|
| | | | 9,151,020 |
| Air Travel - 0.48% | | | |
| Continental Airlines, Inc., Class B * (a) | 54,500 | | 1,367,405 |
| Apparel & Textiles - 0.96% | | | |
| Jones Apparel Group, Inc. | 49,300 | | 1,543,090 |
| Kellwood Company (a) | 21,200 | | 581,092 |
| The Gymboree Corp. * | 18,300 | | 613,965 |
|
|
| | | | 2,738,147 |
| Automobiles - 1.03% | | | |
| PACCAR, Inc. (a) | 53,550 | | 2,927,579 |
| Banking - 5.31% | | | |
| Bank of America Corp. | 152,600 | | 7,854,322 |
| KeyCorp | 23,600 | | 868,244 |
| National City Corp. | 200 | | 6,916 |
| US Bancorp | 46,900 | | 1,504,083 |
| Wells Fargo Company | 139,200 | | 4,837,200 |
|
|
| | | | 15,070,765 |
| Biotechnology - 0.34% | | | |
| Abraxis BioScience, Inc. * (a) | 28,000 | | 696,640 |
| Digene Corp. * | 6,700 | | 279,055 |
|
|
| | | | 975,695 |
| Broadcasting - 0.53% | | | |
| Clear Channel Communications, Inc. | 51,500 | | 1,495,560 |
| Business Services - 1.89% | | | |
| Acxiom Corp. | 17,600 | | 427,504 |
| Computer Sciences Corp. * | 55,800 | | 2,643,804 |
| Robert Half International, Inc. | 74,200 | | 2,295,748 |
|
|
| | | | 5,367,056 |
| Cable and Television - 1.32% | | | |
| DIRECTV Group, Inc. * | 199,500 | | 3,748,605 |
| Cellular Communications - 0.25% | | | |
| Telephone & Data Systems, Inc. | 17,100 | | 725,211 |
| Chemicals - 1.51% | | | |
| Celanese Corp., Series A | 84,600 | | 1,564,254 |
| Lyondell Chemical Company | 105,200 | | 2,733,096 |
|
|
| | | | 4,297,350 |
| Computers & Business Equipment - 4.19% | | | |
| Cisco Systems, Inc. * | 74,400 | | 1,636,056 |
| Dell, Inc. * | 83,500 | | 1,882,925 |
| Hewlett-Packard Company | 115,800 | | 4,233,648 |
| Lexmark International, Inc. * | 40,800 | | 2,287,656 |
| Plexus Corp. * | 8,100 | | 160,542 |
| Western Digital Corp. * | 92,200 | | 1,687,260 |
|
|
| | | | 11,888,087 |
| Cosmetics & Toiletries - 0.97% | | | |
| Colgate-Palmolive Company | 44,600 | | 2,669,756 |
| All Cap Core Fund (continued) | | | |
| | Shares or | | |
| | Principal | | |
| | Amount | | Value |
|
|
| |
| COMMON STOCKS (continued) | | | |
| Cosmetics & Toiletries (continued) | | | |
| Procter & Gamble Company | 1,200 | $ | 74,280 |
|
|
| | | | 2,744,036 |
| Crude Petroleum & Natural Gas - 1.45% | | | |
| Penn Virginia Corp. | 2,800 | | 198,772 |
| Unit Corp. * | 39,300 | | 2,071,503 |
| XTO Energy, Inc. | 40,300 | | 1,844,531 |
|
|
| | | | 4,114,806 |
| Electrical Equipment - 0.36% | | | |
| Wesco International, Inc. * | 17,500 | | 1,023,750 |
| Electrical Utilities - 3.05% | | | |
| Entergy Corp. | 13,200 | | 1,024,980 |
| Exelon Corp. | 71,500 | | 4,360,070 |
| FirstEnergy Corp. | 57,300 | | 3,269,538 |
|
|
| | | | 8,654,588 |
| Electronics - 0.32% | | | |
| Zoran Corp. * | 51,800 | | 923,076 |
| Financial Services - 6.51% | | | |
| Bear Stearns Companies, Inc. | 7,600 | | 990,660 |
| Capital One Financial Corp. | 31,700 | | 2,317,270 |
| Citigroup, Inc. | 72,800 | | 3,592,680 |
| Goldman Sachs Group, Inc. | 27,900 | | 4,147,335 |
| JPMorgan Chase & Company | 141,000 | | 6,438,060 |
| Lehman Brothers Holdings, Inc. | 15,700 | | 1,001,817 |
|
|
| | | | 18,487,822 |
| Food & Beverages - 4.98% | | | |
| General Mills, Inc. | 58,800 | | 3,188,724 |
| H.J. Heinz Company | 3,800 | | 158,992 |
| Pepsi Bottling Group, Inc. | 91,000 | | 3,185,910 |
| PepsiCo, Inc. | 85,800 | | 5,601,024 |
| Starbucks Corp. * | 64,600 | | 2,003,246 |
|
|
| | | | 14,137,896 |
| Furniture & Fixtures - 0.63% | | | |
| Leggett & Platt, Inc. | 77,200 | | 1,779,460 |
| Healthcare Products - 0.71% | | | |
| Dade Behring Holdings, Inc. | 5,500 | | 222,695 |
| Johnson & Johnson | 2,200 | | 142,252 |
| Kyphon, Inc. * (a) | 26,900 | | 974,049 |
| LCA-Vision, Inc. (a) | 15,300 | | 673,659 |
|
|
| | | | 2,012,655 |
| Healthcare Services - 4.25% | | | |
| Coventry Health Care, Inc. * | 47,600 | | 2,581,824 |
| Humana, Inc. * | 42,400 | | 2,583,432 |
| McKesson Corp. | 60,500 | | 3,073,400 |
| Odyssey Healthcare, Inc. * | 11,000 | | 176,440 |
| Wellpoint, Inc. * | 47,100 | | 3,646,011 |
|
|
| | | | 12,061,107 |
| Holdings Companies/Conglomerates - 1.00% | | | |
| General Electric Company | 83,500 | | 2,844,010 |
The accompanying notes are an integral part of the financial statements. 188
John Hancock Funds II
Portfolio of investments — August 31, 2006
(showing percentage of total net assets)
| All Cap Core Fund (continued) | | | |
| | Shares or | | |
| | Principal | | |
| | Amount | | Value |
|
|
| |
| COMMON STOCKS (continued) | | | |
| Homebuilders - 0.16% | | | |
| Meritage Homes Corp. * (a) | 10,900 | $ | 446,355 |
| Hotels & Restaurants - 0.83% | | | |
| Brinker International, Inc. | 26,200 | | 1,007,914 |
| Darden Restaurants, Inc. | 14,700 | | 520,380 |
| Yum! Brands, Inc. | 17,100 | | 835,848 |
|
|
| | | | 2,364,142 |
| Household Appliances - 0.45% | | | |
| The Toro Company | 31,800 | | 1,272,318 |
| Industrial Machinery - 1.06% | | | |
| Caterpillar, Inc. | 45,200 | | 2,999,020 |
| Insurance - 2.77% | | | |
| AFLAC, Inc. | 10,500 | | 473,235 |
| American Financial Group, Inc. | 20,300 | | 948,416 |
| CNA Financial Corp. * | 52,800 | | 1,830,576 |
| HCC Insurance Holdings, Inc. | 16,000 | | 519,840 |
| MetLife, Inc. | 6,000 | | 330,180 |
| Philadelphia Consolidated Holding Corp. * | 30,500 | | 1,102,880 |
| W.R. Berkley Corp. | 76,100 | | 2,663,500 |
|
|
| | | | 7,868,627 |
| International Oil - 2.31% | | | |
| Anadarko Petroleum Corp. | 64,000 | | 3,002,240 |
| ChevronTexaco Corp. | 46,600 | | 3,001,040 |
| Hess Corp. | 12,500 | | 572,250 |
|
|
| | | | 6,575,530 |
| Internet Retail - 0.31% | | | |
| eBay, Inc. * | 31,600 | | 880,376 |
| Internet Service Provider - 0.60% | | | |
| Google, Inc., Class A * | 2,800 | | 1,059,884 |
| Yahoo!, Inc. * | 22,500 | | 648,450 |
|
|
| | | | 1,708,334 |
| Internet Software - 0.31% | | | |
| Symantec Corp. * | 47,300 | | 881,672 |
| Leisure Time - 1.36% | | | |
| Walt Disney Company | 130,700 | | 3,875,255 |
| Manufacturing - 0.31% | | | |
| Danaher Corp. | 13,400 | | 888,286 |
| Medical-Hospitals - 0.06% | | | |
| Manor Care, Inc. | 3,200 | | 167,040 |
| Metal & Metal Products - 1.12% | | | |
| Reliance Steel & Aluminum Company | 62,900 | | 2,061,233 |
| Southern Copper Corp. (a) | 12,100 | | 1,117,072 |
|
|
| | | | 3,178,305 |
| Mining - 0.22% | | | |
| Compass Minerals International, Inc. (a) | 11,900 | | 318,087 |
| Stillwater Mining Company * (a) | 31,600 | | 297,988 |
|
|
| | | | 616,075 |
| Office Furnishings & Supplies - 0.90% | | | |
| Office Depot, Inc. * | 69,700 | | 2,567,748 |
| All Cap Core Fund (continued) | | | |
| | Shares or | | |
| | Principal | | |
| | Amount | | Value |
|
|
| |
| COMMON STOCKS (continued) | | | |
| Petroleum Services - 4.53% | | | |
| Exxon Mobil Corp. | 153,000 | $ | 10,353,510 |
| Valero Energy Corp. | 44,000 | | 2,525,600 |
|
|
| | | | 12,879,110 |
| Pharmaceuticals - 8.16% | | | |
| Abbott Laboratories | 92,300 | | 4,495,010 |
| Alkermes, Inc. * | 58,700 | | 959,745 |
| AmerisourceBergen Corp. | 65,100 | | 2,874,816 |
| Endo Pharmaceutical Holdings, Inc. * | 35,600 | | 1,175,868 |
| Hospira, Inc. * | 57,600 | | 2,109,888 |
| Merck & Company, Inc. | 45,600 | | 1,849,080 |
| Mylan Laboratories, Inc. | 114,000 | | 2,316,480 |
| Pfizer, Inc. | 236,400 | | 6,515,184 |
| Valeant Pharmaceuticals International (a) | 44,200 | | 868,972 |
|
|
| | | | 23,165,043 |
| Publishing - 0.65% | | | |
| McGraw-Hill Companies, Inc. | 33,000 | | 1,845,030 |
| Real Estate - 1.77% | | | |
| Equity Office Properties Trust, REIT | 18,700 | | 693,583 |
| Equity Residential, REIT | 15,200 | | 758,024 |
| Health Care REIT, Inc. | 11,200 | | 447,328 |
| Healthcare Realty Trust, Inc., REIT (a) | 4,000 | | 144,640 |
| Hospitality Properties Trust, REIT | 11,800 | | 546,576 |
| Liberty Property Trust, REIT | 10,000 | | 478,700 |
| ProLogis, REIT | 4,200 | | 237,132 |
| Regency Centers Corp., REIT | 8,400 | | 565,068 |
| Simon Property Group, Inc., REIT | 9,400 | | 797,026 |
| Thornburg Mortgage, Inc., REIT (a) | 15,200 | | 349,144 |
|
|
| | | | 5,017,221 |
| Retail Grocery - 0.19% | | | |
| The Kroger Company | 22,700 | | 540,487 |
| Retail Trade - 3.72% | | | |
| American Eagle Outfitters, Inc. | 20,200 | | 780,326 |
| Childrens Place Retail Stores, Inc. * | 13,500 | | 782,595 |
| Costco Wholesale Corp. | 70,900 | | 3,317,411 |
| J.C. Penney Company, Inc. (a) | 43,300 | | 2,729,632 |
| Kohl's Corp. * | 47,200 | | 2,950,472 |
|
|
| | | | 10,560,436 |
| Sanitary Services - 1.06% | | | |
| Waste Management, Inc. | 87,600 | | 3,002,928 |
| Semiconductors - 3.48% | | | |
| Advanced Micro Devices, Inc. * | 69,900 | | 1,746,801 |
| Freescale Semiconductor, Inc., Class B * | 65,000 | | 2,009,150 |
| Lam Research Corp. * | 45,100 | | 1,929,829 |
| Micron Technology, Inc. * | 121,700 | | 2,102,976 |
| National Semiconductor Corp. | 85,900 | | 2,086,511 |
|
|
| | | | 9,875,267 |
| Software - 1.84% | | | |
| BMC Software, Inc. * | 100,800 | | 2,683,296 |
| Microsoft Corp. | 31,200 | | 801,528 |
The accompanying notes are an integral part of the financial statements. 189
John Hancock Funds II
Portfolio of investments — August 31, 2006
(showing percentage of total net assets)
| All Cap Core Fund (continued) | | | |
| | | Shares or | | |
| | | Principal | | |
| | | Amount | | Value |
|
|
| |
| COMMON STOCKS (continued) | | | | |
| Software (continued) | | | | |
| MicroStrategy, Inc., Class A * (a) | | 19,000 | $ | 1,732,800 |
|
|
| | | | | 5,217,624 |
| |
| Steel - 0.96% | | | | |
| Nucor Corp. | | 46,300 | | 2,262,681 |
| Steel Dynamics, Inc. | | 8,600 | | 453,994 |
|
|
| | | | | 2,716,675 |
| |
| Telecommunications Equipment & | | | | |
| Services - 1.00% | | | | |
| Alaska Communications Systems Group, Inc. (a) | 20,500 | | 282,695 |
| Citizens Communications Company | | 39,400 | | 543,326 |
| Corning, Inc. * | | 56,300 | | 1,252,112 |
| InterDigital Communication Corp. * (a) | | 23,400 | | 777,582 |
|
|
| | | | | 2,855,715 |
| |
| Telephone - 1.95% | | | | |
| U.S. Cellular Corp. * (a) | | 9,200 | | 551,540 |
| Verizon Communications, Inc. | | 141,600 | | 4,981,488 |
|
|
| | | | | 5,533,028 |
| |
| Tires & Rubber - 0.14% | | | | |
| Goodyear Tire & Rubber Company * | | 30,400 | | 413,440 |
| Trucking & Freight - 0.99% | | | | |
| Fedex Corp. | | 8,300 | | 838,549 |
| Ryder Systems, Inc. | | 40,200 | | 1,986,684 |
|
|
| | | | | 2,825,233 |
|
| |
| TOTAL COMMON STOCKS (Cost $246,614,172) | | $ | 251,272,006 |
|
| |
| SHORT TERM INVESTMENTS - 5.01% | | | | |
| State Street Navigator Securities | | | | |
| Lending Prime Portfolio (c) | $ | 12,324,387 | $ | 12,324,387 |
| United States Treasury Bills | | | | |
| zero coupon due 10/19/2006 | | 1,900,000 | | 1,887,409 |
|
| TOTAL SHORT TERM INVESTMENTS | | | | |
| (Cost $14,211,796) | | | $ | 14,211,796 |
|
| |
| REPURCHASE AGREEMENTS - 10.78% | | | | |
| Repurchase Agreement with State | | | | |
| Street Corp. dated 08/31/2006 at | | | | |
| 3.95% to be repurchased at | | | | |
| $30,630,360 on 9/1/2006, | | | | |
| collateralized by $25,055,000 | | | | |
| Federal National Mortgage | | | | |
| Association, 5.55% due | | | | |
| 07/10/2028 (valued at | | | | |
| $23,366,969, including interest) | | | | |
| and $8,480,000 Federal National | | | | |
| Mortgage Association, 5.57% due | | | | |
| 07/14/2028 (valued at $7,874,494, | | | | |
| including interest) (c) | $ | 30,627,000 | $ | 30,627,000 |
|
| TOTAL REPURCHASE AGREEMENTS | | | | |
| (Cost $30,627,000) | | | $ | 30,627,000 |
|
| Total Investments (All Cap Core Fund) | | | |
| (Cost $291,452,968) - 104.26% | | $ | 296,110,802 |
| Liabilities in Excess of Other Assets - (4.26)% | | | (12,087,361) |
|
|
| TOTAL NET ASSETS - 100.00% | | $ | 284,023,441 |
|
|
| |
| |
| All Cap Growth Fund | | | |
| | Shares or | | |
| | Principal | | |
| | Amount | | Value |
|
|
| |
| COMMON STOCKS - 94.36% | | | |
| Aerospace - 4.12% | | | |
| Boeing Company | 30,431 | $ | 2,279,282 |
| General Dynamics Corp. | 27,715 | | 1,872,148 |
| Rockwell Collins, Inc. | 14,913 | | 781,889 |
| United Technologies Corp. | 23,230 | | 1,456,753 |
|
|
| | | | 6,390,072 |
| Agriculture - 1.18% | | | |
| Archer-Daniels-Midland Company | 16,620 | | 684,246 |
| Monsanto Company | 24,080 | | 1,142,355 |
|
|
| | | | 1,826,601 |
| Apparel & Textiles - 0.50% | | | |
| Carter's, Inc. * (a) | 33,544 | | 774,866 |
| Banking - 0.61% | | | |
| Kookmin Bank, ADR | 11,692 | | 942,141 |
| Biotechnology - 0.50% | | | |
| Amgen, Inc. * | 11,414 | | 775,353 |
| Broadcasting - 1.19% | | | |
| News Corp. | 97,000 | | 1,845,910 |
| Computers & Business Equipment - 7.66% | | | |
| Apple Computer, Inc. * | 45,099 | | 3,059,967 |
| Cisco Systems, Inc. * | 203,434 | | 4,473,514 |
| Hewlett-Packard Company | 62,907 | | 2,299,880 |
| Seagate Technology * (a) | 73,276 | | 1,630,391 |
| Western Digital Corp. * | 22,221 | | 406,644 |
|
|
| | | | 11,870,396 |
| Construction & Mining Equipment - 0.96% | | | |
| National Oilwell, Inc. * | 22,722 | | 1,483,747 |
| Cosmetics & Toiletries - 0.93% | | | |
| Colgate-Palmolive Company | 24,205 | | 1,448,911 |
| Crude Petroleum & Natural Gas - 1.39% | | | |
| Occidental Petroleum Corp. | 42,370 | | 2,160,446 |
| Drugs & Health Care - 1.08% | | | |
| Wyeth | 34,384 | | 1,674,501 |
| Electrical Equipment - 2.63% | | | |
| Cooper Industries, Ltd., Class A | 14,709 | | 1,204,373 |
| Emerson Electric Company | 19,169 | | 1,574,733 |
| Fanuc, Ltd. | 7,750 | | 614,823 |
| Wesco International, Inc. * | 11,610 | | 679,185 |
|
|
| | | | 4,073,114 |
| Electronics - 1.65% | | | |
| Amphenol Corp., Class A | 22,111 | | 1,270,719 |
| KDDI Corp. | 194 | | 1,281,156 |
|
|
| | | | 2,551,875 |
The accompanying notes are an integral part of the financial statements. 190
John Hancock Funds II
Portfolio of investments — August 31, 2006
(showing percentage of total net assets)
| All Cap Growth Fund (continued) | | |
| | Shares or | | |
| | Principal | | |
| | Amount | | Value |
|
|
| |
| COMMON STOCKS (continued) | | | |
| Financial Services - 7.97% | | | |
| Charles Schwab Corp. | 98,926 | $ | 1,613,483 |
| Goldman Sachs Group, Inc. | 18,531 | | 2,754,633 |
| Janus Capital Group, Inc. | 71,701 | | 1,274,844 |
| JPMorgan Chase & Company | 65,139 | | 2,974,247 |
| Merrill Lynch & Company, Inc. | 30,508 | | 2,243,253 |
| Morgan Stanley | 22,587 | | 1,485,999 |
|
|
| | | | 12,346,459 |
| Food & Beverages - 1.88% | | | |
| Burger King Holdings, Inc. * (a) | 54,942 | | 798,857 |
| Campbell Soup Company | 6,888 | | 258,782 |
| PepsiCo, Inc. | 28,447 | | 1,857,020 |
|
|
| | | | 2,914,659 |
| Healthcare Products - 2.75% | | | |
| Becton, Dickinson & Company | 26,074 | | 1,817,358 |
| Johnson & Johnson | 13,966 | | 903,041 |
| Varian Medical Systems, Inc. * | 28,813 | | 1,535,733 |
|
|
| | | | 4,256,132 |
| Healthcare Services - 4.39% | | | |
| Cardinal Health, Inc. | 28,498 | | 1,921,335 |
| Caremark Rx, Inc. | 23,035 | | 1,334,648 |
| Health Net, Inc. * | 33,754 | | 1,411,255 |
| IMS Health, Inc. | 19,349 | | 528,034 |
| Omnicare, Inc. (a) | 14,690 | | 665,604 |
| Quest Diagnostics, Inc. | 14,733 | | 947,037 |
|
|
| | | | 6,807,913 |
| Holdings Companies/Conglomerates - 0.87% | | | |
| Textron, Inc. | 16,096 | | 1,349,811 |
| Hotels & Restaurants - 1.25% | | | |
| Darden Restaurants, Inc. | 31,335 | | 1,109,259 |
| Ruby Tuesday, Inc. (a) | 32,068 | | 827,996 |
|
|
| | | | 1,937,255 |
| Industrial Machinery - 1.72% | | | |
| Joy Global, Inc. | 23,485 | | 1,022,537 |
| Komatsu, Ltd. | 52,030 | | 950,998 |
| Terex Corp. * | 15,736 | | 691,282 |
|
|
| | | | 2,664,817 |
| Industrials - 1.16% | | | |
| ABB, Ltd. | 59,167 | | 784,130 |
| Mitsui O.S.K. Lines, Ltd. | 133,440 | | 1,017,671 |
|
|
| | | | 1,801,801 |
| Insurance - 2.33% | | | |
| Assurant, Inc. | 34,713 | | 1,785,984 |
| Chubb Corp. | 15,662 | | 785,606 |
| HCC Insurance Holdings, Inc. | 31,838 | | 1,034,416 |
|
|
| | | | 3,606,006 |
| Internet Service Provider - 1.13% | | | |
| Google, Inc., Class A * | 4,635 | | 1,754,486 |
| Leisure Time - 1.02% | | | |
| Electronic Arts, Inc. * | 31,102 | | 1,585,269 |
| All Cap Growth Fund (continued) | | |
| | Shares or | | |
| | Principal | | |
| | Amount | | Value |
|
|
| |
| COMMON STOCKS (continued) | | | |
| Medical-Hospitals - 0.99% | | | |
| Manor Care, Inc. (a) | 21,962 | $ | 1,146,417 |
| VCA Antech, Inc. * | 11,120 | | 393,870 |
|
|
| | | | 1,540,287 |
| Metal & Metal Products - 1.25% | | | |
| Companhia Vale Do Rio Doce, ADR | 54,668 | | 1,172,082 |
| Precision Castparts Corp. | 13,175 | | 769,947 |
|
|
| | | | 1,942,029 |
| Mining - 2.19% | | | |
| BHP Billiton, Ltd. | 65,740 | | 1,389,239 |
| Phelps Dodge Corp. | 6,548 | | 586,046 |
| Rio Tinto PLC | 28,019 | | 1,416,159 |
|
|
| | | | 3,391,444 |
| Office Furnishings & Supplies - 1.40% | | | |
| Office Depot, Inc. * | 58,836 | | 2,167,518 |
| Petroleum Services - 4.31% | | | |
| Baker Hughes, Inc. | 23,708 | | 1,687,535 |
| ENSCO International, Inc. | 24,653 | | 1,101,743 |
| GlobalSantaFe Corp. | 18,481 | | 909,635 |
| McDermott International, Inc. * | 31,764 | | 1,531,025 |
| Valero Energy Corp. | 25,355 | | 1,455,377 |
|
|
| | | | 6,685,315 |
| Pharmaceuticals - 7.73% | | | |
| Abbott Laboratories | 5,299 | | 258,061 |
| Allergan, Inc. (a) | 16,825 | | 1,927,472 |
| AstraZeneca PLC, SADR | 30,959 | | 2,016,669 |
| Barr Pharmaceuticals, Inc. * | 14,656 | | 828,064 |
| Gilead Sciences, Inc. * | 33,191 | | 2,104,309 |
| Novartis AG, ADR | 30,523 | | 1,743,474 |
| Roche Holdings AG NPV | 16,822 | | 3,093,874 |
|
|
| | | | 11,971,923 |
| Railroads & Equipment - 1.35% | | | |
| Burlington Northern Santa Fe Corp. | 16,854 | | 1,128,375 |
| CSX Corp. | 31,676 | | 957,249 |
|
|
| | | | 2,085,624 |
| Retail Trade - 8.78% | | | |
| Aeropostale, Inc. * | 30,557 | | 776,148 |
| AnnTaylor Stores Corp. * | 19,309 | | 768,498 |
| Best Buy Company, Inc. | 40,878 | | 1,921,266 |
| Costco Wholesale Corp. | 33,036 | | 1,545,754 |
| DSW, Inc., Class A * (a) | 20,260 | | 567,077 |
| Family Dollar Stores, Inc. | 60,491 | | 1,546,755 |
| Federated Department Stores, Inc. | 29,871 | | 1,134,501 |
| J.C. Penney Company, Inc. | 32,772 | | 2,065,947 |
| Limited Brands, Inc. | 43,090 | | 1,108,706 |
| Nordstrom, Inc. | 24,336 | | 908,950 |
| PETsMART, Inc. | 50,192 | | 1,259,819 |
|
|
| | | | 13,603,421 |
| Sanitary Services - 0.81% | | | |
| Waste Management, Inc. | 36,427 | | 1,248,718 |
The accompanying notes are an integral part of the financial statements. 191
John Hancock Funds II
Portfolio of investments — August 31, 2006
(showing percentage of total net assets)
| All Cap Growth Fund (continued) | | |
| | | Shares or | | |
| | | Principal | | |
| | | Amount | | Value |
|
|
| |
| COMMON STOCKS (continued) | | | | |
| Semiconductors - 3.74% | | | | |
| Analog Devices, Inc. | | 69,835 | $ | 2,139,744 |
| Freescale Semiconductor, Inc., Class B * | | 66,383 | | 2,051,899 |
| Microchip Technology, Inc. | | 46,982 | | 1,604,905 |
|
|
| | | | | 5,796,548 |
| Software - 4.64% | | | | |
| BEA Systems, Inc. * | | 130,279 | | 1,788,731 |
| Citrix Systems, Inc. * | | 43,819 | | 1,344,367 |
| Microsoft Corp. | | 91,968 | | 2,362,658 |
| Red Hat, Inc. * (a) | | 51,719 | | 1,201,949 |
| VeriFone Holdings, Inc. * (a) | | 21,391 | | 495,202 |
|
|
| | | | | 7,192,907 |
| Telecommunications Equipment & | | | | |
| Services - 5.28% | | | | |
| Amdocs, Ltd. * | | 96,367 | | 3,657,127 |
| Nokia Oyj, SADR | | 75,476 | | 1,575,939 |
| QUALCOMM, Inc. | | 61,348 | | 2,310,979 |
| Tellabs, Inc. * | | 62,814 | | 640,075 |
|
|
| | | | | 8,184,120 |
| Telephone - 0.52% | | | | |
| Harris Corp. | | 18,232 | | 800,749 |
| Trucking & Freight - 0.50% | | | | |
| Oshkosh Truck Corp. | | 14,856 | | 768,055 |
|
| TOTAL COMMON STOCKS (Cost $136,719,023) | | $ | 146,221,199 |
|
| |
| SHORT TERM INVESTMENTS - 4.58% | | | | |
| State Street Navigator Securities | | | | |
| Lending Prime Portfolio (c) | $ | 7,097,453 | $ | 7,097,453 |
|
| TOTAL SHORT TERM INVESTMENTS | | | | |
| (Cost $7,097,453) | | | $ | 7,097,453 |
|
| |
| REPURCHASE AGREEMENTS - 5.13% | | | | |
| Repurchase Agreement with State | | | | |
| Street Corp. dated 08/31/2006 at | | | | |
| 4.95% to be repurchased at | | | | |
| $7,954,094 on 9/1/2006, | | | | |
| collateralized by $8,225,000 | | | | |
| Federal Home Loan Bank, 4.125% | | | | |
| due 02/15/2008 (valued at | | | | |
| $8,116,701, including interest) (c) | $ | 7,953,000 | $ | 7,953,000 |
|
| TOTAL REPURCHASE AGREEMENTS | | | | |
| (Cost $7,953,000) | | | $ | 7,953,000 |
|
| Total Investments (All Cap Growth Fund) | | | | |
| (Cost $151,769,476) - 104.07% | | | $ | 161,271,652 |
| Liabilities in Excess of Other Assets - (4.07)% | | | (6,300,765) |
|
|
| TOTAL NET ASSETS - 100.00% | | | $ | 154,970,887 |
|
|
| All Cap Value Fund | | | |
| | Shares or | | |
| | Principal | | |
| | Amount | | Value |
|
|
| |
| COMMON STOCKS - 94.19% | | | |
| Aerospace - 1.30% | | | |
| Curtiss Wright Corp. | 3,500 | $ | 108,815 |
| General Dynamics Corp. | 30,100 | | 2,033,255 |
| Moog, Inc., Class A * | 14,187 | | 463,206 |
| Woodward Governor Company | 6,333 | | 213,232 |
|
|
| | | | 2,818,508 |
| Apparel & Textiles - 0.97% | | | |
| VF Corp. | 29,881 | | 2,088,383 |
| Banking - 5.83% | | | |
| Bank of America Corp. | 34,057 | | 1,752,914 |
| Bank of New York Company, Inc. | 38,009 | | 1,282,804 |
| Cullen Frost Bankers, Inc. | 66,635 | | 3,928,800 |
| Marshall & Ilsley Corp. | 61,264 | | 2,856,740 |
| Popular, Inc. | 500 | | 9,525 |
| SunTrust Banks, Inc. | 20,600 | | 1,573,840 |
| Webster Financial Corp. | 25,335 | | 1,196,825 |
|
|
| | | | 12,601,448 |
| Business Services - 3.25% | | | |
| Automatic Data Processing, Inc. | 47,700 | | 2,251,440 |
| Cadence Design Systems, Inc. * | 180,430 | | 2,964,465 |
| R.R. Donnelley & Sons Company | 55,915 | | 1,812,764 |
|
|
| | | | 7,028,669 |
| Cable and Television - 1.79% | | | |
| Comcast Corp.-Special Class A * | 110,537 | | 3,858,847 |
| Chemicals - 1.91% | | | |
| Eastman Chemical Company | 16,370 | | 858,607 |
| Praxair, Inc. | 57,018 | | 3,273,403 |
|
|
| | | | 4,132,010 |
| Commercial Services - 0.63% | | | |
| Shaw Group, Inc. * | 53,979 | | 1,358,112 |
| Computers & Business Equipment - 1.22% | | | |
| Henry, Jack & Associates, Inc. | 34,700 | | 664,852 |
| Sun Microsystems, Inc. * | 396,500 | | 1,978,535 |
|
|
| | | | 2,643,387 |
| Containers & Glass - 1.17% | | | |
| Ball Corp. | 34,431 | | 1,388,946 |
| Sonoco Products Company | 33,900 | | 1,134,972 |
|
|
| | | | 2,523,918 |
| Cosmetics & Toiletries - 1.33% | | | |
| Procter & Gamble Company | 46,294 | | 2,865,599 |
| Domestic Oil - 0.09% | | | |
| Range Resources Corp. | 7,000 | | 195,860 |
| Drugs & Health Care - 1.55% | | | |
| Wyeth | 68,691 | | 3,345,252 |
| Electrical Equipment - 4.73% | | | |
| AMETEK, Inc. | 4,700 | | 201,536 |
| Anixter International, Inc. * (a) | 39,189 | | 2,135,408 |
| Cooper Industries, Ltd., Class A | 32,100 | | 2,628,348 |
| Emerson Electric Company | 34,599 | | 2,842,308 |
| Hubbell, Inc., Class B | 37,062 | | 1,723,383 |
The accompanying notes are an integral part of the financial statements. 192
John Hancock Funds II
Portfolio of investments — August 31, 2006
(showing percentage of total net assets)
| All Cap Value Fund (continued) | | | |
| | Shares or | | |
| | Principal | | |
| | Amount | | Value |
|
|
| |
| COMMON STOCKS (continued) | | | |
| Electrical Equipment (continued) | | | |
| Symbol Technologies, Inc. | 56,900 | $ | 683,369 |
|
|
| | | | 10,214,352 |
| Electrical Utilities - 3.42% | | | |
| Ameren Corp. (a) | 18,340 | | 982,107 |
| Avista Corp. (a) | 11,100 | | 269,064 |
| CMS Energy Corp. * (a) | 50,960 | | 746,054 |
| FPL Group, Inc. | 31,500 | | 1,400,175 |
| PNM Resources, Inc. | 29,700 | | 851,499 |
| The Southern Company (a) | 91,700 | | 3,142,559 |
|
|
| | | | 7,391,458 |
| Electronics - 3.42% | | | |
| AVX Corp. (a) | 132,174 | | 2,195,410 |
| Harman International Industries, Inc. | 6,900 | | 559,728 |
| Rogers Corp. * | 8,476 | | 491,777 |
| Vishay Intertechnology, Inc. * | 102,478 | | 1,435,717 |
| Zebra Technologies Corp., Class A * | 80,000 | | 2,707,200 |
|
|
| | | | 7,389,832 |
| Financial Services - 0.62% | | | |
| Citigroup, Inc. | 27,278 | | 1,346,169 |
| Food & Beverages - 4.96% | | | |
| Campbell Soup Company | 69,514 | | 2,611,641 |
| Diageo PLC, SADR | 40,500 | | 2,895,750 |
| Kraft Foods, Inc., Class A | 6,600 | | 223,806 |
| PepsiCo, Inc. | 76,479 | | 4,992,550 |
|
|
| | | | 10,723,747 |
| Furniture & Fixtures - 0.72% | | | |
| Ethan Allen Interiors, Inc. (a) | 45,791 | | 1,545,446 |
| Gas & Pipeline Utilities - 2.46% | | | |
| AGL Resources, Inc. | 17,100 | | 622,269 |
| El Paso Corp. (a) | 153,800 | | 2,233,176 |
| Nicor, Inc. (a) | 13,758 | | 600,674 |
| NiSource, Inc. | 33,481 | | 708,793 |
| UGI Corp. | 46,100 | | 1,143,280 |
|
|
| | | | 5,308,192 |
| Gold - 1.81% | | | |
| Barrick Gold Corp. | 116,697 | | 3,907,016 |
| Healthcare Products - 0.55% | | | |
| Zimmer Holdings, Inc. * | 17,600 | | 1,196,800 |
| Holdings Companies/Conglomerates - 4.73% | | | |
| Berkshire Hathaway, Inc., Class B * | 845 | | 2,706,957 |
| General Electric Company | 220,979 | | 7,526,545 |
|
|
| | | | 10,233,502 |
| Hotels & Restaurants - 0.81% | | | |
| Brinker International, Inc. | 25,737 | | 990,102 |
| OSI Restaurant Partners, Inc. | 17,400 | | 538,878 |
| Ruby Tuesday, Inc. (a) | 8,900 | | 229,798 |
|
|
| | | | 1,758,778 |
| Industrial Machinery - 4.16% | | | |
| Deere & Company | 5,745 | | 448,685 |
| All Cap Value Fund (continued) | | | |
| | Shares or | | |
| | Principal | | |
| | Amount | | Value |
|
|
| |
| COMMON STOCKS (continued) | | | |
| Industrial Machinery (continued) | | | |
| Dover Corp. | 51,900 | $ | 2,523,378 |
| Grant Prideco, Inc. * | 30,100 | | 1,250,053 |
| IDEX Corp. | 15,878 | | 666,717 |
| Kennametal, Inc. | 10,500 | | 553,770 |
| Parker-Hannifin Corp. | 40,404 | | 2,991,916 |
| W.W. Grainger, Inc. | 8,240 | | 550,432 |
|
|
| | | | 8,984,951 |
| Insurance - 2.92% | | | |
| AFLAC, Inc. | 41,662 | | 1,877,707 |
| Allstate Corp. | 16,100 | | 932,834 |
| American International Group, Inc. | 4,900 | | 312,718 |
| Everest Re Group, Ltd. | 1,400 | | 131,572 |
| Genworth Financial, Inc. | 67,796 | | 2,334,216 |
| Markel Corp. * (a) | 2,000 | | 726,660 |
|
|
| | | | 6,315,707 |
| International Oil - 2.18% | | | |
| ChevronTexaco Corp. | 42,000 | | 2,704,800 |
| EnCana Corp. | 38,100 | | 2,009,394 |
|
|
| | | | 4,714,194 |
| Internet Software - 1.08% | | | |
| McAfee, Inc. * | 102,399 | | 2,330,601 |
| Liquor - 1.03% | | | |
| Anheuser-Busch Companies, Inc. | 44,900 | | 2,217,162 |
| Manufacturing - 3.31% | | | |
| Carlisle Companies, Inc. | 35,177 | | 3,007,634 |
| Eaton Corp. | 17,990 | | 1,196,335 |
| Hexcel Corp. * (a) | 23,900 | | 358,978 |
| Trinity Industries, Inc. (a) | 78,015 | | 2,602,580 |
|
|
| | | | 7,165,527 |
| Metal & Metal Products - 1.74% | | | |
| Crown Holdings, Inc. * | 94,629 | | 1,740,227 |
| Quanex Corp. (a) | 56,185 | | 1,928,831 |
| Timken Company | 2,613 | | 83,721 |
|
|
| | | | 3,752,779 |
| Mining - 2.61% | | | |
| Newmont Mining Corp. | 109,971 | | 5,636,014 |
| Petroleum Services - 6.53% | | | |
| BP PLC, SADR | 10,000 | | 680,500 |
| Exxon Mobil Corp. | 148,091 | | 10,021,318 |
| Halliburton Company | 54,458 | | 1,776,420 |
| Schlumberger, Ltd. | 14,836 | | 909,447 |
| Superior Energy Services, Inc. * | 22,600 | | 721,618 |
|
|
| | | | 14,109,303 |
| Pharmaceuticals - 6.96% | | | |
| Abbott Laboratories | 63,100 | | 3,072,970 |
| GlaxoSmithKline PLC, ADR | 44,052 | | 2,501,273 |
| Mylan Laboratories, Inc. | 139,798 | | 2,840,695 |
| Novartis AG, ADR | 77,570 | | 4,430,798 |
| Pfizer, Inc. | 12,944 | | 356,737 |
The accompanying notes are an integral part of the financial statements. 193
John Hancock Funds II
Portfolio of investments — August 31, 2006
(showing percentage of total net assets)
| All Cap Value Fund (continued) | | | |
| | | Shares or | | |
| | | Principal | | |
| | | Amount | | Value |
|
|
| |
| COMMON STOCKS (continued) | | | | |
| Pharmaceuticals (continued) | | | | |
| Schering-Plough Corp. | | 39,704 | $ | 831,799 |
| Teva Pharmaceutical Industries, Ltd., SADR | 29,200 | | 1,014,992 |
|
|
| | | | | 15,049,264 |
| Railroads & Equipment - 0.83% | | | | |
| GATX Corp. (a) | | 36,900 | | 1,369,359 |
| Union Pacific Corp. | | 5,324 | | 427,783 |
|
|
| | | | | 1,797,142 |
| Real Estate - 0.71% | | | | |
| Host Hotels & Resorts, Inc., REIT | | 68,502 | | 1,544,035 |
| Retail Grocery - 1.79% | | | | |
| The Kroger Company | | 162,334 | | 3,865,172 |
| Retail Trade - 2.42% | | | | |
| Federated Department Stores, Inc. | | 89,914 | | 3,414,934 |
| Foot Locker, Inc. | | 53,659 | | 1,293,182 |
| Wal-Mart Stores, Inc. | | 11,717 | | 523,984 |
|
|
| | | | | 5,232,100 |
| Sanitary Services - 0.81% | | | | |
| Waste Management, Inc. | | 51,300 | | 1,758,564 |
| Steel - 0.05% | | | | |
| Steel Dynamics, Inc. | | 2,190 | | 115,610 |
| Telecommunications Equipment & | | | | |
| Services - 0.92% | | | | |
| Avaya, Inc. * | | 27,353 | | 285,839 |
| Tellabs, Inc. * | | 167,402 | | 1,705,826 |
|
|
| | | | | 1,991,665 |
| Telephone - 2.74% | | | | |
| AT&T, Inc. | | 75,300 | | 2,344,089 |
| BellSouth Corp. | | 12,400 | | 504,928 |
| Qwest Communications International, Inc. * | 67,300 | | 592,913 |
| Verizon Communications, Inc. | | 70,806 | | 2,490,955 |
|
|
| | | | | 5,932,885 |
| Travel Services - 0.52% | | | | |
| Sabre Holdings Corp. | | 51,455 | | 1,127,894 |
| Trucking & Freight - 1.61% | | | | |
| Heartland Express, Inc. (a) | | 83,422 | | 1,341,426 |
| Werner Enterprises, Inc. (a) | | 115,583 | | 2,141,753 |
|
|
| | | | | 3,483,179 |
|
| TOTAL COMMON STOCKS (Cost $186,873,741) | | $ | 203,599,033 |
|
| |
| SHORT TERM INVESTMENTS - 7.90% | | | |
| State Street Navigator Securities | | | | |
| Lending Prime Portfolio (c) | $ | 17,067,785 | $ | 17,067,785 |
|
| TOTAL SHORT TERM INVESTMENTS | | | | |
| (Cost $17,067,785) | | | $ | 17,067,785 |
|
| All Cap Value Fund (continued) | | |
| | | Shares or | |
| | | Principal | |
| | | Amount | Value |
|
|
| |
| REPURCHASE AGREEMENTS - 6.14% | | |
| Repurchase Agreement with State | | | |
| Street Corp. dated 08/31/2006 at | | | |
| 3.95% to be repurchased at | | | |
| $13,276,457 on 09/01/2006, | | | |
| collateralized by $13,360,000 | | | |
| Federal National Mortgage | | | |
| Association, 6.125% due | | | |
| 08/17/2026 (valued at | | | |
| $13,543,700, including interest) (c) | $ | 13,275,000 | | $ | 13,275,000 |
|
| TOTAL REPURCHASE AGREEMENTS | | | |
| (Cost $13,275,000) | | | $ | 13,275,000 |
|
| Total Investments (All Cap Value Fund) | | | |
| (Cost $217,216,526) - 108.23% | | | $ | 233,941,818 |
| Liabilities in Excess of Other Assets - (8.23)% | | (17,780,017) |
|
|
| TOTAL NET ASSETS - 100.00% | | | $ | 216,161,801 |
|
|
| |
| |
| Blue Chip Growth Fund | | | |
| | | Shares or | |
| | | Principal | |
| | | Amount | Value |
|
|
| |
| COMMON STOCKS - 98.94% | | | |
| Advertising - 0.29% | | | |
| Monster Worldwide, Inc. * | | 91,500 | $ | 3,727,710 |
| Aerospace - 1.51% | | | |
| General Dynamics Corp. | | 157,026 | 10,607,106 |
| Rockwell Collins, Inc. | | 80,801 | 4,236,397 |
| United Technologies Corp. | | 70,200 | 4,402,242 |
|
|
| | | | 19,245,745 |
| Agriculture - 0.89% | | | |
| Monsanto Company | | 237,496 | 11,266,810 |
| Banking - 1.69% | | | |
| Northern Trust Corp. | | 178,111 | 9,972,435 |
| Wells Fargo Company | | 331,508 | 11,519,903 |
|
|
| | | | 21,492,338 |
| Biotechnology - 2.86% | | | |
| Amgen, Inc. * | | 280,455 | 19,051,308 |
| Genentech, Inc. * | | 183,678 | 15,157,109 |
| Genzyme Corp. * | | 32,300 | 2,139,229 |
|
|
| | | | 36,347,646 |
| Broadcasting - 0.27% | | | |
| Grupo Televisa SA, SADR | | 182,600 | 3,476,704 |
| Business Services - 2.05% | | | |
| Automatic Data Processing, Inc. | | 329,719 | 15,562,737 |
| First Data Corp. | | 205,636 | 8,836,179 |
| Paychex, Inc. (a) | | 47,657 | 1,711,363 |
|
|
| | | | 26,110,279 |
| Cable and Television - 1.55% | | | |
| E.W. Scripps Company, Class A | | 20,950 | 952,597 |
| Rogers Communications, Inc. | | 107,716 | 5,553,837 |
| Time Warner, Inc. | | 349,586 | 5,810,119 |
The accompanying notes are an integral part of the financial statements. 194
John Hancock Funds II
Portfolio of investments — August 31, 2006
(showing percentage of total net assets)
| Blue Chip Growth Fund (continued) | | |
| | Shares or | | |
| | Principal | | |
| | Amount | | Value |
|
|
| |
| COMMON STOCKS (continued) | | | |
| Cable and Television (continued) | | | |
| Viacom, Inc. * | 203,781 | $ | 7,397,250 |
|
|
| | | | 19,713,803 |
| Cellular Communications - 2.02% | | | |
| America Movil S.A. de C.V., Series L | 280,949 | | 10,482,207 |
| American Tower Corp., Class A * | 425,062 | | 15,242,723 |
|
|
| | | | 25,724,930 |
| Coal - 0.33% | | | |
| CONSOL Energy, Inc. (a) | 114,600 | | 4,179,462 |
| Computers & Business Equipment - 3.37% | | | |
| Apple Computer, Inc. * | 172,700 | | 11,717,695 |
| Cisco Systems, Inc. * | 983,282 | | 21,622,371 |
| Dell, Inc. * | 141,127 | | 3,182,414 |
| EMC Corp. * | 545,648 | | 6,356,799 |
|
|
| | | | 42,879,279 |
| Cosmetics & Toiletries - 1.54% | | | |
| Procter & Gamble Company | 316,968 | | 19,620,319 |
| Crude Petroleum & Natural Gas - 0.08% | | | |
| EOG Resources, Inc. | 16,000 | | 1,037,120 |
| Domestic Oil - 0.42% | | | |
| Murphy Oil Corp. (a) | 109,442 | | 5,352,808 |
| Drugs & Health Care - 1.38% | | | |
| Novartis AG | 160,000 | | 9,110,805 |
| Wyeth | 173,546 | | 8,451,690 |
|
|
| | | | 17,562,495 |
| Electronics - 1.38% | | | |
| Garmin, Ltd. (a) | 181,900 | | 8,505,644 |
| Harman International Industries, Inc. | 111,740 | | 9,064,349 |
|
|
| | | | 17,569,993 |
| Financial Services - 14.69% | | | |
| Ameriprise Financial, Inc. (a) | 14,589 | | 667,155 |
| Charles Schwab Corp. | 646,114 | | 10,538,119 |
| Chicago Merchantile Exchange Holdings, Inc. | 7,000 | | 3,080,000 |
| Citigroup, Inc. | 480,379 | | 23,706,704 |
| Countrywide Financial Corp. | 115,000 | | 3,887,000 |
| E*TRADE Financial Corp. * | 450,771 | | 10,633,688 |
| Franklin Resources, Inc. | 175,335 | | 17,254,717 |
| Goldman Sachs Group, Inc. | 97,424 | | 14,482,078 |
| Legg Mason, Inc. | 138,180 | | 12,610,307 |
| Mellon Financial Corp. | 85,239 | | 3,173,448 |
| Merrill Lynch & Company, Inc. | 181,210 | | 13,324,371 |
| Morgan Stanley | 141,800 | | 9,329,022 |
| SLM Corp. | 308,008 | | 14,947,628 |
| State Street Corp. (c) | 385,665 | | 23,834,097 |
| TD Ameritrade Holding Corp. * | 486,026 | | 8,515,175 |
| UBS AG * | 301,440 | | 17,018,154 |
|
|
| | | | 187,001,663 |
| Food & Beverages - 1.59% | | | |
| PepsiCo, Inc. | 234,166 | | 15,286,356 |
| Blue Chip Growth Fund (continued) | | |
| | Shares or | | |
| | Principal | | |
| | Amount | | Value |
|
|
| |
| COMMON STOCKS (continued) | | | |
| Food & Beverages (continued) | | | |
| Sysco Corp. | 159,105 | $ | 4,994,306 |
|
|
| | | | 20,280,662 |
| Healthcare Products - 3.35% | | | |
| Alcon, Inc. | 21,200 | | 2,497,148 |
| Johnson & Johnson | 131,501 | | 8,502,855 |
| Medtronic, Inc. | 308,564 | | 14,471,651 |
| St. Jude Medical, Inc. * | 210,364 | | 7,659,353 |
| Stryker Corp. | 199,121 | | 9,563,782 |
|
|
| | | | 42,694,789 |
| Healthcare Services - 7.57% | | | |
| Cardinal Health, Inc. | 68,605 | | 4,625,349 |
| Caremark Rx, Inc. | 344,997 | | 19,989,126 |
| DaVita, Inc. * | 23,700 | | 1,383,132 |
| Humana, Inc. * | 161,300 | | 9,828,009 |
| Medco Health Solutions, Inc. * | 96,200 | | 6,096,194 |
| Quest Diagnostics, Inc. | 108,978 | | 7,005,106 |
| UnitedHealth Group, Inc. | 615,641 | | 31,982,550 |
| Wellpoint, Inc. * | 199,128 | | 15,414,499 |
|
|
| | | | 96,323,965 |
| Holdings Companies/Conglomerates - 3.85% | | | |
| General Electric Company | 1,439,999 | | 49,046,367 |
| Hotels & Restaurants - 1.52% | | | |
| Marriott International, Inc., Class A | 194,912 | | 7,340,386 |
| Wynn Resorts, Ltd. * (a) | 155,873 | | 12,066,129 |
|
|
| | | | 19,406,515 |
| Household Products - 0.23% | | | |
| Fortune Brands, Inc. | 40,162 | | 2,915,761 |
| Industrial Machinery - 0.11% | | | |
| Deere & Company | 18,513 | | 1,445,865 |
| Insurance - 3.53% | | | |
| Aetna, Inc. | 172,952 | | 6,445,921 |
| AFLAC, Inc. | 2,389 | | 107,672 |
| American International Group, Inc. | 329,153 | | 21,006,544 |
| Hartford Financial Services Group, Inc. | 112,716 | | 9,677,796 |
| Prudential Financial, Inc. | 105,200 | | 7,722,732 |
|
|
| | | | 44,960,665 |
| Internet Retail - 0.93% | | | |
| Amazon.com, Inc. * (a) | 242,211 | | 7,467,365 |
| eBay, Inc. * | 156,065 | | 4,347,971 |
|
|
| | | | 11,815,336 |
| Internet Service Provider - 3.05% | | | |
| Google, Inc., Class A * | 60,734 | | 22,989,641 |
| Yahoo!, Inc. * | 550,468 | | 15,864,488 |
|
|
| | | | 38,854,129 |
| Internet Software - 0.52% | | | |
| Juniper Networks, Inc. * | 452,919 | | 6,644,322 |
| Leisure Time - 1.25% | | | |
| Harrah's Entertainment, Inc. | 65,448 | | 4,081,337 |
The accompanying notes are an integral part of the financial statements. 195
John Hancock Funds II
Portfolio of investments — August 31, 2006
(showing percentage of total net assets)
| Blue Chip Growth Fund (continued) | | |
| | Shares or | | |
| | Principal | | |
| | Amount | | Value |
|
|
| |
| COMMON STOCKS (continued) | | | |
| Leisure Time (continued) | | | |
| International Game Technology, Inc. | 304,598 | $ | 11,781,851 |
|
|
| | | | 15,863,188 |
| Manufacturing - 3.61% | | | |
| Danaher Corp. | 468,437 | | 31,052,689 |
| Honeywell International, Inc. | 153,595 | | 5,947,199 |
| Illinois Tool Works, Inc. | 203,326 | | 8,926,011 |
|
|
| | | | 45,925,899 |
| Mining - 0.34% | | | |
| BHP Billiton, Ltd. | 207,400 | | 4,382,845 |
| Petroleum Services - 6.40% | | | |
| Baker Hughes, Inc. | 196,641 | | 13,996,906 |
| Exxon Mobil Corp. | 237,962 | | 16,102,889 |
| Schlumberger, Ltd. | 420,708 | | 25,789,400 |
| Smith International, Inc. | 443,428 | | 18,610,673 |
| Total SA, ADR | 102,392 | | 6,904,293 |
|
|
| | | | 81,404,161 |
| Pharmaceuticals - 4.13% | | | |
| Allergan, Inc. | 50,000 | | 5,728,000 |
| Celgene Corp. * | 109,300 | | 4,447,417 |
| Gilead Sciences, Inc. * | 241,219 | | 15,293,284 |
| GlaxoSmithKline PLC, ADR | 14,700 | | 834,666 |
| Pfizer, Inc. | 343,696 | | 9,472,262 |
| Roche Holdings AG NPV | 50,000 | | 9,195,915 |
| Sepracor, Inc. * (a) | 160,488 | | 7,544,541 |
|
|
| | | | 52,516,085 |
| Publishing - 0.06% | | | |
| McGraw-Hill Companies, Inc. | 13,748 | | 768,651 |
| Railroads & Equipment - 0.28% | | | |
| Union Pacific Corp. | 44,006 | | 3,535,882 |
| Retail Trade - 5.95% | | | |
| Best Buy Company, Inc. | 74,810 | | 3,516,070 |
| CVS Corp. | 238,398 | | 7,998,253 |
| Home Depot, Inc. | 342,252 | | 11,735,821 |
| Kohl's Corp. * | 338,070 | | 21,132,756 |
| Target Corp. | 269,978 | | 13,064,235 |
| Wal-Mart Stores, Inc. | 409,336 | | 18,305,506 |
|
|
| | | | 75,752,641 |
| Semiconductors - 5.84% | | | |
| Analog Devices, Inc. (a) | 259,457 | | 7,949,763 |
| Applied Materials, Inc. | 368,300 | | 6,216,904 |
| Intel Corp. | 277,908 | | 5,430,322 |
| Linear Technology Corp. (a) | 266,410 | | 9,060,604 |
| Marvell Technology Group, Ltd. * | 586,990 | | 10,278,195 |
| Maxim Integrated Products, Inc. | 486,628 | | 14,160,875 |
| Texas Instruments, Inc. | 308,482 | | 10,053,428 |
| Xilinx, Inc. | 486,675 | | 11,130,257 |
|
|
| | | | 74,280,348 |
| Software - 4.39% | | | |
| Adobe Systems, Inc. * | 234,325 | | 7,601,503 |
| Blue Chip Growth Fund (continued) | | |
| | | Shares or | | |
| | | Principal | | |
| | | Amount | | Value |
|
|
| |
| COMMON STOCKS (continued) | | | | |
| Software (continued) | | | | |
| Intuit, Inc. * | | 144,678 | $ | 4,372,169 |
| Microsoft Corp. | | 1,213,060 | | 31,163,511 |
| Oracle Corp. * | | 813,438 | | 12,730,305 |
|
|
| | | | | 55,867,488 |
| Telecommunications Equipment & | | | | |
| Services - 2.66% | | | | |
| Corning, Inc. * | | 302,685 | | 6,731,714 |
| Nokia Oyj, SADR | | 628,272 | | 13,118,319 |
| QUALCOMM, Inc. | | 42,623 | | 1,605,609 |
| Telefonaktiebolaget LM Ericsson, SADR (a) | | 151,600 | | 5,063,440 |
| Telus Corp., Non Voting Shares | | 154,882 | | 7,363,090 |
|
|
| | | | | 33,882,172 |
| Travel Services - 1.46% | | | | |
| American Express Company | | 352,948 | | 18,543,888 |
|
| TOTAL COMMON STOCKS (Cost $1,188,453,190) | | $ | 1,259,420,728 |
|
| |
| SHORT TERM INVESTMENTS - 4.47% | | | | |
| State Street Navigator Securities | | | | |
| Lending Prime Portfolio (c) | $ | 48,982,997 | $ | 48,982,997 |
| T. Rowe Price Reserve Investment Fund (c) | | 7,854,809 | | 7,854,809 |
|
| TOTAL SHORT TERM INVESTMENTS | | | | |
| (Cost $56,837,806) | | | $ | 56,837,806 |
|
| |
| REPURCHASE AGREEMENTS - 0.16% | | | | |
| Repurchase Agreement with State | | | | |
| Street Corp. dated 08/31/2006 at | | | | |
| 3.95% to be repurchased at | | | | |
| $2,041,224 on 9/1/2006, | | | | |
| collateralized by $1,720,000 U.S. | | | | |
| Treasury Bond, 6.50% due | | | | |
| 11/26/2015 (valued at $2,083,350, | | | | |
| including interest) (c) | $ | 2,041,000 | $ | 2,041,000 |
|
| TOTAL REPURCHASE AGREEMENTS | | | | |
| (Cost $2,041,000) | | | $ | 2,041,000 |
|
| Total Investments (Blue Chip Growth Fund) | | | | |
| (Cost $1,247,331,996) - 103.57% | | | $ | 1,318,299,534 |
| Liabilities in Excess of Other Assets - (3.57)% | | | (45,448,746) |
|
|
| TOTAL NET ASSETS - 100.00% | | | $ | 1,272,850,788 |
|
|
| |
| |
| Capital Appreciation Fund | | | | |
| | | Shares or | | |
| | | Principal | | |
| | | Amount | | Value |
|
|
| |
| COMMON STOCKS - 98.24% | | | | |
| Aerospace - 3.77% | | | | |
| Boeing Company | | 110,400 | $ | 8,268,960 |
| United Technologies Corp. | | 144,500 | | 9,061,595 |
|
|
| | | | | 17,330,555 |
| Apparel & Textiles - 3.11% | | | | |
| Coach, Inc. * (a) | | 251,756 | | 7,600,514 |
The accompanying notes are an integral part of the financial statements. 196
John Hancock Funds II
Portfolio of investments — August 31, 2006
(showing percentage of total net assets)
| Capital Appreciation Fund (continued) | |
| | Shares or | |
| | Principal | |
| | Amount | Value |
|
|
| |
| COMMON STOCKS (continued) | | |
| Apparel & Textiles (continued) | | |
| NIKE, Inc., Class B | 82,946 $ | 6,698,719 |
|
|
| | | 14,299,233 |
| Biotechnology - 3.77% | | |
| Amgen, Inc. * | 98,425 | 6,686,010 |
| Genentech, Inc. * | 129,131 | 10,655,890 |
|
|
| | | 17,341,900 |
| Broadcasting - 1.18% | | |
| News Corp. | 285,600 | 5,434,968 |
| Cellular Communications - 3.50% | | |
| Motorola, Inc. | 436,900 | 10,214,722 |
| NII Holdings, Inc. * (a) | 110,600 | 5,900,510 |
|
|
| | | 16,115,232 |
| Computers & Business Equipment - 4.62% | | |
| Apple Computer, Inc. * | 152,156 | 10,323,784 |
| Cisco Systems, Inc. * | 497,630 | 10,942,884 |
|
|
| | | 21,266,668 |
| Cosmetics & Toiletries - 2.13% | | |
| Procter & Gamble Company | 158,484 | 9,810,160 |
| Crude Petroleum & Natural Gas - 1.45% | | |
| Occidental Petroleum Corp. | 131,200 | 6,689,888 |
| Drugs & Health Care - 1.07% | | |
| Wyeth | 101,400 | 4,938,180 |
| Electronics - 1.49% | | |
| Agilent Technologies, Inc. * | 213,159 | 6,855,193 |
| Financial Services - 8.87% | | |
| Charles Schwab Corp. | 441,831 | 7,206,264 |
| Goldman Sachs Group, Inc. | 39,710 | 5,902,892 |
| KKR Private Equity Investors, LP * | 161,600 | 3,692,560 |
| Merrill Lynch & Company, Inc. | 89,982 | 6,616,376 |
| NYSE Group, Inc. * (a) | 98,300 | 5,829,190 |
| UBS AG | 204,300 | 11,598,111 |
|
|
| | | 40,845,393 |
| Food & Beverages - 3.76% | | |
| PepsiCo, Inc. | 204,435 | 13,345,517 |
| Starbucks Corp. * | 127,200 | 3,944,472 |
|
|
| | | 17,289,989 |
| Healthcare Products - 3.74% | | |
| Alcon, Inc. | 92,019 | 10,838,918 |
| St. Jude Medical, Inc. * | 175,474 | 6,389,008 |
|
|
| | | 17,227,926 |
| Healthcare Services - 4.81% | | |
| Caremark Rx, Inc. | 124,989 | 7,241,863 |
| UnitedHealth Group, Inc. | 91,300 | 4,743,035 |
| Wellpoint, Inc. * | 131,308 | 10,164,552 |
|
|
| | | 22,149,450 |
| Holdings Companies/Conglomerates - 2.00% | | |
| General Electric Company | 270,388 | 9,209,415 |
| Capital Appreciation Fund (continued) | | |
| | Shares or | | |
| | Principal | | |
| | Amount | | Value |
|
|
| |
| COMMON STOCKS (continued) | | | |
| Hotels & Restaurants - 1.65% | | | |
| Chipotle Mexican Grill, Inc., Class A * (a) | 16,800 | $ | 828,912 |
| Marriott International, Inc., Class A | 179,600 | | 6,763,736 |
|
|
| | | | 7,592,648 |
| Insurance - 2.07% | | | |
| American International Group, Inc. | 149,208 | | 9,522,455 |
| Internet Service Provider - 4.69% | | | |
| Google, Inc., Class A * | 37,793 | | 14,305,784 |
| Yahoo!, Inc. * | 252,092 | | 7,265,292 |
|
|
| | | | 21,571,076 |
| Leisure Time - 3.93% | | | |
| Electronic Arts, Inc. * | 145,608 | | 7,421,640 |
| Walt Disney Company | 360,100 | | 10,676,965 |
|
|
| | | | 18,098,605 |
| Petroleum Services - 2.80% | | | |
| Schlumberger, Ltd. | 129,394 | | 7,931,852 |
| Suncor Energy, Inc. | 63,952 | | 4,961,396 |
|
|
| | | | 12,893,248 |
| Pharmaceuticals - 11.88% | | | |
| Abbott Laboratories | 143,100 | | 6,968,970 |
| Gilead Sciences, Inc. * | 182,686 | | 11,582,293 |
| Novartis AG, ADR | 200,476 | | 11,451,189 |
| Pfizer, Inc. | 176,000 | | 4,850,560 |
| Roche Holdings, Ltd., SADR | 153,311 | | 14,106,927 |
| Sanofi-Aventis, ADR | 127,173 | | 5,716,426 |
|
|
| | | | 54,676,365 |
| Retail Grocery - 1.79% | | | |
| Whole Foods Market, Inc. (a) | 153,534 | | 8,232,493 |
| Retail Trade - 4.51% | | | |
| Federated Department Stores, Inc. | 252,390 | | 9,585,772 |
| Kohl's Corp. * | 36,000 | | 2,250,360 |
| Target Corp. | 134,993 | | 6,532,311 |
| Williams-Sonoma, Inc. (a) | 80,880 | | 2,382,725 |
|
|
| | | | 20,751,168 |
| Semiconductors - 4.77% | | | |
| Broadcom Corp., Class A * | 234,550 | | 6,905,152 |
| Marvell Technology Group, Ltd. * | 449,050 | | 7,862,866 |
| Texas Instruments, Inc. | 220,050 | | 7,171,429 |
|
|
| | | | 21,939,447 |
| Software - 4.17% | | | |
| Adobe Systems, Inc. * | 333,615 | | 10,822,471 |
| Microsoft Corp. | 99,541 | | 2,557,208 |
| SAP AG, SADR | 121,688 | | 5,809,385 |
|
|
| | | | 19,189,064 |
| Telecommunications Equipment & | | | |
| Services - 4.61% | | | |
| Corning, Inc. * | 290,300 | | 6,456,272 |
| Nokia Oyj, SADR | 261,631 | | 5,462,855 |
| QUALCOMM, Inc. | 246,900 | | 9,300,723 |
|
|
| | | | 21,219,850 |
The accompanying notes are an integral part of the financial statements. 197
John Hancock Funds II
Portfolio of investments — August 31, 2006
(showing percentage of total net assets)
| Capital Appreciation Fund (continued) | | |
| | | Shares or | | |
| | | Principal | | |
| | | Amount | | Value |
|
|
| |
| COMMON STOCKS (continued) | | | | |
| Travel Services - 2.10% | | | | |
| American Express Company | | 184,074 | $ | 9,671,248 |
|
| TOTAL COMMON STOCKS (Cost $443,503,982) | | $ | 452,161,817 |
|
| |
| SHORT TERM INVESTMENTS - 5.97% | | | |
| General Electric Capital Corp. | | | | |
| 5.18% due 09/01/2006 | $ | 8,950,000 | $ | 8,950,000 |
| State Street Navigator Securities Lending | | | | |
| Prime Portfolio (c) | | 18,532,002 | | 18,532,002 |
|
| TOTAL SHORT TERM INVESTMENTS | | | | |
| (Cost $27,482,002) | | | $ | 27,482,002 |
|
| Total Investments (Capital Appreciation Fund) | | | |
| (Cost $470,985,984) - 104.21% | | | $ | 479,643,819 |
| Liabilities in Excess of Other Assets - (4.21)% | | | (19,398,950) |
|
|
| TOTAL NET ASSETS - 100.00% | | | $ | 460,244,869 |
|
|
| |
| |
| Core Bond Fund | | | | |
| | | Shares or | | |
| | | Principal | | |
| | | Amount | | Value |
|
|
| |
| U.S. TREASURY OBLIGATIONS - 12.72% | | | |
| U.S. Treasury Bonds - 6.20% | | | | |
| 4.50% due 02/15/2036 (a)*** | $ | 2,450,000 | $ | 2,305,871 |
| 5.375% due 02/15/2031 (a) | | 876,000 | | 931,982 |
| 6.25% due 08/15/2023 to | | | | |
| 05/15/2030 (a)*** | | 6,664,000 | | 7,711,557 |
| 8.875% due 02/15/2019 *** | | 991,000 | | 1,357,282 |
|
|
| | | | | 12,306,692 |
| U.S. Treasury Notes - 6.52% | | | | |
| 4.50% due 02/15/2016 (a) | | 104,000 | | 102,062 |
| 4.50% due 11/15/2015 (a)*** | | 1,220,000 | | 1,197,792 |
| 4.875% due 08/15/2016 | | 205,000 | | 207,322 |
| 4.875% due 05/31/2008 to 07/31/2011 (a) | 5,485,000 | | 5,507,328 |
| 5.00% due 07/31/2008 (a) | | 390,000 | | 391,402 |
| 5.125% due 06/30/2008 to 05/15/2016 (a) | 5,377,000 | | 5,529,581 |
|
|
| | | | | 12,935,487 |
|
| TOTAL U.S. TREASURY OBLIGATIONS | | | |
| (Cost $25,201,312) | | | $ | 25,242,179 |
|
| |
| U.S. GOVERNMENT AGENCY OBLIGATIONS - 38.92% | | |
| Federal Home Loan Bank - 2.97% | | | | |
| 4.625% due 07/18/2007 | | 3,525,000 | | 3,504,626 |
| 5.46% due 11/30/2015 *** | | 2,397,790 | | 2,384,088 |
|
|
| | | | | 5,888,714 |
| Federal Home Loan Mortgage Corp. - 18.74% | | | |
| 3.50% due 05/15/2026 | | 193,289 | | 188,225 |
| 3.57% due 06/15/2029 *** | | 849,387 | | 823,410 |
| 3.90% due 01/15/2023 | | 1,105,179 | | 1,070,676 |
| 4.00% due 04/15/2025 | | 609,757 | | 596,974 |
| 4.50% due 02/01/2019 to 08/01/2035 | | 5,338,718 | | 5,151,494 |
| 4.50% due 08/01/2020 to 07/01/2035 *** | 3,095,292 | | 2,925,071 |
| 5.00% due 10/01/2020 to 03/15/2025 | | 4,879,981 | | 4,791,305 |
| Core Bond Fund (continued) | | | |
| | | Shares or | | |
| | | Principal | | |
| | | Amount | | Value |
|
|
| |
| U.S. GOVERNMENT AGENCY | | | | |
| OBLIGATIONS (continued) | | | | |
| Federal Home Loan Mortgage Corp. | | | | |
| (continued) | | | | |
| 5.00% due 07/01/2035 *** | $ | 1,156,666 | $ | 1,109,578 |
| 5.095% due 02/01/2036 *** | | 1,351,194 | | 1,329,715 |
| 5.50% due 01/01/2018 to 05/15/2026 | | 3,739,274 | | 3,735,325 |
| 5.50% due 11/01/2018 *** | | 756,310 | | 754,591 |
| 5.601% due 05/01/2036 *** | | 1,747,596 | | 1,747,475 |
| 6.00% due 07/01/2036 | | 785,105 | | 786,405 |
| 6.00% TBA ** | | 10,724,000 | | 10,832,915 |
| 6.625% due 09/15/2009 *** | | 1,279,000 | | 1,335,426 |
|
|
| | | | | 37,178,585 |
| Federal National Mortgage | | | | |
| Association - 14.38% | | | | |
| 4.33% due 11/01/2011 | | 192,710 | | 185,011 |
| 4.50% due 02/01/2035 | | 94,872 | | 89,404 |
| 4.653% due 10/01/2012 | | 151,533 | | 148,169 |
| 4.868% due 09/01/2035 | | 203,983 | | 199,165 |
| 5.00% due 03/01/2034 to 12/01/2034 | | 2,844,564 | | 2,733,595 |
| 5.00% due 07/01/2033 *** | | 854,558 | | 821,855 |
| 5.068% due 07/01/2035 | | 423,574 | | 418,011 |
| 5.298% due 04/01/2036 | | 335,251 | | 334,026 |
| 5.504% due 01/01/2033 to 06/01/2036 | | 7,028,123 | | 6,925,762 |
| 5.50% TBA ** | | 11,682,000 | | 11,462,963 |
| 5.662% due 06/01/2036 | | 282,295 | | 283,503 |
| 5.67% due 03/01/2009 | | 430,076 | | 432,678 |
| 5.829% due 07/01/2036 | | 1,236,323 | | 1,246,718 |
| 5.921% due 09/21/2008 | | 1,053,000 | | 1,056,291 |
| 6.00% due 07/01/2036 | | 1,135,721 | | 1,136,939 |
| 6.00% TBA ** | | 457,000 | | 457,429 |
| 6.44% due 06/01/2036 | | 597,471 | | 610,251 |
|
|
| | | | | 28,541,770 |
| Government National Mortgage | | | | |
| Association - 2.83% | | | | |
| 5.50% due 10/20/2034 to 06/15/2035 | | 1,609,883 | | 1,592,501 |
| 6.00% TBA ** | | 1,127,000 | | 1,135,100 |
| 6.50% TBA ** | | 2,825,000 | | 2,882,383 |
|
|
| | | | | 5,609,984 |
|
| TOTAL U.S. GOVERNMENT AGENCY OBLIGATIONS | | |
| (Cost $76,838,741) | | | $ | 77,219,053 |
|
| |
| FOREIGN GOVERNMENT OBLIGATIONS - 0.61% | | |
| Canada - 0.09% | | | | |
| Province of Quebec Canada | | | | |
| 7.50% due 09/15/2029 (a) | | 140,000 | | 175,069 |
| Chile - 0.11% | | | | |
| Republic of Chile | | | | |
| 5.50% due 01/15/2013 | | 210,000 | | 210,777 |
| Mexico - 0.34% | | | | |
| Government of Mexico | | | | |
| 5.625% due 01/15/2017 (a) | | 370,000 | | 364,820 |
| 5.875% due 01/15/2014 (a) | | 174,000 | | 177,045 |
| 6.75% due 09/27/2034 (a) | | 125,000 | | 132,625 |
|
|
| | | | | 674,490 |
The accompanying notes are an integral part of the financial statements. 198
John Hancock Funds II
Portfolio of investments — August 31, 2006
(showing percentage of total net assets)
| Core Bond Fund (continued) | | |
| | | Shares or | |
| | | Principal | |
| | | Amount | Value |
|
|
| |
| FOREIGN GOVERNMENT OBLIGATIONS | | |
| (continued) | | | |
| Russia - 0.07% | | | |
| Russian Federation | | | |
| 5.00% due 03/31/2030 | $ | 125,000 | $ | 138,975 |
|
| TOTAL FOREIGN GOVERNMENT OBLIGATIONS | |
| (Cost $1,162,210) | | | $ | 1,199,311 |
|
| |
| CORPORATE BONDS - 19.54% | | | |
| Aerospace - 0.02% | | | |
| Lockheed Martin Corp. | | | |
| 6.15% due 09/01/2036 | | 30,000 | 30,839 |
| Apparel & Textiles - 0.22% | | | |
| Mohawk Industries, Inc. | | | |
| 5.75% due 01/15/2011 | | 430,000 | 426,542 |
| Automobiles - 0.43% | | | |
| DaimlerChrysler N.A. Holding Corp. | | | |
| 5.75% due 05/18/2009 | | 285,000 | 286,216 |
| 6.50% due 11/15/2013 (a) | | 395,000 | 406,771 |
| 8.50% due 01/18/2031 | | 141,000 | 169,319 |
|
|
| | | | 862,306 |
| Banking - 1.27% | | | |
| Bank of America Corp. | | | |
| 4.25% due 10/01/2010 | | 360,000 | 347,435 |
| 5.375% due 08/15/2011 | | 355,000 | 356,514 |
| 5.375% due 06/15/2014 (a) | | 120,000 | 119,670 |
| Credit Suisse USA, Inc. | | | |
| 5.85% due 08/16/2016 (a) | | 115,000 | 117,277 |
| HSBC Holdings PLC | | | |
| 6.50% due 05/02/2036 | | 240,000 | 252,723 |
| PNC Funding Corp. | | | |
| 5.25% due 11/15/2015 | | 339,000 | 330,962 |
| Royal Bank of Scotland Group PLC | | | |
| 5.00% due 10/01/2014 | | 280,000 | 270,888 |
| Wachovia Corp. | | | |
| 4.875% due 02/15/2014 | | 280,000 | 268,368 |
| Washington Mutual Bank FA | | | |
| 5.65% due 08/15/2014 | | 255,000 | 253,870 |
| Zions Bancorporation | | | |
| 5.50% due 11/16/2015 | | 215,000 | 211,263 |
|
|
| | | | 2,528,970 |
| Broadcasting - 0.10% | | | |
| Viacom, Inc. | | | |
| 5.75% due 04/30/2011 | | 130,000 | 128,930 |
| 6.25% due 04/30/2016 | | 60,000 | 59,222 |
|
|
| | | | 188,152 |
| Business Services - 0.15% | | | |
| Xerox Corp. | | | |
| 6.40% due 03/15/2016 | | 305,000 | 301,979 |
| Cable and Television - 0.70% | | | |
| AOL Time Warner, Inc. | | | |
| 6.875% due 05/01/2012 | | 310,000 | 324,575 |
| Comcast Corp. | | | |
| 5.65% due 06/15/2035 | | 146,000 | 129,440 |
| 5.90% due 03/15/2016 | | 335,000 | 332,087 |
| Core Bond Fund (continued) | | |
| | | Shares or | |
| | | Principal | |
| | | Amount | Value |
|
|
| |
| CORPORATE BONDS (continued) | | | |
| Cable and Television (continued) | | | |
| News America, Inc. | | | |
| 6.40% due 12/15/2035 | $ | 225,000 | $ | 215,607 |
| Rogers Cable, Inc. | | | |
| 5.50% due 03/15/2014 | | 265,000 | 245,456 |
| Time Warner Entertainment Company, LP | | | |
| 8.375% due 07/15/2033 | | 126,000 | 144,497 |
|
|
| | | | 1,391,662 |
| |
| Cellular Communications - 0.69% | | | |
| America Movil SA de CV | | | |
| 6.375% due 03/01/2035 | | 139,000 | 132,812 |
| AT&T Broadband Corp. | | | |
| 8.375% due 03/15/2013 | | 237,000 | 268,643 |
| Cingular Wireless Services, Inc. | | | |
| 8.125% due 05/01/2012 | | 235,000 | 263,110 |
| Verizon Wireless Capital LLC | | | |
| 5.375% due 12/15/2006 | | 375,000 | 374,858 |
| Vodafone Group PLC | | | |
| 5.50% due 06/15/2011 | | 325,000 | 323,987 |
|
|
| | | | 1,363,410 |
| |
| Computers & Business Equipment - 0.15% | | |
| Cisco Systems, Inc. | | | |
| 5.50% due 02/22/2016 | | 295,000 | 293,704 |
| Construction & Mining Equipment - 0.11% | | |
| Caterpillar, Inc. | | | |
| 6.05% due 08/15/2036 | | 210,000 | 216,188 |
| Crude Petroleum & Natural Gas - 0.13% | | |
| EnCana Corp. | | | |
| 6.50% due 08/15/2034 | | 126,000 | 130,676 |
| XTO Energy Inc. | | | |
| 6.10% due 04/01/2036 | | 125,000 | 122,314 |
|
|
| | | | 252,990 |
| |
| Domestic Oil - 0.76% | | | |
| Anadarko Finance Company, Series B | | | |
| 6.75% due 05/01/2011 | | 350,000 | 366,544 |
| ConocoPhillips | | | |
| 5.90% due 10/15/2032 (a) | | 310,000 | 312,870 |
| Devon Financing Corp., ULC | | | |
| 6.875% due 09/30/2011 | | 435,000 | 461,312 |
| Hess Corp. | | | |
| 6.65% due 08/15/2011 | | 350,000 | 366,272 |
|
|
| | | | 1,506,998 |
| |
| Drugs & Health Care - 0.27% | | | |
| Wyeth | | | |
| 5.50% due 02/15/2016 | | 540,000 | 534,892 |
| Electrical Equipment - 0.07% | | | |
| Exelon Generation Company LLC | | | |
| 5.35% due 01/15/2014 | | 145,000 | 141,540 |
| Electrical Utilities - 1.74% | | | |
| Allegheny Energy Supply Company LLC | | | |
| 8.25% due 04/15/2012 | | 195,000 | 210,600 |
| American Electric Power Company, Inc., Series C | | |
| 5.375% due 03/15/2010 (a) | | 210,000 | 209,611 |
The accompanying notes are an integral part of the financial statements. 199
John Hancock Funds II
Portfolio of investments — August 31, 2006
(showing percentage of total net assets)
| Core Bond Fund (continued) | | |
| | | Shares or | |
| | | Principal | |
| | | Amount | Value |
|
|
| |
| CORPORATE BONDS (continued) | | | |
| Electrical Utilities (continued) | | | |
| Dominion Resources, Inc. | | | |
| 5.95% due 06/15/2035 (a) | $ | 136,000 | $ | 128,870 |
| DPL, Inc. | | | |
| 6.875% due 09/01/2011 | | 405,000 | 424,452 |
| Empresa Nacional de Electricidad SA | | | |
| 8.625% due 08/01/2015 (a) | | 160,000 | 183,499 |
| FirstEnergy Corp. | | | |
| 6.45% due 11/15/2011 | | 185,000 | 191,871 |
| Kansas Gas & Electric | | | |
| 5.647% due 03/29/2021 | | 339,000 | 331,576 |
| MidAmerican Energy Holdings Company | | | |
| 6.125% due 04/01/2036 | | 145,000 | 143,178 |
| Nevada Power Company | | | |
| 5.95% due 03/15/2016 | | 300,000 | 296,757 |
| Ohio Edison Company | | | |
| 6.40% due 07/15/2016 | | 115,000 | 119,668 |
| Progress Energy, Inc. | | | |
| 6.85% due 04/15/2012 | | 560,000 | 593,168 |
| PSEG Power LLC | | | |
| 5.00% due 04/01/2014 | | 140,000 | 132,791 |
| Public Service Company of Colorado | | | |
| 7.875% due 10/01/2012 | | 297,000 | 334,056 |
| TXU Electric Delivery Company | | | |
| 6.375% due 01/15/2015 | | 145,000 | 149,181 |
|
|
| | | | 3,449,278 |
| Financial Services - 6.30% | | | |
| AMBAC Financial Group, Inc. | | | |
| 5.95% due 12/05/2035 | | 120,000 | 117,705 |
| Capital One Bank | | | |
| 4.875% due 05/15/2008 | | 445,000 | 441,740 |
| Capital One Financial Corp. | | | |
| 5.50% due 06/01/2015 | | 295,000 | 287,152 |
| 6.15% due 09/01/2016 | | 215,000 | 215,945 |
| 8.75% due 02/01/2007 | | 470,000 | 475,837 |
| CIT Group, Inc., Series MTN | | | |
| 4.75% due 08/15/2008 | | 364,000 | 360,323 |
| Citigroup, Inc. | | | |
| 3.625% due 02/09/2009 | | 715,000 | 689,841 |
| 5.125% due 02/14/2011 (a) | | 285,000 | 283,710 |
| 5.85% due 08/02/2016 | | 285,000 | 292,037 |
| Credit Suisse USA, Inc. | | | |
| 5.50% due 08/16/2011 | | 495,000 | 497,061 |
| General Electric Capital Corp. | | | |
| 4.875% due 03/04/2015 (a) | | 193,000 | 186,541 |
| 6.75% due 03/15/2032 | | 140,000 | 158,005 |
| General Electric Capital Corp., Series A, MTN | | |
| 3.75% due 12/15/2009 (a) | | 456,000 | 436,615 |
| 6.00% due 06/15/2012 | | 578,000 | 597,342 |
| General Motors Acceptance Corp. | | | |
| 6.75% due 12/01/2014 | | 100,000 | 95,869 |
| HSBC Finance Corp. | | | |
| 4.75% due 04/15/2010 | | 907,000 | 890,464 |
| International Lease Finance Corp., Series MTN | | |
| 5.45% due 03/24/2011 | | 445,000 | 445,416 |
| 5.62% due 05/24/2010 (b) | | 215,000 | 215,271 |
| Core Bond Fund (continued) | | |
| | | Shares or | |
| | | Principal | |
| | | Amount | Value |
|
|
| |
| CORPORATE BONDS (continued) | | | |
| Financial Services (continued) | | | |
| JP Morgan Chase & Company | | | |
| 5.125% due 09/15/2014 | $ | 170,000 | $ | 165,583 |
| 5.60% due 06/01/2011 | | 995,000 | 1,005,684 |
| Lazard Group, LLC | | | |
| 7.125% due 05/15/2015 | | 300,000 | 313,679 |
| Lehman Brothers Holdings, Inc., Series MTN | | |
| 5.75% due 05/17/2013 | | 420,000 | 424,649 |
| Merrill Lynch & Company, Inc. | | | |
| 6.05% due 05/16/2016 | | 355,000 | 366,158 |
| Merrill Lynch & Company, Inc., Series MTN | | |
| 5.77% due 07/25/2011 | | 350,000 | 356,352 |
| Merrill Lynch & Company, Inc., Series MTNC | | |
| 4.25% due 02/08/2010 | | 255,000 | 246,788 |
| Morgan Stanley | | | |
| 5.375% due 10/15/2015 | | 325,000 | 317,983 |
| Morgan Stanley, Series MTN | | | |
| 5.625% due 01/09/2012 | | 355,000 | 357,991 |
| 6.25% due 08/09/2026 | | 140,000 | 142,596 |
| Residential Capital Corp. | | | |
| 6.125% due 11/21/2008 | | 475,000 | 476,034 |
| 6.50% due 04/17/2013 | | 130,000 | 131,150 |
| 6.875% due 06/29/2007 (b) | | 220,000 | 221,217 |
| SLM Corp., Series MTN | | | |
| 5.6647% due 07/26/2010 (b) | | 490,000 | 489,952 |
| The Goldman Sachs Group, Inc. | | | |
| 5.125% due 01/15/2015 | | 513,000 | 496,168 |
| 6.45% due 05/01/2036 | | 145,000 | 146,755 |
| Washington Mutual, Inc. | | | |
| 4.00% due 01/15/2009 | | 167,000 | 162,148 |
|
|
| | | | 12,507,761 |
| Food & Beverages - 0.54% | | | |
| Kraft Foods, Inc. | | | |
| 5.25% due 10/01/2013 | | 400,000 | 392,795 |
| 5.625% due 11/01/2011 | | 353,000 | 355,243 |
| SABMiller PLC | | | |
| 5.78% due 07/01/2009 (b) | | 155,000 | 155,007 |
| 6.50% due 07/01/2016 | | 155,000 | 161,608 |
|
|
| | | | 1,064,653 |
| Gas & Pipeline Utilities - 0.51% | | | |
| Duke Capital LLC | | | |
| 7.50% due 10/01/2009 | | 256,000 | 271,506 |
| 8.00% due 10/01/2019 | | 80,000 | 91,367 |
| Energy Transfer Partners LP | | | |
| 5.65% due 08/01/2012 | | 210,000 | 207,402 |
| Kinder Morgan Energy Partners LP | | | |
| 5.80% due 03/15/2035 | | 145,000 | 130,179 |
| Kinder Morgan Finance Company, ULC | | | |
| 5.70% due 01/05/2016 | | 115,000 | 104,642 |
| Kinder Morgan, Inc. | | | |
| 6.50% due 09/01/2012 | | 215,000 | 210,836 |
|
|
| | | | 1,015,932 |
| Healthcare Products - 0.33% | | | |
| Baxter International, Inc. | | | |
| 5.90% due 09/01/2016 | | 210,000 | 212,981 |
The accompanying notes are an integral part of the financial statements. 200
John Hancock Funds II
Portfolio of investments — August 31, 2006
(showing percentage of total net assets)
| Core Bond Fund (continued) | | | |
| | | Shares or | |
| | | Principal | |
| | | Amount | Value |
|
|
| |
| CORPORATE BONDS (continued) | | | |
| Healthcare Products (continued) | | | |
| Boston Scientific Corp. | | | |
| 6.00% due 06/15/2011 | $ | 215,000 | $ | 216,923 |
| 6.25% due 11/15/2035 | | 145,000 | 146,244 |
| 6.40% due 06/15/2016 | | 75,000 | 75,913 |
|
|
| | | | 652,061 |
| |
| Healthcare Services - 0.16% | | | |
| Aetna, Inc. | | | |
| 6.625% due 06/15/2036 | | 100,000 | 104,279 |
| WellPoint, Inc. | | | |
| 5.85% due 01/15/2036 | | 220,000 | 209,914 |
|
|
| | | | 314,193 |
| |
| Insurance - 0.41% | | | |
| American International Group, Inc. | | | |
| 4.70% due 10/01/2010 | | 368,000 | 360,315 |
| GE Global Insurance Holding Corp. | | | |
| 7.00% due 02/15/2026 | | 160,000 | 173,127 |
| Liberty Mutual Insurance Company | | | |
| 7.875% due 10/15/2026 | | 90,000 | 100,403 |
| XL Capital, Ltd. | | | |
| 6.375% due 11/15/2024 (a) | | 185,000 | 182,920 |
|
|
| | | | 816,765 |
| |
| International Oil - 0.20% | | | |
| Pemex Project Funding Master Trust | | | |
| 6.625% due 06/15/2035 (a) | | 120,000 | 117,840 |
| 7.375% due 12/15/2014 | | 124,000 | 134,354 |
| Petro-Canada | | | |
| 5.95% due 05/15/2035 | | 155,000 | 147,274 |
|
|
| | | | 399,468 |
| |
| Investment Companies - 0.29% | | | |
| Allied Capital Corp. | | | |
| 6.625% due 07/15/2011 | | 565,000 | 573,476 |
| Leisure Time - 0.14% | | | |
| Harrah's Operating Company, Inc. | | | |
| 6.50% due 06/01/2016 | | 285,000 | 282,744 |
| Manufacturing - 0.20% | | | |
| Tyco International Group SA | | | |
| 6.375% due 10/15/2011 | | 389,000 | 405,709 |
| Paper - 0.31% | | | |
| Celulosa Arauco y Constitucion SA | | | |
| 5.625% due 04/20/2015 | | 165,000 | 159,460 |
| International Paper Company | | | |
| 5.85% due 10/30/2012 | | 440,000 | 446,914 |
|
|
| | | | 606,374 |
| |
| Petroleum Services - 0.21% | | | |
| Halliburton Company | | | |
| 5.50% due 10/15/2010 | | 167,000 | 167,659 |
| 8.75% due 02/15/2021 (a) | | 203,000 | 256,866 |
|
|
| | | | 424,525 |
| |
| Pharmaceuticals - 0.07% | | | |
| Teva Pharmaceutical Finance LLC | | | |
| 6.15% due 02/01/2036 | | 140,000 | 132,238 |
| Core Bond Fund (continued) | | | |
| | | Shares or | |
| | | Principal | |
| | | Amount | Value |
|
|
| |
| CORPORATE BONDS (continued) | | | |
| Real Estate - 0.76% | | | |
| Developers Diversified Realty Corp., REIT | | | |
| 5.375% due 10/15/2012 | $ | 336,000 | $ | 330,285 |
| Duke Realty LP | | | |
| 5.625% due 08/15/2011 | | 140,000 | 140,199 |
| 5.95% due 02/15/2017 | | 140,000 | 140,932 |
| ProLogis, REIT | | | |
| 5.25% due 11/15/2010 | | 105,000 | 103,892 |
| 5.50% due 04/01/2012 | | 290,000 | 288,138 |
| Simon Property Group LP, REIT | | | |
| 5.60% due 09/01/2011 | | 170,000 | 170,434 |
| 6.10% due 05/01/2016 | | 330,000 | 338,686 |
|
|
| | | | 1,512,566 |
| Telecommunications Equipment & | | | |
| Services - 0.68% | | | |
| Corning, Inc. | | | |
| 7.25% due 08/15/2036 | | 155,000 | 161,405 |
| Deutsche Telekom International Finance BV | | | |
| 5.75% due 03/23/2016 | | 275,000 | 267,502 |
| 8.25% due 06/15/2030 (b) | | 70,000 | 84,444 |
| Embarq Corp. | | | |
| 7.082% due 06/01/2016 | | 210,000 | 214,271 |
| SBC Communications, Inc. | | | |
| 5.10% due 09/15/2014 | | 455,000 | 433,915 |
| 6.15% due 09/15/2034 | | 190,000 | 181,046 |
|
|
| | | | 1,342,583 |
| Telephone - 1.37% | | | |
| AT&T Corp. | | | |
| 7.30% due 11/15/2011 (b) | | 165,000 | 178,137 |
| AT&T, Inc. | | | |
| 6.80% due 05/15/2036 (a) | | 145,000 | 149,932 |
| BellSouth Corp. | | | |
| 6.00% due 11/15/2034 | | 100,000 | 91,783 |
| British Telecommunications PLC | | | |
| zero coupon, Step up to 9.125% on | | | |
| 12/15/2006 due 12/15/2030 (b) | | 119,000 | 153,596 |
| Sprint Capital Corp. | | | |
| 6.00% due 01/15/2007 | | 579,000 | 579,719 |
| 6.125% due 11/15/2008 | | 336,000 | 340,462 |
| 8.375% due 03/15/2012 | | 170,000 | 189,988 |
| Telecom Italia Capital SA | | | |
| 6.00% due 09/30/2034 | | 155,000 | 139,939 |
| 7.20% due 07/18/2036 | | 70,000 | 73,108 |
| Telefonica Emisones SAU | | | |
| 5.984% due 06/20/2011 | | 340,000 | 345,056 |
| Verizon Communications, Inc. | | | |
| 5.35% due 02/15/2011 | | 220,000 | 219,023 |
| 5.55% due 02/15/2016 | | 270,000 | 263,013 |
|
|
| | | | 2,723,756 |
| Transportation - 0.25% | | | |
| Canadian National Railway Company | | | |
| 6.20% due 06/01/2036 | | 225,000 | 236,735 |
The accompanying notes are an integral part of the financial statements. 201
John Hancock Funds II
Portfolio of investments — August 31, 2006
(showing percentage of total net assets)
| Core Bond Fund (continued) | | |
| | | Shares or | |
| | | Principal | |
| | | Amount | Value |
|
|
| |
| CORPORATE BONDS (continued) | | | |
| Transportation (continued) | | | |
| Norfolk Southern Corp. | | | |
| 7.05% due 05/01/2037 | $ | 228,000 | $ | 261,429 |
|
|
| | | | 498,164 |
|
| |
| TOTAL CORPORATE BONDS (Cost $38,632,445) | | $ | 38,762,418 |
|
| |
| MUNICIPAL BONDS - 0.34% | | | |
| Texas - 0.34% | | | |
| Brazos Texas Higher Education Authority, Inc. | | |
| 5.03% due 12/01/2041 | | 685,000 | 682,390 |
|
| TOTAL MUNICIPAL BONDS (Cost $682,014) | | $ | 682,390 |
|
| |
| COLLATERALIZED MORTGAGE | | | |
| OBLIGATIONS - 24.91% | | | |
| Banc of America Commercial Mortgage, Inc., | | |
| Series 2002-PB2, Class B | | | |
| 6.309% due 06/11/2035 | | 143,000 | 149,051 |
| Banc of America Commercial Mortgage, Inc., | | |
| Series 2004-1, Class A4 | | | |
| 4.76% due 11/10/2039 | | 178,000 | 170,896 |
| Bear Stearns Commercial Mortgage Securities, | | |
| Inc., Series 2003-T10, Class A2 | | | |
| 4.74% due 03/13/2040 | | 114,000 | 110,244 |
| Bear Stearns Commercial Mortgage Securities, | | |
| Inc., Series 2004-ESA, Class B | | | |
| 4.888% due 05/14/2016 | | 78,000 | 77,181 |
| Bear Stearns Commercial Mortgage Securities, | | |
| Inc., Series 2004-ESA, Class C | | | |
| 4.937% due 05/14/2016 | | 584,000 | 579,940 |
| Bear Stearns Commercial Mortgage Securities, | | |
| Inc., Series 2005-PWR8, Class AAB | | | |
| 4.581% due 06/11/2041 | | 610,000 | 583,593 |
| Bear Stearns Commercial Mortgage Securities, | | |
| Inc., Series 2006-T22, Class AM | | | |
| 5.6336% due 04/12/2038 (b) | | 344,000 | 345,943 |
| Commercial Mortgage Pass Through Certificates, | | |
| Series 1999-1, Class E | | | |
| 7.2244% due 05/15/2032 (b) | | 443,000 | 459,068 |
| Commercial Mortgage Pass Through Certificates, | | |
| Series 2000-C1, Class C | | | |
| 7.706% due 08/15/2033 | | 74,000 | 79,881 |
| Countrywide Alternative Loan Trust, | | | |
| Series 2005-J4, Class 2A1B | | | |
| 5.4444% due 07/25/2035 (b) | | 78,184 | 78,167 |
| CS First Boston Mortgage Securities Corp., | | |
| Series 2001-CP4, Class A4 | | | |
| 6.18% due 12/15/2035 | | 606,000 | 627,152 |
| CS First Boston Mortgage Securities Corp., | | |
| Series 2002-CKN2, Class A3 | | | |
| 6.133% due 04/15/2037 | | 819,000 | 849,581 |
| CS First Boston Mortgage Securities Corp., | | |
| Series 2002-CKP1, Class A3 | | | |
| 6.439% due 12/15/2035 | | 282,000 | 295,728 |
| CS First Boston Mortgage Securities Corp., | | |
| Series 2002-CKS4, Class A2 | | | |
| 5.183% due 11/15/2036 | | 431,000 | 428,106 |
| Core Bond Fund (continued) | | | |
| | | Shares or | |
| | | Principal | |
| | | Amount | Value |
|
|
| |
| COLLATERALIZED MORTGAGE | | | |
| OBLIGATIONS (continued) | | | |
| CS First Boston Mortgage Securities Corp., | | | |
| Series 2002-CP3, Class A3 | | | |
| 5.603% due 07/15/2035 | $ | 342,000 | $ | 346,357 |
| CS First Boston Mortgage Securities Corp., | | | |
| Series 2003-C4, Class A4 | | | |
| 5.137% due 08/15/2036 (b) | | 238,000 | 234,450 |
| CS First Boston Mortgage Securities Corp., | | | |
| Series 2004-C2, Class A2 | | | |
| 5.416% due 05/15/2036 (b) | | 871,000 | 868,328 |
| Federal Home Loan Mortgage Corp., | | | |
| Series 2003-2682, Class LC | | | |
| 4.50% due 07/15/2032 | | 567,000 | 531,552 |
| Federal Home Loan Mortgage Corp., | | | |
| Series 2004-2727, Class PE | | | |
| 4.50% due 07/15/2032 | | 989,000 | 924,531 |
| Federal Home Loan Mortgage Corp., | | | |
| Series 2004-2904, Class CM | | | |
| 5.00% due 01/15/2018 | | 638,912 | 632,960 |
| Federal Home Loan Mortgage Corp., | | | |
| Series 2005-2941, Class WA | | | |
| 5.00% due 11/15/2024 | | 420,188 | 417,527 |
| Federal Home Loan Mortgage Corp., | | | |
| Series 2005-2948, Class QA | | | |
| 5.00% due 10/15/2025 | | 633,770 | 629,773 |
| Federal Home Loan Mortgage Corp., | | | |
| Series 2005-3017, Class TA | | | |
| 4.50% due 08/15/2035 | | 460,000 | 441,895 |
| Federal Home Loan Mortgage Corp., | | | |
| Series 2005-3020, Class MA | | | |
| 5.50% due 04/15/2027 | | 657,139 | 658,770 |
| Federal Home Loan Mortgage Corp., | | | |
| Series 2005-3026, Class GJ | | | |
| 4.50% due 02/15/2029 | | 584,876 | 574,016 |
| Federal Home Loan Mortgage Corp., | | | |
| Series 2005-3026, Class PC | | | |
| 4.50% due 01/15/2034 | | 315,000 | 290,435 |
| Federal Home Loan Mortgage Corp., | | | |
| Series 2005-3057, Class MD | | | |
| 4.50% due 08/15/2034 | | 386,000 | 356,826 |
| Federal Home Loan Mortgage Corp., | | | |
| Series 2006-3117, Class PN | | | |
| 5.00% due 11/15/2021 | | 1,310,332 | 1,303,030 |
| Federal Home Loan Mortgage Corp., | | | |
| Series 2006-3135, Class JA | | | |
| 6.00% due 09/15/2027 | | 819,396 | 829,876 |
| Federal Home Loan Mortgage Corp., | | | |
| Series 2006-3147, Class PC | | | |
| 5.50% due 04/15/2033 | | 170,000 | 167,924 |
| Federal Home Loan Mortgage Corp., | | | |
| Series 2006-3151, Class LA | | | |
| 6.00% due 11/15/2027 | | 865,066 | 875,115 |
| Federal Home Loan Mortgage Corp., | | | |
| Series 2006-3167, Class QA | | | |
| 6.00% due 10/15/2026 | | 2,028,000 | 2,048,009 |
| Federal Home Loan Mortgage Corp., | | | |
| Series 2006-3176, Class HA | | | |
| 6.00% due 02/15/2028 | | 1,425,008 | 1,444,232 |
The accompanying notes are an integral part of the financial statements. 202
John Hancock Funds II
Portfolio of investments — August 31, 2006
(showing percentage of total net assets)
| Core Bond Fund (continued) | | | |
| | | Shares or | |
| | | Principal | |
| | | Amount | Value |
|
|
| |
| COLLATERALIZED MORTGAGE | | | |
| OBLIGATIONS (continued) | | | |
| Federal Home Loan Mortgage Corp., | | | |
| Series 2006-3178, Class MA | | | |
| 6.00% due 10/15/2026 | $ | 470,606 | $ | 476,459 |
| Federal Home Loan Mortgage Corp., | | | |
| Series 2006-3184, Class LA | | | |
| 6.00% due 03/15/2028 | | 1,402,579 | 1,419,042 |
| Federal Home Loan Mortgage Corp., | | | |
| Series 2006-3192, Class GA | | | |
| 6.00% due 03/15/2027 | | 696,726 | 704,442 |
| Federal National Mortgage Association, | | | |
| Series 2002-T11, Class A | | | |
| 4.768% due 04/25/2012 | | 50,376 | 49,924 |
| Federal National Mortgage Association, | | | |
| Series 2003-34, Class QJ | | | |
| 4.50% due 01/25/2016 | | 1,555,609 | 1,527,121 |
| Federal National Mortgage Association, | | | |
| Series 2003-76, Class DE | | | |
| 4.00% due 09/25/2031 *** | | 1,405,061 | 1,325,394 |
| Federal National Mortgage Association, | | | |
| Series 2003-92, Class KQ | | | |
| 3.50% due 06/25/2023 | | 471,336 | 460,516 |
| Federal National Mortgage Association, | | | |
| Series 2003-T1, Class A | | | |
| 3.807% due 11/25/2012 | | 153,339 | 147,412 |
| Federal National Mortgage Association, | | | |
| Series 2004-69, Class CT | | | |
| 4.50% due 06/25/2018 | | 219,429 | 213,537 |
| Federal National Mortgage Association, | | | |
| Series 2005-38, Class CD | | | |
| 5.00% due 06/25/2019 | | 398,829 | 394,042 |
| Federal National Mortgage Association, | | | |
| Series 2005-45, Class BA | | | |
| 4.50% due 11/25/2014 | | 1,268,577 | 1,254,920 |
| Federal National Mortgage Association, | | | |
| Series 2005-63, Class HA | | | |
| 5.00% due 04/25/2023 | | 738,327 | 727,267 |
| Federal National Mortgage Association, | | | |
| Series 2005-65, Class WG | | | |
| 4.50% due 08/25/2026 | | 984,551 | 969,946 |
| Federal National Mortgage Association, | | | |
| Series 2005-77, Class BX | | | |
| 4.50% due 07/25/2028 | | 204,212 | 200,968 |
| Federal National Mortgage Association, | | | |
| Series 2006-18, Class PA | | | |
| 5.50% due 01/25/2026 | | 472,000 | 472,322 |
| Federal National Mortgage Association, | | | |
| Series 2006-29, Class PA | | | |
| 5.50% due 08/25/2026 | | 1,045,000 | 1,046,707 |
| Federal National Mortgage Association, | | | |
| Series 2006-31, Class PA | | | |
| 5.50% due 11/25/2026 | | 465,000 | 465,804 |
| Federal National Mortgage Association, | | | |
| Series 2006-41, Class MA | | | |
| 5.50% due 04/25/2024 | | 415,000 | 415,684 |
| Federal National Mortgage Association, | | | |
| Series 2006-81, Class NA | | | |
| 6.00% due 02/25/2027 | | 1,178,000 | 1,191,189 |
| Core Bond Fund (continued) | | |
| | | Shares or | |
| | | Principal | |
| | | Amount | Value |
|
|
| |
| COLLATERALIZED MORTGAGE | | | |
| OBLIGATIONS (continued) | | | |
| First Union National Bank Commercial Mortgage, | | |
| Series 2001-C4, Class B | | | |
| 6.417% due 12/12/2033 | $ | 188,000 | $ | 197,436 |
| GE Capital Commercial Mortgage Corp., | | | |
| Series 2001-3, Class A2 | | | |
| 6.07% due 06/10/2038 | | 1,004,000 | 1,038,639 |
| GE Capital Commercial Mortgage Corp., | | | |
| Series 2002-2A, Class A3 | | | |
| 5.349% due 08/11/2036 | | 586,000 | 586,350 |
| GE Capital Commercial Mortgage Corp., | | | |
| Series 2002-3A, Class A2 | | | |
| 4.996% due 12/10/2037 | | 442,000 | 435,163 |
| GE Capital Commercial Mortgage Corp., | | | |
| Series 2003-C2, Class A4 | | | |
| 5.145% due 07/10/2037 | | 835,000 | 824,268 |
| GE Capital Commercial Mortgage Corp., | | | |
| Series 2004-C3, Class A4 | | | |
| 5.189% due 07/10/2039 (b) | | 552,000 | 540,117 |
| GMAC Commercial Mortgage Securities, Inc., | | |
| Series 2002-C3, Class A2 | | | |
| 4.93% due 07/10/2039 | | 127,000 | 124,412 |
| GMAC Commercial Mortgage Securities, Inc., | | |
| Series 2003-C2, Class B | | | |
| 5.4729% due 05/10/2040 (b) | | 308,000 | 310,202 |
| GMAC Commercial Mortgage Securities, Inc., | | |
| Series 2003-C3, Class A4 | | | |
| 5.023% due 04/10/2040 | | 1,041,000 | 1,017,538 |
| GMAC Commercial Mortgage Securities, Inc., | | |
| Series 2004-C1, Class A1 | | | |
| 3.118% due 03/10/2038 | | 261,321 | 253,988 |
| Government National Mortgage Association, | | |
| Series 2006-3, Class A | | | |
| 4.212% due 01/16/2028 | | 121,231 | 118,095 |
| Government National Mortgage Association, | | |
| Series 2006-32, Class A | | | |
| 5.079% due 01/16/2030 | | 326,405 | 324,488 |
| Government National Mortgage Association, | | |
| Series 2006-8, Class A | | | |
| 3.942% due 08/16/2025 | | 192,693 | 187,230 |
| Greenwich Capital Commercial Funding Corp., | | |
| Series 2006-GG7, Class A4 | | | |
| 6.1101% due 07/10/2038 (b) | | 429,000 | 445,166 |
| GS Mortgage Securities Corp. II, | | | |
| Series 1998-C1, Class B | | | |
| 6.97% due 10/18/2030 | | 109,000 | 112,163 |
| GS Mortgage Securities Corp. II, | | | |
| Series 1998-GLII, Class A2 | | | |
| 6.562% due 04/13/2031 | | 728,000 | 739,305 |
| JP Morgan Chase Commercial Mortgage Securities | | |
| Corp., Series 2003-CB7, Class A4 | | | |
| 4.879% due 01/12/2038 (b) | | 270,000 | 262,043 |
| JP Morgan Chase Commercial Mortgage Securities | | |
| Corp., Series 2003-ML1A, Class A2 | | | |
| 4.767% due 03/12/2039 | | 525,000 | 508,014 |
| JP Morgan Chase Commercial Mortgage Securities | | |
| Corp., Series 2004-C3, Class A1 | | | |
| 3.765% due 01/15/2042 | | 952,519 | 928,941 |
The accompanying notes are an integral part of the financial statements. 203
John Hancock Funds II
Portfolio of investments — August 31, 2006
(showing percentage of total net assets)
| Core Bond Fund (continued) | | |
| | | Shares or | |
| | | Principal | |
| | | Amount | Value |
|
|
| |
| COLLATERALIZED MORTGAGE | | | |
| OBLIGATIONS (continued) | | | |
| LB Commercial Conduit Mortgage Trust, | | | |
| Series 1999-C2, Class A1 | | | |
| 7.105% due 10/15/2032 | $ | 29,694 | $ | 29,790 |
| LB-UBS Commercial Mortgage Trust, | | | |
| Series 2003-C7, Class A4 | | | |
| 4.931% due 09/15/2035 (b) | | 801,000 | 781,092 |
| Merrill Lynch Mortgage Trust, | | | |
| Series 2002-MW1, Class A4 | | | |
| 5.619% due 07/12/2034 | | 568,000 | 575,666 |
| Merrill Lynch Mortgage Trust, | | | |
| Series 2004-KEY2, Class A4 | | | |
| 4.864% due 08/12/2039 (b) | | 414,000 | 396,732 |
| Morgan Stanley Capital I, Series 2003-T11, Class A4 | | |
| 5.15% due 06/13/2041 | | 590,000 | 582,989 |
| Morgan Stanley Capital I, | | | |
| Series 2004-HQ4, Class A2 | | | |
| 3.92% due 04/14/2040 | | 283,979 | 277,693 |
| Morgan Stanley Capital I, | | | |
| Series 2005-HQ5, Class AAB | | | |
| 5.037% due 01/14/2042 | | 176,000 | 172,906 |
| Morgan Stanley Capital I, | | | |
| Series 2006-HQ9, Class A4 | | | |
| 5.731% due 07/20/2044 (b) | | 395,000 | 401,992 |
| Morgan Stanley Dean Witter Capital I, | | | |
| Series 2002-IQ3, Class A4 | | | |
| 5.08% due 09/15/2037 | | 682,000 | 672,196 |
| Salomon Brothers Mortgage Securities VII, | | |
| Series 2001-C2, Class A3 | | | |
| 6.499% due 10/13/2011 | | 340,000 | 356,703 |
| Wachovia Bank Commercial Mortgage Trust, | | |
| Series 2002-C1, Class A4 | | | |
| 6.287% due 04/15/2034 | | 347,000 | 362,644 |
| Wachovia Bank Commercial Mortgage Trust, | | |
| Series 2003-C6, Class A3 | | | |
| 4.957% due 08/15/2035 | | 588,000 | 579,477 |
| Wachovia Bank Commercial Mortgage Trust, | | |
| Series 2003-C6, Class A4 | | | |
| 5.125% due 08/15/2035 | | 281,000 | 276,884 |
| Wachovia Bank Commercial Mortgage Trust, | | |
| Series 2003-C8, Class A3 | | | |
| 4.445% due 11/15/2035 | | 186,000 | 180,502 |
| Wachovia Bank Commercial Mortgage Trust, | | |
| Series 2003-C9, Class A4 | | | |
| 5.012% due 12/15/2035 | | 131,000 | 128,042 |
| Wachovia Bank Commercial Mortgage Trust, | | |
| Series 2004-C10, Class A4 | | | |
| 4.748% due 02/15/2041 | | 494,000 | 473,303 |
| Wachovia Bank Commercial Mortgage Trust, | | |
| Series 2004-C14, Class A4 | | | |
| 5.088% due 08/15/2041 (b) | | 497,000 | 486,250 |
| Wachovia Bank Commercial Mortgage Trust, | | |
| Series 2004-C15, Class A4 | | | |
| 4.803% due 10/15/2041 | | 347,000 | 331,824 |
| Wachovia Bank Commercial Mortgage Trust, | | |
| Series 2005-C20, Class APB | | | |
| 5.09% due 07/15/2042 (b) | | 703,000 | 690,765 |
| Core Bond Fund (continued) | | |
| | | Shares or | |
| | | Principal | |
| | | Amount | Value |
|
|
| |
| COLLATERALIZED MORTGAGE | | | |
| OBLIGATIONS (continued) | | | |
| Wachovia Bank Commercial Mortgage Trust, | | |
| Series 2006-C26, Class APB | | | |
| 5.997% due 06/15/2045 | $ | 497,000 | $ | 513,246 |
| Wachovia Mortgage Loan Trust LLC, | | | |
| Series 2006-AMN1, Class A1 | | | |
| 5.3744% due 08/25/2036 (b) | | 314,029 | 313,459 |
|
| TOTAL COLLATERALIZED MORTGAGE OBLIGATIONS | |
| (Cost $49,144,297) | | | $ | 49,410,546 |
|
| |
| ASSET BACKED SECURITIES - 9.32% | | |
| American Express Credit Account Master Trust, | | |
| Series 2006-2, Class A | | | |
| 5.35% due 01/15/2014 | | 361,000 | 365,174 |
| AmeriCredit Automobile Receivables Trust, | | |
| Series 2003-DM, Class A4 | | | |
| 2.84% due 08/06/2010 | | 395,420 | 389,343 |
| Ameriquest Mortgage Securities Inc., | | | |
| Series 2004-R12, Class A3 | | | |
| 4.6588% due 01/25/2035 | | 241,173 | 241,383 |
| Capital Auto Receivables Asset Trust, | | | |
| Series 2004-1, Class A3 | | | |
| 2.00% due 11/15/2007 | | 88,678 | 88,109 |
| Capital Auto Receivables Asset Trust, | | | |
| Series 2006-1, Class A3 | | | |
| 5.03% due 10/15/2009 | | 265,000 | 264,255 |
| Capital One Multi-Asset Execution Trust, | | | |
| Series 2003-C4, Class C4 | | | |
| 6.00% due 08/15/2013 | | 364,000 | 371,430 |
| Capital One Multi-Asset Execution Trust, | | | |
| Series 2006-A10, Class A10 | | | |
| 5.15% due 06/15/2014 | | 282,000 | 282,661 |
| Capital One Prime Auto Receivables Trust, | | |
| Series 2006-1, Class A3 | | | |
| 5.04% due 09/15/2010 | | 342,000 | 341,130 |
| Carrington Mortgage Loan Trust, | | | |
| Series 2005-NC3, Class A1B | | | |
| 5.4844% due 06/25/2035 (b) | | 322,224 | 322,303 |
| Chase Credit Card Master Trust, | | | |
| Series 2003-3, Class A | | | |
| 5.44% due 10/15/2010 (b) | | 355,000 | 355,673 |
| Chase Issuance Trust, Series 2004-A9, Class A9 | | |
| 3.22% due 06/15/2010 | | 435,000 | 425,492 |
| Chase Issuance Trust, Series 2006-A3, Class A3 | | |
| 5.32% due 07/15/2011 (b) | | 845,000 | 845,265 |
| Citibank Credit Card Issuance Trust, | | | |
| Series 2000-A3, Class A3 | | | |
| 6.875% due 11/16/2009 | | 184,000 | 187,414 |
| Citibank Credit Card Issuance Trust, | | | |
| Series 2004-A4, Class A4 | | | |
| 3.20% due 08/24/2009 | | 510,000 | 499,651 |
| Citibank Credit Card Issuance Trust, | | | |
| Series 2005-B1, Class B1 | | | |
| 4.40% due 09/15/2010 | | 256,000 | 251,581 |
| Citibank Credit Card Issuance Trust, | | | |
| Series 2006-A4, Class A4 | | | |
| 5.45% due 05/10/2013 | | 412,000 | 417,408 |
The accompanying notes are an integral part of the financial statements. 204
John Hancock Funds II
Portfolio of investments — August 31, 2006
(showing percentage of total net assets)
| Core Bond Fund (continued) | | |
| | | Shares or | |
| | | Principal | |
| | | Amount | Value |
|
|
| |
| ASSET BACKED SECURITIES | | | |
| (continued) | | | |
| Citicorp Residential Mortgage Securities Inc, | | |
| Series 2006-1, Class A2 | | | |
| 5.682% due 07/25/2036 | $ | 282,000 | $ | 281,994 |
| Countrywide Asset-Backed Certificates, | | | |
| Series 2005-12, Class 1A1 | | | |
| 5.4744% due 02/25/2036 (b) | | 142,043 | 142,067 |
| Countrywide Asset-Backed Certificates, | | | |
| Series 2005-BC4, Class 2A1 | | | |
| 5.4444% due 08/25/2035 (b) | | 82,361 | 82,377 |
| Countrywide Asset-Backed Certificates, | | | |
| Series 2006-11, Class 3AV1 | | | |
| 5.3844% due 09/25/2046 (b) | | 401,836 | 401,836 |
| Countrywide Asset-Backed Certificates, | | | |
| Series 2006-13, Class 3AV2 | | | |
| 5.4744% due 01/25/2037 (b) | | 351,000 | 350,835 |
| Countrywide Asset-Backed Certificates, | | | |
| Series 2006-ABC1, Class A1 | | | |
| 5.3544% due 05/25/2036 (b) | | 325,802 | 325,700 |
| Countrywide Asset-Backed Certificates, | | | |
| Series 2006-S1, Class A2 | | | |
| 5.549% due 08/25/2021 | | 544,000 | 542,470 |
| Drive Auto Receivables Trust, Series 2006-1, Class | | |
| A3 | | | |
| 5.49% due 05/15/2011 | | 311,000 | 312,847 |
| Encore Credit Receivables Trust, | | | |
| Series 2005-3, Class 2A1 | | | |
| 5.4444% due 10/25/2035 (b) | | 72,153 | 72,159 |
| Ford Credit Auto Owner Trust, | | | |
| Series 2005-A, Class A3 | | | |
| 3.48% due 11/15/2008 | | 479,443 | 475,271 |
| Ford Credit Auto Owner Trust, | | | |
| Series 2005-B, Class A3 | | | |
| 4.17% due 01/15/2009 | | 333,000 | 330,671 |
| Ford Credit Auto Owner Trust, | | | |
| Series 2006-B, Class A4 | | | |
| 5.25% due 09/15/2011 | | 476,000 | 476,112 |
| Ford Credit Floorplan Master Owner Trust, | | |
| Series 2006-3, Class A | | | |
| 5.51% due 06/15/2011 (b) | | 426,000 | 426,622 |
| Franklin Auto Trust, Series 2005-1, Class A2 | | |
| 4.84% due 09/22/2008 | | 69,872 | 69,785 |
| Harley-Davidson Motorcycle Trust, Series | | | |
| 2006-2, Class A2 | | | |
| 5.35% due 03/15/2013 | | 140,000 | 140,875 |
| Honda Auto Receivables Owner Trust, | | | |
| Series 2004-2, Class A3 | | | |
| 3.30% due 06/16/2008 | | 449,676 | 446,137 |
| Hyundai Auto Receivables Trust, | | | |
| Series 2005-A, Class A4 | | | |
| 4.18% due 02/15/2012 | | 275,000 | 268,160 |
| M.A.S.Transactions Asset Backed Securities Trust, | | |
| Series 2004-OPT2, Class A2 | | | |
| 5.6744% due 09/25/2034 (b) | | 38,289 | 38,347 |
| M.A.S.Transactions Asset Backed Securities Trust, | | |
| Series 2005-AB1, Class A1B | | | |
| 5.143% due 11/25/2035 (b) | | 184,011 | 182,918 |
| Core Bond Fund (continued) | | |
| | | Shares or | |
| | | Principal | |
| | | Amount | Value |
|
|
| |
| ASSET BACKED SECURITIES | | | |
| (continued) | | | |
| MBNA Master Credit Card Trust USA, | | | |
| Series 2000-L, Class A | | | |
| 6.50% due 04/15/2010 | $ | 285,000 | $ | 289,515 |
| Merrill Lynch Mortgage Investors Inc., | | | |
| Series 2005-SD1, Class A1 | | | |
| 5.5044% due 05/25/2046 (b) | | 113,863 | 113,883 |
| Morgan Stanley ABS Capital I, | | | |
| Series 2004-WMC2, Class A2 | | | |
| 5.6844% due 07/25/2034 (b) | | 75,646 | 75,645 |
| Morgan Stanley ABS Capital I, | | | |
| Series 2006-NC1, Class A1 | | | |
| 5.4044% due 12/25/2035 (b) | | 328,101 | 328,116 |
| Morgan Stanley Home Equity Loans, | | | |
| Series 2006-2, Class A2 | | | |
| 5.4344% due 02/25/2036 (b) | | 210,000 | 210,066 |
| Nissan Auto Lease Trust, Series 2005-A, Class A2 | | |
| 4.61% due 01/15/2008 | | 124,730 | 124,496 |
| Nissan Auto Receivables Owner Trust, | | | |
| Series 2005-B, Class A2 | | | |
| 3.75% due 09/17/2007 | | 31,547 | 31,506 |
| Nissan Auto Receivables Owner Trust, | | | |
| Series 2006-B, Class A3 | | | |
| 5.16% due 02/15/2010 | | 152,000 | 151,953 |
| Nomura Home Equity Loan Inc., | | | |
| Series 2006-WF1, Class A1 | | | |
| 5.45% due 03/25/2036 (b) | | 330,516 | 330,516 |
| Northstar Education Finance, Inc., | | | |
| Series 2005-1, Class A5 | | | |
| 3.98% due 10/28/2045 | | 207,000 | 204,419 |
| Novastar Home Equity Loan, | | | |
| Series 2005-2, Class A2B | | | |
| 5.4744% due 10/25/2035 (b) | | 301,537 | 301,607 |
| Option One Mortgage Loan Trust, | | | |
| Series 2006-1, Class 2A1 | | | |
| 5.3944% due 01/25/2036 (b) | | 241,436 | 241,479 |
| Ownit Mortgage Loan Asset-Backed Certificates, | | |
| Series 2006-1, Class AF1 | | | |
| 5.424% due 12/25/2036 | | 154,426 | 153,582 |
| Peco Energy Transition Trust, | | | |
| Series 2001-A, Class A1 | | | |
| 6.52% due 12/31/2010 | | 168,000 | 175,566 |
| PG&E Energy Recovery Funding LLC, | | | |
| Series 2005-2, Class A2 | | | |
| 5.03% due 03/25/2014 | | 400,000 | 398,702 |
| Providian Gateway Master Trust, | | | |
| Series 2004-DA, Class A | | | |
| 3.35% due 09/15/2011 | | 622,000 | 609,990 |
| SLM Student Loan Trust, Series 2004-1, Class A2 | | |
| 5.625% due 07/25/2018 (b) | | 282,000 | 283,238 |
| SLM Student Loan Trust, Series 2004-1, Class A6 | | |
| 3.46% due 07/25/2039 | | 250,000 | 239,218 |
| Structured Asset Investment Loan Trust, | | | |
| Series 2005-11, Class A4 | | | |
| 5.4144% due 01/25/2036 (b) | | 236,380 | 236,409 |
| Triad Auto Receivables Owner Trust, | | | |
| Series 2003-B, Class A4 | | | |
| 3.20% due 12/13/2010 | | 128,774 | 126,407 |
The accompanying notes are an integral part of the financial statements. 205
John Hancock Funds II
Portfolio of investments — August 31, 2006
(showing percentage of total net assets)
| Core Bond Fund (continued) | | | |
| | | Shares or | | |
| | | Principal | | |
| | | Amount | | Value |
|
|
| |
| ASSET BACKED SECURITIES | | | | |
| (continued) | | | | |
| USAA Auto Owner Trust, Series 2004-3, Class A3 | | | |
| 3.16% due 02/17/2009 | $ | 150,633 | $ | 149,144 |
| USAA Auto Owner Trust, Series 2005-1, Class A3 | | | |
| 3.90% due 07/15/2009 | | 82,412 | | 81,625 |
| USAA Auto Owner Trust, Series 2005-3, Class A2 | | | |
| 4.52% due 06/16/2008 | | 149,093 | | 148,697 |
| USAA Auto Owner Trust, Series 2006-3, Class A4 | | | |
| 5.36% due 06/15/2012 | | 238,000 | | 240,045 |
| Volkswagen Auto Lease Trust, | | | | |
| Series 2006-A, Class A2 | | | | |
| 5.55% due 11/20/2008 | | 295,000 | | 295,738 |
| Wachovia Auto Owner Trust, Series 2004-A, Class | | | |
| A4 | | | | |
| 3.66% due 07/20/2010 | | 562,000 | | 552,903 |
| Wachovia Auto Owner Trust, Series 2005-B, Class | | | |
| A2 | | | | |
| 4.82% due 02/20/2009 | | 277,113 | | 276,420 |
| Washington Mutual Master Note Trust, | | | | |
| Series 2006-M1A, Class M1 | | | | |
| 5.42% due 08/15/2013 (b) | | 540,000 | | 540,000 |
| WFS Financial Owner Trust, | | | | |
| Series 2003-1, Class A4 | | | | |
| 2.74% due 09/20/2010 | | 44,360 | | 44,006 |
| WFS Financial Owner Trust, | | | | |
| Series 2003-3, Class A4 | | | | |
| 3.25% due 05/20/2011 | | 193,575 | | 190,672 |
| WFS Financial Owner Trust, | | | | |
| Series 2003-4, Class A4 | | | | |
| 3.15% due 05/20/2011 | | 72,434 | | 71,314 |
| WFS Financial Owner Trust, | | | | |
| Series 2004-1, Class A4 | | | | |
| 2.81% due 08/22/2011 | | 141,584 | | 138,495 |
| WFS Financial Owner Trust, | | | | |
| Series 2005-3, Class A3A | | | | |
| 4.25% due 06/17/2010 | | 116,000 | | 114,915 |
|
| TOTAL ASSET BACKED SECURITIES | | | | |
| (Cost $18,471,274) | | | $ | 18,485,742 |
|
| |
| SHORT TERM INVESTMENTS - 12.71% | | | |
| Federal Home Loan Mortgage Corp. Discount Notes | | | |
| zero coupon due 06/26/2007 | $ | 2,782,000 | $ | 2,660,005 |
| Rabobank USA Finance Corp. | | | | |
| 5.27% due 09/01/2006 | | 3,181,000 | | 3,181,000 |
| State Street Navigator Securities Lending | | | | |
| Prime Portfolio (c) | | 19,381,094 | | 19,381,094 |
|
| TOTAL SHORT TERM INVESTMENTS | | | | |
| (Cost $25,222,099) | | | $ | 25,222,099 |
|
| Core Bond Fund (continued) | | |
| | | Shares or | |
| | | Principal | |
| | | Amount | Value |
|
|
| |
| REPURCHASE AGREEMENTS - 0.96% | | |
| Repurchase Agreement with State | | | |
| Street Corp. dated 08/31/2006 at | | | |
| 3.95% to be repurchased at | | | |
| $1,896,208 on 09/01/2006, | | | |
| collateralized by $2,015,000 | | | |
| Federal Home Loan Mortgage | | | |
| Corp., 4.125% due 02/24/2011 | | | |
| (valued at $1,934,400, including | | | |
| interest) (c)*** | $ | 1,896,000 | $ | 1,896,000 |
|
| TOTAL REPURCHASE AGREEMENTS | | | |
| (Cost $1,896,000) | | | $ | 1,896,000 |
|
| Total Investments (Core Bond Fund) | | | |
| (Cost $237,250,392) - 120.03% | | | $ | 238,119,738 |
| Liabilities in Excess of Other Assets - (20.03)% | | (39,729,942) |
|
|
| TOTAL NET ASSETS - 100.00% | | | $ | 198,389,796 |
|
|
| |
| |
| Core Equity Fund | | | |
| | | Shares or | |
| | | Principal | |
| | | Amount | Value |
|
|
| |
| COMMON STOCKS - 98.04% | | | |
| Advertising - 1.76% | | | |
| WPP Group PLC | | 861,400 | $ | 10,487,033 |
| Apparel & Textiles - 0.45% | | | |
| NIKE, Inc., Class B | | 33,000 | 2,665,080 |
| Building Materials & Construction - 0.56% | | |
| Masco Corp. | | 122,914 | 3,369,073 |
| Cable and Television - 5.02% | | | |
| DIRECTV Group, Inc. * | | 916,302 | 17,217,315 |
| Time Warner, Inc. | | 764,900 | 12,712,638 |
|
|
| | | | 29,929,953 |
| Computers & Business Equipment - 7.44% | | |
| Cisco Systems, Inc. * | | 381,500 | 8,389,185 |
| Dell, Inc. * | | 423,100 | 9,540,905 |
| Hewlett-Packard Company | | 269,900 | 9,867,544 |
| International Business Machines Corp. | | 95,100 | 7,700,247 |
| Seagate Technology * | | 397,726 | 8,849,403 |
|
|
| | | | 44,347,284 |
| Electrical Utilities - 5.35% | | | |
| The AES Corp. * | | 1,500,700 | 31,874,868 |
| Financial Services - 12.02% | | | |
| Capital One Financial Corp. | | 141,100 | 10,314,410 |
| Citigroup, Inc. | | 335,500 | 16,556,925 |
| Countrywide Financial Corp. | | 519,900 | 17,572,620 |
| JPMorgan Chase & Company | | 596,200 | 27,222,492 |
|
|
| | | | 71,666,447 |
| Healthcare Services - 7.20% | | | |
| Health Net, Inc. * | | 315,144 | 13,176,171 |
| UnitedHealth Group, Inc. | | 572,900 | 29,762,155 |
|
|
| | | | 42,938,326 |
The accompanying notes are an integral part of the financial statements. 206
John Hancock Funds II
Portfolio of investments — August 31, 2006
(showing percentage of total net assets)
| Core Equity Fund (continued) | | | |
| | Shares or | | |
| | Principal | | |
| | Amount | | Value |
|
|
| |
| COMMON STOCKS (continued) | | | |
| Holdings Companies/Conglomerates - 1.18% | | | |
| General Electric Company | 206,600 | $ | 7,036,796 |
| Homebuilders - 4.25% | | | |
| Beazer Homes USA, Inc. | 66,808 | | 2,692,362 |
| Centex Corp. | 190,210 | | 9,691,200 |
| Pulte Homes, Inc. | 332,600 | | 9,868,242 |
| Ryland Group, Inc. | 72,408 | | 3,089,649 |
|
|
| | | | 25,341,453 |
| Insurance - 5.94% | | | |
| Aetna, Inc. | 494,900 | | 18,444,923 |
| American International Group, Inc. | 168,300 | | 10,740,906 |
| St. Paul Travelers Companies, Inc. | 142,400 | | 6,251,360 |
|
|
| | | | 35,437,189 |
| Internet Retail - 10.97% | | | |
| Amazon.com, Inc. * | 748,600 | | 23,079,338 |
| eBay, Inc. * | 573,900 | | 15,988,854 |
| Expedia, Inc. * | 608,500 | | 9,930,720 |
| IAC/InterActiveCorp. * | 575,400 | | 16,387,392 |
|
|
| | | | 65,386,304 |
| Internet Service Provider - 6.82% | | | |
| Google, Inc., Class A * | 63,800 | | 24,150,214 |
| Yahoo!, Inc. * | 571,900 | | 16,482,158 |
|
|
| | | | 40,632,372 |
| Internet Software - 0.27% | | | |
| Symantec Corp. * | 86,000 | | 1,603,040 |
| Leisure Time - 1.68% | | | |
| Electronic Arts, Inc. * | 196,800 | | 10,030,896 |
| Manufacturing - 5.04% | | | |
| Tyco International, Ltd. | 1,148,300 | | 30,028,045 |
| Pharmaceuticals - 1.88% | | | |
| Pfizer, Inc. | 405,785 | | 11,183,435 |
| Photography - 2.61% | | | |
| Eastman Kodak Company | 730,848 | | 15,545,137 |
| Retail Trade - 5.88% | | | |
| Home Depot, Inc. | 365,300 | | 12,526,137 |
| Sears Holdings Corp. * | 156,300 | | 22,524,393 |
|
|
| | | | 35,050,530 |
| Sanitary Services - 0.79% | | | |
| Waste Management, Inc. | 136,800 | | 4,689,504 |
| Software - 0.78% | | | |
| CA, Inc. | 197,300 | | 4,650,361 |
| Telephone - 10.15% | | | |
| Qwest Communications International, Inc. * | 3,503,900 | | 30,869,359 |
| Sprint Nextel Corp. | 1,753,700 | | 29,672,604 |
|
|
| | | | 60,541,963 |
|
| TOTAL COMMON STOCKS (Cost $577,764,706) | | $ | 584,435,089 |
|
| Core Equity Fund (continued) | | |
| | | Shares or | |
| | | Principal | |
| | | Amount | Value |
|
|
| |
| REPURCHASE AGREEMENTS - 2.47% | | |
| Repurchase Agreement with State | | | |
| Street Corp. dated 08/31/2006 at | | | |
| 3.95% to be repurchased at | | | |
| $14,738,617 on 9/1/2006, | | | |
| collateralized by $14,980,000 | | | |
| Federal Home Loan Mortgage | | | |
| Corp., 2.75% due 12/28/2006 | | | |
| (valued at $15,036,175, including | | | |
| interest) | $ | 14,737,000 | | $ | 14,737,000 |
|
| TOTAL REPURCHASE AGREEMENTS | | | |
| (Cost $14,737,000) | | | | $ | 14,737,000 |
|
| Total Investments (Core Equity Fund) | | | |
| (Cost $592,501,706) - 100.51% | | | | $ | 599,172,089 |
| Liabilities in Excess of Other Assets - (0.51)% | | (3,032,638) |
|
|
| TOTAL NET ASSETS - 100.00% | | | | $ | 596,139,451 |
|
|
| |
| |
| Emerging Growth Fund | | | |
| | | Shares or | |
| | | Principal | |
| | | Amount | Value |
|
|
| |
| COMMON STOCKS - 98.30% | | | |
| Advertising - 1.65% | | | |
| Aquantive, Inc. * | | 114,300 $ | 2,834,640 |
| Aerospace - 1.45% | | | |
| ARGON ST, Inc. * (a) | | 96,800 | 2,489,696 |
| Automobiles - 0.83% | | | |
| Force Protection, Inc. * | | 223,600 | 1,419,860 |
| Banking - 5.87% | | | |
| Boston Private Financial Holdings, Inc. (a) | | 69,700 | 1,739,712 |
| IBERIABANK Corp. | | 32,700 | 1,906,410 |
| UCBH Holdings, Inc. | | 68,300 | 1,238,962 |
| Umpqua Holdings Corp. (a) | | 108,190 | 2,961,160 |
| Wintrust Financial Corp. (a) | | 44,295 | 2,228,482 |
|
|
| | | | 10,074,726 |
| Biotechnology - 2.04% | | | |
| Martek Biosciences Corp. * (a) | | 116,600 | 3,506,162 |
| Building Materials & Construction - 1.71% | | |
| Corrections Corp. of America * | | 46,750 | 2,937,770 |
| Buildings - 0.67% | | | |
| Modtech Holdings, Inc. * (a) | | 214,700 | 1,155,086 |
| Business Services - 5.73% | | | |
| Access Integrated Technologies, Inc. * (a) | | 146,750 | 1,326,620 |
| Barrett Business Services, Inc. * | | 97,150 | 1,971,173 |
| Euronet Worldwide, Inc. * (a) | | 153,500 | 3,730,050 |
| FTI Consulting, Inc. * | | 125,500 | 2,803,670 |
|
|
| | | | 9,831,513 |
| Chemicals - 0.46% | | | |
| American Vanguard Corp. (a) | | 52,000 | 782,600 |
| Commercial Services - 2.20% | | | |
| Color Kinetics, Inc. * (a) | | 115,750 | 1,927,238 |
The accompanying notes are an integral part of the financial statements. 207
John Hancock Funds II
Portfolio of investments — August 31, 2006
(showing percentage of total net assets)
| Emerging Growth Fund (continued) | | |
| | Shares or | | |
| | Principal | | |
| | Amount | | Value |
|
|
| |
| COMMON STOCKS (continued) | | | |
| Commercial Services (continued) | | | |
| Stantec, Inc. * | 102,250 | $ | 1,846,635 |
|
|
| | | | 3,773,873 |
| Computers & Business Equipment - 4.59% | | | |
| Lasercard Corp. * (a) | 151,100 | | 1,501,934 |
| Stratasys, Inc. * (a) | 92,550 | | 2,211,020 |
| Trident Microsystems, Inc. * | 201,700 | | 4,161,071 |
|
|
| | | | 7,874,025 |
| Construction Materials - 1.16% | | | |
| Simpson Manufacturing, Inc. (a) | 75,750 | | 1,996,013 |
| Crude Petroleum & Natural Gas - 0.69% | | | |
| Toreador Resources Corp. * (a) | 56,050 | | 1,183,216 |
| Domestic Oil - 0.51% | | | |
| Delta Petroleum Corp. * (a) | 41,450 | | 866,305 |
| Drugs & Health Care - 2.01% | | | |
| Healthextras, Inc. * | 61,850 | | 1,900,650 |
| Matrixx Initiatives, Inc. * (a) | 91,150 | | 1,555,931 |
|
|
| | | | 3,456,581 |
| Electronics - 4.34% | | | |
| Measurement Specialties, Inc. * | 96,200 | | 1,937,468 |
| Medis Technologies, Ltd. * (a) | 160,350 | | 3,211,810 |
| Supertex, Inc. * | 65,000 | | 2,299,050 |
|
|
| | | | 7,448,328 |
| Energy - 3.90% | | | |
| Headwaters, Inc. * (a) | 99,200 | | 2,194,304 |
| InterOil Corp. * (a) | 108,000 | | 1,715,040 |
| KFx, Inc. * (a) | 174,200 | | 2,790,684 |
|
|
| | | | 6,700,028 |
| Financial Services - 1.20% | | | |
| Waddell & Reed Financial, Inc., Class A | 88,650 | | 2,058,453 |
| Food & Beverages - 0.88% | | | |
| Buffalo Wild Wings, Inc. * (a) | 43,450 | | 1,514,232 |
| Healthcare Products - 12.91% | | | |
| Adeza Biomedical Corp. * | 157,950 | | 2,680,412 |
| Caliper Life Sciences, Inc. * (a) | 210,350 | | 1,098,027 |
| Cyberonics, Inc. * (a) | 101,800 | | 1,657,304 |
| Intralase Corp. * (a) | 175,000 | | 3,291,750 |
| Kyphon, Inc. * | 70,600 | | 2,556,426 |
| Nuvasive, Inc. * | 118,200 | | 2,430,192 |
| ResMed, Inc. * | 88,350 | | 3,594,078 |
| Somanetics Corp. * (a) | 108,800 | | 1,834,368 |
| SonoSite, Inc. * (a) | 95,350 | | 3,025,455 |
|
|
| | | | 22,168,012 |
| Healthcare Services - 0.26% | | | |
| Nitromed, Inc. * (a) | 150,300 | | 438,876 |
| Hotels & Restaurants - 2.14% | | | |
| McCormick & Schmick's Seafood | | | |
| Restaurants, Inc. * | 101,550 | | 2,012,721 |
| Texas Roadhouse, Inc., Class A * (a) | 137,500 | | 1,661,000 |
|
|
| | | | 3,673,721 |
| Emerging Growth Fund (continued) | | |
| | Shares or | | |
| | Principal | | |
| | Amount | | Value |
|
|
| |
| COMMON STOCKS (continued) | | | |
| Household Products - 2.26% | | | |
| iRobot Corp. * (a) | 125,000 | $ | 2,212,500 |
| Select Comfort Corp. * (a) | 84,325 | | 1,673,851 |
|
|
| | | | 3,886,351 |
| Industrial Machinery - 0.73% | | | |
| Quixote Corp. | 74,000 | | 1,252,080 |
| Insurance - 2.98% | | | |
| Infinity Property & Casualty Corp. | 70,200 | | 2,664,090 |
| ProAssurance Corp. * | 28,700 | | 1,443,610 |
| United Fire & Casualty Company | 35,900 | | 1,004,482 |
|
|
| | | | 5,112,182 |
| International Oil - 0.15% | | | |
| ATP Oil & Gas Corp. * | 6,600 | | 258,060 |
| Leisure Time - 4.01% | | | |
| Bally Technologies, Inc. * (a) | 146,700 | | 2,309,058 |
| Imax Corp. * (a) | 352,050 | | 1,605,348 |
| Pinnacle Entertainment, Inc. * | 55,000 | | 1,417,900 |
| Progressive Gaming International Corp. * (a) | 210,050 | | 1,552,269 |
|
|
| | | | 6,884,575 |
| Manufacturing - 1.98% | | | |
| Radyne Corp. * | 67,150 | | 820,573 |
| Raven Industries, Inc. (a) | 92,400 | | 2,580,732 |
|
|
| | | | 3,401,305 |
| Medical-Hospitals - 0.76% | | | |
| EV3, Inc. * (a) | 85,400 | | 1,298,934 |
| Office Furnishings & Supplies - 1.60% | | | |
| Global Imaging Systems, Inc. * | 125,200 | | 2,745,636 |
| Petroleum Services - 2.05% | | | |
| Superior Energy Services, Inc. * | 52,700 | | 1,682,711 |
| TETRA Technologies, Inc. * | 66,250 | | 1,842,413 |
|
|
| | | | 3,525,124 |
| Pharmaceuticals - 2.66% | | | |
| Atherogenics, Inc. * | 84,850 | | 1,187,900 |
| Medicis Pharmaceutical Corp., Class A (a) | 115,164 | | 3,373,154 |
|
|
| | | | 4,561,054 |
| Retail Trade - 2.22% | | | |
| A.C. Moore Arts & Crafts, Inc. * (a) | 115,050 | | 2,045,589 |
| Hibbett Sporting Goods, Inc. * | 72,050 | | 1,767,386 |
|
|
| | | | 3,812,975 |
| Semiconductors - 6.09% | | | |
| Actel Corp. * | 129,000 | | 2,002,080 |
| FormFactor, Inc. * | 102,650 | | 4,953,888 |
| Mattson Technology, Inc. * | 238,000 | | 1,863,540 |
| Microsemi Corp. * | 59,000 | | 1,638,430 |
|
|
| | | | 10,457,938 |
| Software - 7.55% | | | |
| Allscripts Healthcare Solution, Inc. * (a) | 118,100 | | 2,404,516 |
| Concur Technologies, Inc. * (a) | 177,550 | | 2,473,271 |
| Faro Technologies, Inc. * (a) | 138,800 | | 2,444,268 |
| Opsware, Inc. * (a) | 450,200 | | 3,173,910 |
The accompanying notes are an integral part of the financial statements. 208
John Hancock Funds II
Portfolio of investments — August 31, 2006
(showing percentage of total net assets)
| Emerging Growth Fund (continued) | | |
| | | Shares or | | |
| | | Principal | | |
| | | Amount | | Value |
|
|
| |
| COMMON STOCKS (continued) | | | | |
| Software (continued) | | | | |
| Progress Software Corp. * | | 96,974 | $ | 2,455,382 |
|
|
| | | | | 12,951,347 |
| Telecommunications Equipment & | | | | |
| Services - 1.63% | | | | |
| Comtech Telecommunications Corp. * (a) | | 85,200 | | 2,788,596 |
| Trucking & Freight - 4.43% | | | | |
| Celadon Group, Inc. * | | 168,475 | | 3,121,842 |
| ID Systems, Inc. * (a) | | 112,100 | | 2,490,862 |
| Oshkosh Truck Corp. | | 38,600 | | 1,995,620 |
|
|
| | | | | 7,608,324 |
|
| TOTAL COMMON STOCKS (Cost $184,076,657) | | $ | 168,728,197 |
|
| |
| SHORT TERM INVESTMENTS - 24.11% | | | |
| State Street Global Advisers Funds (c) | $ | 3,112,714 | $ | 3,112,714 |
| State Street Navigator Securities Lending | | | | |
| Prime Portfolio (c) | | 38,275,542 | | 38,275,542 |
|
| TOTAL SHORT TERM INVESTMENTS | | | | |
| (Cost $41,388,256) | | | $ | 41,388,256 |
|
| Total Investments (Emerging Growth Fund) | | | |
| (Cost $225,464,913) - 122.41% | | | $ | 210,116,453 |
| Liabilities in Excess of Other Assets - (22.41)% | | | (38,461,766) |
|
|
| TOTAL NET ASSETS - 100.00% | | | $ | 171,654,687 |
|
|
| |
| |
| Emerging Small Company Fund | | | |
| | | Shares or | | |
| | | Principal | | |
| | | Amount | | Value |
|
|
| |
| COMMON STOCKS - 96.84% | | | | |
| Advertising - 1.74% | | | | |
| inVentiv Health, Inc. * | | 18,300 | $ | 569,679 |
| ValueClick, Inc. * | | 18,800 | | 331,820 |
|
|
| | | | | 901,499 |
| Aerospace - 2.14% | | | | |
| BE Aerospace, Inc. * | | 31,300 | | 746,818 |
| HEICO Corp., Class A | | 13,400 | | 362,872 |
|
|
| | | | | 1,109,690 |
| Apparel & Textiles - 2.10% | | | | |
| Carter's, Inc. * | | 19,100 | | 441,210 |
| Crocs, Inc. * | | 16,600 | | 448,532 |
| Volcom, Inc. * | | 8,500 | | 198,815 |
|
|
| | | | | 1,088,557 |
| Auto Parts - 1.44% | | | | |
| LKQ Corp. * | | 36,000 | | 747,720 |
| Automobiles - 0.78% | | | | |
| Monro Muffler Brake, Inc. | | 12,500 | | 402,875 |
| Banking - 7.74% | | | | |
| BankAtlantic Bancorp, Inc., Class A | | 20,200 | | 284,214 |
| Capitol Bancorp, Ltd. | | 11,500 | | 484,955 |
| Emerging Small Company Fund (continued) | |
| | Shares or | | |
| | Principal | | |
| | Amount | | Value |
|
|
| |
| COMMON STOCKS (continued) | | | |
| Banking (continued) | | | |
| Digital Insight Corp. * | 14,000 | $ | 364,140 |
| East West Bancorp, Inc. | 9,716 | | 393,498 |
| PrivateBancorp, Inc. | 4,500 | | 199,800 |
| Signature Bank * | 11,125 | | 365,456 |
| Sterling Financial Corp., Spokane | 10,800 | | 357,048 |
| United Community Banks, Inc. | 24,000 | | 753,600 |
| Virginia Commerce Bancorp, Inc. * | 20,600 | | 456,496 |
| Wintrust Financial Corp. | 7,000 | | 352,170 |
|
|
| | | | 4,011,377 |
| Biotechnology - 0.76% | | | |
| Integra LifeSciences Holdings Corp. * | 10,200 | | 392,292 |
| Building Materials & Construction - 1.28% | | | |
| Beacon Roofing Supply, Inc. * | 18,450 | | 339,111 |
| Williams Scotsman International, Inc. * | 15,400 | | 323,246 |
|
|
| | | | 662,357 |
| Business Services - 2.55% | | | |
| Euronet Worldwide, Inc. * | 19,000 | | 461,700 |
| Labor Ready, Inc. * | 28,500 | | 488,205 |
| Sotheby's Holdings, Inc., Class A | 13,400 | | 372,520 |
|
|
| | | | 1,322,425 |
| Cable and Television - 0.79% | | | |
| Central European Media Enterprises-A, Ltd. * | 6,600 | | 409,101 |
| Chemicals - 0.76% | | | |
| Airgas, Inc. | 11,000 | | 394,020 |
| Coal - 0.87% | | | |
| Foundation Coal Holdings, Inc. | 12,500 | | 449,000 |
| Commercial Services - 0.76% | | | |
| Pool Corp. | 10,400 | | 395,928 |
| Computers & Business Equipment - 4.49% | | | |
| Electronics for Imaging, Inc. * | 17,800 | | 410,112 |
| Henry, Jack & Associates, Inc. | 9,600 | | 183,936 |
| Micros Systems, Inc. * | 12,987 | | 621,558 |
| Rackable Systems, Inc. * | 14,800 | | 410,848 |
| Trident Microsystems, Inc. * | 18,700 | | 385,781 |
| Witness Systems, Inc. * | 19,200 | | 312,000 |
|
|
| | | | 2,324,235 |
| Crude Petroleum & Natural Gas - 1.61% | | | |
| Arena Resources, Inc. * | 11,400 | | 440,040 |
| GMX Resources, Inc. * | 12,300 | | 391,878 |
|
|
| | | | 831,918 |
| Drugs & Health Care - 3.38% | | | |
| Conor Medsystems, Inc. * | 15,000 | | 405,000 |
| Healthextras, Inc. * | 18,700 | | 574,651 |
| Illumina, Inc. * | 7,000 | | 235,760 |
| Immucor, Inc. * | 25,800 | | 535,866 |
|
|
| | | | 1,751,277 |
| Electrical Equipment - 1.00% | | | |
| W.H. Brady Company, Class A | 13,600 | | 519,520 |
The accompanying notes are an integral part of the financial statements. 209
John Hancock Funds II
Portfolio of investments — August 31, 2006
(showing percentage of total net assets)
| Emerging Small Company Fund (continued) | |
| | Shares or | | |
| | Principal | | |
| | Amount | | Value |
|
|
| |
| COMMON STOCKS (continued) | | | |
| Electronics - 0.91% | | | |
| Measurement Specialties, Inc. * | 10,174 | $ | 204,904 |
| Supertex, Inc. * | 7,500 | | 265,275 |
| | |
|
| | | | 470,179 |
| Energy - 0.51% | | | |
| Evergreen Solar, Inc. * | 26,000 | | 264,680 |
| Financial Services - 5.44% | | | |
| Affiliated Managers Group, Inc. * | 10,500 | | 971,565 |
| GFI Group, Inc. * | 9,999 | | 464,953 |
| Heartland Payment Systems, Inc. | 9,700 | | 261,997 |
| optionsXpress Holdings, Inc. | 14,900 | | 389,188 |
| Portfolio Recovery Associates, Inc. * | 6,500 | | 258,180 |
| SWS Group, Inc. | 12,200 | | 300,120 |
| United Panam Financial Corp. * | 10,000 | | 170,700 |
| | |
|
| | | | 2,816,703 |
| Food & Beverages - 1.43% | | | |
| Hansen Natural Corp. * | 17,600 | | 484,352 |
| Ruth's Chris Steak House, Inc. * | 13,000 | | 258,440 |
| | |
|
| | | | 742,792 |
| Healthcare Products - 5.40% | | | |
| American Medical Systems Holdings, Inc. * | 26,500 | | 465,340 |
| Arthrocare Corp. * | 8,000 | | 364,880 |
| DJO, Inc. * | 2,650 | | 102,211 |
| Haemonetics Corp. * | 13,900 | | 647,462 |
| PSS World Medical, Inc. * | 23,500 | | 455,900 |
| Viasys Healthcare, Inc. * | 23,000 | | 609,960 |
| Visicu, Inc. * | 12,600 | | 152,838 |
| | |
|
| | | | 2,798,591 |
| Healthcare Services - 1.98% | | | |
| Horizon Health Corp. * | 12,000 | | 164,280 |
| The Advisory Board Company * | 10,800 | | 548,856 |
| United Surgical Partners International, Inc. * | 11,000 | | 310,420 |
| | |
|
| | | | 1,023,556 |
| Hotels & Restaurants - 2.05% | | | |
| McCormick & Schmick's Seafood | | | |
| Restaurants, Inc. * | 15,800 | | 313,156 |
| Orient Express Hotels, Ltd. | 9,631 | | 322,446 |
| Red Robin Gourmet Burgers, Inc. * | 10,100 | | 426,321 |
| | |
|
| | | | 1,061,923 |
| Household Products - 1.27% | | | |
| Central Garden & Pet Company * | 15,000 | | 657,450 |
| Industrial Machinery - 3.49% | | | |
| Actuant Corp., Class A | 8,800 | | 396,880 |
| Energy Conversion Devices, Inc. * | 9,100 | | 318,955 |
| Gardner Denver, Inc. * | 16,700 | | 600,699 |
| H&E Equipment Services, Inc. * | 8,600 | | 224,202 |
| Presstek, Inc. * | 32,800 | | 269,288 |
| | |
|
| | | | 1,810,024 |
| Industrials - 1.29% | | | |
| Harsco Corp. | 8,400 | | 668,304 |
| Emerging Small Company Fund (continued) | |
| | Shares or | | |
| | Principal | | |
| | Amount | | Value |
|
|
| |
| COMMON STOCKS (continued) | | | |
| Insurance - 0.25% | | | |
| Hub International, Ltd. | 4,600 | $ | 131,744 |
| Internet Content - 0.90% | | | |
| RightNow Technologies, Inc. * | 30,533 | | 468,987 |
| Leisure Time - 1.14% | | | |
| Life Time Fitness, Inc. * | 13,200 | | 593,076 |
| Liquor - 1.23% | | | |
| Central European Distribution Corp. * | 27,750 | | 639,083 |
| Manufacturing - 1.05% | | | |
| Coherent, Inc. * | 12,039 | | 436,534 |
| Mettler-Toledo International, Inc. * | 1,809 | | 110,241 |
| | |
|
| | | | 546,775 |
| Medical-Hospitals - 2.57% | | | |
| Lifepoint Hospitals, Inc. * | 7,600 | | 258,780 |
| Psychiatric Solutions, Inc. * | 21,212 | | 678,996 |
| VCA Antech, Inc. * | 11,182 | | 396,067 |
| | |
|
| | | | 1,333,843 |
| Metal & Metal Products - 0.69% | | | |
| RBC Bearings, Inc. * | 16,700 | | 355,209 |
| Mining - 0.34% | | | |
| RTI International Metals, Inc. * | 4,100 | | 177,817 |
| Mutual Funds - 3.41% | | | |
| iShares Russell 2000 Growth Index Fund | 24,500 | | 1,765,225 |
| Office Furnishings & Supplies - 0.76% | | | |
| Knoll, Inc. | 22,000 | | 392,260 |
| Petroleum Services - 4.29% | | | |
| Basic Energy Services, Inc. * | 13,600 | | 388,960 |
| Superior Energy Services, Inc. * | 16,959 | | 541,501 |
| Superior Well Services, Inc. * | 13,474 | | 290,095 |
| Universal Compression Holdings, Inc. * | 9,700 | | 527,971 |
| World Fuel Services Corp. | 13,100 | | 472,124 |
| | |
|
| | | | 2,220,651 |
| Pharmaceuticals - 1.85% | | | |
| Adams Respiratory Therapeutics, Inc. * | 8,600 | | 350,880 |
| Adolor Corp. * | 12,800 | | 319,360 |
| Alkermes, Inc. * | 17,500 | | 286,125 |
| | |
|
| | | | 956,365 |
| Real Estate - 5.37% | | | |
| BioMed Realty Trust, Inc., REIT | 16,900 | | 526,266 |
| Innkeepers USA Trust, REIT | 38,219 | | 632,906 |
| Jones Lang LaSalle, Inc., REIT | 6,684 | | 556,510 |
| Sunstone Hotel Investors, Inc., REIT | 24,000 | | 717,600 |
| Trammell Crow Company, REIT * | 10,100 | | 347,642 |
| | |
|
| | | | 2,780,924 |
| Retail Grocery - 0.91% | | | |
| United Natural Foods, Inc. * | 16,200 | | 470,610 |
| Retail Trade - 3.04% | | | |
| Childrens Place Retail Stores, Inc. * | 8,900 | | 515,933 |
| Guitar Center, Inc. * | 9,600 | | 363,840 |
The accompanying notes are an integral part of the financial statements. 210
John Hancock Funds II
Portfolio of investments — August 31, 2006
(showing percentage of total net assets)
| Emerging Small Company Fund (continued) | |
| | | Shares or | |
| | | Principal | |
| | | Amount | Value |
|
|
| |
| COMMON STOCKS (continued) | | | |
| Retail Trade (continued) | | | |
| Hibbett Sporting Goods, Inc. * | | 16,000 | | $ | 392,480 |
| The Men's Wearhouse, Inc. | | 8,500 | 301,325 |
|
|
| | | | 1,573,578 |
| Semiconductors - 2.99% | | | |
| Advanced Analogic Technologies, Inc. * | | 22,000 | 209,440 |
| Microsemi Corp. * | | 5,500 | 152,735 |
| ON Semiconductor Corp. * | | 34,500 | 207,345 |
| PMC-Sierra, Inc. * | | 67,500 | 461,700 |
| Varian Semiconductor Equipment Associates, | | |
| Inc. * | | 14,643 | 517,044 |
|
|
| | | | 1,548,264 |
| Software - 2.46% | | | |
| Eclipsys Corp. * | | 11,000 | 188,100 |
| Transaction Systems Architects, Inc., Class A * | 24,000 | 796,080 |
| Ultimate Software Group, Inc. * | | 12,900 | 291,540 |
|
|
| | | | 1,275,720 |
| Telecommunications Equipment & | | | |
| Services - 1.72% | | | |
| Aeroflex, Inc. * | | 40,000 | 416,800 |
| Finisar Corp. * | | 63,000 | 233,730 |
| NeuStar, Inc., Class A * | | 8,600 | 242,692 |
|
|
| | | | 893,222 |
| Transportation - 0.92% | | | |
| UTI Worldwide, Inc. | | 20,800 | 479,440 |
| Trucking & Freight - 2.99% | | | |
| Knight Transportation, Inc. | | 24,981 | 429,423 |
| Landstar Systems, Inc. | | 11,800 | 503,860 |
| Old Dominion Freight Lines, Inc. * | | 19,300 | 616,056 |
|
|
| | | | 1,549,339 |
|
| TOTAL COMMON STOCKS (Cost $54,155,049) | | | $ | 50,180,125 |
|
| |
| REPURCHASE AGREEMENTS - 4.81% | | |
| Repurchase Agreement with State | | | |
| Street Corp. dated 08/31/2006 at | | | |
| 3.95% to be repurchased at | | | |
| $2,495,274 on 09/01/2006, | | | |
| collateralized by $2,485,000 | | | |
| Federal Home Loan Mortgage | | | |
| Corp., 6.065% due 05/16/2016 | | | |
| (valued at $2,547,721, including | | | |
| interest) (c) | $ | 2,495,000 | | $ | 2,495,000 |
|
| TOTAL REPURCHASE AGREEMENTS | | | |
| (Cost $2,495,000) | | | | $ | 2,495,000 |
|
| Total Investments (Emerging Small Company Fund) | |
| (Cost $56,650,049) - 101.65% | | | | $ | 52,675,125 |
| Liabilities in Excess of Other Assets - (1.65)% | | (856,340) |
|
|
| TOTAL NET ASSETS - 100.00% | | | | $ | 51,818,785 |
|
|
| Equity-Income Fund | | | |
| | Shares or | | |
| | Principal | | |
| | Amount | | Value |
|
|
| |
| COMMON STOCKS - 95.02% | | | |
| Aerospace - 1.11% | | | |
| Lockheed Martin Corp. | 27,000 | $ | 2,230,200 |
| Raytheon Company | 121,200 | | 5,721,852 |
|
|
| | | | 7,952,052 |
| Aluminum - 0.54% | | | |
| Alcoa, Inc. | 136,500 | | 3,902,535 |
| Auto Parts - 0.51% | | | |
| Genuine Parts Company | 88,350 | | 3,651,506 |
| Automobiles - 0.23% | | | |
| Ford Motor Company (a) | 194,500 | | 1,627,965 |
| Banking - 4.01% | | | |
| Bank of America Corp. | 118,546 | | 6,101,563 |
| Bank of Ireland | 39,800 | | 753,529 |
| Fifth Third Bancorp. | 210,562 | | 8,283,509 |
| Mercantile Bankshares Corp. | 59,425 | | 2,194,565 |
| National City Corp. | 75,500 | | 2,610,790 |
| Northern Trust Corp. | 3,000 | | 167,970 |
| SunTrust Banks, Inc. | 76,300 | | 5,829,320 |
| Wells Fargo Company | 82,000 | | 2,849,500 |
|
|
| | | | 28,790,746 |
| Biotechnology - 0.37% | | | |
| MedImmune, Inc. * | 96,300 | | 2,661,732 |
| Broadcasting - 0.74% | | | |
| CBS Corp., Class B | 186,800 | | 5,333,140 |
| Business Services - 0.55% | | | |
| H & R Block, Inc. | 188,300 | | 3,959,949 |
| Cable and Television - 2.85% | | | |
| Comcast Corp., Class A * | 141,161 | | 4,940,635 |
| EchoStar Communications Corp., Class A * | 80,300 | | 2,549,525 |
| Time Warner, Inc. | 501,700 | | 8,338,254 |
| Viacom, Inc. * | 128,400 | | 4,660,920 |
|
|
| | | | 20,489,334 |
| Cellular Communications - 0.54% | | | |
| Motorola, Inc. | 165,700 | | 3,874,066 |
| Chemicals - 1.23% | | | |
| Chemtura Corp. | 149,624 | | 1,300,233 |
| E.I. Du Pont De Nemours & Company | 171,400 | | 6,850,858 |
| Hercules, Inc. * | 46,200 | | 720,720 |
|
|
| | | | 8,871,811 |
| Computers & Business Equipment - 2.57% | | | |
| Cisco Systems, Inc. * | 267,500 | | 5,882,325 |
| Dell, Inc. * | 201,200 | | 4,537,060 |
| International Business Machines Corp. | 99,900 | | 8,088,903 |
|
|
| | | | 18,508,288 |
| Construction Materials - 0.60% | | | |
| Vulcan Materials Company (a) | 55,200 | | 4,339,272 |
| Cosmetics & Toiletries - 3.42% | | | |
| Avon Products, Inc. | 191,800 | | 5,506,578 |
| Colgate-Palmolive Company | 149,500 | | 8,949,070 |
| International Flavors & Fragrances, Inc. | 144,700 | | 5,754,719 |
The accompanying notes are an integral part of the financial statements. 211
John Hancock Funds II
Portfolio of investments — August 31, 2006
(showing percentage of total net assets)
| Equity-Income Fund (continued) | | | |
| | Shares or | | |
| | Principal | | |
| | Amount | | Value |
|
|
| |
| COMMON STOCKS (continued) | | | |
| Cosmetics & Toiletries (continued) | | | |
| Kimberly-Clark Corp. | 69,400 | $ | 4,406,900 |
|
|
| | | | 24,617,267 |
| Domestic Oil - 0.63% | | | |
| Murphy Oil Corp. | 92,300 | | 4,514,393 |
| Drugs & Health Care - 1.12% | | | |
| Wyeth | 166,000 | | 8,084,200 |
| Electrical Equipment - 0.47% | | | |
| Cooper Industries, Ltd., Class A | 41,200 | | 3,373,456 |
| Electrical Utilities - 2.13% | | | |
| Entergy Corp. | 86,700 | | 6,732,255 |
| FirstEnergy Corp. | 75,675 | | 4,318,016 |
| Pinnacle West Capital Corp. (a) | 60,300 | | 2,770,182 |
| TECO Energy, Inc. | 94,900 | | 1,496,573 |
|
|
| | | | 15,317,026 |
| Electronics - 0.63% | | | |
| Sony Corp. | 104,400 | | 4,519,211 |
| Energy - 2.29% | | | |
| Duke Energy Corp. | 243,800 | | 7,314,000 |
| Progress Energy, Inc. | 110,300 | | 4,889,599 |
| Xcel Energy, Inc. | 204,900 | | 4,261,920 |
|
|
| | | | 16,465,519 |
| Financial Services - 8.00% | | | |
| Charles Schwab Corp. | 401,400 | | 6,546,834 |
| Citigroup, Inc. | 70,596 | | 3,483,913 |
| Federal National Mortgage Association | 63,000 | | 3,316,950 |
| Janus Capital Group, Inc. | 59,200 | | 1,052,576 |
| JPMorgan Chase & Company | 398,714 | | 18,205,281 |
| Mellon Financial Corp. | 215,400 | | 8,019,342 |
| Morgan Stanley | 163,600 | | 10,763,244 |
| State Street Corp. (c) | 98,800 | | 6,105,840 |
|
|
| | | | 57,493,980 |
| Food & Beverages - 3.58% | | | |
| Campbell Soup Company | 115,200 | | 4,328,064 |
| General Mills, Inc. | 120,800 | | 6,550,984 |
| McCormick & Company, Inc. | 88,300 | | 3,215,886 |
| Sara Lee Corp. | 81,300 | | 1,352,019 |
| Sysco Corp. | 63,200 | | 1,983,848 |
| The Coca-Cola Company | 184,600 | | 8,271,926 |
|
|
| | | | 25,702,727 |
| Gas & Pipeline Utilities - 0.93% | | | |
| NiSource, Inc. | 316,400 | | 6,698,188 |
| Healthcare Products - 2.19% | | | |
| Baxter International, Inc. | 102,400 | | 4,544,512 |
| Boston Scientific Corp. * | 174,300 | | 3,039,792 |
| Johnson & Johnson | 126,300 | | 8,166,558 |
|
|
| | | | 15,750,862 |
| Holdings Companies/Conglomerates - 2.84% | | | |
| General Electric Company | 599,300 | | 20,412,158 |
| Equity-Income Fund (continued) | | | |
| | Shares or | | |
| | Principal | | |
| | Amount | | Value |
|
|
| |
| COMMON STOCKS (continued) | | | |
| Homebuilders - 0.33% | | | |
| D.R. Horton, Inc. (a) | 108,600 | $ | 2,381,598 |
| Household Products - 1.54% | | | |
| Fortune Brands, Inc. | 56,400 | | 4,094,640 |
| Newell Rubbermaid, Inc. | 259,100 | | 6,993,109 |
|
|
| | | | 11,087,749 |
| Industrial Machinery - 1.13% | | | |
| Deere & Company | 54,500 | | 4,256,450 |
| Pall Corp. | 141,800 | | 3,859,796 |
|
|
| | | | 8,116,246 |
| Insurance - 5.50% | | | |
| American International Group, Inc. | 143,265 | | 9,143,172 |
| Chubb Corp. | 64,200 | | 3,220,272 |
| Lincoln National Corp. | 108,798 | | 6,604,039 |
| Marsh & McLennan Companies, Inc. | 399,700 | | 10,456,152 |
| St. Paul Travelers Companies, Inc. | 135,449 | | 5,946,211 |
| UnumProvident Corp. | 220,600 | | 4,180,370 |
|
|
| | | | 39,550,216 |
| International Oil - 5.17% | | | |
| Anadarko Petroleum Corp. | 110,400 | | 5,178,864 |
| ChevronTexaco Corp. | 209,260 | | 13,476,344 |
| Hess Corp. | 164,000 | | 7,507,920 |
| Royal Dutch Shell PLC, ADR | 159,300 | | 10,982,142 |
|
|
| | | | 37,145,270 |
| Leisure Time - 0.92% | | | |
| Walt Disney Company | 222,800 | | 6,606,020 |
| Liquor - 1.20% | | | |
| Anheuser-Busch Companies, Inc. | 174,600 | | 8,621,748 |
| Manufacturing - 3.15% | | | |
| 3M Company | 82,400 | | 5,908,080 |
| Eaton Corp. | 38,500 | | 2,560,250 |
| Honeywell International, Inc. | 231,800 | | 8,975,296 |
| Tyco International, Ltd. | 200,000 | | 5,230,000 |
|
|
| | | | 22,673,626 |
| Newspapers - 1.61% | | | |
| Dow Jones & Company, Inc. (a) | 143,700 | | 5,176,074 |
| The New York Times Company, Class A (a) | 283,800 | | 6,391,176 |
|
|
| | | | 11,567,250 |
| Office Furnishings & Supplies - 0.88% | | | |
| Avery Dennison Corp. | 101,600 | | 6,293,104 |
| Paper - 1.98% | | | |
| International Paper Company | 325,925 | | 11,332,412 |
| MeadWestvaco Corp. | 112,400 | | 2,871,820 |
|
|
| | | | 14,204,232 |
| Petroleum Services - 3.56% | | | |
| BP PLC, SADR | 94,892 | | 6,457,401 |
| Exxon Mobil Corp. | 205,424 | | 13,901,042 |
| Schlumberger, Ltd. | 85,600 | | 5,247,280 |
|
|
| | | | 25,605,723 |
The accompanying notes are an integral part of the financial statements. 212
John Hancock Funds II
Portfolio of investments — August 31, 2006
(showing percentage of total net assets)
| Equity-Income Fund (continued) | | | |
| | Shares or | | |
| | Principal | | |
| | Amount | | Value |
|
|
| |
| COMMON STOCKS (continued) | | | |
| Pharmaceuticals - 5.89% | | | |
| Abbott Laboratories | 129,400 | $ | 6,301,780 |
| Bristol-Myers Squibb Company | 176,600 | | 3,841,050 |
| Eli Lilly & Company | 151,600 | | 8,478,988 |
| Merck & Company, Inc. | 279,000 | | 11,313,450 |
| Pfizer, Inc. | 333,100 | | 9,180,236 |
| Schering-Plough Corp. | 152,500 | | 3,194,875 |
|
|
| | | | 42,310,379 |
| Photography - 0.62% | | | |
| Eastman Kodak Company (a) | 208,400 | | 4,432,668 |
| Publishing - 1.28% | | | |
| Tribune Company (a) | 294,400 | | 9,188,224 |
| Railroads & Equipment - 1.66% | | | |
| Norfolk Southern Corp. | 72,300 | | 3,089,379 |
| Union Pacific Corp. | 110,300 | | 8,862,605 |
|
|
| | | | 11,951,984 |
| Real Estate - 0.38% | | | |
| Simon Property Group, Inc., REIT | 32,100 | | 2,721,759 |
| Retail Trade - 2.16% | | | |
| Home Depot, Inc. | 183,300 | | 6,285,357 |
| RadioShack Corp. (a) | 115,600 | | 2,087,736 |
| Wal-Mart Stores, Inc. | 160,600 | | 7,182,032 |
|
|
| | | | 15,555,125 |
| Sanitary Services - 0.77% | | | |
| Waste Management, Inc. | 160,522 | | 5,502,694 |
| Semiconductors - 1.08% | | | |
| Analog Devices, Inc. | 142,400 | | 4,363,136 |
| Intel Corp. | 175,600 | | 3,431,224 |
|
|
| | | | 7,794,360 |
| Software - 1.66% | | | |
| Microsoft Corp. | 465,400 | | 11,956,126 |
| Telecommunications Equipment & | | | |
| Services - 1.55% | | | |
| Lucent Technologies, Inc. * (a) | 883,600 | | 2,058,788 |
| Nokia Oyj, SADR | 296,500 | | 6,190,920 |
| Telus Corp., Non Voting Shares | 34,400 | | 1,635,376 |
| Telus Corp. | 25,400 | | 1,245,154 |
|
|
| | | | 11,130,238 |
| Telephone - 5.50% | | | |
| ALLTEL Corp. | 109,300 | | 5,925,153 |
| AT&T, Inc. | 401,873 | | 12,510,306 |
| Qwest Communications International, Inc. * | 901,700 | | 7,943,977 |
| Sprint Nextel Corp. | 283,700 | | 4,800,204 |
| Verizon Communications, Inc. | 194,752 | | 6,851,375 |
| Windstream Corp. * | 113,008 | | 1,491,706 |
|
|
| | | | 39,522,721 |
| Tobacco - 0.50% | | | |
| UST, Inc. (a) | 67,400 | | 3,562,764 |
| Equity-Income Fund (continued) | | | |
| | | Shares or | | |
| | | Principal | | |
| | | Amount | | Value |
|
|
| |
| COMMON STOCKS (continued) | | | | |
| Toys, Amusements & Sporting Goods - 0.92% | | | |
| Mattel, Inc. | | 352,200 | $ | 6,635,448 |
|
| TOTAL COMMON STOCKS (Cost $626,745,392) | | $ | 683,028,655 |
|
| |
| CORPORATE BONDS - 0.33% | | | | |
| Telecommunications Equipment & | | | | |
| Services - 0.33% | | | | |
| Lucent Technologies, Inc. | | | | |
| 8.00% due 08/01/2031 (a) | $ | 2,366,000 | | 2,366,686 |
|
| TOTAL CORPORATE BONDS (Cost $2,444,494) | | $ | 2,366,686 |
|
| |
| SHORT TERM INVESTMENTS - 9.50% | | | | |
| State Street Navigator Securities | | | | |
| Lending Prime Portfolio (c) | $ | 41,370,005 | $ | 41,370,005 |
| T. Rowe Price Reserve Investment Fund (c) | | 26,919,905 | | 26,919,905 |
|
| TOTAL SHORT TERM INVESTMENTS | | | | |
| (Cost $68,289,910) | | | $ | 68,289,910 |
|
| |
| REPURCHASE AGREEMENTS - 0.49% | | | | |
| Repurchase Agreement with State | | | | |
| Street Corp. dated 08/31/2006 at | | | | |
| 3.95% to be repurchased at | | | | |
| $3,515,386 on 9/1/2006, | | | | |
| collateralized by $3,530,000 | | | | |
| Federal Home Loan Bank, 5.125% | | | | |
| due 06/13/2008 (valued at | | | | |
| $3,587,363, including interest) (c) | $ | 3,515,000 | $ | 3,515,000 |
|
| TOTAL REPURCHASE AGREEMENTS | | | | |
| (Cost $3,515,000) | | | $ | 3,515,000 |
|
| Total Investments (Equity-Income Fund) | | | | |
| (Cost $700,994,796) - 105.34% | | | $ | 757,200,251 |
| Liabilities in Excess of Other Assets - (5.34)% | | | (38,403,258) |
|
|
| TOTAL NET ASSETS - 100.00% | | | $ | 718,796,993 |
|
|
| |
| |
| Fundamental Value Fund | | | | |
| | | Shares or | | |
| | | Principal | | |
| | | Amount | | Value |
|
|
| |
| COMMON STOCKS - 95.31% | | | | |
| Advertising - 0.25% | | | | |
| WPP Group PLC, SADR | | 30,951 | $ | 1,879,035 |
| Banking - 6.50% | | | | |
| Commerce Bancorp, Inc. (a) | | 139,300 | | 4,640,083 |
| Golden West Financial Corp. | | 325,999 | | 24,609,665 |
| Wells Fargo Company | | 582,266 | | 20,233,743 |
|
|
| | | | | 49,483,491 |
| Broadcasting - 1.94% | | | | |
| Liberty Media Holding Corp.-Capital, Series A * | 24,505 | | 2,115,517 |
| News Corp. | | 667,300 | | 12,698,719 |
|
|
| | | | | 14,814,236 |
The accompanying notes are an integral part of the financial statements. 213
John Hancock Funds II
Portfolio of investments — August 31, 2006
(showing percentage of total net assets)
| Fundamental Value Fund (continued) | | |
| | Shares or | | |
| | Principal | | |
| | Amount | | Value |
|
|
| |
| COMMON STOCKS (continued) | | | |
| Business Services - 3.79% | | | |
| Dun & Bradstreet Corp. * | 17,095 | $ | 1,201,949 |
| H & R Block, Inc. | 373,623 | | 7,857,292 |
| Iron Mountain, Inc. * (a) | 244,742 | | 10,031,975 |
| Moody's Corp. | 159,801 | | 9,776,625 |
|
|
| | | | 28,867,841 |
| Cable and Television - 3.65% | | | |
| Comcast Corp.-Special Class A * (a) | 677,657 | | 23,657,006 |
| NTL, Inc. | 155,877 | | 4,129,182 |
|
|
| | | | 27,786,188 |
| Colleges & Universities - 0.36% | | | |
| Apollo Group, Inc., Class A * (a) | 54,600 | | 2,741,466 |
| Computers & Business Equipment - 1.25% | | | |
| Dell, Inc. * | 209,500 | | 4,724,225 |
| Hewlett-Packard Company | 130,984 | | 4,788,775 |
|
|
| | | | 9,513,000 |
| Construction Materials - 1.38% | | | |
| Martin Marietta Materials, Inc. | 65,479 | | 5,392,850 |
| Vulcan Materials Company (a) | 65,170 | | 5,123,014 |
|
|
| | | | 10,515,864 |
| Containers & Glass - 1.81% | | | |
| Sealed Air Corp. (a) | 265,604 | | 13,776,879 |
| Cosmetics & Toiletries - 1.48% | | | |
| Avon Products, Inc. | 98,312 | | 2,822,537 |
| Procter & Gamble Company | 136,500 | | 8,449,350 |
|
|
| | | | 11,271,887 |
| Crude Petroleum & Natural Gas - 6.60% | | | |
| Devon Energy Corp. | 268,409 | | 16,772,879 |
| EOG Resources, Inc. | 224,788 | | 14,570,758 |
| Occidental Petroleum Corp. | 370,382 | | 18,885,778 |
|
|
| | | | 50,229,415 |
| Financial Services - 11.33% | | | |
| Ameriprise Financial, Inc. | 175,913 | | 8,044,502 |
| Citigroup, Inc. | 337,119 | | 16,636,823 |
| HSBC Holdings PLC | 1,243,991 | | 22,551,630 |
| JPMorgan Chase & Company | 717,282 | | 32,751,096 |
| Morgan Stanley | 74,475 | | 4,899,710 |
| State Street Corp. (c) | 22,175 | | 1,370,415 |
|
|
| | | | 86,254,176 |
| Food & Beverages - 1.88% | | | |
| Diageo PLC, SADR | 130,581 | | 9,336,541 |
| Hershey Company (a) | 92,083 | | 4,968,799 |
|
|
| | | | 14,305,340 |
| Healthcare Services - 2.91% | | | |
| Cardinal Health, Inc. | 113,552 | | 7,655,676 |
| Caremark Rx, Inc. | 186,471 | | 10,804,130 |
| HCA, Inc. | 75,451 | | 3,721,243 |
|
|
| | | | 22,181,049 |
| Holdings Companies/Conglomerates - 5.93% | | | |
| Berkshire Hathaway, Inc., Class A * (a) | 262 | | 25,177,414 |
| Fundamental Value Fund (continued) | | |
| | Shares or | | |
| | Principal | | |
| | Amount | | Value |
|
|
| |
| COMMON STOCKS (continued) | | | |
| Holdings Companies/Conglomerates | | | |
| (continued) | | | |
| China Merchants Holdings | | | |
| International Company, Ltd. | 1,361,506 | $ | 3,956,569 |
| Loews Corp. (a) | 415,911 | | 16,004,255 |
|
|
| | | | 45,138,238 |
| Household Products - 0.20% | | | |
| Hunter Douglas NV | 21,840 | | 1,522,666 |
| Industrials - 0.24% | | | |
| Cosco Pacific, Ltd. | 833,715 | | 1,867,482 |
| Insurance - 9.11% | | | |
| American International Group, Inc. | 519,643 | | 33,163,616 |
| Aon Corp. | 148,808 | | 5,144,293 |
| Chubb Corp. | 42,104 | | 2,111,937 |
| Markel Corp. * | 1,247 | | 453,072 |
| Principal Financial Group, Inc. | 43,042 | | 2,291,556 |
| Progressive Corp. | 731,796 | | 17,994,864 |
| Sun Life Financial, Inc. | 28,271 | | 1,165,048 |
| Transatlantic Holdings, Inc. (a) | 114,212 | | 7,014,901 |
|
|
| | | | 69,339,287 |
| International Oil - 4.24% | | | |
| ConocoPhillips | 508,850 | | 32,276,355 |
| Internet Retail - 0.87% | | | |
| Amazon.com, Inc. * (a) | 140,200 | | 4,322,366 |
| Expedia, Inc. * (a) | 51,077 | | 833,577 |
| IAC/InterActiveCorp. * (a) | 51,777 | | 1,474,609 |
|
|
| | | | 6,630,552 |
| Internet Service Provider - 0.31% | | | |
| Liberty Media Holding Corp.-Interactive A * | 124,125 | | 2,365,822 |
| Liquor - 0.73% | | | |
| Heineken Holding NV | 138,125 | | 5,534,132 |
| Manufacturing - 5.83% | | | |
| Harley-Davidson, Inc. (a) | 234,232 | | 13,704,914 |
| Tyco International, Ltd. | 1,174,788 | | 30,720,706 |
|
|
| | | | 44,425,620 |
| Mining - 0.41% | | | |
| BHP Billiton PLC | 85,117 | | 1,620,758 |
| Rio Tinto PLC | 30,200 | | 1,526,393 |
|
|
| | | | 3,147,151 |
| Petroleum Services - 0.73% | | | |
| Transocean, Inc. * | 83,775 | | 5,591,981 |
| Publishing - 1.03% | | | |
| Gannett Company, Inc. | 34,618 | | 1,968,034 |
| Lagardere S.C.A. | 80,087 | | 5,860,214 |
|
|
| | | | 7,828,248 |
| Retail Trade - 6.73% | | | |
| Bed Bath & Beyond, Inc. * | 115,500 | | 3,895,815 |
| CarMax, Inc. * (a) | 45,800 | | 1,726,202 |
| Costco Wholesale Corp. | 580,848 | | 27,177,878 |
| Lowe's Companies, Inc. | 133,300 | | 3,607,098 |
The accompanying notes are an integral part of the financial statements. 214
John Hancock Funds II
Portfolio of investments — August 31, 2006
(showing percentage of total net assets)
| Fundamental Value Fund (continued) | | |
| | | Shares or | | |
| | | Principal | | |
| | | Amount | | Value |
|
|
| |
| COMMON STOCKS (continued) | | | | |
| Retail Trade (continued) | | | | |
| Wal-Mart Stores, Inc. | | 331,195 | $ | 14,811,040 |
|
|
| | | | | 51,218,033 |
| Software - 2.08% | | | | |
| Microsoft Corp. | | 617,026 | | 15,851,398 |
| Telecommunications Equipment & | | | | |
| Services - 0.70% | | | | |
| Nokia Oyj, SADR | | 94,986 | | 1,983,308 |
| SK Telecom Company, Ltd., ADR | | 152,339 | | 3,336,224 |
|
|
| | | | | 5,319,532 |
| Telephone - 1.08% | | | | |
| Sprint Nextel Corp. | | 486,800 | | 8,236,656 |
| Tobacco - 4.96% | | | | |
| Altria Group, Inc. | | 451,903 | | 37,747,458 |
| Travel Services - 4.25% | | | | |
| American Express Company | | 616,065 | | 32,368,055 |
| Trucking & Freight - 0.75% | | | | |
| Kuehne & Nagel International AG | | 32,750 | | 2,297,570 |
| United Parcel Service, Inc., Class B | | 49,142 | | 3,442,397 |
|
|
| | | | | 5,739,967 |
|
| TOTAL COMMON STOCKS (Cost $680,017,725) | | $ | 725,768,500 |
|
| |
| SHORT TERM INVESTMENTS - 7.67% | | | |
| Rabobank USA Finance Corp. | | | | |
| 5.27% due 09/01/2006 | $ | 35,453,000 | $ | 35,453,000 |
| State Street Navigator Securities Lending | | | | |
| Prime Portfolio (c) | | 22,927,961 | | 22,927,961 |
|
| TOTAL SHORT TERM INVESTMENTS | | | | |
| (Cost $58,380,961) | | | $ | 58,380,961 |
|
| Total Investments (Fundamental Value Fund) | | | |
| (Cost $738,398,686) - 102.98% | | | $ | 784,149,461 |
| Liabilities in Excess of Other Assets - (2.98)% | | | (22,725,708) |
|
|
| TOTAL NET ASSETS - 100.00% | | | $ | 761,423,753 |
|
|
| |
| |
| Global Bond Fund | | | | |
| | | Shares or | | |
| | | Principal | | |
| | | Amount | | Value |
|
|
| |
| U.S. TREASURY OBLIGATIONS - 1.94% | | | |
| Treasury Inflation Protected | | | | |
| Securities (d) - 0.74% | | | | |
| 0.875% due 04/15/2010 | $ | 750,162 | $ | 712,654 |
| 2.00% due 01/15/2026 (a) | | 102,222 | | 98,473 |
| 3.375% due 01/15/2007 *** | | 3,585,596 | | 3,584,054 |
|
|
| | | | | 4,395,181 |
| U.S. Treasury Bonds - 1.20% | | | | |
| 7.875% due 02/15/2021 (a)*** | | 5,500,000 | | 7,156,875 |
|
| TOTAL U.S. TREASURY OBLIGATIONS | | | | |
| (Cost $11,526,420) | | | $ | 11,552,056 |
|
| Global Bond Fund (continued) | | |
| | | Shares or | |
| | | Principal | |
| | | Amount | Value |
|
|
| |
| U.S. GOVERNMENT AGENCY OBLIGATIONS - 5.15% | |
| Federal National Mortgage | | | |
| Association - 5.15% | | | |
| 5.482% due 10/01/2044 (b)*** | | $ | 1,916,062 | | $ | 1,935,852 |
| 5.50% TBA ** | | 27,600,000 | 27,082,500 |
| 6.232% due 11/01/2035 (b)*** | | 1,550,554 | 1,597,306 |
|
|
| | | | 30,615,658 |
|
| TOTAL U.S. GOVERNMENT AGENCY OBLIGATIONS | |
| (Cost $30,343,208) | | | | $ | 30,615,658 |
|
| |
| FOREIGN GOVERNMENT OBLIGATIONS - 26.87% | |
| France - 3.16% | | | |
| Government of France | | | |
| 5.50% due 04/25/2010 *** | EUR | 13,800,000 | 18,807,281 |
| Germany - 16.74% | | | |
| Federal Republic of Germany | | | |
| zero coupon due 11/23/2006 | | 1,000,000 | 12,793 |
| 2.50% due 03/23/2007 | | 15,000,000 | 19,096,606 |
| 4.25% due 01/04/2014 *** | | 4,800,000 | 6,355,241 |
| 5.00% due 01/04/2012 *** | | 5,100,000 | 6,953,322 |
| 5.25% due 07/04/2010 *** | | 13,400,000 | 18,156,154 |
| 5.50% due 01/04/2031 *** | | 18,200,000 | 28,521,835 |
| 6.50% due 07/04/2027 *** | | 11,900,000 | 20,509,197 |
|
|
| | | | 99,605,148 |
| Japan - 6.28% | | | |
| Government of Japan | | | |
| 1.00% due 06/10/2016 *** | JPY | 562,800,000 | 4,805,105 |
| 1.50% due 03/20/2015 *** | | 900,000,000 | 7,634,827 |
| 1.50% due 03/20/2011 *** | | 980,000,000 | 8,519,741 |
| 2.40% due 03/20/2034 *** | | 600,000,000 | 5,099,226 |
| 2.50% due 09/20/2035 *** | | 1,300,000,000 | 11,293,799 |
|
|
| | | | 37,352,698 |
| Netherlands - 0.69% | | | |
| Kingdom of Netherlands | | | |
| 3.75% due 07/15/2014 *** | EUR | 3,200,000 | 4,102,909 |
|
| TOTAL FOREIGN GOVERNMENT OBLIGATIONS | |
| (Cost $157,618,841) | | | | $ | 159,868,036 |
|
| |
| CORPORATE BONDS - 9.95% | | | |
| Cayman Islands - 1.05% | | | |
| MUFG Capital Finance 1, Ltd. | | | |
| 6.346% due 07/29/2049 (b)*** | | $ | 1,700,000 | 1,701,712 |
| MUFG Capital Finance 2 | | | |
| 4.85% due 12/31/2049 (b)*** | EUR | 2,500,000 | 3,128,995 |
| Transocean, Inc. | | | |
| 5.5906% due 09/05/2008 | | $ | 1,400,000 | 1,399,689 |
|
|
| | | | 6,230,396 |
| Japan - 0.70% | | | |
| Bank of Tokyo-Mitsubishi UFJ, Ltd., Series EMTN | | |
| 3.50% due 12/16/2015 (b)*** | EUR | 600,000 | 748,225 |
| Sumitomo Mitsui Banking Corp., Series EMTN | | |
| 1.245% due 12/01/2049 (b) | JPY | 300,000,000 | 2,576,030 |
| 1.266% due 12/31/2049 | | 100,000,000 | 858,719 |
|
|
| | | | 4,182,974 |
The accompanying notes are an integral part of the financial statements. 215
John Hancock Funds II
Portfolio of investments — August 31, 2006
(showing percentage of total net assets)
| Global Bond Fund (continued) | | |
| | | Shares or | |
| | | Principal | |
| | | Amount | Value |
|
|
| |
| CORPORATE BONDS (continued) | | | |
| Luxembourg - 0.10% | | | |
| VTB Capital SA for Vneshtorgbank, Series 144A | | |
| 6.1744% due 09/21/2007 (b)*** | $ | 600,000 | | $ | 600,150 |
| Netherlands - 0.50% | | | |
| Rabobank Nederland | | | |
| 5.5269% due 01/15/2009 (b)*** | | 2,500,000 | 2,500,147 |
| Siemens Financieringsmaatschappij NV , | | | |
| Series 144A | | | |
| 5.466% due 08/14/2009 (b)*** | | 500,000 | 499,471 |
|
|
| | | | 2,999,618 |
| |
| Spain - 0.42% | | | |
| Santander US Debt SA Unipersonal, Series 144A | | |
| 5.54% due 02/06/2009 (b)*** | | 2,500,000 | 2,502,022 |
| United Kingdom - 0.44% | | | |
| Royal Bank of Scotland Group PLC, Series 144A | | |
| 5.4244% due 12/21/2007 (b)*** | | 1,200,000 | 1,200,786 |
| Vodafone Group, PLC | | | |
| 5.56% due 06/29/2007 (b)*** | | 1,400,000 | 1,399,885 |
|
|
| | | | 2,600,671 |
| |
| United States - 6.74% | | | |
| American Express Credit Corp., Series MTN | | |
| 5.39% due 05/18/2009 (b)*** | | 1,400,000 | 1,399,992 |
| Atlantic & Western Re, Ltd., Series A | | | |
| 11.5081% due 01/09/2007 (b) | | 1,200,000 | 1,180,475 |
| BellSouth Corp. | | | |
| 5.58% due 08/15/2008 (b)*** | | 1,400,000 | 1,400,053 |
| Charter One Bank N.A., Series BKNT | | | |
| 5.54% due 04/24/2009 (b)*** | | 3,250,000 | 3,251,196 |
| Cisco Systems, Inc. | | | |
| 5.4794% due 02/20/2009 (b)*** | | 2,600,000 | 2,604,238 |
| CIT Group, Inc., Series MTN | | | |
| 5.4625% due 02/21/2008 (b)*** | | 1,100,000 | 1,100,878 |
| Citigroup, Inc. | | | |
| 5.52% due 12/26/2008 (b)*** | | 1,500,000 | 1,500,702 |
| 5.525% due 01/30/2009 (b)*** | | 3,000,000 | 3,000,834 |
| CMS Energy Corp. | | | |
| 7.50% due 01/15/2009 (a)*** | | 800,000 | 822,000 |
| 8.90% due 07/15/2008 *** | | 400,000 | 418,000 |
| 9.875% due 10/15/2007 *** | | 1,340,000 | 1,395,275 |
| Countrywide Bank N.A., Series CD | | | |
| 5.36% due 08/16/2007 (b)*** | | 2,600,000 | 2,599,740 |
| DaimlerChrysler N.A. Holding Corp. | | | |
| 5.87% due 09/10/2007 (b)*** | | 1,500,000 | 1,504,469 |
| Dominion Resources, Inc., Series D | | | |
| 5.79% due 09/28/2007 (b)*** | | 1,500,000 | 1,501,275 |
| Echostar DBS Corp. | | | |
| 5.75% due 10/01/2008 *** | | 100,000 | 99,000 |
| El Paso Corp. | | | |
| 7.625% due 08/16/2007 (a)*** | | 100,000 | 101,250 |
| General Electric Capital Corp., Series MTN | | |
| 5.57% due 01/20/2010 (b)*** | | 2,600,000 | 2,600,988 |
| Genworth Global Funding Trusts | | | |
| 5.3894% due 02/10/2009 (b)*** | | 2,600,000 | 2,601,596 |
| Georgia Pacific Corp. | | | |
| 7.345% due 12/20/2012 (b)*** (f) | | 995,000 | 996,641 |
| Global Bond Fund (continued) | | |
| | | Shares or | |
| | | Principal | |
| | | Amount | Value |
|
|
| |
| CORPORATE BONDS (continued) | | | |
| United States (continued) | | | |
| HSBC Finance Corp., Series MTN | | | |
| 5.5038% due 06/19/2009 (a)(b)*** | | $ | 2,800,000 | | $ | 2,801,756 |
| Merrill Lynch & Company, Inc., Series MTN | | |
| 5.4919% due 08/14/2009 (b)*** | | 300,000 | 299,941 |
| Oracle Corp. and Ozark Holding, Inc. | | | |
| 5.73% due 01/13/2009 (b)*** | | 1,300,000 | 1,301,507 |
| Reynolds American, Inc. | | | |
| 7.3125% due 05/11/2012 (b)(f) | | 1,000,000 | 1,005,469 |
| Shackleton B Event Linked Loan | | | |
| 13.467% due 08/01/2008 (b)(f) | | 1,000,000 | 1,002,197 |
| Shackleton C Event Linked Loan | | | |
| 12.967% due 08/01/2008 (b)(f) | | 1,000,000 | 992,175 |
| Shackleton Re Ltd., Series 144A | | | |
| 13.488% due 02/07/2008 (b) | | 1,000,000 | 1,001,350 |
| US Bancorp | | | |
| 5.3581% due 04/28/2009 (b)*** | | 1,600,000 | 1,600,141 |
|
|
| | | | 40,083,138 |
|
| |
| TOTAL CORPORATE BONDS (Cost $59,057,313) | | $ | 59,198,969 |
|
| |
| MUNICIPAL BONDS - 0.07% | | | |
| Illinois - 0.05% | | | |
| City of Chicago, Illinois | | | |
| 4.75% due 01/01/2030 *** | | 300,000 | 305,412 |
| New York - 0.02% | | | |
| New York City Municipal Water Finance Authority | | |
| 4.75% due 06/15/2038 *** | | 130,000 | 135,767 |
|
| TOTAL MUNICIPAL BONDS (Cost $437,379) | | $ | 441,179 |
|
| |
| COLLATERALIZED MORTGAGE | | | |
| OBLIGATIONS - 18.13% | | | |
| Ireland - 0.17% | | | |
| Paris Residential Funding PLC, Series 1X , Class A | | |
| 2.51% due 07/25/2011 (b)*** | EUR | 770,975 | 987,551 |
| Netherlands - 1.25% | | | |
| Atomium Mortgage Finance BV, | | | |
| Series 2003-I , Class A | | | |
| 2.314% due 07/01/2034 (b)*** | | 1,107,700 | 1,418,442 |
| Delphinus BV, Series 2001-II, Class A1 | | |
| 3.545% due 11/28/2031 (b)*** | | 2,000,000 | 2,697,427 |
| Delphinus BV, Series 2003-I, Class A1 | | | |
| 2.41% due 04/25/2093 (b)*** | | 1,000,000 | 1,286,286 |
| Dutch Mortgage Portfolio Loans, BV, | | | |
| Series III, Class A | | | |
| 3.484% due 11/20/2035 (b)*** | | 1,602,204 | 2,058,673 |
|
|
| | | | 7,460,828 |
| |
| United States - 16.71% | | | |
| American Home Mortgage Investment Trust, | | |
| Series 2004-3 , Class 5A | | | |
| 4.29% due 10/25/2034 (b)*** | | $ | 887,602 | 868,441 |
| Banc of America Commercial Mortgage, Inc., | | |
| Series 2002-2 , Class A2 | | | |
| 4.772% due 07/11/2043 *** | | 2,500,000 | 2,470,402 |
The accompanying notes are an integral part of the financial statements. 216
John Hancock Funds II
Portfolio of investments — August 31, 2006
(showing percentage of total net assets)
| Global Bond Fund (continued) | | |
| | | Shares or | |
| | | Principal | |
| | | Amount | Value |
|
|
| |
| COLLATERALIZED MORTGAGE | | | |
| OBLIGATIONS (continued) | | | |
| United States (continued) | | | |
| Banc of America Funding Corp., | | | |
| Series 2006-A, Class 1A1 | | | |
| 4.6202% due 02/20/2036 (b)*** | | $ | 2,344,057 | | $ | 2,325,666 |
| Banc of America Mortgage Securities, | | | |
| Series 2004-4 , Class 1A9 | | | |
| 5.00% due 05/25/2034 *** | | 2,041,367 | 2,006,094 |
| Bear Stearns Adjustable Rate Mortgage Trust, | | |
| Series 2005-9 , Class A1 | | | |
| 4.625% due 10/25/2035 (b)*** | | 4,125,880 | 4,010,113 |
| Bear Stearns ALT-A Trust | | | |
| 5.84% due 10/25/2036 | | 2,900,000 | 2,902,266 |
| Bella Vista Mortgage Trust, | | | |
| Series 2005-2, Class 2A1 | | | |
| 5.575% due 05/20/2045 (b)*** | | 2,138,881 | 2,145,962 |
| Citigroup Mortgage Loan Trust, Inc., | | | |
| Series 2005-11, Class 1A1 | | | |
| 4.90% due 12/25/2035 (b)*** | | 799,834 | 804,475 |
| Citigroup Mortgage Loan Trust, Inc., | | | |
| Series 2005-11, Class A2A | | | |
| 4.70% due 12/25/2035 *** | | 2,877,613 | 2,823,459 |
| Commercial Mortgage Pass Through | | | |
| Certificates, Series 2006-CN2A, Class A2FL | | |
| 5.278% due 02/05/2019 (b)*** | | 2,600,000 | 2,605,147 |
| Countrywide Alternative Loan Trust, | | | |
| Series 2005-11CB, Class 2A8 | | | |
| 4.50% due 06/25/2035 *** | | 2,145,171 | 2,111,552 |
| Countrywide Alternative Loan Trust, | | | |
| Series 2005-81, Class A1 | | | |
| 5.6044% due 02/25/2037 (b)*** | | 5,968,869 | 5,992,804 |
| Countrywide Alternative Loan Trust, | | | |
| Series 2006-OA1, Class 2A1 | | | |
| 5.535% due 03/20/2046 (b)*** | | 2,412,163 | 2,413,409 |
| Countrywide Home Loan Mortgage | | | |
| Pass Through Trust, Series 2005-HYB9 , | | |
| Class 5A1 | | | |
| 5.25% due 02/20/2036 (b)*** | | 963,447 | 959,380 |
| Countrywide Home Loan Mortgage | | | |
| Pass Through Trust, Series 2005-R2, | | | |
| Class 1AF1 | | | |
| 5.6644% due 06/25/2035 (b)*** | | 227,229 | 226,906 |
| Countrywide Home Loans, | | | |
| Series 2004-12, Class 14A2 | | | |
| 5.6044% due 08/25/2034 (b)*** | | 302,495 | 302,574 |
| Countrywide Home Loans, | | | |
| Series 2004-25, Class 1A1 | | | |
| 5.6544% due 02/25/2035 (b)*** | | 693,333 | 695,925 |
| Countrywide Home Loans, | | | |
| Series 2004-25, Class 2A1 | | | |
| 5.6644% due 02/25/2035 (b)*** | | 810,920 | 814,259 |
| Countrywide Home Loans, | | | |
| Series 2005-HYB9, Class 3A2A | | | |
| 5.25% due 02/20/2036 (b)*** | | 985,749 | 980,043 |
| Credit Suisse First Boston Mortgage | | | |
| Securities Corp., Series 2005-CN2A , Class A1S | | |
| 5.55% due 11/15/2019 (b)*** | | 520,543 | 520,857 |
| Global Bond Fund (continued) | | |
| | | Shares or | |
| | | Principal | |
| | | Amount | Value |
|
|
| |
| COLLATERALIZED MORTGAGE | | | |
| OBLIGATIONS (continued) | | | |
| United States (continued) | | | |
| CSAB Mortgage Backed Trust, | | | |
| Series 2006-1, Class A1A | | | |
| 5.4244% due 06/25/2036 (b)*** | | $ | 1,155,832 | | $ | 1,156,394 |
| Fannie Mae REMICS, Series 2006-16, Class FC | | |
| 5.685% due 03/25/2036 (b)*** | | 2,846,182 | 2,846,772 |
| Federal Home Loan Mortgage Corp., | | | |
| Series 2004-2770 , Class YW | | | |
| 4.00% due 06/15/2022 *** | | 1,971,179 | 1,942,083 |
| Federal Home Loan Mortgage Corp., | | | |
| Series 2004-2895 , Class F | | | |
| 5.68% due 06/15/2031 (b)*** | | 903,802 | 904,508 |
| Federal Home Loan Mortgage Corp., | | | |
| Series 2844 , Class PR | | | |
| 5.00% due 09/15/2017 *** | | 457,540 | 455,509 |
| Federal Home Loan Mortgage Corp., | | | |
| Series T-63, Class 1A1 | | | |
| 5.482% due 02/25/2045 (b)*** | | 746,847 | 742,849 |
| Federal National Mortgage Association | | | |
| Grantor Trust, Series 2005-T4, Class A1B | | |
| 5.4144% due 09/25/2035 (b)*** | | 1,200,000 | 1,200,470 |
| Federal National Mortgage Association, | | | |
| Series 2003-W6, Class F | | | |
| 5.6744% due 09/25/2042 (b)*** | | 1,081,455 | 1,086,784 |
| Federal National Mortgage Association, | | | |
| Series 2004-W2 , Class 5AF | | | |
| 5.6744% due 03/25/2044 (b)*** | | 952,676 | 953,266 |
| Federal National Mortgage Association, | | | |
| Series 2005-120, Class NF | | | |
| 5.4244% due 01/25/2021 (b)*** | | 1,108,424 | 1,105,646 |
| Federal National Mortgage Association, | | | |
| Series 2006-15, Class FC | | | |
| 5.4544% due 03/25/2036 (b)*** | | 2,567,184 | 2,569,862 |
| Federal National Mortgage Association, | | | |
| Series 2006-5, Class 3A2 | | | |
| 4.6798% due 05/25/2035 (b)*** | | 1,200,000 | 1,178,218 |
| First Republic Mortgage Loan Trust, | | | |
| Series 2001-FRB1 , Class A | | | |
| 5.68% due 11/15/2031 (b)*** | | 682,364 | 685,298 |
| Fremont Home Loan Trust, | | | |
| Series 2006-1 , Class 2A1 | | | |
| 5.3844% due 04/25/2036 (b)*** | | 1,687,897 | 1,688,534 |
| GMAC Mortgage Corp Loan Trust, | | | |
| Series 2004-J4 , Class A1 | | | |
| 5.50% due 09/25/2034 *** | | 1,332,210 | 1,319,458 |
| GS Mortgage Securities Corp., | | | |
| Series 2003-1 , Class A2 | | | |
| 6.0244% due 01/25/2032 (b)*** | | 836,704 | 844,835 |
| Harborview Mortgage Loan Trust, | | | |
| Series 2006-1, Class 2A1A | | | |
| 5.565% due 03/19/2037 (b)*** | | 2,456,026 | 2,459,373 |
| LB-UBS Commercial Mortgage Trust, | | | |
| Series 2003-C1 , Class A2 | | | |
| 3.323% due 03/15/2027 *** | | 4,420,000 | 4,294,461 |
| Lehman Brothers Floating Rate Commercial | | |
| Mortgage Trust, Series 2006-LLFA , Class A1 | | |
| 5.4056% due 09/15/2021 (b)*** | | 3,000,000 | 3,004,707 |
The accompanying notes are an integral part of the financial statements. 217
John Hancock Funds II
Portfolio of investments — August 31, 2006
(showing percentage of total net assets)
| Global Bond Fund (continued) | | |
| | | Shares or | |
| | | Principal | |
| | | Amount | Value |
|
|
| |
| COLLATERALIZED MORTGAGE | | | |
| OBLIGATIONS (continued) | | | |
| United States (continued) | | | |
| Lehman XS Trust, Series 2006-4N, Class A1A | | |
| 5.4044% due 04/25/2046 (b)*** | | $ | 2,427,435 | $ | 2,427,152 |
| Mellon Residential Funding Corp., | | | |
| Series 2000-TBC3, Class A1 | | | |
| 5.77% due 12/15/2030 (b)*** | | 1,633,751 | 1,639,006 |
| Merrill Lynch Mortgage Trust, | | | |
| Series 2004-BPC1 , Class A1 | | | |
| 3.585% due 10/12/2041 *** | | 1,006,275 | 982,263 |
| MLCC Mortgage Investors, Inc., | | | |
| Series 2003-C , Class A1 | | | |
| 5.6544% due 06/25/2028 (b)*** | | 1,680,347 | 1,687,625 |
| Residential Accredit Loans, Inc., | | | |
| Series 2006-QO3 , Class A1 | | | |
| 5.5344% due 04/25/2046 (b)*** | | 2,660,904 | 2,660,276 |
| Sequoia Mortgage Trust, Series 5, Class A | | | |
| 5.675% due 10/19/2026 (b)*** | | 539,713 | 540,366 |
| Structured Adjustable Rate Mortgage Loan Trust, | | |
| Series 2004-1, Class 4A2 | | | |
| 4.58% due 02/25/2034 (b)*** | | 1,727,073 | 1,709,182 |
| Structured Adjustable Rate Mortgage Loan Trust, | | |
| Series 2004-19, Class 2A1 | | | |
| 5.8317% due 01/25/2035 (b)*** | | 2,238,811 | 2,247,206 |
| Structured Asset Mortgage Investments, Inc., | | |
| Series 2006-AR3 , Class 12A1 | | | |
| 5.5444% due 05/25/2036 (b)*** | | 2,667,269 | 2,670,218 |
| Thornburg Mortgage Securities Trust, | | | |
| Series 2006-5, Class A1 | | | |
| 5.45% due 08/25/2036 (b)*** | | 2,900,000 | 2,900,454 |
| Wachovia Bank Commercial Mortgage Trust, | | |
| Series 2005-C16 , Class A1 | | | |
| 4.061% due 10/15/2041 *** | | 2,161,163 | 2,117,822 |
| Washington Mutual Mortgage Securities Corp., | | |
| Series 2003-R1 , Class A1 | | | |
| 5.5944% due 12/25/2027 (b)*** | | 1,697,297 | 1,696,367 |
| Washington Mutual Mortgage Securities Corp., | | |
| Series 2005-AR13 , Class A1A1 | | | |
| 5.6144% due 10/25/2045 (b)*** | | 458,533 | 461,432 |
| Washington Mutual Mortgage Securities Corp., | | |
| Series 2005-AR2 , Class 2A1A | | | |
| 5.6344% due 01/25/2045 (b)*** | | 867,672 | 872,807 |
| Washington Mutual Mortgage Securities Corp., | | |
| Series 2005-AR6 , Class 2A1A | | | |
| 5.615% due 04/25/2045 (b)*** | | 1,472,123 | 1,475,522 |
| Washington Mutual Mortgage Securities Corp., | | |
| Series 2006-AR3 , Class A1A | | | |
| 5.432% due 02/25/2046 (b)*** | | 2,398,400 | 2,402,917 |
| Wells Fargo Mortgage Backed Securities Trust, | | |
| Series 2006-AR2 , Class 2A1 | | | |
| 4.95% due 03/25/2036 (b)*** | | 2,544,984 | 2,513,365 |
|
|
| | | | 99,422,741 |
|
| |
| TOTAL COLLATERALIZED MORTGAGE OBLIGATIONS | |
| (Cost $107,286,281) | | | | $ | 107,871,120 |
|
| Global Bond Fund (continued) | | |
| | | Shares or | |
| | | Principal | |
| | | Amount | Value |
|
|
| |
| ASSET BACKED SECURITIES - 16.28% | | |
| United States - 16.28% | | | |
| ACE Securities Corp., | | | |
| Series 2006-ASP4 , Class A2A | | | |
| 5.45% due 08/25/2036 (b)*** | | $ | 2,743,004 | | $ | 2,742,577 |
| ACE Securities Corp., Series 2006-HE1 , Class A2A | | |
| 5.4044% due 02/25/2036 (b)*** | | 1,784,794 | 1,785,225 |
| ACE Securities Corp., Series 2006-NC1 , Class A2A | | |
| 5.3944% due 12/25/2035 (b)*** | | 1,691,534 | 1,691,928 |
| ACE Securities Corp., Series 2006-NC1 , Class A2B | | |
| 5.4744% due 12/25/2035 (b)*** | | 2,500,000 | 2,501,173 |
| Argent Securities, Inc., | | | |
| Series 2005-W4 , Class A1A1 | | | |
| 5.4444% due 02/25/2036 (b)*** | | 1,861,516 | 1,861,781 |
| Argent Securities, Inc., Series 2005-W4, Class A2A | | |
| 5.4644% due 02/25/2036 (b)*** | | 1,451,826 | 1,452,009 |
| Argent Securities, Inc., Series 2006-M2 , Class A2A | | |
| 5.3781% due 09/25/2036 (b)*** | | 2,900,000 | 2,902,273 |
| Asset Backed Funding Certificates, | | | |
| Series 2006-OPT1 , Class A3A | | | |
| 5.408% due 09/25/2036 (b)*** | | 892,135 | 891,996 |
| Asset Backed Securities Corp., Home Equity | | |
| Series 2006-HE3 , Class A3 | | | |
| 5.3844% due 03/25/2036 (b)*** | | 2,003,158 | 2,003,987 |
| Bear Stearns Asset Backed Securities, Inc. | | | |
| 5.75% due 12/15/2046 | | 3,500,000 | 3,511,013 |
| Countrywide Asset-Backed Certificates, | | | |
| Series 2006-1, Class AF1 | | | |
| 5.4544% due 07/25/2036 (b)*** | | 2,196,247 | 2,196,372 |
| Countrywide Asset-Backed Certificates, | | | |
| Series 2006-3, Class 2A1 | | | |
| 5.3944% due 06/25/2036 (b)*** | | 2,166,310 | 2,166,879 |
| Countrywide Asset-Backed Certificates, | | | |
| Series 2006-4, Class 2A1 | | | |
| 5.3944% due 07/25/2036 (b)*** | | 2,365,684 | 2,365,684 |
| FBR Securitization Trust, Series 2005-5, Class AV21 | | |
| 5.444% due 11/25/2035 (b)*** | | 532,387 | 532,450 |
| First NLC Trust, Series 2005-3, Class AV1 | | | |
| 5.4344% due 12/25/2035 (b)*** | | 315,733 | 315,754 |
| First NLC Trust, Series 2005-4, Class A1 | | | |
| 5.4444% due 02/25/2036 (b)*** | | 321,986 | 322,012 |
| GE-WMC Mortgage Securities LLC, | | | |
| Series 2005-2, Class A2A | | | |
| 5.4244% due 12/25/2035 (b)*** | | 246,307 | 246,345 |
| GSAMP Trust, Series 2006-NC1 , Class A1 | | |
| 5.3944% due 02/25/2036 (b)*** | | 1,946,237 | 1,946,540 |
| GSAMP Trust, Series 2006-S1 , Class A2A | | |
| 5.4144% due 11/25/2035 (b)*** | | 2,002,649 | 2,003,276 |
| GSAMP Trust, Series 2006-SD1 , Class A1 | | |
| 5.4444% due 12/25/2035 (b)*** | | 1,695,377 | 1,695,908 |
| GSR Mortgage Loan Trust, | | | |
| Series 2005-HEL1, Class A2A | | | |
| 5.4244% due 11/25/2030 (b)*** | | 1,549,261 | 1,549,330 |
| Home Equity Asset Trust, Series 2005-8, Class 2A1 | | |
| 5.4344% due 02/25/2036 (b)*** | | 665,626 | 665,796 |
| Home Equity Mortgage Trust, | | | |
| Series 2006-1, Class A1A1 | | | |
| 5.4144% due 05/25/2036 (b)*** | | 1,550,575 | 1,550,817 |
The accompanying notes are an integral part of the financial statements. 218
John Hancock Funds II
Portfolio of investments — August 31, 2006
(showing percentage of total net assets)
| Global Bond Fund (continued) | | |
| | | Shares or | |
| | | Principal | |
| | | Amount | Value |
|
|
| |
| ASSET BACKED SECURITIES | | | |
| (continued) | | | |
| United States (continued) | | | |
| Honda Auto Receivables Owner Trust, | | | |
| Series 2006-2 , Class A2 | | | |
| 5.42% due 12/22/2008 *** | | $ | 2,500,000 | | $ | 2,501,953 |
| JP Morgan Mortgage Acquisition Corp., | | | |
| Series 2006-FRE1, Class A2 | | | |
| 5.3944% due 05/25/2035 (b)*** | | 1,276,161 | 1,276,388 |
| JP Morgan Mortgage Acquisition Corp., | | | |
| Series 2006-WMC3, Class A2 | | | |
| 5.38% due 08/25/2036 (b) | | 2,800,000 | 2,801,316 |
| Long Beach Mortgage Loan Trust, | | | |
| Series 2004-4 , Class 1A1 | | | |
| 5.6044% due 10/25/2034 (b)*** | | 2,472,174 | 2,477,400 |
| Long Beach Mortgage Loan Trust, | | | |
| Series 2005-3 , Class 2A1 | | | |
| 5.4444% due 09/25/2035 (b)*** | | 60,423 | 60,431 |
| Long Beach Mortgage Loan Trust, | | | |
| Series 2006-2, Class 2A1 | | | |
| 5.3944% due 03/25/2036 (b)*** | | 1,862,109 | 1,862,411 |
| Long Beach Mortgage Loan Trust, | | | |
| Series 2006-WL1 , Class 2A1 | | | |
| 5.4144% due 01/25/2036 (b)*** | | 4,649,960 | 4,651,507 |
| Mastr Asset Backed Securities Trust, | | | |
| Series 2005-NC2 , Class A1 | | | |
| 5.4344% due 11/25/2035 (b)*** | | 1,754,453 | 1,754,704 |
| Mastr Asset Backed Securities Trust, | | | |
| Series 2006-HE1 , Class A1 | | | |
| 5.4044% due 01/25/2036 (b)*** | | 1,853,850 | 1,854,176 |
| Mastr Asset Backed Securities Trust, | | | |
| Series 2006-NC1 , Class A1 | | | |
| 5.4044% due 01/25/2036 (b)*** | | 1,832,083 | 1,832,501 |
| Morgan Stanley Capital I, | | | |
| Series 2006-NC2 , Class A2A | | | |
| 5.3944% due 02/25/2036 (b)*** | | 3,940,327 | 3,940,757 |
| Nelnet Student Loan Trust, Series 2006-1 , Class A1 | | |
| 5.3781% due 08/23/2011 (b)*** | | 2,413,731 | 2,413,731 |
| New Century Home Equity Loan Trust, | | | |
| Series 2005-B, Class A2A | | | |
| 5.4444% due 10/25/2035 (b)*** | | 739,889 | 739,999 |
| Newcastle Mortgage Securities Trust, | | | |
| Series 2006-1, Class A1 | | | |
| 5.3944% due 03/25/2036 (b)*** | | 1,771,122 | 1,771,486 |
| Nomura Asset Acceptance Corp., | | | |
| Series 2006-S1, Class A1 | | | |
| 5.4644% due 01/25/2036 (b)*** | | 638,545 | 638,844 |
| Park Place Securities, Inc., | | | |
| Series 2005-WHQ4, Class A2A | | | |
| 5.4344% due 09/25/2035 (b)*** | | 490,686 | 490,740 |
| Popular ABS Mortgage Pass-Through Trust, | | |
| Series 2005-4, Class AV1 | | | |
| 5.4344% due 09/25/2035 (b)*** | | 733,158 | 733,123 |
| Residential Asset Mortgage Products, Inc., | | | |
| Series 2006-NC1, Class A1 | | | |
| 5.4044% due 01/25/2036 (b)*** | | 1,649,832 | 1,649,832 |
| Residential Asset Mortgage Products, Inc., | | | |
| Series 2006-NC2 , Class A1 | | | |
| 5.4044% due 02/25/2036 (b)*** | | 3,872,055 | 3,872,055 |
| Global Bond Fund (continued) | | |
| | | Shares or | |
| | | Principal | |
| | | Amount | Value |
|
|
| |
| ASSET BACKED SECURITIES | | | |
| (continued) | | | |
| United States (continued) | | | |
| Residential Asset Mortgage Products, Inc., | | | |
| Series 2006-RS1 , Class AI1 | | | |
| 5.4044% due 01/25/2036 (b)*** | | $ | 1,864,837 | | $ | 1,865,017 |
| Residential Asset Securities Corp., | | | |
| Series 2005-EMX1, Class AI1 | | | |
| 5.4244% due 03/25/2035 (b)*** | | 316,067 | 316,094 |
| Residential Asset Securities Corp., | | | |
| Series 2005-KS12 , Class A1 | | | |
| 5.4144% due 01/25/2036 (b)*** | | 472,225 | 472,315 |
| Residential Asset Securities Corp., | | | |
| Series 2006-EMX1, Class A1 | | | |
| 5.4044% due 01/25/2036 (b)*** | | 1,900,904 | 1,901,204 |
| Residential Asset Securities Corp., | | | |
| Series 2006-KS2, Class A1 | | | |
| 5.3944% due 03/25/2036 (b)*** | | 882,014 | 882,014 |
| Residential Asset Securities Corp., | | | |
| Series 2006-KS6 , Class A1 | | | |
| 5.44% due 08/25/2036 (b)*** | | 2,771,709 | 2,771,277 |
| Residential Asset Securities Corp., | | | |
| Series 2006-KS7 , Class A1 | | | |
| 5.38% due 09/25/2036 (b)*** | | 2,800,000 | 2,799,563 |
| Securitized Asset Backed Receivables LLC Trust, | | |
| Series 2005-FR4, Class A2A | | | |
| 5.4444% due 01/25/2036 (b)*** | | 564,115 | 564,208 |
| Soundview Home Equity Loan Trust, | | | |
| Series 2005-A , Class A | | | |
| 5.4944% due 04/25/2035 (b)*** | | 282,469 | 282,530 |
| Soundview Home Equity Loan Trust, | | | |
| Series 2005-B, Class A1 | | | |
| 5.4344% due 05/25/2035 (b)*** | | 105,489 | 105,488 |
| Soundview Home Equity Loan Trust, | | | |
| Series 2006-EQ1, Class A1 | | | |
| 5.458% due 10/25/2036 (b) | | 2,900,000 | 2,900,909 |
| Specialty Underwriting & Residential Finance, | | |
| Series 2006-BC1, Class A2A | | | |
| 5.4044% due 12/25/2036 (b)*** | | 2,158,499 | 2,159,467 |
| Structured Asset Investment Loan Trust, | | | |
| Series 2005-6, Class A7 | | | |
| 5.4144% due 07/25/2035 (b)*** | | 524,805 | 524,895 |
| Structured Asset Securities Corp., | | | |
| Series 2005-S6 , Class A1 | | | |
| 5.4344% due 11/25/2035 (b)*** | | 936,461 | 936,495 |
| Structured Asset Securities Corp., | | | |
| Series 2005-S7, Class A1 | | | |
| 5.4544% due 12/25/2035 (b)*** | | 2,184,554 | 2,184,741 |
|
|
| | | | 96,890,696 |
|
| |
| TOTAL ASSET BACKED SECURITIES | | | |
| (Cost $96,844,214) | | | $ | 96,890,696 |
|
| |
| OPTIONS - 0.39% | | | |
| United States - 0.39% | | | |
| Chicago Board of Trades American Purchase | | |
| Put United States Treasury Notes 10 yrs Futures | | |
| Expiration 11/21/2006 at $101.00 | | 40,000 | 625 |
The accompanying notes are an integral part of the financial statements. 219
John Hancock Funds II
Portfolio of investments — August 31, 2006
(showing percentage of total net assets)
| Global Bond Fund (continued) | | | |
| | | Shares or | | |
| | | Principal | | |
| | | Amount | | Value |
|
|
| |
| OPTIONS (continued) | | | | |
| United States (continued) | | | | |
| Chicago Board of Trades American Purchase | | | |
| Put United States Treasury Notes 5 yrs Futures | | | |
| Expiration 11/21/2006 at $101.00 | | 712,000 | $ | 11,125 |
| Chicago Mercantile Exchange American Purchase | | | |
| Put on Eurodollar | | | | |
| Expiration 09/17/2007 at $90.75 | | 272,500 | | 681 |
| Expiration 12/18/2006 at $92.50 | | 137,500 | | 344 |
| Expiration 09/18/2006 at $92.75 | | 812,500 | | 2,031 |
| Expiration 03/19/2007 at $92.75 | | 500,000 | | 1,250 |
| Expiration 12/18/2006 at $94.125 | | 812,500 | | 2,031 |
| EuroDollar Futures | | | | |
| Expiration 09/17/2007 at $90.25 | | 1,132,500 | | 2,831 |
| Over The Counter European Style Call | | | | |
| Expiration 12/22/2006 at $4.80 | | 18,200,000 | | 10,574 |
| Expiration 03/08/2007 at $5.00 | | 28,000,000 | | 81,116 |
| Expiration 03/08/2007 at $5.00 | | 65,000,000 | | 188,305 |
| Expiration 03/08/2007 at $5.00 | | 7,000,000 | | 20,279 |
| Expiration 05/17/2007 at $5.00 | | 10,300,000 | | 48,631 |
| Expiration 05/11/2007 at $5.00 | | 14,000,000 | | 64,608 |
| Expiration 06/15/2007 at $5.00 | | 8,600,000 | | 45,070 |
| Expiration 06/15/2007 at $5.00 | | 8,700,000 | | 45,594 |
| Expiration 05/08/2007 at $5.15 | | 33,000,000 | | 174,834 |
| Expiration 05/23/2007 at $5.20 | | 78,100,000 | | 474,770 |
| Expiration 05/09/2007 at $5.20 | | 190,600,000 | | 1,151,903 |
| Over The Counter European Style Put | | | | |
| Expiration 09/06/2006 at $5.50 | | 2,600,000 | | 0 |
|
|
| | | | | 2,326,602 |
|
| TOTAL OPTIONS (Cost $2,041,182) | | | $ | 2,326,602 |
|
| |
| SHORT TERM INVESTMENTS - 29.13% | | | |
| Bank of America Corp. | | | | |
| 5.40% due 11/09/2006 *** | | $ | 1,500,000 | $ | 1,484,475 |
| Barclays U.S. Funding LLC | | | | |
| 5.275% due 11/21/2006 *** | | 2,200,000 | | 2,173,889 |
| 5.385% due 10/26/2006 *** | | 15,600,000 | | 15,471,657 |
| Kingdom Of Belgium | | | | |
| 3.03% due 12/14/2006 *** | EUR | 57,000,000 | | 72,288,944 |
| Danske Corp. | | | | |
| 5.27% due 12/27/2006 *** | | $ | 14,200,000 | | 13,956,790 |
| Dexia Delaware LLC | | | | |
| 5.36% due 10/16/2006 to 10/27/2006 *** | 17,300,000 | | 17,181,142 |
| General Electric Capital Corp. | | | | |
| 5.35% due 10/26/2006 *** | | 14,600,000 | | 14,480,665 |
| State Street Navigator Securities Lending | | | | |
| Prime Portfolio (c) | | 9,309,000 | | 9,309,000 |
| Time Warner, Inc. | | | | |
| 5.24% due 09/19/2006 *** | | 1,400,000 | | 1,396,332 |
| UBS Finance (Delaware) LLC | | | | |
| 5.37% due 10/10/2006 *** | | 4,800,000 | | 4,772,076 |
| UniCredito Italiano SpA | | | | |
| 5.226% due 12/03/2007 *** | | 1,400,000 | | 1,399,487 |
| United States Treasury Bills | | | | |
| zero coupon due 09/14/2006 (a)*** **** | | 20,000 | | 19,964 |
| zero coupon due 09/14/2006 *** **** | | 3,915,000 | | 3,908,185 |
| Global Bond Fund (continued) | | | |
| | | Shares or | | |
| | | Principal | | |
| | | Amount | | Value |
|
|
| |
| SHORT TERM INVESTMENTS (continued) | | | |
| Westpac Banking Corp. | | | | |
| 5.365% due 10/16/2006 *** | | $ | 15,600,000 | $ | 15,495,383 |
|
| TOTAL SHORT TERM INVESTMENTS | | | | |
| (Cost $171,888,483) | | | $ | 173,337,989 |
|
| |
| REPURCHASE AGREEMENTS - 2.00% | | | | |
| Repurchase Agreement with State | | | | |
| Street Corp. dated 08/31/2006 at | | | | |
| 3.95% to be repurchased at | | | | |
| $11,869,302 on 09/01/2006, | | | | |
| collateralized by $12,080,000 | | | | |
| Federal Home Loan Mortgage | | | | |
| Corp., 5.50% due 11/16/2015 | | | | |
| (valued at $12,110,200, including | | | | |
| interest) (c) | | $ | 11,868,000 | $ | 11,868,000 |
|
| TOTAL REPURCHASE AGREEMENTS | | | | |
| (Cost $11,868,000) | | | $ | 11,868,000 |
|
| Total Investments (Global Bond Fund) | | | | |
| (Cost $648,911,321) - 109.91% | | | $ | 653,970,305 |
| Liabilities in Excess of Other Assets - (9.91)% | | | (58,972,368) |
|
|
| TOTAL NET ASSETS - 100.00% | | | $ | 594,997,937 |
|
|
| |
| |
| Global Real Estate Fund | | | | |
| | | Shares or | | |
| | | Principal | | |
| | | Amount | | Value |
|
|
| |
| COMMON STOCKS - 98.03% | | | | |
| Australia - 10.31% | | | | |
| Abacus Property Group | | 1,703,594 | $ | 2,007,993 |
| Aspen Group | | 1,012,889 | | 1,205,463 |
| Centro Properties Group, Ltd. | | 900,453 | | 5,262,077 |
| Centro Retail Group | | 1,152,633 | | 1,472,900 |
| CFS Retail Property Trust * | | 36,216 | | 55,259 |
| Charter Hall Group * | | 1,634,381 | | 1,845,366 |
| Galileo Shopping America Trust | | 102,037 | | 88,742 |
| General Property Trust, Ltd. (a) | | 1,297,526 | | 4,523,763 |
| Lend Lease Corp. | | 160,405 | | 1,922,479 |
| Macquarie DDR Trust (a) | | 1,961,882 | | 1,751,162 |
| Macquarie Goodman Group, Ltd. | | 1,163,763 | | 5,628,874 |
| Stockland Company, Ltd. | | 1,020,106 | | 5,634,448 |
| Valad Property Group | | 40,947 | | 48,419 |
| Westfield Group (a) | | 371,070 | | 5,172,041 |
|
|
| | | | | 36,618,986 |
| Canada - 4.83% | | | | |
| Brookfield Properties Corp. | | 157,480 | | 5,519,674 |
| Canadian Apartment Properties, REIT | | 51,900 | | 832,445 |
| Canadian Real Estate Investment Trust | | 160,050 | | 3,685,062 |
| RioCan Real Estate Investment Trust | | 201,950 | | 4,178,968 |
| Summit Real Estate Investment Trust | | 108,750 | | 2,928,432 |
|
|
| | | | | 17,144,581 |
| Cayman Islands - 0.36% | | | | |
| China Resources Land, Ltd. | | 2,097,000 | | 1,267,322 |
The accompanying notes are an integral part of the financial statements. 220
John Hancock Funds II
Portfolio of investments — August 31, 2006
(showing percentage of total net assets)
| Global Real Estate Fund (continued) | | |
| | Shares or | | |
| | Principal | | |
| | Amount | | Value |
|
|
| |
| COMMON STOCKS (continued) | | | |
| China - 0.39% | | | |
| China Overseas Land & Investment, Ltd. | 1,996,000 | $ | 1,380,809 |
| Denmark - 0.66% | | | |
| Sjaelso Gruppen AS | 8,000 | | 2,359,639 |
| Finland - 0.71% | | | |
| Technopolis Oyj | 350,000 | | 2,529,717 |
| France - 3.39% | | | |
| Fonciere Des Regions | 12,500 | | 1,695,006 |
| Klepierre SA | 22,000 | | 3,087,342 |
| Orco Property Group (a) | 20,000 | | 2,394,756 |
| Unibail | 25,000 | | 4,873,943 |
|
|
| | | | 12,051,047 |
| Germany - 1.14% | | | |
| Colonia Real Estate AG * (a) | 44,800 | | 1,718,166 |
| Patrizia Immobilien AG * | 50,000 | | 1,354,726 |
| Vivacon AG * | 40,000 | | 979,905 |
|
|
| | | | 4,052,797 |
| Greece - 0.27% | | | |
| Eurobank Properties Real Estate Investment | | | |
| Company | 49,650 | | 947,640 |
| Hong Kong - 5.10% | | | |
| Link, REIT * | 1,470,000 | | 3,054,565 |
| Sun Hung Kai Properties, Ltd. | 1,380,000 | | 15,047,544 |
|
|
| | | | 18,102,109 |
| Italy - 1.60% | | | |
| Beni Stabili SpA | 772,848 | | 793,899 |
| Pirelli & C Real Estate SpA | 12,500 | | 724,375 |
| Risanamento SpA | 540,000 | | 4,179,310 |
|
|
| | | | 5,697,584 |
| Japan - 14.21% | | | |
| Aeon Mall Company, Ltd. * (a) | 71,000 | | 3,575,561 |
| Diamond City Company, Ltd. (a) | 56,000 | | 2,681,778 |
| Mitsubishi Estate Company, Ltd. | 725,000 | | 15,629,926 |
| Mitsui Fudosan Company, Ltd. | 657,000 | | 14,723,787 |
| Nippon Building Fund, Inc. | 595 | | 5,830,600 |
| Sumitomo Realty & | | | |
| Development Company, Ltd. (a) | 272,000 | | 8,019,428 |
|
|
| | | | 50,461,080 |
| Netherlands - 0.48% | | | |
| Eurocommercial Properties NV | 40,000 | | 1,703,961 |
| Norway - 0.36% | | | |
| NorGani Hotels ASA * | 129,436 | | 1,269,462 |
| Philippines - 0.24% | | | |
| Megaworld Corp. | 26,093,000 | | 862,494 |
| Singapore - 4.89% | | | |
| CapitaLand, Ltd. | 1,064,000 | | 3,219,119 |
| CapitaMall Trust * (a) | 1,096,000 | | 1,644,035 |
| CDL Hospitality Trusts, REIT * | 2,687,000 | | 1,596,863 |
| City Developments, Ltd. | 255,000 | | 1,596,485 |
| Hongkong Land Holdings, Ltd. (a) | 1,935,000 | | 7,778,700 |
| Global Real Estate Fund (continued) | | |
| | Shares or | | |
| | Principal | | |
| | Amount | | Value |
|
|
| |
| COMMON STOCKS (continued) | | | |
| Singapore (continued) | | | |
| The Ascott Group, Ltd. | 2,350,000 | $ | 1,553,423 |
|
|
| | | | 17,388,625 |
| Spain - 0.54% | | | |
| Renta Corp Real Estate SA * (a) | 30,000 | | 1,080,327 |
| Riofisa SA * | 25,000 | | 826,715 |
|
|
| | | | 1,907,042 |
| Sweden - 1.66% | | | |
| Castellum AB | 300,000 | | 3,229,858 |
| Kungsleden AB | 90,000 | | 872,683 |
| Lennart Wallenstam Byggnads AB | 135,000 | | 1,779,528 |
|
|
| | | | 5,882,069 |
| United Kingdom - 14.06% | | | |
| Big Yellow Group PLC | 260,000 | | 2,256,545 |
| British Land Company PLC | 344,000 | | 8,932,210 |
| Dawnay Day Treveria PLC * | 1,000,000 | | 1,432,760 |
| Derwent Valley Holdings PLC | 76,750 | | 2,636,720 |
| Develica Deutschland, Ltd. * | 2,700,000 | | 3,557,594 |
| Great Portland Estates PLC | 275,000 | | 2,955,622 |
| Hammerson PLC | 223,000 | | 5,395,849 |
| Land Securities Group PLC | 295,000 | | 10,628,447 |
| London Merchant Securities PLC | 170,000 | | 702,549 |
| Macau Property Opp. Fund, Ltd. * | 428,500 | | 788,623 |
| Minerva PLC | 400,000 | | 2,159,055 |
| Slough Estates PLC | 390,000 | | 4,874,138 |
| Terrace Hill Group PLC | 662,605 | | 869,704 |
| Unite Group PLC | 350,000 | | 2,773,006 |
|
|
| | | | 49,962,822 |
| United States - 32.83% | | | |
| AMB Property Corp., REIT | 57,880 | | 3,231,440 |
| Apartment Investment & Management | | | |
| Company, Class A, REIT | 74,380 | | 3,811,231 |
| Archstone-Smith Trust, REIT (a) | 119,050 | | 6,331,079 |
| Avalon Bay Communities, Inc., REIT | 71,060 | | 8,598,260 |
| BioMed Realty Trust, Inc., REIT | 36,540 | | 1,137,856 |
| Boston Properties, Inc., REIT | 59,740 | | 6,071,376 |
| Digital Realty Trust, Inc., REIT | 67,400 | | 2,015,934 |
| Equity Lifestyle Properties, Inc., REIT | 41,830 | | 1,875,239 |
| Equity Office Properties Trust, REIT | 184,450 | | 6,841,250 |
| Equity Residential, REIT | 40,610 | | 2,025,221 |
| Essex Property Trust, Inc., REIT (a) | 30,470 | | 3,823,071 |
| Federal Realty Investment Trust, REIT | 47,490 | | 3,517,584 |
| FelCor Lodging Trust, Inc., REIT | 59,600 | | 1,278,420 |
| Host Hotels & Resorts, Inc., REIT | 304,510 | | 6,863,655 |
| Innkeepers USA Trust, REIT | 31,900 | | 528,264 |
| Kilroy Realty Corp., REIT | 32,310 | | 2,554,752 |
| LaSalle Hotel Properties, REIT | 22,840 | | 1,003,590 |
| LTC Properties, Inc., REIT (a) | 30,130 | | 717,697 |
| Nationwide Health Properties, Inc., REIT | 57,020 | | 1,485,941 |
| ProLogis, REIT | 76,390 | | 4,312,979 |
| Public Storage, Inc., REIT (a) | 69,950 | | 6,061,168 |
| Regency Centers Corp., REIT | 66,480 | | 4,472,110 |
The accompanying notes are an integral part of the financial statements. 221
John Hancock Funds II
Portfolio of investments — August 31, 2006
(showing percentage of total net assets)
| Global Real Estate Fund (continued) | | |
| | | Shares or | | |
| | | Principal | | |
| | | Amount | | Value |
|
|
| |
| COMMON STOCKS (continued) | | | | |
| United States (continued) | | | | |
| Simon Property Group, Inc., REIT | | 132,390 | $ | 11,225,348 |
| SL Green Realty Corp., REIT | | 38,200 | | 4,261,592 |
| Sovran Self Storage, Inc., REIT | | 2,950 | | 159,536 |
| Starwood Hotels & Resorts Worldwide, Inc. | | 58,989 | | 3,141,754 |
| Tanger Factory Outlet Centers, Inc., REIT | | 38,750 | | 1,387,250 |
| The Macerich Company, REIT | | 75,000 | | 5,599,500 |
| Ventas, Inc., REIT | | 87,830 | | 3,517,592 |
| Vornado Realty Trust, REIT | | 82,830 | | 8,772,525 |
|
|
| | | | | 116,623,214 |
|
| TOTAL COMMON STOCKS (Cost $332,465,766) | | $ | 348,213,000 |
|
| |
| SHORT TERM INVESTMENTS - 12.17% | | | | |
| State Street Navigator Securities | | | | |
| Lending Prime Portfolio (c) | $ | 43,240,359 | $ | 43,240,359 |
|
| TOTAL SHORT TERM INVESTMENTS | | | | |
| (Cost $43,240,359) | | | $ | 43,240,359 |
|
| |
| REPURCHASE AGREEMENTS - 1.32% | | | | |
| Repurchase Agreement with State | | | | |
| Street Corp. dated 08/31/2006 at | | | | |
| 3.95% to be repurchased at | | | | |
| $4,680,514 on 9/1/2006, | | | | |
| collateralized by $4,710,000 | | | | |
| Federal National Mortgage | | | | |
| Association, 6.125% due | | | | |
| 08/17/2026 (valued at $4,774,763, | | | | |
| including interest) (c) | $ | 4,680,000 | $ | 4,680,000 |
|
| TOTAL REPURCHASE AGREEMENTS | | | | |
| (Cost $4,680,000) | | | $ | 4,680,000 |
|
| Total Investments (Global Real Estate Fund) | | | | |
| (Cost $380,386,125) - 111.52% | | | $ | 396,133,359 |
| Liabilities in Excess of Other Assets - (11.52)% | | | (40,908,881) |
|
|
| TOTAL NET ASSETS - 100.00% | | | $ | 355,224,478 |
|
|
| |
| The portfolio had the following five top industry concentrations as of | |
| August 31, 2006 (as a percentage of total net assets): | | | |
| Real Estate | | 91.75% | | |
| Commercial Services | | 4.14% | | |
| Hotels & Restaurants | | 1.24% | | |
| Building Materials & Construction | | 0.66% | | |
| Investment Companies | | 0.22% | | |
| |
| |
| High Income Fund | | | | |
| | | Shares or | | |
| | | Principal | | |
| | | Amount | | Value |
|
|
| |
| COMMON STOCKS - 14.29% | | | | |
| Air Travel - 0.72% | | | | |
| AMR Corp. * (a) | | 100,600 | $ | 2,077,390 |
| High Income Fund (continued) | | |
| | | Shares or | |
| | | Principal | |
| | | Amount | Value |
|
|
| |
| COMMON STOCKS (continued) | | | |
| Broadcasting - 2.50% | | | |
| Canadian Satellite Radio Holdings, Inc. * | | 376,845 | | $ | 2,519,905 |
| XM Satellite Radio Holdings, Inc., Class A * (a) | 362,650 | 4,699,944 |
|
|
| | | | 7,219,849 |
| Cable and Television - 3.03% | | | |
| Comcast Corp.-Special Class A * | | 250,650 | 8,750,191 |
| Cellular Communications - 0.24% | | | |
| Dobson Communications Corp., Class A * | �� | 99,650 | 684,596 |
| Leisure Time - 1.56% | | | |
| Isle of Capri Casinos, Inc. * (a) | | 221,850 | 4,521,303 |
| Mining - 2.01% | | | |
| Freeport-McMoran Copper & Gold, Inc., | | | |
| Class B | | 100,000 | 5,821,000 |
| Sanitary Services - 1.13% | | | |
| Allied Waste Industries, Inc. * | | 317,050 | 3,278,297 |
| Telecommunications Equipment & | | | |
| Services - 1.22% | | | |
| Chunghwa Telecom Company, Ltd., ADR (a) | 202,910 | 3,512,366 |
| Telephone - 1.88% | | | |
| Sprint Nextel Corp. | | 321,650 | 5,442,318 |
|
| TOTAL COMMON STOCKS (Cost $44,699,138) | | $ | 41,307,310 |
|
| |
| PREFERRED STOCKS - 0.31% | | | |
| Auto Parts - 0.21% | | | |
| Delphi Trust I * (a) | | 40,000 | 620,000 |
| Containers & Glass - 0.10% | | | |
| Pliant Corp., Series AA * | | 685 | 274,000 |
|
| TOTAL PREFERRED STOCKS (Cost $750,323) | | $ | 894,000 |
|
| |
| CORPORATE BONDS - 77.55% | | | |
| Advertising - 1.61% | | | |
| Vertis, Inc. | | | |
| 9.75% due 04/01/2009 | $ | 3,108,000 | 3,146,850 |
| 10.875% due 06/15/2009 (a) | | 1,500,000 | 1,515,000 |
|
|
| | | | 4,661,850 |
| Aerospace - 0.43% | | | |
| Argo-Tech Corp. | | | |
| 9.25% due 06/01/2011 | | 1,195,000 | 1,233,838 |
| Air Travel - 11.62% | | | |
| American Airlines Inc, Series 91B2 | | | |
| 10.32% due 07/30/2014 | | 980,000 | 931,000 |
| American Airlines Inc., Series 90-K | | | |
| 9.93% due 06/15/2010 | | 512,000 | 478,080 |
| AMR Corp. | | | |
| 4.25% due 09/23/2023 | | 4,500,000 | 6,136,875 |
| 9.00% due 08/01/2012 (a) | | 1,250,000 | 1,234,375 |
| AMR Corp., Series MTNB | | | |
| 10.40% due 03/10/2011 | | 4,500,000 | 4,235,625 |
| Delta Airlines | | | |
| 12.7725% due 03/16/2008 (f) | | 1,500,000 | 1,548,750 |
The accompanying notes are an integral part of the financial statements. 222
John Hancock Funds II
Portfolio of investments — August 31, 2006
(showing percentage of total net assets)
| High Income Fund (continued) | | |
| | | Shares or | |
| | | Principal | |
| | | Amount | Value |
|
|
| |
| CORPORATE BONDS (continued) | | | |
| Air Travel (continued) | | | |
| Northwest Airlines Corp. | | | |
| 6.625% due 05/15/2023 ^ (a) | | $ | 12,850,000 | | $ | 5,943,125 |
| 7.625% due 11/15/2023 ^ (a) | | 5,745,000 | 2,642,700 |
| 10.00% due 02/01/2009 ^ (a) | | 3,800,000 | 1,800,250 |
| Northwest Airlines Inc. | | | |
| 7.626% due 04/01/2010 ^ | | 1,851,177 | 1,751,677 |
| United AirLines Inc., Series 00-2 | | | |
| 7.762% due 10/01/2049 ^ | | 8,339,361 | 6,878,972 |
|
|
| | | | 33,581,429 |
| Broadcasting - 4.36% | | | |
| Canadian Satellite Radio Holdings, Inc., ADR | | |
| 12.75% due 02/15/2014 | | 3,500,000 | 3,456,250 |
| XM Satellite Radio Holdings, Inc. | | | |
| 1.75% due 12/01/2009 (a) | | 3,000,000 | 2,373,750 |
| 9.75% due 05/01/2014 (a) | | 2,665,000 | 2,505,100 |
| 9.9888% due 05/01/2013 (b) | | 4,575,000 | 4,266,188 |
|
|
| | | | 12,601,288 |
| Building Materials & Construction - 0.34% | | |
| Brand Services, Inc. | | | |
| 12.00% due 10/15/2012 | | 864,000 | 972,588 |
| Business Services - 0.32% | | | |
| Allied Security Escrow Corp. | | | |
| 11.375% due 07/15/2011 | | 276,000 | 272,550 |
| Buhrmann US, Inc. | | | |
| 7.875% due 03/01/2015 | | 130,000 | 126,100 |
| CB Richard Ellis Services, Inc. | | | |
| 9.75% due 05/15/2010 | | 496,000 | 529,480 |
|
|
| | | | 928,130 |
| Cable and Television - 6.71% | | | |
| Adelphia Communications Corp., Series B | | | |
| 7.75% due 01/15/2009 ^ | | 3,000,000 | 1,785,000 |
| Atlantic Broadband Finance LLC | | | |
| 9.375% due 01/15/2014 | | 1,986,000 | 1,916,490 |
| Century Communications | | | |
| 8.375% due 12/15/2007 ^ (a) | | 1,000,000 | 1,065,000 |
| Charter Communications Holdings I LLC | | | |
| 11.75 due 05/15/2014 | | 4,340,000 | 2,951,200 |
| Charter Communications Inc. | | | |
| 5.875% due 11/16/2009 (a) | | 4,600,000 | 4,030,750 |
| Charter Communications Operating LLC | | | |
| 8.00% due 04/30/2012 | | 3,440,000 | 3,448,600 |
| DirecTV Holdings LLC | | | |
| 8.375% due 03/15/2013 | | 1,195,000 | 1,254,750 |
| Insight Communications, Inc. | | | |
| 12.25 due 02/15/2011 | | 74,000 | 78,625 |
| Shaw Communications, Inc. | | | |
| 8.25% due 04/11/2010 | | 18,000 | 18,922 |
| Young Broadcasting, Inc. | | | |
| 8.75% due 01/15/2014 | | 37,000 | 31,450 |
| 10.00% due 03/01/2011 (a) | | 3,034,000 | 2,806,450 |
|
|
| | | | 19,387,237 |
| Cellular Communications - 6.49% | | | |
| American Cellular Corp. | | | |
| 10.00% due 08/01/2011 | | 3,500,000 | 3,640,000 |
| High Income Fund (continued) | | |
| | | Shares or | |
| | | Principal | |
| | | Amount | Value |
|
|
| |
| CORPORATE BONDS (continued) | | | |
| Cellular Communications (continued) | | | |
| American Tower Corp. | | | |
| 5.00% due 02/15/2010 | | $ | 441,000 | | $ | 439,346 |
| Centennial Communications Corp. | | | |
| 10.00% due 01/01/2013 | | 815,000 | 812,963 |
| 10.75% due 12/15/2008 | | 92,000 | 92,920 |
| Dobson Cellular Systems, Inc. | | | |
| 8.375% due 11/01/2011 | | 441,000 | 456,435 |
| 8.875% due 10/01/2013 (a) | | 6,250,000 | 6,171,875 |
| Nextel Communications, Inc. | | | |
| 6.875% due 10/31/2013 | | 662,000 | 670,309 |
| Rural Cellular Corp. | | | |
| 9.75% due 01/15/2010 (a) | | 6,500,000 | 6,467,500 |
|
|
| | | | 18,751,348 |
| Chemicals - 2.20% | | | |
| Ethyl Corp. | | | |
| 8.875% due 05/01/2010 | | 2,446,000 | 2,519,380 |
| FMC Corp. | | | |
| 7.00% due 05/15/2008 | | 423,000 | 432,022 |
| 7.75% due 07/01/2011 | | 901,000 | 964,093 |
| Huntsman ICI Chemicals | | | |
| 10.125% due 07/01/2009 | | 1,673,000 | 1,706,460 |
| Johnson Diversey, Inc., Series B | | | |
| 9.625% due 05/15/2012 | | 18,000 | 17,730 |
| Rhodia SA | | | |
| 10.25% due 06/01/2010 | | 644,000 | 706,790 |
|
|
| | | | 6,346,475 |
| Containers & Glass - 3.25% | | | |
| BWAY Corp. | | | |
| 10.00% due 10/15/2010 | | 675,000 | 708,750 |
| Graphic Packaging International Corp. | | | |
| 9.50% due 08/15/2013 (a) | | 2,750,000 | 2,763,750 |
| Pliant Corp. | | | |
| 11.125% due 09/01/2009 ^ (a) | | 552,000 | 532,680 |
| 11.625% due 06/15/2009 ^ | | 761,850 | 841,844 |
| 13.00% due 07/15/2010 ^ (a) | | 90,000 | 54,000 |
| Stone Container Corp. | | | |
| 9.75% due 02/01/2011 | | 2,998,000 | 3,080,445 |
| Stone Container Finance | | | |
| 7.375% due 07/15/2014 | | 18,000 | 16,200 |
| Tekni Plex, Inc., Series B | | | |
| 12.75% due 06/15/2010 (a) | | 1,949,000 | 1,403,280 |
|
|
| | | | 9,400,949 |
| Cosmetics & Toiletries - 0.49% | | | |
| Jafra Cosmetics International, Inc. | | | |
| 10.75% due 05/15/2011 | | 1,324,000 | 1,429,920 |
| Electrical Utilities - 0.01% | | | |
| CMS Energy Corp. | | | |
| 8.50% due 04/15/2011 | | 37,000 | 39,682 |
| Electronics - 0.85% | | | |
| Muzak LLC/Muzak Finance Corp. | | | |
| 9.875% due 03/15/2009 (a) | | 919,000 | 551,400 |
| 10.00% due 02/15/2009 (a) | | 2,170,000 | 1,909,600 |
|
|
| | | | 2,461,000 |
The accompanying notes are an integral part of the financial statements. 223
John Hancock Funds II
Portfolio of investments — August 31, 2006
(showing percentage of total net assets)
| High Income Fund (continued) | | |
| | | Shares or | |
| | | Principal | |
| | | Amount | Value |
|
|
| |
| CORPORATE BONDS (continued) | | | |
| Energy - 0.49% | | | |
| Exide Technologies | | | |
| 10.50% due 03/15/2013 (a) | | $ | 1,600,000 | | $ | 1,408,000 |
| Financial Services - 4.79% | | | |
| BCP Crystal Holdings Corp. | | | |
| 9.625% due 06/15/2014 | | 2,832,000 | 3,069,180 |
| JSG Funding PLC | | | |
| 9.625% due 10/01/2012 | | 820,000 | 855,875 |
| Metallurg Holdings, Inc. | | | |
| 10.50% due 10/01/2010 (a) | | 3,500,000 | 3,465,000 |
| Nexstar Finance Holdings LLC | | | |
| zero coupon, Step up to 11.375% on | | | |
| 04/01/2008 due 04/01/2013 | | 1,122,000 | 925,650 |
| Nexstar Finance, Inc. | | | |
| 7.00% due 01/15/2014 (a) | | 221,000 | 197,795 |
| Ucar Finance, Inc. | | | |
| 10.25% due 02/15/2012 | | 5,092,000 | 5,346,600 |
|
|
| | | | 13,860,100 |
| |
| Food & Beverages - 3.53% | | | |
| ASG Consolidated LLC/ASG Finance, Inc. | | | |
| zero coupon, Step up to 11.5% on | | | |
| 11/01/2008 due 11/01/2011 | | 4,360,000 | 3,782,300 |
| Constellation Brands, Inc., Series B | | | |
| 8.125% due 01/15/2012 | | 55,000 | 57,062 |
| Del Monte Corp. | | | |
| 8.625% due 12/15/2012 | | 2,262,000 | 2,366,618 |
| Dole Food, Inc. | | | |
| 7.25% due 06/15/2010 | | 1,100,000 | 1,031,250 |
| Pinnacle Foods Holding Corp. | | | |
| 8.25% due 12/01/2013 | | 3,016,000 | 2,963,220 |
|
|
| | | | 10,200,450 |
| |
| Gas & Pipeline Utilities - 0.77% | | | |
| Atlas Pipeline Partners LP | | | |
| 8.125% due 12/15/2015 | | 2,170,000 | 2,213,400 |
| Healthcare Products - 0.15% | | | |
| Sybron Dental Specialties, Inc. | | | |
| 8.125% due 06/15/2012 | | 423,000 | 439,920 |
| Healthcare Services - 1.51% | | | |
| Ameripath, Inc. | | | |
| 10.50% due 04/01/2013 | | 3,016,000 | 3,189,420 |
| Insight Health Services Corp. | | | |
| 9.875% due 11/01/2011 | | 405,000 | 187,312 |
| Psychiatric Solutions, Inc. | | | |
| 10.625% due 06/15/2013 | | 938,000 | 1,001,315 |
|
|
| | | | 4,378,047 |
| |
| Holdings Companies/Conglomerates - 2.59% | | |
| UAL Corp. | | | |
| 5.00% due 02/01/2021 (a) | | 8,260,000 | 7,476,952 |
| Homebuilders - 0.02% | | | |
| Meritage Homes Corp. | | | |
| 7.00% due 05/01/2014 | | 18,000 | 16,020 |
| Standard Pacific Corp. | | | |
| 6.50% due 10/01/2008 (a) | | 37,000 | 36,445 |
|
|
| | | | 52,465 |
| High Income Fund (continued) | | |
| | | Shares or | |
| | | Principal | |
| | | Amount | Value |
|
|
| |
| CORPORATE BONDS (continued) | | | |
| Hotels & Restaurants - 1.45% | | | |
| Buffets, Inc. | | | |
| 11.25% due 07/15/2010 | | $ | 460,000 | | $ | 485,300 |
| CCM Merger, Inc. | | | |
| 8.00% due 08/01/2013 | | 2,023,000 | 1,937,022 |
| Turning Stone Casino Resort | | | |
| 9.125% due 12/15/2010 | | 1,563,000 | 1,570,815 |
| Vicorp Restaurants, Inc. | | | |
| 10.50% due 04/15/2011 | | 221,000 | 196,690 |
|
|
| | | | 4,189,827 |
| |
| Industrials - 0.19% | | | |
| Doe Run Resources Corp., Series AI | | | |
| 11.75% due 11/01/2008 | | 591,000 | 559,973 |
| Leisure Time - 6.90% | | | |
| AMC Entertainment, Inc. | | | |
| 9.50% due 02/01/2011 | | 3,500,000 | 3,491,250 |
| AMC Entertainment, Inc., Series B | | | |
| 8.625% due 08/15/2012 | | 18,000 | 18,450 |
| AMF Bowling Worldwide, Inc. | | | |
| 10.00% due 03/01/2010 | | 460,000 | 471,500 |
| Chukchansi Economic Development Authority | | |
| 8.00% due 11/15/2013 | | 2,262,000 | 2,284,620 |
| Jacobs Entertainment, Inc. | | | |
| 9.75% due 06/15/2014 | | 1,800,000 | 1,797,750 |
| Little Traverse Bay Bands of Odawa Indians | | |
| 10.25% due 02/15/2014 | | 2,150,000 | 2,139,250 |
| Majestic Star Casino LLC | | | |
| 9.75% due 01/15/2011 | | 2,750,000 | 2,688,125 |
| MTR Gaming Group, Inc. | | | |
| 9.00% due 06/01/2012 | | 750,000 | 755,625 |
| Trump Entertainment Resorts, Inc. | | | |
| 8.50% due 06/01/2015 (a) | | 6,500,000 | 6,288,750 |
|
|
| | | | 19,935,320 |
| |
| Manufacturing - 0.49% | | | |
| Blount, Inc. | | | |
| 8.875% due 08/01/2012 | | 257,000 | 257,321 |
| Park-Ohio Industries, Inc. | | | |
| 8.375% due 11/15/2014 | | 1,287,000 | 1,164,735 |
|
|
| | | | 1,422,056 |
| |
| Medical-Hospitals - 2.42% | | | |
| Alliance Imaging, Inc. | | | |
| 7.25% due 12/15/2012 | | 2,000,000 | 1,860,000 |
| HealthSouth Corp. | | | |
| 11.4181% due 06/15/2014 (b) | | 5,000,000 | 5,137,500 |
|
|
| | | | 6,997,500 |
| |
| Metal & Metal Products - 0.69% | | | |
| Mueller Group, Inc. | | | |
| 10.00% due 05/01/2012 | | 1,124,000 | 1,225,160 |
| Mueller Holdings, Inc. | | | |
| zero coupon, Step up to 14.75% on | | | |
| 04/15/2009 due 04/15/2014 | | 872,000 | 767,360 |
|
|
| | | | 1,992,520 |
The accompanying notes are an integral part of the financial statements. 224
John Hancock Funds II
Portfolio of investments — August 31, 2006
(showing percentage of total net assets)
| High Income Fund (continued) | | |
| | | Shares or | |
| | | Principal | |
| | | Amount | Value |
|
|
| |
| CORPORATE BONDS (continued) | | | |
| Mining - 1.63% | | | |
| Freeport-McMoran Copper & Gold, Inc. | | | |
| 10.125% due 02/01/2010 | | $ | 4,440,000 | | $ | 4,721,940 |
| Paper - 3.33% | | | |
| Abitibi-Consolidated, Inc. | | | |
| 7.50% due 04/01/2028 | | 347,000 | 272,395 |
| 7.75% due 06/15/2011 (a) | | 846,000 | 780,435 |
| Boise Cascade LLC | | | |
| 7.125% due 10/15/2014 | | 2,813,000 | 2,616,090 |
| Bowater Canada Finance Corp. | | | |
| 7.95% due 11/15/2011 | | 55,000 | 52,800 |
| Bowater, Inc. | | | |
| 9.50% due 10/15/2012 | | 1,269,000 | 1,281,690 |
| Buckeye Technologies, Inc. | | | |
| 9.25% due 09/15/2008 | | 1,030,000 | 1,030,000 |
| Newark Group, Inc. | | | |
| 9.75% due 03/15/2014 | | 1,581,000 | 1,509,855 |
| Norske Skog Canada, Ltd. | | | |
| 7.375% due 03/01/2014 | | 441,000 | 402,412 |
| Pope & Talbot, Inc. | | | |
| 8.375% due 06/01/2013 | | 2,100,000 | 1,680,000 |
|
|
| | | | 9,625,677 |
| |
| Petroleum Services - 0.89% | | | |
| Hanover Compressor Company | | | |
| 8.625% due 12/15/2010 | | 846,000 | 879,840 |
| Hanover Equipment Trust | | | |
| 8.75% due 09/01/2011 | | 1,600,000 | 1,664,000 |
| Premcor Refining Group, Inc. | | | |
| 9.50% due 02/01/2013 | | 37,000 | 40,413 |
|
|
| | | | 2,584,253 |
| |
| Plastics - 0.92% | | | |
| Berry Plastics Corp. | | | |
| 10.75% due 07/15/2012 | | 2,446,000 | 2,666,140 |
| Publishing - 0.75% | | | |
| Block Communications, Inc. | | | |
| 8.25% due 12/15/2015 | | 2,243,000 | 2,172,906 |
| Retail - 0.57% | | | |
| Eye Care Centers of America | | | |
| 10.75% due 02/15/2015 | | 1,545,000 | 1,657,013 |
| Retail Grocery - 0.10% | | | |
| CA FM Lease Trust | | | |
| 8.50% due 07/15/2017 | | 264,056 | 284,671 |
| Retail Trade - 0.99% | | | |
| Jo-Ann Stores, Inc. | | | |
| 7.50% due 03/01/2012 | | 3,177,000 | 2,779,875 |
| PETCO Animal Supplies, Inc. | | | |
| 10.75% due 11/01/2011 | | 74,000 | 77,885 |
|
|
| | | | 2,857,760 |
| |
| Sanitary Services - 1.57% | | | |
| Allied Waste North America, Inc. | | | |
| 4.25% due 04/15/2034 (a) | | 5,000,000 | 4,525,000 |
| Steel - 0.01% | | | |
| United States Steel LLC | | | |
| 10.75% due 08/01/2008 | | 18,000 | 19,395 |
| High Income Fund (continued) | | | |
| | | Shares or | | |
| | | Principal | | |
| | | Amount | | Value |
|
|
| |
| CORPORATE BONDS (continued) | | | | |
| Telecommunications Equipment & | | | | |
| Services - 0.25% | | | | |
| Mobile Satellite Ventures LP | | | | |
| zero coupon, Step up to 14% on | | | | |
| 04/01/2010 due 04/01/2013 | | $ | 1,190,000 | $ | 737,800 |
| Tobacco - 1.09% | | | | |
| Alliance One International, Inc. | | | | |
| 11.00% due 05/15/2012 (a) | | 1,275,000 | | 1,275,000 |
| North Atlantic Trading Company | | | | |
| 9.25% due 03/01/2012 | | 2,265,000 | | 1,868,625 |
|
|
| | | | | 3,143,625 |
| Travel Services - 0.78% | | | | |
| TDS Investor Corp. | | | | |
| 9.875% due 09/01/2014 | | 2,290,000 | | 2,244,200 |
|
| TOTAL CORPORATE BONDS (Cost $227,328,122) | | $ | 224,162,644 |
|
| |
| ASSET BACKED SECURITIES - 0.54% | | | |
| DB Master Finance LLC, Series 2006-1, Class-M1 | | | |
| 8.285% due 06/20/2031 | | 1,525,000 | | 1,552,442 |
|
| TOTAL ASSET BACKED SECURITIES | | | | |
| (Cost $1,539,942) | | | $ | 1,552,442 |
|
| |
| OPTIONS - 0.04% | | | | |
| Put Options - 0.04% | | | | |
| Tesoro Corp. | | | | |
| Expiration 01/20/2007 at $50.00 * | | 101,600 | | 106,680 |
|
| TOTAL OPTIONS (Cost $194,569) | | | $ | 106,680 |
|
| |
| SHORT TERM INVESTMENTS - 27.25% | | | |
| Great Lakes Carbon Income Fund | | $ | 838,891 | $ | 7,769,966 |
| State Street Global Advisers Funds (c) | | 10,550,734 | | 10,550,734 |
| State Street Navigator Securities Lending | | | | |
| Prime Portfolio (c) | | 60,455,958 | | 60,455,958 |
|
| TOTAL SHORT TERM INVESTMENTS | | | | |
| (Cost $78,125,141) | | | $ | 78,776,658 |
|
| Total Investments (High Income Fund) | | | | |
| (Cost $352,637,235) - 119.98% | | | $ | 346,799,734 |
| Liabilities in Excess of Other Assets - (19.98)% | | | (57,740,499) |
|
|
| TOTAL NET ASSETS - 100.00% | | | $ | 289,059,235 |
|
|
| |
| |
| High Yield Fund | | | | |
| | | Shares or | | |
| | | Principal | | |
| | | Amount | | Value |
|
|
| |
| COMMON STOCKS - 0.33% | | | | |
| Cellular Communications - 0.31% | | | | |
| American Tower Corp., Class A * (a) | | 103,281 | $ | 3,703,657 |
| Household Products - 0.01% | | | | |
| Home Interiors * | | 9,260,656 | | 92,606 |
| Internet Content - 0.01% | | | | |
| Globix Corp. * | | 15,039 | | 72,488 |
The accompanying notes are an integral part of the financial statements. 225
John Hancock Funds II
Portfolio of investments — August 31, 2006
(showing percentage of total net assets)
| High Yield Fund (continued) | | | |
| | | Shares or | | |
| | | Principal | | |
| | | Amount | | Value |
|
|
| |
| COMMON STOCKS (continued) | | | | |
| Telecommunications Equipment & | | | | |
| Services - 0.00% | | | | |
| XO Holdings, Inc. * (a) | | 821 | $ | 3,793 |
|
| TOTAL COMMON STOCKS (Cost $4,876,118) | | $ | 3,872,544 |
|
| |
| PREFERRED STOCKS - 0.23% | | | | |
| Broadcasting - 0.09% | | | | |
| Spanish Broadcasting System, Series B * | | 1,000 | | 1,085,000 |
| Crude Petroleum & Natural Gas - 0.14% | | | | |
| Chesapeake Energy Corp. (a) | | 5,993 | | 1,609,121 |
|
| TOTAL PREFERRED STOCKS (Cost $2,578,474) | | $ | 2,694,121 |
|
| |
| WARRANTS - 0.02% | | | | |
| Government of Mexico - 0.02% | | | | |
| United Mexican States | | | | |
| (Expiration Date 10/10/2006; strike | | | | |
| price $25.00) | | 22,500 | | 85,500 |
| (Expiration date 11/09/2006; strike | | | | |
| price $22.50) | | 28,000 | | 100,800 |
|
|
| | | | | 186,300 |
|
| TOTAL WARRANTS (Cost $119,250) | | | $ | 186,300 |
|
| |
| FOREIGN GOVERNMENT OBLIGATIONS - 10.53% | | |
| Argentina - 0.55% | | | | |
| Republic of Argentina, Series GDP | | | | |
| zero coupon due 12/15/2035 (b) | EUR | 587,000 | | 69,836 |
| 0.275% due 12/15/2035 (b) | ARS | 5,863,355 | | 162,792 |
| 2.00% due 01/03/2010 (b) | | 1,870,000 | | 1,004,028 |
| 4.50% due 12/15/2035 (b) | | $ | 48,000 | | 4,560 |
| 5.59% due 08/03/2012 (b) | | 1,000,700 | | 702,992 |
| 5.83% due 12/31/2033 (b) | ARS | 858,956 | | 350,515 |
| 7.00% due 03/18/2049 | EUR | 6,100,000,000 | | 1,137,271 |
| 7.00% due 03/18/2004 ^ | | 625,000 | | 239,460 |
| 7.625 due 08/11/2007 | | 505,000,000 | | 94,913 |
| 8.00% due 02/26/2008 | | 304,137 | | 118,471 |
| 8.00% due 10/30/2009 | | 175,000,000 | | 31,713 |
| 8.125% due 04/21/2008 | | 625,000 | | 233,351 |
| 8.125% due 10/04/2049 | | 375,000 | | 138,639 |
| 8.50% due 02/23/2049 | | 2,400,000 | | 475,640 |
| 9.00% due 05/26/2009 | | 100,000 | | 37,242 |
| 9.00% due 06/20/2049 | | 600,000 | | 226,504 |
| 9.25% due 10/21/2049 | | 225,000 | | 82,751 |
| 9.50% due 03/04/2049 | | 456,000 | | 178,210 |
| 9.75% due 11/26/2049 | | 425,000 | | 155,765 |
| 10.00% due 02/22/2007 | | 775,000 | | 297,326 |
| 11.75% due 05/20/2011 (a) | | 2,425,000 | | 478,215 |
| 11.75% due 11/13/2026 | | 1,800,000 | | 337,304 |
|
|
| | | | | 6,557,498 |
| Brazil - 1.84% | | | | |
| Federative Republic of Brazil | | | | |
| 7.125% due 01/20/2037 | | $ | 1,875,000 | | 1,919,063 |
| 8.00% due 01/15/2018 (a) | | 6,325,000 | | 6,944,850 |
| 8.25% due 01/20/2034 (a) | | 5,850,000 | | 6,727,500 |
| High Yield Fund (continued) | | |
| | | Shares or | |
| | | Principal | |
| | | Amount | Value |
|
|
| |
| FOREIGN GOVERNMENT OBLIGATIONS | | |
| (continued) | | | |
| Brazil (continued) | | | |
| Federative Republic of Brazil (continued) | | | |
| 8.75% due 02/04/2025 | | $ | 1,395,000 | | $ | 1,657,957 |
| 8.875% due 10/14/2019 | | 500,000 | 591,750 |
| 10.50% due 07/14/2014 | | 225,000 | 282,487 |
| 11.00% due 08/17/2040 (a) | | 2,878,000 | 3,760,107 |
|
|
| | | | 21,883,714 |
| Colombia - 0.63% | | | |
| Republic of Colombia | | | |
| 8.125% due 05/21/2024 (a) | | 500,000 | 550,000 |
| 10.375% due 01/28/2033 (a) | | 1,180,000 | 1,598,900 |
| 10.75% due 01/15/2013 (a) | | 3,725,000 | 4,551,950 |
| 11.75% due 02/25/2020 | | 575,000 | 802,125 |
|
|
| | | | 7,502,975 |
| Ecuador - 0.31% | | | |
| Republic of Ecuador | | | |
| 4.00% coupon, Step up to 10.00% on | | | |
| 08/15/2007 due 08/15/2030 (a)(b) | | 3,095,000 | 3,085,715 |
| 9.375% due 12/15/2015 | | 600,000 | 613,500 |
|
|
| | | | 3,699,215 |
| El Salvador - 0.13% | | | |
| Republic of El Salvador | | | |
| 7.75% due 01/24/2023 | | 975,000 | 1,078,350 |
| 8.25% due 04/10/2032 | | 390,000 | 435,435 |
|
|
| | | | 1,513,785 |
| Mexico - 1.71% | | | |
| Government of Mexico | | | |
| 5.875% due 01/15/2014 (a) | | 4,900,000 | 4,985,750 |
| 6.375% due 01/16/2013 | | 4,405,000 | 4,581,200 |
| 6.625% due 03/03/2015 (a) | | 1,274,000 | 1,351,714 |
| 8.00% due 09/24/2022 | | 3,550,000 | 4,277,750 |
| 8.125% due 12/30/2019 | | 800,000 | 964,000 |
| 8.30% due 08/15/2031 | | 525,000 | 659,662 |
| 8.375% due 01/14/2011 (a) | | 500,000 | 556,500 |
| 11.375% due 09/15/2016 | | 2,075,000 | 2,971,400 |
|
|
| | | | 20,347,976 |
| Panama - 0.24% | | | |
| Republic of Panama | | | |
| 9.375% due 04/01/2029 | | 2,150,000 | 2,725,125 |
| 9.625% due 02/08/2011 | | 150,000 | 170,475 |
|
|
| | | | 2,895,600 |
| Peru - 0.58% | | | |
| Republic of Peru | | | |
| 4.00% coupon, Step up to 5.00% on | | | |
| 03/07/2007 due 03/07/2017 (b) | | 421,860 | 415,532 |
| 4.00% coupon, Step up to 5.00% on | | | |
| 03/07/2007 due 03/07/2017 (b) | | 3,341,700 | 3,274,866 |
| 7.35% due 07/21/2025 (a) | | 77,000 | 81,235 |
| 8.375% due 05/03/2016 (a) | | 290,000 | 329,875 |
| 8.75% due 11/21/2033 (a) | | 2,300,000 | 2,771,500 |
| 9.875% due 02/06/2015 | | 25,000 | 30,750 |
|
|
| | | | 6,903,758 |
The accompanying notes are an integral part of the financial statements. 226
John Hancock Funds II
Portfolio of investments — August 31, 2006
(showing percentage of total net assets)
| High Yield Fund (continued) | | |
| | | Shares or | |
| | | Principal | |
| | | Amount | Value |
|
|
| |
| FOREIGN GOVERNMENT OBLIGATIONS | | |
| (continued) | | | |
| Philippines - 0.40% | | | |
| Republic of Philippines | | | |
| 9.50% due 02/02/2030 (a) | | $ | 570,000 | | $ | 695,400 |
| 10.625% due 03/16/2025 (a) | | 3,050,000 | 3,999,313 |
|
|
| | | | 4,694,713 |
| Russia - 2.08% | | | |
| Gazprom OAO, Series A6 | | | |
| 6.95 due 08/06/2009 | RUB | 37,840,000 | 1,424,991 |
| Russian Federation, Series REGS | | | |
| 5.00% due 03/31/2030 | | $ | 15,870,000 | 17,661,723 |
| 8.25% due 03/31/2010 | | 928,895 | 971,253 |
| 11.00% due 07/24/2018 | | 1,160,000 | 1,664,368 |
| 12.75% due 06/24/2028 | | 1,680,000 | 2,996,280 |
|
|
| | | | 24,718,615 |
| South Africa - 0.23% | | | |
| Republic of South Africa | | | |
| 6.50% due 06/02/2014 | | 1,075,000 | 1,122,031 |
| 7.375% due 04/25/2012 (a) | | 835,000 | 897,625 |
| 9.125% due 05/19/2009 | | 675,000 | 734,907 |
|
|
| | | | 2,754,563 |
| Turkey - 1.13% | | | |
| Republic of Turkey | | | |
| 7.00% due 06/05/2020 | | 146,000 | 143,810 |
| 7.25% due 03/15/2015 | | 2,400,000 | 2,439,000 |
| 7.375% due 02/05/2025 | | 1,929,000 | 1,924,178 |
| 8.00% due 02/14/2034 | | 783,000 | 819,214 |
| 9.50% due 01/15/2014 (a) | | 2,709,000 | 3,101,805 |
| 11.00% due 01/14/2013 | | 782,000 | 942,310 |
| 11.50% due 01/23/2012 | | 1,352,000 | 1,637,610 |
| 11.75% due 06/15/2010 | | 450,000 | 526,500 |
| 11.875% due 01/15/2030 (a) | | 1,225,000 | 1,828,312 |
|
|
| | | | 13,362,739 |
| Uruguay - 0.09% | | | |
| Republic of Uruguay | | | |
| 7.25% due 02/15/2011 | | 650,000 | 663,000 |
| 7.50% due 03/15/2015 | | 325,000 | 336,375 |
|
|
| | | | 999,375 |
| Venezuela - 0.61% | | | |
| Republic of Venezuela | | | |
| zero coupon due 04/15/2020 | | 305,000 | 109,037 |
| 5.375% due 08/07/2010 | | 375,000 | 364,500 |
| 5.75% due 02/26/2016 | | 2,241,000 | 2,095,335 |
| 7.65% due 04/21/2025 | | 949,000 | 1,008,313 |
| 10.75% due 09/19/2013 | | 3,000,000 | 3,675,000 |
|
|
| | | | 7,252,185 |
|
| TOTAL FOREIGN GOVERNMENT OBLIGATIONS | |
| (Cost $122,103,726) | | | $ | 125,086,711 |
|
| |
| CORPORATE BONDS - 82.99% | | | |
| Advertising - 1.57% | | | |
| Lamar Media Corp. | | | |
| 6.625% due 08/15/2015 | | 4,275,000 | 4,007,813 |
| High Yield Fund (continued) | | | |
| | | Shares or | |
| | | Principal | |
| | | Amount | Value |
|
|
| |
| CORPORATE BONDS (continued) | | | |
| Advertising (continued) | | | |
| R.H. Donnelley Corp., Series A-1 | | | |
| 6.875% due 01/15/2013 | $ | 1,650,000 | | $ | 1,480,875 |
| R.H. Donnelley Corp., Series A-2 | | | |
| 6.875% due 01/15/2013 | | 3,200,000 | 2,872,000 |
| R.H. Donnelley Corp., Series A-3 | | | |
| 8.875% due 01/15/2016 | | 7,900,000 | 7,781,500 |
| R.H. Donnelley Finance Corp., Series I | | | |
| 10.875% due 12/15/2012 | | 2,300,000 | 2,518,500 |
|
|
| | | | 18,660,688 |
| Aerospace - 1.01% | | | |
| Alliant Techsystems, Inc. | | | |
| 6.75% due 04/01/2016 (a) | | 1,875,000 | 1,823,437 |
| DRS Technologies, Inc. | | | |
| 6.625% due 02/01/2016 | | 145,000 | 141,012 |
| 6.875% due 11/01/2013 | | 4,925,000 | 4,777,250 |
| Sequa Corp. | | | |
| 9.00% due 08/01/2009 | | 2,300,000 | 2,426,500 |
| TransDigm, Inc. | | | |
| 7.75% due 07/15/2014 (a) | | 2,845,000 | 2,823,663 |
|
|
| | | | 11,991,862 |
| Air Travel - 0.31% | | | |
| Continental Airlines, Inc. | | | |
| 6.541% due 09/15/2008 | | 386,819 | 369,821 |
| 6.80% due 07/02/2007 | | 493,330 | 471,635 |
| Continental Airlines, Inc., Series D | | | |
| 7.568% due 12/01/2006 | | 2,840,000 | 2,835,509 |
|
|
| | | | 3,676,965 |
| Apparel & Textiles - 0.80% | | | |
| Levi Strauss & Company | | | |
| 9.75% due 01/15/2015 | | 7,275,000 | 7,529,625 |
| Oxford Industries, Inc. | | | |
| 8.875% due 06/01/2011 | | 1,925,000 | 1,944,250 |
|
|
| | | | 9,473,875 |
| Auto Parts - 0.84% | | | |
| Commercial Vehicle Group, Inc. | | | |
| 8.00% due 07/01/2013 | | 715,000 | 681,038 |
| Keystone Automotive Operations | | | |
| 9.75% due 11/01/2013 (a) | | 3,600,000 | 3,420,000 |
| TRW Automotive, Inc. | | | |
| 9.375% due 02/15/2013 | | 615,000 | 656,513 |
| 11.00% due 02/15/2013 | | 125,000 | 135,937 |
| Visteon Corp. | | | |
| 7.00% due 03/10/2014 (a) | | 1,340,000 | 1,189,250 |
| 8.25% due 08/01/2010 (a) | | 4,020,000 | 3,939,600 |
|
|
| | | | 10,022,338 |
| Auto Services - 1.44% | | | |
| Avis Budget Car Rental LLC | | | |
| 7.625% due 05/15/2014 | | 960,000 | 912,000 |
| Hertz Corp., Class A | | | |
| 8.875% due 01/01/2014 | | 3,750,000 | 3,890,625 |
| 10.50% due 01/01/2016 (a) | | 7,435,000 | 8,011,213 |
The accompanying notes are an integral part of the financial statements. 227
John Hancock Funds II
Portfolio of investments — August 31, 2006
(showing percentage of total net assets)
| High Yield Fund (continued) | | |
| | | Shares or | |
| | | Principal | |
| | | Amount | Value |
|
|
| |
| CORPORATE BONDS (continued) | | | |
| Auto Services (continued) | | | |
| Penhall International Corp. | | | |
| 12.00% due 08/01/2014 (a) | | $ | 4,245,000 | | $ | 4,329,900 |
|
|
| | | | 17,143,738 |
| Automobiles - 4.25% | | | |
| AutoNation, Inc. | | | |
| 7.00% due 04/15/2014 | | 1,510,000 | 1,489,238 |
| 7.5069% due 04/15/2013 (b) | | 1,210,000 | 1,216,050 |
| Ford Motor Company | | | |
| 7.45% due 07/16/2031 (a) | | 34,730,000 | 27,263,050 |
| 8.875% due 01/15/2022 | | 2,555,000 | 2,171,750 |
| 8.90% due 01/15/2032 (a) | | 1,425,000 | 1,278,937 |
| General Motors Corp. | | | |
| 7.20% due 01/15/2011 | | 2,655,000 | 2,379,544 |
| 8.375% due 07/15/2033 (a) | | 17,475,000 | 14,635,312 |
|
|
| | | | 50,433,881 |
| Banking - 0.21% | | | |
| RSHB Capital SA for OJSC Russian Agricultural | | |
| Bank | | | |
| 7.175% due 05/16/2013 (a) | | 2,370,000 | 2,447,025 |
| Broadcasting - 1.27% | | | |
| Barrington Broadcasting | | | |
| 10.50% due 08/15/2014 | | 915,000 | 896,700 |
| CMP Susquehanna Corp. | | | |
| 9.875% due 05/15/2014 | | 895,000 | 834,588 |
| CSC Holdings, Inc. | | | |
| 7.00% due 04/15/2012 | | 2,550,000 | 2,505,375 |
| 7.625% due 07/15/2018 (a) | | 300,000 | 302,625 |
| 7.875% due 02/15/2018 | | 645,000 | 659,513 |
| 8.125% due 08/15/2009 | | 2,575,000 | 2,658,687 |
| CSC Holdings, Inc., Series B | | | |
| 7.625% due 04/01/2011 | | 700,000 | 715,750 |
| 8.125% due 07/15/2009 (a) | | 50,000 | 51,687 |
| Hughes Network Systems LLC/HNS Finance Corp. | | |
| 9.50% due 04/15/2014 | | 2,410,000 | 2,446,150 |
| Radio One, Inc. | | | |
| 6.375% due 02/15/2013 | | 843,000 | 762,915 |
| XM Satellite Radio Holdings, Inc. | | | |
| 9.75% due 05/01/2014 (a) | | 2,470,000 | 2,321,800 |
| 9.9888% due 05/01/2013 (b) | | 1,010,000 | 941,825 |
|
|
| | | | 15,097,615 |
| Building Materials & Construction - 0.89% | | |
| Associated Materials, Inc. | | | |
| zero coupon, Step up to 11.25% on | | | |
| 03/01/2009 due 03/01/2014 | | 4,040,000 | 2,201,800 |
| 9.75% due 04/15/2012 (a) | | 3,540,000 | 3,469,200 |
| NTK Holdings, Inc. | | | |
| zero coupon, Step up to 10.75% on | | | |
| 09/01/2009 due 03/01/2014 | | 7,230,000 | 4,844,100 |
|
|
| | | | 10,515,100 |
| Business Services - 1.94% | | | |
| Activant Solutions, Inc. | | | |
| 9.50% due 05/01/2016 | | 1,775,000 | 1,664,062 |
| Affinion Group, Inc. | | | |
| 10.125% due 10/15/2013 (a) | | 3,715,000 | 3,854,313 |
| High Yield Fund (continued) | | |
| | | Shares or | |
| | | Principal | |
| | | Amount | Value |
|
|
| |
| CORPORATE BONDS (continued) | | | |
| Business Services (continued) | | | |
| Invensys PLC | | | |
| 9.875% due 03/15/2011 | | $ | 2,340,000 | | $ | 2,527,200 |
| Sungard Data Systems, Inc. | | | |
| 9.125% due 08/15/2013 | | 4,075,000 | 4,207,438 |
| 10.25% due 08/15/2015 | | 3,385,000 | 3,456,931 |
| Xerox Corp. | | | |
| 6.40% due 03/15/2016 | | 7,265,000 | 7,193,047 |
| 9.75% due 01/15/2009 | | 100,000 | 108,000 |
|
|
| | | | 23,010,991 |
| Cable and Television - 5.10% | | | |
| Charter Communications Holdings I LLC | | | |
| 11.00% due 10/01/2015 | | 5,660,000 | 5,023,250 |
| 11.75 due 05/15/2014 | | 4,000,000 | 2,720,000 |
| Charter Communications Holdings II LLC/Charter | | |
| Communications Holdings II Capital Corp. | | |
| 10.25% due 09/15/2010 | | 4,940,000 | 5,001,750 |
| Charter Communications Holdings LLC | | | |
| 8.625% due 04/01/2009 (a) | | 1,590,000 | 1,450,875 |
| 10.75% due 10/01/2009 | | 1,000,000 | 915,000 |
| Charter Communications Holdings LLC/Charter | | |
| Communications Holdings Capital Corp. | | |
| 9.625% due 11/15/2009 (a) | | 1,600,000 | 1,456,000 |
| Charter Communications Operating LLC | | | |
| 8.375% due 04/30/2014 | | 1,525,000 | 1,540,250 |
| CSC Holdings, Inc. | | | |
| 7.25% due 07/15/2008 | | 550,000 | 556,187 |
| DirecTV Holdings LLC | | | |
| 6.375% due 06/15/2015 | | 6,185,000 | 5,782,975 |
| Echostar DBS Corp. | | | |
| 6.625% due 10/01/2014 | | 10,075,000 | 9,684,594 |
| 7.125% due 02/01/2016 | | 4,085,000 | 3,977,769 |
| Kabel Deutschland GMBH | | | |
| 10.625% due 07/01/2014 | | 2,855,000 | 3,054,850 |
| Lodgenet Entertainment Corp. | | | |
| 9.50% due 06/15/2013 | | 4,435,000 | 4,756,537 |
| Mediacom Broadband LLC | | | |
| 8.50% due 10/15/2015 | | 375,000 | 371,250 |
| Quebecor Media, Inc. | | | |
| 7.75% due 03/15/2016 | | 955,000 | 945,450 |
| Rainbow National Services LLC | | | |
| 8.75% due 09/01/2012 | | 1,385,000 | 1,461,175 |
| 10.375% due 09/01/2014 | | 3,000,000 | 3,341,250 |
| Rogers Cable, Inc. | | | |
| 5.50% due 03/15/2014 | | 790,000 | 731,737 |
| 6.25% due 06/15/2013 | | 705,000 | 686,494 |
| 8.75% due 05/01/2032 | | 750,000 | 851,250 |
| Sinclair Broadcast Group, Inc. | | | |
| 8.00% due 03/15/2012 | | 4,920,000 | 4,981,500 |
| Videotron Ltee | | | |
| 6.375% due 12/15/2015 | | 1,375,000 | 1,287,344 |
|
|
| | | | 60,577,487 |
| Cellular Communications - 1.89% | | | |
| Alamosa Delaware, Inc. | | | |
| 11.00% due 07/31/2010 | | 1,575,000 | 1,720,687 |
The accompanying notes are an integral part of the financial statements. 228
John Hancock Funds II
Portfolio of investments — August 31, 2006
(showing percentage of total net assets)
| High Yield Fund (continued) | | |
| | | Shares or | |
| | | Principal | |
| | | Amount | Value |
|
|
| |
| CORPORATE BONDS (continued) | | | |
| Cellular Communications (continued) | | | |
| Centennial Communications Corp. | | | |
| 10.125% due 06/15/2013 | | $ | 3,280,000 | | $ | 3,460,400 |
| Rogers Wireless, Inc. | | | |
| 7.25% due 12/15/2012 | | 270,000 | 278,438 |
| 7.50% due 03/15/2015 | | 2,725,000 | 2,847,625 |
| 8.00% due 12/15/2012 (a) | | 5,005,000 | 5,230,225 |
| 9.625% due 05/01/2011 | | 100,000 | 111,750 |
| Rural Cellular Corp. | | | |
| 9.875% due 02/01/2010 (a) | | 4,335,000 | 4,475,888 |
| UbiquiTel Operating Company | | | |
| 9.875% due 03/01/2011 | | 4,025,000 | 4,377,187 |
|
|
| | | | 22,502,200 |
| Chemicals - 1.18% | | | |
| Equistar Chemicals LP | | | |
| 10.625% due 05/01/2011 | | 3,300,000 | 3,547,500 |
| Huntsman ICI Chemicals | | | |
| 10.125% due 07/01/2009 | EUR | 125,000 | 163,104 |
| Huntsman International LLC | | | |
| 7.375% due 01/01/2015 | | $ | 605,000 | 600,463 |
| 9.875% due 03/01/2009 (a) | | 904,000 | 940,160 |
| IMC Global, Inc. | | | |
| 7.30% due 01/15/2028 | | 25,000 | 22,250 |
| 10.875% due 08/01/2013 (a) | | 875,000 | 980,000 |
| Lyondell Chemical Company | | | |
| 9.50% due 12/15/2008 | | 839,000 | 864,170 |
| 11.125% due 07/15/2012 (a) | | 375,000 | 408,750 |
| Lyondell Chemical Company, Series A | | | |
| 9.625% due 05/01/2007 | | 425,000 | 433,500 |
| Methanex Corp. | | | |
| 8.75% due 08/15/2012 | | 1,200,000 | 1,275,000 |
| Montell Finance Company BV | | | |
| 8.10% due 03/15/2027 | | 1,970,000 | 1,827,175 |
| Westlake Chemical Corp. | | | |
| 6.625% due 01/15/2016 (a) | | 3,150,000 | 2,992,500 |
|
|
| | | | 14,054,572 |
| Coal - 0.41% | | | |
| International Coal Group, Inc. | | | |
| 10.25% due 07/15/2014 (a) | | 2,470,000 | 2,550,275 |
| Massey Energy Company | | | |
| 6.625% due 11/15/2010 | | 2,360,000 | 2,324,600 |
|
|
| | | | 4,874,875 |
| Commercial Services - 0.40% | | | |
| DI Finance/DynCorp International LLC, Series B | | |
| 9.50% due 02/15/2013 | | 4,654,000 | 4,805,255 |
| Computers & Business Equipment - 0.15% | | |
| Seagate Technology Holdings | | | |
| 8.00% due 05/15/2009 | | 1,755,000 | 1,803,263 |
| Construction & Mining Equipment - 0.09% | | |
| Terex Corp. | | | |
| 7.375% due 01/15/2014 | | 1,100,000 | 1,100,000 |
| Construction Materials - 0.36% | | | |
| Nortek, Inc. | | | |
| 8.50% due 09/01/2014 | | 4,565,000 | 4,245,450 |
| High Yield Fund (continued) | | | | |
| | | Shares or | | |
| | | Principal | | |
| | | Amount | | Value |
|
|
| |
| CORPORATE BONDS (continued) | | | | |
| Containers & Glass - 1.91% | | | | |
| Graham Packaging Company, Inc. | | | | |
| 9.875% due 10/15/2014 (a) | $ | 5,095,000 | $ | 4,903,938 |
| Graphic Packaging International Corp. | | | | |
| 8.50% due 08/15/2011 | | 3,050,000 | | 3,095,750 |
| 9.50% due 08/15/2013 (a) | | 2,950,000 | | 2,964,750 |
| Owens-Brockway Glass Container, Inc. | | | | |
| 6.75% due 12/01/2014 (a) | | 1,053,000 | | 979,290 |
| 7.75% due 05/15/2011 | | 3,350,000 | | 3,425,375 |
| 8.25% due 05/15/2013 (a) | | 550,000 | | 556,875 |
| 8.75% due 11/15/2012 (a) | | 250,000 | | 265,625 |
| Owens-Illinois, Inc. | | | | |
| 7.35% due 05/15/2008 | | 200,000 | | 200,000 |
| Owens-Illinois, Inc., Series 2010 | | | | |
| 7.50% due 05/15/2010 (a) | | 850,000 | | 841,500 |
| Plastipak Holdings, Inc. | | | | |
| 8.50% due 12/15/2015 | | 1,790,000 | | 1,781,050 |
| Radnor Holdings Corp. | | | | |
| 11.00% due 03/15/2010 | | 2,350,000 | | 564,000 |
| Stone Container Corp. | | | | |
| 8.375% due 07/01/2012 | | 1,505,000 | | 1,433,512 |
| 9.75% due 02/01/2011 | | 1,653,000 | | 1,698,457 |
|
|
| | | | | 22,710,122 |
| Correctional Facilities - 0.52% | | | | |
| Corrections Corp. of America | | | | |
| 6.25% due 03/15/2013 | | 5,575,000 | | 5,386,844 |
| 6.75% due 01/31/2014 | | 750,000 | | 740,625 |
|
|
| | | | | 6,127,469 |
| Cosmetics & Toiletries - 0.21% | | | | |
| Playtex Products, Inc. | | | | |
| 8.00% due 03/01/2011 | | 2,410,000 | | 2,506,400 |
| Crude Petroleum & Natural Gas - 2.50% | | | | |
| Chaparral Energy, Inc. | | | | |
| 8.50% due 12/01/2015 | | 5,150,000 | | 5,188,625 |
| Chesapeake Energy Corp. | | | | |
| 6.25% due 01/15/2018 | | 3,225,000 | | 2,975,062 |
| 6.375% due 06/15/2015 | | 815,000 | | 774,250 |
| 6.50% due 08/15/2017 | | 3,295,000 | | 3,056,112 |
| 6.625% due 01/15/2016 | | 1,980,000 | | 1,900,800 |
| 6.875% due 01/15/2016 | | 2,080,000 | | 2,017,600 |
| 7.00% due 08/15/2014 | | 425,000 | | 420,750 |
| Mariner Energy, Inc. | | | | |
| 7.50% due 04/15/2013 | | 1,820,000 | | 1,769,950 |
| PetroHawk Energy Corp. | | | | |
| 9.125% due 07/15/2013 | | 2,400,000 | | 2,442,000 |
| Plains Exploration & Production Company | | | | |
| 8.75% due 07/01/2012 (a) | | 1,500,000 | | 1,575,000 |
| Pogo Producing Company | | | | |
| 6.875% due 10/01/2017 | | 1,725,000 | | 1,643,063 |
| 7.875% due 05/01/2013 | | 1,330,000 | | 1,356,600 |
| 8.25% due 04/15/2011 (a) | | 925,000 | | 952,750 |
| Quicksilver Resources, Inc. | | | | |
| 7.125% due 04/01/2016 | | 3,800,000 | | 3,629,000 |
|
|
| | | | | 29,701,562 |
The accompanying notes are an integral part of the financial statements. 229
John Hancock Funds II
Portfolio of investments — August 31, 2006
(showing percentage of total net assets)
| High Yield Fund (continued) | | | |
| | | Shares or | |
| | | Principal | |
| | | Amount | Value |
|
|
| |
| CORPORATE BONDS (continued) | | | |
| Domestic Oil - 2.60% | | | |
| Exco Resources, Inc. | | | |
| 7.25% due 01/15/2011 | $ | 5,650,000 | | $ | 5,494,625 |
| Forest Oil Corp. | | | |
| 8.00% due 12/15/2011 | | 2,800,000 | 2,891,000 |
| Magnum Hunter Resources, Inc. | | | |
| 9.60% due 03/15/2012 | | 4,800,000 | 5,088,000 |
| Stone Energy Corp. | | | |
| 6.75% due 12/15/2014 | | 3,855,000 | 3,720,075 |
| 8.25% due 12/15/2011 | | 2,550,000 | 2,562,750 |
| Swift Energy Company | | | |
| 7.625% due 07/15/2011 | | 1,550,000 | 1,565,500 |
| 9.375% due 05/01/2012 | | 3,175,000 | 3,349,625 |
| Whiting Petroleum Corp. | | | |
| 7.00% due 02/01/2014 | | 1,165,000 | 1,147,525 |
| 7.25% due 05/01/2012 | | 5,185,000 | 5,120,187 |
|
|
| | | | 30,939,287 |
| Educational Services - 0.20% | | | |
| Education Management LLC | | | |
| 8.75% due 06/01/2014 | | 2,365,000 | 2,335,438 |
| Electrical Utilities - 2.55% | | | |
| AES China Generating Company | | | |
| 8.25% due 06/26/2010 | | 655,000 | 649,229 |
| AES Corp. | | | |
| 7.75% due 03/01/2014 (a) | | 2,325,000 | 2,394,750 |
| 8.75% due 06/15/2008 (a) | | 850,000 | 884,000 |
| 8.75% due 05/15/2013 | | 100,000 | 107,000 |
| 8.875% due 02/15/2011 | | 2,520,000 | 2,696,400 |
| 9.00% due 05/15/2015 | | 180,000 | 194,175 |
| 9.375% due 09/15/2010 | | 5,000,000 | 5,400,000 |
| 9.50% due 06/01/2009 (a) | | 1,775,000 | 1,890,375 |
| Edison Mission Energy | | | |
| 7.50% due 06/15/2013 | | 540,000 | 540,000 |
| 7.73% due 06/15/2009 | | 2,700,000 | 2,760,750 |
| 7.75% due 06/15/2016 | | 3,140,000 | 3,140,000 |
| Midwest Generation LLC, Series B | | | |
| 8.56% due 01/02/2016 | | 1,360,724 | 1,445,769 |
| Mirant Americas Generation LLC | | | |
| 8.30% due 05/01/2011 ^ | | 6,204,000 | 6,204,000 |
| 8.50% due 10/01/2021 ^ | | 407,000 | 394,790 |
| Orion Power Holdings, Inc. | | | |
| 12.00% due 05/01/2010 | | 1,370,000 | 1,554,950 |
|
|
| | | | 30,256,188 |
| Electronics - 1.13% | | | |
| L-3 Communications Corp. | | | |
| 7.625% due 06/15/2012 | | 2,575,000 | 2,639,375 |
| L-3 Communications Corp., Series B | | | |
| 6.375% due 10/15/2015 | | 8,173,000 | 7,866,512 |
| Spectrum Brands, Inc. | | | |
| 7.375% due 02/01/2015 | | 997,000 | 772,675 |
| 8.50% due 10/01/2013 (a) | | 2,620,000 | 2,177,875 |
|
|
| | | | 13,456,437 |
| Energy - 1.55% | | | |
| Inergy, LP | | | |
| 6.875% due 12/15/2014 | | 3,150,000 | 2,984,625 |
| High Yield Fund (continued) | | |
| | | Shares or | |
| | | Principal | |
| | | Amount | Value |
|
|
| |
| CORPORATE BONDS (continued) | | | |
| Energy (continued) | | | |
| NRG Energy, Inc. | | | |
| 7.25% due 02/01/2014 (a) | | $ | 2,350,000 | | $ | 2,320,625 |
| 7.375% due 02/01/2016 | | 10,300,000 | 10,145,500 |
| Peabody Energy Corp. | | | |
| 6.875% due 03/15/2013 | | 50,000 | 49,500 |
| Sonat, Inc. | | | |
| 7.625% due 07/15/2011 | | 2,900,000 | 2,965,250 |
|
|
| | | | 18,465,500 |
| Financial Services - 7.04% | | | |
| BCP Crystal Holdings Corp. | | | |
| 9.625% due 06/15/2014 | | 385,000 | 417,244 |
| Dow Jones CDX HY, Series 6-T3 | | | |
| 8.125% due 06/29/2011 | | 8,820,000 | 8,814,488 |
| E*Trade Financial Corp. | | | |
| 7.375% due 09/15/2013 | | 2,345,000 | 2,368,450 |
| 7.875% due 12/01/2015 | | 1,005,000 | 1,045,200 |
| El Paso Performance-Linked Trust | | | |
| 7.75% due 07/15/2011 | | 1,430,000 | 1,456,813 |
| Ford Motor Credit Company | | | |
| 7.00% due 10/01/2013 (a) | | 6,770,000 | 6,318,427 |
| 7.875% due 06/15/2010 | | 925,000 | 909,108 |
| 10.4863% due 06/15/2011 (b) | | 7,400,000 | 7,825,485 |
| General Motors Acceptance Corp. | | | |
| 6.875% due 08/28/2012 | | 3,730,000 | 3,611,575 |
| 8.00% due 11/01/2031 (a) | | 22,565,000 | 22,806,220 |
| Global Cash Access LLC | | | |
| 8.75% due 03/15/2012 | | 4,250,000 | 4,446,562 |
| Hexion US Finance Corp/Hexion Nova Scotia | | |
| Finance ULC | | | |
| 9.00% due 07/15/2014 | | 5,800,000 | 5,829,000 |
| iPCS, Inc. | | | |
| 11.50% due 05/01/2012 | | 1,275,000 | 1,434,375 |
| JSG Funding PLC | | | |
| 9.625% due 10/01/2012 | | 3,500,000 | 3,653,125 |
| 10.125% due 10/01/2012 | EUR | 475,000 | 663,091 |
| Nell AF SARL | | | |
| 8.375% due 08/15/2015 (a) | | $ | 3,700,000 | 3,704,625 |
| TNK-BP Finance SA | | | |
| 7.50% due 07/18/2016 (a) | | 1,220,000 | 1,266,222 |
| TRAINS HY-1-2006 | | | |
| 7.548% due 05/01/2016 (a) | | 5,360,000 | 5,315,137 |
| Ucar Finance, Inc. | | | |
| 10.25% due 02/15/2012 | | 1,670,000 | 1,753,500 |
|
|
| | | | 83,638,647 |
| Food & Beverages - 0.57% | | | |
| Ahold Lease USA, Inc., Series A-1 | | | |
| 7.82% due 01/02/2020 | | 0 | 0 |
| Dole Food, Inc. | | | |
| 8.625% due 05/01/2009 | | 1,700,000 | 1,674,500 |
| 8.75% due 07/15/2013 (a) | | 425,000 | 401,625 |
| 8.875% due 03/15/2011 (a) | | 2,625,000 | 2,559,375 |
| Nutro Products, Inc. | | | |
| 9.23% due 10/15/2013 (b) | | 540,000 | 556,200 |
| 10.75% due 04/15/2014 | | 1,485,000 | 1,566,675 |
|
|
| | | | 6,758,375 |
The accompanying notes are an integral part of the financial statements. 230
John Hancock Funds II
Portfolio of investments — August 31, 2006
(showing percentage of total net assets)
| High Yield Fund (continued) | | |
| | | Shares or | |
| | | Principal | |
| | | Amount | Value |
|
|
| |
| CORPORATE BONDS (continued) | | | |
| Furniture & Fixtures - 0.66% | | | |
| Norcraft Companies LP | | | |
| 9.00% due 11/01/2011 | $ | 2,450,000 | | $ | 2,462,250 |
| Norcraft Holdings Capital | | | |
| zero coupon, Step up to 9.75% on | | | |
| 09/01/2008 due 09/01/2012 | | 695,000 | 562,950 |
| Sealy Mattress Company | | | |
| 8.25% due 06/15/2014 (a) | | 4,775,000 | 4,822,750 |
|
|
| | | | 7,847,950 |
| Gas & Pipeline Utilities - 3.02% | | | |
| Colorado Interstate Gas Company | | | |
| 6.80% due 11/15/2015 | | 350,000 | 346,873 |
| Dynegy Holdings, Inc. | | | |
| 7.625% due 10/15/2026 | | 2,700,000 | 2,382,750 |
| El Paso Corp. | | | |
| 7.75% due 01/15/2032 (a) | | 3,725,000 | 3,743,625 |
| 7.80% due 08/01/2031 | | 6,775,000 | 6,791,937 |
| 7.875% due 06/15/2012 (a) | | 5,675,000 | 5,859,437 |
| El Paso Corp., Series MTN | | | |
| 7.375% due 12/15/2012 (a) | | 225,000 | 226,969 |
| El Paso Natural Gas, Series A | | | |
| 7.625% due 08/01/2010 | | 25,000 | 25,688 |
| Northwest Pipeline Corp. | | | |
| 8.125% due 03/01/2010 | | 75,000 | 78,000 |
| Transcontinental Gas Pipe Line Corp. | | | |
| 8.875% due 07/15/2012 | | 2,935,000 | 3,254,181 |
| Williams Companies, Inc. | | | |
| 7.125% due 09/01/2011 | | 50,000 | 50,750 |
| 7.625% due 07/15/2019 (a) | | 3,050,000 | 3,095,750 |
| 7.875% due 09/01/2021 | | 4,500,000 | 4,578,750 |
| 8.125% due 03/15/2012 (a) | | 125,000 | 131,875 |
| 8.75% due 03/15/2032 | | 4,975,000 | 5,360,563 |
|
|
| | | | 35,927,148 |
| Healthcare Products - 0.38% | | | |
| Angiotech Pharmaceuticals, Inc. | | | |
| 7.75% due 04/01/2014 | | 360,000 | 351,000 |
| Leiner Health Products, Inc. | | | |
| 11.00% due 06/01/2012 | | 4,400,000 | 4,180,000 |
|
|
| | | | 4,531,000 |
| Healthcare Services - 2.01% | | | |
| DaVita, Inc. | | | |
| 7.25% due 03/15/2015 (a) | | 6,375,000 | 6,247,500 |
| Extendicare Health Services, Inc. | | | |
| 6.875% due 05/01/2014 | | 3,200,000 | 3,344,000 |
| Psychiatric Solutions, Inc. | | | |
| 7.75% due 07/15/2015 (a) | | 4,850,000 | 4,680,250 |
| Vanguard Health Holding Company I LLC | | | |
| zero coupon, Step up to 11.25% on | | | |
| 10/01/2009 due 10/01/2015 (a) | | 1,915,000 | 1,378,800 |
| Vanguard Health Holding Company II LLC | | | |
| 9.00% due 10/01/2014 | | 8,470,000 | 8,215,900 |
|
|
| | | | 23,866,450 |
| Holdings Companies/Conglomerates - 0.14% | | |
| Ashtead Capital, Inc. | | | |
| 9.00% due 08/15/2016 | | 1,647,000 | 1,679,940 |
| High Yield Fund (continued) | | | |
| | | Shares or | |
| | | Principal | |
| | | Amount | Value |
|
|
| |
| CORPORATE BONDS (continued) | | | |
| Homebuilders - 0.91% | | | |
| Beazer Homes USA, Inc. | | | |
| 6.875% due 07/15/2015 | $ | 300,000 | | $ | 267,000 |
| 8.125% due 06/15/2016 (a) | | 3,445,000 | 3,289,975 |
| 8.625% due 05/15/2011 | | 50,000 | 50,187 |
| K Hovnanian Enterprises, Inc. | | | |
| 6.25% due 01/15/2016 (a) | | 1,290,000 | 1,119,075 |
| 8.625% due 01/15/2017 (a) | | 6,230,000 | 6,082,038 |
|
|
| | | | 10,808,275 |
| Hotels & Restaurants - 1.44% | | | |
| CCM Merger, Inc. | | | |
| 8.00% due 08/01/2013 | | 2,505,000 | 2,398,538 |
| El Pollo Loco, Inc. | | | |
| 11.75% due 11/15/2013 | | 730,000 | 815,775 |
| Hilton Hotels Corp. | | | |
| 7.625% due 12/01/2012 (a) | | 5,350,000 | 5,656,576 |
| Park Place Entertainment Corp. | | | |
| 7.875% due 03/15/2010 | | 525,000 | 547,312 |
| 8.125% due 05/15/2011 | | 2,250,000 | 2,368,125 |
| 8.875% due 09/15/2008 | | 2,525,000 | 2,648,094 |
| 9.375% due 02/15/2007 | | 700,000 | 708,750 |
| Starwood Hotels & Resorts Worldwide, Inc. | | | |
| 7.375% due 05/01/2007 | | 175,000 | 176,531 |
| 7.875% due 05/01/2012 | | 1,625,000 | 1,759,063 |
|
|
| | | | 17,078,764 |
| Industrial Machinery - 0.42% | | | |
| H&E Equipment Services, Inc. | | | |
| 8.375% due 07/15/2016 | | 4,900,000 | 4,973,500 |
| Industrials - 0.49% | | | |
| Dynegy Holdings, Inc. | | | |
| 7.125% due 05/15/2018 | | 6,650,000 | 5,868,625 |
| Insurance - 0.45% | | | |
| Crum & Forster Holdings Corp. | | | |
| 10.375% due 06/15/2013 (a) | | 5,400,000 | 5,373,000 |
| International Oil - 0.03% | | | |
| Newfield Exploration Company | | | |
| 6.625% due 09/01/2014 (a) | | 25,000 | 24,438 |
| Pemex Project Funding Master Trust | | | |
| 9.125% due 10/13/2010 | | 250,000 | 278,750 |
|
|
| | | | 303,188 |
| Internet Content - 0.00% | | | |
| PSINet, Inc. | | | |
| 11.00% due 08/01/2009 ^ | | 193,291 | 1,933 |
| PSINet, Inc., Series B | | | |
| 10.00% due 02/15/2005 ^ | | 494,555 | 4,945 |
|
|
| | | | 6,878 |
| Leisure Time - 6.46% | | | |
| AMC Entertainment, Inc. | | | |
| 11.00% due 02/01/2016 (a) | | 7,075,000 | 7,685,219 |
| Boyd Gaming Corp. | | | |
| 6.75% due 04/15/2014 (a) | | 5,900,000 | 5,560,750 |
| 7.75% due 12/15/2012 (a) | | 25,000 | 25,062 |
| Caesars Entertainment, Inc. | | | |
| 7.00% due 04/15/2013 | | 2,475,000 | 2,554,792 |
The accompanying notes are an integral part of the financial statements. 231
John Hancock Funds II
Portfolio of investments — August 31, 2006
(showing percentage of total net assets)
| High Yield Fund (continued) | | | | |
| | | Shares or | | |
| | | Principal | | |
| | | Amount | | Value |
|
|
| |
| CORPORATE BONDS (continued) | | | | |
| Leisure Time (continued) | | | | |
| Choctaw Resort Development Enterprise | | | | |
| 7.25% due 11/15/2019 | $ | 675,000 | $ | 661,500 |
| Herbst Gaming, Inc. | | | | |
| 7.00% due 11/15/2014 (a) | | 3,750,000 | | 3,609,375 |
| 8.125% due 06/01/2012 | | 800,000 | | 812,000 |
| Inn of the Mountain Gods Resort & Casino | | | | |
| 12.00% due 11/15/2010 (a) | | 4,665,000 | | 4,711,650 |
| Isle of Capri Casinos | | | | |
| 7.00% due 03/01/2014 | | 6,575,000 | | 6,246,250 |
| Las Vegas Sands Corp. | | | | |
| 6.375% due 02/15/2015 | | 4,050,000 | | 3,766,500 |
| MGM Mirage, Inc. | | | | |
| 5.875% due 02/27/2014 | | 1,100,000 | | 1,003,750 |
| 6.625% due 07/15/2015 | | 1,550,000 | | 1,458,938 |
| 6.75% due 09/01/2012 | | 4,100,000 | | 3,987,250 |
| 7.25% due 08/01/2017 | | 825,000 | | 794,062 |
| 8.375% due 02/01/2011 (a) | | 2,800,000 | | 2,880,500 |
| 9.75% due 06/01/2007 | | 1,500,000 | | 1,537,500 |
| Mohegan Tribal Gaming Authority | | | | |
| 6.875% due 02/15/2015 | | 2,625,000 | | 2,506,875 |
| 7.125% due 08/15/2014 | | 3,300,000 | | 3,217,500 |
| Penn National Gaming, Inc. | | | | |
| 6.75% due 03/01/2015 | | 5,200,000 | | 5,005,000 |
| 6.875% due 12/01/2011 | | 825,000 | | 820,875 |
| Pinnacle Entertainment, Inc. | | | | |
| 8.25% due 03/15/2012 | | 2,550,000 | | 2,562,750 |
| 8.75% due 10/01/2013 (a) | | 3,050,000 | | 3,202,500 |
| River Rock Entertainment Authority | | | | |
| 9.75% due 11/01/2011 | | 375,000 | | 397,031 |
| Seneca Gaming Corp. | | | | |
| 7.25% due 05/01/2012 | | 1,825,000 | | 1,793,062 |
| Station Casinos, Inc. | | | | |
| 6.50% due 02/01/2014 | | 500,000 | | 466,250 |
| 6.625% due 03/15/2018 (a) | | 2,500,000 | | 2,231,250 |
| 7.75% due 08/15/2016 | | 2,675,000 | | 2,758,594 |
| Warner Music Group | | | | |
| 7.375% due 04/15/2014 | | 2,200,000 | | 2,117,500 |
| Wynn Las Vegas LLC | | | | |
| 6.625% due 12/01/2014 (a) | | 2,500,000 | | 2,387,500 |
|
|
| | | | | 76,761,785 |
| Manufacturing - 0.43% | | | | |
| Jacuzzi Brands, Inc. | | | | |
| 9.625% due 07/01/2010 | | 2,390,000 | | 2,533,400 |
| Koppers, Inc. | | | | |
| 9.875% due 10/15/2013 | | 2,418,000 | | 2,617,485 |
|
|
| | | | | 5,150,885 |
| Medical-Hospitals - 2.09% | | | | |
| Genesis Healthcare Corp. | | | | |
| 8.00% due 10/15/2013 | | 2,400,000 | | 2,490,000 |
| HCA, Inc, Series MTN | | | | |
| 7.75% due 07/15/2036 | | 655,000 | | 487,822 |
| HCA, Inc. | | | | |
| 5.50% due 12/01/2009 | | 25,000 | | 24,656 |
| 6.30% due 10/01/2012 | | 150,000 | | 125,625 |
| 6.375% due 01/15/2015 | | 3,875,000 | | 3,080,625 |
| High Yield Fund (continued) | | |
| | | Shares or | |
| | | Principal | |
| | | Amount | Value |
|
|
| |
| CORPORATE BONDS (continued) | | | |
| Medical-Hospitals (continued) | | | |
| HCA, Inc. (continued) | | | |
| 6.50% due 02/15/2016 (a) | | $ | 2,100,000 | | $ | 1,653,750 |
| 7.50% due 12/15/2023 | | 3,050,000 | 2,330,929 |
| 7.69% due 06/15/2025 | | 925,000 | 714,826 |
| 8.36% due 04/15/2024 | | 150,000 | 120,628 |
| 8.75% due 09/01/2010 (a) | | 600,000 | 604,500 |
| Tenet Healthcare Corp. | | | |
| 6.875% due 11/15/2031 | | 2,025,000 | 1,533,937 |
| 7.375% due 02/01/2013 (a) | | 5,125,000 | 4,561,250 |
| 9.25% due 02/01/2015 (b) | | 1,200,000 | 1,131,000 |
| 9.875% due 07/01/2014 (a) | | 6,175,000 | 6,020,625 |
|
|
| | | | 24,880,173 |
| Metal & Metal Products - 1.12% | | | |
| Corporacion Nacional Del Cobre de Chile, Inc. | | |
| 5.50% due 10/15/2013 | | 575,000 | 566,375 |
| Metals USA, Inc. | | | |
| 11.125% due 12/01/2015 | | 6,540,000 | 7,210,350 |
| Mueller Group, Inc. | | | |
| 10.00% due 05/01/2012 | | 1,810,000 | 1,972,900 |
| Mueller Holdings, Inc. | | | |
| zero coupon, Step up to 14.75% on | | | |
| 04/15/2009 due 04/15/2014 | | 1,450,000 | 1,276,000 |
| Novelis, Inc. | | | |
| 7.25% due 02/15/2015 (a) | | 1,730,000 | 1,643,500 |
| PNA Group, Inc. | | | |
| 10.75% due 09/01/2016 | | 640,000 | 654,400 |
|
|
| | | | 13,323,525 |
| Mining - 0.10% | | | |
| Vale Overseas Ltd. | | | |
| 8.25% due 01/17/2034 | | 1,021,000 | 1,175,682 |
| Office Furnishings & Supplies - 0.36% | | | |
| Interface, Inc. | | | |
| 9.50% due 02/01/2014 | | 3,075,000 | 3,159,563 |
| 10.375% due 02/01/2010 | | 1,075,000 | 1,170,406 |
|
|
| | | | 4,329,969 |
| Paper - 0.99% | | | |
| Abitibi-Consolidated, Inc. | | | |
| 8.55% due 08/01/2010 (a) | | 450,000 | 444,375 |
| Appleton Papers, Inc. | | | |
| 8.125% due 06/15/2011 | | 1,525,000 | 1,509,750 |
| Appleton Papers, Inc., Series B | | | |
| 9.75% due 06/15/2014 | | 3,465,000 | 3,421,687 |
| NewPage Corp. | | | |
| 11.7388% due 05/01/2012 (b) | | 985,000 | 1,063,800 |
| 12.00% due 05/01/2013 (a) | | 1,210,000 | 1,249,325 |
| P.H. Glatfelter | | | |
| 7.125% due 05/01/2016 (a) | | 940,000 | 926,641 |
| Smurfit Capital Funding PLC | | | |
| 7.50% due 11/20/2025 | | 750,000 | 682,500 |
| Verso Paper Holdings LLC and Verso Paper, Inc. | | |
| 9.125% due 08/01/2014 | | 1,210,000 | 1,203,950 |
| 11.375% due 08/01/2016 (a) | | 1,295,000 | 1,282,050 |
|
|
| | | | 11,784,078 |
The accompanying notes are an integral part of the financial statements. 232
John Hancock Funds II
Portfolio of investments — August 31, 2006
(showing percentage of total net assets)
| High Yield Fund (continued) | | | |
| | | Shares or | |
| | | Principal | |
| | | Amount | Value |
|
|
| |
| CORPORATE BONDS (continued) | | | |
| Petroleum Services - 1.28% | | | |
| Belden & Blake Corp. | | | |
| 8.75% due 07/15/2012 | $ | 5,215,000 | | $ | 5,345,375 |
| Compagnie Generale de Geophysique SA | | | |
| 7.50% due 05/15/2015 (a) | | 1,140,000 | 1,134,300 |
| Dresser-Rand Group, Inc. | | | |
| 7.375% due 11/01/2014 | | 4,375,000 | 4,210,938 |
| Enterprise Products Operating LP | | | |
| 8.375% due 08/01/2066 (b) | | 2,480,000 | 2,585,326 |
| Grant Prideco, Inc., Series B | | | |
| 6.125% due 08/15/2015 | | 1,250,000 | 1,187,500 |
| Pride International, Inc. | | | |
| 7.375% due 07/15/2014 | | 595,000 | 605,412 |
| SESI LLC | | | |
| 6.875% due 06/01/2014 | | 195,000 | 191,100 |
|
|
| | | | 15,259,951 |
| |
| Pharmaceuticals - 0.69% | | | |
| Omnicare, Inc. | | | |
| 6.875% due 12/15/2015 (a) | | 2,900,000 | 2,773,125 |
| Valeant Pharmaceuticals International | | | |
| 7.00% due 12/15/2011 | | 5,825,000 | 5,475,500 |
|
|
| | | | 8,248,625 |
| |
| Publishing - 1.64% | | | |
| CBD Media Holdings, LLC | | | |
| 9.25% due 07/15/2012 | | 2,625,000 | 2,572,500 |
| CBD Media, Inc. | | | |
| 8.625% due 06/01/2011 | | 1,750,000 | 1,715,000 |
| Dex Media East LLC | | | |
| 12.125% due 11/15/2012 (a) | | 575,000 | 641,125 |
| Dex Media West LLC | | | |
| 8.50% due 08/15/2010 | | 50,000 | 51,250 |
| 9.875% due 08/15/2013 | | 1,700,000 | 1,825,375 |
| Dex Media, Inc. | | | |
| zero coupon, Step up to 9.00% on | | | |
| 11/15/2008 due 11/15/2013 (a) | | 4,975,000 | 4,141,687 |
| zero coupon, Step up to 9.00% on | | | |
| 11/15/2008 due 11/15/2013 (a) | | 3,425,000 | 2,851,313 |
| 8.00% due 11/15/2013 | | 25,000 | 24,875 |
| Houghton Mifflin Company | | | |
| zero coupon, Step up to 11.5% on | | | |
| 10/15/2008 due 10/15/2013 | | 3,180,000 | 2,663,250 |
| Primedia, Inc. | | | |
| 8.875% due 05/15/2011 (a) | | 3,035,000 | 2,943,950 |
|
|
| | | | 19,430,325 |
| |
| Railroads & Equipment - 0.41% | | | |
| Grupo Transportacion Ferroviaria Mexicana, | | | |
| S.A. de C.V. | | | |
| 9.375% due 05/01/2012 (a) | | 3,765,000 | 3,986,194 |
| 10.25% due 06/15/2007 | | 580,000 | 591,600 |
| 12.50% due 06/15/2012 | | 205,000 | 227,550 |
|
|
| | | | 4,805,344 |
| |
| Real Estate - 1.63% | | | |
| Felcor Lodging LP, REIT | | | |
| 9.00% due 06/01/2011 | | 3,925,000 | 4,150,687 |
| High Yield Fund (continued) | | | |
| | | Shares or | |
| | | Principal | |
| | | Amount | Value |
|
|
| |
| CORPORATE BONDS (continued) | | | |
| Real Estate (continued) | | | |
| Forest City Enterprises | | | |
| 7.625% due 06/01/2015 | $ | 145,000 | | 146,087 |
| | $ |
| Host Marriott LP, REIT | | | |
| 6.375% due 03/15/2015 | | 2,125,000 | 2,040,000 |
| 7.125% due 11/01/2013 | | 5,550,000 | 5,605,500 |
| 9.50% due 01/15/2007 | | 1,475,000 | 1,491,594 |
| Host Marriott LP, Series Q, REIT | | | |
| 6.75% due 06/01/2016 (a) | | 3,675,000 | 3,564,750 |
| Kimball Hill, Inc. | | | |
| 10.50% due 12/15/2012 | | 1,885,000 | 1,616,388 |
| Ventas Realty LP/ Capital Corp. | | | |
| 6.50% due 06/01/2016 | | 800,000 | 788,000 |
|
|
| | | | 19,403,006 |
| Retail - 0.35% | | | |
| Brookstone Company, Inc. | | | |
| 12.00% due 10/15/2012 | | 620,000 | 564,200 |
| NationsRent, Inc. | | | |
| 9.50% due 05/01/2015 (a) | | 150,000 | 176,208 |
| Suburban Propane Partners LP | | | |
| 6.875% due 12/15/2013 | | 3,515,000 | 3,365,613 |
|
|
| | | | 4,106,021 |
| Retail Trade - 1.04% | | | |
| American Greetings Corp. | | | |
| 7.375% due 06/01/2016 | | 375,000 | 377,344 |
| Blockbuster, Inc. | | | |
| 9.00% due 09/01/2012 (a) | | 2,335,000 | 2,159,875 |
| FTD, Inc. | | | |
| 7.75% due 02/15/2014 | | 2,394,000 | 2,334,150 |
| Neiman Marcus Group, Inc. | | | |
| 10.375% due 10/15/2015 (a) | | 5,625,000 | 6,018,750 |
| Saks, Inc. | | | |
| 9.875% due 10/01/2011 | | 1,375,000 | 1,488,437 |
|
|
| | | | 12,378,556 |
| Sanitary Services - 0.93% | | | |
| Allied Waste North America, Inc. | | | |
| 6.375% due 04/15/2011 (a) | | 1,725,000 | 1,673,250 |
| 7.25% due 03/15/2015 (a) | | 3,000,000 | 2,947,500 |
| 7.875% due 04/15/2013 | | 325,000 | 329,062 |
| 8.50% due 12/01/2008 | | 950,000 | 988,000 |
| Allied Waste North America, Inc., Series B | | | |
| 7.375% due 04/15/2014 (a) | | 810,000 | 791,775 |
| 9.25% due 09/01/2012 | | 4,025,000 | 4,306,750 |
|
|
| | | | 11,036,337 |
| Semiconductors - 0.43% | | | |
| Amkor Technology, Inc. | | | |
| 2.50% due 05/15/2011 | | 2,660,000 | 2,257,675 |
| MagnaChip Semiconductor SA | | | |
| 8.00% due 12/15/2014 (a) | | 4,435,000 | 2,838,400 |
|
|
| | | | 5,096,075 |
| Software - 0.48% | | | |
| UGS Capital Corp. II | | | |
| 10.38% due 06/01/2011 (b) | | 3,410,000 | 3,435,575 |
The accompanying notes are an integral part of the financial statements. 233
John Hancock Funds II
Portfolio of investments — August 31, 2006
(showing percentage of total net assets)
| High Yield Fund (continued) | | |
| | | Shares or | |
| | | Principal | |
| | | Amount | Value |
|
|
| |
| CORPORATE BONDS (continued) | | | |
| Software (continued) | | | |
| UGS Corp. | | | |
| 10.00% due 06/01/2012 | | $ | 2,075,000 | | $ | 2,230,625 |
|
|
| | | | 5,666,200 |
| Steel - 0.77% | | | |
| CitiSteel USA, Inc. | | | |
| 12.49% due 09/01/2010 (b) | | 1,235,000 | 1,268,963 |
| 15.00% due 10/01/2010 (b) | | 980,000 | 1,048,600 |
| International Steel Group, Inc. | | | |
| 6.50% due 04/15/2014 | | 2,275,000 | 2,161,250 |
| IPSCO, Inc. | | | |
| 8.75% due 06/01/2013 | | 1,260,000 | 1,345,050 |
| RathGibson, Inc. | | | |
| 11.25% due 02/15/2014 | | 3,200,000 | 3,296,000 |
|
|
| | | | 9,119,863 |
| Telecommunications Equipment & | | | |
| Services - 4.50% | | | |
| Cincinnati Bell Telephone Company | | | |
| 6.30% due 12/01/2028 | | 255,000 | 218,025 |
| Citizens Communications Company | | | |
| 9.00% due 08/15/2031 (a) | | 2,940,000 | 3,101,700 |
| 9.25% due 05/15/2011 | | 100,000 | 109,375 |
| Hawaiian Telcom Communications, Inc., Series B | | |
| 12.50% due 05/01/2015 (a) | | 4,330,000 | 4,427,425 |
| Insight Midwest LP | | | |
| 9.75% due 10/01/2009 | | 1,400,000 | 1,424,500 |
| 10.50% due 11/01/2010 | | 2,650,000 | 2,749,375 |
| Intelsat Bermuda Ltd. | | | |
| 9.25% due 06/15/2016 | | 3,835,000 | 3,988,400 |
| 11.25% due 06/15/2016 | | 6,980,000 | 7,233,025 |
| Intelsat Ltd. | | | |
| 7.625% due 04/15/2012 (a) | | 3,910,000 | 3,391,925 |
| Lucent Technologies, Inc. | | | |
| 6.45% due 03/15/2029 (a) | | 12,975,000 | 11,061,187 |
| PanAmSat Corp. | | | |
| 9.00% due 08/15/2014 | | 1,425,000 | 1,449,938 |
| United States West Communications, Inc. | | | |
| 6.875% due 09/15/2033 (a) | | 15,086,000 | 13,501,970 |
| Wind Acquisition Finance SA | | | |
| 10.75% due 12/01/2015 | | 700,000 | 760,375 |
|
|
| | | | 53,417,220 |
| Telephone - 2.06% | | | |
| Cincinnati Bell, Inc. | | | |
| 7.00% due 02/15/2015 | | 4,210,000 | 4,104,750 |
| 8.375% due 01/15/2014 (a) | | 615,000 | 617,306 |
| Nordic Telephone Company Holdings | | | |
| 8.875% due 05/01/2016 | | 2,220,000 | 2,319,900 |
| NTL Cable PLC | | | |
| 9.125% due 08/15/2016 (a) | | 2,730,000 | 2,825,550 |
| Qwest Communications International, Inc. | | | |
| 7.25% due 02/15/2011 | | 25,000 | 24,781 |
| 7.50% due 02/15/2014 (a) | | 1,196,000 | 1,185,535 |
| Qwest Communications International, Inc., Series B | | |
| 7.50% due 02/15/2014 (a) | | 4,333,000 | 4,295,086 |
| Qwest Corp. | | | |
| 8.875% due 03/15/2012 | | 2,105,000 | 2,278,663 |
| High Yield Fund (continued) | | | |
| | | Shares or | | |
| | | Principal | | |
| | | Amount | | Value |
|
|
| |
| CORPORATE BONDS (continued) | | | | |
| Telephone (continued) | | | | |
| Telefonos de Mexico SA de CV | | | | |
| 8.75% due 01/31/2016 | MXN | 9,000,000 | $ | 816,345 |
| Windstream Corp. | | | | |
| 8.625% due 08/01/2016 | | $ | 5,685,000 | | 6,011,888 |
|
|
| | | | | 24,479,804 |
| Transportation - 0.39% | | | | |
| Gulfmark Offshore, Inc. | | | | |
| 7.75% due 07/15/2014 (b) | | 750,000 | | 746,250 |
| OMI Corp. | | | | |
| 7.625% due 12/01/2013 | | 3,850,000 | | 3,850,000 |
|
|
| | | | | 4,596,250 |
|
| TOTAL CORPORATE BONDS (Cost $996,044,421) | | $ | 986,046,997 |
|
| |
| SHORT TERM INVESTMENTS - 24.00% | | | |
| State Street Navigator Securities | | | | |
| Lending Prime Portfolio (c) | | $ | 285,165,979 $ | 285,165,979 |
|
| TOTAL SHORT TERM INVESTMENTS | | | | |
| (Cost $285,165,979) | | | $ | 285,165,979 |
|
| |
| REPURCHASE AGREEMENTS - 2.79% | | | |
| Merrill Lynch Tri-Party Repurchase | | | | |
| Agreement dated 08/31/2006 at | | | | |
| 5.23% to be repurchased at | | | | |
| $33,204,823 on 9/1/2006, | | | | |
| collateralized by $34,420,000 U.S. | | | | |
| Treasury Notes, 2.00% due | | | | |
| 01/15/2026 (valued at | | | | |
| $33,955,173, including interest) | | $ | 33,200,000 | $ | 33,200,000 |
|
| TOTAL REPURCHASE AGREEMENTS | | | | |
| (Cost $33,200,000) | | | $ | 33,200,000 |
|
| Total Investments (High Yield Fund) | | | | |
| (Cost $1,444,087,968) - 120.89% | | | $ | 1,436,252,652 |
| Liabilities in Excess of Other Assets - (20.89)% | | | (248,157,152) |
|
|
| TOTAL NET ASSETS - 100.00% | | | $ | 1,188,095,500 |
|
|
| |
| |
| International Equity Index Fund | | | |
| | | Shares or | | |
| | | Principal | | |
| | | Amount | | Value |
|
|
| |
| COMMON STOCKS - 94.67% | | | | |
| Argentina - 0.03% | | | | |
| Petrobras Energia Participaciones SA, ADR, | | | |
| B Shares * | | 2,810 | $ | 29,421 |
| Siderar SA, Class A Shares, ADR | | 603 | | 33,645 |
| Telecom Argentina SA, ADR, B Shares * (a) | 2,416 | | 33,220 |
|
|
| | | | | 96,286 |
| Australia - 4.16% | | | | |
| ABC Learning Centres, Ltd. (a) | | 7,100 | | 35,154 |
| Alinta, Ltd. (a) | | 5,481 | | 46,080 |
| Alumina, Ltd. | | 23,651 | | 114,575 |
| Amcor, Ltd. | | 19,226 | | 98,419 |
The accompanying notes are an integral part of the financial statements. 234
John Hancock Funds II
Portfolio of investments — August 31, 2006
(showing percentage of total net assets)
| International Equity Index Fund (continued) | |
| | Shares or | | |
| | Principal | | |
| | Amount | | Value |
|
|
| |
| COMMON STOCKS (continued) | | | |
| Australia (continued) | | | |
| AMP, Ltd. (a) | 38,484 | $ | 265,703 |
| Ansell, Ltd. (a) | 3,841 | | 27,603 |
| APN News & Media, Ltd. (a) | 5,322 | | 20,260 |
| Aristocrat Leisure, Ltd. (a) | 7,498 | | 74,935 |
| Australia and New Zealand Bank Group, Ltd. (a) | 37,891 | | 787,717 |
| Australia Gas & Light Company, Ltd. (a) | 9,352 | | 143,906 |
| Australian Stock Exchange, Ltd. (a) | 3,611 | | 90,920 |
| Axa Asia Pacific Holdings, Ltd. (a) | 17,831 | | 89,101 |
| Babcock & Brown, Ltd. (a) | 4,314 | | 66,152 |
| BHP Billiton, Ltd. (a) | 72,419 | | 1,530,382 |
| Billabong International, Ltd. (a) | 3,737 | | 42,194 |
| Bluescope Steel, Ltd. (a) | 14,575 | | 75,500 |
| Boral, Ltd. | 12,060 | | 62,564 |
| Brambles Industries, Ltd. (a) | 20,757 | | 189,234 |
| Caltex Australia, Ltd. | 2,589 | | 45,211 |
| Centro Properties Group, Ltd. | 16,936 | | 98,972 |
| CFS Gandel Retail Trust | 28,971 | | 41,994 |
| CFS Retail Property Trust * | 61 | | 93 |
| Challenger Financial Services Group, Ltd. (a) | 7,777 | | 20,825 |
| Coca-Cola Amatil, Ltd. (a) | 11,100 | | 55,467 |
| Cochlear, Ltd. (a) | 1,084 | | 41,597 |
| Coles Myer, Ltd. (a) | 25,099 | | 267,881 |
| Commonwealth Bank of Australia, Ltd. (a) | 26,701 | | 931,325 |
| Commonwealth Property Office Fund, Ltd. | 28,338 | | 30,699 |
| Computershare, Ltd. | 9,855 | | 58,643 |
| CSL, Ltd. (a) | 3,762 | | 145,941 |
| CSR, Ltd. | 19,679 | | 47,291 |
| DB RREEF Trust | 51,702 | | 61,729 |
| DCA Group, Ltd. (a) | 7,794 | | 15,043 |
| Downer EDI, Ltd. (a) | 6,788 | | 29,155 |
| Foster's Group, Ltd. | 41,237 | | 187,185 |
| Futuris Corp., Ltd. | 10,913 | | 17,817 |
| General Property Trust, Ltd. | 41,020 | | 143,014 |
| Goodman Fielder, Ltd. * | 23,651 | | 38,252 |
| Harvey Norman Holding, Ltd. (a) | 10,391 | | 27,270 |
| Iluka Resources, Ltd. (a) | 4,497 | | 25,079 |
| ING Industrial Fund (a) | 14,827 | | 28,845 |
| Investa Property Group, Ltd. | 31,699 | | 57,314 |
| James Hardie Industries, Ltd. | 9,513 | | 48,625 |
| John Fairfax Holdings, Ltd. (a) | 20,471 | | 63,094 |
| Leighton Holdings, Ltd. (a) | 2,745 | | 41,485 |
| Lend Lease Corp. | 7,477 | | 89,613 |
| Lion Nathan, Ltd. | 6,742 | | 41,045 |
| Macquarie Airports, Ltd. | 15,284 | | 34,748 |
| Macquarie Bank, Ltd. (a) | 4,996 | | 246,982 |
| Macquarie Communications | | | |
| Infrastructure Group, Ltd. (a) | 6,747 | | 31,040 |
| Macquarie Goodman Group, Ltd. (a) | 28,352 | | 137,132 |
| Macquarie Infrastructure Group, Ltd. | 52,459 | | 126,065 |
| Macquarie Office Trust (a) | 41,584 | | 45,366 |
| Mayne Nickless, Ltd. (a) | 12,345 | | 30,609 |
| Mayne Pharma, Ltd. * (a) | 12,243 | | 28,674 |
| International Equity Index Fund (continued) | |
| | Shares or | | |
| | Principal | | |
| | Amount | | Value |
|
|
| |
| COMMON STOCKS (continued) | | | |
| Australia (continued) | | | |
| Mirvac Group, Ltd. | 19,609 | $ | 68,366 |
| Multiplex Group, Ltd. (a) | 11,609 | | 29,935 |
| National Australia Bank, Ltd. (a) | 33,202 | | 919,966 |
| Newcrest Mining, Ltd. | 7,166 | | 106,605 |
| NRMA Insurance Group, Ltd. (a) | 33,091 | | 135,566 |
| OneSteel, Ltd. (a) | 10,874 | | 35,340 |
| Orica, Ltd. | 6,427 | | 110,174 |
| Origin Energy, Ltd. (a) | 17,331 | | 88,190 |
| Pacific Brands, Ltd. (a) | 9,227 | | 17,035 |
| Paladin Resources, Ltd. * | 9,622 | | 38,905 |
| PaperlinX, Ltd. (a) | 8,216 | | 21,562 |
| Perpetual Trust of Australia, Ltd. (a) | 843 | | 46,832 |
| Publishing & Broadcasting, Ltd. | 2,590 | | 36,278 |
| Qantas Airways, Ltd., ADR | 20,871 | | 54,773 |
| QBE Insurance Group, Ltd. | 16,562 | | 301,475 |
| Rinker Group, Ltd. | 18,800 | | 197,927 |
| Rio Tinto, Ltd. (a) | 6,009 | | 334,422 |
| Santos, Ltd. | 12,295 | | 104,961 |
| Sonic Healthcare, Ltd. (a) | 5,460 | | 50,360 |
| Stockland Company, Ltd. | 28,490 | | 157,362 |
| Suncorp-Metway, Ltd. (a) | 11,334 | | 177,258 |
| Sydney Roads Group * | 17,413 | | 13,749 |
| TABCORP Holdings, Ltd. (a) | 11,112 | | 128,347 |
| Telstra Corp., Ltd. (a) | 43,155 | | 118,523 |
| Toll Holdings, Ltd. | 11,111 | | 121,130 |
| Transurban Group, Ltd. * (a) | 16,296 | | 86,903 |
| UNiTAB, Ltd. | 2,327 | | 24,943 |
| Wesfarmers, Ltd. (a) | 7,810 | | 200,138 |
| Westfield Group (a) | 30,727 | | 428,275 |
| Westpac Banking Corp., Ltd. | 37,902 | | 675,754 |
| Woodside Petroleum, Ltd. | 9,827 | | 316,824 |
| Woolworths, Ltd. (a) | 24,018 | | 379,293 |
| WorleyParsons, Ltd. | 3,104 | | 42,814 |
| Zinifex, Ltd. | 10,616 | | 96,377 |
| | |
|
| | | | 12,807,881 |
| Austria - 0.42% | | | |
| Andritz AG | 192 | | 30,245 |
| BetandWin.com Interactive | | | |
| Entertainment AG * (a) | 440 | | 16,351 |
| Bohler Uddeholm AG | 860 | | 46,206 |
| Erste Bank der Oesterreichischen | | | |
| Sparkassen AG | 3,778 | | 228,118 |
| Flughafen Wien AG (a) | 200 | | 16,193 |
| Immoeast Immobilien Anlagen AG * | 5,431 | | 63,918 |
| Immofinanz Immobilien Anlage AG * | 9,003 | | 104,230 |
| Mayr-Melnhof Karton AG | 80 | | 14,020 |
| Meinl European Land, Ltd. * | 3,030 | | 65,313 |
| Oesterreichische Elektrizitaets AG, Class A | 1,630 | | 81,989 |
| OMV AG | 3,491 | | 185,869 |
| Raiffeisen International Bank Holding AG (a) | 747 | | 67,274 |
| RHI AG * | 486 | | 16,668 |
| Telekom Austria AG | 7,407 | | 181,170 |
The accompanying notes are an integral part of the financial statements. 235
John Hancock Funds II
Portfolio of investments — August 31, 2006
(showing percentage of total net assets)
| International Equity Index Fund (continued) | |
| | Shares or | | |
| | Principal | | |
| | Amount | | Value |
|
|
| |
| COMMON STOCKS (continued) | | | |
| Austria (continued) | | | |
| Voestalpine AG | 1,664 | $ | 62,966 |
| Wiener Staedtische Allgemeine Versicherung | | | |
| AG | 661 | | 40,453 |
| Wienerberger Baustoffindustrie AG | 1,326 | | 63,560 |
| | |
|
| | | | 1,284,543 |
| Belgium - 1.00% | | | |
| Agfa Gevaert NV (a) | 2,039 | | 47,760 |
| Barco N.V. | 216 | | 19,038 |
| Bekaert SA | 272 | | 26,653 |
| Belgacom SA | 3,526 | | 124,358 |
| Cofinimmo SA | 142 | | 24,777 |
| Colruyt SA (a) | 349 | | 59,245 |
| Compagnie Maritime Belge SA (a) | 338 | | 11,428 |
| Delhaize Group (a) | 1,645 | | 125,105 |
| Dexia | 11,945 | | 306,377 |
| Euronav NV (a) | 320 | | 11,085 |
| Fortis Group SA (a) | 25,210 | | 979,752 |
| Groupe Bruxelles Lambert SA | 1,595 | | 167,211 |
| Interbrew | 3,929 | | 203,711 |
| KBC Bancassurance Holding NV | 3,949 | | 424,600 |
| Mobistar SA | 691 | | 56,750 |
| Omega Pharma SA | 422 | | 24,288 |
| SA D'Ieteren Trading NV (a) | 53 | | 17,662 |
| Solvay SA | 1,373 | | 166,069 |
| Suez SA (a) | 2,066 | | 88,089 |
| UCB SA | 1,898 | | 111,106 |
| Union Miniere SA | 512 | | 74,340 |
| | |
|
| | | | 3,069,404 |
| Bermuda - 0.24% | | | |
| Brilliance China Automotive Holdings, Ltd. * | 37,709 | | 5,722 |
| Central European Media Enterprises, Ltd. * | 542 | | 33,120 |
| Cheung Kong Infrastructure Holdings, Ltd. | 9,000 | | 28,584 |
| Cosco Pacific, Ltd. | 22,855 | | 51,194 |
| Credicorp, Ltd., ADR | 967 | | 35,972 |
| Esprit Holdings, Ltd. | 20,500 | | 170,549 |
| Frontline, Ltd. (a) | 1,050 | | 42,853 |
| Giordano International, Ltd. | 28,000 | | 15,878 |
| Hopson Development Holdings, Ltd., GDR | 12,000 | | 26,293 |
| Johnson Electronic Holdings, Ltd. | 27,500 | | 20,509 |
| Kerry Properties, Ltd. | 9,613 | | 36,279 |
| Li & Fung, Ltd. | 41,600 | | 99,173 |
| Noble Group, Ltd. (a) | 17,000 | | 11,670 |
| Orient Overseas International, Ltd. | 4,000 | | 16,150 |
| SeaDrill, Ltd., GDR * | 4,308 | | 54,348 |
| Sinochem Hong Kong Holding, Ltd., GDR | 32,000 | | 11,727 |
| Texwinca Holdings, Ltd. | 12,000 | | 7,869 |
| TPV Technology, Ltd. | 25,211 | | 26,907 |
| Yue Yuen Industrial Holdings, Ltd. | 9,500 | | 27,485 |
| | |
|
| | | | 722,282 |
| Brazil - 0.93% | | | |
| All America Latina Logistica SA | 700 | | 58,855 |
| International Equity Index Fund (continued) | |
| | Shares or | | |
| | Principal | | |
| | Amount | | Value |
|
|
| |
| COMMON STOCKS (continued) | | | |
| Brazil (continued) | | | |
| Aracruz Celulose SA, ADR (a) | 845 | $ | 43,881 |
| Banco Nossa Caixa SA | 732 | | 14,710 |
| Brasil Telecom Participacoes SA, ADR | 905 | | 27,331 |
| Brasil Telecom Participacoes SA * | 1,400,000 | | 13,694 |
| Centrais Eletricas Brasileiras SA, ADR, B | | | |
| Shares (a) | 2,071 | | 20,841 |
| Centrais Eletricas Brasileiras SA, ADR | 3,447 | | 37,915 |
| Centrais Eletricas Brasileiras SA | 700,000 | | 15,303 |
| Cia Brasileira De Distribuicao Grupo Pao de | | | |
| Acucar, ADR (a) | 436 | | 12,016 |
| Cia de Bebidas das Americas, ADR | 900 | | 35,280 |
| Cia de Concessoes Rodoviarias, ADR | 2,900 | | 28,299 |
| Cia de Saneamento Basico do Estado de Sao | | | |
| Paulo * | 310,000 | | 34,033 |
| Cia Energetica De Minas Gerais, ADR (a) | 1,976 | | 81,984 |
| Cia Vale do Rio Doce | 4,500 | | 96,695 |
| Companhia Siderurgica Nacional SA, ADR (a) | 2,542 | | 74,531 |
| Companhia Vale Do Rio Doce, ADR | 9,634 | | 206,553 |
| Companhia Vale Do Rio Doce, SADR | 13,682 | | 246,276 |
| Cosan SA Industria e Comercio * | 1,129 | | 59,595 |
| Cyrela Brazil Realty SA | 2,000 | | 35,315 |
| Diagnosticos da America SA * | 800 | | 15,359 |
| EDP - Energias do Brasil SA | 1,100 | | 13,925 |
| Empresa Brasileira de Aeronautica SA * | 2,300 | | 22,551 |
| Empresa Brasileira de Aeronautica SA, ADR | 1,575 | | 60,795 |
| Gafisa SA * | 1,380 | | 18,050 |
| Gerdau SA, SADR (a) | 6,241 | | 90,619 |
| Gerdau SA | 1,308 | | 15,526 |
| Lojas Renner SA | 400 | | 23,840 |
| Natura Cosmeticos SA | 1,700 | | 21,775 |
| Perdigao SA | 1,500 | | 15,765 |
| Petroleo Brasileiro SA, ADR, Petro | 5,916 | | 476,948 |
| Petroleo Brasileiro SA, ADR | 4,276 | | 383,386 |
| Petroleo Brasileiro SA | 6,800 | | 150,945 |
| Souza Cruz SA | 1,200 | | 19,647 |
| Submarino SA * | 1,035 | | 21,176 |
| Tele Norte Leste Participacoes SA, ADR | 5,457 | | 70,341 |
| Tele Norte Leste Participacoes SA | 1,400 | | 35,249 |
| Tractebel Energia SA | 2,100 | | 18,933 |
| Unibanco - Uniao de Bancos Brasileiros SA * | 5,400 | | 38,745 |
| Unibanco - Uniao De Bancos | | | |
| Brasileiros SA, ADR * | 1,717 | | 124,225 |
| Usinas Siderurgicas de Minas Gerais SA, | | | |
| ADR * (a) | 1,567 | | 49,478 |
| Vivo Participacoes SA, ADR * (a) | 3,208 | | 10,266 |
| Votorantim Celulose e Papel SA, SADR (a) | 1,189 | | 19,179 |
| | |
|
| | | | 2,859,830 |
| Canada - 6.24% | | | |
| Aber Diamond Corp. | 1,400 | | 50,426 |
| Abitibi Consolidated, Inc. | 7,100 | | 19,247 |
| ACE Aviation Holdings, Inc. * | 1,500 | | 40,257 |
| Agnico-Eagle Mines, Ltd. | 2,400 | | 91,042 |
The accompanying notes are an integral part of the financial statements. 236
John Hancock Funds II
Portfolio of investments — August 31, 2006
(showing percentage of total net assets)
| International Equity Index Fund (continued) | |
| | Shares or | | |
| | Principal | | |
| | Amount | | Value |
|
|
| |
| COMMON STOCKS (continued) | | | |
| Canada (continued) | | | |
| Agrium, Inc. | 2,600 | $ | 60,310 |
| Alcan Aluminum, Ltd. USD | 7,700 | | 345,879 |
| Algoma Steel, Inc. * | 800 | | 26,639 |
| Alimentation Couche Tard, Inc., ADR | 2,800 | | 59,079 |
| Angiotech Pharmaceuticals, Inc. * | 1,700 | | 20,201 |
| ARC Energy Trust, ADR | 2,000 | | 52,609 |
| Astral Media. Inc. | 1,200 | | 41,281 |
| ATI Technologies, Inc. * | 5,700 | | 122,020 |
| Ballard Power Systems, Inc. * | 200 | | 1,225 |
| Bank Nova Scotia Halifax | 20,500 | | 875,647 |
| Bank of Montreal | 10,400 | | 628,896 |
| Barrick Gold Corp. | 17,708 | | 592,053 |
| BCE, Inc. | 5,673 | | 141,332 |
| Bema Gold Corp. * | 9,100 | | 49,256 |
| Biovail Corp. | 3,200 | | 52,107 |
| Bombardier, Inc. * | 32,100 | | 97,462 |
| Brookfield Asset Management, Inc. | 7,450 | | 332,562 |
| Brookfield Properties Corp. | 2,600 | | 91,182 |
| CAE, Inc. | 4,900 | | 41,931 |
| Cameco Corp. | 7,500 | | 306,601 |
| Canadian Imperial Bank of Commerce | 7,000 | | 508,119 |
| Canadian National Railway Company | 11,100 | | 472,927 |
| Canadian Natural Resources, Ltd. | 11,100 | | 582,057 |
| Canadian Oil Sands Trust, ADR | 4,900 | | 149,659 |
| Canadian Pacific Railway, Ltd. | 3,400 | | 166,828 |
| Canadian Tire Corp., Ltd. | 1,600 | | 100,194 |
| Canetic Resources Trust | 4,000 | | 82,158 |
| Canfor Corp. * | 1,800 | | 18,494 |
| Celestica, Inc. * | 3,800 | | 36,398 |
| CGI Group, Inc. * | 5,300 | | 33,525 |
| Cognos, Inc. * | 1,700 | | 54,534 |
| Cott Corp. * | 1,900 | | 32,140 |
| Domtar, Inc. * | 3,900 | | 24,845 |
| Duvernay Oil Corp, ADR * | 1,000 | | 37,248 |
| Eldorado Gold Corp. * | 7,900 | | 39,048 |
| Enbridge, Inc. | 7,200 | | 236,758 |
| EnCana Corp. - CAD | 17,500 | | 917,183 |
| Ensign Energy Services, Inc., ADR | 2,600 | | 53,685 |
| Fairfax Financial Holdings, Ltd. | 400 | | 48,127 |
| Finning International, Inc. | 1,700 | | 61,032 |
| First Calgary Petroleums, Ltd., ADR * | 4,400 | | 39,680 |
| First Quantum Minerals, Ltd., ADR | 1,300 | | 70,600 |
| Fortis, Inc. | 2,100 | | 47,668 |
| Four Seasons Hotels, Inc. | 500 | | 31,541 |
| George Weston, Ltd. | 1,100 | | 77,929 |
| Gildan Activewear, Inc. * | 1,200 | | 60,214 |
| Glamis Gold, Ltd. * | 3,400 | | 155,767 |
| Goldcorp, Inc. | 7,600 | | 209,804 |
| Great-West Lifeco, Inc. | 5,500 | | 145,471 |
| Harvest Energy Trust | 1,900 | | 58,804 |
| Husky Energy, Inc. | 2,700 | | 186,596 |
| IGM Financial, Inc. | 2,600 | | 116,767 |
| International Equity Index Fund (continued) | |
| | Shares or | | |
| | Principal | | |
| | Amount | | Value |
|
|
| |
| COMMON STOCKS (continued) | | | |
| Canada (continued) | | | |
| Imperial Oil, Ltd. | 7,200 | $ | 270,590 |
| Inco, Ltd. | 4,000 | | 311,535 |
| Intrawest Corp. | 900 | | 31,140 |
| Ipsco, Inc. | 1,000 | | 92,025 |
| Ivanhoe Mines, Ltd. * | 4,300 | | 26,927 |
| Jean Coutu Group, Inc. | 2,800 | | 30,590 |
| Kinross Gold Corp. * | 7,700 | | 107,848 |
| Loblaw Companies, Ltd. | 2,400 | | 111,363 |
| Magna International, Inc. | 2,300 | | 164,854 |
| Manulife Financial Corp. | 32,800 | | 1,067,597 |
| MDS, Inc. | 2,800 | | 56,397 |
| Meridian Gold, Inc. * | 2,100 | | 62,033 |
| Methanex Corp. | 2,200 | | 52,403 |
| MI Developments, Inc. | 900 | | 30,855 |
| National Bank of Canada | 3,400 | | 184,248 |
| Nexen, Inc. | 5,500 | | 320,015 |
| Niko Resources, Ltd. | 800 | | 45,716 |
| Nortel Networks Corp. * | 89,400 | | 186,612 |
| Nova Chemicals Corp. | 1,600 | | 50,965 |
| Novelis, Inc. | 1,500 | | 31,284 |
| Onex Corp. | 2,300 | | 51,210 |
| Open Text Corp. * | 800 | | 13,027 |
| OPTI Canada, Inc. * | 3,200 | | 58,786 |
| Pan American Silver Corp * | 1,400 | | 32,133 |
| Penn West Energy Trust, ADR | 1,600 | | 66,608 |
| Penn West Energy Trust | 4,980 | | 206,778 |
| Petro-Canada | 10,600 | | 452,103 |
| Potash Corp. of Saskatchewan, Inc. | 2,200 | | 216,074 |
| Power Corporation Of Canada | 6,900 | | 202,514 |
| Power Financial Corp. | 5,100 | | 159,316 |
| Precision Drilling Trust, ADR | 1,200 | | 43,634 |
| PrimeWest Energy Trust | 1,600 | | 48,738 |
| Provident Energy Trust * | 3,800 | | 49,790 |
| QLT, Inc. * | 1,600 | | 12,232 |
| Quebecor World, Inc. | 1,600 | | 17,812 |
| Research In Motion, Ltd. * | 3,500 | | 288,659 |
| Ritchie Bros. Auctioneers, Inc. | 700 | | 34,284 |
| Rogers Communications, Inc., Class B | 4,700 | | 242,082 |
| RONA, Inc. * | 2,200 | | 43,239 |
| Royal Bank of Canada | 26,800 | | 1,186,160 |
| Saputo, Inc. | 900 | | 30,701 |
| Shaw Communications, Inc. | 3,600 | | 108,002 |
| Shell Canada, Ltd. | 4,200 | | 136,249 |
| Shoppers Drug Mart Corp. | 4,200 | | 176,972 |
| SNC-Lavalin Group, Inc. | 3,000 | | 82,655 |
| Sun Life Financial, Inc. | 12,000 | | 493,598 |
| Suncor Energy, Inc. | 9,500 | | 735,260 |
| Talisman Energy, Inc. | 23,200 | | 406,705 |
| Teck Cominco, Ltd. | 4,200 | | 279,330 |
| Telus Corp. - Non Voting Shares | 3,600 | | 171,371 |
| Telus Corp. | 1,200 | | 58,826 |
| Thomson Corp. | 4,700 | | 188,994 |
The accompanying notes are an integral part of the financial statements. 237
John Hancock Funds II
Portfolio of investments — August 31, 2006
(showing percentage of total net assets)
| International Equity Index Fund (continued) | |
| | Shares or | | |
| | Principal | | |
| | Amount | | Value |
|
|
| |
| COMMON STOCKS (continued) | | | |
| Canada (continued) | | | |
| TransAlta Corp. | 4,200 | $ | 92,148 |
| Trans-Canada Corp. | 10,200 | | 331,259 |
| Trican Well Service, Ltd. | 2,300 | | 46,825 |
| TSX Group, Inc. | 1,300 | | 58,266 |
| UTS Energy Corp., ADR * | 8,500 | | 36,484 |
| Western Oil Sands, Inc. * | 2,900 | | 77,305 |
| Yamana Gold, Inc. * | 5,100 | | 52,168 |
| | |
|
| | | | 19,218,338 |
| Cayman Islands - 0.09% | | | |
| Agile Property Holdings, Ltd. | 21,211 | | 15,328 |
| ASM Pacific Technology, Ltd. | 3,500 | | 18,137 |
| China Resources Land, Ltd. | 21,211 | | 12,819 |
| Foxconn International Holdings, Ltd. * | 45,000 | | 119,488 |
| Hutchison Telecommunications | | | |
| International, Ltd. * | 29,000 | | 51,310 |
| Kingboard Chemical Holdings, Ltd. | 12,000 | | 38,730 |
| Xinao Gas Holdings, Ltd., GDR | 12,000 | | 11,418 |
| | |
|
| | | | 267,230 |
| Chile - 0.23% | | | |
| Banco Santander Chile SA, ADR (a) | 2,667 | | 116,175 |
| Cia Cervecerias Unidas SA, ADR | 457 | | 11,361 |
| Compania de Telecomunicaciones de Chile | | | |
| SA, ADR (a) | 7,734 | | 56,768 |
| Distribucion y Servicio D&S SA, ADR (a) | 966 | | 15,340 |
| Embotelladora Andina SA, ADR, Series A | 915 | | 11,941 |
| Embotelladora Andina SA, ADR, Series B | 1,006 | | 14,627 |
| Empresa Nacional de Electricidad SA, ADR | 6,419 | | 183,776 |
| Enersis SA, ADR | 15,435 | | 190,777 |
| Sociedad Quimica y Minera de | | | |
| Chile SA, ADR, B Shares (a) | 717 | | 78,870 |
| Vina Concha Y Toro SA, ADR (a) | 911 | | 26,191 |
| | |
|
| | | | 705,826 |
| China - 0.72% | | | |
| Air China, Ltd., Class H | 52,066 | | 18,612 |
| Aluminum Corp. of China, Ltd. | 66,780 | | 47,743 |
| Angang New Steel Company, Ltd. Class H | 20,141 | | 16,523 |
| Bank of China, Ltd., H Shares * | 467,500 | | 203,184 |
| Bank of Communications Company, Ltd., | | | |
| Class H | 121,879 | | 76,949 |
| Beijing Capital International Airport Company, | | | |
| Ltd., Class H | 25,211 | | 16,468 |
| Beijing Datang Power Generation | | | |
| Company , Ltd., Class H | 31,568 | | 21,108 |
| BYD Company, Ltd., H Shares * | 2,446 | | 5,536 |
| Chaoda Modern Agriculture Holdings, Ltd. | 31,925 | | 16,092 |
| China Construction Bank | 519,118 | | 224,950 |
| China Life Insurance Company, Ltd. | 148,376 | | 263,289 |
| China Mengniu Dairy Company, Ltd. | 19,498 | | 24,971 |
| China Overseas Land & Investment, Ltd. | 68,921 | | 47,679 |
| China Petroleum & Chemical Corp., Class H | 352,030 | | 209,128 |
| China Shipping Container Lines Company, Ltd. | 38,888 | | 8,751 |
| International Equity Index Fund (continued) | |
| | Shares or | | |
| | Principal | | |
| | Amount | | Value |
|
|
| |
| COMMON STOCKS (continued) | | | |
| China (continued) | | | |
| China Shipping Development Company, Ltd., | | | |
| Class H | 29,568 | $ | 26,310 |
| China Telecom Corp., Ltd. | 294,396 | | 98,801 |
| China Travel International Investment Hong | | | |
| Kong, Ltd. | 57,709 | | 14,099 |
| COSCO Holdings | 29,460 | | 13,334 |
| Dongfeng Motor Group Company, Ltd. * | 52,780 | | 19,342 |
| Guangdong Investment, Ltd. | 52,780 | | 20,360 |
| Guangshen Railway Company, Ltd., Class H | 33,211 | | 13,537 |
| Guangzhou R&F Properties Company, Ltd. | 3,400 | | 17,050 |
| Huadian Power International Corp., Ltd., | | | |
| Class H | 21,211 | | 5,264 |
| Huaneng Power International, Inc., Class H | 64,564 | | 42,921 |
| Hunan Non-Ferrous Metal Corp., Ltd * | 26,000 | | 9,428 |
| Jiangsu Expressway, Ltd. | 22,855 | | 13,342 |
| Jiangxi Copper Company, Ltd., Class H | 29,925 | | 28,398 |
| Lenovo Group, Ltd. | 74,564 | | 31,160 |
| Maanshan Iron & Steel Company, Ltd., Class | | | |
| H | 31,925 | | 9,934 |
| PetroChina Company, Ltd., Class H | 397,739 | | 448,527 |
| PICC Property & Casualty Company, Ltd., | | | |
| Class H | 44,780 | | 15,316 |
| Qingling Motors Co. | 855 | | 119 |
| Shanghai Electric Group Company, Ltd. | 63,136 | | 20,702 |
| Shanghai Forte Land Company | 15,211 | | 4,909 |
| Shenzhen Expressway Company, Ltd. | 12,141 | | 6,276 |
| Sinopec Shanghai Petrochemical | | | |
| Company, Ltd., H Shares | 50,066 | | 23,562 |
| Sinopec Yizheng Chemical Fibre | | | |
| Company, Ltd. * | 21,925 | | 4,370 |
| Sinotrans, Ltd., Class H | 35,390 | | 11,195 |
| Solomon Systech International, Ltd. | 34,000 | | 7,214 |
| Tsingtao Brewery Company, Ltd., Series H | 5,070 | | 6,063 |
| Weichai Power Company, Ltd. | 2,357 | | 5,783 |
| Yanzhou Coal Mining Company, Ltd., Class H | 43,210 | | 30,503 |
| Zhejiang Expressway Company, Ltd., Class H | 32,282 | | 20,755 |
| Zijin Mining Group, Ltd. | 70,149 | | 33,194 |
| ZTE Corp., Class H | 2,557 | | 8,746 |
| | |
|
| | | | 2,211,497 |
| Colombia - 0.03% | | | |
| BanColombia SA, ADR (a) | 3,207 | | 93,324 |
| Czech Republic - 0.10% | | | |
| Cesky Telecom AS * | 2,268 | | 49,790 |
| CEZ AS | 4,171 | | 155,474 |
| Komercni Banka AS | 306 | | 45,431 |
| Philip Morris CR AS | 14 | | 5,887 |
| Unipetrol AS * | 1,460 | | 13,495 |
| Zentiva NV | 460 | | 24,444 |
| | |
|
| | | | 294,521 |
| Denmark - 0.58% | | | |
| A P Moller- Maersk A/S, Series B (a) | 23 | | 191,292 |
| AS Det Ostasiatiske Kompagni | 375 | | 16,029 |
The accompanying notes are an integral part of the financial statements. 238
John Hancock Funds II
Portfolio of investments — August 31, 2006
(showing percentage of total net assets) |
| International Equity Index Fund (continued) | |
| | Shares or | | |
| | Principal | | |
| | Amount | | Value |
|
|
| |
| COMMON STOCKS (continued) | | | |
| Denmark (continued) | | | |
| Bang & Olufsen AS - B Series (a) | 225 | $ | 23,035 |
| Carlsberg AS, B Shares | 700 | | 54,318 |
| Codan AS | 300 | | 21,607 |
| Coloplast AS (a) | 507 | | 38,429 |
| Dampskibsselskabet Torm AS (a) | 300 | | 15,665 |
| Danisco AS (a) | 1,000 | | 74,253 |
| Danske Bank AS | 8,600 | | 330,350 |
| DSV AS | 400 | | 64,753 |
| FLS Industries AS, B Shares | 900 | | 38,893 |
| GN Store Nord AS (a) | 4,500 | | 66,172 |
| H. Lundbeck AS (a) | 1,100 | | 25,324 |
| Jyske Bank * | 1,246 | | 71,793 |
| NKT Holdings AS | 400 | | 26,237 |
| Novo Nordisk AS, Class B | 200 | | 14,765 |
| Novo Nordisk AS | 4,800 | | 354,357 |
| Novozymes AS, B Shares (a) | 1,050 | | 73,735 |
| Sydbank AS | 1,320 | | 49,347 |
| Topdanmark AS * | 400 | | 57,276 |
| TrygVesta AS (a) | 544 | | 33,397 |
| Vestas Wind Systems AS * | 3,800 | | 106,218 |
| William Demant Holdings AS * (a) | 500 | | 36,912 |
| |
|
| | | | 1,784,157 |
Finland - 1.18% | | | |
| Amer Sports Oyj | 1,550 | | 34,402 |
| Cargotec Corp. Oyj, B Shares | 736 | | 31,871 |
| Elisa Oyj, A Shares | 3,300 | | 66,827 |
| Fortum Corp. Oyj | 9,400 | | 252,524 |
| KCI Konecranes Oyj | 1,150 | | 22,803 |
| Kesko Oyj | 1,400 | | 59,173 |
| Kone Corp. Oyj | 1,592 | | 72,135 |
| Metra Oyj, B Shares | 1,300 | | 53,649 |
| Metso Oyj | 2,700 | | 100,303 |
| Neste Oil OYJ | 2,676 | | 84,213 |
| Nokia AB Oyj | 87,900 | | 1,838,493 |
| Nokian Renkaat Oyj (a) | 2,100 | | 36,723 |
| OKO Bank - A | 2,000 | | 32,442 |
| Oriola-KD OYJ * | 1,700 | | 4,089 |
| Orion Oyj * (a) | 1,700 | | 30,946 |
| Outokumpu Oyj | 2,200 | | 55,865 |
| Rautaruukki Oyj | 1,800 | | 52,500 |
| Sampo Oyj, A Shares | 9,100 | | 188,005 |
| SanomaWSOY Oyj (a) | 1,320 | | 32,725 |
| Stora Enso Oyj, R Shares | 12,900 | | 195,718 |
| TietoEnator Oyj (a) | 1,660 | | 47,695 |
| UPM-Kymmene Oyj | 11,100 | | 262,694 |
| Uponor Oyj | 1,200 | | 32,606 |
| YIT Oyj | 2,596 | | 56,290 |
| |
|
| | | | 3,644,691 |
France - 7.50% | | | |
| Accor SA (a) | 4,169 | | 266,393 |
| Air France KLM | 2,241 | | 61,063 |
| International Equity Index Fund (continued) | |
| | Shares or | | |
| | Principal | | |
| | Amount | | Value |
|
|
| |
| COMMON STOCKS (continued) | | | |
| France (continued) | | | |
| Alcatel SA * (a) | 28,635 | $ | 358,621 |
| Alstom RGPT * (a) | 2,207 | | 207,795 |
| Arkema * (a) | 1,122 | | 43,677 |
| Atos Origin SA * | 1,390 | | 72,887 |
| AXA Group | 34,471 | | 1,278,814 |
| BNP Paribas SA (a) | 17,233 | | 1,828,659 |
| Bouygues SA (a) | 4,249 | | 223,400 |
| Business Objects SA * | 2,146 | | 59,819 |
| Cap Gemini SA (a) | 2,571 | | 140,636 |
| Carrefour SA (a) | 12,385 | | 763,024 |
| Casino Guich-Perrachon SA (a) | 953 | | 81,620 |
| CNP Assurances SA (a) | 907 | | 93,577 |
| Compagnie De Saint Gobain SA (a) | 6,543 | | 485,049 |
| Compagnie Generale des Etablissements | | | |
| Michelin, Class B | 2,871 | | 194,655 |
| Credit Agricole S.A. (a) | 12,609 | | 511,484 |
| Dassault Systemes SA | 1,091 | | 60,320 |
| Essilor International SA (a) | 2,084 | | 215,409 |
| European Aeronautic Defence & | | | |
| Space Company (a) | 6,902 | | 207,844 |
| France Telecom SA | 35,454 | | 751,525 |
| Gaz de France (a) | 3,979 | | 147,818 |
| Gecina SA | 184 | | 23,962 |
| Groupe Danone SA | 4,926 | | 676,790 |
| Hermes International SA (a) | 1,314 | | 111,278 |
| Imerys SA | 610 | | 46,352 |
| Klepierre SA | 445 | | 62,448 |
| Lafarge SA (a) | 3,114 | | 400,350 |
| Lagardere S.C.A. (a) | 2,472 | | 180,884 |
| L'Air Liquide SA (a) | 2,502 | | 527,153 |
| L'Oreal SA (a) | 5,944 | | 621,236 |
| LVMH Moet Hennessy SA | 5,154 | | 529,768 |
| M6-Metropole Television (a) | 1,462 | | 45,653 |
| Neopost SA | 613 | | 71,556 |
| PagesJaunes Groupe SA | 2,409 | | 69,000 |
| Pernod-Ricard SA (a) | 1,532 | | 333,756 |
| Peugeot SA (a) | 3,126 | | 176,233 |
| Pinault-Printemps-Redoute SA (a) | 1,331 | | 183,549 |
| Publicis Groupe SA (a) | 2,807 | | 110,670 |
| Renault Regie Nationale SA (a) | 3,903 | | 453,856 |
| Safran SA (a) | 3,386 | | 73,766 |
| Sanofi-Aventis | 21,037 | | 1,885,156 |
| Schneider Electric SA (a) | 4,760 | | 506,928 |
| SCOR (a) | 16,126 | | 38,577 |
| Societe BIC SA | 609 | | 37,816 |
| Societe Des Autoroutes Paris-Rhin-Rhone | 436 | | 31,764 |
| Societe Generale | 7,177 | | 1,156,828 |
| Societe Television Francaise 1 (a) | 2,191 | | 69,987 |
| Sodexho Alliance (a) | 1,829 | | 97,357 |
| STMicroelectronics NV (a) | 14,132 | | 232,307 |
| Suez SA Strip VVPR * | 1,452 | | 19 |
| Suez SA (a) | 19,246 | | 821,830 |
The accompanying notes are an integral part of the financial statements. 239
John Hancock Funds II
Portfolio of investments — August 31, 2006
(showing percentage of total net assets) |
| International Equity Index Fund (continued) | |
| | Shares or | | |
| | Principal | | |
| | Amount | | Value |
|
|
| |
| COMMON STOCKS (continued) | | | |
| France (continued) | | | |
| Technip SA (a) | 2,146 | $ | 123,647 |
| Thales SA (a) | 1,884 | | 81,751 |
| Thomson SA * (a) | 5,367 | | 85,753 |
| Total SA (a) | 45,794 | | 3,087,270 |
| Unibail | 916 | | 178,581 |
| Valeo SA (a) | 1,584 | | 57,872 |
| Vallourec SA (a) | 780 | | 174,618 |
| Veolia Environnement SA | 5,958 | | 333,452 |
| Vinci SA (a) | 4,406 | | 476,274 |
| Vivendi Universal SA | 23,849 | | 819,162 |
| Zodiac SA | 739 | | 44,839 |
| |
|
| | | | 23,094,137 |
Germany - 5.31% | | | |
| Adidas-Salomon AG (a) | 4,168 | | 198,347 |
| Allianz AG | 8,498 | | 1,439,003 |
| Altana AG | 1,539 | | 90,760 |
| BASF AG | 10,729 | | 882,934 |
| Bayer AG | 15,166 | | 750,241 |
| Beiersdorf AG (a) | 990 | | 54,711 |
| Bilfinger Berger AG | 835 | | 45,718 |
| Celesio AG | 1,790 | | 90,678 |
| Commerzbank AG | 13,261 | | 463,121 |
| Continental AG | 2,792 | | 298,234 |
| DaimlerChrysler AG | 19,058 | | 1,004,454 |
| Deutsche Bank AG | 10,764 | | 1,227,582 |
| Deutsche Boerse AG (a) | 2,135 | | 323,565 |
| Deutsche Lufthansa AG | 5,009 | | 99,064 |
| Deutsche Post AG, GDR | 1,460 | | 36,799 |
| Deutsche Post AG | 13,149 | | 332,885 |
| Deutsche Postbank AG | 1,171 | | 91,258 |
| Deutsche Telekom AG | 59,323 | | 864,375 |
| Douglas Holding AG | 661 | | 29,460 |
| E.ON AG | 13,039 | | 1,654,003 |
| Fresenius Medical Care AG | 1,277 | | 168,228 |
| Heidelberger Druckmaschinen AG | 1,353 | | 54,210 |
| Hochtief AG | 949 | | 53,938 |
| Hypo Real Estate Holding AG | 2,772 | | 171,630 |
| Infineon Technologies AG * | 15,740 | | 184,642 |
| IVG Immobilien AG | 1,868 | | 60,410 |
| KarstadtQuelle AG * (a) | 1,238 | | 27,398 |
| Linde AG | 2,214 | | 195,114 |
| MAN AG | 2,608 | | 199,210 |
| Merck & Company AG | 1,067 | | 105,771 |
| Metro AG | 3,134 | | 183,941 |
| MLP AG (a) | 1,068 | | 18,308 |
| Muenchener Rueckversicherungs- | | | |
| Gesellschaft AG | 4,144 | | 623,317 |
| Premiere AG * (a) | 1,468 | | 18,441 |
| ProSieben Sat.1 Media AG | 1,600 | | 42,901 |
| Puma AG | 240 | | 83,120 |
| Qiagen AG * (a) | 2,757 | | 39,431 |
| Rheinmetall AG | 788 | | 52,822 |
| International Equity Index Fund (continued) | |
| | Shares or | | |
| | Principal | | |
| | Amount | | Value |
|
|
| |
| COMMON STOCKS (continued) | | | |
| Germany (continued) | | | |
| RWE AG | 9,426 | $ | 862,644 |
| Salzgitter AG | 883 | | 78,991 |
| SAP AG | 4,688 | | 894,111 |
| Siemens AG | 17,719 | | 1,500,104 |
| Solarworld AG (a) | 804 | | 47,507 |
| Suedzucker AG | 1,309 | | 32,570 |
| Thyssen Krupp AG | 7,693 | | 261,581 |
| Tui AG (a) | 4,369 | | 85,177 |
| Volkswagen AG (a) | 3,489 | | 278,287 |
| Wincor Nixdorf AG | 312 | | 43,401 |
| |
|
| | | | 16,344,397 |
Greece - 0.50% | | | |
| Alpha Bank SA | 8,194 | | 217,610 |
| Athens Stock Exchange SA (ASE) * | 930 | | 14,990 |
| Bank of Piraeus SA | 4,556 | | 119,013 |
| Coca Cola Hellenic Bottling Company SA | 2,200 | | 72,329 |
| Cosmote Mobile Communications SA | 2,130 | | 49,537 |
| EFG Eurobank Ergas SA | 4,874 | | 147,148 |
| Folli-Follie SA | 340 | | 9,090 |
| Germanos SA | 1,160 | | 27,779 |
| Greek Organization of Football Prognostics | 4,730 | | 167,972 |
| Hellenic Petroleum SA | 2,190 | | 28,520 |
| Hellenic Technodomiki Tev SA | 2,430 | | 25,863 |
| Hellenic Telecommunications Organization SA * | 6,750 | | 155,429 |
| Intracom SA * | 1,750 | | 10,835 |
| Motor Oil Hellas Corinth Refineries SA | 910 | | 24,074 |
| National Bank Of Greece SA | 8,097 | | 335,602 |
| Public Power Corp. | 2,140 | | 51,084 |
| Techniki Olympiaki SA | 1,630 | | 6,506 |
| Titan Cement Company SA | 1,180 | | 58,569 |
| Viohalco SA | 2,250 | | 23,890 |
| |
|
| | | | 1,545,840 |
Hong Kong - 1.61% | | | |
| Anhui Conch Cement Company, Ltd., Series H | 9,070 | | 17,051 |
| Bank of East Asia, Ltd. | 30,600 | | 136,141 |
| Beijing Enterprises Holdings, Ltd. | 4,714 | | 7,601 |
| BOC Hong Kong Holdings, Ltd. | 79,000 | | 173,299 |
| Cathay Pacific Airways, Ltd. | 21,000 | | 39,208 |
| Cheung Kong Holdings, Ltd. | 32,000 | | 353,661 |
| China Eastern Airlines Corp., Ltd. * | 24,639 | | 3,327 |
| China Everbright, Ltd. * | 11,784 | | 7,470 |
| China Merchants Holdings | | | |
| International Company, Ltd. | 21,157 | | 61,483 |
| China Mobile, Ltd. | 103,970 | | 699,198 |
| China Pharmaceutical Group, Ltd. * | 498 | | 64 |
| China Resource Power Holdings, Ltd. | 25,211 | | 22,303 |
| China Resources Enterprises, Ltd. | 22,855 | | 52,193 |
| China Southern Airlines Company, Ltd. * | 18,855 | | 4,170 |
| Citic Pacific, Ltd. | 23,033 | | 73,598 |
| CLP Holdings, Ltd. | 38,500 | | 243,566 |
| CNOOC, Ltd. | 318,720 | | 278,272 |
The accompanying notes are an integral part of the financial statements. 240
John Hancock Funds II
Portfolio of investments — August 31, 2006
(showing percentage of total net assets) |
| International Equity Index Fund (continued) | |
| | Shares or | | |
| | Principal | | |
| | Amount | | Value |
|
|
| |
| COMMON STOCKS (continued) | | | |
| Hong Kong (continued) | | | |
| COFCO International, Ltd. | 9,784 | $ | 6,580 |
| Denway Motors, Ltd. | 105,559 | | 33,662 |
| FU JI Food & Catering Services Holdings, Ltd. | 4,000 | | 6,285 |
| Global Bio-Chem Technology Group Company | 22,855 | | 7,612 |
| Gome Electrical Appliances Holdings, Ltd. | 15,427 | | 11,882 |
| Guangzhou Investment Company, Ltd. | 75,493 | | 14,076 |
| Hang Lung Properties, Ltd. | 40,000 | | 85,586 |
| Hang Seng Bank, Ltd. | 16,300 | | 206,450 |
| Henderson Land Development Company, Ltd. | 16,000 | | 90,421 |
| Hong Kong & China Gas Company, Ltd. | 76,000 | | 176,882 |
| Hong Kong Electric Holdings, Ltd. | 29,500 | | 141,109 |
| Hong Kong Exchange & Clearing, Ltd. | 22,000 | | 149,930 |
| Hopewell Holdings, Ltd. | 13,000 | | 37,110 |
| Hutchison Whampoa, Ltd. | 45,000 | | 408,804 |
| Hysan Development Company, Ltd. | 13,195 | | 35,800 |
| Li Ning Company, Ltd. | 12,249 | | 13,404 |
| Link, REIT * | 45,554 | | 94,658 |
| Melco International Development | 16,000 | | 38,555 |
| MTR Corp. | 29,799 | | 76,251 |
| New World Development Company, Ltd. | 54,999 | | 98,727 |
| Nine Dragons Paper Holdings, Ltd. * | 21,600 | | 19,803 |
| PCCW, Ltd. | 75,000 | | 46,869 |
| Ping An Insurance Group Company of China, | | | |
| Ltd. | 21,855 | | 71,520 |
| Semiconductor Manufacturing | | | |
| International Corp. * | 256,912 | | 32,374 |
| Shanghai Industrial Holdings, Ltd. | 10,070 | | 19,656 |
| Shangri-La Asia, Ltd. | 26,000 | | 51,485 |
| Shenzhen Investment, Ltd. | 17,568 | | 6,235 |
| Shun Tak Holdings, Ltd. | 20,000 | | 24,277 |
| Sino Land Company, Ltd. | 28,415 | | 47,937 |
| Sun Hung Kai Properties, Ltd. | 29,000 | | 316,217 |
| Swire Pacific, Ltd., Class A | 20,000 | | 219,623 |
| TCL Multimedia Technology Holdings, Ltd. * | 21,925 | | 1,663 |
| Techtronic Industries Company, Ltd. | 21,500 | | 31,682 |
| Television Broadcasting Company, Ltd. | 6,000 | | 34,062 |
| Travelsky Technology, Ltd. | 4,714 | | 5,510 |
| Weiqiao Textile Company, Ltd. | 8,249 | | 9,154 |
| Wharf Holdings, Ltd. | 26,000 | | 87,927 |
| Wing Hang Bank, Ltd. | 3,500 | | 33,529 |
| |
|
| | | | 4,965,912 |
| Hungary - 0.13% | | | |
| BorsodChem Rt. | 928 | | 12,218 |
| Gedeon Richter Rt. | 284 | | 60,484 |
| Magyar Telekom Rt. * | 9,529 | | 38,827 |
| MOL Magyar Olaj - es Gazipari Rt. | 1,439 | | 145,589 |
| OTP Bank Rt. | 5,117 | | 147,747 |
| |
|
| | | | 404,865 |
| India - 0.84% | | | |
| Bajaj Auto, Ltd., ADR | 987 | | 57,542 |
| Dr Reddy's Laboratories, Ltd., ADR (a) | 2,251 | | 69,353 |
| International Equity Index Fund (continued) | |
| | Shares or | | |
| | Principal | | |
| | Amount | | Value |
|
|
| |
| COMMON STOCKS (continued) | | | |
| India (continued) | | | |
| Grasim Industries, Ltd., ADR | 1,533 | $ | 73,967 |
| Hindalco Industries, Ltd., ADR | 2,729 | | 9,961 |
| ICICI Bank, Ltd., SADR | 11,779 | | 314,382 |
| Infosys Technologies, Ltd., ADR (a) | 15,600 | | 699,660 |
| Larsen & Toubro, Ltd., ADR | 558 | | 28,823 |
| Mahindra & Mahindra, Ltd., ADR | 800 | | 11,320 |
| Ranbaxy Laboratories, Ltd., ADR | 6,577 | | 57,549 |
| Reliance Industries, Ltd., GDR | 15,116 | | 723,301 |
| Satyam Computer Services, Ltd., ADR (a) | 5,572 | | 212,683 |
| State Bank of India, Ltd., ADR (a) | 1,019 | | 49,931 |
| Tata Motors, Ltd., ADR (a) | 7,719 | | 142,416 |
| Videsh Sanchar Nigam, Ltd., ADR (a) | 1,097 | | 19,603 |
| Wipro, Ltd., ADR (a) | 8,936 | | 113,308 |
| |
|
| | | | 2,583,799 |
| Indonesia - 0.21% | | | |
| Aneka Tambang Tbk PT | 14,000 | | 8,292 |
| Astra Agro Lestari Tbk PT | 8,500 | | 8,577 |
| Astra International Tbk PT | 42,000 | | 51,135 |
| Bank Central Asia Tbk PT | 126,500 | | 63,132 |
| Bank Danamon Indonesia Tbk PT | 35,500 | | 19,080 |
| Bank Internasional Indonesia Tbk PT | 402,500 | | 8,168 |
| Bank Mandiri Tbk PT | 125,500 | | 28,908 |
| Bank Pan Indonesia Tbk PT * | 128,750 | | 6,496 |
| Bank Rakyat Indonesia Tbk PT | 112,000 | | 53,439 |
| Berlian Laju Tanker Tbk PT | 48,500 | | 10,586 |
| Bumi Resources Tbk PT | 343,500 | | 28,258 |
| Energi Mega Persada Tbk PT * | 91,500 | | 5,520 |
| Gudang Garam Tbk PT | 12,000 | | 13,294 |
| Indocement Tunggal Prakarsa Tbk PT | 19,500 | | 9,785 |
| Indofood Sukses Makmur Tbk PT | 90,000 | | 11,747 |
| International Nickel Indonesia Tbk PT | 4,000 | | 9,652 |
| Kalbe Farma Tbk PT * | 96,000 | | 11,793 |
| Perusahaan Gas Negara Tbk PT | 37,500 | | 52,032 |
| PT Indonesian Satellite Corp. | 50,500 | | 24,372 |
| PT Telekomunikiasi Indonesia, ADR | 4,500 | | 157,455 |
| Ramayana Lestari Sentosa Tbk PT | 53,000 | | 4,534 |
| Semen Gresik Persero Tbk PT | 3,000 | | 8,342 |
| Telekomunikasi Indonesia Tbk PT | 23,500 | | 20,363 |
| Unilever Indonesia Tbk PT | 32,000 | | 15,707 |
| United Tractors Tbk PT | 27,000 | | 17,029 |
| |
|
| | | | 647,696 |
| Ireland - 0.71% | | | |
| Allied Irish Banks PLC - Dublin | 18,778 | | 490,044 |
| Bank of Ireland | 20,898 | | 395,660 |
| Blackrock International Land PLC * | 5,978 | | 2,982 |
| C&C Group PLC | 6,770 | | 75,524 |
| CRH PLC | 11,485 | | 397,718 |
| DCC PLC | 1,627 | | 40,794 |
| Depfa Bank PLC | 7,425 | | 137,917 |
| Elan Corp. - Dublin * | 9,186 | | 152,765 |
| Fyffes PLC - Dublin | 5,978 | | 12,542 |
The accompanying notes are an integral part of the financial statements. 241
John Hancock Funds II
Portfolio of investments — August 31, 2006
(showing percentage of total net assets) |
| International Equity Index Fund (continued) | |
| | Shares or | | |
| | Principal | | |
| | Amount | | Value |
|
|
| |
| COMMON STOCKS (continued) | | | |
| Ireland (continued) | | | |
| Grafton Group PLC * | 4,878 | $ | 66,645 |
| Greencore Group PLC - Dublin | 2,954 | | 15,456 |
| Iaws Group PLC, ADR | 2,146 | | 43,348 |
| Independent News & Media PLC | 11,543 | | 36,916 |
| Irish Life & Permanent PLC - Dublin | 5,853 | | 150,498 |
| Kerry Group PLC | 2,634 | | 58,630 |
| Kingspan Group PLC - Dublin | 2,757 | | 49,306 |
| Paddy Power PLC | 795 | | 14,492 |
| Ryanair Holdings PLC, SADR * (a) | 608 | | 33,361 |
| |
|
| | | | 2,174,598 |
| Israel - 0.35% | | | |
| Africa-Israel Investments, Ltd. | 239 | | 12,853 |
| Aladdin Knowledge Systems, ADR * (a) | 1,030 | | 16,377 |
| Alvarion, Ltd., ADR * (a) | 1,224 | | 8,617 |
| Audio Codes, Ltd., ADR * (a) | 664 | | 6,600 |
| Bank Hapoalim, Ltd. | 19,985 | | 87,858 |
| Bank Leumi Le-Israel | 17,834 | | 63,546 |
| Bezek Israeli Telecommunications Corp., Ltd. | 21,059 | | 25,407 |
| Check Point Software Technologies, Ltd., ADR * | 3,884 | | 72,204 |
| Clal Industries & Investments, Ltd. | 277 | | 1,401 |
| Clal Insurance Enterprise Holdings, Ltd. | 69 | | 1,252 |
| Discount Investment Corp. | 110 | | 2,418 |
| ECI Telecom, Ltd., ADR * | 1,069 | | 7,643 |
| Ectel, Ltd., ADR * | 70 | | 295 |
| Elbit Systems, Ltd. | 417 | | 11,976 |
| Given Imaging Corp., ADR * (a) | 288 | | 5,550 |
| Harel Insurance Investments, Ltd. | 33 | | 1,344 |
| ICL Israel Chemicals, Ltd. | 10,207 | | 48,726 |
| IDB Development Corp., Ltd. | 409 | | 10,698 |
| Israel Corporation, Ltd. | 46 | | 18,338 |
| Israel Discount Bank, Ltd. * | 8,946 | | 14,593 |
| Koor Industries, Ltd. * | 61 | | 3,073 |
| Lipman Electronic Engineering, Ltd., ADR * | 391 | | 9,810 |
| Makhteshim-Agam Industries, Ltd. | 6,312 | | 32,256 |
| Migdal Insurance Holdings, Ltd. | 919 | | 1,012 |
| M-Systems Flash Disk Pioneers, Ltd., ADR * (a) | 697 | | 30,933 |
| Nice Systems, Ltd. * | 976 | | 24,480 |
| Orbotech, Ltd. * | 634 | | 15,222 |
| Partner Communications, Ltd. | 1,398 | | 13,021 |
| RADWARE, Ltd. ADR * | 1,054 | | 13,944 |
| Retalix, Ltd. * | 65 | | 1,184 |
| Strauss-Elite, Ltd. | 156 | | 1,502 |
| Super-Sol, Ltd. * | 430 | | 1,291 |
| Syneron Medical, Ltd., ADR * (a) | 327 | | 7,750 |
| Tadiran Communications Industries, Ltd. | 35 | | 1,097 |
| Teva Pharmaceutical Industries, Ltd. | 14,486 | | 503,232 |
| United Mizrahi Bank, Ltd. | 2,438 | | 13,586 |
| |
|
| | | | 1,091,089 |
| Italy - 3.03% | | | |
| Alleanza Assicuraz SpA (a) | 9,015 | | 109,039 |
| Assicurazioni Generali SpA | 19,985 | | 751,890 |
| International Equity Index Fund (continued) | |
| | Shares or | | |
| | Principal | | |
| | Amount | | Value |
|
|
| |
| COMMON STOCKS (continued) | | | |
| Italy (continued) | | | |
| Autogrill SpA (a) | 2,441 | $ | 36,941 |
| Autostrade SpA (a) | 5,934 | | 167,763 |
| Banca Fideuram SpA (a) | 6,100 | | 39,095 |
| Banca Intesa SpA - Non convertible | 18,949 | | 120,536 |
| Banca Intesa SpA (a) | 81,335 | | 544,170 |
| Banca Monte dei Paschi Siena SpA (a) | 23,866 | | 144,944 |
| Banca Popolare di Milano SpA (a) | 8,829 | | 122,884 |
| Banche Popolari Unite SpA | 7,410 | | 208,828 |
| Banco Popolare Di Verona e Novara SpA | 7,741 | | 229,742 |
| Benetton Group SpA | 1,203 | | 17,975 |
| Bulgari SpA (a) | 3,076 | | 38,504 |
| Capitalia SpA | 35,221 | | 306,834 |
| Enel SpA | 90,023 | | 802,679 |
| Eni SpA | 54,441 | | 1,664,483 |
| Fiat SpA * (a) | 11,272 | | 161,212 |
| Finmeccanica SpA | 6,422 | | 141,961 |
| Fondiaria-Sai SpA (a) | 1,471 | | 62,174 |
| Gruppo Editoriale L'Espresso SpA (a) | 3,249 | | 17,259 |
| Italcementi SpA (a) | 1,507 | | 37,130 |
| Lottomatica SpA (a) | 1,178 | | 45,510 |
| Luxottica Group SpA (a) | 3,020 | | 87,350 |
| Mediaset SpA | 16,547 | | 190,933 |
| Mediobanca SpA (a) | 10,073 | | 219,318 |
| Mediolanum SpA (a) | 5,322 | | 38,262 |
| Mondadori (Arnoldo) Editore SpA (a) | 2,181 | | 21,079 |
| Pirelli & Company SpA | 58,148 | | 50,619 |
| San Paolo-IMI SpA (a) | 23,157 | | 484,642 |
| Seat Pagine Gialle SpA (a) | 83,914 | | 39,128 |
| Snam Rete Gas SpA (a) | 21,368 | | 99,909 |
| T.E.R.N.A SpA | 23,850 | | 67,809 |
| Telecom Italia SpA | 223,414 | | 617,333 |
| Telecom Italia SpA-RNC | 125,409 | | 308,025 |
| Tiscali SpA * (a) | 4,438 | | 12,973 |
| UniCredito Italiano SpA | 163,338 | | 1,299,670 |
| |
|
| | | | 9,308,603 |
| Japan - 18.83% | | | |
| Access Company, Ltd. * (a) | 5 | | 33,531 |
| Acom Company, Ltd. (a) | 1,400 | | 62,630 |
| Aderans Company, Ltd. (a) | 900 | | 23,314 |
| Advantest Corp. (a) | 1,700 | | 161,808 |
| AEON Company, Ltd. (a) | 12,000 | | 302,160 |
| AEON Credit Service Company, Ltd. | 1,600 | | 38,311 |
| Aiful Corp. (a) | 1,700 | | 68,084 |
| Aisin Seiki Company | 4,000 | | 121,341 |
| Ajinomoto Company, Inc. | 13,000 | | 141,017 |
| Alfresa Holdings Corp. (a) | 500 | | 33,659 |
| All Nippon Airways Company, Ltd. | 12,000 | | 46,935 |
| Alps Electric Company (a) | 3,400 | | 38,156 |
| Amada Company, Ltd. | 7,000 | | 73,129 |
| Amano Corp. (a) | 1,600 | | 22,278 |
| Aoyama Trading Company, Ltd. | 1,100 | | 35,806 |
The accompanying notes are an integral part of the financial statements. 242
John Hancock Funds II
Portfolio of investments — August 31, 2006
(showing percentage of total net assets) |
| International Equity Index Fund (continued) | |
| | Shares or | | |
| | Principal | | |
| | Amount | | Value |
|
|
| |
| COMMON STOCKS (continued) | | | |
| Japan (continued) | | | |
| Arrk Corp. * | 1,400 | $ | 16,880 |
| Asahi Breweries, Ltd. | 7,600 | | 111,518 |
| Asahi Glass Company, Ltd. | 19,000 | | 249,329 |
| Asahi Kasei Corp. (a) | 26,000 | | 171,923 |
| ASATSU-DK, Inc. | 600 | | 19,377 |
| Asics Corp. | 4,000 | | 50,002 |
| Astellas Pharmaceuticals, Inc. | 11,000 | | 446,168 |
| Autobacs Seven Company, Ltd. (a) | 600 | | 24,797 |
| Bank of Fukuoka, Ltd. (a) | 11,000 | | 84,641 |
| Bank of Kyoto, Ltd. | 5,000 | | 52,022 |
| Benesse Corp. | 1,300 | | 48,409 |
| Bridgestone Corp. | 12,600 | | 268,416 |
| Canon Sales Company, Inc. | 1,800 | | 42,717 |
| Canon, Inc. | 22,050 | | 1,097,286 |
| Casio Computer Company, Ltd. (a) | 5,100 | | 97,998 |
| Central Glass Company, Ltd. (a) | 5,000 | | 27,864 |
| Central Japan Railway Company, Ltd. (a) | 33 | | 357,122 |
| Chiba Bank, Ltd. | 16,000 | | 149,018 |
| Chiyoda Corp. (a) | 3,000 | | 65,826 |
| Chubu Electric Power Company, Inc. (a) | 12,900 | | 349,555 |
| Chugai Pharmaceutical Company, Ltd. | 6,100 | | 135,146 |
| Circle K Sunkus Company, Ltd. (a) | 700 | | 14,166 |
| Citizen Watch Company, Ltd. (a) | 7,100 | | 58,685 |
| Coca-Cola West Japan Company, Ltd. | 1,100 | | 21,418 |
| COMSYS Holdings Corp. | 3,000 | | 35,124 |
| Credit Saison Company, Ltd. | 3,300 | | 148,754 |
| CSK Corp. | 1,300 | | 55,831 |
| Dai Nippon Printing Company, Ltd. (a) | 13,000 | | 193,635 |
| Daicel Chemical Industries, Ltd. | 5,000 | | 37,919 |
| Daido Steel Company, Ltd. | 7,000 | | 53,803 |
| Daifuku Co Ltd | 2,000 | | 25,171 |
| Daiichi Sankyo Company, Ltd. (a) | 15,500 | | 427,932 |
| Daikin Industries, Ltd. (a) | 5,100 | | 156,014 |
| Daimaru, Inc. (a) | 4,000 | | 49,389 |
| Dainippon Ink & Chemicals, Inc. (a) | 12,000 | | 44,685 |
| Dainippon Screen Manufacturing Company, | | | |
| Ltd. (a) | 5,000 | | 42,052 |
| Daito Trust Construction Company, Ltd. | 1,700 | | 88,364 |
| Daiwa House Industry Company, Ltd. | 10,000 | | 162,924 |
| Daiwa Securities Group, Inc. (a) | 26,000 | | 309,948 |
| Denki Kagaku Kogyo Kabushiki Kaisha (a) | 8,000 | | 30,676 |
| Denso Corp. | 10,900 | | 379,882 |
| Dentsu, Inc. (a) | 40 | | 116,229 |
| Dowa Mining Company, Ltd. (a) | 5,000 | | 45,588 |
| E-Access, Ltd. (a) | 37 | | 22,101 |
| East Japan Railway Company | 71 | | 524,537 |
| Ebara Corp. (a) | 6,000 | | 24,081 |
| EDION Corp. * (a) | 1,800 | | 32,057 |
| Eisai Company, Ltd. | 5,400 | | 257,220 |
| Electric Power Development Company, Ltd. (a) | 3,500 | | 130,629 |
| Elpida Memory, Inc. * | 1,400 | | 61,915 |
| Familymart Company, Ltd. (a) | 1,300 | | 36,777 |
| International Equity Index Fund (continued) | |
| | Shares or | | |
| | Principal | | |
| | Amount | | Value |
|
|
| |
| COMMON STOCKS (continued) | | | |
| Japan (continued) | | | |
| Fanuc, Ltd. | 3,800 | $ | 301,461 |
| Fast Retailing Company, Ltd. (a) | 1,100 | | 102,637 |
| Fuji Electric Holdings (a) | 11,000 | | 55,865 |
| Fuji Photo Film Company, Ltd. | 10,200 | | 373,738 |
| Fuji Software ABC, Inc. (a) | 900 | | 26,535 |
| Fuji Television Network, Inc. | 11 | | 24,652 |
| Fujikura, Ltd. (a) | 8,000 | | 94,551 |
| Fujitsu, Ltd. (a) | 38,000 | | 304,699 |
| Furukawa Electric Company, Ltd. | 13,000 | | 90,060 |
| Glory, Ltd. (a) | 1,100 | | 20,434 |
| Goodwill Group, Inc. | 17 | | 12,052 |
| Gunma Bank | 7,000 | | 53,803 |
| Gunze, Ltd. | 4,000 | | 23,518 |
| Hakuhodo DY Holdings, Inc. | 430 | | 28,800 |
| Hankyu Department Stores | 2,000 | | 15,918 |
| Hanshin Electric Railway Company, Ltd. * (a) | 3,000 | | 23,288 |
| Haseko Corp. * (a) | 17,000 | | 60,841 |
| Hikari Tsushin, Inc. (a) | 500 | | 27,609 |
| Hino Motors, Ltd. | 6,000 | | 32,312 |
| Hirose Electric Company, Ltd. (a) | 600 | | 77,815 |
| Hitachi Cable, Ltd. (a) | 5,000 | | 23,987 |
| Hitachi Capital Corp. | 900 | | 17,179 |
| Hitachi Chemical, Ltd. | 2,100 | | 50,820 |
| Hitachi Construction Machinery Company, Ltd. | 1,800 | | 39,726 |
| (a) | | | |
| Hitachi High-Technologies Corp * | 1,400 | | 36,982 |
| Hitachi, Ltd. (a) | 69,000 | | 438,030 |
| Hokkaido Electric Power Company, Inc. | 4,000 | | 98,845 |
| Hokugin Financial Group, Inc. (a) | 26,000 | | 102,356 |
| Honda Motor Company, Ltd. | 32,200 | | 1,094,781 |
| House Food Corp. (a) | 1,500 | | 24,464 |
| Hoya Corp. (a) | 8,800 | | 320,191 |
| Ibiden Company, Ltd. | 2,700 | | 138,273 |
| Index Corp. (a) | 26 | | 20,272 |
| Inpex Holdings Inc. * | 17 | | 147,818 |
| Isetan Company, Ltd. (a) | 4,200 | | 70,862 |
| Ishikawajima-Harima Heavy Industries | | | |
| Company, Ltd. | 22,000 | | 64,113 |
| ITO EN, Ltd. | 1,200 | | 39,981 |
| Itochu Corp. | 31,000 | | 260,193 |
| Itochu Techno-Science Corp. (a) | 500 | | 24,157 |
| JAFCO Company, Ltd. (a) | 600 | | 30,983 |
| Japan Airlines System Corp. | 13,000 | | 24,703 |
| Japan Prime Realty Investment Corp. | 8 | | 23,723 |
| Japan Real Estate Investment Corp. (a) | 6 | | 51,638 |
| Japan Retail Fund (a) | 5 | | 36,087 |
| Japan Tobacco, Inc. | 92 | | 350,424 |
| JFE Holdings, Inc. (a) | 11,800 | | 480,627 |
| JGC Corp. | 4,000 | | 71,919 |
| Joyo Bank, Ltd. | 13,000 | | 78,650 |
| JS Group Corporation | 5,400 | | 113,425 |
| JSR Corp. (a) | 3,500 | | 83,358 |
The accompanying notes are an integral part of the financial statements. 243
John Hancock Funds II
Portfolio of investments — August 31, 2006
(showing percentage of total net assets) |
| International Equity Index Fund (continued) | |
| | Shares or | | |
| | Principal | | |
| | Amount | | Value |
|
|
| |
| COMMON STOCKS (continued) | | | |
| Japan (continued) | | | |
| Kajima Corp. (a) | 18,000 | $ | 83,439 |
| Kaken Pharmaceutical Company, Ltd. | 2,000 | | 14,639 |
| Kamigumi Company, Ltd. | 5,000 | | 40,049 |
| Kaneka Corp. | 6,000 | | 54,604 |
| Kansai Electric Power Company, Ltd. (a) | 15,700 | | 376,597 |
| Kansai Paint Company, Ltd. | 4,000 | | 31,460 |
| Kao Corp. | 10,000 | | 266,712 |
| Katokichi Company, Ltd. (a) | 3,500 | | 30,092 |
| Kawasaki Heavy Industries, Ltd. (a) | 28,000 | | 88,518 |
| Kawasaki Kisen Kaisha, Ltd. (a) | 11,000 | | 71,518 |
| KDDI Corp. | 51 | | 336,799 |
| Keihin Electric Express Railway | | | |
| Company, Ltd. (a) | 8,000 | | 55,081 |
| Keio Electric Railway Company, Ltd. (a) | 11,000 | | 71,612 |
| Keisei Electric Railway Company, Ltd. (a) | 4,000 | | 24,268 |
| Keyence Corp. (a) | 800 | | 184,670 |
| Kikkoman Corp. (a) | 3,000 | | 36,556 |
| Kinden Corp. (a) | 2,000 | | 16,173 |
| Kintetsu Corp. (a) | 35,000 | | 113,033 |
| Kirin Brewery Company, Ltd. | 17,000 | | 236,266 |
| KK DaVinci Advisors * (a) | 26 | | 23,484 |
| Kobe Steel Company, Ltd. | 59,000 | | 188,531 |
| Kokuyo Company, Ltd. (a) | 1,700 | | 26,683 |
| Komatsu, Ltd. | 19,000 | | 347,280 |
| Komori Corp. | 1,000 | | 20,493 |
| Konami Corp. (a) | 1,700 | | 43,313 |
| Konica Minolta Holdings, Inc. | 10,500 | | 137,340 |
| Kose Corp. (a) | 600 | | 18,968 |
| Koyo Seiko Company, Ltd. | 3,900 | | 77,764 |
| Kubota Corp. (a) | 24,000 | | 197,554 |
| Kuraray Company, Ltd. (a) | 7,500 | | 85,893 |
| Kurita Water Industries, Ltd. (a) | 2,200 | | 39,087 |
| Kyocera Corp. | 3,300 | | 285,135 |
| KYOWA HAKKO KOGYO COMPANY, LTD. | 6,000 | | 43,969 |
| Kyushu Electric Power (a) | 7,800 | | 186,102 |
| Lawson, Inc. (a) | 1,200 | | 41,924 |
| LeoPalace21 Corp. (a) | 2,800 | | 99,254 |
| Mabuchi Motor Company, Ltd. (a) | 600 | | 38,192 |
| Makita Corp. | 2,200 | | 64,676 |
| Marubeni Corp. | 30,000 | | 160,283 |
| Marui Company, Ltd. (a) | 6,100 | | 90,859 |
| Matsui Securities Company, Ltd. (a) | 2,000 | | 17,775 |
| Matsumotokiyoshi Company, Ltd. (a) | 800 | | 19,428 |
| Matsushita Electric Industrial Company, Ltd. | 41,000 | | 876,912 |
| Matsushita Electric Works, Ltd. | 7,000 | | 74,679 |
| Mediceo Holdings Company, Ltd. | 3,800 | | 70,751 |
| Meiji Dairies Corp. | 5,000 | | 31,400 |
| Meiji Seika Kaisha, Ltd. (a) | 5,000 | | 25,180 |
| Meitec Corp. (a) | 800 | | 25,836 |
| Millea Holdings, Inc. (a) | 30 | | 552,171 |
| Minebea Company, Ltd. | 7,000 | | 39,547 |
| Mitsubishi Chemical Holdings Corp, ADR | 24,500 | | 160,752 |
| International Equity Index Fund (continued) | |
| | Shares or | | |
| | Principal | | |
| | Amount | | Value |
|
|
| |
| COMMON STOCKS (continued) | | | |
| Japan (continued) | | | |
| Mitsubishi Corp. | 28,000 | $ | 570,236 |
| Mitsubishi Electric Corp. | 41,000 | | 338,188 |
| Mitsubishi Estate Company, Ltd. | 23,000 | | 495,846 |
| Mitsubishi Gas & Chemicals Company, Inc. | 8,000 | | 87,325 |
| Mitsubishi Heavy Industries, Ltd. (a) | 66,000 | | 276,699 |
| Mitsubishi Logistc Corp. (a) | 3,000 | | 48,315 |
| Mitsubishi Materials Corp. (a) | 20,000 | | 87,086 |
| Mitsubishi Rayon Company, Ltd. | 12,000 | | 82,826 |
| Mitsubishi Securities Company, Ltd. (a) | 6,000 | | 80,525 |
| Mitsubishi UFJ Financial Group, Inc. | 179 | | 2,440,458 |
| Mitsui & Company, Ltd. | 32,000 | | 463,278 |
| Mitsui Chemicals, Inc. | 12,000 | | 84,359 |
| Mitsui Engineering & Shipbuilding | | | |
| Company, Ltd. * (a) | 13,000 | | 39,768 |
| Mitsui Fudosan Company, Ltd. | 17,000 | | 380,981 |
| Mitsui Mining & Smelting Company, Ltd. | 12,000 | | 67,488 |
| Mitsui O.S.K. Lines, Ltd. (a) | 22,000 | | 167,782 |
| Mitsui Sumitomo Insurance Company, Ltd. | 25,000 | | 305,057 |
| Mitsui Trust Holdings, Inc. | 11,000 | | 128,789 |
| Mitsukoshi, Ltd. (a) | 8,000 | | 37,698 |
| Mitsumi Electric Company, Ltd. (a) | 2,100 | | 28,452 |
| Mizuho Financial Group, Inc. | 199 | | 1,609,228 |
| Murata Manufacturing Company, Ltd. | 4,300 | | 296,059 |
| Namco Bandai Holdings, Inc. (a) | 4,100 | | 64,598 |
| NEC Corp. (a) | 42,000 | | 244,438 |
| NEC Electronics Corp. (a) | 700 | | 23,621 |
| Net One Systems Company, Ltd. (a) | 10 | | 15,082 |
| NGK Insulators, Ltd. | 5,000 | | 68,254 |
| NGK Spark Plug Company, Ltd. (a) | 4,000 | | 81,462 |
| NHK Spring Company, Ltd. (a) | 3,000 | | 33,386 |
| NICHIREI Corp. | 5,000 | | 28,035 |
| Nidec Corp. (a) | 2,300 | | 166,785 |
| Nikko Cordial Corp. | 17,500 | | 222,189 |
| Nikon Corp. (a) | 6,000 | | 108,645 |
| Nintendo Company, Ltd. | 2,100 | | 430,898 |
| Nippon Building Fund, Inc. | 9 | | 88,194 |
| Nippon Electric Glass Company, Ltd. (a) | 5,000 | | 121,426 |
| Nippon Express Company, Ltd. | 16,000 | | 86,848 |
| Nippon Kayaku Company, Ltd. | 3,000 | | 25,972 |
| Nippon Light Metal Company, Ltd. (a) | 10,000 | | 25,734 |
| NIPPON MEAT PACKERS, Inc. | 3,000 | | 33,565 |
| Nippon Mining Holdings, Inc. (a) | 16,000 | | 117,251 |
| Nippon Oil Corp. (a) | 27,000 | | 205,223 |
| Nippon Paper Group, Inc. (a) | 19 | | 70,589 |
| Nippon Sheet Glass Company, Ltd. (a) | 8,000 | | 38,652 |
| Nippon Shokubai Company, Ltd. | 3,000 | | 36,070 |
| Nippon Steel Corp. (a) | 129,000 | | 538,622 |
| Nippon Telegraph & Telephone Corp. | 108 | | 545,729 |
| Nippon Yusen Kabushiki Kaisha (a) | 21,000 | | 130,092 |
| Nippon Zeon Company (a) | 3,000 | | 34,536 |
| Nishimatsu Construction Company, Ltd. (a) | 5,000 | | 18,661 |
| Nishi-Nippon City Bank, Ltd. | 12,000 | | 58,285 |
The accompanying notes are an integral part of the financial statements. 244
John Hancock Funds II
Portfolio of investments — August 31, 2006
(showing percentage of total net assets) |
| International Equity Index Fund (continued) | |
| | Shares or | | |
| | Principal | | |
| | Amount | | Value |
|
|
| |
| COMMON STOCKS (continued) | | | |
| Japan (continued) | | | |
| Nissan Chemical Industries, Ltd. (a) | 3,000 | $ | 38,933 |
| Nissan Motor Company, Ltd. (a) | 47,400 | | 538,806 |
| Nisshin Seifun Group, Inc. | 3,500 | | 37,399 |
| Nisshin Steel Company (a) | 17,000 | | 50,991 |
| Nisshinbo Industries, Inc. (a) | 3,000 | | 32,721 |
| Nissin Food Products Company, Ltd. | 1,800 | | 60,739 |
| Nitori Company, Ltd. | 750 | | 34,958 |
| Nitto Denko Corp. (a) | 3,500 | | 251,417 |
| NOK Corp. (a) | 2,100 | | 55,115 |
| Nomura Real Estate Office Fund, Inc. | 6 | | 46,781 |
| Nomura Research Institute, Ltd. | 500 | | 66,593 |
| Nomura Securities Company, Ltd. (a) | 36,500 | | 706,020 |
| NSK, Ltd. (a) | 9,000 | | 72,012 |
| NTN Corp. | 9,000 | | 68,945 |
| NTT Data Corp. | 28 | | 129,317 |
| NTT DoCoMo, Inc. (a) | 392 | | 607,933 |
| NTT Urban Development Corp. (a) | 4 | | 31,187 |
| Obayashi Corp. (a) | 14,000 | | 96,988 |
| OBIC Company, Ltd. (a) | 150 | | 30,152 |
| Odakyu Electric Railway Company (a) | 12,000 | | 76,179 |
| Oji Paper Company, Ltd. (a) | 16,000 | | 90,801 |
| Oki Electric Industry Company, Ltd. (a) | 10,000 | | 22,070 |
| Okuma Holdings, Inc. * | 3,000 | | 29,679 |
| Okumura Corp. (a) | 4,000 | | 21,916 |
| Olympus Optical Company, Ltd. | 5,000 | | 148,268 |
| Omron Corp. | 4,800 | | 111,661 |
| Onward Kashiyama Company, Ltd. (a) | 3,000 | | 41,950 |
| Oracle Corp. - Japan (a) | 600 | | 26,381 |
| Oriental Land Company, Ltd. | 1,000 | | 57,262 |
| Orix Corp. | 1,780 | | 472,472 |
| Osaka Gas Company, Ltd. (a) | 44,000 | | 161,970 |
| OSG Corp. * (a) | 1,900 | | 30,599 |
| Otsuka Corp. * | 400 | | 39,095 |
| Park24 Company, Ltd. * (a) | 1,100 | | 33,744 |
| Pioneer Electronic Corp. (a) | 3,000 | | 57,390 |
| Promise Company, Ltd. | 1,700 | | 76,051 |
| Q.P. Corp. | 2,700 | | 24,848 |
| Rakuten, Inc. (a) | 134 | | 58,119 |
| Resona Holdings, Inc. * | 97 | | 305,824 |
| Ricoh Company, Ltd. | 14,000 | | 274,978 |
| Rinnai Corp. (a) | 1,000 | | 27,779 |
| Rohm Company, Ltd. (a) | 2,300 | | 213,429 |
| Round One Corp | 8 | | 32,040 |
| Ryohin Keikaku Company, Ltd. (a) | 500 | | 36,428 |
| Sanken Electric Company (a) | 3,000 | | 39,623 |
| SANKYO Company, Ltd. | 1,000 | | 54,109 |
| Santen Pharmaceutical Company, Ltd. | 1,300 | | 32,069 |
| Sanwa Shutter Corp. (a) | 3,000 | | 17,128 |
| Sanyo Electric Company, Ltd. * (a) | 30,000 | | 62,886 |
| Sapporo Hokuyo Holdings, Inc. | 7 | | 76,946 |
| Sapporo Holdings (a) | 6,000 | | 30,012 |
| SBI E*Trade Securities Compnay, Ltd. (a) | 36 | | 43,867 |
| International Equity Index Fund (continued) | |
| | Shares or | | |
| | Principal | | |
| | Amount | | Value |
|
|
| |
| COMMON STOCKS (continued) | | | |
| Japan (continued) | | | |
| SBI Holdings, Inc. | 161 | $ | 61,393 |
| Secom Company, Ltd. | 4,500 | | 223,552 |
| Sega Sammy Holdings, Inc. | 3,900 | | 133,262 |
| Seiko Epson Corp. (a) | 3,000 | | 82,570 |
| Seino Transportation Company, Ltd. | 3,000 | | 34,383 |
| Sekisui Chemical Company, Ltd. | 9,000 | | 78,991 |
| Sekisui House, Ltd. | 11,000 | | 163,282 |
| Seven & I Holdings Company, Ltd. (a) | 16,800 | | 594,095 |
| SFCG Company, Ltd. (a) | 100 | | 19,803 |
| Sharp Corp. (a) | 21,000 | | 375,783 |
| Shimachu Company, Ltd. (a) | 900 | | 25,385 |
| Shimamura Company, Ltd. (a) | 400 | | 39,470 |
| Shimano, Inc. | 1,500 | | 42,180 |
| Shimizu Corp. (a) | 12,000 | | 71,169 |
| Shin-Etsu Chemical Company, Ltd. | 8,200 | | 467,453 |
| Shinko Electric Industries Company, Ltd. | 1,600 | | 46,491 |
| Shinko Securities Company, Ltd. | 10,000 | | 40,475 |
| Shinsei Bank, Ltd. | 28,000 | | 172,502 |
| Shionogi & Company, Ltd. | 6,000 | | 107,878 |
| Shiseido Company, Ltd. (a) | 8,000 | | 158,834 |
| Shizuoka Bank, Ltd. (a) | 12,000 | | 137,429 |
| Showa Denko K.K. (a) | 20,000 | | 85,893 |
| Showa Shell Sekiyu K.K. | 4,400 | | 49,153 |
| SMC Corp. | 1,100 | | 147,067 |
| SOFTBANK Corp. (a) | 15,400 | | 267,701 |
| Sojitz Holdings Corp. * (a) | 7,400 | | 26,105 |
| Sompo Japan Insurance, Inc. | 18,000 | | 237,894 |
| Sony Corp. | 20,700 | | 896,050 |
| Stanley Electric Corp. (a) | 2,900 | | 63,385 |
| Sumco Corp (a) | 1,100 | | 73,112 |
| Sumitomo Bakelite Company, Ltd. | 3,000 | | 24,132 |
| Sumitomo Chemical Company, Ltd. | 32,000 | | 251,953 |
| Sumitomo Corp. | 22,000 | | 297,508 |
| Sumitomo Electric Industries, Ltd. | 15,500 | | 200,098 |
| Sumitomo Heavy Industries, Ltd. | 13,000 | | 112,326 |
| Sumitomo Metal Industries, Ltd. | 87,000 | | 358,067 |
| Sumitomo Metal Mining Company, Ltd. | 11,000 | | 155,128 |
| Sumitomo Mitsui Financial Group, Inc. | 127 | | 1,428,486 |
| Sumitomo Osaka Cement Company, Ltd. | 8,000 | | 22,700 |
| Sumitomo Realty & | | | |
| Development Company, Ltd. | 8,000 | | 235,866 |
| Sumitomo Rubber Industries, Inc. (a) | 4,000 | | 42,606 |
| Sumitomo Titanium Corp. * (a) | 200 | | 40,816 |
| Sumitomo Trust & Banking Company, Ltd. (a) | 26,000 | | 277,159 |
| Suruga Bank, Ltd. (a) | 4,000 | | 50,718 |
| Suzuken Company, Ltd. | 1,600 | | 59,716 |
| T&D Holdings, Inc. | 4,900 | | 363,674 |
| TAIHEIYO CEMENT CORP. (a) | 17,000 | | 64,028 |
| Taisei Corp. | 18,000 | | 64,727 |
| Taisho Pharmaceuticals Company, Ltd. (a) | 3,000 | | 58,668 |
| Taiyo Nippon Sanso Corp. (a) | 6,000 | | 52,303 |
| Taiyo Yuden Company, Ltd. (a) | 2,000 | | 27,182 |
The accompanying notes are an integral part of the financial statements. 245
John Hancock Funds II
Portfolio of investments — August 31, 2006
(showing percentage of total net assets) |
| International Equity Index Fund (continued) | |
| | Shares or | | |
| | Principal | | |
| | Amount | | Value |
|
|
| |
| COMMON STOCKS (continued) | | | |
| Japan (continued) | | | |
| Takara Holdings (a) | 3,000 | $ | 18,227 |
| Takashimaya Company, Ltd. (a) | 6,000 | | 75,668 |
| Takeda Pharmaceutical Company, Ltd. (a) | 18,400 | | 1,218,252 |
| Takefuji Corp. (a) | 2,360 | | 127,296 |
| Tanabe Seiyaku Company, Ltd. (a) | 5,000 | | 63,738 |
| TDK Corp. | 2,700 | | 209,135 |
| Teijin, Ltd. | 18,000 | | 96,630 |
| Terumo Corp. (a) | 3,600 | | 134,975 |
| The 77th Bank, Ltd. (a) | 6,000 | | 43,969 |
| The Bank of Yokohama, Ltd. | 25,000 | | 197,691 |
| The Japan Steel Works, Ltd. (a) | 8,000 | | 56,785 |
| The Tokyo Electric Power Company, Ltd. (a) | 25,000 | | 713,647 |
| THK Company, Ltd. | 2,600 | | 63,142 |
| TIS, Inc. (a) | 1,100 | | 23,199 |
| Tobu Railway Company, Ltd. | 17,000 | | 87,495 |
| Toda Corp. | 4,000 | | 19,224 |
| Toho Company, Ltd. | 2,800 | | 56,427 |
| Toho Titanium Company, Ltd. * | 600 | | 37,220 |
| Tohoku Electric Power Company, Inc. (a) | 8,900 | | 201,730 |
| Tokai Rika Company, Ltd. | 1,400 | | 27,378 |
| Tokuyama Corp. (a) | 5,000 | | 69,320 |
| Tokyo Broadcasting Company, Ltd. | 600 | | 13,472 |
| Tokyo Electron, Ltd. (a) | 3,400 | | 223,663 |
| Tokyo Gas Company, Ltd. (a) | 46,000 | | 244,983 |
| Tokyo Seimitsu Company, Ltd. (a) | 800 | | 38,652 |
| Tokyo Steel Manufacturing Company, Ltd. (a) | 2,200 | | 35,768 |
| Tokyo Style Company, Ltd. | 2,000 | | 23,587 |
| Tokyo Tatemono Company, Ltd. | 6,000 | | 64,931 |
| Tokyu Corp. | 22,000 | | 146,410 |
| Tokyu Land Corp. (a) | 8,000 | | 69,805 |
| TonenGeneral Sekiyu K.K. (a) | 6,000 | | 54,195 |
| Toppan Printing Company, Ltd. (a) | 12,000 | | 135,793 |
| Toray Industries, Inc. | 27,000 | | 215,347 |
| Toshiba Corp. (a) | 61,000 | | 434,545 |
| Tosoh Corp. (a) | 9,000 | | 34,357 |
| Toto, Ltd. | 5,000 | | 50,914 |
| Toyo Seikan Kaisha, Ltd. | 3,000 | | 61,097 |
| Toyo Suisan Kaisha, Ltd. (a) | 2,000 | | 30,489 |
| Toyobo Company, Ltd. | 12,000 | | 31,903 |
| Toyoda Gosei Company, Ltd. | 1,400 | | 29,824 |
| Toyota Industries Corp. | 4,200 | | 175,007 |
| Toyota Motor Corp. (a) | 59,900 | | 3,251,357 |
| Toyota Tsusho Corp. (a) | 4,000 | | 105,321 |
| Trend Micro, Inc. (a) | 2,000 | | 57,603 |
| Ube Industries, Ltd. (a) | 18,000 | | 49,235 |
| UNI Charm Corp. | 900 | | 50,386 |
| Uniden Corp. | 1,000 | | 10,063 |
| UNY Company, Ltd. (a) | 3,000 | | 42,665 |
| Ushio, Inc. | 2,000 | | 44,992 |
| USS Company, Ltd. | 500 | | 33,914 |
| Wacoal Corp. (a) | 2,000 | | 26,177 |
| West Japan Railway Company, Ltd. (a) | 37 | | 157,957 |
| International Equity Index Fund (continued) | |
| | Shares or | | |
| | Principal | | |
| | Amount | | Value |
|
|
| |
| COMMON STOCKS (continued) | | | |
| Japan (continued) | | | |
| Yahoo Japan Corp. | 316 | $ | 118,613 |
| Yakult Honsha Company, Ltd. | 1,900 | | 51,809 |
| Yamada Denki Company, Ltd. | 1,800 | | 193,260 |
| Yamaha Corp. (a) | 3,400 | | 70,547 |
| Yamaha Motor Company, Ltd. | 3,700 | | 98,683 |
| Yamato Transport Company, Ltd. (a) | 8,000 | | 124,613 |
| Yamazaki Baking Company, Ltd. (a) | 3,000 | | 31,034 |
| YASKAWA Electric Corp. (a) | 4,000 | | 46,116 |
| Yokogawa Electric Corp. (a) | 4,000 | | 56,921 |
| |
|
| | | | 57,959,757 |
| Korea - 0.01% | | | |
| LG Philips LCD Company, Ltd., ADR * (a) | 2,120 | | 42,124 |
| Luxembourg - 0.08% | | | |
| Metro International SA, A Shares, GDR * | 734 | | 927 |
| Metro International SA, B Shares, GDR * (a) | 1,469 | | 1,896 |
| Tenaris SA, ADR | 6,960 | | 255,501 |
| |
|
| | | | 258,324 |
| Malaysia - 0.34% | | | |
| AirAsia BHD * | 17,100 | | 6,271 |
| AMMB Holdings BHD | 28,000 | | 18,636 |
| Berjaya Sports Toto BHD * | 13,700 | | 16,748 |
| British American Tobacco Malaysia Berhad | 2,600 | | 29,313 |
| Bursa Malaysia BHD | 6,300 | | 10,098 |
| Commerce Asset Holdings | 44,000 | | 76,501 |
| DRB-Hicom Berhad | 12,700 | | 5,141 |
| Gamuda BHD | 11,600 | | 12,794 |
| Genting Berhad | 7,100 | | 47,449 |
| Golden Hope Plantations BHD | 8,800 | | 11,475 |
| Guinness Anchor BHD | 2,900 | | 4,451 |
| Hong Leong Bank BHD | 9,700 | | 14,098 |
| Hong Leong Credit BHD | 4,400 | | 5,427 |
| IGB Corp. BHD | 13,900 | | 5,400 |
| IJM Corp. BHD | 6,900 | | 11,153 |
| IOI Corporation Berhad | 12,700 | | 58,307 |
| IOI Properties BHD | 1,800 | | 4,108 |
| KLCC Property Holdings BHD | 8,900 | | 5,319 |
| Kuala Lumpur Kepong Berhad | 5,100 | | 15,795 |
| Lafarge Malayan Cement BHD | 24,600 | | 5,380 |
| Magnum Corp BHD | 17,700 | | 10,338 |
| Malakoff BHD | 10,900 | | 28,723 |
| Malayan Bank Berhad | 37,800 | | 115,012 |
| Malaysian Airline System BHD | 5,400 | | 4,430 |
| Malaysian Pacific Industries | 1,800 | | 4,939 |
| Maxis Communications Berhard | 17,600 | | 42,075 |
| Media Prima BHD | 10,300 | | 4,813 |
| MISC BHD | 22,400 | | 51,421 |
| MMC Corp BHD | 6,400 | | 5,564 |
| Mulpha International Berhad * | 16,000 | | 5,303 |
| OYL Industries BHD | 14,100 | | 21,451 |
| Petronas Dagangan BHD | 5,200 | | 5,961 |
| Petronas Gas Berhad * | 8,000 | | 19,343 |
The accompanying notes are an integral part of the financial statements. 246
John Hancock Funds II
Portfolio of investments — August 31, 2006
(showing percentage of total net assets) |
| International Equity Index Fund (continued) | |
| | Shares or | | |
| | Principal | | |
| | Amount | | Value |
|
|
| |
| COMMON STOCKS (continued) | | | |
| Malaysia (continued) | | | |
| PLUS Expressways BHD | 30,300 | $ | 23,213 |
| POS Malaysia & Services Holdings BHD | 6,400 | | 7,928 |
| PPB Group BHD | 9,700 | | 12,069 |
| Proton Holdings BHD * | 5,100 | | 6,844 |
| Public Bank Berhad | 21,000 | | 38,509 |
| Resorts World Berhad | 9,900 | | 32,005 |
| RHB Capital BHD | 13,100 | | 9,751 |
| Road Builder M Holdings BHD | 8,300 | | 5,186 |
| Scomi Group BHD | 12,900 | | 3,049 |
| Shell Refining Company Federation of Malaya | | | |
| BHD * | 3,100 | | 9,180 |
| Sime Darby Berhard | 29,700 | | 48,007 |
| SP Setia BHD | 9,900 | | 10,166 |
| Star Publications Malaysia BHD | 9,200 | | 8,648 |
| Tanjong PLC | 4,500 | | 16,137 |
| Telekom Malaysia BHD | 17,000 | | 42,027 |
| Tenaga Nasional BHD | 20,200 | | 50,212 |
| Transmile Group BHD | 2,600 | | 8,547 |
| UMW Holdings Berhad | 4,200 | | 8,500 |
| YTL Corp. BHD | 12,700 | | 18,113 |
| |
|
| | | | 1,041,328 |
| Mexico - 0.82% | | | |
| Alfa SA de CV | 6,600 | | 32,049 |
| America Movil S.A. de C.V., Series L | 13,200 | | 492,492 |
| America Movil SA de CV | 134,000 | | 250,088 |
| Carso Infraestructura y Construccion SA de | | | |
| CV * | 16,600 | | 12,152 |
| Cemex SA de CV * | 40,104 | | 115,596 |
| Cemex SA, ADR * | 9,908 | | 286,242 |
| Coca-Cola Femsa SA de CV | 6,100 | | 17,823 |
| Consorcio ARA SA de CV | 3,700 | | 17,221 |
| Controladora Comercial Mexicana SA de CV | 7,800 | | 14,650 |
| Corp GEO SA de CV * | 8,900 | | 35,879 |
| Desarrolladora Homex SA de CV * | 3,400 | | 20,946 |
| Empresas ICA Sociedad | | | |
| Controladora SA de CV * | 7,600 | | 25,764 |
| Fomento Economico Mexicano SA de CV | 15,400 | | 145,047 |
| Grupo Aeroportuario del Pacifico SA de CV | 8,900 | | 30,000 |
| Grupo Aeroportuario del Sureste SA de CV | 5,400 | | 18,860 |
| Grupo Bimbo SA de CV | 6,600 | | 21,588 |
| Grupo Carso SA de CV | 12,467 | | 37,123 |
| Grupo Financiero Banorte SA de CV | 28,548 | | 83,542 |
| Grupo Mexico SA | 21,349 | | 68,089 |
| Grupo Modelo SA | 10,800 | | 45,498 |
| Grupo Televisa SA, SADR | 7,240 | | 137,850 |
| Grupo Televisa SA | 14,200 | | 53,927 |
| Industrias Penoles SA de CV | 2,200 | | 18,544 |
| Kimberly-Clark de Mexico SA de CV | 10,000 | | 37,656 |
| Telefonos de Mexico SA de CV, Class L, ADR | 6,500 | | 156,910 |
| Telefonos de Mexico SA de CV | 78,800 | | 95,445 |
| TV Azteca SA de CV * | 26,400 | | 17,415 |
| Urbi Desarrollos Urbanos SA de CV * | 6,100 | | 16,186 |
| International Equity Index Fund (continued) | |
| | | Shares or | | |
| | | Principal | | |
| | | Amount | | Value |
|
|
| |
| COMMON STOCKS (continued) | | | |
| Mexico (continued) | | | | |
| Wal-Mart de Mexico SA | | 66,900 | $ | 228,016 |
| |
|
| | | | | 2,532,598 |
| Netherland Antilles - 0.12% | | | | |
| Mittal Steel Company NV * | | 11,099 | | 369,860 |
| Netherlands - 4.35% | | | | |
| ABN AMRO Holdings NV | | 38,853 | | 1,106,378 |
| Aegon NV | | 29,986 | | 534,733 |
| Akzo Nobel NV | | 5,653 | | 325,133 |
| ASML Holding NV * | | 10,164 | | 221,819 |
| Buhrmann NV (a) | | 2,261 | | 30,717 |
| Corio NV | | 894 | | 60,099 |
| DSM NV | | 3,111 | | 122,895 |
| Euronext NV (a) | | 1,755 | | 157,605 |
| Euronext | | 146 | | 13,018 |
| Fugro NV | | 1,227 | | 54,152 |
| Getronics NV (a) | | 2,318 | | 15,924 |
| Hagemeyer N.V. * (a) | | 9,873 | | 49,889 |
| Heineken NV (a) | | 5,260 | | 243,652 |
| ING Groep NV | | 39,131 | | 1,689,469 |
| Koninklijke (Royal) KPN NV | | 40,338 | | 496,931 |
| Koninklijke (Royal) Philips Electronics NV | 26,085 | | 888,289 |
| Koninklijke Ahold NV * | | 32,560 | | 311,976 |
| Mittal Steel Company NV * | | 3,253 | | 108,363 |
| Oce-Van Der Grinten NV | | 1,518 | | 26,313 |
| Randstad Holdings NV | | 1,023 | | 54,899 |
| Reed Elsevier NV | | 14,786 | | 236,816 |
| Rodamco Europe NV | | 1,109 | | 119,666 |
| Royal Dutch Shell PLC, A Shares | GBP (a) | 79,860 | | 2,764,830 |
| Royal Dutch Shell PLC, B Shares | GBP | 57,277 | | 2,048,358 |
| Royal Numico NV | | 3,686 | | 170,977 |
| SBM Offshore NV | | 2,956 | | 80,961 |
| TNT Post Group NV | | 8,856 | | 332,507 |
| Unilever NV | | 35,771 | | 852,052 |
| Vedior NV | | 3,467 | | 64,044 |
| Wereldhave NV | | 395 | | 41,435 |
| Wolters Kluwer NV | | 5,954 | | 150,353 |
| |
|
| | | | | 13,374,253 |
| New Zealand - 0.12% | | | | |
| Auckland International Airport, Ltd. | 21,664 | | 27,364 |
| Contact Energy, Ltd. | | 6,386 | | 28,628 |
| Fisher & Paykel Appliances Holdings, Ltd. | 5,572 | | 13,128 |
| Fisher & Paykel Healthcare Corp. | | 10,678 | | 28,372 |
| Fletcher Building, Ltd. | | 10,519 | | 59,686 |
| Kiwi Income Property Trust | | 16,706 | | 15,306 |
| Sky City Entertainment Group, Ltd. | 9,523 | | 32,408 |
| Sky Network Television, Ltd. | | 4,317 | | 15,793 |
| Telecom Corp. of New Zealand, Ltd. (a) | 43,131 | | 117,989 |
| Tower, Ltd. * | | 5,738 | | 12,392 |
| Vector, Ltd. | | 5,002 | | 7,202 |
| Warehouse Group, Ltd. (a) | | 2,751 | | 9,002 |
| |
|
| | | | | 367,270 |
The accompanying notes are an integral part of the financial statements. 247
John Hancock Funds II
Portfolio of investments — August 31, 2006
(showing percentage of total net assets) |
| International Equity Index Fund (continued) | |
| | Shares or | | |
| | Principal | | |
| | Amount | | Value |
|
|
| |
| COMMON STOCKS (continued) | | | |
| Norway - 0.68% | | | |
| Acergy SA * (a) | 4,168 | $ | 73,515 |
| Aker Kvaerner ASA | 596 | | 57,039 |
| Den Norske Bank ASA | 14,400 | | 186,219 |
| DET Norske Oljeselskap * (a) | 17,500 | | 30,451 |
| Norsk Hydro ASA | 15,263 | | 393,550 |
| Norske Skogindustrier ASA | 3,700 | | 56,335 |
| Ocean RIG ASA * (a) | 3,683 | | 22,955 |
| Orkla ASA | 4,100 | | 201,057 |
| PAN Fish ASA * | 55,600 | | 53,915 |
| Petrojarl ASA * (a) | 1,231 | | 13,242 |
| Petroleum Geo-Services ASA * | 1,231 | | 64,066 |
| Prosafe ASA (a) | 850 | | 56,675 |
| Schibsted ASA | 1,000 | | 29,344 |
| Statoil ASA | 14,100 | | 380,291 |
| Stolt-Nielsen SA | 800 | | 19,679 |
| Storebrand ASA | 5,000 | | 52,004 |
| Tandberg ASA (a) | 2,600 | | 26,631 |
| Tandberg Television ASA * | 1,800 | | 24,843 |
| Telenor ASA | 16,400 | | 207,542 |
| TGS Nopec Geophysical Company ASA * | 2,300 | | 40,749 |
| Tomra Systems ASA (a) | 3,800 | | 24,585 |
| Yara International ASA | 4,200 | | 61,954 |
| |
|
| | | | 2,076,641 |
| Peru - 0.03% | | | |
| Cia de Minas Buenaventura SA | 404 | | 11,164 |
| Compania de Minas Buenaventura SA, ADR | 1,366 | | 38,180 |
| Minsur SA | 6,938 | | 10,491 |
| Southern Peru Copper Corp. | 134 | | 12,383 |
| Volcan Compania Minera SA, CMN Series B * | 6,579 | | 11,572 |
| |
|
| | | | 83,790 |
| Philippines - 0.08% | | | |
| ABS-CBN Broadcasting Corp. * | 70 | | 23 |
| Ayala Corp. | 2,676 | | 23,167 |
| Ayala Land, Inc. | 113,000 | | 30,015 |
| Banco De Oro * | 7,314 | | 5,325 |
| Bank of the Philippine Islands | 27,840 | | 29,031 |
| Equitable PCI Bank Corp. * | 7,567 | | 11,762 |
| Filinvest Land, Inc. * | 101,057 | | 2,704 |
| First Philippine Holdings Corp. | 5,924 | | 4,895 |
| Globe Telecommunications, Inc. | 690 | | 13,372 |
| Jollibee Foods Corp. | 9,000 | | 5,666 |
| Manila Electric Company * | 8,311 | | 4,415 |
| Megaworld Corp. | 152,823 | | 5,051 |
| Metropolitan Bank & Trust Company | 12,800 | | 9,696 |
| Petron Corp. | 48,152 | | 3,790 |
| Philippine Long Distance Telephone Company | 1,120 | | 42,090 |
| San Miguel Corp. | 9,600 | | 13,411 |
| SM Investments Corp. | 3,447 | | 15,056 |
| SM Prime Holdings, Ltd. | 91,000 | | 14,145 |
| |
|
| | | | 233,614 |
| International Equity Index Fund (continued) | |
| | Shares or | | |
| | Principal | | |
| | Amount | | Value |
|
|
| |
| COMMON STOCKS (continued) | | | |
| Poland - 0.22% | | | |
| Agora SA | 628 | $ | 6,435 |
| Bank BPH SA | 173 | | 44,765 |
| Bank Pekao SA | 1,674 | | 106,389 |
| Bank Zachodni WBK SA | 440 | | 27,036 |
| Boryszew SA * | 550 | | 4,583 |
| BRE Bank SA * | 174 | | 13,315 |
| Budimex SA * | 231 | | 5,468 |
| Computerland SA | 124 | | 3,900 |
| Debica SA | 125 | | 2,278 |
| Globe Trade Centre SA * | 1,200 | | 10,506 |
| Grupa Kety SA | 176 | | 9,017 |
| KGHM Polska Miedz SA | 2,213 | | 76,781 |
| Mondi Packaging Paper Swiecie SA | 251 | | 6,348 |
| Orbis SA | 510 | | 7,756 |
| Polish Oil & Gas Company | 23,489 | | 24,296 |
| Polska Grupa Farmaceutyczna SA | 198 | | 4,045 |
| Polski Koncern Naftowy Orlen SA | 6,022 | | 100,367 |
| Powszechna Kasa Oszczednosci Bank Polski | | | |
| SA | 8,046 | | 96,792 |
| Prokom Software SA | 210 | | 8,988 |
| Softbank SA | 228 | | 2,780 |
| Telekomunikacja Polska SA | 14,080 | | 92,223 |
| TVN SA * | 515 | | 17,868 |
| |
|
| | | | 671,936 |
| Portugal - 0.25% | | | |
| Banco BPI, SA | 6,404 | | 47,925 |
| Banco Comercial dos Acores, SA | 41,088 | | 126,148 |
| Banco Espirito Santo SA | 4,397 | | 67,442 |
| Brisa Auto Estrada, SA | 6,945 | | 71,430 |
| Cimpor-Cimentos De Portugal, SA | 4,257 | | 28,863 |
| Electricidade De Portugal, SA | 38,429 | | 154,363 |
| Jeronimo Martins, SGPS, SA | 715 | | 12,769 |
| Portugal Telecom, SGPS, SA | 16,420 | | 206,062 |
| PT Multimedia.com, SGPS, SA | 1,659 | | 20,480 |
| Sonae Industria SGPS SA New * | 1,154 | | 9,832 |
| Sonae, SGPS, SA | 18,991 | | 31,583 |
| |
|
| | | | 776,897 |
| Russia - 1.26% | | | |
| AFK Sistema, Reg. S, Spons. GDR | 2,162 | | 56,212 |
| Comstar United Telesystems, ADR | 3,812 | | 24,282 |
| Gazprom, ADR | 39,199 | | 1,846,273 |
| JSC MMC Norilsk Nickel, ADR | 1,254 | | 171,171 |
| Lukoil Oil Company, ADR | 7,805 | | 653,278 |
| Mechel Steel Group, ADR (a) | 588 | | 12,407 |
| Mobile Telesystems, ADR | 3,298 | | 120,707 |
| NovaTek OAO, ADR | 1,696 | | 81,171 |
| Novolipetsk Steel, ADR | 2,495 | | 48,029 |
| Polyus Gold Company ZAO, ADR * | 1,080 | | 45,900 |
| RAO Unified Energy System, ADR (a) | 1,348 | | 99,280 |
| Rostelecom, ADR (a) | 1,362 | | 39,294 |
| Sberbank of Russian Federation, ADR | 732 | | 158,844 |
The accompanying notes are an integral part of the financial statements. 248
John Hancock Funds II
Portfolio of investments — August 31, 2006
(showing percentage of total net assets) |
| International Equity Index Fund (continued) | |
| | Shares or | | |
| | Principal | | |
| | Amount | | Value |
|
|
| |
| COMMON STOCKS (continued) | | | |
| Russia (continued) | | | |
| Sibirtelecom, ADR * | 106 | $ | 7,250 |
| Surgutneftegaz, ADR for PFD Shares | 1,139 | | 111,052 |
| Surgutneftegaz, ADR (a) | 2,415 | | 183,540 |
| Tatneft, ADR (a) | 1,082 | | 112,409 |
| UralsvyAzinform, ADR (a) | 991 | | 7,433 |
| VolgaTelecom, ADR * | 612 | | 4,725 |
| Vympel Communicatii, ADR * | 1,525 | | 82,838 |
| Wimm-Bill-Dann Foods OJSC, ADR (a) | 311 | | 14,390 |
| |
|
| | | | 3,880,485 |
| Singapore - 0.65% | | | |
| Allgreen Properties, Ltd. | 9,000 | | 8,352 |
| Ascendas Real Estate Investment Trust * (a) | 20,000 | | 26,187 |
| CapitaLand, Ltd. * | 27,000 | | 81,688 |
| CapitaMall Trust * (a) | 17,000 | | 25,501 |
| Chartered Semiconductor | | | |
| Manufacturing, Ltd. * (a) | 19,000 | | 15,458 |
| City Developments, Ltd. | 11,000 | | 68,868 |
| ComfortDelGro Corp., Ltd. | 38,000 | | 36,230 |
| Cosco Corp. Singapore, Ltd. (a) | 15,000 | | 14,587 |
| Creative Technology, Ltd. (a) | 1,050 | | 6,874 |
| DBS Group Holdings, Ltd. | 24,000 | | 274,582 |
| Fraser and Neave, Ltd. | 17,000 | | 43,005 |
| Haw Par Corp., Ltd. | 2,000 | | 7,500 |
| Jardine Cycle and Carriage, Ltd. | 3,061 | | 21,788 |
| Keppel Corp., Ltd. (a) | 12,000 | | 114,409 |
| Keppel Land, Ltd. | 7,000 | | 19,755 |
| K-REIT Asia * | 1,000 | | 941 |
| Neptune Orient Lines, Ltd. | 10,000 | | 12,267 |
| Olam International, Ltd. | 12,000 | | 12,204 |
| Oversea-Chinese Banking Corp., Ltd. | 53,000 | | 217,282 |
| Parkway Holdings, Ltd. | 11,000 | | 16,780 |
| SembCorp Industries, Ltd. | 17,000 | | 37,602 |
| SembCorp Marine, Ltd. (a) | 10,000 | | 21,992 |
| Singapore Airlines, Ltd. | 12,000 | | 100,680 |
| Singapore Exchange, Ltd. | 17,000 | | 43,005 |
| Singapore Land, Ltd. | 3,000 | | 13,348 |
| Singapore Petroleum Company, Ltd. | 3,000 | | 9,229 |
| Singapore Post, Ltd. | 26,000 | | 16,856 |
| Singapore Press Holdings, Ltd. | 32,000 | | 80,951 |
| Singapore Technologies Engineering, Ltd. | 29,000 | | 53,823 |
| Singapore Telecommunications, Ltd., ADR * | 152,950 | | 242,068 |
| SMRT Corporation, Ltd. | 12,000 | | 8,161 |
| ST Assembly Test Services, Ltd. * (a) | 25,000 | | 16,049 |
| Suntec Real Estate Investment Trust * | 16,000 | | 13,221 |
| United Overseas Bank, Ltd. (a) | 25,000 | | 247,887 |
| United Overseas Land, Ltd. | 10,000 | | 19,958 |
| Venture Corp., Ltd. | 5,000 | | 36,865 |
| Want Want Holdings Company, Ltd. | 10,000 | | 15,000 |
| Wing Tai Holdings, Ltd. | 9,000 | | 10,411 |
| |
|
| | | | 2,011,364 |
| International Equity Index Fund (continued) | |
| | Shares or | | |
| | Principal | | |
| | Amount | | Value |
|
|
| |
| COMMON STOCKS (continued) | | | |
| South Africa - 0.31% | | | |
| African Bank Investments, Ltd. | 2,638 | $ | 9,317 |
| Alexander Forbes, Ltd. * | 1,992 | | 3,906 |
| Allan Gray Property Trust | 6,248 | | 4,608 |
| Anglo Platinum, Ltd. | 374 | | 41,968 |
| AngloGold Ashanti, Ltd. | 863 | | 39,179 |
| Aspen Pharmacare Holdings, Ltd. | 1,234 | | 5,712 |
| Aveng, Ltd. | 2,354 | | 8,729 |
| AVI, Ltd. | 1,907 | | 4,240 |
| Barloworld, Ltd. | 1,249 | | 23,547 |
| Bidvest Group, Ltd. * | 1,479 | | 22,409 |
| Consol, Ltd. | 2,028 | | 4,337 |
| Edgars Consolidated Stores, Ltd. | 2,803 | | 11,032 |
| Ellerine Holdings, Ltd. | 499 | | 4,643 |
| FirstRand, Ltd. | 15,996 | | 39,654 |
| Foschini, Ltd. | 984 | | 6,150 |
| Gold Fields, Ltd. | 2,807 | | 54,577 |
| Grindrod, Ltd. | 1,467 | | 2,622 |
| Harmony Gold Mining Company, Ltd. * | 1,917 | | 26,091 |
| Impala Platinum Holdings, Ltd. | 362 | | 67,116 |
| Imperial Holdings, Ltd. * | 1,071 | | 21,195 |
| Investec, Ltd. | 159 | | 7,773 |
| JD Group, Ltd. | 973 | | 9,000 |
| Kumba Resources, Ltd. | 377 | | 7,616 |
| Lewis Group, Ltd. | 574 | | 3,966 |
| Liberty Group, Ltd. | 531 | | 5,235 |
| Massmart Holdings, Ltd. | 1,110 | | 8,496 |
| Metropolitan Holdings, Ltd. | 2,671 | | 4,477 |
| Mittal Steel South Africa, Ltd. | 1,164 | | 12,334 |
| MTN Group, Ltd. | 7,574 | | 60,167 |
| Murray & Roberts Holdings, Ltd. | 1,779 | | 7,202 |
| Nampak, Ltd. | 2,496 | | 5,948 |
| Naspers, Ltd. | 1,705 | | 29,480 |
| Nedbank Group, Ltd. | 1,145 | | 17,563 |
| Network Healthcare Holdings, Ltd. * | 7,009 | | 11,389 |
| Pick'n Pay Stores, Ltd. | 1,360 | | 5,742 |
| Pretoria Portland Cement Company, Ltd. | 61 | | 3,295 |
| Reunert, Ltd. | 1,017 | | 10,198 |
| Sanlam, Ltd. | 13,077 | | 27,514 |
| Sappi, Ltd. | 1,177 | | 14,998 |
| Sasol, Ltd. | 3,282 | | 113,950 |
| Shoprite Holdings, Ltd. | 2,089 | | 7,166 |
| Spar Group, Ltd. | 1,061 | | 5,511 |
| Standard Bank Group, Ltd. | 6,915 | | 74,744 |
| Steinhoff International Holdings, Ltd. * | 5,224 | | 17,071 |
| Super Group, Ltd. * | 1,290 | | 1,951 |
| Telkom SA, Ltd. * | 1,711 | | 32,317 |
| Tiger Brands, Ltd. | 925 | | 19,591 |
| Tongaat-Hulett Group, Ltd. | 315 | | 4,101 |
| Truworths International, Ltd. | 2,706 | | 8,614 |
| Woolworths Holdings, Ltd. | 4,605 | | 8,461 |
| |
|
| | | | 946,902 |
The accompanying notes are an integral part of the financial statements. 249
John Hancock Funds II
Portfolio of investments — August 31, 2006
(showing percentage of total net assets) |
| International Equity Index Fund (continued) | |
| | Shares or | | |
| | Principal | | |
| | Amount | | Value |
|
|
| |
| COMMON STOCKS (continued) | | | |
| South Korea - 2.22% | | | |
| Asiana Airlines * | 1,534 | $ | 9,686 |
| Cheil Communications, Inc. | 60 | | 12,077 |
| Cheil Industries, Inc. | 990 | | 38,000 |
| CJ Corp. | 400 | | 42,024 |
| Daeduck Electronics Company, Ltd. | 990 | | 8,516 |
| Daegu Bank | 2,730 | | 45,720 |
| Daelim Industrial Company | 580 | | 37,164 |
| Daewoo Engineering & Construction | | | |
| Company, Ltd. | 3,310 | | 60,598 |
| Daewoo International Corp. | 940 | | 36,667 |
| Daewoo Securities Company, Ltd. | 2,500 | | 43,559 |
| Daewoo Shipbuilding & Marine Engineering | | | |
| Company, Ltd. | 2,050 | | 63,333 |
| Daishin Securities Company, Ltd. | 710 | | 14,402 |
| Daum Communications Corp. * | 259 | | 13,444 |
| Dongbu Insurance Company, Ltd. | 580 | | 13,062 |
| Dongkuk Steel Mill Company, Ltd. | 690 | | 11,986 |
| Doosan Infracore Company, Ltd. | 960 | | 16,577 |
| GS Engineering & Construction Corp. | 780 | | 53,387 |
| Hana Financial Group, Inc. | 2,400 | | 103,479 |
| Hanjin Heavy Industries & Construction | | | |
| Company, Ltd. | 720 | | 19,622 |
| Hanjin Shipping Company, Ltd. | 1,200 | | 27,461 |
| Hanmi Pharm Company, Ltd. | 110 | | 12,930 |
| Hanwha Chem Corp. | 1,010 | | 10,243 |
| Hite Brewery Company, Ltd. | 150 | | 17,007 |
| Honam Petrochemical Corp. | 250 | | 12,977 |
| Hyosung Corp. * | 610 | | 11,072 |
| Hyundai Autonet Company, Ltd. * | 1,500 | | 17,007 |
| Hyundai Department Store Company, Ltd. | 240 | | 18,674 |
| Hyundai Development Company | 1,380 | | 56,558 |
| Hyundai Engineering & Construction | | | |
| Company, Ltd. * | 840 | | 44,388 |
| Hyundai Heavy Industries | 960 | | 121,829 |
| Hyundai Marine & Fire | | | |
| Insurance Company, Ltd. | 1,160 | | 15,445 |
| Hyundai Mipo Dockyard | 190 | | 19,566 |
| Hyundai Mobis | 1,180 | | 108,138 |
| Hyundai Motor Company | 3,200 | | 269,621 |
| Hyundai Securities Company, Ltd. | 2,490 | | 32,506 |
| Kangwon Land, Inc. | 2,340 | | 44,300 |
| KCC Corp. | 80 | | 20,305 |
| Kia Motors Corp. | 4,080 | | 64,934 |
| Kookmin Bank, ADR | 5,064 | | 408,057 |
| Kookmin Bank | 2,070 | | 167,521 |
| Korea Electric Power Corp., ADR | 7,816 | | 151,787 |
| Korea Electric Power Corp. | 1,530 | | 58,568 |
| Korea Exchange Bank * | 1,540 | | 18,662 |
| Korea Investment Holdings Company, Ltd. | 590 | | 23,874 |
| Korea Zinc Company, Ltd. | 200 | | 17,267 |
| Korean Air Lines Company, Ltd. | 790 | | 24,899 |
| Korean Reinsurance Company | 1,210 | | 14,349 |
| International Equity Index Fund (continued) | |
| | Shares or | | |
| | Principal | | |
| | Amount | | Value |
|
|
| |
| COMMON STOCKS (continued) | | | |
| South Korea (continued) | | | |
| KT & G Corp. | 2,390 | $ | 140,215 |
| KT Corp., Sponsored ADR | 4,271 | | 94,389 |
| KT Corp. | 770 | | 33,600 |
| KT Freetel Company, Ltd. | 2,110 | | 61,126 |
| LG Chem, Ltd. | 1,000 | | 40,724 |
| LG Electronics, Inc. | 1,980 | | 132,638 |
| LG Household & Health Care, Ltd. | 190 | | 14,605 |
| LG International Corp. | 860 | | 19,278 |
| LG Petrochemical Company, Ltd. | 500 | | 10,870 |
| LG Philips LCD Company, Ltd. * | 890 | | 35,643 |
| Lotte Chilsung Beverage Company, Ltd. | 10 | | 13,315 |
| Lotte Confectionery Company, Ltd. | 20 | | 25,111 |
| Lotte Shopping Company | 180 | | 61,320 |
| LS Cable, Ltd. | 340 | | 11,388 |
| Mirae Asset Securities Company, Ltd. | 240 | | 15,104 |
| NCSoft Corp. * | 240 | | 13,306 |
| NHN Corp. * | 792 | | 74,805 |
| Nong Shim Company, Ltd. | 50 | | 12,040 |
| Orion Corp. | 60 | | 13,231 |
| Pacific Corp. | 110 | | 14,246 |
| Poongsan Corp. | 570 | | 12,422 |
| POSCO, SADR | 4,537 | | 281,793 |
| POSCO | 440 | | 110,532 |
| Pusan Bank | 2,740 | | 35,199 |
| S1 Corp. | 330 | | 13,473 |
| Samsung Corp. | 2,830 | | 80,071 |
| Samsung Electro-Mechanics Company * | 1,300 | | 49,966 |
| Samsung Electronics Company, Ltd., | | | |
| GDR-London | 770 | | 261,800 |
| Samsung Electronics Company, Ltd. | 2,080 | | 1,406,356 |
| Samsung Engineering Company, Ltd. | 710 | | 32,976 |
| Samsung Fine Chemicals Company, Ltd. | 430 | | 10,735 |
| Samsung Fire & Marine | | | |
| Insurance Company, Ltd. | 780 | | 109,533 |
| Samsung Heavy Industries Company, Ltd. | 3,680 | | 88,043 |
| Samsung SDI Company, Ltd. | 740 | | 61,272 |
| Samsung Securities Company, Ltd. | 1,150 | | 67,109 |
| Samsung Techwin Company, Ltd. | 1,030 | | 36,107 |
| Shinhan Financial Group Company, Ltd. | 4,650 | | 209,682 |
| Shinsegae Company, Ltd. | 300 | | 148,853 |
| SK Corp. | 2,300 | | 148,094 |
| SK Telecom Company, Ltd., ADR | 5,517 | | 120,822 |
| SK Telecom Company, Ltd. | 250 | | 48,630 |
| S-Oil Corp. | 960 | | 65,608 |
| The Hancook Tire Company, Ltd. | 2,360 | | 31,422 |
| Tong Yang Investment Bank * | 1,310 | | 18,055 |
| Woongjin Coway Company, Ltd. | 670 | | 15,333 |
| Woori Investment & Securities Company, Ltd. | 2,020 | | 44,125 |
| Yuhan Corp. | 120 | | 18,661 |
| |
|
| | | | 6,816,874 |
| Spain - 3.07% | | | |
| Abertis Infraestructuras SA (a) | 4,968 | | 121,069 |
The accompanying notes are an integral part of the financial statements. 250
John Hancock Funds II
Portfolio of investments — August 31, 2006
(showing percentage of total net assets) |
| International Equity Index Fund (continued) | |
| | Shares or | | |
| | Principal | | |
| | Amount | | Value |
|
|
| |
| COMMON STOCKS (continued) | | | |
| Spain (continued) | | | |
| Acciona SA (a) | 581 | $ | 88,669 |
| Acerinox SA (a) | 4,014 | | 75,483 |
| ACS Actividades SA | 5,194 | | 232,621 |
| Aguas De Barcelona SA-Class A | 1,156 | | 32,386 |
| Altadis SA, Series A | 5,776 | | 273,391 |
| Antena 3 de Television SA (a) | 1,504 | | 34,555 |
| Banco Bilbao Vizcaya Argentaria SA | 70,844 | | 1,616,789 |
| Banco Popular Espanol SA | 18,256 | | 286,086 |
| Banco Santander Central Hispano SA (a) | 124,174 | | 1,923,669 |
| Cintra Concesiones de Infraestructuras de | | | |
| Transporte SA (a) | 4,383 | | 58,144 |
| Corporacion Mapfre SA | 2,065 | | 41,315 |
| Ebro Puleva SA (a) | 1,639 | | 35,120 |
| Endesa SA | 19,863 | | 690,129 |
| Fadesa Inmobiliaria SA (a) | 1,095 | | 35,272 |
| Fomento de Construcciones SA | 934 | | 72,764 |
| Gamesa Corporation Tecno SA (a) | 3,488 | | 73,400 |
| Gas Natural SDG SA | 3,678 | | 122,944 |
| Grupo Ferrovial SA (a) | 1,293 | | 100,402 |
| Iberdrola SA | 17,005 | | 630,421 |
| Iberia Lineas Aereas de Espana SA (a) | 9,151 | | 22,828 |
| Indra Sistemas SA | 2,538 | | 52,695 |
| Industria de Diseno Textil SA (a) | 4,698 | | 211,609 |
| Inmobiliaria Colonial SA | 714 | | 57,315 |
| Metrovacesa SA (a) | 978 | | 92,457 |
| NH Hoteles SA (a) | 1,516 | | 32,891 |
| Promotora de Informaciones SA (a) | 1,493 | | 24,657 |
| Repsol SA (a) | 19,068 | | 547,373 |
| Sacyr Vallehermoso SA (a) | 2,013 | | 77,563 |
| Sogecable SA * (a) | 829 | | 27,223 |
| Telefonica SA | 93,189 | | 1,597,441 |
| Union Fenosa SA (a) | 2,913 | | 127,109 |
| Zeltia SA * (a) | 3,133 | | 23,406 |
| |
|
| | | | 9,439,196 |
| Sweden - 1.79% | | | |
| Alfa Laval AB | 1,900 | | 62,810 |
| Assa Abloy AB, Series B | 6,400 | | 112,189 |
| Atlas Copco AB, Series A | 6,900 | | 177,622 |
| Atlas Copco AB, Series B | 4,200 | | 101,451 |
| Axfood AB | 600 | | 18,344 |
| Billerud Aktibolag AB (a) | 1,000 | | 15,459 |
| Boliden AB (a) | 6,000 | | 112,631 |
| Capio AB * | 1,920 | | 32,464 |
| Castellum AB | 3,000 | | 32,299 |
| D. Carnegie & Company AB | 1,400 | | 24,928 |
| Electrolux AB, Series B (a) | 5,600 | | 86,571 |
| Elekta AB, Series B | 1,687 | | 29,805 |
| Eniro AB | 3,600 | | 42,112 |
| Ericsson LM, Series B | 304,000 | | 1,011,249 |
| Fabege AB | 1,500 | | 29,814 |
| Getinge AB, Series B | 3,600 | | 65,591 |
| Hennes & Mauritz AB, Series B | 9,750 | | 378,835 |
| International Equity Index Fund (continued) | |
| | Shares or | | |
| | Principal | | |
| | Amount | | Value |
|
|
| |
| COMMON STOCKS (continued) | | | |
| Sweden (continued) | | | |
| Hoganas AG, B Shares (a) | 600 | $ | 15,404 |
| Holmen AB, Series B | 1,000 | | 41,892 |
| Husqvarna AB, B Shares * | 5,200 | | 56,164 |
| Kungsleden AB | 2,802 | | 27,170 |
| Lundin Petroleum AB, Series A * (a) | 4,553 | | 50,432 |
| Modern Times Group AB, Series B * (a) | 1,050 | | 54,783 |
| Nobia AB | 1,000 | | 31,056 |
| Nordea Bank AB | 42,500 | | 533,824 |
| OMX AB (a) | 1,400 | | 21,256 |
| Oriflame Cosmetics AB | 865 | | 29,849 |
| Sandvik AB | 20,731 | | 226,771 |
| SAS AB * (a) | 1,500 | | 18,323 |
| Scania AB, Series B | 2,100 | | 99,712 |
| Securitas AB, B Shares | 6,400 | | 112,631 |
| Skandinaviska Enskilda Banken AB, Series A | 9,600 | | 248,451 |
| Skanska AB, Series B | 7,500 | | 118,014 |
| SKF AB, Series B | 8,200 | | 117,144 |
| Ssab Svenskt Stal AB, Series A | 3,000 | | 57,765 |
| Ssab Svenskt Stal AB, Series B | 1,800 | | 32,795 |
| Svenska Cellulosa AB, Series B | 3,900 | | 167,145 |
| Svenska Handelsbanken AB, Series A | 10,500 | | 273,917 |
| Swedish Match AB | 6,500 | | 109,905 |
| Tele2 AB, Series B | 6,354 | | 62,927 |
| Telelogic AB * (a) | 4,000 | | 7,564 |
| Teliasonera AB | 38,000 | | 234,979 |
| Trelleborg AB, Series B (a) | 1,600 | | 31,139 |
| Volvo AB, Series A | 2,000 | | 116,082 |
| Volvo AB, Series B | 4,400 | | 250,217 |
| Wihlborgs Fastigheter AB | 582 | | 9,238 |
| WM Data AB, Series B | 6,000 | | 21,036 |
| |
|
| | | | 5,511,759 |
| Switzerland - 5.52% | | | |
| ABB, Ltd. | 41,048 | | 544,002 |
| Adecco SA | 2,803 | | 163,472 |
| Ciba Specialty Chemicals Holding AG (a) | 1,529 | | 85,454 |
| Clariant AG * (a) | 4,992 | | 60,696 |
| Compagnie Financiere | | | |
| Richemont AG, Series A (a) | 10,854 | | 515,558 |
| Credit Suisse Group AG (a) | 24,751 | | 1,377,285 |
| Geberit AG | 84 | | 97,638 |
| Givaudan AG (a) | 135 | | 108,606 |
| Holcim, Ltd. (a) | 4,221 | | 341,115 |
| Kudelski SA (a) | 688 | | 20,104 |
| Kuehne & Nagel International AG | 1,115 | | 78,223 |
| Kuoni Reisen Holding AG, Series B * | 55 | | 28,755 |
| Logitech International SA * | 3,486 | | 75,162 |
| Lonza Group AG | 825 | | 53,698 |
| Micronas Semiconductor Holding AG * (a) | 604 | | 13,904 |
| Nestle SA | 8,437 | | 2,894,513 |
| Nobel Biocare Holding AG, Series BR | 498 | | 121,099 |
| Novartis AG | 48,678 | | 2,771,849 |
| Phonak Holding AG | 1,039 | | 61,900 |
The accompanying notes are an integral part of the financial statements. 251
John Hancock Funds II
Portfolio of investments — August 31, 2006
(showing percentage of total net assets) |
| International Equity Index Fund (continued) | |
| | Shares or | | |
| | Principal | | |
| | Amount | | Value |
|
|
| |
| COMMON STOCKS (continued) | | | |
| Switzerland (continued) | | | |
| PSP Swiss Property AG * | 1,046 | $ | 54,220 |
| Rieter Holdings AG | 90 | | 38,664 |
| Roche Holdings AG NPV | 14,688 | | 2,701,392 |
| Schindler Holding AG | 1,109 | | 57,711 |
| Serono AG, Series B (a) | 97 | | 67,461 |
| SIG Holding AG * | 121 | | 28,737 |
| Societe Generale de Surveillance Holdings AG | 91 | | 82,982 |
| Straumann Holding AG (a) | 146 | | 30,237 |
| Sulzer AG | 70 | | 56,570 |
| Swatch Group AG, BR shares (a) | 685 | | 133,369 |
| Swatch Group AG (a) | 1,007 | | 39,669 |
| Swiss Re | 7,009 | | 533,473 |
| Swisscom AG (a) | 396 | | 132,487 |
| Syngenta AG * | 2,252 | | 329,850 |
| Synthes AG | 988 | | 107,633 |
| UBS AG | 43,237 | | 2,440,996 |
| Unaxis Holding AG * (a) | 141 | | 41,487 |
| Zurich Financial Services AG | 3,038 | | 690,734 |
| |
|
| | | | 16,980,705 |
| Thailand - 0.20% | | | |
| Advanced Info Service Company, Ltd. | 18,000 | | 43,353 |
| Airports of Thailand PCL | 8,700 | | 12,966 |
| Aromatics Thailand PCL | 4,700 | | 3,784 |
| Bangkok Bank PCL, Foreign Shares | 19,100 | | 55,915 |
| Bangkok Bank PCL | 2,100 | | 5,868 |
| Bangkok Bank, Public Company, Ltd., NVDR | 4,900 | | 13,693 |
| Bangkok Expressway PCL | 7,100 | | 4,025 |
| Banpu PCL, Reg. | 2,600 | | 10,241 |
| BEC World PCL | 18,400 | | 8,961 |
| C.P. Seven Eleven PCL | 31,600 | | 5,298 |
| Charoen Pokphand Foods PCL | 61,300 | | 8,125 |
| Delta Electronics Thailand PCL | 7,300 | | 3,206 |
| Electricity Generating, Public Company, Ltd., | | | |
| NVDR | 1,900 | | 3,868 |
| Electricity Generating, Public Company, Ltd. | 800 | | 1,629 |
| Hana Microelectronics PCL | 11,500 | | 8,034 |
| Italian-Thai Development PCL | 27,400 | | 3,792 |
| Kasikornbank PCL | 2,200 | | 3,659 |
| Kasikornbank PCL | 23,700 | | 40,998 |
| Kasikornbank, Public Company, Ltd., NVDR | 7,000 | | 11,643 |
| Kiatnakin Finance PCL | 4,500 | | 3,413 |
| Kim Eng Securities Thailand PCL | 3,900 | | 2,086 |
| Krung Thai Bank PCL | 57,000 | | 17,294 |
| Land & Houses PCL, Alien MKT REG | 42,300 | | 8,556 |
| Land & Houses PCL | 9,300 | | 1,782 |
| Land & Houses, Public Company, Ltd., NVDR | 21,200 | | 4,062 |
| National Finance PCL | 13,300 | | 5,026 |
| Precious Shipping PCL | 4,200 | | 4,471 |
| PTT Chemical PCL | 5,500 | | 11,344 |
| PTT Exploration & Production PCL | 26,700 | | 76,032 |
| PTT PCL | 17,500 | | 110,845 |
| Ratchaburi Electricity Generating Holding PCL | 5,900 | | 5,221 |
| International Equity Index Fund (continued) | |
| | Shares or | | |
| | Principal | | |
| | Amount | | Value |
|
|
| |
| COMMON STOCKS (continued) | | | |
| Thailand (continued) | | | |
| Sahaviriya Steel Industries PCL * | 106,900 | $ | 3,414 |
| Siam Cement PCL, Foreign Shares | 6,100 | | 37,988 |
| Siam Cement PCL | 800 | | 4,641 |
| Siam Cement, Public Company, Ltd., NVDR | 1,900 | | 11,023 |
| Siam City Cement PCL | 1,300 | | 8,096 |
| Siam Commercial Bank PCL | 16,500 | | 25,469 |
| Siam Makro PCL | 2,000 | | 3,726 |
| Sino Thai Engineering & Construction PCL | 11,800 | | 1,407 |
| Thai Airways International PCL | 10,400 | | 12,178 |
| Thai Union Frozen Products PCL | 1,900 | | 1,163 |
| Thai Union Frozen Products, Public | | | |
| Company, Ltd., NVDR | 4,300 | | 2,632 |
| Tisco Bank PCL | 4,200 | | 2,258 |
| Tisco Finance PLC | 1,200 | | 664 |
| True Corp. PCL * | 33,900 | | 8,165 |
| |
|
| | | | 622,014 |
| Turkey - 0.20% | | | |
| Akbank AS | 15,797 | | 86,293 |
| Akcansa Cimento AS | 982 | | 5,297 |
| Aksigorta AS | 2,511 | | 9,173 |
| Anadolu Efes Biracilik Ve Malt Sanayii AS | 1,158 | | 30,838 |
| Arcelik AS | 2,051 | | 13,235 |
| Aygaz AS * | 1,469 | | 3,431 |
| Cimsa Cimento Sanayi VE Tica AS | 747 | | 4,387 |
| Dogan Sirketler Grubu Holdings AS | 5,280 | | 22,533 |
| Dogan Yayin Holding AS * | 4,369 | | 14,379 |
| Dogus Otomotiv Servis ve Ticaret AS | 790 | | 3,291 |
| Eregli Demir ve Celik Fabrikalari TAS | 4,004 | | 19,548 |
| Ford Otomotiv Sanayi AS | 1,440 | | 10,324 |
| HACI Omer Sabanci Holdings, AS | 9,232 | | 34,986 |
| Hurriyet Gazetecilik AS | 3,847 | | 9,141 |
| Is Gayrimenkul Yatirim Ortakligi AS | 3,046 | | 5,533 |
| KOC Holdings AS * | 5,189 | | 19,310 |
| Migros Turk TAS * | 1,623 | | 15,626 |
| Petkim Petrokimya Holding AS * | 1,680 | | 6,023 |
| Tofas Turk Otomobil Fabrik AS | 2,564 | | 7,003 |
| Trakya Cam Sanayi AS | 2,105 | | 5,146 |
| Tupras Turkiye Petrol Rafine AS | 2,467 | | 45,061 |
| Turk Sise ve Cam Fabrikalari AS * | 3,041 | | 9,303 |
| Turkcell Iletisim Hizmetleri AS - ADR | 3,371 | | 40,452 |
| Turkiye Garanti Bankasi AS | 19,387 | | 56,658 |
| Turkiye Is Bankasi AS | 14,137 | | 81,569 |
| Turkiye Vakiflar Bankasi Tao | 7,872 | | 36,283 |
| Ulker Gida Sanayi ve Ticaret AS | 1,484 | | 3,790 |
| Vestel Elektronik Sanayi AS * | 1,632 | | 4,301 |
| Yapi ve Kredi Bankasi AS * | 13,081 | | 25,546 |
| |
|
| | | | 628,460 |
| United Kingdom - 17.36% | | | |
| 3i Group PLC | 9,994 | | 180,891 |
| Aegis Group PLC | 19,151 | | 46,539 |
| Aggreko PLC | 6,402 | | 34,343 |
The accompanying notes are an integral part of the financial statements. 252
John Hancock Funds II
Portfolio of investments — August 31, 2006
(showing percentage of total net assets) |
| International Equity Index Fund (continued) | |
| | Shares or | | |
| | Principal | | |
| | Amount | | Value |
|
|
| |
| COMMON STOCKS (continued) | | | |
| United Kingdom (continued) | | | |
| AMEC PLC | 6,569 | $ | 40,362 |
| Amvescap PLC | 14,973 | | 154,375 |
| Anglo American PLC | 29,422 | | 1,271,594 |
| ARM Holdings PLC | 26,923 | | 60,817 |
| Arriva PLC | 3,852 | | 43,598 |
| AstraZeneca Group PLC | 32,720 | | 2,118,706 |
| Astro All Asia Networks PLC, GDR | 9,800 | | 12,673 |
| Aviva PLC | 52,528 | | 737,420 |
| BAE Systems PLC | 67,742 | | 477,435 |
| Barclays PLC | 134,626 | | 1,683,808 |
| Barratt Developments PLC | 5,310 | | 100,353 |
| BBA Group PLC | 9,142 | | 46,345 |
| Bellway PLC | 2,214 | | 51,171 |
| Berkeley Group Holdings PLC * | 1,981 | | 48,310 |
| BG Group PLC | 72,301 | | 944,175 |
| BHP Billiton PLC | 50,646 | | 964,377 |
| BICC PLC | 9,818 | | 69,709 |
| BOC Group PLC | 10,751 | | 330,285 |
| Boots Group PLC | 17,506 | | 256,752 |
| Bovis Homes Group PLC | 2,613 | | 41,629 |
| BP PLC | 414,151 | | 4,703,280 |
| Brambles Industries, Ltd. | 15,637 | | 136,829 |
| Britannic Group PLC | 13,836 | | 156,601 |
| British Airways PLC * | 12,165 | | 95,051 |
| British American Tobacco Australasia, Ltd. | 32,521 | | 890,829 |
| British Land Company PLC | 11,032 | | 286,454 |
| British Sky Broadcasting Group PLC | 24,787 | | 264,282 |
| Brixton PLC | 5,015 | | 50,227 |
| BT Group PLC | 175,127 | | 821,179 |
| Bunzl PLC | 6,926 | | 85,967 |
| Burberry Group PLC | 9,066 | | 82,521 |
| Cadbury Schweppes PLC | 44,071 | | 468,633 |
| Capita Group PLC | 14,192 | | 147,672 |
| Carnival PLC | 3,450 | | 147,859 |
| Carphone Warehouse | 8,921 | | 47,728 |
| Cattles PLC | 7,748 | | 48,416 |
| Centrica PLC | 74,743 | | 419,431 |
| Charter Plc * | 3,680 | | 53,692 |
| Close Brothers Group PLC | 2,373 | | 41,258 |
| Cobham PLC | 22,160 | | 72,399 |
| Collins Stewart Tullett PLC | 4,719 | | 70,063 |
| Compass Group PLC | 44,063 | | 213,948 |
| Cookson Group PLC | 4,568 | | 47,488 |
| Corus Group PLC | 18,434 | | 137,547 |
| CSR PLC * (a) | 2,781 | | 62,001 |
| Daily Mail and General Trust PLC | 6,226 | | 68,218 |
| Davis Service Group PLC | 4,197 | | 38,661 |
| De La Rue PLC | 3,325 | | 33,965 |
| Diageo PLC | 59,050 | | 1,050,266 |
| Dixons Group PLC | 39,705 | | 154,834 |
| Electrocomponents PLC | 8,643 | | 39,294 |
| EMAP PLC | 5,016 | | 68,319 |
| International Equity Index Fund (continued) | |
| | Shares or | | |
| | Principal | | |
| | Amount | | Value |
|
|
| |
| COMMON STOCKS (continued) | | | |
| United Kingdom (continued) | | | |
| EMI Group PLC | 15,447 | $ | 78,676 |
| Enterprise Inns PLC | 6,717 | | 130,841 |
| First Choice Holidays PLC | 11,680 | | 47,158 |
| FirstGroup PLC | 7,722 | | 68,598 |
| FKI PLC | 9,466 | | 17,422 |
| Friends Provident Ethical Investment | | | |
| Trust PLC | 33,279 | | 117,747 |
| Gallaher Group PLC | 13,488 | | 232,971 |
| George Wimpey PLC | 7,900 | | 75,289 |
| GKN PLC | 14,104 | | 81,830 |
| GlaxoSmithKline PLC | 120,927 | | 3,422,898 |
| Great Portland Estates PLC | 3,281 | | 35,263 |
| Group 4 Securicor PLC | 22,508 | | 74,500 |
| GUS PLC | 18,580 | | 344,779 |
| Hammerson PLC | 5,810 | | 140,582 |
| Hanson PLC | 14,827 | | 186,715 |
| Hays PLC | 29,667 | | 76,891 |
| HBOS PLC | 79,424 | | 1,515,376 |
| HMV Group PLC | 6,714 | | 19,413 |
| HSBC Holdings PLC | 238,273 | | 4,319,521 |
| ICAP PLC | 10,561 | | 92,965 |
| IMI PLC | 6,793 | | 65,353 |
| Imperial Chemical Industries PLC | 24,504 | | 173,516 |
| Imperial Tobacco Group PLC | 14,211 | | 489,295 |
| Inchcape Plc | 8,832 | | 83,415 |
| Intercontinental Hotels Group PLC | 8,198 | | 143,315 |
| International Power PLC | 30,333 | | 183,201 |
| Intertek Group PLC | 3,065 | | 40,288 |
| Invensys PLC * | 14,917 | | 57,603 |
| Investec PLC | 1,458 | | 74,274 |
| ITV PLC | 83,385 | | 167,740 |
| J Sainsbury PLC | 31,197 | | 211,563 |
| Johnson Matthey PLC | 4,753 | | 119,437 |
| Kesa Electricals PLC | 10,401 | | 61,236 |
| Kingfisher PLC | 50,398 | | 226,252 |
| Ladbrokes PLC | 11,390 | | 82,821 |
| Land Securities Group PLC | 9,982 | | 359,638 |
| Legal & General Group PLC | 137,575 | | 344,138 |
| Liberty International PLC | 5,498 | | 118,914 |
| Lloyds TSB Group PLC | 116,032 | | 1,151,065 |
| Logicacmg PLC | 25,682 | | 76,090 |
| London Stock Exchange Group PLC | 3,108 | | 68,168 |
| Man Group PLC | 37,602 | | 302,029 |
| Marks & Spencer Group PLC | 34,908 | | 393,442 |
| Meggitt PLC | 8,498 | | 50,800 |
| MFI Furniture Group PLC | 9,729 | | 15,638 |
| Michael Page International PLC | 7,525 | | 49,421 |
| Misys PLC | 9,647 | | 45,373 |
| National Express Group PLC | 2,690 | | 42,190 |
| National Grid PLC ADR | 56,016 | | 679,830 |
| Next Group PLC | 5,240 | | 166,163 |
| Old Mutual PLC | 106,406 | | 331,448 |
The accompanying notes are an integral part of the financial statements. 253
John Hancock Funds II
Portfolio of investments — August 31, 2006
(showing percentage of total net assets) |
| International Equity Index Fund (continued) | |
| | Shares or | | |
| | Principal | | |
| | Amount | | Value |
|
|
| |
| COMMON STOCKS (continued) | | | |
| United Kingdom (continued) | | | |
| Pearson PLC | 17,178 | $ | 244,096 |
| Persimmon PLC (a) | 5,618 | | 133,051 |
| Premier Farnell PLC | 6,379 | | 22,782 |
| Provident Financial PLC | 5,072 | | 63,196 |
| Prudential Corp. PLC | 49,448 | | 554,498 |
| Punch Taverns PLC | 5,573 | | 98,009 |
| Rank Group PLC | 12,301 | | 49,958 |
| Reckitt Benckiser PLC | 12,793 | | 530,514 |
| Reed Elsevier PLC | 27,064 | | 290,104 |
| Rentokil Initial PLC | 39,643 | | 113,305 |
| Reuters Group PLC | 28,199 | | 216,712 |
| Rexam PLC | 11,508 | | 118,869 |
| Rio Tinto PLC | 21,796 | | 1,101,631 |
| Rolls-Royce Group PLC * | 36,219 | | 300,566 |
| Royal & Sun Alliance PLC | 63,688 | | 167,794 |
| Royal Bank of Scotland Group PLC | 66,069 | | 2,239,614 |
| SAB Miller PLC | 18,509 | | 364,235 |
| Schroders PLC | 2,444 | | 42,260 |
| Scottish & Newcastle PLC | 17,139 | | 179,478 |
| Scottish & Southern Energy PLC | 17,987 | | 411,958 |
| Scottish Power PLC * | 30,492 | | 359,911 |
| Serco Group PLC | 9,062 | | 60,678 |
| Severn Trent PLC | 7,147 | | 178,779 |
| Signet Group PLC | 36,125 | | 73,529 |
| Slough Estates PLC | 9,210 | | 115,105 |
| Smith & Nephew PLC | 19,062 | | 165,077 |
| Smiths Group PLC | 12,146 | | 198,701 |
| Sportingbet PLC | 8,330 | | 40,129 |
| SSL International PLC | 3,083 | | 17,037 |
| Stagecoach Group PLC | 17,628 | | 38,898 |
| Standard Life PLC * | 45,492 | | 227,593 |
| Tate & Lyle PLC | 10,562 | | 147,171 |
| Taylor Woodrow PLC | 11,561 | | 75,432 |
| Tesco PLC | 162,736 | | 1,167,833 |
| The Sage Group PLC | 26,621 | | 121,156 |
| Tomkins PLC | 17,228 | | 93,236 |
| Travis Perkins PLC | 2,254 | | 72,290 |
| Trinity Mirror PLC | 5,754 | | 49,912 |
| Unilever PLC | 25,897 | | 618,738 |
| United Business Media PLC | 5,512 | | 64,694 |
| United Utilities PLC | 18,612 | | 243,053 |
| Vodafone Group PLC * | 1,096,764 | | 2,373,189 |
| Whitbread PLC * | 4,560 | | 106,173 |
| William Hill PLC | 7,627 | | 92,201 |
| Wolseley PLC | 12,519 | | 272,674 |
| WPP Group PLC | 25,177 | | 306,515 |
| Xstrata PLC | 9,703 | | 435,229 |
| Yell Group PLC | 16,291 | | 164,245 |
| Yorkshire Water PLC | 8,139 | | 127,730 |
| |
|
| | | | 53,423,208 |
| International Equity Index Fund (continued) |
| | Shares or | | |
| | Principal | | |
| | Amount | | Value |
|
|
| |
| COMMON STOCKS (continued) | | | |
| United States - 0.02% | | | |
| Southern Copper Corp. (a) | 700 | $ | 64,624 |
|
| TOTAL COMMON STOCKS (Cost $262,450,713) | | $ | 291,334,729 |
|
| |
| PREFERRED STOCKS - 0.76% | | | |
| Brazil - 0.48% | | | |
| Aracruz Celulose SA | 1,300 | | 6,710 |
| Banco Bradesco SA | 9,700 | | 314,958 |
| Banco Itau Holding Financeira SA * | 11,000 | | 331,477 |
| Braskem SA, A Shares | 2,500 | | 16,291 |
| Centrais Eletricas Brasileiras SA | 900,000 | | 17,994 |
| Cia de Bebidas das Americas, ADR | 2,916 | | 130,812 |
| Cia de Bebidas das Americas | 50,000 | | 22,492 |
| Cia de Gas de Sao Paulo | 50,000 | | 7,170 |
| Cia de Tecidos do Norte de Minas - Coteminas | 90,000 | | 8,155 |
| Cia Paranaense de Energia * | 1,700,000 | | 18,304 |
| Cia Vale do Rio Doce | 6,500 | | 120,906 |
| Duratex SA * | 1,500 | | 15,065 |
| Eletropaulo Metropolitana de Sao Paulo SA * | 160,000 | | 7,099 |
| Embratel Participacoes SA | 5,800,000 | | 18,261 |
| Gol Linhas Aereas Inteligentes SA | 1,100 | | 38,029 |
| Klabin SA, ADR | 12,000 | | 23,880 |
| Lojas Americanas SA | 500,000 | | 22,189 |
| Petroleo Brasileiro SA | 9,200 | | 184,795 |
| Sadia SA, ADR | 9,000 | | 24,174 |
| Tam SA | 1,440 | | 44,725 |
| Telemig Celular Participacoes SA | 5,300,000 | | 8,839 |
| Telesp Celular Participacoes SA * | 7,300 | | 22,915 |
| Tim Participacoes SA | 13,200,000 | | 37,983 |
| Usinas Siderurgicas de Minas Gerais SA | 800 | | 25,120 |
| Votorantim Celulose e Papel SA * | 600 | | 9,768 |
| Weg SA | 3,400 | | 14,453 |
| |
|
| | | | 1,492,564 |
| Germany - 0.17% | | | |
| Henkel KGaA-Vorzug, Non-Voting (a) | 1,204 | | 153,544 |
| Porsche AG, Non-Voting | 161 | | 164,811 |
| RWE AG, Non-Voting | 766 | | 63,224 |
| Volkswagen AG, Non-Voting | 2,291 | | 129,950 |
| |
|
| | | | 511,529 |
| Italy - 0.02% | | | |
| Unipol SpA | 18,278 | | 55,123 |
| South Africa - 0.00% | | | |
| Lereko Mobility Proprietary, Ltd. | 64 | | 355 |
| South Korea - 0.09% | | | |
| Hyundai Motor Company | 820 | | 41,027 |
| LG Electronics, Inc. | 310 | | 12,012 |
| Samsung Electronics Company, Ltd. | 450 | | 234,046 |
| |
|
| | | | 287,085 |
|
| TOTAL PREFERRED STOCKS (Cost $2,090,045) | | $ | 2,346,656 |
|
The accompanying notes are an integral part of the financial statements. 254
John Hancock Funds II
Portfolio of investments — August 31, 2006
(showing percentage of total net assets) |
| International Equity Index Fund (continued) |
| | | Shares or | | |
| | | Principal | | |
| | | Amount | | Value |
| |
|
| |
| WARRANTS - 0.00% | | | | |
| Hong Kong - 0.00% | | | | |
| China Overseas Land & Investment, Ltd. | | | | |
| (Expiration Date 07/18/07, strike price | | | | |
| HKD$4.5) | | 7,365 | $ | 1,089 |
| Indonesia - 0.00% | | | | |
| Bank Pan Indonesia Tbk PT | | | | |
| (Expiration Date 10/07/2009, strike | | | | |
| price IDR$400.00) | | 25,750 | | 494 |
| Switzerland - 0.00% | | | | |
| Swisscom AG | | | | |
| (Expiration Date 09/13/06, strike price | | | | |
| CHF$450.00) | | 396 | | 1,005 |
|
| TOTAL WARRANTS (Cost $1,149) | | | $ | 2,588 |
|
| |
| RIGHTS - 0.00% | | | | |
| Italy - 0.00% | | | | |
| Autostrade (Expiration Date 09/08/06, price | | | |
| EUR$21.31) | | 5,934 | | 7 |
|
| TOTAL RIGHTS (Cost $0) | | | $ | 7 |
|
| |
| SHORT TERM INVESTMENTS - 22.75% | | | |
| AIM Short-Term Investment Trust, | | | | |
| STIC Prime Portfolio, Institutional | | | | |
| Class | $ | 7,686,963 | $ | 7,686,963 |
| Canfor Pulp Income Fund | | 180 | | 1,960 |
| CI Financial Income Fund | | 1,500 | | 40,867 |
| Enerplus Resources Fund | CAD | 2,600 | | 150,951 |
| Federated Prime Obligations Fund | $ | 3,019,133 | | 3,019,133 |
| State Street Navigator Securities Lending | | | | |
| Prime Portfolio (c) | | 59,053,314 | | 59,053,314 |
| Yellow Pages Income Fund | CAD | 4,800 | | 63,456 |
|
| TOTAL SHORT TERM INVESTMENTS | | | | |
| (Cost $70,017,171) | | | $ | 70,016,644 |
|
| Total Investments (International Equity Index Fund) | | |
| (Cost $334,559,078) - 118.18% | | | $ | 363,700,624 |
| Liabilities in Excess of Other Assets - (18.18)% | | | (55,941,607) |
| |
|
| TOTAL NET ASSETS - 100.00% | | | $ | 307,759,017 |
| |
|
| |
| |
| International Opportunities Fund | | | |
| | | Shares or | | |
| | | Principal | | |
| | | Amount | | Value |
| |
|
| |
| COMMON STOCKS - 98.18% | | | | |
| Australia - 1.08% | | | | |
| CSL, Ltd. (a) | | 155,965 | $ | 6,050,422 |
| Austria - 1.00% | | | | |
| Erste Bank der Oesterreichischen | | | | |
| Sparkassen AG | | 93,292 | | 5,633,027 |
| Bermuda - 2.05% | | | | |
| Esprit Holdings, Ltd. | | 1,381,000 | | 11,489,170 |
| International Opportunities Fund (continued) |
| | | Shares or | | | |
| | | Principal | | | |
| | | Amount | | | Value |
| |
|
| |
| COMMON STOCKS (continued) | | | | | |
| Brazil - 2.08% | | | | | |
| Gafisa SA * | | 251,932 | | $ | 3,295,152 |
| Unibanco - Uniao De Bancos | | | | | |
| Brasileiros SA, ADR | | 115,595 | | | 8,363,298 |
| |
|
| | | | | | 11,658,450 |
| Canada - 3.11% | | | | | |
| Canadian National Railway Company | | 135,653 | | | 5,800,522 |
| Shoppers Drug Mart Corp. | | 277,186 | | | 11,679,558 |
| |
|
| | | | | | 17,480,080 |
| China - 1.27% | | | | | |
| CNOOC, Ltd., ADR (a) | | 81,882 | | | 7,137,654 |
| France - 9.55% | | | | | |
| JC Decaux SA (a) | | 211,496 | | | 5,857,543 |
| LVMH Moet Hennessy SA (a) | | 127,355 | | | 13,090,533 |
| Vallourec SA (a) | | 64,182 | | | 14,368,345 |
| Veolia Environnement SA (a) | | 362,533 | | | 20,289,953 |
| |
|
| | | | | | 53,606,374 |
| Germany - 6.36% | | | | | |
| Continental AG | | 227,658 | | | 24,317,831 |
| Hypo Real Estate Holding AG | | 183,335 | | | 11,351,315 |
| |
|
| | | | | | 35,669,146�� |
| Hong Kong - 1.42% | | | | | |
| Shangri-La Asia, Ltd. | | 4,035,778 | | | 7,991,691 |
| India - 0.90% | | | | | |
| ICICI Bank, Ltd., SADR (a) | | 188,393 | | | 5,028,209 |
| Italy - 1.22% | | | | | |
| Banca Intesa SpA | | 421,250 | | | 2,818,363 |
| San Paolo-IMI SpA | | 192,547 | | | 4,029,726 |
| |
|
| | | | | | 6,848,089 |
| Japan - 18.12% | | | | | |
| Credit Saison Company, Ltd. | | 247,476 | | | 11,155,452 |
| Daikin Industries, Ltd. (a) | | 114,205 | | | 3,493,638 |
| Marubeni Corp. (a) | | 2,332,000 | | | 12,459,324 |
| Mitsubishi UFJ Financial Group, Inc. | | 802 | | | 10,934,344 |
| Mitsui Trust Holdings, Inc. | | 484,000 | | | 5,666,704 |
| Nippon Electric Glass Company, Ltd. (a) | | 413,305 | | | 10,037,231 |
| Nomura Securities Company, Ltd. | | 145,000 | | | 2,804,738 |
| Sega Sammy Holdings, Inc. | | 336,518 | | | 11,498,762 |
| Seiyu, Ltd. * (a) | | 1,355,000 | | | 2,609,433 |
| Sumitomo Realty & | | | | | |
| Development Company, Ltd. (a) | | 320,958 | | | 9,462,866 |
| Toyota Motor Corp. (a) | | 224,335 | | | 12,176,848 |
| Yamada Denki Company, Ltd. (a) | | 87,428 | | | 9,386,842 |
| |
|
| | | | | | 101,686,182 |
| Mexico - 4.82% | | | | | |
| America Movil S.A. de C.V., Series L | | 445,113 | | | 16,607,166 |
| Cemex SA, ADR * | | 360,693 | | | 10,420,421 |
| |
|
| | | | | | 27,027,587 |
| Netherlands - 1.53% | | | | | |
| ING Groep NV | | 198,992 | | | 8,591,418 |
The accompanying notes are an integral part of the financial statements. 255
John Hancock Funds II
Portfolio of investments — August 31, 2006
(showing percentage of total net assets) |
| International Opportunities Fund (continued) |
| | | Shares or | | |
| | | Principal | | |
| | | Amount | | Value |
| |
|
| |
| COMMON STOCKS (continued) | | | | |
| Norway - 1.45% | | | | |
| Acergy SA * (a) | | 462,291 | $ | 8,153,861 |
| Singapore - 3.50% | | | | |
| CapitaLand, Ltd. (a) | | 1,782,587 | | 5,393,195 |
| DBS Group Holdings, Ltd. | | 1,245,000 | | 14,243,946 |
| |
|
| | | | | 19,637,141 |
| South Korea - 2.75% | | | | |
| Samsung Electronics Company, Ltd., | | | | |
| GDR-London | | 45,465 | | 15,458,100 |
| Sweden - 1.45% | | | | |
| Telefonaktiebolaget LM Ericsson, SADR (a) | | 243,395 | | 8,129,393 |
| Switzerland - 19.27% | | | | |
| ABB, Ltd. | | 817,740 | | 10,837,358 |
| Lonza Group AG | | 212,711 | | 13,845,095 |
| Nestle SA | | 40,676 | | 13,954,865 |
| Roche Holdings AG NPV (a) | | 122,604 | | 22,549,119 |
| Syngenta AG * | | 159,607 | | 23,377,632 |
| UBS AG (a) | | 417,353 | | 23,562,160 |
| |
|
| | | | | 108,126,229 |
| United Kingdom - 15.25% | | | | |
| BAE Systems PLC | | 2,099,139 | | 14,794,395 |
| BP PLC | | 1,241,209 | | 14,095,713 |
| Carphone Warehouse | | 989,562 | | 5,294,237 |
| Diageo PLC | | 965,296 | | 17,168,799 |
| Man Group PLC | | 1,259,573 | | 10,117,211 |
| Reckitt Benckiser PLC | | 343,106 | | 14,228,287 |
| Tesco PLC | | 1,373,717 | | 9,858,125 |
| |
|
| | | | | 85,556,767 |
|
| TOTAL COMMON STOCKS (Cost $483,415,694) | | $ | 550,958,990 |
|
| |
| SHORT TERM INVESTMENTS - 19.15% | | | | |
| State Street Navigator Securities | | | | |
| Lending Prime Portfolio (c) | $ | 107,481,210 | $ | 107,481,210 |
|
| TOTAL SHORT TERM INVESTMENTS | | | | |
| (Cost $107,481,210) | | | $ | 107,481,210 |
|
| |
| REPURCHASE AGREEMENTS - 1.69% | | | | |
| Repurchase Agreement with State | | | | |
| Street Corp. dated 08/31/2006 at | | | | |
| 3.95% to be repurchased at | | | | |
| $9,471,039 on 9/1/2006, | | | | |
| collateralized by $9,625,000 | | | | |
| Federal Home Loan Mortgage | | | | |
| Corp., 2.75% due 12/28/2006 | | | | |
| (valued at $9,661,094, including | | | | |
| interest) (c) | $ | 9,470,000 | $ | 9,470,000 |
|
| TOTAL REPURCHASE AGREEMENTS | | | | |
| (Cost $9,470,000) | | | $ | 9,470,000 |
|
| Total Investments (International Opportunities Fund) | | |
| (Cost $600,366,904) - 119.02% | | | $ | 667,910,200 |
| Liabilities in Excess of Other Assets - (19.02)% | | | (106,749,490) |
| |
|
| TOTAL NET ASSETS - 100.00% | | | $ | 561,160,710 |
| |
|
| The portfolio had the following five top industry concentrations as of | |
| August 31, 2006 (as a percentage of total net assets): | | | |
| Financial Services | 10.22% | | |
| Banking | 8.38% | | |
| Chemicals | 6.63% | | |
| Electronics | 5.49% | | |
| Liquor | 5.39% | | |
| |
| |
| International Small Cap Fund | | | |
| | Shares or | | |
| | Principal | | |
| | Amount | | Value |
|
|
| |
| COMMON STOCKS - 90.78% | | | |
| Australia - 3.52% | | | |
| Billabong International, Ltd. (a) | 324,316 | $ | 3,661,826 |
| Downer EDI, Ltd. (a) | 347,100 | | 1,490,838 |
| PaperlinX, Ltd. (a) | 2,195,958 | | 5,763,019 |
| Repco Corp., Ltd. (a) | 3,310,055 | | 3,005,036 |
| |
|
| | | | 13,920,719 |
| Belgium - 1.20% | | | |
| Barco N.V. | 53,950 | | 4,755,171 |
| Bermuda - 5.37% | | | |
| Bio-Treat Technology, Ltd. (a) | 4,517,612 | | 2,426,354 |
| Giordano International, Ltd. | 6,390,365 | | 3,623,723 |
| Ngai Lik Industrial Holding, Ltd. | 18,284,513 | | 1,669,292 |
| People's Food Holdings, Ltd. (a) | 10,481,174 | | 7,194,857 |
| Texwinca Holdings, Ltd. | 5,486,907 | | 3,598,226 |
| Yue Yuen Industrial Holdings, Ltd. | 953,833 | | 2,759,596 |
| |
|
| | | | 21,272,048 |
| Brazil - 0.58% | | | |
| Companhia de Saneamento de Minas Gerais * | 244,500 | | 2,284,246 |
| Canada - 9.65% | | | |
| ATS Automation Tooling Systems, Inc. * | 331,900 | | 3,559,981 |
| Domtar, Inc. * | 431,222 | | 2,747,133 |
| Dorel Industries, Inc., Class B * | 164,900 | | 3,875,705 |
| Legacy Hotels Real Estate Investment, REIT | 624,001 | | 4,877,430 |
| Linamar Corp. | 98,217 | | 1,202,585 |
| MDS, Inc. | 332,277 | | 6,692,680 |
| North West Company | 155,533 | | 6,240,153 |
| Open Text Corp. * | 357,953 | | 5,828,684 |
| Quebecor World, Inc. | 285,346 | | 3,176,671 |
| |
|
| | | | 38,201,022 |
| Cayman Islands - 0.33% | | | |
| TCL Communication Technology Holdings, | | | |
| Ltd. * | 37,286,192 | | 1,294,501 |
| China - 2.14% | | | |
| BYD Company, Ltd., H Shares * | 993,269 | | 2,247,865 |
| China Oilfield Services Ltd., H shares | 8,017,031 | | 4,494,597 |
| Sinotrans, Ltd., Class H | 5,482,000 | | 1,734,063 |
| |
|
| | | | 8,476,525 |
| Denmark - 2.45% | | | |
| Vestas Wind Systems AS * | 347,110 | | 9,702,461 |
| Finland - 2.34% | | | |
| Amer Sports Oyj (a) | 237,854 | | 5,279,167 |
The accompanying notes are an integral part of the financial statements. 256
John Hancock Funds II
Portfolio of investments — August 31, 2006
(showing percentage of total net assets) |
| International Small Cap Fund (continued) | | |
| | Shares or | | |
| | Principal | | |
| | Amount | | Value |
|
|
| |
| COMMON STOCKS (continued) | | | |
| Finland (continued) | | | |
| Huhtamaki Oyj (a) | 227,926 | $ | 3,997,484 |
| |
|
| | | | 9,276,651 |
| Germany - 3.05% | | | |
| Jenoptik AG * (a) | 737,145 | | 6,534,940 |
| Vossloh AG (a) | 110,805 | | 5,557,912 |
| |
|
| | | | 12,092,852 |
| Hong Kong - 5.02% | | | |
| China Pharmaceutical Group, Ltd. * | 8,402,384 | | 1,080,422 |
| China Resource Power Holdings, Ltd. | 4,873,273 | | 4,311,217 |
| Chitaly Holdings, Ltd. | 9,456,729 | | 1,532,153 |
| Dah Sing Financial Group | 463,574 | | 3,975,901 |
| Fountain Set Holdings, Ltd. | 11,313,425 | | 2,836,739 |
| Lerado Group Holdings | 12,649,682 | | 1,089,796 |
| Travelsky Technology, Ltd. | 2,277,566 | | 2,662,107 |
| Weiqiao Textile Company, Ltd. | 2,136,106 | | 2,370,414 |
| |
|
| | | | 19,858,749 |
| Indonesia - 0.48% | | | |
| Astra International Tbk PT | 1,560,881 | | 1,900,382 |
| Japan - 4.96% | | | |
| Meitec Corp. (a) | 114,611 | | 3,701,382 |
| Nichii Gakkan Company, Ltd. (a) | 373,866 | | 5,903,231 |
| Sohgo Security Services Company, Ltd. (a) | 462,573 | | 8,513,977 |
| Tokyo Individualized Educational Institute, Inc. (a) | 509,085 | | 1,509,621 |
| |
|
| | | | 19,628,211 |
| Luxembourg - 0.55% | | | |
| Thiel Logistik AG * | 577,341 | | 2,178,762 |
| Mexico - 0.51% | | | |
| Promotora Ambiental SA de CV * | 2,307,500 | | 2,008,452 |
| Netherlands - 6.96% | | | |
| Aalberts Industries NV | 46,833 | | 3,858,276 |
| Draka Holdings * (a) | 216,668 | | 3,927,535 |
| Imtech NV | 44,668 | | 2,407,373 |
| OPG Groep NV | 68,477 | | 6,447,301 |
| Pyaterochka Holding NV, GDR-USD * | 31,845 | | 566,841 |
| Pyaterochka Holding NV-GBP * | 108,308 | | 1,917,052 |
| SBM Offshore NV | 117,904 | | 3,229,242 |
| Vedior NV | 280,804 | | 5,187,116 |
| |
|
| | | | 27,540,736 |
| Norway - 0.80% | | | |
| Prosafe ASA (a) | 47,544 | | 3,170,051 |
| Singapore - 2.87% | | | |
| Huan Hsin Holdings, Ltd. | 3,335,298 | | 1,112,967 |
| Osim International (a) | 4,045,008 | | 4,499,310 |
| Venture Corp., Ltd. (a) | 777,229 | | 5,730,539 |
| |
|
| | | | 11,342,816 |
| South Korea - 7.87% | | | |
| Daeduck Electronics Company, Ltd. | 448,800 | | 3,860,796 |
| Daegu Bank | 405,850 | | 6,796,885 |
| Halla Climate Control Company, Ltd. | 600,100 | | 6,710,433 |
| International Small Cap Fund (continued) | | |
| | | Shares or | | |
| | | Principal | | |
| | | Amount | | Value |
| |
|
| |
| COMMON STOCKS (continued) | | | | |
| South Korea (continued) | | | | |
| Pusan Bank | | 495,420 | $ | 6,364,422 |
| Sindo Ricoh Company, Ltd. | | 78,430 | | 4,111,793 |
| Youngone Corp. | | 747,110 | | 3,322,302 |
| |
|
| | | | | 31,166,631 |
| Sweden - 1.21% | | | | |
| D. Carnegie & Company AB | | 270,066 | | 4,808,695 |
| Switzerland - 2.14% | | | | |
| Kuoni Reisen Holding AG, Series B * | | 4,610 | | 2,410,189 |
| Verwaltungs-und Privat-Bank AG | | 25,155 | | 6,076,185 |
| |
|
| | | | | 8,486,374 |
| Taiwan - 9.04% | | | | |
| Acbel Polytech, Inc. | | 5,100,000 | | 1,305,268 |
| D-Link Corp. | | 9,796,599 | | 9,618,230 |
| Fu Sheng Industrial Company, Ltd. | | 4,922,320 | | 4,323,993 |
| Giant Manufacturing Company, Ltd. | | 850,000 | | 1,202,696 |
| KYE System Corp. | | 3,118,087 | | 2,355,222 |
| Pihsiang Machinery Mfg. Company, Ltd. | | 1,900,000 | | 3,817,441 |
| Taiwan Fu Hsing | | 2,886,000 | | 2,693,097 |
| Taiwan Green Point Enterprises Company, Ltd. | 2,441,796 | | 6,345,895 |
| Test-Rite International Company, Ltd. | | 7,155,672 | | 4,132,581 |
| |
|
| | | | | 35,794,423 |
| Thailand - 3.43% | | | | |
| BEC World PCL | | 5,959,479 | | 2,902,421 |
| Glow Energy PCL | | 6,865,525 | | 5,207,384 |
| Total Access Communication PCL * (a) | | 1,366,012 | | 5,464,048 |
| |
|
| | | | | 13,573,853 |
| United Kingdom - 12.05% | | | | |
| Bodycote International | | 1,043,903 | | 4,636,762 |
| Burberry Group PLC | | 336,989 | | 3,067,365 |
| DS Smith PLC | | 1,108,462 | | 3,310,459 |
| DX Services PLC | | 1,343,454 | | 10,592,907 |
| Future PLC | | 3,705,200 | | 2,237,810 |
| Game Group PLC | | 6,340,196 | | 11,095,792 |
| iSOFT Group PLC (a) | | 3,586,009 | | 3,530,121 |
| John Wood Group PLC | | 801,703 | | 3,496,155 |
| Yule Catto & Company PLC | | 1,287,994 | | 5,727,080 |
| |
|
| | | | | 47,694,451 |
| United States - 2.26% | | | | |
| GSI Group, Inc. * | | 381,584 | | 3,438,072 |
| Quebecor World, Inc. (a) | | 146,526 | | 1,636,695 |
| Steiner Leisure, Ltd. * | | 100,245 | | 3,857,428 |
| |
|
| | | | | 8,932,195 |
|
| TOTAL COMMON STOCKS (Cost $330,340,974) | | $ | 359,360,977 |
|
| |
| SHORT TERM INVESTMENTS - 12.42% | | | |
| State Street Navigator Securities | | | | |
| Lending Prime Portfolio (c) | $ | 49,186,127 | $ | 49,186,127 |
|
| TOTAL SHORT TERM INVESTMENTS | | | | |
| (Cost $49,186,127) | | | $ | 49,186,127 |
|
The accompanying notes are an integral part of the financial statements. 257
John Hancock Funds II
Portfolio of investments — August 31, 2006
(showing percentage of total net assets) |
| International Small Cap Fund (continued) | | |
| | | Shares or | | |
| | | Principal | | |
| | | Amount | | Value |
| |
|
| |
| REPURCHASE AGREEMENTS - 6.78% | | | |
| Repurchase Agreement with State | | | | |
| Street Corp. dated 08/31/2006 at | | | | |
| 3.95% to be repurchased at | | | | |
| $26,835,944 on 09/01/2006, | | | | |
| collateralized by $27,200,000 | | | | |
| Federal National Mortgage | | | | |
| Association, 5.125% due | | | | |
| 12/15/2008 (valued at | | | | |
| $27,370,000, including interest) (c) | $ | 26,833,000 | $ | 26,833,000 |
|
| TOTAL REPURCHASE AGREEMENTS | | | | |
| (Cost $26,833,000) | | | $ | 26,833,000 |
|
| Total Investments (International Small Cap Fund) | | | |
| (Cost $406,360,101) - 109.98% | | | $ | 435,380,104 |
| Liabilities in Excess of Other Assets - (9.98)% | | | (39,515,014) |
| |
|
| TOTAL NET ASSETS - 100.00% | | | $ | 395,865,090 |
| |
|
The portfolio had the following five top industry concentrations as of August 31, 2006 (as a percentage of total net assets):
| Electrical Equipment | 5.84% |
| Banking | 4.86% |
| Apparel & Textiles | 4.76% |
| Business Services | 4.40% |
| Software | 4.03% |
| International Small Company Fund | | |
| | Shares or | | |
| | Principal | | |
| | Amount | | Value |
|
|
| |
| COMMON STOCKS - 98.09% | | | |
| Australia - 5.79% | | | |
| ABB Grain, Ltd. | 31,091 | $ | 158,446 |
| Adelaide Bank, Ltd. (a) | 21,763 | | 225,635 |
| Adelaide Brighton, Ltd. (a) | 105,031 | | 189,102 |
| Adsteam Marine, Ltd. (a) | 56,048 | | 108,608 |
| Alesco Corp., Ltd. (a) | 17,181 | | 118,620 |
| Allegiance Mining NL * | 149,191 | | 35,853 |
| Amadeus Energy, Ltd. * | 46,767 | | 38,890 |
| Amalgamated Holdings, Ltd. | 10,448 | | 40,173 |
| Ansell, Ltd. (a) | 30,331 | | 217,974 |
| Aquila Resources, Ltd. * | 8,911 | | 45,752 |
| ARB Corp., Ltd. | 16,596 | | 43,048 |
| ARC Energy, Ltd. * | 36,745 | | 43,170 |
| Aspen Group (a) | 36,202 | | 43,084 |
| Ausdrill, Ltd. * | 39,839 | | 47,869 |
| Auspine, Ltd. | 13,590 | | 43,545 |
| Austal, Ltd. * | 37,191 | | 90,794 |
| Austar United Communications, Ltd. * (a) | 85,750 | | 76,213 |
| Austereo Group, Ltd. (a) | 68,999 | | 98,172 |
| Australian Agricultural Company, Ltd. | 54,556 | | 76,582 |
| Australian Infrastructure Fund (a) | 68,600 | | 113,043 |
| Australian Pipeline Trust (a) | 53,406 | | 196,383 |
| International Small Company Fund (continued) |
| | Shares or | | |
| | Principal | | |
| | Amount | | Value |
|
|
| |
| COMMON STOCKS (continued) | | | |
| Australia (continued) | | | |
| Australian Worldwide Exploration, Ltd. * (a) | 74,302 | $ | 185,360 |
| AVJennings, Ltd. | 46,840 | | 38,771 |
| Babcock & Brown Environmental | | | |
| Investments, Ltd. * | 19,026 | | 32,223 |
| Ballarat Goldfields NL * | 289,292 | | 51,865 |
| Bank of Queensland, Ltd. (a) | 19,912 | | 232,268 |
| BayCorp Advantage, Ltd. (a) | 39,472 | | 88,232 |
| Beach Petroleum, Ltd. | 90,933 | | 116,546 |
| Bendigo Mining, Ltd. * (a) | 31,918 | | 38,595 |
| Biota Holdings, Ltd. * | 39,986 | | 37,674 |
| Bolnisi Gold NL | 53,676 | | 100,326 |
| Boom Logistics, Ltd. | 25,797 | | 82,265 |
| Bradken, Ltd. | 22,400 | | 99,800 |
| Cabcharge Australia, Ltd. | 19,412 | | 111,071 |
| Campbell Brothers, Ltd. | 10,068 | | 142,864 |
| Candle Australia, Ltd. * | 16,055 | | 42,869 |
| CBH Resources, Ltd. * (a) | 158,181 | | 54,304 |
| Cellestis, Ltd. * | 15,855 | | 38,465 |
| Citigold Corp, Ltd. * | 151,498 | | 60,100 |
| City Pacific, Ltd. (a) | 14,563 | | 50,773 |
| Commander Communications, Ltd. * (a) | 51,087 | | 76,779 |
| Compass Resources NL * | 15,577 | | 49,674 |
| ConnectEast Group * | 204,500 | | 180,195 |
| Consolidated Rutile, Ltd. | 52,500 | | 24,632 |
| Corporate Express Australia, Ltd. (a) | 17,731 | | 68,311 |
| Count Financial, Ltd. (a) | 24,455 | | 41,791 |
| Crane Group, Ltd. (a) | 14,788 | | 124,099 |
| David Jones, Ltd. (a) | 90,909 | | 244,821 |
| Downer EDI, Ltd. (a) | 186,934 | | 802,905 |
| Duet Group | 70,700 | | 145,630 |
| Energy Developments, Ltd. | 25,952 | | 88,105 |
| Envestra, Ltd. | 141,700 | | 124,318 |
| Equigold NL | 27,470 | | 30,597 |
| FKP Property Group | 36,437 | | 148,718 |
| Fleetwood Corp., Ltd. | 7,891 | | 41,779 |
| Flight Centre, Ltd. * (a) | 15,759 | | 138,379 |
| Forest Enterprises Australia, Ltd. * | 81,488 | | 36,679 |
| Funtastic, Ltd. (a) | 32,287 | | 37,687 |
| Futuris Corp., Ltd. (a) | 80,039 | | 130,672 |
| Gindalbie Metals, Ltd. * | 112,045 | | 41,457 |
| GrainCorp., Ltd. | 3,774 | | 23,321 |
| GRD, Ltd. * | 30,341 | | 51,850 |
| Great Southern Plantations, Ltd. (a) | 42,877 | | 89,955 |
| GUD Holdings, Ltd. (a) | 13,336 | | 71,930 |
| Gunns, Ltd. (a) | 55,706 | | 117,295 |
| GWA International, Ltd. (a) | 49,659 | | 117,443 |
| Hardman Resources, Ltd. * (a) | 123,098 | | 135,702 |
| Herald Resources, Ltd. * | 17,198 | | 14,826 |
| Hills Industries, Ltd. (a) | 35,500 | | 135,415 |
| Horizon Oil, Ltd. * | 153,662 | | 40,444 |
| Housewares International, Ltd. | 38,553 | | 45,295 |
| HPAL, Ltd. (a) | 31,154 | | 38,266 |
The accompanying notes are an integral part of the financial statements. 258
John Hancock Funds II
Portfolio of investments — August 31, 2006
(showing percentage of total net assets) |
| International Small Company Fund (continued) |
| | Shares or | | |
| | Principal | | |
| | Amount | | Value |
|
|
| |
| COMMON STOCKS (continued) | | | |
| Australia (continued) | | | |
| IBA Health, Ltd. | 60,537 | $ | 40,180 |
| IBT Education, Ltd. | 26,000 | | 34,910 |
| Incitec Pivot, Ltd. | 11,723 | | 228,059 |
| Independence Group NL * | 19,208 | | 50,702 |
| Indophil Resources NL * | 72,190 | | 45,436 |
| Infomedia, Ltd. | 87,333 | | 49,304 |
| Integrated Group, Ltd. * | 18,608 | | 29,812 |
| Invocare, Ltd. (a) | 11,197 | | 44,419 |
| IOOF Holdings, Ltd. | 13,384 | | 86,586 |
| Iress Market Technology, Ltd. (a) | 19,452 | | 86,072 |
| IWL, Ltd. | 11,971 | | 41,371 |
| JB Hi-Fi, Ltd. (a) | 21,677 | | 82,522 |
| Jubilee Mines NL (a) | 15,147 | | 106,081 |
| Just Group, Ltd. | 31,400 | | 82,405 |
| Kingsgate Consolidated, Ltd. (a) | 11,709 | | 47,522 |
| MacArthur Coal, Ltd. | 24,217 | | 92,191 |
| Macmahon Holdings, Ltd. | 112,511 | | 70,384 |
| Miller's Retail, Ltd. * | 64,163 | | 79,788 |
| Minara Resources, Ltd. (a) | 21,175 | | 57,833 |
| Mincor Resources NL | 54,880 | | 51,079 |
| Mineral Deposits, Ltd. * | 39,608 | | 43,059 |
| Monadelphous Group, Ltd. (a) | 15,546 | | 82,072 |
| Mortgage Choice, Ltd. | 74 | | 148 |
| Mount Gibson Iron, Ltd. * (a) | 64,184 | | 35,990 |
| New Hope Corp., Ltd. | 144,455 | | 148,776 |
| Nido Petroleum, Ltd. * | 256,103 | | 40,053 |
| Oakton, Ltd. | 15,760 | | 43,885 |
| OAMPs, Ltd. | 31,615 | | 88,999 |
| Oceana Gold, Ltd. * (a) | 73,000 | | 43,996 |
| Pacifica Group, Ltd. (a) | 44,486 | | 50,908 |
| Pan Australian Resources, Ltd. * (a) | 123,891 | | 26,465 |
| PaperlinX, Ltd. (a) | 191,164 | | 501,686 |
| Peet & Company, Ltd. | 16,000 | | 45,164 |
| Peptech, Ltd. * | 37,842 | | 35,798 |
| Perilya, Ltd. (a) | 22,014 | | 51,727 |
| Perseverance Corp., Ltd. * | 143,419 | | 37,201 |
| Petsec Energy, Ltd. * | 36,147 | | 72,251 |
| Pharmaxis, Ltd. * | 50,510 | | 84,775 |
| PMP, Ltd. * | 52,337 | | 60,690 |
| Primary Health Care, Ltd. (a) | 21,521 | | 193,080 |
| Prime Television, Ltd. * | 3,886 | | 11,562 |
| Programmed Maintenance Services, Ltd. | 14,398 | | 49,319 |
| pSivida, Ltd. * | 95,189 | | 27,232 |
| RCR Tomlinson, Ltd. | 22,598 | | 37,238 |
| Rebel Sport, Ltd. | 25,251 | | 64,342 |
| Resolute Mining, Ltd. * | 36,122 | | 43,265 |
| Ridley Corp., Ltd. * | 45,977 | | 41,565 |
| Roc Oil Company, Ltd. * (a) | 41,843 | | 122,900 |
| Rural Press, Ltd. | 22,812 | | 192,480 |
| S8, Ltd. | 12,095 | | 32,665 |
| SAI Global, Ltd. | 16,292 | | 42,259 |
| Sally Malay Mining, Ltd. * | 43,373 | | 37,391 |
| International Small Company Fund (continued) |
| | Shares or | | |
| | Principal | | |
| | Amount | | Value |
|
|
| |
| COMMON STOCKS (continued) | | | |
| Australia (continued) | | | |
| Select Harvests, Ltd. | 5,918 | $ | 61,853 |
| ServCorp, Ltd. (a) | 13,939 | | 62,635 |
| Silex Systems, Ltd. * | 13,874 | | 40,962 |
| Sino Gold, Ltd. * (a) | 25,236 | | 92,027 |
| Sino Strategic International, Ltd. * | 11,948 | | 27,254 |
| Skilled Group, Ltd. | 12,505 | | 51,516 |
| Smorgon Steel Group, Ltd. (a) | 39,905 | | 53,581 |
| SMS Management & Technology, Ltd. * | 12,633 | | 35,660 |
| Southern Cross Broadcasting Australia, Ltd. | 5,074 | | 44,903 |
| Spotless Group, Ltd. (a) | 44,521 | | 146,050 |
| St. Barbara, Ltd. * | 100,516 | | 38,725 |
| Straits Resources, Ltd. | 31,023 | | 95,616 |
| STW Communications Group, Ltd. (a) | 36,346 | | 75,421 |
| Summit Resources, Ltd. * | 45,100 | | 51,438 |
| Sunland Group, Ltd. | 50,746 | | 89,043 |
| Ten Network Holdings, Ltd. * | 85,802 | | 177,392 |
| Thakral Holdings Group | 137,513 | | 86,025 |
| The Reject Shop, Ltd. | 8,900 | | 48,276 |
| TimberCorp., Ltd. (a) | 49,460 | | 103,766 |
| Transfield Services, Ltd. | 27,997 | | 178,561 |
| UXC, Ltd. * | 52,216 | | 46,209 |
| Vision Group Holdings, Ltd. | 10,200 | | 30,504 |
| Vision Systems, Ltd. (a) | 61,645 | | 99,231 |
| Western Areas NL * | 27,319 | | 62,525 |
| WHK Group, Ltd. | 18,862 | | 84,180 |
|
|
| | | | 12,793,247 |
| Austria - 1.00% | | | |
| Palfinger AG | 437 | | 43,046 |
| RHI AG * | 2,744 | | 94,110 |
| Wienerberger Baustoffindustrie AG | 43,216 | | 2,071,494 |
|
|
| | | | 2,208,650 |
| Belgium - 0.75% | | | |
| Barco N.V. | 1,899 | | 167,378 |
| Bekaert SA | 500 | | 48,995 |
| CFE (CIE Francois D'enter) | 75 | | 72,150 |
| Deceuninck NV | 4,147 | | 108,860 |
| Duvel Moortgat SA | 873 | | 43,610 |
| Econocom Group | 5,040 | | 38,684 |
| Euronav NV (a) | 3,000 | | 103,926 |
| Exmar NV | 1,797 | | 56,781 |
| Icos Vision Systems NV * | 922 | | 35,372 |
| Innogenetics * | 3,366 | | 40,175 |
| Ion Beam Applications * | 2,557 | | 39,024 |
| Melexis NV | 4,995 | | 82,685 |
| Nord-Sumatra Investissements * | 47 | | 40,284 |
| Omega Pharma SA | 5,762 | | 331,623 |
| Option NV * (a) | 3,580 | | 93,564 |
| Quick Restaurants SA | 2,405 | | 88,144 |
| Recticel SA | 3,266 | | 38,480 |
| SA D'Ieteren Trading NV | 569 | | 189,616 |
The accompanying notes are an integral part of the financial statements. 259
John Hancock Funds II
Portfolio of investments — August 31, 2006
(showing percentage of total net assets) |
| International Small Company Fund (continued) |
| | Shares or | | |
| | Principal | | |
| | Amount | | Value |
|
|
| |
| COMMON STOCKS (continued) | | | |
| Belgium (continued) | | | |
| Van De Velde NV | 870 | $ | 38,007 |
| |
|
| | | | 1,657,358 |
| Bermuda - 0.51% | | | |
| Cafe de Coral Holdings, Ltd. | 58,000 | | 88,451 |
| China Oriental Group Company, Ltd. | 134,000 | | 27,568 |
| Digital China Holdings, Ltd. | 141,000 | | 49,134 |
| Giordano International, Ltd. | 1,113,708 | | 631,540 |
| South China Morning Post, Ltd. | 146,000 | | 54,443 |
| Texwinca Holdings, Ltd. | 423,961 | | 278,027 |
| |
|
| | | | 1,129,163 |
| Brazil - 2.17% | | | |
| Aracruz Celulose SA, ADR (a) | 92,153 | | 4,785,505 |
| Canada - 5.67% | | | |
| Aastra Technologies, Ltd. * | 4,100 | | 107,441 |
| Agricore United | 5,400 | | 38,061 |
| Algoma Steel, Inc. * | 5,400 | | 179,813 |
| Angiotech Pharmaceuticals, Inc. * | 3,200 | | 38,025 |
| ATS Automation Tooling Systems, Inc. * | 2,800 | | 30,033 |
| Ballard Power Systems, Inc. * | 21,400 | | 131,109 |
| BPO Properties, Ltd. | 1,050 | | 47,915 |
| CAE, Inc. | 298,402 | | 2,553,533 |
| Calfrac Well Services, Ltd. | 1,600 | | 36,593 |
| Canadian Western Bank | 5,517 | | 219,653 |
| Cardiome Pharma Corp. * | 11,800 | | 163,141 |
| Cascades, Inc. | 17,950 | | 197,886 |
| Catalyst Paper Corp. * | 43,000 | | 123,562 |
| Centurion Energy International, Inc. * | 5,700 | | 37,857 |
| CHUM, Ltd., Class B | 1,200 | | 50,802 |
| Cogeco Cable Inc. | 1,500 | | 34,211 |
| Denison Mines, Inc. * | 3,200 | | 42,940 |
| Domtar, Inc. * | 381,188 | | 2,428,388 |
| Dorel Industries, Inc., Class B * | 1,800 | | 42,306 |
| Dundee Corp., Class A * | 1,300 | | 52,451 |
| Dundee Wealth Management, Inc. | 21,542 | | 214,125 |
| Emergis, Inc. * | 20,420 | | 97,981 |
| Enerflex Systems, Ltd. | 10,300 | | 306,119 |
| Forzani Group, Ltd. * | 8,400 | | 127,824 |
| Galleon Energy, Inc. * | 9,650 | | 165,680 |
| High River Gold Mines, Ltd. * | 48,300 | | 104,749 |
| Hummingbird, Ltd. * | 1,800 | | 49,869 |
| Imax Corp. * | 9,300 | | 42,019 |
| Kingsway Financial Services, Inc. | 15,200 | | 312,612 |
| Labopharm Inc. * | 12,200 | | 88,966 |
| Laurentian Bank of Canada | 6,400 | | 169,448 |
| Leon's Furniture, Ltd. | 811 | | 31,842 |
| Linamar Corp. | 39,306 | | 481,269 |
| LionOre Mining International, Ltd. * | 44,138 | | 277,595 |
| Martinrea International, Inc. * | 14,200 | | 96,236 |
| MEGA Brands, Inc. * | 2,100 | | 43,835 |
| MOSAID Technologies, Inc. | 1,600 | | 41,914 |
| North American Palladium, Ltd. * | 10,150 | | 77,410 |
| International Small Company Fund (continued) |
| | Shares or | | |
| | Principal | | |
| | Amount | | Value |
|
|
| |
| COMMON STOCKS (continued) | | | |
| Canada (continued) | | | |
| Northern Orion Resources, Inc. * | 37,700 | $ | 175,785 |
| Open Text Corp. * | 71,989 | | 1,172,224 |
| Pason Systems, Inc. | 1,500 | | 22,392 |
| Patheon, Inc. * | 21,400 | | 99,395 |
| Petrobank Energy & Resources, Ltd. * | 12,700 | | 175,584 |
| QLT, Inc. * | 24,600 | | 188,059 |
| Quebecor World, Inc. | 55,545 | | 618,366 |
| Reitman's Canada, Ltd., Class A | 400 | | 7,551 |
| Saskatchewan Wheat Pool * | 20,300 | | 141,246 |
| ShawCor, Ltd. | 2,500 | | 42,245 |
| Sierra Wireless, Inc. * | 6,250 | | 72,290 |
| Stantec, Inc. * | 10,100 | | 182,442 |
| Tesco Corp. * | 7,300 | | 118,671 |
| Tundra Semiconductor Corp. * | 2,300 | | 24,691 |
| Uni-Select, Inc. | 4,200 | | 117,235 |
| Zarlink Semiconductor, Inc. * | 33,700 | | 72,781 |
| |
|
| | | | 12,516,170 |
| China - 0.03% | | | |
| Solomon Systech International, Ltd. | 320,000 | | 67,893 |
| Denmark - 1.02% | | | |
| Alm. Brand Skadesforsikring A/S * | 3,700 | | 200,818 |
| Amagerbanken A/S | 1,350 | | 91,908 |
| AS Det Ostasiatiske Kompagni | 4,300 | | 183,794 |
| Bang & Olufsen AS - B Series (a) | 2,100 | | 214,991 |
| Bavarian Nordic A/S * | 1,050 | | 69,323 |
| Dalhoff Larsen & Horneman A/S | 2,500 | | 43,943 |
| DFDS A/S | 550 | | 46,215 |
| DiBa Bank A/S | 110 | | 35,086 |
| EDB Gruppen | 700 | | 38,053 |
| Fionia Bank A/S | 125 | | 29,624 |
| Fluegger A/S | 300 | | 33,851 |
| Forstaedernes Bank A/S | 700 | | 87,629 |
| Genmab AS * (a) | 5,200 | | 193,504 |
| Nordjyske Bank A/S | 1,190 | | 35,712 |
| Pharmexa A/S * | 10,600 | | 31,083 |
| Ringkjoebing Landbobank A/S (a) | 535 | | 86,974 |
| Royal UNIBREW A/S | 875 | | 94,531 |
| Satair A/S | 1,000 | | 39,099 |
| Schouw & Company | 2,450 | | 128,353 |
| SimCorp. A/S | 1,150 | | 190,503 |
| Spar Nord Bank AS | 12,250 | | 270,990 |
| TK Development Corp. * | 6,500 | | 66,322 |
| Vestjysk Bank A/S | 700 | | 34,451 |
| |
|
| | | | 2,246,757 |
| Finland - 1.51% | | | |
| Aldata Solution Oyj * | 13,900 | | 33,074 |
| Amer Sports Oyj (a) | 41,993 | | 932,034 |
| Aspo Oyj | 4,950 | | 37,930 |
| eQ Oyj | 3,000 | | 12,703 |
| Finnair OYJ | 400 | | 6,002 |
| Finnlines OYJ | 6,400 | | 130,995 |
The accompanying notes are an integral part of the financial statements. 260
John Hancock Funds II
Portfolio of investments — August 31, 2006
(showing percentage of total net assets) |
| International Small Company Fund (continued) |
| | Shares or | | |
| | Principal | | |
| | Amount | | Value |
|
|
| |
| COMMON STOCKS (continued) | | | |
| Finland (continued) | | | |
| F-Secure Oyj | 13,850 | $ | 39,688 |
| Huhtamaki Oyj (a) | 45,417 | | 796,547 |
| KCI Konecranes Oyj | 51,234 | | 1,015,887 |
| Olvi Oyj | 2,000 | | 42,855 |
| Poyry Oyj | 7,200 | | 92,106 |
| Ramirent Oyj | 1,600 | | 65,907 |
| Uponor Oyj | 3,000 | | 81,514 |
| Vaisala Oyj | 1,800 | | 59,869 |
| |
|
| | | | 3,347,111 |
| France - 3.32% | | | |
| Ales Groupe | 1,081 | | 22,555 |
| Alten * | 3,914 | | 119,266 |
| Altran Technologies SA * (a) | 16,346 | | 156,411 |
| April Group | 2,848 | | 141,724 |
| Archos * | 1,721 | | 88,064 |
| Assystem | 4,109 | | 101,239 |
| Audika | 1,625 | | 38,457 |
| Avanquest Software * | 1,218 | | 22,203 |
| Bacou Dalloz | 1,599 | | 192,586 |
| Beneteau SA | 2,321 | | 192,994 |
| Bonduelle S.C.A. (a) | 961 | | 84,826 |
| Bongrain SA | 588 | | 40,619 |
| Bull SA * (a) | 11,140 | | 75,672 |
| Canal Plus | 16,823 | | 173,888 |
| Carbone Lorraine | 2,556 | | 133,668 |
| Cegid (a) | 1,808 | | 76,302 |
| CFF Recycling | 3,722 | | 140,175 |
| Club Mediterranee * (a) | 2,334 | | 124,208 |
| Compagnie Plastic-Omnium SA | 915 | | 39,680 |
| Delachaux SA | 1,765 | | 99,347 |
| Electricite de Strasbourg | 1,094 | | 224,060 |
| Etam Developpement SA | 1,713 | | 128,194 |
| Faurecia * | 1,503 | | 93,232 |
| Fleury Michon SA | 344 | | 20,507 |
| Foncia Groupe | 1,152 | | 55,986 |
| Generale de Sante (a) | 3,037 | | 107,151 |
| Geodis | 799 | | 135,124 |
| GFI Informatique | 9,954 | | 69,780 |
| GL Events | 1,835 | | 82,160 |
| Groupe Crit | 1,884 | | 84,354 |
| Groupe Go Sport * | 364 | | 31,850 |
| Groupe Open * | 2,447 | | 43,668 |
| Groupe Steria SCA (a) | 2,803 | | 140,131 |
| Guerbet | 558 | | 88,871 |
| Guyenne et Gascogne SA | 1,445 | | 176,071 |
| IMS-Intl Metal Service | 1,512 | | 36,944 |
| Ingenico * | 4,381 | | 99,254 |
| IPSOS | 1,456 | | 53,680 |
| Kaufman & Broad SA | 2,353 | | 132,443 |
| Lafuma SA | 416 | | 34,910 |
| Laurent-Perrier | 1,018 | | 75,076 |
| International Small Company Fund (continued) |
| | Shares or | | |
| | Principal | | |
| | Amount | | Value |
|
|
| |
| COMMON STOCKS (continued) | | | |
| France (continued) | | | |
| Lectra | 6,134 | $ | 38,136 |
| LISI (a) | 610 | | 42,919 |
| LVL Medical Groupe SA * | 3,125 | | 39,897 |
| Manitou BF SA | 3,693 | | 158,027 |
| Manutan (Societe) | 1,304 | | 83,407 |
| Mr Bricolage | 1,756 | | 35,740 |
| Nexans SA | 4,405 | | 366,281 |
| Norbert Dentressangle | 1,107 | | 79,303 |
| Orpea * (a) | 2,098 | | 144,929 |
| Penauille Polyservices * | 2,528 | | 37,126 |
| Petit Forestier | 643 | | 41,087 |
| Pierre & Vacances | 1,327 | | 145,821 |
| Pinguely-Haulotte | 1,656 | | 48,745 |
| Provimi SA | 2,418 | | 86,301 |
| Radiall SA | 349 | | 35,717 |
| Rallye SA | 5,515 | | 268,092 |
| Robertet SA | 258 | | 40,266 |
| Rubis | 1,582 | | 125,170 |
| SEB SA (a) | 1,821 | | 217,810 |
| Sopra Group SA | 2,126 | | 153,934 |
| Spir Communication | 493 | | 72,905 |
| SR Teleperformance (a) | 6,339 | | 223,489 |
| Stallergenes | 2,320 | | 88,145 |
| STEF-TFE | 799 | | 44,156 |
| Sucriere de Pithiviers-Le-Vieil | 73 | | 66,303 |
| Synergie SA | 816 | | 35,178 |
| Tessi SA | 206 | | 11,888 |
| Toupargel-Agrigel | 936 | | 53,176 |
| Trigano SA | 2,853 | | 141,243 |
| Ubi Soft Entertainment SA * | 2,883 | | 153,572 |
| Union Financiere de France BQE SA | 725 | | 44,054 |
| Viel et Compagnie | 7,076 | | 38,290 |
| Vilmorin et Compagnie | 901 | | 72,383 |
| Virbac SA | 1,389 | | 78,094 |
| Vranken - Pommery Monopole | 721 | | 41,505 |
| |
|
| | | | 7,330,419 |
| Germany - 3.68% | | | |
| Aareal Bank AG * | 5,955 | | 265,714 |
| Adlink Internet Media AG * | 4,151 | | 82,308 |
| ADVA AG Optical Networking * | 4,237 | | 31,274 |
| Aixtron AG * | 20,549 | | 77,022 |
| Augusta Technologie AG * | 2,266 | | 35,510 |
| AWD Holding AG (a) | 4,069 | | 129,611 |
| Baader Wertpapierhandelsbank AG | 6,179 | | 68,927 |
| Balda AG | 3,189 | | 32,391 |
| Beate Uhse AG | 5,482 | | 33,662 |
| Bechtle AG | 3,518 | | 74,347 |
| Bilfinger Berger AG | 2,926 | | 160,204 |
| Biotest AG | 1,095 | | 43,592 |
| Boewe Systec AG (a) | 1,342 | | 77,494 |
| CENTROTEC Sustainable AG * | 1,081 | | 32,166 |
The accompanying notes are an integral part of the financial statements. 261
John Hancock Funds II
Portfolio of investments — August 31, 2006
(showing percentage of total net assets) |
| International Small Company Fund (continued) |
| | Shares or | | |
| | Principal | | |
| | Amount | | Value |
|
|
| |
| COMMON STOCKS (continued) | | | |
| Germany (continued) | | | |
| Comdirect Bank AG | 8,396 | $ | 82,810 |
| Conergy AG (a) | 1,100 | | 57,807 |
| CTS Eventim AG | 2,979 | | 92,033 |
| Curanum AG | 4,385 | | 39,715 |
| Douglas Holding AG | 8,523 | | 379,862 |
| Drillisch AG * | 6,749 | | 39,456 |
| Duerr AG * | 2,766 | | 70,768 |
| DVB Bank AG | 11 | | 2,842 |
| EM.TV AG * | 9,200 | | 34,837 |
| Epcos AG * (a) | 17,467 | | 242,440 |
| Escada AG * | 2,739 | | 85,494 |
| Evotec AG * (a) | 8,820 | | 38,926 |
| Fielmann AG | 1,902 | | 99,272 |
| Fuchs Petrolub AG | 1,810 | | 93,775 |
| Gerry Weber International AG (a) | 3,420 | | 72,232 |
| Gesco AG | 829 | | 42,314 |
| GFK AG | 2,880 | | 121,248 |
| GPC Biotech AG * (a) | 5,604 | | 81,296 |
| Grenkeleasing AG | 1,687 | | 101,452 |
| Hawesko Holding AG | 716 | | 40,485 |
| Indus Holding AG (a) | 2,245 | | 75,474 |
| IWKA AG * (a) | 6,306 | | 118,987 |
| Jenoptik AG * | 20,577 | | 182,419 |
| Kloeckner-Werke AG (a) | 12,754 | | 190,076 |
| Kontron AG (a) | 7,100 | | 82,017 |
| Krones AG | 1,956 | | 244,216 |
| KSB AG * | 139 | | 42,854 |
| KWS Saat AG | 415 | | 37,375 |
| Leoni AG | 5,350 | | 186,772 |
| Mania Technologie AG * | 6,080 | | 30,334 |
| MasterFlex AG | 1,234 | | 35,155 |
| Mediclin AG * | 8,648 | | 43,035 |
| Medion AG (a) | 5,908 | | 70,288 |
| Mobilcom AG * (a) | 10,782 | | 229,100 |
| Morphosys AG * | 835 | | 46,882 |
| MTU Aero Engines Holding AG | 6,500 | | 224,508 |
| MVV Energie AG | 7,457 | | 214,636 |
| Nemetschek AG | 1,701 | | 44,934 |
| Norddeutsche Affinerie AG (a) | 6,383 | | 149,999 |
| Pfeiffer Vacuum Technology AG | 2,709 | | 168,804 |
| Pfleiderer AG | 5,794 | | 131,637 |
| Qiagen AG * (a) | 23,319 | | 333,509 |
| QSC AG * (a) | 22,823 | | 125,252 |
| R Stahl AG | 1,092 | | 39,114 |
| Rational AG | 513 | | 92,539 |
| REpower Systems AG * | 800 | | 52,398 |
| Rhoen-Klinikum AG | 2,456 | | 100,256 |
| Sartorius AG | 997 | | 41,757 |
| SGL Carbon AG * (a) | 12,140 | | 226,273 |
| SHB Stuttgarter Finanz- und Beteiligungs AG | 951 | | 41,984 |
| Singulus Technologies * (a) | 6,859 | | 89,411 |
| Sixt AG (a) | 2,811 | | 137,510 |
| International Small Company Fund (continued) |
| | Shares or | | |
| | Principal | | |
| | Amount | | Value |
|
|
| |
| COMMON STOCKS (continued) | | | |
| Germany (continued) | | | |
| Software AG | 5,638 | $ | 326,650 |
| Strabag AG | 320 | | 43,351 |
| Suess MicroTec AG * | 4,728 | | 44,878 |
| Takkt AG | 4,283 | | 61,913 |
| Techem AG | 3,577 | | 163,405 |
| Vossloh AG (a) | 7,123 | | 357,285 |
| Wincor Nixdorf AG | 1,125 | | 156,494 |
| Wire Card AG * | 12,980 | | 84,186 |
| Wuerttembergische Lebensversicherung AG | 1,865 | | 94,120 |
|
|
| | | | 8,125,073 |
| Greece - 1.29% | | | |
| Aspis Bank SA * | 7,900 | | 37,797 |
| Astir Palace Hotel SA * | 6,080 | | 45,423 |
| Athens Medical Center SA | 8,110 | | 42,121 |
| Attica Holdings SA | 16,150 | | 74,376 |
| Autohellas SA | 8,930 | | 43,638 |
| Bank of Attica * | 5,325 | | 36,240 |
| Bank of Greece | 1,980 | | 235,941 |
| Blue Star Maritime SA | 12,260 | | 49,560 |
| C. Rokas SA | 3,530 | | 78,303 |
| Delta Holdings SA | 5,900 | | 92,533 |
| Egnatia Bank SA | 10,650 | | 77,657 |
| Ethniki General Insurance Company * | 10,740 | | 82,435 |
| Forthnet SA * | 3,580 | | 32,974 |
| Fourlis SA | 2,950 | | 43,625 |
| Frigoglass SA | 5,740 | | 104,416 |
| GEK Group of Companies, SA | 4,450 | | 39,279 |
| Geniki Bank * | 7,120 | | 85,982 |
| Halcor SA | 19,210 | | 88,468 |
| Hellenic Technodomiki Tev SA | 25,060 | | 266,723 |
| Heracles General Cement Company | 4,800 | | 88,422 |
| Iaso SA | 11,020 | | 83,738 |
| Intracom SA * | 20,200 | | 125,070 |
| J&P-Avax SA | 12,040 | | 85,020 |
| Lamda Detergent SA | 6,403 | | 40,791 |
| Marfin Financial Group SA Holdings | 3,000 | | 100,933 |
| Maritime Company of Lesvos * | 23,670 | | 39,061 |
| Metka SA | 4,120 | | 39,423 |
| Michaniki SA | 17,800 | | 71,955 |
| Minoan Lines Shipping SA * | 16,450 | | 75,336 |
| Mytilineos Holdings SA | 3,990 | | 102,084 |
| Neochimiki Lv Lavrentiadis | 2,640 | | 44,039 |
| Pantechniki SA | 9,420 | | 38,562 |
| S&B Industrial Minerals SA | 3,540 | | 40,213 |
| Sarantis SA | 3,820 | | 37,530 |
| Terna SA | 6,110 | | 81,289 |
| Viohalco SA | 18,430 | | 195,686 |
|
|
| | | | 2,846,643 |
| Hong Kong - 2.37% | | | |
| Allied Group, Ltd. | 34,000 | | 87,088 |
| Allied Properties HK, Ltd. | 56,000 | | 61,063 |
The accompanying notes are an integral part of the financial statements. 262
John Hancock Funds II
Portfolio of investments — August 31, 2006
(showing percentage of total net assets) |
| International Small Company Fund (continued) |
| | Shares or | | |
| | Principal | | |
| | Amount | | Value |
|
|
| |
| COMMON STOCKS (continued) | | | |
| Hong Kong (continued) | | | |
| Asia Financial Holdings, Ltd. | 98,000 | $ | 52,044 |
| Asia Satellite Telecom Holdings Company, Ltd. | 331,720 | | 567,302 |
| Asia Standard International Group | 1,150,000 | | 35,342 |
| Champion Technology Holdings, Ltd. | 248,000 | | 40,818 |
| Chen Hsong Holdings | 74,000 | | 41,011 |
| Chevalier International Holdings, Ltd. | 32,000 | | 38,349 |
| China Aerospace International Holdings, Ltd. * | 509,400 | | 41,921 |
| China Gas Holdings, Ltd. | 248,000 | | 41,137 |
| China Green Holdings, Ltd. | 93,000 | | 40,898 |
| China Insurance International Holdings | | | |
| Company, Ltd. * | 132,000 | | 105,234 |
| China Metal International Holdings, Inc. | 108,000 | | 40,273 |
| China Pharmaceutical Group, Ltd. * | 346,000 | | 44,490 |
| China Rare Earth Holdings, Ltd. | 212,000 | | 43,071 |
| China Resources Logic, Ltd. | 390,000 | | 36,107 |
| China Solar Energy Holdings, Ltd. * | 540,000 | | 34,718 |
| Chinese People Gas Holdings Company, Ltd. * | 654,000 | | 29,013 |
| Chow Sang Sang Holdings | 108,000 | | 48,189 |
| CITIC 21CN Company, Ltd. * | 296,000 | | 35,016 |
| CITIC Resources Holdings, Ltd. * | 364,000 | | 69,739 |
| Clear Media, Ltd. * | 37,000 | | 41,867 |
| COFCO International, Ltd. | 106,000 | | 71,285 |
| Comba Telecom Systems Holdings, Ltd. | 160,000 | | 47,731 |
| Cosco International Holdings, Ltd. | 176,000 | | 49,109 |
| Dickson Concepts International, Ltd. | 37,000 | | 39,346 |
| EganaGoldpfeil Holdings, Ltd. | 130,000 | | 59,342 |
| Emperor Entertainment Hotel, Ltd. | 165,000 | | 38,402 |
| Far East Consortium International, Ltd. | 175,000 | | 74,258 |
| Fong's Industries Company, Ltd. | 66,000 | | 43,706 |
| FU JI Food & Catering Services Holdings, Ltd. | 45,000 | | 70,709 |
| Fubon Bank (Hong Kong), Ltd. | 110,000 | | 40,877 |
| Fushan International Energy Group, Ltd. * | 84,000 | | 13,933 |
| Global Bio-Chem Technology Group Company | 236,000 | | 78,596 |
| Glorious Sun Enterprises, Ltd. | 88,000 | | 42,433 |
| Golden Resorts Group, Ltd. * | 100,000 | | 24,303 |
| GZI Transportation, Ltd. * | 100,000 | | 44,233 |
| Harbour Centre Development, Ltd. | 25,000 | | 39,540 |
| Heng Tai Consumables Group, Ltd. | 325,000 | | 30,089 |
| HKR International, Ltd. | 135,200 | | 68,148 |
| Hongkong Chinese, Ltd. | 298,000 | | 40,617 |
| Hung Hing Printing Group, Ltd. | 134,216 | | 78,697 |
| Hutchison Harbour Ring, Ltd. | 494,000 | | 35,572 |
| I-CABLE Communications, Ltd. | 179,000 | | 33,374 |
| Imagi International Holdings, Ltd. * | 28,000 | | 35,860 |
| Integrated Distribution Services Group, Ltd. | 24,000 | | 41,106 |
| K Wah International Holdings, Ltd. | 210,000 | | 68,317 |
| Kingway Brewery Holdings, Ltd. | 106,000 | | 41,980 |
| Kowloon Development Company, Ltd. | 8,000 | | 15,348 |
| Lai Sun Development * | 1,283,000 | | 58,566 |
| Li Ning Company, Ltd. | 99,000 | | 108,332 |
| Liu Chong Hing Bank, Ltd. | 43,000 | | 93,443 |
| Liu Chong Hing Investment | 40,000 | | 46,805 |
| International Small Company Fund (continued) |
| | Shares or | | |
| | Principal | | |
| | Amount | | Value |
|
|
| |
| COMMON STOCKS (continued) | | | |
| Hong Kong (continued) | | | |
| Lung Kee (Bermuda) Holdings | 76,000 | $ | 34,692 |
| Midland Holdings, Ltd. | 98,000 | | 43,601 |
| Mingyuan Medicare Development | | | |
| Company, Ltd. * | 430,000 | | 37,598 |
| Minmetals Resources, Ltd. * | 140,000 | | 40,144 |
| Nan Hai Corp., Ltd. * | 6,250,000 | | 37,772 |
| Neo-China Group Holdings, Ltd. | 420,000 | | 34,564 |
| Next Media, Ltd. | 150,000 | | 82,937 |
| Oriental Press Group | 202,000 | | 36,364 |
| Pacific Andes International Holdings | 198,000 | | 38,699 |
| Pacific Basin Shipping, Ltd. | 173,000 | | 93,430 |
| Pacific Century Premium Developments, Ltd. | 195,000 | | 54,411 |
| Peace Mark Holdings, Ltd. | 90,000 | | 54,970 |
| Pico Far East Holdings, Ltd. | 200,000 | | 42,433 |
| Playmates Holdings, Ltd. | 384,000 | | 40,489 |
| Ports Design, Ltd. | 52,000 | | 80,371 |
| Prime Success International Group | 122,000 | | 67,142 |
| Public Financial Holdings, Ltd. | 52,000 | | 40,185 |
| PYI Corp., Ltd. | 162,000 | | 45,619 |
| Regal Hotels International Holdings, Ltd. | 838,000 | | 66,808 |
| Road King Infrastructure, Ltd. | 56,000 | | 65,527 |
| SA SA International Holdings, Ltd. | 112,000 | | 34,708 |
| Shanghai Real Estate, Ltd. | 222,000 | | 48,243 |
| Shell Electric Manufacturing Company | 102,000 | | 36,330 |
| Shenzhen International Holdings | 1,002,500 | | 45,762 |
| Shougang Concord International Enterprises | | | |
| Company, Ltd. | 528,000 | | 36,662 |
| Shui On Construction and Materials, Ltd. | 22,000 | | 38,020 |
| Silver Grant International | 182,000 | | 47,507 |
| Singamas Container Holdings, Ltd. | 60,000 | | 30,783 |
| Sino-I Technology, Ltd. * | 2,940,000 | | 40,072 |
| Sinolink Worldwide Holdings | 262,000 | | 48,849 |
| Sinopec Kantons Holdings, Ltd. | 122,000 | | 38,905 |
| Symphony Holdings, Ltd. | 296,000 | | 38,061 |
| TAI Cheung Holdings | 76,000 | | 37,624 |
| TCL Multimedia Technology Holdings, Ltd. * | 390,000 | | 29,587 |
| Tian An China Investment * | 120,000 | | 69,436 |
| Tianjin Development Holdings | 68,000 | | 43,107 |
| Titan Petrochemicals Group, Ltd. | 600,000 | | 40,119 |
| Top Form International Ltd | 226,000 | | 40,975 |
| Truly International Holdings | 34,000 | | 42,364 |
| Varitronix International, Ltd. | 68,000 | | 41,096 |
| Victory City International Holdings | 128,000 | | 40,818 |
| Vision Grande Group Holdings, Ltd. * | 54,000 | | 42,078 |
| Vitasoy International Holdings, Ltd. * | 114,000 | | 47,348 |
| Wai Kee Holdings, Ltd. | 130,000 | | 40,119 |
| Wing On Company International, Ltd. | 7,000 | | 11,593 |
| Yip's Chemical Holdings, Ltd. | 112,000 | | 44,933 |
|
|
| | | | 5,241,602 |
| Hungary - 0.04% | | | |
| EGIS Nyrt. | 672 | | 96,814 |
The accompanying notes are an integral part of the financial statements. 263
John Hancock Funds II
Portfolio of investments — August 31, 2006
(showing percentage of total net assets) |
| International Small Company Fund (continued) |
| | Shares or | | |
| | Principal | | |
| | Amount | | Value |
|
|
| |
| COMMON STOCKS (continued) | | | |
| Indonesia - 0.19% | | | |
| Bakrie and Brothers Tbk PT * | 2,361,500 | $ | 42,739 |
| Bank Niaga Tbk PT | 749,500 | | 57,546 |
| Bank Pan Indonesia Tbk PT * | 915,000 | | 46,167 |
| Berlian Laju Tanker Tbk PT | 306,500 | | 66,901 |
| Indofood Sukses Makmur Tbk PT | 687,500 | | 89,736 |
| Lippo Karawaci Tbk PT * | 431,000 | | 41,601 |
| Ramayana Lestari Sentosa Tbk PT | 475,500 | | 40,681 |
| Tempo Scan Pacific Tbk PT | 54,000 | | 40,276 |
|
|
| | | | 425,647 |
| Ireland - 0.95% | | | |
| Abbey PLC | 6,015 | | 68,867 |
| DCC PLC- London | 1,967 | | 49,571 |
| DCC PLC | 13,674 | | 342,852 |
| Dragon Oil PLC * | 34,938 | | 114,418 |
| FBD Holdings PLC - Dublin * | 3,299 | | 164,168 |
| FBD Holdings PLC - London * | 1,517 | | 75,490 |
| Greencore Group PLC - Dublin | 44,221 | | 231,370 |
| Iaws Group PLC, ADR | 18,171 | | 367,042 |
| IFG Group PLC | 17,394 | | 45,838 |
| Independent News & Media PLC | 41,836 | | 133,797 |
| Irish Continental Group PLC * | 2,933 | | 40,522 |
| Irish Continental Group PLC * | 2,896 | | 40,122 |
| Kenmare Resources PLC * | 66,301 | | 50,889 |
| McInerney Holdings PLC | 5,541 | | 85,060 |
| Paddy Power PLC | 7,635 | | 139,181 |
| United Drug PLC | 34,029 | | 158,020 |
|
|
| | | | 2,107,207 |
| Israel - 0.72% | | | |
| AudioCodes, Ltd. * | 3,202 | | 32,191 |
| Azorim-Investment Development & | | | |
| Construction Company, Ltd. | 2,942 | | 40,888 |
| Blue Square-Israel, Ltd. | 3,465 | | 40,798 |
| Direct Insurance Financial Investments, Ltd. * | 11,285 | | 40,159 |
| Electra (Israel), Ltd. * | 392 | | 48,873 |
| Elron Electronic Industries | 3,817 | | 40,592 |
| Formula Systems, Ltd. * | 3,301 | | 34,470 |
| Israel Salt Industries, Ltd. | 6,825 | | 41,812 |
| Ituran Location and Control, Ltd. | 2,562 | | 36,228 |
| Orbotech, Ltd. * | 45,156 | | 1,084,195 |
| Super-Sol, Ltd. * | 13,963 | | 41,924 |
| Tadiran Communications Industries, Ltd. | 2,432�� | | 76,249 |
| Union Bank of Israel * | 7,661 | | 32,592 |
|
|
| | | | 1,590,971 |
| Italy - 1.99% | | | |
| Actelios SpA * | 8,203 | | 96,962 |
| AEM Torino SpA (a) | 16,049 | | 45,014 |
| Amplifon SpA | 31,967 | | 287,483 |
| Astaldi SpA | 11,817 | | 78,306 |
| Banca Intermobiliare SpA | 17,737 | | 193,660 |
| Banca Popolare dell'Etruria e del Lazio | 11,446 | | 239,255 |
| Banca Profilo SpA | 11,108 | | 35,241 |
| International Small Company Fund (continued) |
| | Shares or | | |
| | Principal | | |
| | Amount | | Value |
|
|
| |
| COMMON STOCKS (continued) | | | |
| Italy (continued) | | | |
| Banco di Desio e della Brianza SpA | 11,958 | $ | 105,551 |
| Biesse SpA | 3,083 | | 46,696 |
| Bonifica Ferraresi e Imprese Agricole SpA | 918 | | 40,151 |
| Brembo SpA | 12,719 | | 136,349 |
| Caltagirone Editore SpA (a) | 9,281 | | 80,319 |
| Caltagirone SpA | 6,678 | | 72,742 |
| Cementir SpA | 24,008 | | 184,888 |
| Credito Artigiano SpA | 21,622 | | 94,597 |
| Credito Bergamasco SpA | 1,294 | | 47,922 |
| Cremonini SpA | 9,400 | | 26,455 |
| Danieli & Company SpA | 7,817 | | 79,549 |
| De Longhi SpA | 23,047 | | 83,879 |
| Esprinet SpA | 4,770 | | 81,340 |
| Gemina SpA * | 37,070 | | 128,395 |
| Gewiss SpA | 4,550 | | 35,040 |
| GranitiFiandre SpA | 7,189 | | 71,917 |
| IMMSI SpA | 35,724 | | 91,400 |
| Impregilo SpA * | 70,148 | | 259,115 |
| Indesit Company SpA (a) | 7,439 | | 86,504 |
| Industria Macchine Automatiche SpA | 5,896 | | 84,476 |
| Interpump SpA | 16,266 | | 141,288 |
| Mariella Burani SpA | 3,142 | | 76,529 |
| Meliorbanca SpA | 17,273 | | 84,630 |
| Mirato SpA | 3,489 | | 39,857 |
| Navigazione Montanari SpA | 17,762 | | 81,799 |
| Permasteelisa SpA | 4,223 | | 73,633 |
| Piccolo Credito Valtellinese Scarl | 13,365 | | 200,550 |
| Premafin Finanziaria SpA | 50,691 | | 152,389 |
| Recordati SpA (a) | 13,404 | | 97,481 |
| SAES Getters SpA | 2,559 | | 79,090 |
| Societa Partecipazioni Finanziarie SpA * | 121,974 | | 120,927 |
| Socotherm SpA (a) | 2,703 | | 41,390 |
| Sogefi SpA | 6,285 | | 43,577 |
| Sol SpA | 10,699 | | 62,959 |
| Stefanel | 8,571 | | 39,965 |
| Targetti Sankey SpA | 4,115 | | 34,664 |
| Telecom Italia Media SpA (a) | 87,213 | | 42,396 |
| Trevi Finanziaria SpA | 5,462 | | 43,810 |
| Vianini Lavori SpA | 2,862 | | 34,928 |
| Vittoria Assicurazioni SpA | 5,949 | | 81,125 |
|
|
| | | | 4,386,193 |
| Japan - 26.22% | | | |
| A&A Material Corp. * (a) | 19,000 | | 30,923 |
| ABILIT Corp. | 3,000 | | 16,540 |
| Achilles Corp. | 29,000 | | 56,342 |
| Aderans Company, Ltd. (a) | 6,100 | | 158,016 |
| Advan Company, Ltd. | 2,200 | | 27,670 |
| Advanex, Inc. | 12,000 | | 32,414 |
| Aeon Fantasy Company, Ltd. * | 1,400 | | 56,069 |
| Ahresty Corp. * | 1,800 | | 51,536 |
| Aica Kogyo Company, Ltd. * | 6,000 | | 80,678 |
The accompanying notes are an integral part of the financial statements. 264
John Hancock Funds II
Portfolio of investments — August 31, 2006
(showing percentage of total net assets) |
| International Small Company Fund (continued) |
| | Shares or | | |
| | Principal | | |
| | Amount | | Value |
|
|
| |
| COMMON STOCKS (continued) | | | |
| Japan (continued) | | | |
| Aichi Corp. (a) | 10,600 | $ | 100,079 |
| Aichi Machine Industry Company, Ltd. * | 12,000 | | 33,948 |
| Aichi Tokei Denki Company, Ltd. | 10,000 | | 30,847 |
| Aigan Company, Ltd. | 4,600 | | 35,748 |
| Aiphone Company, Ltd. | 2,800 | | 47,718 |
| Airport Facilities Company, Ltd. | 7,000 | | 46,048 |
| Aisan Industry Company, Ltd. | 9,300 | | 87,885 |
| Akebono Brake Industry Company, Ltd. (a) | 17,000 | | 142,976 |
| Akindo Sushiro Company, Ltd. | 1,000 | | 28,290 |
| Akita Bank, Ltd. (a) | 27,000 | | 143,794 |
| Aloka Company, Ltd. (a) | 5,000 | | 48,997 |
| Alpha Corp. | 1,000 | | 34,681 |
| Alpha Systems, Inc. * (a) | 1,700 | | 47,369 |
| Alpine Electronics, Inc. | 7,400 | | 102,656 |
| Alps Logistics Company, Ltd. * | 2,000 | | 37,493 |
| Amano Corp. (a) | 10,000 | | 139,236 |
| Amuse, Inc. | 2,000 | | 32,500 |
| Ando Corp. * | 14,000 | | 31,852 |
| Anest Iwata Corp. | 6,000 | | 30,369 |
| Anritsu Corp. (a) | 20,000 | | 102,254 |
| AOI Electronic Company, Ltd. | 1,700 | | 36,794 |
| AOKI Holdings, Inc. | 4,800 | | 85,484 |
| Aomori Bank, Ltd. | 29,000 | | 121,580 |
| Arakawa Chemical Industries, Ltd. | 3,500 | | 37,817 |
| Araya Industrial Company, Ltd. | 14,000 | | 33,999 |
| Ariake Japan Company, Ltd. (a) | 2,500 | | 53,044 |
| Arisawa Manufacturing Company, Ltd. * (a) | 8,200 | | 124,165 |
| Aronkasei Company, Ltd. | 7,000 | | 37,041 |
| Art Corp. (a) | 2,000 | | 59,989 |
| As One Corp. | 1,800 | | 44,634 |
| Asahi Diamond Industrial Company, Ltd. (a) | 12,000 | | 96,221 |
| Asahi Kogyosha Company, Ltd. | 8,000 | | 34,971 |
| Asahi Organic Chemicals | | | |
| Industry Company, Ltd. | 20,000 | | 79,076 |
| Asahi Pretec Corp. (a) | 3,400 | | 128,635 |
| Asahi Soft Drinks Company, Ltd. | 5,000 | | 70,044 |
| Asahi TEC Corp. * | 15,000 | | 32,849 |
| Asanuma Corp. | 17,000 | | 33,463 |
| Ashimori Industry Company, Ltd. | 13,000 | | 34,119 |
| Asia Securities Printing Company, Ltd. | 4,000 | | 39,947 |
| ASKA Pharmaceutical Company, Ltd. | 5,000 | | 43,756 |
| Asunaro Aoki Construction Company, Ltd. * | 11,000 | | 78,454 |
| Atsugi Company, Ltd. * (a) | 27,000 | | 38,652 |
| Aucnet, Inc. | 2,700 | | 40,032 |
| Avex Group Holdings, Inc. (a) | 3,600 | | 79,144 |
| Azel Corp. * | 17,000 | | 34,766 |
| Bando Chemical Industries, Ltd. | 10,000 | | 44,310 |
| Bank of Ikeda, Ltd. * | 3,300 | | 165,344 |
| Bank of Iwate, Ltd. * | 3,200 | | 175,331 |
| Bank of Okinawa, Ltd. | 3,200 | | 140,974 |
| Bank of Saga, Ltd. | 33,000 | | 121,759 |
| Bank of the Ryukyus, Ltd. * | 5,500 | | 128,882 |
| International Small Company Fund (continued) |
| | Shares or | | |
| | Principal | | |
| | Amount | | Value |
|
|
| |
| COMMON STOCKS (continued) | | | |
| Japan (continued) | | | |
| Belluna Company, Ltd. * (a) | 3,400 | $ | 59,103 |
| Best Denki Company, Ltd. * (a) | 7,000 | | 37,698 |
| Bookoff Corp. * (a) | 3,000 | | 60,585 |
| BSL Corp. * (a) | 27,000 | | 29,219 |
| Bunka Shutter Company, Ltd. | 7,000 | | 41,813 |
| C.I. Kasei Company, Ltd. | 4,000 | | 15,236 |
| Cabin Company, Ltd. * (a) | 6,000 | | 30,676 |
| CAC Corp. (a) | 3,400 | | 32,883 |
| Calpis Company, Ltd. | 9,000 | | 68,638 |
| Canon Electronics, Inc. | 3,000 | | 102,765 |
| Canon Finetech, Inc. | 6,000 | | 102,509 |
| Capcom Company, Ltd. (a) | 5,300 | | 76,911 |
| Cawachi, Ltd. * | 3,000 | | 100,209 |
| Cecile Company, Ltd. * | 6,400 | | 26,013 |
| Central Finance Company, Ltd. | 13,000 | | 80,866 |
| Central Glass Company, Ltd. | 7,000 | | 39,010 |
| Century Leasing System, Inc. | 7,600 | | 100,638 |
| CFS Corp. | 6,000 | | 33,744 |
| Chiba Kogyo Bank, Ltd. * | 5,800 | | 97,709 |
| Chino Corp. | 11,000 | | 36,931 |
| Chiyoda Company, Ltd. (a) | 3,800 | | 90,665 |
| Chori Company, Ltd. * (a) | 19,000 | | 35,133 |
| Chudenko Corp. (a) | 5,600 | | 85,893 |
| Chuetsu Pulp & Paper Company, Ltd. | 15,000 | | 33,999 |
| Chugai Mining Company, Ltd. * | 34,900 | | 27,062 |
| Chugai Ro Company, Ltd. * | 9,000 | | 29,679 |
| Chugoku Marine Paints, Ltd. * | 7,000 | | 39,069 |
| Chukyo Bank, Ltd. | 49,000 | | 148,225 |
| Chuo Gyorui Company, Ltd. | 12,000 | | 36,811 |
| Chuo Spring Company, Ltd. | 9,000 | | 45,784 |
| CKD Corp. (a) | 8,000 | | 107,094 |
| Clarion Company, Ltd. * (a) | 52,000 | | 81,530 |
| Cleanup Corp. | 5,000 | | 40,475 |
| CMK Corp. (a) | 8,000 | | 87,666 |
| Coca-Cola Central Japan Company, Ltd. | 15 | | 120,020 |
| Colowide Company, Ltd. * | 5,500 | | 41,852 |
| Columbia Music Entertainment, Inc. * | 29,000 | | 28,665 |
| Commuture Corp. | 4,000 | | 34,425 |
| Computer Engineering & Consulting, Ltd. | 2,900 | | 36,350 |
| Corona Corp. | 4,900 | | 87,474 |
| Cosel Company, Ltd. (a) | 5,600 | | 99,254 |
| Cosmo Securities Company, Ltd. (a) | 22,000 | | 41,055 |
| Cross Plus, Inc. | 2,000 | | 47,378 |
| Cybozu, Inc. * | 45 | | 42,563 |
| D&M Holdings, Inc. * (a) | 12,000 | | 36,811 |
| D.G. Roland Corp. | 1,700 | | 52,294 |
| Dai Nippon Toryo Company, Ltd. * | 22,000 | | 34,306 |
| Dai-Dan Company, Ltd. | 6,000 | | 34,102 |
| Daido Kogyo Company, Ltd. * | 11,000 | | 31,026 |
| Daido Metal Company, Ltd. (a) | 5,000 | | 28,759 |
| Daidoh, Ltd. * (a) | 4,000 | | 62,784 |
| Daihen Corp. * | 20,000 | | 101,061 |
The accompanying notes are an integral part of the financial statements. 265
John Hancock Funds II
Portfolio of investments — August 31, 2006
(showing percentage of total net assets) |
| International Small Company Fund (continued) |
| | Shares or | | |
| | Principal | | |
| | Amount | | Value |
|
|
| |
| COMMON STOCKS (continued) | | | |
| Japan (continued) | | | |
| Daiho Corp. * (a) | 14,000 | $ | 33,522 |
| Daiichi Jitsugyo Company, Ltd. * | 7,000 | | 34,357 |
| Daiken Corp. | 11,000 | | 39,087 |
| Daiki Company, Ltd. | 3,600 | | 39,358 |
| Daiko Clearing Services Corp. | 3,000 | | 47,037 |
| Daikoku Denki Company, Ltd. (a) | 1,400 | | 39,129 |
| Daimei Telecom Engineering Corp. * | 8,000 | | 90,256 |
| Dainichi Company, Ltd. * | 3,800 | | 32,478 |
| Dainichiseika Color & Chemicals | | | |
| Manufacturing Company, Ltd. | 15,000 | | 81,931 |
| Daio Paper Corp. (a) | 4,000 | | 37,357 |
| Daisan Bank, Ltd. | 30,000 | | 103,788 |
| Daiseki Company, Ltd. (a) | 2,700 | | 61,429 |
| Daiso Company, Ltd. | 11,000 | | 34,962 |
| Daisyo Corp. (a) | 2,800 | | 40,441 |
| Daito Bank, Ltd. * | 19,000 | | 31,247 |
| Daiwa Industries, Ltd. | 4,000 | | 28,972 |
| Daiwa Seiko, Inc. * (a) | 18,000 | | 40,799 |
| Daiwabo Company, Ltd. * (a) | 24,000 | | 91,824 |
| Daiwabo Information System Company, Ltd. (a) | 3,000 | | 41,566 |
| DC Company, Ltd. * | 8,000 | | 36,130 |
| Denki Kogyo Company, Ltd. (a) | 8,000 | | 72,191 |
| Densei-Lambda KK | 2,400 | | 37,364 |
| Denyo Company, Ltd. | 3,000 | | 36,684 |
| Descente, Ltd. * | 15,000 | | 66,593 |
| DIA Kensetsu Company, Ltd. * (a) | 15,300 | | 25,423 |
| Dodwell BMS, Ltd. (a) | 5,900 | | 37,053 |
| Doshisha Company, Ltd. (a) | 1,800 | | 32,363 |
| Doutor Coffee Company, Ltd. * (a) | 4,700 | | 84,104 |
| DTS Corp. | 2,400 | | 84,257 |
| Dydo Drinco, Inc. (a) | 3,300 | | 125,133 |
| Dynic Corp. * | 13,000 | | 34,894 |
| Eagle Industry Company, Ltd. | 5,000 | | 45,034 |
| Ehime Bank, Ltd. | 24,000 | | 102,049 |
| Eighteenth Bank, Ltd. | 30,000 | | 155,170 |
| Eiken Chemical Company, Ltd. | 4,000 | | 41,515 |
| Eizo Nanao Corp. | 2,900 | | 80,312 |
| Eneserve Corp. * (a) | 4,800 | | 30,226 |
| Enplas Corp. | 4,400 | | 74,986 |
| Epson Toyocom Corp. * | 7,000 | | 48,315 |
| ESPEC Corp. | 3,000 | | 41,847 |
| Fancl Corp. (a) | 9,400 | | 135,047 |
| FDC Products, Inc. (a) | 1,900 | | 36,185 |
| FDK Corp. * (a) | 21,000 | | 35,610 |
| Foster Electric Company, Ltd. (a) | 3,000 | | 46,909 |
| FP Corp. | 2,900 | | 94,644 |
| France Bed Holdings Company, Ltd. (a) | 42,000 | | 90,188 |
| Fudo Construction Company, Ltd. * | 27,000 | | 26,458 |
| Fuji Company, Ltd. (a) | 5,700 | | 90,924 |
| Fuji Corp., Ltd. | 5,000 | | 30,122 |
| Fuji Kiko Company, Ltd. * | 11,000 | | 32,057 |
| Fuji Kosan Company, Ltd. * | 21,000 | | 31,136 |
| International Small Company Fund (continued) |
| | Shares or | | |
| | Principal | | |
| | Amount | | Value |
|
|
| |
| COMMON STOCKS (continued) | | | |
| Japan (continued) | | | |
| Fuji Kyuko Company, Ltd. * (a) | 10,000 | $ | 52,831 |
| Fuji Oil Company, Ltd. | 12,400 | | 114,221 |
| Fuji Software ABC, Inc. (a) | 5,400 | | 159,209 |
| Fujibo Holdings, Inc. * (a) | 15,000 | | 35,278 |
| Fujicco Company, Ltd. | 7,000 | | 79,332 |
| Fujikura Kasei Company, Ltd. * | 3,000 | | 26,791 |
| Fujikura Rubber, Ltd. | 5,000 | | 37,791 |
| Fujita Corp. * | 5,400 | | 24,388 |
| Fujita Kanko, Inc. | 7,000 | | 52,610 |
| Fujitec Company, Ltd. (a) | 13,000 | | 82,306 |
| Fujitsu Access, Ltd. * | 5,800 | | 31,828 |
| Fujitsu Business Systems, Ltd. | 5,100 | | 81,744 |
| Fujitsu Devices, Inc. | 3,000 | | 39,623 |
| Fujitsu Frontech, Ltd. | 4,000 | | 34,425 |
| Fujitsu General, Ltd. * | 14,000 | | 35,312 |
| Fujiya Company, Ltd. * (a) | 19,000 | | 35,133 |
| Fukuda Corp. | 8,000 | | 31,903 |
| Fukui Bank, Ltd. | 41,000 | | 142,542 |
| Fukushima Bank, Ltd. * | 25,000 | | 37,493 |
| Fukushima Industries Corp. * | 3,000 | | 35,278 |
| Fukuyama Transporting Company, Ltd. (a) | 32,000 | | 107,435 |
| Funai Consulting Company, Ltd. | 5,000 | | 32,338 |
| Furukawa Company, Ltd. * (a) | 50,000 | | 121,426 |
| Furusato Industries, Ltd. | 2,000 | | 32,074 |
| Fuso Lexel, Inc. * | 3,800 | | 33,676 |
| Fuso Pharmaceutical Industries, Ltd. (a) | 13,000 | | 41,762 |
| Futaba Corp. (a) | 5,900 | | 155,852 |
| Future System Consulting Corp. (a) | 36 | | 32,517 |
| Fuyo General Lease Company, Ltd. (a) | 3,000 | | 91,262 |
| Gakken Company, Ltd. * | 13,000 | | 31,571 |
| Gecoss Corp. | 5,500 | | 32,338 |
| Gigas K's Denki Corp. * | 4,600 | | 114,456 |
| GMO internet, Inc. * (a) | 6,000 | | 64,931 |
| Godo Steel, Ltd. (a) | 11,000 | | 62,895 |
| Goldwin, Inc. * | 12,000 | | 33,642 |
| Gourmet Kineya Company, Ltd. | 5,000 | | 40,646 |
| GS Yuasa Corp. * (a) | 72,000 | | 168,719 |
| Gulliver International Company, Ltd. (a) | 1,130 | | 91,956 |
| Gun-Ei Chemical Industry Company, Ltd. | 11,000 | | 33,181 |
| H.I.S. Company, Ltd. | 3,700 | | 96,792 |
| Hakuto Company, Ltd. | 2,700 | | 38,652 |
| Hakuyosha Company, Ltd. | 5,000 | | 16,190 |
| Hanwa Company, Ltd. | 49,000 | | 186,639 |
| Happinet Corp. (a) | 1,600 | | 32,789 |
| Harashin Narus Holdings Company, Ltd. | 3,000 | | 39,138 |
| Harima Chemicals, Inc. | 5,000 | | 37,152 |
| Haruyama Trading Company, Ltd. * | 2,700 | | 37,249 |
| Hayashikane Sangyo Company, Ltd. * (a) | 28,000 | | 37,936 |
| Hazama Corp. * | 18,700 | | 34,737 |
| Heiwado Company, Ltd. | 9,000 | | 165,268 |
| Hibiya Engineering, Ltd. * | 6,000 | | 54,961 |
| Higashi-Nippon Bank, Ltd. * | 35,000 | | 160,752 |
The accompanying notes are an integral part of the financial statements. 266
John Hancock Funds II
Portfolio of investments — August 31, 2006
(showing percentage of total net assets) |
| International Small Company Fund (continued) |
| | Shares or | | |
| | Principal | | |
| | Amount | | Value |
|
|
| |
| COMMON STOCKS (continued) | | | |
| Japan (continued) | | | |
| Hitachi Information Systems, Ltd. | 8,500 | $ | 178,539 |
| Hitachi Kokusai Electric, Inc. (a) | 11,000 | | 123,446 |
| Hitachi Medical Corp. * | 6,000 | | 66,976 |
| Hitachi Plant Technologies, Ltd. * (a) | 25,000 | | 143,155 |
| Hitachi Software Engineering Company, Ltd. (a) | 300 | | 5,368 |
| Hitachi Systems & Services, Ltd. | 4,000 | | 84,189 |
| Hitachi Tool Engineering, Ltd. | 4,000 | | 69,362 |
| Hitachi Transport System, Ltd. (a) | 15,000 | | 148,524 |
| Hitachi Zosen Corp. * | 87,500 | | 97,674 |
| Hochiki Corp. * | 7,000 | | 39,069 |
| Hodogaya Chemical Company, Ltd. * | 8,000 | | 27,677 |
| Hogy Medical Company, Ltd. | 2,300 | | 103,677 |
| Hokkaido Gas Company, Ltd. * | 14,000 | | 36,505 |
| Hokkan Holdings, Ltd. | 11,000 | | 40,493 |
| Hokuetsu Bank, Ltd. | 52,000 | | 132,044 |
| Hokuetsu Paper Mills, Ltd. (a) | 24,000 | | 148,268 |
| Hokuriku Electric Industry Compnay, Ltd. (a) | 12,000 | | 40,595 |
| Hokuto Corp. | 2,800 | | 46,549 |
| Homac Corp. (a) | 6,500 | | 97,870 |
| Horipro, Inc. | 3,300 | | 34,109 |
| Hosiden Corp. (a) | 12,100 | | 126,305 |
| Hosokawa Micron Corp. | 4,000 | | 30,369 |
| Howa Machinery, Ltd. * (a) | 20,000 | | 30,335 |
| IBJ Leasing Company, Ltd. | 4,000 | | 99,527 |
| Ichikoh Industries, Ltd. (a) | 12,000 | | 37,834 |
| Ichiyoshi Securities Company, Ltd. | 5,000 | | 74,688 |
| ICOM, Inc. | 3,000 | | 84,359 |
| IDEC Corp. (a) | 3,500 | | 56,546 |
| Ihara Chemical Industry Company, Ltd. | 10,000 | | 33,232 |
| Iino Kaiun Kaisha, Ltd. (a) | 15,000 | | 136,381 |
| Ikegami Tsushinki Company, Ltd. * | 13,000 | | 23,374 |
| Impact 21 Company, Ltd. (a) | 1,600 | | 29,381 |
| Impress Holdings, Inc. * (a) | 105 | | 37,444 |
| Inaba Denki Sangyo Company, Ltd. * | 3,400 | | 108,065 |
| Inaba Seisakusho Company, Ltd. | 2,400 | | 37,568 |
| Inabata & Company, Ltd. | 11,000 | | 84,641 |
| Inageya Company, Ltd. | 6,000 | | 43,662 |
| Ines Corp. * | 6,600 | | 45,779 |
| Information Services International - | | | |
| Dentsu, Ltd. | 3,400 | | 35,751 |
| Intec, Inc. (a) | 5,000 | | 65,442 |
| Invoice, Inc. * (a) | 2,047 | | 70,818 |
| Iseki & Company, Ltd. * (a) | 30,000 | | 91,773 |
| Ishihara Sangyo | 58,000 | | 85,995 |
| Ishii Hyoki Company, Ltd. * | 1,600 | | 37,970 |
| Itochu Enex Company, Ltd. | 13,200 | | 84,247 |
| Itochu-Shokuhin Company, Ltd. | 2,400 | | 86,916 |
| Itoham Foods, Inc. * (a) | 29,000 | | 112,437 |
| Itoki Corp. | 8,000 | | 93,937 |
| Iwasaki Electric Company, Ltd. * | 11,000 | | 27,839 |
| Iwatani International Corp. * (a) | 33,000 | | 98,419 |
| Iwatsu Electric Company, Ltd. * | 17,000 | | 31,000 |
| International Small Company Fund (continued) |
| | Shares or | | |
| | Principal | | |
| | Amount | | Value |
|
|
| |
| COMMON STOCKS (continued) | | | |
| Japan (continued) | | | |
| Izumiya Company, Ltd. | 15,000 | $ | 108,645 |
| J. Bridge Corp. * (a) | 7,000 | | 23,263 |
| Jalux, Inc. * (a) | 2,200 | | 40,961 |
| Jamco Corp. * | 3,000 | | 31,571 |
| Janome Sewing Machine Company, Ltd. * | 19,000 | | 32,218 |
| Japan Airport Terminal Company, Ltd. (a) | 12,000 | | 147,041 |
| Japan Cash Machine Company, Ltd. * (a) | 2,600 | | 41,098 |
| Japan Digital Laboratory Company, Ltd. | 2,900 | | 43,047 |
| Japan Foundation Engineering Company, Ltd. * | 7,000 | | 28,154 |
| Japan General Estate Company, Ltd. * (a) | 4,400 | | 98,232 |
| Japan Kenzai Company, Ltd. * | 5,700 | | 40,168 |
| Japan Maintenance Company, Ltd. * | 2,000 | | 43,287 |
| Japan Pulp & Paper Company, Ltd. (a) | 23,000 | | 91,526 |
| Japan Radio Company, Ltd. * (a) | 29,000 | | 75,864 |
| Japan Transcity Corp. (a) | 9,000 | | 43,944 |
| Japan Vilene Company, Ltd. | 12,000 | | 73,418 |
| Japan Wool Textile Company, Ltd. | 13,000 | | 112,880 |
| JBCC Holdings, Inc. | 4,200 | | 37,328 |
| Jeans Mate Corp. * | 2,300 | | 23,891 |
| Jeol, Ltd. (a) | 8,000 | | 52,967 |
| JFE Shoji Holdings, Inc. * | 27,000 | | 120,557 |
| JMS Company, Ltd. | 9,000 | | 30,906 |
| J-Oil Mills, Inc. | 11,000 | | 48,366 |
| Joshin Denki Company, Ltd. * (a) | 12,000 | | 78,429 |
| JSAT Corp. | 32 | | 77,986 |
| JSP Corp. | 3,800 | | 34,064 |
| Juki Corp. | 23,000 | | 125,627 |
| Kabuki-Za Company, Ltd. * | 1,000 | | 42,009 |
| Kadokawa Holdings, Inc. * (a) | 3,300 | | 128,226 |
| Kaga Electronics Company, Ltd. (a) | 6,800 | | 137,906 |
| Kagawa Bank, Ltd. | 15,000 | | 86,788 |
| Kagome Company, Ltd. * (a) | 11,800 | | 167,214 |
| Kahma Company, Ltd. (a) | 3,100 | | 73,964 |
| Kaken Pharmaceutical Company, Ltd. (a) | 17,000 | | 124,434 |
| Kameda Seika Company, Ltd. | 4,000 | | 42,163 |
| Kamei Corp. | 5,000 | | 35,746 |
| Kanaden Corp. | 6,000 | | 40,748 |
| Kanagawa Chuo Kotsu Company, Ltd. | 8,000 | | 35,516 |
| Kanamoto Company, Ltd. | 5,000 | | 45,333 |
| Kanematsu Corp. * | 62,000 | | 101,436 |
| Kanto Auto Works, Ltd. | 9,800 | | 116,159 |
| Kanto Denka Kogyo Company, Ltd. * (a) | 5,000 | | 37,237 |
| Kanto Natural Gas Development, Ltd. | 5,000 | | 38,260 |
| Kanto Tsukuba Bank, Ltd. * | 6,500 | | 51,344 |
| Kasai Kogyo Company, Ltd. * | 8,000 | | 32,380 |
| Kasumi Company, Ltd. | 6,000 | | 35,431 |
| Katakura Industries Company, Ltd. (a) | 5,000 | | 79,375 |
| Kato Sangyo Company, Ltd. | 7,000 | | 101,402 |
| Kato Works Company, Ltd. | 10,000 | | 42,521 |
| Katokichi Company, Ltd. (a) | 16,400 | | 141,005 |
| Kawada Industries, Inc. * | 16,000 | | 40,356 |
The accompanying notes are an integral part of the financial statements. 267
John Hancock Funds II
Portfolio of investments — August 31, 2006
(showing percentage of total net assets) |
| International Small Company Fund (continued) |
| | Shares or | | |
| | Principal | | |
| | Amount | | Value |
|
|
| |
| COMMON STOCKS (continued) | | | |
| Japan (continued) | | | |
| Kawai Musical Instruments Manufacturing | | | |
| Company, Ltd. * | 16,000 | $ | 30,540 |
| Kawashima Selkon Textiles Company, Ltd. * (a) | 17,000 | | 29,696 |
| Kayaba Industry Company, Ltd. (a) | 29,000 | | 128,005 |
| Keihanshin Real Estate Company, Ltd. | 6,000 | | 41,259 |
| Keihin Company, Ltd. * (a) | 10,000 | | 38,771 |
| Keiiyu Company, Ltd. | 4,400 | | 33,781 |
| Kentucky Fried Chicken Japan, Ltd. | 3,000 | | 56,112 |
| Kenwood Corp. * | 61,000 | | 110,196 |
| KEY Coffee, Inc. | 3,100 | | 44,642 |
| Kibun Food Chemifa Company, Ltd. * (a) | 4,000 | | 44,821 |
| Kinki Nippon Tourist Company, Ltd. | 9,000 | | 33,207 |
| Kinki Sharyo Company, Ltd. * (a) | 7,000 | | 30,003 |
| Kintetsu World Express, Inc. | 3,800 | | 93,256 |
| Kioritz Corp. | 10,000 | | 30,250 |
| Kishu Paper Company, Ltd. * (a) | 17,000 | | 28,103 |
| Kisoji Company, Ltd. | 2,200 | | 41,524 |
| Kissei Pharmaceutical Company, Ltd. * (a) | 8,000 | | 139,747 |
| Kitagawa Iron Works Company, Ltd. * | 12,000 | | 29,756 |
| Kita-Nippon Bank, Ltd. | 1,400 | | 71,816 |
| Kitano Construction Corp. * | 12,000 | | 30,267 |
| Kitz Corp. | 15,000 | | 126,667 |
| Koa Corp. | 8,000 | | 117,319 |
| Koatsu Gas Kogyo Company, Ltd. | 7,000 | | 42,768 |
| Kohnan Shoji Company, Ltd. (a) | 5,800 | | 59,950 |
| Koike Sanso Kogyo Company, Ltd. * | 9,000 | | 32,593 |
| Kojima Company, Ltd. (a) | 3,100 | | 39,729 |
| Kokusai Kogyo Company, Ltd. * | 12,000 | | 37,220 |
| Komatsu Electronic Metals Company, Ltd. | 4,800 | | 170,968 |
| Komatsu Seiren Company, Ltd. | 9,000 | | 36,658 |
| Komatsu Wall Industry Company, Ltd. (a) | 2,100 | | 35,127 |
| Konaka Company, Ltd. (a) | 4,620 | | 62,870 |
| Kondotec, Inc. * | 3,000 | | 27,992 |
| Konishi Company, Ltd. * | 3,900 | | 38,948 |
| Kosaido Company, Ltd. * | 3,800 | | 28,721 |
| Kosei Securities Company, Ltd. (a) | 18,000 | | 33,744 |
| Krosaki Harima Corp. | 15,000 | | 56,751 |
| KRS Corp. * | 2,700 | | 37,571 |
| Kumagai Gumi Company, Ltd. * (a) | 11,000 | | 26,245 |
| Kumiai Chemical Industry Company, Ltd. | 15,000 | | 34,894 |
| Kurabo Industries, Ltd. * (a) | 39,000 | | 109,667 |
| KUREHA Corp. | 24,000 | | 110,230 |
| Kurimoto, Ltd. (a) | 28,000 | | 75,157 |
| Kuroda Electric Company, Ltd. (a) | 6,200 | | 66,831 |
| Kyoden Company, Ltd. * | 7,000 | | 29,407 |
| Kyodo Printing Company, Ltd. * | 14,000 | | 54,518 |
| Kyodo Shiryo Company, Ltd. * | 24,000 | | 37,834 |
| Kyokuto Kaihatsu Kogyo Company, Ltd. | 5,300 | | 41,820 |
| Kyokuyo Company, Ltd. * | 16,000 | | 38,720 |
| Kyoritsu Maintenance Company, Ltd. (a) | 1,700 | | 51,425 |
| Kyosan Electric Manufacturing Company, Ltd. | 11,000 | | 38,993 |
| Kyoto Kimono Yuzen Company, Ltd. | 24 | | 35,380 |
| International Small Company Fund (continued) |
| | Shares or | | |
| | Principal | | |
| | Amount | | Value |
|
|
| |
| COMMON STOCKS (continued) | | | |
| Japan (continued) | | | |
| Kyowa Leather Cloth Company, Ltd. | 5,200 | $ | 34,340 |
| Kyudenko Corp. * | 7,000 | | 38,055 |
| Kyushu-Shinwa Holdings, Inc. * (a) | 60,000 | | 82,826 |
| Laox Company, Ltd. * (a) | 10,000 | | 27,694 |
| Life Corp. (a) | 11,000 | | 155,128 |
| Livedoor Auto Company, Ltd. * | 29,500 | | 34,438 |
| Macnica, Inc. * | 3,400 | | 94,738 |
| Maeda Corp. * (a) | 33,000 | | 152,972 |
| Maeda Road Construction Company, Ltd. * | 14,000 | | 102,118 |
| Maezawa Industries, Inc. | 5,100 | | 31,550 |
| Maezawa Kasei Industries Company, Ltd. | 2,000 | | 30,472 |
| Maezawa Kyuso Industries Company, Ltd. | 2,400 | | 37,875 |
| Mandom Corp. (a) | 4,200 | | 108,798 |
| Mars Engineering Corp. (a) | 1,600 | | 39,674 |
| Marubun Corp. | 3,000 | | 38,090 |
| Marudai Food Company, Ltd. * | 18,000 | | 48,162 |
| Maruetsu, Inc. * (a) | 13,000 | | 66,797 |
| Maruha Group, Inc. * (a) | 27,000 | | 72,933 |
| Marusan Securities Company, Ltd. * | 8,000 | | 120,455 |
| Maruwa Company, Ltd. | 1,400 | | 33,701 |
| Maruyama Manufacturing Company, Inc. | 10,000 | | 30,421 |
| Maruzen Company, Ltd. * | 23,000 | | 39,393 |
| Maruzen Company, Ltd. | 4,000 | | 23,757 |
| Maruzen Showa Unyu Company, Ltd. | 12,000 | | 41,413 |
| Maspro Denkoh Corp. | 4,000 | | 35,312 |
| Matsuda Sangyo Company, Ltd. * (a) | 2,000 | | 38,175 |
| Matsui Construction Company, Ltd. | 8,000 | | 34,630 |
| Matsuya Company, Ltd. (a) | 5,000 | | 79,247 |
| Matsuya Foods Company, Ltd. | 4,300 | | 63,022 |
| Matsuzakaya Company, Ltd. (a) | 10,000 | | 71,578 |
| Max Company, Ltd. * | 7,000 | | 97,525 |
| Maxvalu Tokai Company, Ltd. * | 3,000 | | 55,217 |
| MEC Company, Ltd. | 2,400 | | 31,187 |
| Megachips Corp. * (a) | 2,400 | | 41,822 |
| Meidensha Corp. * (a) | 17,000 | | 56,061 |
| Meitec Corp. (a) | 9,982 | | 322,370 |
| Meito Sangyo Company, Ltd. * | 2,900 | | 52,635 |
| Meiwa Corp. * (a) | 8,000 | | 20,519 |
| Meiwa Estate Company, Ltd. * | 5,000 | | 78,352 |
| Mercian Corp. | 31,000 | | 73,964 |
| Michinoku Bank, Ltd. | 25,000 | | 103,106 |
| Mikuni Coca-Cola Bottling Company, Ltd. | 9,000 | | 96,246 |
| Milbon Company, Ltd. | 1,200 | | 43,969 |
| Minato Bank, Ltd. * | 77,000 | | 200,775 |
| Ministop Company, Ltd. * | 2,500 | | 48,677 |
| Mito Securities Company, Ltd. | 8,000 | | 46,832 |
| Mitsuba Corp. * (a) | 8,000 | | 75,122 |
| Mitsubishi Cable Industries, Ltd. * (a) | 19,000 | | 30,438 |
| Mitsubishi Kakoki Kaisha, Ltd. * (a) | 11,000 | | 31,775 |
| Mitsubishi Paper Mills, Ltd. * (a) | 47,000 | | 99,723 |
| Mitsubishi Pencil Company, Ltd. | 4,000 | | 45,844 |
| Mitsubishi Plastics, Inc. | 31,000 | | 92,455 |
The accompanying notes are an integral part of the financial statements. 268
John Hancock Funds II
Portfolio of investments — August 31, 2006
(showing percentage of total net assets) |
| International Small Company Fund (continued) |
| | Shares or | | |
| | Principal | | |
| | Amount | | Value |
|
|
| |
| COMMON STOCKS (continued) | | | |
| Japan (continued) | | | |
| Mitsubishi Steel Manufacturing Company, Ltd. (a) | 18,000 | $ | 98,164 |
| Mitsuboshi Belting Company, Ltd. (a) | 14,000 | | 87,325 |
| Mitsui High-Tec, Inc. | 7,100 | | 80,526 |
| Mitsui Home Company, Ltd. | 12,000 | | 94,380 |
| Mitsui Knowledge Industry Company, Ltd. * | 2,600 | | 33,676 |
| Mitsui Mining Company, Ltd. * | 38,000 | | 67,999 |
| Mitsui Sugar Company, Ltd. * (a) | 14,000 | | 50,939 |
| Mitsui-Soko Company, Ltd. (a) | 12,000 | | 70,146 |
| Mitsumi Electric Company, Ltd. (a) | 12,100 | | 163,938 |
| Mitsumura Printing Company, Ltd. * | 7,000 | | 32,747 |
| Mitsuuroko Company, Ltd. * | 13,000 | | 93,494 |
| Miura Company, Ltd. | 4,700 | | 115,543 |
| Miyazaki, Bank Ltd. | 23,000 | | 121,120 |
| Miyoshi Oil & Fat Company, Ltd. | 14,000 | | 28,750 |
| Miyuki Holdings Company, Ltd. | 8,000 | | 31,562 |
| Mizuno Corp. | 18,000 | | 129,453 |
| Mochida Pharmaceutical Company, Ltd. | 16,000 | | 140,565 |
| Modec, Inc. (a) | 7,400 | | 166,154 |
| Morinaga & Company, Ltd. * | 41,000 | | 103,762 |
| Morinaga Milk Industry Company, Ltd. * | 36,000 | | 130,987 |
| Morita Corp. | 6,000 | | 39,368 |
| Mory Industries, Inc. | 11,000 | | 35,243 |
| MOS Food Services, Inc. | 7,000 | | 101,461 |
| Moshi Moshi Hotline, Inc. | 1,100 | | 42,180 |
| Mr Max Corp. | 7,300 | | 39,313 |
| Myojo Foods Company, Ltd. | 7,000 | | 40,262 |
| Nagano Bank, Ltd. | 13,000 | | 47,079 |
| Nagatanien Company, Ltd. | 5,000 | | 38,345 |
| Nakabayashi Company, Ltd. | 14,000 | | 34,357 |
| Nakamuraya Company, Ltd. | 6,000 | | 31,954 |
| Nakayama Steel Works, Ltd. | 22,000 | | 84,922 |
| NEC Fielding, Ltd. (a) | 8,400 | | 107,295 |
| NEC Mobiling, Ltd. | 2,000 | | 37,067 |
| NEC Networks & System Integration Corp. | 7,700 | | 82,344 |
| NEC Tokin Corp. * (a) | 11,000 | | 57,271 |
| Net One Systems Company, Ltd. (a) | 66 | | 99,544 |
| Netmarks, Inc. (a) | 29 | | 29,654 |
| Neturen Company, Ltd. | 8,000 | | 88,620 |
| Nice Corp. * | 22,000 | | 88,484 |
| Nichia Steel Works, Ltd. | 8,000 | | 31,971 |
| Nichias Corp. | 15,000 | | 111,201 |
| Nichiban Company, Ltd. | 10,000 | | 41,328 |
| Nichicon Corp. | 12,000 | | 153,279 |
| Nichiha Corp. * (a) | 4,200 | | 61,986 |
| Nichimo Corp. | 29,000 | | 29,654 |
| Nichiro Corp. * | 23,000 | | 46,449 |
| NIDEC COPAL CORP. (a) | 2,700 | | 31,750 |
| Nidec Tosok Corp. (a) | 2,800 | | 32,019 |
| Nifco, Inc. (a) | 9,000 | | 202,079 |
| Nihon Dempa Kogyo Company, Ltd. (a) | 3,500 | | 132,419 |
| Nihon Eslead Corp. (a) | 2,000 | | 61,182 |
| Nihon Inter Electronics Corp. | 5,000 | | 37,877 |
| International Small Company Fund (continued) |
| | Shares or | | |
| | Principal | | |
| | Amount | | Value |
|
|
| |
| COMMON STOCKS (continued) | | | |
| Japan (continued) | | | |
| Nihon Kagaku Sangyo Company, Ltd. | 5,000 | $ | 36,471 |
| Nihon Kohden Corp. | 5,000 | | 89,259 |
| Nihon Nohyaku Company, Ltd. (a) | 10,000 | | 42,009 |
| Nihon Parkerizing Company, Ltd. | 7,000 | | 119,594 |
| Nihon Tokushu Toryo Company, Ltd. | 6,000 | | 39,368 |
| Nihon Yamamura Glass Company, Ltd. | 26,000 | | 79,758 |
| Nikkiso Company, Ltd. * | 8,000 | | 82,348 |
| Nippei Toyama Corp. * | 4,000 | | 34,085 |
| Nippo Corp. * | 11,000 | | 94,483 |
| Nippon Beet Sugar | | | |
| Manufacturing Company, Ltd. * | 30,000 | | 93,051 |
| Nippon Carbide Industries Company, Inc. * | 16,000 | | 37,629 |
| Nippon Carbon Company, Ltd. * | 12,000 | | 45,094 |
| Nippon Ceramic Company, Ltd. | 3,000 | | 38,294 |
| Nippon Chemical Industrial Company, Ltd. * | 13,000 | | 36,223 |
| Nippon Chemi-Con Corp. (a) | 22,000 | | 157,471 |
| Nippon Chemiphar Company, Ltd. * | 5,000 | | 27,949 |
| Nippon Concrete Industries Company, Ltd. | 15,000 | | 41,413 |
| Nippon Denko Company, Ltd. | 14,000 | | 44,736 |
| Nippon Densetsu Kogyo Company, Ltd. * | 12,000 | | 75,463 |
| Nippon Denwa Shisetsu Company, Ltd. | 10,000 | | 38,004 |
| Nippon Felt Company, Ltd. | 5,000 | | 33,872 |
| Nippon Fine Chemical Company, Ltd. | 6,000 | | 37,323 |
| Nippon Flour Mills Company, Ltd. (a) | 25,000 | | 118,444 |
| Nippon Gas Company, Ltd. | 5,000 | | 40,348 |
| Nippon Jogesuido Sekkei Company, Ltd. | 28 | | 34,357 |
| Nippon Kanzai Company, Ltd. | 3,600 | | 81,445 |
| Nippon Kasei Chemical Company, Ltd. * | 16,000 | | 29,449 |
| Nippon Kinzoku Company, Ltd. | 16,000 | | 33,403 |
| Nippon Koei Company, Ltd. * (a) | 11,000 | | 31,400 |
| Nippon Konpo Unyu Soko Company, Ltd. | 10,000 | | 136,083 |
| Nippon Koshuha Steel Company, Ltd. * (a) | 17,000 | | 33,318 |
| Nippon Metal Industry Company, Ltd. | 17,000 | | 38,098 |
| Nippon Paint Company, Ltd. (a) | 33,000 | | 161,689 |
| Nippon Parking Development Company, Ltd. (a) | 293 | | 51,856 |
| Nippon Pillar Packing Company, Ltd. (a) | 4,000 | | 46,696 |
| Nippon Piston Ring Company, Ltd. * | 13,000 | | 32,457 |
| Nippon Restaurant System, Inc. | 1,300 | | 43,645 |
| Nippon Road Company, Ltd. * | 15,000 | | 35,150 |
| Nippon Seiki Company, Ltd. | 6,000 | | 131,396 |
| Nippon Sharyo, Ltd. | 20,000 | | 50,104 |
| Nippon Shinyaku Company, Ltd. | 12,000 | | 102,152 |
| Nippon Signal Company, Ltd. | 9,000 | | 63,193 |
| Nippon Soda Company, Ltd. * | 26,000 | | 131,601 |
| Nippon Synthetic Chemical Industry | | | |
| Company, Ltd. | 20,000 | | 72,089 |
| Nippon System Development Company, Ltd. (a) | 3,600 | | 137,736 |
| Nippon Thompson Company, Ltd. | 12,000 | | 114,422 |
| Nippon Valqua Industries, Ltd. (a) | 11,000 | | 38,618 |
| Nippon Yakin Kogyo Company, Ltd. (a) | 8,500 | | 36,287 |
| Nippon Yusoki Company, Ltd. * | 5,000 | | 25,691 |
| Nipro Corp. | 9,000 | | 172,553 |
The accompanying notes are an integral part of the financial statements. 269
John Hancock Funds II
Portfolio of investments — August 31, 2006
(showing percentage of total net assets) |
| International Small Company Fund (continued) |
| | Shares or | | |
| | Principal | | |
| | Amount | | Value |
|
|
| |
| COMMON STOCKS (continued) | | | |
| Japan (continued) | | | |
| Nishimatsu Construction Company, Ltd. (a) | 55,000 | $ | 205,275 |
| Nissan Shatai Company, Ltd. | 17,000 | | 95,028 |
| Nissei Corp. | 2,900 | | 32,545 |
| Nissei Plastic Industrial Company, Ltd. | 4,000 | | 33,778 |
| Nissen Company, Ltd. | 5,300 | | 41,188 |
| Nisshin Fire & Marine Ins. Company,Ltd. * (a) | 21,000 | | 97,346 |
| Nisshin Fudosan Company * | 3,000 | | 40,390 |
| Nisshin Oillio Group, Ltd. (a) | 20,000 | | 123,727 |
| Nissin Corp. | 11,000 | | 41,617 |
| Nissin Electric Company, Ltd. * (a) | 19,000 | | 69,942 |
| Nissin Kogyo Company, Ltd. | 6,900 | | 145,226 |
| Nissin Sugar Manufacturing Company, Ltd. * | 12,000 | | 31,699 |
| Nitta Corp. | 4,500 | | 81,675 |
| Nittan Valve Company, Ltd. | 4,000 | | 34,357 |
| Nittetsu Mining Company, Ltd. (a) | 12,000 | | 96,834 |
| Nitto Boseki Company, Ltd. * | 44,000 | | 153,347 |
| Nitto Fuji Flour Milling Company, Ltd. | 11,000 | | 39,087 |
| Nitto Kogyo Corp. | 5,700 | | 111,712 |
| Nitto Kohki Company, Ltd. * | 3,700 | | 82,131 |
| NIWS Company HQ, Ltd. * (a) | 124 | | 93,194 |
| NOF Corp. | 18,000 | | 109,974 |
| Nohmi Bosai, Ltd. | 6,000 | | 43,100 |
| Nomura Company, Ltd. | 6,000 | | 28,324 |
| Noritake Company, Ltd. | 21,000 | | 113,987 |
| Noritsu Koki Company, Ltd. | 3,800 | | 74,799 |
| Noritz Corp. (a) | 7,400 | | 135,256 |
| Nosan Corp. * (a) | 11,000 | | 33,275 |
| NS Solutions Corp. (a) | 5,000 | | 129,095 |
| Odakyu Real Estate Company, Ltd. | 11,000 | | 43,679 |
| Oenon Holdings, Inc. | 9,000 | | 35,661 |
| Oiles Corp. | 4,100 | | 87,866 |
| Oita Bank, Ltd. | 21,000 | | 161,945 |
| Okabe Company, Ltd. * | 9,000 | | 36,735 |
| Okamoto Industries, Inc. (a) | 11,000 | | 41,336 |
| Okamoto Machine Tool Works, Ltd. * | 7,000 | | 32,747 |
| Okamura Corp. | 13,000 | | 134,702 |
| Okinawa Electric Power Company, Inc. | 3,100 | | 183,852 |
| OKK Corp. | 10,000 | | 33,062 |
| Okumura Corp. (a) | 23,000 | | 126,019 |
| Okura Industrial Company, Ltd. | 8,000 | | 38,993 |
| Okuwa Company, Ltd. | 7,000 | | 90,248 |
| Olympic Corp. * | 4,600 | | 35,866 |
| O-M, Ltd. | 8,000 | | 32,176 |
| ONO Sokki Company, Ltd. | 5,000 | | 32,125 |
| Onoken Company, Ltd. | 3,000 | | 39,674 |
| Organo Corp. (a) | 5,000 | | 41,839 |
| Oriental Yeast Company, Ltd. | 6,000 | | 36,863 |
| Origin Electric Company, Ltd. | 6,000 | | 36,965 |
| Osaka Steel Company, Ltd. | 4,100 | | 83,324 |
| Osaki Electric Comany, Ltd. | 4,000 | | 34,732 |
| Oyo Corp. | 3,300 | | 35,909 |
| Pacific Industrial Company, Ltd. | 7,000 | | 42,112 |
| International Small Company Fund (continued) |
| | Shares or | | |
| | Principal | | |
| | Amount | | Value |
|
|
| |
| COMMON STOCKS (continued) | | | |
| Japan (continued) | | | |
| Pacific Metals Company, Ltd. | 16,000 | $ | 121,205 |
| Paramount Bed Company, Ltd. (a) | 5,000 | | 93,307 |
| Parco Company, Ltd. (a) | 6,000 | | 65,494 |
| Paris Miki, Inc. (a) | 5,300 | | 99,808 |
| Pasona, Inc. (a) | 34 | | 67,794 |
| Patlite Corp. | 3,700 | | 35,942 |
| PCA Corp. * | 1,500 | | 27,417 |
| Penta-Ocean Construction Company, Ltd. * (a) | 76,000 | | 103,617 |
| Pentax Corp. * (a) | 13,000 | | 68,459 |
| PIA Corp * (a) | 2,600 | | 39,790 |
| Pigeon Corp. * (a) | 2,800 | | 46,693 |
| Piolax, Inc. | 1,800 | | 35,814 |
| Press Kogyo Company, Ltd. | 12,000 | | 55,422 |
| Prima Meat Packers, Ltd. * (a) | 30,000 | | 38,090 |
| Q'Sai Company, Ltd. | 3,200 | | 45,046 |
| Raito Kogyo Company, Ltd. * | 9,900 | | 33,406 |
| Rasa Industries, Ltd. * (a) | 10,000 | | 39,794 |
| RENOWN, Inc. * (a) | 8,000 | | 108,457 |
| Resort Solution Company, Ltd. * | 9,000 | | 36,965 |
| Resorttrust, Inc. * | 5,500 | | 154,659 |
| Rhythm Watch Company, Ltd. * | 20,000 | | 36,471 |
| Ricoh Elemex Corp. * | 4,000 | | 36,300 |
| Ricoh Leasing Company, Ltd. * | 4,800 | | 129,658 |
| Right On Company, Ltd. | 3,900 | | 126,284 |
| Riken Corp. (a) | 16,000 | | 107,026 |
| Riken Keiki Company, Ltd. | 4,000 | | 36,539 |
| Riken Technos Corp. | 8,000 | | 32,653 |
| Riken Vitamin Company, Ltd. * | 2,000 | | 50,530 |
| Ringer Hut Company, Ltd. (a) | 3,000 | | 38,473 |
| Rock Field Company, Ltd. | 1,800 | | 34,587 |
| Roland Corp. | 4,200 | | 97,704 |
| Royal Holdings Company, Ltd. | 6,000 | | 88,552 |
| Ryobi, Ltd. * | 22,000 | | 163,470 |
| Ryoden Trading Company, Ltd. | 10,000 | | 76,605 |
| Ryosan Company, Ltd. | 9,200 | | 240,671 |
| Ryoshoku, Ltd. (a) | 4,000 | | 101,231 |
| Ryoyo Electro Corp. | 6,600 | | 88,015 |
| S Foods, Inc. | 4,500 | | 39,457 |
| S Science Company, Ltd. | 102,000 | | 34,766 |
| Sagami Chain Company, Ltd. | 4,000 | | 37,357 |
| Saibu Gas Company, Ltd. | 54,000 | | 132,061 |
| Saizeriya Company, Ltd. (a) | 6,400 | | 97,673 |
| Sakai Chemical Industry Company, Ltd. * | 18,000 | | 91,262 |
| Sakata INX Corp. | 8,000 | | 42,265 |
| Sakata Seed Corp. (a) | 8,000 | | 101,299 |
| Sala Corp. | 8,000 | | 39,947 |
| San-Ai Oil Company, Ltd. | 10,000 | | 41,839 |
| Sanden Corp. (a) | 24,000 | | 101,436 |
| Sanei-International Company, Ltd. | 1,300 | | 41,208 |
| Sankei Building Company, Ltd. | 11,000 | | 84,922 |
| Sanki Engineering Company, Ltd. | 12,000 | | 75,668 |
| Sankyo Seiko Company, Ltd. * | 7,000 | | 35,013 |
The accompanying notes are an integral part of the financial statements. 270
John Hancock Funds II
Portfolio of investments — August 31, 2006
(showing percentage of total net assets) |
| International Small Company Fund (continued) |
| | Shares or | | |
| | Principal | | |
| | Amount | | Value |
|
|
| |
| COMMON STOCKS (continued) | | | |
| Japan (continued) | | | |
| Sankyo-Tateyama Holdings, Inc. (a) | 47,000 | $ | 100,524 |
| Sanoh Industrial Company, Ltd. | 5,000 | | 35,661 |
| Sanrio Company, Ltd. * (a) | 6,100 | | 75,785 |
| Sanshin Electronics Company, Ltd. | 5,000 | | 53,939 |
| Sanyo Chemical Industries, Ltd. | 16,000 | | 112,888 |
| Sanyo Denki Company, Ltd. | 6,000 | | 41,822 |
| Sanyo Electric Credit Company, Ltd. | 4,100 | | 74,939 |
| Sanyo Shokai, Ltd. | 18,000 | | 117,336 |
| Sasebo Heavy Industries Company, Ltd. * (a) | 18,000 | | 49,082 |
| Sato Corp. (a) | 2,500 | | 53,151 |
| Sato Shoji Corp. | 3,000 | | 30,830 |
| Satori Electric Company, Ltd. | 2,400 | | 35,564 |
| Secom Techno Service Compnay, Ltd. | 2,000 | | 91,176 |
| Seijo Corp. | 1,300 | | 31,349 |
| Seika Corp. * | 16,000 | | 37,084 |
| Seikagaku Corp. | 7,600 | | 82,764 |
| Seiko Corp. (a) | 10,000 | | 80,184 |
| Seiren Company, Ltd. | 6,000 | | 76,332 |
| Sekisui Plastics Company, Ltd. | 21,000 | | 64,420 |
| Senko Company, Ltd. | 12,000 | | 37,323 |
| Senshu Electric Company, Ltd. | 1,500 | | 38,345 |
| Senshukai Company, Ltd. (a) | 8,000 | | 85,757 |
| Shaddy Company, Ltd. (a) | 2,400 | | 34,337 |
| Shibaura Mechatronics Corp. (a) | 4,000 | | 22,291 |
| Shibusawa Warehouse Company, Ltd. | 10,000 | | 43,032 |
| Shibuya Kogyo Company, Ltd. | 3,300 | | 30,144 |
| Shikibo, Ltd. * | 20,000 | | 30,335 |
| Shikoku Bank, Ltd. | 35,000 | | 162,243 |
| Shikoku Chemicals Corp. | 6,000 | | 40,850 |
| Shikoku Coca-Cola Bottling Company, Ltd. | 3,300 | | 38,074 |
| Shima Seiki Manufacturing, Ltd. (a) | 6,700 | | 161,570 |
| Shimizu Bank, Ltd. | 1,800 | | 77,304 |
| Shin Nippon Air Technologies Company, Ltd. | 4,500 | | 31,750 |
| Shinagawa Refractories Company, Ltd. | 8,000 | | 29,585 |
| Shindengen Electric Manufacturing | | | |
| Company, Ltd. | 15,000 | | 75,157 |
| Shin-Etsu Polymer Company, Ltd. | 7,000 | | 107,367 |
| Shinkawa, Ltd. (a) | 3,500 | | 78,437 |
| Shin-Keisei Electric Railway Company, Ltd. | 10,000 | | 37,408 |
| Shinki Company, Ltd. | 10,500 | | 67,015 |
| Shinko Electric Company, Ltd. * (a) | 12,000 | | 46,219 |
| Shinko Plantech Company, Ltd. * | 6,000 | | 40,902 |
| Shinko Shoji Company, Ltd. | 3,000 | | 37,706 |
| Shin-Kobe Electric Machinery Company, Ltd. | 7,000 | | 36,445 |
| Shinmaywa Industries, Ltd. | 18,000 | | 87,734 |
| Shinsho Corp. * | 13,000 | | 35,226 |
| Shinwa Kaiun Kaisha, Ltd. | 14,000 | | 41,038 |
| Shiroki Corp. * | 12,000 | | 36,607 |
| Shizuki Electric Company, Inc. | 8,000 | | 35,243 |
| Shizuoka Gas Company, Ltd. | 7,000 | | 52,789 |
| Sho-Bond Corp. (a) | 4,200 | | 38,187 |
| Shobunsha Publications, Inc. * | 2,400 | | 29,408 |
| International Small Company Fund (continued) |
| | Shares or | | |
| | Principal | | |
| | Amount | | Value |
|
|
| |
| COMMON STOCKS (continued) | | | |
| Japan (continued) | | | |
| Shochiku Company, Ltd. * (a) | 18,000 | $ | 145,252 |
| Shoko Company, Ltd. (a) | 20,000 | | 35,789 |
| Showa Aircraft Industry Company, Ltd. * | 3,000 | | 42,282 |
| Showa Highpolymer Company, Ltd. | 11,000 | | 41,430 |
| Showa KDE Company, Ltd. * | 10,000 | | 24,711 |
| Showa Sangyo Company, Ltd. * | 33,000 | | 85,765 |
| Siix Corp. | 2,000 | | 31,528 |
| Silver Seiko, Ltd. * (a) | 70,000 | | 39,964 |
| Sinanen Company, Ltd. * | 7,000 | | 36,147 |
| Sintokogio, Ltd. | 9,000 | | 105,526 |
| SMK Corp. | 14,000 | | 95,676 |
| Snow Brand Milk * (a) | 41,000 | | 135,205 |
| SNT Corp. * | 7,000 | | 36,743 |
| Sodick Company, Ltd. | 4,000 | | 35,278 |
| Software Research Associates, Inc. | 3,300 | | 48,985 |
| Sogo Medical Company, Ltd. | 1,400 | | 32,091 |
| Sohgo Security Services Company, Ltd. | 17,540 | | 322,836 |
| Sorun Corp. * | 4,700 | | 44,415 |
| Space Company, Ltd. | 4,200 | | 34,071 |
| SSP Company, Ltd. * (a) | 16,000 | | 91,483 |
| ST Chemical Company, Ltd. (a) | 6,000 | | 82,928 |
| St. Marc Holdings Company, Ltd. (a) | 1,000 | | 66,465 |
| Star Micronics Company, Ltd. (a) | 5,000 | | 97,993 |
| Starzen Company, Ltd. * | 14,000 | | 36,147 |
| STB Leasing Company, Ltd. | 2,000 | | 27,336 |
| Stella Chemifa Corp. (a) | 1,000 | | 39,368 |
| Sugi Pharmacy Company, Ltd. | 6,100 | | 120,331 |
| Sugimoto & Company, Ltd. | 2,000 | | 32,466 |
| Sumida Corp. (a) | 1,800 | | 36,581 |
| Suminoe Textile Company, Ltd. | 11,000 | | 40,118 |
| Sumisho Computer Systems Corp. | 5,400 | | 101,922 |
| Sumitomo Coal Mining Company, Ltd. * | 20,000 | | 30,165 |
| Sumitomo Light Metal Industries, Ltd. (a) | 47,000 | | 103,328 |
| Sumitomo Mitsui Company, Ltd. * (a) | 9,000 | | 34,357 |
| Sumitomo Pipe & Tube Company, Ltd. | 6,000 | | 32,108 |
| Sumitomo Precision Products Company, Ltd. | 6,000 | | 32,210 |
| Sumitomo Seika Chemicals Company, Ltd. | 8,000 | | 49,627 |
| Sun Wave Corp. * | 11,000 | | 33,931 |
| Suntelephone Company, Ltd. | 5,000 | | 38,345 |
| Suruga Corp. | 1,300 | | 94,713 |
| SWCC Showa Holdings Company, Ltd. * | 29,000 | | 42,998 |
| SxL Corp. * (a) | 25,000 | | 28,333 |
| T. Hasegawa Company, Ltd. (a) | 6,900 | | 108,596 |
| Tachibana Eletech Company, Ltd. | 4,000 | | 41,822 |
| Tachihi Enterprise Company, Ltd. * | 2,400 | | 91,824 |
| Tachikawa Corp. | 4,600 | | 30,143 |
| Tachi-S Company, Ltd. * | 4,300 | | 31,841 |
| Tadano, Ltd. | 18,000 | | 171,326 |
| Taihei Dengyo Kaisha, Ltd. * | 6,000 | | 42,640 |
| Taihei Kogyo Company, Ltd. * | 12,000 | | 32,823 |
| Taiho Kogyo Company, Ltd. | 3,400 | | 39,460 |
| Taikisha, Ltd. | 3,000 | | 34,766 |
The accompanying notes are an integral part of the financial statements. 271
John Hancock Funds II
Portfolio of investments — August 31, 2006
(showing percentage of total net assets) |
| International Small Company Fund (continued) |
| | Shares or | | |
| | Principal | | |
| | Amount | | Value |
|
|
| |
| COMMON STOCKS (continued) | | | |
| Japan (continued) | | | |
| Taisei Rotec Corp. * | 18,000 | $ | 34,664 |
| Takagi Securities Company, Ltd. | 6,000 | | 29,142 |
| Takamatsu Corp. * | 6,200 | | 109,360 |
| Takano Company, Ltd. * | 2,000 | | 36,982 |
| Takaoka Electric Manufacturing Company, Ltd. * | 18,000 | | 36,198 |
| Takara Printing Company, Ltd. | 3,300 | | 35,628 |
| Takara Standard Company, Ltd. * | 26,000 | | 156,857 |
| Takasago International Corp. (a) | 16,000 | | 79,894 |
| Takasago Thermal Engineering Company, Ltd. | 12,000 | | 98,368 |
| Takiron Company, Ltd. | 10,000 | | 39,453 |
| Takuma Company, Ltd. (a) | 14,000 | | 75,992 |
| Tamura Corp. | 11,000 | | 40,024 |
| Tamura Taiko Holdings, Inc. * (a) | 9,000 | | 37,425 |
| Tasaki Shinju Company, Ltd. | 7,000 | | 33,284 |
| Tatsuta Electric Wire & Cable Company, Ltd. | 12,000 | | 34,562 |
| Tayca Corp. * | 11,000 | | 31,682 |
| TCM Corp. | 12,000 | | 40,288 |
| Teac Corp. * (a) | 26,000 | | 31,460 |
| Techno Ryowa, Ltd. | 6,400 | | 38,447 |
| Tecmo, Ltd. | 5,300 | | 39,788 |
| Teikoku Piston Ring Company, Ltd. | 3,000 | | 31,571 |
| Teikoku Sen-I Company, Ltd. | 8,000 | | 41,174 |
| Teikoku Tsushin Kogyo Company, Ltd. | 7,000 | | 36,684 |
| Tekken Corp. * (a) | 19,000 | | 36,428 |
| Tenma Corp. | 5,000 | | 90,111 |
| TIS, Inc. (a) | 6,500 | | 137,084 |
| TKC Corp. | 2,900 | | 57,454 |
| Toa Corp/Tokyo | 29,000 | | 35,090 |
| Toa Oil Company, Ltd. | 22,000 | | 36,181 |
| TOA ROAD Corp. * | 15,000 | | 33,105 |
| Toagosei Company, Ltd. | 33,000 | | 133,007 |
| Tobishima Corp. * (a) | 38,500 | | 32,478 |
| Tobu Store Company, Ltd. * | 14,000 | | 38,771 |
| TOC Company, Ltd. | 22,000 | | 122,790 |
| Tocalo Company, Ltd. | 2,000 | | 65,954 |
| Tochigi Bank, Ltd. | 19,000 | | 129,198 |
| Toda Kogyo Corp. | 9,000 | | 37,118 |
| Toei Company, Ltd. (a) | 16,000 | | 122,568 |
| Toenec Corp. | 18,000 | | 77,151 |
| Tohcello Company, Ltd. | 4,000 | | 50,820 |
| Toho Bank, Ltd. | 48,000 | | 219,641 |
| Toho Company, Ltd. | 6,000 | | 41,924 |
| Toho Real Estate Company, Ltd. | 6,000 | | 36,300 |
| Toho Tenax Company, Ltd. * (a) | 12,000 | | 82,110 |
| Toho Zinc Company, Ltd. * | 17,000 | | 132,112 |
| Tohoku Bank, Ltd. | 15,000 | | 31,571 |
| Tohoku Pioneer Corp. | 2,700 | | 42,218 |
| Tokai Carbon Company, Ltd. (a) | 34,000 | | 233,224 |
| Tokai Corp. | 15,000 | | 65,187 |
| Tokai Pulp & Paper Company, Ltd. | 11,000 | | 36,181 |
| Tokimec, Inc. * | 13,000 | | 29,355 |
| Toko Electric Corp. | 8,000 | | 37,970 |
| International Small Company Fund (continued) |
| | Shares or | | |
| | Principal | | |
| | Amount | | Value |
|
|
| |
| COMMON STOCKS (continued) | | | |
| Japan (continued) | | | |
| Toko, Inc. * | 16,000 | $ | 51,945 |
| Tokushima Bank, Ltd. | 19,000 | | 135,188 |
| Tokushu Paper Manufacturing Company, Ltd. | 7,000 | | 35,848 |
| Tokyo Dome Corp. * (a) | 21,000 | | 118,461 |
| Tokyo Energy & Systems, Inc. | 5,000 | | 47,591 |
| Tokyo Kikai Seisakusho, Ltd. (a) | 10,000 | | 30,506 |
| Tokyo Leasing Company, Ltd. (a) | 8,000 | | 97,687 |
| Tokyo Rakutenchi Company, Ltd. | 9,000 | | 42,717 |
| Tokyo Rope Manufacturing Company, Ltd. * | 34,000 | | 73,589 |
| Tokyo Style Company, Ltd. | 8,000 | | 94,346 |
| Tokyo Tekko Company, Ltd. * | 4,000 | | 36,027 |
| Tokyo Theatres Company, Inc. * | 12,000 | | 34,255 |
| Tokyotokeiba Company, Ltd. (a) | 33,000 | | 107,136 |
| Tokyu Community Corp. | 1,300 | | 36,002 |
| Tokyu Livable, Inc. * | 800 | | 65,170 |
| Tokyu Recreation Company, Ltd. | 6,000 | | 34,920 |
| Tokyu Store Chain Company, Ltd. | 8,000 | | 53,581 |
| Toli Corp. * | 10,000 | | 31,273 |
| Tomato Bank, Ltd. | 16,000 | | 39,538 |
| Tomen Electronics Corp. | 2,200 | | 41,711 |
| Tomoe Corp. * | 8,000 | | 28,836 |
| Tomoku Company, Ltd. | 16,000 | | 39,538 |
| Tomy Company, Ltd. (a) | 5,600 | | 40,227 |
| Tonami Transportation Company, Ltd. | 11,000 | | 30,182 |
| Topre Corp. | 9,000 | | 81,982 |
| Topy Industries, Ltd. (a) | 29,000 | | 114,908 |
| Tori Holdings Company, Ltd. * | 73,000 | | 36,079 |
| Torigoe Company, Ltd. | 5,000 | | 37,323 |
| Torii Pharmaceutical Company, Ltd. | 5,100 | | 90,175 |
| Torishima Pump Manufacturing Company, Ltd. | 5,000 | | 41,498 |
| Toshiba Ceramics Company, Ltd. | 22,000 | | 102,356 |
| Toshiba Plant Systems & Services Corp. * | 16,000 | | 84,666 |
| Tosho Printing Company, Ltd. | 9,000 | | 34,587 |
| Totetsu Kogyo Company, Ltd. * | 6,000 | | 36,760 |
| Tottori Bank, Ltd. (a) | 13,000 | | 36,777 |
| Touei Housing Corp. | 4,800 | | 94,074 |
| Towa Bank, Ltd. * | 24,000 | | 57,467 |
| Towa Corp. * (a) | 4,900 | | 33,361 |
| Towa Pharmaceutical Company, Ltd. (a) | 1,600 | | 40,629 |
| Towa Real Estate Development | | | |
| Company, Ltd. * (a) | 15,000 | | 82,059 |
| Toyo Construction Company, Ltd. * (a) | 26,000 | | 24,371 |
| Toyo Corp. (a) | 3,400 | | 46,442 |
| Toyo Electric Manufacturing Company, Ltd. (a) | 6,000 | | 36,454 |
| Toyo Engineering Corp. * (a) | 18,000 | | 77,764 |
| Toyo Kanetsu K K * | 14,000 | | 34,715 |
| Toyo Kohan Company, Ltd. | 22,000 | | 89,983 |
| Toyo Machinery & Metal Company, Ltd. (a) | 4,000 | | 34,357 |
| Toyo Securities Company, Ltd. | 9,000 | | 48,392 |
| Toyo Tire & Rubber Company, Ltd. (a) | 30,000 | | 132,930 |
| Toyo Wharf & Warehouse Company, Ltd. | 17,000 | | 35,491 |
| TRAD Company, Ltd. | 11,000 | | 44,617 |
The accompanying notes are an integral part of the financial statements. 272
John Hancock Funds II
Portfolio of investments — August 31, 2006
(showing percentage of total net assets) |
| International Small Company Fund (continued) |
| | Shares or | | |
| | Principal | | |
| | Amount | | Value |
|
|
| |
| COMMON STOCKS (continued) | | | |
| Japan (continued) | | | |
| Trans Cosmos, Inc. * (a) | 3,900 | $ | 79,924 |
| Trusco Nakayama Corp. (a) | 3,700 | | 74,722 |
| Tsubaki Nakashima Company, Ltd. | 6,500 | | 102,301 |
| Tsubakimoto Chain Company (a) | 23,000 | | 114,064 |
| Tsubakimoto Kogyo Company, Ltd. | 10,000 | | 37,493 |
| Tsudakoma Corp. | 20,000 | | 38,856 |
| Tsugami Corp. (a) | 14,000 | | 83,269 |
| Tsukishima Kikai Company, Ltd. (a) | 7,000 | | 87,683 |
| Tsurumi Manufacturing Company, Ltd. | 4,000 | | 41,549 |
| Tsutsumi Jewelry Company, Ltd. | 3,000 | | 95,607 |
| Tsutsunaka Plastic Industry Company, Ltd. | 10,000 | | 39,283 |
| TTK Company, Ltd. | 6,000 | | 39,368 |
| Ube Material Industries, Ltd. | 12,000 | | 35,789 |
| Uchida Yoko Company, Ltd. | 8,000 | | 46,014 |
| UFJ Central Leasing Company, Ltd. * | 1,000 | | 46,440 |
| Unicharm Petcare Corp. | 2,000 | | 83,337 |
| Uniden Corp. (a) | 12,000 | | 120,762 |
| Unimat Life Corp. * | 2,800 | | 37,220 |
| Union Tool Company * | 1,700 | | 88,944 |
| Unitika, Ltd. * | 73,000 | | 103,881 |
| U-Shin, Ltd. (a) | 5,000 | | 35,448 |
| Valor Company, Ltd. | 6,000 | | 112,735 |
| Venture Link Company, Ltd. * (a) | 9,800 | | 29,228 |
| VITAL-Net, Inc. * | 6,500 | | 38,439 |
| Wakachiku Construction Company, Ltd. * | 17,000 | | 27,668 |
| Warabeya Nichiyo Company, Ltd. * | 2,500 | | 34,532 |
| Watabe Wedding Corp. | 2,000 | | 31,886 |
| WATAMI Company, Ltd. (a) | 3,000 | | 43,177 |
| Wood One Company, Ltd. | 6,000 | | 56,137 |
| Yahagi Construction Company, Ltd. | 8,000 | | 33,880 |
| Yaizu Suisankagaku Industry Company, Ltd. | 2,700 | | 33,337 |
| Yamagata Bank, Ltd. | 27,000 | | 142,184 |
| Yamaichi Electronics Company, Ltd. | 3,100 | | 34,763 |
| Yamatane Corp. * | 20,000 | | 31,869 |
| Yamazen Corp. * | 6,000 | | 35,380 |
| Yaoko Company, Ltd. | 1,900 | | 45,333 |
| Yasuda Warehouse Company, Ltd. | 4,000 | | 39,845 |
| Yellow Hat, Ltd. | 3,600 | | 40,861 |
| Yodogawa Steel Works, Ltd. | 30,000 | | 160,794 |
| Yokohama Reito Company, Ltd. | 10,000 | | 82,911 |
| Yokowo Company, Ltd. | 2,800 | | 34,405 |
| Yomeishu Seizo Company, Ltd. * (a) | 2,000 | | 21,081 |
| Yomiuri Land Company, Ltd. (a) | 6,000 | | 38,294 |
| Yondenko Corp. | 7,000 | | 37,757 |
| Yonekyu Corp. * | 3,500 | | 37,519 |
| Yorozu Corp. | 3,000 | | 32,389 |
| Yoshimoto Kogyo Company, Ltd. (a) | 4,000 | | 82,996 |
| Yoshinoya D&C Company, Ltd. (a) | 48 | | 85,075 |
| Yuasa Trading Company, Ltd. * | 35,000 | | 64,420 |
| Yuken Kogyo Company, Ltd. * | 14,000 | | 37,459 |
| Yukiguni Maitake Company, Ltd. * | 8,500 | | 35,708 |
| Yuraku Real Estate Company, Ltd. * | 13,000 | | 88,731 |
| International Small Company Fund (continued) |
| | Shares or | | |
| | Principal | | |
| | Amount | | Value |
|
|
| |
| COMMON STOCKS (continued) | | | |
| Japan (continued) | | | |
| Yurtec Corp. | 15,000 | $ | 73,751 |
| Yushiro Chemical Industry Company, Ltd. (a) | 2,000 | | 40,390 |
| Zenrin Company, Ltd. (a) | 5,000 | | 118,018 |
| ZERIA Pharmaceutical Company, Ltd. | 5,000 | | 46,653 |
| Zuken, Inc. | 3,800 | | 36,914 |
|
|
| | | | 57,928,479 |
| Luxembourg - 0.25% | | | |
| Thiel Logistik AG * | 145,482 | | 549,018 |
| Malaysia - 0.10% | | | |
| Affin Holdings Berhad | 118,000 | | 53,855 |
| DRB-Hicom Berhad | 53,000 | | 21,453 |
| Island & Peninsular Berhad | 54,600 | | 19,431 |
| KFC Holdings Malaysia Berhad | 35,800 | | 46,878 |
| Malaysian Bulk Carriers Berhad | 53,700 | | 34,720 |
| Mulpha International Berhad * | 108,000 | | 35,795 |
|
|
| | | | 212,132 |
| Mexico - 0.46% | | | |
| Consorcio ARA SA de CV | 21,700 | | 100,999 |
| Controladora Comercial Mexicana SA de CV | 47,700 | | 89,592 |
| Corp GEO SA de CV * | 42,900 | | 172,944 |
| Embotelladoras Arca SA de CV | 38,516 | | 111,513 |
| Empresas ICA Sociedad | | | |
| Controladora SA de CV * | 25,600 | | 86,784 |
| Gruma SA de CV | 17,000 | | 51,321 |
| Grupo Aeroportuario del Sureste SA de CV | 27,200 | | 94,999 |
| Grupo Cementos de Chihuahua SA de CV * | 5,000 | | 17,967 |
| Industrias CH SA * | 29,700 | | 90,669 |
| Industrias Penoles SA de CV | 7,300 | | 61,533 |
| Organizacion Soriana SA de CV | 12,900 | | 61,448 |
| TV Azteca SA de CV * | 113,500 | | 74,873 |
|
|
| | | | 1,014,642 |
| Netherlands - 2.99% | | | |
| Aalberts Industries NV | 16,192 | | 1,333,957 |
| Arcadis NV | 2,012 | | 96,802 |
| Beter Bed Holdings NV | 1,579 | | 31,713 |
| Brunel International NV | 1,093 | | 28,104 |
| Eriks Group NV | 490 | | 26,565 |
| Fornix Biosciences NV | 1,231 | | 34,172 |
| Grolsch NV | 1,634 | | 62,270 |
| Heijmans NV | 3,315 | | 163,098 |
| ICT Automatisering NV | 1,167 | | 24,334 |
| Imtech NV | 15,998 | | 862,209 |
| Macintosh Retail Group NV (a) | 3,032 | | 90,490 |
| OPG Groep NV | 5,986 | | 563,599 |
| SBM Offshore NV | 65,252 | | 1,787,170 |
| Smit Internationale NV | 882 | | 73,791 |
| Stork NV | 4,004 | | 197,150 |
| Telegraaf Media Groep NV (a) | 3,526 | | 82,094 |
| Unit 4 Agresso NV * | 1,972 | | 38,471 |
| Univar NV | 1,440 | | 59,556 |
| USG People NV | 840 | | 57,704 |
The accompanying notes are an integral part of the financial statements. 273
John Hancock Funds II
Portfolio of investments — August 31, 2006
(showing percentage of total net assets) |
| International Small Company Fund (continued) |
| | Shares or | | |
| | Principal | | |
| | Amount | | Value |
|
|
| |
| COMMON STOCKS (continued) | | | |
| Netherlands (continued) | | | |
| Vedior NV | 54,074 | $ | 998,875 |
|
|
| | | | 6,612,124 |
| New Zealand - 0.31% | | | |
| Air New Zealand, Ltd. (a) | 56,772 | | 42,727 |
| Freightways, Ltd. | 20,218 | | 48,957 |
| Infratil, Ltd. (a) | 32,979 | | 89,786 |
| Mainfreight, Ltd. | 12,437 | | 50,139 |
| New Zealand Oil & Gas, Ltd. * | 63,937 | | 36,822 |
| Nuplex Industries, Ltd. (a) | 14,959 | | 62,460 |
| PGG Wrightson, Ltd. | 34,036 | | 40,540 |
| Port of Tauranga, Ltd. | 12,311 | | 39,076 |
| Pumpkin Patch, Ltd. | 30,500 | | 79,843 |
| Ryman Healthcare, Ltd. | 24,524 | | 141,559 |
| Tower, Ltd. * | 22,320 | | 48,204 |
|
|
| | | | 680,113 |
| Norway - 1.42% | | | |
| Acta Holding ASA (a) | 30,000 | | 116,743 |
| Aktiv Kapital ASA (a) | 5,600 | | 81,498 |
| Altinex ASA * | 180,000 | | 33,314 |
| DOF ASA | 5,500 | | 50,462 |
| EDB Business Partner ASA | 4,400 | | 36,541 |
| Ekornes ASA | 3,800 | | 76,341 |
| Expert ASA | 2,800 | | 34,105 |
| Farstad Shipping ASA | 4,000 | | 81,625 |
| Ganger Rolf ASA * | 2,300 | | 68,946 |
| Leroy Seafood Group ASA | 4,400 | | 76,911 |
| Norse Energy Corp., ASA * | 62,000 | | 38,544 |
| Ocean RIG ASA * (a) | 28,500 | | 177,629 |
| Petrolia Drilling ASA * | 90,000 | | 46,555 |
| Prosafe ASA (a) | 23,433 | | 1,562,422 |
| Sinvest ASA * (a) | 7,500 | | 126,946 |
| Solstad Offshore ASA | 2,200 | | 41,066 |
| Sparebanken Midt-Norge | 2,200 | | 25,318 |
| Tandberg ASA (a) | 9,400 | | 96,281 |
| Tandberg Television ASA * (a) | 17,000 | | 234,632 |
| Tomra Systems ASA | 7,921 | | 51,248 |
| Veidekke ASA | 2,100 | | 70,924 |
|
|
| | | | 3,128,051 |
| Philippines - 0.07% | | | |
| Filinvest Land, Inc. * | 1,631,000 | | 43,643 |
| First Philippine Holdings Corp. | 44,800 | | 37,021 |
| Jollibee Foods Corp. | 59,300 | | 37,336 |
| Megaworld Corp. | 1,412,000 | | 46,673 |
|
|
| | | | 164,673 |
| Poland - 0.04% | | | |
| Fabryka Kotlow Rafako SA * | 4,029 | | 41,022 |
| Impexmetal SA * | 893 | | 46,040 |
|
|
| | | | 87,062 |
| Portugal - 0.24% | | | |
| Gescartao SGPS SA * | 1,894 | | 42,376 |
| International Small Company Fund (continued) |
| | Shares or | | |
| | Principal | | |
| | Amount | | Value |
|
|
| |
| COMMON STOCKS (continued) | | | |
| Portugal (continued) | | | |
| Impresa SGPS * | 6,950 | $ | 42,231 |
| Jeronimo Martins, SGPS, SA | 2,533 | | 45,235 |
| Mota Engil SGPS SA | 15,218 | | 87,020 |
| Semapa-Sociedade de Investimento e Gestao | 7,734 | | 82,514 |
| Sonae Industria SGPS SA New * | 10,400 | | 88,606 |
| SONAECOM - SGPS SA * | 22,954 | | 145,058 |
|
|
| | | | 533,040 |
| Singapore - 0.66% | | | |
| Allgreen Properties, Ltd. | 50,000 | | 46,399 |
| Bukit Sembawang Estates, Ltd. | 4,000 | | 47,035 |
| Cerebos Pacific, Ltd. | 22,000 | | 42,230 |
| Chuan Hup Holdings, Ltd. | 192,000 | | 40,882 |
| Creative Technology, Ltd. (a) | 15,150 | | 99,183 |
| GES International, Ltd. | 72,000 | | 55,374 |
| Hi-P International, Ltd. (a) | 80,000 | | 35,594 |
| Hong Leong Asia, Ltd. | 43,000 | | 40,723 |
| HTL International Holdings, Ltd. | 57,000 | | 43,113 |
| Hyflux, Ltd. | 31,000 | | 42,166 |
| Jaya Holdings, Ltd. | 56,000 | | 49,120 |
| Jurong Technologies Industrial Corp., Ltd. (a) | 64,000 | | 45,967 |
| K1 Ventures, Ltd. * | 374,000 | | 89,144 |
| Keppel Telecommunications & Transportation | | | |
| Company, Ltd. | 47,000 | | 48,395 |
| Kim Eng Holdings, Ltd. | 51,000 | | 42,465 |
| MediaRing, Ltd. * | 145,000 | | 33,179 |
| Metro Holdings, Ltd. | 81,000 | | 39,643 |
| MFS Technology, Ltd. * | 56,000 | | 30,967 |
| Midas Holdings, Ltd. | 77,000 | | 44,292 |
| MMI Holding, Ltd. | 88,000 | | 50,060 |
| Petra Foods, Ltd. | 46,000 | | 41,226 |
| Robinson & Company, Ltd. * | 13,000 | | 52,469 |
| SBS Transit, Ltd. | 29,500 | | 40,313 |
| Singapore Food Industries, Ltd. | 68,000 | | 39,331 |
| Sinomem Technology, Ltd. | 76,000 | | 40,577 |
| Straits Trading Company, Ltd. | 39,000 | | 70,648 |
| United Test and Assembly Center, Ltd. * (a) | 215,000 | | 102,492 |
| UOB-Kay Hian Holdings, Ltd. | 75,000 | | 58,635 |
| WBL Corp., Ltd. | 17,000 | | 49,056 |
|
|
| | | | 1,460,678 |
| South Africa - 2.28% | | | |
| Adcorp Holdings, Ltd. | 10,327 | | 33,704 |
| Aeci, Ltd. | 19,328 | | 150,318 |
| Afgri, Ltd. * | 105,073 | | 87,701 |
| African Oxygen, Ltd. | 29,934 | | 129,289 |
| African Rainbow Minerals, Ltd. * | 20,963 | | 174,825 |
| Allied Technologies, Ltd. | 11,687 | | 89,919 |
| Amalgamated Appliance Holding Company | 46,719 | | 35,231 |
| Argent Industrial, Ltd. | 20,036 | | 39,374 |
| Astral Foods, Ltd. | 8,106 | | 96,252 |
| Aveng, Ltd. | 68,362 | | 253,492 |
| Bytes Technology Group, Ltd. | 35,480 | | 64,303 |
The accompanying notes are an integral part of the financial statements. 274
John Hancock Funds II
Portfolio of investments — August 31, 2006
(showing percentage of total net assets) |
| International Small Company Fund (continued) |
| | Shares or | | |
| | Principal | | |
| | Amount | | Value |
|
|
| |
| COMMON STOCKS (continued) | | | |
| South Africa (continued) | | | |
| Capitec Bank Holdings, Ltd. | 8,290 | $ | 35,115 |
| Ceramic Industries, Ltd. | 1,781 | | 33,144 |
| City Lodge Hotels, Ltd. | 5,411 | | 39,836 |
| DataTec, Ltd. * | 22,638 | | 89,445 |
| Dimension Data Holdings PLC * | 260,585 | | 180,587 |
| Distell Group, Ltd. | 3,600 | | 20,499 |
| Distribution & Warehousing Network, Ltd. * | 29,007 | | 38,472 |
| Ellerine Holdings, Ltd. | 26,382 | | 245,482 |
| Famous Brands, Ltd. | 21,997 | | 37,117 |
| Grindrod, Ltd. | 23,622 | | 42,221 |
| Group Five, Ltd. | 19,505 | | 84,380 |
| Highveld Steel & Vanadium Corp., Ltd. | 3,483 | | 29,749 |
| Iliad Africa, Ltd. | 18,612 | | 31,819 |
| Illovo Sugar, Ltd. | 15,751 | | 39,156 |
| Johnnic Communications, Ltd. | 29,319 | | 264,667 |
| Medi-Clinic Corp., Ltd. | 45,472 | | 132,554 |
| Metorex, Ltd. * | 54,859 | | 89,140 |
| Metropolitan Holdings, Ltd. | 136,971 | | 229,601 |
| Mr. Price Group, Ltd. * | 28,241 | | 76,481 |
| Murray & Roberts Holdings, Ltd. | 64,770 | | 262,210 |
| Mustek, Ltd. | 25,208 | | 33,258 |
| Mvelaphanda Group, Ltd. | 40,873 | | 47,966 |
| Nampak, Ltd. | 97,095 | | 231,394 |
| New Clicks Holdings, Ltd. * | 39,503 | | 56,782 |
| Northam Platinum, Ltd. | 43,977 | | 225,977 |
| Omnia Holdings, Ltd. | 5,039 | | 36,467 |
| Peregrine Holdings, Ltd. | 62,815 | | 71,534 |
| Primedia, Ltd. * | 25,101 | | 54,730 |
| PSG Group, Ltd. | 21,133 | | 64,569 |
| Rainbow Chicken, Ltd. | 59,705 | | 83,664 |
| Santam, Ltd. | 15,918 | | 187,886 |
| Sun International, Ltd. | 23,458 | | 309,494 |
| Tongaat-Hulett Group, Ltd. | 13,561 | | 176,563 |
| Trencor, Ltd. | 19,947 | | 72,026 |
| Western Areas, Ltd. * | 29,160 | | 177,945 |
| Wilson Bayly Holmes-Ovcon, Ltd. | 5,031 | | 40,804 |
|
|
| | | | 5,027,142 |
| South Korea - 4.87% | | | |
| Binggrae Company, Ltd. | 990 | | 38,206 |
| Bukwang Pharmaceutical Company, Ltd. | 2,450 | | 45,618 |
| Byucksan Engineering & Construction | | | |
| Company, Ltd. | 4,400 | | 29,750 |
| Cheil Communications, Inc. | 590 | | 118,755 |
| Chong Kun Dang Pharm Corp. | 1,240 | | 45,983 |
| Choongwae Pharma Corp. | 990 | | 41,707 |
| CJ CGV Company, Ltd. | 2,000 | | 53,362 |
| Crown Confectionery Company, Ltd. | 310 | | 32,408 |
| Dacom Corp. | 7,910 | | 173,200 |
| Dae Han Flour Mills Company, Ltd. | 230 | | 31,820 |
| Daeduck Electronics Company, Ltd. | 6,110 | | 52,561 |
| Daeduck GDS Company, Ltd. | 3,600 | | 32,017 |
| Daehan City Gas Company, Ltd. | 1,530 | | 37,082 |
| International Small Company Fund (continued) |
| | Shares or | | |
| | Principal | | |
| | Amount | | Value |
|
|
| |
| COMMON STOCKS (continued) | | | |
| South Korea (continued) | | | |
| Daekyo Company, Ltd. | 1,000 | $ | 75,311 |
| Daerim Corp. * | 1,180 | | 23,321 |
| Daesang Corp. * | 3,090 | | 42,589 |
| Daesung Industrial Company, Ltd. | 550 | | 39,190 |
| Daewoo Motor Sales | 4,910 | | 107,255 |
| Daewoong Pharmaceutical Company, Ltd. | 960 | | 42,241 |
| Daishin Securities Company, Ltd. | 9,110 | | 184,787 |
| Daou Technology, Inc. * | 5,570 | | 34,474 |
| DC Chemical Company, Ltd. | 1,720 | | 77,202 |
| Dong Su Industrial Company, Ltd. | 1,490 | | 30,998 |
| Dong Wha Pharmaceutical Industrial | | | |
| Company, Ltd. | 1,460 | | 47,991 |
| Dong-A Pharmaceutical Company, Ltd. | 1,180 | | 86,289 |
| Dongbu Corp. | 3,980 | | 62,514 |
| Dongbu Hannong Chemicals Company, Ltd. | 2,060 | | 38,571 |
| Dongbu Securities Company, Ltd. | 3,240 | | 30,939 |
| Dongbu Steel Company, Ltd. | 3,980 | | 33,534 |
| DongbuElectronics Company, Ltd. * | 17,000 | | 41,733 |
| Dongkuk Steel Mill Company, Ltd. | 8,030 | | 139,492 |
| Dongwon F&B Company, Ltd. | 640 | | 34,551 |
| Dongwon Systems Corp. | 16,920 | | 36,961 |
| Doosan Corp. * | 1,300 | | 48,817 |
| Doosan Industrial Development Company, Ltd. * | 12,990 | | 133,096 |
| E1 Corp. | 890 | | 37,957 |
| Firstec Company, Ltd. * | 31,110 | | 35,920 |
| FnC Kolon Corp. | 2,670 | | 40,271 |
| Fursys, Inc. | 2,920 | | 87,781 |
| Gwangju Shinsegae Company, Ltd. | 260 | | 33,536 |
| Halla Climate Control Company, Ltd. | 14,530 | | 162,477 |
| Halla Engineering & Construction Corp. | 1,480 | | 33,715 |
| Hana Securities Company, Ltd. | 2,370 | | 25,392 |
| Handok Pharmaceuticals Company, Ltd. | 2,770 | | 39,763 |
| Handsome Company, Ltd. | 3,160 | | 48,155 |
| Hanil Cement Manufacturing Company, Ltd. | 1,310 | | 97,703 |
| Hanjin Heavy Industries & Construction | | | |
| Company, Ltd. | 2,120 | | 57,777 |
| Hanjin Transportation Company, Ltd. | 2,640 | | 67,830 |
| Hankuk Paper Manufacturing Company, Ltd. | 1,070 | | 29,996 |
| Hanmi Pharm Company, Ltd. | 1,450 | | 170,437 |
| Hansol CSN | 8,980 | | 26,248 |
| Hansol LCD, Inc. | 910 | | 50,737 |
| Hansol Paper Company | 8,310 | | 108,051 |
| Hanwha Chem Corp. | 11,170 | | 113,286 |
| Hanwha Securities Company | 3,850 | | 37,845 |
| Honam Petrochemical Corp. | 1,170 | | 60,730 |
| Hotel Shilla Company, Ltd. | 5,200 | | 77,620 |
| Huchems Fine Chemical Corp. | 4,460 | | 36,187 |
| Hwa Sung Industrial Company, Ltd. | 2,440 | | 31,726 |
| Hyosung Corp. * | 6,370 | | 115,625 |
| Hyundai Cement Company | 960 | | 26,762 |
| Hyundai Corp. * | 1,900 | | 48,323 |
| Hyundai Elevator Company, Ltd. | 1,160 | | 88,205 |
The accompanying notes are an integral part of the financial statements. 275
John Hancock Funds II
Portfolio of investments — August 31, 2006
(showing percentage of total net assets) |
| International Small Company Fund (continued) |
| | Shares or | | |
| | Principal | | |
| | Amount | | Value |
|
|
| |
| COMMON STOCKS (continued) | | | |
| South Korea (continued) | | | |
| Hyundai H&S Company, Ltd. | 1,210 | $ | 85,588 |
| Hyundai Hysco | 10,230 | | 103,220 |
| Hyundai Marine & Fire | | | |
| Insurance Company, Ltd. | 12,070 | | 160,707 |
| Hyundai Securities Company, Ltd. | 8,890 | | 116,055 |
| Ilsung Pharmaceutical Company, Ltd. | 650 | | 36,714 |
| Ilyang Pharmaceutical Company, Ltd. | 2,380 | | 43,943 |
| Jeonbuk Bank | 4,050 | | 29,490 |
| KISWIRE, Ltd. | 1,480 | | 34,870 |
| Kolon Engineering & | | | |
| Construction Company, Ltd. | 2,190 | | 34,512 |
| Kolon Industries, Inc. * | 3,240 | | 41,454 |
| Korea Development Corp. | 1,290 | | 30,192 |
| Korea Development Financing Corp. | 710 | | 32,053 |
| Korea Iron & Steel Company, Ltd. | 2,550 | | 89,125 |
| Korea Kumho Petrochemical | 4,530 | | 118,274 |
| Korea Polyol Company, Ltd. | 580 | | 22,021 |
| Korea Zinc Company, Ltd. | 2,060 | | 177,854 |
| Korean Petrochemical Ind. Company, Ltd. | 1,280 | | 34,352 |
| Korean Reinsurance Company | 10,350 | | 122,734 |
| KP Chemical Corp. * | 18,980 | | 84,796 |
| KTBNetwork * | 6,720 | | 33,658 |
| Kumho Electric Company, Ltd. | 700 | | 33,640 |
| Kumho Industrial Company, Ltd. | 5,250 | | 101,303 |
| Kwang Dong Pharmaceutical Company, Ltd. | 10,360 | | 32,437 |
| Kyeryong Construction | | | |
| Industrial Company, Ltd. | 2,160 | | 67,855 |
| Kyobo Securities Company | 3,590 | | 34,356 |
| LG Household & Health Care, Ltd. | 2,200 | | 169,116 |
| LG International Corp. | 9,430 | | 211,387 |
| LG Life Sciences, Ltd. * | 1,060 | | 50,169 |
| LG Petrochemical Company, Ltd. | 7,470 | | 162,400 |
| LIG Non-Life Insurance Company, Ltd. | 8,940 | | 130,192 |
| Lotte Chilsung Beverage Company, Ltd. | 160 | | 213,034 |
| Lotte Midopa Company, Ltd. * | 9,850 | | 180,330 |
| Lotte Samkang Company, Ltd. | 190 | | 27,867 |
| LS Cable, Ltd. | 4,270 | | 143,022 |
| LS Industrial Systems Company, Ltd. | 3,710 | | 129,475 |
| Meritz Securities Company, Ltd. | 5,270 | | 37,057 |
| Moorim Paper Company, Ltd. | 3,770 | | 30,745 |
| Namyang Dairy Products Company, Ltd. | 80 | | 58,168 |
| NH Investment & Securities Company, Ltd. | 2,440 | | 34,264 |
| Nong Shim Company, Ltd. | 150 | | 36,121 |
| Nong Shim Holdings Company, Ltd. | 490 | | 36,138 |
| Orion Corp. | 620 | | 136,724 |
| Ottogi Corp. | 350 | | 34,259 |
| Pantech & Curitel Communications, Inc. * | 26,460 | | 35,093 |
| Pantech Company, Ltd. * | 22,250 | | 85,288 |
| Poonglim Industrial Company, Ltd. | 4,740 | | 40,924 |
| Poongsan Corp. | 5,650 | | 123,126 |
| Pulmuone Company, Ltd. | 1,020 | | 31,406 |
| Pusan City Gas Company, Ltd. | 1,820 | | 36,254 |
| International Small Company Fund (continued) |
| | Shares or | | |
| | Principal | | |
| | Amount | | Value |
|
|
| |
| COMMON STOCKS (continued) | | | |
| South Korea (continued) | | | |
| S&T Corp. | 1,460 | $ | 35,841 |
| S&T Dynamics Company, Ltd. | 6,810 | | 44,486 |
| S1 Corp. | 3,100 | | 126,567 |
| Saehan Industries, Inc. * | 6,020 | | 21,917 |
| Sam Young Electronics Company, Ltd. | 4,150 | | 34,535 |
| Sambu Construction Company, Ltd. | 1,580 | | 40,266 |
| Samchully Company, Ltd. | 770 | | 82,899 |
| Samjin Pharmaceutical Company, Ltd. | 630 | | 36,502 |
| Samsung Fine Chemicals Company, Ltd. | 4,250 | | 106,101 |
| Samwhan Corp. | 1,500 | | 33,625 |
| Samyang Corp. | 1,580 | | 85,299 |
| Samyang Genex Company, Ltd. | 400 | | 29,958 |
| SeAH Holdings Corp. | 560 | | 39,028 |
| Seoul Securities Company, Ltd. | 26,110 | | 38,024 |
| Serim Paper Manufacturing Company, Ltd. * | 2,700 | | 46,622 |
| Shinyoung Securities Company, Ltd. | 1,270 | | 41,283 |
| Sindo Ricoh Company, Ltd. | 1,960 | | 102,756 |
| SK Chemicals Company, Ltd. | 3,110 | | 121,152 |
| SK Gas Company, Ltd. | 1,000 | | 40,568 |
| SK Securities Company, Ltd. | 68,860 | | 82,373 |
| SKC Company, Ltd. | 5,200 | | 111,697 |
| Solomon Mutual Savings Bank | 1,530 | | 27,772 |
| Ssangyong Cement Industrial Company, Ltd. * | 12,410 | | 150,389 |
| Ssangyong Motor Company * | 20,950 | | 99,155 |
| STX Corp. | 2,730 | | 38,053 |
| STX Engine Company, Ltd. | 3,000 | | 56,639 |
| Sudo Pharmaceutical Industry Company, Ltd. * | 14,770 | | 34,799 |
| Sungshin Cement Company, Ltd. | 2,140 | | 27,046 |
| Sungwon Corp. * | 9,330 | | 41,053 |
| Tae Young Corp. | 1,420 | | 70,383 |
| Taegu Department Store Company | 2,330 | | 36,113 |
| Taekwang Industrial Company, Ltd. | 70 | | 51,480 |
| Taihan Electric Wire Company, Ltd. | 5,070 | | 108,377 |
| Tong Yang Investment Bank * | 17,520 | | 241,473 |
| Tong Yang Major Corp. * | 5,140 | | 31,224 |
| Union Steel | 1,390 | | 27,400 |
| Woongjin Coway Company, Ltd. | 3,040 | | 69,569 |
| Woongjin Thinkbig Company, Ltd. | 5,790 | | 106,904 |
| YESCO Company, Ltd. | 1,580 | | 41,910 |
| Youlchon Chemical Company, Ltd. | 3,520 | | 32,478 |
| Young Poong Corp. | 376 | | 88,001 |
| Youngone Corp. | 8,130 | | 36,153 |
| Yuhan Corp. | 1,360 | | 211,494 |
| Yungjin Pharmaceutical Company, Ltd. * | 11,000 | | 35,643 |
|
|
| | | | 10,753,149 |
| Spain - 1.06% | | | |
| Adolfo Dominguez | 1,505 | | 86,637 |
| Amper SA | 3,877 | | 46,968 |
| Baron de Ley * | 714 | | 37,513 |
| Campofrio Alimentacion SA | 2,352 | | 44,079 |
| Construcciones y Auxiliar de Ferrocarriles SA | 288 | | 38,316 |
The accompanying notes are an integral part of the financial statements. 276
John Hancock Funds II
Portfolio of investments — August 31, 2006
(showing percentage of total net assets) |
| International Small Company Fund (continued) |
| | Shares or | | |
| | Principal | | |
| | Amount | | Value |
|
|
| |
| COMMON STOCKS (continued) | | | |
| Spain (continued) | | | |
| Duro Felguera SA (a) | 7,697 | $ | 42,733 |
| Electrificaciones del Norte | 5,639 | | 183,949 |
| FAES FARMA SA (a) | 6,203 | | 169,813 |
| Grupo Empresarial Ence SA | 4,932 | | 217,354 |
| La Seda de Barcelona SA * (a) | 84,819 | | 195,309 |
| Mecalux SA * | 3,078 | | 109,725 |
| Natra SA | 4,190 | | 44,971 |
| Obrascon Huarte Lain SA | 7,972 | | 150,117 |
| Sociedad Nacional Inds., Aplicaciones | | | |
| Celulosa Espanola * (a) | 8,538 | | 45,546 |
| Sol Melia SA (a) | 21,413 | | 383,222 |
| SOS Cuetara SA | 3,473 | | 52,870 |
| Tecnocom Telecomunicaciones y Energia SA * | 3,269 | | 43,826 |
| Tubacex SA (a) | 31,018 | | 184,114 |
| Tubos Reunidos SA | 5,645 | | 113,014 |
| Viscofan SA * (a) | 11,089 | | 162,141 |
|
|
| | | | 2,352,217 |
| Sweden - 2.06% | | | |
| Acando AB * | 14,000 | | 23,962 |
| Active Biotech AB * | 4,200 | | 36,522 |
| AddTech AB | 3,800 | | 56,122 |
| Angpanneforeningen AB, B Shares | 2,000 | | 32,023 |
| Axfood AB | 5,750 | | 175,796 |
| Axis Communications AB | 9,900 | | 83,355 |
| Bergman & Beving AB | 5,500 | | 108,180 |
| Billerud Aktibolag AB (a) | 11,500 | | 177,780 |
| Bong Ljungdahl AB * | 4,000 | | 38,096 |
| Capio AB * (a) | 2,800 | | 47,344 |
| Cardo AB | 5,000 | | 148,380 |
| Clas Ohlson AB | 2,250 | | 48,603 |
| Concordia Maritime AB | 6,500 | | 41,270 |
| D. Carnegie & Company AB (a) | 52,789 | | 939,941 |
| Elekta AB, Series B (a) | 6,000 | | 106,006 |
| Gunnebo AB | 5,274 | | 53,869 |
| Haldex AB (a) | 3,300 | | 62,630 |
| Hoganas AG, B Shares | 7,400 | | 189,982 |
| IBS AB * (a) | 17,000 | | 58,193 |
| Industrial & Financial Systems Corp. * (a) | 56,000 | | 71,885 |
| JM AB | 14,400 | | 224,599 |
| Lindex AB * (a) | 10,000 | | 129,747 |
| Micronic Laser Systems AB * | 7,700 | | 82,368 |
| Munters AB | 1,650 | | 64,566 |
| Narkes Elektriska AB | 600 | | 10,766 |
| New Wave Group AB, B Shares (a) | 6,000 | | 65,011 |
| Nibe Industrier AB, B Shares | 10,200 | | 114,039 |
| Nobia AB (a) | 9,700 | | 301,246 |
| Nolato AB | 3,400 | | 37,309 |
| Obsever AB * | 18,200 | | 79,634 |
| OEM International AB | 900 | | 20,000 |
| Peab AB | 8,800 | | 143,329 |
| Pergo AB * | 9,800 | | 65,334 |
| Proffice AB * | 10,000 | | 23,051 |
| International Small Company Fund (continued) |
| | Shares or | | |
| | Principal | | |
| | Amount | | Value |
|
|
| |
| COMMON STOCKS (continued) | | | |
| Sweden (continued) | | | |
| Protect Data AB | 5,000 | $ | 76,261 |
| Q-Med AB | 14,300 | | 196,887 |
| Rederi AB Transatlantic | 9,000 | | 51,305 |
| Skanditek Industriforvaltning AB | 9,500 | | 51,140 |
| SkiStar AB | 5,100 | | 83,769 |
| Studsvik AB | 1,200 | | 33,044 |
| Sweco AB * | 2,600 | | 72,851 |
| Teleca AB * | 14,200 | | 63,308 |
| WM Data AB, Series B | 20,000 | | 70,118 |
|
|
| | | | 4,559,621 |
| Switzerland - 5.35% | | | |
| Actelion, Ltd. * | 1,985 | | 265,160 |
| AFG Arbonia-Forster Holdings | 351 | | 123,762 |
| Agie Charmilles Holding AG | 386 | | 46,869 |
| Allreal Holding AG | 553 | | 58,048 |
| Also Holding AG | 779 | | 39,086 |
| Ascom Holding AG * | 5,820 | | 63,215 |
| Bank Coop AG | 1,189 | | 77,776 |
| Bank Sarasin & Compagnie AG | 41 | | 114,987 |
| Banque Cantonale Vaudoise | 530 | | 200,302 |
| Barry Callebaut AG * | 617 | | 274,317 |
| Belimo Holding AG | 55 | | 44,136 |
| Berner Kantonalbank | 1,072 | | 179,000 |
| Bucher Industries AG | 1,062 | | 92,883 |
| Charles Voegele Holding AG * | 553 | | 43,726 |
| Clariant AG * | 5,086 | | 61,838 |
| Converium Holding AG | 9,789 | | 115,449 |
| Conzzeta Holding AG | 51 | | 88,879 |
| Daetwyler Holding AG | 21 | | 89,365 |
| Emmi AG | 663 | | 85,448 |
| EMS-Chemie Holding AG | 993 | | 111,478 |
| Energiedienst Holding AG * | 222 | | 90,333 |
| Flughafen Zuerich AG | 524 | | 125,723 |
| Forbo Holding AG * | 319 | | 91,534 |
| Georg Fischer AG * | 439 | | 206,209 |
| Gurit Heberlein | 475 | | 293,386 |
| Helvetia Patria Holding | 609 | | 181,658 |
| Hiestand Holding AG | 37 | | 38,958 |
| Jelmoli Holding AG | 51 | | 94,046 |
| Kudelski SA (a) | 1,673 | | 48,887 |
| Kuoni Reisen Holding AG, Series B * | 3,158 | | 1,651,058 |
| LEM Holding SA | 350 | | 39,292 |
| Lonza Group AG | 4,035 | | 262,633 |
| Luzerner Kantonalbank * | 435 | | 92,469 |
| Medisize Holding AG * | 3,598 | | 250,813 |
| Mobilezone Holding AG | 8,109 | | 42,592 |
| Phoenix Mecano AG | 185 | | 74,978 |
| PubliGroupe SA * | 373 | | 119,123 |
| Rieter Holdings AG | 1,205 | | 517,670 |
| Saurer AG * | 3,870 | | 326,238 |
| SEZ Holding AG * | 2,074 | | 49,509 |
The accompanying notes are an integral part of the financial statements. 277
John Hancock Funds II
Portfolio of investments — August 31, 2006
(showing percentage of total net assets) |
| International Small Company Fund (continued) |
| | Shares or | | |
| | Principal | | |
| | Amount | | Value |
|
|
| |
| COMMON STOCKS (continued) | | | |
| Switzerland (continued) | | | |
| SIG Holding AG * | 3,911 | $ | 928,851 |
| Sika AG * | 225 | | 281,410 |
| St. Galler Kantonalbank | 320 | | 121,910 |
| Sulzer AG | 551 | | 445,284 |
| Swiss Prime Site AG * | 1,559 | | 77,843 |
| Swissfirst AG | 465 | | 28,344 |
| Swisslog Holding AG * | 37,946 | | 39,985 |
| Swissquote Group Holding SA * | 166 | | 43,057 |
| Tamedia AG | 447 | | 48,733 |
| Tecan Group AG | 2,047 | | 107,850 |
| Temenos Group AG * | 3,887 | | 45,370 |
| Valiant Holding * | 5,783 | | 636,566 |
| Valora Holding AG | 858 | | 192,819 |
| Verwaltungs-und Privat-Bank AG | 5,047 | | 1,219,102 |
| Von Roll Holding AG * | 20,062 | | 40,492 |
| Vontobel Holdings AG | 17,200 | | 681,754 |
| Zuger Kantonalbank AG | 35 | | 103,267 |
|
|
| | | | 11,815,470 |
| Thailand - 0.12% | | | |
| Cal-Comp Electronics Thailand PCL | 304,200 | | 30,926 |
| Kiatnakin Finance PCL | 49,600 | | 37,621 |
| Major Cineplex Group PCL | 90,000 | | 37,605 |
| Thai Plastic & Chemical PLC | 98,800 | | 40,493 |
| Thoresen Thai Agencies PLC | 80,100 | | 51,161 |
| Ticon Industrial Connection PLC | 88,400 | | 39,289 |
| Vinythai PCL | 100,000 | | 23,287 |
|
|
| | | | 260,382 |
| Turkey - 0.04% | | | |
| Eczacibasi Ilac Sanayi * | 17,155 | | 41,936 |
| Mardin Cimento Sanayii ve Ticaret | 7,907 | | 44,003 |
|
|
| | | | 85,939 |
| United Kingdom - 15.64% | | | |
| A.G. Barr | 2,441 | | 52,261 |
| Abacus Group PLC | 13,889 | | 42,206 |
| Abbot Group PLC | 30,745 | | 173,992 |
| Aberdeen Asset Management PLC | 72,297 | | 216,949 |
| Acal PLC | 5,883 | | 39,840 |
| AEA Technology PLC * | 18,852 | | 37,654 |
| Aga Foodservice Group PLC | 25,077 | | 182,224 |
| Aggreko PLC | 98,123 | | 526,366 |
| Alfred McAlpine PLC | 15,100 | | 138,091 |
| Alizyme PLC * | 58,896 | | 131,081 |
| Amstrad PLC | 11,470 | | 41,401 |
| Anite Group PLC * | 41,216 | | 57,626 |
| Antisoma PLC * | 137,552 | | 37,940 |
| Arena Leisure PLC | 50,686 | | 38,326 |
| Arla Foods UK PLC | 85,263 | | 78,257 |
| Arriva PLC | 9,180 | | 103,903 |
| Ashtead Group PLC | 42,119 | | 105,559 |
| Autonomy Corp. PLC * | 34,951 | | 258,961 |
| Aveva Group PLC | 7,896 | | 56,175 |
| International Small Company Fund (continued) |
| | Shares or | | |
| | Principal | | |
| | Amount | | Value |
|
|
| |
| COMMON STOCKS (continued) | | | |
| United Kingdom (continued) | | | |
| Avis Europe PLC * (a) | 65,846 | $ | 81,416 |
| Axis-Shield PLC * | 6,029 | | 36,126 |
| Axon Group PLC | 6,844 | | 52,239 |
| Babcock International Group | 32,683 | | 216,045 |
| Bespak PLC | 7,040 | | 89,993 |
| Blacks Leisure Group PLC | 5,193 | | 40,156 |
| Bloomsbury Publishing PLC | 15,244 | | 93,663 |
| Bodycote International | 295,612 | | 1,313,036 |
| Bovis Homes Group PLC | 21,300 | | 339,338 |
| BPP Holdings PLC | 5,823 | | 47,907 |
| Brewin Dolphin Holdings PLC | 36,061 | | 104,953 |
| Brit Insurance Holdings PLC | 50,995 | | 262,884 |
| BSS Group PLC | 6,945 | | 45,083 |
| Burberry Group PLC | 127,914 | | 1,164,308 |
| Business Post Group PLC (a) | 6,109 | | 50,696 |
| Capital & Regional PLC | 10,569 | | 202,456 |
| Care UK PLC | 6,169 | | 61,022 |
| Carillion PLC | 19,053 | | 115,073 |
| Carpetright PLC | 6,062 | | 133,419 |
| Charles Stanley Group PLC | 5,789 | | 37,001 |
| Chemring Group PLC | 7,531 | | 211,020 |
| Chloride Group | 46,548 | | 98,729 |
| Chrysalis Group PLC | 18,683 | | 41,848 |
| COLT Telecom Group SA * (a) | 15,623 | | 38,041 |
| Communisis PLC | 29,820 | | 33,468 |
| Computacenter PLC * | 15,727 | | 78,455 |
| Cookson Group PLC | 28,626 | | 297,590 |
| Costain Group PLC * | 84,259 | | 74,932 |
| Countrywide PLC | 25,160 | | 195,032 |
| Cranswick PLC | 9,285 | | 121,517 |
| Crest Nicholson | 18,269 | | 184,187 |
| Croda International | 16,938 | | 139,756 |
| Dairy Crest Group PLC | 18,208 | | 193,616 |
| Dana Petroleum PLC * | 3,885 | | 90,087 |
| Datamonitor PLC | 12,585 | | 95,101 |
| Davis Service Group PLC | 30,431 | | 280,320 |
| De La Rue PLC | 24,603 | | 251,322 |
| Delta PLC | 17,178 | | 42,153 |
| Detica Group PLC | 13,225 | | 75,975 |
| Development Securities PLC | 9,003 | | 94,535 |
| Devro PLC | 33,835 | | 74,661 |
| Dicom Group PLC | 14,754 | | 70,936 |
| Diploma PLC | 2,919 | | 40,590 |
| Domestic & General Group | 4,202 | | 78,294 |
| Domino Printing Sciences | 29,115 | | 165,321 |
| DS Smith PLC | 179,314 | | 535,527 |
| DTZ Holdings PLC | 19,551 | | 228,166 |
| DX Services PLC | 58,376 | | 460,285 |
| Electrocomponents PLC | 121,262 | | 551,303 |
| Elementis PLC | 72,963 | | 123,527 |
| Emerald Energy PLC * | 6,316 | | 24,420 |
| Ennstone PLC | 39,739 | | 37,041 |
The accompanying notes are an integral part of the financial statements. 278
John Hancock Funds II
Portfolio of investments — August 31, 2006
(showing percentage of total net assets) |
| International Small Company Fund (continued) |
| | Shares or | |
| | Principal | |
| | Amount | Value |
|
|
| |
| COMMON STOCKS (continued) | | |
| United Kingdom (continued) | | |
| Enodis PLC | 17,849 $ | 58,739 |
| Enterprise PLC | 12,951 | 109,877 |
| Entertainment Rights PLC * | 57,976 | 34,464 |
| Erinaceous Group PLC | 12,246 | 66,449 |
| Euromoney Institutional Investor PLC | 19,007 | 165,956 |
| European Motor Holdings PLC | 11,169 | 88,172 |
| Evolution Group PLC | 41,382 | 106,271 |
| Expro International Group | 8,613 | 113,787 |
| F&C Asset Management PLC | 110,863 | 425,996 |
| Fenner PLC | 16,871 | 66,914 |
| Filtrona PLC | 35,950 | 184,813 |
| Findel PLC | 15,671 | 168,726 |
| First Choice Holidays PLC | 37,488 | 151,359 |
| FKI PLC | 45,272 | 83,320 |
| Forth Ports PLC | 6,238 | 217,983 |
| Fuller Smith & Turner | 1,929 | 47,739 |
| Galliford Try PLC | 63,253 | 140,778 |
| Game Group PLC | 182,118 | 318,719 |
| Go-Ahead Group PLC | 4,821 | 169,200 |
| Greene King PLC | 11,999 | 192,644 |
| Gyrus Group PLC * | 30,914 | 221,258 |
| Halfords Group PLC | 12,850 | 81,154 |
| Halma PLC | 70,303 | 254,763 |
| Headlam Group PLC | 15,591 | 156,298 |
| Helical Bar PLC | 17,052 | 125,370 |
| Helphire PLC | 16,744 | 122,548 |
| Henderson Group PLC | 179,841 | 312,169 |
| Henry Boot PLC | 2,686 | 41,897 |
| Highway Insurance Holdings PLC | 55,651 | 74,633 |
| Hill & Smith Holdings PLC | 17,785 | 80,181 |
| Hiscox PLC | 54,162 | 246,241 |
| HMV Group PLC | 34,396 | 99,453 |
| Holidaybreak PLC | 5,473 | 76,313 |
| Homeserve PLC | 57,619 | 1,841,377 |
| Homestyle Group PLC * | 47,841 | 106,704 |
| Hunting PLC | 12,824 | 109,287 |
| IG Group Holdings PLC | 22,657 | 101,714 |
| Intec Telecom Systems PLC * | 40,144 | 28,255 |
| Interserve PLC | 6,095 | 33,565 |
| Intertek Group PLC | 24,314 | 319,597 |
| iSOFT Group PLC | 219,087 | 215,672 |
| Isotron PLC | 3,348 | 38,531 |
| ITE Group PLC | 44,002 | 100,653 |
| J.D. Wetherspoon PLC | 24,171 | 205,987 |
| James Fisher & Sons PLC | 11,043 | 106,083 |
| JJB Sports PLC | 34,953 | 117,852 |
| JKX Oil & Gas PLC | 56,800 | 326,305 |
| John Laing PLC | 9,595 | 49,281 |
| John Wood Group PLC | 186,846 | 814,819 |
| Johnson Service Group PLC | 10,919 | 80,954 |
| Keller Group PLC | 10,102 | 131,249 |
| Kensington Group PLC | 18,377 | 290,498 |
| International Small Company Fund (continued) |
| | Shares or | |
| | Principal | |
| | Amount | Value |
|
|
| |
| COMMON STOCKS (continued) | | |
| United Kingdom (continued) | | |
| Kier Group PLC | 2,616 $ | 80,118 |
| Kiln PLC | 63,629 | 111,355 |
| London Clubs International PLC * | 29,221 | 73,651 |
| Lookers PLC * | 35,795 | 111,669 |
| Luminar PLC | 12,952 | 135,139 |
| M.J. Gleeson Group PLC | 11,305 | 82,633 |
| Marshalls PLC | 22,799 | 136,288 |
| Marylebone Warwick Balfour Group PLC * | 24,660 | 96,164 |
| Matalan PLC | 36,694 | 121,629 |
| Mcbride PLC | 26,220 | 82,297 |
| McCarthy & Stone PLC | 6,438 | 132,877 |
| Melrose Resources PLC | 17,369 | 123,904 |
| Metal Bulletin PLC | 7,120 | 55,056 |
| Metalrax Group PLC | 29,412 | 37,346 |
| MFI Furniture Group PLC | 112,844 | 181,386 |
| MICE Group PLC | 64,572 | 40,842 |
| Michael Page International PLC | 21,914 | 143,921 |
| Minerva PLC | 8,952 | 48,320 |
| Misys PLC | 32,278 | 151,814 |
| Mitie Group | 39,512 | 145,814 |
| Morgan Crucible Company | 40,098 | 208,997 |
| Morgan Sindall PLC | 13,744 | 283,930 |
| Morse PLC | 21,375 | 38,221 |
| Mothercare PLC | 12,706 | 82,963 |
| Mouchel Parkman PLC | 22,298 | 148,882 |
| MyTravel Group PLC * | 74,690 | 282,737 |
| N Brown Group PLC | 40,552 | 173,565 |
| Northgate Information Solutions PLC * | 34,647 | 48,112 |
| Northgate PLC | 8,733 | 162,635 |
| NSB Retail Systems PLC * | 64,125 | 35,680 |
| Oxford Biomedica PLC * | 90,000 | 47,081 |
| Pace Micro Technology PLC * | 44,430 | 47,330 |
| Pendragon PLC | 16,443 | 162,180 |
| Premier Farnell PLC | 52,563 | 187,727 |
| Premier Foods PLC | 16,880 | 84,851 |
| Premier Oil PLC * | 16,835 | 329,851 |
| Protherics PLC * | 31,033 | 47,226 |
| Psion PLC | 17,318 | 38,708 |
| PZ Cussons PLC | 3,268 | 88,835 |
| QXL Ricardo PLC * | 202 | 38,525 |
| Rathbone Brothers | 2,600 | 57,026 |
| Redrow PLC | 28,869 | 276,502 |
| Regus Group PLC * | 122,300 | 229,156 |
| Renishaw PLC | 9,048 | 136,316 |
| Rensburg Sheppards PLC | 4,945 | 63,965 |
| Restaurant Group PLC | 25,822 | 97,257 |
| Retail Decisions PLC * | 14,432 | 46,121 |
| RM PLC | 11,530 | 39,534 |
| Robert Walters PLC | 17,416 | 80,174 |
| Robert Wiseman Dairies PLC | 9,457 | 76,995 |
| ROK PLC | 4,096 | 49,711 |
| Rotork PLC | 11,244 | 155,711 |
The accompanying notes are an integral part of the financial statements. 279
John Hancock Funds II
Portfolio of investments — August 31, 2006
(showing percentage of total net assets) |
| International Small Company Fund (continued) |
| | Shares or | |
| | Principal | |
| | Amount | Value |
|
|
| |
| COMMON STOCKS (continued) | | |
| United Kingdom (continued) | | |
| Royalblue Group PLC | 3,727 $ | 61,999 |
| RPC Group PLC | 19,627 | 87,272 |
| RPS Group PLC | 47,731 | 206,335 |
| Sanctuary Group PLC * | 41,903 | 14,946 |
| Savills PLC | 18,273 | 181,620 |
| SDL PLC * | 10,149 | 39,577 |
| Senior PLC | 36,311 | 42,480 |
| Severfield-Rowen PLC | 1,973 | 55,922 |
| Shanks Group PLC | 30,880 | 110,434 |
| Shore Capital Group PLC | 82,607 | 88,784 |
| SIG PLC | 12,946 | 229,889 |
| Skyepharma PLC * | 127,235 | 63,534 |
| Smiths News PLC * | 27,259 | 246,304 |
| Soco International PLC * (a) | 9,700 | 239,505 |
| Sondex PLC | 6,737 | 40,977 |
| Speedy Hire PLC | 4,678 | 77,730 |
| Spirax-Sarco Engineering PLC | 28,330 | 499,029 |
| Spirent Communications PLC * | 74,246 | 64,615 |
| SSL International PLC | 22,790 | 125,938 |
| St. Modwen Properties PLC | 19,129 | 170,297 |
| Stagecoach Group PLC | 36,547 | 80,645 |
| Stanley Leisure PLC | 3,615 | 45,145 |
| Surfcontrol PLC * | 4,312 | 34,184 |
| Taylor Nelson Sofres PLC | 52,452 | 187,580 |
| TDG PLC | 11,424 | 46,505 |
| Ted Baker PLC | 4,286 | 39,787 |
| Telent PLC * (a) | 12,810 | 121,595 |
| The Weir Group PLC | 30,479 | 260,324 |
| THUS Group PLC * | 17,980 | 40,615 |
| Topps Tiles PLC | 25,010 | 115,249 |
| Town Centre Securities PLC | 11,969 | 128,639 |
| TT electronics PLC | 25,281 | 85,602 |
| UK Coal PLC * | 32,311 | 129,074 |
| Ultra Electronics Holdings | 4,987 | 96,810 |
| Vanco PLC * | 9,115 | 73,691 |
| Venture Production PLC * | 16,210 | 249,459 |
| Vernalis PLC * | 62,378 | 73,272 |
| Victrex PLC | 29,565 | 427,987 |
| Viridian Group PLC | 7,576 | 144,403 |
| Vitec Group PLC | 8,660 | 77,467 |
| VT Group PLC | 12,096 | 113,035 |
| W.S. Atkins PLC | 10,919 | 176,655 |
| Wagon PLC | 23,762 | 91,872 |
| Wellington Underwriting PLC | 31,932 | 56,339 |
| Whatman PLC | 50,013 | 292,547 |
| Wincanton PLC | 9,755 | 61,144 |
| Wolfson Microelectronics PLC * | 17,835 | 162,339 |
| Wolverhampton & Dudley Brew PLC | 14,018 | 360,788 |
| Woolworths Group PLC | 94,167 | 58,217 |
| WSP Group PLC | 6,248 | 54,167 |
| Xaar PLC | 8,223 | 20,257 |
| Xansa PLC | 21,636 | 32,000 |
| International Small Company Fund (continued) |
| | | Shares or | | |
| | | Principal | | |
| | | Amount | | Value |
| |
|
| |
| COMMON STOCKS (continued) | | | | |
| United Kingdom (continued) | | | | |
| Yule Catto & Company PLC | | 83,739 | $ | 372,346 |
| |
|
| | | | | 34,551,601 |
| United States - 0.91% | | | | |
| Akita Drilling, Ltd. | | 2,100 | | 39,850 |
| Bow Valley Energy, Ltd. * | | 12,900 | | 71,689 |
| Cangene Corp. * | | 4,700 | | 35,888 |
| GSI Group Inc. * | | 61,283 | | 552,160 |
| International Uranium Corp. * | | 8,500 | | 47,928 |
| Quest Capital Corp. | | 31,000 | | 86,839 |
| Savanna Energy Services Corp. * | | 5,500 | | 121,018 |
| Steiner Leisure, Ltd. * | | 25,841 | | 994,362 |
| Stratos Global Corp. * | | 6,300 | | 19,583 |
| Van Houtte, Inc. | | 2,200 | | 36,261 |
| |
|
| | | | | 2,005,578 |
|
| TOTAL COMMON STOCKS (Cost $223,386,132) | | $ | 216,683,534 |
|
| |
| PREFERRED STOCKS - 0.40% | | | | |
| Brazil - 0.14% | | | | |
| Klabin SA, ADR | | 48,000 | | 95,518 |
| Sadia SA, ADR | | 36,000 | | 96,695 |
| Suzano Bahia Sul Papel e Celulose SA * | | 10,000 | | 60,960 |
| Weg SA | | 15,000 | | 63,763 |
| |
|
| | | | | 316,936 |
| Germany - 0.26% | | | | |
| Hugo Boss AG (a) | | 13,247 | | 566,004 |
|
| TOTAL PREFERRED STOCKS (Cost $940,641) | | $ | 882,940 |
|
| |
| RIGHTS - 0.01% | | | | |
| United Kingdom - 0.01% | | | | |
| Premier Foods PLC | | 16,880 | | 25,849 |
|
| TOTAL RIGHTS (Cost $18,951) | | | $ | 25,849 |
|
| |
| SHORT TERM INVESTMENTS - 17.98% | | | | |
| State Street Navigator Securities | | | | |
| Lending Prime Portfolio (c) | $ | 39,707,208 | $ | 39,707,208 |
|
| TOTAL SHORT TERM INVESTMENTS | | | | |
| (Cost $39,707,208) | | | $ | 39,707,208 |
|
| |
| REPURCHASE AGREEMENTS - 0.95% | | | | |
| Repurchase Agreement with State | | | | |
| Street Corp. dated 08/31/2006 at | | | | |
| 3.95% to be repurchased at | | | | |
| $2,107,231 on 09/01/2006, | | | | |
| collateralized by $2,210,000 | | | | |
| Federal National Mortgage | | | | |
| Association, 4.25% due | | | | |
| 08/15/2010 (valued at $2,151,988, | | | | |
| including interest) (c) | $ | 2,107,000 | $ | 2,107,000 |
|
| TOTAL REPURCHASE AGREEMENTS | | | | |
| (Cost $2,107,000) | | | $ | 2,107,000 |
|
The accompanying notes are an integral part of the financial statements. 280
John Hancock Funds II
Portfolio of investments — August 31, 2006
(showing percentage of total net assets) |
| Total Investments (International Small Company Fund) | | |
| (Cost $266,159,932) - 117.43% | $ | 259,406,531 |
| Liabilities in Excess of Other Assets - (17.43)% | | (38,495,541) |
|
|
| TOTAL NET ASSETS - 100.00% | $ | 220,910,990 |
|
|
The portfolio had the following five top industry concentrations as of August 31, 2006 (as a percentage of total net assets):
| Building Materials & Construction | 7.05% |
| Banking | 4.66% |
| Paper | 4.54% |
| Food & Beverages | 4.23% |
| Business Services | 3.89% |
International Stock Fund
| | Shares or | | |
| | Principal | | |
| | Amount | | Value |
|
|
| |
| COMMON STOCKS - 94.95% | | | |
| Australia - 2.18% | | | |
| Amcor, Ltd. | 13,592 | $ | 69,578 |
| Australia and New Zealand Bank Group, Ltd. | 9,602 | | 199,616 |
| BHP Billiton, Ltd. | 18,361 | | 388,011 |
| Commonwealth Bank of Australia, Ltd. | 3,796 | | 132,404 |
| Foster's Group, Ltd. | 13,710 | | 62,233 |
| Investa Property Group, Ltd. | 40,193 | | 72,672 |
| Mirvac Group, Ltd. | 26,244 | | 91,499 |
| Qantas Airways, Ltd., ADR | 21,055 | | 55,256 |
| Rio Tinto, Ltd. | 3,603 | | 200,520 |
| Stockland Company, Ltd. | 9,430 | | 52,086 |
| Telstra Corp., Ltd. | 45,633 | | 125,328 |
| Woodside Petroleum, Ltd. | 1,774 | | 57,194 |
| Woolworths, Ltd. | 7,634 | | 120,556 |
| Zinifex, Ltd. | 11,402 | | 103,513 |
|
|
| | | | 1,730,466 |
| Austria - 0.41% | | | |
| Bohler Uddeholm AG | 997 | | 53,567 |
| Oesterreichische Elektrizitaets AG, Class A | 910 | | 45,773 |
| OMV AG | 1,897 | | 101,001 |
| Voestalpine AG | 3,352 | | 126,841 |
|
|
| | | | 327,182 |
| Belgium - 0.84% | | | |
| Colruyt SA | 207 | | 35,139 |
| Delhaize Group | 1,004 | | 76,356 |
| Dexia | 6,480 | | 166,205 |
| Fortis Group SA | 7,068 | | 274,688 |
| UCB SA | 1,983 | | 116,082 |
|
|
| | | | 668,470 |
| Bermuda - 0.09% | | | |
| Frontline, Ltd. | 513 | | 20,937 |
| Noble Group, Ltd. | 3,361 | | 2,307 |
| Ship Finance International, Ltd. (a) | 380 | | 7,668 |
| Yue Yuen Industrial Holdings, Ltd. | 13,718 | | 39,689 |
|
|
| | | | 70,601 |
| Canada - 2.08% | | | |
| Alcan Aluminum, Ltd. USD | 3,500 | | 157,218 |
| BCE, Inc. | 2,988 | | 74,447 |
| International Stock Fund (continued) | | |
| | Shares or | | |
| | Principal | | |
| | Amount | | Value |
|
|
| |
| COMMON STOCKS (continued) | | | |
| Canada (continued) | | | |
| Canadian Imperial Bank of Commerce | 2,870 | $ | 208,329 |
| Canadian Natural Resources, Ltd. | 6,837 | | 358,515 |
| EnCana Corp. - CAD | 1,897 | | 99,422 |
| Goldcorp, Inc. | 3,500 | | 96,620 |
| Magna International, Inc. | 800 | | 57,341 |
| National Bank of Canada | 2,165 | | 117,323 |
| Nexen, Inc. | 1,039 | | 60,454 |
| Petro-Canada | 7,267 | | 309,947 |
| Royal Bank of Canada | 2,574 | | 113,924 |
|
|
| | | | 1,653,540 |
| Denmark - 0.25% | | | |
| A P Moller- Maersk A/S, Series A | 8 | | 65,027 |
| Danske Bank AS | 1,819 | | 69,873 |
| DSV AS | 378 | | 61,191 |
|
|
| | | | 196,091 |
| Finland - 2.39% | | | |
| Amer Sports Oyj | 1,750 | | 38,841 |
| Elcoteq SE | 1,050 | | 19,006 |
| Fortum Corp. Oyj | 10,489 | | 281,779 |
| Kesko Oyj | 2,767 | | 116,951 |
| Metso Oyj | 4,017 | | 149,229 |
| Neste Oil OYJ | 2,150 | | 67,660 |
| Nokia AB Oyj | 22,035 | | 460,878 |
| OKO Bank - A | 2,300 | | 37,308 |
| Oriola-KD OYJ * | 1,300 | | 3,127 |
| Outokumpu Oyj | 6,504 | | 165,157 |
| Rautaruukki Oyj | 5,609 | | 163,597 |
| Sampo Oyj, A Shares | 14,358 | | 296,635 |
| YIT Oyj | 4,316 | | 93,585 |
|
|
| | | | 1,893,753 |
| France - 10.52% | | | |
| Alstom RGPT * | 1,637 | | 154,128 |
| Assurances Generales de France | 490 | | 61,430 |
| AXA Group | 4,290 | | 159,151 |
| BNP Paribas SA | 16,170 | | 1,715,860 |
| Cap Gemini SA | 2,839 | | 155,295 |
| Carrefour SA | 3,325 | | 204,849 |
| Casino Guich-Perrachon SA | 2,367 | | 202,724 |
| Compagnie De Saint Gobain SA | 3,360 | | 249,085 |
| Compagnie Generale des Etablissements | | | |
| Michelin, Class B | 2,099 | | 142,313 |
| Credit Agricole S.A. | 9,737 | | 394,982 |
| Lafarge SA | 916 | | 117,765 |
| L'Oreal SA | 1,290 | | 134,824 |
| LVMH Moet Hennessy SA | 897 | | 92,201 |
| Peugeot SA | 6,551 | | 369,323 |
| Pinault-Printemps-Redoute SA | 458 | | 63,160 |
| Publicis Groupe SA | 2,978 | | 117,412 |
| Renault Regie Nationale SA | 6,094 | | 708,634 |
| Sanofi-Aventis | 1,267 | | 113,538 |
| Schneider Electric SA | 987 | | 105,113 |
The accompanying notes are an integral part of the financial statements. 281
John Hancock Funds II
Portfolio of investments — August 31, 2006
(showing percentage of total net assets) |
| International Stock Fund (continued) | | |
| | Shares or | | |
| | Principal | | |
| | Amount | | Value |
|
|
| |
| COMMON STOCKS (continued) | | | |
| France (continued) | | | |
| Societe Generale | 2,709 | $ | 436,651 |
| Suez SA | 2,631 | | 112,347 |
| Total SA | 33,996 | | 2,291,890 |
| Vallourec SA | 895 | | 200,362 |
| Zodiac SA | 662 | | 40,167 |
|
|
| | | | 8,343,204 |
| Germany - 7.89% | | | |
| Adidas-Salomon AG | 866 | | 41,211 |
| Allianz AG | 1,203 | | 203,709 |
| Altana AG | 3,746 | | 220,915 |
| Bayerische Motoren Werke (BMW) AG | 6,139 | | 317,588 |
| Commerzbank AG | 10,614 | | 370,678 |
| DaimlerChrysler AG | 6,111 | | 322,081 |
| Deutsche Bank AG | 6,413 | | 731,372 |
| Deutsche Boerse AG | 1,645 | | 249,304 |
| Deutsche Post AG | 7,361 | | 186,354 |
| Deutsche Postbank AG | 817 | | 63,670 |
| E.ON AG | 4,458 | | 565,499 |
| Fresenius AG | 559 | | 95,952 |
| Henkel KGaA | 378 | | 43,037 |
| Hochtief AG | 1,810 | | 102,875 |
| KarstadtQuelle AG * (a) | 1,693 | | 37,468 |
| MAN AG | 2,440 | | 186,377 |
| Merck & Company AG | 576 | | 57,098 |
| Muenchener Rueckversicherungs- | | | |
| Gesellschaft AG | 4,906 | | 737,932 |
| Puma AG | 334 | | 115,675 |
| Salzgitter AG | 1,859 | | 166,302 |
| SAP AG | 779 | | 148,574 |
| Solarworld AG | 946 | | 55,898 |
| Suedzucker AG | 4,929 | | 122,641 |
| Thyssen Krupp AG | 16,327 | | 555,158 |
| Tui AG | 7,782 | | 151,716 |
| Volkswagen AG (a) | 5,192 | | 414,120 |
|
|
| | | | 6,263,204 |
| Hong Kong - 0.39% | | | |
| CLP Holdings, Ltd. | 15,904 | | 100,615 |
| Hong Kong Electric Holdings, Ltd. | 17,854 | | 85,402 |
| Hong Kong Exchange & Clearing, Ltd. | 12,500 | | 85,188 |
| MTR Corp. | 14,000 | | 35,824 |
|
|
| | | | 307,029 |
| Ireland - 0.74% | | | |
| CRH PLC | 6,325 | | 219,030 |
| DCC PLC | 2,105 | | 52,779 |
| Depfa Bank PLC | 14,242 | | 264,541 |
| Kerry Group PLC | 2,405 | | 53,533 |
|
|
| | | | 589,883 |
| Italy - 2.78% | | | |
| Banca Monte dei Paschi Siena SpA | 25,201 | | 153,052 |
| Banco Popolare Di Verona e Novara SpA | 4,422 | | 131,239 |
| Benetton Group SpA | 3,397 | | 50,757 |
| International Stock Fund (continued) | | |
| | Shares or | | |
| | Principal | | |
| | Amount | | Value |
|
|
| |
| COMMON STOCKS (continued) | | | |
| Italy (continued) | | | |
| Eni SpA | 44,489 | $ | 1,360,210 |
| Fiat SpA - RNC * | 2,766 | | 36,799 |
| Fiat SpA * (a) | 8,205 | | 117,348 |
| Fondiaria-Sai SpA | 1,442 | | 46,209 |
| Impregilo SpA * | 12,118 | | 44,762 |
| Italcementi SpA | 2,572 | | 40,535 |
| UniCredito Italiano SpA | 27,821 | | 221,370 |
|
|
| | | | 2,202,281 |
| Japan - 24.87% | | | |
| Aderans Company, Ltd. | 865 | | 22,407 |
| AEON Company, Ltd. | 5,289 | | 133,177 |
| Alps Electric Company | 2,946 | | 33,061 |
| Amada Company, Ltd. | 7,487 | | 78,216 |
| Asics Corp. | 4,000 | | 50,002 |
| Canon, Inc. | 7,250 | | 360,786 |
| Chubu Electric Power Company, Inc. | 11,199 | | 303,462 |
| Cosmo Oil Company, Ltd. | 10,000 | | 44,054 |
| Daido Steel Company, Ltd. | 9,040 | | 69,482 |
| Daiei Inc. * | 6,208 | | 120,081 |
| Daiichi Sankyo Company, Ltd. | 4,831 | | 133,377 |
| Daikyo, Inc. * | 16,888 | | 86,919 |
| Daiwa Securities Group, Inc. (a) | 24,000 | | 286,106 |
| East Japan Railway Company | 21 | | 155,145 |
| Eisai Company, Ltd. | 3,880 | | 184,817 |
| Elpida Memory, Inc. * | 1,000 | | 44,225 |
| Fuji Electric Holdings | 11,000 | | 55,865 |
| Fuji Heavy Industries, Ltd. | 23,116 | | 133,746 |
| Fujikura, Ltd. | 9,000 | | 106,370 |
| Fujitsu, Ltd. | 12,000 | | 96,221 |
| Haseko Corp. * | 53,347 | | 190,923 |
| Hokkaido Electric Power Company, Inc. | 3,599 | | 88,936 |
| Honda Motor Company, Ltd. | 50,712 | | 1,724,178 |
| Ibiden Company, Ltd. | 2,036 | | 104,268 |
| Isetan Company, Ltd. | 3,403 | | 57,415 |
| Ishikawajima-Harima Heavy Industries | | | |
| Company, Ltd. | 32,769 | | 95,497 |
| Isuzu Motors, Ltd. | 30,542 | | 99,156 |
| Itochu Corp. | 44,047 | | 369,701 |
| Kansai Electric Power Company, Ltd. (a) | 11,600 | | 278,250 |
| Kao Corp. | 6,050 | | 161,361 |
| Kawasaki Heavy Industries, Ltd. | 20,438 | | 64,612 |
| Kawasaki Kisen Kaisha, Ltd. | 19,000 | | 123,531 |
| Keisei Electric Railway Company, Ltd. | 4,458 | | 27,047 |
| Kenedix, Inc. | 16 | | 77,168 |
| Kirin Brewery Company, Ltd. | 5,000 | | 69,490 |
| KK DaVinci Advisors * | 68 | | 61,420 |
| Kobe Steel Company, Ltd. | 21,744 | | 69,481 |
| Komatsu, Ltd. | 16,949 | | 309,792 |
| Konami Corp. | 3,523 | | 89,760 |
| Kubota Corp. | 18,000 | | 148,166 |
| Kyushu Electric Power | 5,980 | | 142,678 |
| LeoPalace21 Corp. | 2,590 | | 91,810 |
The accompanying notes are an integral part of the financial statements. 282
John Hancock Funds II
Portfolio of investments — August 31, 2006
(showing percentage of total net assets) |
| International Stock Fund (continued) | | |
| | Shares or | | |
| | Principal | | |
| | Amount | | Value |
|
|
| |
| COMMON STOCKS (continued) | | | |
| Japan (continued) | | | |
| Marubeni Corp. | 36,824 | $ | 196,742 |
| Mazda Motor Corp. | 27,488 | | 176,141 |
| Mediceo Holdings Company, Ltd. | 2,400 | | 44,685 |
| Mitsubishi Corp. | 26,895 | | 547,732 |
| Mitsubishi Estate Company, Ltd. | 10,404 | | 224,295 |
| Mitsubishi Heavy Industries, Ltd. | 38,000 | | 159,311 |
| Mitsubishi Materials Corp. | 23,130 | | 100,715 |
| Mitsubishi Rayon Company, Ltd. | 14,920 | | 102,980 |
| Mitsubishi UFJ Financial Group, Inc. | 71 | | 968,003 |
| Mitsui & Company, Ltd. | 14,560 | | 210,791 |
| Mitsui Trust Holdings, Inc. | 29,553 | | 346,008 |
| Mizuho Financial Group, Inc. | 72 | | 582,233 |
| Mizuho Trust & Banking Company, Ltd. * | 31,000 | | 73,171 |
| NGK Spark Plug Company, Ltd. | 3,000 | | 61,097 |
| Nikko Cordial Corp. | 7,000 | | 88,876 |
| Nikon Corp. | 5,227 | | 94,648 |
| Nintendo Company, Ltd. | 700 | | 143,633 |
| Nippon Sheet Glass Company, Ltd. | 10,000 | | 48,315 |
| Nippon Telegraph & Telephone Corp. | 87 | | 439,615 |
| Nippon Yusen Kabushiki Kaisha | 10,000 | | 61,949 |
| Nissan Chemical Industries, Ltd. | 4,992 | | 64,785 |
| Nissan Motor Company, Ltd. | 77,500 | | 880,959 |
| Nomura Securities Company, Ltd. | 13,400 | | 259,196 |
| NTT DoCoMo, Inc. | 238 | | 369,102 |
| Orix Corp. | 1,117 | | 296,490 |
| Osaka Gas Company, Ltd. | 49,120 | | 180,817 |
| Resona Holdings, Inc. * | 138 | | 435,090 |
| Ricoh Company, Ltd. | 18,000 | | 353,543 |
| Seven & I Holdings Company, Ltd. | 2,100 | | 74,262 |
| Shinko Electric Industries Company, Ltd. | 2,767 | | 80,401 |
| Shinko Securities Company, Ltd. | 14,000 | | 56,666 |
| Showa Shell Sekiyu K.K. | 3,600 | | 40,216 |
| Sony Corp. | 4,200 | | 181,807 |
| Sumitomo Chemical Company, Ltd. | 12,000 | | 94,483 |
| Sumitomo Corp. | 15,596 | | 210,906 |
| Sumitomo Light Metal Industries, Ltd. | 15,000 | | 32,977 |
| Sumitomo Metal Industries, Ltd. | 17,334 | | 71,342 |
| Sumitomo Metal Mining Company, Ltd. | 14,000 | | 197,435 |
| Sumitomo Mitsui Financial Group, Inc. | 7 | | 78,735 |
| Sumitomo Realty & | | | |
| Development Company, Ltd. | 8,000 | | 235,866 |
| Sumitomo Trust & Banking Company, Ltd. | 12,448 | | 132,695 |
| TAIHEIYO CEMENT CORP. | 16,097 | | 60,627 |
| Taisho Pharmaceuticals Company, Ltd. | 2,790 | | 54,561 |
| Takashimaya Company, Ltd. | 4,436 | | 55,944 |
| Takeda Pharmaceutical Company, Ltd. | 22,089 | | 1,462,499 |
| The Japan Steel Works, Ltd. | 6,000 | | 42,589 |
| The Tokyo Electric Power Company, Ltd. | 3,539 | | 101,024 |
| Toho Zinc Company, Ltd. * | 7,000 | | 54,399 |
| Tohoku Electric Power Company, Inc. | 5,400 | | 122,398 |
| Tokyo Electron, Ltd. | 1,900 | | 124,988 |
| Tokyo Gas Company, Ltd. | 32,397 | | 172,537 |
| International Stock Fund (continued) | | |
| | | Shares or | | |
| | | Principal | | |
| | | Amount | | Value |
|
|
| |
| COMMON STOCKS (continued) | | | |
| Japan (continued) | | | | |
| Tokyo Seimitsu Company, Ltd. | | 1,001 | $ | 48,363 |
| TonenGeneral Sekiyu K.K. | | 8,133 | | 73,461 |
| Toray Industries, Inc. | | 14,000 | | 111,661 |
| Toshiba Corp. | | 15,000 | | 106,855 |
| Toyo Tire & Rubber Company, Ltd. | 3,812 | | 16,891 |
| Toyota Motor Corp. | | 19,300 | | 1,047,599 |
| Ube Industries, Ltd. | | 2,282 | | 6,242 |
| Yamada Denki Company, Ltd. | | 410 | | 44,020 |
| YASKAWA Electric Corp. | | 6,696 | | 77,199 |
|
|
| | | | | 19,724,729 |
| Netherland Antilles - 0.23% | | | | |
| Mittal Steel Company NV | | 5,489 | | 182,918 |
| Netherlands - 8.77% | | | | |
| ABN AMRO Holdings NV | | 41,066 | | 1,169,400 |
| Aegon NV | | 32,696 | | 583,059 |
| Akzo Nobel NV | | 2,672 | | 153,680 |
| Buhrmann NV | | 4,622 | | 62,793 |
| Corio NV | | 173 | | 11,630 |
| CSM NV | | 2,183 | | 66,576 |
| DSM NV | | 2,381 | | 94,057 |
| Euronext NV | | 1,786 | | 160,389 |
| Hagemeyer N.V. * | | 12,736 | | 64,355 |
| Heineken Holding NV | | 1,950 | | 78,129 |
| Heineken NV | | 8,304 | | 384,655 |
| ING Groep NV | | 42,407 | | 1,830,909 |
| Koninklijke Ahold NV * | | 10,160 | | 97,349 |
| Oce-Van Der Grinten NV | | 2,593 | | 44,947 |
| Reed Elsevier NV | | 12,647 | | 202,557 |
| Royal Dutch Shell PLC, A Shares | GBP | 9,009 | | 311,900 |
| Royal Dutch Shell PLC, A Shares | NLG | 22,563 | | 779,032 |
| Royal Dutch Shell PLC, B Shares GBP | 14,878 | | 532,072 |
| Stork NV * | | 840 | | 41,360 |
| TNT Post Group NV | | 4,127 | | 154,952 |
| Vedior NV | | 4,650 | | 85,897 |
| Wereldhave NV | | 431 | | 45,211 |
|
|
| | | | | 6,954,909 |
| Norway - 0.44% | | | | |
| Norsk Hydro ASA | | 9,137 | | 235,594 |
| Statoil ASA | | 4,318 | | 116,461 |
|
|
| | | | | 352,055 |
| Singapore - 1.00% | | | | |
| Ascendas Real Estate Investment Trust * | 16,000 | | 20,950 |
| CapitaLand, Ltd. | | 29,203 | | 88,353 |
| Cosco Corp. Singapore, Ltd. | | 63,600 | | 61,850 |
| DBS Group Holdings, Ltd. | | 23,231 | | 265,784 |
| Keppel Corp., Ltd. | | 3,072 | | 29,289 |
| Keppel Land, Ltd. | | 16,538 | | 46,672 |
| K-REIT Asia * | | 2,908 | | 2,735 |
| Neptune Orient Lines, Ltd. (a) | | 27,488 | | 33,720 |
| SembCorp Industries, Ltd. | | 27,802 | | 61,496 |
| SembCorp Marine, Ltd. | | 8,267 | | 18,181 |
The accompanying notes are an integral part of the financial statements. 283
John Hancock Funds II
Portfolio of investments — August 31, 2006
(showing percentage of total net assets) |
| International Stock Fund (continued) | | |
| | Shares or | | |
| | Principal | | |
| | Amount | | Value |
|
|
| |
| COMMON STOCKS (continued) | | | |
| Singapore (continued) | | | |
| Singapore Technologies Engineering, Ltd. | 13,683 | $ | 25,395 |
| Singapore Telecommunications, Ltd., ADR * | 54,700 | | 86,571 |
| StarHub Ltd. | 37,290 | | 57,121 |
|
|
| | | | 798,117 |
| Spain - 1.19% | | | |
| ACS Actividades SA | 1,013 | | 45,369 |
| Fomento de Construcciones SA | 981 | | 76,426 |
| Gas Natural SDG SA | 2,753 | | 92,024 |
| Iberdrola SA | 8,232 | | 305,182 |
| Repsol SA | 14,721 | | 422,587 |
|
|
| | | | 941,588 |
| Sweden - 1.44% | | | |
| Alfa Laval AB | 1,400 | | 46,281 |
| Atlas Copco AB, Series A | 6,000 | | 154,454 |
| Boliden AB | 6,150 | | 115,447 |
| Electrolux AB, Series B | 9,073 | | 140,261 |
| Nordea Bank AB | 4,300 | | 54,010 |
| Sandvik AB | 9,500 | | 103,918 |
| Skandinaviska Enskilda Banken AB, Series A | 5,000 | | 129,401 |
| Svenska Cellulosa AB, Series B | 2,494 | | 106,887 |
| Svenska Handelsbanken AB, Series A | 2,600 | | 67,827 |
| Tele2 AB, Series B | 10,120 | | 100,224 |
| Teliasonera AB | 19,500 | | 120,581 |
|
|
| | | | 1,139,291 |
| Switzerland - 4.94% | | | |
| ABB, Ltd. | 36,294 | | 480,998 |
| Compagnie Financiere | | | |
| Richemont AG, Series A | 2,735 | | 129,911 |
| Credit Suisse Group AG | 2,682 | | 149,241 |
| Nestle SA | 1,163 | | 398,995 |
| Novartis AG | 2,683 | | 152,777 |
| Roche Holdings AG NPV | 3,797 | | 698,338 |
| Serono AG, Series B | 101 | | 70,242 |
| Swiss Life Holding * | 209 | | 50,441 |
| Swiss Re | 2,957 | | 225,065 |
| UBS AG * | 12,175 | | 687,354 |
| Unaxis Holding AG * | 146 | | 42,959 |
| Zurich Financial Services AG | 3,655 | | 831,018 |
|
|
| | | | 3,917,339 |
| United Kingdom - 21.51% | | | |
| Alliance & Leicester PLC | 6,632 | | 129,437 |
| Anglo American PLC | 22,505 | | 972,647 |
| Arriva PLC | 4,900 | | 55,460 |
| AstraZeneca Group PLC | 27,578 | | 1,785,748 |
| Aviva PLC | 16,489 | | 231,483 |
| BAE Systems PLC | 13,849 | | 97,605 |
| Barclays PLC | 10,871 | | 135,967 |
| Barratt Developments PLC | 11,219 | | 212,026 |
| BBA Group PLC | 13,245 | | 67,145 |
| Berkeley Group Holdings PLC * | 1,545 | | 37,678 |
| BG Group PLC | 34,684 | | 452,937 |
| International Stock Fund (continued) | | |
| | Shares or | | |
| | Principal | | |
| | Amount | | Value |
|
|
| |
| COMMON STOCKS (continued) | | | |
| United Kingdom (continued) | | | |
| BHP Billiton PLC | 6,604 | $ | 125,750 |
| Boots Group PLC | 15,067 | | 220,978 |
| British American Tobacco Australasia, Ltd. | 7,674 | | 210,209 |
| BT Group PLC | 150,090 | | 703,779 |
| Cable & Wireless PLC | 48,672 | | 113,650 |
| Cadbury Schweppes PLC | 20,967 | | 222,954 |
| Centrica PLC | 68,555 | | 384,706 |
| Cobham PLC | 30,847 | | 100,781 |
| Compass Group PLC | 26,837 | | 130,307 |
| CSR PLC * | 3,264 | | 72,769 |
| Dixons Group PLC | 54,293 | | 211,722 |
| EMI Group PLC | 15,430 | | 78,589 |
| George Wimpey PLC | 26,259 | | 250,256 |
| GlaxoSmithKline PLC | 78,680 | | 2,227,076 |
| GUS PLC | 12,691 | | 235,500 |
| Hanson PLC | 9,587 | | 120,728 |
| HBOS PLC | 27,761 | | 529,668 |
| IMI PLC | 7,442 | | 71,597 |
| Imperial Chemical Industries PLC | 19,542 | | 138,379 |
| Imperial Tobacco Group PLC | 15,687 | | 540,115 |
| J Sainsbury PLC | 26,035 | | 176,557 |
| Johnson Matthey PLC | 2,317 | | 58,223 |
| Kingfisher PLC | 35,206 | | 158,051 |
| Ladbrokes PLC | 9,350 | | 67,988 |
| Lloyds TSB Group PLC | 22,850 | | 226,677 |
| Man Group PLC | 23,109 | | 185,617 |
| Marks & Spencer Group PLC | 22,894 | | 258,035 |
| Next Group PLC | 7,043 | | 223,337 |
| Northern Rock | 2,831 | | 60,046 |
| Rank Group PLC | 10,497 | | 42,632 |
| Rio Tinto PLC | 26,560 | | 1,342,417 |
| Rolls-Royce Group PLC * | 5,984 | | 49,659 |
| Royal & Sun Alliance PLC | 80,565 | | 212,258 |
| Royal Bank of Scotland Group PLC | 35,272 | | 1,195,654 |
| Scottish & Newcastle PLC | 9,048 | | 94,750 |
| Scottish Power PLC * | 15,926 | | 187,982 |
| Standard Chartered PLC | 2,845 | | 71,167 |
| Tate & Lyle PLC | 8,813 | | 122,800 |
| Taylor Woodrow PLC | 36,076 | | 235,386 |
| Tomkins PLC | 24,410 | | 132,105 |
| United Utilities PLC | 10,288 | | 134,350 |
| Vodafone Group PLC * | 316,370 | | 684,565 |
| Wolseley PLC | 2,259 | | 49,203 |
| Xstrata PLC | 4,971 | | 222,975 |
|
|
| | | | 17,060,080 |
|
| TOTAL COMMON STOCKS (Cost $61,852,191) | | $ | 75,316,730 |
|
| |
| PREFERRED STOCKS - 0.38% | | | |
| Germany - 0.21% | | | |
| Bayerische Motoren Werke (BMW) AG | 728 | | 36,963 |
| Henkel KGaA-Vorzug, Non-Voting | 597 | | 76,135 |
The accompanying notes are an integral part of the financial statements. 284
John Hancock Funds II
Portfolio of investments — August 31, 2006
(showing percentage of total net assets) |
| International Stock Fund (continued) | | |
| | | Shares or | | |
| | | Principal | | |
| | | Amount | | Value |
|
|
| |
| PREFERRED STOCKS (continued) | | | | |
| Germany (continued) | | | | |
| Volkswagen AG, Non-Voting | | 939 | $ | 53,262 |
|
|
| | | | | 166,360 |
| |
| Italy - 0.17% | | | | |
| IFI-Istituto Finanziario Industriale SPA * | | 1,715 | | 41,026 |
| Unipol SpA | | 31,645 | | 95,436 |
|
|
| | | | | 136,462 |
|
| |
| TOTAL PREFERRED STOCKS (Cost $209,845) | | $ | 302,822 |
|
| |
| SHORT TERM INVESTMENTS - 1.30% | | | | |
| State Street Navigator Securities | | | | |
| Lending Prime Portfolio (c) | $ | 1,028,026 | $ | 1,028,026 |
|
| TOTAL SHORT TERM INVESTMENTS | | | | |
| (Cost $1,028,026) | | | $ | 1,028,026 |
|
| |
| REPURCHASE AGREEMENTS - 0.50% | | | | |
| Repurchase Agreement with State | | | | |
| Street Corp. dated 08/31/2006 at | | | | |
| 3.95% to be repurchased at | | | | |
| $393,043 on 9/1/2006, | | | | |
| collateralized by $420,000 Federal | | | | |
| Home Loan Mortgage Corp., | | | | |
| 4.125% due 02/24/2011 (valued at | | | | |
| $403,200, including interest) (c) | $ | 393,000 | $ | 393,000 |
|
| TOTAL REPURCHASE AGREEMENTS | | | | |
| (Cost $393,000) | | | $ | 393,000 |
|
| Total Investments (International Stock Fund) | | | |
| (Cost $63,483,062) - 97.13% | | | $ | 77,040,578 |
| Other Assets in Excess of Liabilities - 2.87% | | | | 2,279,263 |
|
|
| TOTAL NET ASSETS - 100.00% | | | $ | 79,319,841 |
|
|
The portfolio had the following five top industry concentrations as of August 31, 2006 (as a percentage of total net assets):
| Banking | 13.05% |
| Automobiles | 8.12% |
| International Oil | 7.57% |
| Insurance | 6.89% |
| Pharmaceuticals | 6.07% |
| International Value Fund | | |
| | Shares or | |
| | Principal | |
| | Amount | Value |
|
|
| |
| COMMON STOCKS - 96.18% | | |
| Australia - 2.17% | | |
| National Australia Bank, Ltd. (a) | 448,016 $ | 12,413,862 |
| Qantas Airways, Ltd., ADR | 3,299,924 | 8,660,240 |
|
|
| | | 21,074,102 |
| Belgium - 1.92% | | |
| Agfa Gevaert NV (a) | 419,030 | 9,814,968 |
| International Value Fund (continued) | | |
| | Shares or | | |
| | Principal | | |
| | Amount | | Value |
|
|
| |
| COMMON STOCKS (continued) | | | |
| Belgium (continued) | | | |
| Belgacom SA | 250,420 | $ | 8,832,044 |
|
|
| | | | 18,647,012 |
| Canada - 1.42% | | | |
| Domtar, Inc. | 1,139,444 | | 7,258,917 |
| Quebecor World, Inc. | 583,900 | | 6,500,382 |
|
|
| | | | 13,759,299 |
| Cayman Islands - 1.30% | | | |
| ACE, Ltd. | 162,056 | | 8,728,336 |
| XL Capital, Ltd., Class A (a) | 58,833 | | 3,861,798 |
|
|
| | | | 12,590,134 |
| China - 0.89% | | | |
| China Telecom Corp., Ltd. | 25,805,589 | | 8,660,540 |
| Denmark - 1.75% | | | |
| Vestas Wind Systems AS * (a) | 607,927 | | 16,992,849 |
| Finland - 2.60% | | | |
| Stora Enso Oyj, R Shares - EUR (a) | 720,110 | | 10,925,441 |
| UPM-Kymmene Oyj | 605,431 | | 14,328,206 |
|
|
| | | | 25,253,647 |
| France - 7.86% | | | |
| Arkema * (a) | 4,627 | | 180,118 |
| AXA Group (a) | 394,136 | | 14,621,756 |
| France Telecom SA (a) | 952,161 | | 20,183,122 |
| Sanofi-Aventis (a) | 152,966 | | 13,707,507 |
| Thomson SA * (a) | 835,850 | | 13,355,072 |
| Total SA (a) | 210,352 | | 14,181,191 |
|
|
| | | | 76,228,766 |
| Germany - 5.43% | | | |
| Bayerische Motoren Werke (BMW) AG | 191,764 | | 9,920,503 |
| Deutsche Post AG | 419,401 | | 10,617,706 |
| E.ON AG | 35,799 | | 4,541,119 |
| Muenchener Rueckversicherungs- | | | |
| Gesellschaft AG | 101,256 | | 15,230,342 |
| Siemens AG | 146,169 | | 12,374,780 |
|
|
| | | | 52,684,450 |
| Hong Kong - 1.65% | | | |
| Hutchison Whampoa, Ltd. | 1,765,620 | | 16,039,842 |
| Israel - 1.52% | | | |
| Check Point Software Technologies, Ltd., ADR * | 794,420 | | 14,768,268 |
| Italy - 3.33% | | | |
| Eni SpA | 479,819 | | 14,670,023 |
| Mediaset SpA (a) | 751,433 | | 8,670,662 |
| UniCredito Italiano SpA (a) | 1,129,147 | | 8,984,549 |
|
|
| | | | 32,325,234 |
| Japan - 5.25% | | | |
| KDDI Corp. | 1,803 | | 11,906,821 |
| Konica Minolta Holdings, Inc. | 1,108,462 | | 14,498,651 |
| Sony Corp. | 313,714 | | 13,579,883 |
| Takeda Pharmaceutical Company, Ltd. (a) | 165,186 | | 10,936,860 |
|
|
| | | | 50,922,215 |
The accompanying notes are an integral part of the financial statements. 285
John Hancock Funds II
Portfolio of investments — August 31, 2006
(showing percentage of total net assets) |
| International Value Fund (continued) | | |
| | Shares or | | |
| | Principal | | |
| | Amount | | Value |
|
|
| |
| COMMON STOCKS (continued) | | | |
| Mexico - 0.77% | | | |
| Telefonos de Mexico SA de CV, Class L, ADR | 310,165 | $ | 7,487,383 |
| Netherlands - 6.86% | | | |
| ING Groep NV | 457,832 | | 19,766,754 |
| Koninklijke (Royal) Philips Electronics NV | 372,296 | | 12,678,033 |
| Reed Elsevier NV (a) | 1,342,355 | | 21,499,441 |
| Royal Dutch Shell PLC, B Shares GBP | 352,313 | | 12,599,529 |
|
|
| | | | 66,543,757 |
| Norway - 3.21% | | | |
| Norske Skogindustrier ASA (a) | 828,524 | | 12,614,755 |
| Telenor ASA | 1,462,611 | | 18,509,377 |
|
|
| | | | 31,124,132 |
| Portugal - 0.47% | | | |
| Portugal Telecom, SGPS, SA | 361,056 | | 4,531,052 |
| Singapore - 2.22% | | | |
| Flextronics International, Ltd. * | 670,540 | | 7,912,372 |
| Venture Corp., Ltd. | 1,842,840 | | 13,587,329 |
|
|
| | | | 21,499,701 |
| South Korea - 4.13% | | | |
| Kookmin Bank, ADR | 94,451 | | 7,610,862 |
| KT Corp., Sponsored ADR | 181,994 | | 4,022,067 |
| Samsung Electronics Company, Ltd., GDR | 64 | | 21,760 |
| Samsung Electronics Company, Ltd., | | | |
| GDR-London | 57,800 | | 19,652,000 |
| SK Telecom Company, Ltd., ADR | 399,323 | | 8,745,174 |
|
|
| | | | 40,051,863 |
| Spain - 4.75% | | | |
| Banco Santander Central Hispano SA (a) | 315,890 | | 4,893,679 |
| Gamesa Corporation Tecno SA | 573,283 | | 12,063,974 |
| Iberdrola SA | 140,164 | | 5,196,253 |
| Repsol SA (a) | 542,822 | | 15,582,450 |
| Telefonica SA - EUR | 484,300 | | 8,301,847 |
|
|
| | | | 46,038,203 |
| Sweden - 0.84% | | | |
| Securitas AB, B Shares | 463,848 | | 8,163,069 |
| Switzerland - 3.25% | | | |
| Nestle SA (a) | 36,727 | | 12,600,067 |
| Swiss Re | 177,723 | | 13,526,943 |
| UBS AG | 94,648 | | 5,343,466 |
|
|
| | | | 31,470,476 |
| Taiwan - 5.29% | | | |
| Chunghwa Telecom Company, Ltd., ADR (a) | 487,947 | | 8,446,355 |
| Compal Electronics, Inc., GDR | 1,842,304 | | 8,198,254 |
| Compal Electronics, Inc. | 6,314,240 | | 5,527,527 |
| Lite-On Technology Corp. | 842,580 | | 10,455,491 |
| Mega Financial Holding Company, Ltd. | 28,130,000 | | 18,682,650 |
|
|
| | | | 51,310,277 |
| United Kingdom - 27.30% | | | |
| Amvescap PLC | 382,002 | | 3,938,517 |
| Aviva PLC | 481,740 | | 6,762,961 |
| International Value Fund (continued) | | |
| | | Shares or | | |
| | | Principal | | |
| | | Amount | | Value |
|
|
| |
| COMMON STOCKS (continued) | | | | |
| United Kingdom (continued) | | | | |
| BAE Systems PLC | | 610,443 | $ | 4,302,304 |
| BBA Group PLC | | 1,374,220 | | 6,966,607 |
| Boots Group PLC | | 907,312 | | 13,306,960 |
| BP PLC | | 1,186,062 | | 13,469,440 |
| British Sky Broadcasting Group PLC | | 1,900,376 | | 20,262,030 |
| Centrica PLC | | 2,211,102 | | 12,407,909 |
| Compass Group PLC | | 5,709,487 | | 27,722,389 |
| GlaxoSmithKline PLC | | 482,985 | | 13,671,129 |
| Group 4 Securicor PLC | | 3,286,910 | | 10,879,398 |
| HSBC Holdings PLC | | 971,360 | | 17,609,253 |
| Morrison W Supermarket | | 3,649,277 | | 15,358,822 |
| Old Mutual PLC | | 3,172,102 | | 9,880,894 |
| Pearson PLC | | 808,116 | | 11,483,178 |
| Reed Elsevier PLC | | 89,874 | | 963,376 |
| Rentokil Initial PLC | | 3,336,007 | | 9,534,748 |
| Royal Bank of Scotland Group PLC | | 706,882 | | 23,961,965 |
| Standard Life PLC * | | 555,060 | | 2,776,921 |
| Tesco PLC | | 1,174,590 | | 8,429,142 |
| Unilever PLC | | 511,051 | | 12,210,169 |
| Vodafone Group PLC | | 8,760,506 | | 18,956,074 |
|
|
| | | | | 264,854,186 |
|
| TOTAL COMMON STOCKS (Cost $827,593,011) | | $ | 933,020,457 |
|
| |
| SHORT TERM INVESTMENTS - 10.82% | | | | |
| State Street Navigator Securities | | | | |
| Lending Prime Portfolio (c) | $ | 104,966,722 | $ | 104,966,722 |
|
| TOTAL SHORT TERM INVESTMENTS | | | | |
| (Cost $104,966,722) | | | $ | 104,966,722 |
|
| |
| REPURCHASE AGREEMENTS - 2.04% | | | | |
| Repurchase Agreement with State | | | | |
| Street Corp. dated 08/31/2006 at | | | | |
| 3.95% to be repurchased at | | | | |
| $19,805,173 on 09/01/2006, | | | | |
| collateralized by $20,075,000 | | | | |
| Federal National Mortgage | | | | |
| Association, 5.125% due | | | | |
| 12/15/2008 (valued at | | | | |
| $20,200,469, including interest) (c) | $ | 19,803,000 | $ | 19,803,000 |
|
| TOTAL REPURCHASE AGREEMENTS | | | | |
| (Cost $19,803,000) | | | $ | 19,803,000 |
|
| Total Investments (International Value Fund) | | | |
| (Cost $952,362,733) - 109.04% | | | $ 1,057,790,179 |
| Liabilities in Excess of Other Assets - (9.04)% | | | (87,699,068) |
|
|
| TOTAL NET ASSETS - 100.00% | | | $ | 970,091,111 |
|
|
The accompanying notes are an integral part of the financial statements. 286
John Hancock Funds II
Portfolio of investments — August 31, 2006
(showing percentage of total net assets) |
The portfolio had the following five top industry concentrations as of August 31, 2006 (as a percentage of total net assets):
| Telecommunications Equipment & Services | 11.26% |
| Insurance | 9.81% |
| Electronics | 9.56% |
| Banking | 5.96% |
| International Oil | 4.27% |
| Investment Quality Bond Fund | | | |
| | | Shares or | | |
| | | Principal | | |
| | | Amount | | Value |
|
|
| |
| U.S. TREASURY OBLIGATIONS - 22.00% | | | |
| Treasury Inflation Protected | | | | |
| Securities (d) - 4.48% | | | | |
| 1.875% due 07/15/2013 | $ | 2,098,987 | $ | 2,047,004 |
| 2.375% due 04/15/2011 (a) | | 3,679,560 | | 3,694,506 |
|
|
| | | | | 5,741,510 |
| U.S. Treasury Bonds - 8.46% | | | | |
| 6.25% due 08/15/2023 (a) | | 2,000,000 | | 2,293,750 |
| 7.875% due 02/15/2021 (a) | | 2,339,000 | | 3,043,624 |
| 8.125% due 08/15/2019 (a)**** | | 885,000 | | 1,156,930 |
| 8.75% due 08/15/2020 (a) | | 1,535,000 | | 2,122,616 |
| 8.875% due 08/15/2017 to 02/15/2019 (a) | 1,655,000 | | 2,239,163 |
|
|
| | | | | 10,856,083 |
| U.S. Treasury Notes - 9.06% | | | | |
| 4.25% due 08/15/2013 (a) | | 9,775,000 | | 9,504,661 |
| 6.50% due 02/15/2010 (a) | | 2,000,000 | | 2,112,656 |
|
|
| | | | | 11,617,317 |
|
| TOTAL U.S. TREASURY OBLIGATIONS | | | |
| (Cost $27,908,856) | | | $ | 28,214,910 |
|
| |
| U.S. GOVERNMENT AGENCY OBLIGATIONS - 12.76% | | |
| Federal Home Loan Bank - 1.66% | | | | |
| 5.80% due 09/02/2008 (a) | | 2,105,000 | | 2,129,540 |
| Federal Home Loan Mortgage Corp. - 2.48% | | | |
| 4.00% due 11/15/2019 | | 135,265 | | 120,907 |
| 5.00% due 03/01/2019 to 12/01/2019 | | 900,751 | | 882,925 |
| 6.30% due 03/15/2023 | | 6,572 | | 6,586 |
| 6.50% due 04/01/2029 to 08/01/2034 | | 35,196 | | 35,812 |
| 6.625% due 09/15/2009 (a) | | 2,030,000 | | 2,119,557 |
| 7.50% due 06/01/2010 to 05/01/2028 | | 12,264 | | 12,687 |
|
|
| | | | | 3,178,474 |
| Federal National Mortgage | | | | |
| Association - 8.22% | | | | |
| 3.125% due 12/15/2007 (a) | | 541,000 | | 527,225 |
| 4.682% due 05/01/2013 | | 215,961 | | 209,621 |
| 4.86% due 01/01/2015 | | 3,013,405 | | 2,927,729 |
| 4.874% due 02/01/2013 | | 359,910 | | 352,561 |
| 5.00% due 03/01/2019 to 06/01/2019 | | 1,774,188 | | 1,740,144 |
| 5.25% due 04/15/2007 (a) | | 676,000 | | 675,545 |
| 5.50% due 08/01/2035 to 11/01/2035 | | 1,430,943 | | 1,404,983 |
| 5.636% due 12/01/2011 | | 225,987 | | 228,729 |
| 5.885% due 11/01/2011 | | 238,262 | | 243,500 |
| 6.051% due 03/01/2012 to 05/01/2012 | | 282,761 | | 290,853 |
| 6.085% due 10/01/2011 | | 155,578 | | 159,579 |
| Investment Quality Bond Fund (continued) | |
| | | Shares or | |
| | | Principal | |
| | | Amount | Value |
|
|
| |
| U.S. GOVERNMENT AGENCY | | | |
| OBLIGATIONS (continued) | | | |
| Federal National Mortgage | | | |
| Association (continued) | | | |
| 6.28% due 04/01/2011 | $ | 135,265 $ | 140,347 |
| 6.34% due 01/01/2008 | | 33,083 | 33,180 |
| 6.43% due 01/01/2008 | | 38,355 | 38,500 |
| 6.44% due 02/01/2011 | | 471,273 | 490,404 |
| 6.46% due 06/01/2009 | | 185,288 | 189,089 |
| 6.50% due 09/01/2031 | | 153 | 156 |
| 6.625% due 09/15/2009 (a) | | 850,000 | 888,208 |
| 6.80% due 10/01/2007 | | 5,254 | 5,273 |
| 7.00% due 06/01/2029 | | 588 | 606 |
|
|
| | | | 10,546,232 |
| Government National Mortgage | | | |
| Association - 0.33% | | | |
| 6.00% due 08/15/2008 to 04/15/2035 | | 125,644 | 126,733 |
| 6.50% due 06/15/2028 to 08/15/2034 | | 74,038 | 75,803 |
| 7.00% due 11/15/2031 to 05/15/2033 | | 215,479 | 222,264 |
| 8.00% due 07/15/2030 to 10/15/2030 | | 3,677 | 3,901 |
|
|
| | | | 428,701 |
| Housing & Urban Development - 0.07% | | | |
| 7.498% due 08/01/2011 | | 81,000 | 86,241 |
|
| TOTAL U.S. GOVERNMENT AGENCY OBLIGATIONS | |
| (Cost $16,522,261) | | $ | 16,369,188 |
|
| |
| FOREIGN GOVERNMENT OBLIGATIONS - 0.27% | |
| Mexico - 0.03% | | | |
| Government of Mexico | | | |
| 6.75% due 09/27/2034 | | 30,000 | 31,830 |
| South Africa - 0.12% | | | |
| Republic of South Africa | | | |
| 7.375% due 04/25/2012 (a) | | 143,000 | 153,725 |
| Trinidad and Tobago - 0.12% | | | |
| Republic of Trinidad & Tobago | | | |
| 9.75% due 07/01/2020 | | 117,000 | 157,449 |
|
| TOTAL FOREIGN GOVERNMENT OBLIGATIONS | |
| (Cost $352,807) | | $ | 343,004 |
|
| |
| CORPORATE BONDS - 41.12% | | | |
| Advertising - 0.01% | | | |
| R.H. Donnelley Corp., Series A-2 | | | |
| 6.875% due 01/15/2013 | | 10,000 | 8,975 |
| Aerospace - 0.40% | | | |
| Argo-Tech Corp. | | | |
| 9.25% due 06/01/2011 | | 5,000 | 5,162 |
| DRS Technologies, Inc. | | | |
| 6.625% due 02/01/2016 | | 5,000 | 4,863 |
| 7.625% due 02/01/2018 | | 5,000 | 5,000 |
| Goodrich Corp. | | | |
| 7.10% due 11/15/2027 | | 240,000 | 262,503 |
| Moog, Inc. | | | |
| 6.25% due 01/15/2015 | | 1,000 | 943 |
| Northrop Grumman Corp. | | | |
| 7.875% due 03/01/2026 | | 15,000 | 18,344 |
The accompanying notes are an integral part of the financial statements. 287
John Hancock Funds II
Portfolio of investments — August 31, 2006
(showing percentage of total net assets) |
| Investment Quality Bond Fund (continued) | |
| | | Shares or | |
| | | Principal | |
| | | Amount | Value |
|
|
| |
| CORPORATE BONDS (continued) | | | |
| Aerospace (continued) | | | |
| Raytheon Company | | | |
| 4.85% due 01/15/2011 | $ | 208,000 $ | 203,793 |
| Sequa Corp. | | | |
| 9.00% due 08/01/2009 | | 6,000 | 6,330 |
|
|
| | | | 506,938 |
| Agriculture - 0.38% | | | |
| Archer-Daniels-Midland Company | | | |
| 6.75% due 12/15/2027 | | 135,000 | 148,788 |
| Bunge Limited Finance Corp. | | | |
| 5.10% due 07/15/2015 | | 79,000 | 72,665 |
| Case New Holland, Inc. | | | |
| 7.125% due 03/01/2014 | | 10,000 | 9,875 |
| 9.25% due 08/01/2011 | | 12,000 | 12,720 |
| Monsanto Co. | | | |
| 5.50% due 07/30/2035 | | 125,000 | 114,106 |
| 5.50% due 08/15/2025 | | 135,000 | 125,899 |
|
|
| | | | 484,053 |
| Air Travel - 0.57% | | | |
| American Airlines | | | |
| 3.857% due 07/09/2010 | | 24,257 | 22,981 |
| Continental Airlines, Inc., Series 974A | | | |
| 6.90% due 01/02/2018 | | 125,059 | 128,077 |
| Continental Airlines, Inc., Series 981A | | | |
| 6.648% due 09/15/2017 | | 296,606 | 295,266 |
| Continental Airlines, Inc., Series ERJ1 | | | |
| 9.798% due 04/01/2021 | | 14,523 | 15,213 |
| Southwest Airlines Company | | | |
| 5.125% due 03/01/2017 | | 200,000 | 187,782 |
| 5.25% due 10/01/2014 | | 84,000 | 81,318 |
|
|
| | | | 730,637 |
| Aluminum - 0.33% | | | |
| Alcan Aluminum, Ltd. | | | |
| 6.125% due 12/15/2033 | | 27,000 | 26,558 |
| 6.45% due 03/15/2011 | | 159,000 | 164,911 |
| Alcoa, Inc. | | | |
| 6.75% due 01/15/2028 | | 208,000 | 229,829 |
|
|
| | | | 421,298 |
| Auto Parts - 0.01% | | | |
| Tenneco Automotive, Inc., Series B | | | |
| 10.25% due 07/15/2013 | | 1,000 | 1,089 |
| TRW Automotive, Inc. | | | |
| 11.00% due 02/15/2013 | | 2,000 | 2,175 |
| United Rentals North America, Inc. | | | |
| 6.50% due 02/15/2012 | | 10,000 | 9,475 |
| Visteon Corp. | | | |
| 7.00% due 03/10/2014 | | 3,000 | 2,662 |
|
|
| | | | 15,401 |
| Auto Services - 0.02% | | | |
| Avis Budget Car Rental LLC | | | |
| 7.625% due 05/15/2014 | | 15,000 | 14,250 |
| Hertz Corp., Class A | | | |
| 8.875% due 01/01/2014 | | 5,000 | 5,187 |
| Investment Quality Bond Fund (continued) | |
| | | Shares or | |
| | | Principal | |
| | | Amount | Value |
|
|
| |
| CORPORATE BONDS (continued) | | | |
| Auto Services (continued) | | | |
| Hertz Corp., Class A (continued) | | | |
| 10.50% due 01/01/2016 | $ | 5,000 $ | 5,388 |
|
|
| | | | 24,825 |
| Automobiles - 0.49% | | | |
| Chrysler Corp. | | | |
| 7.45% due 02/01/2097 | | 135,000 | 137,944 |
| DaimlerChrysler N.A. Holding Corp. | | | |
| 4.75% due 01/15/2008 | | 305,000 | 301,749 |
| 8.50% due 01/18/2031 | | 150,000 | 180,127 |
| Ford Motor Company | | | |
| 7.45% due 07/16/2031 (a) | | 10,000 | 7,850 |
| General Motors Corp. | | | |
| 8.375% due 07/15/2033 | | 4,000 | 3,350 |
|
|
| | | | 631,020 |
| Banking - 4.31% | | | |
| American Express Centurion Bank | | | |
| 4.375% due 07/30/2009 | | 250,000 | 244,888 |
| Bank of America Corp. | | | |
| 4.375% due 12/01/2010 | | 436,000 | 421,558 |
| 7.40% due 01/15/2011 | | 402,000 | 433,825 |
| BB & T Corp. | | | |
| 4.90% due 06/30/2017 | | 192,000 | 180,845 |
| Chase Manhattan Corp. | | | |
| 7.00% due 11/15/2009 | | 135,000 | 141,361 |
| Chevy Chase Bank | | | |
| 6.875% due 12/01/2013 | | 5,000 | 4,975 |
| China Development Bank | | | |
| 5.00% due 10/15/2015 | | 175,000 | 168,532 |
| Citicorp | | | |
| 6.375% due 11/15/2008 | | 231,000 | 236,526 |
| First Republic Bank of San Francisco | | | |
| 7.75% due 09/15/2012 | | 111,000 | 121,733 |
| First Union National Bank | | | |
| 7.80% due 08/18/2010 | | 350,000 | 379,998 |
| Frost National Bank | | | |
| 6.875% due 08/01/2011 | | 135,000 | 143,468 |
| HBOS PLC | | | |
| 6.00% due 11/01/2033 | | 210,000 | 212,863 |
| Huntington National Bank | | | |
| 4.90% due 01/15/2014 (a) | | 250,000 | 238,062 |
| National Australia Bank Ltd. | | | |
| 8.60% due 05/19/2010 | | 23,000 | 25,471 |
| National City Corp. | | | |
| 6.875% due 05/15/2019 | | 260,000 | 285,664 |
| NBD Bancorp | | | |
| 8.25% due 11/01/2024 | | 270,000 | 330,173 |
| Regions Financial Corp. | | | |
| 7.00% due 03/01/2011 | | 12,000 | 12,754 |
| Republic New York Corp. | | | |
| 9.50% due 04/15/2014 | | 135,000 | 166,269 |
| Royal Bank of Scotland Group PLC | | | |
| 6.40% due 04/01/2009 | | 696,000 | 720,663 |
| Sanwa Bank Ltd., New York Branch | | | |
| 7.40% due 06/15/2011 (a) | | 300,000 | 323,123 |
The accompanying notes are an integral part of the financial statements. 288
John Hancock Funds II
Portfolio of investments — August 31, 2006
(showing percentage of total net assets) |
| Investment Quality Bond Fund (continued) | | |
| | | Shares or | | |
| | | Principal | | |
| | | Amount | | Value |
|
|
| |
| CORPORATE BONDS (continued) | | | | |
| Banking (continued) | | | | |
| Sovereign Bancorp, Inc. | | | | |
| 4.80% due 09/01/2010 | $ | 30,000 | $ | 29,202 |
| VTB Capital SA | | | | |
| 6.25% due 07/02/2035 | | 150,000 | | 149,625 |
| Wachovia Corp. | | | | |
| 5.50% due 08/01/2035 (a) | | 250,000 | | 232,924 |
| Wells Fargo Bank NA | | | | |
| 7.55% due 06/21/2010 | | 300,000 | | 323,695 |
| |
|
| | | | | 5,528,197 |
| Broadcasting - 1.34% | | | | |
| BSkyB Finance UK Ltd. | | | | |
| 5.625% due 10/15/2015 | | 300,000 | | 291,538 |
| CanWest Media, Inc. | | | | |
| 8.00% due 09/15/2012 | | 10,000 | | 9,675 |
| Comcast Cable Communications | | | | |
| 8.50% due 05/01/2027 | | 189,000 | | 228,955 |
| CSC Holdings, Inc. | | | | |
| 7.625% due 07/15/2018 (a) | | 21,000 | | 21,184 |
| Grupo Televisa S.A. | | | | |
| 6.625% due 03/18/2025 (a) | | 250,000 | | 250,707 |
| Liberty Media Corp. | | | | |
| 5.70% due 05/15/2013 (a) | | 4,000 | | 3,758 |
| 7.875% due 07/15/2009 | | 9,000 | | 9,407 |
| 8.25% due 02/01/2030 | | 2,000 | | 1,990 |
| News America Holdings, Inc. | | | | |
| 7.75% due 01/20/2024 (a) | | 328,000 | | 357,659 |
| Viacom, Inc. | | | | |
| 6.25% due 04/30/2016 | | 277,000 | | 273,408 |
| 7.875% due 07/30/2030 | | 250,000 | | 271,806 |
| |
|
| | | | | 1,720,087 |
| Building Materials & Construction - 0.46% | | | |
| American Standard, Inc. | | | | |
| 7.375% due 02/01/2008 | | 135,000 | | 137,701 |
| Lowe's Companies, Inc. | | | | |
| 6.50% due 03/15/2029 | | 273,000 | | 295,964 |
| SCL Terminal Aereo Santiago | | | | |
| 6.95% due 07/01/2012 | | 148,237 | | 150,843 |
| |
|
| | | | | 584,508 |
| Business Services - 0.21% | | | | |
| CB Richard Ellis Services, Inc. | | | | |
| 9.75% due 05/15/2010 | | 1,000 | | 1,067 |
| FedEx Corp., Series 981A | | | | |
| 6.72% due 01/15/2022 | | 157,637 | | 168,491 |
| GTECH Holdings Corp. | | | | |
| 4.75% due 10/15/2010 | | 45,000 | | 44,981 |
| Invensys PLC | | | | |
| 9.875% due 03/15/2011 | | 6,000 | | 6,480 |
| Sungard Data Systems, Inc. | | | | |
| 9.125% due 08/15/2013 | | 23,000 | | 23,748 |
| 10.25% due 08/15/2015 | | 4,000 | | 4,085 |
| Xerox Corp. | | | | |
| 6.40% due 03/15/2016 | | 10,000 | | 9,901 |
| 7.20% due 04/01/2016 | | 15,000 | | 15,600 |
| |
|
| | | | | 274,353 |
| Investment Quality Bond Fund (continued) | | |
| | | Shares or | | |
| | | Principal | | |
| | | Amount | | Value |
|
|
| |
| CORPORATE BONDS (continued) | | | | |
| Cable and Television - 1.30% | | | | |
| Cablevision Systems Corp., Series B | | | | |
| 8.00% due 04/15/2012 | $ | 13,000 | $ | 13,065 |
| Charter Communications Holdings I LLC | | | | |
| 11.00% due 10/01/2015 | | 25,000 | | 22,188 |
| Coleman Cable, Inc. | | | | |
| 9.875% due 10/01/2012 | | 15,000 | | 14,606 |
| Comcast Corp. | | | | |
| 5.85% due 11/15/2015 | | 350,000 | | 345,786 |
| 6.50% due 11/15/2035 | | 175,000 | | 172,547 |
| Cox Communications, Inc. | | | | |
| 7.125% due 10/01/2012 | | 208,000 | | 220,051 |
| Cox Enterprises, Inc. | | | | |
| 4.375% due 05/01/2008 | | 64,000 | | 62,666 |
| Echostar DBS Corp. | | | | |
| 6.375% due 10/01/2011 | | 6,000 | | 5,842 |
| LIN Television Corp. | | | | |
| 6.50% due 05/15/2013 | | 5,000 | | 4,613 |
| LIN Television Corp., Series B | | | | |
| 6.50% due 05/15/2013 | | 7,000 | | 6,458 |
| Mediacom Broadband LLC | | | | |
| 8.50% due 10/15/2015 | | 17,000 | | 16,830 |
| Mediacom LLC/Mediacom Capital Corp. | | | | |
| 7.875% due 02/15/2011 (a) | | 5,000 | | 4,912 |
| 9.50% due 01/15/2013 | | 4,000 | | 4,110 |
| Quebecor Media, Inc. | | | | |
| 7.75% due 03/15/2016 | | 10,000 | | 9,900 |
| Rogers Cable, Inc. | | | | |
| 6.25% due 06/15/2013 | | 10,000 | | 9,737 |
| Shaw Communications, Inc. | | | | |
| 8.25% due 04/11/2010 | | 4,000 | | 4,205 |
| Sinclair Broadcast Group, Inc. | | | | |
| 8.00% due 03/15/2012 | | 6,000 | | 6,075 |
| TCI Communications, Inc. | | | | |
| 8.75% due 08/01/2015 | | 183,000 | | 214,292 |
| Time Warner, Inc. | | | | |
| 7.25% due 10/15/2017 | | 60,000 | | 63,951 |
| 7.70% due 05/01/2032 | | 427,000 | | 466,775 |
| |
|
| | | | | 1,668,609 |
| Cellular Communications - 0.62% | | | | |
| American Cellular Corp. | | | | |
| 10.00% due 08/01/2011 | | 6,000 | | 6,240 |
| AT&T Wireless Services, Inc. | | | | |
| 7.875% due 03/01/2011 | | 94,000 | | 102,562 |
| 8.75% due 03/01/2031 | | 217,000 | | 274,274 |
| Cingular Wireless LLC | | | | |
| 7.125% due 12/15/2031 | | 67,000 | | 72,434 |
| Cingular Wireless Services, Inc. | | | | |
| 8.125% due 05/01/2012 | | 56,000 | | 62,698 |
| Dobson Cellular Systems, Inc. | | | | |
| 8.375% due 11/01/2011 (a) | | 15,000 | | 15,525 |
| Rogers Wireless, Inc. | | | | |
| 9.625% due 05/01/2011 | | 27,000 | | 30,173 |
| Vodafone Group PLC | | | | |
| 7.75% due 02/15/2010 | | 211,000 | | 225,603 |
| |
|
| | | | | 789,509 |
The accompanying notes are an integral part of the financial statements. 289
John Hancock Funds II
Portfolio of investments — August 31, 2006
(showing percentage of total net assets) |
| Investment Quality Bond Fund (continued) | | |
| | | Shares or | | |
| | | Principal | | |
| | | Amount | | Value |
|
|
| |
| CORPORATE BONDS (continued) | | | | |
| Chemicals - 0.77% | | | | |
| Agrium Inc. | | | | |
| 7.125% due 05/23/2036 | $ | 225,000 | $ | 235,193 |
| Cytec Industries, Inc. | | | | |
| 4.60% due 07/01/2013 | | 135,000 | | 123,711 |
| 5.50% due 10/01/2010 | | 90,000 | | 88,966 |
| Dow Chemical Company | | | | |
| 5.75% due 12/15/2008 | | 54,000 | | 54,561 |
| 6.00% due 10/01/2012 | | 154,000 | | 158,306 |
| Equistar Chemicals LP | | | | |
| 10.625% due 05/01/2011 | | 8,000 | | 8,600 |
| IMC Global, Inc. | | | | |
| 7.30% due 01/15/2028 | | 3,000 | | 2,670 |
| IMC Global, Inc., Series B | | | | |
| 10.875% due 06/01/2008 | | 43,000 | | 45,903 |
| 11.25% due 06/01/2011 | | 4,000 | | 4,225 |
| Lyondell Chemical Company, Series A | | | | |
| 9.625% due 05/01/2007 | | 9,000 | | 9,180 |
| Methanex Corp. | | | | |
| 8.75% due 08/15/2012 | | 4,000 | | 4,250 |
| Millennium America, Inc. | | | | |
| 9.25% due 06/15/2008 | | 4,000 | | 4,070 |
| Nalco Company | | | | |
| 7.75% due 11/15/2011 | | 4,000 | | 4,070 |
| Potash Corp. | | | | |
| 4.875% due 03/01/2013 | | 250,000 | | 240,919 |
| |
|
| | | | | 984,624 |
| Coal - 0.00% | | | | |
| Massey Energy Company | | | | |
| 6.625% due 11/15/2010 | | 2,000 | | 1,970 |
| Containers & Glass - 0.02% | | | | |
| Ball Corp. | | | | |
| 6.625% due 03/15/2018 | | 5,000 | | 4,812 |
| Crown Americas LLC | | | | |
| 7.625% due 11/15/2013 | | 5,000 | | 5,025 |
| 7.75% due 11/15/2015 | | 5,000 | | 5,025 |
| Owens-Brockway Glass Container, Inc. | | | | |
| 8.25% due 05/15/2013 | | 16,000 | | 16,200 |
| |
|
| | | | | 31,062 |
| Correctional Facilities - 0.00% | | | | |
| Corrections Corp. of America | | | | |
| 6.25% due 03/15/2013 | | 2,000 | | 1,933 |
| Crude Petroleum & Natural Gas - 0.19% | | | | |
| Burlington Resources Finance Company | | | | |
| 7.40% due 12/01/2031 | | 159,000 | | 189,847 |
| Chesapeake Energy Corp. | | | | |
| 6.50% due 08/15/2017 | | 10,000 | | 9,275 |
| 6.625% due 01/15/2016 | | 12,000 | | 11,520 |
| 7.50% due 09/15/2013 | | 3,000 | | 3,030 |
| 7.625% due 07/15/2013 | | 10,000 | | 10,200 |
| PetroHawk Energy Corp. | | | | |
| 9.125% due 07/15/2013 | | 15,000 | | 15,262 |
| Premcor Refining Group, Inc. | | | | |
| 6.75% due 05/01/2014 | | 4,000 | | 4,103 |
| |
|
| | | | | 243,237 |
| Investment Quality Bond Fund (continued) | | |
| | | Shares or | | |
| | | Principal | | |
| | | Amount | | Value |
|
|
| |
| CORPORATE BONDS (continued) | | | | |
| Domestic Oil - 0.56% | | | | |
| Delta Petroleum Corp. | | | | |
| 7.00% due 04/01/2015 | $ | 25,000 | $ | 23,625 |
| Devon Financing Corp., ULC | | | | |
| 6.875% due 09/30/2011 | | 305,000 | | 323,449 |
| Exco Resources, Inc. | | | | |
| 7.25% due 01/15/2011 | | 4,000 | | 3,890 |
| Hess Corp. | | | | |
| 7.30% due 08/15/2031 | | 2,000 | | 2,225 |
| Magnum Hunter Resources, Inc. | | | | |
| 9.60% due 03/15/2012 | | 2,000 | | 2,120 |
| Motiva Enterprises LLC | | | | |
| 5.20% due 09/15/2012 | | 148,000 | | 147,076 |
| Valero Energy Corp. | | | | |
| 8.75% due 06/15/2030 | | 162,000 | | 208,154 |
| Whiting Petroleum Corp. | | | | |
| 7.00% due 02/01/2014 | | 3,000 | | 2,955 |
| 7.25% due 05/01/2013 | | 3,000 | | 2,963 |
| |
|
| | | | | 716,457 |
| |
| Drugs & Health Care - 0.03% | | | | |
| Allegiance Corp. | | | | |
| 7.00% due 10/15/2026 | | 13,000 | | 13,874 |
| Biovail Corp. | | | | |
| 7.875% due 04/01/2010 | | 10,000 | | 9,975 |
| Rite Aid Corp. | | | | |
| 8.125% due 05/01/2010 | | 18,000 | | 18,068 |
| |
|
| | | | | 41,917 |
| |
| Electrical Equipment - 0.31% | | | | |
| Exelon Generation Company LLC | | | | |
| 5.35% due 01/15/2014 | | 187,000 | | 182,538 |
| Nisource Finance Corp. | | | | |
| 3.20% due 11/01/2006 | | 81,000 | | 80,698 |
| Northern States Power Co. | | | | |
| 6.25% due 06/01/2036 | | 125,000 | | 130,760 |
| |
|
| | | | | 393,996 |
| |
| Electrical Utilities - 2.36% | | | | |
| AES Corp. | | | | |
| 9.00% due 05/15/2015 | | 14,000 | | 15,102 |
| Alabama Power Company | | | | |
| 5.875% due 12/01/2022 | | 63,000 | | 63,105 |
| Arizona Public Service Company | | | | |
| 6.375% due 10/15/2011 | | 135,000 | | 138,361 |
| Avista Corp. | | | | |
| 9.75% due 06/01/2008 | | 17,000 | | 18,015 |
| Carolina Power & Light Company | | | | |
| 6.50% due 07/15/2012 | | 371,000 | | 388,145 |
| CMS Energy Corp. | | | | |
| 8.50% due 04/15/2011 | | 4,000 | | 4,290 |
| Commonwealth Edison Company | | | | |
| 6.15% due 03/15/2012 | | 92,000 | | 94,011 |
| Duke Energy Corp. | | | | |
| 5.375% due 01/01/2009 | | 135,000 | | 134,922 |
| Edison Mission Energy | | | | |
| 7.75% due 06/15/2016 | | 20,000 | | 20,000 |
| Georgia Power Company | | | | |
| 5.25% due 12/15/2015 | | 150,000 | | 147,494 |
The accompanying notes are an integral part of the financial statements. 290
John Hancock Funds II
Portfolio of investments — August 31, 2006
(showing percentage of total net assets) |
| Investment Quality Bond Fund (continued) | | |
| | | Shares or | | |
| | | Principal | | |
| | | Amount | | Value |
|
|
| |
| CORPORATE BONDS (continued) | | | | |
| Electrical Utilities (continued) | | | | |
| Midwest Generation LLC | | | | |
| 8.75% due 05/01/2034 | $ | 6,000 | $ | 6,390 |
| Nevada Power Company | | | | |
| 9.00% due 08/15/2013 | | 3,000 | | 3,270 |
| New York State Electric & Gas Corp. | | | | |
| 5.75% due 05/01/2023 | | 74,000 | | 70,359 |
| Northern States Power Co. | | | | |
| 6.50% due 03/01/2028 | | 67,000 | | 71,791 |
| NSTAR | | | | |
| 8.00% due 02/15/2010 | | 270,000 | | 291,302 |
| Ohio Edison Company | | | | |
| 4.00% due 05/01/2008 | | 312,000 | | 304,736 |
| Old Dominion Electric Coop. | | | | |
| 6.25% due 06/01/2011 | | 141,000 | | 146,532 |
| Oncor Electric Delivery Company | | | | |
| 6.375% due 05/01/2012 | | 158,000 | | 162,364 |
| Pacificorp | | | | |
| 6.375% due 05/15/2008 | | 135,000 | | 137,220 |
| Pacificorp Australia LLC | | | | |
| 6.15% due 01/15/2008 | | 111,000 | | 112,038 |
| PSEG Power LLC | | | | |
| 8.625% due 04/15/2031 | | 154,000 | | 197,354 |
| Puget Sound Energy, Inc. | | | | |
| 7.00% due 03/09/2029 | | 54,000 | | 59,038 |
| Reliant Energy, Inc. | | | | |
| 6.75% due 12/15/2014 | | 15,000 | | 14,138 |
| Southern California Edison Company | | | | |
| 6.00% due 01/15/2034 | | 201,000 | | 202,115 |
| TXU Corp., Series O | | | | |
| 4.80% due 11/15/2009 | | 74,000 | | 71,515 |
| TXU Corp., Series P | | | | |
| 5.55% due 11/15/2014 | | 26,000 | | 24,243 |
| Wisconsin Electric Power Company | | | | |
| 6.50% due 06/01/2028 | | 94,000 | | 100,751 |
| Wisconsin Energy Corp. | | | | |
| 6.20% due 04/01/2033 | | 33,000 | | 33,178 |
| |
|
| | | | | 3,031,779 |
| Energy - 0.47% | | | | |
| Aquila, Inc. | | | | |
| 9.95 due 02/01/2011 | | 10,000 | | 11,058 |
| Midamerican Funding LLC | | | | |
| 6.75% due 03/01/2011 | | 260,000 | | 273,397 |
| Mirant North America LLC | | | | |
| 7.375% due 12/31/2013 | | 20,000 | | 19,800 |
| NRG Energy, Inc. | | | | |
| 7.25% due 02/01/2014 | | 5,000 | | 4,938 |
| 7.375% due 02/01/2016 | | 20,000 | | 19,700 |
| Peabody Energy Corp. | | | | |
| 6.875% due 03/15/2013 | | 11,000 | | 10,890 |
| PPL Energy Supply LLC | | | | |
| 6.20% due 05/15/2016 (a) | | 250,000 | | 255,802 |
| TECO Energy, Inc. | | | | |
| 6.75% due 05/01/2015 | | 2,000 | | 1,992 |
| |
|
| | | | | 597,577 |
| Investment Quality Bond Fund (continued) | |
| | | Shares or | | |
| | | Principal | | |
| | | Amount | | Value |
|
|
| |
| CORPORATE BONDS (continued) | | | | |
| Financial Services - 7.66% | | | | |
| Aiful Corp. | | | | |
| 5.00% due 08/10/2010 | $ | 225,000 | $ | 216,513 |
| AMBAC Financial Group, Inc. | | | | |
| 5.95% due 12/05/2035 | | 185,000 | | 181,462 |
| American Financial Group, Inc. | | | | |
| 7.125% due 04/15/2009 | | 245,000 | | 246,576 |
| American General Finance Corp. | | | | |
| 5.375% due 10/01/2012 | | 154,000 | | 152,495 |
| Ameriprise Financial, Inc. | | | | |
| 5.65% due 11/15/2015 | | 275,000 | | 274,423 |
| Amerus Capital I | | | | |
| 8.85% due 02/01/2027 | | 101,000 | | 106,143 |
| Arch Western Finance LLC | | | | |
| 6.75% due 07/01/2013 | | 16,000 | | 15,440 |
| Associates Corp. of North America | | | | |
| 8.55% due 07/15/2009 | | 81,000 | | 87,960 |
| Beneficial Corp. | | | | |
| 8.40% due 05/15/2008 | | 47,000 | | 49,296 |
| CIT Group, Inc. | | | | |
| 5.00% due 02/01/2015 (a) | | 300,000 | | 286,804 |
| Citigroup, Inc. | | | | |
| 4.875% due 05/07/2015 | | 586,000 | | 559,591 |
| Credit Suisse First Boston USA, Inc. | | | | |
| 6.125% due 11/15/2011 | | 450,000 | | 464,712 |
| E*Trade Financial Corp. | | | | |
| 7.375% due 09/15/2013 | | 2,000 | | 2,020 |
| 8.00% due 06/15/2011 | | 3,000 | | 3,112 |
| Equitable Companies, Inc. | | | | |
| 7.00% due 04/01/2028 | | 235,000 | | 258,074 |
| Erac USA Finance Company | | | | |
| 8.00% due 01/15/2011 | | 534,000 | | 583,924 |
| Farmers Exchange Capital | | | | |
| 7.05% due 07/15/2028 | | 350,000 | | 351,570 |
| Ford Motor Credit Company | | | | |
| 6.625% due 06/16/2008 | | 20,000 | | 19,668 |
| 7.00% due 10/01/2013 (a) | | 6,000 | | 5,600 |
| General Electric Capital Corp. | | | | |
| 6.125% due 02/22/2011 | | 67,000 | | 69,290 |
| 6.75% due 03/15/2032 | | 634,000 | | 715,536 |
| General Motors Acceptance Corp. | | | | |
| 6.875% due 09/15/2011 | | 135,000 | | 132,959 |
| 8.00% due 11/01/2031 (a) | | 30,000 | | 30,321 |
| Goldman Sachs Group, Inc. | | | | |
| 6.125% due 02/15/2033 | | 304,000 | | 299,308 |
| 6.875% due 01/15/2011 | | 208,000 | | 219,621 |
| Hartford Financial Services Group, Inc. | | | | |
| 7.90% due 06/15/2010 | | 27,000 | | 29,222 |
| Household Finance Corp. | | | | |
| 6.375% due 11/27/2012 | | 410,000 | | 427,722 |
| 7.00% due 05/15/2012 | | 283,000 | | 304,416 |
| International Lease Finance Corp. | | | | |
| 5.75% due 10/15/2006 | | 94,000 | | 94,008 |
| 5.875% due 05/01/2013 | | 150,000 | | 152,863 |
| John Deere Capital Corp. | | | | |
| 7.00% due 03/15/2012 | | 104,000 | | 111,611 |
The accompanying notes are an integral part of the financial statements. 291
John Hancock Funds II
Portfolio of investments — August 31, 2006
(showing percentage of total net assets) |
| Investment Quality Bond Fund (continued) | | |
| | | Shares or | | |
| | | Principal | | |
| | | Amount | | Value |
|
|
| |
| CORPORATE BONDS (continued) | | | | |
| Financial Services (continued) | | | | |
| JP Morgan Chase Capital XV | | | | |
| 5.875% due 03/15/2035 | $ | 467,000 | $ | 442,744 |
| JSG Funding PLC | | | | |
| 9.625% due 10/01/2012 | | 2,000 | | 2,087 |
| Lehman Brothers Holdings, Inc. | | | | |
| 4.375% due 11/30/2010 (a) | | 117,000 | | 112,883 |
| Mizuho Financial Group, Cayman | | | | |
| 5.79% due 04/15/2014 | | 246,000 | | 247,053 |
| Morgan Stanley | | | | |
| 4.75% due 04/01/2014 | | 401,000 | | 378,949 |
| 6.75% due 04/15/2011 | | 106,000 | | 111,659 |
| Morgan Stanley Dean Witter | | | | |
| 6.60% due 04/01/2012 | | 135,000 | | 142,396 |
| Nationwide Financial Services, Inc. | | | | |
| 6.25% due 11/15/2011 | | 196,000 | | 202,602 |
| Pemex Finance, Ltd. | | | | |
| 8.875% due 11/15/2010 | | 162,000 | | 173,839 |
| Sun Canada Financial Company | | | | |
| 7.25% due 12/15/2015 | | 229,000 | | 247,796 |
| Sunamerica, Inc. | | | | |
| 8.125% due 04/28/2023 | | 135,000 | | 166,604 |
| TIAA Global Markets | | | | |
| 4.125% due 11/15/2007 | | 200,000 | | 196,348 |
| UFJ Finance Aruba AEC | | | | |
| 6.75% due 07/15/2013 | | 111,000 | | 118,129 |
| United States Bancorp Oregon | | | | |
| 7.50% due 06/01/2026 | | 700,000 | | 826,929 |
| |
|
| | | | | 9,822,278 |
| Food & Beverages - 1.32% | | | | |
| Cia Brasileira de Bebidas | | | | |
| 8.75% due 09/15/2013 | | 371,000 | | 426,650 |
| Conagra, Inc. | | | | |
| 6.75% due 09/15/2011 | | 275,000 | | 289,048 |
| Constellation Brands, Inc. | | | | |
| 7.25% due 09/01/2016 | | 15,000 | | 15,075 |
| General Mills, Inc. | | | | |
| 6.00% due 02/15/2012 | | 86,000 | | 88,036 |
| Kraft Foods, Inc. | | | | |
| 5.625% due 11/01/2011 | | 160,000 | | 161,016 |
| 6.50% due 11/01/2031 | | 266,000 | | 282,053 |
| Molson Coors Capital Financial | | | | |
| 4.85% due 09/22/2010 | | 117,000 | | 114,521 |
| Pepsi Bottling Group, Inc., Series B | | | | |
| 7.00% due 03/01/2029 | | 142,000 | | 160,927 |
| Tricon Global Restaurants, Inc. | | | | |
| 7.65% due 05/15/2008 | | 147,000 | | 151,918 |
| |
|
| | | | | 1,689,244 |
| Forest Products - 0.29% | | | | |
| Weyerhaeuser Company | | | | |
| 6.75% due 03/15/2012 | | 308,000 | | 322,112 |
| 7.95% due 03/15/2025 | | 40,000 | | 43,580 |
| |
|
| | | | | 365,692 |
| Funeral Services - 0.01% | | | | |
| Service Corp. International | | | | |
| 7.00% due 06/15/2017 | | 20,000 | | 19,150 |
| Investment Quality Bond Fund (continued) | | |
| | | Shares or | | |
| | | Principal | | |
| | | Amount | | Value |
|
|
| |
| CORPORATE BONDS (continued) | | | | |
| Gas & Pipeline Utilities - 0.58% | | | | |
| Duke Energy Field Services | | | | |
| 5.75% due 11/15/2006 | $ | 33,000 | $ | 33,006 |
| El Paso Production Holding Company | | | | |
| 7.75% due 06/01/2013 | | 10,000 | | 10,150 |
| Kinder Morgan Energy Partners LP | | | | |
| 7.125% due 03/15/2012 | | 208,000 | | 219,361 |
| National Gas Company | | | | |
| 6.05% due 01/15/2036 | | 250,000 | | 237,569 |
| Northern Border Partners, LP | | | | |
| 7.10% due 03/15/2011 | | 135,000 | | 142,993 |
| Praxair, Inc. | | | | |
| 6.50% due 03/01/2008 | | 81,000 | | 82,463 |
| Tennessee Gas Pipeline Company | | | | |
| 8.375% due 06/15/2032 | | 5,000 | | 5,633 |
| Williams Companies, Inc. | | | | |
| 7.125% due 09/01/2011 | | 13,000 | | 13,195 |
| 7.875% due 09/01/2021 | | 1,000 | | 1,018 |
| 8.125% due 03/15/2012 | | 1,000 | | 1,055 |
| |
|
| | | | | 746,443 |
| Healthcare Products - 0.02% | | | | |
| Angiotech Pharmaceuticals, Inc. | | | | |
| 7.75% due 04/01/2014 | | 4,000 | | 3,900 |
| CDRV Investors, Inc. | | | | |
| zero coupon, Step up to 9.625% on | | | | |
| 01/01/2010 due 01/01/2015 | | 28,000 | | 20,160 |
| |
|
| | | | | 24,060 |
| Healthcare Services - 0.16% | | | | |
| DaVita, Inc. | | | | |
| 6.625% due 03/15/2013 | | 2,000 | | 1,950 |
| 7.25% due 03/15/2015 | | 2,000 | | 1,960 |
| Insight Health Services Corp. | | | | |
| 9.174% due 11/01/2011 | | 20,000 | | 18,300 |
| WellPoint, Inc. | | | | |
| 5.00% due 01/15/2011 | | 185,000 | | 181,866 |
| |
|
| | | | | 204,076 |
| Homebuilders - 0.62% | | | | |
| Beazer Homes USA, Inc. | | | | |
| 8.625% due 05/15/2011 | | 12,000 | | 12,045 |
| Centex Corp. | | | | |
| 7.875% due 02/01/2011 | | 260,000 | | 279,115 |
| D.R. Horton, Inc. | | | | |
| 7.875% due 08/15/2011 | | 225,000 | | 239,444 |
| 9.75% due 09/15/2010 (a) | | 14,000 | | 15,495 |
| KB Home | | | | |
| 6.25% due 06/15/2015 (a) | | 5,000 | | 4,507 |
| Pulte Homes, Inc. | | | | |
| 7.875% due 08/01/2011 | | 100,000 | | 107,437 |
| 8.125% due 03/01/2011 | | 125,000 | | 134,197 |
| |
|
| | | | | 792,240 |
| Hotels & Restaurants - 0.20% | | | | |
| Aztar Corp. | | | | |
| 9.00% due 08/15/2011 | | 4,000 | | 4,180 |
| Marriott International, Inc. | | | | |
| 4.625% due 06/15/2012 | | 228,000 | | 215,762 |
The accompanying notes are an integral part of the financial statements. 292
John Hancock Funds II
Portfolio of investments — August 31, 2006
(showing percentage of total net assets) |
| Investment Quality Bond Fund (continued) | | |
| | | Shares or | | |
| | | Principal | | |
| | | Amount | | Value |
|
|
| |
| CORPORATE BONDS (continued) | | | | |
| Hotels & Restaurants (continued) | | | | |
| Park Place Entertainment Corp. | | | | |
| 8.125% due 05/15/2011 | $ | 24,000 | $ | 25,260 |
| Riviera Holdings Corp. | | | | |
| 11.00% due 06/15/2010 | | 10,000 | | 10,525 |
| |
|
| | | | | 255,727 |
| |
| Household Products - 0.29% | | | | |
| Procter & Gamble, Series A | | | | |
| 9.36% due 01/01/2021 | | 295,386 | | 371,850 |
| Industrial Machinery - 0.01% | | | | |
| The Manitowoc Company, Inc. | | | | |
| 10.50% due 08/01/2012 | | 7,000 | | 7,525 |
| Industrials - 0.02% | | | | |
| Dynegy Holdings, Inc. | | | | |
| 7.125% due 05/15/2018 | | 15,000 | | 13,237 |
| Goodman Global Holding Company, Inc. | | | | |
| 7.875% due 12/15/2012 (a) | | 10,000 | | 9,375 |
| |
|
| | | | | 22,612 |
| |
| Insurance - 4.70% | | | | |
| AAG Holding Company, Inc. | | | | |
| 6.875% due 06/01/2008 | | 231,000 | | 231,232 |
| ACE Capital Trust II | | | | |
| 9.70% due 04/01/2030 | | 198,000 | | 257,645 |
| ACE INA Holdings, Inc. | | | | |
| 5.875% due 06/15/2014 | | 125,000 | | 124,802 |
| Aetna Inc. | | | | |
| 6.00% due 06/15/2016 | | 250,000 | | 254,572 |
| AIG SunAmerica Global Financing X | | | | |
| 6.90% due 03/15/2032 | | 100,000 | | 110,700 |
| Allied World Assurance Holdings Ltd. | | | | |
| 7.50% due 08/01/2016 | | 145,000 | | 148,391 |
| Allstate Corp. | | | | |
| 5.55% due 05/09/2035 | | 294,000 | | 272,430 |
| Cigna Corp. | | | | |
| 7.875% due 05/15/2027 | | 11,000 | | 12,738 |
| Citizens Property Insurance Corp. | | | | |
| 7.125% due 02/25/2019 | | 503,000 | | 562,553 |
| Dai Ichi Mutual Life Insurance Company | | | | |
| 5.73% due 03/17/2014 | | 200,000 | | 198,778 |
| Equitable Life Assurance Society | | | | |
| 7.70% due 12/01/2015 | | 250,000 | | 285,082 |
| Everest Reinsurance Holdings, Inc. | | | | |
| 8.75% due 03/15/2010 | | 394,000 | | 431,340 |
| Fidelity National Title Group, Inc. | | | | |
| 7.30% due 08/15/2011 | | 81,000 | | 84,233 |
| Jackson National Life Insurance Company | | | | |
| 8.15% due 03/15/2027 | | 377,000 | | 456,306 |
| Liberty Mutual Insurance Company | | | | |
| 7.697% due 10/15/2097 | | 429,000 | | 424,920 |
| Metlife, Inc. | | | | |
| 5.375% due 12/15/2012 | | 150,000 | | 149,458 |
| 5.70% due 06/15/2035 | | 208,000 | | 197,714 |
| Nationwide Mutual Insurance Company | | | | |
| 8.25% due 12/01/2031 | | 260,000 | | 311,966 |
| Navigators Group, Inc. | | | | |
| 7.00% due 05/01/2016 (a) | | 59,000 | | 59,858 |
| Investment Quality Bond Fund (continued) | | |
| | | Shares or | | |
| | | Principal | | |
| | | Amount | | Value |
|
|
| |
| CORPORATE BONDS (continued) | | | | |
| Insurance (continued) | | | | |
| New York Life Insurance Company | | | | |
| 5.875% due 05/15/2033 | $ | 100,000 | $ | 100,191 |
| Ohio National Life Insurance Company | | | | |
| 8.50% due 05/15/2026 | | 155,000 | | 181,316 |
| Premium Asset Trust | | | | |
| 4.125% due 03/12/2009 | | 87,000 | | 81,874 |
| Principal Life Global Funding I | | | | |
| 6.125% due 10/15/2033 | | 108,000 | | 110,520 |
| Prudential Financial | | | | |
| 7.65% due 07/01/2007 | | 200,000 | | 203,878 |
| Reinsurance Group of America, Inc. | | | | |
| 6.75% due 12/15/2011 | | 135,000 | | 140,022 |
| Safeco Corp. | | | | |
| 4.875% due 02/01/2010 | | 132,000 | | 130,120 |
| 7.25% due 09/01/2012 | | 18,000 | | 19,597 |
| The St. Paul Companies, Inc. | | | | |
| 5.50% due 12/01/2015 | | 55,000 | | 54,068 |
| 5.75% due 03/15/2007 | | 127,000 | | 127,223 |
| W.R. Berkley Corp. | | | | |
| 5.125% due 09/30/2010 | | 54,000 | | 53,200 |
| 5.60% due 05/15/2015 (a) | | 263,000 | | 255,410 |
| |
|
| | | | | 6,032,137 |
| International Oil - 0.31% | | | | |
| Canadian Natural Resources, Ltd. | | | | |
| 6.45% due 06/30/2033 | | 37,000 | | 37,768 |
| Canadian Oil Sands | | | | |
| 7.90% due 09/01/2021 | | 135,000 | | 157,218 |
| Kerr-McGee Corp. | | | | |
| 7.125% due 10/15/2027 | | 15,000 | | 15,963 |
| Newfield Exploration Co. | | | | |
| 6.625% due 04/15/2016 | | 10,000 | | 9,725 |
| Pemex Project Funding Master Trust | | | | |
| 9.125% due 10/13/2010 | | 150,000 | | 167,250 |
| Pioneer Natural Resources Company | | | | |
| 6.875% due 05/01/2018 | | 15,000 | | 14,814 |
| |
|
| | | | | 402,738 |
| Leisure Time - 0.09% | | | | |
| AMC Entertainment, Inc. | | | | |
| 11.00% due 02/01/2016 (a) | | 15,000 | | 16,294 |
| Majestic Star Casino LLC | | | | |
| 9.75% due 01/15/2011 | | 15,000 | | 14,663 |
| Mandalay Resort Group | | | | |
| 10.25% due 08/01/2007 | | 7,000 | | 7,245 |
| MGM Mirage, Inc. | | | | |
| 6.00% due 10/01/2009 | | 20,000 | | 19,550 |
| Movie Gallery, Inc. | | | | |
| 11.00% due 05/01/2012 | | 2,000 | | 1,335 |
| MTR Gaming Group, Inc. | | | | |
| 9.00% due 06/01/2012 | | 10,000 | | 10,075 |
| OED Corp./ Diamond Jo | | | | |
| 8.75% due 04/15/2012 | | 15,000 | | 14,962 |
| Seneca Gaming Corp. | | | | |
| 7.25% due 05/01/2012 | | 1,000 | | 982 |
| Station Casinos, Inc. | | | | |
| 6.00% due 04/01/2012 | | 5,000 | | 4,781 |
The accompanying notes are an integral part of the financial statements. 293
John Hancock Funds II
Portfolio of investments — August 31, 2006
(showing percentage of total net assets) |
| Investment Quality Bond Fund (continued) | | |
| | | Shares or | | |
| | | Principal | | |
| | | Amount | | Value |
|
|
| |
| CORPORATE BONDS (continued) | | | | |
| Leisure Time (continued) | | | | |
| Station Casinos, Inc. (continued) | | | | |
| 6.625% due 03/15/2018 | $ | 5,000 | $ | 4,463 |
| 6.875% due 03/01/2016 | | 11,000 | | 10,189 |
| Wynn Las Vegas LLC | | | | |
| 6.625% due 12/01/2014 | | 9,000 | | 8,595 |
| |
|
| | | | | 113,134 |
| |
| Life Sciences - 0.00% | | | | |
| Fisher Scientific International, Inc. | | | | |
| 6.125% due 07/01/2015 | | 4,000 | | 3,955 |
| 6.75% due 08/15/2014 | | 1,000 | | 1,014 |
| |
|
| | | | | 4,969 |
| |
| Manufacturing - 0.50% | | | | |
| Koppers, Inc. | | | | |
| 9.875% due 10/15/2013 | | 1,000 | | 1,083 |
| Siemens Financierings NV | | | | |
| 5.75% due 10/17/2016 | | 300,000 | | 303,626 |
| Tyco International Group SA | | | | |
| 6.75% due 02/15/2011 | | 325,000 | | 342,370 |
| |
|
| | | | | 647,079 |
| |
| Medical-Hospitals - 0.38% | | | | |
| HCA, Inc. | | | | |
| 6.375% due 01/15/2015 | | 20,000 | | 15,900 |
| 7.875% due 02/01/2011 | | 20,000 | | 19,050 |
| Laboratory Corp. of America Holdings | | | | |
| 5.625% due 12/15/2015 | | 200,000 | | 197,074 |
| Quest Diagnostics, Inc. | | | | |
| 5.45% due 11/01/2015 | | 125,000 | | 121,399 |
| 7.50% due 07/12/2011 | | 100,000 | | 108,270 |
| Tenet Healthcare Corp. | | | | |
| 9.875% due 07/01/2014 | | 25,000 | | 24,375 |
| Triad Hospitals, Inc. | | | | |
| 7.00% due 05/15/2012 | | 4,000 | | 3,930 |
| |
|
| | | | | 489,998 |
| |
| Metal & Metal Products - 0.19% | | | | |
| FastenTech, Inc. | | | | |
| 11.50% due 05/01/2011 | | 10,000 | | 10,200 |
| Hawk Corp. | | | | |
| 8.75% due 11/01/2014 | | 2,000 | | 2,000 |
| Inco, Ltd. | | | | |
| 5.70% due 10/15/2015 | | 233,000 | | 226,069 |
| Novelis, Inc. | | | | |
| 7.25% due 02/15/2015 | | 3,000 | | 2,850 |
| |
|
| | | | | 241,119 |
| |
| Mining - 0.16% | | | | |
| Corporacion Nacional Del Cobre de Chile - | | | | |
| CODELCO | | | | |
| 6.375% due 11/30/2012 (a) | | 200,000 | | 207,582 |
| Newspapers - 0.10% | | | | |
| News America Holdings, Inc. | | | | |
| 9.25% due 02/01/2013 (a) | | 109,000 | | 128,340 |
| Office Furnishings & Supplies - 0.00% | | | | |
| IKON Office Solutions, Inc. | | | | |
| 7.75% due 09/15/2015 | | 5,000 | | 5,025 |
| Investment Quality Bond Fund (continued) | | |
| | | Shares or | | |
| | | Principal | | |
| | | Amount | | Value |
|
|
| |
| CORPORATE BONDS (continued) | | | | |
| Paper - 0.24% | | | | |
| Abitibi-Consolidated, Inc. | | | | |
| 8.55% due 08/01/2010 (a) | $ | 9,000 | $ | 8,887 |
| Bowater Canada Finance Corp. | | | | |
| 7.95% due 11/15/2011 (a) | | 16,000 | | 15,360 |
| Georgia-Pacific Corp. | | | | |
| 8.00% due 01/15/2024 | | 7,000 | | 6,895 |
| Norske Skog Canada, Ltd. | | | | |
| 8.625% due 06/15/2011 | | 5,000 | | 4,913 |
| Temple-Inland, Inc. | | | | |
| 6.375% due 01/15/2016 | | 100,000 | | 102,600 |
| 6.625% due 01/15/2018 | | 125,000 | | 129,428 |
| Willamette Industries, Inc. | | | | |
| 7.00% due 02/01/2018 | | 40,000 | | 41,786 |
| |
|
| | | | | 309,869 |
| Petroleum Services - 0.66% | | | | |
| Baker Hughes, Inc. | | | | |
| 6.875% due 01/15/2029 | | 27,000 | | 30,243 |
| Halliburton Company | | | | |
| 5.50% due 10/15/2010 | | 192,000 | | 192,757 |
| Hornbeck Offshore Services, Inc. | | | | |
| 6.125% due 12/01/2014 | | 3,000 | | 2,797 |
| Noram Energy Corp. | | | | |
| 6.50% due 02/01/2008 | | 263,000 | | 265,960 |
| Petroleum Export, Ltd. | | | | |
| 5.265% due 06/15/2011 | | 113,800 | | 111,731 |
| Pride International, Inc. | | | | |
| 7.375% due 07/15/2014 | | 5,000 | | 5,087 |
| XTO Energy, Inc. | | | | |
| 4.90% due 02/01/2014 | | 250,000 | | 236,827 |
| |
|
| | | | | 845,402 |
| Pharmaceuticals - 0.37% | | | | |
| AmerisourceBergen Corp. | | | | |
| 5.625% due 09/15/2012 | | 3,000 | | 2,919 |
| 5.875% due 09/15/2015 | | 3,000 | | 2,907 |
| Athena Neurosciences, Inc. | | | | |
| 7.25% due 02/21/2008 | | 3,000 | | 2,978 |
| Mylan Laboratories, Inc. | | | | |
| 6.375% due 08/15/2015 | | 4,000 | | 3,855 |
| Omnicare, Inc. | | | | |
| 6.75% due 12/15/2013 | | 5,000 | | 4,800 |
| 6.875% due 12/15/2015 | | 5,000 | | 4,781 |
| Schering Plough Corp. | | | | |
| 5.55% due 12/01/2013 | | 85,000 | | 84,837 |
| 6.75% due 12/01/2033 (b) | | 344,000 | | 373,574 |
| |
|
| | | | | 480,651 |
| Publishing - 0.10% | | | | |
| Dex Media East LLC | | | | |
| 12.125% due 11/15/2012 | | 4,000 | | 4,460 |
| Dex Media, Inc. | | | | |
| zero coupon, Step up to 9.00% on | | | | |
| 11/15/2008 due 11/15/2013 | | 7,000 | | 5,827 |
| 8.00% due 11/15/2013 | | 15,000 | | 14,925 |
| E.W. Scripps Company | | | | |
| 6.625% due 10/15/2007 | | 67,000 | | 67,343 |
The accompanying notes are an integral part of the financial statements. 294
John Hancock Funds II
Portfolio of investments — August 31, 2006
(showing percentage of total net assets) |
| Investment Quality Bond Fund (continued) | | |
| | | Shares or | | |
| | | Principal | | |
| | | Amount | | Value |
|
|
| |
| CORPORATE BONDS (continued) | | | | |
| Publishing (continued) | | | | |
| Scholastic Corp. | | | | |
| 5.00% due 04/15/2013 | $ | 35,000 | $ | 30,918 |
| |
|
| | | | | 123,473 |
| Railroads & Equipment - 0.13% | | | | |
| Canadian National Railway Company | | | | |
| 7.375% due 10/15/2031 | | 142,000 | | 170,771 |
| Greenbrier Companies, Inc. | | | | |
| 8.375% due 05/15/2015 | | 2,000 | | 2,015 |
| |
|
| | | | | 172,786 |
| Real Estate - 3.37% | | | | |
| AMB Property LP, REIT | | | | |
| 5.45% due 12/01/2010 | | 80,000 | | 80,367 |
| 7.50% due 06/30/2018 | | 106,000 | | 117,317 |
| Archstone-Smith Trust, REIT | | | | |
| 5.75% due 03/15/2016 | | 300,000 | | 299,843 |
| Developers Diversified Realty Corp., REIT | | | | |
| 5.375% due 10/15/2012 | | 228,000 | | 224,122 |
| Duke Realty Corp. LP, REIT | | | | |
| 5.25% due 01/15/2010 | | 275,000 | | 271,946 |
| EOP Operating LP, REIT | | | | |
| 4.65% due 10/01/2010 | | 175,000 | | 169,114 |
| ERP Operating LP, REIT | | | | |
| 5.125% due 03/15/2016 | | 201,000 | | 192,208 |
| 5.375% due 08/01/2016 | | 125,000 | | 121,441 |
| Federal Realty Investment Trust, REIT | | | | |
| 5.65% due 06/01/2016 | | 55,000 | | 54,427 |
| Health Care Property Investors, Inc., REIT | | | | |
| 6.00% due 03/01/2015 | | 175,000 | | 174,196 |
| 7.072 due 06/08/2015 (b) | | 67,000 | | 71,894 |
| Healthcare Realty Trust, Inc., REIT | | | | |
| 8.125% due 05/01/2011 | | 377,000 | | 409,368 |
| Host Marriott LP, REIT | | | | |
| 9.50% due 01/15/2007 | | 16,000 | | 16,180 |
| Kimco Realty Corp. - REIT | | | | |
| 5.584% due 11/23/2015 | | 125,000 | | 123,411 |
| Liberty Property LP, REIT | | | | |
| 7.25% due 03/15/2011 | | 377,000 | | 400,474 |
| Prologis, REIT | | | | |
| 5.625% due 11/15/2015 | | 175,000 | | 172,332 |
| Realty Income Corp., REIT | | | | |
| 5.375% due 09/15/2017 | | 135,000 | | 129,418 |
| Reckson Operating Partnership, REIT | | | | |
| 6.00% due 03/31/2016 | | 235,000 | | 234,522 |
| Regency Centers LP, REIT | | | | |
| 7.95% due 01/15/2011 | | 169,000 | | 183,873 |
| Rouse Company LP, REIT | | | | |
| 6.75% due 05/01/2013 | | 15,000 | | 14,934 |
| Simon Property Group LP, REIT | | | | |
| 5.10% due 06/15/2015 | | 129,000 | | 123,314 |
| 5.75% due 12/01/2015 | | 225,000 | | 225,095 |
| Spieker Properties LP, REIT | | | | |
| 7.25% due 05/01/2009 | | 60,000 | | 62,970 |
| United Dominion Realty Trust, Inc., REIT | | | | |
| 5.25% due 01/15/2016 (a) | | 142,000 | | 136,002 |
| 6.05% due 06/01/2013 | | 300,000 | | 302,815 |
| Investment Quality Bond Fund (continued) | | |
| | | Shares or | | |
| | | Principal | | |
| | | Amount | | Value |
|
|
| |
| CORPORATE BONDS (continued) | | | | |
| Real Estate (continued) | | | | |
| Ventas Realty LP, REIT | | | | |
| 6.75% due 06/01/2010 | $ | 2,000 | $ | 2,037 |
| 7.125% due 06/01/2015 | | 3,000 | | 3,071 |
| |
|
| | | | | 4,316,691 |
| |
| Retail - 0.28% | | | | |
| CVS Corp. | | | | |
| 5.88% due 01/10/2028 | | 360,597 | | 354,930 |
| Retail Grocery - 0.16% | | | | |
| Delhaize America, Inc. | | | | |
| 9.00% due 04/15/2031 | | 2,000 | | 2,340 |
| Kroger Co. | | | | |
| 6.75% due 04/15/2012 | | 179,000 | | 187,464 |
| Pathmark Stores, Inc. | | | | |
| 8.75% due 02/01/2012 | | 18,000 | | 17,415 |
| |
|
| | | | | 207,219 |
| |
| Retail Trade - 0.60% | | | | |
| Federated Department Stores, Inc. | | | | |
| 6.90% due 04/01/2029 (a) | | 156,000 | | 159,594 |
| Fortune Brands, Inc. | | | | |
| 5.125% due 01/15/2011 | | 245,000 | | 240,167 |
| Lazy Days RV Center, Inc. | | | | |
| 11.75% due 05/15/2012 | | 9,000 | | 8,460 |
| Neff Corp. | | | | |
| 11.25% due 06/15/2012 | | 5,000 | | 5,375 |
| Target Corp. | | | | |
| 6.35% due 01/15/2011 | | 142,000 | | 147,898 |
| Wal-Mart Stores, Inc. | | | | |
| 4.125% due 02/15/2011 | | 218,000 | | 208,700 |
| |
|
| | | | | 770,194 |
| |
| Sanitary Services - 0.02% | | | | |
| Allied Waste North America, Inc. | | | | |
| 8.50% due 12/01/2008 | | 22,000 | | 22,880 |
| Semiconductors - 0.00% | | | | |
| MagnaChip Semiconductor SA | | | | |
| 6.875% due 12/15/2011 | | 2,000 | | 1,630 |
| 8.00% due 12/15/2014 | | 3,000 | | 1,920 |
| |
|
| | | | | 3,550 |
| |
| Steel - 0.02% | | | | |
| International Steel Group, Inc. | | | | |
| 6.50% due 04/15/2014 | | 15,000 | | 14,250 |
| United States Steel LLC | | | | |
| 10.75% due 08/01/2008 | | 9,000 | | 9,697 |
| |
|
| | | | | 23,947 |
| |
| Telecommunications Equipment & | | | | |
| Services - 0.82% | | | | |
| Bellsouth Corp. | | | | |
| 4.75% due 11/15/2012 | | 302,000 | | 286,082 |
| Citizens Communications Company | | | | |
| 9.25% due 05/15/2011 | | 12,000 | | 13,125 |
| France Telecom SA | | | | |
| 7.75 due 03/01/2011 | | 267,000 | | 291,557 |
| GCI, Inc. | | | | |
| 7.25% due 02/15/2014 | | 15,000 | | 14,362 |
The accompanying notes are an integral part of the financial statements. 295
John Hancock Funds II
Portfolio of investments — August 31, 2006
(showing percentage of total net assets) |
| Investment Quality Bond Fund (continued) | | |
| | | Shares or | | |
| | | Principal | | |
| | | Amount | | Value |
|
|
| |
| CORPORATE BONDS (continued) | | | | |
| Telecommunications Equipment & | | | | |
| Services (continued) | | | | |
| Insight Midwest LP | | | | |
| 10.50% due 11/01/2010 | $ | 12,000 | $ | 12,450 |
| Insight Midwest LP/ Insight Capital, Inc. | | | | |
| 9.75% due 10/01/2009 | | 4,000 | | 4,070 |
| Intelsat Bermuda Ltd. | | | | |
| 9.25% due 06/15/2016 | | 10,000 | | 10,400 |
| Intelsat Subsidiary Holding Co., Ltd. | | | | |
| 8.25% due 01/15/2013 | | 17,000 | | 16,958 |
| 8.63% due 01/15/2015 | | 2,000 | | 2,020 |
| PanAmSat Corp. | | | | |
| 9.00% due 08/15/2014 | | 1,000 | | 1,018 |
| SBC Communications, Inc. | | | | |
| 5.875% due 08/15/2012 | | 150,000 | | 151,504 |
| Singapore Telecommunications, Ltd. | | | | |
| 7.375% due 12/01/2031 | | 208,000 | | 245,586 |
| Syniverse Technologies Inc., Series B | | | | |
| 7.75% due 08/15/2013 | | 6,000 | | 5,835 |
| United States West Communications, Inc. | | | | |
| 6.875% due 09/15/2033 | | 3,000 | | 2,685 |
| |
|
| | | | | 1,057,652 |
| |
| Telephone - 1.33% | | | | |
| Alltel Corp. | | | | |
| 7.875% due 07/01/2032 | | 40,000 | | 45,578 |
| Ameritech Capital Funding Corp. | | | | |
| 6.45% due 01/15/2018 | | 148,000 | | 149,825 |
| AT&T Corp. | | | | |
| 7.30% due 11/15/2011 (b) | | 9,000 | | 9,717 |
| 8.00% due 11/15/2031 (b) | | 2,000 | | 2,389 |
| British Telecommunications PLC | | | | |
| 8.375%, Step up to 8.625% on 12/15/2006 | | | |
| due 12/15/2010 (b) | | 156,000 | | 174,007 |
| Qwest Capital Funding, Inc. | | | | |
| 7.25% due 02/15/2011 (a) | | 5,000 | | 4,950 |
| Qwest Communications International, Inc. | | | | |
| 7.25% due 02/15/2011 | | 13,000 | | 12,886 |
| Sprint Capital Corp. | | | | |
| 6.875% due 11/15/2028 | | 402,000 | | 405,926 |
| Telecom Italia Capital SA | | | | |
| 6.00% due 09/30/2034 | | 409,000 | | 369,260 |
| Telefonica Emisones SAU | | | | |
| 7.045% due 06/20/2036 | | 175,000 | | 183,001 |
| Verizon Communications, Inc. | | | | |
| 8.75% due 11/01/2021 | | 285,000 | | 339,093 |
| Windstream Corp. | | | | |
| 8.625% due 08/01/2016 | | 10,000 | | 10,575 |
| |
|
| | | | | 1,707,207 |
| |
| Tobacco - 0.25% | | | | |
| Alliance One International, Inc. | | | | |
| 11.00% due 05/15/2012 | | 2,000 | | 2,000 |
| Altria Group, Inc. | | | | |
| 7.00% due 11/04/2013 | | 269,000 | | 292,639 |
| Reynolds American, Inc. | | | | |
| 7.25% due 06/01/2013 | | 15,000 | | 15,365 |
| Investment Quality Bond Fund (continued) | | |
| | | Shares or | | |
| | | Principal | | |
| | | Amount | | Value |
| |
|
| |
| CORPORATE BONDS (continued) | | | | |
| Tobacco (continued) | | | | |
| Reynolds American, Inc. (continued) | | | | |
| 7.30% due 07/15/2015 | $ | 6,000 | $ | 6,156 |
| |
|
| | | | | 316,160 |
|
| |
| TOTAL CORPORATE BONDS (Cost $53,612,872) | | $ | 52,738,591 |
|
| |
| MUNICIPAL BONDS - 0.73% | | | | |
| Arizona - 0.11% | | | | |
| Phoenix Arizona Civic Improvement Corp. | | | | |
| 6.30% due 07/01/2008 | | 135,000 | | 137,537 |
| California - 0.25% | | | | |
| San Bernardino County California, Series A | | | |
| 5.15% due 08/01/2011 | | 120,000 | | 119,379 |
| Southern California Public Power Authority Project, | | | |
| Series B | | | | |
| 6.93% due 05/15/2017 | | 175,000 | | 197,447 |
| |
|
| | | | | 316,826 |
| |
| Florida - 0.12% | | | | |
| Miami Beach Florida Redevelopment Agency Tax | | | |
| Increment Revenue | | | | |
| 8.95% due 12/01/2022 | | 135,000 | | 158,372 |
| Indiana - 0.01% | | | | |
| Indiana Bond Bank Revenue | | | | |
| 5.02% due 01/15/2016 | | 15,000 | | 14,574 |
| Maryland - 0.03% | | | | |
| Maryland State Transportation Authority, Ltd. | | | |
| 5.84% due 07/01/2011 | | 40,000 | | 41,164 |
| Michigan - 0.14% | | | | |
| Detroit Michigan Downtown Development Authority | | | |
| 6.20% due 07/01/2008 | | 180,000 | | 183,071 |
| New Jersey - 0.02% | | | | |
| Jersey City, NJ, Municipal Utilities Authority | | | |
| 4.55% due 05/15/2012 | | 20,000 | | 19,298 |
| New York - 0.05% | | | | |
| Sales Tax Asset Receivable Corp., Series B | | | |
| 4.25% due 10/15/2011 | | 65,000 | | 62,202 |
|
| TOTAL MUNICIPAL BONDS (Cost $955,787) | | $ | 933,044 |
|
| |
| COLLATERALIZED MORTGAGE | | | | |
| OBLIGATIONS - 9.97% | | | | |
| Asset Securitization Corp., | | | | |
| Series 1997-D5, Class A1B | | | | |
| 6.66% due 02/14/2043 | | 26,290 | | 26,320 |
| Asset Securitization Corp., | | | | |
| Series 1997-D5, Class A1D | | | | |
| 6.85% due 02/14/2043 | | 500,000 | | 525,587 |
| Banc of America Commercial Mortgage, Inc, Series | | | |
| 2006-2, Class A4 | | | | |
| 5.93% due 05/10/2045 (b) | | 500,000 | | 513,083 |
| Banc of America Commercial Mortgage, Inc., | | | |
| Series 2002-PB2 Class A4 | | | | |
| 6.186% due 06/11/2035 | | 405,797 | | 421,655 |
The accompanying notes are an integral part of the financial statements. 296
John Hancock Funds II
Portfolio of investments — August 31, 2006
(showing percentage of total net assets) |
| Investment Quality Bond Fund (continued) | | |
| | | Shares or | | |
| | | Principal | | |
| | | Amount | | Value |
| |
|
| |
| COLLATERALIZED MORTGAGE | | | | |
| OBLIGATIONS (continued) | | | | |
| Bear Stearns Commercial Mortgage Securities, | | | |
| Inc., Series 2003-T12, Class A4 | | | | |
| 4.68% due 08/13/2039 | $ | 405,797 | $ | 389,876 |
| Bear Stearns Commercial Mortgage Securities, | | | |
| Series 2006-PW12, Class AM | | | | |
| 5.93% due 09/11/2038 (b) | | 500,000 | | 512,452 |
| Bear Stearns Commercial Mortgage Securities, | | | |
| Series 2005-T20, Class A4A | | | | |
| 5.3028% due 10/12/2042 (b) | | 500,000 | | 491,899 |
| Chase Commercial Mortgage Securities Corp., | | | |
| Series 1998-1, Class A2 | | | | |
| 6.56% due 05/18/2030 | | 429,031 | | 434,705 |
| Chase Commercial Mortgage Securities Corp., | | | |
| Series 1998-2, Class A2 | | | | |
| 6.39% due 11/18/2030 | | 317,199 | | 323,062 |
| Citigroup/Deutsche Bank Commercial | | | | |
| Mortgage Trust, Series 2005-CD1, Class A4 | | | |
| 5.3997% due 07/15/2044 (b) | | 500,000 | | 493,988 |
| Commercial Mortgage Asset Trust, Series | | | | |
| 1999-C1, Class A3 | | | | |
| 6.64% due 01/17/2032 | | 405,797 | | 418,177 |
| Commercial Mortgage Pass Through Certificates, | | | |
| Series 2005-C6, Class A5A | | | | |
| 5.116% due 06/10/2044 (b) | | 500,000 | | 487,461 |
| Commercial Mortgage Pass Through Certificates, | | | |
| Series 2006-C7, Class A4 | | | | |
| 5.96% due 06/10/2046 (b) | | 500,000 | | 513,311 |
| CS First Boston Mortgage Securities Corp, Series | | | |
| 2003-C3, Class A5 | | | | |
| 3.936% due 05/15/2038 | | 500,000 | | 460,555 |
| First Union - Chase Commercial Mortgage, | | | |
| Series 1999-C2, Class A2 | | | | |
| 6.645% due 06/15/2031 | | 363,674 | | 373,606 |
| General Electric Capital Assurance Company, | | | |
| Series 2003-1, Class A5 | | | | |
| 5.7426% due 05/12/2035 | | 89,275 | | 90,888 |
| Government National Mortgage Association, Series | | | |
| 2006-38, Class XS | | | | |
| 1.92% IO due 09/16/2035 (b) | | 111,000 | | 5,585 |
| Greenwich Capital Commercial Funding Corp., | | | |
| Series 2005-GG5, Class A5 | | | | |
| 5.224% due 04/10/2037 (b) | | 500,000 | | 491,577 |
| GS Mortgage Securities Corp. II, Series 2006-GG6, | | | |
| Class A4 | | | | |
| 5.553% due 04/10/2038 (b) | | 500,000 | | 502,985 |
| JP Morgan Chase Commercial Mortgage Securities | | | |
| Corp, Series 2004-CBX, Class A6 | | | | |
| 4.899% due 01/12/2037 | | 315,000 | | 303,470 |
| JP Morgan Chase Commercial Mortgage Securities | | | |
| Corp., Series 2006-LDP7, Class A4 | | | | |
| 6.0658% due 04/15/2045 (b) | | 500,000 | | 517,610 |
| JP Morgan Chase Commercial Mortgage | | | | |
| Securities Corp., Series 2005-LDP4, Class A4 | | | |
| 4.918% due 10/15/2042 (b) | | 500,000 | | 480,465 |
| LB-UBS Commercial Mortgage Trust, | | | | |
| Series 2001-C7, Class A3 | | | | |
| 5.642% due 12/15/2025 | | 266,206 | | 268,190 |
| Investment Quality Bond Fund (continued) | | |
| | | Shares or | | |
| | | Principal | | |
| | | Amount | | Value |
| | |
|
| |
| COLLATERALIZED MORTGAGE | | | | |
| OBLIGATIONS (continued) | | | | |
| LB-UBS Commercial Mortgage Trust, | | | | |
| Series 2002-C1,Class A4 | | | | |
| 6.462% due 03/15/2031 | $ | 202,898 | $ | 213,614 |
| LB-UBS Commercial Mortgage Trust, | | | | |
| Series 2006-C4, Class A4 | | | | |
| 6.0977% due 06/15/2038 (b) | | 500,000 | | 518,747 |
| Merrill Lynch Mortgage Trust, Series 2005-CIP1, | | | |
| Class A4 | | | | |
| 5.047% due 07/12/2038 (b) | | 500,000 | | 485,412 |
| Merrill Lynch Mortgage Trust, Series 2006-C1, | | | |
| Class A4 | | | | |
| 5.8442% due 05/12/2039 (b) | | 500,000 | | 509,666 |
| Morgan Stanley Capital I, Inc., Series 1998-WF2, | | | |
| Class A2 | | | | |
| 6.54% due 07/15/2030 | | 129,036 | | 130,974 |
| Morgan Stanley Capital I, Inc., Series 1999-WF1, | | | |
| Class A2 | | | | |
| 6.21% due 11/15/2031 | | 374,437 | | 379,568 |
| Morgan Stanley Dean Witter Capital I, Series | | | |
| 2001-TOP5, Class A4 | | | | |
| 6.39% due 10/15/2035 | | 270,531 | | 282,681 |
| Morgan Stanley Dean Witter Capital I, | | | | |
| Series 2001, Class A4 | | | | |
| 6.39% due 07/15/2033 | | 113,623 | | 118,685 |
| Morgan Stanley Dean Witter | | | | |
| Capital I, Series 2002-TOP7, Class A2 | | | | |
| 5.98% due 01/15/2039 | | 40,579 | | 41,779 |
| Nomura Asset Securities Corp., | | | | |
| Series 1998-D6, Class A1B | | | | |
| 6.59% due 03/15/2030 | | 385,507 | | 392,015 |
| Prudential Commercial Mortgage Trust, Series | | | |
| 2003-PWR1, Class A1 | | | | |
| 3.669% due 02/11/2036 | | 290,506 | | 278,271 |
| Prudential Commercial Mortgage Trust, | | | | |
| Series 2003-PWR1, Class A2 | | | | |
| 4.493% due 02/11/2036 | | 405,797 | | 385,984 |
|
| TOTAL COLLATERALIZED MORTGAGE OBLIGATIONS | | |
| (Cost $12,815,286) | | | $ | 12,783,903 |
|
| |
| ASSET BACKED SECURITIES - 6.91% | | | |
| Advanta Business Card Master Trust, | | | | |
| Series 2005-A4, Class A4 | | | | |
| 4.75% due 01/20/2011 | | 370,000 | | 368,030 |
| AESOP Funding II LLC, Series 2003-4, Class A | | | |
| 2.86% due 08/20/2009 | | 235,000 | | 225,555 |
| AmeriCredit Automobile Receivables Trust, | | | |
| Series 2005-AX, Class A4 | | | | |
| 3.93% due 10/06/2011 | | 700,000 | | 686,898 |
| Bank One Auto Securitization Trust, | | | | |
| Series 2003-1, Class A4 | | | | |
| 2.43% due 03/22/2010 | | 510,301 | | 501,846 |
| Capital One Multi-Asset Execution Trust, | | | | |
| Series 2003-A4, Class A4 | | | | |
| 3.65% due 07/15/2011 | | 415,000 | | 403,305 |
| Carmax Auto Owner Trust, Series 2004-2, Class A4 | | | |
| 3.46% due 09/15/2011 | | 405,000 | | 394,333 |
The accompanying notes are an integral part of the financial statements. 297
John Hancock Funds II
Portfolio of investments — August 31, 2006
(showing percentage of total net assets) |
| Investment Quality Bond Fund (continued) | |
| | | Shares or | | |
| | | Principal | | |
| | | Amount | | Value |
|
|
| |
| ASSET BACKED SECURITIES | | | | |
| (continued) | | | | |
| Chase Manhattan Auto Owner Trust, | | | | |
| Series 2005-B, Class A4 | | | | |
| 4.88% due 06/15/2012 | $ | 700,000 | $ | 696,469 |
| Ford Credit Auto Owner Trust, Series 2005-C, | | | |
| Class A4 | | | | |
| 4.36% due 06/15/2010 | | 279,000 | | 273,998 |
| Harley-Davidson Motorcycle Trust, | | | | |
| Series 2005-1, Class A2 | | | | |
| 3.76% due 12/17/2012 | | 405,000 | | 395,532 |
| Honda Auto Receivables Owner Trust, | | | | |
| Series 2005-1, Class A4 | | | | |
| 3.82% due 05/21/2010 | | 606,000 | | 592,005 |
| M&I Auto Loan Trust, Series 2005-1, Class A4 | | | |
| 4.86% due 03/21/2011 | | 700,000 | | 695,472 |
| Massachusetts RRB Special Purpose Trust, | | | | |
| Series 1999-1, Class A5 | | | | |
| 7.03% due 03/15/2012 | | 600,000 | | 626,842 |
| Massachusetts RRB Special Purpose Trust, | | | | |
| Series 2001-1, Class A | | | | |
| 6.53% due 06/01/2015 | | 91,887 | | 95,961 |
| Peco Energy Transition Trust, | | | | |
| Series 2001-A, Class A1 | | | | |
| 6.52% due 12/31/2010 | | 33,000 | | 34,486 |
| Providian Gateway Master Trust, | | | | |
| Series 2004-DA, Class A | | | | |
| 3.35% due 09/15/2011 | | 405,000 | | 397,180 |
| USAA Auto Owner Trust, Series 2004-1, Class A4 | | | |
| 2.67% due 10/15/2010 | | 112,000 | | 109,806 |
| USAA Auto Owner Trust, Series 2005-4, Class A4 | | | |
| 4.89% due 08/15/2012 | | 700,000 | | 696,401 |
| Wachovia Auto Owner Trust, | | | | |
| Series 2005-B, Class A5 | | | | |
| 4.93% due 11/20/2012 | | 700,000 | | 699,016 |
| WFS Financial Owner Trust, | | | | |
| Series 2005-2, Class A4 | | | | |
| 4.39% due 11/19/2012 | | 290,000 | | 286,716 |
| World Omni Auto Receivables Trust, | | | | |
| Series 2005-A, Class A4 | | | | |
| 3.82% due 11/12/2011 | | 700,000 | | 683,402 |
|
| TOTAL ASSET BACKED SECURITIES | | | | |
| (Cost $8,889,777) | | | $ | 8,863,253 |
|
| |
| SHORT TERM INVESTMENTS - 23.89% | | | |
| State Street Navigator Securities | | | | |
| Lending Prime Portfolio (c) | $ | 30,637,942 | $ | 30,637,942 |
|
| TOTAL SHORT TERM INVESTMENTS | | | | |
| (Cost $30,637,942) | | | $ | 30,637,942 |
|
| Investment Quality Bond Fund (continued) | | |
| | | Shares or | | |
| | | Principal | | |
| | | Amount | | Value |
|
|
| |
| REPURCHASE AGREEMENTS - 7.57% | | | |
| Repurchase Agreement with Banc of | | | | |
| America dated 08/31/2006 at | | | | |
| 5.22% to be repurchased at | | | | |
| $9,704,407 on 9/1/2006, | | | | |
| collateralized by $9,230,000 U.S. | | | | |
| Treasury Notes, 5.50% due | | | | |
| 08/15/2026 (valued at $9,899,828, | | | | |
| including interest) | $ | 9,703,000 | $ | 9,703,000 |
|
| TOTAL REPURCHASE AGREEMENTS | | | | |
| (Cost $9,703,000) | | | $ | 9,703,000 |
|
| Total Investments (Investment Quality Bond Fund) | | |
| (Cost $161,398,588) - 125.22% | | | $ | 160,586,835 |
| Liabilities in Excess of Other Assets - (25.22)% | | | (32,339,400) |
| |
|
| TOTAL NET ASSETS - 100.00% | | | $ | 128,247,435 |
| |
|
| |
| |
| Large Cap Fund | | | | |
| | | Shares or | | |
| | | Principal | | |
| | | Amount | | Value |
|
|
| |
| COMMON STOCKS - 97.99% | | | | |
| Advertising - 2.16% | | | | |
| Omnicom Group, Inc. | | 47,875 | $ | 4,185,233 |
| Aerospace - 0.91% | | | | |
| Northrop Grumman Corp. | | 26,465 | | 1,768,127 |
| Auto Parts - 2.70% | | | | |
| BorgWarner, Inc. | | 26,669 | | 1,512,399 |
| Johnson Controls, Inc. | | 51,627 | | 3,713,530 |
| |
|
| | | | | 5,225,929 |
| Banking - 5.58% | | | | |
| City National Corp. | | 8,500 | | 559,300 |
| Fifth Third Bancorp. | | 97,495 | | 3,835,453 |
| Wells Fargo Company | | 184,978 | | 6,427,986 |
| |
|
| | | | | 10,822,739 |
| Biotechnology - 2.57% | | | | |
| Cephalon, Inc. * (a) | | 18,403 | | 1,049,339 |
| Genzyme Corp. * | | 48,002 | | 3,179,173 |
| Millennium Pharmaceuticals, Inc. * | | 69,500 | | 754,770 |
| |
|
| | | | | 4,983,282 |
| Broadcasting - 1.12% | | | | |
| News Corp. | | 78,300 | | 1,490,049 |
| Univision Communications, Inc., Class A * | 19,555 | | 675,821 |
| |
|
| | | | | 2,165,870 |
| Building Materials & Construction - 2.08% | | | |
| Masco Corp. | | 147,078 | | 4,031,408 |
| Business Services - 2.10% | | | | |
| Accenture, Ltd., Class A | | 51,970 | | 1,541,430 |
| H & R Block, Inc. | | 43,100 | | 906,393 |
| R.H. Donnelley Corp. * (a) | | 29,824 | | 1,620,040 |
| |
|
| | | | | 4,067,863 |
The accompanying notes are an integral part of the financial statements. 298
John Hancock Funds II
Portfolio of investments — August 31, 2006
(showing percentage of total net assets) |
| Large Cap Fund (continued) | | | |
| | Shares or | | |
| | Principal | | |
| | Amount | | Value |
|
|
| |
| COMMON STOCKS (continued) | | | |
| Cable and Television - 1.42% | | | |
| DIRECTV Group, Inc. * | 146,909 | $ | 2,760,420 |
| Computers & Business Equipment - 1.03% | | | |
| Dell, Inc. * | 88,400 | | 1,993,420 |
| Crude Petroleum & Natural Gas - 1.79% | | | |
| EOG Resources, Inc. | 27,300 | | 1,769,586 |
| Marathon Oil Corp. | 20,369 | | 1,700,811 |
|
|
| | | | 3,470,397 |
| Drugs & Health Care - 3.36% | | | |
| Wyeth | 133,718 | | 6,512,067 |
| Electrical Utilities - 4.50% | | | |
| American Electric Power Company, Inc. | 45,443 | | 1,657,761 |
| Exelon Corp. | 92,113 | | 5,617,051 |
| Northeast Utilities | 23,600 | | 538,316 |
| Pepco Holdings, Inc. | 35,481 | | 900,862 |
|
|
| | | | 8,713,990 |
| Energy - 1.11% | | | |
| Sempra Energy | 43,114 | | 2,143,628 |
| Financial Services - 15.27% | | | |
| Citigroup, Inc. | 178,634 | | 8,815,588 |
| Federal Home Loan Mortgage Corp. | 47,045 | | 2,992,062 |
| JPMorgan Chase & Company | 86,899 | | 3,967,808 |
| Mellon Financial Corp. | 99,432 | | 3,701,854 |
| Morgan Stanley | 107,313 | | 7,060,122 |
| PNC Financial Services Group, Inc. | 43,304 | | 3,065,490 |
|
|
| | | | 29,602,924 |
| Food & Beverages - 0.96% | | | |
| Sysco Corp. | 59,500 | | 1,867,705 |
| Gas & Pipeline Utilities - 0.59% | | | |
| NiSource, Inc. | 54,198 | | 1,147,372 |
| Healthcare Products - 3.47% | | | |
| Johnson & Johnson | 70,608 | | 4,565,513 |
| Medtronic, Inc. | 45,934 | | 2,154,305 |
|
|
| | | | 6,719,818 |
| Healthcare Services - 4.98% | | | |
| Caremark Rx, Inc. | 34,913 | | 2,022,859 |
| Medco Health Solutions, Inc. * | 43,750 | | 2,772,438 |
| UnitedHealth Group, Inc. | 93,343 | | 4,849,169 |
|
|
| | | | 9,644,466 |
| Hotels & Restaurants - 0.24% | | | |
| Wyndham Worldwide Corp. * | 16,003 | | 468,242 |
| Insurance - 4.52% | | | |
| Allstate Corp. | 35,600 | | 2,062,664 |
| American International Group, Inc. | 71,868 | | 4,586,616 |
| Hartford Financial Services Group, Inc. | 24,538 | | 2,106,832 |
|
|
| | | | 8,756,112 |
| Internet Service Provider - 0.65% | | | |
| Salesforce.Com, Inc. * (a) | 36,600 | | 1,261,968 |
| Large Cap Fund (continued) | | | |
| | Shares or | | |
| | Principal | | |
| | Amount | | Value |
|
|
| |
| COMMON STOCKS (continued) | | | |
| Internet Software - 1.42% | | | |
| Symantec Corp. * (a) | 148,188 | $ | 2,762,224 |
| Leisure Time - 1.61% | | | |
| Carnival Corp. | 74,299 | | 3,113,128 |
| Life Sciences - 0.89% | | | |
| Waters Corp. * | 40,545 | | 1,729,244 |
| Liquor - 0.81% | | | |
| Anheuser-Busch Companies, Inc. | 31,800 | | 1,570,284 |
| Manufacturing - 2.92% | | | |
| Harley-Davidson, Inc. | 32,800 | | 1,919,128 |
| Illinois Tool Works, Inc. | 85,048 | | 3,733,607 |
| |
|
| | | | 5,652,735 |
| Petroleum Services - 3.69% | | | |
| Baker Hughes, Inc. | 1,928 | | 137,235 |
| ENSCO International, Inc. | 40,200 | | 1,796,538 |
| Exxon Mobil Corp. | 29,869 | | 2,021,235 |
| GlobalSantaFe Corp. | 39,100 | | 1,924,502 |
| Halliburton Company | 38,800 | | 1,265,656 |
| |
|
| | | | 7,145,166 |
| Pharmaceuticals - 3.65% | | | |
| Allergan, Inc. | 42,463 | | 4,864,562 |
| Bristol-Myers Squibb Company | 101,299 | | 2,203,253 |
| |
|
| | | | 7,067,815 |
| Railroads & Equipment - 1.85% | | | |
| Burlington Northern Santa Fe Corp. | 53,450 | | 3,578,477 |
| Real Estate - 0.30% | | | |
| Realogy Corp., REIT * | 26,904 | | 575,735 |
| Retail Grocery - 1.16% | | | |
| The Kroger Company | 94,598 | | 2,252,378 |
| Retail Trade - 2.47% | | | |
| Costco Wholesale Corp. | 56,290 | | 2,633,809 |
| Kohl's Corp. * | 34,505 | | 2,156,908 |
| |
|
| | | | 4,790,717 |
| Semiconductors - 3.58% | | | |
| Analog Devices, Inc. | 62,300 | | 1,908,872 |
| Intel Corp. | 186,700 | | 3,648,118 |
| Xilinx, Inc. | 60,091 | | 1,374,281 |
| |
|
| | | | 6,931,271 |
| Software - 5.27% | | | |
| Microsoft Corp. | 288,089 | | 7,401,007 |
| Oracle Corp. * | 180,285 | | 2,821,460 |
| |
|
| | | | 10,222,467 |
| Telecommunications Equipment & | | | |
| Services - 0.28% | | | |
| Embarq Corp. * | 11,666 | | 550,052 |
| Telephone - 3.49% | | | |
| AT&T, Inc. | 90,374 | | 2,813,342 |
| Sprint Nextel Corp. | 233,127 | | 3,944,509 |
| |
|
| | | | 6,757,851 |
The accompanying notes are an integral part of the financial statements. 299
John Hancock Funds II
Portfolio of investments — August 31, 2006
(showing percentage of total net assets) |
| Large Cap Fund (continued) | | | | |
| | | Shares or | | |
| | | Principal | | |
| | | Amount | | Value |
| |
|
| |
| COMMON STOCKS (continued) | | | | |
| Trucking & Freight - 1.49% | | | | |
| Fedex Corp. | | 28,583 | $ | 2,887,740 |
|
| TOTAL COMMON STOCKS (Cost $180,265,843) | | $ | 189,900,264 |
|
| |
| SHORT TERM INVESTMENTS - 3.46% | | | | |
| State Street Navigator Securities | | | | |
| Lending Prime Portfolio (c) | $ | 6,601,703 | $ | 6,601,703 |
| United States Treasury Bill | | | | |
| zero coupon due 01/04/2007 | | 100,000 | | 98,231 |
|
| TOTAL SHORT TERM INVESTMENTS | | | | |
| (Cost $6,699,934) | | | $ | 6,699,934 |
|
| |
| REPURCHASE AGREEMENTS - 1.71% | | | | |
| Repurchase Agreement with State | | | | |
| Street Corp. dated 08/31/2006 at | | | | |
| 3.95% to be repurchased at | | | | |
| $3,326,365 on 09/01/2006, | | | | |
| collateralized by $3,375,000 | | | | |
| Federal National Mortgage | | | | |
| Association, 5.125% due | | | | |
| 12/15/2008 (valued at $3,396,094, | | | | |
| including interest) (c) | $ | 3,326,000 | $ | 3,326,000 |
|
| TOTAL REPURCHASE AGREEMENTS | | | | |
| (Cost $3,326,000) | | | $ | 3,326,000 |
|
| Total Investments (Large Cap Fund) | | | | |
| (Cost $190,291,777) - 103.16% | | | $ | 199,926,198 |
| Liabilities in Excess of Other Assets - (3.16)% | | | (6,123,136) |
|
|
| TOTAL NET ASSETS - 100.00% | | | $ | 193,803,062 |
|
|
| Large Cap Value Fund | | | |
| | Shares or | | |
| | Principal | | |
| | Amount | | Value |
|
|
| |
| COMMON STOCKS - 99.75% | | | |
| Aerospace - 1.76% | | | |
| Lockheed Martin Corp. | 6,520 | $ | 538,552 |
| Northrop Grumman Corp. | 49,000 | | 3,273,690 |
| Raytheon Company | 46,000 | | 2,171,660 |
| |
|
| | | | 5,983,902 |
| Agriculture - 1.41% | | | |
| Archer-Daniels-Midland Company | 116,000 | | 4,775,720 |
| Apparel & Textiles - 0.30% | | | |
| Jones Apparel Group, Inc. | 33,000 | | 1,032,900 |
| Auto Parts - 0.73% | | | |
| Autoliv, Inc. | 44,000 | | 2,486,880 |
| Auto Services - 0.46% | | | |
| AutoNation, Inc. * | 80,000 | | 1,554,400 |
| Automobiles - 1.20% | | | |
| General Motors Corp. | 140,000 | | 4,085,200 |
| Banking - 1.64% | | | |
| Bank of America Corp. | 108,000 | | 5,558,760 |
| Large Cap Value Fund (continued) | | |
| | Shares or | | |
| | Principal | | |
| | Amount | | Value |
|
|
| |
| COMMON STOCKS (continued) | | | |
| Business Services - 2.00% | | | |
| Cadence Design Systems, Inc. * | 51,000 | $ | 837,930 |
| Computer Sciences Corp. * | 33,000 | | 1,563,540 |
| Convergys Corp. * | 112,000 | | 2,337,440 |
| NCR Corp. * | 11,454 | | 398,485 |
| Reynolds & Reynolds Company, Class A | 43,000 | | 1,649,480 |
|
|
| | | | 6,786,875 |
| Cellular Communications - 1.22% | | | |
| Motorola, Inc. | 177,000 | | 4,138,260 |
| Chemicals - 0.41% | | | |
| Albemarle Corp. | 25,000 | | 1,372,500 |
| Computers & Business Equipment - 2.93% | | | |
| Hewlett-Packard Company | 161,000 | | 5,886,160 |
| International Business Machines Corp. | 50,000 | | 4,048,500 |
|
|
| | | | 9,934,660 |
| Cosmetics & Toiletries - 0.46% | | | |
| Procter & Gamble Company | 25,000 | | 1,547,500 |
| Crude Petroleum & Natural Gas - 5.78% | | | |
| Apache Corp. | 30,000 | | 1,958,400 |
| Devon Energy Corp. | 77,000 | | 4,811,730 |
| Marathon Oil Corp. | 58,000 | | 4,843,000 |
| Occidental Petroleum Corp. | 109,000 | | 5,557,910 |
| Sunoco, Inc. | 34,000 | | 2,444,940 |
|
|
| | | | 19,615,980 |
| Domestic Oil - 0.98% | | | |
| Frontier Oil Corp. | 102,000 | | 3,335,400 |
| Electrical Utilities - 1.02% | | | |
| Alliant Corp. | 95,000 | | 3,476,050 |
| Electronics - 0.84% | | | |
| Agilent Technologies, Inc. * | 46,000 | | 1,479,360 |
| Synopsys, Inc. * | 72,000 | | 1,365,120 |
|
|
| | | | 2,844,480 |
| Financial Services - 16.24% | | | |
| Bear Stearns Companies, Inc. | 31,000 | | 4,040,850 |
| CIT Group, Inc. | 84,000 | | 3,785,040 |
| Citigroup, Inc. | 327,000 | | 16,137,450 |
| Countrywide Financial Corp. | 123,000 | | 4,157,400 |
| Goldman Sachs Group, Inc. | 27,000 | | 4,013,550 |
| JPMorgan Chase & Company | 256,000 | | 11,688,960 |
| Lehman Brothers Holdings, Inc. | 74,000 | | 4,721,940 |
| Morgan Stanley | 100,000 | | 6,579,000 |
|
|
| | | | 55,124,190 |
| Food & Beverages - 2.62% | | | |
| Campbell Soup Company | 96,000 | | 3,606,720 |
| Del Monte Foods Company | 151,000 | | 1,676,100 |
| H.J. Heinz Company | 86,000 | | 3,598,240 |
|
|
| | | | 8,881,060 |
| Gas & Pipeline Utilities - 0.80% | | | |
| ONEOK, Inc. | 71,000 | | 2,717,170 |
The accompanying notes are an integral part of the financial statements. 300
John Hancock Funds II
Portfolio of investments — August 31, 2006
(showing percentage of total net assets) |
| Large Cap Value Fund (continued) | | |
| | Shares or | | |
| | Principal | | |
| | Amount | | Value |
|
|
| |
| COMMON STOCKS (continued) | | | |
| Healthcare Services - 5.30% | | | |
| Cardinal Health, Inc. | 26,000 | $ | 1,752,920 |
| Caremark Rx, Inc. | 63,000 | | 3,650,220 |
| Humana, Inc. * | 45,000 | | 2,741,850 |
| IMS Health, Inc. | 124,000 | | 3,383,960 |
| Laboratory Corp. of America Holdings * | 25,000 | | 1,710,500 |
| McKesson Corp. | 10,926 | | 555,041 |
| Medco Health Solutions, Inc. * | 15,000 | | 950,550 |
| Wellpoint, Inc. * | 42,000 | | 3,251,220 |
|
|
| | | | 17,996,261 |
| Holdings Companies/Conglomerates - 0.79% | | | |
| General Electric Company | 79,000 | | 2,690,740 |
| Industrial Machinery - 1.50% | | | |
| AGCO Corp. * | 135,000 | | 3,354,750 |
| Cummins, Inc. | 15,000 | | 1,722,300 |
|
|
| | | | 5,077,050 |
| Insurance - 9.77% | | | |
| Aetna, Inc. | 106,000 | | 3,950,620 |
| Ambac Financial Group, Inc. | 45,000 | | 3,896,550 |
| American Financial Group, Inc. | 1,586 | | 74,098 |
| Chubb Corp. | 91,000 | | 4,564,560 |
| Hartford Financial Services Group, Inc. | 23,000 | | 1,974,780 |
| MGIC Investment Corp. (a) | 63,000 | | 3,645,810 |
| PMI Group, Inc. | 54,000 | | 2,334,960 |
| Principal Financial Group, Inc. (a) | 40,000 | | 2,129,600 |
| Prudential Financial, Inc. | 64,000 | | 4,698,240 |
| SAFECO Corp. | 67,000 | | 3,866,570 |
| St. Paul Travelers Companies, Inc. | 46,000 | | 2,019,400 |
|
|
| | | | 33,155,188 |
| International Oil - 7.34% | | | |
| Anadarko Petroleum Corp. | 96,000 | | 4,503,360 |
| ChevronTexaco Corp. | 166,000 | | 10,690,400 |
| ConocoPhillips | 97,000 | | 6,152,710 |
| Hess Corp. | 78,000 | | 3,570,840 |
|
|
| | | | 24,917,310 |
| Internet Software - 0.32% | | | |
| Checkfree Corp. * | 30,000 | | 1,074,000 |
| Leisure Time - 1.67% | | | |
| Walt Disney Company | 191,000 | | 5,663,150 |
| Manufacturing - 2.31% | | | |
| Honeywell International, Inc. | 76,000 | | 2,942,720 |
| Illinois Tool Works, Inc. | 48,000 | | 2,107,200 |
| Rockwell Automation, Inc. | 8,282 | | 466,939 |
| SPX Corp. (a) | 44,000 | | 2,323,200 |
|
|
| | | | 7,840,059 |
| Metal & Metal Products - 0.22% | | | |
| Commercial Metals Company | 35,000 | | 755,650 |
| Mining - 1.94% | | | |
| Freeport-McMoran Copper & Gold, Inc., | | | |
| Class B (a) | 64,000 | | 3,725,440 |
| Large Cap Value Fund (continued) | | |
| | Shares or | | |
| | Principal | | |
| | Amount | | Value |
|
|
| |
| COMMON STOCKS (continued) | | | |
| Mining (continued) | | | |
| Phelps Dodge Corp. (a) | 32,000 | $ | 2,864,000 |
| |
|
| | | | 6,589,440 |
| Office Furnishings & Supplies - 0.20% | | | |
| Steelcase, Inc. Class A (a) | 47,000 | | 681,500 |
| Paper - 0.41% | | | |
| MeadWestvaco Corp. (a) | 55,000 | | 1,405,250 |
| Petroleum Services - 8.82% | | | |
| Exxon Mobil Corp. | 346,000 | | 23,413,820 |
| Tesoro Petroleum Corp. (a) | 24,000 | | 1,550,640 |
| Valero Energy Corp. | 87,000 | | 4,993,800 |
| |
|
| | | | 29,958,260 |
| Pharmaceuticals - 4.72% | | | |
| AmerisourceBergen Corp. | 14,450 | | 638,112 |
| Merck & Company, Inc. | 165,000 | | 6,690,750 |
| Pfizer, Inc. | 316,000 | | 8,708,960 |
| |
|
| | | | 16,037,822 |
| Retail Grocery - 1.24% | | | |
| Safeway, Inc. | 136,000 | | 4,206,480 |
| Retail Trade - 1.83% | | | |
| AnnTaylor Stores Corp. * | 56,000 | | 2,228,800 |
| Circuit City Stores, Inc. | 67,000 | | 1,581,870 |
| J.C. Penney Company, Inc. | 31,000 | | 1,954,240 |
| Nordstrom, Inc. | 12,159 | | 454,138 |
| |
|
| | | | 6,219,048 |
| Semiconductors - 2.39% | | | |
| Fairchild Semiconductor International, Inc. * | 194,000 | | 3,497,820 |
| Intersil Corp., Class A | 3,172 | | 80,410 |
| Micron Technology, Inc. * | 232,000 | | 4,008,960 |
| Novellus Systems, Inc. * (a) | 19,000 | | 530,480 |
| |
|
| | | | 8,117,670 |
| Software - 0.49% | | | |
| BMC Software, Inc. * | 12,335 | | 328,358 |
| Compuware Corp. * | 175,000 | | 1,330,000 |
| |
|
| | | | 1,658,358 |
| Steel - 2.30% | | | |
| Nucor Corp. | 85,000 | | 4,153,950 |
| United States Steel Corp. | 63,000 | | 3,664,710 |
| |
|
| | | | 7,818,660 |
| Telecommunications Equipment & | | | |
| Services - 0.78% | | | |
| Avaya, Inc. * | 203,000 | | 2,121,350 |
| Citizens Communications Company (a) | 39,000 | | 537,810 |
| |
|
| | | | 2,659,160 |
| Telephone - 0.75% | | | |
| Qwest Communications International, Inc. * (a) | 290,000 | | 2,554,900 |
| Tires & Rubber - 0.47% | | | |
| Goodyear Tire & Rubber Company * (a) | 118,000 | | 1,604,800 |
| Toys, Amusements & Sporting Goods - 1.09% | | | |
| Hasbro, Inc. | 108,000 | | 2,192,400 |
The accompanying notes are an integral part of the financial statements. 301
John Hancock Funds II
Portfolio of investments — August 31, 2006
(showing percentage of total net assets) |
| Large Cap Value Fund (continued) | | |
| | | Shares or | | |
| | | Principal | | |
| | | Amount | | Value |
| |
|
| |
| COMMON STOCKS (continued) | | | | |
| Toys, Amusements & Sporting Goods | | | | |
| (continued) | | | | |
| Mattel, Inc. | | 80,000 | $ | 1,507,200 |
|
|
| | | | | 3,699,600 |
| Travel Services - 0.30% | | | | |
| Sabre Holdings Corp. | | 47,000 | | 1,030,240 |
|
| TOTAL COMMON STOCKS (Cost $320,761,258) | | $ | 338,662,483 |
|
| |
| SHORT TERM INVESTMENTS - 4.39% | | | |
| State Street Navigator Securities | | | | |
| Lending Prime Portfolio (c) | $ | 14,896,485 | $ | 14,896,485 |
|
| TOTAL SHORT TERM INVESTMENTS | | | | |
| (Cost $14,896,485) | | | $ | 14,896,485 |
|
| Total Investments (Large Cap Value Fund) | | | |
| (Cost $335,657,743) - 104.14% | | | $ | 353,558,968 |
| Liabilities in Excess of Other Assets - (4.14)% | | | (14,045,199) |
|
|
| TOTAL NET ASSETS - 100.00% | | | $ | 339,513,769 |
|
|
| |
| |
| Mid Cap Core Fund | | | | |
| | | Shares or | | |
| | | Principal | | |
| | | Amount | | Value |
| |
|
| |
| COMMON STOCKS - 79.47% | | | | |
| Advertising - 1.20% | | | | |
| Omnicom Group, Inc. | | 41,795 | $ | 3,653,719 |
| Aerospace - 1.32% | | | | |
| Goodrich Corp. | | 103,730 | | 4,040,284 |
| Auto Parts - 1.18% | | | | |
| Genuine Parts Company | | 87,330 | | 3,609,349 |
| Banking - 1.65% | | | | |
| Marshall & Ilsley Corp. | | 72,520 | | 3,381,607 |
| SVB Financial Group * (a) | | 36,578 | | 1,652,960 |
|
|
| | | | | 5,034,567 |
| Biotechnology - 1.08% | | | | |
| Techne Corp. * | | 64,764 | | 3,296,488 |
| Business Services - 6.24% | | | | |
| Cadence Design Systems, Inc. * | | 302,123 | | 4,963,881 |
| H & R Block, Inc. | | 197,815 | | 4,160,049 |
| Pitney Bowes, Inc. | | 84,083 | | 3,665,178 |
| Rentokil Initial PLC | | 1,040,143 | | 2,972,866 |
| The ServiceMaster Company | | 287,163 | | 3,299,503 |
|
|
| | | | | 19,061,477 |
| Cable and Television - 1.48% | | | | |
| E.W. Scripps Company, Class A | | 99,468 | | 4,522,810 |
| Chemicals - 3.96% | | | | |
| Rohm & Haas Company | | 99,350 | | 4,381,335 |
| Sigma-Aldrich Corp. (a) | | 106,226 | | 7,715,194 |
|
|
| | | | | 12,096,529 |
| Mid Cap Core Fund (continued) | | | |
| | Shares or | | |
| | Principal | | |
| | Amount | | Value |
|
|
| |
| COMMON STOCKS (continued) | | | |
| Computers & Business Equipment - 1.82% | | | |
| Xerox Corp. * | 375,146 | $ | 5,555,912 |
| Construction Materials - 1.38% | | | |
| Sherwin-Williams Company | 81,816 | | 4,224,978 |
| Containers & Glass - 0.98% | | | |
| Pactiv Corp. * | 112,445 | | 3,005,655 |
| Cosmetics & Toiletries - 6.21% | | | |
| Avon Products, Inc. | 194,229 | | 5,576,314 |
| Estee Lauder Companies, Inc., Class A | 181,781 | | 6,700,448 |
| International Flavors & Fragrances, Inc. | 168,278 | | 6,692,416 |
|
|
| | | | 18,969,178 |
| Drugs & Health Care - 0.49% | | | |
| ImClone Systems, Inc. * (a) | 50,037 | | 1,496,106 |
| Electrical Utilities - 1.53% | | | |
| Wisconsin Energy Corp. | 108,687 | | 4,673,541 |
| Food & Beverages - 2.74% | | | |
| Cadbury Schweppes PLC | 786,949 | | 8,368,087 |
| Funeral Services - 1.96% | | | |
| Service Corp. International | 713,201 | | 5,990,888 |
| Gas & Pipeline Utilities - 1.44% | | | |
| UGI Corp. | 177,506 | | 4,402,149 |
| Healthcare Products - 0.94% | | | |
| Kinetic Concepts, Inc. * | 91,187 | | 2,881,509 |
| Holdings Companies/Conglomerates - 1.16% | | | |
| Groupe Bruxelles Lambert SA | 33,734 | | 3,536,488 |
| Industrial Machinery - 5.89% | | | |
| Atlas Copco AB, Series A | 58,600 | | 1,508,495 |
| Dover Corp. | 93,037 | | 4,523,459 |
| FMC Technologies, Inc. * | 49,776 | | 2,927,824 |
| ITT Corp. | 30,759 | | 1,505,653 |
| Pall Corp. | 151,744 | | 4,130,472 |
| Parker-Hannifin Corp. | 28,256 | | 2,092,357 |
| W.W. Grainger, Inc. | 19,795 | | 1,322,306 |
|
|
| | | | 18,010,566 |
| Insurance - 5.19% | | | |
| Axis Capital Holdings, Ltd. | 113,506 | | 3,681,000 |
| Genworth Financial, Inc. | 114,615 | | 3,946,194 |
| Marsh & McLennan Companies, Inc. | 120,697 | | 3,157,434 |
| XL Capital, Ltd., Class A (a) | 77,382 | | 5,079,354 |
|
|
| | | | 15,863,982 |
| International Oil - 0.76% | | | |
| Noble Corp. | 35,512 | | 2,322,130 |
| Internet Software - 1.40% | | | |
| Juniper Networks, Inc. * | 95,590 | | 1,402,305 |
| McAfee, Inc. * | 126,187 | | 2,872,016 |
|
|
| | | | 4,274,321 |
| Life Sciences - 2.68% | | | |
| PerkinElmer, Inc. | 188,422 | | 3,472,618 |
| The accompanying notes are an integral part of the financial statements. 302 |
John Hancock Funds II
Portfolio of investments — August 31, 2006
(showing percentage of total net assets) |
| Mid Cap Core Fund (continued) | | |
| | Shares or | |
| | Principal | |
| | Amount | Value |
|
|
| |
| COMMON STOCKS (continued) | | |
| Life Sciences (continued) | | |
| Waters Corp. * | 110,436 $ | 4,710,095 |
|
|
| | | 8,182,713 |
| Liquor - 1.31% | | |
| Heineken NV | 86,779 | 4,019,746 |
| Manufacturing - 0.97% | | |
| Mettler-Toledo International, Inc. * | 48,704 | 2,968,022 |
| Medical-Hospitals - 1.13% | | |
| Health Management Associates, Inc., Class A | 165,727 | 3,465,352 |
| Paper - 0.96% | | |
| MeadWestvaco Corp. | 114,600 | 2,928,030 |
| Petroleum Services - 1.82% | | |
| Japan Petroleum Exploration Company, Ltd. * | 31,100 | 2,040,561 |
| Smith International, Inc. | 84,101 | 3,529,719 |
|
|
| | | 5,570,280 |
| Pharmaceuticals - 2.36% | | |
| Forest Laboratories, Inc. * | 82,618 | 4,129,248 |
| Hospira, Inc. * | 83,986 | 3,076,407 |
|
|
| | | 7,205,655 |
| Publishing - 1.04% | | |
| Mcclatchy Company, Class A | 78,699 | 3,192,819 |
| Retail Grocery - 2.31% | | |
| SUPERVALU, Inc. | 108,844 | 3,108,585 |
| The Kroger Company | 166,556 | 3,965,698 |
|
|
| | | 7,074,283 |
| Retail Trade - 3.16% | | |
| 99 Cents Only Stores * (a) | 190,446 | 2,163,467 |
| Gap, Inc. | 233,124 | 3,918,814 |
| RadioShack Corp. (a) | 198,949 | 3,593,019 |
|
|
| | | 9,675,300 |
| Sanitary Services - 1.39% | | |
| Republic Services, Inc. | 109,937 | 4,263,357 |
| Semiconductors - 2.24% | | |
| Analog Devices, Inc. | 93,142 | 2,853,871 |
| Linear Technology Corp. | 117,674 | 4,002,093 |
|
|
| | | 6,855,964 |
| Software - 1.43% | | |
| Business Objects, SADR * (a) | 156,946 | 4,372,516 |
| Steel - 1.16% | | |
| Tenaris SA, ADR | 96,500 | 3,542,515 |
| Telecommunications Equipment & | | |
| Services - 2.48% | | |
| ADTRAN, Inc. | 151,709 | 3,773,003 |
| SK Telecom Company, Ltd., ADR | 173,308 | 3,795,445 |
|
|
| | | 7,568,448 |
| Travel Services - 1.03% | | |
| Sabre Holdings Corp. | 143,512 | 3,145,783 |
|
| TOTAL COMMON STOCKS (Cost $230,199,317) | | $ | 242,921,496 |
| Mid Cap Core Fund (continued) | | | |
| | | Shares or | | |
| | | Principal | | |
| | | Amount | | Value |
| |
|
| |
| PREFERRED STOCKS - 1.60% | | | | |
| Household Products - 1.60% | | | | |
| Henkel KGaA-Vorzug, Non-Voting | | 38,272 | $ | 4,880,768 |
|
| TOTAL PREFERRED STOCKS (Cost $4,325,140) | | $ | 4,880,768 |
|
| |
| SHORT TERM INVESTMENTS - 6.50% | | | | |
| State Street Navigator Securities | | | | |
| Lending Prime Portfolio (c) | $ | 19,867,086 | $ | 19,867,086 |
|
| TOTAL SHORT TERM INVESTMENTS | | | | |
| (Cost $19,867,086) | | | $ | 19,867,086 |
|
| |
| REPURCHASE AGREEMENTS - 17.38% | | | | |
| Repurchase Agreement with State | | | | |
| Street Corp. dated 08/31/2006 at | | | | |
| 4.95% to be repurchased at | | | | |
| $53,139,305 on 9/1/2006, | | | | |
| collateralized by $16,705,000 | | | | |
| Federal Home Loan Bank, 4.00% | | | | |
| due 10/29/2009 (valued at | | | | |
| $16,391,781, including interest) | | | | |
| and $38,530,000 Federal Home | | | | |
| Loan Bank, 4.16% due 02/01/2010 | | | | |
| (valued at $37,807,563, including | | | | |
| interest) (c) | $ | 53,132,000 | $ | 53,132,000 |
|
| TOTAL REPURCHASE AGREEMENTS | | | | |
| (Cost $53,132,000) | | | $ | 53,132,000 |
|
| Total Investments (Mid Cap Core Fund) | | | | |
| (Cost $307,523,543) - 104.95% | | | $ | 320,801,350 |
| Liabilities in Excess of Other Assets - (4.95)% | | | (15,130,255) |
|
|
| TOTAL NET ASSETS - 100.00% | | | $ | 305,671,095 |
|
|
| |
| |
| Mid Cap Index Fund | | | | |
| | | Shares or | | |
| | | Principal | | |
| | | Amount | | Value |
| |
|
| |
| COMMON STOCKS - 93.17% | | | | |
| Aerospace - 0.29% | | | | |
| Alliant Techsystems, Inc. * | | 5,281 | $ | 403,944 |
| Sequa Corp., Class A * | | 1,012 | | 92,901 |
|
|
| | | | | 496,845 |
| Air Travel - 0.36% | | | | |
| Airtran Holdings, Inc. * (a) | | 13,607 | | 155,800 |
| Alaska Air Group, Inc. * | | 5,888 | | 222,979 |
| JetBlue Airways Corp. * (a) | | 23,177 | | 237,332 |
|
|
| | | | | 616,111 |
| Apparel & Textiles - 0.77% | | | | |
| Mohawk Industries, Inc. * (a) | | 8,017 | | 568,245 |
| Polo Ralph Lauren Corp., Class A | | 9,123 | | 538,166 |
| Timberland Company, Class A * | | 7,951 | | 225,888 |
|
|
| | | | | 1,332,299 |
| Auto Parts - 1.11% | | | | |
| ArvinMeritor, Inc. (a) | | 10,564 | | 156,875 |
| BorgWarner, Inc. | | 8,581 | | 486,629 |
The accompanying notes are an integral part of the financial statements. 303
John Hancock Funds II
Portfolio of investments — August 31, 2006
(showing percentage of total net assets) |
| Mid Cap Index Fund (continued) | | | |
| | Shares or | | |
| | Principal | | |
| | Amount | | Value |
|
|
| |
| COMMON STOCKS (continued) | | | |
| Auto Parts (continued) | | | |
| Federal Signal Corp. | 7,234 | $ | 112,923 |
| Gentex Corp. (a) | 23,051 | | 333,778 |
| Lear Corp. (a) | 10,095 | | 205,332 |
| Modine Manufacturing Company | 5,033 | | 117,219 |
| O'Reilly Automotive, Inc. * | 16,970 | | 503,839 |
|
|
| | | | 1,916,595 |
| Auto Services - 0.34% | | | |
| ADESA, Inc. | 13,472 | | 297,597 |
| Copart, Inc. * | 10,433 | | 292,854 |
|
|
| | | | 590,451 |
| Banking - 4.58% | | | |
| Associated Banc-Corp. | 19,825 | | 625,280 |
| Astoria Financial Corp. | 12,707 | | 390,105 |
| Bank of Hawaii Corp. | 7,624 | | 372,204 |
| Cathay General Bancorp, Inc. (a) | 7,720 | | 287,879 |
| City National Corp. (a) | 6,222 | | 409,408 |
| Colonial Bancgroup, Inc. | 23,176 | | 567,580 |
| Cullen Frost Bankers, Inc. | 7,187 | | 423,745 |
| First Niagara Financial Group, Inc. | 16,661 | | 249,249 |
| FirstMerit Corp. | 11,959 | | 275,177 |
| Greater Bay Bancorp | 7,549 | | 214,920 |
| Investors Financial Services Corp. (a) | 9,858 | | 457,017 |
| Mercantile Bankshares Corp. | 18,472 | | 682,171 |
| New York Community Bancorp, Inc. (a) | 39,349 | | 645,717 |
| SVB Financial Group * | 5,327 | | 240,727 |
| TCF Financial Corp. | 16,807 | | 438,158 |
| Texas Regional Bancshares, Inc., Class A | 6,815 | | 260,810 |
| Washington Federal, Inc. | 13,076 | | 290,549 |
| Webster Financial Corp. | 7,913 | | 373,810 |
| Westamerica Bancorp (a) | 4,712 | | 225,375 |
| Wilmington Trust Corp. | 10,226 | | 450,455 |
|
|
| | | | 7,880,336 |
| Biotechnology - 1.52% | | | |
| Affymetrix, Inc. * (a) | 10,113 | | 215,508 |
| Cephalon, Inc. * (a) | 9,106 | | 519,224 |
| Charles River Laboratories International, Inc. * | 10,813 | | 439,440 |
| Invitrogen Corp. * | 7,977 | | 485,401 |
| Martek Biosciences Corp. * (a) | 4,818 | | 144,877 |
| Millennium Pharmaceuticals, Inc. * | 47,193 | | 512,516 |
| Techne Corp. * | 5,902 | | 300,412 |
|
|
| | | | 2,617,378 |
| Broadcasting - 0.28% | | | |
| Belo Corp., Class A | 13,522 | | 220,409 |
| Emmis Communications Corp., Class A * | 5,575 | | 68,182 |
| Entercom Communications Corp. (a) | 4,991 | | 126,821 |
| Westwood One, Inc. | 9,600 | | 70,368 |
|
|
| | | | 485,780 |
| Building Materials & Construction - 0.27% | | | |
| Dycom Industries, Inc. * (a) | 6,044 | | 122,391 |
| Mid Cap Index Fund (continued) | | | |
| | Shares or | | |
| | Principal | | |
| | Amount | | Value |
|
|
| |
| COMMON STOCKS (continued) | | | |
| Building Materials & Construction | | | |
| (continued) | | | |
| RPM International, Inc. | 17,773 | $ | 334,310 |
|
|
| | | | 456,701 |
| Business Services - 5.47% | | | |
| Acxiom Corp. | 11,571 | | 281,060 |
| Alliance Data Systems Corp. * | 10,105 | | 510,707 |
| Banta Corp. | 3,599 | | 169,333 |
| Brinks Company | 7,248 | | 412,918 |
| Cadence Design Systems, Inc. * | 42,352 | | 695,843 |
| Catalina Marketing Corp. | 5,675 | | 162,589 |
| Cendant Corp. | 149,900 | | 289,307 |
| Ceridian Corp. * | 20,838 | | 497,403 |
| ChoicePoint, Inc. * | 12,904 | | 466,480 |
| Corporate Executive Board Company | 6,000 | | 525,840 |
| CSG Systems International, Inc. * | 7,152 | | 192,532 |
| Deluxe Corp. (a) | 7,691 | | 137,823 |
| DST Systems, Inc. * | 9,196 | | 542,840 |
| Dun & Bradstreet Corp. * | 9,422 | | 662,461 |
| Fair Isaac Corp. | 9,785 | | 342,573 |
| Gartner Group, Inc., Class A * (a) | 8,725 | | 136,023 |
| Harte-Hanks, Inc. | 8,360 | | 221,540 |
| Jacobs Engineering Group, Inc. * | 8,786 | | 765,173 |
| Kelly Services, Inc., Class A | 2,908 | | 79,417 |
| Korn/Ferry International * (a) | 6,353 | | 129,728 |
| Manpower, Inc. | 13,141 | | 776,764 |
| MPS Group, Inc. * | 15,467 | | 217,466 |
| Navigant Consulting Company * (a) | 7,841 | | 154,389 |
| Reynolds & Reynolds Company, Class A | 7,834 | | 300,512 |
| Rollins, Inc. | 4,413 | | 93,732 |
| Sotheby's Holdings, Inc., Class A | 7,068 | | 196,490 |
| SRA International, Inc., Class A * (a) | 5,684 | | 159,209 |
| The BISYS Group, Inc. * | 18,056 | | 185,796 |
| Wind River Systems, Inc. * | 11,323 | | 115,155 |
|
|
| | | | 9,421,103 |
| Cellular Communications - 0.49% | | | |
| RF Micro Devices, Inc. * (a) | 28,526 | | 188,842 |
| Telephone & Data Systems, Inc. | 15,409 | | 653,496 |
|
|
| | | | 842,338 |
| Chemicals - 2.68% | | | |
| Airgas, Inc. | 10,093 | | 361,531 |
| Albemarle Corp. | 5,817 | | 319,353 |
| Cabot Corp. (a) | 9,508 | | 315,951 |
| Cabot Microelectronics Corp. * (a) | 3,629 | | 114,096 |
| Chemtura Corp. (a) | 36,022 | | 313,031 |
| Cytec Industries, Inc. | 6,077 | | 324,208 |
| Ferro Corp. | 6,373 | | 108,851 |
| FMC Corp. | 5,863 | | 358,347 |
| Lubrizol Corp. | 10,250 | | 445,772 |
| Lyondell Chemical Company | 30,773 | | 799,483 |
| Minerals Technologies, Inc. | 2,981 | | 154,982 |
| Olin Corp. | 10,840 | | 162,925 |
The accompanying notes are an integral part of the financial statements. 304
John Hancock Funds II
Portfolio of investments — August 31, 2006
(showing percentage of total net assets) |
| Mid Cap Index Fund (continued) | | | |
| | Shares or | | |
| | Principal | | |
| | Amount | | Value |
|
|
| |
| COMMON STOCKS (continued) | | | |
| Chemicals (continued) | | | |
| Sensient Technologies Corp. | 6,948 | $ | 139,794 |
| The Scotts Company, Class A (a) | 6,761 | | 290,182 |
| Valspar Corp. | 15,281 | | 406,475 |
|
|
| | | | 4,614,981 |
| Coal - 1.42% | | | |
| Arch Coal, Inc. (a) | 21,438 | | 702,095 |
| Peabody Energy Corp. | 39,688 | | 1,749,050 |
|
|
| | | | 2,451,145 |
| Colleges & Universities - 0.57% | | | |
| Career Education Corp. * | 14,640 | | 280,356 |
| Corinthian Colleges, Inc. * | 12,914 | | 156,517 |
| DeVry, Inc. * (a) | 8,802 | | 196,725 |
| ITT Educational Services, Inc. * | 5,378 | | 355,432 |
|
|
| | | | 989,030 |
| Computers & Business Equipment - 3.04% | | | |
| 3Com Corp. * | 58,676 | | 259,935 |
| Avocent Corp. * | 7,343 | | 221,979 |
| CDW Corp. | 9,285 | | 541,315 |
| Cognizant Technology Solutions Corp., | | | |
| Class A * | 21,048 | | 1,471,466 |
| Diebold, Inc. (a) | 10,098 | | 423,207 |
| Henry, Jack & Associates, Inc. | 11,393 | | 218,290 |
| Ingram Micro, Inc., Class A * | 17,770 | | 319,860 |
| National Instruments Corp. | 8,356 | | 231,962 |
| Palm, Inc. * (a) | 13,739 | | 200,040 |
| Plexus Corp. * | 6,858 | | 135,926 |
| Sybase, Inc. * | 13,492 | | 311,260 |
| Tech Data Corp. * | 8,327 | | 290,529 |
| Western Digital Corp. * | 33,086 | | 605,474 |
|
|
| | | | 5,231,243 |
| Construction Materials - 0.64% | | | |
| Florida Rock Industries, Inc. (a) | 7,099 | | 264,012 |
| Granite Construction, Inc. | 4,955 | | 265,835 |
| Martin Marietta Materials, Inc. | 6,855 | | 564,578 |
|
|
| | | | 1,094,425 |
| Containers & Glass - 0.55% | | | |
| Longview Fibre Company | 11,720 | | 244,245 |
| Packaging Corp. of America | 9,026 | | 208,862 |
| Sonoco Products Company | 14,848 | | 497,111 |
|
|
| | | | 950,218 |
| Crude Petroleum & Natural Gas - 2.33% | | | |
| Helmerich & Payne, Inc. | 15,721 | | 385,636 |
| Newfield Exploration Company * | 19,281 | | 833,710 |
| Patterson-UTI Energy, Inc. | 25,710 | | 704,454 |
| Pioneer Natural Resources Company | 19,384 | | 808,507 |
| Plains Exploration & Production Company * | 11,798 | | 519,230 |
| Pogo Producing Company | 8,690 | | 385,923 |
| Quicksilver Resources, Inc. * (a) | 10,150 | | 381,843 |
|
|
| | | | 4,019,303 |
| Mid Cap Index Fund (continued) | | | |
| | Shares or | | |
| | Principal | | |
| | Amount | | Value |
|
|
| |
| COMMON STOCKS (continued) | | | |
| Domestic Oil - 1.25% | | | |
| Denbury Resources, Inc. * | 17,848 | $ | 553,466 |
| Forest Oil Corp. * (a) | 8,285 | | 280,613 |
| Noble Energy, Inc. | 26,557 | | 1,312,447 |
|
|
| | | | 2,146,526 |
| Drugs & Health Care - 0.42% | | | |
| Hillenbrand Industries, Inc. | 9,198 | | 524,930 |
| Perrigo Company | 12,548 | | 202,525 |
|
|
| | | | 727,455 |
| Educational Services - 0.21% | | | |
| Laureate Education, Inc. * | 7,692 | | 369,370 |
| Electrical Equipment - 0.64% | | | |
| AMETEK, Inc. | 10,627 | | 455,686 |
| Hubbell, Inc., Class B (a) | 9,114 | | 423,801 |
| Varian, Inc. * | 4,632 | | 216,222 |
|
|
| | | | 1,095,709 |
| Electrical Utilities - 4.43% | | | |
| Alliant Corp. | 17,621 | | 644,752 |
| Black Hills Corp. (a) | 4,984 | | 173,493 |
| DPL, Inc. (a) | 17,113 | | 475,742 |
| Duquesne Light Holdings, Inc. (a) | 11,748 | | 231,318 |
| Great Plains Energy, Inc. (a) | 11,914 | | 363,615 |
| Hawaiian Electric Industries, Inc. (a) | 12,161 | | 333,455 |
| IDACORP, Inc. | 6,415 | | 246,464 |
| Northeast Utilities | 23,022 | | 525,132 |
| NSTAR | 16,012 | | 527,275 |
| OGE Energy Corp. (a) | 13,608 | | 506,762 |
| Pepco Holdings, Inc. | 28,539 | | 724,605 |
| PNM Resources, Inc. | 10,317 | | 295,788 |
| Puget Energy, Inc. | 17,395 | | 393,649 |
| Quanta Services, Inc. * (a) | 17,767 | | 315,009 |
| Sierra Pacific Resources * | 33,050 | | 487,488 |
| Westar Energy, Inc. | 13,062 | | 318,582 |
| Wisconsin Energy Corp. | 17,537 | | 754,091 |
| WPS Resources Corp. | 6,042 | | 310,438 |
|
|
| | | | 7,627,658 |
| Electronics - 2.50% | | | |
| Amphenol Corp., Class A | 13,431 | | 771,880 |
| Arrow Electronics, Inc. * | 18,264 | | 509,566 |
| Avnet, Inc. * | 21,957 | | 429,479 |
| DRS Technologies, Inc. (a) | 5,986 | | 247,641 |
| Imation Corp. | 5,229 | | 207,225 |
| Kemet Corp. * | 13,008 | | 107,056 |
| Mentor Graphics Corp. * | 12,035 | | 174,507 |
| Synopsys, Inc. * | 21,514 | | 407,905 |
| Teleflex, Inc. | 6,035 | | 336,813 |
| Thomas & Betts Corp. * | 8,141 | | 367,648 |
| Vishay Intertechnology, Inc. * (a) | 27,648 | | 387,348 |
| Zebra Technologies Corp., Class A * | 10,609 | | 359,009 |
|
|
| | | | 4,306,077 |
The accompanying notes are an integral part of the financial statements. 305
John Hancock Funds II
Portfolio of investments — August 31, 2006
(showing percentage of total net assets) |
| Mid Cap Index Fund (continued) | | | |
| | Shares or | | |
| | Principal | | |
| | Amount | | Value |
|
|
| |
| COMMON STOCKS (continued) | | | |
| Energy - 1.76% | | | |
| Energy East Corp. (a) | 22,139 | $ | 536,871 |
| Hanover Compressor Company * (a) | 13,806 | | 259,829 |
| MDU Resources Group, Inc. | 26,409 | | 647,020 |
| SCANA Corp. | 17,312 | | 715,851 |
| Southwestern Energy Company * | 25,133 | | 863,319 |
|
|
| | | | 3,022,890 |
| Financial Services - 2.92% | | | |
| A.G. Edwards, Inc. | 11,332 | | 598,556 |
| AmeriCredit Corp. * | 19,553 | | 459,300 |
| Eaton Vance Corp. | 19,178 | | 509,943 |
| Fidelity National Information Services, Inc. | 14,139 | | 518,053 |
| IndyMac Bancorp, Inc. | 9,823 | | 384,079 |
| Jefferies Group, Inc. | 15,104 | | 376,392 |
| Leucadia National Corp. (a) | 24,631 | | 633,755 |
| Moneygram International, Inc. | 12,702 | | 398,843 |
| Raymond James Financial, Inc. | 13,358 | | 370,284 |
| SEI Investments Company | 9,449 | | 482,277 |
| Waddell & Reed Financial, Inc., Class A | 12,705 | | 295,010 |
|
|
| | | | 5,026,492 |
| Food & Beverages - 1.01% | | | |
| Bob Evans Farms, Inc. (a) | 5,375 | | 152,328 |
| Hormel Foods Corp. | 10,953 | | 401,427 |
| PepsiAmericas, Inc. | 8,985 | | 206,565 |
| Smithfield Foods, Inc. * | 14,831 | | 445,375 |
| The J.M. Smucker Company | 8,726 | | 424,345 |
| Tootsie Roll Industries, Inc. (a) | 3,849 | | 111,660 |
|
|
| | | | 1,741,700 |
| Forest Products - 0.26% | | | |
| Rayonier, Inc. | 11,472 | | 453,144 |
| Furniture & Fixtures - 0.08% | | | |
| Furniture Brands International, Inc. (a) | 7,343 | | 140,618 |
| Gas & Pipeline Utilities - 2.39% | | | |
| AGL Resources, Inc. | 11,683 | | 425,144 |
| Aquila, Inc. * | 56,043 | | 256,677 |
| Equitable Resources, Inc. | 18,076 | | 666,281 |
| National Fuel Gas Company (a) | 12,589 | | 480,522 |
| ONEOK, Inc. | 16,480 | | 630,690 |
| Questar Corp. | 12,826 | | 1,109,962 |
| Vectren Corp. | 11,421 | | 314,763 |
| WGL Holdings, Inc. | 7,310 | | 227,122 |
|
|
| | | | 4,111,161 |
| Healthcare Products - 3.16% | | | |
| Advanced Medical Optics, Inc. * (a) | 10,296 | | 495,752 |
| Beckman Coulter, Inc. | 9,464 | | 518,343 |
| Cytyc Corp. * | 17,141 | | 409,499 |
| DENTSPLY International, Inc. | 23,671 | | 771,201 |
| Edwards Lifesciences Corp. * | 8,837 | | 412,600 |
| Gen-Probe, Inc. * | 7,734 | | 375,950 |
| Henry Schein, Inc. * | 13,240 | | 660,279 |
| Intuitive Surgical, Inc. * | 5,481 | | 517,406 |
| Mid Cap Index Fund (continued) | | | |
| | Shares or | | |
| | Principal | | |
| | Amount | | Value |
|
|
| |
| COMMON STOCKS (continued) | | | |
| Healthcare Products (continued) | | | |
| STERIS Corp. | 9,868 | $ | 234,661 |
| Varian Medical Systems, Inc. * | 19,697 | | 1,049,850 |
|
|
| | | | 5,445,541 |
| Healthcare Services - 1.63% | | | |
| Apria Healthcare Group, Inc. * (a) | 6,357 | | 129,619 |
| Covance, Inc. * | 9,528 | | 599,026 |
| Health Net, Inc. * | 17,289 | | 722,853 |
| Lincare Holdings, Inc. * | 14,335 | | 530,825 |
| Omnicare, Inc. (a) | 18,161 | | 822,875 |
|
|
| | | | 2,805,198 |
| Homebuilders - 0.79% | | | |
| Beazer Homes USA, Inc. (a) | 6,054 | | 243,976 |
| Hovnanian Enterprises, Inc., Class A * (a) | 5,367 | | 142,172 |
| M.D.C. Holdings, Inc. (a) | 4,917 | | 210,398 |
| Ryland Group, Inc. (a) | 6,836 | | 291,692 |
| Toll Brothers, Inc. * (a) | 17,526 | | 463,037 |
|
|
| | | | 1,351,275 |
| Hotels & Restaurants - 1.14% | | | |
| Applebee's International, Inc. (a) | 11,135 | | 231,051 |
| Boyd Gaming Corp. (a) | 6,577 | | 237,824 |
| Brinker International, Inc. | 12,714 | | 489,108 |
| CBRL Group, Inc. (a) | 4,635 | | 175,388 |
| OSI Restaurant Partners, Inc. (a) | 9,882 | | 306,046 |
| Ruby Tuesday, Inc. (a) | 8,849 | | 228,481 |
| The Cheesecake Factory, Inc. * (a) | 11,856 | | 295,096 |
|
|
| | | | 1,962,994 |
| Household Products - 0.68% | | | |
| Blyth, Inc. | 3,943 | | 84,696 |
| Church & Dwight, Inc. (a) | 9,692 | | 373,142 |
| Energizer Holdings, Inc. * | 8,584 | | 573,926 |
| Tupperware Brands Corp. | 8,091 | | 145,719 |
|
|
| | | | 1,177,483 |
| Industrial Machinery - 2.37% | | | |
| AGCO Corp. * | 13,573 | | 337,289 |
| Donaldson Company, Inc. | 10,177 | | 339,708 |
| Flowserve Corp. * | 8,428 | | 431,008 |
| FMC Technologies, Inc. * | 10,249 | | 602,846 |
| Graco, Inc. | 10,258 | | 387,752 |
| Grant Prideco, Inc. * | 19,628 | | 815,151 |
| Joy Global, Inc. | 18,531 | | 806,840 |
| Kennametal, Inc. | 5,935 | | 313,012 |
| Tecumseh Products Company, Class A * (a) | 2,770 | | 41,135 |
|
|
| | | | 4,074,741 |
| Industrials - 0.86% | | | |
| Crane Company | 7,562 | | 302,329 |
| Fastenal Company (a) | 18,569 | | 681,111 |
| Harsco Corp. | 6,289 | | 500,353 |
|
|
| | | | 1,483,793 |
| Insurance - 5.68% | | | |
| American Financial Group, Inc. | 7,065 | | 330,077 |
The accompanying notes are an integral part of the financial statements. 306
John Hancock Funds II
Portfolio of investments — August 31, 2006
(showing percentage of total net assets) |
| Mid Cap Index Fund (continued) | | | |
| | Shares or | | |
| | Principal | | |
| | Amount | | Value |
|
|
| |
| COMMON STOCKS (continued) | | | |
| Insurance (continued) | | | |
| Amerus Group Company | 5,818 | $ | 394,460 |
| Arthur J. Gallagher & Company (a) | 14,497 | | 388,520 |
| Brown & Brown, Inc. | 16,735 | | 501,046 |
| Everest Re Group, Ltd. | 9,732 | | 914,613 |
| Fidelity National Financial, Inc. | 26,200 | | 1,054,026 |
| First American Corp. | 14,489 | | 588,543 |
| Hanover Insurance Group, Inc. | 7,614 | | 338,823 |
| HCC Insurance Holdings, Inc. | 16,671 | | 541,641 |
| Horace Mann Educators Corp. | 6,446 | | 118,349 |
| Mercury General Corp. (a) | 5,324 | | 267,638 |
| Ohio Casualty Corp. | 9,532 | | 247,355 |
| Old Republic International Corp. | 34,457 | | 720,151 |
| PMI Group, Inc. | 13,401 | | 579,459 |
| Protective Life Corp. | 10,477 | | 482,256 |
| Radian Group, Inc. (a) | 12,354 | | 739,758 |
| Stancorp Financial Group, Inc. | 8,200 | | 381,874 |
| Unitrin, Inc. | 6,786 | | 297,770 |
| W.R. Berkley Corp. | 25,377 | | 888,195 |
|
|
| | | | 9,774,554 |
| Internet Software - 0.96% | | | |
| Checkfree Corp. * | 13,700 | | 490,460 |
| F5 Networks, Inc. * | 6,079 | | 304,497 |
| McAfee, Inc. * | 23,915 | | 544,305 |
| RSA Security, Inc. * | 11,316 | | 315,151 |
|
|
| | | | 1,654,413 |
| Leisure Time - 0.39% | | | |
| Callaway Golf Company | 9,757 | | 130,841 |
| International Speedway Corp., Class A | 5,276 | | 255,358 |
| Scientific Games Corp., Class A * (a) | 9,838 | | 285,991 |
|
|
| | | | 672,190 |
| Life Sciences - 0.34% | | | |
| Pharmaceutical Product Development, Inc. | 15,211 | | 579,843 |
| Manufacturing - 2.10% | | | |
| Cameron International Corp. * | 17,315 | | 829,562 |
| Carlisle Companies, Inc. | 4,609 | | 394,069 |
| Lancaster Colony Corp. (a) | 3,684 | | 162,612 |
| Mine Safety Appliances Company (a) | 3,945 | | 139,850 |
| Nordson Corp. | 5,059 | | 202,562 |
| Pentair, Inc. | 15,242 | | 455,736 |
| Roper Industries, Inc. | 13,020 | | 603,868 |
| SPX Corp. | 8,961 | | 473,141 |
| Trinity Industries, Inc. | 10,622 | | 354,350 |
|
|
| | | | 3,615,750 |
| Medical-Hospitals - 1.36% | | | |
| Community Health Systems, Inc. * | 14,736 | | 571,167 |
| Lifepoint Hospitals, Inc. * | 8,618 | | 293,443 |
| Triad Hospitals, Inc. * | 13,124 | | 578,243 |
| Universal Health Services, Inc., Class B | 8,122 | | 459,868 |
| VCA Antech, Inc. * | 12,456 | | 441,192 |
|
|
| | | | 2,343,913 |
| Mid Cap Index Fund (continued) | | | |
| | Shares or | | |
| | Principal | | |
| | Amount | | Value |
|
|
| |
| COMMON STOCKS (continued) | | | |
| Metal & Metal Products - 1.32% | | | |
| Commercial Metals Company | 18,038 | $ | 389,440 |
| Precision Castparts Corp. | 20,097 | | 1,174,469 |
| Reliance Steel & Aluminum Company | 9,481 | | 310,692 |
| Timken Company | 12,622 | | 404,409 |
|
|
| | | | 2,279,010 |
| Mining - 0.20% | | | |
| Lincoln Electric Holding, Inc. | 6,361 | | 350,046 |
| Mobile Homes - 0.13% | | | |
| Thor Industries, Inc. (a) | 5,184 | | 218,661 |
| Newspapers - 0.49% | | | |
| Lee Enterprises, Inc. (a) | 6,857 | | 169,779 |
| Washington Post Company, Class B | 878 | | 674,102 |
|
|
| | | | 843,881 |
| Office Furnishings & Supplies - 0.34% | | | |
| Herman Miller, Inc. | 9,945 | | 280,847 |
| HNI Corp. (a) | 7,767 | | 309,903 |
|
|
| | | | 590,750 |
| Paper - 0.30% | | | |
| Bowater, Inc. (a) | 8,384 | | 190,568 |
| P.H. Glatfelter Company | 6,664 | | 95,629 |
| Potlatch Corp. (a) | 5,791 | | 221,853 |
|
|
| | | | 508,050 |
| Petroleum Services - 1.95% | | | |
| ENSCO International, Inc. | 23,053 | | 1,030,239 |
| Pride International, Inc. * | 24,276 | | 629,477 |
| Smith International, Inc. | 30,052 | | 1,261,282 |
| Tidewater, Inc. | 9,041 | | 430,442 |
|
|
| | | | 3,351,440 |
| Pharmaceuticals - 1.32% | | | |
| Medicis Pharmaceutical Corp., Class A (a) | 8,160 | | 239,007 |
| Par Pharmaceutical Companies, Inc. * (a) | 5,254 | | 94,309 |
| PDL BioPharma, Inc. * (a) | 17,160 | | 338,052 |
| Sepracor, Inc. * (a) | 16,303 | | 766,404 |
| Valeant Pharmaceuticals International (a) | 13,912 | | 273,510 |
| Vertex Pharmaceuticals, Inc. * | 16,516 | | 568,976 |
|
|
| | | | 2,280,258 |
| Publishing - 0.49% | | | |
| American Greetings Corp., Class A (a) | 8,631 | | 211,632 |
| Media General, Inc., Class A | 3,607 | | 141,827 |
| Readers Digest Association, Inc., Class A (a) | 14,447 | | 185,066 |
| Scholastic Corp. * | 5,398 | | 162,264 |
| Valassis Communications, Inc. * | 7,164 | | 141,274 |
|
|
| | | | 842,063 |
| Railroads & Equipment - 0.16% | | | |
| GATX Corp. | 7,631 | | 283,186 |
| Real Estate - 3.85% | | | |
| AMB Property Corp., REIT | 13,193 | | 736,565 |
| Developers Diversified Realty Corp., REIT | 16,444 | | 889,620 |
| Highwoods Properties, Inc., REIT | 8,116 | | 306,298 |
The accompanying notes are an integral part of the financial statements. 307
John Hancock Funds II
Portfolio of investments — August 31, 2006
(showing percentage of total net assets) |
| Mid Cap Index Fund (continued) | | | |
| | Shares or | | |
| | Principal | | |
| | Amount | | Value |
|
|
| |
| COMMON STOCKS (continued) | | | |
| Real Estate (continued) | | | |
| Hospitality Properties Trust, REIT | 10,787 | $ | 499,654 |
| Liberty Property Trust, REIT | 13,373 | | 640,166 |
| Mack-California Realty Corp., REIT | 9,342 | | 496,527 |
| New Plan Realty Trust, Inc., REIT | 15,682 | | 432,666 |
| Regency Centers Corp., REIT | 10,281 | | 691,603 |
| The Macerich Company, REIT | 10,762 | | 803,491 |
| United Dominion Realty Trust, Inc., REIT (a) | 20,131 | | 614,197 |
| Weingarten Realty Investors, REIT | 12,092 | | 512,943 |
|
|
| | | | 6,623,730 |
| Retail Grocery - 0.08% | | | |
| Ruddick Corp. | 5,191 | | 133,876 |
| Retail Trade - 6.52% | | | |
| 99 Cents Only Stores * (a) | 7,197 | | 81,758 |
| Abercrombie & Fitch Company, Class A | 13,192 | | 851,280 |
| Advance Auto Parts, Inc. | 16,199 | | 487,914 |
| Aeropostale, Inc. * | 8,173 | | 207,594 |
| American Eagle Outfitters, Inc. | 19,758 | | 763,252 |
| AnnTaylor Stores Corp. * | 10,999 | | 437,760 |
| Barnes & Noble, Inc. | 7,925 | | 288,153 |
| BJ's Wholesale Club, Inc. * | 9,991 | | 263,263 |
| Borders Group, Inc. | 9,620 | | 184,031 |
| CarMax, Inc. * | 15,749 | | 593,580 |
| Chico's FAS, Inc. * | 27,286 | | 503,154 |
| Claire's Stores, Inc. | 14,699 | | 401,724 |
| Coldwater Creek, Inc. * (a) | 9,012 | | 247,560 |
| Dollar Tree Stores, Inc. * | 15,675 | | 451,126 |
| Foot Locker, Inc. | 23,287 | | 561,217 |
| GameStop Corp., Class A * (a) | 8,892 | | 388,403 |
| Michael's Stores, Inc. | 19,809 | | 852,777 |
| MSC Industrial Direct Company, Inc., Class A | 8,169 | | 321,532 |
| Pacific Sunwear of California, Inc. * | 10,800 | | 144,288 |
| Payless ShoeSource, Inc. * | 10,099 | | 236,922 |
| PETsMART, Inc. | 21,003 | | 527,175 |
| Pier 1 Imports, Inc. (a) | 13,055 | | 83,421 |
| Regis Corp. (a) | 6,845 | | 251,143 |
| Rent-A-Center, Inc. * | 10,409 | | 282,084 |
| Ross Stores, Inc. | 21,419 | | 524,551 |
| Saks, Inc. * | 20,524 | | 296,161 |
| United Rentals, Inc. * (a) | 10,228 | | 221,538 |
| Urban Outfitters, Inc. * (a) | 16,599 | | 260,438 |
| Williams-Sonoma, Inc. (a) | 17,267 | | 508,686 |
|
|
| | | | 11,222,485 |
| Sanitary Services - 0.93% | | | |
| Aqua America, Inc. (a) | 19,416 | | 459,965 |
| Republic Services, Inc. | 18,039 | | 699,553 |
| Stericycle, Inc. * (a) | 6,635 | | 442,488 |
|
|
| | | | 1,602,006 |
| Semiconductors - 3.69% | | | |
| Atmel Corp. * | 64,221 | | 370,555 |
| Cree, Inc. * (a) | 11,552 | | 215,098 |
| Cypress Semiconductor Corp. * (a) | 20,939 | | 327,486 |
| Mid Cap Index Fund (continued) | | | |
| | Shares or | | |
| | Principal | | |
| | Amount | | Value |
|
|
| |
| COMMON STOCKS (continued) | | | |
| Semiconductors (continued) | | | |
| Fairchild Semiconductor International, Inc. * | 18,229 | $ | 328,669 |
| Integrated Device Technology, Inc. * | 30,021 | | 517,262 |
| International Rectifier Corp. * (a) | 10,725 | | 378,592 |
| Intersil Corp., Class A | 21,248 | | 538,637 |
| Lam Research Corp. * | 21,083 | | 902,142 |
| Lattice Semiconductor Corp. * | 17,108 | | 125,231 |
| MEMC Electronic Materials, Inc. * | 24,760 | | 957,717 |
| Micrel, Inc. * | 9,515 | | 95,340 |
| Microchip Technology, Inc. | 32,139 | | 1,097,868 |
| Semtech Corp. * | 10,920 | | 142,724 |
| Silicon Laboratories, Inc. * | 6,917 | | 243,963 |
| Triquint Semiconductor, Inc. * | 20,940 | | 103,234 |
|
|
| | | | 6,344,518 |
| Software - 0.63% | | | |
| Activision, Inc. * | 41,658 | | 537,388 |
| Advent Software, Inc. * (a) | 2,355 | | 77,126 |
| Macrovision Corp. * | 7,752 | | 180,467 |
| McDATA Corp., Class A * (a) | 23,841 | | 102,278 |
| Transaction Systems Architects, Inc., Class A * | 5,606 | | 185,951 |
|
|
| | | | 1,083,210 |
| Steel - 0.32% | | | |
| Steel Dynamics, Inc. | 6,495 | | 342,871 |
| Worthington Industries, Inc. (a) | 10,757 | | 205,566 |
|
|
| | | | 548,437 |
| Telecommunications Equipment & | | | |
| Services - 0.76% | | | |
| ADTRAN, Inc. | 10,242 | | 254,719 |
| Commscope, Inc. * (a) | 8,697 | | 254,039 |
| Newport Corp. * | 6,091 | | 107,384 |
| Plantronics, Inc. (a) | 7,129 | | 127,752 |
| Polycom, Inc. * | 13,079 | | 311,149 |
| Powerwave Technologies, Inc. * (a) | 16,810 | | 127,420 |
| UTStarcom, Inc. * (a) | 15,756 | | 129,357 |
|
|
| | | | 1,311,820 |
| Telephone - 0.62% | | | |
| Cincinnati Bell, Inc. * | 37,017 | | 186,936 |
| Harris Corp. | 20,129 | | 884,066 |
|
|
| | | | 1,071,002 |
| Tires & Rubber - 0.04% | | | |
| Bandag, Inc. (a) | 1,754 | | 66,757 |
| Tobacco - 0.09% | | | |
| Universal Corp. | 3,856 | | 148,957 |
| Transportation - 1.98% | | | |
| Alexander & Baldwin, Inc. (a) | 6,632 | | 290,880 |
| C.H. Robinson Worldwide, Inc. | 26,041 | | 1,193,199 |
| Con-way, Inc. | 7,193 | | 344,185 |
| Expeditors International of Washington, Inc. | 31,986 | | 1,275,282 |
| Overseas Shipholding Group, Inc. (a) | 4,445 | | 296,481 |
|
|
| | | | 3,400,027 |
The accompanying notes are an integral part of the financial statements. 308
John Hancock Funds II
Portfolio of investments — August 31, 2006
(showing percentage of total net assets) |
| Mid Cap Index Fund (continued) | | | |
| | | Shares or | | |
| | | Principal | | |
| | | Amount | | Value |
| |
|
| |
| COMMON STOCKS (continued) | | | | |
| Trucking & Freight - 0.92% | | | | |
| J.B. Hunt Transport Services, Inc. (a) | | 18,518 | $ | 363,879 |
| Oshkosh Truck Corp. | | 11,037 | | 570,613 |
| Swift Transportation, Inc. * | | 8,061 | | 186,934 |
| Werner Enterprises, Inc. (a) | | 7,645 | | 141,662 |
| YRC Worldwide, Inc. * (a) | | 8,613 | | 316,786 |
|
|
| | | | | 1,579,874 |
|
| |
| TOTAL COMMON STOCKS (Cost $162,502,045) | | $ | 160,400,814 |
|
| |
| SHORT TERM INVESTMENTS - 24.30% | | | |
| Federal Home Loan Bank Discount Notes | | | | |
| zero coupon due 10/04/2006 | $ | 2,000,000 | $ | 1,990,485 |
| Federal Home Loan Mortgage Corp. Discount Notes | | | |
| zero coupon due 10/10/2006 | | 2,000,000 | | 1,988,853 |
| Federal National Mortgage Association | | | | |
| Discount Notes | | | | |
| zero coupon due 10/04/2006 to | | | | |
| 10/16/2006 | | 5,000,000 | | 4,973,054 |
| Rabobank USA Finance Corp. | | | | |
| 5.27% due 09/01/2006 | | 1,530,000 | | 1,530,000 |
| State Street Navigator Securities Lending | | | | |
| Prime Portfolio (c) | | 30,804,574 | | 30,804,574 |
| United States Treasury Bills | | | | |
| zero coupon due 10/19/2006 | | 550,000 | | 546,359 |
|
| TOTAL SHORT TERM INVESTMENTS | | | | |
| (Cost $41,833,325) | | | $ | 41,833,325 |
|
| |
| REPURCHASE AGREEMENTS - 0.32% | | | |
| Repurchase Agreement with State | | | | |
| Street Corp. dated 08/31/2006 at | | | | |
| 4.96% to be repurchased at | | | | |
| $541,075 on 09/01/2006, | | | | |
| collateralized by $590,000 United | | | | |
| States Treasury Bonds, 4.50% due | | | | |
| 02/15/2036 (valued at $553,863, | | | | |
| including interest) (c) | $ | 541,000 | $ | 541,000 |
|
| TOTAL REPURCHASE AGREEMENTS | | | | |
| (Cost $541,000) | | | $ | 541,000 |
|
| Total Investments (Mid Cap Index Fund) | | | |
| (Cost $204,876,370) - 117.79% | | | $ | 202,775,139 |
| Liabilities in Excess of Other Assets - (17.79)% | | | (30,619,646) |
|
|
| TOTAL NET ASSETS - 100.00% | | | $ | 172,155,493 |
|
|
| |
| |
| Mid Cap Stock Fund | | | | |
| | | Shares or | | |
| | | Principal | | |
| | | Amount | | Value |
| |
|
| |
| COMMON STOCKS - 96.27% | | | | |
| Advertising - 0.80% | | | | |
| Focus Media Holding Ltd., ADR * (a) | | 40,800 | $ | 2,407,200 |
| Aerospace - 2.66% | | | | |
| Alliant Techsystems, Inc. * (a) | | 72,415 | | 5,539,023 |
| Mid Cap Stock Fund (continued) | | |
| | Shares or | |
| | Principal | |
| | Amount | Value |
|
|
| |
| COMMON STOCKS (continued) | | |
| Aerospace (continued) | | |
| Rockwell Collins, Inc. | 47,092 $ | 2,469,034 |
|
|
| | | 8,008,057 |
| Air Travel - 2.33% | | |
| Gol Linhas Aereas Inteligentes SA, ADR (a) | 113,740 | 3,970,663 |
| Southwest Airlines Company | 176,025 | 3,048,753 |
|
|
| | | 7,019,416 |
| Auto Parts - 0.97% | | |
| LKQ Corp. * | 141,000 | 2,928,570 |
| Biotechnology - 2.37% | | |
| Cephalon, Inc. * (a) | 58,777 | 3,351,465 |
| ICOS Corp. * (a) | 78,812 | 1,937,199 |
| Millennium Pharmaceuticals, Inc. * | 170,583 | 1,852,531 |
|
|
| | | 7,141,195 |
| Broadcasting - 0.72% | | |
| Sirius Satellite Radio, Inc. * (a) | 531,075 | 2,172,097 |
| Business Services - 7.07% | | |
| Corporate Executive Board Company | 27,615 | 2,420,179 |
| DST Systems, Inc. * (a) | 49,000 | 2,892,470 |
| Equifax, Inc. | 125,100 | 3,976,929 |
| Fluor Corp. | 31,800 | 2,748,156 |
| Foster Wheeler, Ltd. * (a) | 58,000 | 2,521,260 |
| Resources Connection, Inc. * | 186,700 | 4,555,480 |
| URS Corp. * | 52,900 | 2,145,095 |
|
|
| | | 21,259,569 |
| Cable and Television - 0.98% | | |
| Gemstar-TV Guide International, Inc. * | 918,500 | 2,948,385 |
| Cellular Communications - 3.13% | | |
| American Tower Corp., Class A * | 105,749 | 3,792,159 |
| Crown Castle International Corp. * (a) | 76,220 | 2,618,919 |
| Leap Wireless International, Inc. * | 64,800 | 2,997,648 |
|
|
| | | 9,408,726 |
| Chemicals - 2.24% | | |
| Kingboard Chemical Holdings, Ltd. | 984,000 | 3,175,847 |
| Wacker Chemie AG * | 29,681 | 3,578,618 |
|
|
| | | 6,754,465 |
| Commercial Services - 0.85% | | |
| Live Nation, Inc. * | 121,200 | 2,542,776 |
| Computers & Business Equipment - 3.70% | | |
| Cognizant Technology Solutions Corp., | | |
| Class A * | 43,367 | 3,031,787 |
| Network Appliance, Inc. * (a) | 237,000 | 8,114,880 |
|
|
| | | 11,146,667 |
| Containers & Glass - 2.51% | | |
| Ball Corp. | 91,500 | 3,691,110 |
| Jarden Corp. * (a) | 132,068 | 3,872,234 |
|
|
| | | 7,563,344 |
| Cosmetics & Toiletries - 1.95% | | |
| Alberto-Culver Company, Class B | 58,100 | 2,860,263 |
The accompanying notes are an integral part of the financial statements. 309
John Hancock Funds II
Portfolio of investments — August 31, 2006
(showing percentage of total net assets) |
| Mid Cap Stock Fund (continued) | | |
| | Shares or | |
| | Principal | |
| | Amount | Value |
|
|
| |
| COMMON STOCKS (continued) | | |
| Cosmetics & Toiletries (continued) | | |
| Nu Skin Enterprises, Inc., Class A | 173,800 $ | 3,010,216 |
|
|
| | | 5,870,479 |
| Crude Petroleum & Natural Gas - 0.95% | | |
| Chesapeake Energy Corp. | 90,628 | 2,861,126 |
| Drugs & Health Care - 2.05% | | |
| Shionogi & Company, Ltd. | 263,347 | 4,734,883 |
| Zymogenetics, Inc. * (a) | 73,500 | 1,421,490 |
|
|
| | | 6,156,373 |
| Electrical Equipment - 0.77% | | |
| Tektronix, Inc. | 82,146 | 2,328,018 |
| Electronics - 1.87% | | |
| Barco N.V. | 29,312 | 2,583,569 |
| Garmin, Ltd. (a) | 65,000 | 3,039,400 |
|
|
| | | 5,622,969 |
| Energy - 2.21% | | |
| Suntech Power Holdings Co., Ltd., ADR * | 185,500 | 5,379,500 |
| VeraSun Energy Corp. * (a) | 57,900 | 1,274,958 |
|
|
| | | 6,654,458 |
| Financial Services - 5.98% | | |
| E*TRADE Financial Corp. * | 119,695 | 2,823,605 |
| Julius Baer Holding, Ltd. | 35,851 | 3,437,767 |
| Nasdaq Stock Market, Inc. * (a) | 124,816 | 3,558,504 |
| Nuveen Investments, Class A (a) | 81,700 | 3,900,358 |
| State Street Corp. (c) | 69,276 | 4,281,257 |
|
|
| | | 18,001,491 |
| Healthcare Products - 3.19% | | |
| Hologic, Inc. * (a) | 78,300 | 3,380,994 |
| Kyphon, Inc. * (a) | 123,500 | 4,471,935 |
| The Medicines Company * (a) | 77,239 | 1,742,512 |
|
|
| | | 9,595,441 |
| Healthcare Services - 2.19% | | |
| Covance, Inc. * | 42,435 | 2,667,888 |
| IMS Health, Inc. | 143,200 | 3,907,928 |
|
|
| | | 6,575,816 |
| Industrial Machinery - 1.64% | | |
| Energy Conversion Devices, Inc. * (a) | 84,900 | 2,975,745 |
| Joy Global, Inc. | 44,800 | 1,950,592 |
|
|
| | | 4,926,337 |
| International Oil - 0.77% | | |
| Nabors Industries, Ltd. * | 70,900 | 2,331,192 |
| Internet Service Provider - 0.70% | | |
| Redback Networks, Inc. * (a) | 112,800 | 2,102,592 |
| Internet Software - 0.52% | | |
| Tencent Holdings, Ltd. | 719,300 | 1,572,352 |
| Leisure Time - 1.57% | | |
| DreamWorks Animation SKG, Class A * | 114,239 | 2,420,724 |
| Harrah's Entertainment, Inc. | 36,775 | 2,293,289 |
|
|
| | | 4,714,013 |
| Mid Cap Stock Fund (continued) | | | |
| | Shares or | | |
| | Principal | | |
| | Amount | | Value |
|
|
| |
| COMMON STOCKS (continued) | | | |
| Life Sciences - 1.21% | | | |
| Pharmaceutical Product Development, Inc. | 95,120 | $ | 3,625,974 |
| Manufacturing - 1.92% | | | |
| Roper Industries, Inc. (a) | 48,500 | | 2,249,430 |
| Vallourec SA | 15,700 | | 3,514,740 |
|
|
| | | | 5,764,170 |
| Medical-Hospitals - 0.13% | | | |
| Health Management Associates, Inc., Class A | 18,200 | | 380,562 |
| Metal & Metal Products - 1.12% | | | |
| Cameco Corp. | 82,252 | | 3,368,219 |
| Mining - 2.27% | | | |
| Phelps Dodge Corp. | 35,500 | | 3,177,250 |
| Teck Cominco, Ltd., Class B | 54,700 | | 3,655,054 |
|
|
| | | | 6,832,304 |
| Petroleum Services - 0.69% | | | |
| BJ Services Company | 60,784 | | 2,085,499 |
| Pharmaceuticals - 5.14% | | | |
| Alkermes, Inc. * (a) | 83,101 | | 1,358,701 |
| Amylin Pharmaceuticals, Inc. * (a) | 84,467 | | 3,828,889 |
| Elan Corp. PLC, ADR * (a) | 161,900 | | 2,676,207 |
| Forest Laboratories, Inc. * | 106,262 | | 5,310,975 |
| Herbalife, Ltd. * | 22,400 | | 731,808 |
| Vertex Pharmaceuticals, Inc. * (a) | 44,876 | | 1,545,978 |
|
|
| | | | 15,452,558 |
| Retail Trade - 5.91% | | | |
| Fossil, Inc. * (a) | 162,100 | | 3,050,722 |
| GameStop Corp., Class A * (a) | 31,400 | | 1,371,552 |
| Kohl's Corp. * | 95,300 | | 5,957,203 |
| Tiffany & Company | 123,107 | | 3,890,181 |
| Williams-Sonoma, Inc. | 119,607 | | 3,523,622 |
|
|
| | | | 17,793,280 |
| Sanitary Services - 1.23% | | | |
| Stericycle, Inc. * (a) | 55,304 | | 3,688,224 |
| Semiconductors - 4.34% | | | |
| Fairchild Semiconductor International, Inc. * | 160,300 | | 2,890,209 |
| Integrated Device Technology, Inc. * | 232,400 | | 4,004,252 |
| International Rectifier Corp. * | 78,500 | | 2,771,050 |
| Silicon-On-Insulator Technologies * | 110,900 | | 3,377,897 |
|
|
| | | | 13,043,408 |
| Software - 11.51% | | | |
| Activision, Inc. * | 397,800 | | 5,131,620 |
| Adobe Systems, Inc. * | 156,100 | | 5,063,884 |
| American Reprographics Company * | 60,700 | | 1,852,564 |
| Autodesk, Inc. * | 89,800 | | 3,121,448 |
| Cognos, Inc. * (a) | 101,611 | | 3,304,390 |
| Red Hat, Inc. * (a) | 144,000 | | 3,346,560 |
| TomTom NV * | 56,548 | | 2,303,275 |
| Transaction Systems Architects, Inc., Class A * | 74,200 | | 2,461,214 |
| VeriFone Holdings, Inc. * (a) | 198,494 | | 4,595,136 |
The accompanying notes are an integral part of the financial statements. 310
John Hancock Funds II
Portfolio of investments — August 31, 2006
(showing percentage of total net assets) |
| Mid Cap Stock Fund (continued) | | | |
| | | Shares or | | |
| | | Principal | | |
| | | Amount | | Value |
| |
|
| |
| COMMON STOCKS (continued) | | | | |
| Software (continued) | | | | |
| Verint Systems, Inc. * | | 104,600 | $ | 3,457,030 |
| |
|
| | | | | 34,637,121 |
| Telecommunications Equipment & | | | | |
| Services - 3.06% | | | | |
| Amdocs, Ltd. * | | 72,300 | | 2,743,785 |
| NeuStar, Inc., Class A * | | 103,900 | | 2,932,058 |
| Polycom, Inc. * (a) | | 148,600 | | 3,535,194 |
| |
|
| | | | | 9,211,037 |
| Travel Services - 1.05% | | | | |
| Ctrip.com International Ltd., ADR (a) | | 61,000 | | 3,149,430 |
|
| TOTAL COMMON STOCKS (Cost $273,227,435) | | $ | 289,644,910 |
|
| |
| SHORT TERM INVESTMENTS - 24.41% | | | | |
| State Street Navigator Securities | | | | |
| Lending Prime Portfolio (c) | $ | 73,452,448 | $ | 73,452,448 |
|
| TOTAL SHORT TERM INVESTMENTS | | | | |
| (Cost $73,452,448) | | | $ | 73,452,448 |
|
| |
| REPURCHASE AGREEMENTS - 4.12% | | | | |
| Repurchase Agreement with Banc of | | | | |
| America dated 08/31/2006 at | | | | |
| 5.22% to be repurchased at | | | | |
| $12,378,795 on 9/1/2006, | | | | |
| collateralized by $11,775,000 U.S. | | | | |
| Treasury Notes, 5.50% due | | | | |
| 08/15/2028 (valued at | | | | |
| $12,629,521, including interest) | $ | 12,377,000 | $ | 12,377,000 |
|
| TOTAL REPURCHASE AGREEMENTS | | | | |
| (Cost $12,377,000) | | | $ | 12,377,000 |
|
| Total Investments (Mid Cap Stock Fund) | | | | |
| (Cost $359,056,883) - 124.80% | | | $ | 375,474,358 |
| Liabilities in Excess of Other Assets - (24.80)% | | | (74,604,580) |
| |
|
| TOTAL NET ASSETS - 100.00% | | | $ | 300,869,778 |
| |
|
| |
| |
| Mid Cap Value Fund | | | | |
| | | Shares or | | |
| | | Principal | | |
| | | Amount | | Value |
| |
|
| |
| COMMON STOCKS - 95.85% | | | | |
| Advertising - 2.30% | | | | |
| The Interpublic Group of Companies, Inc. * (a) | | 359,006 | $ | 3,295,675 |
| Agriculture - 2.86% | | | | |
| Monsanto Company | | 30,096 | | 1,427,754 |
| Mosaic Company * (a) | | 164,129 | | 2,665,455 |
| |
|
| | | | | 4,093,209 |
| Auto Parts - 1.79% | | | | |
| Genuine Parts Company | | 61,893 | | 2,558,038 |
| Broadcasting - 1.97% | | | | |
| Clear Channel Communications, Inc. | | 97,200 | | 2,822,688 |
| Mid Cap Value Fund (continued) | | | |
| | Shares or | | |
| | Principal | | |
| | Amount | | Value |
|
|
| |
| COMMON STOCKS (continued) | | | |
| Business Services - 6.54% | | | |
| Cadence Design Systems, Inc. * | 170,829 | $ | 2,806,720 |
| R.H. Donnelley Corp. * | 58,853 | | 3,196,895 |
| R.R. Donnelley & Sons Company | 103,676 | | 3,361,176 |
|
|
| | | | 9,364,791 |
| Chemicals - 3.33% | | | |
| Chemtura Corp. | 176,631 | | 1,534,923 |
| Eastman Chemical Company | 61,762 | | 3,239,417 |
|
|
| | | | 4,774,340 |
| Computers & Business Equipment - 1.33% | | | |
| Sybase, Inc. * (a) | 82,556 | | 1,904,567 |
| Containers & Glass - 4.38% | | | |
| Ball Corp. | 78,122 | | 3,151,442 |
| Pactiv Corp. * | 116,473 | | 3,113,323 |
|
|
| | | | 6,264,765 |
| Crude Petroleum & Natural Gas - 1.65% | | | |
| EOG Resources, Inc. | 36,415 | | 2,360,420 |
| Electrical Equipment - 1.70% | | | |
| Hubbell, Inc., Class B | 52,437 | | 2,438,321 |
| Electrical Utilities - 6.39% | | | |
| Ameren Corp. (a) | 52,742 | | 2,824,334 |
| CMS Energy Corp. * | 178,223 | | 2,609,185 |
| Northeast Utilities | 116,321 | | 2,653,282 |
| Puget Energy, Inc. | 46,757 | | 1,058,111 |
|
|
| | | | 9,144,912 |
| Gas & Pipeline Utilities - 2.40% | | | |
| NiSource, Inc. | 124,651 | | 2,638,862 |
| Southwest Gas Corp. | 23,545 | | 793,466 |
|
|
| | | | 3,432,328 |
| Healthcare Products - 1.16% | | | |
| Bausch & Lomb, Inc. (a) | 34,445 | | 1,667,482 |
| Hotels & Restaurants - 2.18% | | | |
| Brinker International, Inc. | 43,532 | | 1,674,676 |
| OSI Restaurant Partners, Inc. | 46,800 | | 1,449,396 |
|
|
| | | | 3,124,072 |
| Household Products - 1.69% | | | |
| Newell Rubbermaid, Inc. (a) | 52,279 | | 1,411,010 |
| Tupperware Brands Corp. (a) | 56,161 | | 1,011,460 |
|
|
| | | | 2,422,470 |
| Industrial Machinery - 2.97% | | | |
| CNH Global NV | 21,008 | | 461,966 |
| Cummins, Inc. (a) | 13,617 | | 1,563,504 |
| W.W. Grainger, Inc. | 33,388 | | 2,230,318 |
|
|
| | | | 4,255,788 |
| Insurance - 11.10% | | | |
| ACE, Ltd. | 22,063 | | 1,188,313 |
| Aetna, Inc. | 37,028 | | 1,380,034 |
| Conseco, Inc. * | 108,263 | | 2,241,044 |
| Everest Re Group, Ltd. | 14,970 | | 1,406,881 |
| Genworth Financial, Inc. | 51,317 | | 1,766,844 |
The accompanying notes are an integral part of the financial statements. 311
John Hancock Funds II
Portfolio of investments — August 31, 2006
(showing percentage of total net assets) |
| Mid Cap Value Fund (continued) | | | |
| | Shares or | | |
| | Principal | | |
| | Amount | | Value |
|
|
| |
| COMMON STOCKS (continued) | | | |
| Insurance (continued) | | | |
| PartnerRe, Ltd. | 44,415 | $ | 2,855,884 |
| PMI Group, Inc. | 17,654 | | 763,359 |
| SAFECO Corp. | 27,400 | | 1,581,254 |
| XL Capital, Ltd., Class A (a) | 41,186 | | 2,703,449 |
| |
|
| | | | 15,887,062 |
| Internet Software - 1.99% | | | |
| McAfee, Inc. * | 125,054 | | 2,846,229 |
| Manufacturing - 1.76% | | | |
| Snap-on, Inc. | 57,534 | | 2,514,236 |
| Metal & Metal Products - 1.69% | | | |
| Timken Company | 75,444 | | 2,417,226 |
| Mining - 0.52% | | | |
| Potash Corp. of Saskatchewan, Inc. | 7,639 | | 748,393 |
| Office Furnishings & Supplies - 1.83% | | | |
| OfficeMax, Inc. | 62,945 | | 2,614,106 |
| Paper - 2.73% | | | |
| Bowater, Inc. (a) | 74,565 | | 1,694,862 |
| MeadWestvaco Corp. | 86,879 | | 2,219,759 |
| |
|
| | | | 3,914,621 |
| Petroleum Services - 3.33% | | | |
| GlobalSantaFe Corp. | 49,566 | | 2,439,639 |
| Halliburton Company | 71,586 | | 2,335,135 |
| |
|
| | | | 4,774,774 |
| Pharmaceuticals - 3.92% | | | |
| King Pharmaceuticals, Inc. * | 172,029 | | 2,790,311 |
| Mylan Laboratories, Inc. (a) | 138,988 | | 2,824,236 |
| |
|
| | | | 5,614,547 |
| Publishing - 1.37% | | | |
| American Greetings Corp., Class A (a) | 79,974 | | 1,960,962 |
| Real Estate - 1.93% | | | |
| Host Hotels & Resorts, Inc., REIT (a) | 122,622 | | 2,763,900 |
| Retail Grocery - 2.75% | | | |
| Safeway, Inc. | 66,173 | | 2,046,731 |
| The Kroger Company | 79,600 | | 1,895,276 |
| |
|
| | | | 3,942,007 |
| Retail Trade - 3.08% | | | |
| Federated Department Stores, Inc. | 60,866 | | 2,311,691 |
| Foot Locker, Inc. | 87,326 | | 2,104,556 |
| |
|
| | | | 4,416,247 |
| Sanitary Services - 0.95% | | | |
| Allied Waste Industries, Inc. * | 131,300 | | 1,357,642 |
| Telecommunications Equipment & | | | |
| Services - 6.25% | | | |
| ADC Telecommunications, Inc. * | 126,949 | | 1,732,854 |
| Avaya, Inc. * | 226,644 | | 2,368,430 |
| Embarq Corp. * | 31,100 | | 1,466,365 |
| JDS Uniphase Corp. * (a) | 616,600 | | 1,399,682 |
| Level 3 Communications, Inc. * (a) | 36,800 | | 163,024 |
| Mid Cap Value Fund (continued) | | | |
| | | Shares or | | |
| | | Principal | | |
| | | Amount | | Value |
| |
|
| |
| COMMON STOCKS (continued) | | | | |
| Telecommunications Equipment & | | | | |
| Services (continued) | | | | |
| Tellabs, Inc. * | | 178,011 | $ | 1,813,932 |
| |
|
| | | | | 8,944,287 |
| |
| Telephone - 3.55% | | | | |
| CenturyTel, Inc. | | 45,953 | | 1,829,848 |
| Qwest Communications International, Inc. * | | 369,700 | | 3,257,057 |
| |
|
| | | | | 5,086,905 |
| |
| Travel Services - 2.46% | | | | |
| Sabre Holdings Corp. | | 160,631 | | 3,521,032 |
|
| TOTAL COMMON STOCKS (Cost $128,408,878) | | $ | 137,248,042 |
|
| |
| SHORT TERM INVESTMENTS - 14.60% | | | | |
| State Street Navigator Securities | | | | |
| Lending Prime Portfolio (c) | $ | 20,909,218 | $ | 20,909,218 |
|
| TOTAL SHORT TERM INVESTMENTS | | | | |
| (Cost $20,909,218) | | | $ | 20,909,218 |
|
| |
| REPURCHASE AGREEMENTS - 4.07% | | | | |
| Repurchase Agreement with State | | | | |
| Street Corp. dated 08/31/2006 at | | | | |
| 3.95% to be repurchased at | | | | |
| $5,820,639 on 09/01/2006, | | | | |
| collateralized by $6,060,000 | | | | |
| Federal National Mortgage | | | | |
| Association, 5.80% due | | | | |
| 02/09/2026 (valued at $5,938,800, | | | | |
| including interest) (c) | $ | 5,820,000 | $ | 5,820,000 |
|
| TOTAL REPURCHASE AGREEMENTS | | | | |
| (Cost $5,820,000) | | | $ | 5,820,000 |
|
| Total Investments (Mid Cap Value Fund) | | | | |
| (Cost $155,138,096) - 114.52% | | | $ | 163,977,260 |
| Liabilities in Excess of Other Assets - (14.52)% | | | (20,792,617) |
| |
|
| TOTAL NET ASSETS - 100.00% | | | $ | 143,184,643 |
| |
|
| |
| |
| Mid Cap Value Equity Fund | | | | |
| | | Shares or | | |
| | | Principal | | |
| | | Amount | | Value |
| |
|
| |
| COMMON STOCKS - 95.58% | | | | |
| Advertising - 0.55% | | | | |
| The Interpublic Group of Companies, Inc. * (a) | | 58,593 | $ | 537,884 |
| Aerospace - 0.45% | | | | |
| Goodrich Corp. | | 11,411 | | 444,458 |
| Agriculture - 0.86% | | | | |
| Archer-Daniels-Midland Company | | 9,265 | | 381,440 |
| Monsanto Company | | 2,843 | | 134,872 |
| Mosaic Company * (a) | | 20,388 | | 331,101 |
| |
|
| | | | | 847,413 |
| |
| Air Travel - 0.72% | | | | |
| AMR Corp. * (a) | | 9,675 | | 199,789 |
The accompanying notes are an integral part of the financial statements. 312
John Hancock Funds II
Portfolio of investments — August 31, 2006
(showing percentage of total net assets) |
| Mid Cap Value Equity Fund (continued) | | |
| | Shares or | | |
| | Principal | | |
| | Amount | | Value |
|
|
| |
| COMMON STOCKS (continued) | | | |
| Air Travel (continued) | | | |
| Continental Airlines, Inc., Class B * (a) | 12,469 | $ | 312,847 |
| US Airways Group, Inc. * (a) | 4,500 | | 190,125 |
|
|
| | | | 702,761 |
| Apparel & Textiles - 2.29% | | | |
| Liz Claiborne, Inc. | 26,840 | | 1,003,011 |
| Mohawk Industries, Inc. * (a) | 3,906 | | 276,857 |
| VF Corp. | 13,790 | | 963,783 |
|
|
| | | | 2,243,651 |
| Auto Parts - 0.57% | | | |
| Genuine Parts Company | 5,433 | | 224,546 |
| Johnson Controls, Inc. | 4,670 | | 335,913 |
|
|
| | | | 560,459 |
| Automobiles - 0.88% | | | |
| Ford Motor Company (a) | 103,200 | | 863,784 |
| Banking - 2.16% | | | |
| AmSouth Bancorp. | 32,746 | | 938,173 |
| Comerica, Inc. | 14,688 | | 840,888 |
| Huntington Bancshares, Inc. | 14,093 | | 337,104 |
|
|
| | | | 2,116,165 |
| Building Materials & Construction - 2.00% | | | |
| American Standard Companies, Inc. | 36,077 | | 1,506,936 |
| Chicago Bridge & Iron Company NV | 16,709 | | 451,310 |
|
|
| | | | 1,958,246 |
| Business Services - 4.52% | | | |
| Computer Sciences Corp. * (a) | 16,659 | | 789,303 |
| Dun & Bradstreet Corp. * | 3,758 | | 264,225 |
| Electronic Data Systems Corp. | 46,912 | | 1,117,913 |
| Fluor Corp. | 8,215 | | 709,940 |
| Pitney Bowes, Inc. | 6,384 | | 278,279 |
| R.H. Donnelley Corp. * (a) | 18,245 | | 991,068 |
| R.R. Donnelley & Sons Company | 8,844 | | 286,723 |
|
|
| | | | 4,437,451 |
| Chemicals - 2.56% | | | |
| Cabot Corp. | 7,319 | | 243,211 |
| Eastman Chemical Company | 16,174 | | 848,326 |
| Imperial Chemical Industries PLC (a) | 10,564 | | 299,384 |
| Lubrizol Corp. | 5,724 | | 248,937 |
| PPG Industries, Inc. | 13,812 | | 875,128 |
|
|
| | | | 2,514,986 |
| Computers & Business Equipment - 0.27% | | | |
| Diebold, Inc. | 5,938 | | 248,861 |
| Xerox Corp. * | 1,339 | | 19,831 |
|
|
| | | | 268,692 |
| Construction & Mining Equipment - 0.36% | | | |
| National Oilwell, Inc. * | 5,483 | | 358,040 |
| Construction Materials - 0.53% | | | |
| USG Corp. * (a) | 10,106 | | 515,406 |
| Crude Petroleum & Natural Gas - 2.22% | | | |
| Newfield Exploration Company * | 9,565 | | 413,591 |
| Mid Cap Value Equity Fund (continued) | | |
| | Shares or | | |
| | Principal | | |
| | Amount | | Value |
|
|
| |
| COMMON STOCKS (continued) | | | |
| Crude Petroleum & Natural Gas | | | |
| (continued) | | | |
| Pioneer Natural Resources Company | 22,056 | $ | 919,956 |
| Sunoco, Inc. | 11,709 | | 841,994 |
|
|
| | | | 2,175,541 |
| Electrical Equipment - 0.93% | | | |
| Ballard Power Systems, Inc. * (a) | 14,405 | | 88,879 |
| Cooper Industries, Ltd., Class A | 9,488 | | 776,877 |
| Plug Power, Inc. * (a) | 10,061 | | 47,689 |
|
|
| | | | 913,445 |
| Electrical Utilities - 7.71% | | | |
| American Electric Power Company, Inc. | 16,307 | | 594,879 |
| CMS Energy Corp. * | 13,397 | | 196,132 |
| Consolidated Edison, Inc. (a) | 15,752 | | 727,743 |
| Constellation Energy Group, Inc. | 9,544 | | 573,499 |
| DPL, Inc. (a) | 21,556 | | 599,257 |
| DTE Energy Company (a) | 16,764 | | 699,729 |
| Edison International | 23,850 | | 1,040,814 |
| Mirant Corp. * | 13,857 | | 401,437 |
| Pinnacle West Capital Corp. | 32,423 | | 1,489,513 |
| PPL Corp. | 17,142 | | 599,456 |
| Reliant Energy, Inc. * | 25,716 | | 346,137 |
| TECO Energy, Inc. | 18,600 | | 293,322 |
|
|
| | | | 7,561,918 |
| Electronics - 0.42% | | | |
| Solectron Corp. * | 131,248 | | 412,119 |
| Energy - 3.07% | | | |
| Energy East Corp. | 38,092 | | 923,731 |
| Fuelcell Energy, Inc. * (a) | 7,513 | | 73,177 |
| MDU Resources Group, Inc. | 13,300 | | 325,850 |
| SCANA Corp. | 6,800 | | 281,180 |
| Sempra Energy | 14,654 | | 728,597 |
| Southwestern Energy Company * | 8,566 | | 294,242 |
| Xcel Energy, Inc. | 18,467 | | 384,113 |
|
|
| | | | 3,010,890 |
| Financial Services - 0.26% | | | |
| Amvescap PLC | 24,805 | | 255,745 |
| Food & Beverages - 1.17% | | | |
| Del Monte Foods Company | 38,807 | | 430,758 |
| Tyson Foods, Inc., Class A (a) | 48,733 | | 717,837 |
|
|
| | | | 1,148,595 |
| Forest Products - 0.81% | | | |
| Rayonier, Inc. | 20,037 | | 791,462 |
| Gas & Pipeline Utilities - 3.36% | | | |
| El Paso Corp. | 51,726 | | 751,061 |
| Enbridge, Inc. | 24,374 | | 803,855 |
| NiSource, Inc. | 60,072 | | 1,271,724 |
| Questar Corp. | 5,431 | | 469,999 |
|
|
| | | | 3,296,639 |
The accompanying notes are an integral part of the financial statements. 313
John Hancock Funds II
Portfolio of investments — August 31, 2006
(showing percentage of total net assets) |
| Mid Cap Value Equity Fund (continued) | | |
| | Shares or | | |
| | Principal | | |
| | Amount | | Value |
|
|
| |
| COMMON STOCKS (continued) | | | |
| Healthcare Services - 2.60% | | | |
| Health Net, Inc. * | 11,431 | $ | 477,930 |
| Humana, Inc. * | 23,973 | | 1,460,675 |
| McKesson Corp. | 4,619 | | 234,645 |
| Omnicare, Inc. | 8,402 | | 380,695 |
|
|
| | | | 2,553,945 |
| Holdings Companies/Conglomerates - 1.89% | | | |
| Loews Corp. | 36,153 | | 1,391,167 |
| Textron, Inc. | 5,581 | | 468,023 |
|
|
| | | | 1,859,190 |
| Hotels & Restaurants - 0.74% | | | |
| Hilton Hotels Corp. | 28,456 | | 724,774 |
| Household Appliances - 0.86% | | | |
| Whirlpool Corp. (a) | 10,450 | | 845,510 |
| Industrial Machinery - 3.61% | | | |
| AGCO Corp. * (a) | 45,820 | | 1,138,627 |
| Dover Corp. | 10,136 | | 492,812 |
| Energy Conversion Devices, Inc. * (a) | 2,973 | | 104,204 |
| Ingersoll-Rand Company, Class A | 29,895 | | 1,136,608 |
| Manitowoc, Inc. | 7,026 | | 310,549 |
| Terex Corp. * | 8,100 | | 355,833 |
|
|
| | | | 3,538,633 |
| Insurance - 13.63% | | | |
| ACE, Ltd. | 34,277 | | 1,846,159 |
| Aon Corp. | 57,245 | | 1,978,960 |
| Axis Capital Holdings, Ltd. | 24,072 | | 780,655 |
| Conseco, Inc. * | 9,808 | | 203,025 |
| Everest Re Group, Ltd. | 23,617 | | 2,219,526 |
| Lincoln National Corp. | 17,483 | | 1,061,218 |
| PartnerRe, Ltd. (a) | 23,300 | | 1,498,190 |
| Torchmark Corp. | 10,889 | | 677,405 |
| Willis Group Holdings, Ltd. | 17,052 | | 617,623 |
| XL Capital, Ltd., Class A | 37,911 | | 2,488,478 |
|
|
| | | | 13,371,239 |
| International Oil - 1.91% | | | |
| Hess Corp. | 15,409 | | 705,424 |
| Nabors Industries, Ltd. * (a) | 14,783 | | 486,065 |
| Weatherford International, Ltd. * | 15,821 | | 680,303 |
|
|
| | | | 1,871,792 |
| Internet Software - 0.46% | | | |
| McAfee, Inc. * | 19,994 | | 455,063 |
| Leisure Time - 1.89% | | | |
| Regal Entertainment Group, Class A (a) | 43,600 | | 860,228 |
| Royal Caribbean Cruises, Ltd. (a) | 27,195 | | 992,074 |
|
|
| | | | 1,852,302 |
| Manufacturing - 3.71% | | | |
| Cameron International Corp. * | 15,484 | | 741,839 |
| Eaton Corp. | 14,156 | | 941,374 |
| Reddy Ice Holdings, Inc. | 13,060 | | 309,783 |
| Rockwell Automation, Inc. | 14,287 | | 805,501 |
| Mid Cap Value Equity Fund (continued) | | |
| | Shares or | | |
| | Principal | | |
| | Amount | | Value |
|
|
| |
| COMMON STOCKS (continued) | | | |
| Manufacturing (continued) | | | |
| Stanley Works | 17,765 | $ | 839,041 |
|
|
| | | | 3,637,538 |
| Medical-Hospitals - 0.47% | | | |
| Health Management Associates, Inc., Class A | 22,245 | | 465,143 |
| Mining - 0.94% | | | |
| Freeport-McMoran Copper & Gold, Inc., | | | |
| Class B (a) | 8,478 | | 493,504 |
| Phelps Dodge Corp. | 4,843 | | 433,449 |
|
|
| | | | 926,953 |
| Paper - 0.78% | | | |
| Bowater, Inc. (a) | 11,884 | | 270,123 |
| MeadWestvaco Corp. | 9,227 | | 235,750 |
| Temple-Inland, Inc. | 5,849 | | 260,398 |
|
|
| | | | 766,271 |
| Petroleum Services - 4.78% | | | |
| BJ Services Company | 20,200 | | 693,062 |
| ENSCO International, Inc. | 8,189 | | 365,966 |
| GlobalSantaFe Corp. | 25,478 | | 1,254,027 |
| McDermott International, Inc. * | 31,078 | | 1,497,960 |
| Smith International, Inc. | 12,924 | | 542,420 |
| Suncor Energy, Inc. | 4,338 | | 336,542 |
|
|
| | | | 4,689,977 |
| Pharmaceuticals - 2.24% | | | |
| AmerisourceBergen Corp. | 17,592 | | 776,863 |
| Hospira, Inc. * | 6,072 | | 222,417 |
| King Pharmaceuticals, Inc. * | 20,371 | | 330,418 |
| Mylan Laboratories, Inc. | 32,575 | | 661,924 |
| Watson Pharmaceuticals, Inc. * | 8,079 | | 207,145 |
|
|
| | | | 2,198,767 |
| Photography - 0.62% | | | |
| Eastman Kodak Company (a) | 28,605 | | 608,428 |
| Publishing - 0.87% | | | |
| Tribune Company (a) | 27,234 | | 849,973 |
| Railroads & Equipment - 0.97% | | | |
| CSX Corp. | 31,536 | | 953,018 |
| Real Estate - 1.78% | | | |
| Boston Properties, Inc., REIT | 2,873 | | 291,983 |
| Crescent Real Estate Equities Company, REIT (a) | 21,845 | | 472,944 |
| Equity Residential, REIT | 19,585 | | 976,704 |
|
|
| | | | 1,741,631 |
| Retail Trade - 1.96% | | | |
| Family Dollar Stores, Inc. | 28,016 | | 716,369 |
| Federated Department Stores, Inc. | 23,040 | | 875,059 |
| Ritchie Brothers Auctioneers, Inc. (a) | 6,770 | | 331,392 |
|
|
| | | | 1,922,820 |
| Sanitary Services - 0.11% | | | |
| Insituform Technologies, Inc., Class A * | 4,682 | | 107,452 |
| Semiconductors - 2.48% | | | |
| Intersil Corp., Class A | 32,954 | | 835,384 |
The accompanying notes are an integral part of the financial statements. 314
John Hancock Funds II
Portfolio of investments — August 31, 2006
(showing percentage of total net assets) |
| Mid Cap Value Equity Fund (continued) | | |
| | | Shares or | | |
| | | Principal | | |
| | | Amount | | Value |
| |
|
| |
| COMMON STOCKS (continued) | | | | |
| Semiconductors (continued) | | | | |
| Microchip Technology, Inc. | | 15,008 | $ | 512,673 |
| National Semiconductor Corp. | | 44,641 | | 1,084,330 |
|
|
| | | | | 2,432,387 |
| Software - 0.96% | | | | |
| BMC Software, Inc. * | | 35,551 | | 946,368 |
| Steel - 0.30% | | | | |
| Nucor Corp. | | 6,089 | | 297,569 |
| Telecommunications Equipment & | | | | |
| Services - 1.45% | | | | |
| Citizens Communications Company | | 36,179 | | 498,908 |
| Tellabs, Inc. * | | 90,356 | | 920,728 |
|
|
| | | | | 1,419,636 |
| Telephone - 2.71% | | | | |
| CenturyTel, Inc. | | 25,614 | | 1,019,949 |
| Qwest Communications International, Inc. * (a) | 95,895 | | 844,835 |
| Windstream Corp. * | | 60,295 | | 795,894 |
|
|
| | | | | 2,660,678 |
| Tobacco - 1.90% | | | | |
| Loews Corp. - Carolina Group | | 20,400 | | 1,168,104 |
| Reynolds American, Inc. (a) | | 10,710 | | 696,900 |
|
|
| | | | | 1,865,004 |
| Toys, Amusements & Sporting Goods - 0.29% | | | |
| Hasbro, Inc. | | 14,176 | | 287,773 |
|
| TOTAL COMMON STOCKS (Cost $96,362,520) | | $ | 93,785,584 |
|
| |
| CORPORATE BONDS - 0.64% | | | | |
| Telephone - 0.64% | | | | |
| Qwest Communications International, Inc. | | | | |
| 3.50% due 11/15/2025 | $ | 381,000 | | 627,221 |
|
| TOTAL CORPORATE BONDS (Cost $515,303) | | $ | 627,221 |
|
| |
| SHORT TERM INVESTMENTS - 22.55% | | | |
| Chesham Finance LLC | | | | |
| 5.28% due 09/01/2006 | $ | 3,000,000 | $ | 3,000,000 |
| Sheffield Receivables Corp. | | | | |
| 5.28% due 09/01/2006 | | 1,900,000 | | 1,900,000 |
| State Street Navigator Securities Lending | | | | |
| Prime Portfolio (c) | | 17,229,156 | | 17,229,156 |
|
| TOTAL SHORT TERM INVESTMENTS | | | | |
| (Cost $22,129,156) | | | $ | 22,129,156 |
|
| Total Investments (Mid Cap Value Equity Fund) | | | |
| (Cost $119,006,979) - 118.77% | | | $ | 116,541,961 |
| Liabilities in Excess of Other Assets - (18.77)% | | | (18,418,181) |
|
|
| TOTAL NET ASSETS - 100.00% | | | $ | 98,123,780 |
|
|
| Natural Resources Fund | | | |
| | Shares or | | |
| | Principal | | |
| | Amount | | Value |
|
|
| |
| COMMON STOCKS - 94.51% | | | |
| Aluminum - 1.81% | | | |
| Alcoa, Inc. | 490,225 | $ | 14,015,533 |
| Chemicals - 0.04% | | | |
| Arkema, ADR * | 7,769 | | 302,617 |
| Coal - 1.50% | | | |
| CONSOL Energy, Inc. (a) | 211,586 | | 7,716,541 |
| Massey Energy Company (a) | 154,223 | | 3,892,589 |
|
|
| | | | 11,609,130 |
| Crude Petroleum & Natural Gas - 7.14% | | | |
| EOG Resources, Inc. | 307,269 | | 19,917,177 |
| Newfield Exploration Company * (a) | 163,752 | | 7,080,636 |
| Surgutneftegaz, ADR (a) | 111,145 | | 8,447,020 |
| XTO Energy, Inc. | 430,786 | | 19,717,075 |
|
|
| | | | 55,161,908 |
| Domestic Oil - 5.82% | | | |
| Noble Energy, Inc. | 167,364 | | 8,271,129 |
| Suncor Energy, Inc. | 289,307 | | 22,391,131 |
| Western Oil Sands, Inc. * | 539,011 | | 14,368,431 |
|
|
| | | | 45,030,691 |
| Gas & Pipeline Utilities - 0.76% | | | |
| Equitable Resources, Inc. | 160,260 | | 5,907,184 |
| Gold - 2.24% | | | |
| Barrick Gold Corp. | 200,256 | | 6,704,571 |
| Gold Fields, Ltd. | 545,149 | | 10,599,383 |
|
|
| | | | 17,303,954 |
| International Oil - 23.98% | | | |
| Canadian Natural Resources, Ltd. | 752,933 | | 39,481,952 |
| China Petroleum and Chemical Corp., ADR (a) | 129,165 | | 7,631,068 |
| ConocoPhillips | 241,428 | | 15,313,778 |
| EnCana Corp. - CAD | 692,754 | | 36,307,534 |
| Lukoil Oil Company, ADR | 203,227 | | 17,010,100 |
| Petroleo Brasileiro SA, ADR | 203,249 | | 18,223,305 |
| Royal Dutch Shell PLC, ADR, Class B shares | 119,249 | | 8,533,458 |
| Royal Dutch Shell PLC, ADR | 156,669 | | 10,800,761 |
| Talisman Energy, Inc. | 1,830,498 | | 32,089,334 |
|
|
| | | | 185,391,290 |
| Metal & Metal Products - 14.06% | | | |
| Alumina, Ltd. | 2,125,111 | | 10,294,918 |
| Cameco Corp. | 753,222 | | 30,844,441 |
| Companhia Siderurgica Nacional SA, ADR (a) | 234,297 | | 6,869,588 |
| Companhia Vale Do Rio Doce, ADR | 481,478 | | 10,322,888 |
| Companhia Vale Do Rio Doce, SADR | 1,530,352 | | 27,546,336 |
| Vedanta Resources PLC | 880,673 | | 22,800,303 |
|
|
| | | | 108,678,474 |
| Mining - 13.02% | | | |
| Aluminum Corp. China, Ltd., ADR (a) | 117,172 | | 8,213,757 |
| Anglo American PLC | 179,843 | | 7,772,660 |
| Anglo Platinum, Ltd. | 210,463 | | 23,616,985 |
| Freeport-McMoran Copper & Gold, Inc., | | | |
| Class B (a) | 211,630 | | 12,318,982 |
| Impala Platinum Holdings, Ltd. | 37,912 | | 7,029,029 |
The accompanying notes are an integral part of the financial statements. 315
John Hancock Funds II
Portfolio of investments — August 31, 2006
(showing percentage of total net assets) |
| Natural Resources Fund (continued) | | |
| | | Shares or | | |
| | | Principal | | |
| | | Amount | | Value |
| |
|
| |
| COMMON STOCKS (continued) | | | | |
| Mining (continued) | | | | |
| Newmont Mining Corp. | | 298,900 | $ | 15,318,625 |
| Xstrata PLC | | 587,211 | | 26,339,395 |
|
|
| | | | | 100,609,433 |
| Paper - 2.41% | | | | |
| Abitibi-Consolidated, Inc. | | 286,519 | | 773,602 |
| International Paper Company | | 512,965 | | 17,835,793 |
|
|
| | | | | 18,609,395 |
| Petroleum Services - 19.93% | | | | |
| BP PLC, SADR (a) | | 356,327 | | 24,248,052 |
| Exxon Mobil Corp. | | 499,805 | | 33,821,804 |
| GlobalSantaFe Corp. | | 120,723 | | 5,941,986 |
| Halliburton Company | | 374,202 | | 12,206,469 |
| Petro-Canada | | 248,731 | | 10,608,687 |
| Repsol YPF SA, ADR | | 190,076 | | 5,458,983 |
| Total SA, ADR | | 319,262 | | 21,527,837 |
| Transocean, Inc. * | | 101,585 | | 6,780,799 |
| Valero Energy Corp. | | 582,266 | | 33,422,068 |
|
|
| | | | | 154,016,685 |
| Steel - 1.80% | | | | |
| Mittal Steel Company, NV (a) | | 406,625 | | 13,926,906 |
|
| TOTAL COMMON STOCKS (Cost $617,090,119) | | $ | 730,563,200 |
|
| |
| PREFERRED STOCKS - 0.23% | | | | |
| Mining - 0.23% | | | | |
| Anglo American Platinum Corp., Ltd.- ZAR * | | 42,800 | | 1,762,405 |
|
| TOTAL PREFERRED STOCKS (Cost $1,196,524) | | $ | 1,762,405 |
|
| |
| SHORT TERM INVESTMENTS - 9.43% | | | | |
| State Street Navigator Securities | | | | |
| Lending Prime Portfolio (c) | $ | 72,883,888 | $ | 72,883,888 |
|
| TOTAL SHORT TERM INVESTMENTS | | | | |
| (Cost $72,883,888) | | | $ | 72,883,888 |
|
| |
| REPURCHASE AGREEMENTS - 4.59% | | | | |
| Repurchase Agreement with Banc of | | | | |
| America dated 08/31/2006 at | | | | |
| 5.22% to be repurchased at | | | | |
| $35,467,142 on 9/1/2006, | | | | |
| collateralized by $33,730,000 U.S. | | | | |
| Treasury Notes, 5.50% due | | | | |
| 08/15/2028 (valued at | | | �� | |
| $36,177,812, including interest) | $ | 35,462,000 | $ | 35,462,000 |
|
| TOTAL REPURCHASE AGREEMENTS | | | | |
| (Cost $35,462,000) | | | $ | 35,462,000 |
|
| Total Investments (Natural Resources Fund) | | | | |
| (Cost $726,632,531) - 108.76% | | | $ | 840,671,493 |
| Liabilities in Excess of Other Assets - (8.76)% | | | (67,727,442) |
|
|
| TOTAL NET ASSETS - 100.00% | | | $ | 772,944,051 |
|
|
| Quantitative All Cap Fund | | | |
| | Shares or | | |
| | Principal | | |
| | Amount | | Value |
|
|
| |
| COMMON STOCKS - 99.37% | | | |
| Advertising - 0.32% | | | |
| 24/7 Real Media, Inc. * | 1,792 | $ | 16,271 |
| Air Travel - 0.51% | | | |
| Continental Airlines, Inc., Class B * | 1,023 | | 25,667 |
| Aluminum - 0.99% | | | |
| Alcan Aluminum, Ltd. | 338 | | 15,251 |
| Century Aluminum Company * | 1,002 | | 34,779 |
|
|
| | | | 50,030 |
| Apparel & Textiles - 4.26% | | | |
| Coach, Inc. * | 3,121 | | 94,223 |
| Guess?, Inc. * | 799 | | 32,599 |
| Movado Group, Inc. | 1,789 | | 40,235 |
| Phillips-Van Heusen Corp. | 823 | | 31,801 |
| Wolverine World Wide, Inc. | 658 | | 16,601 |
|
|
| | | | 215,459 |
| Automobiles - 1.68% | | | |
| General Motors Corp. | 2,104 | | 61,395 |
| Rush Enterprises, Inc., Class A * | 1,342 | | 23,485 |
|
|
| | | | 84,880 |
| Banking - 6.10% | | | |
| Bank of America Corp. | 3,259 | | 167,741 |
| Corus Bankshares, Inc. | 2,724 | | 59,410 |
| FirstFed Financial Corp. * | 667 | | 33,924 |
| Unibanco - Uniao De Bancos | | | |
| Brasileiros SA, ADR * | 656 | | 47,461 |
|
|
| | | | 308,536 |
| Building Materials & Construction - 0.39% | | | |
| Builders FirstSource, Inc. * | 1,297 | | 19,714 |
| Business Services - 3.27% | | | |
| Alliance Data Systems Corp. * | 935 | | 47,255 |
| Cadence Design Systems, Inc. * | 2,906 | | 47,745 |
| Compucredit Corp. * | 692 | | 20,172 |
| Healthcare Services Group, Inc. | 785 | | 17,812 |
| Labor Ready, Inc. * | 1,015 | | 17,387 |
| Syntel, Inc. | 671 | | 14,702 |
|
|
| | | | 165,073 |
| Chemicals - 0.74% | | | |
| Celanese Corp., Series A | 809 | | 14,958 |
| Georgia Gulf Corp. | 837 | | 22,214 |
|
|
| | | | 37,172 |
| Computers & Business Equipment - 5.18% | | | |
| Brocade Communications Systems, Inc. * | 7,843 | | 48,627 |
| Cisco Systems, Inc. * | 5,672 | | 124,727 |
| Cognizant Technology Solutions Corp., | | | |
| Class A * | 215 | | 15,031 |
| Sybase, Inc. * | 2,091 | | 48,239 |
| Witness Systems, Inc. * | 1,557 | | 25,301 |
|
|
| | | | 261,925 |
| Cosmetics & Toiletries - 1.92% | | | |
| Alberto-Culver Company, Class B | 546 | | 26,880 |
The accompanying notes are an integral part of the financial statements. 316
John Hancock Funds II
Portfolio of investments — August 31, 2006
(showing percentage of total net assets) |
| Quantitative All Cap Fund (continued) | | |
| | Shares or | | |
| | Principal | | |
| | Amount | | Value |
|
|
| |
| COMMON STOCKS (continued) | | | |
| Cosmetics & Toiletries (continued) | | | |
| Colgate-Palmolive Company | 1,171 | $ | 70,096 |
|
|
| | | | 96,976 |
| Crude Petroleum & Natural Gas - 1.78% | | | |
| Patterson-UTI Energy, Inc. | 3,288 | | 90,091 |
| Domestic Oil - 0.28% | | | |
| Oil States International, Inc. * | 449 | | 14,350 |
| Drugs & Health Care - 0.21% | | | |
| Candela Corp. * | 1,031 | | 10,753 |
| Electrical Equipment - 0.67% | | | |
| Littelfuse, Inc. * | 414 | | 14,950 |
| Wesco International, Inc. * | 328 | | 19,188 |
|
|
| | | | 34,138 |
| Electrical Utilities - 0.80% | | | |
| FirstEnergy Corp. | 709 | | 40,456 |
| Electronics - 1.02% | | | |
| Amphenol Corp., Class A | 209 | | 12,011 |
| Sycamore Networks, Inc. * | 5,725 | | 21,011 |
| Thomas & Betts Corp. * | 409 | | 18,470 |
|
|
| | | | 51,492 |
| Energy - 3.60% | | | |
| Energen Corp. | 640 | | 27,930 |
| Ormat Technologies, Inc. | 421 | | 15,320 |
| Sempra Energy | 667 | | 33,163 |
| TXU Corp. | 1,594 | | 105,539 |
|
|
| | | | 181,952 |
| Financial Services - 9.59% | | | |
| AmeriCredit Corp. * | 943 | | 22,151 |
| Barclays PLC, SADR | 521 | | 26,363 |
| Bear Stearns Companies, Inc. | 646 | | 84,206 |
| Countrywide Financial Corp. | 2,119 | | 71,622 |
| Federal National Mortgage Association | 343 | | 18,059 |
| Fremont General Corp. | 3,369 | | 48,109 |
| Goldman Sachs Group, Inc. | 870 | | 129,326 |
| Lehman Brothers Holdings, Inc. | 1,332 | | 84,995 |
|
|
| | | | 484,831 |
| Food & Beverages - 4.39% | | | |
| Domino's Pizza, Inc. | 945 | | 23,105 |
| Pepsi Bottling Group, Inc. | 664 | | 23,247 |
| PepsiCo, Inc. | 2,226 | | 145,313 |
| Starbucks Corp. * | 983 | | 30,483 |
|
|
| | | | 222,148 |
| Healthcare Products - 4.00% | | | |
| Bruker BioSciences Corp. * | 1,904 | | 13,442 |
| ICU Medical, Inc. * | 395 | | 17,384 |
| Johnson & Johnson | 2,401 | | 155,249 |
| Varian Medical Systems, Inc. * | 302 | | 16,097 |
|
|
| | | | 202,172 |
| Healthcare Services - 5.09% | | | |
| Caremark Rx, Inc. | 978 | | 56,665 |
| Quantitative All Cap Fund (continued) | | |
| | Shares or | | |
| | Principal | | |
| | Amount | | Value |
|
|
| |
| COMMON STOCKS (continued) | | | |
| Healthcare Services (continued) | | | |
| Covance, Inc. * | 585 | $ | 36,779 |
| Emdeon Corp. * | 2,439 | | 28,902 |
| Phase Forward, Inc. * | 1,154 | | 13,606 |
| UnitedHealth Group, Inc. | 2,334 | | 121,251 |
|
|
| | | | 257,203 |
| Holdings Companies/Conglomerates - 1.28% | | | |
| General Electric Company | 1,898 | | 64,646 |
| Hotels & Restaurants - 3.19% | | | |
| Brinker International, Inc. | 678 | | 26,083 |
| McDonald's Corp. | 3,767 | | 135,235 |
|
|
| | | | 161,318 |
| Industrial Machinery - 4.39% | | | |
| Caterpillar, Inc. | 918 | | 60,909 |
| Ceradyne, Inc. * | 1,024 | | 45,128 |
| Cummins, Inc. | 556 | | 63,840 |
| Ingersoll-Rand Company, Class A | 651 | | 24,751 |
| Terex Corp. * | 623 | | 27,368 |
|
|
| | | | 221,996 |
| Insurance - 3.99% | | | |
| Endurance Specialty Holdings, Ltd. | 1,372 | | 44,274 |
| IPC Holdings, Ltd. | 930 | | 25,994 |
| RenaissanceRe Holdings, Ltd. | 2,063 | | 106,244 |
| Zenith National Insurance Corp. | 661 | | 24,986 |
|
|
| | | | 201,498 |
| International Oil - 2.19% | | | |
| Callon Petroleum Company * | 1,615 | | 24,984 |
| ConocoPhillips | 1,349 | | 85,567 |
|
|
| | | | 110,551 |
| Internet Software - 1.34% | | | |
| Akamai Technologies, Inc. * | 1,722 | | 67,502 |
| Liquor - 0.96% | | | |
| Central European Distribution Corp. * | 2,097 | | 48,294 |
| Manufacturing - 0.57% | | | |
| Illinois Tool Works, Inc. | 657 | | 28,842 |
| Metal & Metal Products - 0.49% | | | |
| Southern Copper Corp. | 270 | | 24,926 |
| Petroleum Services - 3.43% | | | |
| ENSCO International, Inc. | 529 | | 23,641 |
| Exxon Mobil Corp. | 968 | | 65,504 |
| Pioneer Drilling Company * | 1,745 | | 24,587 |
| Repsol YPF SA, ADR | 701 | | 20,133 |
| Todco, Class A * | 1,065 | | 39,437 |
|
|
| | | | 173,302 |
| Pharmaceuticals - 2.37% | | | |
| Abbott Laboratories | 457 | | 22,256 |
| Eli Lilly & Company | 290 | | 16,220 |
| Pfizer, Inc. | 2,948 | | 81,247 |
|
|
| | | | 119,723 |
The accompanying notes are an integral part of the financial statements. 317
John Hancock Funds II
Portfolio of investments — August 31, 2006
(showing percentage of total net assets) |
| Quantitative All Cap Fund (continued) | | |
| | Shares or | | |
| | Principal | | |
| | Amount | | Value |
|
|
| |
| COMMON STOCKS (continued) | | | |
| Railroads & Equipment - 0.67% | | | |
| Burlington Northern Santa Fe Corp. | 505 | $ | 33,810 |
| Real Estate - 2.41% | | | |
| First Industrial Realty Trust, Inc., REIT | 1,268 | | 54,930 |
| Hospitality Properties Trust, REIT | 1,446 | | 66,979 |
|
|
| | | | 121,909 |
| Retail Trade - 2.64% | | | |
| CVS Corp. | 1,590 | | 53,344 |
| J. Crew Group, Inc. * | 414 | | 10,487 |
| Kohl's Corp. * | 504 | | 31,505 |
| Staples, Inc. | 612 | | 13,807 |
| United Rentals, Inc. * | 1,130 | | 24,476 |
|
|
| | | | 133,619 |
| Semiconductors - 1.73% | | | |
| Applied Micro Circuits Corp. * | 9,394 | | 25,645 |
| DSP Group, Inc. * | 991 | | 24,250 |
| Marvell Technology Group, Ltd. * | 2,151 | | 37,664 |
|
|
| | | | 87,559 |
| Software - 4.08% | | | |
| BEA Systems, Inc. * | 5,062 | | 69,501 |
| Blackbaud, Inc. | 1,514 | | 34,989 |
| Microsoft Corp. | 1,648 | | 42,337 |
| VeriFone Holdings, Inc. * | 2,559 | | 59,241 |
|
|
| | | | 206,068 |
| Steel - 0.46% | | | |
| POSCO, SADR | 376 | | 23,353 |
| Telecommunications Equipment & | | | |
| Services - 1.80% | | | |
| Ciena Corp. * | 8,108 | | 32,027 |
| NICE Systems, Ltd. * | 1,222 | | 30,501 |
| SK Telecom Company, Ltd., ADR | 1,300 | | 28,470 |
|
|
| | | | 90,998 |
| Telephone - 2.58% | | | |
| AT&T, Inc. | 3,075 | | 95,725 |
| Cincinnati Bell, Inc. * | 6,854 | | 34,613 |
|
|
| | | | 130,338 |
| Tobacco - 0.71% | | | |
| Altria Group, Inc. | 429 | | 35,834 |
| Trucking & Freight - 1.30% | | | |
| Plains All American Pipeline LP | 512 | | 23,552 |
| YRC Worldwide, Inc. * | 1,144 | | 42,076 |
|
|
| | | | 65,628 |
|
| TOTAL COMMON STOCKS (Cost $4,981,271) | | $ | 5,023,003 |
|
| Total Investments (Quantitative All Cap Fund) | | | |
| (Cost $4,981,271) - 99.37% | | $ | 5,023,003 |
| Other Assets in Excess of Liabilities - 0.63% | | | 31,834 |
|
|
| TOTAL NET ASSETS - 100.00% | | $ | 5,054,837 |
|
|
| Quantitative Mid Cap Fund | | | |
| | Shares or | | |
| | Principal | | |
| | Amount | | Value |
|
|
| |
| COMMON STOCKS - 97.37% | | | |
| Aerospace - 0.85% | | | |
| Moog, Inc., Class A * | 47,900 | $ | 1,563,935 |
| Apparel & Textiles - 2.44% | | | |
| Gildan Activewear, Inc. * (a) | 19,000 | | 949,240 |
| Guess?, Inc. * (a) | 39,200 | | 1,599,360 |
| Polo Ralph Lauren Corp., Class A | 32,600 | | 1,923,074 |
| |
|
| | | | 4,471,674 |
| Automobiles - 0.46% | | | |
| United Auto Group, Inc. (a) | 41,700 | | 851,514 |
| Banking - 5.01% | | | |
| Colonial Bancgroup, Inc. | 151,700 | | 3,715,133 |
| Compass Bancshares, Inc. | 31,700 | | 1,838,600 |
| Cullen Frost Bankers, Inc. | 30,200 | | 1,780,592 |
| Zions Bancorp. | 23,440 | | 1,851,526 |
| |
|
| | | | 9,185,851 |
| Business Services - 4.65% | | | |
| Alliance Data Systems Corp. * | 53,350 | | 2,696,309 |
| Ceridian Corp. * | 39,100 | | 933,317 |
| Corporate Executive Board Company | 20,193 | | 1,769,714 |
| MPS Group, Inc. * | 106,500 | | 1,497,390 |
| URS Corp. * | 40,200 | | 1,630,110 |
| |
|
| | | | 8,526,840 |
| Cellular Communications - 0.91% | | | |
| American Tower Corp., Class A * | 46,600 | | 1,671,076 |
| Chemicals - 1.52% | | | |
| Airgas, Inc. | 77,861 | | 2,788,981 |
| Coal - 0.91% | | | |
| Peabody Energy Corp. | 37,900 | | 1,670,253 |
| Commercial Services - 2.98% | | | |
| CB Richard Ellis Group, Inc. * | 127,600 | | 2,934,800 |
| Pool Corp. (a) | 66,504 | | 2,531,807 |
| |
|
| | | | 5,466,607 |
| Computers & Business Equipment - 2.33% | | | |
| Cognizant Technology Solutions Corp., | | | |
| Class A * | 45,679 | | 3,193,419 |
| Logitech International S.A., ADR * (a) | 49,500 | | 1,079,100 |
| |
|
| | | | 4,272,519 |
| Containers & Glass - 1.87% | | | |
| Pactiv Corp. * | 61,700 | | 1,649,241 |
| Silgan Holdings, Inc. | 50,359 | | 1,782,709 |
| |
|
| | | | 3,431,950 |
| Crude Petroleum & Natural Gas - 2.91% | | | |
| Patterson-UTI Energy, Inc. | 95,650 | | 2,620,810 |
| XTO Energy, Inc. | 59,174 | | 2,708,394 |
| |
|
| | | | 5,329,204 |
| Domestic Oil - 2.46% | | | |
| Oil States International, Inc. * | 65,900 | | 2,106,164 |
| St. Mary Land & Exploration Company (a) | 58,960 | | 2,405,568 |
| |
|
| | | | 4,511,732 |
The accompanying notes are an integral part of the financial statements. 318
John Hancock Funds II
Portfolio of investments — August 31, 2006
(showing percentage of total net assets) |
| Quantitative Mid Cap Fund (continued) | |
| | Shares or | |
| | Principal | |
| | Amount | Value |
|
|
| |
| COMMON STOCKS (continued) | | |
| Electrical Equipment - 3.49% | | |
| AMETEK, Inc. | 69,442 $ | 2,977,673 |
| Anixter International, Inc. * | 45,700 | 2,490,193 |
| Wesco International, Inc. * | 15,700 | 918,450 |
|
|
| | | 6,386,316 |
| Electrical Utilities - 1.43% | | |
| Allegheny Energy, Inc. * (a) | 62,600 | 2,612,924 |
| Electronics - 3.87% | | |
| Amphenol Corp., Class A (a) | 31,371 | 1,802,891 |
| Arrow Electronics, Inc. * | 32,600 | 909,540 |
| AVX Corp. (a) | 58,200 | 966,702 |
| Thomas & Betts Corp. * | 56,250 | 2,540,250 |
| Trimble Navigation, Ltd. * | 17,600 | 861,872 |
|
|
| | | 7,081,255 |
| Energy - 1.79% | | |
| NRG Energy, Inc. * (a) | 64,650 | 3,273,876 |
| Financial Services - 3.54% | | |
| AllianceBernstein Holding LP * (a) | 30,109 | 2,008,270 |
| E*TRADE Financial Corp. * | 58,100 | 1,370,579 |
| Moneygram International, Inc. | 44,600 | 1,400,440 |
| The First Marblehead Corp. (a) | 32,600 | 1,711,500 |
|
|
| | | 6,490,789 |
| Food & Beverages - 2.31% | | |
| Constellation Brands, Inc., Class A * | 86,186 | 2,352,016 |
| Hormel Foods Corp. (a) | 51,110 | 1,873,181 |
|
|
| | | 4,225,197 |
| Gas & Pipeline Utilities - 3.12% | | |
| Magellan Midstream Partners LP (a) | 64,553 | 2,378,778 |
| Questar Corp. | 38,562 | 3,337,156 |
|
|
| | | 5,715,934 |
| Healthcare Products - 3.63% | | |
| Hologic, Inc. * | 44,500 | 1,921,510 |
| Intuitive Surgical, Inc. * (a) | 26,300 | 2,482,720 |
| ResMed, Inc. * (a) | 55,100 | 2,241,468 |
|
|
| | | 6,645,698 |
| Healthcare Services - 2.41% | | |
| Laboratory Corp. of America Holdings * | 28,200 | 1,929,444 |
| Sierra Health Services, Inc. * | 57,800 | 2,479,620 |
|
|
| | | 4,409,064 |
| Hotels & Restaurants - 1.84% | | |
| Choice Hotels, Inc. | 21,300 | 807,483 |
| Darden Restaurants, Inc. | 72,600 | 2,570,040 |
|
|
| | | 3,377,523 |
| Household Appliances - 0.74% | | |
| The Toro Company | 33,800 | 1,352,338 |
| Industrials - 2.32% | | |
| Crane Company | 25,800 | 1,031,484 |
| Harsco Corp. | 40,366 | 3,211,519 |
|
|
| | | 4,243,003 |
| Quantitative Mid Cap Fund (continued) | | |
| | Shares or | | |
| | Principal | | |
| | Amount | | Value |
|
|
| |
| COMMON STOCKS (continued) | | | |
| Insurance - 6.60% | | | |
| American Financial Group, Inc. | 30,700 | $ | 1,434,304 |
| Arch Capital Group, Ltd. * | 44,500 | | 2,652,200 |
| CNA Financial Corp. * | 32,600 | | 1,130,242 |
| Radian Group, Inc. | 29,000 | | 1,736,520 |
| RenaissanceRe Holdings, Ltd. | 30,400 | | 1,565,600 |
| W.R. Berkley Corp. | 102,247 | | 3,578,645 |
|
|
| | | | 12,097,511 |
| Internet Software - 1.06% | | | |
| Akamai Technologies, Inc. * | 49,400 | | 1,936,480 |
| Leisure Time - 0.66% | | | |
| Scientific Games Corp., Class A * (a) | 41,510 | | 1,206,696 |
| Life Sciences - 1.01% | | | |
| Pharmaceutical Product Development, Inc. | 48,700 | | 1,856,444 |
| Medical-Hospitals - 0.98% | | | |
| VCA Antech, Inc. * | 50,500 | | 1,788,710 |
| Mutual Funds - 4.78% | | | |
| Midcap SPDR Trust, Series 1 (a) | 64,000 | | 8,759,680 |
| Petroleum Services - 1.85% | | | |
| Superior Energy Services, Inc. * | 54,500 | | 1,740,185 |
| Tesoro Petroleum Corp. | 25,600 | | 1,654,016 |
|
|
| | | | 3,394,201 |
| Pharmaceuticals - 2.47% | | | |
| Celgene Corp. * (a) | 60,078 | | 2,444,574 |
| Elan Corp. PLC, ADR * (a) | 125,800 | | 2,079,474 |
|
|
| | | | 4,524,048 |
| Publishing - 0.50% | | | |
| McGraw-Hill Companies, Inc. | 16,300 | | 911,333 |
| Real Estate - 1.84% | | | |
| Host Hotels & Resorts, Inc., REIT | 64,200 | | 1,447,068 |
| SL Green Realty Corp., REIT | 17,200 | | 1,918,832 |
|
|
| | | | 3,365,900 |
| Retail Trade - 5.08% | | | |
| American Eagle Outfitters, Inc. | 53,600 | | 2,070,568 |
| Circuit City Stores, Inc. | 80,400 | | 1,898,244 |
| Coldwater Creek, Inc. * (a) | 146,100 | | 4,013,367 |
| Rent-A-Center, Inc. * | 48,500 | | 1,314,350 |
|
|
| | | | 9,296,529 |
| Sanitary Services - 3.41% | | | |
| Aqua America, Inc. (a) | 106,481 | | 2,522,535 |
| Republic Services, Inc. | 96,000 | | 3,722,880 |
|
|
| | | | 6,245,415 |
| Semiconductors - 2.48% | | | |
| Integrated Device Technology, Inc. * | 90,400 | | 1,557,592 |
| Intersil Corp., Class A | 52,900 | | 1,341,015 |
| MEMC Electronic Materials, Inc. * | 42,450 | | 1,641,966 |
|
|
| | | | 4,540,573 |
| Software - 0.74% | | | |
| ANSYS, Inc. * | 28,900 | | 1,350,786 |
The accompanying notes are an integral part of the financial statements. 319
John Hancock Funds II
Portfolio of investments — August 31, 2006
(showing percentage of total net assets) |
| Quantitative Mid Cap Fund (continued) | | |
| | | Shares or | | |
| | | Principal | | |
| | | Amount | | Value |
| |
|
| |
| COMMON STOCKS (continued) | | | | |
| Telecommunications Equipment & | | | | |
| Services - 2.71% | | | | |
| Amdocs, Ltd. * | | 60,600 | $ | 2,299,770 |
| Polycom, Inc. * | | 111,900 | | 2,662,101 |
| |
|
| | | | | 4,961,871 |
| Transportation - 0.92% | | | | |
| Con-way, Inc. | | 35,100 | | 1,679,535 |
| Trucking & Freight - 0.49% | | | | |
| Werner Enterprises, Inc. (a) | | 48,900 | | 906,117 |
|
| TOTAL COMMON STOCKS (Cost $168,408,495) | | $ | 178,377,882 |
|
| |
| SHORT TERM INVESTMENTS - 25.46% | | | |
| Rabobank USA Finance Corp. | | | | |
| 5.27% due 09/01/2006 | $ | 4,200,000 | $ | 4,200,000 |
| State Street Navigator Securities Lending | | | | |
| Prime Portfolio (c) | | 42,435,825 | | 42,435,825 |
|
| TOTAL SHORT TERM INVESTMENTS | | | | |
| (Cost $46,635,825) | | | $ | 46,635,825 |
|
| Total Investments (Quantitative Mid Cap Fund) | | | |
| (Cost $215,044,320) - 122.83% | | | $ | 225,013,707 |
| Liabilities in Excess of Other Assets - (22.83)% | | | (41,829,444) |
| |
|
| TOTAL NET ASSETS - 100.00% | | | $ | 183,184,263 |
| |
|
| |
| |
| Quantitative Value Fund | | | | |
| | | Shares or | | |
| | | Principal | | |
| | | Amount | | Value |
| |
|
| |
| COMMON STOCKS - 99.01% | | | | |
| Aerospace - 0.92% | | | | |
| Northrop Grumman Corp. | | 63,200 | $ | 4,222,392 |
| Air Travel - 1.48% | | | | |
| Continental Airlines, Inc., Class B * (a) | | 270,800 | | 6,794,372 |
| Apparel & Textiles - 1.43% | | | | |
| Coach, Inc. * | | 217,100 | | 6,554,249 |
| Automobiles - 0.47% | | | | |
| General Motors Corp. | | 73,700 | | 2,150,566 |
| Banking - 9.22% | | | | |
| Bank of America Corp. | | 306,000 | | 15,749,820 |
| KeyCorp (a) | | 199,900 | | 7,354,321 |
| US Bancorp | | 333,600 | | 10,698,552 |
| Wachovia Corp. | | 154,300 | | 8,429,409 |
| |
|
| | | | | 42,232,102 |
| Business Services - 1.70% | | | | |
| Cadence Design Systems, Inc. * | | 191,600 | | 3,147,988 |
| MPS Group, Inc. * | | 330,700 | | 4,649,642 |
| |
|
| | | | | 7,797,630 |
| Cable and Television - 0.35% | | | | |
| Time Warner, Inc. | | 98,000 | | 1,628,760 |
| Quantitative Value Fund (continued) | | |
| | Shares or | | |
| | Principal | | |
| | Amount | | Value |
|
|
| |
| COMMON STOCKS (continued) | | | |
| Chemicals - 0.71% | | | |
| Dow Chemical Company | 85,500 | $ | 3,260,115 |
| Coal - 0.23% | | | |
| CONSOL Energy, Inc. (a) | 28,700 | | 1,046,689 |
| Computers & Business Equipment - 1.18% | | | |
| Cisco Systems, Inc. * | 76,500 | | 1,682,235 |
| Cognizant Technology Solutions Corp., | | | |
| Class A * | 26,100 | | 1,824,651 |
| Sybase, Inc. * | 82,100 | | 1,894,047 |
|
|
| | | | 5,400,933 |
| Construction Materials - 0.40% | | | |
| Sherwin-Williams Company | 35,800 | | 1,848,712 |
| Cosmetics & Toiletries - 1.71% | | | |
| Colgate-Palmolive Company | 83,600 | | 5,004,296 |
| Procter & Gamble Company | 46,000 | | 2,847,400 |
|
|
| | | | 7,851,696 |
| Crude Petroleum & Natural Gas - 1.99% | | | |
| Patterson-UTI Energy, Inc. | 246,500 | | 6,754,100 |
| W&T Offshore, Inc. | 73,400 | | 2,355,406 |
|
|
| | | | 9,109,506 |
| Electrical Utilities - 1.36% | | | |
| PPL Corp. | 178,400 | | 6,238,648 |
| Electronics - 1.14% | | | |
| Arrow Electronics, Inc. * | 121,700 | | 3,395,430 |
| Dolby Laboratories, Inc. * | 85,300 | | 1,850,157 |
|
|
| | | | 5,245,587 |
| Energy - 3.48% | | | |
| Energen Corp. | 147,200�� | | 6,423,808 |
| Sempra Energy | 191,300 | | 9,511,436 |
|
|
| | | | 15,935,244 |
| Financial Services - 17.18% | | | |
| AmeriCredit Corp. * | 170,000 | | 3,993,300 |
| Bear Stearns Companies, Inc. | 47,000 | | 6,126,450 |
| Citigroup, Inc. | 398,800 | | 19,680,780 |
| Countrywide Financial Corp. | 338,300 | | 11,434,540 |
| Federal National Mortgage Association | 68,400 | | 3,601,260 |
| Goldman Sachs Group, Inc. | 47,400 | | 7,046,010 |
| JPMorgan Chase & Company | 74,400 | | 3,397,104 |
| Lehman Brothers Holdings, Inc. | 177,100 | | 11,300,751 |
| Morgan Stanley | 184,400 | | 12,131,676 |
|
|
| | | | 78,711,871 |
| Food & Beverages - 3.61% | | | |
| Constellation Brands, Inc., Class A * | 122,700 | | 3,348,483 |
| Pepsi Bottling Group, Inc. | 192,900 | | 6,753,429 |
| PepsiCo, Inc. | 98,700 | | 6,443,136 |
|
|
| | | | 16,545,048 |
| Gas & Pipeline Utilities - 0.78% | | | |
| Questar Corp. | 41,100 | | 3,556,794 |
| Healthcare Products - 0.84% | | | |
| Advanced Medical Optics, Inc. * (a) | 27,800 | | 1,338,570 |
The accompanying notes are an integral part of the financial statements. 320
John Hancock Funds II
Portfolio of investments — August 31, 2006
(showing percentage of total net assets) |
| Quantitative Value Fund (continued) | | |
| | Shares or | | |
| | Principal | | |
| | Amount | | Value |
|
|
| |
| COMMON STOCKS (continued) | | | |
| Healthcare Products (continued) | | | |
| Johnson & Johnson | 38,600 | $ | 2,495,876 |
| |
|
| | | | 3,834,446 |
| Healthcare Services - 2.69% | | | |
| Caremark Rx, Inc. | 91,500 | | 5,301,510 |
| Emdeon Corp. * (a) | 255,400 | | 3,026,490 |
| UnitedHealth Group, Inc. | 77,000 | | 4,000,150 |
| |
|
| | | | 12,328,150 |
| Holdings Companies/Conglomerates - 1.29% | | | |
| General Electric Company | 173,000 | | 5,892,380 |
| Hotels & Restaurants - 3.01% | | | |
| Brinker International, Inc. | 65,000 | | 2,500,550 |
| McDonald's Corp. | 314,000 | | 11,272,600 |
| |
|
| | | | 13,773,150 |
| Household Products - 0.55% | | | |
| Newell Rubbermaid, Inc. | 93,100 | | 2,512,769 |
| Industrial Machinery - 1.18% | | | |
| Terex Corp. * | 123,100 | | 5,407,783 |
| Insurance - 6.96% | | | |
| Axis Capital Holdings, Ltd. | 188,200 | | 6,103,326 |
| Endurance Specialty Holdings, Ltd. (a) | 182,500 | | 5,889,275 |
| MGIC Investment Corp. | 80,600 | | 4,664,322 |
| RenaissanceRe Holdings, Ltd. | 6,600 | | 339,900 |
| W.R. Berkley Corp. | 121,000 | | 4,235,000 |
| XL Capital, Ltd., Class A (a) | 162,000 | | 10,633,680 |
| |
|
| | | | 31,865,503 |
| International Oil - 6.13% | | | |
| ChevronTexaco Corp. | 123,700 | | 7,966,280 |
| ConocoPhillips | 257,900 | | 16,358,597 |
| Hess Corp. | 81,800 | | 3,744,804 |
| |
|
| | | | 28,069,681 |
| Internet Software - 1.29% | | | |
| Akamai Technologies, Inc. * | 103,400 | | 4,053,280 |
| Symantec Corp. * | 99,200 | | 1,849,088 |
| |
|
| | | | 5,902,368 |
| Leisure Time - 0.71% | | | |
| Walt Disney Company | 110,100 | | 3,264,465 |
| Medical-Hospitals - 0.49% | | | |
| VCA Antech, Inc. * | 63,900 | | 2,263,338 |
| Metal & Metal Products - 0.87% | | | |
| Reliance Steel & Aluminum Company | 57,500 | | 1,884,275 |
| Southern Copper Corp. (a) | 22,600 | | 2,086,432 |
| |
|
| | | | 3,970,707 |
| Mining - 0.48% | | | |
| Alliance Resource Partners LP (a) | 59,800 | | 2,194,062 |
| Petroleum Services - 4.40% | | | |
| Exxon Mobil Corp. | 297,700 | | 20,145,359 |
| Pharmaceuticals - 2.29% | | | |
| Eli Lilly & Company | 84,300 | | 4,714,899 |
| Quantitative Value Fund (continued) | | |
| | | Shares or | | |
| | | Principal | | |
| | | Amount | | Value |
| |
|
| |
| COMMON STOCKS (continued) | | | | |
| Pharmaceuticals (continued) | | | | |
| Pfizer, Inc. | | 208,900 | $ | 5,757,284 |
|
|
| | | | | 10,472,183 |
| Real Estate - 2.46% | | | | |
| Hospitality Properties Trust, REIT (a) | | 115,700 | | 5,359,224 |
| Host Hotels & Resorts, Inc., REIT | | 51,900 | | 1,169,826 |
| iStar Financial, Inc., REIT | | 113,500 | | 4,757,920 |
|
|
| | | | | 11,286,970 |
| Retail Trade - 2.70% | | | | |
| CVS Corp. | | 256,400 | | 8,602,220 |
| Staples, Inc. | | 166,200 | | 3,749,472 |
|
|
| | | | | 12,351,692 |
| Semiconductors - 0.48% | | | | |
| Applied Micro Circuits Corp. * | | 807,200 | | 2,203,656 |
| Software - 1.55% | | | | |
| BEA Systems, Inc. * | | 262,800 | | 3,608,244 |
| Microsoft Corp. | | 75,000 | | 1,926,750 |
| VeriFone Holdings, Inc. * (a) | | 67,600 | | 1,564,940 |
|
|
| | | | | 7,099,934 |
| Steel - 1.22% | | | | |
| Mittal Steel Company, NV (a) | | 113,400 | | 3,883,950 |
| United States Steel Corp. | | 29,500 | | 1,716,015 |
|
|
| | | | | 5,599,965 |
| Telecommunications Equipment & | | | | |
| Services - 2.58% | | | | |
| Amdocs, Ltd. * | | 123,400 | | 4,683,030 |
| Ciena Corp. * | | 844,100 | | 3,334,195 |
| Citizens Communications Company | | 185,100 | | 2,552,529 |
| SK Telecom Company, Ltd., ADR | | 57,800 | | 1,265,820 |
|
|
| | | | | 11,835,574 |
| Telephone - 4.30% | | | | |
| AT&T, Inc. | | 632,400 | | 19,686,612 |
| Tobacco - 1.20% | | | | |
| Altria Group, Inc. | | 65,700 | | 5,487,921 |
|
| TOTAL COMMON STOCKS (Cost $424,469,220) | | $ | 453,579,582 |
|
| |
| SHORT TERM INVESTMENTS - 6.16% | | | |
| Rabobank USA Finance Corp. | | | | |
| 5.27% due 09/01/2006 | $ | 3,620,000 | $ | 3,620,000 |
| State Street Navigator Securities Lending | | | | |
| Prime Portfolio (c) | | 24,592,740 | | 24,592,740 |
|
| TOTAL SHORT TERM INVESTMENTS | | | | |
| (Cost $28,212,740) | | | $ | 28,212,740 |
|
| Total Investments (Quantitative Value Fund) | | | |
| (Cost $452,681,960) - 105.17% | | | $ | 481,792,322 |
| Liabilities in Excess of Other Assets - (5.17)% | | | (23,675,142) |
|
|
| TOTAL NET ASSETS - 100.00% | | | $ | 458,117,180 |
|
|
The accompanying notes are an integral part of the financial statements. 321
John Hancock Funds II
Portfolio of investments — August 31, 2006
(showing percentage of total net assets) |
| Real Estate Equity Fund | | | |
| | Shares or | | |
| | Principal | | |
| | Amount | | Value |
|
|
| �� |
| COMMON STOCKS - 93.65% | | | |
| Construction Materials - 1.24% | | | |
| Forest City Enterprises, Inc. | 63,100 | $ | 3,393,518 |
| Hotels & Restaurants - 1.29% | | | |
| Hilton Hotels Corp. (a) | 139,700 | | 3,558,159 |
| Paper - 1.21% | | | |
| Plum Creek Timber Company, Inc. | 95,600 | | 3,329,748 |
| Real Estate - 89.91% | | | |
| Alexandria Real Estate Equities, Inc., REIT | 29,700 | | 2,911,194 |
| AMB Property Corp., REIT | 155,630 | | 8,688,823 |
| Archstone-Smith Trust, REIT | 202,890 | | 10,789,690 |
| Avalon Bay Communities, Inc., REIT | 40,790 | | 4,935,590 |
| Boston Properties, Inc., REIT | 99,750 | | 10,137,592 |
| BRE Properties, Inc., Class A, REIT (a) | 65,840 | | 3,890,486 |
| Brookfield Properties Corp. | 141,600 | | 4,963,080 |
| Camden Property Trust, REIT | 83,100 | | 6,447,729 |
| CBL & Associates Properties, Inc., REIT (a) | 81,200 | | 3,308,088 |
| Cousins Properties, Inc., REIT (a) | 105,800 | | 3,636,346 |
| Developers Diversified Realty Corp., REIT | 96,300 | | 5,209,830 |
| Duke Realty Corp., REIT | 148,810 | | 5,651,804 |
| EastGroup Properties, Inc., REIT (a) | 128,300 | | 6,544,583 |
| Equity Residential, REIT | 225,850 | | 11,263,139 |
| Essex Property Trust, Inc., REIT (a) | 25,700 | | 3,224,579 |
| Federal Realty Investment Trust, REIT | 65,380 | | 4,842,697 |
| General Growth Properties, Inc., REIT | 157,060 | | 7,119,530 |
| Host Hotels & Resorts, Inc., REIT | 421,850 | | 9,508,499 |
| Kilroy Realty Corp., REIT | 71,430 | | 5,647,970 |
| Kimco Realty Corp., REIT | 146,000 | | 6,066,300 |
| LaSalle Hotel Properties, REIT | 117,920 | | 5,181,405 |
| Mack-California Realty Corp., REIT (a) | 125,310 | | 6,660,227 |
| Maguire Properties, Inc., REIT (a) | 123,400 | | 4,924,894 |
| New Plan Realty Trust, Inc., REIT | 232,800 | | 6,422,952 |
| Post Properties, Inc., REIT (a) | 82,900 | | 3,995,780 |
| ProLogis, REIT | 185,170 | | 10,454,698 |
| PS Business Parks, Inc., REIT (a) | 51,570 | | 3,151,958 |
| Public Storage, Inc., REIT (a) | 55,000 | | 4,765,750 |
| Reckson Associates Realty Corp., REIT | 205,210 | | 8,780,936 |
| Regency Centers Corp., REIT | 85,550 | | 5,754,949 |
| Simon Property Group, Inc., REIT | 173,680 | | 14,726,327 |
| SL Green Realty Corp., REIT | 70,370 | | 7,850,477 |
| Strategic Hotel Cap, Inc., REIT (a) | 142,500 | | 2,907,000 |
| The Macerich Company, REIT | 134,920 | | 10,073,127 |
| United Dominion Realty Trust, Inc., REIT (a) | 128,600 | | 3,923,586 |
| Vornado Realty Trust, REIT | 103,100 | | 10,919,321 |
| Washington Real Estate Investment Trust, | | | |
| REIT (a) | 162,880 | | 6,616,186 |
| Weingarten Realty Investors, REIT | 123,900 | | 5,255,838 |
|
|
| | | | 247,152,960 |
|
| TOTAL COMMON STOCKS (Cost $235,882,314) | | $ | 257,434,385 |
| | |
|
| Real Estate Equity Fund (continued) | | |
| | | Shares or | | |
| | | Principal | | |
| | | Amount | | Value |
| |
|
| |
| CORPORATE BONDS - 5.67% | | | | |
| Real Estate - 5.67% | | | | |
| BRE Properties Inc, Series 144A | | | | |
| 4.125% due 08/15/2026 | $ | 2,775,000 | $ | 2,836,050 |
| EOP Operating LP | | | | |
| 4.00% due 07/15/2026 | | 11,060,000 | | 11,450,639 |
| Weingarten Realty Investors, Series 144A | | | | |
| 3.95% due 08/01/2026 (a) | | 1,273,000 | | 1,292,426 |
|
|
| | | | | 15,579,115 |
|
| TOTAL CORPORATE BONDS (Cost $15,100,461) | | $ | 15,579,115 |
|
| |
| SHORT TERM INVESTMENTS - 12.53% | | | | |
| State Street Navigator Securities | | | | |
| Lending Prime Portfolio (c) | $ | 34,447,109 | $ | 34,447,109 |
|
| TOTAL SHORT TERM INVESTMENTS | | | | |
| (Cost $34,447,109) | | | $ | 34,447,109 |
|
| |
| REPURCHASE AGREEMENTS - 0.83% | | | | |
| Repurchase Agreement with State | | | | |
| Street Corp. dated 08/31/2006 at | | | | |
| 3.95% to be repurchased at | | | | |
| $2,297,252 on 9/1/2006, | | | | |
| collateralized by $2,330,000 | | | | |
| Federal National Mortgage | | | | |
| Association, 5.125% due | | | | |
| 12/15/2008 (valued at $2,344,563, | | | | |
| including interest) (c) | $ | 2,297,000 | $ | 2,297,000 |
|
| TOTAL REPURCHASE AGREEMENTS | | | | |
| (Cost $2,297,000) | | | $ | 2,297,000 |
|
| Total Investments (Real Estate Equity Fund) | | | | |
| (Cost $287,726,884) - 112.68% | | | $ | 309,757,609 |
| Liabilities in Excess of Other Assets - (12.68)% | | | (34,863,143) |
|
|
| TOTAL NET ASSETS - 100.00% | | | $ | 274,894,466 |
|
|
| |
| |
| Real Estate Securities Fund | | | | |
| | | Shares or | | |
| | | Principal | | |
| | | Amount | | Value |
| |
|
| |
| COMMON STOCKS - 97.58% | | | | |
| Hotels & Restaurants - 2.37% | | | | |
| Starwood Hotels & Resorts Worldwide, Inc. | | 75,832 | $ | 4,038,812 |
| Real Estate - 95.21% | | | | |
| AMB Property Corp., REIT | | 91,640 | | 5,116,261 |
| Apartment Investment & Management | | | | |
| Company, Class A, REIT | | 85,363 | | 4,374,000 |
| Archstone-Smith Trust, REIT | | 179,880 | | 9,566,018 |
| Avalon Bay Communities, Inc., REIT | | 72,124 | | 8,727,004 |
| BioMed Realty Trust, Inc., REIT | | 45,730 | | 1,424,032 |
| Boston Properties, Inc., REIT | | 83,742 | | 8,510,699 |
| BRE Properties, Inc., Class A, REIT | | 33,630 | | 1,987,197 |
| Brookfield Properties Corp. | | 75,100 | | 2,632,255 |
| Digital Realty Trust, Inc., REIT | | 63,468 | | 1,898,328 |
| Entertainment Properties Trust, REIT | | 25,843 | | 1,288,532 |
| Equity Lifestyle Properties, Inc., REIT | | 30,161 | | 1,352,118 |
The accompanying notes are an integral part of the financial statements. 322
John Hancock Funds II
Portfolio of investments — August 31, 2006
(showing percentage of total net assets) |
| Real Estate Securities Fund (continued) | | |
| | | Shares or | | |
| | | Principal | | |
| | | Amount | | Value |
| |
|
| |
| COMMON STOCKS (continued) | | | | |
| Real Estate (continued) | | | | |
| Equity Office Properties Trust, REIT | | 247,850 | $ | 9,192,757 |
| Equity Residential, REIT | | 154,910 | | 7,725,362 |
| Essex Property Trust, Inc., REIT | | 26,624 | | 3,340,513 |
| Federal Realty Investment Trust, REIT | | 57,446 | | 4,255,025 |
| FelCor Lodging Trust, Inc., REIT | | 81,050 | | 1,738,523 |
| General Growth Properties, Inc., REIT | | 100,104 | | 4,537,714 |
| Highwoods Properties, Inc., REIT | | 33,540 | | 1,265,800 |
| Host Hotels & Resorts, Inc., REIT | | 419,300 | | 9,451,022 |
| Innkeepers USA Trust, REIT | | 40,200 | | 665,712 |
| Kilroy Realty Corp., REIT | | 25,360 | | 2,005,215 |
| LaSalle Hotel Properties, REIT | | 27,762 | | 1,219,862 |
| LTC Properties, Inc., REIT | | 27,581 | | 656,979 |
| Mack-California Realty Corp., REIT | | 47,997 | | 2,551,041 |
| Nationwide Health Properties, Inc., REIT | | 70,164 | | 1,828,474 |
| ProLogis, REIT | | 116,292 | | 6,565,846 |
| Public Storage, Inc., REIT | | 81,430 | | 7,055,910 |
| Regency Centers Corp., REIT | | 77,020 | | 5,181,135 |
| Simon Property Group, Inc., REIT | | 170,293 | | 14,439,143 |
| SL Green Realty Corp., REIT | | 52,430 | | 5,849,091 |
| Sovran Self Storage, Inc., REIT | | 21,522 | | 1,163,910 |
| Tanger Factory Outlet Centers, Inc., REIT | | 23,100 | | 826,980 |
| The Macerich Company, REIT | | 78,924 | | 5,892,466 |
| Ventas, Inc., REIT | | 129,816 | | 5,199,131 |
| Vornado Realty Trust, REIT | | 107,359 | | 11,370,392 |
| Washington Real Estate Investment Trust, | | | | |
| REIT (a) | | 37,900 | | 1,539,498 |
|
|
| | | | | 162,393,945 |
|
| TOTAL COMMON STOCKS (Cost $133,591,003) | | $ | 166,432,757 |
|
| |
| SHORT TERM INVESTMENTS - 0.92% | | | | |
| State Street Navigator Securities | | | | |
| Lending Prime Portfolio (c) | $ | 1,572,850 | $ | 1,572,850 |
|
| TOTAL SHORT TERM INVESTMENTS | | | | |
| (Cost $1,572,850) | | | $ | 1,572,850 |
|
| |
| REPURCHASE AGREEMENTS - 2.89% | | | | |
| Repurchase Agreement with State | | | | |
| Street Corp. dated 08/31/2006 at | | | | |
| 3.95% to be repurchased at | | | | |
| $4,925,540 on 9/1/2006, | | | | |
| collateralized by $4,960,000 | | | | |
| Federal National Mortgage | | | | |
| Association, 6.125% due | | | | |
| 08/17/2026 (valued at $5,028,200, | | | | |
| including interest) (c) | $ | 4,925,000 | $ | 4,925,000 |
|
| TOTAL REPURCHASE AGREEMENTS | | | | |
| (Cost $4,925,000) | | | $ | 4,925,000 |
|
| Total Investments (Real Estate Securities Fund) | | | |
| (Cost $140,088,853) - 101.39% | | | $ | 172,930,607 |
| Liabilities in Excess of Other Assets - (1.39)% | | | (2,368,972) |
|
|
| TOTAL NET ASSETS - 100.00% | | | $ | 170,561,635 |
|
|
| Real Return Bond Fund | | | | |
| | | Shares or | | |
| | | Principal | | |
| | | Amount | | Value |
|
|
| |
| U.S. TREASURY OBLIGATIONS - 104.72% | | | |
| Treasury Inflation Protected | | | | |
| Securities (d) - 104.15% | | | | |
| 0.875% due 04/15/2010 | $ | 81,928,651 | $ | 77,832,218 |
| 1.875% due 07/15/2013 to 07/15/2015 *** | 127,367,340 | | 123,904,893 |
| 2.00% due 07/15/2014 to 01/15/2026 *** | 160,950,546 | | 157,188,235 |
| 2.375% due 04/15/2011 to 01/15/2025 *** | 71,021,483 | | 72,452,718 |
| 2.50% due 07/15/2016 (a)*** | | 2,009,260 | | 2,054,703 |
| 3.00% due 07/15/2012 *** | | 31,369,520 | | 32,650,024 |
| 3.375% due 01/15/2007 *** | | 24,843,058 | | 24,832,375 |
| 3.50% due 01/15/2011 *** | | 49,631,840 | | 52,165,794 |
| 3.625% due 01/15/2008 (a)*** | | 53,369,716 | | 54,068,112 |
| 3.625% due 04/15/2028 *** | | 3,763,200 | | 4,687,683 |
| 3.875% due 01/15/2009 | | 28,403,201 | | 29,348,488 |
| 3.875% due 04/15/2029 *** | | 76,764,752 | | 99,758,175 |
|
|
| | | | | 730,943,418 |
| U.S. Treasury Bonds - 0.47% | | | | |
| 4.50% due 02/15/2036 (a)*** | | 3,500,000 | | 3,294,102 |
| U.S. Treasury Notes - 0.10% | | | | |
| 4.50% due 02/28/2011 (a)*** | | 700,000 | | 694,532 |
|
| TOTAL U.S. TREASURY OBLIGATIONS | | | | |
| (Cost $739,265,272) | | | $ | 734,932,052 |
|
| |
| U.S. GOVERNMENT AGENCY OBLIGATIONS - 5.14% | | |
| Federal National Mortgage | | | | |
| Association - 4.48% | | | | |
| 5.482% due 10/01/2044 (b)*** | | 239,508 | | 241,982 |
| 5.50% due 03/01/2034 to 09/01/2035 *** | 10,679,170 | | 10,489,027 |
| 5.50% TBA ** | | 14,700,000 | | 14,424,375 |
| 6.00% TBA ** | | 6,300,000 | | 6,305,909 |
|
|
| | | | | 31,461,293 |
| Small Business Administration - 0.66% | | | | |
| 4.504% due 02/01/2014 *** | | 1,634,331 | | 1,575,998 |
| 4.88% due 11/01/2024 *** | | 3,141,621 | | 3,060,709 |
|
|
| | | | | 4,636,707 |
|
| TOTAL U.S. GOVERNMENT AGENCY OBLIGATIONS | | |
| (Cost $35,271,697) | | | $ | 36,098,000 |
|
| |
| FOREIGN GOVERNMENT OBLIGATIONS - 8.19% | | |
| Canada - 0.07% | | | | |
| Government of Canada | | | | |
| 3.00% due 12/01/2036 *** | CAD | 425,608 | | 509,614 |
| France - 3.08% | | | | |
| Government of France | | | | |
| zero coupon due 09/21/2006 *** | EUR | 9,370,000 | | 11,967,901 |
| zero coupon due 12/07/2006 *** | | 7,620,000 | | 9,670,344 |
|
|
| | | | | 21,638,245 |
| Netherlands - 4.83% | | | | |
| Kingdom of Netherlands | | | | |
| zero coupon due 10/31/2006 *** | | 26,590,000 | | 33,850,572 |
The accompanying notes are an integral part of the financial statements. 323
John Hancock Funds II
Portfolio of investments — August 31, 2006
(showing percentage of total net assets) |
| Real Return Bond Fund (continued) | | |
| | | Shares or | | |
| | | Principal | | |
| | | Amount | | Value |
|
|
| |
| FOREIGN GOVERNMENT OBLIGATIONS | | | |
| (continued) | | | | |
| Russia - 0.21% | | | | |
| Russian Federation, Series REGS | | | | |
| 5.00% due 03/31/2030 *** | $ | 1,300,000 | $ | 1,446,770 |
|
| TOTAL FOREIGN GOVERNMENT OBLIGATIONS | | |
| (Cost $57,091,363) | | | $ | 57,445,201 |
|
| |
| CORPORATE BONDS - 1.07% | | | | |
| Banking - 0.20% | | | | |
| Wachovia Bank NA, Series BKNT | | | | |
| 5.3081% due 12/02/2010 (b)*** | | 1,400,000 | | 1,400,255 |
| Cable and Television - 0.20% | | | | |
| CSC Holdings, Inc. | | | | |
| 7.875% due 12/15/2007 *** | | 1,400,000 | | 1,426,250 |
| Crude Petroleum & Natural Gas - 0.06% | | | |
| Pemex Project Funding Master Trust | | | | |
| 9.25% due 03/30/2018 *** | | 350,000 | | 430,500 |
| Financial Services - 0.23% | | | | |
| Citigroup, Inc. | | | | |
| 5.525% due 01/30/2009 (b)*** | | 600,000 | | 600,167 |
| General Electric Capital Corp., MTN | | | | |
| 5.34% due 12/12/2008 (b)*** | | 500,000 | | 500,322 |
| Rabobank Nederland | | | | |
| 5.5269% due 01/15/2009 (b)*** | | 500,000 | | 500,030 |
| |
|
| | | | | 1,600,519 |
| |
| Gas & Pipeline Utilities - 0.02% | | | | |
| El Paso Corp. | | | | |
| 7.625% due 08/16/2007 *** | | 100,000 | | 101,250 |
| Hotels & Restaurants - 0.22% | | | | |
| Park Place Entertainment Corp. | | | | |
| 8.875% due 09/15/2008 (a)*** | | 1,500,000 | | 1,573,125 |
| Paper - 0.14% | | | | |
| Georgia Pacific Corp. | | | | |
| 7.345% due 12/20/2012 (b)*** (f) | | 995,000 | | 996,640 |
|
| TOTAL CORPORATE BONDS (Cost $7,557,094) | | $ | 7,528,539 |
|
| |
| MUNICIPAL BONDS - 0.03% | | | | |
| New York - 0.03% | | | | |
| New York City Municipal Finance Authority Water & | | |
| Sewer System Revenue, Series D | | | | |
| 4.75% due 06/15/2038 *** | | 200,000 | | 202,958 |
|
| TOTAL MUNICIPAL BONDS (Cost $202,086) | | $ | 202,958 |
|
| |
| COLLATERALIZED MORTGAGE | | | | |
| OBLIGATIONS - 0.15% | | | | |
| Citigroup Mortgage Loan Trust, Inc., | | | | |
| Series 2005-11, Class 1A1 | | | | |
| 4.90% due 12/25/2035 (b)*** | | 177,741 | | 178,772 |
| Lehman XS Trust, Series 2006-10N, Class 1A1A | | | |
| 5.4044% due 07/25/2046 (b)*** | | 880,341 | | 872,617 |
|
| TOTAL COLLATERALIZED MORTGAGE OBLIGATIONS | | |
| (Cost $1,057,131) | | | $ | 1,051,389 |
|
| Real Return Bond Fund (continued) | | |
| | | Shares or | | |
| | | Principal | | |
| | | Amount | | Value |
|
|
| |
| ASSET BACKED SECURITIES - 0.10% | | | | |
| Merrill Lynch Mortgage Investors, Inc., | | | | |
| Series 2006-WMC1, Class A2A | | | | |
| 5.4044% due 01/25/2037 (b)*** | $ | 348,101 | $ | 348,119 |
| Residential Asset Securities Corp., | | | | |
| Series 2006-KS3, Class AI1 | | | | |
| 5.3944% due 04/25/2036 (b)*** | | 164,186 | | 164,241 |
| Soundview Home Equity Loan Trust, | | | | |
| Series 2006-1, Class A1 | | | | |
| 5.3944% due 02/25/2036 (b)*** | | 106,472 | | 106,492 |
| Soundview Home Equity Loan Trust, | | | | |
| Series 2006-2, Class A1 | | | | |
| 5.3944% due 03/25/2036 (b)*** | | 65,154 | | 65,165 |
|
| TOTAL ASSET BACKED SECURITIES | | | | |
| (Cost $683,913) | | | $ | 684,017 |
|
| |
| OPTIONS - 0.03% | | | | |
| Call Options - 0.03% | | | | |
| Over The Counter European Style Call | | | | |
| Expiration 06/07/2007 at $5.25 | | 25,000,000 | | 177,011 |
| Expiration 06/07/2007 at $5.25 | | 6,000,000 | | 42,483 |
| |
|
| | | | | 219,494 |
|
| |
| TOTAL OPTIONS (Cost $132,078) | | | $ | 219,494 |
|
| |
| SHORT TERM INVESTMENTS - 10.33% | | | |
| Government of France | | | | |
| zero coupon due 09/28/2006 *** | EUR | 46,240,000 | $ | 59,029,491 |
| State Street Navigator Securities | | | | |
| Lending Prime Portfolio (c) | $ | 11,227,436 | | 11,227,436 |
| Total SA | | | | |
| 5.26% due 09/01/2006 *** | | 1,200,000 | | 1,200,000 |
| United States Treasury Bills | | | | |
| zero coupon due 09/14/2006 to | | | | |
| 11/30/2006 *** **** | | 1,055,000 | | 1,049,652 |
|
| TOTAL SHORT TERM INVESTMENTS | | | | |
| (Cost $69,870,298) | | | $ | 72,506,579 |
|
| |
| REPURCHASE AGREEMENTS - 1.23% | | | |
| Repurchase Agreement with State | | | | |
| Street Corp. dated 08/31/2006 at | | | | |
| 3.95% to be repurchased at | | | | |
| $8,637,948 on 09/01/2006, | | | | |
| collateralized by $9,050,000 | | | | |
| Federal National Mortgage | | | | |
| Association, 4.25% due | | | | |
| 08/15/2010 (valued at $8,812,438, | | | | |
| including interest) (c) | $ | 8,637,000 | $ | 8,637,000 |
|
| TOTAL REPURCHASE AGREEMENTS | | | | |
| (Cost $8,637,000) | | | $ | 8,637,000 |
|
| Total Investments (Real Return Bond Fund) | | | |
| (Cost $919,767,932) - 130.99% | | | $ | 919,305,229 |
| Liabilities in Excess of Other Assets - (30.99)% | | | (217,507,823) |
| |
|
| TOTAL NET ASSETS - 100.00% | | | $ | 701,797,406 |
| |
|
The accompanying notes are an integral part of the financial statements. 324
John Hancock Funds II
Portfolio of investments — August 31, 2006
(showing percentage of total net assets) |
| Small Cap Fund | | | |
| | Shares or | | |
| | Principal | | |
| | Amount | | Value |
|
|
| |
| COMMON STOCKS - 98.20% | | | |
| Advertising - 2.29% | | | |
| inVentiv Health, Inc. * | 177,190 | $ | 5,515,925 |
| Apparel & Textiles - 3.81% | | | |
| Hartmarx Corp. * (a) | 323,290 | | 1,930,041 |
| Warnaco Group, Inc. * (a) | 360,050 | | 7,247,807 |
| |
|
| | | | 9,177,848 |
| Auto Parts - 2.66% | | | |
| LKQ Corp. * (a) | 307,690 | | 6,390,721 |
| Banking - 6.80% | | | |
| Boston Private Financial Holdings, Inc. (a) | 212,060 | | 5,293,018 |
| First Community Bancorp | 86,880 | | 4,657,637 |
| Placer Sierra Bancshares | 133,340 | | 3,168,158 |
| Tierone Corp. | 95,160 | | 3,245,908 |
| |
|
| | | | 16,364,721 |
| Chemicals - 4.94% | | | |
| Arch Chemicals, Inc. (a) | 149,300 | | 4,141,582 |
| Cytec Industries, Inc. (a) | 145,150 | | 7,743,753 |
| |
|
| | | | 11,885,335 |
| Coal - 0.78% | | | |
| James River Coal Company * (a) | 127,780 | | 1,882,199 |
| Computers & Business Equipment - 5.07% | | | |
| Avocent Corp. * (a) | 271,170 | | 8,197,469 |
| Parametric Technology Corp. * (a) | 248,700 | | 4,006,557 |
| |
|
| | | | 12,204,026 |
| Construction Materials - 1.98% | | | |
| Clarcor, Inc. (a) | 158,860 | | 4,757,857 |
| Cosmetics & Toiletries - 4.53% | | | |
| Intermediate Parfums, Inc. (a) | 194,010 | | 3,148,782 |
| Playtex Products, Inc. * (a) | 588,900 | | 7,744,035 |
| |
|
| | | | 10,892,817 |
| Crude Petroleum & Natural Gas - 3.12% | | | |
| Petroquest Energy, Inc. * (a) | 624,820 | | 7,516,585 |
| Domestic Oil - 2.81% | | | |
| Forest Oil Corp. * (a) | 87,120 | | 2,950,755 |
| Mariner Energy, Inc. * | 201,520 | | 3,808,728 |
| |
|
| | | | 6,759,483 |
| Electronics - 7.63% | | | |
| Daktronics, Inc. (a) | 367,400 | | 7,667,638 |
| Trimble Navigation, Ltd. * | 218,270 | | 10,688,682 |
| |
|
| | | | 18,356,320 |
| Healthcare Products - 10.78% | | | |
| Cantel Medical Corp. * (a) | 300,920 | | 4,252,000 |
| Hologic, Inc. * (a) | 138,530 | | 5,981,725 |
| Inverness Medical Innovations, Inc. * (a) | 219,390 | | 7,408,800 |
| Kensey Nash Corp. * (a) | 165,970 | | 4,494,468 |
| SurModics, Inc. * (a) | 108,510 | | 3,795,680 |
| |
|
| | | | 25,932,673 |
| Healthcare Services - 1.65% | | | |
| Air Methods Corp. * (a) | 170,650 | | 3,976,145 |
| Small Cap Fund (continued) | | | |
| | | Shares or | | |
| | | Principal | | |
| | | Amount | | Value |
| |
|
| |
| COMMON STOCKS (continued) | | | | |
| Industrial Machinery - 2.82% | | | | |
| Presstek, Inc. * (a) | | 304,730 | $ | 2,501,834 |
| Watts Water Technologies, Inc., Class A (a) | 138,430 | | 4,292,714 |
|
|
| | | | | 6,794,548 |
| Insurance - 5.48% | | | | |
| James River Group, Inc. * | | 48,820 | | 1,376,236 |
| National Interstate Corp. | | 137,590 | | 3,820,874 |
| Philadelphia Consolidated Holding Corp. * (a) | 220,930 | | 7,988,829 |
|
|
| | | | | 13,185,939 |
| Internet Software - 1.95% | | | | |
| Lionbridge Technologies, Inc. * (a) | | 658,270 | | 4,686,882 |
| Leisure Time - 3.47% | | | | |
| Gaylord Entertainment Company * (a) | | 190,770 | | 8,340,464 |
| Medical-Hospitals - 2.63% | | | | |
| IRIS International, Inc. * | | 180,000 | | 1,765,800 |
| Lifepoint Hospitals, Inc. * | | 133,970 | | 4,561,679 |
|
|
| | | | | 6,327,479 |
| Petroleum Services - 1.85% | | | | |
| Hercules Offshore, Inc. * (a) | | 98,110 | | 3,131,671 |
| Metretek Technologies, Inc. * (a) | | 114,810 | | 1,309,982 |
|
|
| | | | | 4,441,653 |
| Publishing - 1.46% | | | | |
| Courier Corp. | | 95,510 | | 3,518,588 |
| Railroads & Equipment - 1.94% | | | | |
| Genesee & Wyoming, Inc., Class A * (a) | | 187,480 | | 4,666,377 |
| Retail Trade - 7.39% | | | | |
| Big Lots, Inc. * (a) | | 257,730 | | 4,729,346 |
| Build A Bear Workshop, Inc. * (a) | | 178,720 | | 3,901,458 |
| Cost Plus, Inc. * (a) | | 287,230 | | 2,924,001 |
| New York & Company, Inc. * (a) | | 357,810 | | 4,086,190 |
| Tractor Supply Company * | | 50,000 | | 2,129,000 |
|
|
| | | | | 17,769,995 |
| Sanitary Services - 1.55% | | | | |
| Aqua America, Inc. (a) | | 157,560 | | 3,732,596 |
| Semiconductors - 2.03% | | | | |
| Silicon Image, Inc. * | | 419,630 | | 4,871,904 |
| Software - 6.78% | | | | |
| Emageon, Inc. * (a) | | 157,460 | | 2,426,459 |
| Secure Computing Corp. * | | 633,450 | | 4,022,407 |
| Take-Two Interactive Software, Inc. * (a) | | 277,070 | | 3,380,254 |
| Transaction Systems Architects, Inc., Class A * | 195,260 | | 6,476,774 |
|
|
| | | | | 16,305,894 |
|
| TOTAL COMMON STOCKS (Cost $228,223,230) | | $ | 236,254,974 |
|
| |
| SHORT TERM INVESTMENTS - 23.24% | | | |
| State Street Navigator Securities | | | | |
| Lending Prime Portfolio (c) | $ | 55,917,662 | $ | 55,917,662 |
|
| TOTAL SHORT TERM INVESTMENTS | | | | |
| (Cost $55,917,662) | | | $ | 55,917,662 |
|
The accompanying notes are an integral part of the financial statements. 325
John Hancock Funds II
Portfolio of investments — August 31, 2006
(showing percentage of total net assets) |
| Small Cap Fund (continued) | | | |
| | | Shares or | | |
| | | Principal | | |
| | | Amount | | Value |
|
|
| |
| REPURCHASE AGREEMENTS - 1.61% | | | |
| Repurchase Agreement with State | | | | |
| Street Corp. dated 08/31/2006 at | | | | |
| 3.95% to be repurchased at | | | | |
| $3,866,424 on 09/01/2006, | | | | |
| collateralized by $4,050,000 | | | | |
| Federal National Mortgage | | | | |
| Association, 4.25% due | | | | |
| 08/15/2010 (valued at $3,943,688, | | | | |
| including interest) (c) | $ | 3,866,000 | $ | 3,866,000 |
|
| TOTAL REPURCHASE AGREEMENTS | | | | |
| (Cost $3,866,000) | | | $ | 3,866,000 |
|
| Total Investments (Small Cap Fund) | | | | |
| (Cost $288,006,892) - 123.05% | | | $ | 296,038,636 |
| Liabilities in Excess of Other Assets - (23.05)% | | | (55,447,397) |
|
|
| TOTAL NET ASSETS - 100.00% | | | $ | 240,591,239 |
|
|
| |
| |
| Small Cap Index Fund | | | | |
| | | Shares or | | |
| | | Principal | | |
| | | Amount | | Value |
|
|
| |
| COMMON STOCKS - 95.73% | | | | |
| Advertising - 0.41% | | | | |
| 24/7 Real Media, Inc. * (a) | | 4,713 | $ | 42,794 |
| Aquantive, Inc. * | | 7,189 | | 178,287 |
| inVentiv Health, Inc. * | | 2,777 | | 86,448 |
| Marchex, Inc., Class B * (a) | | 2,218 | | 36,420 |
| ValueClick, Inc. * | | 9,682 | | 170,887 |
|
|
| | | | | 514,836 |
| Aerospace - 1.22% | | | | |
| AAR Corp. * (a) | | 3,427 | | 76,456 |
| ARGON ST, Inc. * (a) | | 1,340 | | 34,465 |
| Aviall, Inc. * | | 3,236 | | 154,551 |
| BE Aerospace, Inc. * | | 7,320 | | 174,655 |
| Curtiss Wright Corp. (a) | | 4,172 | | 129,708 |
| EDO Corp. (a) | | 1,667 | | 38,891 |
| Esterline Technologies Corp. * | | 2,391 | | 83,757 |
| GenCorp, Inc. * (a) | | 5,283 | | 72,747 |
| HEICO Corp. (a) | | 2,077 | | 68,811 |
| Innovative Solutions & Support, Inc. * (a) | | 1,380 | | 20,231 |
| Integral Systems, Inc. (a) | | 1,160 | | 36,470 |
| K&F Industries Holdings, Inc. * | | 1,836 | | 34,480 |
| Moog, Inc., Class A * | | 3,514 | | 114,732 |
| MTC Technologies, Inc. * | | 1,086 | | 22,806 |
| Orbital Sciences Corp., Class A * | | 5,215 | | 94,339 |
| Sequa Corp., Class A * | | 654 | | 60,037 |
| Teledyne Technologies, Inc. * | | 3,249 | | 124,567 |
| TransDigm Group, Inc. * | | 1,092 | | 24,712 |
| Triumph Group, Inc. | | 1,517 | | 66,687 |
| Woodward Governor Company | | 2,886 | | 97,172 |
|
|
| | | | | 1,530,274 |
| Agriculture - 0.19% | | | | |
| Delta & Pine Land Company | | 3,411 | | 138,009 |
| Small Cap Index Fund (continued) | | |
| | Shares or | | |
| | Principal | | |
| | Amount | | Value |
|
|
| |
| COMMON STOCKS (continued) | | | |
| Agriculture (continued) | | | |
| Tejon Ranch Company * (a) | 1,047 | $ | 45,429 |
| The Andersons, Inc. (a) | 1,197 | | 49,089 |
|
|
| | | | 232,527 |
| Air Freight - 0.05% | | | |
| ABX Air, Inc. * | 5,919 | | 32,850 |
| ExpressJet Holdings, Inc. * (a) | 4,852 | | 33,916 |
|
|
| | | | 66,766 |
| Air Travel - 0.52% | | | |
| Airtran Holdings, Inc. * | 8,455 | | 96,810 |
| Alaska Air Group, Inc. * | 3,665 | | 138,794 |
| Frontier Airlines Holdings, Inc. * (a) | 3,693 | | 25,629 |
| JetBlue Airways Corp. * (a) | 16,143 | | 165,304 |
| Mesa Air Group, Inc. * (a) | 3,637 | | 28,732 |
| Republic Airways Holdings, Inc. * | 3,122 | | 49,765 |
| SkyWest, Inc. | 5,944 | | 143,667 |
|
|
| | | | 648,701 |
| Aluminum - 0.18% | | | |
| Aleris International, Inc. * | 2,970 | | 152,272 |
| Century Aluminum Company * | 2,181 | | 75,702 |
|
|
| | | | 227,974 |
| Amusement & Theme Parks - 0.03% | | | |
| Great Wolf Resorts, Inc. * | 2,794 | | 33,835 |
| Apparel & Textiles - 1.74% | | | |
| Bebe Stores, Inc. (a) | 2,258 | | 50,308 |
| Brown Shoe, Inc. | 2,708 | | 86,521 |
| Carter's, Inc. * (a) | 4,603 | | 106,329 |
| Cherokee, Inc. | 955 | | 35,163 |
| Columbia Sportswear Company * (a) | 1,284 | | 62,685 |
| Crocs, Inc. * (a) | 980 | | 26,479 |
| Deckers Outdoor Corp. * (a) | 1,067 | | 43,758 |
| G & K Services, Class A | 2,120 | | 70,342 |
| Guess?, Inc. * | 1,986 | | 81,029 |
| Hartmarx Corp. * | 3,678 | | 21,958 |
| Iconix Brand Group, Inc. * (a) | 3,389 | | 50,225 |
| Interface, Inc., Class A * | 4,585 | | 58,275 |
| Joseph A. Bank Clothiers, Inc. * (a) | 1,734 | | 41,495 |
| Kellwood Company (a) | 2,495 | | 68,388 |
| K-Swiss, Inc., Class A | 2,549 | | 70,123 |
| Maidenform Brands, Inc. * | 1,525 | | 27,130 |
| Movado Group, Inc. | 1,816 | | 40,842 |
| Oakley, Inc. (a) | 2,416 | | 39,743 |
| Oxford Industries, Inc. (a) | 1,494 | | 61,373 |
| Phillips-Van Heusen Corp. | 5,241 | | 202,512 |
| Quiksilver, Inc. * | 11,587 | | 162,218 |
| Skechers United States of America, Inc., | | | |
| Class A * | 1,067 | | 24,157 |
| Stage Stores, Inc. | 2,580 | | 68,009 |
| Stride Rite Corp. | 3,984 | | 54,780 |
| The Gymboree Corp. * | 3,179 | | 106,655 |
| Timberland Company, Class A * | 4,776 | | 135,686 |
The accompanying notes are an integral part of the financial statements. 326
John Hancock Funds II
Portfolio of investments — August 31, 2006
(showing percentage of total net assets) |
| Small Cap Index Fund (continued) | | |
| | Shares or | | |
| | Principal | | |
| | Amount | | Value |
|
|
| |
| COMMON STOCKS (continued) | | | |
| Apparel & Textiles (continued) | | | |
| True Religion Apparel, Inc. * (a) | 1,339 | $ | 27,182 |
| Under Armour, Inc., Class A * (a) | 1,975 | | 68,019 |
| Unifirst Corp. | 986 | | 30,605 |
| Volcom, Inc. * (a) | 1,356 | | 31,717 |
| Warnaco Group, Inc. * | 4,545 | | 91,491 |
| Wolverine World Wide, Inc. | 5,365 | | 135,359 |
|
|
| | | | 2,180,556 |
| Auto Parts - 0.83% | | | |
| Accuride Corp. * | 2,482 | | 27,079 |
| Aftermarket Technology Corp. * | 2,223 | | 44,860 |
| American Axle & Manufacturing Holdings, Inc. (a) | 4,899 | | 81,764 |
| ArvinMeritor, Inc. (a) | 6,689 | | 99,332 |
| Commercial Vehicle Group, Inc. * | 2,139 | | 41,967 |
| CSK Auto Corp. * | 4,256 | | 48,816 |
| Federal Signal Corp. | 4,636 | | 72,368 |
| Fuel Systems Solutions, Inc. * | 1,223 | | 16,853 |
| Keystone Automotive Industries, Inc. * | 1,612 | | 55,437 |
| Lear Corp. (a) | 6,351 | | 129,179 |
| LKQ Corp. * | 4,273 | | 88,750 |
| Miller Industries, Inc. * | 1,082 | | 19,411 |
| Modine Manufacturing Company | 3,240 | | 75,460 |
| Pep Boys - Manny, Moe & Jack | 5,243 | | 67,320 |
| Superior Industries International, Inc. (a) | 2,288 | | 38,690 |
| Titan International, Inc. (a) | 1,653 | | 29,126 |
| Visteon Corp. * | 12,106 | | 103,749 |
|
|
| | | | 1,040,161 |
| Auto Services - 0.14% | | | |
| Dollar Thrifty Automotive Group, Inc. * | 2,371 | | 101,194 |
| Lithia Motors, Inc., Class A | 1,637 | | 41,776 |
| Midas, Inc. * | 1,672 | | 32,705 |
|
|
| | | | 175,675 |
| Automobiles - 0.27% | | | |
| Americas Car Mart, Inc. * (a) | 1,069 | | 16,869 |
| Group 1 Automotive, Inc. | 2,360 | | 106,908 |
| Monaco Coach Corp. | 2,723 | | 28,755 |
| Monro Muffler Brake, Inc. | 1,254 | | 40,416 |
| Rush Enterprises, Inc., Class A * | 2,286 | | 40,005 |
| Tenneco, Inc. * | 4,316 | | 98,189 |
|
|
| | | | 331,142 |
| Banking - 9.27% | | | |
| 1st Source Corp. | 1,317 | | 39,444 |
| Alabama National BanCorp | 1,522 | | 103,207 |
| Amcore Financial, Inc. | 2,220 | | 66,711 |
| Americanwest BanCorp | 1,559 | | 34,485 |
| Ameris Bancorp (a) | 1,535 | | 40,340 |
| Anchor BanCorp Wisconsin, Inc. | 2,043 | | 59,696 |
| Arrow Financial Corp. | 1,474 | | 39,769 |
| Bancorp, Inc. * | 1,273 | | 29,674 |
| Bank Granite Corp. | 1,819 | | 39,581 |
| Bank Mutual Corp. | 6,099 | | 75,079 |
| Bank of the Ozarks, Inc. (a) | 1,316 | | 42,007 |
| Small Cap Index Fund (continued) | | |
| | Shares or | | |
| | Principal | | |
| | Amount | | Value |
|
|
| |
| COMMON STOCKS (continued) | | | |
| Banking (continued) | | | |
| BankAtlantic Bancorp, Inc., Class A | 4,556 | $ | 64,103 |
| BankFinancial Corp. (a) | 2,697 | | 47,036 |
| BankUnited Financial Corp., Class A | 3,061 | | 78,882 |
| Banner Corp. | 1,325 | | 54,881 |
| Berkshire Hill Bancorp, Inc. | 1,160 | | 43,291 |
| Boston Private Financial Holdings, Inc. | 3,393 | | 84,689 |
| Brookline Bancorp, Inc. | 6,224 | | 83,090 |
| Camden National Corp. (a) | 913 | | 39,716 |
| Capital City Bank Group, Inc. (a) | 1,373 | | 44,142 |
| Capital Corp of the West | 1,204 | | 40,707 |
| Capitol Bancorp, Ltd. | 1,349 | | 56,887 |
| Cardinal Financial Corp. | 2,746 | | 30,508 |
| Cascade Bancorp (a) | 2,191 | | 77,868 |
| Cathay General Bancorp, Inc. (a) | 4,899 | | 182,684 |
| Centennial Bank Holdings, Inc. * (a) | 5,792 | | 57,688 |
| Center Financial Corp. | 1,414 | | 34,502 |
| Central Pacific Financial Corp. | 2,945 | | 106,580 |
| Chemical Financial Corp. (a) | 2,599 | | 76,722 |
| Chittenden Corp. | 4,460 | | 128,671 |
| Citizens Banking Corp. | 4,160 | | 104,832 |
| Citizens First Bancorp, Inc. | 1,063 | | 25,140 |
| City Bank Lynnwood WA | 945 | | 48,072 |
| CoBiz, Inc. (a) | 1,661 | | 37,838 |
| Columbia Bankcorp Oregon (a) | 1,399 | | 34,625 |
| Columbia Banking System, Inc. | 1,634 | | 51,112 |
| Community Bank Systems, Inc. | 2,956 | | 64,648 |
| Community Banks, Inc. (a) | 2,467 | | 64,438 |
| Community Trust Bancorp, Inc. | 1,591 | | 61,126 |
| Corus Bankshares, Inc. (a) | 3,688 | | 80,435 |
| CVB Financial Corp. | 5,977 | | 89,296 |
| Digital Insight Corp. * | 3,278 | | 85,261 |
| Dime Community Bancorp, Inc. | 2,884 | | 41,212 |
| Doral Financial Corp. (a) | 8,497 | | 42,570 |
| Downey Financial Corp. (a) | 1,949 | | 119,649 |
| F.N.B. Corp. (a) | 5,662 | | 92,687 |
| Fidelity Bankshares, Inc. (a) | 2,445 | | 92,641 |
| First BanCorp Puerto Rico | 6,621 | | 60,847 |
| First Charter Corp. | 3,137 | | 76,198 |
| First Commonwealth Financial Corp. (a) | 7,031 | | 90,419 |
| First Community Bancorp | 1,870 | | 100,251 |
| First Community Bancshares, Inc. | 1,239 | | 42,188 |
| First Financial BanCorp. | 3,492 | | 54,126 |
| First Financial Bankshares, Inc. (a) | 2,092 | | 81,274 |
| First Financial Corp. (a) | 1,624 | | 53,657 |
| First Financial Holdings, Inc. | 1,457 | | 50,325 |
| First Merchants Corp. | 2,065 | | 50,324 |
| First Midwest BanCorp, Inc., Illinois | 4,771 | | 178,197 |
| First Niagara Financial Group, Inc. | 10,664 | | 159,533 |
| First Place Financial Corp. | 1,996 | | 46,966 |
| First Republic Bank | 2,077 | | 88,522 |
| First State BanCorp. | 1,938 | | 49,593 |
| FirstFed Financial Corp. * (a) | 1,589 | | 80,817 |
The accompanying notes are an integral part of the financial statements. 327
John Hancock Funds II
Portfolio of investments — August 31, 2006
(showing percentage of total net assets) |
| Small Cap Index Fund (continued) | | |
| | Shares or | | |
| | Principal | | |
| | Amount | | Value |
|
|
| |
| COMMON STOCKS (continued) | | | |
| Banking (continued) | | | |
| FirstMerit Corp. | 7,503 | $ | 172,644 |
| Flag Financial Corp. | 1,544 | | 38,538 |
| Flagstar Bancorp, Inc. (a) | 4,039 | | 58,727 |
| Flushing Financial Corp. | 2,249 | | 39,425 |
| FNB Corp. of Virginia (a) | 1,076 | | 38,069 |
| Franklin Bank Corp. * (a) | 2,481 | | 49,322 |
| Frontier Financial Corp. (a) | 2,604 | | 106,478 |
| GB&T Bancshares, Inc. (a) | 1,726 | | 36,350 |
| Glacier Bancorp, Inc. (a) | 3,214 | | 104,391 |
| Great Southern Bancorp, Inc. (a) | 1,243 | | 34,642 |
| Greater Bay Bancorp | 4,790 | | 136,371 |
| Greenhill & Company, Inc. (a) | 1,667 | | 91,735 |
| Hancock Holding Company | 2,580 | | 133,747 |
| Hanmi Financial Corp. | 3,920 | | 76,518 |
| Harleysville National Corp. (a) | 2,911 | | 60,162 |
| Heartland Financial USA, Inc. (a) | 1,646 | | 44,327 |
| Heritage Commerce Corp. (a) | 1,576 | | 36,926 |
| Horizon Financial Corp. (a) | 1,222 | | 36,587 |
| IBERIABANK Corp. | 1,056 | | 61,565 |
| Independent Bank Corp. - MA | 799 | | 27,286 |
| Independent Bank Corp. - MI | 2,419 | | 60,722 |
| Integra Bank Corp. | 1,941 | | 50,117 |
| Interchange Financial Services Corp. (a) | 2,090 | | 47,380 |
| International Bancshares Corp. | 4,465 | | 127,297 |
| Irwin Financial Corp. (a) | 2,031 | | 38,670 |
| ITLA Capital Corp. | 736 | | 38,603 |
| KNBT Bancorp, Inc. | 3,171 | | 51,370 |
| Lakeland Bancorp, Inc. (a) | 2,295 | | 33,970 |
| Lakeland Financial Corp. | 1,625 | | 40,056 |
| Macatawa Bank Corp. (a) | 1,617 | | 37,628 |
| MAF Bancorp, Inc. | 3,319 | | 136,975 |
| MainSource Financial Group, Inc. | 2,228 | | 37,765 |
| MB Financial, Inc. | 2,329 | | 85,940 |
| Mercantile Bank Corp. | 1,031 | | 41,776 |
| Mid-State Bancshares | 2,295 | | 62,126 |
| Midwest Banc Holdings, Inc. (a) | 1,885 | | 45,183 |
| Nara Bancorp, Inc. | 2,220 | | 41,070 |
| National Penn Bancshares, Inc. (a) | 4,522 | | 92,475 |
| Netbank, Inc. | 4,655 | | 28,582 |
| Newalliance Bancshares, Inc. | 10,437 | | 152,171 |
| Northwest Bancorp, Inc. (a) | 1,918 | | 51,019 |
| Old National Bancorp (a) | 6,458 | | 120,829 |
| Old Second Bancorp, Inc. | 1,637 | | 49,699 |
| Omega Financial Corp. (a) | 1,488 | | 45,726 |
| Oriental Financial Group, Inc. | 2,507 | | 30,736 |
| Pacific Capital Bancorp | 4,489 | | 125,512 |
| Park National Corp. (a) | 1,161 | | 120,291 |
| Partners Trust Financial Group, Inc. | 4,906 | | 53,770 |
| Peoples Bancorp, Inc. | 1,378 | | 41,671 |
| PFF Bancorp, Inc. | 2,374 | | 85,678 |
| Pinnacle Financial Partners, Inc. * (a) | 1,623 | | 57,373 |
| Placer Sierra Bancshares | 1,232 | | 29,272 |
| Small Cap Index Fund (continued) | | |
| | Shares or | | |
| | Principal | | |
| | Amount | | Value |
|
|
| |
| COMMON STOCKS (continued) | | | |
| Banking (continued) | | | |
| PremierWest Bancorp (a) | 1,875 | $ | 28,950 |
| PrivateBancorp, Inc. (a) | 1,708 | | 75,835 |
| Prosperity Bancshares, Inc. | 2,506 | | 88,412 |
| Provident Bankshares Corp. | 3,249 | | 121,773 |
| Provident Financial Services, Inc. | 6,531 | | 121,803 |
| Provident New York Bancorp (a) | 4,385 | | 61,171 |
| R & G Financial Corp., Class B | 3,021 | | 21,751 |
| Renasant Corp. (a) | 1,719 | | 52,481 |
| Republic Bancorp, Inc. | 7,256 | | 93,820 |
| S & T Bancorp, Inc. (a) | 2,661 | | 82,677 |
| S.Y. Bancorp, Inc. (a) | 1,457 | | 41,029 |
| Sandy Spring Bancorp, Inc. | 1,628 | | 59,406 |
| SCBT Financial Corp. | 1,178 | | 45,848 |
| Seacoast Banking Corp. of Florida | 1,461 | | 44,955 |
| Security Bank Corp. | 1,727 | | 38,685 |
| Shore Bancshares, Inc. (a) | 1,209 | | 34,324 |
| Signature Bank * | 2,796 | | 91,849 |
| Simmons First National Corp., Class A (a) | 1,632 | | 47,034 |
| Smithtown Bancorp, Inc. (a) | 1,055 | | 29,424 |
| Southwest Bancorp, Inc. | 1,651 | | 43,834 |
| State National Bancshares, Inc. (a) | 1,136 | | 43,168 |
| Sterling Bancorp | 2,028 | | 39,404 |
| Sterling Bancshares, Inc. | 4,405 | | 91,360 |
| Sterling Financial Corp., Pennsylvania (a) | 2,661 | | 59,580 |
| Sterling Financial Corp., Spokane | 3,403 | | 112,503 |
| Suffolk Bancorp (a) | 1,266 | | 44,107 |
| Susquehanna Bancshares, Inc. | 4,544 | | 111,192 |
| SVB Financial Group * | 3,339 | | 150,889 |
| Texas Capital Bancshares, Inc. * | 2,287 | | 45,397 |
| Texas Regional Bancshares, Inc., Class A | 4,352 | | 166,551 |
| Texas United Bancshares, Inc. (a) | 1,004 | | 33,303 |
| Tierone Corp. | 1,864 | | 63,581 |
| Tompkins Trustco, Inc. | 856 | | 38,400 |
| Trico Bancshares | 677 | | 16,675 |
| TrustCo Bank Corp. (a) | 7,595 | | 83,545 |
| Trustmark Corp. | 4,458 | | 140,739 |
| UCBH Holdings, Inc. (a) | 8,956 | | 162,462 |
| Umpqua Holdings Corp. (a) | 5,355 | | 146,566 |
| Union Bankshares Corp. | 1,026 | | 43,420 |
| United Bankshares, Inc. | 3,594 | | 133,948 |
| United Community Banks, Inc. (a) | 3,297 | | 103,526 |
| Univest Corp. of Pennsylvania (a) | 1,420 | | 42,401 |
| Vineyard National Bancorp Company (a) | 1,193 | | 32,485 |
| Virginia Commerce Bancorp, Inc. * (a) | 1,681 | | 37,251 |
| Virginia Financial Group, Inc. | 979 | | 42,645 |
| W Holding Company, Inc. (a) | 10,369 | | 52,363 |
| Washington Trust Bancorp, Inc. | 1,450 | | 38,266 |
| Wesbanco, Inc. | 2,223 | | 67,424 |
| West Bancorp. (a) | 2,126 | | 36,957 |
| West Coast Bancorp | 1,708 | | 52,162 |
| Westamerica Bancorp (a) | 3,009 | | 143,920 |
| Western Alliance Bancorp * (a) | 1,243 | | 45,879 |
The accompanying notes are an integral part of the financial statements. 328
John Hancock Funds II
Portfolio of investments — August 31, 2006
(showing percentage of total net assets) |
| Small Cap Index Fund (continued) | | |
| | Shares or | | |
| | Principal | | |
| | Amount | | Value |
|
|
| |
| COMMON STOCKS (continued) | | | |
| Banking (continued) | | | |
| Willow Grove Bancorp, Inc. | 2,097 | $ | 34,433 |
| Wintrust Financial Corp. | 2,458 | | 123,662 |
| Yardville National Bancorp | 1,207 | | 43,609 |
|
|
| | | | 11,595,555 |
| Biotechnology - 1.99% | | | |
| Affymetrix, Inc. * (a) | 6,334 | | 134,978 |
| Alnylam Pharmaceuticals, Inc. * (a) | 3,036 | | 39,529 |
| Applera Corp. - Celera Genomics Group * | 7,208 | | 100,335 |
| Arena Pharmaceuticals, Inc. * (a) | 4,444 | | 54,528 |
| Bio Reference Labs, Inc. * | 1,097 | | 24,759 |
| Bio-Rad Laboratories, Inc., Class A * | 1,771 | | 130,009 |
| Coley Pharmaceutical Group, Inc. * (a) | 1,880 | | 19,496 |
| Combinatorx, Inc. * (a)(e) | 2,729 | | 20,604 |
| Cotherix, Inc. * (a) | 1,785 | | 12,192 |
| Cytokinetics, Inc. * | 2,468 | | 16,832 |
| deCODE genetics, Inc. * (a) | 5,910 | | 33,332 |
| Digene Corp. * | 1,642 | | 68,389 |
| Exelixis, Inc. * | 7,897 | | 76,838 |
| Genitope Corp. * (a) | 2,518 | | 7,327 |
| Genomic Health, Inc. * | 1,386 | | 19,626 |
| Genta, Inc. * (a) | 13,804 | | 21,120 |
| Geron Corp. * (a) | 6,197 | | 43,503 |
| Human Genome Sciences, Inc. * (a) | 12,311 | | 138,252 |
| ICOS Corp. * (a) | 6,163 | | 151,486 |
| Integra LifeSciences Holdings Corp. * | 1,840 | | 70,766 |
| Intermune, Inc. * (a) | 2,462 | | 42,445 |
| Keryx Biopharmaceuticals, Inc. * (a) | 4,090 | | 56,156 |
| Lexicon Genetics, Inc. * (a) | 6,564 | | 27,437 |
| Martek Biosciences Corp. * (a) | 3,009 | | 90,481 |
| Medarex, Inc. * | 11,502 | | 123,531 |
| Metabasis Therapeutics, Inc. * | 2,432 | | 14,324 |
| MGI Pharma, Inc. * (a) | 7,368 | | 111,478 |
| Momenta Pharmaceuticals, Inc. * | 2,063 | | 32,740 |
| Monogram Biosciences, Inc. * (a) | 13,591 | | 24,464 |
| Myogen, Inc. * (a) | 3,987 | | 138,748 |
| Myriad Genetics, Inc. * (a) | 3,716 | | 93,978 |
| Nabi Biopharmaceuticals * (a) | 5,784 | | 34,299 |
| Nektar Therapeutics * (a) | 8,435 | | 147,781 |
| Neurocrine Biosciences, Inc. * | 3,541 | | 41,040 |
| Panacos Pharmaceuticals, Inc. * | 5,100 | | 28,815 |
| PRA International * (a) | 1,704 | | 44,270 |
| Progenics Pharmaceuticals, Inc. * | 2,108 | | 47,725 |
| Sangamo Biosciences, Inc. * (a) | 2,747 | | 15,191 |
| Sirna Therapeutics, Inc. * (a) | 4,089 | | 23,103 |
| Solexa, Inc. * | 2,438 | | 21,211 |
| Tanox, Inc. * (a) | 2,313 | | 34,718 |
| Telik, Inc. * (a) | 4,922 | | 87,759 |
| Trimeris, Inc. * | 2,008 | | 18,735 |
|
|
| | | | 2,484,330 |
| Broadcasting - 0.66% | | | |
| Acacia Research - Acacia Technologies * | 2,765 | | 29,751 |
| Small Cap Index Fund (continued) | | |
| | Shares or | | |
| | Principal | | |
| | Amount | | Value |
|
|
| |
| COMMON STOCKS (continued) | | | |
| Broadcasting (continued) | | | |
| Belo Corp., Class A | 8,560 | $ | 139,528 |
| Citadel Broadcasting Corp. | 3,509 | | 32,248 |
| CKX, Inc. * (a) | 4,789 | | 47,746 |
| Cox Radio, Inc., Class A * | 4,433 | | 70,307 |
| Cumulus Media, Inc., Class A * (a) | 3,792 | | 38,072 |
| Emmis Communications Corp., Class A * | 3,180 | | 38,891 |
| Entercom Communications Corp. | 3,037 | | 77,170 |
| Entravision Communications Corp., Class A * | 6,516 | | 48,414 |
| Gray Television, Inc. | 4,582 | | 29,279 |
| Journal Communications, Inc. | 4,385 | | 48,103 |
| Mediacom Communications Corp., Class A * | 5,472 | | 37,429 |
| Radio One, Inc., Class D * | 7,328 | | 44,994 |
| Sinclair Broadcast Group, Inc., Class A | 4,741 | | 36,601 |
| Spanish Broadcasting System, Inc., Class A * (a) | 5,083 | | 22,111 |
| Westwood One, Inc. | 6,689 | | 49,030 |
| World Wrestling Entertainment, Inc., Class A | 2,270 | | 39,226 |
|
|
| | | | 828,900 |
| Building Materials & Construction - 0.83% | | | |
| Apogee Enterprises, Inc. | 2,909 | | 43,664 |
| Beacon Roofing Supply, Inc. * (a) | 4,172 | | 76,681 |
| Builders FirstSource, Inc. * | 1,514 | | 23,013 |
| Dycom Industries, Inc. * | 3,809 | | 77,132 |
| ElkCorp (a) | 1,974 | | 55,608 |
| EMCOR Group, Inc. * | 2,967 | | 164,491 |
| Griffon Corp. * (a) | 2,838 | | 67,147 |
| Home Solutions of America, Inc. * (a) | 3,815 | | 20,181 |
| Infrasource Services, Inc. * (a) | 2,535 | | 43,830 |
| Interline Brands, Inc. * | 2,629 | | 65,830 |
| Levitt Corp., Class A (a) | 1,732 | | 21,425 |
| LSI Industries, Inc. | 2,116 | | 38,786 |
| NCI Building Systems, Inc. * (a) | 1,933 | | 105,039 |
| Perini Corp. * | 2,113 | | 50,649 |
| Sterling Construction Company, Inc. * | 921 | | 18,190 |
| Trex Company, Inc. * (a) | 1,165 | | 31,373 |
| U.S. Concrete, Inc. * | 3,485 | | 21,363 |
| WCI Commmunities, Inc. * (a) | 3,144 | | 48,543 |
| Williams Scotsman International, Inc. * (a) | 2,842 | | 59,654 |
|
|
| | | | 1,032,599 |
| Business Services - 4.85% | | | |
| ABM Industries, Inc. (a) | 4,293 | | 77,231 |
| Administaff, Inc. | 2,163 | | 74,732 |
| ADVO, Inc. | 2,995 | | 85,627 |
| AMERCO, Inc. * (a) | 979 | | 69,382 |
| Arbitron, Inc. | 2,857 | | 107,195 |
| Banta Corp. | 2,306 | | 108,497 |
| BearingPoint, Inc. * (a) | 17,391 | | 145,389 |
| Black Box Corp. | 1,659 | | 63,938 |
| Bowne & Company, Inc. | 3,251 | | 50,130 |
| Bright Horizons Family Solutions, Inc. * | 2,664 | | 106,294 |
| Catalina Marketing Corp. | 4,365 | | 125,057 |
| CDI Corp. (a) | 1,308 | | 27,403 |
The accompanying notes are an integral part of the financial statements. 329
John Hancock Funds II
Portfolio of investments — August 31, 2006
(showing percentage of total net assets) |
| Small Cap Index Fund (continued) | | |
| | Shares or | | |
| | Principal | | |
| | Amount | | Value |
|
|
| |
| COMMON STOCKS (continued) | | | |
| Business Services (continued) | | | |
| Clark, Inc. | 2,002 | $ | 25,846 |
| Coinstar, Inc. * | 2,667 | | 70,009 |
| Compass Diversified Trust (a) | 1,577 | | 23,198 |
| Compucredit Corp. * (a) | 1,982 | | 57,775 |
| COMSYS IT Partners, Inc. * (a) | 1,693 | | 31,236 |
| Cornell Corrections, Inc. * (a) | 1,355 | | 23,902 |
| CoStar Group, Inc. * | 1,602 | | 64,529 |
| CRA International, Inc. * | 1,135 | | 51,064 |
| CSG Systems International, Inc. * | 4,517 | | 121,598 |
| Deluxe Corp. | 4,857 | | 87,037 |
| Diamond Management & Technology | | | |
| Consultants, Inc. * | 3,001 | | 27,939 |
| eFunds Corp. * | 4,435 | | 102,981 |
| Electro Rent Corp. * | 2,036 | | 32,800 |
| Ennis Business Forms, Inc. | 2,734 | | 56,457 |
| Euronet Worldwide, Inc. * (a) | 3,325 | | 80,798 |
| Exponent, Inc. * | 1,858 | | 28,539 |
| Ezcorp, Inc., Class A * | 1,142 | | 44,846 |
| First Consulting Group * | 2,533 | | 22,746 |
| Forrester Research, Inc. * | 1,366 | | 40,324 |
| FTI Consulting, Inc. * | 3,782 | | 84,490 |
| Gartner Group, Inc., Class A * | 5,342 | | 83,282 |
| Geo Group, Inc. * | 1,260 | | 56,284 |
| Gevity HR, Inc. (a) | 2,519 | | 64,763 |
| Global Cash Access, Inc. * | 3,184 | | 49,129 |
| GSI Commerce, Inc. * (a) | 3,764 | | 49,384 |
| Healthcare Services Group, Inc. | 2,761 | | 62,647 |
| Heidrick & Struggles International, Inc. * | 1,784 | | 63,439 |
| Hudson Highland Group, Inc. * (a) | 2,479 | | 24,840 |
| Huron Consulting Group, Inc. * | 1,681 | | 63,475 |
| ICT Group, Inc. * | 729 | | 21,105 |
| Infocrossing, Inc. * (a) | 1,998 | | 23,936 |
| Informatica Corp. * | 8,147 | | 119,272 |
| Insight Enterprises, Inc. * | 4,674 | | 84,179 |
| Intervoice Brite, Inc. * | 4,082 | | 29,023 |
| Jackson Hewitt Tax Service, Inc. | 3,370 | | 106,492 |
| John H. Harland Company | 2,596 | | 96,987 |
| Kanbay International, Inc. * | 3,195 | | 59,139 |
| Kelly Services, Inc., Class A | 2,037 | | 55,630 |
| Kendle International, Inc. * | 1,193 | | 31,519 |
| Kenexa Corp. * | 1,515 | | 38,723 |
| Kforce, Inc. * | 2,870 | | 35,330 |
| Korn/Ferry International * | 4,031 | | 82,313 |
| Labor Ready, Inc. * | 5,165 | | 88,476 |
| LECG Corp. * | 2,436 | | 41,290 |
| Lightbridge, Inc. * | 2,746 | | 32,677 |
| MAXIMUS, Inc. | 2,024 | | 53,879 |
| McGrath Rentcorp | 2,160 | | 49,248 |
| MPS Group, Inc. * | 9,740 | | 136,944 |
| Navigant Consulting Company * | 4,031 | | 79,370 |
| NCO Group, Inc. * | 3,067 | | 80,355 |
| Net 1 UEPS Technologies, Inc. * (a) | 4,566 | | 110,862 |
| Small Cap Index Fund (continued) | | |
| | Shares or | | |
| | Principal | | |
| | Amount | | Value |
|
|
| |
| COMMON STOCKS (continued) | | | |
| Business Services (continued) | | | |
| On Assignment, Inc. * | 2,764 | $ | 26,341 |
| Paxar Corp. * | 4,008 | | 78,036 |
| Perot Systems Corp., Class A * | 8,139 | | 116,876 |
| PHH Corp. * | 5,022 | | 126,102 |
| Pre-Paid Legal Services, Inc. (a) | 990 | | 37,184 |
| Quest Software, Inc. * | 6,295 | | 87,689 |
| Resource America, Inc. | 1,741 | | 35,865 |
| Resources Connection, Inc. * | 4,557 | | 111,191 |
| Rewards Network, Inc. * (a) | 2,773 | | 12,063 |
| Rollins, Inc. | 2,869 | | 60,938 |
| Scansource, Inc. * | 2,458 | | 76,296 |
| Sirva, Inc. * (a) | 5,092 | | 15,429 |
| SITEL Corp. * | 6,592 | | 19,776 |
| Sonicwall, Inc. * | 6,131 | | 62,904 |
| Sotheby's Holdings, Inc., Class A | 5,736 | | 159,461 |
| Source Interlink Companies * (a) | 3,347 | | 36,984 |
| Spherion Corp. * | 5,555 | | 41,496 |
| SRA International, Inc., Class A * | 3,610 | | 101,116 |
| StarTek, Inc. | 1,334 | | 15,168 |
| TALX Corp. | 3,044 | | 75,187 |
| Teletech Holdings, Inc. * | 3,120 | | 47,112 |
| Tetra Tech, Inc. * | 5,452 | | 90,503 |
| The BISYS Group, Inc. * | 11,379 | | 117,090 |
| Tyler Technologies, Inc. * (a) | 3,878 | | 50,724 |
| Viad Corp. | 2,115 | | 74,934 |
| Volt Information Sciences, Inc. * (a) | 821 | | 35,007 |
| Watson Wyatt Worldwide, Inc., Class A | 4,010 | | 159,037 |
| Wind River Systems, Inc. * | 7,144 | | 72,654 |
| Wireless Facilities, Inc. * (a) | 6,656 | | 14,577 |
| Zhone Technologies, Inc. * (a) | 11,755 | | 19,043 |
|
|
| | | | 6,069,764 |
| Cable and Television - 0.35% | | | |
| Charter Communications, Inc., Class A * (a) | 37,503 | | 52,129 |
| Gemstar-TV Guide International, Inc. * | 23,479 | | 75,367 |
| Lin TV Corp. * | 3,216 | | 23,477 |
| LodgeNet Entertainment Corp. * | 1,739 | | 33,058 |
| Superior Essex, Inc. * | 1,931 | | 68,956 |
| Time Warner Telecom, Inc., Class A * (a) | 7,211 | | 129,582 |
| TiVo, Inc. * (a) | 7,283 | | 60,085 |
|
|
| | | | 442,654 |
| Cellular Communications - 0.41% | | �� | |
| Brightpoint, Inc. * | 4,778 | | 79,506 |
| Dobson Communications Corp., Class A * | 14,071 | | 96,668 |
| iPCS, Inc. * | 1,603 | | 83,228 |
| Novatel Wireless, Inc * (a) | 2,866 | | 31,956 |
| RF Micro Devices, Inc. * (a) | 18,017 | | 119,272 |
| Syniverse Holdings, Inc. * | 2,260 | | 37,855 |
| USA Mobility, Inc. * (a) | 2,682 | | 61,284 |
|
|
| | | | 509,769 |
| Chemicals - 1.60% | | | |
| A. Schulman, Inc. | 2,526 | | 59,588 |
The accompanying notes are an integral part of the financial statements. 330
John Hancock Funds II
Portfolio of investments — August 31, 2006
(showing percentage of total net assets) |
| Small Cap Index Fund (continued) | | |
| | Shares or | | |
| | Principal | | |
| | Amount | | Value |
|
|
| |
| COMMON STOCKS (continued) | | | |
| Chemicals (continued) | | | |
| Albany Molecular Research, Inc. * | 2,635 | $ | 25,823 |
| American Vanguard Corp. (a) | 1,791 | | 26,955 |
| Arch Chemicals, Inc. | 2,294 | | 63,636 |
| Balchem Corp. | 1,380 | | 27,476 |
| Cabot Microelectronics Corp. * | 2,328 | | 73,192 |
| Calgon Carbon Corp. * (a) | 4,334 | | 20,240 |
| Cambrex Corp. | 2,558 | | 57,683 |
| CF Industries Holdings, Inc. | 5,144 | | 81,584 |
| Ferro Corp. | 4,050 | | 69,174 |
| Georgia Gulf Corp. | 3,238 | | 85,937 |
| H.B. Fuller Company | 5,554 | | 106,803 |
| Hercules, Inc. * | 10,743 | | 167,591 |
| Innospec, Inc. | 1,313 | | 36,016 |
| MacDermid, Inc. | 2,692 | | 77,126 |
| Minerals Technologies, Inc. | 1,886 | | 98,053 |
| Newmarket Corp. | 1,630 | | 100,946 |
| Olin Corp. | 6,850 | | 102,955 |
| OM Group, Inc. * | 2,774 | | 110,960 |
| Omnova Solutions, Inc. * | 4,637 | | 26,060 |
| Pioneer Companies, Inc. * | 1,246 | | 30,353 |
| PolyOne Corp. * | 8,799 | | 76,287 |
| Rockwood Holdings, Inc. * | 3,339 | | 70,052 |
| Sensient Technologies Corp. | 4,546 | | 91,465 |
| Terra Industries, Inc. * (a) | 8,953 | | 65,715 |
| Tronox, Inc. | 3,995 | | 51,535 |
| UAP Holding Corp. | 4,854 | | 101,109 |
| W. R. Grace & Company * (a) | 6,424 | | 65,525 |
| Zoltek Companies, Inc. * (a) | 1,366 | | 34,901 |
|
|
| | | | 2,004,740 |
| Coal - 0.09% | | | |
| International Coal Group, Inc. * (a) | 10,739 | | 67,011 |
| James River Coal Company * (a) | 1,637 | | 24,113 |
| Westmoreland Coal Company * (a) | 847 | | 19,261 |
|
|
| | | | 110,385 |
| Colleges & Universities - 0.18% | | | |
| Corinthian Colleges, Inc. * | 8,245 | | 99,930 |
| DeVry, Inc. * | 5,786 | | 129,317 |
|
|
| | | | 229,247 |
| Commercial Services - 0.65% | | | |
| CBIZ, Inc. * (a) | 5,936 | | 46,301 |
| Cenveo, Inc. * | 5,062 | | 106,302 |
| Chemed Corp. | 2,482 | | 97,816 |
| Coinmach Service Corp. | 3,000 | | 29,700 |
| Color Kinetics, Inc. * (a) | 1,387 | | 23,094 |
| DynCorp International, Inc. * | 2,508 | | 27,287 |
| Live Nation, Inc. * | 5,987 | | 125,607 |
| Medifast, Inc. * (a) | 1,276 | | 15,159 |
| Morningstar, Inc. * (a) | 1,341 | | 51,307 |
| PeopleSupport, Inc. * | 1,970 | | 33,470 |
| Perficient, Inc. * (a) | 1,837 | | 24,799 |
| Providence Service Corp. * (a) | 1,344 | | 32,014 |
| Small Cap Index Fund (continued) | | |
| | Shares or | | |
| | Principal | | |
| | Amount | | Value |
|
|
| |
| COMMON STOCKS (continued) | | | |
| Commercial Services (continued) | | | |
| TNS, Inc. * (a) | 2,349 | $ | 37,255 |
| Vertrue, Inc. * (a) | 784 | | 33,234 |
| Waste Services, Inc. * (a) | 2,831 | | 27,404 |
| Wright Express Corp. * | 3,862 | | 103,888 |
|
|
| | | | 814,637 |
| Computers & Business Equipment - 3.37% | | | |
| 3Com Corp. * | 36,857 | | 163,277 |
| 3D Systems Corp. * (a) | 1,443 | | 23,261 |
| ADE Corp. * | 1,013 | | 32,588 |
| Agilysys, Inc. | 2,931 | | 39,627 |
| Avanex Corp. * (a) | 16,012 | | 28,181 |
| Avocent Corp. * | 4,629 | | 139,935 |
| Benchmark Electronics, Inc. * | 6,008 | | 149,840 |
| Blue Coat Systems, Inc. * (a) | 1,497 | | 25,464 |
| Brocade Communications Systems, Inc. * | 25,767 | | 159,755 |
| CACI International, Inc., Class A * | 2,863 | | 151,911 |
| CalAmp Corp. * | 2,208 | | 14,860 |
| Cogent, Inc. * (a) | 4,051 | | 57,848 |
| Digi International, Inc. * | 2,429 | | 32,209 |
| Echelon Corp. * (a) | 3,208 | | 28,262 |
| Electronics for Imaging, Inc. * | 5,477 | | 126,190 |
| EMS Technologies, Inc. * | 1,642 | | 30,016 |
| Extreme Networks, Inc. * | 11,444 | | 42,228 |
| Falconstor Software, Inc. * (a) | 3,861 | | 27,336 |
| FileNET Corp. * | 3,998 | | 139,690 |
| Foundry Networks, Inc. * | 13,766 | | 167,532 |
| Gateway, Inc. * (a) | 26,478 | | 52,956 |
| Gerber Scientific, Inc. * | 2,299 | | 35,451 |
| Henry, Jack & Associates, Inc. | 7,505 | | 143,796 |
| Hypercom Corp. * | 5,123 | | 47,849 |
| IHS, Inc., Class A * | 2,192 | | 65,782 |
| InPhonic, Inc. * (a) | 2,709 | | 19,180 |
| Intergraph Corp. * | 2,781 | | 103,898 |
| Intermec, Inc. * (a) | 4,750 | | 142,310 |
| Internap Network Services Corp. * (a) | 2,929 | | 35,002 |
| Ixia * | 4,066 | | 40,863 |
| Komag, Inc. * (a) | 2,906 | | 104,500 |
| Kronos, Inc. * | 3,029 | | 92,445 |
| L-1 Identity Solutions, Inc. * (a) | 6,268 | | 94,587 |
| Merge Technologies, Inc. * (a) | 2,201 | | 16,309 |
| Micros Systems, Inc. * | 3,687 | | 176,460 |
| Mindspeed Technologies, Inc. * (a) | 11,362 | | 21,701 |
| Mobility Electronics, Inc. * (a) | 2,711 | | 17,594 |
| MTS Systems Corp. | 1,776 | | 59,620 |
| Ness Technologies, Inc. * | 2,782 | | 32,160 |
| Netscout Systems, Inc. * | 2,849 | | 20,142 |
| Palm, Inc. * (a) | 8,602 | | 125,245 |
| Parametric Technology Corp. * | 10,515 | | 169,397 |
| Pegasus Wireless Corp. * | 5,195 | | 17,819 |
| Plexus Corp. * | 4,314 | | 85,503 |
| Quantum Corp. * | 18,195 | | 40,211 |
The accompanying notes are an integral part of the financial statements. 331
John Hancock Funds II
Portfolio of investments — August 31, 2006
(showing percentage of total net assets) |
| Small Cap Index Fund (continued) | | |
| | Shares or | | |
| | Principal | | |
| | Amount | | Value |
|
|
| |
| COMMON STOCKS (continued) | | | |
| Computers & Business Equipment | | | |
| (continued) | | | |
| Rackable Systems, Inc. * (a) | 2,618 | $ | 72,676 |
| Radiant Systems, Inc. * | 2,721 | | 30,094 |
| RadiSys Corp. * (a) | 2,065 | | 48,879 |
| SI International, Inc. * | 1,294 | | 37,384 |
| Sigma Designs * (a) | 2,377 | | 33,207 |
| Silicon Storage Technology, Inc. * | 8,714 | | 36,599 |
| Sonic Solutions * (a) | 2,492 | | 37,405 |
| Standard Microsystems Corp. * | 2,104 | | 59,059 |
| Stratasys, Inc. * (a) | 1,066 | | 25,467 |
| Sybase, Inc. * | 8,495 | | 195,980 |
| Sykes Enterprises, Inc. * | 2,809 | | 56,489 |
| Synaptics, Inc. * (a) | 2,411 | | 60,974 |
| Transmeta Corp. * (a) | 19,612 | | 23,142 |
| Trident Microsystems, Inc. * (a) | 5,396 | | 111,319 |
| Witness Systems, Inc. * | 3,205 | | 52,081 |
|
|
| | | | 4,221,545 |
| Construction & Mining Equipment - 0.45% | | | |
| A.S.V., Inc. * (a) | 1,995 | | 30,663 |
| Astec Industries, Inc. * | 1,608 | | 37,933 |
| Bucyrus International, Inc., Class A | 2,964 | | 153,031 |
| Carbo Ceramics, Inc. (a) | 1,912 | | 76,365 |
| Kaman Corp., Class A | 2,400 | | 42,984 |
| Layne Christensen Company * (a) | 1,207 | | 36,596 |
| Matrix Service Company * (a) | 2,250 | | 29,678 |
| Washington Group International, Inc. * | 2,727 | | 161,466 |
|
|
| | | | 568,716 |
| Construction Materials - 0.72% | | | |
| Ameron International Corp. | 851 | | 59,689 |
| Applied Industrial Technologies, Inc. | 4,258 | | 96,273 |
| Clarcor, Inc. | 4,917 | | 147,264 |
| Columbus McKinnon Corp. * | 1,781 | | 32,931 |
| Comfort Systems USA, Inc. | 3,872 | | 50,452 |
| Granite Construction, Inc. | 3,262 | | 175,006 |
| Regal-Beloit Corp. | 2,916 | | 125,855 |
| Simpson Manufacturing, Inc. (a) | 3,489 | | 91,935 |
| Standex International Corp. | 1,348 | | 39,699 |
| Universal Forest Products, Inc. | 1,587 | | 77,382 |
|
|
| | | | 896,486 |
| Containers & Glass - 0.38% | | | |
| Graphic Packaging Corp. * (a) | 7,244 | | 28,107 |
| Greif, Inc., Class A | 1,567 | | 111,022 |
| Interpool, Inc. | 1,283 | | 27,841 |
| Longview Fibre Company | 4,833 | | 100,720 |
| Mobile Mini, Inc. * | 3,383 | | 91,070 |
| Silgan Holdings, Inc. | 2,256 | | 79,862 |
| TAL International Group, Inc. * | 1,584 | | 37,161 |
|
|
| | | | 475,783 |
| Cosmetics & Toiletries - 0.23% | | | |
| Chattem, Inc. * (a) | 1,664 | | 57,708 |
| Elizabeth Arden, Inc. * | 2,594 | | 37,691 |
| Small Cap Index Fund (continued) | | |
| | Shares or | | |
| | Principal | | |
| | Amount | | Value |
|
|
| |
| COMMON STOCKS (continued) | | | |
| Cosmetics & Toiletries (continued) | | | |
| Nu Skin Enterprises, Inc., Class A | 5,519 | $ | 95,589 |
| Playtex Products, Inc. * | 5,434 | | 71,457 |
| Revlon, Inc., Class A * (a) | 16,035 | | 20,845 |
|
|
| | | | 283,290 |
| Crude Petroleum & Natural Gas - 0.93% | | | |
| Allis-Chalmers Energy, Inc. * | 1,306 | | 24,096 |
| Arena Resources, Inc. * (a) | 1,100 | | 42,460 |
| Bill Barrett Corp. * (a) | 2,682 | | 77,563 |
| Bois d'Arc Energy, Inc. * (a) | 1,717 | | 28,142 |
| Complete Production Services, Inc. * | 2,507 | | 55,655 |
| Edge Petroleum Corp. * | 1,824 | | 34,419 |
| EXCO Resources, Inc. * | 4,972 | | 66,426 |
| Gasco Energy, Inc. * (a) | 7,679 | | 22,423 |
| GMX Resources, Inc. * (a) | 820 | | 26,125 |
| Goodrich Petroleum Corp. * (a) | 1,241 | | 39,315 |
| Harvest Natural Resources, Inc. * (a) | 3,754 | | 48,014 |
| Hydril * | 1,713 | | 112,116 |
| Parallel Petroleum Corp. * (a) | 3,366 | | 80,717 |
| Penn Virginia Corp. | 1,807 | | 128,279 |
| Petroquest Energy, Inc. * | 4,016 | | 48,312 |
| Quest Resource Corp. * (a) | 2,194 | | 25,867 |
| SulphCo, Inc. * (a) | 3,473 | | 23,165 |
| Swift Energy Company * | 2,776 | | 121,478 |
| Toreador Resources Corp. * (a) | 1,276 | | 26,936 |
| Transmeridian Exploration, Inc. * (a) | 6,885 | | 35,113 |
| Vaalco Energy, Inc. * (a) | 5,613 | | 46,139 |
| Western Refining, Inc. | 2,225 | | 52,443 |
|
|
| | | | 1,165,203 |
| Domestic Oil - 1.45% | | | |
| Atlas America, Inc. * | 1,700 | | 78,183 |
| Berry Petroleum Company, Class A (a) | 3,415 | | 106,651 |
| Brigham Exploration Company * | 4,630 | | 32,549 |
| Carrizo Oil & Gas, Inc. * (a) | 2,043 | | 56,918 |
| Comstock Resources, Inc. * | 4,123 | | 118,578 |
| Delta Petroleum Corp. * (a) | 5,086 | | 106,297 |
| Encore Aquisition Company * | 5,026 | | 135,953 |
| Energy Partners, Ltd. * (a) | 3,675 | | 91,691 |
| Exploration Company * (a) | 2,947 | | 34,568 |
| GeoGlobal Resources, Inc. * (a) | 3,324 | | 17,983 |
| Giant Industries, Inc. * | 1,405 | | 114,789 |
| Houston Exploration Company * | 2,763 | | 177,247 |
| Mariner Energy, Inc. * | 6,992 | | 132,149 |
| McMoran Exploration Company * (a) | 2,493 | | 46,370 |
| Meridian Resource Corp. * | 8,901 | | 29,907 |
| Oil States International, Inc. * | 4,689 | | 149,860 |
| Stone Energy Corp. * | 2,594 | | 114,577 |
| Syntroleum Corp. * (a) | 4,148 | | 19,827 |
| Union Drilling, Inc. * | 1,576 | | 22,458 |
| Warren Resources, Inc. * (a) | 5,123 | | 74,130 |
| Whiting Petroleum Corp. * | 3,506 | | 157,770 |
|
|
| | | | 1,818,455 |
The accompanying notes are an integral part of the financial statements. 332
John Hancock Funds II
Portfolio of investments — August 31, 2006
(showing percentage of total net assets) |
| Small Cap Index Fund (continued) | | |
| | Shares or | | |
| | Principal | | |
| | Amount | | Value |
|
|
| |
| COMMON STOCKS (continued) | | | |
| Drugs & Health Care - 2.18% | | | |
| Abaxis, Inc. * (a) | 1,930 | $ | 46,359 |
| Abiomed, Inc. * (a) | 2,367 | | 35,316 |
| Acadia Pharmaceuticals, Inc. * (a) | 2,574 | | 22,291 |
| Alpharma Inc., Class A | 3,994 | | 83,634 |
| Ariad Pharmaceuticals, Inc. * (a) | 6,239 | | 29,635 |
| Arrow International, Inc. | 2,177 | | 70,339 |
| Bioenvision, Inc. * (a) | 3,838 | | 23,220 |
| Biomarin Pharmaceutical, Inc. * | 8,097 | | 134,734 |
| Candela Corp. * | 2,325 | | 24,250 |
| Cell Genesys, Inc. * (a) | 4,809 | | 23,997 |
| CNS, Inc. | 1,328 | | 37,450 |
| Conmed Corp. * | 2,704 | | 55,405 |
| Conor Medsystems, Inc. * (a) | 2,574 | | 69,498 |
| CV Therapeutics, Inc. * (a) | 4,229 | | 47,576 |
| Datascope Corp. | 1,313 | | 43,237 |
| Dendreon Corp. * (a) | 6,971 | | 33,670 |
| Depome, Inc. * (a) | 4,204 | | 20,305 |
| Diversa Corp. * | 2,997 | | 27,572 |
| Durect Corp. * | 5,760 | | 20,966 |
| Emisphere Technologies, Inc. * (a) | 2,513 | | 20,783 |
| Enzon Pharmaceuticals, Inc. * (a) | 4,290 | | 35,092 |
| Gentiva Health Services, Inc. * | 2,734 | | 49,403 |
| Healthextras, Inc. * | 2,619 | | 80,482 |
| I-Flow Corp. * (a) | 2,431 | | 29,318 |
| Illumina, Inc. * | 3,939 | | 132,666 |
| Immucor, Inc. * | 6,448 | | 133,925 |
| Invacare Corp. | 2,946 | | 68,377 |
| K-V Pharmaceutical Company, Class A * | 3,663 | | 81,795 |
| Landauer, Inc. | 969 | | 46,434 |
| Luminex Corp. * (a) | 3,063 | | 58,228 |
| Mannatech, Inc. (a) | 1,655 | | 23,964 |
| Matria Healthcare, Inc. * (a) | 1,993 | | 53,811 |
| Maxygen, Inc. * (a) | 3,205 | | 26,473 |
| Medical Action, Inc. * | 1,150 | | 28,106 |
| Mentor Corp. (a) | 3,397 | | 164,890 |
| Meridian Bioscience, Inc. | 2,026 | | 48,340 |
| Molina Healthcare, Inc. * | 1,186 | | 43,929 |
| New River Pharmaceuticals, Inc. * (a) | 1,515 | | 39,511 |
| Northfield Laboratories, Inc. * (a) | 2,633 | | 28,542 |
| Option Care, Inc. (a) | 2,722 | | 35,985 |
| OraSure Technologies, Inc. * (a) | 4,439 | | 30,452 |
| Pain Therapeutics, Inc. * (a) | 3,498 | | 28,334 |
| Parexel International Corp. * | 2,588 | | 85,663 |
| Perrigo Company | 7,358 | | 118,758 |
| Quidel Corp. * (a) | 2,990 | | 34,206 |
| Res-Care, Inc. * | 2,230 | | 44,711 |
| Savient Pharmaceuticals, Inc. * | 6,125 | | 39,690 |
| Vital Signs, Inc. | 701 | | 38,029 |
| West Pharmaceutical Services, Inc. | 3,067 | | 122,404 |
| Xenoport, Inc. * | 1,930 | | 42,344 |
| Zymogenetics, Inc. * (a) | 3,502 | | 67,729 |
|
|
| | | | 2,731,828 |
| Small Cap Index Fund (continued) | | |
| | Shares or | | |
| | Principal | | |
| | Amount | | Value |
|
|
| |
| COMMON STOCKS (continued) | | | |
| Educational Services - 0.22% | | | |
| eCollege.com * (a) | 1,827 | $ | 22,691 |
| INVESTools, Inc. * | 4,435 | | 39,915 |
| Leapfrog Enterprises, Inc., Class A * | 3,454 | | 26,458 |
| Strayer Education, Inc. | 1,370 | | 144,398 |
| Universal Technical Institute, Inc. * | 2,236 | | 41,254 |
|
|
| | | | 274,716 |
| Electrical Equipment - 1.69% | | | |
| A.O. Smith Corp. | 1,935 | | 77,613 |
| Aaon, Inc. | 1,073 | | 26,085 |
| American Science & Engineering, Inc. * (a) | 874 | | 40,169 |
| Anaren, Inc. * | 1,741 | | 39,277 |
| Anixter International, Inc. * | 3,098 | | 168,810 |
| Audiovox Corp., Class A * | 1,834 | | 27,162 |
| Baldor Electric Company | 3,092 | | 91,554 |
| Capstone Turbine Corp. * (a) | 10,486 | | 20,028 |
| China BAK Battery, Inc. * (a) | 2,937 | | 18,797 |
| Cohu, Inc. | 2,229 | | 37,380 |
| DTS, Inc. * | 1,792 | | 32,937 |
| Encore Wire Corp. * (a) | 2,207 | | 82,895 |
| Excel Technology, Inc. * | 1,288 | | 37,713 |
| FLIR Systems, Inc. * (a) | 6,520 | | 180,604 |
| General Cable Corp. * | 4,763 | | 183,518 |
| Genlyte Group, Inc. * | 2,352 | | 154,127 |
| Greatbatch, Inc. * (a) | 2,089 | | 51,097 |
| Lamson & Sessions Company * | 1,346 | | 34,013 |
| Littelfuse, Inc. * | 2,137 | | 77,167 |
| Methode Electronics, Inc., Class A | 3,778 | | 29,997 |
| Metrologic Instruments, Inc. * (a) | 1,425 | | 22,999 |
| Plug Power, Inc. * (a) | 7,063 | | 33,479 |
| Power-One, Inc. * (a) | 6,732 | | 45,710 |
| Sirf Technology Holdings, Inc. * (a) | 4,836 | | 127,332 |
| Universal Electronics, Inc. * | 1,677 | | 30,169 |
| Varian, Inc. * | 2,932 | | 136,866 |
| Vicor Corp. (a) | 1,953 | | 24,530 |
| W.H. Brady Company, Class A | 4,256 | | 162,579 |
| Watsco, Inc. | 2,631 | | 115,606 |
|
|
| | | | 2,110,213 |
| Electrical Utilities - 1.56% | | | |
| Allete, Inc. | 2,395 | | 110,026 |
| Avista Corp. | 4,669 | | 113,177 |
| Black Hills Corp. | 3,196 | | 111,253 |
| CH Energy Group, Inc. (a) | 1,612 | | 79,181 |
| Cleco Corp. | 4,811 | | 120,083 |
| Duquesne Light Holdings, Inc. | 7,338 | | 144,485 |
| El Paso Electric Company * | 4,668 | | 111,612 |
| Empire District Electric Company | 3,004 | | 67,890 |
| IDACORP, Inc. | 4,040 | | 155,217 |
| ITC Holdings Corp. (a) | 1,434 | | 48,856 |
| MGE Energy, Inc. | 2,119 | | 71,220 |
| NorthWestern Corp. | 3,427 | | 119,397 |
| Otter Tail Corp. | 2,864 | | 86,350 |
The accompanying notes are an integral part of the financial statements. 333
John Hancock Funds II
Portfolio of investments — August 31, 2006
(showing percentage of total net assets) |
| Small Cap Index Fund (continued) | | |
| | Shares or | | |
| | Principal | | |
| | Amount | | Value |
|
|
| |
| COMMON STOCKS (continued) | | | |
| Electrical Utilities (continued) | | | |
| Pike Electric Corp. * | 1,603 | $ | 28,117 |
| PNM Resources, Inc. | 6,444 | | 184,749 |
| UIL Holding Corp. | 2,373 | | 86,709 |
| Unisource Energy Corp. | 3,377 | | 116,540 |
| Westar Energy, Inc. | 8,176 | | 199,413 |
|
|
| | | | 1,954,275 |
| Electronics - 1.98% | | | |
| Adaptec, Inc. * | 10,847 | | 44,690 |
| Anadigics, Inc. * (a) | 4,662 | | 34,778 |
| Analogic Corp. | 1,327 | | 75,413 |
| Ansoft Corp. * | 1,627 | | 39,113 |
| Bel Fuse, Inc., Class B (a) | 1,068 | | 39,484 |
| Belden CDT, Inc. | 4,003 | | 143,067 |
| Bookham, Inc * (a) | 5,955 | | 18,937 |
| Checkpoint Systems, Inc. * | 3,713 | | 67,391 |
| Comtech Group, Inc. * (a) | 1,511 | | 16,848 |
| CTS Corp. | 3,463 | | 50,906 |
| Cubic Corp. | 1,582 | | 31,846 |
| Daktronics, Inc. (a) | 3,699 | | 77,198 |
| Electro Scientific Industries, Inc. * | 2,808 | | 55,907 |
| Enersys * (a) | 4,445 | | 78,988 |
| FEI Company * (a) | 2,235 | | 46,399 |
| Franklin Electric, Inc. | 2,171 | | 104,664 |
| Hutchinson Technology, Inc. * (a) | 2,455 | | 50,671 |
| Identix, Inc. * (a) | 0 | | 0 |
| II-VI, Inc. * | 2,322 | | 48,925 |
| Imation Corp. | 3,275 | | 129,788 |
| Integrated Electrical Services, Inc. * (a) | 1,613 | | 26,421 |
| Itron, Inc. * | 2,391 | | 133,848 |
| Kemet Corp. * | 8,106 | | 66,712 |
| LoJack Corp. * | 1,866 | | 38,962 |
| Maxwell Technologies, Inc. * (a) | 1,506 | | 29,728 |
| Measurement Specialties, Inc. * (a) | 1,479 | | 29,787 |
| Medis Technologies, Ltd. * (a) | 1,949 | | 39,038 |
| Mentor Graphics Corp. * | 7,618 | | 110,461 |
| Mercury Computer Systems, Inc. * | 2,129 | | 26,442 |
| MoSys, Inc. * (a) | 2,706 | | 18,374 |
| Multi-Fineline Electronix, Inc. * (a) | 859 | | 19,396 |
| OSI Systems, Inc. * (a) | 1,547 | | 30,460 |
| Park Electrochemical Corp. | 1,937 | | 50,556 |
| Photon Dynamics, Inc. * | 1,826 | | 24,523 |
| Portalplayer, Inc. * | 2,420 | | 29,427 |
| Portland General Electric Company | 2,504 | | 63,852 |
| RAE Systems, Inc. * (a) | 4,641 | | 14,016 |
| Rogers Corp. * | 1,651 | | 95,791 |
| Supertex, Inc. * (a) | 1,167 | | 41,277 |
| Sycamore Networks, Inc. * | 17,160 | | 62,977 |
| Taser International, Inc. * (a) | 6,000 | | 46,620 |
| Technitrol, Inc. | 3,839 | | 108,682 |
| TTM Technologies, Inc. * | 3,996 | | 51,389 |
| Universal Display Corp. * (a) | 2,378 | | 25,231 |
| Small Cap Index Fund (continued) | | |
| | Shares or | | |
| | Principal | | |
| | Amount | | Value |
|
|
| |
| COMMON STOCKS (continued) | | | |
| Electronics (continued) | | | |
| X-Rite, Inc. | 3,045 | $ | 27,070 |
| Zoran Corp. * | 4,618 | | 82,293 |
| Zygo Corp. * | 1,854 | | 24,677 |
|
|
| | | | 2,473,023 |
| Energy - 0.70% | | | |
| Alon USA Energy, Inc. | 1,167 | | 40,927 |
| Evergreen Solar, Inc. * (a) | 6,288 | | 64,012 |
| Fuelcell Energy, Inc. * (a) | 5,021 | | 48,904 |
| Hanover Compressor Company * (a) | 9,662 | | 181,839 |
| Headwaters, Inc. * (a) | 3,972 | | 87,861 |
| KFx, Inc. * (a) | 6,711 | | 107,510 |
| New Jersey Resources Corp. | 2,749 | | 136,515 |
| Ormat Technologies, Inc. (a) | 780 | | 28,384 |
| Pacific Ethanol, Inc. * (a) | 2,386 | | 44,213 |
| Quantum Fuel Systems Technologies | | | |
| Worldwide, Inc. * (a) | 5,093 | | 15,126 |
| Rosetta Resources, Inc. * (a) | 4,847 | | 89,718 |
| SunPower Corp., Class A. * | 1,000 | | 32,060 |
|
|
| | | | 877,069 |
| Financial Services - 2.46% | | | |
| Accredited Home Lenders Holding Company * | 1,713 | | 54,696 |
| Ace Cash Express, Inc. * | 1,228 | | 36,361 |
| Advance America Cash Advance Centers, Inc. (a) | 6,444 | | 100,140 |
| Advanta Corp., Class B | 1,899 | | 64,300 |
| Asset Acceptance Capital Corp. * | 1,671 | | 24,714 |
| Asta Funding, Inc. (a) | 1,175 | | 38,834 |
| Bankrate, Inc. * (a) | 981 | | 27,880 |
| Calamos Asset Management, Inc. | 2,234 | | 58,575 |
| Cass Information Systems, Inc. (a) | 486 | | 25,797 |
| CharterMac (a) | 5,204 | | 104,757 |
| City Holding Company | 1,840 | | 72,459 |
| Cohen & Steers, Inc. (a) | 1,296 | | 37,079 |
| Commercial Capital Bancorp, Inc. | 4,726 | | 75,096 |
| Credit Acceptance Corp. * | 980 | | 27,871 |
| Delphi Financial Group, Inc. | 3,999 | | 155,481 |
| Dollar Financial Corp. * | 1,206 | | 23,023 |
| Federal Agricultural Mortgage Corp., Class C (a) | 1,215 | | 34,081 |
| Financial Federal Corp. | 2,648 | | 69,378 |
| Fremont General Corp. | 6,280 | | 89,678 |
| Friedman, Billings, Ramsey Group, Inc. | 13,830 | | 114,098 |
| GFI Group, Inc. * (a) | 1,135 | | 52,778 |
| Harbor Florida Bancshares, Inc. | 2,053 | | 90,927 |
| Heartland Payment Systems, Inc. (a) | 1,304 | | 35,221 |
| Interactive Data Corp. * | 3,344 | | 65,342 |
| International Securities Exchange, Inc. | 3,613 | | 153,733 |
| Investors Bancorp, Inc. * | 5,127 | | 73,675 |
| Investors Real Estate Trust, SBI (a) | 5,543 | | 53,047 |
| Knight Capital Group, Inc. * | 9,917 | | 173,151 |
| LaBranche & Company, Inc. * (a) | 5,030 | | 41,749 |
| MarketAxess Holdings, Inc. * | 3,378 | | 31,821 |
| Marlin Business Services Corp. * | 1,471 | | 32,877 |
The accompanying notes are an integral part of the financial statements. 334
John Hancock Funds II
Portfolio of investments �� August 31, 2006
(showing percentage of total net assets) |
| Small Cap Index Fund (continued) | | |
| | Shares or | | |
| | Principal | | |
| | Amount | | Value |
|
|
| |
| COMMON STOCKS (continued) | | | |
| Financial Services (continued) | | | |
| National Financial Partners Corp. | 3,535 | $ | 130,159 |
| NBT Bancorp, Inc. (a) | 3,409 | | 79,702 |
| Ocwen Financial Corp. * (a) | 3,339 | | 49,250 |
| optionsXpress Holdings, Inc. | 1,953 | | 51,012 |
| Piper Jaffray Companies, Inc. * | 1,974 | | 115,637 |
| Portfolio Recovery Associates, Inc. * (a) | 1,549 | | 61,526 |
| Stifel Financial Corp. * (a) | 1,251 | | 39,994 |
| SWS Group, Inc. | 1,615 | | 39,729 |
| UMB Financial Corp. | 3,062 | | 106,772 |
| United Community Financial Corp. | 3,231 | | 41,066 |
| United Panam Financial Corp. * | 1,105 | | 18,862 |
| Waddell & Reed Financial, Inc., Class A | 8,053 | | 186,991 |
| World Acceptance Corp. * | 1,787 | | 71,426 |
| WSFS Financial Corp. | 745 | | 47,121 |
|
|
| | | | 3,077,866 |
| Food & Beverages - 1.38% | | | |
| Bob Evans Farms, Inc. | 3,437 | | 97,405 |
| Buffalo Wild Wings, Inc. * (a) | 773 | | 26,939 |
| Chiquita Brands International, Inc. | 4,010 | | 67,809 |
| Coca-Cola Bottling Company | 558 | | 32,699 |
| Cosi, Inc. * (a) | 3,750 | | 19,650 |
| Denny's Corp. * | 9,368 | | 31,476 |
| Diamond Foods, Inc. (a) | 1,691 | | 25,247 |
| Domino's Pizza, Inc. | 3,559 | | 87,018 |
| Fisher Communications, Inc. * | 915 | | 39,253 |
| Flowers Foods, Inc. | 4,969 | | 134,908 |
| Gold Kist, Inc. * | 4,934 | | 99,469 |
| Hain Celestial Group, Inc. * | 2,987 | | 70,344 |
| Imperial Sugar Company (a) | 1,158 | | 35,620 |
| J & J Snack Foods Corp. | 1,413 | | 44,750 |
| Jones Soda Company * (a) | 2,601 | | 19,794 |
| Lance, Inc. | 2,995 | | 68,316 |
| MGP Ingredients, Inc. | 983 | | 23,680 |
| Nuco2, Inc. * (a) | 1,583 | | 43,137 |
| Peets Coffee & Tea, Inc. * (a) | 1,457 | | 36,731 |
| Performance Food Group Company * (a) | 3,338 | | 82,148 |
| Pilgrim's Pride Corp. | 3,800 | | 92,568 |
| Premium Standard Farms, Inc. | 1,513 | | 25,600 |
| Ralcorp Holdings, Inc. * | 2,556 | | 126,445 |
| Ruth's Chris Steak House, Inc. * (a) | 1,758 | | 34,949 |
| Sanderson Farms, Inc. (a) | 1,645 | | 51,423 |
| Seabord Corp. (a) | 34 | | 47,600 |
| Spartan Stores, Inc. | 2,274 | | 41,000 |
| The Steak & Shake Company * | 2,793 | | 44,884 |
| Tootsie Roll Industries, Inc. | 3,445 | | 99,939 |
| TreeHouse Foods, Inc. * | 3,017 | | 76,934 |
|
|
| | | | 1,727,735 |
| Forest Products - 0.06% | | | |
| Caraustar Industries, Inc. * | 3,166 | | 23,967 |
| Deltic Timber Corp. | 1,003 | | 47,572 |
|
|
| | | | 71,539 |
| Small Cap Index Fund (continued) | | |
| | Shares or | | |
| | Principal | | |
| | Amount | | Value |
|
|
| |
| COMMON STOCKS (continued) | | | |
| Funeral Services - 0.11% | | | |
| Alderwoods Group, Inc. * | 3,974 | $ | 78,645 |
| Stewart Enterprises, Inc., Class A | 10,241 | | 59,193 |
|
|
| | | | 137,838 |
| Furniture & Fixtures - 0.31% | | | |
| American Woodmark Corp. (a) | 1,165 | | 36,732 |
| Ethan Allen Interiors, Inc. (a) | 3,090 | | 104,288 |
| Furniture Brands International, Inc. (a) | 4,152 | | 79,511 |
| Kimball International, Inc., Class B | 2,509 | | 44,259 |
| La-Z-Boy, Inc. (a) | 4,860 | | 67,797 |
| Sealy Corp. | 1,680 | | 23,150 |
| Stanley Furniture Company, Inc. | 1,351 | | 33,694 |
|
|
| | | | 389,431 |
| Gas & Pipeline Utilities - 1.42% | | | |
| American States Water Company (a) | 1,687 | | 64,831 |
| Aquila, Inc. * | 35,092 | | 160,721 |
| Aurora Oil & Gas Corp. * | 6,791 | | 30,967 |
| California Water Service Group | 1,729 | | 65,840 |
| Crosstex Energy, Inc. (a) | 872 | | 80,398 |
| Maverick Tube Corp. * | 3,488 | | 224,174 |
| Nicor, Inc. (a) | 4,133 | | 180,447 |
| Northwest Natural Gas Company | 2,803 | | 107,215 |
| Peoples Energy Corp. (a) | 3,598 | | 152,483 |
| Piedmont Natural Gas, Inc. (a) | 7,252 | | 189,060 |
| South Jersey Industries, Inc. | 2,892 | | 83,839 |
| Southwest Gas Corp. | 3,882 | | 130,823 |
| Southwest Water Company (a) | 2,482 | | 32,192 |
| The Laclede Group, Inc. | 2,200 | | 71,698 |
| Transmontaigne, Inc. * | 4,340 | | 49,216 |
| WGL Holdings, Inc. | 4,693 | | 145,812 |
|
|
| | | | 1,769,716 |
| Gold - 0.04% | | | |
| Royal Gold, Inc. (a) | 1,855 | | 55,260 |
| Healthcare Products - 2.58% | | | |
| Adeza Biomedical Corp. * | 1,573 | | 26,694 |
| Align Technology, Inc. * (a) | 5,471 | | 34,194 |
| American Medical Systems Holdings, Inc. * | 6,574 | | 115,439 |
| Angiodynamics, Inc. * | 1,237 | | 22,414 |
| Arthrocare Corp. * (a) | 2,483 | | 113,250 |
| Aspect Medical Systems, Inc. * (a) | 1,610 | | 31,105 |
| Biosite, Inc. * (a) | 1,636 | | 71,984 |
| Bruker BioSciences Corp. * | 3,837 | | 27,089 |
| Cerus Corp. * | 3,017 | | 19,550 |
| Computer Programs & Systems, Inc. | 966 | | 32,863 |
| Conceptus, Inc. * (a) | 2,218 | | 38,261 |
| Cyberonics, Inc. * (a) | 2,053 | | 33,423 |
| Cypress Biosciences, Inc. * | 3,425 | | 24,660 |
| DJO, Inc. * | 2,160 | | 83,311 |
| Encore Medical Corp. * | 5,896 | | 37,675 |
| Foxhollow Technologies, Inc. * | 1,760 | | 55,141 |
| Haemonetics Corp. * | 2,510 | | 116,916 |
| Health Tronics, Inc. * | 3,697 | | 24,326 |
The accompanying notes are an integral part of the financial statements. 335
John Hancock Funds II
Portfolio of investments — August 31, 2006
(showing percentage of total net assets) |
| Small Cap Index Fund (continued) | | |
| | Shares or | | |
| | Principal | | |
| | Amount | | Value |
|
|
| |
| COMMON STOCKS (continued) | | | |
| Healthcare Products (continued) | | | |
| Hologic, Inc. * | 4,310 | $ | 186,106 |
| ICU Medical, Inc. * (a) | 1,396 | | 61,438 |
| Intralase Corp. * (a) | 2,045 | | 38,466 |
| Inverness Medical Innovations, Inc. * (a) | 2,606 | | 88,005 |
| Kensey Nash Corp. * (a) | 1,188 | | 32,171 |
| Kyphon, Inc. * | 4,174 | | 151,141 |
| LCA-Vision, Inc. (a) | 1,971 | | 86,783 |
| LifeCell Corp. * (a) | 3,138 | | 94,705 |
| Mannkind Corp. * (a) | 2,089 | | 38,479 |
| Merit Medical Systems, Inc. * (a) | 2,786 | | 39,060 |
| Molecular Devices Corp. * | 1,644 | | 39,472 |
| Natus Medical, Inc. * (a) | 1,985 | | 25,964 |
| Nuvasive, Inc. * (a) | 3,156 | | 64,887 |
| Owens & Minor, Inc. | 3,813 | | 122,664 |
| PetMed Express, Inc. * | 1,986 | | 24,825 |
| Polymedica Corp. | 2,198 | | 89,217 |
| PSS World Medical, Inc. * | 6,408 | | 124,315 |
| Sirona Dental Systems, Inc. * (a) | 1,656 | | 50,376 |
| SonoSite, Inc. * (a) | 1,568 | | 49,753 |
| Spectranetics Corp. * | 3,051 | | 33,256 |
| Stereotaxis, Inc. * (a) | 2,409 | | 26,812 |
| STERIS Corp. | 6,392 | | 152,002 |
| SurModics, Inc. * (a) | 1,526 | | 53,379 |
| Symmetry Medical, Inc. * | 3,281 | | 45,507 |
| The Medicines Company * (a) | 4,715 | | 106,370 |
| Thermogenesis Corp. * (a) | 5,974 | | 25,091 |
| Thoratec Corp. * (a) | 5,012 | | 73,476 |
| Tripath Imaging, Inc. * | 3,338 | | 29,274 |
| USANA Health Sciences, Inc. * (a) | 902 | | 40,374 |
| Ventana Medical Systems, Inc. * | 2,726 | | 127,141 |
| Viasys Healthcare, Inc. * | 3,063 | | 81,231 |
| Wright Medical Group, Inc. * | 3,251 | | 74,350 |
| Zoll Medical Corp. * | 1,004 | | 38,062 |
|
|
| | | | 3,222,447 |
| Healthcare Services - 1.48% | | | |
| Air Methods Corp. * (a) | 1,072 | | 24,978 |
| Amedisys, Inc. * (a) | 1,546 | | 62,567 |
| Amerigroup Corp. * | 4,890 | | 154,231 |
| AMN Healthcare Services, Inc. * | 3,106 | | 74,544 |
| Apria Healthcare Group, Inc. * | 4,069 | | 82,967 |
| Capital Senior Living Corp. * | 2,622 | | 25,145 |
| Cross Country Healthcare, Inc. * | 3,169 | | 52,035 |
| Enzo Biochem, Inc. * (a) | 2,685 | | 34,314 |
| Five Star Quality Care, Inc. * | 3,141 | | 32,195 |
| Genesis HealthCare Corp. * | 1,879 | | 85,570 |
| Healthspring, Inc. * | 1,828 | | 36,395 |
| Healthways, Inc. * | 3,284 | | 169,520 |
| Horizon Health Corp. * (a) | 1,631 | | 22,328 |
| Intermagnetics General Corp. * (a) | 4,020 | | 109,465 |
| Kindred Healthcare, Inc. * | 3,174 | | 98,838 |
| LHC Group, Inc. * | 1,304 | | 31,296 |
| Small Cap Index Fund (continued) | | |
| | Shares or | | |
| | Principal | | |
| | Amount | | Value |
|
|
| |
| COMMON STOCKS (continued) | | | |
| Healthcare Services (continued) | | | |
| Magellan Health Services, Inc. * | 3,526 | $ | 169,495 |
| National Healthcare Corp. (a) | 721 | | 35,307 |
| Odyssey Healthcare, Inc. * | 3,380 | | 54,215 |
| Palomar Medical Technologies, Inc. * (a) | 1,660 | | 65,902 |
| Per-Se Technologies, Inc. * (a) | 3,167 | | 72,176 |
| Phase Forward, Inc. * | 3,291 | | 38,801 |
| Radiation Therapy Services, Inc. * (a) | 1,219 | | 35,254 |
| Sun Healthcare Group, Inc. * | 2,484 | | 26,256 |
| Symbion, Inc. * | 1,827 | | 42,240 |
| The Advisory Board Company * | 1,769 | | 89,901 |
| United Surgical Partners International, Inc. * | 4,229 | | 119,342 |
|
|
| | | | 1,845,277 |
| Holdings Companies/Conglomerates - 0.07% | | | |
| PICO Holdings, Inc. * | 1,002 | | 33,958 |
| United Industrial Corp. | 903 | | 48,644 |
|
|
| | | | 82,602 |
| Homebuilders - 0.24% | | | |
| Champion Enterprises, Inc. * | 7,224 | | 49,267 |
| Hovnanian Enterprises, Inc., Class A * (a) | 4,673 | | 123,788 |
| M/I Homes, Inc. (a) | 1,153 | | 37,311 |
| Meritage Homes Corp. * (a) | 2,126 | | 87,060 |
|
|
| | | | 297,426 |
| Hotels & Restaurants - 1.89% | | | |
| AFC Enterprises, Inc. * (a) | 2,653 | | 39,689 |
| Ameristar Casinos, Inc. (a) | 2,444 | | 50,908 |
| Applebee's International, Inc. | 6,993 | | 145,105 |
| Aztar Corp. * | 3,406 | | 178,713 |
| BJ's Restaurants, Inc. * (a) | 1,426 | | 26,281 |
| California Pizza Kitchen, Inc. * | 1,924 | | 54,949 |
| CBRL Group, Inc. | 2,919 | | 110,455 |
| CEC Entertainment, Inc. * | 3,143 | | 100,199 |
| Century Casinos, Inc. * | 2,410 | | 24,702 |
| Chipotle Mexican Grill, Inc., Class A * (a) | 734 | | 36,216 |
| CKE Restaurants, Inc. | 5,675 | | 88,133 |
| IHOP Corp. | 1,777 | | 82,968 |
| Jack In the Box, Inc. * | 3,326 | | 159,581 |
| Krispy Kreme Doughnuts, Inc. * (a) | 5,247 | | 43,288 |
| Landry's Restaurants, Inc. | 1,546 | | 42,283 |
| Lodgian, Inc. * | 2,179 | | 27,259 |
| Lone Star Steakhouse & Saloon, Inc. | 1,761 | | 48,040 |
| Luby's Cafeterias, Inc. * | 2,337 | | 22,225 |
| Magna Entertainment Corp., Class A * (a) | 4,521 | | 19,712 |
| Marcus Corp. | 2,126 | | 43,732 |
| McCormick & Schmick's Seafood | | | |
| Restaurants, Inc. * | 1,278 | | 25,330 |
| Morgans Hotel Group Company * (a) | 1,839 | | 24,459 |
| MTR Gaming Group, Inc. * | 2,734 | | 21,872 |
| O'Charley's, Inc. * | 2,409 | | 44,542 |
| P.F. Chang's China Bistro, Inc. * (a) | 2,488 | | 87,702 |
| Papa Johns International, Inc. * (a) | 2,360 | | 80,240 |
| RARE Hospitality International, Inc. * | 3,237 | | 92,708 |
The accompanying notes are an integral part of the financial statements. 336
John Hancock Funds II
Portfolio of investments — August 31, 2006
(showing percentage of total net assets) |
| Small Cap Index Fund (continued) | | |
| | Shares or | | |
| | Principal | | |
| | Amount | | Value |
|
|
| |
| COMMON STOCKS (continued) | | | |
| Hotels & Restaurants (continued) | | | |
| Red Robin Gourmet Burgers, Inc. * (a) | 1,588 | $ | 67,029 |
| Ruby Tuesday, Inc. | 5,515 | | 142,397 |
| Ryan's Restaurant Group, Inc. * | 4,047 | | 63,781 |
| Sonic Corp. * | 8,118 | | 178,028 |
| Texas Roadhouse, Inc., Class A * (a) | 4,934 | | 59,603 |
| Triarc Companies, Inc. | 5,847 | | 85,191 |
| Trump Entertainment Resorts, Inc. * (a) | 2,707 | | 48,915 |
|
|
| | | | 2,366,235 |
| Household Appliances - 0.19% | | | |
| Consolidated Tomoka Land Company (a) | 607 | | 40,450 |
| Drew Industries, Inc. * (a) | 1,790 | | 46,737 |
| Jacuzzi Brands, Inc. * | 7,392 | | 73,329 |
| Lifetime Brands, Inc. | 1,261 | | 25,170 |
| National Presto Industries, Inc. | 555 | | 30,192 |
| Technical Olympic USA, Inc. (a) | 1,952 | | 23,736 |
|
|
| | | | 239,614 |
| Household Products - 0.48% | | | |
| Blyth, Inc. | 2,562 | | 55,032 |
| Central Garden & Pet Company * (a) | 2,088 | | 91,517 |
| iRobot Corp. * (a) | 1,160 | | 20,532 |
| Martha Stewart Living | | | |
| Omnimedia, Inc., Class A * (a) | 2,444 | | 46,241 |
| Select Comfort Corp. * (a) | 5,061 | | 100,461 |
| Smith & Wesson Holding Corp. * (a) | 2,767 | | 27,393 |
| Tempur-Pedic International, Inc. * (a) | 4,685 | | 75,194 |
| Tupperware Brands Corp. | 5,833 | | 105,052 |
| TurboChef Technologies, Inc. * (a) | 1,281 | | 12,925 |
| WD-40 Company | 1,810 | | 62,898 |
|
|
| | | | 597,245 |
| Housing & Urban Development - 0.02% | | | |
| Cavco Industries, Inc. * | 750 | | 25,515 |
| Industrial Machinery - 1.54% | | | |
| Actuant Corp., Class A (a) | 2,590 | | 116,809 |
| Albany International Corp., Class A | 2,593 | | 90,548 |
| Badger Meter, Inc. (a) | 1,449 | | 37,920 |
| Briggs & Stratton Corp. | 4,807 | | 135,317 |
| Cascade Corp. | 1,208 | | 45,904 |
| Ceradyne, Inc. * (a) | 2,541 | | 111,982 |
| Circor International, Inc. | 1,692 | | 48,543 |
| Cognex Corp. | 4,392 | | 112,128 |
| Dionex Corp. * | 1,937 | | 97,663 |
| Energy Conversion Devices, Inc. * (a) | 3,655 | | 128,108 |
| EnPro Industries, Inc. * | 2,037 | | 64,043 |
| Flow International Corp. * (a) | 3,611 | | 47,521 |
| Gehl Company * | 1,050 | | 27,405 |
| Gorman Rupp Company (a) | 1,068 | | 31,773 |
| H&E Equipment Services, Inc. * | 1,108 | | 28,886 |
| Kadant, Inc. * | 1,468 | | 38,726 |
| Lindsay Manufacturing Company | 1,255 | | 35,793 |
| Lufkin Industries, Inc. | 1,408 | | 88,704 |
| NACCO Industries, Inc., Class A | 518 | | 69,168 |
| Small Cap Index Fund (continued) | | |
| | Shares or | | |
| | Principal | | |
| | Amount | | Value |
|
|
| |
| COMMON STOCKS (continued) | | | |
| Industrial Machinery (continued) | | | |
| NATCO Group, Inc. * | 1,437 | $ | 52,494 |
| OYO Geospace Corp. * | 444 | | 26,724 |
| Presstek, Inc. * (a) | 3,088 | | 25,352 |
| Raser Technologies, Inc. * (a) | 2,127 | | 7,657 |
| Robbins & Myers, Inc. | 1,305 | | 37,584 |
| Rofin Sinar Technologies, Inc. * | 1,482 | | 81,154 |
| Tecumseh Products Company, Class A * (a) | 1,735 | | 25,765 |
| Tennant Company | 1,610 | | 43,567 |
| The Middleby Corp. * | 659 | | 51,758 |
| Tredegar Industries, Inc. | 3,296 | | 54,384 |
| Valmont Industries, Inc. | 1,724 | | 89,924 |
| Watts Water Technologies, Inc., Class A (a) | 2,410 | | 74,734 |
|
|
| | | | 1,928,038 |
| Industrials - 0.14% | | | |
| Brookfield Homes Corp. (a) | 1,189 | | 28,060 |
| Clean Harbors, Inc. * | 1,497 | | 62,560 |
| GrafTech International, Ltd. * | 9,433 | | 51,410 |
| Intevac, Inc. * | 2,025 | | 34,020 |
|
|
| | | | 176,050 |
| Insurance - 2.31% | | | |
| 21st Century Insurance Group | 3,307 | | 49,704 |
| Alfa Corp. | 3,388 | | 57,257 |
| American Equity Investment Life Holding | | | |
| Company (a) | 5,465 | | 63,230 |
| American Physicians Capital, Inc. * | 795 | | 39,217 |
| Argonaut Group, Inc. * | 3,052 | | 93,849 |
| Capital Title Group, Inc. * | 3,223 | | 25,043 |
| CNA Surety Corp. * | 1,688 | | 33,591 |
| Commerce Group, Inc. | 5,297 | | 157,798 |
| Direct General Corp. | 1,806 | | 24,056 |
| Donegal Group, Inc. | 1,606 | | 29,856 |
| Enstar Group, Inc. * (a) | 391 | | 37,106 |
| FBL Financial Group, Inc., Class A | 1,464 | | 48,546 |
| FPIC Insurance Group, Inc. * | 1,153 | | 47,550 |
| Harleysville Group, Inc. | 1,421 | | 51,142 |
| Hilb, Rogal and Hamilton Company | 3,460 | | 149,714 |
| Horace Mann Educators Corp. | 4,279 | | 78,563 |
| Infinity Property & Casualty Corp. | 2,073 | | 78,670 |
| James River Group, Inc. * | 1,053 | | 29,684 |
| LandAmerica Financial Group, Inc. (a) | 1,658 | | 104,852 |
| Meadowbrook Insurance Group, Inc. * | 2,672 | | 27,629 |
| Midland Company | 1,206 | | 49,928 |
| National Interstate Corp. | 1,599 | | 44,404 |
| National Western Life Insurance Company, | | | |
| Class A * | 259 | | 59,648 |
| Navigators Group, Inc. * | 1,312 | | 60,457 |
| Ohio Casualty Corp. | 6,135 | | 159,203 |
| Phoenix Companies, Inc. | 10,711 | | 158,094 |
| PMA Capital Corp., Class A * | 3,561 | | 33,295 |
| Presidential Life Corp. | 2,164 | | 51,006 |
| ProAssurance Corp. * | 3,040 | | 152,912 |
The accompanying notes are an integral part of the financial statements. 337
John Hancock Funds II
Portfolio of investments — August 31, 2006
(showing percentage of total net assets) |
| Small Cap Index Fund (continued) | | |
| | Shares or | | |
| | Principal | | |
| | Amount | | Value |
|
|
| |
| COMMON STOCKS (continued) | | | |
| Insurance (continued) | | | |
| RLI Corp. | 2,219 | $ | 108,509 |
| Safety Insurance Group, Inc. | 1,438 | | 73,942 |
| SCPIE Holdings, Inc. * | 1,254 | | 29,858 |
| SeaBright Insurance Holdings, Inc. * | 1,838 | | 23,269 |
| Selective Insurance Group, Inc. | 2,693 | | 140,090 |
| State Auto Financial Corp. | 1,471 | | 46,101 |
| Stewart Information Services Corp. | 1,693 | | 57,748 |
| Tower Group, Inc. | 1,691 | | 49,310 |
| Triad Guaranty, Inc. * | 1,159 | | 58,263 |
| U.S.I. Holdings Corp. * (a) | 4,492 | | 60,058 |
| United Fire & Casualty Company | 2,055 | | 57,499 |
| Universal American Financial Corp. * | 3,724 | | 57,089 |
| Zenith National Insurance Corp. | 3,538 | | 133,736 |
|
|
| | | | 2,891,476 |
| International Oil - 0.15% | | | |
| ATP Oil & Gas Corp. * | 1,956 | | 76,480 |
| Callon Petroleum Company * | 2,097 | | 32,441 |
| Parker Drilling Company * | 10,404 | | 73,868 |
|
|
| | | | 182,789 |
| Internet Content - 0.62% | | | |
| Audible, Inc. * (a) | 2,587 | | 20,541 |
| CMGI, Inc. * (a) | 43,851 | | 48,675 |
| CNET Networks, Inc. * (a) | 14,137 | | 133,312 |
| Digitas, Inc. * | 8,532 | | 76,276 |
| Harris Interactive, Inc. * | 5,574 | | 30,824 |
| InfoSpace, Inc. * | 2,966 | | 65,934 |
| Internet Cap Group, Inc. * | 3,874 | | 34,866 |
| Jupitermedia Corp. * (a) | 2,293 | | 16,372 |
| Move, Inc. * (a) | 9,450 | | 43,281 |
| NetFlix, Inc. * (a) | 3,728 | | 74,597 |
| ProQuest Company * | 2,506 | | 33,605 |
| RightNow Technologies, Inc. * (a) | 1,527 | | 23,455 |
| Safeguard Scientifics, Inc. * (a) | 12,315 | | 24,261 |
| Schawk, Inc., Class A (a) | 1,582 | | 30,279 |
| Sohu.com, Inc. * | 2,458 | | 53,609 |
| The Knot, Inc. * | 1,509 | | 26,287 |
| TheStreet.com, Inc. | 1,951 | | 20,993 |
| WebSideStory, Inc. * (a) | 1,869 | | 23,680 |
|
|
| | | | 780,847 |
| Internet Retail - 0.22% | | | |
| Ariba, Inc. * (a) | 7,108 | | 58,854 |
| Blue Nile, Inc. * (a) | 1,394 | | 47,842 |
| Drugstore.com, Inc. * (a) | 8,274 | | 26,229 |
| Overstock.com, Inc. * (a) | 1,150 | | 21,747 |
| Priceline.com, Inc. * | 2,405 | | 80,303 |
| Stamps.com, Inc. * (a) | 1,785 | | 33,986 |
|
|
| | | | 268,961 |
| Internet Service Provider - 0.42% | | | |
| C-COR.net Corp. * | 4,667 | | 37,103 |
| Cogent Communications Group, Inc. * | 2,186 | | 20,286 |
| Covad Communications Group, Inc. * (a) | 27,923 | | 42,443 |
| Small Cap Index Fund (continued) | | |
| | Shares or | | |
| | Principal | | |
| | Amount | | Value |
|
|
| |
| COMMON STOCKS (continued) | | | |
| Internet Service Provider | | | |
| (continued) | | | |
| Earthlink, Inc. * | 12,569 | $ | 92,382 |
| NETGEAR, Inc. * | 3,134 | | 61,646 |
| Online Resources Corp. * | 2,437 | | 25,905 |
| Redback Networks, Inc. * (a) | 5,231 | | 97,506 |
| Terremark Worldwide, Inc. * (a) | 3,736 | | 20,025 |
| TriZetto Group, Inc. * | 4,104 | | 56,307 |
| United Online, Inc. | 6,101 | | 69,978 |
|
|
| | | | 523,581 |
| Internet Software - 1.22% | | | |
| Agile Software Corp. * | 5,739 | | 33,114 |
| Art Technology Group, Inc. * | 10,820 | | 29,647 |
| Chordiant Software, Inc. * | 8,444 | | 22,546 |
| Click Commerce, Inc. * (a) | 1,113 | | 20,379 |
| Cybersource Corp. * | 3,013 | | 32,992 |
| DealerTrack Holdings, Inc. * | 1,044 | | 22,707 |
| Digital River, Inc. * (a) | 3,736 | | 181,345 |
| eResearch Technology, Inc. * (a) | 4,736 | | 41,251 |
| Internet Security Systems, Inc. * | 3,719 | | 102,868 |
| Interwoven, Inc. * | 4,166 | | 45,701 |
| Lionbridge Technologies, Inc. * | 5,759 | | 41,004 |
| NIC, Inc. * (a) | 4,074 | | 21,307 |
| Openwave Systems, Inc. * (a) | 8,893 | | 71,944 |
| RealNetworks, Inc. * | 10,104 | | 111,447 |
| RSA Security, Inc. * | 7,139 | | 198,821 |
| S1 Corp. * | 7,041 | | 35,839 |
| Safenet, Inc. * (a) | 2,433 | | 45,740 |
| Sapient Corp. * | 7,714 | | 37,567 |
| Stellent, Inc. | 2,942 | | 31,509 |
| TIBCO Software, Inc. * | 19,847 | | 155,997 |
| VASCO Data Security International, Inc. * (a) | 2,587 | | 23,283 |
| Vignette Corp. * | 2,894 | | 40,024 |
| WebEx Communications, Inc. * | 3,950 | | 141,015 |
| WebMethods, Inc. * | 5,185 | | 40,910 |
|
|
| | | | 1,528,957 |
| Investment Companies - 0.44% | | | |
| Apollo Investment Corp. | 7,753 | | 154,828 |
| Ares Cap Corp. | 3,853 | | 65,694 |
| Capital Southwest Corp. (a) | 331 | | 36,182 |
| GAMCO Investors, Inc. (a) | 670 | | 25,681 |
| Gladstone Capital Corp. (a) | 1,758 | | 39,801 |
| Harris & Harris Group, Inc. * (a) | 2,268 | | 26,626 |
| MCG Capital Corp. (a) | 5,169 | | 82,911 |
| Medallion Financial Corp. | 1,909 | | 22,316 |
| MVC Capital, Inc. * | 1,979 | | 27,033 |
| NGP Capital Resources Company (a) | 2,263 | | 32,044 |
| Technology Investment Capital Corp. | 2,494 | | 37,310 |
|
|
| | | | 550,426 |
| Leisure Time - 1.40% | | | |
| Ambassadors International, Inc. (a) | 877 | | 29,344 |
| Arctic Cat, Inc. | 1,444 | | 24,014 |
The accompanying notes are an integral part of the financial statements. 338
John Hancock Funds II
Portfolio of investments — August 31, 2006
(showing percentage of total net assets) |
| Small Cap Index Fund (continued) | | |
| | Shares or | | |
| | Principal | | |
| | Amount | | Value |
|
|
| |
| COMMON STOCKS (continued) | | | |
| Leisure Time (continued) | | | |
| Bally Technologies, Inc. * (a) | 4,969 | $ | 78,212 |
| Bally Total Fitness Holding Corp. * (a) | 4,402 | | 13,206 |
| Blockbuster, Inc., Class A * (a) | 18,122 | | 72,307 |
| Bluegreen Corp. * (a) | 2,214 | | 25,350 |
| Callaway Golf Company | 7,231 | | 96,968 |
| Carmike Cinemas, Inc. (a) | 1,369 | | 25,587 |
| Churchill Downs, Inc. | 923 | | 37,308 |
| Dover Downs Gaming & Entertainment, Inc. | 1,606 | | 21,087 |
| Gaylord Entertainment Company * | 3,810 | | 166,573 |
| Isle of Capri Casinos, Inc. * (a) | 1,536 | | 31,304 |
| K2, Inc. * | 4,615 | | 53,765 |
| Lakes Gaming, Inc. * (a) | 2,473 | | 24,037 |
| Life Time Fitness, Inc. * | 2,909 | | 130,701 |
| Monarch Casino & Resort, Inc. * | 1,110 | | 21,057 |
| Multimedia Games, Inc. * (a) | 2,769 | | 26,527 |
| Parkervision, Inc. * (a) | 1,823 | | 11,248 |
| Pinnacle Entertainment, Inc. * | 4,520 | | 116,526 |
| Polaris Industries, Inc. (a) | 3,914 | | 149,123 |
| Progressive Gaming International Corp. * (a) | 3,518 | | 25,998 |
| RC2 Corp. * | 2,021 | | 67,966 |
| Riviera Holdings Corp. * | 1,210 | | 24,018 |
| Shuffle Master, Inc. * (a) | 3,325 | | 92,535 |
| Six Flags, Inc. * | 6,635 | | 34,635 |
| Speedway Motorsports, Inc. | 1,533 | | 57,135 |
| Steinway Musical Instruments, Inc. * | 931 | | 23,852 |
| The Nautilus Group, Inc. (a) | 3,131 | | 38,762 |
| Topps, Inc. | 3,859 | | 33,689 |
| Vail Resorts, Inc. * | 2,885 | | 108,534 |
| West Marine, Inc. * (a) | 1,637 | | 22,378 |
| WMS Industries, Inc. * (a) | 2,577 | | 69,063 |
|
|
| | | | 1,752,809 |
| Life Sciences - 0.21% | | | |
| American Ecology Corp. | 1,552 | | 30,155 |
| Dawson Geophysical Company * (a) | 921 | | 25,171 |
| Incyte Corp. * (a) | 8,015 | | 40,957 |
| Ionatron, Inc. * (a) | 3,129 | | 19,181 |
| Pharmanet Development Group, Inc. * | 1,781 | | 34,854 |
| Senomyx, Inc. * | 2,815 | | 43,632 |
| Symyx Technologies, Inc. * | 3,203 | | 73,349 |
|
|
| | | | 267,299 |
| Liquor - 0.08% | | | |
| Boston Beer Company, Inc. * | 1,078 | | 34,625 |
| Central European Distribution Corp. * (a) | 3,024 | | 69,643 |
|
|
| | | | 104,268 |
| Manufacturing - 1.25% | | | |
| Acuity Brands, Inc. | 4,236 | | 181,004 |
| American Railcar Industries, Inc. | 908 | | 27,503 |
| AptarGroup, Inc. | 3,332 | | 171,598 |
| Barnes Group, Inc. | 3,554 | | 58,357 |
| Blout International, Inc. * | 3,730 | | 33,756 |
| Coherent, Inc. * | 2,939 | | 106,568 |
| Small Cap Index Fund (continued) | | |
| | Shares or | | |
| | Principal | | |
| | Amount | | Value |
|
|
| |
| COMMON STOCKS (continued) | | | |
| Manufacturing (continued) | | | |
| ESCO Technologies, Inc. * | 2,424 | $ | 123,721 |
| Freightcar America, Inc. (a) | 689 | | 40,100 |
| Gen Tek, Inc. * | 1,125 | | 33,626 |
| Goodman Global, Inc. * | 2,292 | | 28,856 |
| Hexcel Corp. * (a) | 8,796 | | 132,116 |
| Input/Output, Inc. * (a) | 6,643 | | 66,231 |
| Insteel Industries, Inc. | 1,363 | | 28,405 |
| Kaydon Corp. | 2,688 | | 102,440 |
| Lancaster Colony Corp. | 2,409 | | 106,333 |
| Mine Safety Appliances Company (a) | 2,948 | | 104,507 |
| Nordson Corp. | 2,813 | | 112,633 |
| Radyne Corp. * | 1,966 | | 24,025 |
| Raven Industries, Inc. (a) | 1,582 | | 44,185 |
| Reddy Ice Holdings, Inc. | 1,757 | | 41,676 |
|
|
| | | | 1,567,640 |
| Medical-Hospitals - 0.59% | | | |
| Advanced Magnetics, Inc. * (a) | 801 | | 29,357 |
| AmSurg Corp. * | 2,910 | | 70,044 |
| Centene Corp. * (a) | 4,081 | | 63,051 |
| Cepheid, Inc. * (a) | 5,235 | | 42,665 |
| DexCom, Inc. * (a) | 1,710 | | 21,956 |
| EV3, Inc. * (a) | 1,437 | | 21,857 |
| Hana Biosciences, Inc. * | 2,949 | | 21,823 |
| Hythiam, Inc. * (a) | 2,917 | | 16,364 |
| IRIS International, Inc. * | 1,884 | | 18,482 |
| MWI Veterinary Supply, Inc. * | 559 | | 19,403 |
| Neurometrix, Inc. * (a) | 1,210 | | 32,803 |
| Novavax, Inc. * (a) | 6,230 | | 26,353 |
| Psychiatric Solutions, Inc. * | 5,041 | | 161,362 |
| RehabCare Group, Inc. * | 1,797 | | 26,380 |
| Sunrise Senior Living, Inc. * (a) | 4,197 | | 123,854 |
| Vital Images, Inc. * | 1,306 | | 38,344 |
|
|
| | | | 734,098 |
| Metal & Metal Products - 0.61% | | | |
| A. M. Castle & Company | 985 | | 27,836 |
| Ampco-Pittsburgh Corp. | 776 | | 22,380 |
| Dynamic Materials Corp. (a) | 1,128 | | 41,251 |
| Gibraltar Industries, Inc. | 2,318 | | 56,096 |
| L.B. Foster Company * (a) | 1,121 | | 25,054 |
| Ladish Company, Inc. * | 1,352 | | 47,279 |
| Matthews International Corp., Class A | 3,113 | | 110,823 |
| Metal Management, Inc. | 2,523 | | 64,538 |
| Mueller Industries, Inc. | 3,499 | | 134,082 |
| Mueller Water Products, Inc. * | 2,494 | | 42,398 |
| NN, Inc. | 2,248 | | 28,235 |
| Quanex Corp. | 3,551 | | 121,906 |
| RBC Bearings, Inc. * | 2,041 | | 43,412 |
|
|
| | | | 765,290 |
| Mining - 0.68% | | | |
| Alpha Natural Resources, Inc. * (a) | 4,858 | | 88,076 |
| AMCOL International Corp. (a) | 2,093 | | 48,599 |
The accompanying notes are an integral part of the financial statements. 339
John Hancock Funds II
Portfolio of investments — August 31, 2006
(showing percentage of total net assets) |
| Small Cap Index Fund (continued) | | |
| | Shares or | | |
| | Principal | | |
| | Amount | | Value |
|
|
| |
| COMMON STOCKS (continued) | | | |
| Mining (continued) | | | |
| Brush Engineered Materials, Inc. * | 1,870 | $ | 49,966 |
| Cleveland-Cliffs, Inc. (a) | 4,162 | | 151,788 |
| Coeur d'Alene Mines Corp. * (a) | 26,160 | | 142,049 |
| Compass Minerals International, Inc. | 3,099 | | 82,836 |
| Hecla Mining Company * (a) | 11,270 | | 73,368 |
| RTI International Metals, Inc. * (a) | 2,151 | | 93,289 |
| Stillwater Mining Company * | 3,858 | | 36,381 |
| USEC, Inc. | 8,198 | | 82,882 |
|
|
| | | | 849,234 |
| Mobile Homes - 0.13% | | | |
| Fleetwood Enterprises, Inc. * (a) | 6,081 | | 42,749 |
| Skyline Corp. | 771 | | 30,077 |
| Winnebago Industries, Inc. (a) | 3,095 | | 90,374 |
|
|
| | | | 163,200 |
| Newspapers - 0.11% | | | |
| Journal Register Company | 4,070 | | 29,711 |
| Lee Enterprises, Inc. | 4,365 | | 108,077 |
|
|
| | | | 137,788 |
| Office Furnishings & Supplies - 0.57% | | | |
| Acco Brands Corp. * | 4,262 | | 92,315 |
| Global Imaging Systems, Inc. * | 5,064 | | 111,053 |
| Herman Miller, Inc. | 6,210 | | 175,370 |
| IKON Office Solutions, Inc. | 10,415 | | 148,414 |
| Knoll, Inc. | 3,142 | | 56,022 |
| United Stationers, Inc. * | 2,949 | | 135,153 |
|
|
| | | | 718,327 |
| Paper - 0.46% | | | |
| Bowater, Inc. (a) | 5,172 | | 117,560 |
| Buckeye Technologies, Inc. * | 4,027 | | 32,739 |
| Chesapeake Corp. | 2,141 | | 31,044 |
| Mercer International, Inc. * (a) | 3,052 | | 28,841 |
| Neenah Paper, Inc. | 1,526 | | 51,228 |
| P.H. Glatfelter Company | 4,256 | | 61,074 |
| Potlatch Corp. | 3,621 | | 138,720 |
| Rock-Tenn Company, Class A | 3,086 | | 59,622 |
| Wausau-Mosinee Paper Corp. | 4,370 | | 59,476 |
|
|
| | | | 580,304 |
| Petroleum Services - 1.44% | | | |
| Atwood Oceanics, Inc. * | 2,553 | | 109,779 |
| Basic Energy Services, Inc. * | 1,209 | | 34,577 |
| Bronco Drilling Company, Inc. * (a) | 1,377 | | 26,728 |
| Dril-Quip, Inc. * | 1,048 | | 80,476 |
| Grey Wolf, Inc. * (a) | 18,349 | | 134,131 |
| Gulfmark Offshore, Inc. * | 1,596 | | 48,439 |
| Hercules Offshore, Inc. * | 1,960 | | 62,563 |
| Hornbeck Offshore Services, Inc. * | 2,339 | | 78,614 |
| Lone Star Technologies, Inc. * | 2,909 | | 131,865 |
| Metretek Technologies, Inc. * (a) | 1,688 | | 19,260 |
| Newpark Resources, Inc. * | 8,499 | | 47,084 |
| PetroHawk Energy Corp. * | 13,457 | | 150,046 |
| Small Cap Index Fund (continued) | | |
| | Shares or | | |
| | Principal | | |
| | Amount | | Value |
|
|
| |
| COMMON STOCKS (continued) | | | |
| Petroleum Services (continued) | | | |
| Petroleum Development Corp. * | 1,591 | $ | 67,936 |
| Pioneer Drilling Company * | 3,959 | | 55,782 |
| Rentech, Inc. * | 13,145 | | 68,880 |
| RPC, Inc. (a) | 2,034 | | 41,575 |
| Superior Well Services, Inc. * (a) | 1,157 | | 24,910 |
| Universal Compression Holdings, Inc. * | 2,867 | | 156,051 |
| Veritas DGC, Inc. * | 3,367 | | 200,572 |
| Warrior Energy Service Corp. * | 1,109 | | 21,182 |
| W-H Energy Services, Inc. * | 2,794 | | 141,013 |
| World Fuel Services Corp. | 2,630 | | 94,785 |
|
|
| | | | 1,796,248 |
| Pharmaceuticals - 2.20% | | | |
| Adams Respiratory Therapeutics, Inc. * (a) | 2,881 | | 117,545 |
| Adolor Corp. * | 4,269 | | 106,512 |
| ADVENTRX Pharmaceuticals, Inc. * (a) | 5,876 | | 21,447 |
| Akorn, Inc. * (a) | 4,808 | | 18,751 |
| Alexion Pharmaceuticals, Inc. * (a) | 2,978 | | 111,824 |
| Alkermes, Inc. * | 8,286 | | 135,476 |
| American Oriental Bioengineering, Inc. * | 4,554 | | 24,182 |
| Andrx Corp. * | 6,968 | | 166,117 |
| Array BioPharma, Inc. * | 3,947 | | 33,471 |
| Atherogenics, Inc. * | 3,734 | | 52,276 |
| Auxilium Pharmaceuticals, Inc. * (a) | 2,103 | | 18,233 |
| AVANIR Pharmaceuticals * (a) | 3,276 | | 23,161 |
| AVI BioPharma, Inc. * (a) | 5,376 | | 22,203 |
| Bentley Pharmaceuticals, Inc. * (a) | 2,017 | | 22,631 |
| Biocryst Pharmaceuticals, Inc. * (a) | 2,308 | | 23,588 |
| Bradley Pharmaceuticals, Inc., Class A * (a) | 1,597 | | 23,652 |
| Connetics Corp. * | 3,310 | | 35,880 |
| Cubist Pharmaceuticals, Inc. * | 5,107 | | 119,810 |
| Encysive Pharmaceuticals, Inc. * (a) | 5,812 | | 25,631 |
| Hi-Tech Pharmacal Company, Inc. * | 976 | | 16,699 |
| Idenix Pharmaceuticals, Inc. * (a) | 2,431 | | 24,577 |
| Indevus Pharmaceuticals, Inc. * (a) | 5,349 | | 33,806 |
| Isis Pharmaceuticals, Inc. * (a) | 6,964 | | 53,205 |
| Medicis Pharmaceutical Corp., Class A (a) | 5,113 | | 149,760 |
| Nastech Pharmaceutical Company, Inc. * (a) | 2,124 | | 32,242 |
| Noven Pharmaceuticals, Inc. * (a) | 2,304 | | 57,508 |
| NPS Pharmaceuticals, Inc. * | 4,801 | | 21,412 |
| Nuvelo, Inc. * | 4,877 | | 101,003 |
| Onyx Pharmaceuticals, Inc. * (a) | 3,875 | | 58,551 |
| OSI Pharmaceuticals, Inc. * (a) | 5,356 | | 199,618 |
| Par Pharmaceutical Companies, Inc. * (a) | 3,327 | | 59,720 |
| Penwest Pharmaceuticals Company * | 2,184 | | 39,094 |
| Peregrine Pharmaceuticals, Inc. * (a) | 18,361 | | 25,338 |
| Pharmion Corp. * | 2,292 | | 42,585 |
| Pozen, Inc. * (a) | 2,549 | | 31,633 |
| Prestige Brands Holdings, Inc. * | 3,251 | | 32,575 |
| Regeneron Pharmaceuticals, Inc. * | 4,287 | | 68,078 |
| Renovis, Inc. * (a) | 2,098 | | 30,924 |
| Rigel Pharmaceuticals, Inc. * (a) | 2,504 | | 24,840 |
The accompanying notes are an integral part of the financial statements. 340
John Hancock Funds II
Portfolio of investments — August 31, 2006
(showing percentage of total net assets) |
| Small Cap Index Fund (continued) | | |
| | Shares or | | |
| | Principal | | |
| | Amount | | Value |
|
|
| |
| COMMON STOCKS (continued) | | | |
| Pharmaceuticals (continued) | | | |
| Salix Pharmaceuticals, Ltd. * | 4,400 | $ | 59,004 |
| Santarus, Inc. * (a) | 4,534 | | 36,363 |
| Sciele Pharma, Inc. * (a) | 2,761 | | 48,317 |
| Supergen, Inc. * (a) | 4,675 | | 22,767 |
| United Therapeutics Corp. * | 2,214 | | 120,862 |
| Valeant Pharmaceuticals International | 8,751 | | 172,045 |
| ViroPharma, Inc. * | 6,491 | | 81,202 |
|
|
| | | | 2,746,118 |
| Plastics - 0.11% | | | |
| AEP Industries, Inc. * | 762 | | 33,376 |
| PW Eagle, Inc. (a) | 1,029 | | 35,881 |
| Spartech Corp. | 3,080 | | 69,392 |
|
|
| | | | 138,649 |
| Publishing - 0.58% | | | |
| American Greetings Corp., Class A (a) | 5,013 | | 122,919 |
| Consolidated Graphics, Inc. * | 1,109 | | 68,958 |
| Courier Corp. | 1,063 | | 39,161 |
| Media General, Inc., Class A | 2,098 | | 82,493 |
| Playboy Enterprises, Inc., Class B * (a) | 2,328 | | 22,163 |
| PRIMEDIA, Inc. * (a) | 19,214 | | 32,664 |
| Readers Digest Association, Inc., Class A (a) | 9,124 | | 116,878 |
| Scholastic Corp. * | 3,365 | | 101,152 |
| Sun-Times Media Group, Inc. | 7,440 | | 55,874 |
| Valassis Communications, Inc. * | 4,496 | | 88,661 |
|
|
| | | | 730,923 |
| Railroads & Equipment - 0.38% | | | |
| Florida East Coast Indiana, Inc. (a) | 3,318 | | 180,566 |
| Genesee & Wyoming, Inc., Class A * | 3,418 | | 85,074 |
| Greenbrier Company, Inc. (a) | 1,326 | | 36,836 |
| RailAmerica, Inc. * | 3,963 | | 39,987 |
| Wabtec Corp. | 4,553 | | 128,440 |
|
|
| | | | 470,903 |
| Real Estate - 7.01% | | | |
| Aames Investment Corp., REIT (a) | 5,037 | | 20,198 |
| Acadia Realty Trust, REIT | 3,176 | | 78,257 |
| Affordable Residential Communities, REIT * | 3,421 | | 35,510 |
| Alexander's, Inc., REIT * | 198 | | 56,974 |
| Alexandria Real Estate Equities, Inc., REIT | 2,133 | | 209,077 |
| American Campus Communities, Inc., REIT | 1,847 | | 47,967 |
| American Financial Realty Trust, REIT | 12,082 | | 138,581 |
| American Home Mortgage Investment Corp., | | | |
| REIT (a) | 4,137 | | 131,143 |
| Anthracite Capital, Inc., REIT | 5,737 | | 73,720 |
| Anworth Mortgage Asset Corp., REIT | 4,874 | | 38,163 |
| Ashford Hospitality Trust, Inc., REIT | 5,657 | | 67,714 |
| Avatar Holdings, Inc., REIT * (a) | 627 | | 34,560 |
| BioMed Realty Trust, Inc., REIT | 5,256 | | 163,672 |
| California Coastal Communities, Inc., REIT * | 1,135 | | 34,788 |
| Capital Lease Funding, Inc., REIT | 3,557 | | 40,656 |
| Cedar Shopping Centers, Inc., REIT | 3,202 | | 49,247 |
| Corporate Office Properties Trust, REIT | 3,142 | | 147,580 |
| Small Cap Index Fund (continued) | | |
| | Shares or | | |
| | Principal | | |
| | Amount | | Value |
|
|
| |
| COMMON STOCKS (continued) | | | |
| Real Estate (continued) | | | |
| Cousins Properties, Inc., REIT | 3,627 | $ | 124,660 |
| Crescent Real Estate Equities Company, REIT | 7,298 | | 158,002 |
| Deerfield Triarc Capital Corp., REIT | 5,174 | | 68,607 |
| DiamondRock Hospitality Company, REIT | 6,186 | | 103,925 |
| Digital Realty Trust, Inc., REIT | 1,727 | | 51,655 |
| EastGroup Properties, Inc., REIT | 2,215 | | 112,987 |
| Education Realty Trust, Inc., REIT (a) | 2,660 | | 37,692 |
| Entertainment Properties Trust, REIT | 2,588 | | 129,038 |
| Equity Inns, Inc., REIT | 5,215 | | 80,207 |
| Equity Lifestyle Properties, Inc., REIT | 1,910 | | 85,625 |
| Equity One, Inc., REIT | 3,622 | | 91,093 |
| Extra Space Storage, Inc., REIT | 4,404 | | 77,070 |
| FelCor Lodging Trust, Inc., REIT | 5,656 | | 121,321 |
| Fieldstone Investment Corp., REIT | 4,830 | | 41,490 |
| First Industrial Realty Trust, Inc., REIT (a) | 4,195 | | 181,727 |
| First Potomac Realty Trust, REIT | 2,317 | | 71,850 |
| Franklin Street Properties Corp., REIT (a) | 4,683 | | 88,040 |
| Getty Realty Corp., REIT (a) | 1,809 | | 54,451 |
| Glenborough Realty Trust, Inc., REIT (a) | 3,152 | | 81,353 |
| Glimcher Realty Trust, REIT (a) | 3,619 | | 88,304 |
| GMH Communities Trust, REIT | 3,861 | | 49,382 |
| Gramercy Captial Corp., REIT | 1,907 | | 51,680 |
| Healthcare Realty Trust, Inc., REIT (a) | 4,498 | | 162,648 |
| Heritage Property Investment Trust, REIT | 2,563 | | 93,191 |
| Hersha Hospitality Trust, REIT (a) | 4,052 | | 40,804 |
| Highland Hospitality Corp., REIT | 5,688 | | 78,324 |
| Highwoods Properties, Inc., REIT | 5,043 | | 190,323 |
| Home Properties, Inc., REIT | 3,227 | | 183,552 |
| HomeBanc Corp., Georgia, REIT (a) | 5,757 | | 38,572 |
| Impac Mortgage Holdings, Inc., REIT (a) | 7,216 | | 65,593 |
| Inland Real Estate Corp., REIT (a) | 6,616 | | 106,848 |
| Innkeepers USA Trust, REIT | 4,126 | | 68,327 |
| Jer Investors Trust, Inc., REIT | 2,922 | | 48,768 |
| Kite Realty Group Trust, REIT | 3,067 | | 49,961 |
| KKR Financial Corp., REIT | 7,503 | | 179,397 |
| LaSalle Hotel Properties, REIT | 3,751 | | 164,819 |
| Lexington Corporate Property Trust, REIT | 5,064 | | 106,445 |
| LTC Properties, Inc., REIT | 2,467 | | 58,764 |
| Luminent Mortgage Capital, Inc., REIT | 4,001 | | 40,530 |
| Maguire Properties, Inc., REIT | 3,545 | | 141,481 |
| Medical Properties Trust, Inc., REIT | 4,081 | | 54,645 |
| MFA Mortgage Investments, Inc., REIT | 7,732 | | 54,356 |
| Mid-America Apartment Communities, Inc., | | | |
| REIT | 2,270 | | 137,108 |
| MortgageIT Holdings, Inc., REIT (a) | 2,851 | | 41,282 |
| National Health Investments, Inc., REIT | 2,337 | | 63,894 |
| National Retail Properties, Inc., REIT | 5,593 | | 124,388 |
| Nationwide Health Properties, Inc., REIT | 7,047 | | 183,645 |
| Newcastle Investment Corp., REIT | 4,273 | | 117,337 |
| Newkirk Realty Trust, Inc., REIT | 2,180 | | 36,624 |
| NorthStar Realty Finance Corp., REIT | 4,252 | | 50,981 |
| Novastar Financial, Inc., REIT (a) | 3,106 | | 91,503 |
The accompanying notes are an integral part of the financial statements. 341
John Hancock Funds II
Portfolio of investments — August 31, 2006
(showing percentage of total net assets) |
| Small Cap Index Fund (continued) | | |
| | Shares or | | |
| | Principal | | |
| | Amount | | Value |
|
|
| |
| COMMON STOCKS (continued) | | | |
| Real Estate (continued) | | | |
| Omega Healthcare Investors, REIT | 5,580 | $ | 82,417 |
| Parkway Properties, Inc., REIT | 1,406 | | 68,922 |
| Pennsylvania Real Estate | | | |
| Investment Trust, REIT (a) | 3,454 | | 146,173 |
| Post Properties, Inc., REIT | 3,975 | | 191,595 |
| PS Business Parks, Inc., REIT | 1,545 | | 94,430 |
| RAIT Investment Trust, REIT | 2,707 | | 75,742 |
| Ramco-Gershenson Properties Trust, REIT (a) | 1,884 | | 60,288 |
| Realty Income Corp., REIT (a) | 7,788 | | 191,507 |
| Redwood Trust, Inc., REIT | 1,885 | | 91,686 |
| Republic Property Trust, REIT | 3,083 | | 33,820 |
| Saul Centers, Inc., REIT | 1,134 | | 49,510 |
| Saxon Capital, Inc., REIT | 4,927 | | 68,535 |
| Senior Housing Properties Trust, REIT | 6,092 | | 123,972 |
| Sovran Self Storage, Inc., REIT | 1,725 | | 93,288 |
| Spirit Finance Corp., REIT | 9,200 | | 104,420 |
| Strategic Hotel Cap, Inc., REIT | 6,822 | | 139,169 |
| Sun Communities, Inc., REIT | 1,931 | | 62,159 |
| Sunstone Hotel Investors, Inc., REIT | 5,436 | | 162,536 |
| Tanger Factory Outlet Centers, Inc., REIT | 3,049 | | 109,154 |
| The Mills Corp., REIT (a) | 5,185 | | 93,226 |
| Trammell Crow Company, REIT * | 3,417 | | 117,613 |
| Trustreet Properties, Inc., REIT (a) | 6,499 | | 79,093 |
| Universal Health Realty Income Trust, REIT | 1,588 | | 57,628 |
| Urstadt Biddle Properties, Inc., REIT | 2,776 | | 47,803 |
| U-Store-It Trust, REIT | 4,418 | | 88,007 |
| Washington Real Estate Investment Trust, | | | |
| REIT (a) | 4,263 | | 173,163 |
| Windrose Medical Properties Trust, REIT | 2,611 | | 39,531 |
| Winston Hotels, Inc., REIT | 3,143 | | 37,433 |
|
|
| | | | 8,774,896 |
| Retail - 0.14% | | | |
| Books-A-Million, Inc. (a) | 1,667 | | 26,589 |
| Core-Mark Holding Company, Inc. * (a) | 1,050 | | 32,823 |
| Tween Brands, Inc. * | 3,214 | | 109,469 |
|
|
| | | | 168,881 |
| Retail Grocery - 0.39% | | | |
| Ingles Markets, Inc. | 1,447 | | 37,043 |
| Nash-Finch Company (a) | 1,376 | | 31,442 |
| Pathmark Stores, Inc. * | 5,107 | | 49,589 |
| Ruddick Corp. | 3,882 | | 100,117 |
| Smart & Final, Inc. * | 1,510 | | 25,021 |
| The Great Atlantic & Pacific Tea Company, | | | |
| Inc. * (a) | 1,796 | | 41,182 |
| United Natural Foods, Inc. * | 4,045 | | 117,507 |
| Weis Markets, Inc. (a) | 978 | | 38,641 |
| Wild Oats Markets, Inc. * (a) | 2,791 | | 45,605 |
|
|
| | | | 486,147 |
| Retail Trade - 3.66% | | | |
| 99 Cents Only Stores * (a) | 4,527 | | 51,427 |
| A.C. Moore Arts & Crafts, Inc. * (a) | 1,630 | | 28,981 |
| Small Cap Index Fund (continued) | | |
| | Shares or | | |
| | Principal | | |
| | Amount | | Value |
|
|
| |
| COMMON STOCKS (continued) | | | |
| Retail Trade (continued) | | | |
| Aaron Rents, Inc., Class B | 4,192 | $ | 98,135 |
| Aeropostale, Inc. * | 5,172 | | 131,369 |
| Big 5 Sporting Goods Corp. | 2,274 | | 44,639 |
| Big Lots, Inc. * (a) | 10,677 | | 195,923 |
| Borders Group, Inc. | 6,142 | | 117,497 |
| Build A Bear Workshop, Inc. * | 1,463 | | 31,937 |
| Building Materials Holding Corp. (a) | 2,742 | | 71,621 |
| Cabela's, Inc. * (a) | 3,076 | | 61,766 |
| Cache, Inc. * | 1,511 | | 23,919 |
| Casey's General Stores, Inc. | 4,814 | | 113,803 |
| Cash America International, Inc. | 2,817 | | 103,863 |
| Casual Male Retail Group, Inc. * (a) | 3,119 | | 35,089 |
| Cato Corp., Class A | 2,983 | | 69,295 |
| Charlotte Russe Holding, Inc. * (a) | 1,499 | | 40,023 |
| Charming Shoppes, Inc. * | 11,706 | | 154,051 |
| Childrens Place Retail Stores, Inc. * | 2,152 | | 124,751 |
| Christopher & Banks Corp. | 3,497 | | 85,152 |
| Citi Trends, Inc. * (a) | 650 | | 20,430 |
| Conn's, Inc. * (a) | 844 | | 16,838 |
| Cost Plus, Inc. * (a) | 2,254 | | 22,946 |
| DSW, Inc., Class A * (a) | 1,586 | | 44,392 |
| Finish Line, Inc. | 4,242 | | 47,214 |
| First Cash Financial Services, Inc. * | 2,769 | | 57,678 |
| Fossil, Inc. * (a) | 4,146 | | 78,028 |
| Fred's, Inc., Class A | 3,892 | | 51,024 |
| Gaiam, Inc., Class A * (a) | 1,765 | | 20,333 |
| Genesco, Inc. * | 2,224 | | 61,116 |
| Guitar Center, Inc. * | 2,516 | | 95,356 |
| Haverty Furniture Companies, Inc. (a) | 2,408 | | 33,832 |
| Hibbett Sporting Goods, Inc. * | 3,474 | | 85,217 |
| Hot Topic, Inc. * (a) | 4,273 | | 42,217 |
| Jo Ann Stores, Inc. * (a) | 2,342 | | 34,685 |
| Longs Drug Stores Corp. | 3,024 | | 137,380 |
| Marinemax, Inc. * (a) | 1,612 | | 36,641 |
| NBTY, Inc. * | 5,216 | | 166,182 |
| New York & Company, Inc. * | 2,108 | | 24,073 |
| Pacific Sunwear of California, Inc. * | 6,941 | | 92,732 |
| Pantry, Inc. * | 2,171 | | 101,733 |
| Payless ShoeSource, Inc. * | 6,311 | | 148,056 |
| PETCO Animal Supplies, Inc. * | 5,493 | | 154,628 |
| Pier 1 Imports, Inc. (a) | 8,242 | | 52,666 |
| Regis Corp. | 4,335 | | 159,051 |
| Rent-A-Center, Inc. * | 6,608 | | 179,077 |
| Restoration Hardware, Inc. * (a) | 3,247 | | 22,826 |
| Retail Ventures, Inc. * (a) | 1,987 | | 28,474 |
| School Specialty, Inc. * (a) | 2,266 | | 80,964 |
| Shoe Carnival, Inc. * | 960 | | 21,946 |
| Sonic Automotive, Inc. (a) | 2,904 | | 61,420 |
| Spectrum Brands, Inc. * (a) | 3,539 | | 28,170 |
| Stein Mart, Inc. | 2,712 | | 32,246 |
| Steven Madden, Ltd. * | 2,019 | | 74,400 |
| Talbots, Inc. (a) | 2,125 | | 46,771 |
The accompanying notes are an integral part of the financial statements. 342
John Hancock Funds II
Portfolio of investments — August 31, 2006
(showing percentage of total net assets) |
| Small Cap Index Fund (continued) | | |
| | Shares or | | |
| | Principal | | |
| | Amount | | Value |
|
|
| |
| COMMON STOCKS (continued) | | | |
| Retail Trade (continued) | | | |
| The Buckle, Inc. | 1,017 | $ | 34,476 |
| The Dress Barn, Inc. * | 4,411 | | 77,854 |
| The Men's Wearhouse, Inc. | 4,525 | | 160,411 |
| The Wet Seal, Inc., Class A * (a) | 6,723 | | 38,388 |
| The Yankee Candle, Inc. | 3,875 | | 100,169 |
| Tuesday Morning Corp. (a) | 2,889 | | 38,944 |
| ValueVision Media, Inc., Class A * | 3,194 | | 35,262 |
| Zale Corp. * | 4,565 | | 122,114 |
| Zumiez, Inc. * (a) | 1,398 | | 31,161 |
|
|
| | | | 4,582,762 |
| Sanitary Services - 0.24% | | | |
| Casella Waste Systems, Inc., Class A * | 2,343 | | 27,577 |
| Darling International, Inc. * | 7,050 | | 29,117 |
| Insituform Technologies, Inc., Class A * | 2,596 | | 59,578 |
| Synagro Technologies, Inc. (a) | 6,455 | | 25,755 |
| Waste Connections, Inc. * | 4,147 | | 152,485 |
|
|
| | | | 294,512 |
| Semiconductors - 2.91% | | | |
| Actel Corp. * | 2,677 | | 41,547 |
| Advanced Analogic Technologies, Inc. * | 3,588 | | 34,158 |
| Advanced Energy Industries, Inc. * | 3,376 | | 48,513 |
| American Superconductor Corp. * (a) | 3,323 | | 33,130 |
| Amis Holdings, Inc. * | 4,184 | | 38,116 |
| Amkor Technology, Inc. * | 9,657 | | 54,755 |
| Applied Micro Circuits Corp. * | 27,649 | | 75,482 |
| Asyst Technologies, Inc. * | 4,680 | | 35,053 |
| ATMI, Inc. * | 3,540 | | 102,200 |
| Axcelis Technologies, Inc. * | 9,586 | | 60,296 |
| Brooks Automation, Inc. * | 7,068 | | 98,245 |
| Cirrus Logic, Inc. * | 8,305 | | 60,793 |
| Conexant Systems, Inc. * (a) | 45,275 | | 93,266 |
| Credence Systems Corp. * (a) | 10,004 | | 25,310 |
| Cymer, Inc. * | 3,638 | | 149,704 |
| Diodes, Inc. * | 1,876 | | 70,237 |
| DSP Group, Inc. * | 2,944 | | 72,040 |
| Emcore Corp. * (a) | 3,959 | | 29,890 |
| Emulex Corp. * | 7,934 | | 137,417 |
| Entegris, Inc. * | 12,983 | | 140,995 |
| Exar Corp. * | 3,103 | | 43,380 |
| FormFactor, Inc. * | 4,329 | | 208,918 |
| Genesis Microchip, Inc. * (a) | 3,339 | | 43,140 |
| Hittite Microwave Corp. * | 1,245 | | 56,249 |
| Ikanos Communications, Inc. * | 2,101 | | 26,809 |
| International Displayworks, Inc. * (a) | 4,761 | | 27,852 |
| IXYS Corp. * | 2,873 | | 25,225 |
| Kopin Corp. * (a) | 6,967 | | 26,126 |
| Kulicke & Soffa Industries, Inc. * (a) | 5,417 | | 42,632 |
| Lattice Semiconductor Corp. * | 10,842 | | 79,363 |
| LTX Corp. * (a) | 5,898 | | 29,903 |
| Mattson Technology, Inc. * | 5,026 | | 39,354 |
| Micrel, Inc. * | 6,870 | | 68,837 |
| Small Cap Index Fund (continued) | | |
| | Shares or | | |
| | Principal | | |
| | Amount | | Value |
|
|
| |
| COMMON STOCKS (continued) | | | |
| Semiconductors (continued) | | | |
| Microsemi Corp. * | 6,714 | $ | 186,448 |
| Microtune, Inc. * | 5,231 | | 31,491 |
| MIPS Technologies, Inc., Class A * | 4,396 | | 30,596 |
| MKS Instruments, Inc. * | 3,425 | | 71,548 |
| Netlogic Microsystems, Inc. * (a) | 1,512 | | 44,619 |
| OmniVision Technologies, Inc. * (a) | 5,031 | | 83,515 |
| ON Semiconductor Corp. * (a) | 14,368 | | 86,352 |
| Pericom Semiconductor Corp. * | 3,127 | | 29,081 |
| Photronics, Inc. * | 3,933 | | 57,068 |
| PLX Technology, Inc. * (a) | 2,527 | | 27,089 |
| Power Integrations, Inc. * | 44 | | 810 |
| Rudolph Technologies, Inc. * | 2,353 | | 42,119 |
| Semitool, Inc. * (a) | 2,384 | | 26,033 |
| Semtech Corp. * | 6,834 | | 89,320 |
| Silicon Image, Inc. * | 7,724 | | 89,676 |
| Skyworks Solutions, Inc. * (a) | 15,053 | | 69,695 |
| Tessera Technologies, Inc. * (a) | 4,361 | | 143,477 |
| TranSwitch Corp. * (a) | 13,020 | | 23,176 |
| Triquint Semiconductor, Inc. * | 13,253 | | 65,337 |
| Ultratech, Inc. * (a) | 2,304 | | 33,708 |
| Varian Semiconductor Equipment Associates, | | | |
| Inc. * | 5,392 | | 190,391 |
| Veeco Instruments, Inc. * | 2,872 | | 70,249 |
| Volterra Semiconductor Corp. * (a) | 1,890 | | 28,501 |
|
|
| | | | 3,639,234 |
| Shipbuilding - 0.03% | | | |
| Maritrans, Inc. (a) | 1,389 | | 34,378 |
| Software - 2.98% | | | |
| Actuate Corp. * | 5,955 | | 22,510 |
| Advent Software, Inc. * | 2,071 | | 67,825 |
| Allscripts Healthcare Solution, Inc. * (a) | 4,362 | | 88,810 |
| Altiris, Inc. * | 2,254 | | 50,940 |
| American Reprographics Company * | 2,500 | | 76,300 |
| ANSYS, Inc. * | 3,122 | | 145,922 |
| Aspen Technology, Inc. * | 4,646 | | 51,849 |
| Avid Technology, Inc. * (a) | 3,988 | | 158,842 |
| Blackbaud, Inc. | 4,151 | | 95,930 |
| Blackboard, Inc. * (a) | 2,639 | | 70,329 |
| Borland Software Corp. * | 7,515 | | 44,188 |
| Bottomline Technologies, Inc. * | 2,100 | | 21,189 |
| CIBER, Inc. * | 5,402 | | 35,707 |
| Concur Technologies, Inc. * (a) | 3,103 | | 43,225 |
| Convera Corp. * (a) | 2,935 | | 18,285 |
| Covansys Corp. * | 2,985 | | 51,223 |
| Dendrite International, Inc. * | 3,623 | | 36,303 |
| Eclipsys Corp. * | 4,283 | | 73,239 |
| Emageon, Inc. * (a) | 2,104 | | 32,423 |
| Epicor Software Corp. * | 5,242 | | 64,896 |
| EPIQ Systems, Inc. * (a) | 1,688 | | 25,117 |
| Equinix, Inc. * (a) | 2,705 | | 155,997 |
| Hyperion Solutions Corp. * | 5,578 | | 184,743 |
The accompanying notes are an integral part of the financial statements. 343
John Hancock Funds II
Portfolio of investments — August 31, 2006
(showing percentage of total net assets) |
| Small Cap Index Fund (continued) | | |
| | Shares or | | |
| | Principal | | |
| | Amount | | Value |
|
|
| |
| COMMON STOCKS (continued) | | | |
| Software (continued) | | | |
| i2 Technologies, Inc. * (a) | 1,492 | $ | 24,320 |
| Igate Corp. * | 2,714 | | 12,864 |
| InfoUSA, Inc. * | 3,328 | | 27,489 |
| Intermediate Telephone, Inc. | 2,060 | | 45,402 |
| iPass, Inc. * (a) | 6,304 | | 28,746 |
| JDA Software Group, Inc. * | 2,839 | | 47,099 |
| Keane, Inc. * (a) | 4,069 | | 62,988 |
| Lawson Software, Inc. * | 11,755 | | 78,288 |
| Macrovision Corp. * | 4,901 | | 114,095 |
| Magma Design Automation, Inc. * (a) | 3,696 | | 28,016 |
| Manhattan Associates, Inc. * | 2,638 | | 61,228 |
| Mantech International Corp. * | 1,724 | | 52,479 |
| MapInfo Corp. * | 2,286 | | 28,346 |
| McDATA Corp., Class A * | 14,607 | | 62,664 |
| MicroStrategy, Inc., Class A * (a) | 954 | | 87,005 |
| Midway Games, Inc. * (a) | 3,423 | | 31,492 |
| Monolithic Power Systems, Inc. * | 2,308 | | 20,911 |
| MRO Software, Inc. * | 1,943 | | 49,916 |
| Neoware Systems, Inc. * (a) | 1,973 | | 25,452 |
| Nuance Communications, Inc. * (a) | 11,868 | | 93,164 |
| Omnicell, Inc. * (a) | 2,645 | | 47,398 |
| Open Solutions, Inc. * | 1,963 | | 57,987 |
| Opnet Technologies, Inc. * | 1,513 | | 20,637 |
| Opsware, Inc. * (a) | 7,774 | | 54,807 |
| Packeteer, Inc. * | 3,357 | | 33,738 |
| PDF Solutions, Inc. * (a) | 2,158 | | 27,968 |
| Progress Software Corp. * | 3,929 | | 99,482 |
| Quality Systems, Inc. * | 1,565 | | 62,757 |
| Secure Computing Corp. * (a) | 4,357 | | 27,667 |
| Smith Micro Software, Inc. * (a) | 2,032 | | 27,351 |
| SPSS, Inc. * | 1,865 | | 47,315 |
| Take-Two Interactive Software, Inc. * (a) | 6,729 | | 82,094 |
| Taleo Corp. * (a) | 1,432 | | 15,050 |
| THQ, Inc. * | 5,999 | | 154,774 |
| Tradestation Group, Inc. * (a) | 2,494 | | 36,537 |
| Transaction Systems Architects, Inc., Class A * | 3,547 | | 117,654 |
| Ultimate Software Group, Inc. * | 2,323 | | 52,500 |
| VA Software Corp. * (a) | 6,269 | | 23,446 |
| Verint Systems, Inc. * | 1,271 | | 42,007 |
| Websense, Inc. * | 4,535 | | 93,739 |
|
|
| | | | 3,722,664 |
| Steel - 0.77% | | | |
| AK Steel Holding Corp. * | 10,382 | | 130,917 |
| Chaparral Steel Company * | 2,187 | | 156,196 |
| NS Group, Inc. * | 2,124 | | 96,684 |
| Olympic Steel, Inc. | 854 | | 23,613 |
| Oregon Steel Mills, Inc. * | 3,380 | | 162,815 |
| Ryerson, Inc. (a) | 2,444 | | 51,764 |
| Schnitzer Steel Industries, Inc. | 2,145 | | 68,104 |
| Steel Technologies, Inc. | 1,214 | | 26,999 |
| Texas Industries, Inc. | 2,164 | | 101,578 |
| Small Cap Index Fund (continued) | | |
| | Shares or | | |
| | Principal | | |
| | Amount | | Value |
|
|
| |
| COMMON STOCKS (continued) | | | |
| Steel (continued) | | | |
| Wheeling-Pittsburgh Corp. * (a) | 1,113 | $ | 19,611 |
| Worthington Industries, Inc. (a) | 6,828 | | 130,483 |
|
|
| | | | 968,764 |
| Telecommunications Equipment & | | | |
| Services - 2.63% | | | |
| ADTRAN, Inc. | 6,433 | | 159,989 |
| Aeroflex, Inc. * | 7,129 | | 74,284 |
| Alaska Communications Systems Group, Inc. (a) | 4,244 | | 58,525 |
| Andrew Corp. * | 14,987 | | 138,630 |
| Arris Group, Inc. * | 10,094 | | 115,677 |
| At Road, Inc. * (a) | 6,180 | | 29,231 |
| Atheros Communications, Inc. * (a) | 4,875 | | 79,316 |
| Broadwing Corp. * (a) | 7,217 | | 82,635 |
| Carrier Access Corp. * | 2,267 | | 20,448 |
| Commonwealth Telephone Enterprises, Inc. | 2,192 | | 77,290 |
| Commscope, Inc. * | 5,444 | | 159,019 |
| Comtech Telecommunications Corp. * | 2,174 | | 71,155 |
| Consolidated Communications Holdings, Inc. | 2,487 | | 42,652 |
| CT Communications, Inc. (a) | 1,981 | | 45,642 |
| Ditech Networks, Inc. * | 3,269 | | 28,800 |
| Essex Corp. * | 1,917 | | 28,525 |
| Fairpoint Communications, Inc. | 2,816 | | 46,042 |
| FiberTower Corp. * | 5,238 | | 40,699 |
| Finisar Corp. * (a) | 21,503 | | 79,776 |
| First Avenue Networks, Inc. * (a) | 0 | | 0 |
| General Communication, Inc. * | 5,289 | | 67,223 |
| Golden Telecom, Inc. | 2,104 | | 64,172 |
| Harmonic, Inc. * | 7,129 | | 44,271 |
| InterDigital Communication Corp. * (a) | 5,155 | | 171,301 |
| Iowa Telecommunications Services, Inc. | 3,311 | | 64,300 |
| J2 Global Communications, Inc. * (a) | 4,687 | | 117,784 |
| Loral Space & Communications, Inc. * (a) | 1,167 | | 29,992 |
| Mastec, Inc. * (a) | 3,828 | | 44,367 |
| MRV Communications, Inc. * (a) | 12,120 | | 30,179 |
| Newport Corp. * | 3,854 | | 67,946 |
| NTELOS Holdings Corp. * | 1,582 | | 21,721 |
| Oplink Communications, Inc. * | 1,629 | | 31,977 |
| Plantronics, Inc. (a) | 4,422 | | 79,242 |
| Polycom, Inc. * | 8,214 | | 195,411 |
| Powerwave Technologies, Inc. * (a) | 10,505 | | 79,628 |
| Premiere Global Services, Inc. * | 6,922 | | 53,992 |
| Price Communications Corp. * | 4,417 | | 80,743 |
| RCN Corp. * (a) | 2,785 | | 72,048 |
| SAVVIS, Inc. * (a) | 3,099 | | 77,506 |
| Shenandoah Telecommunications Company | 838 | | 36,838 |
| Sirenza Microdevices, Inc. * (a) | 2,482 | | 23,008 |
| Sonus Networks, Inc. * (a) | 23,770 | | 115,522 |
| Stratex Networks, Inc. * (a) | 9,281 | | 33,876 |
| SureWest Communications (a) | 1,601 | | 30,387 |
| Symmetricom, Inc. * (a) | 4,544 | | 33,898 |
| Tekelec, Inc. * (a) | 5,463 | | 72,658 |
| UTStarcom, Inc. * (a) | 11,357 | | 93,241 |
The accompanying notes are an integral part of the financial statements. 344
John Hancock Funds II
Portfolio of investments — August 31, 2006
(showing percentage of total net assets) |
| Small Cap Index Fund (continued) | | |
| | Shares or | | |
| | Principal | | |
| | Amount | | Value |
|
|
| |
| COMMON STOCKS (continued) | | | |
| Telecommunications Equipment & | | | |
| Services (continued) | | | |
| Viasat, Inc. * | 2,123 | $ | 57,427 |
| Vonage Holdings Corp. * (a) | 2,941 | | 25,028 |
|
|
| | | | 3,294,021 |
| Telephone - 0.23% | | | |
| Cbeyond Communications, Inc. * (a) | 1,621 | | 38,483 |
| Cincinnati Bell, Inc. * | 23,409 | | 118,215 |
| IDT Corp. * (a) | 5,032 | | 71,857 |
| North Pittsburgh Systems, Inc. (a) | 1,625 | | 40,592 |
| TALK America Holdings, Inc. * (a) | 3,510 | | 20,358 |
|
|
| | | | 289,505 |
| Tires & Rubber - 0.12% | | | |
| Bandag, Inc. (a) | 1,181 | | 44,949 |
| Cooper Tire & Rubber Company (a) | 5,844 | | 57,446 |
| Myers Indiana, Inc. | 2,634 | | 43,277 |
|
|
| | | | 145,672 |
| Tobacco - 0.18% | | | |
| Alliance One International, Inc. | 9,111 | | 36,717 |
| Schweitzer Mauduit International, Inc. | 1,661 | | 31,559 |
| Universal Corp. | 2,429 | | 93,832 |
| Vector Group, Ltd. (a) | 3,572 | | 61,689 |
|
|
| | | | 223,797 |
| Toys, Amusements & Sporting Goods - 0.11% | | | |
| Jakks Pacific, Inc. * (a) | 2,673 | | 43,677 |
| Marvel Entertainment, Inc. * (a) | 4,462 | | 95,665 |
|
|
| | | | 139,342 |
| Transportation - 0.49% | | | |
| American Commercial Lines, Inc. * | 2,939 | | 154,298 |
| Atlas Air Worldwide Holdings, Inc. * | 1,955 | | 85,883 |
| Bristow Group, Inc. * | 2,271 | | 84,731 |
| Dynamex, Inc. * (a) | 1,584 | | 33,818 |
| Marten Transport, Ltd. * | 1,625 | | 27,072 |
| Pacer International, Inc. | 3,684 | | 101,421 |
| PHI, Inc. * | 1,369 | | 42,781 |
| Saia, Inc. * | 1,517 | | 46,648 |
| U. S. Xpress Enterprises, Inc., Class A * | 1,040 | | 21,663 |
| USA Truck, Inc. * | 1,058 | | 17,637 |
|
|
| | | | 615,952 |
| Travel Services - 0.05% | | | |
| Ambassadors Group, Inc. | 2,048 | | 57,610 |
| Trucking & Freight - 0.84% | | | |
| Arkansas Best Corp. | 2,448 | | 108,079 |
| Celadon Group, Inc. * | 2,306 | | 42,730 |
| EGL, Inc. * | 3,016 | | 92,199 |
| Forward Air Corp. | 3,049 | | 97,995 |
| Heartland Express, Inc. | 5,866 | | 94,325 |
| Hub Group, Inc., Class A * | 3,889 | | 90,614 |
| ID Systems, Inc. * (a) | 1,234 | | 27,420 |
| Knight Transportation, Inc. | 5,486 | | 94,304 |
| Navistar International Corp. * | 5,871 | | 134,681 |
| Small Cap Index Fund (continued) | | |
| | | Shares or | | |
| | | Principal | | |
| | | Amount | | Value |
| |
|
| |
| COMMON STOCKS (continued) | | | | |
| Trucking & Freight (continued) | | | | |
| Old Dominion Freight Lines, Inc. * | | 2,736 | $ | 87,333 |
| Trico Marine Services, Inc. * | | 1,279 | | 45,878 |
| Wabash National Corp. (a) | | 3,078 | | 42,446 |
| Werner Enterprises, Inc. (a) | | 4,989 | | 92,446 |
| |
|
| | | | | 1,050,450 |
| Utility Service - 0.04% | | | | |
| SJW Corp. | | 1,619 | | 49,137 |
|
| TOTAL COMMON STOCKS (Cost $118,737,034) | | $ | 119,753,322 |
|
| |
| SHORT TERM INVESTMENTS - 29.90% | | | |
| Federal Home Loan Mortgage Corp. Discount Notes | | | |
| zero coupon due 10/10/2006 | $ | 1,800,000 | $ | 1,789,967 |
| Federal National Mortgage Association | | | | |
| Discount Notes | | | | |
| zero coupon due 10/04/2006 | | 1,500,000 | | 1,492,939 |
| Rabobank USA Finance Corp. | | | | |
| 5.27% due 09/01/2006 | | 1,470,000 | | 1,470,000 |
| State Street Navigator Securities Lending | | | | |
| Prime Portfolio (c) | | 32,157,578 | | 32,157,578 |
| United States Treasury Bills | | | | |
| zero coupon due 10/19/2006 **** | | 500,000 | | 496,687 |
|
| TOTAL SHORT TERM INVESTMENTS | | | | |
| (Cost $37,407,171) | | | $ | 37,407,171 |
|
| Total Investments (Small Cap Index Fund) | | | |
| (Cost $156,144,205) - 125.63% | | | $ | 157,160,493 |
| Liabilities in Excess of Other Assets - (25.63)% | | | (32,064,055) |
| |
|
| TOTAL NET ASSETS - 100.00% | | | $ | 125,096,438 |
| |
|
| |
| |
| Small Cap Opportunities Fund | | | |
| | | Shares or | | |
| | | Principal | | |
| | | Amount | | Value |
| |
|
| |
| COMMON STOCKS - 94.01% | | | | |
| Aluminum - 0.85% | | | | |
| Century Aluminum Company * (a) | | 60,508 | $ | 2,100,233 |
| Apparel & Textiles - 0.77% | | | | |
| Wolverine World Wide, Inc. (a) | | 75,014 | | 1,892,603 |
| Auto Parts - 3.55% | | | | |
| American Axle & Manufacturing Holdings, Inc. (a) | 68,357 | | 1,140,878 |
| BorgWarner, Inc. | | 73,010 | | 4,140,397 |
| Commercial Vehicle Group, Inc. * | | 121,712 | | 2,387,990 |
| Noble International, Ltd. (a) | | 84,702 | | 1,094,350 |
| |
|
| | | | | 8,763,615 |
| Auto Services - 0.59% | | | | |
| Lithia Motors, Inc., Class A | | 22,680 | | 578,794 |
| Spartan Motors, Inc. * | | 51,271 | | 881,861 |
| |
|
| | | | | 1,460,655 |
| Automobiles - 1.28% | | | | |
| Rush Enterprises, Inc., Class A * | | 19,628 | | 343,490 |
The accompanying notes are an integral part of the financial statements. 345
John Hancock Funds II
Portfolio of investments — August 31, 2006
(showing percentage of total net assets) |
| Small Cap Opportunities Fund (continued) | |
| | Shares or | | |
| | Principal | | |
| | Amount | | Value |
|
|
| |
| COMMON STOCKS (continued) | | | |
| Automobiles (continued) | | | |
| United Auto Group, Inc. (a) | 138,014 | $ | 2,818,246 |
|
|
| | | | 3,161,736 |
| Banking - 3.65% | | | |
| Bank of the Ozarks, Inc. (a) | 39,745 | | 1,268,660 |
| Capitol Bancorp, Ltd. | 13,700 | | 577,729 |
| First Midwest BanCorp, Inc., Illinois | 33,000 | | 1,232,550 |
| IBERIABANK Corp. | 23,000 | | 1,340,900 |
| Mercantile Bank Corp. | 28,900 | | 1,171,028 |
| Sterling Financial Corp., Spokane | 36,500 | | 1,206,690 |
| SVB Financial Group * | 23,100 | | 1,043,889 |
| UCBH Holdings, Inc. | 40,000 | | 725,600 |
| Wintrust Financial Corp. | 8,800 | | 442,728 |
|
|
| | | | 9,009,774 |
| Biotechnology - 0.54% | | | |
| Techne Corp. * | 26,200 | | 1,333,580 |
| Building Materials & Construction - 1.70% | | | |
| Builders FirstSource, Inc. * (a) | 196,149 | | 2,981,465 |
| Eagle Materials, Inc. | 34,240 | | 1,227,504 |
|
|
| | | | 4,208,969 |
| Business Services - 0.84% | | | |
| SRA International, Inc., Class A * (a) | 73,700 | | 2,064,337 |
| Computers & Business Equipment - 3.96% | | | |
| CACI International, Inc., Class A * | 46,592 | | 2,472,171 |
| Digi International, Inc. * | 239,402 | | 3,174,471 |
| Komag, Inc. * (a) | 45,100 | | 1,621,796 |
| Sonic Solutions * (a) | 168,105 | | 2,523,256 |
|
|
| | | | 9,791,694 |
| Construction & Mining Equipment - 1.48% | | | |
| Pason Systems, Inc. | 245,672 | | 3,667,376 |
| Construction Materials - 0.71% | | | |
| Universal Forest Products, Inc. (a) | 35,818 | | 1,746,486 |
| Crude Petroleum & Natural Gas - 1.08% | | | |
| Cimarex Energy Company (a) | 41,400 | | 1,585,620 |
| Unit Corp. * | 20,631 | | 1,087,460 |
|
|
| | | | 2,673,080 |
| Domestic Oil - 1.22% | | | |
| Brigham Exploration Company * (a) | 130,157 | | 915,004 |
| Oil States International, Inc. * (a) | 65,876 | | 2,105,397 |
|
|
| | | | 3,020,401 |
| Drugs & Health Care - 1.31% | | | |
| Qiagen NV * (a) | 124,400 | | 1,798,824 |
| West Pharmaceutical Services, Inc. | 36,300 | | 1,448,733 |
|
|
| | | | 3,247,557 |
| Electrical Equipment - 2.83% | | | |
| AMETEK, Inc. | 99,295 | | 4,257,770 |
| FLIR Systems, Inc. * (a) | 98,700 | | 2,733,990 |
|
|
| | | | 6,991,760 |
| Electrical Utilities - 0.60% | | | |
| Allete, Inc. | 24,041 | | 1,104,443 |
| Small Cap Opportunities Fund (continued) | |
| | Shares or | | |
| | Principal | | |
| | Amount | | Value |
|
|
| |
| COMMON STOCKS (continued) | | | |
| Electrical Utilities (continued) | | | |
| Pike Electric Corp. * | 21,400 | $ | 375,356 |
|
|
| | | | 1,479,799 |
| Electronics - 0.95% | | | |
| NAM TAI Electronics, Inc. | 64,200 | | 962,358 |
| TTM Technologies, Inc. * | 108,732 | | 1,398,293 |
|
|
| | | | 2,360,651 |
| Energy - 2.68% | | | |
| Headwaters, Inc. * (a) | 50,318 | | 1,113,034 |
| New Jersey Resources Corp. | 28,445 | | 1,412,579 |
| Southwestern Energy Company * | 119,146 | | 4,092,665 |
|
|
| | | | 6,618,278 |
| Financial Services - 4.08% | | | |
| Accredited Home Lenders Holding Company * (a) | 82,840 | | 2,645,081 |
| Affiliated Managers Group, Inc. * (a) | 48,320 | | 4,471,050 |
| Commercial Capital Bancorp, Inc. | 100,280 | | 1,593,449 |
| Harbor Florida Bancshares, Inc. | 31,100 | | 1,377,419 |
|
|
| | | | 10,086,999 |
| Gas & Pipeline Utilities - 0.15% | | | |
| Atlas Pipeline Partners, L.P. | 8,700 | | 378,450 |
| Healthcare Products - 2.45% | | | |
| American Medical Systems Holdings, Inc. * (a) | 82,600 | | 1,450,456 |
| Orthofix International NV * | 24,734 | | 971,799 |
| Polymedica Corp. (a) | 55,716 | | 2,261,512 |
| Respironics, Inc. * | 37,176 | | 1,372,166 |
|
|
| | | | 6,055,933 |
| Homebuilders - 2.82% | | | |
| Beazer Homes USA, Inc. (a) | 23,200 | | 934,960 |
| Meritage Homes Corp. * (a) | 66,300 | | 2,714,985 |
| Ryland Group, Inc. (a) | 77,712 | | 3,315,971 |
|
|
| | | | 6,965,916 |
| Household Appliances - 1.16% | | | |
| Drew Industries, Inc. * (a) | 109,344 | | 2,854,972 |
| Household Products - 1.04% | | | |
| Tempur-Pedic International, Inc. * (a) | 160,348 | | 2,573,585 |
| Industrial Machinery - 4.60% | | | |
| Actuant Corp., Class A (a) | 52,257 | | 2,356,791 |
| Ceradyne, Inc. * (a) | 89,612 | | 3,949,201 |
| FMC Technologies, Inc. * | 20,983 | | 1,234,220 |
| Rush Enterprises, Inc., Class B * | 94,165 | | 1,541,481 |
| The Middleby Corp. * (a) | 29,256 | | 2,297,766 |
|
|
| | | | 11,379,459 |
| Insurance - 3.42% | | | |
| American Equity Investment Life Holding | | | |
| Company (a) | 64,700 | | 748,579 |
| Aspen Insurance Holdings, Ltd. | 86,610 | | 2,141,865 |
| Assured Guaranty, Ltd. (a) | 54,153 | | 1,448,593 |
| Hub International, Ltd. | 53,023 | | 1,518,579 |
| Max Re Capital, Ltd. | 44,200 | | 1,025,882 |
The accompanying notes are an integral part of the financial statements. 346
John Hancock Funds II
Portfolio of investments — August 31, 2006
(showing percentage of total net assets) |
| Small Cap Opportunities Fund (continued) | |
| | Shares or | | |
| | Principal | | |
| | Amount | | Value |
|
|
| |
| COMMON STOCKS (continued) | | | |
| Insurance (continued) | | | |
| Triad Guaranty, Inc. * (a) | 31,143 | $ | 1,565,558 |
|
|
| | | | 8,449,056 |
| Internet Service Provider - 1.34% | | | |
| NETGEAR, Inc. * (a) | 126,748 | | 2,493,133 |
| Tom Online, Inc., ADR * (a) | 61,100 | | 823,017 |
|
|
| | | | 3,316,150 |
| Leisure Time - 1.18% | | | |
| Penn National Gaming, Inc. * | 87,949 | | 2,912,871 |
| Manufacturing - 2.11% | | | |
| Carlisle Companies, Inc. | 40,655 | | 3,476,003 |
| Raven Industries, Inc. (a) | 62,526 | | 1,746,351 |
|
|
| | | | 5,222,354 |
| Medical-Hospitals - 0.73% | | | |
| VCA Antech, Inc. * | 50,868 | | 1,801,745 |
| Metal & Metal Products - 1.66% | | | |
| Quanex Corp. (a) | 62,950 | | 2,161,073 |
| Reliance Steel & Aluminum Company | 59,484 | | 1,949,291 |
|
|
| | | | 4,110,364 |
| Mining - 1.35% | | | |
| AMCOL International Corp. (a) | 143,710 | | 3,336,946 |
| Mobile Homes - 2.14% | | | |
| Thor Industries, Inc. (a) | 79,078 | | 3,335,510 |
| Winnebago Industries, Inc. (a) | 66,573 | | 1,943,932 |
|
|
| | | | 5,279,442 |
| Petroleum Services - 1.89% | | | |
| Core Laboratories N.V. * | 34,466 | | 2,528,770 |
| TETRA Technologies, Inc. * | 77,360 | | 2,151,382 |
|
|
| | | | 4,680,152 |
| Real Estate - 19.84% | | | |
| Aames Investment Corp., REIT (a) | 332,447 | | 1,333,113 |
| American Home Mortgage Investment Corp., | | | |
| REIT (a) | 171,543 | | 5,437,913 |
| Anthracite Capital, Inc., REIT | 92,756 | | 1,191,915 |
| Ashford Hospitality Trust, Inc., REIT | 261,889 | | 3,134,811 |
| BioMed Realty Trust, Inc., REIT | 41,000 | | 1,276,740 |
| Corporate Office Properties Trust, REIT | 59,547 | | 2,796,923 |
| Equity One, Inc., REIT (a) | 94,073 | | 2,365,936 |
| FBR Capital Markets Corp., REIT * | 89,200 | | 1,338,000 |
| First Potomac Realty Trust, REIT | 58,800 | | 1,823,388 |
| Gramercy Captial Corp., REIT | 69,604 | | 1,886,268 |
| HomeBanc Corp., Georgia, REIT (a) | 143,700 | | 962,790 |
| Jer Investors Trust, Inc., REIT | 167,548 | | 2,796,376 |
| KKR Financial Corp., REIT | 185,137 | | 4,426,626 |
| LaSalle Hotel Properties, REIT | 79,180 | | 3,479,169 |
| Luminent Mortgage Capital, Inc., REIT | 118,611 | | 1,201,529 |
| New Century Financial Corp., REIT (a) | 64,102 | | 2,481,388 |
| Newcastle Investment Corp., REIT | 156,565 | | 4,299,275 |
| RAIT Investment Trust, REIT | 114,143 | | 3,193,721 |
| Redwood Trust, Inc., REIT | 53,846 | | 2,619,070 |
| Small Cap Opportunities Fund (continued) | |
| | | Shares or | | |
| | | Principal | | |
| | | Amount | | Value |
|
|
| |
| COMMON STOCKS (continued) | | | | |
| Real Estate (continued) | | | | |
| Saxon Capital, Inc., REIT (a) | | 70,100 | $ | 975,091 |
|
|
| | | | | 49,020,042 |
| Retail Grocery - 1.04% | | | | |
| Ruddick Corp. (a) | | 47,871 | | 1,234,593 |
| United Natural Foods, Inc. * (a) | | 45,745 | | 1,328,892 |
|
|
| | | | | 2,563,485 |
| Retail Trade - 2.39% | | | | |
| Cabela's, Inc. * (a) | | 88,340 | | 1,773,867 |
| First Cash Financial Services, Inc. * | | 137,972 | | 2,873,957 |
| Tractor Supply Company * | | 29,600 | | 1,260,368 |
|
|
| | | | | 5,908,192 |
| Semiconductors - 1.51% | | | | |
| Diodes, Inc. * (a) | | 96,396 | | 3,609,066 |
| Silicon Motion Technology Corp. * | | 9,100 | | 134,680 |
|
|
| | | | | 3,743,746 |
| Software - 0.54% | | | | |
| Websense, Inc. * | | 64,034 | | 1,323,583 |
| Steel - 0.50% | | | | |
| NS Group, Inc. * | | 27,400 | | 1,247,248 |
| Telecommunications Equipment & | | | | |
| Services - 1.42% | | | | |
| DataPath, Inc. * | | 100,900 | | 1,109,900 |
| J2 Global Communications, Inc. * (a) | | 95,200 | | 2,392,376 |
|
|
| | | | | 3,502,276 |
| Trucking & Freight - 4.06% | | | | |
| Landstar Systems, Inc. | | 61,968 | | 2,646,033 |
| Old Dominion Freight Lines, Inc. * | | 115,487 | | 3,686,345 |
| Oshkosh Truck Corp. | | 71,434 | | 3,693,138 |
|
|
| | | | | 10,025,516 |
|
| TOTAL COMMON STOCKS (Cost $217,148,772) | | $ | 232,331,066 |
|
| |
| SHORT TERM INVESTMENTS - 25.68% | | | | |
| State Street Navigator Securities | | | | |
| Lending Prime Portfolio (c) | $ | 63,456,325 | $ | 63,456,325 |
|
| TOTAL SHORT TERM INVESTMENTS | | | | |
| (Cost $63,456,325) | | | $ | 63,456,325 |
|
| |
| REPURCHASE AGREEMENTS - 6.47% | | | | |
| Repurchase Agreement with State | | | | |
| Street Corp. dated 08/31/2006 at | | | | |
| 3.95% to be repurchased at | | | | |
| $15,997,755 on 9/1/2006, | | | | |
| collateralized by $16,780,000 | | | | |
| Federal National Mortgage | | | | |
| Association, 5.70% due | | | | |
| 03/27/2023 (valued at | | | | |
| $16,318,550, including interest) (c) | $ | 15,996,000 | $ | 15,996,000 |
|
| TOTAL REPURCHASE AGREEMENTS | | | | |
| (Cost $15,996,000) | | | $ | 15,996,000 |
|
The accompanying notes are an integral part of the financial statements. 347
John Hancock Funds II
Portfolio of investments — August 31, 2006
(showing percentage of total net assets) |
| Total Investments (Small Cap Opportunities Fund) | | |
| (Cost $296,601,097) - 126.16% | | $ | 311,783,391 |
| Liabilities in Excess of Other Assets - (26.16)% | | | (64,651,866 |
|
|
| TOTAL NET ASSETS - 100.00% | | $ | 247,131,525 |
|
|
| |
| |
| Small Company Fund | | | |
| | Shares or | | |
| | Principal | | |
| | Amount | | Value |
|
|
| |
| COMMON STOCKS - 99.90% | | | |
| Aerospace - 0.51% | | | |
| Alliant Techsystems, Inc. * (a) | 2,927 | $ | 223,886 |
| Armor Holdings, Inc. * (a) | 2,779 | | 146,926 |
| Teledyne Technologies, Inc. * | 2,714 | | 104,055 |
|
|
| | | | 474,867 |
| Agriculture - 0.89% | | | |
| Delta & Pine Land Company | 20,541 | | 831,089 |
| Air Travel - 0.36% | | | |
| Frontier Airlines Holdings, Inc. * (a) | 6,954 | | 48,261 |
| Mesa Air Group, Inc. * (a) | 5,537 | | 43,742 |
| SkyWest, Inc. (a) | 9,915 | | 239,646 |
|
|
| | | | 331,649 |
| Apparel & Textiles - 3.01% | | | |
| Brown Shoe, Inc. (a) | 33,408 | | 1,067,386 |
| DHB Industries, Inc. * (a) | 17,669 | | 48,590 |
| Kellwood Company (a) | 20,674 | | 566,674 |
| Mothers Work, Inc. * | 2,206 | | 84,291 |
| Perry Ellis International, Inc. * (a) | 1,531 | | 41,276 |
| The Gymboree Corp. * | 30,024 | | 1,007,305 |
|
|
| | | | 2,815,522 |
| Auto Parts - 1.14% | | | |
| Accuride Corp. * (a) | 11,298 | | 123,261 |
| ArvinMeritor, Inc. (a) | 63,580 | | 944,163 |
|
|
| | | | 1,067,424 |
| Automobiles - 1.21% | | | |
| Group 1 Automotive, Inc. (a) | 24,872 | | 1,126,702 |
| Banking - 6.44% | | | |
| BancFirst Corp. | 3,110 | | 147,321 |
| Bank of Hawaii Corp. | 18,791 | | 917,377 |
| BankUnited Financial Corp., Class A | 3,776 | | 97,307 |
| Center Financial Corp. (a) | 4,417 | | 107,775 |
| City Bank Lynnwood WA | 356 | | 18,110 |
| City National Corp. | 8,606 | | 566,275 |
| Columbia Banking System, Inc. (a) | 506 | | 15,828 |
| Commerce Bancshares, Inc. | 7,168 | | 359,260 |
| Community Trust Bancorp, Inc. (a) | 488 | | 18,749 |
| Corus Bankshares, Inc. (a) | 43,518 | | 949,128 |
| Cullen Frost Bankers, Inc. (a) | 3,947 | | 232,715 |
| Downey Financial Corp. (a) | 14,985 | | 919,929 |
| Financial Institutions, Inc. | 957 | | 23,906 |
| First Citizens Bancshares, Inc. | 733 | | 143,521 |
| First Regional Bancorp * | 2,652 | | 74,919 |
| FirstFed Financial Corp. * (a) | 14,472 | | 736,046 |
| Greater Bay Bancorp | 1,076 | | 30,634 |
| Hancock Holding Company (a) | 934 | | 48,418 |
| Intervest Bancshares Corp. * (a) | 3,863 | | 162,323 |
| Small Company Fund (continued) | | |
| | Shares or | | |
| | Principal | | |
| | Amount | | Value |
|
|
| |
| COMMON STOCKS (continued) | | | |
| Banking (continued) | | | |
| ITLA Capital Corp. | 349 | $ | 18,305 |
| Nara Bancorp, Inc. (a) | 930 | | 17,205 |
| Pacific Capital Bancorp | 6,407 | | 179,140 |
| Preferred Bank, Los Angeles, CA | 751 | | 42,093 |
| Trustmark Corp. (a) | 2,373 | | 74,916 |
| Whitney Holding Corp. | 1,574 | | 55,357 |
| Wilmington Trust Corp. (a) | 1,424 | | 62,727 |
|
|
| | | | 6,019,284 |
| Biotechnology - 0.02% | | | |
| Cephalon, Inc. * (a) | 352 | | 20,071 |
| Broadcasting - 0.18% | | | |
| New Frontier Media, Inc. * | 2,419 | | 20,295 |
| Sinclair Broadcast Group, Inc., Class A (a) | 18,544 | | 143,160 |
|
|
| | | | 163,455 |
| Building Materials & Construction - 1.47% | | | |
| BlueLinx Holdings, Inc. (a) | 25,205 | | 266,417 |
| EMCOR Group, Inc. * (a) | 19,952 | | 1,106,139 |
|
|
| | | | 1,372,556 |
| Business Services - 5.22% | | | |
| Acxiom Corp. | 41,582 | | 1,010,027 |
| Arbinet-Thexchange, Inc. * | 6,693 | | 34,067 |
| Convergys Corp. * | 4,155 | | 86,715 |
| CSG Systems International, Inc. * | 1,697 | | 45,683 |
| Dun & Bradstreet Corp. * | 561 | | 39,444 |
| Ezcorp, Inc., Class A * (a) | 542 | | 21,284 |
| Global Payments, Inc. | 34,637 | | 1,317,938 |
| ICT Group, Inc. * (a) | 3,265 | | 94,522 |
| John H. Harland Company (a) | 26,396 | | 986,154 |
| Kforce, Inc. * | 6,881 | | 84,705 |
| Labor Ready, Inc. * (a) | 7,276 | | 124,638 |
| Rewards Network, Inc. * (a) | 29,456 | | 128,134 |
| Sotheby's Holdings, Inc., Class A | 1,243 | | 34,555 |
| Spherion Corp. * (a) | 12,310 | | 91,956 |
| Standard Parking Corp. * (a) | 2,403 | | 81,462 |
| Volt Information Sciences, Inc. * (a) | 16,329 | | 696,269 |
|
|
| | | | 4,877,553 |
| Cable and Television - 0.20% | | | |
| LodgeNet Entertainment Corp. * (a) | 9,812 | | 186,526 |
| Cellular Communications - 0.34% | | | |
| Tessco Technologies, Inc. * | 6,235 | | 145,899 |
| USA Mobility, Inc. * (a) | 7,453 | | 170,301 |
|
|
| | | | 316,200 |
| Chemicals - 3.69% | | | |
| Celanese Corp., Series A | 49,097 | | 907,803 |
| FMC Corp. | 5,172 | | 316,113 |
| Georgia Gulf Corp. (a) | 6,351 | | 168,556 |
| OM Group, Inc. * (a) | 17,441 | | 697,640 |
| Pioneer Companies, Inc. * (a) | 9,145 | | 222,772 |
| PolyOne Corp. * | 3,315 | | 28,741 |
| Sensient Technologies Corp. | 15,644 | | 314,757 |
The accompanying notes are an integral part of the financial statements. 348
John Hancock Funds II
Portfolio of investments — August 31, 2006
(showing percentage of total net assets) |
| Small Company Fund (continued) | | |
| | Shares or | | |
| | Principal | | |
| | Amount | | Value |
|
|
| |
| COMMON STOCKS (continued) | | | |
| Chemicals (continued) | | | |
| Westlake Chemical Corp. (a) | 26,524 | $ | 794,659 |
|
|
| | | | 3,451,041 |
| Coal - 0.29% | | | |
| Massey Energy Company (a) | 10,613 | | 267,872 |
| Commercial Services - 0.30% | | | |
| Vertrue, Inc. * (a) | 6,582 | | 279,011 |
| Computers & Business Equipment - 4.24% | | | |
| Agilysys, Inc. (a) | 29,405 | | 397,556 |
| Brocade Communications Systems, Inc. * (a) | 39,403 | | 244,298 |
| Gerber Scientific, Inc. * | 1,257 | | 19,383 |
| Komag, Inc. * (a) | 31,325 | | 1,126,447 |
| MTS Systems Corp. (a) | 9,375 | | 314,719 |
| Plexus Corp. * | 45,212 | | 896,102 |
| Sybase, Inc. * (a) | 29,822 | | 687,993 |
| Sykes Enterprises, Inc. * | 13,781 | | 277,136 |
|
|
| | | | 3,963,634 |
| Construction & Mining Equipment - 0.04% | | | |
| Matrix Service Company * | 2,945 | | 38,845 |
| Construction Materials - 1.08% | | | |
| Applied Industrial Technologies, Inc. (a) | 11,733 | | 265,283 |
| Regal-Beloit Corp. | 1,607 | | 69,358 |
| Universal Forest Products, Inc. (a) | 12,328 | | 601,113 |
| USG Corp. * (a) | 1,470 | | 74,970 |
|
|
| | | | 1,010,724 |
| Crude Petroleum & Natural Gas - 1.13% | | | |
| Harvest Natural Resources, Inc. * (a) | 52,550 | | 672,115 |
| Penn Virginia Corp. (a) | 300 | | 21,297 |
| Pogo Producing Company (a) | 5,640 | | 250,472 |
| Swift Energy Company * (a) | 2,596 | | 113,601 |
|
|
| | | | 1,057,485 |
| Domestic Oil - 2.73% | | | |
| Frontier Oil Corp. | 48,241 | | 1,577,481 |
| Holly Corp. | 1,603 | | 73,449 |
| St. Mary Land & Exploration Company | 22,106 | | 901,925 |
|
|
| | | | 2,552,855 |
| Drugs & Health Care - 2.63% | | | |
| Alliance Imaging, Inc. * (a) | 12,453 | | 80,695 |
| Alpharma Inc., Class A (a) | 15,041 | | 314,959 |
| Candela Corp. * (a) | 12,854 | | 134,067 |
| ImClone Systems, Inc. * (a) | 22,258 | | 665,514 |
| Molina Healthcare, Inc. * | 10,694 | | 396,106 |
| Nutraceutical International Corp. * | 9,367 | | 131,325 |
| Pain Therapeutics, Inc. * (a) | 10,243 | | 82,968 |
| Savient Pharmaceuticals, Inc. * | 2,860 | | 18,533 |
| Vital Signs, Inc. | 1,322 | | 71,719 |
| West Pharmaceutical Services, Inc. | 14,163 | | 565,245 |
|
|
| | | | 2,461,131 |
| Electrical Equipment - 1.95% | | | |
| A.O. Smith Corp. | 25,912 | | 1,039,330 |
| Small Company Fund (continued) | | |
| | Shares or | | |
| | Principal | | |
| | Amount | | Value |
|
|
| |
| COMMON STOCKS (continued) | | | |
| Electrical Equipment (continued) | | | |
| American Science & Engineering, Inc. * (a) | 4,173 | $ | 191,791 |
| Littelfuse, Inc. * | 4,232 | | 152,818 |
| Wesco International, Inc. * (a) | 7,544 | | 441,324 |
|
|
| | | | 1,825,263 |
| Electrical Utilities - 0.45% | | | |
| Pepco Holdings, Inc. (a) | 4,119 | | 104,581 |
| Unisource Energy Corp. | 9,192 | | 317,216 |
|
|
| | | | 421,797 |
| Electronics - 2.48% | | | |
| Ansoft Corp. * | 4,074 | | 97,939 |
| Arrow Electronics, Inc. * (a) | 16,418 | | 458,062 |
| AVX Corp. (a) | 5,359 | | 89,013 |
| Mentor Graphics Corp. * | 1,272 | | 18,444 |
| Merix Corp. * | 8,714 | | 105,701 |
| Planar Systems, Inc. * (a) | 17,755 | | 174,532 |
| Teleflex, Inc. | 10,041 | | 560,388 |
| TTM Technologies, Inc. * (a) | 16,342 | | 210,158 |
| Zoran Corp. * | 25,950 | | 462,429 |
| Zygo Corp. * | 10,528 | | 140,128 |
|
|
| | | | 2,316,794 |
| Energy - 1.62% | | | |
| Energen Corp. | 30,975 | | 1,351,749 |
| New Jersey Resources Corp. | 3,271 | | 162,438 |
|
|
| | | | 1,514,187 |
| Financial Services - 2.75% | | | |
| Calamos Asset Management, Inc. (a) | 7,947 | | 208,370 |
| City Holding Company (a) | 4,346 | | 171,146 |
| IndyMac Bancorp, Inc. | 19,462 | | 760,964 |
| Ocwen Financial Corp. * (a) | 62,208 | | 917,568 |
| SWS Group, Inc. (a) | 11,809 | | 290,502 |
| Taylor Capital Group, Inc. (a) | 866 | | 25,469 |
| World Acceptance Corp. * (a) | 4,955 | | 198,051 |
|
|
| | | | 2,572,070 |
| Food & Beverages - 2.93% | | | |
| Coca-Cola Bottling Company | 326 | | 19,104 |
| Del Monte Foods Company | 78,755 | | 874,180 |
| Domino's Pizza, Inc. | 37,933 | | 927,462 |
| M & F Worldwide Corp. * | 9,911 | | 158,477 |
| Seabord Corp. (a) | 445 | | 623,000 |
| Spartan Stores, Inc. | 7,496 | | 135,153 |
|
|
| | | | 2,737,376 |
| Furniture & Fixtures - 0.07% | | | |
| American Woodmark Corp. (a) | 1,999 | | 63,028 |
| Gas & Pipeline Utilities - 1.03% | | | |
| UGI Corp. | 35,579 | | 882,359 |
| Vectren Corp. | 2,825 | | 77,857 |
|
|
| | | | 960,216 |
| Healthcare Products - 3.54% | | | |
| Bruker BioSciences Corp. * | 6,016 | | 42,473 |
| Cantel Medical Corp. * (a) | 11,181 | | 157,988 |
The accompanying notes are an integral part of the financial statements. 349
John Hancock Funds II
Portfolio of investments — August 31, 2006
(showing percentage of total net assets) |
| Small Company Fund (continued) | | |
| | Shares or | | |
| | Principal | | |
| | Amount | | Value |
|
|
| |
| COMMON STOCKS (continued) | | | |
| Healthcare Products (continued) | | | |
| Dade Behring Holdings, Inc. | 23,556 | $ | 953,782 |
| Edwards Lifesciences Corp. * | 405 | | 18,909 |
| Haemonetics Corp. * | 1,487 | | 69,264 |
| Health Tronics, Inc. * (a) | 6,502 | | 42,783 |
| Henry Schein, Inc. * | 451 | | 22,491 |
| ICU Medical, Inc. * (a) | 3,488 | | 153,507 |
| IDEXX Laboratories, Inc. * (a) | 1,636 | | 150,528 |
| Kinetic Concepts, Inc. * | 15,651 | | 494,572 |
| Molecular Devices Corp. * (a) | 8,683 | | 208,479 |
| PSS World Medical, Inc. * (a) | 19,599 | | 380,221 |
| SurModics, Inc. * (a) | 3,814 | | 133,414 |
| USANA Health Sciences, Inc. * (a) | 1,721 | | 77,032 |
| Zoll Medical Corp. * (a) | 10,704 | | 405,789 |
|
|
| | | | 3,311,232 |
| Healthcare Services - 4.04% | | | |
| Air Methods Corp. * (a) | 1,326 | | 30,896 |
| Magellan Health Services, Inc. * | 10,271 | | 493,727 |
| Palomar Medical Technologies, Inc. * (a) | 8,043 | | 319,307 |
| Sierra Health Services, Inc. * (a) | 40,015 | | 1,716,644 |
| Wellcare Health Plans, Inc. * (a) | 21,553 | | 1,208,692 |
|
|
| | | | 3,769,266 |
| Holdings Companies/Conglomerates - 0.09% | | | |
| PICO Holdings, Inc. * | 1,386 | | 46,971 |
| United Industrial Corp. (a) | 742 | | 39,972 |
|
|
| | | | 86,943 |
| Homebuilders - 0.90% | | | |
| NVR, Inc. * (a) | 1,642 | | 843,413 |
| Hotels & Restaurants - 2.20% | | | |
| Interstate Hotels & Resorts, Inc. * | 58,066 | | 603,306 |
| Luby's Cafeterias, Inc. * | 17,008 | | 161,746 |
| Marcus Corp. | 8,786 | | 180,728 |
| Papa Johns International, Inc. * (a) | 32,578 | | 1,107,652 |
|
|
| | | | 2,053,432 |
| Industrial Machinery - 2.92% | | | |
| Cummins, Inc. (a) | 12,820 | | 1,471,993 |
| EnPro Industries, Inc. * (a) | 4,507 | | 141,700 |
| Flow International Corp. * (a) | 30,221 | | 397,708 |
| Gardner Denver, Inc. * | 8,868 | | 318,982 |
| Manitowoc, Inc. (a) | 5,475 | | 241,995 |
| The Middleby Corp. * | 1,959 | | 153,860 |
|
|
| | | | 2,726,238 |
| Industrials - 0.69% | | | |
| Crane Company | 16,065 | | 642,279 |
| Insurance - 3.17% | | | |
| American Financial Group, Inc. (a) | 12,877 | | 601,614 |
| FPIC Insurance Group, Inc. * (a) | 1,803 | | 74,356 |
| Harleysville Group, Inc. | 3,281 | | 118,083 |
| LandAmerica Financial Group, Inc. (a) | 20,852 | | 1,318,681 |
| Philadelphia Consolidated Holding Corp. * | 2,796 | | 101,103 |
| Protective Life Corp. | 5,767 | | 265,455 |
| Small Company Fund (continued) | | |
| | Shares or | | |
| | Principal | | |
| | Amount | | Value |
|
|
| |
| COMMON STOCKS (continued) | | | |
| Insurance (continued) | | | |
| Safety Insurance Group, Inc. (a) | 6,829 | $ | 351,147 |
| Selective Insurance Group, Inc. (a) | 2,564 | | 133,379 |
|
|
| | | | 2,963,818 |
| Internet Content - 0.27% | | | |
| TheStreet.com, Inc. (a) | 23,810 | | 256,196 |
| Internet Service Provider - 0.48% | | | |
| TriZetto Group, Inc. * (a) | 11,849 | | 162,568 |
| United Online, Inc. (a) | 24,545 | | 281,531 |
|
|
| | | | 444,099 |
| Internet Software - 0.81% | | | |
| RealNetworks, Inc. * (a) | 68,425 | | 754,728 |
| Leisure Time - 0.28% | | | |
| Handleman Company (a) | 4,555 | | 31,748 |
| Monarch Casino & Resort, Inc. * (a) | 1,899 | | 36,024 |
| Regal Entertainment Group, Class A | 3,155 | | 62,248 |
| Steinway Musical Instruments, Inc. * (a) | 4,953 | | 126,896 |
|
|
| | | | 256,916 |
| Manufacturing - 0.71% | | | |
| Mettler-Toledo International, Inc. * | 10,813 | | 658,944 |
| Metal & Metal Products - 0.43% | | | |
| Metal Management, Inc. | 13,671 | | 349,704 |
| Quanex Corp. | 1 | | 17 |
| Shiloh Industries, Inc * | 4,016 | | 55,582 |
|
|
| | | | 405,303 |
| Office Furnishings & Supplies - 0.28% | | | |
| CompX International, Inc. (a) | 1,227 | | 19,693 |
| Global Imaging Systems, Inc. * | 5,005 | | 109,760 |
| OfficeMax, Inc. (a) | 3,084 | | 128,078 |
|
|
| | | | 257,531 |
| Petroleum Services - 3.41% | | | |
| Core Laboratories N.V. * | 254 | | 18,636 |
| Grey Wolf, Inc. * (a) | 67,973 | | 496,883 |
| Lone Star Technologies, Inc. * | 3,940 | | 178,600 |
| McDermott International, Inc. * | 25,444 | | 1,226,401 |
| SEACOR SMIT, Inc. * (a) | 3,663 | | 318,791 |
| Seitel, Inc. * | 113,586 | | 445,257 |
| Tesoro Petroleum Corp. | 7,776 | | 502,407 |
|
|
| | | | 3,186,975 |
| Pharmaceuticals - 1.97% | | | |
| Alkermes, Inc. * (a) | 50,569 | | 826,803 |
| Bradley Pharmaceuticals, Inc., Class A * | 2,989 | | 44,267 |
| King Pharmaceuticals, Inc. * (a) | 58,109 | | 942,528 |
| Watson Pharmaceuticals, Inc. * | 864 | | 22,153 |
|
|
| | | | 1,835,751 |
| Photography - 0.20% | | | |
| CPI Corp. | 4,611 | | 181,812 |
| Plastics - 0.21% | | | |
| Spartech Corp. | 8,854 | | 199,481 |
The accompanying notes are an integral part of the financial statements. 350
John Hancock Funds II
Portfolio of investments — August 31, 2006
(showing percentage of total net assets) |
| Small Company Fund (continued) | | |
| | Shares or | | |
| | Principal | | |
| | Amount | | Value |
|
|
| |
| COMMON STOCKS (continued) | | | |
| Publishing - 1.60% | | | |
| Consolidated Graphics, Inc. * | 10,971 | $ | 682,177 |
| John Wiley & Sons, Inc., Class A | 5,954 | | 205,413 |
| Warner Music Group Corp. | 24,223 | | 604,121 |
|
|
| | | | 1,491,711 |
| Railroads & Equipment - 0.40% | | | |
| Kansas City Southern * (a) | 14,007 | | 369,084 |
| Real Estate - 3.12% | | | |
| CBL & Associates Properties, Inc., REIT (a) | 17,813 | | 725,702 |
| FelCor Lodging Trust, Inc., REIT (a) | 6,110 | | 131,060 |
| Mission West Properties, Inc., REIT | 6,206 | | 67,335 |
| New Century Financial Corp., REIT (a) | 5,220 | | 202,066 |
| NorthStar Realty Finance Corp., REIT | 51,779 | | 620,830 |
| Saul Centers, Inc., REIT (a) | 1,632 | | 71,253 |
| Taubman Centers, Inc., REIT | 27,286 | | 1,099,353 |
|
|
| | | | 2,917,599 |
| Retail Trade - 5.36% | | | |
| Big Lots, Inc. * (a) | 16,334 | | 299,729 |
| Bon-Ton Stores, Inc. (a) | 13,699 | | 375,489 |
| Building Materials Holding Corp. (a) | 34,190 | | 893,043 |
| Dollar Tree Stores, Inc. * | 37,331 | | 1,074,386 |
| FTD Group, Inc. * (a) | 2,372 | | 37,596 |
| NBTY, Inc. * | 5,264 | | 167,711 |
| Pantry, Inc. * (a) | 19,199 | | 899,665 |
| Payless ShoeSource, Inc. * | 9,643 | | 226,225 |
| The Dress Barn, Inc. * (a) | 58,672 | | 1,035,561 |
|
|
| | | | 5,009,405 |
| Semiconductors - 1.92% | | | |
| Amkor Technology, Inc. * | 18,364 | | 104,124 |
| Kulicke & Soffa Industries, Inc. * (a) | 29,979 | | 235,934 |
| MKS Instruments, Inc. * | 23,681 | | 494,696 |
| OmniVision Technologies, Inc. * | 1,293 | | 21,464 |
| ON Semiconductor Corp. * (a) | 155,577 | | 935,018 |
|
|
| | | | 1,791,236 |
| Software - 1.96% | | | |
| Actuate Corp. * (a) | 9,658 | | 36,507 |
| American Reprographics Company * (a) | 966 | | 29,482 |
| Aspen Technology, Inc. * (a) | 50,374 | | 562,174 |
| DucoCorp, Inc. * | 2,500 | | 20,000 |
| InfoUSA, Inc. * | 1,432 | | 11,828 |
| Interactive Intelligence, Inc. * | 1,517 | | 17,582 |
| MicroStrategy, Inc., Class A * (a) | 12,016 | | 1,095,859 |
| SPSS, Inc. * | 1,243 | | 31,535 |
| VeriFone Holdings, Inc. * | 1,151 | | 26,646 |
|
|
| | | | 1,831,613 |
| Steel - 2.61% | | | |
| AK Steel Holding Corp. * | 19,281 | | 243,133 |
| Chaparral Steel Company * (a) | 4,697 | | 335,460 |
| Novamerican Steel, Inc * | 2,209 | | 71,704 |
| Olympic Steel, Inc. (a) | 15,376 | | 425,146 |
| Ryerson, Inc. (a) | 16,408 | | 347,522 |
| Small Company Fund (continued) | | |
| | | Shares or | | |
| | | Principal | | |
| | | Amount | | Value |
|
|
| |
| COMMON STOCKS (continued) | | | | |
| Steel (continued) | | | | |
| Steel Dynamics, Inc. (a) | | 19,267 | $ | 1,017,105 |
|
|
| | | | | 2,440,070 |
| Telecommunications Equipment & | | | | |
| Services - 1.28% | | | | |
| CT Communications, Inc. (a) | | 22,208 | | 511,673 |
| InterDigital Communication Corp. * (a) | | 18,336 | | 609,305 |
| Sirenza Microdevices, Inc. * (a) | | 8,226 | | 76,255 |
|
|
| | | | | 1,197,233 |
| Telephone - 0.53% | | | | |
| CenturyTel, Inc. | | 12,417 | | 494,445 |
| Tobacco - 1.24% | | | | |
| Loews Corp. - Carolina Group | | 20,299 | | 1,162,321 |
| Toys, Amusements & Sporting Goods - 0.78% | | | |
| Jakks Pacific, Inc. * (a) | | 44,569 | | 728,257 |
| Transportation - 0.46% | | | | |
| Bristow Group, Inc. * | | 4,105 | | 153,157 |
| Kirby Corp. * (a) | | 9,411 | | 276,025 |
|
|
| | | | | 429,182 |
| Trucking & Freight - 1.64% | | | | |
| Arkansas Best Corp. (a) | | 4,626 | | 204,238 |
| EGL, Inc. * (a) | | 5,671 | | 173,362 |
| Forward Air Corp. (a) | | 5,869 | | 188,630 |
| Heartland Express, Inc. (a) | | 11,106 | | 178,590 |
| Knight Transportation, Inc. (a) | | 10,340 | | 177,745 |
| Landstar Systems, Inc. (a) | | 10,433 | | 445,489 |
| Old Dominion Freight Lines, Inc. * (a) | | 5,261 | | 167,931 |
|
|
| | | | | 1,535,985 |
|
| TOTAL COMMON STOCKS (Cost $92,006,911) | | $ | 93,328,725 |
|
| |
| SHORT TERM INVESTMENTS - 25.06% | | | | |
| State Street Navigator Securities | | | | |
| Lending Prime Portfolio (c) | $ | 23,408,260 | $ | 23,408,260 |
|
| TOTAL SHORT TERM INVESTMENTS | | | | |
| (Cost $23,408,260) | | | $ | 23,408,260 |
|
| |
| REPURCHASE AGREEMENTS - 0.51% | | | | |
| Repurchase Agreement with State | | | | |
| Street Corp. dated 08/31/2006 at | | | | |
| 3.95% to be repurchased at | | | | |
| $481,053 on 9/1/2006, | | | | |
| collateralized by $480,000 Federal | | | | |
| Home Loan Mortgage Corp., | | | | |
| 6.065% due 05/16/2016 (valued at | | | | |
| $492,115, including interest) (c) | $ | 481,000 | $ | 481,000 |
|
| TOTAL REPURCHASE AGREEMENTS | | | | |
| (Cost $481,000) | | | $ | 481,000 |
|
| Total Investments (Small Company Fund) | | | | |
| (Cost $115,896,171) - 125.47% | | | $ | 117,217,985 |
| Liabilities in Excess of Other Assets - (25.47)% | | | (23,792,419) |
|
|
| TOTAL NET ASSETS - 100.00% | | | $ | 93,425,566 |
|
|
The accompanying notes are an integral part of the financial statements. 351
John Hancock Funds II
Portfolio of investments — August 31, 2006
(showing percentage of total net assets) |
| Small Company Growth Fund | | | |
| | Shares or | | |
| | Principal | | |
| | Amount | | Value |
|
|
| |
| COMMON STOCKS - 97.82% | | | |
| Advertising - 1.48% | | | |
| Aquantive, Inc. * | 24,830 | $ | 615,784 |
| ValueClick, Inc. * | 27,057 | | 477,556 |
|
|
| | | | 1,093,340 |
| Aerospace - 0.52% | | | |
| TransDigm Group, Inc. * | 16,852 | | 381,361 |
| Agriculture - 0.76% | | | |
| Delta & Pine Land Company | 13,828 | | 559,481 |
| Apparel & Textiles - 0.99% | | | |
| Joseph A. Bank Clothiers, Inc. * | 10,671 | | 255,357 |
| Warnaco Group, Inc. * | 23,505 | | 473,156 |
|
|
| | | | 728,513 |
| Banking - 4.86% | | | |
| East West Bancorp, Inc. | 18,956 | | 767,718 |
| Greenhill & Company, Inc. | 6,101 | | 335,738 |
| PrivateBancorp, Inc. | 9,055 | | 402,042 |
| SVB Financial Group * | 12,407 | | 560,672 |
| Texas Capital Bancshares, Inc. * | 15,342 | | 304,539 |
| Texas Regional Bancshares, Inc., Class A | 10,044 | | 384,384 |
| UCBH Holdings, Inc. | 32,151 | | 583,219 |
| Virginia Commerce Bancorp, Inc. * | 11,286 | | 250,098 |
|
|
| | | | 3,588,410 |
| Biotechnology - 3.44% | | | |
| Human Genome Sciences, Inc. * | 27,250 | | 306,017 |
| Integra LifeSciences Holdings Corp. * | 14,941 | | 574,631 |
| Millipore Corp. * | 6,486 | | 416,271 |
| Myogen, Inc. * | 8,912 | | 310,138 |
| Myriad Genetics, Inc. * | 19,726 | | 498,871 |
| Nektar Therapeutics * | 24,872 | | 435,757 |
|
|
| | | | 2,541,685 |
| Building Materials & Construction - 0.66% | | | |
| Eagle Materials, Inc. | 13,688 | | 490,715 |
| Business Services - 4.73% | | | |
| CoStar Group, Inc. * | 12,651 | | 509,582 |
| Euronet Worldwide, Inc. * | 19,677 | | 478,151 |
| Global Payments, Inc. | 9,359 | | 356,110 |
| Informatica Corp. * | 40,881 | | 598,498 |
| Jackson Hewitt Tax Service, Inc. | 12,963 | | 409,631 |
| Korn/Ferry International * | 31,341 | | 639,983 |
| MPS Group, Inc. * | 35,784 | | 503,123 |
|
|
| | | | 3,495,078 |
| Computers & Business Equipment - 1.77% | | | |
| Cogent, Inc. * | 21,099 | | 301,294 |
| Kronos, Inc. * | 13,314 | | 406,343 |
| Micros Systems, Inc. * | 12,541 | | 600,212 |
|
|
| | | | 1,307,849 |
| Construction & Mining Equipment - 0.90% | | | |
| Bucyrus International, Inc., Class A | 12,855 | | 663,704 |
| Construction Materials - 1.37% | | | |
| JLG Industries, Inc. | 26,253 | | 458,378 |
| Small Company Growth Fund (continued) | | |
| | Shares or | | |
| | Principal | | |
| | Amount | | Value |
|
|
| |
| COMMON STOCKS (continued) | | | |
| Construction Materials (continued) | | | |
| Regal-Beloit Corp. | 12,920 | $ | 557,627 |
|
|
| | | | 1,016,005 |
| Crude Petroleum & Natural Gas - 2.30% | | | |
| Bill Barrett Corp. * | 16,291 | | 471,136 |
| Hydril * | 8,586 | | 561,954 |
| Unit Corp. * | 12,650 | | 666,781 |
|
|
| | | | 1,699,871 |
| Domestic Oil - 2.00% | | | |
| Encore Aquisition Company * | 20,431 | | 552,658 |
| Range Resources Corp. | 19,152 | | 535,873 |
| Whiting Petroleum Corp. * | 8,667 | | 390,015 |
|
|
| | | | 1,478,546 |
| Drugs & Health Care - 1.15% | | | |
| CV Therapeutics, Inc. * | 13,537 | | 152,291 |
| Mentor Corp. | 14,401 | | 699,025 |
|
|
| | | | 851,316 |
| Electrical Equipment - 3.81% | | | |
| General Cable Corp. * | 19,363 | | 746,056 |
| Sirf Technology Holdings, Inc. * | 21,940 | | 577,680 |
| Varian, Inc. * | 17,250 | | 805,230 |
| Wesco International, Inc. * | 11,723 | | 685,796 |
|
|
| | | | 2,814,762 |
| Electrical Utilities - 0.78% | | | |
| Pike Electric Corp. * | 32,943 | | 577,820 |
| Electronics - 2.22% | | | |
| Thomas & Betts Corp. * | 17,243 | | 778,694 |
| Trimble Navigation, Ltd. * | 17,634 | | 863,536 |
|
|
| | | | 1,642,230 |
| Financial Services - 1.36% | | | |
| Affiliated Managers Group, Inc. * | 7,820 | | 723,585 |
| National Financial Partners Corp. | 7,643 | | 281,415 |
|
|
| | | | 1,005,000 |
| Food & Beverages - 0.66% | | | |
| Performance Food Group Company * | 19,729 | | 485,531 |
| Healthcare Products - 4.76% | | | |
| American Medical Systems Holdings, Inc. * | 32,808 | | 576,109 |
| Cyberonics, Inc. * | 18,544 | | 301,896 |
| Gen-Probe, Inc. * | 11,329 | | 550,703 |
| Kyphon, Inc. * | 10,794 | | 390,851 |
| Nuvasive, Inc. * | 27,705 | | 569,615 |
| The Medicines Company * | 21,108 | | 476,196 |
| Wright Medical Group, Inc. * | 28,483 | | 651,406 |
|
|
| | | | 3,516,776 |
| Healthcare Services - 4.39% | | | |
| Genesis HealthCare Corp. * | 13,149 | | 598,806 |
| Magellan Health Services, Inc. * | 11,628 | | 558,958 |
| Palomar Medical Technologies, Inc. * | 2,608 | | 103,538 |
| Pediatrix Medical Group, Inc. * | 15,193 | | 695,839 |
| Per-Se Technologies, Inc. * | 26,984 | | 614,965 |
The accompanying notes are an integral part of the financial statements. 352
John Hancock Funds II
Portfolio of investments — August 31, 2006
(showing percentage of total net assets) |
| Small Company Growth Fund (continued) | | |
| | Shares or | | |
| | Principal | | |
| | Amount | | Value |
|
|
| |
| COMMON STOCKS (continued) | | | |
| Healthcare Services (continued) | | | |
| The Advisory Board Company * | 13,277 | $ | 674,737 |
|
|
| | | | 3,246,843 |
| Holdings Companies/Conglomerates - 0.79% | | | |
| United Industrial Corp. | 10,811 | | 582,388 |
| Hotels & Restaurants - 4.07% | | | |
| Applebee's International, Inc. | 18,946 | | 393,129 |
| Choice Hotels, Inc. | 12,361 | | 468,605 |
| Four Seasons Hotels, Inc. | 7,960 | | 502,356 |
| Jack In the Box, Inc. * | 12,911 | | 619,470 |
| P.F. Chang's China Bistro, Inc. * | 14,515 | | 511,654 |
| RARE Hospitality International, Inc. * | 18,029 | | 516,351 |
|
|
| | | | 3,011,565 |
| Household Products - 1.84% | | | |
| Church & Dwight, Inc. | 15,559 | | 599,021 |
| Tempur-Pedic International, Inc. * | 47,498 | | 762,343 |
|
|
| | | | 1,361,364 |
| Industrial Machinery - 2.45% | | | |
| Actuant Corp., Class A | 10,628 | | 479,323 |
| Ceradyne, Inc. * | 13,111 | | 577,802 |
| FMC Technologies, Inc. * | 12,857 | | 756,248 |
|
|
| | | | 1,813,373 |
| Insurance - 1.69% | | | |
| HCC Insurance Holdings, Inc. | 19,135 | | 621,696 |
| ProAssurance Corp. * | 12,436 | | 625,531 |
|
|
| | | | 1,247,227 |
| Internet Content - 0.53% | | | |
| Digitas, Inc. * | 43,498 | | 388,872 |
| Internet Service Provider - 0.82% | | | |
| NETGEAR, Inc. * | 30,682 | | 603,515 |
| Internet Software - 0.86% | | | |
| F5 Networks, Inc. * | 12,682 | | 635,241 |
| Manufacturing - 1.76% | | | |
| Acuity Brands, Inc. | 14,992 | | 640,608 |
| Coherent, Inc. * | 18,221 | | 660,694 |
|
|
| | | | 1,301,302 |
| Medical-Hospitals - 1.99% | | | |
| Lifepoint Hospitals, Inc. * | 17,507 | | 596,113 |
| VCA Antech, Inc. * | 24,648 | | 873,032 |
|
|
| | | | 1,469,145 |
| Mining - 0.69% | | | |
| Lincoln Electric Holding, Inc. | 9,253 | | 509,193 |
| Petroleum Services - 3.97% | | | |
| Core Laboratories N.V. * | 11,167 | | 819,323 |
| Grey Wolf, Inc. * | 70,695 | | 516,780 |
| Superior Energy Services, Inc. * | 23,372 | | 746,268 |
| Veritas DGC, Inc. * | 14,249 | | 848,813 |
|
|
| | | | 2,931,184 |
| Small Company Growth Fund (continued) | | |
| | Shares or | | |
| | Principal | | |
| | Amount | | Value |
|
|
| |
| COMMON STOCKS (continued) | | | |
| Pharmaceuticals - 2.56% | | | |
| Alkermes, Inc. * | 24,301 | $ | 397,321 |
| Medicis Pharmaceutical Corp., Class A | 16,575 | | 485,482 |
| Sciele Pharma, Inc. * | 27,125 | | 474,688 |
| United Therapeutics Corp. * | 9,795 | | 534,709 |
|
|
| | | | 1,892,200 |
| Real Estate - 0.79% | | | |
| BioMed Realty Trust, Inc., REIT | 18,749 | | 583,844 |
| Retail Trade - 6.46% | | | |
| Charlotte Russe Holding, Inc. * | 19,538 | | 521,665 |
| Childrens Place Retail Stores, Inc. * | 10,308 | | 597,555 |
| Coldwater Creek, Inc. * | 27,739 | | 761,990 |
| Dick's Sporting Goods, Inc. * | 15,540 | | 642,268 |
| DSW, Inc., Class A * | 13,674 | | 382,735 |
| Hot Topic, Inc. * | 45,687 | | 451,388 |
| Longs Drug Stores Corp. | 13,293 | | 603,901 |
| Regis Corp. | 11,724 | | 430,154 |
| United Rentals, Inc. * | 17,846 | | 386,544 |
|
|
| | | | 4,778,200 |
| Semiconductors - 7.16% | | | |
| Cirrus Logic, Inc. * | 73,299 | | 536,549 |
| Emulex Corp. * | 46,690 | | 808,671 |
| FormFactor, Inc. * | 11,806 | | 569,757 |
| Microsemi Corp. * | 30,039 | | 834,183 |
| Power Integrations, Inc. * | 35,512 | | 653,421 |
| Silicon Laboratories, Inc. * | 14,917 | | 526,122 |
| Tessera Technologies, Inc. * | 20,542 | | 675,832 |
| Varian Semiconductor Equipment Associates, | | | |
| Inc. * | 19,412 | | 685,438 |
|
|
| | | | 5,289,973 |
| Software - 6.35% | | | |
| Allscripts Healthcare Solution, Inc. * | 26,677 | | 543,144 |
| ANSYS, Inc. * | 13,012 | | 608,181 |
| Blackboard, Inc. * | 22,572 | | 601,544 |
| Eclipsys Corp. * | 30,779 | | 526,321 |
| Epicor Software Corp. * | 40,236 | | 498,121 |
| MicroStrategy, Inc., Class A * | 6,639 | | 605,477 |
| Orbotech, Ltd. * | 15,259 | | 366,368 |
| THQ, Inc. * | 36,489 | | 941,416 |
|
|
| | | | 4,690,572 |
| Steel - 0.89% | | | |
| Carpenter Technology Corp. | 6,873 | | 658,708 |
| Telecommunications Equipment & | | | |
| Services - 4.49% | | | |
| Aeroflex, Inc. * | 47,837 | | 498,462 |
| NeuStar, Inc., Class A * | 18,913 | | 533,725 |
| NICE Systems, Ltd. * | 26,320 | | 656,947 |
| Polycom, Inc. * | 34,079 | | 810,739 |
| SBA Communications Corp. * | 31,894 | | 820,952 |
|
|
| | | | 3,320,825 |
The accompanying notes are an integral part of the financial statements. 353
John Hancock Funds II
Portfolio of investments — August 31, 2006
(showing percentage of total net assets) |
| Small Company Growth Fund (continued) | | |
| | | Shares or | | |
| | | Principal | | |
| | | Amount | | Value |
| |
|
| |
| COMMON STOCKS (continued) | | | | |
| Toys, Amusements & Sporting Goods - 0.84% | | | |
| Marvel Entertainment, Inc. * | | 29,002 | $ | 621,803 |
| Trucking & Freight - 1.91% | | | | |
| Forward Air Corp. | | 16,244 | | 522,082 |
| Hub Group, Inc., Class A * | | 17,887 | | 416,767 |
| Swift Transportation, Inc. * | | 20,447 | | 474,166 |
| |
|
| | | | | 1,413,015 |
|
| TOTAL COMMON STOCKS (Cost $67,407,445) | | $ | 72,288,345 |
|
| |
| REPURCHASE AGREEMENTS - 1.94% | | | |
| Repurchase Agreement with State | | | | |
| Street Corp. dated 08/31/2006 at | | | | |
| 4.95% to be repurchased at | | | | |
| $1,437,198 on 9/1/2006, | | | | |
| collateralized by $1,490,000 | | | | |
| Federal Home Loan Bank, 4.125% | | | | |
| due 02/15/2008 (valued at | | | | |
| $1,470,381, including interest) (c) | $ | 1,437,000 | $ | 1,437,000 |
|
| TOTAL REPURCHASE AGREEMENTS | | | | |
| (Cost $1,437,000) | | | $ | 1,437,000 |
|
| Total Investments (Small Company Growth Fund) | | | |
| (Cost $68,844,445) - 99.76% | | | $ | 73,725,345 |
| Other Assets in Excess of Liabilities - 0.24% | | | 175,450 |
| |
|
| TOTAL NET ASSETS - 100.00% | | | $ | 73,900,795 |
| |
|
| |
| |
| Small Company Value Fund | | | |
| | | Shares or | | |
| | | Principal | | |
| | | Amount | | Value |
| |
|
| |
| COMMON STOCKS - 97.76% | | | | |
| Aerospace - 1.13% | | | | |
| EDO Corp. (a) | | 59,200 $ | | 1,381,136 |
| Woodward Governor Company | | 89,200 | | 3,003,364 |
| |
|
| | | | | 4,384,500 |
| Apparel & Textiles - 0.81% | | | | |
| Culp, Inc. * | | 40,000 | | 203,600 |
| G & K Services, Class A | | 88,200 | | 2,926,476 |
| |
|
| | | | | 3,130,076 |
| Auto Parts - 0.24% | | | | |
| Accuride Corp. * (a) | | 85,000 | | 927,350 |
| Auto Services - 1.13% | | | | |
| Dollar Thrifty Automotive Group, Inc. * (a) | 102,500 | | 4,374,700 |
| Banking - 7.68% | | | | |
| Boston Private Financial Holdings, Inc. (a) | | 73,500 | | 1,834,560 |
| East West Bancorp, Inc. | | 155,700 | | 6,305,850 |
| First Republic Bank (a) | | 159,700 | | 6,806,414 |
| Home Bancshares, Inc. | | 14,300 | | 302,445 |
| Netbank, Inc. | | 147,200 | | 903,808 |
| SVB Financial Group * (a) | | 121,000 | | 5,467,990 |
| Texas Regional Bancshares, Inc., Class A (a) | 191,469 | | 7,327,519 |
| Small Company Value Fund (continued) | | |
| | Shares or | | |
| | Principal | | |
| | Amount | | Value |
|
|
| |
| COMMON STOCKS (continued) | | | |
| Banking (continued) | | | |
| Wintrust Financial Corp. | 16,776 | $ | 844,000 |
|
|
| | | | 29,792,586 |
| Biotechnology - 1.34% | | | |
| Exelixis, Inc. * (a) | 155,700 | | 1,514,961 |
| Myriad Genetics, Inc. * (a) | 145,600 | | 3,682,224 |
|
|
| | | | 5,197,185 |
| Broadcasting - 0.28% | | | |
| Saga Communications, Inc., Class A * | 136,500 | | 1,086,540 |
| Building Materials & Construction - 0.43% | | | |
| ElkCorp (a) | 58,800 | | 1,656,396 |
| Business Services - 3.85% | | | |
| Electro Rent Corp. * | 139,000 | | 2,239,290 |
| FTI Consulting, Inc. * (a) | 126,000 | | 2,814,840 |
| McGrath Rentcorp (a) | 158,500 | | 3,613,800 |
| MPS Group, Inc. * | 312,500 | | 4,393,750 |
| StarTek, Inc. (a) | 113,900 | | 1,295,043 |
| Wireless Facilities, Inc. * (a) | 269,700 | | 590,643 |
|
|
| | | | 14,947,366 |
| Chemicals - 3.24% | | | |
| Airgas, Inc. | 117,300 | | 4,201,686 |
| Arch Chemicals, Inc. | 100,000 | | 2,774,000 |
| Innospec, Inc. (a) | 86,000 | | 2,358,980 |
| MacDermid, Inc. | 113,400 | | 3,248,910 |
|
|
| | | | 12,583,576 |
| Commercial Services - 1.45% | | | |
| Live Nation, Inc. * (a) | 48,700 | | 1,021,726 |
| Pool Corp. (a) | 121,100 | | 4,610,277 |
|
|
| | | | 5,632,003 |
| Construction & Mining Equipment - 0.48% | | | |
| Carbo Ceramics, Inc. (a) | 46,700 | | 1,865,198 |
| Construction Materials - 3.55% | | | |
| Ameron International Corp. (a) | 43,500 | | 3,051,090 |
| Florida Rock Industries, Inc. (a) | 93,337 | | 3,471,203 |
| JLG Industries, Inc. | 321,300 | | 5,609,898 |
| Universal Forest Products, Inc. | 33,900 | | 1,652,964 |
|
|
| | | | 13,785,155 |
| Crude Petroleum & Natural Gas - 1.76% | | | |
| Penn Virginia Corp. | 96,300 | | 6,836,337 |
| Domestic Oil - 2.50% | | | |
| Forest Oil Corp. * (a) | 108,700 | | 3,681,669 |
| Mariner Energy, Inc. * (a) | 86,002 | | 1,625,438 |
| Union Drilling, Inc. * (a) | 39,000 | | 555,750 |
| Whiting Petroleum Corp. * (a) | 85,200 | | 3,834,000 |
|
|
| | | | 9,696,857 |
| Drugs & Health Care - 2.42% | | | |
| Arrow International, Inc. (a) | 65,200 | | 2,106,612 |
| Diversa Corp. * (a) | 190,700 | | 1,754,440 |
| Landauer, Inc. (a) | 37,800 | | 1,811,376 |
The accompanying notes are an integral part of the financial statements. 354
John Hancock Funds II
Portfolio of investments — August 31, 2006
(showing percentage of total net assets) |
| Small Company Value Fund (continued) | | |
| | Shares or | | |
| | Principal | | |
| | Amount | | Value |
|
|
| |
| COMMON STOCKS (continued) | | | |
| Drugs & Health Care (continued) | | | |
| West Pharmaceutical Services, Inc. (a) | 93,100 | $ | 3,715,621 |
| |
|
| | | | 9,388,049 |
| Electrical Equipment - 2.08% | | | |
| C & D Technologies, Inc. (a) | 118,000 | | 938,100 |
| Genlyte Group, Inc. * | 55,200 | | 3,617,256 |
| Littelfuse, Inc. * | 84,044 | | 3,034,829 |
| Methode Electronics, Inc., Class A | 61,800 | | 490,692 |
| |
|
| | | | 8,080,877 |
| Electrical Utilities - 2.45% | | | |
| Black Hills Corp. (a) | 96,000 | | 3,341,760 |
| Cleco Corp. (a) | 122,900 | | 3,067,584 |
| El Paso Electric Company * | 128,700 | | 3,077,217 |
| |
|
| | | | 9,486,561 |
| Electronics - 2.98% | | | |
| Analogic Corp. (a) | 26,600 | | 1,511,678 |
| Belden CDT, Inc. (a) | 123,950 | | 4,429,973 |
| Franklin Electric, Inc. (a) | 116,700 | | 5,626,107 |
| |
|
| | | | 11,567,758 |
| Energy - 0.04% | | | |
| GeoMet, Inc. * | 12,600 | | 135,450 |
| Financial Services - 0.35% | | | |
| American Capital Strategies, Ltd. (a) | 34,900 | | 1,351,677 |
| Food & Beverages - 0.06% | | | |
| Centerplate, Inc. (a) | 14,600 | | 216,956 |
| Forest Products - 0.81% | | | |
| Deltic Timber Corp. (a) | 66,000 | | 3,130,380 |
| Furniture & Fixtures - 0.64% | | | |
| Stanley Furniture Company, Inc. (a) | 99,400 | | 2,479,036 |
| Gas & Pipeline Utilities - 1.48% | | | |
| Southwest Gas Corp. | 90,000 | | 3,033,000 |
| Valley National Gases, Inc. (a) | 31,000 | | 966,580 |
| Vectren Corp. | 63,500 | | 1,750,060 |
| |
|
| | | | 5,749,640 |
| Gold - 0.69% | | | |
| Meridian Gold, Inc. * (a) | 90,500 | | 2,691,470 |
| Healthcare Products - 1.31% | | | |
| Owens & Minor, Inc. | 157,600 | | 5,069,992 |
| Homebuilders - 0.11% | | | |
| M/I Homes, Inc. | 12,500 | | 404,500 |
| Hotels & Restaurants - 1.55% | | | |
| RARE Hospitality International, Inc. * | 147,000 | | 4,210,080 |
| Ruby Tuesday, Inc. (a) | 69,900 | | 1,804,818 |
| |
|
| | | | 6,014,898 |
| Industrial Machinery - 1.04% | | | |
| IDEX Corp. | 96,250 | | 4,041,538 |
| Insurance - 4.17% | | | |
| Markel Corp. * (a) | 9,600 | | 3,487,968 |
| Max Re Capital, Ltd. | 119,100 | | 2,764,311 |
| Small Company Value Fund (continued) | | |
| | Shares or | | |
| | Principal | | |
| | Amount | | Value |
|
|
| |
| COMMON STOCKS (continued) | | | |
| Insurance (continued) | | | |
| Midland Company (a) | 78,500 | $ | 3,249,900 |
| ProAssurance Corp. * (a) | 132,700 | | 6,674,810 |
|
|
| | | | 16,176,989 |
| Internet Software - 1.05% | | | |
| RSA Security, Inc. * | 145,700 | | 4,057,745 |
| Investment Companies - 1.69% | | | |
| Allied Capital Corp. (a) | 93,800 | | 2,869,342 |
| First Financial Fund, Inc. * (a) | 185,500 | | 3,183,180 |
| Hercules Technology Growth Capital, Inc. (a) | 43,999 | | 519,188 |
|
|
| | | | 6,571,710 |
| Life Sciences - 0.47% | | | |
| Symyx Technologies, Inc. * (a) | 79,500 | | 1,820,550 |
| Manufacturing - 2.01% | | | |
| AptarGroup, Inc. | 76,900 | | 3,960,350 |
| Nordson Corp. | 96,200 | | 3,851,848 |
|
|
| | | | 7,812,198 |
| Metal & Metal Products - 2.83% | | | |
| Gibraltar Industries, Inc. | 130,300 | | 3,153,260 |
| Matthews International Corp., Class A | 137,600 | | 4,898,560 |
| Metal Management, Inc. | 114,300 | | 2,923,794 |
|
|
| | | | 10,975,614 |
| Mobile Homes - 1.25% | | | |
| Skyline Corp. (a) | 53,200 | | 2,075,332 |
| Winnebago Industries, Inc. (a) | 94,600 | | 2,762,320 |
|
|
| | | | 4,837,652 |
| Mutual Funds - 0.71% | | | |
| iShares Russell 2000 Index Fund (a) | 15,000 | | 1,076,550 |
| iShares Russell 2000 Value Index Fund (a) | 23,000 | | 1,692,340 |
|
|
| | | | 2,768,890 |
| Newspapers - 0.23% | | | |
| Journal Register Company | 123,500 | | 901,550 |
| Paper - 1.25% | | | |
| Chesapeake Corp. (a) | 36,700 | | 532,150 |
| Potlatch Corp. (a) | 55,400 | | 2,122,374 |
| Wausau-Mosinee Paper Corp. (a) | 161,000 | | 2,191,210 |
|
|
| | | | 4,845,734 |
| Petroleum Services - 4.76% | | | |
| Atwood Oceanics, Inc. * (a) | 59,200 | | 2,545,600 |
| Lone Star Technologies, Inc. * | 41,900 | | 1,899,327 |
| TETRA Technologies, Inc. * | 245,900 | | 6,838,479 |
| Todco, Class A * (a) | 106,800 | | 3,954,804 |
| W-H Energy Services, Inc. * | 63,800 | | 3,219,986 |
|
|
| | | | 18,458,196 |
| Pharmaceuticals - 0.39% | | | |
| Pharmion Corp. * (a) | 80,300 | | 1,491,974 |
| Publishing - 0.07% | | | |
| Courier Corp. (a) | 7,700 | | 283,668 |
The accompanying notes are an integral part of the financial statements. 355
John Hancock Funds II
Portfolio of investments — August 31, 2006
(showing percentage of total net assets) |
| Small Company Value Fund (continued) | | |
| | Shares or | | |
| | Principal | | |
| | Amount | | Value |
|
|
| |
| COMMON STOCKS (continued) | | | |
| Railroads & Equipment - 0.93% | | | |
| Genesee & Wyoming, Inc., Class A * (a) | 144,150 | $ | 3,587,893 |
| Real Estate - 6.81% | | | |
| Columbia Equity Trust, Inc., REIT (a) | 61,000 | | 921,100 |
| First Potomac Realty Trust, REIT | 103,200 | | 3,200,232 |
| Glenborough Realty Trust, Inc., REIT (a) | 61,500 | | 1,587,315 |
| Innkeepers USA Trust, REIT | 90,600 | | 1,500,336 |
| Kilroy Realty Corp., REIT | 100,800 | | 7,970,256 |
| LaSalle Hotel Properties, REIT (a) | 99,500 | | 4,372,030 |
| Strategic Hotel Cap, Inc., REIT (a) | 159,000 | | 3,243,600 |
| Washington Real Estate Investment Trust, | | | |
| REIT (a) | 89,100 | | 3,619,242 |
|
|
| | | | 26,414,111 |
| Retail Grocery - 0.59% | | | |
| Nash-Finch Company (a) | 45,100 | | 1,030,535 |
| Wild Oats Markets, Inc. * (a) | 78,000 | | 1,274,520 |
|
|
| | | | 2,305,055 |
| Retail Trade - 5.44% | | | |
| Aaron Rents, Inc., Class A | 5,350 | | 115,239 |
| Aaron Rents, Inc., Class B (a) | 267,500 | | 6,262,175 |
| Building Materials Holding Corp. (a) | 78,500 | | 2,050,420 |
| Casey's General Stores, Inc. (a) | 136,600 | | 3,229,224 |
| CSS Industries, Inc. | 75,500 | | 2,249,145 |
| Fred's, Inc., Class A (a) | 115,400 | | 1,512,894 |
| Hancock Fabrics, Inc. (a) | 93,100 | | 276,507 |
| Haverty Furniture Companies, Inc. (a) | 179,100 | | 2,516,355 |
| Stein Mart, Inc. | 244,000 | | 2,901,160 |
|
|
| | | | 21,113,119 |
| Sanitary Services - 2.37% | | | |
| Casella Waste Systems, Inc., Class A * (a) | 170,600 | | 2,007,962 |
| Insituform Technologies, Inc., Class A * (a) | 173,700 | | 3,986,415 |
| Synagro Technologies, Inc. (a) | 101,900 | | 406,581 |
| Waste Connections, Inc. * | 76,200 | | 2,801,874 |
|
|
| | | | 9,202,832 |
| Semiconductors - 2.33% | | | |
| ATMI, Inc. * (a) | 70,200 | | 2,026,674 |
| Brooks Automation, Inc. * | 311,000 | | 4,322,900 |
| Entegris, Inc. * (a) | 248,537 | | 2,699,112 |
|
|
| | | | 9,048,686 |
| Software - 2.76% | | | |
| Packeteer, Inc. * (a) | 149,300 | | 1,500,465 |
| Progress Software Corp. * | 135,000 | | 3,418,200 |
| SPSS, Inc. * | 109,100 | | 2,767,867 |
| Websense, Inc. * | 146,000 | | 3,017,820 |
|
|
| | | | 10,704,352 |
| Steel - 1.17% | | | |
| Carpenter Technology Corp. (a) | 47,400 | | 4,542,816 |
| Telecommunications Equipment & | | | |
| Services - 0.51% | | | |
| Premiere Global Services, Inc. * (a) | 253,500 | | 1,977,300 |
| Small Company Value Fund (continued) | | |
| | | Shares or | | |
| | | Principal | | |
| | | Amount | | Value |
| |
|
| |
| COMMON STOCKS (continued) | | | | |
| Tires & Rubber - 0.55% | | | | |
| Myers Indiana, Inc. | | 129,000 | $ | 2,119,470 |
| Tobacco - 0.19% | | | | |
| Alliance One International, Inc. (a) | | 183,000 | | 737,490 |
| Transportation - 3.09% | | | | |
| Kirby Corp. * (a) | | 163,400 | | 4,792,522 |
| Macquarie Infrastructure Company Trust (a) | | 97,300 | | 3,162,250 |
| UTI Worldwide, Inc. (a) | | 174,300 | | 4,017,615 |
|
|
| | | | | 11,972,387 |
| Trucking & Freight - 2.26% | | | | |
| Landstar Systems, Inc. (a) | | 205,500 | | 8,774,850 |
|
| TOTAL COMMON STOCKS (Cost $347,050,382) | | $ | 379,207,438 |
|
| |
| SHORT TERM INVESTMENTS - 26.00% | | | | |
| State Street Navigator Securities | | | | |
| Lending Prime Portfolio (c) | $ | 95,479,263 | $ | 95,479,263 |
| T. Rowe Price Reserve Investment Fund (c) | | 5,388,413 | | 5,388,413 |
|
| TOTAL SHORT TERM INVESTMENTS | | | | |
| (Cost $100,867,676) | | | $ | 100,867,676 |
|
| |
| REPURCHASE AGREEMENTS - 0.86% | | | | |
| Repurchase Agreement with State | | | | |
| Street Corp. dated 08/31/2006 at | | | | |
| 3.95% to be repurchased at | | | | |
| $3,343,367 on 9/1/2006, | | | | |
| collateralized by $3,390,000 | | | | |
| Federal National Mortgage | | | | |
| Association, 5.125% due | | | | |
| 12/15/2008 (valued at $3,411,188, | | | | |
| including interest) (c) | $ | 3,343,000 | $ | 3,343,000 |
|
| TOTAL REPURCHASE AGREEMENTS | | | | |
| (Cost $3,343,000) | | | $ | 3,343,000 |
|
| Total Investments (Small Company Value Fund) | | | |
| (Cost $451,261,058) - 124.62% | | | $ | 483,418,114 |
| Liabilities in Excess of Other Assets - (24.62)% | | | (95,503,020) |
|
|
| TOTAL NET ASSETS - 100.00% | | | $ | 387,915,094 |
|
|
| |
| |
| Special Value Fund | | | | |
| | | Shares or | | |
| | | Principal | | |
| | | Amount | | Value |
| |
|
| |
| COMMON STOCKS - 86.19% | | | | |
| Aerospace - 1.85% | | | | |
| HEICO Corp., Class A (a) | | 39,601 | $ | 1,072,395 |
| Orbital Sciences Corp., Class A * | | 71,205 | | 1,288,099 |
|
|
| | | | | 2,360,494 |
| Air Travel - 1.21% | | | | |
| Airtran Holdings, Inc. * (a) | | 95,300 | | 1,091,185 |
| SkyWest, Inc. | | 18,753 | | 453,260 |
|
|
| | | | | 1,544,445 |
The accompanying notes are an integral part of the financial statements. 356
John Hancock Funds II
Portfolio of investments — August 31, 2006
(showing percentage of total net assets) |
| Special Value Fund (continued) | | | |
| | Shares or | | |
| | Principal | | |
| | Amount | | Value |
|
|
| |
| COMMON STOCKS (continued) | | | |
| Apparel & Textiles - 0.80% | | | |
| Timberland Company, Class A * | 36,004 | $ | 1,022,874 |
| Auto Parts - 0.77% | | | |
| Lear Corp. (a) | 48,078 | | 977,907 |
| Banking - 10.62% | | | |
| BancTrust Financial Group, Inc. (a) | 32,511 | | 863,167 |
| Cascade Financial Corp. | 40,186 | | 642,976 |
| Central Pacific Financial Corp. (a) | 39,133 | | 1,416,223 |
| City Bank Lynnwood WA (a) | 4,493 | | 228,559 |
| City National Corp. (a) | 9,400 | | 618,520 |
| Cullen Frost Bankers, Inc. | 20,380 | | 1,201,605 |
| First Security Group, Inc. (a) | 70,461 | | 799,732 |
| First State BanCorp. (a) | 42,275 | | 1,081,817 |
| IBERIABANK Corp. (a) | 7,952 | | 463,602 |
| Investors Financial Services Corp. (a) | 14,400 | | 667,584 |
| Midwest Banc Holdings, Inc. (a) | 44,910 | | 1,076,493 |
| Tompkins Trustco, Inc. (a) | 7,506 | | 336,719 |
| UCBH Holdings, Inc. (a) | 113,800 | | 2,064,332 |
| Umpqua Holdings Corp. (a) | 49,225 | | 1,347,288 |
| Webster Financial Corp. | 15,753 | | 744,172 |
|
|
| | | | 13,552,789 |
| Building Materials & Construction - 0.99% | | | |
| EMCOR Group, Inc. * | 22,834 | | 1,265,917 |
| Business Services - 4.62% | | | |
| Black Box Corp. | 24,544 | | 945,926 |
| John H. Harland Company (a) | 20,747 | | 775,108 |
| Korn/Ferry International * (a) | 10,963 | | 223,865 |
| Labor Ready, Inc. * | 57,864 | | 991,210 |
| Perot Systems Corp., Class A * (a) | 85,054 | | 1,221,375 |
| Watson Wyatt Worldwide, Inc., Class A (a) | 43,773 | | 1,736,037 |
|
|
| | | | 5,893,521 |
| Chemicals - 0.41% | | | |
| Cabot Microelectronics Corp. * (a) | 16,510 | | 519,074 |
| Computers & Business Equipment - 1.81% | | | |
| Foundry Networks, Inc. * | 113,500 | | 1,381,295 |
| Rimage Corp. * (a) | 16,590 | | 389,201 |
| Tech Data Corp. * | 15,509 | | 541,109 |
|
|
| | | | 2,311,605 |
| Construction & Mining Equipment - 1.62% | | | |
| National Oilwell, Inc. * | 31,667 | | 2,067,855 |
| Construction Materials - 0.47% | | | |
| Patrick Industries, Inc. * (a) | 47,053 | | 598,985 |
| Cosmetics & Toiletries - 0.65% | | | |
| Steiner Leisure, Ltd. * | 21,428 | | 824,549 |
| Crude Petroleum & Natural Gas - 1.11% | | | |
| XTO Energy, Inc. (a) | 30,968 | | 1,417,405 |
| Domestic Oil - 1.32% | | | |
| Denbury Resources, Inc. * | 54,230 | | 1,681,672 |
| Electrical Equipment - 1.04% | | | |
| Tektronix, Inc. | 47,067 | | 1,333,879 |
| Special Value Fund (continued) | | | |
| | Shares or | | |
| | Principal | | |
| | Amount | | Value |
|
|
| |
| COMMON STOCKS (continued) | | | |
| Electrical Utilities - 0.20% | | | |
| MGE Energy, Inc. (a) | 7,705 | $ | 258,965 |
| Electronics - 3.11% | | | |
| ATI Technologies, Inc. * | 62,855 | | 1,350,754 |
| Bel Fuse, Inc., Class B (a) | 10,456 | | 386,559 |
| DRS Technologies, Inc. (a) | 35,622 | | 1,473,682 |
| Mercury Computer Systems, Inc. * (a) | 60,715 | | 754,080 |
|
|
| | | | 3,965,075 |
| Energy - 0.52% | | | |
| New Jersey Resources Corp. (a) | 13,302 | | 660,577 |
| Financial Services - 1.77% | | | |
| Financial Federal Corp. (a) | 28,615 | | 749,713 |
| Portfolio Recovery Associates, Inc. * (a) | 38,058 | | 1,511,664 |
|
|
| | | | 2,261,377 |
| Food & Beverages - 1.56% | | | |
| Del Monte Foods Company | 154,961 | | 1,720,067 |
| Pilgrim's Pride Corp. (a) | 11,200 | | 272,832 |
|
|
| | | | 1,992,899 |
| Furniture & Fixtures - 0.57% | | | |
| Furniture Brands International, Inc. (a) | 37,769 | | 723,276 |
| Gas & Pipeline Utilities - 0.50% | | | |
| Northwest Natural Gas Company (a) | 16,589 | | 634,529 |
| Gold - 0.36% | | | |
| Meridian Gold, Inc. * | 15,470 | | 460,078 |
| Healthcare Services - 3.77% | | | |
| Amerigroup Corp. * (a) | 37,040 | | 1,168,242 |
| Apria Healthcare Group, Inc. * (a) | 34,881 | | 711,223 |
| Cross Country Healthcare, Inc. * (a) | 64,305 | | 1,055,888 |
| Enzo Biochem, Inc. * (a) | 35,300 | | 451,134 |
| MedQuist, Inc. * | 50,225 | | 502,250 |
| National Dentex Corp. * (a) | 43,827 | | 931,324 |
|
|
| | | | 4,820,061 |
| Hotels & Restaurants - 1.31% | | | |
| O'Charley's, Inc. * (a) | 72,791 | | 1,345,906 |
| OSI Restaurant Partners, Inc. (a) | 10,600 | | 328,282 |
|
|
| | | | 1,674,188 |
| Household Products - 0.49% | | | |
| Tupperware Brands Corp. | 34,800 | | 626,748 |
| Industrial Machinery - 3.96% | | | |
| Albany International Corp., Class A (a) | 35,283 | | 1,232,082 |
| IDEX Corp. | 35,062 | | 1,472,254 |
| Kennametal, Inc. | 21,087 | | 1,112,128 |
| Sauer-Danfoss, Inc. (a) | 55,071 | | 1,241,851 |
|
|
| | | | 5,058,315 |
| Industrials - 1.91% | | | |
| Crane Company | 43,484 | | 1,738,490 |
| Harsco Corp. | 8,777 | | 698,298 |
|
|
| | | | 2,436,788 |
The accompanying notes are an integral part of the financial statements. 357
John Hancock Funds II
Portfolio of investments — August 31, 2006
(showing percentage of total net assets)
| Special Value Fund (continued) | | | |
| | Shares or | | |
| | Principal | | |
| | Amount | | Value |
|
|
| |
| COMMON STOCKS (continued) | | | |
| Insurance - 4.54% | | | |
| CNA Surety Corp. * | 49,026 | $ | 975,617 |
| Midland Company (a) | 33,942 | | 1,405,199 |
| PMI Group, Inc. (a) | 37,333 | | 1,614,279 |
| Triad Guaranty, Inc. * (a) | 35,824 | | 1,800,873 |
| |
|
| | | | 5,795,968 |
| Internet Service Provider - 0.98% | | | |
| NETGEAR, Inc. * (a) | 63,600 | | 1,251,012 |
| Internet Software - 0.76% | | | |
| McAfee, Inc. * | 42,662 | | 970,987 |
| Leisure Time - 0.96% | | | |
| Callaway Golf Company (a) | 50,600 | | 678,546 |
| K2, Inc. * (a) | 46,532 | | 542,098 |
| |
|
| | | | 1,220,644 |
| Manufacturing - 5.22% | | | |
| AptarGroup, Inc. | 21,527 | | 1,108,640 |
| Goodman Global, Inc. * | 14,720 | | 185,325 |
| Input/Output, Inc. * (a) | 36,900 | | 367,893 |
| Kaydon Corp. | 40,127 | | 1,529,240 |
| Pentair, Inc. (a) | 42,840 | | 1,280,916 |
| Roper Industries, Inc. | 28,768 | | 1,334,260 |
| Snap-on, Inc. | 19,755 | | 863,294 |
| |
|
| | | | 6,669,568 |
| Medical-Hospitals - 0.53% | | | |
| RehabCare Group, Inc. * (a) | 46,567 | | 683,604 |
| Metal & Metal Products - 2.97% | | | |
| Gibraltar Industries, Inc. | 52,399 | | 1,268,056 |
| Mueller Industries, Inc. | 26,802 | | 1,027,053 |
| RBC Bearings, Inc. * | 14,700 | | 312,669 |
| Timken Company (a) | 37,139 | | 1,189,933 |
| |
|
| | | | 3,797,711 |
| Mutual Funds - 5.76% | | | |
| iShares Nasdaq Biotechnology Index Fund * (a) | 16,150 | | 1,190,901 |
| iShares Russell 2000 Value Index Fund (a) | 83,723 | | 6,160,338 |
| |
|
| | | | 7,351,239 |
| Office Furnishings & Supplies - 0.65% | | | |
| United Stationers, Inc. * | 18,171 | | 832,777 |
| Petroleum Services - 0.23% | | | |
| Superior Well Services, Inc. * (a) | 13,665 | | 294,207 |
| Pharmaceuticals - 0.59% | | | |
| Bentley Pharmaceuticals, Inc. * (a) | 67,083 | | 752,671 |
| Railroads & Equipment - 0.91% | | | |
| Wabtec Corp. | 41,079 | | 1,158,839 |
| Real Estate - 5.17% | | | |
| American Land Lease, Inc., REIT | 19,998 | | 478,552 |
| Cousins Properties, Inc., REIT (a) | 33,547 | | 1,153,010 |
| Duke Realty Corp., REIT | 14,009 | | 532,062 |
| Host Hotels & Resorts, Inc., REIT | 44,695 | | 1,007,425 |
| LaSalle Hotel Properties, REIT | 27,320 | | 1,200,441 |
| Liberty Property Trust, REIT | 12,496 | | 598,184 |
| Special Value Fund (continued) | | | |
| | | Shares or | | |
| | | Principal | | |
| | | Amount | | Value |
|
|
| |
| COMMON STOCKS (continued) | | | | |
| Real Estate (continued) | | | | |
| Pan Pacific Retail Properties, Inc., REIT (a) | | 23,337 | $ | 1,629,389 |
| | |
|
| | | | | 6,599,063 |
| Retail Trade - 2.92% | | | | |
| Cato Corp., Class A | | 49,598 | | 1,152,162 |
| Deb Shops, Inc. (a) | | 37,695 | | 888,848 |
| Dillard's, Inc., Class A (a) | | 32,771 | | 1,021,800 |
| The Buckle, Inc. (a) | | 19,777 | | 670,440 |
| |
|
| | | | | 3,733,250 |
| Semiconductors - 1.09% | | | | |
| Exar Corp. * | | 58,833 | | 822,485 |
| OmniVision Technologies, Inc. * (a) | | 34,300 | | 569,380 |
| |
|
| | | | | 1,391,865 |
| Software - 0.87% | | | | |
| Dendrite International, Inc. * | | 43,037 | | 431,231 |
| EPIQ Systems, Inc. * (a) | | 45,517 | | 677,293 |
| |
|
| | | | | 1,108,524 |
| Tires & Rubber - 0.98% | | | | |
| Cooper Tire & Rubber Company (a) | | 126,790 | | 1,246,346 |
| Transportation - 0.88% | | | | |
| Kirby Corp. * | | 38,438 | | 1,127,387 |
| Trucking & Freight - 0.86% | | | | |
| Arkansas Best Corp. (a) | | 24,803 | | 1,095,052 |
|
| TOTAL COMMON STOCKS (Cost $102,602,402) | | $ | 110,026,561 |
|
| |
| SHORT TERM INVESTMENTS - 24.37% | | | | |
| State Street Navigator Securities | | | | |
| Lending Prime Portfolio (c) | $ | 31,115,018 | $ | 31,115,018 |
|
| TOTAL SHORT TERM INVESTMENTS | | | | |
| (Cost $31,115,018) | | | $ | 31,115,018 |
|
| |
| REPURCHASE AGREEMENTS - 14.14% | | | | |
| Repurchase Agreement with State | | | | |
| Street Corp. dated 08/31/2006 at | | | | |
| 3.95% to be repurchased at | | | | |
| $18,054,981 on 09/01/2006, | | | | |
| collateralized by $19,745,000 | | | | |
| Federal National Mortgage | | | | |
| Association, 5.55% due | | | | |
| 07/10/2028 (valued at | | | | |
| $18,414,720, including interest) (c) | $ | 18,053,000 | $ | 18,053,000 |
|
| TOTAL REPURCHASE AGREEMENTS | | | | |
| (Cost $18,053,000) | | | $ | 18,053,000 |
|
| Total Investments (Special Value Fund) | | | | |
| (Cost $151,770,420) - 124.70% | | | $ | 159,194,579 |
| Liabilities in Excess of Other Assets - (24.70)% | | | (31,532,786) |
| |
|
| TOTAL NET ASSETS - 100.00% | | | $ | 127,661,793 |
| |
|
The accompanying notes are an integral part of the financial statements. 358
John Hancock Funds II
Portfolio of investments — August 31, 2006
(showing percentage of total net assets)
| Spectrum Income Fund | | | |
| | Shares or | | |
| | Principal | | |
| | Amount | | Value |
|
|
| |
| COMMON STOCKS - 17.46% | | | |
| Aerospace - 0.20% | | | |
| Lockheed Martin Corp. | 5,200 | $ | 429,520 |
| Raytheon Company | 22,500 | | 1,062,225 |
| |
|
| | | | 1,491,745 |
| Aluminum - 0.10% | | | |
| Alcoa, Inc. | 26,500 | | 757,635 |
| Auto Parts - 0.10% | | | |
| Genuine Parts Company | 17,700 | | 731,541 |
| Automobiles - 0.04% | | | |
| Ford Motor Company (a) | 40,500 | | 338,985 |
| Banking - 0.74% | | | |
| AmSouth Bancorp. | 390 | | 11,174 |
| Bank of America Corp. | 22,340 | | 1,149,840 |
| Bank of Ireland | 10,400 | | 196,902 |
| Citizens Banking Corp. | 300 | | 7,560 |
| Fifth Third Bancorp. | 39,600 | | 1,557,864 |
| Mercantile Bankshares Corp. | 11,400 | | 421,002 |
| National City Corp. | 14,800 | | 511,784 |
| Northern Trust Corp. | 400 | | 22,396 |
| Regions Financial Corp. | 660 | | 23,753 |
| SunTrust Banks, Inc. | 13,900 | | 1,061,960 |
| US Bancorp | 2,830 | | 90,758 |
| Wells Fargo Company | 16,600 | | 576,850 |
| |
|
| | | | 5,631,843 |
| Biotechnology - 0.08% | | | |
| MedImmune, Inc. * | 20,800 | | 574,912 |
| Broadcasting - 0.14% | | | |
| CBS Corp., Class B | 36,950 | | 1,054,923 |
| Business Services - 0.09% | | | |
| H & R Block, Inc. | 33,200 | | 698,196 |
| Cable and Television - 0.55% | | | |
| Comcast Corp., Class A * (a) | 25,200 | | 882,000 |
| EchoStar Communications Corp., Class A * | 14,100 | | 447,675 |
| Rogers Communications, Inc. | 5,875 | | 302,915 |
| Time Warner, Inc. | 97,500 | | 1,620,450 |
| Viacom, Inc. * | 25,650 | | 931,095 |
| |
|
| | | | 4,184,135 |
| Cellular Communications - 0.10% | | | |
| Motorola, Inc. | 31,800 | | 743,484 |
| Chemicals - 0.24% | | | |
| Chemtura Corp. | 32,500 | | 282,425 |
| E.I. Du Pont De Nemours & Company | 34,590 | | 1,382,562 |
| Hercules, Inc. * | 10,400 | | 162,240 |
| |
|
| | | | 1,827,227 |
| Computers & Business Equipment - 0.46% | | | |
| Cisco Systems, Inc. * | 50,400 | | 1,108,296 |
| Dell, Inc. * | 38,000 | | 856,900 |
| International Business Machines Corp. | 19,600 | | 1,587,012 |
| |
|
| | | | 3,552,208 |
| Spectrum Income Fund (continued) | | |
| | Shares or | | |
| | Principal | | |
| | Amount | | Value |
|
|
| |
| COMMON STOCKS (continued) | | | |
| Construction Materials - 0.11% | | | |
| Vulcan Materials Company | 11,100 | $ | 872,571 |
| Cosmetics & Toiletries - 0.62% | | | |
| Avon Products, Inc. | 36,200 | | 1,039,302 |
| Colgate-Palmolive Company | 29,200 | | 1,747,912 |
| International Flavors & Fragrances, Inc. | 26,200 | | 1,041,974 |
| Kimberly-Clark Corp. | 13,900 | | 882,650 |
| |
|
| | |
| | | | 4,711,838 |
| Domestic Oil - 0.11% | | | |
| Murphy Oil Corp. (a) | 17,700 | | 865,707 |
| Drugs & Health Care - 0.20% | | | |
| Wyeth | 31,300 | | 1,524,310 |
| Electrical Equipment - 0.09% | | | |
| Cooper Industries, Ltd., Class A | 8,300 | | 679,604 |
| Electrical Utilities - 0.38% | | | |
| Entergy Corp. | 16,000 | | 1,242,400 |
| FirstEnergy Corp. | 15,500 | | 884,430 |
| Pinnacle West Capital Corp. | 11,700 | | 537,498 |
| TECO Energy, Inc. | 16,000 | | 252,320 |
| |
|
| | |
| | | | 2,916,648 |
| Electronics - 0.12% | | | |
| Sony Corp. | 20,500 | | 887,393 |
| Energy - 0.43% | | | |
| Duke Energy Corp. | 48,840 | | 1,465,200 |
| Progress Energy, Inc. | 21,700 | | 961,961 |
| Xcel Energy, Inc. | 42,330 | | 880,464 |
| |
|
| | |
| | | | 3,307,625 |
| Financial Services - 1.47% | | | |
| Charles Schwab Corp. | 76,400 | | 1,246,084 |
| Citigroup, Inc. | 14,240 | | 702,744 |
| Federal National Mortgage Association | 12,500 | | 658,125 |
| Janus Capital Group, Inc. | 11,300 | | 200,914 |
| JPMorgan Chase & Company | 77,900 | | 3,556,914 |
| Mellon Financial Corp. | 41,200 | | 1,533,876 |
| Morgan Stanley | 32,000 | | 2,105,280 |
| State Street Corp. (c) | 19,600 | | 1,211,280 |
| Washington Mutual, Inc. | 240 | | 10,054 |
| |
|
| | |
| | | | 11,225,271 |
| Food & Beverages - 0.62% | | | |
| Campbell Soup Company | 20,400 | | 766,428 |
| General Mills, Inc. | 22,500 | | 1,220,175 |
| McCormick & Company, Inc. | 16,800 | | 611,856 |
| Sara Lee Corp. | 14,900 | | 247,787 |
| Sysco Corp. | 11,200 | | 351,568 |
| The Coca-Cola Company | 35,100 | | 1,572,831 |
| |
|
| | |
| | | | 4,770,645 |
| Gas & Pipeline Utilities - 0.21% | | | |
| NiSource, Inc. | 65,460 | | 1,385,788 |
| Williams Companies, Inc. | 9,695 | | 238,788 |
| |
|
| | |
| | | | 1,624,576 |
The accompanying notes are an integral part of the financial statements. 359
John Hancock Funds II
Portfolio of investments — August 31, 2006
(showing percentage of total net assets)
| Spectrum Income Fund (continued) | | |
| | Shares or | | |
| | Principal | | |
| | Amount | | Value |
|
|
| |
| COMMON STOCKS (continued) | | | |
| Healthcare Products - 0.37% | | | |
| Baxter International, Inc. | 18,800 | $ | 834,344 |
| Boston Scientific Corp. * | 30,200 | | 526,688 |
| Johnson & Johnson | 23,200 | | 1,500,112 |
|
|
| | | | 2,861,144 |
| Holdings Companies/Conglomerates - 0.50% | | | |
| General Electric Company | 112,700 | | 3,838,562 |
| Homebuilders - 0.06% | | | |
| D.R. Horton, Inc. (a) | 20,700 | | 453,951 |
| Household Products - 0.28% | | | |
| Fortune Brands, Inc. | 11,000 | | 798,600 |
| Newell Rubbermaid, Inc. | 48,400 | | 1,306,316 |
|
|
| | | | 2,104,916 |
| Industrial Machinery - 0.21% | | | |
| Deere & Company | 11,200 | | 874,720 |
| Pall Corp. | 27,300 | | 743,106 |
|
|
| | | | 1,617,826 |
| Insurance - 1.00% | | | |
| American International Group, Inc. | 27,800 | | 1,774,196 |
| Chubb Corp. | 12,600 | | 632,016 |
| Lincoln National Corp. | 21,300 | | 1,292,910 |
| Marsh & McLennan Companies, Inc. | 77,100 | | 2,016,936 |
| St. Paul Travelers Companies, Inc. | 24,800 | | 1,088,720 |
| UnumProvident Corp. (a) | 44,200 | | 837,590 |
|
|
| | | | 7,642,368 |
| International Oil - 0.95% | | | |
| Anadarko Petroleum Corp. | 21,600 | | 1,013,256 |
| ChevronTexaco Corp. | 41,850 | | 2,695,140 |
| Hess Corp. | 31,780 | | 1,454,888 |
| Royal Dutch Shell PLC, ADR | 30,800 | | 2,123,352 |
|
|
| | | | 7,286,636 |
| Investment Companies - 0.01% | | | |
| Allied Capital Corp. (a) | 2,300 | | 70,357 |
| Leisure Time - 0.22% | | | |
| Lakes Gaming, Inc. * (a) | 18,850 | | 183,222 |
| Regal Entertainment Group, Class A (a) | 12,425 | | 245,145 |
| Walt Disney Company | 42,000 | | 1,245,300 |
|
|
| | | | 1,673,667 |
| Liquor - 0.22% | | | |
| Anheuser-Busch Companies, Inc. | 33,300 | | 1,644,354 |
| Manufacturing - 0.55% | | | |
| 3M Company | 14,400 | | 1,032,480 |
| Eaton Corp. | 7,300 | | 485,450 |
| Honeywell International, Inc. | 44,200 | | 1,711,424 |
| Tyco International, Ltd. | 36,400 | | 951,860 |
|
|
| | | | 4,181,214 |
| Newspapers - 0.29% | | | |
| Dow Jones & Company, Inc. (a) | 28,200 | | 1,015,764 |
| The New York Times Company, Class A (a) | 52,300 | | 1,177,796 |
|
|
| | | | 2,193,560 |
| Spectrum Income Fund (continued) | | |
| | Shares or | | |
| | Principal | | |
| | Amount | | Value |
|
|
| |
| COMMON STOCKS (continued) | | | |
| Office Furnishings & Supplies - 0.16% | | | |
| Avery Dennison Corp. (a) | 19,200 | $ | 1,189,248 |
| Paper - 0.37% | | | |
| International Paper Company | 64,670 | | 2,248,576 |
| MeadWestvaco Corp. | 23,220 | | 593,271 |
|
|
| | | | 2,841,847 |
| Petroleum Services - 0.63% | | | |
| BP PLC, SADR | 17,500 | | 1,190,875 |
| Exxon Mobil Corp. | 39,700 | | 2,686,499 |
| Schlumberger, Ltd. | 15,800 | | 968,540 |
|
|
| | | | 4,845,914 |
| Pharmaceuticals - 1.09% | | | |
| Abbott Laboratories | 23,800 | | 1,159,060 |
| Bristol-Myers Squibb Company | 36,700 | | 798,225 |
| Eli Lilly & Company | 28,400 | | 1,588,412 |
| Merck & Company, Inc. | 57,540 | | 2,333,247 |
| Pfizer, Inc. | 69,315 | | 1,910,322 |
| Schering-Plough Corp. | 27,300 | | 571,935 |
|
|
| | | | 8,361,201 |
| Photography - 0.12% | | | |
| Eastman Kodak Company (a) | 42,900 | | 912,483 |
| Publishing - 0.23% | | | |
| Tribune Company (a) | 55,400 | | 1,729,034 |
| Railroads & Equipment - 0.30% | | | |
| Norfolk Southern Corp. | 15,100 | | 645,223 |
| Union Pacific Corp. | 20,900 | | 1,679,315 |
|
|
| | | | 2,324,538 |
| Real Estate - 0.08% | | | |
| Simon Property Group, Inc., REIT | 6,300 | | 534,177 |
| Weingarten Realty Investors, REIT | 2,585 | | 109,656 |
|
|
| | | | 643,833 |
| Retail Trade - 0.39% | | | |
| Home Depot, Inc. | 35,000 | | 1,200,150 |
| RadioShack Corp. (a) | 22,600 | | 408,156 |
| Wal-Mart Stores, Inc. | 31,400 | | 1,404,208 |
|
|
| | | | 3,012,514 |
| Sanitary Services - 0.15% | | | |
| Synagro Technologies, Inc. (a) | 26,900 | | 107,331 |
| Waste Management, Inc. | 30,000 | | 1,028,400 |
|
|
| | | | 1,135,731 |
| Semiconductors - 0.18% | | | |
| Analog Devices, Inc. | 23,700 | | 726,168 |
| Intel Corp. | 33,400 | | 652,636 |
|
|
| | | | 1,378,804 |
| Software - 0.31% | | | |
| Microsoft Corp. | 91,100 | | 2,340,359 |
| Telecommunications Equipment & | | | |
| Services - 0.34% | | | |
| Lucent Technologies, Inc. * (a) | 154,600 | | 360,218 |
| Nokia Oyj, SADR | 56,100 | | 1,171,368 |
The accompanying notes are an integral part of the financial statements. 360
John Hancock Funds II
Portfolio of investments — August 31, 2006
(showing percentage of total net assets)
| Spectrum Income Fund (continued) | | |
| | | Shares or | | |
| | | Principal | | |
| | | Amount | | Value |
|
|
| |
| COMMON STOCKS (continued) | | | | |
| Telecommunications Equipment & | | | | |
| Services (continued) | | | | |
| Telus Corp., Non Voting Shares | | 16,805 | $ | 798,910 |
| Telus Corp. | | 5,800 | | 284,326 |
|
|
| | | | | 2,614,822 |
| Telephone - 0.99% | | | | |
| ALLTEL Corp. | | 20,000 | | 1,084,200 |
| AT&T, Inc. | | 75,835 | | 2,360,743 |
| Qwest Communications International, Inc. * (a) | 175,600 | | 1,547,036 |
| Sprint Nextel Corp. | | 58,400 | | 988,128 |
| Verizon Communications, Inc. | | 36,700 | | 1,291,106 |
| Windstream Corp. * | | 20,678 | | 272,950 |
|
|
| | | | | 7,544,163 |
| Tobacco - 0.09% | | | | |
| UST, Inc. (a) | | 12,820 | | 677,665 |
| Toys, Amusements & Sporting Goods - 0.17% | | | |
| Mattel, Inc. | | 68,500 | | 1,290,540 |
|
| TOTAL COMMON STOCKS (Cost $122,773,152) | | $ | 133,384,273 |
|
| |
| PREFERRED STOCKS - 0.30% | | | | |
| Broadcasting - 0.04% | | | | |
| Spanish Broadcasting System, Series B * | | 300 | | 325,500 |
| Building Materials & Construction - 0.07% | | | |
| General Motors Corp., Series B * (a) | | 27,700 | | 523,530 |
| Energy - 0.04% | | | | |
| NRG Energy, Inc., Series 4 * | | 100 | | 137,137 |
| NRG Energy, Inc. * (a) | | 150 | | 205,728 |
|
|
| | | | | 342,865 |
| Financial Services - 0.09% | | | | |
| Ford Motor Company Capital Trust II * | | 19,275 | | 656,121 |
| Telecommunications Equipment & | | | | |
| Services - 0.06% | | | | |
| Lucent Technologies Capital Trust I * | | 475 | | 471,200 |
|
| TOTAL PREFERRED STOCKS (Cost $2,262,011) | | $ | 2,319,216 |
|
| |
| U.S. TREASURY OBLIGATIONS - 6.05% | | | |
| Treasury Inflation Protected | | | | |
| Securities (d) - 0.24% | | | | |
| 1.875% due 07/15/2013 | $ | 276,148 | | 269,308 |
| 2.00% due 07/15/2014 to 01/15/2026 (a) | 1,309,230 | | 1,281,744 |
| 3.625% due 01/15/2008 (a) | | 269,988 | | 273,522 |
|
|
| | | | | 1,824,574 |
| U.S. Treasury Bonds - 3.20% | | | | |
| 4.50% due 02/15/2036 (a) | | 1,215,000 | | 1,143,524 |
| 5.375% due 02/15/2031 (a) | | 1,365,000 | | 1,452,232 |
| 5.50% due 08/15/2028 (a) | | 477,000 | | 512,663 |
| 6.00% due 02/15/2026 (a) | | 2,561,000 | | 2,892,529 |
| 6.125% due 08/15/2029 (a) | | 877,000 | | 1,019,512 |
| 6.25% due 08/15/2023 to 05/15/2030 (a) | 4,798,000 | | 5,610,594 |
| 6.375% due 08/15/2027 (a) | | 370,000 | | 438,479 |
| 6.50% due 11/15/2026 (a) | | 800,000 | | 956,875 |
| Spectrum Income Fund (continued) | |
| | | Shares or | |
| | | Principal | |
| | | Amount | Value |
|
|
| |
| U.S. TREASURY OBLIGATIONS | | | |
| (continued) | | | |
| U.S. Treasury Bonds (continued) | | | |
| 7.125% due 02/15/2023 (a) | $ | 2,006,000 $ | 2,490,573 |
| 7.50% due 11/15/2016 (a) | | 980,000 | 1,192,001 |
| 7.625% due 02/15/2025 (a) | | 1,311,000 | 1,730,418 |
| 7.875% due 02/15/2021 (a) | | 976,000 | 1,270,020 |
| 8.00% due 11/15/2021 (a) | | 270,000 | 357,476 |
| 8.875% due 08/15/2017 to 02/15/2019 (a) | 2,490,000 | 3,384,534 |
|
|
| | | | 24,451,430 |
| U.S. Treasury Notes - 2.53% | | | |
| 3.50% due 05/31/2007 (a) | | 235,000 | 232,347 |
| 3.625% due 06/30/2007 (a) | | 460,000 | 454,682 |
| 3.875% due 09/15/2010 (a) | | 2,215,000 | 2,148,377 |
| 4.00% due 03/15/2010 | | 100,000 | 97,738 |
| 4.00% due 04/15/2010 to 02/15/2015 (a) | 385,000 | 369,000 |
| 4.25% due 08/15/2013 to 11/15/2014 (a) | 8,775,000 | 8,505,293 |
| 4.50% due 11/15/2015 (a) | | 960,000 | 942,525 |
| 4.75% due 03/31/2011 (a) | | 330,000 | 330,593 |
| 4.875% due 02/15/2012 (a)**** | | 4,010,000 | 4,046,026 |
| 5.125% due 05/15/2016 (a) | | 2,085,000 | 2,144,210 |
|
|
| | | | 19,270,791 |
| U.S. Treasury Strips - 0.08% | | | |
| zero coupon due 05/15/2020 | | 1,250,000 | 632,725 |
|
| TOTAL U.S. TREASURY OBLIGATIONS | | |
| (Cost $44,992,629) | | $ | 46,179,520 |
|
| |
| U.S. GOVERNMENT AGENCY OBLIGATIONS - 19.89% | |
| Federal Agricultural Mortgage Corp. - 0.05% | | |
| 6.00% due 07/01/2021 to 08/01/2021 | | 357,075 | 360,771 |
| Federal Farm Credit Bank - 0.08% | | | |
| 1.875% due 01/16/2007 | | 640,000 | 631,748 |
| Federal Home Loan Bank - 0.20% | | | |
| 3.00% due 04/15/2009 | | 600,000 | 571,643 |
| 3.875% due 08/22/2008 | | 350,000 | 342,281 |
| 5.25% due 06/18/2014 (a) | | 590,000 | 596,119 |
|
|
| | | | 1,510,043 |
| Federal Home Loan Mortgage Corp. - 2.19% | | |
| 1.00% due 03/01/2036 | | 630,895 | 620,161 |
| 3.55% due 11/15/2007 | | 600,000 | 587,999 |
| 4.00% due 12/15/2009 | | 425,000 | 411,731 |
| 4.50% due 10/01/2007 to 09/01/2035 | | 1,362,602 | 1,305,196 |
| 4.522% due 09/01/2032 | | 58,663 | 58,354 |
| 4.545% due 09/01/2035 | | 340,192 | 328,737 |
| 4.625% due 02/21/2008 | | 650,000 | 645,589 |
| 4.72% due 08/01/2035 | | 488,920 | 476,578 |
| 4.788% due 07/01/2035 | | 96,104 | 95,262 |
| 5.00% due 01/01/2009 to 11/01/2035 | | 6,255,010 | 6,029,057 |
| 5.055% due 11/01/2035 | | 267,935 | 263,115 |
| 5.125% due 02/27/2009 to 07/15/2012 | | 2,395,000 | 2,398,377 |
| 5.428% due 01/01/2036 | | 138,829 | 137,754 |
| 5.50% due 03/01/2018 to 04/01/2029 | | 1,574,726 | 1,571,776 |
| 5.75% due 05/23/2011 | | 465,000 | 467,278 |
| 6.00% due 11/01/2011 to 12/01/2033 | | 301,074 | 303,279 |
The accompanying notes are an integral part of the financial statements. 361
John Hancock Funds II
Portfolio of investments — August 31, 2006
(showing percentage of total net assets)
| Spectrum Income Fund (continued) | | |
| | | Shares or | | |
| | | Principal | | |
| | | Amount | | Value |
|
|
| |
| U.S. GOVERNMENT AGENCY | | | | |
| OBLIGATIONS (continued) | | | | |
| Federal Home Loan Mortgage Corp. | | | | |
| (continued) | | | | |
| 6.50% due 05/01/2017 to 01/01/2036 | $ | 928,489 | $ | 944,244 |
| 7.00% due 02/01/2024 to 06/01/2032 | | 71,907 | | 74,037 |
| 7.50% due 05/01/2024 to 06/01/2024 | | 6,061 | | 6,304 |
| 10.50% due 05/01/2019 | | 947 | | 962 |
|
|
| | | | | 16,725,790 |
| Federal National Mortgage | | | | |
| Association - 6.43% | | | | |
| 1.00% due 10/01/2035 to 08/01/2036 | | 2,421,870 | | 2,398,129 |
| 3.25% due 08/15/2008 (a) | | 675,000 | | 651,883 |
| 3.825% due 10/01/2033 | | 209,552 | | 203,826 |
| 3.875% due 07/15/2008 | | 350,000 | | 342,328 |
| 4.026% due 07/01/2027 | | 2,427 | | 2,435 |
| 4.375% due 09/15/2012 (a) | | 410,000 | | 395,930 |
| 4.50% due 02/15/2011 to 09/01/2035 | | 5,870,930 | | 5,598,293 |
| 4.625% due 10/15/2014 | | 780,000 | | 756,516 |
| 4.694% due 09/01/2035 | | 569,539 | | 556,273 |
| 4.793% due 11/01/2035 | | 356,273 | | 353,798 |
| 4.836% due 06/01/2035 | | 217,848 | | 216,100 |
| 5.00% due 01/01/2009 to 10/01/2035 | | 2,509,090 | | 2,444,792 |
| 5.00% TBA ** | | 585,000 | | 560,320 |
| 5.3067% due 02/17/2009 (a)(b) | | 260,000 | | 252,850 |
| 5.319% due 12/01/2035 | | 231,601 | | 229,187 |
| 5.375% due 07/15/2016 to 12/01/2035 | | 732,646 | | 739,253 |
| 5.455% due 01/01/2019 | | 1,712 | | 1,708 |
| 5.50% due 07/01/2013 to 01/01/2036 | | 14,067,567 | | 13,891,844 |
| 5.544% due 12/01/2035 | | 420,395 | | 418,829 |
| 5.685% due 12/01/2035 | | 139,628 | | 138,788 |
| 5.715% due 01/01/2036 | | 957,562 | | 954,303 |
| 5.75% due 02/15/2008 (a) | | 580,000 | | 584,873 |
| 6.00% due 05/15/2011 to 01/01/2036 | | 10,101,866 | | 10,211,487 |
| 6.00% TBA ** | | 818,000 | | 825,028 |
| 6.50% due 06/01/2013 to 09/01/2036 | | 3,697,395 | | 3,757,381 |
| 7.00% due 12/01/2029 to 02/01/2030 | | 3,336 | | 3,438 |
| 7.00% TBA ** | | 515,000 | | 528,679 |
| 7.125% due 06/15/2010 | | 1,400,000 | | 1,500,103 |
| 7.125% due 01/15/2030 (a) | | 440,000 | | 548,920 |
|
|
| | | | | 49,067,294 |
| Government National Mortgage | | | | |
| Association - 10.94% | | | | |
| 4.00% due 09/15/2018 | | 808,631 | | 762,866 |
| 4.50% due 09/15/2018 to 01/20/2035 | | 2,022,706 | | 1,911,565 |
| 5.00% due 02/15/2018 to 05/15/2036 | | 19,442,135 | | 18,844,573 |
| 5.50% due 02/15/2018 to 04/20/2036 | | 18,037,086 | | 17,864,829 |
| 5.50% TBA ** | | 3,777,770 | | 3,738,114 |
| 6.00% due 12/20/2008 to 02/15/2036 | | 14,184,245 | | 14,329,772 |
| 6.00% TBA ** | | 7,123,903 | | 7,187,547 |
| 6.50% due 07/15/2009 to 07/20/2035 | | 11,921,265 | | 12,183,722 |
| 6.50% TBA ** | | 804,413 | | 820,970 |
| 7.00% due 09/15/2012 to 08/20/2036 | | 4,412,620 | | 4,543,891 |
| 7.50% due 09/15/2012 to 06/15/2032 | | 506,476 | | 527,274 |
| 8.00% due 08/15/2007 to 06/20/2029 | | 412,303 | | 436,091 |
| Spectrum Income Fund (continued) | | |
| | | Shares or | | |
| | | Principal | | |
| | | Amount | | Value |
|
|
| |
| U.S. GOVERNMENT AGENCY | | | | |
| OBLIGATIONS (continued) | | | | |
| Government National Mortgage | | | | |
| Association (continued) | | | | |
| 8.50% due 07/15/2008 to 02/15/2027 | $ | 104,601 | $ | 111,699 |
| 9.00% due 03/15/2009 to 05/15/2024 | | 59,936 | | 63,964 |
| 9.25% due 10/15/2016 to 12/15/2019 | | 6,180 | | 6,670 |
| 9.50% due 06/15/2009 to 12/15/2024 | | 20,145 | | 21,709 |
| 9.75% due 07/15/2017 to 02/15/2021 | | 4,606 | | 5,054 |
| 10.00% due 02/15/2016 to 03/15/2026 | | 80,706 | | 89,088 |
| 10.25% due 05/15/2020 to 11/15/2020 | | 4,834 | | 5,348 |
| 10.50% due 09/15/2015 to 07/15/2019 | | 10,934 | | 12,139 |
| 11.00% due 12/15/2009 to 07/20/2020 | | 35,943 | | 39,484 |
| 11.50% due 03/15/2010 to 11/15/2019 | | 20,108 | | 22,264 |
| 11.75% due 08/15/2013 | | 1,649 | | 1,833 |
| 12.00% due 10/15/2010 to 06/15/2015 | | 18,485 | | 20,684 |
| 12.25% due 03/15/2014 to 07/20/2015 | | 1,594 | | 1,755 |
| 12.50% due 04/15/2010 to 07/15/2015 | | 7,242 | | 7,948 |
| 12.75% due 12/20/2013 to 12/20/2014 | | 1,532 | | 1,691 |
| 13.00% due 01/15/2011 to 09/20/2015 | | 6,154 | | 6,853 |
| 13.50% due 05/15/2010 to 01/15/2015 | | 4,282 | | 4,781 |
|
|
| | | | | 83,574,178 |
|
| TOTAL U.S. GOVERNMENT AGENCY OBLIGATIONS | | |
| (Cost $152,609,459) | | | $ | 151,869,824 |
|
| |
| FOREIGN GOVERNMENT OBLIGATIONS - 12.61% | | |
| Argentina - 0.19% | | | | |
| Republic of Argentina | | | | |
| zero coupon, Step up to 2.5% on | | | | |
| 03/31/2009 due 12/31/2038 (a) | | 225,000 | | 97,875 |
| zero coupon, Step up to 1.18% on | | | | |
| 03/31/2009 due 12/31/2038 (b) | ARS | 700,000 | | 111,997 |
| 0.275% due 12/15/2035 (b) | | 1,499,445 | | 41,631 |
| 4.50% due 12/15/2035 (a)(b) | $ | 425,000 | | 40,375 |
| 5.59% due 08/03/2012 (b) | | 725,000 | | 509,313 |
| 5.83% due 12/31/2033 (b) | ARS | 600,000 | | 244,843 |
| 7.00% due 03/28/2011 | $ | 75,000 | | 74,550 |
| City of Buenos Aires | | | | |
| 7.875% due 04/11/2011 | | 300,000 | | 300,750 |
|
|
| | | | | 1,421,334 |
| Austria - 0.11% | | | | |
| Republic of Austria | | | | |
| 5.50% due 01/15/2010 | EUR | 568,000 | | 770,055 |
| 6.25% due 07/15/2027 | | 49,000 | | 82,109 |
|
|
| | | | | 852,164 |
| Belgium - 0.48% | | | | |
| Kingdom of Belgium | | | | |
| 4.25% due 09/28/2013 | | 484,000 | | 641,001 |
| 5.00% due 03/28/2035 | | 610,000 | | 902,123 |
| 6.25% due 03/28/2007 | | 1,621,000 | | 2,104,976 |
|
|
| | | | | 3,648,100 |
| Brazil - 0.80% | | | | |
| Federative Republic of Brazil | | | | |
| 6.00% due 05/15/2009 | BRL | 200,000 | | 133,568 |
| 6.00% due 05/15/2015 | | 1,782,000 | | 1,123,286 |
The accompanying notes are an integral part of the financial statements. 362
John Hancock Funds II
Portfolio of investments — August 31, 2006
(showing percentage of total net assets)
| Spectrum Income Fund (continued) | |
| | | Shares or | |
| | | Principal | |
| | | Amount | Value |
|
|
| |
| FOREIGN GOVERNMENT OBLIGATIONS | | |
| (continued) | | | |
| Brazil (continued) | | | |
| Federative Republic of Brazil (continued) | | | |
| 6.00% due 05/15/2011 | BRL | 813,000 | $ | 570,649 |
| 7.875% due 03/07/2015 (a) | $ | 50,000 | 54,950 |
| 8.00% due 01/15/2018 (a) | | 1,795,000 | 1,970,910 |
| 8.75% due 02/04/2025 | | 375,000 | 445,687 |
| 8.875% due 10/14/2019 | | 150,000 | 177,525 |
| 10.00% due 01/01/2014 | BRL | 2,014,000 | 773,127 |
| 10.00% due 01/01/2012 | | 907,000 | 364,059 |
| 11.00% due 08/17/2040 | $ | 370,000 | 483,405 |
|
|
| | | | 6,097,166 |
| Canada - 0.19% | | | |
| Government of Canada | | | |
| 4.00% due 09/01/2010 (a) | CAD | 335,000 | 302,818 |
| 5.75% due 06/01/2033 | | 225,000 | 254,044 |
| Province of Quebec | | | |
| 9.375% due 01/16/2023 | | 246,000 | 339,823 |
| Province of Ontario | | | |
| 5.00% due 03/08/2014 | | 552,000 | 521,473 |
|
|
| | | | 1,418,158 |
| Colombia - 0.08% | | | |
| Republic of Colombia | | | |
| 7.375% due 01/27/2017 | $ | 250,000 | 260,000 |
| 10.75% due 01/15/2013 | | 165,000 | 201,630 |
| 11.75% due 02/25/2020 (a) | | 125,000 | 174,375 |
|
|
| | | | 636,005 |
| Denmark - 0.09% | | | |
| Kingdom of Denmark | | | |
| 5.00% due 11/15/2013 | DKK | 3,277,000 | 606,697 |
| 7.00% due 11/10/2024 | | 364,000 | 86,140 |
|
|
| | | | 692,837 |
| Ecuador - 0.03% | | | |
| Republic of Ecuador | | | |
| 4.00% coupon, Step up to 10.00% on | | | |
| 08/15/2007 due 08/15/2030 (b) | $ | 200,000 | 199,400 |
| Finland - 0.02% | | | |
| Republic of Finland | | | |
| 5.00% due 07/04/2007 | EUR | 136,000 | 176,150 |
| France - 1.35% | | | |
| Government of France | | | |
| 4.00% due 10/25/2014 | | 640,000 | 834,321 |
| 4.00% due 04/25/2009 | | 1,400,000 | 1,810,915 |
| 4.75% due 10/25/2012 | | 585,000 | 792,927 |
| 5.00% due 07/16/2014 | | 50,000 | 65,848 |
| 5.00% due 10/25/2016 | | 227,000 | 320,059 |
| 5.50% due 04/25/2029 | | 637,000 | 990,489 |
| 5.50% due 04/25/2010 | | 2,470,000 | 3,366,231 |
| 5.75% due 10/25/2032 | | 1,005,000 | 1,635,342 |
| 6.50% due 10/25/2006 | | 400,000 | 513,859 |
|
|
| | | | 10,329,991 |
| Spectrum Income Fund (continued) | | |
| | | Shares or | | |
| | | Principal | | |
| | | Amount | | Value |
|
|
| |
| FOREIGN GOVERNMENT OBLIGATIONS | | | |
| (continued) | | | | |
| Germany - 2.04% | | | | |
| Federal Republic of Germany | | | | |
| 2.25% due 12/15/2006 | EUR | 3,000,000 | $ | 3,826,532 |
| 3.25% due 07/04/2015 | | 1,522,000 | | 1,878,096 |
| 4.00% due 01/04/2037 | | 850,000 | | 1,083,399 |
| 4.00% due 02/16/2007 | | 600,000 | | 769,584 |
| 4.50% due 01/04/2013 | | 121,000 | | 162,017 |
| 4.75% due 07/04/2028 | | 302,000 | | 426,852 |
| 4.75% due 07/04/2034 | | 625,000 | | 894,693 |
| 5.50% due 01/04/2031 | | 595,000 | | 932,445 |
| 6.00% due 07/04/2007 | | 1,308,000 | | 1,706,977 |
| 6.00% due 01/04/2007 | | 3,000,000 | | 3,869,926 |
|
|
| | | | | 15,550,521 |
| Greece - 0.01% | | | | |
| Republic of Greece | | | | |
| 4.60% due 05/20/2013 | | 70,000 | | 93,364 |
| Indonesia - 0.09% | | | | |
| Republic of Indonesia | | | | |
| 6.875% due 03/09/2017 (a) | $ | 700,000 | | 703,884 |
| Iraq - 0.11% | | | | |
| Republic of Iraq, Series REGS | | | | |
| 5.80% due 01/15/2028 (a) | | 1,250,000 | | 803,125 |
| Ireland - 0.05% | | | | |
| Republic of Ireland | | | | |
| 4.00% due 04/18/2010 | EUR | 96,000 | | 124,513 |
| 5.00% due 04/18/2013 | | 185,000 | | 255,216 |
|
|
| | | | | 379,729 |
| Italy - 0.34% | | | | |
| Republic of Italy | | | | |
| 4.25% due 08/01/2014 | | 187,000 | | 245,433 |
| 5.00% due 10/15/2007 | | 332,000 | | 431,458 |
| 6.00% due 11/01/2007 | | 1,025,000 | | 1,347,269 |
| 6.00% due 05/01/2031 | | 271,000 | | 432,688 |
| 7.25% due 11/01/2026 | | 75,000 | | 133,995 |
|
|
| | | | | 2,590,843 |
| Jamaica - 0.08% | | | | |
| Government of Jamaica | | | | |
| 9.00% due 06/02/2015 | $ | 215,000 | | 223,600 |
| 10.625% due 06/20/2017 (a) | | 350,000 | | 403,900 |
|
|
| | | | | 627,500 |
| Japan - 1.49% | | | | |
| Government of Japan | | | | |
| 1.00% due 12/20/2012 | JPY | 179,450,000 | | 1,502,404 |
| 1.00% due 06/10/2016 | | 216,900,000 | | 1,851,861 |
| 1.10% due 09/20/2012 | | 67,450,000 | | 569,482 |
| 1.30% due 12/20/2013 | | 138,400,000 | | 1,170,211 |
| 1.40% due 03/21/2011 | | 244,300,000 | | 2,114,630 |
| 1.50% due 03/20/2015 | | 131,400,000 | | 1,114,685 |
| 1.90% due 03/20/2025 | | 183,000,000 | | 1,511,174 |
| 1.90% due 12/20/2010 | | 24,600,000 | | 217,387 |
| 1.90% due 06/20/2016 | | 32,800,000 | | 286,162 |
| 2.00% due 06/20/2022 | | 55,200,000 | | 471,089 |
The accompanying notes are an integral part of the financial statements. 363
John Hancock Funds II
Portfolio of investments — August 31, 2006
(showing percentage of total net assets)
| Spectrum Income Fund (continued) | |
| | | Shares or | |
| | | Principal | |
| | | Amount | Value |
|
|
| |
| FOREIGN GOVERNMENT OBLIGATIONS | | |
| (continued) | | | |
| Japan (continued) | | | |
| Government of Japan (continued) | | | |
| 2.00% due 12/20/2033 | JPY | 53,200,000 | $ | 417,364 |
| 2.20% due 06/22/2020 | | 18,000,000 | 159,163 |
|
|
| | | | 11,385,612 |
| Lebanon - 0.01% | | | |
| Government of Lebanon | | | |
| 8.25% due 04/12/2021 (a) | $ | 100,000 | 96,500 |
| Malaysia - 0.08% | | | |
| Malaysia Government Bond | | | |
| 3.756% due 04/28/2011 | MYR | 781,000 | 209,206 |
| 6.812% due 11/29/2006 | | 196,000 | 53,722 |
| 6.90% due 03/15/2007 | | 1,182,000 | 326,786 |
|
|
| | | | 589,714 |
| Mexico - 0.98% | | | |
| Government of Mexico | | | |
| 4.625% due 10/08/2008 | $ | 365,000 | 359,525 |
| 5.625% due 01/15/2017 (a) | | 200,000 | 197,200 |
| 6.625% due 03/03/2015 (a) | | 120,000 | 127,320 |
| 6.75% due 09/27/2034 | | 100,000 | 106,100 |
| 7.50% due 04/08/2033 | | 65,000 | 75,237 |
| 8.00% due 12/24/2008 | MXN | 11,150,000 | 1,030,465 |
| 8.00% due 12/28/2006 | | 1,750,000 | 160,786 |
| 8.00% due 12/17/2015 | | 3,680,000 | 330,794 |
| 8.00% due 12/19/2013 | | 8,500,000 | 773,407 |
| 8.125% due 12/30/2019 | $ | 265,000 | 319,325 |
| 9.00% due 12/22/2011 | MXN | 27,065,000 | 2,586,853 |
| 9.00% due 12/20/2012 | | 3,350,000 | 320,436 |
| 9.50% due 12/18/2014 | | 6,070,000 | 597,240 |
| 10.00% due 12/05/2024 | | 5,090,000 | 533,320 |
|
|
| | | | 7,518,008 |
| Netherlands - 0.51% | | | |
| Kingdom of Netherlands | | | |
| 5.00% due 07/15/2011 | EUR | 188,000 | 255,321 |
| 5.50% due 01/15/2028 | | 137,000 | 212,046 |
| 5.75% due 02/15/2007 | | 2,650,000 | 3,424,120 |
|
|
| | | | 3,891,487 |
| Panama - 0.02% | | | |
| Republic of Panama | | | |
| 6.70% due 01/26/2036 | $ | 163,000 | 159,740 |
| Peru - 0.06% | | | |
| Republic of Peru | | | |
| 8.375% due 05/03/2016 | | 400,000 | 455,000 |
| Philippines - 0.08% | | | |
| Republic of Philippines | | | |
| 9.50% due 02/02/2030 | | 200,000 | 244,000 |
| 9.875% due 01/15/2019 | | 100,000 | 121,375 |
| 10.625% due 03/16/2025 | | 175,000 | 229,469 |
|
|
| | | | 594,844 |
| Poland - 0.73% | | | |
| Republic of Poland | | | |
| 5.00% due 10/24/2013 | PLN | 5,100,000 | 1,602,460 |
| Spectrum Income Fund (continued) | |
| | | Shares or | |
| | | Principal | |
| | | Amount | Value |
|
|
| |
| FOREIGN GOVERNMENT OBLIGATIONS | | |
| (continued) | | | |
| Poland (continued) | | | |
| Republic of Poland, Series 0509 (continued) | | |
| 6.00% due 05/24/2009 | PLN | 3,890,000 | $ | 1,288,488 |
| 6.00% due 11/24/2010 | | 7,995,000 | 2,653,080 |
|
|
| | | | 5,544,028 |
| Portugal - 0.02% | | | |
| Republic of Portugal | | | |
| 5.15% due 06/15/2011 | EUR | 118,000 | 160,346 |
| Russia - 0.23% | | | |
| Russian Federation, Series REGS | | | |
| 5.00% due 03/31/2030 | $ | 1,600,000 | 1,780,640 |
| Serbia - 0.11% | | | |
| Republic of Serbia | | | |
| zero coupon, Step up to 6.75% on | | | |
| 11/01/2009 due 11/01/2024 | | 900,000 | 801,720 |
| South Africa - 0.19% | | | |
| Republic of South Africa | | | |
| 6.50% due 06/02/2014 | | 485,000 | 506,219 |
| 8.50% due 06/23/2017 | | 250,000 | 299,687 |
| Republic of South Africa | | | |
| 13.00% due 08/31/2010 | ZAR | 3,451,000 | 547,425 |
| 13.50% due 09/15/2015 | | 500,000 | 89,871 |
|
|
| | | | 1,443,202 |
| Spain - 0.51% | | | |
| Kingdom of Spain | | | |
| 4.00% due 01/31/2010 | EUR | 46,000 | 59,661 |
| 5.50% due 03/08/2011 | AUD | 560,000 | 416,954 |
| 5.75% due 07/30/2032 | EUR | 127,000 | 205,827 |
| 6.00% due 01/31/2008 | | 2,427,000 | 3,206,510 |
|
|
| | | | 3,888,952 |
| Sweden - 0.18% | | | |
| Kingdom of Sweden | | | |
| 5.00% due 01/28/2009 | SEK | 9,800,000 | 1,401,372 |
| Turkey - 0.30% | | | |
| Republic of Turkey | | | |
| 6.875% due 03/17/2036 (a) | $ | 850,000 | 792,625 |
| 7.25% due 03/15/2015 | | 50,000 | 50,812 |
| 7.375% due 02/05/2025 | | 40,000 | 39,900 |
| 11.50% due 01/23/2012 (a) | | 100,000 | 121,125 |
| 14.00% due 01/19/2011 | TRY | 1,465,000 | 900,307 |
| 15.00% due 02/10/2010 | | 320,000 | 202,117 |
| 20.00% due 10/17/2007 | | 300,000 | 220,417 |
|
|
| | | | 2,327,303 |
| Ukraine - 0.01% | | | |
| Republic of Ukraine | | | |
| 7.65% due 06/11/2013 | $ | 100,000 | 106,670 |
| United Kingdom - 0.95% | | | |
| Government of United Kingdom | | | |
| 4.25% due 03/07/2011 | GBP | 2,525,000 | 4,714,363 |
| 4.25% due 06/07/2032 | | 1,305,000 | 2,512,475 |
|
|
| | | | 7,226,838 |
The accompanying notes are an integral part of the financial statements. 364
John Hancock Funds II
Portfolio of investments — August 31, 2006
(showing percentage of total net assets)
| Spectrum Income Fund (continued) | |
| | | Shares or | |
| | | Principal | |
| | | Amount | Value |
|
|
| |
| FOREIGN GOVERNMENT OBLIGATIONS | | |
| (continued) | | | |
| Uruguay - 0.03% | | | |
| Republic of Uruguay | | | |
| 7.625% due 03/21/2036 | $ | 100,000 | $ | 99,500 |
| 8.00% due 11/18/2022 | | 150,000 | 157,125 |
|
|
| | | | 256,625 |
| Vietnam - 0.06% | | | |
| Socialist Republic of Vietnam | | | |
| 6.875% due 01/15/2016 (a) | | 425,000 | 440,284 |
|
| TOTAL FOREIGN GOVERNMENT OBLIGATIONS | |
| (Cost $94,918,947) | | $ | 96,289,156 |
|
| |
| CORPORATE BONDS - 28.09% | | | |
| Advertising - 0.42% | | | |
| Advanstar Communications, Inc. | | | |
| 10.75% due 08/15/2010 | | 425,000 | 459,000 |
| Advanstar Communications, Inc., Series B | | | |
| 15.00% due 10/15/2011 | | 200,000 | 208,500 |
| Lamar Advertising Company | | | |
| 2.875% due 12/31/2010 (a) | | 425,000 | 495,350 |
| Lamar Media Corp. | | | |
| 6.625% due 08/15/2015 | | 325,000 | 304,688 |
| R.H. Donnelley Corp. | | | |
| 10.875% due 12/15/2012 | | 350,000 | 383,250 |
| R.H. Donnelley Corp., Series A-3 | | | |
| 8.875% due 01/15/2016 | | 1,350,000 | 1,329,750 |
|
|
| | | | 3,180,538 |
| Aerospace - 0.36% | | | |
| Aviall, Inc. | | | |
| 7.625% due 07/01/2011 (a) | | 225,000 | 236,531 |
| BE Aerospace, Inc., Series B | | | |
| 8.875% due 05/01/2011 | | 250,000 | 260,625 |
| Boeing Company | | | |
| 8.75% due 08/15/2021 | | 55,000 | 72,048 |
| GenCorp, Inc. | | | |
| 9.50% due 08/15/2013 | | 550,000 | 572,000 |
| Moog, Inc. | | | |
| 6.25% due 01/15/2015 | | 275,000 | 259,188 |
| Northrop Grumman Corp. | | | |
| 7.125% due 02/15/2011 | | 355,000 | 379,046 |
| 7.75% due 03/01/2016 | | 35,000 | 40,563 |
| Raytheon Company | | | |
| 6.15% due 11/01/2008 | | 170,000 | 172,891 |
| Rolls-Royce Group PLC, EMTN | | | |
| 4.50% due 03/16/2011 | EUR | 26,000 | 33,866 |
| Sequa Corp. | | | |
| 9.00% due 08/01/2009 | $ | 25,000 | 26,375 |
| TransDigm, Inc. | | | |
| 7.75% due 07/15/2014 | | 475,000 | 471,438 |
| United Technologies Corp. | | | |
| 5.40% due 05/01/2035 | | 110,000 | 104,467 |
| Vought Aircraft Industries, Inc. | | | |
| 8.00% due 07/15/2011 | | 125,000 | 112,500 |
|
|
| | | | 2,741,538 |
| Spectrum Income Fund (continued) | |
| | | Shares or | |
| | | Principal | |
| | | Amount | Value |
|
|
| |
| CORPORATE BONDS (continued) | | | |
| Agriculture - 0.17% | | | |
| Bunge, Ltd. | | | |
| 4.375% due 12/15/2008 | $ | 475,000 | $ | 463,205 |
| Case New Holland, Inc. | | | |
| 9.25% due 08/01/2011 | | 325,000 | 344,500 |
| Phosphate Resource Partners LP | | | |
| 7.00% due 02/15/2008 | | 100,000 | 99,750 |
| Terra Capital, Inc. | | | |
| 11.50% due 06/01/2010 | | 375,000 | 407,813 |
|
|
| | | | 1,315,268 |
| |
| Air Travel - 0.01% | | | |
| Air Jamaica, Ltd., Series REGS | | | |
| 9.375% due 07/08/2015 | | 75,000 | 78,000 |
| Aluminum - 0.05% | | | |
| Alcoa, Inc. | | | |
| 4.25% due 08/15/2007 | | 55,000 | 54,208 |
| Century Aluminum Company | | | |
| 7.50% due 08/15/2014 | | 300,000 | 298,500 |
|
|
| | | | 352,708 |
| |
| Amusement & Theme Parks - 0.05% | | | |
| Universal City Development Partners | | | |
| 11.75% due 04/01/2010 | | 375,000 | 405,938 |
| Apparel & Textiles - 0.20% | | | |
| Broder Brothers, Series B | | | |
| 11.25% due 10/15/2010 | | 225,000 | 212,062 |
| Collins & Aikman Floorcoverings, Inc. | | | |
| 9.75% due 02/15/2010 | | 300,000 | 294,750 |
| INVISTA | | | |
| 9.25% due 05/01/2012 | | 675,000 | 708,750 |
| Rafaella Apparel Group, Inc. | | | |
| 11.25% due 06/15/2011 | | 300,000 | 289,500 |
|
|
| | | | 1,505,062 |
| |
| Auto Parts - 0.11% | | | |
| Accuride Corp. | | | |
| 8.50% due 02/01/2015 | | 250,000 | 233,125 |
| Commercial Vehicle Group, Inc. | | | |
| 8.00% due 07/01/2013 | | 50,000 | 47,625 |
| Lear Corp., Series B | | | |
| 8.11% due 05/15/2009 (a) | | 150,000 | 144,750 |
| Tenneco Automotive, Inc. | | | |
| 8.625% due 11/15/2014 (a) | | 400,000 | 399,000 |
|
|
| | | | 824,500 |
| |
| Auto Services - 0.21% | | | |
| Adesa, Inc. | | | |
| 7.625% due 06/15/2012 | | 250,000 | 246,250 |
| Avis Budget Car Rental LLC | | | |
| 7.625% due 05/15/2014 | | 175,000 | 166,250 |
| 7.905% due 05/15/2014 (b) | | 50,000 | 47,500 |
| Erac USA Finance Company | | | |
| 7.95% due 12/15/2009 | | 115,000 | 123,198 |
| Hertz Corp., Class A | | | |
| 8.875% due 01/01/2014 | | 625,000 | 648,437 |
| 10.50% due 01/01/2016 (a) | | 350,000 | 377,125 |
|
|
| | | | 1,608,760 |
The accompanying notes are an integral part of the financial statements. 365
John Hancock Funds II
Portfolio of investments — August 31, 2006
(showing percentage of total net assets)
| Spectrum Income Fund (continued) | |
| | | Shares or | |
| | | Principal | |
| | | Amount | Value |
|
|
| |
| CORPORATE BONDS (continued) | | | |
| Automobiles - 0.25% | | | |
| AutoNation, Inc. | | | |
| 7.00% due 04/15/2014 | $ | 550,000 | $ | 542,438 |
| 7.5069% due 04/15/2013 (b) | | 100,000 | 100,500 |
| DaimlerChrysler N.A. Holding Corp. | | | |
| 6.50% due 11/15/2013 (a) | | 460,000 | 473,708 |
| 8.50% due 01/18/2031 (a) | | 60,000 | 72,051 |
| DaimlerChrysler N.A. Holding Corp., Series MTN | | |
| 5.9175% due 08/03/2009 (b) | | 470,000 | 470,788 |
| ERAC USA Finance Company | | | |
| 5.60% due 05/01/2015 | | 240,000 | 234,367 |
|
|
| | | | 1,893,852 |
| Banking - 1.36% | | | |
| Australia & New Zealand Banking Group, | | | |
| Ltd., EMTN | | | |
| 4.45% due 02/05/2015 (b) | EUR | 39,000 | 50,765 |
| BAC Capital Trust VI | | | |
| 5.625% due 03/08/2035 | $ | 395,000 | 361,590 |
| Banca Intesa SpA, EMTN | | | |
| 5.85% due 05/08/2014 (b) | EUR | 67,000 | 89,551 |
| Banca Monte dei Paschi di Siena SpA, EMTN | | |
| 4.50% due 09/24/2015 (b) | | 75,000 | 97,337 |
| Bank Nederlandse Gemeenten, EMTN | | | |
| 4.00% due 07/15/2014 | | 105,000 | 135,339 |
| Bank of America Corp. | | | |
| 5.25% due 02/01/2007 | $ | 150,000 | 149,853 |
| 5.75% due 08/15/2016 | | 210,000 | 213,045 |
| Bank of Ireland | | | |
| 6.45% due 02/10/2010 | EUR | 49,000 | 67,715 |
| Bank One Corp. | | | |
| 5.25% due 01/30/2013 (a) | $ | 200,000 | 197,763 |
| Banknorth Capital Trust I, Series B | | | |
| 10.52% due 05/01/2027 | | 25,000 | 26,920 |
| Banque du Liban, Series ECD | | | |
| 10.00% due 04/25/2015 | | 300,000 | 326,250 |
| Barclays Bank PLC, EMTN | | | |
| 5.75% due 03/08/2011 | EUR | 36,000 | 49,467 |
| BB&T Capital Trust II | | | |
| 6.75% due 06/07/2036 | $ | 405,000 | 428,853 |
| BNP Paribas, EMTN | | | |
| 5.25% due 12/17/2012 | EUR | 36,000 | 49,281 |
| Colonial Bank, N.A. | | | |
| 9.375% due 06/01/2011 | $ | 185,000 | 209,142 |
| Credit Agricole SA, Series TSDI | | | |
| zero coupon, Step up to 6% on | | | |
| 06/20/2018 due 06/20/2049 (b) | GBP | 100,000 | 180,949 |
| Credit Suisse Group Finance Guernsey, Ltd. | | | |
| 6.375% due 06/07/2013 | EUR | 51,000 | 73,538 |
| Deutsche Bank AG | | | |
| 5.125% due 01/31/2013 | | 72,000 | 97,206 |
| Greenpoint Capital Trust I | | | |
| 9.10% due 06/01/2027 | $ | 25,000 | 26,627 |
| HBOS PLC | | | |
| 3.125% due 01/12/2007 | | 170,000 | 168,564 |
| 6.00% due 11/01/2033 | | 420,000 | 425,726 |
| HBOS PLC, EMTN | | | |
| 4.375% due 10/30/2019 (b) | EUR | 54,000 | 69,649 |
| Spectrum Income Fund (continued) | |
| | | Shares or | |
| | | Principal | |
| | | Amount | Value |
|
|
| |
| CORPORATE BONDS (continued) | | | |
| Banking (continued) | | | |
| HSBC Bank PLC, EMTN | | | |
| 4.25% due 03/18/2016 (b) | EUR | 61,000 | $ | 78,754 |
| HSBC Holdings PLC | | | |
| 6.50% due 05/02/2036 | $ | 175,000 | 184,277 |
| 9.875% due 04/08/2018 | GBP | 60,000 | 142,593 |
| Huntington National Bank, Series BKNT | | | |
| 4.375% due 01/15/2010 | $ | 220,000 | 213,408 |
| Independence Community Bank Corp. | | | |
| 3.75% due 04/01/2014 (b) | | 15,000 | 14,371 |
| ING Bank NV, EMTN | | | |
| 5.50% due 01/04/2012 | EUR | 36,000 | 49,343 |
| Islandsbanki HF | | | |
| 5.6669% due 10/15/2008 (b) | $ | 200,000 | 198,677 |
| Keybank NA | | | |
| 5.80% due 07/01/2014 | | 40,000 | 40,556 |
| Keybank NA, Series BKNT | | | |
| 4.412% due 03/18/2008 | | 55,000 | 54,271 |
| KeyCorp, MTN, Series G | | | |
| 4.70% due 05/21/2009 | | 45,000 | 44,306 |
| KfW Bankengruppe, EMTN | | | |
| 4.75% due 12/07/2010 | GBP | 524,000 | 986,029 |
| Kreditanstalt fuer Wiederaufbau | | | |
| 4.70% due 06/02/2037 | CAD | 275,000 | 247,861 |
| Kreditanstalt fuer Wiederaufbau, Series EXCH | | |
| 5.50% due 12/07/2015 | GBP | 390,000 | 777,169 |
| Landwirtschaftliche Rentenbank, Series 7 | | | |
| 3.75% due 06/15/2009 | $ | 110,000 | 106,513 |
| Marshall & Ilsley Bank, Series BKNT | | | |
| 3.80% due 02/08/2008 | | 110,000 | 107,743 |
| 4.125% due 09/04/2007 | | 50,000 | 49,401 |
| Mizuho Capital Investment EUR 1, Ltd. | | | |
| 5.02% due 06/29/2049 (b) | EUR | 50,000 | 63,973 |
| Nordea Bank Finland PLC, EMTN | | | |
| 5.75% due 03/26/2014 (b) | | 52,000 | 69,591 |
| Northern Rock PLC, EMTN | | | |
| 5.75% due 02/28/2017 | GBP | 99,000 | 191,666 |
| Northern Trust Company, Series BKNT | | | |
| 4.60% due 02/01/2013 | $ | 120,000 | 114,858 |
| Northern Trust Corp. | | | |
| 5.30% due 08/29/2011 | | 144,000 | 144,375 |
| Rabobank Nederland, EMTN | | | |
| 3.125% due 07/19/2010 | EUR | 75,000 | 94,073 |
| Regions Bank, Series BKNT | | | |
| 2.90% due 12/15/2006 | $ | 120,000 | 119,174 |
| Royal Bank of Scotland PLC, EMTN | | | |
| zero coupon, Step up to 6.935% on | | | |
| 09/08/2014 due 06/29/2049 (b) | GBP | 104,000 | 204,495 |
| Sanpaolo IMI SpA, EMTN | | | |
| 3.75% due 06/09/2015 (b) | EUR | 64,000 | 80,841 |
| Standard Chartered Bank, EMTN | | | |
| 3.625% due 02/03/2017 (b) | | 64,000 | 79,708 |
| Sumitomo Mitsui Banking Corp, Series REGS | | |
| 4.375% due 07/29/2049 (b) | | 50,000 | 61,602 |
| Sumitomo Mitsui Banking Corp. | | | |
| 5.625% due 07/29/2049 (b) | $ | 200,000 | 193,279 |
The accompanying notes are an integral part of the financial statements. 366
John Hancock Funds II
Portfolio of investments — August 31, 2006
(showing percentage of total net assets)
| Spectrum Income Fund (continued) | |
| | | Shares or | |
| | | Principal | |
| | | Amount | Value |
|
|
| |
| CORPORATE BONDS (continued) | | | |
| Banking (continued) | | | |
| Suncorp-Metway, Ltd. | | | |
| 4.625% due 06/15/2013 | $ | 30,000 | $ | 28,608 |
| Svensk Exportkredit AB | | | |
| 2.875% due 01/26/2007 | | 130,000 | 128,883 |
| Svenska Handelsbanken, EMTN | | | |
| 6.125% due 03/29/2049 (b) | GBP | 49,000 | 94,636 |
| US Bancorp, MTN, Series P | | | |
| 4.50% due 07/29/2010 (a) | $ | 190,000 | 185,568 |
| US Bank NA | | | |
| 6.50% due 02/01/2008 | | 260,000 | 263,965 |
| Wachovia Bank NA, Series BKNT | | | |
| 4.875% due 02/01/2015 | | 360,000 | 343,605 |
| Wachovia Corp. | | | |
| 5.4156% due 07/20/2007 (b) | | 65,000 | 65,069 |
| 5.50% due 08/01/2035 (a) | | 110,000 | 102,487 |
| 6.40% due 04/01/2008 | | 90,000 | 91,648 |
| Webster Capital Trust II, Series B | | | |
| 10.00% due 04/01/2027 | | 35,000 | 37,309 |
| Webster Financial Corp. | | | |
| 5.125% due 04/15/2014 | | 200,000 | 191,083 |
| Wells Fargo Company | | | |
| 4.20% due 01/15/2010 | | 205,000 | 198,639 |
| 4.875% due 01/12/2011 | | 225,000 | 221,858 |
| Westpac Banking Corp. | | | |
| 2.875% due 06/25/2008 | EUR | 21,000 | 26,492 |
| World Savings Bank FSB, Series BKNT | | | |
| 4.125% due 12/15/2009 (a) | $ | 195,000 | 188,649 |
|
|
| | | | 10,376,536 |
| Biotechnology - 0.06% | | | |
| Amgen, Inc. | | | |
| 4.00% due 11/18/2009 | | 130,000 | 125,441 |
| Genentech, Inc. | | | |
| 4.40% due 07/15/2010 | | 125,000 | 121,526 |
| 4.75% due 07/15/2015 | | 205,000 | 194,595 |
|
|
| | | | 441,562 |
| Broadcasting - 0.48% | | | |
| Allbritton Communications Company | | | |
| 7.75% due 12/15/2012 | | 800,000 | 791,000 |
| Canadian Satellite Radio Holdings, Inc., ADR | | |
| 12.75% due 02/15/2014 | | 250,000 | 246,875 |
| CanWest Media, Inc. | | | |
| 8.00% due 09/15/2012 | | 400,000 | 387,000 |
| Fisher Communications, Inc. | | | |
| 8.625% due 09/15/2014 | | 225,000 | 231,187 |
| Gray Television, Inc. | | | |
| 9.25% due 12/15/2011 | | 375,000 | 390,000 |
| Liberty Media Corp. | | | |
| 4.00% due 11/15/2029 | | 600,000 | 395,250 |
| 6.8294% due 09/17/2006 (b) | | 35,000 | 35,012 |
| LIN Television Corp. | | | |
| 2.50% due 05/15/2033 | | 72,000 | 65,700 |
| News America, Inc. | | | |
| 6.20% due 12/15/2034 | | 190,000 | 177,542 |
| 7.375% due 10/17/2008 | | 125,000 | 129,899 |
| Spectrum Income Fund (continued) | |
| | | Shares or | |
| | | Principal | |
| | | Amount | Value |
|
|
| |
| CORPORATE BONDS (continued) | | | |
| Broadcasting (continued) | | | |
| Sirius Satellite Radio, Inc. | | | |
| 9.625% due 08/01/2013 (a) | $ | 425,000 | $ | 403,750 |
| Viacom, Inc. | | | |
| 5.75% due 04/30/2011 | | 335,000 | 332,243 |
| XM Satellite Radio Holdings, Inc. | | | |
| 9.75% due 05/01/2014 | | 50,000 | 47,000 |
|
|
| | | | 3,632,458 |
| Building Materials & Construction - 0.35% | | |
| Brand Services, Inc. | | | |
| 12.00% due 10/15/2012 | | 350,000 | 393,988 |
| Building Materials Corporation of America | | | |
| 7.75% due 08/01/2014 (a) | | 625,000 | 565,625 |
| Columbus McKinnon Corp. | | | |
| 8.875% due 11/01/2013 (a) | | 300,000 | 306,000 |
| CRH America, Inc. | | | |
| 6.40% due 10/15/2033 | | 65,000 | 64,008 |
| Interline Brands, Inc. | | | |
| 8.125% due 06/15/2014 | | 475,000 | 478,563 |
| Lafarge SA | | | |
| 6.15% due 07/15/2011 (a) | | 140,000 | 142,492 |
| Texas Industries, Inc. | | | |
| 7.25% due 07/15/2013 | | 500,000 | 500,625 |
| U.S. Concrete, Inc. | | | |
| 8.375% due 04/01/2014 | | 250,000 | 239,375 |
|
|
| | | | 2,690,676 |
| Buildings - 0.04% | | | |
| D.R. Horton, Inc. | | | |
| 4.875% due 01/15/2010 | | 70,000 | 67,652 |
| 5.625% due 09/15/2014 | | 285,000 | 267,220 |
|
|
| | | | 334,872 |
| Business Services - 0.68% | | | |
| Affinity Group, Inc. | | | |
| 9.00% due 02/15/2012 | | 350,000 | 350,000 |
| 10.875% due 02/15/2012 | | 111,170 | 105,612 |
| Dun & Bradstreet Corp. | | | |
| 5.50% due 03/15/2011 | | 120,000 | 120,331 |
| FTI Consulting, Inc. | | | |
| 7.625% due 06/15/2013 | | 375,000 | 377,812 |
| GTECH Holdings Corp. | | | |
| 4.50% due 12/01/2009 | | 250,000 | 249,945 |
| 4.75% due 10/15/2010 | | 30,000 | 29,987 |
| Insurance Auto Auctions, Inc. | | | |
| 11.00% due 04/01/2013 | | 250,000 | 248,750 |
| Invensys PLC | | | |
| 9.875% due 03/15/2011 (a) | | 344,000 | 371,520 |
| iPayment, Inc. | | | |
| 9.75% due 05/15/2014 | | 425,000 | 430,313 |
| Nebraska Book Company, Inc. | | | |
| 8.625% due 03/15/2012 | | 425,000 | 387,812 |
| Sungard Data Systems, Inc. | | | |
| 9.125% due 08/15/2013 | | 1,073,000 | 1,107,873 |
| Universal Compression, Inc. | | | |
| 7.25% due 05/15/2010 | | 200,000 | 202,000 |
| Xerox Corp. | | | |
| 6.40% due 03/15/2016 | | 326,000 | 322,771 |
The accompanying notes are an integral part of the financial statements. 367
John Hancock Funds II
Portfolio of investments — August 31, 2006
(showing percentage of total net assets)
| Spectrum Income Fund (continued) | |
| | | Shares or | |
| | | Principal | |
| | | Amount | Value |
|
|
| |
| CORPORATE BONDS (continued) | | | |
| Business Services (continued) | | | |
| Xerox Corp. (continued) | | | |
| 6.75% due 02/01/2017 | $ | 780,000 | $ | 781,950 |
| 7.625% due 06/15/2013 | | 125,000 | 129,219 |
|
|
| | | | 5,215,895 |
| Cable and Television - 1.08% | | | |
| Charter Communications Operating LLC | | | |
| 8.00% due 04/30/2012 | | 1,200,000 | 1,203,000 |
| Comcast Cable Communications, Inc. | | | |
| 8.375% due 05/01/2007 | | 120,000 | 122,239 |
| Comcast Corp. | | | |
| 4.95% due 06/15/2016 | | 307,000 | 283,157 |
| Cox Communications, Inc. | | | |
| 7.125% due 10/01/2012 (a) | | 266,000 | 281,411 |
| 7.75% due 11/01/2010 | | 115,000 | 123,728 |
| Cox Enterprises, Inc. | | | |
| 4.375% due 05/01/2008 | | 135,000 | 132,187 |
| CSC Holdings, Inc. | | | |
| 7.25% due 07/15/2008 | | 775,000 | 783,719 |
| DirecTV Holdings LLC | | | |
| 6.375% due 06/15/2015 | | 1,000,000 | 935,000 |
| 8.375% due 03/15/2013 | | 150,000 | 157,500 |
| E.W. Scripps Company | | | |
| 4.30% due 06/30/2010 | | 50,000 | 47,917 |
| EchoStar Communications Corp. | | | |
| 5.75% due 05/15/2008 (a) | | 150,000 | 150,000 |
| Echostar DBS Corp. | | | |
| 5.75% due 10/01/2008 | | 15,000 | 14,850 |
| 6.625% due 10/01/2014 | | 425,000 | 408,531 |
| Kabel Deutschland GMBH | | | |
| 10.625% due 07/01/2014 | | 300,000 | 321,000 |
| News America, Inc. | | | |
| 6.40% due 12/15/2035 | | 220,000 | 210,816 |
| Rainbow National Services LLC | | | |
| 8.75% due 09/01/2012 | | 100,000 | 105,500 |
| Rogers Cable, Inc. | | | |
| 5.50% due 03/15/2014 | | 160,000 | 148,200 |
| 6.75% due 03/15/2015 | | 400,000 | 397,000 |
| Shaw Communications, Inc. | | | |
| 7.40% due 10/17/2007 | CAD | 45,000 | 41,786 |
| 8.25% due 04/11/2010 | $ | 125,000 | 131,406 |
| Sinclair Broadcast Group, Inc. | | | |
| 8.00% due 03/15/2012 | | 625,000 | 632,812 |
| 8.75% due 12/15/2011 | | 125,000 | 130,469 |
| Superior Essex Communications & | | | |
| Essex Group, Inc. | | | |
| 9.00% due 04/15/2012 | | 225,000 | 228,375 |
| Time Warner Entertainment Company LP | | | |
| 7.25% due 09/01/2008 | | 355,000 | 366,541 |
| 8.375% due 03/15/2023 | | 406,000 | 456,812 |
| Videotron Ltee | | | |
| 6.375% due 12/15/2015 | | 100,000 | 93,625 |
| 6.875% due 01/15/2014 | | 315,000 | 309,094 |
|
|
| | | | 8,216,675 |
| Spectrum Income Fund (continued) | | |
| | | Shares or | | |
| | | Principal | | |
| | | Amount | | Value |
|
|
| |
| CORPORATE BONDS (continued) | | | | |
| Cellular Communications - 1.18% | | | | |
| Alamosa Delaware, Inc. | | | | |
| 11.00% due 07/31/2010 | $ | 400,000 | $ | 437,000 |
| America Movil SA de CV | | | | |
| 6.375% due 03/01/2035 | | 175,000 | | 167,210 |
| American Cellular Corp. | | | | |
| 10.00% due 08/01/2011 | | 200,000 | | 208,000 |
| American Tower Corp. | | | | |
| 3.00% due 08/15/2012 (a) | | 275,000 | | 508,063 |
| 7.125% due 10/15/2012 | | 250,000 | | 253,125 |
| 7.25% due 12/01/2011 | | 50,000 | | 51,375 |
| 7.50% due 05/01/2012 (a) | | 50,000 | | 50,875 |
| AT&T Broadband Corp. | | | | |
| 8.375% due 03/15/2013 | | 409,000 | | 463,608 |
| AT&T Wireless Services, Inc. | | | | |
| 7.875% due 03/01/2011 | | 120,000 | | 130,930 |
| Centennial Communications Corp. | | | | |
| 10.00% due 01/01/2013 (a) | | 150,000 | | 149,625 |
| 10.125% due 06/15/2013 | | 525,000 | | 553,875 |
| Cingular Wireless Services, Inc. | | | | |
| 8.125% due 05/01/2012 | | 10,000 | | 11,196 |
| Digicel, Ltd. | | | | |
| 9.25% due 09/01/2012 | | 500,000 | | 521,250 |
| Dobson Cellular Systems, Inc. | | | | |
| 8.875% due 10/01/2013 (a) | | 200,000 | | 197,500 |
| 9.875% due 11/01/2012 (a) | | 225,000 | | 240,187 |
| Horizon PCS, Inc. | | | | |
| 11.375% due 07/15/2012 | | 125,000 | | 140,938 |
| mmO2 PLC, EMTN | | | | |
| 6.375% due 01/25/2007 | EUR | 33,000 | | 42,656 |
| Motorola, Inc. | | | | |
| 7.50% due 05/15/2025 | $ | 65,000 | | 74,204 |
| Nextel Communications, Inc. | | | | |
| 6.875% due 10/31/2013 | | 1,290,000 | | 1,306,191 |
| 7.375% due 08/01/2015 | | 370,000 | | 380,707 |
| Nextel Partners, Inc. | | | | |
| 8.125% due 07/01/2011 | | 200,000 | | 210,000 |
| Rogers Wireless, Inc. | | | | |
| 6.375% due 03/01/2014 | | 575,000 | | 563,500 |
| 7.50% due 03/15/2015 | | 50,000 | | 52,250 |
| 8.00% due 12/15/2012 | | 975,000 | | 1,018,875 |
| 9.625% due 05/01/2011 | | 200,000 | | 223,500 |
| Rural Cellular Corp. | | | | |
| 9.875% due 02/01/2010 | | 150,000 | | 154,875 |
| 10.898% due 11/01/2012 | | 100,000 | | 103,000 |
| UbiquiTel Operating Company | | | | |
| 9.875% due 03/01/2011 | | 300,000 | | 326,250 |
| US Unwired, Inc., Series B | | | | |
| 10.00% due 06/15/2012 | | 250,000 | | 275,000 |
| Verizon Wireless Capital LLC | | | | |
| 5.375% due 12/15/2006 | | 165,000 | | 164,937 |
|
|
| | | | | 8,980,702 |
| Chemicals - 0.35% | | | | |
| Arco Chemical Company | | | | |
| 10.25% due 11/01/2010 | | 100,000 | | 109,750 |
The accompanying notes are an integral part of the financial statements. 368
John Hancock Funds II
Portfolio of investments — August 31, 2006
(showing percentage of total net assets)
| Spectrum Income Fund (continued) | |
| | | Shares or | |
| | | Principal | |
| | | Amount | Value |
|
|
| |
| CORPORATE BONDS (continued) | | | |
| Chemicals (continued) | | | |
| Crystal US Holdings 3 | | | |
| LLC/Crystal US Sub 3 Corp., Series A | | | |
| zero coupon, Step up to 10% on | | | |
| 10/01/2009 due 10/01/2014 | $ | 250,000 | $ | 202,500 |
| Crystal US Holdings 3 | | | |
| LLC/Crystal US Sub 3 Corp., Series B | | | |
| zero coupon, Step up to 10.5% on | | | |
| 10/01/2009 due 10/01/2014 | | 375,000 | 299,063 |
| Domtar, Inc. | | | |
| 7.875% due 10/15/2011 | | 150,000 | 148,875 |
| Dow Chemical Company | | | |
| 6.125% due 02/01/2011 (a) | | 120,000 | 123,314 |
| Dow Chemical Company, EMTN | | | |
| 4.375% due 06/25/2010 | EUR | 38,000 | 49,244 |
| Equistar Chemicals LP | | | |
| 8.75% due 02/15/2009 | $ | 25,000 | 25,937 |
| Hercules, Inc. | | | |
| 6.75% due 10/15/2029 | | 200,000 | 188,500 |
| Huntsman LLC | | | |
| 11.625% due 10/15/2010 | | 150,000 | 166,500 |
| IMC Global, Inc. | | | |
| 10.875% due 08/01/2013 | | 25,000 | 28,000 |
| IMC Global, Inc., Series B | | | |
| 10.875% due 06/01/2008 | | 100,000 | 106,750 |
| 11.25% due 06/01/2011 | | 25,000 | 26,406 |
| Lubrizol Corp. | | | |
| 4.625% due 10/01/2009 | | 60,000 | 58,684 |
| 5.875% due 12/01/2008 | | 195,000 | 196,461 |
| Lyondell Chemical Company | | | |
| 10.50% due 06/01/2013 | | 325,000 | 357,500 |
| 11.125% due 07/15/2012 | | 100,000 | 109,000 |
| Praxair, Inc. | | | |
| 4.75% due 07/15/2007 | | 85,000 | 84,528 |
| Rockwood Specialties Group, Inc. | | | |
| 7.50% due 11/15/2014 | | 150,000 | 147,375 |
| 10.625% due 05/15/2011 | | 225,000 | 241,313 |
|
|
| | | | 2,669,700 |
| |
| Coal - 0.10% | | | |
| Alpha Natural Resources LLC | | | |
| 10.00% due 06/01/2012 | | 225,000 | 240,750 |
| Foundation PA Coal Company | | | |
| 7.25% due 08/01/2014 | | 475,000 | 461,937 |
| Massey Energy Company | | | |
| 6.625% due 11/15/2010 | | 50,000 | 49,250 |
|
|
| | | | 751,937 |
| |
| Commercial Services - 0.09% | | | |
| Brickman Group, Ltd., Series B | | | |
| 11.75% due 12/15/2009 | | 450,000 | 481,500 |
| Mac-Gray Corp. | | | |
| 7.625% due 08/15/2015 | | 225,000 | 228,375 |
|
|
| | | | 709,875 |
| |
| Computers & Business Equipment - 0.19% | | |
| Broadview Networks Holdings, Inc. | | | |
| 11.375% due 09/01/2012 | | 175,000 | 177,844 |
| Spectrum Income Fund (continued) | |
| | | Shares or | |
| | | Principal | |
| | | Amount | Value |
|
|
| |
| CORPORATE BONDS (continued) | | | |
| Computers & Business Equipment | | | |
| (continued) | | | |
| Cisco Systems, Inc. | | | |
| 5.25% due 02/22/2011 | $ | 290,000 | $ | 289,993 |
| Hewlett-Packard Company | | | |
| 5.50% due 07/01/2007 | | 200,000 | 200,078 |
| International Business Machines Corp., MTN | | |
| 2.375% due 11/01/2006 | | 120,000 | 119,456 |
| 3.80% due 02/01/2008 | | 180,000 | 176,281 |
| Unisys Corp. | | | |
| 6.875% due 03/15/2010 (a) | | 225,000 | 210,375 |
| 7.875% due 04/01/2008 | | 175,000 | 174,781 |
| 8.00% due 10/15/2012 | | 75,000 | 69,469 |
|
|
| | | | 1,418,277 |
| Construction & Mining Equipment - 0.04% | | |
| JLG Industries, Inc. | | | |
| 8.375% due 06/15/2012 (a) | | 200,000 | 208,000 |
| Terex Corp. | | | |
| 7.375% due 01/15/2014 | | 100,000 | 100,000 |
|
|
| | | | 308,000 |
| Containers & Glass - 0.47% | | | |
| Ball Corp. | | | |
| 6.875% due 12/15/2012 | | 575,000 | 575,000 |
| BWAY Corp. | | | |
| 10.00% due 10/15/2010 | | 400,000 | 419,000 |
| Graham Packaging Company | | | |
| 8.50% due 10/15/2012 | | 75,000 | 72,563 |
| Graphic Packaging International Corp. | | | |
| 8.50% due 08/15/2011 | | 275,000 | 279,125 |
| 9.50% due 08/15/2013 (a) | | 75,000 | 75,375 |
| Greif, Inc. | | | |
| 8.875% due 08/01/2012 | | 225,000 | 236,250 |
| Owens-Brockway Glass Container, Inc. | | | |
| 8.25% due 05/15/2013 | | 525,000 | 531,562 |
| 8.75% due 11/15/2012 | | 355,000 | 377,187 |
| 8.875% due 02/15/2009 | | 350,000 | 359,625 |
| Owens-Illinois, Inc. | | | |
| 7.35% due 05/15/2008 (a) | | 75,000 | 75,000 |
| Sealed Air Corp. | | | |
| 5.375% due 04/15/2008 | | 230,000 | 229,382 |
| Silgan Holdings, Inc. | | | |
| 6.75% due 11/15/2013 | | 175,000 | 171,063 |
| Stone Container Corp. | | | |
| 9.75% due 02/01/2011 | | 64,000 | 65,760 |
| Stone Container Finance | | | |
| 7.375% due 07/15/2014 | | 125,000 | 112,500 |
|
|
| | | | 3,579,392 |
| Cosmetics & Toiletries - 0.04% | | | |
| Chattem, Inc. | | | |
| 7.00% due 03/01/2014 | | 350,000 | 334,250 |
| Crude Petroleum & Natural Gas - 1.14% | | | |
| Amerada Hess Corp. | | | |
| 7.375% due 10/01/2009 | | 75,000 | 79,202 |
| 7.875% due 10/01/2029 | | 298,000 | 347,398 |
The accompanying notes are an integral part of the financial statements. 369
John Hancock Funds II
Portfolio of investments — August 31, 2006
(showing percentage of total net assets)
| Spectrum Income Fund (continued) | |
| | | Shares or | |
| | | Principal | |
| | | Amount | Value |
|
|
| |
| CORPORATE BONDS (continued) | | | |
| Crude Petroleum & Natural Gas | | | |
| (continued) | | | |
| AmeriGas Partners LP | | | |
| 7.25% due 05/20/2015 | $ | 1,175,000 | $ | 1,154,437 |
| Atlantic Richfield Corp. | | | |
| 9.125% due 03/01/2011 (a) | | 105,000 | 121,301 |
| Chaparral Energy, Inc. | | | |
| 8.50% due 12/01/2015 | | 325,000 | 327,438 |
| Chesapeake Energy Corp. | | | |
| 6.375% due 06/15/2015 | | 450,000 | 427,500 |
| 6.50% due 08/15/2017 | | 1,055,000 | 978,512 |
| 6.625% due 01/15/2016 | | 375,000 | 360,000 |
| Clayton Williams Energy, Inc. | | | |
| 7.75% due 08/01/2013 | | 275,000 | 257,125 |
| Compton Petroleum Finance Corp. | | | |
| 7.625% due 12/01/2013 | | 575,000 | 560,625 |
| Denbury Resources, Inc. | | | |
| 7.50% due 04/01/2013 | | 300,000 | 303,000 |
| 7.50% due 12/15/2015 | | 375,000 | 378,750 |
| EnCana Corp. | | | |
| 4.60% due 08/15/2009 | | 190,000 | 185,971 |
| 6.50% due 08/15/2034 | | 45,000 | 46,670 |
| EnCana Holdings Finance Corp. | | | |
| 5.80% due 05/01/2014 | | 400,000 | 402,887 |
| Encore Acquisition Company | | | |
| 7.25% due 12/01/2017 | | 350,000 | 342,125 |
| Hilcorp Energy I LP | | | |
| 7.75% due 11/01/2015 | | 400,000 | 393,000 |
| 10.50% due 09/01/2010 | | 375,000 | 406,875 |
| Massey Energy Company | | | |
| 6.875% due 12/15/2013 | | 200,000 | 185,500 |
| PetroHawk Energy Corp. | | | |
| 9.125% due 07/15/2013 | | 525,000 | 534,188 |
| Plains Exploration & Production Company | | | |
| 8.75% due 07/01/2012 | | 275,000 | 288,750 |
| Range Resources Corp. | | | |
| 7.50% due 05/15/2016 | | 425,000 | 428,187 |
| Sempra Energy | | | |
| 5.8625% due 05/21/2008 (b) | | 180,000 | 180,214 |
|
|
| | | | 8,689,655 |
| Domestic Oil - 0.43% | | | |
| ConocoPhillips | | | |
| 5.90% due 10/15/2032 (a) | | 180,000 | 181,666 |
| Devon Financing Corp., ULC | | | |
| 6.875% due 09/30/2011 | | 545,000 | 577,966 |
| 7.875% due 09/30/2031 | | 185,000 | 221,202 |
| Diamond Offshore Drilling, Inc. | | | |
| 4.875% due 07/01/2015 | | 240,000 | 225,137 |
| 5.15% due 09/01/2014 | | 395,000 | 380,478 |
| Forest Oil Corp. | | | |
| 8.00% due 12/15/2011 | | 375,000 | 387,188 |
| Magnum Hunter Resources, Inc. | | | |
| 9.60% due 03/15/2012 | | 200,000 | 212,000 |
| Range Resources Corp. | | | |
| 6.375% due 03/15/2015 | | 700,000 | 668,500 |
| Spectrum Income Fund (continued) | |
| | | Shares or | |
| | | Principal | |
| | | Amount | Value |
|
|
| |
| CORPORATE BONDS (continued) | | | |
| Domestic Oil (continued) | | | |
| Swift Energy Company | | | |
| 7.625% due 07/15/2011 | $ | 50,000 | $ | 50,500 |
| 9.375% due 05/01/2012 (a) | | 50,000 | 52,750 |
| Valero Energy Corp. | | | |
| 3.50% due 04/01/2009 | | 320,000 | 305,572 |
| 4.75% due 04/01/2014 (a) | | 65,000 | 60,974 |
|
|
| | | | 3,323,933 |
| Drugs & Health Care - 0.06% | | | |
| Biovail Corp. | | | |
| 7.875% due 04/01/2010 | | 200,000 | 199,500 |
| CVS Corp. | | | |
| 3.875% due 11/01/2007 | | 240,000 | 235,624 |
|
|
| | | | 435,124 |
| Educational Services - 0.19% | | | |
| AAC Group Holding Corp. | | | |
| zero coupon, Step up to 10.25% on | | | |
| 10/01/2008 due 10/01/2012 | | 200,000 | 160,500 |
| Education Management Corp. | | | |
| 10.25% due 06/01/2016 | | 1,300,000 | 1,287,000 |
|
|
| | | | 1,447,500 |
| Electrical Equipment - 0.11% | | | |
| Exelon Generation Company LLC | | | |
| 5.35% due 01/15/2014 | | 170,000 | 165,943 |
| General Cable Corp. | | | |
| 9.50% due 11/15/2010 | | 275,000 | 294,250 |
| Telex Communications Holdings, Inc. | | | |
| 11.50% due 10/15/2008 | | 325,000 | 346,125 |
|
|
| | | | 806,318 |
| Electrical Utilities - 1.45% | | | |
| AES Corp. | | | |
| 7.75% due 03/01/2014 | | 135,000 | 139,050 |
| 8.875% due 02/15/2011 | | 275,000 | 294,250 |
| 9.00% due 05/15/2015 | | 930,000 | 1,003,238 |
| 9.375% due 09/15/2010 | | 300,000 | 324,000 |
| Alabama Power Company | | | |
| 3.50% due 11/15/2007 | | 150,000 | 146,746 |
| 5.59% due 08/25/2009 (b) | | 160,000 | 160,573 |
| Allegheny Energy Supply Company LLC | | | |
| 7.80% due 03/15/2011 | | 250,000 | 263,438 |
| 8.25% due 04/15/2012 | | 50,000 | 54,000 |
| Appalachian Power Company | | | |
| 5.83% due 06/29/2007 (b) | | 70,000 | 70,107 |
| 6.375% due 04/01/2036 | | 170,000 | 170,373 |
| Black Hills Corp. | | | |
| 6.50% due 05/15/2013 | | 235,000 | 236,751 |
| CE Electric UK Funding Company | | | |
| 6.995% due 12/30/2007 | | 200,000 | 203,500 |
| CenterPoint Energy Transition Bond Co., LLC, | | |
| Series A-2 | | | |
| 4.97% due 08/01/2014 | | 175,000 | 173,833 |
| Centerpoint Energy, Inc., Series B | | | |
| 5.875% due 06/01/2008 | | 110,000 | 110,394 |
| 7.25% due 09/01/2010 | | 205,000 | 216,163 |
The accompanying notes are an integral part of the financial statements. 370
John Hancock Funds II
Portfolio of investments — August 31, 2006
(showing percentage of total net assets)
| Spectrum Income Fund (continued) | |
| | | Shares or | |
| | | Principal | |
| | | Amount | Value |
|
|
| |
| CORPORATE BONDS (continued) | | | |
| Electrical Utilities (continued) | | | |
| CMS Energy Corp. | | | |
| 8.50% due 04/15/2011 | $ | 50,000 | $ | 53,625 |
| 9.875% due 10/15/2007 | | 475,000 | 494,594 |
| Consumers Energy Co. | | | |
| 5.80% due 09/15/2035 (a) | | 100,000 | 93,903 |
| Dominion Resources, Inc. | | | |
| 4.125% due 02/15/2008 | | 65,000 | 63,838 |
| Edison SpA, EMTN | | | |
| 5.125% due 12/10/2010 | EUR | 30,000 | 40,009 |
| El Paso Electric Company | | | |
| 6.00% due 05/15/2035 | $ | 245,000 | 234,399 |
| Elia System Operator SA | | | |
| 4.75% due 05/13/2014 | EUR | 68,000 | 90,243 |
| Enbw International Finance BV, EMTN | | | |
| 5.875% due 02/28/2012 | | 36,000 | 50,076 |
| Energy East Corp. | | | |
| 5.75% due 11/15/2006 | $ | 125,000 | 125,095 |
| Entergy Louisiana LLC | | | |
| 5.83% due 11/01/2010 | | 35,000 | 34,795 |
| FirstEnergy Corp. | | | |
| 6.45% due 11/15/2011 | | 245,000 | 254,100 |
| FirstEnergy Corp., Series A | | | |
| 5.50% due 11/15/2006 | | 42,000 | 41,993 |
| MidAmerican Energy Holdings Company | | | |
| 6.125% due 04/01/2036 | | 220,000 | 217,235 |
| Midwest Generation LLC | | | |
| 8.75% due 05/01/2034 | | 950,000 | 1,011,750 |
| Mirant Americas Generation LLC | | | |
| 8.30% due 05/01/2011 ^ | | 400,000 | 400,000 |
| Mission Energy Holding Co. | | | |
| 13.50% due 07/15/2008 | | 400,000 | 447,500 |
| National Grid PLC, EMTN | | | |
| 5.00% due 07/02/2018 | EUR | 22,000 | 28,646 |
| National Power Corp. | | | |
| 9.6481% due 08/23/2011 (b) | $ | 200,000 | 219,814 |
| Nevada Power Company | | | |
| 5.875% due 01/15/2015 | | 45,000 | 44,482 |
| Orion Power Holdings, Inc. | | | |
| 12.00% due 05/01/2010 | | 350,000 | 397,250 |
| Pacific Gas & Electric Company | | | |
| 4.80% due 03/01/2014 | | 235,000 | 224,723 |
| 6.05% due 03/01/2034 | | 50,000 | 49,419 |
| Pepco Holdings, Inc. | | | |
| 5.50% due 08/15/2007 | | 110,000 | 109,947 |
| PPL Capital Funding, Inc. | | | |
| 4.33% due 03/01/2009 | | 285,000 | 276,705 |
| RWE Finance BV, EMTN | | | |
| 5.375% due 04/18/2008 | EUR | 33,000 | 43,292 |
| 6.375% due 06/03/2013 | GBP | 49,000 | 98,659 |
| San Diego Gas & Electric Company | | | |
| 5.35% due 05/15/2035 (a) | $ | 60,000 | 56,020 |
| Scottish Power UK PLC | | | |
| 8.375% due 02/20/2017 | GBP | 39,000 | 91,799 |
| Sierra Pacific Resources | | | |
| 7.803% due 06/15/2012 | $ | 125,000 | 130,306 |
| 8.625% due 03/15/2014 | | 850,000 | 913,673 |
| Spectrum Income Fund (continued) | |
| | | Shares or | |
| | | Principal | |
| | | Amount | Value |
|
|
| |
| CORPORATE BONDS (continued) | | | |
| Electrical Utilities (continued) | | | |
| Southern California Edison Company | | | |
| 4.65% due 04/01/2015 (a) | $ | 275,000 | $ | 258,273 |
| Tri-State Generation & Transmission Association | | |
| 6.04% due 01/31/2018 | | 110,000 | 110,070 |
| Vattenfall Treasury AB, EMTN | | | |
| 6.00% due 04/03/2009 | EUR | 35,000 | 47,133 |
| Virginia Electric and Power Company | | | |
| 4.50% due 12/15/2010 | $ | 35,000 | 33,676 |
| 6.00% due 01/15/2036 | | 310,000 | 300,117 |
| Westar Energy, Inc. | | | |
| 5.10% due 07/15/2020 | | 185,000 | 169,777 |
| Western Power Distribution Holdings, Ltd. | | | |
| 6.875% due 12/15/2007 | | 160,000 | 161,416 |
| Wisconsin Electric Power Company | | | |
| 3.50% due 12/01/2007 (a) | | 120,000 | 117,443 |
|
|
| | | | 11,102,211 |
| Electronics - 0.10% | | | |
| Celestica, Inc. | | | |
| 7.875% due 07/01/2011 | | 250,000 | 249,375 |
| L-3 Communications Corp., Series B | | | |
| 6.375% due 10/15/2015 | | 550,000 | 529,375 |
|
|
| | | | 778,750 |
| Energy - 0.86% | | | |
| Copano Energy LLC | | | |
| 8.125% due 03/01/2016 | | 250,000 | 253,125 |
| Duke Capital LLC | | | |
| 6.25% due 02/15/2013 (a) | | 450,000 | 456,138 |
| Duke Capital LLC, Series B | | | |
| 6.75% due 07/15/2018 | | 90,000 | 94,069 |
| Enterprise Products Operating LP | | | |
| 4.95% due 06/01/2010 | | 175,000 | 170,882 |
| Enterprise Products Operating LP, Series B | | | |
| 4.00% due 10/15/2007 | | 80,000 | 78,662 |
| 5.60% due 10/15/2014 | | 120,000 | 116,945 |
| Ferrellgas Partners LP | | | |
| 8.75% due 06/15/2012 | | 250,000 | 258,750 |
| Florida Power & Light Company | | | |
| 6.20% due 06/01/2036 | | 110,000 | 114,937 |
| Mirant North America LLC | | | |
| 7.375% due 12/31/2013 | | 1,725,000 | 1,707,750 |
| Niagara Mohawk Power Corp., Series G | | | |
| 7.75% due 10/01/2008 | | 50,000 | 52,190 |
| NRG Energy, Inc. | | | |
| 7.25% due 02/01/2014 | | 400,000 | 395,000 |
| 7.375% due 02/01/2016 | | 1,830,000 | 1,802,550 |
| Peabody Energy Corp. | | | |
| 6.875% due 03/15/2013 | | 200,000 | 198,000 |
| Progress Energy, Inc. | | | |
| 5.625% due 01/15/2016 | | 400,000 | 393,806 |
| Stone Energy Corp. | | | |
| 8.24% due 07/15/2010 (b) | | 400,000 | 396,000 |
| TXU Energy Company LLC | | | |
| 6.125% due 03/15/2008 (a) | | 45,000 | 45,341 |
The accompanying notes are an integral part of the financial statements. 371
John Hancock Funds II
Portfolio of investments — August 31, 2006
(showing percentage of total net assets)
| Spectrum Income Fund (continued) | |
| | | Shares or | |
| | | Principal | |
| | | Amount | Value |
|
|
| |
| CORPORATE BONDS (continued) | | | |
| Energy (continued) | | | |
| Xcel Energy, Inc. | | | |
| 7.00% due 12/01/2010 | $ | 30,000 | $ | 31,673 |
|
|
| | | | 6,565,818 |
| Financial Services - 3.39% | | | |
| AAC Group Holding Corp. | | | |
| 12.75% due 10/01/2012 (a) | | 225,000 | 227,812 |
| AIG SunAmerica Global Financing XII | | | |
| 5.30% due 05/30/2007 | | 75,000 | 74,919 |
| Altria Finance Cayman Islands, Ltd. | | | |
| 5.625% due 06/24/2008 | EUR | 61,000 | 80,211 |
| American Commercial Lines, Inc. | | | |
| 9.50% due 02/15/2015 | $ | 350,000 | 381,500 |
| American Express Credit Corp. | | | |
| 5.30% due 12/02/2015 | | 50,000 | 49,617 |
| American Express Credit Corp., EMTN | | | |
| 3.625% due 10/13/2009 | EUR | 55,000 | 69,854 |
| American General Finance Corp., Series I, MTN | | |
| 5.40% due 12/01/2015 (a) | $ | 250,000 | 245,921 |
| American Honda Finance Corp. | | | |
| 4.50% due 05/26/2009 | | 365,000 | 358,353 |
| Arch Western Finance LLC | | | |
| 6.75% due 07/01/2013 | | 275,000 | 265,375 |
| BCP Crystal Holdings Corp. | | | |
| 9.625% due 06/15/2014 | | 550,000 | 596,062 |
| Bear Stearns Companies, Inc. | | | |
| 4.00% due 01/31/2008 | | 150,000 | 147,427 |
| 5.50% due 08/15/2011 | | 275,000 | 276,234 |
| BHP Billiton Finance USA, Ltd. | | | |
| 4.80% due 04/15/2013 | | 340,000 | 328,030 |
| Boeing Capital Corp., MTN, Series X | | | |
| 6.35% due 11/15/2007 (a) | | 160,000 | 161,727 |
| Capital One Bank | | | |
| 6.50% due 06/13/2013 | | 330,000 | 343,001 |
| Capital One Financial Corp. | | | |
| 4.738% due 05/17/2007 | | 160,000 | 159,072 |
| 6.15% due 09/01/2016 | | 215,000 | 215,945 |
| Caterpillar Financial Services Corp., MTN, Series F | | |
| 4.50% due 09/01/2008 | | 140,000 | 137,813 |
| CIT Group, Inc. | | | |
| 5.50% due 11/30/2007 | | 65,000 | 64,989 |
| 6.00% due 04/01/2036 | | 165,000 | 159,334 |
| CIT Group, Inc., GMTN | | | |
| 4.25% due 09/22/2011 | EUR | 50,000 | 64,354 |
| CIT Group, Inc., MTN | | | |
| 5.555% due 08/15/2008 (a)(b) | $ | 115,000 | 115,287 |
| Citigroup, Inc. | | | |
| 3.625% due 02/09/2009 | | 130,000 | 125,426 |
| 3.875% due 05/21/2010 | EUR | 35,000 | 44,868 |
| 4.75% due 02/10/2019 (b) | | 100,000 | 132,243 |
| 5.00% due 09/15/2014 | $ | 175,000 | 169,318 |
| 5.30% due 01/07/2016 (a) | | 285,000 | 281,160 |
| Countrywide Financial Corp. | | | |
| 6.25% due 05/15/2016 | | 455,000 | 459,422 |
| Countrywide Home Loans, Inc., MTN | | | |
| 4.125% due 09/15/2009 | | 150,000 | 144,813 |
| Spectrum Income Fund (continued) | | |
| | | Shares or | | |
| | | Principal | | |
| | | Amount | | Value |
|
|
| |
| CORPORATE BONDS (continued) | | | | |
| Financial Services (continued) | | | | |
| Credit Suisse USA, Inc. | | | | |
| 5.50% due 08/16/2011 | $ | 170,000 | $ | 170,708 |
| Dollar Financial Group, Inc. | | | | |
| 9.75% due 11/15/2011 | | 148,000 | | 159,100 |
| Erac USA Finance Co. | | | | |
| 6.75% due 05/15/2007 | | 150,000 | | 150,776 |
| ERP Operating LP | | | | |
| 3.85% due 08/15/2026 | | 15,000 | | 15,130 |
| Ford Motor Credit Company | | | | |
| 5.372% due 04/15/2012 (b) | | 1,350,000 | | 1,427,166 |
| 5.80% due 01/12/2009 | | 330,000 | | 316,125 |
| 6.3744% due 03/21/2007 (b) | | 50,000 | | 49,921 |
| 6.3663% due 11/16/2006 (b) | | 110,000 | | 110,035 |
| 6.50% due 01/25/2007 (a) | | 60,000 | | 60,093 |
| 7.0769% due 01/15/2010 (b) | | 100,000 | | 94,456 |
| 7.375% due 10/28/2009 | | 960,000 | | 941,578 |
| 9.875% due 08/10/2011 | | 775,000 | | 809,722 |
| Franklin Resources, Inc. | | | | |
| 3.70% due 04/15/2008 | | 60,000 | | 58,443 |
| Fund American Companies, Inc. | | | | |
| 5.875% due 05/15/2013 | | 205,000 | | 201,259 |
| GE Capital European Funding, Series EMTN | | | |
| 3.50% due 02/14/2013 | EUR | 110,000 | | 137,596 |
| GE Capital UK Funding, EMTN | | | | |
| 5.625% due 12/12/2014 | GBP | 75,000 | | 146,798 |
| General Electric Capital Corp. | | | | |
| 6.125% due 02/22/2011 | $ | 220,000 | | 227,518 |
| General Electric Capital Corp., Series A, MTN | | | |
| 5.00% due 06/15/2007 | | 130,000 | | 129,679 |
| 6.00% due 06/15/2012 | | 50,000 | | 51,673 |
| General Motors Acceptance Corp. | | | | |
| 5.625% due 05/15/2009 (a) | | 290,000 | | 280,505 |
| 6.00% due 10/16/2006 | EUR | 63,000 | | 80,670 |
| 6.4569% due 07/16/2007 (b) | $ | 180,000 | | 178,892 |
| 6.75% due 12/01/2014 (a) | | 425,000 | | 407,442 |
| 6.875% due 08/28/2012 | | 1,000,000 | | 968,251 |
| 7.75% due 01/19/2010 (a) | | 625,000 | | 635,283 |
| GIE Suez Alliance, EMTN | | | | |
| 5.125% due 06/24/2015 | EUR | 47,000 | | 64,032 |
| Global Cash Access LLC | | | | |
| 8.75% due 03/15/2012 | $ | 500,000 | | 523,125 |
| Goldman Sachs Capital, Inc. | | | | |
| 6.345% due 02/15/2034 (a) | | 666,000 | | 657,478 |
| Goldman Sachs Group, Inc. | | | | |
| 4.25% due 08/04/2010 | EUR | 48,000 | | 62,125 |
| 5.6331% due 07/02/2007 (b) | $ | 65,000 | | 65,094 |
| 6.60% due 01/15/2012 | | 150,000 | | 157,333 |
| HSBC Finance Corp. | | | | |
| 5.00% due 06/30/2015 (a) | | 430,000 | | 412,802 |
| 5.50% due 01/19/2016 | | 440,000 | | 436,817 |
| 5.75% due 01/30/2007 | | 95,000 | | 95,130 |
| HSBC USA, Inc. | | | | |
| 4.625% due 04/01/2014 | | 100,000 | | 94,747 |
| International Lease Finance Corp. | | | | |
| 3.75% due 08/01/2007 | | 160,000 | | 157,450 |
The accompanying notes are an integral part of the financial statements. 372
John Hancock Funds II
Portfolio of investments — August 31, 2006
(showing percentage of total net assets)
| Spectrum Income Fund (continued) | |
| | | Shares or | |
| | | Principal | |
| | | Amount | Value |
|
|
| |
| CORPORATE BONDS (continued) | | | |
| Financial Services (continued) | | | |
| International Lease Finance Corp., EMTN | | | |
| 4.125% due 10/09/2008 | EUR | 70,000 | $ | 89,987 |
| International Lease Finance Corp., Series MTN | | |
| 5.45% due 03/24/2011 | $ | 325,000 | 325,304 |
| iPCS, Inc. | | | |
| 11.50% due 05/01/2012 | | 150,000 | 168,750 |
| Jefferies Group, Inc. | | | |
| 6.25% due 01/15/2036 | | 260,000 | 247,911 |
| John Deere Capital Corp. | | | |
| 3.90% due 01/15/2008 | | 85,000 | 83,395 |
| 7.00% due 03/15/2012 | | 400,000 | 429,275 |
| JP Morgan Chase Capital XVIII, Series R | | | |
| 6.95% due 08/17/2036 | | 115,000 | 121,029 |
| JPMorgan Chase & Company | | | |
| 3.125% due 12/11/2006 | | 125,000 | 124,252 |
| JPMorgan Chase & Company, EMTN | | | |
| 4.25% due 06/09/2011 | EUR | 39,000 | 50,600 |
| 4.375% due 11/12/2019 (b) | | 50,000 | 64,216 |
| JSG Funding PLC | | | |
| 7.75% due 04/01/2015 | $ | 275,000 | 250,250 |
| 9.625% due 10/01/2012 | | 425,000 | 443,594 |
| Legg Mason, Inc. | | | |
| 6.75% due 07/02/2008 | | 165,000 | 169,021 |
| Lehman Brothers Holdings, Inc. | | | |
| 3.50% due 08/07/2008 | | 290,000 | 280,355 |
| Lehman Brothers Holdings, Inc., Series MTNG | | |
| 3.95% due 11/10/2009 | | 325,000 | 312,471 |
| 4.80% due 03/13/2014 | | 200,000 | 190,709 |
| Mangrove Bay Pass Through Trust | | | |
| 6.102% due 07/15/2033 (b) | | 200,000 | 190,640 |
| MBNA America Bank NA, EMTN | | | |
| 4.625% due 08/03/2009 | | 300,000 | 295,282 |
| MBNA Europe Funding Plc, EMTN | | | |
| 4.50% due 01/23/2009 | EUR | 33,000 | 42,907 |
| Mellon Funding Corp. | | | |
| 6.375% due 11/08/2011 | GBP | 49,000 | 97,995 |
| Merrill Lynch & Company, Inc. | | | |
| 6.05% due 05/16/2016 | $ | 575,000 | 593,073 |
| Merrill Lynch & Company, Inc., EMTN | | | |
| 4.625% due 10/02/2013 | EUR | 68,000 | 89,377 |
| Merrill Lynch & Company, Inc., Series CPI | | | |
| 4.33% due 03/02/2009 (b) | $ | 150,000 | 145,398 |
| Mizuho Capital Investment 1, Ltd. | | | |
| 6.686% due 03/29/2049 (b) | | 126,000 | 126,208 |
| Morgan Stanley, Series GMTN | | | |
| 5.125% due 11/30/2015 | GBP | 100,000 | 186,723 |
| Morgan Stanley, Series MTN | | | |
| 6.25% due 08/09/2026 | $ | 100,000 | 101,854 |
| MUFG Capital Finance 1, Ltd. | | | |
| 6.346% due 07/29/2049 (b) | | 200,000 | 200,201 |
| National Rural Utilities Cooperative Finance Corp. | | |
| 3.875% due 02/15/2008 | | 200,000 | 196,173 |
| 4.375% due 10/01/2010 | | 100,000 | 96,639 |
| Nationwide Building Society, EMTN | | | |
| 3.375% due 08/17/2015 (b) | EUR | 55,000 | 68,857 |
| Spectrum Income Fund (continued) | |
| | | Shares or | |
| | | Principal | |
| | | Amount | Value |
|
|
| |
| CORPORATE BONDS (continued) | | | |
| Financial Services (continued) | | | |
| Nell AF SARL | | | |
| 8.375% due 08/15/2015 (a) | $ | 625,000 | $ | 625,781 |
| 8.375% due 08/15/2015 | EUR | 50,000 | 66,361 |
| Nexstar Finance Holdings LLC | | | |
| zero coupon, Step up to 11.375% on | | | |
| 04/01/2008 due 04/01/2013 | $ | 450,000 | 371,250 |
| Nexstar Finance, Inc. | | | |
| 7.00% due 01/15/2014 (a) | | 275,000 | 246,125 |
| Nisource Finance Corp. | | | |
| 5.9681% due 11/23/2009 (b) | | 140,000 | 140,073 |
| Nissan Motor Acceptance Corp. | | | |
| 4.625% due 03/08/2010 | | 120,000 | 116,395 |
| Residential Capital Corp. | | | |
| 6.125% due 11/21/2008 | | 151,000 | 151,329 |
| 6.6069% due 04/17/2009 (b) | | 170,000 | 170,724 |
| 7.3369% due 04/17/2009 (b) | | 125,000 | 125,556 |
| SLM Corp., MTN | | | |
| 5.625% due 08/01/2033 | | 45,000 | 42,090 |
| SLM Corp., MTN, Series A | | | |
| 5.685% due 01/26/2009 (b) | | 220,000 | 220,755 |
| SLM Corp., Series CPI | | | |
| 4.30% due 04/01/2009 (b) | | 365,000 | 351,422 |
| Stripes Acquisition LLC | | | |
| 10.625% due 12/15/2013 | | 200,000 | 210,000 |
| Sun Life Canada US Capital Trust | | | |
| 8.526% due 05/29/2049 | | 270,000 | 285,630 |
| Torchmark Corp. | | | |
| 6.375% due 06/15/2016 | | 230,000 | 237,354 |
| Toyota Motor Credit Corp. | | | |
| 2.875% due 08/01/2008 | | 235,000 | 225,108 |
| UBS AG | | | |
| 4.50% due 09/16/2019 | EUR | 62,000 | 80,973 |
|
|
| | | | 25,864,411 |
| Food & Beverages - 0.70% | | | |
| B&G Foods Holding Corp. | | | |
| 8.00% due 10/01/2011 | $ | 500,000 | 507,500 |
| Birds Eye Foods, Inc. | | | |
| 11.875% due 11/01/2008 | | 75,000 | 75,563 |
| Cott Beverages USA, Inc. | | | |
| 8.00% due 12/15/2011 | | 265,000 | 268,313 |
| Del Monte Corp. | | | |
| 8.625% due 12/15/2012 | | 325,000 | 340,031 |
| Dole Food, Inc. | | | |
| 8.625% due 05/01/2009 | | 175,000 | 172,375 |
| 8.875% due 03/15/2011 (a) | | 225,000 | 219,375 |
| General Mills, Inc. | | | |
| 3.875% due 11/30/2007 | | 215,000 | 210,396 |
| 6.449% due 10/15/2006 | | 150,000 | 150,142 |
| Kraft Foods, Inc. | | | |
| 4.625% due 11/01/2006 | | 105,000 | 104,845 |
| Le*Nature's, Inc. | | | |
| 10.00% due 06/15/2013 | | 200,000 | 209,000 |
| Level 3 Financing, Inc. | | | |
| 10.75% due 10/15/2011 | | 500,000 | 520,625 |
The accompanying notes are an integral part of the financial statements. 373
John Hancock Funds II
Portfolio of investments — August 31, 2006
(showing percentage of total net assets)
| Spectrum Income Fund (continued) | |
| | | Shares or | |
| | | Principal | |
| | | Amount | Value |
|
|
| |
| CORPORATE BONDS (continued) | | | |
| Food & Beverages (continued) | | | |
| McCormick & Company, Inc. | | | |
| 5.20% due 12/15/2015 | $ | 430,000 | $ | 421,862 |
| 5.80% due 07/15/2011 | | 130,000 | 132,117 |
| McCormick & Company, Inc., MTN | | | |
| 3.35% due 04/15/2009 | | 110,000 | 105,931 |
| Nutro Products, Inc. | | | |
| 9.23% due 10/15/2013 (b) | | 150,000 | 154,500 |
| 10.75% due 04/15/2014 | | 375,000 | 395,625 |
| Panamerican Beverages, Inc. | | | |
| 7.25% due 07/01/2009 | | 35,000 | 36,120 |
| PepsiAmericas, Inc. | | | |
| 4.875% due 01/15/2015 | | 55,000 | 52,624 |
| SABMiller PLC | | | |
| 6.20% due 07/01/2011 | | 485,000 | 497,513 |
| Sysco Corp. | | | |
| 5.375% due 09/21/2035 (a) | | 100,000 | 94,196 |
| Tate & Lyle International Finance PlC | | | |
| 6.125% due 06/15/2011 | | 200,000 | 203,464 |
| The Wornick Company | | | |
| 10.875% due 07/15/2011 | | 200,000 | 190,000 |
| Tricon Global Restaurants, Inc. | | | |
| 7.65% due 05/15/2008 | | 185,000 | 191,190 |
| William Wrigley Jr. Company | | | |
| 4.65% due 07/15/2015 | | 60,000 | 56,699 |
|
|
| | | | 5,310,006 |
| Forest Products - 0.02% | | | |
| Weyerhaeuser Company | | | |
| 7.375% due 03/15/2032 | | 115,000 | 120,353 |
| Furniture & Fixtures - 0.13% | | | |
| Norcraft Companies LP | | | |
| 9.00% due 11/01/2011 | | 275,000 | 276,375 |
| Norcraft Holdings Capital | | | |
| zero coupon, Step up to 9.75% on | | | |
| 09/01/2008 due 09/01/2012 | | 225,000 | 182,250 |
| Sealy Mattress Company | | | |
| 8.25% due 06/15/2014 (a) | | 500,000 | 505,000 |
|
|
| | | | 963,625 |
| Gas & Pipeline Utilities - 0.82% | | | |
| ANR Pipeline Company | | | |
| 8.875% due 03/15/2010 | | 110,000 | 115,395 |
| Aquila Canada Finance Corp. | | | |
| 7.75% due 06/15/2011 | | 200,000 | 209,500 |
| Atlas Pipeline Partners LP | | | |
| 8.125% due 12/15/2015 | | 50,000 | 51,000 |
| 8.125% due 12/15/2015 | | 175,000 | 178,500 |
| Atmos Energy Corp. | | | |
| 4.00% due 10/15/2009 | | 230,000 | 219,572 |
| 5.95% due 10/15/2034 | | 40,000 | 37,525 |
| Boardwalk Pipelines LLC | | | |
| 5.50% due 02/01/2017 | | 90,000 | 86,684 |
| Colorado Interstate Gas Company | | | |
| 5.95% due 03/15/2015 | | 300,000 | 282,203 |
| 6.80% due 11/15/2015 | | 400,000 | 396,426 |
| Duke Capital LLC | | | |
| 7.50% due 10/01/2009 | | 130,000 | 137,874 |
| Spectrum Income Fund (continued) | |
| | | Shares or | |
| | | Principal | |
| | | Amount | Value |
|
|
| |
| CORPORATE BONDS (continued) | | | |
| Gas & Pipeline Utilities (continued) | | | |
| El Paso Natural Gas, Series A | | | |
| 7.625% due 08/01/2010 | $ | 15,000 | $ | 15,413 |
| El Paso Production Holding Company | | | |
| 7.75% due 06/01/2013 | | 575,000 | 583,625 |
| Kinder Morgan Finance Company, ULC | | | |
| 5.35% due 01/05/2011 (a) | | 130,000 | 124,597 |
| 5.70% due 01/05/2016 | | 480,000 | 436,766 |
| National Gas Company | | | |
| 6.05% due 01/15/2036 | | 105,000 | 99,779 |
| National Gas Co of Trinidad & Tobago Ltd, | | | |
| Series REGS | | | |
| 6.05% due 01/15/2036 | | 100,000 | 95,639 |
| Panhandle Eastern Pipe Line Company | | | |
| 4.80% due 08/15/2008 | | 155,000 | 152,467 |
| Panhandle Eastern Pipe Line Company, Series B | | |
| 2.75% due 03/15/2007 | | 130,000 | 128,096 |
| Piedmont Natural Gas Company | | | |
| 6.00% due 12/19/2033 | | 15,000 | 15,079 |
| Roseton/Danskammer, Series A | | | |
| 7.27% due 11/08/2010 | | 200,000 | 199,000 |
| Southern California Gas Co. | | | |
| 5.75% due 11/15/2035 | | 265,000 | 262,091 |
| Southern Natural Gas Company | | | |
| 8.875% due 03/15/2010 | | 460,000 | 482,562 |
| Sunoco, Inc. | | | |
| 4.875% due 10/15/2014 | | 30,000 | 28,316 |
| Williams Companies, Inc. | | | |
| 7.625% due 07/15/2019 (a) | | 50,000 | 50,750 |
| 7.75% due 06/15/2031 | | 100,000 | 97,750 |
| 8.125% due 03/15/2012 | | 1,550,000 | 1,635,250 |
| 8.75% due 03/15/2032 | | 25,000 | 26,937 |
| Williams Companies, Inc., Series A | | | |
| 7.50% due 01/15/2031 | | 125,000 | 120,313 |
|
|
| | | | 6,269,109 |
| Gold - 0.02% | | | |
| Newmont Mining Corp. | | | |
| 5.875% due 04/01/2035 | | 130,000 | 120,492 |
| Healthcare Products - 0.12% | | | |
| Fresenius Medical Care Capital Trust | | | |
| 7.875% due 02/01/2008 | | 280 | 284,200 |
| 7.875% due 06/15/2011 | | 25,000 | 25,500 |
| Medtronic, Inc., Series B | | | |
| 4.375% due 09/15/2010 | | 145,000 | 140,346 |
| 4.75% due 09/15/2015 | | 330,000 | 310,780 |
| VWR International, Inc. | | | |
| 6.875% due 04/15/2012 | | 50,000 | 48,750 |
| 8.00% due 04/15/2014 (a) | | 100,000 | 99,000 |
|
|
| | | | 908,576 |
| Healthcare Services - 0.26% | | | |
| Concentra Operating Corp. | | | |
| 9.125% due 06/01/2012 | | 200,000 | 208,250 |
| 9.50% due 08/15/2010 | | 75,000 | 78,000 |
| DaVita, Inc. | | | |
| 6.625% due 03/15/2013 | | 275,000 | 268,125 |
| 7.25% due 03/15/2015 | | 200,000 | 196,000 |
The accompanying notes are an integral part of the financial statements. 374
John Hancock Funds II
Portfolio of investments — August 31, 2006
(showing percentage of total net assets)
| Spectrum Income Fund (continued) | |
| | | Shares or | |
| | | Principal | |
| | | Amount | Value |
|
|
| |
| CORPORATE BONDS (continued) | | | |
| Healthcare Services (continued) | | | |
| Team Health, Inc. | | | |
| 11.25% due 12/01/2013 | $ | 225,000 | $ | 232,875 |
| UnitedHealth Group, Inc. | | | |
| 5.25% due 03/15/2011 | | 235,000 | 233,690 |
| US Oncology, Inc. | | | |
| 9.00% due 08/15/2012 | | 150,000 | 155,250 |
| 10.75% due 08/15/2014 | | 75,000 | 81,562 |
| Vanguard Health Holding Company II LLC | | | |
| 9.00% due 10/01/2014 | | 250,000 | 242,500 |
| WellPoint, Inc. | | | |
| 4.25% due 12/15/2009 | | 40,000 | 38,681 |
| 5.00% due 01/15/2011 | | 280,000 | 275,257 |
|
|
| | | | 2,010,190 |
| Holdings Companies/Conglomerates - 0.24% | | |
| Hutchison Whampoa Finance, Ltd. | | | |
| 5.875% due 07/08/2013 | EUR | 62,000 | 85,912 |
| 6.95% due 08/01/2007 | $ | 100,000 | 101,303 |
| Hutchison Whampoa International, Ltd. | | | |
| 6.25% due 01/24/2014 | | 420,000 | 432,178 |
| Leucadia National Corp. | | | |
| 7.00% due 08/15/2013 | | 415,000 | 408,775 |
| Visant Corp. | | | |
| 7.625% due 10/01/2012 | | 325,000 | 318,500 |
| Visant Holding Corp. | | | |
| zero coupon, Step up to 10.25% on | | | |
| 12/01/2008 due 12/01/2013 | | 600,000 | 484,500 |
|
|
| | | | 1,831,168 |
| Homebuilders - 0.17% | | | |
| Centex Corp. | | | |
| 4.55% due 11/01/2010 | | 75,000 | 71,499 |
| 5.45% due 08/15/2012 | | 260,000 | 251,797 |
| KB Home | | | |
| 6.25% due 06/15/2015 (a) | | 190,000 | 171,273 |
| Lennar Corp. | | | |
| 5.95% due 10/17/2011 | | 25,000 | 24,832 |
| Lennar Corp., Series B | | | |
| 5.60% due 05/31/2015 | | 205,000 | 193,336 |
| 6.1456% due 03/19/2009 (b) | | 70,000 | 69,957 |
| MDC Holdings, Inc., MTN | | | |
| 5.375% due 12/15/2014 | | 60,000 | 54,332 |
| NVR, Inc. | | | |
| 5.00% due 06/15/2010 | | 115,000 | 111,215 |
| Pulte Homes, Inc. | | | |
| 4.875% due 07/15/2009 (a) | | 70,000 | 68,494 |
| 5.20% due 02/15/2015 (a) | | 325,000 | 299,704 |
| Ryland Group, Inc. | | | |
| 5.375% due 01/15/2015 | | 20,000 | 18,084 |
|
|
| | | | 1,334,523 |
| Hotels & Restaurants - 0.29% | | | |
| American Casino & Entertainment Properties LLC | | |
| 7.85% due 02/01/2012 | | 400,000 | 405,000 |
| Harrah's Operating Company, Inc. | | | |
| 5.50% due 07/01/2010 | | 505,000 | 498,586 |
| Spectrum Income Fund (continued) | |
| | | Shares or | |
| | | Principal | |
| | | Amount | Value |
|
|
| |
| CORPORATE BONDS (continued) | | | |
| Hotels & Restaurants (continued) | | | |
| Majestic Holding Company LLC | | | |
| zero coupon, Step up to 12.5% on | | | |
| 10/15/2008 due 10/15/2011 | $ | 125,000 | $ | 91,875 |
| O'Charleys, Inc. | | | |
| 9.00% due 11/01/2013 | | 250,000 | 255,000 |
| Poster Financial Group, Inc. | | | |
| 8.75% due 12/01/2011 | | 400,000 | 418,000 |
| Real Mex Restaurants, Inc. | | | |
| 10.00% due 04/01/2010 | | 165,000 | 171,600 |
| Resorts International Hotel and Casino, Inc. | | | |
| 11.50% due 03/15/2009 | | 25,000 | 26,156 |
| Restaurant Company | | | |
| 10.00% due 10/01/2013 | | 275,000 | 245,438 |
| Yum! Brands, Inc. | | | |
| 7.70% due 07/01/2012 | | 130,000 | 142,305 |
|
|
| | | | 2,253,960 |
| |
| Household Appliances - 0.04% | | | |
| Gregg Appliances, Inc. | | | |
| 9.00% due 02/01/2013 | | 150,000 | 135,375 |
| Whirlpool Corp. | | | |
| 6.125% due 06/15/2011 | | 140,000 | 141,977 |
|
|
| | | | 277,352 |
| |
| Household Products - 0.06% | | | |
| Simmons Bedding Company | | | |
| zero coupon, Step up to 10.00% on | | | |
| 12/15/2009 due 12/15/2014 | | 350,000 | 244,125 |
| 7.875% due 01/15/2014 (a) | | 250,000 | 241,250 |
|
|
| | | | 485,375 |
| |
| Industrial Machinery - 0.05% | | | |
| H&E Equipment Services, Inc. | | | |
| 8.375% due 07/15/2016 | | 400,000 | 406,000 |
| Insurance - 0.56% | | | |
| ACE INA Holdings, Inc. | | | |
| 5.875% due 06/15/2014 | | 150,000 | 149,763 |
| Allstate Financial Global Funding | | | |
| 5.25% due 02/01/2007 | | 100,000 | 99,929 |
| Allstate Life Funding LLC, EMTN | | | |
| 6.375% due 01/17/2011 | GBP | 49,000 | 96,789 |
| ASIF II, EMTN | | | |
| 5.625% due 02/01/2012 | | 49,000 | 94,730 |
| Cigna Corp. | | | |
| 7.40% due 05/15/2007 | $ | 80,000 | 80,937 |
| Cincinnati Financial Corp. | | | |
| 6.92% due 05/15/2028 | | 150,000 | 162,072 |
| Genworth Financial, Inc. | | | |
| 5.75% due 06/15/2014 | | 380,000 | 385,176 |
| Highmark, Inc. | | | |
| 6.80% due 08/15/2013 | | 225,000 | 235,786 |
| ING Security Life Institutional Funding | | | |
| 2.70% due 02/15/2007 | | 195,000 | 192,269 |
| Jefferson-Pilot Capital Trust A | | | |
| 8.14% due 01/15/2046 | | 120,000 | 125,449 |
| Marsh & McLennan Companies, Inc. | | | |
| 5.375% due 07/15/2014 | | 465,000 | 444,197 |
The accompanying notes are an integral part of the financial statements. 375
John Hancock Funds II
Portfolio of investments — August 31, 2006
(showing percentage of total net assets)
| Spectrum Income Fund (continued) | |
| | | Shares or | |
| | | Principal | |
| | | Amount | Value |
|
|
| |
| CORPORATE BONDS (continued) | | | |
| Insurance (continued) | | | |
| MassMutual Global Funding II | | | |
| 3.25% due 06/15/2007 | $ | 140,000 | $ | 137,717 |
| Monumental Global Funding, Ltd., EMTN | | | |
| 5.375% due 03/13/2009 | EUR | 39,000 | 51,674 |
| Nationwide Financial Services, Inc. | | | |
| 5.90% due 07/01/2012 | $ | 200,000 | 203,189 |
| Nationwide Mutual Insurance Company | | | |
| 6.60% due 04/15/2034 | | 135,000 | 132,302 |
| New York Life Global Funding | | | |
| 4.625% due 08/16/2010 | | 235,000 | 229,650 |
| NLV Financial Corp. | | | |
| 7.50% due 08/15/2033 | | 160,000 | 169,242 |
| Ohio National Financial Services, Inc. | | | |
| 6.35% due 04/01/2013 | | 15,000 | 15,438 |
| Pacific Life Funding LLC, EMTN | | | |
| 5.125% due 01/20/2015 | GBP | 89,000 | 168,785 |
| 5.50% due 05/14/2009 | EUR | 39,000 | 51,876 |
| Principal Life Global Funding I | | | |
| 5.25% due 01/15/2013 | $ | 190,000 | 187,892 |
| Principal Life Income Funding Trusts | | | |
| 5.20% due 11/15/2010 (a) | | 40,000 | 39,811 |
| Principal Financial Global Funding LLC, EMTN | | |
| 4.50% due 01/22/2009 | EUR | 39,000 | 50,439 |
| Prudential Funding LLC, MTN | | | |
| 6.60% due 05/15/2008 | $ | 150,000 | 153,016 |
| RLI Corp. | | | |
| 5.95% due 01/15/2014 | | 35,000 | 34,169 |
| Security Benefit Life Insurance Company | | | |
| 7.45% due 10/01/2033 | | 95,000 | 105,662 |
| The St. Paul Companies, Inc. | | | |
| 5.75% due 03/15/2007 | | 55,000 | 55,097 |
| Transamerica Capital II | | | |
| 7.65% due 12/01/2026 | | 135,000 | 149,749 |
| Transatlantic Holdings, Inc. | | | |
| 5.75% due 12/14/2015 | | 170,000 | 166,757 |
| Travelers Insurance Company Institutional | | | |
| Funding, Ltd. | | | |
| 5.75% due 12/06/2011 | GBP | 49,000 | 95,194 |
| Travelers Property Casualty Corp. | | | |
| 3.75% due 03/15/2008 | $ | 40,000 | 38,948 |
|
|
| | | | 4,303,704 |
| International Oil - 0.44% | | | |
| Canadian Natural Resources, Ltd. | | | |
| 6.45% due 06/30/2033 | | 75,000 | 76,556 |
| Newfield Exploration Company | | | |
| 6.625% due 09/01/2014 | | 35,000 | 34,213 |
| OAO Gazprom, Series REGS | | | |
| 9.625% due 03/01/2013 | | 200,000 | 236,120 |
| Pemex Project Funding Master Trust | | | |
| 5.75% due 12/15/2015 | | 665,000 | 647,045 |
| 6.625% due 06/15/2035 | | 335,000 | 328,970 |
| 6.6294% due 06/15/2010 (b) | | 395,000 | 404,085 |
| 7.75% due 09/28/2049 | | 344,000 | 350,536 |
| 8.625% due 02/01/2022 | | 175,000 | 210,875 |
| Spectrum Income Fund (continued) | |
| | | Shares or | |
| | | Principal | |
| | | Amount | Value |
|
|
| |
| CORPORATE BONDS (continued) | | | |
| International Oil (continued) | | | |
| Pemex Project Funding Master Trust, Series REGS | | |
| 6.25% due 08/05/2013 | EUR | 65,000 | $ | 90,171 |
| 6.625% due 06/15/2035 | $ | 200,000 | 196,400 |
| Petro-Canada | | | |
| 5.95% due 05/15/2035 | | 265,000 | 251,791 |
| PF Export Receivables Master Trust | | | |
| 6.436% due 06/01/2015 | | 72,624 | 73,350 |
| XTO Energy, Inc. | | | |
| 5.65% due 04/01/2016 | | 200,000 | 197,666 |
| YPF SA, MTN, Series C | | | |
| 10.00% due 11/02/2028 | | 220,000 | 264,550 |
|
|
| | | | 3,362,328 |
| Investment Companies - 0.01% | | | |
| BES Finance, Ltd., EMTN | | | |
| 6.25% due 05/17/2011 | EUR | 66,000 | 92,109 |
| Leisure Time - 1.00% | | | |
| AMC Entertainment, Inc. | | | |
| 8.00% due 03/01/2014 | $ | 325,000 | 303,875 |
| 11.00% due 02/01/2016 | | 650,000 | 706,063 |
| AMF Bowling Worldwide, Inc. | | | |
| 10.00% due 03/01/2010 | | 200,000 | 205,000 |
| Boyd Gaming Corp. | | | |
| 8.75% due 04/15/2012 | | 200,000 | 209,750 |
| Chukchansi Economic Development Authority | | |
| 8.06% due 11/15/2012 | | 150,000 | 154,500 |
| Cinemark, Inc. | | | |
| zero coupon, Step up to 9.75% on | | | |
| 03/15/2009 due 03/15/2014 | | 725,000 | 565,500 |
| 9.00% due 02/01/2013 | | 250,000 | 258,750 |
| Festival Fun Parks LLC | | | |
| 10.875% due 04/15/2014 | | 100,000 | 98,250 |
| Herbst Gaming, Inc. | | | |
| 8.125% due 06/01/2012 | | 75,000 | 76,125 |
| International Speedway Corp. | | | |
| 4.20% due 04/15/2009 | | 90,000 | 86,429 |
| Little Traverse Bay Bands of Odawa Indians | | |
| 10.25% due 02/15/2014 | | 175,000 | 174,125 |
| Lottomatica SpA | | | |
| 4.80% due 12/22/2008 | EUR | 30,000 | 38,769 |
| Majestic Star Casino LLC | | | |
| 9.50% due 10/15/2010 | $ | 225,000 | 231,469 |
| Mandalay Resort Group | | | |
| 10.25% due 08/01/2007 | | 75,000 | 77,625 |
| MGM Mirage, Inc. | | | |
| 6.00% due 10/01/2009 | | 180,000 | 175,950 |
| 6.625% due 07/15/2015 | | 325,000 | 305,906 |
| 6.75% due 09/01/2012 | | 15,000 | 14,587 |
| 8.50% due 09/15/2010 | | 450,000 | 473,625 |
| 9.75% due 06/01/2007 | | 100,000 | 102,500 |
| MTR Gaming Group, Inc. | | | |
| 9.00% due 06/01/2012 | | 100,000 | 100,750 |
| Penn National Gaming, Inc. | | | |
| 6.75% due 03/01/2015 | | 525,000 | 505,313 |
| Pinnacle Entertainment, Inc. | | | |
| 8.25% due 03/15/2012 | | 125,000 | 125,625 |
The accompanying notes are an integral part of the financial statements. 376
John Hancock Funds II
Portfolio of investments — August 31, 2006
(showing percentage of total net assets)
| Spectrum Income Fund (continued) | |
| | | Shares or | |
| | | Principal | |
| | | Amount | Value |
|
|
| |
| CORPORATE BONDS (continued) | | | |
| Leisure Time (continued) | | | |
| Pokagon Gaming Authority | | | |
| 10.375% due 06/15/2014 | $ | 375,000 | $ | 396,563 |
| Royal Caribbean Cruises, Ltd. | | | |
| 7.00% due 06/15/2013 (a) | | 100,000 | 100,407 |
| Speedway Motorsports, Inc. | | | |
| 6.75% due 06/01/2013 | | 335,000 | 329,137 |
| Station Casinos, Inc. | | | |
| 6.00% due 04/01/2012 | | 65,000 | 62,156 |
| 6.50% due 02/01/2014 | | 150,000 | 139,875 |
| 6.875% due 03/01/2016 | | 150,000 | 138,937 |
| 7.75% due 08/15/2016 | | 580,000 | 598,125 |
| Town Sports International, Inc. | | | |
| 9.625% due 04/15/2011 | | 112,000 | 117,880 |
| Trump Entertainment Resorts, Inc. | | | |
| 8.50% due 06/01/2015 | | 525,000 | 507,937 |
| Tunica-Biloxi Gaming Authority | | | |
| 9.00% due 11/15/2015 | | 225,000 | 231,188 |
|
|
| | | | 7,612,691 |
| Life Sciences - 0.07% | | | |
| Fisher Scientific International, Inc. | | | |
| 6.125% due 07/01/2015 | | 525,000 | 519,094 |
| Manufacturing - 0.23% | | | |
| Koppers, Inc. | | | |
| 9.875% due 10/15/2013 | | 256,000 | 277,120 |
| RBS Global & Rexnord Corp. | | | |
| 9.50% due 08/01/2014 | | 700,000 | 703,500 |
| 11.75% due 08/01/2016 | | 100,000 | 103,000 |
| Stewart & Stevenson LLC | | | |
| 10.00% due 07/15/2014 | | 275,000 | 281,875 |
| Tyco International Group SA | | | |
| 6.375% due 10/15/2011 | | 390,000 | 406,752 |
| Tyco International Group SA, EMTN | | | |
| 5.50% due 11/19/2008 | EUR | 10,000 | 13,129 |
|
|
| | | | 1,785,376 |
| Medical-Hospitals - 0.24% | | | |
| Community Health Systems, Inc. | | | |
| 6.50% due 12/15/2012 | $ | 200,000 | 187,000 |
| CRC Health Corp. | | | |
| 10.75% due 02/01/2016 | | 225,000 | 229,500 |
| Genesis Healthcare Corp. | | | |
| 8.00% due 10/15/2013 | | 400,000 | 415,000 |
| HCA, Inc. | | | |
| 8.75% due 09/01/2010 | | 650,000 | 654,875 |
| Triad Hospitals, Inc. | | | |
| 7.00% due 11/15/2013 | | 400,000 | 382,000 |
|
|
| | | | 1,868,375 |
| Metal & Metal Products - 0.30% | | | |
| Earle M. Jorgensen Company | | | |
| 9.75% due 06/01/2012 | | 450,000 | 478,125 |
| Gibraltar Industries, Inc. | | | |
| 8.00% due 12/01/2015 | | 675,000 | 668,250 |
| Hawk Corp. | | | |
| 8.75% due 11/01/2014 | | 181,000 | 181,000 |
| Spectrum Income Fund (continued) | |
| | | Shares or | |
| | | Principal | |
| | | Amount | Value |
|
|
| |
| CORPORATE BONDS (continued) | | | |
| Metal & Metal Products (continued) | | | |
| Indalex Holding Corp. | | | |
| 11.50% due 02/01/2014 | $ | 175,000 | $ | 186,375 |
| Metals USA, Inc. | | | |
| 11.125% due 12/01/2015 | | 100,000 | 110,250 |
| Mobile Mini, Inc. | | | |
| 9.50% due 07/01/2013 | | 124,000 | 132,680 |
| Neenah Foundary Company | | | |
| 11.00% due 09/30/2010 | | 150,000 | 162,000 |
| Novelis, Inc. | | | |
| 7.25% due 02/15/2015 | | 325,000 | 308,750 |
| Rio Tinto Finance PLC, EMTN | | | |
| 5.125% due 05/10/2007 | EUR | 27,000 | 34,879 |
|
|
| | | | 2,262,309 |
| Mining - 0.02% | | | |
| Barrick Gold Finance Company | | | |
| 4.875% due 11/15/2014 | $ | 30,000 | 28,447 |
| Placer Dome, Inc. | | | |
| 6.45% due 10/15/2035 | | 25,000 | 25,469 |
| Rio Tinto Finance USA, Ltd. | | | |
| 2.625% due 09/30/2008 | | 140,000 | 132,237 |
|
|
| | | | 186,153 |
| Office Furnishings & Supplies - 0.13% | | | |
| ACCO Brands Corp. | | | |
| 7.625% due 08/15/2015 | | 200,000 | 189,500 |
| IKON Office Solutions, Inc. | | | |
| 7.75% due 09/15/2015 (a) | | 275,000 | 276,375 |
| Interface, Inc. | | | |
| 9.50% due 02/01/2014 | | 25,000 | 25,687 |
| 10.375% due 02/01/2010 | | 300,000 | 326,625 |
| Staples, Inc. | | | |
| 7.125% due 08/15/2007 | | 200,000 | 202,403 |
|
|
| | | | 1,020,590 |
| Paper - 0.33% | | | |
| Abitibi-Consolidated, Inc. | | | |
| 5.25% due 06/20/2008 | | 175,000 | 167,563 |
| 6.95% due 12/15/2006 | | 10,000 | 10,050 |
| 8.55% due 08/01/2010 (a) | | 125,000 | 123,437 |
| Boise Cascade LLC | | | |
| 7.125% due 10/15/2014 | | 485,000 | 451,050 |
| Celulosa Arauco y Constitucion SA | | | |
| 5.125% due 07/09/2013 (a) | | 80,000 | 75,979 |
| 8.625% due 08/15/2010 | | 220,000 | 242,395 |
| Domtar, Inc. | | | |
| 5.375% due 12/01/2013 | | 175,000 | 149,625 |
| Georgia-Pacific Corp. | | | |
| 7.70% due 06/15/2015 | | 100,000 | 99,125 |
| 8.125% due 05/15/2011 | | 150,000 | 153,375 |
| Jefferson Smurfit Corp. | | | |
| 8.25% due 10/01/2012 | | 200,000 | 189,500 |
| NewPage Corp. | | | |
| 10.00% due 05/01/2012 (a) | | 25,000 | 26,031 |
| 11.7388% due 05/01/2012 (b) | | 175,000 | 189,000 |
| 12.00% due 05/01/2013 (a) | | 175,000 | 180,688 |
The accompanying notes are an integral part of the financial statements. 377
John Hancock Funds II
Portfolio of investments — August 31, 2006
(showing percentage of total net assets)
| Spectrum Income Fund (continued) | |
| | | Shares or | |
| | | Principal | |
| | | Amount | Value |
|
|
| |
| CORPORATE BONDS (continued) | | | |
| Paper (continued) | | | |
| Norske Skog Canada, Ltd. | | | |
| 7.375% due 03/01/2014 | $ | 200,000 | $ | 182,500 |
| Verso Paper Holdings LLC and Verso Paper, Inc. | | |
| 9.125% due 08/01/2014 | | 175,000 | 174,125 |
| Verso Paper Holdings LLC and Verso Paper, Inc. | | |
| 9.25% due 08/01/2014 | | 75,000 | 75,563 |
|
|
| | | | 2,490,006 |
| Petroleum Services - 0.48% | | | |
| BP Canada Finance Company | | | |
| 3.375% due 10/31/2007 | | 60,000 | 58,687 |
| Dresser-Rand Group, Inc. | | | |
| 7.375% due 11/01/2014 | | 454,000 | 436,975 |
| Gaz Capital for Gazprom, Series EMTN | | | |
| 4.56% due 12/09/2012 | EUR | 100,000 | 126,262 |
| Gaz Capital for Gazprom, Series REGS | | | |
| 8.625% due 04/28/2034 (a) | $ | 1,030,000 | 1,281,320 |
| Halliburton Company | | | |
| 5.50% due 10/15/2010 | | 375,000 | 376,479 |
| Hanover Compressor Company | | | |
| 7.50% due 04/15/2013 | | 300,000 | 299,250 |
| 9.00% due 06/01/2014 | | 100,000 | 106,000 |
| Hanover Equipment Trust | | | |
| 8.75% due 09/01/2011 | | 350,000 | 364,000 |
| Premcor Refining Group, Inc. | | | |
| 6.75% due 02/01/2011 | | 120,000 | 125,534 |
| Pride International, Inc. | | | |
| 7.375% due 07/15/2014 | | 50,000 | 50,875 |
| SESI LLC | | | |
| 6.875% due 06/01/2014 | | 450,000 | 441,000 |
|
|
| | | | 3,666,382 |
| Pharmaceuticals - 0.22% | | | |
| AmerisourceBergen Corp. | | | |
| 5.625% due 09/15/2012 | | 400,000 | 389,238 |
| Aventis SA, EMTN | | | |
| 4.25% due 09/15/2010 | EUR | 65,000 | 84,180 |
| Hospira, Inc. | | | |
| 4.95% due 06/15/2009 | $ | 80,000 | 78,989 |
| Merck & Company, Inc. | | | |
| 2.50% due 03/30/2007 | | 100,000 | 98,407 |
| Mylan Laboratories, Inc. | | | |
| 5.75% due 08/15/2010 (a) | | 150,000 | 145,875 |
| Omnicare, Inc. | | | |
| 6.75% due 12/15/2013 | | 350,000 | 336,000 |
| 6.875% due 12/15/2015 | | 125,000 | 119,531 |
| Teva Pharmaceutical Finance LLC | | | |
| 5.55% due 02/01/2016 | | 200,000 | 194,275 |
| Warner Chilcott Corp. | | | |
| 8.75% due 02/01/2015 | | 200,000 | 200,000 |
|
|
| | | | 1,646,495 |
| Photography - 0.08% | | | |
| Eastman Kodak Company | | | |
| 7.25% due 11/15/2013 (a) | | 640,000 | 616,349 |
| Spectrum Income Fund (continued) | |
| | | Shares or | |
| | | Principal | |
| | | Amount | Value |
|
|
| |
| CORPORATE BONDS (continued) | | | |
| Plastics - 0.03% | | | |
| Covalence Specialty Materials Corp. | | | |
| 10.25% due 03/01/2016 | $ | 250,000 | $ | 240,000 |
| Publishing - 0.28% | | | |
| Dex Media East LLC | | | |
| 9.875% due 11/15/2009 | | 150,000 | 158,250 |
| 12.125% due 11/15/2012 | | 250,000 | 278,750 |
| Dex Media West LLC | | | |
| 8.50% due 08/15/2010 | | 25,000 | 25,625 |
| 9.875% due 08/15/2013 | | 225,000 | 241,593 |
| Haights Cross Communications, Inc. | | | |
| 12.50% due 08/15/2011 (a) | | 175,000 | 106,969 |
| Haights Cross Operating Company | | | |
| 11.75% due 08/15/2011 | | 300,000 | 309,375 |
| Houghton Mifflin Company | | | |
| 8.25% due 02/01/2011 | | 300,000 | 303,000 |
| Medianews Group, Inc. | | | |
| 6.375% due 04/01/2014 | | 75,000 | 66,375 |
| 6.875% due 10/01/2013 | | 375,000 | 343,125 |
| Morris Publishing Group LLC | | | |
| 7.00% due 08/01/2013 | | 300,000 | 285,000 |
|
|
| | | | 2,118,062 |
| Railroads & Equipment - 0.13% | | | |
| Canadian National Railway Company | | | |
| 6.25% due 08/01/2034 | | 204,000 | 215,784 |
| Grupo Transportacion Ferroviaria Mexicana, | | |
| S.A. de C.V. | | | |
| 9.375% due 05/01/2012 | | 125,000 | 132,344 |
| Norfolk Southern Corp. | | | |
| 5.59% due 05/17/2025 | | 30,000 | 28,985 |
| 6.00% due 04/30/2008 | | 240,000 | 242,223 |
| 7.25% due 02/15/2031 | | 35,000 | 40,597 |
| 7.35% due 05/15/2007 | | 240,000 | 242,878 |
| Union Pacific Corp. | | | |
| 5.75% due 10/15/2007 (a) | | 85,000 | 85,127 |
|
|
| | | | 987,938 |
| Real Estate - 0.57% | | | |
| AMB Property LP, Series MTN | | | |
| 5.90% due 08/15/2013 | | 45,000 | 45,383 |
| Archstone-Smith Operating Trust, REIT | | | |
| 5.25% due 05/01/2015 | | 180,000 | 174,556 |
| 5.625% due 08/15/2014 | | 15,000 | 14,981 |
| Arden Realty LP, REIT | | | |
| 5.20% due 09/01/2011 | | 60,000 | 59,740 |
| AvalonBay Communities, Inc., REIT | | | |
| 4.95% due 03/15/2013 | | 60,000 | 57,728 |
| 6.125% due 11/01/2012 | | 185,000 | 190,398 |
| AvalonBay Communities, Inc., Series MTN | | | |
| 6.625% due 09/15/2011 | | 265,000 | 277,810 |
| BF Saul, REIT | | | |
| 7.50% due 03/01/2014 | | 150,000 | 152,250 |
| Camden Property Trust, REIT | | | |
| 4.375% due 01/15/2010 | | 90,000 | 87,289 |
| Developers Diversified Realty Corp., REIT | | | |
| 3.875% due 01/30/2009 (a) | | 30,000 | 28,925 |
The accompanying notes are an integral part of the financial statements. 378
John Hancock Funds II
Portfolio of investments — August 31, 2006
(showing percentage of total net assets)
| Spectrum Income Fund (continued) | |
| | | Shares or | |
| | | Principal | |
| | | Amount | Value |
|
|
| |
| CORPORATE BONDS (continued) | | | |
| Real Estate (continued) | | | |
| EOP Operating LP | | | |
| 4.00% due 07/15/2026 | $ | 125,000 | $ | 129,415 |
| Federal Realty Investment Trust | | | |
| 6.00% due 07/15/2012 | | 135,000 | 137,455 |
| Felcor Lodging LP, REIT | | | |
| 9.00% due 06/01/2011 | | 75,000 | 79,313 |
| 9.5703% due 06/01/2011 (b) | | 225,000 | 230,625 |
| Host Marriott LP, REIT | | | |
| 6.375% due 03/15/2015 | | 75,000 | 72,000 |
| 7.125% due 11/01/2013 | | 250,000 | 252,500 |
| Host Marriott LP, Series Q, REIT | | | |
| 6.75% due 06/01/2016 | | 1,100,000 | 1,067,000 |
| iStar Financial, Inc. | | | |
| 5.80% due 03/15/2011 | | 45,000 | 45,112 |
| iStar Financial, Inc., REIT | | | |
| 6.05% due 04/15/2015 | | 45,000 | 45,146 |
| iStar Financial, Inc., Series B, REIT | | | |
| 4.875% due 01/15/2009 | | 90,000 | 88,659 |
| Kimco Realty Corp., MTN, REIT | | | |
| 4.904% due 02/18/2015 | | 60,000 | 56,722 |
| Reckson Operating Partnership, REIT | | | |
| 6.00% due 03/31/2016 | | 210,000 | 209,573 |
| Simon Property Group LP, REIT | | | |
| 4.60% due 06/15/2010 | | 235,000 | 228,532 |
| 5.375% due 06/01/2011 | | 55,000 | 54,807 |
| Simon Property Group, LP, REIT | | | |
| 3.75% due 01/30/2009 | | 180,000 | 173,273 |
| Ventas Realty LP, REIT | | | |
| 6.75% due 06/01/2010 | | 200,000 | 203,750 |
| Ventas Realty LP/ Capital Corp. | | | |
| 6.50% due 06/01/2016 | | 150,000 | 147,750 |
| Vornado Realty LP, REIT | | | |
| 4.50% due 08/15/2009 | | 80,000 | 77,869 |
|
|
| | | | 4,388,561 |
| Retail - 0.16% | | | |
| Home Depot, Inc. | | | |
| 5.40% due 03/01/2016 | | 280,000 | 277,338 |
| JC Penney Company, Inc. | | | |
| 7.375% due 08/15/2008 | | 355,000 | 366,769 |
| Leslie's Poolmart | | | |
| 7.75% due 02/01/2013 | | 350,000 | 344,750 |
| Sunstate Equipment Company LLC | | | |
| 10.50% due 04/01/2013 | | 225,000 | 234,562 |
|
|
| | | | 1,223,419 |
| Retail Grocery - 0.17% | | | |
| Couche-Tard US LP | | | |
| 7.50% due 12/15/2013 | | 450,000 | 454,500 |
| Delhaize America, Inc. | | | |
| 8.125% due 04/15/2011 | | 45,000 | 48,223 |
| Pathmark Stores, Inc. | | | |
| 8.75% due 02/01/2012 | | 325,000 | 314,438 |
| Safeway, Inc. | | | |
| 4.125% due 11/01/2008 | | 65,000 | 63,187 |
| The Kroger Company | | | |
| 7.80% due 08/15/2007 | | 110,000 | 111,790 |
| Spectrum Income Fund (continued) | |
| | | Shares or | |
| | | Principal | |
| | | Amount | Value |
|
|
| |
| CORPORATE BONDS (continued) | | | |
| Retail Grocery (continued) | | | |
| The Kroger Company (continued) | | | |
| 8.05% due 02/01/2010 | $ | 290,000 | $ | 311,228 |
|
|
| | | | 1,303,366 |
| Retail Trade - 0.46% | | | |
| American Greetings Corp. | | | |
| 7.375% due 06/01/2016 | | 100,000 | 100,625 |
| Fortune Brands, Inc. | | | |
| 5.125% due 01/15/2011 | | 70,000 | 68,619 |
| FTD, Inc. | | | |
| 7.75% due 02/15/2014 | | 525,000 | 511,875 |
| GSC Holdings Corp. | | | |
| 8.00% due 10/01/2012 (a) | | 1,125,000 | 1,148,906 |
| Home Depot, Inc. | | | |
| 3.75% due 09/15/2009 (a) | | 115,000 | 110,715 |
| J.C. Penney Company, Inc. | | | |
| 9.00% due 08/01/2012 | | 155,000 | 179,480 |
| May Department Stores Company | | | |
| 3.95% due 07/15/2007 | | 125,000 | 123,180 |
| Neff Corp. | | | |
| 11.25% due 06/15/2012 | | 350,000 | 376,250 |
| The Pantry, Inc. | | | |
| 7.75% due 02/15/2014 | | 375,000 | 369,375 |
| Wal-Mart Stores, Inc. | | | |
| 4.75% due 01/29/2013 | GBP | 68,000 | 126,947 |
| 5.25% due 09/01/2035 | $ | 235,000 | 216,345 |
| 6.875% due 08/10/2009 | | 155,000 | 162,073 |
|
|
| | | | 3,494,390 |
| Sanitary Services - 0.16% | | | |
| Allied Waste North America, Inc. | | | |
| 8.50% due 12/01/2008 | | 225,000 | 234,000 |
| Allied Waste North America, Inc., Series B | | | |
| 9.25% due 09/01/2012 | | 175,000 | 187,250 |
| Casella Waste Systems, Inc. | | | |
| 9.75% due 02/01/2013 | | 750,000 | 785,625 |
| Oakmont Asset Trust | | | |
| 4.514% due 12/22/2008 | | 20,000 | 19,473 |
| Waste Management, Inc. | | | |
| 7.375% due 05/15/2029 | | 15,000 | 16,951 |
|
|
| | | | 1,243,299 |
| Semiconductors - 0.23% | | | |
| Flextronics International, Ltd. | | | |
| 6.25% due 11/15/2014 | | 175,000 | 167,344 |
| Freescale Semiconductor, Inc. | | | |
| 6.875% due 07/15/2011 | | 435,000 | 443,700 |
| Intel Corp. | | | |
| 2.95% due 12/15/2035 | | 250,000 | 219,062 |
| 2.95% due 12/15/2035 (a) | | 125,000 | 109,531 |
| Spansion LLC | | | |
| 11.25% due 01/15/2016 | | 225,000 | 230,344 |
| STATS ChipPAC, Ltd. | | | |
| 6.75% due 11/15/2011 | | 100,000 | 96,000 |
| 7.50% due 07/19/2010 | | 500,000 | 501,250 |
|
|
| | | | 1,767,231 |
The accompanying notes are an integral part of the financial statements. 379
John Hancock Funds II
Portfolio of investments — August 31, 2006
(showing percentage of total net assets)
| Spectrum Income Fund (continued) | |
| | | Shares or | |
| | | Principal | |
| | | Amount | Value |
|
|
| |
| CORPORATE BONDS (continued) | | | |
| Software - 0.22% | | | |
| Oracle Corp. | | | |
| 5.00% due 01/15/2011 | $ | 580,000 | $ | 571,058 |
| Serena Software, Inc. | | | |
| 10.375% due 03/15/2016 | | 125,000 | 127,031 |
| SS&C Technologies, Inc. | | | |
| 11.75% due 12/01/2013 | | 100,000 | 104,500 |
| UGS Capital Corp. II | | | |
| 10.38% due 06/01/2011 (b) | | 475,000 | 478,562 |
| UGS Corp. | | | |
| 10.00% due 06/01/2012 | | 400,000 | 430,000 |
|
|
| | | | 1,711,151 |
| Steel - 0.05% | | | |
| Gerdau Ameristeel Corp. | | | |
| 10.375% due 07/15/2011 | | 350,000 | 377,125 |
| Telecommunications Equipment & | | | |
| Services - 0.78% | | | |
| Citizens Communications Company | | | |
| 6.25% due 01/15/2013 | | 200,000 | 193,250 |
| 9.00% due 08/15/2031 | | 400,000 | 422,000 |
| Deutsche Telekom International Finance BV | | |
| 3.875% due 07/22/2008 | | 85,000 | 82,874 |
| 6.625% due 07/11/2011 | EUR | 60,000 | 85,176 |
| 7.50% due 05/29/2007 | | 26,000 | 34,125 |
| Dycom Industries, Inc. | | | |
| 8.125% due 10/15/2015 | $ | 275,000 | 277,750 |
| France Telecom SA | | | |
| 7.75 due 03/01/2011 | | 520,000 | 567,826 |
| France Telecom SA, EMTN | | | |
| 7.00% due 12/23/2009 | EUR | 65,000 | 90,637 |
| 8.125% due 01/28/2033 (a) | | 10,000 | 17,274 |
| Insight Midwest LP | | | |
| 9.75% due 10/01/2009 | $ | 100,000 | 101,750 |
| Intelsat Ltd. | | | |
| 10.4844% due 01/15/2012 (b) | | 400,000 | 406,000 |
| Intelsat Subsidiary Holding Co., Ltd. | | | |
| 8.25% due 01/15/2013 | | 225,000 | 224,438 |
| Lucent Technologies, Inc. | | | |
| 6.50% due 01/15/2028 | | 275,000 | 231,688 |
| 8.00% due 08/01/2031 (a) | | 236,000 | 236,068 |
| Nortel Networks, Ltd. | | | |
| 9.73% due 07/15/2011 (b) | | 550,000 | 555,500 |
| PanAmSat Corp. | | | |
| 9.00% due 08/15/2014 | | 400,000 | 407,000 |
| SBC Communications, Inc. | | | |
| 5.10% due 09/15/2014 | | 80,000 | 76,293 |
| 6.45% due 06/15/2034 (a) | | 405,000 | 399,389 |
| Syniverse Technologies Inc., Series B | | | |
| 7.75% due 08/15/2013 | | 300,000 | 291,750 |
| Telus Corp. | | | |
| 7.50% due 06/01/2007 | | 110,000 | 111,529 |
| 8.00% due 06/01/2011 | | 170,000 | 186,946 |
| Verizon Global Funding Corp. | | | |
| 7.25% due 12/01/2010 | | 110,000 | 117,374 |
| 7.75% due 12/01/2030 | | 285,000 | 320,279 |
| Spectrum Income Fund (continued) | | |
| | | Shares or | | |
| | | Principal | | |
| | | Amount | | Value |
|
|
| |
| CORPORATE BONDS (continued) | | | | |
| Telecommunications Equipment & | | | | |
| Services (continued) | | | | |
| Wind Acquisition Finance SA | | | | |
| 10.75% due 12/01/2015 | $ | 450,000 | $ | 488,812 |
| Zeus Special Subsidiary, Ltd. | | | | |
| zero coupon, Step up to 9.25% on | | | | |
| 02/01/2010 due 02/01/2015 | | 100,000 | | 68,500 |
|
|
| | | | | 5,994,228 |
| Telephone - 1.11% | | | | |
| AT&T Corp. | | | | |
| 7.30% due 11/15/2011 (b) | | 50,000 | | 53,981 |
| AT&T, Inc. | | | | |
| 5.30% due 11/15/2010 | | 340,000 | | 337,293 |
| 5.6119% due 11/14/2008 (b) | | 100,000 | | 100,265 |
| BellSouth Corp. | | | | |
| 5.53% due 11/15/2007 (b) | | 110,000 | | 110,126 |
| Nordic Telephone Company Holdings | | | | |
| 8.25% due 05/01/2016 | EUR | 100,000 | | 135,121 |
| 8.875% due 05/01/2016 | $ | 1,150,000 | | 1,201,750 |
| Qwest Corp. | | | | |
| 7.50% due 10/01/2014 | | 850,000 | | 864,875 |
| 7.875% due 09/01/2011 | | 350,000 | | 364,875 |
| 8.5794% due 06/15/2013 (b) | | 125,000 | | 134,531 |
| 8.875% due 03/15/2012 | | 575,000 | | 622,437 |
| Sprint Capital Corp. | | | | |
| 6.875% due 11/15/2028 | | 380,000 | | 383,711 |
| 7.625% due 01/30/2011 | | 295,000 | | 316,530 |
| Telecom Italia Capital SA | | | | |
| 4.00% due 01/15/2010 | | 150,000 | | 142,525 |
| 5.25% due 11/15/2013 | | 325,000 | | 309,606 |
| 7.20% due 07/18/2036 | | 280,000 | | 292,433 |
| Telecom Italia Finance SA, EMTN | | | | |
| 5.875% due 01/24/2008 | EUR | 14,000 | | 18,390 |
| 6.875% due 01/24/2013 | | 52,000 | | 74,740 |
| 7.75% due 01/24/2033 | | 11,000 | | 17,258 |
| Telefonica Emisones SAU | | | | |
| 5.984% due 06/20/2011 | $ | 185,000 | | 187,751 |
| 6.421% due 06/20/2016 | | 345,000 | | 352,752 |
| Telefonica Europe BV, Series EMTN | | | | |
| 5.125% due 02/14/2013 | EUR | 30,000 | | 39,800 |
| Telefonos de Mexico SA de CV | | | | |
| 4.50% due 11/19/2008 | $ | 120,000 | | 117,221 |
| 4.75% due 01/27/2010 | | 155,000 | | 150,819 |
| 5.50% due 01/27/2015 | | 350,000 | | 339,443 |
| US LEC Corp. | | | | |
| 13.62% due 10/01/2009 (b) | | 375,000 | | 396,094 |
| Valor Telecommunications Enterprise | | | | |
| 7.75% due 02/15/2015 | | 225,000 | | 237,375 |
| Windstream Corp. | | | | |
| 8.625% due 08/01/2016 | | 1,085,000 | | 1,147,387 |
|
|
| | | | | 8,449,089 |
| Tires & Rubber - 0.04% | | | | |
| Goodyear Tire & Rubber Company | | | | |
| 7.857% due 08/15/2011 (a) | | 325,000 | | 313,625 |
The accompanying notes are an integral part of the financial statements. 380
John Hancock Funds II
Portfolio of investments — August 31, 2006
(showing percentage of total net assets)
| Spectrum Income Fund (continued) | |
| | | Shares or | |
| | | Principal | |
| | | Amount | Value |
|
|
| |
| CORPORATE BONDS (continued) | | | |
| Tobacco - 0.16% | | | |
| Altria Group, Inc. | | | |
| 7.20% due 02/01/2007 | $ | 130,000 | $ | 130,566 |
| BAT International Finance PLC, EMTN | | | |
| 5.125% due 07/09/2013 | EUR | 61,000 | 81,013 |
| Imperial Tobacco Finance PLC, EMTN | | | |
| 6.875% due 06/13/2012 | GBP | 49,000 | 99,599 |
| Reynolds American, Inc. | | | |
| 6.50% due 07/15/2010 | $ | 45,000 | 45,364 |
| 7.25% due 06/01/2013 | | 675,000 | 691,426 |
| 7.625% due 06/01/2016 | | 175,000 | 182,587 |
|
|
| | | | 1,230,555 |
| Toys, Amusements & Sporting Goods - 0.05% | | |
| K2, Inc. | | | |
| 7.375% due 07/01/2014 | | 410,000 | 397,700 |
| Transportation - 0.35% | | | |
| Bombardier, Inc. | | | |
| 6.30% due 05/01/2014 | | 375,000 | 333,750 |
| 6.75% due 05/01/2012 | | 875,000 | 821,406 |
| Bristow Group, Inc. | | | |
| 6.125% due 06/15/2013 | | 425,000 | 397,375 |
| CHC Helicopter Corp. | | | |
| 7.375% due 05/01/2014 | | 450,000 | 423,000 |
| Evergreen International Aviation, Inc. | | | |
| 12.00% due 05/15/2010 | | 150,000 | 160,500 |
| FedEx Corp. | | | |
| 2.65% due 04/01/2007 | | 200,000 | 196,571 |
| 5.50% due 08/15/2009 | | 75,000 | 75,385 |
| Mobile Services Group, Inc. | | | |
| 9.75% due 08/01/2014 | | 300,000 | 304,125 |
|
|
| | | | 2,712,112 |
| Utility Service - 0.04% | | | |
| Public Service Company of New Mexico | | | |
| 4.40% due 09/15/2008 | | 210,000 | 205,451 |
| Veolia Environnement, EMTN | | | |
| 5.875% due 02/01/2012 | EUR | 30,000 | 41,380 |
| Veolia Environnement, Series EMTN | | | |
| 4.875% due 05/28/2013 | | 50,000 | 66,251 |
|
|
| | | | 313,082 |
|
| TOTAL CORPORATE BONDS (Cost $215,286,341) | $ | 214,568,314 |
|
| |
| CONVERTIBLE BONDS - 0.10% | | | |
| Insurance - 0.01% | | | |
| Fortis Insurance NV | | | |
| 7.75% due 01/26/2008 | $ | 25,000 | 33,660 |
| Internet Retail - 0.04% | | | |
| Amazon.com, Inc. | | | |
| 4.75% due 02/01/2009 | | 350,000 | 339,062 |
| Telecommunications Equipment & | | | |
| Services - 0.05% | | | |
| Juniper Networks, Inc. | | | |
| zero coupon due 06/15/2008 | | 400,000 | 400,000 |
|
| TOTAL CONVERTIBLE BONDS (Cost $783,476) | $ | 772,722 |
| Spectrum Income Fund (continued) | |
| | | Shares or | |
| | | Principal | |
| | | Amount | Value |
|
|
| |
| MUNICIPAL BONDS - 0.10% | | | |
| California - 0.06% | | | |
| California State Public Works Board | | | |
| 5.00% due 01/01/2021 | $ | 225,000 | $ | 237,861 |
| State of California | | | |
| 5.25% due 04/01/2034 | | 100,000 | 106,055 |
| 5.50% due 11/01/2033 | | 100,000 | 108,469 |
|
|
| | | | 452,385 |
| |
| Kansas - 0.01% | | | |
| Kansas Development Finance Authority | | | |
| 5.501% due 05/01/2034 | | 120,000 | 119,531 |
| New York - 0.02% | | | |
| New York City Housing Development Corp. | | |
| 6.42% due 11/01/2027 | | 160,000 | 164,325 |
| Oregon - 0.01% | | | |
| State of Oregon | | | |
| 5.892% due 06/01/2027 | | 60,000 | 61,833 |
|
| TOTAL MUNICIPAL BONDS (Cost $788,262) | $ | 798,074 |
|
| |
| COLLATERALIZED MORTGAGE | | | |
| OBLIGATIONS - 5.54% | | | |
| Banc of America Commercial Mortgage, Inc., | | |
| Series 2003-1, Class A1 | | | |
| 3.878% due 09/11/2036 | | 88,185 | 84,939 |
| Banc of America Commercial Mortgage, Inc., | | |
| Series 2003-1, Class A2 | | | |
| 4.648% due 09/11/2036 | | 796,000 | 766,672 |
| Banc of America Mortgage Securities, | | | |
| Series 2003-L, Class 2A2 | | | |
| 4.2611% due 01/25/2034 (b) | | 533,994 | 523,884 |
| Banc of America Mortgage Securities, | | | |
| Series 2004-A, Class 2A2 | | | |
| 4.1179% due 02/25/2034 (b) | | 291,527 | 285,639 |
| Banc of America Mortgage Securities, | | | |
| Series 2004-D, Class 2A2 | | | |
| 4.198% due 05/25/2034 (b) | | 131,650 | 128,933 |
| Banc of America Mortgage Securities, | | | |
| Series 2004-H, Class 2A2 | | | |
| 4.7489% due 09/25/2034 (b) | | 302,250 | 298,573 |
| Banc of America Mortgage Securities, | | | |
| Series 2004-I, Class 3A2 | | | |
| 4.9159% due 10/25/2034 (b) | | 148,550 | 146,380 |
| Banc of America Mortgage Securities, | | | |
| Series 2005-A, Class 2A2 | | | |
| 4.459% due 02/25/2035 (b) | | 1,101,688 | 1,078,220 |
| Banc of America Mortgage Securities, | | | |
| Series 2005-J, Class 2A1 | | | |
| 5.0996% due 11/25/2035 (b) | | 530,611 | 526,174 |
| Banc of America Mortgage Securities, | | | |
| Series 2005-J, Class 3A1 | | | |
| 5.2714% due 11/25/2035 (b) | | 257,684 | 254,198 |
| Bear Stearns Commercial Mortgage Securities, | | |
| Series 1998-C1, Class A2 | | | |
| 6.44% due 06/16/2030 | | 100,000 | 101,639 |
| Bear Stearns Commercial Mortgage Securities, | | |
| Series 2005-PW10, Class A1 | | | |
| 5.085% due 12/11/2040 | | 947,675 | 943,662 |
The accompanying notes are an integral part of the financial statements. 381
John Hancock Funds II
Portfolio of investments — August 31, 2006
(showing percentage of total net assets)
| Spectrum Income Fund (continued) | |
| | | Shares or | |
| | | Principal | |
| | | Amount | Value |
|
|
| |
| COLLATERALIZED MORTGAGE | | | |
| OBLIGATIONS (continued) | | | |
| Bear Stearns Commercial Mortgage Securities, | | |
| Series 2005-PWR8, Class A4 | | | |
| 4.674% due 06/11/2041 | $ | 578,000 | $ | 546,028 |
| Bear Stearns Commercial Mortgage Securities, | | |
| Series 2005-PWR9, Class A1 | | | |
| 4.498% due 09/15/2042 | | 145,323 | 142,927 |
| Bear Stearns Commercial Mortgage Securities, | | |
| Series 2005-PWR9, Class AAB | | | |
| 4.804% due 09/11/2042 | | 462,000 | 448,111 |
| Bear Stearns Commercial Mortgage Securities, | | |
| Series 2005-T18, Class A1 | | | |
| 4.274% due 02/13/2042 (b) | | 499,519 | 489,656 |
| Bear Stearns Commercial Mortgage Securities, | | |
| Series 2005-T20, Class A1 | | | |
| 4.94% due 10/12/2042 | | 40,628 | 40,323 |
| Bear Stearns Commercial Mortgage Securities, | | |
| Series 2006-PW12, Class A1 | | | |
| 5.546% due 09/11/2038 (b) | | 206,392 | 207,860 |
| Bear Stearns Commercial Mortgage Securities, | | |
| Series 2006-PW12, Class A4 | | | |
| 5.8955% due 09/11/2038 (b) | | 1,400,000 | 1,432,171 |
| Bear Stearns Commercial Mortgage Securities, | | |
| Series 2002-TOP8, Class A2 | | | |
| 4.83% due 08/15/2038 | | 320,000 | 311,468 |
| Citigroup Mortgage Loan Trust, Inc. | | | |
| 4.70% due 02/25/2036 | | 926,924 | 909,610 |
| Citigroup Mortgage Loan Trust, Inc., | | | |
| Series 2006-AR2, Class 1AB | | | |
| 5.591% due 03/25/2036 | | 500,703 | 503,561 |
| Citigroup/Deutsche Bank Commercial | | | |
| Mortgage Trust, Series 2005-CD1, Class A4 | | |
| 5.3997% due 07/15/2044 (b) | | 950,000 | 938,577 |
| Citigroup/Deutsche Bank Commercial | | | |
| Mortgage Trust, Series 2005-CD1, Class AJ | | |
| 5.3997% due 07/15/2044 (b) | | 75,000 | 73,759 |
| Commercial Mortgage Pass Through Certificates, | | |
| Series 2005-LP5, Class A1 | | | |
| 4.235% due 05/10/2043 | | 454,369 | 446,462 |
| CS First Boston Mortgage Securities Corp., | | |
| Series 2005-C1, Class A2 | | | |
| 4.609% due 02/15/2038 | | 149,000 | 146,065 |
| DLJ Commercial Mortgage Corp., | | | |
| Series 1999-CG2,Class A1B | | | |
| 7.30% due 06/10/2032 | | 629,000 | 657,720 |
| Federal Home Loan Mortgage Corp. Stated Final, | | |
| Series 2004-SF4, Class B | | | |
| 2.37% due 12/15/2009 | | 86,732 | 84,298 |
| Federal Home Loan Mortgage Corp. Stated Final, | | |
| Series 2004-SF4, Class C | | | |
| 3.32% due 12/15/2011 | | 64,000 | 60,965 |
| Federal Home Loan Mortgage Corp. Strips, Series | | |
| 1998-199, Class PO | | | |
| zero coupon PO due 08/01/2028 | | 12,549 | 10,104 |
| Federal Home Loan Mortgage Corp., Series | | |
| 1993-1633, Class PL | | | |
| 6.50% due 03/15/2023 | | 56,334 | 56,284 |
| Spectrum Income Fund (continued) | |
| | | Shares or | |
| | | Principal | |
| | | Amount | Value |
|
|
| |
| COLLATERALIZED MORTGAGE | | | |
| OBLIGATIONS (continued) | | | |
| Federal Home Loan Mortgage Corp., Series | | | |
| 1994-1671, Class G | | | |
| 6.50% due 08/15/2023 | $ | 10,053 | $ | 10,054 |
| Federal Home Loan Mortgage Corp., Series | | | |
| 2003-2586, Class NJ | | | |
| 4.50% due 08/15/2016 | | 395,276 | 386,778 |
| Federal Home Loan Mortgage Corp., Series | | | |
| 2003-2614, Class IH | | | |
| 4.50% IO due 05/15/2016 | | 267,000 | 31,849 |
| Federal Home Loan Mortgage Corp., Series | | | |
| 2003-2627, Class IE | | | |
| 4.50% IO due 04/15/2018 | | 92,908 | 9,284 |
| Federal Home Loan Mortgage Corp., Series | | | |
| 2003-2631, Class KI | | | |
| 4.50% IO due 01/15/2015 | | 254,158 | 15,162 |
| Federal Home Loan Mortgage Corp., Series | | | |
| 2003-2631, Class LI | | | |
| 4.50% IO due 06/15/2011 | | 78,013 | 1,570 |
| Federal Home Loan Mortgage Corp., Series | | | |
| 2003-2631, Class MV | | | |
| 4.00% due 01/15/2022 | | 191,000 | 189,005 |
| Federal Home Loan Mortgage Corp., Series | | | |
| 2003-2631, Class PC | | | |
| 4.50% due 03/15/2016 | | 1,224,000 | 1,192,762 |
| Federal Home Loan Mortgage Corp., Series | | | |
| 2003-2681, Class PC | | | |
| 5.00% due 01/15/2019 | | 255,000 | 252,530 |
| Federal Home Loan Mortgage Corp., Series | | | |
| 2003-2686, Class JG | | | |
| 5.50% due 04/15/2028 | | 847,000 | 845,508 |
| Federal Home Loan Mortgage Corp., Series | | | |
| 2003-41, Class YV | | | |
| 5.50% due 04/25/2014 | | 301,377 | 301,945 |
| Federal Home Loan Mortgage Corp., Series | | | |
| 2004-2844, Class PQ | | | |
| 5.00% due 05/15/2023 | | 149,000 | 148,410 |
| Federal Home Loan Mortgage Corp., Series | | | |
| 2004-2872, Class YB | | | |
| 5.00% due 06/15/2023 | | 318,000 | 316,099 |
| Federal Home Loan Mortgage Corp., Series | | | |
| 2004-2882, Class YB | | | |
| 5.00% due 10/15/2027 | | 400,000 | 393,691 |
| Federal Home Loan Mortgage Corp., Series | | | |
| 2004-2890, Class PB | | | |
| 5.00% due 11/15/2027 | | 798,000 | 785,412 |
| Federal Home Loan Mortgage Corp., Series | | | |
| 2005-2934, Class NB | | | |
| 5.00% due 01/15/2028 | | 106,000 | 104,179 |
| Federal Home Loan Mortgage Corp., Series | | | |
| 2005-46, Class CN | | | |
| 5.00% due 01/25/2020 | | 313,000 | 309,407 |
| Federal Home Loan Mortgage Corp., Series | | | |
| 2005-R003, Class VA | | | |
| 5.50% due 08/15/2016 | | 541,564 | 541,157 |
| Federal Home Loan Mortgage Corp., Series | | | |
| 2006-3123, Class VB | | | |
| 6.00% due 09/15/2013 | | 276,923 | 282,548 |
The accompanying notes are an integral part of the financial statements. 382
John Hancock Funds II
Portfolio of investments — August 31, 2006
(showing percentage of total net assets)
| Spectrum Income Fund (continued) | |
| | | Shares or | |
| | | Principal | |
| | | Amount | Value |
|
|
| |
| COLLATERALIZED MORTGAGE | | | |
| OBLIGATIONS (continued) | | | |
| Federal Home Loan Mortgage Corp., Series | | |
| 2006-3152, Class DA | | | |
| 6.00% due 09/15/2025 | $ | 200,000 | $ | 202,586 |
| Federal Home Loan Mortgage Corp., Series | | |
| 2006-3162, Class OD | | | |
| 6.00% due 06/15/2035 | | 375,000 | 378,500 |
| Federal Home Loan Mortgage Corp., Series | | |
| 2006-3177, Class PA | | | |
| 6.00% due 12/15/2026 | | 415,738 | 420,986 |
| Federal Home Loan Mortgage Corp., Series | | |
| 2006-3195, Class PN | | | |
| 6.50% due 08/15/2030 | | 1,219,597 | 1,248,927 |
| Federal Home Loan Mortgage Corp., Series | | |
| 2006-R007, Class VA | | | |
| 6.00% due 09/15/2016 | | 1,276,868 | 1,299,742 |
| Federal National Mortgage Association Interest | | |
| Strip, Series 2002-319, Class 2 | | | |
| 6.50% IO due 02/01/2032 | | 47,206 | 11,036 |
| Federal National Mortgage Association, Series | | |
| 1993-8, Class L | | | |
| 9.00% due 01/25/2008 | | 5,058 | 5,122 |
| Federal National Mortgage Association, Series | | |
| 2002-43, Class A | | | |
| 6.00% due 06/25/2016 | | 624 | 623 |
| Federal National Mortgage Association, Series | | |
| 2002-74, Class PJ | | | |
| 5.00% due 03/25/2015 | | 615,000 | 610,377 |
| Federal National Mortgage Association, Series | | |
| 2002-84, Class VA | | | |
| 5.50% due 11/25/2013 | | 219,344 | 219,752 |
| Federal National Mortgage Association, Series | | |
| 2003-40, Class NI | | | |
| 5.50% IO due 11/25/2028 | | 81,693 | 5,840 |
| Federal National Mortgage Association, Series | | |
| 2003-92, Class NM | | | |
| 3.50% due 04/25/2013 | | 455,157 | 445,701 |
| Federal National Mortgage Association, Series | | |
| 2004-21, Class AC | | | |
| 4.00% due 05/25/2016 | | 97,463 | 94,668 |
| Federal National Mortgage Association, Series | | |
| 2006-3136, Class PB | | | |
| 6.00% due 01/15/2030 | | 411,000 | 418,070 |
| Federal National Mortgage Association, Series | | |
| 2006-35, Class GK | | | |
| 6.00% due 08/25/2032 | | 445,705 | 451,507 |
| Federal National Mortgage Association, Series | | |
| 2006-49, Class CA | | | |
| 6.00% due 02/25/2031 | | 430,378 | 436,032 |
| GE Capital Commercial Mortgage Corp., | | | |
| Series 2001-1, Class A2 | | | |
| 6.531% due 05/15/2033 | | 465,000 | 486,610 |
| GE Capital Commercial Mortgage Corp., | | | |
| Series 2005-C4, Class A1 | | | |
| 5.082% due 11/10/2045 | | 525,732 | 523,761 |
| Government National Mortgage Association, Series | | |
| 1997-16, Class PL | | | |
| 6.50% due 10/20/2027 | | 322,000 | 331,078 |
| Spectrum Income Fund (continued) | |
| | | Shares or | |
| | | Principal | |
| | | Amount | Value |
|
|
| |
| COLLATERALIZED MORTGAGE | | | |
| OBLIGATIONS (continued) | | | |
| Government National Mortgage Association, Series | | |
| 1998-12, Class Z | | | |
| 6.50% due 05/20/2028 | $ | 62,143 | $ | 63,485 |
| Government National Mortgage Association, Series | | |
| 1998-6, Class EA | | | |
| zero coupon PO due 03/16/2028 | | 46,659 | 38,347 |
| Government National Mortgage Association, Series | | |
| 1999-15, Class PB | | | |
| 5.00% due 08/16/2028 | | 13,823 | 13,782 |
| Government National Mortgage Association, Series | | |
| 2001-48, Class PC | | | |
| 6.50% due 10/20/2031 | | 410,870 | 421,508 |
| Government National Mortgage Association, Series | | |
| 2003-3, Class LM | | | |
| 5.50% due 02/20/2032 | | 401,000 | 399,289 |
| Government National Mortgage Association, Series | | |
| 2003-49, Class C | | | |
| 4.485% due 10/16/2033 (b) | | 67,000 | 62,013 |
| Government National Mortgage Association, Series | | |
| 2003-70, Class TD | | | |
| 5.50% due 10/20/2030 | | 908,000 | 904,938 |
| Government National Mortgage Association, Series | | |
| 2004-43, Class D | | | |
| 4.994% due 03/16/2030 (b) | | 56,000 | 54,270 |
| Government National Mortgage Association, Series | | |
| 2004-44, Class PC | | | |
| 5.50% due 05/20/2031 | | 928,000 | 932,539 |
| Government National Mortgage Association, Series | | |
| 2005-94, Class PB | | | |
| 5.50% due 12/20/2035 | | 135,000 | 131,485 |
| Greenwich Capital Commercial Funding Corp., | | |
| Series 2004-GG1, Class A2 | | | |
| 3.835% due 06/10/2036 | | 134,156 | 132,764 |
| Greenwich Capital Commercial Funding Corp., | | |
| Series 2005-GG3, Class AAB | | | |
| 4.619% due 08/10/2042 (b) | | 146,000 | 140,386 |
| GSR Mortgage Loan Trust, | | | |
| Series 2005-AR6, Class 3A1 | | | |
| 4.5607% due 09/25/2035 (b) | | 1,154,474 | 1,131,511 |
| |
| JP Morgan Chase Commercial Mortgage Securities Corp., | |
| Series 2001-CIB2, Class A2 | | | |
| 6.244% due 04/15/2035 | | 1,269,946 | 1,289,001 |
| |
| JP Morgan Chase Commercial Mortgage Securities Corp., | |
| Series 2001-CIBC, Class A3 | | | |
| 6.26% due 03/15/2033 | | 283,000 | 292,304 |
| |
| JP Morgan Chase Commercial Mortgage Securities Corp., | |
| Series 2005-LDP4, Class A1 | | | |
| 4.613% due 10/15/2042 | | 41,193 | 40,681 |
| |
| JP Morgan Chase Commercial Mortgage Securities Corp., | |
| Series 2005-LDP4, Class ASB | | | |
| 4.824% due 10/15/2042 (b) | | 621,000 | 600,822 |
The accompanying notes are an integral part of the financial statements. 383
John Hancock Funds II
Portfolio of investments — August 31, 2006
(showing percentage of total net assets)
| Spectrum Income Fund (continued) | |
| | | Shares or | |
| | | Principal | |
| | | Amount | Value |
|
|
| |
| COLLATERALIZED MORTGAGE | | | |
| OBLIGATIONS (continued) | | | |
| |
| JP Morgan Chase Commercial Mortgage Securities Corp., | |
| Series 2006-CB14, Class A4 | | | |
| 5.481% due 12/12/2044 (b) | $ | 1,740,000 | $ | 1,738,980 |
| LB-UBS Commercial Mortgage Trust, | | | |
| Series 2003-C8, Class A1 | | | |
| 3.636% due 11/15/2027 | | 822,613 | 801,504 |
| LB-UBS Commercial Mortgage Trust, | | | |
| Series 2004-C2, Class A2 | | | |
| 3.246% due 03/15/2029 | | 633,000 | 604,799 |
| LB-UBS Commercial Mortgage Trust, | | | |
| Series 2004-C4, Class A2 | | | |
| 4.567% due 06/15/2029 (b) | | 457,000 | 450,309 |
| LB-UBS Commercial Mortgage Trust, | | | |
| Series 2005-C1, Class A4 | | | |
| 4.742% due 02/15/2030 | | 133,000 | 126,856 |
| LB-UBS Commercial Mortgage Trust, | | | |
| Series 2006-C1, Class A1 | | | |
| 5.018% due 02/15/2031 | | 242,214 | 241,240 |
| LB-UBS Commercial Mortgage Trust, | | | |
| Series 2006-C1, Class A4 | | | |
| 5.156% due 02/15/2031 | | 2,017,500 | 1,970,767 |
| Morgan Stanley Dean Witter | | | |
| Capita I, Series 2002-TOP7, Class A1 | | | |
| 5.38% due 01/15/2039 | | 66,278 | 66,478 |
| Morgan Stanley Dean Witter | | | |
| Capital I, Series 2002-TOP7, Class A2 | | | |
| 5.98% due 01/15/2039 | | 366,000 | 376,827 |
| Morgan Stanley Capital I, Series 2006-T23, Class A1 | | |
| 5.682% due 08/12/2041 | | 235,000 | 237,640 |
| Morgan Stanley Capital I, Series 2006-T23, Class A4 | | |
| 5.983% due 08/12/2041 | | 485,000 | 500,438 |
| Vendee Mortgage Trust, Series 1996-3, Class 4 | | |
| 9.6146% due 03/15/2025 (b) | | 17,109 | 18,209 |
| Washington Mutual, Inc., Series 2005-AR3, Class | | |
| A2 | | | |
| 4.6429% due 03/25/2035 (b) | | 494,820 | 485,030 |
| Washington Mutual, Inc., Series 2004-AR1, Class A | | |
| 4.229% due 03/25/2034 (b) | | 225,947 | 221,894 |
| Wells Fargo Mortgage Backed Securities Trust, | | |
| Series 2003-O, Class 5A1 | | | |
| 4.811% due 01/25/2034 (b) | | 680,791 | 662,520 |
| Wells Fargo Mortgage Backed Securities Trust, | | |
| Series 2005-AR2, Class 2A2 | | | |
| 4.5459% due 03/25/2035 (b) | | 496,775 | 489,256 |
| Wells Fargo Mortgage Backed Securities Trust, | | |
| Series 2005-AR2, Class 3A1 | | | |
| 4.941% due 03/25/2035 (b) | | 293,802 | 288,884 |
|
| TOTAL COLLATERALIZED MORTGAGE OBLIGATIONS | |
| (Cost $42,296,081) | | $ | 42,283,886 |
|
| |
| ASSET BACKED SECURITIES - 2.27% | | |
| AmeriCredit Automobile Receivables Trust, | | |
| Series 2006-RM, Class A3 | | | |
| 5.53% due 01/06/2014 | | 795,000 | 803,214 |
| Spectrum Income Fund (continued) | |
| | | Shares or | |
| | | Principal | |
| | | Amount | Value |
|
|
| |
| ASSET BACKED SECURITIES | | | |
| (continued) | | | |
| BankBoston Home Equity Loan Trust, | | | |
| Series 1998-2, Class A6 | | | |
| 6.64% due 12/25/2028 | $ | 70,925 | $ | 71,298 |
| Bay View Auto Trust, Series 2005-3, Class A4 | | |
| 5.01% due 06/25/2014 | | 342,000 | 339,748 |
| Cabela's Master Credit Card Trust, Series 2005-1A, | | |
| Class A1 | | | |
| 4.97% due 10/15/2013 | | 140,000 | 139,497 |
| Capital Auto Receivables Asset Trust, | | | |
| Series 2004-1, Class A4 | | | |
| 2.64% due 11/17/2008 | | 191,000 | 187,231 |
| Capital Auto Receivables Asset Trust, | | | |
| Series 2004-1, Class CTFS | | | |
| 2.84% due 09/15/2010 | | 149,000 | 145,601 |
| Capital Auto Receivables Asset Trust, | | | |
| Series 2006-SN1A, Class B | | | |
| 5.50% due 04/20/2010 | | 275,000 | 274,939 |
| Capital Auto Receivables Asset Trust, | | | |
| Series 2006-SN1A, Class A4A | | | |
| 5.46% due 03/20/2010 | | 1,575,000 | 1,574,941 |
| Capital Auto Receivables Asset Trust, | | | |
| Series 2006-SN1A, Class A4B | | | |
| 5.435% due 03/20/2010 (b) | | 325,000 | 325,000 |
| Capital One Multi-Asset Execution Trust, | | | |
| Series 2004-A8, Class A8 | | | |
| 5.46% due 08/15/2014 (b) | | 624,000 | 627,103 |
| Capital One Prime Auto Receivables Trust, | | |
| Series 2006-1, Class A4 | | | |
| 5.01% due 11/15/2011 | | 260,000 | 259,481 |
| Chase Funding Mortgage Loan | | | |
| Asset-Backed Certificates, | | | |
| Series 2002-2, Class 1M1 | | | |
| 5.599% due 09/25/2031 | | 33,273 | 33,012 |
| Chase Funding Mortgage Loan | | | |
| Asset-Backed Certificates, | | | |
| Series 2002-4, Class 2A1 | | | |
| 5.6944% due 10/25/2032 (b) | | 21,613 | 21,657 |
| Chase Funding Mortgage Loan | | | |
| Asset-Backed Certificates, | | | |
| Series 2003-3, Class 1A6 | | | |
| 3.717% due 10/25/2014 | | 246,608 | 234,949 |
| CNH Equipment Trust, Series 2003-B, Class A4B | | |
| 3.38% due 02/15/2011 | | 250,000 | 245,998 |
| Credit-Based Asset Servicing and Securitization, | | |
| Series 2005-CB5, Class AF2 | | | |
| 4.831% due 08/25/2035 | | 293,000 | 289,032 |
| Credit-Based Asset Servicing and Securitization, | | |
| Series 2006-CB3, Class AV3 | | | |
| 5.4944% due 03/25/2036 (b) | | 865,000 | 865,397 |
| Detroit Edison Securitization Funding LLC, | | |
| Series 2001-1, Class A5 | | | |
| 6.42% due 03/01/2015 | | 450,000 | 475,817 |
| GE Equipment Small Ticket LLC, | | | |
| Series 2005-1A, Class A4 | | | |
| 4.51% due 12/22/2014 | | 337,000 | 331,446 |
| GS Auto Loan Trust, Series 2004-1, Class A3 | | |
| 2.13% due 11/15/2007 | | 8,393 | 8,368 |
The accompanying notes are an integral part of the financial statements. 384
John Hancock Funds II
Portfolio of investments — August 31, 2006
(showing percentage of total net assets)
| Spectrum Income Fund (continued) | |
| | | Shares or | |
| | | Principal | |
| | | Amount | Value |
|
|
| |
| ASSET BACKED SECURITIES | | | |
| (continued) | | | |
| Harley-Davidson Motorcycle Trust, | | | |
| Series 2003-3, Class A2 | | | |
| 2.76% due 05/15/2011 | $ | 70,851 | $ | 69,682 |
| Harley-Davidson Motorcycle Trust, | | | |
| Series 2003-4, Class A2 | | | |
| 2.69% due 04/15/2011 | | 84,535 | 82,433 |
| Hertz Vehicle Financing LLC, | | | |
| Series 2004-1A, Class A2 | | | |
| 2.38% due 05/25/2008 | | 265,000 | 261,134 |
| Honda Auto Receivables Owner Trust, | | | |
| Series 2003-5, Class A4 | | | |
| 2.96% due 04/20/2009 | | 194,000 | 190,710 |
| Household Affinity Credit Card Master Note Trust I, | | |
| Series 2003-1, Class A | | | |
| 5.45% due 02/15/2010 (b) | | 106,000 | 106,180 |
| Household Automotive Trust, | | | |
| Series 2006-2, Class A4 | | | |
| 5.67% due 05/17/2013 | | 220,000 | 225,749 |
| Hyundai Auto Receivables Trust, | | | |
| Series 2003-A, Class A4 | | | |
| 3.02% due 10/15/2010 | | 149,953 | 146,979 |
| Hyundai Auto Receivables Trust, | | | |
| Series 2006-A, Class A4 | | | |
| 5.26% due 06/25/2014 | | 515,000 | 516,851 |
| John Deere Owner Trust, Series 2005-A, Class A4 | | |
| 4.16% due 05/15/2012 | | 50,000 | 48,947 |
| John Deere Owner Trust, Series 2006-A, Class A4 | | |
| 5.39% due 06/17/2013 | | 250,000 | 250,274 |
| M&I Auto Loan Trust, Series 2005-1, Class A4 | | |
| 4.86% due 03/21/2011 | | 140,000 | 139,094 |
| Marriott Vacation Club Owner Trust, | | | |
| Series 2006-1A, Class A | | | |
| 5.737% due 04/20/2028 | | 422,956 | 427,214 |
| Marriott Vacation Club Owner Trust, | | | |
| Series 2006-1A, Class B | | | |
| 5.827% due 04/20/2028 | | 35,617 | 35,976 |
| MBNA Credit Card Master Note Trust, | | | |
| Series 2005-A3, Class A3 | | | |
| 4.10% due 10/15/2012 | | 1,150,000 | 1,112,450 |
| MBNA Master Credit Card Trust USA, | | | |
| Series 2000-D, Class A | | | |
| 5.53% due 09/15/2009 (b) | | 225,000 | 225,307 |
| Morgan Stanley ABS Capital I, | | | |
| Series 2006-HE4, Class A3 | | | |
| 5.23% due 06/25/2036 | | 475,000 | 476,155 |
| Navistar Financial Corp., Owner Trust, | | | |
| Series 2003-B, Class A3 | | | |
| 5.53% due 04/15/2008 (b) | | 65,619 | 65,655 |
| New Century Home Equity Loan | | | |
| Trust, Series 2005-A, Class A6 | | | |
| 4.954% due 08/25/2035 | | 895,000 | 863,397 |
| New Century Home Equity Loan | | | |
| Trust, Series 2005-A, Class M2 | | | |
| 5.344% due 08/25/2035 | | 215,000 | 209,612 |
| Nissan Auto Receivables Owner Trust, | | | |
| Series 2004-A, Class A4 | | | |
| 2.76% due 07/15/2009 | | 316,000 | 308,512 |
| Spectrum Income Fund (continued) | |
| | | Shares or | |
| | | Principal | |
| | | Amount | Value |
|
|
| |
| ASSET BACKED SECURITIES | | | |
| (continued) | | | |
| Onyx Acceptance Owner | | | |
| Trust, Series 2005-A, ClassA4 | | | |
| 3.91% due 09/15/2011 | $ | 250,000 | $ | 244,740 |
| Peco Energy Transition Trust, | | | |
| Series 2001-A, Class A1 | | | |
| 6.52% due 12/31/2010 | | 447,000 | 467,131 |
| PP&L Transition Bond Company LLC, | | | |
| Series 1999-1, Class A8 | | | |
| 7.15% due 06/25/2009 | | 111,000 | 114,518 |
| PSE&G Transition Funding LLC, | | | |
| Series 2001-1, Class A6 | | | |
| 6.61% due 06/15/2015 | | 281,000 | 300,301 |
| Reliant Energy Transport Bond Company, | | | |
| Series 2001-1, Class A4 | | | |
| 5.63% due 09/15/2015 | | 334,000 | 340,566 |
| Residential Asset Mortgage Products, Inc., | | | |
| Series 2003-RZ2, Class A1 | | | |
| 3.60% due 04/25/2033 | | 39,062 | 38,080 |
| Residential Asset Mortgage Products, Inc., | | | |
| Series 2003-RZ4, Class M1 | | | |
| 5.27% due 10/25/2033 | | 50,000 | 49,139 |
| Residential Asset Mortgage Products, Inc., | | | |
| Series 2004-RZ3, Class AI2 | | | |
| 3.42% due 10/25/2027 (b) | | 9,193 | 9,155 |
| Residential Asset Mortgage Products, Inc., | | | |
| Series 2005-RZ4, Class A3 | | | |
| 5.7244% due 12/25/2034 (b) | | 253,000 | 255,399 |
| Residential Asset Securities Corp, | | | |
| Series 2005-KS10, Class 1A2 | | | |
| 5.5744% due 11/25/2035 (b) | | 224,000 | 224,391 |
| Residential Asset Securities Corp, | | | |
| Series 2006-KS3, Class AI3 | | | |
| 5.4944% due 04/25/2036 (b) | | 600,000 | 600,990 |
| Sovereign Bank Home Equity Loan Trust, | | | |
| Series 2000-1, Class A6 | | | |
| 7.25% due 02/25/2015 | | 8,179 | 8,363 |
| Susquehanna Auto Lease Trust, | | | |
| Series 2006-1, Class A3 | | | |
| 5.21% due 03/16/2009 | | 200,000 | 199,906 |
| Triad Auto Receivables Owner Trust, | | | |
| Series 2006-B, Class A3 | | | |
| 5.41% due 08/12/2011 | | 300,000 | 301,594 |
| Triad Auto Receivables Owner Trust, | | | |
| Series 2006-B, Class A4 | | | |
| 5.52% due 11/12/2012 | | 500,000 | 506,551 |
| USAA Auto Owner Trust, Series 2005-2, Class A4 | | |
| 4.17% due 02/15/2011 | | 150,000 | 147,176 |
| Volkswagen Auto Lease Trust, | | | |
| Series 2006-A, Class A4 | | | |
| 5.54% due 04/20/2011 | | 245,000 | 247,527 |
| Wachovia Auto Owner Trust, | | | |
| Series 2006-A, Class A4 | | | |
| 5.38% due 03/20/2013 | | 225,000 | 227,074 |
|
| TOTAL ASSET BACKED SECURITIES | | | |
| (Cost $17,253,484) | | | $ | 17,298,641 |
|
The accompanying notes are an integral part of the financial statements. 385
John Hancock Funds II
Portfolio of investments — August 31, 2006
(showing percentage of total net assets)
| Spectrum Income Fund (continued) | |
| | | Shares or | |
| | | Principal | |
| | | Amount | Value |
|
|
| |
| SUPRANATIONAL OBLIGATIONS - 0.03% | | |
| Supranational - 0.03% | | | |
| Eurofima, EMTN | | | |
| 6.50% due 08/22/2011 | AUD | 325,000 | $ | 251,592 |
|
| TOTAL SUPRANATIONAL OBLIGATIONS | | |
| (Cost $248,457) | | | $ | 251,592 |
|
| |
| SHORT TERM INVESTMENTS - 14.92% | | |
| Malaysia Government Bond, Series 182 | | | |
| 0.01% due 01/12/2007 | MYR | 1,182,000 $ | 316,774 |
| State Street Navigator Securities | | | |
| Lending Prime Portfolio (c) | $ | 83,287,899 | 83,287,899 |
| T. Rowe Price Reserve Investment Fund (c) | | 30,330,726 | 30,330,726 |
|
| TOTAL SHORT TERM INVESTMENTS | | | |
| (Cost $113,934,206) | | | $ | 113,935,399 |
|
| |
| REPURCHASE AGREEMENTS - 3.51% | | |
| Repurchase Agreement with State | | | |
| Street Corp. dated 08/31/2006 at | | | |
| 3.95% to be repurchased at | | | |
| $26,774,937 on 9/1/2006, | | | |
| collateralized by $27,380,000 | | | |
| Federal Home Loan Mortgage | | | |
| Corp., 0.00% due 09/15/2006 | | | |
| (valued at $27,311,550, including | | | |
| interest) (c)*** | $ | 26,772,000 | $ | 26,772,000 |
|
| TOTAL REPURCHASE AGREEMENTS | | | |
| (Cost $26,772,000) | | | $ | 26,772,000 |
|
| Total Investments (Spectrum Income Fund) | | |
| (Cost $834,918,505) - 110.87% | | | $ | 846,722,617 |
| Liabilities in Excess of Other Assets - (10.87)% | | (82,991,645) |
|
|
| TOTAL NET ASSETS - 100.00% | | | $ | 763,730,972 |
|
|
| |
| |
| Strategic Bond Fund | | | |
| | | Shares or | |
| | | Principal | |
| | | Amount | Value |
|
|
| |
| COMMON STOCKS - 0.18% | | | |
| Cellular Communications - 0.18% | | | |
| American Tower Corp., Class A * | | 15,666 $ | 561,783 |
| Household Products - 0.00% | | | |
| Home Interiors * | | 674,617 | 6,746 |
|
| TOTAL COMMON STOCKS (Cost $551,187) | $ | 568,529 |
|
| |
| PREFERRED STOCKS - 0.02% | | | |
| Crude Petroleum & Natural Gas - 0.02% | | |
| Chesapeake Energy Corp. * (a) | | 266 | 71,421 |
|
| TOTAL PREFERRED STOCKS (Cost $66,834) | $ | | 71,421 |
| Strategic Bond Fund (continued) | | | |
| | | Shares or | | |
| | | Principal | | |
| | | Amount | | Value |
|
|
| |
| WARRANTS - 0.01% | | | | |
| Government of Mexico - 0.01% | | | | |
| United Mexican States | | | | |
| (Expiration Date 10/10/2006; strike | | | | |
| price $25.00) | | 5,000 | $ | 19,000 |
|
| TOTAL WARRANTS (Cost $12,500) | | | $ | 19,000 |
|
| |
| U.S. TREASURY OBLIGATIONS - 4.50% | | | |
| Treasury Inflation Protected | | | | |
| Securities (d) - 0.41% | | | | |
| 2.00% due 01/15/2016 to | | | | |
| 01/15/2026 (a) | $ | 1,328,886 | | 1,288,008 |
| U.S. Treasury Bonds - 1.05% | | | | |
| 4.50% due 02/15/2036 (a) | | 2,570,000 | | 2,418,812 |
| 6.125% due 08/15/2029 (a)**** | | 440,000 | | 511,500 |
| 6.25% due 08/15/2023 (a) | | 290,000 | | 332,526 |
|
|
| | | | | 3,262,838 |
| U.S. Treasury Notes - 3.04% | | | | |
| 4.00% due 02/15/2014 (a) | | 1,610,000 | | 1,536,167 |
| 4.25% due 11/15/2014 (a) | | 1,425,000 | | 1,378,354 |
| 5.125% due 05/15/2016 (a) | | 6,370,000 | | 6,550,895 |
|
|
| | | | | 9,465,416 |
|
| TOTAL U.S. TREASURY OBLIGATIONS | | | |
| (Cost $13,765,502) | | | $ | 14,016,262 |
|
| |
| U.S. GOVERNMENT AGENCY OBLIGATIONS - 31.55% | | |
| Federal Home Loan Mortgage Corp. - 0.10% | | | |
| 5.125% due 04/18/2011 | | 280,000 | | 280,998 |
| 8.00% due 05/01/2010 | | 8,606 | | 8,795 |
| 8.50% due 05/01/2008 | | 4,416 | | 4,486 |
|
|
| | | | | 294,279 |
| Federal National Mortgage | | | | |
| Association - 26.66% | | | | |
| 5.00% TBA ** | | 17,400,000 | | 16,789,872 |
| 5.50% TBA ** | | 43,000,000 | | 42,354,374 |
| 5.625% due 05/19/2011 | | 1,220,000 | | 1,232,267 |
| 5.916% due 11/01/2035 | | 377,983 | | 390,374 |
| 6.00% TBA ** | | 16,000,000 | | 16,003,471 |
| 6.50% due 10/01/2032 | | 793,623 | | 808,183 |
| 6.50% TBA ** | | 5,300,000 | | 5,379,500 |
| 7.50% due 07/01/2030 to 02/01/2031 | | 54,802 | | 56,691 |
| 8.00% due 07/01/2027 to 08/01/2027 | | 50,788 | | 53,832 |
| 8.80% due 01/25/2019 | | 34,237 | | 36,584 |
| 10.40% due 04/25/2019 | | 11,658 | | 12,534 |
|
|
| | | | | 83,117,682 |
| Government National Mortgage | | | | |
| Association - 4.79% | | | | |
| 5.00% TBA ** | | 5,000,000 | | 4,842,190 |
| 6.00% TBA ** | | 10,000,000 | | 10,081,250 |
| 7.50% due 04/15/2022 to 10/15/2027 | | 21,227 | | 22,155 |
|
|
| | | | | 14,945,595 |
|
| TOTAL U.S. GOVERNMENT AGENCY OBLIGATIONS | | |
| (Cost $97,815,228) | | | $ | 98,357,556 |
|
The accompanying notes are an integral part of the financial statements. 386
John Hancock Funds II
Portfolio of investments — August 31, 2006
(showing percentage of total net assets)
| Strategic Bond Fund (continued) | | |
| | | Shares or | |
| | | Principal | |
| | | Amount | Value |
|
|
| |
| FOREIGN GOVERNMENT OBLIGATIONS - 10.62% | |
| Brazil - 3.68% | | | |
| Federative Republic of Brazil | | | |
| 8.00% due 01/15/2018 (a) | $ | 1,015,000 | $ | 1,114,470 |
| 8.25% due 01/20/2034 *** | | 3,500,000 | 4,025,000 |
| 8.75% due 02/04/2025 | | 815,000 | 968,628 |
| 11.00% due 08/17/2040 (a) | | 4,115,000 | 5,376,247 |
|
|
| | | | 11,484,345 |
| Colombia - 0.21% | | | |
| Republic of Colombia | | | |
| 8.125% due 05/21/2024 | | 195,000 | 214,500 |
| 10.00% due 01/23/2012 (a) | | 140,000 | 162,960 |
| 10.75% due 01/15/2013 | | 235,000 | 287,170 |
|
|
| | | | 664,630 |
| Italy - 0.14% | | | |
| Republic of Italy | | | |
| 5.804% due 10/25/2032 | | 440,000 | 443,276 |
| Mexico - 1.32% | | | |
| Government of Mexico | | | |
| 5.625% due 01/15/2017 (a) | | 1,424,000 | 1,404,064 |
| 5.875% due 01/15/2014 (a) | | 675,000 | 686,813 |
| 6.375% due 01/16/2013 (a) | | 616,000 | 640,640 |
| 7.50% due 04/08/2033 | | 624,000 | 722,280 |
| 8.125% due 12/30/2019 | | 440,000 | 530,200 |
| 10.375% due 02/17/2009 | | 104,000 | 115,648 |
|
|
| | | | 4,099,645 |
| Panama - 0.74% | | | |
| Republic of Panama | | | |
| 6.70% due 01/26/2036 | | 148,000 | 145,040 |
| 7.25% due 03/15/2015 | | 150,000 | 158,250 |
| 9.375% due 04/01/2029 *** | | 1,574,000 | 1,995,045 |
|
|
| | | | 2,298,335 |
| Russia - 4.53% | | | |
| Russian Federation, Series REGS | | | |
| 5.00% due 03/31/2030 | | 12,681,000 | 14,112,685 |
|
| TOTAL FOREIGN GOVERNMENT OBLIGATIONS | |
| (Cost $31,698,327) | | | $ | 33,102,916 |
|
| |
| CORPORATE BONDS - 46.17% | | | |
| Advertising - 0.39% | | | |
| Lamar Media Corp. | | | |
| 6.625% due 08/15/2015 | | 150,000 | 140,625 |
| R.H. Donnelley Corp., Series A-1 | | | |
| 6.875% due 01/15/2013 | | 100,000 | 89,750 |
| R.H. Donnelley Corp., Series A-2 | | | |
| 6.875% due 01/15/2013 | | 175,000 | 157,062 |
| R.H. Donnelley Corp., Series A-3 | | | |
| 8.875% due 01/15/2016 | | 500,000 | 492,500 |
| R.H. Donnelley Finance Corp., Series I | | | |
| 10.875% due 12/15/2012 | | 300,000 | 328,500 |
|
|
| | | | 1,208,437 |
| Aerospace - 0.20% | | | |
| Alliant Techsystems, Inc. | | | |
| 6.75% due 04/01/2016 | | 85,000 | 82,662 |
| Strategic Bond Fund (continued) | | |
| | | Shares or | |
| | | Principal | |
| | | Amount | Value |
|
|
| |
| CORPORATE BONDS (continued) | | | |
| Aerospace (continued) | | | |
| DRS Technologies, Inc. | | | |
| 6.875% due 11/01/2013 | $ | 400,000 | $ | 388,000 |
| 7.625% due 02/01/2018 | | 25,000 | 25,000 |
| TransDigm, Inc. | | | |
| 7.75% due 07/15/2014 | | 130,000 | 129,025 |
|
|
| | | | 624,687 |
| Air Travel - 0.05% | | | |
| Continental Airlines, Inc. | | | |
| 6.541% due 09/15/2008 | | 28,867 | 27,598 |
| Continental Airlines, Inc., Series D | | | |
| 7.568% due 12/01/2006 | | 140,000 | 139,779 |
|
|
| | | | 167,377 |
| Apparel & Textiles - 0.16% | | | |
| Levi Strauss & Company | | | |
| 9.75% due 01/15/2015 | | 475,000 | 491,625 |
| Auto Parts - 0.17% | | | |
| Commercial Vehicle Group, Inc. | | | |
| 8.00% due 07/01/2013 | | 75,000 | 71,437 |
| Keystone Automotive Operations | | | |
| 9.75% due 11/01/2013 | | 150,000 | 142,500 |
| TRW Automotive, Inc. | | | |
| 9.375% due 02/15/2013 | | 70,000 | 74,725 |
| Visteon Corp. | | | |
| 7.00% due 03/10/2014 | | 70,000 | 62,125 |
| 8.25% due 08/01/2010 (a) | | 175,000 | 171,500 |
|
|
| | | | 522,287 |
| Auto Services - 0.24% | | | |
| Hertz Corp., Class A | | | |
| 8.875% due 01/01/2014 | | 250,000 | 259,375 |
| 10.50% due 01/01/2016 (a) | | 260,000 | 280,150 |
| Penhall International Corp. | | | |
| 12.00% due 08/01/2014 | | 190,000 | 193,800 |
|
|
| | | | 733,325 |
| Automobiles - 1.82% | | | |
| DaimlerChrysler N.A. Holding Corp. | | | |
| 4.05% due 06/04/2008 | | 910,000 | 887,196 |
| Ford Motor Company | | | |
| 6.625% due 10/01/2028 | | 150,000 | 112,500 |
| 7.45% due 07/16/2031 (a) | | 1,235,000 | 969,475 |
| 8.875% due 01/15/2022 | | 90,000 | 76,500 |
| 8.90% due 01/15/2032 | | 100,000 | 89,750 |
| General Motors Corp. | | | |
| 8.25% due 07/15/2023 | | 100,000 | 83,000 |
| 8.375% due 07/15/2033 (a) | | 4,125,000 | 3,454,688 |
|
|
| | | | 5,673,109 |
| Banking - 2.69% | | | |
| Bank of America Corp. | | | |
| 7.40% due 01/15/2011 *** | | 1,160,000 | 1,251,833 |
| Glitnir Banki HF | | | |
| 6.33% due 07/28/2011 | | 440,000 | 445,248 |
| 6.693% due 06/15/2016 (b) | | 620,000 | 631,034 |
| Kaupthing Bank | | | |
| 5.758% due 04/12/2011 *** | | 1,080,000 | 1,078,329 |
The accompanying notes are an integral part of the financial statements. 387
John Hancock Funds II
Portfolio of investments — August 31, 2006
(showing percentage of total net assets)
| Strategic Bond Fund (continued) | | |
| | | Shares or | |
| | | Principal | |
| | | Amount | Value |
|
|
| |
| CORPORATE BONDS (continued) | | | |
| Banking (continued) | | | |
| Kaupthing Bank (continued) | | | |
| 7.125% due 05/19/2016 | $ | 230,000 | $ | 236,019 |
| Resona Preferred Global Securities (Cayman), Ltd. | | |
| 7.191% due 12/29/2049 (b) | | 440,000 | 456,390 |
| Standard Chartered Bank | | | |
| 8.00% due 05/30/2031 | | 1,075,000 | 1,321,162 |
| Wachovia Corp. | | | |
| 5.25% due 08/01/2014 | | 1,740,000 | 1,708,228 |
| Wells Fargo Company | | | |
| 5.30% due 08/26/2011 | | 1,250,000 | 1,251,837 |
|
|
| | | | 8,380,080 |
| Broadcasting - 0.50% | | | |
| Barrington Broadcasting | | | |
| 10.50% due 08/15/2014 | | 40,000 | 39,200 |
| CMP Susquehanna Corp. | | | |
| 9.875% due 05/15/2014 | | 35,000 | 32,637 |
| CSC Holdings, Inc. | | | |
| 7.00% due 04/15/2012 | | 250,000 | 245,625 |
| 7.625% due 07/15/2018 | | 25,000 | 25,219 |
| 8.125% due 08/15/2009 | | 325,000 | 335,562 |
| CSC Holdings, Inc., Series B | | | |
| 8.125% due 07/15/2009 | | 25,000 | 25,844 |
| Hughes Network Systems LLC/HNS Finance Corp. | | |
| 9.50% due 04/15/2014 | | 110,000 | 111,650 |
| News America, Inc. | | | |
| 5.30% due 12/15/2014 (a) | | 605,000 | 588,917 |
| XM Satellite Radio Holdings, Inc. | | | |
| 9.75% due 05/01/2014 | | 80,000 | 75,200 |
| 9.9888% due 05/01/2013 (b) | | 80,000 | 74,600 |
|
|
| | | | 1,554,454 |
| Building Materials & Construction - 0.15% | | |
| Associated Materials, Inc. | | | |
| zero coupon, Step up to 11.25% on | | | |
| 03/01/2009 due 03/01/2014 | | 575,000 | 313,375 |
| NTK Holdings, Inc. | | | |
| zero coupon, Step up to 10.75% on | | | |
| 09/01/2009 due 03/01/2014 | | 240,000 | 160,800 |
|
|
| | | | 474,175 |
| Business Services - 0.66% | | | |
| Activant Solutions, Inc. | | | |
| 9.50% due 05/01/2016 | | 130,000 | 121,875 |
| Affinion Group, Inc. | | | |
| 10.125% due 10/15/2013 | | 245,000 | 254,187 |
| Electronic Data Systems Corp. | | | |
| 7.125% due 10/15/2009 | | 720,000 | 750,661 |
| Invensys PLC | | | |
| 9.875% due 03/15/2011 | | 114,000 | 123,120 |
| Sungard Data Systems, Inc. | | | |
| 9.125% due 08/15/2013 | | 275,000 | 283,938 |
| 10.25% due 08/15/2015 | | 60,000 | 61,275 |
| Xerox Corp. | | | |
| 6.40% due 03/15/2016 | | 475,000 | 470,296 |
|
|
| | | | 2,065,352 |
| Strategic Bond Fund (continued) | | |
| | | Shares or | |
| | | Principal | |
| | | Amount | Value |
|
|
| |
| CORPORATE BONDS (continued) | | | |
| Cable and Television - 1.84% | | | |
| Charter Communications Holdings I LLC | | | |
| 11.00% due 10/01/2015 | $ | 250,000 | $ | 221,875 |
| 11.75 due 05/15/2014 | | 75,000 | 51,000 |
| 13.50% due 01/15/2014 | | 95,000 | 70,063 |
| Charter Communications Holdings II LLC/Charter | | |
| Communications Holdings II Capital Corp. | | |
| 10.25% due 09/15/2010 | | 220,000 | 222,750 |
| Charter Communications Holdings LLC | | | |
| 8.625% due 04/01/2009 (a) | | 60,000 | 54,750 |
| 10.75% due 10/01/2009 | | 50,000 | 45,750 |
| Charter Communications Holdings LLC/Charter | | |
| Communications Holdings Capital Corp. | | |
| 9.625% due 11/15/2009 | | 80,000 | 72,800 |
| Charter Communications Operating LLC | | | |
| 8.375% due 04/30/2014 | | 225,000 | 227,250 |
| Comcast Corp. | | | |
| 6.50% due 01/15/2015 | | 460,000 | 474,871 |
| 6.50% due 01/15/2017 | | 230,000 | 237,661 |
| DirecTV Holdings LLC | | | |
| 6.375% due 06/15/2015 | | 285,000 | 266,475 |
| Echostar DBS Corp. | | | |
| 6.625% due 10/01/2014 | | 825,000 | 793,031 |
| 7.125% due 02/01/2016 | | 110,000 | 107,112 |
| Kabel Deutschland GMBH | | | |
| 10.625% due 07/01/2014 | | 100,000 | 107,000 |
| Lodgenet Entertainment Corp. | | | |
| 9.50% due 06/15/2013 | | 315,000 | 337,837 |
| Rainbow National Services LLC | | | |
| 8.75% due 09/01/2012 | | 40,000 | 42,200 |
| 10.375% due 09/01/2014 | | 25,000 | 27,844 |
| Rogers Cable, Inc. | | | |
| 6.25% due 06/15/2013 | | 25,000 | 24,344 |
| 8.75% due 05/01/2032 | | 350,000 | 397,250 |
| Sinclair Broadcast Group, Inc. | | | |
| 8.00% due 03/15/2012 | | 240,000 | 243,000 |
| Time Warner Entertainment Company, LP | | | |
| 8.375% due 07/15/2033 | | 430,000 | 493,126 |
| Time Warner, Inc. | | | |
| 7.625% due 04/15/2031 | | 955,000 | 1,034,187 |
| Videotron Ltee | | | |
| 6.375% due 12/15/2015 | | 200,000 | 187,250 |
|
|
| | | | 5,739,426 |
| Cellular Communications - 0.61% | | | |
| Alamosa Delaware, Inc. | | | |
| 11.00% due 07/31/2010 | | 125,000 | 136,562 |
| American Tower Corp. | | | |
| 7.125% due 10/15/2012 | | 250,000 | 253,125 |
| AT&T Broadband Corp. | | | |
| 8.375% due 03/15/2013 | | 785,000 | 889,810 |
| Rogers Wireless, Inc. | | | |
| 7.25% due 12/15/2012 | | 30,000 | 30,938 |
| 8.00% due 12/15/2012 | | 20,000 | 20,900 |
| Rural Cellular Corp. | | | |
| 9.875% due 02/01/2010 | | 290,000 | 299,425 |
The accompanying notes are an integral part of the financial statements. 388
John Hancock Funds II
Portfolio of investments — August 31, 2006
(showing percentage of total net assets)
| Strategic Bond Fund (continued) | | |
| | | Shares or | |
| | | Principal | |
| | | Amount | Value |
|
|
| |
| CORPORATE BONDS (continued) | | | |
| Cellular Communications (continued) | | | |
| UbiquiTel Operating Company | | | |
| 9.875% due 03/01/2011 | $ | 250,000 | $ | 271,875 |
|
|
| | | | 1,902,635 |
| |
| Chemicals - 0.34% | | | |
| Arco Chemical Company | | | |
| 9.80% due 02/01/2020 | | 75,000 | 85,687 |
| Equistar Chemicals LP | | | |
| 10.625% due 05/01/2011 | | 200,000 | 215,000 |
| Huntsman International LLC | | | |
| 9.875% due 03/01/2009 (a) | | 172,000 | 178,880 |
| IMC Global, Inc. | | | |
| 10.875% due 08/01/2013 | | 25,000 | 28,000 |
| Lyondell Chemical Company | | | |
| 11.125% due 07/15/2012 | | 225,000 | 245,250 |
| Methanex Corp. | | | |
| 8.75% due 08/15/2012 | | 110,000 | 116,875 |
| Westlake Chemical Corp. | | | |
| 6.625% due 01/15/2016 | | 200,000 | 190,000 |
|
|
| | | | 1,059,692 |
| |
| Coal - 0.04% | | | |
| International Coal Group, Inc. | | | |
| 10.25% due 07/15/2014 | | 110,000 | 113,575 |
| Commercial Services - 0.07% | | | |
| DI Finance/DynCorp International LLC, Series B | | |
| 9.50% due 02/15/2013 | | 210,000 | 216,825 |
| Computers & Business Equipment - 0.03% | | |
| Seagate Technology Holdings | | | |
| 8.00% due 05/15/2009 | | 80,000 | 82,200 |
| Construction Materials - 0.08% | | | |
| Nortek, Inc. | | | |
| 8.50% due 09/01/2014 | | 270,000 | 251,100 |
| Containers & Glass - 0.42% | | | |
| Graham Packaging Company, Inc. | | | |
| 9.875% due 10/15/2014 (a) | | 215,000 | 206,937 |
| Graphic Packaging International Corp. | | | |
| 8.50% due 08/15/2011 | | 400,000 | 406,000 |
| Owens-Brockway Glass Container, Inc. | | | |
| 7.75% due 05/15/2011 | | 200,000 | 204,500 |
| 8.25% due 05/15/2013 | | 50,000 | 50,625 |
| Owens-Illinois, Inc. | | | |
| 7.35% due 05/15/2008 | | 325,000 | 325,000 |
| Plastipak Holdings, Inc. | | | |
| 8.50% due 12/15/2015 | | 95,000 | 94,525 |
| Radnor Holdings Corp. | | | |
| 11.00% due 03/15/2010 | | 125,000 | 30,000 |
|
|
| | | | 1,317,587 |
| |
| Cosmetics & Toiletries - 0.04% | | | |
| Playtex Products, Inc. | | | |
| 8.00% due 03/01/2011 | | 110,000 | 114,400 |
| Crude Petroleum & Natural Gas - 1.55% | | |
| Anadarko Finance Company, Series B | | | |
| 7.50% due 05/01/2031 | | 730,000 | 824,880 |
| Strategic Bond Fund (continued) | | |
| | | Shares or | |
| | | Principal | |
| | | Amount | Value |
|
|
| |
| CORPORATE BONDS (continued) | | | |
| Crude Petroleum & Natural Gas | | | |
| (continued) | | | |
| Chaparral Energy, Inc. | | | |
| 8.50% due 12/01/2015 | $ | 350,000 | $ | 352,625 |
| Chesapeake Energy Corp. | | | |
| 6.25% due 01/15/2018 | | 325,000 | 299,813 |
| 6.50% due 08/15/2017 | | 100,000 | 92,750 |
| 7.00% due 08/15/2014 | | 200,000 | 198,000 |
| Conoco, Inc. | | | |
| 6.95% due 04/15/2029 | | 1,250,000 | 1,421,110 |
| Mariner Energy, Inc. | | | |
| 7.50% due 04/15/2013 | | 80,000 | 77,800 |
| PetroHawk Energy Corp. | | | |
| 9.125% due 07/15/2013 | | 110,000 | 111,925 |
| Plains Exploration & Production Company | | | |
| 7.125% due 06/15/2014 | | 250,000 | 256,250 |
| Pogo Producing Company | | | |
| 6.875% due 10/01/2017 | | 200,000 | 190,500 |
| 7.875% due 05/01/2013 | | 20,000 | 20,400 |
| Quicksilver Resources, Inc. | | | |
| 7.125% due 04/01/2016 | | 250,000 | 238,750 |
| XTO Energy, Inc. | | | |
| 6.25% due 04/15/2013 | | 730,000 | 750,083 |
|
|
| | | | 4,834,886 |
| Domestic Oil - 0.70% | | | |
| Exco Resources, Inc. | | | |
| 7.25% due 01/15/2011 | | 425,000 | 413,313 |
| Forest Oil Corp. | | | |
| 8.00% due 12/15/2011 | | 325,000 | 335,562 |
| Magnum Hunter Resources, Inc. | | | |
| 9.60% due 03/15/2012 | | 250,000 | 265,000 |
| Stone Energy Corp. | | | |
| 8.25% due 12/15/2011 | | 400,000 | 402,000 |
| Swift Energy Company | | | |
| 7.625% due 07/15/2011 | | 400,000 | 404,000 |
| Whiting Petroleum Corp. | | | |
| 7.00% due 02/01/2014 | | 375,000 | 369,375 |
|
|
| | | | 2,189,250 |
| Drugs & Health Care - 0.34% | | | |
| Humana, Inc. | | | |
| 6.30% due 08/01/2018 | | 1,065,000 | 1,067,570 |
| Educational Services - 0.03% | | | |
| Education Management LLC | | | |
| 8.75% due 06/01/2014 | | 105,000 | 103,688 |
| Electrical Utilities - 5.28% | | | |
| AES Corp. | | | |
| 7.75% due 03/01/2014 | | 3,345,000 | 3,445,350 |
| 8.75% due 06/15/2008 | | 1,150,000 | 1,196,000 |
| 8.875% due 02/15/2011 | | 645,000 | 690,150 |
| 9.375% due 09/15/2010 | | 1,100,000 | 1,188,000 |
| 9.50% due 06/01/2009 (a) | | 880,000 | 941,600 |
| Dominion Resources, Inc. | | | |
| 5.70% due 09/17/2012 (a) | | 730,000 | 731,347 |
| Edison Mission Energy | | | |
| 7.75% due 06/15/2016 | | 140,000 | 140,000 |
The accompanying notes are an integral part of the financial statements. 389
John Hancock Funds II
Portfolio of investments — August 31, 2006
(showing percentage of total net assets)
| Strategic Bond Fund (continued) | | |
| | | Shares or | |
| | | Principal | |
| | | Amount | Value |
|
|
| |
| CORPORATE BONDS (continued) | | | |
| Electrical Utilities (continued) | | | |
| Exelon Corp. | | | |
| 5.625% due 06/15/2035 (a) | $ | 590,000 | $ | 540,392 |
| FirstEnergy Corp. | | | |
| 6.45% due 11/15/2011 | | 430,000 | 445,971 |
| 7.375% due 11/15/2031 | | 770,000 | 870,775 |
| Midwest Generation LLC, Series B | | | |
| 8.56% due 01/02/2016 | | 129,394 | 137,481 |
| Mirant Americas Generation LLC | | | |
| 8.30% due 05/01/2011 ^ | | 395,000 | 395,000 |
| Orion Power Holdings, Inc. | | | |
| 12.00% due 05/01/2010 | | 60,000 | 68,100 |
| Pacific Gas & Electric Company | | | |
| 6.05% due 03/01/2034 | | 490,000 | 484,302 |
| TXU Corp., Series P | | | |
| 5.55% due 11/15/2014 | | 240,000 | 223,778 |
| TXU Corp., Series R | | | |
| 6.55% due 11/15/2034 (a) | | 5,300,000 | 4,899,087 |
| TXU Electric Delivery Company | | | |
| 6.375% due 01/15/2015 | | 50,000 | 51,442 |
|
|
| | | | 16,448,775 |
| Electronics - 0.23% | | | |
| L-3 Communications Corp. | | | |
| 7.625% due 06/15/2012 | | 550,000 | 563,750 |
| L-3 Communications Corp., Series B | | | |
| 6.375% due 10/15/2015 | | 75,000 | 72,187 |
| Spectrum Brands, Inc. | | | |
| 7.375% due 02/01/2015 | | 87,000 | 67,425 |
|
|
| | | | 703,362 |
| Energy - 0.68% | | | |
| Duke Energy Company | | | |
| 4.20% due 10/01/2008 | | 1,131,000 | 1,103,451 |
| Inergy, LP | | | |
| 6.875% due 12/15/2014 | | 200,000 | 189,500 |
| NRG Energy, Inc. | | | |
| 7.25% due 02/01/2014 | | 150,000 | 148,125 |
| 7.375% due 02/01/2016 | | 700,000 | 689,500 |
|
|
| | | | 2,130,576 |
| Financial Services - 10.16% | | | |
| Aiful Corp. | | | |
| 5.00% due 08/10/2010 | | 440,000 | 423,403 |
| Credit Suisse USA, Inc. | | | |
| 5.50% due 08/16/2011 | | 270,000 | 271,124 |
| Dow Jones CDX HY, Series 6-T1 | | | |
| 8.625% due 06/29/2011 *** | | 9,000,000 | 8,988,750 |
| E*Trade Financial Corp. | | | |
| 7.375% due 09/15/2013 | | 105,000 | 106,050 |
| 7.875% due 12/01/2015 | | 45,000 | 46,800 |
| El Paso Performance-Linked Trust | | | |
| 7.75% due 07/15/2011 | | 980,000 | 998,375 |
| Ford Motor Credit Company | | | |
| 7.00% due 10/01/2013 (a) | | 80,000 | 74,664 |
| 7.375% due 10/28/2009 | | 430,000 | 421,748 |
| 7.875% due 06/15/2010 | | 1,875,000 | 1,842,785 |
| 9.875% due 08/10/2011 | | 225,000 | 234,250 |
| Strategic Bond Fund (continued) | | |
| | | Shares or | |
| | | Principal | |
| | | Amount | Value |
|
|
| |
| CORPORATE BONDS (continued) | | | |
| Financial Services (continued) | | | |
| Ford Motor Credit Company (continued) | | | |
| 10.4863% due 06/15/2011 (b) | $ | 836,000 | $ | 884,068 |
| General Motors Acceptance Corp. | | | |
| 4.375% due 12/10/2007 | | 350,000 | 340,392 |
| 5.125% due 05/09/2008 | | 250,000 | 243,069 |
| 5.85% due 01/14/2009 | | 350,000 | 339,685 |
| 6.125% due 08/28/2007 (a) | | 330,000 | 327,941 |
| 6.75% due 12/01/2014 (a) | | 675,000 | 647,114 |
| 6.875% due 09/15/2011 | | 1,600,000 | 1,575,806 |
| 7.25% due 03/02/2011 | | 25,000 | 24,943 |
| 8.00% due 11/01/2031 (a) | | 3,675,000 | 3,714,286 |
| Global Cash Access LLC | | | |
| 8.75% due 03/15/2012 | | 250,000 | 261,562 |
| Goldman Sachs Group LP | | | |
| 4.50% due 06/15/2010 | | 580,000 | 563,610 |
| Hexion US Finance Corp/Hexion Nova Scotia | | |
| Finance ULC | | | |
| 9.00% due 07/15/2014 | | 260,000 | 261,300 |
| HSBC Finance Capital Trust IX | | | |
| 5.911% due 11/30/2035 (b) | | 1,650,000 | 1,635,957 |
| International Lease Finance Corp. | | | |
| 5.875% due 05/01/2013 | | 815,000 | 830,557 |
| iPCS, Inc. | | | |
| 11.50% due 05/01/2012 | | 250,000 | 281,250 |
| J.P. Morgan Chase & Company | | | |
| 6.625% due 03/15/2012 | | 970,000 | 1,024,493 |
| JSG Funding PLC | | | |
| 9.625% due 10/01/2012 | | 225,000 | 234,844 |
| Lehman Brothers Holdings, Inc. | | | |
| 4.50% due 07/26/2010 | | 775,000 | 751,700 |
| Morgan Stanley | | | |
| 4.75% due 04/01/2014 | | 1,470,000 | 1,389,163 |
| Nell AF SARL | | | |
| 8.375% due 08/15/2015 (a) | | 222,000 | 222,277 |
| Residential Capital Corp. | | | |
| 6.00% due 02/22/2011 | | 720,000 | 716,095 |
| Shinsei Finance Cayman Ltd. | | | |
| 6.418% due 01/29/2049 (b) | | 550,000 | 543,156 |
| TNK-BP Finance SA | | | |
| 7.50% due 07/18/2016 (a) | | 1,330,000 | 1,380,390 |
| Ucar Finance, Inc. | | | |
| 10.25% due 02/15/2012 | | 80,000 | 84,000 |
|
|
| | | | 31,685,607 |
| Food & Beverages - 0.04% | | | |
| Nutro Products, Inc. | | | |
| 9.23% due 10/15/2013 (b) | | 40,000 | 41,200 |
| 10.75% due 04/15/2014 | | 90,000 | 94,950 |
|
|
| | | | 136,150 |
| Forest Products - 0.44% | | | |
| Weyerhaeuser Company | | | |
| 6.75% due 03/15/2012 | | 1,300,000 | 1,359,565 |
| Furniture & Fixtures - 0.16% | | | |
| Norcraft Companies LP | | | |
| 9.00% due 11/01/2011 | | 125,000 | 125,625 |
The accompanying notes are an integral part of the financial statements. 390
John Hancock Funds II
Portfolio of investments — August 31, 2006
(showing percentage of total net assets)
| Strategic Bond Fund (continued) | | |
| | | Shares or | |
| | | Principal | |
| | | Amount | Value |
|
|
| |
| CORPORATE BONDS (continued) | | | |
| Furniture & Fixtures (continued) | | | |
| Norcraft Holdings Capital | | | |
| zero coupon, Step up to 9.75% on | | | |
| 09/01/2008 due 09/01/2012 | $ | 15,000 | $ | 12,150 |
| Sealy Mattress Company | | | |
| 8.25% due 06/15/2014 (a) | | 350,000 | 353,500 |
|
|
| | | | 491,275 |
| Gas & Pipeline Utilities - 3.91% | | | |
| Dynegy Holdings, Inc. | | | |
| 8.375% due 05/01/2016 *** | | 830,000 | 817,550 |
| El Paso Corp. | | | |
| 7.75% due 01/15/2032 (a) | | 5,800,000 | 5,829,000 |
| 7.80% due 08/01/2031 *** | | 3,280,000 | 3,288,200 |
| 7.875% due 06/15/2012 (a) | | 500,000 | 516,250 |
| El Paso Corp., Series MTN | | | |
| 7.375% due 12/15/2012 (a) | | 475,000 | 479,156 |
| Kinder Morgan Energy Partners LP | | | |
| 5.00% due 12/15/2013 (a) | | 140,000 | 132,440 |
| 6.30% due 02/01/2009 | | 100,000 | 101,302 |
| 6.75% due 03/15/2011 | | 100,000 | 103,852 |
| 7.125% due 03/15/2012 | | 20,000 | 21,092 |
| Williams Companies, Inc. | | | |
| 7.625% due 07/15/2019 (a) | | 25,000 | 25,375 |
| 7.875% due 09/01/2021 | | 375,000 | 381,563 |
| 8.75% due 03/15/2032 | | 450,000 | 484,875 |
|
|
| | | | 12,180,655 |
| Healthcare Products - 0.06% | | | |
| Angiotech Pharmaceuticals, Inc. | | | |
| 7.75% due 04/01/2014 | | 15,000 | 14,625 |
| Leiner Health Products, Inc. | | | |
| 11.00% due 06/01/2012 | | 195,000 | 185,250 |
|
|
| | | | 199,875 |
| Healthcare Services - 0.36% | | | |
| DaVita, Inc. | | | |
| 7.25% due 03/15/2015 | | 420,000 | 411,600 |
| Extendicare Health Services, Inc. | | | |
| 6.875% due 05/01/2014 | | 25,000 | 26,125 |
| 9.50% due 07/01/2010 | | 65,000 | 67,925 |
| Vanguard Health Holding Company II LLC | | | |
| 9.00% due 10/01/2014 | | 640,000 | 620,800 |
|
|
| | | | 1,126,450 |
| Holdings Companies/Conglomerates - 0.02% | | |
| Ashtead Capital, Inc. | | | |
| 9.00% due 08/15/2016 | | 73,000 | 74,460 |
| Homebuilders - 0.15% | | | |
| Beazer Homes USA, Inc. | | | |
| 6.875% due 07/15/2015 | | 15,000 | 13,350 |
| 8.125% due 06/15/2016 (a) | | 150,000 | 143,250 |
| K Hovnanian Enterprises, Inc. | | | |
| 6.25% due 01/15/2016 | | 60,000 | 52,050 |
| 8.625% due 01/15/2017 (a) | | 280,000 | 273,350 |
|
|
| | | | 482,000 |
| Strategic Bond Fund (continued) | | |
| | | Shares or | |
| | | Principal | |
| | | Amount | Value |
|
|
| |
| CORPORATE BONDS (continued) | | | |
| Hotels & Restaurants - 0.13% | | | |
| CCM Merger, Inc. | | | |
| 8.00% due 08/01/2013 | $ | 105,000 | $ | 100,537 |
| El Pollo Loco, Inc. | | | |
| 11.75% due 11/15/2013 | | 55,000 | 61,463 |
| Park Place Entertainment Corp. | | | |
| 9.375% due 02/15/2007 | | 250,000 | 253,125 |
|
|
| | | | 415,125 |
| |
| Industrial Machinery - 0.02% | | | |
| H&E Equipment Services, Inc. | | | |
| 8.375% due 07/15/2016 | | 75,000 | 76,125 |
| Insurance - 0.08% | | | |
| Crum & Forster Holdings Corp. | | | |
| 10.375% due 06/15/2013 (a) | | 250,000 | 248,750 |
| International Oil - 0.13% | | | |
| OAO Gazprom, Series REGS | | | |
| 9.625% due 03/01/2013 | | 150,000 | 177,090 |
| Pemex Project Funding Master Trust | | | |
| 5.75% due 12/15/2015 | | 170,000 | 165,410 |
| 6.625% due 06/15/2035 | | 80,000 | 78,560 |
|
|
| | | | 421,060 |
| |
| Leisure Time - 0.76% | | | |
| AMC Entertainment, Inc. | | | |
| 11.00% due 02/01/2016 | | 285,000 | 309,581 |
| Boyd Gaming Corp. | | | |
| 6.75% due 04/15/2014 | | 400,000 | 377,000 |
| Caesars Entertainment, Inc. | | | |
| 7.00% due 04/15/2013 | | 140,000 | 144,513 |
| Herbst Gaming, Inc. | | | |
| 8.125% due 06/01/2012 | | 250,000 | 253,750 |
| Inn of the Mountain Gods Resort & Casino | | | |
| 12.00% due 11/15/2010 | | 190,000 | 191,900 |
| Isle of Capri Casinos | | | |
| 7.00% due 03/01/2014 | | 50,000 | 47,500 |
| Las Vegas Sands Corp. | | | |
| 6.375% due 02/15/2015 | | 250,000 | 232,500 |
| MGM Mirage, Inc. | | | |
| 6.625% due 07/15/2015 | | 150,000 | 141,188 |
| Mohegan Tribal Gaming Authority | | | |
| 6.875% due 02/15/2015 | | 150,000 | 143,250 |
| 7.125% due 08/15/2014 | | 150,000 | 146,250 |
| River Rock Entertainment Authority | | | |
| 9.75% due 11/01/2011 | | 15,000 | 15,881 |
| Station Casinos, Inc. | | | |
| 7.75% due 08/15/2016 | | 250,000 | 257,813 |
| Warner Music Group | | | |
| 7.375% due 04/15/2014 | | 100,000 | 96,250 |
|
|
| | | | 2,357,376 |
| |
| Manufacturing - 1.66% | | | |
| Jacuzzi Brands, Inc. | | | |
| 9.625% due 07/01/2010 | | 105,000 | 111,300 |
| Tyco International Group SA | | | |
| 6.00% due 11/15/2013 | | 1,040,000 | 1,072,806 |
| 6.125% due 11/01/2008 | | 890,000 | 902,161 |
The accompanying notes are an integral part of the financial statements. 391
John Hancock Funds II
Portfolio of investments — August 31, 2006
(showing percentage of total net assets)
| Strategic Bond Fund (continued) | | |
| | | Shares or | |
| | | Principal | |
| | | Amount | Value |
|
|
| |
| CORPORATE BONDS (continued) | | | |
| Manufacturing (continued) | | | |
| Tyco International Group SA (continued) | | | |
| 6.875% due 01/15/2029 | $ | 2,760,000 | $ | 3,080,469 |
|
|
| | | | 5,166,736 |
| Medical-Hospitals - 0.80% | | | |
| Genesis Healthcare Corp. | | | |
| 8.00% due 10/15/2013 | | 175,000 | 181,562 |
| HCA, Inc. | | | |
| 6.30% due 10/01/2012 | | 21,000 | 17,588 |
| 6.375% due 01/15/2015 | | 265,000 | 210,675 |
| 6.50% due 02/15/2016 (a) | | 331,000 | 260,663 |
| 7.50% due 12/15/2023 | | 25,000 | 19,106 |
| 7.69% due 06/15/2025 | | 25,000 | 19,320 |
| Tenet Healthcare Corp. | | | |
| 6.875% due 11/15/2031 | | 1,125,000 | 852,187 |
| 7.375% due 02/01/2013 (a) | | 125,000 | 111,250 |
| 9.25% due 02/01/2015 (b) | | 200,000 | 188,500 |
| 9.875% due 07/01/2014 | | 640,000 | 624,000 |
|
|
| | | | 2,484,851 |
| Metal & Metal Products - 0.13% | | | |
| Metals USA, Inc. | | | |
| 11.125% due 12/01/2015 | | 195,000 | 214,988 |
| Mueller Group, Inc. | | | |
| 10.00% due 05/01/2012 | | 85,000 | 92,650 |
| Mueller Holdings, Inc. | | | |
| zero coupon, Step up to 14.75% on | | | |
| 04/15/2009 due 04/15/2014 | | 65,000 | 57,200 |
| PNA Group, Inc. | | | |
| 10.75% due 09/01/2016 | | 30,000 | 30,675 |
|
|
| | | | 395,513 |
| Office Furnishings & Supplies - 0.09% | | | |
| Interface, Inc. | | | |
| 9.50% due 02/01/2014 | | 100,000 | 102,750 |
| 10.375% due 02/01/2010 | | 150,000 | 163,312 |
|
|
| | | | 266,062 |
| Paper - 0.25% | | | |
| Appleton Papers, Inc., Series B | | | |
| 9.75% due 06/15/2014 | | 305,000 | 301,187 |
| NewPage Corp. | | | |
| 11.7388% due 05/01/2012 (b) | | 65,000 | 70,200 |
| 12.00% due 05/01/2013 (a) | | 45,000 | 46,463 |
| P.H. Glatfelter | | | |
| 7.125% due 05/01/2016 | | 75,000 | 73,934 |
| Smurfit Capital Funding PLC | | | |
| 7.50% due 11/20/2025 | | 200,000 | 182,000 |
| Verso Paper Holdings LLC and Verso Paper, Inc. | | |
| 9.125% due 08/01/2014 | | 50,000 | 49,750 |
| 11.375% due 08/01/2016 | | 45,000 | 44,550 |
|
|
| | | | 768,084 |
| Petroleum Services - 0.58% | | | |
| Belden & Blake Corp. | | | |
| 8.75% due 07/15/2012 | | 235,000 | 240,875 |
| Compagnie Generale de Geophysique SA | | | |
| 7.50% due 05/15/2015 | | 50,000 | 49,750 |
| Strategic Bond Fund (continued) | | |
| | | Shares or | |
| | | Principal | |
| | | Amount | Value |
|
|
| |
| CORPORATE BONDS (continued) | | | |
| Petroleum Services (continued) | | | |
| Dresser-Rand Group, Inc. | | | |
| 7.375% due 11/01/2014 | $ | 300,000 | $ | 288,750 |
| Enterprise Products Operating LP | | | |
| 8.375% due 08/01/2066 (b) | | 110,000 | 114,672 |
| Gaz Capital for Gazprom, Series REGS | | | |
| 8.625% due 04/28/2034 (a) | | 800,000 | 995,200 |
| Grant Prideco, Inc., Series B | | | |
| 6.125% due 08/15/2015 | | 75,000 | 71,250 |
| Pride International, Inc. | | | |
| 7.375% due 07/15/2014 | | 25,000 | 25,437 |
| SESI LLC | | | |
| 6.875% due 06/01/2014 | | 10,000 | 9,800 |
|
|
| | | | 1,795,734 |
| |
| Pharmaceuticals - 0.20% | | | |
| Omnicare, Inc. | | | |
| 6.875% due 12/15/2015 | | 200,000 | 191,250 |
| Valeant Pharmaceuticals International | | | |
| 7.00% due 12/15/2011 | | 450,000 | 423,000 |
|
|
| | | | 614,250 |
| |
| Photography - 2.38% | | | |
| Eastman Kodak Company | | | |
| 3.375% due 10/15/2033 (a)*** | | 4,210,000 | 4,041,600 |
| 7.25% due 11/15/2013 *** | | 3,500,000 | 3,370,661 |
|
|
| | | | 7,412,261 |
| |
| Pollution Control - 0.00% | | | |
| Safety-Kleen Services, Inc. | | | |
| 9.25% due 06/01/2008 ^ | | 175,000 | 175 |
| Publishing - 0.28% | | | |
| Dex Media East LLC | | | |
| 12.125% due 11/15/2012 | | 125,000 | 139,375 |
| Dex Media West LLC | | | |
| 8.50% due 08/15/2010 | | 150,000 | 153,750 |
| 9.875% due 08/15/2013 | | 75,000 | 80,531 |
| Dex Media, Inc. | | | |
| zero coupon, Step up to 9.00% on | | | |
| 11/15/2008 due 11/15/2013 | | 100,000 | 83,250 |
| zero coupon, Step up to 9.00% on | | | |
| 11/15/2008 due 11/15/2013 | | 200,000 | 166,500 |
| Houghton Mifflin Company | | | |
| zero coupon, Step up to 11.5% on | | | |
| 10/15/2008 due 10/15/2013 | | 150,000 | 125,625 |
| Primedia, Inc. | | | |
| 8.875% due 05/15/2011 | | 140,000 | 135,800 |
|
|
| | | | 884,831 |
| |
| Railroads & Equipment - 0.08% | | | |
| Grupo Transportacion Ferroviaria Mexicana, | | |
| S.A. de C.V. | | | |
| 9.375% due 05/01/2012 | | 110,000 | 116,462 |
| 10.25% due 06/15/2007 | | 100,000 | 102,000 |
| 12.50% due 06/15/2012 | | 40,000 | 44,400 |
|
|
| | | | 262,862 |
The accompanying notes are an integral part of the financial statements. 392
John Hancock Funds II
Portfolio of investments — August 31, 2006
(showing percentage of total net assets)
| Strategic Bond Fund (continued) | | |
| | | Shares or | |
| | | Principal | |
| | | Amount | Value |
|
|
| |
| CORPORATE BONDS (continued) | | | |
| Real Estate - 0.42% | | | |
| Felcor Lodging LP, REIT | | | |
| 9.00% due 06/01/2011 | $ | 300,000 | $ | 317,250 |
| Forest City Enterprises | | | |
| 7.625% due 06/01/2015 | | 5,000 | 5,037 |
| Host Marriott LP, REIT | | | |
| 6.375% due 03/15/2015 | | 200,000 | 192,000 |
| 7.125% due 11/01/2013 | | 500,000 | 505,000 |
| Host Marriott LP, Series Q, REIT | | | |
| 6.75% due 06/01/2016 | | 175,000 | 169,750 |
| Kimball Hill, Inc. | | | |
| 10.50% due 12/15/2012 | | 85,000 | 72,888 |
| Ventas Realty LP/ Capital Corp. | | | |
| 6.50% due 06/01/2016 | | 35,000 | 34,475 |
|
|
| | | | 1,296,400 |
| Retail - 0.08% | | | |
| Brookstone Company, Inc. | | | |
| 12.00% due 10/15/2012 | | 35,000 | 31,850 |
| NationsRent, Inc. | | | |
| 9.50% due 05/01/2015 (a) | | 65,000 | 76,357 |
| Suburban Propane Partners LP | | | |
| 6.875% due 12/15/2013 | | 160,000 | 153,200 |
|
|
| | | | 261,407 |
| Retail Trade - 0.19% | | | |
| American Greetings Corp. | | | |
| 7.375% due 06/01/2016 | | 15,000 | 15,094 |
| Blockbuster, Inc. | | | |
| 9.00% due 09/01/2012 (a) | | 105,000 | 97,125 |
| FTD, Inc. | | | |
| 7.75% due 02/15/2014 | | 225,000 | 219,375 |
| Neiman Marcus Group, Inc. | | | |
| 10.375% due 10/15/2015 (a) | | 255,000 | 272,850 |
|
|
| | | | 604,444 |
| Sanitary Services - 0.40% | | | |
| Allied Waste North America, Inc. | | | |
| 6.375% due 04/15/2011 | | 125,000 | 121,250 |
| 7.25% due 03/15/2015 | | 250,000 | 245,625 |
| 8.50% due 12/01/2008 | | 125,000 | 130,000 |
| Waste Management, Inc. | | | |
| 6.375% due 11/15/2012 | | 730,000 | 758,250 |
|
|
| | | | 1,255,125 |
| Semiconductors - 0.07% | | | |
| Amkor Technology, Inc. | | | |
| 2.50% due 05/15/2011 | | 100,000 | 84,875 |
| MagnaChip Semiconductor SA | | | |
| 8.00% due 12/15/2014 | | 200,000 | 128,000 |
|
|
| | | | 212,875 |
| Software - 0.08% | | | |
| UGS Capital Corp. II | | | |
| 10.38% due 06/01/2011 (b) | | 155,000 | 156,163 |
| UGS Corp. | | | |
| 10.00% due 06/01/2012 | | 90,000 | 96,750 |
|
|
| | | | 252,913 |
| Strategic Bond Fund (continued) | | |
| | | Shares or | |
| | | Principal | |
| | | Amount | Value |
|
|
| |
| CORPORATE BONDS (continued) | | | |
| Steel - 0.10% | | | |
| CitiSteel USA, Inc. | | | |
| 12.49% due 09/01/2010 (b) | $ | 100,000 | $ | 102,750 |
| International Steel Group, Inc. | | | |
| 6.50% due 04/15/2014 | | 100,000 | 95,000 |
| RathGibson, Inc. | | | |
| 11.25% due 02/15/2014 | | 110,000 | 113,300 |
|
|
| | | | 311,050 |
| |
| Telecommunications Equipment & | | | |
| Services - 1.24% | | | |
| Cincinnati Bell Telephone Company | | | |
| 6.30% due 12/01/2028 | | 5,000 | 4,275 |
| Citizens Communications Company | | | |
| 9.00% due 08/15/2031 | | 175,000 | 184,625 |
| Deutsche Telekom International Finance BV | | |
| 5.75% due 03/23/2016 (a) | | 430,000 | 418,276 |
| Hawaiian Telcom Communications, Inc., Series B | | |
| 12.50% due 05/01/2015 (a) | | 150,000 | 153,375 |
| Intelsat Bermuda Ltd. | | | |
| 9.25% due 06/15/2016 | | 170,000 | 176,800 |
| 11.25% due 06/15/2016 | | 305,000 | 316,056 |
| Intelsat Ltd. | | | |
| 7.625% due 04/15/2012 | | 210,000 | 182,175 |
| Lucent Technologies, Inc. | | | |
| 6.45% due 03/15/2029 | | 825,000 | 703,312 |
| PanAmSat Corp. | | | |
| 9.00% due 08/15/2014 | | 75,000 | 76,313 |
| Royal KPN NV | | | |
| 8.00% due 10/01/2010 | | 580,000 | 624,261 |
| United States West Communications, Inc. | | | |
| 6.875% due 09/15/2033 | | 1,147,000 | 1,026,565 |
|
|
| | | | 3,866,033 |
| |
| Telephone - 1.06% | | | |
| Cincinnati Bell, Inc. | | | |
| 7.00% due 02/15/2015 | | 85,000 | 82,875 |
| 8.375% due 01/15/2014 (a) | | 140,000 | 140,525 |
| Nordic Telephone Company Holdings | | | |
| 8.875% due 05/01/2016 | | 180,000 | 188,100 |
| NTL Cable PLC | | | |
| 9.125% due 08/15/2016 | | 100,000 | 103,500 |
| Qwest Communications International, Inc. | | | |
| 7.50% due 02/15/2014 | | 87,000 | 86,239 |
| Qwest Communications International, Inc., Series B | | |
| 7.50% due 02/15/2014 | | 306,000 | 303,322 |
| Qwest Corp. | | | |
| 8.875% due 03/15/2012 | | 125,000 | 135,312 |
| Sprint Capital Corp. | | | |
| 8.375% due 03/15/2012 | | 940,000 | 1,050,520 |
| Telecom Italia Capital SA | | | |
| 5.25% due 10/01/2015 | | 500,000 | 467,366 |
| Telefonos de Mexico SA de CV | | | |
| 8.75% due 01/31/2016 | MXN | 2,000,000 | 181,410 |
| Verizon Florida, Inc., Series F | | | |
| 6.125% due 01/15/2013 (a) | $ | 295,000 | 296,420 |
The accompanying notes are an integral part of the financial statements. 393
John Hancock Funds II
Portfolio of investments — August 31, 2006
(showing percentage of total net assets)
| Strategic Bond Fund (continued) | | |
| | | Shares or | |
| | | Principal | |
| | | Amount | Value |
|
|
| |
| CORPORATE BONDS (continued) | | | |
| Telephone (continued) | | | |
| Windstream Corp. | | | |
| 8.625% due 08/01/2016 | $ | 255,000 | $ | 269,663 |
|
|
| | | | 3,305,252 |
| |
| Tobacco - 0.30% | | | |
| Altria Group, Inc. | | | |
| 7.00% due 11/04/2013 | | 870,000 | 946,454 |
| Transportation - 0.05% | | | |
| Gulfmark Offshore, Inc. | | | |
| 7.75% due 07/15/2014 (b) | | 20,000 | 19,900 |
| Horizon Lines LLC | | | |
| 9.00% due 11/01/2012 | | 122,000 | 125,203 |
| OMI Corp. | | | |
| 7.625% due 12/01/2013 | | 25,000 | 25,000 |
|
|
| | | | 170,103 |
|
| |
| TOTAL CORPORATE BONDS (Cost $143,387,684) | | $ | 143,958,343 |
|
| |
| COLLATERALIZED MORTGAGE | | | |
| OBLIGATIONS - 13.31% | | | |
| Banc of America Commercial Mortgage Inc., Series | | |
| 2006-1, Class A4 | | | |
| 5.372% due 09/10/2045 (b) | | 340,000 | 337,735 |
| Commercial Mortgage Asset Trust, | | | |
| Series 1999-C1, Class C | | | |
| 7.35% due 01/17/2032 | | 295,000 | 327,930 |
| Commercial Mortgage Pass-Through Certificates, | | |
| Series 2001-J2A, Class A1 | | | |
| 5.447% due 07/16/2034 | | 323,208 | 325,008 |
| Commercial Mortgage Pass-Through Certificates, | | |
| Series 2003-FL9, Class E | | | |
| 6.33% due 11/15/2015 (b)*** | | 137,810 | 137,856 |
| Countrywide Alternative Loan Trust, Series | | |
| 2006-OA9, Class 1A1 | | | |
| 5.525% due 07/20/2046 (b)*** | | 2,886,937 | 2,887,630 |
| Countrywide Alternative Loan Trust, Series | | |
| 2006-OA9, Class 2A1B | | | |
| 5.525% due 07/20/2046 (b)*** | | 1,875,576 | 1,875,604 |
| Countrywide Home Loans, Series 2006-HYB3, | | |
| Class 2A1A | | | |
| 5.7863% due 05/20/2036 (b) | | 167,535 | 168,905 |
| Credit Suisse Mortgage Capital Certificates, Series | | |
| 2006-C1, Class A4 | | | |
| 5.609% due 02/15/2039 (b) | | 1,675,000 | 1,684,731 |
| First Boston Mortgage Securities Corp. STRIP, | | |
| Series D, IO | | | |
| 10.965% due 05/25/2017 *** | | 16,985 | 4,211 |
| First Union National Bank Commercial Mortgage, | | |
| Series 2000-C1 | | | |
| 0.7777% IO due 05/17/2032 (b) | | 13,343,514 | 322,439 |
| Green Tree Financial Corp., Series 1997-6, Class A8 | | |
| 7.07% due 01/15/2029 | | 641,175 | 658,483 |
| GSRPM Mortgage Loan Trust, Series 2003-1, | | |
| Class A3 | | | |
| 5.8244% due 01/25/2032 (b) | | 192,309 | 193,659 |
| Impac CMB Trust, Series 2003-4, Class 1A1 | | |
| 5.6444% due 10/25/2033 (b)*** | | 150,440 | 150,495 |
| Strategic Bond Fund (continued) | | |
| | | Shares or | |
| | | Principal | |
| | | Amount | Value |
|
|
| |
| COLLATERALIZED MORTGAGE | | | |
| OBLIGATIONS (continued) | | | |
| Indymac Index Mortgage Loan Trust, Series | | |
| 2006-AR6, Class 2A1A | | | |
| 5.5244% due 06/25/2047 (b)*** | $ | 5,033,360 | $ | 5,024,953 |
| J.P. Morgan Chase Commercial Mortgage | | | |
| Securities Corp, Series 2006-CB15, Class A4 | | |
| 5.814% due 06/12/2043 (b) | | 2,370,000 | 2,428,356 |
| J.P. Morgan Mortgage Trust, Series 2005-A6, | | |
| Class 7A1 | | | |
| 4.9827% due 08/25/2035 (b) | | 125,267 | 123,502 |
| Luminent Mortgage Trust, Series 2006-4, Class A1A | | |
| 5.5144% due 05/25/2046 (b)*** | | 2,741,675 | 2,737,773 |
| Master Adjustable Rate Mortgages Trust., | | | |
| Series 2006-2, Class 3A1 | | | |
| 4.8496% due 01/25/2036 (b) | | 168,579 | 166,258 |
| Master Adjustable Rate Mortgages Trust., | | | |
| Series 2006-OA1, Class 1A1 | | | |
| 5.5344% due 04/25/2046 (b)*** | | 4,743,552 | 4,747,101 |
| Merit Securities Corp., Series 11PA, Class B2 | | |
| 6.8281% due 09/28/2032 (b)*** | | 885,099 | 759,251 |
| Merrill Lynch Mortgage Trust, Series 2006-C1, | | |
| Class A4 | | | |
| 5.8442% due 05/12/2039 (b) | | 970,000 | 988,753 |
| Morgan Stanley Mortgage Loan Trust, Series | | |
| 2004-8AR, Class 4A1 | | | |
| 5.3722% due 10/25/2034 (b) | | 908,360 | 909,493 |
| Novastar Mortgage-Backed Notes, Series | | | |
| 2006-MTA1, Class 2A1A | | | |
| 5.5144% due 09/25/2046 (b)*** | | 2,815,441 | 2,815,710 |
| Structured Asset Mortgage Investments Inc., | | |
| Series 2005-AR3, Class 2A1 | | | |
| 6.6178% due 08/25/2035 (b) | | 553,301 | 564,854 |
| Structured Asset Mortgage Investments, Inc., | | |
| Series 2006-AR6, Class 1A3 | | | |
| 5.585% due 07/25/2036 (b)*** | | 2,889,638 | 2,888,609 |
| Thornburg Mortgage Securities Trust, Series | | |
| 2006-3, Class A2 | | | |
| 5.4294% due 06/25/2036 (b) | | 2,847,532 | 2,841,991 |
| Thornburg Mortgage Securities Trust, Series | | |
| 2006-3, Class A3 | | | |
| 5.4344% due 06/25/2036 (b) | | 2,853,438 | 2,858,392 |
| Washington Mutual, Inc., Series 2005-AR17, Class | | |
| A1A1 | | | |
| 5.5944% due 12/25/2045 (b)*** | | 2,574,961 | 2,583,205 |
|
| TOTAL COLLATERALIZED MORTGAGE OBLIGATIONS | |
| (Cost $41,539,990) | | | $ | 41,512,887 |
|
| |
| ASSET BACKED SECURITIES - 11.27% | | |
| ACE Securities Corp., Series 2006-GP1, Class A | | |
| 5.4544% due 02/25/2031 (b)*** | | 2,655,200 | 2,655,176 |
| Ameriquest Mortgage Securities, Inc., | | | |
| Series 2004-R11, Class M5 | | | |
| 6.5244% due 11/25/2034 (b)*** | | 315,000 | 319,786 |
| Amortizing Residential Corp. Trust, | | | |
| Series 2002-BC6, Class M2 | | | |
| 6.5244% due 08/25/2032 (b)*** | | 104,695 | 105,521 |
The accompanying notes are an integral part of the financial statements. 394
John Hancock Funds II
Portfolio of investments — August 31, 2006
(showing percentage of total net assets)
| Strategic Bond Fund (continued) | | |
| | | Shares or | |
| | | Principal | |
| | | Amount | Value |
|
|
| |
| ASSET BACKED SECURITIES | | | |
| (continued) | | | |
| Asset Backed Securities Corp., | | | |
| Series 2003-HE2, Class M2 | | | |
| 7.23% due 04/15/2033 (b)*** | $ | 354,482 | $ | 355,065 |
| Bear Stearns Asset Backed Securities Inc, Series | | |
| 2003-ABF1, Class A | | | |
| 5.6944% due 01/25/2034 (b)*** | | 64,448 | 64,662 |
| Countrywide Asset-Backed Certificates, | | | |
| Series 2004-5, Class M4 | | | |
| 6.5744% due 06/25/2034 (b)*** | | 420,000 | 426,328 |
| Countrywide Home Equity Loan Trust, Series | | |
| 2002-B, Class A1 | | | |
| 5.58% due 04/15/2028 (b)*** | | 97,744 | 97,867 |
| EMC Mortgage Loan Trust, Series 2003-B, Class A1 | | |
| 5.8744% due 11/25/2041 (b)*** | | 441,610 | 443,599 |
| GSAMP Trust, Series 2006-S4, Class A1 | | | |
| 5.475% due 05/25/2036 (b)*** | | 2,550,812 | 2,550,947 |
| IndyMac Seconds Asset Backed Trust, Series | | |
| 2006-A, Class A | | | |
| 5.4544% due 06/25/2036 (b)*** | | 2,653,061 | 2,653,040 |
| IXIS Real Estate Capital Trust, Series 2006-HE2, | | |
| Class A1 | | | |
| 5.445% due 08/25/2036 *** | | 4,528,502 | 4,528,470 |
| Merrill Lynch Mortgage Investors, Inc. Series | | |
| 2005-WM1N, Class N1 | | | |
| 5.00% due 09/25/2035 *** | | 15,678 | 15,573 |
| Mid State Trust, Series 6, Class A1 | | | |
| 7.34% due 07/01/2035 *** | | 688,440 | 725,246 |
| Morgan Stanley Mortgage Loan Trust, Series | | |
| 2006-4SL, Class A1 | | | |
| 5.4744% due 03/25/2036 (b)*** | | 2,368,623 | 2,369,284 |
| Novastar Home Equity Loan, | | | |
| Series 2004-1, Class M4 | | | |
| 6.2994% due 06/25/2034 (b)*** | | 315,000 | 317,491 |
| RAAC Series, Series 2006-RP2, Class A | | | |
| 5.5744% due 02/25/2037 (b)*** | | 2,591,436 | 2,596,295 |
| Residential Asset Mortgage Products Inc, Series | | |
| 2003-RS4, Class AIIB | | | |
| 5.6544% due 05/25/2033 (b) | | 96,355 | 97,412 |
| Residential Asset Securities Corp., | | | |
| Series 2002-KS2, Class MII2 | | | |
| 6.9744% due 04/25/2032 (b)*** | | 52,479 | 52,511 |
| SACO I Trust, Inc., Series 2006-5, Class 1A | | |
| 5.4744% due 04/25/2036 (b)*** | | 4,512,316 | 4,515,443 |
| SACO I Trust, Inc., Series 2006-5, Class 2A3 | | |
| 5.5044% due 05/25/2036 (b)*** | | 2,040,000 | 2,039,980 |
| SACO I Trust, Inc., Series 2006-6, Class A | | | |
| 5.4544% due 06/25/2036 (b)*** | | 2,599,575 | 2,599,554 |
| Sail Net Interest Margin Notes, Series 2004-BN2A, | | |
| Class A | | | |
| 5.00% due 12/27/2034 *** | | 27,351 | 27,295 |
| Sail Net Interest Margin Notes, Series 2004-2A, | | |
| Class A | | | |
| 5.50% due 03/27/2034 *** | | 23,442 | 8,386 |
| SLM Student Loan Trust, Series 2006-5, Class A2 | | |
| 5.429% due 07/25/2017 (b)*** | | 2,900,000 | 2,899,548 |
| Strategic Bond Fund (continued) | | | |
| | | Shares or | | |
| | | Principal | | |
| | | Amount | | Value |
|
|
| |
| ASSET BACKED SECURITIES | | | | |
| (continued) | | | | |
| Structured Asset Securities Corp., Series | | | | |
| 2006-ARS1, Class A1 | | | | |
| 5.4344% due 02/25/2036 (b)*** | $ | 2,675,980 | $ | 2,676,818 |
|
| TOTAL ASSET BACKED SECURITIES | | | | |
| (Cost $35,144,313) | | | $ | 35,141,297 |
|
| |
| SUPRANATIONAL OBLIGATIONS - 0.31% | | | |
| Venezuela - 0.31% | | | | |
| Corporacion Andina de Fomento, Series EXCH | | | |
| 6.875% due 03/15/2012 | | 916,000 | | 967,137 |
|
| TOTAL SUPRANATIONAL OBLIGATIONS | | | |
| (Cost $984,820) | | | $ | 967,137 |
|
| |
| OPTIONS - 2.30% | | | | |
| Call Options - 2.30% | | | | |
| Eurodollar Futures | | | | |
| Expiration 09/18/2006 at $94.00 | | 3,975,000 | | 2,404,875 |
| Expiration 12/18/2006 at $94.00 | | 245,000 | | 160,475 |
| Eurodollar Midcurve 1 yr. Futures | | | | |
| Expiration 09/15/2006 at $94.75 | | 32,500 | | 9,750 |
| U.S Treasury Bond | | | | |
| Expiration 11/21/2006 at $110.00 | | 160,000 | | 302,500 |
| U.S. Treasury Notes 5 year Futures | | | | |
| Expiration 11/21/2006 at $102.00 | | 61,000 | | 189,672 |
| U.S. Treasury Notes 5 yr. Futures | | | | |
| Expiration 11/21/2006 at $100.00 | | 801,000 | | 4,092,609 |
|
|
| | | | | 7,159,881 |
| |
| Put Options - 0.00% | | | | |
| Eurodollar Futures | | | | |
| Expiration 03/19/2007 at $93.00 | | 30,000 | | 75 |
|
| TOTAL OPTIONS (Cost $6,052,798) | | | $ | 7,159,956 |
|
| |
| SHORT TERM INVESTMENTS - 15.97% | | | |
| Canadian Treasury Bill | | | | |
| 4.78% due 09/20/2006 | $ | 350,000 | $ | 349,102 |
| Federal National Mortgage Association | | | | |
| zero coupon due 09/20/2006 to | | | | |
| 09/25/2006 **** | | 285,000 | | 284,113 |
| State Street Navigator Securities Lending | | | | |
| Prime Portfolio (c) | | 49,146,472 | | 49,146,472 |
|
| TOTAL SHORT TERM INVESTMENTS | | | | |
| (Cost $49,779,688) | | | $ | 49,779,687 |
|
The accompanying notes are an integral part of the financial statements. 395
John Hancock Funds II
Portfolio of investments — August 31, 2006
(showing percentage of total net assets)
| Strategic Bond Fund (continued) | | | |
| | | Shares or | | |
| | | Principal | | |
| | | Amount | | Value |
|
|
| |
| REPURCHASE AGREEMENTS - 9.04% | | | |
| Merrill Lynch Tri-Party Repurchase | | | | |
| Agreement dated 08/31/2006 at | | | | |
| 5.23% to be repurchased at | | | | |
| $28,204,097 on 9/1/2006, | | | | |
| collateralized by $14,000,000 | | | | |
| Federal Home Loan Bank, 5.125% | | | | |
| due 08/15/2019 (valued at | | | | |
| $13,961,889, including interest) | | | | |
| and $14,000,000 Federal Home | | | | |
| Loan Mortgage Corp., 4.00% due | | | | |
| 08/17/2007 (valued at | | | | |
| $13,881,778, including interest) | | | | |
| and $980,000 Federal Home Loan | | | | |
| Mortgage Corp., 5.40% due | | | | |
| 02/28/2011 (valued at $976,766, | | | | |
| including interest) *** | $ | 28,200,000 | $ | 28,200,000 |
|
| TOTAL REPURCHASE AGREEMENTS | | | | |
| (Cost $28,200,000) | | | $ | 28,200,000 |
|
| Total Investments (Strategic Bond Fund) | | | |
| (Cost $448,998,871) - 145.25% | | | $ | 452,854,991 |
| Liabilities in Excess of Other Assets - (45.25)% | | | (141,085,751) |
|
|
| TOTAL NET ASSETS - 100.00% | | | $ | 311,769,240 |
|
|
| |
| |
| Strategic Income Fund | | | | |
| | | Shares or | | |
| | | Principal | | |
| | | Amount | | Value |
|
|
| |
| COMMON STOCKS - 1.37% | | | | |
| Mining - 1.17% | | | | |
| Newmont Mining Corp. | | 40,000 | $ | 2,050,000 |
| Silver Standard Resources, Inc., ADR * (a) | | 50,000 | | 1,237,000 |
|
|
| | | | | 3,287,000 |
| |
| Paper - 0.20% | | | | |
| Abitibi-Consolidated, Inc. (a) | | 212,000 | | 572,400 |
|
| TOTAL COMMON STOCKS (Cost $3,768,346) | | $ | 3,859,400 |
|
| |
| U.S. TREASURY OBLIGATIONS - 12.74% | | | |
| U.S. Treasury Bonds - 1.21% | | | | |
| 8.125% due 08/15/2019 (a)**** | $ | 930,000 | | 1,215,757 |
| 9.25% due 02/15/2016 (a) | | 1,635,000 | | 2,188,026 |
|
|
| | | | | 3,403,783 |
| |
| U.S. Treasury Notes - 11.53% | | | | |
| 4.25% due 08/15/2013 (a) | | 8,035,000 | | 7,812,784 |
| 4.625% due 03/31/2008 (a) | | 1,585,000 | | 1,579,242 |
| 4.875% due 07/31/2011 to 08/15/2016 (a) | 13,060,000 | | 13,193,531 |
| 6.125% due 08/15/2007 (a) | | 9,720,000 | | 9,818,337 |
|
|
| | | | | 32,403,894 |
|
| |
| TOTAL U.S. TREASURY OBLIGATIONS | | | |
| (Cost $35,663,805) | | | $ | 35,807,677 |
|
| Strategic Income Fund (continued) | |
| | | Shares or | |
| | | Principal | |
| | | Amount | Value |
|
|
| |
| U.S. GOVERNMENT AGENCY OBLIGATIONS - 0.47% | |
| Federal National Mortgage | | | |
| Association - 0.47% | | | |
| 5.50% TBA ** | $ | 1,330,000 | $ | 1,305,063 |
|
| TOTAL U.S. GOVERNMENT AGENCY OBLIGATIONS | |
| (Cost $1,302,361) | | | $ | 1,305,063 |
|
| |
| FOREIGN GOVERNMENT OBLIGATIONS - 45.67% | |
| Australia - 3.58% | | | |
| Commonwealth of Australia | | | |
| 7.50% due 09/15/2009 | AUD | 12,600,000 | 10,059,358 |
| Austria - 0.23% | | | |
| Republic of Austria, Series EMTN | | | |
| 6.00% due 09/26/2008 | NZD | 1,000,000 | 640,341 |
| Canada - 20.48% | | | |
| Government of Canada | | | |
| 4.00% due 09/01/2010 (a) | CAD | 4,100,000 | 3,706,135 |
| 4.50% due 09/01/2007 | | 5,500,000 | 4,988,343 |
| 4.50% due 06/01/2015 (a) | | 4,800,000 | 4,471,701 |
| 5.50% due 06/01/2009 | | 11,000,000 | 10,326,869 |
| 5.50% due 06/01/2010 | | 6,000,000 | 5,703,755 |
| 6.00% due 06/01/2008 | | 4,250,000 | 3,967,806 |
| 6.00% due 06/01/2011 | | 13,500,000 | 13,239,064 |
| Province of Ontario | | | |
| 5.00% due 03/08/2014 | | 3,800,000 | 3,589,852 |
| 5.70% due 12/01/2008 | | 5,500,000 | 5,135,454 |
| 5.75% due 03/03/2008 | NZD | 1,800,000 | 1,152,612 |
| 6.25% due 06/16/2015 | CAD | 2,000,000 | 1,277,486 |
|
|
| | | | 57,559,077 |
| Colombia - 1.47% | | | |
| Republic of Colombia | | | |
| 10.00% due 01/23/2012 | $ | 110,000 | 128,040 |
| 10.75% due 01/15/2013 | | 3,290,000 | 4,020,380 |
|
|
| | | | 4,148,420 |
| Germany - 2.14% | | | |
| Federal Republic of Germany | | | |
| 5.00% due 01/04/2012 | EUR | 1,300,000 | 1,772,415 |
| 5.00% due 07/04/2012 | | 3,100,000 | 4,241,246 |
|
|
| | | | 6,013,661 |
| Ireland - 0.82% | | | |
| Republic of Ireland | | | |
| 4.60% due 04/18/2016 | | 1,700,000 | 2,319,888 |
| Italy - 2.74% | | | |
| Italy Buoni Poliennali Del Tesoro | | | |
| 4.25% due 08/01/2013 | | 2,373,000 | 3,116,901 |
| 4.75% due 02/01/2013 | | 1,000,000 | 1,350,299 |
| 6.75% due 02/01/2007 | | 2,500,000 | 3,242,528 |
|
|
| | | | 7,709,728 |
| Mexico - 0.75% | | | |
| Government of Mexico | | | |
| 5.625% due 01/15/2017 | $ | 520,000 | 512,720 |
| 5.875% due 01/15/2014 (a) | | 550,000 | 559,625 |
| 6.375% due 01/16/2013 | | 490,000 | 509,600 |
| 8.125% due 12/30/2019 | | 360,000 | 433,800 |
The accompanying notes are an integral part of the financial statements. 396
John Hancock Funds II
Portfolio of investments — August 31, 2006
(showing percentage of total net assets)
| Strategic Income Fund (continued) | |
| | | Shares or | |
| | | Principal | |
| | | Amount | Value |
|
|
| |
| FOREIGN GOVERNMENT OBLIGATIONS | | |
| (continued) | | | |
| Mexico (continued) | | | |
| Government of Mexico, Series XW (continued) | | |
| 10.375% due 02/17/2009 (a) | $ | 80,000 | $ | 88,960 |
|
|
| | | | 2,104,705 |
| |
| New Zealand - 0.28% | | | |
| New Zealand Government Bond, Series 708 | | | |
| 6.00% due 07/15/2008 | NZD | 1,200,000 | 776,621 |
| Norway - 5.95% | | | |
| Kingdom of Norway | | | |
| 5.00% due 05/15/2015 | NOK | 28,200,000 | 4,754,869 |
| 6.00% due 05/16/2011 | | 47,800,000 | 8,222,967 |
| 6.75% due 01/15/2007 | | 23,400,000 | 3,744,552 |
|
|
| | | | 16,722,388 |
| |
| Panama - 0.29% | | | |
| Republic of Panama | | | |
| 7.25% due 03/15/2015 (a) | $ | 780,000 | 822,900 |
| Spain - 4.33% | | | |
| Kingdom of Spain | | | |
| 4.20% due 07/30/2013 | EUR | 3,700,000 | 4,878,095 |
| 5.00% due 07/30/2012 | | 1,800,000 | 2,464,077 |
| 5.35% due 10/31/2011 | | 3,500,000 | 4,831,124 |
|
|
| | | | 12,173,296 |
| |
| United Kingdom - 2.61% | | | |
| United Kingdom Gilt | | | |
| 4.50% due 03/07/2007 | GBP | 1,650,000 | 3,132,672 |
| 5.00% due 03/07/2008 | | 2,200,000 | 4,193,322 |
|
|
| | | | 7,325,994 |
|
| |
| TOTAL FOREIGN GOVERNMENT OBLIGATIONS | |
| (Cost $127,382,689) | | | $ | 128,376,377 |
|
| |
| CORPORATE BONDS - 23.46% | | | |
| Advertising - 0.11% | | | |
| Vertis, Inc. | | | |
| 9.75% due 04/01/2009 | $ | 300,000 | 303,750 |
| Aerospace - 0.26% | | | |
| Argo-Tech Corp. | | | |
| 9.25% due 06/01/2011 | | 225,000 | 232,313 |
| Sequa Corp. | | | |
| 9.00% due 08/01/2009 | | 475,000 | 501,125 |
|
|
| | | | 733,438 |
| |
| Apparel & Textiles - 0.09% | | | |
| Collins & Aikman Floorcoverings, Inc. | | | |
| 9.75% due 02/15/2010 (a) | | 250,000 | 245,625 |
| Banking - 2.37% | | | |
| Kreditanstalt fuer Wiederaufbau, Series EMTN | | |
| 5.73% due 08/20/2007 | NZD | 1,000,000 | 643,997 |
| Kreditanstalt fuer Wiederaufbau, Series INTL | | |
| 1.85% due 09/20/2010 | JPY | 263,000,000 | 2,317,343 |
| Landwirtschaftliche Rentenbank, Series EMTN | | |
| 6.50% due 09/17/2009 | NZD | 1,000,000 | 644,129 |
| Oesterreichische Kontrollbank AG | | | |
| 1.80% due 03/22/2010 | JPY | 263,000,000 | 2,311,401 |
| Strategic Income Fund (continued) | |
| | | Shares or | |
| | | Principal | |
| | | Amount | Value |
|
|
| |
| CORPORATE BONDS (continued) | | | |
| Banking (continued) | | | |
| Rabobank Nederland, Series EMTN | | | |
| 0.20% due 06/20/2008 | JPY | 88,000,000 | $ | 743,713 |
|
|
| | | | 6,660,583 |
| |
| Broadcasting - 0.62% | | | |
| Allbritton Communications Company | | | |
| 7.75% due 12/15/2012 | $ | 1,245,000 | 1,230,994 |
| Radio One, Inc. | | | |
| 6.375% due 02/15/2013 | | 225,000 | 203,625 |
| 8.875% due 07/01/2011 | | 200,000 | 203,000 |
| Salem Communications Corp. | | | |
| 7.75% due 12/15/2010 | | 100,000 | 99,625 |
|
|
| | | | 1,737,244 |
| |
| Building Materials & Construction - 0.05% | | |
| Brand Services, Inc. | | | |
| 12.00% due 10/15/2012 | | 125,000 | 140,710 |
| Business Services - 0.07% | | | |
| Allied Security Escrow Corp. | | | |
| 11.375% due 07/15/2011 | | 200,000 | 197,500 |
| Cable and Television - 0.89% | | | |
| Atlantic Broadband Finance LLC | | | |
| 9.375% due 01/15/2014 | | 300,000 | 289,500 |
| DirecTV Holdings LLC | | | |
| 8.375% due 03/15/2013 | | 175,000 | 183,750 |
| Mediacom Broadband LLC | | | |
| 8.50% due 10/15/2015 | | 75,000 | 74,250 |
| Mediacom LLC/Mediacom Capital Corp. | | | |
| 9.50% due 01/15/2013 | | 125,000 | 128,437 |
| Sinclair Broadcast Group, Inc. | | | |
| 8.00% due 03/15/2012 | | 1,581,000 | 1,600,763 |
| Young Broadcasting, Inc. | | | |
| 10.00% due 03/01/2011 (a) | | 250,000 | 231,250 |
|
|
| | | | 2,507,950 |
| |
| Cellular Communications - 1.46% | | | |
| America Movil SA de CV | | | |
| 9.00% due 01/15/2016 | MXN | 12,000,000 | 1,126,831 |
| Centennial Communications Corp. | | | |
| 10.00% due 01/01/2013 | $ | 1,000,000 | 997,500 |
| Dobson Cellular Systems, Inc. | | | |
| 8.875% due 10/01/2013 | | 1,000,000 | 987,500 |
| Rural Cellular Corp. | | | |
| 9.75% due 01/15/2010 | | 1,000,000 | 995,000 |
|
|
| | | | 4,106,831 |
| |
| Chemicals - 0.13% | | | |
| Ethyl Corp. | | | |
| 8.875% due 05/01/2010 | | 200,000 | 206,000 |
| Huntsman ICI Chemicals | | | |
| 10.125% due 07/01/2009 | | 50,000 | 51,000 |
| Nova Chemicals Corp. | | | |
| 6.50% due 01/15/2012 (a) | | 125,000 | 115,937 |
|
|
| | | | 372,937 |
| |
| Coal - 0.07% | | | |
| Massey Energy Company | | | |
| 6.625% due 11/15/2010 | | 200,000 | 197,000 |
The accompanying notes are an integral part of the financial statements. 397
John Hancock Funds II
Portfolio of investments — August 31, 2006
(showing percentage of total net assets)
| Strategic Income Fund (continued) | |
| | | Shares or | |
| | | Principal | |
| | | Amount | Value |
|
|
| |
| CORPORATE BONDS (continued) | | | |
| Containers & Glass - 1.91% | | | |
| Graphic Packaging International Corp. | | | |
| 8.50% due 08/15/2011 | $ | 1,000,000 | $ | 1,015,000 |
| 9.50% due 08/15/2013 (a) | | 1,000,000 | 1,005,000 |
| Owens-Brockway Glass Container, Inc. | | | |
| 8.25% due 05/15/2013 | | 1,450,000 | 1,468,125 |
| Stone Container Corp. | | | |
| 8.375% due 07/01/2012 | | 925,000 | 881,063 |
| 9.75% due 02/01/2011 | | 967,000 | 993,592 |
|
|
| | | | 5,362,780 |
| Diversified Financial Services - 2.70% | | | |
| General Electric Capital Corp. | | | |
| 6.625% due 02/04/2010 | NZD | 4,600,000 | 2,968,458 |
| General Electric Capital Corp., Series EMTN | | |
| 8.75% due 10/05/2015 | MXN | 21,000,000 | 1,878,927 |
| 9.50% due 12/11/2014 | | 5,500,000 | 514,373 |
| Toyota Motor Credit Corp. | | | |
| 0.75% due 06/09/2008 | JPY | 262,000,000 | 2,236,981 |
|
|
| | | | 7,598,739 |
| Financial Services - 0.36% | | | |
| BCP Crystal Holdings Corp. | | | |
| 9.625% due 06/15/2014 | $ | 250,000 | 270,937 |
| JSG Funding PLC | | | |
| 9.625% due 10/01/2012 | | 700,000 | 730,625 |
|
|
| | | | 1,001,562 |
| Food & Beverages - 0.16% | | | |
| Del Monte Corp. | | | |
| 8.625% due 12/15/2012 (a) | | 200,000 | 209,250 |
| Pinnacle Foods Holding Corp. | | | |
| 8.25% due 12/01/2013 (a) | | 250,000 | 245,625 |
|
|
| | | | 454,875 |
| Gas & Pipeline Utilities - 0.49% | | | |
| Atlas Pipeline Partners LP | | | |
| 8.125% due 12/15/2015 | | 200,000 | 204,000 |
| MarkWest Energy Partners LP | | | |
| 8.50% due 07/15/2016 | | 1,000,000 | 1,012,500 |
| Targa Resources, Inc. | | | |
| 8.50% due 11/01/2013 | | 175,000 | 174,563 |
|
|
| | | | 1,391,063 |
| Healthcare Products - 0.79% | | | |
| Hanger Orthopedic Group, Inc. | | | |
| 10.25% due 06/01/2014 | | 650,000 | 651,625 |
| Pfizer Inc, Series INTL | | | |
| 0.80% due 03/18/2008 | JPY | 183,000,000 | 1,561,673 |
|
|
| | | | 2,213,298 |
| Healthcare Services - 0.47% | | | |
| Ameripath, Inc. | | | |
| 10.50% due 04/01/2013 | $ | 275,000 | 290,812 |
| Healthsouth Corp. | | | |
| 10.75% due 06/15/2016 (a) | | 1,000,000 | 1,022,500 |
|
|
| | | | 1,313,312 |
| Hotels & Restaurants - 0.86% | | | |
| CCM Merger, Inc. | | | |
| 8.00% due 08/01/2013 | | 1,365,000 | 1,306,988 |
| Strategic Income Fund (continued) | |
| | | Shares or | |
| | | Principal | |
| | | Amount | Value |
|
|
| |
| CORPORATE BONDS (continued) | | | |
| Hotels & Restaurants (continued) | | | |
| Hilton Hotels Corp. | | | |
| 7.625% due 12/01/2012 | $ | 250,000 | $ | 264,326 |
| Landry's Restaurants, Inc., Series B | | | |
| 7.50% due 12/15/2014 | | 390,000 | 368,550 |
| Starwood Hotels & Resorts Worldwide, Inc. | | | |
| 7.875% due 05/01/2012 | | 175,000 | 189,437 |
| Turning Stone Casino Resort | | | |
| 9.125% due 12/15/2010 | | 300,000 | 301,500 |
|
|
| | | | 2,430,801 |
| Industrial Machinery - 0.17% | | | |
| Manitowoc, Inc. | | | |
| 7.125% due 11/01/2013 | | 485,000 | 477,725 |
| International Oil - 2.30% | | | |
| Pan American Energy LLC | | | |
| 7.75% due 02/09/2012 | | 1,500,000 | 1,509,375 |
| Pemex Project Funding Master Trust | | | |
| 5.75% due 12/15/2015 (a) | | 130,000 | 126,490 |
| 7.375% due 12/15/2014 | | 710,000 | 769,285 |
| 8.50% due 02/15/2008 | | 3,095,000 | 3,215,705 |
| 9.125% due 10/13/2010 | | 750,000 | 836,250 |
|
|
| | | | 6,457,105 |
| Leisure Time - 2.91% | | | |
| AMF Bowling Worldwide, Inc. | | | |
| 10.00% due 03/01/2010 | | 250,000 | 256,250 |
| Caesars Entertainment, Inc. | | | |
| 7.00% due 04/15/2013 | | 110,000 | 113,546 |
| Choctaw Resort Development Enterprise | | | |
| 7.25% due 11/15/2019 | | 250,000 | 245,000 |
| Chukchansi Economic Development Authority | | |
| 8.00% due 11/15/2013 | | 200,000 | 202,000 |
| Cinemark, Inc. | | | |
| zero coupon, Step up to 9.75% on | | | |
| 03/15/2009 due 03/15/2014 | | 350,000 | 273,000 |
| Isle of Capri Casinos | | | |
| 7.00% due 03/01/2014 | | 1,100,000 | 1,045,000 |
| Jacobs Entertainment, Inc. | | | |
| 9.75% due 06/15/2014 | | 1,500,000 | 1,498,125 |
| MGM Mirage, Inc. | | | |
| 6.75% due 09/01/2012 | | 475,000 | 461,937 |
| Mohegan Tribal Gaming Authority | | | |
| 7.125% due 08/15/2014 | | 1,375,000 | 1,340,625 |
| MTR Gaming Group, Inc. | | | |
| 9.00% due 06/01/2012 | | 1,000,000 | 1,007,500 |
| Penn National Gaming, Inc. | | | |
| 6.75% due 03/01/2015 | | 300,000 | 288,750 |
| 6.875% due 12/01/2011 | | 100,000 | 99,500 |
| Pokagon Gaming Authority | | | |
| 10.375% due 06/15/2014 | | 500,000 | 528,750 |
| Station Casinos, Inc. | | | |
| 6.50% due 02/01/2014 | | 400,000 | 373,000 |
| 6.625% due 03/15/2018 | | 325,000 | 290,063 |
| 6.875% due 03/01/2016 (a) | | 175,000 | 162,094 |
|
|
| | | | 8,185,140 |
The accompanying notes are an integral part of the financial statements. 398
John Hancock Funds II
Portfolio of investments — August 31, 2006
(showing percentage of total net assets)
| Strategic Income Fund (continued) | |
| | | Shares or | |
| | | Principal | |
| | | Amount | Value |
|
|
| |
| CORPORATE BONDS (continued) | | | |
| Manufacturing - 0.11% | | | |
| Blount, Inc. | | | |
| 8.875% due 08/01/2012 | $ | 150,000 | $ | 150,188 |
| Park-Ohio Industries, Inc. | | | |
| 8.375% due 11/15/2014 | | 175,000 | 158,375 |
|
|
| | | | 308,563 |
| |
| Medical-Hospitals - 0.88% | | | |
| Alliance Imaging, Inc. | | | |
| 7.25% due 12/15/2012 (a) | | 1,000,000 | 930,000 |
| HealthSouth Corp. | | | |
| 11.4181% due 06/15/2014 (a)(b) | | 1,500,000 | 1,541,250 |
|
|
| | | | 2,471,250 |
| |
| Metal & Metal Products - 0.47% | | | |
| Mueller Group, Inc. | | | |
| 10.00% due 05/01/2012 | | 130,000 | 141,700 |
| Mueller Holdings, Inc. | | | |
| zero coupon, Step up to 14.75% on | | | |
| 04/15/2009 due 04/15/2014 | | 39,000 | 34,320 |
| Novelis, Inc. | | | |
| 7.25% due 02/15/2015 | | 215,000 | 204,250 |
| PNA Group, Inc. | | | |
| 10.75% due 09/01/2016 | | 920,000 | 940,700 |
|
|
| | | | 1,320,970 |
| |
| Mining - 0.33% | | | |
| Drummond Company, Inc. | | | |
| 7.375% due 02/15/2016 | | 1,000,000 | 940,000 |
| Paper - 0.87% | | | |
| Abitibi-Consolidated, Inc. | | | |
| 7.75% due 06/15/2011 (a) | | 75,000 | 69,187 |
| 8.375% due 04/01/2015 (a) | | 340,000 | 309,400 |
| 8.55% due 08/01/2010 (a) | | 50,000 | 49,375 |
| 8.85% due 08/01/2030 | | 210,000 | 179,025 |
| Boise Cascade LLC | | | |
| 7.125% due 10/15/2014 | | 350,000 | 325,500 |
| Buckeye Technologies, Inc. | | | |
| 9.25% due 09/15/2008 | | 100,000 | 100,000 |
| Newark Group, Inc. | | | |
| 9.75% due 03/15/2014 | | 225,000 | 214,875 |
| Pope & Talbot, Inc. | | | |
| 8.375% due 06/01/2013 | | 1,500,000 | 1,200,000 |
|
|
| | | | 2,447,362 |
| |
| Petroleum Services - 0.37% | | | |
| Allis-Chalmers Energy, Inc. | | | |
| 9.00% due 01/15/2014 | | 920,000 | 936,100 |
| Hanover Equipment Trust | | | |
| 8.75% due 09/01/2011 | | 100,000 | 104,000 |
|
|
| | | | 1,040,100 |
| |
| Plastics - 0.12% | | | |
| Berry Plastics Corp. | | | |
| 10.75% due 07/15/2012 | | 300,000 | 327,000 |
| Publishing - 0.16% | | | |
| Block Communications, Inc. | | | |
| 8.25% due 12/15/2015 | | 200,000 | 193,750 |
| Strategic Income Fund (continued) | | |
| | | Shares or | | |
| | | Principal | | |
| | | Amount | | Value |
|
|
| |
| CORPORATE BONDS (continued) | | | | |
| Publishing (continued) | | | | |
| CBD Media Holdings, LLC | | | | |
| 9.25% due 07/15/2012 (a) | $ | 250,000 | $ | 245,000 |
|
|
| | | | | 438,750 |
| |
| Retail Trade - 0.06% | | | | |
| PETCO Animal Supplies, Inc. | | | | |
| 10.75% due 11/01/2011 | | 175,000 | | 184,188 |
| Sanitary Services - 0.05% | | | | |
| Allied Waste North America, Inc., Series B | | | | |
| 9.25% due 09/01/2012 | | 125,000 | | 133,750 |
| Telecommunications Equipment & | | | | |
| Services - 0.08% | | | | |
| Insight Midwest LP | | | | |
| 10.50% due 11/01/2010 | | 225,000 | | 233,437 |
| Telephone - 0.36% | | | | |
| Cincinnati Bell, Inc. | | | | |
| 8.375% due 01/15/2014 (a) | | 1,000,000 | | 1,003,750 |
| Tobacco - 0.30% | | | | |
| Alliance One International, Inc. | | | | |
| 11.00% due 05/15/2012 | | 845,000 | | 845,000 |
| Transportation - 0.06% | | | | |
| Mobile Services Group, Inc. | | | | |
| 9.75% due 08/01/2014 | | 160,000 | | 162,200 |
|
| TOTAL CORPORATE BONDS (Cost $66,473,354) | | $ | 65,946,288 |
|
| |
| COLLATERALIZED MORTGAGE | | | | |
| OBLIGATIONS - 5.06% | | | | |
| Bank of America Alternative Loan Trust, | | | | |
| Series 2006-1, Class 4CB1 | | | | |
| 6.50% due 02/25/2036 | | 3,245,148 | | 3,276,409 |
| Countrywide Home Loan Mortgage Pass Through | | | |
| Trust, Series 2005-27, Class 2A1 | | | | |
| 5.50% due 12/25/2035 | | 7,707,789 | | 7,505,459 |
| Wamu Alternative Mortgage Pass-Through | | | | |
| Certificates, Series 2006-3, Class 4CB | | | | |
| 6.50% due 03/25/2036 | | 3,409,939 | | 3,441,899 |
|
| TOTAL COLLATERALIZED MORTGAGE OBLIGATIONS | | |
| (Cost $14,206,926) | | | $ | 14,223,767 |
|
| |
| SUPRANATIONAL OBLIGATIONS - 0.69% | | | |
| Supranational - 0.42% | | | | |
| European Investment Bank | | | | |
| 6.75% due 11/17/2008 | NZD | 1,800,000 | | 1,169,646 |
| Venezuela - 0.27% | | | | |
| Corporacion Andina de Fomento, Series EXCH | | | |
| 6.875% due 03/15/2012 | $ | 730,000 | | 770,753 |
|
| TOTAL SUPRANATIONAL OBLIGATIONS | | | |
| (Cost $1,921,208) | | | $ | 1,940,399 |
|
| |
| SHORT TERM INVESTMENTS - 35.37% | | | |
| Canadian Treasury Bill | | | | |
| zero coupon due 04/19/2007 | CAD | 4,400,000 | $ | 3,873,642 |
| 4.78% due 09/20/2006 | $ | 290,000 | | 289,256 |
| Great Lakes Carbon Income Fund | | 72,855 | | 674,797 |
The accompanying notes are an integral part of the financial statements. 399
John Hancock Funds II
Portfolio of investments — August 31, 2006
(showing percentage of total net assets)
| Strategic Income Fund (continued) | | |
| | | Shares or | | |
| | | Principal | | |
| | | Amount | | Value |
|
|
| |
| SHORT TERM INVESTMENTS (continued) | | | |
| Mexico Cetes, Series BI | | | | |
| zero coupon due 01/04/2007 | MXN | 60,000,000 | $ | 5,362,577 |
| State Street Global Advisers Funds (c) | $ | 18,441,401 | | 18,441,401 |
| State Street Navigator Securities Lending | | | | |
| Prime Portfolio (c) | | 70,775,414 | | 70,775,414 |
|
| TOTAL SHORT TERM INVESTMENTS | | | | |
| (Cost $99,295,533) | | | $ | 99,417,087 |
|
| Total Investments (Strategic Income Fund) | | | |
| (Cost $350,014,222) - 124.83% | | | $ | 350,876,058 |
| Liabilities in Excess of Other Assets - (24.83)% | | | (69,782,625) |
|
|
| TOTAL NET ASSETS - 100.00% | | | $ | 281,093,433 |
|
|
| |
| |
| Strategic Value Fund | | | | |
| | | Shares or | | |
| | | Principal | | |
| | | Amount | | Value |
|
|
| |
| COMMON STOCKS - 97.50% | | | | |
| Banking - 3.66% | | | | |
| Bank of America Corp. | | 108,461 | $ | 5,582,488 |
| Broadcasting - 3.23% | | | | |
| CBS Corp., Class B | | 172,233 | | 4,917,252 |
| Building Materials & Construction - 3.14% | | | |
| Masco Corp. | | 174,779 | | 4,790,692 |
| Cable and Television - 1.03% | | | | |
| E.W. Scripps Company, Class A | | 34,400 | | 1,564,168 |
| Computers & Business Equipment - 4.47% | | | |
| Dell, Inc. * | | 156,450 | | 3,527,948 |
| Diebold, Inc. | | 18,800 | | 787,908 |
| Sun Microsystems, Inc. * | | 500,758 | | 2,498,782 |
|
|
| | | | | 6,814,638 |
| Containers & Glass - 3.22% | | | | |
| Owens-Illinois, Inc. * | | 323,219 | | 4,900,000 |
| Cosmetics & Toiletries - 2.33% | | | | |
| Alberto-Culver Company, Class B | | 17,160 | | 844,787 |
| Estee Lauder Companies, Inc., Class A | | 73,381 | | 2,704,824 |
|
|
| | | | | 3,549,611 |
| Crude Petroleum & Natural Gas - 5.13% | | | |
| Apache Corp. | | 56,680 | | 3,700,070 |
| Devon Energy Corp. | | 65,894 | | 4,117,716 |
|
|
| | | | | 7,817,786 |
| Drugs & Health Care - 4.17% | | | | |
| Wyeth | | 130,400 | | 6,350,480 |
| Electrical Utilities - 3.24% | | | | |
| FPL Group, Inc. (a) | | 111,240 | | 4,944,618 |
| Financial Services - 8.72% | | | | |
| JPMorgan Chase & Company | | 151,226 | | 6,904,979 |
| Mellon Financial Corp. | | 131,147 | | 4,882,603 |
| Merrill Lynch & Company, Inc. | | 20,392 | | 1,499,424 |
|
|
| | | | | 13,287,006 |
| Strategic Value Fund (continued) | | |
| | Shares or | |
| | Principal | |
| | Amount | Value |
|
|
| |
| COMMON STOCKS (continued) | | |
| Industrial Machinery - 1.78% | | |
| Pall Corp. | 99,760 | $ | 2,715,467 |
| Insurance - 7.63% | | |
| Allstate Corp. | 68,575 | 3,973,235 |
| Conseco, Inc. * (a) | 211,151 | 4,370,826 |
| St. Paul Travelers Companies, Inc. | 74,700 | 3,279,330 |
|
|
| | | 11,623,391 |
| International Oil - 1.97% | | |
| Noble Corp. | 45,995 | 3,007,613 |
| Internet Software - 5.64% | | |
| Symantec Corp. * | 461,204 | 8,596,843 |
| Liquor - 0.58% | | |
| Molson Coors Brewing Company, Class B | 12,643 | 888,803 |
| Manufacturing - 3.87% | | |
| Tyco International, Ltd. | 225,473 | 5,896,119 |
| Medical-Hospitals - 1.32% | | |
| Tenet Healthcare Corp. * | 254,602 | 2,006,264 |
| Newspapers - 2.67% | | |
| The New York Times Company, Class A (a) | 180,510 | 4,065,085 |
| Office Furnishings & Supplies - 2.30% | | |
| OfficeMax, Inc. | 84,465 | 3,507,831 |
| Paper - 1.52% | | |
| Bowater, Inc. (a) | 101,895 | 2,316,073 |
| Petroleum Services - 1.71% | | |
| GlobalSantaFe Corp. | 53,092 | 2,613,188 |
| Pharmaceuticals - 3.87% | | |
| Merck & Company, Inc. | 145,527 | 5,901,120 |
| Retail Trade - 3.78% | | |
| Saks, Inc. * (a) | 233,910 | 3,375,321 |
| Wal-Mart Stores, Inc. | 53,270 | 2,382,235 |
|
|
| | | 5,757,556 |
| Software - 4.38% | | |
| Compuware Corp. * | 470,045 | 3,572,342 |
| Oracle Corp. * | 197,881 | 3,096,838 |
|
|
| | | 6,669,180 |
| Telecommunications Equipment & | | |
| Services - 4.21% | | |
| Embarq Corp. * | 13,458 | 634,545 |
| Nortel Networks Corp. * | 2,763,769 | 5,776,277 |
|
|
| | | 6,410,822 |
| Telephone - 6.18% | | |
| Sprint Nextel Corp. | 91,312 | 1,544,999 |
| Verizon Communications, Inc. | 223,700 | 7,869,766 |
|
|
| | | 9,414,765 |
| Toys, Amusements & Sporting Goods - 1.75% | | |
| Mattel, Inc. | 141,676 | 2,669,176 |
|
| TOTAL COMMON STOCKS (Cost $144,303,725) | | $ | 148,578,035 |
The accompanying notes are an integral part of the financial statements. 400
John Hancock Funds II
Portfolio of investments — August 31, 2006
(showing percentage of total net assets)
| Strategic Value Fund (continued) | | |
| | | Shares or | |
| | | Principal | |
| | | Amount | Value |
|
|
| |
| SHORT TERM INVESTMENTS - 12.24% | | |
| Citigroup Funding, Inc. | | | |
| zero coupon due 09/01/2006 | $ | 5,318,000 | $ | 5,318,000 |
| State Street Navigator Securities Lending | | |
| Prime Portfolio (c) | | 13,329,847 | 13,329,847 |
|
| TOTAL SHORT TERM INVESTMENTS | | |
| (Cost $18,647,847) | | | $ | 18,647,847 |
|
| Total Investments (Strategic Value Fund) | | |
| (Cost $162,951,572) - 109.74% | | | $ | 167,225,882 |
| Liabilities in Excess of Other Assets - (9.74)% | | (14,838,381) |
|
|
| TOTAL NET ASSETS - 100.00% | | | $ | 152,387,501 |
|
|
| |
| |
| Total Return Fund | | | |
| | | Shares or | |
| | | Principal | |
| | | Amount | Value |
|
|
| |
| U.S. TREASURY OBLIGATIONS - 1.24% | | |
| Treasury Inflation Protected | | | |
| Securities (d) - 1.24% | | | |
| 2.00% due 01/15/2026 (a)*** | $ | 12,062,196 $ | 11,619,755 |
| 2.375% due 01/15/2025 (a)*** | | 2,045,046 | 2,087,385 |
| 3.625% due 04/15/2028 (a)*** | | 501,760 | 625,024 |
|
|
| | | | 14,332,164 |
|
| TOTAL U.S. TREASURY OBLIGATIONS | | |
| (Cost $14,163,544) | | | $ | 14,332,164 |
|
| |
| U.S. GOVERNMENT AGENCY OBLIGATIONS - 44.43% | |
| Federal National Mortgage | | | |
| Association - 44.43% | | | |
| 3.719% due 07/01/2034 *** | | 911,514 | 905,434 |
| 4.347% due 11/01/2034 to | | | |
| 03/01/2035 (b)*** | | 2,713,026 | 2,696,735 |
| 4.463% due 05/01/2035 (b)*** | | 2,136,996 | 2,118,846 |
| 4.460% due 01/01/2035 *** | | 749,603 | 733,589 |
| 4.84% due 06/01/2035 *** | | 2,226,883 | 2,191,902 |
| 5.50% due 06/01/2035 (b)*** | | 1,028,801 | 1,010,137 |
| 5.50% due 12/01/2034 to 05/01/2036 *** | 203,345,207 | 199,834,594 |
| 5.50% TBA ** | | 310,000,000 | 304,187,500 |
| 6.232% due 11/01/2035 (b)*** | | 1,317,971 | 1,357,710 |
|
|
| | | | 515,036,447 |
|
| TOTAL U.S. GOVERNMENT AGENCY OBLIGATIONS | |
| (Cost $513,856,006) | | | $ | 515,036,447 |
|
| |
| FOREIGN GOVERNMENT OBLIGATIONS - 5.67% | |
| Belgium - 0.32% | | | |
| Kingdom of Belgium | | | |
| zero coupon due 09/14/2006 *** | EUR | 2,920,000 | 3,731,689 |
| Germany - 2.16% | | | |
| Federal Republic of Germany, Series 0606 | | |
| zero coupon due 12/13/2006 *** | | 19,700,000 | 24,989,287 |
| Total Return Fund (continued) | | |
| | | Shares or | |
| | | Principal | |
| | | Amount | Value |
|
|
| |
| FOREIGN GOVERNMENT OBLIGATIONS | | |
| (continued) | | | |
| Netherlands - 3.19% | | | |
| Kingdom of Netherlands | | | |
| zero coupon due 10/31/2006 *** | EUR | 29,100,000 | $ | 37,045,291 |
|
| TOTAL FOREIGN GOVERNMENT OBLIGATIONS | |
| (Cost $64,974,548) | | | $ | 65,766,267 |
|
| |
| CORPORATE BONDS - 19.78% | | | |
| Automobiles - 0.86% | | | |
| DaimlerChrysler N.A. Holding Corp. | | | |
| 5.4863% due 03/07/2007 (b)*** | $ | 10,000,000 | 10,005,280 |
| Banking - 4.45% | | | |
| ANZ National International Ltd., Series 144A | | |
| 5.5394% due 08/07/2009 (b) | | 2,600,000 | 2,596,901 |
| Bank of America Corp. | | | |
| 5.4056% due 06/19/2009 (b)*** | | 11,100,000 | 11,100,477 |
| BNP Paribas | | | |
| 5.186% due 06/29/2049 (b)*** | | 6,000,000 | 5,635,260 |
| HSBC Bank USA | | | |
| 5.4944% due 09/21/2007 (b)*** | | 5,000,000 | 5,005,275 |
| HSBC Bank USA, Series BKNT | | | |
| 5.53% due 06/10/2009 (b)*** | | 900,000 | 900,219 |
| HSBC Finance Corp. | | | |
| 5.4594% due 09/15/2008 (b)*** | | 4,300,000 | 4,310,316 |
| Royal Bank of Scotland Group PLC | | | |
| 7.648% due 08/31/2049 (b)*** | | 5,000,000 | 5,666,310 |
| Sumitomo Mitsui Banking Corp. | | | |
| 5.625% due 07/29/2049 (b)*** | | 5,200,000 | 5,025,254 |
| USB Capital IX | | | |
| 6.189% due 04/15/2042 (a)(b)*** | | 300,000 | 301,255 |
| Wachovia Bank NA, Series BKNT | | | |
| 5.46% due 05/25/2010 (b)*** | | 11,000,000 | 10,999,186 |
|
|
| | | | 51,540,453 |
| |
| Cable and Television - 0.09% | | | |
| Cablevision | | | |
| 6.87% due 03/23/2013 (b)*** (f) | | 997,500 | 993,951 |
| Diversified Financial Services - 1.89% | | |
| General Electric Capital Corp., Series MTNA | | |
| 5.4494% due 12/15/2009 (b)*** | | 11,000,000 | 11,030,635 |
| Wells Fargo & Company | | | |
| 5.4294% due 09/15/2009 (a)(b)*** | | 10,900,000 | 10,917,484 |
|
|
| | | | 21,948,119 |
| |
| Electrical Utilities - 0.15% | | | |
| FirstEnergy Corp., Series A | | | |
| 5.50% due 11/15/2006 *** | | 1,800,000 | 1,799,685 |
| Financial Services - 9.60% | | | |
| American Express Credit Corp. | | | |
| 5.35% due 12/12/2007 (b)*** | | 2,100,000 | 2,101,033 |
| American Express Credit Corp., Series MTN | | |
| 5.082% due 03/02/2009 (b)*** | | 2,300,000 | 2,300,529 |
| Atlantic & Western Re, Ltd., Series A | | | |
| 11.5081% due 01/09/2007 (b) | | 250,000 | 245,932 |
| Bear Stearns Companies, Inc. | | | |
| 5.635% due 04/29/2008 (b)*** | | 5,300,000 | 5,313,923 |
The accompanying notes are an integral part of the financial statements. 401
John Hancock Funds II
Portfolio of investments — August 31, 2006
(showing percentage of total net assets)
| Total Return Fund (continued) | | |
| | | Shares or | |
| | | Principal | |
| | | Amount | Value |
|
|
| |
| CORPORATE BONDS (continued) | | | |
| Financial Services (continued) | | | |
| Bear Stearns Companies, Inc., Series MTN | | | |
| 5.4894% due 08/21/2009 (b)*** | $ | 1,800,000 | $ | 1,800,567 |
| Bear Stearns Companies, Inc., Series MTNB | | |
| 5.5888% due 03/30/2009 (b)*** | | 2,500,000 | 2,501,548 |
| CIT Group Holdings, Inc. | | | |
| 5.635% due 01/30/2009 (b)*** | | 1,300,000 | 1,302,711 |
| CIT Group, Inc. | | | |
| 5.4656% due 12/19/2007 (b)*** | | 5,000,000 | 5,004,970 |
| 5.78% due 07/28/2011 (b)*** | | 2,700,000 | 2,701,739 |
| CIT Group, Inc., Series MTN | | | |
| 5.5463% due 08/17/2009 (b)*** | | 2,300,000 | 2,299,000 |
| Citigroup Global Markets Holdings, Inc., Series | | |
| MTNA | | | |
| 5.4956% due 03/17/2009 (b)*** | | 2,400,000 | 2,401,886 |
| Citigroup, Inc. | | | |
| 5.52% due 12/26/2008 (b)*** | | 1,400,000 | 1,400,655 |
| 5.5156% due 05/02/2008 (b)*** | | 5,000,000 | 5,005,910 |
| 5.525% due 01/30/2009 (b)*** | | 1,500,000 | 1,500,417 |
| 6.125% due 08/25/2036 *** | | 3,500,000 | 3,548,098 |
| Goldman Sachs Group, Inc. | | | |
| 5.5388% due 06/23/2009 (b)*** | | 1,700,000 | 1,700,165 |
| Goldman Sachs Group, Inc., Series B MTN | | |
| 5.8406% due 07/23/2009 (b)*** | | 1,100,000 | 1,107,309 |
| Goldman Sachs Group, Inc., Series MTN | | | |
| 5.5359% due 11/10/2008 (b)*** | | 5,700,000 | 5,706,253 |
| Goldman Sachs Group, Inc., Series MTNB | | | |
| 5.5269% due 12/22/2008 (b)*** | | 2,800,000 | 2,802,321 |
| HBOS Treasury Services PLC, Series MTN | | |
| 5.5469% due 07/17/2009 (b)*** | | 3,900,000 | 3,900,294 |
| International Lease Finance Corp., Series MTN | | |
| 5.62% due 05/24/2010 (b)*** | | 18,700,000 | 18,723,599 |
| John Deere Capital Corp., Series MTN | | | |
| 5.3993% due 07/15/2008 (b)*** | | 2,400,000 | 2,399,064 |
| Lehman Brothers Holdings, Inc., Series MTN | | |
| 5.3781% due 11/24/2008 (b)*** | | 1,200,000 | 1,199,816 |
| 5.6588% due 12/23/2010 (a)(b)*** | | 10,000,000 | 10,015,580 |
| Merrill Lynch & Company, Inc., Series MTN | | |
| 5.4919% due 08/14/2009 (b)*** | | 2,300,000 | 2,299,549 |
| 5.685% due 07/25/2011 (b)*** | | 3,200,000 | 3,202,096 |
| Merrill Lynch & Company, Inc., Series MTNB | | |
| 5.575% due 01/30/2009 (b)*** | | 3,200,000 | 3,202,557 |
| Morgan Stanley, Series GMTN | | | |
| 5.55% due 02/09/2009 (b)*** | | 5,100,000 | 5,108,884 |
| SLM Corp., Series MTNA | | | |
| 5.625% due 07/27/2009 (b)*** | | 10,500,000 | 10,508,516 |
|
|
| | | | 111,304,921 |
| International Oil - 0.27% | | | |
| Pemex Project Funding Master Trust | | | |
| 5.75% due 12/15/2015 *** | | 800,000 | 778,400 |
| Transocean, Inc. | | | |
| 5.5906% due 09/05/2008 | | 2,300,000 | 2,299,489 |
|
|
| | | | 3,077,889 |
| Software - 0.22% | | | |
| Oracle Corp. and Ozark Holding, Inc. | | | |
| 5.73% due 01/13/2009 (b)*** | | 2,500,000 | 2,502,898 |
| Total Return Fund (continued) | | |
| | | Shares or | |
| | | Principal | |
| | | Amount | Value |
|
|
| |
| CORPORATE BONDS (continued) | | | |
| Telecommunications Equipment & | | | |
| Services - 0.52% | | | |
| Embarq Corp. | | | |
| 6.738% due 06/01/2013 *** | $ | 2,600,000 | $ | 2,652,689 |
| 7.082% due 06/01/2016 *** | | 3,300,000 | 3,367,115 |
|
|
| | | | 6,019,804 |
| |
| Telephone - 1.16% | | | |
| AT&T, Inc. | | | |
| 5.495% due 05/15/2008 (b)*** | | 1,700,000 | 1,699,978 |
| 5.6119% due 11/14/2008 (b)*** | | 1,600,000 | 1,604,234 |
| AT&T, Inc., Series 144A | | | |
| 4.214% due 06/05/2007 *** | | 3,200,000 | 3,168,672 |
| BellSouth Corp. | | | |
| 5.58% due 08/15/2008 (b)*** | | 3,800,000 | 3,800,144 |
| Telecom Italia Capital SA | | | |
| 6.1081% due 07/18/2011 (b)*** | | 3,200,000 | 3,205,094 |
|
|
| | | | 13,478,122 |
| |
| Tobacco - 0.37% | | | |
| Philip Morris Companies, Inc. | | | |
| 7.75% due 01/15/2027 *** | | 3,600,000 | 4,350,089 |
| Transportation - 0.20% | | | |
| FedEx Corp. | | | |
| 5.5794% due 08/08/2007 (b)*** | | 2,300,000 | 2,300,108 |
|
| TOTAL CORPORATE BONDS (Cost $229,364,940) | | $ | 229,321,319 |
|
| |
| MUNICIPAL BONDS - 0.58% | | | |
| Iowa - 0.10% | | | |
| Tobacco Settlement Authority of Iowa, Series A | | |
| 6.50% due 06/01/2023 *** | | 1,185,000 | 1,173,600 |
| Nevada - 0.01% | | | |
| Truckee Meadows Water Authority | | | |
| 5.00% due 07/01/2036 (b)*** | | 67,000 | 76,174 |
| Pennsylvania - 0.13% | | | |
| Pennsylvania Higher Educational Facilties Authority | | |
| 4.75% due 07/15/2013 *** | | 1,500,000 | 1,564,740 |
| Texas - 0.04% | | | |
| Eagle Mountain & Saginaw Independent School | | |
| District | | | |
| 4.75% due 08/15/2033 *** | | 500,000 | 509,845 |
| Virginia - 0.04% | | | |
| Tobacco Settlement Financing Corp. | | | |
| 5.625% due 06/01/2037 *** | | 400,000 | 418,172 |
| Wisconsin - 0.26% | | | |
| Badger Tobacco Asset Securitization Corp. | | |
| 6.125% due 06/01/2027 *** | | 2,795,000 | 2,983,690 |
|
| TOTAL MUNICIPAL BONDS (Cost $6,661,651) | | $ | 6,726,221 |
|
| |
| COLLATERALIZED MORTGAGE | | | |
| OBLIGATIONS - 9.54% | | | |
| American Home Mortgage Investment Trust, Series | | |
| 2004-4, Class 4A | | | |
| 4.39% due 02/25/2045 *** | | 424,216 | 416,093 |
The accompanying notes are an integral part of the financial statements. 402
John Hancock Funds II
Portfolio of investments — August 31, 2006
(showing percentage of total net assets)
| Total Return Fund (continued) | | |
| | | Shares or | |
| | | Principal | |
| | | Amount | Value |
|
|
| |
| COLLATERALIZED MORTGAGE | | | |
| OBLIGATIONS (continued) | | | |
| Citigroup Mortgage Loan Trust, Inc., | | | |
| Series 2005-11, Class 1A1 | | | |
| 4.90% due 12/25/2035 (b)*** | $ | 1,866,280 | $ | 1,877,108 |
| Citigroup Mortgage Loan Trust, Inc., | | | |
| Series 2005-11, Class A2A | | | |
| 4.70% due 12/25/2035 *** | | 649,784 | 637,555 |
| Countrywide Alternative Loan Trust, | | | |
| Series 2005-81, Class A1 | | | |
| 5.6044% due 02/25/2037 (b)*** | | 9,284,908 | 9,322,140 |
| Countrywide Home Loans, | | | |
| Series 2005-HYB9, Class 3A2A | | | |
| 5.25% due 02/20/2036 (b)*** | | 806,522 | 801,853 |
| CS First Boston Mortgage Securities Corp., | | |
| Series 2005-C6, Class A1 | | | |
| 4.938% due 12/15/2040 *** | | 1,564,836 | 1,554,193 |
| Federal Home Loan Mortgage Corp., Series 2637, | | |
| Class F | | | |
| 5.73% due 06/15/2018 (b)*** | | 489,432 | 489,698 |
| Federal Home Loan Mortgage Corp., Series 3036, | | |
| Class NA | | | |
| 5.00% due 07/15/2024 *** | | 4,600,000 | 4,572,511 |
| Federal Home Loan Mortgage Corp., Series 3149, | | |
| Class LF | | | |
| 5.63% due 05/15/2036 (b)*** | | 1,900,000 | 1,900,105 |
| Federal Home Loan Mortgage Corp., | | | |
| Series 2844 , Class PR | | | |
| 5.00% due 09/15/2017 *** | | 2,630,856 | 2,619,179 |
| Federal Home Loan Mortgage Corp., | | | |
| Series T-63, Class 1A1 | | | |
| 5.482% due 02/25/2045 (b)*** | | 474,547 | 472,007 |
| Federal National Mortgage Association, Series | | |
| 2005-33, Class QA | | | |
| 5.00% due 06/25/2027 *** | | 3,365,689 | 3,340,759 |
| Federal National Mortgage Association, | | | |
| Series 2003-W6, Class F | | | |
| 5.6744% due 09/25/2042 (b)*** | | 2,926,290 | 2,940,709 |
| Federal National Mortgage Association, | | | |
| Series 2005-120, Class NF | | | |
| 5.4244% due 01/25/2021 (b)*** | | 35,469,554 | 35,380,689 |
| Federal National Mortgage Association, | | | |
| Series 2006-5, Class 3A2 | | | |
| 4.6798% due 05/25/2035 (b)*** | | 500,000 | 490,924 |
| GE Capital Commercial Mortgage Corp., | | | |
| Series 2002-3A, Class A1 | | | |
| 4.229% due 12/10/2037 (b)*** | | 7,254,025 | 7,089,873 |
| Government National Mortgage Association, Series | | |
| 2003-4, Class LA | | | |
| 4.00% due 07/16/2027 *** | | 532,956 | 526,863 |
| LB-UBS Commercial Mortgage Trust, Series | | |
| 2005-C7, Class A1 | | | |
| 4.99% due 11/15/2030 *** | | 1,925,239 | 1,916,327 |
| Lehman Brothers Floating Rate Commercial | | |
| Mortgage Trust, Series 2006-LLFA , Class A1 | | |
| 5.4056% due 09/15/2021 (b)*** | | 2,600,000 | 2,604,079 |
| Mellon Residential Funding Corp., | | | |
| Series 2000-TBC3, Class A1 | | | |
| 5.77% due 12/15/2030 (b)*** | | 7,509,520 | 7,533,678 |
| Total Return Fund (continued) | | |
| | | Shares or | |
| | | Principal | |
| | | Amount | Value |
|
|
| |
| COLLATERALIZED MORTGAGE | | | |
| OBLIGATIONS (continued) | | | |
| Structured Asset Mortgage Investments, Inc., | | |
| Series 2005-AR8, Class A1A | | | |
| 5.6044% due 02/25/2036 (b)*** | $ | 947,093 | $ | 947,555 |
| Structured Asset Securities Corp., Series | | | |
| 2005-AR1, Class A3 | | | |
| 5.4244% due 09/25/2035 (b)*** | | 4,830,078 | 4,830,569 |
| Thornburg Mortgage Securities Trust, | | | |
| Series 2006-5, Class A1 | | | |
| 5.45% due 08/25/2036 (b)*** | | 6,100,000 | 6,100,956 |
| Washington Mutual Inc., Series 2001-7, Class A | | |
| 5.628% due 05/25/2041 (b)*** | | 846,448 | 854,623 |
| Washington Mutual Inc., Series 2005-AR19, Class | | |
| A1A1 | | | |
| 5.5944% due 12/25/2045 (b)*** | | 8,207,446 | 8,231,336 |
| Wells Fargo Mortgage Backed Securities Trust, | | |
| Series 2006-AR2 , Class 2A1 | | | |
| 4.95% due 03/25/2036 (b)*** | | 3,204,795 | 3,164,978 |
|
| TOTAL COLLATERALIZED MORTGAGE OBLIGATIONS | |
| (Cost $110,645,557) | | | $ | 110,616,360 |
|
| |
| ASSET BACKED SECURITIES - 5.32% | | |
| Argent Securities, Inc., Series 2005-W4, Class A2A | | |
| 5.4644% due 02/25/2036 (b)*** | | 2,737,728 | 2,738,074 |
| Argent Securities, Inc., Series 2006-M2 , Class A2A | | |
| 5.3781% due 09/25/2036 (b)*** | | 1,600,000 | 1,601,254 |
| Countrywide Asset-Backed Certificates, Series | | |
| 2006-16, Class 2A1 | | | |
| 5.375% due 10/25/2036 | | 1,500,000 | 1,500,705 |
| Countrywide Asset-Backed Certificates, Series | | |
| 2006-15, Class A1 | | | |
| 5.434% due 10/25/2036 | | 3,200,000 | 3,201,003 |
| First NLC Trust, Series 2005-3, Class AV1 | | | |
| 5.4344% due 12/25/2035 (b)*** | | 564,995 | 565,033 |
| Fremont Home Loan Trust, | | | |
| Series 2005-E, Class 2A1 | | | |
| 5.4144% due 01/25/2036 (b)*** | | 1,063,023 | 1,063,015 |
| GE-WMC Mortgage Securities LLC, | | | |
| Series 2005-2, Class A2A | | | |
| 5.4244% due 12/25/2035 (b)*** | | 21,613,419 | 21,616,790 |
| GSR Mortgage Loan Trust, | | | |
| Series 2005-HEL1, Class A2A | | | |
| 5.4244% due 11/25/2030 (b)*** | | 1,363,349 | 1,363,411 |
| Home Equity Mortgage Trust, Series 2005-HF1, | | |
| Class A2A | | | |
| 5.4344% due 02/25/2036 (b)*** | | 1,028,799 | 1,028,894 |
| Indymac Residential Asset Backed Trust, | | | |
| Series 2005-D, Class AII1 | | | |
| 5.4244% due 03/25/2036 (b)*** | | 1,386,934 | 1,387,151 |
| JP Morgan Mortgage Acquisition Corp., | | | |
| Series 2006-WMC3, Class A2 | | | |
| 5.38% due 08/25/2036 (b) | | 1,700,000 | 1,700,799 |
| Long Beach Mortgage Loan Trust, | | | |
| Series 2004-4 , Class 1A1 | | | |
| 5.6044% due 10/25/2034 (b)*** | | 1,079,800 | 1,082,083 |
| Merrill Lynch Mortgage Investors, Inc., Series | | |
| 2005-SL1, Class A | | | |
| 5.5244% due 06/25/2035 (b)*** | | 2,106,527 | 2,106,740 |
The accompanying notes are an integral part of the financial statements. 403
John Hancock Funds II
Portfolio of investments — August 31, 2006
(showing percentage of total net assets)
| Total Return Fund (continued) | | |
| | | Shares or | |
| | | Principal | |
| | | Amount | Value |
|
|
| |
| ASSET BACKED SECURITIES | | | |
| (continued) | | | |
| Newcastle Mortgage Securities Trust, | | | |
| Series 2006-1, Class A1 | | | |
| 5.3944% due 03/25/2036 (b)*** | $ | 4,312,297 | $ | 4,313,183 |
| Nissan Auto Lease Trust, Series 2004-A, Class A3 | | |
| 2.90% due 08/15/2007 *** | | 91,621 | 91,518 |
| Option One Mortgage Loan Trust, Series 2005-4, | | |
| Class A2 | | | |
| 5.4244% due 11/25/2035 (b)*** | | 2,744,462 | 2,744,882 |
| Residential Asset Securities Corp., | | | |
| Series 2006-KS6 , Class A1 | | | |
| 5.44% due 08/25/2036 (b)*** | | 1,979,792 | 1,979,483 |
| SLM Student Loan Trust, Series 2004-8, Class A2 | | |
| 5.505% due 07/25/2013 (b)*** | | 39,722 | 39,732 |
| SLM Student Loan Trust, Series 2005-1, Class A1 | | |
| 5.495% due 01/26/2015 (b)*** | | 1,486,237 | 1,486,501 |
| SLM Student Loan Trust, Series 2005-2, Class A2 | | |
| 5.495% due 01/25/2013 (b)*** | | 2,009,892 | 2,010,236 |
| Soundview Home Equity Loan Trust, | | | |
| Series 2005-B, Class A1 | | | |
| 5.4344% due 05/25/2035 (b)*** | | 189,880 | 189,879 |
| Soundview Home Equity Loan Trust, | | | |
| Series 2006-EQ1, Class A1 | | | |
| 5.458% due 10/25/2036 (b) | | 3,000,000 | 3,000,940 |
| Structured Asset Securities Corp., | | | |
| Series 2005-S7, Class A1 | | | |
| 5.4544% due 12/25/2035 (b)*** | | 2,586,971 | 2,587,193 |
| Wachovia Auto Owner Trust, Series 2005-B, Class | | |
| A2 | | | |
| 4.82% due 02/20/2009 *** | | 2,330,856 | 2,325,029 |
|
| TOTAL ASSET BACKED SECURITIES | | | |
| (Cost $61,716,918) | | | $ | 61,723,528 |
|
| |
| OPTIONS - 0.41% | | | |
| Call Options - 0.40% | | | |
| Over The Counter European Style Call | | | |
| Expiration 07/02/2007 at $3.96 * | | 33,000,000 | 241,015 |
| Expiration 07/02/2007 at $3.96 * | | 10,000,000 | 73,035 |
| Expiration 07/02/2007 at $3.96 * | | 21,000,000 | 153,373 |
| Expiration 07/02/2007 at $4.10 * | | 22,000,000 | 197,226 |
| Expiration 12/22/2006 at $4.80 * | | 29,000,000 | 16,849 |
| Expiration 03/08/2007 at $5.00 * | | 30,000,000 | 86,910 |
| Expiration 03/08/2007 at $5.00 * | | 16,000,000 | 46,352 |
| Expiration 02/01/2007 at $5.17 * | | 27,500,000 | 109,246 |
| Expiration 05/23/2007 at $5.20 * | | 52,000,000 | 316,108 |
| Expiration 05/09/2007 at $5.20 * | | 61,300,000 | 370,470 |
| Expiration 06/07/2007 at $5.25 * | | 53,000,000 | 375,264 |
| Expiration 06/07/2007 at $5.25 * | | 10,000,000 | 70,804 |
| Expiration 07/02/2007 at $5.25 * | | 142,000,000 | 1,058,958 |
| Expiration 07/02/2007 at $5.37 * | | 110,700,000 | 984,426 |
| Expiration 06/30/2007 at $5.50 * | | 52,000,000 | 549,951 |
|
|
| | | | 4,649,987 |
| Put Options - 0.01% | | | |
| Chicago Mercantile Exchange American Purchase | | |
| Put on Eurodollar | | | |
| Expiration 09/17/2007 at $90.75 * | | 1,030,000 | 2,575 |
| Total Return Fund (continued) | | | |
| | | Shares or | | |
| | | Principal | | |
| | | Amount | | Value |
|
|
| |
| OPTIONS (continued) | | | | |
| Put Options (continued) | | | | |
| Chicago Mercantile Exchange American Purchase | | | |
| Put on Eurodollar (continued) | | | | |
| Expiration 06/18/2007 at $91.00 * | | 1,915,000 | $ | 4,788 |
| Expiration 06/18/2007 at $91.25 * | | 3,637,500 | | 9,094 |
| Expiration 09/17/2007 at $91.25 * | | 1,642,500 | | 4,106 |
| Expiration 12/18/2006 at $92.00 * | | 2,650,000 | | 6,625 |
| Expiration 03/19/2007 at $92.00 * | | 680,000 | | 1,700 |
| Expiration 12/18/2006 at $92.25 * | | 1,737,500 | | 4,344 |
| Expiration 09/18/2006 at $92.50 * | | 2,290,000 | | 5,725 |
| Expiration 12/18/2006 at $92.75 * | | 635,000 | | 1,587 |
| Expiration 12/18/2006 at $93.375 * | | 222,500 | | 556 |
| Expiration 09/18/2006 at $94.00 * | | 635,000 | | 1,587 |
| Expiration 12/18/2006 at $94.125 * | | 1,025,000 | | 2,563 |
|
|
| | | | | 45,250 |
|
| TOTAL OPTIONS (Cost $3,143,545) | | | $ | 4,695,237 |
|
| |
| SHORT TERM INVESTMENTS - 38.61% | | | |
| Bank of America Corp. | | | | |
| 5.275% due 12/01/2006 *** | $ | 23,400,000 | $ | 23,087,984 |
| Barclays Bank PLC NY | | | | |
| 5.491% due 01/29/2007 *** | | 10,200,000 | | 10,199,315 |
| Barclays U.S. Funding LLC | | | | |
| 5.405% due 10/20/2006 *** | | 23,200,000 | | 23,029,322 |
| Cox Communications, Inc. | | | | |
| 4.00% due 01/16/2007 *** | | 2,000,000 | | 2,000,000 |
| Danske Corp. | | | | |
| 5.265% due 12/27/2006 *** | | 600,000 | | 589,733 |
| 5.34% due 09/05/2006 *** | | 3,600,000 | | 3,597,864 |
| 5.37% due 10/30/2006 *** | | 30,700,000 | | 30,429,814 |
| Government of France | | | | |
| zero coupon due 09/28/2006 to | | | | |
| 12/21/2006 *** | EUR | 25,230,000 | | 32,087,651 |
| Federal Republic of Germany, Series 0506 | | | | |
| zero coupon due 09/13/2006 to | | | | |
| 11/15/2006 *** | | 65,360,000 | | 83,388,763 |
| Government of France | | | | |
| zero coupon due 09/14/2006 *** | | 38,340,000 | | 48,998,688 |
| Ixis Corp. | | | | |
| 5.26% due 09/07/2006 *** | $ | 31,200,000 | | 31,172,648 |
| Kingdom of Belgium | | | | |
| zero coupon due 10/12/2006 *** | EUR | 840,000 | | 1,071,202 |
| Rabobank USA Finance Corp. | | | | |
| 5.27% due 09/01/2006 *** | $ | 16,300,000 | | 16,300,000 |
| Societe Generale North America, Inc. | | | | |
| 5.26% due 12/01/2006 *** | | 31,700,000 | | 31,278,513 |
| 5.38% due 10/12/2006 *** | | 600,000 | | 596,324 |
| Spain Letras del Tesoro | | | | |
| zero coupon due 12/22/2006 *** | EUR | 4,300,000 | | 5,451,313 |
| State Street Navigator Securities | | | | |
| Lending Prime Portfolio (c) | $ | 28,221,891 | | 28,221,891 |
| Total SA | | | | |
| 5.26% due 09/01/2006 *** | | 31,800,000 | | 31,800,000 |
| UBS Finance (Delaware) LLC | | | | |
| 5.26% due 09/01/2006 *** | | 8,800,000 | | 8,800,000 |
| 5.28% due 11/16/2006 *** | | 2,800,000 | | 2,768,789 |
The accompanying notes are an integral part of the financial statements. 404
John Hancock Funds II
Portfolio of investments — August 31, 2006
(showing percentage of total net assets)
| Total Return Fund (continued) | | |
| | | Shares or | |
| | | Principal | |
| | | Amount | Value |
|
|
| |
| SHORT TERM INVESTMENTS (continued) | | |
| UBS Finance (Delaware) LLC (continued) | | | |
| 5.375% due 10/11/2006 to | | | |
| 10/26/2006 *** | $ | 23,400,000 | $ | 23,236,286 |
| United States Treasury Bills | | | |
| zero coupon due 09/14/2006 to | | | |
| 11/30/2006 *** **** | | 7,825,000 | 7,764,891 |
| Viacom, Inc. | | | |
| 5.594% due 05/29/2007 *** | | 1,700,000 | 1,700,000 |
|
| TOTAL SHORT TERM INVESTMENTS | | | |
| (Cost $445,618,548) | | | $ | 447,570,991 |
|
| |
| REPURCHASE AGREEMENTS - 4.03% | | | |
| Repurchase Agreement with State | | | |
| Street Corp. dated 08/31/2006 at | | | |
| 3.95% to be repurchased at | | | |
| $46,748,129 on 09/01/2006, | | | |
| collateralized by $47,500,000 | | | |
| Federal Home Loan Mortgage | | | |
| Corp., 2.75% due 12/28/2006 | | | |
| (valued at $47,678,125, including | | | |
| interest) (c) | $ | 46,743,000 | $ | 46,743,000 |
|
| TOTAL REPURCHASE AGREEMENTS | | | |
| (Cost $46,743,000) | | | $ | 46,743,000 |
|
| Total Investments (Total Return Fund) | | | |
| (Cost $1,496,888,257) - 129.61% | | | $ | 1,502,531,534 |
| Liabilities in Excess of Other Assets - (29.61)% | | (343,256,842) |
|
|
| TOTAL NET ASSETS - 100.00% | | | $ | 1,159,274,692 |
|
|
| |
| |
| U.S. Global Leaders Growth Fund | |
| | | Shares or | |
| | | Principal | |
| | | Amount | Value |
|
|
| |
| COMMON STOCKS - 99.10% | | | |
| Biotechnology - 9.98% | | | |
| Amgen, Inc. * | | 348,840 | $ | 23,696,701 |
| Genzyme Corp. * | | 360,907 | 23,902,871 |
|
|
| | | | 47,599,572 |
| |
| Business Services - 5.04% | | | |
| Automatic Data Processing, Inc. | | 508,848 | 24,017,626 |
| Computers & Business Equipment - 2.93% | | | |
| Dell, Inc. * | | 620,270 | 13,987,089 |
| Cosmetics & Toiletries - 8.27% | | | |
| Colgate-Palmolive Company | | 309,167 | 18,506,737 |
| Procter & Gamble Company | | 338,360 | 20,944,484 |
|
|
| | | | 39,451,221 |
| |
| Financial Services - 3.95% | | | |
| State Street Corp. (c) | | 305,164 | 18,859,135 |
| Food & Beverages - 15.51% | | | |
| PepsiCo, Inc. | | 363,400 | 23,722,752 |
| Starbucks Corp. * | | 540,712 | 16,767,479 |
| Sysco Corp. | | 495,743 | 15,561,373 |
| U.S. Global Leaders Growth Fund (continued) |
| | | Shares or | | |
| | | Principal | | |
| | | Amount | | Value |
|
|
| |
| COMMON STOCKS (continued) | | | | |
| Food & Beverages (continued) | | | | |
| The Coca-Cola Company | | 400,625 | $ | 17,952,006 |
|
|
| | | | | 74,003,610 |
| Healthcare Products - 8.45% | | | | |
| Johnson & Johnson | | 222,344 | | 14,376,763 |
| Medtronic, Inc. | | 298,582 | | 14,003,496 |
| Stryker Corp. | | 248,000 | | 11,911,440 |
|
|
| | | | | 40,291,699 |
| Holdings Companies/Conglomerates - 4.89% | | | |
| General Electric Company | | 684,799 | | 23,324,254 |
| Insurance - 3.48% | | | | |
| American International Group, Inc. | | 259,914 | | 16,587,712 |
| Internet Retail - 3.38% | | | | |
| eBay, Inc. * | | 578,697 | | 16,122,498 |
| Leisure Time - 2.28% | | | | |
| Electronic Arts, Inc. * | | 213,796 | | 10,897,182 |
| Pharmaceuticals - 4.16% | | | | |
| Teva Pharmaceutical Industries, Ltd., SADR (a) | 571,073 | | 19,850,497 |
| Retail Grocery - 0.99% | | | | |
| Whole Foods Market, Inc. | | 88,000 | | 4,718,560 |
| Retail Trade - 12.79% | | | | |
| Costco Wholesale Corp. | | 347,119 | | 16,241,698 |
| Home Depot, Inc. | | 506,143 | | 17,355,643 |
| Staples, Inc. | | 1,018,921 | | 22,986,858 |
| Wal-Mart Stores, Inc. | | 99,214 | | 4,436,850 |
|
|
| | | | | 61,021,049 |
| Software - 7.08% | | | | |
| Microsoft Corp. | | 942,806 | | 24,220,686 |
| SAP AG, SADR | | 200,000 | | 9,548,000 |
|
|
| | | | | 33,768,686 |
| Telecommunications Equipment & | | | | |
| Services - 2.99% | | | | |
| QUALCOMM, Inc. | | 378,000 | | 14,239,260 |
| Trucking & Freight - 2.93% | | | | |
| United Parcel Service, Inc., Class B | | 199,280 | | 13,959,564 |
|
| TOTAL COMMON STOCKS (Cost $487,321,730) | | $ | 472,699,214 |
|
| |
| SHORT TERM INVESTMENTS - 0.59% | | | |
| State Street Navigator Securities | | | | |
| Lending Prime Portfolio (c) | $ | 2,825,622 | $ | 2,825,622 |
|
| TOTAL SHORT TERM INVESTMENTS | | | | |
| (Cost $2,825,622) | | | $ | 2,825,622 |
|
The accompanying notes are an integral part of the financial statements. 405
John Hancock Funds II
Portfolio of investments — August 31, 2006
(showing percentage of total net assets)
| U.S. Global Leaders Growth Fund (continued) |
| | | Shares or | | |
| | | Principal | | |
| | | Amount | | Value |
|
|
| |
| REPURCHASE AGREEMENTS - 1.13% | | | |
| Repurchase Agreement with State | | | | |
| Street Corp. dated 08/31/2006 at | | | | |
| 3.95% to be repurchased at | | | | |
| $5,402,593 on 09/01/2006, | | | | |
| collateralized by $5,910,000 | | | | |
| Federal National Mortgage | | | | |
| Association, 5.55% due | | | | |
| 07/10/2028 (valued at $5,511,826, | | | | |
| including interest) (c) | $ | 5,402,000 | $ | 5,402,000 |
|
| TOTAL REPURCHASE AGREEMENTS | | | | |
| (Cost $5,402,000) | | | $ | 5,402,000 |
|
| Total Investments (U.S. Global Leaders Growth Fund) | | |
| (Cost $495,549,352) - 100.82% | | | $ | 480,926,836 |
| Liabilities in Excess of Other Assets - (0.82)% | | | (3,913,010) |
|
|
| TOTAL NET ASSETS - 100.00% | | | $ | 477,013,826 |
|
|
| |
| |
| U.S. Government Securities Fund | | | |
| | | Shares or | | |
| | | Principal | | |
| | | Amount | | Value |
|
|
| |
| U.S. TREASURY OBLIGATIONS - 19.71% | | | |
| U.S. Treasury Bonds - 0.08% | | | | |
| 6.625% due 02/15/2027 **** | $ | 128,000 | $ | 155,410 |
| U.S. Treasury Notes - 19.63% | | | | |
| 3.375% due 10/15/2009 | | 2,574,000 | | 2,475,465 |
| 3.375% due 11/15/2008 **** | | 926,000 | | 899,414 |
| 3.50% due 05/31/2007 *** | | 10,171,000 | | 10,056,179 |
| 4.00% due 04/15/2010 to 02/15/2014 *** | 8,220,000 | | 7,963,235 |
| 4.25% due 08/15/2015 | | 445,000 | | 429,216 |
| 4.875% due 07/31/2011 | | 18,000,000 | | 18,133,596 |
|
|
| | | | | 39,957,105 |
|
| TOTAL U.S. TREASURY OBLIGATIONS | | | |
| (Cost $40,146,621) | | | $ | 40,112,515 |
|
| |
| U.S. GOVERNMENT AGENCY OBLIGATIONS - 81.34% | | |
| Federal Home Loan Bank - 1.06% | | | | |
| 5.80% due 09/02/2008 *** | | 2,145,000 | | 2,170,007 |
| Federal Home Loan Mortgage Corp. - 2.92% | | | |
| 5.00% due 08/01/2033 | | 1,687,722 | | 1,624,610 |
| 5.00% TBA ** | | 3,000,000 | | 2,875,314 |
| 6.00% due 10/01/2010 to 12/01/2028 | | 538,416 | | 542,287 |
| 6.50% due 12/01/2010 *** | | 36,872 | | 37,021 |
| 7.00% due 02/01/2011 to 06/01/2032 | | 779,150 | | 800,049 |
| 7.50% due 05/01/2007 *** | | 3,360 | | 3,377 |
| 9.00% due 10/01/2017 | | 12,113 | | 12,388 |
| 9.50% due 08/01/2020 | | 27,112 | | 29,544 |
| 11.75% due 12/01/2013 | | 1,396 | | 1,539 |
| 12.00% due 07/01/2020 | | 9,341 | | 10,131 |
|
|
| | | | | 5,936,260 |
| Federal National Mortgage | | | | |
| Association - 65.26% | | | | |
| 5.00% TBA ** | | 45,300,000 | | 43,548,577 |
| U.S. Government Securities Fund (continued) |
| | | Shares or | | |
| | | Principal | | |
| | | Amount | | Value |
|
|
| |
| U.S. GOVERNMENT AGENCY | | | | |
| OBLIGATIONS (continued) | | | | |
| Federal National Mortgage | | | | |
| Association (continued) | | | | |
| 5.3067% due 02/17/2009 (b)*** | $ | 1,544,000 | $ | 1,501,540 |
| 5.50% due 04/01/2018 | | 657,327 | | 656,230 |
| 5.50% due 05/01/2018 *** | | 1,508,484 | | 1,505,967 |
| 5.50% TBA ** | | 43,000,000 | | 42,388,750 |
| 6.00% TBA ** | | 33,560,000 | | 33,584,162 |
| 6.50% due 02/01/2026 to 06/01/2029 | | 322,914 | | 329,545 |
| 6.50% due 07/01/2032 *** | | 1,540,009 | | 1,581,451 |
| 6.50% TBA ** | | 5,000,000 | | 5,075,000 |
| 6.527% due 05/25/2030 (b) | | 676,296 | | 679,311 |
| 7.00% due 07/01/2022 to 01/01/2034 | | 944,122 | | 971,525 |
| 7.50% due 09/01/2029 to 02/01/2031 | | 153,153 | | 158,644 |
| 8.00% due 06/01/2017 to 03/01/2033 | | 423,067 | | 447,778 |
| 8.25% due 09/01/2008 *** | | 1,274 | | 1,288 |
| 8.50% due 08/01/2019 | | 152,214 | | 162,112 |
| 8.50% due 02/01/2009 *** | | 545 | | 555 |
| 8.75% due 08/01/2009 to 12/01/2009 | | 27,489 | | 27,894 |
| 8.75% due 10/01/2011 *** | | 98 | | 98 |
| 9.00% due 05/01/2021 | | 8,070 | | 8,688 |
| 11.50% due 09/15/2013 to 09/01/2019 | | 32,012 | | 35,147 |
| 12.00% due 01/01/2013 to 04/20/2016 | | 90,503 | | 101,622 |
| 12.50% due 01/01/2013 to 09/20/2015 | | 44,010 | | 48,308 |
| 13.50% due 11/15/2014 | | 23,695 | | 26,398 |
|
|
| | | | | 132,840,590 |
| Government National Mortgage | | | | |
| Association - 12.10% | | | | |
| 5.50% TBA ** | | 8,100,000 | | 8,021,527 |
| 6.00% TBA ** | | 15,600,000 | | 15,741,367 |
| 6.50% due 02/15/2034 to 09/15/2034 | | 452,426 | | 462,726 |
| 7.50% due 03/15/2026 to 12/15/2027 | | 208,520 | | 217,669 |
| 7.50% due 08/15/2027 *** | | 37 | | 39 |
| 8.50% due 06/15/2025 | | 180,394 | | 194,854 |
| 11.00% due 09/15/2015 | | 673 | | 745 |
|
|
| | | | | 24,638,927 |
|
| TOTAL U.S. GOVERNMENT AGENCY OBLIGATIONS | | |
| (Cost $164,950,965) | | | $ | 165,585,784 |
|
| |
| COLLATERALIZED MORTGAGE | | | | |
| OBLIGATIONS - 26.00% | | | | |
| American Home Mortgage Assets, Series 2006-3, | | | |
| Class 3A12 | | | | |
| 5.5144% due 10/25/2046 (b)*** | | 1,902,892 | | 1,902,446 |
| American Home Mortgage Investment Trust, Series | | | |
| 2006-2, Class 1A1 | | | | |
| 5.4044% due 06/25/2046 (b)*** | | 1,864,194 | | 1,865,346 |
| Bear Stearns Alt-A Trust, Series 2004-11, Class 2A2 | | | |
| 4.951% due 11/25/2034 (b)*** | | 1,873,617 | | 1,894,110 |
| Countrywide Alternative Loan Trust, Series | | | |
| 2005-17, Class 2A1 | | | | |
| 5.5644% due 07/25/2035 (b)*** | | 786,239 | | 788,501 |
| Countrywide Alternative Loan Trust, Series | | | |
| 2005-59, Class 1A1 | | | | |
| 5.655% due 11/20/2035 (b)*** | | 564,541 | | 566,411 |
The accompanying notes are an integral part of the financial statements. 406
John Hancock Funds II
Portfolio of investments — August 31, 2006
(showing percentage of total net assets)
| U.S. Government Securities Fund (continued) | |
| | | Shares or | |
| | | Principal | |
| | | Amount | Value |
|
|
| |
| COLLATERALIZED MORTGAGE | | | |
| OBLIGATIONS (continued) | | | |
| Countrywide Alternative Loan Trust, Series | | |
| 2006-OA10, Class 4A1 | | | |
| 5.5144% due 08/25/2046 (b)*** | $ | 1,890,157 | $ | 1,889,641 |
| Countrywide Alternative Loan Trust, Series | | |
| 2006-OA11, Class A4 | | | |
| 5.5144% due 09/25/2046 (b)*** | | 1,876,198 | 1,876,611 |
| Countrywide Alternative Loan Trust, Series | | |
| 2006-OA7, Class 3A1 | | | |
| 5.595% due 06/25/2046 (b)*** | | 1,639,672 | 1,639,672 |
| Countrywide Alternative Loan Trust, Series | | |
| 2006-OA9, Class 1A1 | | | |
| 5.525% due 07/20/2046 (b)*** | | 1,891,442 | 1,891,896 |
| Countrywide Alternative Loan Trust, Series | | |
| 2006-OA9, Class 2A1B | | | |
| 5.525% due 07/20/2046 (b)*** | | 1,875,576 | 1,875,604 |
| Countrywide Alternative Loan Trust, Series | | |
| 2006-OC2, Class 2A3 | | | |
| 5.6144% due 02/25/2036 (b)*** | | 1,000,000 | 1,001,100 |
| Countrywide Home Loans, Series 2006-OA5, Class | | |
| 1A1 | | | |
| 5.5244% due 04/25/2046 (b)*** | | 1,166,426 | 1,167,019 |
| Federal Home Loan Mortgage Corp., | | | |
| Series 2525, Class AM | | | |
| 4.50% due 04/15/2032 | | 240,246 | 216,202 |
| Federal Home Loan Mortgage Corp., | | | |
| Series 2686, Class QI | | | |
| 5.50% due 01/15/2023 *** | | 2,666,057 | 70,675 |
| Federal National Mortgage Association Whole | | |
| Loan, Series 2005-W3, Class 2AF | | | |
| 5.5444% due 03/25/2045 (b) | | 755,994 | 757,269 |
| Federal National Mortgage Association Whole | | |
| Loan, Series 2003-W14, Class 2A | | | |
| 5.4707% due 01/25/2043 (b)*** | | 1,296,042 | 1,322,363 |
| Harborview Mortgage Loan Trust, Series 2005-7, | | |
| Class 1A1 | | | |
| 5.734% due 06/19/2045 (b)*** | | 849,897 | 849,897 |
| Impac CMB Trust, Series 2004-5, Class 1A1 | | |
| 5.6844% due 10/25/2034 (b)*** | | 1,630,207 | 1,632,157 |
| Impac Secured Assets Corp., Series 2005-2, Class | | |
| A1 | | | |
| 5.6444% due 03/25/2036 (b)*** | | 1,671,434 | 1,674,543 |
| Lehman XS Trust, Series 2006-2N, Class 1A1 | | |
| 5.5844% due 02/25/2046 (b)*** | | 1,806,442 | 1,809,935 |
| Lehman XS Trust, Series 2006-GP3, Class 3A1A | | |
| 5.3944% due 06/25/2046 (b)*** | | 1,865,232 | 1,863,832 |
| Lehman XS Trust, Series 2006-GP4, Class 3A1A | | |
| 5.3944% due 08/25/2046 (b)*** | | 1,900,756 | 1,899,983 |
| Luminent Mortgage Trust, Series 2006-4, Class A1A | | |
| 5.5144% due 05/25/2046 (b)*** | | 1,796,270 | 1,793,713 |
| Master Adjustable Rate Mortgages Trust, Series | | |
| 2004-15, Class 1A1 | | | |
| 4.6079% due 12/25/2034 (b) | | 328,529 | 330,247 |
| Morgan Stanley Mortgage Loan Trust, Series | | |
| 2006-8AR, Class 1A2 | | | |
| 5.3944% due 06/25/2036 (b)*** | | 1,730,560 | 1,731,264 |
| U.S. Government Securities Fund (continued) | |
| | | Shares or | |
| | | Principal | |
| | | Amount | Value |
|
|
| |
| COLLATERALIZED MORTGAGE | | | |
| OBLIGATIONS (continued) | | | |
| Novastar Mortgage-Backed Notes, Series | | | |
| 2006-MTA1, Class 2A1A | | | |
| 5.5144% due 09/25/2046 (b)*** | $ | 1,844,599 | $ | 1,844,775 |
| RAAC Series, Series 2006-RP3, Class A | | | |
| 5.5944% due 05/25/2036 (b) | | 2,072,598 | 2,077,455 |
| Structured Asset Mortgage Investments, Inc., | | |
| Series 2006-AR6, Class 1A1 | | | |
| 5.5044% due 07/25/2036 (b) | | 1,893,211 | 1,893,665 |
| Structured Asset Mortgage Investments, Inc., | | |
| Series 2006-AR7, Class A1A | | | |
| 5.54% due 08/25/2036 (b) | | 1,900,000 | 1,899,480 |
| Thornburg Mortgage Securities Trust, Series | | |
| 2005-3, Class A3 | | | |
| 5.5844% due 10/25/2035 (b) | | 1,755,610 | 1,757,755 |
| Thornburg Mortgage Securities Trust, Series | | |
| 2005-4, Class A4 | | | |
| 5.524% due 12/25/2035 (b) | | 1,925,043 | 1,928,164 |
| Thornburg Mortgage Securities Trust, Series | | |
| 2006-3, Class A2 | | | |
| 5.4294% due 06/25/2036 (b) | | 1,865,624 | 1,861,994 |
| Thornburg Mortgage Securities Trust, Series | | |
| 2006-3, Class A3 | | | |
| 5.4344% due 06/25/2036 (b) | | 1,869,494 | 1,872,740 |
| Washington Mutual, Inc., Series 2005-AR17, Class | | |
| A1A1 | | | |
| 5.5944% due 12/25/2045 (b)*** | | 1,687,043 | 1,692,445 |
| Zuni Mortgage Loan Trust, Series 2006-OA1, Class | | |
| A1 | | | |
| 5.615% due 08/25/2036 (b) | | 1,792,568 | 1,790,326 |
|
| TOTAL COLLATERALIZED MORTGAGE OBLIGATIONS | |
| (Cost $52,896,576) | | | $ | 52,929,236 |
|
| |
| ASSET BACKED SECURITIES - 21.71% | | |
| ACE Securities Corp., Series 2006-GP1, Class A | | |
| 5.4544% due 02/25/2031 (b)*** | | 1,739,614 | 1,739,598 |
| ACE Securities Corp., Series 2006-SL3, Class A1 | | |
| 5.4244% due 06/25/2036 (b)*** | | 1,746,127 | 1,746,277 |
| Aegis Asset Backed Securities Trust, Series | | |
| 2004-2, Class A3 | | | |
| 5.8044% due 06/25/2034 (b)*** | | 1,061,774 | 1,062,770 |
| AmeriCredit Automobile Receivables Trust, Series | | |
| 2003-BX, Class A4B | | | |
| 5.8762% due 01/06/2010 (b)*** | | 567,223 | 567,849 |
| Amortizing Residential Collateral Trust, Series | | |
| 2001-BC6, Class A | | | |
| 5.6744% due 10/25/2031 (b)*** | | 988,032 | 989,136 |
| Carrington Mortgage Loan Trust, Series 2005-NC5, | | |
| Class A1 | | | |
| 5.4444% due 10/25/2035 (b)*** | | 1,111,993 | 1,112,184 |
| CIT Equipment Collateral, Series 2006-VT1, Class | | |
| A2 | | | |
| 5.13% due 03/20/2008 | | 1,000,000 | 997,909 |
| Countrywide Asset-Backed Certificates, Series | | |
| 2002-BC2, Class A | | | |
| 5.8644% due 04/25/2032 (b)*** | | 631,711 | 631,956 |
The accompanying notes are an integral part of the financial statements. 407
John Hancock Funds II
Portfolio of investments — August 31, 2006
(showing percentage of total net assets)
| U.S. Government Securities Fund (continued) | |
| | | Shares or | |
| | | Principal | |
| | | Amount | Value |
|
|
| |
| ASSET BACKED SECURITIES | | | |
| (continued) | | | |
| Countrywide Home Equity Loan Trust, Series | | |
| 2004-I, Class A | | | |
| 5.62% due 02/15/2034 (b)*** | $ | 1,601,133 | $ | 1,605,870 |
| Countrywide Home Equity Loan Trust, Series | | |
| 2005-E, Class 2A | | | |
| 5.55% due 11/15/2035 (b)*** | | 579,712 | 580,799 |
| Countrywide Home Equity Loan Trust, Series | | |
| 2006-E, Class 2A | | | |
| 5.47% due 07/15/2036 (b)*** | | 1,803,385 | 1,803,889 |
| Countrywide Home Equity Loan Trust, Series | | |
| 2006-RES, Class 4E1B | | | |
| 5.59% due 06/15/2029 (b)*** | | 1,811,057 | 1,813,320 |
| Countrywide Home Equity Loan Trust, Series | | |
| 2006-RES, Class 4F1B | | | |
| 5.59% due 05/15/2034 (b)*** | | 1,815,648 | 1,817,917 |
| Credit Suisse Mortgage Capital Certificates, Series | | |
| 2006-CF2, Class A1 | | | |
| 5.5844% due 05/25/2036 (b)*** | | 1,646,551 | 1,650,154 |
| GMAC Mortgage Corp. Loan Trust, Series | | | |
| 2006-HE1, Class A | | | |
| 5.5344% due 11/25/2036 (b)*** | | 1,900,000 | 1,900,402 |
| GSAA Home Equity Trust, Series 2005-5, Class A4 | | |
| 5.5944% due 02/25/2035 (b)*** | | 1,900,000 | 1,905,641 |
| GSAMP Trust, Series 2006-S4, Class A1 | | | |
| 5.475% due 05/25/2036 (b)*** | | 2,550,812 | 2,550,947 |
| IndyMac Seconds Asset Backed Trust, Series | | |
| 2006-A, Class A | | | |
| 5.4544% due 06/25/2036 (b)*** | | 1,738,212 | 1,738,199 |
| Long Beach Mortgage Loan Trust, Series 2005-3, | | |
| Class 2A2 | | | |
| 5.6044% due 09/25/2035 (b)*** | | 1,900,000 | 1,903,812 |
| Morgan Stanley ABS Capital I, Series 2005-WMC2, | | |
| Class A1MZ | | | |
| 5.5744% due 02/25/2035 (b)*** | | 1,221,976 | 1,222,548 |
| Morgan Stanley ABS Capital I, Series 2005-WMC3, | | |
| Class A1MZ | | | |
| 5.5844% due 03/25/2035 (b)*** | | 1,142,300 | 1,142,644 |
| Morgan Stanley ABS Capital I, Series 2005-WMC4, | | |
| Class A1MZ | | | |
| 5.5844% due 04/25/2035 (b)*** | | 1,400,942 | 1,404,129 |
| Morgan Stanley IXIS Real Estate Capital Trust, | | |
| Series 2006-1, Class A1 | | | |
| 5.3544% due 07/25/2036 (b)*** | | 1,756,576 | 1,756,563 |
| Morgan Stanley Mortgage Loan Trust, Series | | |
| 2006-4SL, Class A1 | | | |
| 5.4744% due 03/25/2036 (b)*** | | 1,551,856 | 1,552,290 |
| SACO I Trust, Inc., Series 2006-6, Class A | | | |
| 5.4544% due 06/25/2036 (b)*** | | 1,703,170 | 1,703,156 |
| SACO I Trust, Inc., Series 2006-7, Class A1 | | |
| 5.515% due 07/25/2036 (b) | | 1,783,277 | 1,783,262 |
| SLM Student Loan Trust, Series 2006-5, Class A2 | | |
| 5.429% due 07/25/2017 (b)*** | | 1,900,000 | 1,899,704 |
| Structured Asset Securities Corp., Series | | | |
| 2006-ARS1, Class A1 | | | |
| 5.4344% due 02/25/2036 (b)*** | | 1,753,229 | 1,753,777 |
| U.S. Government Securities Fund (continued) |
| | | Shares or | |
| | | Principal | |
| | | Amount | Value |
|
|
| |
| ASSET BACKED SECURITIES | | | |
| (continued) | | | |
| Truman Capital Mortgage Loan Trust, Series | | | |
| 2006-1, Class A | | | |
| 5.66% due 03/25/2036 (b) | $ | 1,848,780 | $ | 1,848,909 |
|
| TOTAL ASSET BACKED SECURITIES | | | |
| (Cost $44,178,519) | | | $ | 44,185,611 |
|
| |
| REPURCHASE AGREEMENTS - 25.54% | | | |
| Merrill Lynch Tri-Party Repurchase | | | |
| Agreement dated 08/31/2006 at | | | |
| 5.23% to be repurchased at | | | |
| $52,007,555 on 09/01/2006, | | | |
| collateralized by $51,995,000 U.S. | | | |
| Treasury Notes, 0.875% due | | | |
| 04/15/2010 (valued at | | | |
| $53,211,837, including interest) *** | $ | 52,000,000 | $ | 52,000,000 |
|
| TOTAL REPURCHASE AGREEMENTS | | | |
| (Cost $52,000,000) | | | $ | 52,000,000 |
|
| Total Investments (U.S. Government Securities Fund) | |
| (Cost $354,172,681) - 174.30% | | | $ | 354,813,146 |
| Liabilities in Excess of Other Assets - (74.30)% | | (151,248,377) |
|
|
| TOTAL NET ASSETS - 100.00% | | | $ | 203,564,769 |
|
|
| |
| |
| U.S. High Yield Bond Fund | | | |
| | | Shares or | |
| | | Principal | |
| | | Amount | Value |
|
|
| |
| CORPORATE BONDS - 92.12% | | | |
| Advertising - 1.43% | | | |
| R.H. Donnelley Corp., Series A-3 | | | |
| 8.875% due 01/15/2016 | $ | 900,000 | $ | 886,500 |
| Sheridan Group, Inc. | | | |
| 10.25% due 08/15/2011 | | 1,500,000 | 1,511,250 |
| Vertis, Inc. | | | |
| 9.75% due 04/01/2009 | | 1,717,000 | 1,738,463 |
|
|
| | | | 4,136,213 |
| |
| Aerospace - 0.21% | | | |
| Sequa Corp., Series B | | | |
| 8.875% due 04/01/2008 | | 600,000 | 624,000 |
| Apparel & Textiles - 0.40% | | | |
| Levi Strauss & Company | | | |
| 12.25% due 12/15/2012 | | 750,000 | 840,000 |
| Phillips-Van Heusen | | | |
| 7.25% due 02/15/2011 | | 325,000 | 324,188 |
|
|
| | | | 1,164,188 |
| |
| Auto Parts - 0.81% | | | |
| ArvinMeritor, Inc. | | | |
| 8.75% due 03/01/2012 (a) | | 450,000 | 438,750 |
| Delphi Corp. | | | |
| 13.250% due 06/14/2011 (b)(f) | | 1,000,000 | 1,034,690 |
| TRW Automotive, Inc. | | | |
| 9.375% due 02/15/2013 | | 600,000 | 640,500 |
The accompanying notes are an integral part of the financial statements. 408
John Hancock Funds II
Portfolio of investments — August 31, 2006
(showing percentage of total net assets)
| U.S. High Yield Bond Fund (continued) | |
| | | Shares or | |
| | | Principal | |
| | | Amount | Value |
|
|
| |
| CORPORATE BONDS (continued) | | | |
| Auto Parts (continued) | | | |
| Visteon Corp. | | | |
| 8.61% due 06/12/2013 (b)(f) | $ | 250,000 | $ | 249,062 |
|
|
| | | | 2,363,002 |
| |
| Auto Services - 0.82% | | | |
| Hertz Corp., Class A | | | |
| 8.875% due 01/01/2014 | | 500,000 | 518,750 |
| 10.50% due 01/01/2016 (a) | | 225,000 | 242,438 |
| Penhall International Corp. | | | |
| 12.00% due 08/01/2014 (a) | | 1,600,000 | 1,632,000 |
|
|
| | | | 2,393,188 |
| |
| Automobiles - 2.11% | | | |
| Asbury Automotive Group, Inc. | | | |
| 9.00% due 06/15/2012 | | 900,000 | 911,250 |
| AutoNation, Inc. | | | |
| 7.5069% due 04/15/2013 (b) | | 200,000 | 201,000 |
| Avis Budget Car Rental LLC | | | |
| 6.750% due 04/17/2012 (b)(f) | | 978,571 | 971,722 |
| CSK Automotive, Inc. | | | |
| 8.542% due 06/30/2012 (b)(f) | | 500,000 | 502,190 |
| Dana Corp. | | | |
| 7.220% due 03/03/2008 (b)(f) | | 170,000 | 169,716 |
| Ford Motor Company | | | |
| 7.45% due 07/16/2031 (a) | | 575,000 | 451,375 |
| General Motors Corp. | | | |
| 8.375% due 07/15/2033 | | 1,900,000 | 1,591,250 |
| Group 1 Automotive, Inc. | | | |
| 8.25% due 08/15/2013 | | 85,000 | 85,956 |
| Sonic Automotive, Inc., Series B | | | |
| 8.625% due 08/15/2013 | | 1,258,000 | 1,248,565 |
|
|
| | | | 6,133,024 |
| |
| Banking - 0.31% | | | |
| Chevy Chase Bank | | | |
| 6.875% due 12/01/2013 | | 900,000 | 895,500 |
| Broadcasting - 1.14% | | | |
| Barrington Broadcasting | | | |
| 10.50% due 08/15/2014 | | 2,000,000 | 1,960,000 |
| Fisher Communications, Inc. | | | |
| 8.625% due 09/15/2014 | | 1,300,000 | 1,335,750 |
|
|
| | | | 3,295,750 |
| |
| Building Materials & Construction - 0.83% | | |
| Atrium Company, Inc. | | | |
| 8.08% due 05/31/2012 (b)(f) | | 534,353 | 515,651 |
| Atrium Company, Inc., Tranche DD VA | | | |
| 8.25% due 05/31/2012 (b)(f) | | 65,647 | 65,647 |
| Brand Services, Inc. | | | |
| 12.00% due 10/15/2012 | | 311,000 | 350,086 |
| Masonite International | | | |
| 7.49% due 04/06/2013 (b)(f) | | 992,462 | 974,350 |
| Quality Home Brands Holdings Corp., Tranche 2nd | | |
| Lien | | | |
| 11.939% due 06/16/2013 (b)(f) | | 500,000 | 504,375 |
|
|
| | | | 2,410,109 |
| U.S. High Yield Bond Fund (continued) | | |
| | | Shares or | | |
| | | Principal | | |
| | | Amount | | Value |
|
|
| |
| CORPORATE BONDS (continued) | | | | |
| Business Services - 2.88% | | | | |
| Cornell Companies, Inc. | | | | |
| 10.75% due 07/01/2012 | $ | 600,000 | $ | 637,500 |
| Education Management Corp., Tranche C | | | | |
| 8.063% due 05/24/2013 (b)(f) | | 1,000,000 | | 1,004,380 |
| Rural/Metro Corp. | | | | |
| 9.875% due 03/15/2015 | | 1,550,000 | | 1,588,750 |
| SunGard Data Systems, Inc. | | | | |
| 3.75% due 01/15/2009 (a) | | 125,000 | | 116,250 |
| 4.875% due 01/15/2014 | | 600,000 | | 517,500 |
| 9.125% due 08/15/2013 | | 1,600,000 | | 1,652,000 |
| 10.25% due 08/15/2015 | | 1,750,000 | | 1,787,188 |
| Williams Scotsman International, Inc. | | | | |
| 8.50% due 10/01/2015 | | 1,045,000 | | 1,060,675 |
|
|
| | | | | 8,364,243 |
| Cable and Television - 7.24% | | | | |
| Charter Communications Holdings LLC | | | | |
| 8.75% due 11/15/2013 (a) | | 600,000 | | 600,000 |
| Charter Communications Operating LLC | | | | |
| 8.00% due 04/30/2012 | | 1,925,000 | | 1,929,812 |
| 8.375% due 04/30/2014 | | 5,650,000 | | 5,706,500 |
| 9.4544% due 12/15/2010 | | 600,000 | | 615,000 |
| CSC Holdings, Inc. | | | | |
| 7.218% due 03/23/2013 (b)(f) | | 2,497,500 | | 2,484,738 |
| 7.25% due 07/15/2008 | | 600,000 | | 606,750 |
| 7.875% due 12/15/2007 | | 1,200,000 | | 1,222,500 |
| DirecTV Holdings LLC | | | | |
| 6.375% due 06/15/2015 | | 3,900,000 | | 3,646,500 |
| 8.375% due 03/15/2013 | | 430,000 | | 451,500 |
| EchoStar DBS Corp. | | | | |
| 7.125% due 02/01/2016 | | 2,000,000 | | 1,947,500 |
| Videotron Ltee | | | | |
| 6.375% due 12/15/2015 | | 950,000 | | 889,438 |
| 6.875% due 01/15/2014 | | 915,000 | | 897,844 |
|
|
| | | | | 20,998,082 |
| Cellular Communications - 5.68% | | | | |
| Alamosa Delaware, Inc. | | | | |
| 8.50% due 01/31/2012 | | 2,830,000 | | 2,999,800 |
| Centennial Communications Corp. | | | | |
| 8.125% due 02/01/2014 | | 403,000 | | 391,917 |
| 10.00% due 01/01/2013 (a) | | 2,025,000 | | 2,019,937 |
| 10.75% due 12/15/2008 (a) | | 33,000 | | 33,330 |
| Dobson Cellular Systems, Inc. | | | | |
| 8.375% due 11/01/2011 (a) | | 759,000 | | 785,565 |
| 8.375% due 11/01/2011 | | 1,500,000 | | 1,552,500 |
| 8.875% due 10/01/2013 (a) | | 3,350,000 | | 3,308,125 |
| 9.875% due 11/01/2012 (a) | | 800,000 | | 854,000 |
| Rural Cellular Corp. | | | | |
| 8.25% due 03/15/2012 | | 400,000 | | 410,000 |
| 8.25% due 03/15/2012 | | 1,100,000 | | 1,127,500 |
| 9.875% due 02/01/2010 (a) | | 1,750,000 | | 1,806,875 |
| Telcordia Technologies, Inc. | | | | |
| 10.00% due 03/15/2013 | | 725,000 | | 578,188 |
The accompanying notes are an integral part of the financial statements. 409
John Hancock Funds II
Portfolio of investments — August 31, 2006
(showing percentage of total net assets)
| U.S. High Yield Bond Fund (continued) | |
| | | Shares or | |
| | | Principal | |
| | | Amount | Value |
|
|
| |
| CORPORATE BONDS (continued) | | | |
| Cellular Communications (continued) | | | |
| UbiquiTel Operating Company | | | |
| 9.875% due 03/01/2011 | $ | 550,000 | $ | 598,125 |
|
|
| | | | 16,465,862 |
| Chemicals - 0.62% | | | |
| Chemtura Corp. | | | |
| 6.875% due 06/01/2016 | | 725,000 | 701,438 |
| Equistar Chemicals LP | | | |
| 10.125% due 09/01/2008 | | 250,000 | 263,750 |
| Huntsman International LLC | | | |
| 7.375% due 01/01/2015 | | 325,000 | 322,562 |
| Lyondell Chemical Company, Series A | | | |
| 9.625% due 05/01/2007 | | 500,000 | 510,000 |
|
|
| | | | 1,797,750 |
| Commercial Services - 1.05% | | | |
| Mac-Gray Corp. | | | |
| 7.625% due 08/15/2015 | | 2,250,000 | 2,283,750 |
| Safety-Kleen, Inc., Letter of Credit | | | |
| 7.938% due 07/27/2013 (b)(f) | | 165,254 | 165,461 |
| Safety-Kleen, Inc., Tranche B | | | |
| 7.938% due 07/27/2013 (b)(f) | | 584,746 | 585,476 |
|
|
| | | | 3,034,687 |
| Containers & Glass - 1.00% | | | |
| Crown Holdings, Inc. | | | |
| 7.00% due 12/15/2006 | | 125,000 | 125,000 |
| 8.00% due 04/15/2023 | | 1,025,000 | 968,625 |
| Graham Packaging Company | | | |
| 8.50% due 10/15/2012 | | 600,000 | 580,500 |
| Owens-Brockway Glass Container, Inc. | | | |
| 8.25% due 05/15/2013 | | 1,200,000 | 1,215,000 |
|
|
| | | | 2,889,125 |
| Correctional Facilities - 0.31% | | | |
| Corrections Corp. of America | | | |
| 6.25% due 03/15/2013 | | 600,000 | 579,750 |
| 6.75% due 01/31/2014 | | 335,000 | 330,813 |
|
|
| | | | 910,563 |
| Crude Petroleum & Natural Gas - 2.16% | | | |
| AmeriGas Partners LP | | | |
| 7.125% due 05/20/2016 | | 770,000 | 748,825 |
| 7.25% due 05/20/2015 | | 75,000 | 73,687 |
| Chesapeake Energy Corp. | | | |
| 6.50% due 08/15/2017 | | 500,000 | 463,750 |
| 6.625% due 01/15/2016 | | 400,000 | 384,000 |
| 6.875% due 01/15/2016 | | 600,000 | 582,000 |
| 6.875% due 11/15/2020 | | 250,000 | 235,625 |
| 7.50% due 09/15/2013 (a) | | 800,000 | 808,000 |
| 7.75% due 01/15/2015 (a) | | 140,000 | 142,800 |
| Hanover Equipment Trust, Series A | | | |
| 8.50% due 09/01/2008 | | 500,000 | 508,750 |
| Massey Energy Company | | | |
| 6.875% due 12/15/2013 (a) | | 670,000 | 621,425 |
| PetroHawk Energy Corp. | | | |
| 9.125% due 07/15/2013 | | 800,000 | 814,000 |
| U.S. High Yield Bond Fund (continued) | |
| | | Shares or | |
| | | Principal | |
| | | Amount | Value |
|
|
| |
| CORPORATE BONDS (continued) | | | |
| Crude Petroleum & Natural Gas | | | |
| (continued) | | | |
| Tesoro Corp. | | | |
| 6.625% due 11/01/2015 | $ | 900,000 | $ | 868,500 |
|
|
| | | | 6,251,362 |
| Domestic Oil - 1.04% | | | |
| ALON USA LP | | | |
| 7.906% due 06/07/2013 (b)(f) | | 1,000,000 | 1,008,750 |
| Eagle Rock Energy, Inc. | | | |
| 7.490% due 12/01/2012 (b)(f) | | 370,064 | 370,064 |
| Petroleum Geo-Services, Tranche B | | | |
| 8.000% due 12/16/2012 (b)(f) | | 375,662 | 378,479 |
| Petroquest Energy Inc | | | |
| 10.375% due 05/15/2012 | | 1,200,000 | 1,248,000 |
|
|
| | | | 3,005,293 |
| Electrical Utilities - 0.53% | | | |
| Nevada Power Company | | | |
| 5.95% due 03/15/2016 | | 250,000 | 247,298 |
| Sierra Pacific Power Company | | | |
| 6.00% due 05/15/2016 | | 375,000 | 372,219 |
| Sierra Pacific Resources | | | |
| 8.625% due 03/15/2014 | | 850,000 | 913,673 |
|
|
| | | | 1,533,190 |
| Electronics - 0.69% | | | |
| Communications & Power Industries, Inc. | | | |
| 8.00% due 02/01/2012 | | 710,000 | 715,325 |
| L-3 Communications Corp. | | | |
| 5.875% due 01/15/2015 | | 600,000 | 567,000 |
| 6.125% due 07/15/2013 | | 7,000 | 6,738 |
| L-3 Communications Corp., Series B | | | |
| 6.375% due 10/15/2015 | | 750,000 | 721,875 |
|
|
| | | | 2,010,938 |
| Energy - 2.95% | | | |
| Chesapeake Energy Corp. | | | |
| 7.50% due 06/15/2014 | | 1,355,000 | 1,365,162 |
| Covanta Energy Corp., 1st Lien | | | |
| 8.081% due 06/24/2012 (b)(f) | | 626,180 | 629,311 |
| Covanta Energy Corp., Letter of Credit | | | |
| 4.960% due 06/24/2012 (b)(f) | | 873,820 | 878,189 |
| NRG Energy, Inc. | | | |
| 7.17% due 02/02/2013 (b)(f) | | 1,496,250 | 1,502,205 |
| 7.25% due 02/01/2014 | | 500,000 | 493,750 |
| 7.375% due 02/01/2016 | | 2,800,000 | 2,758,000 |
| Plum Point Energy Associates LLC, Letter of Credit | | |
| 7.167% due 03/15/2014 (b)(f) | | 194,286 | 195,743 |
| Plum Point Energy Associates LLC, Tranche 1 | | |
| 8.749% due 03/15/2014 (b)(f) | | 715,677 | 719,255 |
|
|
| | | | 8,541,615 |
| Financial Services - 8.42% | | | |
| BLB Hold-Wembley Term Loan | | | |
| 7.83% due 06/30/2011 (b)(f) | | 275,000 | 277,923 |
| Consolidated Communications Holdings | | | |
| 9.75% due 04/01/2012 | | 96,000 | 100,560 |
| Dow Jones CDX HY, Series 6-T1 | | | |
| 8.625% due 06/29/2011 | | 7,000,000 | 6,991,250 |
The accompanying notes are an integral part of the financial statements. 410
John Hancock Funds II
Portfolio of investments — August 31, 2006
(showing percentage of total net assets)
| U.S. High Yield Bond Fund (continued) | |
| | | Shares or | |
| | | Principal | |
| | | Amount | Value |
|
|
| |
| CORPORATE BONDS (continued) | | | |
| Financial Services (continued) | | | |
| El Paso Performance-Linked Trust | | | |
| 7.75% due 07/15/2011 | $ | 850,000 | $ | 865,937 |
| Ford Motor Credit Company | | | |
| 7.00% due 10/01/2013 (a) | | 1,775,000 | 1,656,604 |
| 7.25% due 10/25/2011 | | 430,000 | 410,950 |
| General Motors Acceptance Corp. | | | |
| 6.75% due 12/01/2014 (a) | | 800,000 | 766,950 |
| 8.00% due 11/01/2031 (a) | | 4,210,000 | 4,255,005 |
| Linsco Private Ledger Holding | | | |
| 8.746% due 06/27/2013 (b)(f) | | 1,741,250 | 1,758,662 |
| NASDAQ Stock Market, Inc., Tranche B | | | |
| 7.249% due 04/18/2012 (b)(f) | | 623,240 | 622,854 |
| NASDAQ Stock Market, Inc., Tranche C | | | |
| 7.249% due 04/18/2012 (b)(f) | | 361,278 | 361,278 |
| PCA LLC | | | |
| 11.875% due 08/01/2009 ^ | | 95,000 | 19,475 |
| Stripes Acquisition LLC | | | |
| 10.625% due 12/15/2013 | | 160,000 | 168,000 |
| Thornburg Mortgage, Inc. | | | |
| 8.00% due 05/15/2013 | | 500,000 | 490,000 |
| TRAINS HY-1-2006 | | | |
| 7.548% due 05/01/2016 | | 1,200,000 | 1,189,956 |
| VNU, Inc., Tranche B | | | |
| 8.19% due 08/07/2013 (b)(f) | | 4,500,000 | 4,476,105 |
|
|
| | | | 24,411,509 |
| Food & Beverages - 2.32% | | | |
| Del Monte Corp. | | | |
| 8.625% due 12/15/2012 | | 1,413,000 | 1,478,351 |
| Dole Food Company | | | |
| 6.341% due 04/11/2013 (b)(f) | | 997,733 | 981,160 |
| Dole Food, Inc. | | | |
| 7.25% due 06/15/2010 (a) | | 1,440,000 | 1,350,000 |
| 8.875% due 03/15/2011 (a) | | 950,000 | 926,250 |
| SUPERVALU, Inc., Tranche B | | | |
| 7.063% due 05/30/2012 (b)(f) | | 1,995,000 | 1,990,851 |
|
|
| | | | 6,726,612 |
| Funeral Services - 0.55% | | | |
| Service Corp. International | | | |
| 6.50% due 03/15/2008 | | 600,000 | 600,000 |
| 7.00% due 06/15/2017 | | 1,025,000 | 981,438 |
| 7.70% due 04/15/2009 (a) | | 25,000 | 25,562 |
|
|
| | | | 1,607,000 |
| Gas & Pipeline Utilities - 3.38% | | | |
| Colorado Interstate Gas Company | | | |
| 6.80% due 11/15/2015 | | 375,000 | 371,650 |
| El Paso Corp. | | | |
| 6.75% due 05/15/2009 (a) | | 425,000 | 425,000 |
| 7.42% due 02/15/2037 | | 250,000 | 236,250 |
| 7.625% due 08/16/2007 (a) | | 200,000 | 202,500 |
| 7.75% due 01/15/2032 (a) | | 2,525,000 | 2,537,625 |
| 7.875% due 06/15/2012 (a) | | 1,950,000 | 2,013,375 |
| El Paso Corp., Series MTN | | | |
| 7.375% due 12/15/2012 | | 550,000 | 554,812 |
| U.S. High Yield Bond Fund (continued) | |
| | | Shares or | |
| | | Principal | |
| | | Amount | Value |
|
|
| |
| CORPORATE BONDS (continued) | | | |
| Gas & Pipeline Utilities (continued) | | | |
| Northwest Pipeline Corp. | | | |
| 7.00% due 06/15/2016 | $ | 250,000 | $ | 252,813 |
| Pacific Energy Partners LP | | | |
| 6.25% due 09/15/2015 | | 300,000 | 293,250 |
| Targa Resources, Inc. | | | |
| 7.750% due 10/31/2012 (b)(f) | | 476,240 | 477,283 |
| Transmontaigne, Inc. | | | |
| 9.125% due 06/01/2010 | | 750,000 | 801,345 |
| Williams Companies, Inc. | | | |
| 7.5081% due 10/01/2010 (b) | | 500,000 | 505,000 |
| 8.75% due 03/15/2032 | | 1,050,000 | 1,131,375 |
|
|
| | | | 9,802,278 |
| |
| Healthcare Products - 0.46% | | | |
| Accellent, Inc. | | | |
| 10.50% due 12/01/2013 | | 1,299,000 | 1,341,218 |
| Healthcare Services - 1.56% | | | |
| Ameripath, Inc. | | | |
| 10.50% due 04/01/2013 | | 1,084,000 | 1,146,330 |
| DaVita, Inc. | | | |
| 6.625% due 03/15/2013 | | 475,000 | 463,125 |
| Healthsouth Corp. | | | |
| 10.75% due 06/15/2016 (a) | | 1,125,000 | 1,150,313 |
| Healthsouth Corp., Tranche B | | | |
| 8.520% due 03/10/2013 (b)(f) | | 1,750,000 | 1,751,977 |
|
|
| | | | 4,511,745 |
| |
| Hotels & Restaurants - 2.81% | | | |
| Aztar Corp. | | | |
| 9.00% due 08/15/2011 (a) | | 75,000 | 78,375 |
| Buffets, Inc. | | | |
| 11.25% due 07/15/2010 | | 1,390,000 | 1,466,450 |
| Denny's Corp. | | | |
| 10.00% due 10/01/2012 (a) | | 975,000 | 982,312 |
| Gaylord Entertainment Company | | | |
| 6.75% due 11/15/2014 | | 1,005,000 | 954,750 |
| O'Charleys, Inc. | | | |
| 9.00% due 11/01/2013 | | 2,550,000 | 2,601,000 |
| Real Mex Restaurants, Inc. | | | |
| 10.00% due 04/01/2010 | | 2,000,000 | 2,080,000 |
|
|
| | | | 8,162,887 |
| |
| Household Appliances - 0.51% | | | |
| ALH Finance LLC | | | |
| 8.50% due 01/15/2013 (a) | | 1,400,000 | 1,368,500 |
| Fedders North America, Inc. | | | |
| 9.875% due 03/01/2014 (a) | | 175,000 | 120,750 |
|
|
| | | | 1,489,250 |
| |
| Industrial Machinery - 1.01% | | | |
| H&E Equipment Services, Inc. | | | |
| 8.375% due 07/15/2016 | | 1,250,000 | 1,268,750 |
| JLG Industries, Inc. | | | |
| 8.25% due 05/01/2008 | | 1,600,000 | 1,648,000 |
|
|
| | | | 2,916,750 |
The accompanying notes are an integral part of the financial statements. 411
John Hancock Funds II
Portfolio of investments — August 31, 2006
(showing percentage of total net assets)
| U.S. High Yield Bond Fund (continued) | |
| | | Shares or | |
| | | Principal | |
| | | Amount | Value |
|
|
| |
| CORPORATE BONDS (continued) | | | |
| Leisure Time - 7.29% | | | |
| AMC Entertainment, Inc., Series B | | | |
| 8.625% due 08/15/2012 | $ | 1,057,000 | $ | 1,083,425 |
| Aztar Corp. | | | |
| 7.875% due 06/15/2014 | | 575,000 | 621,000 |
| Bombardier Recreational Products, Inc., Tranche B | | |
| 8.24% due 06/26/2013 (b)(f) | | 850,000 | 848,411 |
| Chukchansi Economic Development Authority | | |
| 8.00% due 11/15/2013 | | 1,203,000 | 1,215,030 |
| 8.06% due 11/15/2012 | | 125,000 | 128,750 |
| Cinemark, Inc. | | | |
| 9.00% due 02/01/2013 | | 1,000,000 | 1,035,000 |
| Hard Rock Hotel, Inc. | | | |
| 8.875% due 06/01/2013 | | 495,000 | 531,506 |
| Majestic Star Casino LLC | | | |
| 9.50% due 10/15/2010 | | 750,000 | 771,563 |
| Mandalay Resort Group | | | |
| 6.50% due 07/31/2009 (a) | | 350,000 | 346,938 |
| MGM Mirage, Inc. | | | |
| 5.875% due 02/27/2014 | | 275,000 | 250,937 |
| 6.00% due 10/01/2009 | | 1,500,000 | 1,466,250 |
| 6.625% due 07/15/2015 | | 250,000 | 235,313 |
| 8.50% due 09/15/2010 | | 1,250,000 | 1,315,625 |
| Mohegan Tribal Gaming Authority | | | |
| 6.125% due 02/15/2013 (a) | | 670,000 | 639,013 |
| MTR Gaming Group, Inc. | | | |
| 9.00% due 06/01/2012 | | 500,000 | 503,750 |
| MTR Gaming Group, Inc., Series B | | | |
| 9.75% due 04/01/2010 | | 250,000 | 262,812 |
| Penn National Gaming, Inc. | | | |
| 6.875% due 12/01/2011 | | 750,000 | 746,250 |
| River Rock Entertainment Authority | | | |
| 9.75% due 11/01/2011 | | 1,050,000 | 1,111,687 |
| San Pasqual Casino Development Group | | | |
| 8.00% due 09/15/2013 | | 975,000 | 981,094 |
| Speedway Motorsports, Inc. | | | |
| 6.75% due 06/01/2013 | | 900,000 | 884,250 |
| Station Casinos, Inc. | | | |
| 6.00% due 04/01/2012 | | 1,750,000 | 1,673,437 |
| 6.50% due 02/01/2014 | | 250,000 | 233,125 |
| 6.625% due 03/15/2018 | | 800,000 | 714,000 |
| 6.875% due 03/01/2016 (a) | | 2,006,000 | 1,858,057 |
| True Temper Sports, Inc. | | | |
| 8.375% due 09/15/2011 | | 600,000 | 534,000 |
| Wynn Las Vegas LLC | | | |
| 6.625% due 12/01/2014 | | 1,215,000 | 1,160,325 |
|
|
| | | | 21,151,548 |
| Manufacturing - 0.22% | | | |
| Bombardier, Inc. | | | |
| 7.45% due 05/01/2034 (a) | | 750,000 | 648,750 |
| Medical-Hospitals - 1.60% | | | |
| Fresenius Medical Care, Inc. - Tranche B | | | |
| 6.387% due 03/22/2013 (b)(f) | | 500,000 | 496,875 |
| HCA, Inc. | | | |
| 5.50% due 12/01/2009 | | 300,000 | 295,875 |
| 7.875% due 02/01/2011 | | 885,000 | 842,963 |
| U.S. High Yield Bond Fund (continued) | |
| | | Shares or | |
| | | Principal | |
| | | Amount | Value |
|
|
| |
| CORPORATE BONDS (continued) | | | |
| Medical-Hospitals (continued) | | | |
| Multiplan, Inc. | | | |
| 10.375% due 04/15/2016 | $ | 1,950,000 | $ | 1,964,625 |
| Skilled Healthcare Group, Inc. | | | |
| 11.00% due 01/15/2014 | | 515,000 | 543,325 |
| X-Rite, Inc., Tranche 2nd Lien | | | |
| 10.346% due 06/30/2013 (b)(f) | | 500,000 | 500,000 |
|
|
| | | | 4,643,663 |
| Office Furnishings & Supplies - 0.12% | | | |
| IKON Office Solutions, Inc. | | | |
| 7.75% due 09/15/2015 (a) | | 350,000 | 351,750 |
| Paper - 2.44% | | | |
| Abitibi-Consolidated, Inc. | | | |
| 5.25% due 06/20/2008 | | 450,000 | 429,750 |
| 6.95% due 04/01/2008 (a) | | 1,293,000 | 1,283,302 |
| Georgia-Pacific Corp. | | | |
| 7.485% due 02/14/2013 (b)(f) | | 1,701,475 | 1,702,122 |
| Georgia-Pacific Corp., Tranche C | | | |
| 8.30% due 02/14/2011 (b)(f) | | 2,180,000 | 2,197,811 |
| Neenah Paper, Inc. | | | |
| 7.375% due 11/15/2014 | | 800,000 | 745,000 |
| P.H. Glatfelter | | | |
| 7.125% due 05/01/2016 | | 725,000 | 714,696 |
|
|
| | | | 7,072,681 |
| Petroleum Services - 0.43% | | | |
| Hanover Compressor Company | | | |
| 8.625% due 12/15/2010 | | 304,000 | 316,160 |
| 9.00% due 06/01/2014 | | 324,000 | 343,440 |
| Hanover Equipment Trust | | | |
| 8.75% due 09/01/2011 | | 575,000 | 598,000 |
|
|
| | | | 1,257,600 |
| Pharmaceuticals - 0.17% | | | |
| Omnicare, Inc. | | | |
| 6.875% due 12/15/2015 (a) | | 505,000 | 482,906 |
| Publishing - 2.46% | | | |
| American Media Operations, Inc. | | | |
| 8.875% due 01/15/2011 | | 330,000 | 287,100 |
| Dex Media East LLC | | | |
| 12.125% due 11/15/2012 | | 300,000 | 334,500 |
| Dex Media West LLC | | | |
| 9.875% due 08/15/2013 | | 400,000 | 429,500 |
| Houghton Mifflin Company | | | |
| zero coupon, Step up to 11.5% on | | | |
| 10/15/2008 due 10/15/2013 | | 767,000 | 642,362 |
| 8.25% due 02/01/2011 | | 3,100,000 | 3,131,000 |
| 9.875% due 02/01/2013 | | 600,000 | 621,000 |
| Medianews Group, Inc. | | | |
| 6.875% due 10/01/2013 | | 400,000 | 366,000 |
| Nielsen Finance LLC | | | |
| zero coupon, Step up to 12.5% on | | | |
| 08/01/2011 due 08/01/2016 (a) | | 850,000 | 486,625 |
| Primedia, Inc. | | | |
| 8.00% due 05/15/2013 | | 830,000 | 740,775 |
| 8.875% due 05/15/2011 (a) | | 100,000 | 97,000 |
|
|
| | | | 7,135,862 |
The accompanying notes are an integral part of the financial statements. 412
John Hancock Funds II
Portfolio of investments — August 31, 2006
(showing percentage of total net assets)
| U.S. High Yield Bond Fund (continued) | |
| | | Shares or | |
| | | Principal | |
| | | Amount | Value |
|
|
| |
| CORPORATE BONDS (continued) | | | |
| Railroads & Equipment - 0.59% | | | |
| Greenbrier Companies, Inc. | | | |
| 8.375% due 05/15/2015 | $ | 1,700,000 | $ | 1,712,750 |
| Real Estate - 4.43% | | | |
| Ashton Woods USA | | | |
| 9.50% due 10/01/2015 | | 440,000 | 381,700 |
| BF Saul, REIT | | | |
| 7.50% due 03/01/2014 | | 1,800,000 | 1,827,000 |
| Capital Automotive LP REIT | | | |
| 7.160% due 12/16/2010 (b)(f) | | 703,286 | 704,067 |
| Felcor Suites LP, REIT | | | |
| 7.625% due 10/01/2007 (a) | | 2,000,000 | 2,020,000 |
| Host Marriott LP, REIT | | | |
| 7.125% due 11/01/2013 | | 250,000 | 252,500 |
| 9.50% due 01/15/2007 | | 250,000 | 252,812 |
| Host Marriott LP, Series M, REIT | | | |
| 7.00% due 08/15/2012 | | 1,100,000 | 1,108,250 |
| Host Marriott LP, Series Q, REIT | | | |
| 6.75% due 06/01/2016 | | 2,800,000 | 2,716,000 |
| Rouse Company LP, REIT | | | |
| 6.75% due 05/01/2013 | | 2,905,000 | 2,892,235 |
| Trizec Properties, Inc. | | | |
| 6.525% due 03/31/2007 (b)(f) | | 700,000 | 698,544 |
|
|
| | | | 12,853,108 |
| Retail - 1.29% | | | |
| Ferrellgas Escrow LLC | | | |
| 6.75% due 05/01/2014 | | 650,000 | 625,625 |
| Suburban Propane Partners LP | | | |
| 6.875% due 12/15/2013 | | 340,000 | 325,550 |
| Sunstate Equipment Company LLC | | | |
| 10.50% due 04/01/2013 | | 500,000 | 521,250 |
| Toys R Us, Inc., Tranche B | | | |
| 8.402% due 12/09/2008 (b)(f) | | 2,250,000 | 2,258,438 |
|
|
| | | | 3,730,863 |
| Retail Trade - 1.47% | | | |
| American Greetings Corp. | | | |
| 7.375% due 06/01/2016 | | 400,000 | 402,500 |
| Neff Corp. | | | |
| 11.25% due 06/15/2012 | | 2,250,000 | 2,418,750 |
| Payless Shoesource, Inc. | | | |
| 8.25% due 08/01/2013 | | 1,400,000 | 1,435,000 |
|
|
| | | | 4,256,250 |
| Sanitary Services - 1.19% | | | |
| Allied Waste North America, Inc. | | | |
| 6.50% due 11/15/2010 | | 800,000 | 786,000 |
| 7.125% due 05/15/2016 | | 1,600,000 | 1,560,000 |
| 7.875% due 04/15/2013 (a) | | 800,000 | 810,000 |
| Allied Waste North America, Inc., Series B | | | |
| 5.75% due 02/15/2011 (a) | | 300,000 | 285,000 |
|
|
| | | | 3,441,000 |
| Semiconductors - 2.34% | | | |
| Amkor Technology, Inc. | | | |
| 7.75% due 05/15/2013 | | 20,000 | 18,800 |
| 9.25% due 06/01/2016 (a) | | 825,000 | 785,812 |
| U.S. High Yield Bond Fund (continued) | |
| | | Shares or | |
| | | Principal | |
| | | Amount | Value |
|
|
| |
| CORPORATE BONDS (continued) | | | |
| Semiconductors (continued) | | | |
| Avago Technologies Financial Services | | | |
| 10.125% due 12/01/2013 | $ | 2,300,000 | $ | 2,406,375 |
| 11.875% due 12/01/2015 (a) | | 1,375,000 | 1,483,281 |
| Sensata Technologies BV | | | |
| 8.00% due 05/01/2014 (a) | | 850,000 | 833,000 |
| Spansion LLC | | | |
| 11.25% due 01/15/2016 | | 1,225,000 | 1,254,094 |
|
|
| | | | 6,781,362 |
| Software - 0.10% | | | |
| UGS Capital Corp. II | | | |
| 10.38% due 06/01/2011 (b) | | 300,000 | 302,250 |
| Telecommunications Equipment & | | | |
| Services - 4.45% | | | |
| Citizens Communications Company | | | |
| 7.05% due 10/01/2046 | | 1,100,000 | 946,000 |
| 7.625% due 08/15/2008 (a) | | 725,000 | 746,750 |
| Eschelon Operating Company | | | |
| 8.375% due 03/15/2010 | | 700,000 | 675,500 |
| Intelsat Bermuda Ltd. | | | |
| 11.25% due 06/15/2016 | | 3,265,000 | 3,383,356 |
| Intelsat Ltd. | | | |
| 5.25% due 11/01/2008 | | 1,750,000 | 1,666,875 |
| Level 3 Communications, Inc., Tranche 1st Lien | | |
| 8.413% due 12/01/2011 (b)(f) | | 1,000,000 | 1,005,000 |
| PanAmSat Corp. | | | |
| 9.00% due 08/15/2014 | | 2,450,000 | 2,492,875 |
| 9.00% due 06/15/2016 | | 805,000 | 817,075 |
| Time Warner Telecom Holdings, Inc. | | | |
| 9.25% due 02/15/2014 | | 1,125,000 | 1,170,000 |
|
|
| | | | 12,903,431 |
| Telephone - 4.18% | | | |
| Cincinnati Bell, Inc. | | | |
| 7.00% due 02/15/2015 | | 720,000 | 702,000 |
| 7.25% due 07/15/2013 | | 600,000 | 609,750 |
| GTE Hawaiian Telephone Company, Series B | | |
| 7.375% due 09/01/2006 | | 600,000 | 600,000 |
| Qwest Communications International, Inc., Series B | | |
| 7.50% due 02/15/2014 | | 500,000 | 495,625 |
| Qwest Corp. | | | |
| 7.50% due 10/01/2014 | | 500,000 | 508,750 |
| 7.625% due 06/15/2015 | | 300,000 | 307,875 |
| 7.875% due 09/01/2011 | | 2,900,000 | 3,023,250 |
| 8.875% due 03/15/2012 | | 2,700,000 | 2,922,750 |
| Valor Telecommunications Enterprise | | | |
| 7.75% due 02/15/2015 | | 1,450,000 | 1,529,750 |
| Windstream Corp. | | | |
| 8.125% due 08/01/2013 | | 550,000 | 580,250 |
| 8.625% due 08/01/2016 | | 800,000 | 846,000 |
|
|
| | | | 12,126,000 |
| Tobacco - 0.81% | | | |
| Reynolds American, Inc. | | | |
| 6.50% due 07/15/2010 | | 250,000 | 252,020 |
| 7.625% due 06/01/2016 | | 2,000,000 | 2,086,712 |
|
|
| | | | 2,338,732 |
The accompanying notes are an integral part of the financial statements. 413
John Hancock Funds II
Portfolio of investments — August 31, 2006
(showing percentage of total net assets)
| U.S. High Yield Bond Fund (continued) | | |
| | | Shares or | | |
| | | Principal | | |
| | | Amount | | Value |
|
|
| |
| CORPORATE BONDS (continued) | | | | |
| Transportation - 1.31% | | | | |
| AWAS Aviation Corp., Tranche 2nd Lien | | | | |
| 11.50% due 03/20/2013 (b)(f) | $ | 294,016 | $ | 294,751 |
| Bombardier, Inc. | | | | |
| 6.75% due 05/01/2012 | | 650,000 | | 610,188 |
| Continental Airlines Inc., Series 00-1 | | | | |
| 8.499% due 05/01/2011 | | 474,943 | | 470,592 |
| Gulfmark Offshore, Inc. | | | | |
| 7.75% due 07/15/2014 (b) | | 900,000 | | 895,500 |
| Laidlaw International, Inc., Tranche B | | | | |
| 9.00% due 07/31/2013 (b)(f) | | 500,000 | | 503,125 |
| Trailer Bridge, Inc. | | | | |
| 9.25% due 11/15/2011 | | 500,000 | | 508,750 |
| US Airways Group, Inc. | | | | |
| 8.999% due 03/31/2011 (b)(f) | | 500,000 | | 502,500 |
|
|
| | | | | 3,785,406 |
|
| |
| TOTAL CORPORATE BONDS (Cost $267,932,926) | | $ | 267,162,845 |
|
| |
| ASSET BACKED SECURITIES - 0.44% | | | | |
| DB Master Finance LLC, Series 2006-1, Class-M1 | | | |
| 8.285% due 06/20/2031 | | 1,250,000 | | 1,272,494 |
|
| TOTAL ASSET BACKED SECURITIES | | | | |
| (Cost $1,249,974) | | | $ | 1,272,494 |
|
| |
| SHORT TERM INVESTMENTS - 12.66% | | | | |
| State Street Navigator Securities | | | | |
| Lending Prime Portfolio (c) | $ | 36,710,913 | $ | 36,710,913 |
|
| TOTAL SHORT TERM INVESTMENTS | | | | |
| (Cost $36,710,913) | | | $ | 36,710,913 |
|
| |
| REPURCHASE AGREEMENTS - 6.10% | | | | |
| Repurchase Agreement with State | | | | |
| Street Corp. dated 08/31/2006 at | | | | |
| 3.95% to be repurchased at | | | | |
| $17,712,943 on 09/01/2006, | | | | |
| collateralized by $18,820,000 | | | | |
| Federal Home Loan Mortgage | | | | |
| Corp., 4.125% due 02/24/2011 | | | | |
| (valued at $18,067,200, including | | | | |
| interest) (c) | $ | 17,711,000 | $ | 17,711,000 |
|
| TOTAL REPURCHASE AGREEMENTS | | | | |
| (Cost $17,711,000) | | | $ | 17,711,000 |
|
| Total Investments (U.S. High Yield Bond Fund) | | | |
| (Cost $323,604,813) - 111.32% | | | $ | 322,857,252 |
| Liabilities in Excess of Other Assets - (11.32)% | | | (32,843,725) |
|
|
| TOTAL NET ASSETS - 100.00% | | | $ | 290,013,527 |
|
|
| |
| |
| U.S. Multi Sector Fund | | | | |
| | | Shares or | | |
| | | Principal | | |
| | | Amount | | Value |
|
|
| |
| COMMON STOCKS - 95.00% | | | | |
| Aerospace - 1.41% | | | | |
| Armor Holdings, Inc. * | | 2,000 | $ | 105,740 |
| U.S. Multi Sector Fund (continued) | | |
| | Shares or | | |
| | Principal | | |
| | Amount | | Value |
|
|
| |
| COMMON STOCKS (continued) | | | |
| Aerospace (continued) | | | |
| Boeing Company | 23,900 | $ | 1,790,110 |
| General Dynamics Corp. | 51,400 | | 3,472,070 |
| Goodrich Corp. | 14,700 | | 572,565 |
| Lockheed Martin Corp. | 19,900 | | 1,643,740 |
| Northrop Grumman Corp. | 77,400 | | 5,171,094 |
| Raytheon Company | 16,200 | | 764,802 |
| United Technologies Corp. | 61,100 | | 3,831,581 |
|
|
| | | | 17,351,702 |
| Agriculture - 0.31% | | | |
| Archer-Daniels-Midland Company | 93,200 | | 3,837,044 |
| Air Freight - 0.02% | | | |
| ExpressJet Holdings, Inc. * (a) | 30,800 | | 215,292 |
| Air Travel - 0.06% | | | |
| SkyWest, Inc. | 29,100 | | 703,347 |
| Aluminum - 0.27% | | | |
| Alcoa, Inc. | 117,500 | | 3,359,325 |
| Apparel & Textiles - 0.83% | | | |
| Columbia Sportswear Company * (a) | 12,800 | | 624,896 |
| Deckers Outdoor Corp. * (a) | 7,400 | | 303,474 |
| Jones Apparel Group, Inc. | 43,000 | | 1,345,900 |
| Kellwood Company | 5,900 | | 161,719 |
| K-Swiss, Inc., Class A (a) | 14,800 | | 407,148 |
| Liz Claiborne, Inc. | 49,100 | | 1,834,867 |
| Mohawk Industries, Inc. * (a) | 28,700 | | 2,034,256 |
| Oakley, Inc. (a) | 29,900 | | 491,855 |
| Oxford Industries, Inc. (a) | 14,400 | | 591,552 |
| Polo Ralph Lauren Corp., Class A | 3,800 | | 224,162 |
| Skechers United States of America, Inc., | | | |
| Class A * | 4,900 | | 110,936 |
| Timberland Company, Class A * | 23,100 | | 656,271 |
| VF Corp. | 18,600 | | 1,299,954 |
| Weyco Group, Inc. (a) | 2,000 | | 42,580 |
|
|
| | | | 10,129,570 |
| Auto Parts - 0.77% | | | |
| Aftermarket Technology Corp. * | 6,300 | | 127,134 |
| American Axle & Manufacturing Holdings, Inc. (a) | 16,400 | | 273,716 |
| ArvinMeritor, Inc. (a) | 20,800 | | 308,880 |
| AutoZone, Inc. * | 28,100 | | 2,537,430 |
| Genuine Parts Company | 44,700 | | 1,847,451 |
| Johnson Controls, Inc. | 37,300 | | 2,682,989 |
| Keystone Automotive Industries, Inc. * (a) | 4,900 | | 168,511 |
| O'Reilly Automotive, Inc. * | 25,500 | | 757,095 |
| TRW Automotive Holdings Corp. * | 31,300 | | 771,858 |
|
|
| | | | 9,475,064 |
| Auto Services - 0.26% | | | |
| AutoNation, Inc. * | 161,800 | | 3,143,774 |
| Lithia Motors, Inc., Class A | 3,700 | | 94,424 |
|
|
| | | | 3,238,198 |
| Automobiles - 0.67% | | | |
| Ford Motor Company (a) | 576,900 | | 4,828,653 |
The accompanying notes are an integral part of the financial statements. 414
John Hancock Funds II
Portfolio of investments — August 31, 2006
(showing percentage of total net assets)
| U.S. Multi Sector Fund (continued) | | |
| | Shares or | | |
| | Principal | | |
| | Amount | | Value |
|
|
| |
| COMMON STOCKS (continued) | | | |
| Automobiles (continued) | | | |
| PACCAR, Inc. (a) | 56,400 | $ | 3,083,388 |
| Tenneco, Inc. * | 14,900 | | 338,975 |
|
|
| | | | 8,251,016 |
| Banking - 1.23% | | | |
| 1st Source Corp. (a) | 660 | | 19,767 |
| Anchor BanCorp Wisconsin, Inc. (a) | 5,800 | | 169,476 |
| BancFirst Corp. | 700 | | 33,159 |
| Bank of America Corp. | 56,800 | | 2,923,496 |
| BB&T Corp. (a) | 27,500 | | 1,177,000 |
| BOK Financial Corp. | 900 | | 46,800 |
| Camden National Corp. (a) | 300 | | 13,050 |
| City Bank Lynnwood WA (a) | 1,100 | | 55,957 |
| Comerica, Inc. | 31,300 | | 1,791,925 |
| First Community Bancorp | 3,800 | | 203,718 |
| First Indiana Corp. (a) | 8,200 | | 200,490 |
| Frontier Financial Corp. (a) | 700 | | 28,623 |
| Hancock Holding Company (a) | 4,600 | | 238,464 |
| Harleysville National Corp. (a) | 1,260 | | 26,044 |
| ITLA Capital Corp. | 2,200 | | 115,390 |
| Macatawa Bank Corp. (a) | 1,065 | | 24,783 |
| MainSource Financial Group, Inc. | 700 | | 11,865 |
| National City Corp. | 183,900 | | 6,359,262 |
| Northern Trust Corp. | 12,000 | | 671,880 |
| Old Second Bancorp, Inc. (a) | 1,900 | | 57,684 |
| Park National Corp. (a) | 400 | | 41,444 |
| United Bankshares, Inc. | 2,900 | | 108,083 |
| Virginia Commerce Bancorp, Inc. * (a) | 1,350 | | 29,916 |
| Wilmington Trust Corp. | 16,600 | | 731,230 |
|
|
| | | | 15,079,506 |
| Biotechnology - 0.18% | | | |
| Applera Corp. | 53,700 | | 1,645,905 |
| Genentech, Inc. * | 5,000 | | 412,600 |
| Techne Corp. * | 3,200 | | 162,880 |
|
|
| | | | 2,221,385 |
| Broadcasting - 0.08% | | | |
| CBS Corp., Class B | 4,400 | | 125,620 |
| News Corp. | 40,100 | | 763,103 |
| Sinclair Broadcast Group, Inc., Class A (a) | 17,500 | | 135,100 |
|
|
| | | | 1,023,823 |
| Building Materials & Construction - 0.62% | | | |
| American Standard Companies, Inc. | 60,500 | | 2,527,085 |
| Dycom Industries, Inc. * (a) | 15,800 | | 319,950 |
| Eagle Materials, Inc. | 18,700 | | 670,395 |
| EMCOR Group, Inc. * | 29,900 | | 1,657,656 |
| Lennox International, Inc. | 25,900 | | 609,686 |
| LSI Industries, Inc. | 13,600 | | 249,288 |
| Masco Corp. | 48,400 | | 1,326,644 |
| NCI Building Systems, Inc. * (a) | 2,200 | | 119,548 |
| Perini Corp. * | 6,100 | | 146,217 |
|
|
| | | | 7,626,469 |
| U.S. Multi Sector Fund (continued) | | |
| | Shares or | | |
| | Principal | | |
| | Amount | | Value |
|
|
| |
| COMMON STOCKS (continued) | | | |
| Business Services - 2.73% | | | |
| Affiliated Computer Services, Inc., Class A * (a) | 52,800 | $ | 2,710,752 |
| CDI Corp. (a) | 4,100 | | 85,895 |
| Cendant Corp. | 42,000 | | 81,060 |
| Compucredit Corp. * (a) | 16,400 | | 478,060 |
| Computer Sciences Corp. * | 44,600 | | 2,113,148 |
| CSG Systems International, Inc. * | 26,400 | | 710,688 |
| Deluxe Corp. (a) | 16,700 | | 299,264 |
| DST Systems, Inc. * | 10,400 | | 613,912 |
| Electronic Data Systems Corp. | 36,700 | | 874,561 |
| Equifax, Inc. | 18,400 | | 584,936 |
| FactSet Research Systems, Inc. | 16,900 | | 745,290 |
| Fair Isaac Corp. | 29,000 | | 1,015,290 |
| First Data Corp. | 125,200 | | 5,379,844 |
| Fluor Corp. | 3,700 | | 319,754 |
| Forrester Research, Inc. * | 5,000 | | 147,600 |
| Global Payments, Inc. | 7,000 | | 266,350 |
| H & R Block, Inc. | 21,700 | | 456,351 |
| Hudson Highland Group, Inc. * (a) | 7,100 | | 71,142 |
| Jacobs Engineering Group, Inc. * | 11,200 | | 975,408 |
| Lightbridge, Inc. * | 10,600 | | 126,140 |
| Manpower, Inc. | 35,300 | | 2,086,583 |
| MAXIMUS, Inc. | 8,100 | | 215,622 |
| Moody's Corp. | 101,300 | | 6,197,534 |
| MPS Group, Inc. * | 24,300 | | 341,658 |
| On Assignment, Inc. * | 13,400 | | 127,702 |
| Paxar Corp. * | 3,700 | | 72,039 |
| Paychex, Inc. | 38,200 | | 1,371,762 |
| Pitney Bowes, Inc. | 69,900 | | 3,046,941 |
| Pre-Paid Legal Services, Inc. (a) | 9,200 | | 345,552 |
| Robert Half International, Inc. | 39,900 | | 1,234,506 |
| Sirva, Inc. * (a) | 7,500 | | 22,725 |
| Spherion Corp. * | 33,800 | | 252,486 |
| StarTek, Inc. | 4,200 | | 47,754 |
| Tyler Technologies, Inc. * | 3,300 | | 43,164 |
|
|
| | | | 33,461,473 |
| Cellular Communications - 0.27% | | | |
| Motorola, Inc. | 141,400 | | 3,305,932 |
| Chemicals - 0.24% | | | |
| A. Schulman, Inc. | 4,300 | | 101,437 |
| Airgas, Inc. | 3,100 | | 111,042 |
| Albany Molecular Research, Inc. * | 9,500 | | 93,100 |
| Cabot Corp. | 8,400 | | 279,132 |
| E.I. Du Pont De Nemours & Company | 45,900 | | 1,834,623 |
| H.B. Fuller Company | 8,400 | | 161,532 |
| PolyOne Corp. * | 20,600 | | 178,602 |
| Sensient Technologies Corp. | 9,300 | | 187,116 |
|
|
| | | | 2,946,584 |
| Colleges & Universities - 0.11% | | | |
| Career Education Corp. * | 3,300 | | 63,195 |
| ITT Educational Services, Inc. * | 19,100 | | 1,262,319 |
|
|
| | | | 1,325,514 |
The accompanying notes are an integral part of the financial statements. 415
John Hancock Funds II
Portfolio of investments — August 31, 2006
(showing percentage of total net assets)
| U.S. Multi Sector Fund (continued) | | |
| | Shares or | | |
| | Principal | | |
| | Amount | | Value |
|
|
| |
| COMMON STOCKS (continued) | | | |
| Commercial Services - 0.00% | | | |
| Vertrue, Inc. * (a) | 1,000 | $ | 42,390 |
| Computers & Business Equipment - 3.36% | | | |
| Benchmark Electronics, Inc. * | 4,700 | | 117,218 |
| CalAmp Corp. * (a) | 5,900 | | 39,707 |
| CDW Corp. | 14,300 | | 833,690 |
| Dell, Inc. * | 560,300 | | 12,634,765 |
| Diebold, Inc. | 11,400 | | 477,774 |
| Hewlett-Packard Company | 404,300 | | 14,781,208 |
| Ingram Micro, Inc., Class A * | 54,100 | | 973,800 |
| International Business Machines Corp. | 78,300 | | 6,339,951 |
| Lexmark International, Inc. * | 52,900 | | 2,966,103 |
| Plexus Corp. * | 3,100 | | 61,442 |
| Rimage Corp. * (a) | 2,100 | | 49,266 |
| Sykes Enterprises, Inc. * | 14,900 | | 299,639 |
| Tech Data Corp. * | 28,600 | | 997,854 |
| Western Digital Corp. * | 36,000 | | 658,800 |
|
|
| | | | 41,231,217 |
| Construction & Mining Equipment - 0.01% | | | |
| Kaman Corp., Class A | 8,100 | | 145,071 |
| Construction Materials - 0.34% | | | |
| Ameron International Corp. | 3,700 | | 259,518 |
| Columbus McKinnon Corp. * | 6,400 | | 118,336 |
| Comfort Systems USA, Inc. | 6,100 | | 79,483 |
| Florida Rock Industries, Inc. | 2,800 | | 104,132 |
| Granite Construction, Inc. | 8,400 | | 450,660 |
| Martin Marietta Materials, Inc. | 22,100 | | 1,820,156 |
| Simpson Manufacturing, Inc. (a) | 13,800 | | 363,630 |
| Standex International Corp. | 800 | | 23,560 |
| Universal Forest Products, Inc. (a) | 9,400 | | 458,344 |
| USG Corp. * (a) | 8,600 | | 438,600 |
|
|
| | | | 4,116,419 |
| Containers & Glass - 0.05% | | | |
| Greif, Inc., Class A | 400 | | 28,340 |
| Pactiv Corp. * | 18,200 | | 486,486 |
| Smurfit-Stone Container Corp. * | 10,200 | | 116,178 |
|
|
| | | | 631,004 |
| Cosmetics & Toiletries - 0.30% | | | |
| Avon Products, Inc. | 20,100 | | 577,071 |
| Colgate-Palmolive Company | 45,300 | | 2,711,658 |
| Playtex Products, Inc. * (a) | 29,400 | | 386,610 |
|
|
| | | | 3,675,339 |
| Crude Petroleum & Natural Gas - 1.17% | | | |
| Apache Corp. | 25,900 | | 1,690,752 |
| Devon Energy Corp. | 25,800 | | 1,612,242 |
| Marathon Oil Corp. | 25,300 | | 2,112,550 |
| Newfield Exploration Company * | 2,300 | | 99,452 |
| Occidental Petroleum Corp. | 115,200 | | 5,874,048 |
| Pogo Producing Company (a) | 2,600 | | 115,466 |
| Sunoco, Inc. | 40,300 | | 2,897,973 |
|
|
| | | | 14,402,483 |
| U.S. Multi Sector Fund (continued) | | |
| | Shares or | | |
| | Principal | | |
| | Amount | | Value |
|
|
| |
| COMMON STOCKS (continued) | | | |
| Domestic Oil - 0.08% | | | |
| St. Mary Land & Exploration Company (a) | 23,600 | $ | 962,880 |
| Drugs & Health Care - 0.23% | | | |
| Wyeth | 57,900 | | 2,819,730 |
| Educational Services - 0.01% | | | |
| Renaissance Learning, Inc. (a) | 4,800 | | 62,208 |
| Electrical Equipment - 0.97% | | | |
| A.O. Smith Corp. (a) | 11,300 | | 453,243 |
| Anaren, Inc. * | 6,400 | | 144,384 |
| Baldor Electric Company | 3,700 | | 109,557 |
| Cohu, Inc. | 7,700 | | 129,129 |
| Emerson Electric Company | 101,400 | | 8,330,010 |
| Genlyte Group, Inc. * | 9,600 | | 629,088 |
| Greatbatch, Inc. * (a) | 6,900 | | 168,774 |
| Molex, Inc. | 24,800 | | 904,456 |
| Tektronix, Inc. | 16,900 | | 478,946 |
| Watsco, Inc. (a) | 9,400 | | 413,036 |
| Wesco International, Inc. * | 1,900 | | 111,150 |
|
|
| | | | 11,871,773 |
| Electrical Utilities - 0.26% | | | |
| Black Hills Corp. (a) | 7,100 | | 247,151 |
| CenterPoint Energy, Inc. (a) | 43,900 | | 634,355 |
| Edison International | 20,200 | | 881,528 |
| FirstEnergy Corp. | 24,000 | | 1,369,440 |
|
|
| | | | 3,132,474 |
| Electronics - 0.66% | | | |
| Agilent Technologies, Inc. * | 76,700 | | 2,466,672 |
| Amphenol Corp., Class A | 4,600 | | 264,362 |
| Arrow Electronics, Inc. * | 16,900 | | 471,510 |
| Avnet, Inc. * | 32,400 | | 633,744 |
| AVX Corp. (a) | 11,100 | | 184,371 |
| Cubic Corp. (a) | 2,300 | | 46,299 |
| Daktronics, Inc. (a) | 13,200 | | 275,484 |
| Harman International Industries, Inc. | 1,300 | | 105,456 |
| Imation Corp. | 14,100 | | 558,783 |
| Planar Systems, Inc. * (a) | 3,700 | | 36,371 |
| Rogers Corp. * | 2,600 | | 150,852 |
| Supertex, Inc. * (a) | 7,100 | | 251,127 |
| Synopsys, Inc. * | 44,700 | | 847,512 |
| Technitrol, Inc. | 9,500 | | 268,945 |
| Teleflex, Inc. | 15,400 | | 859,474 |
| Thermo Electron Corp. * | 16,500 | | 646,800 |
|
|
| | | | 8,067,762 |
| Financial Services - 7.83% | | | |
| Advanta Corp., Class B | 1,600 | | 54,176 |
| Asset Acceptance Capital Corp. * | 6,200 | | 91,698 |
| Bear Stearns Companies, Inc. | 14,500 | | 1,890,075 |
| Charles Schwab Corp. | 195,400 | | 3,186,974 |
| CIT Group, Inc. | 27,900 | | 1,257,174 |
| Citigroup, Inc. | 151,700 | | 7,486,395 |
| Credit Acceptance Corp. * (a) | 800 | | 22,752 |
The accompanying notes are an integral part of the financial statements. 416
John Hancock Funds II
Portfolio of investments — August 31, 2006
(showing percentage of total net assets)
| U.S. Multi Sector Fund (continued) | | |
| | Shares or | | |
| | Principal | | |
| | Amount | | Value |
|
|
| |
| COMMON STOCKS (continued) | | | |
| Financial Services (continued) | | | |
| E*TRADE Financial Corp. * | 87,300 | $ | 2,059,407 |
| Federal Agricultural Mortgage Corp., Class C (a) | 5,600 | | 157,080 |
| Federal Home Loan Mortgage Corp. | 67,500 | | 4,293,000 |
| Federal National Mortgage Association | 448,700 | | 23,624,055 |
| Federated Investors, Inc., Class B | 28,100 | | 940,788 |
| Fiserv, Inc. * | 32,200 | | 1,422,274 |
| Goldman Sachs Group, Inc. | 52,800 | | 7,848,720 |
| Investment Technology Group, Inc. * | 7,600 | | 351,196 |
| Janus Capital Group, Inc. | 10,900 | | 193,802 |
| Jefferies Group, Inc. | 20,300 | | 505,876 |
| JPMorgan Chase & Company | 210,000 | | 9,588,600 |
| Lehman Brothers Holdings, Inc. | 48,600 | | 3,101,166 |
| Mellon Financial Corp. | 69,300 | | 2,580,039 |
| Merrill Lynch & Company, Inc. | 89,100 | | 6,551,523 |
| Moneygram International, Inc. | 32,600 | | 1,023,640 |
| Morgan Stanley | 55,900 | | 3,677,661 |
| PNC Financial Services Group, Inc. | 40,400 | | 2,859,916 |
| Raymond James Financial, Inc. | 32,500 | | 900,900 |
| State Street Corp. (c) | 41,600 | | 2,570,880 |
| Stifel Financial Corp. * (a) | 600 | | 19,182 |
| Student Loan Corp. (a) | 3,000 | | 551,400 |
| SWS Group, Inc. | 2,700 | | 66,420 |
| T. Rowe Price Group, Inc. | 3,100 | | 136,586 |
| TD Ameritrade Holding Corp. * | 47,700 | | 835,704 |
| United Panam Financial Corp. * | 2,000 | | 34,140 |
| Waddell & Reed Financial, Inc., Class A | 10,400 | | 241,488 |
| Washington Mutual, Inc. | 141,800 | | 5,940,002 |
|
|
| | | | 96,064,689 |
| Food & Beverages - 4.02% | | | |
| Dean Foods Company * | 56,300 | | 2,230,606 |
| Flowers Foods, Inc. | 16,400 | | 445,260 |
| H.J. Heinz Company | 25,000 | | 1,046,000 |
| Hormel Foods Corp. | 4,500 | | 164,925 |
| Kraft Foods, Inc., Class A (a) | 55,100 | | 1,868,441 |
| National Beverage Corp. * (a) | 1,400 | | 19,684 |
| Pepsi Bottling Group, Inc. | 61,200 | | 2,142,612 |
| PepsiCo, Inc. | 13,300 | | 868,224 |
| Performance Food Group Company * (a) | 16,200 | | 398,682 |
| Sanderson Farms, Inc. (a) | 11,800 | | 368,868 |
| Sara Lee Corp. | 87,500 | | 1,455,125 |
| Starbucks Corp. * | 338,800 | | 10,506,188 |
| Sysco Corp. | 108,300 | | 3,399,537 |
| The Coca-Cola Company | 498,700 | | 22,346,747 |
| Tyson Foods, Inc., Class A (a) | 136,100 | | 2,004,753 |
|
|
| | | | 49,265,652 |
| Furniture & Fixtures - 0.16% | | | |
| Ethan Allen Interiors, Inc. (a) | 19,700 | | 664,875 |
| Furniture Brands International, Inc. (a) | 35,600 | | 681,740 |
| Kimball International, Inc., Class B | 2,200 | | 38,808 |
| La-Z-Boy, Inc. (a) | 20,800 | | 290,160 |
| U.S. Multi Sector Fund (continued) | | |
| | Shares or | | |
| | Principal | | |
| | Amount | | Value |
|
|
| |
| COMMON STOCKS (continued) | | | |
| Furniture & Fixtures (continued) | | | |
| Leggett & Platt, Inc. | 14,600 | $ | 336,530 |
|
|
| | | | 2,012,113 |
| Gas & Pipeline Utilities - 0.05% | | | |
| Maverick Tube Corp. * (a) | 10,400 | | 668,408 |
| Healthcare Products - 2.73% | | | |
| Baxter International, Inc. | 53,400 | | 2,369,892 |
| Becton, Dickinson & Company | 4,800 | | 334,560 |
| Biomet, Inc. | 13,200 | | 431,772 |
| Computer Programs & Systems, Inc. (a) | 7,400 | | 251,748 |
| IDEXX Laboratories, Inc. * | 3,600 | | 331,236 |
| Johnson & Johnson | 438,100 | | 28,327,546 |
| Owens & Minor, Inc. | 8,900 | | 286,313 |
| PSS World Medical, Inc. * | 6,500 | | 126,100 |
| Respironics, Inc. * | 3,300 | | 121,803 |
| St. Jude Medical, Inc. * | 3,100 | | 112,871 |
| Varian Medical Systems, Inc. * | 15,500 | | 826,150 |
|
|
| | | | 33,519,991 |
| Healthcare Services - 6.41% | | | |
| AMN Healthcare Services, Inc. * | 9,300 | | 223,200 |
| Cardinal Health, Inc. | 190,000 | | 12,809,800 |
| Caremark Rx, Inc. | 72,500 | | 4,200,650 |
| CorVel Corp. * | 500 | | 15,500 |
| Express Scripts, Inc. * | 132,000 | | 11,098,560 |
| Health Net, Inc. * | 49,400 | | 2,065,414 |
| Lincare Holdings, Inc. * | 58,000 | | 2,147,740 |
| McKesson Corp. | 274,900 | | 13,964,920 |
| National Healthcare Corp. (a) | 700 | | 34,279 |
| Odyssey Healthcare, Inc. * | 5,700 | | 91,428 |
| Quest Diagnostics, Inc. | 48,800 | | 3,136,864 |
| UnitedHealth Group, Inc. | 540,900 | | 28,099,755 |
| Weight Watchers International, Inc. | 18,000 | | 764,280 |
|
|
| | | | 78,652,390 |
| Holdings Companies/Conglomerates - 0.34% | | | |
| Loews Corp. | 76,700 | | 2,951,416 |
| Textron, Inc. | 10,900 | | 914,074 |
| United Industrial Corp. (a) | 6,100 | | 328,607 |
|
|
| | | | 4,194,097 |
| Homebuilders - 0.94% | | | |
| Beazer Homes USA, Inc. (a) | 11,300 | | 455,390 |
| Centex Corp. | 31,800 | | 1,620,210 |
| D.R. Horton, Inc. (a) | 55,600 | | 1,219,308 |
| Hovnanian Enterprises, Inc., Class A * (a) | 5,600 | | 148,344 |
| KB Home | 24,200 | | 1,034,792 |
| Lennar Corp., Class A | 34,100 | | 1,529,044 |
| M.D.C. Holdings, Inc. (a) | 7,000 | | 299,530 |
| M/I Homes, Inc. (a) | 17,800 | | 576,008 |
| Meritage Homes Corp. * (a) | 1,700 | | 69,615 |
| NVR, Inc. * (a) | 2,200 | | 1,130,030 |
| Pulte Homes, Inc. | 70,100 | | 2,079,867 |
| Ryland Group, Inc. (a) | 20,000 | | 853,400 |
The accompanying notes are an integral part of the financial statements. 417
John Hancock Funds II
Portfolio of investments — August 31, 2006
(showing percentage of total net assets)
| U.S. Multi Sector Fund (continued) | | |
| | Shares or | | |
| | Principal | | |
| | Amount | | Value |
|
|
| |
| COMMON STOCKS (continued) | | | |
| Homebuilders (continued) | | | |
| Standard Pacific Corp. (a) | 22,600 | $ | 540,818 |
|
|
| | | | 11,556,356 |
| Hotels & Restaurants - 1.15% | | | |
| Applebee's International, Inc. | 54,900 | | 1,139,175 |
| Brinker International, Inc. | 39,300 | | 1,511,871 |
| CBRL Group, Inc. (a) | 23,000 | | 870,320 |
| Choice Hotels, Inc. | 8,500 | | 322,235 |
| Darden Restaurants, Inc. | 74,500 | | 2,637,300 |
| IHOP Corp. (a) | 3,900 | | 182,091 |
| Jack In the Box, Inc. * | 18,900 | | 906,822 |
| Papa Johns International, Inc. * (a) | 39,800 | | 1,353,200 |
| Ruby Tuesday, Inc. (a) | 15,000 | | 387,300 |
| Ryan's Restaurant Group, Inc. * | 26,100 | | 411,336 |
| Sonic Corp. * (a) | 19,400 | | 425,442 |
| Wendy's International, Inc. | 42,000 | | 2,683,800 |
| Wyndham Worldwide Corp. * | 8,400 | | 245,784 |
| Yum! Brands, Inc. | 20,000 | | 977,600 |
|
|
| | | | 14,054,276 |
| Household Appliances - 0.48% | | | |
| Drew Industries, Inc. * (a) | 2,700 | | 70,497 |
| Whirlpool Corp. (a) | 72,100 | | 5,833,611 |
|
|
| | | | 5,904,108 |
| Household Products - 0.42% | | | |
| Blyth, Inc. | 18,300 | | 393,084 |
| Energizer Holdings, Inc. * | 12,000 | | 802,320 |
| Newell Rubbermaid, Inc. | 122,100 | | 3,295,479 |
| Select Comfort Corp. * (a) | 17,650 | | 350,352 |
| Tupperware Brands Corp. | 18,200 | | 327,782 |
|
|
| | | | 5,169,017 |
| Housing & Urban Development - 0.00% | | | |
| Cavco Industries, Inc. * | 700 | | 23,814 |
| Industrial Machinery - 1.11% | | | |
| Caterpillar, Inc. | 55,900 | | 3,708,965 |
| Cummins, Inc. | 8,700 | | 998,934 |
| Deere & Company | 22,500 | | 1,757,250 |
| Flowserve Corp. * | 13,700 | | 700,618 |
| Graco, Inc. | 2,900 | | 109,620 |
| ITT Corp. | 18,000 | | 881,100 |
| NACCO Industries, Inc., Class A | 2,300 | | 307,119 |
| Parker-Hannifin Corp. | 18,000 | | 1,332,900 |
| Tennant Company | 5,600 | | 151,536 |
| Terex Corp. * | 20,400 | | 896,172 |
| Valmont Industries, Inc. | 6,600 | | 344,256 |
| W.W. Grainger, Inc. | 36,300 | | 2,424,840 |
|
|
| | | | 13,613,310 |
| Industrials - 0.15% | | | |
| Crane Company | 17,100 | | 683,658 |
| Fastenal Company (a) | 24,200 | | 887,656 |
| Harsco Corp. | 1,500 | | 119,340 |
| Lawson Products, Inc. | 1,700 | | 65,620 |
| U.S. Multi Sector Fund (continued) | | |
| | Shares or | | |
| | Principal | | |
| | Amount | | Value |
|
|
| |
| COMMON STOCKS (continued) | | | |
| Industrials (continued) | | | |
| Michael Baker Corp. * | 1,000 | $ | 22,000 |
|
|
| | | | 1,778,274 |
| Insurance - 8.25% | | | |
| 21st Century Insurance Group (a) | 11,100 | | 166,833 |
| AFLAC, Inc. | 283,500 | | 12,777,345 |
| Allstate Corp. | 36,900 | | 2,137,986 |
| Ambac Financial Group, Inc. | 43,800 | | 3,792,642 |
| American Financial Group, Inc. | 15,900 | | 742,848 |
| American International Group, Inc. | 208,800 | | 13,325,616 |
| American National Insurance Company | 100 | | 11,504 |
| Amerus Group Company | 15,800 | | 1,071,240 |
| Aon Corp. | 118,300 | | 4,089,631 |
| Brown & Brown, Inc. | 38,400 | | 1,149,696 |
| Chubb Corp. | 70,600 | | 3,541,296 |
| CIGNA Corp. | 19,000 | | 2,148,330 |
| Cincinnati Financial Corp. | 2,400 | | 111,984 |
| CNA Surety Corp. * | 1,500 | | 29,850 |
| Commerce Group, Inc. (a) | 11,500 | | 342,585 |
| Conseco, Inc. * | 26,700 | | 552,690 |
| Donegal Group, Inc. | 5,900 | | 109,681 |
| Erie Indemnity Company, Class A (a) | 10,300 | | 525,712 |
| FBL Financial Group, Inc., Class A | 4,000 | | 132,640 |
| Fidelity National Financial, Inc. | 64,900 | | 2,610,927 |
| First American Corp. | 38,700 | | 1,571,994 |
| Hanover Insurance Group, Inc. | 26,000 | | 1,157,000 |
| Harleysville Group, Inc. | 3,700 | | 133,163 |
| HCC Insurance Holdings, Inc. | 25,600 | | 831,744 |
| LandAmerica Financial Group, Inc. (a) | 12,900 | | 815,796 |
| Lincoln National Corp. | 65,183 | | 3,956,608 |
| Marsh & McLennan Companies, Inc. | 9,500 | | 248,520 |
| MBIA, Inc. | 40,400 | | 2,489,852 |
| MetLife, Inc. | 48,900 | | 2,690,967 |
| MGIC Investment Corp. | 50,600 | | 2,928,222 |
| National Western Life Insurance Company, | | | |
| Class A * | 900 | | 207,270 |
| Nationwide Financial Services, Inc., Class A | 6,800 | | 329,188 |
| Old Republic International Corp. | 144,575 | | 3,021,618 |
| PMI Group, Inc. | 62,500 | | 2,702,500 |
| Presidential Life Corp. (a) | 10,100 | | 238,057 |
| Principal Financial Group, Inc. | 20,100 | | 1,070,124 |
| Progressive Corp. | 344,200 | | 8,463,878 |
| Protective Life Corp. | 20,300 | | 934,409 |
| Prudential Financial, Inc. | 22,900 | | 1,681,089 |
| Radian Group, Inc. | 24,000 | | 1,437,120 |
| Reinsurance Group of America, Inc. | 6,900 | | 356,592 |
| St. Paul Travelers Companies, Inc. | 89,900 | | 3,946,610 |
| Stancorp Financial Group, Inc. | 14,800 | | 689,236 |
| State Auto Financial Corp. | 2,700 | | 84,618 |
| Stewart Information Services Corp. | 12,200 | | 416,142 |
| Torchmark Corp. | 61,200 | | 3,807,252 |
| Transatlantic Holdings, Inc. (a) | 6,800 | | 417,656 |
| Triad Guaranty, Inc. * (a) | 2,400 | | 120,648 |
The accompanying notes are an integral part of the financial statements. 418
John Hancock Funds II
Portfolio of investments — August 31, 2006
(showing percentage of total net assets)
| U.S. Multi Sector Fund (continued) | | |
| | Shares or | | |
| | Principal | | |
| | Amount | | Value |
|
|
| |
| COMMON STOCKS (continued) | | | |
| Insurance (continued) | | | |
| Universal American Financial Corp. * | 26,000 | $ | 398,580 |
| UnumProvident Corp. (a) | 119,900 | | 2,272,105 |
| W.R. Berkley Corp. | 70,000 | | 2,450,000 |
|
|
| | | | 101,239,594 |
| International Oil - 0.98% | | | |
| Anadarko Petroleum Corp. | 198,000 | | 9,288,180 |
| ConocoPhillips | 18,077 | | 1,146,624 |
| Hess Corp. | 34,300 | | 1,570,254 |
|
|
| | | | 12,005,058 |
| Internet Service Provider - 0.05% | | | |
| Earthlink, Inc. * | 67,600 | | 496,860 |
| United Online, Inc. | 12,100 | | 138,787 |
|
|
| | | | 635,647 |
| Internet Software - 0.02% | | | |
| WebMethods, Inc. * | 33,900 | | 267,471 |
| Leisure Time - 0.32% | | | |
| Bally Total Fitness Holding Corp. * (a) | 16,600 | | 49,800 |
| Bluegreen Corp. * (a) | 9,100 | | 104,195 |
| International Game Technology, Inc. | 84,600 | | 3,272,328 |
| Marine Products Corp. (a) | 1,300 | | 11,492 |
| Walt Disney Company | 15,100 | | 447,715 |
|
|
| | | | 3,885,530 |
| Life Sciences - 0.05% | | | |
| Pharmaceutical Product Development, Inc. | 15,400 | | 587,048 |
| Liquor - 0.44% | | | |
| Anheuser-Busch Companies, Inc. | 78,900 | | 3,896,082 |
| Brown Forman Corp., Class B | 19,200 | | 1,478,016 |
|
|
| | | | 5,374,098 |
| Manufacturing - 1.43% | | | |
| Acuity Brands, Inc. | 14,600 | | 623,858 |
| Barnes Group, Inc. | 12,000 | | 197,040 |
| Danaher Corp. | 69,200 | | 4,587,268 |
| Eaton Corp. | 29,500 | | 1,961,750 |
| Harley-Davidson, Inc. (a) | 55,900 | | 3,270,709 |
| Illinois Tool Works, Inc. | 126,900 | | 5,570,910 |
| Kaydon Corp. | 5,800 | | 221,038 |
| Nordson Corp. | 8,200 | | 328,328 |
| Rockwell Automation, Inc. | 12,800 | | 721,664 |
| SPX Corp. | 2,100 | | 110,880 |
|
|
| | | | 17,593,445 |
| Medical-Hospitals - 0.01% | | | |
| Health Management Associates, Inc., Class A | 5,400 | | 112,914 |
| Metal & Metal Products - 0.16% | | | |
| Commercial Metals Company | 5,100 | | 110,109 |
| Metal Management, Inc. | 6,500 | | 166,270 |
| Mueller Industries, Inc. | 5,500 | | 210,760 |
| Reliance Steel & Aluminum Company | 41,200 | | 1,350,124 |
| Timken Company | 3,700 | | 118,548 |
|
|
| | | | 1,955,811 |
| U.S. Multi Sector Fund (continued) | | |
| | Shares or | | |
| | Principal | | |
| | Amount | | Value |
|
|
| |
| COMMON STOCKS (continued) | | | |
| Mining - 0.10% | | | |
| Lincoln Electric Holding, Inc. (a) | 21,900 | $ | 1,205,157 |
| Mobile Homes - 0.17% | | | |
| Thor Industries, Inc. (a) | 36,900 | | 1,556,442 |
| Winnebago Industries, Inc. (a) | 19,300 | | 563,560 |
|
|
| | | | 2,120,002 |
| Office Furnishings & Supplies - 0.41% | | | |
| HNI Corp. (a) | 14,500 | | 578,550 |
| IKON Office Solutions, Inc. | 24,200 | | 344,850 |
| Office Depot, Inc. * | 109,300 | | 4,026,612 |
| The Standard Register Company (a) | 7,500 | | 96,225 |
|
|
| | | | 5,046,237 |
| Paper - 0.09% | | | |
| International Paper Company | 17,400 | | 604,998 |
| Temple-Inland, Inc. | 10,200 | | 454,104 |
|
|
| | | | 1,059,102 |
| Petroleum Services - 1.17% | | | |
| Baker Hughes, Inc. | 31,700 | | 2,256,406 |
| BJ Services Company | 28,900 | | 991,559 |
| Exxon Mobil Corp. | 146,100 | | 9,886,587 |
| Tesoro Petroleum Corp. (a) | 9,500 | | 613,795 |
| Valero Energy Corp. | 11,000 | | 631,400 |
|
|
| | | | 14,379,747 |
| Pharmaceuticals - 12.52% | | | |
| Abbott Laboratories | 73,300 | | 3,569,710 |
| Allergan, Inc. | 19,400 | | 2,222,464 |
| AmerisourceBergen Corp. | 175,900 | | 7,767,744 |
| Barr Pharmaceuticals, Inc. * | 41,300 | | 2,333,450 |
| Bristol-Myers Squibb Company | 81,600 | | 1,774,800 |
| Forest Laboratories, Inc. * | 263,000 | | 13,144,740 |
| King Pharmaceuticals, Inc. * | 58,000 | | 940,760 |
| Merck & Company, Inc. | 1,061,000 | | 43,023,550 |
| Pfizer, Inc. | 2,858,900 | | 78,791,284 |
|
|
| | | | 153,568,502 |
| Photography - 0.10% | | | |
| Eastman Kodak Company (a) | 59,000 | | 1,254,930 |
| Plastics - 0.01% | | | |
| Spartech Corp. | 6,400 | | 144,192 |
| Publishing - 0.26% | | | |
| Cadmus Communications Corp. | 600 | | 9,840 |
| Gannett Company, Inc. | 49,600 | | 2,819,760 |
| Valassis Communications, Inc. * | 18,000 | | 354,960 |
|
|
| | | | 3,184,560 |
| Railroads & Equipment - 0.57% | | | |
| Burlington Northern Santa Fe Corp. | 54,900 | | 3,675,555 |
| CSX Corp. | 16,400 | | 495,608 |
| Norfolk Southern Corp. | 11,100 | | 474,303 |
| Union Pacific Corp. | 28,300 | | 2,273,905 |
| Wabtec Corp. | 3,200 | | 90,272 |
|
|
| | | | 7,009,643 |
The accompanying notes are an integral part of the financial statements. 419
John Hancock Funds II
Portfolio of investments — August 31, 2006
(showing percentage of total net assets)
| U.S. Multi Sector Fund (continued) | | |
| | Shares or | | |
| | Principal | | |
| | Amount | | Value |
|
|
| |
| COMMON STOCKS (continued) | | | |
| Real Estate - 0.02% | | | |
| Realogy Corp., REIT * | 10,500 | $ | 224,700 |
| Retail - 0.00% | | | |
| Rex Stores Corp. * | 900 | | 12,249 |
| Retail Grocery - 1.70% | | | |
| Ingles Markets, Inc. (a) | 7,600 | | 194,560 |
| Nash-Finch Company (a) | 22,900 | | 523,265 |
| Ruddick Corp. | 6,400 | | 165,056 |
| Safeway, Inc. | 192,900 | | 5,966,397 |
| Smart & Final, Inc. * | 3,300 | | 54,681 |
| SUPERVALU, Inc. | 82,990 | | 2,370,194 |
| The Kroger Company | 482,600 | | 11,490,706 |
| Wild Oats Markets, Inc. * (a) | 4,100 | | 66,994 |
|
|
| | | | 20,831,853 |
| Retail Trade - 11.66% | | | |
| Bed Bath & Beyond, Inc. * | 130,400 | | 4,398,392 |
| Best Buy Company, Inc. | 32,600 | | 1,532,200 |
| Casey's General Stores, Inc. | 7,700 | | 182,028 |
| Cato Corp., Class A | 13,400 | | 311,282 |
| Charlotte Russe Holding, Inc. * (a) | 10,200 | | 272,340 |
| Costco Wholesale Corp. | 75,000 | | 3,509,250 |
| Dollar General Corp. | 53,800 | | 691,868 |
| Family Dollar Stores, Inc. (a) | 29,500 | | 754,315 |
| First Cash Financial Services, Inc. * | 16,400 | | 341,612 |
| Home Depot, Inc. | 1,373,500 | | 47,097,315 |
| Longs Drug Stores Corp. | 2,200 | | 99,946 |
| Lowe's Companies, Inc. | 1,377,400 | | 37,272,444 |
| NBTY, Inc. * | 4,800 | | 152,928 |
| Pantry, Inc. * (a) | 6,700 | | 313,962 |
| Payless ShoeSource, Inc. * | 4,100 | | 96,186 |
| Ross Stores, Inc. | 21,000 | | 514,290 |
| Sonic Automotive, Inc. (a) | 8,700 | | 184,005 |
| Staples, Inc. | 125,100 | | 2,822,256 |
| Steven Madden, Ltd. * | 17,600 | | 648,560 |
| Talbots, Inc. (a) | 9,300 | | 204,693 |
| The Buckle, Inc. | 5,300 | | 179,670 |
| The TJX Companies, Inc. | 53,100 | | 1,420,425 |
| United Rentals, Inc. * (a) | 20,300 | | 439,698 |
| Walgreen Company | 219,200 | | 10,841,632 |
| Wal-Mart Stores, Inc. | 643,700 | | 28,786,264 |
|
|
| | | | 143,067,561 |
| Sanitary Services - 0.23% | | | |
| Allied Waste Industries, Inc. * | 7,800 | | 80,652 |
| Ecolab, Inc. | 14,200 | | 633,036 |
| Waste Management, Inc. | 60,700 | | 2,080,796 |
|
|
| | | | 2,794,484 |
| Semiconductors - 1.38% | | | |
| Applied Materials, Inc. | 91,400 | | 1,542,832 |
| Intel Corp. | 386,500 | | 7,552,210 |
| Intersil Corp., Class A | 3,800 | | 96,330 |
| Micrel, Inc. * | 36,500 | | 365,730 |
| U.S. Multi Sector Fund (continued) | | |
| | Shares or | | |
| | Principal | | |
| | Amount | | Value |
|
|
| |
| COMMON STOCKS (continued) | | | |
| Semiconductors (continued) | | | |
| Microchip Technology, Inc. | 17,600 | $ | 601,216 |
| National Semiconductor Corp. | 47,500 | | 1,153,775 |
| NVIDIA Corp. * | 50,600 | | 1,472,966 |
| QLogic Corp. * | 25,900 | | 476,042 |
| Texas Instruments, Inc. | 114,300 | | 3,725,037 |
|
|
| | | | 16,986,138 |
| Software - 0.54% | | | |
| BEA Systems, Inc. * | 97,000 | | 1,331,810 |
| BMC Software, Inc. * | 40,700 | | 1,083,434 |
| Citrix Systems, Inc. * | 38,700 | | 1,187,316 |
| Compuware Corp. * | 12,600 | | 95,760 |
| EPIQ Systems, Inc. * (a) | 2,700 | | 40,176 |
| Intuit, Inc. * | 86,200 | | 2,604,964 |
| JDA Software Group, Inc. * (a) | 2,100 | | 34,839 |
| Transaction Systems Architects, Inc., Class A * | 8,500 | | 281,945 |
|
|
| | | | 6,660,244 |
| Steel - 0.36% | | | |
| Nucor Corp. | 80,100 | | 3,914,487 |
| Olympic Steel, Inc. (a) | 10,100 | | 279,265 |
| Ryerson, Inc. (a) | 11,900 | | 252,042 |
|
|
| | | | 4,445,794 |
| Telecommunications Equipment & | | | |
| Services - 1.06% | | | |
| ADTRAN, Inc. | 27,600 | | 686,412 |
| Commscope, Inc. * | 8,900 | | 259,969 |
| Corning, Inc. * | 33,300 | | 740,592 |
| Polycom, Inc. * | 13,400 | | 318,786 |
| QUALCOMM, Inc. | 292,700 | | 11,026,009 |
| SureWest Communications (a) | 1,100 | | 20,878 |
|
|
| | | | 13,052,646 |
| Telephone - 4.45% | | | |
| ALLTEL Corp. | 38,900 | | 2,108,769 |
| AT&T, Inc. | 613,400 | | 19,095,142 |
| BellSouth Corp. | 251,400 | | 10,237,008 |
| CenturyTel, Inc. | 37,800 | | 1,505,196 |
| Harris Corp. | 16,600 | | 729,072 |
| Qwest Communications International, Inc. * (a) | 189,300 | | 1,667,733 |
| TALK America Holdings, Inc. * (a) | 14,600 | | 84,680 |
| Verizon Communications, Inc. | 543,400 | | 19,116,812 |
|
|
| | | | 54,544,412 |
| Tires & Rubber - 0.04% | | | |
| Goodyear Tire & Rubber Company * (a) | 37,900 | | 515,440 |
| Tobacco - 1.12% | | | |
| Altria Group, Inc. | 136,400 | | 11,393,492 |
| Reynolds American, Inc. (a) | 7,600 | | 494,532 |
| UST, Inc. (a) | 34,000 | | 1,797,240 |
|
|
| | | | 13,685,264 |
| Transportation - 0.71% | | | |
| C.H. Robinson Worldwide, Inc. | 100,000 | | 4,582,000 |
| Expeditors International of Washington, Inc. | 89,100 | | 3,552,417 |
The accompanying notes are an integral part of the financial statements. 420
John Hancock Funds II
Portfolio of investments — August 31, 2006
(showing percentage of total net assets)
| U.S. Multi Sector Fund (continued) | | |
| | | Shares or | | |
| | | Principal | | |
| | | Amount | | Value |
|
|
| |
| COMMON STOCKS (continued) | | | | |
| Transportation (continued) | | | | |
| Kirby Corp. * | | 6,400 | $ | 187,712 |
| Pacer International, Inc. | | 6,600 | | 181,698 |
| Saia, Inc. * | | 4,700 | | 144,525 |
|
|
| | | | | 8,648,352 |
| Travel Services - 0.06% | | | | |
| Sabre Holdings Corp. | | 33,000 | | 723,360 |
| Trucking & Freight - 1.27% | | | | |
| Arkansas Best Corp. | | 14,800 | | 653,420 |
| Celadon Group, Inc. * | | 9,800 | | 181,594 |
| EGL, Inc. * | | 5,200 | | 158,964 |
| Fedex Corp. | | 105,200 | | 10,628,356 |
| Forward Air Corp. | | 18,500 | | 594,590 |
| J.B. Hunt Transport Services, Inc. | | 27,100 | | 532,515 |
| Landstar Systems, Inc. | | 20,800 | | 888,160 |
| Old Dominion Freight Lines, Inc. * | | 3,700 | | 118,104 |
| Oshkosh Truck Corp. | | 9,200 | | 475,640 |
| Ryder Systems, Inc. | | 21,800 | | 1,077,356 |
| Swift Transportation, Inc. * (a) | | 13,000 | | 301,470 |
|
|
| | | | | 15,610,169 |
|
| TOTAL COMMON STOCKS (Cost $1,140,488,559) | | $ 1,165,619,843 |
|
| |
| SHORT TERM INVESTMENTS - 4.81% | | | | |
| State Street Navigator Securities | | | | |
| Lending Prime Portfolio (c) | $ | 59,044,947 | $ | 59,044,947 |
|
| TOTAL SHORT TERM INVESTMENTS | | | | |
| (Cost $59,044,947) | | | $ | 59,044,947 |
|
| |
| REPURCHASE AGREEMENTS - 4.57% | | | | |
| Repurchase Agreement with State | | | | |
| Street Corp. dated 08/31/2006 at | | | | |
| 3.95% to be repurchased at | | | | |
| $56,044,149 on 9/1/2006, | | | | |
| collateralized by $56,245,000 | | | | |
| Federal Home Loan Bank, 5.125% | | | | |
| due 06/13/2008 (valued at | | | | |
| $57,158,981, including interest) (c) | $ | 56,038,000 | $ | 56,038,000 |
|
| TOTAL REPURCHASE AGREEMENTS | | | | |
| (Cost $56,038,000) | | | $ | 56,038,000 |
|
| Total Investments (U.S. Multi Sector Fund) | | | | |
| (Cost $1,255,571,506) - 104.38% | | | $ 1,280,702,790 |
| Liabilities in Excess of Other Assets - (4.38)% | | | (53,736,897) |
|
|
| TOTAL NET ASSETS - 100.00% | | | $ 1,226,965,893 |
|
|
| |
| |
| Value & Restructuring Fund | | | | |
| | | Shares or | | |
| | | Principal | | |
| | | Amount | | Value |
|
|
| |
| COMMON STOCKS - 96.98% | | | | |
| Aerospace - 2.75% | | | | |
| Empresa Brasileira de Aeronautica SA, ADR | | 102,704 | $ | 3,964,375 |
| Value & Restructuring Fund (continued) | |
| | Shares or | |
| | Principal | |
| | Amount | Value |
|
|
| |
| COMMON STOCKS (continued) | | |
| Aerospace (continued) | | |
| United Technologies Corp. | 66,906 $ | 4,195,675 |
|
|
| | | 8,160,050 |
| Air Travel - 2.56% | | |
| Copa Holdings SA, Class A | 86,725 | 2,542,777 |
| Gol Linhas Aereas Inteligentes SA, ADR (a) | 144,449 | 5,042,715 |
|
|
| | | 7,585,492 |
| Broadcasting - 2.09% | | |
| CBS Corp., Class B | 105,256 | 3,005,059 |
| XM Satellite Radio Holdings, Inc., Class A * (a) | 247,105 | 3,202,481 |
|
|
| | | 6,207,540 |
| Building Materials & Construction - 0.48% | | |
| Eagle Materials, Inc. | 39,381 | 1,411,809 |
| Business Services - 0.61% | | |
| Cendant Corp. | 148,749 | 287,086 |
| MasterCard, Inc. * (a) | 27,480 | 1,536,132 |
|
|
| | | 1,823,218 |
| Cable and Television - 0.83% | | |
| EchoStar Communications Corp., Class A * | 77,160 | 2,449,830 |
| Cellular Communications - 2.86% | | |
| America Movil S.A. de C.V., Series L | 227,243 | 8,478,437 |
| Chemicals - 3.66% | | |
| Celanese Corp., Series A | 176,314 | 3,260,046 |
| CF Industries Holdings, Inc. | 46,000 | 729,560 |
| Lanxess AG * | 51,722 | 2,119,277 |
| PPG Industries, Inc. | 56,552 | 3,583,135 |
| Tronox, Inc. (a) | 91,139 | 1,166,579 |
|
|
| | | 10,858,597 |
| Coal - 3.50% | | |
| CONSOL Energy, Inc. | 183,294 | 6,684,732 |
| Foundation Coal Holdings, Inc. | 64,590 | 2,320,073 |
| International Coal Group, Inc. * (a) | 221,524 | 1,382,310 |
|
|
| | | 10,387,115 |
| Commercial Services - 0.23% | | |
| Castlepoint Holdings, Ltd. * | 61,100 | 672,100 |
| Computers & Business Equipment - 1.06% | | |
| International Business Machines Corp. | 38,872 | 3,147,466 |
| Containers & Glass - 0.60% | | |
| Smurfit-Stone Container Corp. * | 156,401 | 1,781,407 |
| Cosmetics & Toiletries - 0.92% | | |
| Avon Products, Inc. | 94,953 | 2,726,101 |
| Crude Petroleum & Natural Gas - 3.53% | | |
| Devon Energy Corp. | 100,660 | 6,290,243 |
| Mariner Energy LLC * | 37,240 | 703,836 |
| Pinnacle Gas Resources, Inc. * | 28,500 | 313,500 |
| W&T Offshore, Inc. (a) | 98,828 | 3,171,391 |
|
|
| | | 10,478,970 |
| Domestic Oil - 2.51% | | |
| Mariner Energy, Inc. * | 7,268 | 137,365 |
The accompanying notes are an integral part of the financial statements. 421
John Hancock Funds II
Portfolio of investments — August 31, 2006
(showing percentage of total net assets)
| Value & Restructuring Fund (continued) | | |
| | Shares or | | |
| | Principal | | |
| | Amount | | Value |
|
|
| |
| COMMON STOCKS (continued) | | | |
| Domestic Oil (continued) | | | |
| Murphy Oil Corp. | 59,500 | $ | 2,910,145 |
| Noble Energy, Inc. | 89,138 | | 4,405,200 |
|
|
| | | | 7,452,710 |
| Drugs & Health Care - 0.72% | | | |
| Wyeth | 44,144 | | 2,149,813 |
| Electrical Utilities - 0.53% | | | |
| Enel SpA | 176,602 | | 1,574,649 |
| Electronics - 1.01% | | | |
| Harman International Industries, Inc. | 36,889 | | 2,992,436 |
| Energy - 1.30% | | | |
| Duke Energy Corp. | 61,220 | | 1,836,600 |
| Rosetta Resources, Inc. * (a) | 109,285 | | 2,022,865 |
|
|
| | | | 3,859,465 |
| Financial Services - 13.20% | | | |
| Amvescap PLC (a) | 148,484 | | 3,100,346 |
| Capital One Financial Corp. | 29,140 | | 2,130,134 |
| CIT Group, Inc. | 75,430 | | 3,398,876 |
| Citigroup, Inc. | 99,265 | | 4,898,728 |
| Federal Home Loan Mortgage Corp. | 66,737 | | 4,244,473 |
| Friedman, Billings, Ramsey Group, Inc. (a) | 129,610 | | 1,069,283 |
| JPMorgan Chase & Company | 84,346 | | 3,851,238 |
| Lehman Brothers Holdings, Inc. | 65,303 | | 4,166,984 |
| Morgan Stanley | 92,059 | | 6,056,562 |
| PNC Financial Services Group, Inc. | 49,442 | | 3,499,999 |
| Washington Mutual, Inc. | 65,123 | | 2,728,002 |
|
|
| | | | 39,144,625 |
| Food & Beverages - 2.67% | | | |
| ConAgra Foods, Inc. | 76,771 | | 1,827,150 |
| Dean Foods Company * | 103,148 | | 4,086,724 |
| Kraft Foods, Inc., Class A (a) | 44,065 | | 1,494,244 |
| Vintage Wine Trust, Inc. | 58,161 | | 523,449 |
|
|
| | | | 7,931,567 |
| Furniture & Fixtures - 0.88% | | | |
| Leggett & Platt, Inc. | 113,160 | | 2,608,338 |
| Gas & Pipeline Utilities - 1.14% | | | |
| El Paso Corp. | 233,390 | | 3,388,823 |
| Healthcare Products - 1.37% | | | |
| Baxter International, Inc. | 91,368 | | 4,054,912 |
| Healthcare Services - 0.96% | | | |
| HCA, Inc. | 57,419 | | 2,831,905 |
| Holdings Companies/Conglomerates - 1.45% | | | |
| Loews Corp. | 111,754 | | 4,300,294 |
| Homebuilders - 2.13% | | | |
| Centex Corp. (a) | 123,694 | | 6,302,209 |
| Hotels & Restaurants - 0.29% | | | |
| Wyndham Worldwide Corp. * | 29,750 | | 870,479 |
| Household Appliances - 2.67% | | | |
| Black & Decker Corp. | 107,351 | | 7,905,328 |
| Value & Restructuring Fund (continued) | | |
| | Shares or | | |
| | Principal | | |
| | Amount | | Value |
|
|
| |
| COMMON STOCKS (continued) | | | |
| Household Products - 1.04% | | | |
| Newell Rubbermaid, Inc. | 113,813 | $ | 3,071,813 |
| Industrial Machinery - 1.01% | | | |
| AGCO Corp. * (a) | 119,926 | | 2,980,161 |
| Insurance - 4.75% | | | |
| ACE, Ltd. | 101,751 | | 5,480,309 |
| Marsh & McLennan Companies, Inc. | 96,252 | | 2,517,952 |
| MetLife, Inc. | 75,658 | | 4,163,460 |
| People's Choice * | 116,874 | | 350,622 |
| Primus Guaranty, Ltd. * (a) | 134,114 | | 1,557,063 |
|
|
| | | | 14,069,406 |
| International Oil - 5.90% | | | |
| Anadarko Petroleum Corp. | 66,256 | | 3,108,069 |
| ConocoPhillips | 115,250 | | 7,310,308 |
| Petroleo Brasileiro SA, ADR | 78,902 | | 7,074,353 |
|
|
| | | | 17,492,730 |
| Investment Companies - 1.51% | | | |
| Apollo Investment Corp. | 107,152 | | 2,139,825 |
| MCG Capital Corp. (a) | 146,652 | | 2,352,298 |
|
|
| | | | 4,492,123 |
| Manufacturing - 1.20% | | | |
| Tyco International, Ltd. | 135,550 | | 3,544,632 |
| Metal & Metal Products - 1.20% | | | |
| Southern Copper Corp. (a) | 38,561 | | 3,559,951 |
| Mining - 0.63% | | | |
| Alpha Natural Resources, Inc. * (a) | 103,805 | | 1,881,985 |
| Petroleum Services - 1.98% | | | |
| PetroHawk Energy Corp. * | 163,260 | | 1,820,349 |
| Todco, Class A * (a) | 109,649 | | 4,060,302 |
|
|
| | | | 5,880,651 |
| Pharmaceuticals - 1.70% | | | |
| AmerisourceBergen Corp. | 78,122 | | 3,449,868 |
| Bristol-Myers Squibb Company | 72,871 | | 1,584,944 |
|
|
| | | | 5,034,812 |
| Railroads & Equipment - 1.96% | | | |
| Union Pacific Corp. | 72,372 | | 5,815,090 |
| Real Estate - 2.49% | | | |
| DiamondRock Hospitality Company, REIT | 149,230 | | 2,507,064 |
| FBR Capital Markets Corp., REIT * | 41,000 | | 615,000 |
| Host Hotels & Resorts, Inc., REIT | 80,423 | | 1,812,734 |
| Realogy Corp., REIT * | 37,187 | | 795,807 |
| Taberna Realty Finance Trust, REIT | 13,311 | | 191,678 |
| Ventas, Inc., REIT | 36,331 | | 1,455,057 |
|
|
| | | | 7,377,340 |
| Retail Trade - 3.46% | | | |
| The TJX Companies, Inc. | 132,379 | | 3,541,138 |
| United Rentals, Inc. * (a) | 170,528 | | 3,693,636 |
| Zale Corp. * (a) | 112,562 | | 3,011,034 |
|
|
| | | | 10,245,808 |
The accompanying notes are an integral part of the financial statements. 422
John Hancock Funds II
Portfolio of investments — August 31, 2006
(showing percentage of total net assets)
| Value & Restructuring Fund (continued) | | |
| | | Shares or | | |
| | | Principal | | |
| | | Amount | | Value |
|
|
| |
| COMMON STOCKS (continued) | | | | |
| Steel - 0.73% | | | | |
| Schnitzer Steel Industries, Inc. (a) | | 67,976 | $ | 2,158,238 |
| Telecommunications Equipment & | | | | |
| Services - 1.81% | | | | |
| DataPath, Inc. * | | 80,000 | | 880,000 |
| Nokia Oyj, SADR | | 147,838 | | 3,086,858 |
| Plantronics, Inc. (a) | | 77,422 | | 1,387,402 |
|
|
| | | | | 5,354,260 |
| Telephone - 3.62% | | | | |
| Harris Corp. | | 164,512 | | 7,225,367 |
| Sprint Nextel Corp. | | 109,204 | | 1,847,732 |
| Windstream Corp. | | 125,152 | | 1,652,006 |
|
|
| | | | | 10,725,105 |
| Tobacco - 1.65% | | | | |
| Loews Corp. - Carolina Group | | 85,650 | | 4,904,319 |
| Transportation - 0.68% | | | | |
| Aries Maritime Transport, Ltd. (a) | | 37,194 | | 407,646 |
| Arlington Tankers, Ltd. (a) | | 43,132 | | 995,918 |
| Omega Navigation Enterprises, Inc. | | 41,469 | | 607,521 |
|
|
| | | | | 2,011,085 |
| Trucking & Freight - 1.15% | | | | |
| Ryder Systems, Inc. | | 68,746 | | 3,397,427 |
|
| TOTAL COMMON STOCKS (Cost $278,714,078) | | $ | 287,532,621 |
|
| |
| PREFERRED STOCKS - 1.38% | | | | |
| Chemicals - 0.20% | | | | |
| Celanese Corp. * (a) | | 22,031 | | 605,852 |
| Financial Services - 1.18% | | | | |
| Ford Motor Company Capital Trust II * | | 102,649 | | 3,494,172 |
|
| TOTAL PREFERRED STOCKS (Cost $3,709,123) | | $ | 4,100,024 |
|
| |
| SHORT TERM INVESTMENTS - 14.33% | | | | |
| State Street Navigator Securities | | | | |
| Lending Prime Portfolio (c) | $ | 42,492,506 | $ | 42,492,506 |
|
| TOTAL SHORT TERM INVESTMENTS | | | | |
| (Cost $42,492,506) | | | $ | 42,492,506 |
|
| |
| REPURCHASE AGREEMENTS - 2.09% | | | | |
| Repurchase Agreement with State | | | | |
| Street Corp. dated 08/31/2006 at | | | | |
| 3.95% to be repurchased at | | | | |
| $6,201,680 on 09/01/2006, | | | | |
| collateralized by $6,290,000 | | | | |
| Federal National Mortgage | | | | |
| Association, 5.125% due | | | | |
| 12/15/2008 (valued at $6,329,313, | | | | |
| including interest) (c) | $ | 6,201,000 | $ | 6,201,000 |
|
| TOTAL REPURCHASE AGREEMENTS | | | | |
| (Cost $6,201,000) | | | $ | 6,201,000 |
|
| Total Investments (Value & Restructuring Fund) | | |
| (Cost $331,116,707) - 114.78% | $ | 340,326,151 |
| Liabilities in Excess of Other Assets - (14.78)% | | (43,831,444) |
|
|
| TOTAL NET ASSETS - 100.00% | $ | 296,494,707 |
|
|
| |
| |
| Vista Fund | | |
| | Shares or | |
| | Principal | |
| | Amount | Value |
|
|
| |
| COMMON STOCKS - 94.98% | | |
| Advertising - 0.58% | | |
| Focus Media Holding Ltd., ADR * (a) | 12,100 $ | 713,900 |
| Aerospace - 2.08% | | |
| BE Aerospace, Inc. * | 106,935 | 2,551,469 |
| Agriculture - 4.32% | | |
| Archer-Daniels-Midland Company | 44,808 | 1,844,746 |
| Delta & Pine Land Company | 10,283 | 416,050 |
| Monsanto Company | 64,100 | 3,040,904 |
|
|
| | | 5,301,700 |
| Banking - 2.02% | | |
| Colonial Bancgroup, Inc. | 5,469 | 133,936 |
| Compass Bancshares, Inc. (a) | 40,400 | 2,343,200 |
|
|
| | | 2,477,136 |
| Building Materials & Construction - 0.48% | | |
| Corrections Corp. of America * | 9,300 | 584,412 |
| Business Services - 3.99% | | |
| Alliance Data Systems Corp. * | 66,900 | 3,381,126 |
| Foster Wheeler, Ltd. * | 34,628 | 1,505,279 |
|
|
| | | 4,886,405 |
| Cable and Television - 0.51% | | |
| Rogers Communications, Inc., Class B | 12,200 | 628,383 |
| Cellular Communications - 12.15% | | |
| America Movil S.A. de C.V., Series L | 81,522 | 3,041,586 |
| American Tower Corp., Class A * (a) | 87,712 | 3,145,352 |
| Crown Castle International Corp. * (a) | 16,400 | 563,504 |
| Leap Wireless International, Inc. * (a) | 53,990 | 2,497,577 |
| NII Holdings, Inc. * | 105,900 | 5,649,765 |
|
|
| | | 14,897,784 |
| Chemicals - 0.51% | | |
| OM Group, Inc. * | 15,500 | 620,000 |
| Computers & Business Equipment - 0.50% | | |
| Cognizant Technology Solutions Corp., | | |
| Class A * | 8,700 | 608,217 |
| Drugs & Health Care - 0.46% | | |
| Illumina, Inc. * (a) | 16,600 | 559,088 |
| Electrical Equipment - 0.98% | | |
| Anixter International, Inc. * | 10,700 | 583,043 |
| Molex, Inc. | 17,000 | 619,990 |
|
|
| | | 1,203,033 |
| Electrical Utilities - 2.43% | | |
| Allegheny Energy, Inc. * (a) | 57,500 | 2,400,050 |
| Quanta Services, Inc. * (a) | 32,781 | 581,207 |
|
|
| | | 2,981,257 |
| Electronics - 4.10% | | |
| Amphenol Corp., Class A | 10,200 | 586,194 |
The accompanying notes are an integral part of the financial statements. 423
John Hancock Funds II
Portfolio of investments — August 31, 2006
(showing percentage of total net assets)
| Vista Fund (continued) | | | |
| | Shares or | | |
| | Principal | | |
| | Amount | | Value |
|
|
| |
| COMMON STOCKS (continued) | | | |
| Electronics (continued) | | | |
| Mentor Graphics Corp. * | 40,800 | $ | 591,600 |
| Thermo Electron Corp. * | 98,200 | | 3,849,440 |
|
|
| | | | 5,027,234 |
| Energy - 0.94% | | | |
| Southwestern Energy Company * (a) | 33,500 | | 1,150,725 |
| Financial Services - 2.44% | | | |
| Bear Stearns Companies, Inc. | 4,300 | | 560,505 |
| Investment Technology Group, Inc. * | 26,870 | | 1,241,663 |
| SEI Investments Company | 23,400 | | 1,194,336 |
|
|
| | | | 2,996,504 |
| Food & Beverages - 1.68% | | | |
| Campbell Soup Company | 23,600 | | 886,652 |
| H.J. Heinz Company | 20,700 | | 866,088 |
| Hershey Company | 5,600 | | 302,176 |
|
|
| | | | 2,054,916 |
| Healthcare Products - 1.46% | | | |
| Advanced Medical Optics, Inc. * (a) | 24,700 | | 1,189,305 |
| Hologic, Inc. * (a) | 13,900 | | 600,202 |
|
|
| | | | 1,789,507 |
| Healthcare Services - 7.19% | | | |
| Caremark Rx, Inc. | 10,300 | | 596,782 |
| Covance, Inc. * | 38,000 | | 2,389,060 |
| Emdeon Corp. * (a) | 49,400 | | 585,390 |
| Express Scripts, Inc. * | 7,200 | | 605,376 |
| Humana, Inc. * | 24,600 | | 1,498,878 |
| Laboratory Corp. of America Holdings * | 18,600 | | 1,272,612 |
| Quest Diagnostics, Inc. | 29,000 | | 1,864,120 |
|
|
| | | | 8,812,218 |
| Industrial Machinery - 1.13% | | | |
| Alstom RGPT * | 14,700 | | 1,384,046 |
| Industrials - 0.57% | | | |
| ABB, Ltd. | 52,500 | | 695,773 |
| Insurance - 2.47% | | | |
| American Financial Group, Inc. | 13,000 | | 607,360 |
| Arch Capital Group, Ltd. * | 10,700 | | 637,720 |
| Radian Group, Inc. | 9,400 | | 562,872 |
| Torchmark Corp. (a) | 19,700 | | 1,225,537 |
|
|
| | | | 3,033,489 |
| Internet Software - 0.98% | | | |
| Akamai Technologies, Inc. * | 30,512 | | 1,196,070 |
| Leisure Time - 2.92% | | | |
| International Game Technology, Inc. | 39,800 | | 1,539,464 |
| Las Vegas Sands Corp. * | 29,200 | | 2,038,452 |
|
|
| | | | 3,577,916 |
| Life Sciences - 2.38% | | | |
| Pharmaceutical Product Development, Inc. | 76,614 | | 2,920,526 |
| Medical-Hospitals - 1.21% | | | |
| Manor Care, Inc. (a) | 28,400 | | 1,482,480 |
| Vista Fund (continued) | | | |
| | Shares or | | |
| | Principal | | |
| | Amount | | Value |
|
|
| |
| COMMON STOCKS (continued) | | | |
| Metal & Metal Products - 2.03% | | | |
| Precision Castparts Corp. | 42,645 | $ | 2,492,174 |
| Office Furnishings & Supplies - 0.50% | | | |
| Office Depot, Inc. * | 16,600 | | 611,544 |
| Petroleum Services - 12.16% | | | |
| Core Laboratories N.V. * | 18,295 | | 1,342,304 |
| Diamond Offshore Drilling, Inc. (a) | 8,300 | | 601,584 |
| Dril-Quip, Inc. * (a) | 11,500 | | 883,085 |
| McDermott International, Inc. * | 108,500 | | 5,229,700 |
| Oceaneering International, Inc. * | 41,600 | | 1,496,352 |
| Superior Energy Services, Inc. * | 55,200 | | 1,762,536 |
| TETRA Technologies, Inc. * | 129,300 | | 3,595,833 |
|
|
| | | | 14,911,394 |
| Pharmaceuticals - 1.59% | | | |
| Amylin Pharmaceuticals, Inc. * (a) | 12,300 | | 557,559 |
| Celgene Corp. * (a) | 34,300 | | 1,395,667 |
|
|
| | | | 1,953,226 |
| Real Estate - 3.51% | | | |
| Archstone-Smith Trust, REIT | 28,400 | | 1,510,312 |
| Camden Property Trust, REIT | 23,400 | | 1,815,606 |
| Jones Lang LaSalle, Inc., REIT | 11,800 | | 982,468 |
|
|
| | | | 4,308,386 |
| Retail Grocery - 1.24% | | | |
| Safeway, Inc. | 49,100 | | 1,518,663 |
| Retail Trade - 4.44% | | | |
| American Eagle Outfitters, Inc. | 48,000 | | 1,854,240 |
| AnnTaylor Stores Corp. * | 15,000 | | 597,000 |
| Kohl's Corp. * | 29,200 | | 1,825,292 |
| Rent-A-Center, Inc. * | 43,300 | | 1,173,430 |
|
|
| | | | 5,449,962 |
| Semiconductors - 2.65% | | | |
| MEMC Electronic Materials, Inc. * | 50,100 | | 1,937,868 |
| Micron Technology, Inc. * | 37,400 | | 646,272 |
| NVIDIA Corp. * | 23,000 | | 669,530 |
|
|
| | | | 3,253,670 |
| Software - 0.50% | | | |
| BEA Systems, Inc. * | 45,000 | | 617,850 |
| Steel - 1.48% | | | |
| Oregon Steel Mills, Inc. * | 37,600 | | 1,811,192 |
| Telecommunications Equipment & | | | |
| Services - 3.20% | | | |
| Commscope, Inc. * | 20,900 | | 610,489 |
| SBA Communications Corp. * | 128,788 | | 3,315,003 |
|
|
| | | | 3,925,492 |
| Transportation - 1.20% | | | |
| American Commercial Lines, Inc. * (a) | 27,991 | | 1,469,527 |
|
| TOTAL COMMON STOCKS (Cost $105,705,181) | | $ | 116,457,268 |
|
| |
The accompanying notes are an integral part of the financial statements. 424
John Hancock Funds II
Portfolio of investments — August 31, 2006
(showing percentage of total net assets)
| Vista Fund (continued) | | | |
| | | Shares or | |
| | | Principal | |
| | | Amount | Value |
|
|
| |
| SHORT TERM INVESTMENTS - 11.36% | | | |
| State Street Navigator Securities | | | |
| Lending Prime Portfolio (c) | $ | 13,929,842 | $ | 13,929,842 |
|
| TOTAL SHORT TERM INVESTMENTS | | | |
| (Cost $13,929,842) | | | $ | 13,929,842 |
|
| |
| REPURCHASE AGREEMENTS - 6.56% | | | |
| Repurchase Agreement with State | | | |
| Street Corp. dated 08/31/2006 at | | | |
| 3.95% to be repurchased at | | | |
| $8,038,882 on 9/1/2006, | | | |
| collateralized by $8,000,000 | | | |
| Federal Home Loan Mortgage | | | |
| Corp., 6.065% due 05/16/2016 | | | |
| (valued at $8,201,920, including | | | |
| interest) | $ | 8,038,000 $ | 8,038,000 |
|
| TOTAL REPURCHASE AGREEMENTS | | | |
| (Cost $8,038,000) | | | $ | 8,038,000 |
|
| Total Investments (Vista Fund) | | | |
| (Cost $127,673,023) - 112.90% | | | $ | 138,425,110 |
| Liabilities in Excess of Other Assets - (12.90)% | | (15,815,407) |
|
|
| TOTAL NET ASSETS - 100.00% | | | $ | 122,609,703 |
|
|
| |
| |
| Footnotes | | | |
| Percentages are stated as a percent of net assets. | | |
| Key to Currency Abbreviations |
| ARS | - Argentine Peso |
| AUD | - Australian Dollar |
| BRL | - Brazilian Real |
| CAD | - Canadian Dollar |
| CHF | - Swiss Franc |
| COP | - Colombian Peso |
| CZK | - Czech Koruna |
| DKK | - Danish Krone |
| EUR | - European Currency |
| FIM | - Finnish Markka |
| FRF | - French Franc |
| DEM | - German Deutsche Mark |
| GBP | - British Pound |
| GRD | - Greek Drachma |
| HKD | - Hong Kong Dollar |
| HUF | - Hungarian Forint |
| IDR | - Indonesian Rupiah |
| ILS | - Israeli Shekel |
| INR | - Indian Rupee |
| ITL | - Italian Lira |
| IEP | - Irish Punt |
| JPY | - Japanese Yen |
| KRW | - South Korean Won |
| MXN | - Mexican Peso |
| MYR | - Malaysian Ringgit |
| NLG | - Netherlands Guilder |
| NZD | - New Zealand Dollar |
| NOK | - Norwegian Krone |
| PHP | - Philippines Peso |
| PLN | - Polish Zloty |
| SEK | - Swedish Krona |
| SGD | - Singapore Dollar |
| THB | - Thai Baht |
| TRY | - Turkish Lira |
| TWD | - Taiwan Dollar |
| USD | - US Dollar |
| ZAR | - South African Rand |
| |
| Key to Security Abbreviations and Legend |
| ADR | - American Depositary Receipts |
| ADS | - American Depositary Shares |
| BKNT | - Bank Note |
| CDO | - Collateralized Debt Obligation |
| ESOP | - Employee Stock Ownership Program |
| EMTN | - European Medium Term Note |
| EWCO | - European Written Call Option |
| GDR | - Global Depositary Receipts |
| GMTN | - Global Medium Term Note |
| GTD | - Guaranteed |
| IO | - Interest Only (Carries notional principal amount) |
| MTN | - Medium Term Note |
| NIM | - Net Interest Margin |
| OTC | - Over The Counter |
| PCL | - Public Company Limited |
| PIK | - Paid In Kind |
| PO | - Principal Only |
| REIT | - Real Estate Investment Trust |
| REMIC | - Real Estate Mortgage Investment Conduit |
| SBI | - Shares Beneficial Interest |
| SADR | - Sponsored American Depositary Receipts |
| SPDR | - Standard & Poor's Depositary Receipts |
| TBA | - To Be Announced |
| TIPS | - Treasury Inflation Protected Security |
The accompanying notes are an integral part of the financial statements. 425
John Hancock Funds II
Portfolio of investments — August 31, 2006
(showing percentage of total net assets)
^ Non-Income Producing, issuer is in bankruptcy and is in default of
interest payments
* Non-Income Producing
(a) All or a portion of this security was out on loan
(b) Floating Rate Note
(c) Investment is an affiliate of the Trust's subadvisor or custodian bank
(d) Principal amount of security is adjusted for inflation
(e) Security Fair Valued on August 31, 2006
(f) Term Loan
** Purchased on a forward commitment
*** At August 31, 2006, all or a portion of this security was pledged to cover
forward commitments purchased.
**** At August 31, 2006, all or a portion of this security was pledged to cover
margin requirements for open futures contracts.
The accompanying notes are an integral part of the financial statements. 426
John Hancock Funds II
Notes to Financial Statements
1. ORGANIZATION The John Hancock Funds II (the “Trust”) is a newly organized Trust that was established as a Massachusetts business trust on June 28, 2005. The Trust is registered under the Investment Company Act of 1940, as amended, as an open-end investment management company. It is a series company, which means it has multiple Funds, each with a stated investment objective that it pursues through separate investment policies.
The Trust currently offers sixty-one separate investment funds, fifty-six of which are as follows. The other five funds, the Lifestyle Portfolios are covered in separate reports.
| Absolute Return | International Equity Index | Quantitative Value | U.S. Government Securities |
| Active Bond | International Opportunities | Real Estate Equity | U.S. High Yield Bond |
| All Cap Core | International Small Cap | Real Estate Securities | U.S. Multi Sector |
| All Cap Growth | International Small Company | Real Return Bond | Value & Restructuring |
| All Cap Value | International Stock | Small Cap | Vista |
| Blue Chip Growth | International Value | Small Cap Index | |
| Capital Appreciation | Investment Quality Bond | Small Cap Opportunities | |
| Core Bond | Large Cap | Small Company | |
| Core Equity | Large Cap Value | Small Company Growth | |
| Emerging Growth | Mid Cap Core | Small Company Value | |
| Emerging Small Company | Mid Cap Index | Special Value | |
| Equity-Income | Mid Cap Stock | Spectrum Income | |
| Fundamental Value | Mid Cap Value | Strategic Bond | |
| Global Bond | Mid Cap Value Equity | Strategic Income | |
| Global Real Estate | Natural Resources | Strategic Value | |
| High Income | Quantitative All Cap | Total Return | |
| High Yield | Quantitative Mid Cap | U.S. Global Leaders Growth | |
Each of the Funds, with the exception of Absolute Return, Core Equity, Global Bond, Global Real Estate, Natural Resources, Real Estate Equity, Real Estate Securities, Real Return Bond, U.S. Global Leaders Growth, and U.S. Multi Sector, is diversified for purposes of the 1940 Act.
The Absolute Return Portfolio operates as a “Fund of Funds”, investing in Class NAV shares of underlying funds of the Trust, and in shares of John Hancock Funds III and in other permitted investments.
John Hancock Investment Management Services, LLC (“JHIMS” or the “Adviser”), a Delaware limited liability company controlled by John Hancock Life Insurance Company (U.S.A.) (“John Hancock USA”), serves as investment adviser for the Trust and John Hancock Funds, LLC, an affiliate of the Adviser serves as principal underwriter. John Hancock Life Insurance Company of New York (“John Hancock New York”) is a wholly owned subsidiary of John Hancock USA. John Hancock USA and John Hancock New York are indirect wholly owned subsidiaries of The Manufacturers Life Insurance Company (“Manulife”), which in turn is a wholly owned subsidiary of Manulife Financial Corporation (“MFC”), a publicly traded company. Manulife Financial Corporation and its subsidiaries are known collectively as “Manulife Financial.”
At August 31, 2006 John Hancock USA owned 500,000 shares of beneficial interest of Absolute Return and Quantitative All Cap.
The Trust offers six classes of shares. Class A, Class B and Class C shares are offered by the Absolute Return Portfolio and Quantitative All Cap, Class I shares are offered by Quantitative All Cap, Class 1 shares are offered by all Funds with the exception of All Cap Core, Global Real Estate, High Income, International Equity Index, International Small Company, Mid Cap Index, Mid Cap Value Equity, Quantitative All Cap, Real Estate Equity, Small Cap Index, Small Company Growth, Spectrum Income, Strategic Income, U.S. Multi Sector, Value & Restructuring, and Vista. Class NAV shares are offered by each Fund except the Absolute Return Portfolio, International Stock, Quantitative All Cap and Real Estate Securities. Class A, B, and C shares are open to all retail investors. Class I shares are offered without any sales charge to various institutional and certain individual investors. Class 1 shares are sold only to certain exempt separate accounts of John Hancock USA and John Hancock New York. Class NAV shares are sold to Absolute Return Portfolio, Lifestyle Portfolios and to certain institutional investors. The shares of each class represent an interest in the same portfolio of investments of the Fund, and have equal rights as to voting, redemptions, dividends and liquidation, except that certain expenses, subject to the approval of the Trustees, may be applied differently to each class of shares in accordance with current regulations of the Securities and Exchange Commission and the Internal Revenue Service. Shareholders of a class that bears distribution and service expenses under the terms of a distribution plan have exclusive voting rights to that distribution plan.
TRANSACTIONS WITH AFFILIATES In accordance with the provisions of Rule 17a-7 under the Investment Company Act of 1940, the following Funds had transactions with other investment companies managed by the Adviser during the period ended August 31, 2006:
| | Securities | | Securities |
| Fund | Purchased | Fund | Purchased |
|
| Active Bond | $30,301,592 | Large Cap Value | $51,521,227 |
| All Cap Growth | 98,798,769 | Mid Cap Core | 38,570,448 |
| All Cap Value | 86,922,640 | Mid Cap Stock | 124,413,857 |
| Blue Chip Growth | 316,533,066 | Mid Cap Value | 110,022,338 |
| Capital Appreciation | 73,055,233 | Natural Resources | 175,862,266 |
| Core Bond | 54,735,339 | Quantitative Mid Cap | 119,725,249 |
| Core Equity | 137,955,468 | Quantitative Value | 218,234,113 |
| Emerging Growth | 220,368,575 | Real Estate Securities | 231,747,990 |
| Emerging Small Company | 80,407,901 | Real Return Bond | 30,716,184 |
| Equity-Income | 314,487,283 | Small Cap | 52,695,271 |
| Fundamental Value | 181,255,872 | Small Cap Opportunities | 72,118,864 |
| Global Bond | 144,533,513 | Small Company | 17,136,629 |
| High Yield | 243,144,865 | Small Company Value | 164,993,124 |
| International Opportunities | 84,657,804 | Special Value | 11,223,102 |
| International Small Cap | 93,201,858 | Strategic Bond | 106,952,521 |
| International Stock | 160,507,420 | Strategic Value | 35,432,428 |
| International Value | 279,045,705 | Total Return | 214,557,112 |
| Investment Quality Bond | 59,092,020 | U.S. Global Leaders Growth | 100,184,303 |
| Large Cap | 30,397,391 | U.S. Government Securities | 33,508,063 |
| | | U.S. High Yield Bond | 41,274,193 |
427
John Hancock Funds II
Notes to Financial Statements
ORGANIZATION, CONTINUED
The trades were executed at the last sale price at the end of the day on October 14, 2005. All transactions were executed in accordance with Rule 17a-7 policies and in accordance with the Trust’s Rule 17a-7 procedures.
Effective October 28, 2005, approximately $12 billion of assets held in separate accounts of John Hancock Life Insurance Company (U.S.A.) and invested in certain unaffiliated mutual funds were transferred into the Funds of John Hancock Funds II. All costs associated with the transfer of these assets were borne by the Adviser. In addition, the Adviser or the sub-adviser to the following Funds made payments to the Funds during the period: All Cap Value in the amount of $457,281 effective December 20, 2005; International Opportunities in the amount of $3,948,536 effective December 30, 2005; and Mid Cap Stock in the amount of $1,357,491 effective January 27, 2006. These payments were made to reimburse the Funds for any lost investment opportunity that may have resulted from the timing of the investment of these assets that was effective October 28, 2005. These amounts are included in realized gains in these respective funds.
Merger of International Stock Fund The Board of Trustees voted to transfer on August 30, 2006, substantially all of the value of International Stock Class NAV into the John Hancock Funds III — International Core Fund. Securities with a value of $999,328,193 and unrealized appreciation of $122,941,560 were redeemed in-kind from Class NAV. As part of this tax free merger, $122,941,560 will not be taxable to the remaining shareholders of the International Stock Fund and is included in realized gains in the Fund’s Statement of Operations.
2. SIGNIFICANT ACCOUNTING POLICIES In the preparation of the financial statements, the Funds follow the policies described below. The preparation of financial statements in conformity with accounting principles generally accepted in the United States of America requires management to make estimates and assumptions that affect the reported amounts of assets and liabilities at the date of the financial statements and the reported amounts of income and expenses during the reporting period. Actual results may differ from these estimates.
Security Valuation The net asset value of the shares of each Fund is determined daily as of the close of the New York Stock Exchange, normally at 4:00 P.M. Eastern time. Investments in underlying funds of the Fund of Funds Portfolios are valued at their respective net asset values each business day and securities in the underlying funds are valued in accordance with their respective valuation policies, as outlined in the underlying funds’ financial statements. Short-term debt instruments with remaining maturities of 60 days or less are valued at amortized cost, and thereafter assume a constant amortization to maturity of any discount or premium, which approximates market value. Investments in State Street Navigator Securities Lending Prime Portfolio are valued at their net asset value each business day. All other securities held by the Funds are valued at the last sale price or official closing price (closing bid price or last evaluated quote if no sale has occurred) as of the close of business on a principal securities exchange (domestic or foreign) or, lacking any sales, at the closing bid price. Securities traded only in the over-the-counter market are valued at the last bid price quoted by brokers making markets in the securities at the close of trading. Fund securities for which there are no such quotations, principally debt securities, are valued based on the valuation provided by an independent pricing service, which utilizes both dealer-supplied and electronic data processing techniques.
Other assets and securities for which no such quotations are readily available are valued at their fair value as determined in good faith under consistently applied procedures established by and under the general supervision of the Board of Trustees. Generally, trading in non-U.S. securities is substantially completed each day at various times prior to the close of trading on the New York Stock Exchange. The values of such securities used in computing the net asset value of a Fund’s shares are generally determined as of such times. Occasionally, significant events that affect the values of such securities may occur between the times at which such values are generally determined and the close of the New York Stock Exchange. In such events, these securities will then be valued at their fair value as determined in good faith under consistently applied procedures established by and under the general supervision of the Board of Trustees.
In deciding whether to make a fair value adjustment to the price of a security, the Board of Trustees or their designee may review a variety of factors, including, developments in foreign markets, the performance of U.S. securities markets and the performance of instruments trading in U.S. markets that represent foreign securities and baskets of foreign securities. The Funds may also fair value securities in other situations, for example, when a particular foreign market is closed, but the Fund is calculating the net asset value. In view of these factors, it is likely that Funds investing significant amounts of assets in securities in foreign markets will be fair valued more frequently than Funds investing significant amounts of assets in frequently traded, U.S. exchange listed securities of large capitalization U.S. issuers.
For purposes of determining when fair value adjustments may be appropriate with respect to Funds that invest in securities in foreign markets that close prior to the New York Stock Exchange, the Funds will, on an ongoing basis, monitor for “significant market events.” A “significant market event” may be a certain percentage change in the value of an index or of certain Exchange Traded Funds that track foreign markets in which Funds have significant investments. If a significant market event occurs due to a change in the value of the index or of Exchange Traded Funds, the pricing for all Funds that invest in foreign markets that have closed prior to the New York Stock Exchange will promptly be reviewed and potential adjustments to the net asset value of such Funds will be recommended to the Trust’s Pricing Committee where applicable.
Fair value pricing of securities is intended to help ensure that the net asset value of a Fund’s shares reflects the value of the Fund’s securities as of the close of the New York Stock Exchange (as opposed to a value which is no longer accurate as of such close), thus limiting the opportunity for aggressive traders to purchase shares of a Fund at deflated prices, reflecting stale security valuations, and to promptly sell such shares at a gain. However, a security’s valuation may differ depending on the method used for determining value and no assurance can be given that fair value pricing of securities will successfully eliminate all potential opportunities for such trading gains.
Repurchase Agreements Each Fund may enter into repurchase agreements. When a Fund enters into a repurchase agreement through its custodian, it receives delivery of securities, the amount of which at the time of purchase and each subsequent business day is required to be maintained at such a level that the market value is generally at least 102% of the repurchase amount. Each Fund will take constructive receipt of all securities underlying the repurchase agreements it has entered into until such agreements expire. If the seller defaults, a Fund would suffer a loss to the extent that proceeds from the sale of underlying securities were less than the repurchase amount. Each Fund may enter into repurchase agreements maturing within seven days with domestic dealers, banks or other financial institutions deemed to be creditworthy by the Adviser. Collateral for certain tri-party repurchase agreements is held at the custodian bank in a segregated account for the benefit of the Fund and the counterparty.
428
John Hancock Funds II
Notes to Financial Statements
SIGNIFICANT ACCOUNTING POLICIES, CONTINUED
Foreign Currency Transactions The accounting records of the Funds are maintained in U.S. dollars. Foreign currency amounts are translated into U.S. dollars on the following basis:
(i) market value of securities, other assets and other liabilities at the current rate of exchange at period end of such currencies against U.S. dollars; and
(ii) purchases and sales of securities, income and expenses at the rate of exchange quoted on the respective dates of such transactions.
Net realized gains and losses on foreign currency transactions represent net gains and losses from sales and maturities of foreign currency contracts, disposition of foreign currencies, the difference between the amount of net investment income accrued and the U.S. dollar amount actually received, and gains and losses between trade and settlement date on purchases and sales of securities. The effects of changes in foreign currency exchange rates on investments in securities are included with the net realized and unrealized gain or loss on investment securities.
Certain Funds may be subject to capital gains and repatriation taxes imposed by certain countries in which they invest. Such taxes are generally based upon income and/or capital gains earned or repatriated. Taxes are accrued based upon net investment income, net realized gains and net unrealized appreciation.
Investing in securities of foreign companies and foreign governments involves special risks and consideration not typically associated with investing in securities of domestic companies and the U. S. Government. These risks include revaluation of currencies and future adverse political and economic developments. Moreover, securities of foreign companies and foreign governments and their markets may be less liquid and their prices more volatile than those of the United States.
Security Transactions and Related Investment Income Investment security and underlying funds transactions are accounted for on a trade date plus one basis for daily net asset value calculations. However, for financial reporting purposes, investment transactions are reported on trade date. Interest income is accrued as earned. Dividend income is recorded on the ex-dividend date. Foreign dividends are recorded on the ex-date or as soon after the ex-date that the Fund becomes aware of such dividends, net of all taxes. Discounts/premiums are accreted/amortized for financial reporting purposes. Non-cash dividends are recorded at the fair market value of the securities received. Debt obligations may be placed in a non-accrual status and related interest income may be reduced by ceasing current accruals and writing off interest receivables when the collection of all or a portion of interest has become doubtful, based upon consistently applied procedures. The fund earns certain fees in connection with its floating rate loan purchasing activities. These fees are in addition to interest payments earned and may include amendment fees, commitment fees, consent fees, and prepayment fees. These fees are recorded as income in the accompanying financial statements.
Inflation indexed securities are fixed-income securities whose principal value is periodically adjusted according to the rate of inflation. Interest is accrued based upon the principal value, which is adjusted for inflation. Principal of inflation index protected securities is increased or decreased by the rate of change in the Consumer Price Index. Interest income includes accretion of discounts and amortization of premiums as well as accretion or amortization of principal of inflation index protected securities.
From time to time, certain of the Funds may invest in Real Estate Investment Trusts (“REITs”) and as a result, will estimate the components of distributions from these securities. Distributions from REITs received in excess of income are recorded as a reduction of cost of investments and/or as a realized gain.
The Funds use specific identification method for determining realized gain or loss on investments for both financial and federal income tax reporting purposes.
Multi-class Operations All income, expenses (except for class-specific expenses) and realized and unrealized gains (losses) are allocated to each class of shares based upon the relative net assets of each class. Dividends to shareholders from net investment income are determined at a class level and distributions from capital gains are determined at a Fund level.
Expense Allocation Expenses not directly attributable to a particular Fund are allocated based on the relative share of net assets of each Fund at the time the expense was incurred. Class-specific expenses, such as Distribution (Rule 12b-1) fees, are accrued daily and charged directly to the respective share classes.
Purchased and Written Options All Funds may purchase and sell put and call options on securities (whether or not it holds the securities in its Fund), securities indices, currencies and futures contracts.
When a Fund writes a put or call option, an amount equal to the premium received by the Fund is recorded as a liability and is subsequently “marked-to-market” to reflect the current market value of the option written. If an option expires or if the Fund enters into an offsetting purchase option, the Fund realizes a gain (or loss if the cost of an offsetting purchase option exceeds the premium received when the option was written). If a written call option is exercised, the Fund realizes a gain or loss from the sale of the underlying security with the proceeds of the sale increased by the premium originally received. If a written put option is exercised, the amount of the premium originally received reduces the cost of the security that the Fund purchases upon exercise of the option.
When a Fund purchases a put or call option, the premium paid by the Fund is included in the Portfolio of Investments and subsequently “marked-to-market” to reflect the current market value of the option. If the purchased option expires, the Fund realizes a loss for the cost of the option. If a Fund enters into a closing sale transaction, the Fund realizes a gain or loss, depending on whether proceeds from the closing sale transaction are greater or less than the original cost of the option. If a Fund exercises a call option, the cost of the securities acquired by exercising the call is increased by the premium paid to buy the call. If a Fund exercises a put option, it realizes a gain or loss from the sale of the underlying security and the proceeds from such sale are decreased by the premium originally paid.
The Funds may use options to manage exposure to fluctuations in currency values. Writing puts and buying calls may increase the Fund’s exposure to the underlying instrument. Buying puts and writing calls may decrease the Fund’s exposure to the underlying instrument. Losses may arise from changes in the value of the underlying instruments, if there is an illiquid secondary market for the contracts or if the counterparties do not perform under the terms of the contract.
429
John Hancock Funds II
Notes to Financial Statements
| SIGNIFICANT ACCOUNTING POLICIES, CONTINUED | |
| |
| Written options for the period ended August 31, 2006 were as follows: |
| |
| | Number of Contracts | Premiums Received |
|
| Global Bond | | |
| Outstanding, beginning of period | — | — |
| Options written | 2,919,402,503 | $3,973,008 |
| Option closed | (15,200,000) | (212,346) |
| Options expired | (76,402,049) | (1,266,834) |
| Outstanding, end of period | 2,827,800,454 | $2,493,828 |
|
| |
| High Income | | |
| Outstanding, beginning of period | — | — |
| Options written | 1,000 | $517,604 |
| Option closed | — | — |
| Options expired | — | — |
| Option exercised | — | — |
| Outstanding, end of period | 1,000 | $517,604 |
|
| |
| Real Return Bond | | |
| Outstanding, beginning of period | — | — |
| Options written | 54,802,178 | $834,390 |
| Options expired | (13,802,178) | (502,470) |
| Outstanding, end of period | 41,000,000 | $331,920 |
|
| |
| Spectrum Income | | |
| Outstanding, beginning of period | — | — |
| Options written | 1 | $652 |
| Option closed | — | — |
| Options exercised | (1) | (652) |
| Outstanding, end of period | — | $ — |
|
| |
| Strategic Bond | | |
| Outstanding, beginning of period | — | — |
| Options written | 2,285 | $1,261,882 |
| Option closed | (1,110) | (842,233) |
| Options expired | (434) | (186,175) |
| Outstanding, end of period | 741 | $233,474 |
|
| |
| Total Return | | |
| Outstanding, beginning of period | — | — |
| Options written | 295,504,926 | $5,082,025 |
| Option closed | (11,000,192) | (234,438) |
| Options expired | (7,503,180) | (748,729) |
| Outstanding, end of period | 277,001,554 | $4,098,858 |
|
| |
| Value & Restructuring | | |
| Outstanding, beginning of period | — | — |
| Options written | 656 | $429,163 |
| Option closed | (379) | (304,390) |
| Options expired | (139) | (54,805) |
| Option exercised | (138) | (69,968) |
| Outstanding, end of period | — | $— |
The following is a summary of open written options outstanding at August 31, 2006:
| Fund | Name of Issuer | Number of Contracts | Exercise Price | Expiration Date | Value |
|
| Global Bond | Calls | | | | |
|
| | Interest Rate Swap 3 Month USD LIBOR | 7,800,000 | 4.85% | Dec 2006 | ($12,090) |
| | Interest Rate Swap 3 Month USD LIBOR | 28,000,000 | 5.04% | Mar 2007 | (172,928) |
| | Interest Rate Swap 3 Month USD LIBOR | 12,000,000 | 5.04% | Mar 2007 | (74,112) |
| | Interest Rate Swap 3 Month USD LIBOR | 3,000,000 | 5.04% | Mar 2007 | (18,528) |
| | Interest Rate Swap 3 Month USD LIBOR | 14,300,000 | 5.28% | May 2007 | (186,257) |
| | Interest Rate Swap 3 Month USD LIBOR | 81,600,000 | 5.315% | May 2007 | (1,175,532) |
| | Interest Rate Swap 3 Month USD LIBOR | 4,800,000 | 5.25% | May 2007 | (76,258) |
| | Interest Rate Swap 3 Month USD LIBOR | 6,600,000 | 5.25% | May 2007 | (104,854) |
| | Interest Rate Swap 3 Month USD LIBOR | 35,500,000 | 5.30% | May 2007 | (493,308) |
| | Interest Rate Swap 6 Month GBP LIBOR | 2,600,000 | 4.85% | Jun 2007 | (55,668) |
| | Interest Rate Swap 6 Month GBP LIBOR | 2,600,000 | 4.85% | Jun 2007 | (56,141) |
| | Interest Rate Swap 6 Month JPY LIBOR | 1,300,000,000 | 1.98% | Sep 2006 | (182,991) |
430
John Hancock Funds II
Notes to Financial Statements
| SIGNIFICANT ACCOUNTING POLICIES, CONTINUED | | | | |
| Fund | Name of Issuer | Number of Contracts | Exercise Price | Expiration Date | Value |
|
| Global Bond | Calls | | | | |
|
| | Japanese Yen | 24,000,000 | JPY 120 | May 2007 | (183,120) |
| | British Telecom | 5,000,000 | $0.20 | Jun 2008 | (26,524) |
| | U.S.Treasury 10-Year Note Futures | 170 | 107.00 | Nov 2006 | (162,031) |
|
| | | 1,527,800,170 | | | ($2,980,342) |
| |
| Global Bond | Puts | | | | |
|
| | Interest Rate Swap 6 Month JPY LIBOR | 1,300,000,000 | 1.98% | Sep 2006 | ($5,425) |
| | U.S.Treasury 10-Year Note Futures | 141 | $103.00 | Nov 2006 | (4,406) |
| | U.S.Treasury 30-Year Bonds Futures | 141 | 104.00 | Nov 2006 | (4,406) |
| | U.S.Treasury 30-Year Bonds Futures | 2 | 105.00 | Nov 2006 | (125) |
|
| | | 1,300,000,284 | | | ($14,362) |
| |
| High Income | Calls | | | | |
|
| | Freeport McMoran Copper and Gold | 55 | $55.00 | Nov 2006 | ($31,900) |
| | Freeport McMoran Copper and Gold | 945 | 60.00 | Jan 2007 | (444,150) |
|
| | | 1,000 | | | ($476,050) |
| |
| Real Return Bond | Calls | | | | |
|
| | Interest Rate Swap 3 Month USD LIBOR | 14,000,000 | 5.30% | Jan 2007 | ($169,301) |
| | Interest Rate Swap 3 Month USD LIBOR | 11,000,000 | 5.34% | Jun 2007 | (173,034) |
| | Interest Rate Swap 3 Month USD LIBOR | 2,000,000 | 5.325% | Jun 2007 | (30,682) |
|
| | | 27,000,000 | | | ($373,017) |
| |
| | Puts | | | | |
|
| | Interest Rate Swap 3 Month USD LIBOR | 8,000,000 | 5.90% | Jan 2007 | ($6,842) |
| | Interest Rate Swap 3 Month USD LIBOR | 6,000,000 | 6.10% | Jan 2007 | (1,867) |
|
| | | 14,000,000 | | | ($8,709) |
| |
| Strategic Bond | Calls | | | | |
|
| | Eurodollar Futures | 27 | $94.375 | Sep 2006 | ($15,525) |
| | Eurodollar Futures | 38 | 94.50 | Sep 2006 | (10,212) |
| | Eurodollar Futures | 188 | 94.75 | Sep 2006 | (1,175) |
| | Eurodollar Futures | 11 | 94.875 | Sep 2006 | (69) |
| | U.S.Treasury 5-Year Note Futures | 45 | 104.50 | Nov 2006 | (40,781) |
| | U.S.Treasury 10-Year Note Futures | 119 | 107.00 | Nov 2006 | (113,422) |
| | U.S.Treasury 10-Year Note Futures | 85 | 108.00 | Nov 2006 | (45,156) |
| | U.S.Treasury 10-Year Note Futures | 27 | 109.00 | Nov 2006 | (7,172) |
| | U.S.Treasury 30-Year Bonds Futures | 2 | 111.00 | Nov 2006 | (2,656) |
|
| | | 542 | | | ($236,168) |
| |
| | Puts | | | | |
|
| | Eurodollar Futures | 16 | $94.50 | Sep 2006 | ($200) |
| | Eurodollar Futures | 54 | 94.625 | Sep 2006 | (3,712) |
| | Eurodollar Futures | 10 | 94.50 | Dec 2006 | (875) |
| | U.S.Treasury 10-Year Note Futures | 5 | 104.00 | Nov 2006 | (313) |
| | U.S.Treasury 10-Year Note Futures | 27 | 105.00 | Nov 2006 | (3,797) |
| | U.S.Treasury 30-Year Bonds Futures | 54 | 100.00 | Nov 2006 | (844) |
| | U.S.Treasury 30-Year Bonds Futures | 27 | 103.00 | Nov 2006 | (422) |
| | U.S.Treasury 30-Year Bonds Futures | 6 | 107.00 | Nov 2006 | (1,125) |
|
| | | 199 | | | ($11,288) |
431
John Hancock Funds II
Notes to Financial Statements
| SIGNIFICANT ACCOUNTING POLICIES, CONTINUED | | | | |
| Fund | Name of Issuer | Number of Contracts | Exercise Price | Expiration Date | Value |
|
| Total Return | Calls | | | | |
|
| | Eurodollar Futures | 38 | $95.50 | Sep 2006 | ($237) |
| | Interest Rate Swap 3 Month USD LIBOR | 12,000,000 | 4.85% | Dec 2006 | (18,600) |
| | Interest Rate Swap 3 Month USD LIBOR | 11,900,000 | 5.24% | Feb 2007 | (116,555) |
| | Interest Rate Swap 3 Month USD LIBOR | 13,000,000 | 5.04% | Mar 2007 | (80,288) |
| | Interest Rate Swap 3 Month USD LIBOR | 7,000,000 | 5.04% | Mar 2007 | (43,232) |
| | Interest Rate Swap 3 Month USD LIBOR | 26,800,000 | 5.315% | May 2007 | (386,082) |
| | Interest Rate Swap 3 Month USD LIBOR | 22,000,000 | 5.30% | May 2007 | (305,712) |
| | Interest Rate Swap 3 Month USD LIBOR | 4,000,000 | 5.325% | Jun 2007 | (61,365) |
| | Interest Rate Swap 3 Month USD LIBOR | 23,000,000 | 5.34% | Jun 2007 | (361,798) |
| | Interest Rate Swap 3 Month USD LIBOR | 23,000,000 | 5.60% | Jun 2007 | (543,095) |
| | Interest Rate Swap 3 Month USD LIBOR | 36,300,000 | 5.50% | Jul 2007 | (900,867) |
| | Interest Rate Swap 3 Month USD LIBOR | 62,000,000 | 5.37% | Jul 2007 | (1,056,378) |
| | Interest Rate Swap 6 Month EURIBOR | 4,000,000 | 4.10% | Jul 2007 | (80,387) |
| | Interest Rate Swap 6 Month EURIBOR | 9,000,000 | 4.23% | Jul 2007 | (218,780) |
| | Interest Rate Swap 6 Month EURIBOR | 14,000,000 | 4.10% | Jul 2007 | (281,353) |
| | Interest Rate Swap 6 Month EURIBOR | 9,000,000 | 4.10% | Jul 2007 | (180,870) |
| | U.S.Treasury 30-Year Bonds Futures | 321 | 111.00 | Nov 2006 | (426,328) |
|
| | | 277,000,359 | | | ($5,061,927) |
| |
| | Puts | | | | |
|
| | Eurodollar Futures | 50 | $95.00 | Sep 2006 | ($49,375) |
| | Eurodollar Futures | 627 | 95.25 | Dec 2006 | (936,581) |
| | Eurodollar Futures | 88 | 95.00 | Dec 2006 | (79,200) |
| | Eurodollar Futures | 34 | 95.50 | Dec 2006 | (71,825) |
| | Eurodollar Futures | 40 | 95.25 | Mar 2007 | (50,500) |
| | Eurodollar Futures | 36 | 94.75 | Mar 2007 | (13,950) |
| | U.S.Treasury 30-Year Bonds Futures | 169 | 105.00 | Nov 2006 | (10,563) |
| | U.S.Treasury 30-Year Bonds Futures | 151 | 104.00 | Nov 2006 | (4,719) |
|
| | | 1,195 | | | ($1,216,713) |
| |
| |
| The following is a summary of forward volatility options with premiums to be determined on a future date outstanding at August 31, 2006: | |
| | | | Notional | Unrealized | |
| Fund | Name of Issuer | | Amount | Depreciation | |
|
| Global Bond | Call & Put | | | | |
|
| | U.S. Dollar Forward Delta/Neutral Straddle vs. Japanese Yen | | | |
| | Strike and premium determined on 2/13/2007, | | | |
| | based upon implied volatility parament of 8.80% | $17,900,000 | ($22,769) | |
| |
| | U.S. Dollar Forward Delta/Neutral Straddle vs. Japanese Yen | | | |
| | Strike and premium determined on 1/17/2007, | | | |
| | based upon implied volatility parament of 8.75% | $10,500,000 | (9,182) | |
|
| | | | | ($31,951) | |
Securities Lending All Funds, with the exception of Absolute Return, may lend securities in amounts up to 33 1 / 3% of each Fund’s total non-cash assets to brokers, dealers and other financial institutions, provided such loans are callable at any time and are at all times fully secured by cash, cash equivalents or securities issued or guaranteed by the U.S. Government or its agencies or instrumentalities, marked to market to the value of the loaned securities on a daily basis. The Funds may bear the risk of delay in recovery of, or even of rights in, the securities loaned should the borrower of the securities fail financially. Consequently, loans of Fund securities will only be made to firms deemed by the subadvisers to be creditworthy. The Funds receive compensation for lending their securities either in the form of fees or by retaining a portion of interest on the investment of any cash received as collateral. Cash collateral is invested in the State Street Navigator Securities Lending Prime Portfolio.
432
John Hancock Funds II
Notes to Financial Statements
SIGNIFICANT ACCOUNTING POLICIES, CONTINUED
All collateral received will be in an amount equal to at least 100% of the market value of the loaned securities and is intended to be maintained at that level during the period of the loan. The market value of the loaned securities is determined at the close of business of the Fund and any additional required collateral is delivered to the Fund the next business day. During the loan period, the Fund continues to retain rights of ownership, including dividends and interest of the loaned securities. As of August 31, 2006 the values of securities loaned, cash and securities collateral were as follows:
| Fund | Value of Securities Loaned | Value of Cash Collateral | Value of Securities Collateral |
|
| Active Bond | $81,697,633 | $83,363,396 | — |
| All Cap Core | 12,028,205 | 12,324,387 | — |
| All Cap Growth | 6,928,300 | 7,097,453 | — |
| All Cap Value | 16,658,524 | 17,067,785 | — |
| Blue Chip Growth | 47,949,100 | 48,982,997 | — |
| Capital Appreciation | 18,108,656 | 18,532,002 | — |
| Core Bond | 18,991,238 | 19,381,094 | — |
| Emerging Growth | 37,271,615 | 38,275,542 | — |
| Equity-Income | 40,404,082 | 41,370,005 | — |
| Fundamental Value | 22,455,397 | 22,927,961 | — |
| Global Bond | 9,124,648 | 9,309,000 | — |
| Global Real Estate | 41,422,785 | 43,240,359 | — |
| High Income | 59,127,174 | 60,455,958 | — |
| High Yield | 279,406,317 | 285,165,979 | — |
| International Equity Index | 56,232,027 | 59,053,314 | — |
| International Opportunities | 102,487,713 | 107,481,210 | — |
| International Small Cap | 46,558,890 | 49,186,127 | — |
| International Small Company | 37,750,230 | 39,707,208 | $7,162 |
| International Stock | 978,177 | 1,028,026 | — |
| International Value | 100,205,333 | 104,966,722 | — |
| Investment Quality Bond | 30,020,994 | 30,637,942 | — |
| Large Cap | 6,464,141 | 6,601,703 | — |
| Large Cap Value | 14,553,765 | 14,896,485 | — |
| Mid Cap Core | 19,407,625 | 19,867,086 | — |
| Mid Cap Index | 30,056,185 | 30,804,574 | — |
| Mid Cap Stock | 71,681,651 | 73,452,448 | — |
| Mid Cap Value | 20,377,144 | 20,909,218 | — |
| Mid Cap Value Equity | 16,791,394 | 17,229,156 | — |
| Natural Resources | 71,298,145 | 72,883,888 | — |
| Quantitative Mid Cap | 41,490,539 | 42,435,825 | — |
| Quantitative Value | 24,016,341 | 24,592,740 | — |
| Real Estate Equity | 33,658,317 | 34,447,109 | — |
| Real Return Bond | 11,000,333 | 11,227,436 | — |
| Small Cap | 54,437,362 | 55,917,662 | — |
| Small Cap Index | 31,219,839 | 32,156,326 | 6,563 |
| Small Cap Opportunities | 61,872,659 | 63,456,325 | — |
| Small Company | 22,846,131 | 23,408,260 | — |
| Small Company Value | 93,113,462 | 95,479,263 | — |
| Special Value | 30,324,584 | 31,115,018 | — |
| Spectrum Income | 81,569,665 | 83,287,899 | — |
| Strategic Bond | 48,170,381 | 49,146,472 | — |
| Strategic Income | 69,120,975 | 70,775,414 | — |
| Strategic Value | 13,033,306 | 13,329,847 | — |
| Total Return | 27,645,085 | 28,221,891 | — |
| U.S. Global Leaders Growth | 2,766,722 | 2,825,622 | — |
| U.S. High Yield Bond | 35,968,218 | 36,710,913 | — |
| U.S. Multi Sector | 57,531,004 | 59,044,947 | — |
| Value & Restructuring | 41,400,946 | 42,492,506 | — |
| Vista | 13,612,271 | 13,929,842 | — |
Dollar Rolls All Funds, with the exception of Absolute Return, may enter into mortgage dollar rolls in which they sell debt securities for delivery currently and simultaneously contract to repurchase similar, but not identical, securities at the same price or a lower price on an agreed upon date. The Funds receive compensation as consideration for entering into the commitment to repurchase. The compensation is the difference between the current sale price and the forward price for the future purchase (often referred to as the “drop”) as well as by the interest earned on the cash proceeds of the initial sale. A Fund may also be compensated by the receipt of a commitment fee. As the holder, the counterparty receives all principal and interest payments, including prepayments, made with respect to the similar security. Dollar rolls may be renewed with a new sale and repurchase price with a cash settlement made at renewal without physical delivery of the securities subject to the contract.
433
John Hancock Funds II
Notes to Financial Statements
SIGNIFICANT ACCOUNTING POLICIES, CONTINUED
Futures All Funds may purchase and sell financial futures contracts and options on those contracts. The Funds invest in contracts based on financial instruments such as U.S. Treasury Bonds or Notes on securities indices such as the S&P 500 Index, in order to hedge against a decline in the value of securities owned by the Funds.
Upon entering into futures contracts, a Fund is required to deposit with a broker an amount, termed the initial margin, which typically represents a certain percentage of the purchase price indicated in the futures contract. Payments to and from the broker, known as variation margin, are required to be made on a daily basis as the price of the futures contract fluctuates, making the long or short positions in the contract more or less valuable. If the position is closed out by taking an opposite position prior to the settlement date of the futures contract, a final determination of variation margin is made, cash is required to be paid to or released by the broker, and the Fund realizes a gain or loss.
When a Fund sells a futures contract based on a financial instrument, the Fund becomes obligated to deliver that kind of instrument at an agreed upon date for a specified price. The Fund realizes a gain or loss depending on whether the price of an offsetting purchase is less or more than the price of the initial sale or on whether the price of an offsetting sale is more or less than the price of the initial purchase. The Fund could be exposed to risks if it could not close out futures positions because of an illiquid secondary market or the inability of counterparties to meet the terms of their contracts. Futures contracts are valued at the quoted daily settlement prices established by the exchange on which they trade.
The following is a summary of open futures contracts at August 31, 2006:
| | | | | | | Unrealized |
| Fund | Open Contracts | Number of Contracts | Position | Expiration Date | Appreciation (Depreciation) |
|
| Global Bond | 5 Year German Euro-BOBL | | 666 | Long | Sep 2006 | $1,040,236 |
| | 5 Year German Euro-BOBL | | 334 | Long | Dec 2006 | 68,363 |
| | 10 Year German Euro-BUND | | 190 | Long | Sep 2006 | 507,748 |
| | 10 Year German Euro-BUND | | 36 | Long | Dec 2006 | 6,668 |
| | Canadian Bankers' Acceptance | 230 | Long | Dec 2006 | 135,635 |
| | Eurodollar | | 275 | Long | Sep 2006 | (337,963) |
| | Eurodollar | | 88 | Long | Dec 2006 | 18,700 |
| | Eurodollar | | 417 | Long | Jun 2007 | 182,437 |
| | Eurodollar | | 222 | Long | Sep 2007 | 188,700 |
| | Eurodollar | | 35 | Long | Sep 2008 | 24,500 |
| | Eurodollar | | 35 | Long | Dec 2008 | 24,500 |
| | Eurodollar | | 35 | Long | Mar 2009 | 24,063 |
| | Eurodollar | | 35 | Long | Jun 2009 | 24,062 |
| | Japan 10 Year Government Bonds | 46 | Long | Sep 2006 | 1,190,405 |
| | Japan 10 Year Government Bonds | 31 | Long | Dec 2006 | 59,052 |
| | U.S. Treasury 5-Year Note | | 1,278 | Long | Dec 2006 | 313,756 |
| | U.S. Treasury 10-Year Note | | 172 | Long | Dec 2006 | 75,250 |
| | U.S. Treasury 30-Year Bonds | | 90 | Long | Sep 2006 | 241,875 |
| | Canadian Bankers' Acceptance | 230 | Short | Jun 2007 | (171,938) |
|
| | | | | | | $3,616,049 |
| |
| International Equity Index | All Share Index | | 95 | Long | Sep 2006 | $429,475 |
| | CAC 40 10 Euro Index | | 6 | Long | Sep 2006 | 11,002 |
| | DAX Index | | 1 | Long | Sep 2006 | 1,421 |
| | FTSE 100 Index | | 9 | Long | Sep 2006 | 19,157 |
| | IBEX 35 Index | | 1 | Long | Sep 2006 | 1,479 |
| | MSCI Taiwan Stock Index | | 193 | Long | Sep 2006 | 112,839 |
| | OMX 30 Index | | 9 | Long | Sep 2006 | 1,917 |
| | S&P/Canada 60 Index | | 2 | Long | Sep 2006 | 4,240 |
| | SPI 200 Future | | 2 | Long | Sep 2006 | 3,772 |
| | TOPIX Index | | 7 | Long | Sep 2006 | 23,472 |
|
| | | | | | | $608,774 |
| |
| International Stock | DAX Index | | 13 | Long | Sep 2006 | $66,503 |
| | MSCI Singapore Stock Index | | 13 | Long | Sep 2006 | 7,382 |
| | TOPIX Index | | 9 | Long | Sep 2006 | 93,467 |
| | CAC 40 10 Euro Index | | 4 | Short | Sep 2006 | (2,368) |
| | EOE Dutch Stock Index | | 1 | Short | Sep 2006 | (1,237) |
| | FTSE 100 Index | | 12 | Short | Sep 2006 | (6,485) |
| | OMX 30 Index | | 3 | Short | Sep 2006 | (840) |
| | S&P/Toronto Stock Exchange 60 Index | 12 | Short | Sep 2006 | (14,631) |
| | SPI 200 Index | | 5 | Short | Sep 2006 | (15,388) |
|
| | | | | | | $126,403 |
434
John Hancock Funds II
Notes to Financial Statements
| SIGNIFICANT ACCOUNTING POLICIES, CONTINUED | | | | |
| |
| | | | | | | Unrealized |
| Fund | Open Contracts | Number of Contracts | Position | Expiration Date | Appreciation (Depreciation) |
|
| Investment Quality Bond | U.S. Treasury 5-Year Note | | 26 | Short | Dec 2006 | ($6,579) |
| | U.S. Treasury 10-Year Note | | 55 | Short | Dec 2006 | (44,319) |
|
| | | | | | | ($50,898) |
| |
| Mid Cap Index | S&P Mid Cap 400 Index | | 31 | Long | Sep 2006 | $232,383 |
|
| | | | | | | $232,383 |
| |
| Real Return Bond | Eurodollar | | 141 | Long | Dec 2006 | ($205,075) |
| | Eurodollar | | 249 | Long | Mar 2007 | (308,375) |
| | Eurodollar | | 120 | Long | Jun 2007 | (116,325) |
| | Eurodollar | | 249 | Long | Sep 2007 | (150,013) |
| | Eurodollar | | 108 | Long | Dec 2007 | (57,950) |
| | Eurodollar | | 65 | Long | Sep 2008 | 12,187 |
| | Eurodollar | | 65 | Long | Dec 2008 | 12,188 |
| | Eurodollar | | 65 | Long | Mar 2009 | 11,375 |
| | Eurodollar | | 65 | Long | Jun 2009 | 13,000 |
| | U.S. Treasury 5-Year Note | | 50 | Long | Dec 2006 | 11,719 |
| | U.S. Treasury 10-Year Note | | 201 | Long | Dec 2006 | 87,938 |
| | U.S. Treasury 30-Year Bonds | | 72 | Short | Dec 2006 | (9,000) |
|
| | | | | | | ($698,331) |
| |
| Small Cap Index | Russell 2000 Index | | 14 | Long | Sep 2006 | $199,152 |
|
| | | | | | | $199,152 |
| |
| Spectrum Income | U.S. Treasury 5-Year Note | | 21 | Long | Dec 2006 | $6,478 |
| | U.S. Treasury 10-Year Note | | 33 | Long | Dec 2006 | 13,531 |
| | U.S. Treasury 30-Year Bonds | | 7 | Long | Dec 2006 | 5,003 |
| | 10 Year Mini Japan Government Bond | 10 | Short | Sep 2006 | (33,017) |
| | U.S. Treasury 10-Year Note | | 17 | Short | Dec 2006 | (4,295) |
| | U.S. Treasury 30-Year Bonds | | 8 | Short | Dec 2006 | (5,782) |
|
| | | | | | | ($18,082) |
| |
| Strategic Bond | Eurodollar | | 10 | Long | Sep 2006 | $2,637 |
| | Eurodollar | | 33 | Long | Dec 2006 | 11,210 |
| | Eurodollar | | 13 | Long | Mar 2007 | 8,523 |
| | Eurodollar | | 9 | Long | Mar 2008 | 6,930 |
| | Japanese Yen | | 225 | Long | Sep 2006 | (664,788) |
| | U.S. Treasury 30-Year Bonds | | 4 | Long | Sep 2006 | 4,980 |
| | Euro Currency | | 100 | Short | Sep 2006 | 89,500 |
| | Eurodollar | | 16 | Short | Sep 2007 | (4,230) |
| | U.S. Treasury 5-Year Note | | 307 | Short | Dec 2006 | (55,816) |
| | U.S. Treasury 10-Year Note | | 243 | Short | Sep 2006 | (166,136) |
| | U.S. Treasury 10-Year Note | | 352 | Short | Dec 2006 | (171,689) |
| | U.S. Treasury 30-Year Bonds | | 247 | Short | Dec 2006 | (325,860) |
|
| | | | | | | ($1,264,739) |
435
John Hancock Funds II
Notes to Financial Statements
| SIGNIFICANT ACCOUNTING POLICIES, CONTINUED | | | |
| |
| | | | | | Unrealized |
| Fund | Open Contracts | Number of Contracts | Position | Expiration Date | Appreciation (Depreciation) |
|
| Total Return | 5 Year German Euro-BOBL | 35 | Long | Sep 2006 | $40,296 |
| | 5 Year German Euro-BOBL | 18 | Long | Dec 2006 | 3,684 |
| | 10 Year German Euro-BUND | 22 | Long | Sep 2006 | 48,923 |
| | 10 Year German Euro-BUND | 4 | Long | Dec 2006 | 662 |
| | Eurodollar | 1,872 | Long | Dec 2006 | (823,550) |
| | Eurodollar | 1,563 | Long | Mar 2007 | (1,261,775) |
| | Eurodollar | 1,818 | Long | Jun 2007 | (730,525) |
| | Eurodollar | 1,655 | Long | Sep 2007 | (81,116) |
| | Eurodollar | 907 | Long | Dec 2007 | 476,450 |
| | Eurodollar | 178 | Long | Mar 2008 | 144,725 |
| | Eurodollar | 39 | Long | Jun 2008 | 26,813 |
| | LIBOR | 43 | Long | Jun 2007 | 3,067 |
| | LIBOR | 76 | Long | Sep 2007 | 11,391 |
| | LIBOR | 48 | Long | Dec 2007 | 8,744 |
| | U.S. Treasury 5-Year Note | 344 | Long | Dec 2006 | 80,627 |
| | U.S. Treasury 10-Year Note | 621 | Long | Dec 2006 | 213,622 |
| | U.S. Treasury 30-Year Bonds | 93 | Long | Sep 2006 | 257,531 |
|
| | | | | | ($1,580,431) |
| |
| U.S. Government Securities | U.S. Treasury 2-Year Note | 11 | Long | Dec 2006 | $2,867 |
| | U.S. Treasury 5-Year Note | 102 | Long | Dec 2006 | 35,803 |
| | U.S. Treasury 30-Year Bonds | 15 | Long | Dec 2006 | 11,175 |
| | U.S. Treasury 10-Year Note | 20 | Short | Sep 2006 | (35,881) |
| | U.S. Treasury 10-Year Note | 49 | Short | Dec 2006 | (25,050) |
|
| | | | | | ($11,086) |
| |
| U.S. Multi Sector | S&P 500 Index | 110 | Long | Sep 2006 | $993,904 |
|
| | | | | | $993,904 |
Swap Contracts All Funds may enter into interest rate swaps. Interest rate swaps involve the exchange of commitments to pay or receive interest of one instrument for that of another instrument (for example, an exchange of floating rate payments for fixed rate payments with respect to a notional principal amount). The Funds settle accrued net receivable or payable balances under the swap contracts on a periodic basis. Accrued interest receivable or payable on the swap contracts is recorded as realized gain or loss. The Funds record changes in the value of the swaps as unrealized gains or losses on swap contracts.
Credit default swaps involve the exchange of a fixed rate premium for protection against the loss in value of an underlying debt instrument in the event of a defined credit event (such as payment default or bankruptcy). Under the terms of the swap, one party acts as “guarantor” receiving periodic payment that is a fixed percentage applied to a notional principal amount. In return the party agrees to purchase the notional amount of the underlying instrument, at par, if a credit event occurs during the term of the swap. Certain Funds may enter into credit default swaps in which either they or their counterparties act as guarantors. By acting as the guarantor of a swap, a Fund assumes the market and credit risk of the underlying instrument including liquidity and loss of value.
Swap contracts are subject to risks related to the counterparty’s ability to perform under the contract, and may decline in value if the counterparty’s creditworthiness deteriorates. The risks may arise from unanticipated movement in interest rates. The Funds may also suffer losses if it is unable to terminate outstanding swap contracts or reduce its exposure through offsetting transactions.
The Funds had the following interest rate swap contracts open at August 31, 2006:
| | | | | | | Unrealized |
| | Notional | | Payments Made | Payments Received | Termination | Appreciation |
| Fund | Amount | Currency | by Fund | by Fund | Date | (Depreciation) |
|
| Global Bond | | | | | | |
| | $6,000,000 | AUD | 6 Month BBR-BBSW | Fixed 6.00% | Jun 2009 | ($19,789) |
| | 18,200,000 | AUD | 6 Month BBA-BBSW | Fixed 6.00% | Dec 2011 | (126,981) |
| | 10,500,000 | AUD | Fixed 6.00% | 6 Month BBA-BBSW | Dec 2016 | 84,426 |
| | 1,500,000 | EUR | Fixed 4.00% | 6 Month EURIBOR | Dec 2011 | (13,669) |
| | 14,600,000 | EUR | Fixed 4.00% | 6 Month EURIBOR | Dec 2011 | (133,045) |
| | 27,600,000 | EUR | Fixed 4.00% | 6 Month EURIBOR | Dec 2011 | (251,509) |
| | 13,400,000 | EUR | Fixed 4.00% | 6 Month EURIBOR | Dec 2014 | (51,875) |
| | 15,900,000 | EUR | Fixed 4.00% | 6 Month EURIBOR | Dec 2014 | (61,553) |
| | 18,500,000 | EUR | Fixed 4.00% | 6 Month EURIBOR | Dec 2014 | (71,618) |
| | 400,000 | EUR | 6 Month EURIBOR | Fixed 6.00% | Jun 2034 | 72,833 |
| | 500,000 | EUR | 6 Month EURIBOR | Fixed 6.00% | Jun 2034 | 92,199 |
| | 13,600,000 | EUR | 6 Month EURIBOR | Fixed 6.00% | Jun 2034 | 2,476,314 |
| | 80,000,000 | GBP | 6 Month LIBOR | Fixed 5.00% | Jun 2009 | (438,661) |
| | 5,300,000 | GBP | 6 Month LIBOR | Fixed 5.00% | Sep 2010 | (43,478) |
| | 9,400,000 | GBP | 6 Month LIBOR | Fixed 5.00% | Sep 2010 | (77,113) |
436
John Hancock Funds II
Notes to Financial Statements
| SIGNIFICANT ACCOUNTING POLICIES, CONTINUED | | | | |
| |
| | | | | | | Unrealized |
| | Notional | | Payments Made | Payments Received | Termination | Appreciation |
| Fund | Amount | Currency | by Fund | by Fund | Date | (Depreciation) |
|
| Global Bond | | | | | | |
| | 18,700,000 | GBP | 6 Month LIBOR | Fixed 5.00% | Sep 2010 | (153,405) |
| | 200,000 | GBP | 6 Month LIBOR | Fixed 5.00% | Sep 2015 | 1,529 |
| | 2,100,000 | GBP | 6 Month LIBOR | Fixed 5.00% | Sep 2015 | 16,051 |
| | 12,700,000 | GBP | Fixed 4.50% | 6 Month LIBOR | Sep 2017 | 10,376 |
| | 2,300,000 | GBP | Fixed 4.10% | 6 Month LIBOR | Jun 2036 | 258,950 |
| | 23,400,000,000 | JPY | 6 Month LIBOR | Fixed 1.00% | Mar 2008 | 469,921 |
| | 2,700,000,000 | JPY | 6 Month LIBOR | Fixed 1.00% | Sep 2008 | 23,663 |
| | 5,900,000,000 | JPY | Fixed 1.50% | 6 Month LIBOR | Dec 2010 | (626,753) |
| | 4,100,000,000 | JPY | Fixed 2.00% | 6 Month LIBOR | Dec 2013 | (1,095,952) |
| | 4,200,000 | USD | 3 Month LIBOR | Fixed 5.00% | Dec 2011 | (30,665) |
| | 30,600,000 | USD | Fixed 5.00% | 3 Month LIBOR | Dec 2011 | 223,827 |
| | 71,100,000 | USD | 3 Month LIBOR | Fixed 5.00% | Dec 2011 | 520,068 |
| | 20,300,000 | USD | Fixed 5.00% | 3 Month LIBOR | Dec 2016 | 448,707 |
| | 2,300,000 | USD | 3 Month LIBOR | Fixed 5.00% | Dec 2036 | (139,331) |
| | 5,100,000 | USD | 3 Month LIBOR | Fixed 5.00% | Dec 2036 | (308,952) |
| | 5,100,000 | USD | 3 Month LIBOR | Fixed 5.00% | Dec 2036 | (308,952) |
| | 13,100,000 | USD | 3 Month LIBOR | Fixed 5.00% | Dec 2036 | (793,583) |
|
| | | | | | | ($48,020) |
| |
| Real Return Bond | | | | | | |
| | $2,200,000 | EUR | FRCPXTOB | Fixed 2.04% | Feb 2011 | ($10,817) |
| | 5,500,000 | EUR | FRCPXTOB | Fixed 2.1375% | Jan 2016 | (42,234) |
| | 1,500,000 | GBP | Fixed 4.25% | 6 Month LIBOR-BBA | Jun 2036 | 100,227 |
| | 2,300,000 | USD | 3 Month LIBOR-BBA | Fixed 5.00% | Dec 2008 | (6,714) |
| | 2,400,000 | USD | 3 Month LIBOR-BBA | Fixed 5.00% | Dec 2008 | (7,006) |
| | 126,000,000 | USD | 3 Month LIBOR-BBA | Fixed 5.00% | Jun 2009 | 21,189 |
| | 3,100,000 | USD | Fixed 5.00% | 3 Month LIBOR-BBA | Dec 2013 | 40,286 |
| | 1,400,000 | USD | Fixed 5.00% | 3 Month LIBOR-BBA | Dec 2016 | 30,945 |
| | 6,700,000 | USD | Fixed 5.00% | 3 Month LIBOR-BBA | Dec 2021 | 250,562 |
| | 7,100,000 | USD | Fixed 5.00% | 3 Month LIBOR-BBA | Dec 2026 | 347,399 |
| | 11,500,000 | USD | Fixed 5.00% | 3 Month LIBOR-BBA | Dec 2036 | 696,656 |
| | 6,400,000 | USD | Fixed 5.00% | 3 Month LIBOR-BBA | Dec 2036 | 387,705 |
|
| | | | | | | $1,808,198 |
| |
| Total Return | | | | | | |
| | $5,500,000 | EUR | 6 Month EURIBOR | Fixed 6.00% | Jun 2034 | $1,001,450 |
| | 400,000 | GBP | Fixed 4.00% | 6 Month LIBOR BBA | Dec 2035 | 5,891 |
| | 20,400,000 | USD | 3 Month LIBOR BBA | Fixed 5.00% | Dec 2008 | (59,548) |
| | 20,000,000 | USD | 3 Month LIBOR BBA | Fixed 5.00% | Dec 2011 | (146,292) |
| | 2,600,000 | USD | 3 Month LIBOR BBA | Fixed 5.00% | Dec 2013 | (37,448) |
| | 16,500,000 | USD | 3 Month LIBOR BBA | Fixed 5.00% | Dec 2016 | (364,713) |
| | 1,300,000 | USD | 3 Month LIBOR BBA | Fixed 5.00% | Dec 2035 | (53,418) |
| | 2,700,000 | USD | 3 Month LIBOR BBA | Fixed 5.00% | Dec 2036 | (163,563) |
| | 1,700,000 | USD | 3 Month LIBOR BBA | Fixed 5.00% | Dec 2036 | (102,984) |
|
| | | | | | | $79,375 |
437
John Hancock Funds II
Notes to Financial Statements
| SIGNIFICANT ACCOUNTING POLICIES, CONTINUED | | | | | |
| |
| The Funds had the following credit default swap contracts open on August 31, 2006: | | | | |
| | | | | | | | Unrealized |
| | | | | Buy/Sell | (Pay)/Receive | Termination | Appreciation |
| Fund | Default Amount | Issuer | Notional Amount | Protection† | Fixed Rate | Date | (Depreciation) |
|
| Global Bond | | | | | | | |
| | $10,000,000 | Federative Republic of Brazil | $4,100,000 | Sell | 1.38% | Aug 2011 | $14,677 |
| | 10,000,000 | Federative Republic of Brazil | 2,300,000 | Buy | (2.18) | Aug 2016 | (18,120) |
| | 10,000,000 | Federative Republic of Brazil | 2,000,000 | Sell | 1.37 | Aug 2011 | 6,302 |
| | 10,000,000 | Federative Republic of Brazil | 1,100,000 | Buy | (2.16) | Aug 2016 | (7,105) |
| | 10,000,000 | Federative Republic of Brazil | 1,500,000 | Buy | (2.135) | Aug 2016 | (7,028) |
| | 10,000,000 | Federative Republic of Brazil | 2,700,000 | Sell | 1.345 | Aug 2011 | 5,617 |
| | 10,000,000 | Federative Republic of Brazil | 4,000,000 | Sell | 1.34 | Aug 2011 | 7,465 |
| | 10,000,000 | Federative Republic of Brazil | 2,200,000 | Buy | (2.13) | Aug 2016 | (9,527) |
| | 10,000,000 | Federative Republic of Brazil | 5,000,000 | Sell | 1.28 | Aug 2011 | (3,524) |
| | 10,000,000 | Federative Republic of Brazil | 2,800,000 | Buy | (2.06) | Aug 2016 | 1,784 |
| | 10,000,000 | Federative Republic of Brazil | 3,100,000 | Sell | 1.35 | Aug 2011 | 7,113 |
| | 10,000,000 | Federative Republic of Brazil | 1,700,000 | Buy | (2.14) | Aug 2016 | (8,568) |
| | 10,000,000 | Russian Federation | 1,800,000 | Sell | 0.30 | Sep 2006 | 172 |
|
| | | | | | | | ($10,742) |
| Total Return | | | | | | | |
| | $10,000,000 | General Motors Acceptance Corp. | $4,600,000 | Sell | 2.10% | Dec 2006 | $21,484 |
| | 10,000,000 | Federative Republic of Brazil | 900,000 | Sell | 1.66 | Mar 2013 | 1,116 |
| | 10,000,000 | Russian Federation | 300,000 | Sell | 0.39 | Sep 2006 | 45 |
|
| | | | | | | | $22,645 |
| † If the fund is a seller of protection and a credit event occurs, as defined under the terms of that particular swap agreement, the fund will pay to the buyer of the protection an amount up to the |
| notional value of the swap and in certain instances, take delivery of the security. | | | | | |
BBA — British Bankers Association
BBSW — Bank Bill Swap Rates
BBR — Bank Bill Rate
CDOR — Canadian Dollar Offered Rate
CBK — Canada Bankers Acceptance
FRCPXTOB — French CPI Ex Tobacco
Currency symbols are defined as follows:
AUD Australian Dollar
EUR European Currency
GBP British Pound
JPY Japanese Yen
Forward Foreign Currency Contracts All Funds, with the exception of U.S. Government Securities, may purchase and sell forward foreign currency contracts in order to hedge a specific transaction or Fund position. Forward foreign currency contracts are valued at forward foreign currency exchange rates and marked to market daily. Net realized gains (losses) on foreign currency and forward foreign currency contracts shown in the Statements of Operations include net gains or losses realized by a Fund on contracts that have matured.
The net U.S. dollar value of foreign currency underlying all contractual commitments held at the end of the period, the resulting net unrealized appreciation (depreciation) and related net receivable or payable amount are determined using forward foreign currency exchange rates supplied by a quotation service. The Funds could be exposed to risks in excess of amounts recognized on the Statements of Assets and Liabilities if the counterparties to the contracts are unable to meet the terms of their contracts or if the value of the forward foreign currency contract changes unfavorably.
At August 31, 2006 certain Funds entered into forward foreign currency contracts, which contractually obligate the Funds to deliver currencies at future dates. Open forward foreign currency contracts at August 31, 2006 were as follows:
| | | | | Unrealized |
| | | Principal Amount | Settlement | Appreciation |
| Fund | Currency | Covered by Contract | Date | (Depreciation) |
|
| Global Bond | Buys | | | |
|
| | Australian Dollar | 1,295,800 | Sep 2006 | $1,114 |
| | Australian Dollar | 2,650,000 | Sep 2006 | 12,684 |
| | Australian Dollar | 6,471,000 | Sep 2006 | 3,221 |
| | Australian Dollar | 1,958,000 | Sep 2006 | (813) |
| | Australian Dollar | 1,213,000 | Sep 2006 | 4,249 |
| | Canadian Dollar | 13,836,000 | Sep 2006 | 372,783 |
| | Chilean Peso | 56,050,000 | Sep 2006 | 879 |
438
John Hancock Funds II
Notes to Financial Statements
| SIGNIFICANT ACCOUNTING POLICIES, CONTINUED | | |
| |
| | | | | Unrealized |
| | | Principal Amount | Settlement | Appreciation |
| Fund | Currency | Covered by Contract | Date | (Depreciation) |
|
| Global Bond | Buys | | | |
|
| | Chilean Peso | 56,050,000 | Sep 2006 | $614 |
| | Chinese Yuan Renminbi | 2,375,000 | Mar 2007 | (4,576) |
| | Chinese Yuan Renminbi | 1,662,000 | Mar 2007 | (3,119) |
| | Chinese Yuan Renminbi | 20,396,936 | May 2007 | (41,869) |
| | Chinese Yuan Renminbi | 12,748,556 | May 2007 | (25,816) |
| | Chinese Yuan Renminbi | 2,974,000 | May 2007 | (6,485) |
| | Chinese Yuan Renminbi | 14,957,092 | Aug 2007 | (7,875) |
| | Chinese Yuan Renminbi | 13,844,137 | Aug 2007 | (5,661) |
| | Danish Krone | 27,028,000 | Sep 2006 | (30,854) |
| | Euro | 38,081,000 | Sep 2006 | (85,603) |
| | Euro | 520,000 | Sep 2006 | (5,561) |
| | Indian Rupee | 7,958,000 | Feb 2007 | 674 |
| | Japanese Yen | 19,263,992,000 | Sep 2006 | (1,418,685) |
| | Japanese Yen | 51,600,000 | Sep 2006 | (4,295) |
| | Japanese Yen | 62,000,000 | Sep 2006 | (7,462) |
| | Mexican Peso | 1,503,150 | Dec 2006 | 305 |
| | Mexican Peso | 1,526,850 | Dec 2006 | 340 |
| | New Taiwan Dollar | 31,798,000 | Feb 2007 | (9,960) |
| | New Taiwan Dollar | 23,926,000 | Feb 2007 | (6,258) |
| | Polish Zloty | 33,770 | Nov 2006 | 25 |
| | Polish Zloty | 46,230 | Nov 2006 | 26 |
| | Pound Sterling | 18,387,000 | Sep 2006 | 803,571 |
| | Pound Sterling | 298,000 | Sep 2006 | 3,499 |
| | Pound Sterling | 688,000 | Sep 2006 | (6,076) |
| | Singapore Dollar | 1,829,000 | Sep 2006 | (1,488) |
| | South African Rand | 379,000 | Oct 2006 | (2,219) |
| | South Korean Won | 1,446,869,000 | Feb 2007 | 1,489 |
| | Swedish Krona | 33,619,000 | Sep 2006 | (42,552) |
|
| | | | | ($511,754) |
| |
| | Sells | | | |
|
| | Canadian Dollar | 1,944,651 | Sep 2006 | ($41,938) |
| | Euro | 22,426,598 | Sep 2006 | (227,115) |
| | Japanese Yen | 8,535,656 | Sep 2006 | 18,229 |
| | Japanese Yen | 12,506,803 | Sep 2006 | 232,833 |
| | New Taiwan Dollar | 546,207 | Sep 2006 | 17,608 |
| | New Zealand Dollar | 2,008,568 | Sep 2006 | (50,532) |
| | New Zealand Dollar | 4,932,448 | Sep 2006 | (99,907) |
| | New Zealand Dollar | 1,493,758 | Sep 2006 | 3,179 |
|
| | | | | ($147,643) |
| |
| High Income | Sells | | | |
|
| | Canadian Dollar | 9,944,578 | Sep 2006 | ($184,378) |
|
| | | | | ($184,378) |
| |
| International Equity Index | Buys | | | |
|
| | Australian Dollar | 125,000 | Sep 2006 | $4,098 |
| | Australian Dollar | 125,000 | Sep 2006 | 526 |
| | Canadian Dollar | 127,000 | Sep 2006 | 1,535 |
| | Canadian Dollar | 137,000 | Sep 2006 | 502 |
| | Euro | 97,000 | Sep 2006 | 1,771 |
| | Euro | 490,000 | Sep 2006 | 229 |
| | Japanese Yen | 65,000,000 | Sep 2006 | (4,182) |
| | Japanese Yen | 46,200,000 | Sep 2006 | (6,902) |
| | Pound Sterling | 228,000 | Sep 2006 | 18,258 |
| | Pound Sterling | 294,000 | Sep 2006 | 1,541 |
| | South African Rand | 17,940,000 | Sep 2006 | 64,808 |
| | Swedish Krona | 838,000 | Sep 2006 | 761 |
|
| | | | | $82,945 |
439
John Hancock Funds II
Notes to Financial Statements
| SIGNIFICANT ACCOUNTING POLICIES, CONTINUED | | |
| |
| | | | | Unrealized |
| | | Principal Amount | Settlement | Appreciation |
| Fund | Currency | Covered by Contract | Date | (Depreciation) |
|
| International Stock | Buys | | | |
|
| | Japanese Yen | 386,100,000 | Nov 2006 | ($7,466) |
| | Norwegian Krone | 11,200,000 | Nov 2006 | (12,832) |
| | Swedish Krona | 18,560,000 | Nov 2006 | (15,425) |
| | Swiss Franc | 5,383,000 | Nov 2006 | ($32,598) |
|
| | | | | ($68,321) |
| |
| | Sells | | | |
|
| | Australian Dollar | 1,068,362 | Nov 2006 | $2,064 |
| | Euro | 5,116,637 | Nov 2006 | 26,278 |
| | Pound Sterling | 4,010,084 | Nov 2006 | 10,924 |
|
| | | | | $39,266 |
| |
| Global Real Estate | Buys | | | |
|
| | Australian Dollar | 3,179,000 | Sep 2006 | $9,886 |
| | Hong Kong Dollar | 19,371,000 | Sep 2006 | 238 |
|
| | | | | $10,124 |
| |
| | Sells | | | |
|
| | Australian Dollar | 38,615,916 | Sep 2006 | ($46,635) |
| | Canadian Dollar | 10,935,782 | Sep 2006 | (39,235) |
| | Danish Krone | 1,897,759 | Sep 2006 | (531,303) |
| | Euro | 35,150,529 | Sep 2006 | (84,024) |
| | Hong Kong Dollar | 23,573,185 | Sep 2006 | 2,301 |
| | Japanese Yen | 50,751,729 | Sep 2006 | 387,502 |
| | Pound Sterling | 44,895,287 | Sep 2006 | (311,123) |
| | Singapore Dollar | 9,924,211 | Sep 2006 | (35,838) |
| | Swedish Krona | 5,991,407 | Sep 2006 | 30,830 |
|
| | | | | ($627,525) |
| |
| Real Return Bond | Buys | | | |
|
| | Japanese Yen | 1,190,106,000 | Nov 2006 | ($200,724) |
| | Japanese Yen | 1,190,106,000 | Nov 2006 | (227,858) |
|
| | | | | ($428,582) |
| |
| | Sells | | | |
|
| | Canadian Dollar | 482,281 | Sep 2006 | ($14,818) |
| | Euro | 106,073,073 | Sep 2006 | (227,782) |
|
| | | | | ($242,600) |
| |
| Spectrum Income | Buys | | | |
|
| | Australian Dollar | 280,351 | Nov 2006 | ($120) |
| | Brazilian Real | 541,200 | Jan 2007 | (1,398) |
| | Canadian Dollar | 2,180,884 | Nov 2006 | 1,608 |
| | Chinese Yuan Renminbi | 5,099,277 | Oct 2006 | (9,953) |
| | Czech Koruna | 3,360,168 | Nov 2006 | (1,243) |
| | Danish Krone | 267,039 | Nov 2006 | 5 |
| | Euro | 2,751,646 | Nov 2006 | (6,912) |
| | Hungarian Forint | 36,861,000 | Nov 2006 | (79) |
| | Japanese Yen | 1,778,637,396 | Nov 2006 | (184,184) |
| | Malaysian Ringgit | 223,328 | Nov 2006 | (61) |
| | Norwegian Krone | 930,000 | Nov 2006 | (1,305) |
| | Philippine Peso | 25,857,740 | Sep 2006 | $9,023 |
| | Philippine Peso | 21,929,860 | Oct 2006 | 13,367 |
| | Polish Zloty | 241,230 | Nov 2006 | (553) |
| | Pound Sterling | 295,255 | Nov 2006 | 273 |
| | Singapore Dollar | 336,775 | Nov 2006 | 17 |
| | South Korean Won | 2,036,867,000 | Nov 2006 | 6,447 |
| | Swedish Krona | 9,831,847 | Nov 2006 | (20,849) |
| | Thailand Baht | 6,977,928 | Nov 2006 | (120) |
|
| | | | | ($196,037) |
440
John Hancock Funds II
Notes to Financial Statements
| SIGNIFICANT ACCOUNTING POLICIES, CONTINUED | | |
| |
| | | | | Unrealized |
| | | Principal Amount | Settlement | Appreciation |
| Fund | Currency | Covered by Contract | Date | (Depreciation) |
|
| Spectrum Income | Sells | | | |
|
| | Brazilian Real | 599,102 | Sep 2006 | ($25,722) |
| | Brazilian Real | 1,061,000 | Nov 2006 | 82 |
| | Brazilian Real | 882,000 | Jan 2007 | 3,855 |
| | Chinese Yuan Renminbi | 652,081 | Oct 2006 | 9,034 |
| | Danish Krone | 42,391 | Nov 2006 | 157 |
| | Euro | 3,260,572 | Nov 2006 | 31,481 |
| | Japanese Yen | 88,305 | Nov 2006 | 763 |
| | Mexican Peso | 849,422 | Sep 2006 | $7,085 |
| | Mexican Peso | 554,995 | Sep 2006 | 5,796 |
| | Mexican Peso | 741,361 | Sep 2006 | 214 |
| | Mexican Peso | 416,531 | Oct 2006 | (4,083) |
| | Mexican Peso | 669,633 | Nov 2006 | 3,224 |
| | Mexican Peso | 2,640,080 | Nov 2006 | 24,881 |
| | Polish Zloty | 860,423 | Oct 2006 | 181 |
| | Polish Zloty | 2,787,033 | Nov 2006 | 14,721 |
| | Polish Zloty | 827,579 | Nov 2006 | 14,535 |
| | Pound Sterling | 2,536,992 | Nov 2006 | (8,008) |
| | South African Rand | 250,086 | Nov 2006 | 2,123 |
| | Turkish Lira | 449,138 | Oct 2006 | (47,226) |
| | Turkish Lira | 835,528 | Nov 2006 | 2,301 |
|
| | | | | $35,394 |
| |
| Strategic Income | Buys | | | |
|
| | Australian Dollar | 3,400,000 | Sep 2006 | ($6,767) |
| | Canadian Dollar | 19,500,753 | Sep 2006 | 136,679 |
| | Canadian Dollar | 1,510,299 | Sep 2006 | 15,930 |
| | Canadian Dollar | 1,086,682 | Sep 2006 | 12,806 |
| | Canadian Dollar | 2,557,233 | Sep 2006 | 12,788 |
| | Euro | 3,000,000 | Sep 2006 | 1,177 |
| | Euro | 3,500,000 | Sep 2006 | 175 |
| | Euro | 2,900,000 | Sep 2006 | (34,246) |
| | Euro | 1,300,000 | Sep 2006 | (11,731) |
| | Euro | 700,000 | Sep 2006 | (1,956) |
| | New Zealand Dollar | 1,400,000 | Sep 2006 | 19,603 |
|
| | | | | $144,458 |
| |
| | Sells | | | |
|
| | Australian Dollar | 9,592,925 | Sep 2006 | ($433,552) |
| | Canadian Dollar | 29,459,359 | Sep 2006 | (160,047) |
| | Canadian Dollar | 300,000 | Sep 2006 | (3,019) |
| | Canadian Dollar | 8,579,195 | Sep 2006 | (56,036) |
| | Canadian Dollar | 600,000 | Sep 2006 | (226) |
| | Canadian Dollar | 5,800,000 | Sep 2006 | (10,727) |
| | Canadian Dollar | 1,400,000 | Sep 2006 | (1,022) |
| | Euro | 29,145,963 | Sep 2006 | (457,520) |
| | Euro | 1,799,014 | Sep 2006 | 4,863 |
| | New Zealand Dollar | 9,340,530 | Sep 2006 | (851,921) |
| | Pound Sterling | 4,359,650 | Sep 2006 | (17,312) |
| | Pound Sterling | 2,992,968 | Sep 2006 | (147,027) |
|
| | | | | ($2,133,546) |
441
John Hancock Funds II
Notes to Financial Statements
| SIGNIFICANT ACCOUNTING POLICIES, CONTINUED | | |
| |
| | | | | Unrealized |
| | | Principal Amount | Settlement | Appreciation |
| Fund | Currency | Covered by Contract | Date | (Depreciation) |
|
| Total Return | Buys | | | |
|
| | Canadian Dollar | 3,612,000 | Sep 2006 | $97,318 |
| | Chinese Yuan Renminbi | 4,959,738 | Mar 2007 | (7,711) |
| | Chinese Yuan Renminbi | 3,088,200 | Mar 2007 | (5,448) |
| | Japanese Yen | 1,660,686,000 | Nov 2006 | (317,956) |
| | Japanese Yen | 1,660,687,000 | Nov 2006 | (280,092) |
| | New Taiwan Dollar | 12,518,000 | Feb 2007 | (3,392) |
| | Pound Sterling | 2,516,000 | Sep 2006 | 109,957 |
| | Singapore Dollar | 629,000 | Sep 2006 | (512) |
| | South Korean Won | 310,339,000 | May 2007 | (5,561) |
| | South Korean Won | 542,457,000 | May 2007 | (10,399) |
| | South Korean Won | 192,597,000 | May 2007 | (4,717) |
| | South Korean Won | 502,659,000 | May 2007 | (10,493) |
|
| | | | | ($439,006) |
| |
| | Sells | | | |
|
| | Euro | 92,507,555 | Sep 2006 | ($77,019) |
| | Euro | 46,239,768 | Sep 2006 | (99,295) |
| | Euro | 88,030,454 | Sep 2006 | (891,490) |
| | Pound Sterling | 3,462,363 | Sep 2006 | ($9,587) |
| | Pound Sterling | 755,564 | Sep 2006 | (5,411) |
|
| | | | | ($1,082,802) |
| |
| Vista | Sells | | | |
|
| | Canadian Dollar | 311,742 | Sep 2006 | ($735) |
| | Euro | 677,813 | Sep 2006 | 1,979 |
| | Swiss Franc | 348,175 | Sep 2006 | (761) |
|
| | | | | $483 |
Forward Commitments All Funds may purchase or sell debt securities on a when issued or forward delivery basis, which means that the obligations will be delivered to the Funds at a future date, which may be a month or more after the date of commitment. The price of the underlying securities and the date when the securities will be delivered and paid for are fixed at the time the transaction is negotiated.
The Fund may receive compensation for interest forgone in the purchase of forward delivery securities. With respect to purchase commitments, each Fund identifies securities as segregated in its records with a value at least equal to the amount of the commitment. Losses may arise due to changes in the value of the underlying securities or if the counterparty does not perform under the contract, or if the issuer does not issue the securities due to political, economic or other factors. The value of the securities underlying a forward commitment to purchase securities, and the subsequent fluctuations in their value, are taken into account when determining the Fund’s net asset value starting on the day the Fund agrees to purchase the securities. The market values of the securities purchased on a forward delivery basis are identified in the Portfolio of Investments.
Federal Income Taxes Each Fund qualifies as a “regulated investment company” by complying with the applicable provisions of the Internal Revenue Code and will not be subject to federal income tax on taxable income that is distributed to shareholders. Therefore, no federal income tax provision is required.
New Accounting Pronouncement In June 2006, Financial Accounting Standards Board (FASB) Interpretation No. 48, Accounting for Uncertainty in Income Taxes (the “Interpretation”) was issued, and is effective for fiscal years beginning after December 15, 2006 and is to be applied to all open tax years as of the effective date. This Interpretation prescribes a minimum threshold for financial statement recognition of the benefit of a tax position taken or expected to be taken in a tax return, and requires certain expanded disclosures. Management is currently evaluating the application of the Interpretation to the Fund, and has not at this time quantified the impact, if any, resulting from the adoption of this Interpretation on the Fund’s financial statements.
In September 2006, FASB Standard No. 157, Fair Value Measurements (“FAS 157”) was issued, and is effective for fiscal years beginning after November 15, 2007. FAS 157 defines fair value, establishing a framework for measuring fair value and expands disclosure about fair value measurements. Management is currently evaluating the application of FAS 157 to the Fund, and its impact, if any, resulting from the adoption of FAS 157 on the Fund’s financial statements.
Distribution of Income and Gains The Funds record distributions to shareholders from net investment income and net realized gains, if any, on the ex-dividend date. Distributions paid by the Funds with respect to each class of shares are calculated in the same manner, at the same time and are in the same amount, except for the effect of expenses that may be applied differently to each class. Such distributions, on a tax basis, are determined in conformity with income tax regulations, which may differ from accounting principles generally accepted in the United States of America. Distributions in excess of tax basis earnings and profits, if any, are reported in each Fund’s financial statements as a return of capital.
Capital Accounts The Funds report the undistributed net investment income and accumulated undistributed net realized gain (loss) accounts on a basis approximating amounts available for future tax distributions (or to offset future taxable realized gains when a capital loss carryforward is available). Accordingly, each Fund may periodically make reclassifications among certain capital accounts without affecting its net asset value.
442
John Hancock Funds II
Notes to Financial Statements (Unaudited)
3. INVESTMENT ADVISORY AND OTHER AGREEMENTS
Advisory Fees The Trust has entered into an Investment Advisory Agreement with the Adviser. The Adviser is responsible for managing the corporate and business affairs of the Trust and for selecting and compensating subadvisers to handle the investment and reinvestment of the assets of each Fund, subject to the supervision of the Trust’s Board of Trustees. As compensation for its services, the Adviser receives an advisory fee from the Trust. Advisory fees charged to each Fund are as follows:
| Fund | Average Net Assets — All Asset Levels |
|
| Active Bond | 0.600% |
| Emerging Growth | 0.800 |
| Global Bond | 0.700 |
| Real Estate Securities | 0.700 |
| Real Return Bond | 0.700 |
| Small Cap | 0.850 |
| Special Value1 | 0.950 |
| Total Return | 0.700 |
1 Until June 1, 2006, the Fund paid monthly advisory fees equivalent, on an annual basis, to the sum of : (a) 1.000% of the of the Fund’s average net assets and (b) 0.950% of the Fund’s average net assets in excess of $500 million.
| | | Between | |
| | First | $500 million | Excess |
| | $500 million | and $1 billion | Over $1 billion |
| | of Aggregate | of Aggregate | of Aggregate |
| Fund | Net Assets | Net Assets | Net Assets |
|
| All Cap Core | 0.800% | 0.750% | 0.750% |
| All Cap Growth1 | 0.850 | 0.825 | 0.800 |
| Blue Chip Growth | 0.825 | 0.825 | 0.800 |
| Emerging Small Company2 | 0.970 | 0.900 | 0.900 |
| Equity-Income | 0.825 | 0.825 | 0.800 |
| Large Cap Value3 | 0.825 | 0.800 | 0.775 |
| Mid Cap Core4 | 0.850 | 0.825 | 0.825 |
| Quantitative Value | 0.700 | 0.650 | 0.600 |
| U.S. Global Leaders Growth | 0.7125 | 0.675 | 0.675 |
| Value & Restructuring | 0.850 | 0.800 | 0.800 |
1 Until January 1, 2006 the Fund paid monthly advisory fees equivalent, on an annual basis to the sum of (a) 0.90% of the first $500 million of the Fund’s average net assets and (b) 0.85% of the Fund’s average net assets in excess of $500 million.
2 Until April 28, 2006, the Fund paid monthly advisory fees equivalent, on an annual basis, to the sum of: (a) 1.000% of the first $500 million of the Fund’s average net assets, (b) 0.970% of the next $500 million of the Fund’s average net assets and (c) 0.950% of the Fund’s average net assets in excess of $1 billion.
3 Until June 1, 2006, the Fund paid monthly advisory fees equivalent, on an annual basis, to the sum of: (a) 0.850% of the first $300 million of the Fund’s average net assets, (b) 0.825% of the next $200 million of the Fund’s average net assets and (c) 0.800% of the Fund’s average net assets in excess of $500 million.
4 Until June 1, 2006, the Fund paid monthly advisory fees equivalent, on an annual basis, to the sum of: (a) 0.950% of the first $10 million of the Fund’s average net assets, (b) 0.900% of the next $40 million of the Fund’s average net assets, (c) 0.875% of the next $150 million of the Fund’s average net assets, (d) 0.850% of the next $300 million of the Fund’s average net assets and (e) 0.825% of the Fund’s average net assets in excess of $500 million.
| | | Between | Between | Between | |
| | First | $50 million | $200 million | $500 million | Excess |
| | $50 million | and $200 million | and $500 million | and $1 billion | Over $1 billion |
| | of Aggregate | of Aggregate | of Aggregate | of Aggregate | of Aggregate |
| Fund | Net Assets | Net Assets | Net Assets | Net Assets | Net Assets |
|
| Absolute Return | 0.200% | 0.200% | 0.175% | 0.150% | 0.150% |
| International Small Cap | 1.050 | 1.050 | 0.950 | 0.850 | 0.850 |
| International Value | 0.950 | 0.950 | 0.850 | 0.800 | 0.800 |
| Mid Cap Stock | 0.875 | 0.875 | 0.850 | 0.825 | 0.825 |
| Mid Cap Value | 0.900 | 0.900 | 0.850 | 0.825 | 0.825 |
| Natural Resources | 1.050 | 1.000 | 1.000 | 1.000 | 1.000 |
| Quantitative All Cap | 0.750 | 0.700 | 0.700 | 0.700 | 0.700 |
| Quantitative Mid Cap | 0.750 | 0.750 | 0.650 | 0.650 | 0.650 |
| Small Cap Opportunities | 1.000 | 1.000 | 1.000 | 0.950 | 0.950 |
| Small Company Value | 1.050 | 1.050 | 1.050 | 1.000 | 1.000 |
| | | Between | Between | |
| | First | $50 million | $250 million | Excess |
| | $50 million | and $250 million | and $500 million | Over $500 million |
| | of Aggregate | of Aggregate | of Aggregate | of Aggregate |
| Fund | Net Assets | Net Assets | Net Assets | Net Assets |
|
| All Cap Value | 0.850% | 0.850% | 0.800% | 0.750% |
| Fundamental Value | 0.850 | 0.800 | 0.800 | 0.750 |
443
John Hancock Funds II
Notes to Financial Statements
| INVESTMENT ADVISORY AND OTHER AGREEMENTS, CONTINUED | | |
| |
| | | Between | Between | |
| | First | $200 million | $400 million | Excess |
| | $200 million | and $400 million | and $1 billion | Over $1 billion |
| | of Aggregate | of Aggregate | of Aggregate | of Aggregate |
| Fund | Net Assets | Net Assets | Net Assets | Net Assets |
|
| Vista1 | 0.900% | 0.850% | 0.825% | 0.800% |
1 Until June 1, 2006, the Fund paid monthly advisory fees equivalent, on an annual basis, to the sum of: (a) 0.900% of the first $250 million of the Fund’s average net assets, (b) 0.850% of the next $250 million of the Fund’s average net assets, (c) 0.825% of the next $500 million of the Fund’s average net assets and (d) 0.800% of the Fund’s average net assets in excess of $1 billion.
| | First | Between $300 million | Between $500 million | Excess over |
| | $300 million | and $500 million | and $1 billion | $1 billion |
| | of Aggregate | of Aggregate | of Aggregate | of Aggregate |
| Fund | Net Assets | Net Assets | Net Assets | Net Assets |
|
| Capital Appreciation1 | 0.850% | 0.800% | 0.700% | 0.670% |
| 1 Until April 28, 2006, the Fund paid monthly advisory fees equivalent, on an annual basis, to the sum of: (a) 0.850% of the first $300 million of the Fund’s average net assets and (b) 0.800% of the |
| Fund’s average net assets in excess of $300 million. | | | |
| | First | Excess | | |
| | $350 million | Over $350 million | | |
| | of Aggregate | of Aggregate | | |
| Fund | Net Assets | Net Assets | | |
| |
| Core Equity | 0.850% | 0.750% | | |
| | First | Between $500 million | Between $1 billion | Excess over |
| | $500 million | and $1 billion | and $2.5 billion | $2.5 billion |
| | of Aggregate | of Aggregate | of Aggregate | of Aggregate |
| Fund | Net Assets | Net Assets | Net Assets | Net Assets |
|
| U.S. Multi Sector | 0.780% | 0.760% | 0.750% | 0.740% |
| | First | Between $100 million | Excess | |
| | $100 million | and $1 billion | Over $1 billion | |
| | of Aggregate | of Aggregate | of Aggregate | |
| Fund | Net Assets | Net Assets | Net Assets | |
| |
| International Stock1 | 0.920% | 0.895% | 0.880% | |
| International Small Company | 1.030 | 0.980 | 0.980 | |
1 For the purposes of determining Aggregate Net Assets, the assets of the International Stock and the International Core Trust, a series of John Hancock Trust and the International Core Fund, a series of John Hancock Funds III are included. John Hancock Funds III is a retail mutual funds advised by JHIMS and distributed by an affiliate of JHIMS, John Hancock Funds, LLC.
| | First | Between $750 million | Excess |
| | $750 million | and $1.5 billion | Over $1.5 billion |
| | of Aggregate | of Aggregate | of Aggregate |
| Fund | Net Assets | Net Assets | Net Assets |
|
| International Opportunities1 | 0.900% | 0.850% | 0.800% |
1 Until January 1, 2006 the Fund paid monthly advisory fees equivalent, on an annual basis to the sum of (a) 1.00% of the first $250 million of the Fund’s average net assets, (b) 0.95% of the next $250 million of the Fund’s average net assets and (c) 0.90% of the Fund’s average net assets in excess of $500 million.
| | First | Excess |
| | $125 million | Over $125 million |
| | of Aggregate | of Aggregate |
| Fund | Net Assets | Net Assets |
|
| Small Company | 1.050% | 1.000% |
| | First | Excess |
| Fund | $250 million | Over $250 million |
|
| Small Company Growth1 | 1.050% | 1.000% |
1 When Aggregate Net Assets exceed $1 billion, the advisory fee for Small Company Growth is 1.00% on all assets.
| | First | Between $250 million | Between $500 million | Excess over |
| | $250 million | and $500 million | and $1 billion | $1 billion |
| | of Aggregate | of Aggregate | of Aggregate | of Aggregate |
| Fund | Net Assets | Net Assets | Net Assets | Net Assets |
|
| Mid Cap Value Equity | 0.875% | 0.850% | 0.825% | 0.800% |
| Real Estate Equity | 0.875 | 0.850 | 0.825 | 0.825 |
| Spectrum Income | 0.800 | 0.725 | 0.725 | 0.725 |
444
John Hancock Funds II
Notes to Financial Statements
| INVESTMENT ADVISORY AND OTHER AGREEMENTS, CONTINUED | | |
| |
| | First | Between $250 million | Between $500 million | Excess over |
| | $250 million | and $500 million | and $750 million | $750 million |
| | of Aggregate | of Aggregate | of Aggregate | of Aggregate |
| Fund | Net Assets | Net Assets | Net Assets | Net Assets |
|
| Global Real Estate | 0.950% | 0.950% | 0.925% | 0.900% |
| Large Cap1 | 0.780 | 0.730 | 0.680 | 0.650 |
1 Until June 1, 2006, the Fund paid monthly advisory fees equivalent, on an annual basis, to the sum of: (a) 0.850% of the first $250 million of the Fund’s average net assets, (b) 0.800% of the next $250 million of the Fund’s average net assets and (c) 0.750% of the Fund’s average net assets in excess of $500 million.
| | First | Between $300 million | Between $600 million | Between $900 million | Excess over |
| | $300 million | and $600 million | and $900 million | and $1.5 billion | $1.5 billion |
| | of Aggregate | of Aggregate | of Aggregate | of Aggregate | of Aggregate |
| Fund | Net Assets | Net Assets | Net Assets | Net Assets | Net Assets |
|
| Strategic Value | 0.850% | 0.825% | 0.800% | 0.775% | 0.700% |
| | First | Excess | | | |
| | $100 million | Over $100 million | | | |
| | of Aggregate | of Aggregate | | | |
| Fund | Net Assets | Net Assets | | | |
| |
| International Equity Index | 0.550% | 0.530% | | | |
| | First | Between $250 million | Excess over | | |
| | $250 million | and $500 million | $500 million | | |
| | of Aggregate | of Aggregate | of Aggregate | | |
| Fund | Net Assets | Net Assets | Net Assets | | |
| |
| Mid Cap Index | 0.490% | 0.480% | 0.460% | | |
| Small Cap Index | 0.490 | 0.480 | 0.460 | | |
| | First | Excess | | | |
| | $500 million | Over $500 million | | | |
| | of Aggregate | of Aggregate | | | |
| Fund | Net Assets | Net Assets | | | |
| |
| High Yield1 | 0.700% | 0.650% | | | |
| Investment Quality Bond | 0.600 | 0.550 | | | |
| Strategic Bond2 | 0.700 | 0.650 | | | |
| Strategic Income | 0.725 | 0.650 | | | |
| U.S. Government Securities3 | 0.620 | 0.550 | | | |
1 Until April 28, 2006, the Fund paid monthly advisory fees equivalent, on an annual basis, to the sum of: (a) 0.725% of the first $500 million of the Fund’s average net assets and (b) 0.650% of the Fund’s average net assets in excess of $500 million.
2 Until April 28, 2006, the Fund paid monthly advisory fees equivalent, on an annual basis, to the sum of: (a) 0.725% of the first $500 million of the Fund’s average net assets and (b) 0.650% of the Fund’s average net assets in excess of $500 million.
3 Until April 28, 2006, the Fund paid monthly advisory fees equivalent, on an annual basis, to the sum of: (a) 0.650% of the first $500 million of the Fund’s average net assets and (b) 0.550% of the Fund’s average net assets in excess of $500 million.
| | First | Excess | |
| | $200 million | Over $200 million | |
| | of Aggregate | of Aggregate | |
| Fund | Net Assets | Net Assets | |
| |
| U.S. High Yield Bond | 0.750% | 0.720% | |
| | First | Between $200 million | |
| | $200 million | and $400 million | Excess Over $400 million |
| | of Aggregate | of Aggregate | of Aggregate |
| Fund | Net Assets | Net Assets | Net Assets |
|
| Core Bond1 | 0.690% | 0.640% | 0.570% |
1 Until June 1, 2006, the Fund paid monthly advisory fees equivalent, on an annual basis, to the sum of: (a) 0.690% of the first $200 million of the Fund’s average net assets, (b) 0.640% of the next $200 million of the Fund’s average net assets and (c) 0.600% of the Fund’s average net assets in excess of $400 million.
445
John Hancock Funds II
Notes to Financial Statements
| INVESTMENT ADVISORY AND OTHER AGREEMENTS, CONTINUED | | |
| |
| | | Between | Between | |
| | First | $150 million | $500 million | Excess |
| | $150 million | and $500 million | and $2.5 billion | Over $2.5 billion |
| | of Aggregate | of Aggregate | of Aggregate | of Aggregate |
| Fund | Net Assets | Net Assets | Net Assets | Net Assets |
|
| High Income | 0.725% | 0.675% | 0.650% | 0.600% |
For purposes of determining Aggregate Net Assets, the net assets of this series of the Trust and a similar series of John Hancock Trust are included.
John Hancock Trust is an open-end investment company advised by JHIMS and distributed by an affiliate of JHIMS, John Hancock Distributors, LLC.
Expense Reimbursement The Adviser has contractually agreed to waive advisory fees or reimburse each Fund if the total of all expenses (excluding taxes, portfolio brokerage commissions, interest, litigation and indemnification expenses, extraordinary expenses not incurred in the ordinary course of the Funds’ business, advisory fees, Rule 12b-1 fees, transfer agent fees, blue sky fees, printing and postage and fees under any agreements or plans of the Funds dealing with services for shareholders and others with beneficial interests in shares of the Funds) exceed the following:
- 0.05% of average daily net assets of Absolute Return and International Equity Index;
- 0.06% of average daily net assets of Emerging Small Company; and
- 0.075% of average daily net assets of Mid Cap Index and Small Cap Index;
- 0.75% of average daily net assets of Global Bond, Global Real Estate, International Stock, International Opportunities, International Small Cap, International Small Company, and International Value; and
- 0.50% of average daily net assets in the case of all other Funds with the exception of Quantitative All Cap.
The Adviser reserves the right to terminate this limitation in the future.
In the case of Quantitative All Cap, the Adviser has contractually agreed to waive advisory fees or reimburse for certain other fund expenses so that total fund operating expenses do not exceed 1.30% for Class A, 2.00% for Class B, 2.00% for Class C and 0.85% for Class I of the average annual net assets attributable to the respective classes. This expense reimbursement shall continue in effect until July 31, 2007 and thereafter until termination by the Adviser on notice to the Trust.
In addition, the Adviser voluntarily agreed to waive a portion of its advisory fee for Blue Chip Growth, Emerging Small Company, Equity-Income, International Value, Mid Cap Index, Quantitative All Cap, Real Estate Equity, Small Cap Index, Small Company Value and Spectrum Income in the amount of $158,836, $82,214, $108,998, $136,471, $1,216, $23,320, $16,911, $10,729, $80,667 and $74,483, respectively.
Administration Fees The Funds have an agreement with the Adviser that requires the Funds to reimburse the Adviser for all expenses associated with providing the administrative, financial, accounting and recordkeeping services of the Funds, including the preparation of all tax returns, annual, semi-annual and periodic reports to shareholders and the preparation of all regulatory reports.
Distribution Plan The Trust has a Distribution Agreement with John Hancock Funds, LLC (the “Distributor”), a wholly owned subsidiary of the Adviser. The Funds have adopted a Distribution Plan with respect to Class A, Class B, Class C and Class 1, pursuant to Rule 12b-1 under the Investment Company Act of 1940, to reimburse the Distributor for the services it provides as distributor of shares of the Funds. Accordingly, the Funds make monthly payments to the Distributor at an annual rate not to exceed 0.30% of Class A average daily net asset value, 1.00% of Class B average daily net asset value, 1.00% of Class C average daily net asset value and 0.05% of Class 1 average daily net asset value. A maximum of 0.25% of such payments may be service fees, as defined by the Conduct Rules of the National Association of Securities Dealers. Under the Conduct Rules, curtailment of a portion of the Fund’s 12b-1 payments could oc cur under certain circumstances.
Sales Charges Class A shares are assessed up-front sales charges of up to 5% of the net asset value of such shares. During the period ended August 31, 2006, there were no up-front sales charges received by JH Funds with regard to sales of Class A shares.
Class B shares that are redeemed within six years of purchase are subject to a contingent deferred sales charge (“CDSC”) at declining rates, beginning at 5.00% of the lesser of the current market value at the time of redemption or the original purchase cost of the shares being redeemed. Class C shares that are redeemed within one year of purchase are subject to a CDSC at a rate of 1.00% of the lesser of the current market value at the time of redemption or the original purchase cost of the shares being redeemed. Proceeds from the CDSCs are paid to the Distributor and are used, in whole or in part, to defray its expenses for providing distribution-related services to the Fund in connection with the sale of Class B and Class C shares. During the period ended August 31, 2006, there were no CDSCs received by the Distributor.
Transfer Agent Fees The Funds have a Transfer Agency Agreement with John Hancock Signature Services, Inc. (“Signature Services”), an indirect subsidiary of MFC. For Class A, Class B and Class C shares, the Funds pay a monthly transfer agent fee at an annual rate of 0.05% of each class’ average daily net assets, plus a fee based on the number of shareholder accounts and reimbursement for certain out-of-pocket expenses. Expenses not directly attributable to a particular class of shares are aggregated and allocated to each class on the basis of its relative net asset value.
Signature Services has agreed to limit the transfer agent fees so that such fees do not exceed 0.20% annually of Class A, Class B and Class C share average daily net assets for all funds except International Stock, cap at 0.30% annually. This agreement is effective until December 31, 2006. Signature Services reserves the right to terminate this limitation in the future.
Trustees’ Fees The Trust compensates each Trustee who is not an employee of the Adviser or its affiliates. Total Trustees’ expenses are allocated to each Fund based on its average daily net asset value.
446
John Hancock Funds II
Notes to Financial Statements
4. GUARANTEES AND INDEMNIFICATIONS Under the Trust’s organizational documents, its Officers and Trustees are indemnified against certain liability arising out of the performance of their duties to the Trust. Additionally, in the normal course of business, the Trust enters into contracts with service providers that contain general indemnification clauses. The Trust’s maximum exposure under these arrangements is unknown, as this would involve future claims that may be made against the Trust that have not yet occurred. However, based on experience, the Trust believes the risk of loss to be remote.
5. LINE OF CREDIT All Funds have entered into an agreement which enables them to participate in a $100 million unsecured committed line of credit with State Street Corporation. Borrowings will be made solely to temporarily finance the repurchase of capital shares. Interest is charged to each participating Fund based on its borrowings at a rate per annum equal to the Federal Funds rate plus 0.50% . In addition, a commitment fee of 0.07% per annum, payable at the end of each calendar quarter, based on the average daily-unused portion of the line of credit, is charged to each participating Fund on a prorated basis based on average net assets. For the period ended August 31, 2006 there was no borrowings under the line of credit.
6. CAPITAL SHARES Share activities for the Funds for period ended August 31, 2006 were as follows:
| Absolute Return Fund | Period ended 8-31-06a |
| | Shares | Amount |
|
| Class A shares | | |
| Sold | 125,000 | $1,250,000 |
| Net increase (decrease) | 125,000 | $1,250,000 |
|
| Class B shares | | |
| Sold | 125,000 | $1,250,000 |
| Net increase (decrease) | 125,000 | $1,250,000 |
|
| Class C shares | | |
| Sold | 125,000 | $1,250,000 |
| Net increase (decrease) | 125,000 | $1,250,000 |
|
| Class 1 shares | | |
| Sold | 125,000 | $1,250,000 |
| Net increase (decrease) | 125,000 | $1,250,000 |
|
| Net increase (decrease) | 500,000 | $5,000,000 |
| a Period from 6-26-06 (commencement of operations) to 8-31-06. | | |
| |
| Active Bond Fund | Period ended 8-31-06b |
| | Shares | Amount |
|
| Class 1 shares | | |
| Sold | 4,410,359 | $42,335,086 |
| Distributions reinvested | 101,841 | 954,551 |
| Repurchased | (629,790) | (6,032,748) |
| Net increase (decrease) | 3,882,410 | $37,256,889 |
|
| Class NAV shares | | |
| Sold | 40,800,418 | $391,259,642 |
| Distributions reinvested | 1,092,312 | 10,220,932 |
| Repurchased | (296,193) | (2,824,688) |
| Net increase (decrease) | 41,596,537 | $398,655,886 |
|
| Net increase (decrease) | 45,478,947 | $435,912,775 |
| b Class 1 and Class NAV shares began operations on 10-15-05 and 10-27-05, respectively. | | |
| |
| All Cap Core Fund | Period ended 8-31-06c |
| | Shares | Amount |
|
| Class NAV shares | | |
| Sold | 28,631,304 | $285,677,276 |
| Repurchased | (39) | (386) |
|
| Net increase (decrease) | 28,631,265 | $285,676,890 |
| c Period from 4-28-06 (commencement of operations) to 8-31-06. | | |
| |
| All Cap Growth Fund | Period ended 8-31-06d |
| | Shares | Amount |
|
| Class 1 shares | | |
| Sold | 2,255,731 | $35,128,332 |
| Distributions reinvested | 923 | 15,666 |
| Repurchased | (294,829) | (4,975,207) |
| Net increase (decrease) | 1,961,825 | $30,168,791 |
|
| Class NAV shares | | |
| Sold | 7,460,531 | $118,167,808 |
| Distributions reinvested | 2,919 | 49,558 |
| Repurchased | (1) | (12) |
| Net increase (decrease) | 7,463,449 | $118,217,354 |
|
| Net increase (decrease) | 9,425,274 | $148,386,145 |
| d Period from 10-15-05 (commencement of operations) to 8-31-06. | | |
447
John Hancock Funds II
Notes to Financial Statements
| CAPITAL SHARES, CONTINUED | | |
| |
| All Cap Value Fund | Period ended 8-31-06a |
| | Shares | Amount |
|
| Class 1 shares | | |
| Sold | 1,534,041 | $21,741,293 |
| Distributions reinvested | 1,978 | 29,388 |
| Repurchased | (206,788) | (3,153,743) |
| Net increase (decrease) | 1,329,231 | $18,616,938 |
|
| Class NAV shares | | |
| Sold | 12,329,873 | $173,586,947 |
| Distributions reinvested | 18,130 | 268,692 |
| Net increase (decrease) | 12,348,003 | $173,855,639 |
|
| Net increase (decrease) | 13,677,234 | $192,472,577 |
| a Period from 10-15-05 (commencement of operations) to 8-31-06. | | |
| |
| Blue Chip Growth Fund | Period ended 8-31-06a |
| | Shares | Amount |
|
| Class 1 shares | | |
| Sold | 11,420,290 | $192,142,629 |
| Distributions reinvested | 5,306 | 96,099 |
| Repurchased | (1,056,336) | (18,624,249) |
| Net increase (decrease) | 10,369,260 | $173,614,479 |
|
| Class NAV shares | | |
| Sold | 64,643,103 | $1,091,778,066 |
| Distributions reinvested | 44,161 | 798,874 |
| Repurchased | (3,576,152) | (65,139,214) |
| Net increase (decrease) | 61,111,112 | $1,027,437,726 |
|
| Net increase (decrease) | 71,480,372 | $1,201,052,205 |
| a Period from 10-15-05 (commencement of operations) to 8-31-06. | | |
| |
| Capital Appreciation Fund | Period ended 8-31-06a |
| | Shares | Amount |
|
| Class 1 shares | | |
| Sold | 7,646,975 | $75,934,658 |
| Repurchased | (478,192) | (4,595,575) |
| Net increase (decrease) | 7,168,783 | $71,339,083 |
|
| Class NAV shares | | |
| Sold | 42,013,807 | $401,821,454 |
| Repurchased | (475,720) | (4,570,774) |
| Net increase (decrease) | 41,538,087 | $397,250,680 |
|
| Net increase (decrease) | 48,706,870 | $468,589,763 |
| a Period from 10-15-05 (commencement of operations) to 8-31-06. | | |
| |
| Core Bond Fund | Period ended 8-31-06a |
| | Shares | Amount |
|
| Class 1 shares | | |
| Sold | 79,232 | $988,911 |
| Distributions reinvested | 1,398 | 16,947 |
| Repurchased | (3,699) | (45,815) |
| Net increase (decrease) | 76,931 | $960,043 |
|
| Class NAV shares | | |
| Sold | 15,383,056 | $192,087,432 |
| Distributions reinvested | 406,966 | 4,956,804 |
| Repurchased | (6,839) | (84,833) |
| Net increase (decrease) | 15,783,183 | $196,959,403 |
|
| Net increase (decrease) | 15,860,114 | $197,919,446 |
| a Period from 10-15-05 (commencement of operations) to 8-31-06. | | |
448
John Hancock Funds II
Notes to Financial Statements
| CAPITAL SHARES, CONTINUED | | |
| |
| Core Equity Fund | Period ended 8-31-06a |
| | Shares | Amount |
|
| Class 1 shares | | |
| Sold | 916,332 | $12,817,352 |
| Repurchased | (66,319) | (967,554) |
| Net increase (decrease) | 850,013 | $11,849,798 |
|
| Class NAV shares | | |
| Sold | 41,574,157 | $583,783,533 |
| Repurchased | (640,480) | (9,611,239) |
| Net increase (decrease) | 40,933,677 | $574,172,294 |
|
| Net increase (decrease) | 41,783,690 | $586,022,092 |
| a Period from 10-15-05 (commencement of operations) to 8-31-06. | | |
| |
| Emerging Growth Fund | Period ended 8-31-06a |
| | Shares | Amount |
|
| Class 1 shares | | |
| Sold | 14,616,000 | $242,600,553 |
| Repurchased | (8,047,719) | (133,391,250) |
| Net increase (decrease) | 6,568,281 | $109,209,303 |
|
| Class NAV shares | | |
| Sold | 2,848,551 | $47,801,605 |
| Repurchased | (58,751) | (1,081,054) |
| Net increase (decrease) | 2,789,800 | $46,720,551 |
|
| Net increase (decrease) | 9,358,081 | $155,929,854 |
| a Period from 10-15-05 (commencement of operations) to 8-31-06. | | |
| |
| Emerging Small Company Fund | Period ended 8-31-06b |
| | Shares | Amount |
|
| Class 1 shares | | |
| Sold | 2,017,391 | $57,714,464 |
| Repurchased | (232,021) | (7,072,654) |
| Net increase (decrease) | 1,785,370 | $50,641,810 |
|
| Class NAV shares | | |
| Sold | 3,401 | $100,000 |
| Net increase (decrease) | 3,401 | $100,000 |
|
| Net increase (decrease) | 1,788,771 | $50,741,810 |
| b Class 1 and Class NAV shares began operations on 10-15-05 and 6-26-06, respectively. | | |
| |
| Equity-Income Fund | Period ended 8-31-06a |
| | Shares | Amount |
|
| Class 1 shares | | |
| Sold | 10,841,153 | $175,415,443 |
| Distributions reinvested | 35,892 | 612,671 |
| Repurchased | (757,673) | (13,117,365) |
| Net increase (decrease) | 10,119,372 | $162,910,749 |
|
| Class NAV shares | | |
| Sold | 41,740,567 | $679,203,718 |
| Distributions reinvested | 139,155 | 2,371,194 |
| Repurchased | (12,320,846) | (221,623,437) |
| Net increase (decrease) | 29,558,876 | $459,951,475 |
|
| Net increase (decrease) | 39,678,248 | $622,862,224 |
| a Period from 10-15-05 (commencement of operations) to 8-31-06. | | |
| |
| Fundamental Value Fund | Period ended 8-31-06a |
| | Shares | Amount |
|
| Class 1 shares | | |
| Sold | 4,406,006 | $64,352,852 |
| Distributions reinvested | 7,132 | 109,544 |
| Repurchased | (192,621) | (2,947,427) |
| Net increase (decrease) | 4,220,517 | $61,514,969 |
|
| Class NAV shares | | |
| Sold | 43,805,878 | $643,905,194 |
| Distributions reinvested | 80,076 | 1,226,769 |
| Repurchased | (8,097) | (119,942) |
| Net increase (decrease) | 43,877,857 | $645,012,021 |
|
| Net increase (decrease) | 48,098,374 | $706,526,990 |
| a Period from 10-15-05 (commencement of operations) to 8-31-06. | | |
449
John Hancock Funds II
Notes to Financial Statements
| CAPITAL SHARES, CONTINUED | | |
| |
| Global Bond Fund | Period ended 8-31-06a |
| | Shares | Amount |
|
| Class 1 shares | | |
| Sold | 3,319,111 | $48,301,151 |
| Distributions reinvested | 15,790 | 227,540 |
| Repurchased | (565,053) | (8,153,979) |
| Net increase (decrease) | 2,769,848 | $40,374,712 |
|
| Class NAV shares | | |
| Sold | 37,810,358 | $545,663,651 |
| Distributions reinvested | 194,896 | 2,800,652 |
| Repurchased | (555,964) | (8,062,548) |
| Net increase (decrease) | 37,449,290 | $540,401,755 |
|
| Net increase (decrease) | 40,219,138 | $580,776,467 |
| a Period from 10-15-05 (commencement of operations) to 8-31-06. | | |
| |
| Global Real Estate Fund | Period ended 8-31-06b |
| | Shares | Amount |
|
| Class NAV shares | | |
| Sold | 35,315,465 | $352,026,731 |
| Repurchased | (828,195) | (8,290,766) |
|
| Net increase (decrease) | 34,487,270 | $343,735,965 |
| b Period from 4-28-06 (commencement of operations) to 8-31-06. | | |
| |
| High Income Fund | Period ended 8-31-06b |
| | Shares | Amount |
|
| Class NAV shares | | |
| Sold | 28,959,651 | $289,253,392 |
| Distributions reinvested | 323,060 | 3,127,218 |
| Repurchased | (66) | (663) |
|
| Net increase (decrease) | 29,282,645 | $292,379,947 |
| b Period from 4-28-06 (commencement of operations) to 8-31-06. | | |
| |
| High Yield Fund | Period ended 8-31-06a |
| | Shares | Amount |
|
| Class 1 shares | | |
| Sold | 4,684,483 | $47,431,727 |
| Distributions reinvested | 241,386 | 2,373,236 |
| Repurchased | (583,626) | (5,964,590) |
| Net increase (decrease) | 4,342,243 | $43,840,373 |
|
| Class NAV shares | | |
| Sold | 148,852,350 | $1,504,335,643 |
| Distributions reinvested | 6,834,498 | 67,041,478 |
| Repurchased | (42,180,007) | (440,523,474) |
| Net increase (decrease) | 113,506,841 | $1,130,853,647 |
|
| Net increase (decrease) | 117,849,084 | $1,174,694,020 |
| a Period from 10-15-05 (commencement of operations) to 8-31-06. | | |
| |
| International Equity Index Fund | Period ended 8-31-06c |
| | Shares | Amount |
|
| Class NAV shares | | |
| Sold | 16,356,516 | $274,978,009 |
| Distributions reinvested | 125,191 | 2,080,681 |
| Repurchased | (254,897) | (4,623,820) |
|
| Net increase (decrease) | 16,226,810 | $272,434,870 |
450
John Hancock Funds II
Notes to Financial Statements
| CAPITAL SHARES, CONTINUED | | |
| |
| International Opportunities Fund | Period ended 8-31-06a |
| | Shares | Amount |
|
| Class 1 shares | | |
| Sold | 601,742 | $9,273,103 |
| Distributions reinvested | 2,943 | 42,136 |
| Repurchased | (50,208) | (778,720) |
| Net increase (decrease) | 554,477 | $8,536,519 |
|
| Class NAV shares | | |
| Sold | 34,334,780 | $486,232,885 |
| Distributions reinvested | 1,294,925 | 18,582,164 |
| Repurchased | (1,453,315) | (22,354,475) |
| Net increase (decrease) | 34,176,390 | $482,460,574 |
|
| Net increase (decrease) | 34,730,867 | $490,997,093 |
| a Period from 10-15-05 (commencement of operations) to 8-31-06. | | |
| |
| International Small Cap Fund | Period ended 8-31-06a |
| | Shares | Amount |
|
| Class 1 shares | | |
| Sold | 2,219,040 | $42,103,836 |
| Distributions reinvested | 3,177 | 59,757 |
| Repurchased | (458,599) | (9,035,256) |
| Net increase (decrease) | 1,763,618 | $33,128,337 |
|
| Class NAV shares | | |
| Sold | 27,389,877 | $502,849,801 |
| Distributions reinvested | 54,397 | 1,022,670 |
| Repurchased | (10,310,152) | (226,267,466) |
| Net increase (decrease) | 17,134,122 | $277,605,005 |
|
| Net increase (decrease) | 18,897,740 | $310,733,342 |
| a Period from 10-15-05 (commencement of operations) to 8-31-06. | | |
| |
| International Small Company Fund | Period ended 8-31-06b |
| | Shares | Amount |
|
| Class NAV shares | | |
| Sold | 23,673,770 | $234,475,079 |
|
| Net increase (decrease) | 23,673,770 | $234,475,079 |
| b Period from 4-28-06 (commencement of operations) to 8-31-06. | | |
| |
| International Stock Fund | Period ended 8-31-06a |
| | Shares | Amount |
|
| Class 1 shares | | |
| Sold | 6,153,666 | $81,216,450 |
| Distributions reinvested | 234,224 | 3,150,274 |
| Repurchased | (647,183) | (8,791,237) |
| Net increase (decrease) | 5,740,707 | $75,575,487 |
|
| Class NAV sharesc | | |
| Sold | 76,895,091 | $921,835,178 |
| Distributions reinvested | 3,946,080 | 52,200,374 |
| In kind redemptiond | (72,837,332) | (999,328,193) |
| Repurchased | (8,003,839) | (110,232,993) |
| Net increase (decrease) | — | ($135,525,634) |
|
| Net increase (decrease) | 5,740,707 | ($59,950,147) |
a Period from 10-15-05 (commencement of operations) to 8-31-06.
c Class NAV shares of International Stock were terminated on 8-29-06.
d Refer to merger of International Stock Fund footnote 1.
451
John Hancock Funds II
Notes to Financial Statements
| CAPITAL SHARES, CONTINUED | | |
| |
| International Value Fund | Period ended 8-31-06a |
| | Shares | Amount |
|
| Class 1 shares | | |
| Sold | 7,948,556 | $122,657,545 |
| Distributions reinvested | 22,472 | 353,039 |
| Repurchased | (464,178) | (7,536,803) |
| Net increase (decrease) | 7,506,850 | $115,473,781 |
|
| Class NAV shares | | |
| Sold | 57,595,544 | $868,428,490 |
| Distributions reinvested | 183,500 | 2,875,449 |
| Repurchased | (11,028,757) | (195,470,875) |
| Net increase (decrease) | 46,750,287 | $675,833,064 |
|
| Net increase (decrease) | 54,257,137 | $791,306,845 |
| a Period from 10-15-05 (commencement of operations) to 8-31-06. | | |
| |
| Investment Quality Bond Fund | Period ended 8-31-06a |
| | Shares | Amount |
|
| Class 1 shares | | |
| Sold | 3,270,289 | $38,683,682 |
| Distributions reinvested | 93,593 | 1,074,307 |
| Repurchased | (400,700) | (4,711,127) |
| Net increase (decrease) | 2,963,182 | $35,046,862 |
|
| Class NAV shares | | |
| Sold | 7,735,080 | $91,307,476 |
| Distributions reinvested | 245,235 | 2,811,572 |
| Repurchased | (35,590) | (421,740) |
| Net increase (decrease) | 7,944,725 | $93,697,308 |
|
| Net increase (decrease) | 10,907,907 | $128,744,170 |
| a Period from 10-15-05 (commencement of operations) to 8-31-06. | | |
| |
| Large Cap Fund | Period ended 8-31-06a |
| | Shares | Amount |
|
| Class 1 shares | | |
| Sold | 302,458 | $4,282,728 |
| Distributions reinvested | 100 | 1,427 |
| Repurchased | (162,086) | (2,317,240) |
| Net increase (decrease) | 140,472 | $1,966,915 |
|
| Class NAV shares | | |
| Sold | 13,058,478 | $177,726,453 |
| Distributions reinvested | 14,836 | 212,011 |
| Repurchased | (53) | (777) |
| Net increase (decrease) | 13,073,261 | $177,937,687 |
|
| Net increase (decrease) | 13,213,733 | $179,904,602 |
| a Period from 10-15-05 (commencement of operations) to 8-31-06. | | |
| |
| Large Cap Value Fund | Period ended 8-31-06a |
| | Shares | Amount |
|
| Class 1 shares | | |
| Sold | 4,869,615 | $109,652,824 |
| Distributions reinvested | 1,106 | 24,237 |
| Repurchased | (285,910) | (6,490,215) |
| Net increase (decrease) | 4,584,811 | $103,186,846 |
|
| Class NAV shares | | |
| Sold | 10,165,283 | $218,373,407 |
| Distributions reinvested | 13,349 | 293,006 |
| Repurchased | (55) | (1,305) |
| Net increase (decrease) | 10,178,577 | $218,665,108 |
|
| Net increase (decrease) | 14,763,388 | $321,851,954 |
| a Period from 10-15-05 (commencement of operations) to 8-31-06. | | |
452
John Hancock Funds II
Notes to Financial Statements
| CAPITAL SHARES, CONTINUED | | |
| |
| Mid Cap Core Fund | Period ended 8-31-06a |
| | Shares | Amount |
|
| Class 1 shares | | |
| Sold | 718,564 | $11,713,771 |
| Distributions reinvested | 480 | 8,276 |
| Repurchased | (67,573) | (1,161,767) |
| Net increase (decrease) | 651,471 | $10,560,280 |
|
| Class NAV shares | | |
| Sold | 22,063,224 | $357,331,711 |
| Distributions reinvested | 21,720 | 374,238 |
| Repurchased | (5,028,099) | (90,053,219) |
| Net increase (decrease) | 17,056,845 | $267,652,730 |
|
| Net increase (decrease) | 17,708,316 | $278,213,010 |
| a Period from 10-15-05 (commencement of operations) to 8-31-06. | | |
| |
| Mid Cap Index Fund | Period ended 8-31-06a |
| | Shares | Amount |
|
| Class NAV shares | | |
| Sold | 9,364,334 | $172,967,966 |
| Distributions reinvested | 5,412 | 98,937 |
| Repurchased | (9) | (167) |
|
| Net increase (decrease) | 9,369,737 | $173,066,736 |
| a Period from 10-29-05 (commencement of operations) to 8-31-06. | | |
| |
| Mid Cap Stock Fund | Period ended 8-31-06a |
| | Shares | Amount |
|
| Class 1 shares | | |
| Sold | 7,177,859 | $101,765,405 |
| Distributions reinvested | 7,197 | 110,835 |
| Repurchased | (433,964) | (6,723,460) |
| Net increase (decrease) | 6,751,092 | $95,152,780 |
|
| Class NAV shares | | |
| Sold | 12,263,280 | $175,063,032 |
| Distributions reinvested | 12,654 | 195,005 |
| Repurchased | (13,321) | (200,978) |
| Net increase (decrease) | 12,262,613 | $175,057,059 |
|
| Net increase (decrease) | 19,013,705 | $270,209,839 |
| a Period from 10-15-05 (commencement of operations) to 8-31-06. | | |
| |
| Mid Cap Value Fund | Period ended 8-31-06a |
| | Shares | Amount |
|
| Class 1 shares | | |
| Sold | 5,216,018 | $93,070,872 |
| Distributions reinvested | 8,173 | 156,021 |
| Repurchased | (270,546) | (5,091,481) |
| Net increase (decrease) | 4,953,645 | $88,135,412 |
|
| Class NAV shares | | |
| Sold | 7,331,183 | $131,352,458 |
| Distributions reinvested | 12,119 | 230,981 |
| Repurchased | (4,708,091) | (91,289,836) |
| Net increase (decrease) | 2,635,211 | $40,293,603 |
|
| Net increase (decrease) | 7,588,856 | $128,429,015 |
| a Period from 10-15-05 (commencement of operations) to 8-31-06. | | |
| |
| Mid Cap Value Equity Fund | Period ended 8-31-06b |
| | Shares | Amount |
|
| Class NAV shares | | |
| Sold | 10,163,245 | $101,230,202 |
|
| Net increase (decrease) | 10,163,245 | $101,230,202 |
| b Period from 4-28-06 (commencement of operations) to 8-31-06. | | |
453
John Hancock Funds II
Notes to Financial Statements
| CAPITAL SHARES, CONTINUED | | |
| |
| Natural Resources Fund | Period ended 8-31-06a |
| | Shares | Amount |
|
| Class 1 shares | | |
| Sold | 2,667,622 | $84,051,737 |
| Distributions reinvested | 1,596 | 51,094 |
| Repurchased | (390,223) | (12,861,630) |
| Net increase (decrease) | 2,278,995 | $71,241,201 |
|
| Class NAV shares | | |
| Sold | 26,990,316 | $791,451,774 |
| Distributions reinvested | 21,664 | 691,085 |
| Repurchased | (7,583,489) | (243,417,369) |
| Net increase (decrease) | 19,428,491 | $548,725,490 |
|
| Net increase (decrease) | 21,707,486 | $619,966,691 |
| a Period from 10-15-05 (commencement of operations) to 8-31-06. | | |
| |
| Quantitative All Cap Fund | Period ended 8-31-06c |
| | Shares | Amount |
|
| Class A shares | | |
| Sold | 125,000 | $1,250,000 |
| Net increase (decrease) | 125,000 | $1,250,000 |
|
| Class B shares | | |
| Sold | 125,000 | $1,250,000 |
| Net increase (decrease) | 125,000 | $1,250,000 |
|
| Class C shares | | |
| Sold | 125,000 | $1,250,000 |
| Net increase (decrease) | 125,000 | $1,250,000 |
|
| Class I shares | | |
| Sold | 125,000 | $1,250,000 |
| Net increase (decrease) | 125,000 | $1,250,000 |
|
| Net increase (decrease) | 500,000 | $5,000,000 |
| c Period from 7-28-06 (commencement of operations) to 8-31-06. | | |
| |
| Quantitative Mid Cap Fund | Period ended 8-31-06a |
| | Shares | Amount |
|
| Class 1 shares | | |
| Sold | 10,131,602 | $139,050,728 |
| Distributions reinvested | 4,513 | 67,201 |
| Repurchased | (821,113) | (12,018,583) |
| Net increase (decrease) | 9,315,002 | $127,099,346 |
|
| Class NAV shares | | |
| Sold | 3,477,624 | $48,688,174 |
| Distributions reinvested | 1,504 | 22,396 |
| Net increase (decrease) | 3,479,128 | $48,710,570 |
|
| Net increase (decrease) | 12,794,130 | $175,809,916 |
| a Class 1 and Class NAV shares began operations on 10-15-05 and 10-27-05, respectively. | | |
| |
| Quantitative Value Fund | Period ended 8-31-06b |
| | Shares | Amount |
|
| Class 1 shares | | |
| Sold | 12,177,329 | $172,995,129 |
| Distributions reinvested | 20,598 | 316,796 |
| Repurchased | (6,412,260) | (91,864,606) |
| Net increase (decrease) | 5,785,667 | $81,447,319 |
|
| Class NAV shares | | |
| Sold | 21,861,897 | $322,294,660 |
| Distributions reinvested | 59,655 | 917,492 |
| Repurchased | (46,554) | (752,703) |
| Net increase (decrease) | 21,874,998 | $322,459,449 |
|
| Net increase (decrease) | 27,660,665 | $403,906,768 |
| b Period from 10-15-05 (commencement of operations) to 8-31-06. | | |
| |
| Real Estate Equity Fund | Period ended 8-31-06c |
| | Shares | Amount |
|
| Class NAV shares | | |
| Sold | 26,299,462 | $262,958,482 |
| Repurchased | (1,276,416) | (13,500,524) |
|
| Net increase (decrease) | 25,023,046 | $249,457,958 |
| c Period from 4-28-06 (commencement of operations) to 8-31-06. | | |
454
John Hancock Funds II
Notes to Financial Statements
| CAPITAL SHARES, CONTINUED | | |
| |
| Real Estate Securities Fund | Period ended 8-31-06b |
| | Shares | Amount |
|
| Class 1 shares | | |
| Sold | 6,284,572 | $148,199,995 |
| Distributions reinvested | 39,680 | 993,592 |
| Repurchased | (627,908) | (16,050,282) |
| Net increase (decrease) | 5,696,344 | $133,143,305 |
|
| Class NAV sharesd | | |
| Sold | 22,695,411 | $537,633,578 |
| Distributions reinvested | 153,457 | 3,836,410 |
| Repurchased | (22,848,868) | (620,415,037) |
| Net increase (decrease) | — | ($78,945,049) |
|
| Net increase (decrease) | 5,696,344 | $54,198,256 |
| b Period from 10-15-05 (commencement of operations) to 8-31-06. | | |
| d Class NAV shares of Real Estate Securities Fund were terminated on 5-1-06. | | |
| |
| Real Return Bond Fund | Period ended 8-31-06b |
| | Shares | Amount |
|
| Class 1 shares | | |
| Sold | 1,454,328 | $19,581,447 |
| Distributions reinvested | 36,073 | 467,161 |
| Repurchased | (196,896) | (2,628,853) |
| Net increase (decrease) | 1,293,505 | $17,419,755 |
|
| Class NAV shares | | |
| Sold | 50,304,888 | $671,385,157 |
| Distributions reinvested | 1,498,244 | 19,250,689 |
| Repurchased | (414,756) | (5,458,616) |
| Net increase (decrease) | 51,388,376 | $685,177,230 |
|
| Net increase (decrease) | 52,681,881 | $702,596,985 |
| b Period from 10-15-05 (commencement of operations) to 8-31-06. | | |
| |
| Small Cap Fund | Period ended 8-31-06a |
| | Shares | Amount |
|
| Class 1 shares | | |
| Sold | 71,459 | $1,051,472 |
| Repurchased | (14,710) | (218,414) |
| Net increase (decrease) | 56,749 | $833,058 |
|
| Class NAV shares | | |
| Sold | 17,159,599 | $234,797,473 |
| Repurchased | (84,253) | (1,306,123) |
| Net increase (decrease) | 17,075,346 | $233,491,350 |
|
| Net increase (decrease) | 17,132,095 | $234,324,408 |
| a Period from 10-15-05 (commencement of operations) to 8-31-06. | | |
| |
| Small Cap Index Fund | Period ended 8-31-06b |
| | Shares | Amount |
|
| Class NAV shares | | |
| Sold | 7,837,004 | $119,876,928 |
| Distributions reinvested | 5,687 | 86,672 |
| Repurchased | (2) | (40) |
|
| Net increase (decrease) | 7,842,689 | $119,963,560 |
| b Period from 10-29-05 (commencement of operations) to 8-31-06. | | |
| |
| Small Cap Opportunities Fund | Period ended 8-31-06a |
| | Shares | Amount |
|
| Class 1 shares | | |
| Sold | 1,423,438 | $31,374,556 |
| Distributions reinvested | 2,275 | 52,542 |
| Repurchased | (115,637) | (2,690,949) |
| Net increase (decrease) | 1,310,076 | $28,736,149 |
|
| Class NAV shares | | |
| Sold | 11,275,084 | $243,592,568 |
| Distributions reinvested | 21,585 | 496,243 |
| Repurchased | (1,933,247) | (49,121,188) |
| Net increase (decrease) | 9,363,422 | $194,967,623 |
|
| Net increase (decrease) | 10,673,498 | $223,703,772 |
| a Period from 10-15-05 (commencement of operations) to 8-31-06. | | |
455
John Hancock Funds II
Notes to Financial Statements
| CAPITAL SHARES, CONTINUED | | |
| |
| Small Company Fund | Period ended 8-31-06a |
| | Shares | Amount |
|
| Class 1 shares | | |
| Sold | 444,470 | $6,952,364 |
| Repurchased | (50,652) | (835,677) |
| Net increase (decrease) | 393,818 | $6,116,687 |
|
| Class NAV shares | | |
| Sold | 5,775,746 | $88,554,245 |
| Repurchased | (116,590) | (1,993,906) |
| Net increase (decrease) | 5,659,156 | $86,560,339 |
|
| Net increase (decrease) | 6,052,974 | $92,677,026 |
| a Period from 10-15-05 (commencement of operations) to 8-31-06. | | |
| |
| Small Company Growth Fund | Period ended 8-31-06b |
| | Shares | Amount |
|
| Class NAV shares | | |
| Sold | 6,665,333 | $67,787,539 |
| Repurchased | (4) | (51) |
|
| Net increase (decrease) | 6,665,329 | $67,787,488 |
| b Period from 10-29-05 (commencement of operations) to 8-31-06. | | |
| |
| Small Company Value Fund | Period ended 8-31-06a |
| | Shares | Amount |
|
| Class 1 shares | | |
| Sold | 6,651,337 | $142,249,964 |
| Distributions reinvested | 11,964 | 272,671 |
| Repurchased | (381,270) | (8,873,772) |
| Net increase (decrease) | 6,282,031 | $133,648,863 |
|
| Class NAV shares | | |
| Sold | 10,194,775 | $220,030,278 |
| Distributions reinvested | 17,657 | 401,689 |
| Repurchased | (86,262) | (2,158,577) |
| Net increase (decrease) | 10,126,170 | $218,273,390 |
|
| Net increase (decrease) | 16,408,201 | $351,922,253 |
| a Period from 10-15-05 (commencement of operations) to 8-31-06. | | |
| |
| Special Value Fund | Period ended 8-31-06a |
| | Shares | Amount |
|
| Class 1 shares | | |
| Sold | 208,064 | $4,049,944 |
| Distributions reinvested | 60 | 1,203 |
| Repurchased | (19,736) | (404,619) |
| Net increase (decrease) | 188,388 | $3,646,528 |
|
| Class NAV shares | | |
| Sold | 6,047,081 | $115,644,477 |
| Distributions reinvested | 3,993 | 80,458 |
| Repurchased | (17,449) | (373,044) |
| Net increase (decrease) | 6,033,625 | $115,351,891 |
|
| Net increase (decrease) | 6,222,013 | $118,998,419 |
| a Period from 10-15-05 (commencement of operations) to 8-31-06. | | |
| |
| Spectrum Income Fund | Period ended 8-31-06b |
| | Shares | Amount |
|
| Class NAV shares | | |
| Sold | 72,620,367 | $729,434,258 |
| Distributions reinvested | 1,821,119 | 18,140,475 |
| Repurchased | (70,634) | (713,593) |
|
| Net increase (decrease) | 74,370,852 | $746,861,140 |
| b Period from 10-29-05 (commencement of operations) to 8-31-06. | | |
456
John Hancock Funds II
Notes to Financial Statements
| CAPITAL SHARES, CONTINUED | | |
| |
| Strategic Bond Fund | Period ended 8-31-06a |
| | Shares | Amount |
|
| Class 1 shares | | |
| Sold | 3,816,438 | $45,216,126 |
| Distributions reinvested | 154,844 | 1,757,818 |
| Repurchased | (428,849) | (5,062,957) |
| Net increase (decrease) | 3,542,433 | $41,910,987 |
|
| Class NAV shares | | |
| Sold | 41,372,661 | $489,625,288 |
| Distributions reinvested | 1,154,531 | 13,154,541 |
| Repurchased | (19,596,041) | (232,996,134) |
| Net increase (decrease) | 22,931,151 | $269,783,695 |
|
| Net increase (decrease) | 26,473,584 | $311,694,682 |
| a Period from 10-15-05 (commencement of operations) to 8-31-06. | | |
| |
| Strategic Income Fund | Period ended 8-31-06c |
| | Shares | Amount |
|
| Class NAV shares | | |
| Sold | 27,748,210 | $277,448,128 |
| Distributions reinvested | 204,788 | 2,008,968 |
| Repurchased | (60) | (599) |
|
| Net increase (decrease) | 27,952,938 | $279,456,497 |
| c Period from 4-28-06 (commencement of operations) to 8-31-06. | | |
| |
| Strategic Value Fund | Period ended 8-31-06a |
| | Shares | Amount |
|
| Class 1 shares | | |
| Sold | 1,404,164 | $14,582,944 |
| Distributions reinvested | 1,752 | 18,908 |
| Repurchased | (146,786) | (1,583,780) |
| Net increase (decrease) | 1,259,130 | $13,018,072 |
|
| Class NAV shares | | |
| Sold | 12,695,614 | $131,570,173 |
| Distributions reinvested | 16,987 | 182,609 |
| Repurchased | (1,481) | (16,860) |
| Net increase (decrease) | 12,711,120 | $131,735,922 |
|
| Net increase (decrease) | 13,970,250 | $144,753,994 |
| a Period from 10-15-05 (commencement of operations) to 8-31-06. | | |
| |
| Total Return Fund | Period ended 8-31-06a |
| | Shares | Amount |
|
| Class 1 shares | | |
| Sold | 9,048,783 | $123,937,034 |
| Distributions reinvested | 207,106 | 2,773,005 |
| Repurchased | (708,309) | (9,688,915) |
| Net increase (decrease) | 8,547,580 | $117,021,124 |
|
| Class NAV shares | | |
| Sold | 74,491,595 | $1,015,920,334 |
| Distributions reinvested | 1,802,766 | 24,067,715 |
| Repurchased | (568,832) | (7,736,934) |
| Net increase (decrease) | 75,725,529 | $1,032,251,115 |
|
| Net increase (decrease) | 84,273,109 | $1,149,272,239 |
| a Period from 10-15-05 (commencement of operations) to 8-31-06. | | |
| |
| U.S. Global Leaders Growth Fund | Period ended 8-31-06a |
| | Shares | Amount |
|
| Class 1 shares | | |
| Sold | 2,202,160 | $28,041,942 |
| Distributions reinvested | 798 | 10,881 |
| Repurchased | (245,208) | (3,204,861) |
| Net increase (decrease) | 1,957,750 | $24,847,962 |
|
| Class NAV shares | | |
| Sold | 35,653,852 | $470,772,227 |
| Distributions reinvested | 14,555 | 198,524 |
| Repurchased | (46) | (606) |
| Net increase (decrease) | 35,668,361 | $470,970,145 |
|
| Net increase (decrease) | 37,626,111 | $495,818,107 |
| a Period from 10-15-05 (commencement of operations) to 8-31-06. | | |
457
John Hancock Funds II
Notes to Financial Statements
| CAPITAL SHARES, CONTINUED | | |
| |
| U.S. Government Securities Fund | Period ended 8-31-06a |
| | Shares | Amount |
|
| Class 1 shares | | |
| Sold | 3,851,037 | $52,131,775 |
| Distributions reinvested | 81,104 | 1,075,609 |
| Repurchased | (775,755) | (10,473,685) |
| Net increase (decrease) | 3,156,386 | $42,733,699 |
|
| Class NAV shares | | |
| Sold | 11,671,805 | $157,472,769 |
| Distributions reinvested | 276,030 | 3,648,865 |
| Repurchased | (102,426) | (1,383,028) |
| Net increase (decrease) | 11,845,409 | $159,738,606 |
|
| Net increase (decrease) | 15,001,795 | $202,472,305 |
| a Period from 10-15-05 (commencement of operations) to 8-31-06. | | |
| |
| U.S. High Yield Bond Fund | Period ended 8-31-06a |
| | Shares | Amount |
|
| Class 1 shares | | |
| Sold | 168,182 | $2,186,988 |
| Distributions reinvested | 3,037 | 38,635 |
| Repurchased | (32,243) | (416,648) |
| Net increase (decrease) | 138,976 | $1,808,975 |
|
| Class NAV shares | | |
| Sold | 21,370,555 | $276,725,027 |
| Distributions reinvested | 710,275 | 9,044,306 |
| Repurchased | (50) | (663) |
| Net increase (decrease) | 22,080,780 | $285,768,670 |
|
| Net increase (decrease) | 22,219,756 | $287,577,645 |
| a Period from 10-15-05 (commencement of operations) to 8-31-06. | | |
| |
| U.S. Multi Sector Fund | Period ended 8-31-06b |
| | Shares | Amount |
|
| Class NAV shares | | |
| Sold | 117,752,970 | $1,188,168,264 |
| Distributions reinvested | 134,960 | 1,421,127 |
| Repurchased | (75,255) | (771,951) |
|
| Net increase (decrease) | 117,812,675 | $1,188,817,440 |
| b Period from 10-29-05 (commencement of operations) to 8-31-06. | | |
| |
| Value & Restructuring Fund | Period ended 8-31-06b |
| | Shares | Amount |
|
| Class NAV shares | | |
| Sold | 27,215,074 | $289,386,759 |
| Distributions reinvested | 37,778 | 406,118 |
| Repurchased | (499,385) | (5,569,033) |
|
| Net increase (decrease) | 26,753,467 | $284,223,844 |
| b Period from 10-29-05 (commencement of operations) to 8-31-06. | | |
| |
| Vista Fund | Period ended 8-31-06b |
| | Shares | Amount |
|
| Class NAV shares | | |
| Sold | 11,612,583 | $118,006,782 |
| Repurchased | (157,272) | (1,869,987) |
|
| Net increase (decrease) | 11,455,311 | $116,136,795 |
| b Period from 10-29-05 (commencement of operations) to 8-31-06. | | |
458
John Hancock Funds II
Notes to Financial Statements
8. INVESTMENT TRANSACTIONS The following summarizes the securities transactions (except for short-term investments and any transactions with affiliates in October 2005) for the Funds for the period ended August 31, 2006:
| | | Purchases | Sales and Maturities |
| Fund | U.S. Government | Other Issuers | U.S. Government | Other Issuers |
| Absolute Return | — | $4,647,829 | — | — |
| Active Bond | $1,729,781,252 | 258,695,888 | $1,497,000,577 | $59,807,271 |
| All Cap Core | — | 454,534,934 | — | 202,718,533 |
| All Cap Growth | — | 283,790,820 | — | 144,058,732 |
| All Cap Value | — | 271,866,093 | — | 90,362,010 |
| Blue Chip Growth | — | 1,509,303,489 | — | 316,921,611 |
| Capital Appreciation | — | 655,709,494 | — | 194,738,911 |
| Core Bond | 820,085,919 | 188,596,418 | 720,128,994 | 103,765,159 |
| Core Equity | — | 637,814,132 | — | 63,409,603 |
| Emerging Growth | 2,970,144 | 478,032,222 | 2,995,623 | 326,024,049 |
| Emerging Small Company | — | 160,580,449 | — | 111,748,136 |
| Equity-Income | — | 884,217,458 | — | 285,559,298 |
| Fundamental Value | — | 722,582,888 | — | 47,432,730 |
| Global Bond | 217,414,591 | 1,301,637,227 | 291,241,240 | 795,832,949 |
| Global Real Estate | — | 628,507,046 | — | 286,968,800 |
| High Income | — | 482,050,819 | 6,691 | 200,156,946 |
| High Yield | — | 2,135,505,954 | — | 1,017,171,224 |
| International Equity Index | — | 286,573,589 | — | 23,913,847 |
| International Opportunities | — | 887,779,171 | — | 419,065,648 |
| International Small Cap | — | 652,649,473 | — | 374,133,375 |
| International Small Company | — | 350,086,823 | — | 118,186,977 |
| International Stock | 3,532,201 | 1,642,107,593 | 3,575,000 | 1,621,480,615x |
| International Value | — | 1,302,068,112 | — | 524,155,724 |
| Investment Quality Bond | 75,318,390 | 84,711,506 | 29,224,347 | 7,351,078 |
| Large Cap | — | 217,030,123 | — | 39,696,784 |
| Large Cap Value | — | 427,145,997 | — | 104,905,842 |
| Mid Cap Core | — | 529,764,242 | — | 307,058,850 |
| Mid Cap Index | — | 171,049,621 | — | 9,339,365 |
| Mid Cap Stock | — | 523,329,418 | — | 263,951,769 |
| Mid Cap Value Equity | — | 117,100,407 | — | 19,319,099 |
| Mid Cap Value | — | 247,887,074 | — | 124,695,657 |
| Natural Resources | — | 1,077,650,839 | — | 488,035,419 |
| Quantitative All Cap | — | 6,039,576 | — | 1,064,566 |
| Quantitative Mid Cap | — | 383,976,753 | — | 212,842,732 |
| Quantitative Value | — | 871,707,946 | — | 468,012,000 |
| Real Estate Equity | — | 381,114,648 | — | 131,211,427 |
| Real Estate Securities | — | 918,763,439 | — | 860,737,608 |
| Real Return Bond | 2,230,596,995 | 255,579,978 | 1,497,282,522 | 46,863,911 |
| Small Cap | — | 338,970,956 | — | 109,456,875 |
| Small Cap Index | — | 146,313,850 | — | 30,831,039 |
| Small Cap Opportunities | — | 349,771,943 | — | 139,084,382 |
| Small Company | — | 184,997,867 | — | 92,620,256 |
| Small Company Growth | — | 96,245,155 | — | 30,509,752 |
| Small Company Value | — | 383,984,642 | — | 39,821,079 |
| Special Value | — | 128,155,203 | — | 26,434,718 |
| Spectrum Income | 875,645,751 | 613,710,702 | 640,871,573 | 104,680,572 |
| Strategic Bond | 711,619,464 | 476,261,417 | 548,782,954 | 212,970,435 |
| Strategic Income | 81,477,422 | 302,654,648 | 43,503,879 | 88,412,949 |
| Strategic Value | — | 196,147,126 | — | 54,155,314 |
| Total Return | 3,561,880,103 | 618,405,617 | 3,176,253,093 | 67,764,249 |
| U.S. Global Leaders Growth | — | 562,491,070 | — | 69,397,765 |
| U.S. Government Securities | 393,449,755 | 99,860,287 | 210,338,582 | 1,899,777 |
| U.S. High Yield Bond | — | 484,965,339 | — | 215,451,136 |
| U.S. Multi Sector | — | 2,339,280,006 | — | 1,202,753,894 |
| Value & Restructuring | — | 316,135,888 | — | 34,670,831 |
| Vista | — | 326,857,111 | — | 217,162,641 |
x Includes redemption-in-kind activity. Refer to Merger of International Stock footnote 1.
459
John Hancock Funds II
Notes to Financial Statements
INVESTMENT TRANSACTIONS, CONTINUED
The cost of investments owned on August 31, 2006, including short-term investments, for federal income tax purposes, was as follows:
| | | | | Net Unrealized |
| | Aggregate | Unrealized | Unrealized | Appreciation/ |
| Fund | Cost | Appreciation | (Depreciation) | (Depreciation) |
|
| Absolute Return Portfolio | $5,017,463 | $162,999 | ($2,465) | $160,534 |
| Active Bond Fund | 592,597,327 | 2,726,441 | (2,353,385) | 373,056 |
| All Cap Core Fund | 291,452,968 | 10,629,691 | (5,971,857) | 4,657,834 |
| All Cap Growth Fund | 151,769,476 | 12,849,634 | (3,347,458) | 9,502,176 |
| All Cap Value Fund | 217,216,526 | 18,724,163 | (1,998,871) | 16,725,292 |
| Blue Chip Growth Fund | 1,247,331,996 | 113,057,905 | (42,090,367) | 70,967,538 |
| Capital Appreciation Fund | 470,985,984 | 26,299,283 | (17,641,448) | 8,657,835 |
| Core Bond Fund | 237,554,879 | 1,351,849 | (786,990) | 564,859 |
| Core Equity Fund | 592,501,706 | 48,251,655 | (41,581,272) | 6,670,383 |
| Emerging Growth Fund | 225,518,309 | 5,755,905 | (21,157,761) | (15,401,856) |
| Emerging Small Company Fund | 56,650,049 | 1,591,452 | (5,566,376) | (3,974,924) |
| Equity-Income Fund | 701,399,023 | 67,526,848 | (11,725,620) | 55,801,228 |
| Fundamental Value Fund | 738,398,726 | 60,897,872 | (15,147,137) | 45,750,735 |
| Global Bond Fund | 651,984,384 | 5,413,974 | (3,428,053) | 1,985,921 |
| Global Real Estate Fund | 385,654,943 | 15,995,432 | (5,517,016) | 10,478,416 |
| High Income Fund | 352,868,511 | 4,435,137 | (10,503,914) | (6,068,777) |
| High Yield Fund | 1,446,599,922 | 16,808,484 | (27,155,754) | (10,347,270) |
| International Equity Index Fund | 335,370,969 | 33,127,550 | (4,797,895) | 28,329,655 |
| International Opportunities Fund | 600,366,904 | 69,734,370 | (2,191,074) | 67,543,296 |
| International Small Cap Fund | 407,541,127 | 52,285,013 | (24,446,036) | 27,838,977 |
| International Small Company Fund | 266,167,785 | 8,029,152 | (14,790,406) | (6,761,254) |
| International Stock Fund | 63,590,525 | 13,830,262 | (380,209) | 13,450,053 |
| International Value Fund | 952,362,733 | 121,092,968 | (15,665,522) | 105,427,446 |
| Investment Quality Bond Fund | 161,897,617 | 386,834 | (1,697,616) | (1,310,782) |
| Large Cap Fund | 190,291,777 | 14,496,258 | (4,861,837) | 9,634,421 |
| Large Cap Value Fund | 335,657,743 | 21,347,014 | (3,445,789) | 17,901,225 |
| Mid Cap Core Fund | 307,523,543 | 19,165,010 | (5,887,203) | 13,277,807 |
| Mid Cap Index Fund | 204,876,370 | 7,804,406 | (9,905,637) | (2,101,231) |
| Mid Cap Stock Fund | 359,056,883 | 26,819,082 | (10,401,607) | 16,417,475 |
| Mid Cap Value Equity Fund | 119,006,979 | 3,027,824 | (5,492,842) | (2,465,018) |
| Mid Cap Value Fund | 155,138,096 | 12,901,711 | (4,062,547) | 8,839,164 |
| Natural Resources Fund | 726,632,531 | 120,645,282 | (6,606,320) | 114,038,962 |
| Quantitative Mid Cap Fund | 215,044,320 | 14,094,108 | (4,124,721) | 9,969,387 |
| Quantitative All Cap Fund | 4,981,271 | 151,824 | (110,092) | 41,732 |
| Quantitative Value Fund | 452,694,576 | 35,078,763 | (5,981,017) | 29,097,746 |
| Real Estate Equity Fund | 287,726,884 | 22,622,487 | (591,762) | 22,030,725 |
| Real Estate Securities Fund | 140,088,853 | 32,842,510 | (756) | 32,841,754 |
| Real Return Bond Fund | 925,995,473 | 3,867,722 | (10,557,966) | (6,690,244) |
| Small Cap Fund | 288,006,892 | 24,392,040 | (16,360,296) | 8,031,744 |
| Small Cap Index Fund | 156,144,205 | 8,310,381 | (7,294,093) | 1,016,288 |
| Small Cap Opportunities Fund | 296,601,097 | 25,294,255 | (10,111,961) | 15,182,294 |
| Small Company Fund | 115,896,171 | 6,133,749 | (4,811,935) | 1,321,814 |
| Small Company Growth Fund | 68,844,445 | 8,009,768 | (3,128,868) | 4,880,900 |
| Small Company Value Fund | 451,261,058 | 48,188,768 | (16,031,712) | 32,157,056 |
| Special Value Fund | 151,796,321 | 11,194,448 | (3,796,190) | 7,398,258 |
| Spectrum Income Fund | 836,228,546 | 17,676,401 | (7,182,330) | 10,494,071 |
| Strategic Bond Fund | 449,274,693 | 6,177,027 | (2,596,729) | 3,580,298 |
| Strategic Income Fund | 350,512,877 | 2,214,219 | (1,851,038) | 363,181 |
| Strategic Value Fund | 162,951,572 | 11,700,337 | (7,426,027) | 4,274,310 |
| Total Return Fund | 1,496,933,252 | 7,874,718 | (2,276,436) | 5,598,282 |
| U.S. Global Leaders Growth Fund | 495,549,352 | 12,650,288 | (27,272,804) | (14,622,516) |
| U.S. Government Securities Fund | 354,204,855 | 1,055,909 | (447,618) | 608,291 |
| U.S. High Yield Bond Fund | 323,960,705 | 1,953,126 | (3,056,579) | (1,103,453) |
| U.S. Multi Sector Fund | 1,256,427,871 | 76,516,171 | (52,241,252) | 24,274,919 |
| Value & Restructuring Fund | 331,116,707 | 22,412,186 | (13,202,742) | 9,209,444 |
| Vista Fund | 127,673,023 | 11,702,469 | (950,382) | 10,752,087 |
460
John Hancock Funds II
Notes to Financial Statements
9. FEDERAL INCOME TAX INFORMATION Federal income tax regulations may differ from generally accepted accounting principles and income and capital gain distributions determined in accordance with tax regulations may differ from net investment income and realized gains recognized for financial reporting purposes. Accordingly, the composition of net assets for tax purposes differs from amounts reflected in the accompanying financial statements. These differences are primarily due to differing treatment for futures and options transactions, foreign currency transactions, paydowns, market discount on debt securities, losses deferred with respect to wash sales, investments in passive foreign investment companies, equalization debits, and excise tax regulations.
The tax basis components of distributable earnings at August 31, 2006 were as follows:
| | Undistributed | Undistributed Long | Capital Loss | Post-October |
| Fund | Ordinary Income | Term Capital Gains | Carryforward | Deferral |
|
| Absolute Return | $50,675 | — | — | — |
| Active Bond | 3,596,353 | — | — | $3,153,615 |
| All Cap Core | 1,289,516 | — | — | 7,600,798 |
| All Cap Growth | 92,702 | — | $188,525 | 2,814,240 |
| All Cap Value | 6,966,240 | — | — | — |
| Blue Chip Growth | 4,776,090 | — | 271,560 | 3,657,188 |
| Capital Appreciation | 467,182 | — | 21,055 | 17,446,886 |
| Core Bond | 1,678,000 | — | — | 1,763,916 |
| Core Equity | 3,447,577 | — | — | — |
| Emerging Growth | 31,143,754 | — | — | — |
| Emerging Small Company | 5,058,738 | $164 | — | — |
| Equity-Income | 40,111,905 | 16,461 | — | — |
| Fundamental Value | 9,152,352 | — | — | — |
| Global Bond | 12,115,806 | — | — | 2,283,829 |
| Global Real Estate | 10,231,492 | — | — | 8,654,114 |
| High Income | 3,305,682 | — | — | 968,818 |
| High Yield | 23,712,400 | — | — | — |
| International Equity Index | 6,381,891 | — | — | — |
| International Opportunities | 2,598,649 | — | — | — |
| International Small Cap | 57,653,593 | — | — | — |
| International Small Company | 873,524 | — | — | 7,554,175 |
| International Stock | 2,744,696 | — | — | — |
| International Value | 73,333,065 | — | — | — |
| Investment Quality Bond | 1,200,498 | 2,499 | — | 382,383 |
| Large Cap | 4,155,184 | 108,946 | — | — |
| Large Cap Value | 1,242,158 | — | 43,455 | 1,435,442 |
| Mid Cap Core | 14,188,063 | — | — | — |
| Mid Cap Index | 1,438,205 | 1,920 | — | 250,122 |
| Mid Cap Stock | 14,234,633 | 19,598 | — | — |
| Mid Cap Value Equity | 230,465 | 16,379 | — | 888,294 |
| Mid Cap Value | 5,926,108 | 1,032 | — | — |
| Natural Resources | 36,383,734 | 2,564,857 | — | — |
| Quantitative Mid Cap | 209,090 | 3,009 | — | 2,787,571 |
| Quantitative All Cap | 15,777 | — | — | — |
| Quantitative Value | 25,095,422 | 29,779 | — | — |
| Real Estate Equity | 2,859,711 | 546,072 | — | — |
| Real Estate Securities | 80,631,044 | 2,929,872 | — | — |
| Real Return Bond | 3,268,662 | 1,566,656 | — | — |
| Small Cap | — | — | 74,789 | 1,216,063 |
| Small Cap Index | 3,940,833 | 176,258 | — | — |
| Small Cap Opportunities | 8,141,007 | 119,756 | — | — |
| Small Company | — | — | — | 365,945 |
| Small Company Growth | 1,232,409 | — | — | — |
| Small Company Value | 3,841,928 | 15,127 | — | — |
| Special Value | 1,228,849 | 36,902 | — | — |
| Spectrum Income | 6,345,492 | 59,929 | — | — |
| Strategic Bond | 3,123,030 | 141 | — | 5,510,107 |
| Strategic Income | 1,779,783 | — | — | 507,126 |
| Strategic Value | 3,360,833 | — | — | — |
| Total Return | 8,545,753 | — | 470,118 | 2,293,342 |
| U.S. Global Leaders Growth | 1,593,153 | — | — | 5,771,575 |
| U.S. Government Securities | 1,806,527 | — | — | 1,314,336 |
| U.S. High Yield Bond | 3,837,060 | — | — | 266,583 |
| U.S. Multi Sector | 13,002,758 | 887,518 | — | — |
| Value & Restructuring | 2,978,595 | 87,519 | — | — |
| Vista | — | — | — | 3,974,440 |
461
John Hancock Funds II
Notes to Financial Statements
FEDERAL INCOME TAX INFORMATION, CONTINUED
The tax character of distributions paid during the period ended August 31, 2006 was as follows:
| | | 2006 Distributions |
|
| | Ordinary | Long Term |
| Fund | Income | Capital Gains |
|
| Active Bond | $11,175,483 | — |
| All Cap Growth | 65,224 | — |
| All Cap Value | 298,080 | — |
| Blue Chip Growth | 894,973 | — |
| Core Bond | 4,973,751 | — |
| Equity-Income | 2,983,865 | — |
| Fundamental Value | 1,336,313 | — |
| Global Bond | 3,028,192 | — |
| High Income | 3,127,218 | — |
| High Yield | 69,414,714 | — |
| International Equity Index | 2,080,681 | — |
| International Opportunities | 18,624,300 | — |
| International Small Cap | 1,082,427 | — |
| International Stock | 55,245,573 | $105,075 |
| International Value | 3,228,488 | — |
| Investment Quality Bond | 3,885,879 | — |
| Large Cap | 213,439 | — |
| Large Cap Value | 317,242 | — |
| Mid Cap Core | 382,514 | — |
| Mid Cap Index | 98,937 | — |
| Mid Cap Stock | 305,840 | — |
| Mid Cap Value | 387,001 | — |
| Natural Resources | 742,179 | — |
| Quantitative Mid Cap | 89,597 | — |
| Quantitative Value | 1,234,288 | — |
| Real Estate Securities | 4,074,530 | 755,472 |
| Real Return Bond | 19,717,849 | — |
| Small Cap Index | 86,672 | — |
| Small Cap Opportunities | 548,785 | — |
| Small Company Value | 674,360 | — |
| Special Value | 81,660 | — |
| Spectrum Income | 18,140,475 | — |
| Strategic Bond | 14,870,223 | 42,136 |
| Strategic Income | 2,008,968 | — |
| Strategic Value | 201,517 | — |
| Total Return | 26,840,720 | — |
| U.S. Global Leaders Growth | 209,406 | — |
| U.S. Government Securities | 4,688,432 | 36,042 |
| U.S. High Yield Bond | 9,082,941 | — |
| U.S. Multi Sector | 1,421,127 | — |
| Value & Restructuring | 406,118 | — |
| |
| At August 31, 2006 capital loss carryforwards available to offset future realized gains were approximately: |
| |
| | | Capital Loss Carryforward |
| Fund | | Expiring at August 31, 2014 |
|
| All Cap Growth | | $188,525 |
| Blue Chip Growth | | 271,560 |
| Capital Appreciation | | 21,055 |
| Large Cap Value | | 43,455 |
| Small Cap | | 74,789 |
| Total Return | | 470,118 |
462
John Hancock Funds II
Notes to Financial Statements
10. INVESTMENT IN AFFILIATED UNDERLYING FUNDS Absolute Return invests primarily in the underlying funds that are managed by affiliates of the Adviser. The Fund does not invest in the underlying funds for the purpose of exercising management or control.
A summary of the Fund’s transactions in the securities of affiliated issuers in which the Fund’s holdings represent 5% or more of the outstanding voting securities of the issuer, during the period ended August 31, 2006 is set forth below.
| Affiliate — Class NAV | Shares Purchased | Ending Share Amount | Ending Value |
|
| Capital Appreciation Fund | 21,668 | 21,668 | $204,767 |
| Core Bond Fund | 12,400 | 12,400 | 155,123 |
| Emerging Small Company Fund | 3,401 | 3,401 | 98,537 |
| Equity-Income Fund | 5,807 | 5,807 | 105,168 |
| Fundamental Value Fund | 6,588 | 6,588 | 104,282 |
| Global Bond Fund | 6,974 | 6,974 | 103,138 |
| High Income Fund | 41,253 | 41,253 | 407,164 |
| High Yield Fund | 10,288 | 10,288 | 103,699 |
| International Opportunities Fund | 6,689 | 6,689 | 108,094 |
| International Small Company | 16,873 | 16,873 | 157,424 |
| International Value Fund | 6,020 | 6,020 | 107,646 |
| Investment Quality Bond Fund | 13,196 | 13,196 | 155,055 |
| Large Cap Fund | 10,722 | 10,722 | 157,291 |
| Large Cap Value Fund | 4,507 | 4,507 | 103,695 |
| Natural Resources Fund | 5,929 | 5,929 | 211,088 |
| Quantitative Value Fund | 6,468 | 6,468 | 107,115 |
| Real Estate Equity Fund | 45,918 | 45,918 | 504,643 |
| Real Return Bond Fund | 39,215 | 39,215 | 522,338 |
| Small Company Value Fund | 6,418 | 6,418 | 151,669 |
| Spectrum Income Fund | 30,242 | 30,242 | 310,583 |
| Strategic Bond Fund | 17,824 | 17,824 | 209,793 |
| Strategic Income Fund | 15,298 | 15,298 | 153,899 |
| Total Return Fund | 26,398 | 26,398 | 362,971 |
| U.S. Government Securities Fund | 7,609 | 7,609 | 103,181 |
463
PricewaterhouseCoopers LLP
Report of Independent Registered Public Accounting Firm
To the Board of Trustees and Shareholders of John Hancock Funds II:
In our opinion, the accompanying statements of assets and liabilities, including the portfolios of investments, and the related statements of operations and of changes in net assets and the financial highlights present fairly, in all material respects, the financial position of the Funds (identified in Note 1) comprising John Hancock Funds II (the “Trust”) at August 31, 2006, and the results of each of their operations, the changes in each of their net assets and the financial highlights for each of the periods indicated therein, in conformity with accounting principles generally accepted in the United States of America. These financial statements and financial highlights (hereafter referred to as “financial statements”) are the responsibility of the Trust’s management; our responsibility is to express an opinion on these financial statements based on our audit. We conducted our audit of these financial statements in accordance with the standards of the Public Company Accounting Oversight Board (United States). Those standards require that we plan and perform the audit to obtain reasonable assurance about whether the financial statements are free of material misstatement. An audit includes examining, on a test basis, evidence supporting the amounts and disclosures in the financial statements, assessing the accounting principles used and significant estimates made by management, and evaluating the overall financial statement presentation. We believe that our audit, which included confirmation of investments owned at August 31, 2006 by correspondence with the custodian, transfer agents and brokers, provides a reasonable basis for our opinion.
PricewaterhouseCoopers LLP
Boston, Massachusetts
October 26, 2006
464
John Hancock Funds II
Federal Income Tax Information (Unaudited)
For federal income tax purposes, the following information is furnished with respect to the distributions of the Fund, if any, paid during its taxable year ended August 31, 2006.
DIVIDEND RECEIVED DEDUCTION Corporate shareholders are generally entitled to take the dividend received deduction on the portion of a Fund’s dividend distribution that qualifies under tax law. The percentage of the Fund’s fiscal 2006 ordinary income dividends that qualifies for the corporate dividend received deduction is set forth below.
| Fund | August 2006 |
|
| Absolute Return | 97.62% |
| Active Bond | 0.07% |
| All Cap Core | 96.84% |
| All Cap Growth | 100.00% |
| All Cap Value | 34.83% |
| Blue Chip Growth | 100.00% |
| Capital Appreciation | 100.00% |
| Core Bond | 0.00% |
| Core Equity | 84.76% |
| Emerging Growth | 1.44% |
| Emerging Small Company | 2.48% |
| Equity-Income | 32.40% |
| Fundamental Value | 69.35% |
| Global Bond | 0.00% |
| Global Real Estate | 5.96% |
| High Income | 3.57% |
| High Yield | 0.16% |
| International Equity Index | 1.16% |
| International Opportunities | 0.00% |
| International Small Cap | 0.52% |
| International Small Company | 0.00% |
| International Stock | 0.45% |
| International Value | 0.00% |
| Investment Quality Bond | 0.00% |
| Large Cap | 54.23% |
| Large Cap Value | 100.00% |
| Mid Cap Core | 17.30% |
| Mid Cap Index | 47.68% |
| Mid Cap Stock | 3.52% |
| Mid Cap Value Equity | 100.00% |
| Mid Cap Value | 30.08% |
| Natural Resources | 9.18% |
| Quantitative Mid Cap | 100.00% |
| Quantitative All Cap | 61.67% |
| Quantitative Value | 35.28% |
| Real Estate Equity | 100.00% |
| Real Estate Securities | 0.03% |
| Real Return Bond | 0.00% |
| Small Cap | 0.00% |
| Small Cap Index | 13.37% |
| Small Cap Opportunities | 8.52% |
| Small Company | 0.00% |
| Small Company Growth | 7.49% |
| Small Company Value | 75.28% |
| Special Value | 64.75% |
| Spectrum Income | 9.66% |
| Strategic Bond | 0.01% |
| Strategic Income | 0.36% |
| Strategic Value | 58.10% |
| Total Return | 0.00% |
| U.S. Global Leaders Growth | 98.67% |
| U.S. Government Securities | 0.00% |
| U.S. High Yield Bond | 0.00% |
| U.S. Multi Sector | 69.62% |
| Value & Restructuring | 100.00% |
| Vista | 0.00% |
QUALIFIED DIVIDEND INCOME The Fund hereby designates the maximum amount allowable of its net taxable income as qualified dividend income as provided in the Jobs and Growth Tax Relief Reconciliation Act of 2003. This amount will be reflected on Form 1099-DIV for the calendar year 2006.
Shareholders will be mailed a 2006 U.S. Treasury Department Form 1099-DIV in January 2007. This will reflect the total of all distributions that are taxable for calendar year 2006.
465
John Hancock Funds II
Evaluation of Advisory and Subadvisory Agreements by the Board of Trustees (Unaudited)
This section describes the evaluation by the Board of Trustees of the Advisory Agreement and each of the Subadvisory Agreements.
EVALUATION BY THE BOARD OF TRUSTEES
The Board of Trustees of John Hancock Funds II (the “Trust”), including all the Trustees who are not “interested persons” as defined in the Investment Company Act of 1940, as amended (the “Independent Trustees”), is responsible for selecting the adviser, John Hancock Investment Management Services, LLC (the “Adviser” or “JHIMS”), approving the Adviser’s selection of subadvisers for each of the funds of the Trust (the “Funds”) and approving the Trust’s advisory and subadvisory agreements (and any sub-subadvisory agreements), their periodic continuation and any amendments. Consistent with SEC rules, the Board regularly evaluates the Trust’s advisory and subadvisory (and any sub-subadvisory) arrangements, including consideration of the factors listed below. The Board may also consider other factors (including conditions and trends prevailing generally in the economy, the securities markets and the in dustry) and does not treat any single factor as determinative, and each Trustee may attribute different weights to different factors. The Board is furnished with an analysis of its fiduciary obligations in connection with its evaluation and, throughout the evaluation process, the Board is assisted by counsel for the Trust and the Independent Trustees are also separately assisted by independent legal counsel. The factors regularly considered by the Board are:
1. the nature, extent and quality of the services to be provided by the Adviser to the Trust and by the subadvisers to the Funds;
2. the investment performance of the Funds and their subadvisers;
3. the extent to which economies of scale would be realized as a Fund grows and whether fee levels reflect these economies of scale for the benefit of Trust shareholders;
4. the costs of the services to be provided and the profits to be realized by the Adviser and its affiliates (including any subadvisers that are affiliated with the Adviser) from the Adviser’s relationship with the Trust; and
5. comparative services rendered and comparative advisory and subadvisory fee rates.
The Board believes that information relating to all these factors is relevant to its evaluation of the Trust’s advisory agreements. With respect to its evaluation of subadvisory agreements (including sub-subadvisory agreements) with subadvisers not affiliated with the Adviser, the Board believes that, in view of the Trust’s “manager-of-managers” advisory structure, the cost of the services to be provided and the profits to be realized by those subadvisers that are not affiliated with the Adviser from their relationship with the Trust generally are not a material factor to the Board’s consideration of subadvisory agreements because such fees are paid to subadvisers by the Adviser and not by the Funds and because the Board relies on the ability of the Adviser to negotiate such subadvisory fees at arms-length.
In evaluating subadvisory arrangements, the Board also considers other material business relationships that unaffiliated subadvisers and their affiliates have with the Adviser or its affiliates, including the involvement by certain affiliates of certain subadvisers in the distribution of financial products, including shares of the Trust, offered by the Adviser and other affiliates of the Adviser (“Material Relationships”).
BOARD EVALUATION OF AMENDMENTS TO ADVISORY AND SUBADVISORY AGREEMENTS AND OF NEW SUBADVISORY AGREEMENTS
This section describes the evaluation by the Board of Trustees of:
(a) an amendment to the advisory agreement between the Trust and the Adviser to add the following new portfolios:
1. International Small Company Fund
2. Global Real Estate Fund
3. Real Estate Equity Fund
4. Mid Cap Value Equity Fund
5. Absolute Return Portfolio
6. High Income Fund (collectively, the “New Funds”)
(b) the amendment to the advisory agreements between the Trust and the Adviser to decrease the advisory fee for the Emerging Small Company Fund
(c) amendments (“Amendments”) to the subadvisory agreement between the Adviser and each of the subadvisers listed below:
1. T. Rowe Price Associates, Inc.
(to add the Real Estate Equity Fund)
2. MFC Global Investment Management (U.S.A.) Limited
(to add the Absolute Return Portfolio)
3. Deutsche Asset Management, Inc.
(to add the Global Real Estate Fund)
4. Sovereign Asset Management, LLC
(to add the High Income Fund)
(Each of the subadvisers listed above are collectively referred to as the “Existing Subadvisers.”)
(d) the new subadvisory agreements (the “New Subadvisory Agreements”) between the Adviser and each of the subadvisers listed below:
1. Dimensional Fund Advisers Inc.
(relating to the International Small Company Fund)
2. RiverSource Investments, LLC
(relating to the Mid Cap Value Equity Fund)
3. RCM Capital Management LLC (“RCM”)
(relating to the Emerging Small Company Fund, an existing portfolio of the Trust)
4. RREEF America L.L.C.
RREEF Global Advisers Limited Deutsche Investments Australia Limited
Deutsche Asset Management (Hong Kong) Limited Deutsche Asset Management International GMBH
(sub-subadvisory agreements each relating to the Global Real Estate Fund and in the case of RREEF America L.L.C. also relating to the Real Estate Securities Fund, an existing portfolio of the Trust)
5. Western Asset Management Company
(relating to the U.S. Government Securities Fund, High Yield Fund and the Strategic Bond Fund, each existing portfolios of the Trust)
6. Western Asset Management Company Limited
(sub-subadvisory agreement relating to the Strategic Bond Fund and High Yield Fund, existing portfolios of the Trust)
466
John Hancock Funds II
Evaluation of Advisory and Subadvisory Agreements by the Board of Trustees (Unaudited) — continued
(Each of the subadvisers above are collectively referred to as the “New Subadvisers.”)
(The Existing Subadvisers and the New Subadvisers are collectively referred to as the “Subadvisers.”)
APPROVAL OF ADVISORY AGREEMENT
At its meeting on March 30-31, 2006, the Board, including all the Independent Trustees, approved an amendment to the Advisory Agreement between the Trust and JHIMS with respect to the New Funds and the Emerging Small Company Fund.
In approving the amendment to the Advisory Agreement, and with reference to the factors which it regularly considers, the Board:
1 (a) considered the high value to the Trust of continuing its relationship with JHIMS as the Trust’s Adviser, the skills and competency with which JHIMS has in the past managed the Trust’s affairs and its subadvisory relationships, JHIMS’s oversight and monitoring of subadvisers’ investment performance and compliance programs including its timeliness in responding to performance issues, and the qualifications of JHIMS’s personnel,
(b) considered JHIMS’s compliance policies and procedures and its responsiveness to regulatory changes and mutual fund industry developments, and
(c) JHIMS’s administrative capabilities, including its ability to supervise the other service providers for the Funds and concluded that JHIMS may reasonably be expected to ably perform its services under the Advisory Agreement with respect to the New Funds and may reasonably be expected to continue to ably perform its services under the Advisory Agreement with respect to the Emerging Small Company Fund.
2 (a) in the case of each New Portfolio (except the Absolute Return Portfolio), reviewed the investment performance of portfolios of the Subadviser that are managed comparably to New Portfolio as set forth in the chart below; the comparative performance of their respective benchmarks; and JHIMS’ analysis of such performance and its plans and recommendations regarding the Trust’s subadvisory arrangements generally and with respect to the New Portfolio; and concluded that the portfolios of the Subadviser that are managed comparably to the New Portfolio have performed well or within a range that the Board deemed competitive, and that JHIMS may reasonably be expected to ably monitor the performance of the New Portfolio and its Subadviser.
(b) because there are no funds managed by the Subadviser that have comparable investment objectives and policies to those of the Absolute Return Portfolio, the Board considered the Subadviser’s performance in managing other funds in the Trust and that JHIMS may reasonably be expected to ably monitor the performance of the Absolute Return Portfolio and its Subadviser.
(c) in the case of the Emerging Small Company Fund, an existing portfolio of the Trust, reviewed the investment performance of portfolios of RCM Capital Management LLC (“RCM”) that are managed comparably to Emerging Small Company Fund as set forth in Appendix A below; the comparative performance of their respective benchmarks; and JHIMS’s analysis of such performance and its plans and recommendations regarding the Fund’s subadvisory arrangements generally and with respect to the Emerging Small Company Fund; and concluded that the portfolios of RCM that are managed comparably to the Emerging Small Company Fund have performed well or within a range that the Board deemed competitive, and that JHIMS may reasonably be expected to ably monitor the performance of the Emerging Small Company Fund and RCM.
3 reviewed the advisory fee structure for the New Funds and the Emerging Small Company Fund and the incorporation therein of any subadvisory fee breakpoints in the advisory fees charged and concluded (i) that to the extent that the New Funds and the Emerging Small Company Fund have subadvisory fees with breakpoints, those breakpoints are reflected as breakpoints in the advisory fees for these funds, (ii) that the Emerging Small Company Fund and each New Fund with a subadviser that is not affiliated with the Adviser have subadvisory fees which are the product of arms-length negotiations between the Adviser and the subadviser and which in all cases contain breakpoints, and (iii) that, although economies of scale cannot be measured with precision, these arrangements permit shareholders of these funds to benefit from economies of scale if the fund grows.
4 (a) reviewed the financial statements of JHIMS and John Hancock Life Insurance Company (U.S.A.) (“JHLICO (U.S.A.)”),
(b) reviewed the anticipated profitability of JHIMS’ relationship to the New Funds in terms of the fees it expects to receive with respect to New Funds and whether JHIMS has the financial ability to provide a high level of services to the New Funds,
(c) reviewed the anticipated profitability of JHIMS’ relationship to the Emerging Small Company Trust in terms of the fees it has received and expects to receive with respect to the Emerging Small Company Trust and whether JHIMS has the financial ability to continue to provide a high level of services to the Emerging Small Company Fund,
(d) considered that JHIMS derives reputational and other indirect benefits from providing advisory services to the Emerging Small Company Fund,
(e) considered that JHIMS will derive reputational and other indirect benefits from providing advisory services to the New Funds, and
(f) noted that JHIMS will pay the subadvisory fees out of the advisory fees JHIMS receives from the New Funds and the Emerging Small Company Fund and concluded that the advisory fees to be paid by the New Funds and the Emerging Small Company Fund will not be unreasonable in light of such information; and
5 reviewed comparative information with respect to the advisory fee rates and concluded that the anticipated advisory fees for the New Funds and the Emerging Small Company Fund are within the range of those incurred by other comparable funds and that the advisory structure for the New Funds and the Emerging Small Company Fund is thus competitive within the industry (see Appendix A below for additional information on advisory fees for the New Funds and the Emerging Small Company Fund). The Board also took into account the level and quality of services to be provided by JHIMS with respect to the Funds as well as the other factors considered.
467
John Hancock Funds II
Evaluation of Advisory and Subadvisory Agreements by the Board of Trustees (Unaudited) — continued
APPROVAL OF SUBADVISORY AGREEMENTS
At its meeting on March 30-31, 2006, the Board, including all the Independent Trustees, approved the Amendments and the New Subadvisory Agreements.
In making its determination with reference to these respective factors, the Board reviewed:
(i) information relating to each Subadviser’s business which included information such as: business performance, assets under management, financial stability and personnel;
(ii) except in the case of the Absolute Return Fund, the investment performance of the Subadviser’s portfolios managed comparably to the portfolio to be managed by the Subadviser and comparative performance information relating to the benchmark;
(iii) in the case of the Absolute Return Fund, investment performance of other portfolios managed by the Subadviser;
(iv) the proposed subadvisory fee for the portfolio to be managed by the Subadviser and comparative fee information; and
(v) information relating to the nature and scope of Material Relationships (as described below) and their significance to the Adviser and the Subadvisers.
The Board noted that in the case of the RREEF America L.L.C., RREEF Global Advisers Limited, Deutsche Investments Australia Limited, Deutsche Asset Management (Hong Kong) Limited and Deutsche Asset Management International GMBH sub-subadvisory agreements that the sub-subadvisory fee would be paid by Deutsche Asset Management, Inc. out of the subadvisory fee and would not be an expense of the Real Estate Equity Fund or Real Estate Securities Fund.
The Board noted that in the case of the Western Asset Management Company Limited sub-subadvisory agreement, that the sub-subadvisory fee would be paid by Western Asset Management Company out of the subadvisory fee and would not be an expense of the Strategic Bond Fund or the High Yield Fund.
The Board’s decision to approve the Amendments and the New Subadvisory Agreements was based on a number of determinations, including the following:
(1) Each Subadviser has extensive experience and demonstrated skills as a manager and may be expected to provide a high quality of investment personnel to each portfolio;
(2) In the case of the Real Estate Securities Fund, RREEF will operate under the ongoing supervision of DeAM which has been the subadviser to the Fund since the Fund’s inception and which retains ultimate responsibility for portfolio management as subadviser;
(3) In the case of each portfolio to be managed by a Subadviser, except the Absolute Return Portfolio, although not without variation, the current and historical performance of the portfolios of the Subadviser managed comparably to the fund of the Trust to be managed by the Subadviser has been within a competitive range of the current and historical performance these portfolios’ respective benchmark (see Appendix A for further information on performance);
(4) In the case of the Absolute Return Portfolio, although not without variation, the current and historical performance of the other funds of the Trust managed by the Subadviser has been within a competitive range of the current and historical performance these funds’ respective benchmark;
(5) The subadvisory fees are within industry norms and, with respect to the new funds with unaffiliated subadvisers, are the product of arms-length negotiations between the Adviser and the Subadvisers (see Appendix A for further information on subadvisory fees).
(6) The Material Relationships consist of arrangements in which certain unaffiliated subadvisers or their affiliates provide advisory, distribution or management services in connection with financial products sponsored by the Trust’s adviser or its affiliates, which may include other registered investment companies, a 529 education savings plan, managed separate accounts and exempt group annuity contracts sold to qualified plans, and which in no case contained elements which would cause the Board to conclude that approval of the subadvisory agreement with the subadviser would be inappropriate.
BOARD EVALUATION OF NEW SUBADVISORY AGREEMENT FOR THE SMALL CAP FUND
At its meeting held on March 30-31, 2006, the Board of Trustees, including all of the Independent Trustees, approved a new subadvisory agreement appointing Independence Investments LLC (“New Independence”) to replace Independence Investment LLC (“Old Independence”) as the subadviser to the Small Cap Fund.
The Adviser requested the Board to approve a new subadvisory agreement with New Independence for the Small Cap Fund since the subadvisory agreement with Old Independence terminated as a result of New Independence, a newly formed subsidiary of Convergent Capital Management LLC (“Convergent”), succeeding to the business operations of Old Independence, an indirect wholly-owned subsidiary of Manulife Financial Corporation (“MFC”) on May 31, 2006 (the “Transaction”). Information regarding the Board’s approval of the subadvisory agreement with New Independence is set forth below.
In making its determination with respect to subadvisory agreements, and with reference to the factors which it considers, the Board reviews (1) information relating to the subadviser’s business; which may include information such as business performance, representative clients, assets under management, financial stability, personnel and, if applicable, past subadvisory services to Funds or affiliated funds of the Trust; (2) the investment performance of comparatively managed funds of the Fund and comparative performance information relating to the comparatively managed fund’s benchmark and comparable funds; (3) the proposed subadvisory fee for each Fund and comparative fee information; and (4) information relating to the nature and scope of other material business relationships which unaffiliated subadvisers may have with the Adviser or its affiliates, including the involvement by certain affiliates of certain sub-advisers in the distribution of financial products, including shares of the Trust, offered by the Adviser and other affiliates of the Adviser.
Particular considerations of the Board in approving the new subadvisory agreement with New Independence for the Small Cap Fund include the following:
1. New Independence will continue the business operations of Old Independence, the Old Independence portfolio manager is expected to continue to manage the assets of the Fund as an employee of New Independence and New Independence may generally be expected to provide at least the same level and quality of management services as Old Independence;
2. Although the limited performance history of the Fund, which commenced operations on October 17, 2005, was not considered
468
John Hancock Funds II
Evaluation of Advisory and Subadvisory Agreements by the Board of Trustees (Unaudited) — continued
significant, the Trustees noted that the current and historical performance of comparatively managed mutual funds and other accounts managed by the subadviser, although not without variation, has generally been within the range of or exceeded the performance of their benchmarks; and
3. The subadvisory fee with respect to the Fund under the new subadvisory agreement with New Independence is within industry norms, is the same as under the old subadvisory agreement with Old Independence, is paid by the Adviser and not by the Fund and will not result in any advisory fee increases with respect to the Fund.
In addition, the Board considered the potential conflicts of interest related to the arrangements between MFC and Convergent in connection with the transfer of Old Independence to New Independence. Under these arrangements, MFC will receive additional consideration for the Transaction on certain anniversary dates of the closing thereof to the extent the revenue received by New Independence from the management of proprietary accounts of MFC and its affiliates or accounts for which MFC or its affiliates act as investment adviser, including the Fund, meet certain revenue targets. The Board considered in particular the potential conflict of interest between the Adviser’s fiduciary duties in managing subadvisory arrangements to act in the best interests of the Fund and its shareholders and the financial incentives of MFC to influ-ence the Adviser to support the continuation of the subadvisory agreement with New Independence for the periods for which contingent payments may be made to MFC. The Board concluded that, notwithstanding the potential conflicts of interest, approval of the subadvisory agreement was in the best interests of shareholders in view of the bene-fits to shareholders expected from the continuity in subadvisory services that will be afforded by New Independence, the lack of any limitations in the arrangement between MFC and Convergent upon the rights of the Adviser to recommend termination of the subadvisory agreement with New Independence, the Adviser’s fiduciary duties to act in the best interests of the Fund and Fund shareholders and the Board’s ability to monitor conflicts of interest.
RELATED ARRANGEMENTS BETWEEN MFC AND CONVERGENT
In consideration for the transfer of assets and liabilities of Old Independence to New Independence in the Transaction as described above, Convergent paid MFC a specified amount at closing. MFC will also receive additional consideration on certain anniversary dates of the closing to the extent the revenue received by New Independence from the management of proprietary accounts of MFC and its affiliates or accounts for which MFC or its affiliates act as investment adviser, including the Small Cap Fund, meet certain revenue targets. Consequently, while these contingent payments are not dependent upon the approval or continuation of the subadvisory agreement with respect to the Fund, the revenues earned by New Independence as a result of its subadvisory relationship with the Fund would count towards the revenue target necessary for MFC to earn the contingent payments. Nothing in the arrangements between MFC and Convergent imposes any limitations upon the rights of the Adviser to recommend termination of the subadvisory agreement with New Independence. However, these arrangements present certain conflicts of interest because MFC, as the ultimate parent entity of the Adviser, has a financial incentive to influence the Adviser to support the continuation of the subadvisory agreement with New Independence for the periods for which contingent payments may be made to MFC. As discussed above, in approving the new subadvisory agreement with New Independence, the Board of Trustees, including the Independent Trustees, was aware of and considered these potential conflicts of interest.
BOARD EVALUATION OF NEW SUBADVISORY AGREEMENT FOR THE EMERGING GROWTH FUND
At its meeting on March 31, 2006, the Board, including the Independent Trustees, approved entering into a new subadvisory agreement between the Adviser and Sovereign Asset Management LLC (“Sovereign”) to replace MFC Global Investment Management (U.S.A.) LLC (“MFC Global”) as the subadviser for the Emerging Growth Fund.
At its meeting on December 12-13, 2005, the Board of Trustees discussed with the Adviser the performance of the John Hancock Trust Emerging Growth Trust, the Fund’s corresponding portfolio, having lagged behind that of its peer group and benchmark index since inception to September 2005 and the fact that the then current MFC Global portfolio manager for the Emerging Growth Fund was being reassigned and would no longer manage the portfolio. At the Board’s meeting, the Adviser recommended to the Board that the subadviser to the Emerging Growth Fund be replaced with Sovereign, another subadviser affiliated with the Adviser. The Adviser made this recommendation following a review of the capabilities of several affiliated and non-affiliated investment managers to manage the portfolio.
In making its determination with respect to the new subadvisory agreement with Sovereign with respect to the Emerging Growth Fund, and with reference to the factors described above that the Board generally considers in reviewing subadvisory agreements, the Board reviewed: (i) information relating to the subadviser’s business which included information such as: business performance, representative clients, assets under management, financial stability and personnel; (ii) the investment performance of comparatively managed funds and their respective benchmarks; and (iii) the subadvisory fee for the Fund.
The Board’s decision to approve the subadvisory agreement with Sovereign was based on a number of determinations, including the following:
(1) The performance of the John Hancock Trust Emerging Growth Trust, the Fund’s corresponding portfolio, lagged that of its peer group and benchmark index since inception to September 2005.
(2) The portfolio managers in the Sovereign investment management team have been with Sovereign since 2002, have almost 50 years of combined experience and are responsible for managing over 31 accounts with assets of approximately $467 million. Sovereign has extensive experience and demonstrated skills as a manager with respect to equity securities and in using a variety of investment strategies and may be expected to provide a high quality of investment management services and personnel to the Fund;
(3) Although not without variation, the current and historical performance of comparable funds and other client accounts managed by Sovereign have generally been within the range of or exceeded the performance of the fund and its benchmark index;
(4) The subadvisory fee rates for the fund under Sovereign would be the same as the subadvisory fee rates charged by MFC Global and is within industry norms; and
(5) There would be no change in the advisory fee rates for the fund as a result of the new subadvisory agreement.
469
John Hancock Funds II
Appendix A
| Portfolio | Performance of Comparable | | |
| And Subadviser | Funds as of December 31, 2005 | Estimated Fees and Expenses | Comments |
|
| Absolute Return | No comparable funds managed | Advisory fees for this Fund were | |
| | by subadviser. | higher than its peer group median. | |
| (MFC Global Investment | | | |
| Management (U.S.A.) Limited) | | Total expenses for this Fund were | |
| | | higher than its peer group median. | |
|
| Emerging Small Company | Performance of RCM Capital | Subadvisory fees for this Trust were | The Board noted that advisory and |
| | Management’s U.S. Small Cap Core | higher than its peer group median. | subadvisory fees for the portfolio |
| (RCM Capital Management) | Growth composite outperformed | | would decrease as a result of the |
| | its benchmark index over the one | Advisory fees for this Trust were | change of subadviser from Franklin |
| | and three year periods and | higher than its peer group median. | Adviser, Inc. to RCM Capital |
| | underperformed its benchmark | | Management. |
| | index over the five year period. | Total expenses for this Trust were | |
| | | in line with its peer group median. | |
| | Performance of the composite | | |
| | outperformed its peer group | | |
| | average over the one and three | | |
| | year periods and underperformed | | |
| | over the five year period. | | |
|
| Global Real Estate | Comparable performance is | Subadvisory fees for this Fund were | The Board noted that the peer |
| | not available. | higher than its peer group median. | group is primarily comprised of |
| (Subadviser: Deutsche Asset | | | US-centric strategies, as compared |
| Management, Inc. | | Advisory fees for this Fund were | to the fund. |
| | | higher than its peer group median. | |
| sub-subadvisers: | | | |
| RREEF America L.L.C. | | Total expenses for this Fund were | |
| RREEF Global Advisers Limited | | lower than its peer group median. | |
| Deutsche Investments | | | |
| Australia Limited | | | |
| Deutsche Asset Management | | | |
| (Hong Kong) Limited | | | |
| Deutsche Asset Management | | | |
| International GMBH) | | | |
|
| High Income | Performance of the High Yield | Subadvisory fees for this Trust were | |
| | Fund of John Hancock Funds has | lower than its peer group median. | |
| (Sovereign Asset | outperformed its benchmark | | |
| Management, LLC) | index over the one, three and five | Advisory fees for this Trust were | |
| | year periods. | higher than its peer group median. | |
| |
| | Performance of the fund has | Total expenses for this Trust were | |
| | outperformed its peer group | higher than its peer group median. | |
| | average over the one, three and | | |
| | five year periods. | | |
|
| High Yield | Performance of the WAMCO High | Subadvisory fees for this Fund were | The Board noted that advisory and |
| | Yield Composite has outperformed | lower than its peer group median. | subadvisory fees for the portfolio |
| (Subadviser: | its benchmark index over the one | | would decrease as a result of the |
| Western Asset Management | year period and has underperformed | Advisory fees for this Fund were | change of subadviser from Salomon |
| Company Limited) | its benchmark index over the three | higher than its peer group median. | Brother Asset Management Inc. to |
| | and five year periods. | | Western Asset Management Company. |
| | | Total expenses for this Fund were | |
| | Performance of the WAMCO High | lower than its peer group median. | |
| | Yield Composite has outperformed | | |
| | its peer group average over the one, | | |
| | three and five year periods. | | |
470
John Hancock Funds II
Appendix A — continued
| Portfolio | Performance of Comparable | | |
| and Subadviser | Funds as of December 31, 2005 | Estimated Fees and Expenses | Comments |
|
| International Small Company | Comparable performance is | Subadvisory fees for this Fund were | The Board noted that the peer group |
| | not available. | higher than its peer group median. | for this portfolio only included |
| (Dimensional Fund | | | two funds. |
| Advisers, Inc.) | | Advisory fees for this Fund were | |
| | | higher than its peer group median. | |
| |
| | | Total expenses for this Fund were | |
| | | higher than its peer group median. | |
|
| Mid Cap Value Equity | Performance of the RiverSource | Subadvisory fees for this Fund were | |
| | Mid Cap Value Mutual Fund has | lower than its peer group median. | |
| (RiverSource Investments, LLC) | outperformed its benchmark index | | |
| | over the one and three year periods. | Advisory fees for this Fund were | |
| | | higher than its peer group median. | |
| | Performance of the RiverSource | | |
| | Mid Cap Value Mutual Fund has | Total expenses for this Fund were | |
| | outperformed its peer group average | slightly higher than its peer | |
| | over the one and three year periods. | group median. | |
|
| Real Estate Equity | Performance of the Real Estate | Subadvisory fees for this Fund were | |
| | Fund of T. Rowe Price has | lower than its peer group median. | |
| (T. Rowe Price Associates, Inc.) | outperformed its benchmark | | |
| | index over the one, three and five | Advisory fees for this Fund were | |
| | year periods. | higher than its peer group median. | |
| |
| | Performance of the Real Estate | Total expenses for this Fund were | |
| | Fund of T. Rowe Price has | lower than its peer group median. | |
| | outperformed its peer group | | |
| | average over the one, three and | | |
| | five year periods. | | |
|
| Real Estate Securities | Performance of the DWS RREEF | Subadvisory fees for this Fund were | The Board noted that advisory and |
| | Real Estate Securities Fund, | lower than its peer group median. | subadvisory fees for the portfolio |
| (Subadviser: | the model for the Trust, has | | would not change as a result of the |
| Deutsche Asset | outperformed its benchmark | Advisory fees for this Fund were | addition of RREEF America L.L.C. as a |
| Management, Inc. | index over the one, three and five | lower than its peer group median. | sub-subadviser to the portfolio. |
| | year periods. | | |
| sub-subadviser: | | Total expenses for this Fund were | |
| RREEF America L.L.C.) | Performance of the Fund has | lower than its peer group median. | |
| | outperformed its peer group | | |
| | average over the one, three and | | |
| | five year periods. | | |
|
| Strategic Bond | Performance of the Western Asset | Subadvisory fees for this Fund were | The Board noted that advisory and |
| | Core Plus Bond Institutional | lower than its peer group median. | subadvisory fees for the portfolio |
| (Subadviser: | Mutual Fund underperformed its | | would decrease as a result of the |
| Western Asset | benchmark over the one year | Advisory fees for this Fund were | change of subadviser from Salomon |
| Management Company | period and has outperformed its | higher than its peer group median. | Brother Asset Management Inc. to |
| | benchmark index over the three | | Western Asset Management Company. |
| Sub-subadviser: | and five year periods. | Total expenses for this Fund were | |
| Western Asset Management | | lower than its peer group median. | |
| Company Limited) | Performance of the Western Asset | | |
| | Core Plus Bond Institutional | | |
| | Mutual Fund has outperformed | | |
| | its peer group average over the one, | | |
| | three and five year periods. | | |
471
John Hancock Funds II
Appendix A — continued
| Portfolio | Performance of Comparable | | |
| And Subadviser | Funds as of December 31, 2005 | Estimated Fees and Expenses | Comments |
|
| U.S. Government Securities | Performance of a blended group | Subadvisory fees for this Fund were | The Board noted that the peer group |
| | of U.S. Government accounts | in line with its peer group median. | for this portfolio consisted only of |
| (Western Asset | managed by Western Asset | | two funds. |
| Management Company) | Management has outperformed | Advisory fees for this Fund were in | |
| | its blended benchmark of U.S. | line with its peer group median. | The Board noted that advisory and |
| | Government indexes and the Short | | subadvisory fees for the portfolio |
| | Government Bond peer group | Total expenses for this Fund were | would decrease as a result of the |
| | average over the one, three and | lower than its peer group median. | change of subadviser from Salomon |
| | five year periods. | | Brother Asset Management Inc. to |
| | | | Western Asset Management Company. |
472
John Hancock Funds II
Trustees and Officers (Unaudited)
This chart provides information about the Trustees and Officers who oversee your John Hancock fund. Officers elected by the Trustees manage the day-to-day operations of the Fund and execute policies formulated by the Trustees.
| Independent Trustees | | |
| |
| Name, age | | Number of |
| Position(s) held with Trust | Trustee | John Hancock |
| Principal occupation(s) and other | of Fund | funds overseen |
| directorships during past 5 years | since1 | by Trustee |
|
| Charles L. Bardelis, Born: 1941 | 2005 | 209 |
|
| President and Executive Officer, Island Commuter Corp. (Marine Transport). | | |
| Trustee of John Hancock Trust (since 1988) and John Hancock Funds III (since 2005). | | |
|
| |
| Peter S. Burgess, Born: 1942 | 2005 | 209 |
|
| Consultant (financial, accounting and auditing matters (since 1999); Certified Public Accountant; Partner, | | |
| Arthur Andersen (prior to 1999). | | |
| Director of the following publicly traded companies: PMA Capital Corporation (since 2004) and Lincoln Educational | | |
| Services Corporation (since 2004). | | |
| Trustee of John Hancock Trust (since 2005) and John Hancock Funds III (since 2005). | | |
|
| |
| Elizabeth G. Cook, Born: 1937 | 2005 | 209 |
|
| Expressive Arts Therapist, Massachusetts General Hospital (September 2001 to present); Expressive Arts Therapist, | | |
| Dana Farber Cancer Institute (September 2000 to January 2004); President, The Advertising Club of Greater Boston. | | |
| Trustee of John Hancock Trust (since 2005) and John Hancock Funds III (since 2005). | | |
|
| |
| William H. Cunningham, Born: 1944 | 2005 | 160 |
|
| Former Chancellor, University of Texas System and former President of the University of Texas, Austin, Texas; Chairman | | |
| and CEO, IBT Technologies (until 2001); Director of the following: Hire.com (until 2004), STC Broadcasting, Inc. and | | |
| Sunrise Television Corp. (until 2001), Symtx, Inc. (electronic manufacturing) (since 2001), Adorno/Rogers Technology, Inc. | | |
| (until 2004), Pinnacle Foods Corporation (until 2003), rate Genius (until 2003), Lincoln National Corporation (insurance) | | |
| (since 2006), Jefferson-Pilot Corporation (diversified life insurance company) (until 2006), New Century Equity Holdings | | |
| (formerly Billing Concepts) (until 2001), eCertain (until 2001), ClassMap.com (until 2001), Agile Ventures (until 2001), | | |
| AskRed.com (until 2001), Southwest Airlines, Introgen and Viasystems Group, Inc. (electronic manufacturer) (until 2003); | | |
| Advisory Director, Interactive Bridge, Inc. (college fundraising) (until 2001); Advisory Director, Q Investments (until 2003); | | |
| Advisory Director, JP Morgan Chase Bank (formerly Texas Commerce Bank - Austin), LIN Television (since 2002), WilTel | | |
| Communications (until 2003) and Hayes Lemmerz International, Inc. (diversified automotive parts supply company) | | |
| (since 2003). | | |
| Trustee of John Hancock Funds (since 2005) and John Hancock Funds III (since 2005). | | |
|
| |
| Charles L. Ladner, Born: 1938 | 2005 | 160 |
|
| Chairman and Trustee, Dunwoody Village, Inc. (retirement services) (until 2003); Senior Vice President and Chief Financial | | |
| Officer, UGI Corporation (public utility holding company) (retired 1998); Vice President and Director for AmeriGas, Inc. | | |
| (retired 1998); Director of AmeriGas Partners, L.P. (gas distribution) (until 1997); Director, EnergyNorth, Inc. (until 1995); | | |
| Director, Parks and History Association (since 2007). | | |
| Trustee of John Hancock Funds (since 2004) and John Hancock Funds III (since 2005). | | |
|
| |
| Hassell H. McClellan, Born: 1945 | 2005 | 209 |
|
| Associate Professor, The Wallace E. Carroll School of Management, Boston College. | | |
| Trustee of John Hancock Trust (since 2005) and John Hancock Funds III (since 2005). | | |
|
| |
| James. M. Oates, Born: 1946 | 2005 | 209 |
|
| Managing Director, Wydown Group (financial consulting firm) (since 1994); Chairman, Emerson Investment Management, | | |
| Inc. (since 2000); Chairman, Hudson Castle Group, Inc. (formerly IBEX Capital Markets, Inc.) (financial services company) | | |
| (since 1997). | | |
| Director of the following publicly traded companies: Stifel Financial (since 1996); Investor Financial Services Corporation | | |
| (since 1995); and Connecticut River Bancorp, Director (since 1998). Director, Phoenix Mutual Funds (since 1988; | | |
| overseeing 20 portfolios). | | |
| Trustee of John Hancock Trust (since 2004) and John Hancock Funds III (since 2005). | | |
| |
| 1 Because the Trust does not hold regular annual shareholders meetings, each Trustee holds office for an indefinite term until his/her successor is duly |
| elected and qualified or until he/she dies, retires, resigns, is removed or becomes disqualified. | | |
473
John Hancock Funds II
Trustees and Officers (Unaudited) — continued
| Non-Independent Trustees3 | | |
| |
| Name, age | | Number of |
| Position(s) held with Trust | Trustee | John Hancock |
| Principal occupation(s) and other | of Fund | funds overseen |
| directorships during past 5 years | since1 | by Trustee |
|
| James R. Boyle, Born: 1959 | 2005 | 262 |
|
| Chairman and Director, John Hancock Advisers, LLC (the “Adviser”), The Berkeley Financial Group, LLC (“The Berkeley Group”) (holding company) |
| and John Hancock Funds, LLC (since 2005); President, John Hancock Annuities; Executive Vice President, John Hancock Life Insurance Company |
| (since June, 2004); President U.S. Annuities; Senior Vice President, The Manufacturers Life Insurance Company (U.S.A) (prior to 2004). | |
| |
| Principal officers who are not Trustees | | |
| |
| |
| Name, age | | |
| Position(s) held with Trust | | Officer |
| Principal occupation(s) and | | of Fund |
| directorships during past 5 years | | since |
|
| Keith Hartstein2 , Born: 1956 | | 2005 |
|
| President and Chief Executive Officer | | |
| Senior Vice President, Manulife Financial Corporation (since 2004); Director, President and Chief Executive Officer, the Adviser and The Berkeley Group, |
| John Hancock Funds, LLC (since 2005); Director, MFC Global Investment Management (U.S.), LLC (“MFC Global (U.S.)”) (since 2005); Director, |
| John Hancock Signature Services, Inc. (since 2005); President and Chief Executive Officer, John Hancock Investment Management Services, LLC |
| (since 2006); President and Chief Executive Officer, John Hancock Funds, John Hancock Funds II, John Hancock Funds III, John Hancock Trust,; |
| Director, Chairman and President, NM Capital Management, Inc. (since 2005); Chairman, Investment Company Institute Sales Force Marketing |
| Committee (since 2003); Director, President and Chief Executive Officer, MFC Global (U.S.) (2005-2006); Executive Vice President, John Hancock |
| Funds, LLC (until 2005). | | |
|
| |
| John Vrysen2 , Born: 1955 | | 2005 |
|
| Chief Financial Officer | | |
| Director, Executive Vice President and Chief Financial Officer, the Adviser, The Berkeley Group and John Hancock Funds, LLC (since 2005); Executive |
| Vice President and Chief Financial Officer, John Hancock Investment Management Services, LLC (since 2005), Vice President and Chief Financial |
| Officer, MFC Global (U.S.) (since 2005); Director, John Hancock Signature Services, Inc. (since 2005); Chief Financial Officer, John Hancock Funds, |
| John Hancock Funds II, John Hancock Funds III, John Hancock Trust (since 2005); Vice President and General Manager, Fixed Annuities, U.S. Wealth |
| Management (until 2005); Vice President, Operations Manulife Wood Logan (2000-2004). | | |
|
| |
| Francis V. Knox, Jr.2 , Born: 1947 | | 2005 |
|
| Chief Compliance Officer | | |
| Vice President and Chief Compliance Officer, John Hancock Investment Management Services, LLC, the Adviser and MFC Global (U.S.) (since 2005); |
| Chief Compliance Officer, John Hancock Funds, John Hancock Funds II, John Hancock Funds III and John Hancock Trust (since 2005); Vice President and |
| Assistant Treasurer, Fidelity Group of Funds (until 2004); Vice President and Ethics & Compliance Officer, Fidelity Investments (until 2001). | |
|
| |
| Gordon Shone2 , Born: 1956 | | 2005 |
|
| Treasurer | | |
| Treasurer, John Hancock Funds (since 2006); John Hancock Funds II, John Hancock Funds III and John Hancock Trust (since 2005); Vice President and |
| Chief Financial Officer, John Hancock Trust (2003-2005); Senior Vice President, John Hancock Life Insurance Company (U.S.A.) (since 2001); | |
| Vice President, John Hancock Investment Management Services, Inc. and John Hancock Advisers, LLC (since 2006), The Manufacturers Life Insurance |
| Company (U.S.A.) (1998 to 2000). | | |
|
| |
| Thomas M. Kinzler2 , Born: 1955 | | 2006 |
|
| Secretary and Chief Legal Officer | | |
| Vice President and Counsel for John Hancock Life Insurance Company (U.S.A.) (since 2006); Secretary and Chief Legal Officer, John Hancock Funds, |
| John Hancock Funds II, John Hancock Funds III and John Hancock Trust (since 2006); Vice President and Associate General Counsel for Massachusetts |
| Mutual Life Insurance Company (1999-2006); Secretary and Chief Legal Counsel for MML Series Investment Fund (2000-2006); Secretary and Chief |
| Legal Counsel for MassMutual Institutional Funds (2000-2004); Secretary and Chief Legal Counsel for MassMutual Select Funds and MassMutual |
| Premier Funds (2004-2006). | | |
| |
| 1 Because the Trust does not hold regular annual shareholders meetings, each Trustee holds office for an indefinite term until his successor is duly elected |
| and qualified or until he dies, retires, resigns, is removed or becomes disqualified. | | |
| 2 Affiliated with the investment adviser. | | |
| 3 Non-Independent Trustee: holds positions with the Fund’s investment adviser, underwriter, and/ or certain other affiliates. | | |
474
John Hancock Funds II
Trustees and Officers (Unaudited) — continued
The business address for all Trustees and Officers is 601 Congress Street, Boston, Massachusetts 02210-2805.
The Statement of Additional Information, a separate document with supplemental information not contained in the Prospectus, includes additional information on the Board of Trustees and can be obtained without charge by calling 1-800-344-1029 or on the Securities and Exchange Commission (“SEC”) Web site at www.sec.gov.
PROXY VOTING POLICY A description of the Trust’s proxy voting policies and procedures and information regarding how the Trust voted proxies relating to fund securities during the most recent twelve-month period ended August 31 is available without charge, upon request, by calling 1-800-344-1029 or on the Trust’s website at www.jhfunds.com or on the SEC internet website at www.sec.gov.
QUARTERLY PORTFOLIO DISCLOSURE The fund files a complete schedule of portfolio holdings with the Securities and Exchange Commission for the first and third quarters of each fiscal year on Form N-Q.The fund’s Form N-Q is available electronically on the SEC’s Web site (www.sec.gov); hard copies may be reviewed and copied at the SEC’s Public Reference Room, 450 Fifth St., N.W., Washington, DC 20549. For more information on the Public Reference Room, call 1-800-SEC-0330.
475
Management of the Trust
Trustees
Charles L. Bardelis
Peter S. Burgess
Elizabeth G. Cook
William H. Cunningham
Charles L. Ladner
Hassell H. McLellan
James M. Oates
James R. Boyle
Officers
Keith F. Hartstein, President
John G. Vrysen, Chief Financial Officer
Francis V. Knox, Vice President and Chief Compliance Officer
Gordon M. Shone, Treasurer
Thomas M. Kinzler, Secretary and Chief Legal Officer
George M. Boyd, Assistant Secretary
Investment Adviser
John Hancock Investment Management Services, LLC
Boston, Massachusetts

601 Congress Street
Boston MA 02210-2805
JHF2AN 8/06
ITEM 2. CODE OF ETHICS.
(a) As of the end of the period, August 31, 2006, the registrant has adopted a code of ethics, as defined in Item 2 of Form N-CSR, that applies to its Chief Executive Officer and Chief Financial Officer (respectively, the principal executive officer and the principal financial officer, the “Covered Officers”). A copy of the code of ethics is filed as an exhibit to this Form N-CSR.
(b)Not Applicable
(c)Not Applicable
(d)Not Applicable
(e)Not Applicable
(f)(1) A copy of the Code of Ethics is attached hereto.
JOHN HANCOCK FUNDS II
JOHN HANCOCK FUNDS III
SARBANES-OXLEY CODE OF ETHICS
FOR
PRINCIPAL EXECUTIVE AND
PRINCIPAL FINANCIAL OFFICERS
I. Covered Officers/Purpose of the Code
This code of ethics (this “Code”) for John Hancock Funds II and John Hancock Funds III, each a registered management investment company under the Investment Company Act of 1940, as amended (“1940 Act”), which may issue shares in separate and distinct series (each investment company and series thereunder to be hereinafter referred to as a “Fund”), applies to each Fund’s Principal Executive Officer (“President”) and Principal Financial Officer (“Chief Financial Officer”) (the “Covered Officers,” as set forth in Exhibit A) for the purpose of promoting:
* honest and ethical conduct, including the ethical handling of actual or apparent conflicts of interest between personal and professional relationships;
* full, fair, accurate, timely and understandable disclosure in reports and documents that the Fund files with, or submits to, the Securities and Exchange Commission (“SEC”) and in other public communications made by the Fund;
* compliance with applicable laws and governmental rules and regulations;
* the prompt internal reporting of violations of the Code to an appropriate person or persons identified in the Code; and
* accountability for adherence to the Code.
Each Covered Officer should adhere to a high standard of business ethics and should be sensitive to situations that may give rise to actual as well as apparent conflicts of interest.
II. Covered Officers Should Handle Ethically Actual and Apparent Conflicts of Interest
Overview. A “conflict of interest” occurs when a Covered Officer’s private interest interferes with the interests of, or his service to, the Fund. For example, a conflict of interest would arise if a Covered Officer, or a member of his family, receives improper personal benefits as a result of his position with the Fund. Certain conflicts of interest arise out of the relationships between Covered Officers and the Fund and already are subject to conflict of interest provisions in the Investment Company Act of 1940, as amended (the “Investment Company Act”) and the Investment Advisers Act of 1940, as amended (the “Investment Advisers Act”). For example, Covered Officers may not individually engage in certain transactions (such as the purchase or sale of securities or other property) with the Fund because of their status as “affiliated persons” of the Fund. Each Covered Officer is an officer or employee of the investment adviser or a service provider (“Service Provider”) to the Fund. The Fund’s, the investment adviser’s and the Service Provider’s compliance programs and procedures are designed to prevent, or identify and correct, violations of these provisions. This Code does not, and is not intended to, repeat or replace these programs and procedures, and such conflicts fall outside of the parameters of this Code.
Although typically not presenting an opportunity for improper personal benefit, conflicts arise from, or as a result of, the contractual relationship between the Fund and the investment adviser and the Service Provider of which the Covered Officers are also officers or employees. As a result, this Code recognizes that the Covered Officers will, in the normal course of their duties (whether formally for the Fund, for the investment adviser or for the Service Provider), be involved in establishing policies and implementing decisions which will have different effects on the investment adviser, the Service Provider and the Fund. The participation of the Covered Officers in such activities is inherent in the contractual relationship between the Fund and the investment adviser and the Service Provider and is consistent with the performance by the Covered Officers of their duties as officers of the Fund. Thus, if such participation is performed in conformity with the provisions of the Investment Company Act and the Investment Advisers Act, it will be deemed to have been handled ethically. In addition, it is recognized by the Fund’s Board of Directors (the “Board”) that the Covered Officers may also be officers or employees of one or more other investment companies covered by other Codes.
Other conflicts of interest are covered by the Code, even if such conflicts of interest are not subject to provisions in the Investment Company Act and the Investment Advisers Act. The following list provides examples of conflicts of interest under the Code, but Covered Officers should keep in mind that these examples are not exhaustive. The overarching principle is that the personal interest of a Covered Officer should not be placed improperly before the interest of the Fund.
* * *
2
Each Covered Officer must:
* not use his/her personal influence or personal relationships improperly to influence investment decisions or financial reporting by the Fund whereby the Covered Officer would benefit personally to the detriment of the Fund;
* not cause the Fund to take action, or fail to take action, for the individual personal benefit of the Covered Officer rather than for the benefit of the Fund; and
* not use material non-public knowledge of portfolio transactions made or contemplated for the Fund to trade personally or cause others to trade personally in contemplation of the market effect of such transactions.
Additionally, conflicts of interest may arise in other situations, the propriety of which may be discussed, if material, with the Fund’s Chief Compliance Officer (“CCO”). Examples of these include:
* service as a director/trustee on the board of any public or private company;
* the receipt of any non-nominal gifts;
* the receipt of any entertainment from any company with which the Fund has current or prospective business dealings unless such entertainment is business-related, reasonable in cost, appropriate as to time and place, and not so frequent as to raise any question of impropriety (or other formulation as the Fund already uses in another code of conduct);
* any ownership interest in, or any consulting or employment relationship with, any of the Fund’s service providers, other than its investment adviser, any sub-adviser, principal underwriter, administrator or any affiliated person thereof; and
* a direct or indirect financial interest in commissions, transaction charges or spreads paid by the Fund for effecting portfolio transactions or for selling or redeeming shares other than an interest arising from the Covered Officer’s employment, such as compensation or equity ownership.
III. Disclosure & Compliance
* Each Covered Officer should familiarize him- or herself with the disclosure requirements generally applicable to the Fund;
* Each Covered Officer should not knowingly misrepresent, or cause others to misrepresent, facts about the Fund to others, whether within or outside the Fund, including to the Fund’s directors and auditors, and to governmental regulators and self-regulatory organizations;
* Each Covered Officer should, to the extent appropriate within his/her area of responsibility, consult with other officers and employees of the Fund and the
3
Fund’s adviser or any sub-adviser with the goal of promoting full, fair, accurate, timely and understandable disclosure in the reports and documents the Fund files with, or submits to, the SEC and in other public communications made by the Fund; and
* It is the responsibility of each Covered Officer to promote compliance with the standards and restrictions imposed by applicable laws, rules and regulations.
IV. Reporting and Accountability
Each Covered Officer must:
* upon adoption of the Code (or thereafter as applicable, upon becoming a Covered Officer), affirm in writing to the Board that he/she has received, read, and understands the Code;
* annually thereafter affirm to the Board that he/she has complied with the requirements of the Code;
* not retaliate against any employee or Covered Officer or their affiliated persons for reports of potential violations that are made in good faith;
* notify the Fund’s CCO promptly if he/she knows of any violation of this Code (Note: failure to do so is itself a violation of this Code); and
* report at least annually any change in his/her affiliations from the prior year.
The Fund’s CCO is responsible for applying this Code to specific situations in which questions are presented under it and has the authority to interpret this Code in any particular situation. However, any approvals or waivers sought by the Principal Executive Officer will be considered by the Fund’s Board or a designated committee thereof (the “Committee”).
The Fund will follow these procedures in investigating and enforcing this Code:
* the Fund’s CCO will take all appropriate action to investigate any potential violations reported to him/her;
* if, after such investigation, the CCO believes that no violation has occurred, the CCO is not required to take any further action;
* any matter that the CCO believes is a violation will be reported to the Board or, if applicable, Committee;
* if the Board or, if applicable, Committee concurs that a violation has occurred, the Board, either upon its determination of a violation or upon recommendation of the Committee, if applicable, will consider appropriate action, which may include review of, and appropriate modifications to,
4
applicable policies and procedures; notification to appropriate personnel of the Service Provider or the investment adviser or its board; or a recommendation to dismiss the Covered Officer;
* the Committee will be responsible for granting waivers, as appropriate; and
* any changes to or waivers of this Code will, to the extent required, be disclosed as provided by SEC rules.
V. Other Policies and Procedures
This Code shall be the sole code of ethics adopted by the Fund for purposes of Section 406 of the Sarbanes-Oxley Act of 2002 and the rules and forms applicable to registered investment companies thereunder. Insofar as other policies or procedures of the Fund, the Fund’s adviser, any sub-adviser, principal underwriter or other service providers govern or purport to govern the behavior or activities of the Covered Officers who are subject to this Code, they are superseded by this Code to the extent that they overlap or conflict with the provisions of this Code. The Fund’s and its investment adviser’s codes of ethics under Rule 204A-1 under the Investment Advisers Act and Rule 17j-1 under the Investment Company Act, respectively, are separate requirements applying to the Covered Officers and others, and are not part of this Code.
VI. Amendments
Any amendments to this Code, other than amendments to Exhibit A, must be approved or ratified by a majority vote of the Fund’s Board, including a majority of independent directors.
VII. Confidentiality
All reports and records prepared or maintained pursuant to this Code will be considered confidential and shall be maintained and protected accordingly. Except as otherwise required by law or this Code, such matters shall not be disclosed to anyone other than the Fund’s Board and its counsel, the investment adviser and the relevant Service Providers.
VIII. Internal Use
The Code is intended solely for the internal use by the Fund and does not constitute an admission, by or on behalf of the Fund, as to any fact, circumstance, or legal conclusion.
5
Exhibit A
Persons Covered by this Code of Ethics
(As of August__, 2005)
John Hancock Funds II
Principal Executive Officer and President
Principal Financial Officer and Chief Financial Officer
John Hancock Funds III
Principal Executive Officer and President
Principal Financial Officer and Chief Financial Officer
(f)(2) The Registrant will provide a copy of the Code of Ethics to any person without charge, upon request by calling the following toll free number (800) 344-1029.
ITEM 3. AUDIT COMMITTEE FINANCIAL EXPERT.
The Board of Trustees of the Registrant has determined that it has one “audit committee financial expert” as that term is defined in Item 3(b) of Form N-CSR: Peter S. Burgess, who is “independent” as that term is defined in Item 3(a) (2) of Form N-CSR.
ITEM 4. PRINCIPAL ACCOUNTANT FEES AND SERVICES.
(a) AUDIT FEES:
2006: $1,346,000
These fees represent aggregate fees billed for the period from commencement of operations (10/15/05) to fiscal year end (8/31/06) (the “Reporting Period”) for professional services rendered by the principal accountant, PricewaterhouseCoopers LLP (“PWC”), for the audits of the Registrant’s annual financial statements or services that are normally provided by the accountant in connection with statutory and regulatory filing or engagements for such period.
(b) AUDIT RELATED FEES:
2006: $629,000
These fees represent the aggregate fees billed for the Reporting Period for assurance and related services by PWC that are reasonably related to the performance of the audit of the Registrant’s financial statements and are not reported under paragraph (a) of this Item. Such fees relate to professional services rendered by PWC for separate audit reports in connection with 17f-2 security counts and fund merger audit services.
(c) TAX FEES:
2006: $374,000
These fees represent aggregate fees billed for the Reporting Period for professional services rendered by PWC for tax compliance, tax advice and tax planning. The tax services provided by PWC related to the review of the Registrant’s federal and state income tax returns, excise tax calculations and returns and a review of the Registrant’s calculations of capital gain and income distributions.
(d) ALL OTHER FEES; None.
(e) (1) The audit committee’s pre-approval policies and procedures described in paragraph (c) (7) of Rule 2-01 of Regulation S-X are attached.
September 2005
John Hancock Funds II
Audit Committee
Audit and Non-Audit Services Pre-Approval Policy |
I. Statement of Principles
Under the Sarbanes-Oxley Act of 2002 (the “Act”), the Audit Committee of the Board of Trustees is responsible for the appointment, compensation and oversight of the services provided by the independent auditor to John Hancock Funds II (the “Trust”). As part of this responsibility, the Audit Committee is required to pre-approve the audit and non-audit services performed by the Trust’s independent auditor (the “Auditor”) in order to assure that these services do not impair the Auditor’s independence. In addition, these procedures also require the Audit Committee to pre-approve non-audit services provided by the Auditor to Manulife Financial Corporation (or any subsidiary thereof) where such services provided have a direct impact on the operations or financial reporting of the Trust as further assurance that such services do not impair the Auditor’s independence.
This Policy follows two different approaches to pre-approving services: (1) proposed services may be pre-approved (“general pre-approval”), or (2) proposed services will require specific pre-approval (“specific pre-approval”). Unless a type of service provided by the Auditor has received general pre-approval, it will require specific pre-approval by the Audit Committee.
Exhibit I to this Policy describes the Audit, Audit-related, Tax and All Other Services that have been pre-approved by the Audit Committee. The Audit Committee will annually review these services. It is expected that such review will occur at the regularly scheduled April Audit Committee meeting.
II. Delegation
The Audit Committee may delegate pre-approval authority to its chairperson or any other member or members. The member to whom such authority is delegated must report, for informational purposes only, any pre-approval decisions to the Audit Committee at its next meeting following the pre-approval. If pre-approval of any services to be provided by the Auditors is required before the next regularly scheduled Audit Committee meeting, the Audit Committee hereby authorizes its chairman to provide such pre-approval.
III. Audit Services
The Trust’s annual audit services engagement scope and terms will be subject to the general pre-approval of the Audit Committee. Audit services include the annual financial statement audit and other procedures required to be performed by the independent auditor in order to be able to form an opinion on the Trust’s financial statements. The Audit services that are pre-approved are set forth in Exhibit I.
IV. Audit-related Services
Audit-related services are assurance and related services that are reasonably related to the performance of the audit or review of the Trust’s financial statements or that are traditionally performed by the independent auditor.
The audit-related services that are pre-approved are set forth in Exhibit I.
V. Tax Services
The SEC has stated generally that an independent auditor may provide tax services to a mutual fund, such as tax compliance, tax planning and tax advice, since such services do not impair the auditor’s independence.
The tax services that are pre-approved are listed in Exhibit I.
VI. All Other Services
The Audit Committee believes that other types of non-audit services are also permitted and that it may grant general pre-approval to non-audit services that it believes (a) are routine and recurring services, (b) would not impair the independence of the auditor and (c) are consistent with the Act and the rules relating thereto.
The non-audit services for which the Audit Committee has granted general pre-approval are set forth in Exhibit I.
The Auditor is permitted to assist management with internal investigations and fact-finding into alleged improprieties; however, these services are subject to specific pre-approval and engagement by the Audit Committee.
VII. Prohibited Services
Services which result in the auditor losing independence status under the rule include (1) Bookkeeping or other services related to the accounting records or financial statements of the Trust; (2) Financial information systems design and implementation; (3) Appraisal or valuation services, fairness opinions, or contribution-in-kind reports; (4) Actuarial services (i.e., setting actuarial reserves versus actuarial audit work); (5) Internal audit outsourcing services; (6) Management functions or human resources; (7) Broker or dealer, investment advisor, or investment banking services; (8) Legal services and expert services unrelated to the audit; (9) Any other service that the Public Company Accounting Oversight Board determines, by regulation, is impermissible.
VIII. Procedures
At least annually, the Trust’s Chief Financial Officer and the Auditor shall jointly submit to the Audit Committee for approval a revised EXHIBIT I. If any of the fee amounts listed on EXHIBIT I change materially subsequent to the Audit Committees approval, an updated EXHIBIT I will be presented to the Audit Committee at the next regularly scheduled meeting.
EXHIBIT I
John Hancock Funds II
Schedule of Audit, Audit-Related, Tax and Other Non-Audit Services
Subject to General Pre-Approval |
| Service | | Summary of Services | Projected Fees/ Fee Cap |
|
| Audit Services | | | |
|
| Audit | Recurring audit of financial statements of the Trust in | JHF II as of 8/31/2006 |
| | accordance with generally accepted auditing standards | |
| | including, but not limited to: | $1,529,584 plus $139,650 out-of-pocket |
| | | | expenses including non-recurring fees of |
| | • | Annual letter regarding the Trust’s internal control to be | $570,000 based on 49 funds approved on August |
| | | included in the annual report to the SEC on Form N- | 23, 2005. |
| | | SAR; | |
| | • | Review of the annual poet-effective amendment to the | Actual number of funds is 59, an increase of 10. |
| | | Trust’s registration statement on SEC Form N-1A, and | Fee increase due to scope change is $195,833 |
| | | consent to the incorporation by reference of our report | plus out-of-pocket of $28,500 (average of |
| | | on the Trust’s financial statements in such SEC filing; | $28,500/fund for both audit and tax). There is a |
| | • | Review of each Trust portfolio’s tax provision and RIC | corresponding increase in non-recurring fees of |
| | | qualification calculation | $35,000 as well. |
| | • | Accounting consultations and tax services required to | |
| | | perform an audit in accordance with Generally | |
| | | Accepted Auditing Standards. | |
|
| |
| |
| |
| |
| | Other audit and special reports including, but not limited to: | Up to but not to exceed $30,000 per instance. |
| | | | (was$15k) |
| | • | All services relating to any subsequent filings of | |
| | | registration statements (including amendments thereto) | |
| | | for the Trust with the SEC, including issuance of | |
| | | auditor consents. | |
|
| Service | | Summary of Services | Projected Fees/ Fee Cap |
|
| Audit-Related Services | | | |
|
| Consultations | Includes consultations relating to new regulatory rules and | Up to but not to exceed $25,000 per instance |
| concerning accounting | guidance, unusual or non-recurring transactions and other | (was $10k) |
| and financial reporting | regulatory or financial reporting matters which are generally | |
| standards | non-recurring. | |
|
| Other auditing | Auditing procedures and special reports, including those | $24,500 including expenses for the required 17f- |
| procedures and | needed for: | 2 security counts |
| issuance of special | • | Separate audit reports in connection with 17f-2 security | |
| purpose reports | | counts | |
|
| | • | Various government agencies tax authorities and Fund | Up to but not to exceed $25,000 per instance |
| | | mergers | (was $10k) |
|
| Tax Services | | | |
|
| |
| Tax Services | Recurring tax services including, but not limited to: | John Hancock Funds II as of 8/31/2006 |
| | • | Review of each Trust portfolio’s federal, and if | |
| | | applicable, state tax returns | $267,540 plus $29,726 out-of-pocket expenses |
| | • | Review required Trust portfolio distributions to avoid | based on 49 funds approved on August 23, 2005. |
| | | excise tax and review related excise tax returns | |
| | | | Actual number of funds is 59, an increase of 10. |
| | | | Fee increase due to scope change is $54,600 plus |
| | | | out-of-pocket of $6,067 (average of |
| | | | $28,500/fund for both audit and tax). |
|
| Consultations on various | Consultation on U.S. tax matters, such as, funs | |
| tax matters | reorganizations; tax basis earnings and profits | Up to but not to exceed $30,000 per instance |
| | computations, evaluating the tax characteristics if certain | (was $10k) |
| | expenses and income items; advice on accounting methods, | |
| | timing issues, compliance matters and characterization | |
| | issues. | |
|
| Other Non-Audit | Training and industry updates | Up to but not to exceed $25,000 per instance |
| Services | | (was $5k) |
| Overall Cap | In addition to the per instance caps, this reflect an overall | Up to but not to exceed $50,000 |
| | cap on the Trust. | |
|
NOTE: Fees included above have been approved by the audit committee at the August 23, 2005 and March 30, 2006 Board of Trustee meetings for JHF II with a fiscal year end of August 31, 2006.
(2) Amount approved by the Audit Committee pursuant paragraph (c) (7) ((i) (7) of Rule 2-01 of Regulation S-X: None.
(f) Not Applicable.
(g) Aggregate non-audit fees billed by PWC for non-audit services rendered to Registrant for Reporting Period was $0. Aggregate non-audit fees billed by PWC for non-audit service rendered to the Registrant’s investment adviser and service affiliates for the Reporting Period was $0. These amounts include fees for non-audit services required to be pre-approved and fees for non-audit services that did not require pre-approval since they did not relate to the Registrant’s operations and financial reporting.
(h) The Registrant’s audit committee of the Board of Trustees has considered the provision of non-audit services that were rendered to the Registrant’s investment adviser and service affiliates that were not pre-approved pursuant to paragraph (c) (7) of Rule 2-01 of Regulation S-X, to be compatible with maintaining PWC’s independence
ITEM 5. AUDIT COMMITTEE OF LISTED REGISTRANTS Not Applicable.
ITEM 6. SCHEDULE OF INVESTMENTS. Included with Item 1.
ITEM 7. DISCLOSURE OF PROXY VOTING POLICIES AND PROCEDURES FOR CLOSED-END MANAGEMENT INVESTMENT COMPANIES. Not Applicable.
ITEM 8. PORTFOLIO MANAGERS OF CLOSED-END MANAGEMENT INVESTMENT COMPANIES. Not Applicable.
ITEM 9. PURCHASE OF EQUITY SECURITIES BY CLOSED-END MANAGEMENT INVESTMENT COMPANIES AND AFFILIATED PURCHASERS. Not Applicable.
ITEM 10. SUBMISSION OF MATTERS TO VOTE OF SECURITY HOLDERS. Not Applicable.
ITEM 11. CONTROLS AND PROCEDURES.
(a) EVALUATION OF DISCLOSURE CONTROLS AND PROCEDURES. The Registrant maintains disclosure controls and procedures that are designed to ensure that information required to be disclosed in this Form N-CSR is recorded, processed, summarized and reported within the periods specified in the rules and forms of the Securities and Exchange Commission. Such disclosure controls and procedures include controls and procedures designed to ensure that such information is accumulated and communicated to the Registrant's management, including its principal executive officer and principal financial officer, as appropriate, to allow timely decisions regarding required disclosure.
Within 90 days prior to the filing date of this Form N-CSR, the Registrant had carried out an evaluation, under the supervision and with the participation of the Registrant's management, including the Registrant's principal executive officer and the Registrant's principal financial officer, of the effectiveness of the design and operation of the Registrant's disclosure controls and procedures relating to information required to be disclosed on Form N-CSR. Based on such evaluation, the Registrant's principal executive officer and principal financial officer concluded that the Registrant's disclosure controls and procedures are operating effectively to ensure that:
(i) information required to be disclosed in this Form N-CSR is recorded, processed, summarized and reported within the periods specified in the rules and forms of the Securities and Exchange Commission, and (ii) information is accumulated and communicated to the Registrant’s management, including its principal executive officer and principal financial officer, as appropriate, to allow timely decisions regarding required disclosure.
(b) CHANGE IN REGISTRANT’S INTERNAL CONTROL: Not Applicable.
ITEM 12. EXHIBITS.
(a)(1) SEE ATTACHED CODE OF ETHICS.
(a)(2)(i) CERTIFICATION OF PRINCIPAL EXECUTIVE OFFICER.
(a)(2)(ii) CERTIFICATION OF PRINCIPAL FINANCIAL OFFICER.
(b) CERTIFICATION PURSUANT TO Rule 30a-2(b) OF THE INVESTMENT COMPANY ACT OF 1940
SIGNATURES
Pursuant to the requirements of the Securities Exchange Act of 1934 and the Investment Company Act of 1940, the registrant has duly caused this report to be signed on its behalf by the undersigned, thereunto duly authorized.
JOHN HANCOCK FUNDS II
_______________________________
/S/ Keith F. Hartstein
President and
Chief Executive Officer
Date October 27, 2006
Pursuant to the requirements of the Securities Exchange Act of 1934 and the Investment Company Act of 1940, this report has been signed below by the following persons on behalf of the registrant and in the capacities and on the dates indicated.
________________________________
/S/ Keith F. Hartstein
President and
Chief Executive Officer
Date October 27, 2006
_________________________________
/S/ John G. Vrysen
Chief Financial Officer
Date October 27, 2006