The table below summarizes the change in unrealized appreciation (depreciation) rec ognized in the net increase (decrease) in net assets from operations, classified by derivative instrument and risk category:
Under the Trust’s organizational documents, its Officers and Trustees are indemnified against certain liabilities arising out of the performance of their duties to the Trust. Additionally, in the normal course of business, the Trust enters into contracts with service providers that contain general indemnification clauses. The Trust’s maximum exposure under these arrangements is unknown, as this would involve future claims that may be made against the Trust that have not yet occurred.
The Trust has entered into an Investment Advisory Agreement with the Adviser. The Adviser is responsible for managing the corporate and business affairs of the Trust and for selecting and compensating subadvisers to handle the investment of the assets of the Portfolio, subject to the supervision of the Board of Trustees. The advisory fee has two components: (a) a fee on assets invested in affiliated Funds (Affiliated Funds Assets) and (b) a fee on assets not invested in affiliated Funds (Other Assets). Affiliated Funds are any fund of JHF II and JHF III. Under the Advisory Agreement, the Portfolio pays a daily management fee to the Adviser as stated below.
The fee on assets invested in a fund of JHF II or JHF III is stated as an annual percentage of the current value of the aggregate net assets of all the John Hancock LifeCycle Portfolios determined in accordance with the following schedule, and that rate is applied to the Affiliated Fund Assets of each John Hancock LifeCycle Portfolio.
The fee on Other Assets is stated as an annual percentage of the current value of the aggregate net assets of all the John Hancock LifeCycle Portfolios determined in accordance with the following schedule, and that rate is applied to the Other Assets of each John Hancock LifeCycle Portfolio.
MFC Global Investment Management (U.S.A) Limited acts as Subadviser to the Portfolio. The Portfolio is not responsible for the payment of subadvisory fees. The investment management fees incurred for the year ended August 31, 2009, were equivalent to an annual effective rate of 0.12% of the Portfolio’s average daily net assets.
Expense reimbursements
The Adviser has contractually agreed to reimburse for certain Portfolio level expenses (excluding management fees, underlying fund expenses, Rule 12b-1 fees, transfer agency fees, service plan fees, state registration fees, printing and postage fees, taxes, brokerage commissions, interest, litigation and indemnification expenses, other expenses not incurred in the ordinary course of the Portfolio’s business, and fees under any agreement or plans of the Portfolio dealing with services for shareholders and others with beneficial interests in shares of the Portfolio) that exceed 0.09% of the average annual net assets. Also, the Adviser has agreed to reimburse or to make a payment to a specific class of shares of the Portfolio in an amount equal to the amount by which the expenses attributable to such class of shares exceed the percentage of average annual net assets (on an annualized basis) attributable as follows: 0.50% for Class A, 1.20% for Class B, 1.20% for Class C, 1.05% for Class R, 0.80% for Class R1, 0.55% for Class R2, 0.70% for Class R3, 0.40% for Class R4, 0.10% for Class R5, and 0.05% for Class 1 for the Lifecycle funds. These expense reimbursements shall continue in effect until December 31, 2009, and thereafter until terminated by the Adviser on notice to JHF II.
For the year ended August 31, 2009, the expense reductions related to this limitation amounted to $9,017 for Class A, $11,007 for Class B, $13,691 for Class C, $10,366 for Class R, $10,351 for Class R1, $10,770 for Class R2, $10,381 for Class R3, $10,371 for Class R4, $10,515 for Class R5 and $9 for Class 1, and is reflected as a reduction of total expenses in the Statement of Operations.
Accounting and legal services fees
Pursuant to the Service Agreement, the Portfolio will reimburse the Adviser for all expenses associated with providing the administrative, financial, legal, accounting and recordkeeping services of the Portfolio, including the preparation of all tax returns, annual, semiannual and periodic reports to shareholders and the preparation of all regulatory reports. These expenses are allocated based on the relative share of net assets of each John Hancock LifeCycle Portfolio at the time the expense was incurred.
The accounting and legal services fees incurred for the year ended August 31, 2009, were equivalent to an annual effective rate of 0.02% of the Portfolio’s average daily net assets.
Distribution and service plans
The Trust has a Distribution Agreement with the Distributor. The Portfolio has adopted Distribution Plans with respect to Class A, Class B, Class C, Class R, Class R1, Class R2, Class R3, Class R4 and Class 1, pursuant to Rule 12b-1 under the 1940 Act, to reimburse the Distributor for the services it provides as distributor of shares of the Portfolio. Accordingly, the Portfolio makes daily payments to the Distributor at an annual rate not to exceed 0.30%, 1.00%, 1.00%, 0.75%, 0.50%, 0.25%, 0.50%, 0.25% and 0.05% of the average daily net assets of Class A, Class B, Class C, Class R, Class R1, Class R2, Class R3, Class R4 and Class 1, respectively. A maximum of 0.25% of average daily net assets
20
may be service fees, as defined by the Conduct Rules of the Financial Industry Regulatory Authority. Under the Conduct Rules, curtailment of a portion of the Portfolio’s 12b-1 payments could occur under certain circumstances.
The Portfolio has also adopted a Service Plan with respect to Class R, Class R1, Class R2, Class R3, Class R4 and Class R5 shares (the “Service Plan”). Under the Service Plan, the Portfolio pays up to 0.25%, 0.25%, 0.25%, 0.15%, 0.10% and 0.05% of average daily net assets of Class R, Class R1, Class R2, Class R3, Class R4 and Class R5 shares, respectively, for certain other services.
Sales charges
Class A shares are assessed up-front sales charges of up to 5% of the net asset value of such shares. During the year ended August 31, 2009 the Distributor received net up-front sales charges of $77,564 with regard to sales of Class A shares. Of this amount, $12,748 was retained and used for printing prospectuses, advertising, sales literature and other purposes, $64,100 was paid as sales commissions to unrelated broker-dealers and $716 was paid as sales commission to affiliated to sales personnel.
Class B shares that are redeemed within six years of purchase are subject to a contingent deferred sales charge (“CDSC”) at declining rates, beginning at 5.00% of the lesser of the current market value at the time of redemption or the original purchase cost of the shares being redeemed. Class C shares that are redeemed within one year of purchase are subject to a CDSC at a rate of 1.00% of the lesser of the current market value at the time of redemption or the original purchase cost of the shares being redeemed. Proceeds from the CDSCs are paid to the Distributor and are used, in whole or in part, to defray its expenses for providing distribution-related services to the Portfolio in connection with the sale of Class B and Class C shares. During the year ended August 31, 2009, CDSCs received by the Distributor amounted to $1,987 for Class B shares and $1,037 for Class C shares.
Transfer agent fees
The Portfolios have a transfer agent agreement with John Hancock Signature Services, Inc. (Signature Services), an indirect subsidiary of MFC. The transfer agent fees are made up of three components:
• The Fund pays a monthly transfer agent fee at an annual rate of 0.05% of each class’s average daily net assets for all classes;
• a monthly fee based on an annual rate of $16.50 per shareholder account; and
• Signature Services is reimbursed for certain out-of-pocket expenses.
Signature Services has contractually agreed to limit the transfer agent fees so that such fees do not exceed 0.20% annually of Class A, Class B, Class C, Class R, Class R1, Class R2, Class R3, Class R4 and Class R5 shares average daily net assets. This agreement expired December 31, 2008.
In addition, Signature Services voluntarily agreed to further limit transfer agent fees for Class R, Class R1, Class R2, Class R3, Class R4 and Class R5 shares so that such fees do not exceed 0.05% annually of each class’s average daily net assets. For the year ended
21
August 31, 2009, the transfer agent voluntary fees reductions amounted to $267 for Class B, $3 for Class R, $21 for Class R1 and $24 for Class R2 and is reflected as a reduction of total expenses in the Statement of Operations.
The Portfolio may receive earnings credits from the transfer agent as a result of uninvested cash balances. These credits are used to reduce a portion of the Portfolio’s transfer agent fees and out of pocket expenses. During the year ended August 31, 2009, there were no earning credits received by the Portfolio.
Class level expenses for the year ended August 31, 2009, were as follows:
| | | | | | | | | | | | | |
| | | | | | | | | State | | | | |
| | | Distribution and | | | Transfer agent | | | registration | | | Printing and | |
Share Class | | | service fees | | | fees | | | fees | | | postage fees | |
Class A | | $ | 23,707 | | $ | 8,502 | | $ | 11,460 | | $ | 4,863 | |
Class B | | | 3,437 | | | 1,575 | | | 10,364 | | | 22 | |
Class C | | | 35,301 | | | 4,792 | | | 10,766 | | | 5,197 | |
Class R | | | 596 | | | 237 | | | 10,370 | | | 2 | |
Class R1 | | | 447 | | | 270 | | | 10,370 | | | 1 | |
Class R2 | | | 450 | | | 416 | | | 10,816 | | | 2 | |
Class R3 | | | 858 | | | 262 | | | 10,370 | | | 1 | |
Class R4 | | | 250 | | | 146 | | | 10,370 | | | 2 | |
Class R5 | | | 2 | | | 137 | | | 10,474 | | | 1 | |
Class 1 | | | 98,746 | | | — | | | — | | | — | |
| | | | | | | | | | | | | |
Total | | $ | 163,794 | | $ | 16,337 | | $ | 95,360 | | $ | 10,091 | |
| | | | | | | | | | | | | |
6. Trustee Fees
The Trust compensates each Trustee who is not an employee of the Adviser or its affiliates. Total Trustees’ expenses are allocated to each John Hancock LifeCycle Portfolio based on its average daily net asset value.
7. Portfolio share transactions
Share transactions for the Portfolio for the years ended August 31, 2009 and 2008, were as follows:
| | | | | | | | | | | | | |
| | Year ended | | Year ended | |
| | 8/31/09 | | 8/31/08 | |
| | | | | |
| | Shares | | Amount | | Shares | | Amount | |
Class A shares | | | | | | | | | | | | | |
Sold | | | 545,003 | | $ | 3,994,463 | | | 823,146 | | $ | 8,271,824 | |
Distributions reinvested | | | 55,429 | | | 386,973 | | | 26,078 | | | 261,289 | |
Repurchased | | | (779,128 | ) | | (5,539,141 | ) | | (141,454 | ) | | (1,376,430 | ) |
| | | | | | | | | | | | | |
Net increase (decrease) | | | (178,696 | ) | $ | (1,157,705 | ) | | 707,770 | | $ | 7,156,683 | |
| | | | | | | | | | | | | |
Class B shares | | | | | | | | | | | | | |
Sold | | | 22,018 | | $ | 165,426 | | | 27,292 | | $ | 280,517 | |
Distributions reinvested | | | 1,151 | | | 8,130 | | | 1,270 | | | 12,810 | |
Repurchased | | | (20,436 | ) | | (135,656 | ) | | (20,551 | ) | | (201,914 | ) |
| | | | | | | | | | | | | |
Net increase | | | 2,733 | | $ | 37,900 | | | 8,011 | | $ | 91,413 | |
| | | | | | | | | | | | | |
Class C shares | | | | | | | | | | | | | |
Sold | | | 69,929 | | $ | 548,685 | | | 665,373 | | $ | 6,704,880 | |
Distributions reinvested | | | 26,823 | | | 186,036 | | | 11,420 | | | 114,105 | |
Repurchased | | | (461,577 | ) | | (3,227,062 | ) | | (135,683 | ) | | (1,322,073 | ) |
| | | | | | | | | | | | | |
Net increase (decrease) | | | (364,825 | ) | $ | (2,492,341 | ) | | 541,110 | | $ | 5,496,912 | |
| | | | | | | | | | | | | |
Class R shares | | | | | | | | | | | | | |
Sold | | | 38 | | $ | 290 | | | 4,734 | | $ | 45,493 | |
Distributions reinvested | | | 600 | | | 4,127 | | | 394 | | | 3,963 | |
Repurchased | | | (23 | ) | | (164 | ) | | (4,741 | ) | | (45,064 | ) |
| | | | | | | | | | | | | |
Net increase | | | 615 | | $ | 4,253 | | | 387 | | $ | 4,392 | |
| | | | | | | | | | | | | |
Class R1 shares | | | | | | | | | | | | | |
Sold | | | 18,446 | | $ | 121,016 | | | 115 | | $ | 1,135 | |
Distributions reinvested | | | 662 | | | 4,558 | | | 404 | | | 4,064 | |
Repurchased | | | (17,457 | ) | | (108,906 | ) | | — | | | — | |
| | | | | | | | | | | | | |
Net increase | | | 1,651 | | $ | 16,668 | | | 519 | | $ | 5,199 | |
| | | | | | | | | | | | | |
Class R2 shares | | | | | | | | | | | | | |
Sold | | | 66,186 | | $ | 474,889 | | | 10,844 | | $ | 108,356 | |
Distributions reinvested | | | 1,272 | | | 8,752 | | | 531 | | | 5,321 | |
Repurchased | | | (62,136 | ) | | (451,469 | ) | | (5,468 | ) | | (52,471 | ) |
| | | | | | | | | | | | | |
Net increase | | | 5,322 | | $ | 32,172 | | | 5,907 | | $ | 61,206 | |
| | | | | | | | | | | | | |
Class R3 shares | | | | | | | | | | | | | |
Sold | | | 14,471 | | $ | 109,458 | | | 9,187 | | $ | 95,388 | |
Distributions reinvested | | | 1,184 | | | 8,181 | | | 674 | | | 6,767 | |
Repurchased | | | (13,447 | ) | | (88,456 | ) | | (684 | ) | | (6,788 | ) |
| | | | | | | | | | | | | |
Net increase | | | 2,208 | | $ | 29,183 | | | 9,177 | | $ | 95,367 | |
| | | | | | | | | | | | | |
Class R4 shares | | | | | | | | | | | | | |
Sold | | | 5,323 | | $ | 37,453 | | | 97 | | $ | 946 | |
Distributions reinvested | | | 780 | | | 5,387 | | | 440 | | | 4,426 | |
| | | | | | | | | | | | | |
Net increase | | | 6,103 | | $ | 42,840 | | | 537 | | $ | 5,372 | |
| | | | | | | | | | | | | |
Class R5 shares | | | | | | | | | | | | | |
Sold | | | 2,657 | | $ | 18,703 | | | 980 | | $ | 9,618 | |
Distributions reinvested | | | 846 | | | 5,863 | | | 474 | | | 4,769 | |
Repurchased | | | (57 | ) | | (386 | ) | | (1 | ) | | (8 | ) |
| | | | | | | | | | | | | |
Net increase | | | 3,446 | | $ | 24,180 | | | 1,453 | | $ | 14,379 | |
| | | | | | | | | | | | | |
Class 1 shares | | | | | | | | | | | | | |
Sold | | | 15,710,756 | | $ | 112,536,786 | | | 22,765,338 | | $ | 228,178,574 | |
Distributions reinvested | | | 1,724,700 | | | 11,943,271 | | | 565,986 | | | 5,643,203 | |
Repurchased | | | (9,664,087 | ) | | (68,124,832 | ) | | (7,198,772 | ) | | (71,496,368 | ) |
| | | | | | | | | | | | | |
Net increase | | | 7,771,369 | | $ | 56,355,225 | | | 16,132,552 | | $ | 162,325,409 | |
| | | | | | | | | | | | | |
Net increase | | | 7,249,926 | | $ | 52,892,375 | | | 17,407,423 | | $ | 175,256,332 | |
| | | | | | | | | | | | | |
22
8. Purchases and sales of securities
Purchases and proceeds from sales of securities, other than short-term securities, during the year ended August 31, 2009, aggregated $194,518,681 and $149,758,325, respectively.
9. Investment in affiliated underlying funds
The Portfolio invests primarily in underlying funds that are managed by affiliates of the Adviser. The Portfolio does not invest in affiliated underlying funds for the purpose of exercising management or control; however the Portfolio’s investments may represent a significant portion of each underlying fund’s net assets. For the year ended August 31, 2009, the Portfolio held 5% or more of the following underlying fund’s net assets:
| |
Portfolio Affiliate Class NAV | Percentage of Underlying
Funds’ Net Assets |
Investment Quality Bond | 5.49% |
10. Subsequent Events
The Portfolio was terminated and liquidated on October 23, 2009. The termination and liquidation of the Portfilio was approved by the Board of Trustees on June 26, 2009.
23
Auditors report
Report of Independent Registered Public Accounting Firm
To the Board of Trustees and Shareholders of John Hancock Funds II:
In our opinion, the accompanying statement of assets and liabilities, including the portfolio of investments, and the related statements of operations and of changes in net assets and the financial highlights present fairly, in all material respects, the financial position of John Hancock Lifecycle Retirement Portfolio (the “Portfolio”) at August 31, 2009, the results of its operations, the changes in its net assets and the financial highlights for each of the periods indicated, in conformity with accounting principles generally accepted in the United States of America. These financial statements and financial highlights (hereafter referred to as “financial statements”) are the responsibility of the Trust’s management; our responsibility is to express an opinion on these financial statements based on our audits. We conducted our audits of these financial statements in accordance with the standards of the Public Company Accounting Oversight Board (United States). Those standards require that we plan and perform the audit to obtain reasonable assurance about whether the financial statements are free of material misstatement. An audit includes examining, on a test basis, evidence supporting the amounts and disclosures in the financial statements, assessing the accounting principles used and significant estimates made by management, and evaluating the overall financial statement presentation. We believe that our audits, which included confirmation of securities at August 31, 2009 by correspondence with the custodian, transfer agent, and brokers, and the application of alternative auditing procedures where securities purchased confirmations had not been received, provide a reasonable basis for our opinion.
As disclosed in Note 10 to the Financial Statements, the Portfolio was liquidated on October 23, 2009.
PricewaterhouseCoopers LLP
Boston, Massachusetts
October 23, 2009
24
Tax Information (Unaudited)
For federal income tax purposes, the following information is furnished with respect to the distributions of the Portfolio, if any, paid during its taxable year ended August 31, 2009.
The Portfolio has designated distributions to shareholders of $917,579 as a long-term capital gain dividend.
With respect to the ordinary dividends paid by the Portfolios for the year ended August 31, 2009, 17.93% of the dividends qualifies for the corporate dividends-received deduction.
The Portfolio hereby designates the maximum amount allowable of its net taxable income as qualified dividend income as provided in the Jobs and Growth Tax Relief Reconciliation Act of 2003. This amount will be reflected on Form 1099-DIV for the calendar year 2009.
Shareholders will be mailed a 2009 U.S. Treasury Department Form 1099-DIV in January 2010. This will reflect the total of all distributions that are taxable for calendar year 2009.
25
John Hancock Funds II
EVALUATION OF ADVISORY AND SUBADVISORY
AGREEMENTS BY THE BOARD OF TRUSTEES
This section describes the evaluation by the Board of Trustees of the Advisory Agreement (the “Advisory Agreement”) and each of the Subadvisory Agreements (the “Subadvisory Agreements”) for each of the portfolios (the “Funds”) of John Hancock Funds II (the “Trust”) discussed in this annual report.
Evaluation by the Board of Trustees
The Board, including the Independent Trustees, is responsible for selecting the Trust’s adviser, John Hancock Investment Management Services, LLC (the “Adviser” or “JHIMS”), approving the Adviser’s selection of subadvisers for each of the portfolios of the Trust and approving the Trust’s advisory and subadvisory (and any sub-subadvisory) agreements, their periodic continuation and any amendments. Consistent with SEC rules, the Board regularly evaluates the Trust’s advisory and subadvisory arrangements, including consideration of the factors listed below. The Board may also consider other factors (including conditions and trends prevailing generally in the economy, the securities markets and the industry) and does not treat any single factor as determinative, and each Trustee may attribute different weights to different factors. The Board is furnished with an analysis of its fiduciary obligations in connection with its evaluation and, throughout the evaluation process, the Board is assisted by counsel for the Trust and the Independent Trustees are also separately assisted by independent legal counsel. The factors considered by the Board are:
| | |
| 1. | the nature, extent and quality of the services to be provided by the Adviser to the Trust and by the subadvisers to the Funds; |
| | |
| 2. | the investment performance of the Funds and their subadvisers; |
| | |
| 3. | the extent to which economies of scale would be realized as a Fund grows and whether fee levels reflect these economies of scale for the benefit of Trust shareholders; |
| | |
| 4. | the costs of the services to be provided and the profits to be realized by the Adviser and its affiliates (including any subadvisers that are affiliated with the Adviser) from the Adviser’s relationship with the Trust; and |
| | |
| 5. | comparative services rendered and comparative advisory and subadvisory fee rates. |
The Board believes that information relating to all of these factors is relevant to its evaluation of the Trust’s advisory agreement. With respect to its evaluation of subadvisory agreements (including any sub-subadvisory agreements) with subadvisers not affiliated with the Adviser, the Board believes that, in view of the Trust’s “manager-of-managers” advisory structure, the costs of the services to be provided and the profits to be realized by those subadvisers that are not affiliated with the Adviser from their relationship with the Trust generally are not a material factor in the Board’s consideration of these subadvisory agreements because such fees are paid by the Adviser and not by the Funds and the Board relies on the ability of the Adviser to negotiate the subadvisory fees at arms-length.
In evaluating subadvisory arrangements, the Board also considers other material business relationships that unaffiliated subadvisers and their affiliates have with the Adviser or its affiliates, including the involvement by certain affiliates of certain subadvisers in the distribution of financial products, including shares of the Trust, offered by the Adviser and other affiliates of the Adviser (“Material Relationships”).
Approval of Advisory Agreement
At its meeting on May 28-29, 2009, the Board, including all the Independent Trustees, approved the Advisory Agreement.
26
In approving the renewal of the Advisory Agreement, and with reference to the factors that it regularly considers, the Board:
(1) -- (a) considered the high value to the Trust of continuing its relationship with JHIMS as the Trust’s adviser, the skills and competency with which JHIMS has in the past managed the Trust’s affairs and its subadvisory relationships, JHIMS’s oversight and monitoring of the subadvisers’ investment performance and compliance programs including its timeliness in responding to performance issues and the qualifications of JHIMS’s personnel,
(b) considered JHIMS’s compliance policies and procedures and its responsiveness to regulatory changes and mutual fund industry developments, and
(c) considered JHIMS’s administrative capabilities, including its ability to supervise the other service providers for the Funds and concluded that JHIMS may reasonably be expected to continue to perform its services under the Advisory Agreement with respect to the Funds;
(2) -- reviewed the investment performance of each of the Funds; the comparative performance of their respective benchmarks, comparable funds (i.e., funds having approximately the same investment objective), if any; and JHIMS’s analysis of such performance and its plans and recommendations regarding the Trust’s subadvisory arrangements generally and with respect to particular Funds; and concluded that each of the Funds has generally performed well or within a range that the Board deemed competitive except as discussed in Appendix A and in such cases, that appropriate action is being taken to address performance, if necessary, or that such performance is reasonable in light of all factors considered, and that JHIMS may reasonably be expected to continue ably to monitor the performance of the Funds and each of their subadvisers;
(3) -- reviewed the Trust’s advisory fee structure and the incorporation therein of any subadvisory fee breakpoints in the advisory fees charged and concluded (i) that to the extent that Funds have subadvisory fees with breakpoints, those breakpoints are reflected as breakpoints in the advisory fees for Funds, (ii) that all Funds with a subadviser that is not affiliated with the Adviser have subadvisory fees which are the product of arms-length negotiations between the Adviser and the subadviser and which in many, but not all, cases contain breakpoints, and (iii) that, although economies of scale cannot be measured with precision, these arrangements permit shareholders of Funds with advisory fee breakpoints to benefit from economies of scale if those Funds grow;
(4) -- (a) reviewed the financial statements of JHIMS and considered (i) an analysis presented by JHIMS regarding the net profitability to JHIMS of each Fund,
(b) reviewed the profitability of the JHIMS’s relationship with each Fund in terms of the total amount of annual advisory fees it received with respect to the Fund and whether JHIMS has the financial ability to continue to provide a high level of services to the Fund,
(c) considered that JHIMS derives reputational and other indirect benefits from providing advisory services to the Funds,
(d) noted that JHIMS pays the subadvisory fees out of the advisory fees JHIMS receives from the Funds and concluded that the advisory fees paid by the Trust with respect to the Funds are not unreasonable in light of such information; and
(e) considered that the Adviser should be entitled to earn a reasonable level of profits in exchange for the level of services it provide to each Fund and the entrepreneurial risk that it assumes as Adviser. Based upon its review, the Board concluded that the Advisor and its affiliates’ anticipated level of profitability from their relationship with each Fund was reasonable and not excessive.
(5) -- reviewed comparative information with respect to the advisory fee rates and concluded that the Trust’s advisory fees are generally within a competitive range of those incurred by other comparable funds. In this regard, the Board took into account management’s discussion with respect to the advisory fee structure. The Board also noted that JHIMS is currently waiving fees and or reimbursing expenses with respect to certain of the Funds and that the Adviser pays the subadvisory fees of the Funds. The Board also took into account the level and quality of services provided by JHIMS with respect to the Funds, as well as the other factors considered.
27
In addition, the Trustees reviewed the advisory fee to be paid to the Adviser for each Fund and concluded that the advisory fee to be paid to the Adviser with respect to each Fund is based on services provided that are in addition to, rather than duplicative of, the services provided pursuant to the advisory agreements for the underlying portfolios of the Fund and that the additional services are necessary because of the differences between the investment policies, strategies and techniques of a Fund and those of its underlying portfolios.
Additional information that the Board considered in approving the Advisory Agreement is set forth in Appendix A.
28
Approval of Subadvisory Agreements
At its meeting on May 28-29, 2009, the Board, including all the Independent Trustees, renewed and approved the Subadvisory Agreements.
In making its determination with respect to the factors that it considers, the Board reviewed:
(1) information relating to each subadviser’s business, which may include information such as: business performance, assets under management and personnel;
(2) the historical and current performance of the Fund and comparative performance information relating to the Fund’s benchmark and comparable funds;
(3) the subadvisory fee for each Fund and comparative fee information; and
(4) information relating to the nature and scope of Material Relationships and their significance to the Trust’s adviser and unaffiliated subadvisers.
The Board noted that in the case of each sub-subadvisory agreement, that the sub-subadvisory fee would be paid by the Subadviser out of the subadvisory fee and would not be an expense of the Fund.
The Board’s decision to approve each Subadvisory Agreement was based on a number of determinations, including the following:
(1) The Subadviser has extensive experience and demonstrated skills as a manager;
(2) Although not without variation, the current and historical performance of each Fund managed by a Subadviser has generally been in line with or outperformed the current and historical performance of comparable funds and the Fund’s respective benchmarks with the exceptions noted in Appendix A (with respect to such exceptions, the Board concluded that appropriate action was being taken to address such Funds’ performance, if necessary, or that performance was reasonable in light of all factors considered);
(3) The subadvisory fees are generally competitive within the range of industry norms and, with respect to each Subadviser that is not affiliated with the Adviser, are a product of arms-length negotiation between the Adviser and the subadviser;
(4) With respect to those Funds that have subadvisory fees that contain breakpoints, such breakpoints are reflected as breakpoints in the advisory fees for the Funds in order to permit shareholders to benefit from economies of scale if those Funds grow; and
(5) The Material Relationships consist of arrangements in which unaffiliated subadvisers or their affiliates provide advisory, distribution or management services in connection with financial products sponsored by the Trust’s adviser or its affiliates, which may include other registered investment companies, a 529 education savings plan, managed separate accounts and exempt group annuity contracts sold to qualified plans, and which in no case contained elements which would cause the Board to conclude that approval of the subadvisory agreement with the subadviser would be inappropriate.
In addition, the Trustees reviewed the subadvisory fee to be paid to the subadviser for each Fund and concluded that the subadvisory fee to be paid to the subadviser with respect to each Fund is based on services provided that are in addition to, rather than duplicative of, the services provided pursuant to the subadvisory agreements for the underlying portfolios of the Fund and that the additional services are necessary because of the differences between the investment policies, strategies and techniques of a Fund and those of its underlying portfolios.
Additional information that the Board considered for a particular Fund is set forth in Appendix A.
29
JOHN HANCOCK FUNDS II
APPENDIX A
LIFECYCLE RETIREMENT PORTFOLIO
PORTFOLIO
(SUBADVISER) | | PERFORMANCE OF
PORTFOLIO,
AS OF MARCH 31, 2009 | | FEES AND EXPENSES | | OTHER
COMMENTS |
JHF II
Lifecycle Retirement
(MFC Global Investment Management (U.S.A.) Limited)*
| | The Fund underperformed the benchmark index over the one- year period.
The Fund underperformed the Morningstar Category Average over the one-year period. | | No subadvisory fee comparative information recorded due to limited size of peer group.
Net management fees for this Fund are higher than the peer group median.
Total expenses for this Fund are slightly higher than the peer group median. | | The Board took into account management’s proposed plan to liquidate the Fund. |
*Deutsche Investment Management America Inc. provides subadvisory consulting services to MFC Global (U.S.A.) in its management of the Portfolio.
30
Trustees and Officers
This chart provides information about the Trustees and Officers who oversee your John Hancock fund. Officers elected by the Trustees manage the day-to-day operations of the Portfolio and execute policies formulated by the Trustees.
Independent Trustees
| | | |
| | | Number of |
Name, Year of Birth | | Trustee | John Hancock |
Position(s) held with Fund | | of Fund | funds overseen |
Principal occupation(s) and other directorships during past 5 years | | since1 | by Trustee |
| | | |
Charles L. Bardelis, Born: 1941 | | 2005 | 212 |
Director, Island Commuter Corp. (Marine Transport). Trustee of John Hancock Trust (since 1988) and former Trustee of John Hancock Funds III (2005–2006). | | | |
| | | |
Peter S. Burgess, Born: 1942 | | 2005 | 212 |
Consultant (financial, accounting and auditing matters) (since 1999); Certified Public Accountant. Partner, Arthur Andersen (independent public accounting firm) (prior to 1999). Director of the following publicly traded companies: PMA Capital Corporation (since 2004) and Lincoln Educational Services Corporation (since 2004). Trustee of John Hancock Trust (since 2005), and former Trustee of John Hancock Funds III (2005–2006). | | | |
| | | |
Theron S. Hoffman,2 Born: 1947 | | 2008 | 212 |
Trustee of John Hancock Trust and John Hancock Funds II (since September 2008); Chief Executive Officer, T. Hoffman Associates, LLC (since 2003); Director, The Todd Organization (since 2003); President, Westport Resources Management (2006–2008); Partner/Operating Head & Senior Managing Director, Putnam Investments (2000–2003). | | | |
| | | |
Hassell H. McClellan, Born: 1945 | | 2005 | 212 |
Associate Professor, The Graduate School of The Wallace E. Carroll School of Management, Boston College. Trustee of John Hancock Trust (since 2005), former Trustee of John Hancock Funds III (2005–2006) and Trustee of Phoenix Edge Series Fund (since 2008). | | | |
| | | |
James M. Oates, Born: 1946 | | 2005 | 212 |
Chairman of the Board of John Hancock Funds II; Managing Director, Wydown Group (finan- cial consulting firm) (since 1994); Chairman, Emerson Investment Management, Inc. (since 2000); Chairman, Hudson Castle Group, Inc. (formerly IBEX Capital Markets, Inc.) (financial services company) (1997–2006). Director of the following publicly traded companies: Stifel Financial (since 1996); Investor Financial Services Corporation (since 1995); and Connecticut River Bancorp, Director (since 1998); Virtus Investment Management (since 2009); and Emerson Investment Management (since 2000). Trustee of John Hancock Trust (since 2004) and former Trustee of John Hancock Funds III (2005–2006). | | | |
| | | |
Steven M. Roberts,2 Born: 1944 | | 2008 | 212 |
Trustee of John Hancock Trust and John Hancock Funds II (since September 2008); Board of Governors Deputy Director, Federal Reserve System (2005–2008); Partner, KPMG (1987–2004). | | | |
| |
1 | Because the Trust does not hold regular annual shareholders meetings, each Trustee holds office for an indefinite term until his/her successor is duly elected and qualified or until he/she dies, retires, resigns, is removed or becomes disqualified. Trustees may be removed (provided the aggregate number of Trustees after such removal shall not be less than one) with cause or without cause, by the action of two-thirds of the remaining Trustees or by action of two-thirds of the outstanding Shares of the Trust. |
| |
2 | Mr. Hoffman and Mr. Roberts were appointed by the Board as Trustees on September 26, 2008. |
31
Annual report | Lifecycle Retirement
| | | |
Trustee Emeritus | | | |
| | | |
| | | Number of |
Name, Year of Birth | | Trustee | John Hancock |
Position(s) held with Fund | | of Fund | funds overseen |
Principal occupation(s) and other directorships during past 5 years | | since | by Trustee |
| | | |
John D. Richardson,1 Born: 1938 | | 2006 | 212 |
Former Trustee of JHT (Retired, December 14, 2006). Former Senior Executive Vice President, Office of the President, MFC, February 2000 to March 2002 (Retired, March 2002); Executive Vice President and General Manager, U.S. Operations, Manulife Financial, January 1995 to January 2000. | | | |
1 Mr. Richardson became a non-voting Trustee Emeritus on December 14, 2006.
Non-Independent Trustees1
| | | |
| | | Number of |
Name, Year of Birth | | Trustee | John Hancock |
Position(s) held with Fund | | of Fund | funds overseen |
Principal occupation(s) and other directorships during past 5 years | | since1,2 | by Trustee |
| | | |
James R. Boyle,2 Born: 1959 | | 2005 | 264 |
Executive Vice President, Manulife Financial Corporation (since 1999); Director and President, John Hancock Variable Life Insurance Company (since 2007); Director and Executive Vice President, John Hancock Life Insurance Company (since 2004); Chairman and Director, John Hancock Advisers, LLC (the Adviser), John Hancock Funds, LLC (John Hancock Funds) and The Berkeley Financial Group, LLC (The Berkeley Group) (holding company) (since 2005); Chairman and Director, John Hancock Investment Management Services, LLC (since 2006); Senior Vice President, The Manufacturers Life Insurance Company (U.S.A.) (until 2004). | | | |
| | | |
Grace K. Fey,3,4 Born: 1946 | | 2008 | 212 |
Trustee of John Hancock Trust and John Hancock Funds II (since September 2008); Chief Executive Officer, Grace Fey Advisors (since 2007); Director & Executive Vice President, Frontier Capital Management Company (1988–2007). | | | |
| |
1 | Because the Trust does not hold regular annual shareholders meetings, each Trustee holds office for an indefinite term until his/her successor is duly elected and qualified or until he/she dies, retires, resigns, is removed or becomes disqualified. Trustees may be removed (provided the aggregate number of Trustees after such removal shall not be less than one) with cause or without cause, by the action of two-thirds of the remaining Trustees or by action of two-thirds of the outstanding Shares of the Trust holds positions with the Fund’s investment adviser, underwriter and certain other affiliates. |
| |
2 | Mr. Boyle is an “interested person” (as defined in the 1940 Act) due to his position with Manulife Financial Corporation (or its affiliates), the ultimate parent of the Adviser. |
| |
3 | Ms. Fey was appointed by the Board as Trustee on September 26, 2008. |
| |
4 | Ms. Fey is an “interested person” (as defined by the 1940 Act) due to a deferred compensation arrangement with her former employer, Frontier Capital Management Company, which is a subadviser of certain funds of John Hancock Funds II and John Hancock Trust. |
32
Lifecycle Retirement | Annual report
| |
Principal officers who are not Trustees | |
| |
Name, age | |
Position(s) held with Portfolio | Officer of |
Principal occupation(s) and | Portfolio |
directorships during past 5 years | since |
| |
Hugh McHaffie, Born: 1959 | 2009 |
President | |
Executive Vice President, John Hancock Wealth Management (since 2006, including prior positions); Senior Vice President, Individual Business Product Management, MetLife, Inc. (1999–2006); Vice President, Annuity Product Management, John Hancock Life Insurance Company (1990–1999). | |
| |
Thomas M. Kinzler, Born: 1955 | 2006 |
Secretary and Chief Legal Officer | |
Vice President and Counsel, John Hancock Life Insurance Company (U.S.A.) (since 2006); Secretary and Chief Legal Officer, John Hancock Funds, John Hancock Funds II and John Hancock Trust (since 2006); Vice President and Associate General Counsel, Massachusetts Mutual Life Insurance Company (1999–2006); Secretary and Chief Legal Counsel, MML Series Investment Fund (2000–2006); Secretary and Chief Legal Counsel, MassMutual Institutional Funds (2000–2004); Secretary and Chief Legal Counsel, MassMutual Select Funds and MassMutual Premier Funds (2004–2006). | |
| |
Francis V. Knox, Jr., Born: 1947 | 2005 |
Chief Compliance Officer | |
Vice President and Chief Compliance Officer, John Hancock Investment Management Services, LLC, the Adviser and MFC Global (U.S.) (since 2005); Chief Compliance Officer, John Hancock Funds, John Hancock Funds II, John Hancock Funds III and John Hancock Trust (since 2005); Vice President and Assistant Treasurer, Fidelity Group of Funds (until 2004); Vice President and Ethics & Compliance Officer, Fidelity Investments (until 2001). | |
| |
Michael J. Leary, Born: 1965 | 2007 |
Treasurer | |
Vice President, John Hancock Life Insurance Company (U.S.A.) and Treasurer for John Hancock Funds, John Hancock Funds II, John Hancock Funds III and John Hancock Trust (since May 2009); Assistant Treasurer, John Hancock Funds, John Hancock Funds II, John Hancock Funds III and John Hancock Trust (2007–2009); Vice President and Director of Fund Administration, JP Morgan (2004–2007); Vice President and Senior Manager of Fund Administration, JP Morgan (1993–2004); Manager, Ernst & Young, LLC (1988–1993). | |
| |
Charles A. Rizzo, Born: 1957 | 2007 |
Chief Financial Officer | |
Chief Financial Officer, John Hancock Funds, John Hancock Funds II, John Hancock Funds III and John Hancock Trust (since 2007); Assistant Treasurer, Goldman Sachs Mutual Fund Complex (registered investment companies) (2005– 2007); Vice President, Goldman Sachs (2005–2007); Managing Director and Treasurer of Scudder Funds, Deutsche Asset Management (2003–2005); Director, Tax and Financial Reporting, Deutsche Asset Management (2002–2003); Vice President and Treasurer, Deutsche Global Fund Services (1999–2002). | |
| |
John G. Vrysen, Born: 1955 | 2007 |
Chief Operating Officer (since 2005) | |
Senior Vice President, Manulife Financial Corporation (since 2006); Director, Executive Vice President and Chief Operating Officer, the Adviser, The Berkeley Group, John Hancock Investment Management Services, LLC and John Hancock Funds, LLC (since 2007); Chief Operating Officer, John Hancock Funds, John Hancock Funds II, John Hancock Funds III and John Hancock Trust (since 2007); Director, John Hancock Signature Services, Inc. (since 2005); Chief Financial Officer, the Adviser, The Berkeley Group, Manulife Financial Corporation Global Investment Management (U.S.), LLC, John Hancock Investment Management Services, LLC, John Hancock Funds, LLC, John Hancock Funds, John Hancock Funds II, John Hancock Funds III and John Hancock Trust (2005–2007); Vice President, Manulife Financial Corporation (until 2006). | |
The business address for all Trustees and Officers is 601 Congress Street, Boston, Massachusetts 02210-2805.
The Statement of Additional Information of the Fund includes additional information about members of the Board of Trustees of the Fund and is available without charge, upon request, by calling 1-800-225-5291.
33
Annual report | Lifecycle Retirement
|
Trustees |
James M. Oates, Chairman** |
James R. Boyle† |
Grace K. Fey† |
Charles L. Bardelis* |
Peter S. Burgess* |
Theron S. Hoffman** |
Hassell H. McClellan** |
Steven M. Roberts* |
John D. Richardson, Trustee Emeritus |
*Member of the Audit Committee |
**Member of the Compliance Committee |
†Non-Independent Trustees |
|
Officers |
Hugh McHaffie |
President |
Thomas M. Kinzler |
Secretary and Chief Legal Officer |
Francis V. Knox, Jr. |
Chief Compliance Officer |
Michael J. Leary |
Treasurer |
Charles A. Rizzo |
Chief Financial Officer |
John G. Vrysen |
Chief Operating Officer |
|
Investment adviser |
John Hancock Investment Management Services, LLC |
|
Investment Subadviser |
MFC Global Investment Management (U.S.A.) Limited |
|
Principal distributor |
John Hancock Funds, LLC |
|
Custodian |
State Street Bank and Trust Company |
|
Transfer agent |
John Hancock Signature Services, Inc. |
|
Legal counsel |
K&L Gates LLP |
The Fund’s proxy voting policies and procedures, as well as the Fund’s proxy voting record for the most recent twelve month period ended June 30, are available free of charge on the Securities and Exchange Commission (SEC) Website at sec.gov or on our Website.
The Fund’s complete list of portfolio holdings, for the first and third fiscal quarters, is filed with the SEC on Form3N-Q. The Fund’s Form N-Q is available on our Website and the SEC’s Website, www.sec.gov, and can be reviewed and copied (for a fee) at the SEC’s Public Reference Room in Washington, DC. Call 1-800-SEC-0330 to3receive information on the operation of the SEC’s Public Reference Room.
We make this information on your fund, as well as monthly portfolio holdings, and other fund details available on our Website www.jhfunds.com or by calling 1-800-225-5291.
| | |
You can also contact us: | | |
1-800-225-5291 | Regular mail: | Express mail: |
jhfunds.com | John Hancock Signature Services, Inc. | John Hancock Signature Services, Inc. |
| P.O. Box 9510 | Mutual Fund Image Operations |
| Portsmouth, NH 03802-9510 | 164 Corporate Drive |
| | Portsmouth, NH 03801 |
Month-end portfolio holdings are available at www.jhfunds.com.
Lifecycle Retirement | Annual report
John Hancock Funds II
Annual Report — Table of Contents
Manager’s Commentary and Fund Performance (See below for each Fund’s page #) | | 3 |
Shareholder Expense Examples | | 63 |
Portfolio of Investments (See below for each Fund’s page #) | | 69 |
Statements of Assets and Liabilities | | 376 |
Statements of Operations | | 388 |
Statements of Changes in Net Assets | | 400 |
Notes to Financial Statements | | 422 |
Report of Independent Registered Public Accounting Firm | | 492 |
Evaluation of Advisory and Subadvisory Agreements by the Board of Trustees | | 495 |
Trustees and Officers Information | | 514 |
Fund
| | | | Manager’s Commentary &
Fund Performance | | Portfolio of
Investments |
|---|
| Active Bond Fund | | | | | 4 | | | | 69 | |
| All Cap Core Fund | | | | | 5 | | | | 87 | |
| All Cap Growth Fund | | | | | 6 | | | | 90 | |
| All Cap Value Fund | | | | | 7 | | | | 92 | |
| Alpha Opportunities Fund | | | | | 8 | | | | 94 | |
| Alternative Asset Allocation Fund | | | | | 9 | | | | 99 | |
| American Diversified Growth & Income Portfolio | | | | | 10 | | | | 99 | |
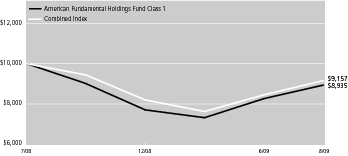
| American Fundamental Holdings Portfolio | | | | | 11 | | | | 99 | |
| American Global Diversification Portfolio | | | | | 12 | | | | 100 | |
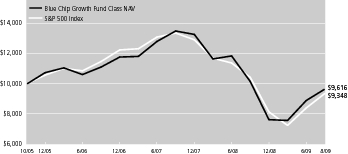
| Blue Chip Growth Fund | | | | | 13 | | | | 100 | |
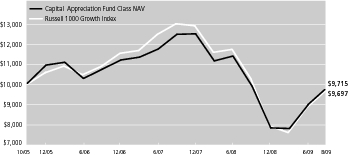
| Capital Appreciation Fund | | | | | 14 | | | | 102 | |
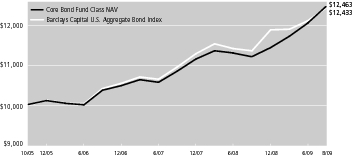
| Core Bond Fund | | | | | 15 | | | | 103 | |
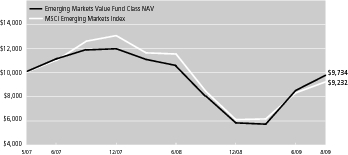
| Emerging Markets Value Fund | | | | | 16 | | | | 111 | |
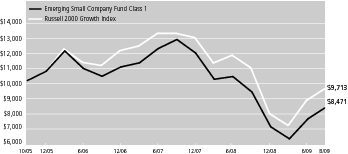
| Emerging Small Company Fund | | | | | 17 | | | | 125 | |
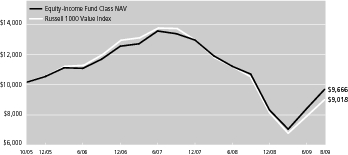
| Equity-Income Fund | | | | | 18 | | | | 127 | |
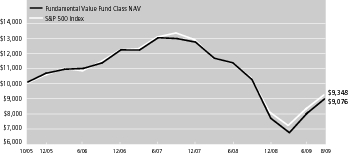
| Fundamental Value Fund | | | | | 19 | | | | 129 | |
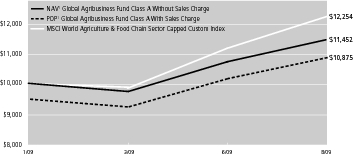
| Global Agribusiness Fund | | | | | 20 | | | | 131 | |
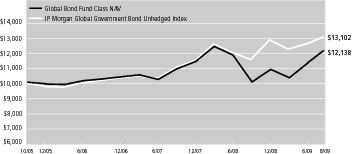
| Global Bond Fund | | | | | 21 | | | | 132 | |
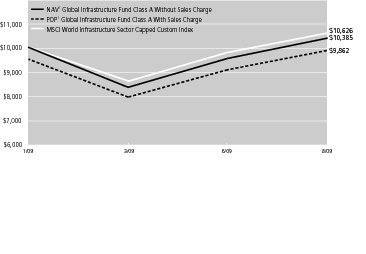
| Global Infrastructure Fund | | | | | 22 | | | | 140 | |
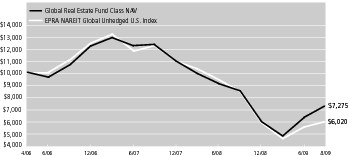
| Global Real Estate Fund | | | | | 23 | | | | 141 | |
| Global Timber Fund | | | | | 24 | | | | 143 | |
| High Income Fund | | | | | 25 | | | | 144 | |
| High Yield Fund | | | | | 26 | | | | 148 | |
| Index 500 Fund | | | | | 27 | | | | 156 | |
| International Equity Index Fund | | | | | 28 | | | | 162 | |
| International Opportunities Fund | | | | | 29 | | | | 180 | |
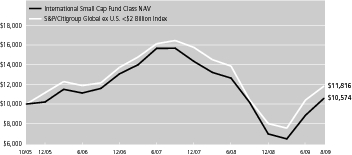
| International Small Cap Fund | | | | | 30 | | | | 182 | |
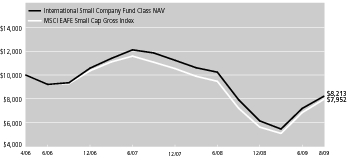
| International Small Company Fund | | | | | 31 | | | | 183 | |
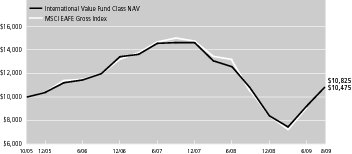
| International Value Fund | | | | | 32 | | | | 208 | |
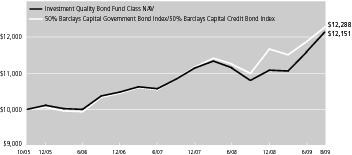
| Investment Quality Bond Fund | | | | | 33 | | | | 209 | |
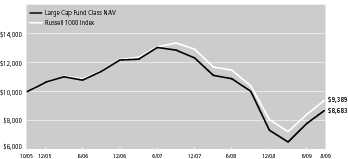
| Large Cap Fund | | | | | 34 | | | | 220 | |
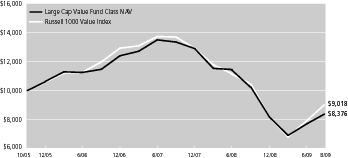
| Large Cap Value Fund | | | | | 35 | | | | 222 | |
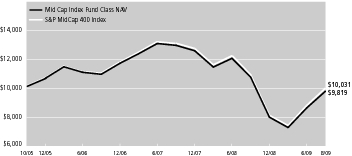
| Mid Cap Index Fund | | | | | 36 | | | | 223 | |
| Mid Cap Stock Fund | | | | | 37 | | | | 229 | |
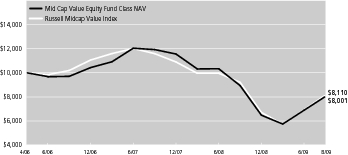
| Mid Cap Value Equity Fund | | | | | 38 | | | | 231 | |
| Mid Value Fund | | | | | 39 | | | | 233 | |
| Natural Resources Fund | | | | | 40 | | | | 236 | |
| Real Estate Equity Fund | | | | | 41 | | | | 237 | |
| Real Estate Securities Fund | | | | | 42 | | | | 237 | |
| Real Return Bond Fund | | | | | 43 | | | | 238 | |
| Short Term Government Income Fund | | | | | 44 | | | | 242 | |
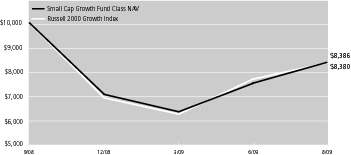
| Small Cap Growth Fund | | | | | 45 | | | | 242 | |
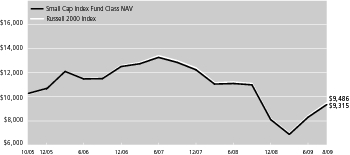
| Small Cap Index Fund | | | | | 46 | | | | 244 | |
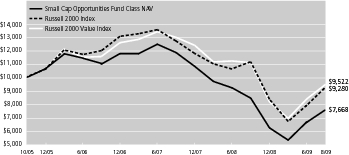
| Small Cap Opportunities Fund | | | | | 47 | | | | 263 | |
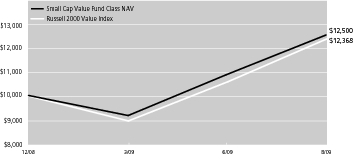
| Small Cap Value Fund | | | | | 48 | | | | 274 | |
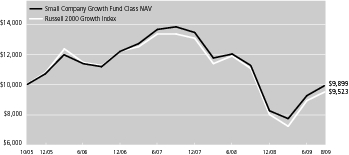
| Small Company Growth Fund | | | | | 49 | | | | 275 | |
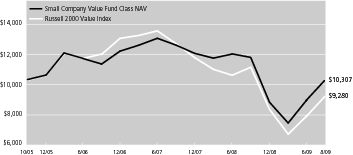
| Small Company Value Fund | | | | | 50 | | | | 277 | |
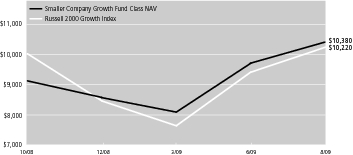
| Smaller Company Growth Fund | | | | | 51 | | | | 280 | |
| Spectrum Income Fund | | | | | 52 | | | | 292 | |
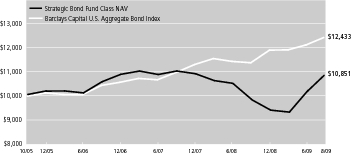
| Strategic Bond Fund | | | | | 53 | | | | 323 | |
| Strategic Income Fund | | | | | 54 | | | | 333 | |
| Total Bond Market Fund | | | | | 55 | | | | 340 | |
| Total Return Fund | | | | | 56 | | | | 348 | |
| U.S. Government Securities Fund | | | | | 57 | | | | 356 | |
| U.S. High Yield Bond Fund | | | | | 58 | | | | 359 | |
| U.S. Multi Sector Fund | | | | | 59 | | | | 365 | |
| Value Fund | | | | | 60 | | | | 370 | |
| Value & Restructuring Fund | | | | | 61 | | | | 371 | |
| Vista Fund | | | | | 62 | | | | 372 | |
2
John Hancock Funds II
Manager’s Commentary and Fund Performance
Fund Performance
In the following pages we have set forth information regarding the performance of each Fund of the John Hancock Funds II (the Trust). There are several ways to evaluate a Fund’s historical performance. One can look at the total percentage change in value, the average annual percentage change or the growth of a hypothetical $10,000 investment. With respect to all performance information presented, it is important to understand that past performance does not guarantee future results. Return and principal fluctuate, and shares, when redeemed, may be worth more or less than their original cost.
Performance Tables
The Performance Tables show two types of total return information: cumulative and average annual total returns. A cumulative total return is an expression of a Fund’s total change in share value in percentage terms over a set period of time — one, five and ten years (or since the Fund’s inception if less than the applicable period). An average annual total return takes the Fund’s cumulative total return for a time period greater than one year and shows what would have happened if the Fund had performed at a constant rate each year. The tables show all cumulative and average annual total returns, net of fees and expenses of the Trust, but do not reflect the insurance (separate account) expenses (including a possible contingent deferred sales charge) that invest in the Fund. If these were included, performance would be lower.
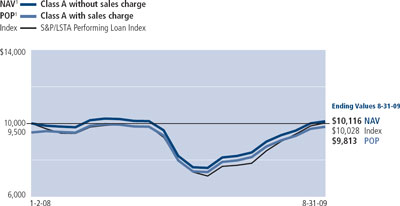
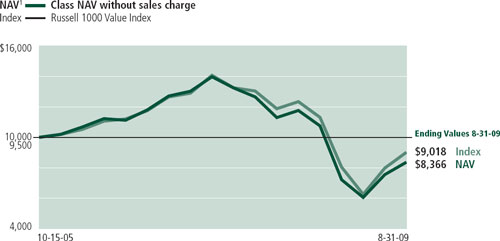
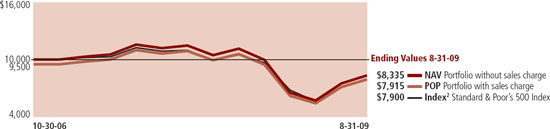
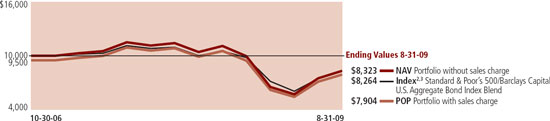
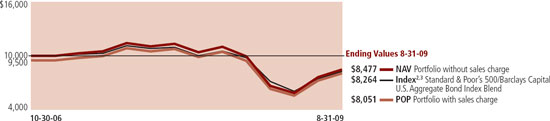
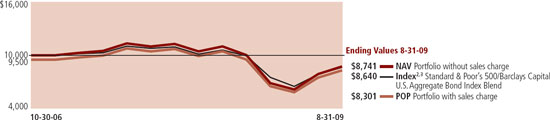
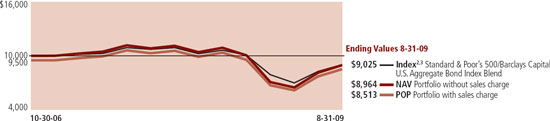
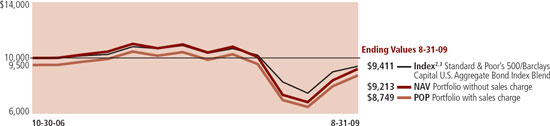
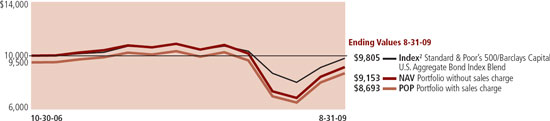
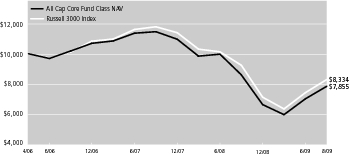
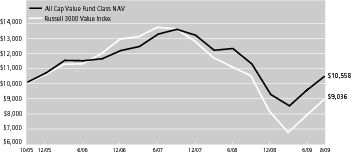
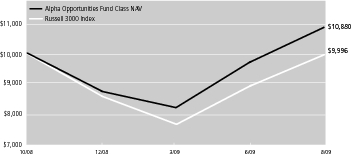
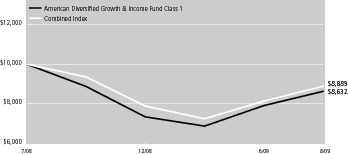
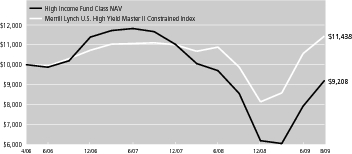
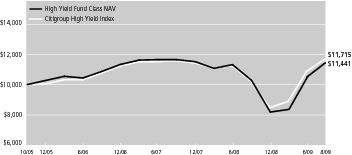
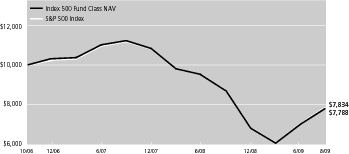
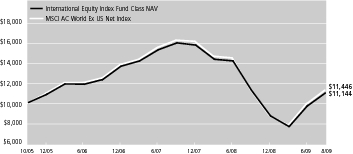
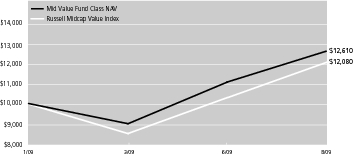
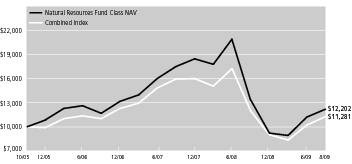
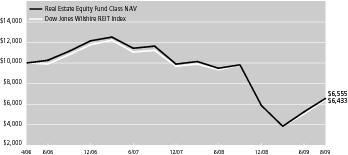
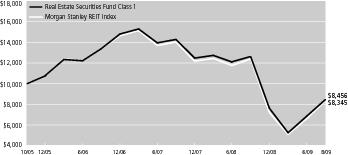
Graph — Change in Value of $10,000 Investment and Comparative Indices
The performance graph for each Fund shows the change in value of a $10,000 investment over the life or ten-year period of each Fund, whichever is shorter. Each Fund’s performance is compared with the performance of one or more broad-based securities indices as a “benchmark.” All performance information includes the reinvestment of dividends and capital gain distributions, as well as the deduction of ongoing management fees and Fund operating expenses. The benchmarks used for comparison are unmanaged and include reinvestment of dividends and capital gains distributions, if any, but do not reflect any fees or expenses. Funds that invest in multiple asset classes are compared with a customized benchmark. This benchmark is comprised of a set percentage allocation from each of the asset classes in which the Fund invests.
Portfolio Manager’s Commentary
Finally, we have provided a commentary by each portfolio manager regarding each Fund’s performance during the period ended August 31, 2009. The views expressed are those of the portfolio manager as of August 31, 2009, and are subject to change based on market and other conditions. Information about a Fund’s holdings, asset allocation or country diversification is historical and is no indication of future fund composition, which will vary. Information provided in this report should not be considered a recommendation to purchase or sell securities. The Funds are not insured by the FDIC, are not a deposit or other obligation of, or guaranteed by banks and are subject to investment risks including loss of principal amount invested. For a more detailed discussion of the risks associated with the Funds, see the Trust prospectus.
“Standard & Poor’s,” “Standard & Poor’s 500,” “S&P 500” and “S&P MidCap 400 Index” are trademarks of The McGraw-Hill Companies, Inc. “Russell 1000,” “Russell 2000,” “Russell 3000” and “Russell Midcap” are trademarks of Frank Russell Company. “Wilshire 5000” is a trademark of Wilshire Associates. “Morgan Stanley European Australian Far East Free”, “EAFE” and “MSCI” are trademarks of Morgan Stanley & Co. Incorporated. “Barclays Capital” is a registered trademark of Barclays Bank PLC. ”Lipper“ is a registered trademark of Reuters S.A. None of the Trusts are sponsored, endorsed, managed, advised, sold or promoted by any of these companies, and none of these companies make any representation regarding the advisability of investing in the Trust.
3
Active Bond Fund
Subadviser: Declaration Management & Research, LLC and MFC Global Investment Management (U.S.), LLC
Portfolio Managers: Peter Farley, James E. Shallcross, Barry Evans, Howard C. Greene and Jeffrey N. Givens
INVESTMENT OBJECTIVE & POLICIES 4 The Fund seeks income and capital appreciation by investing at least 80% of its net assets in a diversified mix of debt securities and instruments.
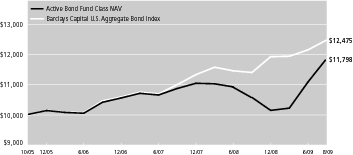
CHANGE IN VALUE OF $10,000 INVESTMENT AND COMPARATIVE INDICES
Sector Weighting* | % of Total |
Financial | 22.14 |
Federal National Mortgage Association | 20.06 |
Mortgage Securities | 14.85 |
Energy | 7.66 |
Communications | 5.41 |
Utilities | 4.98 |
Consumer, Non-cyclical | 4.70 |
Consumer, Cyclical | 2.79 |
U.S. Treasury Notes | 2.63 |
Industrial | 2.59 |
|
| * | Top Sectors as a percentage of market value. Does not include short-term securities and investments in the John Hancock Collateral
Investment Trust, if applicable. |
PORTFOLIO MANAGERS’ COMMENTARY
Performance 4 For the year ended August 31, 2009, the Active Bond Class NAV returned +8.73%, compared to the +7.94% return of the Barclays Capital U.S. Aggregate Bond Index.
Declaration Commentary:
Market Environment 4 Short-term interest rates fell sharply as the Federal Reserve focused on providing maximum liquidity to combat the financial crisis. Over the course of the year, the market and the economy responded to many historic events: the worst housing market since the Great Depression, the failure of Lehman Brothers, the conservatorship of the Fannie Mae and Freddie Mac, and the bailouts of AIG, Chrysler and General Motors. The government response to the crisis was swift and in most cases effective. The Troubled Asset Relief Program (TARP) stabilized many financial institutions. The Term Asset-Backed Securities Loan Facility (TALF) rejuvenated the market for asset-backed securities and commercial mortgage-backed securities.
The Fed kept the commercial paper market functioning. Equity markets bottomed in March and then recovered half of their losses, finishing down roughly 20% for the 12-month period. The financial crisis has abated now to the point that special Fed liquidity programs are being unwound. It was a very challenging market to navigate, with the credit crisis continuing to unfold and economy shrinking and going through massive job losses, while certain asset classes recovered so strongly that they finished the period at pre-crisis spread levels.
The portfolio outperformed the benchmark as fixed income credit sectors initially sold off, but then rallied later in the period. The portfolio added exposure to corporate credit and commercial mortgage-backed securities at historically wide spread levels, which greatly helped performance. Specifically, adding exposure to bank and finance, insurance and REITS was beneficial. Non-agency mortgage sectors failed to recover fully as the abysmal housing market weighed on performance.
The U.S. economy is expected to transition to a period of sluggish growth from the current recession. Growth will come from business investment, though a rebound in consumer spending is hard to foresee as unemployment remains high. The Fed is expected to leave interest rates on hold until early 2010 though regional reports of recovery are increasing odds of a rate hike. Credit markets have recovered dramatically, though some areas of value remain in corporate bonds and commercial mortgage-backed securities.
MFC Commentary:
Market Environment 4 U.S. bonds posted positive results for the 12-month period despite tremendous market volatility and unprecedented turmoil in the economy and Financial sector. The period began with a severe economic downturn and a liquidity crisis in the credit markets that crippled the financial sector, leading to the bankruptcy or takeover of several major financial institutions. In this environment, Treasury bonds and other high-quality securities posted strong gains amid a substantial flight to quality, while corporate bonds declined sharply as investors shunned riskier securities. In early 2009, however, market conditions changed as the federal government’s efforts to thaw the credit markets, shore up the Financial sector, and stimulate economic growth began to bear fruit. By mid-2009, the U.S. economy was showing signs of stabilization, and liquidity in the credit markets had gradually improved. As a result, bond market leadership shifted — a more positive outlook led to a rally in riskier assets, with corporate bonds posting the best returns, while Treasury securities lagged.
The portfolio’s exposure to corporate bonds hurt performance in the beginning of the period. However, a move to increase corporate bond exposure in late 2008 and early 2009, when corporate bonds were trading at significantly depressed valuations, contributed to the portfolio’s outperformance of its benchmark. At the beginning of the 12-month period, corporate bonds made up about a third of the portfolio, which was low by historical standards. However, as we took advantage of tremendous price dislocations in the corporate bond market, the portfolio’s corporate bond holdings increased to more than half of the portfolio by the end of the period. This strategy proved favorable as corporate bonds outperformed by a substantial margin in the last six months. The fund’s limited exposure to Treasury bonds also added value as these securities underperformed.
We believe that the economy is in a nascent recovery phase that appears to be sustainable, given the enormous amount of federal stimulus in place. However, we expect the recovery to progress at a gradual pace. Despite the rebound in corporate bonds so far in 2009, valuations are comparable to those in late 2002, the peak of the last recession. As a result, we still believe this segment of the bond market is attractively valued.
PERFORMANCE TABLE1
|
|
|
| Average Annual Total Return
|
| Cumulative Total Return
|
|
|---|
Period Ended August 31, 2009 | | | | | 1-year | | | | 5-year | | | | 10-year | | | | Since
inception | | | | 1-year | | | | 5-year | | | | 10-year | | | | Since
inception | |
| Active Bond Class 1 (began 10/15/05) | | | | | 8.68 | % | | | — | | | | — | | | | 4.20 | % | | | 8.68 | % | | | — | | | | — | | | | 17.31 | % |
| Active Bond Class NAV (began 10/27/05) | | | | | 8.73 | % | | | — | | | | — | | | | 4.39 | % | | | 8.73 | % | | | — | | | | — | | | | 17.98 | % |
Barclays Capital U.S. Aggregate Bond (10/15/05)2,3,4 | | | | | 7.94 | % | | | — | | | | — | | | | 5.77 | % | | | 7.94 | % | | | — | | | | — | | | | 24.33 | % |
Barclays Capital U.S. Aggregate Bond Index (10/27/05)2,3,4 | | | | | 7.94 | % | | | — | | | | — | | | | 5.92 | % | | | 7.94 | % | | | — | | | | — | | | | 24.75 | % |
| 1 | | Performance does not reflect the deduction of taxes on fund distributions or redemptions of fund shares. Past performance does not predict future performance. |
| 2 | | Since inception returns for the indices may begin on the month-end closest to the actual inception date of the fund. |
| 3 | | Barclays Capital U.S. Aggregate Bond Index is an unmanaged index of dollar-denominated and nonconvertible investment-grade debt issues. |
| 4 | | It is not possible to invest directly in an index. |
The expense ratios of the Fund, both net (including any fee waivers or expense limitations) and gross (excluding any fee waivers or expense limitations), are set forth according to the most recent publicly available prospectuses for the Fund and may differ from the expense ratios disclosed in the Financial Highlights tables in this report. The net expenses equal the gross expenses and are as follows: Class 1 – 0.72% and Class NAV – 0.67%.
4
All Cap Core Fund
Subadviser: Deutsche Investment Management Americas Inc.
Portfolio Managers: Robert Wang and James Francis
INVESTMENT OBJECTIVE & POLICIES 4 To seek long-term growth of capital by investing in common stocks and other equity securities within all asset classes primarily in the Russell 3000 Index.
CHANGE IN VALUE OF $10,000 INVESTMENT AND COMPARATIVE INDICES
Sector Weighting* | % of Total |
Consumer, Non-cyclical | 22.06 |
Industrial | 12.16 |
Financial | 11.61 |
Communications | 10.07 |
Energy | 8.70 |
Technology | 7.51 |
Consumer, Cyclical | 5.82 |
Basic Materials | 5.14 |
Utilities | 3.14 |
|
| * | Top Sectors as a percentage of market value. Does not include short-term securities and investments in the John Hancock Collateral
Investment Trust, if applicable. |
PORTFOLIO MANAGERS’ COMMENTARY
Performance 4 For the year ended August 31, 2009, the All Cap Core Class NAV returned –20.07%, compared to the –18.62% return of the Russell 3000 Index.
Market Environment 4 The last 12 months was one of the most extreme periods in recent stock market history. The final four months of 2008 witnessed the collapse of Lehman Brothers and AIG as well as the demise of several major banks including Wachovia and Washington Mutual. 2008 ended on a positive note as the markets rallied in December. However, recovery hopes were dashed after the market swooned in the first quarter. Since March, financial markets have recovered dramatically as it appears the economy is on the mend. The case for recovery has been bolstered by the many Fed-sponsored lending programs that have helped restore liquidity to the market. In addition, several federal programs, including “Cash for Clunkers” and the first-time homebuyer credit, have enticed consumers to resume making big-ticket purchases, a key component of economic growth.
Housing is showing significant improvements as evidenced by the most recent housing report, which showed that new home sales, in line with gains in existing home sales, surged 9.6% in July following an upward revised 9.1% surge in June. The 433,000 annual unit pace is the best since September 2008. The strong sales pulled down new homes on the market to 271,000 versus 280,000 in June and down from 419,000 a year ago. The 271,000 level is the lowest since 1993. Supply at the current sales rate is down to 7.5 months, the lowest level since April 2007 and well down from June’s 8.5 months.
All told, we expect the recovery to continue. However, the levels of growth should be sluggish due to continued job losses and the large amounts of excess productive capacity in the U.S. and around the globe.
The fund underperformed its benchmark during the period. Stocks within the banks, consumer durables and apparel, and materials industry groups contributed most to relative performance. The largest detractors from relative performance were energy, pharmaceuticals and biotechnology, and transportation.
| | | | | | | | | | | | | | | | | | |
|---|
PERFORMANCE TABLE 1
|
|
|
| Average Annual Total Return
|
| Cumulative Total Return
|
|
|---|
Period Ended August 31, 2009 | | | | | 1-year | | | | 5-year | | | | 10-year | | | | Since
inception | | | | 1-year | | | | 5-year | | | | 10-year | | | | Since
inception | |
| All Cap Core Class NAV (began 4/28/06) | | | | | –20.07 | % | | | — | | | | — | | | | –6.97 | % | | | –20.07 | % | | | — | | | | — | | | | –21.45 | % |
Russell 3000 Index2,3,4 | | | | | –18.62 | % | | | — | | | | — | | | | –5.31 | % | | | –18.62 | % | | | — | | | | — | | | | –16.66 | % |
| 1 | | Performance does not reflect the deduction of taxes on fund distributions or redemptions of fund shares. Past performance does not predict future performance. |
| 2 | | Since inception returns for the indices may begin on the month-end closest to the actual inception date of the fund. |
| 3 | | Russell 3000 Index is an unmanaged index of the 3,000 largest U.S. companies based on total market capitalization, which represents approximately 98% of the investable U.S. equity market. |
| 4 | | It is not possible to invest directly in an index. |
The expense ratios of the Fund, both net (including any fee waivers or expense limitations) and gross (excluding any fee waivers or expense limitations), are set forth according to the most recent publicly available prospectuses for the Fund and may differ from the expense ratios disclosed in the Financial Highlights tables in this report. For Class NAV, the net expense equals the gross expense and is 0.80%.
5
All Cap Growth Fund
Subadviser: Invesco AIM Capital Management, Inc.
Portfolio Managers: Robert J. Lloyd & Ryan A. Amerman
INVESTMENT OBJECTIVE & POLICIES 4 To seek long-term capital appreciation by investing the Fund’s assets primarily in common stocks of companies that are believed to benefit from new or innovative products, services or processes as well as those that have experienced above-average, long-term growth in earnings and have excellent prospects for future growth.
CHANGE IN VALUE OF $10,000 INVESTMENT AND COMPARATIVE INDICES
Sector Weighting* | % of Total |
Consumer, Non-cyclical | 26.09 |
Technology | 17.52 |
Industrial | 13.57 |
Consumer, Cyclical | 11.82 |
Communications | 11.04 |
Financial | 6.53 |
Energy | 5.77 |
Basic Materials | 2.70 |
|
| * | Top Sectors as a percentage of market value. Does not include short-term securities and investments in the John Hancock Collateral
Investment Trust, if applicable. |
PORTFOLIO MANAGERS’ COMMENTARY
Performance 4 For the year ended August 31, 2009, the All Cap Growth Class 1 returned –23.94%, compared to the –17.17% return of the Russell 3000 Growth Index.
Market Environment 4 Major U.S. equity markets fell by double digits during the period, as significant problems in the credit markets, weakness in the housing market, rising energy and food prices and a deteriorating outlook for corporate earnings led to a global economic recession. However, global equity markets began to recover some of these losses in early March 2009.
The Fund’s key detractors from relative results versus its benchmark included Energy, Industrials and Materials, driven largely by poor stock selection and an overweight position in late 2008, when many stocks in these sectors were battered by the global economic slowdown. Underperformance in the Information Technology and Consumer Discretionary sectors was driven by stock selection and an underweight position in early 2009 when many stocks in these sectors rallied as the market began to rebound.
Among the Fund’s key contributors to relative performance were Telecommunications and Utilities, driven primarily by good stock selection. Outperformance in the Financials sector was due to stock selection and an underweight position when many of these stocks had weak performance because of the credit crisis.
Early in the period, the portfolio had significant exposure to sectors benefiting from global economic expansion and development, including Energy, Materials and Industrials. During the fourth quarter of 2008, we repositioned the portfolio for an economic recession. We significantly reduced the Fund’s exposure to the Energy, Materials and Industrials sectors, and built overweight positions in more defensive sectors such as Health Care and Consumer Staples. This defensive positioning aided performance as the stock market faltered through early 2009. However, when the market began to recover in March, this defensive positioning hurt performance. We began to reposition the portfolio in April, as the economy showed signs of stabilizing and we identified companies with the potential for sustainable earnings growth in a more stable economic environment. This repositioning included a reduction in the more defensive Health Care and Consumer Staples sectors, and a significant increase in the more economically sensitive sectors, including Information Technology and Consumer Discretionary.
| | | | | | | | | | | | | | | | | | |
|---|
PERFORMANCE TABLE 1
|
|
|
| Average Annual Total Return
|
| Cumulative Total Return
|
|
|---|
Period Ended August 31, 2009 | | | | | 1-year | | | | 5-year | | | | 10-year | | | | Since
inception | | | | 1-year | | | | 5-year | | | | 10-year | | | | Since
inception | |
| All Cap Growth Class 1 (began 10/15/05) | | | | | –23.94 | % | | | — | | | | — | | | | –5.10 | % | | | –23.94 | % | | | — | | | | — | | | | –18.37 | % |
Russell 3000 Growth Index2,3,4 | | | | | –17.17 | % | | | — | | | | — | | | | –0.78 | % | | | –17.17 | % | | | — | | | | — | | | | –2.97 | % |
| 1 | | Performance does not reflect the deduction of taxes on fund distributions or redemptions of fund shares. Past performance does not predict future performance. |
| 2 | | Since inception returns for the indices may begin on the month-end closest to the actual inception date of the fund. |
| 3 | | Russell 3000 Growth Index is an unmanaged index that measures the performance of those Russell 3000 Index companies with higher price-to-book ratios and higher forecasted growth values. The stocks in this index are also members of either the Russell 1000 Growth or the Russell 2000 Growth indexes. |
| 4 | | It is not possible to invest directly in an index. |
The expense ratios of the Fund, both net (including any fee waivers or expense limitations) and gross (excluding any fee waivers or expense limitations), are set forth according to the most recent publicly available prospectuses for the Fund and may differ from the expense ratios disclosed in the Financial Highlights tables in this report. For Class 1, the net expense equals the gross expense and is 0.98%.
6
All Cap Value Fund
Subadviser: Lord, Abbett & Co. LLC
Portfolio Managers: Robert P. Fetch and Deepak Khana
INVESTMENT OBJECTIVE & POLICIES 4 To seek capital appreciation by investing in equity securities of U.S. and multinational companies in all capitalization ranges that are believed to be undervalued.
CHANGE IN VALUE OF $10,000 INVESTMENT AND COMPARATIVE INDICES
Sector Weighting* | % of Total |
Financial | 21.84 |
Consumer, Non-cyclical | 19.96 |
Industrial | 14.41 |
Consumer, Cyclical | 13.70 |
Energy | 10.28 |
Technology | 5.35 |
Basic Materials | 3.77 |
Communications | 1.61 |
|
| * | Top Sectors as a percentage of market value. Does not include short-term securities and investments in the John Hancock Collateral
Investment Trust, if applicable. |
PORTFOLIO MANAGERS’ COMMENTARY
Performance 4 For the year ended August 31, 2009, the All Cap Value Class NAV returned –14.34%, compared to the –20.30% return of the Russell 3000 Value Index.
Market Environment 4 The U.S. suffered a substantial slowdown in economic activity during the later half of 2008, marked by continuing weak housing prices, banks reluctant to lend money and a slowing job market. As we moved through 2009, however, we began to see early evidence of a bottoming in overall economic activity.
During the period, large-, mid- and small-cap stocks within the Russell 3000 Value Index all declined by double digits. Within Morningstar’s market capitalization definitions, the portfolio’s weighting in large-cap stocks at period end was 56.5% versus 69.7% for the benchmark. Exposure to mid-cap stocks was 38.3% versus 20.8%, and the small-cap allocation was 3.8% versus 9.5% for the portfolio and benchmark, respectively.
Health Care was the portfolio’s best contributing sector relative to the benchmark Index. Stock selection within the Consumer Staples sector also aided relative performance. An agricultural processor rose sharply in the poor stock market environment of late 2008 following a September quarter earnings result that far surpassed analysts’ expectations. Fears of a margin squeeze evaporated as corn prices fell dramatically in the second half of 2008.
Stock selection within the Energy sector was the largest detractor from performance. Stock selection within Technology also hurt relative performance somewhat.
| | | | | | | | | | | | | | | | | | |
|---|
PERFORMANCE TABLE 1
|
|
|
| Average Annual Total Return
|
| Cumulative Total Return
|
|
|---|
Period Ended August 31, 2009 | | | | | 1-year | | | | 5-year | | | | 10-year | | | | Since
inception | | | | 1-year | | | | 5-year | | | | 10-year | | | | Since
inception | |
| All Cap Value Class 1 (began 10/15/05) | | | | | –14.42 | % | | | — | | | | — | | | | 1.36 | % | | | –14.42 | % | | | — | | | | — | | | | 5.40 | % |
| All Cap Value Class NAV (began 10/15/05) | | | | | –14.34 | % | | | — | | | | — | | | | 1.41 | % | | | –14.34 | % | | | — | | | | — | | | | 5.58 | % |
Russell 3000 Value Index2,3,4 | | | | | –20.30 | % | | | — | | | | — | | | | –2.58 | % | | | –20.30 | % | | | — | | | | — | | | | –9.64 | % |
| 1 | | Performance does not reflect the deduction of taxes on fund distributions or redemptions of fund shares. Past performance does not predict future performance. |
| 2 | | Since inception returns for the indices may begin on the month-end closest to the actual inception date of the fund. |
| 3 | | Russell 3000 Value Index is an unmanaged index that measures the performance of those Russell 3000 companies with lower price-to-book ratios and lower forecasted growth values. The stocks in this index are also members of either the Russell 1000 Value or Russell 2000 Value indices. |
| 4 | | It is not possible to invest directly in an index. |
The expense ratios of the Fund, both net (including any fee waivers or expense limitations) and gross (excluding any fee waivers or expense limitations), are set forth according to the most recent publicly available prospectuses for the Fund and may differ from the expense ratios disclosed in the Financial Highlights tables in this report. The net expenses equal the gross expenses and are as follows: Class 1 – 0.97% and Class NAV – 0.92%.
7
Alpha Opportunities Fund
Subadviser: Wellington Management Company, LLP
Portfolio Managers: Kent Stahl, CFA and Gregg Thomas, CFA
INVESTMENT OBJECTIVE & POLICIES 4 To seek long-term total return by employing a “multiple sleeve structure” which means the Fund has several components that are managed separately in different investment styles. The Fund seeks to obtain its objective by combining these different components into a single fund. For purposes of the Fund, “total return” means growth of capital and investment income (dividends and interest).
CHANGE IN VALUE OF $10,000 INVESTMENT AND COMPARATIVE INDICES
Sector Weighting* | % of Total |
Consumer, Non-cyclical | 16.61 |
Financial | 15.15 |
Consumer, Cyclical | 10.91 |
Industrial | 10.38 |
Technology | 10.06 |
Energy | 9.86 |
Communications | 7.82 |
Basic Materials | 5.43 |
Investment Companies | 1.14 |
Utilities | 0.32 |
|
| * | Top Sectors as a percentage of market value. Does not include short-term securities and investments in the John Hancock Collateral
Investment Trust, if applicable. |
PORTFOLIO MANAGERS’ COMMENTARY
Performance 4 From its inception on October 7, 2008 to August 31, 2009, the Alpha Opportunities Class NAV returned +8.80%, compared to the –0.04% return of the Russell 3000 Index.
Market Environment 4 Global equity markets rose during the reporting period despite continuing difficulty in credit markets and recessionary struggles in countries across the globe. Equity markets bottomed in March 2009 before rebounding off of their lows, as many companies beat earnings expectations, driven by significant cost-cutting measures. Several countries began to report economic growth in August 2009 and declared that they had moved out of recession and into recovery.
Over the same period, six of the 10 sectors within the Russell 3000 Index registered positive returns. Information Technology (16.5%), Materials (8.7%) and Consumer Discretionary (8.5%) performed the best. Financials (–15.8%), Energy (–7.8%) and Industrials (–5.5%) performed the worst.
The fund’s relative outperformance was driven by both strong sector allocation and security selection decisions. The fund benefited from an underweight to and security selection within Financials, as well as an allocation to cash. Results in Health Care (overweight) and Consumer Staples (underweight) were also positive on both a sector allocation and security selection basis. Security selection within Materials and an underweight to Information Technology detracted from relative performance.
| | | | | | | | | | | | | | | | | | |
|---|
PERFORMANCE TABLE1
|
|
|
| Average Annual Total Return
|
| Cumulative Total Return
|
|
|---|
Period Ended August 31, 2009 | | | | | 1-year | | | | 5-year | | | | 10-year | | | | Since
inception | | | | 1-year | | | | 5-year | | | | 10-year | | | | Since
inception | |
| Alpha Opportunities Class NAV (began 10/7/08) | | | | | — | | | | — | | | | — | | | | — | | | | — | | | | — | | | | — | | | | 8.80 | % |
Russell 3000 Index2,3,4 | | | | | — | | | | — | | | | — | | | | — | | | | — | | | | — | | | | — | | | | –0.04 | % |
| 1 | | Performance does not reflect the deduction of taxes on fund distributions or redemptions of fund shares. Past performance does not predict future performance. |
| 2 | | Since inception returns for the indices may begin on the month-end closest to the actual inception date of the fund. |
| 3 | | Russell 3000 Index is an unmanaged index of the 3,000 largest U.S. companies based on total market capitalization, which represents approximately 98% of the investable U.S. equity market. |
| 4 | | It is not possible to invest directly in an index. |
The expense ratios of the Fund, both net (including any fee waivers or expense limitations) and gross (excluding any fee waivers or expense limitations), are set forth according to the most recent publicly available prospectuses for the Fund and may differ from the expense ratios disclosed in the Financial Highlights tables in this report. For Class NAV, the net expense equals the gross expense and is 1.07%.
8
Alternative Asset Allocation Fund
Subadviser: MFC Global Investment Management (U.S.A.) Limited
Portfolio Managers: Steve Orlich and Scott Warlow
INVESTMENT OBJECTIVE & POLICIES 4 To seek long-term growth of capital by investing in “alternative asset classes”. The fund will allocate its assets among other funds in the John Hancock Funds complex and other investment companies, including ETFs, that emphasize alternative or non-traditional asset categories or investment categories. Alternative or non-traditional asset categories generally have a low correlation with the broad U.S. stock and bond market.
CHANGE IN VALUE OF $10,000 INVESTMENT AND COMPARATIVE INDICES
Sector Weighting* | % of Total |
Emerging Markets | 16.22 |
Real Estate | 16.21 |
Bank Loan | 13.53 |
Treasury Inflation-Protected Securities | 11.58 |
Global Bond | 9.64 |
International Small Cap | 9.00 |
High Yield Bond | 8.88 |
Exchange Traded Funds and Other | 8.70 |
Natural Resources | 6.24 |
|
| * | Top Sectors as a percentage of market value. Does not include short-term securities and investments in the John Hancock Collateral
Investment Trust, if applicable. |
PORTFOLIO MANAGERS’ COMMENTARY
Fund Results 4 From its inception on January 2, 2009 to August 31, 2009, the Alternative Asset Allocation Class A returned +28.20%, compared to the +13.79% return of the Combined Index.
Market Environment 4 The eight months ended August 31, 2009 marked a period of extraordinary ups and downs for the U.S. stock market. Panic selling characterized the difficult months of January and February, as investors reacted to dismal economic news. There was virtually nowhere for investors to hide as the sharp selloff in the market was accompanied by steep losses in commodities, real estate and a number of other asset classes. Overall, U.S. stocks experienced their worst year since the Great Depression in 1931.
Most fixed income asset classes also struggled in early 2009. Facing a crisis of confidence, investors fled to the safety of Treasury securities, making the asset class one of the best-performing areas and one of the few to post positive returns during that time. On the opposite side, high-yield bonds suffered double-digit losses, and even many investment-grade corporate bonds did poorly.
However, equities began to rally vigorously in March. The spectacular gains were spurred by bargain hunting and a reduction in the desperate fear that had gripped market participants since the fall. Many equity asset classes outpaced the S&P 500 Index during the recovery. Global equity markets rallied as well, with riskier asset classes such as emerging markets producing especially strong returns (note that these returns were helped by considerable dollar weakness). The credit markets also improved in the second half of the period, buoyed by significant action on the part of the government. The segments that had sustained some of the worst damage in 2008, high-yield bonds and bank loans, performed best as investors began to shift assets back into riskier areas.
From an asset allocation standpoint, the portfolio benefited on the equity side from allocations to emerging market equities, international small cap equities and global real estate, all of which outperformed the S&P 500 Index. On the fixed income side, the portfolio’s results were buoyed by bank loans and high yield bonds, both of which outpaced the Barclay’s Capital Aggregate Bond Index. Conversely, an allocation to global bonds detracted from performance. From a manager perspective, Emerging Markets (Dimensional) added to performance by outperforming its benchmark, the MSCI Emerging Markets Index. Additionally, Natural Resources (Wellington) aided the portfolio’s results by beating its benchmark, the MSCI Global Natural Resources Index, while Real Return Bond (PIMCO) outpaced the Barclays Capital U.S. TIPS Index. Conversely, Floating Rate Income (WAMCO)underperformed the Barclays Capital U.S. High Yield Loan Index and detracted from the portfolio’s overall results.
| | | | | | | | | | | | | | | | | | |
|---|
PERFORMANCE TABLE2,6
|
|
|
| Average Annual Total Return
|
| Cumulative Total Return
|
|
|---|
Period Ended August 31, 2009 | | | | | 1-year | | | | 5-year | | | | 10-year | | | | Since
inception | | | | 1-year | | | | 5-year | | | | 10-year | | | | Since
inception | |
| Alternative Asset Allocation Class A (began 1/2/09) | | | | | — | | | | — | | | | — | | | | — | | | | — | | | | — | | | | — | | | | 28.20 | % |
Combined Index3,4,5 | | | | | — | | | | — | | | | — | | | | — | | | | — | | | | — | | | | — | | | | 13.79 | % |
| 1 | | NAV represents net asset value and POP represents public offering price. |
| 2 | | Performance does not reflect the deduction of taxes on fund distributions or redemptions of fund shares. Past performance does not predict future performance. |
| 3 | | Since inception returns for the indices may begin on the month-end closest to the actual inception date of the fund. |
| 4 | | The Combined Index represents 55% of the MSCI AC World Index and 45% Barclays Capital U.S. Aggregate Bond Index. |
| 5 | | It is not possible to invest directly in an index. |
| 6 | | Since inception, a portion of the Alternative Asset Allocation Fund expenses were reimbursed. If such expenses had not been reimbursed, returns would be lower. |
The expense ratios of the Fund, both net (including any fee waivers or expense limitations) and gross (excluding any fee waivers or expense limitations), are set forth according to the most recent publicly available prospectuses for the Fund and may differ from the expense ratios disclosed in the Financial Highlights tables in this report. For Class A, the net expense equals the gross expense and is 1.65%.
9
American Diversified Growth & Income Portfolio*
*As of September 25, 2009, name changed to Core Diversified Growth & Income.
Subadviser: MFC Global Investment Management (U.S.A.) Limited
Portfolio Managers: Steve Orlich and Scott Warlow
INVESTMENT OBJECTIVE & POLICIES 4 To seek long-term growth of capital and income by investing in other funds and other investment companies. Under normal market conditions, the fund will generally invest between 65% and 75% of its assets in equity securities, which include securities held by the underlying funds, and between 25% and 35% of its assets in fixed income securities, which include securities held by the underlying funds.
CHANGE IN VALUE OF $10,000 INVESTMENT AND COMPARATIVE INDICES
Sector Weighting* | % of Total |
Energy | 23.94 |
Large Value | 17.97 |
U.S. Large Cap | 15.96 |
Intermediate Bond | 14.10 |
Financial | 6.04 |
International Mid Cap | 4.99 |
International | 4.99 |
Utilities | 4.01 |
Diversified | 3.99 |
High Yield Bond | 2.01 |
|
| * | Top Sectors as a percentage of market value. Does not include short-term securities and investments in the John Hancock Collateral
Investment Trust, if applicable. |
PORTFOLIO MANAGERS’ COMMENTARY
Fund Results 4 For the year ended August 31, 2009, the American Diversified Growth & Income Class 1 returned –11.47%, compared to the –11.69% return of the Combined Index.
Market Environment 4 The 12 months ended August 31, 2009 marked a period of extraordinary ups and downs for the U.S. stock market. Panic selling characterized the difficult months from September through February, as investors reacted to dismal economic news, including freefalling home prices, surging unemployment, and declining GDP. There was virtually nowhere for investors to hide as the sharp selloff in the market was accompanied by steep losses in commodities, real estate and a number of other asset classes. Overall, U.S. stocks experienced their worst year since the Great Depression in 1931.
Most fixed income asset classes also struggled in late 2008 and early 2009. Facing a crisis of confidence, investors fled to the safety of Treasury securities, making the asset class one of the best-performing areas and one of the few to post positive returns during that time. On the opposite side, high-yield bonds suffered double-digit losses, and even many investment-grade corporate bonds did poorly.
The market decline continued into early 2009; however equities began to rally vigorously in March. The spectacular gains were spurred by bargain hunting and a reduction in the desperate fear that had gripped market participants since the fall. Many equity asset classes outpaced the S&P 500 Index during the recovery. Global equity markets rallied as well, with riskier asset classes such as emerging markets producing especially strong returns (note that these returns were helped by considerable dollar weakness). The credit markets also improved in the second half of the period, buoyed by significant action on the part of the government. The segments that had sustained some of the worst damage in 2008, high-yield bonds and bank loans, performed best as investors began to shift assets back into riskier areas.
From an asset allocation standpoint, the portfolio benefited from exposure to international large cap equities, international small cap equities, emerging market equities, and global bonds. Conversely, an allocation to high yield bonds detracted from performance. From a manager perspective, The Investment Company of America contributed positively to results by outperforming the S&P 500 Index. EuroPacific Growth Fund, Capital World Growth and Income Fund, and New Perspective Fund also helped the portfolio’s overall results by outperforming their respective benchmarks. Conversely, The Bond Fund of America underperformed the Barclays Capital U.S. Aggregate Bond Index by a significant margin and detracted from the portfolio’s performance. Washington Mutual Investors Fund and American Capital World Bond Fund also caused a drag by lagging their respective benchmarks.
| | | | | | | | | | | | | | | | | | |
|---|
PERFORMANCE TABLE1,5
|
|
|
| Average Annual Total Return
|
| Cumulative Total Return
|
|
|---|
Period Ended August 31, 2009 | | | | | 1-year | | | | 5-year | | | | 10-year | | | | Since
inception | | | | 1-year | | | | 5-year | | | | 10-year | | | | Since
inception | |
American Diversified Growth & Income Class 1
(began 7/01/08) | | | | | –11.47 | % | | | — | | | | — | | | | –11.82 | % | | | –11.47 | % | | | — | | | | — | | | | –13.68 | % |
Combined Index2,3,4 | | | | | –11.69 | % | | | — | | | | — | | | | –9.57 | % | | | –11.69 | % | | | — | | | | — | | | | –11.11 | % |
| 1 | | Performance does not reflect the deduction of taxes on fund distributions or redemptions of fund shares. Past performance does not predict future performance. |
| 2 | | Since inception returns for the indices may begin on the month-end closest to the actual inception date of the fund. |
| 3 | | The Combined Index represents 75% of the Standard & Poor’s 500 Index and 25% of the Barclays Capital U.S. Aggregate Bond Index. |
| 4 | | It is not possible to invest directly in an index. |
| 5 | | Since inception, a portion of the American Diversified Growth & Income Portfolio expenses were reimbursed. If such expenses had not been reimbursed, returns would be lower. |
The expense ratios of the Fund, both net (including any fee waivers or expense limitations) and gross (excluding any fee waivers or expense limitations), are set forth according to the most recent publicly available prospectuses for the Fund and may differ from the expense ratios disclosed in the Financial Highlights tables in this report. For Class 1, the net expense equals the gross expense and is 0.59%.
10
American Fundamental Holdings Portfolio*
*As of September 25, 2009, name changed to Core Fundamental Holdings Portfolio.
Subadviser: MFC Global Investment Management (U.S.A.) Limited
Portfolio Managers: Steve Orlich and Scott Warlow
INVESTMENT OBJECTIVE & POLICIES 4 To seek long-term growth of capital by investing in other funds and other investment companies. Under normal market conditions, the fund will generally invest between 55% and 65% of its assets in equity securities, which include securities held by the underlying funds, and between 35% and 45% of its assets in fixed income securities, which include securities held by the underlying funds.
CHANGE IN VALUE OF $10,000 INVESTMENT AND COMPARATIVE INDICES
Sector Weighting* | % of Total |
Intermediate Bond | 25.14 |
Energy | 21.93 |
International | 12.96 |
Large Value | 11.96 |
U.S. Large Cap | 11.96 |
Government | 8.05 |
Utilities | 8.00 |
|
| * | Top Sectors as a percentage of market value. Does not include short-term securities and investments in the John Hancock Collateral
Investment Trust, if applicable. |
PORTFOLIO MANAGERS’ COMMENTARY
Fund Results 4 For the year ended August 31, 2009, the American Fundamental Holdings Class 1 returned –8.64%, compared to the –9.05% return of the Combined Index.
Market Environment 4 The 12 months ended August 31, 2009 marked a period of extraordinary ups and downs for the U.S. stock market. Panic selling characterized the difficult months from September through February, as investors reacted to dismal economic news, including freefalling home prices, surging unemployment, and declining GDP. There was virtually nowhere for investors to hide as the sharp selloff in the market was accompanied by steep losses in commodities, real estate and a number of other asset classes. Overall, U.S. stocks experienced their worst year since the Great Depression in 1931.
Most fixed income asset classes also struggled in late 2008 and early 2009. Facing a crisis of confidence, investors fled to the safety of Treasury securities, making the asset class one of the best-performing areas and one of the few to post positive returns during that time. On the opposite side, high-yield bonds suffered double-digit losses, and even many investment-grade corporate bonds did poorly.
The market decline continued into early 2009; however equities began to rally vigorously in March. The spectacular gains were spurred by bargain hunting and a reduction in the desperate fear that had gripped market participants since the fall. Many equity asset classes outpaced the S&P 500 Index during the recovery. Global equity markets rallied as well, with riskier asset classes such as emerging markets producing especially strong returns (note that these returns were helped by considerable dollar weakness). The credit markets also improved in the second half of the period, buoyed by significant action on the part of the government. The segments that had sustained some of the worst damage in 2008, high-yield bonds and bank loans, performed best as investors began to shift assets back into riskier areas.
From an asset allocation standpoint, the portfolio benefited from exposure to international equities, which outperformed the S&P 500 during the period. From a manager selection perspective, three of the five funds in the portfolio outperformed their individual benchmarks. Specifically, The Investment Company of America and The Income Fund of America both outpaced the S&P 500 Index, while EuroPacific Growth Fund beat the MSCI EAFE Index. On the negative side, The Bond Fund of America underperformed the Barclays Capital U.S. Aggregate Bond Index by a significant margin and detracted from the portfolio’s overall results. Washington Mutual Investors Fund also hurt performance by lagging the S&P 500 Index.
| | | | | | | | | | | | | | | | | | |
|---|
PERFORMANCE TABLE1,5
|
|
|
| Average Annual Total Return
|
| Cumulative Total Return
|
|
|---|
Period Ended August 31, 2009 | | | | | 1-year | | | | 5-year | | | | 10-year | | | | Since
inception | | | | 1-year | | | | 5-year | | | | 10-year | | | | Since
inception | |
| American Fundamental Holdings Class 1 (began 7/01/08) | | | | | –8.64 | % | | | — | | | | — | | | | –9.18 | % | | | –8.64 | % | | | — | | | | — | | | | –10.65 | % |
Combined Index2,3,4 | | | | | –9.05 | % | | | — | | | | — | | | | –7.25 | % | | | –9.05 | % | | | — | | | | — | | | | –8.43 | % |
| 1 | | Performance does not reflect the deduction of taxes on fund distributions or redemptions of fund shares. Past performance does not predict future performance. |
| 2 | | Since inception returns for the indices may begin on the month-end closest to the actual inception date of the fund. |
| 3 | | The Combined Index represents 65% of the Standard & Poor’s 500 Index and 35% of the Barclays Capital U.S. Aggregate Bond Index. |
| 4 | | It is not possible to invest directly in an index. |
| 5 | | Since inception, a portion of the American Fundamental Holdings Portfolio expenses were reimbursed. If such expenses had not been reimbursed, returns would be lower. |
The expense ratios of the Fund, both net (including any fee waivers or expense limitations) and gross (excluding any fee waivers or expense limitations), are set forth according to the most recent publicly available prospectuses for the Fund and may differ from the expense ratios disclosed in the Financial Highlights tables in this report. For Class 1, the net expense equals the gross expense and is 0.54%.
11
American Global Diversification Portfolio*
*As of September 25, 2009, name changed to Core Global Diversification Portfolio.
Subadviser: MFC Global Investment Management (U.S.A.) Limited
Portfolio Managers: Steve Orlich and Scott Warlow
INVESTMENT OBJECTIVE & POLICIES 4 To seek long-term growth of capital by investing in other funds and other investment companies. Under normal market conditions, the fund will generally invest a significant portion of its assets in securities, which include securities held by the underlying funds, of issuers located in a number of different countries throughout the world, excluding the U.S. and will generally invest between 65% and 75% of its assets in equity securities, which include securities held by the underlying funds, and between 25% and 35% of its assets in fixed income securities, which include securities held by the underlying funds.
CHANGE IN VALUE OF $10,000 INVESTMENT AND COMPARATIVE INDICES
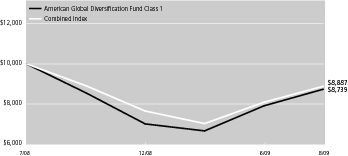
Sector Weighting* | % of Total |
Intermediate Bond | 20.99 |
International Small Cap | 16.01 |
International Mid Cap | 16.00 |
Diversified | 12.00 |
International | 10.00 |
U.S. Large Cap | 10.00 |
Large Value | 8.00 |
High Yield Bond | 7.00 |
|
| * | Top Sectors as a percentage of market value. Does not include short-term securities and investments in the John Hancock Collateral
Investment Trust, if applicable. |
PORTFOLIO MANAGERS’ COMMENTARY
Performance 4 For the year ended August 31, 2009, the American Global Diversification Class 1 returned –8.11%, compared to the –8.97% return of the Combined Index.
Environment 4 The 12 months ended August 31, 2009 marked a period of extraordinary ups and downs for the U.S. stock market. Panic selling characterized the difficult months from September through February, as investors reacted to dismal economic news, including freefalling home prices, surging unemployment, and declining GDP. There was virtually nowhere for investors to hide as the sharp selloff in the market was accompanied by steep losses in commodities, real estate and a number of other asset classes. Overall, U.S. stocks experienced their worst year since the Great Depression in 1931.
Most fixed income asset classes also struggled in late 2008 and early 2009. Facing a crisis of confidence, investors fled to the safety of Treasury securities, making the asset class one of the best-performing areas and one of the few to post positive returns during that time. On the opposite side, high-yield bonds suffered double-digit losses, and even many investment-grade corporate bonds did poorly.
The market decline continued into early 2009; however equities began to rally vigorously in March. The spectacular gains were spurred by bargain hunting and a reduction in the desperate fear that had gripped market participants since the fall. Many equity asset classes outpaced the S&P 500 Index during the recovery. Global equity markets rallied as well, with riskier asset classes such as emerging markets producing especially strong returns (note that these returns were helped by considerable dollar weakness). The credit markets also improved in the second half of the period, buoyed by significant action on the part of the government. The segments that had sustained some of the worst damage in 2008, high-yield bonds and bank loans, performed best as investors began to shift assets back into riskier areas.
From an asset allocation standpoint, the portfolio benefited from exposure to emerging market equities, international small cap equities and international large cap equities, all of which outperformed the S&P 500 Index. Conversely, exposure to high yield bonds, which underperformed the Barclay’s Capital Aggregate Bond Index, detracted from performance. From a manager perspective, Capital World Growth and Income Fund and New Perspective Fund both added to performance by outperforming the MSCI World Index, while EuroPacific Growth Fund contributed positively by beating the MSCI EAFE Index. Conversely, The Bond Fund of America underperformed the Barclays Capital U.S. Aggregate Bond Index by a significant margin and detracted from the portfolio’s overall results. Additionally, New World Fund, SMALLCAP World Fund, and American High-Income Trust all caused a drag on performance by lagging their respective benchmarks.
| | | | | | | | | | | | | | | | | | |
|---|
PERFORMANCE TABLE1,5
|
|
|
| Average Annual Total Return
|
| Cumulative Total Return
|
|
|---|
Period Ended August 31, 2009 | | | | | 1-year | | | | 5-year | | | | 10-year | | | | Since
inception | | | | 1-year | | | | 5-year | | | | 10-year | | | | Since
inception | |
| American Global Diversification Class 1 (began 7/01/08) | | | | | –8.11 | % | | | — | | | | — | | | | –10.89 | % | | | –8.11 | % | | | — | | | | — | | | | –12.61 | % |
Combined Index2,3,4 | | | | | –8.97 | % | | | — | | | | — | | | | –9.60 | % | | | –8.97 | % | | | — | | | | — | | | | –11.13 | % |
| 1 | | Performance does not reflect the deduction of taxes on fund distributions or redemption of fund shares. Past performance does not predict future performance. |
| 2 | | Since inception returns for the indices may begin on the month end closest to the actual inception date of the fund. |
| 3 | | The Combined Index represents 70% of the MSCI AC World Index and 30% of the Barclays Capital U.S. Aggregate Bond Index. |
| 4 | | It is not possible to invest directly in an index. |
| 5 | | Since inception, a portion of the American Global Diversification Portfolio expenses were reimbursed. If such expenses had not been reimbursed, returns would be lower. |
The expense ratios of the Fund, both net (including any fee waivers or expense limitations) and gross (excluding any fee waivers or expense limitations), are set forth according to the most recent publicly available prospectuses for the Fund and may differ from the expense ratios disclosed in the Financial Highlights tables in this report. For Class 1, the net expense equals the gross expense and is 0.75%.
12
Blue Chip Growth Fund
Subadviser: T. Rowe Price Associates, Inc.
Portfolio Manager: Larry J. Puglia
INVESTMENT OBJECTIVE & POLICIES 4 To provide long-term growth of capital with current income as a secondary objective. The Fund invests at least 80% of its net assets in common stocks of large- and medium-sized blue chip growth companies that are considered well established in their industries and have the potential for above-average earnings growth.
CHANGE IN VALUE OF $10,000 INVESTMENT AND COMPARATIVE INDICES
Sector Weighting* | % of Total |
Communications | 19.57 |
Consumer, Non-cyclical | 19.04 |
Financial | 16.76 |
Technology | 16.18 |
Consumer, Cyclical | 9.40 |
Energy | 6.38 |
Industrial | 6.12 |
Basic Materials | 2.10 |
Utilities | 0.62 |
|
| * | Top Sectors as a percentage of market value. Does not include short-term securities and investments in the John Hancock Collateral
Investment Trust, if applicable. |
PORTFOLIO MANAGER’S COMMENTARY
Performance 4 For the year ended August 31, 2009, the Blue Chip Growth Class NAV returned –17.90%, compared to the –18.25% return of the S&P 500 Index.
Market Environment 4 Although the portfolio could not avoid losses for the 12 months ended August 31, 2009, it held its value relatively well in a challenging market environment. Sector positioning significantly helped the portfolio’s results compared with the S&P 500 Index, but this was partially offset by relatively weak stock selection results.
The past 12 months has been one of the most volatile periods in U.S. market history, including both an historic decline in the fall of 2008 and an aggressive pursuit of recovery through 2009 to date. Ultimately, large-cap U.S. stocks, as represented by the S&P 500 Index, finished the 12 months with a loss of approximately 18%.
Reflecting a severe financial crisis and related credit crunch, Financials stocks led the 2008 market downdraft. Despite a strong recovery in 2009, they still had the worst results of any market sector for the year. Not far behind were the Energy, Industrials and Business Services, and Materials sectors, all of which were hampered by the deteriorating global economy. While all sectors declined for the period, stable growth segments, such as Health Care and Consumer Staples, held their value better than other sectors. Information Technology stocks also outperformed. After several years of retrenchment in that sector, many large Technology firms offered investors sound financials and attractive valuations.
The most meaningful contributor to performance was an underweight in Financials during a stretch where the sector had very poor results. We avoided or limited losses in firms that were hard hit by the financial crisis. However, we are becoming more constructive on Financials. We think government support, clearer regulation and an improved economy are all helping to stabilize the industry. Overweights in Information Technology and Health Care also added significant value. Within Health Care, we had relatively good results in both the biotechnology and health care services segments. Long-term, we saw an appealing combination of growth potential and attractive valuations in both sectors.
Among detractors, an underweight to Consumer Staples weighed on relative results, but we see limited long-term growth potential in this sector. Disappointing stock selection results in the Energy and Industrials and Business Services sectors also limited our outperformance for the period.
| | | | | | | | | | | | | | | | | | |
|---|
PERFORMANCE TABLE1,3
|
|
|
| Average Annual Total Return
|
| Cumulative Total Return
|
|
|---|
Period Ended August 31, 2009 | | | | | 1-year | | | | 5-year | | | | 10-year | | | | Since
inception | | | | 1-year | | | | 5-year | | | | 10-year | | | | Since
inception | |
| Blue Chip Growth Class 1 (began 10/15/05) | | | | | –17.95 | % | | | — | | | | — | | | | –1.06 | % | | | –17.95 | % | | | — | | | | — | | | | –4.03 | % |
| Blue Chip Growth Class NAV (began 10/15/05) | | | | | –17.90 | % | | | — | | | | — | | | | –1.00 | % | | | –17.90 | % | | | — | | | | — | | | | –3.84 | % |
S&P 500 Index2,4,5 | | | | | –18.25 | % | | | — | | | | — | | | | –1.72 | % | | | –18.25 | % | | | — | | | | — | | | | –6.52 | % |
| 1 | | Performance does not reflect the deduction of taxes on fund distributions or redemptions of fund shares. Past performance does not predict future performance. |
| 2 | | Since inception returns for the indices may begin on the month-end closest to the actual inception date of the fund. |
| 3 | | Since inception, a portion of the Blue Chip Growth Fund expenses were reimbursed. If such expenses had not been reimbursed, returns would be lower. |
| 4 | | S&P 500 Index is an unmanaged index that includes 500 widely traded common stocks. |
| 5 | | It is not possible to invest directly in an index. |
The expense ratios of the Fund, both net (including any fee waivers or expense limitations) and gross (excluding any fee waivers or expense limitations), are set forth according to the most recent publicly available prospectuses for the Fund and may differ from the expense ratios disclosed in the Financial Highlights tables in this report. The net expenses equal the gross expenses and are as follows: Class 1 – 0.89% and Class NAV – 0.84%.
13
Capital Appreciation Fund
Subadviser: Jennison Associates LLC
Portfolio Managers: Michael Del Balso, Kathleen A. McCarragher and Spiros Segalas
INVESTMENT OBJECTIVE & POLICIES 4 To seek long-term growth of capital by investing at least 65% of the Fund’s total assets in equity-related securities of companies that exceed $1 billion in market capitalization and that are believed to have above-average growth prospects.
CHANGE IN VALUE OF $10,000 INVESTMENT AND COMPARATIVE INDICES
Sector Weighting* | % of Total |
Consumer, Non-cyclical | 27.80 |
Technology | 21.52 |
Communications | 14.58 |
Consumer, Cyclical | 10.53 |
Energy | 7.80 |
Financial | 6.39 |
Basic Materials | 1.67 |
Industrial | 0.44 |
|
| * | Top Sectors as a percentage of market value. Does not include short-term securities and investments in the John Hancock Collateral
Investment Trust, if applicable. |
PORTFOLIO MANAGERS’ COMMENTARY
Performance 4 For the year ended August 31, 2009, the Capital Appreciation Class NAV returned –12.39%, compared to the –16.76% return of the Russell 1000 Growth Index.
Market Environment 4 The year was marked by economic and market turmoil. The credit crisis that began in 2007 escalated in September 2008, with the collapse of Lehman Brothers, the U.S. government’s urgent takeover of several “too big to fail” financial institutions, and the distressed sales of a couple of large commercial banking franchises.
The credit crunch prompted unprecedented coordination between the Treasury Department and Federal Reserve to resuscitate credit markets and stabilize the financial system. These actions failed to thwart the most severe recession in recent history. However, a variety of government programs helped stabilize and stimulate the economy. U.S. equity markets rebounded on signs of economic stabilization in the last half of the period. Rising foreclosures, low interest rates, and the increased availability of mortgage credit stimulated housing activity. Businesses continued to rein in labor costs, contributing to a national unemployment rate of 9.7% by the end of August 2009.
The fund outperformed its benchmark, largely on solid stock selection in the Health Care, Consumer Discretionary, Financials, Materials and Energy sectors. Health Care holdings benefited from an improved pricing environment, growing unit demand, industry consolidation, and differentiated product offerings. In Consumer Discretionary, one key holding, an Internet retailer, benefited from the rise in e-commerce. The fund’s top-performing Financials stock rose on solid fixed income, currency, and commodities revenues, a strong balance sheet, and steady navigation of the troubled market environment. In Energy, holdings of note benefited from differentiated international positions, offshore drilling execution, and the promise of production growth. An overweight position in Health Care and an underweight stance in Industrials also worked well.
Stock selection detracted from the fund’s return relative to the benchmark in Industrials, where holdings declined on concerns that the financial crisis and global slowdown would curtail infrastructure investments and weaken pricing power.
| | | | | | | | | | | | | | | | | | |
|---|
PERFORMANCE TABLE1
|
|
|
| Average Annual Total Return
|
| Cumulative Total Return
|
|
|---|
Period Ended August 31, 2009 | | | | | 1-year | | | | 5-year | | | | 10-year | | | | Since
inception | | | | 1-year | | | | 5-year | | | | 10-year | | | | Since
inception | |
| Capital Appreciation Class 1 (began 10/15/05) | | | | | –12.37 | % | | | — | | | | — | | | | –0.80 | % | | | –12.37 | % | | | — | | | | — | | | | –3.08 | % |
| Capital Appreciation Class NAV (began 10/15/05) | | | | | –12.39 | % | | | — | | | | — | | | | –0.74 | % | | | –12.39 | % | | | — | | | | — | | | | –2.85 | % |
Russell 1000 Growth Index2,3,4 | | | | | –16.76 | % | | | — | | | | — | | | | –0.79 | % | | | –16.76 | % | | | — | | | | — | | | | –3.03 | % |
| 1 | | Performance does not reflect the deduction of taxes on fund distributions or redemptions of fund shares. Past performance does not predict future performance. |
| 2 | | Since inception returns for the indices may begin on the month-end closest to the actual inception date of the fund. |
| 3 | | Russell 1000 Growth Index is an unmanaged index composed of the Russell 1000 securities that have a greater-than-average growth orientation. |
| 4 | | It is not possible to invest directly in an index. |
The expense ratios of the Fund, both net (including any fee waivers or expense limitations) and gross (excluding any fee waivers or expense limitations), are set forth according to the most recent publicly available prospectuses for the Fund and may differ from the expense ratios disclosed in the Financial Highlights tables in this report. The net expenses equal the gross expenses and are as follows: Class 1 – 0.80% and Class NAV – 0.75%.
14
Core Bond Fund
Subadviser: Wells Capital Management, Inc.
Portfolio Managers: William Stevens, Thomas O’Connor, Lynne Royer, Troy Ludgood
INVESTMENT OBJECTIVE & POLICIES 4 The Fund seeks total return consisting of income and capital appreciation by investing at least 80% of its net assets in a broad range of investment grade debt securities, including U.S. Government obligations, corporate bonds, mortgage-backed and other asset-backed securities and money market instruments.
CHANGE IN VALUE OF $10,000 INVESTMENT AND COMPARATIVE INDICES
Sector Weighting* | % of Total |
Federal National Mortgage Association | 27.00 |
Mortgage Securities | 17.52 |
U.S. Treasury Notes | 13.50 |
Financial | 7.42 |
Federal Home Loan Mortgage Corp. | 6.43 |
Asset Backed Securities | 4.72 |
Consumer, Non-cyclical | 3.04 |
Communications | 3.03 |
U.S. Treasury Bonds | 3.01 |
Energy | 2.76 |
|
| * | Top Sectors as a percentage of market value. Does not include short-term securities and investments in the John Hancock Collateral
Investment Trust, if applicable. |
PORTFOLIO MANAGERS’ COMMENTARY
Performance 4 For the year ended August 31, 2009, the Core Bond Class NAV returned +9.69%, compared to the +7.94% return of the Barclays Capital U.S. Aggregate Bond Index.
Market Environment 4 This fiscal year began with the U.S. subprime and liquidity crisis evolving into a global credit and liquidity freeze that tipped the global economy into recession. In September, Lehman Brothers filed for bankruptcy, AIG was rescued by the Federal Reserve, and Bank of America purchased Merrill Lynch with eventual help from the U.S. Treasury. The Fed and Treasury moved aggressively and creatively to stabilize the markets through a series of actions including significant federal funds rate cuts, placing Fannie Mae and Freddie Mac into conservatorship, and committing funds to buy Agency mortgage-backed securities and Agency debt. In addition, the Troubled Asset Relief Program (TARP) was created to help unclog the financial markets.
Most recently, economic data has turned more positive, hinting at a possible bottoming in the economic cycle. While weak jobs numbers remains the Achilles’ heel of a broad-based economic recovery, the market has found hope in improved housing data, vehicle sales, and business and consumer confidence. Risk appetites have increased, resulting in higher than average returns for fixed income assets.
While volatility and liquidity over the last year presented near-term challenges, we viewed the pricing of fixed income assets as providing historic opportunities to buy very cheap assets. Consistent with our investment process, security selection was the largest contributor to performance. Security selection and relative value trading in structured products, especially pass-through mortgage-backed securities and commercial mortgage-backed securities (CMBS), all helped drive performance. Timely shifts in the fund’s allocation to corporate bonds enhanced performance. Security selection, particularly in non-corporates, telecommunications, REITs, cable/media and health care, added to results. Opportunistic positioning in the bank/finance sector and not owning some of the worst-performing finance names, enhanced return. Purchases of new issues in health care and telecommunications also added to relative returns. Overweights in CMBS and asset-backed securities, while detracting from performance in late 2008, were large contributors to performance in 2009, as yield spreads tightened significantly. Security selection in high quality asset-backed securities benefited our relative returns. Limited exposure to non-agency mortgages and underweights in Agency and Treasury debt early in the fiscal year detracted from performance.
| | | | | | | | | | | | | | | | | | |
|---|
PERFORMANCE TABLE1
|
|
|
| Average Annual Total Return
|
| Cumulative Total Return
|
|
|---|
Period Ended August 31, 2009 | | | | | 1-year | | | | 5-year | | | | 10-year | | | | Since
inception | | | | 1-year | | | | 5-year | | | | 10-year | | | | Since
inception | |
| Core Bond Class 1 (began 10/15/05) | | | | | 9.71 | % | | | — | | | | — | | | | 5.80 | % | | | 9.71 | % | | | — | | | | — | | | | 24.45 | % |
| Core Bond Class NAV (began 10/15/05) | | | | | 9.69 | % | | | — | | | | — | | | | 5.84 | % | | | 9.69 | % | | | — | | | | — | | | | 24.63 | % |
Barclays Capital U.S. Aggregate Bond Index2,3,4 | | | | | 7.94 | % | | | — | | | | — | | | | 5.77 | % | | | 7.94 | % | | | — | | | | — | | | | 24.33 | % |
| 1 | | Performance does not reflect the deduction of taxes on fund distributions or redemptions of fund shares. Past performance does not predict future performance. |
| 2 | | Since inception returns for the indices may begin on the month-end closest to the actual inception date of the fund. |
| 3 | | Barclays Capital U.S. Aggregate Bond Index is an unmanaged index of dollar-denominated and nonconvertible investment-grade debt issues. |
| 4 | | It is not possible to invest directly in an index. |
The expense ratios of the Fund, both net (including any fee waivers or expense limitations) and gross (excluding any fee waivers or expense limitations), are set forth according to the most recent publicly available prospectuses for the Fund and may differ from the expense ratios disclosed in the Financial Highlights tables in this report. The net expenses equal the gross expenses and are as follows: Class 1 – 0.80% and Class NAV – 0.75%.
15
Emerging Markets Value Fund
Subadviser: Dimensional Fund Advisors LP
Portfolio Manager: Karen E. Umland
INVESTMENT OBJECTIVE & POLICIES 4 To seek long-term capital appreciation by investing primarily in companies associated with emerging markets.
CHANGE IN VALUE OF $10,000 INVESTMENT AND COMPARATIVE INDICES
Sector Weighting* | % of Total |
Financial | 29.40 |
Basic Materials | 15.39 |
Industrial | 14.92 |
Consumer, Cyclical | 9.35 |
Consumer, Non-cyclical | 6.58 |
Diversified | 5.21 |
Energy | 4.64 |
Technology | 3.76 |
Communications | 1.53 |
Utilities | 1.39 |
|
| * | Top Sectors as a percentage of market value. Does not include short-term securities and investments in the John Hancock Collateral
Investment Trust, if applicable. |
PORTFOLIO MANAGER’S COMMENTARY
Performance 4 For the year ended August 31, 2009, the Emerging Markets Value Class NAV returned +1.07%, compared to the –9.71% return of the MSCI Emerging Markets Index.
Market Environment 4 The 12 months from September 2008 to August 2009 were characterized by two completely different periods. From September 2008 to early March 2009, global equity markets fell by about 50%, as the global financial crisis and the slowdown in many of the world’s leading economies became more severe. Then, from early March to August 2009, equity markets around the world, especially in emerging markets, rebounded sharply, as fears of a systemic collapse of the world economy abated and financial markets began to show some signs of stabilization. Throughout this period, volatility and divergent performance in emerging markets was at extraordinarily high levels, especially in late 2008 and the early part of 2009. As a result, small differences in portfolio weights between different strategies or between strategies and benchmarks often resulted in large differences in performance.
The fund’s lack of exposure to Russia, which underperformed relative to most emerging markets, and other allocation differences across countries had a large positive impact on relative performance. Composition differences within countries, especially in China and India, also had a strong positive impact on relative performance.
The portfolio’s overweight to deep value stocks, which greatly outperformed relative to growth stocks, and other differences in allocation along the value/growth dimensions had a large positive impact on relative performance. On the other hand, composition differences within various value and growth segments had a negative but weaker impact on relative performance.
The portfolio’s overweight to the smallest stocks, which outperformed all other market capitalization segments, and other differences in allocation had a strong positive impact on relative performance. Within the different market capitalization segments, especially among the smallest stocks, the portfolio’s baskets of securities generally outperformed those of the Index.
The fund’s overweight to the Consumer Discretionary sector, which outperformed most other sectors, and other differences in allocation across sectors added to results. Composition differences within the different sectors, especially in the financial sector, also greatly aided relative performance.
| | | | | | | | | | | | | | | | | | |
|---|
PERFORMANCE TABLE1
|
|
|
| Average Annual Total Return
|
| Cumulative Total Return
|
|
|---|
Period Ended August 31, 2009 | | | | | 1-year | | | | 5-year | | | | 10-year | | | | Since
inception | | | | 1-year | | | | 5-year | | | | 10-year | | | | Since
inception | |
| Emerging Markets Value Class NAV (began 5/1/07) | | | | | 1.07 | % | | | — | | | | — | | | | –1.15 | % | | | 1.07 | % | | | — | | | | — | | | | –2.66 | % |
MSCI Emerging Markets Index2,3,4 | | | | | –9.71 | % | | | — | | | | — | | | | –3.36 | % | | | –9.71 | % | | | — | | | | — | | | | –7.68 | % |
| 1 | | Performance does not reflect the deduction of taxes on fund distributions or redemptions of fund shares. Past performance does not predict future performance. |
| 2 | | Since inception returns for the indices may begin on the month-end closest to the actual inception date of the fund. |
| 3 | | MSCI Emerging Markets Index is an unmanaged index designed to measure the performance of developing markets. |
| 4 | | It is not possible to invest directly in an index. |
The expense ratios of the Fund, both net (including any fee waivers or expense limitations) and gross (excluding any fee waivers or expense limitations), are set forth according to the most recent publicly available prospectuses for the Fund and may differ from the expense ratios disclosed in the Financial Highlights tables in this report. For Class NAV, the net expense equals the gross expense and is 1.08%.
16
Emerging Small Company Fund
Subadviser: RCM Capital Management LLC
Portfolio Managers: Thomas J. Ross and Louise M. Laufersweiler
INVESTMENT OBJECTIVE & POLICIES 4 To seek long-term capital appreciation by investing at least 80% of the Fund’s total net assets in equity securities of U.S. companies with smaller capitalizations.
CHANGE IN VALUE OF $10,000 INVESTMENT AND COMPARATIVE INDICES
Sector Weighting* | % of Total |
Consumer, Non-cyclical | 21.82 |
Technology | 18.87 |
Consumer, Cyclical | 15.96 |
Industrial | 11.69 |
Financial | 7.90 |
Communications | 6.32 |
Energy | 3.25 |
Basic Materials | 2.49 |
|
| * | Top Sectors as a percentage of market value. Does not include short-term securities and investments in the John Hancock Collateral
Investment Trust, if applicable. |
PORTFOLIO MANAGERS’ COMMENTARY
Performance 4 For the year ended August 31, 2009, the Emerging Small Company Class 1 returned –18.65%, compared to the –22.02% return of the Russell 2000 Growth Index.
Market Environment 4 U.S. small-cap growth equities have experienced an exceptionally volatile past 12 months. The financial crisis that battered equity markets through the latter half of 2008 and the beginning of 2009 reversed in March, and equities, particularly small caps, began to rally. While U.S. small-cap stocks lagged large caps over the year ended August 31, 2009, they have handily outperformed large caps coming off of the March 9th lows.
Relative returns were driven by strong stock selection within the Industrials, Energy and Technology sectors as well as by a defensive cash position relative to the benchmark. In contrast, an overweight to Financials, and weak selection within the Health Care, Consumer Staples and Consumer Discretionary sectors hurt.
Given their sensitivity to the macroeconomic environment as well as their reliance on capital markets, small caps were particularly affected by the deleveraging that occurred as the credit crisis unfolded. As the crisis accelerated in the final months of 2008, investors began selling assets perceived to be riskier and began hoarding cash and cash equivalents. As lending ground to a standstill globally, credit spreads spiked to historic levels, posing huge challenges for companies reliant on short-term lending. Between September 1, 2008 and the March 9, 2009 bottom, small-cap growth stocks lost 52%.
As credit markets began to thaw and volatility declined, small-cap stocks regained their footing. In line with previous market corrections, small-cap stocks led the rebound posting returns of 62% between the March low and August 31, 2009. Though small caps have performed very well since March, low-quality companies have rallied the most, posing a challenge for the fund, which focuses on high-quality small caps. As a result of the exceptionally strong performance of the smallest stocks, with the lowest share prices, and worst quality characteristics, a majority of active managers lagged the benchmark coming off the market bottom. However, as the summer wore on, investor focus appeared to shift back to company fundamentals, making it easier for active managers to outperform. By the end of August, active small-cap investors could point to a growing list of indicators that the low-quality rally was finally nearing an end.
| | | | | | | | | | | | | | | | | | |
|---|
PERFORMANCE TABLE1,3
|
|
|
| Average Annual Total Return
|
| Cumulative Total Return
|
|
|---|
Period Ended August 31, 2009 | | | | | 1-year | | | | 5-year | | | | 10-year | | | | Since
inception | | | | 1-year | | | | 5-year | | | | 10-year | | | | Since
inception | |
| Emerging Small Company Class 1 (began 10/15/05) | | | | | –18.65 | % | | | — | | | | — | | | | –4.19 | % | | | –18.65 | % | | | — | | | | — | | | | –15.29 | % |
Russell 2000 Growth Index2,4,5 | | | | | –22.02 | % | | | — | | | | — | | | | –0.75 | % | | | –22.02 | % | | | — | | | | — | | | | –2.87 | % |
| 1 | | Performance does not reflect the deduction of taxes on fund distributions or redemptions of fund shares. Past performance does not predict future performance. |
| 2 | | Since inception returns for the indices may begin on the month-end closest to the actual inception date of the fund. |
| 3 | | Since inception, a portion of the Emerging Small Company Fund expenses were reimbursed. If such expenses had not been reimbursed, returns would be lower. |
| 4 | | Russell 2000 Growth Index is an unmanaged index that contains those securities from the Russell 2000 Index with a greater than average growth orientation. |
| 5 | | It is not possible to invest directly in an index. |
The expense ratios of the Fund, both net (including any fee waivers or expense limitations) and gross (excluding any fee waivers or expense limitations), are set forth according to the most recent publicly available prospectuses for the Fund and may differ from the expense ratios disclosed in the Financial Highlights tables in this report. For Class 1, the net expense equals the gross expense and is 1.13%.
17
Equity-Income Fund
Subadviser: T. Rowe Price Associates, Inc.
Portfolio Manager: Brian C. Rogers
INVESTMENT OBJECTIVE & POLICIES 4 To provide substantial dividend income and also long-term capital appreciation. The Fund invests at least 80% of its net assets in equity securities, with at least 65% in common stocks of well-established companies paying above-average dividends.
CHANGE IN VALUE OF $10,000 INVESTMENT AND COMPARATIVE INDICES
Sector Weighting* | % of Total |
Financial | 19.66 |
Energy | 13.85 |
Industrial | 11.58 |
Consumer, Non-cyclical | 10.66 |
Consumer, Cyclical | 9.48 |
Communications | 8.53 |
Basic Materials | 5.64 |
Technology | 4.68 |
Utilities | 4.61 |
|
| * | Top Sectors as a percentage of market value. Does not include short-term securities and investments in the John Hancock Collateral
Investment Trust, if applicable. |
PORTFOLIO MANAGER’S COMMENTARY
Performance 4 For the year ended August 31, 2009, the Equity Income Class NAV returned –15.68%, compared to the –20.27% return of the Russell 1000 Value Index.
Market Environment 4 The past 12 months saw the emergence of one of the greatest financial crises and economic contractions of the postwar era. The Russell 1000 Value Index posted a significant double-digit negative return for the one-year period, with all sectors declining. Industrials and Business Services, Financials and Materials were the hardest hit, reflecting the ongoing financial crisis, the restructuring of the U.S. auto industry, and declining commodity prices, respectively. The traditionally defensive Consumer Staples and Health Care sectors held up best, posting only single-digit losses.
Against that backdrop, the portfolio posted a double-digit negative return, but nonetheless outpaced its Russell index. Broadly speaking, stock selection helped relative results, while sector allocation detracted. The primary relative contribution came from stock choices within the Financials sector. The most beneficial positions were concentrated in the diversified financial services industry. We remain considerably underweight in this sector, focusing on individual firms that we believe are most likely to make it through the current turmoil.
Stock selection in Energy helped relative results as well. Energy has long been an important area of investment for the portfolio, with a focus on companies that are positioned to find and develop new capacity. We believe that economic recovery and increased emerging-market demand should both work in the favor of energy firms. Our holdings in Industrials and Business Services also held their value better than their benchmark peers. Within the sector, we favor both industrial conglomerates and more focused companies with strong business models, balance sheets and cash flows.
The most significant relative detractor came from Consumer Discretionary, where our beneficial overweight position was not enough to offset weak stock selection. Our focus in Consumer Discretionary is on media companies, particularly in the cable industry.
| | | | | | | | | | | | | | | | | | |
|---|
PERFORMANCE TABLE1,3
|
|
|
| Average Annual Total Return
|
| Cumulative Total Return
|
|
|---|
Period Ended August 31, 2009 | | | | | 1-year | | | | 5-year | | | | 10-year | | | | Since
inception | | | | 1-year | | | | 5-year | | | | 10-year | | | | Since
inception | |
| Equity-Income Class 1 (began 10/15/05) | | | | | –15.65 | % | | | — | | | | — | | | | –0.90 | % | | | –15.65 | % | | | — | | | | — | | | | –3.44 | % |
| Equity-Income Class NAV (began 10/15/05) | | | | | –15.68 | % | | | — | | | | — | | | | –0.87 | % | | | –15.68 | % | | | — | | | | — | | | | –3.34 | % |
Russell 1000 Value Index2,4,5 | | | | | –20.27 | % | | | — | | | | — | | | | –2.63 | % | | | –20.27 | % | | | — | | | | — | | | | –9.82 | % |
| 1 | | Performance does not reflect the deduction of taxes on fund distributions or redemptions of fund shares. Past performance does not predict future performance. |
| 2 | | Since inception returns for the indices may begin on the month-end closest to the actual inception date of the fund. |
| 3 | | Since inception, a portion of the Equity-Income Fund expenses were reimbursed. If such expenses had not been reimbursed, returns would be lower. |
| 4 | | Russell 1000 Value Index is an unmanaged index containing those securities in the Russell 1000 Index with a less-than-average growth orientation. |
| 5 | | It is not possible to invest directly in an index. |
The expense ratios of the Fund, both net (including any fee waivers or expense limitations) and gross (excluding any fee waivers or expense limitations), are set forth according to the most recent publicly available prospectuses for the Fund and may differ from the expense ratios disclosed in the Financial Highlights tables in this report. For Class NAV, the net expense equals the gross expense and is 0.84%.
18
Fundamental Value Fund
Subadviser: Davis Selected Advisers, L.P.
Portfolio Managers: Christopher C. Davis and Kenneth Charles Feinberg
INVESTMENT OBJECTIVE & POLICIES 4 To seek growth of capital. The Fund invests primarily in common stocks of U.S. companies with market capitalization of at least $10 billion.
CHANGE IN VALUE OF $10,000 INVESTMENT AND COMPARATIVE INDICES
Sector Weighting* | % of Total |
Financial | 27.42 |
Consumer, Non-cyclical | 17.31 |
Energy | 13.56 |
Consumer, Cyclical | 10.38 |
Technology | 6.34 |
Industrial | 5.64 |
Communications | 4.90 |
Basic Materials | 2.24 |
Diversified | 0.88 |
Utilities | 0.17 |
|
| * | Top Sectors as a percentage of market value. Does not include short-term securities and investments in the John Hancock Collateral
Investment Trust, if applicable. |
PORTFOLIO MANAGERS’ COMMENTARY
Performance 4 For the year ended August 31, 2009, the Fundamental Value Class NAV returned –18.75%, compared to the –18.25% return of the S&P 500 Index.
Market Environment 4 All sectors within the Index turned in negative performance. The sectors that posted the worst performance over the period were Financials, Industrials and Energy. The sectors that turned in the strongest (but still negative) performance were Consumer Staples, Health Care and Information Technology.
The Fund’s Financial companies outperformed the corresponding benchmark sector (–20% versus –29% for the Index), but they were still the largest detractors from performance. A higher relative average weighting in this sector (28% versus 13% for the Index) detracted from performance. The second largest detractor from performance was the Energy sector. The Fund’s Energy companies underperformed the corresponding benchmark sector (–29% versus –28% for the Index) and a higher relative average weighting (17% versus 13% for the Index) also held back performance. Consumer Staples companies detracted from performance. The Fund’s Consumer Staples holdings underperformed the corresponding benchmark sector (–16% versus –9% for the Index).
Health Care companies made a positive contribution to the Fund’s performance. The portfolio’s Health Care companies outperformed the corresponding benchmark sector (flat versus –11% for the Index). A lower relative average weighting in this relatively strong sector (6% versus 14% for the Index) took away from performance. Individual companies contributing to performance included two Consumer Discretionary companies and two Information Technology companies.
The Fund held approximately 14% of its assets in foreign companies (including American Depositary Receipts) at August 31, 2009. As a whole, these companies outperformed the domestic companies within the portfolio.
| | | | | | | | | | | | | | | | | | |
|---|
PERFORMANCE TABLE1
|
|
|
| Average Annual Total Return
|
| Cumulative Total Return
|
|
|---|
Period Ended August 31, 2009 | | | | | 1-year | | | | 5-year | | | | 10-year | | | | Since
inception | | | | 1-year | | | | 5-year | | | | 10-year | | | | Since
inception | |
| Fundamental Value Class 1 (began 10/15/05) | | | | | –18.72 | % | | | — | | | | — | | | | –2.50 | % | | | –18.72 | % | | | — | | | | — | | | | –9.35 | % |
| Fundamental Value Class NAV (began 10/15/05) | | | | | –18.75 | % | | | — | | | | — | | | | –2.47 | % | | | –18.75 | % | | | — | | | | — | | | | –9.24 | % |
S&P 500 Index2,3,4 | | | | | –18.25 | % | | | — | | | | — | | | | –1.72 | % | | | –18.25 | % | | | — | | | | — | | | | –6.52 | % |
| 1 | | Performance does not reflect the deduction of taxes on fund distributions or redemptions of fund shares. Past performance does not predict future performance. |
| 2 | | Since inception returns for the indices may begin on the month-end closest to the actual inception date of the fund. |
| 3 | | S&P 500 Index is an unmanaged index that includes 500 widely traded common stocks. |
| 4 | | It is not possible to invest directly in an index. |
The expense ratios of the Fund, both net (including any fee waivers or expense limitations) and gross (excluding any fee waivers or expense limitations), are set forth according to the most recent publicly available prospectuses for the Fund and may differ from the expense ratios disclosed in the Financial Highlights tables in this report. The net expenses equal the gross expenses and are as follows: Class 1 – 0.85% and Class NAV – 0.80%.
19
Global Agribusiness Fund
Subadviser: MFC Global Investment Management (U.S.A.) Limited
Portfolio Managers: Jennifer Doroty, Norman Ali and Robert Lutzko
INVESTMENT OBJECTIVE & POLICIES 4 To seek long-term capital appreciation by investing in equities and equity-related securities of companies involved in the agribusiness sector.
CHANGE IN VALUE OF $10,000 INVESTMENT AND COMPARATIVE INDICES
Sector Weighting* | % of Total |
Consumer, Non-cyclical | 55.76 |
Basic Materials | 43.72 |
Industrial | 0.52 |
|
| * | Top Sectors as a percentage of market value. Does not include short-term securities and investments in the John Hancock Collateral
Investment Trust, if applicable. |
PORTFOLIO MANAGERS’ COMMENTARY
Performance 4 For the period from the Fund’s inception on January 2, 2009 to August 31, 2009, the Global Agribusiness Class A returned +14.52%, compared to the +22.54% return of the MSCI World Agricultural & Food Chain Sector Capped Custom Index.
Market Environment 4 The year 2009 has been a year of extreme volatility. Global economic concerns caused markets to tumble during the first two months of the year. On March 9, global indices bottomed to lows not seen in years and the fund was down nearly 11% year-to-date. The following day, the fund gained nearly 5.3%. This illustrates the unprecedented market volatility. In the months ahead, markets rallied and delivered spectacular returns not seen in decades. Investors’ confidence increased on expectations that global economic conditions were improving, and as a result risk appetite increased. Emerging markets, small-cap cyclical and Financial stocks were among the largest beneficiaries.
It has been a volatile year for the fund, particularly due to extreme volatility in the fertilizer industry which represents approximately one-third of the portfolio. The fund’s strong performance during the first few months of the year was led by the fertilizer industry. The fund was trading in line with its industry index. Fertilizer, in particular potash-based fertilizer stocks, collapsed in May and June, tumbling by more than 30% as the global recession diminished potash pricing and demand. The fund lagged its benchmark return mainly because of an overweight position in the fertilizer industry and underweight position in Consumer Staples.
We expect volatility to remain high in the near-term. In the fertilizer sector, we believe stocks will gradually improve. Even though the recent months have been challenging for the fertilizer sector and fertilizer prices have declined materially, they are still near record levels. In the months ahead, our outlook for fertilizers is positive as we expect demand to improve, fertilizer pricing to stabilize, and commodity prices to appreciate. Our outlook for the Consumer Staples sector is increasingly positive, given improving economic conditions. We believe this sector will continue to gradually strengthen and appreciate. Our principal objective is for long-term capital appreciation and growth. We are maintaining our disciplined investment approach and continue to invest in stocks and sectors with superior quantitative rankings and strong fundamentals.
| | | | | | | | | | | | | | | | | | |
|---|
PERFORMANCE TABLE2,6
|
|
|
| Average Annual Total Return
|
| Cumulative Total Return
|
|
|---|
Period Ended August 31, 2009 | | | | | 1-year | | | | 5-year | | | | 10-year | | | | Since
inception | | | | 1-year | | | | 5-year | | | | 10-year | | | | Since
inception | |
| Global Agribusiness Class A (began 1/2/09) | | | | | — | | | | — | | | | — | | | | — | | | | — | | | | — | | | | — | | | | 14.52 | % |
| Global Agribusiness Class I (began 1/2/09) | | | | | — | | | | — | | | | — | | | | — | | | | — | | | | — | | | | — | | | | 14.84 | % |
MSCI World Agriculture & Food Chain Sector Capped Custom Index3,4,5 | | | | | — | | | | — | | | | — | | | | — | | | | — | | | | — | | | | — | | | | 22.54 | % |
| 1 | | NAV represents net asset value and POP represents public offering price. |
| 2 | | Performance does not reflect the deduction of taxes on fund distributions or redemptions of fund shares. Past performance does not predict future performance. |
| 3 | | Since inception returns for the indices may begin on the month-end closest to the actual inception date of the fund. |
| 4 | | MSCI World Agriculture & Food Chain Sector Capped Custom Index is an equity-based index designed to measure the performance of the various components of the agriculture and food industries — from production through to distribution. The sector capped weighting scheme applies one-third of the index weight at each Quarterly Index Review to both the Agricultural Products and the Fertilizers & Agricultural Chemicals Sub-Industries. The remaining third is split between the Food Distributors and Packaged Foods & Meats Sub-Industries. |
| 5 | | It is not possible to invest directly in an index. |
| 6 | | Since inception, a portion of the Global Agribusiness Fund expenses were reimbursed. If such expenses had not been reimbursed, returns would be lower. |
The expense ratios of the Fund, both net (including any fee waivers or expense limitations) and gross (excluding any fee waivers or expense limitations), are set forth according to the most recent publicly available prospectuses for the Fund and may differ from the expense ratios disclosed in the Financial Highlights tables in this report. The waivers and expense limitations are contractual until at least December 31, 2009. For Class A, the net expense is 1.45%. Had the fee waivers and expense limitations not been in place, the gross expense would be 3.66%.
20
Global Bond Fund
Subadviser: Pacific Investment Management Company LLC
Portfolio Manager: Scott Mather
INVESTMENT OBJECTIVE & POLICIES 4 To seek maximum total return, consistent with preservation of capital and prudent investment management. The Fund invests at least 80% of its net assets in fixed-income instruments, which may be represented by futures contracts (including related options) with respect to such securities, and options on such securities.
CHANGE IN VALUE OF $10,000 INVESTMENT AND COMPARATIVE INDICES
Sector Weighting* | % of Total |
Financial | 30.31 |
Government | 26.07 |
Mortgage Securities | 12.59 |
Federal National Mortgage Association | 8.50 |
Government National Mortgage Association | 6.50 |
Asset Backed Securities | 2.93 |
Communications | 1.67 |
Consumer, Non-cyclical | 1.31 |
U.S. Treasury Notes | 0.85 |
Industrial | 0.84 |
|
| * | Top Sectors as a percentage of market value. Does not include short-term securities and investments in the John Hancock Collateral
Investment Trust, if applicable. |
PORTFOLIO MANAGER’S COMMENTARY
Performance 4 For the year ended August 31, 2009, the Global Bond Class NAV returned +6.14%, compared to the +10.39% return of the JP Morgan Global Government Bond Unhedged Index.
Market Environment 4 Early in the period, most fixed income securities lost ground, as the most severe credit crisis since the 1930s rocked global markets with the collapse and deep troubles of large financial institutions. Massive deleveraging produced an upheaval in the U.S. financial system and an unprecedented level of intervention by the Federal Reserve and the U.S. Treasury took place. Through the end of 2008, interest rates fell worldwide and yield curves in the U.S., Europe and the U.K. steepened, as investors fled to the safety of government bonds, particularly shorter maturities.
During 2009, interest rates rose and capital flowed back toward riskier assets. Government policy initiatives helped restore a measure of stability to financial markets after the extreme stress and volatility of 2008. Higher U.S. Treasury yields were a drag on economic recovery, as they muted the impact of narrower yield and credit premiums for borrowers, especially in the home mortgage market. While some of the weakening in U.S. Treasury valuations could be explained by a reversal of 2008’s flight to liquidity and quality, other factors were in play as well. Investors worried that the massive new issuance of U.S. Treasuries looming on the horizon would overwhelm demand. Another concern was that the Fed’s injection of liquidity would eventually fuel inflation once the economy started to recover.
Developed global bonds posted weak returns during the first half and strong returns during the second half of the fiscal year. Global yield curves steepened sharply as short-dated government bonds outperformed in a flight to quality. U.S. duration positioning detracted from performance overall as U.S. yields fell in the first half and rose in the second half. However, duration positioning in the U.K. and Euroland added to returns over the year as yields fell in both regions. An allocation to mortgages was positive for returns as these bonds outperformed U.S. Treasuries. Exposure to investment grade corporates added slightly to returns as the sector outperformed U.S. Treasuries over the year. However, an emphasis on high-grade financials more than offset this positive impact as financial names underperformed U.S. Treasuries despite their rebound in 2009.
| | | | | | | | | | | | | | | | | | |
|---|
PERFORMANCE TABLE1
|
|
|
| Average Annual Total Return
|
| Cumulative Total Return
|
|
|---|
Period Ended August 31, 2009 | | | | | 1-year | | | | 5-year | | | | 10-year | | | | Since
inception | | | | 1-year | | | | 5-year | | | | 10-year | | | | Since
inception | |
| Global Bond Class 1 (began 10/15/05) | | | | | 6.02 | % | | | — | | | | — | | | | 5.04 | % | | | 6.02 | % | | | — | | | | — | | | | 21.01 | % |
| Global Bond Class NAV (began 10/15/05) | | | | | 6.14 | % | | | — | | | | — | | | | 5.12 | % | | | 6.14 | % | | | — | | | | — | | | | 21.38 | % |
JP Morgan Global Government Bond Unhedged Index2,3,4 | | | | | 10.39 | % | | | — | | | | — | | | | 7.14 | % | | | 10.39 | % | | | — | | | | — | | | | 31.02 | % |
| 1 | | Performance does not reflect the deduction of taxes on fund distributions or redemptions of fund shares. Past performance does not predict future performance. |
| 2 | | Since inception returns for the indices may begin on the month-end closest to the actual inception date of the fund. |
| 3 | | JP Morgan Global Government Bond Unhedged Index is an unmanaged index which measures the performance of leading government bond markets based on total return in U.S. currency. By including only traded issues, the Index provides a realistic measure of market performance for international investors. It is calculated by J.P. Morgan, and reflects reinvestment of all applicable dividends, capital gains and interest. |
| 4 | | It is not possible to invest directly in an index. |
The expense ratios of the Fund, both net (including any fee waivers or expense limitations) and gross (excluding any fee waivers or expense limitations), are set forth according to the most recent publicly available prospectuses for the Fund and may differ from the expense ratios disclosed in the Financial Highlights tables in this report. The net expenses equal the gross expenses and are as follows: Class 1 – 0.88% and Class NAV – 0.83%.
21
Global Infrastructure Fund
Subadviser: MFC Global Investment Management (U.S.A.) Limited
Portfolio Managers: Jennifer Doroty, Norman Ali and Robert Lutzko
INVESTMENT OBJECTIVE & POLICIES 4 To seek long–term capital appreciation by investing in equities and equity-related securities of companies involved in the infrastructure sector.
CHANGE IN VALUE OF $10,000 INVESTMENT AND COMPARATIVE INDICES
Sector Weighting* | % of Total |
Communications | 33.80 |
Utilities | 31.45 |
Energy | 16.99 |
Consumer, Non-cyclical | 10.36 |
Industrial | 6.01 |
Consumer, Cyclical | 1.01 |
Financial | 0.38 |
|
| * | Top Sectors as a percentage of market value. Does not include short-term securities and investments in the John Hancock Collateral
Investment Trust, if applicable. |
PORTFOLIO MANAGERS’ COMMENTARY
Performance 4 For the period from the Fund’s inception on January 2, 2009 to August 31, 2009, the Global Infrastructure Class A returned +3.85%, compared to the +6.26% return of the MSCI World Infrastructure Sector Capped Custom Index.
Market Environment 4 Concerns over the global macroeconomic environment hurt equity markets in the first two months of 2009. By mid-March, global indices were off 50% from their recent peaks. In the months ahead, markets rallied and delivered spectacular returns not seen in decades, triggered by better-than-expected economic and company-specific results. A sharp market rally was justified, given the extreme pessimistic outlook that drove the sell-off up until mid-March. Investor confidence increased on expectations that global economic conditions were improving, encouraged by aggressive government stimulus initiatives. As a result, risk appetite increased. Within the infrastructure segment, the main beneficiaries were companies in the construction and engineering industry.
The fund’s performance was hurt by depreciation of the U.S. Dollar relative to other currencies. Also, the sharp sell-off in March was due to the poor prospects of the Telecommunication Services and Industrials sectors, given the weak global economic outlook at the time. In four of the six months following, the fund outperformed the benchmark, consistently narrowing the performance gap. In particular, strong stock selection in the Industrials and Telecommunication sectors helped to boost performance. However, the gain was offset by our underweight position in the Energy sector. We continue to focus on companies that have high quantitative rankings that we believe to be of higher quality with strong fundamentals.
We expect an improvement in economic conditions through 2009 and into 2010 as businesses start to see the effects of aggressive government initiatives in the U.S. and around the world. We are seeing better-than-expected economic and company-specific results in recent months and we are cautiously optimistic that the worst for the economy and perhaps equity markets is behind us. We expect near-term market volatility given the magnitude and speed by which this rally has manifested itself, but we remain positive that as the fiscal stimulus committed by governments starts to hit companies’ order books, higher-quality companies will particularly benefit. As such, we are maintaining our disciplined investment approach and continue looking to invest in stocks and sectors with superior quantitative rankings and strong fundamentals.
| | | | | | | | | | | | | | | | | | |
|---|
PERFORMANCE TABLE2,6
|
|
|
| Average Annual Total Return
|
| Cumulative Total Return
|
|
|---|
Period Ended August 31, 2009 | | | | | 1-year | | | | 5-year | | | | 10-year | | | | Since
inception | | | | 1-year | | | | 5-year | | | | 10-year | | | | Since
inception | |
| Global Infrastructure Fund Class A (began 1/2/09) | | | | | — | | | | — | | | | — | | | | — | | | | — | | | | — | | | | — | | | | 3.85 | % |
| Global Infrastructure Fund Class I (began 1/2/09) | | | | | — | | | | — | | | | — | | | | — | | | | — | | | | — | | | | — | | | | 4.16 | % |
MSCI World Infrastructure Sector Capped Custom Index3,4,5 | | | | | — | | | | — | | | | — | | | | — | | | | — | | | | — | | | | — | | | | 6.26 | % |
| 1 | | NAV represents net asset value and POP represents public offering price. |
| 2 | | Performance does not reflect the deduction of taxes on fund distributions or redemptions of fund shares. Past performance does not predict future performance. |
| 3 | | Since inception returns for the indices may begin on the month-end closest to the actual inception date of the fund. |
| 4 | | MSCI World Infrastructure Sector Capped Custom Index is a free float-adjusted market capitalization-weighted index comprised of listed infrastructure companies based on the Global Industry Classification System (GICS®). The capped weighting is designed to reduce excessive concentration in large sectors, without over-inflating a small sector. |
| 5 | | It is not possible to invest directly in an index. |
| 6 | | Since inception, a portion of the Global Infrastructure Fund expenses were reimbursed. If such expenses had not been reimbursed, returns would be lower. |
The expense ratios of the Fund, both net (including any fee waivers or expense limitations) and gross (excluding any fee waivers or expense limitations), are set forth according to the most recent publicly available prospectuses for the Fund and may differ from the expense ratios disclosed in the Financial Highlights tables in this report. The waivers and expense limitations are contractual until at least December 31, 2009. For Class A, the net expense is 1.45%. Had the fee waivers and expense limitations not been in place, the gross expense would be 3.66%.
22
Global Real Estate Fund
Subadviser: Deutsche Investment Management Americas Inc.
Portfolio Managers: John F. Robertson, Daniel Ekins, John Hammond, William Leung and John W. Vojticek
INVESTMENT OBJECTIVE & POLICIES 4 The Fund seeks a combination of long-term capital appreciation and current income by primarily investing in equity securities of U.S. REITs, foreign entities with tax-transparent structures similar to REITs, and U.S. and foreign real estate operating companies.
CHANGE IN VALUE OF $10,000 INVESTMENT AND COMPARATIVE INDICES
Sector Weighting* | % of Total |
Financial | 89.41 |
Consumer, Non-cyclical | 3.75 |
Consumer, Cyclical | 0.70 |
Diversified | 0.05 |
|
| * | Top Sectors as a percentage of market value. Does not include short-term securities and investments in the John Hancock Collateral
Investment Trust, if applicable. |
PORTFOLIO MANAGERS’ COMMENTARY
Performance 4 For the year ended August 31, 2009, the Global Real Estate Class NAV returned–20.28%, compared to the –35.82% return of the EPRA NAREIT Global Unhedged U.S. Index.
Market Environment 4 Following a horrific first few months of the reporting period, global property stocks staged a rally during December that would look quite solid in a normal market. However, despite the rally, global property securities remained at record negative returns. Asia’s relatively attractive quarterly return was led by government intervention in the region attempting to stimulate real estate markets, but this region also was very negative. This negative performance continued in the start of 2009, as the outlook for fundamentals was universally negative, with both occupancy and market rents expected to drop for all regions and property types. Combined with stressed balance sheets in several regions, this made for a feast among short sellers.
Relief finally came as the United States led the way as investors applauded institutionally driven equity recapitalizations at modest discounts. Europe also responded well to rights offerings in the UK, which, while more dilutive, drove strong performance in the region. Asia performed well, based on positive news regarding stimulus measures, particularly those in China. This strong performance tailed off, but returned at the end of the period, as global economic data continued to surprise on the upside and credit markets continued to show sequential improvement. The U.S. also finished strong. The debt capital markets were the main catalyst behind the positive returns in the U.S., as all parts of the debt spectrum witnessed continued spread contraction.
Overall, the fund’s stock selection had a positive impact on performance. Stock selection was strong in Australia and Europe, but it detracted somewhat from performance in Asia. In the Americas, stock selection had a relatively neutral effect on performance. Overall, regional selection aided performance slightly. Over the period, our allocations to Asia and Australia boosted performance. This was almost offset by negative results from allocations to Europe and the Americas.
The fund used currency forwards to hedge against anticipated currency exchange rates. Over this period, a hedged portfolio performed slightly better than an unhedged portfolio with similar risk.
| | | | | | | | | | | | | | | | | | |
|---|
PERFORMANCE TABLE1
|
|
|
| Average Annual Total Return
|
| Cumulative Total Return
|
|
|---|
Period Ended August 31, 2009 | | | | | 1-year | | | | 5-year | | | | 10-year | | | | Since
inception | | | | 1-year | | | | 5-year | | | | 10-year | | | | Since
inception | |
| Global Real Estate Class NAV (began 4/28/06) | | | | | –20.28 | % | | | — | | | | — | | | | –9.08 | % | | | –20.28 | % | | | — | | | | — | | | | –27.25 | % |
EPRA NAREIT Global Unhedged U.S. Index2,3,4 | | | | | –35.82 | % | | | — | | | | — | | | | –14.11 | % | | | –35.82 | % | | | — | | | | — | | | | –39.80 | % |
| 1 | | Performance does not reflect the deduction of taxes on fund distributions or redemptions of fund shares. Past performance does not predict future performance. |
| 2 | | Since inception returns for the indices may begin on the month-end closest to the actual inception date of the fund. |
| 3 | | EPRA NAREIT Global Unhedged U.S. Index is an unmanaged index. Designed to track the performance of listed real estate companies and REITs worldwide, the series acts as a performance measure of the overall market and is also suitable for use as the basis for investment products such as derivatives and Exchange Traded Funds (ETFs). |
| 4 | | It is not possible to invest directly in an index. |
The expense ratios of the Fund, both net (including any fee waivers or expense limitations) and gross (excluding any fee waivers or expense limitations), are set forth according to the most recent publicly available prospectuses for the Fund and may differ from the expense ratios disclosed in the Financial Highlights tables in this report. For Class NAV, the net expense equals the gross expense and is 1.07%.
23
Global Timber Fund
Subadviser: MFC Global Investment Management (U.S.A.) Limited
Portfolio Managers: Jennifer Doroty, Norman Ali and Robert Lutzko
INVESTMENT OBJECTIVE & POLICIES 4 To seek long-term capital appreciation by investing in equities and equity-related securities of companies involved in the timber sector.
CHANGE IN VALUE OF $10,000 INVESTMENT AND COMPARATIVE INDICES
Sector Weighting* | % of Total |
Basic Materials | 86.35 |
Industrial | 10.02 |
Consumer, Non-cyclical | 3.63 |
|
| * | Top Sectors as a percentage of market value. Does not include short-term securities and investments in the John Hancock Collateral
Investment Trust, if applicable. |
PORTFOLIO MANAGERS’ COMMENTARY
Performance 4 For the period from the Fund’s inception on January 2, 2009 to August 31, 2009, the Global Timber Class A returned +13.98%, compared to the +19.09% return of the S&P Global Timber & Forestry Index.
Market Environment 4 Concerns over the global macroeconomic environment hurt equity markets in the first two months of 2009. By mid-March, global indices were off 50% from their recent peaks. In the months ahead, markets rallied and delivered spectacular returns not seen in decades, triggered by better-than-expected economic and company-specific results. A sharp market rally was justified, given the extreme pessimistic outlook that drove the sell-off up until mid-March. Investor confidence increased on expectations that global economic conditions were improving, encouraged by aggressive government stimulus initiatives. As a result, risk appetite increased. Within the infrastructure segment, the main beneficiaries were companies in the construction and engineering industry.
It has been a volatile year for the fund. Weakness in the U.S. housing sector contributed to low demand for forest products, but it was offset by strong demand in paper packaging products. The fund saw an extreme sell-off in the forest products and paper products in the first few months of the year on an extremely pessimistic outlook. Since then, there has been strong demand for paper products and we have seen signs of recovery in the housing market. The fund benefited from an underweight position in forest products and overweight position in paper products. Due to the sharp sell-off in January and February, the stock weighed on the fund’s performance despite 150% recovery in the stock from its March low. The fund consistently narrowed the performance gap throughout the year, outperforming the benchmark in five of eight months.
Given its cyclical nature, we are not surprised at the strong performance for the sector following the March low, yet we remain cognizant of the current global economic environment. However, we maintain a positive outlook on early cyclical sectors in the near-term, while consistently monitoring housing sectors for a robust sign of recovery. Therefore, we expect to remain underweight in forest products given a weak U.S. housing sector while holding an overweight position in the early cyclicals, including paper packaging and other paper products. We remain disciplined in our investment process and continue to invest in companies with excellent quantitative rankings and strong fundamentals with exceptional upward potential.
| | | | | | | | | | | | | | | | | | |
|---|
PERFORMANCE TABLE2,6
|
|
|
| Average Annual Total Return
|
| Cumulative Total Return
|
|
|---|
Period Ended August 31, 2009 | | | | | 1-year | | | | 5-year | | | | 10-year | | | | Since
inception | | | | 1-year | | | | 5-year | | | | 10-year | | | | Since
inception | |
| Global Timber Fund Class A (began 1/2/09) | | | | | — | | | | — | | | | — | | | | — | | | | — | | | | — | | | | — | | | | 13.98 | % |
| Global Timber Fund Class I (began 1/2/09) | | | | | — | | | | — | | | | — | | | | — | | | | — | | | | — | | | | — | | | | 14.31 | % |
S&P Global Timber & Forestry Index2,3,4 | | | | | — | | | | — | | | | — | | | | — | | | | — | | | | — | | | | — | | | | 19.09 | % |
| 1 | | NAV represents net asset value and POP represents public offering price. |
| 2 | | Performance does not reflect the deduction of taxes on fund distributions or redemptions of fund shares. Past performance does not predict future performance. |
| 3 | | Since inception returns for the indices may begin on the month-end closest to the actual inception date of the fund. |
| 4 | | S&P Global Timber & Forestry Index is comprised of 25 of the largest publicly traded companies engaged in the ownership, management or the upstream supply chain of forests and timberlands. |
| 5 | | It is not possible to invest directly in an index. |
| 6 | | Since inception, a portion of the Global Timber Fund expenses were reimbursed. If such expenses had not been reimbursed, returns would be lower. |
The expense ratios of the Fund, both net (including any fee waivers or expense limitations) and gross (excluding any fee waivers or expense limitations), are set forth according to the most recent publicly available prospectuses for the Fund and may differ from the expense ratios disclosed in the Financial Highlights tables in this report. The waivers and expense limitations are contractual until at least December 31, 2009. For Class A, the net expense is 1.45%. Had the fee waivers and expense limitations not been in place, the gross expense would be 3.66%.
24
High Income Fund
Subadviser: MFC Global Investment Management (U.S.), LLC
Portfolio Managers: Arthur N. Calavritinos, John F. Iles and Joseph Rizzo
INVESTMENT OBJECTIVE & POLICIES 4 To seek high current income with capital appreciation as a secondary goal by investing primarily in U.S. and foreign fixed-income securities that are rated BB/Ba or lower and unrated equivalents.
CHANGE IN VALUE OF $10,000 INVESTMENT AND COMPARATIVE INDICES
Sector Weighting* | % of Total |
Consumer, Cyclical | 47.93 |
Communications | 27.60 |
Basic Materials | 6.45 |
Financial | 6.14 |
Industrial | 5.29 |
Utilities | 3.03 |
Mortgage Securities | 1.32 |
Consumer, Non-cyclical | 0.54 |
Energy | 0.53 |
Asset Backed Securities | 0.51 |
|
| * | Top Sectors as a percentage of market value. Does not include short-term securities and investments in the John Hancock Collateral
Investment Trust, if applicable. |
PORTFOLIO MANAGERS’ COMMENTARY
Performance 4 For the year ended August 31, 2009, the High Income Class NAV returned –5.78%, compared to the +6.43% return of the Merrill Lynch U.S. High Yield Master II Constrained Index.
Market Environment 4 The last 12 months covered a remarkable period that included some of the worst months in high-yield market history in late 2008 as well as some of the very best in 2009. The late 2008 struggles came at the height of the economic and financial crises and sent the spread (yield over Treasuries) on the high-yield market to an all-time high above 2000 basis points (or 20 percentage points). But those record-high yields and optimism over government measures to support the credit markets and economy triggered massive cash inflows, making for improved market liquidity, and the re-opening of the new issue and refinancing windows for high-yield issuers. On the strength of that demand, the spread over Treasuries ended the period at 912 basis points.
The fund had disappointing relative and absolute results, in part because of poor performance from a number of our airline holdings, which suffered from a decline in travel volumes in late 2008 and so far in 2009. The sector was also hurt by the effects of fuel hedges they were forced to put in place after the spike in crude oil prices in 2008. Without the effect of these hedges, the industry operated on a positive free cash flow basis despite the severe decline in revenue. In that environment, several of the fund’s airline holdings detracted from performance. Other notable detractors were positions that defaulted at the height of the financial crisis, including a broadcasting and a casino holding.
The fund enjoyed strong positive contributions from a number of large, long-held positions, including one where we worked with the company and a strategic investor to help restructure some of their near-term debt, alleviating the company’s short-term re-financing issues that occurred at the height of the credit crisis. Another key contributor was a large stake in a cable operator, which delivered solid business results and announced a proposal to restructure into a less-levered balance sheet. The portfolio also benefited from stakes in several auto parts suppliers.
| | | | | | | | | | | | | | | | | | |
|---|
PERFORMANCE TABLE1
|
|
|
| Average Annual Total Return
|
| Cumulative Total Return
|
|
|---|
Period Ended August 31, 2009 | | | | | 1-year | | | | 5-year | | | | 10-year | | | | Since
inception | | | | 1-year | | | | 5-year | | | | 10-year | | | | Since
inception | |
| High Income Class NAV (began 4/28/06) | | | | | –5.78 | % | | | — | | | | — | | | | –2.44 | % | | | –5.78 | % | | | — | | | | — | | | | –7.92 | % |
Merrill Lynch U.S. High Yield Master II Constrained Index2,3,4 | | | | | 6.43 | % | | | — | | | | — | | | | 4.10 | % | | | 6.43 | % | | | — | | | | — | | | | 14.38 | % |
| 1 | | Performance does not reflect the deduction of taxes on fund distributions or redemptions of fund shares. Past performance does not predict future performance. |
| 2 | | Since inception returns for the indices may begin on the month-end closest to the actual inception date of the fund. |
| 3 | | Merrill Lynch U.S. High Yield Master II Constrained Index is an unmanaged index composed of U.S. currency high-yield bonds issued by U.S. and non-U.S. issuers. |
| 4 | | It is not possible to invest directly in an index. |
The expense ratios of the Fund, both net (including any fee waivers or expense limitations) and gross (excluding any fee waivers or expense limitations), are set forth according to the most recent publicly available prospectuses for the Fund and may differ from the expense ratios disclosed in the Financial Highlights tables in this report. For Class NAV, the net expense equals the gross expense and is 0.72%.
25
High Yield Fund
Subadviser: Western Asset Management Company
Portfolio Manager: S. Kenneth Leech, Steven A. Walsh, Mike Buchanan, Keith J. Gardner
INVESTMENT OBJECTIVE & POLICIES 4 To realize an above-average total return over a market cycle of three to five years, consistent with reasonable risk, by investing primarily in high yield securities, including corporate bonds, preferred stocks, U.S. government and foreign securities, mortgage-backed securities and loan assignments or participations and convertible securities.
CHANGE IN VALUE OF $10,000 INVESTMENT AND COMPARATIVE INDICES
Sector Weighting* | % of Total |
Communications | 15.17 |
Financial | 14.64 |
Consumer, Cyclical | 14.19 |
Energy | 13.14 |
Consumer, Non-cyclical | 11.73 |
Basic Materials | 9.56 |
Industrial | 6.76 |
Utilities | 5.92 |
Government | 4.07 |
Technology | 1.15 |
|
| * | Top Sectors as a percentage of market value. Does not include short-term securities and investments in the John Hancock Collateral
Investment Trust, if applicable. |
PORTFOLIO MANAGERS’ COMMENTARY
Performance 4 For the year ended August 31, 2009, the High Yield Class NAV returned +3.62%, compared to the +5.31% return of the Citigroup High Yield Index.
Market Environment 4 The period was defined by extreme volatility and was a tale of two halves. For the first six months, the Index tumbled 22.75% before soaring 36.33% in the second six months. The beginning of the period was marked by the failure of Lehman Brothers and a massive capital infusion at AIG from the U.S. government to avoid a potential collapse of the global financial system. During this period, liquidity was difficult to come by and extremely expensive.
Though the entire asset class suffered steep losses, it was those credits perceived to be most levered to economic activity that performed the worst. For example, BB-rated securities, generally regarded as higher quality, returned –9.99 from last September through February 2009, while CCC-rated issues, generally regarded as lower quality, returned –37.12% over the same period. Government policy actions were implemented in the aftermath of the financial crisis, designed to help stabilize the economy and financial institutions. These actions began to take root during the first half of 2009. Demand for risk and measures of liquidity increased as economic indicators provided hope that the worst of the crisis was over. In May, the U.S. government released the anxiously anticipated results of the bank stress tests they had conducted on the 19 largest U.S. financial institutions. The findings were benign and provided relief to investors that the doomsday predictions made by some in January and February that banks were generally insolvent was erroneous. The second-quarter earnings season provided further confirmation that the markets had stabilized as results were generally better than expected.
Quality positioning helped relative performance due to the fund’s overweight to lower-rated high yield securities, as CCC-rated issues in general returned 21.70%. Issue selection had a neutral impact on relative performance as five of the top 10 portfolio overweights outperformed and the other five underperformed. The top 10 overweights made up 15% of the portfolio. Sector allocation hurt relative performance due in large part to an underweight to Financials, which returned 41.14%.
| | | | | | | | | | | | | | | | | | |
|---|
PERFORMANCE TABLE1
|
|
|
| Average Annual Total Return
|
| Cumulative Total Return
|
|
|---|
Period Ended August 31, 2009 | | | | | 1-year | | | | 5-year | | | | 10-year | | | | Since
inception | | | | 1-year | | | | 5-year | | | | 10-year | | | | Since
inception | |
| High Yield Class 1 (began 10/15/05) | | | | | 3.66 | % | | | — | | | | — | | | | 3.49 | % | | | 3.66 | % | | | — | | | | — | | | | 14.22 | % |
| High Yield Class NAV (began 10/15/05) | | | | | 3.62 | % | | | — | | | | — | | | | 3.53 | % | | | 3.62 | % | | | — | | | | — | | | | 14.41 | % |
Citigroup High Yield Index2,3,4 | | | | | 5.31 | % | | | — | | | | — | | | | 4.12 | % | | | 5.31 | % | | | — | | | | — | | | | 17.15 | % |
| 1 | | Performance does not reflect the deduction of taxes on fund distributions or redemptions of fund shares. Past performance does not predict future performance. |
| 2 | | Since inception returns for the indices may begin on the month-end closest to the actual inception date of the fund. |
| 3 | | Citigroup High Yield Index is an unmanaged index which measures the performance of below-investment grade debt issued by corporations domiciled in the U.S. or Canada. |
| 4 | | It is not possible to invest directly in an index. |
The expense ratios of the Fund, both net (including any fee waivers or expense limitations) and gross (excluding any fee waivers or expense limitations), are set forth according to the most recent publicly available prospectuses for the Fund and may differ from the expense ratios disclosed in the Financial Highlights tables in this report. The net expenses equal the gross expenses and are as follows: Class 1 – 0.75% and Class NAV – 0.70%.
26
Index 500 Fund
Subadviser: MFC Global Investment Management (U.S.A.) Limited
Portfolio Managers: Carson Jen and Narayan Ramani
INVESTMENT OBJECTIVE & POLICIES 4 To approximate the aggregate total return of a broad-based U.S. domestic equity market index by investing at least 80% of the Fund’s net assets in (a) common stocks that are included in the S&P 500 Index and (b) securities that are believed as a group to behave in a manner similar to the Index.
CHANGE IN VALUE OF $10,000 INVESTMENT AND COMPARATIVE INDICES
Sector Weighting* | % of Total |
Consumer, Non-cyclical | 21.16 |
Financial | 14.85 |
Technology | 12.41 |
Energy | 11.53 |
Communications | 10.04 |
Industrial | 9.64 |
Consumer, Cyclical | 8.59 |
Basic Materials | 3.58 |
Utilities | 3.09 |
Diversified | 0.05 |
|
| * | Top Sectors as a percentage of market value. Does not include short-term securities and investments in the John Hancock Collateral
Investment Trust, if applicable. |
PORTFOLIO MANAGERS’ COMMENTARY
Performance 4 For the year ended August 31, 2009, Index 500 Class NAV returned –18.66%, compared to the –18.25% return of the S&P 500 Index.
Market Environment 4 The past year has witnessed major historical events among U.S. financial institutions, including the bankruptcies of Lehman Brothers and Washington Mutual, and the government takeover of AIG, Fannie Mae and Freddie Mac. Throughout the year, we also saw a major reduction in credit access for corporations, small businesses and individuals.
During the first quarter of 2009, Barack Obama became president of the United States. In January, the House approved his $819 billion economic recovery plan. Economists believe that President Obama’s stimulus plan and Federal Reserve measures will help the U.S. economy by late 2009 to early 2010. By the end of the second quarter of 2009, unemployment in the U.S. rose to a 26-year high. The jobless rate increased to 9.7% at the end of August. The bankruptcies of such large companies as General Motors and Chrysler contributed significantly to these recent job losses. The Conference Board’s Consumer Confidence Index remained low through the year, reaching 54 in August 2009. The lowest confidence level was in February 2009 when it dipped to 25.
During the past 12 months, Information Technology and Health Care were the best performing sectors, returning –1.9% and –10.8%, respectively. Financials and Industrials were the worst performers, returning –31.7% and –24.8%, respectively.
The job benefits of the federal stimulus program have yet to be felt in the real economy. Until then, continued market volatility is expected in the upcoming quarters.
The Index 500 Fund is designed to track the performance of the S&P 500 Index. Any difference in performance is attributable to trading costs and other expenses not incurred by the index.
| | | | | | | | | | | | | | | | | | |
|---|
PERFORMANCE TABLE1
|
|
|
| Average Annual Total Return
|
| Cumulative Total Return
|
|
|---|
Period Ended August 31, 2009 | | | | | 1-year | | | | 5-year | | | | 10-year | | | | Since
inception | | | | 1-year | | | | 5-year | | | | 10-year | | | | Since
inception | |
| Index 500 Class NAV (began 10/27/06) | | | | | –18.66 | % | | | — | | | | — | | | | –8.41 | % | | | –18.66 | % | | | — | | | | — | | | | –22.12 | % |
S&P 500 Index2,3,4 | | | | | –18.25 | % | | | — | | | | — | | | | –8.22 | % | | | –18.25 | % | | | — | | | | — | | | | –21.66 | % |
| 1 | | Performance does not reflect the deduction of taxes on fund distributions or redemptions of fund shares. Past performance does not predict future performance. |
| 2 | | Since inception returns for the indices may begin on the month-end closest to the actual inception date of the fund. |
| 3 | | S&P 500 Index is an unmanaged index that includes 500 widely traded common stocks. |
| 4 | | It is not possible to invest directly in an index. |
The expense ratios of the Fund, both net (including any fee waivers or expense limitations) and gross (excluding any fee waivers or expense limitations), are set forth according to the most recent publicly available prospectuses for the Fund and may differ from the expense ratios disclosed in the Financial Highlights tables in this report. For Class NAV, the net expense equals the gross expense and is 0.49%.
27
International Equity Index Fund
Subadviser: SSgA Funds Management, Inc.
Portfolio Managers: Karl Schneider and Thomas Coleman
INVESTMENT OBJECTIVE & POLICIES 4 The Fund seeks to track the performance of a broad-based equity index of foreign companies primarily in developed countries and, to a lesser extent, in emerging market countries. The Fund primarily invests in securities listed in the Morgan Stanley Capital International All Country World excluding U.S. Index.
CHANGE IN VALUE OF $10,000 INVESTMENT AND COMPARATIVE INDICES
Sector Weighting* | % of Total |
Financial | 25.03 |
Consumer, Non-cyclical | 14.17 |
Industrial | 10.42 |
Energy | 9.98 |
Basic Materials | 9.87 |
Communications | 8.71 |
Consumer, Cyclical | 7.52 |
Utilities | 4.91 |
Technology | 3.66 |
Diversified | 1.05 |
|
| * | Top Sectors as a percentage of market value. Does not include short-term securities and investments in the John Hancock Collateral
Investment Trust, if applicable. |
PORTFOLIO MANAGERS’ COMMENTARY
Performance 4 For the year ended August 31, 2009, the International Equity Index Class NAV returned –14.15%, compared to the –14.41% return of the MSCI AC World Ex US Net Index.
Market Environment 4 After losing nearly half of their value from August 2008 to early March 2009, international equity markets rebounded significantly from their March lows. The subprime and credit crisis that first came to light in 2007 continued to punish financial stocks and other interrelated sectors, though many within the financial sector also enjoyed the significant rebound since March. Risk appetites seemed to hesitate a bit when the second half of 2009 got underway, as a disappointing U.S. employment release left investors wondering whether the strong equity rallies of the second quarter could be sustained. With deflation fears ebbing further, volatility measures tumbled anew, credit spreads embarked on another leg lower, and resurgent financial shares kicked off a remarkably persistent advance in global equities that carried through to the end of the summer.
All developed market countries posted negative returns over the last year, as did all emerging market countries. Emerging markets as a group once again outperformed developed markets –10% versus –15% for the 12 months ending in August. On a regional basis, the Asia-Pacific region was the leader, with a return of –7% versus –18% for Europe and –14% for Latin America. All 10 sectors had negative returns for the period. Energy (–24%) and Industrials (–22%) led the downward charge. Consumer Staples (–8%) and Health Care (–11%) were the best performing sectors.
By utilizing a passive, replication investment style, the fund owns largely the same stocks and sectors in approximately the same weights as the MSCI ACWI ex US Index. As such, we expect the fund to have returns similar to those of the underlying benchmark. As of August 31, 2009, the Index’s four largest sectors were Financials (26.5%), Materials (10.8%), Energy (10.7%), and Industrials (10.0%).
| | | | | | | | | | | | | | | | | | |
|---|
PERFORMANCE TABLE1
|
|
|
| Average Annual Total Return
|
| Cumulative Total Return
|
|
|---|
Period Ended August 31, 2009 | | | | | 1-year | | | | 5-year | | | | 10-year | | | | Since
inception | | | | 1-year | | | | 5-year | | | | 10-year | | | | Since
inception | |
| International Equity Index Class NAV (began 10/29/05) | | | | | –14.15 | % | | | — | | | | — | | | | 2.86 | % | | | –14.15 | % | | | — | | | | — | | | | 11.44 | % |
MSCI AC World Ex US Net Index2,3,4 | | | | | –14.41 | % | | | — | | | | — | | | | 3.58 | % | | | –14.41 | % | | | — | | | | — | | | | 14.46 | % |
| 1 | | Performance does not reflect the deduction of taxes on fund distributions or redemptions of fund shares. Past performance does not predict future performance. |
| 2 | | Current subadviser has managed the fund since October 29, 2005. |
| 3 | | Since inception returns for the indices may begin on the month-end closest to the actual inception date of the fund. |
| 4 | | MSCI AC World ex US Net Index is a free float-adjusted market capitalization index that is designed to measure equity market performance in the global developed and emerging markets excluding U.S. |
| 5 | | It is not possible to invest directly in an index. |
The expense ratios of the Fund, both net (including any fee waivers or expense limitations) and gross (excluding any fee waivers or expense limitations), are set forth according to the most recent publicly available prospectuses for the Fund and may differ from the expense ratios disclosed in the Financial Highlights tables in this report. For Class NAV, the net expense equals the gross expense and is 0.56%.
28
International Opportunities Fund
Subadviser: Marsico Capital Management, LLC
Portfolio Manager: James G. Gendelman
INVESTMENT OBJECTIVE & POLICIES 4 To seek long-term growth of capital by investing at least 65% of its total assets in common stocks of foreign companies that are selected for their long-term growth potential.
CHANGE IN VALUE OF $10,000 INVESTMENT AND COMPARATIVE INDICES
Sector Weighting* | % of Total |
Financial | 27.08 |
Industrial | 15.68 |
Consumer, Non-cyclical | 11.41 |
Energy | 9.34 |
Consumer, Cyclical | 9.14 |
Communications | 6.93 |
Technology | 6.56 |
Basic Materials | 5.99 |
Diversified | 0.45 |
|
| * | Top Sectors as a percentage of market value. Does not include short-term securities and investments in the John Hancock Collateral
Investment Trust, if applicable. |
PORTFOLIO MANAGER’S COMMENTARY
Performance 4 For the year ended August 31, 2009, the International Opportunities Class NAV returned –20.06%, compared to the –14.47% return of the MSCI EAFE® Gross Index.
Market Environment 4 Equity performance in developed markets was weak for the 12-month period ended August 31, 2009, but still managed to outperform the U.S. equity market (using the S&P 500 Index as a reference). None of the 10 sectors in the MSCI EAFE Index had gains in the period and six sectors had losses of 10% or more. The weakest areas were Materials, Information Technology, Financials, Utilities, Industrials and Energy. Consumer Staples and Telecommunication Services, while still posting losses, emerged as the strongest areas.
Stock selection and an emphasis in the weak-performing Industrials sector were the largest negative performance factors. Mobile telecommunication services providers in Latin America and South Africa hurt performance, as did a Canada-based wireless telecommunications and cable television service provider. Although active currency management is not a central facet of the fund’s investment process, currency fluctuations may at times affect the fund’s performance. For the period, currency fluctuations had a material, negative effect on performance results relative to the EAFE Index. There were a few bright spots to the fund’s performance. In particular, stock selection was strong in the semiconductors & semiconductor equipment, banks, and food beverage & tobacco industry groups, and an emphasis in the relatively strong-performing pharmaceuticals biotechnology & life sciences industry helped results.
| | | | | | | | | | | | | | | | | | |
|---|
PERFORMANCE TABLE1
|
|
|
| Average Annual Total Return
|
| Cumulative Total Return
|
|
|---|
Period Ended August 31, 2009 | | | | | 1-year | | | | 5-year | | | | 10-year | | | | Since
inception | | | | 1-year | | | | 5-year | | | | 10-year | | | | Since
inception | |
| International Opportunities Class 1 (began 10/15/05) | | | | | –20.11 | % | | | — | | | | — | | | | 1.80 | % | | | –20.11 | % | | | — | | | | — | | | | 7.15 | % |
| International Opportunities Class NAV (began 10/15/05) | | | | | –20.06 | % | | | — | | | | — | | | | 1.85 | % | | | –20.06 | % | | | — | | | | — | | | | 7.38 | % |
MSCI EAFE Gross Index3,4,5 | | | | | –14.47 | % | | | — | | | | — | | | | 1.19 | % | | | –14.47 | % | | | — | | | | — | | | | 4.75 | % |
| 1 | | Performance does not reflect the deduction of taxes on fund distributions or redemptions of fund shares. Past performance does not predict future performance. |
| 2 | | Since inception returns for the indices may begin on the month-end closest to the actual inception date of the fund. |
| 3 | | MSCI EAFE Gross Index (Europe, Australia, Far East) is a free-float-adjusted market capitalization index that is designed to measure developed market equity performance, excluding the U.S. & Canada. As of June 2007, the MSCI EAFE Gross Index consisted of 21 developed market country indices. |
| 4 | | It is not possible to invest directly in an index. |
The expense ratios of the Fund, both net (including any fee waivers or expense limitations) and gross (excluding any fee waivers or expense limitations), are set forth according to the most recent publicly available prospectuses for the Fund and may differ from the expense ratios disclosed in the Financial Highlights tables in this report. The net expenses equal the gross expenses and are as follows: Class 1 – 1.04% and Class NAV – 0.99%.
29
International Small Cap Fund
Subadviser: Franklin Templeton Investment Corp.
Portfolio Manager: Bradley Radin
INVESTMENT OBJECTIVE & POLICIES 4 To seek long-term capital appreciation. The Fund will invest at least 80% of its net assets in securities issued by foreign companies which have total stock market capitalizations or annual revenues of $2 billion or less.
CHANGE IN VALUE OF $10,000 INVESTMENT AND COMPARATIVE INDICES
Sector Weighting* | % of Total |
Consumer, Cyclical | 26.36 |
Industrial | 23.13 |
Financial | 17.69 |
Consumer, Non-cyclical | 14.25 |
Basic Materials | 4.44 |
Technology | 3.70 |
Communications | 2.91 |
Energy | 1.94 |
Diversified | 1.31 |
Utilities | 1.04 |
|
| * | Top Sectors as a percentage of market value. Does not include short-term securities and investments in the John Hancock Collateral
Investment Trust, if applicable. |
PORTFOLIO MANAGER’S COMMENTARY
Performance 4 For the year ended August 31, 2009, the International Small Cap Class NAV returned –9.94%, compared to the –5.96% return of the S&P/Citigroup Global ex U.S. <$2 Billion Index.
Market Environment 4 Stock selection in the Consumer Discretionary and Financials sectors detracted from the fund’s performance relative to the benchmark index during the period, as did an underweighting and stock selection in the Materials sector.
On the positive side, stock selection in the Health Care and Industrials sectors contributed to relative performance, as did an underweighting and stock selection in the Energy sector. One of the Fund’s top contributors was a North American pharmaceutical company focused on a drug delivery technology platform used to develop better formulations of established drugs. We believe the company has strong research and development and a proven ability to control costs.
During the year, the fund was significantly overweighted in the Consumer Discretionary sector and, to a lesser extent, Health Care. Meanwhile, it was relatively underweighted in the Financials, Materials and Consumer Staples sectors. These weightings were a result of our bottom-up stock selection process and were indicative of where our analysts were finding the value opportunities they feel are most attractive.
At period-end, equity markets may remain volatile given lingering economic uncertainties worldwide. Regardless of the economic outlook, we base our stock selection on company fundamentals. We are continually searching for stocks selling at a discount to our assessment of their intrinsic worth. If anything, volatility in global stock markets may enable us to purchase investments in what we believe to be exceptional companies selling at undervalued prices.
The first half of the 12-month period was marked by the bursting of the credit and commodities bubbles, the onset of global recession and the precipitous decline of equity markets. The second half featured a sharp market recovery amid renewed optimism. Generally, market sectors and regions traditionally considered defensive most effectively limited losses during the first half of the year, although declines were nearly universal. In the second half of the year, beaten-down cyclical sectors and more volatile emerging markets regions led performance as global equities staged a dramatic recovery.
| | | | | | | | | | | | | | | | | | |
|---|
PERFORMANCE TABLE1
|
|
|
| Average Annual Total Return
|
| Cumulative Total Return
|
|
|---|
Period Ended August 31, 2009 | | | | | 1-year | | | | 5-year | | | | 10-year | | | | Since
inception | | | | 1-year | | | | 5-year | | | | 10-year | | | | Since
inception | |
| International Small Cap Class 1 (began 10/15/05) | | | | | –9.88 | % | | | — | | | | — | | | | 1.38 | % | | | –9.88 | % | | | — | | | | — | | | | 5.47 | % |
| International Small Cap Class NAV (began 10/15/05) | | | | | –9.94 | % | | | — | | | | — | | | | 1.45 | % | | | –9.94 | % | | | — | | | | — | | | | 5.74 | % |
S&P/Citigroup Global ex U.S. <$2 Billion Index2,3,4 | | | | | –5.96 | % | | | — | | | | — | | | | 4.39 | % | | | –5.96 | % | | | — | | | | — | | | | 18.16 | % |
| 1 | | Performance does not reflect the deduction of taxes on fund distributions or redemptions of fund shares. Past performance does not predict future performance. |
| 2 | | Since inception returns for the indices may begin on the month-end closest to the actual inception date of the fund. |
| 3 | | S&P/Citigroup Global ex U.S. <$2 Billion Index is an unmanaged index which follows an objective, free float-weighted, rules based methodology, capturing the broad investable opportunity set. |
| 4 | | It is not possible to invest directly in an index. |
The expense ratios of the Fund, both net (including any fee waivers or expense limitations) and gross (excluding any fee waivers or expense limitations), are set forth according to the most recent publicly available prospectuses for the Fund and may differ from the expense ratios disclosed in the Financial Highlights tables in this report. The net expenses equal the gross expenses and are as follows: Class 1 – 1.18% and Class NAV – 1.13%.
30
International Small Company Fund
Subadviser: Dimensional Fund Advisors LP
Portfolio Manager: Karen E. Umland
INVESTMENT OBJECTIVE & POLICIES 4 The Fund seeks long-term capital appreciation by investing at least 80% of its net assets in securities of small cap companies. The Fund will primarily invest its assets in equity securities of non-U.S. small companies of developed markets but may also invest in emerging markets.
CHANGE IN VALUE OF $10,000 INVESTMENT AND COMPARATIVE INDICES
Sector Weighting* | % of Total |
Industrial | 24.18 |
Consumer, Cyclical | 15.58 |
Consumer, Non-cyclical | 15.44 |
Financial | 13.26 |
Basic Materials | 10.12 |
Communications | 6.24 |
Energy | 5.78 |
Technology | 4.95 |
Diversified | 1.25 |
Utilities | 1.03 |
|
| * | Top Sectors as a percentage of market value. Does not include short-term securities and investments in the John Hancock Collateral
Investment Trust, if applicable. |
PORTFOLIO MANAGER’S COMMENTARY
Performance 4 For the year ended August 31, 2009, the International Small Company Class NAV returned –12.23%, compared to the –8.51% return of the MSCI EAFE Small Cap Gross Index.
Market Environment 4 The 12 months from September 2008 to August 2009 were characterized by two completely different periods. From September 2008 to early March 2009, global equity markets fell by about 50%, as the global financial crisis and the slowdown in many of the world’s leading economies became more severe. Then, from early March to August 2009, equity markets around the world rebounded sharply, as fears of a systemic collapse of the world economy abated and financial markets began to show some signs of stabilization. Throughout this period, volatility and divergent performance in developed markets was at extraordinarily high levels, especially in late 2008 and the early part of 2009. As a result, small differences in portfolio weights between different strategies or between strategies and benchmarks often resulted in large differences in performance.
The fund’s exposure to Canada and other differences in allocation across regions had a large negative impact on relative performance. On the other hand, differences in composition within regions, especially in Japan, had a slight positive impact on relative performance.
The portfolio’s overweight to the smallest stocks by market capitalization and other differences in allocation across the market capitalization segments aided relative performance. However, composition differences within the market capitalization segments had a negative and stronger effect on the fund’s relative performance.
Allocation across sectors slightly dampened relative performance. Composition differences within sectors, especially in Financials, Materials and Consumer Discretionary strongly detracted from fund performance. Differences in allocation to industry sectors are a byproduct of the fund’s investment process, rather than specific sector bets.
| | | | | | | | | | | | | | | | | | |
|---|
PERFORMANCE TABLE1
|
|
|
| Average Annual Total Return
|
| Cumulative Total Return
|
|
|---|
Period Ended August 31, 2009 | | | | | 1-year | | | | 5-year | | | | 10-year | | | | Since
inception | | | | 1-year | | | | 5-year | | | | 10-year | | | | Since
inception | |
| International Small Company Class NAV (began 4/28/06) | | | | | –12.23 | % | | | — | | | | — | | | | –5.72 | % | | | –12.23 | % | | | — | | | | — | | | | –17.87 | % |
MSCI EAFE Small Cap Gross Index2,3,4 | | | | | –8.51 | % | | | — | | | | — | | | | –6.63 | % | | | –8.51 | % | | | — | | | | — | | | | –20.48 | % |
| 1 | | Performance does not reflect the deduction of taxes on fund distributions or redemptions of fund shares. Past performance does not predict future performance. |
| 2 | | Since inception returns for the indices may begin on the month-end closest to the actual inception date of the fund. |
| 3 | | MSCI EAFE Small Cap Gross Index is an unmanaged index that is a free float-adjusted market capitalization index that is designed to measure developed market equity performance, excluding the US & Canada and targets 40% of the eligible small cap universe in each industry group of each country represented by the MSCI EAFE Index. As of June 2007 the MSCI EAFE Index consisted of 21 developed market country indices. |
| 4 | | It is not possible to invest directly in an index. |
The expense ratios of the Fund, both net (including any fee waivers or expense limitations) and gross (excluding any fee waivers or expense limitations), are set forth according to the most recent publicly available prospectuses for the Fund and may differ from the expense ratios disclosed in the Financial Highlights tables in this report. For Class NAV, the net expense equals the gross expense and is 1.10%.
31
International Value Fund
Subadviser: Templeton Investment Counsel, LLC
Portfolio Managers: Tucker Scott, Cindy Sweeting, and Antonio Docal
INVESTMENT OBJECTIVE & POLICIES 4 To seek long-term growth of capital. The Fund invests at least 80% of its total assets in equity securities of companies located outside the U.S., including emerging markets.
CHANGE IN VALUE OF $10,000 INVESTMENT AND COMPARATIVE INDICES
Sector Weighting* | % of Total |
Communications | 20.55 |
Consumer, Non-cyclical | 17.41 |
Financial | 16.60 |
Technology | 9.90 |
Consumer, Cyclical | 9.32 |
Energy | 8.30 |
Industrial | 7.90 |
Utilities | 2.22 |
Diversified | 1.08 |
|
| * | Top Sectors as a percentage of market value. Does not include short-term securities and investments in the John Hancock Collateral
Investment Trust, if applicable. |
PORTFOLIO MANAGERS’ COMMENTARY
Performance 4 For the year ended August 31, 2009, the International Value Class NAV returned –9.85%, compared to the –14.47% return of the MSCI EAFE Gross Index.
Market Environment 4 During the fiscal year, the Financials sector was a significant detractor from fund returns relative to the benchmark index due to stock selection and an underweighted position, and this group contained several of the portfolio’s worst-performing stocks. More generally, our cautious exposure to the sector helped limit losses during the bear market, but hindered relative performance as the sector rebounded strongly over the spring and summer. Materials, like Financials, is a highly cyclical and seemingly overvalued sector in which the fund has long been underweighted. Our underweighting in Materials helped limit losses when markets collapsed through March 2009, but also limited the upside as markets recovered. Within the sector, our concentration in deep-value paper companies pressured performance, as the pulp industry remained cyclically depressed.
European and Asian stocks delivered the best returns relative to the benchmark index. In particular, stock selection in the U.K. and positions in non-index countries Taiwan and South Korea were major contributors. By sector, stock selection in the more cyclical Information Technology, Consumer Discretionary and Industrials sectors contributed to the portfolio’s relative performance as the economy and markets rebounded in the period’s latter half. The Fund’s Information Technology stocks delivered positive absolute returns overall compared with the index’s roughly 20% sector decline, and were the portfolio’s top relative performers.
The Fund’s overweighted Consumer Discretionary stocks also had strong gains and outperformed the benchmark, led by holdings in the retailing industry. The Fund’s Industrials stocks also performed better than the Index’s sector return as market optimism emerged with nascent signs of economic recovery.
The Fund did not hold any derivative securities during the period under review.
The first half of the 12-month period was marked by the bursting of the credit and commodities bubbles, the onset of global recession and the precipitous decline of equity markets. The second half featured a sharp market recovery amid renewed optimism. Generally, market sectors and regions traditionally considered defensive most effectively limited losses during the first half of the year, although declines were nearly universal. In the second half of the year, beaten-down cyclical sectors and more volatile emerging markets regions led performance as global equities staged a dramatic recovery.
| | | | | | | | | | | | | | | | | | |
|---|
PERFORMANCE TABLE1,3
|
|
|
| Average Annual Total Return
|
| Cumulative Total Return
|
|
|---|
Period Ended August 31, 2009 | | | | | 1-year | | | | 5-year | | | | 10-year | | | | Since
inception | | | | 1-year | | | | 5-year | | | | 10-year | | | | Since
inception | |
| International Value Class 1 (began 10/15/05) | | | | | –9.96 | % | | | — | | | | — | | | | 2.00 | % | | | –9.96 | % | | | — | | | | — | | | | 7.97 | % |
| International Value Class NAV (began 10/15/05) | | | | | –9.85 | % | | | — | | | | — | | | | 2.07 | % | | | –9.85 | % | | | — | | | | — | | | | 8.25 | % |
MSCI EAFE Gross Index2,4,5 | | | | | –14.47 | % | | | — | | | | — | | | | 1.19 | % | | | –14.47 | % | | | — | | | | — | | | | 4.75 | % |
| 1 | | Performance does not reflect the deduction of taxes on fund distributions or redemptions of fund shares. Past performance does not predict future performance. |
| 2 | | Since inception returns for the indices may begin on the month-end closest to the actual inception date of the fund. |
| 3 | | Since inception, a portion of the International Value Fund expenses were reimbursed. If such expenses had not been reimbursed, returns would be lower. |
| 4 | | MSCI EAFE Gross Index (Europe, Australia, Far East) is a free-float-adjusted market capitalization index that is designed to measure developed market equity performance, excluding the U.S. & Canada. As of June 2007, the MSCI EAFE Index consisted of 21 developed market country indices. |
| 5 | | It is not possible to invest directly in an index. |
The expense ratios of the Fund, both net (including any fee waivers or expense limitations) and gross (excluding any fee waivers or expense limitations), are set forth according to the most recent publicly available prospectuses for the Fund and may differ from the expense ratios disclosed in the Financial Highlights tables in this report. The waivers and expense limitations are contractual until at least December 31, 2009. The net expenses are as follows: Class 1 – 0.98% and Class NAV – 0.93%. Had the fee waivers and expense limitations not been in place, the gross expenses would be as follows: Class 1 – 0.99% and Class NAV – 0.94%.
32
Investment Quality Bond Fund
Subadviser: Wellington Management Company, LLP
Portfolio Managers: Thomas L. Pappas, CFA, Christopher L. Gootkind, CFA and Christopher A. Jones, CFA
INVESTMENT OBJECTIVE & POLICIES 4 To provide a high level of current income consistent with the maintenance of principal and liquidity. The Fund invests at least 80% of its net assets in bonds rated investment grade at the time of investment. The Fund will tend to focus on corporate bonds and U.S. government bonds with intermediate to longer term maturities.
CHANGE IN VALUE OF $10,000 INVESTMENT AND COMPARATIVE INDICES
Sector Weighting* | % of Total |
U.S. Treasury Bonds | 24.60 |
Financial | 19.02 |
Communications | 8.49 |
Mortgage Securities | 8.37 |
Consumer, Non-cyclical | 7.04 |
Utilities | 5.88 |
Federal National Mortgage Association | 3.43 |
Energy | 2.68 |
Government | 2.61 |
U.S. Treasury Notes | 1.69 |
|
| * | Top Sectors as a percentage of market value. Does not include short-term securities and investments in the John Hancock Collateral
Investment Trust, if applicable. |
PORTFOLIO MANAGERS’ COMMENTARY
Performance 4 For the year ended August 31, 2009, the Investment Quality Bond Class NAV returned +8.23%, compared to the +8.28% return of the 50% Barclays Capital Government Bond Index/50% Barclays Capital Credit Bond Index.
Market Environment 4 In the latter half of 2008, Treasury yields reached record lows and equity markets plummeted globally as financial market turmoil worsened and a U.S. recession was confirmed. Following the bankruptcy of Lehman Brothers, credit markets froze and risk aversion dominated markets. Negative economic news was pervasive with increasing unemployment, declining consumer confidence, falling equity markets, and further deterioration in the housing market. Unprecedented government intervention was initiated, including actions to support the short-term funding markets, banking system, auto industry, and the reduction of consumer borrowing costs.
Signs of market and global economic stabilization materialized in the first half of 2009. Positive sentiment returned with a rally in global equities, better-than-expected earnings and economic readings, and improved liquidity conditions. Importantly, financial institutions regained access to unsecured credit and equity markets and raised capital. Credit and securitized spreads tightened in the latter half of the period as government intervention reduced the risk of a severe and prolonged recession and market liquidity conditions improved.
Contributing to relative results were the fund’s allocations to agency mortgages, commercial mortgage-backed securities (CMBS), high yield corporate bonds, and non-dollar rate positions. Agency mortgages posted positive excess returns following the announcement, initiation, and expansion of the Federal Reserve’s agency MBS purchase program. CMBS rebounded in mid-2009 following the expansion of the Term Asset-Backed Loan Facility (TALF) and announcement of the Public Private Investment Program (PPIP), both of which target the CMBS market. As government intervention increased and the risk of a depression dissipated, high yield bonds rebounded and outperformed. The fund’s non-dollar rate positions in the UK and Germany performed well in the first quarter. Lastly, the portfolio benefited from an underweight to the investment grade corporate bond sector during the credit crisis in 2008.
Detracting from the fund’s performance was an allocation to Treasury Inflation-Protected Securities (TIPS) and security selection within the investment grade corporate bond allocation. TIPS underperformed late in 2008 as the recession intensified and the market revised its expectations materially downwards for growth and inflation. The fund was hurt by corporate bond selection, in particular an overweight to corporate debt issued by Financials, which were at the epicenter of the credit crunch.
| | | | | | | | | | | | | | | | | | |
|---|
PERFORMANCE TABLE1
|
|
|
| Average Annual Total Return
|
| Cumulative Total Return
|
|
|---|
Period Ended August 31, 2009 | | | | | 1-year | | | | 5-year | | | | 10-year | | | | Since
inception | | | | 1-year | | | | 5-year | | | | 10-year | | | | Since
inception | |
| Investment Quality Bond Class 1 (began 10/15/05) | | | | | 8.16 | % | | | — | | | | — | | | | 5.09 | % | | | 8.16 | % | | | — | | | | — | | | | 21.25 | % |
| Investment Quality Bond Class NAV (began 10/15/05) | | | | | 8.23 | % | | | — | | | | — | | | | 5.15 | % | | | 8.23 | % | | | — | | | | — | | | | 21.51 | % |
50% Barclays Capital Government Bond Index/ 50% Barclays Capital Credit Bond Index2,3,4 | | | | | 8.28 | % | | | — | | | | — | | | | 5.40 | % | | | 8.28 | % | | | — | | | | — | | | | 22.88 | % |
| 1 | | Performance does not reflect the deduction of taxes on fund distributions or redemptions of fund shares. Past performance does not predict future performance. |
| 2 | | Since inception returns for the indices may begin on the month-end closest to the actual inception date of the fund. |
| 3 | | Barclays Capital Government Bond Index and Barclays Capital Credit Bond Index Blend-A blended index is used combining 50% of the Barclays Capital Government Bond Index which is an unmanaged index that represents securities issued by the U.S. Government (i.e. securities in the Treasury and Agency indices); and 50% Barclays Capital Credit Bond Index, which is an unmanaged index of publicly issued U.S. corporate and specified foreign debentures and secured notes that meet the specified maturity, liquidity, and quality requirements. To qualify, bonds must be SEC registered. |
| 4 | | It is not possible to invest directly in an index. |
The expense ratios of the Fund, both net (including any fee waivers or expense limitations) and gross (excluding any fee waivers or expense limitations), are set forth according to the most recent publicly available prospectuses for the Fund and may differ from the expense ratios disclosed in the Financial Highlights tables in this report. The net expenses equal the gross expenses and are as follows: Class 1 – 0.76% and Class NAV – 0.71%.
33
Large Cap Fund
Subadviser: UBS Global Asset Management (Americas) Inc.
Portfolio Managers: John Leonard, Thomas Cole, Thomas Digenan and Scott Hazen
INVESTMENT OBJECTIVE & POLICIES 4 To seek to maximize total return, consisting of capital appreciation and current income. The Fund invests at least 80% of its net assets in equity securities of U.S. large capitalization companies as in the Russell 1000 Index.
CHANGE IN VALUE OF $10,000 INVESTMENT AND COMPARATIVE INDICES
Sector Weighting* | % of Total |
Consumer, Non-cyclical | 23.16 |
Technology | 15.85 |
Financial | 13.77 |
Energy | 13.73 |
Industrial | 9.96 |
Communications | 7.75 |
Utilities | 5.31 |
Consumer, Cyclical | 5.19 |
Basic Materials | 1.32 |
Investment Companies | 0.49 |
|
| * | Top Sectors as a percentage of market value. Does not include short-term securities and investments in the John Hancock Collateral
Investment Trust, if applicable. |
PORTFOLIO MANAGERS’ COMMENTARY
Performance 4 For the year ended August 31, 2009, the Large Cap Class NAV returned –21.65%, compared to the –18.39% return of the Russell 1000 Index.
Market Environment 4 The year began with the market declining precipitously based on a dire economic outlook. The U.S. equity market, as well as other markets around the world, then rallied fast and furiously as the economic news upgraded from terrible to just bad. During this time, portfolio performance has underperformed overall with recent periods of outperformance not yet overcoming poor results early in the fiscal year. The overall underperformance was primarily driven by industry selection while stock selection has continued to help, especially in the most recent months. An overweight to semiconductors and an underweight to materials benefited performance the most from industry selection but were offset by the negative impact of an underweight to technology hardware and overweight to banks.
The biggest challenge facing investors in this environment is becoming overly fixated on the short-term economic updates. There will be relatively positive news in areas such as autos and even housing, where the news could not get much worse. At the same time, unemployment and other pressures on consumers may not abate for some time. The longer-term economic concerns revolve around the transition of consumers from not being bound by gravity to carrying a weight around their necks. As the tail winds of easy credit, rising home prices and lower tax rates reverse and savings rates increase, consumers will probably not feel the resiliency we saw during the early part of this decade before the housing bubble popped.
Currently, the obvious head winds include earnings, which remain under pressure, increasing unemployment, which hurts consumers’ ability/willingness to spend, and economic stimulus, which could have a long-term inflationary impact if not unwound effectively. The economic tail winds include unprecedented government actions to support economic stability, signs that financial stress and volatility have begun to stabilize, strong economic growth from China, and global cash levels at near-record highs.
Attractive price/value opportunities are not limited, nor are they necessarily more likely during strong economic times. As we witnessed earlier in 2009, sometimes the direst economic circumstances give rise to the greatest investment opportunities. While we believe there are still significant economic challenges ahead, and some of the most dramatic mispricings have partially corrected themselves in recent months, we find the current price/value opportunities to be compelling.
| | | | | | | | | | | | | | | | | | |
|---|
PERFORMANCE TABLE1
|
|
|
| Average Annual Total Return
|
| Cumulative Total Return
|
|
|---|
Period Ended August 31, 2009 | | | | | 1-year | | | | 5-year | | | | 10-year | | | | Since
inception | | | | 1-year | | | | 5-year | | | | 10-year | | | | Since
inception | |
| Large Cap Class 1 (began 10/15/05) | | | | | –21.66 | % | | | — | | | | — | | | | –3.62 | % | | | –21.66 | % | | | — | | | | — | | | | –13.33 | % |
| Large Cap Class NAV (began 10/15/05) | | | | | –21.65 | % | | | — | | | | — | | | | –3.58 | % | | | –21.65 | % | | | — | | | | — | | | | –13.17 | % |
Russell 1000 Index2,3,4 | | | | | –18.39 | % | | | — | | | | — | | | | –1.61 | % | | | –18.39 | % | | | — | | | | — | | | | –6.11 | % |
| 1 | | Performance does not reflect the deduction of taxes on fund distributions or redemptions of fund shares. Past performance does not predict future performance. |
| 2 | | Since inception returns for the indices may begin on the month-end closest to the actual inception date of the fund. |
| 3 | | Russell 1000 Index is an unmanaged index which measures the performance of the 1,000 largest companies in the Russell 3000 Index. |
| 4 | | It is not possible to invest directly in an index. |
The expense ratios of the Fund, both net (including any fee waivers or expense limitations) and gross (excluding any fee waivers or expense limitations), are set forth according to the most recent publicly available prospectuses for the Fund and may differ from the expense ratios disclosed in the Financial Highlights tables in this report. The net expenses equal the gross expenses and are as follows: Class 1 – 0.80% and Class NAV – 0.75%.
34
Large Cap Value Fund
Subadviser: BlackRock Investment Management, LLC
Portfolio Managers: Robert C. Doll, Jr. and Daniel Hanson
INVESTMENT OBJECTIVE & POLICIES 4 To seek long-term growth of capital by investing primarily in a diversified portfolio of equity securities of large-cap companies located in the U.S. At least 80% of the Fund’s net assets are invested in equity securities of large-capitalization companies in the Russell 1000 Value Index.
CHANGE IN VALUE OF $10,000 INVESTMENT AND COMPARATIVE INDICES
Sector Weighting* | % of Total |
Energy | 23.76 |
Consumer, Non-cyclical | 23.03 |
Financial | 13.60 |
Industrial | 8.24 |
Consumer, Cyclical | 7.68 |
Communications | 6.52 |
Utilities | 5.87 |
Technology | 5.76 |
Basic Materials | 0.45 |
|
| * | Top Sectors as a percentage of market value. Does not include short-term securities and investments in the John Hancock Collateral
Investment Trust, if applicable. |
PORTFOLIO MANAGERS’ COMMENTARY
Performance 4 For the year ended August 31, 2009, the Large Cap Value Class NAV returned –25.90%, compared to the –20.27% return of the Russell 1000 Value Index.
Market Environment 4 Detracting from the fund’s performance relative to the benchmark were underweights and security selection in the Financials and Consumer Staples sectors. Our underweight in Consumer Staples during the year was based on valuations. Though we liked the defensive nature of the sector, valuations were too expensive to merit investment. Our underweight and security selection in Financials strongly benefited performance in the first half of the annual period, through the market’s low in early March. The overall underperformance in the sector — and in the fund overall — came from the period following the market bottom. During this sharp rally, extremely low-quality names significantly outperformed high-quality names. Financial companies were the most significant beneficiaries of the flight from quality. The benchmark’s holdings in the Financials sector were up by more than 120% from March 9 to August 31, 2009, doubling the return of the overall Index within that time frame.
Contributing to performance was security selection in both the Consumer Discretionary and Health Care sectors. In Consumer Discretionary, we focused on discount retailers and other companies positioned to benefit from a trade down in consumer behavior. We have recently taken a portion of this bet off the table as the holdings didn’t significantly participate in the recent rally. Our broad-based holdings in Health Care contributed to results during the year. Adding most notably in the sector were our biotechnology and equipment & supplies holdings.
The Russell 1000 Value Index was down by more than 20% for the one-year period. The benchmark’s holdings in the Industrials and Financials sectors were the worst performers during the period. On the whole, the year can be spliced into two distinct halves, with the first ending in early March and the second going through the fiscal year-end. In the first half, the Index was down by more than 50%. Financials and Materials performed the worst, falling by more than 60%. In the second half, the benchmark was up nearly 60%. Financials and Materials, which lagged earlier in the period, were the top performers, each gaining more than 100%.
| | | | | | | | | | | | | | | | | | |
|---|
PERFORMANCE TABLE1
|
|
|
| Average Annual Total Return
|
| Cumulative Total Return
|
|
|---|
Period Ended August 31, 2009 | | | | | 1-year | | | | 5-year | | | | 10-year | | | | Since
inception | | | | 1-year | | | | 5-year | | | | 10-year | | | | Since
inception | |
| Large Cap Value Class 1 (began 10/15/05) | | | | | –25.96 | % | | | — | | | | — | | | | –4.52 | % | | | –25.96 | % | | | — | | | | — | | | | –16.42 | % |
| Large Cap Value Class NAV (began 10/15/05) | | | | | –25.90 | % | | | — | | | | — | | | | –4.46 | % | | | –25.90 | % | | | — | | | | — | | | | –16.24 | % |
Russell 1000 Value Index2,3,4 | | | | | –20.27 | % | | | — | | | | — | | | | –2.63 | % | | | –20.27 | % | | | — | | | | — | | | | –9.82 | % |
| 1 | | Performance does not reflect the deduction of taxes on fund distributions or redemptions of fund shares. Past performance does not predict future performance. |
| 2 | | Since inception returns for the indices may begin on the month-end closest to the actual inception date of the fund. |
| 3 | | Russell 1000 Value Index is an unmanaged index containing those securities in the Russell 1000 Index with a less-than-average growth orientation. |
| 4 | | It is not possible to invest directly in an index. |
The expense ratios of the Fund, both net (including any fee waivers or expense limitations) and gross (excluding any fee waivers or expense limitations), are set forth according to the most recent publicly available prospectuses for the Fund and may differ from the expense ratios disclosed in the Financial Highlights tables in this report. The net expenses equal the gross expenses and are as follows: Class 1 – 0.88% and Class NAV – 0.83%.
35
Mid Cap Index Fund
Subadviser: MFC Global Investment Management (U.S.A.) Limited
Portfolio Managers: Carson Jen and Narayan Ramani
INVESTMENT OBJECTIVE & POLICIES 4 The Fund seeks to approximate the aggregate total return of a mid-capitalization U.S. domestic equity market index by primarily investing in (a) common stocks that are included in the S&P MidCap 400 Index and (b) securities that are believed as a group to behave in a manner similar to the index.
CHANGE IN VALUE OF $10,000 INVESTMENT AND COMPARATIVE INDICES
Sector Weighting* | % of Total |
Consumer, Non-cyclical | 17.97 |
Financial | 15.87 |
Industrial | 14.30 |
Consumer, Cyclical | 12.11 |
Technology | 6.94 |
Energy | 5.61 |
Utilities | 5.05 |
Basic Materials | 4.71 |
Communications | 3.78 |
|
| * | Top Sectors as a percentage of market value. Does not include short-term securities and investments in the John Hancock Collateral
Investment Trust, if applicable. |
PORTFOLIO MANAGERS’ COMMENTARY
Performance 4 For the year ended August 31, 2009, the Mid Cap Index Class NAV returned –18.69%, compared to the –18.17% return of the S&P MidCap 400 Index.
Market Environment 4 The past year has witnessed major historical events among U.S. financial institutions, including the bankruptcies of Lehman Brothers and Washington Mutual, and the government takeover of AIG, Fannie Mae and Freddie Mac. Throughout the year, we also saw a major reduction in credit access for corporations, small businesses and individuals.
During the first quarter of 2009, Barack Obama became president of the United States. In January, the House approved his $819 billion economic recovery plan. Economists believe that President Obama’s stimulus plan and Federal Reserve measures will help the U.S. economy by late 2009 to early 2010. By the end of the second quarter of 2009, unemployment in the U.S. rose to a 26-year high. The jobless rate increased to 9.7% at the end of August. The bankruptcies of such large companies as General Motors and Chrysler contributed significantly to these recent job losses. The Conference Board’s Consumer Confidence Index remained low through the year, reaching 54 in August 2009. The lowest confidence level was in February 2009 when it dipped to 25.
During the past 12 months, Information Technology and Consumer Staples were the best performing sectors, returning 2.1% and –7.1%, respectively. Energy and Financials were the worst performers, returning –25.1% and –23.4%, respectively.
The job benefits of the federal stimulus program have yet to be felt in the real economy. Until then, continued market volatility is expected in the upcoming quarters.
The Mid Cap Index Fund is designed to track the performance of the S&P MidCap 400 Index. Any difference in performance is attributable to trading costs and other expenses not incurred by the index.
| | | | | | | | | | | | | | | | | | |
|---|
PERFORMANCE TABLE1
|
|
|
| Average Annual Total Return
|
| Cumulative Total Return
|
|
|---|
Period Ended August 31, 2009 | | | | | 1-year | | | | 5-year | | | | 10-year | | | | Since
inception | | | | 1-year | | | | 5-year | | | | 10-year | | | | Since
inception | |
| Mid Cap Index Class NAV (began 10/29/05) | | | | | –18.69 | % | | | — | | | | — | | | | –0.47 | % | | | –18.69 | % | | | — | | | | — | | | | –1.81 | % |
S&P MidCap 400 Index2,3,4 | | | | | –18.17 | % | | | — | | | | — | | | | 0.08 | % | | | –18.17 | % | | | — | | | | — | | | | 0.31 | % |
| 1 | | Performance does not reflect the deduction of taxes on fund distributions or redemptions of fund shares. Past performance does not predict future performance. |
| 2 | | Since inception returns for the indices may begin on the month-end closest to the actual inception date of the fund. |
| 3 | | S&P MidCap 400 Index is an unmanaged index of 400 domestic stocks of medium-sized companies. |
| 4 | | It is not possible to invest directly in an index. |
The expense ratios of the Fund, both net (including any fee waivers or expense limitations) and gross (excluding any fee waivers or expense limitations), are set forth according to the most recent publicly available prospectuses for the Fund and may differ from the expense ratios disclosed in the Financial Highlights tables in this report. For Class NAV, the net expense equals the gross expense and is 0.49%.
36
Mid Cap Stock Fund
Subadviser: Wellington Management Company, LLP
Portfolio Managers: Michael T. Carmen, CFA and Mario E. Abularach, CFA
INVESTMENT OBJECTIVE & POLICIES 4 To seek long-term growth of capital by investing at least 80% of the Fund’s net assets in equity securities of medium-sized companies with significant capital appreciation potential.
CHANGE IN VALUE OF $10,000 INVESTMENT AND COMPARATIVE INDICES
Sector Weighting* | % of Total |
Consumer, Non-cyclical | 25.63 |
Consumer, Cyclical | 24.58 |
Industrial | 13.98 |
Technology | 12.37 |
Communications | 7.42 |
Financial | 5.00 |
Energy | 2.24 |
Basic Materials | 0.38 |
|
| * | Top Sectors as a percentage of market value. Does not include short-term securities and investments in the John Hancock Collateral
Investment Trust, if applicable. |
PORTFOLIO MANAGERS’ COMMENTARY
Performance 4 For the year ended August 31, 2009, the Mid Cap Stock Class NAV returned –26.30%, compared to the –20.21% return of the Russell Midcap Growth Index.
Market Environment 4 For the one-year period ended August 31, 2009, U.S. mid cap equities, as measured by the S&P 400 MidCap Index, fell 18.2%. The U.S. economy entered a recession as consumer demand slowed, unemployment rose, and credit markets froze, leading to a significant drop in equity valuations. Equity markets bottomed in March 2009 before rebounding, gaining 50% off of their lows, as many companies beat earnings expectations, driven by significant cost-cutting measures. Some signs of a recovery have begun to emerge as revised second-quarter GDP growth came in better than expected, sales of both new and existing homes increased, and payroll losses slowed.
The Fund’s underperformance during the period was largely the result of stock selection, particularly in the Health Care, Materials and Financials sectors.
Results from sector allocation were positive for the period, as the fund benefited from an underweight to the Energy sector and an overweight to the Consumer Discretionary sector. Performance was also helped by an overweight to the Heath Care sector in select periods of the year.
| | | | | | | | | | | | | | | | | | |
|---|
PERFORMANCE TABLE1
|
|
|
| Average Annual Total Return
|
| Cumulative Total Return
|
|
|---|
Period Ended August 31, 2009 | | | | | 1-year | | | | 5-year | | | | 10-year | | | | Since
inception | | | | 1-year | | | | 5-year | | | | 10-year | | | | Since
inception | |
| Mid Cap Stock Class 1 (began 10/15/05) | | | | | –26.33 | % | | | — | | | | — | | | | 0.19 | % | | | –26.33 | % | | | — | | | | — | | | | 0.73 | % |
| Mid Cap Stock Class NAV (began 10/15/05) | | | | | –26.30 | % | | | — | | | | — | | | | 0.23 | % | | | –26.30 | % | | | — | | | | — | | | | 0.88 | % |
Russell Midcap Growth Index3,4,5 | | | | | –20.21 | % | | | — | | | | — | | | | –0.86 | % | | | –20.21 | % | | | — | | | | — | | | | –3.29 | % |
| 1 | | Performance does not reflect the deduction of taxes on fund distributions or redemptions of fund shares. Past performance does not predict future performance. |
| 2 | | Since inception returns for the indices may begin on the month-end closest to the actual inception date of the fund. |
| 3 | | Russell Mid Cap Growth Index is an unmanaged index that contains those stocks from the Russell Mid Cap Index with a greater than average growth orientation. |
| 4 | | It is not possible to invest directly in an index. |
The expense ratios of the Fund, both net (including any fee waivers or expense limitations) and gross (excluding any fee waivers or expense limitations), are set forth according to the most recent publicly available prospectuses for the Fund and may differ from the expense ratios disclosed in the Financial Highlights tables in this report. The net expenses equal the gross expenses and are as follows: Class 1 – 0.93% and Class NAV – 0.88%.
37
Mid Cap Value Equity Fund
Subadviser: RiverSource Investments, LLC
Portfolio Managers: Steve Schroll, Laton Spahr, Warren Spitz and Paul Stocking
INVESTMENT OBJECTIVE & POLICIES 4 To seek long-term growth of capital. The Fund invests at least 80% of its net assets in equity securities of medium-sized companies.
CHANGE IN VALUE OF $10,000 INVESTMENT AND COMPARATIVE INDICES
Sector Weighting* | % of Total |
Financial | 17.98 |
Industrial | 14.98 |
Consumer, Cyclical | 11.25 |
Consumer, Non-cyclical | 9.84 |
Technology | 9.29 |
Energy | 7.94 |
Basic Materials | 7.83 |
Utilities | 5.15 |
Communications | 4.08 |
|
| * | Top Sectors as a percentage of market value. Does not include short-term securities and investments in the John Hancock Collateral
Investment Trust, if applicable. |
PORTFOLIO MANAGERS’ COMMENTARY
Performance 4 For the year ended August 31, 2009, the Mid Cap Value Equity Class NAV returned –21.56%, compared to the –20.00% return of the Russell Midcap Value Index.
Market Environment 4 The annual period was dominated by a severe and sustained global recession. During the period, all sectors in the benchmark with the exception of Integrated Oils were negative performers, with the Energy sector leading the decline. In March 2009, equity markets began to rally based on several factors: data indicating a deceleration in economic decline; better-than-expected corporate earnings (based on draconian cost-cutting); glimmers of improvement in the housing market; and increasing liquidity in the credit markets. Unemployment increased during the period and remains high, suppressing consumer spending.
The top-contributing sector to relative return during the period was Financial Services, fueled in large part by an overweight in property and casualty insurers. The greatest detractor from portfolio return at the sector level was Autos and Transportation, due in large part to railroad holdings.
While certainly encouraged by the March-through-August equity market rally, we believe that the equity market will likely trade in a range-bound manner for the rest of 2009, with the potential for volatility to spike again, depending on the scope of the U.S. government’s agenda and the clarity of economic data. After the strong rally of the past six months, we believe that the market will need to see better corporate revenues and earnings before achieving a more sustained upward trend. Our longer-term view is more bullish and so we intend to maintain an offensive stance rather than a defensive one. We believe that equity valuations as of August 31 are still relatively attractive from a longer-term perspective and that returns on equity could be quite good.
At the end of August, the fund was biased toward sectors and companies that could benefit from global economic growth. On a sector basis, we are encouraged by spending trends within Technology. Basic Materials and other industrial-related areas of the market appear attractive given the various global government initiatives intended to spur the development of infrastructure.
| | | | | | | | | | | | | | | | | | |
|---|
PERFORMANCE TABLE1
|
|
|
| Average Annual Total Return
|
| Cumulative Total Return
|
|
|---|
Period Ended August 31, 2009 | | | | | 1-year | | | | 5-year | | | | 10-year | | | | Since
inception | | | | 1-year | | | | 5-year | | | | 10-year | | | | Since
inception | |
| Mid Cap Value Equity Class NAV (began 4/28/06) | | | | | –21.56 | % | | | — | | | | — | | | | –6.45 | % | | | –21.56 | % | | | — | | | | — | | | | –19.99 | % |
Russell Midcap Value Index2,3,4 | | | | | –20.00 | % | | | — | | | | — | | | | –6.07 | % | | | –20.00 | % | | | — | | | | — | | | | –18.90 | % |
| 1 | | Performance does not reflect the deduction of taxes on fund distributions or redemptions of fund shares. Past performance does not predict future performance. |
| 2 | | Since inception returns for the indices may begin on the month-end closest to the actual inception date of the fund. |
| 3 | | Russell Midcap Value Index is an unmanaged index that measures the performance of those Russell Midcap companies with lower price-to-book ratios and lower forecasted growth values. The stocks are also members of the Russell 1000 Value Index. |
| 4 | | It is not possible to invest directly in an index. |
The expense ratios of the Fund, both net (including any fee waivers or expense limitations) and gross (excluding any fee waivers or expense limitations), are set forth according to the most recent publicly available prospectuses for the Fund and may differ from the expense ratios disclosed in the Financial Highlights tables in this report. For Class NAV, the net expense equals the gross expense and is 0.97%.
38
Mid Value Fund
Subadviser: T. Rowe Price Associates, Inc.
Portfolio Managers: Ned Norton, Kim DeDominicus and Charles Shriver
INVESTMENT OBJECTIVE & POLICIES 4 The fund seeks long-term capital appreciation by investing, under normal market conditions, in both equity and fixed income securities.
CHANGE IN VALUE OF $10,000 INVESTMENT AND COMPARATIVE INDICES
Sector Weighting* | % of Total |
Financial | 22.19 |
Consumer, Non-cyclical | 20.89 |
Consumer, Cyclical | 11.49 |
Energy | 9.16 |
Communications | 8.09 |
Utilities | 8.01 |
Basic Materials | 6.87 |
Industrial | 5.98 |
Technology | 4.80 |
|
| * | Top Sectors as a percentage of market value. Does not include short-term securities and investments in the John Hancock Collateral
Investment Trust, if applicable. |
PORTFOLIO MANAGERS’ COMMENTARY
Performance 4 For the period from the Fund’s inception on January 2, 2009 to August 31, 2009, the Mid Value Class NAV returned +26.10%, compared to the +20.80% return of the Russell Midcap Value Index.
Market Environment 4 Mid-cap value stocks surged recently, resulting in double-digit positive returns for the Russell Midcap Value Index. Through beneficial sector allocation and strong stock selection, the portfolio turned in even higher returns.
After the disastrous market of 2008 and early 2009, stocks have rebounded sharply since March behind investor confidence that the bottom of the global economy was imminent. The recovery has proven uneven, however. Interest rates and commodity prices dropped, which spurred consumer spending. Equity and bond markets have opened, with greater liquidity allowing corporations to refinance, and the government stimulus has stabilized the Financials sector. In this environment, mid-cap value stocks outperformed mid-cap growth stocks as well as both large- and small-cap value stocks.
The greatest relative contributor to results was stock picks among Materials companies, where the portfolio is slightly overweight. Contributors included a mining company, a containerboard and corrugated packaging producer and a manufacturer of paper and wood products. An overweight to the Consumer Discretionary sector also boosted relative returns. A global auto parts and components company led the outperformance in this group. Worries about the future of the U.S. auto industry have lessened, brightening the horizon for parts suppliers. While the macro environment for the American consumer is difficult, we see opportunity for patient investors in quality companies that are attractively priced.
The portfolio is also overweight in Information Technology companies, which was advantageous during the period. While reduced business spending has hurt the sector, technology companies have faced a challenging environment for a long time, and many firms have already compensated. As a result, pricing is attractive, companies have started carrying more cash on their balance sheets, and business processes have been streamlined.
Stock selection in the Telecommunication Services group detracted from returns, but being underweight in the weak sector largely offset the relative loss.
| | | | | | | | | | | | | | | | | | |
|---|
PERFORMANCE TABLE1,5
|
|
|
| Average Annual Total Return
|
| Cumulative Total Return
|
|
|---|
Period Ended August 31, 2009 | | | | | 1-year | | | | 5-year | | | | 10-year | | | | Since
inception | | | | 1-year | | | | 5-year | | | | 10-year | | | | Since
inception | |
| Mid Value Fund Class NAV (began 1/2/09) | | | | | — | | | | — | | | | — | | | | — | | | | — | | | | — | | | | — | | | | 26.10 | % |
Russell Midcap Value Index3,4,5 | | | | | — | | | | — | | | | — | | | | — | | | | — | | | | — | | | | — | | | | 20.80 | % |
| 1 | | Performance does not reflect the deduction of taxes on fund distributions or redemptions of fund shares. Past performance does not predict future performance. |
| 2 | | Since inception returns for the indices may begin on the month-end closest to the actual inception date of the fund. |
| 3 | | Russell Midcap Value Index is an unmanaged index that measures the performance of those Russell Midcap companies with lower price-to-book ratios and lower forecasted growth values. The stocks are also members of the Russell 1000 Value Index. |
| 4 | | It is not possible to invest directly in an index. |
| 5 | | Since inception, a portion of the Mid Value Fund expenses were reimbursed. If such expenses had not been reimbursed, returns would be lower. |
The expense ratios of the Fund, both net (including any fee waivers or expense limitations) and gross (excluding any fee waivers or expense limitations), are set forth according to the most recent publicly available prospectuses for the Fund and may differ from the expense ratios disclosed in the Financial Highlights tables in this report. For Class NAV, the net expense equals the gross expense and is 0.91%.
39
Natural Resources Fund
Subadviser: Wellington Management Company, LLP
Portfolio Managers: Karl E. Bandtel and James A. Bevilacqua
INVESTMENT OBJECTIVE & POLICIES 4 The Fund seeks long-term total return by investing primarily in equity and equity-related securities of natural resource-related companies worldwide.
CHANGE IN VALUE OF $10,000 INVESTMENT AND COMPARATIVE INDICES
Sector Weighting* | % of Total |
Energy | 60.80 |
Basic Materials | 27.93 |
|
| * | Top Sectors as a percentage of market value. Does not include short-term securities and investments in the John Hancock Collateral
Investment Trust, if applicable. |
PORTFOLIO MANAGERS’ COMMENTARY
Performance 4 For the year ended August 31, 2009, the Natural Resources Class NAV returned –27.20%, compared to the –23.62% return of the Combined Index.
Market Environment 4 Global equity markets fell during the one-year period as difficulty in credit markets persisted and many countries struggled through recession. Equity markets bottomed in March 2009 before rebounding off their lows, as many companies beat earnings expectations driven by significant cost-cutting measures. Several countries began to report economic growth in August 2009 and declared that they had moved out of recession and into recovery. Natural resources stocks, while down for the one-year period, have similarly begun to recover, led by Chinese demand for industrial metals.
Underperformance was primarily the result of weak security selection, particularly in the Oil & Gas and Metals & Mining industries. Underweights to Metals & Mining and Paper & Forest Products detracted from relative results as well. Relative detractors from performance included a diversified natural resources company and two mining companies.
The fund benefited from an underweight to Energy Equipment & Services and an overweight to Gas Utilities. A gold producer was among the top relative contributors to performance along with underweight positions in two mining companies
| | | | | | | | | | | | | | | | | | |
|---|
PERFORMANCE TABLE1
|
|
|
| Average Annual Total Return
|
| Cumulative Total Return
|
|
|---|
Period Ended August 31, 2009 | | | | | 1-year | | | | 5-year | | | | 10-year | | | | Since
inception | | | | 1-year | | | | 5-year | | | | 10-year | | | | Since
inception | |
| Natural Resources Class 1 (began 10/15/05) | | | | | –27.25 | % | | | — | | | | — | | | | 5.21 | % | | | –27.25 | % | | | — | | | | — | | | | 21.78 | % |
| Natural Resources Class NAV (began 10/15/05) | | | | | –27.20 | % | | | — | | | | — | | | | 5.26 | % | | | –27.20 | % | | | — | | | | — | | | | 22.02 | % |
Combined Index2,3,4 | | | | | –23.62 | % | | | — | | | | — | | | | 3.12 | % | | | –23.62 | % | | | — | | | | — | | | | 12.81 | % |
| 1 | | Performance does not reflect the deduction of taxes on fund distributions or redemptions of fund shares. Past performance does not predict future performance. |
| 2 | | Since inception returns for the indices may begin on the month-end closest to the actual inception date of the fund. |
| 3 | | The Combined Index is comprised of 60% MSCI World Energy Index, 30% MSCI World Metals & Mining Index and 10% MSCI World Paper & Forest Products Index. |
| 4 | | It is not possible to invest directly in an index. |
The expense ratios of the Fund, both net (including any fee waivers or expense limitations) and gross (excluding any fee waivers or expense limitations), are set forth according to the most recent publicly available prospectuses for the Fund and may differ from the expense ratios disclosed in the Financial Highlights tables in this report. The net expenses equal the gross expenses and are as follows: Class 1 – 1.11% and Class NAV – 1.06%.
40
Real Estate Equity Fund
Subadviser: T. Rowe Price Associates, Inc.
Portfolio Manager: David M. Lee
INVESTMENT OBJECTIVE & POLICIES 4 The Fund seeks long-term growth through a combination of capital appreciation and current income by primarily investing in the equity securities of real estate companies.
CHANGE IN VALUE OF $10,000 INVESTMENT AND COMPARATIVE INDICES
Sector Weighting* | % of Total |
Financial | 74.11 |
Consumer, Cyclical | 2.99 |
Basic Materials | 1.15 |
|
| * | Top Sectors as a percentage of market value. Does not include short-term securities and investments in the John Hancock Collateral
Investment Trust, if applicable. |
PORTFOLIO MANAGER’S COMMENTARY
Performance 4 For the year ended August 31, 2009, the Real Estate Equity Class NAV returned –34.63%, compared to the –34.72% return of the Dow Jones Wilshire REIT Index.
Market Environment 4 Despite the bounce-back early in the second quarter of 2009, major real estate segments sold off considerably over the 12-month period on concerns that commercial real estate companies, both public and private, faced challenges in refinancing borrowings in the tight credit environment.
The health care segment was the best performer for the 12-month period as investors have been drawn to this subsector due to the perception that it will be immune or resistant to any economic slowdown. The lodging segment held up relatively well, as did apartments. However, continued employment weakness may create significant challenges for apartment landlords.
Industrial stocks pulled back as mounting concerns about consumer and commercial weakness held back domestic economic expansion. Shopping center REITs also suffered due to rising unemployment and weak consumer trends. Headwinds still loom for the real estate segment, including further deleveraging and potential drops in occupancy rates due to economic weakness. The low levels of new supply remain favorable to the long-term prospects for commercial real estate as demand recovers. However, job losses have translated into softening demand for commercial real estate properties.
Over the last year, regional malls was the largest contributor to relative performance. The sector’s recent equity capital-raising activities have helped diminish some investor skepticism towards the group. We continue to adhere to our long-term investment strategy, and portfolio turnover has remained relatively low despite the market volatility.
Solid stock selection in industrial REITs was also the largest contributor to relative performance, though absolute returns in the subsector were the worst of any segment in the Index.
Our underweight to health care REITs was the largest detractor from relative results as investors have been drawn to this subsector due to the perception that it will be immune or resistant to any economic slowdown. A lack of exposure to several popular names in the combined office and industrial segment also detracted from results as this was one of the best performing subsectors in the index.
| | | | | | | | | | | | | | | | | | |
|---|
PERFORMANCE TABLE1,3
|
|
|
| Average Annual Total Return
|
| Cumulative Total Return
|
|
|---|
Period Ended August 31, 2009 | | | | | 1-year | | | | 5-year | | | | 10-year | | | | Since
inception | | | | 1-year | | | | 5-year | | | | 10-year | | | | Since
inception | |
| Real Estate Equity Class NAV (began 4/28/06) | | | | | –34.63 | % | | | — | | | | — | | | | –11.87 | % | | | –34.63 | % | | | — | | | | — | | | | –34.45 | % |
Dow Jones Wilshire REIT Index2,4,5 | | | | | –34.72 | % | | | — | | | | — | | | | –12.37 | % | | | –34.72 | % | | | — | | | | — | | | | –35.67 | % |
| 1 | | Performance does not reflect the deduction of taxes on fund distributions or redemptions of fund shares. Past performance does not predict future performance. |
| 2 | | Since inception returns for the indices may begin on the month-end closest to the actual inception date of the fund. |
| 3 | | Since inception, a portion of the Real Estate Equity Fund expenses were reimbursed. If such expenses had not been reimbursed, returns would be lower. |
| 4 | | Dow Jones Wilshire REIT Index is an unmanaged index consisting of actively traded real estate investment trusts. |
| 5 | | It is not possible to invest directly in an index. |
The expense ratios of the Fund, both net (including any fee waivers or expense limitations) and gross (excluding any fee waivers or expense limitations), are set forth according to the most recent publicly available prospectuses for the Fund and may differ from the expense ratios disclosed in the Financial Highlights tables in this report. For Class NAV, the net expense equals the gross expense and is 0.91%.
41
Real Estate Securities Fund
Subadviser: Deutsche Investment Management Americas Inc.
Portfolio Managers: Jerry W. Ehlinger, John F. Robertson, John W. Vojticek and Asad Kazim
INVESTMENT OBJECTIVE & POLICIES 4 To seek a combination of long-term capital appreciation and current income by primarily investing in equity securities of REITs and real estate companies.
CHANGE IN VALUE OF $10,000 INVESTMENT AND COMPARATIVE INDICES
Sector Weighting* | % of Total |
Financial | 83.73 |
Diversified | 0.12 |
|
| * | Top Sectors as a percentage of market value. Does not include short-term securities and investments in the John Hancock Collateral
Investment Trust, if applicable. |
PORTFOLIO MANAGERS’ COMMENTARY
Performance 4 For the year ended August 31, 2009, the Real Estate Securities Class 1 returned –33.01%, compared to the –32.76% return of the Morgan Stanley REIT Index.
Market Environment 4 As the reporting period started, real estate investment trusts were outperforming broader equity indices. This changed abruptly as REITs erased their year-to-date relative gains on the back of a dramatic decline of more than 60% through November 20, which marked the bottom for 2008. This decline came from the belief that the once unthinkable scenario is now possible — that a REIT with substantial equity beyond its outstanding debt would need to declare bankruptcy. These concerns manifested themselves through the meaningful widening seen in commercial mortgage-backed securities. From that date, REITs rebounded more than 55% through year-end, but in 2009, REIT prices continued to be hurt by lack of confidence in the financial sector. Continued concerns regarding REITs’ ability to refinance existing debt resulted in significant negative performance.
There were some signs of life in real estate debt markets, but the market remained skeptical overall. The REIT market then rebounded very sharply from lows in early March. Strengthening in all credit markets coupled with a large amount of equity issuance put most constituents in the REIT sector in a position to address their capital needs through 2012. Prices rose for many secondary issuers as default risk that was reflected in equity prices was removed. This continued through the end of the reporting period as unsecured debt markets opened for a larger number of issuers. Positive economic releases coupled with a handful of asset sales announcements are suggesting that the bottom in both real estate values and fundamentals may be behind us.
Overall, our stock selection had a positive impact on performance. Strong stock selection in the Retail, Office, Apartments, and Health Care sectors benefited performance, while weaker stock selection in the Industrial, Regional Malls and Self Storage sectors detracted from results. Stock selection in the Hotels sector had a slightly positive impact on performance. Overall, sector selection hurt performance. Our underweight to the underperforming Retail sector aided performance. However, this was more than offset by our allocation to Industrial stocks, and our underweight to the underperforming Regional Mall stocks. Other sector allocations had a roughly neutral effect on performance.
| | | | | | | | | | | | | | | | | | |
|---|
PERFORMANCE TABLE1
|
|
|
| Average Annual Total Return
|
| Cumulative Total Return
|
|
|---|
Period Ended August 31, 2009 | | | | | 1-year | | | | 5-year | | | | 10-year | | | | Since
inception | | | | 1-year | | | | 5-year | | | | 10-year | | | | Since
inception | |
| Real Estate Securities Class 1 (began 10/15/05) | | | | | –33.01 | % | | | — | | | | — | | | | –4.23 | % | | | –33.01 | % | | | — | | | | — | | | | –15.44 | % |
Morgan Stanley REIT Index2,3,4 | | | | | –32.76 | % | | | — | | | | — | | | | –4.56 | % | | | –32.76 | % | | | — | | | | — | | | | –16.55 | % |
| 1 | | Performance does not reflect the deduction of taxes on fund distributions or redemptions of fund shares. Past performance does not predict future performance. |
| 2 | | Since inception returns for the indices may begin on the month-end closest to the actual inception date of the fund. |
| 3 | | Morgan Stanley REIT Index is an unmanaged index consisting of the most actively traded real estate investment trusts. |
| 4 | | It is not possible to invest directly in an index. |
The expense ratios of the Fund, both net (including any fee waivers or expense limitations) and gross (excluding any fee waivers or expense limitations), are set forth according to the most recent publicly available prospectuses for the Fund and may differ from the expense ratios disclosed in the Financial Highlights tables in this report. For Class 1, the net expense equals the gross expense and is 0.82%.
42
Real Return Bond Fund
Subadviser: Pacific Investment Management Company LLC
Portfolio Manager: Mihir Worah
INVESTMENT OBJECTIVE & POLICIES 4 The Fund seeks maximum real return, consistent with preservation of real capital and prudent investment management, by investing at least 80% of its net assets in inflation-indexed bonds of varying maturities issued by the U.S. and non-U.S. governments, their agencies or instrumentalities, and corporations or derivatives based thereon.
CHANGE IN VALUE OF $10,000 INVESTMENT AND COMPARATIVE INDICES
Sector Weighting* | % of Total |
Treasury Inflation-Protected Securities | 75.86 |
Financial | 8.41 |
Government | 1.79 |
Asset Backed Securities | 1.58 |
Federal Home Loan Mortgage Corp. | 1.55 |
Mortgage Securities | 1.28 |
Consumer, Non-cyclical | 0.89 |
Energy | 0.78 |
Consumer, Cyclical | 0.29 |
Technology | 0.28 |
|
| * | Top Sectors as a percentage of market value. Does not include short-term securities and investments in the John Hancock Collateral
Investment Trust, if applicable. |
PORTFOLIO MANAGER’S COMMENTARY
Performance 4 For the year ended August 31, 2009, the Real Return Bond Class NAV returned +1.11%, compared to the –0.48% return of the Barclays Capital Global Real U.S. TIPS Index.
Market Environment 4 Early in the period, most fixed income securities lost ground, as the most severe credit crisis since the 1930s rocked global markets with the collapse and deep troubles of large financial institutions. Massive deleveraging produced an upheaval in the U.S. financial system and an unprecedented level of intervention by the Federal Reserve and the U.S. Treasury took place. Through the end of 2008, interest rates fell worldwide and yield curves in the U.S., Europe and the U.K. steepened, as investors fled to the safety of government bonds, particularly shorter maturities.
During 2009, interest rates rose and capital flowed back toward riskier assets. Government policy initiatives helped restore a measure of stability to financial markets after the extreme stress and volatility of 2008. Higher U.S. Treasury yields were a drag on economic recovery, as they muted the impact of narrower yield and credit premiums for borrowers, especially in the home mortgage market. While some of the weakening in U.S. Treasury valuations could be explained by a reversal of 2008’s flight to liquidity and quality, other factors were in play as well. Investors worried that the massive new issuance of U.S. Treasuries looming on the horizon would overwhelm demand. Another concern was that the Fed’s injection of liquidity would eventually fuel inflation once the economy started to recover.
An emphasis on shorter maturities in the U.S., U.K., and Euroland added to returns over the past fiscal year as yield curves steepened dramatically across all three regions. Overweight nominal duration in the U.S. added to returns as U.S. yields fell. Favoring inflation-linked bonds (ILBs) over nominal securities in Japan detracted from returns, as real yields rose due to very poor liquidity and demand for ILBs. In the U.S., an overweight to Treasury Inflation Protected Securities (TIPS) also hurt performance as real interest rates rose amid extremely illiquid market conditions and sharply declining commodity prices. An allocation to U.S. agency mortgages was positive as these bonds outperformed U.S. Treasuries. Exposure to investment grade corporates added slightly to returns as the sector outperformed U.S. Treasuries. However, an emphasis on high-grade financials more than offset this positive impact as financial names underperformed U.S. Treasuries, despite their rebound in 2009.
| | | | | | | | | | | | | | | | | | |
|---|
PERFORMANCE TABLE1
|
|
|
| Average Annual Total Return
|
| Cumulative Total Return
|
|
|---|
Period Ended August 31, 2009 | | | | | 1-year | | | | 5-year | | | | 10-year | | | | Since
inception | | | | 1-year | | | | 5-year | | | | 10-year | | | | Since
inception | |
| Real Return Bond Class 1 (began 10/15/05) | | | | | 0.99 | % | | | — | | | | — | | | | 4.50 | % | | | 0.99 | % | | | — | | | | — | | | | 18.63 | % |
| Real Return Bond Class NAV (began 10/15/05) | | | | | 1.11 | % | | | — | | | | — | | | | 4.54 | % | | | 1.11 | % | | | — | | | | — | | | | 18.80 | % |
Barclays Capital Global Real U.S. TIPS Index2,3,4 | | | | | –0.48 | % | | | — | | | | — | | | | 4.59 | % | | | –0.48 | % | | | — | | | | — | | | | 19.02 | % |
| 1 | | Performance does not reflect the deduction of taxes on fund distributions or redemptions of fund shares. Past performance does not predict future performance. |
| 2 | | Since inception returns for the indices may begin on the month-end closest to the actual inception date of the fund. |
| 3 | | Barclays Capital Global Real U.S.TIPS Index is an unmanaged index that consists of Inflation-Protection securities issued by the U.S.Treasury. |
| 4 | | It is not possible to invest directly in an index. |
The expense ratios of the Fund, both net (including any fee waivers or expense limitations) and gross (excluding any fee waivers or expense limitations), are set forth according to the most recent publicly available prospectuses for the Fund and may differ from the expense ratios disclosed in the Financial Highlights tables in this report. The net expenses equal the gross expenses and are as follows: Class 1 – 0.80% and Class NAV – 0.75%.
43
Short Term Government Income Fund
Subadviser: MFC Global Investment Management (U.S.), LLC
Portfolio Managers: Jeff Given and Howard Greene
INVESTMENT OBJECTIVE & POLICIES 4 To seek a high level of current income consistent with preservation of capital by investing, under normal circumstances, at least 80% of its assets in obligations issued or guaranteed by the U.S. government and its agencies, authorities or instrumentalities (U.S. government securities). Under normal circumstances, the Fund’s dollar-weighted average maturity is not more than 3 years. Maintaining a stable share price is a secondary goal.
CHANGE IN VALUE OF $10,000 INVESTMENT AND COMPARATIVE INDICES
Sector Weighting* | % of Total |
U.S. Treasury Notes | 18.82 |
Federal Farm Credit Bank | 15.81 |
Tennessee Valley Authority | 10.60 |
Government | 9.99 |
Federal National Mortgage Association | 9.00 |
Federal Agricultural Mortgage Corp. | 9.00 |
Federal Home Loan Mortgage Corp. | 8.95 |
Federal Home Loan Bank | 7.30 |
Mortgage Securities | 5.36 |
Financial | 2.15 |
|
| * | Top Sectors as a percentage of market value. Does not include short-term securities and investments in the John Hancock Collateral
Investment Trust, if applicable. |
PORTFOLIO MANAGERS’ COMMENTARY
Performance 4 For the period from the Fund’s inception on January 2, 2009 to August 31, 2009, the Short Term Government Income Class NAV returned +1.40%, compared to the +0.61% return of the Barclays Capital U.S. Government 1–5 Year Index.
Market Environment 4 Short-term U.S. government securities posted mixed but generally positive returns for the reporting period. At the beginning of the period, short-term Treasury yields were near historically low levels amid a severe economic downturn and a liquidity crisis in the credit markets that led the Federal Reserve to cut its federal funds rate target to a range of 0% to 0.25%. However, by the spring of 2009, the U.S. economy began to show signs of stabilization, and liquidity in the credit markets gradually improved. As a result, short-term Treasury yields rose as the market priced in future interest rate increases from the Fed, pushing the prices of short-term Treasury securities lower. Although short-term Treasury securities produced modestly negative returns for the reporting period, other short-term government bonds fared better. Fifteen-year mortgage-backed securities, which tend to have an average life comparable to five-year Treasury securities, generated the best returns. Adjustable-rate mortgage-backed securities and short-term government agency bonds also delivered positive returns for the period.
The portfolio’s outperformance of its benchmark index resulted primarily from its limited exposure to Treasury securities, which made up about 20% of the portfolio (versus 68% of the Index). Modest exposure to mortgage-backed securities, which are not represented in the Index, also added value during the period. The portfolio focused on securities backed by 15-year fixed-rate mortgages and hybrid adjustable-rate mortgages. The remainder of the portfolio was invested in a diversified array of short-term government agency securities. At the beginning of the period, the portfolio held a notable position in short-term Treasury Inflation-Protected Securities, which were pricing in a flat to declining inflation rate at the time. These securities subsequently rallied as the market began to factor in a higher expected inflation rate, and we took advantage of the gains to reduce our position.
We continue to expect positive but modest economic growth through the end of 2009, which will likely keep short-term interest rates in a fairly narrow range. Consumers’ efforts to pay down debt should limit economic activity, and the relatively high unemployment rate should keep labor costs in check, dampening inflation.
| | | | | | | | | | | | | | | | | | |
|---|
PERFORMANCE TABLE1,5
|
|
|
| Average Annual Total Return
|
| Cumulative Total Return
|
|
|---|
Period Ended August 31, 2009 | | | | | 1-year | | | | 5-year | | | | 10-year | | | | Since
inception | | | | 1-year | | | | 5-year | | | | 10-year | | | | Since
inception | |
Short Term Government Income Class NAV
(began 1/2/09) | | | | | — | | | | — | | | | — | | | | — | | | | — | | | | — | | | | — | | | | 1.40 | % |
Barclays Capital US Govt 1-5 Yr Index2,3,4 | | | | | — | | | | — | | | | — | | | | — | | | | — | | | | — | | | | — | | | | 0.61 | % |
| 1 | | Performance does not reflect the deduction of taxes on fund distributions or redemptions of fund shares. Past performance does not predict future performance. |
| 2 | | Since inception returns for the indices may begin on the month-end closest to the actual inception date of the fund. |
| 3 | | The Barclays Capital U.S. Govt 1–5 Yr Index is an unmanaged index of securities issued by the U.S. government with maturities of one to five years. |
| 4 | | It is not possible to invest directly in an index. |
| 5 | | Since inception, a portion of the Short Term Government Income Fund expenses were reimbursed. If such expenses had not been reimbursed, returns would be lower. |
The expense ratios of the Fund, both net (including any fee waivers or expense limitations) and gross (excluding any fee waivers or expense limitations), are set forth according to the most recent publicly available prospectuses for the Fund and may differ from the expense ratios disclosed in the Financial Highlights tables in this report. For Class NAV, the net expense equals the gross expense and is 0.65%.
44
Small Cap Growth Fund
Subadviser: Wellington Management Company, LLP
Portfolio Manager: Steven Angeli, CFA
INVESTMENT OBJECTIVE & POLICIES 4 To seek long-term capital appreciation by investing, under normal circumstances, at least 80% of its net assets (plus any borrowings for investment purposes) in small-cap companies.
CHANGE IN VALUE OF $10,000 INVESTMENT AND COMPARATIVE INDICES
Sector Weighting* | % of Total |
Consumer, Non-cyclical | 28.91 |
Consumer, Cyclical | 24.47 |
Industrial | 14.99 |
Technology | 13.70 |
Communications | 9.48 |
Financial | 5.09 |
Energy | 2.50 |
Basic Materials | 0.86 |
|
| * | Top Sectors as a percentage of market value. Does not include short-term securities and investments in the John Hancock Collateral
Investment Trust, if applicable. |
PORTFOLIO MANAGERS’ COMMENTARY
Performance 4 For the period from its inception on September 10, 2008 to August 31, 2009, the Small Cap Growth Class NAV returned –16.20%, compared to the –16.14% return of the Russell 2000 Growth Index.
Market Environment 4 For the one-year period ended August 31, 2009, U.S. small cap equities, as measured by the Russell 2000 Index, fell 20.6%. The U.S. economy entered a recession as consumer demand slowed, unemployment rose, and credit markets froze, leading to a significant drop in equity valuations. Equity markets bottomed in March 2009 before rebounding, gaining 50% off of their lows, as many companies beat earnings expectations, driven by significant cost-cutting measures. Some signs of a recovery have begun to emerge as revised second-quarter GDP growth came in better than expected, sales of both new and existing homes increased, and payroll losses slowed.
Security selection drove the Fund’s outperformance during the period, particularly in the Information Technology, Industrials, Financials and Consumer Discretionary sectors. The Fund also benefited from an underweight to the Energy sector and an overweight to Consumer Discretionary.
Security selection within the Health Care and Materials sectors detracted from relative results, as did an underweight to Information Technology.
| | | | | | | | | | | | | | | | | | |
|---|
PERFORMANCE TABLE1
|
|
|
| Average Annual Total Return
|
| Cumulative Total Return
|
|
|---|
Period Ended August 31, 2009 | | | | | 1-year | | | | 5-year | | | | 10-year | | | | Since
inception | | | | 1-year | | | | 5-year | | | | 10-year | | | | Since
inception | |
| Small Cap Growth Class NAV (began 9/10/08) | | | | | — | | | | — | | | | — | | | | — | | | | — | | | | — | | | | — | | | | –16.20 | % |
Russell 2000 Growth Index2,3,4 | | | | | — | | | | — | | | | — | | | | — | | | | — | | | | — | | | | — | | | | –16.14 | % |
| 1 | | Performance does not reflect the deduction of taxes on fund distributions or redemptions of fund shares. Past performance does not predict future performance. |
| 2 | | Since inception returns for the indices may begin on the month-end closest to the actual inception date of the fund. |
| 3 | | Russell 2000 Growth Index in an unmanaged index that contains these securities from the Russell 2000 Index with a greater than average growth orientation. |
| 4 | | It is not possible to invest directly in an index. |
The expense ratios of the Fund, both net (including any fee waivers or expense limitations) and gross (excluding any fee waivers or expense limitations), are set forth according to the most recent publicly available prospectuses for the Fund and may differ from the expense ratios disclosed in the Financial Highlights tables in this report. For Class NAV, the net expense equals the gross expense and is 1.17%.
45
Small Cap Index Fund
Subadviser: MFC Global Investment Management (U.S.A.) Limited
Portfolio Managers: Carson Jen and Narayan Ramani
INVESTMENT OBJECTIVE & POLICIES 4 The Fund seeks to approximate the aggregate total return of a small-cap U.S. domestic equity market index by investing primarily in (a) common stocks that are included in the Russell 2000 Index and (b) securities that are believed as a group to behave in a manner similar to the Index.
CHANGE IN VALUE OF $10,000 INVESTMENT AND COMPARATIVE INDICES
Sector Weighting* | % of Total |
Consumer, Non-cyclical | 20.85 |
Financial | 17.76 |
Industrial | 12.55 |
Consumer, Cyclical | 12.21 |
Technology | 9.03 |
Communications | 7.07 |
Basic Materials | 3.45 |
Energy | 3.36 |
Utilities | 3.11 |
Diversified | 0.01 |
|
| * | Top Sectors as a percentage of market value. Does not include short-term securities and investments in the John Hancock Collateral
Investment Trust, if applicable. |
PORTFOLIO MANAGERS’ COMMENTARY
Performance 4 For the year ended August 31, 2009, the Small Cap Index Class NAV returned –21.60%, compared to the –21.29% return of the Russell 2000 Index.
Market Environment 4 The past year has witnessed major historical events among U.S. financial institutions, including the bankruptcies of Lehman Brothers and Washington Mutual, and the government takeover of AIG, Fannie Mae and Freddie Mac. Throughout the year, we also saw a major reduction in credit access for corporations, small businesses and individuals.
During the first quarter of 2009, Barack Obama became president of the United States. In January, the House approved his $819 billion economic recovery plan. Economists believe that President Obama’s stimulus plan and Federal Reserve measures will help the U.S. economy by late 2009 to early 2010. By the end of the second quarter of 2009, unemployment in the U.S. rose to a 26-year high. The jobless rate increased to 9.7% at the end of August. The bankruptcies of such large companies as General Motors and Chrysler contributed significantly to these recent job losses. The Conference Board’s Consumer Confidence Index remained low through the year, reaching 54 in August 2009. The lowest confidence level was in February 2009 when it dipped to 25.
The job benefits of the federal stimulus program have yet to be felt in the real economy. Until then, continued market volatility is expected in the upcoming quarters.
The Small Cap Index Fund is designed to track the performance of the Russell 2000 Index. Any difference in performance is attributable to trading costs and other expenses not incurred by the index.
| | | | | | | | | | | | | | | | | | |
|---|
PERFORMANCE TABLE1,3
|
|
|
| Average Annual Total Return
|
| Cumulative Total Return
|
|
|---|
Period Ended August 31, 2009 | | | | | 1-year | | | | 5-year | | | | 10-year | | | | Since
inception | | | | 1-year | | | | 5-year | | | | 10-year | | | | Since
inception | |
| Small Cap Index Class NAV (began 10/29/05) | | | | | –21.60 | % | | | — | | | | — | | | | –1.83 | % | | | –21.60 | % | | | — | | | | — | | | | –6.85 | % |
Russell 2000 Index2,4,5 | | | | | –21.29 | % | | | — | | | | — | | | | –1.36 | % | | | –21.29 | % | | | — | | | | — | | | | –5.14 | % |
| 1 | | Performance does not reflect the deduction of taxes on fund distributions or redemptions of fund shares. Past performance does not predict future performance. |
| 2 | | Since inception returns for the indices may begin on the month-end closest to the actual inception date of the fund. |
| 3 | | Since inception, a portion of the Small Cap Index Fund expenses were reimbursed. If such expenses had not been reimbursed, returns would be lower. |
| 4 | | Russell 2000 Index is an unmanaged index composed of 2,000 U.S. small capitalization stocks. |
| 5 | | It is not possible to invest directly in an index. |
The expense ratios of the Fund, both net (including any fee waivers or expense limitations) and gross (excluding any fee waivers or expense limitations), are set forth according to the most recent publicly available prospectuses for the Fund and may differ from the expense ratios disclosed in the Financial Highlights tables in this report. For Class NAV, the net expense equals the gross expense and is 0.56%.
46
Small Cap Opportunities Fund
Subadviser: Dimensional Fund Advisors LP and Invesco AIM Capital Management, Inc.
Portfolio Managers: Juliet S. Ellis, Juan R. Hartsfield, Clay Manley and Stephen Clark
INVESTMENT OBJECTIVE & POLICIES 4 To seek long-term capital appreciation by investing primarily in equity securities of small-capitalization companies.
CHANGE IN VALUE OF $10,000 INVESTMENT AND COMPARATIVE INDICES
Sector Weighting* | % of Total |
Consumer, Cyclical | 17.27 |
Industrial | 16.18 |
Financial | 14.78 |
Consumer, Non-cyclical | 11.79 |
Communications | 8.60 |
Technology | 8.38 |
Energy | 6.48 |
Basic Materials | 4.40 |
Utilities | 1.75 |
|
| * | Top Sectors as a percentage of market value. Does not include short-term securities and investments in the John Hancock Collateral
Investment Trust, if applicable. |
PORTFOLIO MANAGERS’ COMMENTARY
Performance 4 For the year ended August 31, 2009, the Small Cap Opportunities Class NAV returned –18.24%, compared to the –21.29% return of the Russell 2000 Index.
Invesco Aim Commentary
Market Environment 4 Major U.S. equity markets fell by double digits during much of the period, as significant problems in the credit markets, weakness in the housing market, rising energy and food prices and a deteriorating outlook for corporate earnings led to a global economic recession. However, global equity markets began to recover some of these losses in early March 2009.
The Fund underperformed its benchmark by the widest margin in the Health Care sector, driven by stock selection. The Fund had relatively weak results in the Financials, Materials, Utilities and Energy sectors. This weakness was offset by strength in other sectors, including Consumer Staples, Consumer Discretionary and Industrials. The Fund outperformed by the widest margin in the Consumer Staples sector, driven by stock selection and an overweight position. Outperformance in the Consumer Discretionary sector was driven by stock selection and an underweight position. Outperformance in the Industrials sector was also due to stock selection.
At the end of the reporting period, the largest overweight positions versus the Russell 2000 Index were in the energy, semiconductor, transportation, and capital goods industry groups. The largest underweight positions were in the real estate, pharmaceuticals/biotechnology/life sciences, banks and technology hardware/equipment industry groups.
DFA Commentary
Market Environment 4 Dimensional Fund Advisors LP started to manage this portion of the portfolio on December 19, 2008.
While the U.S. equity market had excellent returns in the first eight months of 2009 (the return for the broad U.S. market, as measured by the Russell 3000 Index, was 16.3%), those months were characterized by two extraordinary periods. From January to early March, equity prices continued to decline at a fast pace. From early March until August, prices rose sharply as the fears of a systemic collapse of the world economy subsided and financial markets showed signs of stabilization. Volatility and divergent performance in various markets moderated from the levels reached in the fall of 2008, but remained above historical averages. Small differences in portfolio weights between different strategies or between strategies and benchmarks often resulted in large performance differences.
The portfolio’s greater exposure than the Index to deep value stocks, which greatly outperformed growth stocks, had a large positive impact on relative performance. Composition differences also had a strong positive impact on relative performance. The Fund’s greater exposure than the Index to mid-cap stocks, and other differences in allocation across the market capitalization segments had a negative impact on relative performance, as small-cap and micro-cap stocks outperformed larger stocks. However, composition differences within different market capitalization segments had a positive impact on the portfolio’s relative performance.
The exclusion of REITs and the Utilities sector, one of the worst-performing sectors from January to August, added to the portfolio’s relative performance. The Fund’s overweight to the Consumer Discretionary sector and other sector allocation differences boosted the portfolio’s relative performance. Composition differences within those sectors, especially in the Consumer Discretionary and Industrials sectors, also had a large positive impact on results.
| | | | | | | | | | | | | | | | | | |
|---|
PERFORMANCE TABLE1,7
|
|
|
| Average Annual Total Return
|
| Cumulative Total Return
|
|
|---|
Period Ended August 31, 2009 | | | | | 1-year | | | | 5-year | | | | 10-year | | | | Since
inception | | | | 1-year | | | | 5-year | | | | 10-year | | | | Since
inception | |
| Small Cap Opportunities Class 1 (began 10/15/05) | | | | | –18.28 | % | | | — | | | | — | | | | –6.66 | % | | | –18.28 | % | | | — | | | | — | | | | –23.47 | % |
| Small Cap Opportunities Class NAV (began 10/15/05) | | | | | –18.24 | % | | | — | | | | — | | | | –6.62 | % | | | –18.24 | % | | | — | | | | — | | | | –23.32 | % |
Russell 2000 Index2,3,5,6 | | | | | –21.29 | % | | | — | | | | — | | | | –1.25 | % | | | –21.29 | % | | | — | | | | — | | | | –4.78 | % |
Russell 2000 Value Index2,4,5,6 | | | | | –20.68 | % | | | — | | | | — | | | | –1.91 | % | | | –20.68 | % | | | — | | | | — | | | | –7.20 | % |
| 1 | | Performance does not reflect the deduction of taxes on fund distributions or redemptions of fund shares. Past performance does not predict future performance. |
| 2 | | Since inception returns for the indices may begin on the month-end closest to the actual inception date of the fund. |
| 3 | | Russell 2000 Index is an unmanaged index composed of 2,000 U.S. Small Capitalization Stocks. |
| 4 | | Russell 2000 Value Index is an unmanaged index that measures the performance of those Russell 2000 companies with lower price-to-book ratios and lower forecasted growth values. |
| 5 | | In December 2008, the index changed from Russell 2000 Value Index to Russell 2000 Index to more accurately reflect the investment objective of the Small Cap Opportunities Fund. |
| 6 | | It is not possible to invest directly in an index. |
| 7 | | Since inception, a portion of the Small Cap Opportunities Fund expenses were reimbursed. If such expenses had not been reimbursed, returns would be lower. |
The expense ratios of the Fund, both net (including any fee waivers or expense limitations) and gross (excluding any fee waivers or expense limitations), are set forth according to the most recent publicly available prospectuses for the Fund and may differ from the expense ratios disclosed in the Financial Highlights tables in this report. The net expenses equal the gross expenses and are as follows: Class 1 – 1.11% and Class NAV – 1.06%.
47
Small Cap Value Fund
Subadviser: Wellington Management Company, LLP
Portfolio Managers: Timothy McCormack, CFA and Shaun Pedersen
INVESTMENT OBJECTIVE & POLICIES 4 To seek long-term capital appreciation by investing in, under normal market conditions, at least 80% of its net assets (plus any borrowings for investment purposes) in small-cap companies that are believed to be undervalued by various measures and offer good prospects for capital appreciation.
CHANGE IN VALUE OF $10,000 INVESTMENT AND COMPARATIVE INDICES
Sector Weighting* | % of Total |
Financial | 24.88 |
Industrial | 21.26 |
Consumer, Non-cyclical | 17.30 |
Consumer, Cyclical | 14.76 |
Utilities | 5.73 |
Energy | 4.56 |
Technology | 3.78 |
Basic Materials | 3.64 |
Communications | 1.31 |
|
| * | Top Sectors as a percentage of market value. Does not include short-term securities and investments in the John Hancock Collateral
Investment Trust, if applicable. |
PORTFOLIO MANAGERS’ COMMENTARY
Performance 4 From the fund’s inception on December 16, 2008 to August 31, 2009, the Small Cap Value Class NAV returned +25.00%, compared to the +23.68% return of the Russell 2000 Value Index.
Market Environment 4 For the reporting period, small-cap U.S. equities, as measured by the Russell 2000 Index, gained 27.9%. Equity markets fell during the first quarter of 2009 before bottoming in March. Equities subsequently rebounded sharply as corporate earnings exceeded expectations, primarily driven by significant cost-cutting measures. While revenue growth remains challenged, some signs of an economic recovery began to emerge as revised second quarter GDP came in better than expected, sales of both new and existing homes improved off low levels, and payroll losses slowed. Mid-cap stocks outperformed small-cap stocks, which in turn outpaced their large-cap counterparts, as measured by the S&P 400 MidCap, Russell 2000, and S&P 500 indices, respectively. Growth stocks outperformed value stocks as measured by the Russell 2000 Growth and Russell 2000 Value indices.
The fund benefited from strong stock selection in the Financials, Industrials, Consumer Staples and Utilities sectors. Among the top contributors to performance were a specialty department store retailer, a diversified manufacturer, and a data storage provider. Weaker security selection within the Consumer Discretionary, Information Technology and Materials sectors detracted from relative results. Among the top relative detractors were an energy exploration and production company, a thermal management technology manufacturer, and a financial holding company. The fund’s weights versus the Index, which were driven by bottom-up stock decisions, contributed to relative performance due to an overweight to the Consumer Discretionary sector and an underweight to Financials.
| | | | | | | | | | | | | | | | | | |
|---|
PERFORMANCE TABLE1
|
|
|
| Average Annual Total Return
|
| Cumulative Total Return
|
|
|---|
Period Ended August 31, 2009 | | | | | 1-year | | | | 5-year | | | | 10-year | | | | Since
inception | | | | 1-year | | | | 5-year | | | | 10-year | | | | Since
inception | |
| Small Cap Value Class NAV (began 12/16/08) | | | | | — | | | | — | | | | — | | | | — | | | | — | | | | — | | | | — | | | | 25.00 | % |
Russell 2000 Value Index2,3,4 | | | | | — | | | | — | | | | — | | | | — | | | | — | | | | — | | | | — | | | | 23.68 | % |
| 1 | | Performance does not reflect the deduction of taxes on fund distributions or redemptions of fund shares. Past performance does not predict future performance. |
| 2 | | Since inception returns for the indices may begin on the month-end closest to the actual inception date of the fund. |
| 3 | | Russell 2000 Value Index is an unmanaged index that measures the performance of those Russell 2000 companies with lower price-to-book ratios and lower forecasted growth values. |
| 4 | | It is not possible to invest directly in an index. |
The expense ratios of the Fund, both net (including any fee waivers or expense limitations) and gross (excluding any fee waivers or expense limitations), are set forth according to the most recent publicly available prospectuses for the Fund and may differ from the expense ratios disclosed in the Financial Highlights tables in this report. For Class NAV, the net expense equals the gross expense and is 1.17%.
48
Small Company Growth Fund
Subadviser: Invesco AIM Capital Management, Inc.
Portfolio Managers: Juliet S. Ellis, Juan R. Hartsfield and Clay Manley
INVESTMENT OBJECTIVE & POLICIES 4 To seek long-term growth of capital by investing at least 80% of the Fund’s net assets in securities of small-capitalization companies.
CHANGE IN VALUE OF $10,000 INVESTMENT AND COMPARATIVE INDICES
Sector Weighting* | % of Total |
Consumer, Non-cyclical | 19.05 |
Technology | 15.62 |
Consumer, Cyclical | 12.95 |
Industrial | 12.80 |
Financial | 7.39 |
Communications | 6.50 |
Energy | 5.14 |
Utilities | 1.47 |
Basic Materials | 0.37 |
|
| * | Top Sectors as a percentage of market value. Does not include short-term securities and investments in the John Hancock Collateral
Investment Trust, if applicable. |
PORTFOLIO MANAGERS’ COMMENTARY
Performance 4 For the year ended August 31, 2009, the Small Company Growth Class NAV returned –20.42%, compared to the –22.02% return of the Russell 2000 Growth Index.
Market Environment 4 Major U.S. equity markets fell by double digits during much of the period, as significant problems in the credit markets, weakness in the housing market, rising energy and food prices and a deteriorating outlook for corporate earnings led to a global economic recession. However, global equity markets began to recover some of these losses in early March 2009.
The Fund outperformed its benchmark by the widest margin in the Energy sector, largely due to stock selection. The Energy sector was the weakest performing sector in the Russell 2000 Growth Index during the period. In this environment, the Fund’s holdings generally held up better than those of the benchmark.
The Fund outperformed in the Industrials sector, driven by stock selection. The Fund’s holdings in this sector generally held up better than those of the benchmark index. Good stock selection was also the reason the fund outperformed in the Consumer Discretionary sector. Several of the Fund’s Consumer Services holdings, including some restaurant operators, also made key contributions to performance. Underperformance was concentrated in the Health Care sector, where it was driven by stock selection.
At period end, the largest overweight positions versus the Russell 2000 Growth Index were in the energy, semiconductors, diversified financials and media industry groups. The largest underweight positions were in the consumer durables/apparel, pharmaceuticals/life sciences/biotechnology, health care equipment/services, and food/beverage/tobacco industry groups.
| | | | | | | | | | | | | | | | | | |
|---|
PERFORMANCE TABLE1
|
|
|
| Average Annual Total Return
|
| Cumulative Total Return
|
|
|---|
Period Ended August 31, 2009 | | | | | 1-year | | | | 5-year | | | | 10-year | | | | Since
inception | | | | 1-year | | | | 5-year | | | | 10-year | | | | Since
inception | |
| Small Company Growth Class NAV (began 10/29/05) | | | | | –20.42 | % | | | — | | | | — | | | | –0.26 | % | | | –20.42 | % | | | — | | | | — | | | | –1.01 | % |
Russell 2000 Growth Index2,3,4 | | | | | –22.02 | % | | | — | | | | — | | | | –1.26 | % | | | –22.02 | % | | | — | | | | — | | | | –4.77 | % |
| 1 | | Performance does not reflect the deduction of taxes on fund distributions or redemptions of fund shares. Past performance does not predict future performance. |
| 2 | | Since inception returns for the indices may begin on the month-end closest to the actual inception date of the fund. |
| 3 | | Russell 2000 Growth Index is an unmanaged index that contains those securities from the Russell 2000 Index with a greater than average growth orientation. |
| 4 | | It is not possible to invest directly in an index. |
The expense ratios of the Fund, both net (including any fee waivers or expense limitations) and gross (excluding any fee waivers or expense limitations), are set forth according to the most recent publicly available prospectuses for the Fund and may differ from the expense ratios disclosed in the Financial Highlights tables in this report. For Class NAV, the net expense equals the gross expense and is 1.10%.
49
Small Company Value Fund
Subadviser: T. Rowe Price Associates, Inc.
Portfolio Manager: Preston G. Athey
INVESTMENT OBJECTIVE & POLICIES 4 To seek long-term growth of capital by investing at least 80% of the Fund’s net assets in companies with market capitalizations that do not exceed the maximum market capitalization of any security in the Russell 2000 Value Index at the time of purchase. The Fund invests in small companies whose common stocks are believed to be undervalued.
CHANGE IN VALUE OF $10,000 INVESTMENT AND COMPARATIVE INDICES
Sector Weighting* | % of Total |
Industrial | 21.26 |
Financial | 18.25 |
Consumer, Cyclical | 12.15 |
Consumer, Non-cyclical | 12.10 |
Basic Materials | 8.19 |
Technology | 5.72 |
Energy | 4.75 |
Utilities | 3.44 |
Communications | 2.25 |
Investment Companies | 1.02 |
|
| * | Top Sectors as a percentage of market value. Does not include short-term securities and investments in the John Hancock Collateral
Investment Trust, if applicable. |
PORTFOLIO MANAGER’S COMMENTARY
Performance 4 For the year ended August 31, 2009, the Small Company Value Class NAV returned –18.43%, compared to the –20.68% return of the Russell 2000 Value Index.
Market Environment 4 The past 12 months saw the emergence of one of the greatest financial crises and economic contractions of the postwar era. The Russell 2000 Value Index posted significant double-digit losses during the period. It held up better than its small-cap growth counterpart, but underperformed its large-cap value peer. All sectors declined. Energy was the worst performer by far, reflecting declining commodity prices due to the economic downturn. Telecommunication Services, Industrials and Business Services and Financials also dropped substantially. The traditionally defensive Consumer Staples and Utilities sectors held up relatively well, but still posted losses.
Against that backdrop, the portfolio posted a double-digit loss, but still outpaced its Russell index. Broadly speaking, stock selection helped relative results, while sector allocation detracted. Financials provided the greatest boost to relative returns, due to stock selection and a beneficial underweight. We are sharply underweight in this sector, which makes up nearly a third of the Index, but we have selectively added to our holdings as we find attractive valuations.
In Consumer Discretionary, we benefited from stock selection and an overweight. Though this sector faces considerable challenges from depressed consumer spending, we believe that valuations are well below historical norms. We continue to seek out strong companies that can successfully navigate this difficult environment. Our stock holdings in Health Care also held their value better than their benchmark peers. The portfolio is slightly overweight in Health Care due to its relatively low sensitivity to shifts in economic conditions, long-term growth prospects, and wide range of reasonably valued companies.
Energy was the leading detractor due to an unfavorable overweight and weak stock selection. Despite this sector’s poor performance this year, we believe that an imbalance between supply and demand will begin to emerge, helping long-term prospects. Our overweight in Industrials, as well as an underweight in Consumer Staples, also broadly hurt relative results.
| | | | | | | | | | | | | | | | | | |
|---|
PERFORMANCE TABLE1,3,6
|
|
|
| Average Annual Total Return
|
| Cumulative Total Return
|
|
|---|
Period Ended August 31, 2009 | | | | | 1-year | | | | 5-year | | | | 10-year | | | | Since
inception | | | | 1-year | | | | 5-year | | | | 10-year | | | | Since
inception | |
| Small Company Value Class 1 (began 10/15/05) | | | | | –18.47 | % | | | — | | | | — | | | | 0.74 | % | | | –18.47 | % | | | — | | | | — | | | | 2.88 | % |
| Small Company Value Class NAV (began 10/15/05) | | | | | –18.43 | % | | | — | | | | — | | | | 0.78 | % | | | –18.43 | % | | | — | | | | — | | | | 3.07 | % |
Russell 2000 Value Index2,4,5 | | | | | –20.68 | % | | | — | | | | — | | | | –1.91 | % | | | –20.68 | % | | | — | | | | — | | | | –7.20 | % |
| 1 | | Performance does not reflect the deduction of taxes on fund distributions or redemptions of fund shares. Past performance does not predict future performance. |
| 2 | | Since inception returns for the indices may begin on the month-end closest to the actual inception date of the fund. |
| 3 | | Since inception, a portion of the Small Company Value Fund expenses were reimbursed. If such expenses had not been reimbursed, returns would be lower. |
| 4 | | Russell 2000 Value Index is an unmanaged index that measures the performance of those Russell 2000 companies with lower price-to-book ratios and lower forecasted growth values. |
| 5 | | It is not possible to invest directly in an index. |
| 6 | | Since inception, a portion of the Small Company Value Fund expenses were reimbursed. If such expenses had not been reimbursed, returns would be lower. |
The expense ratios of the Fund, both net (including any fee waivers or expense limitations) and gross (excluding any fee waivers or expense limitations), are set forth according to the most recent publicly available prospectuses for the Fund and may differ from the expense ratios disclosed in the Financial Highlights tables in this report. The net expenses equal the gross expenses and are as follows: Class 1 – 1.12% and Class NAV – 1.07%.
50
Smaller Company Growth Fund
Subadviser: Frontier Capital Management Company, MFC Global Investment Management (U.S.A.) Limited, Perimeter Capital Management, LLC
Portfolio Managers: Michael Cavarreta, Christopher Scarpa, Carson Jen, Narayu Ramani, Mark Garfinkel and James Behre
INVESTMENT OBJECTIVE & POLICIES 4 To seek long-term capital appreciation by investing, under normal market conditions, at least 80% of its assets in small cap equity securities.
CHANGE IN VALUE OF $10,000 INVESTMENT AND COMPARATIVE INDICES
Sector Weighting* | % of Total |
Consumer, Non-cyclical | 19.86 |
Consumer, Cyclical | 15.47 |
Communications | 14.97 |
Industrial | 14.51 |
Technology | 9.22 |
Financial | 7.21 |
Energy | 6.24 |
Basic Materials | 2.45 |
Investment Companies | 0.88 |
Utilities | 0.31 |
|
| * | Top Sectors as a percentage of market value. Does not include short-term securities and investments in the John Hancock Collateral
Investment Trust, if applicable. |
PORTFOLIO MANAGERS’ COMMENTARY
Performance 4 From the fund’s inception on October 7, 2008 to August 31, 2009, the Smaller Company Growth Class NAV returned +3.80%, compared to the +2.20% return of the Russell 2000 Growth Index.
Frontier Commentary
Market Environment 4 The two sectors contributing most significantly to performance were Consumer Discretionary and Producer Durables. The fund was underweight Consumer Discretionary stocks, which hurt performance slightly. However, this was more than offset by very strong stock selection. In Producer Durables, we maintained a slight underweight and again achieved significant outperformance with solid stock selection. The single largest detractor was the Health Care sector. Our slight underweight had a small positive effect, but poor stock selection had a substantially negative impact.
The fund lost relative ground in the second quarter, during which time performance was driven by stocks with the smallest market capitalizations, lowest price-to-earnings ratios, lowest return on equity, and stocks that traded below $5 a share. It was difficult for the portfolio’s returns to keep pace with performance from these areas, given the fund’s bias towards higher-quality, better-managed companies.
The economic data is no longer universally grim, equity markets have staged a meaningful rally, and credit market strains have eased. While we believe that the most intense phase of the domestic and global economic downturn has ended, the outlook remains fragile and any recovery is likely to be constrained for some time. With this in mind, the fund is very cautious in selecting stocks. Only companies not requiring a strong, sustained advance in domestic economic activity in order to grow their earnings or companies with exceptionally attractive risk/reward characteristics will be considered for inclusion in the portfolio.
Perimeter Commentary
Market Environment 4 The most recent year was a tale of two very different markets. It not only included one of the worst quarters in the U.S. equity markets since 1929 but also an extraordinary rally, where the Russell 2000 Growth Index appreciated nearly 54% in just 70 trading days. In addition to the tremendous magnitude of the market’s movement, much of the rebound since the market’s bottom on March 9 was concentrated in small, low-valuation, negative return companies versus larger, more profitable and generally higher-quality companies.
As concerns over the depth and breadth of the financial crisis exacerbated the market sell-off in late 2008, we remained dedicated to our investment discipline, where our broad diversification helped to dampen volatility. Despite the market’s lower-quality rally and the fund’s higher quality characteristics, the fund benefited from strong stock selection, particularly in Technology, Industrials and Energy. The portfolio’s excess returns were also attributable to overweight positions in the top-performing Technology and Consumer Discretionary sectors as well as from an underweight position in Health Care.
The fund was also rewarded for moderating our Technology sector overweight in early 2008 in advance of the software industry’s lengthening sales cycles, smaller deal sizes and headwinds from a strengthening dollar due to large international exposure. Our persistent overweight to Technology, one of the best performing sectors over the past year, was the result of uncovering a number of companies in the sector that had strong, long-term growth prospects and traded at compelling valuations. By contrast, our underweight to the Health Care sector reflected our continued concerns over the impact of the credit crisis coupled with the specter of health care reform. We also avoided biotechnology companies as they generally do not possess strong balance sheets or earnings growth characteristics.
We continue to manage our portfolio using our bottom-up research, focusing on companies that demonstrate strong growth characteristics and we look forward to a more rational market where business fundamentals and strong earnings growth drive positive investment results.
MFC Commentary
Market Environment 4 The past year has witnessed major historical events among U.S. financial institutions, including the bankruptcies of Lehman Brothers and Washington Mutual, and the government takeover of AIG, Fannie Mae and Freddie Mac. Throughout the year, we also saw a major reduction in credit access for corporations, small businesses and individuals.
During the first quarter of 2009, Barack Obama became president of the United States. In January, the House approved his $819-billion economic recovery plan. Economists believe that President Obama’s stimulus plan and Federal Reserve measures will help the U.S. economy by late 2009 to early 2010. By the end of the second quarter of 2009, unemployment in the U.S. rose to a 26-year high. The jobless rate increased to 9.7% at the end of August. The bankruptcies of such large companies as General Motors and Chrysler contributed significantly to these job losses in the second quarter of 2009.
The Conference Board’s Consumer Confidence Index was still low through the year, reaching 54 in August 2009. The lowest confidence level was in February 2009, when it dipped to a level of 25. The job benefits of the Obama administration’s stimulus program has yet to be felt in the real economy. Until then, continued market volatility is expected in the upcoming quarters.
| | | | | | | | | | | | | | | | | | |
|---|
PERFORMANCE TABLE1,2,6
|
|
|
| Average Annual Total Return
|
| Cumulative Total Return
|
|
|---|
Period Ended August 31, 2009 | | | | | 1-year | | | | 5-year | | | | 10-year | | | | Since
inception | | | | 1-year | | | | 5-year | | | | 10-year | | | | Since
inception | |
| Smaller Company Growth Class NAV (began 10/7/08) | | | | | — | | | | — | | | | — | | | | — | | | | — | | | | — | | | | — | | | | 3.80 | % |
Russell 2000 Growth Index3,4,5 | | | | | — | | | | — | | | | — | | | | — | | | | — | | | | — | | | | — | | | | 2.20 | % |
| 1 | | Performance does not reflect the deduction of taxes on fund distributions or redemptions of fund shares. Past performance does not predict future performance. |
| 2 | | Since inception, a portion of the Smaller Company Growth Fund expenses were reimbursed. If such expenses had not been reimbursed, returns would be lower. |
| 3 | | Since inception returns for the indices may begin on the month-end closest to the actual inception date of the fund. |
| 4 | | Russell 2000 Growth Index is an unmanaged index that contains those securities from the Russell 2000 Index with a greater than average growth orientation. |
| 5 | | It is not possible to invest directly in an index. |
| 6 | | Since inception, a portion of the Smaller Company Growth Fund expenses were reimbursed. If such expenses had not been reimbursed, returns would be lower. |
The expense ratios of the Fund, both net (including any fee waivers or expense limitations) and gross (excluding any fee waivers or expense limitations), are set forth according to the most recent publicly available prospectuses for the Fund and may differ from the expense ratios disclosed in the Financial Highlights tables in this report. The waivers and expense limitations are contractual until at least October 31, 2009. For Class NAV, the net expense is 1.04%. Had the fee waivers and expense limitations not been in place, the gross expense would be 1.15%.
51
Spectrum Income Fund
Subadviser: T. Rowe Price Associates, Inc.
Portfolio Managers: Edmund M. Notzon III, Daniel O. Shackelford, Mark J. Vaselkiv, Ian Kelson, Brian Rogers and Andrew McCormick
INVESTMENT OBJECTIVE & POLICIES 4 To seek a high level of current income with moderate share price fluctuation. The Fund seeks to maintain broad exposure primarily to domestic and international fixed-income markets in an attempt to reduce the impact of markets that are declining and to benefit from good performance in particular market segments over time. The Fund diversifies its assets widely among various income and equity market segments.
CHANGE IN VALUE OF $10,000 INVESTMENT AND COMPARATIVE INDICES
Sector Weighting* | % of Total |
Financial | 13.44 |
Government | 11.73 |
Government National Mortgage Association | 9.65 |
Communications | 8.72 |
Energy | 6.93 |
Federal National Mortgage Association | 6.11 |
Consumer, Non-cyclical | 5.94 |
Consumer, Cyclical | 5.40 |
Industrial | 4.68 |
U.S. Treasury Notes | 3.62 |
|
| * | Top Sectors as a percentage of market value. Does not include short-term securities and investments in the John Hancock Collateral
Investment Trust, if applicable. |
PORTFOLIO MANAGERS’ COMMENTARY
Performance 4 For the year ended August 31, 2009, the Spectrum Income Class NAV returned +5.85%, compared to the +7.94% return of the Barclays Capital U.S. Aggregate Bond Index.
Market Environment 4 In a year when fixed-income securities significantly outpaced stocks, the portfolio’s dividend-paying stock portion proved to be a significant liability from a relative-return standpoint. However, stock selection within that component was favorable and helped mitigate the negative effects.
Results were solid outside of the portfolio’s stock position, and some key strategic choices added value against the benchmark. We gradually reduced the portfolio’s weighting in U.S. Treasuries throughout last fall, fearing that they were becoming overvalued. The move proved beneficial, as Treasuries lagged for the past six months.
Throughout the period, we gradually increased our position in corporate, high yield and emerging market bonds as they declined at the end of last year. We were able to purchase compelling securities at very attractive valuations, and benefited as all three sectors have outperformed during much of 2009 to date. We believe our measured allocations to these diversifying sectors create the potential for a long-term performance advantage while keeping portfolio volatility close to that of the overall bond market.
The past 12 months have been one of the most volatile periods in U.S. market history. Global stocks endured a historic decline in the fall of 2008 before recovering significantly year-to-date. Most bond sectors that carry credit risk, including corporate bonds, high yield and international bonds, were also battered at the end of last year but have bounced back so far in 2009. On the other hand, Treasuries rallied during the worst of the financial crunch, but have since lost ground as investors have become worried about inflation.
We remain optimistic that the actions taken by governments and central banks around the world to increase liquidity, restore investor confidence, and get global economies moving again are beginning to have their desired effect. A gradually improving environment should be supportive of the more economically sensitive segments of the portfolio, such as high yield bonds and dividend-paying stocks, while more interest rate-sensitive segments of the bond market may be hampered by upward pressure on rates following these significant levels of fiscal and monetary stimulus.
| | | | | | | | | | | | | | | | | | |
|---|
PERFORMANCE TABLE1,3
|
|
|
| Average Annual Total Return
|
| Cumulative Total Return
|
|
|---|
Period Ended August 31, 2009 | | | | | 1-year | | | | 5-year | | | | 10-year | | | | Since
inception | | | | 1-year | | | | 5-year | | | | 10-year | | | | Since
inception | |
| Spectrum Income Class NAV (began 10/29/05) | | | | | 5.85 | % | | | — | | | | — | | | | 5.28 | % | | | 5.85 | % | | | — | | | | — | | | | 21.92 | % |
Barclays Capital U.S. Aggregate Bond Index2,4,5 | | | | | 7.94 | % | | | — | | | | — | | | | 5.73 | % | | | 7.94 | % | | | — | | | | — | | | | 23.94 | % |
| 1 | | Performance does not reflect the deduction of taxes on fund distributions or redemptions of fund shares. Past performance does not predict future performance. |
| 2 | | Since inception returns for the indices may begin on the month-end closest to the actual inception date of the fund. |
| 3 | | Since inception, a portion of the Spectrum Income Fund expenses were reimbursed. If such expenses had not been reimbursed, returns would be lower. |
| 4 | | Barclays Capital U.S. Aggregate Bond Index is an unmanaged index of dollar-denominated and nonconvertible investment-grade debt issues. |
| 5 | | It is not possible to invest directly in an index. |
The expense ratios of the Fund, both net (including any fee waivers or expense limitations) and gross (excluding any fee waivers or expense limitations), are set forth according to the most recent publicly available prospectuses for the Fund and may differ from the expense ratios disclosed in the Financial Highlights tables in this report. For Class NAV, the net expense equals the gross expense and is 0.86%.
52
Strategic Bond Fund
Subadviser: Western Asset Management Company
Portfolio Managers: S. Kenneth Leech, Steven A. Walsh, Keith J. Gardner, Mark Lindbloom and Mike Buchanan
INVESTMENT OBJECTIVE & POLICIES 4 To seek a high level of total return consistent with preservation of capital by investing at least 80% of the Fund’s net assets in fixed-income securities.
CHANGE IN VALUE OF $10,000 INVESTMENT AND COMPARATIVE INDICES