|
| UNITED STATES |
| SECURITIES AND EXCHANGE COMMISSION |
| Washington, D.C. 20549 |
| |
| FORM N-CSR |
| |
| CERTIFIED SHAREHOLDER REPORT OF REGISTERED MANAGEMENT INVESTMENT COMPANIES |
| Investment Company Act file number 811-21779 |
| |
| JOHN HANCOCK FUNDS II |
| --------------------------------------------------------- |
| (Exact name of registrant as specified in charter) |
| |
| 601 CONGRESS STREET, BOSTON, MA 02210-2805 |
| ------------------------------------------------------------- |
| (Address of principal executive offices) (Zip code) |
| |
| SALVATORE SCHIAVONE, 601 CONGRESS STREET, BOSTON, MA 02210-2805 |
| ------------------------------------------------------------------------------------------ |
| (Name and address of agent for service) |
| |
| Registrant's telephone number, including area code: (617) 663-4497 |
| ------------------- |
| |
| Date of fiscal year end: 9/30 |
| |
| Date of reporting period: 3/31/13 |
ITEM 1. REPORTS TO STOCKHOLDERS.
The Registrant prepared a semiannual report to shareholders for the period ended March 31, 2013 for International Growth Equity Fund.

A look at performance
Total returns for the period ended March 31, 2013
| | | | | | | | | | |
| | Average annual total returns (%) | | Cumulative total returns (%) | | |
| | with maximum sales charge | | | with maximum sales charge | | |
|
| 1-year | 5-year | 10-year | Since
inception 1 | | 6-months | 1-year | 5-year | 10-year | Since
inception 1 |
|
| Class A | –0.26 | –0.65 | — | 1.42 | | 3.12 | –0.21 | –3.20 | — | 9.08 |
|
| Class I2 | 6.37 | 1.73 | — | 3.66 | | 9.12 | 6.37 | 8.97 | — | 24.77 |
|
Performance figures assume all distributions have been reinvested. Figures reflect maximum sales charge on Class A shares of 5%. Sales charges are not applicable to Class I shares.
The expense ratios of the Fund, both net (including any fee waivers or expense limitations) and gross (excluding any fee waivers or expense limitations), are set forth according to the most recent publicly available prospectuses for the Fund and may differ from those disclosed in the Financial highlights tables in this report. The fee waivers and expense limitations are contractual until at least 1-31-15 for Class A and Class I shares. Had the fee waivers and expense limitations not been in place, gross expenses would apply. The expense ratios are as follows:
| | | | | | |
| | Class A | Class I | | | | |
| Net (%) | 1.35 | 1.10 | | | | |
| Gross (%) | 2.19 | 1.69 | | | | |
The returns reflect past results and should not be considered indicative of future performance. The return and principal value of an investment will fluctuate so that shares, when redeemed, may be worth more or less than their original cost. Due to market volatility, the Fund’s current performance may be higher or lower than the performance shown. For performance data current to the most recent month end, please call 1-800-225-5291 or visit the Fund’s Web site at www.jhfunds.com.
The performance table above and the chart on the next page do not reflect the deduction of taxes that a shareholder would pay on Fund distributions or the redemption of Fund shares. The Fund’s performance results reflect any applicable fee waivers or expense reductions, without which the expenses would increase and results would have been less favorable.
See the following page for footnotes.
| |
| 6 | International Growth Equity Fund | Semiannual report |

| | | | |
| | | With maximum | Without | |
| | Start date | sales charge | sales charge | Index |
|
| |
| Class I2 | 1-31-07 | $12,477 | $12,477 | $10,808 |
|
MSCI World ex-USA Growth Index (gross of foreign withholding taxes on dividends) is a free float-adjusted market capitalization weighted index that is designed to measure the equity market performance of developed markets, excluding the United States of America, that have higher than average growth characteristics.
It is not possible to invest directly in an index. Index figures do not reflect expenses or sales charges, which would have resulted in lower values if they did.
Footnotes related to performance pages
1 The Fund is the successor to Turner International Growth Fund (the Predecessor Fund). The performance information shown for Class A shares is the historical performance of the Predecessor Fund’s Investor class shares, which commenced operations on 10-31-08. Periods prior to 10-31-08 represent the performance of the Predecessor Fund’s Institutional class shares, which commenced operations on 1-31-07. Performance for Class A shares for all periods shown has been recalculated to reflect the gross fees and expenses and sales charges of the Fund’s Class A shares, which were first offered on 1-14-13. The performance history of Institutional class shares of the Predecessor Fund was redesignated as that of John Hancock International Growth Equity Fund Class I shares, which were first offered on 1-14-13.
2 For certain types of investors as described in the Fund’s prospectuses.
| |
| Semiannual report | International Growth Equity Fund | 7 |
Your expenses
These examples are intended to help you understand your ongoing operating expenses of investing in the Fund so you can compare these costs with the ongoing costs of investing in other mutual funds.
Understanding fund expenses
As a shareholder of the Fund, you incur two types of costs:
■ Transaction costs which include sales charges (loads) on purchases or redemptions (varies by share class), minimum account fee charge, etc.
■ Ongoing operating expenses including management fees, distribution and service fees (if applicable), and other fund expenses.
We are going to present only your ongoing operating expenses here.
Actual expenses/actual returns
This example is intended to provide information about the Fund’s actual ongoing operating expenses, and is based on the Fund’s actual return. It assumes an account value of $1,000.00 on October 1, 2012 with the same investment held until March 31, 2013.
| | | |
| | Account value | Ending value | Expenses paid during |
| | on 10-1-12 | on 3-31-13 | period ended 3-31-131 |
|
| Class A | $1,000.00 | $1,099.70 | $7.07 |
|
| Class I | 1,000.00 | 1,101.10 | 5.76 |
|
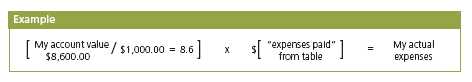
Together with the value of your account, you may use this information to estimate the operating expenses that you paid over the period. Simply divide your account value at March 31, 2013, by $1,000.00, then multiply it by the “expenses paid” for your share class from the table above. For example, for an account value of $8,600.00, the operating expenses should be calculated as follows:
| |
| 8 | International Growth Equity Fund | Semiannual report |
Hypothetical example for comparison purposes
This table allows you to compare the Fund’s ongoing operating expenses with those of any other fund. It provides an example of the Fund’s hypothetical account values and hypothetical expenses based on each class’s actual expense ratio and an assumed 5% annualized return before expenses (which is not the Fund’s actual return). It assumes an account value of $1,000.00 on October 1, 2012, with the same investment held until March 31, 2013. Look in any other fund shareholder report to find its hypothetical example and you will be able to compare these expenses. Please remember that these hypothetical account values and expenses may not be used to estimate the actual ending account balance or expenses you paid for the period.
| | | |
| | Account value | Ending value | Expenses paid during |
| | on 10-1-12 | on 3-31-13 | period ended 3-31-131 |
|
| Class A | $1,000.00 | $1,018.20 | $6.79 |
|
| Class I | 1,000.00 | 1,019.40 | 5.54 |
|
Remember, these examples do not include any transaction costs, therefore, these examples will not help you to determine the relative total costs of owning different funds. If transaction costs were included, your expenses would have been higher. See the prospectus for details regarding transaction costs.
1 Expenses are equal to the Fund’s annualized expense ratio of 1.35% and 1.10% for Class A and Class I shares, respectively, multiplied by the average account value over the period, multiplied by 182/365 (to reflect the one-half year period).
| |
| Semiannual report | International Growth Equity Fund | 9 |
Portfolio summary
| | | | |
| Top 10 Holdings (22.6% of Net Assets on 3-31-13)1,2 | | | |
|
| Nestle SA | 4.2% | | Diageo PLC | 1.8% |
| |
|
| Roche Holdings AG | 3.4% | | L’Oreal SA | 1.7% |
| |
|
| Toyota Motor Corp. | 2.7% | | BHP Billiton, Ltd. | 1.7% |
| |
|
| Unilever NV | 1.9% | | BT Group PLC | 1.7% |
| |
|
| British American Tobacco PLC | 1.9% | | Japan Tobacco, Inc. | 1.6% |
| |
|
| |
| Sector Composition1,3 | | | | |
|
| Consumer Staples | 17.7% | | Information Technology | 8.2% |
| |
|
| Industrials | 16.5% | | Energy | 6.9% |
| |
|
| Consumer Discretionary | 13.0% | | Telecommunication Services | 2.6% |
| |
|
| Financials | 13.0% | | Utilities | 0.7% |
| |
|
| Materials | 9.6% | | Short-Term Investments & Other | 2.6% |
| |
|
| Health Care | 9.2% | | | |
| | | |
| |
| Top 10 Countries1,2,3 | | | | |
|
| United Kingdom | 17.9% | | France | 5.0% |
| |
|
| Switzerland | 12.5% | | Australia | 4.8% |
| |
|
| Japan | 12.3% | | United States | 4.0% |
| |
|
| Canada | 7.2% | | Hong Kong | 3.8% |
| |
|
| Germany | 6.3% | | Brazil | 3.7% |
| |
|
1 As a percentage of net assets on 3-31-13.
2 Cash and cash equivalents not included.
3 Foreign investing, especially in emerging markets, has additional risks, such as currency and market volatility and political and social instability. Emerging market countries may experience higher inflation, interest rates and unemployment as well as greater social, economic, regulatory and political uncertainties than more developed countries. Growth stocks may be subject to greater price fluctuations because their prices tend to place greater emphasis on earnings expectations. Currency transactions are impacted by fluctuations in exchange rates, which may adversely affect the U.S. dollar value of a Fund’s investments. Sector investing is subject to greater risks than the market as a whole. Because the Fund may focus on particular sectors of the economy, its performance may depend on the performance of those sectors and investments focused in one sector may fluctuate more widely than investments diversified across sectors. For additional information on these and other risk considerations, please see the Fund’s prospectus.
| |
| 10 | International Growth Equity Fund | Semiannual report |
Fund’s investments
As of 3-31-13 (unaudited)
| | |
| | Shares | Value |
|
| Common Stocks 97.4% | | $31,932,117 |
|
| (Cost $27,949,866) | | |
| | | |
| Argentina 1.0% | | 331,201 |
| | | |
| MercadoLibre, Inc. | 3,430 | 331,201 |
| | | |
| Australia 4.8% | | 1,570,154 |
| | | |
| BHP Billiton, Ltd. | 16,390 | 560,866 |
|
| CSL, Ltd. | 8,290 | 513,369 |
|
| Rio Tinto, Ltd. | 8,300 | 495,919 |
| | | |
| Brazil 3.7% | | 1,202,002 |
| | | |
| Banco do Brasil SA | 24,240 | 328,438 |
|
| Companhia de Bebidas das Americas, ADR | 7,310 | 309,432 |
|
| Cosan SA Industria e Comercio | 13,800 | 308,404 |
|
| Embraer SA | 28,741 | 255,728 |
| | | |
| Canada 7.2% | | 2,348,975 |
| | | |
| Canadian Pacific Railway, Ltd. | 3,480 | 454,043 |
|
| Enbridge, Inc. | 10,930 | 508,923 |
|
| Goldcorp, Inc. | 9,890 | 332,766 |
|
| Lululemon Athletica, Inc. (I) | 3,960 | 246,906 |
|
| Silver Wheaton Corp. | 9,160 | 286,743 |
|
| Suncor Energy, Inc. | 17,340 | 519,594 |
| | | |
| China 1.7% | | 564,741 |
| | | |
| Tencent Holdings, Ltd. | 10,040 | 319,736 |
|
| Want Want China Holdings, Ltd. | 159,690 | 245,005 |
| | | |
| Denmark 1.4% | | 455,441 |
| | | |
| Novo Nordisk A/S, Class B | 2,790 | 455,441 |
| | | |
| France 5.0% | | 1,638,121 |
| | | |
| L’Oreal SA | 3,615 | 573,591 |
|
| LVMH Moet Hennessy Louis Vuitton SA | 1,818 | 312,326 |
|
| Remy Cointreau SA | 2,090 | 241,667 |
|
| Schneider Electric SA | 6,980 | 510,537 |
| | | |
| Germany 6.3% | | 2,058,671 |
| | | |
| Adidas AG | 4,908 | 509,612 |
|
| BASF SE | 6,050 | 530,073 |
|
| GEA Group AG | 15,440 | 509,288 |
|
| Linde AG | 2,740 | 509,698 |
| | |
| See notes to financial statements | Semiannual report | International Growth Equity Fund | 11 |
| | |
| | Shares | Value |
| Hong Kong 3.8% | | $1,238,268 |
| | | |
| AIA Group, Ltd. | 109,732 | 479,558 |
|
| Beijing Enterprises Holdings, Ltd. | 40,880 | 315,250 |
|
| China Resource Power Holdings, Ltd. | 81,510 | 244,867 |
|
| Yuexiu Transport Infrastructure, Ltd. | 378,920 | 198,593 |
| | | |
| Ireland 1.6% | | 521,162 |
| | | |
| Experian PLC | 29,967 | 521,162 |
| | | |
| Italy 1.4% | | 476,214 |
| | | |
| Salvatore Ferragamo Italia SpA | 17,187 | 476,214 |
| | | |
| Japan 12.3% | | 4,028,221 |
| | | |
| FANUC Corp. | 3,120 | 480,000 |
|
| Hitachi, Ltd. | 87,940 | 512,889 |
|
| Honda Motor Company, Ltd. | 12,290 | 473,576 |
|
| Japan Tobacco, Inc. | 16,860 | 539,617 |
|
| Komatsu, Ltd. | 17,280 | 412,409 |
|
| Mitsui Fudosan Company, Ltd. | 16,620 | 474,111 |
|
| Murata Manufacturing Company, Ltd. | 3,250 | 245,584 |
|
| Toyota Motor Corp. | 17,270 | 890,035 |
| | | |
| Mexico 0.8% | | 273,132 |
| | | |
| Concentradora Fibra Hotelera Mexicana SA de CV | 163,170 | 273,132 |
| | | |
| Netherlands 3.1% | | 1,002,153 |
| | | |
| NXP Semiconductor NV (I) | 12,350 | 373,711 |
|
| Unilever NV | 15,330 | 628,442 |
| | | |
| Norway 1.3% | | 441,027 |
| | | |
| Petroleum Geo-Services ASA | 28,470 | 441,027 |
| | | |
| Panama 1.1% | | 363,614 |
| | | |
| Copa Holdings SA, Class A | 3,040 | 363,614 |
| | | |
| Philippines 1.4% | | 462,312 |
| | | |
| Metro Pacific Investments Corp. | 1,690,861 | 230,797 |
|
| Metropolitan Bank & Trust Company | 80,850 | 231,515 |
| | | |
| Russia 1.0% | | 340,358 |
| | | |
| Magnit OJSC, GDR (I) | 5,220 | 235,683 |
|
| Sberbank of Russia, ADR | 2,860 | 36,465 |
|
| Sberbank of Russia, ADR (London Exchange) | 5,310 | 68,210 |
| | | |
| South Korea 1.5% | | 503,941 |
| | | |
| Samsung Electronics Company, Ltd. | 370 | 503,941 |
| | | |
| Spain 1.2% | | 386,067 |
| | | |
| Inditex SA | 2,897 | 386,067 |
| | | |
| Sweden 3.0% | | 992,497 |
| | | |
| Assa Abloy AB, Series B | 13,100 | 535,833 |
|
| Swedbank AB, Class A (L) | 20,043 | 456,664 |
| | | |
| Switzerland 12.5% | | 4,088,175 |
| | | |
| Cie Financiere Richemont SA | 5,810 | 456,729 |
|
| Credit Suisse Group AG (I) | 12,425 | 327,914 |
|
| Nestle SA | 18,926 | 1,369,221 |
|
| Roche Holdings AG | 4,730 | 1,104,328 |
| | |
| 12 | International Growth Equity Fund | Semiannual report | See notes to financial statements |
| | | |
| | | Shares | Value |
| Switzerland (continued) | | | |
| | | | |
| STMicroelectronics NV | | 50,588 | $389,597 |
|
| Wolseley PLC | | 8,812 | 440,386 |
| | | | |
| Turkey 1.0% | | | 325,811 |
| | | | |
| Turkcell Iletisim Hizmetleri AS, ADR (I) | | 19,580 | 325,811 |
| | | | |
| United Kingdom 17.9% | | | 5,857,437 |
| | | | |
| BG Group PLC | | 27,760 | 476,551 |
|
| British American Tobacco PLC | | 11,430 | 611,993 |
|
| BT Group PLC | | 128,770 | 542,584 |
|
| Countrywide PLC (I) | | 84,436 | 500,355 |
|
| Diageo PLC | | 19,000 | 598,290 |
|
| Esure Group PLC (I) | | 74,030 | 337,455 |
|
| GlaxoSmithKline PLC | | 20,540 | 480,772 |
|
| Intercontinental Hotels Group PLC | | 17,213 | 526,270 |
|
| Rexam PLC | | 52,640 | 422,127 |
|
| Rolls-Royce Holdings PLC | | 23,330 | 400,894 |
|
| Rolls-Royce Holdings PLC, C Shares (I) | | 2,500,400 | 3,799 |
|
| SABMiller PLC (I) | | 8,340 | 439,231 |
|
| Standard Chartered PLC | | 19,962 | 517,116 |
| | | | |
| United States 1.4% | | | 462,422 |
| | | | |
| Catamaran Corp. (I) | | 8,720 | 462,422 |
| |
| | Yield (%) | Shares | Value |
|
| Securities Lending Collateral 1.3% | | | $424,818 |
|
| (Cost $424,801) | | | |
| | | | |
| John Hancock Collateral Investment Trust (W) | 0.2481 (Y) | 42,445 | 424,818 |
|
| |
| Short-Term Investments 1.6% | | | $531,848 |
|
| (Cost $531,848) | | | |
| | | | |
| Money Market Funds 1.6% | | | 531,848 |
| | | | |
| State Street Institutional Treasury Plus Money | | | |
| Market Fund | 0.0241 (Y) | 531,848 | 531,848 |
| |
| Total investments (Cost $28,906,515)† 100.3% | | | $32,888,783 |
|
| |
| Other assets and liabilities, net (0.3%) | | | ($88,188) |
|
| |
| Total net assets 100.0% | | | $32,800,595 |
|
The percentage shown for each investment category is the total value of the category as a percentage of the net assets of the Fund.
ADR American Depositary Receipts
GDR Global Depositary Receipt
(I) Non-income producing security.
(L) A portion of this security is on loan as of 3-31-13.
(W) Investment is an affiliate of the Fund, the advisor and/or subadvisor. This investment represents collateral received for securities lending.
(Y) The rate shown is the annualized seven-day yield as of 3-31-13.
| | |
| See notes to financial statements | Semiannual report | International Growth Equity Fund | 13 |
† At 3-31-13, the aggregate cost of investment securities for federal income tax purposes was $29,626,230. Net unrealized appreciation aggregated $3,262,553, of which $3,550,040 related to appreciated investment securities and $287,487 related to depreciated investment securities.
The Fund had the following sector composition as a percentage of net assets on 3-31-13:
| | | | | |
| Consumer Staples | 17.7% | | | | |
| Industrials | 16.5% | | | | |
| Consumer Discretionary | 13.0% | | | | |
| Financials | 13.0% | | | | |
| Materials | 9.6% | | | | |
| Health Care | 9.2% | | | | |
| Information Technology | 8.2% | | | | |
| Energy | 6.9% | | | | |
| Telecommunication Services | 2.6% | | | | |
| Utilities | 0.7% | | | | |
| Short-Term Investments & Other | 2.6% | | | | |
| | |
| 14 | International Growth Equity Fund | Semiannual report | See notes to financial statements |
F I N A N C I A L S T A T E M E N T S
Financial statements
Statement of assets and liabilities 3-31-13 (unaudited)
This Statement of assets and liabilities is the Fund’s balance sheet. It shows the value of what the Fund owns, is due and owes. You’ll also find the net asset value and the maximum public offering price per share.
| |
| Assets | |
|
| Investments in unaffiliated issuers, at value (Cost $28,481,714), including | |
| $410,274 of securities loaned | $32,463,965 |
| Investments in affiliated issuers, at value (Cost $424,801) | 424,818 |
| | |
| Total investments, at value (Cost $28,906,515) | 32,888,783 |
| Cash | 193,439 |
| Foreign currency, at value (Cost $40,936) | 40,883 |
| Receivable for fund shares sold | 21,146 |
| Dividends and interest receivable | 126,738 |
| Receivable for securities lending income | 2,301 |
| Receivable due from advisor | 6,499 |
| Other receivables and prepaid expenses | 2,722 |
| | |
| Total assets | 33,282,511 |
| |
| Liabilities | |
|
| Payable for fund shares repurchased | 24,536 |
| Payable upon return of securities loaned | 424,800 |
| Payable to affiliates | |
| Accounting and legal services fees | 410 |
| Transfer agent fees | 3,063 |
| Other liabilities and accrued expenses | 29,107 |
| | |
| Total liabilities | 481,916 |
| | |
| Net assets | 32,800,595 |
| |
| Net assets consist of | |
|
| Paid-in capital | $29,469,720 |
| Undistributed net investment income | 127,777 |
| Accumulated net realized gain (loss) on investments and foreign | |
| currency transactions | (778,790) |
| Net unrealized appreciation (depreciation) on investments and translation | |
| of assets and liabilities in foreign currencies | 3,981,888 |
| | |
| Net assets | $32,800,595 |
| |
| Net asset value per share | |
|
| Based on net asset values and shares outstanding — the Fund has an | |
| unlimited number of shares authorized with no par value | |
| Class A ($4,572,647 ÷ 387,993 shares) | $11.79 |
| Class I ($28,227,948 ÷ 2,382,642 shares) | $11.85 |
| |
| Maximum offering price per share | |
|
| Class A (net asset value per share ÷ 95%)1 | $12.41 |
1 On single retail sales of less than $50,000. On sales of $50,000 or more and on group sales the offering price is reduced.
| | |
| See notes to financial statements | Semiannual report | International Growth Equity Fund | 15 |
F I N A N C I A L S T A T E M E N T S
Statement of operations For the period ended 3-31-13 (unaudited)
This Statement of operations summarizes the Fund’s investment income earned and expenses incurred in operating the Fund. It also shows net gains (losses) for the period stated.
| |
| Investment income | |
|
| Dividends | $477,911 |
| Securities lending | 2,301 |
| Interest | 78 |
| Less foreign taxes withheld | (25,820) |
| | |
| Total investment income | 454,470 |
| |
| Expenses | |
|
| Investment management fees | 133,735 |
| Distribution and service fees | 7,524 |
| Accounting and legal services fees | 10,758 |
| Transfer agent fees | 15,291 |
| Trustees’ fees | 1,069 |
| State registration fees | 13,370 |
| Printing and postage | 6,830 |
| Professional fees | 21,286 |
| Custodian fees | 39,342 |
| Registration and filing fees | 14,800 |
| Other | 2,580 |
| | |
| Total expenses | 266,585 |
| Less expense reductions | (86,185) |
| | |
| Net expenses | 180,400 |
| | |
| Net investment income | 274,070 |
| |
| Realized and unrealized gain (loss) | |
|
| Net realized gain (loss) on | |
| Investments in unaffiliated issuers | 1,416,247 |
| Foreign currency transactions | (18,889) |
| | 1,397,358 |
| Change in net unrealized appreciation (depreciation) of | |
| Investments in unaffiliated issuers | 1,426,218 |
| Investments in affiliated issuers | 17 |
| Translation of assets and liabilities in foreign currencies | 267 |
| | 1,426,502 |
| Net realized and unrealized gain | 2,823,860 |
| | |
| Increase in net assets from operations | $3,097,930 |
| | |
| 16 | International Growth Equity Fund | Semiannual report | See notes to financial statements |
F I N A N C I A L S T A T E M E N T S
Statements of changes in net assets
These Statements of changes in net assets show how the value of the Fund’s net assets has changed during the last two periods. The difference reflects earnings less expenses, any investment gains and losses, distributions, if any, paid to shareholders and the net of Fund share transactions.
| | |
| | Six months | |
| | ended | Year |
| | 3-31-13 | ended |
| | (Unaudited) | 9-30-12 |
|
| Increase (decrease) in net assets | | |
|
| From operations | | |
| Net investment income | $274,070 | $162,480 |
| Net realized gain (loss) | 1,397,358 | (1,452,847) |
| Change in net unrealized appreciation (depreciation) | 1,426,502 | 3,859,223 |
| | | |
| Increase in net assets resulting from operations | 3,097,930 | 2,568,856 |
| | | |
| Distributions to shareholders | | |
| From net investment income | | |
| Class A | (38,207) | — |
| Class I | (231,228) | — |
| | | |
| Total distributions | (269,435) | — |
| | | |
| From Fund share transactions | 395,564 | 16,083,620 |
| | | |
| Total increase | 3,224,059 | 18,652,476 |
| |
| Net assets | | |
|
| Beginning of period | 29,576,536 | 10,924,060 |
| | | |
| End of period | $32,800,595 | $29,576,536 |
| | | |
| Undistributed net investment income | $127,777 | $123,142 |
| | |
| See notes to financial statements | Semiannual report | International Growth Equity Fund | 17 |
Financial highlights
The Financial highlights show how the Fund’s net asset value for a share has changed during the period.
| | | | | | |
| CLASS A SHARES Period ended | | 3-31-131,2 | 9-30-123 | 9-30-113 | 9-30-103 | 9-30-093,4 |
| |
| Per share operating performance | | | | | | |
|
| Net asset value, beginning of period | | $10.79 | $9.17 | $9.39 | $8.24 | $6.27 |
| Net investment income5 | | 0.09 | 0.08 | 0.05 | 0.05 | 0.07 |
| Net realized and unrealized gain (loss) on investments | | 0.98 | 1.54 | (0.20) | 1.23 | 2.01 |
| Total from investment operations | | 1.07 | 1.62 | (0.15) | 1.28 | 2.08 |
| Less distributions | | | | | | |
| From net investment income | | (0.07) | — | (0.07) | (0.13) | (0.11) |
| Net asset value, end of period | | $11.79 | $10.79 | $9.17 | $9.39 | $8.24 |
| Total return (%)6 | | 9.977 | 17.67 | (1.67) | 15.61 | 33.95 |
| |
| Ratios and supplemental data | | | | | | |
|
| Net assets, end of period (in millions) | | $5 | $6 | $5 | —8 | —8 |
| Ratios (as a percentage of average net assets): | | | | | | |
| Expenses before reductions | | 1.959 | 2.15 | 2.46 | 4.15 | 5.599 |
| Expenses net of fee waivers and credits | | 1.359 | 1.35 | 1.35 | 1.35 | 1.299 |
| Net investment income | | 1.409 | 0.78 | 0.44 | 0.61 | 1.149 |
| Portfolio turnover (%) | | 89 | 138 | 210 | 120 | 139 |
| | |
1 Six months ended 3-31-13. Unaudited.
2 After the close of business on 1-11-13, holders of Investor Class shares of the former Turner International Growth Fund (the Predecessor Fund) became owners of an equal number of full and fractional Class A shares of the John Hancock International Growth Equity Fund. These shares were first offered on 1-14-13. Additionally, the accounting and performance history of the Investor Class shares of the Predecessor Fund was redesignated as that of John Hancock International Growth Equity Fund Class A.
3 Audited by previous independent registered public accounting firm.
4 Commenced operations on 10-31-08.
5 Based on the average daily shares outstanding.
6 Total returns would have been lower had certain expenses not been reduced during the applicable periods shown.
7 Not annualized.
8 Less than $500,000.
9 Annualized.
| | |
| 18 | International Growth Equity Fund | Semiannual report | See notes to financial statements |
| | | | | | |
| CLASS I SHARES Period ended | 3-31-131,2 | 9-30-123 | 9-30-113 | 9-30-103 | 9-30-093 | 9-30-083 |
| |
| Per share operating performance | | | | | | |
|
| Net asset value, beginning of period | $10.86 | $9.21 | $9.41 | $8.24 | $8.34 | $12.21 |
| Net investment income4 | 0.10 | 0.11 | 0.08 | 0.04 | 0.08 | 0.12 |
| Net realized and unrealized gain (loss) | | | | | | |
| on investments | 0.99 | 1.54 | (0.19) | 1.26 | (0.07) | (3.87) |
| Total from investment operations | 1.09 | 1.65 | (0.11) | 1.30 | 0.01 | (3.75) |
| Less distributions | | | | | | |
| From net investment income | (0.10) | — | (0.09) | (0.13) | (0.11) | (0.02) |
| From net realized gain | — | — | — | — | — | (0.10) |
| Total distributions | (0.10) | —�� | (0.09) | (0.13) | (0.11) | (0.12) |
| Net asset value, end of period | $11.85 | $10.86 | $9.21 | $9.41 | $8.24 | $8.34 |
| Total return (%)5 | 10.116 | 17.92 | (1.32) | 15.88 | 0.71 | (31.04) |
| |
| Ratios and supplemental data | | | | | | |
|
| Net assets, end of period (in millions) | $28 | $23 | $6 | $5 | $4 | $3 |
| Ratios (as a percentage of average net assets): | | | | | | |
| Expenses before reductions | 1.647 | 1.90 | 2.41 | 3.93 | 5.24 | 3.05 |
| Expenses net of fee waivers and credits | 1.107 | 1.10 | 1.10 | 1.10 | 1.10 | 1.108 |
| Net investment income | 1.817 | 1.03 | 0.70 | 0.51 | 1.31 | 1.10 |
| Portfolio turnover (%) | 89 | 138 | 210 | 120 | 139 | 245 |
| |
1 Six months ended 3-31-13. Unaudited.
2 After the close of business on 1-11-13, holders of Institutional Class shares of the former Turner International Growth Fund (the Predecessor Fund) became owners of an equal number of full and fractional Class I shares of the John Hancock International Growth Equity Fund. These shares were first offered on 1-14-13. Additionally, the accounting and performance history of the Institutional Class shares of the Predecessor Fund was redesignated as that of John Hancock International Growth Equity Fund Class I.
3 Audited by previous independent registered public accounting firm.
4 Based on the average daily shares outstanding.
5 Total returns would have been lower had certain expenses not been reduced during the applicable periods shown.
6 Not annualized.
7 Annualized.
8 Excluding fees paid indirectly, the ratio of net expenses to average net assets would have been 1.11%.
| | |
| See notes to financial statements | Semiannual report | International Growth Equity Fund | 19 |
Notes to financial statements
(unaudited)
Note 1 — Organization
John Hancock International Growth Equity Fund (the Fund) is a series of John Hancock Funds II (the Trust), an open-end management investment company organized as a Massachusetts business trust and registered under the Investment Company Act of 1940, as amended (the 1940 Act). The investment objective of the Fund is to seek long-term capital appreciation.
The Fund may offer multiple classes of shares. The shares currently offered by the Fund are detailed in the Statement of assets and liabilities. Class A is open to all investors. Class I shares are offered to institutions and certain investors. Shareholders of each class have exclusive voting rights to matters that affect that class. The distribution and service fees, if any, transfer agent fees, printing and postage and state registration fees for each class may differ.
The Fund is the accounting and performance successor of the Turner International Growth Fund (the Predecessor Fund). At the close of business on January 11, 2013, the Fund acquired substantially all the assets and assumed the liabilities of the Predecessor Fund pursuant to an agreement and plan of reorganization, in exchange for Class A and Class I shares of the Fund.
Note 2 — Significant accounting policies
The financial statements have been prepared in conformity with accounting principles generally accepted in the United States of America, which require management to make certain estimates and assumptions at the date of the financial statements. Actual results could differ from those estimates and those differences could be significant. Events or transactions occurring after the end of the fiscal period through the date that the financial statements were issued have been evaluated in the preparation of the financial statements. The following summarizes the significant accounting policies of the Fund:
Security valuation. Investments are stated at value as of the close of regular trading on the New York Stock Exchange (NYSE), normally at 4:00 P.M., Eastern Time. In order to value the securities, the Fund uses the following valuation techniques: Equity securities held by the Fund are valued at the last sale price or official closing price on the principal securities exchange on which they trade. In the event there were no sales during the day or closing prices are not available, then the securities are valued using the last quoted bid or evaluated price. Investments by the Fund in open-end mutual funds, including John Hancock Collateral Investment Trust (JHCIT), are valued at their respective net asset values each business day. Foreign securities and currencies are valued in U.S. dollars, based on foreign currency exchange rates supplied by an independent pricing service. Certain securities traded only in the over-the-counter market are valued at the last bid price quoted by brokers making markets in the securities at the close of trading.
Other portfolio securities and assets, where reliable market quotations are not available, are valued at fair value as determined in good faith by the Fund’s Pricing Committee following procedures established by the Board of Trustees, which include price verification procedures. The frequency with which these fair valuation procedures are used cannot be predicted. Generally, trading in foreign securities is substantially completed each day at various times prior to the close of trading on the NYSE. Significant market events that affect the values of foreign securities may occur between the time when the valuation of the securities is generally determined and the close of the NYSE. During significant market events, these securities will be valued at fair value, as determined in good faith, following procedures established by the Board of Trustees. The Fund may use a fair
| |
| 20 | International Growth Equity Fund | Semiannual report |
valuation model to value foreign securities in order to adjust for events that may occur between the close of foreign exchanges and the close of the NYSE.
The Fund uses a three-tier hierarchy to prioritize the pricing assumptions, referred to as inputs, used in valuation techniques to measure fair value. Level 1 includes securities valued using quoted prices in active markets for identical securities. Level 2 includes securities valued using other significant observable inputs. Observable inputs may include quoted prices for similar securities, interest rates, prepayment speeds and credit risk. Prices for securities valued using these inputs are received from independent pricing vendors and brokers and are based on an evaluation of the inputs described. Level 3 includes securities valued using significant unobservable inputs when market prices are not readily available or reliable, including the Fund’s own assumptions in determining the fair value of investments. Factors used in determining value may include market or issuer specific events or trends, changes in interest rates and credit quality. The inputs or methodology used for valuing securities are not necessarily an indication of the risks associated with investing in those securities. Changes in valuation techniques may result in transfers into or out of an assigned level within the disclosure hierarchy.
The following is a summary of the values by input classification of the Fund’s investments as of March 31, 2013, by major security category or type:
| | | | |
| | | | | LEVEL 3 |
| | | | LEVEL 2 | SIGNIFICANT |
| | TOTAL MARKET | LEVEL 1 | SIGNIFICANT | UNOBSERVABLE |
| | VALUE AT 3-31-13 | QUOTED PRICE | OBSERVABLE INPUTS | INPUTS |
|
| Common Stocks | | | | |
|
| Argentina | $331,201 | $331,201 | — | — |
| Australia | 1,570,154 | — | $1,570,154 | — |
| Brazil | 1,202,002 | 1,202,002 | — | — |
| Canada | 2,348,975 | 2,348,975 | — | — |
| China | 564,741 | — | 564,741 | — |
| Denmark | 455,441 | — | 455,441 | — |
| France | 1,638,121 | — | 1,638,121 | — |
| Germany | 2,058,671 | — | 2,058,671 | — |
| Hong Kong | 1,238,268 | — | 1,238,268 | — |
| Ireland | 521,162 | — | 521,162 | — |
| Italy | 476,214 | — | 476,214 | — |
| Japan | 4,028,221 | — | 4,028,221 | — |
| Mexico | 273,132 | — | 273,132 | — |
| Netherlands | 1,002,153 | 373,711 | 628,442 | — |
| Norway | 441,027 | — | 441,027 | — |
| Panama | 363,614 | 363,614 | — | — |
| Philippines | 462,312 | — | 462,312 | — |
| Russia | 340,358 | 36,465 | 303,893 | — |
| South Korea | 503,941 | — | 503,941 | — |
| Spain | 386,067 | — | 386,067 | — |
| Sweden | 992,497 | — | 992,497 | — |
| Switzerland | 4,088,175 | — | 4,088,175 | — |
| Turkey | 325,811 | 325,811 | — | — |
| United Kingdom | 5,857,437 | — | 5,857,437 | — |
| United States | 462,422 | 462,422 | — | — |
| Securities Lending | | | | |
| Collateral | 424,818 | 424,818 | — | — |
| Short-Term Investments | 531,848 | 531,848 | — | — |
| |
|
| Total Investments | | | | |
| in Securities | $32,888,783 | $6,400,867 | $26,487,916 | — |
| |
| Semiannual report | International Growth Equity Fund | 21 |
Security transactions and related investment income. Investment security transactions are accounted for on a trade date plus one basis for daily net asset value calculations. However, for financial reporting purposes, investment transactions are reported on trade date. Interest income is accrued as earned. Dividend income is recorded on the ex-date, except for dividends of foreign securities where the dividend may not be known until after the ex-date. In those cases, dividend income, net of withholding taxes, is recorded when the Fund becomes aware of the dividends. Foreign taxes are provided for based on the Fund’s understanding of the tax rules and rates that exist in the foreign markets in which it invests. Gains and losses on securities sold are determined on the basis of identified cost and may include proceeds from litigation.
Securities lending. The Fund may lend its securities to earn additional income. It receives cash collateral from the borrower in an amount not less than the market value of the loaned securities. The Fund will invest its collateral in JHCIT, an affiliate of the Fund, which has a floating net asset value (NAV) and invests in short term investments as part of the securities lending program, and as a result, the Fund will receive the benefit of any gains and bear any losses generated by JHCIT. Although risk of the loss of the securities lent is mitigated by holding the collateral and through securities lending provider indemnification, the Fund could experience a delay in recovering its securities and a possible loss of income or value if the borrower fails to return the securities or if collateral investments decline in value or possible loss of rights in the collateral should the borrower fail financially. The Fund may receive compensation for lending its securities by retaining a portion of the return on the investment of the collateral and compensation from fees earned from borrowers of the securities. Net income received from JHCIT is a component of securities lending income as recorded on the Statement of operations.
Foreign currency translation. Assets, including investments and liabilities denominated in foreign currencies, are translated into U.S. dollar values each day at the prevailing exchange rate. Purchases and sales of securities, income and expenses are translated into U.S. dollars at the prevailing exchange rate on the date of the transaction. The effect of changes in foreign currency exchange rates on the value of securities is reflected as a component of the realized and unrealized gains (losses) on investments.
Funds that invest internationally generally carry more risk than funds that invest strictly in U.S. securities. Risks can result from differences in economic and political conditions, regulations, market practices (including higher transaction costs), accounting standards and other factors. Foreign investments are also subject to a decline in the value of a foreign currency versus the U.S. dollar, which reduces the dollar value of securities denominated in that currency.
Foreign taxes. The Fund may be subject to withholding tax on income or capital gains or repatriation taxes as imposed by certain countries in which it invests. Taxes are accrued based upon investment income, realized gains or unrealized appreciation.
Line of credit. The Fund may borrow from banks for temporary or emergency purposes, including meeting redemption requests that otherwise might require the untimely sale of securities. Pursuant to the custodian agreement, the custodian may loan money to the Fund to make properly authorized payments. The Fund is obligated to repay the custodian for any overdraft, including any related costs or expenses. The custodian may have a lien, security interest or security entitlement in any Fund property that is not otherwise segregated or pledged, to the maximum extent permitted by law, to the extent of any overdraft.
In addition, the Fund and other affiliated funds have entered into an agreement with Citibank N.A. that enables them to participate in a $300 million unsecured committed line of credit. A commitment fee, payable at the end of each calendar quarter, based on the average daily unused portion of the line of credit, is charged to each participating fund on a pro rata basis and is reflected in other expenses on the Statement of operations. From January 14, 2013 to March 27, 2013,
| |
| 22 | International Growth Equity Fund | Semiannual report |
the Fund participated in a $200 million unsecured line of credit, also with Citibank, with terms otherwise similar to the existing agreement. Commitment fees for the period January 14, 2013 to March 31, 2013 were $96. For the period ended March 31, 2013 the Fund had no borrowings under either line of credit.
Expenses. Within the John Hancock Funds complex, expenses that are directly attributable to an individual fund are allocated to such fund. Expenses that are not readily attributable to a specific fund are allocated among all funds in an equitable manner, taking into consideration, among other things, the nature and type of expense and the fund’s relative net assets. Expense estimates are accrued in the period to which they relate and adjustments are made when actual amounts are known.
Class allocations. Income, common expenses and realized and unrealized gains (losses) are determined at the fund level and allocated daily to each class of shares based on the net assets of the class. Class-specific expenses, such as distribution and service fees, if any, transfer agent fees, printing and postage and state registration fees are calculated daily for each class, based on the net asset value of the class and the applicable specific expense rates.
Federal income taxes. The Fund intends to continue to qualify as a regulated investment company by complying with the applicable provisions of the Internal Revenue Code and will not be subject to federal income tax on taxable income that is distributed to shareholders. Therefore, no federal income tax provision is required.
Under the Regulated Investment Company Modernization Act of 2010, the Fund is permitted to carry forward capital losses incurred in taxable years beginning after December 22, 2010 for an unlimited period. Any losses incurred during those taxable years will be required to be utilized prior to the losses incurred in pre-enactment taxable years. As a result of this ordering rule, pre-enactment capital loss carryforwards may be more likely to expire unused. Additionally, post-enactment capital losses that are carried forward will retain their character as either short-term or long-term capital losses rather than being considered all short-term as under previous law.
For federal income tax purposes, as of September 30, 2012, the Fund has a capital loss carryforward of $580,850 available to offset future net realized capital gains. The following table details the capital loss carryforward available as of September 30, 2012:
| | | |
| CAPITAL LOSS CARRYFORWARDS EXPIRING AT SEPTEMBER 30, | NO EXPIRATION DATE |
| 2017 | 2018 | SHORT TERM | LONG TERM |
|
| $437,362 | $76,469 | $67,019 | — |
As of September 30, 2012, the Fund had no uncertain tax positions that would require financial statement recognition, derecognition or disclosure. The Fund’s federal tax returns are subject to examination by the Internal Revenue Service for a period of three years.
Distribution of income and gains. Distributions to shareholders from net investment income and net realized gains, if any, are recorded on the ex-date. The Fund generally declares and pays dividends and capital gain distributions, if any, annually.
Distributions paid by the Fund with respect to each class of shares are calculated in the same manner, at the same time and in the same amount, except for the effect of class level expenses that may be applied differently to each class.
Such distributions on a tax basis are determined in conformity with income tax regulations, which may differ from accounting principles generally accepted in the United States of America.
Capital accounts within the financial statements are adjusted for permanent book-tax differences. These adjustments have no impact on net assets or the results of operations. Temporary book-tax
| |
| Semiannual report | International Growth Equity Fund | 23 |
differences, if any, will reverse in a subsequent period. Book-tax differences are primarily attributable to foreign currency transactions, wash sales loss deferrals and investments in passive foreign investment companies.
Note 3 — Guarantees and indemnifications
Under the Trust’s organizational documents, its Officers and Trustees are indemnified against certain liabilities arising out of the performance of their duties to the Trust, including the Fund. Additionally, in the normal course of business, the Fund enters into contracts with service providers that contain general indemnification clauses. The Fund’s maximum exposure under these arrangements is unknown, as this would involve future claims that may be made against the Fund that have not yet occurred. The risk of material loss from such claims is considered remote.
Note 4 — Fees and transactions with affiliates
John Hancock Investment Management Services, LLC (the Advisor) serves as investment advisor for the Fund. John Hancock Funds, LLC (the Distributor), an affiliate of the Advisor, serves as principal underwriter of the Fund. The Advisor and the Distributor are indirect wholly owned subsidiaries of Manulife Financial Corporation.
Management fee. The Fund has an investment management agreement with the Advisor under which the Fund pays a daily management fee to the Advisor equivalent, on an annual basis, to the sum of: (a) 0.850% of the first $750,000,000 of the Fund’s average net assets; (b) 0.800% of the next $500,000,000; and (c) 0.750% of the Fund’s average net assets in excess over $1,250,000,000. The Advisor has a subadvisory agreement with Turner Investments, L.P. (Turner). The Fund is not responsible for payment of the subadvisory fees. Prior to January 14, 2013, the Fund paid a daily management fee to Turner, on an annual basis of 0.850% based on average net assets.
The Advisor has contractually agreed to waive a portion of its management fee for certain funds (the Participating Portfolios) of the Trust and John Hancock Variable Insurance Trust. The waiver equals, on an annualized basis, 0.01% of that portion of the aggregate net assets of all the Participating Portfolios that exceeds $75 billion but is less than $100 billion; and 0.015% of that portion of the aggregate net assets of all the Participating Portfolios that equals or exceeds $100 billion. The amount of the reimbursement is calculated daily and allocated among all the Participating Portfolios in proportion to the daily net assets of each fund. This arrangement may be amended or terminated at any time by the Advisor upon notice to the funds and with the approval of the Board of Trustees.
The Advisor has contractually agreed to waive all or a portion of its management fee and/or reimburse or pay operating expenses of the Fund to the extent necessary to maintain the Fund’s total operating expenses at 1.35% and 1.10%, for Class A and Class I, respectively, excluding certain expenses such as taxes, brokerage commissions, interest expense and acquired fund fees and expenses, short dividend expense, litigation and indemnification expenses, and other extraordinary expenses not incurred in the ordinary course of the Fund’s business. The current expense limitation agreement expires on January 31, 2015, unless renewed by mutual agreement of the Fund and the Advisor based upon a determination that this is appropriate under the circumstances at that time.
Additionally, the Advisor has voluntarily agreed to waive and/or reimburse a portion of its management fee or other expenses of the Fund if certain expenses of the Fund exceed 0.25% of average net assets. Expenses excluded from this waiver include taxes, brokerage commissions, interest expense, litigation and indemnification expenses and other extraordinary expenses not incurred in the ordinary course of the Fund’s business, advisory fees, Rule 12b-1 fees, transfer agent and service fees, blue sky fees, printing and postage expenses, acquired fund fees and short dividend expense. This voluntary expense reimbursement may be terminated at any time by the Advisor on notice to the Fund.
| |
| 24 | International Growth Equity Fund | Semiannual report |
Accordingly, these expense reductions amounted to $6,206 and $27,676 for Class A and Class I, respectively, for the period January 14, 2013 to March 31, 2013.
Prior to January 14, 2013, the Predecessor Fund’s advisor had contractually agreed to waive all or a portion of its fees, excluding acquired fund fees and expenses, and interest expenses relating to short sales, to reimburse expenses in order that total Fund operating expenses did not exceed 1.35% and 1.10% for Investor Class and Institutional Class, respectively.
Accordingly, these expense reductions amounted to $10,515 and $41,788 for Investor Class and Institutional Class, respectively, for the period October 1, 2012 to January 11, 2013.
The investment management fees, including the impact of the waivers and reimbursements described above, incurred for the six months ended March 31, 2013 were equivalent to a net annual effective rate of 0.30% of the Fund’s average daily net assets.
Expense recapture. The Advisor may recapture operating expenses reimbursed or fees waived under previous expense limitation or waiver arrangements for a period of three years following the beginning of the month in which such reimbursements or waivers originally occurred to the extent that the Fund is below its expense limitation during this period.
Accounting and legal services. Pursuant to a service agreement, the Fund reimburses the Advisor for all expenses associated with providing the administrative, financial, legal, accounting and recordkeeping services to the Fund, including the preparation of all tax returns, periodic reports to shareholders and regulatory reports, among other services. These expenses are allocated to each share class based on its relative net assets at the time the expense was incurred. These accounting and legal services fees incurred for the period January 14, 2013 to March 31, 2013, amounted to an annual rate of 0.01% of the Fund’s average daily net assets.
Prior to January 14, 2013, pursuant to an administration agreement, Turner provided administrative services to the Fund, as part of Turner Funds. For its services Turner received an annual fee of 0.15% of the aggregate average daily net assets of Turner Funds up to $2 billion and 0.12% of the aggregate average daily net assets over $2 billion. Turner Funds also had a sub-administration Agreement with Citi Funds Services Ohio, Inc., which provided certain fund accounting services to Turner Funds. These administrative and sub-administrative services fees amounted to an annual rate of 0.12% and 0.03% of the Fund’s average daily net assets, respectively, for the period October 1, 2012 through January 11, 2013.
For the six-month period ended March 31, 2013, the combined accounting and legal services and administrative and sub-administrative fees amounted to an annual rate of 0.068%.
Distribution and service plans. The Fund has a distribution agreement with the Distributor. The Fund has adopted distribution and service plans with respect to Class A shares pursuant to Rule 12b-1 under the 1940 Act, to pay the Distributor for services provided as the distributor of shares of the Fund. The Fund may pay up to the following contractual rate of distribution and service fees under these arrangements, expressed as an annual percentage of average daily net assets for each Class A shares.
| | | | | |
| CLASS | RULE 12b–1 FEE | | | | |
| | | | |
| Class A | 0.30% | | | | |
For the period from October 1, 2012 to January 11, 2013, the Predecessor Fund paid DST Systems, Inc. 0.25% of average daily net assets of Investor Class shares for shareholder services fees, which amounted to $4,267.
| |
| Semiannual report | International Growth Equity Fund | 25 |
Sales charges. Class A shares are assessed up-front sales charges, which resulted in payments to the Distributor amounting to $895 for the period from January 14, 2013 to March 31, 2013. Of this amount, $139 was retained and used for printing prospectuses, advertising, sales literature and other purposes and $756 was paid as sales commissions to broker-dealers.
Class A shares may be subject to contingent deferred sales charges (CDSCs). Certain Class A shares that are acquired through purchases of $1 million or more and are redeemed within one year of purchase are subject to a 1.00% sales charge. CDSCs are applied to the lesser of the current market value at the time of redemption or the original purchase cost of the shares being redeemed. Proceeds from CDSCs are used to compensate the Distributor for providing distribution-related services. During the period January 14, 2013 to March 31, 2013, the Fund did not pay CDSCs for Class A shares.
Transfer agent fees. The Fund has a transfer agent agreement with John Hancock Signature Services, Inc. (Signature Services), an affiliate of the Advisor. The transfer agent fees paid to Signature Services are determined based on the cost to Signature Services (Signature Services Cost) of providing recordkeeping services. The Signature Services Cost includes a component of allocated John Hancock corporate overhead for providing transfer agent services to the Fund and to all other John Hancock affiliated funds. It also includes out-of-pocket expenses that are comprised of payments made to third-parties for recordkeeping services provided to their clients who invest in one or more John Hancock funds. In addition, Signature Services Cost may be reduced by certain fees that Signature Services receives in connection with retirement and small accounts. Signature Services Cost is calculated monthly and allocated, as applicable, to four categories of share classes: Institutional Share Classes, Retirement Share Classes, Municipal Bond Classes and all other Retail Share Classes. Within each of these categories, the applicable costs are allocated to the affected John Hancock affiliated funds and/or classes, based on the relative average daily net assets.
Prior to January 14, 2013, DST Systems, Inc. served as transfer agent of the Predecessor Fund.
Class level expenses. Class level expenses for the six months ended March 31, 2013 were:
| | | | |
| | DISTRIBUTION AND | TRANSFER | PRINTING AND | STATE |
| CLASS | SERVICE FEES | AGENT FEES | POSTAGE | REGISTRATION FEES |
|
| A | $7,524 | $3,326 | $1,176 | $2,482 |
| I | — | 11,965 | 5,654 | 10,888 |
| Total | $7,524 | $15,291 | $6,830 | $13,370 |
Trustee expenses. The Trust compensates each Trustee who is not an employee of the Advisor or its affiliates. The costs of paying Trustee compensation and expenses are allocated to each Fund based on its average daily net assets.
Note 5 — Fund share transactions
Transactions in Fund shares for the six months ended March 31, 2013 and for the year ended September 30, 2012 were as follows:
| | | | |
| | Six months ended 3-31-13 | | Year ended 9-30-12 |
| | Shares | Amount | Shares | Amount |
| Class A shares | | | | |
|
| Sold | 68,557 | $757,295 | 648,843 | $6,899,468 |
| Distributions reinvested | 3,427 | 38,005 | — | — |
| Repurchased | (255,797) | (2,886,119) | (612,673) | (6,345,955) |
| | | | | |
| Net increase (decrease) | (183,813) | ($2,090,819) | 36,170 | $553,513 |
| |
| 26 | International Growth Equity Fund | Semiannual report |
| | | | |
| | Six months ended 3-31-13 | | Year ended 9-30-12 |
| | Shares | Amount | Shares | Amount |
| Class I shares | | | | |
|
| Sold | 227,145 | $2,482,762 | 1,509,128 | $15,611,150 |
| Distributions reinvested | 20,275 | 225,863 | — | — |
| Repurchased | (19,158) | (222,242) | (7,869) | (81,043) |
| | | | | |
| Net increase | 228,262 | $2,486,383 | 1,501,259 | $15,530,107 |
| |
| Net increase | 44,449 | $395,564 | 1,537,429 | $16,083,620 |
|
Note 6 — Purchase and sale of securities
Purchases and sales of securities, other than short-term securities, aggregated $27,514,769 and $27,621,719, respectively, for the six months ended March 31, 2013.
Note 7 — Reorganization
At the close of business on January 11, 2013, the Fund acquired all the assets and liabilities of the Predecessor Fund in exchange for the Class A and Class I shares of the Fund. The Fund had no assets, liabilities or operations prior to the reorganization.
The Agreement provided for (a) the acquisition of all the assets, subject to all of the liabilities, of the Predecessor Fund in exchange for a representative amount of shares of the Fund; (b) the liquidation of the Predecessor Fund; and (c) the distribution to the Predecessor Fund’s shareholders of the Fund’s shares. The reorganization was intended to allow the Fund to be better positioned to increase asset size and achieve additional economies of scale by increasing sales and spreading fixed expenses over a larger asset base. As a result of the reorganization, the Fund is the legal survivor, and the accounting and performance successor to the Predecessor Fund. Investor Class and Institutional Class shares of the Predecessor Fund have been redesignated as that of Class A and Class I shares, respectively, of the Fund.
Based on the opinion of tax counsel, the reorganization qualified as a tax-free reorganization for federal income tax purposes with no gain or loss recognized by the Predecessor Fund or its shareholders. Thus, the investments were transferred to the Fund at the Predecessor Fund’s identified cost. All distributable amounts of net income and realized gains from the Predecessor Fund were distributed prior to the reorganization. In addition, the expenses of the reorganization were borne by the Advisors of both the Predecessor Fund and the Fund. The effective time of the reorganization occurred immediately after the close of regularly scheduled trading on the NYSE on January 11, 2013. The following outlines the reorganization:
| | | | |
| | ACQUIRED NET ASSET | APPRECIATION OF | | |
| | VALUE OF THE | PREDECESSOR FUND'S | SHARES ISSUED | TOTAL NET ASSETS |
| PREDECESSOR FUND | PREDECESSOR FUND | INVESTMENTS | BY THE FUND | AFTER COMBINATION |
|
| Turner International | $33,298,902 | $4,223,198 | 2,903,133.108 | $33,298,902 |
| Growth Fund | | | | |
| |
| Semiannual report | International Growth Equity Fund | 27 |
Evaluation of Advisory and Subadvisory Agreements by the Board of Trustees
At an in-person meeting held on September 18–20, 2012, the Board of Trustees (the Board) of John Hancock Funds II (the Trust), including all of the Trustees who are not considered to be “interested persons” of the Trust under the Investment Company Act of 1940, as amended (the 1940 Act) (the Independent Trustees), approved the following new series of the Trust:
International Growth Equity Fund (the New Portfolio)
This section describes the evaluation by the Board of Trustees of:
(a) an amendment to the advisory agreement between the Trust and John Hancock Investment Management Services, LLC (the Advisor or JHIMS) (the Advisory Agreement) to add the New Portfolio; and
(b) the subadvisory agreement between the Advisor and Turner Investments, L.P. (the Subadvisor) with respect to the New Portfolio (the Subadvisory Agreement).
Evaluation by the Board of Trustees
The Board, including the Independent Trustees, is responsible for selecting the Advisor, approving the Advisor’s selection of subadvisors for each of the portfolios of the Trust (the Funds) and approving the Trust’s advisory and subadvisory (and any sub-subadvisory) agreements, their periodic continuation and any amendments. Consistent with Securities and Exchange Commission rules, the Board regularly evaluates the Trust’s advisory and subadvisory arrangements, including consideration of the factors listed below. The Board may also consider other factors (including conditions and trends prevailing generally in the economy, the securities markets and the industry) and does not treat any single factor as determinative, and each Trustee may attribute different weights to different factors. The Board is furnished with an analysis of its fiduciary obligations in connection with its evaluation and, throughout the evaluation process, the Board is assisted by counsel for the Trust and the Independent Trustees are also separately assisted by independent legal counsel. The factors considered by the Board are:
1. the nature, extent and quality of the services to be provided by the Advisor to the Trust and by the subadvisors to the Funds;
2. the investment performance of the Funds and their subadvisors;
3. the extent to which economies of scale would be realized as a Fund grows and whether fee levels reflect these economies of scale for the benefit of Fund shareholders;
4. the costs of the services to be provided and the profits to be realized by the Advisor and its affiliates (including any subadvisors that are affiliated with the Advisor) from the Advisor’s relationship with the Trust; and
5. comparative services rendered and comparative advisory and subadvisory fee rates.
The Board believes that information relating to all of these factors is relevant to its evaluation of the Trust’s advisory agreement. The Board also takes into account any indirect benefits expected to be derived by the Advisor and its affiliates and the subadvisors and their affiliates from their relationships with the Funds. With respect to its evaluation of subadvisory agreements (including any sub-subadvisory agreements) with subadvisors not affiliated with the Advisor, the Board believes that, in view of the Trust’s manager-of-managers advisory structure, the costs of the services to be provided and the profits to be realized by those subadvisors that are not affiliated with the Advisor
| |
| 28 | International Growth Equity Fund | Semiannual report |
from their relationship with the Trust generally are not a material factor in the Board’s consideration of these subadvisory agreements because such fees are paid by the Advisor and not by the Funds and the Board relies on the ability of the Advisor to negotiate the subadvisory fees at arm’s-length.
In evaluating subadvisory arrangements, the Board also considers other material business relationships that unaffiliated subadvisors and their affiliates have with the Advisor or its affiliates, including the involvement by certain affiliates of certain subadvisors in the distribution of financial products, including shares of the Trust, offered by the Advisor and other affiliates of the Advisor (Material Relationships).
Approval of Advisory and Subadvisory Agreements
At an in-person meeting on September 18–20, 2012, the Board, including all the Independent Trustees, approved the Advisory Agreement and the Subadvisory Agreement with respect to the New Portfolio.
In considering the Advisory Agreement and the Subadvisory Agreement, the Board received in advance of the meeting a variety of materials relating to the New Portfolio, the Advisor and the Subadvisor, including comparative performance, fee and expense information for a peer group of similar mutual funds, including performance information for relevant benchmark indices and other information provided by the Advisor and the Subadvisor regarding the nature, extent and quality of services to be provided by the Advisor and the Subadvisor under their respective Agreements. The Board also took into account discussions with management and information provided to the Board in its meetings throughout the year with respect to the services provided by the Advisor with respect to other funds in the Trust and in John Hancock Variable Insurance Trust (JHVIT), including quarterly performance reports prepared by management containing reviews of investment results. The Board also took into account information with respect to the New Portfolio presented at their June and September 2012 meetings, including a presentation from the Subadvisor with respect to the New Portfolio at the September 2012 meeting.
Throughout the process, the Trustees were afforded the opportunity to ask questions of and request additional information from management. The Independent Trustees also received a memorandum from their independent counsel discussing the legal standards for their consideration of the proposed Agreements with respect to the New Portfolio and discussed the proposed Agreements in private sessions with their independent legal counsel at which no representatives of management were present.
Approval of Advisory Agreement
In considering the nature, extent and quality of the services to be provided by the Advisor, the Board took into account their knowledge of JHIMS’s management and the quality of the performance of its duties through Board meetings, discussions and reports during the preceding year and through each Trustee’s experience as a Trustee of the Trust and of other trusts in the fund complex. The Board considered that JHIMS is responsible for the management of the day-to-day operations of the Funds, including but not limited to, general supervision of and coordination of the services provided by the subadvisors, and is also responsible for monitoring and reviewing the activities of the subadvisors and other third-party service providers. The Board also noted that on a regular basis it receives and reviews information from the Trust’s Chief Compliance Officer (CCO) regarding the Funds’ compliance policies and procedures established pursuant to Rule 38a-1 under the 1940 Act. The Board also considers the Advisor’s risk management processes.
In approving the Advisory Agreement, and with reference to the factors that it regularly considers when considering approval of advisory and subadvisory agreements as listed above, the Board:
| |
| Semiannual report | International Growth Equity Fund | 29 |
(1) — (a) considered the high value to the Trust of continuing its relationship with JHIMS as the Trust’s advisor, the skills and competency with which JHIMS has in the past managed the Trust’s affairs and its subadvisory relationships, JHIMS’ oversight and monitoring of sub-advisors’ investment performance and compliance programs including its timeliness in responding to performance issues and the qualifications of JHIMS’ personnel;
(b) considered JHIMS’ compliance policies and procedures and noted its responsiveness to regulatory changes and mutual fund industry developments;
(c) considered JHIMS’ administrative capabilities, including its ability to supervise the other service providers for the New Portfolio;
(d) considered the financial condition of the Advisor and whether it had the financial wherewithal to provide a high level and quality of services to the New Portfolio; and
(e) recognized the Advisor’s reputation and experience in serving as an investment advisor to the Trust, and considered the benefit to shareholders of investing in funds that are part of a family of funds offering a variety of investments.
The Board concluded that JHIMS may reasonably be expected to provide a high quality of services under the Advisory Agreement with respect to the New Portfolio.
(2) — Considered the performance of other comparable funds or accounts, if any, managed by the Advisor and the Subadvisor and the performance of their respective benchmarks and/or peer groups.
(3) — (a) with respect to each Fund (except those listed below) and the New Portfolio, considered that the Advisor has agreed to waive its management fee for each of these Funds and the New Portfolio and each of the funds of JHVIT (the Participating Portfolios) or otherwise reimburse the expenses of the Participating Portfolios as follows (the Reimbursement) and that, at the request of the Board, the Reimbursement rate was increased effective May 31, 2011. The current Reimbursement rate is as follows: The Reimbursement shall equal, on an annualized basis, 0.01% of that portion of the aggregate net assets of all the Participating Portfolios that exceeds $75 billion but is less than $100 billion and 0.015% of that portion of the aggregate net assets of all the Participating Portfolios that equals or exceeds $100 billion. The amount of the Reimbursement shall be calculated daily and allocated among all the Participating Portfolios in proportion to the daily net assets of each Participating Portfolio, and that Reimbursement may be terminated or modified by the Advisor only upon notice to the Trust and approval of the Board of Trustees of the Trust. (The Funds that are not Participating Portfolios as of the date of this report are each of the funds of funds, money market funds and index funds of the Trust and JHVIT.)
(b) reviewed the Trust’s and New Portfolio’s advisory fee structure and the incorporation therein of any subadvisory fee breakpoints in the advisory fees charged and concluded that (i) the New Portfolio contains breakpoints at the subadvisory fee level and that such breakpoints are reflected as breakpoints in the advisory fees for the New Portfolio and (ii) although economies of scale cannot be measured with precision, these arrangements permit shareholders of the New Portfolio to benefit from economies of scale if the assets of the New Portfolio grow; and
(c) The Board also considered the effect of the New Portfolio’s growth in size on its performance and fees. The Board also noted that if the New Portfolio’s assets increase over time, the New Portfolio may realize other economies of scale if assets increase proportionally more than certain other fixed expenses.
| |
| 30 | International Growth Equity Fund | Semiannual report |
(4) — (a) reviewed and considered information presented by JHIMS regarding the anticipated profitability of JHIMS’ relationship with the New Portfolio and whether JHIMS has the financial ability to provide a high level of services to the New Portfolio;
(b) considered that JHIMS also will provide administrative services to the New Portfolio on a cost basis pursuant to an administrative services agreement;
(c) John Hancock Signature Services, LLC and John Hancock Funds, LLC, affiliates of the Advisor, will provide transfer agency services and distribution services to the New Portfolio, respectively;
(d) that JHIMS also will derive reputational and other indirect benefits from providing advisory services to the New Portfolio;
(e) noted that the subadvisory fees for the New Portfolio are paid by JHIMS and are negotiated at arm’s length;
(f) took into account the Reimbursement in place, as well as that the Advisor had entered into an expense limitation agreement with respect to certain of the New Portfolio’s expenses; and
(g) considered that the Advisor should be entitled to earn a reasonable level of profits in exchange for the level of services it provides to the New Portfolio and the entrepreneurial risk that it assumes as Advisor.
Based upon its review, the Board concluded that the Advisor and its affiliates’ anticipated level of profitability, if any, from their relationship with the New Portfolio was reasonable and not excessive.
(5) — reviewed comparative information including, among other data, the New Portfolio’s contractual and actual advisory and subadvisory fees and anticipated total expenses as compared to similarly situated investment companies deemed to be comparable to the New Portfolio. In comparing the New Portfolio’s actual and contractual management fee to that of comparable funds, the Board noted that such fee includes both advisory and administrative costs.
The Board determined that the New Portfolio’s advisory fees are generally within a competitive range of those incurred by other comparable funds. In this regard, the Board took into account management’s discussion with respect to the advisory/subadvisory fee structure, including the amount of the advisory fee retained by the Advisor after payment of the subadvisory fee. The Board also noted that JHIMS will be waiving fees and/or reimbursing expenses with respect to the New Portfolio. The Board also noted that the Advisor pays the subadvisory fees of the New Portfolio, and that such fees are negotiated at arm’s length with respect to the Subadvisor. The Board also noted management’s discussion of the New Portfolio’s anticipated expenses. The Board also took into account the level and quality of services expected to be provided by JHIMS with respect to the New Portfolio, as well as the other factors considered. The Board concluded that the advisory fees to be paid by the Trust with respect to the New Portfolio were reasonable.
Additional information relating to the New Portfolio’s fees and expenses and performance that the Board considered in approving the Advisory Agreement is set forth in Appendix A.
| |
| Semiannual report | International Growth Equity Fund | 31 |
Approval of Subadvisory Agreement
In making its determination with respect to the factors that it considers in considering approval of the Subadvisory Agreement, the Board reviewed:
(1) information relating to the Subadvisor’s business;
(2) the investment performance of the Turner International Growth Fund, the predecessor to the Fund that will be reorganized into the Fund, managed by the Subadvisor; and
(3) the proposed subadvisory fees for the New Portfolio, including any breakpoints, and comparative fee information as set forth in Appendix A.
With respect to the services to be provided by the Subadvisor, the Board received information provided to the Board by the Subadvisor, as well as considered information presented at prior meetings. The Board considered the Subadvisor’s current level of staffing and its overall resources, as well as its compensation program. The Board reviewed the Subadvisor’s history and investment experience, as well as information regarding the qualifications, background and responsibilities of the Subadvisor’s investment and compliance personnel who would provide services to the New Portfolio. The Board also considered, among other things, the Subadvisor’s compliance program and any disciplinary history. The Board also considered the Subadvisor’s risk assessment and monitoring process. The Board noted the Subadvisor’s regulatory history, including whether it was currently involved in any regulatory actions or investigations as well as material litigation, and any settlements and amelioratory actions undertaken, as appropriate. The Board also noted that the CCO and his staff conducted compliance reviews with the Subadvisor, which included evaluating the regulatory compliance systems of the Subadvisor and procedures reasonably designed by it to assure compliance with the federal securities laws. The Board also took into account the financial condition of the Subadvisor.
The Board considered the Subadvisor’s investment process and philosophy. The Board took into account that the Subadvisor’s responsibilities include the development and maintenance of an investment program for the New Portfolio which is consistent with the New Portfolio’s investment objectives, the selection of investment securities and the placement of orders for the purchase and sale of such securities, as well as the implementation of compliance controls related to performance of these services.
The Board also received information with respect to any Material Relationships with respect to the Subadvisor, which include arrangements in which unaffiliated subadvisors or their affiliates provide advisory, distribution or management services in connection with financial products sponsored by the Trust’s advisor or its affiliates, and may include other registered investment companies, a 529 education savings plan, managed separate accounts and exempt group annuity contracts sold to qualified plans. The Board also received information and took into account any other potential conflicts of interests the Advisor might have in connection with the Subadvisory Agreement.
The Board’s decision to approve the Subadvisory Agreement was based on a number of determinations, including the following:
(1) The Subadvisor’s investment personnel have extensive experience and demonstrated skills as a manager and may reasonably be expected to provide a high quality of investment management services and personnel to the New Portfolio;
(2) The proposed subadvisory fees are (i) competitive and within the range of industry norms and (ii) will be paid by JHIMS out of the advisory fees it receives from the New Portfolio and are a product of arm’s length negotiation between the Advisor and the Subadvisor; and the Board concluded that the New Portfolio’s subadvisory fees are reasonable; and
| |
| 32 | International Growth Equity Fund | Semiannual report |
(3) The New Portfolio’s subadvisory fee breakpoints are reflected as breakpoints in the advisory fees for the New Portfolio in order to permit shareholders to benefit from economies of scale if the assets of the New Portfolio grow.
Additional information relating to the New Portfolio that the Board considered for the New Portfolio is set forth in Appendix A.
Based on their evaluation of all factors that they deemed to be material, including those factors described above, and assisted by the advice of independent counsel, the Board, including the Independent Trustees, concluded that approval of the Advisory Agreement and the Subadvisory Agreement with respect to the New Portfolio would be in the best interest of the New Portfolio and its shareholders. Accordingly, the Board, and the Independent Trustees voting separately, approved the Advisory Agreement and the Subadvisory Agreement.
| | |
| Appendix A |
|
| Portfolio | | Estimated Fees And Expenses |
| (Subadvisor) | Comparable Fund Performance | (Lipper Category) |
|
| |
| International | Benchmark Index — The comparable | Subadvisory fees for this Fund are |
| Growth Equity | Fund outperformed for the one year | lower than the peer group median. |
| Fund | period, and outperformed for the three | |
| | and five year periods. | |
| | | Advisory fees for this Fund are equal to |
| (Turner | Morningstar Category — The | the peer group median. |
| Investments, L.P.) | comparable Fund underperformed for | |
| | the one year period, and outperformed | Total expenses for this Fund are below |
| | for the three and five year periods. | the peer group median. |
|
| |
| Semiannual report | International Growth Equity Fund | 33 |
More information
| |
| Trustees | Investment advisor |
| James M. Oates, Chairperson | John Hancock Investment Management |
| Steven R. Pruchansky, Vice Chairperson | Services, LLC |
| Charles L. Bardelis* | |
| James R. Boyle† | Subadvisor |
| Craig Bromley† | Turner Investments, L.P. |
| Peter S. Burgess* | |
| William H. Cunningham | Principal distributor |
| Grace K. Fey | John Hancock Funds, LLC |
| Theron S. Hoffman* | |
| Deborah C. Jackson | Custodian |
| Hassell H. McClellan | State Street Bank and Trust Company |
| Gregory A. Russo | |
| Warren A. Thomson† | Transfer agent |
| | John Hancock Signature Services, Inc. |
| Officers | |
| Hugh McHaffie | Legal counsel |
| President | K&L Gates LLP |
| | |
| Andrew G. Arnott | |
| Executive Vice President | |
| | |
| Thomas M. Kinzler | |
| Secretary and Chief Legal Officer | |
| | |
| Francis V. Knox, Jr. | |
| Chief Compliance Officer | |
| | |
| Charles A. Rizzo | |
| Chief Financial Officer | |
| | |
| Salvatore Schiavone | |
| Treasurer | |
| |
| *Member of the Audit Committee | |
| †Non-Independent Trustee | |
The Fund’s proxy voting policies and procedures, as well as the Fund’s proxy voting record for the most recent twelve-month period ended June 30, are available free of charge on the Securities and Exchange Commission (SEC) Web site at www.sec.gov or on our Web site.
The Fund’s complete list of portfolio holdings, for the first and third fiscal quarters, is filed with the SEC on Form N-Q. The Fund’s Form N-Q is available on our Web site and the SEC’s Web site, www.sec.gov, and can be reviewed and copied (for a fee) at the SEC’s Public Reference Room in Washington, DC. Call 1-800-SEC-0330 to receive information on the operation of the SEC’s Public Reference Room.
We make this information on your fund, as well as monthly portfolio holdings, and other fund details available on our Web site at www.jhfunds.com or by calling 1-800-225-5291.
| | |
| You can also contact us: | | |
| 1-800-225-5291 | Regular mail: | Express mail: |
| jhfunds.com | John Hancock Signature Services, Inc. | John Hancock Signature Services, Inc. |
| | P.O. Box 55913 | Mutual Fund Image Operations |
| | Boston, MA 02205-5913 | 30 Dan Road |
| | | Canton, MA 02021 |
| |
| 34 | International Growth Equity Fund | Semiannual report |

1-800-225-5291
1-800-554-6713 TDD
1-800-338-8080 EASI-Line
www.jhfunds.com

| |
| This report is for the information of the shareholders of John Hancock International Growth Equity Fund. | |
| It is not authorized for distribution to prospective investors unless preceded or accompanied by a prospectus. | 420SA 3/13 |
| MF138246 | 5/13 |
ITEM 2. CODE OF ETHICS.
(a)Not Applicable
(b)Not Applicable
(c)Not Applicable
(d)Not Applicable
(e)Not Applicable
(f)Not Applicable
ITEM 3. AUDIT COMMITTEE FINANCIAL EXPERT.
Not Applicable
ITEM 4. PRINCIPAL ACCOUNTANT FEES AND SERVICES.
(a) Not Applicable
(b) Not Applicable
(c) Not Applicable
(d) Not Applicable
(e) Not Applicable
(f) Not Applicable.
(g) Not Applicable
(h) Not Applicable
ITEM 5. AUDIT COMMITTEE OF LISTED REGISTRANTS
Not Applicable.
ITEM 6. SCHEDULE OF INVESTMENTS.
(a) Included with Item 1.
(b) Not Applicable.
ITEM 7. DISCLOSURE OF PROXY VOTING POLICIES AND PROCEDURES FOR CLOSED-END MANAGEMENT INVESTMENT COMPANIES.
Not Applicable.
ITEM 8. PORTFOLIO MANAGERS OF CLOSED-END MANAGEMENT INVESTMENT COMPANIES.
Not Applicable.
ITEM 9. PURCHASE OF EQUITY SECURITIES BY CLOSED-END MANAGEMENT INVESTMENT COMPANIES AND AFFILIATED PURCHASERS.
Not Applicable.
ITEM 10. SUBMISSION OF MATTERS TO VOTE OF SECURITY HOLDERS.
Not Applicable.
ITEM 11. CONTROLS AND PROCEDURES.
(a) EVALUATION OF DISCLOSURE CONTROLS AND PROCEDURES. The Registrant maintains disclosure controls and procedures that are designed to ensure that information required
to be disclosed in this Form N-CSR is recorded, processed, summarized and reported within the periods specified in the rules and forms of the Securities and Exchange Commission. Such disclosure controls and procedures include controls and procedures designed to ensure that such information is accumulated and communicated to the Registrant's management, including its principal executive officer and principal financial officer, as appropriate, to allow timely decisions regarding required disclosure.
Within 90 days prior to the filing date of this Form N-CSR, the Registrant had carried out an evaluation, under the supervision and with the participation of the Registrant's management, including the Registrant's principal executive officer and the Registrant's principal financial officer, of the effectiveness of the design and operation of the Registrant's disclosure controls and procedures relating to information required to be disclosed on Form N-CSR. Based on such evaluation, the Registrant's principal executive officer and principal financial officer concluded that the Registrant's disclosure controls and procedures are operating effectively to ensure that:
(i) information required to be disclosed in this Form N-CSR is recorded, processed, summarized and reported within the periods specified in the rules and forms of the Securities and Exchange Commission, and
(ii) information is accumulated and communicated to the Registrant’s management, including its principal executive officer and principal financial officer, as appropriate, to allow timely decisions regarding required disclosure.
(b) CHANGE IN REGISTRANT’S INTERNAL CONTROL: Not Applicable.
ITEM 12. EXHIBITS.
(a)(1) Not applicable
(a)(2)(i) CERTIFICATION OF PRINCIPAL EXECUTIVE OFFICER.
(a)(2)(ii) CERTIFICATION OF PRINCIPAL FINANCIAL OFFICER.
(b) CERTIFICATION PURSUANT TO Rule 30a-2(b) OF THE INVESTMENT COMPANY ACT OF 1940
SIGNATURES
Pursuant to the requirements of the Securities Exchange Act of 1934 and the Investment Company Act of 1940, the registrant has duly caused this report to be signed on its behalf by the undersigned, thereunto duly authorized.
JOHN HANCOCK FUNDS II
/s/ Hugh McHaffie
Hugh McHaffie
President
Date: May 22, 2013
Pursuant to the requirements of the Securities Exchange Act of 1934 and the Investment Company Act of 1940, this report has been signed below by the following persons on behalf of the registrant and in the capacities and on the dates indicated.
/s/ Hugh McHaffie
Hugh McHaffie
President
Date: May 22, 2013
/s/ Charles A. Rizzo
Charles A. Rizzo
Chief Financial Officer
Date: May 22, 2013