|
| UNITED STATES |
| SECURITIES AND EXCHANGE COMMISSION |
| Washington, D.C. 20549 |
| |
| FORM N-CSR |
| |
| CERTIFIED SHAREHOLDER REPORT OF REGISTERED MANAGEMENT INVESTMENT COMPANIES |
| Investment Company Act file number 811-21779 |
| |
| JOHN HANCOCK FUNDS II |
| --------------------------------------------------------- |
| (Exact name of registrant as specified in charter) |
| |
| 601 CONGRESS STREET, BOSTON, MA 02210-2805 |
| ------------------------------------------------------------- |
| (Address of principal executive offices) (Zip code) |
| |
| SALVATORE SCHIAVONE, 601 CONGRESS STREET, BOSTON, MA 02210-2805 |
| ------------------------------------------------------------------------------------------ |
| (Name and address of agent for service) |
| |
| Registrant's telephone number, including area code: (617) 663-4497 |
| -------------- |
| Date of fiscal year end: 12/31 |
| |
| Date of reporting period: 6/30/13 |
ITEM 1. REPORTS TO STOCKHOLDERS.
The Registrant prepared one semiannual report to shareholders for the period ended June 30, 2013. The report applies to the 5 Lifestyle Portfolios.

Management’s discussion of
Fund performance
By the Portfolio Management Team at John Hancock Asset Management
John Hancock
Lifestyle Portfolios
Market review
The U.S. economy continued along a slow-growth trajectory during the first half of 2013, buoyed by a recovering housing market and slowly improving employment data. Domestic equities posted solid gains for the period. Yet, even as equity prices were rising, many investors were expecting a dramatic pullback during the year’s second quarter. Indeed, for the past few years, second-quarter corrections in the equity market seem to have become a relatively common event. And, as mid-June arrived this year—as if on cue—equity returns again gave up a portion of their earlier gains in the final two weeks.
Unlike last year’s second quarter, however, this year’s second-quarter pullback in equities was not driven by the risks that had previously challenged the markets. In fact, these headwinds — among them, the eurozone debt crisis, a fiscal policy stalemate in the U.S., and an economic hard landing in China — were not of particular concern from a fundamental perspective. Instead, the equity markets’ pullback in June was mainly driven by a statement from Federal Reserve Board (Fed) Chairman Ben Bernanke. He suggested the central bank might begin a gradual tapering of its purchases of bond assets toward the end of this year if economic growth continued to improve. This foreshadowing of an eventual end to the Fed’s quantitative easing (QE) program was at the heart of a lot of the volatility that occurred late in the quarter, with many of the markets’ asset classes — particularly equities, but also interest-rate-sensitive assets such as U.S. Treasuries — suffering losses.
| | |
| | | For the |
| Market index | six months ended |
| total returns | | June 30, 2013 |
|
| U.S. Stocks | | |
|
| S&P 500 Index | | 13.82% |
| Russell Midcap Index | | 15.45% |
| Russell 2000 Index | | 15.86% |
| FTSE NAREIT All Equity REIT Index | 5.80% |
| |
| International Stocks | | |
|
| MSCI EAFE Index | | 4.47% |
| MSCI Emerging Markets Index | –9.40% |
| MSCI EAFE Small Cap Index | 5.93% |
| |
| Fixed Income | | |
|
| Barclays U.S. Aggregate Bond Index | –2.45% |
| Bank of America Merrill Lynch US High |
| Yield Master II Index | | 1.46% |
| JPM Global Government Bonds | |
| Unhedged Index | | –5.80% |
For the first half of 2013 as a whole, however, the U.S. equity markets delivered solid results. Large-capitalization stocks, as represented by the S&P 500 Index, advanced 13.82%, with the more-economically sensitive mid-cap and small-cap stocks moving slightly higher. Meanwhile, returns from foreign equities were far less robust, trailing their U.S. counterparts as Europe continued its attempts to pull out of recession and emerging-market economies saw continued moderation in their growth trends. The MSCI EAFE Index rose only 4.47% through the first six months of the year, while the MSCI Emerging Markets Index ended in negative territory, posting a -9.40% return.
U.S. equities significantly outperformed U.S. bonds in the year-to-date period. The Barclays U.S. Aggregate Bond Index, a proxy for intermediate-term government debt, returned -2.45% as core bonds began to experience heightened selling pressure amid rising interest rates. By comparison, credit-oriented sectors of the bond market fared slightly better, led by bank loans and high-yield bonds.
| |
| 2 | Lifestyle Portfolios | Semiannual report |
Outlook
Despite the second-quarter slowdown in the equity markets, we believe there is surprising resilience in the global economy, with the still-unfolding recovery of the U.S. economy likely to play a lead role in restoring global growth momentum. The U.S. housing market is improving, job creation is gaining traction, and equity markets appear poised to rebound. Given this backdrop, we would anticipate further growth in the U.S. economy during the back half of 2013 and in 2014, as the housing market gains more solid footing, investment accelerates, and consumer spending solidifies. Consumers should be aided by relatively low energy costs, stronger household balance sheets, and still relatively low interest rates.
We believe the main risk to the U.S. expansion is now the tide of enthusiasm for deficit reduction — a long-run necessity but a short-term hurdle. The Fed continues to provide as much support as it can, but its impact is probably diminishing. Chairman Bernanke has highlighted the gradual progress of the recovery and the need for continuing QE for as long as unemployment remains above a presumed threshold and inflation pressure shows no obvious signs of emerging. But his remarks in mid-June, although guarded and without commitments, suggest that the Fed might begin tapering off QE later this year. How the capital markets react to a gradual withdrawal of stimulus will be closely watched.

Meanwhile, the eurozone has been in recession for six quarters, and the continent is still suffering through the trauma of bringing government spending back in line with revenues. For now, the European Central Bank has successfully calmed financial markets with its promise to do “whatever it takes,” but structural reforms are still needed if Europe is to prevent a recurrence of the same problems. Our forecast calls for still-weak but positive growth in the eurozone in 2014. Elsewhere, a new actively engaged government in Japan implies a brighter outlook, as Prime Minister Shinzo Abe is implementing aggressive growth initiatives aimed at ending the deflationary spiral that has plagued Japan’s economy for over 20 years.
In what remains of 2013 and on into 2014, we believe special care should be taken to build a portfolio that can reasonably withstand unexpected shocks that may occur in the economic or geopolitical landscape, consistent with the level of risk investors are comfortable taking on. We wish to stress the importance of maintaining a well-diversified, global portfolio that includes not only traditional equity and fixed-income securities, but also exposure to more nontraditional strategies, such as absolute return funds.
| |
| Semiannual report | Lifestyle Portfolios | 3 |
Lifestyle Aggressive Portfolio
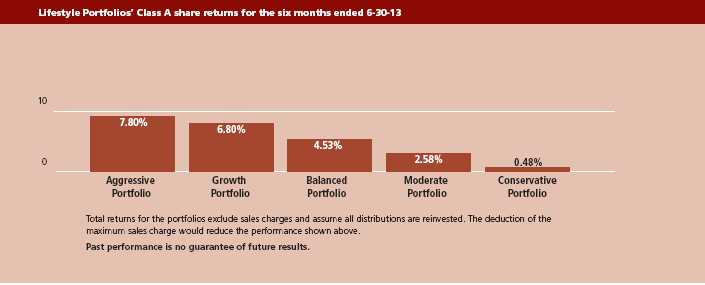
For the six-month period ended June 30, 2013, the portfolio’s Class A shares returned 7.80%, excluding sales charges. In comparison, the portfolio’s benchmark, the S&P 500 Index, returned 13.82% for the same period, and the Morningstar, Inc. large blend fund category returned an average 13.26%.†
The portfolio underperformed its benchmark index over the period. Its relative underperformance was primarily driven by our asset allocation positioning and, to a lesser degree, by the performance of our underlying fund managers. Overseas markets substantially underperformed the broad U.S. stock market, and the portfolio’s exposure to emerging-market and international large-cap stocks was the most significant drag on relative performance. An allocation to global natural resources also detracted, as these stocks underperformed the broader market due to soft commodity prices, slack demand and oversupply.
Although many of the funds in the portfolio posted solid returns over the six months, the performance of our underlying fund managers in aggregate also detracted from relative results. In the large-cap space, several underlying funds underperformed, including Capital Appreciation Fund (Jennison). Among international funds in the portfolio, China Emerging Leaders Fund (Atlantis) and International Value Fund (Templeton) detracted.
We continued to maintain our defensive equity theme, which incorporates a small group of underlying funds whose strategies, when combined, tend to exhibit less volatility than the broader equity market. This defensive theme helped generate competitive risk-adjusted results and mitigate volatility during the period. The portfolio also benefited from its allocation to healthcare. One of the top returns came from the portfolio’s absolute return allocation. In a period when alternative “safe haven” strategies posted very weak positive or even negative returns, the absolute return allocation gained over 5%, led by Currency Strategies Fund (First Quadrant).
The portfolio’s relative performance was also aided by its investments in Alpha Opportunities Fund (Wellington) and Technical Opportunities Fund (Wellington).
Lifestyle Growth Portfolio
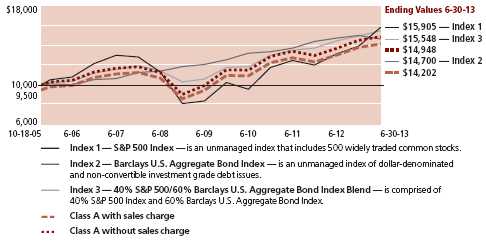
For the six-month period ended June 30, 2013, the portfolio’s Class A shares returned 6.80%, excluding sales charges. In comparison, the S&P 500 Index returned 13.82% over the same period, and the Barclays U.S. Aggregate Bond Index returned -2.45%. A blended benchmark comprising 80% S&P 500 Index and 20% Barclays U.S. Aggregate Bond Index returned 10.42%. The Morningstar, Inc. aggressive allocation fund category returned an average 7.20%.†
The portfolio underperformed its blended benchmark index over the period. Its relative underperformance was primarily driven by our asset allocation positioning and, to a lesser extent, by the performance of our underlying fund managers. As overseas markets substantially underperformed the broad U.S. stock market, the portfolio’s exposure to emerging-market and international large-cap stocks was the most significant drag on relative performance. Although many of the funds in the portfolio posted solid returns, the performance of our underlying fund managers in aggregate was slightly negative for the six months. In the large-cap space, several underlying funds underperformed, including Capital Appreciation Fund (Jennison). Among international funds in the portfolio, China Emerging Leaders Fund (Atlantis) and International Value Fund (Templeton) detracted.
We continued to maintain our defensive equity theme, which incorporates a small group of underlying funds whose strategies, when combined, tend to exhibit less volatility than the broader equity market. This defensive theme helped generate competitive risk-adjusted results. The portfolio also benefited from its allocation to healthcare.
One of the top returns came from the portfolio’s absolute return allocation. In a period when alternative “safe haven” strategies posted very weak positive or even negative returns, the absolute return allocation gained over 5%, led by Currency Strategies Fund (First Quadrant). In the fixed-income space, our allocation to high-yield bonds and bank loans made positive contributions to the portfolio’s performance versus its blended benchmark. Strategic Income Opportunities Fund (John Hancock) was a standout within our allocation to multi-sector bonds.
| |
| 4 | Lifestyle Portfolios | Semiannual report |
Lifestyle Balanced Portfolio
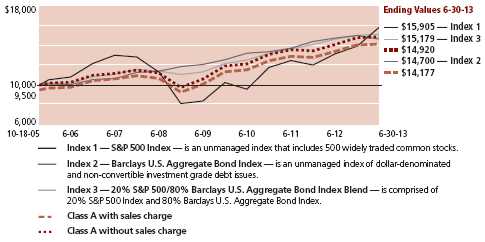
For the six-month period ended June 30, 2013, the portfolio’s Class A shares returned 4.53%, excluding sales charges. In comparison, the S&P 500 Index returned 13.82% over the same period, and the Barclays U.S. Aggregate Bond Index returned -2.45%. A blended benchmark comprising 60% S&P 500 Index and 40% Barclays U.S. Aggregate Bond Index returned 7.10%. The Morningstar, Inc. moderate allocation fund category returned an average 5.92%.†
The portfolio underperformed its blended benchmark over the six months. Its underperformance during the period was primarily driven by our asset class positioning and, to a lesser extent, by the performance of our underlying fund managers. As overseas markets substantially underperformed the broad U.S. stock market, the portfolio’s exposure to emerging-market and international large-cap stocks was the most significant drag on relative performance. Although many of the funds in the portfolio posted solid returns, the performance of our underlying fund managers in aggregate was slightly negative for the six months. In the large-cap space, several underlying funds underperformed, including Capital Appreciation Fund (Jennison). Among international funds in the portfolio, China Emerging Leaders Fund (Atlantis) and International Value Fund (Templeton) detracted.
We continued to maintain our defensive equity theme, which incorporates a small group of underlying funds whose strategies, when combined, tend to exhibit less volatility than the broader equity market. This defensive theme helped generate competitive risk-adjusted results and mitigate volatility during the period. The portfolio also benefited from its allocation to healthcare.
One of the top returns came from the portfolio’s absolute return allocation. In a period when alternative “safe haven” strategies posted very weak positive or even negative returns, the absolute return allocation gained over 5%, led by Currency Strategies Fund (First Quadrant). In the fixed-income space, our allocation to bank loans and high-yield bonds made positive contributions to the portfolio’s performance versus the blended benchmark. Strategic Income Opportunities Fund (John Hancock) was a standout within our allocation to multi-sector bonds.
Lifestyle Moderate Portfolio
For the six-month period ended June 30, 2013, the portfolio’s Class A shares returned 2.58%, excluding sales charges. In comparison, the S&P 500 Index returned 13.82% over the same period, and the Barclays U.S. Aggregate Bond Index returned -2.45%. A blended benchmark comprising 40% S&P 500 Index and 60% Barclays U.S. Aggregate Bond Index returned 3.84%. The Morningstar, Inc. conservative allocation fund category returned an average 1.50%.†
The portfolio underperformed its blended benchmark over the six months. Its underperformance during the period was primarily driven by our asset class positioning and, to a lesser extent, by the performance of our underlying fund managers. As overseas markets substantially underperformed the broad U.S. stock market, the portfolio’s exposure to emerging-market and international large-cap stocks was the most significant drag on relative performance. An allocation to global natural resources also detracted, as these stocks underperformed the broader market due to soft commodity prices, slack demand and oversupply. Although many of the funds in the portfolio posted solid returns, the performance of our underlying fund managers in aggregate was slightly negative for the six months. Detractors included international funds International Value Fund (Templeton) and International Growth Opportunities Fund (Baillie Gifford).
We continued to maintain our defensive equity theme, which incorporates a small group of underlying funds whose strategies, when combined, tend to exhibit less volatility than the broader equity market. This defensive theme helped generate competitive risk-adjusted results and mitigate volatility during the period.
One of the top returns came from the portfolio’s absolute return allocation. In a period when alternative “safe haven” strategies posted very weak positive or even negative returns, the absolute return allocation gained over 5%, led by Currency Strategies Fund (First Quadrant). In the fixed-income space, our allocation to bank loans and high-yield bonds made positive contributions to the portfolio’s performance versus the blended benchmark. Strategic Income Opportunities Fund (John Hancock) was a standout within our allocation to multi-sector bonds.
| |
| Semiannual report | Lifestyle Portfolios | 5 |
Lifestyle Conservative Portfolio
For the six-month period ended June 30, 2013, the portfolio’s Class A shares returned 0.48%, excluding sales charges. In comparison, the S&P 500 Index returned 13.82% over the same period, and the Barclays U.S. Aggregate Bond Index returned -2.45%. A blended benchmark comprising 20% S&P 500 Index and 80% Barclays U.S. Aggregate Bond Index returned 0.66%. The Morningstar, Inc. conservative allocation fund category returned an average 1.50%.†
The portfolio slightly underperformed its blended benchmark over the period. Its relative results were helped by our asset class positioning, while the performance of our underlying fund managers was a slight detractor. The portfolio’s allocation to international equities detracted, particularly in its investments in emerging-market and international large-cap stocks. Although many of the funds in the portfolio posted solid returns, the performance of our underlying fund managers in aggregate was slightly negative. Detractors included overseas holding International Value Fund (Templeton).
The portfolio’s allocations to banks loans and high-yield bonds were the biggest contributing factors to our performance, with our multi-sector bond allocation also providing a lift. Within the equity space, we continued to maintain a defensive theme, which incorporates a small group of underlying equity funds whose strategies, when combined, tend to exhibit less volatility than the broader equity market. This defensive theme helped generate competitive risk-adjusted results and mitigate volatility during the period.
The portfolio also enjoyed positive contributions from Currency Strategies Fund (First Quadrant) within its absolute return allocation, as well as from Strategic Income Opportunities Fund (John Hancock) within its allocation to multi-sector bonds.
This commentary reflects the views of the portfolio managers through the end of the period discussed in this report. As such, they are in no way a guarantee of future events and are not intended to be used as investment advice or a recommendation regarding any specific security. They are also subject to change at any time as market and other conditions warrant.
The portfolios’ performance depends on the subadvisors’ skill in determining the strategic asset class allocations, the mix of underlying funds and the performance of those underlying funds. The underlying funds’ performance may be lower than the performance of the asset class that they were selected to represent. The portfolios are subject to the same risks as the underlying funds in which they invest, which include the following: stocks and bonds can decline due to adverse issuer, market, regulatory, or economic developments; foreign investing, especially in emerging markets, has additional risks, such as currency and market volatility and political and social instability; and the securities of small-capitalization companies are subject to higher volatility than larger, more established companies; and high-yield bonds are subject to additional risks, such as increased risk of default. For additional information on these and other risk considerations, please see the portfolios’ prospectuses.
† Figures from Morningstar, Inc. include reinvested distributions and do not take into account sales charges. Actual load-adjusted performance is lower.
| |
| 6 | Lifestyle Portfolios | Semiannual report |
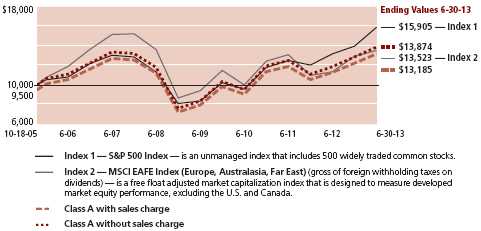
John Hancock Lifestyle Aggressive Portfolio
Growth of $10,000
This chart and table show what happened to a hypothetical $10,000 investment in John Hancock Lifestyle Aggressive Portfolio for the share classes and periods indicated, assuming all distributions were reinvested. For comparison, we’ve shown the same investment in two separate indexes.
| | |
| Asset Allocation* | |
| | |
| EQUITY | 96.9% OF TOTAL |
|
| U.S. Large Cap | | 44.5% |
|
| International Large Cap | | 13.0% |
|
| Emerging Markets | | 9.3% |
|
| Large Blend | | 7.1% |
|
| U.S. Mid Cap | | 6.9% |
|
| International Small Cap | | 4.8% |
|
| U.S. Small Cap | | 4.1% |
|
| Natural Resources | | 1.9% |
|
| Global Large Cap | | 1.8% |
|
| Health Sciences | | 1.8% |
|
| Real Estate | | 1.2% |
|
| Small Cap Growth | | 0.5% |
|
| ALTERNATIVE | 3.1% OF TOTAL |
|
| Currency | | 2.1% |
|
| Global Absolute Return Strategies | 1.0% |
|
| * As a percentage of net assets on 6-30-13. | |
| | |
Performance chart
Total returns with maximum sales charge for the period ended 6-30-13
| | | | | | | | | | | | |
| | Class A | Class B | Class C | Class R11 | Class R21,2 | Class R31 | Class R41 | Class R51 | Class R61,2 | Class 11 | Index 1 | Index 2 |
| | |
| Start date | 10-18-05 | 10-18-05 | 10-18-05 | 9-18-06 | 10-18-05 | 10-18-05 | 10-18-05 | 10-18-05 | 10-15-05 | 10-15-05 | 10-15-05 | 10-15-05 |
|
| Average annual total returns | | | | | | | | | | | |
|
| 1 year | 10.92% | 10.87% | 15.02% | 16.23% | 16.75% | 16.43% | 16.83% | 17.08% | 17.37% | 17.28% | 20.60% | 19.14% |
|
| 5 years | 2.22% | 2.14% | 2.55% | 2.88% | 2.38% | 2.99% | 3.31% | 3.62% | 2.42% | 3.78% | 7.01% | –0.16% |
|
| Since inception | 3.66% | 3.57% | 3.62% | 2.89% | 3.33% | 4.10% | 4.40% | 4.70% | 3.18% | 4.84% | 6.24% | 3.93% |
|
| Cumulative returns | | | | | | | | | | | | |
|
| 6 months | 2.42% | 2.40% | 6.47% | 7.55% | 7.76% | 7.66% | 7.82% | 7.89% | 8.07% | 7.99% | 13.82% | 4.47% |
|
| 5 years | 11.58% | 11.16% | 13.41% | 15.27% | 12.46% | 15.85% | 17.65% | 19.46% | 12.71% | 20.39% | 40.33% | –0.77% |
|
| Since inception | 31.85% | 31.05% | 31.50% | 21.31% | 28.71% | 36.31% | 39.28% | 42.41% | 27.30% | 43.95% | 59.52% | 34.58% |
|
It is not possible to invest directly in an index. Index figures do not reflect expenses or sales charges, which would have resulted in lower values if they did. Index since inception returns are from 10-15-05, the start date of the oldest share class (Class 1).
Performance figures assume all distributions have been reinvested. Returns with maximum sales charge reflect a sales charge on Class A shares of 5%, and the applicable contingent deferred sales charge (CDSC) on Class B and Class C shares. The Class B shares’ CDSC declines annually between years 1–6 according to the following schedule: 5, 4, 3, 3, 2, 1%. No sales charges will be assessed after the sixth year. Class C shares held for less than one year are subject to a 1% CDSC. Sales charges are not applicable to Class R1, Class R2, Class R3, Class R4, Class R5, Class R6, Class 1, and Class 5 shares.
Performance of the classes will vary based on the difference in sales charges paid by shareholders investing in the different classes and the fee structure of those classes.
The expense ratios of the portfolio, both net (including any fee waivers, expense limitations or recoupments) and gross (excluding any fee waivers, expense limitations or recoupments), are set forth according to the most recent publicly available prospectuses for the portfolio and may differ from those disclosed in the Financial highlights tables in this report. The fee waivers and expense limitations are contractual at least until 4-30-14 for Class R2 and R6 shares. Had the fee waivers, expense limitations and recoupments not been in place gross expenses would apply. For all other classes the net expenses equal the gross expenses. The expense ratios are as follows:
| | | | | | | | | | |
| | Class A | Class B | Class C | Class R1 | Class R2 | Class R3 | Class R4* | Class R5 | Class R6 | Class 1 |
| Net (%) | 1.50 | 2.28 | 2.20 | 1.93 | 1.54 | 1.80 | 1.42 | 1.19 | 1.04 | 1.04 |
| Gross (%) | 1.50 | 2.28 | 2.20 | 1.93 | 17.46 | 1.80 | 1.52 | 1.19 | 3.49 | 1.04 |
* The portfolio’s distributor has contractually agreed to waive 0.10% of Rule 12b-1 fees for Class R4 shares. The current waiver agreement will remain in effect through 4-30-14.
The returns reflect past results and should not be considered indicative of future performance. The return and principal value of an investment will fluctu-ate so that shares, when redeemed, may be worth more or less than their original cost. Due to market volatility, the portfolio’s current performance may be higher or lower than the performance shown. For performance data current to the most recent month end, please call 1-800-225-5291 or visit the portfolio’s Website at www.jhfunds.com.
This performance information does not reflect the deduction of taxes that a shareholder may pay on portfolio distributions or the redemption of portfolio shares. The portfolio’s performance results reflect any applicable fee waivers or expense reductions, without which the expenses would increase and results would have been less favorable.
1 For certain types of investors as described in the portfolio’s prospectuses.
2 Class R6 shares were first offered on 9-1-11. The returns prior to this date are those of Class 1 shares that have been recalculated to apply the gross fees and expenses of Class R6 shares. Class R2 shares were first offered on 3-1-12. The returns prior to this date are those of Class A shares that have been recalculated to apply the gross fees and expenses of Class R2 shares.
| |
| Semiannual report | Lifestyle Portfolios | 7 |
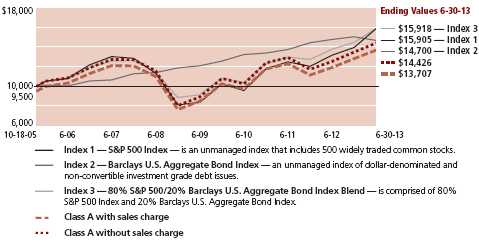
John Hancock Lifestyle Growth Portfolio
Growth of $10,000
This chart and table show what happened to a hypothetical $10,000 investment in John Hancock Lifestyle Growth Portfolio for the share classes and periods indicated, assuming all distributions were reinvested. For comparison, we’ve shown the same investment in a blended index and two separate indexes
| | |
| Asset Allocation* | |
| |
| EQUITY | 81.7% OF TOTAL |
|
| U.S. Large Cap | | 40.3% |
|
| International Large Cap | | 10.2% |
|
| Emerging Markets | | 7.0% |
|
| U.S. Mid Cap | | 5.7% |
|
| Large Blend | | 5.6% |
|
| International Small Cap | | 3.7% |
|
| U.S. Small Cap | | 2.8% |
|
| Global Large Cap | | 1.8% |
|
| Health Sciences | | 1.5% |
|
| Natural Resources | | 1.5% |
|
| Real Estate | | 1.3% |
|
| Small Cap Growth | | 0.3% |
|
| |
| FIXED INCOME | 15.2% OF TOTAL |
|
| Multi-Sector Bond | | 4.2% |
|
| High Yield Bond | | 3.7% |
|
| Intermediate Bond | | 2.9% |
|
| Bank Loan | | 2.8% |
|
| Global Bond | | 1.1% |
|
| Treasury Inflation-Protected Securities | 0.5% |
|
| |
| ALTERNATIVE | 3.1% OF TOTAL |
|
| Currency | | 2.1% |
|
| Global Absolute Return Strategies | 1.0% |
|
| * As a percentage of net assets on 6-30-13. | |
Performance chart
Total returns with maximum sales charge for the period ended 6-30-13
| | | | | | | | | | | | | | |
| | Class A | Class B | Class C | Class R11 | Class R21,2 | Class R31 | Class R41 | Class R51 | Class R61,2 | Class 11 | Class 51 | Index 1 | Index 2 | Index 3 |
| | |
| Start date | 10-18-05 | 10-18-05 | 10-18-05 | 9-18-06 | 10-18-05 | 10-18-05 | 10-18-05 | 10-18-05 | 10-15-05 | 10-15-05 | 7-3-06 | 10-15-05 | 10-15-05 | 10-15-05 |
|
| Average annual total returns | | | | | | | | | | | | | |
|
| 1 year | 9.22% | 9.10% | 13.12% | 14.56% | 14.91% | 14.65% | 15.06% | 15.34% | 15.51% | 15.42% | 15.49% | 20.60% | –0.69% | 16.08% |
|
| 5 years | 3.42% | 3.37% | 3.75% | 4.15% | 3.67% | 4.23% | 4.57% | 4.87% | 4.15% | 4.97% | 5.03% | 7.01% | 5.19% | 6.94% |
|
| Since inception | 4.18% | 4.10% | 4.14% | 3.71% | 3.98% | 4.63% | 4.95% | 5.24% | 4.35% | 5.34% | 4.67% | 6.24% | 5.13% | 6.25% |
|
| Cumulative returns | | | | | | | | | | | | | | |
|
| 6 months | 1.47% | 1.34% | 5.34% | 6.55% | 6.68% | 6.58% | 6.81% | 6.95% | 6.98% | 6.98% | 6.98% | 13.82% | –2.45% | 10.42% |
|
| 5 years | 18.31% | 18.00% | 20.23% | 22.53% | 19.77% | 23.02% | 25.06% | 26.82% | 22.57% | 27.42% | 27.78% | 40.33% | 28.78% | 39.85% |
|
| Since inception | 37.07% | 36.32% | 36.69% | 28.06% | 35.10% | 41.70% | 45.03% | 48.22% | 38.86% | 49.36% | 37.66% | 59.52% | 47.05% | 59.57% |
|
It is not possible to invest directly in an index. Index figures do not reflect expenses or sales charges, which would have resulted in lower values if they did. Index since inception returns are from 10-15-05, the start date of the oldest share class (Class 1).
Performance figures assume all distributions have been reinvested. Returns with maximum sales charge reflect a sales charge on Class A shares of 5%, and the applicable contingent deferred sales charge (CDSC) on Class B and Class C shares. The Class B shares’ CDSC declines annually between years 1–6 according to the following schedule: 5, 4, 3, 3, 2, 1%. No sales charges will be assessed after the sixth year. Class C shares held for less than one year are subject to a 1% CDSC. Sales charges are not applicable to Class R1, Class R2, Class R3, Class R4, Class R5, Class R6, Class 1, and Class 5 shares.
Performance of the classes will vary based on the difference in sales charges paid by shareholders investing in the different classes and the fee structure of those classes.
The expense ratios of the portfolio, both net (including any fee waivers or expense limitations) and gross (excluding any fee waivers or expense limitations), are set forth according to the most recent publicly available prospectuses for the portfolio and may differ from those disclosed in the Financial highlights tables in this report. The fee waivers and expense limitations are contractual at least until 4-30-14 for Class R2 and Class R6 shares. Had the fee waivers and expense limitations not been in place gross expenses would apply. For all other classes the net expenses equal the gross expenses. The following expense ratios include expenses of the underlying affiliated funds in which the portfolio invests. The expense ratios are as follows:
| | | | | | | | | | | |
| | Class A | Class B | Class C | Class R1 | Class R2 | Class R3 | Class R4* | Class R5 | Class R6 | Class 1 | Class 5 |
| Net (%) | 1.45 | 2.16 | 2.15 | 1.81 | 1.50 | 1.69 | 1.29 | 1.07 | 0.99 | 0.99 | 0.94 |
| Gross (%) | 1.45 | 2.16 | 2.15 | 1.81 | 17.33 | 1.69 | 1.39 | 1.07 | 3.11 | 0.99 | 0.94 |
* The portfolio’s distributor has contractually agreed to waive 0.10% of Rule 12b-1 fees for Class R4 shares. The current waiver agreement expires on 4-30-14.
The returns reflect past results and should not be considered indicative of future performance. The return and principal value of an investment will fluctu-ate so that shares, when redeemed, may be worth more or less than their original cost. Due to market volatility, the portfolio’s current performance may be higher or lower than the performance shown. For performance data current to the most recent month end, please call 1-800-225-5291 or visit the portfolio’s Website at www.jhfunds.com.
This performance information does not reflect the deduction of taxes that a shareholder may pay on portfolio distributions or the redemption of portfolio shares. The portfolio’s performance results reflect any applicable fee waivers or expense reductions, without which the expenses would increase and results would have been less favorable.
1 For certain types of investors as described in the portfolio’s prospectuses.
2 Class R6 shares were first offered on 9-1-11. The returns prior to this date are those of Class 1 shares that have been recalculated to apply the gross fees and expenses of Class R6 shares. Class R2 shares were first offered on 3-1-12. The returns prior to this date are those of Class A shares that have been recalculated to apply the gross fees and expenses of Class R2 shares.
| |
| 8 | Lifestyle Portfolios | Semiannual report |
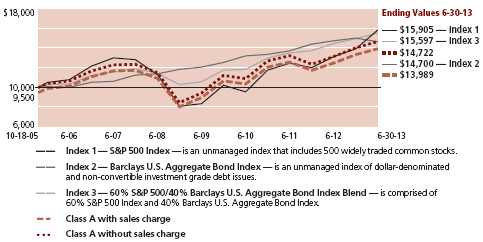
John Hancock Lifestyle Balanced Portfolio
Growth of $10,000
This chart and table show what happened to a hypothetical $10,000 investment in John Hancock Lifestyle Balanced Portfolio for the share classes and periods indicated, assuming all distributions were reinvested. For comparison, we’ve shown the same investment in a blended index and two separate indexes.
| | |
| Asset Allocation* | |
| |
| EQUITY | 60.6% OF TOTAL |
|
| U.S. Large Cap | | 30.5% |
|
| International Large Cap | | 7.6% |
|
| Emerging Markets | | 4.7% |
|
| U.S. Mid Cap | | 3.7% |
|
| Large Blend | | 3.5% |
|
| International Small Cap | | 2.6% |
|
| U.S. Small Cap | | 2.1% |
|
| Global Large Cap | | 1.6% |
|
| Natural Resources | | 1.4% |
|
| Health Sciences | | 1.3% |
|
| Real Estate | | 1.3% |
|
| Small Cap Growth | | 0.3% |
|
| |
| FIXED INCOME | 35.9% OF TOTAL |
|
| Intermediate Bond | | 10.2% |
|
| Multi-Sector Bond | | 9.9% |
|
| High Yield Bond | | 6.0% |
|
| Bank Loan | | 5.9% |
|
| Global Bond | | 2.7% |
|
| Treasury Inflation-Protected Securities | 1.2% |
|
| |
| ALTERNATIVE | 3.5% OF TOTAL |
|
| Currency | | 2.3% |
|
| Global Absolute Return Strategies | 1.2% |
|
| * As a percentage of net assets on 6-30-13. | |
| | |
Performance chart
Total returns with maximum sales charge for the period ended 6-30-13
| | | | | | | | | | | | | | |
| | Class A | Class B | Class C | Class R11 | Class R21,2 | Class R31 | Class R41 | Class R51 | Class R61,2 | Class 11 | Class 51 | Index 1 | Index 2 | Index 3 |
| | |
| Start date | 10-18-05 | 10-18-05 | 10-18-05 | 9-18-06 | 10-18-05 | 10-18-05 | 10-18-05 | 10-18-05 | 10-15-05 | 10-15-05 | 7-3-06 | 10-15-05 | 10-15-05 | 10-15-05 |
|
| Average annual total returns | | | | | | | | | | | | | |
|
| 1 year | 6.11% | 5.81% | 9.90% | 11.29% | 11.66% | 11.45% | 11.89% | 12.11% | 12.23% | 12.15% | 12.29% | 20.60% | –0.69% | 11.69% |
|
| 5 years | 3.94% | 3.88% | 4.28% | 4.59% | 4.20% | 4.77% | 5.11% | 5.40% | 4.68% | 5.49% | 5.55% | 7.01% | 5.19% | 6.72% |
|
| Since inception | 4.45% | 4.36% | 4.43% | 4.07% | 4.25% | 4.91% | 5.23% | 5.52% | 4.61% | 5.60% | 5.20% | 6.24% | 5.13% | 6.14% |
|
| Cumulative returns | | | | | | | | | | | | | | |
|
| 6 months | –0.72% | –0.91% | 3.16% | 4.29% | 4.52% | 4.35% | 4.55% | 4.73% | 4.79% | 4.71% | 4.81% | 13.82% | –2.45% | 7.10% |
|
| 5 years | 21.34% | 20.96% | 23.31% | 25.13% | 22.83% | 26.21% | 28.31% | 30.08% | 25.70% | 30.65% | 30.98% | 40.33% | 28.78% | 38.41% |
|
| Since inception | 39.89% | 38.88% | 39.62% | 31.11% | 37.80% | 44.67% | 48.06% | 51.28% | 41.58% | 52.22% | 42.62% | 59.52% | 47.05% | 58.28% |
|
It is not possible to invest directly in an index. Index figures do not reflect expenses or sales charges, which would have resulted in lower values if they did. Index since inception returns are from 10-15-05, the start date of the oldest share class (Class 1).
Performance figures assume all distributions have been reinvested. Returns with maximum sales charge reflect a sales charge on Class A shares of 5%, and the applicable contingent deferred sales charge (CDSC) on Class B and Class C shares. The Class B shares’ CDSC declines annually between years 1–6 according to the following schedule: 5, 4, 3, 3, 2, 1%. No sales charges will be assessed after the sixth year. Class C shares held for less than one year are subject to a 1% CDSC. Sales charges are not applicable to Class R1, Class R2, Class R3, Class R4, Class R5, Class R6, Class 1, and Class 5 shares.
Performance of the classes will vary based on the difference in sales charges paid by shareholders investing in the different classes and the fee structure of those classes.
The expense ratios of the portfolio, both net (including any fee waivers or expense limitations) and gross (excluding any fee waivers or expense limitations), are set forth according to the most recent publicly available prospectuses for the portfolio and may differ from those disclosed in the Financial highlights tables in this report. The fee waivers and expense limitations are contractual at least until 4-30-14 for Class R2 and Class R6 shares. Had the fee waivers and expense limitations not been in place gross expenses would apply. For all other classes the net expenses equal the gross expenses. The following expense ratios include expenses of the underlying affiliated funds in which the portfolio invests. The expense ratios are as follows:
| | | | | | | | | | | |
| | Class A | Class B | Class C | Class R1 | Class R2 | Class R3 | Class R4* | Class R5 | Class R6 | Class 1 | Class 5 |
| Net (%) | 1.41 | 2.14 | 2.11 | 1.77 | 1.46 | 1.63 | 1.22 | 1.02 | 0.96 | 0.96 | 0.91 |
| Gross (%) | 1.41 | 2.14 | 2.11 | 1.77 | 17.43 | 1.63 | 1.32 | 1.02 | 2.00 | 0.96 | 0.91 |
* The portfolio’s distributor has contractually agreed to waive 0.10% of Rule 12b-1 fees for Class R4 shares. The current waiver agreement will remain in effect through 4-30-14.
The returns reflect past results and should not be considered indicative of future performance. The return and principal value of an investment will fluctu-ate so that shares, when redeemed, may be worth more or less than their original cost. Due to market volatility, the portfolio’s current performance may be higher or lower than the performance shown. For performance data current to the most recent month end, please call 1-800-225-5291 or visit the portfolio’s Website at www.jhfunds.com.
This performance information does not reflect the deduction of taxes that a shareholder may pay on portfolio distributions or the redemption of portfolio shares. The portfolio’s performance results reflect any applicable fee waivers or expense reductions, without which the expenses would increase and results would have been less favorable.
1 For certain types of investors as described in the portfolio’s prospectuses.
2 Class R6 shares were first offered on 9-1-11. The returns prior to this date are those of Class 1 shares that have been recalculated to apply the gross fees and expenses of Class R6 shares. Class R2 shares were first offered on 3-1-12. The returns prior to this date are those of Class A shares that have been recalculated to apply the gross fees and expenses of Class R2 shares.
| |
| Semiannual report | Lifestyle Portfolios | 9 |
John Hancock Lifestyle Moderate Portfolio
Growth of $10,000
This chart and table show what happened to a hypothetical $10,000 investment in John Hancock Lifestyle Moderate Portfolio for the share classes and periods indicated, assuming all distributions were reinvested. For comparison, we’ve shown the same investment in a blended index and two separate indexes.
| | |
| Asset Allocation* | |
| |
| EQUITY | 40.1% OF TOTAL |
|
| U.S. Large Cap | | 22.7% |
|
| International Large Cap | | 4.2% |
|
| Large Blend | | 2.5% |
|
| Emerging Markets | | 2.4% |
|
| U.S. Mid Cap | | 2.4% |
|
| Global Large Cap | | 1.3% |
|
| Real Estate | | 1.2% |
|
| International Small Cap | | 1.1% |
|
| U.S. Small Cap | | 1.1% |
|
| Natural Resources | | 1.0% |
|
| Small Cap Growth | | 0.2% |
|
| |
| FIXED INCOME | 55.7% OF TOTAL |
|
| Intermediate Bond | | 21.0% |
|
| Multi-Sector Bond | | 12.4% |
|
| Bank Loan | | 8.8% |
|
| High Yield Bond | | 7.9% |
|
| Global Bond | | 4.1% |
|
| Treasury Inflation-Protected Securities | 1.5% |
|
| |
| ALTERNATIVE | 4.2% OF TOTAL |
|
| Currency | | 2.5% |
|
| Global Absolute Return Strategies | 1.7% |
|
| * As a percentage of net assets on 6-30-13. | |
Performance chart
Total returns with maximum sales charge for the period ended 6-30-13
| | | | | | | | | | | | | | |
| | Class A | Class B | Class C | Class R11 | Class R21,2 | Class R31 | Class R41 | Class R51 | Class R61,2 | Class 11 | Class 51 | Index 1 | Index 2 | Index 3 |
| | |
| Start date | 10-18-05 | 10-18-05 | 10-18-05 | 9-18-06 | 10-18-05 | 10-18-05 | 10-18-05 | 10-18-05 | 10-15-05 | 10-15-05 | 7-3-06 | 10-15-05 | 10-15-05 | 10-15-05 |
|
| Average annual total returns | | | | | | | | | | | | | |
|
| 1 year | 3.28% | 2.95% | 6.98% | 8.27% | 8.63% | 8.35% | 8.83% | 8.95% | 9.19% | 9.19% | 9.25% | 20.60% | –0.69% | 7.44% |
|
| 5 years | 4.72% | 4.66% | 5.05% | 5.34% | 4.95% | 5.44% | 5.76% | 6.09% | 4.81% | 6.25% | 6.31% | 7.01% | 5.19% | 6.35% |
|
| Since inception | 4.66% | 4.55% | 4.62% | 4.61% | 4.45% | 5.06% | 5.35% | 5.68% | 4.07% | 5.80% | 5.72% | 6.24% | 5.13% | 5.91% |
|
| Cumulative returns | | | | | | | | | | | | | | |
|
| 6 months | –2.53% | –2.79% | 1.22% | 2.32% | 2.49% | 2.36% | 2.63% | 2.68% | 2.76% | 2.75% | 2.78% | 13.82% | –2.45% | 3.84% |
|
| 5 years | 25.95% | 25.57% | 27.92% | 29.70% | 27.35% | 30.34% | 32.30% | 34.39% | 26.45% | 35.39% | 35.78% | 40.33% | 28.78% | 36.04% |
|
| Since inception | 42.02% | 40.85% | 41.60% | 35.78% | 39.84% | 46.29% | 49.43% | 52.98% | 36.05% | 54.47% | 47.56% | 59.52% | 47.05% | 55.71% |
|
It is not possible to invest directly in an index. Index figures do not reflect expenses or sales charges, which would have resulted in lower values if they did. Index since inception returns are from 10-15-05, the start date of the oldest share class (Class 1).
Performance figures assume all distributions have been reinvested. Returns with maximum sales charge reflect a sales charge on Class A shares of 5%, and the applicable contingent deferred sales charge (CDSC) on Class B and Class C shares. The Class B shares’ CDSC declines annually between years 1–6 according to the following schedule: 5, 4, 3, 3, 2, 1%. No sales charges will be assessed after the sixth year. Class C shares held for less than one year are subject to a 1% CDSC. Sales charges are not applicable to Class R1, Class R2, Class R3, Class R4, Class R5, Class R6, Class 1, and Class 5 shares.
Performance of the classes will vary based on the difference in sales charges paid by shareholders investing in the different classes and the fee structure of those classes.
The expense ratios of the portfolio, both net (including any fee waivers or expense limitations) and gross (excluding any fee waivers or expense limitations), are set forth according to the most recent publicly available prospectuses for the portfolio and may differ from those disclosed in the Financial highlights tables in this report. The fee waivers and expense limitations are contractual at least until 4-30-14 for Class R2 and Class R6 shares. Had the fee waivers and expense limitations not been in place gross expenses would apply. For all other classes the net expenses equal the gross expenses. The expense ratios are as follows:
| | | | | | | | | | | |
| | Class A | Class B | Class C | Class R1 | Class R2 | Class R3 | Class R4* | Class R5 | Class R6 | Class 1 | Class 5 |
| Net (%) | 1.37 | 2.10 | 2.08 | 1.80 | 1.42 | 1.68 | 1.28 | 1.07 | 0.91 | 0.91 | 0.86 |
| Gross (%) | 1.37 | 2.10 | 2.08 | 1.80 | 17.08 | 1.68 | 1.38 | 1.07 | 5.59 | 0.91 | 0.86 |
* The portfolio’s distributor has contractually agreed to waive 0.10% of the Rule 12b-1 fees for Class R4 shares. The current waiver agreement will remain in effect through 4-30-14.
The returns reflect past results and should not be considered indicative of future performance. The return and principal value of an investment will fluctu-ate so that shares, when redeemed, may be worth more or less than their original cost. Due to market volatility, the portfolio’s current performance may be higher or lower than the performance shown. For performance data current to the most recent month end, please call 1-800-225-5291 or visit the portfolio’s Website at www.jhfunds.com.
This performance information does not reflect the deduction of taxes that a shareholder may pay on portfolio distributions or the redemption of portfolio shares. The portfolio’s performance results reflect any applicable fee waivers or expense reductions, without which the expenses would increase and results would have been less favorable.
1 For certain types of investors as described in the portfolio’s prospectuses.
2 Class R6 shares were first offered on 9-1-11. The returns prior to this date are those of Class 1 shares that have been recalculated to apply the gross fees and expenses of Class R6 shares. Class R2 shares were first offered on 3-1-12. The returns prior to this date are those of Class A shares that have been recalculated to apply the gross fees and expenses of Class R2 shares.
| |
| 10 | Lifestyle Portfolios | Semiannual report |
John Hancock Lifestyle Conservative Portfolio
Growth of $10,000
This chart and table show what happened to a hypothetical $10,000 investment in John Hancock Lifestyle Conservative Portfolio for the share classes and periods indicated, assuming all distributions were reinvested. For comparison, we’ve shown the same investment in a blended index and two separate indexes.
| | |
| Asset Allocation* | |
| |
| EQUITY | 20.0% OF TOTAL |
|
| U.S. Large Cap | | 12.7% |
|
| International Large Cap | | 2.5% |
|
| Real Estate | | 1.1% |
|
| Emerging Markets | | 1.0% |
|
| Global Large Cap | | 0.9% |
|
| U.S. Mid Cap | | 0.8% |
|
| U.S. Small Cap | | 0.5% |
|
| Natural Resources | | 0.5% |
|
| |
| FIXED INCOME | 75.3% OF TOTAL |
|
| Intermediate Bond | | 30.0% |
|
| Multi-Sector Bond | | 14.5% |
|
| Bank Loan | | 10.5% |
|
| High Yield Bond | | 8.3% |
|
| Global Bond | | 5.2% |
|
| Short-Term Bond | | 4.0% |
|
| Treasury Inflation-Protected Securities | 2.8% |
|
| |
| ALTERNATIVE | 4.7% OF TOTAL |
|
| Currency | | 2.5% |
|
| Global Absolute Return Strategies | 2.2% |
|
| * As a percentage of net assets on 6-30-13. | |
Performance chart
Total returns with maximum sales charge for the period ended 6-30-13
| | | | | | | | | | | | | |
| | Class A | Class B | Class C | Class R11 | Class R21,2 | Class R31 | Class R41 | Class R51 | Class R61,2 | Class 11 | Index 1 | Index 2 | Index 3 |
| | |
| Start date | 10-18-05 | 10-18-05 | 10-18-05 | 9-18-06 | 10-18-05 | 10-18-05 | 10-18-05 | 10-18-05 | 10-15-05 | 10-15-05 | 10-15-05 | 10-15-05 | 10-15-05 |
|
| Average annual total returns | | | | | | | | | | | | |
|
| 1 year | 0.22% | –0.26% | 3.78% | 5.04% | 5.55% | 5.11% | 5.57% | 5.84% | 6.01% | 6.00% | 20.60% | –0.69% | 3.31% |
|
| 5 years | 4.74% | 4.69% | 5.08% | 5.34% | 4.99% | 5.46% | 5.76% | 6.12% | 4.60% | 6.28% | 7.01% | 5.19% | 5.84% |
|
| Since inception | 4.64% | 4.55% | 4.58% | 4.82% | 4.43% | 5.05% | 5.31% | 5.66% | 3.78% | 5.79% | 6.24% | 5.13% | 5.58% |
|
| Cumulative returns | | | | | | | | | | | | | |
|
| 6 months | –4.56% | –4.87% | –0.87% | 0.35% | 0.53% | 0.33% | 0.51% | 0.66% | 0.64% | 0.71% | 13.82% | –2.45% | 0.66% |
|
| 5 years | 26.07% | 25.74% | 28.11% | 29.73% | 27.58% | 30.43% | 32.31% | 34.59% | 25.21% | 35.62% | 40.33% | 28.78% | 32.80% |
|
| Since inception | 41.77% | 40.83% | 41.21% | 37.61% | 39.64% | 46.10% | 48.97% | 52.79% | 33.12% | 54.33% | 59.52% | 47.05% | 51.93% |
|
It is not possible to invest directly in an index. Index figures do not reflect expenses or sales charges, which would have resulted in lower values if they did. Index since inception returns are from 10-15-05, the start date of the oldest share class (Class 1).
Performance figures assume all distributions have been reinvested. Returns with maximum sales charge reflect a sales charge on Class A shares of 5%, and the applicable contingent deferred sales charge (CDSC) on Class B and Class C shares. The Class B shares’ CDSC declines annually between years 1–6 according to the following schedule: 5, 4, 3, 3, 2, 1%. No sales charges will be assessed after the sixth year. Class C shares held for less than one year are subject to a 1% CDSC. Sales charges are not applicable to Class R1, Class R2, Class R3, Class R4, Class R5, Class R6, Class 1, and Class 5 shares.
Performance of the classes will vary based on the difference in sales charges paid by shareholders investing in the different classes and the fee structure of those classes.
The expense ratios of the portfolio, both net (including any fee waivers or expense limitations) and gross (excluding any fee waivers or expense limitations), are set forth according to the most recent publicly available prospectuses for the portfolio and may differ from those disclosed in the Financial highlights tables in this report. The fee waivers and expense limitations are contractual at least until 4-30-14 for Class R2 and Class R6 shares. Had the fee waivers and expense limitations not been in place gross expenses would apply. For all other classes the net expenses equal the gross expenses. The following expense ratios include expenses of the underlying affiliated funds in which the portfolio invests. The expense ratios are as follows:
| | | | | | | | | | |
| | Class A | Class B | Class C | Class R1 | Class R2 | Class R3 | Class R4* | Class R5 | Class R6 | Class 1 |
| Net (%) | 1.32 | 2.06 | 2.02 | 1.84 | 1.37 | 1.73 | 1.26 | 1.07 | 0.87 | 0.87 |
| Gross (%) | 1.32 | 2.06 | 2.02 | 1.84 | 11.40 | 1.73 | 1.36 | 1.07 | 3.26 | 0.87 |
* The portfolio’s distributor has contractually agreed to waive 0.10% of the Rule 12b-1 fees for Class R4. The current waiver agreement will remain in effect through 4-30-14.
The returns reflect past results and should not be considered indicative of future performance. The return and principal value of an investment will fluctu-ate so that shares, when redeemed, may be worth more or less than their original cost. Due to market volatility, the portfolio’s current performance may be higher or lower than the performance shown. For performance data current to the most recent month end, please call 1-800-225-5291 or visit the portfolio’s Website at www.jhfunds.com.
This performance information does not reflect the deduction of taxes that a shareholder may pay on portfolio distributions or the redemption of portfolio shares. The portfolio’s performance results reflect any applicable fee waivers or expense reductions, without which the expenses would increase and results would have been less favorable.
1 For certain types of investors as described in the portfolio’s prospectuses.
2 Class R6 shares were first offered on 9-1-11. The returns prior to this date are those of Class 1 shares that have been recalculated to apply the gross fees and expenses of Class R6 shares. Class R2 shares were first offered on 3-1-12. The returns prior to this date are those of Class A shares that have been recalculated to apply the gross fees and expenses of Class R2 shares.
| |
| Semiannual report | Lifestyle Portfolios | 11 |
Your expenses
As a shareholder of a John Hancock Fund II Lifestyle Portfolio, you incur ongoing costs, such as management fees, distribution and service (12b-1) fees and other expenses. In addition to the operating expenses which the portfolio bears directly, the portfolio indirectly bears a pro rata share of the operating expenses of the affiliated underlying funds in which the portfolio invests. Because the affiliated underlying funds have varied operating expenses and transaction costs and the portfolio may own different proportions of the underlying funds at different times, the amount of expenses incurred indirectly by the portfolio will vary. Had these indirect expenses been reflected in the following analysis, total expenses would have been higher than the amounts shown.
This example is intended to help you understand your ongoing costs (in dollars) of investing in the portfolio so you can compare these costs with the ongoing costs of investing in other mutual funds. The example is based on an investment of $1,000 at the beginning of the period and held for the entire period (January 1, 2013 through June 30, 2013).
Actual expenses:
The first line of each share class in the table on the following page provides information about actual account values and actual expenses. You may use the information in this line, together with the amount you invested, to estimate the expenses that you paid over the period. Simply divide your account value by $1,000 (for example, an $8,600 account value divided by $1,000 = 8.6), then multiply the result by the number in the first line under the heading entitled “Expenses paid during period” to estimate the expenses you paid on your account during this period.
Hypothetical example for comparison purposes:
The second line of each share class in the table on the following page provides information about hypothetical account values and hypothetical expenses based on the actual expense ratio for the share class and an assumed annualized rate of return of 5% per year before expenses, which is not the actual return of the share class. The hypothetical account values and expenses may not be used to estimate the actual ending account balance or expenses you paid for the period. You may use this information to compare the ongoing costs of investing in the portfolio and other funds. To do so, compare this 5% hypothetical example with the 5% hypothetical examples that appear in the shareholder reports of the other funds.
Please note that the expenses shown in the table are meant to highlight your ongoing costs only and do not reflect any transactional costs and insurance-related charges. Therefore, the second line of each share class in the table is useful in comparing ongoing costs only, and will not help you determine the relative total costs of owning different funds. In addition, if these transactional costs were included, your costs would have been higher.
| |
| 12 | Lifestyle Portfolios | Semiannual report |
Shareholder expense example chart
| | | | | |
| | | Beginning | Ending | Expenses Paid | |
| | | Account Value | Account Value | During Period1 | Annualized |
| | | 1-1-13 | 6-30-13 | 1-1-13–6-30-13 | Expense Ratio2 |
| Lifestyle Aggressive Portfolio | | | | |
|
| Class A | Actual | $1,000.00 | $1,078.00 | $2.83 | 0.55% |
| | Hypothetical (5% annualized return before expenses) | 1,000.00 | 1,022.10 | 2.76 | 0.55% |
|
| Class B | Actual | 1,000.00 | 1,074.00 | 6.94 | 1.35% |
| | Hypothetical (5% annualized return before expenses) | 1,000.00 | 1,018.10 | 6.76 | 1.35% |
|
| Class C | Actual | 1,000.00 | 1,074.70 | 6.48 | 1.26% |
| | Hypothetical (5% annualized return before expenses) | 1,000.00 | 1,018.50 | 6.31 | 1.26% |
|
| Class R1 | Actual | 1,000.00 | 1,075.50 | 5.09 | 0.99% |
| | Hypothetical (5% annualized return before expenses) | 1,000.00 | 1,019.90 | 4.96 | 0.99% |
|
| Class R2 | Actual | 1,000.00 | 1,077.60 | 3.19 | 0.62% |
| | Hypothetical (5% annualized return before expenses) | 1,000.00 | 1,021.70 | 3.11 | 0.62% |
|
| Class R3 | Actual | 1,000.00 | 1,076.60 | 4.48 | 0.87% |
| | Hypothetical (5% annualized return before expenses) | 1,000.00 | 1,020.50 | 4.36 | 0.87% |
|
| Class R4 | Actual | 1,000.00 | 1,078.20 | 2.58 | 0.50% |
| | Hypothetical (5% annualized return before expenses) | 1,000.00 | 1,022.30 | 2.51 | 0.50% |
|
| Class R5 | Actual | 1,000.00 | 1,078.90 | 1.44 | 0.28% |
| | Hypothetical (5% annualized return before expenses) | 1,000.00 | 1,023.40 | 1.40 | 0.28% |
|
| Class R6 | Actual | 1,000.00 | 1,080.70 | 0.57 | 0.11% |
| | Hypothetical (5% annualized return before expenses) | 1,000.00 | 1,024.20 | 0.55 | 0.11% |
|
| Class 1 | Actual | 1,000.00 | 1,079.90 | 0.57 | 0.11% |
| | Hypothetical (5% annualized return before expenses) | 1,000.00 | 1,024.20 | 0.55 | 0.11% |
|
| Lifestyle Growth Portfolio | | | | |
| Class A | Actual | $1,000.00 | $1,068.00 | $2.77 | 0.54% |
| | Hypothetical (5% annualized return before expenses) | 1,000.00 | 1,022.10 | 2.71 | 0.54% |
|
| Class B | Actual | 1,000.00 | 1,063.40 | 6.45 | 1.26% |
| | Hypothetical (5% annualized return before expenses) | 1,000.00 | 1,018.50 | 6.31 | 1.26% |
|
| Class C | Actual | 1,000.00 | 1,063.40 | 6.34 | 1.24% |
| | Hypothetical (5% annualized return before expenses) | 1,000.00 | 1,018.60 | 6.21 | 1.24% |
|
| Class R1 | Actual | 1,000.00 | 1,065.50 | 4.56 | 0.89% |
| | Hypothetical (5% annualized return before expenses) | 1,000.00 | 1,020.40 | 4.46 | 0.89% |
|
| Class R2 | Actual | 1,000.00 | 1,066.80 | 3.18 | 0.62% |
| | Hypothetical (5% annualized return before expenses) | 1,000.00 | 1,021.70 | 3.11 | 0.62% |
|
| Class R3 | Actual | 1,000.00 | 1,065.80 | 4.15 | 0.81% |
| | Hypothetical (5% annualized return before expenses) | 1,000.00 | 1,020.80 | 4.06 | 0.81% |
|
| Class R4 | Actual | 1,000.00 | 1,068.10 | 2.00 | 0.39% |
| | Hypothetical (5% annualized return before expenses) | 1,000.00 | 1,022.90 | 1.96 | 0.39% |
|
| Class R5 | Actual | 1,000.00 | 1,069.50 | 0.87 | 0.17% |
| | Hypothetical (5% annualized return before expenses) | 1,000.00 | 1,024.00 | 0.85 | 0.17% |
|
| Class R6 | Actual | 1,000.00 | 1,069.80 | 0.56 | 0.11% |
| | Hypothetical (5% annualized return before expenses) | 1,000.00 | 1,024.20 | 0.55 | 0.11% |
|
| Class 1 | Actual | 1,000.00 | 1,069.80 | 0.56 | 0.11% |
| | Hypothetical (5% annualized return before expenses) | 1,000.00 | 1,024.20 | 0.55 | 0.11% |
|
| Class 5 | Actual | 1,000.00 | 1,069.80 | 0.31 | 0.06% |
| | Hypothetical (5% annualized return before expenses) | 1,000.00 | 1,024.50 | 0.30 | 0.06% |
|
| |
| Semiannual report | Lifestyle Portfolios | 13 |
Shareholder expense example chart, continued
| | | | | |
| | | Beginning | Ending | Expenses Paid | |
| | | Account Value | Account Value | During Period1 | Annualized |
| | | 1-1-13 | 6-30-13 | 1-1-13–6-30-13 | Expense Ratio2 |
| Lifestyle Balanced Portfolio | | | | |
|
| Class A | Actual | $1,000.00 | $1,045.30 | $2.74 | 0.54% |
| | Hypothetical (5% annualized return before expenses) | 1,000.00 | 1,022.10 | 2.71 | 0.54% |
|
| Class B | Actual | 1,000.00 | 1,040.90 | 6.58 | 1.30% |
| | Hypothetical (5% annualized return before expenses) | 1,000.00 | 1,018.30 | 6.51 | 1.30% |
|
| Class C | Actual | 1,000.00 | 1,041.60 | 6.28 | 1.24% |
| | Hypothetical (5% annualized return before expenses) | 1,000.00 | 1,018.60 | 6.21 | 1.24% |
|
| Class R1 | Actual | 1,000.00 | 1,042.90 | 4.51 | 0.89% |
| | Hypothetical (5% annualized return before expenses) | 1,000.00 | 1,020.40 | 4.46 | 0.89% |
|
| Class R2 | Actual | 1,000.00 | 1,045.20 | 3.14 | 0.62% |
| | Hypothetical (5% annualized return before expenses) | 1,000.00 | 1,021.70 | 3.11 | 0.62% |
|
| Class R3 | Actual | 1,000.00 | 1,043.50 | 3.95 | 0.78% |
| | Hypothetical (5% annualized return before expenses) | 1,000.00 | 1,020.90 | 3.91 | 0.78% |
|
| Class R4 | Actual | 1,000.00 | 1,045.50 | 1.83 | 0.36% |
| | Hypothetical (5% annualized return before expenses) | 1,000.00 | 1,023.00 | 1.81 | 0.36% |
|
| Class R5 | Actual | 1,000.00 | 1,047.30 | 0.91 | 0.18% |
| | Hypothetical (5% annualized return before expenses) | 1,000.00 | 1,023.90 | 0.90 | 0.18% |
|
| Class R6 | Actual | 1,000.00 | 1,047.90 | 0.56 | 0.11% |
| | Hypothetical (5% annualized return before expenses) | 1,000.00 | 1,024.20 | 0.55 | 0.11% |
|
| Class 1 | Actual | 1,000.00 | 1,047.10 | 0.56 | 0.11% |
| | Hypothetical (5% annualized return before expenses) | 1,000.00 | 1,024.20 | 0.55 | 0.11% |
|
| Class 5 | Actual | 1,000.00 | 1,048.10 | 0.30 | 0.06% |
| | Hypothetical (5% annualized return before expenses) | 1,000.00 | 1,024.50 | 0.30 | 0.06% |
|
| Lifestyle Moderate Portfolio | | | | |
| Class A | Actual | $1,000.00 | $1,025.80 | $2.76 | 0.55% |
| | Hypothetical (5% annualized return before expenses) | 1,000.00 | 1,022.10 | 2.76 | 0.55% |
|
| Class B | Actual | 1,000.00 | 1,022.10 | 6.42 | 1.28% |
| | Hypothetical (5% annualized return before expenses) | 1,000.00 | 1,018.40 | 6.41 | 1.28% |
|
| Class C | Actual | 1,000.00 | 1,022.20 | 6.27 | 1.25% |
| | Hypothetical (5% annualized return before expenses) | 1,000.00 | 1,018.60 | 6.26 | 1.25% |
|
| Class R1 | Actual | 1,000.00 | 1,023.20 | 4.72 | 0.94% |
| | Hypothetical (5% annualized return before expenses) | 1,000.00 | 1,020.10 | 4.71 | 0.94% |
|
| Class R2 | Actual | 1,000.00 | 1,024.90 | 3.11 | 0.62% |
| | Hypothetical (5% annualized return before expenses) | 1,000.00 | 1,021.70 | 3.11 | 0.62% |
|
| Class R3 | Actual | 1,000.00 | 1,023.60 | 4.37 | 0.87% |
| | Hypothetical (5% annualized return before expenses) | 1,000.00 | 1,020.50 | 4.36 | 0.87% |
|
| Class R4 | Actual | 1,000.00 | 1,026.30 | 2.16 | 0.43% |
| | Hypothetical (5% annualized return before expenses) | 1,000.00 | 1,022.70 | 2.16 | 0.43% |
|
| Class R5 | Actual | 1,000.00 | 1,026.80 | 1.46 | 0.29% |
| | Hypothetical (5% annualized return before expenses) | 1,000.00 | 1,023.40 | 1.45 | 0.29% |
|
| Class R6 | Actual | 1,000.00 | 1,027.60 | 0.55 | 0.11% |
| | Hypothetical (5% annualized return before expenses) | 1,000.00 | 1,024.20 | 0.55 | 0.11% |
|
| Class 1 | Actual | 1,000.00 | 1,027.50 | 0.55 | 0.11% |
| | Hypothetical (5% annualized return before expenses) | 1,000.00 | 1,024.20 | 0.55 | 0.11% |
|
| Class 5 | Actual | 1,000.00 | 1,027.80 | 0.30 | 0.06% |
| | Hypothetical (5% annualized return before expenses) | 1,000.00 | 1,024.50 | 0.30 | 0.06% |
|
| |
| 14 | Lifestyle Portfolios | Semiannual report |
Shareholder expense example chart, continued
| | | | | |
| | | Beginning | Ending | Expenses Paid | |
| | | Account Value | Account Value | During Period1 | Annualized |
| | | 1-1-13 | 6-30-13 | 1-1-13–6-30-13 | Expense Ratio2 |
| Lifestyle Conservative Portfolio | | | | |
|
| Class A | Actual | $1,000.00 | $1,004.80 | $2.73 | 0.55% |
| | Hypothetical (5% annualized return before expenses) | 1,000.00 | 1,022.10 | 2.76 | 0.55% |
|
| Class B | Actual | 1,000.00 | 1,001.10 | 6.30 | 1.27% |
| | Hypothetical (5% annualized return before expenses) | 1,000.00 | 1,018.50 | 6.36 | 1.27% |
|
| Class C | Actual | 1,000.00 | 1,001.30 | 6.20 | 1.25% |
| | Hypothetical (5% annualized return before expenses) | 1,000.00 | 1,018.60 | 6.26 | 1.25% |
|
| Class R1 | Actual | 1,000.00 | 1,003.50 | 4.57 | 0.92% |
| | Hypothetical (5% annualized return before expenses) | 1,000.00 | 1,020.20 | 4.61 | 0.92% |
|
| Class R2 | Actual | 1,000.00 | 1,005.30 | 3.08 | 0.62% |
| | Hypothetical (5% annualized return before expenses) | 1,000.00 | 1,021.70 | 3.11 | 0.62% |
|
| Class R3 | Actual | 1,000.00 | 1,003.30 | 3.82 | 0.77% |
| | Hypothetical (5% annualized return before expenses) | 1,000.00 | 1,021.00 | 3.86 | 0.77% |
|
| Class R4 | Actual | 1,000.00 | 1,005.10 | 2.34 | 0.47% |
| | Hypothetical (5% annualized return before expenses) | 1,000.00 | 1,022.50 | 2.36 | 0.47% |
|
| Class R5 | Actual | 1,000.00 | 1,006.60 | 0.80 | 0.16% |
| | Hypothetical (5% annualized return before expenses) | 1,000.00 | 1,024.00 | 0.80 | 0.16% |
|
| Class R6 | Actual | 1,000.00 | 1,006.40 | 0.55 | 0.11% |
| | Hypothetical (5% annualized return before expenses) | 1,000.00 | 1,024.20 | 0.55 | 0.11% |
|
| Class 1 | Actual | 1,000.00 | 1,007.10 | 0.55 | 0.11% |
| | Hypothetical (5% annualized return before expenses) | 1,000.00 | 1,024.20 | 0.55 | 0.11% |
|
1 Expenses are equal to the annualized expense ratio, multiplied by the average account value over the period, multiplied by the number of days in the period (181) and divided by 365 (to reflect the one-half year period).
2 The portfolios’ expense ratios do not include fees and expenses indirectly incurred by the underlying funds whose expense ratios can vary based on the mix of underlying funds held by portfolios. The range of expense ratios of the underlying funds held by the portfolios was as follows:
| | | | | |
| | Lifestyle | Lifestyle | Lifestyle | Lifestyle | Lifestyle |
| Period ended | Aggressive | Growth | Balanced | Moderate | Conservative |
| 6-30-13 | 0.70%–1.29% | 0.63%–1.29% | 0.62%–1.29% | 0.62%–1.29% | 0.62%–1.29% |
| |
| Semiannual report | Lifestyle Portfolios | 15 |
Portfolios’ investments
| |
| Investment companies | |
| | |
| Underlying Funds’ Subadvisors | |
| | |
| American Century Investment | |
| Management, Inc. | (American Century) |
| | |
| Atlantis Investment Management | |
| (Hong Kong) Ltd. | (Atlantis) |
| | |
| Baillie Gifford Overseas Ltd. | (Baillie Gifford) |
| |
| Columbia Management Investment | |
| Advisers, LLC | (Columbia) |
| | |
| Davis Selected Advisers, L.P. | (Davis) |
| | |
| Declaration Management & Research, LLC | (Declaration) |
| | |
| Deutsche Asset Management | (Deutsche) |
| | |
| Dimensional Fund Advisors LP | (DFA) |
| | |
| Epoch Investment Partners, Inc. | (Epoch) |
| | |
| First Quadrant, L.P. | (First Quadrant) |
| | |
| Franklin Mutual Advisers | (Franklin) |
| | |
| Franklin Templeton Investments Corp. | (Franklin Templeton) |
| | |
| Templeton Investment Counsel, LLC | (Templeton) |
| | |
| Frontier Capital Management Company, LLC | (Frontier) |
| | |
| Grantham, Mayo, Van Otterloo & Co. LLC | (GMO) |
| | |
| Invesco Advisers, Inc. | (Invesco) |
| | |
| Jennison Associates LLC | (Jennison) |
| | |
| John Hancock Asset Management* | (John Hancock) |
| | |
| Lord, Abbett & Co. LLC | (Lord Abbett) |
| |
| Pacific Investment Management | |
| Company LLC | (PIMCO) |
| | |
| Perimeter Capital Management | (Perimeter) |
| | |
| QS Investors Inc. | (QS Investors) |
| | |
| Rainier Investment Management, Inc. | (Rainier) |
| | |
| RCM Capital Management LLC | (RCM) |
| | |
| Robeco Investment Management, Inc. | (Robeco) |
| | |
| RS Investment Management Co. LLC | (RS Investments) |
| |
| Standard Life Investments | |
| (Corporate Funds) Limited | (Standard Life) |
| | |
| Stone Harbor Investment Partners LP | (Stone Harbor) |
| | |
| T. Rowe Price Associates, Inc. | (T. Rowe Price) |
| | |
| Wellington Management Company, LLP | (Wellington) |
| | |
| Wells Capital Management, Incorporated | (Wells Capital) |
| | |
| Western Asset Management Company | (WAMCO) |
* Manulife Asset Management (US) LLC and Manulife Asset Management (North America) Limited are doing business as John Hancock Asset Management.
Lifestyle Aggressive Portfolio
Securities owned by the portfolio on 6-30-13
| | |
| | Shares | Value |
| AFFILIATED INVESTMENT COMPANIES — 100.00% | |
|
| EQUITY 96.9% | | |
| | | |
| John Hancock Funds II (G) 83.5% | | |
|
| All Cap Core, Class NAV (QS Investors) | 10,513,707 | $119,961,403 |
|
| All Cap Value, Class NAV (Lord Abbett) | 7,125,519 | 93,985,602 |
|
| Alpha Opportunities, Class NAV (Wellington) | 18,967,125 | 232,347,279 |
|
| Blue Chip Growth, Class NAV (T. Rowe Price) | 7,919,450 | 216,517,754 |
|
| Capital Appreciation, Class NAV (Jennison) | 12,780,325 | 182,247,433 |
|
| Capital Appreciation Value, Class NAV | | |
| (T. Rowe Price) | 13,318,336 | 161,817,780 |
|
| China Emerging Leaders, Class NAV (Atlantis) | 6,016,783 | 50,781,649 |
|
| Emerging Markets, Class NAV (DFA) | 33,569,183 | 327,299,537 |
|
| Equity-Income, Class NAV (T. Rowe Price) | 9,329,089 | 170,069,289 |
|
| Fundamental Global Franchise, Class NAV | | |
| (John Hancock1) (A) | 3,088,983 | 36,450,004 |
|
| Fundamental Large Cap Value, Class NAV | | |
| (John Hancock1) (A) | 9,681,832 | 121,603,810 |
|
| Fundamental Value, Class NAV (Davis) | 8,357,794 | 153,114,787 |
|
| Global Equity, Class NAV (John Hancock1) (A)(I) | 3,780,268 | 36,744,200 |
|
| Global Real Estate, Class NAV (Deutsche) | 3,518,137 | 29,693,080 |
|
| Health Sciences, Class NAV (T. Rowe Price) | 4,452,464 | 71,684,667 |
|
| Heritage, Class NAV (American Century) | 3,203,596 | 25,372,480 |
|
| International Growth Opportunities Fund, | | |
| Class NAV (Baillie Gifford) | 5,159,112 | 58,659,107 |
|
| International Growth Stock, Class NAV (Invesco) | 7,790,670 | 90,995,030 |
|
| International Small Cap, Class NAV | | |
| (Franklin Templeton) | 4,115,725 | 66,592,435 |
|
| International Small Company, Class NAV (DFA) | 7,959,012 | 68,447,507 |
|
| International Value, Class NAV (Templeton) | 12,232,017 | 177,364,246 |
|
| Mid Cap Stock, Class NAV (Wellington) | 5,746,200 | 117,394,859 |
|
| Mid Cap Value Equity, Class NAV (Columbia) | 1,705,971 | 15,916,707 |
|
| Mid Value, Class NAV (T. Rowe Price) | 6,733,026 | 98,908,157 |
|
| Mutual Shares, Class NAV (Franklin) | 4,803,521 | 62,830,059 |
|
| Natural Resources, Class NAV | | |
| (RS Investments/Wellington) | 4,954,959 | 77,891,963 |
|
| Real Estate Equity, Class NAV (T. Rowe Price) | 1,969,784 | 19,559,953 |
|
| Redwood, Class NAV (RCM) | 3,010,033 | 33,260,870 |
|
| Science and Technology, Class NAV | | |
| (T. Rowe Price/RCM) (I) | 9,379,234 | 99,044,714 |
|
| Small Cap Growth, Class NAV (Wellington) | 2,437,022 | 23,785,336 |
|
| Small Cap Opportunities, Class NAV (Invesco/DFA) | 855,987 | 23,565,321 |
|
| Small Cap Value, Class NAV (Wellington) | 1,384,136 | 25,135,913 |
|
| Small Company Growth, Class NAV (Invesco) | 1,191,004 | 20,663,913 |
|
| Small Company Value, Class NAV (T. Rowe Price) | 1,163,566 | 37,606,453 |
|
| Smaller Company Growth, Class NAV | | |
| (Frontier/John Hancock2(A)/Perimeter) | 2,037,198 | 20,657,186 |
|
| Technical Opportunities, Class NAV (Wellington) (I) | 7,920,569 | 97,739,821 |
|
| U.S. Equity, Class NAV (GMO) | 8,777,927 | 113,674,152 |
|
| Value, Class NAV (Invesco) | 2,383,480 | 25,741,583 |
| | | |
| John Hancock Funds III (G) 12.5% | | |
|
| Disciplined Value, Class NAV (Robeco) | 5,006,370 | 82,354,784 |
|
| Global Shareholder Yield, Class NAV (Epoch) | 4,606,912 | 49,432,165 |
|
| International Core, Class NAV (GMO) | 3,552,599 | 104,552,996 |
|
| International Value Equity, Class NAV | | |
(John Hancock1) (A) | 6,922,240 | 58,562,149 |
|
| Rainier Growth, Class NAV (Rainier) | 2,789,464 | 69,457,653 |
|
| Strategic Growth, Class NAV (John Hancock1) (A) | 11,362,924 | 147,377,127 |
| | |
| 16 | Lifestyle Portfolios | Semiannual report | |
| | | See notes to financial statements |
| | |
| Lifestyle Aggressive Portfolio (continued) |
| | Shares | Value |
| John Hancock Investment Trust (G) 0.9% | |
|
| Small Cap Intrinsic Value, Class NAV | | |
| (John Hancock1) (A) | 3,064,577 | $38,429,798 |
| | | |
| ALTERNATIVE 3.1% | | |
| | | |
| John Hancock Funds II (G) 3.1% | | |
|
| Currency Strategies, Class NAV (First Quadrant) | 8,176,534 | 84,463,600 |
|
| Global Absolute Return Strategies, Class NAV | | |
| (Standard Life) | 3,741,203 | 40,629,461 |
| | | |
| Total Investments (Lifestyle Aggressive Portfolio) |
| (Cost $3,183,420,584) 100.0% | | $4,080,385,772 |
| | | |
| Other assets and liabilities, net 0.0% | | (3,051) |
|
| TOTAL NET ASSETS 100.0% | | $4,080,382,721 |
| | | |
| Percentages are based upon net assets. | | |
|
| |
| |
| |
| Lifestyle Growth Portfolio | |
| Securities owned by the portfolio on 6-30-13 | |
| | Shares | Value |
| AFFILIATED INVESTMENT COMPANIES — 100.00% |
|
| EQUITY 81.7% | | |
| | | |
| John Hancock Funds II (G) 70.1% | | |
|
| All Cap Core, Class NAV (QS Investors) | 25,162,059 | $287,099,096 |
|
| All Cap Value, Class NAV (Lord Abbett) | 18,721,350 | 246,934,613 |
|
| Alpha Opportunities, Class NAV (Wellington) | 46,365,388 | 567,976,004 |
|
| Blue Chip Growth, Class NAV (T. Rowe Price) | 21,238,957 | 580,673,089 |
|
| Capital Appreciation, Class NAV (Jennison) | 34,234,423 | 488,182,878 |
|
| Capital Appreciation Value, Class NAV | | |
| (T. Rowe Price) | 49,031,607 | 595,734,022 |
|
| China Emerging Leaders, Class NAV (Atlantis) | 14,347,924 | 121,096,480 |
|
| Emerging Markets, Class NAV (DFA) | 78,622,133 | 766,565,796 |
|
| Equity-Income, Class NAV (T. Rowe Price) | 24,941,685 | 454,686,925 |
|
| Fundamental Global Franchise, Class NAV | | |
| (John Hancock1) (A) | 10,939,866 | 129,090,423 |
|
| Fundamental Large Cap Value, Class NAV | | |
| (John Hancock1) (A) | 26,309,401 | 330,446,073 |
|
| Fundamental Value, Class NAV (Davis) | 19,649,436 | 359,977,673 |
|
| Global Equity, Class NAV (John Hancock1) (A)(I) | 9,914,028 | 96,364,354 |
|
| Global Real Estate, Class NAV (Deutsche) | 11,816,896 | 99,734,606 |
|
| Health Sciences, Class NAV (T. Rowe Price) | 11,970,412 | 192,723,630 |
|
| Heritage, Class NAV (American Century) | 8,157,801 | 64,609,784 |
|
| International Growth Opportunities, Class NAV | | |
| (Baillie Gifford) | 12,234,167 | 139,102,484 |
|
| International Growth Stock, Class NAV (Invesco) | 18,500,225 | 216,082,631 |
|
| International Small Cap, Class NAV | | |
| (Franklin Templeton) | 9,134,909 | 147,802,833 |
|
| International Small Company, Class NAV (DFA) | 17,728,799 | 152,467,676 |
|
| International Value, Class NAV (Templeton) | 29,078,009 | 421,631,127 |
|
| Mid Cap Stock, Class NAV (Wellington) | 14,661,486 | 299,534,151 |
|
| Mid Cap Value Equity, Class NAV (Columbia) | 4,265,524 | 39,797,343 |
|
| Mid Value, Class NAV (T. Rowe Price) | 17,047,297 | 250,424,798 |
|
| Mutual Shares, Class NAV (Franklin) | 12,832,719 | 167,851,965 |
|
| Natural Resources, Class NAV | | |
| (RS Investments/Wellington) | 11,993,795 | 188,542,454 |
|
| Real Estate Equity, Class NAV (T. Rowe Price) | 6,050,790 | 60,084,340 |
|
| Redwood, Class NAV (RCM) | 9,219,858 | 101,879,426 |
|
| Science and Technology, Class NAV | | |
| (T. Rowe Price/RCM) (I) | 24,902,826 | 262,973,839 |
|
| Small Cap Growth, Class NAV (Wellington) | 5,047,308 | 49,261,722 |
|
| Small Cap Opportunities, Class NAV (Invesco/DFA) | 1,785,644 | 49,158,766 |
|
| Small Cap Value, Class NAV (Wellington) | 2,879,045 | 52,283,454 |
|
| Small Company Growth, Class NAV (Invesco) | 2,446,336 | 42,443,930 |
|
| Small Company Value, Class NAV (T. Rowe Price) | 2,400,122 | 77,571,941 |
|
| Smaller Company Growth, Class NAV | | |
| (Frontier/John Hancock2(A)/Perimeter) | 4,223,730 | 42,828,623 |
|
| Technical Opportunities, Class NAV (Wellington) (I) | 20,972,368 | 258,799,016 |
|
| U.S. Equity, Class NAV (GMO) | 32,222,009 | 417,275,020 |
|
| Value, Class NAV (Invesco) | 6,061,071 | 65,459,568 |
| | |
| Lifestyle Growth Portfolio (continued) |
| | Shares | Value |
| John Hancock Funds III (G) 11.0% | | |
|
| Disciplined Value, Class NAV (Robeco) | 13,355,140 | $219,692,049 |
|
| Global Shareholder Yield, Class NAV (Epoch) | 19,099,587 | 204,938,567 |
|
| International Core, Class NAV (GMO) | 8,384,842 | 246,765,912 |
|
| International Value Equity, Class NAV | | |
| (John Hancock1)(A) | 16,668,241 | 141,013,315 |
|
| Rainier Growth, Class NAV (Rainier) | 7,451,865 | 185,551,445 |
|
| Strategic Growth, Class NAV (John Hancock1) (A) | 30,759,336 | 398,948,583 |
| | | |
| John Hancock Investment Trust (G) 0.6% | |
|
| Small Cap Intrinsic Value, Class NAV | | |
| (John Hancock1)(A) | 6,334,368 | 79,432,971 |
| | | |
| FIXED INCOME 15.2% | | |
| | | |
| John Hancock Funds II (G) 15.2% | | |
|
| Active Bond, Class NAV | | |
| (John Hancock1/Declaration) (A) | 17,680,307 | 178,571,100 |
|
| Asia Total Return Bond, Class NAV | | |
| (John Hancock1) (A)(I) | 8,268,587 | 78,138,144 |
|
| Emerging Markets Debt Fund, Class NAV | | |
| (John Hancock1) (A) | 1,090,785 | 10,678,784 |
|
| Floating Rate Income, Class NAV (WAMCO) | 37,865,405 | 354,798,841 |
|
| Global Bond, Class NAV (PIMCO) | 5,481,792 | 64,794,785 |
|
| Global High Yield, Class NAV (Stone Harbor) | 9,585,083 | 95,850,827 |
|
| High Income, Class NAV (John Hancock1) (A) | 15,634,962 | 125,548,743 |
|
| High Yield, Class NAV (WAMCO) | 13,486,812 | 122,999,728 |
|
| Real Return Bond, Class NAV (PIMCO) | 5,180,481 | 59,420,118 |
|
| Short Duration Credit Opportunities Fund, | | |
| Class NAV (Stone Harbor) | 15,384,922 | 157,849,304 |
|
| Spectrum Income, Class NAV (T. Rowe Price) | 13,965,637 | 151,946,134 |
|
| Strategic Income Opportunities, Class NAV | | |
| (John Hancock1) (A) | 20,421,747 | 223,618,133 |
|
| Total Return, Class NAV (PIMCO) | 12,923,544 | 177,440,255 |
|
| U.S. High Yield Bond, Class NAV (Wells Capital) | 9,946,085 | 122,933,612 |
| | | |
| ALTERNATIVE 3.1% | | |
| | | |
| John Hancock Funds II (G) 3.1% | | |
|
| Currency Strategies, Class NAV (First Quadrant) | 25,415,620 | 262,543,352 |
|
| Global Absolute Return Strategies, Class NAV | | |
| (Standard Life) | 11,608,616 | 126,069,573 |
| | | |
| Total Investments (Lifestyle Growth Portfolio) | |
| (Cost $10,195,178,569) 100.0% | $12,674,696,828 |
| | |
| Other assets and liabilities, net 0.0% | | 660,104 |
|
| TOTAL NET ASSETS 100.0% | | $12,675,356,932 |
| | | |
| Percentages are based upon net assets. | | |
|
| |
| |
| |
| Lifestyle Balanced Portfolio | |
| Securities owned by the portfolio on 6-30-13 | |
| | Shares | Value |
| AFFILIATED INVESTMENT COMPANIES — 100.00% |
|
| EQUITY 60.5% | | |
| | | |
| John Hancock Funds II (G) 51.4% | | |
|
| All Cap Core, Class NAV (QS Investors) | 14,081,937 | $160,674,905 |
|
| All Cap Value, Class NAV (Lord Abbett) | 16,061,213 | 211,847,402 |
|
| Alpha Opportunities, Class NAV (Wellington) | 29,597,514 | 362,569,544 |
|
| Blue Chip Growth, Class NAV (T. Rowe Price) | 16,883,315 | 461,589,821 |
|
| Capital Appreciation, Class NAV (Jennison) | 27,103,169 | 386,491,184 |
|
| Capital Appreciation Value, Class NAV | | |
| (T. Rowe Price) | 46,404,538 | 563,815,141 |
|
| China Emerging Leaders, Class NAV (Atlantis) | 10,142,902 | 85,606,095 |
|
| Emerging Markets, Class NAV (DFA) | 57,241,384 | 558,103,493 |
|
| Equity-Income, Class NAV (T. Rowe Price) | 19,793,064 | 360,827,553 |
|
| Fundamental Global Franchise, Class NAV | | |
| (John Hancock1) (A) | 10,901,840 | 128,641,707 |
|
| Fundamental Large Cap Value, Class NAV | | |
| (John Hancock1) (A) | 21,221,128 | 266,537,365 |
|
| Fundamental Value, Class NAV (Davis) | 13,771,811 | 252,299,569 |
|
| Global Equity, Class NAV (John Hancock1) (A)(I) | 9,525,834 | 92,591,109 |
| | |
| | Semiannual report | Lifestyle Portfolios | 17 |
| See notes to financial statements | | |
| | |
| Lifestyle Balanced Portfolio (continued) |
| | Shares | Value |
| John Hancock Funds II (G) (continued) | | |
|
| Global Real Estate, Class NAV (Deutsche) | 14,080,960 | $118,843,305 |
|
| Health Sciences, Class NAV (T. Rowe Price) | 10,944,497 | 176,206,400 |
|
| Heritage, Class NAV (American Century) | 5,783,433 | 45,804,785 |
|
| International Growth Opportunities, Class NAV | | |
| (Baillie Gifford) | 10,108,870 | 114,937,854 |
|
| International Growth Stock, Class NAV (Invesco) | 15,302,543 | 178,733,708 |
|
| International Small Cap, Class NAV | | |
| (Franklin Templeton) | 6,909,190 | 111,790,689 |
|
| International Small Company, Class NAV (DFA) | 13,531,343 | 116,369,546 |
|
| International Value, Class NAV (Templeton) | 23,732,466 | 344,120,760 |
|
| Mid Cap Stock, Class NAV (Wellington) | 10,230,083 | 209,000,599 |
|
| Mid Cap Value Equity, Class NAV (Columbia) | 2,968,172 | 27,693,048 |
|
| Mid Value, Class NAV (T. Rowe Price) | 11,905,763 | 174,895,653 |
|
| Mutual Shares, Class NAV (Franklin) | 10,256,221 | 134,151,365 |
|
| Natural Resources, Class NAV | | |
| (RS Investments/Wellington) | 12,105,737 | 190,302,178 |
|
| Real Estate Equity, Class NAV (T. Rowe Price) | 6,612,252 | 65,659,662 |
|
| Redwood, Class NAV (RCM) | 10,022,798 | 110,751,917 |
|
| Science and Technology, Class NAV | | |
| (T. Rowe Price/RCM) (I) | 19,002,191 | 200,663,141 |
|
| Small Cap Growth, Class NAV (Wellington) | 4,055,539 | 39,582,064 |
|
| Small Cap Opportunities, Class NAV (Invesco/DFA) | 1,437,779 | 39,582,064 |
|
| Small Cap Value, Class NAV (Wellington) | 2,335,317 | 42,409,354 |
|
| Small Company Growth, Class NAV (Invesco) | 1,955,475 | 33,927,483 |
|
| Small Company Value, Class NAV (T. Rowe Price) | 1,968,255 | 63,614,031 |
|
| Smaller Company Growth, Class NAV | | |
| (Frontier/John Hancock2(A)/Perimeter) | 3,423,755 | 34,716,872 |
|
| Technical Opportunities, Class NAV (Wellington) (I) | 12,181,332 | 150,317,637 |
|
| U.S. Equity, Class NAV (GMO) | 30,902,600 | 400,188,666 |
|
| Value, Class NAV (Invesco) | 4,257,117 | 45,976,867 |
| | | |
| John Hancock Funds III (G) 8.6% | | |
|
| Disciplined Value, Class NAV (Robeco) | 10,728,686 | 176,486,882 |
|
| Global Shareholder Yield, Class NAV (Epoch) | 19,983,382 | 214,421,693 |
|
| International Core, Class NAV (GMO) | 6,917,349 | 203,577,574 |
|
| International Value Equity, Class NAV | | |
| (John Hancock1) (A) | 13,985,546 | 118,317,718 |
|
| Rainier Growth, Class NAV (Rainier) | 5,898,270 | 146,866,923 |
|
| Strategic Growth, Class NAV (John Hancock1) (A) | 24,481,345 | 317,523,050 |
| | | |
| John Hancock Investment Trust (G) 0.5% | |
|
| Small Cap Intrinsic Value, Class NAV | | |
| (John Hancock1) (A) | 5,077,995 | 63,678,053 |
| | | |
| FIXED INCOME 35.9% | | |
| | | |
| John Hancock Funds II (G) 35.9% | | |
|
| Active Bond, Class NAV | | |
| (John Hancock1/Declaration) (A) | 52,959,111 | 534,887,019 |
|
| Asia Total Return Bond, Class NAV | | |
| (John Hancock1) (A)(I) | 15,873,548 | 150,005,027 |
|
| Core Bond, Class NAV (Wells Capital) | 16,840,483 | 212,863,700 |
|
| Emerging Markets Debt Fund, Class NAV | | |
| (John Hancock1) (A) | 1,689,466 | 16,539,868 |
|
| Floating Rate Income, Class NAV (WAMCO) | 85,882,860 | 804,722,394 |
|
| Global Bond, Class NAV (PIMCO) | 19,849,925 | 234,626,114 |
|
| Global High Yield, Class NAV (Stone Harbor) | 17,001,975 | 170,019,752 |
|
| High Income, Class NAV (John Hancock1) (A) | 25,906,539 | 208,029,512 |
|
| High Yield, Class NAV (WAMCO) | 24,179,373 | 220,515,884 |
|
| Investment Quality Bond, Class NAV (Wellington) | 8,118,074 | 99,527,587 |
|
| Real Return Bond, Class NAV (PIMCO) | 14,620,431 | 167,696,339 |
|
| Short Duration Credit Opportunities Fund, | | |
| Class NAV (Stone Harbor) | 42,680,699 | 437,903,967 |
|
| Spectrum Income, Class NAV (T. Rowe Price) | 39,720,776 | 432,162,038 |
|
| Strategic Income Opportunities, | | |
| Class NAV (John Hancock1) (A) | 45,107,410 | 493,926,139 |
|
| Total Return, Class NAV (PIMCO) | 38,841,232 | 533,290,121 |
|
| U.S. High Yield Bond, Class NAV (Wells Capital) | 17,755,376 | 219,456,445 |
| | |
| Lifestyle Balanced Portfolio (continued) |
| | Shares | Value |
| ALTERNATIVE 3.6% | | |
| | | |
| John Hancock Funds II (G) 3.6% | | |
|
| Currency Strategies, Class NAV (First Quadrant) | 30,778,362 | $317,940,478 |
|
| Global Absolute Return Strategies, Class NAV | | |
| (Standard Life) | 15,727,095 | 170,796,253 |
| | | |
| Total Investments (Lifestyle Balanced Portfolio) | |
| (Cost $11,483,423,875) 100.0% | $13,727,615,066 |
| |
| Other assets and liabilities, net 0.0% | | 1,403,906 |
|
| TOTAL NET ASSETS 100.0% | | $13,729,018,972 |
| | | |
| Percentages are based upon net assets. | | |
| |
| |
| |
| Lifestyle Moderate Portfolio | |
| Securities owned by the portfolio on 6-30-13 | |
| | Shares | Value |
| AFFILIATED INVESTMENT COMPANIES — 100.00% |
|
| EQUITY 40.1% | | |
| | | |
| John Hancock Funds II (G) 34.9% | | |
|
| All Cap Value, Class NAV (Lord Abbett) | 5,217,048 | $68,812,868 |
|
| Alpha Opportunities, Class NAV (Wellington) | 6,886,366 | 84,357,982 |
|
| Blue Chip Growth, Class NAV (T. Rowe Price) | 4,023,121 | 109,992,115 |
|
| Capital Appreciation, Class NAV (Jennison) | 6,521,598 | 92,997,986 |
|
| Capital Appreciation Value, Class NAV | | |
| (T. Rowe Price) | 13,239,795 | 160,863,509 |
|
| Emerging Markets, Class NAV (DFA) | 10,933,563 | 106,602,238 |
|
| Equity-Income, Class NAV (T. Rowe Price) | 6,529,282 | 119,028,817 |
|
| Fundamental Global Franchise, Class NAV | | |
| (John Hancock1) (A) | 2,781,203 | 32,818,198 |
|
| Fundamental Large Cap Value, Class NAV | | |
| (John Hancock1) (A) | 6,509,895 | 81,764,286 |
|
| Fundamental Value, Class NAV (Davis) | 3,612,911 | 66,188,530 |
|
| Global Equity, Class NAV (John Hancock1) (A)(I) | 2,463,395 | 23,944,195 |
|
| Global Real Estate, Class NAV (Deutsche) | 3,875,663 | 32,710,594 |
|
| International Growth Opportunities, Class NAV | | |
| (Baillie Gifford) | 2,173,478 | 24,712,445 |
|
| International Growth Stock, Class NAV (Invesco) | 3,326,497 | 38,853,479 |
|
| International Small Cap, Class NAV | | |
| (Franklin Templeton) | 1,559,453 | 25,231,945 |
|
| International Small Company, Class NAV (DFA) | 2,982,290 | 25,647,691 |
|
| International Value, Class NAV (Templeton) | 5,198,519 | 75,378,525 |
|
| Mid Cap Stock, Class NAV (Wellington) | 2,620,070 | 53,528,036 |
|
| Mid Value, Class NAV (T. Rowe Price) | 3,515,207 | 51,638,394 |
|
| Natural Resources, Class NAV | | |
| (RS Investments/Wellington) | 2,829,305 | 44,476,669 |
|
| Real Estate Equity, Class NAV (T. Rowe Price) | 2,172,527 | 21,573,195 |
|
| Redwood, Class NAV (RCM) | 3,497,165 | 38,643,675 |
|
| Small Cap Growth, Class NAV (Wellington) | 1,120,840 | 10,939,399 |
|
| Small Cap Value, Class NAV (Wellington) | 627,489 | 11,395,208 |
|
| Small Company Growth, Class NAV (Invesco) | 525,427 | 9,116,166 |
|
| Small Company Value, Class NAV (T. Rowe Price) | 521,810 | 16,864,907 |
|
| Smaller Company Growth, Class NAV | | |
| (Frontier/John Hancock2(A)/Perimeter) | 935,857 | 9,489,593 |
|
| U.S. Equity, Class NAV (GMO) | 8,149,263 | 105,532,953 |
| | | |
| John Hancock Funds III (G) 5.2% | | |
|
| Global Shareholder Yield, Class NAV (Epoch) | 4,832,400 | 51,851,655 |
|
| International Core, Class NAV (GMO) | 1,521,789 | 44,786,256 |
|
| International Value Equity, Class NAV | | |
| (John Hancock1) (A) | 2,936,368 | 24,841,670 |
|
| Rainier Growth, Class NAV (Rainier) | 1,442,256 | 35,912,183 |
|
| Strategic Growth, Class NAV (John Hancock1) (A) | 5,578,944 | 72,358,909 |
| | | |
| FIXED INCOME 55.7% | | |
| | | |
| John Hancock Funds II (G) 55.7% | | |
|
| Active Bond, Class NAV | | |
| (John Hancock1/Declaration) (A) | 34,410,526 | 347,546,310 |
|
| Asia Total Return Bond, Class NAV | | |
| (John Hancock1) (A)(I) | 6,787,380 | 64,140,745 |
|
| Core Bond, Class NAV (Wells Capital) | 11,006,198 | 139,118,338 |
| | |
| 18 | Lifestyle Portfolios | Semiannual report | |
| | | See notes to financial statements |
| | |
| Lifestyle Moderate Portfolio (continued) |
| | Shares | Value |
| John Hancock Funds II (G) (continued) | | |
|
| Floating Rate Income, Class NAV (WAMCO) | 41,469,528 | $388,569,474 |
|
| Global Bond, Class NAV (PIMCO) | 9,757,895 | 115,338,318 |
|
| Global High Yield, Class NAV (Stone Harbor) | 7,306,701 | 73,067,006 |
|
| High Income, Class NAV (John Hancock1) (A) | 10,938,305 | 87,834,587 |
|
| High Yield, Class NAV (WAMCO) | 10,352,681 | 94,416,453 |
|
| Investment Quality Bond, Class NAV (Wellington) | 7,428,473 | 91,073,084 |
|
| Emerging Markets Debt Fund (John Hancock1) (A) | 818,515 | 8,013,258 |
|
| Real Return Bond, Class NAV (PIMCO) | 5,888,801 | 67,544,547 |
|
| Short Duration Credit Opportunities Fund, | | |
| Class NAV (Stone Harbor) | 17,140,656 | 175,863,132 |
|
| Spectrum Income, Class NAV (T. Rowe Price) | 15,865,546 | 172,617,146 |
|
| Strategic Income Opportunities, Class NAV | | |
| (John Hancock1) (A) | 18,399,065 | 201,469,764 |
|
| Total Return, Class NAV (PIMCO) | 25,263,619 | 346,869,483 |
|
| U.S. High Yield Bond, Class NAV (Wells Capital) | 7,629,809 | 94,304,438 |
| | | |
| ALTERNATIVE 4.2% | | |
| | | |
| John Hancock Funds II (G) 4.2% | | |
|
| Currency Strategies, Class NAV (First Quadrant) | 10,590,281 | 109,397,602 |
|
| Global Absolute Return Strategies, Class NAV | | |
| (Standard Life) | 6,925,060 | 75,206,150 |
| | | |
| Total Investments (Lifestyle Moderate Portfolio) | |
| (Cost $3,953,141,359) 100.0% | | $4,425,244,106 |
| | | |
| Other assets and liabilities, net 0.0% | | 1,245,043 |
|
| TOTAL NET ASSETS 100.0% | | $4,426,489,149 |
| | | |
| Percentages are based upon net assets. | | |
|
| |
| |
| |
| Lifestyle Conservative Portfolio |
| Securities owned by the portfolio on 6-30-13 | |
| | Shares | Value |
| AFFILIATED INVESTMENT COMPANIES — 100.0% | |
|
| EQUITY 20.0% | | |
| | | |
| John Hancock Funds II (G) 18.6% | | |
|
| All Cap Value, Class NAV (Lord Abbett) | 529,825 | $6,988,384 |
|
| Blue Chip Growth, Class NAV (T. Rowe Price) | 4,150,187 | 113,466,112 |
|
| Capital Appreciation Value, Class NAV | | |
| (T. Rowe Price) | 7,254,948 | 88,147,617 |
|
| Emerging Markets, Class NAV (DFA) | 4,085,372 | 39,832,375 |
|
| Equity-Income, Class NAV (T. Rowe Price) | 4,763,709 | 86,842,410 |
|
| Fundamental Global Franchise, Class NAV | | |
| (John Hancock1) (A) | 1,608,688 | 18,982,514 |
|
| Fundamental Large Cap Value, Class NAV | | |
| (John Hancock1) (A) | 585,167 | 7,349,701 |
|
| Fundamental Value, Class NAV (Davis) | 3,059,106 | 56,042,815 |
|
| Global Equity, Class NAV (John Hancock1) (A)(I) | 1,815,351 | 17,645,208 |
|
| Global Real Estate, Class NAV (Deutsche) | 2,831,810 | 23,900,480 |
|
| International Growth Stock, Class NAV (Invesco) | 2,440,748 | 28,507,941 |
|
| International Value, Class NAV (Templeton) | 3,309,837 | 47,992,631 |
|
| Mid Cap Stock, Class NAV (Wellington) | 775,135 | 15,836,012 |
|
| Mid Value, Class NAV (T. Rowe Price) | 1,045,894 | 15,364,181 |
|
| Natural Resources, Class NAV | | |
| (RS Investments/Wellington) | 1,218,984 | 19,162,428 |
|
| Real Estate Equity, Class NAV (T. Rowe Price) | 1,967,161 | 19,533,913 |
|
| Redwood, Class NAV (RCM) | 3,503,294 | 38,711,400 |
|
| Small Cap Growth, Class NAV (Wellington) | 1,000,713 | 9,766,956 |
|
| Small Company Value, Class NAV (T. Rowe Price) | 302,195 | 9,766,956 |
|
| U.S. Equity, Class NAV (GMO) | 4,938,804 | 63,957,508 |
| | | |
| John Hancock Funds III (G) 1.4% | | |
|
| Global Shareholder Yield, Class NAV (Epoch) | 2,997,422 | 32,162,338 |
|
| International Core, Class NAV (GMO) | 743,470 | 21,880,310 |
| | |
| Lifestyle Conservative Portfolio (continued) |
| | Shares | Value |
| FIXED INCOME 75.3% | | |
| | | |
| John Hancock Funds II (G) 75.3% | | |
|
| Active Bond, Class NAV | | |
| (John Hancock1/Declaration) (A) | 38,223,646 | $386,058,824 |
|
| Asia Total Return Bond, Class NAV | | |
| (John Hancock1) (A)(I) | 6,748,077 | 63,769,323 |
|
| Core Bond, Class NAV (Wells Capital) | 15,061,252 | 190,374,223 |
|
| Emerging Markets Debt Fund, Class NAV | | |
| (John Hancock1) (A) | 964,400 | 9,441,478 |
|
| Floating Rate Income, Class NAV (WAMCO) | 43,928,607 | 411,611,044 |
|
| Global Bond, Class NAV (PIMCO) | 11,964,101 | 141,415,670 |
|
| Global High Yield, Class NAV (Stone Harbor) | 6,844,113 | 68,441,126 |
|
| High Income, Class NAV (John Hancock1) (A) | 10,179,263 | 81,739,483 |
|
| High Yield, Class NAV (WAMCO) | 9,573,531 | 87,310,606 |
|
| Investment Quality Bond, Class NAV (Wellington) | 16,544,510 | 202,835,690 |
|
| Real Return Bond, Class NAV (PIMCO) | 9,438,485 | 108,259,418 |
|
| Short Duration Credit Opportunities, Class NAV | | |
| (Stone Harbor) | 17,568,650 | 180,254,346 |
|
| Short Term Government Income, Class NAV | | |
| (John Hancock1) (A) | 16,027,973 | 157,074,131 |
|
| Spectrum Income, Class NAV (T. Rowe Price) | 16,280,332 | 177,130,012 |
|
| Strategic Income Opportunities, Class NAV | | |
| (John Hancock1) (A) | 18,857,262 | 206,487,018 |
|
| Total Return, Class NAV (PIMCO) | 27,964,534 | 383,953,057 |
|
| U.S. High Yield Bond, Class NAV (Wells Capital) | 7,064,042 | 87,311,560 |
| | | |
| ALTERNATIVE 4.7% | | |
| | | |
| John Hancock Funds II (G) 4.7% | | |
|
| Global Absolute Return Strategies, Class NAV | | |
| (Standard Life) | 7,801,983 | 84,729,536 |
|
| Currency Strategies, Class NAV (First Quadrant) | 9,685,043 | 100,046,493 |
| | | |
| Total Investments (Lifestyle Conservative Portfolio) |
| (Cost $3,634,290,084) 100.0% | | $3,910,083,228 |
| | | |
| Other assets and liabilities, net 0.0% | | 210,609 |
|
| TOTAL NET ASSETS 100.0% | | $3,910,293,837 |
| | | |
| Percentages are based upon net assets. | | |
Footnote Legend:
1 Manulife Asset Management (US) LLC is doing business as John Hancock Asset Management.
2 Manulife Asset Management (North America) Limited is doing business as John Hancock Asset Management.
(A) The subadvisor is an affiliate of the advisor.
(G) The portfolio’s subadvisor is shown parenthetically.
(I) Non-income producing.
| | |
| | Semiannual report | Lifestyle Portfolios | 19 |
| See notes to financial statements | | |
F I N A N C I A L S T A T E M E N T S
Financial statements
Statements of assets and liabilities 6-30-13 (Unaudited)
These Statements of assets and liabilities are the portfolios’ balance sheets. They show the value of what each portfolio owns, is due and owes. You’ll also find the net asset value and the maximum offering price per share for each portfolio. Net asset value is calculated by dividing the net assets of each class of shares by the number of outstanding shares in the class.
| | | |
| | Lifestyle | Lifestyle | Lifestyle |
| | Aggressive | Growth | Balanced |
| Assets | | | |
|
| Investments in affiliated underlying funds, at value | $4,080,385,772 | $12,674,696,828 | $13,727,615,066 |
| Cash | 51 | 45 | 46 |
| Receivable for investments sold | 4,572,127 | 16,908,738 | 16,188,725 |
| Receivable for fund shares sold | 465,239 | 3,831,833 | 6,685,901 |
| Dividends and interest receivable | 18,504 | 2,906,382 | 6,459,390 |
| Receivable due from advisor | 70 | 175 | — |
| Other assets | 60,905 | 108,069 | 124,113 |
| | | | |
| Total assets | 4,085,502,668 | 12,698,452,070 | 13,757,073,241 |
| |
| Liabilities | | | |
|
| Payable for investments purchased | — | 3,199,544 | 7,193,069 |
| Payable for fund shares repurchased | 4,916,593 | 19,314,589 | 20,150,483 |
| Distributions payable | — | — | 69,839 |
| Payable to affiliates: Accounting and legal services fees | 78,665 | 199,573 | 216,025 |
Transfer agent fees | 58,973 | 228,243 | 269,838 |
| Trustees’ fees | 1,580 | 4,814 | 4,949 |
| Investment management fees | — | — | 88 |
| Distribution and service fees | 9,322 | 18,604 | 32,799 |
| Other liabilities and accrued expenses | 54,814 | 129,771 | 117,179 |
| Total liabilities | 5,119,947 | 23,095,138 | 28,054,269 |
| | | | |
| Net assets | $4,080,382,721 | $12,675,356,932 | $13,729,018,972 |
| |
| Net assets consist of | | | |
|
| Paid-in capital | $3,678,866,913 | $11,432,001,109 | $12,764,925,975 |
| Undistributed net investment income (loss) | (2,375,471) | 30,546,403 | 108,806 |
| Accumulated undistributed net realized gain (loss) on investments | (493,073,909) | (1,266,708,839) | (1,280,207,000) |
| Net unrealized appreciation (depreciation) on investments | 896,965,188 | 2,479,518,259 | 2,244,191,191 |
| Net assets | $4,080,382,721 | $12,675,356,932 | $13,729,018,972 |
| Investments in affiliated underlying funds, at cost | $3,183,420,584 | $10,195,178,569 | $11,483,423,875 |
|
| Net asset value per share | | | |
|
| |
| The portfolios have an unlimited number of shares authorized with par value of $0.01 | | | |
| per share. Net asset value is calculated by dividing the net assets of each class of | | | |
| shares by the number of outstanding shares in the class. | | | |
| Class A:1 Net assets | $269,324,914 | $1,028,314,288 | $1,207,057,817 |
| Shares outstanding | 19,291,813 | 71,172,482 | 85,171,742 |
| Net asset value and redemption price per share | $13.96 | $14.45 | $14.17 |
| Class B:1 Net assets | $24,778,511 | $110,583,811 | $110,349,197 |
| Shares outstanding | 1,777,526 | 7,661,786 | 7,790,384 |
| Net asset value, offering price and redemption price per share | $13.94 | $14.43 | $14.16 |
| Class C:1 Net assets | $133,906,590 | $534,804,287 | $651,570,258 |
| Shares outstanding | 9,599,644 | 37,085,548 | 45,950,245 |
| Net asset value, offering price and redemption price per share | $13.95 | $14.42 | $14.18 |
| Class R1: Net assets | $8,432,283 | $19,853,189 | $16,959,501 |
| Shares outstanding | 603,856 | 1,371,564 | 1,200,888 |
| Net asset value, offering price and redemption price per share | $13.96 | $14.47 | $14.12 |
| Class R2: Net assets | $1,499,277 | $5,080,782 | $2,270,195 |
| Shares outstanding | 107,907 | 353,553 | 160,827 |
| Net asset value, offering price and redemption price per share | $13.89 | $14.37 | $14.12 |
| Class R3: Net assets | $9,666,897 | $21,552,338 | $34,816,217 |
| Shares outstanding | 694,650 | 1,495,564 | 2,461,678 |
| Net asset value, offering price and redemption price per share | $13.92 | $14.41 | $14.14 |
| Class R4: Net assets | $6,215,648 | $20,464,952 | $71,888,173 |
| Shares outstanding | 446,518 | 1,417,740 | 5,082,476 |
| Net asset value, offering price and redemption price per share | $13.92 | $14.43 | $14.14 |
| Class R5: Net assets | $9,289,861 | $31,522,129 | $39,732,752 |
| Shares outstanding | 666,188 | 2,179,512 | 2,805,804 |
| Net asset value, offering price and redemption price per share | $13.94 | $14.46 | $14.16 |
| Class R6: Net assets | $3,598,784 | $12,232,786 | $12,590,731 |
| Shares outstanding | 258,305 | 848,993 | 892,603 |
| Net asset value, offering price and redemption price per share | $13.93 | $14.41 | $14.11 |
| Class 1: Net assets | $3,613,669,956 | $10,729,271,393 | $11,484,784,704 |
| Shares outstanding | 259,524,720 | 744,412,403 | 814,471,850 |
| Net asset value, offering price and redemption price per share | $13.92 | $14.41 | $14.10 |
| Class 5: Net assets | — | $161,676,977 | $96,999,427 |
| Shares outstanding | — | 11,227,545 | 6,876,460 |
| Net asset value, offering price and redemption price per share | — | $14.40 | $14.11 |
| |
| Maximum public offering price per share | | | |
|
| Class A (net asset value per share ÷ 95%)2 | $14.69 | 15.21 | $14.92 |
1 Redemption price per share is equal to net asset value less any applicable contingent deferred sales charge.
2 On single retail sales of less than $50,000. On sales of $50,000 or more and on group sales the offering price is reduced.
| | |
| 20 | Lifestyle Portfolios | Semiannual report | |
| | | See notes to financial statements |
F I N A N C I A L S T A T E M E N T S
Statements of assets and liabilities 6-30-13 (Unaudited)
Continued
| | |
| | Lifestyle | Lifestyle |
| | Moderate | Conservative |
| Assets | | |
|
| Investments in affiliated underlying funds, at value | $4,425,244,106 | $3,910,083,228 |
| Cash | 56 | 58 |
| Receivable for investments sold | 6,054,155 | 6,486,688 |
| Receivable for fund shares sold | 3,173,389 | 3,447,386 |
| Dividends and interest receivable | 2,871,380 | 2,962,208 |
| Receivable due from advisor | 210 | 313 |
| Other assets | 80,040 | 95,438 |
| Total assets | 4,437,423,336 | 3,923,075,319 |
| | | |
| Liabilities | | |
|
| Payable for investments purchased | 3,201,543 | 3,303,857 |
| Payable for fund shares repurchased | 7,335,526 | 8,898,827 |
| Distributions payable | 155,133 | 342,616 |
| Payable to affiliates: Accounting and legal services fees | 67,063 | 62,299 |
| Transfer agent fees | 113,538 | 124,769 |
| Trustees’ fees | 1,598 | 1,361 |
| Investment management fees | — | — |
| Distribution and service fees | 8,199 | 7,210 |
| Other liabilities and accrued expenses | 51,587 | 40,543 |
| Total liabilities | 10,934,187 | 12,781,482 |
| | | |
| Net assets | $4,426,489,149 | $3,910,293,837 |
| | | |
| Net assets consist of | | |
|
| Paid-in capital | $4,111,197,570 | $3,712,539,188 |
| Undistributed net investment income (loss) | 169,568 | 189,515 |
| Accumulated undistributed net realized gain (loss) on investments | (156,980,736) | (78,228,010) |
| Net unrealized appreciation (depreciation) on investments | 472,102,747 | 275,793,144 |
| Net assets | $4,426,489,149 | $3,910,293,837 |
| Investments in affiliated underlying funds, at cost | $3,953,141,359 | $3,634,290,084 |
| | | |
| Net asset value per share | | |
|
| The portfolios have an unlimited number of shares authorized with par value of $0.01 | | |
| per share. Net asset value is calculated by dividing the net assets of each class of | | |
| shares by the number of outstanding shares in the class. | | |
| Class A:1 Net assets | $470,054,201 | $512,217,818 |
| Shares outstanding | 34,569,481 | 38,290,968 |
| Net asset value and redemption price per share | $13.60 | $13.38 |
| Class B:1 Net assets | $44,407,550 | $48,949,015 |
| Shares outstanding | 3,268,546 | 3,658,461 |
| Net asset value, offering price and redemption price per share | $13.59 | $13.38 |
| Class C:1 Net assets | $322,292,173 | $360,676,356 |
| Shares outstanding | 23,701,134 | 26,969,024 |
| Net asset value, offering price and redemption price per share | $13.60 | $13.37 |
| Class R1: Net assets | $9,556,602 | $9,229,902 |
| Shares outstanding | 703,167 | 690,070 |
| Net asset value, offering price and redemption price per share | $13.59 | $13.38 |
| Class R2: Net assets | $1,120,040 | $815,019 |
| Shares outstanding | 82,594 | 60,980 |
| Net asset value, offering price and redemption price per share | $13.56 | $13.37 |
| Class R3: Net assets | $11,051,336 | $12,140,945 |
| Shares outstanding | 814,303 | 909,371 |
| Net asset value, offering price and redemption price per share | $13.57 | $13.35 |
| Class R4: Net assets | $12,727,527 | $10,568,210 |
| Shares outstanding | 938,799 | 791,002 |
| Net asset value, offering price and redemption price per share | $13.56 | $13.36 |
| Class R5: Net assets | $11,269,431 | $15,898,984 |
| Shares outstanding | 831,005 | 1,188,890 |
| Net asset value, offering price and redemption price per share | $13.56 | $13.37 |
| Class R6: Net assets | $5,456,723 | $3,263,845 |
| Shares outstanding | 402,666 | 244,456 |
| Net asset value, offering price and redemption price per share | $13.55 | $13.35 |
| Class 1: Net assets | $3,495,891,644 | $2,936,533,743 |
| Shares outstanding | 257,725,841 | 219,881,778 |
| Net asset value, offering price and redemption price per share | $13.56 | $13.36 |
| Class 5: Net assets | $42,661,922 | — |
| Shares outstanding | 3,148,015 | — |
| Net asset value, offering price and redemption price per share | $13.55 | — |
| | | |
| Maximum public offering price per share | | |
|
| Class A (net asset value per share ÷ 95%)2 | $14.32 | $14.08 |
1 Redemption price per share is equal to net asset value less any applicable contingent deferred sales charge.
2 On single retail sales of less than $50,000. On sales of $50,000 or more and on group sales the offering price is reduced.
| | |
| | Semiannual report | Lifestyle Portfolios | 21 |
| See notes to financial statements | | |
F I N A N C I A L S T A T E M E N T S
Statements of operations For the six months ended 6-30-13 (Unaudited)
These Statements of operations summarize the portfolios’ investment income earned and expenses directly incurred in operating each portfolio. They also show net gains (losses) for the period stated.
| | | | | |
| | Lifestyle | Lifestyle | Lifestyle | Lifestyle | Lifestyle |
| | Aggressive | Growth | Balanced | Moderate | Conservative |
|
| Investment income | | | | | |
| Income distributions received from affiliated | | | | | |
| underlying funds | $1,404,455 | $43,146,320 | $92,872,059 | $43,552,932 | $47,968,548 |
| Other | 1,222 | 2,350 | 1,128 | — | — |
| | | | | | |
| Total investment income | 1,405,677 | 43,148,670 | 92,873,187 | 43,552,932 | 47,968,548 |
| | | | | | |
| Expenses | | | | | |
|
| Investment management fees | 918,187 | 2,755,488 | 2,938,176 | 904,771 | 817,417 |
| Distribution and service fees | 2,145,102 | 7,482,656 | 8,573,230 | 3,404,097 | 3,568,576 |
| Transfer agent fees | 365,810 | 1,414,993 | 1,656,596 | 695,395 | 781,731 |
| Accounting and legal services fees | 267,459 | 783,685 | 850,176 | 275,446 | 253,906 |
| State registration fees | 67,468 | 96,816 | 116,693 | 87,897 | 85,554 |
| Professional fees | 43,698 | 89,832 | 95,945 | 46,406 | 44,285 |
| Printing and postage | 20,820 | 65,329 | 61,631 | 26,038 | 27,620 |
| Custodian fees | 5,951 | 5,951 | 5,951 | 5,951 | 5,951 |
| Trustees’ fees | 20,942 | 64,974 | 70,583 | 22,940 | 21,230 |
| Registration and filing fees | 10,814 | 11,508 | 17,885 | 15,294 | 15,372 |
| Other | 12,661 | 31,515 | 32,409 | 12,985 | 11,575 |
| Total expenses before reductions and | | | | | |
| amounts recaptured | 3,878,912 | 12,802,747 | 14,419,275 | 5,497,220 | 5,633,217 |
| | | | | | |
| Net expense reductions and amounts recaptured | (97,764) | (200,480) | (191,228) | (20,823) | (19,219) |
| Total expenses | 3,781,148 | 12,602,267 | 14,228,047 | 5,476,397 | 5,613,998 |
| | | | | | |
| Net investment income (loss) | (2,375,471) | 30,546,403 | 78,645,140 | 38,076,535 | 42,354,550 |
| | | | | | |
| Realized and unrealized gain (loss) | | | | | |
|
| Net realized gain (loss) on | | | | | |
| Investments in affiliated underlying funds | 47,162,566 | 118,092,228 | 90,135,116 | 18,808,772 | 12,234,134 |
| Change in net unrealized appreciation | | | | | |
| (depreciation) of | | | | | |
| Investments in affiliated underlying funds | 259,902,210 | 672,907,034 | 439,830,511 | 57,251,769 | (29,576,114) |
| Net realized and unrealized gain (loss) | 307,064,776 | 790,999,262 | 529,965,627 | 76,060,541 | (17,341,980) |
| | | | | | |
| Increase (decrease) in net assets | | | | | |
| from operations | $304,689,305 | $821,545,665 | $608,610,767 | $114,137,076 | $25,012,570 |
| | |
| 22 | Lifestyle Portfolios | Semiannual report | |
| | | See notes to financial statements |
F I N A N C I A L S T A T E M E N T S
Statements of changes in net assets
These Statements of changes in net assets show how the value of the portfolios’ net assets have changed during the last two periods. They reflect earnings less expenses, any investment gains and losses, distributions, if any, paid to shareholders and the net of portfolio share transactions.
| | | | |
| Lifestyle Aggressive | | Lifestyle Growth | |
| | Six Months Ended 6-30-13 | | Six Months Ended 6-30-13 | |
| | (Unaudited) | Year Ended 12-31-12 | (Unaudited) | Year Ended 12-31-12 |
| Increase (decrease) in net assets | | | | |
|
| From operations | | | | |
| Net investment income (loss) | ($2,375,471) | $36,836,695 | $30,546,403 | $181,449,624 |
| Net realized gain (loss) | 47,162,566 | 116,364,569 | 118,092,228 | 351,493,880 |
| Change in net unrealized appreciation (depreciation) | 259,902,210 | 407,908,728 | 672,907,034 | 1,108,277,322 |
| Increase (decrease) in net assets resulting | 304,689,305 | 561,109,992 | 821,545,665 | 1,641,220,826 |
| from operations | | | | |
| |
| Distributions to shareholders | | | | |
| | | | | |
| | | | |
| From net investment income | | | | |
| Class A | — | (1,426,449) | — | (10,466,105) |
| Class B | — | — | — | (544,450) |
| Class C | — | — | — | (2,485,677) |
| Class R1 | — | (25,162) | — | (179,049) |
| Class R2 | — | (584) | — | (1,195) |
| Class R3 | — | (32,965) | — | (179,360) |
| Class R4 | — | (56,166) | — | (263,146) |
| Class R5 | — | (78,266) | — | (480,706) |
| Class R6 | — | (22,535) | — | (56,542) |
| Class 1 | — | (35,346,570) | — | (164,805,425) |
| Class 5 | — | — | — | (2,351,186) |
| From net realized gain | | | | |
| Class A | — | (1,090,597) | — | (4,053,265) |
| Class B | — | (79,362) | — | (493,776) |
| Class C | — | (462,271) | — | (2,212,540) |
| Class R1 | — | (40,909) | — | (87,024) |
| Class R2 | — | (476) | — | (479) |
| Class R3 | — | (46,474) | — | (85,296) |
| Class R4 | — | (38,683) | — | (90,259) |
| Class R5 | — | (39,818) | — | (143,388) |
| Class R6 | — | (9,914) | — | (15,876) |
| Class 1 | — | (15,550,928) | — | (46,274,429) |
| Class 5 | — | — | — | (641,401) |
| | | | | |
| Total distributions | — | (54,348,129) | — | (235,910,574) |
| | | | | |
| From portfolio share transactions | (22,065,461) | (246,993,721) | 30,325,549 | (399,018,075) |
| |
| Total increase (decrease) | 282,623,844 | 259,768,142 | 851,871,214 | 1,006,292,177 |
| | | | | |
| Net assets | | | | |
|
| Beginning of period | 3,797,758,877 | 3,537,990,735 | 11,823,485,718 | 10,817,193,541 |
| | | | | |
| End of period | $4,080,382,721 | $3,797,758,877 | $12,675,356,932 | $11,823,485,718 |
| | | | | |
| Undistributed net investment income (loss) | ($2,375,471) | — | $30,546,403 | — |
| | |
| | Semiannual report | Lifestyle Portfolios | 23 |
| See notes to financial statements | | |
F I N A N C I A L S T A T E M E N T S
Statements of changes in net assets
Continued
| | | | |
| | Lifestyle Balanced | | Lifestyle Moderate | |
| | Six Months Ended 6-30-13 | | Six Months Ended 6-30-13 | |
| | (Unaudited) | Year Ended 12-31-12 | (Unaudited) | Year Ended 12-31-12 |
| Increase (decrease) in net assets | | | | |
|
| From operations | | | | |
| Net investment income (loss) | $78,645,140 | $276,162,385 | $38,076,535 | $110,726,829 |
| Net realized gain (loss) | 90,135,116 | 287,199,896 | 18,808,772 | 88,903,673 |
| Change in net unrealized appreciation | 439,830,511 | 1,030,528,139 | 57,251,769 | 261,491,409 |
| (depreciation) | | | | |
| Increase (decrease) in net assets resulting | 608,610,767 | 1,593,890,420 | 114,137,076 | 461,121,911 |
| from operations | | | | |
| |
| Distributions to shareholders | | | | |
|
| From net investment income | | | | |
| Class A | (4,681,054) | (17,759,117) | (3,176,414) | (8,731,847) |
| Class B | (48,006) | (1,169,470) | (147,001) | (700,988) |
| Class C | (331,822) | (6,391,268) | (1,086,884) | (4,597,803) |
| Class R1 | (39,635) | (266,292) | (50,621) | (177,204) |
| Class R2 | (5,826) | (1,816) | (5,317) | (2,375) |
| Class R3 | (100,881) | (592,809) | (58,985) | (211,712) |
| Class R4 | (349,966) | (1,356,479) | (92,212) | (254,303) |
| Class R5 | (234,194) | (889,211) | (92,001) | (312,381) |
| Class R6 | (61,755) | (65,425) | (44,502) | (18,232) |
| Class 1 | (72,064,461) | (246,402,108) | (32,749,494) | (94,937,676) |
| Class 5 | (618,734) | (1,790,407) | (403,536) | (1,015,929) |
| From net realized gain | | | | |
| Class A | — | (5,017,754) | — | (2,228,251) |
| Class B | — | (519,957) | — | (250,939) |
| Class C | — | (2,801,537) | — | (1,611,104) |
| Class R1 | — | (85,281) | — | (53,353) |
| Class R2 | — | (507) | — | (584) |
| Class R3 | — | (179,741) | — | (57,754) |
| Class R4 | — | (341,854) | — | (61,612) |
| Class R5 | — | (189,156) | — | (53,383) |
| Class R6 | — | (21,516) | — | (8,247) |
| Class 1 | — | (53,477,967) | — | (19,188,839) |
| Class 5 | — | (404,478) | — | (216,562) |
| | | | | |
| Total distributions | (78,536,334) | (339,724,150) | (37,906,967) | (134,691,078) |
| | | | | |
| From portfolio share transactions | 246,738,305 | 375,745,437 | 123,316,915 | 215,103,733 |
| |
| Total increase (decrease) | 776,812,738 | 1,629,911,707 | 199,547,024 | 541,534,566 |
| | | | |
| Net assets | | | | |
|
| Beginning of period | 12,952,206,234 | 11,322,294,527 | 4,226,942,125 | 3,685,407,559 |
| End of period | $13,729,018,972 | $12,952,206,234 | $4,426,489,149 | $4,226,942,125 |
| | | | | |
| Undistributed net investment income (loss) | $108,806 | — | $169,568 | — |
| | |
| 24 | Lifestyle Portfolios | Semiannual report | |
| | | See notes to financial statements |
F I N A N C I A L S T A T E M E N T S
Statements of changes in net assets
Continued
| | |
| Lifestyle Conservative | |
| | Six Months Ended 6-30-13 | |
| | (Unaudited) | Year Ended 12-31-12 |
| Increase (decrease) in net assets | | |
|
| From operations | | |
| Net investment income (loss) | $42,354,550 | $113,727,389 |
| Net realized gain (loss) | 12,234,134 | 54,728,458 |
| Change in net unrealized appreciation | (29,576,114) | 185,828,952 |
| (depreciation) | | |
| Increase in net assets resulting from | 25,012,570 | 354,284,799 |
| operations | 1 | |
| |
| Distributions to shareholders | | |
|
| From net investment income | | |
| Class A | (4,683,653) | (11,673,446) |
| Class B | (275,908) | (916,465) |
| Class C | (2,039,908) | (6,368,376) |
| Class R1 | (68,799) | (189,440) |
| Class R2 | (5,911) | (2,752) |
| Class R3 | (92,489) | (268,491) |
| Class R4 | (91,655) | (252,422) |
| Class R5 | (171,872) | (456,826) |
| Class R6 | (33,023) | (31,303) |
| Class 1 | (34,701,817) | (93,810,074) |
| From net realized gain | | |
| Class A | — | (2,813,285) |
| Class B | — | (290,353) |
| Class C | — | (2,009,193) |
| Class R1 | — | (54,987) |
| Class R2 | — | (622) |
| Class R3 | — | (66,658) |
| Class R4 | — | (48,823) |
| Class R5 | — | (89,119) |
| Class R6 | — | (9,255) |
| Class 1 | — | (18,514,941) |
| | | |
| Total distributions | (42,165,035) | (137,866,831) |
| | | |
| From portfolio share transactions | (62,724,692) | 474,723,107 |
| |
| Total increase (decrease) | (79,877,157) | 691,141,075 |
| | |
| Net assets | | |
|
| Beginning of period | 3,990,170,994 | 3,299,029,919 |
| End of period | $3,910,293,837 | $3,990,170,994 |
| | | |
| Undistributed net investment income (loss) | $189,515 | — |
| | |
| | Semiannual report | Lifestyle Portfolios | 25 |
| See notes to financial statements | | |
Financial highlights
These Financial highlights show how each portfolio’s net asset value for a share has changed since the end of the previous period.
Lifestyle Aggressive
| | | | | | | | | | | | | | | |
| Per share operating performance for a share outstanding throughout the period | | | Ratios and supplemental data | |
|
| | Income (loss) from | | | | | | | | | | | | |
| | investment operations | | Less distributions | | | | | Ratios to average net assets | | | |
| |
| |
| |
| |
| | | | Net | | | | | | | | Expenses | Expenses | | | |
| | | | realized | Total | | | | | | | before | including | | Net | |
| | Net asset | Net | and | from | From net | | | | | | reduc- | reduc- | | assets, | |
| | value, | invest- | unrealized | invest- | invest- | | | | Net asset | | tions and | tions and | Net | end of | |
| | beginning | ment in- | gain (loss) | ment | ment | From net | From | Total | value, end | Total | amounts | amounts | investment | period (in | Portfolio |
| | of period | come (loss) | on invest- | operations | income | realized | paid-in | distribu- | of period | return | recaptured | recaptured | income | millions) | turnover |
| Period ended | ($) | ($)1,2 | ments ($) | ($) | ($) | gain ($) | capital ($) | tions ($) | ($) | (%)3,4 | (%)5 | (%)5 | (loss) (%)1 | ($) | (%) |
|
| CLASS A | | | | | | | | | | | | | | | |
|
| 06-30-20136 | 12.95 | (0.03) | 1.04 | 1.01 | — | — | — | — | 13.96 | 7.807 | 0.558 | 0.558 | (0.24)7 | 269 | 8 |
| 12-31-2012 | 11.30 | 0.08 | 1.71 | 1.79 | (0.08) | (0.06) | — | (0.14) | 12.95 | 15.83 | 0.58 | 0.57 | 0.66 | 239 | 21 |
| 12-31-2011 | 12.34 | 0.05 | (0.92) | (0.87) | (0.05) | (0.12) | — | (0.17) | 11.30 | (7.09) | 0.58 | 0.58 | 0.39 | 200 | 25 |
| 12-31-2010 | 10.82 | 0.04 | 1.64 | 1.68 | (0.04) | (0.12) | — | (0.16) | 12.34 | 15.50 | 0.59 | 0.619 | 0.34 | 185 | 19 |
| 12-31-2009 | 8.02 | 0.06 | 2.83 | 2.89 | (0.05) | (0.04) | — | (0.09) | 10.82 | 36.04 | 0.72 | 0.65 | 0.70 | 138 | 23 |
| 12-31-2008 | 15.22 | 0.10 | (6.58) | (6.48) | (0.09) | (0.63) | — | (0.72) | 8.02 | (42.40) | 0.66 | 0.61 | 0.77 | 78 | 36 |
|
| CLASS B | | | | | | | | | | | | | | | |
|
| 06-30-20136 | 12.98 | (0.09) | 1.05 | 0.96 | — | — | — | — | 13.94 | 7.407 | 1.318 | 1.358 | (0.64)7 | 25 | 8 |
| 12-31-2012 | 11.33 | (0.02) | 1.71 | 1.69 | — | (0.04) | — | (0.04) | 12.98 | 14.94 | 1.33 | 1.35 | (0.18) | 24 | 21 |
| 12-31-2011 | 12.37 | (0.05) | (0.92) | (0.97) | — | (0.07) | — | (0.07) | 11.33 | (7.83) | 1.33 | 1.359 | (0.45) | 23 | 25 |
| 12-31-2010 | 10.86 | (0.05) | 1.64 | 1.59 | — | (0.08) | — | (0.08) | 12.37 | 14.61 | 1.37 | 1.359 | (0.46) | 24 | 19 |
| 12-31-2009 | 8.06 | (0.01) | 2.84 | 2.83 | — | (0.03) | — | (0.03) | 10.86 | 35.09 | 1.60 | 1.35 | (0.15) | 22 | 23 |
| 12-31-2008 | 15.23 | —10 | (6.54) | (6.54) | — | (0.63) | — | (0.63) | 8.06 | (42.84) | 1.51 | 1.35 | 0.01 | 16 | 36 |
|
| CLASS C | | | | | | | | | | | | | | | |
|
| 06-30-20136 | 12.98 | (0.08) | 1.05 | 0.97 | — | — | — | — | 13.95 | 7.477 | 1.268 | 1.268 | (0.59)7 | 134 | 8 |
| 12-31-2012 | 11.33 | (0.01) | 1.71 | 1.70 | — | (0.05) | — | (0.05) | 12.98 | 15.00 | 1.28 | 1.27 | (0.11) | 121 | 21 |
| 12-31-2011 | 12.37 | (0.04) | (0.92) | (0.96) | — | (0.08) | — | (0.08) | 11.33 | (7.76) | 1.29 | 1.28 | (0.36) | 112 | 25 |
| 12-31-2010 | 10.86 | (0.04) | 1.63 | 1.59 | — | (0.08) | — | (0.08) | 12.37 | 14.61 | 1.29 | 1.339 | (0.39) | 111 | 19 |
| 12-31-2009 | 8.06 | (0.01) | 2.84 | 2.83 | — | (0.03) | — | (0.03) | 10.86 | 35.09 | 1.43 | 1.35 | (0.14) | 89 | 23 |
| 12-31-2008 | 15.23 | 0.01 | (6.55) | (6.54) | — | (0.63) | — | (0.63) | 8.06 | (42.79) | 1.36 | 1.31 | 0.05 | 62 | 36 |
|
| CLASS R1 | | | | | | | | | | | | | | | |
|
| 06-30-20136 | 12.98 | (0.06) | 1.04 | 0.98 | — | — | — | — | 13.96 | 7.557 | 1.008 | 0.998 | (0.46)7 | 8 | 8 |
| 12-31-2012 | 11.33 | 0.02 | 1.73 | 1.75 | (0.04) | (0.06) | — | (0.10) | 12.98 | 15.42 | 0.97 | 0.96 | 0.19 | 9 | 21 |
| 12-31-2011 | 12.38 | (0.02) | (0.91) | (0.93) | — | (0.12) | — | (0.12) | 11.33 | (7.49) | 0.99 | 0.98 | (0.14) | 8 | 25 |
| 12-31-2010 | 10.87 | —10 | 1.63 | 1.63 | — | (0.12) | — | (0.12) | 12.38 | 14.99 | 0.91 | 0.969 | (0.03) | 8 | 19 |
| 12-31-2009 | 8.05 | 0.08 | 2.79 | 2.87 | (0.01) | (0.04) | — | (0.05) | 10.87 | 35.66 | 1.16 | 1.05 | 0.81 | 6 | 23 |
| 12-31-2008 | 15.27 | 0.10 | (6.63) | (6.53) | (0.06) | (0.63) | — | (0.69) | 8.05 | (42.56) | 1.49 | 0.85 | 0.83 | 2 | 36 |
|
| CLASS R2 | | | | | | | | | | | | | | | |
|
| 06-30-20136 | 12.89 | (0.03) | 1.03 | 1.00 | — | — | — | — | 13.89 | 7.767 | 2.838 | 0.628 | (0.25)7 | 1 | 8 |
| 12-31-201211 | 12.49 | 0.09 | 0.44 | 0.53 | (0.07) | (0.06) | — | (0.13) | 12.89 | 4.277 | 16.298 | 0.628 | 0.697 | —12 | 2113 |
|
| CLASS R3 | | | | | | | | | | | | | | | |
|
| 06-30-20136 | 12.93 | (0.06) | 1.05 | 0.99 | — | — | — | — | 13.92 | 7.667 | 0.888 | 0.878 | (0.40)7 | 10 | 8 |
| 12-31-2012 | 11.28 | 0.03 | 1.72 | 1.75 | (0.04) | (0.06) | — | (0.10) | 12.93 | 15.53 | 0.88 | 0.88 | 0.27 | 10 | 21 |
| 12-31-2011 | 12.33 | (0.01) | (0.90) | (0.91) | (0.02) | (0.12) | — | (0.14) | 11.28 | (7.41) | 0.87 | 0.87 | (0.06) | 10 | 25 |
| 12-31-2010 | 10.82 | 0.01 | 1.63 | 1.64 | (0.01) | (0.12) | — | (0.13) | 12.33 | 15.21 | 0.85 | 0.84 | 0.06 | 12 | 19 |
| 12-31-2009 | 8.03 | 0.03 | 2.83 | 2.86 | (0.03) | (0.04) | — | (0.07) | 10.82 | 35.59 | 0.95 | 0.95 | 0.31 | 10 | 23 |
| 12-31-2008 | 15.22 | 0.07 | (6.57) | (6.50) | (0.06) | (0.63) | — | (0.69) | 8.03 | (42.54) | 0.91 | 0.86 | 0.59 | 6 | 36 |
|
| CLASS R4 | | | | | | | | | | | | | | | |
|
| 06-30-20136 | 12.91 | (0.03) | 1.04 | 1.01 | — | — | — | — | 13.92 | 7.827 | 0.608 | 0.508 | (0.22)7 | 6 | 8 |
| 12-31-2012 | 11.27 | 0.06 | 1.73 | 1.79 | (0.09) | (0.06) | — | (0.15) | 12.91 | 15.86 | 0.59 | 0.53 | 0.528 | 8 | 21 |
| 12-31-2011 | 12.32 | 0.04 | (0.92) | (0.88) | (0.05) | (0.12) | — | (0.17) | 11.27 | (7.13) | 0.61 | 0.61 | 0.33 | 8 | 25 |
| 12-31-2010 | 10.81 | 0.04 | 1.64 | 1.68 | (0.05) | (0.12) | — | (0.17) | 12.32 | 15.56 | 0.55 | 0.55 | 0.34 | 8 | 19 |
| 12-31-2009 | 8.01 | 0.06 | 2.83 | 2.89 | (0.05) | (0.04) | — | (0.09) | 10.81 | 36.09 | 0.62 | 0.62 | 0.68 | 9 | 23 |
| 12-31-2008 | 15.21 | 0.18 | (6.66) | (6.48) | (0.09) | (0.63) | — | (0.72) | 8.01 | (42.38) | 0.66 | 0.56 | 1.56 | 6 | 36 |
|
| | |
| 26 | Lifestyle Portfolios | Semiannual report | |
| | | See notes to financial statements |
Financial highlights
Continued
| | | | | | | | | | | | | | | |
| Lifestyle Aggressive continued | | | | | | | | | | | | |
| | | | | | | | | | | | | |
| Per share operating performance for a share outstanding throughout the period | | | Ratios and supplemental data | |
|
| | Income (loss) from | | | | | | | | | | | | |
| | investment operations | | Less distributions | | | | | Ratios to average net assets | | | |
| |
| |
| |
| |
| | | | Net | | | | | | | | Expenses | Expenses | | | |
| | | | realized | Total | | | | | | | before | including | | Net | |
| | Net asset | Net | and | from | From net | | | | | | reduc- | reduc- | | assets, | |
| | value, | invest- | unrealized | invest- | invest- | | | | Net asset | | tions and | tions and | Net | end of | |
| | beginning | ment in- | gain (loss) | ment | ment | From net | From | Total | value, end | Total | amounts | amounts | investment | period (in | Portfolio |
| | of period | come (loss) | on invest- | operations | income | realized | paid-in | distribu- | of period | return | recaptured | recaptured | income | millions) | turnover |
| Period ended | ($) | ($)1,2 | ments ($) | ($) | ($) | gain ($) | capital ($) | tions ($) | ($) | (%)3,4 | (%)5 | (%)5 | (loss) (%)1 | ($) | (%) |
|
| CLASS R5 | | | | | | | | | | | | | | | |
|
| 06-30-20136 | 12.92 | (0.01) | 1.03 | 1.02 | — | — | — | — | 13.94 | 7.897 | 0.298 | 0.288 | (0.11)7 | 9 | 8 |
| 12-31-2012 | 11.27 | 0.08 | 1.75 | 1.83 | (0.12) | (0.06) | — | (0.18) | 12.92 | 16.22 | 0.27 | 0.26 | 0.62 | 9 | 21 |
| 12-31-2011 | 12.31 | 0.08 | (0.91) | (0.83) | (0.09) | (0.12) | — | (0.21) | 11.27 | (6.76) | 0.26 | 0.25 | 0.67 | 12 | 25 |
| 12-31-2010 | 10.80 | 0.08 | 1.63 | 1.71 | (0.08) | (0.12) | — | (0.20) | 12.31 | 15.84 | 0.26 | 0.25 | 0.68 | 11 | 19 |
| 12-31-2009 | 8.00 | 0.09 | 2.83 | 2.92 | (0.08) | (0.04) | — | (0.12) | 10.80 | 36.51 | 0.32 | 0.32 | 0.97 | 10 | 23 |
| 12-31-2008 | 15.21 | 0.17 | (6.62) | (6.45) | (0.13) | (0.63) | — | (0.76) | 8.00 | (42.18) | 0.32 | 0.24 | 1.42 | 6 | 36 |
|
| CLASS R6 | | | | | | | | | | | | | | | |
|
| 06-30-20136 | 12.89 | —10 | 1.04 | 1.04 | — | — | — | — | 13.93 | 8.077 | 0.528 | 0.118 | (0.01)7 | 4 | 8 |
| 12-31-2012 | 11.24 | 0.36 | 1.49 | 1.85 | (0.14) | (0.06) | — | (0.20) | 12.89 | 16.43 | 2.57 | 0.11 | 2.88 | 2 | 21 |
| 12-31-201114 | 11.68 | 0.11 | (0.33) | (0.22) | (0.10) | (0.12) | — | (0.22) | 11.24 | (1.87)7 | 16.568 | 0.118 | 0.957 | —12 | 2515 |
|
| CLASS 1 | | | | | | | | | | | | | | | |
|
| 06-30-20136 | 12.89 | —10 | 1.03 | 1.03 | — | — | — | — | 13.92 | 7.997 | 0.118 | 0.118 | (0.02)7 | 3,614 | 8 |
| 12-31-2012 | 11.24 | 0.13 | 1.72 | 1.85 | (0.14) | (0.06) | — | (0.20) | 12.89 | 16.43 | 0.12 | 0.11 | 1.05 | 3,374 | 21 |
| 12-31-2011 | 12.28 | 0.10 | (0.92) | (0.82) | (0.10) | (0.12) | — | (0.22) | 11.24 | (6.66) | 0.11 | 0.11 | 0.78 | 3,164 | 25 |
| 12-31-2010 | 10.77 | 0.09 | 1.63 | 1.72 | (0.09) | (0.12) | — | (0.21) | 12.28 | 16.01 | 0.12 | 0.11 | 0.79 | 3,499 | 19 |
| 12-31-2009 | 7.98 | 0.10 | 2.83 | 2.93 | (0.10) | (0.04) | — | (0.14) | 10.77 | 36.70 | 0.11 | 0.11 | 1.11 | 3,052 | 23 |
| 12-31-2008 | 15.18 | 0.15 | (6.57) | (6.42) | (0.15) | (0.63) | — | (0.78) | 7.98 | (42.08) | 0.12 | 0.12 | 1.24 | 2,120 | 36 |
|
1 Recognition of net investment income by the portfolio is affected by the timing and frequency of the declaration of dividends by the underlying funds in which the Portfolio invests.
2 Based on the average daily shares outstanding.
3 Does not reflect the effect of sales charges, if any.
4 Total returns would have been lower had certain expenses not been reduced during the applicable periods shown.
5 Ratios do not include expenses indirectly incurred from underlying funds whose expense ratios can vary based on the mix of underlying funds held by the portfolio. The range of expense ratios of the underlying funds held by the portfolio was as follows: 0.70% 1.29%, 0.73%–1.48%, 0.48%–1.40%, 0.48%–1.39%, 0.49%–1.40% and 0.49%–2.84% for the periods ended 6-30-13, 12-31-12, 12-31-11, 12-31-10, 12-31-09 and 12-31-08, respectively.
6 Six months ended 6-30-13. Unaudited.
7 Not annualized.
8 Annualized.
9 Includes the impact of expense recapture for the following periods ended: 12-31-11: 0.05% of average net assets for Class B shares. 12-31-10: 0.03%, 0.03%, 0.05% and 0.05% of average net assets for Class A, Class B, Class C and Class R1 shares, respectively. See Note 4.
10 Less than $0.005 per share.
11 The inception date for Class R2 shares is 3-1-12.
12 Less than $500,000.
13 Portfolio turnover is shown for the period from 1-1-12 to 12-31-12.
14 The inception date for Class R6 shares is 9-1-11.
15 Portfolio turnover is shown for the period from 1-1-11 to 12-31-11.
| | | | | | | | | | | | | | | |
| Lifestyle Growth | | | | | | | | | | | | | | |
| | | | | | | | | | | | | | | |
| Per share operating performance for a share outstanding throughout the period | | | Ratios and supplemental data | |
|
| | Income (loss) from | | | | | | | | | | | | |
| | investment operations | | Less distributions | | | | | Ratios to average net assets | | | |
| |
| |
| |
| |
| | | | Net | | | | | | | | Expenses | Expenses | | | |
| | | | realized | Total | | | | | | | before | including | | Net | |
| | Net asset | Net | and | from | From net | | | | | | reduc- | reduc- | | assets, | |
| | value, | invest- | unrealized | invest- | invest- | | | | Net asset | | tions and | tions and | Net | end of | |
| | beginning | ment in- | gain (loss) | ment | ment | From net | From | Total | value, end | Total | amounts | amounts | investment | period (in | Portfolio |
| | of period | come (loss) | on invest- | operations | income | realized | paid-in | distribu- | of period | return | recaptured | recaptured | income | millions) | turnover |
| Period ended | ($) | ($)1,2 | ments ($) | ($) | ($) | gain ($) | capital ($) | tions ($) | ($) | (%)3,4 | (%)5 | (%)5 | (loss) (%)1 | ($) | (%) |
|
| CLASS A | | | | | | | | | | | | | | | |
|
| 06-30-20136 | 13.53 | 0.01 | 0.91 | 0.92 | — | — | — | — | 14.45 | 6.807 | 0.558 | 0.548 | 0.087 | 1,028 | 7 |
| 12-31-2012 | 11.96 | 0.17 | 1.62 | 1.79 | (0.16) | (0.06) | — | (0.22) | 13.53 | 15.01 | 0.57 | 0.56 | 1.28 | 890 | 23 |
| 12-31-2011 | 12.89 | 0.15 | (0.83) | (0.68) | (0.14) | (0.11) | — | (0.25) | 11.96 | (5.30) | 0.58 | 0.57 | 1.14 | 699 | 24 |
| 12-31-2010 | 11.50 | 0.19 | 1.51 | 1.70 | (0.18) | (0.13) | — | (0.31) | 12.89 | 14.77 | 0.56 | 0.55 | 1.58 | 593 | 19 |
| 12-31-2009 | 8.73 | 0.21 | 2.81 | 3.02 | (0.21) | (0.04) | — | (0.25) | 11.50 | 34.54 | 0.64 | 0.62 | 2.17 | 417 | 26 |
| 12-31-2008 | 15.05 | 0.27 | (5.85) | (5.58) | (0.26) | (0.48) | — | (0.74) | 8.73 | (36.89) | 0.59 | 0.57 | 2.14 | 251 | 37 |
| | |
| | Semiannual report | Lifestyle Portfolios | 27 |
| See notes to financial statements | | |
Financial highlights
Continued
| | | | | | | | | | | | | | | |
| Lifestyle Growth continued | | | | | | | | | | | | |
| | | | | | | | | | | | | |
| Per share operating performance for a share outstanding throughout the period | | | Ratios and supplemental data | |
|
| | Income (loss) from | | | | | | | | | | | | |
| | investment operations | | Less distributions | | | | | Ratios to average net assets | | | |
| |
| |
| |
| |
| | | | Net | | | | | | | | Expenses | Expenses | | | |
| | | | realized | Total | | | | | | | before | including | | Net | |
| | Net asset | Net | and | from | From net | | | | | | reduc- | reduc- | | assets, | |
| | value, | invest- | unrealized | invest- | invest- | | | | Net asset | | tions and | tions and | Net | end of | |
| | beginning | ment in- | gain (loss) | ment | ment | From net | From | Total | value, end | Total | amounts | amounts | investment | period (in | Portfolio |
| | of period | come (loss) | on invest- | operations | income | realized | paid-in | distribu- | of period | return | recaptured | recaptured | income | millions) | turnover |
| Period ended | ($) | ($)1,2 | ments ($) | ($) | ($) | gain ($) | capital ($) | tions ($) | ($) | (%)3,4 | (%)5 | (%)5 | (loss) (%)1 | ($) | (%) |
|
| CLASS B | | | | | | | | | | | | | | | |
|
| 06-30-20136 | 13.57 | (0.04) | 0.90 | 0.86 | — | — | — | — | 14.43 | 6.347 | 1.268 | 1.268 | (0.03)7 | 111 | 7 |
| 12-31-2012 | 12.00 | 0.06 | 1.64 | 1.70 | (0.07) | (0.06) | — | (0.13) | 13.57 | 14.18 | 1.28 | 1.28 | 0.50 | 108 | 23 |
| 12-31-2011 | 12.92 | 0.05 | (0.81) | (0.76) | (0.05) | (0.11) | — | (0.16) | 12.00 | (5.91) | 1.29 | 1.309 | 0.37 | 93 | 24 |
| 12-31-2010 | 11.54 | 0.08 | 1.51 | 1.59 | (0.08) | (0.13) | — | (0.21) | 12.92 | 13.81 | 1.29 | 1.359 | 0.69 | 89 | 19 |
| 12-31-2009 | 8.77 | 0.13 | 2.81 | 2.94 | (0.13) | (0.04) | — | (0.17) | 11.54 | 33.53 | 1.48 | 1.35 | 1.32 | 75 | 26 |
| 12-31-2008 | 15.06 | 0.16 | (5.81) | (5.65) | (0.16) | (0.48) | — | (0.64) | 8.77 | (37.35) | 1.41 | 1.32 | 1.30 | 54 | 37 |
|
| CLASS C | | | | | | | | | | | | | | | |
|
| 06-30-20136 | 13.56 | (0.04) | 0.90 | 0.86 | — | — | — | — | 14.42 | 6.347 | 1.258 | 1.248 | (0.27)7 | 535 | 7 |
| 12-31-2012 | 11.99 | 0.07 | 1.63 | 1.70 | (0.07) | (0.06) | — | (0.13) | 13.56 | 14.21 | 1.27 | 1.26 | 0.52 | 485 | 23 |
| 12-31-2011 | 12.91 | 0.05 | (0.81) | (0.76) | (0.05) | (0.11) | — | (0.16) | 11.99 | (5.90) | 1.28 | 1.27 | 0.38 | 422 | 24 |
| 12-31-2010 | 11.53 | 0.10 | 1.51 | 1.61 | (0.10) | (0.13) | — | (0.23) | 12.91 | 13.93 | 1.25 | 1.25 | 0.84 | 404 | 19 |
| 12-31-2009 | 8.76 | 0.14 | 2.81 | 2.95 | (0.14) | (0.04) | — | (0.18) | 11.53 | 33.63 | 1.35 | 1.34 | 1.37 | 305 | 26 |
| 12-31-2008 | 15.05 | 0.17 | (5.81) | (5.64) | (0.17) | (0.48) | — | (0.65) | 8.76 | (37.33) | 1.30 | 1.29 | 1.36 | 206 | 37 |
|
| CLASS R1 | | | | | | | | | | | | | | | |
|
| 06-30-20136 | 13.58 | (0.01) | 0.90 | 0.89 | — | — | — | — | 14.47 | 6.557 | 0.898 | 0.898 | (0.10)7 | 20 | 7 |
| 12-31-2012 | 12.01 | 0.13 | 1.63 | 1.76 | (0.13) | (0.06) | — | (0.19) | 13.58 | 14.67 | 0.87 | 0.86 | 0.97 | 19 | 23 |
| 12-31-2011 | 12.95 | 0.09 | (0.81) | (0.72) | (0.11) | (0.11) | — | (0.22) | 12.01 | (5.59) | 0.92 | 0.92 | 0.70 | 16 | 24 |
| 12-31-2010 | 11.57 | 0.15 | 1.50 | 1.65 | (0.14) | (0.13) | — | (0.27) | 12.95 | 14.28 | 0.87 | 0.86 | 1.24 | 15 | 19 |
| 12-31-2009 | 8.77 | 0.25 | 2.75 | 3.00 | (0.16) | (0.04) | — | (0.20) | 11.57 | 34.15 | 1.02 | 1.02 | 2.45 | 11 | 26 |
| 12-31-2008 | 15.10 | 0.34 | (5.96) | (5.62) | (0.23) | (0.48) | — | (0.71) | 8.77 | (37.05) | 1.34 | 0.83 | 2.81 | 3 | 37 |
|
| CLASS R2 | | | | | | | | | | | | | | | |
|
| 06-30-20136 | 13.47 | 0.05 | 0.85 | 0.90 | — | — | — | — | 14.37 | 6.687 | 2.038 | 0.628 | 0.347 | 5 | 7 |
| 12-31-201210 | 13.05 | 0.16 | 0.48 | 0.64 | (0.16) | (0.06) | — | (0.22) | 13.47 | 4.907 | 16.208 | 0.628 | 1.217 | —11 | 2312 |
|
| CLASS R3 | | | | | | | | | | | | | | | |
|
| 06-30-20136 | 13.52 | (0.01) | 0.90 | 0.89 | — | — | — | — | 14.41 | 6.587 | 0.818 | 0.818 | (0.06)7 | 22 | 7 |
| 12-31-2012 | 11.95 | 0.11 | 1.65 | 1.76 | (0.13) | (0.06) | — | (0.19) | 13.52 | 14.77 | 0.81 | 0.81 | 0.83 | 19 | 23 |
| 12-31-2011 | 12.88 | 0.10 | (0.81) | (0.71) | (0.11) | (0.11) | — | (0.22) | 11.95 | (5.50) | 0.81 | 0.81 | 0.80 | 22 | 24 |
| 12-31-2010 | 11.50 | 0.15 | 1.51 | 1.66 | (0.15) | (0.13) | — | (0.28) | 12.88 | 14.46 | 0.81 | 0.81 | 1.24 | 23 | 19 |
| 12-31-2009 | 8.73 | 0.18 | 2.81 | 2.99 | (0.18) | (0.04) | — | (0.22) | 11.50 | 34.26 | 0.88 | 0.88 | 1.77 | 19 | 26 |
| 12-31-2008 | 15.03 | 0.24 | (5.84) | (5.60) | (0.22) | (0.48) | — | (0.70) | 8.73 | (37.06) | 0.84 | 0.83 | 1.93 | 12 | 37 |
|
| CLASS R4 | | | | | | | | | | | | | | | |
|
| 06-30-20136 | 13.51 | 0.02 | 0.90 | 0.92 | — | — | — | — | 14.43 | 6.817 | 0.508 | 0.398 | 0.157 | 20 | 7 |
| 12-31-2012 | 11.95 | 0.16 | 1.65 | 1.81 | (0.19) | (0.06) | — | (0.25) | 13.51 | 15.11 | 0.50 | 0.44 | 1.21 | 19 | 23 |
| 12-31-2011 | 12.88 | 0.14 | (0.81) | (0.67) | (0.15) | (0.11) | — | (0.26) | 11.95 | (5.18) | 0.52 | 0.52 | 1.08 | 17 | 24 |
| 12-31-2010 | 11.50 | 0.19 | 1.51 | 1.70 | (0.19) | (0.13) | — | (0.32) | 12.88 | 14.80 | 0.48 | 0.48 | 1.57 | 19 | 19 |
| 12-31-2009 | 8.72 | 0.21 | 2.82 | 3.03 | (0.21) | (0.04) | — | (0.25) | 11.50 | 34.73 | 0.54 | 0.54 | 2.11 | 16 | 26 |
| 12-31-2008 | 15.03 | 0.29 | (5.86) | (5.57) | (0.26) | (0.48) | — | (0.74) | 8.72 | (36.87) | 0.56 | 0.56 | 2.34 | 13 | 37 |
|
| CLASS R5 | | | | | | | | | | | | | | | |
|
| 06-30-20136 | 13.52 | 0.04 | 0.90 | 0.94 | — | — | — | — | 14.46 | 6.957 | 0.178 | 0.178 | 0.257 | 32 | 7 |
| 12-31-2012 | 11.95 | 0.21 | 1.63 | 1.84 | (0.21) | (0.06) | — | (0.27) | 13.52 | 15.43 | 0.18 | 0.18 | 1.58 | 32 | 23 |
| 12-31-2011 | 12.88 | 0.19 | (0.82) | (0.63) | (0.19) | (0.11) | — | (0.30) | 11.95 | (4.92) | 0.21 | 0.20 | 1.49 | 26 | 24 |
| 12-31-2010 | 11.50 | 0.21 | 1.52 | 1.73 | (0.22) | (0.13) | — | (0.35) | 12.88 | 15.06 | 0.21 | 0.21 | 1.80 | 22 | 19 |
| 12-31-2009 | 8.72 | 0.25 | 2.81 | 3.06 | (0.24) | (0.04) | — | (0.28) | 11.50 | 35.09 | 0.26 | 0.26 | 2.48 | 18 | 26 |
| 12-31-2008 | 15.04 | 0.33 | (5.87) | (5.54) | (0.30) | (0.48) | — | (0.78) | 8.72 | (36.64) | 0.24 | 0.24 | 2.67 | 10 | 37 |
|
| CLASS R6 | | | | | | | | | | | | | | | |
|
| 06-30-20136 | 13.47 | 0.05 | 0.89 | 0.94 | — | — | — | — | 14.41 | 6.987 | 0.258 | 0.118 | 0.347 | 12 | 7 |
| 12-31-2012 | 11.90 | 0.58 | 1.27 | 1.85 | (0.22) | (0.06) | — | (0.28) | 13.47 | 15.60 | 2.23 | 0.11 | 4.39 | 3 | 23 |
| 12-31-201113 | 12.34 | 0.19 | (0.32) | (0.13) | (0.20) | (0.11) | — | (0.31) | 11.90 | (1.07)7 | 15.948 | 0.108 | 1.587 | —11 | 2414 |
|
| | |
| 28 | Lifestyle Portfolios | Semiannual report | |
| | | See notes to financial statements |
Financial highlights
Continued
| | | | | | | | | | | | | | | |
| Lifestyle Growth continued | | | | | | | | | | | | |
| | | | | | | | | | | | | |
| Per share operating performance for a share outstanding throughout the period | | | Ratios and supplemental data | |
|
| | Income (loss) from | | | | | | | | | | | | |
| | investment operations | | Less distributions | | | | | Ratios to average net assets | | | |
| |
| |
| |
| |
| | | | Net | | | | | | | | Expenses | Expenses | | | |
| | | | realized | Total | | | | | | | before | including | | Net | |
| | Net asset | Net | and | from | From net | | | | | | reduc- | reduc- | | assets, | |
| | value, | invest- | unrealized | invest- | invest- | | | | Net asset | | tions and | tions and | Net | end of | |
| | beginning | ment in- | gain (loss) | ment | ment | From net | From | Total | value, end | Total | amounts | amounts | investment | period (in | Portfolio |
| | of period | come (loss) | on invest- | operations | income | realized | paid-in | distribu- | of period | return | recaptured | recaptured | income | millions) | turnover |
| Period ended | ($) | ($)1,2 | ments ($) | ($) | ($) | gain ($) | capital ($) | tions ($) | ($) | (%)3,4 | (%)5 | (%)5 | (loss) (%)1 | ($) | (%) |
|
| CLASS 1 | | | | | | | | | | | | | | | |
|
| 06-30-20136 | 13.47 | 0.04 | 0.90 | 0.94 | — | — | — | — | 14.41 | 6.987 | 0.118 | 0.118 | 0.297 | 10,729 | 7 |
| 12-31-2012 | 11.91 | 0.21 | 1.63 | 1.84 | (0.22) | (0.06) | — | (0.28) | 13.47 | 15.50 | 0.11 | 0.11 | 1.64 | 10,106 | 23 |
| 12-31-2011 | 12.84 | 0.19 | (0.81) | (0.62) | (0.20) | (0.11) | — | (0.31) | 11.91 | (4.84) | 0.11 | 0.11 | 1.50 | 9,411 | 24 |
| 12-31-2010 | 11.45 | 0.23 | 1.52 | 1.75 | (0.23) | (0.13) | — | (0.36) | 12.84 | 15.30 | 0.11 | 0.11 | 1.92 | 10,305 | 19 |
| 12-31-2009 | 8.68 | 0.25 | 2.81 | 3.06 | (0.25) | (0.04) | — | (0.29) | 11.45 | 35.27 | 0.11 | 0.11 | 2.55 | 8,903 | 26 |
| 12-31-2008 | 15.00 | 0.32 | (5.85) | (5.53) | (0.31) | (0.48) | — | (0.79) | 8.68 | (36.63) | 0.12 | 0.12 | 2.49 | 6,345 | 37 |
|
| CLASS 5 | | | | | | | | | | | | | | | |
|
| 06-30-20136 | 13.46 | 0.05 | 0.89 | 0.94 | — | — | — | — | 14.40 | 6.987 | 0.068 | 0.068 | 0.327 | 162 | 7 |
| 12-31-2012 | 11.90 | 0.23 | 1.62 | 1.85 | (0.23) | (0.06) | — | (0.29) | 13.46 | 15.57 | 0.06 | 0.06 | 1.78 | 142 | 23 |
| 12-31-2011 | 12.82 | 0.21 | (0.81) | (0.60) | (0.21) | (0.11) | — | (0.32) | 11.90 | (4.72) | 0.06 | 0.06 | 1.63 | 111 | 24 |
| 12-31-2010 | 11.44 | 0.25 | 1.50 | 1.75 | (0.24) | (0.13) | — | (0.37) | 12.82 | 15.28 | 0.06 | 0.06 | 2.07 | 98 | 19 |
| 12-31-2009 | 8.67 | 0.27 | 2.80 | 3.07 | (0.26) | (0.04) | — | (0.30) | 11.44 | 35.37 | 0.07 | 0.07 | 2.70 | 68 | 26 |
| 12-31-2008 | 14.98 | 0.35 | (5.86) | (5.51) | (0.32) | (0.48) | — | (0.80) | 8.67 | (36.57) | 0.07 | 0.07 | 2.78 | 41 | 37 |
|
1 Recognition of net investment income by the portfolio is affected by the timing and frequency of the declaration of dividends by the underlying funds in which the
Portfolio invests.
2 Based on the average daily shares outstanding.
3 Does not reflect the effect of sales charges, if any.
4 Total returns would have been lower had certain expenses not been reduced during the applicable periods shown.
5 Ratios do not include expenses indirectly incurred from underlying funds whose expense ratios can vary based on the mix of the underlying funds held by the portfolio. The
range of expense ratios of the underlying funds held by the portfolio was as follows: 0.63%–1.29%, 0.63%–1.48%, 0.48%–1.40%, 0.48%–1.39%, 0.49%–1.40% and
0.49%–2.84% for the period ended 6-30-13, 12-31-12, 12-31-11, 12-31-10, 12-31-09 and 12-31-08, respectively.
6 Six months ended 6-30-13. Unaudited.
7 Not annualized.
8 Annualized.
9 Includes the impact of expense recapture for the following periods ended: 12-31-11: 0.02% of average net assets for Class B shares. 12-31-10: 0.07% of average net assets
for Class B shares. See Note 4.
10 The inception date for Class R2 shares is 3-1-12.
11 Less than $500,000.
12 Portfolio turnover is shown for the period from 1-1-12 to 12-31-12.
13 The inception date for Class R6 shares is 9-1-11.
14 Portfolio turnover is shown for the period from 1-1-11 to 12-31-11.
| | | | | | | | | | | | | | | |
| Lifestyle Balanced | | | | | | | | | | | | | | |
| |
| Per share operating performance for a share outstanding throughout the period | | | Ratios and supplemental data | |
|
| | Income (loss) from | | | | | | | | | | | | |
| | investment operations | | Less distributions | | | | | Ratios to average net assets | | | |
| |
| |
| |
| |
| | | | Net | | | | | | | | Expenses | Expenses | | | |
| | | | realized | Total | | | | | | | before | including | | Net | |
| | Net asset | Net | and | from | From net | | | | | | reduc- | reduc- | | assets, | |
| | value, | invest- | unrealized | invest- | invest- | | | | Net asset | | tions and | tions and | Net | end of | |
| | beginning | ment in- | gain (loss) | ment | ment | From net | From | Total | value, end | Total | amounts | amounts | investment | period (in | Portfolio |
| | of period | come (loss) | on invest- | operations | income | realized | paid-in | distribu- | of period | return | recaptured | recaptured | income | millions) | turnover |
| Period ended | ($) | ($)1,2 | ments ($) | ($) | ($) | gain ($) | capital ($) | tions ($) | ($) | (%)3,4 | (%)5 | (%)5 | (loss) (%)1 | ($) | (%) |
|
| CLASS A | | | | | | | | | | | | | | | |
|
| 06-30-20136 | 13.61 | 0.06 | 0.56 | 0.62 | (0.06) | — | — | (0.06) | 14.17 | 4.537 | 0.548 | 0.548 | 0.427 | 1,207 | 7 |
| 12-31-2012 | 12.26 | 0.26 | 1.40 | 1.66 | (0.24) | (0.07) | — | (0.31) | 13.61 | 13.59 | 0.56 | 0.56 | 1.96 | 1,043 | 20 |
| 12-31-2011 | 12.96 | 0.28 | (0.62) | (0.34) | (0.26) | (0.10) | — | (0.36) | 12.26 | (2.62) | 0.57 | 0.57 | 2.17 | 751 | 23 |
| 12-31-2010 | 11.85 | 0.31 | 1.23 | 1.54 | (0.30) | (0.13) | — | (0.43) | 12.96 | 13.13 | 0.54 | 0.54 | 2.55 | 588 | 19 |
| 12-31-2009 | 9.22 | 0.35 | 2.65 | 3.00 | (0.33) | (0.04) | — | (0.37) | 11.85 | 32.87 | 0.57 | 0.56 | 3.35 | 408 | 319 |
| 12-31-2008 | 14.54 | 0.45 | (4.96) | (4.51) | (0.42) | (0.39) | — | (0.81) | 9.22 | (31.63) | 0.54 | 0.54 | 3.60 | 249 | 36 |
|
| CLASS B | | | | | | | | | | | | | | | |
|
| 06-30-20136 | 13.61 | —10 | 0.56 | 0.56 | (0.01) | — | — | (0.01) | 14.16 | 4.097 | 1.308 | 1.308 | 0.037 | 110 | 7 |
| 12-31-2012 | 12.26 | 0.16 | 1.41 | 1.57 | (0.15) | (0.07) | — | (0.22) | 13.61 | 12.80 | 1.29 | 1.28 | 1.18 | 107 | 20 |
| 12-31-2011 | 12.96 | 0.18 | (0.61) | (0.43) | (0.17) | (0.10) | — | (0.27) | 12.26 | (3.30) | 1.29 | 1.29 | 1.41 | 85 | 23 |
| 12-31-2010 | 11.85 | 0.20 | 1.24 | 1.44 | (0.20) | (0.13) | — | (0.33) | 12.96 | 12.23 | 1.28 | 1.3111 | 1.67 | 74 | 19 |
| 12-31-2009 | 9.21 | 0.25 | 2.68 | 2.93 | (0.25) | (0.04) | — | (0.29) | 11.85 | 31.99 | 1.40 | 1.35 | 2.44 | 64 | 319 |
| 12-31-2008 | 14.53 | 0.33 | (4.94) | (4.61) | (0.32) | (0.39) | — | (0.71) | 9.21 | (32.22) | 1.36 | 1.32 | 2.66 | 46 | 36 |
|
| | |
| | Semiannual report | Lifestyle Portfolios | 29 |
| See notes to financial statements | | |
Financial highlights
Continued
| | | | | | | | | | | | | | | |
| Lifestyle Balanced continued | | | | | | | | | | | | |
| | | | | | | | | | | | | |
| Per share operating performance for a share outstanding throughout the period | | | Ratios and supplemental data | |
|
| | Income (loss) from | | | | | | | | | | | | |
| | investment operations | | Less distributions | | | | | Ratios to average net assets | | | |
| |
| |
| |
| |
| | | | Net | | | | | | | | Expenses | Expenses | | | |
| | | | realized | Total | | | | | | | before | including | | Net | |
| | Net asset | Net | and | from | From net | | | | | | reduc- | reduc- | | assets, | |
| | value, | invest- | unrealized | invest- | invest- | | | | Net asset | | tions and | tions and | Net | end of | |
| | beginning | ment in- | gain (loss) | ment | ment | From net | From | Total | value, end | Total | amounts | amounts | investment | period (in | Portfolio |
| | of period | come (loss) | on invest- | operations | income | realized | paid-in | distribu- | of period | return | recaptured | recaptured | income | millions) | turnover |
| Period ended | ($) | ($)1,2 | ments ($) | ($) | ($) | gain ($) | capital ($) | tions ($) | ($) | (%)3,4 | (%)5 | (%)5 | (loss) (%)1 | ($) | (%) |
|
| CLASS C | | | | | | | | | | | | | | | |
|
| 06-30-20136 | 13.62 | 0.01 | 0.56 | 0.57 | (0.01) | — | — | (0.01) | 14.18 | 4.167 | 1.258 | 1.248 | 0.077 | 652 | 7 |
| 12-31-2012 | 12.27 | 0.16 | 1.41 | 1.57 | (0.15) | (0.07) | — | (0.22) | 13.62 | 12.81 | 1.26 | 1.26 | 1.19 | 579 | 20 |
| 12-31-2011 | 12.97 | 0.18 | (0.61) | (0.43) | (0.17) | (0.10) | — | (0.27) | 12.27 | (3.29) | 1.27 | 1.27 | 1.37 | 484 | 23 |
| 12-31-2010 | 11.86 | 0.22 | 1.23 | 1.45 | (0.21) | (0.13) | — | (0.34) | 12.97 | 12.34 | 1.24 | 1.24 | 1.82 | 448 | 19 |
| 12-31-2009 | 9.22 | 0.27 | 2.67 | 2.94 | (0.26) | (0.04) | — | (0.30) | 11.86 | 32.08 | 1.27 | 1.26 | 2.63 | 327 | 319 |
| 12-31-2008 | 14.55 | 0.34 | (4.95) | (4.61) | (0.33) | (0.39) | — | (0.72) | 9.22 | (32.19) | 1.24 | 1.24 | 2.76 | 209 | 36 |
|
| CLASS R1 | | | | | | | | | | | | | | | |
|
| 06-30-20136 | 13.57 | 0.03 | 0.55 | 0.58 | (0.03) | — | — | (0.03) | 14.12 | 4.297 | 0.898 | 0.898 | 0.237 | 17 | 7 |
| 12-31-2012 | 12.22 | 0.20 | 1.42 | 1.62 | (0.20) | (0.07) | — | (0.27) | 13.57 | 13.29 | 0.86 | 0.86 | 1.52 | 17 | 20 |
| 12-31-2011 | 12.92 | 0.22 | (0.60) | (0.38) | (0.22) | (0.10) | — | (0.32) | 12.22 | (2.94) | 0.94 | 0.94 | 1.68 | 16 | 23 |
| 12-31-2010 | 11.82 | 0.26 | 1.23 | 1.49 | (0.26) | (0.13) | — | (0.39) | 12.92 | 12.75 | 0.88 | 0.88 | 2.17 | 15 | 19 |
| 12-31-2009 | 9.20 | 0.43 | 2.51 | 2.94 | (0.28) | (0.04) | — | (0.32) | 11.82 | 32.21 | 1.07 | 1.07 | 3.96 | 10 | 319 |
| 12-31-2008 | 14.53 | 0.44 | (5.01) | (4.57) | (0.37) | (0.39) | — | (0.76) | 9.20 | (32.01) | 2.58 | 1.06 | 3.69 | 1 | 36 |
|
| CLASS R2 | | | | | | | | | | | | | | | |
|
| 06-30-20136 | 13.56 | 0.11 | 0.50 | 0.61 | (0.05) | — | — | (0.05) | 14.12 | 4.527 | 3.028 | 0.628 | 0.767 | 2 | 7 |
| 12-31-201212 | 13.15 | 0.24 | 0.48 | 0.72 | (0.24) | (0.07) | — | (0.31) | 13.56 | 5.487 | 16.338 | 0.618 | 1.787 | —13 | 2014 |
|
| CLASS R3 | | | | | | | | | | | | | | | |
|
| 06-30-20136 | 13.59 | 0.04 | 0.55 | 0.59 | (0.04) | — | — | (0.04) | 14.14 | 4.357 | 0.788 | 0.788 | 0.297 | 35 | 7 |
| 12-31-2012 | 12.24 | 0.21 | 1.42 | 1.63 | (0.21) | (0.07) | — | (0.28) | 13.59 | 13.38 | 0.78 | 0.77 | 1.62 | 33 | 20 |
| 12-31-2011 | 12.94 | 0.23 | (0.59) | (0.36) | (0.24) | (0.10) | — | (0.34) | 12.24 | (2.82) | 0.79 | 0.78 | 1.79 | 36 | 23 |
| 12-31-2010 | 11.83 | 0.28 | 1.23 | 1.51 | (0.27) | (0.13) | — | (0.40) | 12.94 | 12.89 | 0.79 | 0.79 | 2.28 | 39 | 19 |
| 12-31-2009 | 9.20 | 0.30 | 2.67 | 2.97 | (0.30) | (0.04) | — | (0.34) | 11.83 | 32.62 | 0.84 | 0.84 | 2.94 | 30 | 319 |
| 12-31-2008 | 14.52 | 0.40 | (4.95) | (4.55) | (0.38) | (0.39) | — | (0.77) | 9.20 | (31.89) | 0.81 | 0.80 | 3.21 | 20 | 36 |
|
| CLASS R4 | | | | | | | | | | | | | | | |
|
| 06-30-20136 | 13.59 | 0.07 | 0.55 | 0.62 | (0.07) | — | — | (0.07) | 14.14 | 4.557 | 0.468 | 0.368 | 0.507 | 72 | 7 |
| 12-31-2012 | 12.24 | 0.28 | 1.40 | 1.68 | (0.26) | (0.07) | — | (0.33) | 13.59 | 13.77 | 0.46 | 0.39 | 2.10 | 70 | 20 |
| 12-31-2011 | 12.94 | 0.28 | (0.60) | (0.32) | (0.28) | (0.10) | — | (0.38) | 12.24 | (2.52) | 0.50 | 0.50 | 2.13 | 26 | 23 |
| 12-31-2010 | 11.84 | 0.31 | 1.23 | 1.54 | (0.31) | (0.13) | — | (0.44) | 12.94 | 13.19 | 0.45 | 0.45 | 2.53 | 29 | 19 |
| 12-31-2009 | 9.20 | 0.35 | 2.66 | 3.01 | (0.33) | (0.04) | — | (0.37) | 11.84 | 33.10 | 0.53 | 0.53 | 3.37 | 24 | 319 |
| 12-31-2008 | 14.52 | 0.43 | (4.94) | (4.51) | (0.42) | (0.39) | — | (0.81) | 9.20 | (31.68) | 0.52 | 0.52 | 3.51 | 14 | 36 |
|
| CLASS R5 | | | | | | | | | | | | | | | |
|
| 06-30-20136 | 13.60 | 0.08 | 0.56 | 0.64 | (0.08) | — | — | (0.08) | 14.16 | 4.737 | 0.188 | 0.188 | 0.597 | 40 | 7 |
| 12-31-2012 | 12.26 | 0.28 | 1.42 | 1.70 | (0.29) | (0.07) | — | (0.36) | 13.60 | 13.96 | 0.17 | 0.17 | 2.13 | 39 | 20 |
| 12-31-2011 | 12.96 | 0.31 | (0.60) | (0.29) | (0.31) | (0.10) | — | (0.41) | 12.26 | (2.23) | 0.18 | 0.18 | 2.42 | 42 | 23 |
| 12-31-2010 | 11.85 | 0.35 | 1.23 | 1.58 | (0.34) | (0.13) | — | (0.47) | 12.96 | 13.52 | 0.18 | 0.18 | 2.89 | 38 | 19 |
| 12-31-2009 | 9.21 | 0.39 | 2.65 | 3.04 | (0.36) | (0.04) | — | (0.40) | 11.85 | 33.45 | 0.22 | 0.22 | 3.74 | 27 | 319 |
| 12-31-2008 | 14.52 | 0.54 | (5.01) | (4.47) | (0.45) | (0.39) | — | (0.84) | 9.21 | (31.40) | 0.21 | 0.21 | 4.46 | 15 | 36 |
|
| CLASS R6 | | | | | | | | | | | | | | | |
|
| 06-30-20136 | 13.55 | 0.10 | 0.55 | 0.65 | (0.09) | — | — | (0.09) | 14.11 | 4.797 | 0.248 | 0.118 | 0.717 | 13 | 7 |
| 12-31-2012 | 12.21 | 0.46 | 1.25 | 1.71 | (0.30) | (0.07) | — | (0.37) | 13.55 | 14.09 | 1.15 | 0.11 | 3.50 | 5 | 20 |
| 12-31-201115 | 12.56 | 0.21 | (0.24) | (0.03) | (0.22) | (0.10) | — | (0.32) | 12.21 | (0.22)7 | 16.368 | 0.108 | 1.697 | —13 | 2316 |
|
| CLASS 1 | | | | | | | | | | | | | | | |
|
| 06-30-20136 | 13.55 | 0.09 | 0.55 | 0.64 | (0.09) | — | — | (0.09) | 14.10 | 4.717 | 0.118 | 0.118 | 0.627 | 11,485 | 7 |
| 12-31-2012 | 12.21 | 0.30 | 1.41 | 1.71 | (0.30) | (0.07) | — | (0.37) | 13.55 | 14.09 | 0.11 | 0.11 | 2.31 | 10,974 | 20 |
| 12-31-2011 | 12.90 | 0.32 | (0.59) | (0.27) | (0.32) | (0.10) | — | (0.42) | 12.21 | (2.10) | 0.11 | 0.11 | 2.49 | 9,822 | 23 |
| 12-31-2010 | 11.80 | 0.35 | 1.23 | 1.58 | (0.35) | (0.13) | — | (0.48) | 12.90 | 13.57 | 0.11 | 0.11 | 2.88 | 10,003 | 19 |
| 12-31-2009 | 9.17 | 0.38 | 2.66 | 3.04 | (0.37) | (0.04) | — | (0.41) | 11.80 | 33.59 | 0.11 | 0.11 | 3.65 | 8,557 | 319 |
| 12-31-2008 | 14.47 | 0.47 | (4.91) | (4.44) | (0.47) | (0.39) | — | (0.86) | 9.17 | (31.37) | 0.12 | 0.12 | 3.79 | 6,241 | 36 |
|
| | |
| 30 | Lifestyle Portfolios | Semiannual report | |
| | | See notes to financial statements |
Financial highlights
Continued
| | | | | | | | | | | | | | | |
| Lifestyle Balanced continued | | | | | | | | | | | | |
| | | | | | | | | | | | | |
| Per share operating performance for a share outstanding throughout the period | | | Ratios and supplemental data | |
|
| | Income (loss) from | | | | | | | | | | | | |
| | investment operations | | Less distributions | | | | | Ratios to average net assets | | | |
| |
| |
| |
| |
| | | | Net | | | | | | | | Expenses | Expenses | | | |
| | | | realized | Total | | | | | | | before | including | | Net | |
| | Net asset | Net | and | from | From net | | | | | | reduc- | reduc- | | assets, | |
| | value, | invest- | unrealized | invest- | invest- | | | | Net asset | | tions and | tions and | Net | end of | |
| | beginning | ment in- | gain (loss) | ment | ment | From net | From | Total | value, end | Total | amounts | amounts | investment | period (in | Portfolio |
| | of period | come (loss) | on invest- | operations | income | realized | paid-in | distribu- | of period | return | recaptured | recaptured | income | millions) | turnover |
| Period ended | ($) | ($)1,2 | ments ($) | ($) | ($) | gain ($) | capital ($) | tions ($) | ($) | (%)3,4 | (%)5 | (%)5 | (loss) (%)1 | ($) | (%) |
|
| CLASS 5 | | | | | | | | | | | | | | | |
|
| 06-30-20136 | 13.55 | 0.09 | 0.56 | 0.65 | (0.09) | — | — | (0.09) | 14.11 | 4.817 | 0.068 | 0.068 | 0.667 | 97 | 7 |
| 12-31-2012 | 12.21 | 0.33 | 1.39 | 1.72 | (0.31) | (0.07) | — | (0.38) | 13.55 | 14.14 | 0.06 | 0.06 | 2.49 | 85 | 20 |
| 12-31-2011 | 12.91 | 0.34 | (0.61) | (0.27) | (0.33) | (0.10) | — | (0.43) | 12.21 | (2.13) | 0.06 | 0.06 | 2.65 | 60 | 23 |
| 12-31-2010 | 11.80 | 0.37 | 1.23 | 1.60 | (0.36) | (0.13) | — | (0.49) | 12.91 | 13.71 | 0.06 | 0.06 | 3.07 | 49 | 19 |
| 12-31-2009 | 9.17 | 0.40 | 2.65 | 3.05 | (0.38) | (0.04) | — | (0.42) | 11.80 | 33.66 | 0.07 | 0.07 | 3.89 | 32 | 319 |
| 12-31-2008 | 14.48 | 0.50 | (4.95) | (4.45) | (0.47) | (0.39) | — | (0.86) | 9.17 | (31.38) | 0.07 | 0.07 | 4.07 | 18 | 36 |
|
1 Recognition of net investment income by the portfolio is affected by the timing and frequency of the declaration of dividends by the underlying funds in which the
Portfolio invests.
2 Based on the average daily shares outstanding.
3 Does not reflect the effect of sales charges, if any.
4 Total returns would have been lower had certain expenses not been reduced during the applicable periods shown.
5 Ratios do not include expenses indirectly incurred from underlying funds whose expense ratios can vary based on the mix of underlying funds held by the portfolio. The
range of expense ratios of the underlying funds held by the portfolio was as follows: 0.62%–1.29%, 0.63%–1.48%, 0.48%–1.40%, 0.48%–1.39%, 0.49%–1.40% and
0.49%–2.84% for the periods ended 6-30-13, 12-31-12, 12-31-11, 12-31-10, 12-31-09 and 12-31-08, respectively.
6 Six months ended 6-30-13. Unaudited.
7 Not annualized.
8 Annualized.
9 Excludes merger activity.
10 Less than $0.005 per share.
11 Includes the impact of expense recapture which amounted to 0.03% of average net assets. See Note 4.
12 The inception date for Class R2 shares is 3-1-12.
13 Less than $500,000.
14 Portfolio turnover is shown for the period from 1-1-12 to 12-31-12.
15 The inception date for Class R6 shares is 9-1-11.
16 Portfolio turnover is shown for the period from 1-1-11 to 12-31-11.
| | | | | | | | | | | | | | | |
| Lifestyle Moderate | | | | | | | | | | | | | | |
| | | | | | | | | | | | | | | |
| Per share operating performance for a share outstanding throughout the period | | | Ratios and supplemental data | |
|
| | Income (loss) from | | | | | | | | | | | | |
| | investment operations | | Less distributions | | | | | Ratios to average net assets | | | |
| |
| |
| |
| |
| | | | Net | | | | | | | | Expenses | Expenses | | | |
| | | | realized | Total | | | | | | | before | including | | Net | |
| | Net asset | Net | and | from | From net | | | | | | reduc- | reduc- | | assets, | |
| | value, | invest- | unrealized | invest- | invest- | | | | Net asset | | tions and | tions and | Net | end of | |
| | beginning | ment in- | gain (loss) | ment | ment | From net | From | Total | value, end | Total | amounts | amounts | investment | period (in | Portfolio |
| | of period | come (loss) | on invest- | operations | income | realized | paid-in | distribu- | of period | return | recaptured | recaptured | income | millions) | turnover |
| Period ended | ($) | ($)1,2 | ments ($) | ($) | ($) | gain ($) | capital ($) | tions ($) | ($) | (%)3,4 | (%)5 | (%)5 | (loss) (%)1 | ($) | (%) |
|
| CLASS A | | | | | | | | | | | | | | | |
|
| 06-30-20136 | 13.35 | 0.10 | 0.25 | 0.35 | (0.10) | — | — | (0.10) | 13.60 | 2.587 | 0.558 | 0.558 | 0.737 | 470 | 6 |
| 12-31-2012 | 12.28 | 0.33 | 1.13 | 1.46 | (0.31) | (0.08) | — | (0.39) | 13.35 | 11.94 | 0.57 | 0.57 | 2.50 | 399 | 18 |
| 12-31-2011 | 12.63 | 0.38 | (0.29) | 0.09 | (0.35) | (0.09) | — | (0.44) | 12.28 | 0.73 | 0.58 | 0.58 | 2.96 | 299 | 19 |
| 12-31-2010 | 11.77 | 0.41 | 0.97 | 1.38 | (0.39) | (0.13) | — | (0.52) | 12.63 | 11.85 | 0.55 | 0.55 | 3.37 | 220 | 20 |
| 12-31-2009 | 9.59 | 0.45 | 2.19 | 2.64 | (0.42) | (0.04) | — | (0.46) | 11.77 | 27.88 | 0.54 | 0.54 | 4.27 | 146 | 29 |
| 12-31-2008 | 13.57 | 0.58 | (3.76) | (3.18) | (0.54) | (0.26) | — | (0.80) | 9.59 | (23.88) | 0.53 | 0.53 | 4.81 | 86 | 32 |
|
| CLASS B | | | | | | | | | | | | | | | |
|
| 06-30-20136 | 13.34 | 0.05 | 0.24 | 0.29 | (0.04) | — | — | (0.04) | 13.59 | 2.217 | 1.288 | 1.288 | 0.347 | 44 | 6 |
| 12-31-2012 | 12.27 | 0.23 | 1.14 | 1.37 | (0.22) | (0.08) | — | (0.30) | 13.34 | 11.14 | 1.30 | 1.30 | 1.74 | 45 | 18 |
| 12-31-2011 | 12.63 | 0.28 | (0.29) | (0.01) | (0.26) | (0.09) | — | (0.35) | 12.27 | (0.08) | 1.32 | 1.32 | 2.22 | 35 | 19 |
| 12-31-2010 | 11.76 | 0.30 | 0.99 | 1.29 | (0.29) | (0.13) | — | (0.42) | 12.63 | 11.05 | 1.30 | 1.349 | 2.50 | 26 | 20 |
| 12-31-2009 | 9.58 | 0.35 | 2.20 | 2.55 | (0.33) | (0.04) | — | (0.37) | 11.76 | 26.91 | 1.41 | 1.35 | 3.33 | 20 | 29 |
| 12-31-2008 | 13.56 | 0.45 | (3.74) | (3.29) | (0.43) | (0.26) | — | (0.69) | 9.58 | (24.56) | 1.39 | 1.36 | 3.70 | 14 | 32 |
|
| CLASS C | | | | | | | | | | | | | | | |
|
| 06-30-20136 | 13.35 | 0.05 | 0.25 | 0.30 | (0.05) | — | — | (0.05) | 13.60 | 2.227 | 1.258 | 1.258 | 0.377 | 322 | 6 |
| 12-31-2012 | 12.28 | 0.23 | 1.14 | 1.37 | (0.22) | (0.08) | — | (0.30) | 13.35 | 11.17 | 1.27 | 1.27 | 1.77 | 288 | 18 |
| 12-31-2011 | 12.64 | 0.28 | (0.29) | (0.01) | (0.26) | (0.09) | — | (0.35) | 12.28 | (0.05) | 1.28 | 1.28 | 2.21 | 227 | 19 |
| 12-31-2010 | 11.77 | 0.32 | 0.98 | 1.30 | (0.30) | (0.13) | — | (0.43) | 12.64 | 11.15 | 1.25 | 1.25 | 2.67 | 183 | 20 |
| 12-31-2009 | 9.59 | 0.38 | 2.18 | 2.56 | (0.34) | (0.04) | — | (0.38) | 11.77 | 27.00 | 1.25 | 1.25 | 3.58 | 116 | 29 |
| 12-31-2008 | 13.57 | 0.48 | (3.75) | (3.27) | (0.45) | (0.26) | — | (0.71) | 9.59 | (24.44) | 1.25 | 1.25 | 4.02 | 69 | 32 |
|
| | |
| | Semiannual report | Lifestyle Portfolios | 31 |
| See notes to financial statements | | |
Financial highlights
Continued
| | | | | | | | | | | | | | | |
| Lifestyle Moderate continued | | | | | | | | | | | | |
| | | | | | | | | | | | | |
| Per share operating performance for a share outstanding throughout the period | | | Ratios and supplemental data | |
|
| | Income (loss) from | | | | | | | | | | | | |
| | investment operations | | Less distributions | | | | | Ratios to average net assets | | | |
| |
| |
| |
| |
| | | | Net | | | | | | | | Expenses | Expenses | | | |
| | | | realized | Total | | | | | | | before | including | | Net | |
| | Net asset | Net | and | from | From net | | | | | | reduc- | reduc- | | assets, | |
| | value, | invest- | unrealized | invest- | invest- | | | | Net asset | | tions and | tions and | Net | end of | |
| | beginning | ment in- | gain (loss) | ment | ment | From net | From | Total | value, end | Total | amounts | amounts | investment | period (in | Portfolio |
| | of period | come (loss) | on invest- | operations | income | realized | paid-in | distribu- | of period | return | recaptured | recaptured | income | millions) | turnover |
| Period ended | ($) | ($)1,2 | ments ($) | ($) | ($) | gain ($) | capital ($) | tions ($) | ($) | (%)3,4 | (%)5 | (%)5 | (loss) (%)1 | ($) | (%) |
|
| CLASS R1 | | | | | | | | | | | | | | | |
|
| 06-30-20136 | 13.35 | 0.06 | 0.25 | 0.31 | (0.07) | — | — | (0.07) | 13.59 | 2.327 | 0.948 | 0.948 | 0.507 | 10 | 6 |
| 12-31-2012 | 12.27 | 0.27 | 1.15 | 1.42 | (0.26) | (0.08) | — | (0.34) | 13.35 | 11.58 | 0.96 | 0.96 | 2.10 | 10 | 18 |
| 12-31-2011 | 12.63 | 0.30 | (0.27) | 0.03 | (0.30) | (0.09) | — | (0.39) | 12.27 | 0.21 | 1.03 | 1.03 | 2.32 | 7 | 19 |
| 12-31-2010 | 11.76 | 0.33 | 1.00 | 1.33 | (0.33) | (0.13) | — | (0.46) | 12.63 | 11.45 | 0.93 | 0.989 | 2.72 | 7 | 20 |
| 12-31-2009 | 9.58 | 0.50 | 2.09 | 2.59 | (0.37) | (0.04) | — | (0.41) | 11.76 | 27.35 | 1.14 | 1.06 | 4.57 | 6 | 29 |
| 12-31-2008 | 13.58 | 0.64 | (3.87) | (3.23) | (0.51) | (0.26) | — | (0.77) | 9.58 | (24.21) | 1.97 | 0.85 | 5.39 | 2 | 32 |
|
| CLASS R2 | | | | | | | | | | | | | | | |
|
| 06-30-20136 | 13.32 | 0.16 | 0.17 | 0.33 | (0.09) | — | — | (0.09) | 13.56 | 2.497 | 5.038 | 0.628 | 1.177 | 1 | 6 |
| 12-31-201210 | 12.96 | 0.30 | 0.45 | 0.75 | (0.31) | (0.08) | — | (0.39) | 13.32 | 5.807 | 16.038 | 0.628 | 2.297 | —11 | 1812 |
|
| CLASS R3 | | | | | | | | | | | | | | | |
|
| 06-30-20136 | 13.33 | 0.08 | 0.23 | 0.31 | (0.07) | — | — | (0.07) | 13.57 | 2.367 | 0.878 | 0.878 | 0.557 | 11 | 6 |
| 12-31-2012 | 12.26 | 0.27 | 1.16 | 1.43 | (0.28) | (0.08) | — | (0.36) | 13.33 | 11.64 | 0.88 | 0.88 | 2.08 | 10 | 18 |
| 12-31-2011 | 12.62 | 0.32 | (0.27) | 0.05 | (0.32) | (0.09) | — | (0.41) | 12.26 | 0.38 | 0.88 | 0.88 | 2.54 | 10 | 19 |
| 12-31-2010 | 11.76 | 0.35 | 0.99 | 1.34 | (0.35) | (0.13) | — | (0.48) | 12.62 | 11.56 | 0.87 | 0.87 | 2.87 | 10 | 20 |
| 12-31-2009 | 9.58 | 0.39 | 2.21 | 2.60 | (0.38) | (0.04) | — | (0.42) | 11.76 | 27.43 | 0.95 | 0.95 | 3.72 | 8 | 29 |
| 12-31-2008 | 13.57 | 0.55 | (3.78) | (3.23) | (0.50) | (0.26) | — | (0.76) | 9.58 | (24.22) | 1.00 | 0.86 | 4.55 | 5 | 32 |
|
| CLASS R4 | | | | | | | | | | | | | | | |
|
| 06-30-20136 | 13.31 | 0.11 | 0.24 | 0.35 | (0.10) | — | — | (0.10) | 13.56 | 2.637 | 0.538 | 0.438 | 0.777 | 13 | 6 |
| 12-31-2012 | 12.24 | 0.33 | 1.14 | 1.47 | (0.32) | (0.08) | — | (0.40) | 13.31 | 12.02 | 0.57 | 0.51 | 2.51 | 11 | 18 |
| 12-31-2011 | 12.60 | 0.36 | (0.28) | 0.08 | (0.35) | (0.09) | — | (0.44) | 12.24 | 0.65 | 0.63 | 0.63 | 2.81 | 8 | 19 |
| 12-31-2010 | 11.74 | 0.40 | 0.97 | 1.37 | (0.38) | (0.13) | — | (0.51) | 12.60 | 11.84 | 0.58 | 0.609 | 3.30 | 7 | 20 |
| 12-31-2009 | 9.57 | 0.40 | 2.22 | 2.62 | (0.41) | (0.04) | — | (0.45) | 11.74 | 27.71 | 0.70 | 0.66 | 3.83 | 5 | 29 |
| 12-31-2008 | 13.55 | 0.56 | (3.75) | (3.19) | (0.53) | (0.26) | — | (0.79) | 9.57 | (23.94) | 0.79 | 0.57 | 4.66 | 4 | 32 |
|
| CLASS R5 | | | | | | | | | | | | | | | |
|
| 06-30-20136 | 13.32 | 0.12 | 0.24 | 0.36 | (0.12) | — | — | (0.12) | 13.56 | 2.687 | 0.298 | 0.298 | 0.877 | 11 | 6 |
| 12-31-2012 | 12.26 | 0.31 | 1.19 | 1.50 | (0.36) | (0.08) | — | (0.44) | 13.32 | 12.26 | 0.27 | 0.27 | 2.41 | 9 | 18 |
| 12-31-2011 | 12.62 | 0.41 | (0.28) | 0.13 | (0.40) | (0.09) | — | (0.49) | 12.26 | 1.00 | 0.24 | 0.24 | 3.21 | 15 | 19 |
| 12-31-2010 | 11.75 | 0.46 | 0.97 | 1.43 | (0.43) | (0.13) | — | (0.56) | 12.62 | 12.35 | 0.24 | 0.24 | 3.75 | 11 | 20 |
| 12-31-2009 | 9.58 | 0.46 | 2.19 | 2.65 | (0.44) | (0.04) | — | (0.48) | 11.75 | 28.10 | 0.32 | 0.32 | 4.39 | 8 | 29 |
| 12-31-2008 | 13.56 | 0.63 | (3.78) | (3.15) | (0.57) | (0.26) | — | (0.83) | 9.58 | (23.67) | 0.36 | 0.23 | 5.27 | 5 | 32 |
|
| CLASS R6 | | | | | | | | | | | | | | | |
|
| 06-30-20136 | 13.31 | 0.14 | 0.23 | 0.37 | (0.13) | — | — | (0.13) | 13.55 | 2.767 | 0.378 | 0.118 | 1.017 | 5 | 6 |
| 12-31-2012 | 12.24 | 0.62 | 0.90 | 1.52 | (0.37)�� | (0.08) | — | (0.45) | 13.31 | 12.50 | 4.79 | 0.11 | 4.66 | 2 | 18 |
| 12-31-201113 | 12.51 | 0.24 | (0.17) | 0.07 | (0.25) | (0.09) | — | (0.34) | 12.24 | 0.607 | 16.248 | 0.118 | 1.947 | —11 | 1914 |
|
| CLASS 1 | | | | | | | | | | | | | | | |
|
| 06-30-20136 | 13.32 | 0.13 | 0.24 | 0.37 | (0.13) | — | — | (0.13) | 13.56 | 2.757 | 0.118 | 0.118 | 0.937 | 3,496 | 6 |
| 12-31-2012 | 12.25 | 0.37 | 1.15 | 1.52 | (0.37) | (0.08) | — | (0.45) | 13.32 | 12.49 | 0.11 | 0.11 | 2.87 | 3,414 | 18 |
| 12-31-2011 | 12.61 | 0.41 | (0.27) | 0.14 | (0.41) | (0.09) | — | (0.50) | 12.25 | 1.12 | 0.11 | 0.11 | 3.26 | 3,057 | 19 |
| 12-31-2010 | 11.74 | 0.44 | 1.00 | 1.44 | (0.44) | (0.13) | — | (0.57) | 12.61 | 12.43 | 0.11 | 0.11 | 3.66 | 3,026 | 20 |
| 12-31-2009 | 9.56 | 0.47 | 2.21 | 2.68 | (0.46) | (0.04) | — | (0.50) | 11.74 | 28.49 | 0.11 | 0.11 | 4.49 | 2,503 | 29 |
| 12-31-2008 | 13.54 | 0.59 | (3.73) | (3.14) | (0.58) | (0.26) | — | (0.84) | 9.56 | (23.63) | 0.12 | 0.12 | 4.90 | 1,857 | 32 |
|
| CLASS 5 | | | | | | | | | | | | | | | |
|
| 06-30-20136 | 13.31 | 0.13 | 0.24 | 0.37 | (0.13) | — | — | (0.13) | 13.55 | 2.787 | 0.068 | 0.068 | 0.967 | 43 | 6 |
| 12-31-2012 | 12.24 | 0.39 | 1.14 | 1.53 | (0.38) | (0.08) | — | (0.46) | 13.31 | 12.56 | 0.06 | 0.06 | 3.03 | 39 | 18 |
| 12-31-2011 | 12.60 | 0.44 | (0.29) | 0.15 | (0.42) | (0.09) | — | (0.51) | 12.24 | 1.17 | 0.06 | 0.06 | 3.43 | 27 | 19 |
| 12-31-2010 | 11.73 | 0.47 | 0.97 | 1.44 | (0.44) | (0.13) | — | (0.57) | 12.60 | 12.50 | 0.06 | 0.06 | 3.87 | 22 | 20 |
| 12-31-2009 | 9.56 | 0.51 | 2.17 | 2.68 | (0.47) | (0.04) | — | (0.51) | 11.73 | 28.45 | 0.07 | 0.07 | 4.78 | 14 | 29 |
| 12-31-2008 | 13.54 | 0.67 | (3.80) | (3.13) | (0.59) | (0.26) | — | (0.85) | 9.56 | (23.59) | 0.07 | 0.07 | 5.70 | 8 | 32 |
|
| | |
| 32 | Lifestyle Portfolios | Semiannual report | |
| | | See notes to financial statements |
Financial highlights
Continued
1 Recognition of net investment income by the portfolio is affected by the timing and frequency of the declaration of dividends by the underlying funds in which the
Portfolio invests.
2 Based on the average daily shares outstanding.
3 Does not reflect the effect of sales charges, if any.
4 Total returns would have been lower had certain expenses not been reduced during the applicable periods shown.
5 Ratios do not include expenses indirectly incurred from underlying funds whose expense ratios can vary based on the mix of underlying funds held by the portfolio. The
range of expense ratios of the underlying funds held by the portfolios was as follows: 0.62%–1.29%, 0.63%–1.48%, 0.48%–1.40%, 0.48%–1.14%, 0.49%–1.17% and
0.49%–2.40% for the periods ended 6-30-13, 12-31-12, 12-31-11, 12-31-10, 12-31-09 and 12-31-08, respectively.
6 Six months ended 6-30-13. Unaudited.
7 Not annualized.
8 Annualized.
9 Includes the impact of expense recapture which amounted to 0.04%, 0.05% and 0.02% for Class B, Class R1 and Class R4, respectively, of average net assets. See Note 4.
10 The inception date for Class R2 shares is 3-1-12.
11 Less than $500,000.
12 Portfolio turnover is shown for the period from 1-1-12 to 12-31-12.
13 The inception date for Class R6 shares is 9-1-11.
14 Portfolio turnover is shown for the period from 1-1-11 to 12-31-11.
| | | | | | | | | | | | | | | |
| Lifestyle Conservative | | | | | | | | | | | | | |
| |
| Per share operating performance for a share outstanding throughout the period | | | Ratios and supplemental data | |
|
| | Income (loss) from | | | | | | | | | | | | |
| | investment operations | | Less distributions | | | | | Ratios to average net assets | | | |
| |
| |
| |
| |
| | | | Net | | | | | | | | Expenses | Expenses | | | |
| | | | realized | Total | | | | | | | before | including | | Net | |
| | Net asset | Net | and | from | From net | | | | | | reduc- | reduc- | | assets, | |
| | value, | invest- | unrealized | invest- | invest- | | | | Net asset | | tions and | tions and | Net | end of | |
| | beginning | ment in- | gain (loss) | ment | ment | From net | From | Total | value, end | Total | amounts | amounts | investment | period (in | Portfolio |
| | of period | come (loss) | on invest- | operations | income | realized | paid-in | distribu- | of period | return | recaptured | recaptured | income | millions) | turnover |
| Period ended | ($) | ($)1,2 | ments ($) | ($) | ($) | gain ($) | capital ($) | tions ($) | ($) | (%)3,4 | (%)5 | (%)5 | (loss) (%)1 | ($) | (%) |
|
| CLASS A | | | | | | | | | | | | | | | |
|
| 06-30-20136 | 13.44 | 0.13 | (0.06) | 0.07 | (0.13) | — | — | (0.13) | 13.38 | 0.487 | 0.558 | 0.558 | 0.947 | 512 | 7 |
| 12-31-2012 | 12.63 | 0.38 | 0.88 | 1.26 | (0.37) | (0.08) | — | (0.45) | 13.44 | 10.03 | 0.56 | 0.56 | 2.89 | 472 | 14 |
| 12-31-2011 | 12.77 | 0.46 | (0.11) | 0.35 | (0.43) | (0.06) | — | (0.49) | 12.63 | 2.75 | 0.58 | 0.58 | 3.61 | 340 | 15 |
| 12-31-2010 | 12.15 | 0.48 | 0.71 | 1.19 | (0.45) | (0.12) | — | (0.57) | 12.77 | 9.96 | 0.55 | 0.55 | 3.78 | 218 | 24 |
| 12-31-2009 | 10.39 | 0.54 | 1.77 | 2.31 | (0.50) | (0.05) | — | (0.55) | 12.15 | 22.53 | 0.52 | 0.52 | 4.80 | 141 | 24 |
| 12-31-2008 | 13.32 | 0.73 | (2.75) | (2.02) | (0.63) | (0.28) | — | (0.91) | 10.39 | (15.41) | 0.53 | 0.53 | 6.01 | 87 | 33 |
|
| CLASS B | | | | | | | | | | | | | | | |
|
| 06-30-20136 | 13.44 | 0.08 | (0.06) | 0.02 | (0.08) | — | — | (0.08) | 13.38 | 0.117 | 1.278 | 1.278 | 0.577 | 49 | 7 |
| 12-31-2012 | 12.63 | 0.28 | 0.88 | 1.16 | (0.27) | (0.08) | — | (0.35) | 13.44 | 9.24 | 1.30 | 1.30 | 2.13 | 48 | 14 |
| 12-31-2011 | 12.77 | 0.35 | (0.10) | 0.25 | (0.33) | (0.06) | — | (0.39) | 12.63 | 2.01 | 1.31 | 1.31 | 2.75 | 37 | 15 |
| 12-31-2010 | 12.15 | 0.37 | 0.73 | 1.10 | (0.36) | (0.12) | — | (0.48) | 12.77 | 9.16 | 1.29 | 1.29 | 2.96 | 28 | 24 |
| 12-31-2009 | 10.40 | 0.44 | 1.77 | 2.21 | (0.41) | (0.05) | — | (0.46) | 12.15 | 21.46 | 1.35 | 1.35 | 3.88 | 21 | 24 |
| 12-31-2008 | 13.32 | 0.59 | (2.70) | (2.11) | (0.53) | (0.28) | — | (0.81) | 10.40 | (16.04) | 1.36 | 1.34 | 4.81 | 13 | 33 |
|
| CLASS C | | | | | | | | | | | | | | | |
|
| 06-30-20136 | 13.43 | 0.08 | (0.06) | 0.02 | (0.08) | — | — | (0.08) | 13.37 | 0.137 | 1.258 | 1.258 | 0.607 | 361 | 7 |
| 12-31-2012 | 12.62 | 0.29 | 0.88 | 1.17 | (0.28) | (0.08) | — | (0.36) | 13.43 | 9.28 | 1.26 | 1.26 | 2.17 | 335 | 14 |
| 12-31-2011 | 12.77 | 0.36 | (0.11) | 0.25 | (0.34) | (0.06) | — | (0.40) | 12.62 | 1.95 | 1.28 | 1.28 | 2.81 | 254 | 15 |
| 12-31-2010 | 12.14 | 0.39 | 0.72 | 1.11 | (0.36) | (0.12) | — | (0.48) | 12.77 | 9.28 | 1.24 | 1.24 | 3.10 | 189 | 24 |
| 12-31-2009 | 10.39 | 0.46 | 1.76 | 2.22 | (0.42) | (0.05) | — | (0.47) | 12.14 | 21.58 | 1.24 | 1.24 | 4.08 | 119 | 24 |
| 12-31-2008 | 13.32 | 0.62 | (2.73) | (2.11) | (0.54) | (0.28) | — | (0.82) | 10.39 | (16.03) | 1.24 | 1.24 | 5.05 | 73 | 33 |
|
| CLASS R1 | | | | | | | | | | | | | | | |
|
| 06-30-20136 | 13.43 | 0.10 | (0.05) | 0.05 | (0.10) | — | — | (0.10) | 13.38 | 0.357 | 0.928 | 0.928 | 0.747 | 9 | 7 |
| 12-31-2012 | 12.62 | 0.31 | 0.88 | 1.19 | (0.30) | (0.08) | — | (0.38) | 13.43 | 9.52 | 1.07 | 1.07 | 2.36 | 9 | 14 |
| 12-31-2011 | 12.78 | 0.33 | (0.05) | 0.28 | (0.38) | (0.06) | — | (0.44) | 12.62 | 2.19 | 1.06 | 1.06 | 2.57 | 7 | 15 |
| 12-31-2010 | 12.15 | 0.41 | 0.74 | 1.15 | (0.40) | (0.12) | — | (0.52) | 12.78 | 9.56 | 0.88 | 0.939 | 3.24 | 8 | 24 |
| 12-31-2009 | 10.41 | 0.57 | 1.66 | 2.23 | (0.44) | (0.05) | — | (0.49) | 12.15 | 21.74 | 1.16 | 1.06 | 5.00 | 7 | 24 |
| 12-31-2008 | 13.34 | 1.02 | (3.07) | (2.05) | (0.60) | (0.28) | — | (0.88) | 10.41 | (15.62) | 2.31 | 0.88 | 8.75 | 2 | 33 |
|
| CLASS R2 | | | | | | | | | | | | | | | |
|
| 06-30-20136 | 13.42 | 0.17 | (0.10) | 0.07 | (0.12) | — | — | (0.12) | 13.37 | 0.537 | 4.808 | 0.628 | 1.257 | 1 | 7 |
| 12-31-201210 | 13.12 | 0.35 | 0.39 | 0.74 | (0.36) | (0.08) | — | (0.44) | 13.42 | 5.737 | 10.398 | 0.628 | 2.647 | —11 | 1412 |
|
| CLASS R3 | | | | | | | | | | | | | | | |
|
| 06-30-20136 | 13.41 | 0.11 | (0.06) | 0.05 | (0.11) | — | — | (0.11) | 13.35 | 0.337 | 0.778 | 0.778 | 0.847 | 12 | 7 |
| 12-31-2012 | 12.60 | 0.31 | 0.91 | 1.22 | (0.33) | (0.08) | — | (0.41) | 13.41 | 9.71 | 0.97 | 0.97 | 2.38 | 11 | 14 |
| 12-31-2011 | 12.76 | 0.40 | (0.11) | 0.29 | (0.39) | (0.06) | — | (0.45) | 12.60 | 2.30 | 0.88 | 0.88 | 3.08 | 10 | 15 |
| 12-31-2010 | 12.14 | 0.42 | 0.74 | 1.16 | (0.42) | (0.12) | — | (0.54) | 12.76 | 9.68 | 0.86 | 0.86 | 3.36 | 11 | 24 |
| 12-31-2009 | 10.40 | 0.46 | 1.79 | 2.25 | (0.46) | (0.05) | — | (0.51) | 12.14 | 21.94 | 0.92 | 0.92 | 4.14 | 8 | 24 |
| 12-31-2008 | 13.33 | 0.54 | (2.59) | (2.05) | (0.60) | (0.28) | — | (0.88) | 10.40 | (15.62) | 0.90 | 0.83 | 4.27 | 6 | 33 |
|
| | |
| | Semiannual report | Lifestyle Portfolios | 33 |
| See notes to financial statements | | |
Financial highlights
Continued
| | | | | | | | | | | | | | | |
| Lifestyle Conservative continued | | | | | | | | | | | |
| | | | | | | | | | | | |
| Per share operating performance for a share outstanding throughout the period | | | Ratios and supplemental data | |
|
| | Income (loss) from | | | | | | | | | | | | |
| | investment operations | | Less distributions | | | | | Ratios to average net assets | | | |
| |
| |
| |
| |
| | | | Net | | | | | | | | Expenses | Expenses | | | |
| | | | realized | Total | | | | | | | before | including | | Net | |
| | Net asset | Net | and | from | From net | | | | | | reduc- | reduc- | | assets, | |
| | value, | invest- | unrealized | invest- | invest- | | | | Net asset | | tions and | tions and | Net | end of | |
| | beginning | ment in- | gain (loss) | ment | ment | From net | From | Total | value, end | Total | amounts | amounts | investment | period (in | Portfolio |
| | of period | come (loss) | on invest- | operations | income | realized | paid-in | distribu- | of period | return | recaptured | recaptured | income | millions) | turnover |
| Period ended | ($) | ($)1,2 | ments ($) | ($) | ($) | gain ($) | capital ($) | tions ($) | ($) | (%)3,4 | (%)5 | (%)5 | (loss) (%)1 | ($) | (%) |
|
| CLASS R4 | | | | | | | | | | | | | | | |
|
| 06-30-20136 | 13.42 | 0.14 | (0.07) | 0.07 | (0.13) | — | — | (0.13) | 13.36 | 0.517 | 0.578 | 0.478 | 1.057 | 11 | 7 |
| 12-31-2012 | 12.61 | 0.36 | 0.90 | 1.26 | (0.37) | (0.08) | — | (0.45) | 13.42 | 10.06 | 0.60 | 0.54 | 2.72 | 8 | 14 |
| 12-31-2011 | 12.76 | 0.45 | (0.11) | 0.34 | (0.43) | (0.06) | — | (0.49) | 12.61 | 2.65 | 0.63 | 0.63 | 3.50 | 9 | 15 |
| 12-31-2010 | 12.13 | 0.47 | 0.72 | 1.19 | (0.44) | (0.12) | — | (0.56) | 12.76 | 9.90 | 0.61 | 0.679 | 3.77 | 7 | 24 |
| 12-31-2009 | 10.39 | 0.52 | 1.75 | 2.27 | (0.48) | (0.05) | — | (0.53) | 12.13 | 22.22 | 0.77 | 0.66 | 4.60 | 4 | 24 |
| 12-31-2008 | 13.31 | 0.64 | (2.65) | (2.01) | (0.63) | (0.28) | — | (0.91) | 10.39 | (15.38) | 0.87 | 0.57 | 5.21 | 3 | 33 |
|
| CLASS R5 | | | | | | | | | | | | | | | |
|
| 06-30-20136 | 13.43 | 0.15 | (0.06) | 0.09 | (0.15) | — | — | (0.15) | 13.37 | 0.667 | 0.168 | 0.168 | 1.117 | 16 | 7 |
| 12-31-2012 | 12.62 | 0.41 | 0.89 | 1.30 | (0.41) | (0.08) | — | (0.49) | 13.43 | 10.37 | 0.31 | 0.31 | 3.11 | 15 | 14 |
| 12-31-2011 | 12.77 | 0.50 | (0.12) | 0.38 | (0.47) | (0.06) | — | (0.53) | 12.62 | 3.00 | 0.24 | 0.24 | 3.91 | 16 | 15 |
| 12-31-2010 | 12.15 | 0.50 | 0.74 | 1.24 | (0.50) | (0.12) | — | (0.62) | 12.77 | 10.34 | 0.23 | 0.23 | 3.96 | 9 | 24 |
| 12-31-2009 | 10.40 | 0.57 | 1.75 | 2.32 | (0.52) | (0.05) | — | (0.57) | 12.15 | 22.67 | 0.33 | 0.33 | 5.08 | 9 | 24 |
| 12-31-2008 | 13.32 | 0.86 | (2.83) | (1.97) | (0.67) | (0.28) | — | (0.95) | 10.40 | (15.10) | 0.52 | 0.25 | 7.19 | 4 | 33 |
|
| CLASS R6 | | | | | | | | | | | | | | | |
|
| 06-30-20136 | 13.42 | 0.17 | (0.08) | 0.09 | (0.16) | — | — | (0.16) | 13.35 | 0.647 | 0.578 | 0.118 | 1.257 | 3 | 7 |
| 12-31-2012 | 12.61 | 0.51 | 0.81 | 1.32 | (0.43) | (0.08) | — | (0.51) | 13.42 | 10.56 | 2.50 | 0.11 | 3.83 | 2 | 14 |
| 12-31-201113 | 12.81 | 0.27 | (0.12) | 0.15 | (0.29) | (0.06) | — | (0.35) | 12.61 | 1.167 | 16.168 | 0.118 | 2.137 | —11 | 1514 |
|
| CLASS 1 | | | | | | | | | | | | | | | |
|
| 06-30-20136 | 13.42 | 0.16 | (0.06) | 0.10 | (0.16) | — | — | (0.16) | 13.36 | 0.717 | 0.118 | 0.118 | 1.147 | 2,937 | 7 |
| 12-31-2012 | 12.61 | 0.43 | 0.89 | 1.32 | (0.43) | (0.08) | — | (0.51) | 13.42 | 10.56 | 0.11 | 0.11 | 3.28 | 3,090 | 14 |
| 12-31-2011 | 12.76 | 0.50 | (0.10) | 0.40 | (0.49) | (0.06) | — | (0.55) | 12.61 | 3.16 | 0.11 | 0.11 | 3.85 | 2,626 | 15 |
| 12-31-2010 | 12.13 | 0.51 | 0.75 | 1.26 | (0.51) | (0.12) | — | (0.63) | 12.76 | 10.51 | 0.11 | 0.11 | 4.08 | 2,391 | 24 |
| 12-31-2009 | 10.38 | 0.56 | 1.78 | 2.34 | (0.54) | (0.05) | — | (0.59) | 12.13 | 22.96 | 0.12 | 0.12 | 4.99 | 1,931 | 24 |
| 12-31-2008 | 13.30 | 0.71 | (2.67) | (1.96) | (0.68) | (0.28) | — | (0.96) | 10.38 | (15.02) | 0.12 | 0.12 | 5.71 | 1,393 | 33 |
|
1 Recognition of net investment income by the portfolio is affected by the timing and frequency of the declaration of dividends by the underlying funds in which the
Portfolio invests.
2 Based on the average daily shares outstanding.
3 Does not reflect the effect of sales charges, if any.
4 Total returns would have been lower had certain expenses not been reduced during the applicable periods shown.
5 Ratios do not include expenses indirectly incurred from underlying funds whose expense ratios can vary based on the mix of underlying funds held by the portfolio. The
range of expense ratios of the underlying funds held by the portfolio was as follows: 0.62%–1.29%, 0.63%–1.48%, 0.48%–1.40%, 0.48%–1.13%, 0.49%–1.09% and
0.49%–2.40% for the periods ended 6-30-13, 12-31-12, 12-31-11, 12-31-10, 12-31-09 and 12-31-08, respectively.
6 Six months ended 6-30-13. Unaudited.
7 Not annualized.
8 Annualized.
9 Includes the impact of expense recapture, which amounted to less than 0.005%, 0.05% and 0.06% of average net assets for Class B, Class R1 and Class R4 shares,
respectively. See Note 4.
10 The inception date for Class R2 shares is 3-1-12.
11 Less than $500,000.
12 Portfolio turnover is shown for the period from 1-1-12 to 12-31-12.
13 The inception date for Class R6 shares is 9-1-11.
14 Portfolio turnover is shown for the period from 1-1-11 to 12-31-11.
| | |
| 34 | Lifestyle Portfolios | Semiannual report | |
| | | See notes to financial statements |
Notes to financial statements
(Unaudited)
Note 1 — Organization
John Hancock Funds II (the Trust) is an open-end management investment company organized as a Massachusetts business trust and registered under the Investment Company Act of 1940, as amended (the 1940 Act). The Trust is a series company, which means it has several funds, each with a stated investment objective that it pursues through separate investment policies. The Trust currently offers multiple investment funds, five of which (collectively, Lifestyle Portfolios or the portfolios, and individually the portfolio) are presented in this report. The Lifestyle Portfolios are a series of the Trust and operate as “funds of funds” that invest in Class NAV shares of underlying funds of the Trust, John Hancock Funds III (JHF III) and also in other affiliated funds of the John Hancock funds complex.
The portfolios may offer multiple classes of shares. The shares currently offered by the Trust are detailed in the Statements of Assets and Liabilities. Class A and Class C shares are open to all investors. Class B shares are closed to new investors. Class R1, Class R2, Class R3, Class R4 and Class R5 shares are available only to certain retirement plans. Class R6 shares are only available to certain retirement plans, institutions and other investors. Class 1 shares are offered only to certain affiliates of Manulife Financial Corporation (MFC). Class 5 shares are available only to the John Hancock Freedom 529 Plan. Class B shares convert to Class A shares eight years after purchase. Shareholders of each class have exclusive voting rights to matters that affect that class. The distribution and service fees, if any, transfer agent fees, printing and postage and state registration fees for each class may differ.
The accounting policies of the underlying funds of the portfolios are outlined in the underlying funds’ shareholder reports, available without charge by calling 1-800-344-1029 and jhfunds.com, on the Securities and Exchange Commission (SEC) Web site at www.sec.gov or at the SEC’s public reference room in Washington, D.C. The underlying funds are not covered by this report.
Note 2 — Significant accounting policies
The financial statements have been prepared in conformity with accounting principles generally accepted in the United States of America, which require management to make certain estimates and assumptions as of the date of the financial statements. Actual results could differ from those estimates and those differences could be significant. Events or transactions occurring after the end of the fiscal period through the date that the financial statements were issued have been evaluated in the preparation of the financial statements. The following summarizes the significant accounting policies of the portfolios:
Security valuation. Investments are stated at value as of the close of regular trading on the New York Stock Exchange (NYSE), normally at 4:00 P.M., Eastern Time. In order to value the securities, the portfolios use the following valuation techniques: Investments by the portfolios in underlying affiliated funds and/or other open-end management investment companies are valued at their respective net asset values each business day.
The portfolios use a three-tier hierarchy to prioritize the pricing assumptions, referred to as inputs, used in valuation techniques to measure fair value. Level 1 includes securities valued using quoted prices in active markets for identical securities, including registered investment companies. Level 2 includes securities valued using significant observable inputs. Observable inputs may include quoted prices for similar securities, interest rates, prepayment speeds and credit risk. Prices for securities valued using these inputs are received from independent pricing vendors and brokers and are based on an evaluation of the inputs described. Level 3 includes securities valued using significant unobservable inputs when market prices are not readily available or reliable, including the portfolios’ own assumptions in determining the fair value of investments. Factors used in determining value may include market or issuer specific events or trends, changes in interest rates and credit quality. The inputs or methodology used for valuing securities are not necessarily an indication of the risks associated with investing in those securities. Changes in valuation techniques may result in transfers into or out of an assigned level within the disclosure hierarchy. As of June 30, 2013, all investments are categorized as Level 1 under the hierarchy described above.
Security transactions and related investment income. Investment security transactions are accounted for on a trade date plus one basis for daily net asset value calculations. However, for financial reporting purposes, investment transactions are reported on trade date. Income and capital gain distributions from underlying funds are recorded on ex-date. Gains and losses on securities sold are determined on the basis of identified cost and may include proceeds from litigation.
Line of credit. The portfolios may borrow from banks for temporary or emergency purposes, including meeting redemption requests that otherwise might require the untimely sale of securities. Pursuant to the portfolios’ custodian agreement, the custodian may loan money to the portfolios to make properly authorized payments. The portfolios are obligated to repay the custodian for any overdraft, including any related costs or expenses. The custodian may have a lien, security interest or security entitlement in any portfolio property that is not otherwise segregated or pledged, to the maximum extent permitted by law, to the extent of any overdraft.
| |
| Semiannual report | Lifestyle Portfolios | 35 |
In addition, the portfolios and other affiliated funds have entered into an agreement with Citibank N.A. that enables them to participate in a $300 million unsecured committed line of credit. A commitment fee, payable at the end of each calendar quarter, based on the average daily unused portion of the line of credit, is charged to each participating fund on a pro rata basis and is reflected in other expenses on the Statements of operations. Prior to March 27, 2013, the portfolios participated in a $200 million for unsecured line of credit, also with Citibank, with terms otherwise similar to the existing agreement. For the six months ended June 30, 2013, the portfolios had no borrowings under either line of credit.
The commitment fees for the six months ended June 30, 2013 were as follows:
| | |
| Portfolio | Commitment fees | |
| |
| Lifestyle Aggressive | $756 | |
| Lifestyle Growth | 1,985 | |
| Lifestyle Balanced | 2,141 | |
| Lifestyle Moderate | 815 | |
| Lifestyle Conservative | 757 | |
Expenses. Within the John Hancock Funds complex, expenses that are directly attributable to an individual fund are allocated to such fund. Expenses that are not readily attributable to a specific fund are allocated among all portfolios in an equitable manner, taking into consideration, among other things, the nature and type of expense and the portfolios’ relative net assets. Expense estimates are accrued in the period to which they relate and adjustments are made when actual amounts are known.
Class allocations. Income, common expenses and realized and unrealized gains (losses) are determined at the fund level and allocated daily to each class of shares based on the net assets of the class. Class-specific expenses, such as distribution and service fees, if any, transfer agent fees, state registration fees and printing and postage, for all classes, are calculated daily at the class level based on the appropriate net assets of each class and the specific expense rates applicable to each class.
Federal income taxes. The portfolios intend to continue to qualify as regulated investment companies by complying with the applicable provisions of the Internal Revenue Code and will not be subject to federal income tax on taxable income that is distributed to shareholders. Therefore, no federal income tax provision is required.
Under the Regulated Investment Company Modernization Act of 2010, the portfolios are permitted to carry forward capital losses incurred in taxable years beginning after December 22, 2010 for an unlimited period. Any losses incurred during those taxable years will be required to be utilized prior to the losses incurred in pre-enactment taxable years. As a result of this ordering rule, pre-enactment capital loss carryforwards may be more likely to expire unused. Additionally, post-enactment capital losses that are carried forward will retain their character as either short-term or long-term capital losses rather than being considered all short-term as under previous law.
For federal income tax purposes, the portfolios have a capital loss carryforward available to offset future net realized capital gains. The following table details the capital loss carryforward available as of December 31, 2012:
| | | | | |
| | Capital Loss Carryforward | | | |
| | Expiring at December 31, | | No Expiration Date |
|
| Portfolio | 2016 | 2017 | 2018 | Short-term | Long-term |
|
| Lifestyle Aggressive | — | $354,683,144 | $69,388,579 | — | — |
| Lifestyle Growth | $73,093,672 | 966,013,756 | — | — | — |
| Lifestyle Balanced | — | 949,636,213 | 57,148,343 | — | — |
| Lifestyle Moderate | — | 89,726,256 | 17,269,113 | — | — |
| Lifestyle Conservative | — | 24,617,601 | 4,934,051 | — | — |
As of December 31, 2012, the portfolios had no uncertain tax positions that would require financial statement recognition, derecognition or disclosure. The portfolio’s federal tax returns are subject to examination by the Internal Revenue Service for a period of three years.
The costs of investments owned on June 30, 2013, including short-term investments, for federal income tax purposes, were as follows:
| | | | |
| | | | | Net Unrealized |
| | | Unrealized | Unrealized | Appreciation/ |
| Portfolio | Aggregate Cost | Appreciation | Depreciation | (Depreciation) |
|
| Lifestyle Aggressive | $3,299,585,336 | $789,287,196 | ($8,486,760) | $780,800,436 |
| Lifestyle Growth | 10,540,872,208 | 2,160,004,463 | (26,179,843) | 2,133,824,620 |
| Lifestyle Balanced | 11,846,981,435 | 1,909,525,037 | (28,891,406) | 1,880,633,631 |
| Lifestyle Moderate | 4,021,935,498 | 428,778,917 | (25,470,309) | 403,308,608 |
| Lifestyle Conservative | 3,695,200,575 | 233,742,423 | (18,859,770) | 214,882,653 |
| |
| 36 | Lifestyle Portfolios | Semiannual report |
Distribution of income and gains. Distributions to shareholders from net investment income and net realized gains, if any, are recorded on the ex-date. The Lifestyle Aggressive and Lifestyle Growth Portfolios generally declare and pay income dividends and capital gain distributions, if any, at least annually. The Lifestyle Balanced, Lifestyle Moderate and Lifestyle Conservative Portfolios generally declare and pay income dividends quarterly and capital gain distributions, if any, at least annually.
Distributions paid by the portfolios with respect to each class of shares are calculated in the same manner, at the same time and in the same amount, except for the effect of class level expenses that may be applied differently to each class.
Such distributions, on a tax basis, are determined in conformity with income tax regulations, which may differ from accounting principles generally accepted in the United States of America. Short-term gains from underlying funds are treated as ordinary income for tax purposes.
Capital accounts within the financial statements are adjusted for permanent book-tax differences. These adjustments have no impact on net assets or the results of operations. Temporary book-tax differences, if any, will reverse in a subsequent period. Book-tax differences are primarily attributable to wash sale loss deferrals for all portfolios.
Note 3 — Guarantees and indemnifications
Under the Trust’s organizational documents, its Officers and Trustees are indemnified against certain liabilities arising out of the performance of their duties to the Trust, including the portfolios. Additionally, in the normal course of business, the Trust enters into contracts with service providers that contain general indemnification clauses. The Trust’s maximum exposure under these arrangements is unknown, as this would involve future claims that may be made against the Trust that have not yet occurred. The risk of material loss from such claims is considered remote.
Note 4 — Fees and transactions with affiliates
John Hancock Investment Management Services, LLC (the Advisor), serves as investment adviser for the portfolios. John Hancock Funds, LLC (the Distributor), an affiliate of the Advisor, serves as principal underwriter of the portfolios. The Advisor and the Distributor are indirect wholly owned subsidiaries of Manulife Financial Corporation (MFC).
Management fee. The portfolios pay the Advisor a management fee for its services to the portfolios. The management fee has two components: (a) a fee on assets invested in a fund of the Trust or JHF III and (b) a fee on assets not invested in a fund of the Trust or JHF III (other assets). The fee on assets invested in a fund of the Trust or JHF III is stated as an annual percentage of the current value of the aggregate net assets of the portfolios and the corresponding John Hancock Variable Insurance Trust (JHVIT) Lifestyle Trusts and is equivalent to the sum of: (a) 0.05% of the first $7.5 billion of aggregate net assets and (b) 0.04% of the excess over $7.5 billion of aggregate net assets. The fee on other assets is stated as an annual percentage of the current value of the aggregate net assets of the portfolios and the corresponding JHVIT Lifestyle Trusts and is equivalent to the sum of: (a) 0.50% of the first $7.5 billion of aggregate net assets and (b) 0.49% of the excess over $7.5 billion of aggregate net assets.
John Hancock Asset Management a division of Manulife Asset Management (North America) Limited and John Hancock Asset Management a division of Manulife Asset Management (US) LLC, both indirectly owned subsidiaries of MFC and affiliates of the Advisor, act as subadvisors to the portfolios. QS Investors, LLC also acts as subadvisor consultant. The portfolios are not responsible for payment of the subadvisory fees.
Expense reimbursements. Effective May 1, 2013, the Advisor contractually agreed to reduce its management fee for each portfolio, in an amount equal to the amount by which the expenses, excluding fund level expenses such as advisory fees, taxes, brokerage commissions, interest expense, litigation and indemnification expenses and other extraordinary expenses, acquired fund fees and short dividend expense and expenses for Class R2 and Class R6 shares, to the extent that fees/expenses for each class exceed 0.56% and 0.05%, respectively, of the average daily net assets attributable to the classes. In addition, the Advisor contractually agreed to reduce its management fee for Lifestyle Aggressive Portfolio Class B shares, to the extent that the above expenses exceed 1.29% of the average daily net assets. The current fee waivers will continue in effect until at least April 30, 2014, unless renewed by mutual agreement of the portfolios and the Advisor.
The Advisor voluntarily agreed to reduce its management fee for each portfolio, in an amount equal to the amount by which the expenses, excluding fund level expenses such as advisory fees, taxes, brokerage commissions, interest expense, litigation and indemnification expenses and other extraordinary expenses, acquired fund fees, Rule 12b-1 fees transfer agent fees and service fees, state registration fees, printing and postage fees and short dividend expense and expenses of the fund exceed 0.10% of the average net assets of the fund. This voluntary expense reimbursement will continue in effect until terminated at any time by the Advisor on notice to the Trust.
Additionally, the Advisor voluntarily agreed to waive its advisory fee for each portfolio so that the aggregate advisory fee retained by the Advisor with respect to both the portfolio and the underlying investments (after payment of any subadvisory fees) does not exceed 0.50% of the Lifestyle portfolio’s first $7.5 billion of average daily net assets and 0.49% of the portfolio’s average daily net assets in excess of $7.5 billion. This voluntary waiver may terminate at any time by the Advisor upon notice to the Trust.
| |
| Semiannual report | Lifestyle Portfolios | 37 |
For the six months ended June 30, 2013, the expense reductions related to these plans amounted to the following and are reflected as a reduction of total expenses in the Statements of operations:
| | | | | | | | | | | | |
| | | Expense Reimbursement by Class | |
| |
|
| Portfolio | Class A | Class B | Class C | Class R1 | Class R2 | Class R3 | Class R4 | Class R5 | Class R6 | Class 1 | Class 5 | Total |
|
| Lifestyle Aggressive | $5,474 | $842 | $2,758 | $192 | $8,867 | $214 | $172 | $199 | $5,614 | $75,674 | — | $100,006 |
| Lifestyle Growth | 13,802 | 1,570 | 7,395 | 285 | 8,956 | 293 | 277 | 466 | 5,258 | 150,174 | $2,177 | 190,653 |
| Lifestyle Balanced | 11,899 | 1,158 | 6,544 | 185 | 8,962 | 366 | 744 | 414 | 5,182 | 119,158 | 962 | 155,574 |
| Lifestyle Moderate | — | — | — | — | 9,148 | — | — | — | 5,435 | — | — | 14,583 |
| Lifestyle Conservative | — | — | — | — | 9,119 | — | — | — | 5,776 | — | — | 14,895 |
Expense recapture. The Advisor may recapture operating expenses reimbursed or fees waived under previous expense limitation or waiver arrangements for a period of three years following the beginning of the month in which such reimbursements or waivers originally occurred to the extent that the portfolio is below its expense limitation during this period. The table below outlines the amounts recovered during the six months ended June 30, 2013, and the amount of waived or reimbursed expenses subject to potential recovery and the respective expiration dates. Certain reimbursements or waivers are not subject to recapture.
| | | | | |
| | Amounts eligible for | Amounts eligible for | Amounts eligible for | Amounts eligible for | Amount recovered |
| | recovery through | recovery through | recovery through | recovery through | during the period ended |
| Portfolio | December 1, 2013 | December 1, 2014 | December 1, 2015 | June 1, 2016 | June 30, 2013 |
|
| Lifestyle Aggressive | — | $8,706 | $33,406 | $14,715 | $6,320 |
| Lifestyle Growth | — | 5,277 | 32,094 | 14,092 | — |
| Lifestyle Balanced | — | 5,276 | 32,096 | 14,054 | — |
| Lifestyle Moderate | — | 5,276 | 30,451 | 14,583 | — |
| Lifestyle Conservative | — | 5,276 | 27,378 | 14,895 | — |
| | | |
| Amounts recovered by class | | | |
| | |
| Portfolio | Class B | | |
| | |
| Lifestyle Aggressive | $6,320 | | |
The investment management fees incurred for the six months ended June 30, 2013 were equivalent to a net annual effective rate of 0.04% of each of the portfolios’ average daily net assets.
Accounting and legal services. Pursuant to a service agreement, the portfolios reimburse the Advisor for all expenses associated with providing the administrative, financial, legal, accounting and recordkeeping services to the portfolios, including the preparation of all tax returns, periodic reports to shareholders and regulatory reports, among other services. These expenses are allocated to each share class based on its relative net assets at the time the expense was incurred. These accounting and legal services fees incurred for the six months ended June 30, 2013, amounted to an annual rate of 0.01% of each of the portfolios’ average daily net assets.
Distribution and service plans. The portfolio has a distribution agreement with the Distributor. The portfolios have adopted distribution and service plans with respect to Class A, Class B, Class C, Class R1, Class R2, Class R3, Class R4 and Class 1 shares pursuant to Rule 12b-1 under the 1940 Act, to pay the Distributor for services provided as the distributor of shares of the portfolio. In addition, under a service plan for Class R1, Class R2, Class R3, Class R4 and Class R5 shares, the portfolios pay for certain other services. The portfolios may pay up to the following contractual rates of distribution and service fees under these arrangements, expressed as an annual percentage of average daily net assets for each class of the portfolios’ shares.
| | | | |
| Class | 12b-1 Fee | Service Fee | | |
| | |
| Class A | 0.30% | — | | |
| Class B | 1.00% | — | | |
| Class C | 1.00% | — | | |
| Class R1 | 0.50% | 0.25% | | |
| Class R2 | 0.25% | 0.25% | | |
| Class R3 | 0.50% | 0.15% | | |
| Class R4 | 0.25% | 0.10% | | |
| Class R5 | — | 0.05% | | |
| Class 1 | 0.05% | — | | |
The Distributor has contractually agreed to waive 0.10% of 12b-1 fees for Class R4 shares to limit the 12b-1 fees on Class R4 shares to 0.15% of the average daily net assets of Class R4 shares, until at least April 30, 2014, unless renewed by mutual agreement of the Fund and the Distributor based upon a determination that this is appropriate under the circumstances at the time.
| |
| 38 | Lifestyle Portfolios | Semiannual report |
Accordingly, these fee limitations amounted to the following for Class R4 shares, for the six months ended June 30, 2013:
| | | |
| | Class R4 | | |
| Portfolio | Rule 12b-1 Reimbursement | | |
| | |
| Lifestyle Aggressive | $4,078 | | |
| Lifestyle Growth | 9,827 | | |
| Lifestyle Balanced | 35,654 | | |
| Lifestyle Moderate | 6,240 | | |
| Lifestyle Conservative | 4,324 | | |
Sales charges. Class A shares are assessed up-front sales charges of up to 5% of the net asset value of such shares. The following summarizes the net up-front sales charges received by the Distributor during the six months ended June 30, 2013:
| | | | | |
| Lifestyle Aggressive | Lifestyle Growth | Lifestyle Balanced | Lifestyle Moderate | Lifestyle Conservative |
|
| |
| Net sales charges | $417,156 | $3,130,677 | $4,087,357 | $1,845,758 | $1,861,445 |
| Retained for printing prospectuses, | | | | | |
| advertising and sales literature | 65,879 | 502,001 | 668,659 | 307,307 | 312,940 |
| Sales commission to unrelated broker-dealers | 338,133 | 2,586,617 | 3,369,609 | 1,508,262 | 1,506,197 |
| Sales commission to affiliated sales personnel | 13,144 | 42,059 | 49,089 | 30,189 | 42,308 |
Class A, Class B and Class C shares may be subject to contingent deferred sales charges (CDSCs). Certain Class A shares that are acquired through purchases of $1 million or more and are redeemed within one year of purchase are subject to a 1.00% sales charge. Class B shares that are redeemed within six years of purchase are subject to CDSCs, at declining rates, beginning at 5.00%. Class C shares that are redeemed within one year of purchase are subject to a 1.00% CDSC. CDSCs are applied to the lesser of the current market value at the time of redemption or the original purchase cost of the shares being redeemed. Proceeds from CDSCs are used to compensate the Distributor for providing distribution-related services in connection with the sale of these shares. During the six months ended June 30, 2013, CDSCs received by the Distributor for Class A, Class B and Class C shares were as follows:
| | | | |
| Portfolio | Class A | Class B | Class C | |
| |
| Lifestyle Aggressive | $303 | $32,334 | $6,340 | |
| Lifestyle Growth | 5,970 | 95,243 | 29,784 | |
| Lifestyle Balanced | 829 | 71,778 | 31,639 | |
| Lifestyle Moderate | 613 | 61,842 | 21,780 | |
| Lifestyle Conservative | 530 | 49,440 | 33,276 | |
Transfer agent fees. The portfolios have a transfer agent agreement with John Hancock Signature Services, Inc. (Signature Services), an affiliate of the Advisor. The transfer agent fees paid to Signature Services are determined based on the cost to Signature Services (Signature Services Cost) of providing recordkeeping services. The Signature Services Cost includes a component of allocated John Hancock corporate overhead for providing transfer agent services to the portfolios and to all other John Hancock affiliated funds. It also includes out-of-pocket expenses that are comprised of payments made to third-parties for recordkeeping services provided to their clients who invest in one or more John Hancock funds. In addition, Signature Services Cost may be reduced by certain fees that Signature Services receives in connection with retirement and small accounts. Signature Services Cost is calculated monthly and allocated, as applicable, to four categories of share classes: Institutional Share Classes, Retirement Share Classes, Municipal Bond Classes and all other Retail Share Classes. Within each of these categories, the applicable costs are allocated to the affected John Hancock affiliated funds and/or classes, based on the relative average daily net assets.
Class level expenses. Class level expenses for the six months ended June 30, 2013 were:
| | | | | |
| | | Distributions and | Transfer | State | Printing and |
| Portfolio | Share class | service fees | agent fees | registration fees | postage |
|
| Lifestyle Aggressive | Class A | $388,010 | $224,782 | $12,280 | $10,129 |
| | Class B | 125,926 | 21,953 | 6,696 | 1,859 |
| | Class C | 651,772 | 113,333 | 7,789 | 6,825 |
| | Class R1 | 34,111 | 1,297 | 6,592 | 474 |
| | Class R2 | 1,821 | 106 | 9,064 | 106 |
| | Class R3 | 32,860 | 1,441 | 6,537 | 395 |
| | Class R4 | 13,866 | 1,171 | 6,565 | 324 |
| | Class R5 | 2,357 | 1,350 | 6,373 | 419 |
| | Class R6 | — | 377 | 5,572 | 289 |
| | Class 1 | 894,379 | — | — | — |
| | Total | $2,145,102 | $365,810 | $67,468 | $20,820 |
|
| |
| Semiannual report | Lifestyle Portfolios | 39 |
| | | | | |
| | | Distributions and | Transfer | State | Printing and |
| Portfolio | Share class | service fees | agent fees | registration fees | postage |
|
| Lifestyle Growth | Class A | $1,465,708 | $848,387 | $31,338 | $36,294 |
| | Class B | 556,060 | 96,954 | 8,419 | 6,522 |
| | Class C | 2,618,252 | 455,188 | 14,437 | 19,957 |
| | Class R1 | 73,831 | 2,871 | 6,802 | 621 |
| | Class R2 | 2,921 | 164 | 9,282 | 121 |
| | Class R3 | 67,364 | 2,926 | 6,761 | 533 |
| | Class R4 | 32,429 | 2,802 | 7,123 | 457 |
| | Class R5 | 6,603 | 4,713 | 6,866 | 608 |
| | Class R6 | — | 988 | 5,788 | 216 |
| | Class 1 | 2,659,488 | — | — | — |
| | Total | $7,482,656 | $1,414,993 | $96,816 | $65,329 |
|
| Lifestyle Balanced | Class A | $1,710,800 | $990,165 | $20,224 | $32,148 |
| | Class B | 555,414 | 96,794 | 33,012 | 5,601 |
| | Class C | 3,136,305 | 545,126 | 19,059 | 21,298 |
| | Class R1 | 63,891 | 2,527 | 7,158 | 438 |
| | Class R2 | 1,645 | 97 | 9,278 | 22 |
| | Class R3 | 114,148 | 5,003 | 6,581 | 572 |
| | Class R4 | 124,787 | 10,150 | 8,045 | 806 |
| | Class R5 | 9,936 | 5,669 | 7,554 | 526 |
| | Class R6 | — | 1,065 | 5,782 | 220 |
| | Class 1 | 2,856,304 | — | — | — |
| | Total | $8,573,230 | $1,656,596 | $116,693 | $61,631 |
|
| Lifestyle Moderate | Class A | $656,925 | $380,130 | $23,149 | $12,081 |
| | Class B | 227,058 | 39,605 | 7,338 | 2,263 |
| | Class C | 1,546,482 | 268,902 | 14,982 | 10,133 |
| | Class R1 | 36,108 | 1,425 | 6,549 | 353 |
| | Class R2 | 860 | 55 | 9,274 | 121 |
| | Class R3 | 34,836 | 1,517 | 6,571 | 320 |
| | Class R4 | 20,592 | 1,769 | 6,871 | 291 |
| | Class R5 | 2,535 | 1,441 | 7,416 | 313 |
| | Class R6 | — | 551 | 5,747 | 163 |
| | Class 1 | 878,701 | — | — | — |
| | Total | $3,404,097 | $695,395 | $87,897 | $26,038 |
|
| Lifestyle Conservative | Class A | $742,818 | $430,769 | $26,486 | $12,674 |
| | Class B | 248,056 | 43,239 | 7,651 | 2,316 |
| | Class C | 1,727,417 | 300,858 | 21,646 | 10,910 |
| | Class R1 | 35,943 | 1,360 | 3,685 | 345 |
| | Class R2 | 926 | 58 | 9,229 | 126 |
| | Class R3 | 37,583 | 1,637 | 1,672 | 316 |
| | Class R4 | 13,836 | 1,220 | 6,810 | 293 |
| | Class R5 | 3,172 | 2,249 | 2,579 | 380 |
| | Class R6 | — | 341 | 5,796 | 260 |
| | Class 1 | 758,825 | — | — | — |
| | Total | $3,568,576 | $781,731 | $85,554 | $27,620 |
|
Trustee expenses. The portfolio compensates each Trustee who is not an employee of the Advisor or its affiliates. The costs of paying Trustee compensation and expenses are allocated to each portfolio based on its average daily net assets.
Note 5 — Portfolio share transactions
Transactions in portfolios shares for the six months ended June 30, 2013 and the year ended December 31, 2012 were as follows:
| | | | |
| Lifestyle Aggressive | | | | |
| | Six months ended 6-30-13 | | Year ended 12-31-12 |
| | Shares | Amount | Shares | Amount |
| Class A shares | | | | |
|
| Sold | 3,546,387 | $48,948,452 | 6,546,618 | $81,230,963 |
| Distributions reinvested | — | — | 189,811 | 2,441,000 |
| Repurchased | (2,709,275) | (37,406,799) | (6,006,478) | (74,601,304) |
| | | | | |
| Net increase | 837,112 | $11,541,653 | 729,951 | $9,070,659 |
| |
| Class B shares | | | | |
|
| Sold | 103,006 | $1,423,255 | 238,596 | $2,949,711 |
| Distributions reinvested | — | — | 5,888 | 75,895 |
| Repurchased | (209,807) | (2,898,668) | (359,517) | (4,419,877) |
| | | | | |
| Net decrease | (106,801) | ($1,475,413) | (115,033) | ($1,394,271) |
| |
| 40 | Lifestyle Portfolios | Semiannual report |
| | | | |
| | Six months ended 6-30-13 | | Year ended 12-31-12 |
| | Shares | Amount | Shares | Amount |
|
| Class C shares | | | | |
|
| Sold | 1,069,412 | $14,806,475 | 1,477,006 | $18,287,544 |
| Distributions reinvested | — | — | 34,428 | 444,120 |
| Repurchased | (806,766) | (11,183,322) | (2,028,905) | (25,079,212) |
| | | | | |
| Net increase (decrease) | 262,646 | $3,623,153 | (517,471) | ($6,347,548) |
| |
| Class R1 shares | | | | |
|
| Sold | 70,620 | $978,388 | 198,848 | $2,431,323 |
| Distributions reinvested | — | — | 4,049 | 52,186 |
| Repurchased | (149,987) | (2,096,808) | (267,568) | (3,279,369) |
| | | | | |
| Net decrease | (79,367) | ($1,118,420) | (64,671) | ($795,860) |
| |
| Class R2 shares1 | | | | |
|
| Sold | 100,737 | $1,393,282 | 8,006 | $100,000 |
| Repurchased | (836) | (11,415) | — | — |
| | | | | |
| Net increase | 99,901 | $1,381,867 | 8,006 | $100,000 |
| |
| Class R3 shares | | | | |
|
| Sold | 84,138 | $1,158,509 | 202,975 | $2,501,105 |
| Distributions reinvested | — | — | 5,910 | 75,890 |
| Repurchased | (148,628) | (2,066,497) | (316,823) | (3,900,193) |
| | | | | |
| Net decrease | (64,490) | ($907,988) | (107,938) | ($1,323,198) |
| |
| Class R4 shares | | | | |
|
| Sold | 63,517 | $874,016 | 470,635 | $5,762,193 |
| Distributions reinvested | — | — | 7,398 | 94,846 |
| Repurchased | (274,326) | (3,823,604) | (558,684) | (6,943,072) |
| | | | | |
| Net decrease | (210,809) | ($2,949,588) | (80,651) | ($1,086,033) |
| |
| Class R5 shares | | | | |
|
| Sold | 106,471 | $1,458,816 | 417,659 | $5,182,054 |
| Distributions reinvested | — | — | 9,200 | 118,042 |
| Repurchased | (117,010) | (1,618,987) | (842,458) | (10,587,042) |
| | | | | |
| Net decrease | (10,539) | ($160,171) | (415,599) | ($5,286,946) |
| |
| Class R6 shares | | | | |
|
| Sold | 118,601 | $1,654,700 | 179,670 | $2,262,958 |
| Distributions reinvested | — | — | 2,404 | 30,777 |
| Repurchased | (27,942) | (392,236) | (22,990) | (285,963) |
| | | | | |
| Net increase | 90,659 | $1,262,464 | 159,084 | $2,007,772 |
| |
| Class 1 shares | | | | |
|
| Sold | 4,701,032 | $64,552,358 | 4,755,717 | $58,815,078 |
| Distributions reinvested | — | — | 3,976,367 | 50,897,498 |
| Repurchased | (7,080,975) | (97,815,376) | (28,314,394) | (351,650,872) |
| | | | | |
| Net decrease | (2,379,943) | ($33,263,018) | (19,582,310) | ($241,938,296) |
| |
| Total net decrease | (1,561,631) | ($22,065,461) | (19,986,632) | ($246,993,721) |
|
| |
| |
| Lifestyle Growth | | | | |
| | Six months ended 6-30-13 | | Year ended 12-31-12 |
| | Shares | Amount | Shares | Amount |
| Class A shares | | | | |
|
| Sold | 12,550,394 | $180,211,165 | 21,617,347 | 282,729,682 |
| Distributions reinvested | — | — | 1,047,720 | 14,102,737 |
| Repurchased | (7,104,155) | (102,205,170) | (15,385,999) | (201,129,161) |
| | | | | |
| Net increase | 5,446,239 | $78,005,995 | 7,279,068 | $95,703,258 |
| |
| Class B shares | | | | |
| Sold | 353,655 | $5,075,693 | 1,428,655 | $18,526,780 |
| Distributions reinvested | — | — | 72,488 | 978,594 |
| Repurchased | (653,375) | (9,388,098) | (1,315,668) | (17,132,556) |
| | | | | |
| Net increase (decrease) | (299,720) | ($4,312,405) | 185,475 | $2,372,818 |
| |
| Semiannual report | Lifestyle Portfolios | 41 |
| | | | |
| | Six months ended 6-30-13 | | Year ended 12-31-12 |
| | Shares | Amount | Shares | Amount |
| Class C shares | | | | |
|
| Sold | 4,560,710 | $65,335,971 | 6,989,144 | $91,188,127 |
| Distributions reinvested | — | — | 331,572 | 4,469,588 |
| Repurchased | (3,288,046) | (47,217,170) | (6,714,814) | (87,411,788) |
| | | | | |
| Net increase | 1,272,664 | 18,118,801 | 605,902 | $8,245,927 |
| |
| Class R1 shares | | | | |
|
| Sold | 224,896 | $3,243,975 | 527,633 | $6,872,767 |
| Distributions reinvested | — | — | 15,702 | 212,144 |
| Repurchased | (266,809) | (3,871,036) | (439,681) | (5,699,950) |
| | | | | |
| Net increase (decrease) | (41,913) | ($627,061) | 103,654 | $1,384,961 |
| |
| Class R2 shares1 | | | | |
|
| Sold | 351,887 | $5,125,001 | 7,663 | $100,000 |
| Repurchased | (5,997) | ($87,517) | — | — |
| | | | | |
| Net increase | 345,890 | $5,037,484 | 7,663 | $100,000 |
| |
| Class R3 shares | | | | |
|
| Sold | 292,348 | $4,194,598 | 348,629 | $4,518,692 |
| Distributions reinvested | — | — | 19,624 | 263,747 |
| Repurchased | (183,005) | (2,649,448) | (785,497) | (10,143,064) |
| Net increase (decrease) | 109,343 | $1,545,150 | (417,244) | ($5,360,625) |
| |
| Class R4 shares | | | | |
|
| Sold | 242,332 | $3,498,172 | 1,207,245 | $15,441,879 |
| Distributions reinvested | — | — | 25,659 | 344,864 |
| Repurchased | (259,125) | (3,709,026) | (1,209,750) | (15,997,180) |
| | | | | |
| Net increase (decrease) | (16,793) | ($210,854) | 23,154 | ($210,437) |
| |
| Class R5 shares | | | | |
|
| Sold | 284,965 | $4,089,091 | 1,317,356 | $17,284,507 |
| Distributions reinvested | — | — | 46,280 | 622,462 |
| Repurchased | (448,100) | (6,523,077) | (1,219,079) | (16,168,117) |
| | | | | |
| Net increase (decrease) | (163,135) | ($2,433,986) | 144,557 | $1,738,852 |
| |
| Class R6 shares | | | | |
|
| Sold | 641,543 | $9,241,158 | 253,307 | $3,395,751 |
| Distributions reinvested | — | — | 5,232 | 70,109 |
| Repurchased | (52,097) | (755,506) | (10,608) | (141,624) |
| | | | | |
| Net increase | 589,446 | $8,485,652 | 247,931 | $3,324,236 |
| |
| Class 1 shares | | | | |
|
| Sold | 10,654,202 | $152,032,613 | 11,077,067 | $144,086,192 |
| Distributions reinvested | — | — | 15,752,228 | 211,079,854 |
| Repurchased | (16,354,594) | (235,231,601) | (66,902,791) | (877,159,860) |
| | | | | |
| Net decrease | (5,700,392) | ($83,198,988) | (40,073,496) | ($521,993,814) |
| |
| Class 5 shares | | | | |
|
| Sold | 751,096 | $10,747,716 | 1,378,974 | $17,921,927 |
| Distributions reinvested | — | — | 223,661 | 2,992,587 |
| Repurchased | (58,848) | (831,955) | (400,947) | (5,237,765) |
| | | | | |
| Net increase | 692,248 | $9,915,761 | 1,201,688 | $15,676,749 |
| |
| Total net increase (decrease) | 2,233,877 | $30,325,549 | (30,691,648) | ($399,018,075) |
|
| |
| Lifestyle Balanced | | | | |
| | Six months ended 6-30-13 | | Year ended 12-31-12 |
| | Shares | Amount | Shares | Amount |
| Class A shares | | | | |
|
| Sold | 16,142,859 | $229,824,815 | 29,799,585 | $393,896,550 |
| Distributions reinvested | 323,806 | 4,598,922 | 1,648,142 | 22,203,029 |
| Repurchased | (7,935,511) | (112,947,238) | (16,076,799) | (212,815,312) |
| | | | | |
| Net increase | 8,531,154 | $121,476,499 | 15,370,928 | $203,284,267 |
| |
| 42 | Lifestyle Portfolios | Semiannual report |
| | | | |
| | Six months ended 6-30-13 | | Year ended 12-31-12 |
| | Shares | Amount | Shares | Amount |
| Class B shares | | | | |
|
| Sold | 387,425 | $5,486,155 | 1,870,452 | $424,518,316 |
| Distributions reinvested | 3,220 | 45,590 | 117,766 | 1,591,417 |
| Repurchased | (496,933) | (7,061,747) | (1,002,770) | (13,220,061) |
| | | | | |
| Net increase (decrease) | (106,288) | ($1,530,002) | 985,448 | 412,889,672 |
| |
| Class C shares | | | | |
|
| Sold | 6,676,510 | $94,957,791 | 10,170,971 | $134,241,530 |
| Distributions reinvested | 22,639 | 321,019 | 648,794 | 8,772,999 |
| Repurchased | (3,227,343) | (45,948,820) | (7,790,575) | (102,765,426) |
| | | | | |
| Net increase | 3,471,806 | $49,329,990 | 3,029,190 | $40,249,103 |
| |
| Class R1 shares | | | | |
|
| Sold | 140,111 | $1,987,102 | 510,563 | $6,683,784 |
| Distributions reinvested | 2,103 | 29,766 | 19,161 | 257,539 |
| Repurchased | (215,460) | (3,073,441) | (581,101) | (7,660,314) |
| | | | | |
| Net decrease | (73,246) | ($1,056,573) | (51,377) | ($718,991) |
| |
| Class R2 shares1 | | | | |
|
| Sold | 156,595 | $2,249,598 | 7,605 | $100,000 |
| Distributions reinvested | 298 | 4,212 | — | — |
| Repurchased | (3,671) | (52,992) | — | — |
| | | | | |
| Net increase | 153,222 | $2,200,818 | 7,605 | $100,000 |
| |
| Class R3 shares | | | | |
|
| Sold | 372,341 | $5,281,143 | 788,988 | $10,363,332 |
| Distributions reinvested | 7,075 | 100,273 | 57,078 | 767,299 |
| Repurchased | (345,261) | (4,965,235) | (1,350,324) | (17,819,887) |
| | | | | |
| Net increase (decrease) | 34,155 | $416,181 | (504,258) | ($6,689,256) |
| |
| Class R4 shares | | | | |
|
| Sold | 600,809 | $8,549,691 | 6,336,522 | $83,595,716 |
| Distributions reinvested | 24,690 | 349,966 | 126,337 | 1,697,241 |
| Repurchased | (728,656) | (10,314,778) | (3,411,704) | (45,323,645) |
| | | | | |
| Net increase (decrease) | (103,157) | ($1,415,121) | 3,051,155 | $39,969,312 |
| |
| Class R5 shares | | | | |
|
| Sold | 377,191 | $5,372,382 | 1,450,309 | $19,171,138 |
| Distributions reinvested | 16,468 | 233,779 | 80,278 | 1,077,660 |
| Repurchased | (467,304) | (6,641,256) | (2,067,688) | (27,326,993) |
| | | | | |
| Net decrease | (73,645) | ($1,035,095) | (537,101) | ($7,078,195) |
| |
| Class R6 shares | | | | |
|
| Sold | 640,341 | $9,103,098 | 353,784 | $4,657,544 |
| Distributions reinvested | 4,320 | 61,050 | 6,223 | 83,976 |
| Repurchased | (97,111) | (1,390,129) | (23,203) | (310,274) |
| | | | | |
| Net increase | 547,550 | $7,774,019 | 336,804 | $4,431,246 |
| |
| Class 1 shares | | | | |
|
| Sold | 14,674,770 | $207,481,542 | 34,176,951 | $448,550,959 |
| Distributions reinvested | 5,097,915 | 72,064,461 | 22,417,405 | 299,880,075 |
| Repurchased | (15,392,089) | (217,886,430) | (51,222,941) | (676,975,779) |
| | | | | |
| Net increase | 4,380,596 | $61,659,573 | 5,371,415 | $71,455,255 |
| |
| Class 5 shares | | | | |
|
| Sold | 721,026 | $10,238,898 | 1,434,898 | $18,976,047 |
| Distributions reinvested | 43,755 | 618,734 | 163,876 | 2,194,885 |
| Repurchased | (136,157) | (1,939,616) | (256,469) | (3,317,908) |
| | | | | |
| Net increase | 628,624 | $8,918,016 | 1,342,305 | $17,853,024 |
| |
| Total net increase | 17,390,771 | $246,738,305 | 28,402,114 | $375,745,437 |
|
| |
| Semiannual report | Lifestyle Portfolios | 43 |
| | | | |
| Lifestyle Moderate | | | | |
| | Six months ended 6-30-13 | | Year ended 12-31-12 |
| | Shares | Amount | Shares | Amount |
| Class A shares | | | | |
|
| Sold | 7,712,563 | $106,309,230 | 12,585,088 | $164,396,424 |
| Distributions reinvested | 220,381 | 3,013,656 | 788,832 | 10,431,025 |
| Repurchased | (3,265,744) | (44,965,736) | (7,794,657) | (101,628,949) |
| | | | | |
| Net increase | 4,667,200 | $64,357,150 | 5,579,263 | $73,198,500 |
| |
| Class B shares | | | | |
|
| Sold | 202,705 | $2,775,336 | 877,166 | $11,392,653 |
| Distributions reinvested | 9,665 | 132,005 | 63,761 | 843,884 |
| Repurchased | (298,943) | (4,112,714) | (408,443) | (5,320,085) |
| | | | |
| Net increase (decrease) | (86,573) | ($1,205,373) | 532,484 | $6,916,452 |
| |
| Class C shares | | | | |
|
| Sold | 4,034,397 | $55,561,455 | 6,493,158 | $84,644,883 |
| Distributions reinvested | 74,609 | 1,019,638 | 438,826 | 5,811,808 |
| Repurchased | (1,987,123) | (27,386,773) | (3,837,488) | (50,036,708) |
| | | | | |
| Net increase | 2,121,883 | $29,194,320 | 3,094,496 | $40,419,983 |
| |
| Class R1 shares | | | | |
|
| Sold | 142,729 | $1,955,950 | 334,547 | $4,340,072 |
| Distributions reinvested | 2,833 | 38,706 | 12,333 | 163,215 |
| Repurchased | (156,662) | (2,157,417) | (204,333) | (2,654,134) |
| | | | | |
| Net increase (decrease) | (11,100) | ($162,761) | 142,547 | $1,849,153 |
| |
| Class R2 shares1 | | | | |
|
| Sold | 76,185 | $1,052,896 | 7,716 | $100,000 |
| Distributions reinvested | 206 | 2,799 | — | — |
| Repurchased | (1,513) | (20,889) | — | — |
| | | | | |
| Net increase | 74,878 | $1,034,806 | 7,716 | $100,000 |
| |
| Class R3 shares | | | | |
|
| Sold | 195,968 | $2,704,382 | 260,175 | $3,374,916 |
| Issued in reorganization | — | — | — | — |
| Distributions reinvested | 4,323 | 58,985 | 20,123 | 265,626 |
| Repurchased | (126,032) | (1,742,853) | (376,016) | (4,863,415) |
| | | | | |
| Net increase (decrease) | 74,259 | $1,020,514 | (95,718) | ($1,222,873) |
| |
| Class R4 shares | | | | |
|
| Sold | 275,457 | $3,754,227 | 570,862 | $7,382,594 |
| Distributions reinvested | 6,762 | 92,212 | 23,965 | 315,915 |
| Repurchased | (169,319) | (2,321,042) | (418,916) | (5,497,168) |
| | | | | |
| Net increase | 112,900 | $1,525,397 | 175,911 | $2,201,341 |
| |
| Class R5 shares | | | | |
|
| Sold | 244,312 | $3,375,073 | 416,723 | $5,420,537 |
| Distributions reinvested | 6,724 | 91,683 | 27,676 | 363,887 |
| Repurchased | (131,712) | (1,813,707) | (989,460) | (12,870,594) |
| | | | | |
| Net increase (decrease) | 119,324 | $1,653,049 | (545,061) | ($7,086,170) |
| |
| Class R6 shares2 | | | | |
|
| Sold | 325,833 | $4,454,284 | 132,468 | $1,768,610 |
| Distributions reinvested | 3,194 | 43,485 | 1,723 | 22,882 |
| Repurchased | (54,409) | (747,070) | (14,137) | (189,742) |
| | | | | |
| Net increase | 274,618 | $3,750,699 | 120,054 | $1,601,750 |
| |
| Class 1 shares | | | | |
|
| Sold | 5,621,869 | $77,061,972 | 13,540,901 | $175,499,000 |
| Distributions reinvested | 2,399,981 | 32,749,494 | 8,662,040 | 114,126,515 |
| Repurchased | (6,587,976) | (90,513,284) | (15,429,208) | (201,695,879) |
| | | | | |
| Net increase | 1,433,874 | $19,298,182 | 6,773,733 | $87,929,636 |
| |
| 44 | Lifestyle Portfolios | Semiannual report |
| | | | |
| | Six months ended 6-30-13 | | Year ended 12-31-12 |
| | Shares | Amount | Shares | Amount |
| Class 5 shares | | | | |
|
| Sold | 260,617 | $3,576,278 | 887,000 | $11,536,611 |
| Distributions reinvested | 29,607 | 403,536 | 93,554 | 1,232,491 |
| Repurchased | (81,541) | (1,128,882) | (276,740) | (3,573,141) |
| | | | | |
| Net increase | 208,683 | $2,850,932 | 703,814 | 9,195,961 |
| |
| Total net increase | 8,989,946 | $123,316,915 | 16,489,239 | $215,103,733 |
|
| |
| Lifestyle Conservative | | | | |
| | Six months ended 6-30-13 | | Year ended 12-31-12 |
| | Shares | Amount | Shares | Amount |
| Class A shares | | | | |
|
| Sold | 7,867,797 | $107,529,008 | 16,485,132 | $218,406,695 |
| Distributions reinvested | 327,550 | 4,422,834 | 1,019,305 | 13,597,012 |
| Repurchased | (5,018,918) | (68,545,464) | (9,311,796) | (122,976,803) |
| | | | | |
| Net increase | 3,176,429 | $43,406,378 | 8,192,641 | $109,026,904 |
| |
| Class B shares | | | | |
|
| Sold | 328,914 | $4,484,097 | 1,085,716 | $14,340,232 |
| Distributions reinvested | 17,235 | 232,615 | 75,238 | 1,004,631 |
| Repurchased | (293,885) | (4,015,945) | (475,249) | (6,288,066) |
| | | | | |
| Net increase | 52,264 | $700,767 | 685,705 | $9,056,797 |
| |
| Class C shares | | | | |
|
| Sold | 5,004,500 | $68,252,229 | 8,677,376 | $114,808,866 |
| Distributions reinvested | 131,444 | 1,772,124 | 533,856 | 7,123,334 |
| Repurchased | (3,110,681) | (42,382,313) | (4,407,940) | (58,316,268) |
| | | | | |
| Net increase | 2,025,263 | $27,642,040 | 4,803,292 | $63,615,932 |
| |
| Class R1 shares | | | | |
|
| Sold | 133,710 | $1,820,943 | 355,693 | $4,723,573 |
| Distributions reinvested | 4,422 | 59,697 | 15,971 | 213,057 |
| Repurchased | (132,189) | (1,809,967) | (207,657) | (2,757,838) |
| | | | | |
| Net increase | 5,943 | $70,673 | 164,007 | $2,178,792 |
| |
| Class R2 shares1 | | | | |
|
| Sold | 55,459 | $756,868 | 7,622 | $100,000 |
| Distributions reinvested | 316 | 4,250 | — | — |
| Repurchased | (2,417) | (32,945) | — | — |
| | | | | |
| Net increase | 53,358 | $728,173 | 7,622 | $100,000 |
| |
| Class R3 shares | | | | |
|
| Sold | 205,130 | $2,803,002 | 332,721 | $4,381,713 |
| Distributions reinvested | 6,867 | 92,489 | 24,838 | 330,471 |
| Repurchased | (122,123) | (1,664,187) | (355,405) | (4,671,166) |
| | | | | |
| Net increase | 89,874 | $1,231,304 | 2,154 | $41,018 |
| |
| Class R4 shares | | | | |
|
| Sold | 270,090 | $3,694,265 | 498,780 | $6,562,898 |
| Distributions reinvested | 6,805 | 91,655 | 22,529 | 299,530 |
| Repurchased | (90,292) | (1,228,371) | (611,503) | (8,087,876) |
| | | | | |
| Net increase (decrease) | 186,603 | $2,557,549 | (90,194) | ($1,225,448) |
| |
| Class R5 shares | | | | |
|
| Sold | 327,981 | $4,493,398 | 943,275 | $12,427,797 |
| Distributions reinvested | 12,572 | 169,660 | 40,401 | 537,917 |
| Repurchased | (270,113) | (3,706,985) | (1,115,453) | (14,626,308) |
| | | | | |
| Net increase (decrease) | 70,440 | $956,073 | (131,777) | ($1,660,594) |
| |
| Class R6 shares | | | | |
|
| Sold | 167,546 | $2,288,308 | 125,404 | $1,659,520 |
| Distributions reinvested | 2,363 | 31,799 | 2,732 | 36,576 |
| Repurchased | (45,938) | (629,795) | (15,458) | (207,702) |
| | | | | |
| Net increase | 123,971 | $1,690,312 | 112,678 | $1,488,394 |
| |
| Semiannual report | Lifestyle Portfolios | 45 |
| | | | |
| | Six months ended 6-30-13 | | Year ended 12-31-12 |
| | Shares | Amount | Shares | Amount |
| Class 1 shares | | | | |
|
| Sold | 2,318,377 | $31,726,421 | 25,753,594 | $341,811,558 |
| Distributions reinvested | 2,572,094 | 34,701,817 | 8,441,260 | 112,325,015 |
| Repurchased | (15,282,990) | (208,136,199) | (12,200,592) | (162,035,261) |
| | | | | |
| Net increase (decrease) | (10,392,519) | (141,707,961) | 21,994,262 | 292,101,312 |
| |
| Total net increase (decrease) | (4,608,374) | ($62,724,692) | 35,740,390 | $474,723,107 |
|
| | | | | |
| 1 The inception date for Class R2 shares is 3-1-12. | | | | |
Affiliates of the Trust owned shares of beneficial interest of the following portfolios on June 30, 2013.
| | | |
| Portfolio | Class | % by Class | |
| |
| Lifestyle Aggressive | R2 | 7% | |
| Lifestyle Aggressive | R6 | 3% | |
| Lifestyle Growth | R2 | 2% | |
| Lifestyle Growth | R6 | 1% | |
| Lifestyle Balanced | R2 | 5% | |
| Lifestyle Balanced | R6 | 1% | |
| Lifestyle Moderate | R2 | 9% | |
| Lifestyle Moderate | R6 | 2% | |
| Lifestyle Conservative | R2 | 13% | |
| Lifestyle Conservative | R6 | 3% | |
The affiliates of the Trust owned 100% of shares of beneficial interest of Class 1 of each portfolio and 100% of Class 5 for Lifestyle Growth, Lifestyle Balanced and Lifestyle Moderate on June 30, 2013.
Note 6 — Purchase and sale of securities
The following summarizes the purchases and sales of the affiliated underlying funds for the six months ended June 30, 2013:
| | | |
| Portfolio | Purchases | Sales | |
| |
| Lifestyle Aggressive | $307,047,726 | $331,204,803 | |
| Lifestyle Growth | 987,451,686 | 926,065,778 | |
| Lifestyle Balanced | 1,142,651,870 | 896,757,176 | |
| Lifestyle Moderate | 373,945,220 | 251,388,958 | |
| Lifestyle Conservative | 266,425,742 | 328,570,919 | |
Note 7 — Investment in affiliated underlying funds
The portfolios invest primarily in affiliated underlying funds that are managed by the Advisor and its affiliates. The portfolios do not invest in the affiliated underlying funds for the purpose of exercising management or control; however, the portfolios’ investment may represent a significant portion of each underlying fund’s net assets. For the six months ended June 30, 2013, the following portfolios held 5% or more of an underlying fund’s net assets:
| |
| | Percent of Underlying |
| Portfolio Affiliate Class NAV | Funds’ Net Assets |
|
| Lifestyle Aggressive | |
| John Hancock Funds II | |
| All Cap Core | 21.1% |
| All Cap Value | 11.8% |
| Alpha Opportunities | 17.0% |
| Blue Chip Growth | 9.4% |
| Capital Appreciation | 9.3% |
| Capital Appreciation Value | 8.8% |
| China Emerging Leaders | 16.3% |
| Currency Strategies | 7.0% |
| Emerging Markets | 13.9% |
| Equity-Income | 8.3% |
| Fundamental Global Franchise | 9.0% |
| Fundamental Large Cap Value | 13.5% |
| Fundamental Value | 14.7% |
| Global Equity | 11.7% |
| Global Real Estate | 7.9% |
| Health Sciences | 13.5% |
| Heritage | 17.3% |
| International Growth Opportunities | 10.3% |
| International Growth Stock | 15.0% |
| International Small Cap | 12.5% |
| International Small Company | 15.4% |
| International Value | 11.1% |
| |
| | Percent of Underlying |
| Portfolio Affiliate Class NAV | Funds’ Net Assets |
|
| Lifestyle Aggressive (continued) | |
| Mid Cap Stock | 10.6% |
| Mid Cap Value Equity | 19.1% |
| Mid Value | 15.0% |
| Mutual Shares | 15.6% |
| Natural Resources | 9.9% |
| Real Estate Equity | 8.9% |
| Redwood | 7.2% |
| Science & Technology | 14.8% |
| Small Cap Growth | 15.2% |
| Small Cap Opportunities | 6.9% |
| Small Cap Value | 17.5% |
| Small Company Growth | 17.5% |
| Small Company Value | 10.5% |
| Smaller Company Growth | 17.5% |
| Technical Opportunities | 15.9% |
| U.S. Equity | 7.9% |
| Value | 15.6% |
| John Hancock Funds III | |
| International Core | 8.5% |
| International Value Equity | 15.0% |
| Rainier Growth | 6.8% |
| Strategic Growth | 14.1% |
| |
| | Percent of Underlying |
| Portfolio Affiliate Class NAV | Funds’ Net Assets |
|
| Lifestyle Aggressive (continued) | |
| John Hancock Investment Trust | |
| Small Cap Intrinsic Value | 14.4% |
| Lifestyle Growth | |
| John Hancock Funds II | |
| Active Bond | 10.6% |
| All Cap Core | 50.5% |
| All Cap Value | 30.9% |
| Alpha Opportunities | 41.6% |
| Asia Total Return Bond | 19.6% |
| Blue Chip Growth | 25.3% |
| Capital Appreciation | 25.0% |
| Capital Appreciation Value | 32.3% |
| China Emerging Leaders | 38.9% |
| Currency Strategies | 21.9% |
| Emerging Markets Debt | 21.4% |
| Emerging Markets | 32.5% |
| Equity-Income | 22.3% |
| Floating Rate Income | 11.0% |
| Fundamental Global Franchise | 31.7% |
| Fundamental Large Cap Value | 36.6% |
| Fundamental Value | 34.6% |
| Global Bond | 9.4% |
| Global Equity | 30.7% |
| Global High Yield | 18.4% |
| Global Real Estate | 26.6% |
| Health Sciences | 36.4% |
| Heritage | 44.0% |
| High Income | 24.7% |
| High Yield | 11.5% |
| International Growth Opportunities | 24.4% |
| International Growth Stock | 35.7% |
| International Small Cap | 27.7% |
| International Small Company | 34.4% |
| International Value | 26.4% |
| Mid Cap Stock | 27.0% |
| Mid Cap Value Equity | 47.7% |
| Mid Value | 37.9% |
| Mutual Shares | 41.6% |
| Natural Resources | 23.9% |
| Real Estate Equity | 27.4% |
| Real Return Bond | 10.0% |
| Redwood | 22.1% |
| Science & Technology | 39.3% |
| Short Duration Credit Opportunities | 13.9% |
| Small Cap Growth | 31.5% |
| Small Cap Opportunities | 14.4% |
| Small Cap Value | 36.4% |
| Small Company Growth | 35.9% |
| Small Company Value | 21.7% |
| Smaller Company Growth | 36.2% |
| Spectrum Income | 14.6% |
| Strategic Income Opportunities | 5.5% |
| Technical Opportunities | 42.1% |
| Total Return | 7.1% |
| U.S. Equity | 29.0% |
| U.S. High Yield Bond | 17.5% |
| Value | 39.6% |
| John Hancock Funds III | |
| Global Shareholder Yield | 11.4% |
| International Core | 20.0% |
| International Value Equity | 36.2% |
| Rainier Growth | 18.1% |
| Strategic Growth | 38.2% |
| John Hancock Investment Trust | |
| Small Cap Intrinsic Value | 29.9% |
| |
| | Percent of Underlying |
| Portfolio Affiliate Class NAV | Funds’ Net Assets |
|
| Lifestyle Balanced | |
| John Hancock Funds II | |
| Active Bond | 31.7% |
| All Cap Core | 28.4% |
| All Cap Value | 26.5% |
| Alpha Opportunities | 26.6% |
| Asia Total Return Bond | 37.6% |
| Blue Chip Growth | 20.1% |
| Capital Appreciation | 19.8% |
| Capital Appreciation Value | 30.6% |
| China Emerging Leaders | 27.5% |
| Core Bond | 33.8% |
| Currency Strategies | 27.3% |
| Emerging Markets Debt | 33.1% |
| Emerging Markets | 23.7% |
| Equity-Income | 17.7% |
| Floating Rate Income | 24.9% |
| Fundamental Global Franchise | 32.2% |
| Fundamental Large Cap Value | 29.5% |
| Fundamental Value | 24.3% |
| Global Bond | 34.0% |
| Global Equity | 29.5% |
| Global High Yield | 32.4% |
| Global Real Estate | 31.7% |
| Health Sciences | 33.3% |
| Heritage | 31.2% |
| High Income | 40.9% |
| High Yield | 20.7% |
| International Growth Opportunities | 20.1% |
| International Growth Stock | 29.5% |
| International Small Cap | 20.9% |
| International Small Company | 26.3% |
| International Value | 21.6% |
| Investment Quality Bond | 21.6% |
| Mid Cap Stock | 18.8% |
| Mid Cap Value Equity | 33.2% |
| Mid Value | 26.4% |
| Mutual Shares | 33.3% |
| Natural Resources | 24.2% |
| Real Estate Equity | 29.9% |
| Real Return Bond | 28.1% |
| Redwood | 24.1% |
| Science & Technology | 30.0% |
| Short Duration Credit Opportunities | 38.3% |
| Small Cap Growth | 26.1% |
| Small Cap Opportunities | 11.6% |
| Small Cap Value | 29.8% |
| Small Company Growth | 28.9% |
| Small Company Value | 17.8% |
| Smaller Company Growth | 29.3% |
| Spectrum Income | 41.5% |
| Strategic Income Opportunities | 12.2% |
| Technical Opportunities | 24.5% |
| Total Return | 21.3% |
| U.S. Equity | 27.8% |
| U.S. High Yield Bond | 31.3% |
| Value | 27.8% |
| John Hancock Funds III | |
| Global Shareholder Yield | 12.0% |
| International Core | 16.5% |
| International Value Equity | 30.4% |
| Rainier Growth | 14.4% |
| Strategic Growth | 30.4% |
| John Hancock Investment Trust | |
| Small Cap Intrinsic Value | 23.9% |
| |
| Semiannual report | Lifestyle Portfolios | 47 |
| |
| | Percent of Underlying |
| Portfolio Affiliate Class NAV | Funds’ Net Assets |
|
| Lifestyle Moderate | |
| John Hancock Funds II | |
| Active Bond | 20.6% |
| All Cap Value | 8.6% |
| Alpha Opportunities | 6.2% |
| Asia Total Return Bond | 16.1% |
| Capital Appreciation Value | 8.7% |
| Core Bond | 22.1% |
| Currency Strategies | 9.1% |
| Emerging Markets Debt | 16.0% |
| Equity-Income | 5.8% |
| Floating Rate Income | 12.1% |
| Fundamental Global Franchise | 8.1% |
| Fundamental Large Cap Value | 9.1% |
| Fundamental Value | 6.4% |
| Global Bond | 16.7% |
| Global Equity | 7.6% |
| Global High Yield | 14.0% |
| Global Real Estate | 8.7% |
| High Income | 17.3% |
| High Yield | 8.8% |
| International Growth Stock | 6.4% |
| International Small Company | 5.8% |
| Investment Quality Bond | 19.7% |
| Mid Value | 7.8% |
| Natural Resources | 5.7% |
| Real Estate Equity | 9.8% |
| Real Return Bond | 11.3% |
| Redwood | 8.4% |
| Short Duration Credit Opportunities | 15.4% |
| Small Cap Growth | 7.0% |
| Small Cap Value | 7.9% |
| Small Company Growth | 7.7% |
| Smaller Company Growth | 8.0% |
| Spectrum Income | 16.6% |
| Strategic Income Opportunities | 5.0% |
| Total Return | 13.9% |
| U.S. Equity | 7.3% |
| U.S. High Yield Bond | 13.4% |
| John Hancock Funds III | |
| International Value Equity | 6.4% |
| Strategic Growth | 6.9% |
| |
| | Percent of Underlying |
| Portfolio Affiliate Class NAV | Funds’ Net Assets |
|
| Lifestyle Conservative | |
| John Hancock Funds II | |
| Active Bond | 22.9% |
| Asia Total Return Bond | 16.0% |
| Core Bond | 30.2% |
| Currency Strategies | 8.3% |
| Emerging Markets Debt | 18.9% |
| Floating Rate Income | 12.8% |
| Fundamental Value | 5.4% |
| Global Bond | 20.5% |
| Global Equity | 5.6% |
| Global High Yield | 13.1% |
| Global Real Estate | 6.4% |
| High Income | 16.1% |
| High Yield | 8.2% |
| Investment Quality Bond | 43.9% |
| Real Estate Equity | 8.9% |
| Real Return Bond | 18.1% |
| Redwood | 8.4% |
| Short Duration Credit Opportunities | 15.8% |
| Short Term Government Income | 68.5% |
| Small Cap Growth | 6.2% |
| Spectrum Income | 17.0% |
| Strategic Income Opportunities | 5.1% |
| Total Return | 15.4% |
| U.S. High Yield Bond | 12.4% |
| |
| 48 | Lifestyle Portfolios | Semiannual report |
EVALUATION OF ADVISORY AND SUBADVISORY AGREEMENTS BY THE BOARD OF TRUSTEES
This section describes the evaluation by the Board of Trustees (the “Board”) of John Hancock Funds II (the “Trust”) of the Advisory Agreement (the “Advisory Agreement”) and each of the Subadvisory Agreements (the “Subadvisory Agreements”) with respect to each of the portfolios of the Trust included in this report (the “Funds” or the “Fund of Funds”).
Approval of Advisory and Subadvisory Agreements
At in-person meetings held on May 16–17, 2013, the Board, including the Trustees who are not considered to be “interested persons” of the Trust under the Investment Company Act of 1940, as amended (the “1940 Act”) (the “Independent Trustees”), reapproved for an annual period, the continuation of the Advisory Agreement between the Trust and John Hancock Investment Management Services, LLC (the “Advisor”) and the applicable Subadvisory Agreements between the Advisor and the investment subadvisors (each, a “Subadvisor” and collectively, the “Subadvisors”) with respect to each of the Funds identified in Appendix A.
In considering the Advisory Agreement and the Subadvisory Agreements with respect to each Fund, the Board received in advance of the meeting a variety of materials relating to each Fund, the Advisor and each Subadvisor, including comparative performance, fee and expense information for peer groups of similar mutual funds prepared by an independent third-party provider of mutual fund data; performance information for relevant indices; with respect to each Subadvisor, comparative performance information for comparably managed accounts, as applicable; and other information provided by the Advisor and the Subadvisors regarding the nature, extent and quality of services provided by the Advisor and the Subadvisors under their respective Agreements, as well as information regarding the Advisor’s revenues and costs of providing services to the Funds and compensation paid to affiliates of the Advisor. At the meeting at which the renewal of the Advisory Agreement and Subadvisory Agreements is considered, particular focus is given to information concerning Fund performance, comparability of fees and total expenses, and profitability. However, the Board notes that the evaluation process with respect to the Advisor and the Subadvisors is an ongoing one. In this regard, the Board also took into account discussions with management and information provided to the Board at prior meetings with respect to the services provided by the Advisor and the Subadvisors to the Funds, including quarterly performance reports prepared by management containing reviews of investment results, and periodic presentations from the Subadvisors with respect to the Funds they manage. The Board noted the affiliation of certain of the Subadvisors with the Advisor, noting any potential conflicts of interest. The Board also considered the nature, quality, and extent of the services to be provided to the Funds by the Advisor’s affiliates, including distribution services.
Throughout the process, the Board asked questions of and requested additional information from management. The Board is assisted by counsel for the Trust and the Independent Trustees are also separately assisted by independent legal counsel throughout the process. The Independent Trustees also received a memorandum from their independent counsel discussing the legal standards for their consideration of the proposed continuation of the Agreements and discussed the proposed continuation of the Agreements in private sessions with their independent legal counsel at which no representatives of management were present.
Approval of Advisory Agreement
In approving the Advisory Agreement with respect to each Fund, the Board, including the Independent Trustees, considered a variety of factors, including those discussed below. The Board also considered other factors (including conditions and trends prevailing generally in the economy, the securities markets and the industry) and did not treat any single factor as determinative, and each Trustee may have attributed different weights to different factors. The Board’s conclusions may be based in part on its consideration of the advisory and subadvisory arrangements in prior years and on the Board’s ongoing regular review of Fund performance and operations throughout the year.
Nature, Extent and Quality of Services. Among the information received by the Board from the Advisor relating to the nature, extent and quality of services provided to the Funds, the Board reviewed information provided by the Advisor relating to its operations and personnel, descriptions of its organizational and management structure, and information regarding the Advisor’s compliance and regulatory history, including its Form ADV. The Board also noted that on a regular basis it receives and reviews information from the Trust’s Chief Compliance Officer (“CCO”) regarding the Funds’ compliance policies and procedures established pursuant to Rule 38a-1 under the 1940 Act. The Board also considered the Advisor’s risk management processes. The Board considered that the Advisor is responsible for the management of the day-to-day operations of the Funds, including but not limited to general supervision of and coordination of the services provided by the Subadvisors, and is also responsible for monitoring and reviewing the activities of the Subadvisors and other third-party service providers.
In considering the nature, extent and quality of the services provided by the Advisor, the Trustees also took into account their knowledge of the Advisor’s management and the quality of the performance of the Advisor’s duties, through Board meetings, discussions and reports during the preceding year and through each Trustee’s experience as a Trustee of the Trust and of the other trusts in the complex.
In the course of their deliberations regarding the Advisory Agreement, the Board considered, among other things:
(a) the skills and competency with which the Advisor has in the past managed the Trust’s affairs and its subadvisory relationships, the Advisor’s oversight and monitoring of the Subadvisors’ investment performance and compliance programs, such as the Subadvisors’ compliance with fund policies and objectives, review of brokerage matters including with respect to trade allocation and best execution, and the Advisor’s timeliness in responding to performance issues;
| |
| Semiannual report | Lifestyle Portfolios | 49 |
(b) the background, qualifications and skills of the Advisor’s personnel;
(c) the Advisor’s compliance policies and procedures and its responsiveness to regulatory changes and mutual fund industry developments;
(d) the Advisor’s administrative capabilities, including its ability to supervise the other service providers for the Funds;
(e) the financial condition of the Advisor and whether it had the financial wherewithal to provide a high level and quality of services to the Funds; and
(f) the Advisor’s reputation and experience in serving as an investment adviser to the Trust and the benefit to shareholders of investing in funds that are part of a family of funds offering a variety of investments.
The Board concluded that the Advisor may reasonably be expected to continue to provide a high quality of services under the Advisory Agreement with respect to the Funds.
Investment Performance. In considering each Fund’s performance, the Board noted that it reviews at its regularly scheduled meetings information about the Funds’ performance results. In connection with the consideration of the Advisory Agreement, the Board:
(a) reviewed information prepared by management regarding the Funds’ performance;
(b) considered the comparative performance of each Fund’s respective benchmark;
(c) considered the performance of comparable funds, if any, as included in the report prepared by an independent third-party provider of mutual fund data. Such report included each Fund’s ranking within a smaller group of peer funds and the Fund’s ranking within broader groups of funds; and
(d) took into account the Advisor’s analysis of each Fund’s performance and its plans and recommendations regarding the Trust’s subadvisory arrangements generally and with respect to particular Funds.
The Board concluded that the performance of each of the Funds has generally been in line with or generally outperformed the historical performance of comparable funds and the Fund’s respective benchmark, with certain exceptions noted in Appendix A. In such cases, the Board concluded that such performance is being reasonably addressed and/or monitored.
Fees and Expenses. The Board reviewed comparative information prepared by an independent third-party provider of mutual fund data including, among other data, each Fund’s contractual and net management fees (and subadvisory fees, to the extent available) and total expenses, as compared to similarly situated investment companies deemed to be comparable to the Fund. The Board considered each Fund’s ranking within a smaller group of peer funds chosen by the independent third-party provider, as well as the Fund’s ranking within broader groups of funds. In comparing each Fund’s contractual and net management fees to that of comparable funds, the Board noted that such fee includes both advisory and administrative costs.
The Board took into account management’s discussion with respect to the advisory/subadvisory fee structure, including the amount of the advisory fee retained by the Advisor after payment of the subadvisory fee. The Board also noted that the Advisor pays the subadvisory fees of the Funds, and that such fees are negotiated at arm’s length with respect to the unaffiliated Subadvisor. The Board also took into account that management had agreed to implement an overall fee waiver across a number of funds in the complex, which is discussed further below. The Board also noted management’s discussion of the Funds’ expenses, as well as any actions taken over the past several years to reduce the Funds’ operating expenses. The Board reviewed information provided by the Advisor concerning investment advisory fees charged to other clients (including other funds in the complex) having similar investment mandates, if any. The Board considered any differences between the Advisor’s and Subadvisor’s services to a Fund and the services they provide to other such comparable clients or funds. The Board concluded that the advisory fee paid with respect to each of the Funds is reasonable.
In addition, the Trustees reviewed the advisory fee to be paid to the Advisor for each Fund of Funds and concluded that such fee is based on services provided that are in addition to, rather than duplicative of, the services provided pursuant to the advisory agreements for the underlying portfolios of the Fund of Funds, and that the additional services are necessary because of the differences between the investment policies, strategies and techniques of a Fund of Funds and those of its underlying portfolios.
Profitability/Indirect Benefits. In considering the costs of the services to be provided and the profits to be realized by the Advisor and its affiliates (including any Subadvisors that are affiliated with the Advisor) from the Advisor’s relationship with the Trust, the Board:
| |
| 50 | Lifestyle Portfolios | Semiannual report |
(a) reviewed financial information of the Advisor;
(b) reviewed and considered an analysis presented by the Advisor regarding the net profitability to the Advisor and its affiliates, of each Fund;
(c) received and reviewed profitability information with respect to the John Hancock fund complex as a whole;
(d) received information with respect to the Advisor’s allocation methodologies used in preparing the profitability data;
(e) considered that the John Hancock insurance companies that are affiliates of the Advisor, as shareholders of the Trust directly or through their separate accounts, receive certain tax credits or deductions relating to foreign taxes paid and dividends received by certain Funds of the Trust and noted that these tax benefits, which are not available to participants in qualified retirement plans under applicable income tax law, are reflected in the profitability analysis reviewed by the Board;
(f) considered that the Advisor also provides administrative services to the Funds on a cost basis pursuant to an administrative services agreement;
(g) noted that certain of the Funds’ Subadvisors are affiliates of the Advisor;
(h) noted that affiliates of the Advisor provide transfer agency services and distribution services to the Funds, and that the Trust’s distributor also receives Rule 12b-1 payments to support distribution of the products;
(i) noted that the Advisor also derives reputational and other indirect benefits from providing advisory services to the Funds;
(j) noted that the subadvisory fees for the Funds are paid by the Advisor and are negotiated at arms’ length with respect to the unaffiliated Subadvisor;
(k) with respect to each Fund of Funds, the Board noted that the advisory fee is in addition to the fees received by the Advisor and its affiliates with regard to the Underlying Portfolios in which the Funds may invest; and
(l) considered that the Advisor should be entitled to earn a reasonable level of profits in exchange for the level of services it provides to each Fund and the entrepreneurial risk that it assumes as Advisor.
Based upon its review, the Board concluded that the level of profitability, if any, of the Advisor and its affiliates (including any Subadvisors that are affiliated with the Advisor), from their relationship with each Fund was reasonable and not excessive.
Economies of Scale. In considering the extent to which economies of scale would be realized as a Fund grows and whether fee levels reflect these economies of scale for the benefit of Fund shareholders, the Board:
(a) considered that the Advisor has agreed, effective June 1, 2013, to waive its management fee for certain of the underlying portfolios it advises in which each Fund of Funds may invest and for each of the other John Hancock open-end funds (except those listed below) (the “Participating Portfolios”) or otherwise reimburse the expenses of the Participating Portfolios as follows (the “Reimbursement”): The Reimbursement shall equal, on an annualized basis, 0.01% of that portion of the aggregate net assets of all the Participating Portfolios that exceeds $75 billion but is less than or equal to $125 billion, 0.0125% of that portion of the aggregate net assets of all the Participating Portfolios that exceeds $125 billion but is less than or equal to $150 billion and 0.0150% of that portion of the aggregate net assets of all the Participating Portfolios that exceeds $150 billion. (The funds that are not Participating Portfolios as of the date of this annual report are each of the fund of funds, money market funds, and index funds of the Trust, John Hancock Variable Insurance Trust and the John Hancock closed-end funds.);
(b) reviewed the Trust’s advisory fee structure and concluded that (i) the Funds’ fee structures contain breakpoints at the advisory fee level and (ii) although economies of scale cannot be measured with precision, these arrangements permit shareholders to benefit from economies of scale if those Funds grow. The Board also took into account management’s discussion of the Funds’ advisory fee structure; and
(c) considered the effect of the Funds’ growth in size on their performance and fees. The Board also noted that if the Funds’ assets increase over time, the Funds may realize other economies of scale.
Approval of Subadvisory Agreements
In making its determination with respect to approval of the Subadvisory Agreements, the Board reviewed:
(1) information relating to each Subadvisor’s business, including current subadvisory services to the Trust (and other funds in the John Hancock family of funds);
(2) the historical and current performance of each Fund and comparative performance information relating to the Fund’s benchmark and comparable funds;
(3) the subadvisory fee for each Fund, and comparative fee information, where available, prepared by an independent third-party provider of mutual fund data; and
| |
| Semiannual report | Lifestyle Portfolios | 51 |
(4) information relating to the nature and scope of any material relationships and their significance to the Trust’s Advisor and the unaffiliated Subadvisor.
Nature, Extent and Quality of Services. With respect to the services provided by each of the Subadvisors with respect to each Fund, the Board received information provided to the Board by each Subadvisor, including the Subadvisor’s Form ADV, as well as took into account information presented throughout the past year. The Board considered each Subadvisor’s current level of staffing and its overall resources, as well as received information relating to a Subadvisor’s compensation program. The Board reviewed each Subadvisor’s history and investment experience, as well as information regarding the qualifications, background and responsibilities of the Subadvisor’s investment and compliance personnel who provide services to the Funds. The Board also considered, among other things, each Subadvisor’s compliance program and any disciplinary history. The Board also considered each Subadvisor’s risk assessment and monitoring process. The Board reviewed each Subadvisor’s regulatory history, including whether it was currently involved in any regulatory actions or investigations, as well as material litigation, and any settlements and remedial actions undertaken, as appropriate. The Board noted that the Advisor conducts regular, periodic reviews of each Subadvisor and its operations, including regarding investment processes and organizational and staffing matters. The Board also noted that the CCO and his staff conduct regular, periodic compliance reviews with each of the Subadvisors and present reports to the Independent Trustees regarding the same, which includes evaluating the regulatory compliance systems of the Subadvisors and procedures reasonably designed by them to assure compliance with the federal securities laws. The Board also took into account the financial condition of each Subadvisor.
The Board considered each Subadvisor’s investment process and philosophy. The Board took into account that each Subadvisor’s responsibilities include the development and maintenance of an investment program for the applicable Fund that is consistent with the Fund’s investment objectives, the selection of investment securities and the placement of orders for the purchase and sale of such securities, as well as the implementation of compliance controls related to performance of these services. The Board also received information with respect to each Subadvisor’s brokerage policies and practices, including with respect to best execution and soft dollars.
Subadvisor Compensation. In considering the cost of services to be provided by each Subadvisor and the profitability to that Subadvisor of its relationship with the Fund, the Board noted that the fees under the Subadvisory Agreements are paid by the Advisor and not the Funds. With respect to each Fund, the Board also relied on the ability of the Advisor to negotiate the Subadvisory Agreement with the Subadvisor that is not affiliated with the Advisor and the fees thereunder at arm’s length. As a result, the costs of the services to be provided and the profits to be realized by the unaffiliated Subadvisor from its relationship with the Trust were not a material factor in the Board’s consideration of such Subadvisory Agreement.
The Board also received information regarding the nature and scope (including their significance to the Advisor and its affiliates and to the unaffiliated Subadvisor) of any material relationships with respect to the unaffiliated Subadvisor, which include arrangements in which unaffiliated subadvisors or their affiliates provide advisory, distribution or management services in connection with financial products sponsored by the Trust’s Advisor or its affiliates, and may include shares of the Trust, other registered investment companies, a 529 education savings plan, managed separate accounts and exempt group annuity contracts sold to qualified plans. The Board also received information and took into account any other potential conflicts of interests the Advisor might have in connection with the Subadvisory Agreements.
In addition, the Board considered other potential indirect benefits that the Subadvisor and its affiliates may receive from the Subadvisor’s relationship with the Fund, such as the opportunity to provide advisory services to additional portfolios of the Trusts and reputational benefits.
Subadvisory Fees. The Board considered that the Fund pays an advisory fee to the Advisor and that, in turn, the Advisor pays a subadvisory fee to each Subadvisor. As noted above, the Board also considered, if available, each Fund’s subadvisory fees as compared to similarly situated investment companies deemed to be comparable to the Fund as included in the report prepared by the independent third-party provider of mutual fund data. The Board also took into account the subadvisory fees paid by the Advisor to fees charged by each Fund’s Subadvisor to manage other subadvised portfolios and portfolios not subject to regulation under the 1940 Act, as applicable.
Subadvisor Performance. As noted above, the Board considered each Fund’s performance as compared to the Fund’s respective peer group and benchmark and noted that the Board reviews information about the Fund’s performance results at its regularly scheduled meetings. The Board noted the Advisor’s expertise and resources in monitoring the performance, investment style, and risk-adjusted performance of each Subadvisor. The Board was mindful of the Advisor’s focus on each Subadvisor’s performance. The Board also noted each Subadvisor’s long-term performance record for similar accounts, as applicable.
| |
| 52 | Lifestyle Portfolios | Semiannual report |
The Board’s decision to approve the Subadvisory Agreements with respect to each Fund was based on a number of determinations, including the following:
(1) Each Subadvisor has extensive experience and demonstrated skills as a manager;
(2) Although not without variation, the performance of each Fund managed by a Subadvisor generally has been in line with or outperformed the historical performance of comparable funds and the Fund’s respective benchmarks and each Fund’s overall performance is satisfactory, with the exceptions noted in Appendix A (with respect to such exceptions, the Board concluded that performance is being reasonably addressed and/or monitored);
(3) The subadvisory fees are reasonable in relation to the level and quality of services being provided; and
(4) Noted that the subadvisory fees are paid by the Advisor, and that the fee structure for each of the Funds contains breakpoints at the advisory fee level.
In addition, the Trustees reviewed the subadvisory fee to be paid to each Subadvisor for the Fund of Funds and concluded that such subadvisory fee is based on services provided that are in addition to, rather than duplicative of, the services provided pursuant to the subadvisory agreements for the underlying portfolios of the Fund of Funds, and that the additional services are necessary because of the differences between the investment policies, strategies and techniques of a Fund of Funds and those of its underlying portfolios.
Additional information relating to each Fund’s fees and expenses and performance that the Board considered in approving the Advisory Agreement and Subadvisory Agreements for a particular Fund is set forth in Appendix A.
Based on their evaluation of all factors that they deemed to be material, including those factors described above, the Board, including the Independent Trustees, concluded that renewal of the Advisory Agreement and each of the Subadvisory Agreements with respect to each Fund would be in the best interest of each of the respective Funds and its shareholders. Accordingly, the Board, and the Independent Trustees voting separately, approved the Advisory Agreement and Subadvisory Agreements with respect to each Fund for an additional one-year period.
| |
| Semiannual report | Lifestyle Portfolios | 53 |
| | | |
| | | |
| Portfolio | Performance of Trust, | Fees and Expenses | Comments |
| (Subadvisor) | as of December 31, 2012 | | |
|
| |
| |
| JHF II Lifestyle | Benchmark Index — The | Net management fees for this | The Board took into account |
| Aggressive Portfolio | Fund outperformed for the | Fund are higher than the peer | management’s discussion |
| | one-year period and under- | group median. | of the Fund’s performance, |
| John Hancock Asset | performed for the three- and | | including the differences in |
| Management a division | five-year periods. | Total expenses for this Fund | investment allocations from |
| of Manulife Asset | | are lower than the peer | the peer group that contributed |
| Management (North | Lipper Category — The Fund | group median. | to relative underperformance, |
| America) Limited | outperformed the average for | | and the favorable performance |
| | the one-year period and under- | | relative to its benchmark |
| John Hancock Asset | performed the average for the | | index and peer group for |
| Management a division | three- and five-year periods. | | the one-year period. |
| of Manulife Asset | | | |
| Management (US) LLC | | | The Board took into account |
| | | | management’s discussion of |
| QS Investors, LLC | | | the Fund’s expenses. |
|
| |
| JHF II Lifestyle | Benchmark Index — The | Net management fees for this | The Board took into account |
| Balanced Portfolio | Fund outperformed for the | Fund are lower than the peer | management’s discussion |
| | one-year period and under- | group median. | of the Fund’s performance |
| John Hancock Asset | performed for the three- and | | relative to its benchmark and |
| Management a division | five-year periods. | Total expenses for this Fund | peer group, including the |
| of Manulife Asset | | are lower than the peer | favorable performance of |
| Management (North | Lipper Category — The Fund | group median. | the Fund relative to its peer |
| America) Limited | outperformed the average for | | group for the one-, three- |
| | the one-, three- and five-year | | and five- year periods. |
| John Hancock Asset | periods. | | |
| Management a division | | | |
| of Manulife Asset | | | |
| Management (US) LLC | | | |
| |
| QS Investors, LLC | | | |
|
| |
| JHF II Lifestyle | Benchmark Index — The Fund | Net management fees for this | |
| Conservative Portfolio | outperformed for the one-, | Fund are lower than the peer | |
| | three- and five-year periods. | group median. | |
| John Hancock Asset | | | |
| Management a division | Lipper Category — The Fund | Total expenses for this Fund | |
| of Manulife Asset | outperformed the average | are lower than the peer | |
| Management (North | for the one-, three- and | group median. | |
| America) Limited | five-year periods. | | |
| |
| John Hancock Asset | | | |
| Management a division | | | |
| of Manulife Asset | | | |
| Management (US) LLC | | | |
| |
| QS Investors, LLC | | | |
|
| |
| 54 | Lifestyle Portfolios | Semiannual report |
| | | |
| | | |
| Portfolio | Performance of Trust, | Fees and Expenses | Comments |
| (Subadvisor) | as of December 31, 2012 | | |
|
| |
| |
| JHF II Lifestyle | Benchmark Index — The | Net management fees for this | The Board took into account |
| Growth Portfolio | Fund outperformed for the | Fund are higher than the peer | management’s discussion of |
| | one-year period and under- | group median. | the Fund’s performance, includ- |
| John Hancock Asset | performed for the three- and | | ing relative to the benchmark |
| Management a division | five-year periods. | Total expenses for this | index and its peer group and |
| of Manulife Asset | | Fund are lower than the | any differences in investment |
| Management (North | Lipper Category — The | peer group median. | strategies from those of the peer |
| America) Limited | Fund outperformed the | | group. The Board also noted the |
| | average for the one- and | | Fund’s favorable performance |
| John Hancock Asset | five-year periods and under- | | relative to its peer group for the |
| Management a division | performed the average for the | | one- and five-year periods and |
| of Manulife Asset | three-year period. | | its benchmark index for the |
| Management (US) LLC | | | one-year period. |
| |
| QS Investors, LLC | | | |
|
| |
| JHF II Lifestyle | Benchmark Index — The | Net management fees for this | |
| Moderate Portfolio | Fund outperformed for the | Fund are lower than the peer | |
| | one- and three-year periods | group median. | |
| John Hancock Asset | and underperformed for the | | |
| Management a division | five-year period. | Total expenses for this | |
| of Manulife Asset | | Fund are lower than the | |
| Management (North | Lipper Category — The | peer group median. | |
| America) Limited | Fund outperformed the | | |
| | average for the one- , three- | | |
| John Hancock Asset | and five-year periods. | | |
| Management a division | | | |
| of Manulife Asset | | | |
| Management (US) LLC | | | |
| |
| QS Investors, LLC | | | |
|
| |
| Semiannual report | Lifestyle Portfolios | 55 |
| |
| Trustees | Investment advisor |
| James M. Oates, Chairperson | John Hancock Investment Management Services, LLC |
| Steven R. Pruchansky, Vice Chairperson | |
| Charles L. Bardelis* | Subadvisors |
| James R. Boyle† | John Hancock Asset Management a division of |
| Craig Bromley† | Manulife Asset Management (US) LLC |
| Peter S. Burgess* | |
| William H. Cunningham | John Hancock Asset Management a division of |
| Grace K. Fey | Manulife Asset Management (North America) Limited |
| Theron S. Hoffman* | |
| Deborah C. Jackson | QS Investors, Inc. (Subadvisor Consultant) |
| Hassell H. McClellan | |
| Gregory A. Russo | Principal distributor |
| Warren A. Thomson† | John Hancock Funds, LLC |
| | |
| Officers | Custodian |
| Hugh McHaffie | State Street Bank and Trust Company |
| President | |
| | Transfer agent |
| Andrew G. Arnott | John Hancock Signature Services, Inc. |
| Executive Vice President | |
| | Legal counsel |
| Thomas M. Kinzler | K&L Gates LLP |
| Secretary and Chief Legal Officer | |
| | Independent registered public accounting firm |
| Francis V. Knox, Jr. | PricewaterhouseCoopers LLP |
| Chief Compliance Officer | |
| | |
| Charles A. Rizzo | |
| Chief Financial Officer | |
| | |
| Salvatore Schiavone | |
| Treasurer | |
| | |
| *Member of the Audit Committee | |
| †Non-Independent Trustee | |
The portfolios’ proxy voting policies and procedures, as well as the portfolios’ proxy voting record for the most recent twelve-month period ended June 30, are available free of charge on the Securities and Exchange Commission (SEC) website at sec.gov or on our website.
The portfolios’ complete list of portfolio holdings, for the first and third fiscal quarters, is filed with the SEC on Form N-Q. The portfolios’ Form N-Q is available on our website and the SEC’s website, sec.gov, and can be reviewed and copied (for a fee) at the SEC’s Public Reference Room in Washington, DC. Call 202-551-8090 to receive information on the operation of the SEC’s Public Reference Room.
We make this information on your portfolio, as well as monthly portfolio holdings, and other fund details available on our website at jhfunds.com or by calling 800-225-5291.
| | |
| You can also contact us: | | |
| 800-225-5291 | Regular mail: | Express mail: |
| jhfunds.com | John Hancock Signature Services, Inc. | John Hancock Signature Services, Inc. |
| | P.O. Box 55913 | Mutual Fund Operations |
| | Boston, MA 02205-5913 | 30 Dan Road |
| | | Canton, MA 02021 |
|
| |
| 56 | Lifestyle Portfolios | Semiannual report |

800-225-5291
800-338-8080 EASI-Line
jhfunds.com

| | |
| This report is for the information of the shareholders of John Hancock Lifestyle Portfolios. | | |
| It is not authorized for distribution to prospective investors unless preceded or accompanied by a prospectus. | LSSA 6/13 |
| | | 8/13 |
ITEM 2. CODE OF ETHICS.
(a)Not Applicable
(b)Not Applicable
(c)Not Applicable
(d)Not Applicable
(e)Not Applicable
(f)Not Applicable
ITEM 3. AUDIT COMMITTEE FINANCIAL EXPERT.
Not Applicable
ITEM 4. PRINCIPAL ACCOUNTANT FEES AND SERVICES.
(a) Not Applicable
(b) Not Applicable
(c) Not Applicable
(d) Not Applicable
(e) Not Applicable
(f) Not Applicable
(g) Not Applicable
(h) Not Applicable
ITEM 5. AUDIT COMMITTEE OF LISTED REGISTRANTS
Not Applicable.
ITEM 6. SCHEDULE OF INVESTMENTS.
(a) Included with Item 1.
(b) Not Applicable
ITEM 7. DISCLOSURE OF PROXY VOTING POLICIES AND PROCEDURES FOR CLOSED-END MANAGEMENT INVESTMENT COMPANIES.
Not Applicable.
ITEM 8. PORTFOLIO MANAGERS OF CLOSED-END MANAGEMENT INVESTMENT COMPANIES.
Not Applicable.
ITEM 9. PURCHASE OF EQUITY SECURITIES BY CLOSED-END MANAGEMENT INVESTMENT COMPANIES AND AFFILIATED PURCHASERS.
Not Applicable.
ITEM 10. SUBMISSION OF MATTERS TO VOTE OF SECURITY HOLDERS.
Not Applicable.
ITEM 11. CONTROLS AND PROCEDURES.
(a) EVALUATION OF DISCLOSURE CONTROLS AND PROCEDURES. The Registrant maintains disclosure controls and procedures that are designed to ensure that information required to be disclosed in this Form N-CSR is recorded, processed, summarized and reported within the
periods specified in the rules and forms of the Securities and Exchange Commission. Such disclosure controls and procedures include controls and procedures designed to ensure that such information is accumulated and communicated to the Registrant's management, including its principal executive officer and principal financial officer, as appropriate, to allow timely decisions regarding required disclosure.
Within 90 days prior to the filing date of this Form N-CSR, the Registrant had carried out an evaluation, under the supervision and with the participation of the Registrant's management, including the Registrant's principal executive officer and the Registrant's principal financial officer, of the effectiveness of the design and operation of the Registrant's disclosure controls and procedures relating to information required to be disclosed on Form N-CSR. Based on such evaluation, the Registrant's principal executive officer and principal financial officer concluded that the Registrant's disclosure controls and procedures are operating effectively to ensure that:
(i) information required to be disclosed in this Form N-CSR is recorded, processed, summarized and reported within the periods specified in the rules and forms of the Securities and Exchange Commission, and
(ii) information is accumulated and communicated to the Registrant’s management, including its principal executive officer and principal financial officer, as appropriate, to allow timely decisions regarding required disclosure.
(b) CHANGE IN REGISTRANT’S INTERNAL CONTROL: Not Applicable.
ITEM 12. EXHIBITS.
(a)(1) Not applicable
(a)(2)(i) CERTIFICATION OF PRINCIPAL EXECUTIVE OFFICER.
(a)(2)(ii) CERTIFICATION OF PRINCIPAL FINANCIAL OFFICER.
(b) CERTIFICATION PURSUANT TO Rule 30a-2(b) OF THE INVESTMENT COMPANY ACT OF 1940
Pursuant to the requirements of the Securities Exchange Act of 1934 and the Investment Company Act of 1940, the registrant has duly caused this report to be signed on its behalf by the undersigned, thereunto duly authorized.
|
| JOHN HANCOCK FUNDS II |
| |
| |
| |
| |
| /s/ Hugh McHaffie |
| Hugh McHaffie |
| President |
| Date: August 20, 2013 |
Pursuant to the requirements of the Securities Exchange Act of 1934 and the Investment Company Act of 1940, this report has been signed below by the following persons on behalf of the registrant and in the capacities and on the dates indicated.
|
| /s/ Hugh McHaffie |
| Hugh McHaffie |
| President |
| Date: August 20, 2013 |
| |
| |
| |
| |
| /s/ Charles A. Rizzo |
| Charles A. Rizzo |
| Chief Financial Officer |
| Date: August 20, 2013 |