UNITED STATES
SECURITIES AND EXCHANGE COMMISSION
Washington, D.C. 20549
FORM N-CSR
CERTIFIED SHAREHOLDER REPORT OF REGISTERED MANAGEMENT INVESTMENT COMPANIES
Investment Company Act file number 811-21779
JOHN HANCOCK FUNDS II
---------------------------------------------------------
(Exact name of registrant as specified in charter)
200 BERKELEY STREET, BOSTON, MA 02116
-------------------------------------------------------------------
(Address of principal executive offices) (Zip code)
SALVATORE SCHIAVONE, 200 Berkeley Street, BOSTON, MA 02116
------------------------------------------------------------------------------------------
(Name and address of agent for service)
Registrant's telephone number, including area code: (617) 663-4497
--------------
Date of fiscal year end: August 31
------
Date of reporting period: August 31, 2021
-------
ITEM 1. REPORTS TO STOCKHOLDERS.
The Registrant prepared five annual reports to shareholders for the period ended August 31, 2021 for series of John Hancock Funds II with August 31 fiscal year end. The first report applies to 11 of the Registrant's funds, the second report applies to John Hancock Global Equity Fund, the third report applies to John Hancock Strategic Income Opportunities Fund, the fourth report applies to John Hancock Floating Rate Income Fund, and the fifth report applies to John Hancock Opportunistic Fixed Income Fund.


| 3 | |
| 15 | |
| 17 | |
| 114 | |
| 117 | |
| 120 | |
| 122 | |
| 124 | |
| 145 | |
| 146 | |
| 147 | |
| 151 | |
| 155 | |
| 156 | |
| 160 |
| Fund | Manager’s commentary and fund performance | Portfolio of investments | ||
| 4 | 17 | |||
| 5 | 18 | |||
| 6 | 27 | |||
| 7 | 37 | |||
| 8 | 39 | |||
| 9 | 47 | |||
| Fund | Manager’s commentary and fund performance | Portfolio of investments | ||
| 10 | 64 | |||
| 11 | 65 | |||
| 12 | 67 | |||
| 13 | 69 | |||
| 14 | 106 | |||
| 2 |

| Sector Composition (% of net assets) | |
| Information technology | 46.1 |
| Consumer discretionary | 26.2 |
| Communication services | 16.6 |
| Health care | 5.3 |
| Consumer staples | 3.1 |
| Financials | 1.3 |
| Industrials | 1.3 |
| Short-term investments and other | 0.1 |
| PERFORMANCE TABLE | Average Annual Total Return | Cumulative Total Return | |||
| Periods Ending August 31, 2021 | 1-year | 5-year | 10-year | 5-year | 10-year |
| Capital Appreciation Fund Class 1 | 24.71 | 26.85 | 20.08 | 228.49 | 523.07 |
| Capital Appreciation Fund Class NAV | 24.75 | 26.92 | 20.13 | 229.28 | 526.11 |
| Russell 1000 Growth Index | 28.53 | 24.35 | 19.45 | 197.34 | 491.35 |
| Class 1 | Class NAV | |
| Gross (%) | 0.80 | 0.75 |
| Net (%) | 0.79 | 0.74 |

| Portfolio Composition (% of net assets) | |
| Common stocks | 72.2 |
| Term loans | 10.8 |
| Corporate bonds | 8.1 |
| Preferred securities | 1.4 |
| Short-term investments and other | 7.5 |
| PERFORMANCE TABLE | Average Annual Total Return | Cumulative Total Return | |||
| Periods Ending August 31, 2021 | 1-year | 5-year | 10-year | 5-year | 10-year |
| Capital Appreciation Value Fund Class NAV | 25.84 | 14.29 | 13.77 | 95.03 | 263.18 |
| S&P 500 Index | 31.17 | 18.02 | 16.34 | 128.95 | 354.24 |
| Blended Index | 17.92 | 12.14 | 11.15 | 77.37 | 187.85 |
| Class NAV | |
| Gross (%) | 0.87 |
| Net (%) | 0.86 |

| Portfolio Composition (% of total investments) | |
| U.S. Government | 32.8 |
| Corporate bonds | 27.2 |
| U.S. Government Agency | 20.9 |
| Collateralized mortgage obligations | 8.7 |
| Asset backed securities | 7.6 |
| Foreign government obligations | 1.0 |
| Municipal bonds | 0.3 |
| Short-term investments | 1.5 |
| PERFORMANCE TABLE | Average Annual Total Return | Cumulative Total Return | |||
| Periods Ending August 31, 2021 | 1-year | 5-year | 10-year | 5-year | 10-year |
| Core Bond Fund Class 1 | 0.17 | 2.99 | 3.27 | 15.88 | 37.99 |
| Core Bond Fund Class NAV | 0.22 | 3.05 | 3.32 | 16.19 | 38.65 |
| Bloomberg U.S. Aggregate Bond Index | -0.08 | 3.11 | 3.18 | 16.55 | 36.71 |
| Class 1 | Class NAV | |
| Gross (%) | 0.66 | 0.61 |
| Net (%) | 0.65 | 0.60 |

| Industry Composition (% of net assets) | |
| Biotechnology | 32.7 |
| Health care equipment and supplies | 21.6 |
| Health care providers and services | 16.0 |
| Life sciences tools and services | 12.1 |
| Pharmaceuticals | 11.2 |
| Health care technology | 4.8 |
| Capital markets | 0.6 |
| Specialty retail | 0.3 |
| Insurance | 0.2 |
| Internet and direct marketing retail | 0.1 |
| Short-term investments and other | 0.4 |
| PERFORMANCE TABLE | Average Annual Total Return | Cumulative Total Return | |||
| Periods Ending August 31, 2021 | 1-year | 5-year | Since inception | 5-year | Since inception |
| Health Sciences Fund Class NAV (began 9/30/11) | 31.27 | 18.31 | 21.24 | 131.84 | 575.90 |
| S&P 500 Index | 31.17 | 18.02 | 17.04 | 128.95 | 376.39 |
| Lipper Health/Biotechnology Index | 23.09 | 16.82 | 19.42 | 117.57 | 481.76 |
| Class NAV | |
| Gross (%) | 1.11 |
| Net (%) | 1.10 |

| Portfolio Composition (% of net assets) | |
| Corporate bonds | 82.0 |
| Term loans | 6.9 |
| Asset backed securities | 5.0 |
| Convertible bonds | 1.8 |
| Common stocks | 0.8 |
| Preferred securities | 0.7 |
| Foreign government obligations | 0.7 |
| Short-term investments and other | 2.1 |
| PERFORMANCE TABLE | Average Annual Total Return | Cumulative Total Return | |||
| Periods Ending August 31, 2021 | 1-year | 5-year | 10-year | 5-year | 10-year |
| High Yield Fund Class 1 | 11.30 | 6.52 | 6.30 | 37.11 | 84.15 |
| Bloomberg U.S. High Yield 2% Issuer-Capped Index | 10.14 | 6.65 | 7.06 | 37.94 | 97.83 |
| Class 1 | |
| Gross (%) | 0.85 |
| Net (%) | 0.84 |

| Sector Composition (% of net assets) | |
| Financials | 22.0 |
| Information technology | 12.2 |
| Consumer discretionary | 11.9 |
| Industrials | 11.4 |
| Health care | 9.0 |
| Consumer staples | 7.8 |
| Materials | 7.4 |
| Communication services | 5.7 |
| Energy | 3.4 |
| Utilities | 2.8 |
| Real estate | 2.1 |
| Short-term investments and other | 4.3 |
| PERFORMANCE TABLE | Average Annual Total Return | Cumulative Total Return | |
| Periods Ending August 31, 2021 | 1-year | Since inception | Since inception |
| International Strategic Equity Allocation Fund Class NAV (began 10/17/16) | 22.25 | 9.27 | 54.03 |
| MSCI All Country World ex-USA Index | 24.87 | 10.30 | 61.28 |
| Class NAV | |
| Gross (%) | 0.71 |
| Net (%) | 0.70 |

| Sector Composition (% of net assets) | |
| Consumer discretionary | 31.4 |
| Information technology | 25.8 |
| Health care | 19.8 |
| Industrials | 8.8 |
| Communication services | 6.5 |
| Financials | 5.5 |
| Consumer staples | 0.1 |
| Real estate | 0.1 |
| Short-term investments and other | 2.0 |
| PERFORMANCE TABLE | Average Annual Total Return | Cumulative Total Return | |||
| Periods Ending August 31, 2021 | 1-year | 5-year | 10-year | 5-year | 10-year |
| Mid Cap Stock Fund Class 1 | 33.87 | 24.86 | 18.43 | 203.47 | 442.78 |
| Mid Cap Stock Fund Class NAV | 33.91 | 24.93 | 18.49 | 204.32 | 445.38 |
| Russell Midcap Growth Index | 35.17 | 20.44 | 16.88 | 153.46 | 375.94 |
| Class 1 | Class NAV | |
| Gross (%) | 0.92 | 0.87 |
| Net (%) | 0.91 | 0.86 |

| Sector Composition (% of net assets) | |
| Financials | 17.6 |
| Health care | 15.9 |
| Energy | 11.5 |
| Materials | 9.9 |
| Consumer staples | 8.4 |
| Utilities | 7.4 |
| Real estate | 6.5 |
| Industrials | 6.4 |
| Communication services | 4.4 |
| Consumer discretionary | 2.6 |
| Information technology | 2.1 |
| Short-term investments and other | 7.3 |
| PERFORMANCE TABLE | Average Annual Total Return | Cumulative Total Return | |||
| Periods Ending August 31, 2021 | 1-year | 5-year | 10-year | 5-year | 10-year |
| Mid Value Fund Class NAV | 33.10 | 10.29 | 12.18 | 63.17 | 215.47 |
| Russell Midcap Value Index | 44.50 | 11.52 | 13.26 | 72.48 | 247.40 |
| Class NAV | |
| Gross (%) | 0.99 |
| Net (%) | 0.98 |

| Sector Composition (% of net assets) | |
| Information technology | 55.2 |
| Consumer discretionary | 23.0 |
| Communication services | 16.2 |
| Industrials | 0.6 |
| Health care | 0.5 |
| Short-term investments and other | 4.5 |
| PERFORMANCE TABLE | Average Annual Total Return | Cumulative Total Return | |||
| Periods Ending August 31, 2021 | 1-year | 5-year | Since inception | 5-year | Since inception |
| Science & Technology Fund Class NAV (began 2/14/13) | 30.29 | 27.37 | 22.99 | 235.17 | 485.95 |
| S&P 500 Index | 31.17 | 18.02 | 15.88 | 128.95 | 252.45 |
| Lipper Science and Technology Index | 38.22 | 27.43 | 22.14 | 236.03 | 452.50 |
| Class NAV | |
| Gross (%) | 1.11 |
| Net (%) | 1.10 |

| Sector Composition (% of net assets) | |
| Information technology | 19.2 |
| Financials | 15.3 |
| Health care | 13.1 |
| Consumer discretionary | 11.7 |
| Industrials | 9.7 |
| Communication services | 7.6 |
| Consumer staples | 5.3 |
| Materials | 4.6 |
| Real estate | 4.1 |
| Energy | 2.6 |
| Utilities | 2.1 |
| Short-term investments and other | 4.7 |
| PERFORMANCE TABLE | Average Annual Total Return | Cumulative Total Return | |||
| Periods Ending August 31, 2021 | 1-year | 5-year | Since inception | 5-year | Since inception |
| Strategic Equity Allocation Fund Class NAV (began 4/13/12) | 28.84 | 13.81 | 12.02 | 90.92 | 190.25 |
| S&P 500 Index | 31.17 | 18.02 | 15.72 | 128.95 | 293.61 |
| Blended Index | 30.60 | 15.56 | 13.03 | 106.12 | 215.73 |
| Class NAV | |
| Gross (%) | 0.68 |
| Net (%) | 0.67 |
| Sector Composition (% of net assets) | |
| Information technology | 26.0 |
| Health care | 16.6 |
| Consumer discretionary | 11.4 |
| Financials | 10.7 |
| Communication services | 10.6 |
| Industrials | 7.0 |
| Real estate | 4.7 |
| Consumer staples | 4.1 |
| Materials | 2.2 |
| Energy | 2.1 |
| Utilities | 1.4 |
| Short-term investments and other | 3.2 |
| PERFORMANCE TABLE | Average Annual Total Return | Cumulative Total Return | |
| Periods Ending August 31, 2021 | 1-year | Since inception | Since inception |
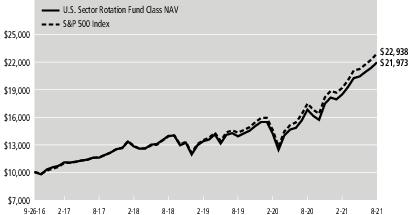
| U.S. Sector Rotation Fund Class NAV (began 9/26/16) | 30.62 | 17.31 | 119.73 |
| S&P 500 Index | 31.17 | 18.33 | 129.38 |
| Class NAV | |
| Gross (%) | 0.67 |
| Net (%) | 0.66 |
| Account value on 3-1-2021 | Ending value on 8-31-2021 | Expenses paid during period ended 8-31-20211 | Annualized expense ratio | ||
| Capital Appreciation Fund | |||||
| Class 1 | Actual expenses/actual returns | $1,000.00 | $1,171.90 | $4.27 | 0.78% |
| Hypothetical example | 1,000.00 | 1,021.30 | 3.97 | 0.78% | |
| Class NAV | Actual expenses/actual returns | 1,000.00 | 1,172.10 | 4.00 | 0.73% |
| Hypothetical example | 1,000.00 | 1,021.50 | 3.72 | 0.73% | |
| Capital Appreciation Value Fund | |||||
| Class NAV | Actual expenses/actual returns | $1,000.00 | $1,141.80 | $4.37 | 0.81% |
| Hypothetical example | 1,000.00 | 1,021.10 | 4.13 | 0.81% | |
| Core Bond Fund | |||||
| Class 1 | Actual expenses/actual returns | $1,000.00 | $1,012.60 | $3.30 | 0.65% |
| Hypothetical example | 1,000.00 | 1,021.90 | 3.31 | 0.65% | |
| Class NAV | Actual expenses/actual returns | 1,000.00 | 1,012.90 | 3.04 | 0.60% |
| Hypothetical example | 1,000.00 | 1,022.20 | 3.06 | 0.60% | |
| Health Sciences Fund | |||||
| Class NAV | Actual expenses/actual returns | $1,000.00 | $1,157.50 | $5.22 | 0.96% |
| Hypothetical example | 1,000.00 | 1,020.40 | 4.89 | 0.96% | |
| High Yield Fund | |||||
| Class 1 | Actual expenses/actual returns | $1,000.00 | $1,042.10 | $4.22 | 0.82% |
| Hypothetical example | 1,000.00 | 1,021.10 | 4.18 | 0.82% | |
| International Strategic Equity Allocation Fund | |||||
| Class NAV | Actual expenses/actual returns | $1,000.00 | $1,062.00 | $2.86 | 0.55% |
| Hypothetical example | 1,000.00 | 1,022.40 | 2.80 | 0.55% | |
| Mid Cap Stock Fund | |||||
| Class 1 | Actual expenses/actual returns | $1,000.00 | $1,067.90 | $4.74 | 0.91% |
| Hypothetical example | 1,000.00 | 1,020.60 | 4.63 | 0.91% | |
| Class NAV | Actual expenses/actual returns | 1,000.00 | 1,068.00 | 4.48 | 0.86% |
| Hypothetical example | 1,000.00 | 1,020.90 | 4.38 | 0.86% | |
| Account value on 3-1-2021 | Ending value on 8-31-2021 | Expenses paid during period ended 8-31-20211 | Annualized expense ratio | ||
| Mid Value Fund | |||||
| Class NAV | Actual expenses/actual returns | $1,000.00 | $1,078.90 | $4.87 | 0.93% |
| Hypothetical example | 1,000.00 | 1,020.50 | 4.74 | 0.93% | |
| Science & Technology Fund | |||||
| Class NAV | Actual expenses/actual returns | $1,000.00 | $1,063.50 | $5.51 | 1.06% |
| Hypothetical example | 1,000.00 | 1,019.90 | 5.40 | 1.06% | |
| Strategic Equity Allocation Fund | |||||
| Class NAV | Actual expenses/actual returns | $1,000.00 | $1,127.30 | $2.84 | 0.53% |
| Hypothetical example | 1,000.00 | 1,022.50 | 2.70 | 0.53% | |
| U.S. Sector Rotation Fund | |||||
| Class NAV | Actual expenses/actual returns | $1,000.00 | $1,188.30 | $2.92 | 0.53% |
| Hypothetical example | 1,000.00 | 1,022.50 | 2.70 | 0.53% | |
| 1 | Expenses are equal to the annualized expense ratio, multiplied by the average account value over the period, multiplied by 184/365 (to reflect the one-half year period). |
| Shares or Principal Amount | Value | ||||
| COMMON STOCKS – 99.9% | |||||
| Communication services – 16.6% | |||||
| Entertainment – 3.1% | |||||
| Netflix, Inc. (A) | 96,674 | $ | 55,025,874 | ||
| ROBLOX Corp., Class A (A) | 139,194 | 11,420,868 | |||
| 66,446,742 | |||||
| Interactive media and services – 13.5% | |||||
| Alphabet, Inc., Class A (A) | 23,399 | 67,715,536 | |||
| Alphabet, Inc., Class C (A) | 21,990 | 63,974,188 | |||
| Facebook, Inc., Class A (A) | 227,248 | 86,213,346 | |||
| Match Group, Inc. (A) | 200,295 | 27,528,545 | |||
| Snap, Inc., Class A (A) | 562,844 | 42,838,057 | |||
| 288,269,672 | |||||
| 354,716,414 | |||||
| Consumer discretionary – 26.2% | |||||
| Automobiles – 4.9% | |||||
| Tesla, Inc. (A) | 143,441 | 105,532,413 | |||
| Hotels, restaurants and leisure – 2.7% | |||||
| Airbnb, Inc., Class A (A) | 149,196 | 23,123,888 | |||
| Chipotle Mexican Grill, Inc. (A) | 14,714 | 28,005,598 | |||
| Marriott International, Inc., Class A (A) | 45,177 | 6,105,220 | |||
| 57,234,706 | |||||
| Internet and direct marketing retail – 7.7% | |||||
| Amazon.com, Inc. (A) | 39,386 | 136,700,529 | |||
| MercadoLibre, Inc. (A) | 14,338 | 26,775,498 | |||
| 163,476,027 | |||||
| Multiline retail – 1.4% | |||||
| Target Corp. | 123,384 | 30,473,380 | |||
| Specialty retail – 3.3% | |||||
| Carvana Company (A) | 85,733 | 28,125,568 | |||
| The Home Depot, Inc. | 61,707 | 20,127,589 | |||
| The TJX Companies, Inc. | 308,055 | 22,401,760 | |||
| 70,654,917 | |||||
| Textiles, apparel and luxury goods – 6.2% | |||||
| Kering SA | 35,486 | 28,265,329 | |||
| Lululemon Athletica, Inc. (A) | 73,914 | 29,578,165 | |||
| LVMH Moet Hennessy Louis Vuitton SE | 51,292 | 37,997,630 | |||
| NIKE, Inc., Class B | 220,331 | 36,297,329 | |||
| 132,138,453 | |||||
| 559,509,896 | |||||
| Consumer staples – 3.1% | |||||
| Food and staples retailing – 1.2% | |||||
| Costco Wholesale Corp. | 57,455 | 26,170,178 | |||
| Personal products – 1.9% | |||||
| The Estee Lauder Companies, Inc., Class A | 119,450 | 40,671,531 | |||
| 66,841,709 | |||||
| Financials – 1.3% | |||||
| Capital markets – 1.3% | |||||
| S&P Global, Inc. | 38,302 | 16,999,194 | |||
| The Goldman Sachs Group, Inc. | 27,462 | 11,355,812 | |||
| 28,355,006 | |||||
| Health care – 5.3% | |||||
| Biotechnology – 0.5% | |||||
| BioNTech SE, ADR (A) | 28,838 | 9,493,181 | |||
| Health care equipment and supplies – 2.5% | |||||
| Danaher Corp. | 79,110 | 25,644,298 | |||
| DexCom, Inc. (A) | 29,537 | 15,637,479 | |||
| Shares or Principal Amount | Value | ||||
| COMMON STOCKS (continued) | |||||
| Health care equipment and supplies (continued) | |||||
| Intuitive Surgical, Inc. (A) | 10,922 | $ | 11,506,982 | ||
| 52,788,759 | |||||
| Health care providers and services – 0.7% | |||||
| UnitedHealth Group, Inc. | 37,091 | 15,439,871 | |||
| Pharmaceuticals – 1.6% | |||||
| Eli Lilly & Company | 135,906 | 35,103,161 | |||
| 112,824,972 | |||||
| Industrials – 1.3% | |||||
| Road and rail – 1.3% | |||||
| Uber Technologies, Inc. (A) | 722,580 | 28,281,781 | |||
| Information technology – 46.1% | |||||
| IT services – 18.8% | |||||
| Adyen NV (A)(B) | 14,908 | 48,183,772 | |||
| Mastercard, Inc., Class A | 96,372 | 33,366,878 | |||
| Okta, Inc. (A) | 40,690 | 10,725,884 | |||
| PayPal Holdings, Inc. (A) | 151,467 | 43,722,464 | |||
| Shopify, Inc., Class A (A) | 62,888 | 95,890,365 | |||
| Snowflake, Inc., Class A (A) | 48,523 | 14,767,975 | |||
| Square, Inc., Class A (A) | 202,900 | 54,391,403 | |||
| Twilio, Inc., Class A (A) | 115,808 | 41,338,824 | |||
| Visa, Inc., Class A | 253,425 | 58,059,668 | |||
| 400,447,233 | |||||
| Semiconductors and semiconductor equipment – 6.0% | |||||
| NVIDIA Corp. | 438,178 | 98,086,145 | |||
| Taiwan Semiconductor Manufacturing Company, Ltd., ADR | 258,637 | 30,780,389 | |||
| 128,866,534 | |||||
| Software – 16.6% | |||||
| Adobe, Inc. (A) | 121,966 | 80,948,834 | |||
| Atlassian Corp. PLC, Class A (A) | 73,059 | 26,817,037 | |||
| Crowdstrike Holdings, Inc., Class A (A) | 131,397 | 36,922,557 | |||
| DocuSign, Inc. (A) | 71,602 | 21,211,376 | |||
| HubSpot, Inc. (A) | 15,990 | 10,944,675 | |||
| Microsoft Corp. | 327,443 | 98,848,493 | |||
| salesforce.com, Inc. (A) | 164,054 | 43,518,605 | |||
| The Trade Desk, Inc., Class A (A) | 249,554 | 19,976,798 | |||
| Workday, Inc., Class A (A) | 53,388 | 14,583,466 | |||
| 353,771,841 | |||||
| Technology hardware, storage and peripherals – 4.7% | |||||
| Apple, Inc. | 662,359 | 100,565,967 | |||
| 983,651,575 | |||||
| TOTAL COMMON STOCKS (Cost $711,353,146) | $ | 2,134,181,353 | |||
| SHORT-TERM INVESTMENTS – 0.0% | |||||
| Short-term funds – 0.0% | |||||
| State Street Institutional U.S. Government Money Market Fund, Premier Class, 0.0250% (C) | 491,873 | 491,873 | |||
| TOTAL SHORT-TERM INVESTMENTS (Cost $491,873) | $ | 491,873 | |||
| Total Investments (Capital Appreciation Fund) (Cost $711,845,019) – 99.9% | $ | 2,134,673,226 | |||
| Other assets and liabilities, net – 0.1% | 1,902,001 | ||||
| TOTAL NET ASSETS – 100.0% | $ | 2,136,575,227 | |||
| Security Abbreviations and Legend | |
| ADR | American Depositary Receipt |
| (A) | Non-income producing security. |
| (B) | These securities are exempt from registration under Rule 144A of the Securities Act of 1933. Such securities may be resold, normally to qualified institutional buyers, in transactions exempt from registration. |
| The accompanying notes are an integral part of the financial statements. | 17 |
| (C) | The rate shown is the annualized seven-day yield as of 8-31-21. |
| Shares or Principal Amount | Value | ||||
| COMMON STOCKS – 72.2% | |||||
| Communication services – 6.3% | |||||
| Interactive media and services – 6.3% | |||||
| Alphabet, Inc., Class A (A)(B) | 7,163 | $ | 20,729,364 | ||
| Alphabet, Inc., Class C (A)(B) | 17,598 | 51,196,806 | |||
| Facebook, Inc., Class A (B) | 40,748 | 15,458,976 | |||
| 87,385,146 | |||||
| Consumer discretionary – 10.5% | |||||
| Hotels, restaurants and leisure – 4.8% | |||||
| Hilton Worldwide Holdings, Inc. (A)(B) | 82,171 | 10,259,871 | |||
| Marriott International, Inc., Class A (A)(B) | 68,088 | 9,201,412 | |||
| McDonald's Corp. | 14,400 | 3,419,424 | |||
| Yum! Brands, Inc. | 332,616 | 43,582,674 | |||
| 66,463,381 | |||||
| Internet and direct marketing retail – 5.7% | |||||
| Amazon.com, Inc. (A)(B) | 23,053 | 80,012,122 | |||
| Specialty retail – 0.0% | |||||
| Ross Stores, Inc. (A) | 6,400 | 757,760 | |||
| 147,233,263 | |||||
| Consumer staples – 1.7% | |||||
| Beverages – 1.6% | |||||
| Keurig Dr. Pepper, Inc. | 371,792 | 13,261,821 | |||
| PepsiCo, Inc. | 27,200 | 4,253,808 | |||
| The Coca-Cola Company (A) | 91,500 | 5,152,365 | |||
| 22,667,994 | |||||
| Food products – 0.1% | |||||
| Mondelez International, Inc., Class A | 26,500 | 1,644,855 | |||
| 24,312,849 | |||||
| Financials – 9.3% | |||||
| Banks – 4.8% | |||||
| Bank of America Corp. (A) | 525,400 | 21,935,450 | |||
| The PNC Financial Services Group, Inc. | 234,923 | 44,893,785 | |||
| 66,829,235 | |||||
| Capital markets – 1.0% | |||||
| CME Group, Inc. | 12,800 | 2,582,016 | |||
| Intercontinental Exchange, Inc. | 96,538 | 11,539,187 | |||
| 14,121,203 | |||||
| Insurance – 3.5% | |||||
| Arthur J. Gallagher & Company | 30,086 | 4,320,951 | |||
| Marsh & McLennan Companies, Inc. (A) | 282,504 | 44,409,629 | |||
| 48,730,580 | |||||
| 129,681,018 | |||||
| Health care – 14.6% | |||||
| Health care equipment and supplies – 4.8% | |||||
| Becton, Dickinson and Company | 54,199 | 13,641,888 | |||
| Danaher Corp. (A) | 143,787 | 46,609,994 | |||
| Hologic, Inc. (B) | 53,852 | 4,262,386 | |||
| Medtronic PLC (A) | 13,000 | 1,735,240 | |||
| 66,249,508 | |||||
| Health care providers and services – 5.5% | |||||
| Humana, Inc. (A) | 85,422 | 34,631,787 | |||
| UnitedHealth Group, Inc. | 102,250 | 42,563,608 | |||
| 77,195,395 | |||||
| Life sciences tools and services – 4.3% | |||||
| PerkinElmer, Inc. | 114,448 | 21,149,990 | |||
| Shares or Principal Amount | Value | ||||
| COMMON STOCKS (continued) | |||||
| Life sciences tools and services (continued) | |||||
| Thermo Fisher Scientific, Inc. | 70,280 | $ | 39,001,886 | ||
| 60,151,876 | |||||
| 203,596,779 | |||||
| Industrials – 7.7% | |||||
| Aerospace and defense – 0.8% | |||||
| Lockheed Martin Corp. | 9,000 | 3,238,200 | |||
| Northrop Grumman Corp. (A) | 10,300 | 3,787,310 | |||
| Teledyne Technologies, Inc. (B) | 8,852 | 4,101,840 | |||
| 11,127,350 | |||||
| Commercial services and supplies – 1.2% | |||||
| Waste Connections, Inc. | 110,498 | 14,277,447 | |||
| Waste Management, Inc. (A) | 13,200 | 2,047,452 | |||
| 16,324,899 | |||||
| Industrial conglomerates – 5.0% | |||||
| General Electric Company | 603,311 | 63,595,013 | |||
| Roper Technologies, Inc. | 12,828 | 6,199,516 | |||
| 69,794,529 | |||||
| Machinery – 0.7% | |||||
| Ingersoll Rand, Inc. (B) | 185,659 | 9,843,640 | |||
| 107,090,418 | |||||
| Information technology – 14.5% | |||||
| Communications equipment – 0.4% | |||||
| Cisco Systems, Inc. | 100,300 | 5,919,706 | |||
| Electronic equipment, instruments and components – 0.9% | |||||
| TE Connectivity, Ltd. | 82,696 | 12,422,593 | |||
| IT services – 4.1% | |||||
| Fiserv, Inc. (A)(B) | 70,599 | 8,315,856 | |||
| FleetCor Technologies, Inc. (B) | 49,805 | 13,112,660 | |||
| Global Payments, Inc. (A) | 41,425 | 6,737,362 | |||
| Visa, Inc., Class A (A) | 129,671 | 29,707,626 | |||
| 57,873,504 | |||||
| Semiconductors and semiconductor equipment – 0.3% | |||||
| NXP Semiconductors NV | 16,200 | 3,485,106 | |||
| Software – 8.8% | |||||
| Microsoft Corp. (A) | 333,611 | 100,710,489 | |||
| salesforce.com, Inc. (B) | 81,979 | 21,746,569 | |||
| 122,457,058 | |||||
| 202,157,967 | |||||
| Real estate – 0.2% | |||||
| Equity real estate investment trusts – 0.2% | |||||
| American Tower Corp. | 8,631 | 2,521,719 | |||
| Utilities – 7.4% | |||||
| Electric utilities – 2.6% | |||||
| American Electric Power Company, Inc. | 188,556 | 16,888,961 | |||
| Duke Energy Corp. | 345 | 36,108 | |||
| Exelon Corp. | 392,965 | 19,263,144 | |||
| 36,188,213 | |||||
| Multi-utilities – 4.8% | |||||
| Ameren Corp. | 273,165 | 23,962,034 | |||
| CMS Energy Corp. | 174,269 | 11,175,871 | |||
| NiSource, Inc. | 460,206 | 11,344,078 | |||
| Public Service Enterprise Group, Inc. | 329,453 | 21,065,225 | |||
| 67,547,208 | |||||
| 103,735,421 | |||||
| TOTAL COMMON STOCKS (Cost $699,079,094) | $ | 1,007,714,580 | |||
| PREFERRED SECURITIES – 1.4% | |||||
| Financials – 0.0% | |||||
| The accompanying notes are an integral part of the financial statements. | 18 |
| Shares or Principal Amount | Value | ||||
| PREFERRED SECURITIES (continued) | |||||
| Capital markets – 0.0% | |||||
| The Charles Schwab Corp., 5.950% | 8,000 | $ | 203,040 | ||
| Utilities – 1.4% | |||||
| Electric utilities – 0.3% | |||||
| Alabama Power Company, 5.000% | 12,843 | 339,569 | |||
| American Electric Power Company, Inc., 6.125% | 42,588 | 2,168,581 | |||
| Duke Energy Corp., 5.625% | 12,428 | 337,544 | |||
| SCE Trust IV (5.375% to 9-15-25, then 3 month LIBOR + 3.132%) | 68,192 | 1,711,619 | |||
| 4,557,313 | |||||
| Multi-utilities – 1.1% | |||||
| CMS Energy Corp., 5.875% | 134,765 | 3,656,174 | |||
| CMS Energy Corp., 5.875% | 183,598 | 4,988,358 | |||
| DTE Energy Company, 5.250% | 57,616 | 1,502,049 | |||
| NiSource, Inc., 7.750% | 26,352 | 2,718,472 | |||
| NiSource, Inc. (6.500% to 3-15-24, then 5 Year CMT + 3.632%) | 71,444 | 1,973,283 | |||
| 14,838,336 | |||||
| 19,395,649 | |||||
| TOTAL PREFERRED SECURITIES (Cost $18,477,967) | $ | 19,598,689 | |||
| CORPORATE BONDS - 8.1% | |||||
| Communication services - 2.8% | |||||
| Altice France Holding SA 10.500%, 05/15/2027 (C) | $ | 1,665,000 | 1,829,419 | ||
| CCO Holdings LLC | |||||
| 4.000%, 03/01/2023 (C) | 1,110,000 | 1,116,716 | |||
| 5.000%, 02/01/2028 (C) | 5,487,000 | 5,748,181 | |||
| 5.125%, 05/01/2027 (C) | 3,655,000 | 3,818,781 | |||
| Netflix, Inc. | |||||
| 4.375%, 11/15/2026 | 3,760,000 | 4,253,500 | |||
| 4.875%, 04/15/2028 | 4,495,000 | 5,253,531 | |||
| 4.875%, 06/15/2030 (C) | 145,000 | 173,541 | |||
| 5.500%, 02/15/2022 | 350,000 | 356,962 | |||
| 5.875%, 02/15/2025 to 11/15/2028 | 8,323,000 | 10,127,380 | |||
| 6.375%, 05/15/2029 | 4,450,000 | 5,701,563 | |||
| Photo Holdings Merger Sub, Inc. 8.500%, 10/01/2026 (C) | 495,000 | 537,075 | |||
| Sirius XM Radio, Inc. 5.000%, 08/01/2027 (C) | 455,000 | 477,181 | |||
| 39,393,830 | |||||
| Consumer discretionary - 2.3% | |||||
| Cedar Fair LP | |||||
| 5.250%, 07/15/2029 | 2,080,000 | 2,130,710 | |||
| 5.375%, 06/01/2024 to 04/15/2027 | 4,520,000 | 4,585,488 | |||
| 5.500%, 05/01/2025 (C) | 570,000 | 594,225 | |||
| 6.500%, 10/01/2028 | 2,070,000 | 2,243,300 | |||
| Clarios Global LP | |||||
| 6.250%, 05/15/2026 (C) | 639,000 | 673,346 | |||
| 6.750%, 05/15/2025 (C) | 359,000 | 380,091 | |||
| Hilton Domestic Operating Company, Inc. 5.375%, 05/01/2025 (C) | 100,000 | 104,911 | |||
| KFC Holding Company/Pizza Hut Holdings LLC/Taco Bell of America LLC 4.750%, 06/01/2027 (C) | 4,560,000 | 4,779,533 | |||
| Life Time, Inc. 5.750%, 01/15/2026 (C) | 1,270,000 | 1,301,750 | |||
| Marriott International, Inc. 3.125%, 06/15/2026 | 415,000 | 443,348 | |||
| Six Flags Entertainment Corp. | |||||
| 4.875%, 07/31/2024 (C) | 4,458,000 | 4,506,236 | |||
| 5.500%, 04/15/2027 (C) | 2,977,000 | 3,081,195 | |||
| Shares or Principal Amount | Value | ||||
| CORPORATE BONDS (continued) | |||||
| Consumer discretionary (continued) | |||||
| Six Flags Theme Parks, Inc. 7.000%, 07/01/2025 (C) | $ | 2,123,000 | $ | 2,268,956 | |
| Yum! Brands, Inc. | |||||
| 3.875%, 11/01/2023 | 990,000 | 1,040,738 | |||
| 4.750%, 01/15/2030 (C) | 420,000 | 463,575 | |||
| 5.350%, 11/01/2043 | 1,834,000 | 2,035,740 | |||
| 6.875%, 11/15/2037 | 925,000 | 1,200,188 | |||
| 7.750%, 04/01/2025 (C) | 275,000 | 296,282 | |||
| 32,129,612 | |||||
| Financials - 1.1% | |||||
| Acrisure LLC 7.000%, 11/15/2025 (C) | 2,600,000 | 2,648,750 | |||
| Alliant Holdings Intermediate LLC 6.750%, 10/15/2027 (C) | 75,000 | 78,000 | |||
| AmWINS Group, Inc. 4.875%, 06/30/2029 (C) | 240,000 | 243,900 | |||
| HUB International, Ltd. 7.000%, 05/01/2026 (C) | 6,866,000 | 7,103,563 | |||
| State Street Corp. (3 month LIBOR + 3.597%) 3.716%, 12/15/2021 (D)(E) | 517,000 | 520,236 | |||
| The Bank of New York Mellon Corp. (3 month LIBOR + 3.420%) 3.555%, 12/20/2021 (D)(E) | 1,450,000 | 1,461,512 | |||
| USI, Inc. 6.875%, 05/01/2025 (C) | 2,980,000 | 3,040,494 | |||
| 15,096,455 | |||||
| Health care - 0.3% | |||||
| Avantor Funding, Inc. 4.625%, 07/15/2028 (C) | 1,060,000 | 1,120,844 | |||
| Hadrian Merger Sub, Inc. 8.500%, 05/01/2026 (C) | 1,095,000 | 1,136,063 | |||
| Surgery Center Holdings, Inc. 10.000%, 04/15/2027 (C) | 500,000 | 543,750 | |||
| Teleflex, Inc. 4.625%, 11/15/2027 | 707,000 | 740,583 | |||
| Tenet Healthcare Corp. 4.625%, 09/01/2024 (C) | 450,000 | 460,688 | |||
| 4,001,928 | |||||
| Industrials - 1.4% | |||||
| Delta Air Lines, Inc. | |||||
| 4.500%, 10/20/2025 (C) | 2,380,000 | 2,552,550 | |||
| 4.750%, 10/20/2028 (C) | 925,000 | 1,031,372 | |||
| General Electric Company (3 month LIBOR + 3.330%) 3.449%, 12/15/2021 (D)(E) | 7,948,000 | 7,709,560 | |||
| Korn Ferry 4.625%, 12/15/2027 (C) | 480,000 | 497,000 | |||
| Lennox International, Inc. 3.000%, 11/15/2023 | 510,000 | 535,164 | |||
| Mileage Plus Holdings LLC 6.500%, 06/20/2027 (C) | 1,425,000 | 1,548,049 | |||
| Sensata Technologies BV | |||||
| 4.875%, 10/15/2023 (C) | 507,000 | 542,546 | |||
| 5.000%, 10/01/2025 (C) | 700,000 | 782,509 | |||
| 5.625%, 11/01/2024 (C) | 415,000 | 461,688 | |||
| United Airlines 2012-1 Class A Pass Through Trust 4.150%, 04/11/2024 | 806,313 | 846,556 | |||
| US Airways 2010-1 Class A Pass Through Trust 6.250%, 04/22/2023 | 35,441 | 35,920 | |||
| The accompanying notes are an integral part of the financial statements. | 19 |
| Shares or Principal Amount | Value | ||||
| CORPORATE BONDS (continued) | |||||
| Industrials (continued) | |||||
| US Airways 2012-2 Class A Pass Through Trust 4.625%, 06/03/2025 | $ | 144,044 | $ | 142,994 | |
| US Airways 2013-1 Class A Pass Through Trust 3.950%, 11/15/2025 | 354,465 | 358,896 | |||
| US Airways 2013-1 Class B Pass Through Trust 5.375%, 11/15/2021 | 294,809 | 294,084 | |||
| Welbilt, Inc. 9.500%, 02/15/2024 | 1,692,000 | 1,747,836 | |||
| Xylem, Inc. 4.875%, 10/01/2021 | 100,000 | 100,367 | |||
| 19,187,091 | |||||
| Information technology - 0.0% | |||||
| Clarivate Science Holdings Corp. | |||||
| 3.875%, 07/01/2028 (C) | 695,000 | 707,315 | |||
| 4.875%, 07/01/2029 (C) | 220,000 | 226,923 | |||
| 934,238 | |||||
| Real estate - 0.1% | |||||
| SBA Communications Corp. | |||||
| 3.875%, 02/15/2027 | 720,000 | 748,282 | |||
| 4.875%, 09/01/2024 | 1,080,000 | 1,096,200 | |||
| 1,844,482 | |||||
| Utilities - 0.1% | |||||
| NiSource, Inc. (5.650% to 6-15-23, then 5 Year CMT + 2.843%) 06/15/2023 (D) | 1,525,000 | 1,593,625 | |||
| TOTAL CORPORATE BONDS (Cost $104,783,642) | $ | 114,181,261 | |||
| TERM LOANS (F) – 10.8% | |||||
| Communication services – 0.4% | |||||
| Delta 2 Lux Sarl, 2018 USD Term Loan (1 month LIBOR + 2.500%) 3.500%, 02/01/2024 | 5,635,000 | 5,611,051 | |||
| Eagle Broadband Investments LLC, Term Loan (3 month LIBOR + 3.000%) 3.750%, 11/12/2027 | 477,600 | 477,003 | |||
| 6,088,054 | |||||
| Consumer discretionary – 0.6% | |||||
| Four Seasons Hotels, Ltd., New 1st Lien Term Loan (1 month LIBOR + 2.000%) 2.085%, 11/30/2023 | 979,690 | 972,185 | |||
| IRB Holding Corp., 2020 4th Amendment Incremental Term Loan (3 month LIBOR + 3.250%) 4.250%, 12/15/2027 | 2,247,121 | 2,244,312 | |||
| IRB Holding Corp., 2020 Term Loan B (3 month LIBOR + 2.750%) 3.750%, 02/05/2025 | 1,314,008 | 1,308,673 | |||
| Life Time, Inc., 2021 Term Loan B (3 month LIBOR + 4.750%) 5.750%, 12/16/2024 | 2,174,707 | 2,162,333 | |||
| SeaWorld Parks & Entertainment, Inc., 2021 Term Loan B (3 month LIBOR + 3.000%) 3.500%, 08/12/2028 | 943,392 | 934,665 | |||
| Woof Holdings, Inc., 1st Lien Term Loan (3 month LIBOR + 3.750%) 4.500%, 12/21/2027 | 613,463 | 613,463 | |||
| 8,235,631 | |||||
| Shares or Principal Amount | Value | ||||
| TERM LOANS (F)(continued) | |||||
| Consumer staples – 0.3% | |||||
| Sunshine Luxembourg VII Sarl, 2021 Term Loan B3 (3 month LIBOR + 3.750%) 4.500%, 10/01/2026 | $ | 3,863,388 | $ | 3,865,320 | |
| Financials – 3.5% | |||||
| Acrisure LLC, 2021 Incremental Term Loan B (3 month LIBOR + 3.750%) 3.852%, 02/15/2027 | 710,000 | 702,460 | |||
| Alliant Holdings Intermediate LLC, 2018 Term Loan B (1 month LIBOR + 3.250%) 3.335%, 05/09/2025 | 3,043,684 | 3,009,442 | |||
| Alliant Holdings Intermediate LLC, 2020 Term Loan B3 (1 month LIBOR + 3.750%) 4.250%, 11/05/2027 | 2,964,477 | 2,964,121 | |||
| Alliant Holdings Intermediate LLC, Term Loan B (1 month LIBOR + 3.250%) 3.335%, 05/09/2025 | 1,657,924 | 1,638,344 | |||
| HUB International, Ltd., 2018 Term Loan B (3 month LIBOR + 2.750%) 2.875%, 04/25/2025 | 18,638,482 | 18,416,311 | |||
| HUB International, Ltd., 2021 Term Loan B (3 month LIBOR + 3.250%) 4.000%, 04/25/2025 | 7,726,946 | 7,716,669 | |||
| Hyperion Refinance Sarl, 2020 Incremental Term Loan B (1 month LIBOR + 3.750%) 4.750%, 11/12/2027 | 1,600,385 | 1,596,384 | |||
| Ryan Specialty Group LLC, Term Loan (1 month LIBOR + 3.000%) 3.750%, 09/01/2027 | 1,023,322 | 1,020,764 | |||
| USI, Inc., 2017 Repriced Term Loan (3 month LIBOR + 3.000%) 3.147%, 05/16/2024 | 6,606,817 | 6,545,704 | |||
| USI, Inc., 2019 Incremental Term Loan B (3 month LIBOR + 3.250%) 3.397%, 12/02/2026 | 5,102,717 | 5,045,311 | |||
| 48,655,510 | |||||
| Health care – 1.6% | |||||
| ADMI Corp., 2021 Incremental Term Loan B3 (1 month LIBOR + 3.500%) 4.000%, 12/23/2027 | 2,855,000 | 2,844,294 | |||
| ADMI Corp., 2021 Term Loan B2 (1 month LIBOR + 3.125%) 3.625%, 12/23/2027 | 1,885,275 | 1,857,392 | |||
| Avantor Funding, Inc. 2021 Term Loan B4 (1 month LIBOR + 2.000%) 2.500%, 11/21/2024 | 250,000 | 249,270 | |||
| CPI Holdco LLC, 2021 Term Loan (1 month LIBOR + 3.750%) 3.835%, 11/04/2026 | 753,037 | 751,426 | |||
| Dino Grandparent, Inc., 2019 Term Loan A3 (1 month LIBOR + 2.250%) 2.375%, 02/20/2023 | 3,450,000 | 3,415,500 | |||
| Heartland Dental LLC, 2018 1st Lien Term Loan (1 month LIBOR + 3.500%) 3.585%, 04/30/2025 | 5,852,956 | 5,784,652 | |||
| Heartland Dental LLC, 2021 Incremental Term Loan (1 month LIBOR + 4.000%) 4.096%, 04/30/2025 | 475,000 | 473,418 | |||
| Loire Finco Luxembourg Sarl, Term Loan (1 month LIBOR + 3.000%) 3.085%, 04/21/2027 | 3,060,348 | 2,997,855 | |||
| The accompanying notes are an integral part of the financial statements. | 20 |
| Shares or Principal Amount | Value | ||||
| TERM LOANS (F)(continued) | |||||
| Health care (continued) | |||||
| Pacific Dental Services, Inc., 2021 Term Loan (1 month LIBOR + 3.500%) 4.250%, 05/05/2028 | $ | 500,000 | $ | 500,940 | |
| PetVet Care Centers LLC, 2018 1st Lien Term Loan (1 month LIBOR + 2.750%) 2.835%, 02/14/2025 | 356,774 | 351,719 | |||
| PetVet Care Centers LLC, 2018 Incremental Term Loan (1 month LIBOR + 3.250%) 3.335%, 02/14/2025 | 1,103,786 | 1,091,832 | |||
| PetVet Care Centers LLC, 2021 Term Loan B3 (1 month LIBOR + 3.500%) 4.250%, 02/14/2025 | 1,281,533 | 1,279,393 | |||
| 21,597,691 | |||||
| Industrials – 1.7% | |||||
| Camelot US Acquisition LLC, 2020 Incremental Term Loan B (1 month LIBOR + 3.000%) 4.000%, 10/30/2026 | 3,358,125 | 3,358,125 | |||
| CoreLogic, Inc., Term Loan (1 month LIBOR + 3.500%) 4.000%, 06/02/2028 | 2,805,000 | 2,791,845 | |||
| Filtration Group Corp., 2018 1st Lien Term Loan (1 month LIBOR + 3.000%) 3.085%, 03/29/2025 | 971,834 | 962,242 | |||
| Filtration Group Corp., 2018 EUR Term Loan (3 month EURIBOR + 3.500%) 3.500%, 03/29/2025 | EUR | 1,752,969 | 2,063,361 | ||
| Filtration Group Corp., 2020 Incremental Term Loan (1 month LIBOR + 3.750%) 4.750%, 03/29/2025 | $ | 342,413 | 342,413 | ||
| Gardner Denver, Inc., 2020 USD Term Loan B (1 month LIBOR + 2.750%) 2.835%, 03/01/2027 | 391,050 | 390,319 | |||
| Mileage Plus Holdings LLC, 2020 Term Loan B (3 month LIBOR + 5.250%) 6.250%, 06/21/2027 | 6,225,000 | 6,598,500 | |||
| SkyMiles IP, Ltd., 2020 SkyMiles Term Loan B (3 month LIBOR + 3.750%) 4.750%, 10/20/2027 | 2,795,000 | 2,962,169 | |||
| TK Elevator U.S. Newco, Inc., Term Loan B (3 month LIBOR + 3.500%) 4.000%, 07/29/2027 | 4,138,660 | 4,132,907 | |||
| Welbilt, Inc., 2018 Term Loan B (1 month LIBOR + 2.500%) 2.585%, 10/23/2025 | 575,000 | 569,250 | |||
| 24,171,131 | |||||
| Information technology – 2.7% | |||||
| Applied Systems, Inc., 2017 1st Lien Term Loan (3 month LIBOR + 3.250% and Prime rate + 2.250%) 3.774%, 09/19/2024 | 3,208,826 | 3,203,467 | |||
| Applied Systems, Inc., 2021 2nd Lien Term Loan (3 month LIBOR + 5.500%) 6.250%, 09/19/2025 | 366,814 | 370,680 | |||
| Ascend Learning LLC, 2017 Term Loan B (1 month LIBOR + 3.000%) 4.000%, 07/12/2024 | 244,188 | 243,839 | |||
| Azalea Topco, Inc., 2021 Term Loan B (1 and 3 month LIBOR + 3.750%) 4.500%, 07/24/2026 | 728,425 | 728,425 | |||
| Azalea TopCo, Inc., Term Loan (1 and 3 month LIBOR + 3.500%) 3.628%, 07/24/2026 | 4,666,177 | 4,614,849 | |||
| Shares or Principal Amount | Value | ||||
| TERM LOANS (F)(continued) | |||||
| Information technology (continued) | |||||
| CCC Intelligent Solutions, Inc., 2017 1st Lien Term Loan (1 month LIBOR + 3.000%) 4.000%, 04/29/2024 | $ | 6,831,625 | $ | 6,828,756 | |
| Celestial Saturn Parent, Inc., 2nd Lien Term Loan (1 month LIBOR + 6.500%) 7.000%, 06/04/2029 | 230,000 | 232,875 | |||
| Project Boost Purchaser LLC, 2021 Incremental Term Loan (1 month LIBOR + 3.500%) 4.000%, 05/30/2026 | 425,000 | 423,406 | |||
| RealPage, Inc., 1st Lien Term Loan (1 month LIBOR + 3.250%) 3.750%, 04/24/2028 | 4,245,000 | 4,217,959 | |||
| RealPage, Inc., 2nd Lien Term Loan (1 month LIBOR + 6.500%) 7.250%, 04/22/2029 | 225,000 | 229,219 | |||
| Solera LLC, USD Term Loan B (6 month LIBOR + 4.000%) 4.500%, 06/02/2028 | 475,000 | 474,430 | |||
| UKG, Inc., 2020 2nd Lien Incremental Term Loan (3 month LIBOR + 6.750%) 7.500%, 05/03/2027 | 600,000 | 608,628 | |||
| UKG, Inc., 2021 Incremental Term Loan (3 month LIBOR + 3.250%) 4.000%, 05/04/2026 | 14,767,210 | 14,767,210 | |||
| UKG, Inc., Term Loan B (1 month LIBOR + 3.750%) 3.835%, 05/04/2026 | 682,838 | 682,981 | |||
| 37,626,724 | |||||
| Materials – 0.0% | |||||
| HB Fuller Company, 2017 Term Loan B (1 month LIBOR + 2.000%) 2.088%, 10/20/2024 | 271,345 | 271,421 | |||
| TOTAL TERM LOANS (Cost $149,663,928) | $ | 150,511,482 | |||
| SHORT-TERM INVESTMENTS – 10.0% | |||||
| Short-term funds – 10.0% | |||||
| State Street Institutional U.S. Government Money Market Fund, Premier Class, 0.0250% (G) | 9,577,594 | 9,577,594 | |||
| T. Rowe Price Government Reserve Fund, 0.0295% (G) | 129,756,415 | 129,756,415 | |||
| TOTAL SHORT-TERM INVESTMENTS (Cost $139,334,009) | $ | 139,334,009 | |||
| Total Investments (Capital Appreciation Value Fund) (Cost $1,111,338,640) – 102.5% | $ | 1,431,340,021 | |||
| Other assets and liabilities, net – (2.5%) | (35,544,516) | ||||
| TOTAL NET ASSETS – 100.0% | $ | 1,395,795,505 | |||
| Currency Abbreviations | |
| EUR | Euro |
| Security Abbreviations and Legend | |
| CMT | Constant Maturity Treasury |
| EURIBOR | Euro Interbank Offered Rate |
| LIBOR | London Interbank Offered Rate |
| (A) | All or a portion of this security is segregated at the custodian as collateral for certain derivatives. |
| (B) | Non-income producing security. |
| (C) | These securities are exempt from registration under Rule 144A of the Securities Act of 1933. Such securities may be resold, normally to qualified institutional buyers, in transactions exempt from registration. |
| The accompanying notes are an integral part of the financial statements. | 21 |
| (D) | Perpetual bonds have no stated maturity date. Date shown as maturity date is next call date. |
| (E) | Variable rate obligation. The coupon rate shown represents the rate at period end. |
| (F) | Term loans are variable rate obligations. The coupon rate shown represents the rate at period end. |
| (G) | The rate shown is the annualized seven-day yield as of 8-31-21. |
| Options on securities | ||||||||
| Counterparty (OTC)/ Exchange- traded | Name of issuer | Currency | Exercise price | Expiration date | Number of contracts | Notional amount | Premium | Value |
| Calls | ||||||||
| GSI | Alphabet, Inc., Class A | USD | 1,960.00 | Sep 2022 | 2 | 200 | $36,883 | $(197,027) |
| GSI | Alphabet, Inc., Class A | USD | 1,960.00 | Sep 2022 | 2 | 200 | 48,181 | (197,027) |
| GSI | Alphabet, Inc., Class A | USD | 1,980.00 | Sep 2022 | 3 | 300 | 53,401 | (290,173) |
| GSI | Alphabet, Inc., Class A | USD | 1,980.00 | Sep 2022 | 2 | 200 | 46,477 | (193,448) |
| GSI | Alphabet, Inc., Class A | USD | 2,000.00 | Sep 2022 | 3 | 300 | 51,390 | (284,836) |
| GSI | Alphabet, Inc., Class A | USD | 2,000.00 | Sep 2022 | 2 | 200 | 44,224 | (189,890) |
| GSI | Alphabet, Inc., Class A | USD | 2,100.00 | Sep 2022 | 3 | 300 | 42,218 | (258,641) |
| GSI | Alphabet, Inc., Class A | USD | 2,100.00 | Sep 2022 | 2 | 200 | 37,453 | (172,428) |
| SFG | Alphabet, Inc., Class A | USD | 2,450.00 | Sep 2022 | 1 | 100 | 26,747 | (58,385) |
| SFG | Alphabet, Inc., Class A | USD | 2,500.00 | Sep 2022 | 2 | 200 | 49,294 | (109,664) |
| SFG | Alphabet, Inc., Class A | USD | 2,550.00 | Sep 2022 | 1 | 100 | 22,722 | (51,399) |
| SFG | Alphabet, Inc., Class A | USD | 2,600.00 | Sep 2022 | 1 | 100 | 20,922 | (48,091) |
| GSI | Alphabet, Inc., Class A | USD | 3,200.00 | Jan 2023 | 3 | 300 | 54,291 | (74,329) |
| GSI | Alphabet, Inc., Class A | USD | 3,300.00 | Jan 2023 | 2 | 200 | 30,994 | (43,073) |
| GSI | Alphabet, Inc., Class A | USD | 3,400.00 | Jan 2023 | 2 | 200 | 26,094 | (37,350) |
| GSI | Alphabet, Inc., Class A | USD | 3,500.00 | Jan 2023 | 2 | 200 | 22,194 | (32,321) |
| GSI | Alphabet, Inc., Class C | USD | 1,760.00 | Jan 2022 | 16 | 1,600 | 161,159 | (1,855,917) |
| GSI | Alphabet, Inc., Class C | USD | 1,780.00 | Jan 2022 | 16 | 1,600 | 151,699 | (1,824,309) |
| GSI | Alphabet, Inc., Class C | USD | 1,800.00 | Jan 2022 | 16 | 1,600 | 143,040 | (1,792,722) |
| GSI | Alphabet, Inc., Class C | USD | 1,980.00 | Jun 2022 | 2 | 200 | 32,360 | (194,103) |
| GSI | Alphabet, Inc., Class C | USD | 1,980.00 | Jun 2022 | 3 | 300 | 63,629 | (291,155) |
| GSI | Alphabet, Inc., Class C | USD | 2,000.00 | Jun 2022 | 2 | 200 | 30,815 | (190,410) |
| GSI | Alphabet, Inc., Class C | USD | 2,000.00 | Jun 2022 | 3 | 300 | 61,060 | (285,615) |
| GSI | Alphabet, Inc., Class C | USD | 2,100.00 | Jun 2022 | 2 | 200 | 25,013 | (172,194) |
| GSI | Alphabet, Inc., Class C | USD | 2,100.00 | Jun 2022 | 3 | 300 | 49,903 | (258,290) |
| SFG | Alphabet, Inc., Class C | USD | 2,550.00 | Jun 2022 | 2 | 200 | 44,192 | (98,151) |
| SFG | Alphabet, Inc., Class C | USD | 2,600.00 | Jun 2022 | 2 | 200 | 40,386 | (91,049) |
| SFG | Alphabet, Inc., Class C | USD | 2,650.00 | Jun 2022 | 2 | 200 | 36,780 | (84,230) |
| CSFB | Amazon.com, Inc. | USD | 3,800.00 | Jan 2022 | 2 | 200 | 66,229 | (17,332) |
| CSFB | Amazon.com, Inc. | USD | 3,800.00 | Jan 2022 | 3 | 300 | 124,580 | (25,999) |
| CSFB | Amazon.com, Inc. | USD | 3,800.00 | Jan 2022 | 3 | 300 | 103,625 | (25,999) |
| CSFB | Amazon.com, Inc. | USD | 3,900.00 | Jan 2022 | 2 | 200 | 60,555 | (12,822) |
| CSFB | Amazon.com, Inc. | USD | 3,900.00 | Jan 2022 | 2 | 200 | 76,676 | (12,822) |
| CSFB | Amazon.com, Inc. | USD | 3,900.00 | Jan 2022 | 3 | 300 | 95,700 | (19,233) |
| RBC | Amazon.com, Inc. | USD | 3,900.00 | Jan 2022 | 3 | 300 | 71,991 | (19,233) |
| CITI | Amazon.com, Inc. | USD | 4,000.00 | Jan 2022 | 5 | 500 | 136,635 | (23,526) |
| CSFB | Amazon.com, Inc. | USD | 4,000.00 | Jan 2022 | 2 | 200 | 55,372 | (9,410) |
| CSFB | Amazon.com, Inc. | USD | 4,000.00 | Jan 2022 | 2 | 200 | 71,412 | (9,410) |
| CSFB | Amazon.com, Inc. | USD | 4,000.00 | Jan 2022 | 3 | 300 | 88,463 | (14,116) |
| RBC | Amazon.com, Inc. | USD | 4,000.00 | Jan 2022 | 3 | 300 | 65,391 | (14,116) |
| CITI | Amazon.com, Inc. | USD | 4,100.00 | Jan 2022 | 4 | 400 | 100,668 | (13,857) |
| RBC | Amazon.com, Inc. | USD | 4,100.00 | Jan 2022 | 3 | 300 | 59,091 | (10,393) |
| CITI | Amazon.com, Inc. | USD | 4,200.00 | Jan 2022 | 4 | 400 | 92,508 | (10,304) |
| RBC | Amazon.com, Inc. | USD | 4,200.00 | Jan 2022 | 3 | 300 | 53,481 | (7,728) |
| CITI | Amazon.com, Inc. | USD | 4,300.00 | Jan 2022 | 5 | 500 | 106,535 | (9,732) |
| RBC | Amazon.com, Inc. | USD | 4,300.00 | Jan 2022 | 2 | 200 | 32,794 | (3,893) |
| CITI | Amazon.com, Inc. | USD | 4,500.00 | Jan 2023 | 2 | 200 | 57,156 | (26,989) |
| CITI | Amazon.com, Inc. | USD | 4,600.00 | Jan 2023 | 2 | 200 | 52,293 | (23,934) |
| CITI | Amazon.com, Inc. | USD | 4,700.00 | Jan 2023 | 2 | 200 | 47,862 | (21,223) |
| CITI | Amazon.com, Inc. | USD | 4,800.00 | Jan 2023 | 2 | 200 | 43,788 | (18,819) |
| CITI | Amazon.com, Inc. | USD | 4,900.00 | Jan 2023 | 1 | 100 | 20,032 | (8,346) |
| CITI | Amazon.com, Inc. | USD | 5,000.00 | Jan 2023 | 1 | 100 | 18,330 | (7,405) |
| CITI | Amazon.com, Inc. | USD | 5,100.00 | Jan 2023 | 1 | 100 | 16,783 | (6,574) |
| CITI | Ameren Corp. | USD | 90.00 | Dec 2021 | 73 | 7,300 | 13,072 | (13,448) |
| CITI | Ameren Corp. | USD | 95.00 | Dec 2021 | 73 | 7,300 | 5,707 | (3,633) |
| The accompanying notes are an integral part of the financial statements. | 22 |
| Options on securities (continued) | ||||||||
| Counterparty (OTC)/ Exchange- traded | Name of issuer | Currency | Exercise price | Expiration date | Number of contracts | Notional amount | Premium | Value |
| Calls (continued) | ||||||||
| JPM | American Electric Power Company, Inc. | USD | 90.00 | Jan 2022 | 215 | 21,500 | $78,266 | $(73,428) |
| JPM | American Electric Power Company, Inc. | USD | 90.00 | Jan 2022 | 37 | 3,700 | 13,274 | (12,637) |
| JPM | American Electric Power Company, Inc. | USD | 90.00 | Jan 2022 | 23 | 2,300 | 7,946 | (7,855) |
| JPM | American Electric Power Company, Inc. | USD | 95.00 | Jan 2022 | 216 | 21,600 | 47,632 | (30,663) |
| JPM | American Electric Power Company, Inc. | USD | 95.00 | Jan 2022 | 73 | 7,300 | 16,507 | (10,363) |
| JPM | American Electric Power Company, Inc. | USD | 95.00 | Jan 2022 | 47 | 4,700 | 9,837 | (6,672) |
| JPM | American Electric Power Company, Inc. | USD | 97.50 | Jan 2022 | 105 | 10,500 | 10,256 | (8,770) |
| JPM | American Electric Power Company, Inc. | USD | 100.00 | Jan 2022 | 105 | 10,500 | 6,345 | (4,866) |
| CITI | American Tower Corp. | USD | 210.00 | Jan 2022 | 22 | 2,200 | 54,934 | (181,644) |
| CITI | American Tower Corp. | USD | 220.00 | Jan 2022 | 22 | 2,200 | 43,934 | (160,107) |
| CITI | American Tower Corp. | USD | 230.00 | Jan 2022 | 21 | 2,100 | 33,117 | (132,545) |
| CITI | American Tower Corp. | USD | 230.00 | Jan 2022 | 7 | 700 | 16,242 | (44,182) |
| CITI | American Tower Corp. | USD | 240.00 | Jan 2022 | 7 | 700 | 13,339 | (37,575) |
| CITI | American Tower Corp. | USD | 250.00 | Jan 2022 | 7 | 700 | 10,645 | (31,229) |
| CSFB | Bank of America Corp. | USD | 30.00 | Jan 2022 | 858 | 85,800 | 180,180 | (1,020,367) |
| SFG | Bank of America Corp. | USD | 30.00 | Jan 2022 | 1,419 | 141,900 | 364,683 | (1,687,530) |
| CSFB | Bank of America Corp. | USD | 32.00 | Jan 2022 | 435 | 43,500 | 106,662 | (435,420) |
| CSFB | Bank of America Corp. | USD | 35.00 | Jan 2022 | 869 | 86,900 | 136,085 | (637,381) |
| RBC | Bank of America Corp. | USD | 37.00 | Jan 2022 | 645 | 64,500 | 179,742 | (368,064) |
| CSFB | Bank of America Corp. | USD | 40.00 | Jan 2022 | 188 | 18,800 | 64,223 | (68,049) |
| JPM | Cisco Systems, Inc. | USD | 45.00 | Jan 2022 | 161 | 16,100 | 75,187 | (228,766) |
| JPM | Cisco Systems, Inc. | USD | 45.00 | Jan 2022 | 86 | 8,600 | 39,302 | (122,198) |
| JPM | Cisco Systems, Inc. | USD | 45.00 | Jan 2022 | 87 | 8,700 | 37,149 | (123,619) |
| JPM | Cisco Systems, Inc. | USD | 47.50 | Jan 2022 | 161 | 16,100 | 57,477 | (190,000) |
| JPM | Cisco Systems, Inc. | USD | 47.50 | Jan 2022 | 86 | 8,600 | 29,842 | (101,491) |
| JPM | Cisco Systems, Inc. | USD | 47.50 | Jan 2022 | 87 | 8,700 | 28,449 | (102,671) |
| JPM | Cisco Systems, Inc. | USD | 50.00 | Jan 2022 | 162 | 16,200 | 43,254 | (153,477) |
| JPM | Cisco Systems, Inc. | USD | 50.00 | Jan 2022 | 86 | 8,600 | 22,532 | (81,475) |
| JPM | Cisco Systems, Inc. | USD | 50.00 | Jan 2022 | 87 | 8,700 | 21,054 | (82,423) |
| JPM | CME Group, Inc. | USD | 220.00 | Jan 2022 | 64 | 6,400 | 70,296 | (22,094) |
| JPM | CME Group, Inc. | USD | 230.00 | Jan 2022 | 64 | 6,400 | 54,282 | (11,544) |
| CSFB | Danaher Corp. | USD | 250.00 | Jan 2022 | 135 | 13,500 | 257,445 | (1,039,349) |
| CSFB | Danaher Corp. | USD | 270.00 | Jan 2022 | 14 | 1,400 | 22,698 | (82,225) |
| CSFB | Danaher Corp. | USD | 280.00 | Jan 2022 | 14 | 1,400 | 18,481 | (70,130) |
| CSFB | Danaher Corp. | USD | 280.00 | Jan 2022 | 21 | 2,100 | 26,450 | (105,195) |
| CSFB | Danaher Corp. | USD | 290.00 | Jan 2022 | 21 | 2,100 | 19,973 | (88,032) |
| JPM | Danaher Corp. | USD | 300.00 | Jan 2022 | 62 | 6,200 | 61,393 | (212,884) |
| JPM | Danaher Corp. | USD | 300.00 | Jan 2022 | 65 | 6,500 | 74,203 | (223,184) |
| CITI | Exelon Corp. | USD | 40.00 | Jan 2022 | 54 | 5,400 | 26,028 | (50,261) |
| CITI | Exelon Corp. | USD | 40.00 | Jan 2022 | 15 | 1,500 | 6,277 | (13,961) |
| CITI | Exelon Corp. | USD | 43.00 | Jan 2022 | 54 | 5,400 | 17,928 | (35,749) |
| CITI | Exelon Corp. | USD | 43.00 | Jan 2022 | 15 | 1,500 | 4,260 | (9,930) |
| CITI | Exelon Corp. | USD | 45.00 | Jan 2022 | 54 | 5,400 | 13,446 | (26,914) |
| CITI | Exelon Corp. | USD | 45.00 | Jan 2022 | 15 | 1,500 | 3,120 | (7,476) |
| CITI | Exelon Corp. | USD | 47.00 | Jan 2022 | 323 | 32,300 | 54,949 | (114,124) |
| CITI | Exelon Corp. | USD | 47.00 | Jan 2022 | 105 | 10,500 | 16,880 | (37,099) |
| CITI | Exelon Corp. | USD | 50.00 | Jan 2022 | 105 | 10,500 | 8,192 | (19,026) |
| JPM | Facebook, Inc., Class A | USD | 340.00 | Jan 2022 | 39 | 3,900 | 100,507 | (201,640) |
| JPM | Facebook, Inc., Class A | USD | 345.00 | Jan 2022 | 39 | 3,900 | 94,196 | (187,140) |
| JPM | Facebook, Inc., Class A | USD | 380.00 | Jan 2022 | 3 | 300 | 5,817 | (7,845) |
| JPM | Facebook, Inc., Class A | USD | 400.00 | Jan 2022 | 170 | 17,000 | 365,959 | (293,572) |
| JPM | Facebook, Inc., Class A | USD | 400.00 | Jan 2022 | 102 | 10,200 | 126,923 | (176,143) |
| JPM | Facebook, Inc., Class A | USD | 345.00 | Sep 2022 | 21 | 2,100 | 81,770 | (142,708) |
| JPM | Facebook, Inc., Class A | USD | 360.00 | Sep 2022 | 21 | 2,100 | 70,363 | (124,255) |
| GSI | Fiserv, Inc. | USD | 130.00 | Jan 2022 | 42 | 4,200 | 21,432 | (11,992) |
| GSI | Fiserv, Inc. | USD | 135.00 | Jan 2022 | 42 | 4,200 | 15,729 | (7,869) |
| JPM | FleetCor Technologies, Inc. | USD | 300.00 | Jan 2022 | 16 | 1,600 | 31,952 | (7,878) |
| JPM | FleetCor Technologies, Inc. | USD | 310.00 | Jan 2022 | 11 | 1,100 | 17,567 | (3,492) |
| JPM | General Electric Company | USD | 96.00 | Jan 2022 | 67 | 6,700 | 82,321 | (94,987) |
| JPM | General Electric Company | USD | 96.00 | Jan 2022 | 67 | 6,700 | 87,544 | (94,987) |
| JPM | General Electric Company | USD | 120.00 | Jan 2022 | 67 | 6,700 | 44,834 | (23,821) |
| JPM | General Electric Company | USD | 120.00 | Jan 2022 | 67 | 6,700 | 45,292 | (23,821) |
| SFG | General Electric Company | USD | 120.00 | Jan 2022 | 269 | 26,900 | 234,349 | (95,633) |
| GSI | Global Payments, Inc. | USD | 230.00 | Jan 2022 | 32 | 3,200 | 19,556 | (1,630) |
| The accompanying notes are an integral part of the financial statements. | 23 |
| Options on securities (continued) | ||||||||
| Counterparty (OTC)/ Exchange- traded | Name of issuer | Currency | Exercise price | Expiration date | Number of contracts | Notional amount | Premium | Value |
| Calls (continued) | ||||||||
| GSI | Global Payments, Inc. | USD | 240.00 | Jan 2022 | 32 | 3,200 | $15,803 | $(1,148) |
| CITI | Hilton Worldwide Holdings, Inc. | USD | 125.00 | Jan 2022 | 27 | 2,700 | 27,749 | (26,589) |
| CITI | Hilton Worldwide Holdings, Inc. | USD | 125.00 | Jan 2022 | 13 | 1,300 | 12,761 | (12,802) |
| CITI | Hilton Worldwide Holdings, Inc. | USD | 125.00 | Jan 2022 | 16 | 1,600 | 16,049 | (15,756) |
| CITI | Hilton Worldwide Holdings, Inc. | USD | 130.00 | Jan 2022 | 27 | 2,700 | 23,346 | (20,047) |
| CITI | Hilton Worldwide Holdings, Inc. | USD | 130.00 | Jan 2022 | 13 | 1,300 | 10,686 | (9,652) |
| CITI | Hilton Worldwide Holdings, Inc. | USD | 130.00 | Jan 2022 | 16 | 1,600 | 13,428 | (11,880) |
| CITI | Hilton Worldwide Holdings, Inc. | USD | 130.00 | Jan 2022 | 44 | 4,400 | 65,167 | (32,669) |
| CITI | Hilton Worldwide Holdings, Inc. | USD | 135.00 | Jan 2022 | 44 | 4,400 | 57,627 | (24,103) |
| GSI | Hilton Worldwide Holdings, Inc. | USD | 135.00 | Jan 2022 | 129 | 12,900 | 180,975 | (70,666) |
| GSI | Hilton Worldwide Holdings, Inc. | USD | 140.00 | Jan 2022 | 129 | 12,900 | 155,872 | (51,248) |
| JPM | Intercontinental Exchange, Inc. | USD | 125.00 | Jan 2022 | 53 | 5,300 | 16,822 | (17,310) |
| JPM | Intercontinental Exchange, Inc. | USD | 130.00 | Jan 2022 | 54 | 5,400 | 32,895 | (9,538) |
| JPM | Intercontinental Exchange, Inc. | USD | 130.00 | Jan 2022 | 53 | 5,300 | 10,625 | (9,361) |
| JPM | Intercontinental Exchange, Inc. | USD | 135.00 | Jan 2022 | 54 | 5,400 | 24,616 | (4,651) |
| SFG | Keurig Dr. Pepper, Inc. | USD | 32.00 | Dec 2021 | 328 | 32,800 | 71,504 | (129,546) |
| JPM | Lockheed Martin Corp. | USD | 340.00 | Jan 2022 | 30 | 3,000 | 94,110 | (88,165) |
| JPM | Lockheed Martin Corp. | USD | 360.00 | Jan 2022 | 30 | 3,000 | 68,610 | (51,154) |
| JPM | Lockheed Martin Corp. | USD | 375.00 | Jan 2022 | 30 | 3,000 | 53,310 | (31,346) |
| CSFB | Marriott International, Inc., Class A | USD | 145.00 | Jan 2022 | 50 | 5,000 | 61,467 | (34,575) |
| CSFB | Marriott International, Inc., Class A | USD | 145.00 | Jan 2022 | 6 | 600 | 7,128 | (4,149) |
| CSFB | Marriott International, Inc., Class A | USD | 145.00 | Jan 2022 | 30 | 3,000 | 38,225 | (20,745) |
| CSFB | Marriott International, Inc., Class A | USD | 150.00 | Jan 2022 | 50 | 5,000 | 53,935 | (26,533) |
| CSFB | Marriott International, Inc., Class A | USD | 150.00 | Jan 2022 | 6 | 600 | 6,290 | (3,184) |
| CSFB | Marriott International, Inc., Class A | USD | 150.00 | Jan 2022 | 30 | 3,000 | 33,586 | (15,920) |
| CSFB | Marriott International, Inc., Class A | USD | 155.00 | Jan 2022 | 42 | 4,200 | 47,675 | (16,839) |
| CSFB | Marriott International, Inc., Class A | USD | 160.00 | Jan 2022 | 42 | 4,200 | 40,158 | (12,535) |
| CSFB | Marriott International, Inc., Class A | USD | 165.00 | Jan 2022 | 33 | 3,300 | 55,888 | (7,233) |
| CSFB | Marriott International, Inc., Class A | USD | 170.00 | Jan 2022 | 33 | 3,300 | 50,521 | (5,250) |
| GSI | Marsh & McLennan Companies, Inc. | USD | 150.00 | Oct 2021 | 84 | 8,400 | 14,918 | (68,241) |
| GSI | Marsh & McLennan Companies, Inc. | USD | 155.00 | Oct 2021 | 84 | 8,400 | 8,091 | (38,488) |
| CITI | McDonald's Corp. | USD | 210.00 | Jan 2022 | 26 | 2,600 | 49,374 | (78,727) |
| RBC | McDonald's Corp. | USD | 210.00 | Jan 2022 | 22 | 2,200 | 39,974 | (66,615) |
| CITI | McDonald's Corp. | USD | 220.00 | Jan 2022 | 27 | 2,700 | 38,529 | (59,301) |
| RBC | McDonald's Corp. | USD | 220.00 | Jan 2022 | 21 | 2,100 | 29,127 | (46,123) |
| CITI | McDonald's Corp. | USD | 230.00 | Jan 2022 | 27 | 2,700 | 28,539 | (39,618) |
| RBC | McDonald's Corp. | USD | 230.00 | Jan 2022 | 21 | 2,100 | 21,462 | (30,814) |
| CSFB | Medtronic PLC | USD | 115.00 | Jan 2022 | 43 | 4,300 | 52,116 | (85,061) |
| CSFB | Medtronic PLC | USD | 125.00 | Jan 2022 | 43 | 4,300 | 32,121 | (50,134) |
| CSFB | Medtronic PLC | USD | 130.00 | Jan 2022 | 44 | 4,400 | 24,508 | (36,677) |
| SFG | Microsoft Corp. | USD | 250.00 | Jan 2022 | 71 | 7,100 | 92,797 | (393,349) |
| SFG | Microsoft Corp. | USD | 255.00 | Jan 2022 | 71 | 7,100 | 83,567 | (361,277) |
| SFG | Microsoft Corp. | USD | 260.00 | Jan 2022 | 71 | 7,100 | 75,047 | (329,767) |
| SFG | Microsoft Corp. | USD | 265.00 | Jan 2022 | 55 | 5,500 | 81,510 | (231,551) |
| BOA | Microsoft Corp. | USD | 270.00 | Jan 2022 | 32 | 3,200 | 42,970 | (121,169) |
| SFG | Microsoft Corp. | USD | 270.00 | Jan 2022 | 55 | 5,500 | 72,985 | (208,259) |
| BOA | Microsoft Corp. | USD | 275.00 | Jan 2022 | 32 | 3,200 | 37,563 | (108,098) |
| SFG | Microsoft Corp. | USD | 275.00 | Jan 2022 | 56 | 5,600 | 68,152 | (189,171) |
| BOA | Microsoft Corp. | USD | 280.00 | Jan 2022 | 32 | 3,200 | 32,647 | (95,592) |
| CITI | Microsoft Corp. | USD | 280.00 | Jan 2022 | 221 | 22,100 | 453,492 | (660,180) |
| SFG | Microsoft Corp. | USD | 300.00 | Jan 2023 | 93 | 9,300 | 169,911 | (338,117) |
| SFG | Microsoft Corp. | USD | 300.00 | Jan 2023 | 93 | 9,300 | 175,026 | (338,117) |
| SFG | Microsoft Corp. | USD | 320.00 | Jan 2023 | 32 | 3,200 | 56,883 | (87,444) |
| SFG | Microsoft Corp. | USD | 320.00 | Jan 2023 | 32 | 3,200 | 61,099 | (87,444) |
| CITI | Microsoft Corp. | USD | 330.00 | Jan 2023 | 21 | 2,100 | 30,850 | (49,388) |
| CITI | Microsoft Corp. | USD | 330.00 | Jan 2023 | 21 | 2,100 | 31,030 | (49,388) |
| CITI | Microsoft Corp. | USD | 330.00 | Jan 2023 | 17 | 1,700 | 30,220 | (39,981) |
| SFG | Microsoft Corp. | USD | 330.00 | Jan 2023 | 32 | 3,200 | 48,405 | (75,258) |
| SFG | Microsoft Corp. | USD | 330.00 | Jan 2023 | 32 | 3,200 | 51,807 | (75,258) |
| CITI | Microsoft Corp. | USD | 340.00 | Jan 2023 | 21 | 2,100 | 26,073 | (42,323) |
| CITI | Microsoft Corp. | USD | 340.00 | Jan 2023 | 21 | 2,100 | 26,180 | (42,323) |
| CITI | Microsoft Corp. | USD | 340.00 | Jan 2023 | 17 | 1,700 | 25,631 | (34,261) |
| CITI | Microsoft Corp. | USD | 340.00 | Jan 2023 | 43 | 4,300 | 87,102 | (86,661) |
| CITI | Microsoft Corp. | USD | 340.00 | Jan 2023 | 19 | 1,900 | 38,578 | (38,292) |
| The accompanying notes are an integral part of the financial statements. | 24 |
| Options on securities (continued) | ||||||||
| Counterparty (OTC)/ Exchange- traded | Name of issuer | Currency | Exercise price | Expiration date | Number of contracts | Notional amount | Premium | Value |
| Calls (continued) | ||||||||
| SFG | Microsoft Corp. | USD | 340.00 | Jan 2023 | 32 | 3,200 | $41,247 | $(64,492) |
| SFG | Microsoft Corp. | USD | 340.00 | Jan 2023 | 32 | 3,200 | 43,795 | (64,492) |
| CITI | Microsoft Corp. | USD | 350.00 | Jan 2023 | 21 | 2,100 | 21,927 | (36,131) |
| CITI | Microsoft Corp. | USD | 350.00 | Jan 2023 | 21 | 2,100 | 22,163 | (36,131) |
| CITI | Microsoft Corp. | USD | 350.00 | Jan 2023 | 17 | 1,700 | 21,637 | (29,249) |
| CITI | Microsoft Corp. | USD | 350.00 | Jan 2023 | 43 | 4,300 | 74,101 | (73,983) |
| CITI | Microsoft Corp. | USD | 350.00 | Jan 2023 | 19 | 1,900 | 33,056 | (32,690) |
| SFG | Microsoft Corp. | USD | 350.00 | Jan 2023 | 32 | 3,200 | 34,689 | (55,057) |
| SFG | Microsoft Corp. | USD | 350.00 | Jan 2023 | 32 | 3,200 | 37,065 | (55,057) |
| CITI | Microsoft Corp. | USD | 360.00 | Jan 2023 | 43 | 4,300 | 62,793 | (62,957) |
| CITI | Microsoft Corp. | USD | 360.00 | Jan 2023 | 19 | 1,900 | 28,142 | (27,818) |
| CITI | Mondelez International, Inc., Class A | USD | 57.50 | Jan 2022 | 89 | 8,900 | 42,008 | (48,921) |
| CITI | Mondelez International, Inc., Class A | USD | 60.00 | Jan 2022 | 88 | 8,800 | 30,976 | (32,351) |
| CITI | Mondelez International, Inc., Class A | USD | 62.50 | Jan 2022 | 88 | 8,800 | 17,336 | (19,568) |
| CSFB | Northrop Grumman Corp. | USD | 300.00 | Jan 2022 | 16 | 1,600 | 44,272 | (113,004) |
| CSFB | Northrop Grumman Corp. | USD | 300.00 | Jan 2022 | 18 | 1,800 | 48,546 | (127,130) |
| CSFB | Northrop Grumman Corp. | USD | 315.00 | Jan 2022 | 16 | 1,600 | 32,912 | (91,220) |
| CSFB | Northrop Grumman Corp. | USD | 315.00 | Jan 2022 | 19 | 1,900 | 41,173 | (108,323) |
| CSFB | Northrop Grumman Corp. | USD | 325.00 | Jan 2022 | 16 | 1,600 | 28,112 | (77,403) |
| CSFB | Northrop Grumman Corp. | USD | 325.00 | Jan 2022 | 18 | 1,800 | 32,706 | (87,079) |
| JPM | NXP Semiconductors NV | USD | 195.00 | Jan 2022 | 27 | 2,700 | 47,606 | (78,339) |
| JPM | NXP Semiconductors NV | USD | 195.00 | Jan 2022 | 27 | 2,700 | 52,314 | (78,339) |
| JPM | NXP Semiconductors NV | USD | 200.00 | Jan 2022 | 27 | 2,700 | 44,441 | (69,424) |
| JPM | NXP Semiconductors NV | USD | 200.00 | Jan 2022 | 27 | 2,700 | 47,232 | (69,424) |
| JPM | NXP Semiconductors NV | USD | 210.00 | Jan 2022 | 27 | 2,700 | 37,817 | (53,468) |
| JPM | NXP Semiconductors NV | USD | 210.00 | Jan 2022 | 27 | 2,700 | 40,310 | (53,468) |
| SFG | PepsiCo, Inc. | USD | 140.00 | Jan 2022 | 43 | 4,300 | 48,891 | (74,234) |
| SFG | PepsiCo, Inc. | USD | 140.00 | Jan 2022 | 48 | 4,800 | 52,176 | (82,866) |
| SFG | PepsiCo, Inc. | USD | 145.00 | Jan 2022 | 43 | 4,300 | 39,216 | (56,329) |
| SFG | PepsiCo, Inc. | USD | 145.00 | Jan 2022 | 48 | 4,800 | 41,136 | (62,879) |
| SFG | PepsiCo, Inc. | USD | 155.00 | Jan 2022 | 43 | 4,300 | 23,306 | (26,933) |
| SFG | PepsiCo, Inc. | USD | 155.00 | Jan 2022 | 47 | 4,700 | 23,594 | (29,438) |
| JPM | Roper Technologies, Inc. | USD | 490.00 | Nov 2021 | 11 | 1,100 | 11,698 | (17,417) |
| JPM | Roper Technologies, Inc. | USD | 500.00 | Nov 2021 | 11 | 1,100 | 6,689 | (12,547) |
| CSFB | Ross Stores, Inc. | USD | 130.00 | Jan 2022 | 22 | 2,200 | 22,524 | (8,049) |
| BOA | Ross Stores, Inc. | USD | 135.00 | Jan 2022 | 10 | 1,000 | 10,440 | (2,471) |
| CSFB | Ross Stores, Inc. | USD | 135.00 | Jan 2022 | 22 | 2,200 | 20,530 | (5,436) |
| BOA | Ross Stores, Inc. | USD | 140.00 | Jan 2022 | 10 | 1,000 | 8,654 | (1,635) |
| JPM | Teledyne Technologies, Inc. | USD | 410.00 | Sep 2021 | 5 | 500 | 10,970 | (26,873) |
| JPM | Teledyne Technologies, Inc. | USD | 410.00 | Sep 2021 | 5 | 500 | 11,654 | (26,873) |
| JPM | Teledyne Technologies, Inc. | USD | 420.00 | Sep 2021 | 5 | 500 | 9,426 | (21,985) |
| JPM | Teledyne Technologies, Inc. | USD | 420.00 | Sep 2021 | 5 | 500 | 9,863 | (21,985) |
| JPM | Teledyne Technologies, Inc. | USD | 470.00 | Dec 2021 | 11 | 1,100 | 22,338 | (23,797) |
| JPM | Teledyne Technologies, Inc. | USD | 480.00 | Dec 2021 | 11 | 1,100 | 18,834 | (19,036) |
| CSFB | The Coca-Cola Company | USD | 50.00 | Jan 2022 | 129 | 12,900 | 53,060 | (84,991) |
| CSFB | The Coca-Cola Company | USD | 50.00 | Jan 2022 | 176 | 17,600 | 54,912 | (115,957) |
| CSFB | The Coca-Cola Company | USD | 52.50 | Jan 2022 | 129 | 12,900 | 38,767 | (57,344) |
| CSFB | The Coca-Cola Company | USD | 52.50 | Jan 2022 | 176 | 17,600 | 39,072 | (78,237) |
| CSFB | The Coca-Cola Company | USD | 55.00 | Jan 2022 | 129 | 12,900 | 27,591 | (34,854) |
| CSFB | The Coca-Cola Company | USD | 55.00 | Jan 2022 | 176 | 17,600 | 27,632 | (47,552) |
| CITI | The PNC Financial Services Group, Inc. | USD | 175.00 | Jan 2022 | 43 | 4,300 | 51,300 | (92,738) |
| CITI | The PNC Financial Services Group, Inc. | USD | 180.00 | Jan 2022 | 43 | 4,300 | 43,851 | (77,633) |
| CITI | The PNC Financial Services Group, Inc. | USD | 180.00 | Jan 2022 | 46 | 4,600 | 60,551 | (83,049) |
| CITI | The PNC Financial Services Group, Inc. | USD | 185.00 | Jan 2022 | 43 | 4,300 | 37,477 | (63,879) |
| CITI | The PNC Financial Services Group, Inc. | USD | 185.00 | Jan 2022 | 46 | 4,600 | 52,304 | (68,336) |
| CITI | The PNC Financial Services Group, Inc. | USD | 190.00 | Jan 2022 | 46 | 4,600 | 44,989 | (55,213) |
| CITI | The PNC Financial Services Group, Inc. | USD | 195.00 | Jan 2022 | 65 | 6,500 | 59,292 | (61,943) |
| CITI | The PNC Financial Services Group, Inc. | USD | 195.00 | Jan 2022 | 64 | 6,400 | 58,161 | (60,990) |
| CITI | The PNC Financial Services Group, Inc. | USD | 200.00 | Jan 2022 | 65 | 6,500 | 49,569 | (48,340) |
| CITI | The PNC Financial Services Group, Inc. | USD | 200.00 | Jan 2022 | 64 | 6,400 | 43,428 | (47,596) |
| CITI | Thermo Fisher Scientific, Inc. | USD | 560.00 | Jan 2022 | 21 | 2,100 | 41,026 | (64,037) |
| CITI | Thermo Fisher Scientific, Inc. | USD | 580.00 | Jan 2022 | 9 | 900 | 24,367 | (19,478) |
| CITI | Thermo Fisher Scientific, Inc. | USD | 580.00 | Jan 2022 | 17 | 1,700 | 48,213 | (36,792) |
| CITI | Thermo Fisher Scientific, Inc. | USD | 580.00 | Jan 2022 | 21 | 2,100 | 29,597 | (45,449) |
| The accompanying notes are an integral part of the financial statements. | 25 |
| Options on securities (continued) | ||||||||
| Counterparty (OTC)/ Exchange- traded | Name of issuer | Currency | Exercise price | Expiration date | Number of contracts | Notional amount | Premium | Value |
| Calls (continued) | ||||||||
| CITI | Thermo Fisher Scientific, Inc. | USD | 600.00 | Jan 2022 | 9 | 900 | $20,136 | $(13,556) |
| CITI | Thermo Fisher Scientific, Inc. | USD | 600.00 | Jan 2022 | 17 | 1,700 | 39,900 | (25,605) |
| CITI | UnitedHealth Group, Inc. | USD | 400.00 | Jan 2022 | 21 | 2,100 | 50,565 | (68,102) |
| CITI | UnitedHealth Group, Inc. | USD | 410.00 | Jan 2022 | 21 | 2,100 | 41,722 | (55,613) |
| CITI | UnitedHealth Group, Inc. | USD | 420.00 | Jan 2022 | 21 | 2,100 | 38,214 | (44,615) |
| CITI | UnitedHealth Group, Inc. | USD | 460.00 | Jan 2022 | 11 | 1,100 | 17,559 | (7,939) |
| CITI | UnitedHealth Group, Inc. | USD | 470.00 | Jan 2022 | 11 | 1,100 | 14,363 | (5,770) |
| JPM | Visa, Inc., Class A | USD | 220.00 | Jan 2022 | 63 | 6,300 | 88,326 | (112,204) |
| CSFB | Visa, Inc., Class A | USD | 225.00 | Jan 2022 | 74 | 7,400 | 98,800 | (108,996) |
| GSI | Visa, Inc., Class A | USD | 225.00 | Jan 2022 | 23 | 2,300 | 27,416 | (33,877) |
| GSI | Visa, Inc., Class A | USD | 225.00 | Jan 2022 | 23 | 2,300 | 30,981 | (33,877) |
| GSI | Visa, Inc., Class A | USD | 225.00 | Jan 2022 | 47 | 4,700 | 61,230 | (69,227) |
| JPM | Visa, Inc., Class A | USD | 225.00 | Jan 2022 | 63 | 6,300 | 77,616 | (92,794) |
| CSFB | Visa, Inc., Class A | USD | 230.00 | Jan 2022 | 74 | 7,400 | 87,382 | (88,649) |
| GSI | Visa, Inc., Class A | USD | 230.00 | Jan 2022 | 23 | 2,300 | 23,506 | (27,553) |
| GSI | Visa, Inc., Class A | USD | 230.00 | Jan 2022 | 23 | 2,300 | 26,956 | (27,553) |
| GSI | Visa, Inc., Class A | USD | 230.00 | Jan 2022 | 47 | 4,700 | 54,779 | (56,304) |
| JPM | Visa, Inc., Class A | USD | 230.00 | Jan 2022 | 63 | 6,300 | 67,851 | (75,472) |
| CSFB | Visa, Inc., Class A | USD | 235.00 | Jan 2022 | 74 | 7,400 | 75,366 | (70,866) |
| CSFB | Visa, Inc., Class A | USD | 240.00 | Jan 2022 | 44 | 4,400 | 55,185 | (33,097) |
| CSFB | Visa, Inc., Class A | USD | 245.00 | Jan 2022 | 44 | 4,400 | 48,545 | (25,543) |
| CSFB | Visa, Inc., Class A | USD | 245.00 | Jan 2022 | 50 | 5,000 | 52,348 | (29,026) |
| CITI | Visa, Inc., Class A | USD | 250.00 | Jan 2022 | 144 | 14,400 | 122,943 | (63,418) |
| CSFB | Visa, Inc., Class A | USD | 250.00 | Jan 2022 | 50 | 5,000 | 43,323 | (22,020) |
| GSI | Visa, Inc., Class A | USD | 250.00 | Jan 2022 | 45 | 4,500 | 54,990 | (19,818) |
| GSI | Visa, Inc., Class A | USD | 250.00 | Jan 2022 | 30 | 3,000 | 27,898 | (13,212) |
| CSFB | Visa, Inc., Class A | USD | 255.00 | Jan 2022 | 21 | 2,100 | 17,711 | (6,902) |
| CSFB | Visa, Inc., Class A | USD | 255.00 | Jan 2022 | 50 | 5,000 | 35,543 | (16,433) |
| GSI | Visa, Inc., Class A | USD | 255.00 | Jan 2022 | 30 | 3,000 | 22,597 | (9,860) |
| CSFB | Visa, Inc., Class A | USD | 260.00 | Jan 2022 | 21 | 2,100 | 14,900 | (5,073) |
| GSI | Visa, Inc., Class A | USD | 260.00 | Jan 2022 | 45 | 4,500 | 42,165 | (10,871) |
| CSFB | Visa, Inc., Class A | USD | 265.00 | Jan 2022 | 21 | 2,100 | 12,508 | (3,678) |
| GSI | Visa, Inc., Class A | USD | 270.00 | Jan 2022 | 45 | 4,500 | 32,040 | (5,649) |
| CSFB | Waste Management, Inc. | USD | 115.00 | Jan 2022 | 22 | 2,200 | 17,644 | (88,620) |
| CSFB | Waste Management, Inc. | USD | 115.00 | Jan 2022 | 22 | 2,200 | 17,754 | (88,620) |
| CSFB | Waste Management, Inc. | USD | 120.00 | Jan 2022 | 22 | 2,200 | 16,434 | (78,011) |
| CSFB | Waste Management, Inc. | USD | 120.00 | Jan 2022 | 22 | 2,200 | 15,994 | (78,011) |
| CSFB | Waste Management, Inc. | USD | 130.00 | Jan 2022 | 22 | 2,200 | 9,174 | (57,280) |
| CSFB | Waste Management, Inc. | USD | 130.00 | Jan 2022 | 22 | 2,200 | 8,294 | (57,280) |
| JPM | Yum! Brands, Inc. | USD | 105.00 | Jan 2022 | 24 | 2,400 | 26,928 | (64,600) |
| JPM | Yum! Brands, Inc. | USD | 110.00 | Jan 2022 | 24 | 2,400 | 21,288 | (53,553) |
| JPM | Yum! Brands, Inc. | USD | 120.00 | Jan 2022 | 75 | 7,500 | 32,128 | (103,963) |
| JPM | Yum! Brands, Inc. | USD | 120.00 | Jan 2022 | 46 | 4,600 | 21,022 | (63,764) |
| JPM | Yum! Brands, Inc. | USD | 120.00 | Jan 2022 | 19 | 1,900 | 8,683 | (26,337) |
| JPM | Yum! Brands, Inc. | USD | 120.00 | Jan 2022 | 67 | 6,700 | 31,959 | (92,874) |
| JPM | Yum! Brands, Inc. | USD | 125.00 | Jan 2022 | 86 | 8,600 | 27,692 | (88,056) |
| $14,791,701 | $(30,662,491) | |||||||
| Derivatives Currency Abbreviations | |
| USD | U.S. Dollar |
| Derivatives Abbreviations | |
| BOA | Bank of America, N.A. |
| CITI | Citibank, N.A. |
| CSFB | Credit Suisse First Boston International |
| GSI | Goldman Sachs International |
| JPM | JPMorgan Chase Bank, N.A. |
| OTC | Over-the-counter |
| RBC | Royal Bank of Canada |
| SFG | Susquehanna Financial Group, LLLP |
| The accompanying notes are an integral part of the financial statements. | 26 |
| Shares or Principal Amount | Value | ||||
| U.S. GOVERNMENT AND AGENCY OBLIGATIONS – 58.5% | |||||
| U.S. Government – 35.7% | |||||
| U.S. Treasury Bonds | |||||
| 1.125%, 05/15/2040 to 08/15/2040 | $ | 42,924,000 | $ | 38,228,492 | |
| 1.375%, 11/15/2040 to 08/15/2050 | 31,706,000 | 28,605,351 | |||
| 1.625%, 11/15/2050 | 5,647,000 | 5,254,136 | |||
| 1.750%, 08/15/2041 | 23,029,000 | 22,665,574 | |||
| 1.875%, 02/15/2041 | 16,664,000 | 16,791,584 | |||
| 2.000%, 08/15/2051 | 10,497,000 | 10,683,978 | |||
| 2.250%, 05/15/2041 | 11,545,000 | 12,353,150 | |||
| 2.375%, 05/15/2051 | 7,095,000 | 7,835,541 | |||
| 2.500%, 02/15/2045 | 9,057,000 | 10,089,710 | |||
| U.S. Treasury Notes | |||||
| 0.125%, 05/31/2022 to 01/15/2024 | 112,741,000 | 112,582,517 | |||
| 0.250%, 08/31/2025 to 10/31/2025 | 46,145,000 | 45,405,405 | |||
| 0.375%, 04/15/2024 to 01/31/2026 | 109,177,000 | 108,461,416 | |||
| 0.500%, 02/28/2026 to 08/31/2027 | 31,342,000 | 30,672,273 | |||
| 0.625%, 07/31/2026 | 10,520,000 | 10,447,675 | |||
| 0.750%, 05/31/2026 to 01/31/2028 | 45,533,000 | 45,453,670 | |||
| 0.875%, 06/30/2026 | 10,118,000 | 10,174,123 | |||
| 1.000%, 07/31/2028 | 2,760,000 | 2,746,200 | |||
| 1.125%, 08/31/2028 | 11,493,000 | 11,523,528 | |||
| 1.250%, 08/15/2031 | 18,138,000 | 18,044,476 | |||
| 1.500%, 11/30/2024 | 17,540,000 | 18,131,290 | |||
| 1.750%, 11/30/2021 to 02/28/2022 | 2,746,000 | 2,759,099 | |||
| 1.875%, 02/28/2022 | 30,508,000 | 30,784,479 | |||
| 2.000%, 02/15/2022 | 23,544,000 | 23,751,849 | |||
| 2.125%, 05/15/2025 | 13,546,000 | 14,320,133 | |||
| 637,765,649 | |||||
| U.S. Government Agency – 22.8% | |||||
| Federal Home Loan Mortgage Corp. | |||||
| 2.000%, 12/01/2050 | 2,812,894 | 2,862,329 | |||
| 2.500%, 01/01/2036 | 8,181,108 | 8,667,583 | |||
| 2.820%, (12 month LIBOR + 1.641%), 05/01/2049 (A) | 1,530,620 | 1,583,162 | |||
| 3.500%, 04/01/2049 | 1,673,421 | 1,819,599 | |||
| 4.000%, 01/01/2035 to 07/01/2049 | 7,831,798 | 8,533,932 | |||
| 4.500%, 06/01/2039 to 07/01/2039 | 111,182 | 123,941 | |||
| 5.000%, 05/01/2048 to 03/01/2049 | 6,650,641 | 7,511,301 | |||
| Federal National Mortgage Association | |||||
| 2.000%, TBA (B) | 47,700,000 | 48,735,283 | |||
| 2.000%, 05/01/2031 to 04/01/2051 | 13,363,194 | 13,779,318 | |||
| 2.500%, TBA (B) | 78,800,000 | 81,750,907 | |||
| 2.500%, 12/01/2035 to 10/01/2050 | 32,987,693 | 34,736,743 | |||
| 2.500%, 06/01/2036 (B) | 3,355,709 | 3,562,591 | |||
| 2.688%, (12 month LIBOR + 1.578%), 06/01/2045 (A) | 1,217,006 | 1,260,425 | |||
| 2.691%, (12 month LIBOR + 1.586%), 01/01/2046 (A) | 3,881,227 | 4,030,598 | |||
| 3.000%, 01/01/2043 to 07/01/2060 | 28,462,214 | 30,457,255 | |||
| 4.000%, 09/01/2033 to 08/01/2059 | 24,996,565 | 27,755,099 | |||
| 4.500%, 05/01/2034 to 04/01/2050 | 28,722,783 | 32,255,663 | |||
| 5.000%, 07/01/2044 to 11/01/2049 | 16,346,287 | 18,388,159 | |||
| 5.500%, 12/01/2048 to 06/01/2049 | 7,324,679 | 8,428,128 | |||
| Government National Mortgage Association | |||||
| 2.500%, TBA (B) | 8,800,000 | 9,125,340 | |||
| 2.500%, 06/20/2051 to 07/20/2051 | 30,412,928 | 31,572,298 | |||
| 3.500%, 01/20/2048 | 1,189,243 | 1,290,552 | |||
| 4.000%, 03/20/2048 to 07/20/2049 | 5,586,896 | 6,114,863 | |||
| 4.500%, 08/15/2047 to 05/20/2049 | 5,383,986 | 5,842,079 | |||
| 5.000%, 12/20/2039 to 03/20/2049 | 16,279,497 | 17,666,099 | |||
| 407,853,247 | |||||
| TOTAL U.S. GOVERNMENT AND AGENCY OBLIGATIONS (Cost $1,042,499,538) | $ | 1,045,618,896 | |||
| Shares or Principal Amount | Value | ||||
| FOREIGN GOVERNMENT OBLIGATIONS – 1.1% | |||||
| Chile – 0.1% | |||||
| Republic of Chile 2.550%, 07/27/2033 | $ | 933,000 | $ | 949,523 | |
| Colombia – 0.0% | |||||
| Republic of Colombia | |||||
| 3.250%, 04/22/2032 | 448,000 | 437,185 | |||
| 3.875%, 02/15/2061 | 377,000 | 329,849 | |||
| 767,034 | |||||
| Italy – 0.1% | |||||
| Republic of Italy 3.875%, 05/06/2051 | 798,000 | 896,459 | |||
| Japan – 0.1% | |||||
| Japan Bank for International Cooperation 1.750%, 10/17/2024 | 1,576,000 | 1,631,320 | |||
| Mexico – 0.4% | |||||
| Government of Mexico | |||||
| 3.750%, 04/19/2071 | 1,538,000 | 1,440,122 | |||
| 3.771%, 05/24/2061 | 326,000 | 310,821 | |||
| 4.280%, 08/14/2041 | 2,226,000 | 2,381,686 | |||
| 4.500%, 04/22/2029 | 2,291,000 | 2,621,225 | |||
| 4.750%, 03/08/2044 | 400,000 | 450,196 | |||
| 7,204,050 | |||||
| Paraguay – 0.1% | |||||
| Republic of Paraguay | |||||
| 2.739%, 01/29/2033 (C) | 501,000 | 495,239 | |||
| 5.400%, 03/30/2050 (C) | 944,000 | 1,127,136 | |||
| 1,622,375 | |||||
| Peru – 0.3% | |||||
| Republic of Peru | |||||
| 2.392%, 01/23/2026 | 1,151,000 | 1,190,284 | |||
| 2.783%, 01/23/2031 | 3,742,000 | 3,822,790 | |||
| 3.300%, 03/11/2041 | 983,000 | 995,337 | |||
| 6,008,411 | |||||
| TOTAL FOREIGN GOVERNMENT OBLIGATIONS (Cost $18,548,657) | $ | 19,079,172 | |||
| CORPORATE BONDS – 29.6% | |||||
| Communication services – 2.3% | |||||
| AT&T, Inc. | |||||
| 2.250%, 02/01/2032 | 1,276,000 | 1,268,006 | |||
| 3.100%, 02/01/2043 | 278,000 | 275,394 | |||
| 3.500%, 06/01/2041 | 588,000 | 619,571 | |||
| 3.500%, 09/15/2053 (C) | 2,359,000 | 2,423,177 | |||
| 3.550%, 09/15/2055 (C) | 576,000 | 589,391 | |||
| 3.800%, 12/01/2057 (C) | 1,054,000 | 1,121,026 | |||
| 3.850%, 06/01/2060 | 852,000 | 908,596 | |||
| Charter Communications Operating LLC | |||||
| 3.500%, 06/01/2041 | 747,000 | 755,189 | |||
| 3.900%, 06/01/2052 | 1,164,000 | 1,201,644 | |||
| 4.400%, 12/01/2061 | 487,000 | 533,610 | |||
| 4.464%, 07/23/2022 | 526,000 | 541,206 | |||
| 4.800%, 03/01/2050 | 1,080,000 | 1,261,354 | |||
| Comcast Corp. | |||||
| 1.500%, 02/15/2031 | 1,428,000 | 1,369,120 | |||
| 3.750%, 04/01/2040 | 1,111,000 | 1,275,681 | |||
| Discovery Communications LLC | |||||
| 4.000%, 09/15/2055 | 680,000 | 727,989 | |||
| 4.650%, 05/15/2050 | 176,000 | 208,821 | |||
| Netflix, Inc. | |||||
| 3.625%, 06/15/2025 (C) | 981,000 | 1,052,123 | |||
| 5.875%, 11/15/2028 | 1,054,000 | 1,306,960 | |||
| Telefonica Emisiones SA 5.520%, 03/01/2049 | 445,000 | 586,910 | |||
| The accompanying notes are an integral part of the financial statements. | 27 |
| Shares or Principal Amount | Value | ||||
| CORPORATE BONDS (continued) | |||||
| Communication services (continued) | |||||
| T-Mobile USA, Inc. | |||||
| 2.250%, 02/15/2026 | $ | 1,274,000 | $ | 1,301,073 | |
| 2.250%, 02/15/2026 (C) | 6,408,000 | 6,544,170 | |||
| 2.875%, 02/15/2031 | 967,000 | 993,593 | |||
| 3.375%, 04/15/2029 (C) | 3,047,000 | 3,219,338 | |||
| 3.500%, 04/15/2031 (C) | 2,438,000 | 2,595,861 | |||
| Verizon Communications, Inc. | |||||
| 2.550%, 03/21/2031 | 526,000 | 543,328 | |||
| 2.650%, 11/20/2040 | 2,311,000 | 2,242,219 | |||
| 2.875%, 11/20/2050 | 444,000 | 427,736 | |||
| 3.400%, 03/22/2041 | 1,111,000 | 1,190,314 | |||
| 3.550%, 03/22/2051 | 1,291,000 | 1,402,672 | |||
| 3.700%, 03/22/2061 | 807,000 | 887,306 | |||
| 4.329%, 09/21/2028 | 382,000 | 446,055 | |||
| ViacomCBS, Inc. | |||||
| 4.200%, 05/19/2032 | 60,000 | 69,260 | |||
| 4.600%, 01/15/2045 | 110,000 | 132,564 | |||
| 4.950%, 01/15/2031 to 05/19/2050 | 840,000 | 1,048,564 | |||
| 5.850%, 09/01/2043 | 207,000 | 285,878 | |||
| 41,355,699 | |||||
| Consumer discretionary – 2.2% | |||||
| Advance Auto Parts, Inc. 3.900%, 04/15/2030 | 1,390,000 | 1,547,199 | |||
| Amazon.com, Inc. | |||||
| 1.000%, 05/12/2026 | 3,758,000 | 3,778,201 | |||
| 1.650%, 05/12/2028 | 1,693,000 | 1,724,150 | |||
| 2.100%, 05/12/2031 | 2,643,000 | 2,709,947 | |||
| 2.700%, 06/03/2060 | 256,000 | 249,114 | |||
| 3.100%, 05/12/2051 | 1,336,000 | 1,439,319 | |||
| 3.250%, 05/12/2061 | 571,000 | 623,395 | |||
| AutoNation, Inc. | |||||
| 1.950%, 08/01/2028 | 821,000 | 816,226 | |||
| 2.400%, 08/01/2031 | 1,150,000 | 1,136,290 | |||
| Ford Motor Company 4.750%, 01/15/2043 | 450,000 | 485,438 | |||
| Ford Motor Credit Company LLC | |||||
| 2.700%, 08/10/2026 | 2,134,000 | 2,154,700 | |||
| 3.625%, 06/17/2031 | 2,477,000 | 2,551,310 | |||
| 4.000%, 11/13/2030 | 836,000 | 881,980 | |||
| General Motors Company 5.400%, 04/01/2048 | 319,000 | 404,046 | |||
| Hyundai Capital America | |||||
| 0.800%, 01/08/2024 (C) | 1,743,000 | 1,736,833 | |||
| 1.250%, 09/18/2023 (C) | 858,000 | 865,793 | |||
| 1.300%, 01/08/2026 (C) | 1,712,000 | 1,693,787 | |||
| 1.800%, 10/15/2025 (C) | 1,372,000 | 1,388,979 | |||
| 2.000%, 06/15/2028 (C) | 834,000 | 830,358 | |||
| Marriott International, Inc. | |||||
| 2.850%, 04/15/2031 | 2,476,000 | 2,525,946 | |||
| 5.750%, 05/01/2025 | 554,000 | 636,452 | |||
| Sodexo, Inc. 1.634%, 04/16/2026 (C) | 1,531,000 | 1,551,842 | |||
| Starbucks Corp. | |||||
| 1.300%, 05/07/2022 | 700,000 | 704,574 | |||
| 3.350%, 03/12/2050 | 860,000 | 919,939 | |||
| 3.500%, 11/15/2050 | 1,097,000 | 1,202,381 | |||
| The Home Depot, Inc. | |||||
| 2.375%, 03/15/2051 | 613,000 | 574,156 | |||
| 3.125%, 12/15/2049 | 1,071,000 | 1,148,434 | |||
| 3.300%, 04/15/2040 | 228,000 | 252,722 | |||
| The Trustees of the University of Pennsylvania 3.610%, 02/15/2119 | 954,000 | 1,111,457 | |||
| Yale University | |||||
| 0.873%, 04/15/2025 | 985,000 | 992,877 | |||
| Shares or Principal Amount | Value | ||||
| CORPORATE BONDS (continued) | |||||
| Consumer discretionary (continued) | |||||
| Yale University (continued) | |||||
| 1.482%, 04/15/2030 | $ | 844,000 | $ | 836,942 | |
| 39,474,787 | |||||
| Consumer staples – 1.5% | |||||
| Altria Group, Inc. | |||||
| 2.350%, 05/06/2025 | 239,000 | 249,297 | |||
| 2.450%, 02/04/2032 | 649,000 | 634,314 | |||
| 3.400%, 02/04/2041 | 1,780,000 | 1,711,090 | |||
| 3.700%, 02/04/2051 | 585,000 | 567,967 | |||
| 3.875%, 09/16/2046 | 1,142,000 | 1,153,131 | |||
| 4.000%, 02/04/2061 | 153,000 | 150,203 | |||
| Anheuser-Busch Companies LLC | |||||
| 4.700%, 02/01/2036 | 1,558,000 | 1,920,691 | |||
| 4.900%, 02/01/2046 | 1,398,000 | 1,783,763 | |||
| Anheuser-Busch InBev Worldwide, Inc. | |||||
| 3.750%, 07/15/2042 | 503,000 | 553,554 | |||
| 4.375%, 04/15/2038 | 1,637,000 | 1,953,527 | |||
| 4.600%, 04/15/2048 | 821,000 | 1,009,592 | |||
| BAT Capital Corp. | |||||
| 2.259%, 03/25/2028 | 295,000 | 296,423 | |||
| 2.726%, 03/25/2031 | 2,580,000 | 2,571,392 | |||
| 4.906%, 04/02/2030 | 301,000 | 349,080 | |||
| Bunge, Ltd. Finance Corp. | |||||
| 1.630%, 08/17/2025 | 959,000 | 974,153 | |||
| 2.750%, 05/14/2031 | 3,424,000 | 3,516,232 | |||
| 3.750%, 09/25/2027 | 2,788,000 | 3,097,382 | |||
| Molson Coors Beverage Company 4.200%, 07/15/2046 | 1,912,000 | 2,160,447 | |||
| The Estee Lauder Companies, Inc. 1.950%, 03/15/2031 | 1,656,000 | 1,678,783 | |||
| Walmart, Inc. 3.050%, 07/08/2026 | 517,000 | 566,122 | |||
| 26,897,143 | |||||
| Energy – 1.7% | |||||
| Aker BP ASA 4.000%, 01/15/2031 (C) | 812,000 | 893,923 | |||
| BP Capital Markets America, Inc. 3.379%, 02/08/2061 | 1,288,000 | 1,340,440 | |||
| Devon Energy Corp. | |||||
| 4.750%, 05/15/2042 | 291,000 | 334,215 | |||
| 5.000%, 06/15/2045 | 1,018,000 | 1,204,598 | |||
| 5.250%, 09/15/2024 (C) | 416,000 | 461,685 | |||
| 5.600%, 07/15/2041 | 141,000 | 176,295 | |||
| Diamondback Energy, Inc. 4.400%, 03/24/2051 | 471,000 | 539,733 | |||
| Enable Midstream Partners LP | |||||
| 3.900%, 05/15/2024 | 156,000 | 165,859 | |||
| 4.150%, 09/15/2029 | 647,000 | 708,643 | |||
| 4.400%, 03/15/2027 | 1,091,000 | 1,213,565 | |||
| 4.950%, 05/15/2028 | 1,850,000 | 2,104,865 | |||
| Energy Transfer LP | |||||
| 5.150%, 03/15/2045 | 281,000 | 326,139 | |||
| 5.300%, 04/15/2047 | 172,000 | 203,441 | |||
| 5.350%, 05/15/2045 | 422,000 | 500,722 | |||
| 6.000%, 06/15/2048 | 225,000 | 287,480 | |||
| 6.050%, 06/01/2041 | 256,000 | 321,918 | |||
| 6.100%, 02/15/2042 | 287,000 | 359,386 | |||
| 6.125%, 12/15/2045 | 492,000 | 632,630 | |||
| Equinor ASA 3.250%, 11/18/2049 | 405,000 | 438,027 | |||
| Galaxy Pipeline Assets Bidco, Ltd. | |||||
| 1.750%, 09/30/2027 (C) | 1,731,000 | 1,758,201 | |||
| 2.160%, 03/31/2034 (C) | 1,292,000 | 1,285,902 | |||
| 2.625%, 03/31/2036 (C) | 817,000 | 816,149 | |||
| 2.940%, 09/30/2040 (C) | 497,000 | 504,795 | |||
| The accompanying notes are an integral part of the financial statements. | 28 |
| Shares or Principal Amount | Value | ||||
| CORPORATE BONDS (continued) | |||||
| Energy (continued) | |||||
| Lundin Energy Finance BV | |||||
| 2.000%, 07/15/2026 (C) | $ | 2,922,000 | $ | 2,944,709 | |
| 3.100%, 07/15/2031 (C) | 2,199,000 | 2,231,181 | |||
| Marathon Oil Corp. 5.200%, 06/01/2045 | 354,000 | 428,044 | |||
| Oleoducto Central SA 4.000%, 07/14/2027 (C) | 654,000 | 675,255 | |||
| Petroleos del Peru SA 5.625%, 06/19/2047 (C) | 874,000 | 911,586 | |||
| Petroleos Mexicanos | |||||
| 2.378%, 04/15/2025 | 350,000 | 361,455 | |||
| 2.460%, 12/15/2025 | 1,530,450 | 1,592,851 | |||
| Phillips 66 3.900%, 03/15/2028 | 41,000 | 46,052 | |||
| Pioneer Natural Resources Company 1.900%, 08/15/2030 | 1,477,000 | 1,425,404 | |||
| Qatar Petroleum | |||||
| 2.250%, 07/12/2031 (C) | 1,423,000 | 1,434,902 | |||
| 3.125%, 07/12/2041 (C) | 411,000 | 422,931 | |||
| 3.300%, 07/12/2051 (C) | 1,047,000 | 1,081,342 | |||
| 30,134,323 | |||||
| Financials – 9.2% | |||||
| Alleghany Corp. 3.250%, 08/15/2051 | 832,000 | 850,980 | |||
| American International Group, Inc. | |||||
| 3.400%, 06/30/2030 | 1,240,000 | 1,363,770 | |||
| 4.375%, 06/30/2050 | 734,000 | 919,689 | |||
| Antares Holdings LP 3.950%, 07/15/2026 (C) | 502,000 | 536,392 | |||
| ANZ New Zealand International, Ltd. 1.250%, 06/22/2026 (C) | 1,695,000 | 1,701,601 | |||
| Assured Guaranty US Holdings, Inc. | |||||
| 3.150%, 06/15/2031 | 852,000 | 900,197 | |||
| 3.600%, 09/15/2051 | 556,000 | 574,343 | |||
| Athene Global Funding | |||||
| 1.985%, 08/19/2028 (C) | 1,668,000 | 1,661,430 | |||
| 2.500%, 03/24/2028 (C) | 2,220,000 | 2,295,857 | |||
| Athene Holding, Ltd. | |||||
| 3.500%, 01/15/2031 | 416,000 | 452,620 | |||
| 4.125%, 01/12/2028 | 782,000 | 878,406 | |||
| Bank of America Corp. 3.500%, 04/19/2026 | 281,000 | 309,392 | |||
| Bank of America Corp. (0.976% to 4-22-24, then SOFR + 0.690%) 04/22/2025 | 2,989,000 | 3,005,875 | |||
| Bank of America Corp. (1.197% to 10-24-25, then SOFR + 1.010%) 10/24/2026 | 4,206,000 | 4,188,420 | |||
| Bank of America Corp. (1.319% to 6-19-25, then SOFR + 1.150%) 06/19/2026 | 2,486,000 | 2,494,270 | |||
| Bank of America Corp. (1.658% to 3-11-26, then SOFR + 0.910%) 03/11/2027 | 5,559,000 | 5,620,049 | |||
| Bank of America Corp. (1.734% to 7-22-26, then SOFR + 0.960%) 07/22/2027 | 6,015,000 | 6,095,271 | |||
| Bank of America Corp. (1.898% to 7-23-30, then SOFR + 1.530%) 07/23/2031 | 1,094,000 | 1,071,545 | |||
| Bank of America Corp. (1.922% to 10-24-30, then SOFR + 1.370%) 10/24/2031 | 922,000 | 903,203 | |||
| Shares or Principal Amount | Value | ||||
| CORPORATE BONDS (continued) | |||||
| Financials (continued) | |||||
| Bank of America Corp. (2.015% to 2-13-25, then 3 month LIBOR + 0.640%) 02/13/2026 | $ | 281,000 | $ | 289,391 | |
| Bank of America Corp. (2.456% to 10-22-24, then 3 month LIBOR + 0.870%) 10/22/2025 | 1,527,000 | 1,598,557 | |||
| Bank of America Corp. (2.496% to 2-13-30, then 3 month LIBOR + 0.990%) 02/13/2031 | 1,549,000 | 1,592,808 | |||
| Bank of America Corp. (2.592% to 4-29-30, then SOFR + 2.150%) 04/29/2031 | 1,780,000 | 1,842,703 | |||
| Bank of America Corp. (2.687% to 4-22-31, then SOFR + 1.320%) 04/22/2032 | 5,438,000 | 5,651,503 | |||
| Bank of America Corp. (3.004% to 12-20-22, then 3 month LIBOR + 0.790%) 12/20/2023 | 2,191,000 | 2,262,208 | |||
| Bank of America Corp. (3.311% to 4-22-41, then SOFR + 1.580%) 04/22/2042 | 1,189,000 | 1,281,994 | |||
| Bank of America Corp. (3.483% to 3-13-51, then SOFR + 1.650%) 03/13/2052 | 545,000 | 604,480 | |||
| Bank of America Corp. (3.559% to 4-23-26, then 3 month LIBOR + 1.060%) 04/23/2027 | 1,361,000 | 1,492,956 | |||
| Barclays PLC (1.007% to 12-10-23, then 1 Year CMT + 0.800%) 12/10/2024 | 2,273,000 | 2,283,159 | |||
| Blackstone Holdings Finance Company LLC | |||||
| 1.625%, 08/05/2028 (C) | 828,000 | 819,406 | |||
| 2.850%, 08/05/2051 (C) | 994,000 | 984,113 | |||
| Brighthouse Financial, Inc. 4.700%, 06/22/2047 | 843,000 | 955,581 | |||
| Credit Suisse AG 1.250%, 08/07/2026 | 4,233,000 | 4,210,166 | |||
| Credit Suisse Group AG (3.091% to 5-14-31, then SOFR + 1.730%) 05/14/2032 (C) | 1,494,000 | 1,558,359 | |||
| Deutsche Bank AG 0.898%, 05/28/2024 | 1,443,000 | 1,443,571 | |||
| Deutsche Bank AG (3.035% to 5-28-31, then SOFR + 1.718%) 05/28/2032 | 883,000 | 910,892 | |||
| Deutsche Bank AG (3.729% to 1-14-31, then SOFR + 2.757%) 01/14/2032 | 718,000 | 740,557 | |||
| DNB Bank ASA (1.535% to 5-25-26, then 1 Year CMT + 0.720%) 05/25/2027 (C) | 1,481,000 | 1,489,391 | |||
| Enstar Group, Ltd. 3.100%, 09/01/2031 | 1,389,000 | 1,386,648 | |||
| FS KKR Capital Corp. | |||||
| 2.625%, 01/15/2027 | 821,000 | 820,983 | |||
| 3.400%, 01/15/2026 | 2,190,000 | 2,284,740 | |||
| GE Capital Funding LLC | |||||
| 3.450%, 05/15/2025 | 682,000 | 739,379 | |||
| 4.400%, 05/15/2030 | 1,008,000 | 1,180,818 | |||
| GE Capital International Funding Company 4.418%, 11/15/2035 | 2,429,000 | 2,948,345 | |||
| JPMorgan Chase & Co. (0.824% to 6-1-24, then SOFR + 0.540%) 06/01/2025 | 2,528,000 | 2,532,347 | |||
| JPMorgan Chase & Co. (1.040% to 2-4-26, then SOFR + 0.695%) 02/04/2027 | 5,519,000 | 5,449,523 | |||
| The accompanying notes are an integral part of the financial statements. | 29 |
| Shares or Principal Amount | Value | ||||
| CORPORATE BONDS (continued) | |||||
| Financials (continued) | |||||
| JPMorgan Chase & Co. (1.045% to 11-19-25, then SOFR + 0.800%) 11/19/2026 | $ | 3,078,000 | $ | 3,050,929 | |
| JPMorgan Chase & Co. (2.069% to 6-1-28, then SOFR + 1.015%) 06/01/2029 | 2,750,000 | 2,788,530 | |||
| JPMorgan Chase & Co. (2.083% to 4-22-25, then SOFR + 1.850%) 04/22/2026 | 2,414,000 | 2,492,967 | |||
| JPMorgan Chase & Co. (2.182% to 6-1-27, then SOFR + 1.890%) 06/01/2028 | 1,690,000 | 1,742,846 | |||
| JPMorgan Chase & Co. (3.328% to 4-22-51, then SOFR + 1.580%) 04/22/2052 | 1,685,000 | 1,833,210 | |||
| Macquarie Group, Ltd. (1.629% to 9-23-26, then SOFR + 0.910%) 09/23/2027 (C) | 2,466,000 | 2,476,624 | |||
| Mitsubishi UFJ Financial Group, Inc. (0.953% to 7-19-24, then 1 Year CMT + 0.550%) 07/19/2025 | 3,324,000 | 3,336,171 | |||
| Mitsubishi UFJ Financial Group, Inc. (1.538% to 7-20-26, then 1 Year CMT + 0.750%) 07/20/2027 | 3,284,000 | 3,304,949 | |||
| Mitsubishi UFJ Financial Group, Inc. (2.309% to 7-20-31, then 1 Year CMT + 0.950%) 07/20/2032 | 1,717,000 | 1,732,351 | |||
| Morgan Stanley (0.790% to 5-30-24, then SOFR + 0.525%) 05/30/2025 | 5,753,000 | 5,740,418 | |||
| Morgan Stanley (0.791% to 1-22-24, then SOFR + 0.509%) 01/22/2025 | 6,825,000 | 6,837,998 | |||
| Morgan Stanley (0.864% to 10-21-24, then SOFR + 0.745%) 10/21/2025 | 1,989,000 | 1,988,697 | |||
| Morgan Stanley (0.985% to 12-10-25, then SOFR + 0.720%) 12/10/2026 | 2,808,000 | 2,773,969 | |||
| Morgan Stanley (1.512% to 7-20-26, then SOFR + 0.858%) 07/20/2027 | 4,096,000 | 4,112,283 | |||
| Morgan Stanley (2.239% to 7-21-31, then SOFR + 1.178%) 07/21/2032 | 1,637,000 | 1,641,322 | |||
| Nomura Holdings, Inc. | |||||
| 1.653%, 07/14/2026 | 2,804,000 | 2,806,633 | |||
| 2.172%, 07/14/2028 | 2,251,000 | 2,250,640 | |||
| 2.608%, 07/14/2031 | 1,247,000 | 1,260,006 | |||
| NTT Finance Corp. 1.162%, 04/03/2026 (C) | 2,808,000 | 2,806,487 | |||
| Oaktree Specialty Lending Corp. 2.700%, 01/15/2027 | 863,000 | 871,657 | |||
| Owl Rock Capital Corp. | |||||
| 2.875%, 06/11/2028 | 576,000 | 579,301 | |||
| 3.400%, 07/15/2026 | 2,393,000 | 2,504,227 | |||
| Pricoa Global Funding I 1.200%, 09/01/2026 (C) | 2,521,000 | 2,519,565 | |||
| SBL Holdings, Inc. 5.000%, 02/18/2031 (C) | 1,909,000 | 2,053,250 | |||
| Societe Generale SA (2.889% to 6-9-31, then 1 Year CMT + 1.300%) 06/09/2032 (C) | 1,315,000 | 1,341,040 | |||
| Societe Generale SA (3.653% to 7-8-30, then 5 Year CMT + 3.000%) 07/08/2035 (C) | 1,122,000 | 1,173,619 | |||
| Svensk Exportkredit AB 0.750%, 04/06/2023 | 2,422,000 | 2,441,885 | |||
| The Andrew W. Mellon Foundation 0.947%, 08/01/2027 | 672,000 | 663,127 | |||
| The Goldman Sachs Group, Inc. (0.657% to 9-10-23, then SOFR + 0.505%) 09/10/2024 | 4,110,000 | 4,107,120 | |||
| Shares or Principal Amount | Value | ||||
| CORPORATE BONDS (continued) | |||||
| Financials (continued) | |||||
| The Goldman Sachs Group, Inc. (1.542% to 9-10-26, then SOFR + 0.818%) 09/10/2027 | $ | 2,740,000 | $ | 2,752,864 | |
| The Goldman Sachs Group, Inc. (2.383% to 7-21-31, then SOFR + 1.248%) 07/21/2032 | 1,910,000 | 1,930,955 | |||
| Trust Fibra Uno | |||||
| 5.250%, 01/30/2026 (C) | 880,000 | 985,996 | |||
| 6.390%, 01/15/2050 (C) | 682,000 | 828,835 | |||
| 164,908,359 | |||||
| Health care – 3.2% | |||||
| AbbVie, Inc. | |||||
| 2.300%, 11/21/2022 | 1,718,000 | 1,757,069 | |||
| 3.200%, 11/21/2029 | 277,000 | 302,767 | |||
| 3.750%, 11/14/2023 | 156,000 | 166,480 | |||
| 4.050%, 11/21/2039 | 638,000 | 749,628 | |||
| 4.250%, 11/21/2049 | 543,000 | 658,706 | |||
| 4.300%, 05/14/2036 | 399,000 | 475,841 | |||
| 4.400%, 11/06/2042 | 141,000 | 171,527 | |||
| 4.450%, 05/14/2046 | 405,000 | 495,922 | |||
| Aetna, Inc. 3.875%, 08/15/2047 | 436,000 | 494,879 | |||
| Amgen, Inc. | |||||
| 1.650%, 08/15/2028 | 2,216,000 | 2,209,768 | |||
| 3.000%, 01/15/2052 | 388,000 | 388,368 | |||
| Astrazeneca Finance LLC | |||||
| 1.200%, 05/28/2026 | 1,127,000 | 1,132,959 | |||
| 1.750%, 05/28/2028 | 1,943,000 | 1,973,476 | |||
| AstraZeneca PLC 3.000%, 05/28/2051 | 562,000 | 597,679 | |||
| Biogen, Inc. 3.150%, 05/01/2050 | 551,000 | 544,511 | |||
| Bristol-Myers Squibb Company 2.550%, 11/13/2050 | 1,707,000 | 1,659,302 | |||
| Centene Corp. 2.450%, 07/15/2028 | 2,322,000 | 2,355,582 | |||
| CVS Health Corp. | |||||
| 2.700%, 08/21/2040 | 869,000 | 853,339 | |||
| 3.000%, 08/15/2026 | 593,000 | 640,171 | |||
| 3.700%, 03/09/2023 | 205,000 | 214,561 | |||
| 4.300%, 03/25/2028 | 429,000 | 493,947 | |||
| 4.780%, 03/25/2038 | 866,000 | 1,077,719 | |||
| 5.050%, 03/25/2048 | 1,043,000 | 1,380,584 | |||
| DH Europe Finance II Sarl | |||||
| 2.050%, 11/15/2022 | 877,000 | 895,720 | |||
| 2.200%, 11/15/2024 | 1,510,000 | 1,576,174 | |||
| 2.600%, 11/15/2029 | 1,119,000 | 1,178,271 | |||
| Gilead Sciences, Inc. | |||||
| 2.600%, 10/01/2040 | 953,000 | 929,078 | |||
| 2.800%, 10/01/2050 | 1,229,000 | 1,193,932 | |||
| 4.000%, 09/01/2036 | 492,000 | 575,977 | |||
| HCA, Inc. | |||||
| 5.375%, 02/01/2025 | 3,543,000 | 3,990,304 | |||
| 5.875%, 02/01/2029 | 383,000 | 464,388 | |||
| Humana, Inc. 1.350%, 02/03/2027 | 1,905,000 | 1,898,003 | |||
| Pfizer, Inc. | |||||
| 2.550%, 05/28/2040 | 1,915,000 | 1,949,948 | |||
| 2.700%, 05/28/2050 | 391,000 | 396,213 | |||
| 2.800%, 03/11/2022 | 529,000 | 536,315 | |||
| Regeneron Pharmaceuticals, Inc. | |||||
| 1.750%, 09/15/2030 | 1,828,000 | 1,758,380 | |||
| 2.800%, 09/15/2050 | 680,000 | 643,520 | |||
| Royalty Pharma PLC 3.350%, 09/02/2051 | 768,000 | 745,221 | |||
| The accompanying notes are an integral part of the financial statements. | 30 |
| Shares or Principal Amount | Value | ||||
| CORPORATE BONDS (continued) | |||||
| Health care (continued) | |||||
| Shire Acquisitions Investments Ireland DAC 2.875%, 09/23/2023 | $ | 1,144,000 | $ | 1,194,528 | |
| STERIS Irish FinCo Unlimited Company 3.750%, 03/15/2051 | 1,595,000 | 1,747,082 | |||
| Takeda Pharmaceutical Company, Ltd. | |||||
| 2.050%, 03/31/2030 | 2,124,000 | 2,118,101 | |||
| 3.175%, 07/09/2050 | 1,912,000 | 1,979,786 | |||
| 4.400%, 11/26/2023 | 1,047,000 | 1,130,826 | |||
| Thermo Fisher Scientific, Inc. | |||||
| 1.750%, 10/15/2028 | 1,884,000 | 1,901,058 | |||
| 2.000%, 10/15/2031 | 1,776,000 | 1,773,188 | |||
| 2.800%, 10/15/2041 | 440,000 | 449,615 | |||
| 4.497%, 03/25/2030 | 782,000 | 933,174 | |||
| UnitedHealth Group, Inc. | |||||
| 2.300%, 05/15/2031 | 1,451,000 | 1,502,586 | |||
| 2.750%, 05/15/2040 | 422,000 | 433,763 | |||
| 2.900%, 05/15/2050 | 416,000 | 430,607 | |||
| 3.050%, 05/15/2041 | 287,000 | 304,437 | |||
| 3.250%, 05/15/2051 | 1,383,000 | 1,515,135 | |||
| 56,940,115 | |||||
| Industrials – 1.9% | |||||
| Adani International Container Terminal Private, Ltd. 3.000%, 02/16/2031 (C) | 500,000 | 490,605 | |||
| Adani Ports & Special Economic Zone, Ltd. 4.200%, 08/04/2027 (C) | 1,054,000 | 1,118,470 | |||
| Crowley Conro LLC 4.181%, 08/15/2043 | 803,658 | 950,835 | |||
| DAE Funding LLC | |||||
| 1.550%, 08/01/2024 (C) | 2,798,000 | 2,792,404 | |||
| 2.625%, 03/20/2025 (C) | 929,000 | 947,234 | |||
| Delta Air Lines, Inc. | |||||
| 4.500%, 10/20/2025 (C) | 2,235,000 | 2,397,038 | |||
| 4.750%, 10/20/2028 (C) | 3,245,000 | 3,618,164 | |||
| GXO Logistics, Inc. | |||||
| 1.650%, 07/15/2026 (C) | 1,479,000 | 1,480,819 | |||
| 2.650%, 07/15/2031 (C) | 236,000 | 239,488 | |||
| Howmet Aerospace, Inc. 3.000%, 01/15/2029 (B) | 1,630,000 | 1,662,600 | |||
| John Deere Capital Corp. | |||||
| 0.550%, 07/05/2022 | 1,688,000 | 1,692,987 | |||
| 1.200%, 04/06/2023 | 1,300,000 | 1,318,520 | |||
| Northrop Grumman Corp. 3.250%, 08/01/2023 to 01/15/2028 | 2,601,000 | 2,778,931 | |||
| Rockwell Automation, Inc. 0.350%, 08/15/2023 | 826,000 | 826,189 | |||
| The Boeing Company | |||||
| 2.196%, 02/04/2026 | 2,086,000 | 2,093,848 | |||
| 3.250%, 02/01/2028 to 02/01/2035 | 1,856,000 | 1,957,241 | |||
| 3.625%, 02/01/2031 | 1,187,000 | 1,287,330 | |||
| 3.750%, 02/01/2050 | 1,206,000 | 1,248,401 | |||
| 5.150%, 05/01/2030 | 551,000 | 651,923 | |||
| 5.705%, 05/01/2040 | 335,000 | 433,845 | |||
| 5.805%, 05/01/2050 | 370,000 | 502,536 | |||
| Union Pacific Corp. | |||||
| 2.150%, 02/05/2027 | 872,000 | 908,402 | |||
| 2.400%, 02/05/2030 | 1,080,000 | 1,119,625 | |||
| 2.950%, 03/01/2022 | 979,000 | 992,215 | |||
| 3.150%, 03/01/2024 | 467,000 | 496,757 | |||
| 34,006,407 | |||||
| Information technology – 2.8% | |||||
| Apple, Inc. | |||||
| 1.400%, 08/05/2028 | 2,209,000 | 2,202,798 | |||
| Shares or Principal Amount | Value | ||||
| CORPORATE BONDS (continued) | |||||
| Information technology (continued) | |||||
| Apple, Inc. (continued) | |||||
| 1.700%, 08/05/2031 | $ | 1,657,000 | $ | 1,639,978 | |
| 2.375%, 02/08/2041 | 551,000 | 540,827 | |||
| 2.550%, 08/20/2060 | 1,291,000 | 1,214,485 | |||
| 2.650%, 05/11/2050 to 02/08/2051 | 2,736,000 | 2,710,315 | |||
| 2.700%, 08/05/2051 | 994,000 | 989,659 | |||
| 2.800%, 02/08/2061 | 551,000 | 550,747 | |||
| 2.850%, 08/05/2061 | 552,000 | 551,031 | |||
| Broadcom Corp. 3.875%, 01/15/2027 | 416,000 | 459,060 | |||
| Broadcom, Inc. | |||||
| 2.450%, 02/15/2031 (C) | 962,000 | 953,357 | |||
| 3.150%, 11/15/2025 | 720,000 | 771,014 | |||
| 3.419%, 04/15/2033 (C) | 2,947,000 | 3,127,084 | |||
| 3.469%, 04/15/2034 (C) | 1,420,000 | 1,503,364 | |||
| 4.150%, 11/15/2030 | 978,000 | 1,100,024 | |||
| Dell International LLC | |||||
| 4.900%, 10/01/2026 | 281,000 | 325,181 | |||
| 6.100%, 07/15/2027 | 560,000 | 690,613 | |||
| 8.350%, 07/15/2046 | 590,000 | 968,287 | |||
| HP, Inc. 2.200%, 06/17/2025 | 1,771,000 | 1,836,737 | |||
| Intel Corp. | |||||
| 1.600%, 08/12/2028 | 1,387,000 | 1,395,226 | |||
| 2.000%, 08/12/2031 | 2,164,000 | 2,176,708 | |||
| 2.800%, 08/12/2041 | 888,000 | 900,639 | |||
| 3.050%, 08/12/2051 | 1,115,000 | 1,149,489 | |||
| 3.200%, 08/12/2061 | 777,000 | 805,378 | |||
| KLA Corp. 3.300%, 03/01/2050 | 748,000 | 817,303 | |||
| Microsoft Corp. 2.921%, 03/17/2052 | 557,000 | 598,974 | |||
| NXP BV | |||||
| 3.150%, 05/01/2027 (C) | 548,000 | 588,837 | |||
| 3.250%, 05/11/2041 (C) | 602,000 | 645,936 | |||
| 3.875%, 06/18/2026 (C) | 2,201,000 | 2,438,642 | |||
| Oracle Corp. | |||||
| 2.300%, 03/25/2028 | 599,000 | 618,950 | |||
| 2.800%, 04/01/2027 | 1,681,000 | 1,793,393 | |||
| 2.875%, 03/25/2031 | 412,000 | 433,943 | |||
| 3.650%, 03/25/2041 | 1,130,000 | 1,207,590 | |||
| 3.950%, 03/25/2051 | 790,000 | 872,472 | |||
| 4.100%, 03/25/2061 | 225,000 | 255,020 | |||
| salesforce.com, Inc. | |||||
| 0.625%, 07/15/2024 | 1,094,000 | 1,096,387 | |||
| 2.700%, 07/15/2041 | 492,000 | 501,947 | |||
| 3.050%, 07/15/2061 | 382,000 | 397,776 | |||
| VMware, Inc. | |||||
| 0.600%, 08/15/2023 | 2,732,000 | 2,735,012 | |||
| 1.000%, 08/15/2024 | 1,912,000 | 1,920,039 | |||
| 1.400%, 08/15/2026 | 2,185,000 | 2,182,262 | |||
| 1.800%, 08/15/2028 | 1,201,000 | 1,188,989 | |||
| 3.900%, 08/21/2027 | 225,000 | 252,105 | |||
| 4.700%, 05/15/2030 | 1,105,000 | 1,320,256 | |||
| 50,427,834 | |||||
| Materials – 0.5% | |||||
| LYB International Finance III LLC | |||||
| 3.375%, 10/01/2040 | 1,648,000 | 1,742,409 | |||
| 3.625%, 04/01/2051 | 1,079,000 | 1,171,600 | |||
| Teck Resources, Ltd. | |||||
| 3.900%, 07/15/2030 | 495,000 | 539,550 | |||
| 5.200%, 03/01/2042 | 649,000 | 779,436 | |||
| 6.125%, 10/01/2035 | 562,000 | 725,058 | |||
| 6.250%, 07/15/2041 | 633,000 | 842,773 | |||
| The accompanying notes are an integral part of the financial statements. | 31 |
| Shares or Principal Amount | Value | ||||
| CORPORATE BONDS (continued) | |||||
| Materials (continued) | |||||
| Westlake Chemical Corp. | |||||
| 3.125%, 08/15/2051 | $ | 1,579,000 | $ | 1,529,784 | |
| 3.600%, 08/15/2026 | 602,000 | 664,457 | |||
| 4.375%, 11/15/2047 | 574,000 | 669,540 | |||
| 8,664,607 | |||||
| Real estate – 1.7% | |||||
| Agree LP | |||||
| 2.000%, 06/15/2028 | 1,201,000 | 1,204,242 | |||
| 2.600%, 06/15/2033 | 275,000 | 278,285 | |||
| American Tower Corp. | |||||
| 1.600%, 04/15/2026 | 1,111,000 | 1,122,350 | |||
| 2.700%, 04/15/2031 | 393,000 | 407,613 | |||
| Brixmor Operating Partnership LP | |||||
| 2.250%, 04/01/2028 | 385,000 | 393,035 | |||
| 2.500%, 08/16/2031 | 666,000 | 669,513 | |||
| Crown Castle International Corp. | |||||
| 1.050%, 07/15/2026 | 1,650,000 | 1,626,147 | |||
| 2.100%, 04/01/2031 | 3,051,000 | 2,987,630 | |||
| 2.500%, 07/15/2031 | 1,206,000 | 1,223,539 | |||
| 2.900%, 04/01/2041 | 770,000 | 756,274 | |||
| 4.000%, 03/01/2027 | 276,000 | 309,867 | |||
| Essex Portfolio LP | |||||
| 1.700%, 03/01/2028 | 1,442,000 | 1,435,989 | |||
| 2.550%, 06/15/2031 | 568,000 | 583,542 | |||
| Federal Realty Investment Trust 3.950%, 01/15/2024 | 762,000 | 815,779 | |||
| GLP Capital LP 5.300%, 01/15/2029 | 557,000 | 654,041 | |||
| Mid-America Apartments LP | |||||
| 3.950%, 03/15/2029 | 554,000 | 631,437 | |||
| 4.000%, 11/15/2025 | 675,000 | 748,469 | |||
| 4.300%, 10/15/2023 | 565,000 | 604,095 | |||
| Regency Centers LP 2.950%, 09/15/2029 | 1,198,000 | 1,272,573 | |||
| Rexford Industrial Realty LP 2.150%, 09/01/2031 | 610,000 | 599,406 | |||
| Scentre Group Trust 1 3.625%, 01/28/2026 (C) | 869,000 | 949,455 | |||
| Spirit Realty LP | |||||
| 2.100%, 03/15/2028 | 1,097,000 | 1,102,191 | |||
| 2.700%, 02/15/2032 | 605,000 | 609,248 | |||
| 3.200%, 02/15/2031 | 767,000 | 814,320 | |||
| 3.400%, 01/15/2030 | 664,000 | 712,474 | |||
| 4.000%, 07/15/2029 | 318,000 | 356,871 | |||
| 4.450%, 09/15/2026 | 72,000 | 81,098 | |||
| STORE Capital Corp. | |||||
| 2.750%, 11/18/2030 | 976,000 | 993,905 | |||
| 4.500%, 03/15/2028 | 2,081,000 | 2,364,973 | |||
| 4.625%, 03/15/2029 | 703,000 | 806,225 | |||
| VEREIT Operating Partnership LP | |||||
| 2.200%, 06/15/2028 | 590,000 | 604,014 | |||
| 2.850%, 12/15/2032 | 799,000 | 845,350 | |||
| 3.400%, 01/15/2028 | 585,000 | 638,809 | |||
| Vornado Realty LP 3.400%, 06/01/2031 | 395,000 | 412,685 | |||
| 29,615,444 | |||||
| Utilities – 2.6% | |||||
| Baltimore Gas and Electric Company 2.250%, 06/15/2031 | 821,000 | 838,246 | |||
| Black Hills Corp. 3.875%, 10/15/2049 | 495,000 | 536,005 | |||
| Comision Federal de Electricidad 3.875%, 07/26/2033 (C) | 1,842,000 | 1,846,163 | |||
| Consumers Energy Company | |||||
| 2.500%, 05/01/2060 | 467,000 | 428,502 | |||
| Shares or Principal Amount | Value | ||||
| CORPORATE BONDS (continued) | |||||
| Utilities (continued) | |||||
| Consumers Energy Company (continued) | |||||
| 2.650%, 08/15/2052 | $ | 607,000 | $ | 595,070 | |
| Dominion Energy, Inc. | |||||
| 1.450%, 04/15/2026 | 697,000 | 702,896 | |||
| 2.250%, 08/15/2031 | 1,110,000 | 1,120,817 | |||
| 3.300%, 04/15/2041 | 444,000 | 473,769 | |||
| DTE Electric Company 2.950%, 03/01/2050 | 1,217,000 | 1,266,695 | |||
| DTE Energy Company | |||||
| 1.050%, 06/01/2025 | 576,000 | 574,764 | |||
| 2.950%, 03/01/2030 | 737,000 | 780,721 | |||
| Duke Energy Carolinas LLC 2.550%, 04/15/2031 | 557,000 | 584,394 | |||
| Duke Energy Corp. | |||||
| 2.550%, 06/15/2031 | 2,190,000 | 2,252,023 | |||
| 3.500%, 06/15/2051 | 329,000 | 347,018 | |||
| Duke Energy Progress LLC 2.500%, 08/15/2050 | 827,000 | 776,716 | |||
| Enel Finance International NV 1.375%, 07/12/2026 (C) | 842,000 | 844,345 | |||
| Entergy Arkansas LLC 2.650%, 06/15/2051 | 737,000 | 711,653 | |||
| Evergy Kansas Central, Inc. 3.450%, 04/15/2050 | 734,000 | 807,260 | |||
| Evergy, Inc. | |||||
| 2.450%, 09/15/2024 | 1,029,000 | 1,075,259 | |||
| 2.900%, 09/15/2029 | 731,000 | 781,041 | |||
| Eversource Energy 1.400%, 08/15/2026 | 832,000 | 833,774 | |||
| Interstate Power & Light Company 3.500%, 09/30/2049 | 422,000 | 468,522 | |||
| ITC Holdings Corp. 2.700%, 11/15/2022 | 1,113,000 | 1,141,164 | |||
| Jersey Central Power & Light Company 2.750%, 03/01/2032 (C) | 900,000 | 935,912 | |||
| Metropolitan Edison Company 4.300%, 01/15/2029 (C) | 1,232,000 | 1,388,150 | |||
| MidAmerican Energy Company 2.700%, 08/01/2052 | 711,000 | 698,641 | |||
| Mississippi Power Company | |||||
| 3.100%, 07/30/2051 | 984,000 | 1,016,906 | |||
| 3.950%, 03/30/2028 | 1,358,000 | 1,536,037 | |||
| 4.250%, 03/15/2042 | 377,000 | 452,930 | |||
| NextEra Energy Capital Holdings, Inc. 1.900%, 06/15/2028 | 1,097,000 | 1,112,422 | |||
| Northern States Power Company 3.200%, 04/01/2052 | 554,000 | 607,314 | |||
| NSTAR Electric Company 3.100%, 06/01/2051 | 506,000 | 544,342 | |||
| Pacific Gas & Electric Company | |||||
| 2.100%, 08/01/2027 | 1,612,000 | 1,559,335 | |||
| 3.500%, 08/01/2050 | 201,000 | 181,132 | |||
| 3.950%, 12/01/2047 | 1,238,000 | 1,173,749 | |||
| 4.200%, 06/01/2041 | 475,000 | 464,711 | |||
| 4.500%, 07/01/2040 | 281,000 | 283,547 | |||
| 4.750%, 02/15/2044 | 276,000 | 280,866 | |||
| 4.950%, 07/01/2050 | 827,000 | 875,350 | |||
| PacifiCorp 2.900%, 06/15/2052 | 709,000 | 708,102 | |||
| Pennsylvania Electric Company 3.250%, 03/15/2028 (C) | 467,000 | 497,367 | |||
| Piedmont Natural Gas Company, Inc. 2.500%, 03/15/2031 | 827,000 | 847,137 | |||
| Public Service Company of Colorado 1.875%, 06/15/2031 | 1,262,000 | 1,264,206 | |||
| The accompanying notes are an integral part of the financial statements. | 32 |
| Shares or Principal Amount | Value | ||||
| CORPORATE BONDS (continued) | |||||
| Utilities (continued) | |||||
| Public Service Company of Oklahoma | |||||
| 2.200%, 08/15/2031 | $ | 832,000 | $ | 836,447 | |
| 3.150%, 08/15/2051 | 555,000 | 568,193 | |||
| Public Service Electric & Gas Company | |||||
| 1.900%, 08/15/2031 | 1,101,000 | 1,100,673 | |||
| 2.050%, 08/01/2050 | 228,000 | 202,248 | |||
| 2.700%, 05/01/2050 | 1,223,000 | 1,221,398 | |||
| Public Service Enterprise Group, Inc. 1.600%, 08/15/2030 | 357,000 | 341,552 | |||
| Southern California Edison Company 4.125%, 03/01/2048 | 616,000 | 666,095 | |||
| Southern Company Gas Capital Corp. 1.750%, 01/15/2031 | 866,000 | 836,940 | |||
| The AES Corp. 1.375%, 01/15/2026 | 1,187,000 | 1,180,326 | |||
| Trans-Allegheny Interstate Line Company 3.850%, 06/01/2025 (C) | 388,000 | 421,074 | |||
| Virginia Electric and Power Company 2.450%, 12/15/2050 | 805,000 | 750,192 | |||
| WEC Energy Group, Inc. | |||||
| 0.800%, 03/15/2024 | 1,393,000 | 1,399,810 | |||
| 1.375%, 10/15/2027 | 799,000 | 789,565 | |||
| Wisconsin Electric Power Company 1.700%, 06/15/2028 | 502,000 | 503,081 | |||
| 47,032,567 | |||||
| TOTAL CORPORATE BONDS (Cost $516,314,404) | $ | 529,457,285 | |||
| MUNICIPAL BONDS – 0.3% | |||||
| Board of Regents of the University of Texas 2.439%, 08/15/2049 | 600,000 | 588,880 | |||
| County of Clark Department of Aviation (Nevada) 6.820%, 07/01/2045 | 1,115,000 | 1,770,013 | |||
| North Texas Tollway Authority 6.718%, 01/01/2049 | 459,000 | 776,815 | |||
| Port Authority of New York & New Jersey 4.458%, 10/01/2062 | 1,010,000 | 1,388,110 | |||
| The Ohio State University 4.800%, 06/01/2111 | 600,000 | 894,551 | |||
| TOTAL MUNICIPAL BONDS (Cost $4,182,671) | $ | 5,418,369 | |||
| COLLATERALIZED MORTGAGE OBLIGATIONS – 9.5% | |||||
| Commercial and residential – 3.9% | |||||
| Angel Oak Mortgage Trust LLC | |||||
| Series 2019-2, Class A1, 3.628%, 03/25/2049 (C)(D) | 399,829 | 403,870 | |||
| Series 2020-2, Class A1A, 2.531%, 01/26/2065 (C)(D) | 520,825 | 528,798 | |||
| Series 2020-5, Class A1, 1.373%, 05/25/2065 (C)(D) | 636,325 | 639,344 | |||
| Barclays Commercial Mortgage Trust Series 2019-C3, Class A3 3.319%, 05/15/2052 | 188,000 | 206,389 | |||
| Benchmark Mortgage Trust Series 2021-B28, Class A5 2.224%, 08/15/2054 (D) | 1,093,000 | 1,116,329 | |||
| Bunker Hill Loan Depositary Trust Series 2019-2, Class A1 2.879%, 07/25/2049 (C) | 1,425,472 | 1,445,963 | |||
| CD Mortgage Trust Series 2019-CD8, Class A4 2.912%, 08/15/2057 | 706,000 | 757,997 | |||
| Shares or Principal Amount | Value | ||||
| COLLATERALIZED MORTGAGE OBLIGATIONS (continued) | |||||
| Commercial and residential (continued) | |||||
| CFCRE Commercial Mortgage Trust Series 2017-C8, Class ASB 3.367%, 06/15/2050 | $ | 536,000 | $ | 573,934 | |
| COLT Mortgage Loan Trust | |||||
| Series 2019-4, Class A1, 2.579%, 11/25/2049 (C)(D) | 811,216 | 812,565 | |||
| Series 2021-2, Class A1, 0.924%, 08/25/2066 (C)(D) | 1,452,626 | 1,450,693 | |||
| Commercial Mortgage Trust (Cantor Fitzgerald/Deutsche Bank AG) | |||||
| Series 2013-CR10, Class A4, 4.210%, 08/10/2046 (D) | 45,000 | 47,840 | |||
| Series 2013-CR11, Class A4, 4.258%, 08/10/2050 | 3,182,000 | 3,399,887 | |||
| Series 2013-CR6, Class A4, 3.101%, 03/10/2046 | 2,628,000 | 2,689,964 | |||
| Series 2014-UBS4, Class A4, 3.420%, 08/10/2047 | 1,335,000 | 1,404,594 | |||
| Series 2015-LC23, Class A3, 3.521%, 10/10/2048 | 649,000 | 692,547 | |||
| CSAIL Commercial Mortgage Trust | |||||
| Series 2015-C2, Class A4, 3.504%, 06/15/2057 | 368,000 | 397,909 | |||
| Series 2015-C4, Class A4, 3.808%, 11/15/2048 | 589,000 | 647,702 | |||
| Series 2019-C16, Class A3, 3.329%, 06/15/2052 | 1,566,000 | 1,720,764 | |||
| Series 2019-C17, Class A4, 2.763%, 09/15/2052 | 752,000 | 796,301 | |||
| Series 2021-C20, Class A3, 2.805%, 03/15/2054 | 408,000 | 435,650 | |||
| GCAT Trust Series 2019-NQM1, Class A1 2.985%, 02/25/2059 (C) | 489,590 | 491,520 | |||
| GS Mortgage Securities Trust | |||||
| Series 2013-GC14, Class A5, 4.243%, 08/10/2046 | 718,000 | 761,920 | |||
| Series 2014-GC18, Class A4, 4.074%, 01/10/2047 | 1,530,000 | 1,633,335 | |||
| Series 2020-GSA2, Class A4, 1.721%, 12/12/2053 | 1,407,000 | 1,386,046 | |||
| Impact Funding Affordable Multifamily Housing Mortgage Loan Trust Series 2010-1, Class A1 5.314%, 01/25/2051 (C) | 2,321,360 | 2,472,691 | |||
| JPMBB Commercial Mortgage Securities Trust | |||||
| Series 2013-C12, Class A5, 3.664%, 07/15/2045 | 1,055,000 | 1,102,473 | |||
| Series 2014-C23, Class A4, 3.670%, 09/15/2047 | 572,403 | 609,157 | |||
| Series 2015-C28, Class A3, 2.912%, 10/15/2048 | 2,868,003 | 2,972,690 | |||
| JPMorgan Chase Commercial Mortgage Securities Trust | |||||
| Series 2013-C16, Class A4, 4.166%, 12/15/2046 | 1,578,000 | 1,683,147 | |||
| Series 2016-JP4, Class A3, 3.393%, 12/15/2049 | 631,000 | 686,691 | |||
| Mello Warehouse Securitization Trust | |||||
| Series 2021-1, Class A (1 month LIBOR + 0.700%), 0.792%, 02/25/2055 (A)(C) | 820,000 | 820,000 | |||
| The accompanying notes are an integral part of the financial statements. | 33 |
| Shares or Principal Amount | Value | ||||
| COLLATERALIZED MORTGAGE OBLIGATIONS (continued) | |||||
| Commercial and residential (continued) | |||||
| Mello Warehouse Securitization Trust (continued) | |||||
| Series 2021-2, Class A (1 month LIBOR + 0.750%), 0.834%, 04/25/2055 (A)(C) | $ | 2,244,000 | $ | 2,245,786 | |
| MFRA Trust Series 2021-NQM2, Class A1 1.029%, 11/25/2064 (C)(D) | 922,393 | 921,399 | |||
| Morgan Stanley Bank of America Merrill Lynch Trust Series 2015-C20, Class A4 3.249%, 02/15/2048 | 231,000 | 246,683 | |||
| Morgan Stanley Capital Trust | |||||
| Series 2020-HR8, Class A3, 1.790%, 07/15/2053 | 1,000,000 | 994,515 | |||
| Series 2021-L6, Class A4, 2.444%, 06/15/2054 | 348,000 | 361,363 | |||
| MSG III Securitization Trust Series 2021-1, Class A (1 month LIBOR + 0.750%) 0.842%, 06/25/2054 (A)(C) | 859,000 | 857,932 | |||
| New Residential Mortgage Loan Trust Series 2019-NQM4, Class A1 2.492%, 09/25/2059 (C)(D) | 857,117 | 863,623 | |||
| NewRez Warehouse Securitization Trust Series 2021-1, Class A (1 month LIBOR + 0.750%) 0.834%, 05/25/2055 (A)(C) | 5,844,000 | 5,857,376 | |||
| STAR Trust Series 2021-1, Class A1 1.219%, 05/25/2065 (C)(D) | 1,568,916 | 1,573,278 | |||
| Starwood Mortgage Residential Trust | |||||
| Series 2020-1, Class A1, 2.275%, 02/25/2050 (C)(D) | 1,848,127 | 1,866,599 | |||
| Series 2020-3, Class A1, 1.486%, 04/25/2065 (C)(D) | 1,572,521 | 1,580,896 | |||
| Series 2020-INV1, Class A1, 1.027%, 11/25/2055 (C)(D) | 1,333,966 | 1,332,992 | |||
| Verus Securitization Trust | |||||
| Series 2019-3, Class A1, 2.784%, 07/25/2059 (C) | 1,456,746 | 1,466,084 | |||
| Series 2019-INV2, Class A1, 2.913%, 07/25/2059 (C)(D) | 1,010,693 | 1,022,503 | |||
| Series 2019-INV3, Class A1, 2.692%, 11/25/2059 (C)(D) | 1,443,369 | 1,463,430 | |||
| Series 2020-1, Class A1, 2.417%, 01/25/2060 (C) | 572,510 | 579,971 | |||
| Series 2020-2, Class A1, 2.226%, 05/25/2060 (C)(D) | 1,419,721 | 1,428,597 | |||
| Series 2020-5, Class A1, 1.218%, 05/25/2065 (C) | 544,605 | 546,274 | |||
| Series 2021-1, Class A1, 0.815%, 01/25/2066 (C)(D) | 1,829,266 | 1,827,717 | |||
| Series 2021-3, Class A1, 1.046%, 06/25/2066 (C)(D) | 1,420,522 | 1,422,208 | |||
| Series 2021-4, Class A1, 0.938%, 07/25/2066 (C)(D) | 1,426,034 | 1,424,367 | |||
| Series 2021-R1, Class A1, 0.820%, 10/25/2063 (C)(D) | 2,130,222 | 2,129,730 | |||
| Series 2021-R3, Class A1, 1.020%, 04/25/2064 (C)(D) | 1,306,666 | 1,301,813 | |||
| Shares or Principal Amount | Value | ||||
| COLLATERALIZED MORTGAGE OBLIGATIONS (continued) | |||||
| Commercial and residential (continued) | |||||
| Visio Trust Series 2020-1R, Class A1 1.312%, 11/25/2055 (C) | $ | 1,504,650 | $ | 1,511,147 | |
| 69,614,993 | |||||
| U.S. Government Agency – 5.6% | |||||
| Federal Home Loan Mortgage Corp. | |||||
| Series 264, Class 30, 3.000%, 07/15/2042 | 2,480,022 | 2,602,350 | |||
| Series 4205, Class PA, 1.750%, 05/15/2043 | 1,135,910 | 1,178,097 | |||
| Series 4426, Class QC, 1.750%, 07/15/2037 | 1,993,781 | 2,046,663 | |||
| Series 4705, Class A, 4.500%, 09/15/2042 | 286,699 | 290,390 | |||
| Series 4742, Class PA, 3.000%, 10/15/2047 | 1,998,244 | 2,072,320 | |||
| Series 4763, Class CA, 3.000%, 09/15/2038 | 369,629 | 395,179 | |||
| Series 4767, Class KA, 3.000%, 03/15/2048 | 603,619 | 645,666 | |||
| Series 4846, Class PF (1 month LIBOR + 0.350%), 0.446%, 12/15/2048 (A) | 358,328 | 358,077 | |||
| Series 4880, Class DA, 3.000%, 05/15/2050 | 2,562,132 | 2,746,022 | |||
| Series 5091, Class AB, 1.500%, 03/25/2051 | 5,148,599 | 5,163,153 | |||
| Series 5092, Class DT, 1.500%, 11/25/2049 | 5,421,118 | 5,466,246 | |||
| Series 5119, Class AB, 1.500%, 08/25/2049 | 960,291 | 970,634 | |||
| Federal National Mortgage Association | |||||
| Series 1998-61, Class PL, 6.000%, 11/25/2028 | 166,967 | 187,825 | |||
| Series 2012-151, Class NX, 1.500%, 01/25/2043 | 1,342,157 | 1,361,603 | |||
| Series 2013-11, Class AP, 1.500%, 01/25/2043 | 4,327,984 | 4,400,544 | |||
| Series 2013-43, Class BP, 1.750%, 05/25/2043 | 1,536,128 | 1,590,179 | |||
| Series 2014-73, Class MA, 2.500%, 11/25/2044 | 927,409 | 969,032 | |||
| Series 2015-84, Class PA, 1.700%, 08/25/2033 | 5,251,152 | 5,426,913 | |||
| Series 2016-48, Class MA, 2.000%, 06/25/2038 | 5,348,945 | 5,574,347 | |||
| Series 2016-57, Class PC, 1.750%, 06/25/2046 | 10,215,220 | 10,368,133 | |||
| Series 2017-13, Class PA, 3.000%, 08/25/2046 | 1,131,063 | 1,187,911 | |||
| Series 2017-42, Class H, 3.000%, 11/25/2043 | 1,066,143 | 1,097,318 | |||
| Series 2017-M7, Class A2, 2.961%, 02/25/2027 (D) | 562,000 | 611,010 | |||
| Series 2018-14, Class KC, 3.000%, 03/25/2048 | 1,718,638 | 1,837,210 | |||
| Series 2018-15, Class AB, 3.000%, 03/25/2048 | 491,033 | 524,509 | |||
| Series 2018-8, Class KL, 2.500%, 03/25/2047 | 1,226,957 | 1,282,886 | |||
| Series 2019-25, Class PA, 3.000%, 05/25/2048 | 3,505,002 | 3,709,929 | |||
| Series 2019-8, Class GA, 3.000%, 03/25/2049 | 5,105,547 | 5,433,126 | |||
| The accompanying notes are an integral part of the financial statements. | 34 |
| Shares or Principal Amount | Value | ||||
| COLLATERALIZED MORTGAGE OBLIGATIONS (continued) | |||||
| U.S. Government Agency (continued) | |||||
| Federal National Mortgage Association (continued) | |||||
| Series 2020-48, Class AB, 2.000%, 07/25/2050 | $ | 2,098,425 | $ | 2,143,685 | |
| Series 2020-48, Class DA, 2.000%, 07/25/2050 | 6,701,999 | 6,823,255 | |||
| Series 2021-27, Class EC, 1.500%, 05/25/2051 | 7,818,794 | 7,890,896 | |||
| Series 414, Class A35, 3.500%, 10/25/2042 | 1,316,759 | 1,435,116 | |||
| Government National Mortgage Association | |||||
| Series 2012-141, Class WA, 4.535%, 11/16/2041 (D) | 367,494 | 410,775 | |||
| Series 2017-167, Class BQ, 2.500%, 08/20/2044 | 1,242,092 | 1,287,669 | |||
| Series 2018-11, Class PC, 2.750%, 12/20/2047 | 2,176,052 | 2,239,835 | |||
| Series 2019-132, Class NA, 3.500%, 09/20/2049 | 2,468,832 | 2,618,640 | |||
| Series 2019-31, Class JC, 3.500%, 03/20/2049 | 1,280,795 | 1,374,334 | |||
| Series 2021-23, Class MG, 1.500%, 02/20/2051 | 5,186,969 | 5,274,074 | |||
| 100,995,551 | |||||
| TOTAL COLLATERALIZED MORTGAGE OBLIGATIONS (Cost $167,446,205) | $ | 170,610,544 | |||
| ASSET BACKED SECURITIES – 8.3% | |||||
| AmeriCredit Automobile Receivables Trust Series 2020-2, Class A2A 0.600%, 12/18/2023 | 890,369 | 891,125 | |||
| Avis Budget Rental Car Funding AESOP LLC | |||||
| Series 2017-1A, Class A 3.070%, 09/20/2023 (C) | 939,000 | 960,731 | |||
| Series 2019-3A, Class A 2.360%, 03/20/2026 (C) | 1,054,000 | 1,100,933 | |||
| Capital One Multi-Asset Execution Trust Series 2021-A2, Class A2 1.390%, 07/15/2030 | 4,747,000 | 4,767,259 | |||
| College Ave Student Loans LLC | |||||
| Series 2017-A, Class A1 (1 month LIBOR + 1.650%) 1.734%, 11/26/2046 (A)(C) | 689,347 | 696,698 | |||
| Series 2018-A, Class A2 4.130%, 12/26/2047 (C) | 866,369 | 914,471 | |||
| Series 2019-A, Class A2 3.280%, 12/28/2048 (C) | 899,758 | 931,558 | |||
| Series 2021-A, Class A2 1.600%, 07/25/2051 (C) | 1,288,653 | 1,292,003 | |||
| Ford Credit Auto Owner Trust | |||||
| Series 2018-1, Class A 3.190%, 07/15/2031 (C) | 772,000 | 832,001 | |||
| Series 2019-1, Class A 3.520%, 07/15/2030 (C) | 3,514,000 | 3,756,310 | |||
| Series 2021-1, Class A 1.370%, 10/17/2033 (C) | 1,132,000 | 1,146,602 | |||
| GMF Floorplan Owner Revolving Trust Series 2019-2, Class A 2.900%, 04/15/2026 (C) | 1,369,000 | 1,450,625 | |||
| Hertz Vehicle Financing III LP Series 2021-2A, Class A 1.680%, 12/27/2027 (C) | 2,803,000 | 2,831,477 | |||
| Shares or Principal Amount | Value | ||||
| ASSET BACKED SECURITIES (continued) | |||||
| Hertz Vehicle Financing LLC Series 2021-1A, Class A 1.210%, 12/26/2025 (C) | $ | 953,000 | $ | 958,225 | |
| Navient Private Education Loan Trust | |||||
| Series 2014-AA, Class A3 (1 month LIBOR + 1.600%) 1.696%, 10/15/2031 (A)(C) | 739,000 | 750,748 | |||
| Series 2016-AA, Class A2B (1 month LIBOR + 2.150%) 2.246%, 12/15/2045 (A)(C) | 280,508 | 288,335 | |||
| Series 2020-IA, Class A1A 1.330%, 04/15/2069 (C) | 4,498,549 | 4,496,962 | |||
| Navient Private Education Refi Loan Trust | |||||
| Series 2018-A, Class A2 3.190%, 02/18/2042 (C) | 1,257,999 | 1,273,286 | |||
| Series 2018-DA, Class A2A 4.000%, 12/15/2059 (C) | 1,113,152 | 1,171,704 | |||
| Series 2019-CA, Class A2 3.130%, 02/15/2068 (C) | 2,746,916 | 2,807,336 | |||
| Series 2019-D, Class A2A 3.010%, 12/15/2059 (C) | 2,813,143 | 2,944,230 | |||
| Series 2019-FA, Class A2 2.600%, 08/15/2068 (C) | 1,844,319 | 1,885,301 | |||
| Series 2019-GA, Class A 2.400%, 10/15/2068 (C) | 941,194 | 960,850 | |||
| Series 2020-A, Class A2A 2.460%, 11/15/2068 (C) | 2,121,000 | 2,186,560 | |||
| Series 2020-BA, Class A2 2.120%, 01/15/2069 (C) | 857,428 | 870,071 | |||
| Series 2020-DA, Class A 1.690%, 05/15/2069 (C) | 808,136 | 816,866 | |||
| Series 2020-EA, Class A 1.690%, 05/15/2069 (C) | 338,000 | 343,353 | |||
| Series 2020-GA, Class A 1.170%, 09/16/2069 (C) | 673,528 | 678,197 | |||
| Series 2020-HA, Class A 1.310%, 01/15/2069 (C) | 1,334,487 | 1,345,025 | |||
| Series 2021-A, Class A 0.840%, 05/15/2069 (C) | 899,998 | 899,146 | |||
| Series 2021-BA, Class A 0.940%, 07/15/2069 (C) | 2,202,906 | 2,205,005 | |||
| Series 2021-CA, Class A 1.060%, 10/15/2069 (C) | 175,611 | 176,093 | |||
| Navient Private Education Refi Loan Trust 2021-E Series 2021-EA, Class A 0.970%, 12/16/2069 (C) | 4,232,000 | 4,234,552 | |||
| Navient Student Loan Trust Series 2019-BA, Class A2A 3.390%, 12/15/2059 (C) | 1,831,893 | 1,923,541 | |||
| Nelnet Student Loan Trust | |||||
| Series 2004-3, Class A5 (3 month LIBOR + 0.180%) 0.305%, 10/27/2036 (A) | 245,480 | 242,104 | |||
| Series 2004-4, Class A5 (3 month LIBOR + 0.160%) 0.285%, 01/25/2037 (A) | 1,571,159 | 1,553,694 | |||
| Series 2005-1, Class A5 (3 month LIBOR + 0.110%) 0.235%, 10/25/2033 (A) | 4,404,266 | 4,340,656 | |||
| Series 2005-2, Class A5 (3 month LIBOR + 0.100%) 0.235%, 03/23/2037 (A) | 4,543,126 | 4,475,733 | |||
| Series 2005-3, Class A5 (3 month LIBOR + 0.120%) 0.255%, 12/24/2035 (A) | 3,310,971 | 3,265,048 | |||
| The accompanying notes are an integral part of the financial statements. | 35 |
| Shares or Principal Amount | Value | ||||
| ASSET BACKED SECURITIES (continued) | |||||
| Nelnet Student Loan Trust (continued) | |||||
| Series 2005-4, Class A4 (3 month LIBOR + 0.180%) 0.315%, 03/22/2032 (A) | $ | 550,607 | $ | 533,962 | |
| Santander Drive Auto Receivables Trust | |||||
| Series 2020-1, Class A3 2.030%, 02/15/2024 | 398,872 | 399,935 | |||
| Series 2020-3, Class A3 0.520%, 07/15/2024 | 1,014,000 | 1,014,792 | |||
| Series 2020-4, Class A3 0.480%, 07/15/2024 | 917,000 | 917,919 | |||
| Santander Retail Auto Lease Trust Series 2021-B, Class A3 0.510%, 08/20/2024 (C) | 870,000 | 871,122 | |||
| Santander Revolving Auto Loan Trust Series 2019-A, Class A 2.510%, 01/26/2032 (C) | 976,000 | 1,028,774 | |||
| SLM Student Loan Trust | |||||
| Series 2003-1, Class A5C (3 month LIBOR + 0.750%) 0.869%, 12/15/2032 (A)(C) | 800,037 | 745,118 | |||
| Series 2003-10A, Class A4 (3 month LIBOR + 0.670%) 0.789%, 12/17/2068 (A)(C) | 3,345,000 | 3,351,281 | |||
| Series 2007-2, Class A4 (3 month LIBOR + 0.060%) 0.185%, 07/25/2022 (A) | 3,942,841 | 3,866,841 | |||
| Series 2007-3, Class A4 (3 month LIBOR + 0.060%) 0.185%, 01/25/2022 (A) | 1,247,457 | 1,216,468 | |||
| Series 2010-1, Class A (1 month LIBOR + 0.400%) 0.484%, 03/25/2025 (A) | 310,547 | 305,514 | |||
| Series 2012-1, Class A3 (1 month LIBOR + 0.950%) 1.034%, 09/25/2028 (A) | 2,489,913 | 2,465,059 | |||
| Series 2012-2, Class A (1 month LIBOR + 0.700%) 0.784%, 01/25/2029 (A) | 1,991,814 | 1,957,134 | |||
| Series 2012-6, Class A3 (1 month LIBOR + 0.750%) 0.834%, 05/26/2026 (A) | 524,188 | 518,877 | |||
| Series 2013-4, Class A (1 month LIBOR + 0.550%) 0.634%, 06/25/2043 (A) | 3,894,506 | 3,894,690 | |||
| SMB Private Education Loan Trust | |||||
| Series 2016-A, Class A2A 2.700%, 05/15/2031 (C) | 1,399,876 | 1,434,790 | |||
| Series 2016-B, Class A2A 2.430%, 02/17/2032 (C) | 235,287 | 240,998 | |||
| Series 2016-B, Class A2B (1 month LIBOR + 1.450%) 1.546%, 02/17/2032 (A)(C) | 160,314 | 162,464 | |||
| Series 2018-C, Class A2A 3.630%, 11/15/2035 (C) | 915,419 | 962,928 | |||
| Series 2019-A, Class A2A 3.440%, 07/15/2036 (C) | 5,680,414 | 5,950,043 | |||
| Series 2020-B, Class A1A 1.290%, 07/15/2053 (C) | 2,131,348 | 2,139,159 | |||
| Series 2020-PTA, Class A2A 1.600%, 09/15/2054 (C) | 1,967,000 | 1,994,621 | |||
| Series 2020-PTB, Class A2A 1.600%, 09/15/2054 (C) | 9,024,373 | 9,133,491 | |||
| Series 2021-A, Class APT1 1.070%, 01/15/2053 (C) | 6,716,978 | 6,664,209 | |||
| Series 2021-B, Class A 1.310%, 07/17/2051 (C) | 2,784,705 | 2,792,285 | |||
| Shares or Principal Amount | Value | ||||
| ASSET BACKED SECURITIES (continued) | |||||
| SMB Private Education Loan Trust (continued) | |||||
| Series 2021-C, Class A1 (1 month LIBOR + 0.400%) 0.493%, 01/15/2053 (A)(C) | $ | 1,201,221 | $ | 1,201,430 | |
| Series 2021-C, Class A2 (1 month LIBOR + 0.800%) 0.893%, 01/15/2053 (A)(C) | 2,226,000 | 2,232,019 | |||
| Series 2021-D, Class A1A 1.340%, 03/17/2053 (C) | 4,263,000 | 4,271,026 | |||
| SoFi Professional Loan Program LLC | |||||
| Series 2016-A, Class A2 2.760%, 12/26/2036 (C) | 451,276 | 455,248 | |||
| Series 2017-C, Class A1 (1 month LIBOR + 0.600%) 0.684%, 07/25/2040 (A)(C) | 106,153 | 106,219 | |||
| Series 2017-D, Class A2FX 2.650%, 09/25/2040 (C) | 520,229 | 531,247 | |||
| Series 2017-E, Class A1 (1 month LIBOR + 0.500%) 0.584%, 11/26/2040 (A)(C) | 45,091 | 45,114 | |||
| Series 2017-E, Class A2B 2.720%, 11/26/2040 (C) | 1,327,175 | 1,348,038 | |||
| Series 2018-A, Class A2B 2.950%, 02/25/2042 (C) | 435,571 | 443,587 | |||
| Series 2018-B, Class A2FX 3.340%, 08/25/2047 (C) | 3,669,384 | 3,765,088 | |||
| Series 2020-C, Class AFX 1.950%, 02/15/2046 (C) | 2,063,048 | 2,098,845 | |||
| Series 2021-A, Class AFX 1.030%, 08/17/2043 (C) | 997,398 | 998,704 | |||
| Toyota Auto Loan Extended Note Trust | |||||
| Series 2020-1A, Class A 1.350%, 05/25/2033 (C) | 1,176,000 | 1,199,797 | |||
| Series 2021-1A, Class A 1.070%, 02/27/2034 (C) | 2,909,000 | 2,921,370 | |||
| Triton Container Finance VIII LLC Series 2020-1A, Class A 2.110%, 09/20/2045 (C) | 1,104,656 | 1,117,638 | |||
| Verizon Master Trust Series 2021-1, Class A 0.500%, 05/20/2027 | 2,803,000 | 2,807,819 | |||
| TOTAL ASSET BACKED SECURITIES (Cost $147,157,180) | $ | 148,770,077 | |||
| SHORT-TERM INVESTMENTS – 1.6% | |||||
| Short-term funds – 1.6% | |||||
| State Street Institutional U.S. Government Money Market Fund, Premier Class, 0.0250% (E) | 28,387,227 | 28,387,227 | |||
| TOTAL SHORT-TERM INVESTMENTS (Cost $28,387,227) | $ | 28,387,227 | |||
| Total Investments (Core Bond Fund) (Cost $1,924,535,882) – 108.9% | $ | 1,947,341,570 | |||
| Other assets and liabilities, net – (8.9%) | (159,041,729) | ||||
| TOTAL NET ASSETS – 100.0% | $ | 1,788,299,841 | |||
| Security Abbreviations and Legend | |
| CMT | Constant Maturity Treasury |
| LIBOR | London Interbank Offered Rate |
| SOFR | Secured Overnight Financing Rate |
| TBA | To Be Announced. A forward mortgage-backed securities trade issued by a U.S. Government Agency, to be delivered at an agreed-upon future settlement date. |
| (A) | Variable rate obligation. The coupon rate shown represents the rate at period end. |
| The accompanying notes are an integral part of the financial statements. | 36 |
| (B) | Security purchased or sold on a when-issued or delayed delivery basis. |
| (C) | These securities are exempt from registration under Rule 144A of the Securities Act of 1933. Such securities may be resold, normally to qualified institutional buyers, in transactions exempt from registration. Rule 144A securities amounted to $248,738,101 or 13.9% of the fund's net assets as of 8-31-21. |
| (D) | Variable or floating rate security, the interest rate of which adjusts periodically based on a weighted average of interest rates and prepayments on the underlying pool of assets. The interest rate shown is the current rate as of period end. |
| (E) | The rate shown is the annualized seven-day yield as of 8-31-21. |
| Shares or Principal Amount | Value | ||||
| COMMON STOCKS – 98.7% | |||||
| Consumer discretionary – 0.2% | |||||
| Internet and direct marketing retail – 0.1% | |||||
| Shop Apotheke Europe NV (A)(B) | 1,475 | $ | 263,095 | ||
| Specialty retail – 0.1% | |||||
| JAND, Inc., Class A (B)(C)(D) | 16,938 | 470,538 | |||
| 733,633 | |||||
| Consumer staples – 0.0% | |||||
| Food products – 0.0% | |||||
| Freshpet, Inc. (B) | 630 | 80,728 | |||
| Financials – 0.8% | |||||
| Capital markets – 0.6% | |||||
| BCLS Acquisition Corp., Class A (B) | 17,428 | 172,189 | |||
| CM Life Sciences II, Inc. (B) | 14,503 | 172,006 | |||
| CM Life Sciences III, Inc. (B) | 32,624 | 331,460 | |||
| Dynamics Special Purpose Corp., Class A (B) | 26,772 | 265,578 | |||
| Eucrates Biomedical Acquisition Corp. (B) | 17,270 | 172,527 | |||
| Frontier Acquisition Corp. (B) | 18,343 | 182,513 | |||
| FS Development Corp. II, Class A (B) | 22,037 | 217,946 | |||
| Health Sciences Acquisitions Corp. 2 (B) | 19,166 | 187,348 | |||
| Helix Acquisition Corp., Class A (B) | 17,736 | 175,586 | |||
| Orion Acquisition Corp. (B) | 18,697 | 186,409 | |||
| Revolution Healthcare Acquisition Corp. (B) | 46,061 | 453,701 | |||
| 2,517,263 | |||||
| Insurance – 0.2% | |||||
| Bright Health Group, Inc. (B) | 84,573 | 783,146 | |||
| 3,300,409 | |||||
| Health care – 97.7% | |||||
| Biotechnology – 32.7% | |||||
| AbbVie, Inc. | 59,968 | 7,242,935 | |||
| Abcam PLC (B) | 33,630 | 714,050 | |||
| AC Immune SA (B) | 7,100 | 84,614 | |||
| ACADIA Pharmaceuticals, Inc. (B) | 31,129 | 545,069 | |||
| Acceleron Pharma, Inc. (B) | 33,638 | 4,503,455 | |||
| ADC Therapeutics SA (B) | 22,072 | 643,840 | |||
| Agios Pharmaceuticals, Inc. (B) | 12,486 | 557,874 | |||
| Akero Therapeutics, Inc. (B) | 9,438 | 224,058 | |||
| Alector, Inc. (B) | 15,420 | 416,803 | |||
| Alkermes PLC (B) | 4,712 | 147,297 | |||
| Allogene Therapeutics, Inc. (B) | 26,326 | 627,875 | |||
| Alnylam Pharmaceuticals, Inc. (B) | 25,039 | 5,043,606 | |||
| Amgen, Inc. | 13,731 | 3,096,752 | |||
| Amicus Therapeutics, Inc. (B) | 10,300 | 117,317 | |||
| Annexon, Inc. (B) | 11,935 | 195,137 | |||
| Apellis Pharmaceuticals, Inc. (B) | 30,227 | 1,990,448 | |||
| Arcutis Biotherapeutics, Inc. (B) | 10,195 | 215,828 | |||
| Argenx SE, ADR (B) | 17,748 | 5,874,943 | |||
| Shares or Principal Amount | Value | ||||
| COMMON STOCKS (continued) | |||||
| Biotechnology (continued) | |||||
| Ascendis Pharma A/S, ADR (B) | 14,754 | $ | 2,312,394 | ||
| Avidity Biosciences, Inc. (B) | 16,037 | 366,285 | |||
| BeiGene, Ltd., ADR (B) | 5,801 | 1,788,448 | |||
| Biogen, Inc. (B) | 12,679 | 4,297,040 | |||
| BioNTech SE, ADR (B) | 21,636 | 7,122,355 | |||
| Blueprint Medicines Corp. (B) | 15,267 | 1,423,953 | |||
| Burning Rock Biotech, Ltd., ADR (B) | 11,762 | 219,126 | |||
| C4 Therapeutics, Inc. (B) | 24,850 | 997,231 | |||
| Celldex Therapeutics, Inc. (B) | 13,095 | 689,452 | |||
| Centessa Pharmaceuticals PLC, ADR (B) | 25,333 | 558,593 | |||
| Cerevel Therapeutics Holdings, Inc. (B) | 35,361 | 1,119,529 | |||
| CRISPR Therapeutics AG (B) | 5,732 | 716,213 | |||
| CureVac NV (B) | 8,100 | 533,223 | |||
| Day One Biopharmaceuticals, Inc. (B) | 11,446 | 318,542 | |||
| Deciphera Pharmaceuticals, Inc. (B) | 3,534 | 111,321 | |||
| Denali Therapeutics, Inc. (B) | 31,186 | 1,659,095 | |||
| Design Therapeutics, Inc. (B) | 21,545 | 338,687 | |||
| Dicerna Pharmaceuticals, Inc. (B) | 19,892 | 409,377 | |||
| Enanta Pharmaceuticals, Inc. (B) | 2,400 | 137,280 | |||
| Exact Sciences Corp. (B) | 29,480 | 3,077,122 | |||
| Exelixis, Inc. (B) | 93,847 | 1,799,047 | |||
| Fate Therapeutics, Inc. (B) | 25,980 | 1,903,035 | |||
| F-star Therapeutics, Inc. (B) | 18,217 | 144,279 | |||
| Generation Bio Company (B) | 38,263 | 956,575 | |||
| Genmab A/S (B) | 4,794 | 2,271,075 | |||
| Global Blood Therapeutics, Inc. (B) | 5,467 | 156,848 | |||
| Ideaya Biosciences, Inc. (B) | 18,565 | 436,278 | |||
| IGM Biosciences, Inc. (B) | 7,566 | 538,775 | |||
| Imago Biosciences, Inc. (B) | 15,649 | 411,099 | |||
| Immuneering Corp., Class A (B) | 28,884 | 706,791 | |||
| Immunocore Holdings PLC, ADR (B) | 9,252 | 319,749 | |||
| Incyte Corp. (B) | 52,477 | 4,013,966 | |||
| Insmed, Inc. (B) | 50,704 | 1,421,740 | |||
| Intellia Therapeutics, Inc. (B) | 11,050 | 1,773,857 | |||
| Invitae Corp. (B) | 20,286 | 601,074 | |||
| Ionis Pharmaceuticals, Inc. (B) | 30,458 | 1,211,010 | |||
| Iovance Biotherapeutics, Inc. (B) | 34,513 | 830,728 | |||
| IVERIC bio, Inc. (B) | 56,659 | 598,886 | |||
| Karuna Therapeutics, Inc. (B) | 9,235 | 1,098,042 | |||
| Kodiak Sciences, Inc. (B) | 26,617 | 2,506,789 | |||
| Kronos Bio, Inc. (B) | 10,993 | 229,864 | |||
| Kymera Therapeutics, Inc. (B) | 15,701 | 975,660 | |||
| Lyell Immunopharma, Inc. (B) | 24,905 | 393,250 | |||
| MaxCyte, Inc. (B) | 21,513 | 322,505 | |||
| MaxCyte, Inc. (B) | 9,349 | 143,601 | |||
| MeiraGTx Holdings PLC (B) | 14,764 | 184,698 | |||
| Mersana Therapeutics, Inc. (B) | 8,481 | 118,140 | |||
| Mirati Therapeutics, Inc. (B) | 14,644 | 2,485,526 | |||
| Moderna, Inc. (B) | 27,089 | 10,204,155 | |||
| Molecular Templates, Inc. (B) | 18,453 | 120,314 | |||
| Monte Rosa Therapeutics, Inc. (B) | 24,009 | 856,881 | |||
| Morphic Holding, Inc. (B) | 4,443 | 279,953 | |||
| Neurocrine Biosciences, Inc. (B) | 9,199 | 875,745 | |||
| Novavax, Inc. (B) | 6,302 | 1,503,279 | |||
| Nurix Therapeutics, Inc. (B) | 15,779 | 507,926 | |||
| PMV Pharmaceuticals, Inc. (B) | 3,600 | 109,260 | |||
| Prelude Therapeutics, Inc. (B) | 9,948 | 355,044 | |||
| Progenics Pharmaceuticals, Inc. (B)(D) | 33,200 | 1,418 | |||
| Protagonist Therapeutics, Inc. (B) | 18,704 | 907,144 | |||
| Prothena Corp. PLC (B) | 22,208 | 1,490,601 | |||
| PTC Therapeutics, Inc. (B) | 8,647 | 377,442 | |||
| Radius Health, Inc. (B) | 11,664 | 161,663 | |||
| RAPT Therapeutics, Inc. (B) | 16,529 | 540,498 | |||
| Recursion Pharmaceuticals, Inc., Class A (B) | 13,014 | 328,213 | |||
| The accompanying notes are an integral part of the financial statements. | 37 |
| Shares or Principal Amount | Value | ||||
| COMMON STOCKS (continued) | |||||
| Biotechnology (continued) | |||||
| Regeneron Pharmaceuticals, Inc. (B) | 9,633 | $ | 6,486,862 | ||
| REGENXBIO, Inc. (B) | 2,700 | 87,210 | |||
| Relay Therapeutics, Inc. (B) | 6,652 | 213,064 | |||
| Repare Therapeutics, Inc. (B) | 8,900 | 302,600 | |||
| Replimune Group, Inc. (B) | 26,811 | 851,517 | |||
| REVOLUTION Medicines, Inc. (B) | 15,100 | 439,259 | |||
| Rocket Pharmaceuticals, Inc. (B) | 14,966 | 511,987 | |||
| Sage Therapeutics, Inc. (B) | 10,180 | 470,418 | |||
| Sana Biotechnology, Inc. (B) | 12,065 | 289,439 | |||
| Sarepta Therapeutics, Inc. (B) | 6,807 | 531,763 | |||
| Scholar Rock Holding Corp. (B) | 19,503 | 770,954 | |||
| Seagen, Inc. (B) | 20,647 | 3,460,437 | |||
| Seres Therapeutics, Inc. (B) | 16,633 | 106,618 | |||
| Solid Biosciences, Inc. (B) | 50,944 | 138,058 | |||
| SpringWorks Therapeutics, Inc. (B) | 5,275 | 396,153 | |||
| Stoke Therapeutics, Inc. (B) | 7,017 | 183,705 | |||
| Syndax Pharmaceuticals, Inc. (B) | 11,580 | 202,534 | |||
| Tenaya Therapeutics, Inc. (B) | 15,168 | 307,152 | |||
| Turning Point Therapeutics, Inc. (B) | 10,463 | 805,860 | |||
| Twist Bioscience Corp. (B) | 8,949 | 1,013,116 | |||
| Ultragenyx Pharmaceutical, Inc. (B) | 32,389 | 3,118,737 | |||
| uniQure NV (B) | 9,702 | 281,358 | |||
| Vertex Pharmaceuticals, Inc. (B) | 37,732 | 7,557,342 | |||
| Xencor, Inc. (B) | 22,616 | 766,004 | |||
| Zai Lab, Ltd., ADR (B) | 9,137 | 1,320,297 | |||
| Zeneca, Inc. (B)(D) | 33,315 | 20,489 | |||
| Zentalis Pharmaceuticals, Inc. (B) | 19,466 | 1,327,387 | |||
| Zymeworks, Inc. (B) | 7,967 | 262,831 | |||
| 139,832,741 | |||||
| Health care equipment and supplies – 20.9% | |||||
| Alcon, Inc. | 11,338 | 933,785 | |||
| AtriCure, Inc. (B) | 7,215 | 531,168 | |||
| Becton, Dickinson and Company | 20,286 | 5,105,986 | |||
| Danaher Corp. | 51,943 | 16,837,843 | |||
| Dentsply Sirona, Inc. | 17,826 | 1,099,864 | |||
| DexCom, Inc. (B) | 6,233 | 3,299,875 | |||
| Hologic, Inc. (B) | 56,188 | 4,447,280 | |||
| ICU Medical, Inc. (B) | 345 | 68,776 | |||
| Inari Medical, Inc. (B) | 3,405 | 278,733 | |||
| Insulet Corp. (B) | 6,863 | 2,043,870 | |||
| Intuitive Surgical, Inc. (B) | 15,836 | 16,684,176 | |||
| iRhythm Technologies, Inc. (B) | 2,480 | 118,544 | |||
| Lantheus Holdings, Inc. (B) | 17,492 | 461,264 | |||
| Nevro Corp. (B) | 5,485 | 669,170 | |||
| Novocure, Ltd. (B) | 12,915 | 1,733,322 | |||
| Ortho Clinical Diagnostics Holdings PLC (B) | 69,390 | 1,418,332 | |||
| Outset Medical, Inc. (B) | 14,028 | 691,440 | |||
| Penumbra, Inc. (B) | 11,857 | 3,260,082 | |||
| Pulmonx Corp. (B) | 5,987 | 240,618 | |||
| Quidel Corp. (B) | 9,508 | 1,226,057 | |||
| Shockwave Medical, Inc. (B) | 20,598 | 4,412,298 | |||
| STERIS PLC | 4,079 | 877,026 | |||
| Stryker Corp. | 36,158 | 10,019,382 | |||
| Teleflex, Inc. | 8,679 | 3,432,197 | |||
| The Cooper Companies, Inc. | 4,322 | 1,947,969 | |||
| West Pharmaceutical Services, Inc. | 14,101 | 6,368,294 | |||
| Zimmer Biomet Holdings, Inc. | 8,533 | 1,283,790 | |||
| 89,491,141 | |||||
| Health care providers and services – 16.0% | |||||
| Accolade, Inc. (B) | 11,714 | 555,009 | |||
| Agiliti, Inc. (B) | 37,295 | 795,502 | |||
| agilon health, Inc. (B) | 24,075 | 842,625 | |||
| Alignment Healthcare, Inc. (B) | 62,709 | 1,108,068 | |||
| Anthem, Inc. | 17,030 | 6,388,464 | |||
| Shares or Principal Amount | Value | ||||
| COMMON STOCKS (continued) | |||||
| Health care providers and services (continued) | |||||
| Centene Corp. (B) | 96,039 | $ | 6,048,536 | ||
| Cigna Corp. | 20,978 | 4,439,994 | |||
| Guardant Health, Inc. (B) | 18,461 | 2,349,531 | |||
| HCA Healthcare, Inc. | 24,760 | 6,263,785 | |||
| Humana, Inc. | 17,286 | 7,008,090 | |||
| Innovage Holding Corp. (B) | 13,692 | 205,791 | |||
| Molina Healthcare, Inc. (B) | 14,192 | 3,814,384 | |||
| Oak Street Health, Inc. (B) | 11,091 | 518,282 | |||
| Option Care Health, Inc. (B) | 38,515 | 1,030,276 | |||
| Surgery Partners, Inc. (B) | 18,339 | 902,279 | |||
| The Pennant Group, Inc. (B) | 11,905 | 363,936 | |||
| UnitedHealth Group, Inc. | 61,743 | 25,701,758 | |||
| 68,336,310 | |||||
| Health care technology – 4.8% | |||||
| Certara, Inc. (B) | 21,481 | 721,117 | |||
| Doximity, Inc., Class A (B) | 13,303 | 1,223,876 | |||
| Doximity, Inc., Class B (B)(C) | 127,476 | 11,182,351 | |||
| Multiplan Corp. (B) | 33,283 | 199,698 | |||
| Phreesia, Inc. (B) | 24,828 | 1,776,443 | |||
| Schrodinger, Inc. (B) | 4,255 | 253,981 | |||
| Sema4 Holdings Corp. (B) | 32,652 | 310,194 | |||
| Sophia Genetics SA (B) | 25,451 | 503,166 | |||
| Veeva Systems, Inc., Class A (B) | 12,397 | 4,115,556 | |||
| 20,286,382 | |||||
| Life sciences tools and services – 12.1% | |||||
| 10X Genomics, Inc., Class A (B) | 11,035 | 1,941,277 | |||
| Adaptive Biotechnologies Corp. (B) | 27,096 | 984,127 | |||
| Agilent Technologies, Inc. | 47,859 | 8,397,819 | |||
| Avantor, Inc. (B) | 91,335 | 3,602,252 | |||
| Berkeley Lights, Inc. (B) | 11,736 | 417,332 | |||
| Bio-Techne Corp. | 2,588 | 1,291,774 | |||
| Bruker Corp. | 43,409 | 3,833,449 | |||
| Evotec SE (B) | 17,987 | 894,713 | |||
| Lonza Group AG | 1,747 | 1,477,484 | |||
| Maravai LifeSciences Holdings, Inc., Class A (B) | 16,791 | 993,691 | |||
| Mettler-Toledo International, Inc. (B) | 994 | 1,543,513 | |||
| Olink Holding AB, ADR (B) | 28,657 | 917,311 | |||
| Pacific Biosciences of California, Inc. (B) | 65,843 | 2,061,544 | |||
| Quanterix Corp. (B) | 14,019 | 715,670 | |||
| Quantum-Si, Inc. (B) | 41,200 | 400,464 | |||
| Rapid Micro Biosystems, Inc., Class A (B) | 13,669 | 258,344 | |||
| Repligen Corp. (B) | 2,882 | 815,548 | |||
| Seer, Inc. (B) | 61,522 | 2,459,650 | |||
| Thermo Fisher Scientific, Inc. | 30,113 | 16,711,209 | |||
| Waters Corp. (B) | 2,644 | 1,094,669 | |||
| Wuxi Biologics Cayman, Inc. (A)(B) | 65,500 | 1,014,068 | |||
| 51,825,908 | |||||
| Pharmaceuticals – 11.2% | |||||
| Arvinas, Inc. (B) | 12,351 | 1,064,780 | |||
| AstraZeneca PLC, ADR | 108,523 | 6,324,720 | |||
| ATAI Life Sciences NV (B) | 12,728 | 208,485 | |||
| Atea Pharmaceuticals, Inc. (B) | 22,459 | 667,481 | |||
| Cara Therapeutics, Inc. (B) | 12,686 | 200,185 | |||
| Catalent, Inc. (B) | 17,231 | 2,247,612 | |||
| Daiichi Sankyo Company, Ltd. | 23,700 | 562,932 | |||
| Eisai Company, Ltd. | 11,700 | 964,896 | |||
| Elanco Animal Health, Inc. (B) | 21,961 | 733,058 | |||
| Eli Lilly & Company | 60,424 | 15,606,915 | |||
| Longboard Pharmaceuticals, Inc. (B) | 14,364 | 134,734 | |||
| Merck & Company, Inc. | 51,826 | 3,953,806 | |||
| Merck KGaA | 9,785 | 2,324,884 | |||
| NGM Biopharmaceuticals, Inc. (B) | 8,626 | 188,306 | |||
| Pfizer, Inc. | 150,884 | 6,951,226 | |||
| The accompanying notes are an integral part of the financial statements. | 38 |
| Shares or Principal Amount | Value | ||||
| COMMON STOCKS (continued) | |||||
| Pharmaceuticals (continued) | |||||
| Reata Pharmaceuticals, Inc., Class A (B) | 4,198 | $ | 447,129 | ||
| Roche Holding AG | 9,321 | 3,742,893 | |||
| Royalty Pharma PLC, Class A | 36,152 | 1,397,275 | |||
| 47,721,317 | |||||
| 417,493,799 | |||||
| TOTAL COMMON STOCKS (Cost $246,987,138) | $ | 421,608,569 | |||
| PREFERRED SECURITIES – 0.9% | |||||
| Consumer discretionary – 0.2% | |||||
| Specialty retail – 0.2% | |||||
| JAND, Inc., Series D (B)(C)(D) | 37,822 | 1,050,695 | |||
| Health care – 0.7% | |||||
| Health care equipment and supplies – 0.7% | |||||
| Sartorius AG | 4,334 | 2,855,294 | |||
| TOTAL PREFERRED SECURITIES (Cost $1,106,641) | $ | 3,905,989 | |||
| WARRANTS – 0.0% | |||||
| Sema4 Holdings Corp. (Expiration Date: 9-24-27; Strike Price: $11.50) (B) | 7,150 | 19,663 | |||
| TOTAL WARRANTS (Cost $24,206) | $ | 19,663 | |||
| SHORT-TERM INVESTMENTS – 0.7% | |||||
| Short-term funds – 0.7% | |||||
| State Street Institutional U.S. Government Money Market Fund, Premier Class, 0.0250% (E) | 1,172,543 | 1,172,543 | |||
| T. Rowe Price Government Reserve Fund, 0.0295% (E) | 1,926,524 | 1,926,524 | |||
| TOTAL SHORT-TERM INVESTMENTS (Cost $3,099,067) | $ | 3,099,067 | |||
| Total Investments (Health Sciences Fund) (Cost $251,217,052) – 100.3% | $ | 428,633,288 | |||
| Other assets and liabilities, net – (0.3%) | (1,387,704) | ||||
| TOTAL NET ASSETS – 100.0% | $ | 427,245,584 | |||
| Security Abbreviations and Legend | |
| ADR | American Depositary Receipt |
| (A) | These securities are exempt from registration under Rule 144A of the Securities Act of 1933. Such securities may be resold, normally to qualified institutional buyers, in transactions exempt from registration. |
| (B) | Non-income producing security. |
| (C) | Restricted security as to resale, excluding 144A securities. For more information on this security refer to the Notes to financial statements. |
| (D) | Security is valued using significant unobservable inputs and is classified as Level 3 in the fair value hierarchy. Refer to Note 2 to the financial statements. |
| (E) | The rate shown is the annualized seven-day yield as of 8-31-21. |
| Shares or Principal Amount | Value | ||||
| FOREIGN GOVERNMENT OBLIGATIONS – 0.7% | |||||
| Argentina – 0.4% | |||||
| Provincia de Buenos Aires 7.875%, 06/15/2027 (A) | $ | 870,000 | $ | 468,713 | |
| Republic of Argentina | |||||
| 1.000%, 07/09/2029 | 54,775 | 22,426 | |||
| (0.500% to 7-9-23, then 0.750% to 7-9-27, then 1.750% thereafter), 07/09/2030 | 716,203 | 279,470 | |||
| Shares or Principal Amount | Value | ||||
| FOREIGN GOVERNMENT OBLIGATIONS (continued) | |||||
| Argentina (continued) | |||||
| Republic of Argentina (continued) | |||||
| (1.125% to 7-9-22, then 1.500% to 7-9-23, then 3.625% to 7-9-24, then 4.125% to 7-9-27, then 4.750% to 7-9-28, then 5.000% thereafter), 07/09/2035 | $ | 476,895 | $ | 166,441 | |
| 937,050 | |||||
| Brazil – 0.3% | |||||
| Federative Republic of Brazil 10.000%, 01/01/2023 to 01/01/2027 | BRL | 4,175,000 | 832,816 | ||
| Indonesia – 0.0% | |||||
| Republic of Indonesia 8.375%, 03/15/2034 | IDR | 543,000,000 | 43,592 | ||
| TOTAL FOREIGN GOVERNMENT OBLIGATIONS (Cost $2,893,433) | $ | 1,813,458 | |||
| CORPORATE BONDS – 82.0% | |||||
| Communication services – 12.0% | |||||
| Allen Media LLC 10.500%, 02/15/2028 (B) | $ | 2,150,000 | 2,077,438 | ||
| Altice Financing SA 5.750%, 08/15/2029 (B) | 1,050,000 | 1,078,256 | |||
| Altice France Holding SA 10.500%, 05/15/2027 (B) | 290,000 | 318,638 | |||
| Altice France SA | |||||
| 5.125%, 07/15/2029 (B) | 630,000 | 636,943 | |||
| 7.375%, 05/01/2026 (B) | 475,000 | 493,036 | |||
| CCO Holdings LLC | |||||
| 4.250%, 02/01/2031 to 01/15/2034 (B) | 1,540,000 | 1,555,585 | |||
| 4.500%, 05/01/2032 | 760,000 | 794,086 | |||
| 5.125%, 05/01/2027 (B) | 1,000,000 | 1,044,810 | |||
| Charter Communications Operating LLC 6.484%, 10/23/2045 | 250,000 | 348,627 | |||
| Cinemark USA, Inc. 5.875%, 03/15/2026 (B) | 640,000 | 636,800 | |||
| Clear Channel Outdoor Holdings, Inc. 7.500%, 06/01/2029 (B) | 930,000 | 962,550 | |||
| CSC Holdings LLC | |||||
| 4.500%, 11/15/2031 (B) | 600,000 | 603,888 | |||
| 6.500%, 02/01/2029 (B) | 1,560,000 | 1,721,850 | |||
| DIRECTV Holdings LLC 5.875%, 08/15/2027 (B) | 830,000 | 867,350 | |||
| DISH DBS Corp. | |||||
| 5.125%, 06/01/2029 (C) | 1,020,000 | 1,014,880 | |||
| 7.750%, 07/01/2026 | 2,000,000 | 2,290,900 | |||
| Frontier Communications Holdings LLC | |||||
| 5.000%, 05/01/2028 (B) | 300,000 | 313,500 | |||
| 6.750%, 05/01/2029 (B) | 370,000 | 395,974 | |||
| iHeartCommunications, Inc. | |||||
| 4.750%, 01/15/2028 (B) | 280,000 | 289,100 | |||
| 5.250%, 08/15/2027 (B) | 780,000 | 817,284 | |||
| Intelsat Jackson Holdings SA 8.000%, 02/15/2024 (A)(B) | 330,000 | 342,375 | |||
| Match Group Holdings II LLC 4.625%, 06/01/2028 (B) | 510,000 | 532,542 | |||
| Netflix, Inc. | |||||
| 4.875%, 06/15/2030 (B) | 500,000 | 598,418 | |||
| 5.375%, 11/15/2029 (B) | 180,000 | 221,369 | |||
| 6.375%, 05/15/2029 | 400,000 | 512,500 | |||
| News Corp. 3.875%, 05/15/2029 (B) | 800,000 | 822,600 | |||
| Playtika Holding Corp. 4.250%, 03/15/2029 (B) | 700,000 | 706,125 | |||
| Sprint Capital Corp. 8.750%, 03/15/2032 | 1,650,000 | 2,526,843 | |||
| The accompanying notes are an integral part of the financial statements. | 39 |
| Shares or Principal Amount | Value | ||||
| CORPORATE BONDS (continued) | |||||
| Communication services (continued) | |||||
| Sprint Corp. | |||||
| 7.625%, 02/15/2025 | $ | 40,000 | $ | 47,350 | |
| 7.875%, 09/15/2023 | 370,000 | 419,192 | |||
| Switch, Ltd. | |||||
| 3.750%, 09/15/2028 (B) | 700,000 | 712,187 | |||
| 4.125%, 06/15/2029 (B) | 690,000 | 711,563 | |||
| Time Warner Cable LLC 7.300%, 07/01/2038 | 680,000 | 990,576 | |||
| T-Mobile USA, Inc. | |||||
| 3.500%, 04/15/2031 | 190,000 | 202,303 | |||
| 3.500%, 04/15/2031 (B) | 950,000 | 1,011,513 | |||
| Univision Communications, Inc. 9.500%, 05/01/2025 (B) | 350,000 | 381,500 | |||
| UPC Holding BV 5.500%, 01/15/2028 (B) | 400,000 | 422,180 | |||
| Urban One, Inc. 7.375%, 02/01/2028 (B) | 660,000 | 711,150 | |||
| Virgin Media Secured Finance PLC 5.500%, 05/15/2029 (B) | 800,000 | 857,000 | |||
| Virgin Media Vendor Financing Notes IV DAC 5.000%, 07/15/2028 (B) | 510,000 | 528,488 | |||
| Vmed O2 UK Financing I PLC 4.750%, 07/15/2031 (B) | 900,000 | 923,859 | |||
| ZoomInfo Technologies LLC 3.875%, 02/01/2029 (B) | 1,080,000 | 1,088,370 | |||
| 33,531,498 | |||||
| Consumer discretionary – 16.6% | |||||
| Academy, Ltd. 6.000%, 11/15/2027 (B) | 650,000 | 696,313 | |||
| Adtalem Global Education, Inc. 5.500%, 03/01/2028 (B) | 1,360,000 | 1,392,300 | |||
| American Axle & Manufacturing, Inc. | |||||
| 5.000%, 10/01/2029 (D) | 1,450,000 | 1,449,565 | |||
| 6.500%, 04/01/2027 (D) | 670,000 | 703,500 | |||
| American News Company LLC (8.500% Cash or 10.000% PIK) 8.500%, 09/01/2026 (B) | 1,162,715 | 1,340,029 | |||
| Bath & Body Works, Inc. | |||||
| 5.250%, 02/01/2028 | 1,640,000 | 1,836,792 | |||
| 6.625%, 10/01/2030 (B) | 340,000 | 391,850 | |||
| 9.375%, 07/01/2025 (B) | 370,000 | 478,688 | |||
| Boyne USA, Inc. 4.750%, 05/15/2029 (B) | 680,000 | 702,100 | |||
| Caesars Entertainment, Inc. 6.250%, 07/01/2025 (B) | 500,000 | 528,475 | |||
| Carnival Corp. 5.750%, 03/01/2027 (B) | 920,000 | 940,544 | |||
| Carriage Services, Inc. 4.250%, 05/15/2029 (B) | 920,000 | 921,435 | |||
| Carrols Restaurant Group, Inc. 5.875%, 07/01/2029 (B) | 470,000 | 453,550 | |||
| Empire Communities Corp. 7.000%, 12/15/2025 (B) | 900,000 | 949,500 | |||
| Everi Holdings, Inc. 5.000%, 07/15/2029 (B) | 480,000 | 491,280 | |||
| Fontainebleau Las Vegas Holdings LLC 10.250%, 06/15/2015 (A)(B) | 2,983,778 | 7,459 | |||
| Ford Motor Company 9.000%, 04/22/2025 | 660,000 | 806,322 | |||
| Ford Motor Credit Company LLC | |||||
| 4.000%, 11/13/2030 | 2,490,000 | 2,626,950 | |||
| 5.113%, 05/03/2029 | 1,160,000 | 1,310,800 | |||
| 5.125%, 06/16/2025 | 500,000 | 548,750 | |||
| Shares or Principal Amount | Value | ||||
| CORPORATE BONDS (continued) | |||||
| Consumer discretionary (continued) | |||||
| Full House Resorts, Inc. 8.250%, 02/15/2028 (B) | $ | 770,000 | $ | 827,750 | |
| International Game Technology PLC 4.125%, 04/15/2026 (B) | 520,000 | 540,046 | |||
| Marston's Issuer PLC (3 month GBP LIBOR + 2.550%) 2.578%, 07/16/2035 (E) | GBP | 380,000 | 417,954 | ||
| Melco Resorts Finance, Ltd. 5.375%, 12/04/2029 (B) | $ | 650,000 | 672,552 | ||
| Mohegan Gaming & Entertainment 7.875%, 10/15/2024 (B)(D) | 180,000 | 188,550 | |||
| NCL Corp., Ltd. | |||||
| 3.625%, 12/15/2024 (B) | 1,530,000 | 1,445,850 | |||
| 5.875%, 03/15/2026 (B) | 310,000 | 310,775 | |||
| 10.250%, 02/01/2026 (B) | 1,420,000 | 1,640,384 | |||
| 12.250%, 05/15/2024 (B) | 860,000 | 1,014,800 | |||
| NMG Holding Company, Inc. 7.125%, 04/01/2026 (B) | 680,000 | 719,950 | |||
| Nordstrom, Inc. 5.000%, 01/15/2044 | 940,000 | 934,624 | |||
| Party City Holdings, Inc. 8.750%, 02/15/2026 (B) | 740,000 | 771,450 | |||
| PetSmart, Inc. | |||||
| 4.750%, 02/15/2028 (B) | 500,000 | 520,625 | |||
| 7.750%, 02/15/2029 (B) | 250,000 | 274,688 | |||
| Rent-A-Center, Inc. 6.375%, 02/15/2029 (B) | 640,000 | 689,600 | |||
| Royal Caribbean Cruises, Ltd. | |||||
| 4.250%, 07/01/2026 (B) | 760,000 | 741,000 | |||
| 5.500%, 08/31/2026 to 04/01/2028 (B) | 1,900,000 | 1,919,299 | |||
| Sands China, Ltd. 5.400%, 08/08/2028 | 200,000 | 230,120 | |||
| Scientific Games International, Inc. 7.000%, 05/15/2028 (B) | 860,000 | 927,037 | |||
| Sizzling Platter LLC 8.500%, 11/28/2025 (B) | 460,000 | 474,375 | |||
| Speedway Motorsports LLC 4.875%, 11/01/2027 (B) | 690,000 | 707,229 | |||
| StoneMor, Inc. 8.500%, 05/15/2029 (B) | 1,060,000 | 1,084,073 | |||
| Sugarhouse HSP Gaming Prop Mezz LP 5.875%, 05/15/2025 (B) | 380,000 | 379,772 | |||
| The Michaels Companies, Inc. | |||||
| 5.250%, 05/01/2028 (B) | 440,000 | 451,550 | |||
| 7.875%, 05/01/2029 (B) | 800,000 | 824,360 | |||
| TopBuild Corp. 3.625%, 03/15/2029 (B) | 830,000 | 830,813 | |||
| Viking Cruises, Ltd. | |||||
| 5.875%, 09/15/2027 (B) | 570,000 | 551,475 | |||
| 7.000%, 02/15/2029 (B) | 1,980,000 | 2,001,879 | |||
| 13.000%, 05/15/2025 (B) | 1,000,000 | 1,157,500 | |||
| VOC Escrow, Ltd. 5.000%, 02/15/2028 (B) | 990,000 | 978,863 | |||
| WW International, Inc. 4.500%, 04/15/2029 (B) | 1,120,000 | 1,107,400 | |||
| Wynn Macau, Ltd. | |||||
| 5.125%, 12/15/2029 (B) | 300,000 | 298,125 | |||
| 5.625%, 08/26/2028 (B) | 1,090,000 | 1,104,126 | |||
| Wynn Resorts Finance LLC 7.750%, 04/15/2025 (B) | 900,000 | 956,250 | |||
| 46,271,046 | |||||
| Consumer staples – 1.1% | |||||
| Edgewell Personal Care Company 4.125%, 04/01/2029 (B) | 350,000 | 352,188 | |||
| The accompanying notes are an integral part of the financial statements. | 40 |
| Shares or Principal Amount | Value | ||||
| CORPORATE BONDS (continued) | |||||
| Consumer staples (continued) | |||||
| Kraft Heinz Foods Company | |||||
| 5.200%, 07/15/2045 | $ | 580,000 | $ | 744,275 | |
| 5.500%, 06/01/2050 | 220,000 | 293,421 | |||
| Simmons Foods, Inc. 4.625%, 03/01/2029 (B) | 820,000 | 834,473 | |||
| Triton Water Holdings, Inc. 6.250%, 04/01/2029 (B) | 820,000 | 811,579 | |||
| 3,035,936 | |||||
| Energy – 10.3% | |||||
| Antero Resources Corp. 5.375%, 03/01/2030 (B) | 580,000 | 590,109 | |||
| Apache Corp. | |||||
| 5.100%, 09/01/2040 | 600,000 | 667,500 | |||
| 7.750%, 12/15/2029 | 320,000 | 390,400 | |||
| Berry Petroleum Company LLC 7.000%, 02/15/2026 (B) | 1,790,000 | 1,776,503 | |||
| Blue Racer Midstream LLC | |||||
| 6.625%, 07/15/2026 (B) | 1,600,000 | 1,668,000 | |||
| 7.625%, 12/15/2025 (B) | 130,000 | 140,563 | |||
| Cheniere Energy Partners LP 4.000%, 03/01/2031 (B) | 650,000 | 684,125 | |||
| Chesapeake Energy Corp. 5.500%, 02/01/2026 (B) | 90,000 | 94,048 | |||
| CNX Midstream Partners LP 6.500%, 03/15/2026 (B) | 20,000 | 20,550 | |||
| Colgate Energy Partners III LLC 5.875%, 07/01/2029 (B) | 1,360,000 | 1,377,000 | |||
| Comstock Resources, Inc. | |||||
| 5.875%, 01/15/2030 (B) | 500,000 | 501,345 | |||
| 7.500%, 05/15/2025 (B) | 96,000 | 99,360 | |||
| Continental Resources, Inc. 5.750%, 01/15/2031 (B) | 610,000 | 743,438 | |||
| DCP Midstream Operating LP | |||||
| 6.450%, 11/03/2036 (B) | 310,000 | 375,875 | |||
| 6.750%, 09/15/2037 (B) | 1,000,000 | 1,242,500 | |||
| Endeavor Energy Resources LP | |||||
| 5.500%, 01/30/2026 (B) | 270,000 | 279,509 | |||
| 5.750%, 01/30/2028 (B) | 50,000 | 52,625 | |||
| 6.625%, 07/15/2025 (B) | 550,000 | 583,248 | |||
| Energy Transfer LP (6.500% to 11-15-26, then 5 Year CMT + 5.694%) 11/15/2026 (F) | 230,000 | 235,814 | |||
| EQM Midstream Partners LP | |||||
| 5.500%, 07/15/2028 | 620,000 | 676,563 | |||
| 6.000%, 07/01/2025 (B) | 260,000 | 280,800 | |||
| 6.500%, 07/01/2027 (B) | 490,000 | 546,350 | |||
| 6.500%, 07/15/2048 | 400,000 | 451,720 | |||
| EQT Corp. | |||||
| 5.000%, 01/15/2029 | 1,000,000 | 1,137,320 | |||
| 6.625%, 02/01/2025 | 400,000 | 458,488 | |||
| MEG Energy Corp. | |||||
| 5.875%, 02/01/2029 (B) | 350,000 | 360,469 | |||
| 7.125%, 02/01/2027 (B) | 1,200,000 | 1,262,712 | |||
| Northern Oil and Gas, Inc. 8.125%, 03/01/2028 (B) | 420,000 | 436,275 | |||
| Oasis Petroleum, Inc. 6.375%, 06/01/2026 (B) | 1,350,000 | 1,409,063 | |||
| Occidental Petroleum Corp. | |||||
| 6.125%, 01/01/2031 | 330,000 | 399,036 | |||
| 8.875%, 07/15/2030 | 1,000,000 | 1,372,290 | |||
| Occidental Petroleum Corp. (3 month LIBOR + 1.450%) 1.644%, 08/15/2022 (E) | 80,000 | 79,675 | |||
| PBF Holding Company LLC 9.250%, 05/15/2025 (B) | 220,000 | 212,300 | |||
| Shares or Principal Amount | Value | ||||
| CORPORATE BONDS (continued) | |||||
| Energy (continued) | |||||
| Penn Virginia Escrow LLC 9.250%, 08/15/2026 (B) | $ | 1,730,000 | $ | 1,682,425 | |
| Petrobras Global Finance BV | |||||
| 5.750%, 02/01/2029 | 40,000 | 45,679 | |||
| 6.850%, 06/05/2115 | 580,000 | 642,811 | |||
| Range Resources Corp. | |||||
| 8.250%, 01/15/2029 (B) | 800,000 | 888,048 | |||
| 9.250%, 02/01/2026 | 520,000 | 568,628 | |||
| Tallgrass Energy Partners LP 6.000%, 12/31/2030 (B) | 1,000,000 | 1,017,120 | |||
| Targa Resources Partners LP 4.875%, 02/01/2031 | 800,000 | 870,240 | |||
| Vesta Energy Corp. 8.125%, 07/24/2023 (B) | CAD | 920,000 | 597,947 | ||
| Western Midstream Operating LP | |||||
| 3.950%, 06/01/2025 | $ | 80,000 | 83,800 | ||
| 4.350%, 02/01/2025 | 790,000 | 830,148 | |||
| 5.500%, 08/15/2048 | 810,000 | 928,337 | |||
| 28,760,756 | |||||
| Financials – 8.8% | |||||
| Acuris Finance U.S., Inc. 5.000%, 05/01/2028 (B) | 550,000 | 545,875 | |||
| AmWINS Group, Inc. 4.875%, 06/30/2029 (B) | 1,220,000 | 1,239,825 | |||
| Apollo Commercial Real Estate Finance, Inc. 4.625%, 06/15/2029 (B) | 700,000 | 681,660 | |||
| Barclays PLC (5.088% to 6-20-29, then 3 month LIBOR + 3.054%) 06/20/2030 | 310,000 | 361,909 | |||
| Barclays PLC (8.000% to 6-15-24, then 5 Year CMT + 5.672%) 06/15/2024 (F) | 400,000 | 454,500 | |||
| BNP Paribas SA (7.375% to 8-19-25, then 5 Year U.S. Swap Rate + 5.150%) 08/19/2025 (B)(F) | 820,000 | 957,555 | |||
| Burford Capital Global Finance LLC 6.250%, 04/15/2028 (B) | 930,000 | 981,150 | |||
| Compass Group Diversified Holdings LLC 5.250%, 04/15/2029 (B) | 660,000 | 690,881 | |||
| Credit Agricole SA (8.125% to 12-23-25, then 5 Year U.S. Swap Rate + 6.185%) 12/23/2025 (B)(F) | 820,000 | 997,415 | |||
| Credit Suisse Group AG (6.375% to 8-21-26, then 5 Year CMT + 4.822%) 08/21/2026 (B)(F) | 1,350,000 | 1,490,913 | |||
| FirstCash, Inc. 4.625%, 09/01/2028 (B) | 930,000 | 967,116 | |||
| Global Aircraft Leasing Company, Ltd. (6.500% Cash or 7.250% PIK) 6.500%, 09/15/2024 (B) | 2,759,701 | 2,735,542 | |||
| Highlands Holdings Bond Issuer, Ltd. (7.625% Cash or 8.375% PIK) 7.625%, 10/15/2025 (B) | 660,000 | 700,425 | |||
| Intesa Sanpaolo SpA 4.198%, 06/01/2032 (B) | 640,000 | 658,745 | |||
| Ladder Capital Finance Holdings LLLP | |||||
| 4.250%, 02/01/2027 (B) | 530,000 | 532,650 | |||
| 4.750%, 06/15/2029 (B) | 600,000 | 613,500 | |||
| LD Holdings Group LLC | |||||
| 6.125%, 04/01/2028 (B) | 820,000 | 805,941 | |||
| 6.500%, 11/01/2025 (B) | 760,000 | 775,200 | |||
| Lloyds Banking Group PLC (6.750% to 6-27-26, then 5 Year CMT + 4.815%) 06/27/2026 (F) | 610,000 | 700,951 | |||
| Midcap Financial Issuer Trust | |||||
| 5.625%, 01/15/2030 (B) | 450,000 | 447,750 | |||
| The accompanying notes are an integral part of the financial statements. | 41 |
| Shares or Principal Amount | Value | ||||
| CORPORATE BONDS (continued) | |||||
| Financials (continued) | |||||
| Midcap Financial Issuer Trust (continued) | |||||
| 6.500%, 05/01/2028 (B) | $ | 890,000 | $ | 931,349 | |
| Navient Corp. 5.000%, 03/15/2027 | 330,000 | 346,500 | |||
| NMI Holdings, Inc. 7.375%, 06/01/2025 (B) | 800,000 | 905,000 | |||
| Quicken Loans LLC 3.875%, 03/01/2031 (B) | 860,000 | 879,748 | |||
| Rocket Mortgage LLC 5.250%, 01/15/2028 (B) | 890,000 | 938,950 | |||
| Starwood Property Trust, Inc. 3.625%, 07/15/2026 (B) | 360,000 | 362,250 | |||
| StoneX Group, Inc. 8.625%, 06/15/2025 (B) | 640,000 | 692,480 | |||
| UBS Group AG (7.000% to 1-31-24, then 5 Year U.S. Swap Rate + 4.344%) 01/31/2024 (B)(F) | 1,170,000 | 1,282,659 | |||
| UniCredit SpA (5.459% to 6-30-30, then 5 Year CMT + 4.750%) 06/30/2035 (B) | 790,000 | 873,117 | |||
| 24,551,556 | |||||
| Health care – 6.9% | |||||
| AdaptHealth LLC | |||||
| 4.625%, 08/01/2029 (B) | 650,000 | 651,820 | |||
| 5.125%, 03/01/2030 (B) | 960,000 | 972,365 | |||
| Akumin, Inc. 7.000%, 11/01/2025 (B) | 1,000,000 | 943,400 | |||
| Bausch Health Americas, Inc. 9.250%, 04/01/2026 (B) | 1,551,000 | 1,671,203 | |||
| Bausch Health Companies, Inc. | |||||
| 5.000%, 02/15/2029 (B) | 1,600,000 | 1,494,048 | |||
| 6.250%, 02/15/2029 (B) | 1,000,000 | 992,500 | |||
| Centene Corp. 4.625%, 12/15/2029 | 600,000 | 658,134 | |||
| Community Health Systems, Inc. | |||||
| 6.125%, 04/01/2030 (B) | 1,180,000 | 1,189,381 | |||
| 6.625%, 02/15/2025 (B) | 940,000 | 988,060 | |||
| 6.875%, 04/15/2029 (B) | 1,700,000 | 1,765,875 | |||
| Endo Luxembourg Finance Company I Sarl 6.125%, 04/01/2029 (B) | 960,000 | 950,400 | |||
| HCA, Inc. 5.625%, 09/01/2028 | 1,500,000 | 1,788,750 | |||
| Legacy LifePoint Health LLC 4.375%, 02/15/2027 (B) | 380,000 | 379,050 | |||
| Par Pharmaceutical, Inc. 7.500%, 04/01/2027 (B) | 910,000 | 921,375 | |||
| Radiology Partners, Inc. 9.250%, 02/01/2028 (B) | 700,000 | 750,750 | |||
| RegionalCare Hospital Partners Holdings, Inc. 9.750%, 12/01/2026 (B) | 600,000 | 638,250 | |||
| Tenet Healthcare Corp. 4.625%, 06/15/2028 (B) | 1,000,000 | 1,035,000 | |||
| Teva Pharmaceutical Finance Company LLC 6.150%, 02/01/2036 | 500,000 | 555,000 | |||
| U.S. Renal Care, Inc. 10.625%, 07/15/2027 (B) | 1,000,000 | 1,049,810 | |||
| 19,395,171 | |||||
| Industrials – 12.0% | |||||
| Air Canada 3.875%, 08/15/2026 (B) | 680,000 | 683,400 | |||
| Allied Universal Holdco LLC | |||||
| 4.625%, 06/01/2028 (B) | 420,000 | 421,050 | |||
| 6.000%, 06/01/2029 (B) | 610,000 | 609,945 | |||
| Shares or Principal Amount | Value | ||||
| CORPORATE BONDS (continued) | |||||
| Industrials (continued) | |||||
| Allied Universal Holdco LLC (continued) | |||||
| 6.625%, 07/15/2026 (B) | $ | 500,000 | $ | 534,375 | |
| Alta Equipment Group, Inc. 5.625%, 04/15/2026 (B) | 950,000 | 976,125 | |||
| American Airlines, Inc. | |||||
| 5.500%, 04/20/2026 (B) | 200,000 | 210,800 | |||
| 5.750%, 04/20/2029 (B) | 1,150,000 | 1,241,845 | |||
| Anagram International, Inc. (5.000% Cash and 5.000% PIK) 10.000%, 08/15/2026 (B) | 82,982 | 80,493 | |||
| ATS Automation Tooling Systems, Inc. 4.125%, 12/15/2028 (B) | 460,000 | 474,012 | |||
| Brundage-Bone Concrete Pumping Holdings, Inc. 6.000%, 02/01/2026 (B) | 680,000 | 709,750 | |||
| CoreCivic, Inc. 8.250%, 04/15/2026 | 950,000 | 1,002,820 | |||
| Cornerstone Building Brands, Inc. 6.125%, 01/15/2029 (B) | 640,000 | 684,192 | |||
| CP Atlas Buyer, Inc. 7.000%, 12/01/2028 (B) | 650,000 | 663,000 | |||
| Delta Air Lines, Inc. 4.750%, 10/20/2028 (B) | 1,260,000 | 1,404,896 | |||
| Doman Building Materials Group, Ltd. 5.250%, 05/15/2026 (B) | CAD | 770,000 | 614,889 | ||
| Foundation Building Materials, Inc. 6.000%, 03/01/2029 (B) | $ | 690,000 | 680,202 | ||
| GFL Environmental, Inc. 3.750%, 08/01/2025 (B) | 500,000 | 515,000 | |||
| H&E Equipment Services, Inc. 3.875%, 12/15/2028 (B) | 1,240,000 | 1,245,208 | |||
| Hawaiian Brand Intellectual Property, Ltd. 5.750%, 01/20/2026 (B) | 780,000 | 821,441 | |||
| Legends Hospitality Holding Company LLC 5.000%, 02/01/2026 (B) | 1,340,000 | 1,380,200 | |||
| Madison IAQ LLC 5.875%, 06/30/2029 (B) | 1,210,000 | 1,238,738 | |||
| Mileage Plus Holdings LLC 6.500%, 06/20/2027 (B) | 550,000 | 597,493 | |||
| Park-Ohio Industries, Inc. 6.625%, 04/15/2027 | 100,000 | 99,193 | |||
| PM General Purchaser LLC 9.500%, 10/01/2028 (B) | 710,000 | 772,054 | |||
| Prime Security Services Borrower LLC 6.250%, 01/15/2028 (B) | 1,800,000 | 1,865,250 | |||
| Resideo Funding, Inc. 4.000%, 09/01/2029 (B) | 840,000 | 840,294 | |||
| Sensata Technologies BV 4.000%, 04/15/2029 (B) | 400,000 | 414,020 | |||
| Sensata Technologies, Inc. 4.375%, 02/15/2030 (B) | 550,000 | 589,875 | |||
| Spirit Loyalty Cayman, Ltd. 8.000%, 09/20/2025 (B) | 792,000 | 896,940 | |||
| SRM Escrow Issuer LLC 6.000%, 11/01/2028 (B) | 1,000,000 | 1,060,000 | |||
| The ADT Security Corp. 4.125%, 08/01/2029 (B) | 860,000 | 858,891 | |||
| The Boeing Company 5.150%, 05/01/2030 | 430,000 | 508,760 | |||
| Titan International, Inc. 7.000%, 04/30/2028 (B) | 970,000 | 1,013,854 | |||
| TK Elevator US Newco, Inc. 5.250%, 07/15/2027 (B) | 590,000 | 623,376 | |||
| The accompanying notes are an integral part of the financial statements. | 42 |
| Shares or Principal Amount | Value | ||||
| CORPORATE BONDS (continued) | |||||
| Industrials (continued) | |||||
| TransDigm, Inc. | |||||
| 4.625%, 01/15/2029 (B) | $ | 720,000 | $ | 711,000 | |
| 6.250%, 03/15/2026 (B) | 960,000 | 1,008,000 | |||
| 8.000%, 12/15/2025 (B) | 370,000 | 395,900 | |||
| United Airlines 2020-1 Class B Pass Through Trust 4.875%, 01/15/2026 | 289,618 | 303,843 | |||
| United Airlines, Inc. | |||||
| 4.375%, 04/15/2026 (B) | 140,000 | 145,236 | |||
| 4.625%, 04/15/2029 (B) | 2,410,000 | 2,500,375 | |||
| United Rentals North America, Inc. 5.250%, 01/15/2030 | 1,260,000 | 1,381,275 | |||
| XPO CNW, Inc. 6.700%, 05/01/2034 | 740,000 | 891,974 | |||
| 33,669,984 | |||||
| Information technology – 5.2% | |||||
| Alliance Data Systems Corp. 4.750%, 12/15/2024 (B) | 600,000 | 615,750 | |||
| Black Knight InfoServ LLC 3.625%, 09/01/2028 (B) | 600,000 | 607,500 | |||
| Clarivate Science Holdings Corp. 4.875%, 07/01/2029 (B) | 470,000 | 484,791 | |||
| CommScope, Inc. | |||||
| 4.750%, 09/01/2029 (B) | 710,000 | 718,989 | |||
| 8.250%, 03/01/2027 (B) | 1,800,000 | 1,897,560 | |||
| Elastic NV 4.125%, 07/15/2029 (B) | 750,000 | 761,603 | |||
| Entegris, Inc. 3.625%, 05/01/2029 (B) | 450,000 | 465,030 | |||
| Gartner, Inc. | |||||
| 3.625%, 06/15/2029 (B) | 1,130,000 | 1,163,081 | |||
| 3.750%, 10/01/2030 (B) | 190,000 | 198,816 | |||
| Helios Software Holdings, Inc. 4.625%, 05/01/2028 (B) | 1,030,000 | 1,019,370 | |||
| MPH Acquisition Holdings LLC 5.750%, 11/01/2028 (B) | 860,000 | 821,300 | |||
| NCR Corp. 5.125%, 04/15/2029 (B) | 640,000 | 663,576 | |||
| Open Text Holdings, Inc. 4.125%, 02/15/2030 (B) | 550,000 | 579,068 | |||
| Paysafe Finance PLC 4.000%, 06/15/2029 (B) | 1,010,000 | 972,862 | |||
| Rackspace Technology Global, Inc. 3.500%, 02/15/2028 (B) | 900,000 | 864,000 | |||
| Rocket Software, Inc. 6.500%, 02/15/2029 (B) | 280,000 | 263,822 | |||
| Shift4 Payments LLC 4.625%, 11/01/2026 (B) | 600,000 | 622,332 | |||
| Square, Inc. 3.500%, 06/01/2031 (B) | 810,000 | 842,400 | |||
| Vericast Merger Sub, Inc. 11.000%, 09/15/2026 (B) | 860,000 | 911,600 | |||
| 14,473,450 | |||||
| Materials – 4.2% | |||||
| ARD Finance SA (6.500% Cash or 7.250% PIK) 6.500%, 06/30/2027 (B) | 740,000 | 779,353 | |||
| Ardagh Metal Packaging Finance USA LLC 4.000%, 09/01/2029 (B) | 1,250,000 | 1,274,063 | |||
| Ardagh Packaging Finance PLC 5.250%, 08/15/2027 (B) | 720,000 | 745,200 | |||
| Cascades, Inc. 5.375%, 01/15/2028 (B) | 800,000 | 843,000 | |||
| First Quantum Minerals, Ltd. | |||||
| 6.875%, 03/01/2026 to 10/15/2027 (B) | 2,240,000 | 2,401,535 | |||
| Shares or Principal Amount | Value | ||||
| CORPORATE BONDS (continued) | |||||
| Materials (continued) | |||||
| First Quantum Minerals, Ltd. (continued) | |||||
| 7.500%, 04/01/2025 (B) | $ | 246,000 | $ | 254,918 | |
| Freeport-McMoRan, Inc. 5.450%, 03/15/2043 | 1,790,000 | 2,288,837 | |||
| Hudbay Minerals, Inc. | |||||
| 4.500%, 04/01/2026 (B) | 250,000 | 251,300 | |||
| 6.125%, 04/01/2029 (B) | 500,000 | 537,500 | |||
| Kraton Polymers LLC 4.250%, 12/15/2025 (B) | 480,000 | 493,003 | |||
| Mercer International, Inc. 5.125%, 02/01/2029 | 260,000 | 261,997 | |||
| Midwest Vanadium Pty, Ltd. 11.500%, 02/15/2018 (A)(B) | 1,953,148 | 2,969 | |||
| Northwest Acquisitions ULC 7.125%, 11/01/2022 (A)(B) | 1,140,000 | 114 | |||
| Olin Corp. 5.000%, 02/01/2030 | 560,000 | 601,031 | |||
| Summit Materials LLC 5.250%, 01/15/2029 (B) | 970,000 | 1,026,988 | |||
| 11,761,808 | |||||
| Real estate – 3.8% | |||||
| Diversified Healthcare Trust | |||||
| 4.375%, 03/01/2031 | 500,000 | 490,625 | |||
| 4.750%, 02/15/2028 | 800,000 | 810,000 | |||
| 9.750%, 06/15/2025 | 680,000 | 748,000 | |||
| Five Point Operating Company LP 7.875%, 11/15/2025 (B) | 1,240,000 | 1,296,854 | |||
| Forestar Group, Inc. | |||||
| 3.850%, 05/15/2026 (B) | 580,000 | 585,075 | |||
| 5.000%, 03/01/2028 (B) | 420,000 | 433,650 | |||
| IIP Operating Partnership LP 5.500%, 05/25/2026 (B) | 390,000 | 409,526 | |||
| Kennedy-Wilson, Inc. 5.000%, 03/01/2031 | 930,000 | 967,470 | |||
| MPT Operating Partnership LP | |||||
| 4.625%, 08/01/2029 | 700,000 | 748,417 | |||
| 5.000%, 10/15/2027 | 300,000 | 317,625 | |||
| Park Intermediate Holdings LLC 5.875%, 10/01/2028 (B) | 410,000 | 436,650 | |||
| Realogy Group LLC | |||||
| 5.750%, 01/15/2029 (B) | 520,000 | 544,206 | |||
| 7.625%, 06/15/2025 (B) | 520,000 | 559,884 | |||
| Service Properties Trust 5.500%, 12/15/2027 | 640,000 | 686,287 | |||
| The GEO Group, Inc. | |||||
| 5.875%, 10/15/2024 | 480,000 | 434,400 | |||
| 6.000%, 04/15/2026 (D) | 1,500,000 | 1,267,500 | |||
| 10,736,169 | |||||
| Utilities – 1.1% | |||||
| Calpine Corp. 5.000%, 02/01/2031 (B) | 700,000 | 712,250 | |||
| Suburban Propane Partners LP 5.000%, 06/01/2031 (B) | 460,000 | 473,800 | |||
| Sunnova Energy Corp. 5.875%, 09/01/2026 (B) | 650,000 | 654,680 | |||
| Superior Plus LP 4.500%, 03/15/2029 (B) | 340,000 | 352,172 | |||
| Talen Energy Supply LLC | |||||
| 6.625%, 01/15/2028 (B) | 600,000 | 514,860 | |||
| 7.250%, 05/15/2027 (B) | 285,000 | 246,337 | |||
| 7.625%, 06/01/2028 (B) | 70,000 | 60,557 | |||
| 3,014,656 | |||||
| TOTAL CORPORATE BONDS (Cost $224,800,573) | $ | 229,202,030 | |||
| The accompanying notes are an integral part of the financial statements. | 43 |
| Shares or Principal Amount | Value | ||||
| CONVERTIBLE BONDS – 1.8% | |||||
| Communication services – 0.5% | |||||
| DISH Network Corp. 3.375%, 08/15/2026 | $ | 1,050,000 | $ | 1,095,259 | |
| Spotify USA, Inc. 2.239%, 03/15/2026 (B)(G) | 390,000 | 352,217 | |||
| 1,447,476 | |||||
| Consumer discretionary – 0.3% | |||||
| DraftKings, Inc. 0.650%, 03/15/2028 (B)(G) | 220,000 | 210,748 | |||
| Liberty Latin America, Ltd. 2.000%, 07/15/2024 | 90,000 | 91,467 | |||
| The Cheesecake Factory, Inc. 0.375%, 06/15/2026 | 400,000 | 373,969 | |||
| 676,184 | |||||
| Energy – 0.3% | |||||
| Cheniere Energy, Inc. 4.250%, 03/15/2045 | 1,080,000 | 902,972 | |||
| Financials – 0.2% | |||||
| Apollo Commercial Real Estate Finance, Inc. 4.750%, 08/23/2022 | 460,000 | 466,348 | |||
| Health care – 0.1% | |||||
| Halozyme Therapeutics, Inc. 0.250%, 03/01/2027 (B) | 290,000 | 263,947 | |||
| Industrials – 0.3% | |||||
| Spirit Airlines, Inc. 1.000%, 05/15/2026 | 980,000 | 904,638 | |||
| Information technology – 0.0% | |||||
| Alteryx, Inc. 0.500%, 08/01/2024 | 90,000 | 84,321 | |||
| Real estate – 0.1% | |||||
| Realogy Group LLC 0.250%, 06/15/2026 (B) | 260,000 | 260,002 | |||
| TOTAL CONVERTIBLE BONDS (Cost $4,906,271) | $ | 5,005,888 | |||
| TERM LOANS (H) – 6.9% | |||||
| Communication services – 0.4% | |||||
| Gannett Holdings LLC, 2021 Term Loan B (3 month LIBOR + 7.000%) 7.750%, 01/29/2026 | 606,565 | 610,356 | |||
| iHeartCommunications, Inc., 2020 Term Loan (1 month LIBOR + 3.000%) 3.085%, 05/01/2026 | 395,515 | 391,809 | |||
| 1,002,165 | |||||
| Consumer discretionary – 2.0% | |||||
| Adtalem Global Education, Inc., 2021 Term Loan B (1 month LIBOR + 4.500%) 5.250%, 02/11/2028 | 870,000 | 870,653 | |||
| Equinox Holdings, Inc., 2020 Term Loan B2 (3 month LIBOR + 9.000%) 10.000%, 03/08/2024 | 415,800 | 414,761 | |||
| First Brands Group LLC, 2021 Term Loan (1 month LIBOR + 5.000%) 6.000%, 03/30/2027 | 369,075 | 371,382 | |||
| Great Outdoors Group LLC, 2021 Term Loan B (6 month LIBOR + 4.250%) 5.000%, 03/06/2028 | 358,200 | 359,393 | |||
| Harbor Freight Tools USA, Inc., 2021 Term Loan B (1 month LIBOR + 2.750%) 3.250%, 10/19/2027 | 696,491 | 693,643 | |||
| PetSmart, Inc., 2021 Term Loan B (6 month LIBOR + 3.750%) 4.500%, 02/12/2028 | 540,000 | 540,448 | |||
| Shares or Principal Amount | Value | ||||
| TERM LOANS (H) (continued) | |||||
| Consumer discretionary (continued) | |||||
| Rent-A-Center, Inc., 2021 Term Loan B (1 month LIBOR + 4.000%) 4.750%, 02/17/2028 | $ | 628,425 | $ | 630,587 | |
| Spencer Spirit IH LLC, Term Loan B (1 month LIBOR + 6.000%) 6.085%, 06/19/2026 | 750,644 | 745,764 | |||
| The Michaels Companies, Inc., 2021 Term Loan B (1 month LIBOR + 4.250%) 5.000%, 04/15/2028 | 700,000 | 700,000 | |||
| Truck Hero, Inc., 2021 Term Loan B (1 month LIBOR + 3.250%) 4.000%, 01/31/2028 | 359,100 | 357,394 | |||
| 5,684,025 | |||||
| Financials – 0.6% | |||||
| Acrisure LLC, 2020 Term Loan B (2 month LIBOR + 3.500%) 3.607%, 02/15/2027 | 533,250 | 524,921 | |||
| Amerilife Holdings LLC, 2020 Term Loan (1 month LIBOR + 4.000%) 4.096%, 03/18/2027 | 178,227 | 177,336 | |||
| Asurion LLC, 2021 Term Loan B9 (1 month LIBOR + 3.250%) 3.335%, 07/31/2027 | 798,000 | 781,872 | |||
| Deerfield Dakota Holding LLC, 2021 USD 2nd Lien Term Loan (1 month LIBOR + 6.750%) 7.500%, 04/07/2028 | 250,000 | 255,625 | |||
| 1,739,754 | |||||
| Health care – 1.0% | |||||
| Eyecare Partners LLC, 2020 2nd Lien Term Loan (2 month LIBOR + 8.250%) 8.357%, 02/18/2028 | 430,000 | 411,725 | |||
| Eyecare Partners LLC, 2020 Term Loan (2 month LIBOR + 3.750%) 3.857%, 02/18/2027 | 573,591 | 568,164 | |||
| Jazz Financing Lux Sarl, USD Term Loan (1 month LIBOR + 3.500%) 4.000%, 05/05/2028 | 270,000 | 270,000 | |||
| Option Care Health, Inc., Term Loan B (1 month LIBOR + 3.750%) 3.835%, 08/06/2026 | 758,450 | 756,743 | |||
| US Renal Care, Inc., 2019 Term Loan B (1 month LIBOR + 5.000%) 5.125%, 06/26/2026 | 814,259 | 813,820 | |||
| 2,820,452 | |||||
| Industrials – 1.1% | |||||
| Allied Universal Holdco LLC, 2021 USD Incremental Term Loan B (1 month LIBOR + 3.750%) 4.250%, 05/12/2028 | 800,000 | 799,664 | |||
| CoreCivic, Inc., 2019 Term Loan (1 month LIBOR + 4.500%) 5.500%, 12/18/2024 | 302,044 | 298,772 | |||
| Delta Topco, Inc., 2020 Term Loan B (3 month LIBOR + 3.750%) 4.500%, 12/01/2027 | 698,250 | 698,501 | |||
| Mileage Plus Holdings LLC, 2020 Term Loan B (3 month LIBOR + 5.250%) 6.250%, 06/21/2027 | 480,000 | 508,800 | |||
| Prime Security Services Borrower LLC, 2021 Term Loan (1, 6 and 12 month LIBOR + 2.750%) 3.500%, 09/23/2026 | 698,250 | 696,721 | |||
| 3,002,458 | |||||
| Information technology – 1.6% | |||||
| Dcert Buyer, Inc., 2019 Term Loan B (1 month LIBOR + 4.000%) 4.085%, 10/16/2026 | 698,232 | 696,682 | |||
| The accompanying notes are an integral part of the financial statements. | 44 |
| Shares or Principal Amount | Value | ||||
| TERM LOANS (H) (continued) | |||||
| Information technology (continued) | |||||
| Dcert Buyer, Inc., 2021 2nd Lien Term Loan (1 month LIBOR + 7.000%) 7.085%, 02/16/2029 | $ | 880,000 | $ | 886,283 | |
| Global Tel*Link Corp., 2018 1st Lien Term Loan (1 month LIBOR + 4.250%) 4.335%, 11/29/2025 | 797,702 | 738,161 | |||
| Peraton Corp., Term Loan B (1 month LIBOR + 3.750%) 4.500%, 02/01/2028 | 448,875 | 448,781 | |||
| Rackspace Technology Global, Inc., 2021 Term Loan (3 month LIBOR + 2.750%) 3.500%, 02/15/2028 | 548,625 | 542,508 | |||
| Redstone Holdco 2 LP, 2021 2nd Lien Term Loan (3 month LIBOR + 7.750%) 8.500%, 04/27/2029 | 570,000 | 560,498 | |||
| Redstone Holdco 2 LP, 2021 Term Loan (3 month LIBOR + 4.750%) 5.500%, 04/27/2028 | 500,000 | 498,125 | |||
| Vericast Corp., Term Loan B7 (1 month LIBOR + 4.750%) 5.750%, 11/03/2023 | 193,169 | 181,579 | |||
| 4,552,617 | |||||
| Materials – 0.2% | |||||
| Arctic Canadian Diamond Company, Ltd., 2nd Lien PIK Term Loan (3 month LIBOR + 5.000% or 12.500% PIK) 5.000%, 12/31/2027 (I) | 462,729 | 462,729 | |||
| TOTAL TERM LOANS (Cost $19,196,642) | $ | 19,264,200 | |||
| ASSET BACKED SECURITIES – 5.0% | |||||
| AMMC CLO, Ltd. Series 2017-20A, Class E (3 month LIBOR + 5.810%) 6.000%, 04/17/2029 (B)(E) | 700,000 | 687,519 | |||
| Ares CLO, Ltd. Series 2017-44A, Class CR (3 month LIBOR + 3.400%) 3.599%, 04/15/2034 (B)(E) | 410,000 | 410,188 | |||
| Ballyrock CLO, Ltd. Series 2016-1A, Class ER (3 month LIBOR + 6.950%) 7.191%, 10/15/2028 (B)(E) | 250,000 | 250,575 | |||
| Barings CLO, Ltd. Series 2020-4A, Class E (3 month LIBOR + 5.680%) 5.904%, 01/20/2032 (B)(E) | 350,000 | 344,507 | |||
| Benefit Street Partners CLO XI, Ltd. Series 2017-12A, Class C (3 month LIBOR + 3.050%) 3.291%, 10/15/2030 (B)(E) | 250,000 | 243,501 | |||
| BlueMountain CLO XXXI, Ltd. Series 2021-31A, Class E (3 month LIBOR + 6.530%) 6.664%, 04/19/2034 (B)(E) | 170,000 | 168,170 | |||
| BlueMountain CLO, Ltd. | |||||
| Series 2012-2A, Class ER2 (3 month LIBOR + 5.750%) 5.932%, 11/20/2028 (B)(E) | 250,000 | 248,235 | |||
| Series 2016-2A, Class DR (3 month LIBOR + 7.790%) 7.972%, 08/20/2032 (B)(E) | 375,000 | 375,896 | |||
| Cathedral Lake VI, Ltd. Series 2021-6A, Class E (3 month LIBOR + 7.210%) 7.329%, 04/25/2034 (B)(E) | 125,000 | 119,666 | |||
| Shares or Principal Amount | Value | ||||
| ASSET BACKED SECURITIES (continued) | |||||
| Cook Park CLO, Ltd. Series 2018-1A, Class E (3 month LIBOR + 5.400%) 5.623%, 04/17/2030 (B)(E) | $ | 750,000 | $ | 734,698 | |
| Cumberland Park CLO, Ltd. Series 2015-2A, Class ER (3 month LIBOR + 5.650%) 5.874%, 07/20/2028 (B)(E) | 250,000 | 250,313 | |||
| Dryden 70 CLO, Ltd. Series 2018-70A, Class E (3 month LIBOR + 6.050%) 6.234%, 01/16/2032 (B)(E) | 750,000 | 744,627 | |||
| Goldentree Loan Management U.S. CLO 6, Ltd. Series 2019-6A, Class E (3 month LIBOR + 5.220%) 5.408%, 01/20/2033 (B)(E) | 550,000 | 532,587 | |||
| Greenwood Park CLO, Ltd. | |||||
| Series 2018-1A, Class D (3 month LIBOR + 2.500%) 2.741%, 04/15/2031 (B)(E) | 530,000 | 522,728 | |||
| Series 2018-1A, Class E (3 month LIBOR + 4.950%) 5.191%, 04/15/2031 (B)(E) | 750,000 | 725,219 | |||
| Greywolf CLO IV, Ltd. Series 2019-1RA, Class CR (3 month LIBOR + 3.650%) 3.831%, 04/17/2034 (B)(E) | 390,000 | 390,177 | |||
| Grippen Park CLO, Ltd. Series 2017-1A, Class E (1 month LIBOR + 5.700%) 5.924%, 01/20/2030 (B)(E) | 440,000 | 437,428 | |||
| Halsey Point CLO I, Ltd. Series 2019-1A, Class E (3 month LIBOR + 7.700%) 7.924%, 01/20/2033 (B)(E) | 600,000 | 600,242 | |||
| LCM XXII, Ltd. Series 2022-A, Class DR (3 month LIBOR + 5.500%) 5.724%, 10/20/2028 (B)(E) | 500,000 | 477,424 | |||
| Madison Park Funding XIII, Ltd. Series 2014-13A, Class DR2 (3 month LIBOR + 2.850%) 3.073%, 04/19/2030 (B)(E) | 1,000,000 | 993,415 | |||
| Mountain View CLO IX, Ltd. Series 2015-9A, Class CR (3 month LIBOR + 3.120%) 3.304%, 07/15/2031 (B)(E) | 670,000 | 641,591 | |||
| Oaktree CLO, Ltd. Series 2019-1A, Class D (3 month LIBOR + 3.800%) 4.022%, 04/22/2030 (B)(E) | 250,000 | 245,134 | |||
| OZLM XI, Ltd. Series 2015-11A, Class CR (3 month LIBOR + 3.600%) 3.805%, 10/30/2030 (B)(E) | 1,000,000 | 1,000,030 | |||
| Rockland Park CLO, Ltd. Series 2021-1A, Class E (3 month LIBOR + 6.250%) 6.412%, 04/20/2034 (B)(E) | 200,000 | 200,130 | |||
| Sculptor CLO XXVI, Ltd. Series 26A, Class E (3 month LIBOR + 7.250%) 7.412%, 07/20/2034 (B)(E) | 390,000 | 389,946 | |||
| The accompanying notes are an integral part of the financial statements. | 45 |
| Shares or Principal Amount | Value | ||||
| ASSET BACKED SECURITIES (continued) | |||||
| Shackleton CLO, Ltd. Series 2013-3A, Class DR (3 month LIBOR + 3.020%) 3.261%, 07/15/2030 (B)(E) | $ | 500,000 | $ | 480,463 | |
| Symphony CLO, Ltd. Series 2020-22A, Class D (3 month LIBOR + 3.150%) 3.340%, 04/18/2033 (B)(E) | 500,000 | 500,212 | |||
| TCI-Symphony CLO, Ltd. Series 2016-1A, Class DR (3 month LIBOR + 3.000%) 3.225%, 10/13/2029 (B)(E) | 540,000 | 540,056 | |||
| Voya CLO, Ltd. Series 2017-1A, Class C (3 month LIBOR + 3.330%) 3.553%, 04/17/2030 (B)(E) | 500,000 | 497,813 | |||
| Zais CLO, Ltd. Series 2020-16A, Class D1 (3 month LIBOR + 5.480%) 5.770%, 10/20/2031 (B)(E) | 250,000 | 250,362 | |||
| TOTAL ASSET BACKED SECURITIES (Cost $13,903,887) | $ | 14,002,852 | |||
| COMMON STOCKS – 0.8% | |||||
| Communication services – 0.0% | |||||
| New Cotai, Inc., Class B (I)(J)(K) | 11 | 0 | |||
| Consumer discretionary – 0.1% | |||||
| Party City Holdco, Inc. (K) | 14,839 | 101,054 | |||
| Energy – 0.7% | |||||
| Berry Corp. | 110,224 | 661,344 | |||
| Hercules Offshore, Inc. (I)(K) | 120,022 | 3,424 | |||
| KCAD Holdings I, Ltd. (I)(J)(K) | 752,218,031 | 752 | |||
| MWO Holdings LLC (I)(J)(K) | 1,134 | 8,584 | |||
| Oasis Petroleum, Inc. | 9,426 | 816,197 | |||
| Permian Production (K) | 35,417 | 1,771 | |||
| Southwestern Energy Company (K) | 124,047 | 564,414 | |||
| 2,056,486 | |||||
| TOTAL COMMON STOCKS (Cost $21,173,472) | $ | 2,157,540 | |||
| PREFERRED SECURITIES – 0.7% | |||||
| Energy – 0.4% | |||||
| MPLX LP, 8.461% | 17,615 | 587,989 | |||
| Targa Resources Corp., 9.500% | 500 | 536,790 | |||
| 1,124,779 | |||||
| Financials – 0.3% | |||||
| B. Riley Financial, Inc., 5.250% | 13,100 | 323,439 | |||
| B. Riley Financial, Inc., 6.000% | 11,650 | 301,153 | |||
| B. Riley Financial, Inc., 6.875% | 6,325 | 161,983 | |||
| GMAC Capital Trust I (3 month LIBOR + 5.785%), 5.910% (E) | 3,133 | 82,461 | |||
| 869,036 | |||||
| TOTAL PREFERRED SECURITIES (Cost $1,955,821) | $ | 1,993,815 | |||
| SHORT-TERM INVESTMENTS – 1.5% | |||||
| Short-term funds – 1.5% | |||||
| John Hancock Collateral Trust, 0.0356% (L)(M) | 383,079 | 3,833,513 | |||
| State Street Institutional Treasury Plus Money Market Fund, Premier Class, 0.0101% (L) | 434,965 | 434,965 | |||
| TOTAL SHORT-TERM INVESTMENTS (Cost $4,267,780) | $ | 4,268,478 | |||
| Total Investments (High Yield Fund) (Cost $293,097,879) – 99.4% | $ | 277,708,261 | |||
| Other assets and liabilities, net – 0.6% | 1,646,110 | ||||
| TOTAL NET ASSETS – 100.0% | $ | 279,354,371 | |||
| Currency Abbreviations | |
| BRL | Brazilian Real |
| CAD | Canadian Dollar |
| GBP | Pound Sterling |
| IDR | Indonesian Rupiah |
| Security Abbreviations and Legend | |
| CMT | Constant Maturity Treasury |
| LIBOR | London Interbank Offered Rate |
| PIK | Pay-in-Kind Security - Represents a payment-in-kind which may pay interest in additional par and/or cash. Rates shown are the current rate and most recent payment rate. |
| (A) | Non-income producing - Issuer is in default. |
| (B) | These securities are exempt from registration under Rule 144A of the Securities Act of 1933. Such securities may be resold, normally to qualified institutional buyers, in transactions exempt from registration. Rule 144A securities amounted to $194,727,219 or 69.7% of the fund's net assets as of 8-31-21. |
| (C) | Security purchased or sold on a when-issued or delayed delivery basis. |
| (D) | All or a portion of this security is on loan as of 8-31-21. |
| (E) | Variable rate obligation. The coupon rate shown represents the rate at period end. |
| (F) | Perpetual bonds have no stated maturity date. Date shown as maturity date is next call date. |
| (G) | Zero coupon bonds are issued at a discount from their principal amount in lieu of paying interest periodically. Rate shown is the effective yield at period end. |
| (H) | Term loans are variable rate obligations. The coupon rate shown represents the rate at period end. |
| (I) | Security is valued using significant unobservable inputs and is classified as Level 3 in the fair value hierarchy. Refer to Note 2 to the financial statements. |
| (J) | Restricted security as to resale, excluding 144A securities. For more information on this security refer to the Notes to financial statements. |
| (K) | Non-income producing security. |
| (L) | The rate shown is the annualized seven-day yield as of 8-31-21. |
| (M) | Investment is an affiliate of the fund, the advisor and/or subadvisor. This security represents the investment of cash collateral received for securities lending. |
| The accompanying notes are an integral part of the financial statements. | 46 |
| Open contracts | Number of contracts | Position | Expiration date | Notional basis^ | Notional value^ | Unrealized appreciation (depreciation) |
| 5-Year U.S. Treasury Note Futures | 156 | Long | Dec 2021 | $19,275,587 | $19,300,125 | $24,538 |
| $24,538 |
| Contract to buy | Contract to sell | Counterparty (OTC) | Contractual settlement date | Unrealized appreciation | Unrealized depreciation | ||
| GBP | 587,667 | USD | 813,901 | MSCS | 10/19/2021 | — | $(5,861) |
| MXN | 3,526,523 | USD | 174,507 | MSCS | 10/19/2021 | — | (15) |
| USD | 72,596 | CAD | 91,114 | JPM | 10/19/2021 | $383 | — |
| USD | 902,715 | CAD | 1,132,731 | MSCS | 10/19/2021 | 4,965 | — |
| USD | 76,024 | EUR | 64,004 | BNP | 10/19/2021 | 382 | — |
| USD | 225,970 | EUR | 190,000 | MSCS | 10/19/2021 | 1,421 | — |
| $7,151 | $(5,876) | ||||||
| Credit default swaps - Seller | |||||||||||
| Counterparty (OTC)/ Centrally cleared | Reference obligation | Implied credit spread | Notional amount | Currency | USD notional amount | Received fixed rate | Fixed payment frequency | Maturity date | Unamortized upfront payment paid (received) | Unrealized appreciation (depreciation) | Value |
| Centrally cleared | Ford Motor Credit Company LLC | 1.075% | 400,000 | USD | $400,000 | 5.000% | Quarterly | Jun 2023 | $(15,683) | $47,902 | $32,219 |
| Centrally cleared | Occidental Petroleum Corp. | 1.714% | 810,000 | USD | 810,000 | 1.000% | Quarterly | Jun 2026 | (35,771) | 11,023 | (24,748) |
| $1,210,000 | $(51,454) | $58,925 | $7,471 | ||||||||
| Derivatives Currency Abbreviations | |
| CAD | Canadian Dollar |
| EUR | Euro |
| GBP | Pound Sterling |
| MXN | Mexican Peso |
| USD | U.S. Dollar |
| Derivatives Abbreviations | |
| BNP | BNP Paribas |
| JPM | JPMorgan Chase Bank, N.A. |
| MSCS | Morgan Stanley Capital Services LLC |
| OTC | Over-the-counter |
| Shares or Principal Amount | Value | ||||
| COMMON STOCKS - 88.3% | |||||
| Australia - 4.4% | |||||
| Afterpay, Ltd. (A) | 13,112 | $ | 1,275,398 | ||
| AGL Energy, Ltd. | 37,319 | 175,577 | |||
| Ampol, Ltd. | 14,183 | 284,835 | |||
| APA Group | 70,262 | 470,480 | |||
| Aristocrat Leisure, Ltd. | 34,793 | 1,154,804 | |||
| ASX, Ltd. | 11,783 | 754,137 | |||
| Aurizon Holdings, Ltd. | 113,524 | 312,331 | |||
| AusNet Services, Ltd. | 109,938 | 155,269 | |||
| Australia & New Zealand Banking Group, Ltd. | 171,384 | 3,468,848 | |||
| BHP Group PLC | 141,395 | 4,396,825 | |||
| Shares or Principal Amount | Value | ||||
| COMMON STOCKS (continued) | |||||
| Australia (continued) | |||||
| BHP Group, Ltd. | 177,855 | $ | 5,884,625 | ||
| BlueScope Steel, Ltd. | 30,315 | 554,229 | |||
| Brambles, Ltd. | 88,874 | 785,584 | |||
| Cochlear, Ltd. | 3,956 | 671,953 | |||
| Coles Group, Ltd. | 80,239 | 1,058,934 | |||
| Commonwealth Bank of Australia | 107,218 | 7,812,137 | |||
| Computershare, Ltd. | 32,896 | 395,298 | |||
| Crown Resorts, Ltd. (A) | 23,047 | 156,322 | |||
| CSL, Ltd. | 27,466 | 6,246,951 | |||
| The accompanying notes are an integral part of the financial statements. | 47 |
| Shares or Principal Amount | Value | ||||
| COMMON STOCKS (continued) | |||||
| Australia (continued) | |||||
| Dexus | 65,577 | $ | 510,322 | ||
| Domino's Pizza Enterprises, Ltd. | 3,634 | 415,285 | |||
| Endeavour Group, Ltd. (A) | 80,494 | 429,863 | |||
| Evolution Mining, Ltd. | 101,732 | 290,269 | |||
| Fortescue Metals Group, Ltd. | 102,073 | 1,556,130 | |||
| Goodman Group | 100,506 | 1,697,560 | |||
| Insurance Australia Group, Ltd. | 153,587 | 586,467 | |||
| Lendlease Corp., Ltd. | 41,321 | 359,043 | |||
| Macquarie Group, Ltd. | 20,894 | 2,535,919 | |||
| Magellan Financial Group, Ltd. | 8,550 | 269,639 | |||
| Medibank Private, Ltd. | 169,845 | 440,036 | |||
| Mirvac Group | 238,402 | 542,934 | |||
| MMG, Ltd. (A) | 172,000 | 82,842 | |||
| National Australia Bank, Ltd. | 199,194 | 4,015,984 | |||
| Newcrest Mining, Ltd. | 49,187 | 888,062 | |||
| Northern Star Resources, Ltd. | 66,238 | 471,213 | |||
| Oil Search, Ltd. | 118,420 | 320,890 | |||
| Orica, Ltd. | 24,951 | 238,722 | |||
| Origin Energy, Ltd. | 106,213 | 343,312 | |||
| Qantas Airways, Ltd. (A) | 57,116 | 211,484 | |||
| QBE Insurance Group, Ltd. | 92,118 | 792,702 | |||
| Ramsay Health Care, Ltd. | 11,052 | 554,953 | |||
| REA Group, Ltd. | 3,163 | 353,998 | |||
| Reece, Ltd. | 17,464 | 265,781 | |||
| Rio Tinto, Ltd. | 22,451 | 1,826,730 | |||
| Santos, Ltd. | 112,943 | 495,066 | |||
| Scentre Group | 313,190 | 651,396 | |||
| SEEK, Ltd. | 20,133 | 476,911 | |||
| Sonic Healthcare, Ltd. | 27,418 | 868,034 | |||
| South32, Ltd. | 286,858 | 653,763 | |||
| Stockland | 144,160 | 485,804 | |||
| Suncorp Group, Ltd. | 80,266 | 730,343 | |||
| Sydney Airport (A) | 80,372 | 466,572 | |||
| Tabcorp Holdings, Ltd. | 133,288 | 464,229 | |||
| Telstra Corp., Ltd. | 251,544 | 705,220 | |||
| The GPT Group | 117,149 | 414,738 | |||
| Transurban Group | 165,293 | 1,710,829 | |||
| Treasury Wine Estates, Ltd. | 43,650 | 402,029 | |||
| Vicinity Centres | 232,946 | 294,085 | |||
| Washington H. Soul Pattinson & Company, Ltd. | 6,449 | 168,148 | |||
| Wesfarmers, Ltd. | 68,381 | 2,986,644 | |||
| Westpac Banking Corp. | 221,133 | 4,160,296 | |||
| WiseTech Global, Ltd. | 8,801 | 309,365 | |||
| Woodside Petroleum, Ltd. | 57,713 | 816,092 | |||
| Woolworths Group, Ltd. | 76,185 | 2,319,070 | |||
| 75,593,311 | |||||
| Austria - 0.2% | |||||
| Erste Group Bank AG | 25,131 | 1,003,460 | |||
| OMV AG | 13,134 | 727,501 | |||
| Raiffeisen Bank International AG | 13,004 | 311,788 | |||
| Verbund AG | 6,065 | 664,377 | |||
| voestalpine AG | 10,334 | 469,111 | |||
| 3,176,237 | |||||
| Belgium - 0.7% | |||||
| Ageas SA/NV | 14,779 | 738,550 | |||
| Anheuser-Busch InBev SA/NV | 60,496 | 3,710,353 | |||
| Elia Group SA/NV | 2,342 | 294,145 | |||
| Etablissements Franz Colruyt NV | 4,219 | 236,170 | |||
| Groupe Bruxelles Lambert SA | 9,007 | 1,031,895 | |||
| KBC Group NV | 19,696 | 1,655,250 | |||
| Proximus SADP | 11,969 | 234,669 | |||
| Sofina SA | 1,229 | 543,299 | |||
| Shares or Principal Amount | Value | ||||
| COMMON STOCKS (continued) | |||||
| Belgium (continued) | |||||
| Solvay SA | 5,844 | $ | 764,925 | ||
| UCB SA | 10,051 | 1,149,924 | |||
| Umicore SA | 15,495 | 1,019,601 | |||
| 11,378,781 | |||||
| Brazil - 1.0% | |||||
| Ambev SA | 284,200 | 939,858 | |||
| Americanas SA (A) | 23,210 | 185,651 | |||
| Atacadao SA | 29,200 | 102,495 | |||
| B3 SA - Brasil Bolsa Balcao | 372,760 | 1,014,298 | |||
| Banco Bradesco SA | 86,508 | 333,598 | |||
| Banco BTG Pactual SA | 68,600 | 374,920 | |||
| Banco do Brasil SA | 52,000 | 306,018 | |||
| Banco Inter SA | 20,600 | 270,069 | |||
| Banco Santander Brasil SA | 24,700 | 200,340 | |||
| BB Seguridade Participacoes SA | 45,900 | 169,191 | |||
| BRF SA (A) | 39,300 | 178,001 | |||
| CCR SA | 72,400 | 171,521 | |||
| Centrais Eletricas Brasileiras SA | 19,100 | 138,998 | |||
| Cia de Saneamento Basico do Estado de Sao Paulo | 20,700 | 144,637 | |||
| Cia Siderurgica Nacional SA | 41,600 | 280,455 | |||
| Cosan SA | 62,100 | 264,815 | |||
| CPFL Energia SA | 13,800 | 77,503 | |||
| Energisa SA | 10,500 | 90,099 | |||
| Engie Brasil Energia SA | 11,125 | 80,789 | |||
| Equatorial Energia SA | 54,200 | 266,765 | |||
| Hapvida Participacoes e Investimentos SA (B) | 66,900 | 190,448 | |||
| Hypera SA | 22,900 | 157,529 | |||
| JBS SA | 63,200 | 380,975 | |||
| Klabin SA (A) | 42,500 | 216,248 | |||
| Localiza Rent a Car SA | 36,545 | 391,968 | |||
| Lojas Renner SA | 53,839 | 396,285 | |||
| Magazine Luiza SA | 175,400 | 618,724 | |||
| Natura & Company Holding SA (A) | 53,500 | 534,090 | |||
| Notre Dame Intermedica Participacoes SA | 31,200 | 482,349 | |||
| Petrobras Distribuidora SA | 70,100 | 368,612 | |||
| Petroleo Brasileiro SA | 224,200 | 1,210,579 | |||
| Raia Drogasil SA | 63,600 | 314,384 | |||
| Rede D'Or Sao Luiz SA (B) | 14,200 | 188,993 | |||
| Rumo SA (A) | 77,300 | 279,851 | |||
| Suzano SA (A) | 44,827 | 528,825 | |||
| Telefonica Brasil SA | 30,100 | 254,559 | |||
| TIM SA | 50,400 | 121,448 | |||
| TOTVS SA | 29,300 | 224,391 | |||
| Ultrapar Participacoes SA | 43,500 | 121,478 | |||
| Vale SA | 238,070 | 4,543,349 | |||
| Via S/A (A) | 76,800 | 154,319 | |||
| WEG SA | 101,040 | 694,860 | |||
| 17,964,285 | |||||
| Canada - 6.3% | |||||
| Agnico Eagle Mines, Ltd. | 13,943 | 802,332 | |||
| Air Canada (A) | 9,985 | 193,978 | |||
| Algonquin Power & Utilities Corp. | 35,796 | 555,815 | |||
| Alimentation Couche-Tard, Inc., Class B | 48,732 | 1,969,134 | |||
| AltaGas, Ltd. | 17,057 | 341,640 | |||
| Atco, Ltd., Class I | 5,131 | 172,640 | |||
| B2Gold Corp. | 62,263 | 240,830 | |||
| Ballard Power Systems, Inc. (A) | 13,753 | 231,751 | |||
| Bank of Montreal | 37,341 | 3,716,194 | |||
| Barrick Gold Corp. | 101,962 | 2,049,504 | |||
| BCE, Inc. | 5,129 | 267,497 | |||
| BlackBerry, Ltd. (A) | 30,718 | 350,117 | |||
| The accompanying notes are an integral part of the financial statements. | 48 |
| Shares or Principal Amount | Value | ||||
| COMMON STOCKS (continued) | |||||
| Canada (continued) | |||||
| Brookfield Asset Management Reinsurance Partners, Ltd., Class A (A) | 513 | $ | 31,350 | ||
| Brookfield Asset Management, Inc., Class A | 73,747 | 4,102,803 | |||
| CAE, Inc. (A) | 16,481 | 475,887 | |||
| Cameco Corp. | 22,792 | 421,101 | |||
| Canadian Apartment Properties REIT | 5,208 | 252,258 | |||
| Canadian Imperial Bank of Commerce | 25,956 | 2,985,974 | |||
| Canadian National Railway Company | 40,855 | 4,805,518 | |||
| Canadian Natural Resources, Ltd. | 67,788 | 2,243,212 | |||
| Canadian Pacific Railway, Ltd. | 38,399 | 2,638,457 | |||
| Canadian Tire Corp., Ltd., Class A | 3,421 | 520,613 | |||
| Canadian Utilities, Ltd., Class A | 8,253 | 233,595 | |||
| Canopy Growth Corp. (A) | 13,086 | 225,179 | |||
| CCL Industries, Inc., Class B | 8,889 | 507,419 | |||
| Cenovus Energy, Inc. | 75,426 | 625,934 | |||
| CGI, Inc. (A) | 13,095 | 1,170,366 | |||
| CI Financial Corp. | 1,530 | 29,699 | |||
| Constellation Software, Inc. | 1,156 | 1,959,139 | |||
| Dollarama, Inc. | 16,993 | 774,864 | |||
| Emera, Inc. | 14,872 | 702,078 | |||
| Empire Company, Ltd., Class A | 10,100 | 326,620 | |||
| Enbridge, Inc. | 116,373 | 4,579,653 | |||
| Fairfax Financial Holdings, Ltd. | 1,628 | 720,635 | |||
| First Capital Real Estate Investment Trust | 895 | 12,783 | |||
| First Quantum Minerals, Ltd. | 33,771 | 703,445 | |||
| FirstService Corp. | 2,299 | 426,982 | |||
| Fortis, Inc. | 27,467 | 1,258,346 | |||
| Franco-Nevada Corp. | 10,933 | 1,594,910 | |||
| George Weston, Ltd. | 4,492 | 484,217 | |||
| GFL Environmental, Inc. | 9,011 | 317,472 | |||
| Gildan Activewear, Inc. | 11,742 | 451,383 | |||
| Great-West Lifeco, Inc. | 19,183 | 593,439 | |||
| Hydro One, Ltd. (B) | 19,778 | 492,236 | |||
| iA Financial Corp., Inc. | 7,089 | 393,094 | |||
| IGM Financial, Inc. | 5,658 | 206,337 | |||
| Imperial Oil, Ltd. | 15,021 | 397,536 | |||
| Intact Financial Corp. | 9,306 | 1,267,428 | |||
| Inter Pipeline, Ltd. | 22,716 | 360,100 | |||
| Ivanhoe Mines, Ltd., Class A (A) | 34,886 | 281,488 | |||
| Keyera Corp. | 13,054 | 314,335 | |||
| Kinross Gold Corp. | 73,835 | 444,186 | |||
| Kirkland Lake Gold, Ltd. | 15,353 | 612,222 | |||
| Lightspeed Commerce, Inc. (A) | 5,582 | 619,677 | |||
| Loblaw Companies, Ltd. | 10,457 | 736,752 | |||
| Lundin Mining Corp. | 38,835 | 313,967 | |||
| Magna International, Inc. | 16,572 | 1,308,658 | |||
| Metro, Inc. | 14,610 | 744,251 | |||
| National Bank of Canada | 19,541 | 1,551,013 | |||
| Northland Power, Inc. | 13,099 | 433,363 | |||
| Nutrien, Ltd. | 32,926 | 2,001,684 | |||
| Nuvei Corp. (A) | 3,282 | 425,400 | |||
| Onex Corp. | 4,922 | 344,870 | |||
| Open Text Corp. | 16,040 | 879,902 | |||
| Pan American Silver Corp. | 12,044 | 312,734 | |||
| Parkland Corp. | 8,778 | 262,091 | |||
| Pembina Pipeline Corp. | 31,779 | 968,496 | |||
| Power Corp. of Canada | 34,551 | 1,192,368 | |||
| Quebecor, Inc., Class B | 10,098 | 251,960 | |||
| Restaurant Brands International, Inc. | 15,930 | 1,023,490 | |||
| RioCan Real Estate Investment Trust | 10,317 | 183,255 | |||
| Ritchie Brothers Auctioneers, Inc. | 6,387 | 400,184 | |||
| Rogers Communications, Inc., Class B | 20,762 | 1,057,806 | |||
| Royal Bank of Canada | 82,032 | 8,426,542 | |||
| Shares or Principal Amount | Value | ||||
| COMMON STOCKS (continued) | |||||
| Canada (continued) | |||||
| Saputo, Inc. | 14,564 | $ | 409,683 | ||
| Shaw Communications, Inc., Class B | 27,015 | 795,044 | |||
| Shopify, Inc., Class A (A) | 6,421 | 9,805,124 | |||
| SmartCentres Real Estate Investment Trust | 892 | 21,571 | |||
| Sun Life Financial, Inc. | 36,193 | 1,863,510 | |||
| Suncor Energy, Inc. | 87,731 | 1,638,285 | |||
| TC Energy Corp. | 54,166 | 2,571,667 | |||
| Teck Resources, Ltd., Class B | 27,083 | 610,717 | |||
| TELUS Corp. | 25,709 | 592,368 | |||
| The Bank of Nova Scotia | 69,993 | 4,335,555 | |||
| The Toronto-Dominion Bank | 104,160 | 6,764,022 | |||
| Thomson Reuters Corp. | 10,275 | 1,200,603 | |||
| TMX Group, Ltd. | 3,446 | 379,111 | |||
| Toromont Industries, Ltd. | 4,859 | 408,547 | |||
| West Fraser Timber Company, Ltd. | 4,993 | 385,541 | |||
| Wheaton Precious Metals Corp. | 25,727 | 1,159,464 | |||
| WSP Global, Inc. | 6,601 | 861,874 | |||
| Yamana Gold, Inc. | 57,062 | 251,920 | |||
| 109,328,794 | |||||
| Chile - 0.1% | |||||
| Antofagasta PLC | 26,552 | 531,888 | |||
| Banco de Chile | 2,819,023 | 275,474 | |||
| Banco de Credito e Inversiones SA | 3,306 | 143,208 | |||
| Banco Santander Chile | 3,894,414 | 205,781 | |||
| Cencosud SA | 91,038 | 171,760 | |||
| Cencosud Shopping SA | 33,996 | 48,324 | |||
| Cia Cervecerias Unidas SA | 9,179 | 92,639 | |||
| Colbun SA | 482,702 | 79,899 | |||
| Empresas CMPC SA | 71,446 | 158,708 | |||
| Empresas COPEC SA | 24,599 | 228,842 | |||
| Enel Americas SA | 1,365,763 | 191,916 | |||
| Enel Chile SA | 1,697,251 | 86,634 | |||
| Falabella SA | 47,477 | 188,044 | |||
| 2,403,117 | |||||
| China - 7.6% | |||||
| 21Vianet Group, Inc., ADR (A) | 5,200 | 102,908 | |||
| 360 DigiTech, Inc., ADR (A) | 5,100 | 116,280 | |||
| 3SBio, Inc. (A)(B) | 75,600 | 84,221 | |||
| 51job, Inc., ADR (A) | 1,800 | 138,240 | |||
| AAC Technologies Holdings, Inc. | 43,100 | 238,932 | |||
| Agile Group Holdings, Ltd. | 69,900 | 80,160 | |||
| Agora, Inc., ADR (A) | 2,900 | 98,368 | |||
| Agricultural Bank of China, Ltd., H Shares | 1,548,200 | 519,015 | |||
| Air China, Ltd., H Shares (A) | 105,300 | 70,622 | |||
| Airtac International Group | 8,000 | 243,515 | |||
| Akeso, Inc. (A)(B) | 17,000 | 88,048 | |||
| Alibaba Group Holding, Ltd. (A) | 895,600 | 18,753,497 | |||
| A-Living Smart City Services Company, Ltd. (B) | 33,000 | 131,153 | |||
| Aluminum Corp. of China, Ltd., H Shares (A) | 234,600 | 170,237 | |||
| Anhui Conch Cement Company, Ltd., H Shares | 73,600 | 398,221 | |||
| Anhui Gujing Distillery Company, Ltd., B Shares | 6,200 | 75,661 | |||
| ANTA Sports Products, Ltd. | 63,500 | 1,304,345 | |||
| Autohome, Inc., ADR | 4,100 | 181,466 | |||
| AviChina Industry & Technology Company, Ltd., H Shares | 147,000 | 123,003 | |||
| Baidu, Inc., ADR (A) | 15,900 | 2,496,618 | |||
| Bank of China, Ltd., H Shares | 4,719,600 | 1,653,906 | |||
| Bank of Communications Company, Ltd., H Shares | 512,900 | 294,560 | |||
| The accompanying notes are an integral part of the financial statements. | 49 |
| Shares or Principal Amount | Value | ||||
| COMMON STOCKS (continued) | |||||
| China (continued) | |||||
| Baozun, Inc., ADR (A) | 3,600 | $ | 86,688 | ||
| BeiGene, Ltd., ADR (A) | 2,700 | 832,410 | |||
| Beijing Capital International Airport Company, Ltd., H Shares (A) | 108,900 | 65,558 | |||
| Bilibili, Inc., ADR (A) | 9,500 | 762,185 | |||
| Burning Rock Biotech, Ltd., ADR (A) | 2,600 | 48,438 | |||
| BYD Company, Ltd., H Shares | 46,500 | 1,563,289 | |||
| BYD Electronic International Company, Ltd. | 39,900 | 182,518 | |||
| CanSino Biologics, Inc., H Shares (A)(B)(C) | 4,800 | 189,691 | |||
| China Aoyuan Group, Ltd. | 72,000 | 43,047 | |||
| China Bohai Bank Company, Ltd., H Shares (B) | 148,500 | 60,117 | |||
| China Cinda Asset Management Company, Ltd., H Shares | 567,200 | 100,599 | |||
| China CITIC Bank Corp., Ltd., H Shares | 530,000 | 243,654 | |||
| China Communications Services Corp., Ltd., H Shares | 149,200 | 79,285 | |||
| China Conch Venture Holdings, Ltd. | 96,300 | 394,139 | |||
| China Construction Bank Corp., H Shares | 5,694,500 | 4,103,218 | |||
| China East Education Holdings, Ltd. (A)(B) | 31,500 | 33,797 | |||
| China Everbright Bank Company, Ltd., H Shares | 180,000 | 64,516 | |||
| China Evergrande Group (C) | 117,900 | 66,161 | |||
| China Feihe, Ltd. (B) | 210,000 | 379,475 | |||
| China Galaxy Securities Company, Ltd., H Shares | 223,000 | 125,183 | |||
| China Hongqiao Group, Ltd. | 135,500 | 200,977 | |||
| China Huarong Asset Management Company, Ltd., H Shares (A)(B)(D) | 650,600 | 42,663 | |||
| China Huishan Dairy Holdings Company, Ltd. (A)(D) | 175,000 | 0 | |||
| China International Capital Corp., Ltd., H Shares (B) | 85,600 | 199,043 | |||
| China Lesso Group Holdings, Ltd. | 64,000 | 136,982 | |||
| China Life Insurance Company, Ltd., H Shares | 458,200 | 768,289 | |||
| China Literature, Ltd. (A)(B)(C) | 23,800 | 200,192 | |||
| China Longyuan Power Group Corp., Ltd., H Shares | 197,700 | 402,942 | |||
| China Medical System Holdings, Ltd. | 80,300 | 157,610 | |||
| China Meidong Auto Holdings, Ltd. | 32,000 | 160,507 | |||
| China Merchants Bank Company, Ltd., H Shares | 229,700 | 1,894,476 | |||
| China Minsheng Banking Corp., Ltd., H Shares (C) | 327,020 | 136,574 | |||
| China Molybdenum Company, Ltd., H Shares | 192,100 | 149,870 | |||
| China National Building Material Company, Ltd., H Shares | 229,700 | 313,678 | |||
| China Oilfield Services, Ltd., H Shares | 108,000 | 93,813 | |||
| China Pacific Insurance Group Company, Ltd., H Shares | 162,400 | 457,703 | |||
| China Petroleum & Chemical Corp., H Shares | 1,437,300 | 691,539 | |||
| China Railway Group, Ltd., H Shares | 235,600 | 112,835 | |||
| China Resources Mixc Lifestyle Services, Ltd. (B) | 20,200 | 106,012 | |||
| China Resources Pharmaceutical Group, Ltd. (B) | 99,600 | 51,798 | |||
| China Shenhua Energy Company, Ltd., H Shares | 201,000 | 444,473 | |||
| Shares or Principal Amount | Value | ||||
| COMMON STOCKS (continued) | |||||
| China (continued) | |||||
| China Southern Airlines Company, Ltd., H Shares (A) | 100,800 | $ | 58,626 | ||
| China Tower Corp., Ltd., H Shares (B) | 2,480,000 | 325,294 | |||
| China Vanke Company, Ltd., H Shares | 100,300 | 270,625 | |||
| China Yuhua Education Corp., Ltd. (B) | 88,000 | 47,023 | |||
| Chindata Group Holdings, Ltd., ADR (A) | 5,100 | 60,588 | |||
| Chongqing Rural Commercial Bank Company, Ltd., H Shares | 144,700 | 55,354 | |||
| CIFI Ever Sunshine Services Group, Ltd. | 44,000 | 90,893 | |||
| CIFI Holdings Group Company, Ltd. | 196,000 | 131,756 | |||
| CITIC Securities Company, Ltd., H Shares | 136,200 | 344,964 | |||
| CITIC, Ltd. | 351,600 | 436,839 | |||
| COSCO SHIPPING Holdings Company, Ltd., H Shares (A)(C) | 198,600 | 374,835 | |||
| Country Garden Holdings Company, Ltd. | 458,300 | 506,559 | |||
| Country Garden Services Holdings Company, Ltd. | 87,000 | 663,872 | |||
| CSPC Pharmaceutical Group, Ltd. | 530,096 | 672,481 | |||
| Dada Nexus, Ltd., ADR (A) | 3,500 | 82,880 | |||
| Dali Foods Group Company, Ltd. (B) | 118,000 | 66,095 | |||
| Daqo New Energy Corp., ADR (A) | 3,100 | 190,061 | |||
| Dongfeng Motor Group Company, Ltd., H Shares | 163,300 | 178,812 | |||
| DouYu International Holdings, Ltd., ADR (A) | 5,600 | 23,968 | |||
| ENN Energy Holdings, Ltd. | 46,600 | 922,105 | |||
| Flat Glass Group Company, Ltd., H Shares (C) | 24,000 | 140,277 | |||
| Fosun International, Ltd. | 152,000 | 192,264 | |||
| Fuyao Glass Industry Group Company, Ltd., H Shares (B) | 35,300 | 217,229 | |||
| Ganfeng Lithium Company, Ltd., H Shares (B) | 15,400 | 354,810 | |||
| Gaotu Techedu, Inc., ADR (A)(C) | 7,200 | 20,736 | |||
| GDS Holdings, Ltd., ADR (A) | 5,200 | 304,096 | |||
| Genscript Biotech Corp. (A) | 66,000 | 313,780 | |||
| GF Securities Company, Ltd., H Shares | 68,000 | 120,839 | |||
| GOME Retail Holdings, Ltd. (A) | 686,200 | 74,144 | |||
| Great Wall Motor Company, Ltd., H Shares | 183,400 | 845,900 | |||
| Greentown China Holdings, Ltd. | 51,000 | 78,232 | |||
| Greentown Service Group Company, Ltd. | 84,000 | 89,828 | |||
| Guangzhou Automobile Group Company, Ltd., H Shares | 173,080 | 174,260 | |||
| Guangzhou R&F Properties Company, Ltd., H Shares | 102,000 | 86,966 | |||
| Guotai Junan Securities Company, Ltd., H Shares (B) | 7,400 | 10,342 | |||
| Haidilao International Holding, Ltd. (B) | 62,000 | 253,033 | |||
| Haier Smart Home Company, Ltd., H Shares | 115,120 | 433,658 | |||
| Haitian International Holdings, Ltd. | 38,400 | 146,824 | |||
| Haitong Securities Company, Ltd., H Shares | 166,500 | 153,834 | |||
| Hangzhou Tigermed Consulting Company, Ltd., H Shares (B) | 7,300 | 129,522 | |||
| Hansoh Pharmaceutical Group Company, Ltd. (B) | 70,000 | 190,858 | |||
| Hello Group, Inc., ADR | 9,500 | 124,830 | |||
| Hengan International Group Company, Ltd. | 38,600 | 223,536 | |||
| HengTen Networks Group, Ltd. (A)(C) | 164,000 | 80,482 | |||
| Hua Hong Semiconductor, Ltd. (A)(B) | 31,000 | 182,443 | |||
| Huaneng Power International, Inc., H Shares | 211,700 | 102,403 | |||
| The accompanying notes are an integral part of the financial statements. | 50 |
| Shares or Principal Amount | Value | ||||
| COMMON STOCKS (continued) | |||||
| China (continued) | |||||
| Huatai Securities Company, Ltd., H Shares (B) | 97,300 | $ | 139,569 | ||
| Huazhu Group, Ltd., ADR (A) | 10,500 | 507,045 | |||
| HUYA, Inc., ADR (A) | 4,700 | 50,243 | |||
| I-Mab, ADR (A) | 1,900 | 134,748 | |||
| Industrial & Commercial Bank of China, Ltd., H Shares | 3,333,800 | 1,856,508 | |||
| Innovent Biologics, Inc. (A)(B) | 68,500 | 553,114 | |||
| iQIYI, Inc., ADR (A) | 16,600 | 150,396 | |||
| JD Health International, Inc. (A)(B) | 16,900 | 158,121 | |||
| JD.com, Inc., ADR (A) | 51,100 | 4,014,416 | |||
| Jiangsu Expressway Company, Ltd., H Shares | 72,900 | 75,623 | |||
| Jiangxi Copper Company, Ltd., H Shares | 65,400 | 132,332 | |||
| Jinxin Fertility Group, Ltd. (A)(B) | 74,000 | 117,589 | |||
| Jiumaojiu International Holdings, Ltd. (B) | 42,000 | 140,964 | |||
| Kaisa Group Holdings, Ltd. (A) | 168,000 | 55,921 | |||
| KE Holdings, Inc., ADR (A) | 21,000 | 379,890 | |||
| Kingdee International Software Group Company, Ltd. (A) | 153,000 | 557,131 | |||
| Kingsoft Cloud Holdings, Ltd., ADR (A)(C) | 3,200 | 103,008 | |||
| Kingsoft Corp., Ltd. | 56,600 | 227,044 | |||
| Kuaishou Technology (A)(B)(C) | 15,900 | 173,489 | |||
| KWG Group Holdings, Ltd. | 76,000 | 80,012 | |||
| Lenovo Group, Ltd. | 428,000 | 472,098 | |||
| Li Auto, Inc., ADR (A) | 27,900 | 860,994 | |||
| Li Ning Company, Ltd. | 132,500 | 1,776,796 | |||
| Logan Group Company, Ltd. | 81,000 | 96,549 | |||
| Longfor Group Holdings, Ltd. (B) | 107,400 | 464,754 | |||
| Lufax Holding, Ltd., ADR (A) | 10,400 | 90,168 | |||
| Meituan, Class B (A)(B) | 213,200 | 6,816,979 | |||
| Microport Scientific Corp. | 37,000 | 229,505 | |||
| Ming Yuan Cloud Group Holdings, Ltd. (A) | 22,000 | 76,445 | |||
| Minth Group, Ltd. | 44,000 | 182,613 | |||
| NetEase, Inc., ADR | 23,700 | 2,308,854 | |||
| New China Life Insurance Company, Ltd., H Shares | 57,100 | 168,088 | |||
| New Oriental Education & Technology Group, Inc., ADR (A) | 91,300 | 206,338 | |||
| NIO, Inc., ADR (A) | 76,400 | 3,003,284 | |||
| Noah Holdings, Ltd., ADR (A) | 2,100 | 81,858 | |||
| Nongfu Spring Company, Ltd., H Shares (B) | 23,400 | 123,832 | |||
| OneConnect Financial Technology Company, Ltd., ADR (A) | 6,800 | 31,960 | |||
| PetroChina Company, Ltd., H Shares | 1,248,700 | 545,457 | |||
| Pharmaron Beijing Company, Ltd., H Shares (B) | 7,900 | 175,279 | |||
| PICC Property & Casualty Company, Ltd., H Shares | 430,950 | 389,627 | |||
| Pinduoduo, Inc., ADR (A) | 25,900 | 2,590,518 | |||
| Ping An Healthcare and Technology Company, Ltd. (A)(B)(C) | 27,000 | 199,545 | |||
| Ping An Insurance Group Company of China, Ltd., H Shares | 374,800 | 2,902,107 | |||
| Poly Property Services Company, Ltd., H Shares | 7,000 | 42,790 | |||
| Postal Savings Bank of China Company, Ltd., H Shares (B) | 474,000 | 341,481 | |||
| Powerlong Real Estate Holdings, Ltd. | 85,000 | 69,053 | |||
| RLX Technology, Inc., ADR (A)(C) | 7,900 | 40,606 | |||
| Shares or Principal Amount | Value | ||||
| COMMON STOCKS (continued) | |||||
| China (continued) | |||||
| Sany Heavy Equipment International Holdings Company, Ltd. | 64,000 | $ | 82,242 | ||
| Seazen Group, Ltd. (A) | 128,000 | 113,368 | |||
| Shandong Gold Mining Company, Ltd., H Shares (B) | 36,250 | 58,577 | |||
| Shandong Weigao Group Medical Polymer Company, Ltd., H Shares | 148,000 | 243,524 | |||
| Shanghai Fosun Pharmaceutical Group Company, Ltd., H Shares (C) | 29,600 | 189,888 | |||
| Shanghai Lujiazui Finance & Trade Zone Development Company, Ltd., B Shares | 61,880 | 55,599 | |||
| Shanghai Pharmaceuticals Holding Company, Ltd., H Shares | 47,300 | 93,835 | |||
| Shenzhou International Group Holdings, Ltd. | 48,800 | 1,057,795 | |||
| Shimao Services Holdings, Ltd. (B) | 35,000 | 82,007 | |||
| Silergy Corp. | 5,000 | 715,093 | |||
| Sinopharm Group Company, Ltd., H Shares | 81,100 | 208,711 | |||
| Sinotruk Hong Kong, Ltd. | 42,000 | 82,751 | |||
| Smoore International Holdings, Ltd. (B) | 70,000 | 375,704 | |||
| Sunac China Holdings, Ltd. | 152,300 | 389,403 | |||
| Sunac Services Holdings, Ltd. (B) | 37,000 | 96,392 | |||
| Sunny Optical Technology Group Company, Ltd. | 42,100 | 1,274,013 | |||
| TAL Education Group, ADR (A) | 24,400 | 129,808 | |||
| Tencent Holdings, Ltd. | 340,300 | 21,017,881 | |||
| Tencent Music Entertainment Group, ADR (A) | 39,400 | 348,296 | |||
| The People's Insurance Company Group of China, Ltd., H Shares | 524,200 | 161,703 | |||
| Tingyi Cayman Islands Holding Corp. | 114,700 | 204,252 | |||
| Tongcheng-Elong Holdings, Ltd. (A) | 58,000 | 135,209 | |||
| Topsports International Holdings, Ltd. (B) | 91,000 | 119,985 | |||
| TravelSky Technology, Ltd., H Shares | 55,500 | 103,965 | |||
| Trip.com Group, Ltd., ADR (A) | 30,000 | 914,700 | |||
| Tsingtao Brewery Company, Ltd., H Shares | 31,000 | 253,655 | |||
| Uni-President China Holdings, Ltd. | 75,000 | 70,887 | |||
| UP Fintech Holding, Ltd., ADR (A)(C) | 4,700 | 64,766 | |||
| Venus MedTech Hangzhou, Inc., H Shares (A)(B) | 12,500 | 59,166 | |||
| Vipshop Holdings, Ltd., ADR (A) | 26,400 | 390,456 | |||
| Want Want China Holdings, Ltd. | 286,500 | 194,694 | |||
| Weibo Corp., ADR (A) | 3,680 | 185,914 | |||
| Weichai Power Company, Ltd., H Shares | 114,000 | 287,662 | |||
| Weimob, Inc. (A)(B)(C) | 100,000 | 146,588 | |||
| WuXi AppTec Company, Ltd., H Shares (B) | 19,883 | 396,528 | |||
| Wuxi Biologics Cayman, Inc. (A)(B) | 199,000 | 3,080,910 | |||
| Xiaomi Corp., Class B (A)(B) | 848,800 | 2,736,033 | |||
| Xinjiang Goldwind Science & Technology Company, Ltd., H Shares (C) | 46,000 | 88,186 | |||
| Xinyi Solar Holdings, Ltd. | 286,000 | 692,173 | |||
| XPeng, Inc., ADR (A) | 22,700 | 964,750 | |||
| Yadea Group Holdings, Ltd. (B) | 70,000 | 124,553 | |||
| Yanzhou Coal Mining Company, Ltd., H Shares | 88,700 | 154,616 | |||
| Yihai International Holding, Ltd. (A) | 28,000 | 151,481 | |||
| Yum China Holdings, Inc. | 24,884 | 1,531,859 | |||
| Zai Lab, Ltd., ADR (A) | 4,500 | 650,250 | |||
| Zhaojin Mining Industry Company, Ltd., H Shares | 57,500 | 46,966 | |||
| The accompanying notes are an integral part of the financial statements. | 51 |
| Shares or Principal Amount | Value | ||||
| COMMON STOCKS (continued) | |||||
| China (continued) | |||||
| Zhejiang Expressway Company, Ltd., H Shares | 89,800 | $ | 78,748 | ||
| Zhenro Properties Group, Ltd. | 77,000 | 44,947 | |||
| ZhongAn Online P&C Insurance Company, Ltd., H Shares (A)(B)(C) | 29,300 | 142,866 | |||
| Zhongsheng Group Holdings, Ltd. | 33,500 | 280,094 | |||
| Zhuzhou CRRC Times Electric Company, Ltd., H Shares (A) | 32,400 | 194,729 | |||
| Zijin Mining Group Company, Ltd., H Shares | 335,200 | 474,300 | |||
| Zoomlion Heavy Industry Science and Technology Company, Ltd., H Shares | 79,000 | 75,278 | |||
| ZTE Corp., H Shares | 45,500 | 160,262 | |||
| ZTO Express Cayman, Inc., ADR | 26,000 | 733,460 | |||
| 130,663,895 | |||||
| Colombia - 0.1% | |||||
| Bancolombia SA | 48,149 | 396,904 | |||
| Ecopetrol SA | 933,444 | 654,549 | |||
| Grupo de Inversiones Suramericana SA | 46,592 | 237,339 | |||
| Interconexion Electrica SA ESP | 84,227 | 507,264 | |||
| 1,796,056 | |||||
| Czech Republic - 0.0% | |||||
| CEZ AS | 10,549 | 332,526 | |||
| Komercni banka AS (A) | 4,969 | 191,063 | |||
| Moneta Money Bank AS (A)(B) | 23,295 | 94,583 | |||
| 618,172 | |||||
| Denmark - 1.7% | |||||
| A.P. Moller - Maersk A/S, Series A | 187 | 506,757 | |||
| A.P. Moller - Maersk A/S, Series B | 376 | 1,071,134 | |||
| Ambu A/S, Class B | 10,051 | 317,873 | |||
| Carlsberg A/S, Class B | 6,231 | 1,088,338 | |||
| Chr. Hansen Holding A/S | 6,293 | 580,420 | |||
| Coloplast A/S, B Shares | 7,096 | 1,229,442 | |||
| Danske Bank A/S | 42,129 | 706,946 | |||
| Demant A/S (A) | 6,540 | 370,968 | |||
| DSV Panalpina A/S | 12,501 | 3,184,278 | |||
| Genmab A/S (A) | 3,950 | 1,871,246 | |||
| GN Store Nord A/S | 7,719 | 581,047 | |||
| Novo Nordisk A/S, B Shares | 103,857 | 10,397,121 | |||
| Novozymes A/S, B Shares | 12,485 | 1,009,251 | |||
| Orsted A/S (B) | 11,396 | 1,811,789 | |||
| Pandora A/S | 6,032 | 723,021 | |||
| Rockwool International A/S, B Shares | 515 | 272,454 | |||
| Tryg A/S | 22,106 | 547,352 | |||
| Vestas Wind Systems A/S | 60,967 | 2,460,069 | |||
| 28,729,506 | |||||
| Finland - 1.0% | |||||
| Elisa OYJ | 10,288 | 659,365 | |||
| Fortum OYJ | 32,671 | 993,034 | |||
| Kesko OYJ, B Shares | 19,984 | 826,928 | |||
| Kone OYJ, B Shares | 24,920 | 2,067,867 | |||
| Neste OYJ | 31,053 | 1,891,497 | |||
| Nokia OYJ (A) | 397,521 | 2,387,959 | |||
| Nordea Bank ABP | 206,161 | 2,421,370 | |||
| Orion OYJ, Class B | 7,705 | 314,288 | |||
| Sampo OYJ, A Shares | 37,450 | 1,935,239 | |||
| Stora Enso OYJ, R Shares | 42,808 | 839,863 | |||
| UPM-Kymmene OYJ | 39,176 | 1,595,973 | |||
| Wartsila OYJ ABP | 34,965 | 496,019 | |||
| 16,429,402 | |||||
| France - 6.9% | |||||
| Accor SA (A) | 10,379 | 357,914 | |||
| Shares or Principal Amount | Value | ||||
| COMMON STOCKS (continued) | |||||
| France (continued) | |||||
| Aeroports de Paris (A) | 1,792 | $ | 211,034 | ||
| Air Liquide SA | 29,245 | 5,241,938 | |||
| Airbus SE (A) | 36,380 | 4,976,640 | |||
| Alstom SA | 17,164 | 737,934 | |||
| Amundi SA (B) | 3,832 | 362,672 | |||
| Arkema SA | 3,801 | 505,171 | |||
| Atos SE | 6,181 | 321,359 | |||
| AXA SA | 122,727 | 3,447,829 | |||
| BioMerieux | 2,538 | 310,843 | |||
| BNP Paribas SA | 69,754 | 4,418,904 | |||
| Bollore SA | 53,273 | 315,752 | |||
| Bouygues SA | 14,055 | 588,535 | |||
| Bureau Veritas SA | 17,928 | 595,840 | |||
| Capgemini SE | 9,912 | 2,228,091 | |||
| Carrefour SA | 37,784 | 752,207 | |||
| Cie de Saint-Gobain | 31,321 | 2,270,550 | |||
| Cie Generale des Etablissements Michelin SCA | 10,430 | 1,688,573 | |||
| CNP Assurances | 13,125 | 224,896 | |||
| Covivio | 3,167 | 301,837 | |||
| Credit Agricole SA | 72,567 | 1,047,411 | |||
| Danone SA | 40,234 | 2,938,117 | |||
| Dassault Aviation SA | 155 | 174,989 | |||
| Dassault Systemes SE | 40,606 | 2,319,250 | |||
| Edenred | 15,100 | 856,463 | |||
| Eiffage SA | 5,148 | 535,642 | |||
| Electricite de France SA | 28,867 | 391,490 | |||
| Engie SA | 112,601 | 1,613,548 | |||
| EssilorLuxottica SA | 17,583 | 3,454,882 | |||
| Eurazeo SE | 2,406 | 247,510 | |||
| Faurecia SE | 7,176 | 346,677 | |||
| Gecina SA | 2,793 | 434,165 | |||
| Getlink SE | 26,979 | 434,590 | |||
| Hermes International | 1,950 | 2,870,025 | |||
| Iliad SA | 891 | 191,600 | |||
| Ipsen SA | 2,318 | 231,859 | |||
| Kering SA | 4,630 | 3,687,889 | |||
| Klepierre SA (A) | 12,611 | 309,172 | |||
| La Francaise des Jeux SAEM (B) | 5,843 | 302,370 | |||
| Legrand SA | 16,458 | 1,888,294 | |||
| L'Oreal SA | 15,546 | 7,293,234 | |||
| LVMH Moet Hennessy Louis Vuitton SE | 17,141 | 12,698,220 | |||
| Orange SA | 123,144 | 1,400,048 | |||
| Orpea SA | 3,142 | 396,077 | |||
| Pernod Ricard SA | 12,929 | 2,721,655 | |||
| Publicis Groupe SA | 13,775 | 904,329 | |||
| Remy Cointreau SA | 1,378 | 271,367 | |||
| Renault SA (A) | 11,857 | 441,366 | |||
| Safran SA | 21,177 | 2,656,558 | |||
| Sanofi | 70,058 | 7,260,708 | |||
| Sartorius Stedim Biotech | 1,700 | 1,031,166 | |||
| Schneider Electric SE | 33,301 | 5,949,768 | |||
| SCOR SE | 10,351 | 317,669 | |||
| SEB SA | 1,666 | 262,248 | |||
| Societe Generale SA | 50,579 | 1,591,928 | |||
| Sodexo SA (A) | 5,436 | 450,431 | |||
| Suez SA | 20,965 | 486,484 | |||
| Teleperformance | 3,614 | 1,598,780 | |||
| Thales SA | 6,587 | 669,025 | |||
| TotalEnergies SE | 154,149 | 6,818,410 | |||
| Ubisoft Entertainment SA (A) | 5,671 | 360,233 | |||
| Unibail-Rodamco-Westfield (Euronext Amsterdam Exchange) (A) | 7,669 | 672,032 | |||
| Valeo | 14,056 | 401,194 | |||
| The accompanying notes are an integral part of the financial statements. | 52 |
| Shares or Principal Amount | Value | ||||
| COMMON STOCKS (continued) | |||||
| France (continued) | |||||
| Veolia Environnement SA | 33,190 | $ | 1,138,990 | ||
| Vinci SA | 32,862 | 3,525,810 | |||
| Vivendi SE (C) | 43,778 | 1,667,571 | |||
| Wendel SE | 1,637 | 237,554 | |||
| Worldline SA (A)(B) | 14,651 | 1,304,568 | |||
| 118,661,885 | |||||
| Germany - 6.2% | |||||
| adidas AG | 13,760 | 4,881,354 | |||
| Allianz SE | 30,241 | 7,099,422 | |||
| BASF SE | 66,455 | 5,140,902 | |||
| Bayer AG | 70,951 | 3,947,063 | |||
| Bayerische Motoren Werke AG | 23,994 | 2,277,479 | |||
| Bechtle AG | 5,808 | 419,944 | |||
| Beiersdorf AG | 7,217 | 875,884 | |||
| Brenntag SE | 11,118 | 1,122,009 | |||
| Carl Zeiss Meditec AG, Bearer Shares | 2,905 | 641,880 | |||
| Commerzbank AG (A) | 70,711 | 442,537 | |||
| Continental AG (A) | 7,928 | 1,065,425 | |||
| Covestro AG (B) | 14,056 | 910,934 | |||
| Daimler AG | 61,963 | 5,226,869 | |||
| Delivery Hero SE (A)(B) | 11,324 | 1,643,460 | |||
| Deutsche Bank AG (A) | 149,989 | 1,854,778 | |||
| Deutsche Boerse AG | 13,761 | 2,373,177 | |||
| Deutsche Lufthansa AG (A)(C) | 21,203 | 212,416 | |||
| Deutsche Post AG | 71,607 | 5,034,621 | |||
| Deutsche Telekom AG | 240,694 | 5,117,934 | |||
| Deutsche Wohnen SE | 24,595 | 1,526,687 | |||
| E.ON SE | 161,187 | 2,126,630 | |||
| Evonik Industries AG | 15,179 | 512,504 | |||
| Fresenius Medical Care AG & Company KGaA | 14,822 | 1,139,662 | |||
| Fresenius SE & Company KGaA | 30,310 | 1,575,914 | |||
| GEA Group AG | 10,940 | 504,966 | |||
| Hannover Rueck SE | 4,626 | 851,307 | |||
| HeidelbergCement AG | 10,730 | 930,575 | |||
| HelloFresh SE (A) | 11,893 | 1,284,061 | |||
| Henkel AG & Company KGaA | 7,459 | 671,346 | |||
| Infineon Technologies AG | 94,661 | 4,030,449 | |||
| KION Group AG | 5,201 | 556,541 | |||
| Knorr-Bremse AG | 5,170 | 620,792 | |||
| LANXESS AG | 6,128 | 446,685 | |||
| LEG Immobilien SE | 5,167 | 824,177 | |||
| Merck KGaA | 9,349 | 2,221,289 | |||
| MTU Aero Engines AG | 3,875 | 889,300 | |||
| Muenchener Rueckversicherungs-Gesellschaft AG | 10,357 | 3,022,879 | |||
| Nemetschek SE | 4,087 | 400,562 | |||
| Puma SE | 7,598 | 922,509 | |||
| Rational AG | 364 | 416,568 | |||
| RWE AG | 46,345 | 1,809,667 | |||
| SAP SE | 75,473 | 11,336,792 | |||
| Scout24 AG (B) | 6,390 | 537,227 | |||
| Siemens AG | 55,318 | 9,176,963 | |||
| Siemens Energy AG (A) | 28,864 | 837,673 | |||
| Siemens Healthineers AG (B) | 19,359 | 1,346,358 | |||
| Symrise AG | 9,183 | 1,306,831 | |||
| TeamViewer AG (A)(B) | 11,503 | 383,240 | |||
| Telefonica Deutschland Holding AG | 71,575 | 200,920 | |||
| Uniper SE | 6,503 | 258,186 | |||
| United Internet AG | 6,900 | 298,237 | |||
| Volkswagen AG | 2,319 | 775,919 | |||
| Vonovia SE | 38,713 | 2,613,546 | |||
| Shares or Principal Amount | Value | ||||
| COMMON STOCKS (continued) | |||||
| Germany (continued) | |||||
| Zalando SE (A)(B) | 11,951 | $ | 1,325,063 | ||
| 107,970,113 | |||||
| Hong Kong - 1.8% | |||||
| AIA Group, Ltd. | 481,200 | 5,745,878 | |||
| Alibaba Health Information Technology, Ltd. (A) | 237,100 | 391,353 | |||
| Alibaba Pictures Group, Ltd. (A) | 685,600 | 73,072 | |||
| Beijing Enterprises Holdings, Ltd. | 32,000 | 110,126 | |||
| Beijing Enterprises Water Group, Ltd. (A) | 260,500 | 107,440 | |||
| BOC Hong Kong Holdings, Ltd. | 147,000 | 444,848 | |||
| Bosideng International Holdings, Ltd. | 190,000 | 155,109 | |||
| Brilliance China Automotive Holdings, Ltd. (A) | 193,500 | 74,691 | |||
| Budweiser Brewing Company APAC, Ltd. (B) | 67,900 | 169,664 | |||
| China Education Group Holdings, Ltd. (C) | 46,000 | 86,969 | |||
| China Everbright Environment Group, Ltd. | 227,200 | 157,078 | |||
| China Everbright, Ltd. | 63,100 | 79,187 | |||
| China Gas Holdings, Ltd. | 182,600 | 528,556 | |||
| China Jinmao Holdings Group, Ltd. | 332,900 | 108,227 | |||
| China Mengniu Dairy Company, Ltd. (A) | 186,900 | 1,124,159 | |||
| China Merchants Port Holdings Company, Ltd. | 88,300 | 148,549 | |||
| China Overseas Land & Investment, Ltd. | 229,500 | 528,696 | |||
| China Overseas Property Holdings, Ltd. | 75,000 | 63,962 | |||
| China Power International Development, Ltd. | 219,000 | 88,434 | |||
| China Resources Beer Holdings Company, Ltd. | 87,200 | 717,079 | |||
| China Resources Cement Holdings, Ltd. | 146,000 | 143,151 | |||
| China Resources Gas Group, Ltd. | 55,100 | 334,010 | |||
| China Resources Land, Ltd. | 189,700 | 704,606 | |||
| China Resources Power Holdings Company, Ltd. | 117,100 | 287,753 | |||
| China State Construction International Holdings, Ltd. | 121,500 | 98,257 | |||
| China Taiping Insurance Holdings Company, Ltd. | 105,000 | 153,414 | |||
| China Traditional Chinese Medicine Holdings Company, Ltd. (A) | 164,000 | 78,060 | |||
| China Youzan, Ltd. (A) | 808,000 | 113,115 | |||
| Chow Tai Fook Jewellery Group, Ltd. | 78,000 | 157,793 | |||
| CK Asset Holdings, Ltd. | 80,000 | 520,967 | |||
| CK Hutchison Holdings, Ltd. | 108,500 | 790,977 | |||
| CK Infrastructure Holdings, Ltd. | 25,500 | 154,608 | |||
| CLP Holdings, Ltd. | 64,500 | 644,737 | |||
| COSCO SHIPPING Ports, Ltd. | 111,700 | 92,890 | |||
| ESR Cayman, Ltd. (A)(B) | 78,600 | 239,446 | |||
| Far East Horizon, Ltd. | 100,800 | 114,539 | |||
| Futu Holdings, Ltd., ADR (A)(C) | 2,000 | 190,380 | |||
| Galaxy Entertainment Group, Ltd. (A) | 86,000 | 551,398 | |||
| Geely Automobile Holdings, Ltd. | 347,300 | 1,258,694 | |||
| Guangdong Investment, Ltd. | 174,900 | 242,897 | |||
| Hang Lung Properties, Ltd. | 78,000 | 187,312 | |||
| Hang Seng Bank, Ltd. | 29,900 | 534,533 | |||
| Henderson Land Development Company, Ltd. | 56,041 | 253,554 | |||
| HK Electric Investments & HK Electric Investments, Ltd. | 83,500 | 83,049 | |||
| HKT Trust & HKT, Ltd. | 146,000 | 199,084 | |||
| Hong Kong & China Gas Company, Ltd. | 434,739 | 698,956 | |||
| Hong Kong Exchanges & Clearing, Ltd. | 47,600 | 3,007,085 | |||
| Hongkong Land Holdings, Ltd. | 44,900 | 188,398 | |||
| The accompanying notes are an integral part of the financial statements. | 53 |
| Shares or Principal Amount | Value | ||||
| COMMON STOCKS (continued) | |||||
| Hong Kong (continued) | |||||
| Hopson Development Holdings, Ltd. | 38,500 | $ | 149,985 | ||
| Hutchmed China, Ltd., ADR (A) | 5,000 | 201,800 | |||
| Jardine Matheson Holdings, Ltd. | 8,500 | 460,949 | |||
| Kingboard Holdings, Ltd. | 40,200 | 197,660 | |||
| Kingboard Laminates Holdings, Ltd. | 56,000 | 110,122 | |||
| Kunlun Energy Company, Ltd. | 232,900 | 246,325 | |||
| Lee & Man Paper Manufacturing, Ltd. | 78,500 | 68,896 | |||
| Link REIT | 81,000 | 744,747 | |||
| Melco Resorts & Entertainment, Ltd., ADR (A) | 8,400 | 115,584 | |||
| MTR Corp., Ltd. | 59,500 | 334,959 | |||
| New World Development Company, Ltd. | 59,250 | 278,690 | |||
| Nine Dragons Paper Holdings, Ltd. | 97,900 | 133,743 | |||
| Perennial Energy Holdings, Ltd. | 45,000 | 9,879 | |||
| Power Assets Holdings, Ltd. | 53,500 | 335,767 | |||
| Shenzhen International Holdings, Ltd. | 74,500 | 97,219 | |||
| Shenzhen Investment, Ltd. | 160,000 | 47,492 | |||
| Shimao Group Holdings, Ltd. | 73,900 | 152,701 | |||
| Sino Biopharmaceutical, Ltd. | 611,350 | 511,319 | |||
| Sino Land Company, Ltd. | 127,000 | 187,035 | |||
| SJM Holdings, Ltd. (A) | 75,000 | 65,266 | |||
| SSY Group, Ltd. | 80,000 | 49,638 | |||
| Sun Art Retail Group, Ltd. (C) | 110,700 | 67,159 | |||
| Sun Hung Kai Properties, Ltd. | 51,500 | 726,355 | |||
| Swire Pacific, Ltd., Class A | 19,500 | 132,012 | |||
| Swire Properties, Ltd. | 45,200 | 122,163 | |||
| Techtronic Industries Company, Ltd. | 54,500 | 1,206,206 | |||
| The Bank of East Asia, Ltd. | 51,000 | 85,544 | |||
| The Wharf Holdings, Ltd. | 82,000 | 276,756 | |||
| Vinda International Holdings, Ltd. (C) | 21,000 | 61,896 | |||
| WH Group, Ltd. (B)(C) | 383,000 | 332,201 | |||
| Wharf Real Estate Investment Company, Ltd. | 66,000 | 326,846 | |||
| Xinyi Glass Holdings, Ltd. | 72,000 | 302,561 | |||
| Yuexiu Property Company, Ltd. | 81,800 | 76,679 | |||
| 31,142,894 | |||||
| Hungary - 0.1% | |||||
| MOL Hungarian Oil & Gas PLC | 29,719 | 243,667 | |||
| OTP Bank NYRT (A) | 16,474 | 994,894 | |||
| Richter Gedeon NYRT | 10,298 | 308,663 | |||
| 1,547,224 | |||||
| Indonesia - 0.4% | |||||
| Adaro Energy Tbk PT | 949,000 | 83,771 | |||
| Aneka Tambang Tbk | 547,000 | 91,593 | |||
| Astra International Tbk PT | 1,328,500 | 486,357 | |||
| Bank Central Asia Tbk PT | 715,200 | 1,641,682 | |||
| Bank Mandiri Persero Tbk PT | 1,207,000 | 515,981 | |||
| Bank Negara Indonesia Persero Tbk PT | 503,300 | 190,179 | |||
| Bank Rakyat Indonesia Persero Tbk PT | 3,579,400 | 984,353 | |||
| Barito Pacific Tbk PT | 1,824,900 | 136,139 | |||
| Charoen Pokphand Indonesia Tbk PT | 478,700 | 214,568 | |||
| Gudang Garam Tbk PT | 32,100 | 74,332 | |||
| Indah Kiat Pulp & Paper Tbk PT | 183,600 | 101,606 | |||
| Indocement Tunggal Prakarsa Tbk PT | 97,200 | 76,589 | |||
| Indofood CBP Sukses Makmur Tbk PT (A) | 147,100 | 86,924 | |||
| Indofood Sukses Makmur Tbk PT (A) | 287,600 | 124,413 | |||
| Kalbe Farma Tbk PT | 1,360,100 | 128,193 | |||
| Merdeka Copper Gold Tbk PT (A) | 691,300 | 136,605 | |||
| Sarana Menara Nusantara Tbk PT | 1,482,900 | 139,295 | |||
| Semen Indonesia Persero Tbk PT | 194,900 | 126,221 | |||
| Telkom Indonesia Persero Tbk PT | 3,229,000 | 770,574 | |||
| Tower Bersama Infrastructure Tbk PT | 508,700 | 111,559 | |||
| Unilever Indonesia Tbk PT | 480,000 | 136,290 | |||
| Shares or Principal Amount | Value | ||||
| COMMON STOCKS (continued) | |||||
| Indonesia (continued) | |||||
| United Tractors Tbk PT | 108,900 | $ | 153,077 | ||
| 6,510,301 | |||||
| Ireland - 0.7% | |||||
| CRH PLC | 49,368 | 2,615,313 | |||
| DCC PLC | 6,719 | 571,145 | |||
| Experian PLC | 61,456 | 2,710,840 | |||
| Flutter Entertainment PLC (A) | 10,426 | 2,026,868 | |||
| James Hardie Industries PLC, CHESS Depositary Interest | 26,753 | 1,031,167 | |||
| Kerry Group PLC, Class A | 9,955 | 1,460,206 | |||
| Kingspan Group PLC | 9,656 | 1,102,667 | |||
| Smurfit Kappa Group PLC | 7,369 | 422,346 | |||
| Smurfit Kappa Group PLC (London Stock Exchange) | 8,098 | 464,145 | |||
| 12,404,697 | |||||
| Israel - 0.3% | |||||
| Azrieli Group, Ltd. | 2,080 | 194,443 | |||
| Bank Hapoalim BM | 54,229 | 466,512 | |||
| Bank Leumi Le-Israel BM | 68,970 | 569,776 | |||
| Check Point Software Technologies, Ltd. (A) | 5,200 | 653,276 | |||
| CyberArk Software, Ltd. (A) | 1,800 | 302,292 | |||
| ICL Group, Ltd. | 32,997 | 233,514 | |||
| Israel Discount Bank, Ltd., Class A (A) | 56,350 | 291,063 | |||
| Mizrahi Tefahot Bank, Ltd. | 6,786 | 225,754 | |||
| Nice, Ltd. (A) | 2,897 | 841,282 | |||
| Teva Pharmaceutical Industries, Ltd., ADR (A) | 50,700 | 477,594 | |||
| Wix.com, Ltd. (A) | 2,500 | 555,200 | |||
| 4,810,706 | |||||
| Italy - 1.2% | |||||
| Amplifon SpA | 7,508 | 392,723 | |||
| Assicurazioni Generali SpA | 70,794 | 1,444,270 | |||
| Atlantia SpA (A) | 29,934 | 560,713 | |||
| Davide Campari-Milano NV | 31,380 | 433,986 | |||
| DiaSorin SpA | 1,514 | 345,417 | |||
| Enel SpA | 493,381 | 4,494,914 | |||
| Eni SpA | 151,857 | 1,873,549 | |||
| Ferrari NV | 7,609 | 1,650,548 | |||
| FinecoBank Banca Fineco SpA (A) | 36,407 | 670,692 | |||
| Infrastrutture Wireless Italiane SpA (B) | 19,729 | 234,724 | |||
| Intesa Sanpaolo SpA | 1,000,739 | 2,831,946 | |||
| Mediobanca Banca di Credito Finanziario SpA (A) | 37,812 | 445,747 | |||
| Moncler SpA | 11,715 | 750,115 | |||
| Nexi SpA (A)(B) | 26,646 | 555,420 | |||
| Poste Italiane SpA (B) | 33,042 | 447,981 | |||
| Prysmian SpA | 15,315 | 576,609 | |||
| Recordati Industria Chimica e Farmaceutica SpA | 6,191 | 406,258 | |||
| Snam SpA | 119,645 | 707,413 | |||
| Telecom Italia SpA | 619,976 | 280,892 | |||
| Telecom Italia SpA, Savings Shares | 354,407 | 171,225 | |||
| Terna - Rete Elettrica Nazionale | 83,102 | 657,341 | |||
| UniCredit SpA | 128,261 | 1,599,286 | |||
| 21,531,769 | |||||
| Japan - 13.2% | |||||
| ABC-Mart, Inc. | 1,800 | 96,235 | |||
| Acom Company, Ltd. | 22,100 | 85,413 | |||
| Advantest Corp. | 11,500 | 990,744 | |||
| Aeon Company, Ltd. (C) | 37,100 | 982,145 | |||
| AGC, Inc. | 11,100 | 536,225 | |||
| The accompanying notes are an integral part of the financial statements. | 54 |
| Shares or Principal Amount | Value | ||||
| COMMON STOCKS (continued) | |||||
| Japan (continued) | |||||
| Aisin Corp. | 8,500 | $ | 324,458 | ||
| Ajinomoto Company, Inc. | 26,600 | 784,072 | |||
| ANA Holdings, Inc. (A) | 8,900 | 210,972 | |||
| Asahi Group Holdings, Ltd. | 26,200 | 1,217,898 | |||
| Asahi Intecc Company, Ltd. | 11,700 | 353,998 | |||
| Asahi Kasei Corp. | 72,500 | 747,481 | |||
| Astellas Pharma, Inc. | 106,800 | 1,799,571 | |||
| Azbil Corp. | 7,000 | 303,548 | |||
| Bandai Namco Holdings, Inc. | 11,400 | 790,693 | |||
| Bridgestone Corp. | 32,600 | 1,500,698 | |||
| Brother Industries, Ltd. | 13,700 | 281,146 | |||
| Canon, Inc. | 57,400 | 1,365,668 | |||
| Capcom Company, Ltd. | 10,000 | 278,491 | |||
| Casio Computer Company, Ltd. | 11,100 | 171,435 | |||
| Central Japan Railway Company | 8,300 | 1,214,870 | |||
| Chubu Electric Power Company, Inc. | 36,600 | 442,582 | |||
| Chugai Pharmaceutical Company, Ltd. | 38,400 | 1,500,401 | |||
| Concordia Financial Group, Ltd. | 63,800 | 247,363 | |||
| Cosmos Pharmaceutical Corp. | 1,100 | 194,793 | |||
| CyberAgent, Inc. | 23,100 | 422,871 | |||
| Dai Nippon Printing Company, Ltd. | 13,100 | 311,253 | |||
| Daifuku Company, Ltd. | 5,800 | 511,914 | |||
| Dai-ichi Life Holdings, Inc. | 59,900 | 1,185,258 | |||
| Daiichi Sankyo Company, Ltd. | 97,600 | 2,318,238 | |||
| Daikin Industries, Ltd. | 14,300 | 3,568,516 | |||
| Daito Trust Construction Company, Ltd. | 3,700 | 406,356 | |||
| Daiwa House Industry Company, Ltd. | 32,600 | 994,096 | |||
| Daiwa House REIT Investment Corp. (C) | 110 | 324,877 | |||
| Daiwa Securities Group, Inc. | 83,900 | 474,624 | |||
| Denso Corp. | 24,800 | 1,735,826 | |||
| Dentsu Group, Inc. | 12,200 | 453,512 | |||
| Disco Corp. | 1,700 | 493,844 | |||
| East Japan Railway Company | 17,200 | 1,156,086 | |||
| Eisai Company, Ltd. | 13,600 | 1,121,589 | |||
| ENEOS Holdings, Inc. | 174,900 | 675,974 | |||
| FANUC Corp. | 11,000 | 2,396,472 | |||
| Fast Retailing Company, Ltd. | 3,300 | 2,173,639 | |||
| Fuji Electric Company, Ltd. | 7,400 | 320,133 | |||
| FUJIFILM Holdings Corp. | 20,700 | 1,703,449 | |||
| Fujitsu, Ltd. | 11,300 | 2,080,183 | |||
| GLP J-REIT (C) | 234 | 424,661 | |||
| GMO Payment Gateway, Inc. | 2,300 | 301,757 | |||
| Hakuhodo DY Holdings, Inc. | 13,200 | 208,140 | |||
| Hamamatsu Photonics KK | 7,900 | 460,436 | |||
| Hankyu Hanshin Holdings, Inc. | 12,800 | 383,034 | |||
| Harmonic Drive Systems, Inc. | 2,500 | 138,035 | |||
| Hikari Tsushin, Inc. | 1,200 | 209,981 | |||
| Hino Motors, Ltd. | 16,700 | 144,507 | |||
| Hirose Electric Company, Ltd. | 1,800 | 299,690 | |||
| Hisamitsu Pharmaceutical Company, Inc. | 2,900 | 116,212 | |||
| Hitachi Construction Machinery Company, Ltd. | 6,200 | 177,625 | |||
| Hitachi Metals, Ltd. (A) | 12,200 | 235,499 | |||
| Hitachi, Ltd. | 55,600 | 3,072,818 | |||
| Honda Motor Company, Ltd. | 93,900 | 2,842,038 | |||
| Hoshizaki Corp. | 3,100 | 291,020 | |||
| Hoya Corp. | 21,400 | 3,455,759 | |||
| Hulic Company, Ltd. | 14,900 | 174,779 | |||
| Ibiden Company, Ltd. | 6,000 | 322,838 | |||
| Idemitsu Kosan Company, Ltd. | 11,397 | 272,965 | |||
| Iida Group Holdings Company, Ltd. | 8,500 | 215,791 | |||
| Inpex Corp. | 58,800 | 404,008 | |||
| Isuzu Motors, Ltd. | 31,800 | 401,992 | |||
| Ito En, Ltd. | 3,000 | 189,847 | |||
| Shares or Principal Amount | Value | ||||
| COMMON STOCKS (continued) | |||||
| Japan (continued) | |||||
| ITOCHU Corp. | 68,300 | $ | 2,054,542 | ||
| Itochu Techno-Solutions Corp. | 5,300 | 163,754 | |||
| Japan Airlines Company, Ltd. (A) | 8,100 | 172,568 | |||
| Japan Exchange Group, Inc. | 29,300 | 697,793 | |||
| Japan Metropolitan Fund Invest (C) | 401 | 389,580 | |||
| Japan Post Bank Company, Ltd. | 21,400 | 187,128 | |||
| Japan Post Holdings Company, Ltd. (A) | 93,100 | 800,169 | |||
| Japan Post Insurance Company, Ltd. | 14,200 | 257,873 | |||
| Japan Real Estate Investment Corp. | 70 | 432,609 | |||
| Japan Tobacco, Inc. | 68,700 | 1,332,958 | |||
| JFE Holdings, Inc. | 28,400 | 460,645 | |||
| JSR Corp. | 11,700 | 405,407 | |||
| Kajima Corp. | 26,300 | 339,803 | |||
| Kakaku.com, Inc. | 7,600 | 236,472 | |||
| Kansai Paint Company, Ltd. | 10,100 | 261,594 | |||
| Kao Corp. | 27,600 | 1,667,222 | |||
| KDDI Corp. | 92,700 | 2,833,413 | |||
| Keio Corp. | 5,800 | 312,096 | |||
| Keisei Electric Railway Company, Ltd. | 7,300 | 224,575 | |||
| Keyence Corp. | 11,200 | 6,723,734 | |||
| Kikkoman Corp. | 8,300 | 623,124 | |||
| Kintetsu Group Holdings Company, Ltd. (A) | 9,600 | 327,900 | |||
| Kirin Holdings Company, Ltd. | 47,100 | 853,299 | |||
| Kobayashi Pharmaceutical Company, Ltd. | 3,000 | 234,820 | |||
| Kobe Bussan Company, Ltd. | 7,800 | 303,420 | |||
| Koei Tecmo Holdings Company, Ltd. | 3,240 | 138,261 | |||
| Koito Manufacturing Company, Ltd. | 6,000 | 367,021 | |||
| Komatsu, Ltd. | 50,500 | 1,228,297 | |||
| Konami Holdings Corp. | 5,400 | 341,831 | |||
| Kose Corp. | 1,900 | 229,299 | |||
| Kubota Corp. | 59,000 | 1,219,039 | |||
| Kurita Water Industries, Ltd. | 5,600 | 262,648 | |||
| Kyocera Corp. | 18,500 | 1,150,090 | |||
| Kyowa Kirin Company, Ltd. | 15,500 | 507,172 | |||
| Lasertec Corp. | 4,300 | 935,289 | |||
| Lawson, Inc. (C) | 2,700 | 129,860 | |||
| Lion Corp. | 12,500 | 212,698 | |||
| Lixil Corp. | 15,300 | 445,256 | |||
| M3, Inc. | 25,300 | 1,696,808 | |||
| Makita Corp. | 12,900 | 741,064 | |||
| Marubeni Corp. | 90,200 | 717,660 | |||
| Mazda Motor Corp. (A) | 32,500 | 282,127 | |||
| McDonald's Holdings Company Japan, Ltd. | 4,400 | 209,876 | |||
| Medipal Holdings Corp. | 10,400 | 198,807 | |||
| MEIJI Holdings Company, Ltd. | 6,900 | 424,365 | |||
| Mercari, Inc. (A) | 5,800 | 286,186 | |||
| MINEBEA MITSUMI, Inc. | 20,900 | 537,306 | |||
| MISUMI Group, Inc. | 16,200 | 642,630 | |||
| Mitsubishi Chemical Holdings Corp. | 73,300 | 643,579 | |||
| Mitsubishi Corp. | 72,300 | 2,175,687 | |||
| Mitsubishi Electric Corp. | 105,000 | 1,435,466 | |||
| Mitsubishi Estate Company, Ltd. | 68,100 | 1,066,199 | |||
| Mitsubishi Gas Chemical Company, Inc. | 9,300 | 175,237 | |||
| Mitsubishi HC Capital, Inc. | 38,000 | 203,489 | |||
| Mitsubishi Heavy Industries, Ltd. | 18,500 | 488,749 | |||
| Mitsubishi UFJ Financial Group, Inc. | 700,300 | 3,799,438 | |||
| Mitsui & Company, Ltd. | 88,700 | 1,956,331 | |||
| Mitsui Chemicals, Inc. | 10,700 | 369,390 | |||
| Mitsui Fudosan Company, Ltd. | 52,700 | 1,209,359 | |||
| Miura Company, Ltd. | 4,900 | 219,984 | |||
| Mizuho Financial Group, Inc. | 138,290 | 1,937,697 | |||
| MonotaRO Company, Ltd. | 14,100 | 312,496 | |||
| The accompanying notes are an integral part of the financial statements. | 55 |
| Shares or Principal Amount | Value | ||||
| COMMON STOCKS (continued) | |||||
| Japan (continued) | |||||
| MS&AD Insurance Group Holdings, Inc. | 27,000 | $ | 873,960 | ||
| Murata Manufacturing Company, Ltd. | 33,000 | 2,720,448 | |||
| Nabtesco Corp. | 6,600 | 260,999 | |||
| NEC Corp. | 14,100 | 740,013 | |||
| Nexon Company, Ltd. | 27,900 | 508,858 | |||
| NGK Insulators, Ltd. | 15,000 | 248,678 | |||
| NH Foods, Ltd. | 4,800 | 186,255 | |||
| Nidec Corp. | 25,700 | 2,935,680 | |||
| Nihon M&A Center, Inc. | 17,200 | 512,906 | |||
| Nintendo Company, Ltd. | 6,400 | 3,074,813 | |||
| Nippon Building Fund, Inc. | 84 | 545,491 | |||
| Nippon Express Company, Ltd. | 4,400 | 299,186 | |||
| Nippon Paint Holdings Company, Ltd. | 40,600 | 504,220 | |||
| Nippon Prologis REIT, Inc. | 115 | 413,546 | |||
| Nippon Sanso Holdings Corp. | 8,800 | 213,263 | |||
| Nippon Shinyaku Company, Ltd. | 2,800 | 227,273 | |||
| Nippon Steel Corp. | 49,100 | 1,003,510 | |||
| Nippon Telegraph & Telephone Corp. | 73,900 | 1,968,902 | |||
| Nippon Yusen KK | 9,400 | 755,900 | |||
| Nissan Chemical Corp. | 7,100 | 398,076 | |||
| Nissan Motor Company, Ltd. (A) | 132,600 | 695,632 | |||
| Nisshin Seifun Group, Inc. | 11,200 | 183,914 | |||
| Nissin Foods Holdings Company, Ltd. | 3,600 | 280,255 | |||
| Nitori Holdings Company, Ltd. | 4,600 | 860,685 | |||
| Nitto Denko Corp. | 8,700 | 659,989 | |||
| Nomura Holdings, Inc. | 178,300 | 861,054 | |||
| Nomura Real Estate Holdings, Inc. | 6,800 | 174,143 | |||
| Nomura Real Estate Master Fund, Inc. (C) | 243 | 374,632 | |||
| Nomura Research Institute, Ltd. | 20,100 | 753,758 | |||
| NSK, Ltd. | 22,200 | 155,753 | |||
| NTT Data Corp. | 36,200 | 651,492 | |||
| Obayashi Corp. | 38,800 | 319,261 | |||
| Obic Company, Ltd. | 4,000 | 759,478 | |||
| Odakyu Electric Railway Company, Ltd. | 16,600 | 386,775 | |||
| Oji Holdings Corp. | 46,400 | 242,895 | |||
| Olympus Corp. | 66,900 | 1,405,733 | |||
| Omron Corp. | 10,700 | 1,008,219 | |||
| Ono Pharmaceutical Company, Ltd. | 21,300 | 511,422 | |||
| Oracle Corp. Japan | 2,200 | 180,543 | |||
| Oriental Land Company, Ltd. | 11,400 | 1,724,773 | |||
| ORIX Corp. | 71,100 | 1,326,547 | |||
| Orix JREIT, Inc. (C) | 150 | 267,374 | |||
| Osaka Gas Company, Ltd. | 21,000 | 393,645 | |||
| Otsuka Corp. | 6,400 | 331,308 | |||
| Otsuka Holdings Company, Ltd. | 22,500 | 957,477 | |||
| Pan Pacific International Holdings Corp. | 23,300 | 443,244 | |||
| Panasonic Corp. | 127,000 | 1,518,294 | |||
| PeptiDream, Inc. (A) | 5,400 | 190,281 | |||
| Persol Holdings Company, Ltd. | 10,200 | 238,125 | |||
| Pigeon Corp. | 6,500 | 188,278 | |||
| Pola Orbis Holdings, Inc. | 5,100 | 111,262 | |||
| Rakuten Group, Inc. | 49,200 | 514,643 | |||
| Recruit Holdings Company, Ltd. | 77,800 | 4,581,035 | |||
| Renesas Electronics Corp. (A) | 72,400 | 775,252 | |||
| Resona Holdings, Inc. | 125,200 | 484,167 | |||
| Ricoh Company, Ltd. | 38,400 | 390,734 | |||
| Rinnai Corp. | 2,000 | 214,994 | |||
| Rohm Company, Ltd. | 5,100 | 490,298 | |||
| Ryohin Keikaku Company, Ltd. | 14,400 | 308,333 | |||
| Santen Pharmaceutical Company, Ltd. | 20,400 | 305,033 | |||
| SBI Holdings, Inc. | 14,200 | 344,024 | |||
| SCSK Corp. | 3,000 | 189,383 | |||
| Secom Company, Ltd. | 12,000 | 909,993 | |||
| Seiko Epson Corp. | 16,100 | 299,859 | |||
| Shares or Principal Amount | Value | ||||
| COMMON STOCKS (continued) | |||||
| Japan (continued) | |||||
| Sekisui Chemical Company, Ltd. | 22,100 | $ | 378,224 | ||
| Sekisui House, Ltd. | 35,400 | 705,282 | |||
| Seven & i Holdings Company, Ltd. | 43,200 | 1,885,091 | |||
| SG Holdings Company, Ltd. | 18,200 | 494,085 | |||
| Sharp Corp. | 12,300 | 162,249 | |||
| Shimadzu Corp. | 13,500 | 604,896 | |||
| Shimano, Inc. | 4,200 | 1,232,518 | |||
| Shimizu Corp. | 32,400 | 232,501 | |||
| Shin-Etsu Chemical Company, Ltd. | 20,400 | 3,369,424 | |||
| Shionogi & Company, Ltd. | 15,300 | 961,310 | |||
| Shiseido Company, Ltd. | 22,900 | 1,517,792 | |||
| SMC Corp. | 3,300 | 2,111,500 | |||
| SoftBank Corp. | 163,800 | 2,192,109 | |||
| SoftBank Group Corp. | 72,000 | 4,057,471 | |||
| Sohgo Security Services Company, Ltd. | 4,000 | 181,206 | |||
| Sompo Holdings, Inc. | 18,900 | 830,801 | |||
| Sony Group Corp. | 72,300 | 7,475,486 | |||
| Square Enix Holdings Company, Ltd. | 4,900 | 284,865 | |||
| Stanley Electric Company, Ltd. | 7,600 | 189,660 | |||
| Subaru Corp. | 35,400 | 655,173 | |||
| SUMCO Corp. | 16,000 | 336,845 | |||
| Sumitomo Chemical Company, Ltd. | 86,500 | 438,522 | |||
| Sumitomo Corp. | 64,300 | 906,166 | |||
| Sumitomo Dainippon Pharma Company, Ltd. | 10,300 | 184,886 | |||
| Sumitomo Electric Industries, Ltd. | 43,600 | 582,304 | |||
| Sumitomo Metal Mining Company, Ltd. | 14,200 | 544,158 | |||
| Sumitomo Mitsui Financial Group, Inc. | 74,600 | 2,574,873 | |||
| Sumitomo Mitsui Trust Holdings, Inc. | 19,100 | 623,867 | |||
| Sumitomo Realty & Development Company, Ltd. | 17,800 | 574,668 | |||
| Suntory Beverage & Food, Ltd. | 7,900 | 316,660 | |||
| Suzuki Motor Corp. | 21,200 | 916,074 | |||
| Sysmex Corp. | 9,600 | 1,091,005 | |||
| T&D Holdings, Inc. | 33,600 | 408,932 | |||
| Taisei Corp. | 11,100 | 347,270 | |||
| Taisho Pharmaceutical Holdings Company, Ltd. | 1,900 | 110,822 | |||
| Takeda Pharmaceutical Company, Ltd. | 90,396 | 3,008,877 | |||
| TDK Corp. | 7,500 | 786,087 | |||
| Terumo Corp. | 37,000 | 1,544,037 | |||
| The Chiba Bank, Ltd. | 31,300 | 195,397 | |||
| The Kansai Electric Power Company, Inc. | 40,100 | 402,975 | |||
| The Shizuoka Bank, Ltd. | 25,400 | 198,975 | |||
| THK Company, Ltd. | 6,900 | 159,753 | |||
| TIS, Inc. | 12,800 | 361,339 | |||
| Tobu Railway Company, Ltd. | 10,500 | 273,751 | |||
| Toho Company, Ltd. | 6,300 | 272,946 | |||
| Toho Gas Company, Ltd. | 4,100 | 191,129 | |||
| Tohoku Electric Power Company, Inc. | 23,400 | 179,123 | |||
| Tokio Marine Holdings, Inc. | 37,400 | 1,829,956 | |||
| Tokyo Century Corp. | 2,100 | 120,082 | |||
| Tokyo Electric Power Company Holdings, Inc. (A) | 88,600 | 232,718 | |||
| Tokyo Electron, Ltd. | 8,600 | 3,683,757 | |||
| Tokyo Gas Company, Ltd. | 21,200 | 407,523 | |||
| Tokyu Corp. | 28,200 | 387,770 | |||
| TOPPAN, Inc. | 15,300 | 262,656 | |||
| Toray Industries, Inc. | 80,500 | 542,789 | |||
| Toshiba Corp. | 23,500 | 1,019,307 | |||
| Tosoh Corp. | 15,300 | 277,701 | |||
| TOTO, Ltd. | 8,100 | 440,836 | |||
| Toyo Suisan Kaisha, Ltd. | 5,000 | 207,212 | |||
| Toyota Industries Corp. | 8,400 | 709,217 | |||
| The accompanying notes are an integral part of the financial statements. | 56 |
| Shares or Principal Amount | Value | ||||
| COMMON STOCKS (continued) | |||||
| Japan (continued) | |||||
| Toyota Motor Corp. | 121,700 | $ | 10,599,260 | ||
| Toyota Tsusho Corp. | 12,300 | 543,881 | |||
| Trend Micro, Inc. | 7,600 | 416,322 | |||
| Tsuruha Holdings, Inc. | 2,200 | 276,224 | |||
| Unicharm Corp. | 23,000 | 1,025,407 | |||
| United Urban Investment Corp. | 170 | 240,132 | |||
| USS Company, Ltd. | 12,300 | 203,213 | |||
| Welcia Holdings Company, Ltd. | 5,200 | 183,375 | |||
| West Japan Railway Company | 9,200 | 502,474 | |||
| Yakult Honsha Company, Ltd. | 7,300 | 420,934 | |||
| Yamada Holdings Company, Ltd. | 38,400 | 164,741 | |||
| Yamaha Corp. | 7,700 | 454,000 | |||
| Yamaha Motor Company, Ltd. | 16,200 | 412,156 | |||
| Yamato Holdings Company, Ltd. | 16,700 | 424,572 | |||
| Yaskawa Electric Corp. | 13,800 | 673,566 | |||
| Yokogawa Electric Corp. | 13,400 | 209,619 | |||
| Z Holdings Corp. | 152,000 | 988,340 | |||
| ZOZO, Inc. | 7,100 | 270,766 | |||
| 228,725,787 | |||||
| Jordan - 0.0% | |||||
| Hikma Pharmaceuticals PLC | 11,728 | 409,364 | |||
| Luxembourg - 0.2% | |||||
| ArcelorMittal SA | 44,507 | 1,492,763 | |||
| Aroundtown SA | 71,980 | 551,559 | |||
| Eurofins Scientific SE | 8,209 | 1,164,783 | |||
| Reinet Investments SCA | 8,642 | 167,438 | |||
| Tenaris SA | 28,568 | 287,545 | |||
| 3,664,088 | |||||
| Macau - 0.0% | |||||
| Sands China, Ltd. (A) | 95,200 | 305,839 | |||
| Wynn Macau, Ltd. (A) | 57,600 | 64,900 | |||
| 370,739 | |||||
| Malaysia - 0.4% | |||||
| AMMB Holdings BHD (A) | 115,800 | 84,441 | |||
| Axiata Group BHD | 166,300 | 165,691 | |||
| CIMB Group Holdings BHD | 392,400 | 463,574 | |||
| Dialog Group BHD | 231,700 | 148,240 | |||
| DiGi.Com BHD | 182,500 | 192,878 | |||
| Fraser & Neave Holdings BHD | 7,200 | 48,341 | |||
| Genting BHD | 129,900 | 157,848 | |||
| Genting Malaysia BHD | 175,900 | 125,723 | |||
| HAP Seng Consolidated BHD | 38,000 | 77,683 | |||
| Hartalega Holdings BHD | 103,700 | 184,036 | |||
| Hong Leong Bank BHD | 40,600 | 187,382 | |||
| Hong Leong Financial Group BHD | 14,800 | 64,911 | |||
| IHH Healthcare BHD | 106,000 | 163,080 | |||
| IOI Corp. BHD | 151,400 | 150,149 | |||
| Kossan Rubber Industries | 78,600 | 58,623 | |||
| Kuala Lumpur Kepong BHD | 26,600 | 136,663 | |||
| Malayan Banking BHD | 237,200 | 479,191 | |||
| Malaysia Airports Holdings BHD (A) | 62,200 | 99,218 | |||
| Maxis BHD | 139,400 | 157,228 | |||
| MISC BHD | 79,300 | 137,591 | |||
| Nestle Malaysia BHD | 3,600 | 116,673 | |||
| Petronas Chemicals Group BHD | 146,900 | 293,194 | |||
| Petronas Dagangan BHD | 16,800 | 80,844 | |||
| Petronas Gas BHD | 46,600 | 188,405 | |||
| PPB Group BHD | 39,400 | 175,611 | |||
| Press Metal Aluminium Holdings BHD | 193,700 | 251,727 | |||
| Public Bank BHD | 882,900 | 888,013 | |||
| QL Resources BHD | 62,250 | 83,223 | |||
| RHB Bank BHD | 107,800 | 145,072 | |||
| Shares or Principal Amount | Value | ||||
| COMMON STOCKS (continued) | |||||
| Malaysia (continued) | |||||
| Sime Darby BHD | 170,300 | $ | 96,598 | ||
| Sime Darby Plantation BHD | 105,100 | 101,909 | |||
| Supermax Corp. BHD | 92,384 | 73,279 | |||
| Telekom Malaysia BHD | 68,400 | 100,724 | |||
| Tenaga Nasional BHD | 137,900 | 347,033 | |||
| Top Glove Corp. BHD | 321,800 | 309,617 | |||
| Westports Holdings BHD | 58,200 | 61,536 | |||
| 6,595,949 | |||||
| Mexico - 0.7% | |||||
| America Movil SAB de CV, Series L | 2,534,700 | 2,484,975 | |||
| Arca Continental SAB de CV | 32,400 | 208,703 | |||
| Becle SAB de CV | 40,100 | 102,846 | |||
| Cemex SAB de CV, Series CPO (A) | 1,119,048 | 923,811 | |||
| Coca-Cola Femsa SAB de CV | 39,090 | 226,611 | |||
| Fibra Uno Administracion SA de CV | 236,400 | 266,486 | |||
| Fomento Economico Mexicano SAB de CV | 143,800 | 1,249,479 | |||
| Gruma SAB de CV, Class B | 16,035 | 182,673 | |||
| Grupo Aeroportuario del Pacifico SAB de CV, B Shares (A) | 30,000 | 349,323 | |||
| Grupo Aeroportuario del Sureste SAB de CV, B Shares | 15,455 | 276,480 | |||
| Grupo Bimbo SAB de CV, Series A | 115,700 | 292,188 | |||
| Grupo Carso SAB de CV, Series A1 | 33,300 | 113,774 | |||
| Grupo Financiero Banorte SAB de CV, Series O | 191,200 | 1,262,069 | |||
| Grupo Financiero Inbursa SAB de CV, Series O (A) | 169,200 | 162,595 | |||
| Grupo Mexico SAB de CV, Series B | 229,600 | 1,064,547 | |||
| Grupo Televisa SAB, Series CPO | 178,500 | 470,158 | |||
| Industrias Penoles SAB de CV (A) | 9,885 | 139,342 | |||
| Kimberly-Clark de Mexico SAB de CV, Class A | 110,200 | 195,555 | |||
| Megacable Holdings SAB de CV, Series CPO | 22,900 | 79,838 | |||
| Orbia Advance Corp. SAB de CV | 77,735 | 222,128 | |||
| Promotora y Operadora de Infraestructura SAB de CV | 17,235 | 128,722 | |||
| Telesites SAB de CV (A)(C) | 98,100 | 89,923 | |||
| Wal-Mart de Mexico SAB de CV | 387,000 | 1,373,307 | |||
| 11,865,533 | |||||
| Netherlands - 3.7% | |||||
| ABN AMRO Bank NV (A)(B) | 25,661 | 357,502 | |||
| Adyen NV (A)(B) | 1,200 | 3,878,488 | |||
| Aegon NV | 116,598 | 575,730 | |||
| Akzo Nobel NV | 11,666 | 1,437,708 | |||
| Argenx SE (A) | 3,626 | 1,209,788 | |||
| ASM International NV | 2,893 | 1,122,462 | |||
| ASML Holding NV | 25,549 | 21,307,537 | |||
| EXOR NV | 6,712 | 560,005 | |||
| Heineken Holding NV | 6,961 | 645,714 | |||
| Heineken NV | 15,779 | 1,728,147 | |||
| ING Groep NV | 237,405 | 3,274,852 | |||
| JDE Peet's NV | 4,502 | 154,719 | |||
| Just Eat Takeaway.com NV (A)(B) | 10,899 | 987,518 | |||
| Koninklijke Ahold Delhaize NV | 63,467 | 2,141,212 | |||
| Koninklijke DSM NV | 10,458 | 2,226,477 | |||
| Koninklijke KPN NV | 203,298 | 651,238 | |||
| Koninklijke Philips NV | 55,511 | 2,558,119 | |||
| Koninklijke Vopak NV | 4,001 | 173,282 | |||
| NN Group NV | 18,079 | 937,807 | |||
| Prosus NV (A) | 29,679 | 2,627,050 | |||
| QIAGEN NV (A) | 16,596 | 918,122 | |||
| The accompanying notes are an integral part of the financial statements. | 57 |
| Shares or Principal Amount | Value | ||||
| COMMON STOCKS (continued) | |||||
| Netherlands (continued) | |||||
| Randstad NV | 7,270 | $ | 535,407 | ||
| Royal Dutch Shell PLC, A Shares | 274,069 | 5,431,912 | |||
| Royal Dutch Shell PLC, B Shares | 247,893 | 4,877,958 | |||
| Stellantis NV | 123,382 | 2,468,136 | |||
| Wolters Kluwer NV | 16,122 | 1,854,041 | |||
| 64,640,931 | |||||
| New Zealand - 0.3% | |||||
| a2 Milk Company, Ltd. (A) | 60,625 | 258,089 | |||
| Auckland International Airport, Ltd. (A) | 103,226 | 524,446 | |||
| Fisher & Paykel Healthcare Corp., Ltd. | 47,066 | 1,098,426 | |||
| Mercury NZ, Ltd. | 55,843 | 261,807 | |||
| Meridian Energy, Ltd. | 104,796 | 387,054 | |||
| Ryman Healthcare, Ltd. | 35,404 | 386,632 | |||
| Spark New Zealand, Ltd. | 152,034 | 522,044 | |||
| Xero, Ltd. (A) | 7,952 | 879,519 | |||
| 4,318,017 | |||||
| Norway - 0.5% | |||||
| Adevinta ASA (A) | 22,491 | 452,639 | |||
| DNB Bank ASA (A) | 76,830 | 1,621,632 | |||
| Equinor ASA | 79,990 | 1,695,319 | |||
| Gjensidige Forsikring ASA | 17,313 | 404,715 | |||
| Mowi ASA | 36,113 | 967,298 | |||
| Norsk Hydro ASA | 110,404 | 762,145 | |||
| Orkla ASA | 61,741 | 551,494 | |||
| Schibsted ASA, B Shares | 7,891 | 366,644 | |||
| Schibsted ASA, Class A | 6,093 | 325,070 | |||
| Telenor ASA | 57,368 | 1,005,028 | |||
| Yara International ASA | 14,349 | 720,649 | |||
| 8,872,633 | |||||
| Peru - 0.1% | |||||
| Cia de Minas Buenaventura SAA, ADR (A) | 21,800 | 163,500 | |||
| Credicorp, Ltd. (A) | 6,953 | 741,398 | |||
| Southern Copper Corp. | 8,600 | 538,274 | |||
| 1,443,172 | |||||
| Philippines - 0.2% | |||||
| Aboitiz Equity Ventures, Inc. | 116,330 | 100,323 | |||
| Ayala Corp. | 16,770 | 266,588 | |||
| Ayala Land, Inc. | 478,880 | 324,611 | |||
| Bank of the Philippine Islands | 107,800 | 180,428 | |||
| BDO Unibank, Inc. | 115,780 | 256,008 | |||
| Globe Telecom, Inc. | 1,500 | 82,112 | |||
| GT Capital Holdings, Inc. | 5,783 | 62,687 | |||
| International Container Terminal Services, Inc. | 60,040 | 224,696 | |||
| JG Summit Holdings, Inc. | 178,332 | 232,716 | |||
| Jollibee Foods Corp. | 25,850 | 104,829 | |||
| Manila Electric Company | 12,750 | 72,240 | |||
| Metro Pacific Investments Corp. | 721,700 | 55,809 | |||
| Metropolitan Bank & Trust Company | 107,789 | 97,890 | |||
| PLDT, Inc. | 4,450 | 130,681 | |||
| SM Investments Corp. | 14,275 | 288,555 | |||
| SM Prime Holdings, Inc. | 596,200 | 406,727 | |||
| Universal Robina Corp. | 51,940 | 157,170 | |||
| 3,044,070 | |||||
| Poland - 0.2% | |||||
| Allegro.eu SA (A)(B) | 21,469 | 398,371 | |||
| Bank Polska Kasa Opieki SA (A) | 11,106 | 310,565 | |||
| CD Projekt SA (C) | 4,196 | 186,347 | |||
| Cyfrowy Polsat SA | 16,863 | 161,062 | |||
| Dino Polska SA (A)(B) | 2,910 | 246,664 | |||
| InPost SA (A) | 12,125 | 237,083 | |||
| Shares or Principal Amount | Value | ||||
| COMMON STOCKS (continued) | |||||
| Poland (continued) | |||||
| KGHM Polska Miedz SA | 8,388 | $ | 390,690 | ||
| LPP SA | 66 | 240,817 | |||
| Orange Polska SA (A) | 37,892 | 81,867 | |||
| PGE Polska Grupa Energetyczna SA (A) | 50,517 | 133,008 | |||
| Polski Koncern Naftowy ORLEN SA | 18,171 | 352,310 | |||
| Polskie Gornictwo Naftowe i Gazownictwo SA | 104,622 | 172,072 | |||
| Powszechna Kasa Oszczednosci Bank Polski SA (A) | 52,667 | 578,133 | |||
| Powszechny Zaklad Ubezpieczen SA (A) | 38,052 | 403,260 | |||
| Santander Bank Polska SA (A) | 2,079 | 164,061 | |||
| 4,056,310 | |||||
| Portugal - 0.1% | |||||
| EDP - Energias de Portugal SA | 157,192 | 862,912 | |||
| Galp Energia SGPS SA | 27,990 | 286,307 | |||
| Jeronimo Martins SGPS SA | 13,878 | 293,985 | |||
| 1,443,204 | |||||
| Romania - 0.0% | |||||
| NEPI Rockcastle PLC | 25,285 | 182,107 | |||
| Singapore - 0.4% | |||||
| Ascendas Real Estate Investment Trust | 105,600 | 238,341 | |||
| BOC Aviation, Ltd. (B) | 12,600 | 94,458 | |||
| CapitaLand Integrated Commercial Trust | 150,136 | 229,308 | |||
| CapitaLand, Ltd. | 86,200 | 255,754 | |||
| City Developments, Ltd. | 13,200 | 66,983 | |||
| DBS Group Holdings, Ltd. | 60,400 | 1,339,254 | |||
| Genting Singapore, Ltd. | 210,100 | 119,059 | |||
| Jardine Cycle & Carriage, Ltd. | 600 | 8,651 | |||
| JOYY, Inc., ADR | 3,400 | 215,220 | |||
| Keppel Corp., Ltd. | 49,200 | 189,669 | |||
| Mapletree Commercial Trust | 70,000 | 105,453 | |||
| Mapletree Logistics Trust | 97,900 | 147,268 | |||
| Oversea-Chinese Banking Corp., Ltd. | 115,700 | 979,101 | |||
| Sea, Ltd., ADR (A) | 500 | 169,160 | |||
| Singapore Airlines, Ltd. (A) | 43,800 | 164,199 | |||
| Singapore Exchange, Ltd. | 26,800 | 196,706 | |||
| Singapore Technologies Engineering, Ltd. | 50,700 | 141,980 | |||
| Singapore Telecommunications, Ltd. | 279,960 | 481,964 | |||
| United Overseas Bank, Ltd. | 40,100 | 759,144 | |||
| UOL Group, Ltd. | 15,500 | 80,442 | |||
| Venture Corp., Ltd. | 9,400 | 133,605 | |||
| Wilmar International, Ltd. | 65,700 | 201,765 | |||
| 6,317,484 | |||||
| South Africa - 1.0% | |||||
| Absa Group, Ltd. (A) | 43,621 | 472,409 | |||
| African Rainbow Minerals, Ltd. | 6,740 | 120,117 | |||
| Anglo American Platinum, Ltd. | 3,171 | 359,668 | |||
| AngloGold Ashanti, Ltd. | 24,841 | 420,883 | |||
| Aspen Pharmacare Holdings, Ltd. (A) | 23,376 | 315,199 | |||
| Bid Corp., Ltd. (A) | 20,169 | 443,270 | |||
| Capitec Bank Holdings, Ltd. | 4,829 | 631,988 | |||
| Clicks Group, Ltd. | 14,517 | 302,823 | |||
| Discovery, Ltd. (A) | 27,861 | 247,378 | |||
| Exxaro Resources, Ltd. | 15,210 | 193,205 | |||
| FirstRand, Ltd. | 305,175 | 1,299,161 | |||
| Gold Fields, Ltd. | 52,819 | 501,640 | |||
| Growthpoint Properties, Ltd. | 201,459 | 214,631 | |||
| Harmony Gold Mining Company, Ltd. | 32,703 | 121,986 | |||
| Impala Platinum Holdings, Ltd. | 47,813 | 732,529 | |||
| Kumba Iron Ore, Ltd. | 3,799 | 170,611 | |||
| Momentum Metropolitan Holdings | 7,680 | 10,442 | |||
| Mr. Price Group, Ltd. | 15,251 | 228,382 | |||
| The accompanying notes are an integral part of the financial statements. | 58 |
| Shares or Principal Amount | Value | ||||
| COMMON STOCKS (continued) | |||||
| South Africa (continued) | |||||
| MTN Group, Ltd. (A) | 102,682 | $ | 942,491 | ||
| MultiChoice Group | 22,209 | 175,833 | |||
| Naspers, Ltd., N Shares | 26,286 | 4,535,362 | |||
| Nedbank Group, Ltd. (A) | 22,762 | 290,067 | |||
| Northam Platinum, Ltd. (A) | 21,382 | 294,609 | |||
| Old Mutual, Ltd. | 290,301 | 306,894 | |||
| Rand Merchant Investment Holdings, Ltd. | 56,243 | 122,371 | |||
| Remgro, Ltd. | 31,809 | 264,407 | |||
| Sanlam, Ltd. | 115,770 | 512,906 | |||
| Sasol, Ltd. (A) | 34,219 | 526,013 | |||
| Shoprite Holdings, Ltd. | 30,060 | 379,912 | |||
| Sibanye Stillwater, Ltd. | 169,044 | 690,385 | |||
| Standard Bank Group, Ltd. | 78,870 | 805,570 | |||
| The Bidvest Group, Ltd. | 17,074 | 240,746 | |||
| The SPAR Group, Ltd. | 11,076 | 158,072 | |||
| Tiger Brands, Ltd. | 10,058 | 128,823 | |||
| Vodacom Group, Ltd. | 38,099 | 376,282 | |||
| Woolworths Holdings, Ltd. (A) | 58,757 | 256,257 | |||
| 17,793,322 | |||||
| South Korea - 3.7% | |||||
| Alteogen, Inc. (A) | 1,760 | 128,695 | |||
| Amorepacific Corp. | 2,048 | 401,132 | |||
| AMOREPACIFIC Group | 1,887 | 93,885 | |||
| BGF retail Company, Ltd. | 495 | 76,075 | |||
| BNK Financial Group, Inc. | 1,724 | 11,505 | |||
| Celltrion Healthcare Company, Ltd. (A) | 5,319 | 565,572 | |||
| Celltrion Pharm, Inc. (A) | 1,032 | 153,473 | |||
| Celltrion, Inc. (A) | 6,136 | 1,546,447 | |||
| Cheil Worldwide, Inc. | 4,471 | 88,932 | |||
| CJ CheilJedang Corp. | 536 | 209,588 | |||
| CJ Corp. | 972 | 84,902 | |||
| CJ ENM Company, Ltd. | 700 | 92,195 | |||
| CJ Logistics Corp. (A) | 570 | 83,988 | |||
| Coway Company, Ltd. | 3,532 | 238,146 | |||
| Daewoo Shipbuilding & Marine Engineering Company, Ltd. (A) | 2,381 | 57,408 | |||
| DB Insurance Company, Ltd. | 3,302 | 166,948 | |||
| Doosan Bobcat, Inc. (A) | 3,287 | 122,482 | |||
| Doosan Heavy Industries & Construction Company, Ltd. (A) | 13,491 | 242,565 | |||
| Douzone Bizon Company, Ltd. | 1,245 | 91,370 | |||
| E-MART, Inc. | 1,271 | 195,829 | |||
| Fila Holdings Corp. | 3,172 | 122,582 | |||
| Green Cross Corp. | 373 | 123,572 | |||
| GS Engineering & Construction Corp. | 4,274 | 164,496 | |||
| GS Holdings Corp. | 3,062 | 111,997 | |||
| Hana Financial Group, Inc. | 19,357 | 749,580 | |||
| Hankook Tire & Technology Company, Ltd. | 4,809 | 192,934 | |||
| Hanmi Pharm Company, Ltd. | 426 | 113,392 | |||
| Hanon Systems | 11,712 | 165,894 | |||
| HLB, Inc. (A) | 5,732 | 274,053 | |||
| HMM Company, Ltd. (A) | 16,480 | 595,562 | |||
| Hotel Shilla Company, Ltd. | 1,978 | 152,795 | |||
| HYBE Company, Ltd. (A) | 869 | 216,398 | |||
| Hyundai Engineering & Construction Company, Ltd. | 5,111 | 243,979 | |||
| Hyundai Glovis Company, Ltd. | 1,219 | 203,354 | |||
| Hyundai Heavy Industries Holdings Company, Ltd. | 3,014 | 169,340 | |||
| Hyundai Mobis Company, Ltd. | 4,261 | 1,017,114 | |||
| Hyundai Motor Company | 8,862 | 1,619,277 | |||
| Hyundai Steel Company | 5,612 | 245,839 | |||
| Shares or Principal Amount | Value | ||||
| COMMON STOCKS (continued) | |||||
| South Korea (continued) | |||||
| Industrial Bank of Korea | 18,318 | $ | 162,341 | ||
| Kakao Corp. | 19,739 | 2,633,793 | |||
| Kangwon Land, Inc. (A) | 6,267 | 149,514 | |||
| KB Financial Group, Inc. | 25,458 | 1,158,086 | |||
| Kia Corp. | 16,803 | 1,229,193 | |||
| KMW Company, Ltd. (A) | 1,660 | 60,849 | |||
| Korea Aerospace Industries, Ltd. | 4,738 | 133,869 | |||
| Korea Electric Power Corp. | 16,420 | 339,278 | |||
| Korea Investment Holdings Company, Ltd. | 2,785 | 228,065 | |||
| Korea Shipbuilding & Offshore Engineering Company, Ltd. (A) | 2,498 | 254,502 | |||
| Korea Zinc Company, Ltd. | 545 | 249,615 | |||
| Korean Air Lines Company, Ltd. (A) | 10,040 | 270,472 | |||
| KT&G Corp. | 7,499 | 527,418 | |||
| Kumho Petrochemical Company, Ltd. | 1,184 | 197,956 | |||
| LG Chem, Ltd. | 2,924 | 1,905,297 | |||
| LG Corp. | 5,569 | 456,781 | |||
| LG Display Company, Ltd. (A) | 15,087 | 265,398 | |||
| LG Electronics, Inc. | 6,802 | 830,740 | |||
| LG Household & Health Care, Ltd. | 597 | 752,105 | |||
| LG Innotek Company, Ltd. | 926 | 171,165 | |||
| LG Uplus Corp. | 13,905 | 168,239 | |||
| Lotte Chemical Corp. | 1,121 | 241,097 | |||
| Lotte Shopping Company, Ltd. | 746 | 69,028 | |||
| LX Holdings Corp. (A) | 958 | 8,133 | |||
| Meritz Securities Company, Ltd. | 21,443 | 98,912 | |||
| Mirae Asset Securities Company, Ltd. | 20,526 | 155,642 | |||
| NAVER Corp. | 7,842 | 2,969,273 | |||
| NCSoft Corp. | 1,046 | 594,868 | |||
| Netmarble Corp. (B) | 1,359 | 150,874 | |||
| NH Investment & Securities Company, Ltd. | 10,582 | 120,572 | |||
| Orion Corp. | 1,490 | 162,335 | |||
| Pan Ocean Company, Ltd. | 17,375 | 124,067 | |||
| Pearl Abyss Corp. (A) | 1,857 | 150,937 | |||
| POSCO | 4,737 | 1,363,452 | |||
| POSCO Chemical Company, Ltd. | 1,983 | 264,943 | |||
| S-1 Corp. | 1,004 | 71,077 | |||
| Samsung Biologics Company, Ltd. (A)(B) | 1,053 | 875,270 | |||
| Samsung C&T Corp. | 5,416 | 619,555 | |||
| Samsung Electro-Mechanics Company, Ltd. | 3,604 | 571,912 | |||
| Samsung Electronics Company, Ltd. | 303,796 | 20,056,074 | |||
| Samsung Engineering Company, Ltd. (A) | 10,151 | 195,039 | |||
| Samsung Fire & Marine Insurance Company, Ltd. | 2,070 | 402,927 | |||
| Samsung Heavy Industries Company, Ltd. (A) | 29,931 | 162,266 | |||
| Samsung Life Insurance Company, Ltd. | 4,804 | 308,018 | |||
| Samsung SDI Company, Ltd. | 3,507 | 2,390,327 | |||
| Samsung SDS Company, Ltd. | 2,229 | 330,861 | |||
| Samsung Securities Company, Ltd. | 4,449 | 189,174 | |||
| Seegene, Inc. | 2,341 | 132,587 | |||
| Shin Poong Pharmaceutical Company, Ltd. | 2,032 | 123,445 | |||
| Shinhan Financial Group Company, Ltd. | 28,134 | 937,246 | |||
| Shinsegae, Inc. | 476 | 110,110 | |||
| SK Biopharmaceuticals Company, Ltd. (A) | 1,741 | 188,036 | |||
| SK Chemicals Company, Ltd. | 490 | 113,785 | |||
| SK Hynix, Inc. | 34,821 | 3,188,225 | |||
| SK Innovation Company, Ltd. (A) | 3,244 | 695,424 | |||
| SK Telecom Company, Ltd. | 2,535 | 651,772 | |||
| SK, Inc. | 2,028 | 459,468 | |||
| SKC Company, Ltd. | 1,352 | 185,055 | |||
| S-Oil Corp. | 2,861 | 233,617 | |||
| The accompanying notes are an integral part of the financial statements. | 59 |
| Shares or Principal Amount | Value | ||||
| COMMON STOCKS (continued) | |||||
| South Korea (continued) | |||||
| Woori Financial Group, Inc. | 32,609 | $ | 315,488 | ||
| Yuhan Corp. | 3,148 | 169,404 | |||
| 63,428,266 | |||||
| Spain - 1.2% | |||||
| ACS Actividades de Construccion y Servicios SA | 12,597 | 340,071 | |||
| Aena SME SA (A)(B) | 3,790 | 605,922 | |||
| Amadeus IT Group SA (A) | 22,774 | 1,390,986 | |||
| Banco Bilbao Vizcaya Argentaria SA (A) | 336,457 | 2,202,108 | |||
| Banco Santander SA (A) | 872,998 | 3,218,962 | |||
| CaixaBank SA | 223,339 | 693,790 | |||
| Cellnex Telecom SA (A)(B) | 25,654 | 1,755,970 | |||
| EDP Renovaveis SA | 16,362 | 434,842 | |||
| Enagas SA | 12,130 | 276,112 | |||
| Endesa SA | 16,072 | 386,406 | |||
| Ferrovial SA | 24,182 | 700,298 | |||
| Grifols SA (C) | 15,042 | 367,724 | |||
| Iberdrola SA | 291,581 | 3,613,116 | |||
| Industria de Diseno Textil SA | 55,166 | 1,884,547 | |||
| Mapfre SA | 7,428 | 16,029 | |||
| Naturgy Energy Group SA | 14,352 | 369,169 | |||
| Red Electrica Corp. SA | 21,388 | 426,552 | |||
| Repsol SA | 75,098 | 861,761 | |||
| Siemens Gamesa Renewable Energy SA (A) | 11,998 | 355,758 | |||
| Telefonica SA | 264,120 | 1,306,890 | |||
| 21,207,013 | |||||
| Sweden - 2.3% | |||||
| Alfa Laval AB | 20,156 | 818,437 | |||
| Assa Abloy AB, B Shares | 63,914 | 2,045,294 | |||
| Atlas Copco AB, A Shares | 42,752 | 2,939,086 | |||
| Atlas Copco AB, B Shares | 24,995 | 1,447,486 | |||
| Boliden AB | 17,371 | 606,479 | |||
| Electrolux AB, Series B | 14,437 | 366,864 | |||
| Embracer Group AB (A) | 16,237 | 369,616 | |||
| Epiroc AB, A Shares | 42,073 | 923,248 | |||
| Epiroc AB, B Shares | 24,838 | 472,043 | |||
| EQT AB | 15,275 | 779,621 | |||
| Essity AB, B Shares | 38,721 | 1,242,857 | |||
| Evolution AB (B) | 10,833 | 1,749,014 | |||
| Fastighets AB Balder, B Shares (A) | 6,734 | 481,940 | |||
| Hennes & Mauritz AB, B Shares (A) | 46,763 | 939,031 | |||
| Hexagon AB, B Shares | 125,894 | 2,183,088 | |||
| Husqvarna AB, B Shares | 26,655 | 358,069 | |||
| ICA Gruppen AB | 6,227 | 309,796 | |||
| Industrivarden AB, A Shares | 7,289 | 268,363 | |||
| Industrivarden AB, C Shares | 9,912 | 345,652 | |||
| Investment AB Latour, B Shares | 9,416 | 328,074 | |||
| Investor AB, B Shares | 117,263 | 2,804,773 | |||
| Kinnevik AB, B Shares (A) | 15,637 | 612,675 | |||
| L.E. Lundbergforetagen AB, B Shares | 4,874 | 311,413 | |||
| Lundin Energy AB | 12,583 | 384,546 | |||
| Nibe Industrier AB, B Shares | 90,998 | 1,268,355 | |||
| Sandvik AB | 72,190 | 1,842,224 | |||
| Securitas AB, B Shares | 19,996 | 332,637 | |||
| Sinch AB (A)(B) | 32,217 | 724,286 | |||
| Skandinaviska Enskilda Banken AB, A Shares | 104,177 | 1,397,217 | |||
| Skanska AB, B Shares | 21,852 | 629,951 | |||
| SKF AB, B Shares | 24,434 | 624,033 | |||
| Svenska Cellulosa AB SCA, B Shares | 38,559 | 681,471 | |||
| Svenska Handelsbanken AB, A Shares | 92,288 | 1,037,013 | |||
| Swedbank AB, A Shares | 57,296 | 1,104,525 | |||
| Shares or Principal Amount | Value | ||||
| COMMON STOCKS (continued) | |||||
| Sweden (continued) | |||||
| Swedish Match AB | 102,325 | $ | 945,349 | ||
| Tele2 AB, B Shares | 31,597 | 474,370 | |||
| Telefonaktiebolaget LM Ericsson, B Shares | 186,358 | 2,207,431 | |||
| Telia Company AB | 166,500 | 715,844 | |||
| Volvo AB, A Shares | 12,188 | 282,755 | |||
| Volvo AB, B Shares | 92,361 | 2,091,313 | |||
| 39,446,239 | |||||
| Switzerland - 6.4% | |||||
| ABB, Ltd. | 104,786 | 3,876,523 | |||
| Adecco Group AG | 9,285 | 516,500 | |||
| Alcon, Inc. | 30,266 | 2,492,676 | |||
| Baloise Holding AG | 3,145 | 501,509 | |||
| Banque Cantonale Vaudoise | 1,724 | 146,186 | |||
| Barry Callebaut AG | 209 | 532,437 | |||
| Chocoladefabriken Lindt & Spruengli AG | 7 | 854,976 | |||
| Chocoladefabriken Lindt & Spruengli AG, Participation Certificates | 62 | 729,380 | |||
| Cie Financiere Richemont SA, A Shares | 31,545 | 3,481,661 | |||
| Clariant AG (A) | 13,064 | 274,931 | |||
| Coca-Cola HBC AG (A) | 13,774 | 498,550 | |||
| Credit Suisse Group AG | 149,113 | 1,579,631 | |||
| EMS-Chemie Holding AG | 408 | 442,089 | |||
| Geberit AG | 2,211 | 1,846,419 | |||
| Givaudan SA | 554 | 2,779,407 | |||
| Glencore PLC (A) | 669,846 | 3,019,497 | |||
| Holcim, Ltd. (A) | 31,805 | 1,812,299 | |||
| Julius Baer Group, Ltd. | 13,711 | 935,825 | |||
| Kuehne + Nagel International AG | 3,221 | 1,177,172 | |||
| Logitech International SA | 10,398 | 1,064,650 | |||
| Lonza Group AG | 4,496 | 3,802,386 | |||
| Nestle SA | 174,066 | 21,982,595 | |||
| Novartis AG | 134,219 | 12,414,034 | |||
| Partners Group Holding AG | 1,376 | 2,439,654 | |||
| Roche Holding AG | 42,514 | 17,071,717 | |||
| Roche Holding AG, Bearer Shares | 1,874 | 838,897 | |||
| Schindler Holding AG | 1,094 | 341,005 | |||
| Schindler Holding AG, Participation Certificates | 2,512 | 811,188 | |||
| SGS SA | 357 | 1,121,993 | |||
| Sika AG | 8,552 | 3,081,340 | |||
| Sonova Holding AG | 3,338 | 1,286,361 | |||
| STMicroelectronics NV | 42,407 | 1,889,090 | |||
| Straumann Holding AG | 626 | 1,209,583 | |||
| Swiss Life Holding AG | 2,072 | 1,079,987 | |||
| Swiss Prime Site AG | 4,477 | 479,066 | |||
| Swiss Re AG | 19,022 | 1,748,923 | |||
| Swisscom AG | 1,527 | 896,253 | |||
| Temenos AG | 4,015 | 637,026 | |||
| The Swatch Group AG | 2,929 | 161,105 | |||
| The Swatch Group AG, Bearer Shares | 1,778 | 501,670 | |||
| UBS Group AG | 222,768 | 3,716,047 | |||
| Vifor Pharma AG | 2,938 | 418,330 | |||
| Zurich Insurance Group AG | 9,338 | 4,097,435 | |||
| 110,588,003 | |||||
| Taiwan - 4.1% | |||||
| Accton Technology Corp. | 30,000 | 303,941 | |||
| Acer, Inc. | 171,000 | 155,193 | |||
| Advantech Company, Ltd. | 22,265 | 310,007 | |||
| ASE Technology Holding Company, Ltd. | 196,000 | 902,575 | |||
| Asia Cement Corp. | 128,000 | 207,194 | |||
| ASMedia Technology, Inc. | 2,000 | 149,181 | |||
| Asustek Computer, Inc. | 42,000 | 490,299 | |||
| AU Optronics Corp. | 488,000 | 307,681 | |||
| The accompanying notes are an integral part of the financial statements. | 60 |
| Shares or Principal Amount | Value | ||||
| COMMON STOCKS (continued) | |||||
| Taiwan (continued) | |||||
| Catcher Technology Company, Ltd. | 41,000 | $ | 246,596 | ||
| Cathay Financial Holding Company, Ltd. | 487,000 | 1,045,871 | |||
| Chailease Holding Company, Ltd. | 77,440 | 742,894 | |||
| Chang Hwa Commercial Bank, Ltd. | 238,893 | 142,133 | |||
| Cheng Shin Rubber Industry Company, Ltd. | 102,000 | 136,944 | |||
| China Development Financial Holding Corp. | 837,000 | 427,760 | |||
| China Life Insurance Company, Ltd. | 133,189 | 138,602 | |||
| China Steel Corp. | 698,000 | 958,817 | |||
| Chunghwa Telecom Company, Ltd. | 223,000 | 902,089 | |||
| Compal Electronics, Inc. | 247,000 | 203,832 | |||
| CTBC Financial Holding Company, Ltd. | 1,098,000 | 910,061 | |||
| Delta Electronics, Inc. | 116,000 | 1,129,950 | |||
| E.Sun Financial Holding Company, Ltd. | 706,484 | 677,232 | |||
| Eclat Textile Company, Ltd. | 11,340 | 227,699 | |||
| Evergreen Marine Corp. Taiwan, Ltd. | 161,900 | 790,322 | |||
| Far Eastern New Century Corp. | 171,000 | 185,134 | |||
| Far EasTone Telecommunications Company, Ltd. | 89,000 | 198,005 | |||
| Feng TAY Enterprise Company, Ltd. | 25,920 | 201,746 | |||
| First Financial Holding Company, Ltd. | 603,291 | 498,257 | |||
| Formosa Chemicals & Fibre Corp. | 209,000 | 633,098 | |||
| Formosa Petrochemical Corp. | 66,000 | 232,659 | |||
| Formosa Plastics Corp. | 228,000 | 841,857 | |||
| Foxconn Technology Company, Ltd. | 55,000 | 131,169 | |||
| Fubon Financial Holding Company, Ltd. | 401,000 | 1,228,279 | |||
| Giant Manufacturing Company, Ltd. | 18,000 | 217,548 | |||
| Globalwafers Company, Ltd. | 13,000 | 406,251 | |||
| Hiwin Technologies Corp. | 16,226 | 190,054 | |||
| Hon Hai Precision Industry Company, Ltd. | 742,800 | 2,966,231 | |||
| Hotai Motor Company, Ltd. | 18,000 | 377,578 | |||
| Hua Nan Financial Holdings Company, Ltd. | 475,267 | 358,133 | |||
| Innolux Corp. | 522,000 | 323,331 | |||
| Inventec Corp. | 153,000 | 133,847 | |||
| Largan Precision Company, Ltd. | 6,000 | 578,494 | |||
| Lite-On Technology Corp. | 125,000 | 275,626 | |||
| MediaTek, Inc. | 90,000 | 2,918,451 | |||
| Mega Financial Holding Company, Ltd. | 641,000 | 758,137 | |||
| Micro-Star International Company, Ltd. | 40,000 | 187,673 | |||
| Nan Ya Plastics Corp. | 307,000 | 992,086 | |||
| Nan Ya Printed Circuit Board Corp. | 13,000 | 196,727 | |||
| Nanya Technology Corp. | 76,000 | 181,228 | |||
| Nien Made Enterprise Company, Ltd. | 9,000 | 134,187 | |||
| Novatek Microelectronics Corp. | 34,000 | 548,678 | |||
| Oneness Biotech Company, Ltd. (A) | 13,000 | 90,342 | |||
| Pegatron Corp. | 119,000 | 277,900 | |||
| Phison Electronics Corp. | 10,000 | 153,260 | |||
| Pou Chen Corp. | 142,000 | 168,661 | |||
| Powertech Technology, Inc. | 44,000 | 178,309 | |||
| President Chain Store Corp. | 32,000 | 329,490 | |||
| Quanta Computer, Inc. | 160,000 | 452,490 | |||
| Realtek Semiconductor Corp. | 27,000 | 538,129 | |||
| Ruentex Development Company, Ltd. | 48,840 | 121,971 | |||
| Shin Kong Financial Holding Company, Ltd. | 707,988 | 242,588 | |||
| SinoPac Financial Holdings Company, Ltd. | 597,601 | 306,867 | |||
| Synnex Technology International Corp. | 78,000 | 151,294 | |||
| Taishin Financial Holding Company, Ltd. | 573,595 | 400,211 | |||
| Taiwan Business Bank | 295,891 | 103,391 | |||
| Taiwan Cement Corp. | 289,988 | 506,316 | |||
| Taiwan Cooperative Financial Holding Company, Ltd. | 529,470 | 426,584 | |||
| Shares or Principal Amount | Value | ||||
| COMMON STOCKS (continued) | |||||
| Taiwan (continued) | |||||
| Taiwan High Speed Rail Corp. | 108,000 | $ | 117,641 | ||
| Taiwan Mobile Company, Ltd. | 95,000 | 346,210 | |||
| Taiwan Semiconductor Manufacturing Company, Ltd. | 1,463,816 | 32,109,154 | |||
| The Shanghai Commercial & Savings Bank, Ltd. | 208,000 | 337,582 | |||
| Unimicron Technology Corp. | 72,000 | 381,584 | |||
| Uni-President Enterprises Corp. | 284,000 | 740,187 | |||
| United Microelectronics Corp. | 703,000 | 1,592,949 | |||
| Vanguard International Semiconductor Corp. | 54,000 | 287,236 | |||
| Walsin Technology Corp. (A) | 19,000 | 123,185 | |||
| Wan Hai Lines, Ltd. | 33,000 | 295,263 | |||
| Win Semiconductors Corp. | 20,000 | 237,353 | |||
| Winbond Electronics Corp. | 179,000 | 189,716 | |||
| Wistron Corp. | 160,040 | 158,065 | |||
| Wiwynn Corp. | 5,000 | 174,553 | |||
| WPG Holdings, Ltd. | 92,960 | 162,157 | |||
| Yageo Corp. | 22,556 | 388,335 | |||
| Yang Ming Marine Transport Corp. (A) | 94,000 | 450,262 | |||
| Yuanta Financial Holding Company, Ltd. | 577,480 | 520,208 | |||
| Zhen Ding Technology Holding, Ltd. | 40,000 | 142,962 | |||
| 70,603,742 | |||||
| Thailand - 0.5% | |||||
| Advanced Info Service PCL, NVDR | 76,900 | 448,400 | |||
| Airports of Thailand PCL, NVDR | 278,100 | 549,464 | |||
| Asset World Corp. PCL, NVDR (A) | 512,600 | 68,859 | |||
| B. Grimm Power PCL, NVDR | 49,200 | 70,551 | |||
| Bangkok Bank PCL, NVDR | 37,400 | 132,069 | |||
| Bangkok Commercial Asset Management PCL, NVDR | 114,900 | 66,262 | |||
| Bangkok Dusit Medical Services PCL, NVDR | 620,500 | 450,106 | |||
| Bangkok Expressway & Metro PCL, NVDR | 492,300 | 132,059 | |||
| Berli Jucker PCL, NVDR | 77,600 | 87,199 | |||
| BTS Group Holdings PCL, NVDR | 504,600 | 147,122 | |||
| Bumrungrad Hospital PCL, NVDR | 30,400 | 125,302 | |||
| Carabao Group PCL, NVDR | 19,100 | 82,929 | |||
| Central Pattana PCL, NVDR | 130,800 | 217,733 | |||
| Central Retail Corp. PCL, NVDR | 117,258 | 124,414 | |||
| Charoen Pokphand Foods PCL, NVDR | 257,800 | 215,999 | |||
| CP ALL PCL, NVDR | 378,200 | 762,462 | |||
| Delta Electronics Thailand PCL, NVDR | 20,300 | 367,580 | |||
| Electricity Generating PCL, NVDR | 18,000 | 101,006 | |||
| Energy Absolute PCL, NVDR | 96,400 | 195,721 | |||
| Global Power Synergy PCL, NVDR | 45,100 | 116,389 | |||
| Gulf Energy Development PCL, NVDR | 186,100 | 240,890 | |||
| Home Product Center PCL, NVDR | 378,300 | 167,618 | |||
| Indorama Ventures PCL, NVDR | 111,500 | 151,139 | |||
| Intouch Holdings PCL, NVDR | 125,000 | 331,492 | |||
| Krung Thai Bank PCL, NVDR | 254,100 | 88,145 | |||
| Krungthai Card PCL, NVDR | 58,400 | 119,928 | |||
| Land & Houses PCL, NVDR | 553,200 | 139,758 | |||
| Minor International PCL, NVDR (A) | 200,600 | 203,742 | |||
| Muangthai Capital PCL, NVDR | 47,400 | 95,093 | |||
| Osotspa PCL, NVDR | 73,500 | 83,172 | |||
| PTT Exploration & Production PCL, NVDR | 90,700 | 313,010 | |||
| PTT Global Chemical PCL, NVDR | 149,600 | 296,668 | |||
| PTT Oil & Retail Business PCL, NVDR | 194,000 | 181,797 | |||
| PTT PCL, NVDR | 651,600 | 771,713 | |||
| Ratch Group PCL, NVDR | 53,700 | 78,690 | |||
| The accompanying notes are an integral part of the financial statements. | 61 |
| Shares or Principal Amount | Value | ||||
| COMMON STOCKS (continued) | |||||
| Thailand (continued) | |||||
| SCG Packaging PCL, NVDR | 81,900 | $ | 177,805 | ||
| Sri Trang Gloves Thailand PCL, NVDR | 65,400 | 75,073 | |||
| Srisawad Corp. PCL, NVDR | 48,700 | 108,292 | |||
| Thai Oil PCL, NVDR | 70,900 | 109,112 | |||
| Thai Union Group PCL, NVDR | 186,100 | 114,881 | |||
| The Siam Cement PCL, NVDR | 51,000 | 679,902 | |||
| The Siam Commercial Bank PCL, NVDR | 56,100 | 185,074 | |||
| True Corp. PCL, NVDR | 717,600 | 73,913 | |||
| 9,248,533 | |||||
| Turkey - 0.1% | |||||
| Akbank TAS | 156,964 | 111,409 | |||
| Aselsan Elektronik Sanayi Ve Ticaret AS | 35,205 | 67,325 | |||
| BIM Birlesik Magazalar AS | 22,103 | 190,752 | |||
| Eregli Demir ve Celik Fabrikalari TAS | 69,257 | 156,665 | |||
| Ford Otomotiv Sanayi AS | 3,430 | 70,869 | |||
| KOC Holding AS | 39,405 | 109,145 | |||
| Turkcell Iletisim Hizmetleri AS | 61,613 | 121,833 | |||
| Turkiye Garanti Bankasi AS | 121,757 | 144,419 | |||
| Turkiye Is Bankasi AS, Class C | 87,364 | 60,478 | |||
| Turkiye Petrol Rafinerileri AS (A) | 5,463 | 66,695 | |||
| Turkiye Sise ve Cam Fabrikalari AS | 71,354 | 76,394 | |||
| 1,175,984 | |||||
| United Arab Emirates - 0.0% | |||||
| NMC Health PLC (A) | 5,577 | 1,143 | |||
| United Kingdom - 8.3% | |||||
| 3i Group PLC | 67,173 | 1,235,388 | |||
| abrdn PLC | 154,272 | 563,666 | |||
| Admiral Group PLC | 13,266 | 659,138 | |||
| Anglo American PLC | 86,949 | 3,672,346 | |||
| Ashtead Group PLC | 30,188 | 2,359,890 | |||
| Associated British Foods PLC | 24,347 | 663,846 | |||
| AstraZeneca PLC | 87,702 | 10,256,203 | |||
| Auto Trader Group PLC (B) | 65,089 | 562,867 | |||
| AVEVA Group PLC | 7,791 | 443,318 | |||
| Aviva PLC | 266,142 | 1,479,252 | |||
| BAE Systems PLC | 217,855 | 1,702,023 | |||
| Barclays PLC | 1,165,208 | 2,954,290 | |||
| Barratt Developments PLC | 69,693 | 708,892 | |||
| BP PLC | 1,359,773 | 5,531,974 | |||
| British American Tobacco PLC | 145,952 | 5,475,168 | |||
| BT Group PLC (A) | 599,068 | 1,400,389 | |||
| Bunzl PLC | 22,854 | 828,079 | |||
| Burberry Group PLC | 27,393 | 701,420 | |||
| CNH Industrial NV | 62,226 | 1,028,647 | |||
| Coca-Cola Europacific Partners PLC | 12,537 | 723,886 | |||
| Compass Group PLC (A) | 119,751 | 2,474,057 | |||
| Croda International PLC | 9,447 | 1,189,207 | |||
| Diageo PLC | 156,558 | 7,526,184 | |||
| Direct Line Insurance Group PLC | 100,503 | 426,700 | |||
| Entain PLC (A) | 39,294 | 1,044,274 | |||
| Evraz PLC | 34,651 | 281,860 | |||
| Ferguson PLC | 15,153 | 2,190,195 | |||
| GlaxoSmithKline PLC | 336,928 | 6,777,531 | |||
| Halma PLC | 25,755 | 1,063,577 | |||
| Hargreaves Lansdown PLC | 24,097 | 500,438 | |||
| HSBC Holdings PLC | 1,360,987 | 7,187,198 | |||
| Imperial Brands PLC | 63,729 | 1,351,493 | |||
| Informa PLC (A) | 101,232 | 739,811 | |||
| InterContinental Hotels Group PLC (A) | 12,524 | 800,212 | |||
| Intertek Group PLC | 10,885 | 789,240 | |||
| J Sainsbury PLC | 113,479 | 474,299 | |||
| JD Sports Fashion PLC | 35,042 | 486,604 | |||
| Johnson Matthey PLC | 13,178 | 532,772 | |||
| Shares or Principal Amount | Value | ||||
| COMMON STOCKS (continued) | �� | ||||
| United Kingdom (continued) | |||||
| Kingfisher PLC | 142,789 | $ | 687,535 | ||
| Land Securities Group PLC | 47,650 | 465,383 | |||
| Legal & General Group PLC | 419,543 | 1,558,454 | |||
| Lloyds Banking Group PLC | 4,761,702 | 2,850,627 | |||
| London Stock Exchange Group PLC | 21,776 | 2,385,434 | |||
| M&G PLC | 177,699 | 503,361 | |||
| Melrose Industries PLC | 294,215 | 678,512 | |||
| Mondi PLC | 33,227 | 916,568 | |||
| National Grid PLC | 237,851 | 3,076,427 | |||
| NatWest Group PLC | 331,266 | 967,288 | |||
| Next PLC | 9,001 | 978,870 | |||
| Ocado Group PLC (A) | 32,483 | 900,276 | |||
| Pearson PLC | 50,717 | 534,843 | |||
| Persimmon PLC | 21,649 | 876,169 | |||
| Phoenix Group Holdings PLC | 50,609 | 433,640 | |||
| Prudential PLC | 176,328 | 3,673,738 | |||
| Reckitt Benckiser Group PLC | 47,713 | 3,642,479 | |||
| RELX PLC | 129,470 | 3,885,558 | |||
| Rentokil Initial PLC | 124,925 | 997,968 | |||
| Rio Tinto PLC | 75,042 | 5,551,943 | |||
| Rolls-Royce Holdings PLC (A) | 559,589 | 882,487 | |||
| Schroders PLC | 9,017 | 468,798 | |||
| Segro PLC | 80,752 | 1,427,222 | |||
| Severn Trent PLC | 16,090 | 611,321 | |||
| Smith & Nephew PLC | 59,345 | 1,136,402 | |||
| Smiths Group PLC | 27,401 | 543,829 | |||
| Spirax-Sarco Engineering PLC | 4,960 | 1,099,911 | |||
| SSE PLC | 70,347 | 1,580,297 | |||
| St. James's Place PLC | 37,400 | 828,216 | |||
| Standard Chartered PLC | 179,679 | 1,120,506 | |||
| Taylor Wimpey PLC | 249,319 | 627,610 | |||
| Tesco PLC | 522,814 | 1,835,408 | |||
| The Berkeley Group Holdings PLC | 8,428 | 559,828 | |||
| The British Land Company PLC | 59,681 | 436,015 | |||
| The Sage Group PLC | 74,336 | 759,161 | |||
| Unilever PLC | 175,706 | 9,783,327 | |||
| United Utilities Group PLC | 46,072 | 670,003 | |||
| Vodafone Group PLC | 1,804,148 | 3,030,205 | |||
| Whitbread PLC (A) | 13,757 | 607,502 | |||
| Wm Morrison Supermarkets PLC | 163,365 | 649,796 | |||
| WPP PLC | 82,850 | 1,123,354 | |||
| 144,132,605 | |||||
| United States - 0.0% | |||||
| Bausch Health Companies, Inc. (A) | 17,579 | 512,190 | |||
| Brookfield Renewable Corp., Class A | 7,440 | 326,047 | |||
| International Flavors & Fragrances, Inc. | 0 | 0 | |||
| 838,237 | |||||
| TOTAL COMMON STOCKS (Cost $1,240,318,259) | $ | 1,527,073,620 | |||
| PREFERRED SECURITIES - 1.1% | |||||
| Brazil - 0.4% | |||||
| Alpargatas SA (A) | 10,900 | 126,416 | |||
| Banco Bradesco SA | 295,961 | 1,325,036 | |||
| Bradespar SA | 13,400 | 163,652 | |||
| Braskem SA, A Shares (A) | 11,500 | 146,764 | |||
| Centrais Eletricas Brasileiras SA, B Shares | 15,500 | 113,219 | |||
| Cia Energetica de Minas Gerais | 64,951 | 169,700 | |||
| Cia Paranaense de Energia, B Shares | 63,500 | 83,999 | |||
| Gerdau SA | 68,900 | 377,359 | |||
| Itau Unibanco Holding SA | 290,800 | 1,740,031 | |||
| Itausa SA | 266,060 | 594,812 | |||
| Lojas Americanas SA | 54,500 | 62,818 | |||
| The accompanying notes are an integral part of the financial statements. | 62 |
| Shares or Principal Amount | Value | ||||
| PREFERRED SECURITIES (continued) | |||||
| Brazil (continued) | |||||
| Petroleo Brasileiro SA | 285,900 | $ | 1,503,369 | ||
| 6,407,175 | |||||
| Chile - 0.0% | |||||
| Sociedad Quimica y Minera de Chile SA, B Shares | 8,520 | 445,694 | |||
| Colombia - 0.1% | |||||
| Bancolombia SA | 84,705 | 705,660 | |||
| Germany - 0.4% | |||||
| Bayerische Motoren Werke AG | 4,057 | 339,643 | |||
| Fuchs Petrolub SE | 4,926 | 249,447 | |||
| Henkel AG & Company KGaA | 12,897 | 1,260,076 | |||
| Porsche Automobil Holding SE | 11,105 | 1,123,471 | |||
| Sartorius AG | 1,888 | 1,243,837 | |||
| Volkswagen AG | 13,472 | 3,204,374 | |||
| 7,420,848 | |||||
| South Korea - 0.2% | |||||
| Hyundai Motor Company | 1,480 | 130,499 | |||
| Hyundai Motor Company, 2nd Preferred | 2,314 | 197,632 | |||
| LG Chem, Ltd. | 489 | 145,477 | |||
| LG Household & Health Care, Ltd. | 130 | 76,979 | |||
| Samsung Electronics Company, Ltd. | 52,488 | 3,200,008 | |||
| 3,750,595 | |||||
| TOTAL PREFERRED SECURITIES (Cost $15,386,228) | $ | 18,729,972 | |||
| EXCHANGE-TRADED FUNDS - 6.3% | |||||
| iShares MSCI India ETF | 1,293,912 | 62,884,123 | |||
| KraneShares Bosera MSCI China A ETF (C) | 450,000 | 20,317,500 | |||
| VanEck Vectors Russia ETF | 753,561 | 22,064,266 | |||
| Xtrackers Harvest CSI 300 China A-Shares ETF | 69,303 | 2,625,891 | |||
| TOTAL EXCHANGE-TRADED FUNDS (Cost $75,742,856) | $ | 107,891,780 | |||
| WARRANTS - 0.0% | |||||
| BTS Group Holdings PCL (Expiration Date: 12-31-22; Strike Price: THB 9.90) (A) | 25,230 | 845 | |||
| BTS Group Holdings PCL (Expiration Date: 12-31-24; Strike Price: THB 11.90) (A) | 50,460 | 2,067 | |||
| BTS Group Holdings PCL (Expiration Date: 12-31-26; Strike Price: THB 14.90) (A) | 100,920 | 3,954 | |||
| Cie Financiere Richemont SA (Expiration Date: 11-22-23; Strike Price: CHF 67.00) (A) | 72,322 | 37,119 | |||
| Minor International PCL (Expiration Date: 10-1-21; Strike Price: THB 48.00) (A) | 1,000 | 9 | |||
| Minor International PCL (Expiration Date: 2-15-24; Strike Price: THB 31.00) (A) | 5,503 | 748 | |||
| Minor International PCL (Expiration Date: 5-5-23; Strike Price: THB 28.00) (A) | 6,072 | 989 | |||
| Shares or Principal Amount | Value | ||||
| WARRANTS (continued) | |||||
| Minor International PCL (Expiration Date: 7-31-23; Strike Price: THB 21.60) (A) | 12,759 | $ | 4,194 | ||
| Srisawad Corp. PCL (Expiration Date: 8-29-25; Strike Price: THB 100.00) (A) | 2,652 | 1,117 | |||
| TOTAL WARRANTS (Cost $0) | $ | 51,042 | |||
| SHORT-TERM INVESTMENTS - 4.0% | |||||
| U.S. Government - 2.5% | |||||
| U.S. Treasury Bill | |||||
| 0.035%, 09/02/2021 * | $ | 11,500,000 | $ | 11,499,990 | |
| 0.041%, 09/21/2021 * | 7,000,000 | 6,999,854 | |||
| 0.050%, 10/28/2021 * | 8,400,000 | 8,399,269 | |||
| 0.051%, 10/12/2021 * | 16,700,000 | 16,699,239 | |||
| 43,598,352 | |||||
| U.S. Government Agency - 0.9% | |||||
| Federal Home Loan Bank Discount Note 0.020%, 09/03/2021 * | 16,300,000 | 16,299,964 | |||
| Short-term funds - 0.6% | |||||
| John Hancock Collateral Trust, 0.0356% (E)(F) | 991,377 | 9,920,810 | |||
| TOTAL SHORT-TERM INVESTMENTS (Cost $69,816,492) | $ | 69,819,126 | |||
| Total Investments (International Strategic Equity Allocation Fund) (Cost $1,401,263,835) - 99.7% | $ | 1,723,565,540 | |||
| Other assets and liabilities, net - 0.3% | 5,112,752 | ||||
| TOTAL NET ASSETS - 100.0% | $ | 1,728,678,292 | |||
| Currency Abbreviations | |
| CHF | Swiss Franc |
| THB | Thai Bhat |
| Security Abbreviations and Legend | |
| ADR | American Depositary Receipt |
| NVDR | Non-Voting Depositary Receipt |
| (A) | Non-income producing security. |
| (B) | These securities are exempt from registration under Rule 144A of the Securities Act of 1933. Such securities may be resold, normally to qualified institutional buyers, in transactions exempt from registration. |
| (C) | All or a portion of this security is on loan as of 8-31-21. |
| (D) | Security is valued using significant unobservable inputs and is classified as Level 3 in the fair value hierarchy. Refer to Note 2 to the financial statements. |
| (E) | The rate shown is the annualized seven-day yield as of 8-31-21. |
| (F) | Investment is an affiliate of the fund, the advisor and/or subadvisor. This security represents the investment of cash collateral received for securities lending. |
| * | Yield represents either the annualized yield at the date of purchase, the stated coupon rate or, for floating rate securities, the rate at period end. |
| The accompanying notes are an integral part of the financial statements. | 63 |
| Open contracts | Number of contracts | Position | Expiration date | Notional basis^ | Notional value^ | Unrealized appreciation (depreciation) |
| Canadian Dollar Currency Futures | 56 | Long | Sep 2021 | $4,592,391 | $4,438,840 | $(153,551) |
| Mini MSCI EAFE Index Futures | 387 | Long | Sep 2021 | 45,444,873 | 45,470,565 | 25,692 |
| Mini MSCI Emerging Markets Index Futures | 313 | Long | Sep 2021 | 21,140,132 | 20,316,830 | (823,302) |
| S&P/TSX 60 Index Futures | 24 | Long | Sep 2021 | 4,534,858 | 4,679,206 | 144,348 |
| $(806,813) |
| Shares or Principal Amount | Value | ||||
| COMMON STOCKS – 95.5% | |||||
| Communication services – 6.5% | |||||
| Entertainment – 2.9% | |||||
| Spotify Technology SA (A) | 267,444 | $ | 62,672,827 | ||
| Interactive media and services – 3.6% | |||||
| Match Group, Inc. (A) | 350,885 | 48,225,634 | |||
| Snap, Inc., Class A (A) | 375,454 | 28,575,804 | |||
| 76,801,438 | |||||
| 139,474,265 | |||||
| Consumer discretionary – 31.4% | |||||
| Automobiles – 1.7% | |||||
| Thor Industries, Inc. | 313,483 | 35,558,377 | |||
| Diversified consumer services – 3.1% | |||||
| 2U, Inc. (A) | 377,252 | 13,969,642 | |||
| Chegg, Inc. (A) | 623,970 | 51,926,783 | |||
| 65,896,425 | |||||
| Hotels, restaurants and leisure – 8.9% | |||||
| Chipotle Mexican Grill, Inc. (A) | 42,476 | 80,845,845 | |||
| DraftKings, Inc., Class A (A)(B) | 1,048,711 | 62,178,075 | |||
| Penn National Gaming, Inc. (A) | 260,084 | 21,092,812 | |||
| Planet Fitness, Inc., Class A (A) | 329,061 | 26,752,659 | |||
| 190,869,391 | |||||
| Household durables – 2.0% | |||||
| Lennar Corp., A Shares | 404,481 | 43,404,856 | |||
| Leisure products – 1.3% | |||||
| Polaris, Inc. | 228,814 | 27,402,765 | |||
| Multiline retail – 2.0% | |||||
| Ollie's Bargain Outlet Holdings, Inc. (A) | 605,860 | 43,852,147 | |||
| Specialty retail – 8.1% | |||||
| EVgo, Inc. (A) | 1,307,000 | 11,998,260 | |||
| Five Below, Inc. (A) | 252,365 | 53,705,796 | |||
| Floor & Decor Holdings, Inc., Class A (A) | 460,640 | 56,796,912 | |||
| Ross Stores, Inc. | 243,655 | 28,848,752 | |||
| Ulta Beauty, Inc. (A) | 55,725 | 21,582,850 | |||
| 172,932,570 | |||||
| Textiles, apparel and luxury goods – 4.3% | |||||
| Lululemon Athletica, Inc. (A) | 232,135 | 92,893,462 | |||
| 672,809,993 | |||||
| Consumer staples – 0.1% | |||||
| Household products – 0.1% | |||||
| The Honest Company, Inc. (A)(C) | 327,276 | 3,246,513 | |||
| Financials – 3.7% | |||||
| Capital markets – 3.7% | |||||
| Ares Management Corp., Class A | 427,214 | 32,972,377 | |||
| Shares or Principal Amount | Value | ||||
| COMMON STOCKS (continued) | |||||
| Capital markets (continued) | |||||
| BowX Acquisition Corp. (A) | 1 | $ | 10 | ||
| Tradeweb Markets, Inc., Class A | 541,928 | 47,153,155 | |||
| 80,125,542 | |||||
| Health care – 19.8% | |||||
| Biotechnology – 3.0% | |||||
| Apellis Pharmaceuticals, Inc. (A) | 194,903 | 12,834,363 | |||
| Ascendis Pharma A/S, ADR (A) | 83,084 | 13,021,755 | |||
| Exact Sciences Corp. (A) | 228,867 | 23,889,137 | |||
| Kodiak Sciences, Inc. (A) | 153,566 | 14,462,846 | |||
| 64,208,101 | |||||
| Health care equipment and supplies – 10.3% | |||||
| ABIOMED, Inc. (A) | 132,612 | 48,265,464 | |||
| Align Technology, Inc. (A) | 86,603 | 61,401,527 | |||
| DexCom, Inc. (A) | 121,773 | 64,469,062 | |||
| Insulet Corp. (A) | 159,035 | 47,362,213 | |||
| 221,498,266 | |||||
| Health care providers and services – 1.4% | |||||
| Oak Street Health, Inc. (A) | 660,312 | 30,856,380 | |||
| Health care technology – 2.4% | |||||
| GoodRx Holdings, Inc., Class A (A)(B) | 986,324 | 37,500,038 | |||
| Multiplan Corp. (A)(B) | 2,228,270 | 13,369,620 | |||
| 50,869,658 | |||||
| Life sciences tools and services – 1.5% | |||||
| Agilent Technologies, Inc. | 181,889 | 31,916,063 | |||
| Pharmaceuticals – 1.2% | |||||
| Elanco Animal Health, Inc. (A) | 614,584 | 20,514,814 | |||
| Reata Pharmaceuticals, Inc., Class A (A) | 36,816 | 3,921,272 | |||
| 24,436,086 | |||||
| 423,784,554 | |||||
| Industrials – 8.8% | |||||
| Building products – 1.0% | |||||
| Johnson Controls International PLC | 302,261 | 22,609,123 | |||
| Commercial services and supplies – 1.7% | |||||
| Copart, Inc. (A) | 254,953 | 36,794,817 | |||
| Machinery – 1.7% | |||||
| Hyzon Motors, Inc. (A) | 528,700 | 4,985,641 | |||
| The Middleby Corp. (A) | 168,929 | 30,903,871 | |||
| 35,889,512 | |||||
| Professional services – 4.4% | |||||
| CoStar Group, Inc. (A) | 770,707 | 65,309,711 | |||
| The accompanying notes are an integral part of the financial statements. | 64 |
| Shares or Principal Amount | Value | ||||
| COMMON STOCKS (continued) | |||||
| Professional services (continued) | |||||
| Leidos Holdings, Inc. | 298,373 | $ | 29,273,375 | ||
| 94,583,086 | |||||
| 189,876,538 | |||||
| Information technology – 25.2% | |||||
| Communications equipment – 2.7% | |||||
| Arista Networks, Inc. (A) | 153,952 | 56,889,883 | |||
| IT services – 1.9% | |||||
| MongoDB, Inc. (A) | 101,073 | 39,603,434 | |||
| Payoneer Global, Inc. (A) | 186,400 | 1,914,328 | |||
| 41,517,762 | |||||
| Semiconductors and semiconductor equipment – 5.4% | |||||
| Marvell Technology, Inc. | 545,880 | 33,402,397 | |||
| MKS Instruments, Inc. | 148,643 | 21,877,277 | |||
| SolarEdge Technologies, Inc. (A) | 119,990 | 34,770,702 | |||
| Universal Display Corp. | 125,055 | 26,085,222 | |||
| 116,135,598 | |||||
| Software – 15.2% | |||||
| Fair Isaac Corp. (A) | 114,903 | 52,825,505 | |||
| Guidewire Software, Inc. (A) | 278,271 | 32,963,983 | |||
| IronSource, Ltd., Class A (A)(B) | 2,489,890 | 24,749,507 | |||
| Paycom Software, Inc. (A) | 163,075 | 79,727,368 | |||
| RingCentral, Inc., Class A (A) | 184,706 | 46,593,936 | |||
| Varonis Systems, Inc. (A) | 628,226 | 43,353,876 | |||
| Workday, Inc., Class A (A) | 164,705 | 44,990,818 | |||
| 325,204,993 | |||||
| 539,748,236 | |||||
| TOTAL COMMON STOCKS (Cost $1,442,764,452) | $ | 2,049,065,641 | |||
| PREFERRED SECURITIES – 0.7% | |||||
| Information technology – 0.6% | |||||
| Software – 0.6% | |||||
| Essence Group Holdings Corp. (A)(C)(D) | 2,958,957 | 8,758,513 | |||
| Lookout, Inc., Series F (A)(C)(D) | 392,767 | 3,640,950 | |||
| 12,399,463 | |||||
| Real estate – 0.1% | |||||
| Real estate management and development – 0.1% | |||||
| WeWork Companies, Inc., Series D1 (A)(C)(D) | 88,086 | 659,225 | |||
| WeWork Companies, Inc., Series D2 (A)(C)(D) | 161,782 | 1,210,757 | |||
| 1,869,982 | |||||
| TOTAL PREFERRED SECURITIES (Cost $14,299,003) | $ | 14,269,445 | |||
| EXCHANGE-TRADED FUNDS – 1.8% | |||||
| iShares Russell Mid-Cap Growth ETF (B) | 321,482 | 37,947,735 | |||
| TOTAL EXCHANGE-TRADED FUNDS (Cost $36,913,089) | $ | 37,947,735 | |||
| SHORT-TERM INVESTMENTS – 4.7% | |||||
| Short-term funds – 2.8% | |||||
| John Hancock Collateral Trust, 0.0356% (E)(F) | 6,042,875 | 60,471,652 | |||
| Shares or Principal Amount | Value | ||||
| SHORT-TERM INVESTMENTS (continued) | |||||
| Repurchase agreement – 1.9% | |||||
| Societe Generale SA Tri-Party Repurchase Agreement dated 8-31-21 at 0.045% to be repurchased at $40,800,051 on 9-1-21, collateralized by $816,083 Federal Home Loan Mortgage Corp., 2.500% - 3.500% due 1-1-50 to 7-1-51 (valued at $854,163), $21,862,413 Government National Mortgage Association, 2.500% - 4.000% due 8-20-46 to 7-20-51 (valued at $22,853,280), $300 U.S. Treasury Bonds, 2.875% - 8.000% due 11-15-21 to 11-15-46 (valued at $332) and $18,039,900 U.S. Treasury Notes, 0.250% - 2.875% due 10-31-23 to 11-30-25 (valued at $17,908,225) | $ | 40,800,000 | $ | 40,800,000 | |
| TOTAL SHORT-TERM INVESTMENTS (Cost $101,250,751) | $ | 101,271,652 | |||
| Total Investments (Mid Cap Stock Fund) (Cost $1,595,227,295) – 102.7% | $ | 2,202,554,473 | |||
| Other assets and liabilities, net – (2.7%) | (57,033,829) | ||||
| TOTAL NET ASSETS – 100.0% | $ | 2,145,520,644 | |||
| Security Abbreviations and Legend | |
| ADR | American Depositary Receipt |
| (A) | Non-income producing security. |
| (B) | All or a portion of this security is on loan as of 8-31-21. |
| (C) | Restricted security as to resale. For more information on this security refer to the Notes to financial statements. |
| (D) | Security is valued using significant unobservable inputs and is classified as Level 3 in the fair value hierarchy. Refer to Note 2 to the financial statements. |
| (E) | The rate shown is the annualized seven-day yield as of 8-31-21. |
| (F) | Investment is an affiliate of the fund, the advisor and/or subadvisor. This security represents the investment of cash collateral received for securities lending. |
| Shares or Principal Amount | Value | ||||
| COMMON STOCKS – 92.4% | |||||
| Communication services – 4.4% | |||||
| Entertainment – 0.2% | |||||
| Madison Square Garden Sports Corp. (A) | 19,427 | $ | 3,512,013 | ||
| Media – 3.9% | |||||
| DISH Network Corp., Class A (A) | 263,165 | 11,471,362 | |||
| Fox Corp., Class A | 298,369 | 11,170,935 | |||
| News Corp., Class A | 1,589,429 | 35,714,470 | |||
| Scholastic Corp. | 276,405 | 9,187,702 | |||
| ViacomCBS, Inc., Class B | 123,000 | 5,098,350 | |||
| 72,642,819 | |||||
| Wireless telecommunication services – 0.3% | |||||
| Telephone & Data Systems, Inc. | 243,654 | 4,951,049 | |||
| 81,105,881 | |||||
| The accompanying notes are an integral part of the financial statements. | 65 |
| Shares or Principal Amount | Value | ||||
| COMMON STOCKS (continued) | |||||
| Consumer discretionary – 2.6% | |||||
| Diversified consumer services – 0.5% | |||||
| Strategic Education, Inc. | 127,507 | $ | 9,981,248 | ||
| Hotels, restaurants and leisure – 0.5% | |||||
| Compass Group PLC (A) | 430,756 | 8,899,398 | |||
| Household durables – 0.3% | |||||
| Mohawk Industries, Inc. (A) | 25,307 | 5,004,712 | |||
| Multiline retail – 0.4% | |||||
| Nordstrom, Inc. (A) | 237,870 | 6,805,461 | |||
| Textiles, apparel and luxury goods – 0.9% | |||||
| Ralph Lauren Corp. | 153,362 | 17,809,929 | |||
| 48,500,748 | |||||
| Consumer staples – 8.3% | |||||
| Beverages – 0.6% | |||||
| Carlsberg A/S, Class B | 66,827 | 11,672,337 | |||
| Food and staples retailing – 1.5% | |||||
| Sysco Corp. | 338,214 | 26,938,745 | |||
| Food products – 5.6% | |||||
| Bunge, Ltd. | 454,815 | 34,434,044 | |||
| Campbell Soup Company | 418,156 | 17,449,650 | |||
| Flowers Foods, Inc. | 1,626,997 | 39,259,438 | |||
| The Kraft Heinz Company | 339,861 | 12,231,597 | |||
| 103,374,729 | |||||
| Household products – 0.6% | |||||
| Kimberly-Clark Corp. | 84,839 | 11,691,663 | |||
| 153,677,474 | |||||
| Energy – 11.3% | |||||
| Energy equipment and services – 2.2% | |||||
| Frank's International NV (A)(B) | 2,407,936 | 6,934,856 | |||
| NOV, Inc. (A) | 690,415 | 9,092,766 | |||
| SEACOR Marine Holdings, Inc. (A) | 195,011 | 836,597 | |||
| TechnipFMC PLC (A) | 2,645,981 | 17,542,854 | |||
| Tidewater, Inc. (A)(B) | 573,567 | 6,596,021 | |||
| 41,003,094 | |||||
| Oil, gas and consumable fuels – 9.1% | |||||
| Cameco Corp. | 1,591,544 | 29,475,395 | |||
| Canadian Natural Resources, Ltd. (B) | 683,198 | 22,593,358 | |||
| Chesapeake Energy Corp. | 146,694 | 8,186,992 | |||
| EQT Corp. (A) | 2,175,255 | 39,872,424 | |||
| Equitrans Midstream Corp. | 1,583,930 | 13,827,709 | |||
| Hess Corp. | 83,664 | 5,751,900 | |||
| Imperial Oil, Ltd. | 1,507,324 | 39,778,280 | |||
| NAC Kazatomprom JSC, GDR | 292,418 | 8,245,066 | |||
| 167,731,124 | |||||
| 208,734,218 | |||||
| Financials – 17.6% | |||||
| Banks – 3.6% | |||||
| Fifth Third Bancorp | 975,294 | 37,899,925 | |||
| Popular, Inc. | 168,658 | 12,807,889 | |||
| Westamerica BanCorp | 279,394 | 15,852,816 | |||
| 66,560,630 | |||||
| Capital markets – 4.3% | |||||
| Lazard, Ltd., Class A | 267,779 | 12,692,725 | |||
| Northern Trust Corp. | 230,930 | 27,369,824 | |||
| State Street Corp. | 411,464 | 38,229,120 | |||
| 78,291,669 | |||||
| Diversified financial services – 1.1% | |||||
| Groupe Bruxelles Lambert SA | 177,814 | 20,371,444 | |||
| Insurance – 8.1% | |||||
| Brighthouse Financial, Inc. (A) | 373,815 | 18,301,982 | |||
| Brown & Brown, Inc. | 419,590 | 24,357,200 | |||
| Shares or Principal Amount | Value | ||||
| COMMON STOCKS (continued) | |||||
| Insurance (continued) | |||||
| CNA Financial Corp. | 454,762 | $ | 20,168,695 | ||
| Kemper Corp. | 222,971 | 15,295,811 | |||
| Loews Corp. | 679,288 | 37,951,821 | |||
| Marsh & McLennan Companies, Inc. | 94,025 | 14,780,730 | |||
| RenaissanceRe Holdings, Ltd. | 107,750 | 16,887,658 | |||
| The Hartford Financial Services Group, Inc. | 20,600 | 1,384,732 | |||
| 149,128,629 | |||||
| Thrifts and mortgage finance – 0.5% | |||||
| Capitol Federal Financial, Inc. | 857,576 | 9,896,427 | |||
| 324,248,799 | |||||
| Health care – 15.9% | |||||
| Biotechnology – 2.0% | |||||
| ACADIA Pharmaceuticals, Inc. (A) | 353,438 | 6,188,699 | |||
| Alkermes PLC (A) | 524,894 | 16,408,186 | |||
| BioMarin Pharmaceutical, Inc. (A) | 76,977 | 6,482,233 | |||
| Galapagos NV (A)(B) | 66,096 | 3,909,584 | |||
| Incyte Corp. (A) | 59,590 | 4,558,039 | |||
| 37,546,741 | |||||
| Health care equipment and supplies – 5.0% | |||||
| Baxter International, Inc. | 375,235 | 28,600,412 | |||
| Dentsply Sirona, Inc. | 395,403 | 24,396,365 | |||
| Hologic, Inc. (A) | 188,395 | 14,911,464 | |||
| Zimmer Biomet Holdings, Inc. | 162,297 | 24,417,584 | |||
| 92,325,825 | |||||
| Health care providers and services – 7.8% | |||||
| Cardinal Health, Inc. | 872,028 | 45,772,746 | |||
| Centene Corp. (A) | 125,000 | 7,872,500 | |||
| Covetrus, Inc. (A) | 440,685 | 9,955,074 | |||
| Fresenius Medical Care AG & Company KGaA | 59,079 | 4,542,580 | |||
| Fresenius SE & Company KGaA | 227,455 | 11,826,120 | |||
| Patterson Companies, Inc. | 880,830 | 26,988,631 | |||
| Select Medical Holdings Corp. | 1,041,579 | 36,007,386 | |||
| 142,965,037 | |||||
| Pharmaceuticals – 1.1% | |||||
| Perrigo Company PLC | 491,890 | 20,142,896 | |||
| 292,980,499 | |||||
| Industrials – 6.4% | |||||
| Aerospace and defense – 2.9% | |||||
| Rolls-Royce Holdings PLC (A) | 6,875,994 | 10,843,593 | |||
| Textron, Inc. | 578,209 | 42,018,448 | |||
| 52,862,041 | |||||
| Air freight and logistics – 0.7% | |||||
| CH Robinson Worldwide, Inc. | 136,346 | 12,279,321 | |||
| Airlines – 0.3% | |||||
| Southwest Airlines Company (A) | 134,485 | 6,694,663 | |||
| Commercial services and supplies – 0.4% | |||||
| Cintas Corp. | 17,306 | 6,849,196 | |||
| Machinery – 1.6% | |||||
| AGCO Corp. | 46,534 | 6,404,009 | |||
| PACCAR, Inc. | 287,012 | 23,497,672 | |||
| 29,901,681 | |||||
| Road and rail – 0.5% | |||||
| JB Hunt Transport Services, Inc. | 56,983 | 10,108,784 | |||
| 118,695,686 | |||||
| The accompanying notes are an integral part of the financial statements. | 66 |
| Shares or Principal Amount | Value | ||||
| COMMON STOCKS (continued) | |||||
| Information technology – 2.1% | |||||
| Electronic equipment, instruments and components – 0.8% | |||||
| National Instruments Corp. | 371,992 | $ | 15,556,705 | ||
| IT services – 0.2% | |||||
| Cognizant Technology Solutions Corp., Class A | 36,921 | 2,817,442 | |||
| Semiconductors and semiconductor equipment – 1.1% | |||||
| Applied Materials, Inc. | 151,475 | 20,468,817 | |||
| 38,842,964 | |||||
| Materials – 9.9% | |||||
| Chemicals – 2.2% | |||||
| Corteva, Inc. | 573,201 | 25,203,648 | |||
| PPG Industries, Inc. | 46,597 | 7,434,551 | |||
| Westlake Chemical Corp. | 94,857 | 8,285,759 | |||
| 40,923,958 | |||||
| Construction materials – 1.9% | |||||
| Summit Materials, Inc., Class A (A) | 630,148 | 21,217,083 | |||
| Vulcan Materials Company | 73,106 | 13,592,599 | |||
| 34,809,682 | |||||
| Metals and mining – 5.8% | |||||
| AngloGold Ashanti, Ltd., ADR | 361,127 | 6,168,049 | |||
| Centerra Gold, Inc. | 124,670 | 931,826 | |||
| Cia de Minas Buenaventura SAA, ADR (A) | 1,535,477 | 11,516,078 | |||
| Franco-Nevada Corp. | 264,650 | 38,607,246 | |||
| Freeport-McMoRan, Inc. | 579,129 | 21,074,504 | |||
| Fresnillo PLC | 1,372,456 | 16,138,963 | |||
| Gold Fields, Ltd., ADR | 1,216,340 | 11,530,903 | |||
| Newmont Corp. | 7,300 | 423,327 | |||
| 106,390,896 | |||||
| 182,124,536 | |||||
| Real estate – 6.5% | |||||
| Equity real estate investment trusts – 6.3% | |||||
| Apartment Income REIT Corp. | 168,151 | 8,545,434 | |||
| Apartment Investment and Management Company, Class A | 1,207,337 | 8,668,680 | |||
| Equity Commonwealth | 288,430 | 7,597,246 | |||
| Equity Residential | 167,879 | 14,113,588 | |||
| Rayonier, Inc. | 745,503 | 27,419,600 | |||
| Regency Centers Corp. | 284,036 | 19,490,550 | |||
| Weyerhaeuser Company | 845,618 | 30,442,248 | |||
| 116,277,346 | |||||
| Real estate management and development – 0.2% | |||||
| The St. Joe Company | 90,735 | 4,198,308 | |||
| 120,475,654 | |||||
| Utilities – 7.4% | |||||
| Electric utilities – 3.9% | |||||
| FirstEnergy Corp. | 1,152,954 | 44,815,322 | |||
| PG&E Corp. (A) | 2,890,706 | 26,507,774 | |||
| 71,323,096 | |||||
| Gas utilities – 0.8% | |||||
| National Fuel Gas Company | 285,970 | 14,816,106 | |||
| Independent power and renewable electricity producers – 1.3% | |||||
| Vistra Corp. | 1,218,181 | 23,255,075 | |||
| Multi-utilities – 1.4% | |||||
| CenterPoint Energy, Inc. | 622,720 | 15,624,045 | |||
| Consolidated Edison, Inc. | 147,035 | 11,093,791 | |||
| 26,717,836 | |||||
| 136,112,113 | |||||
| TOTAL COMMON STOCKS (Cost $1,247,363,343) | $ | 1,705,498,572 | |||
| Shares or Principal Amount | Value | ||||
| PREFERRED SECURITIES – 0.1% | |||||
| Consumer staples – 0.1% | |||||
| Food products – 0.1% | |||||
| Bunge, Ltd., 4.875% | 21,349 | $ | 2,428,449 | ||
| TOTAL PREFERRED SECURITIES (Cost $2,341,214) | $ | 2,428,449 | |||
| CORPORATE BONDS - 0.2% | |||||
| Energy - 0.2% | |||||
| Weatherford International, Ltd. 11.000%, 12/01/2024 (C) | $ | 3,398,000 | 3,550,910 | ||
| TOTAL CORPORATE BONDS (Cost $2,551,949) | $ | 3,550,910 | |||
| SHORT-TERM INVESTMENTS – 7.7% | |||||
| Short-term funds – 7.7% | |||||
| John Hancock Collateral Trust, 0.0356% (D)(E) | 830,566 | 8,311,553 | |||
| State Street Institutional U.S. Government Money Market Fund, Premier Class, 0.0250% (D) | 2,799,623 | 2,799,623 | |||
| T. Rowe Price Government Reserve Fund, 0.0295% (D) | 131,683,525 | 131,683,525 | |||
| TOTAL SHORT-TERM INVESTMENTS (Cost $142,792,426) | $ | 142,794,701 | |||
| Total Investments (Mid Value Fund) (Cost $1,395,048,932) – 100.4% | $ | 1,854,272,632 | |||
| Other assets and liabilities, net – (0.4%) | (7,578,165) | ||||
| TOTAL NET ASSETS – 100.0% | $ | 1,846,694,467 | |||
| Security Abbreviations and Legend | |
| ADR | American Depositary Receipt |
| GDR | Global Depositary Receipt |
| (A) | Non-income producing security. |
| (B) | All or a portion of this security is on loan as of 8-31-21. |
| (C) | These securities are exempt from registration under Rule 144A of the Securities Act of 1933. Such securities may be resold, normally to qualified institutional buyers, in transactions exempt from registration. |
| (D) | The rate shown is the annualized seven-day yield as of 8-31-21. |
| (E) | Investment is an affiliate of the fund, the advisor and/or subadvisor. This security represents the investment of cash collateral received for securities lending. |
| Shares or Principal Amount | Value | ||||
| COMMON STOCKS – 95.5% | |||||
| Communication services – 16.2% | |||||
| Entertainment – 0.5% | |||||
| CTS Eventim AG & Company KGaA (A) | 15,643 | $ | 1,009,285 | ||
| Take-Two Interactive Software, Inc. (A) | 575 | 92,702 | |||
| 1,101,987 | |||||
| Interactive media and services – 15.7% | |||||
| Alphabet, Inc., Class A (A) | 615 | 1,779,779 | |||
| Alphabet, Inc., Class C (A) | 3,728 | 10,845,643 | |||
| Baidu, Inc., ADR (A) | 27,076 | 4,251,474 | |||
| Facebook, Inc., Class A (A) | 25,360 | 9,621,077 | |||
| Kanzhun, Ltd. (A) | 3,412 | 125,766 | |||
| Kuaishou Technology (A)(B) | 3,500 | 38,189 | |||
| Mail.Ru Group, Ltd., GDR (A) | 128,675 | 2,590,344 | |||
| Pinterest, Inc., Class A (A) | 21,412 | 1,189,865 | |||
| Snap, Inc., Class A (A) | 13,595 | 1,034,715 | |||
| Zillow Group, Inc., Class A (A) | 1,145 | 109,462 | |||
| The accompanying notes are an integral part of the financial statements. | 67 |
| Shares or Principal Amount | Value | ||||
| COMMON STOCKS (continued) | |||||
| Interactive media and services (continued) | |||||
| ZoomInfo Technologies, Inc., Class A (A) | 38,505 | $ | 2,510,141 | ||
| 34,096,455 | |||||
| 35,198,442 | |||||
| Consumer discretionary – 23.0% | |||||
| Auto components – 0.2% | |||||
| Aptiv PLC (A) | 3,110 | 473,311 | |||
| Automobiles – 0.6% | |||||
| Ford Motor Company (A) | 51,260 | 667,918 | |||
| General Motors Company (A) | 11,290 | 553,323 | |||
| Tesla, Inc. (A) | 225 | 165,537 | |||
| 1,386,778 | |||||
| Diversified consumer services – 0.2% | |||||
| New Oriental Education & Technology Group, Inc., ADR (A) | 192,611 | 435,301 | |||
| Hotels, restaurants and leisure – 5.9% | |||||
| Booking Holdings, Inc. (A) | 2,104 | 4,838,506 | |||
| Expedia Group, Inc. (A) | 4,685 | 676,983 | |||
| Tongcheng-Elong Holdings, Ltd. (A) | 461,200 | 1,075,142 | |||
| Trip.com Group, Ltd., ADR (A) | 201,699 | 6,149,803 | |||
| 12,740,434 | |||||
| Internet and direct marketing retail – 16.1% | |||||
| Alibaba Group Holding, Ltd., ADR (A) | 31,476 | 5,256,177 | |||
| Amazon.com, Inc. (A) | 3,067 | 10,644,913 | |||
| boohoo Group PLC (A) | 506,882 | 1,974,471 | |||
| Coupang, Inc. (A) | 27,201 | 814,942 | |||
| Deliveroo PLC (A)(B)(C) | 235,141 | 1,127,719 | |||
| Delivery Hero SE (A)(B) | 19,732 | 2,863,720 | |||
| D-MARKET Elektronik Hizmetler ve Ticaret AS, ADR (A) | 30,722 | 268,510 | |||
| DoorDash, Inc., Class A (A) | 2,387 | 456,872 | |||
| Etsy, Inc. (A) | 13,273 | 2,870,419 | |||
| Naspers, Ltd., N Shares | 5,979 | 1,031,611 | |||
| Prosus NV (A) | 12,275 | 1,086,528 | |||
| Wayfair, Inc., Class A (A)(C) | 3,233 | 907,665 | |||
| Zalando SE (A)(B)(C) | 51,406 | 5,699,629 | |||
| 35,003,176 | |||||
| 50,039,000 | |||||
| Health care – 0.5% | |||||
| Health care equipment and supplies – 0.4% | |||||
| Intuitive Surgical, Inc. (A) | 732 | 771,206 | |||
| Health care technology – 0.1% | |||||
| Veeva Systems, Inc., Class A (A) | 730 | 242,345 | |||
| 1,013,551 | |||||
| Industrials – 0.6% | |||||
| Electrical equipment – 0.0% | |||||
| Bloom Energy Corp., Class A (A) | 465 | 9,960 | |||
| Road and rail – 0.6% | |||||
| DiDi Chuxing, Inc. (A)(D) | 16,798 | 525,163 | |||
| Lyft, Inc., Class A (A) | 14,520 | 691,297 | |||
| 1,216,460 | |||||
| 1,226,420 | |||||
| Information technology – 55.2% | |||||
| Communications equipment – 0.6% | |||||
| Arista Networks, Inc. (A) | 360 | 133,031 | |||
| Cisco Systems, Inc. | 16,870 | 995,667 | |||
| F5 Networks, Inc. (A) | 855 | 174,052 | |||
| 1,302,750 | |||||
| Electronic equipment, instruments and components – 1.3% | |||||
| Cognex Corp. | 1,495 | 132,487 | |||
| Flex, Ltd. (A) | 8,610 | 159,974 | |||
| Shares or Principal Amount | Value | ||||
| COMMON STOCKS (continued) | |||||
| Electronic equipment, instruments and components (continued) | |||||
| IPG Photonics Corp. (A) | 1,980 | $ | 337,946 | ||
| Samsung SDI Company, Ltd. | 3,375 | 2,300,355 | |||
| 2,930,762 | |||||
| IT services – 8.2% | |||||
| Adyen NV (A)(B) | 115 | 371,689 | |||
| DXC Technology Company (A) | 25,455 | 934,708 | |||
| EPAM Systems, Inc. (A) | 1,035 | 654,958 | |||
| Fidelity National Information Services, Inc. | 2,362 | 301,793 | |||
| Fiserv, Inc. (A) | 2,330 | 274,451 | |||
| Global Payments, Inc. | 1,369 | 222,654 | |||
| Mastercard, Inc., Class A | 735 | 254,479 | |||
| MongoDB, Inc. (A) | 9,775 | 3,830,138 | |||
| Okta, Inc. (A) | 2,400 | 632,640 | |||
| PayPal Holdings, Inc. (A) | 8,225 | 2,374,229 | |||
| Shopify, Inc., Class A (A) | 615 | 937,740 | |||
| Snowflake, Inc., Class A (A) | 1,092 | 332,350 | |||
| Square, Inc., Class A (A) | 10,195 | 2,732,974 | |||
| Twilio, Inc., Class A (A) | 9,625 | 3,435,740 | |||
| VeriSign, Inc. (A) | 2,079 | 449,605 | |||
| 17,740,148 | |||||
| Semiconductors and semiconductor equipment – 11.4% | |||||
| Advanced Micro Devices, Inc. (A) | 5,050 | 559,136 | |||
| Advantest Corp. | 3,300 | 284,300 | |||
| Applied Materials, Inc. | 23,108 | 3,122,584 | |||
| Infineon Technologies AG | 13,975 | 595,024 | |||
| KLA Corp. | 260 | 88,390 | |||
| Lam Research Corp. | 1,955 | 1,182,423 | |||
| Marvell Technology, Inc. | 10,040 | 614,348 | |||
| Micron Technology, Inc. (A) | 53,775 | 3,963,218 | |||
| NVIDIA Corp. | 6,265 | 1,402,420 | |||
| NXP Semiconductors NV | 5,275 | 1,134,811 | |||
| ON Semiconductor Corp. (A) | 31,470 | 1,396,009 | |||
| Qorvo, Inc. (A) | 2,410 | 453,152 | |||
| QUALCOMM, Inc. | 13,397 | 1,965,206 | |||
| SK Hynix, Inc. | 7,190 | 658,319 | |||
| Skyworks Solutions, Inc. | 1,560 | 286,198 | |||
| STMicroelectronics NV | 12,810 | 570,643 | |||
| Taiwan Semiconductor Manufacturing Company, Ltd., ADR | 13,275 | 1,579,858 | |||
| Teradyne, Inc. | 5,165 | 627,238 | |||
| Tokyo Electron, Ltd. | 2,100 | 899,521 | |||
| Xilinx, Inc. | 21,757 | 3,385,172 | |||
| 24,767,970 | |||||
| Software – 27.4% | |||||
| Adobe, Inc. (A) | 1,210 | 803,077 | |||
| Altair Engineering, Inc., Class A (A) | 2,095 | 155,009 | |||
| Alteryx, Inc., Class A (A) | 3,695 | 273,319 | |||
| Asana, Inc., Class A (A) | 40,690 | 3,074,130 | |||
| Atlassian Corp. PLC, Class A (A) | 2,410 | 884,615 | |||
| Autodesk, Inc. (A) | 905 | 280,631 | |||
| Box, Inc., Class A (A) | 8,310 | 214,232 | |||
| Citrix Systems, Inc. | 45,000 | 4,629,150 | |||
| Cloudflare, Inc., Class A (A) | 2,280 | 275,287 | |||
| Crowdstrike Holdings, Inc., Class A (A) | 10,975 | 3,083,975 | |||
| Datadog, Inc., Class A (A) | 2,930 | 403,754 | |||
| DocuSign, Inc. (A) | 1,565 | 463,616 | |||
| FireEye, Inc. (A) | 5,965 | 108,503 | |||
| Fortinet, Inc. (A) | 4,592 | 1,447,123 | |||
| HubSpot, Inc. (A) | 8,170 | 5,592,120 | |||
| Intuit, Inc. | 3,240 | 1,834,196 | |||
| KnowBe4, Inc., Class A (A)(C) | 7,750 | 190,728 | |||
| Legalzoom.com, Inc. (A)(C) | 1,200 | 41,076 | |||
| McAfee Corp., Class A | 27,418 | 728,222 | |||
| The accompanying notes are an integral part of the financial statements. | 68 |
| Shares or Principal Amount | Value | ||||
| COMMON STOCKS (continued) | |||||
| Software (continued) | |||||
| Microsoft Corp. | 30,756 | $ | 9,284,621 | ||
| Monday.com, Ltd. (A)(C) | 735 | 278,830 | |||
| NortonLifeLock, Inc. | 43,322 | 1,150,632 | |||
| Palo Alto Networks, Inc. (A) | 1,865 | 859,840 | |||
| Paycom Software, Inc. (A) | 7,205 | 3,522,525 | |||
| Procore Technologies, Inc. (A) | 369 | 33,468 | |||
| salesforce.com, Inc. (A) | 34,019 | 9,024,220 | |||
| TeamViewer AG (A)(B) | 34,698 | 1,156,017 | |||
| The Trade Desk, Inc., Class A (A) | 12,405 | 993,020 | |||
| Varonis Systems, Inc. (A) | 7,085 | 488,936 | |||
| Workday, Inc., Class A (A) | 6,838 | 1,867,868 | |||
| Zoom Video Communications, Inc., Class A (A) | 11,187 | 3,238,637 | |||
| Zscaler, Inc. (A) | 11,280 | 3,139,675 | |||
| 59,521,052 | |||||
| Technology hardware, storage and peripherals – 6.3% | |||||
| Apple, Inc. | 26,410 | 4,009,830 | |||
| Pure Storage, Inc., Class A (A) | 171,007 | 4,417,111 | |||
| Samsung Electronics Company, Ltd. | 50,542 | 3,336,693 | |||
| Seagate Technology Holdings PLC | 10,150 | 889,039 | |||
| Western Digital Corp. (A) | 15,670 | 990,344 | |||
| 13,643,017 | |||||
| 119,905,699 | |||||
| TOTAL COMMON STOCKS (Cost $149,730,738) | $ | 207,383,112 | |||
| SHORT-TERM INVESTMENTS – 6.4% | |||||
| Short-term funds – 2.9% | |||||
| John Hancock Collateral Trust, 0.0356% (E)(F) | 182,290 | 1,824,190 | |||
| State Street Institutional U.S. Government Money Market Fund, Premier Class, 0.0250% (E) | 2,327,560 | 2,327,560 | |||
| T. Rowe Price Government Reserve Fund, 0.0295% (E) | 2,022,433 | 2,022,433 | |||
| 6,174,183 | |||||
| Repurchase agreement – 3.5% | |||||
| Repurchase Agreement with State Street Corp. dated 8-31-21 at 0.000% to be repurchased at $7,608,000 on 9-1-21, collateralized by $7,772,400 U.S. Treasury Notes, 0.125% due 8-31-23 (valued at $7,760,260) | $ | 7,608,000 | 7,608,000 | ||
| TOTAL SHORT-TERM INVESTMENTS (Cost $13,781,837) | $ | 13,782,183 | |||
| Total Investments (Science & Technology Fund) (Cost $163,512,575) – 101.9% | $ | 221,165,295 | |||
| Other assets and liabilities, net – (1.9%) | (4,056,491) | ||||
| TOTAL NET ASSETS – 100.0% | $ | 217,108,804 | |||
| Security Abbreviations and Legend | |
| ADR | American Depositary Receipt |
| GDR | Global Depositary Receipt |
| (A) | Non-income producing security. |
| (B) | These securities are exempt from registration under Rule 144A of the Securities Act of 1933. Such securities may be resold, normally to qualified institutional buyers, in transactions exempt from registration. |
| (C) | All or a portion of this security is on loan as of 8-31-21. |
| (D) | Restricted security as to resale, excluding 144A securities. For more information on this security refer to the Notes to financial statements. |
| (E) | The rate shown is the annualized seven-day yield as of 8-31-21. |
| (F) | Investment is an affiliate of the fund, the advisor and/or subadvisor. This security represents the investment of cash collateral received for securities lending. |
| Shares or Principal Amount | Value | ||||
| COMMON STOCKS – 92.5% | |||||
| Communication services – 7.6% | |||||
| Diversified telecommunication services – 1.1% | |||||
| Anterix, Inc. (A) | 1,328 | $ | 78,379 | ||
| AT&T, Inc. | 688,190 | 18,870,170 | |||
| ATN International, Inc. | 1,329 | 60,589 | |||
| Bandwidth, Inc., Class A (A) | 2,587 | 266,202 | |||
| BCE, Inc. | 9,429 | 491,759 | |||
| BT Group PLC (A) | 1,101,659 | 2,575,243 | |||
| Cellnex Telecom SA (A)(B) | 47,177 | 3,229,183 | |||
| China Tower Corp., Ltd., H Shares (B) | 4,562,400 | 598,435 | |||
| Chunghwa Telecom Company, Ltd. | 410,479 | 1,660,486 | |||
| Cincinnati Bell, Inc. (A) | 5,754 | 89,129 | |||
| Cogent Communications Holdings, Inc. | 4,757 | 345,263 | |||
| Consolidated Communications Holdings, Inc. (A) | 8,448 | 78,313 | |||
| Deutsche Telekom AG | 442,619 | 9,411,519 | |||
| Elisa OYJ | 18,919 | 1,212,531 | |||
| Globalstar, Inc. (A)(C) | 68,895 | 137,101 | |||
| HKT Trust & HKT, Ltd. | 268,322 | 365,881 | |||
| IDT Corp., Class B (A) | 2,281 | 99,178 | |||
| Iliad SA | 1,639 | 352,450 | |||
| Infrastrutture Wireless Italiane SpA (B) | 36,278 | 431,614 | |||
| Iridium Communications, Inc. (A) | 44,778 | 1,993,069 | |||
| Koninklijke KPN NV | 373,840 | 1,197,547 | |||
| LG Uplus Corp. | 25,573 | 309,411 | |||
| Liberty Latin America, Ltd., Class A (A) | 6,420 | 91,549 | |||
| Liberty Latin America, Ltd., Class C (A) | 16,031 | 230,686 | |||
| Lumen Technologies, Inc. | 95,880 | 1,179,324 | |||
| Nippon Telegraph & Telephone Corp. | 135,900 | 3,620,754 | |||
| Ooma, Inc. (A) | 2,777 | 52,763 | |||
| Orange Polska SA (A) | 69,692 | 150,573 | |||
| Orange SA | 226,454 | 2,574,601 | |||
| ORBCOMM, Inc. (A) | 8,582 | 98,607 | |||
| Proximus SADP | 22,011 | 431,556 | |||
| Radius Global Infrastructure, Inc., Class A (A) | 5,110 | 91,367 | |||
| Sarana Menara Nusantara Tbk PT | 2,726,900 | 256,149 | |||
| Singapore Telecommunications, Ltd. | 249,110 | 428,855 | |||
| Singapore Telecommunications, Ltd. | 229,178 | 395,933 | |||
| Spark New Zealand, Ltd. | 279,569 | 959,960 | |||
| Swisscom AG | 2,808 | 1,648,119 | |||
| Telecom Italia SpA | 1,140,493 | 516,722 | |||
| Telecom Italia SpA, Savings Shares | 651,477 | 314,749 | |||
| Telefonica Brasil SA | 55,254 | 467,289 | |||
| Telefonica Deutschland Holding AG | 131,623 | 369,482 | |||
| Telefonica SA | 485,724 | 2,403,409 | |||
| Telekom Malaysia BHD | 125,718 | 185,130 | |||
| Telenor ASA | 105,492 | 1,848,110 | |||
| Telesites SAB de CV (A) | 180,500 | 165,455 | |||
| Telia Company AB | 306,152 | 1,316,259 | |||
| Telkom Indonesia Persero Tbk PT | 5,937,860 | 1,417,020 | |||
| Telstra Corp., Ltd. | 462,554 | 1,296,800 | |||
| TELUS Corp. | 47,277 | 1,089,321 | |||
| Tower Bersama Infrastructure Tbk PT | 935,400 | 205,135 | |||
| True Corp. PCL, NVDR (C) | 1,319,800 | 135,940 | |||
| United Internet AG | 12,691 | 548,540 | |||
| The accompanying notes are an integral part of the financial statements. | 69 |
| Shares or Principal Amount | Value | ||||
| COMMON STOCKS (continued) | |||||
| Diversified telecommunication services (continued) | |||||
| Verizon Communications, Inc. | 399,041 | $ | 21,947,255 | ||
| 90,290,864 | |||||
| Entertainment – 1.3% | |||||
| Activision Blizzard, Inc. | 89,831 | 7,399,379 | |||
| Alibaba Pictures Group, Ltd. (A) | 1,260,500 | 134,345 | |||
| AMC Entertainment Holdings, Inc., Class A (A)(C) | 45,871 | 2,161,900 | |||
| Bilibili, Inc., ADR (A) | 17,500 | 1,404,025 | |||
| Bollore SA | 97,980 | 580,733 | |||
| Capcom Company, Ltd. | 18,300 | 509,638 | |||
| CD Projekt SA (C) | 7,716 | 342,672 | |||
| Chicken Soup For The Soul Entertainment, Inc. (A) | 1,528 | 37,069 | |||
| Cinemark Holdings, Inc. (A) | 12,255 | 218,507 | |||
| CuriosityStream, Inc. (A)(C) | 3,323 | 41,538 | |||
| DouYu International Holdings, Ltd., ADR (A) | 10,200 | 43,656 | |||
| Electronic Arts, Inc. | 33,086 | 4,804,418 | |||
| Embracer Group AB (A) | 29,860 | 679,728 | |||
| Eros STX Global Corp. (A) | 40,454 | 32,363 | |||
| HUYA, Inc., ADR (A)(C) | 8,600 | 91,934 | |||
| HYBE Company, Ltd. (A) | 1,598 | 397,933 | |||
| IMAX Corp. (A) | 5,690 | 89,390 | |||
| iQIYI, Inc., ADR (A)(C) | 30,500 | 276,330 | |||
| Koei Tecmo Holdings Company, Ltd. | 6,030 | 257,319 | |||
| Konami Holdings Corp. | 9,900 | 626,689 | |||
| Liberty Media Corp.-Liberty Braves, Class A (A) | 1,881 | 48,906 | |||
| Liberty Media Corp.-Liberty Braves, Class C (A) | 3,442 | 88,976 | |||
| Lions Gate Entertainment Corp., Class A (A) | 6,413 | 82,856 | |||
| Lions Gate Entertainment Corp., Class B (A) | 13,191 | 155,126 | |||
| Live Nation Entertainment, Inc. (A) | 16,702 | 1,448,063 | |||
| Madison Square Garden Entertainment Corp. (A) | 2,714 | 217,636 | |||
| NCSoft Corp. | 1,923 | 1,093,624 | |||
| NetEase, Inc., ADR | 43,620 | 4,249,460 | |||
| Netflix, Inc. (A) | 51,262 | 29,177,818 | |||
| Netmarble Corp. (B) | 2,499 | 277,434 | |||
| Nexon Company, Ltd. | 51,400 | 937,466 | |||
| Nintendo Company, Ltd. | 11,839 | 5,687,919 | |||
| Pearl Abyss Corp. (A) | 3,415 | 277,571 | |||
| Sea, Ltd., ADR (A) | 900 | 304,488 | |||
| Square Enix Holdings Company, Ltd. | 8,900 | 517,407 | |||
| Take-Two Interactive Software, Inc. (A) | 13,371 | 2,155,673 | |||
| Tencent Music Entertainment Group, ADR (A) | 72,400 | 640,016 | |||
| The Marcus Corp. (A) | 2,933 | 45,755 | |||
| The Walt Disney Company (A) | 210,055 | 38,082,972 | |||
| Toho Company, Ltd. | 11,600 | 502,567 | |||
| Ubisoft Entertainment SA (A) | 10,430 | 662,534 | |||
| Vivendi SE | 80,505 | 3,066,561 | |||
| World Wrestling Entertainment, Inc., Class A | 12,065 | 628,707 | |||
| 110,479,101 | |||||
| Interactive media and services – 4.0% | |||||
| Adevinta ASA (A) | 41,359 | 832,363 | |||
| Alphabet, Inc., Class A (A) | 30,956 | 89,585,116 | |||
| Alphabet, Inc., Class C (A) | 29,310 | 85,269,824 | |||
| Auto Trader Group PLC (B) | 119,689 | 1,035,025 | |||
| Autohome, Inc., ADR | 7,500 | 331,950 | |||
| Baidu, Inc., ADR (A) | 29,300 | 4,600,686 | |||
| CarGurus, Inc. (A) | 10,509 | 319,263 | |||
| Shares or Principal Amount | Value | ||||
| COMMON STOCKS (continued) | |||||
| Interactive media and services (continued) | |||||
| Cars.com, Inc. (A) | 7,799 | $ | 99,203 | ||
| Eventbrite, Inc., Class A (A) | 8,532 | 150,846 | |||
| EverQuote, Inc., Class A (A) | 2,279 | 44,874 | |||
| Facebook, Inc., Class A (A) | 246,627 | 93,565,351 | |||
| FuboTV, Inc. (A)(C) | 14,835 | 432,440 | |||
| Hello Group, Inc., ADR | 17,500 | 229,950 | |||
| JOYY, Inc., ADR | 6,300 | 398,790 | |||
| Kakaku.com, Inc. | 13,900 | 432,495 | |||
| Kakao Corp. | 36,299 | 4,843,407 | |||
| Kuaishou Technology (A)(B)(C) | 29,200 | 318,608 | |||
| Liberty TripAdvisor Holdings, Inc., Class A (A) | 9,083 | 33,970 | |||
| MediaAlpha, Inc., Class A (A) | 2,380 | 52,788 | |||
| NAVER Corp. | 14,421 | 5,460,323 | |||
| QuinStreet, Inc. (A) | 5,626 | 100,762 | |||
| REA Group, Ltd. | 5,816 | 650,917 | |||
| Scout24 AG (B) | 11,752 | 988,027 | |||
| SEEK, Ltd. | 37,023 | 877,001 | |||
| Tencent Holdings, Ltd. | 625,712 | 38,645,713 | |||
| TripAdvisor, Inc. (A) | 26,137 | 914,795 | |||
| TrueCar, Inc. (A) | 11,835 | 49,707 | |||
| Twitter, Inc. (A) | 82,152 | 5,298,804 | |||
| Weibo Corp., ADR (A) | 6,700 | 338,484 | |||
| Yelp, Inc. (A) | 26,814 | 1,032,607 | |||
| Z Holdings Corp. | 279,507 | 1,817,419 | |||
| 338,751,508 | |||||
| Media – 0.7% | |||||
| Advantage Solutions, Inc. (A) | 8,677 | 75,577 | |||
| AMC Networks, Inc., Class A (A) | 3,300 | 156,849 | |||
| Audacy, Inc. (A) | 14,316 | 50,822 | |||
| Boston Omaha Corp., Class A (A) | 2,065 | 73,824 | |||
| Cable One, Inc. | 1,448 | 3,040,206 | |||
| Cardlytics, Inc. (A) | 3,610 | 327,716 | |||
| Charter Communications, Inc., Class A (A) | 11,009 | 8,990,610 | |||
| Cheil Worldwide, Inc. | 8,224 | 163,582 | |||
| China Literature, Ltd. (A)(B)(C) | 43,800 | 368,420 | |||
| Clear Channel Outdoor Holdings, Inc. (A) | 41,889 | 110,168 | |||
| Comcast Corp., Class A | 366,481 | 22,238,067 | |||
| comScore, Inc. (A) | 9,460 | 36,705 | |||
| CyberAgent, Inc. | 42,400 | 776,178 | |||
| Cyfrowy Polsat SA | 31,016 | 296,241 | |||
| Daily Journal Corp. (A) | 150 | 51,000 | |||
| Dentsu Group, Inc. | 22,544 | 838,030 | |||
| Discovery, Inc., Series A (A)(C) | 13,489 | 389,023 | |||
| Discovery, Inc., Series C (A) | 24,006 | 662,326 | |||
| DISH Network Corp., Class A (A) | 19,861 | 865,741 | |||
| Entravision Communications Corp., Class A | 6,911 | 48,170 | |||
| Fox Corp., Class A | 26,134 | 978,457 | |||
| Fox Corp., Class B | 12,147 | 420,651 | |||
| Gannett Company, Inc. (A) | 16,267 | 103,295 | |||
| Gray Television, Inc. | 9,644 | 219,305 | |||
| Grupo Televisa SAB, Series CPO | 328,197 | 864,450 | |||
| Hakuhodo DY Holdings, Inc. | 24,300 | 383,167 | |||
| iHeartMedia, Inc., Class A (A) | 12,612 | 313,787 | |||
| Informa PLC (A) | 186,160 | 1,360,467 | |||
| John Wiley & Sons, Inc., Class A | 16,412 | 953,537 | |||
| Loral Space & Communications, Inc. | 1,553 | 65,242 | |||
| Megacable Holdings SAB de CV, Series CPO | 42,100 | 146,776 | |||
| Meredith Corp. (A) | 4,489 | 193,072 | |||
| MultiChoice Group | 40,841 | 323,347 | |||
| News Corp., Class A | 31,264 | 702,502 | |||
| News Corp., Class B | 9,739 | 214,550 | |||
| Omnicom Group, Inc. | 17,192 | 1,258,798 | |||
| The accompanying notes are an integral part of the financial statements. | 70 |
| Shares or Principal Amount | Value | ||||
| COMMON STOCKS (continued) | |||||
| Media (continued) | |||||
| Pearson PLC | 93,268 | $ | 983,567 | ||
| Publicis Groupe SA | 25,333 | 1,663,113 | |||
| Quebecor, Inc., Class B | 18,574 | 463,448 | |||
| Schibsted ASA, B Shares | 14,512 | 674,279 | |||
| Schibsted ASA, Class A | 11,205 | 597,801 | |||
| Scholastic Corp. | 3,276 | 108,894 | |||
| Shaw Communications, Inc., Class B | 49,682 | 1,462,127 | |||
| Sinclair Broadcast Group, Inc., Class A | 5,278 | 158,393 | |||
| Stagwell, Inc. (A) | 7,575 | 52,874 | |||
| TechTarget, Inc. (A) | 2,854 | 241,391 | |||
| TEGNA, Inc. | 83,584 | 1,481,108 | |||
| The EW Scripps Company, Class A | 6,563 | 121,678 | |||
| The Interpublic Group of Companies, Inc. | 31,444 | 1,170,660 | |||
| The New York Times Company, Class A | 38,717 | 1,966,049 | |||
| Thryv Holdings, Inc. (A) | 774 | 23,986 | |||
| ViacomCBS, Inc., Class B | 48,407 | 2,006,470 | |||
| WideOpenWest, Inc. (A) | 5,928 | 125,792 | |||
| WPP PLC | 152,354 | 2,065,745 | |||
| 63,428,033 | |||||
| Wireless telecommunication services – 0.5% | |||||
| Advanced Info Service PCL, NVDR | 141,500 | 825,079 | |||
| America Movil SAB de CV, Series L | 4,661,200 | 4,569,758 | |||
| Axiata Group BHD | 305,853 | 304,732 | |||
| DiGi.Com BHD | 335,420 | 354,494 | |||
| Far EasTone Telecommunications Company, Ltd. | 163,595 | 363,962 | |||
| Globe Telecom, Inc. | 2,755 | 150,813 | |||
| Gogo, Inc. (A)(C) | 6,789 | 91,312 | |||
| Intouch Holdings PCL, NVDR | 229,800 | 609,414 | |||
| KDDI Corp. | 170,367 | 5,207,332 | |||
| Maxis BHD | 256,360 | 289,146 | |||
| MTN Group, Ltd. (A) | 188,831 | 1,733,228 | |||
| PLDT, Inc. | 8,180 | 240,219 | |||
| Rogers Communications, Inc., Class B | 38,181 | 1,945,290 | |||
| Shenandoah Telecommunications Company | 5,537 | 165,169 | |||
| SK Telecom Company, Ltd. | 4,663 | 1,198,900 | |||
| SoftBank Corp. | 301,200 | 4,030,909 | |||
| SoftBank Group Corp. | 132,452 | 7,464,169 | |||
| Taiwan Mobile Company, Ltd. | 174,000 | 634,110 | |||
| Tele2 AB, B Shares | 58,101 | 872,278 | |||
| Telephone & Data Systems, Inc. | 37,784 | 767,771 | |||
| TIM SA | 92,789 | 223,592 | |||
| T-Mobile US, Inc. (A) | 56,484 | 7,739,438 | |||
| Turkcell Iletisim Hizmetleri AS | 113,310 | 224,057 | |||
| United States Cellular Corp. (A) | 1,681 | 53,708 | |||
| Vodacom Group, Ltd. | 70,054 | 691,882 | |||
| Vodafone Group PLC | 3,317,715 | 5,572,336 | |||
| 46,323,098 | |||||
| 649,272,604 | |||||
| Consumer discretionary – 11.6% | |||||
| Auto components – 0.5% | |||||
| Adient PLC (A) | 35,793 | 1,408,097 | |||
| Aisin Corp. | 15,600 | 595,476 | |||
| American Axle & Manufacturing Holdings, Inc. (A) | 12,828 | 113,784 | |||
| Aptiv PLC (A) | 18,700 | 2,845,953 | |||
| BorgWarner, Inc. | 16,584 | 707,805 | |||
| Bridgestone Corp. | 60,000 | 2,762,018 | |||
| Cheng Shin Rubber Industry Company, Ltd. | 187,730 | 252,044 | |||
| Cie Generale des Etablissements Michelin SCA | 19,180 | 3,105,165 | |||
| Continental AG (A) | 14,580 | 1,959,372 | |||
| Cooper-Standard Holdings, Inc. (A) | 2,079 | 48,399 | |||
| Shares or Principal Amount | Value | ||||
| COMMON STOCKS (continued) | |||||
| Auto components (continued) | |||||
| Dana, Inc. | 55,013 | $ | 1,279,602 | ||
| Denso Corp. | 45,716 | 3,199,799 | |||
| Dorman Products, Inc. (A) | 2,979 | 279,609 | |||
| Faurecia SE | 13,197 | 637,556 | |||
| Fox Factory Holding Corp. (A) | 15,942 | 2,449,807 | |||
| Fuyao Glass Industry Group Company, Ltd., H Shares (B) | 65,100 | 400,613 | |||
| Gentex Corp. | 64,387 | 1,983,120 | |||
| Gentherm, Inc. (A) | 3,745 | 321,396 | |||
| Hankook Tire & Technology Company, Ltd. | 8,845 | 354,856 | |||
| Hanon Systems | 21,536 | 305,045 | |||
| Hyundai Mobis Company, Ltd. | 7,835 | 1,870,237 | |||
| Koito Manufacturing Company, Ltd. | 10,976 | 671,403 | |||
| LCI Industries | 2,786 | 394,665 | |||
| Lear Corp. | 14,588 | 2,333,205 | |||
| Magna International, Inc. | 30,476 | 2,406,629 | |||
| Minth Group, Ltd. | 82,000 | 340,324 | |||
| Modine Manufacturing Company (A) | 5,867 | 72,985 | |||
| Motorcar Parts of America, Inc. (A) | 2,451 | 48,579 | |||
| Patrick Industries, Inc. | 2,577 | 210,309 | |||
| Standard Motor Products, Inc. | 2,266 | 97,189 | |||
| Stanley Electric Company, Ltd. | 14,000 | 349,374 | |||
| Stoneridge, Inc. (A) | 3,022 | 70,413 | |||
| Sumitomo Electric Industries, Ltd. | 80,200 | 1,071,118 | |||
| Tenneco, Inc., Class A (A) | 8,023 | 125,159 | |||
| The Goodyear Tire & Rubber Company (A) | 105,516 | 1,671,373 | |||
| Toyota Industries Corp. | 15,529 | 1,311,123 | |||
| Valeo | 25,848 | 737,768 | |||
| Visteon Corp. (A) | 10,576 | 1,117,672 | |||
| XL Fleet Corp. (A) | 4,974 | 33,823 | |||
| XPEL, Inc. (A) | 2,016 | 153,176 | |||
| 40,096,040 | |||||
| Automobiles – 1.5% | |||||
| Arcimoto, Inc. (A)(C) | 3,392 | 42,129 | |||
| Astra International Tbk PT | 2,443,308 | 894,483 | |||
| Bayerische Motoren Werke AG | 44,125 | 4,188,289 | |||
| Brilliance China Automotive Holdings, Ltd. (A) | 316,300 | 122,094 | |||
| BYD Company, Ltd., H Shares | 85,194 | 2,864,145 | |||
| Canoo, Inc. (A)(C) | 9,242 | 66,635 | |||
| Daimler AG | 113,948 | 9,612,055 | |||
| Dongfeng Motor Group Company, Ltd., H Shares | 299,680 | 328,146 | |||
| Ferrari NV | 13,992 | 3,035,152 | |||
| Fisker, Inc. (A)(C) | 17,920 | 249,984 | |||
| Ford Motor Company (A) | 271,091 | 3,532,316 | |||
| Ford Otomotiv Sanayi AS | 6,307 | 130,312 | |||
| Geely Automobile Holdings, Ltd. | 639,000 | 2,315,879 | |||
| General Motors Company (A) | 88,266 | 4,325,917 | |||
| Great Wall Motor Company, Ltd., H Shares | 337,250 | 1,555,505 | |||
| Guangzhou Automobile Group Company, Ltd., H Shares | 319,346 | 321,524 | |||
| Harley-Davidson, Inc. | 40,963 | 1,619,267 | |||
| Honda Motor Company, Ltd. | 172,727 | 5,227,862 | |||
| Hyundai Motor Company | 16,297 | 2,977,808 | |||
| Isuzu Motors, Ltd. | 58,500 | 739,514 | |||
| Kia Corp. | 30,900 | 2,260,431 | |||
| Li Auto, Inc., ADR (A)(C) | 51,400 | 1,586,204 | |||
| Lordstown Motors Corp., Class A (A)(C) | 13,006 | 85,579 | |||
| Mazda Motor Corp. (A) | 59,880 | 519,807 | |||
| NIO, Inc., ADR (A) | 140,500 | 5,523,055 | |||
| Nissan Motor Company, Ltd. (A) | 243,925 | 1,279,653 | |||
| The accompanying notes are an integral part of the financial statements. | 71 |
| Shares or Principal Amount | Value | ||||
| COMMON STOCKS (continued) | |||||
| Automobiles (continued) | |||||
| Renault SA (A) | 21,806 | $ | 811,709 | ||
| Stellantis NV | 226,895 | 4,538,817 | |||
| Subaru Corp. | 65,100 | 1,204,850 | |||
| Suzuki Motor Corp. | 38,900 | 1,680,908 | |||
| Tesla, Inc. (A) | 53,285 | 39,202,840 | |||
| Thor Industries, Inc. | 14,759 | 1,674,113 | |||
| Toyota Motor Corp. | 223,700 | 19,482,780 | |||
| Volkswagen AG | 4,265 | 1,427,036 | |||
| Winnebago Industries, Inc. | 3,634 | 252,999 | |||
| Workhorse Group, Inc. (A)(C) | 14,188 | 139,184 | |||
| XPeng, Inc., ADR (A) | 41,800 | 1,776,500 | |||
| Yadea Group Holdings, Ltd. (B) | 128,000 | 227,754 | |||
| Yamaha Motor Company, Ltd. | 29,800 | 758,163 | |||
| 128,581,398 | |||||
| Distributors – 0.1% | |||||
| Core-Mark Holding Company, Inc. | 5,036 | 231,656 | |||
| Funko, Inc., Class A (A) | 3,132 | 62,452 | |||
| Genuine Parts Company | 15,382 | 1,879,527 | |||
| LKQ Corp. (A) | 29,598 | 1,559,519 | |||
| Pool Corp. | 4,273 | 2,112,144 | |||
| 5,845,298 | |||||
| Diversified consumer services – 0.1% | |||||
| 2U, Inc. (A) | 8,132 | 301,128 | |||
| Adtalem Global Education, Inc. (A) | 5,608 | 207,496 | |||
| American Public Education, Inc. (A) | 2,265 | 59,570 | |||
| Carriage Services, Inc. | 1,969 | 91,027 | |||
| China East Education Holdings, Ltd. (A)(B) | 58,000 | 62,230 | |||
| China Education Group Holdings, Ltd. | 85,000 | 160,704 | |||
| China Yuhua Education Corp., Ltd. (B) | 160,000 | 85,497 | |||
| Coursera, Inc. (A) | 1,423 | 54,743 | |||
| Gaotu Techedu, Inc., ADR (A)(C) | 13,200 | 38,016 | |||
| Graham Holdings Company, Class B | 1,503 | 927,065 | |||
| Grand Canyon Education, Inc. (A) | 12,354 | 1,101,236 | |||
| H&R Block, Inc. | 48,365 | 1,240,562 | |||
| Houghton Mifflin Harcourt Company (A) | 14,455 | 194,709 | |||
| Laureate Education, Inc., Class A (A) | 12,067 | 192,227 | |||
| New Oriental Education & Technology Group, Inc., ADR (A) | 167,900 | 379,454 | |||
| OneSpaWorld Holdings, Ltd. (A) | 6,504 | 68,292 | |||
| Perdoceo Education Corp. (A) | 8,164 | 89,641 | |||
| Service Corp. International | 44,822 | 2,813,029 | |||
| Strategic Education, Inc. | 2,781 | 217,697 | |||
| Stride, Inc. (A) | 4,606 | 157,709 | |||
| TAL Education Group, ADR (A) | 44,862 | 238,666 | |||
| Vivint Smart Home, Inc. (A) | 10,486 | 127,929 | |||
| WW International, Inc. (A) | 18,793 | 406,868 | |||
| 9,215,495 | |||||
| Hotels, restaurants and leisure – 1.6% | |||||
| Accel Entertainment, Inc. (A) | 6,551 | 75,468 | |||
| Accor SA (A) | 19,085 | 658,136 | |||
| Aristocrat Leisure, Ltd. | 63,983 | 2,123,639 | |||
| Asset World Corp. PCL (A) | 138,000 | 18,538 | |||
| Asset World Corp. PCL, NVDR (A) | 804,800 | 108,111 | |||
| Bally's Corp. (A) | 3,673 | 184,532 | |||
| BJ's Restaurants, Inc. (A) | 2,608 | 111,518 | |||
| Bloomin' Brands, Inc. (A) | 10,005 | 268,034 | |||
| Bluegreen Vacations Holding Corp. (A) | 1,985 | 45,437 | |||
| Booking Holdings, Inc. (A) | 4,054 | 9,322,862 | |||
| Boyd Gaming Corp. (A) | 21,512 | 1,320,191 | |||
| Brinker International, Inc. (A) | 5,109 | 272,156 | |||
| Caesars Entertainment, Inc. (A) | 20,611 | 2,094,696 | |||
| Carnival Corp. (A) | 78,842 | 1,903,246 | |||
| Century Casinos, Inc. (A) | 3,357 | 44,883 | |||
| Shares or Principal Amount | Value | ||||
| COMMON STOCKS (continued) | |||||
| Hotels, restaurants and leisure (continued) | |||||
| Chipotle Mexican Grill, Inc. (A) | 2,780 | $ | 5,291,257 | ||
| Choice Hotels International, Inc. | 7,702 | 919,311 | |||
| Churchill Downs, Inc. | 9,242 | 1,945,441 | |||
| Chuy's Holdings, Inc. (A) | 2,344 | 75,617 | |||
| Compass Group PLC (A) | 220,215 | 4,549,631 | |||
| Cracker Barrel Old Country Store, Inc. | 8,989 | 1,290,641 | |||
| Crown Resorts, Ltd. (A) | 42,385 | 287,486 | |||
| Darden Restaurants, Inc. | 12,922 | 1,946,699 | |||
| Dave & Buster's Entertainment, Inc. (A) | 4,892 | 183,059 | |||
| Del Taco Restaurants, Inc. | 3,916 | 34,461 | |||
| Denny's Corp. (A) | 7,282 | 120,444 | |||
| Dine Brands Global, Inc. (A) | 1,837 | 151,957 | |||
| Domino's Pizza Enterprises, Ltd. | 6,683 | 763,717 | |||
| Domino's Pizza, Inc. | 3,835 | 1,982,273 | |||
| Drive Shack, Inc. (A) | 10,517 | 28,711 | |||
| El Pollo Loco Holdings, Inc. (A) | 2,367 | 42,937 | |||
| Entain PLC (A) | 72,260 | 1,920,369 | |||
| Everi Holdings, Inc. (A) | 9,435 | 214,646 | |||
| Evolution AB (B) | 19,922 | 3,216,453 | |||
| Expedia Group, Inc. (A) | 13,969 | 2,018,521 | |||
| Fiesta Restaurant Group, Inc. (A) | 2,307 | 27,707 | |||
| Flutter Entertainment PLC (A) | 19,173 | 3,727,333 | |||
| Full House Resorts, Inc. (A) | 4,058 | 34,818 | |||
| Galaxy Entertainment Group, Ltd. (A) | 158,000 | 1,013,032 | |||
| GAN, Ltd. (A) | 4,753 | 81,276 | |||
| Genting BHD | 238,800 | 290,177 | |||
| Genting Malaysia BHD | 323,360 | 231,119 | |||
| Genting Singapore, Ltd. | 387,500 | 219,588 | |||
| Golden Entertainment, Inc. (A) | 1,918 | 91,527 | |||
| Golden Nugget Online Gaming, Inc. (A) | 3,740 | 80,784 | |||
| Haidilao International Holding, Ltd. (B)(C) | 114,000 | 465,255 | |||
| Hilton Grand Vacations, Inc. (A) | 9,631 | 420,778 | |||
| Hilton Worldwide Holdings, Inc. (A) | 27,508 | 3,434,649 | |||
| Huazhu Group, Ltd., ADR (A) | 19,400 | 936,826 | |||
| InterContinental Hotels Group PLC (A) | 23,031 | 1,471,544 | |||
| International Game Technology PLC (A) | 11,239 | 241,526 | |||
| Jack in the Box, Inc. | 8,509 | 901,614 | |||
| Jiumaojiu International Holdings, Ltd. (B) | 78,000 | 261,791 | |||
| Jollibee Foods Corp. | 47,540 | 192,788 | |||
| Kangwon Land, Inc. (A) | 11,523 | 274,909 | |||
| La Francaise des Jeux SAEM (B) | 10,746 | 556,097 | |||
| Las Vegas Sands Corp. (A) | 32,443 | 1,447,282 | |||
| Lindblad Expeditions Holdings, Inc. (A) | 3,790 | 55,751 | |||
| Marriott International, Inc., Class A (A) | 26,371 | 3,563,777 | |||
| Marriott Vacations Worldwide Corp. (A) | 11,381 | 1,702,029 | |||
| McDonald's Corp. | 73,692 | 17,498,902 | |||
| McDonald's Holdings Company Japan, Ltd. | 8,000 | 381,592 | |||
| Melco Resorts & Entertainment, Ltd., ADR (A) | 15,500 | 213,280 | |||
| MGM Resorts International | 40,210 | 1,713,750 | |||
| Minor International PCL, NVDR (A) | 368,800 | 374,576 | |||
| Monarch Casino & Resort, Inc. (A) | 1,483 | 93,978 | |||
| Nathan's Famous, Inc. | 402 | 26,544 | |||
| NeoGames SA (A) | 700 | 28,847 | |||
| Noodles & Company (A) | 5,012 | 63,101 | |||
| Norwegian Cruise Line Holdings, Ltd. (A) | 36,534 | 944,039 | |||
| ONE Group Hospitality, Inc. (A) | 2,471 | 27,552 | |||
| Oriental Land Company, Ltd. | 21,000 | 3,177,212 | |||
| Papa John's International, Inc. | 12,545 | 1,599,864 | |||
| Penn National Gaming, Inc. (A) | 14,670 | 1,189,737 | |||
| PlayAGS, Inc. (A) | 3,508 | 28,731 | |||
| RCI Hospitality Holdings, Inc. | 993 | 64,158 | |||
| Red Robin Gourmet Burgers, Inc. (A) | 1,933 | 47,320 | |||
| Red Rock Resorts, Inc., Class A (A) | 6,912 | 323,551 | |||
| The accompanying notes are an integral part of the financial statements. | 72 |
| Shares or Principal Amount | Value | ||||
| COMMON STOCKS (continued) | |||||
| Hotels, restaurants and leisure (continued) | |||||
| Restaurant Brands International, Inc. | 29,294 | $ | 1,882,116 | ||
| Royal Caribbean Cruises, Ltd. (A) | 21,622 | 1,788,788 | |||
| Rush Street Interactive, Inc. (A) | 6,095 | 90,694 | |||
| Ruth's Hospitality Group, Inc. (A) | 3,933 | 80,587 | |||
| Sands China, Ltd. (A) | 175,252 | 563,014 | |||
| Scientific Games Corp. (A) | 25,945 | 1,877,121 | |||
| SeaWorld Entertainment, Inc. (A) | 5,769 | 283,777 | |||
| Shake Shack, Inc., Class A (A) | 4,208 | 365,044 | |||
| Six Flags Entertainment Corp. (A) | 20,260 | 855,782 | |||
| SJM Holdings, Ltd. (A) | 137,384 | 119,554 | |||
| Sodexo SA (A) | 9,995 | 828,194 | |||
| Starbucks Corp. | 116,369 | 13,672,194 | |||
| Tabcorp Holdings, Ltd. | 245,114 | 853,706 | |||
| Texas Roadhouse, Inc. | 25,341 | 2,407,395 | |||
| The Cheesecake Factory, Inc. (A) | 4,898 | 228,492 | |||
| The Wendy's Company | 47,207 | 1,086,705 | |||
| Tongcheng-Elong Holdings, Ltd. (A) | 106,400 | 248,038 | |||
| Travel + Leisure Company | 22,975 | 1,258,111 | |||
| Trip.com Group, Ltd., ADR (A) | 55,200 | 1,683,048 | |||
| Whitbread PLC (A) | 25,299 | 1,117,187 | |||
| Wingstop, Inc. | 11,285 | 1,940,230 | |||
| Wyndham Hotels & Resorts, Inc. | 24,898 | 1,810,085 | |||
| Wynn Macau, Ltd. (A) | 105,750 | 119,152 | |||
| Wynn Resorts, Ltd. (A) | 10,394 | 1,056,966 | |||
| Yum China Holdings, Inc. | 45,708 | 2,813,784 | |||
| Yum! Brands, Inc. | 29,420 | 3,854,903 | |||
| 137,940,456 | |||||
| Household durables – 0.7% | |||||
| Barratt Developments PLC | 128,168 | 1,303,674 | |||
| Beazer Homes USA, Inc. (A) | 3,390 | 63,427 | |||
| Casio Computer Company, Ltd. | 20,400 | 315,070 | |||
| Cavco Industries, Inc. (A) | 1,048 | 267,764 | |||
| Century Communities, Inc. | 3,383 | 237,148 | |||
| Coway Company, Ltd. | 6,495 | 437,928 | |||
| D.R. Horton, Inc. | 36,268 | 3,467,946 | |||
| Electrolux AB, Series B | 26,550 | 674,673 | |||
| Ethan Allen Interiors, Inc. | 2,763 | 66,367 | |||
| Flexsteel Industries, Inc. | 868 | 30,311 | |||
| Garmin, Ltd. | 16,570 | 2,890,305 | |||
| GoPro, Inc., Class A (A) | 14,025 | 139,829 | |||
| Green Brick Partners, Inc. (A) | 3,521 | 87,990 | |||
| Haier Smart Home Company, Ltd., H Shares | 211,720 | 797,550 | |||
| Hamilton Beach Brands Holding Company, Class B | 765 | 13,005 | |||
| Helen of Troy, Ltd. (A) | 9,265 | 2,216,095 | |||
| Hooker Furniture Corp. | 1,538 | 47,924 | |||
| Hovnanian Enterprises, Inc., Class A (A) | 596 | 64,791 | |||
| Husqvarna AB, B Shares | 49,022 | 658,536 | |||
| Iida Group Holdings Company, Ltd. | 15,600 | 396,039 | |||
| Installed Building Products, Inc. | 2,681 | 332,927 | |||
| iRobot Corp. (A)(C) | 3,151 | 255,609 | |||
| KB Home | 33,715 | 1,450,756 | |||
| La-Z-Boy, Inc. | 5,214 | 182,542 | |||
| Leggett & Platt, Inc. | 14,730 | 712,785 | |||
| Lennar Corp., A Shares | 30,488 | 3,271,667 | |||
| LG Electronics, Inc. | 12,508 | 1,527,622 | |||
| LGI Homes, Inc. (A) | 2,501 | 400,985 | |||
| Lifetime Brands, Inc. | 1,699 | 31,177 | |||
| M/I Homes, Inc. (A) | 3,195 | 205,726 | |||
| MDC Holdings, Inc. | 6,407 | 334,766 | |||
| Meritage Homes Corp. (A) | 4,215 | 470,141 | |||
| Mohawk Industries, Inc. (A) | 6,474 | 1,280,298 | |||
| Newell Brands, Inc. | 41,847 | 1,063,332 | |||
| Nien Made Enterprise Company, Ltd. | 17,300 | 257,937 | |||
| Shares or Principal Amount | Value | ||||
| COMMON STOCKS (continued) | |||||
| Household durables (continued) | |||||
| NVR, Inc. (A) | 378 | $ | 1,958,017 | ||
| Panasonic Corp. | 233,520 | 2,791,747 | |||
| Persimmon PLC | 39,812 | 1,611,249 | |||
| PulteGroup, Inc. | 29,240 | 1,574,866 | |||
| Purple Innovation, Inc. (A) | 5,742 | 140,105 | |||
| Rinnai Corp. | 3,800 | 408,488 | |||
| SEB SA | 3,064 | 482,310 | |||
| Sekisui Chemical Company, Ltd. | 40,600 | 694,837 | |||
| Sekisui House, Ltd. | 65,200 | 1,298,993 | |||
| Sharp Corp. | 22,540 | 297,325 | |||
| Skyline Champion Corp. (A) | 5,960 | 373,811 | |||
| Sonos, Inc. (A) | 13,593 | 540,050 | |||
| Sony Group Corp. | 133,000 | 13,751,583 | |||
| Taylor Morrison Home Corp. (A) | 48,396 | 1,359,444 | |||
| Taylor Wimpey PLC | 458,498 | 1,154,171 | |||
| Tempur Sealy International, Inc. | 48,827 | 2,182,567 | |||
| The Berkeley Group Holdings PLC | 15,500 | 1,029,581 | |||
| The Lovesac Company (A) | 1,486 | 84,048 | |||
| Toll Brothers, Inc. | 29,929 | 1,917,252 | |||
| TopBuild Corp. (A) | 8,813 | 1,928,196 | |||
| Tri Pointe Homes, Inc. (A) | 44,776 | 1,064,326 | |||
| Tupperware Brands Corp. (A) | 5,711 | 136,322 | |||
| Universal Electronics, Inc. (A) | 1,614 | 81,539 | |||
| Vuzix Corp. (A)(C) | 6,695 | 88,575 | |||
| Whirlpool Corp. | 6,924 | 1,533,874 | |||
| 64,437,918 | |||||
| Internet and direct marketing retail – 2.8% | |||||
| 1-800-Flowers.com, Inc., Class A (A) | 3,031 | 96,265 | |||
| Alibaba Group Holding, Ltd. (A) | 1,647,100 | 34,489,603 | |||
| Allegro.eu SA (A)(B) | 39,483 | 732,632 | |||
| Amazon.com, Inc. (A) | 41,319 | 143,409,572 | |||
| Americanas SA (A) | 42,658 | 341,211 | |||
| Baozun, Inc., ADR (A) | 6,700 | 161,336 | |||
| CarParts.com, Inc. (A) | 5,451 | 94,139 | |||
| CJ ENM Company, Ltd. | 1,288 | 169,640 | |||
| Dada Nexus, Ltd., ADR (A) | 6,500 | 153,920 | |||
| Delivery Hero SE (A)(B) | 20,824 | 3,022,202 | |||
| eBay, Inc. | 62,382 | 4,787,195 | |||
| Etsy, Inc. (A) | 12,251 | 2,649,401 | |||
| Groupon, Inc. (A) | 2,658 | 65,839 | |||
| HelloFresh SE (A) | 21,872 | 2,361,473 | |||
| HengTen Networks Group, Ltd. (A)(C) | 300,000 | 147,222 | |||
| JD Health International, Inc. (A)(B)(C) | 31,050 | 290,512 | |||
| JD.com, Inc., ADR (A) | 93,900 | 7,376,784 | |||
| Just Eat Takeaway.com NV (A)(B) | 20,042 | 1,815,933 | |||
| Lands' End, Inc. (A) | 1,653 | 55,954 | |||
| Liquidity Services, Inc. (A) | 3,047 | 74,347 | |||
| Magnite, Inc. (A) | 11,864 | 344,293 | |||
| Meituan, Class B (A)(B) | 392,000 | 12,534,027 | |||
| Mercari, Inc. (A) | 10,700 | 527,964 | |||
| Naspers, Ltd., N Shares | 48,339 | 8,340,364 | |||
| Ocado Group PLC (A) | 59,735 | 1,655,569 | |||
| Overstock.com, Inc. (A) | 4,857 | 350,433 | |||
| PetMed Express, Inc. (C) | 2,332 | 64,223 | |||
| Pinduoduo, Inc., ADR (A) | 47,600 | 4,760,952 | |||
| Porch Group, Inc. (A) | 1,876 | 37,520 | |||
| Prosus NV (A) | 54,580 | 4,831,176 | |||
| Quotient Technology, Inc. (A) | 10,160 | 73,762 | |||
| Rakuten Group, Inc. | 90,542 | 947,089 | |||
| Revolve Group, Inc. (A) | 4,046 | 232,483 | |||
| Shutterstock, Inc. | 2,624 | 302,442 | |||
| Stamps.com, Inc. (A) | 2,005 | 659,445 | |||
| Stitch Fix, Inc., Class A (A) | 6,666 | 279,372 | |||
| The RealReal, Inc. (A) | 8,994 | 111,885 | |||
| Vipshop Holdings, Ltd., ADR (A) | 48,600 | 718,794 | |||
| The accompanying notes are an integral part of the financial statements. | 73 |
| Shares or Principal Amount | Value | ||||
| COMMON STOCKS (continued) | |||||
| Internet and direct marketing retail (continued) | |||||
| Zalando SE (A)(B) | 26,951 | $ | 2,988,186 | ||
| ZOZO, Inc. | 13,000 | 495,768 | |||
| 242,550,927 | |||||
| Leisure products – 0.2% | |||||
| Acushnet Holdings Corp. | 3,804 | 190,048 | |||
| American Outdoor Brands, Inc. (A) | 1,673 | 46,560 | |||
| AMMO, Inc. (A)(C) | 7,720 | 56,742 | |||
| Bandai Namco Holdings, Inc. | 21,000 | 1,456,539 | |||
| Brunswick Corp. | 20,765 | 2,011,506 | |||
| Callaway Golf Company (A) | 44,033 | 1,235,566 | |||
| Clarus Corp. | 2,741 | 74,254 | |||
| Escalade, Inc. | 1,356 | 31,324 | |||
| Genius Brands International, Inc. (A)(C) | 33,858 | 56,543 | |||
| Giant Manufacturing Company, Ltd. | 32,661 | 394,741 | |||
| Hasbro, Inc. | 14,144 | 1,390,497 | |||
| HLB, Inc. (A) | 10,540 | 503,929 | |||
| Johnson Outdoors, Inc., Class A | 601 | 68,989 | |||
| Latham Group, Inc. (A) | 2,678 | 58,836 | |||
| Malibu Boats, Inc., Class A (A) | 2,345 | 167,902 | |||
| MasterCraft Boat Holdings, Inc. (A) | 2,352 | 58,659 | |||
| Mattel, Inc. (A) | 92,976 | 1,985,038 | |||
| Nautilus, Inc. (A) | 3,603 | 41,074 | |||
| Polaris, Inc. | 15,346 | 1,837,837 | |||
| Shimano, Inc. | 7,800 | 2,288,961 | |||
| Smith & Wesson Brands, Inc. | 6,004 | 144,877 | |||
| Sturm Ruger & Company, Inc. | 1,912 | 149,499 | |||
| Vista Outdoor, Inc. (A) | 6,543 | 267,282 | |||
| Yamaha Corp. | 14,200 | 837,247 | |||
| YETI Holdings, Inc. (A) | 20,000 | 1,986,800 | |||
| 17,341,250 | |||||
| Multiline retail – 0.6% | |||||
| Big Lots, Inc. | 3,915 | 190,504 | |||
| Canadian Tire Corp., Ltd., Class A | 6,292 | 957,527 | |||
| Central Retail Corp. PCL, NVDR | 215,675 | 228,837 | |||
| Dillard's, Inc., Class A | 706 | 134,465 | |||
| Dollar General Corp. | 35,092 | 7,822,358 | |||
| Dollar Tree, Inc. (A) | 34,460 | 3,120,008 | |||
| Dollarama, Inc. | 31,253 | 1,425,106 | |||
| Falabella SA | 87,325 | 345,872 | |||
| Franchise Group, Inc. | 3,333 | 115,755 | |||
| Kohl's Corp. | 41,648 | 2,390,595 | |||
| Lojas Renner SA | 99,025 | 728,880 | |||
| Lotte Shopping Company, Ltd. | 1,373 | 127,044 | |||
| Macy's, Inc. (A) | 35,379 | 792,136 | |||
| Magazine Luiza SA | 322,500 | 1,137,619 | |||
| Next PLC | 16,555 | 1,800,372 | |||
| Nordstrom, Inc. (A) | 29,020 | 830,262 | |||
| Ollie's Bargain Outlet Holdings, Inc. (A) | 15,141 | 1,095,906 | |||
| Pan Pacific International Holdings Corp. | 42,900 | 816,101 | |||
| Ryohin Keikaku Company, Ltd. | 26,500 | 567,418 | |||
| Shinsegae, Inc. | 875 | 202,407 | |||
| Target Corp. | 73,499 | 18,152,783 | |||
| Wesfarmers, Ltd. | 125,751 | 5,492,359 | |||
| Woolworths Holdings, Ltd. (A) | 108,091 | 471,418 | |||
| 48,945,732 | |||||
| Specialty retail – 2.1% | |||||
| ABC-Mart, Inc. | 3,367 | 180,012 | |||
| Abercrombie & Fitch Company, Class A (A) | 6,876 | 245,886 | |||
| Academy Sports & Outdoors, Inc. (A) | 6,982 | 309,093 | |||
| Advance Auto Parts, Inc. | 9,675 | 1,962,574 | |||
| American Eagle Outfitters, Inc. | 57,293 | 1,748,582 | |||
| America's Car-Mart, Inc. (A) | 697 | 90,143 | |||
| Asbury Automotive Group, Inc. (A) | 2,179 | 405,817 | |||
| Shares or Principal Amount | Value | ||||
| COMMON STOCKS (continued) | |||||
| Specialty retail (continued) | |||||
| AutoNation, Inc. (A) | 14,374 | $ | 1,568,060 | ||
| AutoZone, Inc. (A) | 3,196 | 4,951,083 | |||
| Barnes & Noble Education, Inc. (A) | 4,745 | 38,719 | |||
| Bath & Body Works, Inc. | 39,143 | 2,641,370 | |||
| Bed Bath & Beyond, Inc. (A) | 12,400 | 341,496 | |||
| Best Buy Company, Inc. | 32,959 | 3,840,053 | |||
| Big 5 Sporting Goods Corp. (C) | 2,447 | 68,027 | |||
| Blink Charging Company (A)(C) | 4,183 | 135,655 | |||
| Boot Barn Holdings, Inc. (A) | 3,223 | 287,749 | |||
| Caleres, Inc. | 4,201 | 103,303 | |||
| Camping World Holdings, Inc., Class A | 4,833 | 193,030 | |||
| CarMax, Inc. (A) | 24,122 | 3,020,316 | |||
| Chico's FAS, Inc. (A) | 13,709 | 70,876 | |||
| China Meidong Auto Holdings, Ltd. | 60,000 | 300,950 | |||
| Chow Tai Fook Jewellery Group, Ltd. | 143,600 | 290,502 | |||
| Citi Trends, Inc. (A) | 1,022 | 88,035 | |||
| Conn's, Inc. (A) | 2,142 | 52,693 | |||
| Designer Brands, Inc., Class A (A) | 6,861 | 99,485 | |||
| Dick's Sporting Goods, Inc. (C) | 17,470 | 2,459,951 | |||
| Fast Retailing Company, Ltd. | 6,200 | 4,083,803 | |||
| Five Below, Inc. (A) | 14,926 | 3,176,402 | |||
| Foot Locker, Inc. | 27,531 | 1,560,732 | |||
| GameStop Corp., Class A (A) | 15,695 | 3,425,277 | |||
| Genesco, Inc. (A) | 1,670 | 103,590 | |||
| GOME Retail Holdings, Ltd. (A)(C) | 1,262,541 | 136,418 | |||
| Group 1 Automotive, Inc. | 1,977 | 327,075 | |||
| GrowGeneration Corp. (A) | 6,139 | 196,387 | |||
| Guess?, Inc. | 4,574 | 110,645 | |||
| Haverty Furniture Companies, Inc. | 1,934 | 68,908 | |||
| Hennes & Mauritz AB, B Shares (A) | 86,003 | 1,726,993 | |||
| Hibbett, Inc. | 1,835 | 175,591 | |||
| Hikari Tsushin, Inc. | 2,200 | 384,965 | |||
| Home Product Center PCL, NVDR | 696,100 | 308,430 | |||
| Hotai Motor Company, Ltd. | 33,000 | 692,226 | |||
| Hotel Shilla Company, Ltd. | 3,637 | 280,949 | |||
| Industria de Diseno Textil SA | 101,457 | 3,465,914 | |||
| JD Sports Fashion PLC | 64,455 | 895,038 | |||
| Kingfisher PLC | 262,618 | 1,264,511 | |||
| Kirkland's, Inc. (A) | 1,831 | 35,009 | |||
| Lithia Motors, Inc. | 7,932 | 2,627,872 | |||
| Lowe's Companies, Inc. | 104,514 | 21,309,359 | |||
| Lumber Liquidators Holdings, Inc. (A) | 3,385 | 70,611 | |||
| MarineMax, Inc. (A) | 2,435 | 118,390 | |||
| Monro, Inc. | 3,797 | 216,087 | |||
| Mr. Price Group, Ltd. | 28,052 | 420,075 | |||
| Murphy USA, Inc. | 9,503 | 1,475,626 | |||
| National Vision Holdings, Inc. (A) | 9,215 | 552,716 | |||
| Nitori Holdings Company, Ltd. | 8,400 | 1,571,684 | |||
| OneWater Marine, Inc., Class A | 1,220 | 49,398 | |||
| O'Reilly Automotive, Inc. (A) | 10,314 | 6,127,341 | |||
| Party City Holdco, Inc. (A) | 12,677 | 86,330 | |||
| Petrobras Distribuidora SA | 128,900 | 677,804 | |||
| PTT Oil & Retail Business PCL, NVDR | 356,800 | 334,357 | |||
| Rent-A-Center, Inc. | 7,434 | 468,937 | |||
| RH (A) | 4,485 | 3,142,505 | |||
| Ross Stores, Inc. | 52,725 | 6,242,640 | |||
| Sally Beauty Holdings, Inc. (A) | 12,784 | 237,655 | |||
| Shift Technologies, Inc. (A)(C) | 7,607 | 56,596 | |||
| Shoe Carnival, Inc. | 2,009 | 76,905 | |||
| Signet Jewelers, Ltd. | 5,883 | 465,934 | |||
| Sleep Number Corp. (A) | 2,704 | 250,147 | |||
| Sonic Automotive, Inc., Class A | 2,489 | 125,794 | |||
| Sportsman's Warehouse Holdings, Inc. (A) | 4,922 | 87,316 | |||
| The Aaron's Company, Inc. | 3,890 | 103,163 | |||
| The Buckle, Inc. | 3,341 | 129,397 | |||
| The accompanying notes are an integral part of the financial statements. | 74 |
| Shares or Principal Amount | Value | ||||
| COMMON STOCKS (continued) | |||||
| Specialty retail (continued) | |||||
| The Cato Corp., Class A | 2,445 | $ | 42,201 | ||
| The Children's Place, Inc. (A) | 1,582 | 137,381 | |||
| The Container Store Group, Inc. (A) | 3,910 | 45,356 | |||
| The Gap, Inc. | 30,706 | 820,771 | |||
| The Home Depot, Inc. | 157,203 | 51,276,475 | |||
| The ODP Corp. (A) | 5,501 | 259,482 | |||
| The TJX Companies, Inc. | 178,306 | 12,966,412 | |||
| Tilly's, Inc., Class A | 2,790 | 43,440 | |||
| Topsports International Holdings, Ltd. (B) | 167,000 | 220,193 | |||
| Tractor Supply Company | 17,040 | 3,310,020 | |||
| TravelCenters of America, Inc. (A) | 1,552 | 65,137 | |||
| Ulta Beauty, Inc. (A) | 8,096 | 3,135,662 | |||
| Urban Outfitters, Inc. (A) | 26,026 | 859,379 | |||
| USS Company, Ltd. | 22,700 | 375,034 | |||
| Via S/A (A) | 141,300 | 283,923 | |||
| Victoria's Secret & Company (A) | 23,274 | 1,543,066 | |||
| Williams-Sonoma, Inc. | 20,311 | 3,792,064 | |||
| Winmark Corp. | 393 | 82,385 | |||
| Yamada Holdings Company, Ltd. | 70,700 | 303,312 | |||
| Zhongsheng Group Holdings, Ltd. | 61,600 | 515,037 | |||
| Zumiez, Inc. (A) | 2,489 | 100,033 | |||
| 175,113,725 | |||||
| Textiles, apparel and luxury goods – 1.4% | |||||
| adidas AG | 25,303 | 8,976,233 | |||
| ANTA Sports Products, Ltd. | 117,000 | 2,403,281 | |||
| Bosideng International Holdings, Ltd. | 348,000 | 284,094 | |||
| Burberry Group PLC | 50,377 | 1,289,939 | |||
| Capri Holdings, Ltd. (A) | 40,340 | 2,279,613 | |||
| Carter's, Inc. | 11,718 | 1,199,689 | |||
| Cie Financiere Richemont SA, A Shares | 58,009 | 6,402,522 | |||
| Columbia Sportswear Company | 8,149 | 831,279 | |||
| Crocs, Inc. (A) | 24,651 | 3,520,656 | |||
| Deckers Outdoor Corp. (A) | 7,414 | 3,102,388 | |||
| Eclat Textile Company, Ltd. | 20,957 | 420,801 | |||
| EssilorLuxottica SA | 32,335 | 6,353,505 | |||
| Feng TAY Enterprise Company, Ltd. | 47,796 | 372,016 | |||
| Fila Holdings Corp. | 5,835 | 225,493 | |||
| Fossil Group, Inc. (A) | 5,514 | 73,888 | |||
| G-III Apparel Group, Ltd. (A) | 4,982 | 154,093 | |||
| Gildan Activewear, Inc. | 21,596 | 830,187 | |||
| Hanesbrands, Inc. | 38,597 | 720,992 | |||
| Hermes International | 3,585 | 5,276,433 | |||
| Kering SA | 8,515 | 6,782,373 | |||
| Kontoor Brands, Inc. | 5,808 | 313,400 | |||
| Li Ning Company, Ltd. | 243,000 | 3,258,574 | |||
| LPP SA | 122 | 445,147 | |||
| LVMH Moet Hennessy Louis Vuitton SE | 31,522 | 23,351,815 | |||
| Moncler SpA | 21,544 | 1,379,470 | |||
| Movado Group, Inc. | 1,851 | 66,895 | |||
| NIKE, Inc., Class B | 140,957 | 23,221,256 | |||
| Oxford Industries, Inc. | 1,805 | 162,992 | |||
| Pandora A/S | 11,092 | 1,329,533 | |||
| PLBY Group, Inc. (A) | 1,358 | 33,746 | |||
| Pou Chen Corp. | 260,971 | 309,970 | |||
| Puma SE | 13,972 | 1,696,407 | |||
| PVH Corp. (A) | 7,879 | 825,640 | |||
| Ralph Lauren Corp. | 5,334 | 619,437 | |||
| Rocky Brands, Inc. | 836 | 41,532 | |||
| Shenzhou International Group Holdings, Ltd. | 89,800 | 1,946,516 | |||
| Skechers USA, Inc., Class A (A) | 35,767 | 1,803,730 | |||
| Steven Madden, Ltd. | 9,166 | 370,948 | |||
| Superior Group of Companies, Inc. | 1,473 | 35,116 | |||
| Tapestry, Inc. (A) | 30,830 | 1,243,066 | |||
| The Swatch Group AG | 5,397 | 296,854 | |||
| Shares or Principal Amount | Value | ||||
| COMMON STOCKS (continued) | |||||
| Textiles, apparel and luxury goods (continued) | |||||
| The Swatch Group AG, Bearer Shares | 3,268 | $ | 922,078 | ||
| Under Armour, Inc., Class A (A) | 20,859 | 482,677 | |||
| Under Armour, Inc., Class C (A) | 21,716 | 435,623 | |||
| Unifi, Inc. (A) | 1,644 | 38,207 | |||
| Vera Bradley, Inc. (A) | 3,354 | 38,437 | |||
| VF Corp. | 35,551 | 2,718,585 | |||
| Wolverine World Wide, Inc. | 9,119 | 327,007 | |||
| 119,214,133 | |||||
| 989,282,372 | |||||
| Consumer staples – 5.3% | |||||
| Beverages – 1.1% | |||||
| Ambev SA | 522,705 | 1,728,602 | |||
| Anheuser-Busch InBev SA/NV | 111,249 | 6,823,147 | |||
| Anhui Gujing Distillery Company, Ltd., B Shares | 11,300 | 137,897 | |||
| Arca Continental SAB de CV | 59,542 | 383,537 | |||
| Asahi Group Holdings, Ltd. | 48,261 | 2,243,394 | |||
| Becle SAB de CV | 73,800 | 189,277 | |||
| Brown-Forman Corp., Class B | 14,309 | 1,004,778 | |||
| Budweiser Brewing Company APAC, Ltd. (B) | 124,800 | 311,841 | |||
| Carabao Group PCL, NVDR | 35,200 | 152,833 | |||
| Carlsberg A/S, Class B | 11,459 | 2,001,486 | |||
| Celsius Holdings, Inc. (A) | 5,151 | 421,146 | |||
| China Resources Beer Holdings Company, Ltd. (C) | 159,699 | 1,313,266 | |||
| Cia Cervecerias Unidas SA | 16,880 | 170,361 | |||
| Coca-Cola Consolidated, Inc. | 530 | 215,265 | |||
| Coca-Cola Europacific Partners PLC | 23,041 | 1,330,387 | |||
| Coca-Cola Femsa SAB de CV | 71,878 | 416,688 | |||
| Coca-Cola HBC AG (A) | 25,330 | 916,817 | |||
| Constellation Brands, Inc., Class A | 13,239 | 2,795,282 | |||
| Davide Campari-Milano NV | 57,707 | 798,090 | |||
| Diageo PLC | 287,900 | 13,840,121 | |||
| Fomento Economico Mexicano SAB de CV | 264,386 | 2,297,252 | |||
| Fraser & Neave Holdings BHD | 13,300 | 89,297 | |||
| Heineken Holding NV | 12,802 | 1,187,535 | |||
| Heineken NV | 29,016 | 3,177,891 | |||
| Ito En, Ltd. | 5,500 | 348,052 | |||
| Kirin Holdings Company, Ltd. | 86,527 | 1,567,587 | |||
| MGP Ingredients, Inc. | 1,605 | 104,807 | |||
| Molson Coors Beverage Company, Class B | 14,756 | 701,353 | |||
| Monster Beverage Corp. (A) | 28,985 | 2,828,066 | |||
| National Beverage Corp. | 2,686 | 125,033 | |||
| NewAge, Inc. (A)(C) | 16,598 | 29,212 | |||
| Nongfu Spring Company, Ltd., H Shares (B)(C) | 43,000 | 227,554 | |||
| Osotspa PCL, NVDR | 135,100 | 152,878 | |||
| PepsiCo, Inc. | 108,236 | 16,927,028 | |||
| Pernod Ricard SA | 23,775 | 5,004,825 | |||
| Primo Water Corp. | 17,614 | 312,825 | |||
| Remy Cointreau SA | 2,535 | 499,214 | |||
| Suntory Beverage & Food, Ltd. | 14,500 | 581,211 | |||
| The Boston Beer Company, Inc., Class A (A) | 2,479 | 1,413,551 | |||
| The Coca-Cola Company | 303,997 | 17,118,071 | |||
| The Duckhorn Portfolio, Inc. (A)(C) | 2,279 | 48,976 | |||
| Treasury Wine Estates, Ltd. | 80,272 | 739,327 | |||
| Tsingtao Brewery Company, Ltd., H Shares | 57,700 | 472,126 | |||
| 93,147,886 | |||||
| Food and staples retailing – 1.2% | |||||
| Aeon Company, Ltd. | 68,300 | 1,808,100 | |||
| The accompanying notes are an integral part of the financial statements. | 75 |
| Shares or Principal Amount | Value | ||||
| COMMON STOCKS (continued) | |||||
| Food and staples retailing (continued) | |||||
| Alimentation Couche-Tard, Inc., Class B | 89,618 | $ | 3,621,231 | ||
| Atacadao SA | 53,700 | 188,492 | |||
| Berli Jucker PCL, NVDR (C) | 142,800 | 160,465 | |||
| BGF retail Company, Ltd. | 911 | 140,009 | |||
| Bid Corp., Ltd. (A) | 37,092 | 815,200 | |||
| BIM Birlesik Magazalar AS | 40,637 | 350,702 | |||
| BJ's Wholesale Club Holdings, Inc. (A) | 51,956 | 2,943,827 | |||
| Carrefour SA | 69,485 | 1,383,314 | |||
| Casey's General Stores, Inc. | 9,849 | 2,014,711 | |||
| Cencosud SA | 167,452 | 315,929 | |||
| Clicks Group, Ltd. | 26,697 | 556,896 | |||
| Coles Group, Ltd. | 147,557 | 1,947,343 | |||
| Cosmos Pharmaceutical Corp. | 2,100 | 371,877 | |||
| Costco Wholesale Corp. | 43,261 | 19,704,953 | |||
| CP ALL PCL, NVDR | 695,500 | 1,402,147 | |||
| Dino Polska SA (A)(B) | 5,350 | 453,489 | |||
| E-MART, Inc. | 2,338 | 360,227 | |||
| Empire Company, Ltd., Class A | 18,577 | 600,754 | |||
| Endeavour Group, Ltd. (A) | 148,056 | 790,665 | |||
| Etablissements Franz Colruyt NV | 7,759 | 434,331 | |||
| George Weston, Ltd. | 8,262 | 890,605 | |||
| Grocery Outlet Holding Corp. (A) | 23,217 | 604,339 | |||
| HF Foods Group, Inc. (A) | 4,955 | 29,135 | |||
| ICA Gruppen AB | 11,452 | 569,741 | |||
| Ingles Markets, Inc., Class A | 1,768 | 120,030 | |||
| J Sainsbury PLC | 208,692 | 872,250 | |||
| Jeronimo Martins SGPS SA | 25,523 | 540,668 | |||
| Kesko OYJ, B Shares | 36,750 | 1,520,697 | |||
| Kobe Bussan Company, Ltd. | 14,300 | 556,270 | |||
| Koninklijke Ahold Delhaize NV | 116,713 | 3,937,599 | |||
| Lawson, Inc. (C) | 4,900 | 235,672 | |||
| Loblaw Companies, Ltd. | 19,233 | 1,355,068 | |||
| Metro, Inc. | 26,871 | 1,368,842 | |||
| Performance Food Group Company (A) | 14,874 | 746,972 | |||
| President Chain Store Corp. | 59,274 | 610,319 | |||
| PriceSmart, Inc. | 2,640 | 223,370 | |||
| Raia Drogasil SA | 117,030 | 578,496 | |||
| Rite Aid Corp. (A) | 6,305 | 111,851 | |||
| Seven & i Holdings Company, Ltd. | 79,446 | 3,466,732 | |||
| Shoprite Holdings, Ltd. | 55,282 | 698,678 | |||
| SpartanNash Company | 4,203 | 90,365 | |||
| Sprouts Farmers Market, Inc. (A) | 45,119 | 1,123,463 | |||
| Sun Art Retail Group, Ltd. | 203,300 | 123,338 | |||
| Sysco Corp. | 50,063 | 3,987,518 | |||
| Tesco PLC | 961,441 | 3,375,255 | |||
| The Andersons, Inc. | 3,612 | 109,733 | |||
| The Chefs' Warehouse, Inc. (A) | 3,634 | 109,856 | |||
| The Kroger Company | 74,091 | 3,410,409 | |||
| The SPAR Group, Ltd. | 20,370 | 290,712 | |||
| Tsuruha Holdings, Inc. | 4,100 | 514,781 | |||
| United Natural Foods, Inc. (A) | 6,292 | 231,546 | |||
| Walgreens Boots Alliance, Inc. | 70,210 | 3,563,158 | |||
| Wal-Mart de Mexico SAB de CV | 711,700 | 2,525,536 | |||
| Walmart, Inc. | 134,368 | 19,899,901 | |||
| Weis Markets, Inc. | 2,068 | 117,773 | |||
| Welcia Holdings Company, Ltd. | 9,600 | 338,539 | |||
| Wm Morrison Supermarkets PLC | 300,418 | 1,194,931 | |||
| Woolworths Group, Ltd. | 140,100 | 4,264,637 | |||
| 104,673,447 | |||||
| Food products – 1.4% | |||||
| a2 Milk Company, Ltd. (A) | 111,490 | 474,627 | |||
| Ajinomoto Company, Inc. | 48,900 | 1,441,394 | |||
| AppHarvest, Inc. (A)(C) | 5,735 | 48,174 | |||
| Archer-Daniels-Midland Company | 43,769 | 2,626,140 | |||
| Associated British Foods PLC | 44,776 | 1,220,861 | |||
| Shares or Principal Amount | Value | ||||
| COMMON STOCKS (continued) | |||||
| Food products (continued) | |||||
| B&G Foods, Inc. (C) | 7,194 | $ | 218,410 | ||
| Barry Callebaut AG | 384 | 978,256 | |||
| BRF SA (A) | 72,310 | 327,512 | |||
| Calavo Growers, Inc. | 1,974 | 92,620 | |||
| Cal-Maine Foods, Inc. | 3,994 | 144,423 | |||
| Campbell Soup Company | 15,904 | 663,674 | |||
| Charoen Pokphand Foods PCL, NVDR (C) | 474,200 | 397,312 | |||
| Charoen Pokphand Indonesia Tbk PT | 880,303 | 394,578 | |||
| China Feihe, Ltd. (B) | 387,000 | 699,319 | |||
| China Huishan Dairy Holdings Company, Ltd. (A)(D) | 280,500 | 0 | |||
| China Mengniu Dairy Company, Ltd. (A) | 343,353 | 2,065,186 | |||
| Chocoladefabriken Lindt & Spruengli AG | 12 | 1,465,673 | |||
| Chocoladefabriken Lindt & Spruengli AG, Participation Certificates | 114 | 1,341,118 | |||
| CJ CheilJedang Corp. | 986 | 385,548 | |||
| Conagra Brands, Inc. | 37,599 | 1,245,279 | |||
| Dali Foods Group Company, Ltd. (B) | 216,800 | 121,435 | |||
| Danone SA | 73,988 | 5,403,032 | |||
| Darling Ingredients, Inc. (A) | 43,498 | 3,240,601 | |||
| Flowers Foods, Inc. | 52,487 | 1,266,511 | |||
| Fresh Del Monte Produce, Inc. | 3,832 | 125,996 | |||
| General Mills, Inc. | 47,785 | 2,762,451 | |||
| Gruma SAB de CV, Class B | 29,488 | 335,932 | |||
| Grupo Bimbo SAB de CV, Series A | 212,800 | 537,404 | |||
| Hormel Foods Corp. | 22,082 | 1,005,614 | |||
| Hostess Brands, Inc. (A) | 14,758 | 235,538 | |||
| Indofood CBP Sukses Makmur Tbk PT (A) | 270,500 | 159,843 | |||
| Indofood Sukses Makmur Tbk PT (A) | 529,017 | 228,848 | |||
| Ingredion, Inc. | 17,854 | 1,568,652 | |||
| IOI Corp. BHD | 278,400 | 276,100 | |||
| J&J Snack Foods Corp. | 1,659 | 271,678 | |||
| JBS SA | 116,281 | 700,951 | |||
| JDE Peet's NV | 8,279 | 284,523 | |||
| John B. Sanfilippo & Son, Inc. | 1,004 | 85,330 | |||
| Kellogg Company | 19,739 | 1,246,320 | |||
| Kerry Group PLC, Class A | 15,743 | 2,309,195 | |||
| Kerry Group PLC, Class A (London Stock Exchange) | 2,564 | 372,730 | |||
| Kikkoman Corp. | 15,300 | 1,148,649 | |||
| Kuala Lumpur Kepong BHD | 49,000 | 251,747 | |||
| Lamb Weston Holdings, Inc. | 11,459 | 746,554 | |||
| Lancaster Colony Corp. | 7,317 | 1,296,865 | |||
| Landec Corp. (A) | 3,511 | 38,024 | |||
| Limoneira Company | 2,185 | 35,943 | |||
| McCormick & Company, Inc. | 19,507 | 1,683,259 | |||
| MEIJI Holdings Company, Ltd. | 12,700 | 781,076 | |||
| Mission Produce, Inc. (A) | 4,272 | 88,601 | |||
| Mondelez International, Inc., Class A | 110,044 | 6,830,431 | |||
| Mowi ASA | 66,411 | 1,778,839 | |||
| Nestle Malaysia BHD | 6,700 | 217,142 | |||
| Nestle SA | 320,098 | 40,424,773 | |||
| NH Foods, Ltd. | 8,800 | 341,468 | |||
| Nisshin Seifun Group, Inc. | 20,700 | 339,913 | |||
| Nissin Foods Holdings Company, Ltd. | 6,517 | 507,340 | |||
| Orion Corp. | 2,741 | 298,631 | |||
| Orkla ASA | 113,541 | 1,014,191 | |||
| Pilgrim's Pride Corp. (A) | 12,992 | 361,697 | |||
| Post Holdings, Inc. (A) | 15,775 | 1,765,380 | |||
| PPB Group BHD | 72,520 | 323,231 | |||
| QL Resources BHD | 114,500 | 153,077 | |||
| Sanderson Farms, Inc. | 7,579 | 1,489,274 | |||
| Saputo, Inc. | 26,785 | 753,458 | |||
| Seneca Foods Corp., Class A (A) | 777 | 38,050 | |||
| Sime Darby Plantation BHD | 193,200 | 187,334 | |||
| The accompanying notes are an integral part of the financial statements. | 76 |
| Shares or Principal Amount | Value | ||||
| COMMON STOCKS (continued) | |||||
| Food products (continued) | |||||
| Tattooed Chef, Inc. (A)(C) | 5,336 | $ | 112,963 | ||
| Thai Union Group PCL, NVDR | 342,100 | 211,182 | |||
| The Hain Celestial Group, Inc. (A) | 21,799 | 815,501 | |||
| The Hershey Company | 11,468 | 2,037,864 | |||
| The J.M. Smucker Company | 8,585 | 1,061,707 | |||
| The Kraft Heinz Company | 50,785 | 1,827,752 | |||
| The Simply Good Foods Company (A) | 9,629 | 342,985 | |||
| Tiger Brands, Ltd. | 18,498 | 236,922 | |||
| Tingyi Cayman Islands Holding Corp. | 211,100 | 375,915 | |||
| Tootsie Roll Industries, Inc. | 6,476 | 204,965 | |||
| Toyo Suisan Kaisha, Ltd. | 9,200 | 381,271 | |||
| TreeHouse Foods, Inc. (A) | 20,801 | 779,413 | |||
| Tyson Foods, Inc., Class A | 23,093 | 1,813,262 | |||
| Uni-President China Holdings, Ltd. | 137,900 | 130,337 | |||
| Uni-President Enterprises Corp. | 522,805 | 1,362,583 | |||
| Universal Robina Corp. | 95,480 | 288,922 | |||
| Utz Brands, Inc. | 6,629 | 128,735 | |||
| Vital Farms, Inc. (A) | 2,997 | 53,886 | |||
| Want Want China Holdings, Ltd. | 526,912 | 358,068 | |||
| WH Group, Ltd. (B) | 704,270 | 610,860 | |||
| Whole Earth Brands, Inc. (A) | 4,454 | 55,853 | |||
| Wilmar International, Ltd. | 121,100 | 371,898 | |||
| Yakult Honsha Company, Ltd. | 13,400 | 772,672 | |||
| Yihai International Holding, Ltd. (A)(C) | 50,500 | 273,207 | |||
| 116,272,458 | |||||
| Household products – 0.5% | |||||
| Central Garden & Pet Company (A) | 1,528 | 70,364 | |||
| Central Garden & Pet Company, Class A (A) | 4,086 | 170,264 | |||
| Church & Dwight Company, Inc. | 15,670 | 1,310,952 | |||
| Colgate-Palmolive Company | 54,054 | 4,213,509 | |||
| Energizer Holdings, Inc. | 23,212 | 913,160 | |||
| Essity AB, B Shares | 71,206 | 2,285,551 | |||
| Henkel AG & Company KGaA | 13,717 | 1,234,597 | |||
| Kimberly-Clark Corp. | 21,560 | 2,971,184 | |||
| Kimberly-Clark de Mexico SAB de CV, Class A | 202,635 | 359,585 | |||
| Lion Corp. | 23,000 | 391,365 | |||
| Pigeon Corp. | 11,900 | 344,693 | |||
| Reckitt Benckiser Group PLC | 87,741 | 6,698,253 | |||
| The Clorox Company | 7,947 | 1,335,493 | |||
| The Procter & Gamble Company | 156,432 | 22,274,352 | |||
| Unicharm Corp. | 42,388 | 1,889,779 | |||
| Unilever Indonesia Tbk PT | 882,625 | 250,610 | |||
| Vinda International Holdings, Ltd. (C) | 39,000 | 114,950 | |||
| WD-40 Company | 1,542 | 369,509 | |||
| 47,198,170 | |||||
| Personal products – 0.6% | |||||
| Amorepacific Corp. | 3,766 | 737,628 | |||
| AMOREPACIFIC Group | 3,470 | 172,645 | |||
| Beiersdorf AG | 13,271 | 1,610,623 | |||
| BellRing Brands, Inc., Class A (A) | 4,466 | 150,817 | |||
| Coty, Inc., Class A (A) | 75,564 | 738,260 | |||
| Edgewell Personal Care Company | 6,138 | 259,637 | |||
| elf Beauty, Inc. (A) | 5,239 | 162,147 | |||
| Hengan International Group Company, Ltd. | 71,100 | 411,746 | |||
| Inter Parfums, Inc. | 2,067 | 149,940 | |||
| Kao Corp. | 50,700 | 3,062,613 | |||
| Kobayashi Pharmaceutical Company, Ltd. | 5,500 | 430,503 | |||
| Kose Corp. | 3,500 | 422,393 | |||
| LG Household & Health Care, Ltd. | 1,098 | 1,383,268 | |||
| L'Oreal SA | 28,588 | 13,411,750 | |||
| Medifast, Inc. | 1,314 | 299,461 | |||
| Natura & Company Holding SA (A) | 98,480 | 983,124 | |||
| Nu Skin Enterprises, Inc., Class A | 18,978 | 960,666 | |||
| Shares or Principal Amount | Value | ||||
| COMMON STOCKS (continued) | |||||
| Personal products (continued) | |||||
| Pola Orbis Holdings, Inc. | 9,400 | $ | 205,070 | ||
| Shiseido Company, Ltd. | 42,100 | 2,790,350 | |||
| The Beauty Health Company (A) | 5,354 | 137,651 | |||
| The Estee Lauder Companies, Inc., Class A | 14,817 | 5,045,040 | |||
| The Honest Company, Inc. (A) | 3,464 | 35,264 | |||
| Unilever PLC | 323,113 | 17,990,897 | |||
| USANA Health Sciences, Inc. (A) | 1,421 | 137,880 | |||
| Veru, Inc. (A) | 7,597 | 67,765 | |||
| 51,757,138 | |||||
| Tobacco – 0.5% | |||||
| 22nd Century Group, Inc. (A)(C) | 17,723 | 63,271 | |||
| Altria Group, Inc. | 144,978 | 7,282,245 | |||
| British American Tobacco PLC | 268,398 | 10,068,510 | |||
| Gudang Garam Tbk PT | 59,082 | 136,812 | |||
| Imperial Brands PLC | 117,196 | 2,485,351 | |||
| Japan Tobacco, Inc. | 126,400 | 2,452,486 | |||
| KT&G Corp. | 13,790 | 969,875 | |||
| Philip Morris International, Inc. | 122,095 | 12,575,785 | |||
| RLX Technology, Inc., ADR (A)(C) | 14,500 | 74,530 | |||
| Smoore International Holdings, Ltd. (B) | 129,000 | 692,367 | |||
| Swedish Match AB | 188,163 | 1,738,379 | |||
| Turning Point Brands, Inc. | 1,679 | 83,547 | |||
| Universal Corp. | 2,701 | 136,671 | |||
| Vector Group, Ltd. | 16,226 | 243,715 | |||
| 39,003,544 | |||||
| 452,052,643 | |||||
| Energy – 2.6% | |||||
| Energy equipment and services – 0.2% | |||||
| Archrock, Inc. | 15,156 | 116,398 | |||
| Aspen Aerogels, Inc. (A) | 2,484 | 108,675 | |||
| Baker Hughes Company | 70,959 | 1,616,446 | |||
| Cactus, Inc., Class A | 6,152 | 230,762 | |||
| ChampionX Corp. (A) | 72,790 | 1,698,191 | |||
| China Oilfield Services, Ltd., H Shares | 198,000 | 171,991 | |||
| Dialog Group BHD | 426,012 | 272,558 | |||
| DMC Global, Inc. (A) | 2,161 | 86,807 | |||
| Dril-Quip, Inc. (A) | 3,968 | 96,422 | |||
| Frank's International NV (A) | 20,047 | 57,735 | |||
| Halliburton Company | 86,789 | 1,734,044 | |||
| Helix Energy Solutions Group, Inc. (A) | 16,628 | 62,521 | |||
| Helmerich & Payne, Inc. | 11,748 | 316,256 | |||
| Liberty Oilfield Services, Inc., Class A (A) | 9,915 | 101,331 | |||
| Nabors Industries, Ltd. (A) | 825 | 69,581 | |||
| National Energy Services Reunited Corp. (A) | 3,390 | 38,477 | |||
| Newpark Resources, Inc. (A) | 13,035 | 34,152 | |||
| NexTier Oilfield Solutions, Inc. (A) | 20,385 | 73,386 | |||
| NOV, Inc. (A) | 38,106 | 501,856 | |||
| Oceaneering International, Inc. (A) | 11,424 | 140,515 | |||
| Oil States International, Inc. (A) | 7,773 | 45,550 | |||
| Patterson-UTI Energy, Inc. | 21,394 | 166,017 | |||
| ProPetro Holding Corp. (A) | 9,979 | 77,237 | |||
| RPC, Inc. (A) | 8,433 | 32,298 | |||
| Schlumberger NV | 136,403 | 3,824,740 | |||
| Select Energy Services, Inc., Class A (A) | 7,496 | 40,104 | |||
| Solaris Oilfield Infrastructure, Inc., Class A | 4,505 | 33,472 | |||
| Tenaris SA | 52,540 | 528,831 | |||
| TETRA Technologies, Inc. (A) | 14,950 | 48,438 | |||
| Tidewater, Inc. (A) | 4,904 | 56,396 | |||
| U.S. Silica Holdings, Inc. (A) | 8,517 | 74,779 | |||
| 12,455,966 | |||||
| Oil, gas and consumable fuels – 2.4% | |||||
| Adaro Energy Tbk PT | 1,745,645 | 154,093 | |||
| The accompanying notes are an integral part of the financial statements. | 77 |
| Shares or Principal Amount | Value | ||||
| COMMON STOCKS (continued) | |||||
| Oil, gas and consumable fuels (continued) | |||||
| Aemetis, Inc. (A)(C) | 2,815 | $ | 31,303 | ||
| Alto Ingredients, Inc. (A) | 8,830 | 44,945 | |||
| Altus Midstream Company, Class A | 411 | 26,789 | |||
| Ampol, Ltd. | 26,083 | 523,820 | |||
| Antero Midstream Corp. | 76,349 | 733,714 | |||
| Antero Resources Corp. (A) | 32,251 | 442,484 | |||
| APA Corp. | 36,869 | 718,208 | |||
| Arch Resources, Inc. (A) | 1,683 | 127,386 | |||
| Berry Corp. | 8,579 | 51,474 | |||
| Bonanza Creek Energy, Inc. | 3,450 | 134,136 | |||
| BP PLC | 2,500,540 | 10,172,933 | |||
| Brigham Minerals, Inc., Class A | 5,096 | 97,436 | |||
| Cabot Oil & Gas Corp. | 38,986 | 619,488 | |||
| California Resources Corp. (A) | 9,481 | 324,535 | |||
| Callon Petroleum Company (A) | 4,523 | 154,551 | |||
| Cameco Corp. | 41,913 | 774,376 | |||
| Canadian Natural Resources, Ltd. | 124,660 | 4,125,197 | |||
| Cenovus Energy, Inc. | 138,709 | 1,151,098 | |||
| Centennial Resource Development, Inc., Class A (A) | 20,635 | 105,239 | |||
| Centrus Energy Corp., Class A (A) | 1,221 | 35,299 | |||
| Chesapeake Energy Corp. | 11,115 | 620,328 | |||
| Chevron Corp. | 188,536 | 18,244,629 | |||
| China Petroleum & Chemical Corp., H Shares | 2,644,139 | 1,272,194 | |||
| China Shenhua Energy Company, Ltd., H Shares | 369,900 | 817,963 | |||
| Cimarex Energy Company | 27,410 | 1,760,270 | |||
| Clean Energy Fuels Corp. (A) | 15,745 | 124,858 | |||
| CNX Resources Corp. (A) | 83,182 | 944,948 | |||
| Comstock Resources, Inc. (A) | 10,774 | 63,674 | |||
| ConocoPhillips | 131,632 | 7,309,525 | |||
| CONSOL Energy, Inc. (A) | 3,898 | 88,991 | |||
| Contango Oil & Gas Company (A) | 17,371 | 63,057 | |||
| Cosan SA | 114,176 | 486,884 | |||
| CVR Energy, Inc. | 3,616 | 52,070 | |||
| Delek US Holdings, Inc. (A) | 7,503 | 128,376 | |||
| Denbury, Inc. (A) | 5,704 | 401,162 | |||
| Devon Energy Corp. | 58,106 | 1,717,032 | |||
| DHT Holdings, Inc. | 15,883 | 87,833 | |||
| Diamondback Energy, Inc. | 17,656 | 1,361,984 | |||
| Dorian LPG, Ltd. | 3,510 | 46,402 | |||
| DT Midstream, Inc. (A) | 25,822 | 1,199,948 | |||
| Ecopetrol SA | 1,716,497 | 1,203,640 | |||
| Empresas COPEC SA | 45,271 | 421,151 | |||
| Enbridge, Inc. | 214,001 | 8,421,630 | |||
| ENEOS Holdings, Inc. | 321,550 | 1,242,764 | |||
| Energy Fuels, Inc. (A) | 16,165 | 87,453 | |||
| Eni SpA | 279,250 | 3,445,272 | |||
| EOG Resources, Inc. | 56,929 | 3,843,846 | |||
| EQT Corp. (A) | 74,402 | 1,363,789 | |||
| Equinor ASA | 147,095 | 3,117,551 | |||
| Equitrans Midstream Corp. | 154,494 | 1,348,733 | |||
| Extraction Oil & Gas, Inc. (A) | 1,820 | 82,865 | |||
| Exxaro Resources, Ltd. | 27,975 | 355,352 | |||
| Exxon Mobil Corp. | 412,971 | 22,515,179 | |||
| Formosa Petrochemical Corp. | 120,900 | 426,189 | |||
| Frontline, Ltd. (C) | 13,420 | 96,892 | |||
| Galp Energia SGPS SA | 51,474 | 526,523 | |||
| Gevo, Inc. (A)(C) | 22,412 | 139,627 | |||
| Golar LNG, Ltd. (A) | 11,741 | 132,086 | |||
| Green Plains, Inc. (A) | 4,842 | 169,954 | |||
| GS Holdings Corp. | 5,633 | 206,035 | |||
| Hess Corp. | 26,776 | 1,840,850 | |||
| HollyFrontier Corp. | 39,838 | 1,287,963 | |||
| Shares or Principal Amount | Value | ||||
| COMMON STOCKS (continued) | |||||
| Oil, gas and consumable fuels (continued) | |||||
| Idemitsu Kosan Company, Ltd. | 21,028 | $ | 503,632 | ||
| Imperial Oil, Ltd. | 27,625 | 731,105 | |||
| Inpex Corp. | 108,000 | 742,056 | |||
| Inter Pipeline, Ltd. | 41,776 | 662,244 | |||
| International Seaways, Inc. | 4,732 | 81,390 | |||
| Keyera Corp. (C) | 24,007 | 578,078 | |||
| Kinder Morgan, Inc. | 189,977 | 3,090,926 | |||
| Koninklijke Vopak NV | 7,359 | 318,717 | |||
| Kosmos Energy, Ltd. (A) | 47,185 | 111,357 | |||
| Laredo Petroleum, Inc. (A) | 1,452 | 78,452 | |||
| Lundin Energy AB | 23,138 | 707,115 | |||
| Magnolia Oil & Gas Corp., Class A | 15,829 | 248,199 | |||
| Marathon Oil Corp. | 76,884 | 903,387 | |||
| Marathon Petroleum Corp. | 62,143 | 3,683,216 | |||
| Matador Resources Company | 12,532 | 360,295 | |||
| Meta Materials, Inc. (A) | 7,491 | 34,833 | |||
| MOL Hungarian Oil & Gas PLC | 54,660 | 448,158 | |||
| Murphy Oil Corp. | 55,252 | 1,174,658 | |||
| Neste OYJ | 57,106 | 3,478,436 | |||
| Nordic American Tankers, Ltd. | 18,897 | 44,786 | |||
| Northern Oil and Gas, Inc. | 5,516 | 91,566 | |||
| Oasis Petroleum, Inc. | 2,276 | 197,079 | |||
| Occidental Petroleum Corp. | 81,946 | 2,105,193 | |||
| Oil Search, Ltd. | 217,780 | 590,132 | |||
| OMV AG | 24,153 | 1,337,852 | |||
| ONEOK, Inc. | 43,460 | 2,282,519 | |||
| Ovintiv, Inc. | 29,572 | 806,133 | |||
| Par Pacific Holdings, Inc. (A) | 5,246 | 86,507 | |||
| Parkland Corp. | 16,145 | 482,053 | |||
| PBF Energy, Inc., Class A (A) | 11,101 | 115,450 | |||
| PDC Energy, Inc. | 11,247 | 469,562 | |||
| Peabody Energy Corp. (A) | 7,877 | 125,874 | |||
| Pembina Pipeline Corp. | 58,439 | 1,780,985 | |||
| Penn Virginia Corp. (A) | 1,956 | 40,489 | |||
| PetroChina Company, Ltd., H Shares | 2,297,239 | 1,003,480 | |||
| Petroleo Brasileiro SA | 412,309 | 2,226,284 | |||
| Petronas Dagangan BHD | 30,800 | 148,214 | |||
| Phillips 66 | 42,712 | 3,036,396 | |||
| Pioneer Natural Resources Company | 22,607 | 3,383,590 | |||
| Polski Koncern Naftowy ORLEN SA | 33,419 | 647,947 | |||
| Polskie Gornictwo Naftowe i Gazownictwo SA | 192,408 | 316,453 | |||
| PTT Exploration & Production PCL, NVDR | 166,700 | 575,288 | |||
| PTT PCL, NVDR | 1,198,300 | 1,419,187 | |||
| Range Resources Corp. (A) | 26,965 | 394,228 | |||
| Renewable Energy Group, Inc. (A) | 5,005 | 242,342 | |||
| Repsol SA | 138,107 | 1,584,799 | |||
| REX American Resources Corp. (A) | 644 | 54,585 | |||
| Royal Dutch Shell PLC, A Shares | 503,997 | 9,988,939 | |||
| Royal Dutch Shell PLC, B Shares | 455,864 | 8,970,313 | |||
| Santos, Ltd. | 207,704 | 910,433 | |||
| Scorpio Tankers, Inc. | 5,613 | 90,987 | |||
| SFL Corp., Ltd. | 12,265 | 98,488 | |||
| SK Innovation Company, Ltd. (A) | 5,965 | 1,278,730 | |||
| SM Energy Company | 13,203 | 252,177 | |||
| S-Oil Corp. | 5,261 | 429,591 | |||
| Southwestern Energy Company (A) | 76,496 | 348,057 | |||
| Suncor Energy, Inc. | 161,336 | 3,012,782 | |||
| Talos Energy, Inc. (A) | 4,459 | 55,292 | |||
| Targa Resources Corp. | 60,954 | 2,677,100 | |||
| TC Energy Corp. | 99,606 | 4,729,045 | |||
| Teekay Tankers, Ltd., Class A (A)(C) | 3,068 | 35,129 | |||
| Tellurian, Inc. (A) | 36,238 | 115,599 | |||
| Thai Oil PCL, NVDR | 130,300 | 200,526 | |||
| The accompanying notes are an integral part of the financial statements. | 78 |
| Shares or Principal Amount | Value | ||||
| COMMON STOCKS (continued) | |||||
| Oil, gas and consumable fuels (continued) | |||||
| The Williams Companies, Inc. | 118,497 | $ | 2,925,691 | ||
| TotalEnergies SE | 283,472 | 12,538,707 | |||
| Turkiye Petrol Rafinerileri AS (A) | 10,040 | 122,573 | |||
| Ultrapar Participacoes SA | 80,002 | 223,414 | |||
| United Tractors Tbk PT | 200,337 | 281,606 | |||
| Uranium Energy Corp. (A) | 25,469 | 63,927 | |||
| Ur-Energy, Inc. (A) | 23,364 | 30,373 | |||
| Valero Energy Corp. | 39,874 | 2,644,045 | |||
| Vine Energy, Inc., Class A (A) | 2,663 | 39,599 | |||
| W&T Offshore, Inc. (A) | 11,825 | 38,550 | |||
| Washington H. Soul Pattinson & Company, Ltd. (C) | 11,862 | 309,284 | |||
| Whiting Petroleum Corp. (A) | 4,430 | 207,989 | |||
| Woodside Petroleum, Ltd. | 106,133 | 1,500,774 | |||
| World Fuel Services Corp. | 6,957 | 225,129 | |||
| Yanzhou Coal Mining Company, Ltd., H Shares | 162,010 | 282,404 | |||
| 207,768,456 | |||||
| 220,224,422 | |||||
| Financials – 12.8% | |||||
| Banks – 5.8% | |||||
| 1st Source Corp. | 1,808 | 84,976 | |||
| ABN AMRO Bank NV (A)(B) | 47,190 | 657,438 | |||
| Absa Group, Ltd. (A) | 80,224 | 868,814 | |||
| Agricultural Bank of China, Ltd., H Shares | 2,846,400 | 954,221 | |||
| Akbank TAS | 288,667 | 204,888 | |||
| Allegiance Bancshares, Inc. | 2,238 | 83,186 | |||
| Altabancorp | 2,080 | 86,362 | |||
| Amerant Bancorp, Inc. (A) | 2,504 | 66,531 | |||
| American National Bankshares, Inc. | 1,617 | 55,269 | |||
| Ameris Bancorp | 7,517 | 370,137 | |||
| AMMB Holdings BHD (A) | 213,100 | 155,392 | |||
| Arrow Financial Corp. | 1,565 | 57,670 | |||
| Associated Banc-Corp. | 57,579 | 1,187,279 | |||
| Atlantic Capital Bancshares, Inc. (A) | 2,463 | 59,678 | |||
| Atlantic Union Bankshares Corp. | 8,834 | 326,858 | |||
| Australia & New Zealand Banking Group, Ltd. | 315,162 | 6,378,940 | |||
| Banc of California, Inc. | 5,173 | 92,959 | |||
| BancFirst Corp. | 1,957 | 110,688 | |||
| Banco Bilbao Vizcaya Argentaria SA (A) | 618,746 | 4,049,688 | |||
| Banco Bradesco SA | 159,053 | 613,351 | |||
| Banco de Chile | 5,183,089 | 506,491 | |||
| Banco de Credito e Inversiones SA | 6,080 | 263,370 | |||
| Banco do Brasil SA | 95,694 | 563,156 | |||
| Banco Espirito Santo SA (A) | 322,715 | 355 | |||
| Banco Inter SA | 37,900 | 496,875 | |||
| Banco Santander Brasil SA | 45,426 | 368,447 | |||
| Banco Santander Chile | 7,159,467 | 378,307 | |||
| Banco Santander SA (A) | 1,605,418 | 5,919,583 | |||
| Bancolombia SA | 88,550 | 729,939 | |||
| BancorpSouth Bank | 37,153 | 1,089,697 | |||
| Bangkok Bank PCL, NVDR | 69,100 | 244,011 | |||
| Bank Central Asia Tbk PT | 1,315,030 | 3,018,538 | |||
| Bank First Corp. (C) | 816 | 57,936 | |||
| Bank Hapoalim BM | 99,726 | 857,906 | |||
| Bank Leumi Le-Israel BM | 126,834 | 1,047,803 | |||
| Bank Mandiri Persero Tbk PT | 2,219,556 | 948,839 | |||
| Bank Negara Indonesia Persero Tbk PT | 925,653 | 349,771 | |||
| Bank of America Corp. | 725,034 | 30,270,170 | |||
| Bank of China, Ltd., H Shares | 8,679,122 | 3,041,455 | |||
| Bank of Communications Company, Ltd., H Shares | 943,976 | 542,128 | |||
| Bank of Hawaii Corp. | 10,768 | 902,466 | |||
| Bank of Marin Bancorp | 1,974 | 71,459 | |||
| Shares or Principal Amount | Value | ||||
| COMMON STOCKS (continued) | |||||
| Banks (continued) | |||||
| Bank of Montreal | 68,669 | $ | 6,833,971 | ||
| Bank of the Philippine Islands | 198,247 | 331,811 | |||
| Bank OZK | 32,225 | 1,367,307 | |||
| Bank Polska Kasa Opieki SA (A) | 20,422 | 571,075 | |||
| Bank Rakyat Indonesia Persero Tbk PT | 6,582,110 | 1,810,113 | |||
| BankUnited, Inc. | 10,370 | 435,851 | |||
| Banner Corp. | 3,868 | 221,250 | |||
| Banque Cantonale Vaudoise | 3,171 | 268,884 | |||
| Bar Harbor Bankshares | 1,880 | 51,512 | |||
| Barclays PLC | 2,142,770 | 5,432,799 | |||
| BDO Unibank, Inc. | 212,920 | 470,800 | |||
| Berkshire Hills Bancorp, Inc. | 5,686 | 145,732 | |||
| Blue Ridge Bankshares, Inc. | 2,360 | 41,890 | |||
| BNK Financial Group, Inc. | 3,033 | 20,240 | |||
| BNP Paribas SA | 128,275 | 8,126,203 | |||
| BOC Hong Kong Holdings, Ltd. | 270,000 | 817,066 | |||
| Brookline Bancorp, Inc. | 8,931 | 133,697 | |||
| Bryn Mawr Bank Corp. | 2,270 | 92,616 | |||
| Business First Bancshares, Inc. | 2,606 | 62,336 | |||
| Byline Bancorp, Inc. | 2,940 | 72,324 | |||
| Cadence BanCorp | 13,906 | 299,118 | |||
| CaixaBank SA | 410,760 | 1,276,003 | |||
| Cambridge Bancorp | 814 | 69,792 | |||
| Camden National Corp. | 1,667 | 77,799 | |||
| Canadian Imperial Bank of Commerce | 47,731 | 5,490,966 | |||
| Capital City Bank Group, Inc. | 1,816 | 42,113 | |||
| Capitec Bank Holdings, Ltd. | 8,881 | 1,162,286 | |||
| Capstar Financial Holdings, Inc. | 2,595 | 54,599 | |||
| Carter Bankshares, Inc. (A) | 3,614 | 44,055 | |||
| Cathay General Bancorp | 28,424 | 1,130,707 | |||
| CBTX, Inc. | 2,176 | 59,231 | |||
| Central Pacific Financial Corp. | 3,203 | 81,068 | |||
| Century Bancorp, Inc., Class A | 328 | 37,500 | |||
| Chang Hwa Commercial Bank, Ltd. | 439,526 | 261,502 | |||
| China Bohai Bank Company, Ltd., H Shares (B) | 273,000 | 110,517 | |||
| China CITIC Bank Corp., Ltd., H Shares | 974,400 | 447,956 | |||
| China Construction Bank Corp., H Shares | 10,471,296 | 7,545,172 | |||
| China Everbright Bank Company, Ltd., H Shares | 330,595 | 118,493 | |||
| China Merchants Bank Company, Ltd., H Shares | 422,674 | 3,486,048 | |||
| China Minsheng Banking Corp., Ltd., H Shares | 601,700 | 251,288 | |||
| Chongqing Rural Commercial Bank Company, Ltd., H Shares | 266,800 | 102,063 | |||
| CIMB Group Holdings BHD | 721,600 | 852,485 | |||
| CIT Group, Inc. | 37,498 | 2,078,139 | |||
| Citigroup, Inc. | 198,738 | 14,291,250 | |||
| Citizens & Northern Corp. | 2,190 | 54,947 | |||
| Citizens Financial Group, Inc. | 40,953 | 1,793,332 | |||
| City Holding Company | 1,592 | 124,017 | |||
| Civista Bancshares, Inc. | 2,190 | 51,509 | |||
| CNB Financial Corp. | 2,177 | 53,511 | |||
| Coastal Financial Corp. (A) | 1,275 | 37,447 | |||
| Columbia Banking System, Inc. | 8,088 | 294,080 | |||
| Comerica, Inc. | 13,423 | 992,094 | |||
| Commerce Bancshares, Inc. | 28,078 | 1,985,676 | |||
| Commerzbank AG (A) | 130,037 | 813,823 | |||
| Commonwealth Bank of Australia | 197,166 | 14,365,933 | |||
| Community Bank System, Inc. | 5,897 | 436,378 | |||
| Community Trust Bancorp, Inc. | 1,696 | 70,655 | |||
| Concordia Financial Group, Ltd. | 117,300 | 454,790 | |||
| ConnectOne Bancorp, Inc. | 4,179 | 119,561 | |||
| Credicorp, Ltd. (A) | 12,700 | 1,354,201 | |||
| The accompanying notes are an integral part of the financial statements. | 79 |
| Shares or Principal Amount | Value | ||||
| COMMON STOCKS (continued) | |||||
| Banks (continued) | |||||
| Credit Agricole SA | 133,443 | $ | 1,926,078 | ||
| CrossFirst Bankshares, Inc. (A) | 5,430 | 71,785 | |||
| CTBC Financial Holding Company, Ltd. | 2,019,090 | 1,673,492 | |||
| Cullen/Frost Bankers, Inc. | 15,076 | 1,721,981 | |||
| Customers Bancorp, Inc. (A) | 3,322 | 137,564 | |||
| CVB Financial Corp. | 14,298 | 291,107 | |||
| Danske Bank A/S | 77,474 | 1,300,053 | |||
| DBS Group Holdings, Ltd. | 111,072 | 2,462,808 | |||
| Dime Community Bancshares, Inc. | 3,943 | 130,119 | |||
| DNB Bank ASA (A) | 141,285 | 2,982,066 | |||
| E.Sun Financial Holding Company, Ltd. | 1,298,889 | 1,245,108 | |||
| Eagle Bancorp, Inc. | 3,464 | 199,873 | |||
| East West Bancorp, Inc. | 37,817 | 2,773,499 | |||
| Eastern Bankshares, Inc. | 19,285 | 381,457 | |||
| Enterprise Financial Services Corp. | 3,949 | 177,350 | |||
| Equity Bancshares, Inc., Class A (A) | 1,723 | 55,274 | |||
| Erste Group Bank AG | 46,214 | 1,845,288 | |||
| Farmers National Banc Corp. | 3,388 | 52,853 | |||
| FB Financial Corp. | 3,718 | 153,144 | |||
| Fifth Third Bancorp | 67,683 | 2,630,161 | |||
| Financial Institutions, Inc. | 1,965 | 62,408 | |||
| FinecoBank Banca Fineco SpA (A) | 66,950 | 1,233,357 | |||
| First Bancorp (North Carolina) | 3,133 | 130,834 | |||
| First Bancorp (Puerto Rico) | 24,222 | 308,346 | |||
| First Bank | 2,645 | 35,231 | |||
| First Busey Corp. | 5,615 | 133,076 | |||
| First Commonwealth Financial Corp. | 10,415 | 140,811 | |||
| First Community Bankshares, Inc. | 2,073 | 64,761 | |||
| First Financial Bancorp | 10,849 | 255,060 | |||
| First Financial Bankshares, Inc. | 52,398 | 2,495,193 | |||
| First Financial Corp. | 1,429 | 57,774 | |||
| First Financial Holding Company, Ltd. | 1,109,234 | 916,113 | |||
| First Foundation, Inc. | 4,609 | 110,754 | |||
| First Horizon Corp. | 147,247 | 2,413,378 | |||
| First Internet Bancorp | 1,322 | 39,290 | |||
| First Interstate BancSystem, Inc., Class A | 4,455 | 196,287 | |||
| First Merchants Corp. | 6,045 | 248,752 | |||
| First Mid Bancshares, Inc. | 1,865 | 76,279 | |||
| First Midwest Bancorp, Inc. | 12,804 | 239,819 | |||
| First Republic Bank | 16,920 | 3,366,065 | |||
| Flushing Financial Corp. | 3,434 | 78,742 | |||
| FNB Corp. | 85,137 | 994,400 | |||
| Fulton Financial Corp. | 60,881 | 964,964 | |||
| German American Bancorp, Inc. | 2,629 | 98,219 | |||
| Glacier Bancorp, Inc. | 36,180 | 1,926,947 | |||
| Great Southern Bancorp, Inc. | 1,159 | 63,131 | |||
| Great Western Bancorp, Inc. | 6,177 | 191,240 | |||
| Grupo Financiero Banorte SAB de CV, Series O | 351,550 | 2,320,503 | |||
| Grupo Financiero Inbursa SAB de CV, Series O (A) | 311,200 | 299,052 | |||
| Guaranty Bancshares, Inc. | 1,130 | 38,782 | |||
| Hana Financial Group, Inc. | 35,598 | 1,378,496 | |||
| Hancock Whitney Corp. | 32,855 | 1,510,016 | |||
| Hang Seng Bank, Ltd. | 54,895 | 981,378 | |||
| Hanmi Financial Corp. | 3,778 | 72,840 | |||
| HarborOne Bancorp, Inc. | 5,918 | 83,621 | |||
| Heartland Financial USA, Inc. | 4,275 | 201,053 | |||
| Heritage Commerce Corp. | 7,061 | 79,577 | |||
| Heritage Financial Corp. | 4,005 | 101,927 | |||
| Hilltop Holdings, Inc. | 7,137 | 238,875 | |||
| Home BancShares, Inc. | 57,603 | 1,275,906 | |||
| HomeTrust Bancshares, Inc. | 1,938 | 53,915 | |||
| Hong Leong Bank BHD | 74,700 | 344,764 | |||
| Hong Leong Financial Group BHD | 27,300 | 119,735 | |||
| Shares or Principal Amount | Value | ||||
| COMMON STOCKS (continued) | |||||
| Banks (continued) | |||||
| Hope Bancorp, Inc. | 13,178 | $ | 181,725 | ||
| Horizon Bancorp, Inc. | 4,775 | 85,234 | |||
| Howard Bancorp, Inc. (A) | 1,887 | 37,551 | |||
| HSBC Holdings PLC | 2,502,786 | 13,216,848 | |||
| Hua Nan Financial Holdings Company, Ltd. | 873,493 | 658,212 | |||
| Huntington Bancshares, Inc. | 141,861 | 2,203,101 | |||
| Independent Bank Corp. (Massachusetts) | 3,678 | 282,103 | |||
| Independent Bank Corp. (Michigan) | 2,811 | 58,862 | |||
| Independent Bank Group, Inc. | 4,218 | 297,074 | |||
| Industrial & Commercial Bank of China, Ltd., H Shares | 6,129,623 | 3,413,430 | |||
| Industrial Bank of Korea | 33,693 | 298,601 | |||
| ING Groep NV | 436,573 | 6,022,252 | |||
| International Bancshares Corp. | 20,869 | 873,994 | |||
| Intesa Sanpaolo SpA | 1,840,257 | 5,207,661 | |||
| Investors Bancorp, Inc. | 25,464 | 364,390 | |||
| Israel Discount Bank, Ltd., Class A (A) | 103,636 | 535,308 | |||
| Japan Post Bank Company, Ltd. | 39,400 | 344,525 | |||
| JPMorgan Chase & Co. | 291,045 | 46,552,648 | |||
| KB Financial Group, Inc. | 46,816 | 2,129,661 | |||
| KBC Group NV | 36,219 | 3,043,844 | |||
| KeyCorp | 93,312 | 1,896,100 | |||
| Komercni banka AS (A) | 9,140 | 351,441 | |||
| Krung Thai Bank PCL, NVDR | 467,500 | 162,171 | |||
| Lakeland Bancorp, Inc. | 5,648 | 95,338 | |||
| Lakeland Financial Corp. | 2,688 | 178,510 | |||
| Live Oak Bancshares, Inc. | 3,570 | 218,520 | |||
| Lloyds Banking Group PLC | 8,756,530 | 5,242,129 | |||
| M&T Bank Corp. | 12,370 | 1,731,924 | |||
| Macatawa Bank Corp. | 5,295 | 43,472 | |||
| Malayan Banking BHD | 436,033 | 880,872 | |||
| Mediobanca Banca di Credito Finanziario SpA (A) | 69,537 | 819,738 | |||
| Mega Financial Holding Company, Ltd. | 1,177,275 | 1,392,411 | |||
| Mercantile Bank Corp. | 1,968 | 61,402 | |||
| Metrocity Bankshares, Inc. | 2,360 | 48,876 | |||
| Metropolitan Bank & Trust Company | 198,374 | 180,157 | |||
| Metropolitan Bank Holding Corp. (A) | 906 | 70,940 | |||
| Mid Penn Bancorp, Inc. | 1,629 | 43,315 | |||
| Midland States Bancorp, Inc. | 2,623 | 66,362 | |||
| MidWestOne Financial Group, Inc. | 1,882 | 55,256 | |||
| Mitsubishi UFJ Financial Group, Inc. | 1,287,700 | 6,986,340 | |||
| Mizrahi Tefahot Bank, Ltd. | 12,478 | 415,113 | |||
| Mizuho Financial Group, Inc. | 254,270 | 3,562,787 | |||
| Moneta Money Bank AS (A)(B) | 42,857 | 174,009 | |||
| MVB Financial Corp. | 1,172 | 46,341 | |||
| National Australia Bank, Ltd. | 366,302 | 7,385,065 | |||
| National Bank Holdings Corp., Class A | 3,202 | 120,075 | |||
| National Bank of Canada | 35,936 | 2,852,321 | |||
| NatWest Group PLC | 609,180 | 1,778,783 | |||
| NBT Bancorp, Inc. | 4,713 | 169,008 | |||
| Nedbank Group, Ltd. (A) | 41,863 | 533,480 | |||
| Nicolet Bankshares, Inc. (A) | 1,014 | 77,480 | |||
| Nordea Bank ABP | 379,110 | 4,452,663 | |||
| Northrim BanCorp, Inc. | 1,065 | 44,698 | |||
| OceanFirst Financial Corp. | 6,706 | 142,570 | |||
| OFG Bancorp | 5,724 | 136,288 | |||
| Old National Bancorp | 18,232 | 303,745 | |||
| Old Second Bancorp, Inc. | 4,243 | 49,898 | |||
| Origin Bancorp, Inc. | 2,369 | 97,484 | |||
| Orrstown Financial Services, Inc. | 1,860 | 44,380 | |||
| OTP Bank NYRT (A) | 30,292 | 1,829,387 | |||
| Oversea-Chinese Banking Corp., Ltd. | 212,878 | 1,801,460 | |||
| Pacific Premier Bancorp, Inc. | 10,583 | 422,897 | |||
| The accompanying notes are an integral part of the financial statements. | 80 |
| Shares or Principal Amount | Value | ||||
| COMMON STOCKS (continued) | |||||
| Banks (continued) | |||||
| PacWest Bancorp | 31,168 | $ | 1,326,198 | ||
| Park National Corp. | 1,446 | 169,529 | |||
| Peapack-Gladstone Financial Corp. | 2,263 | 75,381 | |||
| Peoples Bancorp, Inc. | 2,161 | 67,510 | |||
| Peoples Financial Services Corp. | 1,085 | 50,008 | |||
| People's United Financial, Inc. | 41,114 | 675,503 | |||
| Pinnacle Financial Partners, Inc. | 20,285 | 1,966,022 | |||
| Postal Savings Bank of China Company, Ltd., H Shares (B) | 871,300 | 627,705 | |||
| Powszechna Kasa Oszczednosci Bank Polski SA (A) | 96,844 | 1,063,071 | |||
| Preferred Bank | 1,582 | 101,074 | |||
| Premier Financial Bancorp, Inc. | 2,000 | 36,020 | |||
| Primis Financial Corp. | 3,411 | 51,131 | |||
| Prosperity Bancshares, Inc. | 24,775 | 1,731,277 | |||
| Public Bank BHD | 1,623,610 | 1,633,011 | |||
| QCR Holdings, Inc. | 1,754 | 91,120 | |||
| Raiffeisen Bank International AG | 23,915 | 573,395 | |||
| RBB Bancorp | 1,836 | 47,259 | |||
| Red River Bancshares, Inc. | 716 | 35,915 | |||
| Regions Financial Corp. | 92,425 | 1,888,243 | |||
| Reliant Bancorp, Inc. | 1,912 | 55,448 | |||
| Renasant Corp. | 6,234 | 218,813 | |||
| Republic Bancorp, Inc., Class A | 1,084 | 54,341 | |||
| Resona Holdings, Inc. | 230,200 | 890,216 | |||
| RHB Bank BHD | 198,241 | 266,782 | |||
| Royal Bank of Canada | 150,851 | 15,495,811 | |||
| S&T Bancorp, Inc. | 4,315 | 128,587 | |||
| Sandy Spring Bancorp, Inc. | 5,118 | 222,991 | |||
| Santander Bank Polska SA (A) | 3,823 | 301,686 | |||
| Seacoast Banking Corp. of Florida | 6,097 | 194,738 | |||
| ServisFirst Bancshares, Inc. | 5,586 | 410,124 | |||
| Shinhan Financial Group Company, Ltd. | 51,737 | 1,723,547 | |||
| Sierra Bancorp | 1,950 | 49,569 | |||
| Signature Bank | 15,361 | 3,983,568 | |||
| Silvergate Capital Corp., Class A (A) | 2,588 | 292,392 | |||
| Simmons First National Corp., Class A | 12,002 | 348,658 | |||
| SinoPac Financial Holdings Company, Ltd. | 1,098,772 | 564,218 | |||
| Skandinaviska Enskilda Banken AB, A Shares | 191,570 | 2,569,327 | |||
| SmartFinancial, Inc. | 1,915 | 47,837 | |||
| Societe Generale SA | 93,015 | 2,927,564 | |||
| South State Corp. | 7,960 | 545,897 | |||
| Southern First Bancshares, Inc. (A) | 1,047 | 53,376 | |||
| Southside Bancshares, Inc. | 3,418 | 128,824 | |||
| Spirit of Texas Bancshares, Inc. | 1,927 | 45,574 | |||
| Standard Bank Group, Ltd. | 145,048 | 1,481,505 | |||
| Standard Chartered PLC | 330,423 | 2,060,562 | |||
| Sterling Bancorp | 51,341 | 1,175,195 | |||
| Stock Yards Bancorp, Inc. | 2,063 | 106,410 | |||
| Sumitomo Mitsui Financial Group, Inc. | 137,179 | 4,734,829 | |||
| Sumitomo Mitsui Trust Holdings, Inc. | 35,138 | 1,147,719 | |||
| SVB Financial Group (A) | 5,640 | 3,155,580 | |||
| Svenska Handelsbanken AB, A Shares | 169,704 | 1,906,913 | |||
| Swedbank AB, A Shares | 105,361 | 2,031,099 | |||
| Synovus Financial Corp. | 39,613 | 1,707,320 | |||
| Taishin Financial Holding Company, Ltd. | 1,055,075 | 736,151 | |||
| Taiwan Business Bank | 543,222 | 189,814 | |||
| Taiwan Cooperative Financial Holding Company, Ltd. | 974,176 | 784,875 | |||
| Texas Capital Bancshares, Inc. (A) | 19,172 | 1,303,504 | |||
| The Bancorp, Inc. (A) | 5,986 | 147,615 | |||
| The Bank of East Asia, Ltd. | 93,893 | 157,489 | |||
| The Bank of Nova Scotia | 128,713 | 7,972,830 | |||
| The Bank of NT Butterfield & Son, Ltd. | 5,580 | 185,870 | |||
| Shares or Principal Amount | Value | ||||
| COMMON STOCKS (continued) | |||||
| Banks (continued) | |||||
| The Chiba Bank, Ltd. | 57,500 | $ | 358,955 | ||
| The First Bancorp, Inc. | 1,589 | 47,177 | |||
| The First Bancshares, Inc. | 2,354 | 95,384 | |||
| The First of Long Island Corp. | 2,924 | 61,989 | |||
| The PNC Financial Services Group, Inc. | 40,848 | 7,806,053 | |||
| The Shanghai Commercial & Savings Bank, Ltd. | 383,000 | 621,604 | |||
| The Shizuoka Bank, Ltd. | 46,600 | 365,049 | |||
| The Siam Commercial Bank PCL, NVDR | 103,100 | 340,126 | |||
| The Toronto-Dominion Bank | 191,543 | 12,438,567 | |||
| Tompkins Financial Corp. | 1,445 | 115,008 | |||
| Towne Bank | 6,872 | 209,390 | |||
| TriCo Bancshares | 3,038 | 120,153 | |||
| TriState Capital Holdings, Inc. (A) | 3,488 | 70,492 | |||
| Triumph Bancorp, Inc. (A) | 2,643 | 217,307 | |||
| Truist Financial Corp. | 129,301 | 7,377,915 | |||
| Trustmark Corp. | 7,015 | 221,814 | |||
| Turkiye Garanti Bankasi AS | 223,926 | 265,603 | |||
| Turkiye Is Bankasi AS, Class C | 160,719 | 111,258 | |||
| U.S. Bancorp | 130,336 | 7,479,983 | |||
| UMB Financial Corp. | 16,427 | 1,504,385 | |||
| Umpqua Holdings Corp. | 58,814 | 1,145,109 | |||
| UniCredit SpA | 235,864 | 2,940,991 | |||
| United Bankshares, Inc. | 49,769 | 1,808,108 | |||
| United Community Banks, Inc. | 9,799 | 295,636 | |||
| United Overseas Bank, Ltd. | 73,757 | 1,396,314 | |||
| Univest Financial Corp. | 3,350 | 90,718 | |||
| Valley National Bancorp | 153,345 | 1,999,619 | |||
| Veritex Holdings, Inc. | 5,351 | 192,261 | |||
| Washington Trust Bancorp, Inc. | 1,978 | 105,348 | |||
| Webster Financial Corp. | 24,103 | 1,217,684 | |||
| Wells Fargo & Company | 397,424 | 18,162,277 | |||
| WesBanco, Inc. | 7,323 | 248,982 | |||
| West BanCorp, Inc. | 2,031 | 62,128 | |||
| Westamerica BanCorp | 2,888 | 163,865 | |||
| Westpac Banking Corp. | 406,647 | 7,650,466 | |||
| Wintrust Financial Corp. | 15,205 | 1,137,942 | |||
| Woori Financial Group, Inc. | 59,971 | 580,212 | |||
| Zions Bancorp NA | 15,749 | 911,867 | |||
| 493,389,848 | |||||
| Capital markets – 2.7% | |||||
| 3i Group PLC | 123,535 | 2,271,943 | |||
| abrdn PLC | 283,713 | 1,036,604 | |||
| Affiliated Managers Group, Inc. | 11,099 | 1,888,051 | |||
| Ameriprise Financial, Inc. | 13,224 | 3,608,962 | |||
| Amundi SA (B) | 7,046 | 666,855 | |||
| Artisan Partners Asset Management, Inc., Class A | 6,615 | 343,715 | |||
| AssetMark Financial Holdings, Inc. (A) | 2,124 | 57,072 | |||
| ASX, Ltd. | 21,668 | 1,386,797 | |||
| B. Riley Financial, Inc. | 2,257 | 147,924 | |||
| B3 SA - Brasil Bolsa Balcao | 685,428 | 1,865,083 | |||
| Banco BTG Pactual SA | 126,100 | 689,175 | |||
| Bangkok Commercial Asset Management PCL, NVDR | 211,200 | 121,797 | |||
| BGC Partners, Inc., Class A | 37,686 | 194,083 | |||
| BlackRock, Inc. | 16,184 | 15,266,205 | |||
| Blucora, Inc. (A) | 5,643 | 92,602 | |||
| Brightsphere Investment Group, Inc. | 6,510 | 177,007 | |||
| Brookfield Asset Management, Inc., Class A | 135,618 | 7,544,903 | |||
| Cboe Global Markets, Inc. | 12,172 | 1,535,498 | |||
| China Cinda Asset Management Company, Ltd., H Shares | 1,043,100 | 185,004 | |||
| China Everbright, Ltd. | 116,984 | 146,808 | |||
| The accompanying notes are an integral part of the financial statements. | 81 |
| Shares or Principal Amount | Value | ||||
| COMMON STOCKS (continued) | |||||
| Capital markets (continued) | |||||
| China Galaxy Securities Company, Ltd., H Shares | 410,100 | $ | 230,213 | ||
| China Huarong Asset Management Company, Ltd., H Shares (A)(B)(D) | 1,063,200 | 69,718 | |||
| China International Capital Corp., Ltd., H Shares (B) | 157,400 | 365,998 | |||
| CI Financial Corp. | 2,792 | 54,196 | |||
| CITIC Securities Company, Ltd., H Shares | 251,100 | 635,980 | |||
| CME Group, Inc. | 40,971 | 8,264,670 | |||
| Cohen & Steers, Inc. | 2,799 | 245,500 | |||
| Cowen, Inc., Class A | 2,911 | 104,912 | |||
| Credit Suisse Group AG | 274,219 | 2,904,943 | |||
| Daiwa Securities Group, Inc. | 154,318 | 872,979 | |||
| Deutsche Bank AG (A) | 275,825 | 3,410,880 | |||
| Deutsche Boerse AG | 25,305 | 4,364,022 | |||
| Diamond Hill Investment Group, Inc. | 369 | 67,538 | |||
| Donnelley Financial Solutions, Inc. (A) | 3,351 | 111,756 | |||
| Ellington Financial, Inc. | 4,616 | 85,488 | |||
| EQT AB | 28,089 | 1,433,635 | |||
| Evercore, Inc., Class A | 10,916 | 1,524,310 | |||
| FactSet Research Systems, Inc. | 10,090 | 3,836,420 | |||
| Federated Hermes, Inc. | 35,605 | 1,204,517 | |||
| Focus Financial Partners, Inc., Class A (A) | 5,853 | 303,654 | |||
| Franklin Resources, Inc. | 31,073 | 1,008,008 | |||
| Futu Holdings, Ltd., ADR (A)(C) | 3,700 | 352,203 | |||
| GCM Grosvenor, Inc., Class A | 4,150 | 46,148 | |||
| GF Securities Company, Ltd., H Shares | 125,200 | 222,485 | |||
| Greenhill & Company, Inc. | 1,874 | 27,623 | |||
| Guotai Junan Securities Company, Ltd., H Shares (B) | 12,600 | 17,609 | |||
| Haitong Securities Company, Ltd., H Shares | 306,300 | 282,999 | |||
| Hamilton Lane, Inc., Class A | 3,846 | 331,025 | |||
| Hargreaves Lansdown PLC | 44,313 | 920,274 | |||
| Hong Kong Exchanges & Clearing, Ltd. | 87,577 | 5,532,594 | |||
| Houlihan Lokey, Inc. | 5,809 | 523,972 | |||
| Huatai Securities Company, Ltd., H Shares (B) | 178,900 | 256,618 | |||
| IGM Financial, Inc. | 10,407 | 379,524 | |||
| Interactive Brokers Group, Inc., Class A | 21,547 | 1,392,798 | |||
| Intercontinental Exchange, Inc. | 64,209 | 7,674,902 | |||
| Invesco, Ltd. | 43,172 | 1,093,115 | |||
| Janus Henderson Group PLC | 45,484 | 1,972,186 | |||
| Japan Exchange Group, Inc. | 53,898 | 1,283,606 | |||
| Jefferies Financial Group, Inc. | 53,328 | 1,971,003 | |||
| Julius Baer Group, Ltd. | 25,215 | 1,721,014 | |||
| Korea Investment Holdings Company, Ltd. | 5,121 | 419,362 | |||
| London Stock Exchange Group PLC | 40,045 | 4,386,684 | |||
| Macquarie Group, Ltd. | 38,423 | 4,663,420 | |||
| Magellan Financial Group, Ltd. | 15,725 | 495,915 | |||
| MarketAxess Holdings, Inc. | 4,334 | 2,062,637 | |||
| Meritz Securities Company, Ltd. | 39,439 | 181,923 | |||
| Mirae Asset Securities Company, Ltd. | 37,753 | 286,268 | |||
| Moelis & Company, Class A | 6,882 | 426,340 | |||
| Moody's Corp. | 18,368 | 6,993,983 | |||
| Morgan Stanley | 169,826 | 17,734,929 | |||
| MSCI, Inc. | 9,404 | 5,967,590 | |||
| Nasdaq, Inc. | 13,105 | 2,565,697 | |||
| NH Investment & Securities Company, Ltd. | 19,465 | 221,786 | |||
| Noah Holdings, Ltd., ADR (A) | 3,900 | 152,022 | |||
| Nomura Holdings, Inc. | 328,000 | 1,583,991 | |||
| Northern Trust Corp. | 23,747 | 2,814,494 | |||
| Onex Corp. | 9,055 | 634,456 | |||
| Open Lending Corp., Class A (A) | 11,785 | 435,691 | |||
| Shares or Principal Amount | Value | ||||
| COMMON STOCKS (continued) | |||||
| Capital markets (continued) | |||||
| Oppenheimer Holdings, Inc., Class A | 1,100 | $ | 51,249 | ||
| Partners Group Holding AG | 2,531 | 4,487,472 | |||
| Piper Sandler Companies | 1,973 | 281,981 | |||
| PJT Partners, Inc., Class A | 2,683 | 211,903 | |||
| Raymond James Financial, Inc. | 13,954 | 1,952,165 | |||
| Reinet Investments SCA | 15,898 | 308,022 | |||
| S&P Global, Inc. | 27,485 | 12,198,393 | |||
| Samsung Securities Company, Ltd. | 8,182 | 347,904 | |||
| SBI Holdings, Inc. | 26,164 | 633,876 | |||
| Schroders PLC | 16,583 | 862,155 | |||
| Sculptor Capital Management, Inc. | 2,598 | 73,523 | |||
| SEI Investments Company | 31,598 | 1,984,670 | |||
| Singapore Exchange, Ltd. | 49,300 | 361,850 | |||
| St. James's Place PLC | 68,777 | 1,523,049 | |||
| State Street Corp. | 39,679 | 3,686,576 | |||
| StepStone Group, Inc., Class A | 4,253 | 203,591 | |||
| Stifel Financial Corp. | 28,014 | 1,935,767 | |||
| StoneX Group, Inc. (A) | 1,876 | 130,738 | |||
| T. Rowe Price Group, Inc. | 25,883 | 5,794,427 | |||
| The Bank of New York Mellon Corp. | 92,051 | 5,083,056 | |||
| The Charles Schwab Corp. | 171,125 | 12,466,456 | |||
| The Goldman Sachs Group, Inc. | 38,817 | 16,051,218 | |||
| TMX Group, Ltd. | 6,339 | 697,383 | |||
| UBS Group AG | 409,662 | 6,833,669 | |||
| UP Fintech Holding, Ltd., ADR (A)(C) | 8,700 | 119,886 | |||
| Virtus Investment Partners, Inc. | 817 | 255,476 | |||
| WisdomTree Investments, Inc. | 16,264 | 102,626 | |||
| 226,993,392 | |||||
| Consumer finance – 0.4% | |||||
| 360 DigiTech, Inc., ADR (A) | 9,400 | 214,320 | |||
| Acom Company, Ltd. | 40,600 | 156,912 | |||
| American Express Company | 74,238 | 12,320,538 | |||
| Atlanticus Holdings Corp. (A) | 640 | 41,088 | |||
| Capital One Financial Corp. | 51,513 | 8,549,613 | |||
| Curo Group Holdings Corp. | 2,662 | 43,577 | |||
| Discover Financial Services | 34,786 | 4,460,261 | |||
| Encore Capital Group, Inc. (A) | 3,451 | 169,824 | |||
| Enova International, Inc. (A) | 4,080 | 134,558 | |||
| EZCORP, Inc., Class A (A) | 6,240 | 42,994 | |||
| FirstCash, Inc. | 15,480 | 1,326,481 | |||
| Green Dot Corp., Class A (A) | 6,049 | 316,000 | |||
| Krungthai Card PCL, NVDR | 107,400 | 220,552 | |||
| LendingClub Corp. (A) | 10,902 | 338,616 | |||
| LendingTree, Inc. (A) | 4,271 | 711,677 | |||
| Lufax Holding, Ltd., ADR (A) | 19,200 | 166,464 | |||
| Muangthai Capital PCL, NVDR | 87,200 | 174,938 | |||
| Navient Corp. | 67,623 | 1,569,530 | |||
| Nelnet, Inc., Class A | 1,851 | 149,709 | |||
| Oportun Financial Corp. (A) | 2,524 | 63,731 | |||
| PRA Group, Inc. (A) | 5,150 | 216,300 | |||
| PROG Holdings, Inc. (A) | 25,541 | 1,208,600 | |||
| Regional Management Corp. | 976 | 58,004 | |||
| SLM Corp. | 86,069 | 1,613,794 | |||
| Srisawad Corp. PCL, NVDR | 89,600 | 199,240 | |||
| Synchrony Financial | 61,712 | 3,070,172 | |||
| World Acceptance Corp. (A) | 500 | 94,935 | |||
| 37,632,428 | |||||
| Diversified financial services – 1.0% | |||||
| Alerus Financial Corp. | 1,846 | 55,122 | |||
| A-Mark Precious Metals, Inc. | 980 | 47,540 | |||
| Banco Latinoamericano de Comercio Exterior SA, Class E | 3,521 | 60,068 | |||
| Berkshire Hathaway, Inc., Class B (A) | 216,250 | 61,797,763 | |||
| Cannae Holdings, Inc. (A) | 9,785 | 312,337 | |||
| Chailease Holding Company, Ltd. | 143,151 | 1,373,278 | |||
| The accompanying notes are an integral part of the financial statements. | 82 |
| Shares or Principal Amount | Value | ||||
| COMMON STOCKS (continued) | |||||
| Diversified financial services (continued) | |||||
| E2open Parent Holdings, Inc. (A) | 4,835 | $ | 57,730 | ||
| Eurazeo SE | 4,426 | 455,312 | |||
| EXOR NV | 12,344 | 1,029,902 | |||
| Far East Horizon, Ltd. | 185,300 | 210,556 | |||
| FirstRand, Ltd. | 561,208 | 2,389,120 | |||
| Groupe Bruxelles Lambert SA | 16,564 | 1,897,672 | |||
| Grupo de Inversiones Suramericana SA | 85,697 | 436,539 | |||
| Industrivarden AB, A Shares | 13,415 | 493,907 | |||
| Industrivarden AB, C Shares | 18,221 | 635,403 | |||
| Investor AB, B Shares | 215,645 | 5,157,936 | |||
| Kinnevik AB, B Shares (A) | 28,756 | 1,126,691 | |||
| L.E. Lundbergforetagen AB, B Shares | 8,964 | 572,733 | |||
| M&G PLC | 326,787 | 925,674 | |||
| Metro Pacific Investments Corp. | 1,327,900 | 102,686 | |||
| Mitsubishi HC Capital, Inc. | 69,800 | 373,777 | |||
| NewStar Financial, Inc. (A)(D) | 5,608 | 570 | |||
| ORIX Corp. | 130,800 | 2,440,397 | |||
| Remgro, Ltd. | 58,510 | 486,354 | |||
| Sofina SA | 2,261 | 999,511 | |||
| Tokyo Century Corp. | 3,900 | 223,010 | |||
| Wendel SE | 3,012 | 437,088 | |||
| Yuanta Financial Holding Company, Ltd. | 1,061,034 | 955,804 | |||
| 85,054,480 | |||||
| Insurance – 2.7% | |||||
| Admiral Group PLC | 24,396 | 1,212,143 | |||
| Aegon NV | 214,443 | 1,058,864 | |||
| Aflac, Inc. | 64,242 | 3,641,237 | |||
| Ageas SA/NV | 27,180 | 1,358,266 | |||
| AIA Group, Ltd. | 884,909 | 10,566,455 | |||
| Alleghany Corp. (A) | 3,713 | 2,512,550 | |||
| Allianz SE | 55,612 | 13,055,571 | |||
| Ambac Financial Group, Inc. (A) | 5,368 | 75,635 | |||
| American Equity Investment Life Holding Company | 9,442 | 299,217 | |||
| American Financial Group, Inc. | 18,375 | 2,534,648 | |||
| American International Group, Inc. | 87,217 | 4,758,560 | |||
| American National Group, Inc. | 829 | 159,583 | |||
| AMERISAFE, Inc. | 2,219 | 127,703 | |||
| Aon PLC, Class A | 22,933 | 6,578,560 | |||
| Argo Group International Holdings, Ltd. | 3,625 | 191,763 | |||
| Arthur J. Gallagher & Company | 20,823 | 2,990,599 | |||
| Assicurazioni Generali SpA | 130,191 | 2,656,032 | |||
| Assurant, Inc. | 6,156 | 1,047,197 | |||
| Aviva PLC | 519,229 | 2,885,934 | |||
| AXA SA | 225,694 | 6,340,533 | |||
| Baloise Holding AG | 5,784 | 922,330 | |||
| BB Seguridade Participacoes SA | 84,408 | 311,135 | |||
| Brighthouse Financial, Inc. (A) | 22,871 | 1,119,764 | |||
| Brookfield Asset Management Reinsurance Partners, Ltd., Class A (A) | 878 | 53,655 | |||
| Brown & Brown, Inc. | 62,361 | 3,620,056 | |||
| BRP Group, Inc., Class A (A) | 5,280 | 198,792 | |||
| Cathay Financial Holding Company, Ltd. | 895,890 | 1,923,994 | |||
| China Development Financial Holding Corp. | 1,540,000 | 787,037 | |||
| China Life Insurance Company, Ltd. | 244,525 | 254,462 | |||
| China Life Insurance Company, Ltd., H Shares | 842,076 | 1,411,953 | |||
| China Pacific Insurance Group Company, Ltd., H Shares | 298,579 | 841,506 | |||
| China Taiping Insurance Holdings Company, Ltd. | 193,000 | 281,990 | |||
| Chubb, Ltd. | 45,704 | 8,405,880 | |||
| Cincinnati Financial Corp. | 15,227 | 1,879,012 | |||
| Citizens, Inc. (A) | 6,794 | 40,560 | |||
| Shares or Principal Amount | Value | ||||
| COMMON STOCKS (continued) | |||||
| Insurance (continued) | |||||
| CNO Financial Group, Inc. | 49,676 | $ | 1,215,075 | ||
| CNP Assurances | 24,146 | 413,740 | |||
| Dai-ichi Life Holdings, Inc. | 110,100 | 2,178,578 | |||
| DB Insurance Company, Ltd. | 6,073 | 307,049 | |||
| Direct Line Insurance Group PLC | 184,840 | 784,762 | |||
| Discovery, Ltd. (A) | 51,247 | 455,022 | |||
| Donegal Group, Inc., Class A | 2,265 | 34,111 | |||
| eHealth, Inc. (A) | 2,781 | 107,486 | |||
| Employers Holdings, Inc. | 3,217 | 132,444 | |||
| Enstar Group, Ltd. (A) | 1,525 | 351,772 | |||
| Everest Re Group, Ltd. | 4,074 | 1,079,203 | |||
| Fairfax Financial Holdings, Ltd. | 2,994 | 1,325,296 | |||
| First American Financial Corp. | 29,254 | 2,063,285 | |||
| Fubon Financial Holding Company, Ltd. | 736,659 | 2,256,413 | |||
| Genworth Financial, Inc., Class A (A) | 56,617 | 212,314 | |||
| Gjensidige Forsikring ASA | 31,841 | 744,327 | |||
| Globe Life, Inc. | 9,636 | 925,731 | |||
| Goosehead Insurance, Inc., Class A | 2,004 | 294,147 | |||
| Great-West Lifeco, Inc. (C) | 35,284 | 1,091,535 | |||
| Greenlight Capital Re, Ltd., Class A (A) | 4,258 | 35,895 | |||
| Hannover Rueck SE | 8,507 | 1,565,515 | |||
| HCI Group, Inc. | 653 | 72,914 | |||
| Horace Mann Educators Corp. | 4,680 | 191,880 | |||
| iA Financial Corp., Inc. | 13,041 | 723,139 | |||
| Independence Holding Company | 575 | 28,739 | |||
| Insurance Australia Group, Ltd. | 282,454 | 1,078,540 | |||
| Intact Financial Corp. | 17,114 | 2,330,836 | |||
| Investors Title Company | 205 | 39,331 | |||
| James River Group Holdings, Ltd. | 4,112 | 151,280 | |||
| Japan Post Holdings Company, Ltd. (A) | 171,100 | 1,470,557 | |||
| Japan Post Insurance Company, Ltd. | 26,100 | 473,978 | |||
| Kemper Corp. | 16,179 | 1,109,879 | |||
| Kinsale Capital Group, Inc. | 8,148 | 1,481,714 | |||
| Legal & General Group PLC | 771,554 | 2,866,039 | |||
| Lincoln National Corp. | 18,188 | 1,248,606 | |||
| Loews Corp. | 22,736 | 1,270,260 | |||
| Maiden Holdings, Ltd. (A) | 9,888 | 30,949 | |||
| Mapfre SA | 12,526 | 27,029 | |||
| Marsh & McLennan Companies, Inc. | 51,684 | 8,124,725 | |||
| MBIA, Inc. (A) | 5,712 | 63,917 | |||
| Medibank Private, Ltd. | 312,351 | 809,240 | |||
| Mercury General Corp. | 7,085 | 423,045 | |||
| MetLife, Inc. | 75,626 | 4,688,812 | |||
| Momentum Metropolitan Holdings | 12,826 | 17,438 | |||
| MS&AD Insurance Group Holdings, Inc. | 49,568 | 1,604,460 | |||
| Muenchener Rueckversicherungs-Gesellschaft AG | 19,046 | 5,558,927 | |||
| National Western Life Group, Inc., Class A | 295 | 65,390 | |||
| New China Life Insurance Company, Ltd., H Shares | 105,000 | 309,093 | |||
| NN Group NV | 33,250 | 1,724,769 | |||
| Old Mutual, Ltd. | 533,909 | 564,426 | |||
| Old Republic International Corp. | 75,551 | 1,964,326 | |||
| Palomar Holdings, Inc. (A) | 2,796 | 251,081 | |||
| Phoenix Group Holdings PLC | 93,092 | 797,650 | |||
| PICC Property & Casualty Company, Ltd., H Shares | 793,848 | 717,728 | |||
| Ping An Insurance Group Company of China, Ltd., H Shares | 689,610 | 5,339,704 | |||
| Poste Italiane SpA (B) | 60,765 | 823,848 | |||
| Power Corp. of Canada | 63,543 | 2,192,892 | |||
| Powszechny Zaklad Ubezpieczen SA (A) | 69,975 | 741,566 | |||
| Primerica, Inc. | 10,513 | 1,607,858 | |||
| Principal Financial Group, Inc. | 25,710 | 1,717,685 | |||
| ProAssurance Corp. | 6,167 | 157,259 | |||
| The accompanying notes are an integral part of the financial statements. | 83 |
| Shares or Principal Amount | Value | ||||
| COMMON STOCKS (continued) | |||||
| Insurance (continued) | |||||
| Prudential Financial, Inc. | 40,044 | $ | 4,239,859 | ||
| Prudential PLC | 324,263 | 6,755,897 | |||
| QBE Insurance Group, Ltd. | 169,408 | 1,457,803 | |||
| Rand Merchant Investment Holdings, Ltd. | 103,507 | 225,206 | |||
| Reinsurance Group of America, Inc. | 18,123 | 2,099,006 | |||
| RenaissanceRe Holdings, Ltd. | 13,232 | 2,073,851 | |||
| RLI Corp. | 15,090 | 1,648,281 | |||
| Safety Insurance Group, Inc. | 1,663 | 135,219 | |||
| Sampo OYJ, A Shares | 68,871 | 3,558,930 | |||
| Samsung Fire & Marine Insurance Company, Ltd. | 3,807 | 741,036 | |||
| Samsung Life Insurance Company, Ltd. | 8,834 | 566,409 | |||
| Sanlam, Ltd. | 212,901 | 943,233 | |||
| SCOR SE | 19,037 | 584,241 | |||
| Selective Insurance Group, Inc. | 22,672 | 1,894,699 | |||
| Selectquote, Inc. (A) | 15,287 | 145,991 | |||
| Shin Kong Financial Holding Company, Ltd. | 1,302,694 | 446,360 | |||
| SiriusPoint, Ltd. (A) | 10,333 | 101,367 | |||
| Sompo Holdings, Inc. | 34,860 | 1,532,365 | |||
| State Auto Financial Corp. | 2,070 | 104,701 | |||
| Stewart Information Services Corp. | 2,966 | 186,710 | |||
| Sun Life Financial, Inc. | 66,563 | 3,427,204 | |||
| Suncorp Group, Ltd. | 147,614 | 1,343,144 | |||
| Swiss Life Holding AG | 3,811 | 1,986,403 | |||
| Swiss Re AG | 34,983 | 3,216,410 | |||
| T&D Holdings, Inc. | 61,800 | 752,143 | |||
| The Allstate Corp. | 30,423 | 4,115,623 | |||
| The Hanover Insurance Group, Inc. | 9,569 | 1,352,195 | |||
| The Hartford Financial Services Group, Inc. | 36,302 | 2,440,220 | |||
| The People's Insurance Company Group of China, Ltd., H Shares | 962,900 | 297,031 | |||
| The Progressive Corp. | 59,471 | 5,729,436 | |||
| The Travelers Companies, Inc. | 25,561 | 4,082,347 | |||
| Tiptree, Inc. | 3,049 | 30,825 | |||
| Tokio Marine Holdings, Inc. | 68,814 | 3,367,021 | |||
| Trupanion, Inc. (A) | 4,320 | 395,626 | |||
| Tryg A/S | 40,652 | 1,006,557 | |||
| United Fire Group, Inc. | 2,494 | 64,744 | |||
| Universal Insurance Holdings, Inc. | 3,560 | 50,694 | |||
| Unum Group | 20,758 | 552,578 | |||
| W.R. Berkley Corp. | 14,242 | 1,072,565 | |||
| Willis Towers Watson PLC | 13,108 | 2,893,198 | |||
| ZhongAn Online P&C Insurance Company, Ltd., H Shares (A)(B) | 54,000 | 263,302 | |||
| Zurich Insurance Group AG | 17,173 | 7,535,363 | |||
| 233,954,178 | |||||
| Mortgage real estate investment trusts – 0.1% | |||||
| Apollo Commercial Real Estate Finance, Inc. | 15,822 | 246,032 | |||
| Arbor Realty Trust, Inc. | 14,238 | 260,271 | |||
| Ares Commercial Real Estate Corp. | 4,374 | 69,022 | |||
| ARMOUR Residential REIT, Inc. | 7,693 | 83,546 | |||
| Blackstone Mortgage Trust, Inc., Class A | 15,359 | 503,929 | |||
| BrightSpire Capital, Inc. | 10,030 | 100,501 | |||
| Broadmark Realty Capital, Inc. | 14,339 | 150,703 | |||
| Capstead Mortgage Corp. | 11,172 | 76,975 | |||
| Chimera Investment Corp. | 25,668 | 393,234 | |||
| Dynex Capital, Inc. | 3,494 | 62,053 | |||
| Granite Point Mortgage Trust, Inc. | 6,312 | 86,853 | |||
| Great Ajax Corp. | 2,911 | 41,132 | |||
| Hannon Armstrong Sustainable Infrastructure Capital, Inc. | 8,629 | 520,933 | |||
| Invesco Mortgage Capital, Inc. | 28,501 | 88,923 | |||
| Shares or Principal Amount | Value | ||||
| COMMON STOCKS (continued) | |||||
| Mortgage real estate investment trusts (continued) | |||||
| KKR Real Estate Finance Trust, Inc. | 3,432 | $ | 73,205 | ||
| Ladder Capital Corp. | 12,942 | 147,668 | |||
| MFA Financial, Inc. | 49,517 | 237,682 | |||
| New York Mortgage Trust, Inc. | 42,878 | 189,521 | |||
| Orchid Island Capital, Inc. | 10,828 | 54,357 | |||
| PennyMac Mortgage Investment Trust | 10,998 | 213,471 | |||
| Ready Capital Corp. | 6,607 | 101,153 | |||
| Redwood Trust, Inc. | 12,652 | 157,770 | |||
| TPG RE Finance Trust, Inc. | 6,836 | 86,134 | |||
| Two Harbors Investment Corp. | 35,396 | 233,614 | |||
| 4,178,682 | |||||
| Thrifts and mortgage finance – 0.1% | |||||
| Axos Financial, Inc. (A) | 6,342 | 307,460 | |||
| Bridgewater Bancshares, Inc. (A) | 2,974 | 48,625 | |||
| Capitol Federal Financial, Inc. | 14,120 | 162,945 | |||
| Columbia Financial, Inc. (A) | 4,346 | 78,358 | |||
| Essent Group, Ltd. | 42,531 | 2,002,359 | |||
| Federal Agricultural Mortgage Corp., Class C | 1,023 | 100,152 | |||
| Flagstar Bancorp, Inc. | 5,687 | 281,279 | |||
| FS Bancorp, Inc. | 1,088 | 37,177 | |||
| Home Bancorp, Inc. | 1,184 | 44,305 | |||
| HomeStreet, Inc. | 2,370 | 96,815 | |||
| Kearny Financial Corp. | 8,502 | 107,890 | |||
| Merchants Bancorp | 1,118 | 40,997 | |||
| Meridian Bancorp, Inc. | 5,349 | 111,152 | |||
| Meta Financial Group, Inc. | 3,588 | 176,494 | |||
| MGIC Investment Corp. | 90,452 | 1,381,202 | |||
| Mr. Cooper Group, Inc. (A) | 8,002 | 311,118 | |||
| New York Community Bancorp, Inc. | 123,977 | 1,552,192 | |||
| NMI Holdings, Inc., Class A (A) | 9,559 | 215,747 | |||
| Northfield Bancorp, Inc. | 5,395 | 91,176 | |||
| Northwest Bancshares, Inc. | 13,564 | 176,603 | |||
| Ocwen Financial Corp. (A) | 1,078 | 30,507 | |||
| PCSB Financial Corp. | 2,104 | 38,356 | |||
| PennyMac Financial Services, Inc. | 3,929 | 261,475 | |||
| Premier Financial Corp. | 4,305 | 130,872 | |||
| Provident Bancorp, Inc. | 2,438 | 39,569 | |||
| Provident Financial Services, Inc. | 8,440 | 186,271 | |||
| Radian Group, Inc. | 21,539 | 508,967 | |||
| Southern Missouri Bancorp, Inc. | 971 | 43,812 | |||
| The Hingham Institution for Savings | 170 | 55,165 | |||
| TrustCo Bank Corp. | 2,368 | 75,989 | |||
| Walker & Dunlop, Inc. | 3,292 | 365,577 | |||
| Washington Federal, Inc. | 27,223 | 906,526 | |||
| Waterstone Financial, Inc. | 2,640 | 53,539 | |||
| WSFS Financial Corp. | 5,257 | 238,720 | |||
| 10,259,391 | |||||
| 1,091,462,399 | |||||
| Health care – 13.1% | |||||
| Biotechnology – 1.7% | |||||
| 3SBio, Inc. (A)(B) | 139,300 | 155,184 | |||
| 4D Molecular Therapeutics, Inc. (A) | 1,194 | 36,477 | |||
| AbbVie, Inc. | 167,773 | 20,263,623 | |||
| ACADIA Pharmaceuticals, Inc. (A) | 13,608 | 238,276 | |||
| Achillion Pharmaceuticals, Inc. (A)(D) | 17,157 | 25,801 | |||
| Aduro Biotech, Inc. (A)(D) | 1,925 | 5,775 | |||
| Aeglea BioTherapeutics, Inc. (A) | 5,206 | 37,744 | |||
| Affimed NV (A) | 13,346 | 93,956 | |||
| Agenus, Inc. (A) | 22,427 | 138,375 | |||
| Agios Pharmaceuticals, Inc. (A) | 6,971 | 311,464 | |||
| Akebia Therapeutics, Inc. (A) | 20,341 | 59,803 | |||
| Akero Therapeutics, Inc. (A) | 3,046 | 72,312 | |||
| Akeso, Inc. (A)(B) | 31,000 | 160,558 | |||
| The accompanying notes are an integral part of the financial statements. | 84 |
| Shares or Principal Amount | Value | ||||
| COMMON STOCKS (continued) | |||||
| Biotechnology (continued) | |||||
| Akouos, Inc. (A) | 3,234 | $ | 38,452 | ||
| Albireo Pharma, Inc. (A) | 2,112 | 64,522 | |||
| Alder Biopharmaceuticals, Inc. (A)(C)(D) | 9,683 | 14,078 | |||
| Aldeyra Therapeutics, Inc. (A)(C) | 5,816 | 55,194 | |||
| Alector, Inc. (A) | 6,583 | 177,938 | |||
| Aligos Therapeutics, Inc. (A) | 2,309 | 39,368 | |||
| Alkermes PLC (A) | 18,065 | 564,712 | |||
| Allakos, Inc. (A) | 3,954 | 352,539 | |||
| Allogene Therapeutics, Inc. (A) | 7,751 | 184,861 | |||
| Allovir, Inc. (A) | 3,494 | 67,260 | |||
| Alteogen, Inc. (A) | 3,237 | 236,697 | |||
| Altimmune, Inc. (A) | 3,901 | 58,476 | |||
| ALX Oncology Holdings, Inc. (A) | 2,043 | 143,010 | |||
| Amgen, Inc. | 54,577 | 12,308,751 | |||
| Amicus Therapeutics, Inc. (A) | 29,844 | 339,923 | |||
| AnaptysBio, Inc. (A) | 2,287 | 58,570 | |||
| Anavex Life Sciences Corp. (A) | 7,029 | 136,995 | |||
| Anika Therapeutics, Inc. (A) | 1,676 | 72,286 | |||
| Annexon, Inc. (A) | 3,664 | 59,906 | |||
| Apellis Pharmaceuticals, Inc. (A) | 7,338 | 483,207 | |||
| Applied Molecular Transport, Inc. (A)(C) | 2,836 | 85,279 | |||
| Applied Therapeutics, Inc. (A) | 2,288 | 35,944 | |||
| AquaBounty Technologies, Inc. (A) | 6,621 | 30,655 | |||
| Arbutus Biopharma Corp. (A) | 10,169 | 34,880 | |||
| Arcturus Therapeutics Holdings, Inc. (A) | 2,443 | 133,901 | |||
| Arcus Biosciences, Inc. (A) | 5,152 | 150,284 | |||
| Arcutis Biotherapeutics, Inc. (A) | 3,224 | 68,252 | |||
| Arena Pharmaceuticals, Inc. (A) | 6,914 | 365,889 | |||
| Argenx SE (A) | 6,668 | 2,224,730 | |||
| Arrowhead Pharmaceuticals, Inc. (A) | 39,178 | 2,629,627 | |||
| Atara Biotherapeutics, Inc. (A) | 9,602 | 143,838 | |||
| Athenex, Inc. (A) | 11,308 | 41,274 | |||
| Athersys, Inc. (A) | 25,298 | 42,501 | |||
| Atossa Therapeutics, Inc. (A)(C) | 13,825 | 52,535 | |||
| Avid Bioservices, Inc. (A) | 6,813 | 165,147 | |||
| Avidity Biosciences, Inc. (A) | 3,631 | 82,932 | |||
| Avita Medical, Inc. (A) | 2,966 | 59,943 | |||
| Avrobio, Inc. (A) | 4,983 | 33,187 | |||
| Beam Therapeutics, Inc. (A) | 5,295 | 587,321 | |||
| BeiGene, Ltd., ADR (A) | 5,000 | 1,541,500 | |||
| Beyondspring, Inc. (A)(C) | 2,786 | 87,230 | |||
| BioAtla, Inc. (A) | 1,436 | 59,005 | |||
| BioCryst Pharmaceuticals, Inc. (A) | 20,085 | 319,753 | |||
| Biogen, Inc. (A) | 14,301 | 4,846,752 | |||
| Biohaven Pharmaceutical Holding Company, Ltd. (A) | 6,087 | 798,858 | |||
| Bioxcel Therapeutics, Inc. (A) | 1,856 | 54,659 | |||
| Black Diamond Therapeutics, Inc. (A) | 2,909 | 29,381 | |||
| Bluebird Bio, Inc. (A) | 7,782 | 142,411 | |||
| Blueprint Medicines Corp. (A) | 6,584 | 614,090 | |||
| Bridgebio Pharma, Inc. (A) | 12,135 | 608,085 | |||
| Brooklyn ImmunoTherapeutics, Inc. (A)(C) | 3,123 | 37,695 | |||
| Burning Rock Biotech, Ltd., ADR (A) | 4,700 | 87,561 | |||
| C4 Therapeutics, Inc. (A)(C) | 3,907 | 156,788 | |||
| Cardiff Oncology, Inc. (A) | 5,069 | 37,156 | |||
| CareDx, Inc. (A) | 5,645 | 413,666 | |||
| Catalyst Pharmaceuticals, Inc. (A) | 11,735 | 64,660 | |||
| Celldex Therapeutics, Inc. (A) | 4,437 | 233,608 | |||
| Celltrion, Inc. (A) | 11,283 | 2,843,635 | |||
| CEL-SCI Corp. (A) | 4,377 | 50,686 | |||
| Cerevel Therapeutics Holdings, Inc. (A) | 4,041 | 127,938 | |||
| ChemoCentryx, Inc. (A) | 6,229 | 98,480 | |||
| Chimerix, Inc. (A) | 8,687 | 61,678 | |||
| Chinook Therapeutics, Inc. (A) | 3,846 | 52,152 | |||
| Clovis Oncology, Inc. (A)(C) | 11,769 | 56,727 | |||
| Shares or Principal Amount | Value | ||||
| COMMON STOCKS (continued) | |||||
| Biotechnology (continued) | |||||
| Codiak Biosciences, Inc. (A) | 1,905 | $ | 32,766 | ||
| Cogent Biosciences, Inc. (A) | 4,524 | 37,459 | |||
| Coherus Biosciences, Inc. (A) | 7,337 | 117,245 | |||
| Cortexyme, Inc. (A)(C) | 2,265 | 218,120 | |||
| Crinetics Pharmaceuticals, Inc. (A) | 4,299 | 101,327 | |||
| CSL, Ltd. | 50,508 | 11,487,676 | |||
| Cue Biopharma, Inc. (A) | 3,948 | 47,337 | |||
| Cullinan Oncology, Inc. (A) | 1,618 | 45,660 | |||
| Curis, Inc. (A) | 9,923 | 87,819 | |||
| Cytokinetics, Inc. (A) | 8,794 | 289,938 | |||
| CytomX Therapeutics, Inc. (A) | 8,328 | 42,639 | |||
| Deciphera Pharmaceuticals, Inc. (A) | 4,529 | 142,664 | |||
| Denali Therapeutics, Inc. (A) | 10,274 | 546,577 | |||
| DermTech, Inc. (A)(C) | 2,682 | 99,770 | |||
| Design Therapeutics, Inc. (A) | 1,653 | 25,985 | |||
| Dicerna Pharmaceuticals, Inc. (A) | 7,818 | 160,894 | |||
| Dynavax Technologies Corp. (A) | 12,272 | 238,813 | |||
| Dyne Therapeutics, Inc. (A) | 3,547 | 60,051 | |||
| Eagle Pharmaceuticals, Inc. (A) | 1,358 | 72,476 | |||
| Editas Medicine, Inc. (A) | 7,719 | 490,851 | |||
| Eiger BioPharmaceuticals, Inc. (A) | 4,379 | 35,645 | |||
| Emergent BioSolutions, Inc. (A) | 17,656 | 1,113,740 | |||
| Enanta Pharmaceuticals, Inc. (A) | 2,187 | 125,096 | |||
| Epizyme, Inc. (A) | 10,935 | 56,425 | |||
| Evelo Biosciences, Inc. (A)(C) | 3,816 | 43,388 | |||
| Exelixis, Inc. (A) | 83,541 | 1,601,481 | |||
| Fate Therapeutics, Inc. (A) | 9,038 | 662,034 | |||
| FibroGen, Inc. (A) | 9,927 | 115,451 | |||
| Flexion Therapeutics, Inc. (A) | 6,452 | 38,583 | |||
| Foghorn Therapeutics, Inc. (A) | 2,582 | 33,514 | |||
| Forma Therapeutics Holdings, Inc. (A) | 3,781 | 90,857 | |||
| Forte Biosciences, Inc. (A) | 1,408 | 41,423 | |||
| Fortress Biotech, Inc. (A) | 9,268 | 30,492 | |||
| Frequency Therapeutics, Inc. (A) | 3,940 | 30,417 | |||
| G1 Therapeutics, Inc. (A) | 4,568 | 69,068 | |||
| Generation Bio Company (A) | 5,062 | 126,550 | |||
| Genmab A/S (A) | 7,263 | 3,440,721 | |||
| Geron Corp. (A) | 39,125 | 56,731 | |||
| Gilead Sciences, Inc. | 119,134 | 8,670,573 | |||
| Global Blood Therapeutics, Inc. (A) | 6,848 | 196,469 | |||
| Gossamer Bio, Inc. (A) | 7,595 | 75,494 | |||
| Green Cross Corp. | 686 | 227,267 | |||
| Grifols SA | 27,663 | 676,264 | |||
| Gritstone bio, Inc. (A) | 5,039 | 46,359 | |||
| GT Biopharma, Inc. (A) | 3,103 | 27,586 | |||
| Halozyme Therapeutics, Inc. (A) | 51,561 | 2,165,046 | |||
| Heron Therapeutics, Inc. (A) | 10,736 | 125,289 | |||
| Homology Medicines, Inc. (A) | 5,486 | 39,444 | |||
| Humanigen, Inc. (A)(C) | 5,139 | 85,205 | |||
| iBio, Inc. (A)(C) | 29,049 | 36,892 | |||
| Ideaya Biosciences, Inc. (A) | 3,288 | 77,268 | |||
| IGM Biosciences, Inc. (A) | 933 | 66,439 | |||
| I-Mab, ADR (A) | 3,500 | 248,220 | |||
| ImmunityBio, Inc. (A) | 7,713 | 87,774 | |||
| ImmunoGen, Inc. (A) | 22,536 | 136,343 | |||
| Immunovant, Inc. (A) | 4,692 | 40,633 | |||
| Incyte Corp. (A) | 17,757 | 1,358,233 | |||
| Infinity Pharmaceuticals, Inc. (A) | 10,834 | 38,352 | |||
| Inhibrx, Inc. (A) | 3,224 | 91,948 | |||
| Innovent Biologics, Inc. (A)(B) | 126,500 | 1,021,443 | |||
| Inovio Pharmaceuticals, Inc. (A)(C) | 23,469 | 202,772 | |||
| Inozyme Pharma, Inc. (A) | 2,067 | 31,873 | |||
| Insmed, Inc. (A) | 11,717 | 328,545 | |||
| Instil Bio, Inc. (A) | 2,182 | 41,131 | |||
| Intellia Therapeutics, Inc. (A) | 7,632 | 1,225,165 | |||
| The accompanying notes are an integral part of the financial statements. | 85 |
| Shares or Principal Amount | Value | ||||
| COMMON STOCKS (continued) | |||||
| Biotechnology (continued) | |||||
| Intercept Pharmaceuticals, Inc. (A) | 3,401 | $ | 50,709 | ||
| Invitae Corp. (A)(C) | 22,596 | 669,519 | |||
| Ironwood Pharmaceuticals, Inc. (A) | 16,353 | 214,224 | |||
| iTeos Therapeutics, Inc. (A) | 2,385 | 67,615 | |||
| IVERIC bio, Inc. (A) | 10,370 | 109,611 | |||
| Kadmon Holdings, Inc. (A) | 20,223 | 110,822 | |||
| KalVista Pharmaceuticals, Inc. (A) | 2,428 | 49,628 | |||
| Karuna Therapeutics, Inc. (A) | 2,518 | 299,390 | |||
| Karyopharm Therapeutics, Inc. (A) | 8,906 | 51,655 | |||
| Keros Therapeutics, Inc. (A) | 1,835 | 61,729 | |||
| Kiniksa Pharmaceuticals, Ltd., Class A (A) | 3,719 | 46,785 | |||
| Kinnate Biopharma, Inc. (A) | 1,746 | 38,622 | |||
| Kodiak Sciences, Inc. (A) | 3,786 | 356,565 | |||
| Kronos Bio, Inc. (A)(C) | 4,493 | 93,949 | |||
| Krystal Biotech, Inc. (A) | 2,050 | 118,777 | |||
| Kura Oncology, Inc. (A) | 7,310 | 134,943 | |||
| Kymera Therapeutics, Inc. (A) | 3,280 | 203,819 | |||
| Lexicon Pharmaceuticals, Inc. (A) | 8,735 | 41,229 | |||
| Ligand Pharmaceuticals, Inc. (A) | 6,145 | 812,984 | |||
| Lineage Cell Therapeutics, Inc. (A) | 14,994 | 37,785 | |||
| MacroGenics, Inc. (A) | 6,706 | 158,329 | |||
| Madrigal Pharmaceuticals, Inc. (A) | 1,300 | 107,575 | |||
| MannKind Corp. (A) | 28,149 | 135,115 | |||
| MEI Pharma, Inc. (A) | 14,075 | 39,410 | |||
| MeiraGTx Holdings PLC (A) | 3,866 | 48,364 | |||
| Mersana Therapeutics, Inc. (A) | 8,060 | 112,276 | |||
| MiMedx Group, Inc. (A)(C) | 12,627 | 186,375 | |||
| Moderna, Inc. (A) | 28,987 | 10,919,113 | |||
| Molecular Templates, Inc. (A) | 4,926 | 32,118 | |||
| Morphic Holding, Inc. (A) | 2,333 | 147,002 | |||
| Mustang Bio, Inc. (A) | 9,758 | 29,664 | |||
| Myriad Genetics, Inc. (A) | 8,684 | 310,714 | |||
| Neoleukin Therapeutics, Inc. (A) | 4,713 | 38,411 | |||
| Neurocrine Biosciences, Inc. (A) | 25,204 | 2,399,421 | |||
| Nkarta, Inc. (A) | 1,687 | 54,558 | |||
| Nurix Therapeutics, Inc. (A) | 3,593 | 115,659 | |||
| Ocugen, Inc. (A)(C) | 20,997 | 159,367 | |||
| Olema Pharmaceuticals, Inc. (A) | 1,517 | 45,389 | |||
| Oncocyte Corp. (A) | 8,800 | 36,080 | |||
| Oncorus, Inc. (A) | 2,795 | 28,872 | |||
| OPKO Health, Inc. (A)(C) | 44,746 | 172,720 | |||
| Organogenesis Holdings, Inc. (A) | 4,377 | 74,672 | |||
| ORIC Pharmaceuticals, Inc. (A) | 3,512 | 77,580 | |||
| Passage Bio, Inc. (A) | 4,515 | 54,270 | |||
| PDL BioPharma, Inc. (A)(D) | 18,396 | 31,089 | |||
| PeptiDream, Inc. (A) | 10,000 | 352,372 | |||
| Pfenex, Inc. (A)(D) | 4,823 | 5,287 | |||
| PMV Pharmaceuticals, Inc. (A) | 3,044 | 92,385 | |||
| Poseida Therapeutics, Inc. (A) | 3,740 | 32,314 | |||
| Praxis Precision Medicines, Inc. (A) | 2,940 | 58,418 | |||
| Precigen, Inc. (A) | 11,089 | 67,088 | |||
| Precision BioSciences, Inc. (A) | 5,624 | 70,694 | |||
| Prelude Therapeutics, Inc. (A) | 1,295 | 46,219 | |||
| Progenics Pharmaceuticals, Inc. (A)(D) | 11,327 | 484 | |||
| Prometheus Biosciences, Inc. (A) | 1,464 | 31,944 | |||
| Protagonist Therapeutics, Inc. (A) | 4,662 | 226,107 | |||
| Prothena Corp. PLC (A) | 3,853 | 258,613 | |||
| PTC Therapeutics, Inc. (A) | 7,865 | 343,307 | |||
| Puma Biotechnology, Inc. (A) | 4,114 | 31,143 | |||
| Radius Health, Inc. (A) | 5,415 | 75,052 | |||
| RAPT Therapeutics, Inc. (A) | 2,075 | 67,853 | |||
| Recursion Pharmaceuticals, Inc., Class A (A)(C) | 2,444 | 61,638 | |||
| Regeneron Pharmaceuticals, Inc. (A) | 9,945 | 6,696,963 | |||
| REGENXBIO, Inc. (A) | 4,524 | 146,125 | |||
| Shares or Principal Amount | Value | ||||
| COMMON STOCKS (continued) | |||||
| Biotechnology (continued) | |||||
| Relay Therapeutics, Inc. (A) | 6,673 | $ | 213,736 | ||
| Replimune Group, Inc. (A) | 3,082 | 97,884 | |||
| REVOLUTION Medicines, Inc. (A) | 6,768 | 196,881 | |||
| Rhythm Pharmaceuticals, Inc. (A) | 5,222 | 67,938 | |||
| Rigel Pharmaceuticals, Inc. (A) | 20,050 | 76,190 | |||
| Rocket Pharmaceuticals, Inc. (A) | 4,576 | 156,545 | |||
| Rubius Therapeutics, Inc. (A) | 5,158 | 112,032 | |||
| Sana Biotechnology, Inc. (A)(C) | 3,121 | 74,873 | |||
| Sangamo Therapeutics, Inc. (A) | 13,530 | 134,082 | |||
| Scholar Rock Holding Corp. (A) | 3,145 | 124,322 | |||
| Seegene, Inc. | 4,306 | 243,878 | |||
| Selecta Biosciences, Inc. (A) | 11,079 | 48,083 | |||
| Seres Therapeutics, Inc. (A) | 8,207 | 52,607 | |||
| Shattuck Labs, Inc. (A) | 3,110 | 65,714 | |||
| Silverback Therapeutics, Inc. (A) | 1,554 | 34,188 | |||
| Sorrento Therapeutics, Inc. (A)(C) | 30,886 | 277,974 | |||
| Spectrum Pharmaceuticals, Inc. (A) | 19,373 | 45,527 | |||
| Spero Therapeutics, Inc. (A) | 3,282 | 63,179 | |||
| SpringWorks Therapeutics, Inc. (A) | 3,309 | 248,506 | |||
| SQZ Biotechnologies Company (A) | 2,948 | 39,208 | |||
| Stoke Therapeutics, Inc. (A) | 2,232 | 58,434 | |||
| Sutro Biopharma, Inc. (A) | 5,082 | 110,381 | |||
| Syndax Pharmaceuticals, Inc. (A) | 5,224 | 91,368 | |||
| Syros Pharmaceuticals, Inc. (A) | 7,707 | 40,847 | |||
| Taysha Gene Therapies, Inc. (A)(C) | 2,722 | 54,113 | |||
| TCR2 Therapeutics, Inc. (A) | 3,738 | 62,686 | |||
| TG Therapeutics, Inc. (A) | 14,500 | 392,515 | |||
| Tonix Pharmaceuticals Holding Corp. (A) | 44,017 | 31,072 | |||
| Translate Bio, Inc. (A) | 7,567 | 283,006 | |||
| Travere Therapeutics, Inc. (A) | 6,690 | 146,043 | |||
| Trevena, Inc. (A) | 23,181 | 30,599 | |||
| Trillium Therapeutics, Inc. (A)(C) | 11,335 | 195,302 | |||
| Turning Point Therapeutics, Inc. (A) | 5,202 | 400,658 | |||
| Twist Bioscience Corp. (A) | 5,321 | 602,390 | |||
| United Therapeutics Corp. (A) | 11,941 | 2,565,882 | |||
| UroGen Pharma, Ltd. (A)(C) | 2,501 | 44,068 | |||
| Vanda Pharmaceuticals, Inc. (A) | 6,196 | 103,721 | |||
| Vaxart, Inc. (A)(C) | 13,644 | 122,114 | |||
| Vaxcyte, Inc. (A) | 4,693 | 123,097 | |||
| VBI Vaccines, Inc. (A)(C) | 22,204 | 80,156 | |||
| Veracyte, Inc. (A) | 7,623 | 366,743 | |||
| Verastem, Inc. (A) | 20,316 | 53,837 | |||
| Vericel Corp. (A) | 5,253 | 284,555 | |||
| Vertex Pharmaceuticals, Inc. (A) | 24,590 | 4,925,131 | |||
| Viking Therapeutics, Inc. (A) | 8,248 | 54,519 | |||
| Vir Biotechnology, Inc. (A) | 6,787 | 349,802 | |||
| Viracta Therapeutics, Inc. (A) | 4,588 | 42,301 | |||
| VistaGen Therapeutics, Inc. (A)(C) | 23,203 | 70,537 | |||
| XBiotech, Inc. | 1,856 | 29,640 | |||
| Xencor, Inc. (A) | 6,411 | 217,141 | |||
| Y-mAbs Therapeutics, Inc. (A) | 4,028 | 123,982 | |||
| Zai Lab, Ltd., ADR (A) | 8,200 | 1,184,900 | |||
| Zentalis Pharmaceuticals, Inc. (A) | 3,757 | 256,190 | |||
| ZIOPHARM Oncology, Inc. (A)(C) | 25,911 | 42,235 | |||
| 140,535,897 | |||||
| Health care equipment and supplies – 3.9% | |||||
| Abbott Laboratories | 312,950 | 39,547,492 | |||
| ABIOMED, Inc. (A) | 7,978 | 2,903,673 | |||
| Accuray, Inc. (A) | 12,111 | 49,292 | |||
| Acutus Medical, Inc. (A) | 2,015 | 25,772 | |||
| Alcon, Inc. | 55,658 | 4,583,931 | |||
| Align Technology, Inc. (A) | 12,684 | 8,992,956 | |||
| Alphatec Holdings, Inc. (A) | 7,936 | 114,913 | |||
| Ambu A/S, Class B (C) | 18,482 | 584,512 | |||
| AngioDynamics, Inc. (A) | 4,190 | 118,577 | |||
| The accompanying notes are an integral part of the financial statements. | 86 |
| Shares or Principal Amount | Value | ||||
| COMMON STOCKS (continued) | |||||
| Health care equipment and supplies (continued) | |||||
| Apyx Medical Corp. (A) | 3,978 | $ | 46,980 | ||
| Asahi Intecc Company, Ltd. | 21,600 | 653,534 | |||
| Asensus Surgical, Inc. (A)(C) | 27,243 | 59,935 | |||
| Aspira Women's Health, Inc. (A)(C) | 9,266 | 35,303 | |||
| AtriCure, Inc. (A) | 5,052 | 371,928 | |||
| Atrion Corp. | 158 | 109,661 | |||
| Avanos Medical, Inc. (A) | 5,436 | 179,388 | |||
| Axogen, Inc. (A) | 4,455 | 76,002 | |||
| Axonics, Inc. (A) | 4,698 | 352,256 | |||
| Baxter International, Inc. | 88,567 | 6,750,577 | |||
| Becton, Dickinson and Company | 51,222 | 12,892,577 | |||
| BioLife Solutions, Inc. (A) | 2,764 | 161,307 | |||
| BioMerieux | 4,667 | 571,594 | |||
| Boston Scientific Corp. (A) | 250,264 | 11,299,420 | |||
| Butterfly Network, Inc. (A) | 3,830 | 47,339 | |||
| Cardiovascular Systems, Inc. (A) | 4,487 | 160,590 | |||
| Carl Zeiss Meditec AG, Bearer Shares | 5,343 | 1,180,575 | |||
| Cerus Corp. (A) | 19,632 | 126,626 | |||
| ClearPoint Neuro, Inc. (A) | 2,286 | 43,137 | |||
| Cochlear, Ltd. | 7,275 | 1,235,706 | |||
| Coloplast A/S, B Shares | 13,050 | 2,261,022 | |||
| CONMED Corp. | 3,249 | 426,724 | |||
| CryoLife, Inc. (A) | 4,345 | 114,013 | |||
| CryoPort, Inc. (A) | 4,600 | 292,422 | |||
| Cutera, Inc. (A) | 2,006 | 99,778 | |||
| CytoSorbents Corp. (A) | 5,546 | 53,075 | |||
| Danaher Corp. | 111,810 | 36,244,330 | |||
| Demant A/S (A) | 12,028 | 682,263 | |||
| Dentsply Sirona, Inc. | 38,452 | 2,372,488 | |||
| DexCom, Inc. (A) | 17,033 | 9,017,611 | |||
| DiaSorin SpA | 2,784 | 635,166 | |||
| Eargo, Inc. (A) | 2,278 | 45,583 | |||
| Edwards Lifesciences Corp. (A) | 109,488 | 12,829,804 | |||
| Envista Holdings Corp. (A) | 42,859 | 1,833,937 | |||
| Fisher & Paykel Healthcare Corp., Ltd. | 86,551 | 2,019,920 | |||
| Glaukos Corp. (A) | 5,100 | 304,113 | |||
| Globus Medical, Inc., Class A (A) | 20,686 | 1,687,978 | |||
| GN Store Nord A/S | 14,196 | 1,068,602 | |||
| Haemonetics Corp. (A) | 19,265 | 1,208,879 | |||
| Hartalega Holdings BHD | 190,800 | 338,613 | |||
| Heska Corp. (A) | 1,076 | 285,463 | |||
| Hill-Rom Holdings, Inc. | 17,718 | 2,579,386 | |||
| Hologic, Inc. (A) | 45,130 | 3,572,040 | |||
| Hoya Corp. | 39,300 | 6,346,324 | |||
| ICU Medical, Inc. (A) | 5,261 | 1,048,780 | |||
| IDEXX Laboratories, Inc. (A) | 15,020 | 10,119,875 | |||
| Inari Medical, Inc. (A) | 3,853 | 315,407 | |||
| Inogen, Inc. (A) | 2,200 | 130,218 | |||
| Integer Holdings Corp. (A) | 3,682 | 363,745 | |||
| Integra LifeSciences Holdings Corp. (A) | 18,933 | 1,424,330 | |||
| Intersect ENT, Inc. (A) | 3,934 | 107,044 | |||
| Intuitive Surgical, Inc. (A) | 20,856 | 21,973,047 | |||
| Invacare Corp. (A) | 4,156 | 35,160 | |||
| iRadimed Corp. (A) | 834 | 28,156 | |||
| iRhythm Technologies, Inc. (A) | 3,383 | 161,707 | |||
| Koninklijke Philips NV | 102,082 | 4,704,258 | |||
| Kossan Rubber Industries | 144,500 | 107,774 | |||
| Lantheus Holdings, Inc. (A) | 7,634 | 201,309 | |||
| LeMaitre Vascular, Inc. | 2,035 | 115,222 | |||
| LivaNova PLC (A) | 18,965 | 1,568,216 | |||
| Masimo Corp. (A) | 13,489 | 3,662,803 | |||
| Medtronic PLC | 236,964 | 31,629,955 | |||
| Meridian Bioscience, Inc. (A) | 4,861 | 98,387 | |||
| Merit Medical Systems, Inc. (A) | 5,792 | 415,692 | |||
| Mesa Laboratories, Inc. | 543 | 144,938 | |||
| Shares or Principal Amount | Value | ||||
| COMMON STOCKS (continued) | |||||
| Health care equipment and supplies (continued) | |||||
| Microport Scientific Corp. (C) | 69,000 | $ | 427,995 | ||
| Misonix, Inc. (A) | 1,510 | 38,354 | |||
| Natus Medical, Inc. (A) | 3,800 | 100,776 | |||
| Neogen Corp. (A) | 40,704 | 1,782,021 | |||
| Nevro Corp. (A) | 3,891 | 474,702 | |||
| NuVasive, Inc. (A) | 19,593 | 1,217,509 | |||
| Olympus Corp. | 123,024 | 2,585,033 | |||
| OraSure Technologies, Inc. (A) | 8,165 | 89,407 | |||
| Ortho Clinical Diagnostics Holdings PLC (A) | 9,959 | 203,562 | |||
| Orthofix Medical, Inc. (A) | 2,169 | 91,966 | |||
| OrthoPediatrics Corp. (A) | 1,578 | 110,618 | |||
| Outset Medical, Inc. (A) | 5,199 | 256,259 | |||
| PAVmed, Inc. (A) | 8,441 | 61,619 | |||
| Penumbra, Inc. (A) | 9,044 | 2,486,648 | |||
| Pulmonx Corp. (A) | 2,931 | 117,797 | |||
| Pulse Biosciences, Inc. (A) | 1,698 | 43,978 | |||
| Quidel Corp. (A) | 10,322 | 1,331,022 | |||
| Quotient, Ltd. (A) | 10,716 | 32,898 | |||
| ResMed, Inc. | 25,630 | 7,446,284 | |||
| SeaSpine Holdings Corp. (A) | 3,825 | 64,184 | |||
| Senseonics Holdings, Inc. (A)(C) | 47,080 | 188,791 | |||
| Shandong Weigao Group Medical Polymer Company, Ltd., H Shares | 269,200 | 442,950 | |||
| Shockwave Medical, Inc. (A) | 3,803 | 814,641 | |||
| SI-BONE, Inc. (A) | 3,773 | 92,099 | |||
| Siemens Healthineers AG (B) | 35,600 | 2,475,870 | |||
| Sientra, Inc. (A) | 7,301 | 44,390 | |||
| Silk Road Medical, Inc. (A) | 3,875 | 229,710 | |||
| Smith & Nephew PLC | 109,134 | 2,089,810 | |||
| Sonova Holding AG | 6,138 | 2,365,392 | |||
| Sri Trang Gloves Thailand PCL | 82,800 | 95,052 | |||
| Sri Trang Gloves Thailand PCL, NVDR (C) | 37,400 | 42,932 | |||
| STAAR Surgical Company (A) | 17,801 | 2,749,720 | |||
| Stereotaxis, Inc. (A) | 6,130 | 43,278 | |||
| STERIS PLC | 17,197 | 3,697,527 | |||
| Straumann Holding AG | 1,151 | 2,224,009 | |||
| Stryker Corp. | 57,730 | 15,996,983 | |||
| Supermax Corp. BHD | 169,988 | 134,834 | |||
| Surmodics, Inc. (A) | 1,563 | 93,889 | |||
| Sysmex Corp. | 17,600 | 2,000,175 | |||
| Tactile Systems Technology, Inc. (A) | 2,204 | 98,034 | |||
| Teleflex, Inc. | 8,231 | 3,255,031 | |||
| Terumo Corp. | 68,146 | 2,843,782 | |||
| The Cooper Companies, Inc. | 8,674 | 3,909,459 | |||
| Top Glove Corp. BHD | 591,800 | 569,396 | |||
| TransMedics Group, Inc. (A) | 2,991 | 97,746 | |||
| Treace Medical Concepts, Inc. (A) | 1,343 | 33,911 | |||
| Utah Medical Products, Inc. | 463 | 41,022 | |||
| Vapotherm, Inc. (A) | 2,677 | 74,019 | |||
| Varex Imaging Corp. (A) | 4,356 | 127,065 | |||
| Venus MedTech Hangzhou, Inc., H Shares (A)(B) | 23,000 | 108,865 | |||
| ViewRay, Inc. (A) | 15,750 | 95,130 | |||
| West Pharmaceutical Services, Inc. | 13,003 | 5,872,415 | |||
| Zimmer Biomet Holdings, Inc. | 36,720 | 5,524,524 | |||
| Zynex, Inc. (A) | 2,577 | 34,558 | |||
| 335,420,751 | |||||
| Health care providers and services – 2.5% | |||||
| 1Life Healthcare, Inc. (A) | 13,215 | 323,900 | |||
| Acadia Healthcare Company, Inc. (A) | 23,923 | 1,581,789 | |||
| Accolade, Inc. (A) | 5,714 | 270,729 | |||
| AdaptHealth Corp. (A) | 8,917 | 214,365 | |||
| Addus HomeCare Corp. (A) | 1,761 | 158,349 | |||
| The accompanying notes are an integral part of the financial statements. | 87 |
| Shares or Principal Amount | Value | ||||
| COMMON STOCKS (continued) | |||||
| Health care providers and services (continued) | |||||
| Agiliti, Inc. (A) | 2,665 | $ | 56,844 | ||
| Alignment Healthcare, Inc. (A)(C) | 3,078 | 54,388 | |||
| Amedisys, Inc. (A) | 8,683 | 1,592,896 | |||
| AmerisourceBergen Corp. | 26,048 | 3,183,326 | |||
| AMN Healthcare Services, Inc. (A) | 5,294 | 600,975 | |||
| Amplifon SpA | 13,808 | 722,260 | |||
| Anthem, Inc. | 43,124 | 16,177,106 | |||
| Apollo Medical Holdings, Inc. (A) | 4,100 | 311,231 | |||
| Apria, Inc. (A) | 898 | 32,032 | |||
| Aveanna Healthcare Holdings, Inc. (A) | 4,606 | 43,481 | |||
| Bangkok Dusit Medical Services PCL, NVDR | 1,140,900 | 827,599 | |||
| Brookdale Senior Living, Inc. (A) | 21,152 | 154,410 | |||
| Bumrungrad Hospital PCL, NVDR (C) | 55,900 | 230,408 | |||
| Cardinal Health, Inc. | 51,103 | 2,682,396 | |||
| Castle Biosciences, Inc. (A) | 2,403 | 184,382 | |||
| Celltrion Healthcare Company, Ltd. (A) | 9,781 | 1,040,017 | |||
| Centene Corp. (A) | 102,637 | 6,464,078 | |||
| Chemed Corp. | 4,252 | 2,026,928 | |||
| Cigna Corp. | 60,438 | 12,791,703 | |||
| Community Health Systems, Inc. (A) | 14,050 | 172,956 | |||
| CorVel Corp. (A) | 983 | 162,008 | |||
| Covetrus, Inc. (A) | 11,780 | 266,110 | |||
| Cross Country Healthcare, Inc. (A) | 4,273 | 92,938 | |||
| CVS Health Corp. | 231,886 | 20,032,632 | |||
| DaVita, Inc. (A) | 12,345 | 1,614,356 | |||
| Encompass Health Corp. | 26,535 | 2,081,671 | |||
| Fresenius Medical Care AG & Company KGaA | 27,257 | 2,095,789 | |||
| Fresenius SE & Company KGaA | 55,740 | 2,898,103 | |||
| Fulgent Genetics, Inc. (A)(C) | 2,296 | 209,487 | |||
| Hanger, Inc. (A) | 4,284 | 102,302 | |||
| Hapvida Participacoes e Investimentos SA (B) | 123,100 | 350,436 | |||
| HCA Healthcare, Inc. | 46,288 | 11,709,938 | |||
| HealthEquity, Inc. (A) | 31,441 | 2,017,569 | |||
| Henry Schein, Inc. (A) | 24,781 | 1,873,196 | |||
| Humana, Inc. | 22,723 | 9,212,359 | |||
| IHH Healthcare BHD | 195,009 | 300,020 | |||
| InfuSystem Holdings, Inc. (A) | 2,371 | 33,787 | |||
| Innovage Holding Corp. (A) | 2,293 | 34,464 | |||
| Jinxin Fertility Group, Ltd. (A)(B) | 136,000 | 216,109 | |||
| Laboratory Corp. of America Holdings (A) | 17,198 | 5,217,529 | |||
| LHC Group, Inc. (A) | 11,869 | 2,216,654 | |||
| Magellan Health, Inc. (A) | 2,645 | 250,270 | |||
| McKesson Corp. | 27,861 | 5,687,545 | |||
| Medipal Holdings Corp. | 19,200 | 367,029 | |||
| MEDNAX, Inc. (A) | 8,624 | 276,917 | |||
| ModivCare, Inc. (A) | 1,400 | 276,164 | |||
| Molina Healthcare, Inc. (A) | 15,568 | 4,184,211 | |||
| National HealthCare Corp. | 1,333 | 98,442 | |||
| National Research Corp. | 1,526 | 82,404 | |||
| NMC Health PLC (A) | 8,800 | 1,804 | |||
| Notre Dame Intermedica Participacoes SA | 57,400 | 887,398 | |||
| Option Care Health, Inc. (A) | 47,422 | 1,268,539 | |||
| Orpea SA | 5,778 | 728,369 | |||
| Owens & Minor, Inc. | 8,161 | 304,242 | |||
| Patterson Companies, Inc. | 32,801 | 1,005,023 | |||
| PetIQ, Inc. (A) | 3,035 | 78,758 | |||
| Ping An Healthcare and Technology Company, Ltd. (A)(B)(C) | 49,600 | 366,571 | |||
| Privia Health Group, Inc. (A) | 2,248 | 67,013 | |||
| Progyny, Inc. (A) | 17,044 | 952,248 | |||
| Quest Diagnostics, Inc. | 23,009 | 3,516,465 | |||
| R1 RCM, Inc. (A) | 51,739 | 1,020,293 | |||
| Shares or Principal Amount | Value | ||||
| COMMON STOCKS (continued) | |||||
| Health care providers and services (continued) | |||||
| RadNet, Inc. (A) | 5,083 | $ | 159,657 | ||
| Ramsay Health Care, Ltd. | 20,325 | 1,020,575 | |||
| Rede D'Or Sao Luiz SA (B) | 26,100 | 347,374 | |||
| Ryman Healthcare, Ltd. | 65,110 | 711,036 | |||
| Select Medical Holdings Corp. | 12,438 | 429,982 | |||
| Shanghai Pharmaceuticals Holding Company, Ltd., H Shares | 86,900 | 172,395 | |||
| Sinopharm Group Company, Ltd., H Shares | 149,100 | 383,710 | |||
| Sonic Healthcare, Ltd. | 50,422 | 1,596,323 | |||
| Surgery Partners, Inc. (A) | 3,608 | 177,514 | |||
| Tenet Healthcare Corp. (A) | 40,428 | 3,046,250 | |||
| The Ensign Group, Inc. | 5,913 | 482,915 | |||
| The Joint Corp. (A) | 1,548 | 158,159 | |||
| The Pennant Group, Inc. (A) | 2,982 | 91,160 | |||
| Tivity Health, Inc. (A) | 5,037 | 117,110 | |||
| Triple-S Management Corp. (A) | 2,518 | 89,389 | |||
| UnitedHealth Group, Inc. | 166,214 | 69,189,902 | |||
| Universal Health Services, Inc., Class B | 13,733 | 2,139,052 | |||
| US Physical Therapy, Inc. | 1,448 | 169,995 | |||
| Viemed Healthcare, Inc. (A) | 4,736 | 30,358 | |||
| 216,568,566 | |||||
| Health care technology – 0.1% | |||||
| Alibaba Health Information Technology, Ltd. (A) | 437,100 | 721,468 | |||
| Allscripts Healthcare Solutions, Inc. (A) | 15,832 | 243,180 | |||
| American Well Corp., Class A (A) | 22,063 | 236,295 | |||
| Castlight Health, Inc., B Shares (A) | 16,141 | 29,215 | |||
| Cerner Corp. | 53,071 | 4,051,971 | |||
| Computer Programs & Systems, Inc. (A) | 1,694 | 60,256 | |||
| Evolent Health, Inc., Class A (A) | 8,826 | 216,767 | |||
| Health Catalyst, Inc. (A) | 5,050 | 275,781 | |||
| HealthStream, Inc. (A) | 2,856 | 86,794 | |||
| Icad, Inc. (A) | 2,887 | 34,817 | |||
| Inovalon Holdings, Inc., Class A (A) | 8,508 | 347,552 | |||
| Inspire Medical Systems, Inc. (A) | 3,032 | 677,834 | |||
| M3, Inc. | 46,500 | 3,118,637 | |||
| Multiplan Corp. (A)(C) | 45,130 | 270,780 | |||
| NextGen Healthcare, Inc. (A) | 6,445 | 98,351 | |||
| Omnicell, Inc. (A) | 4,833 | 750,420 | |||
| OptimizeRx Corp. (A) | 1,901 | 125,808 | |||
| Phreesia, Inc. (A) | 4,319 | 309,024 | |||
| Schrodinger, Inc. (A) | 5,125 | 305,911 | |||
| Simulations Plus, Inc. | 1,777 | 78,721 | |||
| Tabula Rasa HealthCare, Inc. (A) | 2,616 | 81,907 | |||
| Vocera Communications, Inc. (A) | 3,812 | 184,844 | |||
| 12,306,333 | |||||
| Life sciences tools and services – 1.1% | |||||
| Agilent Technologies, Inc. | 34,774 | 6,101,794 | |||
| Berkeley Lights, Inc. (A) | 5,467 | 194,407 | |||
| Bionano Genomics, Inc. (A)(C) | 32,137 | 187,359 | |||
| Bio-Rad Laboratories, Inc., Class A (A) | 2,470 | 1,987,905 | |||
| Charles River Laboratories International, Inc. (A) | 5,759 | 2,556,190 | |||
| ChromaDex Corp. (A) | 5,819 | 49,636 | |||
| Codexis, Inc. (A) | 6,899 | 186,411 | |||
| Eurofins Scientific SE | 15,095 | 2,141,845 | |||
| Fluidigm Corp. (A) | 9,138 | 65,885 | |||
| Genscript Biotech Corp. (A) | 123,400 | 586,674 | |||
| Hangzhou Tigermed Consulting Company, Ltd., H Shares (B) | 13,500 | 239,527 | |||
| Harvard Bioscience, Inc. (A) | 4,767 | 39,375 | |||
| Illumina, Inc. (A) | 16,731 | 7,648,744 | |||
| Inotiv, Inc. (A) | 1,544 | 40,190 | |||
| IQVIA Holdings, Inc. (A) | 21,964 | 5,704,710 | |||
| The accompanying notes are an integral part of the financial statements. | 88 |
| Shares or Principal Amount | Value | ||||
| COMMON STOCKS (continued) | |||||
| Life sciences tools and services (continued) | |||||
| Lonza Group AG | 8,268 | $ | 6,992,464 | ||
| Medpace Holdings, Inc. (A) | 10,631 | 1,938,563 | |||
| Mettler-Toledo International, Inc. (A) | 2,667 | 4,141,398 | |||
| NanoString Technologies, Inc. (A) | 5,138 | 299,032 | |||
| NeoGenomics, Inc. (A) | 12,796 | 622,142 | |||
| Pacific Biosciences of California, Inc. (A) | 21,917 | 686,221 | |||
| PerkinElmer, Inc. | 12,845 | 2,373,756 | |||
| Personalis, Inc. (A) | 4,177 | 88,469 | |||
| Pharmaron Beijing Company, Ltd., H Shares (B) | 14,500 | 321,714 | |||
| QIAGEN NV (A) | 30,519 | 1,688,369 | |||
| Quanterix Corp. (A) | 3,537 | 180,564 | |||
| Repligen Corp. (A) | 13,611 | 3,851,641 | |||
| Samsung Biologics Company, Ltd. (A)(B) | 1,936 | 1,609,232 | |||
| Sartorius Stedim Biotech | 3,126 | 1,896,134 | |||
| Seer, Inc. (A)(C) | 1,809 | 72,324 | |||
| Syneos Health, Inc. (A) | 26,993 | 2,504,411 | |||
| Thermo Fisher Scientific, Inc. | 45,040 | 24,994,948 | |||
| Waters Corp. (A) | 7,071 | 2,927,535 | |||
| WuXi AppTec Company, Ltd., H Shares (B) | 36,546 | 728,838 | |||
| Wuxi Biologics Cayman, Inc. (A)(B) | 366,100 | 5,667,943 | |||
| 91,316,350 | |||||
| Pharmaceuticals – 3.8% | |||||
| 9 Meters Biopharma, Inc. (A) | 26,915 | 34,990 | |||
| Aclaris Therapeutics, Inc. (A) | 4,969 | 80,547 | |||
| Aerie Pharmaceuticals, Inc. (A) | 4,986 | 74,341 | |||
| Amneal Pharmaceuticals, Inc. (A) | 11,920 | 67,229 | |||
| Amphastar Pharmaceuticals, Inc. (A) | 4,280 | 84,145 | |||
| Ampio Pharmaceuticals, Inc. (A)(C) | 23,408 | 38,389 | |||
| ANI Pharmaceuticals, Inc. (A) | 1,248 | 37,852 | |||
| Antares Pharma, Inc. (A) | 19,522 | 76,917 | |||
| Arvinas, Inc. (A) | 4,934 | 425,360 | |||
| Aspen Pharmacare Holdings, Ltd. (A) | 42,990 | 579,671 | |||
| Astellas Pharma, Inc. | 196,400 | 3,309,322 | |||
| AstraZeneca PLC | 161,279 | 18,860,518 | |||
| Atea Pharmaceuticals, Inc. (A)(C) | 7,328 | 217,788 | |||
| Athira Pharma, Inc. (A) | 4,138 | 43,821 | |||
| Axsome Therapeutics, Inc. (A) | 3,240 | 83,203 | |||
| Bausch Health Companies, Inc. (A) | 32,330 | 941,981 | |||
| Bayer AG | 130,475 | 7,258,436 | |||
| BioDelivery Sciences International, Inc. (A) | 11,937 | 46,077 | |||
| Bristol-Myers Squibb Company | 222,374 | 14,867,926 | |||
| Canopy Growth Corp. (A) | 24,065 | 414,101 | |||
| CanSino Biologics, Inc., H Shares (A)(B)(C) | 8,600 | 339,864 | |||
| Cara Therapeutics, Inc. (A) | 5,190 | 81,898 | |||
| Cassava Sciences, Inc. (A)(C) | 4,318 | 245,478 | |||
| Catalent, Inc. (A) | 16,956 | 2,211,741 | |||
| Celltrion Pharm, Inc. (A) | 1,898 | 282,260 | |||
| China Medical System Holdings, Ltd. | 147,500 | 289,507 | |||
| China Resources Pharmaceutical Group, Ltd. (B) | 183,500 | 95,431 | |||
| China Traditional Chinese Medicine Holdings Company, Ltd. (A) | 302,400 | 143,934 | |||
| Chugai Pharmaceutical Company, Ltd. | 70,700 | 2,762,456 | |||
| Citius Pharmaceuticals, Inc. (A)(C) | 14,106 | 31,739 | |||
| Collegium Pharmaceutical, Inc. (A) | 4,083 | 83,824 | |||
| Corcept Therapeutics, Inc. (A) | 10,965 | 233,335 | |||
| CorMedix, Inc. (A) | 4,770 | 30,814 | |||
| CSPC Pharmaceutical Group, Ltd. | 975,792 | 1,237,891 | |||
| Cymabay Therapeutics, Inc. (A) | 9,067 | 35,905 | |||
| Daiichi Sankyo Company, Ltd. | 179,400 | 4,261,184 | |||
| Durect Corp. (A) | 31,155 | 43,305 | |||
| Shares or Principal Amount | Value | ||||
| COMMON STOCKS (continued) | |||||
| Pharmaceuticals (continued) | |||||
| Eisai Company, Ltd. | 25,054 | $ | 2,066,197 | ||
| Elanco Animal Health, Inc. (A)(D) | 6,772 | 0 | |||
| Eli Lilly & Company | 79,236 | 20,465,866 | |||
| Endo International PLC (A) | 26,157 | 59,900 | |||
| Esperion Therapeutics, Inc. (A)(C) | 3,231 | 42,068 | |||
| Evolus, Inc. (A) | 3,936 | 41,722 | |||
| EyePoint Pharmaceuticals, Inc. (A) | 2,823 | 30,884 | |||
| Fulcrum Therapeutics, Inc. (A) | 2,663 | 79,091 | |||
| GlaxoSmithKline PLC | 619,585 | 12,463,327 | |||
| Hanmi Pharm Company, Ltd. | 784 | 208,683 | |||
| Hansoh Pharmaceutical Group Company, Ltd. (B) | 128,000 | 348,996 | |||
| Harmony Biosciences Holdings, Inc. (A) | 2,614 | 88,588 | |||
| Hikma Pharmaceuticals PLC | 21,569 | 752,860 | |||
| Hisamitsu Pharmaceutical Company, Inc. | 5,300 | 212,387 | |||
| Hutchmed China, Ltd., ADR (A) | 9,300 | 375,348 | |||
| Hypera SA | 42,179 | 290,150 | |||
| Innoviva, Inc. (A) | 7,195 | 109,796 | |||
| Intra-Cellular Therapies, Inc. (A) | 8,015 | 266,098 | |||
| Ipsen SA | 4,262 | 426,308 | |||
| Jazz Pharmaceuticals PLC (A) | 16,020 | 2,109,994 | |||
| Johnson & Johnson | 262,139 | 45,384,125 | |||
| Kalbe Farma Tbk PT | 2,501,410 | 235,764 | |||
| KemPharm, Inc. (A) | 3,642 | 33,871 | |||
| Kyowa Kirin Company, Ltd. | 28,428 | 930,186 | |||
| Marinus Pharmaceuticals, Inc. (A) | 4,466 | 55,200 | |||
| Merck & Company, Inc. | 252,051 | 19,228,971 | |||
| Merck KGaA | 17,193 | 4,085,000 | |||
| Mind Medicine MindMed, Inc. (A) | 36,684 | 106,017 | |||
| Nektar Therapeutics (A) | 48,600 | 752,328 | |||
| NGM Biopharmaceuticals, Inc. (A) | 3,626 | 79,156 | |||
| Nippon Shinyaku Company, Ltd. | 5,100 | 413,962 | |||
| Novartis AG | 246,821 | 22,828,688 | |||
| Novo Nordisk A/S, B Shares | 190,987 | 19,119,687 | |||
| Nuvation Bio, Inc. (A) | 4,460 | 41,166 | |||
| Ocular Therapeutix, Inc. (A) | 8,869 | 93,657 | |||
| Omeros Corp. (A)(C) | 6,968 | 113,578 | |||
| Oneness Biotech Company, Ltd. (A) | 25,000 | 173,734 | |||
| Ono Pharmaceutical Company, Ltd. | 39,100 | 938,808 | |||
| Oramed Pharmaceuticals, Inc. (A)(C) | 3,247 | 63,901 | |||
| Organon & Company | 25,188 | 853,621 | |||
| Orion OYJ, Class B | 14,169 | 577,955 | |||
| Otsuka Holdings Company, Ltd. | 41,300 | 1,757,502 | |||
| Pacira BioSciences, Inc. (A) | 4,923 | 291,885 | |||
| Paratek Pharmaceuticals, Inc. (A) | 5,903 | 32,821 | |||
| Perrigo Company PLC | 13,294 | 544,389 | |||
| Pfizer, Inc. | 557,216 | 25,670,941 | |||
| Phathom Pharmaceuticals, Inc. (A) | 2,398 | 85,345 | |||
| Phibro Animal Health Corp., Class A | 2,428 | 58,976 | |||
| Pliant Therapeutics, Inc. (A)(C) | 2,891 | 52,732 | |||
| Prestige Consumer Healthcare, Inc. (A) | 5,570 | 319,662 | |||
| Provention Bio, Inc. (A) | 7,166 | 48,084 | |||
| Reata Pharmaceuticals, Inc., Class A (A) | 3,105 | 330,714 | |||
| Recordati Industria Chimica e Farmaceutica SpA | 11,384 | 747,028 | |||
| Relmada Therapeutics, Inc. (A) | 1,865 | 44,592 | |||
| Revance Therapeutics, Inc. (A) | 7,979 | 213,678 | |||
| Richter Gedeon NYRT | 18,938 | 567,630 | |||
| Roche Holding AG | 78,181 | 31,393,963 | |||
| Roche Holding AG, Bearer Shares | 3,447 | 1,543,052 | |||
| Sanofi | 128,833 | 13,352,073 | |||
| Santen Pharmaceutical Company, Ltd. | 37,400 | 559,227 | |||
| Shanghai Fosun Pharmaceutical Group Company, Ltd., H Shares | 54,500 | 349,624 | |||
| Shin Poong Pharmaceutical Company, Ltd. | 3,738 | 227,086 | |||
| The accompanying notes are an integral part of the financial statements. | 89 |
| Shares or Principal Amount | Value | ||||
| COMMON STOCKS (continued) | |||||
| Pharmaceuticals (continued) | |||||
| Shionogi & Company, Ltd. | 28,063 | $ | 1,763,218 | ||
| SIGA Technologies, Inc. (A) | 5,890 | 38,462 | |||
| Sino Biopharmaceutical, Ltd. | 1,123,525 | 939,690 | |||
| SK Biopharmaceuticals Company, Ltd. (A) | 3,202 | 345,831 | |||
| SSY Group, Ltd. | 147,300 | 91,396 | |||
| Sumitomo Dainippon Pharma Company, Ltd. | 19,000 | 341,052 | |||
| Supernus Pharmaceuticals, Inc. (A) | 5,555 | 152,929 | |||
| Taisho Pharmaceutical Holdings Company, Ltd. | 3,600 | 209,978 | |||
| Takeda Pharmaceutical Company, Ltd. | 166,128 | 5,529,653 | |||
| Tarsus Pharmaceuticals, Inc. (A) | 1,091 | 28,912 | |||
| Teva Pharmaceutical Industries, Ltd., ADR (A) | 93,336 | 879,225 | |||
| TherapeuticsMD, Inc. (A) | 47,913 | 38,091 | |||
| Theravance Biopharma, Inc. (A) | 6,253 | 51,900 | |||
| UCB SA | 18,484 | 2,114,735 | |||
| Viatris, Inc. | 120,314 | 1,760,194 | |||
| Vifor Pharma AG | 5,404 | 769,453 | |||
| WaVe Life Sciences, Ltd. (A) | 5,270 | 33,359 | |||
| Yuhan Corp. | 5,789 | 311,524 | |||
| Zoetis, Inc. | 47,260 | 9,667,506 | |||
| Zogenix, Inc. (A) | 6,592 | 97,628 | |||
| 319,856,558 | |||||
| 1,116,004,455 | |||||
| Industrials – 9.7% | |||||
| Aerospace and defense – 0.9% | |||||
| AAR Corp. (A) | 3,785 | 128,122 | |||
| Aerojet Rocketdyne Holdings, Inc. | 8,334 | 346,028 | |||
| AeroVironment, Inc. (A) | 2,517 | 257,640 | |||
| Airbus SE (A) | 66,900 | 9,151,663 | |||
| Aselsan Elektronik Sanayi Ve Ticaret AS | 64,740 | 123,807 | |||
| Astronics Corp. (A) | 3,157 | 42,178 | |||
| AviChina Industry & Technology Company, Ltd., H Shares | 270,300 | 226,175 | |||
| Axon Enterprise, Inc. (A) | 17,243 | 3,135,984 | |||
| BAE Systems PLC | 400,615 | 3,129,851 | |||
| Byrna Technologies, Inc. (A) | 1,272 | 37,244 | |||
| CAE, Inc. (A) | 30,309 | 875,169 | |||
| Curtiss-Wright Corp. | 10,913 | 1,328,985 | |||
| Dassault Aviation SA | 286 | 322,883 | |||
| Ducommun, Inc. (A) | 1,255 | 66,139 | |||
| General Dynamics Corp. | 16,996 | 3,404,469 | |||
| Hexcel Corp. (A) | 22,332 | 1,266,448 | |||
| Howmet Aerospace, Inc. | 29,022 | 921,449 | |||
| Huntington Ingalls Industries, Inc. | 2,987 | 609,856 | |||
| Kaman Corp. | 3,080 | 120,366 | |||
| Korea Aerospace Industries, Ltd. | 8,714 | 246,208 | |||
| Kratos Defense & Security Solutions, Inc. (A) | 13,778 | 340,592 | |||
| L3Harris Technologies, Inc. | 15,220 | 3,546,412 | |||
| Lockheed Martin Corp. | 18,159 | 6,533,608 | |||
| Maxar Technologies, Inc. | 8,085 | 257,022 | |||
| Mercury Systems, Inc. (A) | 14,971 | 754,239 | |||
| Moog, Inc., Class A | 3,224 | 256,115 | |||
| MTU Aero Engines AG | 7,126 | 1,635,395 | |||
| National Presto Industries, Inc. | 583 | 48,704 | |||
| Northrop Grumman Corp. | 11,114 | 4,086,618 | |||
| PAE, Inc. (A) | 8,346 | 55,835 | |||
| Park Aerospace Corp. | 2,528 | 36,858 | |||
| Parsons Corp. (A) | 2,939 | 104,129 | |||
| Raytheon Technologies Corp. | 112,491 | 9,534,737 | |||
| Rolls-Royce Holdings PLC (A) | 1,029,037 | 1,622,814 | |||
| Safran SA | 38,944 | 4,885,353 | |||
| Singapore Technologies Engineering, Ltd. | 93,500 | 261,837 | |||
| Shares or Principal Amount | Value | ||||
| COMMON STOCKS (continued) | |||||
| Aerospace and defense (continued) | |||||
| Teledyne Technologies, Inc. (A) | 3,448 | $ | 1,597,734 | ||
| Textron, Inc. | 16,758 | 1,217,804 | |||
| Thales SA | 12,112 | 1,230,186 | |||
| The Boeing Company (A) | 40,815 | 8,958,893 | |||
| TransDigm Group, Inc. (A) | 4,075 | 2,475,440 | |||
| Triumph Group, Inc. (A) | 5,862 | 108,213 | |||
| Vectrus, Inc. (A) | 1,392 | 70,032 | |||
| 75,359,234 | |||||
| Air freight and logistics – 0.6% | |||||
| Air Transport Services Group, Inc. (A) | 6,730 | 184,335 | |||
| Atlas Air Worldwide Holdings, Inc. (A) | 3,233 | 236,559 | |||
| CH Robinson Worldwide, Inc. | 13,995 | 1,260,390 | |||
| Deutsche Post AG | 131,680 | 9,258,300 | |||
| DSV Panalpina A/S | 22,988 | 5,855,545 | |||
| Echo Global Logistics, Inc. (A) | 3,040 | 99,955 | |||
| Expeditors International of Washington, Inc. | 17,773 | 2,215,227 | |||
| FedEx Corp. | 25,689 | 6,825,310 | |||
| Forward Air Corp. | 3,073 | 270,946 | |||
| GXO Logistics, Inc. (A) | 27,099 | 2,216,427 | |||
| Hub Group, Inc., Class A (A) | 3,732 | 261,986 | |||
| Hyundai Glovis Company, Ltd. | 2,243 | 374,178 | |||
| InPost SA (A) | 22,297 | 435,979 | |||
| Radiant Logistics, Inc. (A) | 5,347 | 36,627 | |||
| SG Holdings Company, Ltd. | 33,500 | 909,442 | |||
| United Parcel Service, Inc., Class B | 76,118 | 14,890,964 | |||
| Yamato Holdings Company, Ltd. | 30,800 | 783,042 | |||
| ZTO Express Cayman, Inc., ADR | 47,900 | 1,351,259 | |||
| 47,466,471 | |||||
| Airlines – 0.2% | |||||
| Air Canada (A) | 18,371 | 356,892 | |||
| Air China, Ltd., H Shares (A) | 192,966 | 129,416 | |||
| Alaska Air Group, Inc. (A) | 13,100 | 751,154 | |||
| Allegiant Travel Company (A) | 1,703 | 327,725 | |||
| American Airlines Group, Inc. (A)(C) | 67,494 | 1,345,830 | |||
| ANA Holdings, Inc. (A) | 16,400 | 388,756 | |||
| China Southern Airlines Company, Ltd., H Shares (A)(C) | 186,900 | 108,703 | |||
| Delta Air Lines, Inc. (A) | 67,312 | 2,722,097 | |||
| Deutsche Lufthansa AG (A)(C) | 38,990 | 390,610 | |||
| Frontier Group Holdings, Inc. (A) | 4,018 | 61,596 | |||
| Hawaiian Holdings, Inc. (A) | 5,887 | 119,035 | |||
| Japan Airlines Company, Ltd. (A) | 15,000 | 319,570 | |||
| JetBlue Airways Corp. (A) | 84,408 | 1,277,093 | |||
| Korean Air Lines Company, Ltd. (A) | 18,462 | 497,355 | |||
| Mesa Air Group, Inc. (A) | 4,401 | 35,120 | |||
| Qantas Airways, Ltd. (A) | 105,043 | 388,943 | |||
| Singapore Airlines, Ltd. (A) | 80,740 | 302,681 | |||
| SkyWest, Inc. (A) | 5,584 | 260,494 | |||
| Southwest Airlines Company (A) | 62,234 | 3,098,009 | |||
| Spirit Airlines, Inc. (A) | 11,029 | 270,541 | |||
| Sun Country Airlines Holdings, Inc. (A) | 1,952 | 63,225 | |||
| United Airlines Holdings, Inc. (A) | 34,051 | 1,583,712 | |||
| 14,798,557 | |||||
| Building products – 0.8% | |||||
| A.O. Smith Corp. | 16,064 | 1,168,174 | |||
| AAON, Inc. | 4,714 | 321,071 | |||
| AGC, Inc. | 20,484 | 989,553 | |||
| Allegion PLC | 10,749 | 1,547,749 | |||
| American Woodmark Corp. (A) | 1,950 | 137,397 | |||
| Apogee Enterprises, Inc. | 2,873 | 123,482 | |||
| Assa Abloy AB, B Shares | 117,533 | 3,761,137 | |||
| Builders FirstSource, Inc. (A) | 55,217 | 2,942,514 | |||
| Caesarstone, Ltd. | 3,053 | 39,689 | |||
| The accompanying notes are an integral part of the financial statements. | 90 |
| Shares or Principal Amount | Value | ||||
| COMMON STOCKS (continued) | |||||
| Building products (continued) | |||||
| Carlisle Companies, Inc. | 13,913 | $ | 2,932,026 | ||
| Carrier Global Corp. | 97,585 | 5,620,896 | |||
| China Lesso Group Holdings, Ltd. | 118,000 | 252,561 | |||
| Cie de Saint-Gobain | 57,599 | 4,175,521 | |||
| Cornerstone Building Brands, Inc. (A) | 6,245 | 103,792 | |||
| CSW Industrials, Inc. | 1,513 | 200,911 | |||
| Daikin Industries, Ltd. | 26,300 | 6,563,074 | |||
| Fortune Brands Home & Security, Inc. | 16,537 | 1,610,208 | |||
| Geberit AG | 4,066 | 3,395,539 | |||
| Gibraltar Industries, Inc. (A) | 3,677 | 274,525 | |||
| Griffon Corp. | 5,275 | 127,655 | |||
| Insteel Industries, Inc. | 2,160 | 79,920 | |||
| JELD-WEN Holding, Inc. (A) | 9,526 | 262,346 | |||
| Johnson Controls International PLC | 85,622 | 6,404,526 | |||
| Kingspan Group PLC | 17,757 | 2,027,762 | |||
| Lennox International, Inc. | 9,164 | 3,071,590 | |||
| Lixil Corp. | 28,100 | 817,758 | |||
| Masco Corp. | 30,317 | 1,840,848 | |||
| Masonite International Corp. (A) | 2,764 | 330,796 | |||
| Nibe Industrier AB, B Shares | 167,341 | 2,332,443 | |||
| Owens Corning | 27,847 | 2,660,781 | |||
| PGT Innovations, Inc. (A) | 6,699 | 142,220 | |||
| Quanex Building Products Corp. | 3,913 | 92,190 | |||
| Resideo Technologies, Inc. (A) | 16,333 | 526,576 | |||
| Rockwool International A/S, B Shares | 947 | 500,997 | |||
| Simpson Manufacturing Company, Inc. | 16,412 | 1,857,018 | |||
| TOTO, Ltd. | 14,900 | 810,921 | |||
| Trane Technologies PLC | 28,569 | 5,670,947 | |||
| Trex Company, Inc. (A) | 30,752 | 3,375,340 | |||
| UFP Industries, Inc. | 6,750 | 506,790 | |||
| View, Inc. (A)(C) | 10,370 | 51,954 | |||
| Xinyi Glass Holdings, Ltd. | 132,000 | 554,695 | |||
| 70,205,892 | |||||
| Commercial services and supplies – 0.6% | |||||
| ABM Industries, Inc. | 7,610 | 376,847 | |||
| ACCO Brands Corp. | 11,082 | 103,838 | |||
| A-Living Smart City Services Company, Ltd. (B) | 60,750 | 241,441 | |||
| Brady Corp., Class A | 5,257 | 280,356 | |||
| Brambles, Ltd. | 163,439 | 1,444,684 | |||
| BrightView Holdings, Inc. (A) | 4,699 | 72,036 | |||
| Casella Waste Systems, Inc., Class A (A) | 5,532 | 409,313 | |||
| CECO Environmental Corp. (A) | 4,376 | 33,039 | |||
| China Everbright Environment Group, Ltd. | 417,500 | 288,645 | |||
| CIFI Ever Sunshine Services Group, Ltd. | 80,000 | 165,260 | |||
| Cimpress PLC (A) | 2,005 | 190,435 | |||
| Cintas Corp. | 12,876 | 5,095,935 | |||
| Clean Harbors, Inc. (A) | 13,382 | 1,373,261 | |||
| Copart, Inc. (A) | 30,378 | 4,384,153 | |||
| CoreCivic, Inc. (A) | 13,579 | 131,988 | |||
| Country Garden Services Holdings Company, Ltd. | 159,400 | 1,216,335 | |||
| Covanta Holding Corp. | 13,488 | 270,434 | |||
| Dai Nippon Printing Company, Ltd. | 24,100 | 572,610 | |||
| Deluxe Corp. | 4,767 | 182,814 | |||
| Ennis, Inc. | 3,089 | 59,957 | |||
| GFL Environmental, Inc. (C) | 16,571 | 583,824 | |||
| Greentown Service Group Company, Ltd. | 155,000 | 165,755 | |||
| Harsco Corp. (A) | 8,956 | 163,357 | |||
| Healthcare Services Group, Inc. | 28,434 | 743,833 | |||
| Heritage-Crystal Clean, Inc. (A) | 2,025 | 59,819 | |||
| Herman Miller, Inc. | 24,117 | 1,013,638 | |||
| HNI Corp. | 4,927 | 186,684 | |||
| IAA, Inc. (A) | 35,923 | 1,908,230 | |||
| Interface, Inc. | 6,646 | 95,569 | |||
| Shares or Principal Amount | Value | ||||
| COMMON STOCKS (continued) | |||||
| Commercial services and supplies (continued) | |||||
| KAR Auction Services, Inc. (A) | 47,297 | $ | 799,792 | ||
| Kimball International, Inc., Class B | 4,764 | 59,407 | |||
| Matthews International Corp., Class A | 3,497 | 129,494 | |||
| Montrose Environmental Group, Inc. (A) | 2,581 | 129,050 | |||
| MSA Safety, Inc. | 9,710 | 1,581,176 | |||
| Pitney Bowes, Inc. | 19,955 | 149,064 | |||
| Rentokil Initial PLC | 229,732 | 1,835,216 | |||
| Republic Services, Inc. | 30,725 | 3,813,894 | |||
| Ritchie Bros Auctioneers, Inc. | 11,746 | 735,958 | |||
| Rollins, Inc. | 32,315 | 1,257,700 | |||
| RR Donnelley & Sons Company (A) | 8,643 | 42,437 | |||
| S-1 Corp. | 1,847 | 130,756 | |||
| Secom Company, Ltd. | 22,094 | 1,675,448 | |||
| Securitas AB, B Shares | 36,774 | 611,742 | |||
| Sohgo Security Services Company, Ltd. | 7,300 | 330,701 | |||
| SP Plus Corp. (A) | 2,739 | 88,716 | |||
| Steelcase, Inc., Class A | 10,107 | 142,408 | |||
| Stericycle, Inc. (A) | 24,462 | 1,702,555 | |||
| Tetra Tech, Inc. | 20,489 | 2,947,138 | |||
| The Brink's Company | 18,765 | 1,466,672 | |||
| TOPPAN, Inc. | 28,200 | 484,110 | |||
| UniFirst Corp. | 1,686 | 386,212 | |||
| US Ecology, Inc. (A) | 3,665 | 131,390 | |||
| Viad Corp. (A) | 2,333 | 100,762 | |||
| VSE Corp. | 1,255 | 62,737 | |||
| Waste Management, Inc. | 56,668 | 8,789,773 | |||
| 51,398,398 | |||||
| Construction and engineering – 0.4% | |||||
| ACS Actividades de Construccion y Servicios SA | 23,169 | 625,475 | |||
| AECOM (A) | 39,025 | 2,558,479 | |||
| Ameresco, Inc., Class A (A) | 3,463 | 239,466 | |||
| API Group Corp. (A)(B) | 20,458 | 474,421 | |||
| Arcosa, Inc. | 5,433 | 276,105 | |||
| Argan, Inc. | 1,746 | 80,840 | |||
| Bouygues SA | 25,848 | 1,082,352 | |||
| China Communications Services Corp., Ltd., H Shares | 273,200 | 145,178 | |||
| China Conch Venture Holdings, Ltd. | 177,400 | 726,067 | |||
| China Railway Group, Ltd., H Shares | 433,200 | 207,470 | |||
| China State Construction International Holdings, Ltd. | 223,900 | 181,068 | |||
| Comfort Systems USA, Inc. | 4,024 | 305,744 | |||
| Concrete Pumping Holdings, Inc. (A) | 3,584 | 29,783 | |||
| Construction Partners, Inc., Class A (A) | 3,264 | 109,246 | |||
| Dycom Industries, Inc. (A) | 11,586 | 872,773 | |||
| Eiffage SA | 9,468 | 985,134 | |||
| EMCOR Group, Inc. | 20,597 | 2,502,536 | |||
| Ferrovial SA | 44,472 | 1,287,887 | |||
| Fluor Corp. (A) | 49,621 | 826,686 | |||
| Granite Construction, Inc. | 5,150 | 208,781 | |||
| Great Lakes Dredge & Dock Corp. (A) | 7,363 | 111,255 | |||
| GS Engineering & Construction Corp. | 7,861 | 302,551 | |||
| Hyundai Engineering & Construction Company, Ltd. | 9,399 | 448,671 | |||
| IES Holdings, Inc. (A) | 1,029 | 50,318 | |||
| Infrastructure and Energy Alternatives, Inc. (A) | 2,668 | 34,230 | |||
| Kajima Corp. | 48,300 | 624,048 | |||
| MasTec, Inc. (A) | 15,055 | 1,376,629 | |||
| Matrix Service Company (A) | 3,423 | 38,611 | |||
| MYR Group, Inc. (A) | 1,856 | 193,043 | |||
| Northwest Pipe Company (A) | 1,333 | 34,551 | |||
| NV5 Global, Inc. (A) | 1,456 | 153,826 | |||
| Obayashi Corp. | 71,400 | 587,506 | |||
| The accompanying notes are an integral part of the financial statements. | 91 |
| Shares or Principal Amount | Value | ||||
| COMMON STOCKS (continued) | |||||
| Construction and engineering (continued) | |||||
| Primoris Services Corp. | 6,032 | $ | 155,022 | ||
| Quanta Services, Inc. | 37,599 | 3,838,858 | |||
| Samsung Engineering Company, Ltd. (A) | 18,667 | 358,663 | |||
| Shimizu Corp. | 59,500 | 426,970 | |||
| Skanska AB, B Shares | 40,187 | 1,158,512 | |||
| Sterling Construction Company, Inc. (A) | 3,328 | 76,744 | |||
| Taisei Corp. | 20,400 | 638,226 | |||
| Tutor Perini Corp. (A) | 4,710 | 67,918 | |||
| Valmont Industries, Inc. | 5,664 | 1,409,543 | |||
| Vinci SA | 60,431 | 6,483,731 | |||
| WillScot Mobile Mini Holdings Corp. (A) | 21,117 | 625,063 | |||
| WSP Global, Inc. | 12,139 | 1,584,954 | |||
| 34,504,934 | |||||
| Electrical equipment – 0.9% | |||||
| ABB, Ltd. | 192,696 | 7,128,718 | |||
| Acuity Brands, Inc. | 9,518 | 1,756,357 | |||
| Allied Motion Technologies, Inc. | 1,518 | 52,462 | |||
| American Superconductor Corp. (A) | 3,511 | 52,314 | |||
| AMETEK, Inc. | 21,407 | 2,910,710 | |||
| Array Technologies, Inc. (A) | 14,458 | 275,714 | |||
| Atkore, Inc. (A) | 5,289 | 490,661 | |||
| AZZ, Inc. | 2,749 | 147,209 | |||
| Babcock & Wilcox Enterprises, Inc. (A) | 6,780 | 49,494 | |||
| Ballard Power Systems, Inc. (A) | 25,291 | 426,177 | |||
| Beam Global (A)(C) | 1,182 | 36,807 | |||
| Bloom Energy Corp., Class A (A) | 15,741 | 337,172 | |||
| Doosan Heavy Industries & Construction Company, Ltd. (A) | 24,809 | 446,060 | |||
| Eaton Corp. PLC | 36,943 | 6,219,723 | |||
| Emerson Electric Company | 55,596 | 5,865,378 | |||
| Encore Wire Corp. | 2,265 | 192,548 | |||
| EnerSys | 16,202 | 1,370,527 | |||
| Eos Energy Enterprises, Inc. (A) | 2,326 | 30,052 | |||
| FuelCell Energy, Inc. (A) | 36,885 | 230,162 | |||
| Fuji Electric Company, Ltd. | 13,500 | 584,027 | |||
| Generac Holdings, Inc. (A) | 5,836 | 2,550,215 | |||
| GrafTech International, Ltd. | 19,089 | 211,315 | |||
| Hubbell, Inc. | 14,479 | 2,984,267 | |||
| Legrand SA | 30,265 | 3,472,433 | |||
| Mitsubishi Electric Corp. | 193,118 | 2,640,136 | |||
| Nidec Corp. | 47,200 | 5,391,594 | |||
| nVent Electric PLC | 44,699 | 1,535,858 | |||
| Powell Industries, Inc. | 1,311 | 33,168 | |||
| Preformed Line Products Company | 418 | 29,310 | |||
| Prysmian SpA | 28,164 | 1,060,373 | |||
| Regal Beloit Corp. | 10,831 | 1,618,368 | |||
| Rockwell Automation, Inc. | 10,761 | 3,502,167 | |||
| Schneider Electric SE | 59,765 | 10,678,002 | |||
| Schneider Electric SE (Euronext London Exchange) | 1,474 | 262,352 | |||
| Siemens Energy AG (A) | 53,080 | 1,540,456 | |||
| Siemens Gamesa Renewable Energy SA (A) | 22,065 | 654,259 | |||
| Stem, Inc. (A) | 7,063 | 176,504 | |||
| Sunrun, Inc. (A) | 42,947 | 1,900,405 | |||
| Thermon Group Holdings, Inc. (A) | 4,006 | 66,900 | |||
| TPI Composites, Inc. (A) | 4,059 | 147,382 | |||
| Vestas Wind Systems A/S | 112,115 | 4,523,932 | |||
| Vicor Corp. (A) | 2,376 | 293,127 | |||
| WEG SA | 185,796 | 1,277,734 | |||
| Xinjiang Goldwind Science & Technology Company, Ltd., H Shares (C) | 84,800 | 162,569 | |||
| Shares or Principal Amount | Value | ||||
| COMMON STOCKS (continued) | |||||
| Electrical equipment (continued) | |||||
| Zhuzhou CRRC Times Electric Company, Ltd., H Shares (A) | 59,600 | $ | 358,204 | ||
| 75,673,302 | |||||
| Industrial conglomerates – 0.9% | |||||
| 3M Company | 51,920 | 10,110,901 | |||
| Aboitiz Equity Ventures, Inc. | 214,060 | 184,606 | |||
| Ayala Corp. | 30,845 | 490,334 | |||
| CITIC, Ltd. | 646,333 | 803,025 | |||
| CJ Corp. | 1,788 | 156,179 | |||
| CK Hutchison Holdings, Ltd. | 199,472 | 1,454,171 | |||
| DCC PLC | 12,357 | 1,050,396 | |||
| Far Eastern New Century Corp. | 315,133 | 341,180 | |||
| Fosun International, Ltd. | 279,500 | 353,538 | |||
| General Electric Company | 98,285 | 10,360,222 | |||
| Grupo Carso SAB de CV, Series A1 | 61,200 | 209,099 | |||
| GT Capital Holdings, Inc. | 10,638 | 115,314 | |||
| HAP Seng Consolidated BHD | 69,900 | 142,896 | |||
| Hitachi, Ltd. | 102,300 | 5,653,763 | |||
| Honeywell International, Inc. | 62,210 | 14,427,121 | |||
| Investment AB Latour, B Shares | 17,315 | 603,292 | |||
| Jardine Matheson Holdings, Ltd. | 15,632 | 847,713 | |||
| JG Summit Holdings, Inc. | 327,965 | 427,982 | |||
| Keppel Corp., Ltd. | 90,531 | 349,002 | |||
| KOC Holding AS | 72,486 | 200,773 | |||
| LG Corp. | 10,240 | 839,906 | |||
| LX Holdings Corp. (A) | 1,741 | 14,781 | |||
| Melrose Industries PLC | 541,050 | 1,249,328 | |||
| Raven Industries, Inc. (A) | 4,011 | 234,042 | |||
| Roper Technologies, Inc. | 9,426 | 4,555,397 | |||
| Samsung C&T Corp. | 9,959 | 1,139,244 | |||
| Siemens AG | 101,727 | 16,875,979 | |||
| Sime Darby BHD | 313,500 | 177,825 | |||
| SK, Inc. | 3,729 | 844,850 | |||
| SM Investments Corp. | 26,245 | 530,516 | |||
| Smiths Group PLC | 50,392 | 1,000,129 | |||
| The Bidvest Group, Ltd. | 31,403 | 442,787 | |||
| Toshiba Corp. | 43,300 | 1,878,126 | |||
| Turkiye Sise ve Cam Fabrikalari AS | 131,245 | 140,515 | |||
| 78,204,932 | |||||
| Machinery – 1.8% | |||||
| AGCO Corp. | 16,471 | 2,266,739 | |||
| AgEagle Aerial Systems, Inc. (A) | 8,892 | 31,478 | |||
| Airtac International Group | 14,000 | 426,151 | |||
| Alamo Group, Inc. | 1,098 | 170,201 | |||
| Albany International Corp., Class A | 3,403 | 266,557 | |||
| Alfa Laval AB | 37,066 | 1,505,069 | |||
| Alstom SA | 31,565 | 1,357,079 | |||
| Altra Industrial Motion Corp. | 7,340 | 429,830 | |||
| Astec Industries, Inc. | 2,570 | 157,130 | |||
| Atlas Copco AB, A Shares | 78,617 | 5,404,705 | |||
| Atlas Copco AB, B Shares | 45,964 | 2,661,822 | |||
| Barnes Group, Inc. | 5,303 | 252,794 | |||
| Blue Bird Corp. (A) | 2,013 | 43,581 | |||
| Caterpillar, Inc. | 35,225 | 7,427,896 | |||
| Chart Industries, Inc. (A) | 4,111 | 774,430 | |||
| CIRCOR International, Inc. (A) | 2,188 | 78,221 | |||
| CNH Industrial NV | 114,431 | 1,891,640 | |||
| Colfax Corp. (A) | 31,448 | 1,514,850 | |||
| Columbus McKinnon Corp. | 3,143 | 144,735 | |||
| Commercial Vehicle Group, Inc. (A) | 4,028 | 42,334 | |||
| Crane Company | 13,235 | 1,346,926 | |||
| Cummins, Inc. | 9,402 | 2,218,684 | |||
| Daewoo Shipbuilding & Marine Engineering Company, Ltd. (A) | 4,379 | 105,582 | |||
| Daifuku Company, Ltd. | 10,600 | 935,566 | |||
| The accompanying notes are an integral part of the financial statements. | 92 |
| Shares or Principal Amount | Value | ||||
| COMMON STOCKS (continued) | |||||
| Machinery (continued) | |||||
| Deere & Company | 20,059 | $ | 7,582,904 | ||
| Desktop Metal, Inc., Class A (A)(C) | 9,629 | 79,921 | |||
| Donaldson Company, Inc. | 33,621 | 2,277,823 | |||
| Doosan Bobcat, Inc. (A) | 6,044 | 225,214 | |||
| Douglas Dynamics, Inc. | 2,622 | 104,198 | |||
| Dover Corp. | 9,255 | 1,613,702 | |||
| Energy Recovery, Inc. (A) | 4,834 | 98,759 | |||
| Enerpac Tool Group Corp. | 6,807 | 171,264 | |||
| EnPro Industries, Inc. | 2,300 | 196,673 | |||
| Epiroc AB, A Shares | 77,368 | 1,697,759 | |||
| Epiroc AB, B Shares | 45,678 | 868,105 | |||
| ESCO Technologies, Inc. | 2,854 | 257,202 | |||
| Evoqua Water Technologies Corp. (A) | 13,053 | 508,023 | |||
| FANUC Corp. | 20,300 | 4,422,578 | |||
| Federal Signal Corp. | 6,744 | 274,009 | |||
| Flowserve Corp. | 34,739 | 1,350,305 | |||
| Fortive Corp. | 21,769 | 1,608,076 | |||
| Franklin Electric Company, Inc. | 5,137 | 436,542 | |||
| GEA Group AG | 20,115 | 928,464 | |||
| Graco, Inc. | 45,167 | 3,541,996 | |||
| Haitian International Holdings, Ltd. | 70,200 | 268,413 | |||
| Harmonic Drive Systems, Inc. | 4,500 | 248,463 | |||
| Helios Technologies, Inc. | 3,660 | 298,729 | |||
| Hillenbrand, Inc. | 8,440 | 391,785 | |||
| Hino Motors, Ltd. | 30,800 | 266,515 | |||
| Hitachi Construction Machinery Company, Ltd. | 11,400 | 326,601 | |||
| Hiwin Technologies Corp. | 29,044 | 340,190 | |||
| Hoshizaki Corp. | 5,700 | 535,101 | |||
| Hydrofarm Holdings Group, Inc. (A) | 1,300 | 65,728 | |||
| Hyliion Holdings Corp. (A)(C) | 13,385 | 118,190 | |||
| Hyster-Yale Materials Handling, Inc. | 1,160 | 67,988 | |||
| Hyundai Heavy Industries Holdings Company, Ltd. | 5,542 | 311,374 | |||
| Ideanomics, Inc. (A)(C) | 46,571 | 116,893 | |||
| IDEX Corp. | 4,883 | 1,093,792 | |||
| Illinois Tool Works, Inc. | 18,484 | 4,304,184 | |||
| Ingersoll Rand, Inc. (A) | 24,975 | 1,324,175 | |||
| ITT, Inc. | 22,952 | 2,195,818 | |||
| John Bean Technologies Corp. | 3,530 | 514,992 | |||
| Kadant, Inc. | 1,280 | 267,674 | |||
| Kennametal, Inc. | 31,686 | 1,178,085 | |||
| KION Group AG | 9,564 | 1,023,411 | |||
| Knorr-Bremse AG | 9,507 | 1,141,561 | |||
| Komatsu, Ltd. | 92,800 | 2,257,148 | |||
| Kone OYJ, B Shares | 45,826 | 3,802,654 | |||
| Korea Shipbuilding & Offshore Engineering Company, Ltd. (A) | 4,593 | 467,945 | |||
| Kubota Corp. | 108,500 | 2,241,790 | |||
| Kurita Water Industries, Ltd. | 10,289 | 482,568 | |||
| Lincoln Electric Holdings, Inc. | 15,871 | 2,215,750 | |||
| Lindsay Corp. | 1,204 | 198,359 | |||
| Luxfer Holdings PLC | 3,281 | 70,049 | |||
| Lydall, Inc. (A) | 1,991 | 123,402 | |||
| Makita Corp. | 23,600 | 1,355,744 | |||
| Meritor, Inc. (A) | 7,898 | 187,341 | |||
| Miller Industries, Inc. | 1,308 | 48,684 | |||
| MINEBEA MITSUMI, Inc. | 38,500 | 989,774 | |||
| MISUMI Group, Inc. | 29,800 | 1,182,120 | |||
| Mitsubishi Heavy Industries, Ltd. | 34,040 | 899,298 | |||
| Miura Company, Ltd. | 9,100 | 408,542 | |||
| Mueller Industries, Inc. | 6,257 | 279,125 | |||
| Mueller Water Products, Inc., Class A | 17,614 | 292,745 | |||
| Nabtesco Corp. | 12,100 | 478,498 | |||
| NGK Insulators, Ltd. | 27,600 | 457,568 | |||
| Shares or Principal Amount | Value | ||||
| COMMON STOCKS (continued) | |||||
| Machinery (continued) | |||||
| Nikola Corp. (A)(C) | 22,734 | $ | 237,116 | ||
| NN, Inc. (A) | 6,410 | 34,870 | |||
| Nordson Corp. | 14,406 | 3,437,272 | |||
| NSK, Ltd. | 40,800 | 286,249 | |||
| Omega Flex, Inc. | 325 | 49,400 | |||
| Oshkosh Corp. | 18,291 | 2,095,783 | |||
| Otis Worldwide Corp. | 25,939 | 2,392,095 | |||
| PACCAR, Inc. | 22,324 | 1,827,666 | |||
| Parker-Hannifin Corp. | 8,299 | 2,462,064 | |||
| Park-Ohio Holdings Corp. | 1,189 | 30,652 | |||
| Pentair PLC | 10,687 | 824,609 | |||
| Proto Labs, Inc. (A) | 3,153 | 233,826 | |||
| Rational AG | 670 | 766,760 | |||
| RBC Bearings, Inc. (A) | 2,783 | 644,320 | |||
| REV Group, Inc. | 3,364 | 54,699 | |||
| Rexnord Corp. | 13,459 | 817,769 | |||
| Samsung Heavy Industries Company, Ltd. (A) | 55,039 | 298,385 | |||
| Sandvik AB | 132,754 | 3,387,763 | |||
| Sany Heavy Equipment International Holdings Company, Ltd. | 118,000 | 151,634 | |||
| Schindler Holding AG | 2,013 | 627,462 | |||
| Schindler Holding AG, Participation Certificates | 4,619 | 1,491,590 | |||
| Sinotruk Hong Kong, Ltd. | 77,100 | 151,907 | |||
| SKF AB, B Shares | 44,934 | 1,147,592 | |||
| SMC Corp. | 5,996 | 3,836,529 | |||
| Snap-on, Inc. | 3,478 | 782,376 | |||
| Spirax-Sarco Engineering PLC | 9,122 | 2,022,853 | |||
| SPX Corp. (A) | 4,914 | 307,027 | |||
| SPX FLOW, Inc. | 4,756 | 383,001 | |||
| Standex International Corp. | 1,345 | 133,478 | |||
| Stanley Black & Decker, Inc. | 10,385 | 2,007,109 | |||
| Techtronic Industries Company, Ltd. | 100,000 | 2,213,222 | |||
| Tennant Company | 2,049 | 151,585 | |||
| Terex Corp. | 26,256 | 1,340,369 | |||
| The ExOne Company (A)(C) | 2,062 | 50,622 | |||
| The Gorman-Rupp Company | 2,417 | 84,764 | |||
| The Greenbrier Companies, Inc. | 3,629 | 160,039 | |||
| The Manitowoc Company, Inc. (A) | 3,953 | 95,860 | |||
| The Middleby Corp. (A) | 14,830 | 2,713,000 | |||
| The Shyft Group, Inc. | 3,914 | 172,255 | |||
| The Timken Company | 18,230 | 1,340,634 | |||
| The Toro Company | 28,540 | 3,137,688 | |||
| THK Company, Ltd. | 12,600 | 291,723 | |||
| Titan International, Inc. (A) | 6,263 | 52,046 | |||
| TriMas Corp. (A) | 4,906 | 157,532 | |||
| Trinity Industries, Inc. | 31,310 | 908,929 | |||
| Volvo AB, A Shares | 22,420 | 520,131 | |||
| Volvo AB, B Shares | 169,838 | 3,845,607 | |||
| Wabash National Corp. | 5,868 | 91,189 | |||
| Wabtec Corp. | 11,425 | 1,025,851 | |||
| Wartsila OYJ ABP | 64,302 | 912,199 | |||
| Watts Water Technologies, Inc., Class A | 3,055 | 524,146 | |||
| Weichai Power Company, Ltd., H Shares | 208,980 | 527,329 | |||
| Welbilt, Inc. (A) | 14,712 | 344,261 | |||
| Woodward, Inc. | 15,630 | 1,890,292 | |||
| Xylem, Inc. | 11,577 | 1,578,061 | |||
| Yaskawa Electric Corp. (C) | 25,400 | 1,239,752 | |||
| Zoomlion Heavy Industry Science and Technology Company, Ltd., H Shares | 145,200 | 138,359 | |||
| 152,967,584 | |||||
| Marine – 0.1% | |||||
| A.P. Moller - Maersk A/S, Series A | 345 | 934,926 | |||
| A.P. Moller - Maersk A/S, Series B | 692 | 1,971,341 | |||
| The accompanying notes are an integral part of the financial statements. | 93 |
| Shares or Principal Amount | Value | ||||
| COMMON STOCKS (continued) | |||||
| Marine (continued) | |||||
| COSCO SHIPPING Holdings Company, Ltd., H Shares (A)(C) | 365,289 | $ | 689,441 | ||
| Costamare, Inc. | 5,996 | 86,222 | |||
| Eagle Bulk Shipping, Inc. (A) | 1,001 | 49,439 | |||
| Evergreen Marine Corp. Taiwan, Ltd. | 276,748 | 1,350,956 | |||
| Genco Shipping & Trading, Ltd. | 3,741 | 72,912 | |||
| HMM Company, Ltd. (A) | 30,306 | 1,095,213 | |||
| Kirby Corp. (A) | 16,023 | 858,673 | |||
| Kuehne + Nagel International AG | 5,923 | 2,164,666 | |||
| Matson, Inc. | 4,835 | 382,787 | |||
| MISC BHD | 145,800 | 252,972 | |||
| Nippon Yusen KK | 17,300 | 1,391,177 | |||
| Pan Ocean Company, Ltd. | 31,952 | 228,154 | |||
| Wan Hai Lines, Ltd. | 60,000 | 536,842 | |||
| Yang Ming Marine Transport Corp. (A) | 173,000 | 828,674 | |||
| 12,894,395 | |||||
| Professional services – 0.9% | |||||
| 51job, Inc., ADR (A) | 3,300 | 253,440 | |||
| Acacia Research Corp. (A) | 6,712 | 40,876 | |||
| Adecco Group AG | 17,075 | 949,837 | |||
| ASGN, Inc. (A) | 20,042 | 2,248,512 | |||
| Barrett Business Services, Inc. | 915 | 70,913 | |||
| Bureau Veritas SA | 32,971 | 1,095,798 | |||
| CACI International, Inc., Class A (A) | 6,278 | 1,616,836 | |||
| CBIZ, Inc. (A) | 5,556 | 189,515 | |||
| CRA International, Inc. | 838 | 77,926 | |||
| Equifax, Inc. | 17,759 | 4,835,065 | |||
| Experian PLC | 113,014 | 4,985,060 | |||
| Exponent, Inc. | 5,840 | 682,696 | |||
| Forrester Research, Inc. (A) | 1,361 | 64,716 | |||
| Franklin Covey Company (A) | 1,548 | 67,292 | |||
| FTI Consulting, Inc. (A) | 9,122 | 1,274,435 | |||
| GP Strategies Corp. (A) | 1,595 | 32,985 | |||
| Heidrick & Struggles International, Inc. | 2,239 | 96,770 | |||
| Huron Consulting Group, Inc. (A) | 2,544 | 125,597 | |||
| ICF International, Inc. | 2,071 | 193,970 | |||
| IHS Markit, Ltd. | 54,663 | 6,592,358 | |||
| Insperity, Inc. | 13,692 | 1,510,775 | |||
| Intertek Group PLC | 20,017 | 1,451,371 | |||
| Jacobs Engineering Group, Inc. | 19,001 | 2,564,375 | |||
| KBR, Inc. | 53,529 | 2,084,419 | |||
| Kelly Services, Inc., Class A | 4,097 | 79,646 | |||
| Kforce, Inc. | 2,330 | 136,119 | |||
| Korn Ferry | 6,024 | 425,837 | |||
| Leidos Holdings, Inc. | 19,398 | 1,903,138 | |||
| ManpowerGroup, Inc. | 14,535 | 1,764,840 | |||
| ManTech International Corp., Class A | 3,045 | 241,073 | |||
| Nielsen Holdings PLC | 52,311 | 1,122,594 | |||
| Nihon M&A Center, Inc. | 31,700 | 945,298 | |||
| Persol Holdings Company, Ltd. | 18,700 | 436,562 | |||
| Randstad NV | 13,369 | 984,575 | |||
| Recruit Holdings Company, Ltd. | 143,000 | 8,420,147 | |||
| Rekor Systems, Inc. (A) | 4,109 | 44,870 | |||
| RELX PLC | 238,085 | 7,145,209 | |||
| Resources Connection, Inc. | 3,900 | 61,620 | |||
| Robert Half International, Inc. | 16,457 | 1,701,654 | |||
| Science Applications International Corp. | 15,453 | 1,301,606 | |||
| SGS SA | 657 | 2,064,845 | |||
| Teleperformance | 6,647 | 2,940,537 | |||
| Thomson Reuters Corp. | 18,897 | 2,208,058 | |||
| TriNet Group, Inc. (A) | 4,558 | 419,701 | |||
| TrueBlue, Inc. (A) | 3,999 | 109,293 | |||
| Upwork, Inc. (A) | 13,154 | 588,115 | |||
| Verisk Analytics, Inc. | 23,652 | 4,772,028 | |||
| Willdan Group, Inc. (A) | 1,352 | 51,119 | |||
| Shares or Principal Amount | Value | ||||
| COMMON STOCKS (continued) | |||||
| Professional services (continued) | |||||
| Wolters Kluwer NV | 29,647 | $ | 3,409,427 | ||
| 76,383,448 | |||||
| Road and rail – 0.9% | |||||
| ArcBest Corp. | 2,882 | 192,316 | |||
| Aurizon Holdings, Ltd. | 208,777 | 574,394 | |||
| Avis Budget Group, Inc. (A) | 19,547 | 1,773,890 | |||
| BTS Group Holdings PCL, NVDR | 927,900 | 270,539 | |||
| Canadian National Railway Company | 75,130 | 8,837,072 | |||
| Canadian Pacific Railway, Ltd. | 70,614 | 4,852,001 | |||
| Central Japan Railway Company | 15,188 | 2,223,065 | |||
| CJ Logistics Corp. (A) | 1,048 | 154,419 | |||
| Covenant Logistics Group, Inc. (A) | 1,747 | 42,557 | |||
| CSX Corp. | 239,113 | 7,778,346 | |||
| Daseke, Inc. (A) | 5,088 | 48,082 | |||
| East Japan Railway Company | 31,600 | 2,123,970 | |||
| Hankyu Hanshin Holdings, Inc. | 23,600 | 706,219 | |||
| Heartland Express, Inc. | 5,570 | 93,465 | |||
| JB Hunt Transport Services, Inc. | 8,785 | 1,558,459 | |||
| Kansas City Southern | 9,569 | 2,685,731 | |||
| Keio Corp. | 10,720 | 576,840 | |||
| Keisei Electric Railway Company, Ltd. | 13,435 | 413,310 | |||
| Kintetsu Group Holdings Company, Ltd. (A) | 17,600 | 601,149 | |||
| Knight-Swift Transportation Holdings, Inc. | 32,649 | 1,695,463 | |||
| Landstar System, Inc. | 10,239 | 1,720,459 | |||
| Localiza Rent a Car SA | 67,245 | 721,244 | |||
| Marten Transport, Ltd. | 7,009 | 109,270 | |||
| MTR Corp., Ltd. | 109,368 | 615,694 | |||
| Nippon Express Company, Ltd. | 8,080 | 549,413 | |||
| Norfolk Southern Corp. | 26,334 | 6,676,722 | |||
| Odakyu Electric Railway Company, Ltd. | 30,500 | 710,640 | |||
| Old Dominion Freight Line, Inc. | 10,007 | 2,889,221 | |||
| Rumo SA (A) | 142,200 | 514,811 | |||
| Ryder System, Inc. | 14,360 | 1,141,476 | |||
| Saia, Inc. (A) | 9,899 | 2,377,047 | |||
| Tobu Railway Company, Ltd. | 19,300 | 503,180 | |||
| Tokyu Corp. | 51,893 | 713,565 | |||
| U.S. Xpress Enterprises, Inc., Class A (A) | 3,521 | 30,774 | |||
| Union Pacific Corp. | 69,908 | 15,158,851 | |||
| Werner Enterprises, Inc. | 22,208 | 1,047,329 | |||
| West Japan Railway Company | 16,900 | 923,022 | |||
| XPO Logistics, Inc. (A) | 27,099 | 2,355,174 | |||
| Yellow Corp. (A) | 6,312 | 38,440 | |||
| 75,997,619 | |||||
| Trading companies and distributors – 0.5% | |||||
| Alta Equipment Group, Inc. (A) | 2,423 | 32,129 | |||
| Applied Industrial Technologies, Inc. | 4,387 | 389,609 | |||
| Ashtead Group PLC | 55,515 | 4,339,768 | |||
| Beacon Roofing Supply, Inc. (A) | 6,300 | 324,324 | |||
| BlueLinx Holdings, Inc. (A) | 1,054 | 60,668 | |||
| BOC Aviation, Ltd. (B) | 23,300 | 174,673 | |||
| Boise Cascade Company | 4,448 | 257,317 | |||
| Brenntag SE | 20,447 | 2,063,477 | |||
| Bunzl PLC | 42,028 | 1,522,814 | |||
| CAI International, Inc. | 1,835 | 102,705 | |||
| DXP Enterprises, Inc. (A) | 2,174 | 65,177 | |||
| Fastenal Company | 52,670 | 2,941,620 | |||
| Ferguson PLC | 27,865 | 4,027,557 | |||
| GATX Corp. | 13,388 | 1,227,412 | |||
| Global Industrial. Inc. | 1,498 | 57,658 | |||
| GMS, Inc. (A) | 4,819 | 238,107 | |||
| H&E Equipment Services, Inc. | 3,680 | 125,304 | |||
| Herc Holdings, Inc. (A) | 2,818 | 370,426 | |||
| ITOCHU Corp. | 125,637 | 3,779,302 | |||
| Lawson Products, Inc. (A) | 621 | 32,758 | |||
| The accompanying notes are an integral part of the financial statements. | 94 |
| Shares or Principal Amount | Value | ||||
| COMMON STOCKS (continued) | |||||
| Trading companies and distributors (continued) | |||||
| Marubeni Corp. | 165,800 | $ | 1,319,157 | ||
| McGrath RentCorp | 2,753 | 192,104 | |||
| Mitsubishi Corp. | 133,000 | 4,002,298 | |||
| Mitsui & Company, Ltd. | 163,200 | 3,599,471 | |||
| MonotaRO Company, Ltd. | 26,000 | 576,233 | |||
| MRC Global, Inc. (A) | 9,523 | 78,089 | |||
| MSC Industrial Direct Company, Inc., Class A | 12,527 | 1,054,899 | |||
| NOW, Inc. (A) | 12,955 | 99,494 | |||
| Reece, Ltd. | 32,114 | 488,736 | |||
| Rush Enterprises, Inc., Class A | 4,386 | 193,423 | |||
| Rush Enterprises, Inc., Class B | 1,136 | 48,155 | |||
| Sumitomo Corp. | 118,255 | 1,666,541 | |||
| Textainer Group Holdings, Ltd. (A) | 5,397 | 179,288 | |||
| Titan Machinery, Inc. (A) | 2,321 | 66,659 | |||
| Toromont Industries, Ltd. | 8,937 | 751,426 | |||
| Toyota Tsusho Corp. | 22,693 | 1,003,437 | |||
| Transcat, Inc. (A) | 853 | 57,799 | |||
| Triton International, Ltd. | 7,506 | 410,728 | |||
| United Rentals, Inc. (A) | 6,638 | 2,340,891 | |||
| Univar Solutions, Inc. (A) | 45,208 | 1,067,361 | |||
| Veritiv Corp. (A) | 1,748 | 156,743 | |||
| W.W. Grainger, Inc. | 4,014 | 1,740,872 | |||
| Watsco, Inc. | 8,774 | 2,442,857 | |||
| WESCO International, Inc. (A) | 4,989 | 583,813 | |||
| 46,253,279 | |||||
| Transportation infrastructure – 0.2% | |||||
| Aena SME SA (A)(B) | 6,970 | 1,114,322 | |||
| Aeroports de Paris (A) | 3,295 | 388,034 | |||
| Airports of Thailand PCL, NVDR | 511,400 | 1,010,413 | |||
| Atlantia SpA (A) | 55,047 | 1,031,121 | |||
| Auckland International Airport, Ltd. (A) | 189,831 | 964,445 | |||
| Bangkok Expressway & Metro PCL, NVDR (C) | 905,400 | 242,872 | |||
| Beijing Capital International Airport Company, Ltd., H Shares (A) | 200,211 | 120,528 | |||
| CCR SA | 133,215 | 315,596 | |||
| China Merchants Port Holdings Company, Ltd. | 164,031 | 275,954 | |||
| COSCO SHIPPING Ports, Ltd. | 205,108 | 170,567 | |||
| Getlink SE | 49,613 | 799,190 | |||
| Grupo Aeroportuario del Pacifico SAB de CV, B Shares (A) | 55,200 | 642,754 | |||
| Grupo Aeroportuario del Sureste SAB de CV, B Shares | 28,420 | 508,416 | |||
| International Container Terminal Services, Inc. | 110,410 | 413,203 | |||
| Jiangsu Expressway Company, Ltd., H Shares | 136,055 | 141,136 | |||
| Macquarie Infrastructure Corp. | 8,188 | 326,292 | |||
| Malaysia Airports Holdings BHD (A) | 114,422 | 182,520 | |||
| Promotora y Operadora de Infraestructura SAB de CV | 31,700 | 236,756 | |||
| Shenzhen International Holdings, Ltd. | 137,000 | 178,778 | |||
| Sydney Airport (A) | 147,794 | 857,966 | |||
| Taiwan High Speed Rail Corp. | 198,632 | 216,364 | |||
| Transurban Group | 303,959 | 3,146,057 | |||
| Westports Holdings BHD | 107,000 | 113,133 | |||
| Zhejiang Expressway Company, Ltd., H Shares | 166,982 | 146,430 | |||
| 13,542,847 | |||||
| 825,650,892 | |||||
| Shares or Principal Amount | Value | ||||
| COMMON STOCKS (continued) | |||||
| Information technology – 19.1% | |||||
| Communications equipment – 0.7% | |||||
| Accton Technology Corp. | 55,000 | $ | 557,224 | ||
| ADTRAN, Inc. | 5,484 | 113,299 | |||
| Arista Networks, Inc. (A) | 6,071 | 2,243,417 | |||
| Aviat Networks, Inc. (A) | 1,141 | 40,437 | |||
| BYD Electronic International Company, Ltd. (C) | 73,800 | 337,590 | |||
| CalAmp Corp. (A) | 4,432 | 50,259 | |||
| Calix, Inc. (A) | 6,165 | 287,289 | |||
| Cambium Networks Corp. (A) | 1,066 | 39,943 | |||
| Casa Systems, Inc. (A) | 4,106 | 28,906 | |||
| Ciena Corp. (A) | 41,309 | 2,359,983 | |||
| Cisco Systems, Inc. | 465,612 | 27,480,420 | |||
| Clearfield, Inc. (A) | 1,395 | 63,207 | |||
| Comtech Telecommunications Corp. | 3,016 | 76,968 | |||
| Digi International, Inc. (A) | 3,898 | 85,678 | |||
| DZS, Inc. (A) | 2,312 | 31,929 | |||
| EchoStar Corp., Class A (A) | 4,717 | 127,359 | |||
| EMCORE Corp. (A) | 4,677 | 34,984 | |||
| Extreme Networks, Inc. (A) | 14,090 | 152,595 | |||
| F5 Networks, Inc. (A) | 6,587 | 1,340,916 | |||
| Harmonic, Inc. (A) | 10,268 | 94,876 | |||
| Infinera Corp. (A) | 20,224 | 171,297 | |||
| Inseego Corp. (A)(C) | 9,686 | 81,362 | |||
| Juniper Networks, Inc. | 36,210 | 1,049,366 | |||
| KMW Company, Ltd. (A) | 3,054 | 111,947 | |||
| Lumentum Holdings, Inc. (A) | 20,233 | 1,752,987 | |||
| Motorola Solutions, Inc. | 18,746 | 4,578,148 | |||
| NETGEAR, Inc. (A) | 3,376 | 120,624 | |||
| NetScout Systems, Inc. (A) | 27,537 | 755,065 | |||
| Nokia OYJ (A) | 731,029 | 4,391,387 | |||
| Plantronics, Inc. (A) | 3,885 | 115,695 | |||
| Ribbon Communications, Inc. (A) | 8,280 | 54,068 | |||
| Telefonaktiebolaget LM Ericsson, B Shares | 342,705 | 4,059,376 | |||
| ViaSat, Inc. (A) | 18,144 | 936,956 | |||
| Viavi Solutions, Inc. (A) | 25,667 | 418,115 | |||
| ZTE Corp., H Shares | 83,715 | 294,864 | |||
| 54,438,536 | |||||
| Electronic equipment, instruments and components – 1.3% | |||||
| 908 Devices, Inc. (A) | 886 | 31,896 | |||
| AAC Technologies Holdings, Inc. | 79,100 | 438,504 | |||
| Advanced Energy Industries, Inc. | 4,339 | 391,291 | |||
| Akoustis Technologies, Inc. (A)(C) | 5,495 | 54,510 | |||
| Amphenol Corp., Class A | 66,028 | 5,059,726 | |||
| Arlo Technologies, Inc. (A) | 9,980 | 61,876 | |||
| Arrow Electronics, Inc. (A) | 19,771 | 2,396,641 | |||
| AU Optronics Corp. | 897,851 | 566,089 | |||
| Avnet, Inc. | 26,525 | 1,073,202 | |||
| Azbil Corp. | 12,900 | 559,395 | |||
| Badger Meter, Inc. | 3,259 | 349,006 | |||
| Belden, Inc. | 16,897 | 967,353 | |||
| Benchmark Electronics, Inc. | 4,005 | 108,255 | |||
| CDW Corp. | 15,490 | 3,107,449 | |||
| Cognex Corp. | 47,079 | 4,172,141 | |||
| Coherent, Inc. (A) | 6,539 | 1,652,209 | |||
| Corning, Inc. | 85,598 | 3,423,064 | |||
| CTS Corp. | 3,576 | 125,446 | |||
| Daktronics, Inc. (A) | 5,589 | 34,037 | |||
| Delta Electronics Thailand PCL | 30,200 | 546,843 | |||
| Delta Electronics Thailand PCL, NVDR | 7,100 | 128,562 | |||
| Delta Electronics, Inc. | 212,898 | 2,073,828 | |||
| ePlus, Inc. (A) | 1,480 | 160,166 | |||
| Fabrinet (A) | 4,141 | 426,606 | |||
| FARO Technologies, Inc. (A) | 2,053 | 141,534 | |||
| Foxconn Technology Company, Ltd. | 101,180 | 241,303 | |||
| The accompanying notes are an integral part of the financial statements. | 95 |
| Shares or Principal Amount | Value | ||||
| COMMON STOCKS (continued) | |||||
| Electronic equipment, instruments and components (continued) | |||||
| Halma PLC | 47,364 | $ | 1,955,934 | ||
| Hamamatsu Photonics KK | 14,600 | 850,932 | |||
| Hexagon AB, B Shares | 231,510 | 4,014,541 | |||
| Hirose Electric Company, Ltd. | 3,330 | 554,427 | |||
| Hon Hai Precision Industry Company, Ltd. | 1,365,172 | 5,451,553 | |||
| Ibiden Company, Ltd. | 11,100 | 597,250 | |||
| Identiv, Inc. (A) | 2,558 | 45,430 | |||
| II-VI, Inc. (A) | 39,747 | 2,503,266 | |||
| Innolux Corp. | 960,300 | 594,818 | |||
| Insight Enterprises, Inc. (A) | 3,889 | 400,139 | |||
| IPG Photonics Corp. (A) | 3,966 | 676,917 | |||
| Iteris, Inc. (A) | 5,633 | 32,108 | |||
| Itron, Inc. (A) | 5,086 | 427,275 | |||
| Jabil, Inc. | 35,699 | 2,205,484 | |||
| Keyence Corp. | 20,506 | 12,310,425 | |||
| Keysight Technologies, Inc. (A) | 20,354 | 3,651,101 | |||
| Kimball Electronics, Inc. (A) | 2,851 | 68,909 | |||
| Kingboard Holdings, Ltd. | 74,100 | 364,344 | |||
| Kingboard Laminates Holdings, Ltd. | 103,000 | 202,546 | |||
| Knowles Corp. (A) | 9,904 | 198,080 | |||
| Kyocera Corp. | 34,100 | 2,119,895 | |||
| Largan Precision Company, Ltd. | 10,590 | 1,021,041 | |||
| LG Display Company, Ltd. (A) | 27,747 | 488,102 | |||
| LG Innotek Company, Ltd. | 1,704 | 314,972 | |||
| Littelfuse, Inc. | 6,546 | 1,868,228 | |||
| Luna Innovations, Inc. (A) | 3,954 | 42,585 | |||
| Methode Electronics, Inc. | 4,223 | 196,665 | |||
| MicroVision, Inc. (A)(C) | 17,932 | 264,138 | |||
| Murata Manufacturing Company, Ltd. | 60,597 | 4,995,482 | |||
| Nan Ya Printed Circuit Board Corp. | 25,000 | 378,322 | |||
| Napco Security Technologies, Inc. (A) | 1,632 | 63,860 | |||
| National Instruments Corp. | 35,083 | 1,467,171 | |||
| nLight, Inc. (A) | 4,872 | 134,516 | |||
| Novanta, Inc. (A) | 3,734 | 572,123 | |||
| Omron Corp. | 19,567 | 1,843,721 | |||
| OSI Systems, Inc. (A) | 1,876 | 185,611 | |||
| Ouster, Inc. (A) | 3,627 | 30,467 | |||
| PAR Technology Corp. (A)(C) | 2,681 | 182,120 | |||
| PC Connection, Inc. | 1,209 | 58,528 | |||
| Plexus Corp. (A) | 3,151 | 289,356 | |||
| Rogers Corp. (A) | 2,101 | 446,273 | |||
| Samsung Electro-Mechanics Company, Ltd. | 6,627 | 1,051,625 | |||
| Samsung SDI Company, Ltd. | 6,449 | 4,395,553 | |||
| Sanmina Corp. (A) | 7,177 | 283,348 | |||
| ScanSource, Inc. (A) | 2,868 | 102,043 | |||
| Shimadzu Corp. | 24,900 | 1,115,697 | |||
| Sunny Optical Technology Group Company, Ltd. | 77,350 | 2,340,732 | |||
| SYNNEX Corp. | 11,058 | 1,405,140 | |||
| Synnex Technology International Corp. | 143,544 | 278,428 | |||
| TDK Corp. | 13,700 | 1,435,917 | |||
| TE Connectivity, Ltd. | 36,485 | 5,480,777 | |||
| Trimble, Inc. (A) | 27,728 | 2,612,532 | |||
| TTM Technologies, Inc. (A) | 11,723 | 164,122 | |||
| Unimicron Technology Corp. | 132,000 | 699,570 | |||
| Velodyne Lidar, Inc. (A)(C) | 8,226 | 54,292 | |||
| Venture Corp., Ltd. | 17,400 | 247,311 | |||
| Vishay Intertechnology, Inc. | 50,272 | 1,104,476 | |||
| Vishay Precision Group, Inc. (A) | 1,482 | 55,382 | |||
| Vontier Corp. | 44,998 | 1,636,577 | |||
| Walsin Technology Corp. (A) | 35,000 | 226,920 | |||
| WPG Holdings, Ltd. | 170,360 | 297,171 | |||
| Yageo Corp. | 40,726 | 701,158 | |||
| Shares or Principal Amount | Value | ||||
| COMMON STOCKS (continued) | |||||
| Electronic equipment, instruments and components (continued) | |||||
| Yokogawa Electric Corp. | 24,700 | $ | 386,387 | ||
| Zebra Technologies Corp., Class A (A) | 5,912 | 3,471,349 | |||
| Zhen Ding Technology Holding, Ltd. | 73,817 | 263,825 | |||
| 112,169,919 | |||||
| IT services – 3.0% | |||||
| 21Vianet Group, Inc., ADR (A) | 9,600 | 189,984 | |||
| Accenture PLC, Class A | 61,200 | 20,597,472 | |||
| Adyen NV (A)(B) | 2,207 | 7,133,189 | |||
| Afterpay, Ltd. (A) | 24,112 | 2,345,360 | |||
| Akamai Technologies, Inc. (A) | 15,693 | 1,777,232 | |||
| Alliance Data Systems Corp. | 13,255 | 1,300,448 | |||
| Amadeus IT Group SA (A) | 41,881 | 2,558,003 | |||
| Atos SE | 11,368 | 591,039 | |||
| Automatic Data Processing, Inc. | 40,969 | 8,564,160 | |||
| Bechtle AG | 10,680 | 772,212 | |||
| BigCommerce Holdings, Inc., Series 1 (A) | 5,333 | 317,527 | |||
| Brightcove, Inc. (A) | 4,817 | 54,721 | |||
| Broadridge Financial Solutions, Inc. | 11,181 | 1,925,592 | |||
| Cantaloupe, Inc. (A) | 6,877 | 70,420 | |||
| Capgemini SE | 18,228 | 4,097,423 | |||
| Cass Information Systems, Inc. | 1,671 | 75,329 | |||
| CGI, Inc. (A) | 24,081 | 2,152,240 | |||
| Chindata Group Holdings, Ltd., ADR (A) | 9,300 | 110,484 | |||
| Cognizant Technology Solutions Corp., Class A | 50,779 | 3,874,945 | |||
| Computershare, Ltd. | 60,497 | 726,967 | |||
| Concentrix Corp. (A) | 11,101 | 1,924,802 | |||
| Conduent, Inc. (A) | 19,074 | 139,240 | |||
| CSG Systems International, Inc. | 3,680 | 177,413 | |||
| DigitalOcean Holdings, Inc. (A)(C) | 1,481 | 91,348 | |||
| DXC Technology Company (A) | 24,533 | 900,852 | |||
| Edenred | 27,767 | 1,574,930 | |||
| EVERTEC, Inc. | 6,785 | 313,806 | |||
| EVO Payments, Inc., Class A (A) | 5,342 | 135,900 | |||
| ExlService Holdings, Inc. (A) | 3,679 | 453,032 | |||
| Fidelity National Information Services, Inc. | 59,706 | 7,628,636 | |||
| Fiserv, Inc. (A) | 57,344 | 6,754,550 | |||
| FleetCor Technologies, Inc. (A) | 8,025 | 2,112,822 | |||
| Fujitsu, Ltd. | 20,700 | 3,810,598 | |||
| Gartner, Inc. (A) | 8,287 | 2,558,528 | |||
| GDS Holdings, Ltd., ADR (A) | 9,600 | 561,408 | |||
| Genpact, Ltd. | 46,438 | 2,409,203 | |||
| Global Payments, Inc. | 28,423 | 4,622,717 | |||
| GMO Payment Gateway, Inc. | 4,300 | 564,154 | |||
| GreenSky, Inc., Class A (A) | 8,612 | 68,465 | |||
| Grid Dynamics Holdings, Inc. (A) | 3,456 | 92,517 | |||
| i3 Verticals, Inc., Class A (A) | 2,463 | 71,205 | |||
| IBM Corp. | 86,028 | 12,073,170 | |||
| International Money Express, Inc. (A) | 3,881 | 70,789 | |||
| Itochu Techno-Solutions Corp. | 9,800 | 302,791 | |||
| Jack Henry & Associates, Inc. | 7,152 | 1,261,470 | |||
| Kingsoft Cloud Holdings, Ltd., ADR (A)(C) | 5,900 | 189,921 | |||
| Limelight Networks, Inc. (A) | 16,545 | 44,672 | |||
| LiveRamp Holdings, Inc. (A) | 25,593 | 1,254,057 | |||
| Mastercard, Inc., Class A | 84,224 | 29,160,876 | |||
| MAXIMUS, Inc. | 23,233 | 2,023,362 | |||
| MoneyGram International, Inc. (A) | 8,937 | 80,344 | |||
| NEC Corp. | 25,900 | 1,359,314 | |||
| Nexi SpA (A)(B)(C) | 49,000 | 1,021,377 | |||
| Nomura Research Institute, Ltd. | 36,900 | 1,383,763 | |||
| NTT Data Corp. | 66,600 | 1,198,600 | |||
| Nuvei Corp. (A)(B) | 6,036 | 782,362 | |||
| Obic Company, Ltd. | 7,300 | 1,386,047 | |||
| The accompanying notes are an integral part of the financial statements. | 96 |
| Shares or Principal Amount | Value | ||||
| COMMON STOCKS (continued) | |||||
| IT services (continued) | |||||
| Otsuka Corp. | 11,800 | $ | 610,849 | ||
| Paya Holdings, Inc. (A) | 9,390 | 90,614 | |||
| Paychex, Inc. | 30,879 | 3,534,719 | |||
| PayPal Holdings, Inc. (A) | 113,103 | 32,648,312 | |||
| Perficient, Inc. (A) | 3,665 | 436,941 | |||
| Rackspace Technology, Inc. (A) | 6,162 | 86,083 | |||
| Repay Holdings Corp. (A) | 8,876 | 204,237 | |||
| Sabre Corp. (A) | 85,162 | 956,369 | |||
| Samsung SDS Company, Ltd. | 4,099 | 608,434 | |||
| SCSK Corp. | 5,500 | 347,202 | |||
| Shopify, Inc., Class A (A) | 11,808 | 18,031,288 | |||
| The Hackett Group, Inc. | 3,169 | 62,112 | |||
| The Western Union Company | 39,401 | 852,638 | |||
| TIS, Inc. | 23,500 | 663,396 | |||
| TravelSky Technology, Ltd., H Shares | 102,900 | 192,756 | |||
| TTEC Holdings, Inc. | 2,073 | 218,619 | |||
| Tucows, Inc., Class A (A)(C) | 1,085 | 80,409 | |||
| Unisys Corp. (A) | 7,394 | 179,009 | |||
| VeriSign, Inc. (A) | 9,541 | 2,063,337 | |||
| Verra Mobility Corp. (A) | 15,196 | 235,690 | |||
| Visa, Inc., Class A | 162,887 | 37,317,412 | |||
| WEX, Inc. (A) | 11,927 | 2,189,439 | |||
| Wix.com, Ltd. (A) | 4,700 | 1,043,776 | |||
| Worldline SA (A)(B) | 26,943 | 2,399,085 | |||
| 254,846,514 | |||||
| Semiconductors and semiconductor equipment – 4.6% | |||||
| Advanced Micro Devices, Inc. (A) | 117,575 | 13,017,904 | |||
| Advantest Corp. | 21,100 | 1,817,799 | |||
| Alpha & Omega Semiconductor, Ltd. (A) | 2,488 | 72,276 | |||
| Ambarella, Inc. (A) | 3,931 | 407,134 | |||
| Amkor Technology, Inc. | 40,127 | 1,102,289 | |||
| Analog Devices, Inc. | 52,051 | 8,481,787 | |||
| Applied Materials, Inc. | 88,800 | 11,999,544 | |||
| ASE Technology Holding Company, Ltd. | 359,422 | 1,655,128 | |||
| ASM International NV | 5,320 | 2,064,121 | |||
| ASMedia Technology, Inc. | 3,000 | 223,772 | |||
| ASML Holding NV | 46,983 | 39,183,227 | |||
| Atomera, Inc. (A)(C) | 2,480 | 61,182 | |||
| Axcelis Technologies, Inc. (A) | 3,774 | 187,606 | |||
| AXT, Inc. (A) | 5,197 | 48,384 | |||
| Broadcom, Inc. | 39,510 | 19,644,767 | |||
| Brooks Automation, Inc. | 19,806 | 1,682,718 | |||
| CEVA, Inc. (A) | 2,593 | 125,112 | |||
| Cirrus Logic, Inc. (A) | 15,335 | 1,283,079 | |||
| CMC Materials, Inc. | 11,081 | 1,469,562 | |||
| Cohu, Inc. (A) | 5,431 | 193,778 | |||
| Cree, Inc. (A) | 30,782 | 2,615,854 | |||
| Daqo New Energy Corp., ADR (A) | 5,700 | 349,467 | |||
| Diodes, Inc. (A) | 4,884 | 472,918 | |||
| Disco Corp. | 3,000 | 871,490 | |||
| DSP Group, Inc. (A) | 2,806 | 61,451 | |||
| Enphase Energy, Inc. (A) | 13,131 | 2,281,249 | |||
| First Solar, Inc. (A) | 22,672 | 2,131,168 | |||
| Flat Glass Group Company, Ltd., H Shares (C) | 45,000 | 263,020 | |||
| FormFactor, Inc. (A) | 8,787 | 341,639 | |||
| Globalwafers Company, Ltd. | 24,000 | 750,002 | |||
| Hua Hong Semiconductor, Ltd. (A)(B) | 57,100 | 336,049 | |||
| Ichor Holdings, Ltd. (A) | 3,153 | 139,709 | |||
| Impinj, Inc. (A) | 2,136 | 124,507 | |||
| Infineon Technologies AG | 174,077 | 7,411,809 | |||
| Intel Corp. | 390,749 | 21,123,891 | |||
| KLA Corp. | 14,833 | 5,042,627 | |||
| Kopin Corp. (A)(C) | 9,154 | 53,826 | |||
| Kulicke & Soffa Industries, Inc. | 6,891 | 483,679 | |||
| Shares or Principal Amount | Value | ||||
| COMMON STOCKS (continued) | |||||
| Semiconductors and semiconductor equipment (continued) | |||||
| Lam Research Corp. | 13,801 | $ | 8,347,121 | ||
| Lasertec Corp. | 7,900 | 1,718,322 | |||
| Lattice Semiconductor Corp. (A) | 51,664 | 3,209,368 | |||
| MACOM Technology Solutions Holdings, Inc. (A) | 5,498 | 333,784 | |||
| MaxLinear, Inc. (A) | 7,896 | 412,408 | |||
| MediaTek, Inc. | 165,752 | 5,374,877 | |||
| Microchip Technology, Inc. | 26,469 | 4,165,162 | |||
| Micron Technology, Inc. (A) | 108,517 | 7,997,703 | |||
| MKS Instruments, Inc. | 14,757 | 2,171,935 | |||
| Monolithic Power Systems, Inc. | 4,162 | 2,059,899 | |||
| Nanya Technology Corp. | 139,196 | 331,924 | |||
| NeoPhotonics Corp. (A) | 6,054 | 56,544 | |||
| Novatek Microelectronics Corp. | 63,900 | 1,031,192 | |||
| NVE Corp. | 619 | 43,460 | |||
| NVIDIA Corp. | 241,146 | 53,980,532 | |||
| NXP Semiconductors NV | 26,684 | 5,740,529 | |||
| Onto Innovation, Inc. (A) | 5,499 | 407,641 | |||
| PDF Solutions, Inc. (A) | 3,619 | 81,500 | |||
| Phison Electronics Corp. | 17,884 | 274,090 | |||
| Photronics, Inc. (A) | 6,990 | 105,339 | |||
| Power Integrations, Inc. | 6,789 | 737,557 | |||
| Powertech Technology, Inc. | 80,199 | 325,005 | |||
| Qorvo, Inc. (A) | 10,895 | 2,048,587 | |||
| QUALCOMM, Inc. | 109,154 | 16,011,800 | |||
| Rambus, Inc. (A) | 12,642 | 300,880 | |||
| Realtek Semiconductor Corp. | 50,584 | 1,008,175 | |||
| Renesas Electronics Corp. (A) | 133,200 | 1,426,292 | |||
| Rohm Company, Ltd. | 9,400 | 903,687 | |||
| Semtech Corp. (A) | 24,584 | 1,718,913 | |||
| Silergy Corp. | 9,000 | 1,287,166 | |||
| Silicon Laboratories, Inc. (A) | 16,921 | 2,667,088 | |||
| SiTime Corp. (A) | 1,449 | 308,405 | |||
| SK Hynix, Inc. | 64,034 | 5,862,980 | |||
| Skyworks Solutions, Inc. | 15,976 | 2,930,957 | |||
| SMART Global Holdings, Inc. (A) | 1,624 | 78,699 | |||
| SolarEdge Technologies, Inc. (A) | 13,856 | 4,015,192 | |||
| STMicroelectronics NV | 77,985 | 3,473,974 | |||
| SUMCO Corp. | 29,400 | 618,952 | |||
| SunPower Corp. (A) | 9,042 | 194,855 | |||
| Synaptics, Inc. (A) | 13,352 | 2,533,943 | |||
| Taiwan Semiconductor Manufacturing Company, Ltd. | 2,692,915 | 59,069,686 | |||
| Teradyne, Inc. | 16,089 | 1,953,848 | |||
| Texas Instruments, Inc. | 89,367 | 17,061,054 | |||
| Tokyo Electron, Ltd. | 15,815 | 6,774,253 | |||
| Ultra Clean Holdings, Inc. (A) | 4,912 | 227,131 | |||
| United Microelectronics Corp. | 1,292,774 | 2,929,336 | |||
| Universal Display Corp. | 11,435 | 2,385,227 | |||
| Vanguard International Semiconductor Corp. | 99,302 | 528,204 | |||
| Veeco Instruments, Inc. (A) | 5,665 | 129,105 | |||
| Win Semiconductors Corp. | 37,000 | 439,103 | |||
| Winbond Electronics Corp. | 329,000 | 348,697 | |||
| Xilinx, Inc. | 23,789 | 3,701,331 | |||
| Xinyi Solar Holdings, Ltd. | 527,000 | 1,275,438 | |||
| 392,694,374 | |||||
| Software – 5.5% | |||||
| 8x8, Inc. (A) | 12,040 | 290,766 | |||
| A10 Networks, Inc. (A) | 6,894 | 95,758 | |||
| ACI Worldwide, Inc. (A) | 44,745 | 1,442,131 | |||
| Adobe, Inc. (A) | 49,438 | 32,812,001 | |||
| Agilysys, Inc. (A) | 2,159 | 122,696 | |||
| Agora, Inc., ADR (A)(C) | 5,300 | 179,776 | |||
| Alarm.com Holdings, Inc. (A) | 5,336 | 449,985 | |||
| The accompanying notes are an integral part of the financial statements. | 97 |
| Shares or Principal Amount | Value | ||||
| COMMON STOCKS (continued) | |||||
| Software (continued) | |||||
| Altair Engineering, Inc., Class A (A) | 5,124 | $ | 379,125 | ||
| American Software, Inc., Class A | 3,732 | 94,681 | |||
| ANSYS, Inc. (A) | 9,014 | 3,293,355 | |||
| Appfolio, Inc., Class A (A) | 2,115 | 249,782 | |||
| Appian Corp. (A) | 4,437 | 475,646 | |||
| Asana, Inc., Class A (A) | 8,328 | 629,180 | |||
| Aspen Technology, Inc. (A) | 18,131 | 2,347,965 | |||
| Autodesk, Inc. (A) | 22,755 | 7,056,098 | |||
| Avaya Holdings Corp. (A) | 9,333 | 188,247 | |||
| AVEVA Group PLC | 14,328 | 815,279 | |||
| Benefitfocus, Inc. (A) | 3,209 | 38,733 | |||
| Blackbaud, Inc. (A) | 18,459 | 1,286,408 | |||
| BlackBerry, Ltd. (A) | 56,489 | 643,849 | |||
| Blackline, Inc. (A) | 6,035 | 658,419 | |||
| Bottomline Technologies DE, Inc. (A) | 5,028 | 212,534 | |||
| Box, Inc., Class A (A) | 16,572 | 427,226 | |||
| BTRS Holdings, Inc. (A) | 5,485 | 59,841 | |||
| Cadence Design Systems, Inc. (A) | 28,780 | 4,704,954 | |||
| CDK Global, Inc. | 32,462 | 1,350,419 | |||
| Cerence, Inc. (A) | 14,342 | 1,555,246 | |||
| Ceridian HCM Holding, Inc. (A) | 35,009 | 3,933,261 | |||
| ChannelAdvisor Corp. (A) | 3,364 | 86,186 | |||
| Check Point Software Technologies, Ltd. (A) | 9,600 | 1,206,048 | |||
| China Youzan, Ltd. (A) | 1,488,000 | 208,311 | |||
| Citrix Systems, Inc. | 12,842 | 1,321,057 | |||
| Cleanspark, Inc. (A)(C) | 3,925 | 54,165 | |||
| Cloudera, Inc. (A) | 26,073 | 415,343 | |||
| CommVault Systems, Inc. (A) | 17,023 | 1,378,352 | |||
| Constellation Software, Inc. | 2,126 | 3,603,053 | |||
| Cornerstone OnDemand, Inc. (A) | 7,088 | 406,142 | |||
| CyberArk Software, Ltd. (A) | 3,300 | 554,202 | |||
| Dassault Systemes SE | 74,670 | 4,264,852 | |||
| Digimarc Corp. (A)(C) | 1,627 | 47,573 | |||
| Digital Turbine, Inc. (A) | 9,520 | 556,444 | |||
| Domo, Inc., Class B (A) | 3,115 | 278,793 | |||
| Douzone Bizon Company, Ltd. | 2,289 | 167,988 | |||
| Ebix, Inc. | 3,038 | 87,434 | |||
| eGain Corp. (A) | 2,743 | 32,313 | |||
| Envestnet, Inc. (A) | 20,623 | 1,647,159 | |||
| Fair Isaac Corp. (A) | 7,671 | 3,526,666 | |||
| Fortinet, Inc. (A) | 14,020 | 4,418,263 | |||
| GTY Technology Holdings, Inc. (A) | 4,099 | 30,251 | |||
| Intelligent Systems Corp. (A) | 935 | 36,082 | |||
| InterDigital, Inc. | 3,491 | 251,736 | |||
| Intuit, Inc. | 28,262 | 15,999,401 | |||
| j2 Global, Inc. (A) | 16,164 | 2,225,783 | |||
| JFrog, Ltd. (A) | 5,852 | 224,951 | |||
| Kingdee International Software Group Company, Ltd. (A) | 281,800 | 1,026,139 | |||
| Kingsoft Corp., Ltd. | 104,000 | 417,184 | |||
| Lightspeed Commerce, Inc. (A) | 10,264 | 1,139,441 | |||
| LivePerson, Inc. (A) | 7,217 | 462,610 | |||
| Manhattan Associates, Inc. (A) | 16,959 | 2,764,147 | |||
| Marathon Digital Holdings, Inc. (A) | 10,786 | 437,804 | |||
| Microsoft Corp. | 778,960 | 235,152,445 | |||
| MicroStrategy, Inc., Class A (A) | 884 | 613,761 | |||
| Mimecast, Ltd. (A) | 22,508 | 1,571,283 | |||
| Ming Yuan Cloud Group Holdings, Ltd. (A)(C) | 41,000 | 142,465 | |||
| Mitek Systems, Inc. (A) | 4,797 | 107,309 | |||
| Model N, Inc. (A) | 3,953 | 134,046 | |||
| Momentive Global, Inc. (A) | 14,510 | 284,541 | |||
| Nemetschek SE | 7,516 | 736,635 | |||
| Nice, Ltd. (A) | 5,327 | 1,546,948 | |||
| Shares or Principal Amount | Value | ||||
| COMMON STOCKS (continued) | |||||
| Software (continued) | |||||
| NortonLifeLock, Inc. | 59,980 | $ | 1,593,069 | ||
| OneConnect Financial Technology Company, Ltd., ADR (A) | 12,500 | 58,750 | |||
| OneSpan, Inc. (A) | 4,072 | 78,467 | |||
| Open Text Corp. | 29,499 | 1,618,219 | |||
| Oracle Corp. | 187,885 | 16,746,190 | |||
| Oracle Corp. Japan | 4,000 | 328,260 | |||
| PagerDuty, Inc. (A) | 9,143 | 391,320 | |||
| Paycom Software, Inc. (A) | 5,081 | 2,484,101 | |||
| Paylocity Holding Corp. (A) | 10,021 | 2,697,653 | |||
| Ping Identity Holding Corp. (A) | 4,978 | 129,179 | |||
| Progress Software Corp. | 4,903 | 228,284 | |||
| PROS Holdings, Inc. (A) | 4,570 | 197,607 | |||
| PTC, Inc. (A) | 10,877 | 1,432,066 | |||
| Q2 Holdings, Inc. (A) | 6,160 | 542,634 | |||
| QAD, Inc., Class A | 1,330 | 115,723 | |||
| Qualys, Inc. (A) | 12,810 | 1,503,638 | |||
| Rapid7, Inc. (A) | 6,189 | 752,087 | |||
| Rimini Street, Inc. (A) | 5,254 | 50,176 | |||
| Riot Blockchain, Inc. (A) | 9,521 | 355,324 | |||
| Sailpoint Technologies Holdings, Inc. (A) | 34,826 | 1,631,946 | |||
| salesforce.com, Inc. (A) | 99,879 | 26,494,902 | |||
| SAP SE | 138,790 | 20,847,639 | |||
| Sapiens International Corp. NV | 3,525 | 100,604 | |||
| ServiceNow, Inc. (A) | 20,421 | 13,143,772 | |||
| ShotSpotter, Inc. (A) | 1,025 | 40,826 | |||
| Sinch AB (A)(B) | 59,245 | 1,331,916 | |||
| Smith Micro Software, Inc. (A) | 5,905 | 29,466 | |||
| Sprout Social, Inc., Class A (A) | 4,984 | 606,054 | |||
| SPS Commerce, Inc. (A) | 4,045 | 548,219 | |||
| Sumo Logic, Inc. (A) | 9,259 | 193,050 | |||
| Synopsys, Inc. (A) | 15,778 | 5,242,083 | |||
| TeamViewer AG (A)(B) | 21,153 | 704,745 | |||
| Telos Corp. (A) | 1,997 | 65,901 | |||
| Temenos AG | 7,383 | 1,171,397 | |||
| Tenable Holdings, Inc. (A) | 10,277 | 455,990 | |||
| Teradata Corp. (A) | 29,217 | 1,597,878 | |||
| The Sage Group PLC | 136,699 | 1,396,042 | |||
| TOTVS SA | 54,000 | 413,553 | |||
| Trend Micro, Inc. | 14,000 | 766,909 | |||
| Tyler Technologies, Inc. (A) | 4,213 | 2,046,254 | |||
| Upland Software, Inc. (A) | 3,281 | 127,893 | |||
| Varonis Systems, Inc. (A) | 11,941 | 824,048 | |||
| Verint Systems, Inc. (A) | 7,194 | 321,140 | |||
| Veritone, Inc. (A) | 3,375 | 70,436 | |||
| VirnetX Holding Corp. (A)(C) | 8,109 | 36,409 | |||
| Vonage Holdings Corp. (A) | 27,305 | 385,001 | |||
| Weimob, Inc. (A)(B) | 183,000 | 268,255 | |||
| WiseTech Global, Ltd. | 16,186 | 568,956 | |||
| Workiva, Inc. (A) | 4,735 | 664,178 | |||
| Xero, Ltd. (A) | 14,623 | 1,617,352 | |||
| Xperi Holding Corp. | 11,935 | 255,051 | |||
| Yext, Inc. (A) | 12,675 | 171,366 | |||
| Zix Corp. (A) | 6,702 | 51,873 | |||
| Zuora, Inc., Class A (A) | 11,909 | 202,215 | |||
| 471,054,733 | |||||
| Technology hardware, storage and peripherals – 4.0% | |||||
| 3D Systems Corp. (A) | 13,688 | 416,663 | |||
| Acer, Inc. | 314,008 | 284,982 | |||
| Advantech Company, Ltd. | 41,834 | 582,475 | |||
| Apple, Inc. | 1,733,130 | 263,141,062 | |||
| Asustek Computer, Inc. | 77,354 | 903,014 | |||
| Avid Technology, Inc. (A) | 4,089 | 105,537 | |||
| Brother Industries, Ltd. | 25,100 | 515,092 | |||
| Canon, Inc. | 105,496 | 2,509,974 | |||
| The accompanying notes are an integral part of the financial statements. | 98 |
| Shares or Principal Amount | Value | ||||
| COMMON STOCKS (continued) | |||||
| Technology hardware, storage and peripherals (continued) | |||||
| Catcher Technology Company, Ltd. | 76,475 | $ | 459,961 | ||
| Compal Electronics, Inc. | 455,148 | 375,603 | |||
| Corsair Gaming, Inc. (A)(C) | 3,006 | 87,024 | |||
| Diebold Nixdorf, Inc. (A) | 8,327 | 90,598 | |||
| Eastman Kodak Company (A) | 5,803 | 42,246 | |||
| FUJIFILM Holdings Corp. | 38,015 | 3,128,337 | |||
| Hewlett Packard Enterprise Company | 144,287 | 2,230,677 | |||
| HP, Inc. | 132,722 | 3,947,152 | |||
| Inventec Corp. | 281,495 | 246,257 | |||
| Lenovo Group, Ltd. | 787,764 | 868,929 | |||
| Lite-On Technology Corp. | 229,018 | 504,987 | |||
| Logitech International SA | 19,121 | 1,957,796 | |||
| Micro-Star International Company, Ltd. | 73,300 | 343,911 | |||
| NCR Corp. (A) | 34,895 | 1,482,340 | |||
| NetApp, Inc. | 24,594 | 2,187,144 | |||
| Pegatron Corp. | 218,500 | 510,262 | |||
| Quanta Computer, Inc. | 295,000 | 834,278 | |||
| Quantum Corp. (A) | 7,246 | 45,215 | |||
| Ricoh Company, Ltd. | 70,700 | 719,398 | |||
| Samsung Electronics Company, Ltd. | 558,666 | 36,882,140 | |||
| Seagate Technology Holdings PLC | 22,000 | 1,926,980 | |||
| Seiko Epson Corp. | 29,669 | 552,578 | |||
| Super Micro Computer, Inc. (A) | 4,837 | 176,744 | |||
| Turtle Beach Corp. (A) | 1,789 | 50,825 | |||
| Western Digital Corp. (A) | 33,859 | 2,139,889 | |||
| Wistron Corp. | 294,580 | 290,944 | |||
| Wiwynn Corp. | 9,000 | 314,196 | |||
| Xerox Holdings Corp. | 42,982 | 967,525 | |||
| Xiaomi Corp., Class B (A)(B) | 1,560,700 | 5,030,779 | |||
| 336,853,514 | |||||
| 1,622,057,590 | |||||
| Materials – 4.5% | |||||
| Chemicals – 2.1% | |||||
| AdvanSix, Inc. (A) | 3,087 | 112,676 | |||
| Air Liquide SA | 53,779 | 9,639,475 | |||
| Air Products & Chemicals, Inc. | 21,312 | 5,743,797 | |||
| Akzo Nobel NV | 21,453 | 2,643,852 | |||
| Albemarle Corp. | 11,240 | 2,660,958 | |||
| American Vanguard Corp. | 3,618 | 55,464 | |||
| Amyris, Inc. (A) | 18,946 | 285,137 | |||
| Arkema SA | 6,990 | 929,006 | |||
| Asahi Kasei Corp. | 133,400 | 1,375,364 | |||
| Ashland Global Holdings, Inc. | 14,565 | 1,327,017 | |||
| Avient Corp. | 34,540 | 1,799,189 | |||
| Balchem Corp. | 3,573 | 501,721 | |||
| Barito Pacific Tbk PT | 3,355,900 | 250,354 | |||
| BASF SE | 122,206 | 9,453,760 | |||
| Cabot Corp. | 21,409 | 1,143,241 | |||
| Celanese Corp. | 10,846 | 1,720,176 | |||
| CF Industries Holdings, Inc. | 20,657 | 938,241 | |||
| Chase Corp. | 783 | 89,654 | |||
| Chr. Hansen Holding A/S | 11,572 | 1,067,315 | |||
| Clariant AG (A) | 24,028 | 505,668 | |||
| Corteva, Inc. | 70,982 | 3,121,079 | |||
| Covestro AG (B) | 25,850 | 1,675,274 | |||
| Croda International PLC | 17,372 | 2,186,815 | |||
| Danimer Scientific, Inc. (A) | 7,861 | 153,604 | |||
| Dow, Inc. | 71,934 | 4,524,649 | |||
| DuPont de Nemours, Inc. | 51,245 | 3,793,155 | |||
| Eastman Chemical Company | 13,146 | 1,487,601 | |||
| Ecolab, Inc. | 23,956 | 5,398,724 | |||
| Ecovyst, Inc. | 5,822 | 75,744 | |||
| EMS-Chemie Holding AG | 750 | 812,664 | |||
| Evonik Industries AG | 27,915 | 942,524 | |||
| Ferro Corp. (A) | 9,175 | 190,840 | |||
| Shares or Principal Amount | Value | ||||
| COMMON STOCKS (continued) | |||||
| Chemicals (continued) | |||||
| FMC Corp. | 12,411 | $ | 1,162,042 | ||
| Formosa Chemicals & Fibre Corp. | 384,471 | 1,164,630 | |||
| Formosa Plastics Corp. | 419,040 | 1,547,245 | |||
| FutureFuel Corp. | 3,710 | 29,717 | |||
| GCP Applied Technologies, Inc. (A) | 5,626 | 134,124 | |||
| Givaudan SA | 1,018 | 5,107,283 | |||
| Hawkins, Inc. | 2,226 | 84,321 | |||
| HB Fuller Company | 5,794 | 391,501 | |||
| ICL Group, Ltd. | 60,683 | 429,442 | |||
| Indorama Ventures PCL, NVDR | 205,100 | 278,015 | |||
| Ingevity Corp. (A) | 15,201 | 1,222,008 | |||
| Innospec, Inc. | 2,735 | 255,996 | |||
| International Flavors & Fragrances, Inc. | 23,971 | 3,631,607 | |||
| Intrepid Potash, Inc. (A) | 1,240 | 38,452 | |||
| Johnson Matthey PLC | 24,234 | 979,751 | |||
| JSR Corp. | 21,500 | 744,979 | |||
| Kansai Paint Company, Ltd. | 18,600 | 481,747 | |||
| Koninklijke DSM NV | 19,231 | 4,094,224 | |||
| Koppers Holdings, Inc. (A) | 2,476 | 81,460 | |||
| Kraton Corp. (A) | 3,567 | 150,242 | |||
| Kronos Worldwide, Inc. | 2,615 | 34,623 | |||
| Kumho Petrochemical Company, Ltd. | 2,178 | 364,145 | |||
| LANXESS AG | 11,271 | 821,573 | |||
| LG Chem, Ltd. | 5,377 | 3,503,686 | |||
| Linde PLC | 50,095 | 15,759,386 | |||
| Livent Corp. (A) | 16,600 | 412,842 | |||
| Lotte Chemical Corp. | 2,061 | 443,266 | |||
| LyondellBasell Industries NV, Class A | 24,792 | 2,487,877 | |||
| Minerals Technologies, Inc. | 12,686 | 997,627 | |||
| Mitsubishi Chemical Holdings Corp. | 134,750 | 1,183,113 | |||
| Mitsubishi Gas Chemical Company, Inc. | 17,100 | 322,209 | |||
| Mitsui Chemicals, Inc. | 19,600 | 676,639 | |||
| Nan Ya Plastics Corp. | 564,610 | 1,824,565 | |||
| NewMarket Corp. | 1,952 | 682,673 | |||
| Nippon Paint Holdings Company, Ltd. | 74,700 | 927,715 | |||
| Nippon Sanso Holdings Corp. | 16,100 | 390,174 | |||
| Nissan Chemical Corp. | 13,100 | 734,478 | |||
| Nitto Denko Corp. | 16,044 | 1,217,111 | |||
| Novozymes A/S, B Shares | 22,960 | 1,856,020 | |||
| Nutrien, Ltd. | 60,551 | 3,681,101 | |||
| Olin Corp. | 38,196 | 1,903,689 | |||
| Orbia Advance Corp. SAB de CV | 143,080 | 408,851 | |||
| Orica, Ltd. | 45,889 | 439,049 | |||
| Orion Engineered Carbons SA (A) | 6,827 | 120,633 | |||
| Petronas Chemicals Group BHD | 270,245 | 539,374 | |||
| PPG Industries, Inc. | 22,831 | 3,642,686 | |||
| PTT Global Chemical PCL, NVDR (C) | 275,100 | 545,544 | |||
| PureCycle Technologies, Inc. (A)(C) | 3,907 | 57,472 | |||
| Quaker Chemical Corp. | 1,517 | 393,085 | |||
| Rayonier Advanced Materials, Inc. (A) | 7,603 | 53,677 | |||
| RPM International, Inc. | 34,524 | 2,840,980 | |||
| Sasol, Ltd. (A) | 62,928 | 967,326 | |||
| Sensient Technologies Corp. | 15,979 | 1,387,776 | |||
| Shin-Etsu Chemical Company, Ltd. | 37,437 | 6,183,388 | |||
| Sika AG | 15,726 | 5,666,176 | |||
| SK Chemicals Company, Ltd. | 902 | 209,457 | |||
| SKC Company, Ltd. | 2,486 | 340,271 | |||
| Solvay SA | 10,746 | 1,406,553 | |||
| Stepan Company | 2,340 | 275,090 | |||
| Sumitomo Chemical Company, Ltd. | 159,200 | 807,083 | |||
| Symrise AG | 16,887 | 2,403,188 | |||
| The Chemours Company | 44,125 | 1,478,629 | |||
| The Mosaic Company | 33,281 | 1,070,983 | |||
| The Scotts Miracle-Gro Company | 10,840 | 1,700,037 | |||
| The Sherwin-Williams Company | 23,049 | 6,999,290 | |||
| The accompanying notes are an integral part of the financial statements. | 99 |
| Shares or Principal Amount | Value | ||||
| COMMON STOCKS (continued) | |||||
| Chemicals (continued) | |||||
| Toray Industries, Inc. | 148,100 | $ | 998,596 | ||
| Tosoh Corp. | 28,200 | 511,842 | |||
| Tredegar Corp. | 3,312 | 43,983 | |||
| Trinseo SA | 4,337 | 225,220 | |||
| Tronox Holdings PLC, Class A | 12,904 | 272,662 | |||
| Umicore SA | 28,495 | 1,875,028 | |||
| Valvoline, Inc. | 48,271 | 1,455,853 | |||
| Yara International ASA | 26,388 | 1,325,282 | |||
| 175,483,100 | |||||
| Construction materials – 0.3% | |||||
| Anhui Conch Cement Company, Ltd., H Shares | 135,110 | 731,028 | |||
| Asia Cement Corp. | 235,687 | 381,507 | |||
| Cemex SAB de CV, Series CPO (A) | 2,057,888 | 1,698,854 | |||
| China National Building Material Company, Ltd., H Shares | 422,900 | 577,512 | |||
| China Resources Cement Holdings, Ltd. | 269,900 | 264,634 | |||
| CRH PLC | 90,784 | 4,809,367 | |||
| Eagle Materials, Inc. | 11,297 | 1,771,821 | |||
| Forterra, Inc. (A) | 3,332 | 76,769 | |||
| HeidelbergCement AG | 19,731 | 1,711,200 | |||
| Holcim, Ltd. (A) | 58,490 | 3,332,850 | |||
| Indocement Tunggal Prakarsa Tbk PT | 178,720 | 140,822 | |||
| James Hardie Industries PLC, CHESS Depositary Interest | 49,199 | 1,896,322 | |||
| Martin Marietta Materials, Inc. | 6,006 | 2,289,788 | |||
| POSCO Chemical Company, Ltd. | 3,646 | 487,132 | |||
| Semen Indonesia Persero Tbk PT | 358,492 | 232,166 | |||
| Summit Materials, Inc., Class A (A) | 13,221 | 445,151 | |||
| Taiwan Cement Corp. | 533,544 | 931,563 | |||
| The Siam Cement PCL, NVDR | 93,800 | 1,250,485 | |||
| United States Lime & Minerals, Inc. | 247 | 36,084 | |||
| Vulcan Materials Company | 12,775 | 2,375,256 | |||
| 25,440,311 | |||||
| Containers and packaging – 0.3% | |||||
| Amcor PLC | 148,470 | 1,907,840 | |||
| AptarGroup, Inc. | 17,518 | 2,361,426 | |||
| Avery Dennison Corp. | 7,994 | 1,801,768 | |||
| Ball Corp. | 31,610 | 3,033,296 | |||
| CCL Industries, Inc., Class B | 16,347 | 933,152 | |||
| Greif, Inc., Class A | 9,763 | 618,193 | |||
| Greif, Inc., Class B | 789 | 48,524 | |||
| International Paper Company | 37,724 | 2,266,835 | |||
| Klabin SA (A) | 78,142 | 397,601 | |||
| Myers Industries, Inc. | 4,160 | 94,848 | |||
| O-I Glass, Inc. (A) | 17,735 | 268,331 | |||
| Packaging Corp. of America | 9,148 | 1,387,752 | |||
| Pactiv Evergreen, Inc. | 4,922 | 67,678 | |||
| Ranpak Holdings Corp. (A) | 4,000 | 122,800 | |||
| SCG Packaging PCL, NVDR (C) | 154,700 | 335,853 | |||
| Sealed Air Corp. | 14,635 | 893,174 | |||
| Silgan Holdings, Inc. | 20,896 | 886,617 | |||
| Smurfit Kappa Group PLC | 28,283 | 1,621,008 | |||
| Sonoco Products Company | 26,821 | 1,751,411 | |||
| UFP Technologies, Inc. (A) | 868 | 60,751 | |||
| Westrock Company | 25,627 | 1,333,629 | |||
| 22,192,487 | |||||
| Metals and mining – 1.7% | |||||
| 1911 Gold Corp. (A) | 2,060 | 556 | |||
| African Rainbow Minerals, Ltd. | 12,397 | 220,933 | |||
| Agnico Eagle Mines, Ltd. | 25,640 | 1,475,420 | |||
| Allegheny Technologies, Inc. (A) | 14,365 | 256,559 | |||
| Aluminum Corp. of China, Ltd., H Shares (A) | 432,880 | 314,118 | |||
| Shares or Principal Amount | Value | ||||
| COMMON STOCKS (continued) | |||||
| Metals and mining (continued) | |||||
| Aneka Tambang Tbk | 1,005,900 | $ | 168,435 | ||
| Anglo American Platinum, Ltd. | 5,832 | 661,490 | |||
| Anglo American PLC | 159,895 | 6,753,245 | |||
| AngloGold Ashanti, Ltd. | 45,681 | 773,976 | |||
| Antofagasta PLC | 48,829 | 978,135 | |||
| ArcelorMittal SA | 81,850 | 2,745,248 | |||
| Arconic Corp. (A) | 12,412 | 428,090 | |||
| B2Gold Corp. | 114,528 | 442,989 | |||
| Barrick Gold Corp. | 187,502 | 3,768,914 | |||
| BHP Group PLC | 260,019 | 8,085,533 | |||
| BHP Group, Ltd. | 327,066 | 10,821,506 | |||
| BlueScope Steel, Ltd. | 55,754 | 1,019,312 | |||
| Boliden AB | 31,946 | 1,115,340 | |||
| Carpenter Technology Corp. | 5,395 | 179,923 | |||
| Century Aluminum Company (A) | 5,914 | 75,817 | |||
| China Hongqiao Group, Ltd. | 248,800 | 369,025 | |||
| China Molybdenum Company, Ltd., H Shares | 355,500 | 277,349 | |||
| China Steel Corp. | 1,283,958 | 1,763,725 | |||
| Cia de Minas Buenaventura SAA, ADR (A) | 40,100 | 300,750 | |||
| Cia Siderurgica Nacional SA | 76,466 | 515,511 | |||
| Cleveland-Cliffs, Inc. (A) | 122,478 | 2,874,559 | |||
| Coeur Mining, Inc. (A) | 27,956 | 197,090 | |||
| Commercial Metals Company | 45,537 | 1,485,417 | |||
| Compass Minerals International, Inc. | 12,869 | 861,322 | |||
| Constellium SE (A) | 13,789 | 278,814 | |||
| Eregli Demir ve Celik Fabrikalari TAS | 127,335 | 288,043 | |||
| Evolution Mining, Ltd. | 187,080 | 533,789 | |||
| Evraz PLC | 63,725 | 518,353 | |||
| First Quantum Minerals, Ltd. | 62,106 | 1,293,660 | |||
| Fortescue Metals Group, Ltd. | 187,706 | 2,861,625 | |||
| Franco-Nevada Corp. | 20,105 | 2,932,925 | |||
| Freeport-McMoRan, Inc. | 141,128 | 5,135,648 | |||
| Ganfeng Lithium Company, Ltd., H Shares (B)(C) | 28,200 | 649,717 | |||
| Gatos Silver, Inc. (A) | 4,218 | 60,486 | |||
| Glencore PLC (A) | 1,231,812 | 5,552,679 | |||
| Gold Fields, Ltd. | 97,131 | 922,486 | |||
| Grupo Mexico SAB de CV, Series B | 422,200 | 1,957,542 | |||
| Harmony Gold Mining Company, Ltd. | 60,143 | 224,341 | |||
| Haynes International, Inc. | 1,474 | 57,855 | |||
| Hecla Mining Company | 60,333 | 371,048 | |||
| Hitachi Metals, Ltd. (A) | 22,400 | 432,391 | |||
| Hyundai Steel Company | 10,321 | 452,122 | |||
| Impala Platinum Holdings, Ltd. | 87,927 | 1,347,103 | |||
| Industrias Penoles SAB de CV (A) | 18,165 | 256,059 | |||
| Ivanhoe Mines, Ltd., Class A (A) | 64,158 | 517,678 | |||
| JFE Holdings, Inc. | 52,200 | 846,677 | |||
| Jiangxi Copper Company, Ltd., H Shares | 119,825 | 242,457 | |||
| Kaiser Aluminum Corp. | 1,779 | 224,617 | |||
| KGHM Polska Miedz SA | 15,425 | 718,453 | |||
| Kinross Gold Corp. | 135,799 | 816,957 | |||
| Kirkland Lake Gold, Ltd. | 28,235 | 1,125,909 | |||
| Korea Zinc Company, Ltd. | 1,003 | 459,383 | |||
| Kumba Iron Ore, Ltd. (C) | 6,985 | 313,692 | |||
| Lundin Mining Corp. | 71,427 | 577,462 | |||
| Materion Corp. | 2,281 | 166,581 | |||
| Merdeka Copper Gold Tbk PT (A) | 1,271,200 | 251,197 | |||
| MMG, Ltd. (A) | 320,000 | 154,125 | |||
| MP Materials Corp. (A)(C) | 8,189 | 274,905 | |||
| Newcrest Mining, Ltd. | 90,452 | 1,633,091 | |||
| Newmont Corp. | 77,151 | 4,473,986 | |||
| Nippon Steel Corp. | 90,378 | 1,847,154 | |||
| Norsk Hydro ASA | 203,032 | 1,401,579 | |||
| The accompanying notes are an integral part of the financial statements. | 100 |
| Shares or Principal Amount | Value | ||||
| COMMON STOCKS (continued) | |||||
| Metals and mining (continued) | |||||
| Northam Platinum, Ltd. (A) | 39,321 | $ | 541,779 | ||
| Northern Star Resources, Ltd. | 121,807 | 866,527 | |||
| Novagold Resources, Inc. (A) | 27,223 | 196,822 | |||
| Nucor Corp. | 28,817 | 3,387,727 | |||
| Olympic Steel, Inc. | 1,137 | 30,995 | |||
| Pan American Silver Corp. | 22,147 | 575,069 | |||
| Perennial Energy Holdings, Ltd. | 85,000 | 18,661 | |||
| POSCO | 8,711 | 2,507,289 | |||
| Press Metal Aluminium Holdings BHD | 356,200 | 462,907 | |||
| Reliance Steel & Aluminum Company | 16,983 | 2,548,129 | |||
| Rio Tinto PLC | 137,997 | 10,209,601 | |||
| Rio Tinto, Ltd. | 41,287 | 3,359,321 | |||
| Royal Gold, Inc. | 17,489 | 1,947,050 | |||
| Ryerson Holding Corp. | 1,897 | 43,916 | |||
| Schnitzer Steel Industries, Inc., Class A | 2,919 | 138,098 | |||
| Shandong Gold Mining Company, Ltd., H Shares (B)(C) | 67,000 | 108,267 | |||
| Sibanye Stillwater, Ltd. | 310,862 | 1,269,577 | |||
| South32, Ltd. | 527,560 | 1,202,332 | |||
| Southern Copper Corp. | 15,900 | 995,181 | |||
| Steel Dynamics, Inc. | 53,490 | 3,610,040 | |||
| Sumitomo Metal Mining Company, Ltd. | 26,000 | 996,345 | |||
| SunCoke Energy, Inc. | 9,418 | 65,455 | |||
| Teck Resources, Ltd., Class B | 49,806 | 1,123,117 | |||
| TimkenSteel Corp. (A) | 5,221 | 71,423 | |||
| United States Steel Corp. | 71,885 | 1,922,924 | |||
| Vale SA | 437,871 | 8,356,369 | |||
| voestalpine AG | 19,005 | 862,731 | |||
| Warrior Met Coal, Inc. | 5,795 | 129,750 | |||
| Wheaton Precious Metals Corp. | 47,308 | 2,132,075 | |||
| Worthington Industries, Inc. | 13,150 | 762,043 | |||
| Yamana Gold, Inc. | 104,952 | 463,348 | |||
| Zhaojin Mining Industry Company, Ltd., H Shares (C) | 105,600 | 86,254 | |||
| Zijin Mining Group Company, Ltd., H Shares | 616,329 | 872,091 | |||
| 142,966,089 | |||||
| Paper and forest products – 0.1% | |||||
| Clearwater Paper Corp. (A) | 1,962 | 63,745 | |||
| Domtar Corp. (A) | 5,582 | 306,061 | |||
| Empresas CMPC SA | 131,410 | 291,911 | |||
| Glatfelter Corp. | 5,137 | 81,165 | |||
| Indah Kiat Pulp & Paper Tbk PT | 337,700 | 186,886 | |||
| Lee & Man Paper Manufacturing, Ltd. | 144,500 | 126,821 | |||
| Louisiana-Pacific Corp. | 27,258 | 1,729,248 | |||
| Mondi PLC | 61,105 | 1,685,577 | |||
| Neenah, Inc. | 1,936 | 97,555 | |||
| Nine Dragons Paper Holdings, Ltd. | 179,200 | 244,809 | |||
| Oji Holdings Corp. | 85,300 | 446,529 | |||
| Schweitzer-Mauduit International, Inc. | 3,543 | 135,591 | |||
| Stora Enso OYJ, R Shares | 78,722 | 1,544,472 | |||
| Suzano SA (A) | 82,467 | 972,864 | |||
| Svenska Cellulosa AB SCA, B Shares | 70,908 | 1,253,188 | |||
| UPM-Kymmene OYJ | 72,041 | 2,934,847 | |||
| Verso Corp., Class A | 3,508 | 66,827 | |||
| West Fraser Timber Company, Ltd. | 9,184 | 709,155 | |||
| 12,877,251 | |||||
| 378,959,238 | |||||
| Real estate – 4.1% | |||||
| Equity real estate investment trusts – 3.5% | |||||
| Acadia Realty Trust | 9,609 | 203,903 | |||
| Agree Realty Corp. | 7,395 | 551,297 | |||
| Alexander & Baldwin, Inc. | 8,146 | 170,088 | |||
| Alexander's, Inc. | 241 | 64,178 | |||
| Shares or Principal Amount | Value | ||||
| COMMON STOCKS (continued) | |||||
| Equity real estate investment trusts (continued) | |||||
| Alexandria Real Estate Equities, Inc. | 26,943 | $ | 5,560,227 | ||
| American Assets Trust, Inc. | 5,660 | 225,381 | |||
| American Campus Communities, Inc. | 36,752 | 1,868,839 | |||
| American Finance Trust, Inc. | 12,656 | 109,095 | |||
| American Tower Corp. | 89,305 | 26,092,242 | |||
| Apartment Income REIT Corp. | 41,806 | 2,124,581 | |||
| Apartment Investment and Management Company, Class A | 16,874 | 121,155 | |||
| Apple Hospitality REIT, Inc. | 23,481 | 347,049 | |||
| Armada Hoffler Properties, Inc. | 6,991 | 93,889 | |||
| Ascendas Real Estate Investment Trust | 194,500 | 438,990 | |||
| AvalonBay Communities, Inc. | 27,419 | 6,294,854 | |||
| Boston Properties, Inc. | 27,895 | 3,151,856 | |||
| Braemar Hotels & Resorts, Inc. (A) | 5,881 | 29,640 | |||
| Brandywine Realty Trust | 18,933 | 262,790 | |||
| Brixmor Property Group, Inc. | 79,161 | 1,856,325 | |||
| Broadstone Net Lease, Inc. | 15,949 | 437,003 | |||
| BRT Apartments Corp. | 1,763 | 34,237 | |||
| Camden Property Trust | 26,040 | 3,907,042 | |||
| Canadian Apartment Properties REIT | 9,580 | 464,022 | |||
| CapitaLand Integrated Commercial Trust | 276,476 | 422,272 | |||
| CareTrust REIT, Inc. | 10,942 | 240,615 | |||
| CatchMark Timber Trust, Inc., Class A | 6,164 | 71,133 | |||
| Centerspace | 1,479 | 149,645 | |||
| Chatham Lodging Trust (A) | 5,725 | 68,700 | |||
| City Office REIT, Inc. | 5,319 | 84,944 | |||
| Columbia Property Trust, Inc. | 12,891 | 215,538 | |||
| Community Healthcare Trust, Inc. | 2,626 | 127,387 | |||
| CorePoint Lodging, Inc. (A) | 4,719 | 68,237 | |||
| CoreSite Realty Corp. | 11,459 | 1,700,172 | |||
| Corporate Office Properties Trust | 42,437 | 1,195,875 | |||
| Cousins Properties, Inc. | 39,627 | 1,528,017 | |||
| Covivio | 5,824 | 555,068 | |||
| Crown Castle International Corp. | 84,884 | 16,526,066 | |||
| CTO Realty Growth, Inc. | 807 | 45,265 | |||
| CyrusOne, Inc. | 32,665 | 2,514,552 | |||
| Daiwa House REIT Investment Corp. | 202 | 596,592 | |||
| Dexus | 120,591 | 938,441 | |||
| DiamondRock Hospitality Company (A) | 23,809 | 215,233 | |||
| Digital Realty Trust, Inc. | 55,305 | 9,065,043 | |||
| DigitalBridge Group, Inc. (A) | 54,181 | 373,849 | |||
| Diversified Healthcare Trust | 27,580 | 103,425 | |||
| Douglas Emmett, Inc. | 43,970 | 1,451,450 | |||
| Duke Realty Corp. | 73,649 | 3,867,309 | |||
| Easterly Government Properties, Inc. | 9,433 | 201,583 | |||
| EastGroup Properties, Inc. | 15,065 | 2,715,617 | |||
| Empire State Realty Trust, Inc., Class A | 16,224 | 166,620 | |||
| EPR Properties | 19,932 | 1,011,549 | |||
| Equinix, Inc. | 17,594 | 14,839,659 | |||
| Equity Commonwealth | 12,493 | 329,066 | |||
| Equity Residential | 67,581 | 5,681,535 | |||
| Essential Properties Realty Trust, Inc. | 13,203 | 427,909 | |||
| Essex Property Trust, Inc. | 12,766 | 4,222,227 | |||
| Extra Space Storage, Inc. | 26,265 | 4,909,191 | |||
| Farmland Partners, Inc. | 3,387 | 41,491 | |||
| Federal Realty Investment Trust | 13,897 | 1,692,238 | |||
| Fibra Uno Administracion SA de CV | 434,800 | 490,135 | |||
| First Capital Real Estate Investment Trust | 1,590 | 22,710 | |||
| First Industrial Realty Trust, Inc. | 34,422 | 1,927,288 | |||
| Four Corners Property Trust, Inc. | 8,502 | 243,242 | |||
| Franklin Street Properties Corp. | 12,902 | 61,930 | |||
| Gecina SA | 5,137 | 798,535 | |||
| Getty Realty Corp. | 4,351 | 137,622 | |||
| Gladstone Commercial Corp. | 4,201 | 95,069 | |||
| Gladstone Land Corp. | 3,024 | 71,215 | |||
| The accompanying notes are an integral part of the financial statements. | 101 |
| Shares or Principal Amount | Value | ||||
| COMMON STOCKS (continued) | |||||
| Equity real estate investment trusts (continued) | |||||
| Global Medical REIT, Inc. | 6,589 | $ | 101,602 | ||
| Global Net Lease, Inc. | 10,745 | 182,665 | |||
| GLP J-REIT | 431 | 782,174 | |||
| Goodman Group | 184,822 | 3,121,666 | |||
| Growthpoint Properties, Ltd. | 370,458 | 394,680 | |||
| Healthcare Realty Trust, Inc. | 53,494 | 1,606,425 | |||
| Healthpeak Properties, Inc. | 105,850 | 3,810,600 | |||
| Hersha Hospitality Trust (A) | 4,146 | 38,889 | |||
| Highwoods Properties, Inc. | 27,738 | 1,267,349 | |||
| Host Hotels & Resorts, Inc. (A) | 138,681 | 2,296,557 | |||
| Hudson Pacific Properties, Inc. | 40,240 | 1,061,531 | |||
| Independence Realty Trust, Inc. | 11,254 | 230,482 | |||
| Indus Realty Trust, Inc. | 549 | 38,490 | |||
| Industrial Logistics Properties Trust | 7,222 | 198,099 | |||
| Innovative Industrial Properties, Inc. | 2,670 | 656,580 | |||
| Iron Mountain, Inc. | 56,708 | 2,707,807 | |||
| iStar, Inc. | 7,939 | 209,987 | |||
| Japan Metropolitan Fund Invest | 737 | 716,011 | |||
| Japan Real Estate Investment Corp. | 129 | 797,237 | |||
| JBG SMITH Properties | 29,446 | 887,208 | |||
| Kilroy Realty Corp. | 28,249 | 1,854,547 | |||
| Kimco Realty Corp. | 118,021 | 2,571,678 | |||
| Kite Realty Group Trust | 9,405 | 190,545 | |||
| Klepierre SA (A) | 23,191 | 568,551 | |||
| Lamar Advertising Company, Class A | 23,110 | 2,630,611 | |||
| Land Securities Group PLC | 87,624 | 855,793 | |||
| Lexington Realty Trust | 30,410 | 411,447 | |||
| Life Storage, Inc. | 20,488 | 2,549,527 | |||
| Link REIT | 148,925 | 1,369,276 | |||
| LTC Properties, Inc. | 4,369 | 150,774 | |||
| Mack-Cali Realty Corp. (A) | 9,973 | 178,317 | |||
| Mapletree Commercial Trust | 129,200 | 194,637 | |||
| Mapletree Logistics Trust | 180,500 | 271,520 | |||
| Medical Properties Trust, Inc. | 156,799 | 3,211,244 | |||
| Mid-America Apartment Communities, Inc. | 22,486 | 4,325,632 | |||
| Mirvac Group | 438,418 | 998,447 | |||
| Monmouth Real Estate Investment Corp. | 10,639 | 201,928 | |||
| National Health Investors, Inc. | 4,826 | 288,691 | |||
| National Retail Properties, Inc. | 46,805 | 2,228,386 | |||
| National Storage Affiliates Trust | 27,120 | 1,552,620 | |||
| NETSTREIT Corp. | 4,493 | 116,189 | |||
| New Senior Investment Group, Inc. | 9,417 | 82,210 | |||
| NexPoint Residential Trust, Inc. | 2,460 | 159,383 | |||
| Nippon Building Fund, Inc. | 155 | 1,006,560 | |||
| Nippon Prologis REIT, Inc. | 212 | 762,363 | |||
| Nomura Real Estate Master Fund, Inc. | 446 | 687,596 | |||
| Office Properties Income Trust | 5,632 | 149,417 | |||
| Omega Healthcare Investors, Inc. | 62,740 | 2,103,672 | |||
| One Liberty Properties, Inc. | 1,982 | 63,107 | |||
| Orix JREIT, Inc. | 275 | 490,186 | |||
| Outfront Media, Inc. (A) | 16,399 | 406,039 | |||
| Paramount Group, Inc. | 20,884 | 185,032 | |||
| Park Hotels & Resorts, Inc. (A) | 63,043 | 1,206,643 | |||
| Pebblebrook Hotel Trust | 49,685 | 1,094,561 | |||
| Physicians Realty Trust | 81,317 | 1,505,178 | |||
| Piedmont Office Realty Trust, Inc., Class A | 13,937 | 248,357 | |||
| Plymouth Industrial REIT, Inc. | 3,468 | 81,706 | |||
| Postal Realty Trust, Inc., Class A | 1,736 | 33,939 | |||
| PotlatchDeltic Corp. | 25,319 | 1,315,322 | |||
| Preferred Apartment Communities, Inc. | 6,015 | 75,067 | |||
| Prologis, Inc. | 145,296 | 19,565,559 | |||
| PS Business Parks, Inc. | 7,559 | 1,188,502 | |||
| Public Storage | 29,899 | 9,675,615 | |||
| QTS Realty Trust, Inc., Class A | 7,671 | 598,185 | |||
| Shares or Principal Amount | Value | ||||
| COMMON STOCKS (continued) | |||||
| Equity real estate investment trusts (continued) | |||||
| Rayonier, Inc. | 37,062 | $ | 1,363,140 | ||
| Realty Income Corp. | 73,373 | 5,298,998 | |||
| Regency Centers Corp. | 31,026 | 2,129,004 | |||
| Retail Opportunity Investments Corp. | 13,181 | 238,312 | |||
| Retail Properties of America, Inc., Class A | 24,151 | 319,276 | |||
| Retail Value, Inc. | 2,087 | 52,175 | |||
| Rexford Industrial Realty, Inc. | 35,737 | 2,213,192 | |||
| RioCan Real Estate Investment Trust | 18,978 | 337,096 | |||
| RLJ Lodging Trust | 18,546 | 267,619 | |||
| RPT Realty | 9,271 | 119,967 | |||
| Ryman Hospitality Properties, Inc. (A) | 6,058 | 503,238 | |||
| Sabra Health Care REIT, Inc. | 81,802 | 1,308,832 | |||
| Safehold, Inc. | 1,993 | 178,593 | |||
| Saul Centers, Inc. | 1,388 | 63,959 | |||
| SBA Communications Corp. | 21,476 | 7,709,240 | |||
| Scentre Group | 575,941 | 1,197,883 | |||
| Segro PLC | 148,500 | 2,624,601 | |||
| Seritage Growth Properties, Class A (A) | 4,283 | 69,256 | |||
| Service Properties Trust | 18,820 | 215,113 | |||
| Simon Property Group, Inc. | 64,525 | 8,675,386 | |||
| SITE Centers Corp. | 19,482 | 313,855 | |||
| SL Green Realty Corp. | 18,488 | 1,295,639 | |||
| SmartCentres Real Estate Investment Trust | 1,565 | 37,846 | |||
| Spirit Realty Capital, Inc. | 30,646 | 1,586,543 | |||
| STAG Industrial, Inc. | 18,024 | 761,514 | |||
| Stockland | 265,107 | 893,382 | |||
| STORE Capital Corp. | 64,896 | 2,340,799 | |||
| Summit Hotel Properties, Inc. (A) | 12,060 | 112,399 | |||
| Sunstone Hotel Investors, Inc. (A) | 24,220 | 280,710 | |||
| Tanger Factory Outlet Centers, Inc. | 11,200 | 187,264 | |||
| Terreno Realty Corp. | 7,583 | 506,620 | |||
| The British Land Company PLC | 109,748 | 801,790 | |||
| The GEO Group, Inc. | 13,446 | 104,207 | |||
| The GPT Group | 215,434 | 762,692 | |||
| The Macerich Company | 66,868 | 1,142,105 | |||
| UDR, Inc. | 58,299 | 3,149,312 | |||
| UMH Properties, Inc. | 4,559 | 108,048 | |||
| Unibail-Rodamco-Westfield (A) | 6,612 | 579,408 | |||
| Unibail-Rodamco-Westfield (Euronext Amsterdam Exchange) (A) | 7,490 | 656,347 | |||
| United Urban Investment Corp. | 312 | 440,713 | |||
| Uniti Group, Inc. | 22,065 | 288,390 | |||
| Universal Health Realty Income Trust | 1,543 | 91,392 | |||
| Urban Edge Properties | 42,443 | 803,870 | |||
| Urstadt Biddle Properties, Inc., Class A | 3,677 | 70,157 | |||
| Ventas, Inc. | 73,680 | 4,121,659 | |||
| Vicinity Centres | 428,379 | 540,810 | |||
| Vornado Realty Trust | 30,836 | 1,291,412 | |||
| Washington Real Estate Investment Trust | 9,489 | 238,553 | |||
| Welltower, Inc. | 82,004 | 7,177,810 | |||
| Weyerhaeuser Company | 147,151 | 5,297,436 | |||
| Whitestone REIT | 5,034 | 49,384 | |||
| Xenia Hotels & Resorts, Inc. (A) | 12,949 | 225,572 | |||
| 298,273,058 | |||||
| Real estate management and development – 0.6% | |||||
| Agile Group Holdings, Ltd. | 126,600 | 145,183 | |||
| Aroundtown SA | 132,365 | 1,014,270 | |||
| Ayala Land, Inc. | 880,670 | 596,965 | |||
| Azrieli Group, Ltd. | 3,824 | 357,475 | |||
| CapitaLand, Ltd. | 158,900 | 471,453 | |||
| CBRE Group, Inc., Class A (A) | 65,925 | 6,348,578 | |||
| Cencosud Shopping SA | 62,534 | 88,890 | |||
| Central Pattana PCL, NVDR (C) | 242,200 | 403,172 | |||
| China Aoyuan Group, Ltd. | 132,000 | 78,919 | |||
| China Evergrande Group (C) | 217,035 | 121,792 | |||
| The accompanying notes are an integral part of the financial statements. | 102 |
| Shares or Principal Amount | Value | ||||
| COMMON STOCKS (continued) | |||||
| Real estate management and development (continued) | |||||
| China Jinmao Holdings Group, Ltd. | 612,400 | $ | 199,093 | ||
| China Overseas Land & Investment, Ltd. | 421,797 | 971,688 | |||
| China Overseas Property Holdings, Ltd. | 140,000 | 119,396 | |||
| China Resources Land, Ltd. | 348,705 | 1,295,202 | |||
| China Resources Mixc Lifestyle Services, Ltd. (B) | 37,000 | 194,181 | |||
| China Vanke Company, Ltd., H Shares | 184,400 | 497,540 | |||
| CIFI Holdings Group Company, Ltd. | 358,700 | 241,126 | |||
| City Developments, Ltd. | 24,400 | 123,818 | |||
| CK Asset Holdings, Ltd. | 147,198 | 958,567 | |||
| Country Garden Holdings Company, Ltd. | 842,167 | 930,847 | |||
| Cushman & Wakefield PLC (A) | 13,314 | 241,516 | |||
| Daito Trust Construction Company, Ltd. | 6,900 | 757,799 | |||
| Daiwa House Industry Company, Ltd. | 60,000 | 1,829,624 | |||
| Dalian Wanda Commercial Properties Company, Ltd., H Shares (A)(B) | 37,400 | 253,903 | |||
| Deutsche Wohnen SE | 45,228 | 2,807,442 | |||
| ESR Cayman, Ltd. (A)(B) | 144,600 | 440,508 | |||
| eXp World Holdings, Inc. | 7,063 | 323,839 | |||
| Fastighets AB Balder, B Shares (A) | 12,384 | 886,300 | |||
| FirstService Corp. | 4,227 | 785,060 | |||
| Forestar Group, Inc. (A) | 2,077 | 43,181 | |||
| FRP Holdings, Inc. (A) | 856 | 49,391 | |||
| Greentown China Holdings, Ltd. (C) | 93,500 | 143,425 | |||
| Guangzhou R&F Properties Company, Ltd., H Shares | 187,400 | 159,779 | |||
| Hang Lung Properties, Ltd. | 144,000 | 345,806 | |||
| Henderson Land Development Company, Ltd. | 103,376 | 467,718 | |||
| Hongkong Land Holdings, Ltd. | 82,500 | 346,165 | |||
| Hopson Development Holdings, Ltd. | 70,900 | 276,205 | |||
| Hulic Company, Ltd. | 27,400 | 321,406 | |||
| Jones Lang LaSalle, Inc. (A) | 13,677 | 3,315,715 | |||
| Kaisa Group Holdings, Ltd. (A) | 308,800 | 102,788 | |||
| KE Holdings, Inc., ADR (A) | 38,700 | 700,083 | |||
| Kennedy-Wilson Holdings, Inc. | 13,448 | 295,722 | |||
| KWG Group Holdings, Ltd. | 139,500 | 146,865 | |||
| Land & Houses PCL, NVDR | 1,017,100 | 256,955 | |||
| LEG Immobilien SE | 9,502 | 1,515,645 | |||
| Lendlease Corp., Ltd. | 75,990 | 660,285 | |||
| Logan Group Company, Ltd. | 148,500 | 177,006 | |||
| Longfor Group Holdings, Ltd. (B) | 197,300 | 853,779 | |||
| Marcus & Millichap, Inc. (A) | 2,655 | 104,129 | |||
| Mitsubishi Estate Company, Ltd. | 125,200 | 1,960,177 | |||
| Mitsui Fudosan Company, Ltd. | 97,004 | 2,226,045 | |||
| NEPI Rockcastle PLC | 46,498 | 334,887 | |||
| New World Development Company, Ltd. | 108,064 | 508,294 | |||
| Newmark Group, Inc., Class A | 16,984 | 231,322 | |||
| Nomura Real Estate Holdings, Inc. | 12,500 | 320,116 | |||
| Poly Property Services Company, Ltd., H Shares | 12,800 | 78,245 | |||
| Powerlong Real Estate Holdings, Ltd. | 157,000 | 127,545 | |||
| Rafael Holdings, Inc., Class B (A) | 1,156 | 48,379 | |||
| RE/MAX Holdings, Inc., Class A | 2,174 | 72,807 | |||
| Realogy Holdings Corp. (A) | 12,910 | 226,571 | |||
| Redfin Corp. (A) | 11,512 | 559,138 | |||
| Ruentex Development Company, Ltd. | 89,620 | 223,814 | |||
| Seazen Group, Ltd. (A) | 236,800 | 209,730 | |||
| Shanghai Lujiazui Finance & Trade Zone Development Company, Ltd., B Shares | 113,851 | 102,294 | |||
| Shenzhen Investment, Ltd. | 294,900 | 87,533 | |||
| Shimao Group Holdings, Ltd. | 136,200 | 281,433 | |||
| Shimao Services Holdings, Ltd. (B) | 64,000 | 149,956 | |||
| Sino Land Company, Ltd. | 234,075 | 344,726 | |||
| SM Prime Holdings, Inc. | 1,096,200 | 747,827 | |||
| Shares or Principal Amount | Value | ||||
| COMMON STOCKS (continued) | |||||
| Real estate management and development (continued) | |||||
| Sumitomo Realty & Development Company, Ltd. | 32,783 | $ | 1,058,389 | ||
| Sun Hung Kai Properties, Ltd. | 95,000 | 1,339,877 | |||
| Sunac China Holdings, Ltd. | 279,700 | 715,142 | |||
| Sunac Services Holdings, Ltd. (B) | 68,000 | 177,154 | |||
| Swire Pacific, Ltd., Class A | 36,000 | 243,714 | |||
| Swire Properties, Ltd. | 83,000 | 224,326 | |||
| Swiss Prime Site AG | 8,234 | 881,088 | |||
| Tejon Ranch Company (A) | 2,498 | 48,012 | |||
| The RMR Group, Inc., Class A | 1,864 | 86,378 | |||
| The St. Joe Company | 3,771 | 174,484 | |||
| The Wharf Holdings, Ltd. | 150,125 | 506,682 | |||
| UOL Group, Ltd. | 28,600 | 148,428 | |||
| Vonovia SE | 71,190 | 4,806,098 | |||
| Wharf Real Estate Investment Company, Ltd. | 120,125 | 594,883 | |||
| Yuexiu Property Company, Ltd. | 150,900 | 141,452 | |||
| Zhenro Properties Group, Ltd. (C) | 142,000 | 82,890 | |||
| 53,836,030 | |||||
| 352,109,088 | |||||
| Utilities – 2.1% | |||||
| Electric utilities – 1.1% | |||||
| ALLETE, Inc. | 19,766 | 1,332,624 | |||
| Alliant Energy Corp. | 15,416 | 937,139 | |||
| American Electric Power Company, Inc. | 30,802 | 2,758,935 | |||
| AusNet Services, Ltd. | 202,296 | 285,708 | |||
| Centrais Eletricas Brasileiras SA | 35,200 | 256,165 | |||
| CEZ AS | 19,398 | 611,463 | |||
| Chubu Electric Power Company, Inc. | 67,300 | 813,819 | |||
| CK Infrastructure Holdings, Ltd. | 47,500 | 287,995 | |||
| CLP Holdings, Ltd. | 118,500 | 1,184,517 | |||
| CPFL Energia SA | 25,400 | 142,650 | |||
| Duke Energy Corp. | 47,410 | 4,961,931 | |||
| Edison International | 23,387 | 1,352,704 | |||
| EDP - Energias de Portugal SA | 289,062 | 1,586,819 | |||
| Electricite de France SA | 53,087 | 719,959 | |||
| Elia Group SA/NV | 4,307 | 540,940 | |||
| Emera, Inc. | 27,351 | 1,291,187 | |||
| Endesa SA | 29,557 | 710,614 | |||
| Enel Americas SA | 2,511,545 | 352,920 | |||
| Enel Chile SA | 3,121,141 | 159,315 | |||
| Enel SpA | 907,288 | 8,265,791 | |||
| Energisa SA | 19,400 | 166,469 | |||
| Entergy Corp. | 12,368 | 1,368,024 | |||
| Equatorial Energia SA | 99,590 | 490,169 | |||
| Evergy, Inc. | 14,131 | 967,267 | |||
| Eversource Energy | 21,170 | 1,920,754 | |||
| Exelon Corp. | 60,228 | 2,952,377 | |||
| FirstEnergy Corp. | 33,522 | 1,303,000 | |||
| Fortis, Inc. | 50,512 | 2,314,107 | |||
| Fortum OYJ | 60,081 | 1,826,161 | |||
| Hawaiian Electric Industries, Inc. | 29,105 | 1,268,978 | |||
| HK Electric Investments & HK Electric Investments, Ltd. | 154,000 | 153,169 | |||
| Hydro One, Ltd. (B) | 36,375 | 905,303 | |||
| Iberdrola SA | 536,207 | 6,644,391 | |||
| IDACORP, Inc. | 13,466 | 1,418,643 | |||
| Interconexion Electrica SA ESP | 154,887 | 932,819 | |||
| Korea Electric Power Corp. | 30,196 | 623,924 | |||
| Manila Electric Company | 23,440 | 132,808 | |||
| Mercury NZ, Ltd. | 102,695 | 481,460 | |||
| MGE Energy, Inc. | 3,892 | 313,462 | |||
| NextEra Energy, Inc. | 120,893 | 10,153,803 | |||
| NRG Energy, Inc. | 15,085 | 688,932 | |||
| OGE Energy Corp. | 53,360 | 1,889,478 | |||
| The accompanying notes are an integral part of the financial statements. | 103 |
| Shares or Principal Amount | Value | ||||
| COMMON STOCKS (continued) | |||||
| Electric utilities (continued) | |||||
| Origin Energy, Ltd. | 195,330 | $ | 631,364 | ||
| Orsted A/S (B) | 20,957 | 3,331,839 | |||
| Otter Tail Corp. | 4,664 | 255,914 | |||
| PGE Polska Grupa Energetyczna SA (A) | 92,909 | 244,622 | |||
| Pinnacle West Capital Corp. | 6,950 | 534,455 | |||
| PNM Resources, Inc. | 32,439 | 1,605,731 | |||
| Portland General Electric Company | 10,065 | 516,838 | |||
| Power Assets Holdings, Ltd. | 98,500 | 618,188 | |||
| PPL Corp. | 47,423 | 1,391,865 | |||
| Red Electrica Corp. SA | 39,336 | 784,499 | |||
| SSE PLC | 129,363 | 2,906,039 | |||
| Tenaga Nasional BHD | 253,536 | 638,037 | |||
| Terna - Rete Elettrica Nazionale | 152,807 | 1,208,713 | |||
| The Kansai Electric Power Company, Inc. | 73,700 | 740,630 | |||
| The Southern Company | 65,249 | 4,288,817 | |||
| Tohoku Electric Power Company, Inc. | 43,100 | 329,923 | |||
| Tokyo Electric Power Company Holdings, Inc. (A) | 162,900 | 427,874 | |||
| Verbund AG | 11,153 | 1,221,732 | |||
| Xcel Energy, Inc. | 33,172 | 2,280,575 | |||
| 91,426,348 | |||||
| Gas utilities – 0.3% | |||||
| AltaGas, Ltd. | 31,374 | 628,400 | |||
| APA Group | 129,199 | 865,126 | |||
| Atmos Energy Corp. | 8,054 | 785,346 | |||
| Beijing Enterprises Holdings, Ltd. | 58,714 | 202,061 | |||
| Brookfield Infrastructure Corp., Class A (C) | 4,144 | 263,558 | |||
| Chesapeake Utilities Corp. | 1,923 | 251,336 | |||
| China Gas Holdings, Ltd. | 335,800 | 972,011 | |||
| China Resources Gas Group, Ltd. | 100,100 | 606,795 | |||
| Enagas SA | 22,309 | 507,813 | |||
| ENN Energy Holdings, Ltd. | 85,800 | 1,697,780 | |||
| Hong Kong & China Gas Company, Ltd. | 799,124 | 1,284,798 | |||
| Kunlun Energy Company, Ltd. | 430,490 | 455,304 | |||
| National Fuel Gas Company | 24,305 | 1,259,242 | |||
| Naturgy Energy Group SA | 26,395 | 678,945 | |||
| New Jersey Resources Corp. | 36,563 | 1,365,262 | |||
| Northwest Natural Holding Company | 3,516 | 180,898 | |||
| ONE Gas, Inc. | 20,068 | 1,441,284 | |||
| Osaka Gas Company, Ltd. | 38,700 | 725,431 | |||
| Petronas Gas BHD | 85,699 | 346,482 | |||
| Snam SpA | 220,001 | 1,300,779 | |||
| South Jersey Industries, Inc. | 11,622 | 288,342 | |||
| Southwest Gas Holdings, Inc. | 21,802 | 1,532,899 | |||
| Spire, Inc. | 19,431 | 1,296,048 | |||
| Toho Gas Company, Ltd. | 7,545 | 351,725 | |||
| Tokyo Gas Company, Ltd. | 39,100 | 751,610 | |||
| UGI Corp. | 55,635 | 2,576,457 | |||
| 22,615,732 | |||||
| Independent power and renewable electricity producers – 0.1% | |||||
| B. Grimm Power PCL, NVDR | 90,400 | 129,630 | |||
| Brookfield Renewable Corp., Class A | 13,682 | 599,594 | |||
| China Common Rich Renewable Energy Investments, Ltd. (A)(D) | 1,136,000 | 31,404 | |||
| China Longyuan Power Group Corp., Ltd., H Shares | 363,300 | 740,459 | |||
| China Power International Development, Ltd. | 402,900 | 162,694 | |||
| China Resources Power Holdings Company, Ltd. | 214,332 | 526,683 | |||
| Clearway Energy, Inc., Class A | 3,607 | 107,272 | |||
| Clearway Energy, Inc., Class C | 9,607 | 301,564 | |||
| Colbun SA | 887,798 | 146,952 | |||
| Shares or Principal Amount | Value | ||||
| COMMON STOCKS (continued) | |||||
| Independent power and renewable electricity producers (continued) | |||||
| EDP Renovaveis SA | 30,089 | $ | 799,656 | ||
| Electricity Generating PCL, NVDR | 33,100 | 185,738 | |||
| Energy Absolute PCL, NVDR | 177,200 | 359,769 | |||
| Engie Brasil Energia SA | 20,483 | 148,746 | |||
| Global Power Synergy PCL, NVDR | 82,900 | 213,939 | |||
| Gulf Energy Development PCL | 43,000 | 55,660 | |||
| Gulf Energy Development PCL, NVDR | 299,200 | 387,287 | |||
| Huaneng Power International, Inc., H Shares | 387,864 | 187,617 | |||
| Meridian Energy, Ltd. | 192,712 | 711,761 | |||
| Northland Power, Inc. | 24,089 | 796,952 | |||
| Ormat Technologies, Inc. | 5,076 | 361,056 | |||
| Ratch Group PCL, NVDR | 98,800 | 144,778 | |||
| Sunnova Energy International, Inc. (A) | 9,726 | 352,081 | |||
| The AES Corp. | 41,063 | 980,174 | |||
| Uniper SE | 11,960 | 474,844 | |||
| 8,906,310 | |||||
| Multi-utilities – 0.5% | |||||
| AGL Energy, Ltd. | 68,631 | 322,892 | |||
| Algonquin Power & Utilities Corp. | 65,833 | 1,022,208 | |||
| Ameren Corp. | 15,751 | 1,381,678 | |||
| Atco, Ltd., Class I | 9,441 | 317,656 | |||
| Avista Corp. | 7,850 | 328,523 | |||
| Black Hills Corp. | 23,776 | 1,672,166 | |||
| Canadian Utilities, Ltd., Class A | 15,180 | 429,658 | |||
| CenterPoint Energy, Inc. | 35,779 | 897,695 | |||
| CMS Energy Corp. | 17,840 | 1,144,079 | |||
| Consolidated Edison, Inc. | 21,130 | 1,594,259 | |||
| Dominion Energy, Inc. | 49,710 | 3,869,426 | |||
| DTE Energy Company | 11,940 | 1,436,860 | |||
| E.ON SE | 296,412 | 3,910,729 | |||
| Engie SA | 207,067 | 2,967,227 | |||
| MDU Resources Group, Inc. | 53,634 | 1,725,406 | |||
| National Grid PLC | 437,383 | 5,657,206 | |||
| NiSource, Inc. | 24,173 | 595,864 | |||
| NorthWestern Corp. | 19,209 | 1,221,692 | |||
| Public Service Enterprise Group, Inc. | 31,131 | 1,990,516 | |||
| RWE AG | 85,227 | 3,327,922 | |||
| Sempra Energy | 19,419 | 2,570,299 | |||
| Suez SA | 38,554 | 894,631 | |||
| Unitil Corp. | 1,739 | 86,254 | |||
| Veolia Environnement SA | 61,035 | 2,094,556 | |||
| WEC Energy Group, Inc. | 19,442 | 1,836,880 | |||
| 43,296,282 | |||||
| Water utilities – 0.1% | |||||
| American States Water Company | 4,082 | 376,401 | |||
| American Water Works Company, Inc. | 11,185 | 2,038,466 | |||
| Artesian Resources Corp., Class A | 1,305 | 51,430 | |||
| Beijing Enterprises Water Group, Ltd. (A) | 477,700 | 197,021 | |||
| Cadiz, Inc. (A) | 2,534 | 34,057 | |||
| California Water Service Group | 5,720 | 363,506 | |||
| Cia de Saneamento Basico do Estado de Sao Paulo | 37,998 | 265,504 | |||
| Essential Utilities, Inc. | 59,589 | 2,957,402 | |||
| Global Water Resources, Inc. | 1,993 | 39,860 | |||
| Guangdong Investment, Ltd. | 321,980 | 447,159 | |||
| Middlesex Water Company | 1,945 | 212,802 | |||
| Pure Cycle Corp. (A) | 2,798 | 41,830 | |||
| Severn Trent PLC | 29,588 | 1,124,159 | |||
| SJW Group | 3,162 | 219,221 | |||
| The York Water Company | 1,596 | 82,306 | |||
| The accompanying notes are an integral part of the financial statements. | 104 |
| Shares or Principal Amount | Value | ||||
| COMMON STOCKS (continued) | |||||
| Water utilities (continued) | |||||
| United Utilities Group PLC | 84,721 | $ | 1,232,054 | ||
| 9,683,178 | |||||
| 175,927,850 | |||||
| TOTAL COMMON STOCKS (Cost $6,078,332,294) | $ | 7,873,003,553 | |||
| PREFERRED SECURITIES – 0.4% | |||||
| Consumer discretionary – 0.1% | |||||
| Automobiles – 0.1% | |||||
| Bayerische Motoren Werke AG | 7,461 | 624,619 | |||
| Hyundai Motor Company | 2,721 | 239,925 | |||
| Hyundai Motor Company, 2nd Preferred | 4,255 | 363,407 | |||
| Porsche Automobil Holding SE | 20,423 | 2,066,156 | |||
| Volkswagen AG | 24,774 | 5,892,608 | |||
| 9,186,715 | |||||
| Internet and direct marketing retail – 0.0% | |||||
| Lojas Americanas SA | 100,326 | 115,638 | |||
| Textiles, apparel and luxury goods – 0.0% | |||||
| Alpargatas SA (A) | 20,100 | 233,116 | |||
| 9,535,469 | |||||
| Consumer staples – 0.0% | |||||
| Household products – 0.0% | |||||
| Henkel AG & Company KGaA | 23,716 | 2,317,127 | |||
| Personal products – 0.0% | |||||
| LG Household & Health Care, Ltd. | 238 | 140,931 | |||
| 2,458,058 | |||||
| Energy – 0.0% | |||||
| Oil, gas and consumable fuels – 0.0% | |||||
| Petroleo Brasileiro SA | 525,733 | 2,764,501 | |||
| Financials – 0.1% | |||||
| Banks – 0.1% | |||||
| Banco Bradesco SA | 544,098 | 2,435,961 | |||
| Bancolombia SA | 155,759 | 1,297,596 | |||
| Itau Unibanco Holding SA | 534,767 | 3,199,832 | |||
| Itausa SA | 489,359 | 1,094,026 | |||
| 8,027,415 | |||||
| Health care – 0.0% | |||||
| Health care equipment and supplies – 0.0% | |||||
| Sartorius AG | 3,471 | 2,286,739 | |||
| Information technology – 0.1% | |||||
| Technology hardware, storage and peripherals – 0.1% | |||||
| Samsung Electronics Company, Ltd. | 96,523 | 5,884,666 | |||
| Materials – 0.1% | |||||
| Chemicals – 0.1% | |||||
| Braskem SA, A Shares (A) | 21,200 | 270,555 | |||
| Fuchs Petrolub SE | 9,059 | 458,738 | |||
| LG Chem, Ltd. | 899 | 267,451 | |||
| Sociedad Quimica y Minera de Chile SA, B Shares | 15,668 | 819,617 | |||
| 1,816,361 | |||||
| Metals and mining – 0.0% | |||||
| Bradespar SA | 24,600 | 300,435 | |||
| Gerdau SA | 126,683 | 693,831 | |||
| 994,266 | |||||
| 2,810,627 | |||||
| Utilities – 0.0% | |||||
| Electric utilities – 0.0% | |||||
| Centrais Eletricas Brasileiras SA, B Shares | 28,579 | 208,755 | |||
| Cia Energetica de Minas Gerais | 119,359 | 311,855 | |||
| Shares or Principal Amount | Value | ||||
| PREFERRED SECURITIES (continued) | |||||
| Electric utilities (continued) | |||||
| Cia Paranaense de Energia, B Shares | 116,800 | $ | 154,505 | ||
| 675,115 | |||||
| TOTAL PREFERRED SECURITIES (Cost $28,565,862) | $ | 34,442,590 | |||
| EXCHANGE-TRADED FUNDS – 2.4% | |||||
| iShares MSCI India ETF | 2,395,010 | 116,397,486 | |||
| iShares MSCI Russia ETF (C) | 239,440 | 10,827,477 | |||
| KraneShares Bosera MSCI China A ETF (C) | 339,628 | 15,334,204 | |||
| VanEck Vectors Russia ETF (C) | 1,040,234 | 30,458,052 | |||
| Xtrackers Harvest CSI 300 China A-Shares ETF (C) | 725,523 | 27,490,066 | |||
| TOTAL EXCHANGE-TRADED FUNDS (Cost $147,261,033) | $ | 200,507,285 | |||
| RIGHTS – 0.0% | |||||
| Pan American Silver Corp. (Expiration Date: 2-22-29) (A)(E) | 37,553 | 28,916 | |||
| TOTAL RIGHTS (Cost $11,142) | $ | 28,916 | |||
| WARRANTS – 0.0% | |||||
| BTS Group Holdings PCL (Expiration Date: 11-20-26; Strike Price: THB 14.90) (A) | 185,580 | 5,756 | |||
| BTS Group Holdings PCL (Expiration Date: 11-7-24; Strike Price: THB 11.90) (A) | 92,790 | 3,406 | |||
| BTS Group Holdings PCL (Expiration Date: 9-5-22; Strike Price: THB 9.90) (A) | 46,395 | 1,512 | |||
| Cie Financiere Richemont SA (Expiration Date: 11-22-23; Strike Price: CHF 67.00) (A) | 119,346 | 61,253 | |||
| Minor International PCL (Expiration Date: 2-15-24; Strike Price: THB 31.00) (A) | 9,247 | 1,257 | |||
| Minor International PCL (Expiration Date: 5-5-23; Strike Price: THB 28.00) (A) | 10,203 | 1,662 | |||
| Minor International PCL (Expiration Date: 7-31-23; Strike Price: THB 21.60) (A) | 20,359 | 6,692 | |||
| Minor International PCL (Expiration Date: 9-30-21; Strike Price: THB 41.88) (A) | 1,847 | 17 | |||
| Nabors Industries, Ltd. (Expiration Date: 6-11-26; Strike Price: $166.67) (A) | 439 | 2,546 | |||
| Srisawad Corp. PCL (Expiration Date: 8-29-25; Strike Price: THB 100.00) (A) | 4,236 | 1,784 | |||
| Whiting Petroleum Corp., Class A (Expiration Date: 9-1-24; Strike Price: $73.44) (A) | 701 | 3,827 | |||
| Whiting Petroleum Corp., Class B (Expiration Date: 9-1-25; Strike Price: $83.45) (A) | 350 | 2,030 | |||
| TOTAL WARRANTS (Cost $11,112) | $ | 91,742 | |||
| SHORT-TERM INVESTMENTS – 4.9% | |||||
| U.S. Government – 3.2% | |||||
| U.S. Treasury Bill | |||||
| 0.011%, 09/21/2021 * | $ | 4,000,000 | 3,999,917 | ||
| 0.040%, 09/09/2021 * | 110,000,000 | 109,999,099 | |||
| 0.040%, 09/28/2021 * | 29,000,000 | 28,999,239 | |||
| 0.042%, 09/28/2021 * | 56,000,000 | 55,998,530 | |||
| 0.050%, 10/26/2021 * | 16,600,000 | 16,598,605 | |||
| The accompanying notes are an integral part of the financial statements. | 105 |
| Shares or Principal Amount | Value | ||||
| SHORT-TERM INVESTMENTS (continued) | |||||
| U.S. Government (continued) | |||||
| U.S. Treasury Bill (continued) | |||||
| 0.050%, 10/28/2021 * | $ | 44,000,000 | $ | 43,996,168 | |
| 0.051%, 10/12/2021 * | 13,000,000 | 12,999,408 | |||
| 272,590,966 | |||||
| U.S. Government Agency – 0.5% | |||||
| Federal Home Loan Bank Discount Note | |||||
| 0.018%, 09/01/2021 * | 8,500,000 | 8,500,000 | |||
| 0.040%, 09/09/2021 * | 35,000,000 | 34,999,689 | |||
| 43,499,689 | |||||
| Short-term funds – 0.8% | |||||
| John Hancock Collateral Trust, 0.0356% (F)(G) | 6,704,524 | 67,092,842 | |||
| Repurchase agreement – 0.4% | |||||
| Repurchase Agreement with State Street Corp. dated 8-31-21 at 0.000% to be repurchased at $32,423,000 on 9-1-21, collateralized by $33,123,400 U.S. Treasury Notes, 0.125% due 8-31-23 (valued at $33,071,661) | $ | 32,423,000 | 32,423,000 | ||
| TOTAL SHORT-TERM INVESTMENTS (Cost $415,589,988) | $ | 415,606,497 | |||
| Total Investments (Strategic Equity Allocation Fund) (Cost $6,669,771,431) – 100.2% | $ | 8,523,680,583 | |||
| Other assets and liabilities, net – (0.2%) | (13,006,172) | ||||
| TOTAL NET ASSETS – 100.0% | $ | 8,510,674,411 | |||
| Currency Abbreviations | |
| CHF | Swiss Franc |
| THB | Thai Bhat |
| Security Abbreviations and Legend | |
| ADR | American Depositary Receipt |
| NVDR | Non-Voting Depositary Receipt |
| (A) | Non-income producing security. |
| (B) | These securities are exempt from registration under Rule 144A of the Securities Act of 1933. Such securities may be resold, normally to qualified institutional buyers, in transactions exempt from registration. |
| (C) | All or a portion of this security is on loan as of 8-31-21. |
| (D) | Security is valued using significant unobservable inputs and is classified as Level 3 in the fair value hierarchy. Refer to Note 2 to the financial statements. |
| (E) | Strike price and/or expiration date not available. |
| (F) | The rate shown is the annualized seven-day yield as of 8-31-21. |
| (G) | Investment is an affiliate of the fund, the advisor and/or subadvisor. This security represents the investment of cash collateral received for securities lending. |
| * | Yield represents either the annualized yield at the date of purchase, the stated coupon rate or, for floating rate securities, the rate at period end. |
| Open contracts | Number of contracts | Position | Expiration date | Notional basis^ | Notional value^ | Unrealized appreciation (depreciation) |
| Canadian Dollar Currency Futures | 150 | Long | Sep 2021 | $12,017,742 | $11,898,000 | $(119,742) |
| MSCI EAFE Index Futures | 1,070 | Long | Sep 2021 | 124,345,225 | 125,805,250 | 1,460,025 |
| MSCI Emerging Markets Index Futures | 882 | Long | Sep 2021 | 57,803,375 | 57,294,720 | (508,655) |
| Russell 2000 E-Mini Index Futures | 65 | Long | Sep 2021 | 7,052,229 | 7,381,400 | 329,171 |
| S&P 500 Index E-Mini Futures | 704 | Long | Sep 2021 | 152,323,970 | 159,121,600 | 6,797,630 |
| S&P Mid 400 Index E-Mini Futures | 137 | Long | Sep 2021 | 36,282,510 | 37,702,400 | 1,419,890 |
| S&P/TSX 60 Index Futures | 69 | Long | Sep 2021 | 13,180,514 | 13,452,717 | 272,203 |
| $9,650,522 |
| Shares or Principal Amount | Value | ||||
| COMMON STOCKS – 96.8% | |||||
| Communication services – 10.6% | |||||
| Diversified telecommunication services – 1.0% | |||||
| AT&T, Inc. | 196,668 | $ | 5,392,637 | ||
| Lumen Technologies, Inc. | 27,400 | 337,020 | |||
| Verizon Communications, Inc. | 114,036 | 6,271,980 | |||
| 12,001,637 | |||||
| Entertainment – 2.0% | |||||
| Activision Blizzard, Inc. | 25,671 | 2,114,520 | |||
| Electronic Arts, Inc. | 9,455 | 1,372,961 | |||
| Live Nation Entertainment, Inc. (A) | 4,773 | 413,819 | |||
| Netflix, Inc. (A) | 14,649 | 8,338,064 | |||
| Shares or Principal Amount | Value | ||||
| COMMON STOCKS (continued) | |||||
| Entertainment (continued) | |||||
| Take-Two Interactive Software, Inc. (A) | 3,821 | $ | 616,022 | ||
| The Walt Disney Company (A) | 60,029 | 10,883,258 | |||
| 23,738,644 | |||||
| Interactive media and services – 6.5% | |||||
| Alphabet, Inc., Class A (A) | 8,847 | 25,602,776 | |||
| Alphabet, Inc., Class C (A) | 8,376 | 24,367,794 | |||
| Facebook, Inc., Class A (A) | 70,480 | 26,738,702 | |||
| The accompanying notes are an integral part of the financial statements. | 106 |
| Shares or Principal Amount | Value | ||||
| COMMON STOCKS (continued) | |||||
| Interactive media and services (continued) | |||||
| Twitter, Inc. (A) | 23,477 | $ | 1,514,267 | ||
| 78,223,539 | |||||
| Media – 0.9% | |||||
| Charter Communications, Inc., Class A (A) | 3,146 | 2,569,212 | |||
| Comcast Corp., Class A | 104,732 | 6,355,138 | |||
| Discovery, Inc., Series A (A)(B) | 3,855 | 111,178 | |||
| Discovery, Inc., Series C (A) | 6,860 | 189,267 | |||
| DISH Network Corp., Class A (A) | 5,676 | 247,417 | |||
| Fox Corp., Class A | 7,469 | 279,639 | |||
| Fox Corp., Class B | 3,471 | 120,201 | |||
| News Corp., Class A | 8,935 | 200,769 | |||
| News Corp., Class B | 2,783 | 61,309 | |||
| Omnicom Group, Inc. | 4,913 | 359,730 | |||
| The Interpublic Group of Companies, Inc. | 8,986 | 334,549 | |||
| ViacomCBS, Inc., Class B | 13,833 | 573,378 | |||
| 11,401,787 | |||||
| Wireless telecommunication services – 0.2% | |||||
| T-Mobile US, Inc. (A) | 16,142 | 2,211,777 | |||
| 127,577,384 | |||||
| Consumer discretionary – 11.4% | |||||
| Auto components – 0.1% | |||||
| Aptiv PLC (A) | 5,344 | 813,303 | |||
| BorgWarner, Inc. | 4,739 | 202,261 | |||
| 1,015,564 | |||||
| Automobiles – 1.1% | |||||
| Ford Motor Company (A) | 77,471 | 1,009,447 | |||
| General Motors Company (A) | 25,224 | 1,236,228 | |||
| Tesla, Inc. (A) | 15,228 | 11,203,544 | |||
| 13,449,219 | |||||
| Distributors – 0.1% | |||||
| Genuine Parts Company | 4,396 | 537,147 | |||
| LKQ Corp. (A) | 8,458 | 445,652 | |||
| Pool Corp. | 1,221 | 603,540 | |||
| 1,586,339 | |||||
| Hotels, restaurants and leisure – 1.8% | |||||
| Booking Holdings, Inc. (A) | 1,159 | 2,665,318 | |||
| Caesars Entertainment, Inc. (A) | 5,890 | 598,601 | |||
| Carnival Corp. (A) | 22,531 | 543,898 | |||
| Chipotle Mexican Grill, Inc. (A) | 794 | 1,511,244 | |||
| Darden Restaurants, Inc. | 3,693 | 556,350 | |||
| Domino's Pizza, Inc. | 1,096 | 566,511 | |||
| Expedia Group, Inc. (A) | 3,992 | 576,844 | |||
| Hilton Worldwide Holdings, Inc. (A) | 7,861 | 981,524 | |||
| Las Vegas Sands Corp. (A) | 9,271 | 413,579 | |||
| Marriott International, Inc., Class A (A) | 7,536 | 1,018,415 | |||
| McDonald's Corp. | 21,059 | 5,000,670 | |||
| MGM Resorts International | 11,491 | 489,746 | |||
| Norwegian Cruise Line Holdings, Ltd. (A) | 10,441 | 269,795 | |||
| Penn National Gaming, Inc. (A) | 4,192 | 339,971 | |||
| Royal Caribbean Cruises, Ltd. (A) | 6,179 | 511,189 | |||
| Starbucks Corp. | 33,256 | 3,907,247 | |||
| Wynn Resorts, Ltd. (A) | 2,970 | 302,019 | |||
| Yum! Brands, Inc. | 8,408 | 1,101,700 | |||
| 21,354,621 | |||||
| Household durables – 0.4% | |||||
| D.R. Horton, Inc. | 10,364 | 991,006 | |||
| Garmin, Ltd. | 4,735 | 825,926 | |||
| Hamilton Beach Brands Holding Company, Class B | 294 | 4,998 | |||
| Leggett & Platt, Inc. | 4,209 | 203,674 | |||
| Lennar Corp., A Shares | 8,713 | 934,992 | |||
| Mohawk Industries, Inc. (A) | 1,850 | 365,856 | |||
| Shares or Principal Amount | Value | ||||
| COMMON STOCKS (continued) | |||||
| Household durables (continued) | |||||
| Newell Brands, Inc. | 11,959 | $ | 303,878 | ||
| NVR, Inc. (A) | 108 | 559,434 | |||
| PulteGroup, Inc. | 8,356 | 450,054 | |||
| Whirlpool Corp. | 1,979 | 438,408 | |||
| 5,078,226 | |||||
| Internet and direct marketing retail – 3.6% | |||||
| Amazon.com, Inc. (A) | 11,808 | 40,983,088 | |||
| eBay, Inc. | 17,827 | 1,368,044 | |||
| Etsy, Inc. (A) | 3,501 | 757,126 | |||
| 43,108,258 | |||||
| Leisure products – 0.0% | |||||
| Hasbro, Inc. | 4,042 | 397,369 | |||
| Multiline retail – 0.7% | |||||
| Dollar General Corp. | 10,028 | 2,235,341 | |||
| Dollar Tree, Inc. (A) | 9,848 | 891,638 | |||
| Target Corp. | 21,004 | 5,187,568 | |||
| 8,314,547 | |||||
| Specialty retail – 2.9% | |||||
| Advance Auto Parts, Inc. | 2,765 | 560,880 | |||
| AutoZone, Inc. (A) | 913 | 1,414,374 | |||
| Bath & Body Works, Inc. | 11,186 | 754,831 | |||
| Best Buy Company, Inc. | 9,419 | 1,097,408 | |||
| CarMax, Inc. (A) | 6,893 | 863,073 | |||
| Lowe's Companies, Inc. | 29,867 | 6,089,583 | |||
| O'Reilly Automotive, Inc. (A) | 2,948 | 1,751,348 | |||
| Ross Stores, Inc. | 15,067 | 1,783,933 | |||
| The Gap, Inc. | 8,775 | 234,556 | |||
| The Home Depot, Inc. | 44,925 | 14,653,637 | |||
| The TJX Companies, Inc. | 50,956 | 3,705,520 | |||
| Tractor Supply Company | 4,870 | 945,998 | |||
| Ulta Beauty, Inc. (A) | 2,314 | 896,235 | |||
| 34,751,376 | |||||
| Textiles, apparel and luxury goods – 0.7% | |||||
| Hanesbrands, Inc. | 11,030 | 206,040 | |||
| NIKE, Inc., Class B | 40,282 | 6,636,057 | |||
| PVH Corp. (A) | 2,252 | 235,987 | |||
| Ralph Lauren Corp. | 1,524 | 176,982 | |||
| Tapestry, Inc. (A) | 8,810 | 355,219 | |||
| Under Armour, Inc., Class A (A) | 5,961 | 137,938 | |||
| Under Armour, Inc., Class C (A) | 6,206 | 124,492 | |||
| VF Corp. | 10,160 | 776,935 | |||
| 8,649,650 | |||||
| 137,705,169 | |||||
| Consumer staples – 4.1% | |||||
| Beverages – 1.0% | |||||
| Brown-Forman Corp., Class B | 4,089 | 287,130 | |||
| Constellation Brands, Inc., Class A | 3,783 | 798,743 | |||
| Molson Coors Beverage Company, Class B | 4,217 | 200,434 | |||
| Monster Beverage Corp. (A) | 8,283 | 808,172 | |||
| PepsiCo, Inc. | 30,931 | 4,837,299 | |||
| The Coca-Cola Company | 86,875 | 4,891,931 | |||
| 11,823,709 | |||||
| Food and staples retailing – 1.2% | |||||
| Costco Wholesale Corp. | 12,363 | 5,631,223 | |||
| Sysco Corp. | 14,307 | 1,139,553 | |||
| The Kroger Company | 21,173 | 974,593 | |||
| Walgreens Boots Alliance, Inc. | 20,064 | 1,018,248 | |||
| Walmart, Inc. | 38,399 | 5,686,892 | |||
| 14,450,509 | |||||
| Food products – 0.6% | |||||
| Archer-Daniels-Midland Company | 12,508 | 750,480 | |||
| Campbell Soup Company | 4,545 | 189,663 | |||
| The accompanying notes are an integral part of the financial statements. | 107 |
| Shares or Principal Amount | Value | ||||
| COMMON STOCKS (continued) | |||||
| Food products (continued) | |||||
| Conagra Brands, Inc. | 10,745 | $ | 355,874 | ||
| General Mills, Inc. | 13,656 | 789,453 | |||
| Hormel Foods Corp. | 6,311 | 287,403 | |||
| Kellogg Company | 5,641 | 356,173 | |||
| Lamb Weston Holdings, Inc. | 3,275 | 213,366 | |||
| McCormick & Company, Inc. | 5,575 | 481,067 | |||
| Mondelez International, Inc., Class A | 31,448 | 1,951,977 | |||
| The Hershey Company | 3,277 | 582,323 | |||
| The J.M. Smucker Company | 2,453 | 303,363 | |||
| The Kraft Heinz Company | 14,513 | 522,323 | |||
| Tyson Foods, Inc., Class A | 6,599 | 518,153 | |||
| 7,301,618 | |||||
| Household products – 0.7% | |||||
| Church & Dwight Company, Inc. | 4,478 | 374,629 | |||
| Colgate-Palmolive Company | 15,447 | 1,204,094 | |||
| Kimberly-Clark Corp. | 6,161 | 849,047 | |||
| The Clorox Company | 2,271 | 381,642 | |||
| The Procter & Gamble Company | 44,705 | 6,365,545 | |||
| 9,174,957 | |||||
| Personal products – 0.1% | |||||
| The Estee Lauder Companies, Inc., Class A | 4,234 | 1,441,635 | |||
| Tobacco – 0.5% | |||||
| Altria Group, Inc. | 41,431 | 2,081,079 | |||
| Philip Morris International, Inc. | 34,892 | 3,593,876 | |||
| 5,674,955 | |||||
| 49,867,383 | |||||
| Energy – 2.1% | |||||
| Energy equipment and services – 0.2% | |||||
| Baker Hughes Company | 20,278 | 461,933 | |||
| Halliburton Company | 24,802 | 495,544 | |||
| NOV, Inc. (A) | 10,890 | 143,421 | |||
| Schlumberger NV | 38,981 | 1,093,027 | |||
| 2,193,925 | |||||
| Oil, gas and consumable fuels – 1.9% | |||||
| APA Corp. | 10,536 | 205,241 | |||
| Cabot Oil & Gas Corp. | 11,141 | 177,030 | |||
| Chevron Corp. | 53,879 | 5,213,871 | |||
| ConocoPhillips | 37,617 | 2,088,872 | |||
| Devon Energy Corp. | 16,605 | 490,678 | |||
| Diamondback Energy, Inc. | 5,046 | 389,248 | |||
| EOG Resources, Inc. | 16,269 | 1,098,483 | |||
| Exxon Mobil Corp. | 118,017 | 6,434,287 | |||
| Hess Corp. | 7,652 | 526,075 | |||
| Kinder Morgan, Inc. | 54,291 | 883,315 | |||
| Marathon Oil Corp. | 21,972 | 258,171 | |||
| Marathon Petroleum Corp. | 17,759 | 1,052,576 | |||
| Occidental Petroleum Corp. | 23,418 | 601,608 | |||
| ONEOK, Inc. | 12,420 | 652,298 | |||
| Phillips 66 | 12,206 | 867,725 | |||
| Pioneer Natural Resources Company | 6,461 | 967,018 | |||
| The Williams Companies, Inc. | 33,864 | 836,102 | |||
| Valero Energy Corp. | 11,395 | 755,602 | |||
| 23,498,200 | |||||
| 25,692,125 | |||||
| Financials – 10.7% | |||||
| Banks – 3.6% | |||||
| Bank of America Corp. | 207,197 | 8,650,475 | |||
| Citigroup, Inc. | 56,794 | 4,084,057 | |||
| Citizens Financial Group, Inc. | 11,703 | 512,474 | |||
| Comerica, Inc. | 3,836 | 283,519 | |||
| Fifth Third Bancorp | 19,342 | 751,630 | |||
| Shares or Principal Amount | Value | ||||
| COMMON STOCKS (continued) | |||||
| Banks (continued) | |||||
| First Republic Bank | 4,835 | $ | 961,875 | ||
| Huntington Bancshares, Inc. | 40,540 | 629,586 | |||
| JPMorgan Chase & Co. | 83,174 | 13,303,681 | |||
| KeyCorp | 26,666 | 541,853 | |||
| M&T Bank Corp. | 3,535 | 494,935 | |||
| People's United Financial, Inc. | 11,749 | 193,036 | |||
| Regions Financial Corp. | 26,413 | 539,618 | |||
| SVB Financial Group (A) | 1,612 | 901,914 | |||
| The PNC Financial Services Group, Inc. | 11,673 | 2,230,710 | |||
| Truist Financial Corp. | 36,951 | 2,108,424 | |||
| U.S. Bancorp | 37,247 | 2,137,605 | |||
| Wells Fargo & Company | 113,574 | 5,190,332 | |||
| Zions Bancorp NA | 4,501 | 260,608 | |||
| 43,776,332 | |||||
| Capital markets – 3.2% | |||||
| Ameriprise Financial, Inc. | 3,779 | 1,031,327 | |||
| BlackRock, Inc. | 4,625 | 4,362,716 | |||
| Cboe Global Markets, Inc. | 3,479 | 438,876 | |||
| CME Group, Inc. | 11,708 | 2,361,738 | |||
| Franklin Resources, Inc. | 8,880 | 288,067 | |||
| Intercontinental Exchange, Inc. | 18,349 | 2,193,256 | |||
| Invesco, Ltd. | 12,338 | 312,398 | |||
| MarketAxess Holdings, Inc. | 1,238 | 589,189 | |||
| Moody's Corp. | 5,249 | 1,998,662 | |||
| Morgan Stanley | 48,532 | 5,068,197 | |||
| MSCI, Inc. | 2,687 | 1,705,116 | |||
| Nasdaq, Inc. | 3,745 | 733,196 | |||
| Northern Trust Corp. | 6,786 | 804,277 | |||
| Raymond James Financial, Inc. | 3,988 | 557,921 | |||
| S&P Global, Inc. | 7,855 | 3,486,206 | |||
| State Street Corp. | 11,339 | 1,053,506 | |||
| T. Rowe Price Group, Inc. | 7,397 | 1,655,966 | |||
| The Bank of New York Mellon Corp. | 26,306 | 1,452,617 | |||
| The Charles Schwab Corp. | 48,904 | 3,562,656 | |||
| The Goldman Sachs Group, Inc. | 11,093 | 4,587,066 | |||
| 38,242,953 | |||||
| Consumer finance – 0.7% | |||||
| American Express Company | 21,216 | 3,521,007 | |||
| Capital One Financial Corp. | 14,721 | 2,443,244 | |||
| Discover Financial Services | 9,941 | 1,274,635 | |||
| Synchrony Financial | 17,636 | 877,391 | |||
| 8,116,277 | |||||
| Diversified financial services – 1.5% | |||||
| Berkshire Hathaway, Inc., Class B (A) | 61,799 | 17,660,300 | |||
| NewStar Financial, Inc. (A)(C) | 2,317 | 235 | |||
| 17,660,535 | |||||
| Insurance – 1.7% | |||||
| Aflac, Inc. | 18,359 | 1,040,588 | |||
| American International Group, Inc. | 24,924 | 1,359,853 | |||
| Aon PLC, Class A | 6,554 | 1,880,080 | |||
| Arthur J. Gallagher & Company | 5,951 | 854,683 | |||
| Assurant, Inc. | 1,759 | 299,223 | |||
| Chubb, Ltd. | 13,061 | 2,402,179 | |||
| Cincinnati Financial Corp. | 4,351 | 536,913 | |||
| Everest Re Group, Ltd. | 1,164 | 308,344 | |||
| Globe Life, Inc. | 2,754 | 264,577 | |||
| Lincoln National Corp. | 5,198 | 356,843 | |||
| Loews Corp. | 6,497 | 362,987 | |||
| Marsh & McLennan Companies, Inc. | 14,770 | 2,321,844 | |||
| MetLife, Inc. | 21,612 | 1,339,944 | |||
| Principal Financial Group, Inc. | 7,347 | 490,853 | |||
| Prudential Financial, Inc. | 11,444 | 1,211,691 | |||
| The Allstate Corp. | 8,694 | 1,176,124 | |||
| The accompanying notes are an integral part of the financial statements. | 108 |
| Shares or Principal Amount | Value | ||||
| COMMON STOCKS (continued) | |||||
| Insurance (continued) | |||||
| The Hartford Financial Services Group, Inc. | 10,374 | $ | 697,340 | ||
| The Progressive Corp. | 16,996 | 1,637,395 | |||
| The Travelers Companies, Inc. | 7,305 | 1,166,682 | |||
| Unum Group | 5,932 | 157,910 | |||
| W.R. Berkley Corp. | 4,070 | 306,512 | |||
| Willis Towers Watson PLC | 3,746 | 826,817 | |||
| 20,999,382 | |||||
| 128,795,479 | |||||
| Health care – 16.6% | |||||
| Biotechnology – 1.7% | |||||
| AbbVie, Inc. | 47,945 | 5,790,797 | |||
| Amgen, Inc. | 15,597 | 3,517,591 | |||
| Biogen, Inc. (A) | 4,087 | 1,385,125 | |||
| Gilead Sciences, Inc. | 34,046 | 2,477,868 | |||
| Incyte Corp. (A) | 5,075 | 388,187 | |||
| Moderna, Inc. (A) | 8,284 | 3,120,500 | |||
| Regeneron Pharmaceuticals, Inc. (A) | 2,842 | 1,913,803 | |||
| Vertex Pharmaceuticals, Inc. (A) | 7,027 | 1,407,438 | |||
| 20,001,309 | |||||
| Health care equipment and supplies – 6.0% | |||||
| Abbott Laboratories | 89,434 | 11,301,775 | |||
| ABIOMED, Inc. (A) | 2,280 | 829,829 | |||
| Align Technology, Inc. (A) | 3,625 | 2,570,125 | |||
| Baxter International, Inc. | 25,310 | 1,929,128 | |||
| Becton, Dickinson and Company | 14,638 | 3,684,385 | |||
| Boston Scientific Corp. (A) | 71,520 | 3,229,128 | |||
| Danaher Corp. | 31,953 | 10,357,884 | |||
| Dentsply Sirona, Inc. | 10,989 | 678,021 | |||
| DexCom, Inc. (A) | 4,868 | 2,577,217 | |||
| Edwards Lifesciences Corp. (A) | 31,289 | 3,666,445 | |||
| Hologic, Inc. (A) | 12,897 | 1,020,798 | |||
| IDEXX Laboratories, Inc. (A) | 4,292 | 2,891,778 | |||
| Intuitive Surgical, Inc. (A) | 5,960 | 6,279,218 | |||
| Medtronic PLC | 67,719 | 9,039,132 | |||
| ResMed, Inc. | 7,324 | 2,127,842 | |||
| STERIS PLC | 4,915 | 1,056,774 | |||
| Stryker Corp. | 16,498 | 4,571,596 | |||
| Teleflex, Inc. | 2,352 | 930,122 | |||
| The Cooper Companies, Inc. | 2,479 | 1,117,310 | |||
| West Pharmaceutical Services, Inc. | 3,716 | 1,678,220 | |||
| Zimmer Biomet Holdings, Inc. | 10,494 | 1,578,822 | |||
| 73,115,549 | |||||
| Health care providers and services – 4.1% | |||||
| AmerisourceBergen Corp. | 7,444 | 909,731 | |||
| Anthem, Inc. | 12,324 | 4,623,102 | |||
| Cardinal Health, Inc. | 14,604 | 766,564 | |||
| Centene Corp. (A) | �� | 29,331 | 1,847,266 | ||
| Cigna Corp. | 17,272 | 3,655,619 | |||
| CVS Health Corp. | 66,268 | 5,724,893 | |||
| DaVita, Inc. (A) | 3,528 | 461,357 | |||
| HCA Healthcare, Inc. | 13,228 | 3,346,419 | |||
| Henry Schein, Inc. (A) | 7,082 | 535,328 | |||
| Humana, Inc. | 6,494 | 2,632,797 | |||
| Laboratory Corp. of America Holdings (A) | 4,915 | 1,491,113 | |||
| McKesson Corp. | 7,962 | 1,625,363 | |||
| Quest Diagnostics, Inc. | 6,576 | 1,005,010 | |||
| UnitedHealth Group, Inc. | 47,500 | 19,772,825 | |||
| Shares or Principal Amount | Value | ||||
| COMMON STOCKS (continued) | |||||
| Health care providers and services (continued) | |||||
| Universal Health Services, Inc., Class B | 3,925 | $ | 611,358 | ||
| 49,008,745 | |||||
| Health care technology – 0.1% | |||||
| Cerner Corp. | 15,166 | 1,157,924 | |||
| Life sciences tools and services – 1.4% | |||||
| Agilent Technologies, Inc. | 9,938 | 1,743,821 | |||
| Bio-Rad Laboratories, Inc., Class A (A) | 706 | 568,203 | |||
| Charles River Laboratories International, Inc. (A) | 1,646 | 730,594 | |||
| Illumina, Inc. (A) | 4,781 | 2,185,682 | |||
| IQVIA Holdings, Inc. (A) | 6,277 | 1,630,325 | |||
| Mettler-Toledo International, Inc. (A) | 762 | 1,183,256 | |||
| PerkinElmer, Inc. | 3,671 | 678,401 | |||
| Thermo Fisher Scientific, Inc. | 12,871 | 7,142,761 | |||
| Waters Corp. (A) | 2,021 | 836,734 | |||
| 16,699,777 | |||||
| Pharmaceuticals – 3.3% | |||||
| Bristol-Myers Squibb Company | 63,549 | 4,248,886 | |||
| Catalent, Inc. (A) | 4,846 | 632,112 | |||
| Elanco Animal Health, Inc. (A)(C) | 2,471 | 0 | |||
| Eli Lilly & Company | 22,644 | 5,848,719 | |||
| Johnson & Johnson | 74,913 | 12,969,688 | |||
| Merck & Company, Inc. | 72,030 | 5,495,169 | |||
| Organon & Company | 7,198 | 243,940 | |||
| Perrigo Company PLC | 3,799 | 155,569 | |||
| Pfizer, Inc. | 159,239 | 7,336,141 | |||
| Viatris, Inc. | 34,383 | 503,023 | |||
| Zoetis, Inc. | 13,506 | 2,762,787 | |||
| 40,196,034 | |||||
| 200,179,338 | |||||
| Industrials – 7.0% | |||||
| Aerospace and defense – 1.0% | |||||
| General Dynamics Corp. | 4,857 | 972,906 | |||
| Howmet Aerospace, Inc. | 8,294 | 263,335 | |||
| Huntington Ingalls Industries, Inc. | 854 | 174,361 | |||
| L3Harris Technologies, Inc. | 4,349 | 1,013,360 | |||
| Lockheed Martin Corp. | 5,190 | 1,867,362 | |||
| Northrop Grumman Corp. | 3,176 | 1,167,815 | |||
| Raytheon Technologies Corp. | 32,147 | 2,724,780 | |||
| Teledyne Technologies, Inc. (A) | 985 | 456,429 | |||
| Textron, Inc. | 4,789 | 348,017 | |||
| The Boeing Company (A) | 11,664 | 2,560,248 | |||
| TransDigm Group, Inc. (A) | 1,165 | 707,703 | |||
| 12,256,316 | |||||
| Air freight and logistics – 0.6% | |||||
| CH Robinson Worldwide, Inc. | 3,999 | 360,150 | |||
| Expeditors International of Washington, Inc. | 5,079 | 633,047 | |||
| FedEx Corp. | 7,341 | 1,950,430 | |||
| United Parcel Service, Inc., Class B | 21,753 | 4,255,539 | |||
| 7,199,166 | |||||
| Airlines – 0.2% | |||||
| Alaska Air Group, Inc. (A) | 3,744 | 214,681 | |||
| American Airlines Group, Inc. (A) | 19,288 | 384,603 | |||
| Delta Air Lines, Inc. (A) | 19,236 | 777,904 | |||
| Southwest Airlines Company (A) | 17,785 | 885,337 | |||
| United Airlines Holdings, Inc. (A) | 9,731 | 452,589 | |||
| 2,715,114 | |||||
| Building products – 0.6% | |||||
| A.O. Smith Corp. | 4,591 | 333,858 | |||
| Allegion PLC | 3,072 | 442,337 | |||
| Carrier Global Corp. | 27,887 | 1,606,291 | |||
| The accompanying notes are an integral part of the financial statements. | 109 |
| Shares or Principal Amount | Value | ||||
| COMMON STOCKS (continued) | |||||
| Building products (continued) | |||||
| Fortune Brands Home & Security, Inc. | 4,726 | $ | 460,171 | ||
| Johnson Controls International PLC | 24,469 | 1,830,281 | |||
| Masco Corp. | 8,664 | 526,078 | |||
| Trane Technologies PLC | 8,164 | 1,620,554 | |||
| 6,819,570 | |||||
| Commercial services and supplies – 0.5% | |||||
| Cintas Corp. | 3,680 | 1,456,434 | |||
| Copart, Inc. (A) | 8,681 | 1,252,842 | |||
| Republic Services, Inc. | 8,780 | 1,089,861 | |||
| Rollins, Inc. | 9,235 | 359,426 | |||
| Waste Management, Inc. | 16,194 | 2,511,851 | |||
| 6,670,414 | |||||
| Construction and engineering – 0.1% | |||||
| Quanta Services, Inc. | 10,745 | 1,097,065 | |||
| Electrical equipment – 0.5% | |||||
| AMETEK, Inc. | 6,118 | 831,864 | |||
| Eaton Corp. PLC | 10,558 | 1,777,545 | |||
| Emerson Electric Company | 15,888 | 1,676,184 | |||
| Generac Holdings, Inc. (A) | 1,668 | 728,883 | |||
| Rockwell Automation, Inc. | 3,075 | 1,000,759 | |||
| 6,015,235 | |||||
| Industrial conglomerates – 0.9% | |||||
| 3M Company | 14,837 | 2,889,357 | |||
| General Electric Company | 28,087 | 2,960,651 | |||
| Honeywell International, Inc. | 17,778 | 4,122,896 | |||
| Roper Technologies, Inc. | 2,694 | 1,301,956 | |||
| 11,274,860 | |||||
| Machinery – 0.9% | |||||
| Caterpillar, Inc. | 10,066 | 2,122,617 | |||
| Cummins, Inc. | 2,687 | 634,078 | |||
| Deere & Company | 5,732 | 2,166,868 | |||
| Dover Corp. | 2,645 | 461,182 | |||
| Fortive Corp. | 6,221 | 459,545 | |||
| IDEX Corp. | 1,395 | 312,480 | |||
| Illinois Tool Works, Inc. | 5,282 | 1,229,967 | |||
| Ingersoll Rand, Inc. (A) | 7,137 | 378,404 | |||
| Otis Worldwide Corp. | 7,413 | 683,627 | |||
| PACCAR, Inc. | 6,380 | 522,331 | |||
| Parker-Hannifin Corp. | 2,372 | 703,701 | |||
| Pentair PLC | 3,054 | 235,647 | |||
| Snap-on, Inc. | 994 | 223,600 | |||
| Stanley Black & Decker, Inc. | 2,968 | 573,625 | |||
| Wabtec Corp. | 3,265 | 293,164 | |||
| Xylem, Inc. | 3,309 | 451,050 | |||
| 11,451,886 | |||||
| Professional services – 0.6% | |||||
| Equifax, Inc. | 5,075 | 1,381,720 | |||
| IHS Markit, Ltd. | 15,621 | 1,883,893 | |||
| Jacobs Engineering Group, Inc. | 5,430 | 732,833 | |||
| Leidos Holdings, Inc. | 5,543 | 543,824 | |||
| Nielsen Holdings PLC | 14,949 | 320,806 | |||
| Robert Half International, Inc. | 4,703 | 486,290 | |||
| Verisk Analytics, Inc. | 6,759 | 1,363,696 | |||
| 6,713,062 | |||||
| Road and rail – 0.9% | |||||
| CSX Corp. | 68,333 | 2,222,872 | |||
| JB Hunt Transport Services, Inc. | 2,510 | 445,274 | |||
| Kansas City Southern | 2,735 | 767,632 | |||
| Norfolk Southern Corp. | 7,526 | 1,908,142 | |||
| Old Dominion Freight Line, Inc. | 2,860 | 825,739 | |||
| Shares or Principal Amount | Value | ||||
| COMMON STOCKS (continued) | |||||
| Road and rail (continued) | |||||
| Union Pacific Corp. | 19,978 | $ | 4,332,030 | ||
| 10,501,689 | |||||
| Trading companies and distributors – 0.2% | |||||
| Fastenal Company | 15,052 | 840,654 | |||
| United Rentals, Inc. (A) | 1,897 | 668,977 | |||
| W.W. Grainger, Inc. | 1,147 | 497,454 | |||
| 2,007,085 | |||||
| 84,721,462 | |||||
| Information technology – 26.0% | |||||
| Communications equipment – 0.9% | |||||
| Arista Networks, Inc. (A) | 1,735 | 641,135 | |||
| Cisco Systems, Inc. | 133,061 | 7,853,260 | |||
| F5 Networks, Inc. (A) | 1,882 | 383,119 | |||
| Juniper Networks, Inc. | 10,348 | 299,885 | |||
| Motorola Solutions, Inc. | 5,357 | 1,308,287 | |||
| 10,485,686 | |||||
| Electronic equipment, instruments and components – 0.6% | |||||
| Amphenol Corp., Class A | 18,869 | 1,445,931 | |||
| CDW Corp. | 4,427 | 888,100 | |||
| Corning, Inc. | 24,462 | 978,235 | |||
| IPG Photonics Corp. (A) | 1,133 | 193,380 | |||
| Keysight Technologies, Inc. (A) | 5,817 | 1,043,453 | |||
| TE Connectivity, Ltd. | 10,427 | 1,566,344 | |||
| Trimble, Inc. (A) | 7,924 | 746,599 | |||
| Zebra Technologies Corp., Class A (A) | 1,690 | 992,317 | |||
| 7,854,359 | |||||
| IT services – 4.3% | |||||
| Accenture PLC, Class A | 17,490 | 5,886,434 | |||
| Akamai Technologies, Inc. (A) | 4,485 | 507,926 | |||
| Automatic Data Processing, Inc. | 11,708 | 2,447,440 | |||
| Broadridge Financial Solutions, Inc. | 3,195 | 550,243 | |||
| Cognizant Technology Solutions Corp., Class A | 14,511 | 1,107,334 | |||
| DXC Technology Company (A) | 7,011 | 257,444 | |||
| Fidelity National Information Services, Inc. | 17,063 | 2,180,140 | |||
| Fiserv, Inc. (A) | 16,387 | 1,930,225 | |||
| FleetCor Technologies, Inc. (A) | 2,293 | 603,701 | |||
| Gartner, Inc. (A) | 2,368 | 731,096 | |||
| Global Payments, Inc. | 8,123 | 1,321,125 | |||
| IBM Corp. | 24,585 | 3,450,259 | |||
| Jack Henry & Associates, Inc. | 2,044 | 360,521 | |||
| Mastercard, Inc., Class A | 24,069 | 8,333,410 | |||
| Paychex, Inc. | 8,824 | 1,010,083 | |||
| PayPal Holdings, Inc. (A) | 32,322 | 9,330,069 | |||
| The Western Union Company | 11,260 | 243,666 | |||
| VeriSign, Inc. (A) | 2,727 | 589,741 | |||
| Visa, Inc., Class A | 46,549 | 10,664,376 | |||
| 51,505,233 | |||||
| Semiconductors and semiconductor equipment – 4.9% | |||||
| Advanced Micro Devices, Inc. (A) | 33,600 | 3,720,192 | |||
| Analog Devices, Inc. | 14,874 | 2,423,756 | |||
| Applied Materials, Inc. | 25,377 | 3,429,194 | |||
| Broadcom, Inc. | 11,291 | 5,613,998 | |||
| Enphase Energy, Inc. (A) | 3,753 | 652,009 | |||
| Intel Corp. | 111,667 | 6,036,718 | |||
| KLA Corp. | 4,239 | 1,441,090 | |||
| Lam Research Corp. | 3,944 | 2,385,410 | |||
| Microchip Technology, Inc. | 7,564 | 1,190,271 | |||
| Micron Technology, Inc. (A) | 31,012 | 2,285,584 | |||
| Monolithic Power Systems, Inc. | 1,189 | 588,472 | |||
| NVIDIA Corp. | 68,914 | 15,426,399 | |||
| NXP Semiconductors NV | 7,626 | 1,640,581 | |||
| Qorvo, Inc. (A) | 3,113 | 585,337 | |||
| The accompanying notes are an integral part of the financial statements. | 110 |
| Shares or Principal Amount | Value | ||||
| COMMON STOCKS (continued) | |||||
| Semiconductors and semiconductor equipment (continued) | |||||
| QUALCOMM, Inc. | 31,194 | $ | 4,575,848 | ||
| Skyworks Solutions, Inc. | 4,565 | 837,495 | |||
| Teradyne, Inc. | 4,598 | 558,381 | |||
| Texas Instruments, Inc. | 25,539 | 4,875,650 | |||
| Xilinx, Inc. | 6,798 | 1,057,701 | |||
| 59,324,086 | |||||
| Software – 8.8% | |||||
| Adobe, Inc. (A) | 14,128 | 9,376,754 | |||
| ANSYS, Inc. (A) | 2,576 | 941,167 | |||
| Autodesk, Inc. (A) | 6,503 | 2,016,515 | |||
| Cadence Design Systems, Inc. (A) | 8,225 | 1,344,623 | |||
| Citrix Systems, Inc. | 3,670 | 377,533 | |||
| Fortinet, Inc. (A) | 4,007 | 1,262,766 | |||
| Intuit, Inc. | 8,077 | 4,572,470 | |||
| Microsoft Corp. | 222,608 | 67,200,903 | |||
| NortonLifeLock, Inc. | 17,141 | 455,265 | |||
| Oracle Corp. | 53,693 | 4,785,657 | |||
| Paycom Software, Inc. (A) | 1,452 | 709,883 | |||
| PTC, Inc. (A) | 3,108 | 409,199 | |||
| salesforce.com, Inc. (A) | 28,543 | 7,571,602 | |||
| ServiceNow, Inc. (A) | 5,836 | 3,756,283 | |||
| Synopsys, Inc. (A) | 4,509 | 1,498,070 | |||
| Tyler Technologies, Inc. (A) | 1,204 | 584,783 | |||
| 106,863,473 | |||||
| Technology hardware, storage and peripherals – 6.5% | |||||
| Apple, Inc. | 495,287 | 75,199,431 | |||
| Hewlett Packard Enterprise Company | 41,234 | 637,478 | |||
| HP, Inc. | 37,929 | 1,128,008 | |||
| NetApp, Inc. | 7,028 | 625,000 | |||
| Seagate Technology Holdings PLC | 6,287 | 550,678 | |||
| Western Digital Corp. (A) | 9,676 | 611,523 | |||
| 78,752,118 | |||||
| 314,784,955 | |||||
| Materials – 2.2% | |||||
| Chemicals – 1.5% | |||||
| Air Products & Chemicals, Inc. | 6,091 | 1,641,585 | |||
| Albemarle Corp. | 3,212 | 760,409 | |||
| Celanese Corp. | 3,100 | 491,660 | |||
| CF Industries Holdings, Inc. | 5,903 | 268,114 | |||
| Corteva, Inc. | 20,285 | 891,931 | |||
| Dow, Inc. | 20,557 | 1,293,035 | |||
| DuPont de Nemours, Inc. | 14,645 | 1,084,023 | |||
| Eastman Chemical Company | 3,757 | 425,142 | |||
| Ecolab, Inc. | 6,846 | 1,542,815 | |||
| FMC Corp. | 3,547 | 332,106 | |||
| International Flavors & Fragrances, Inc. | 6,850 | 1,037,775 | |||
| Linde PLC | 14,316 | 4,503,670 | |||
| LyondellBasell Industries NV, Class A | 7,085 | 710,980 | |||
| PPG Industries, Inc. | 6,525 | 1,041,064 | |||
| The Mosaic Company | 9,511 | 306,064 | |||
| The Sherwin-Williams Company | 6,587 | 2,000,274 | |||
| 18,330,647 | |||||
| Construction materials – 0.1% | |||||
| Martin Marietta Materials, Inc. | 1,716 | 654,225 | |||
| Vulcan Materials Company | 3,651 | 678,830 | |||
| 1,333,055 | |||||
| Containers and packaging – 0.3% | |||||
| Amcor PLC | 42,429 | 545,213 | |||
| Avery Dennison Corp. | 2,284 | 514,791 | |||
| Ball Corp. | 9,033 | 866,807 | |||
| International Paper Company | 10,781 | 647,830 | |||
| Packaging Corp. of America | 2,614 | 396,544 | |||
| Sealed Air Corp. | 4,182 | 255,227 | |||
| Shares or Principal Amount | Value | ||||
| COMMON STOCKS (continued) | |||||
| Containers and packaging (continued) | |||||
| Westrock Company | 7,324 | $ | 381,141 | ||
| 3,607,553 | |||||
| Metals and mining – 0.3% | |||||
| Freeport-McMoRan, Inc. | 40,331 | 1,467,645 | |||
| Newmont Corp. | 22,048 | 1,278,564 | |||
| Nucor Corp. | 8,235 | 968,107 | |||
| 3,714,316 | |||||
| 26,985,571 | |||||
| Real estate – 4.7% | |||||
| Equity real estate investment trusts – 4.5% | |||||
| Alexandria Real Estate Equities, Inc. | 7,700 | 1,589,049 | |||
| American Tower Corp. | 25,521 | 7,456,471 | |||
| AvalonBay Communities, Inc. | 7,836 | 1,798,989 | |||
| Boston Properties, Inc. | 7,972 | 900,756 | |||
| Crown Castle International Corp. | 24,258 | 4,722,790 | |||
| Digital Realty Trust, Inc. | 15,805 | 2,590,598 | |||
| Duke Realty Corp. | 21,047 | 1,105,178 | |||
| Equinix, Inc. | 5,028 | 4,240,867 | |||
| Equity Residential | 19,313 | 1,623,644 | |||
| Essex Property Trust, Inc. | 3,648 | 1,206,540 | |||
| Extra Space Storage, Inc. | 7,506 | 1,402,946 | |||
| Federal Realty Investment Trust | 3,971 | 483,549 | |||
| Healthpeak Properties, Inc. | 30,249 | 1,088,964 | |||
| Host Hotels & Resorts, Inc. (A) | 39,631 | 656,289 | |||
| Iron Mountain, Inc. | 16,206 | 773,837 | |||
| Kimco Realty Corp. | 33,727 | 734,911 | |||
| Mid-America Apartment Communities, Inc. | 6,426 | 1,236,170 | |||
| Prologis, Inc. | 41,522 | 5,591,353 | |||
| Public Storage | 8,544 | 2,764,924 | |||
| Realty Income Corp. | 20,968 | 1,514,309 | |||
| Regency Centers Corp. | 8,867 | 608,454 | |||
| SBA Communications Corp. | 6,137 | 2,202,999 | |||
| Simon Property Group, Inc. | 18,440 | 2,479,258 | |||
| UDR, Inc. | 16,660 | 899,973 | |||
| Ventas, Inc. | 21,056 | 1,177,873 | |||
| Vornado Realty Trust | 8,812 | 369,047 | |||
| Welltower, Inc. | 23,435 | 2,051,266 | |||
| Weyerhaeuser Company | 42,052 | 1,513,872 | |||
| 54,784,876 | |||||
| Real estate management and development – 0.2% | |||||
| CBRE Group, Inc., Class A (A) | 18,840 | 1,814,292 | |||
| 56,599,168 | |||||
| Utilities – 1.4% | |||||
| Electric utilities – 0.9% | |||||
| Alliant Energy Corp. | 4,406 | 267,841 | |||
| American Electric Power Company, Inc. | 8,802 | 788,395 | |||
| Duke Energy Corp. | 13,549 | 1,418,038 | |||
| Edison International | 6,683 | 386,545 | |||
| Entergy Corp. | 3,534 | 390,896 | |||
| Evergy, Inc. | 4,038 | 276,401 | |||
| Eversource Energy | 6,050 | 548,917 | |||
| Exelon Corp. | 17,212 | 843,732 | |||
| FirstEnergy Corp. | 9,580 | 372,375 | |||
| NextEra Energy, Inc. | 34,548 | 2,901,687 | |||
| NRG Energy, Inc. | 4,311 | 196,883 | |||
| Pinnacle West Capital Corp. | 1,986 | 152,723 | |||
| PPL Corp. | 13,552 | 397,751 | |||
| The Southern Company | 18,646 | 1,225,602 | |||
| The accompanying notes are an integral part of the financial statements. | 111 |
| Shares or Principal Amount | Value | ||||
| COMMON STOCKS (continued) | |||||
| Electric utilities (continued) | |||||
| Xcel Energy, Inc. | 9,480 | $ | 651,750 | ||
| 10,819,536 | |||||
| Gas utilities – 0.0% | |||||
| Atmos Energy Corp. | 2,302 | 224,468 | |||
| Independent power and renewable electricity producers – 0.0% | |||||
| The AES Corp. | 11,735 | 280,114 | |||
| Multi-utilities – 0.4% | |||||
| Ameren Corp. | 4,501 | 394,828 | |||
| CenterPoint Energy, Inc. | 10,225 | 256,545 | |||
| CMS Energy Corp. | 5,098 | 326,935 | |||
| Consolidated Edison, Inc. | 6,038 | 455,567 | |||
| Dominion Energy, Inc. | 14,206 | 1,105,795 | |||
| DTE Energy Company | 3,412 | 410,600 | |||
| NiSource, Inc. | 6,908 | 170,282 | |||
| Public Service Enterprise Group, Inc. | 8,897 | 568,874 | |||
| Sempra Energy | 5,550 | 734,598 | |||
| WEC Energy Group, Inc. | 5,556 | 524,931 | |||
| 4,948,955 | |||||
| Water utilities – 0.1% | |||||
| American Water Works Company, Inc. | 3,196 | 582,471 | |||
| 16,855,544 | |||||
| TOTAL COMMON STOCKS (Cost $880,108,420) | $ | 1,169,763,578 | |||
| RIGHTS – 0.0% | |||||
| Pan American Silver Corp. (Expiration Date: 2-22-29) (A)(D) | 13,589 | 10,464 | |||
| TOTAL RIGHTS (Cost $4,020) | $ | 10,464 | |||
| SHORT-TERM INVESTMENTS – 3.4% | |||||
| U.S. Government – 0.9% | |||||
| U.S. Treasury Bill 0.050%, 10/26/2021 * | $ | 11,000,000 | 10,999,076 | ||
| Shares or Principal Amount | Value | ||||
| SHORT-TERM INVESTMENTS (continued) | |||||
| U.S. Government Agency – 1.7% | |||||
| Federal Home Loan Bank Discount Note 0.040%, 09/09/2021 * | $ | 20,000,000 | $ | 19,999,822 | |
| Short-term funds – 0.0% | |||||
| John Hancock Collateral Trust, 0.0356% (E)(F) | 9,685 | 96,923 | |||
| Repurchase agreement – 0.8% | |||||
| Repurchase Agreement with State Street Corp. dated 8-31-21 at 0.000% to be repurchased at $9,458,000 on 9-1-21, collateralized by $9,662,300 U.S. Treasury Notes, 0.125% due 8-31-23 (valued at $9,647,207) | $ | 9,458,000 | 9,458,000 | ||
| TOTAL SHORT-TERM INVESTMENTS (Cost $40,553,878) | $ | 40,553,821 | |||
| Total Investments (U.S. Sector Rotation Fund) (Cost $920,666,318) – 100.2% | $ | 1,210,327,863 | |||
| Other assets and liabilities, net – (0.2%) | (2,221,266) | ||||
| TOTAL NET ASSETS – 100.0% | $ | 1,208,106,597 | |||
| Security Abbreviations and Legend | |
| (A) | Non-income producing security. |
| (B) | All or a portion of this security is on loan as of 8-31-21. |
| (C) | Security is valued using significant unobservable inputs and is classified as Level 3 in the fair value hierarchy. Refer to Note 2 to the financial statements. |
| (D) | Strike price and/or expiration date not available. |
| (E) | The rate shown is the annualized seven-day yield as of 8-31-21. |
| (F) | Investment is an affiliate of the fund, the advisor and/or subadvisor. This security represents the investment of cash collateral received for securities lending. |
| * | Yield represents either the annualized yield at the date of purchase, the stated coupon rate or, for floating rate securities, the rate at period end. |
| Open contracts | Number of contracts | Position | Expiration date | Notional basis^ | Notional value^ | Unrealized appreciation (depreciation) |
| S&P 500 Index E-Mini Futures | 196 | Long | Sep 2021 | $43,052,008 | $44,300,900 | $1,248,892 |
| $1,248,892 |
| The accompanying notes are an integral part of the financial statements. | 112 |
| United States | 84.4% |
| Canada | 5.9% |
| France | 3.1% |
| Netherlands | 2.3% |
| Taiwan | 1.4% |
| Australia | 1.3% |
| Argentina | 1.2% |
| Other countries | 0.4% |
| TOTAL | 100.0% |
| United States | 88.0% |
| Germany | 3.3% |
| Switzerland | 1.9% |
| United Kingdom | 1.7% |
| Netherlands | 1.5% |
| Denmark | 1.1% |
| China | 1.0% |
| Other countries | 1.5% |
| TOTAL | 100.0% |
| United States | 81.3% |
| Cayman Islands | 6.4% |
| Canada | 3.7% |
| United Kingdom | 1.7% |
| Luxembourg | 1.3% |
| France | 1.1% |
| Switzerland | 1.0% |
| Other countries | 3.5% |
| TOTAL | 100.0% |
| United States | 89.3% |
| Canada | 4.4% |
| Sweden | 2.9% |
| Israel | 2.8% |
| Other countries | 0.6% |
| TOTAL | 100.0% |
| United States | 81.2% |
| Canada | 7.1% |
| United Kingdom | 2.0% |
| Ireland | 2.0% |
| Belgium | 1.3% |
| South Africa | 1.0% |
| Other countries | 5.4% |
| TOTAL | 100.0% |
| United States | 76.2% |
| China | 8.2% |
| Germany | 5.2% |
| South Korea | 3.3% |
| United Kingdom | 1.4% |
| Netherlands | 1.2% |
| Russia | 1.2% |
| Other countries | 3.3% |
| TOTAL | 100.0% |
| United States | 65.0% |
| Japan | 4.9% |
| United Kingdom | 3.5% |
| China | 2.8% |
| Switzerland | 2.6% |
| France | 2.6% |
| Germany | 2.5% |
| Canada | 2.4% |
| Australia | 1.6% |
| Taiwan | 1.5% |
| Other countries | 10.6% |
| TOTAL | 100.0% |
| The accompanying notes are an integral part of the financial statements. | 113 |
| Assets | Capital Appreciation Fund | Capital Appreciation Value Fund | Core Bond Fund | Health Sciences Fund |
| Unaffiliated investments, at value (including securities loaned) | $2,134,673,226 | $1,431,340,021 | $1,947,341,570 | $428,633,288 |
| Cash | — | 159,763 | — | 210 |
| Foreign currency, at value | — | 7 | — | 109,537 |
| Dividends and interest receivable | 836,276 | 3,299,185 | 5,587,062 | 233,842 |
| Receivable for fund shares sold | 81,503 | — | 96,313 | 7,233 |
| Receivable for investments sold | 10,594,898 | 4,550,650 | 16,648,174 | 381,460 |
| Receivable for delayed delivery securities sold | — | — | 84,943,697 | — |
| Receivable for securities lending income | — | — | 44 | — |
| Other assets | 61,043 | 45,768 | 73,061 | 714,893 |
| Total assets | 2,146,246,946 | 1,439,395,394 | 2,054,689,921 | 430,080,463 |
| Liabilities | ||||
| Written options, at value | — | 30,662,491 | — | — |
| Payable for collateral on sale commitments | — | — | 250,000 | — |
| Payable for investments purchased | 2,461,000 | 9,983,984 | 35,442,750 | 225,170 |
| Payable for delayed delivery securities purchased | — | — | 229,910,335 | — |
| Payable for fund shares repurchased | 6,842,763 | 2,677,169 | 350,340 | 2,468,355 |
| Payable to affiliates | ||||
| Investment management fees | — | — | — | 1 |
| Accounting and legal services fees | 80,747 | 54,009 | 69,463 | 16,544 |
| Trustees' fees | 547 | 364 | 468 | 110 |
| Other liabilities and accrued expenses | 286,662 | 221,872 | 366,724 | 124,699 |
| Total liabilities | 9,671,719 | 43,599,889 | 266,390,080 | 2,834,879 |
| Net assets | $2,136,575,227 | $1,395,795,505 | $1,788,299,841 | $427,245,584 |
| Net assets consist of | ||||
| Paid-in capital | $248,585,432 | $881,705,486 | $1,758,423,556 | $204,388,877 |
| Total distributable earnings (loss) | 1,887,989,795 | 514,090,019 | 29,876,285 | 222,856,707 |
| Net assets | $2,136,575,227 | $1,395,795,505 | $1,788,299,841 | $427,245,584 |
| Unaffiliated investments, including repurchase agreements, at cost | $711,845,019 | $1,111,338,640 | $1,924,535,882 | $251,217,052 |
| Foreign currency, at cost | — | $7 | — | $109,554 |
| Premiums received on written options | — | $14,791,701 | — | — |
| Securities loaned, at value | — | — | — | — |
| Net asset value per share | ||||
| The funds have an unlimited number of shares authorized with no par value. Net asset value is calculated by dividing the net assets of each class of shares by the number of outstanding shares in the class. | ||||
| Class 1 | ||||
| Net assets | $907,659,794 | — | $184,695,336 | — |
| Shares outstanding | 37,727,755 | — | 13,997,576 | — |
| Net asset value, offering price and redemption price per share | $24.06 | — | $13.19 | — |
| Class NAV | ||||
| Net assets | $1,228,915,433 | $1,395,795,505 | $1,603,604,505 | $427,245,584 |
| Shares outstanding | 50,818,742 | 111,097,762 | 121,741,220 | 61,795,428 |
| Net asset value, offering price and redemption price per share | $24.18 | $12.56 | $13.17 | $6.91 |
| The accompanying notes are an integral part of the financial statements. | 114 |
| Assets | High Yield Fund | International Strategic Equity Allocation Fund | Mid Cap Stock Fund | Mid Value Fund |
| Unaffiliated investments, at value (including securities loaned) | $273,874,748 | $1,713,644,730 | $2,101,282,821 | $1,845,961,079 |
| Affiliated investments, at value | 3,833,513 | 9,920,810 | 60,471,652 | 8,311,553 |
| Repurchase agreements, at value | — | — | 40,800,000 | — |
| Total investments, at value | 277,708,261 | 1,723,565,540 | 2,202,554,473 | 1,854,272,632 |
| Receivable for centrally cleared swaps | 704,980 | — | — | — |
| Unrealized appreciation on forward foreign currency contracts | 7,151 | — | — | — |
| Receivable for futures variation margin | — | 226,273 | — | — |
| Cash | 598,057 | 398,285 | 9,076 | — |
| Foreign currency, at value | 275,179 | 3,942,398 | — | 132 |
| Collateral held at broker for futures contracts | 156,140 | 4,604,557 | — | — |
| Dividends and interest receivable | 3,451,244 | 6,646,614 | 225,075 | 2,360,551 |
| Receivable for fund shares sold | — | — | 7,461,657 | 2,635 |
| Receivable for investments sold | 1,928,996 | — | — | 282,613 |
| Receivable for securities lending income | 2,915 | 14,137 | 20,061 | 2,049 |
| Other assets | 10,605 | 87,350 | 63,345 | 43,639 |
| Total assets | 284,843,528 | 1,739,485,154 | 2,210,333,687 | 1,856,964,251 |
| Liabilities | ||||
| Unrealized depreciation on forward foreign currency contracts | 5,876 | — | — | — |
| Payable for futures variation margin | 1,211 | — | — | — |
| Payable for investments purchased | 267,883 | — | — | 1,106,152 |
| Payable for delayed delivery securities purchased | 1,034,085 | — | — | — |
| Payable for fund shares repurchased | 215,325 | 580,206 | 4,092,762 | 570,285 |
| Payable upon return of securities loaned | 3,833,260 | 9,917,527 | 60,366,856 | 8,314,135 |
| Payable to affiliates | ||||
| Accounting and legal services fees | 10,745 | 66,675 | 81,981 | 69,822 |
| Trustees' fees | 73 | 444 | 553 | 467 |
| Other liabilities and accrued expenses | 120,699 | 242,010 | 270,891 | 208,923 |
| Total liabilities | 5,489,157 | 10,806,862 | 64,813,043 | 10,269,784 |
| Net assets | $279,354,371 | $1,728,678,292 | $2,145,520,644 | $1,846,694,467 |
| Net assets consist of | ||||
| Paid-in capital | $376,109,048 | $1,382,422,168 | $1,068,083,484 | $1,306,430,596 |
| Total distributable earnings (loss) | (96,754,677) | 346,256,124 | 1,077,437,160 | 540,263,871 |
| Net assets | $279,354,371 | $1,728,678,292 | $2,145,520,644 | $1,846,694,467 |
| Unaffiliated investments, including repurchase agreements, at cost | $289,265,064 | $1,391,345,520 | $1,534,776,544 | $1,386,739,654 |
| Affiliated investments, at cost | $3,832,815 | $9,918,315 | $60,450,751 | $8,309,278 |
| Foreign currency, at cost | $275,266 | $3,937,875 | — | $131 |
| Securities loaned, at value | $3,580,953 | $11,798,303 | $93,843,498 | $9,456,560 |
| Net asset value per share | ||||
| The funds have an unlimited number of shares authorized with no par value. Net asset value is calculated by dividing the net assets of each class of shares by the number of outstanding shares in the class. | ||||
| Class 1 | ||||
| Net assets | $279,354,371 | — | $630,731,450 | — |
| Shares outstanding | 33,607,304 | — | 21,889,962 | — |
| Net asset value, offering price and redemption price per share | $8.31 | — | $28.81 | — |
| Class NAV | ||||
| Net assets | — | $1,728,678,292 | $1,514,789,194 | $1,846,694,467 |
| Shares outstanding | — | 150,623,909 | 51,561,667 | 96,446,096 |
| Net asset value, offering price and redemption price per share | — | $11.48 | $29.38 | $19.15 |
| The accompanying notes are an integral part of the financial statements. | 115 |
| Assets | Science & Technology Fund | Strategic Equity Allocation Fund | U.S. Sector Rotation Fund |
| Unaffiliated investments, at value (including securities loaned) | $211,733,105 | $8,424,164,741 | $1,200,772,940 |
| Affiliated investments, at value | 1,824,190 | 67,092,842 | 96,923 |
| Repurchase agreements, at value | 7,608,000 | 32,423,000 | 9,458,000 |
| Total investments, at value | 221,165,295 | 8,523,680,583 | 1,210,327,863 |
| Receivable for futures variation margin | — | 1,448,504 | — |
| Cash | 918 | 2,571 | 36,626 |
| Foreign currency, at value | 263,793 | 8,466,947 | — |
| Collateral held at broker for futures contracts | — | 37,658,521 | 2,672,000 |
| Dividends and interest receivable | 31,112 | 14,976,775 | 1,375,450 |
| Receivable for fund shares sold | 3,691 | — | — |
| Receivable for investments sold | 350,395 | 46 | 46 |
| Receivable for securities lending income | 8,063 | 136,706 | 134 |
| Other assets | 12,163 | 342,907 | 40,398 |
| Total assets | 221,835,430 | 8,586,713,560 | 1,214,452,517 |
| Liabilities | |||
| Payable for futures variation margin | — | — | 46,103 |
| Payable for investments purchased | 618,001 | 383 | — |
| Payable for fund shares repurchased | 2,164,400 | 7,275,067 | 5,938,594 |
| Payable upon return of securities loaned | 1,823,187 | 67,050,009 | 96,844 |
| Payable to affiliates | |||
| Accounting and legal services fees | 8,686 | 322,861 | 46,590 |
| Trustees' fees | 58 | 2,160 | 314 |
| Other liabilities and accrued expenses | 112,294 | 1,388,669 | 217,475 |
| Total liabilities | 4,726,626 | 76,039,149 | 6,345,920 |
| Net assets | $217,108,804 | $8,510,674,411 | $1,208,106,597 |
| Net assets consist of | |||
| Paid-in capital | $46,250,200 | $5,801,638,849 | $743,555,120 |
| Total distributable earnings (loss) | 170,858,604 | 2,709,035,562 | 464,551,477 |
| Net assets | $217,108,804 | $8,510,674,411 | $1,208,106,597 |
| Unaffiliated investments, including repurchase agreements, at cost | $161,688,731 | $6,602,694,969 | $920,569,422 |
| Affiliated investments, at cost | $1,823,844 | $67,076,462 | $96,896 |
| Foreign currency, at cost | $234,618 | $8,514,448 | — |
| Securities loaned, at value | $2,704,391 | $71,376,136 | $94,801 |
| Net asset value per share | |||
| The funds have an unlimited number of shares authorized with no par value. Net asset value is calculated by dividing the net assets of each class of shares by the number of outstanding shares in the class. | |||
| Class NAV | |||
| Net assets | $217,108,804 | $8,510,674,411 | $1,208,106,597 |
| Shares outstanding | 39,292,569 | 568,520,862 | 95,711,541 |
| Net asset value, offering price and redemption price per share | $5.53 | $14.97 | $12.62 |
| The accompanying notes are an integral part of the financial statements. | 116 |
| Investment income | Capital Appreciation Fund | Capital Appreciation Value Fund | Core Bond Fund | Health Sciences Fund |
| Dividends | $6,898,843 | $13,102,189 | — | $2,692,731 |
| Interest | 1,700 | 13,676,689 | $38,186,234 | 601 |
| Securities lending | 38,717 | 1,800 | 110 | — |
| Less foreign taxes withheld | (245,129) | (45,272) | — | (31,090) |
| Total investment income | 6,694,131 | 26,735,406 | 38,186,344 | 2,662,242 |
| Expenses | ||||
| Investment management fees | 14,553,422 | 12,212,849 | 14,606,767 | 4,329,109 |
| Distribution and service fees | 411,320 | — | 99,139 | — |
| Accounting and legal services fees | 298,732 | 212,432 | 364,095 | 64,443 |
| Trustees' fees | 37,813 | 26,837 | 50,270 | 8,316 |
| Custodian fees | 260,496 | 174,088 | 308,394 | 73,360 |
| Printing and postage | 14,417 | 14,389 | 14,814 | 14,368 |
| Professional fees | 98,023 | 91,549 | 147,545 | 79,946 |
| Other | 92,590 | 58,857 | 90,567 | 24,163 |
| Total expenses | 15,766,813 | 12,791,001 | 15,681,591 | 4,593,705 |
| Less expense reductions | (175,465) | (629,166) | (214,520) | (248,280) |
| Net expenses | 15,591,348 | 12,161,835 | 15,467,071 | 4,345,425 |
| Net investment income (loss) | (8,897,217) | 14,573,571 | 22,719,273 | (1,683,183) |
| Realized and unrealized gain (loss) | ||||
| Net realized gain (loss) on | ||||
| Unaffiliated investments and foreign currency transactions | 560,565,600 | 227,222,523 | 28,444,797 | 62,574,609 |
| Affiliated investments | (10,487) | (91) | (22) | — |
| Written options | — | 5,981,954 | — | — |
| 560,555,113 | 233,204,386 | 28,444,775 | 62,574,609 | |
| Change in net unrealized appreciation (depreciation) of | ||||
| Unaffiliated investments and translation of assets and liabilities in foreign currencies | (82,358,917) | 101,256,163 | (66,179,126) | 60,319,973 |
| Affiliated investments | (1,356) | (73) | — | — |
| Written options | — | (5,526,694) | — | — |
| (82,360,273) | 95,729,396 | (66,179,126) | 60,319,973 | |
| Net realized and unrealized gain (loss) | 478,194,840 | 328,933,782 | (37,734,351) | 122,894,582 |
| Increase (decrease) in net assets from operations | $469,297,623 | $343,507,353 | $(15,015,078) | $121,211,399 |
| The accompanying notes are an integral part of the financial statements. | 117 |
| Investment income | High Yield Fund | International Strategic Equity Allocation Fund | Mid Cap Stock Fund | Mid Value Fund |
| Dividends | $213,800 | $44,844,558 | $3,661,991 | $19,004,563 |
| Interest | 13,076,249 | 28,595 | 14,190 | 604,156 |
| Securities lending | 10,848 | 464,250 | 203,418 | 128,982 |
| Less foreign taxes withheld | (710) | (4,086,040) | — | (621,005) |
| Non-cash dividends | — | — | — | 7,318,279 |
| Total investment income | 13,300,187 | 41,251,363 | 3,879,599 | 26,434,975 |
| Expenses | ||||
| Investment management fees | 1,621,270 | 10,881,578 | 16,699,739 | 14,812,475 |
| Distribution and service fees | 115,805 | — | 313,562 | — |
| Accounting and legal services fees | 33,251 | 248,975 | 289,215 | 225,191 |
| Trustees' fees | 3,903 | 31,924 | 35,165 | 25,718 |
| Custodian fees | 39,246 | 637,946 | 221,459 | 156,194 |
| Printing and postage | 14,356 | 14,393 | 15,301 | 14,382 |
| Professional fees | 97,686 | 129,155 | 114,117 | 87,240 |
| Other | 21,263 | 59,000 | 63,915 | 50,959 |
| Total expenses | 1,946,780 | 12,002,971 | 17,752,473 | 15,372,159 |
| Less expense reductions | (19,686) | (2,301,879) | (169,906) | (843,470) |
| Net expenses | 1,927,094 | 9,701,092 | 17,582,567 | 14,528,689 |
| Net investment income (loss) | 11,373,093 | 31,550,271 | (13,702,968) | 11,906,286 |
| Realized and unrealized gain (loss) | ||||
| Net realized gain (loss) on | ||||
| Unaffiliated investments and foreign currency transactions | 3,748,919 | 111,463,443 | 636,169,677 | 135,182,909 |
| Affiliated investments | (453) | 7,554 | 23,204 | 19,799 |
| Futures contracts | (123,167) | 13,410,623 | — | — |
| Forward foreign currency contracts | (70,250) | — | — | — |
| Swap contracts | 126,508 | — | — | — |
| 3,681,557 | 124,881,620 | 636,192,881 | 135,202,708 | |
| Change in net unrealized appreciation (depreciation) of | ||||
| Unaffiliated investments and translation of assets and liabilities in foreign currencies | 8,705,875 | 198,426,229 | (40,582,956) | 262,694,148 |
| Affiliated investments | 693 | (47,567) | (33,449) | (26,327) |
| Futures contracts | (4,582) | (2,399,984) | — | — |
| Forward foreign currency contracts | 123,664 | — | — | — |
| Swap contracts | (29,353) | — | — | — |
| 8,796,297 | 195,978,678 | (40,616,405) | 262,667,821 | |
| Net realized and unrealized gain (loss) | 12,477,854 | 320,860,298 | 595,576,476 | 397,870,529 |
| Increase in net assets from operations | $23,850,947 | $352,410,569 | $581,873,508 | $409,776,815 |
| The accompanying notes are an integral part of the financial statements. | 118 |
| Investment income | Science & Technology Fund | Strategic Equity Allocation Fund | U.S. Sector Rotation Fund |
| Dividends | $1,406,844 | $143,548,970 | $17,346,910 |
| Interest | 16,560 | 111,653 | 13,056 |
| Securities lending | 31,048 | 1,955,304 | 7,410 |
| Less foreign taxes withheld | (85,347) | (7,067,747) | (826) |
| Total investment income | 1,369,105 | 138,548,180 | 17,366,550 |
| Expenses | |||
| Investment management fees | 2,937,204 | 49,811,177 | 7,695,554 |
| Accounting and legal services fees | 41,009 | 1,145,541 | 176,447 |
| Trustees' fees | 5,988 | 138,474 | 23,032 |
| Custodian fees | 75,338 | 1,433,655 | 161,939 |
| Printing and postage | 14,367 | 16,889 | 14,384 |
| Professional fees | 66,219 | 340,180 | 101,513 |
| Other | 21,284 | 212,886 | 51,971 |
| Total expenses | 3,161,409 | 53,098,802 | 8,224,840 |
| Less expense reductions | (154,276) | (10,537,381) | (1,627,925) |
| Net expenses | 3,007,133 | 42,561,421 | 6,596,915 |
| Net investment income (loss) | (1,638,028) | 95,986,759 | 10,769,635 |
| Realized and unrealized gain (loss) | |||
| Net realized gain (loss) on | |||
| Unaffiliated investments and foreign currency transactions | 138,113,926 | 1,075,868,605 | 247,345,108 |
| Affiliated investments | 1,303 | 88,340 | 899 |
| Futures contracts | — | 91,737,141 | 13,582,472 |
| Forward foreign currency contracts | — | (818,026) | — |
| 138,115,229 | 1,166,876,060 | 260,928,479 | |
| Change in net unrealized appreciation (depreciation) of | |||
| Unaffiliated investments and translation of assets and liabilities in foreign currencies | (53,603,482) | 771,378,084 | 61,550,087 |
| Affiliated investments | (2,043) | (141,257) | (1,406) |
| Futures contracts | — | (5,755,536) | (951,824) |
| Forward foreign currency contracts | — | 912,300 | — |
| (53,605,525) | 766,393,591 | 60,596,857 | |
| Net realized and unrealized gain (loss) | 84,509,704 | 1,933,269,651 | 321,525,336 |
| Increase in net assets from operations | $82,871,676 | $2,029,256,410 | $332,294,971 |
| The accompanying notes are an integral part of the financial statements. | 119 |
| Capital Appreciation Fund | Capital Appreciation Value Fund | Core Bond Fund | ||||
| Increase (decrease) in net assets | Year ended 8-31-21 | Year ended 8-31-20 | Year ended 8-31-21 | Year ended 8-31-20 | Year ended 8-31-21 | Year ended 8-31-20 |
| From operations | ||||||
| Net investment income (loss) | $(8,897,217) | $(3,462,785) | $14,573,571 | $17,284,127 | $22,719,273 | $49,991,767 |
| Net realized gain | 560,555,113 | 317,258,341 | 233,204,386 | 215,718,533 | 28,444,775 | 141,018,658 |
| Change in net unrealized appreciation (depreciation) | (82,360,273) | 609,814,990 | 95,729,396 | (50,839,592) | (66,179,126) | (13,324,621) |
| Increase (decrease) in net assets resulting from operations | 469,297,623 | 923,610,546 | 343,507,353 | 182,163,068 | (15,015,078) | 177,685,804 |
| Distributions to shareholders | ||||||
| From earnings | ||||||
| Class 1 | (137,564,075) | (56,812,578) | — | — | (11,967,506) | (5,663,456) |
| Class NAV | (217,716,247) | (118,001,591) | (244,603,933) | (163,904,965) | (149,414,270) | (84,643,885) |
| Total distributions | (355,280,322) | (174,814,169) | (244,603,933) | (163,904,965) | (161,381,776) | (90,307,341) |
| From fund share transactions | ||||||
| From fund share transactions | (160,715,577) | (302,337,259) | (144,992,873) | (183,411,560) | (748,913,797) | (241,509,188) |
| Total increase (decrease) | (46,698,276) | 446,459,118 | (46,089,453) | (165,153,457) | (925,310,651) | (154,130,725) |
| Net assets | ||||||
| Beginning of year | 2,183,273,503 | 1,736,814,385 | 1,441,884,958 | 1,607,038,415 | 2,713,610,492 | 2,867,741,217 |
| End of year | $2,136,575,227 | $2,183,273,503 | $1,395,795,505 | $1,441,884,958 | $1,788,299,841 | $2,713,610,492 |
| Health Sciences Fund | High Yield Fund | International Strategic Equity Allocation Fund | ||||
| Increase (decrease) in net assets | Year ended 8-31-21 | Year ended 8-31-20 | Year ended 8-31-21 | Year ended 8-31-20 | Year ended 8-31-21 | Year ended 8-31-20 |
| From operations | ||||||
| Net investment income (loss) | $(1,683,183) | $(886,617) | $11,373,093 | $12,152,111 | $31,550,271 | $33,836,684 |
| Net realized gain (loss) | 62,574,609 | 19,376,248 | 3,681,557 | (5,557,140) | 124,881,620 | (16,781,002) |
| Change in net unrealized appreciation (depreciation) | 60,319,973 | 74,906,432 | 8,796,297 | (201,371) | 195,978,678 | 134,577,310 |
| Increase in net assets resulting from operations | 121,211,399 | 93,396,063 | 23,850,947 | 6,393,600 | 352,410,569 | 151,632,992 |
| Distributions to shareholders | ||||||
| From earnings | ||||||
| Class 1 | — | — | (11,176,548) | (13,263,417) | — | — |
| Class NAV | (28,188,283) | (10,491,735) | — | — | (29,611,689) | (48,976,734) |
| Total distributions | (28,188,283) | (10,491,735) | (11,176,548) | (13,263,417) | (29,611,689) | (48,976,734) |
| From fund share transactions | ||||||
| From fund share transactions | (93,850,844) | 73,156,528 | 64,345,818 | (41,216,177) | (308,361,789) | (22,035,645) |
| Total increase (decrease) | (827,728) | 156,060,856 | 77,020,217 | (48,085,994) | 14,437,091 | 80,620,613 |
| Net assets | ||||||
| Beginning of year | 428,073,312 | 272,012,456 | 202,334,154 | 250,420,148 | 1,714,241,201 | 1,633,620,588 |
| End of year | $427,245,584 | $428,073,312 | $279,354,371 | $202,334,154 | $1,728,678,292 | $1,714,241,201 |
| The accompanying notes are an integral part of the financial statements. | 120 |
| Mid Cap Stock Fund | Mid Value Fund | Science & Technology Fund | ||||
| Increase (decrease) in net assets | Year ended 8-31-21 | Year ended 8-31-20 | Year ended 8-31-21 | Year ended 8-31-20 | Year ended 8-31-21 | Year ended 8-31-20 |
| From operations | ||||||
| Net investment income (loss) | $(13,702,968) | $(7,548,649) | $11,906,286 | $14,163,421 | $(1,638,028) | $1,168,951 |
| Net realized gain | 636,192,881 | 378,123,836 | 135,202,708 | 19,096,216 | 138,115,229 | 47,749,983 |
| Change in net unrealized appreciation (depreciation) | (40,616,405) | 229,210,337 | 262,667,821 | 87,816,613 | (53,605,525) | 72,345,467 |
| Increase in net assets resulting from operations | 581,873,508 | 599,785,524 | 409,776,815 | 121,076,250 | 82,871,676 | 121,264,401 |
| Distributions to shareholders | ||||||
| From earnings | ||||||
| Class 1 | (149,685,105) | (51,552,722) | — | — | — | — |
| Class NAV | (307,295,923) | (139,556,442) | (48,958,611) | (34,817,897) | (62,832,282) | (25,176,071) |
| Total distributions | (456,981,028) | (191,109,164) | (48,958,611) | (34,817,897) | (62,832,282) | (25,176,071) |
| From fund share transactions | ||||||
| From fund share transactions | 179,671,998 | (158,836,130) | 163,868,600 | 5,201,638 | (166,090,302) | (16,965,217) |
| Total increase (decrease) | 304,564,478 | 249,840,230 | 524,686,804 | 91,459,991 | (146,050,908) | 79,123,113 |
| Net assets | ||||||
| Beginning of year | 1,840,956,166 | 1,591,115,936 | 1,322,007,663 | 1,230,547,672 | 363,159,712 | 284,036,599 |
| End of year | $2,145,520,644 | $1,840,956,166 | $1,846,694,467 | $1,322,007,663 | $217,108,804 | $363,159,712 |
| Strategic Equity Allocation Fund | U.S. Sector Rotation Fund | |||
| Increase (decrease) in net assets | Year ended 8-31-21 | Year ended 8-31-20 | Year ended 8-31-21 | Year ended 8-31-20 |
| From operations | ||||
| Net investment income | $95,986,759 | $127,307,237 | $10,769,635 | $20,137,853 |
| Net realized gain | 1,166,876,060 | 127,972,793 | 260,928,479 | 73,990,019 |
| Change in net unrealized appreciation (depreciation) | 766,393,591 | 810,620,910 | 60,596,857 | 152,965,549 |
| Increase in net assets resulting from operations | 2,029,256,410 | 1,065,900,940 | 332,294,971 | 247,093,421 |
| Distributions to shareholders | ||||
| From earnings | ||||
| Class NAV | (468,363,031) | (243,595,412) | (127,527,639) | (127,843,285) |
| Total distributions | (468,363,031) | (243,595,412) | (127,527,639) | (127,843,285) |
| From fund share transactions | ||||
| From fund share transactions | (632,350,355) | (569,005,474) | (291,544,447) | (321,321,113) |
| Total increase (decrease) | 928,543,024 | 253,300,054 | (86,777,115) | (202,070,977) |
| Net assets | ||||
| Beginning of year | 7,582,131,387 | 7,328,831,333 | 1,294,883,712 | 1,496,954,689 |
| End of year | $8,510,674,411 | $7,582,131,387 | $1,208,106,597 | $1,294,883,712 |
| The accompanying notes are an integral part of the financial statements. | 121 |
| Per share operating performance for a share outstanding throughout each period | Ratios and supplemental data | |||||||||||||||||
| Income (loss) from investment operations | Less distributions | Ratios to average net assets | ||||||||||||||||
| Period ended | Net asset value, beginning of period ($) | Net investment income (loss) ($)1 | Net realized and unrealized gain (loss) on investments ($) | Total from investment operations ($) | From net investment income ($) | From net realized gain ($) | Total distributions ($) | Net asset value, end of period ($) | Total return (%)2 | Expenses before reductions (%) | Expenses including reductions (%) | Net investment income (loss) (%) | Net assets, end of period (in millions) | Portfolio turnover (%) | ||||
| Capital Appreciation Fund | ||||||||||||||||||
| Class 1 | ||||||||||||||||||
| 08-31-2021 | 23.01 | (0.10) | 5.14 | 5.04 | — | (3.99) | (3.99) | 24.06 | 24.71 | 0.79 | 0.78 | (0.46) | 908 | 45 | ||||
| 08-31-2020 | 15.66 | (0.04) | 9.09 | 9.05 | — | (1.70) | (1.70) | 23.01 | 62.93 | 0.80 | 0.79 | (0.23) | 810 | 47 | ||||
| 08-31-2019 | 18.80 | —3 | (0.46) | (0.46) | (0.02) | (2.66) | (2.68) | 15.66 | 0.84 | 0.80 | 0.79 | (0.03) | 584 | 50 | ||||
| 08-31-2018 | 18.56 | 0.02 | 4.25 | 4.27 | (0.01) | (4.02) | (4.03) | 18.80 | 26.71 | 0.79 | 0.78 | 0.11 | 687 | 39 | ||||
| 08-31-2017 | 16.60 | 0.01 | 3.89 | 3.90 | (0.01) | (1.93) | (1.94) | 18.56 | 26.53 | 0.79 | 0.78 | 0.07 | 582 | 45 | ||||
| Class NAV | ||||||||||||||||||
| 08-31-2021 | 23.10 | (0.09) | 5.16 | 5.07 | — | (3.99) | (3.99) | 24.18 | 24.75 | 0.74 | 0.73 | (0.41) | 1,229 | 45 | ||||
| 08-31-2020 | 15.71 | (0.03) | 9.12 | 9.09 | —3 | (1.70) | (1.70) | 23.10 | 63.00 | 0.75 | 0.74 | (0.18) | 1,373 | 47 | ||||
| 08-31-2019 | 18.85 | —3 | (0.45) | (0.45) | (0.03) | (2.66) | (2.69) | 15.71 | 0.89 | 0.75 | 0.74 | 0.03 | 1,153 | 50 | ||||
| 08-31-2018 | 18.60 | 0.03 | 4.26 | 4.29 | (0.02) | (4.02) | (4.04) | 18.85 | 26.76 | 0.74 | 0.73 | 0.15 | 1,128 | 39 | ||||
| 08-31-2017 | 16.63 | 0.02 | 3.90 | 3.92 | (0.02) | (1.93) | (1.95) | 18.60 | 26.62 | 0.74 | 0.73 | 0.11 | 1,222 | 45 | ||||
| 1. Based on average daily shares outstanding. 2. Total returns would have been lower had certain expenses not been reduced during the applicable periods. 3. Less than $0.005 per share. | ||||||||||||||||||
| Capital Appreciation Value Fund | ||||||||||||||||||
| Class NAV | ||||||||||||||||||
| 08-31-2021 | 11.92 | 0.12 | 2.63 | 2.75 | (0.14) | (1.97) | (2.11) | 12.56 | 25.84 | 0.86 | 0.82 | 0.98 | 1,396 | 57 | ||||
| 08-31-2020 | 11.75 | 0.14 | 1.33 | 1.47 | (0.20) | (1.10) | (1.30) | 11.92 | 13.38 | 0.87 | 0.83 | 1.20 | 1,442 | 79 | ||||
| 08-31-2019 | 12.27 | 0.19 | 0.76 | 0.95 | (0.33) | (1.14) | (1.47) | 11.75 | 10.07 | 0.85 | 0.81 | 1.66 | 1,607 | 63 | ||||
| 08-31-2018 | 12.26 | 0.27 | 1.06 | 1.33 | (0.18) | (1.14) | (1.32) | 12.27 | 11.61 | 0.85 | 0.81 | 2.28 | 1,785 | 78 | ||||
| 08-31-2017 | 11.62 | 0.18 | 1.06 | 1.24 | (0.20) | (0.40) | (0.60) | 12.26 | 11.26 | 0.85 | 0.81 | 1.51 | 1,880 | 61 | ||||
| 1. Based on average daily shares outstanding. 2. Total returns would have been lower had certain expenses not been reduced during the applicable periods. | ||||||||||||||||||
| Core Bond Fund | ||||||||||||||||||
| Class 1 | ||||||||||||||||||
| 08-31-2021 | 13.96 | 0.11 | (0.08) | 0.03 | (0.22) | (0.58) | (0.80) | 13.19 | 0.17 | 0.66 | 0.65 | 0.84 | 185 | 310 | ||||
| 08-31-2020 | 13.50 | 0.23 | 0.66 | 0.89 | (0.31) | (0.12) | (0.43) | 13.96 | 6.76 | 0.66 | 0.65 | 1.73 | 207 | 347 | ||||
| 08-31-2019 | 12.66 | 0.33 | 0.86 | 1.19 | (0.35) | — | (0.35) | 13.50 | 9.59 | 0.66 | 0.65 | 2.60 | 175 | 447 | ||||
| 08-31-2018 | 13.15 | 0.27 | (0.48) | (0.21) | (0.28) | — | (0.28) | 12.66 | (1.58) | 0.67 | 0.66 | 2.08 | 161 | 277 | ||||
| 08-31-2017 | 13.49 | 0.22 | (0.17) | 0.05 | (0.24) | (0.15) | (0.39) | 13.15 | 0.46 | 0.67 | 0.66 | 1.70 | 190 | 363 | ||||
| Class NAV | ||||||||||||||||||
| 08-31-2021 | 13.94 | 0.12 | (0.08) | 0.04 | (0.23) | (0.58) | (0.81) | 13.17 | 0.22 | 0.61 | 0.60 | 0.89 | 1,604 | 310 | ||||
| 08-31-2020 | 13.47 | 0.24 | 0.66 | 0.90 | (0.31) | (0.12) | (0.43) | 13.94 | 6.90 | 0.61 | 0.60 | 1.81 | 2,507 | 347 | ||||
| 08-31-2019 | 12.64 | 0.34 | 0.84 | 1.18 | (0.35) | — | (0.35) | 13.47 | 9.58 | 0.61 | 0.60 | 2.63 | 2,693 | 447 | ||||
| 08-31-2018 | 13.13 | 0.27 | (0.47) | (0.20) | (0.29) | — | (0.29) | 12.64 | (1.54) | 0.62 | 0.61 | 2.14 | 1,548 | 277 | ||||
| 08-31-2017 | 13.47 | 0.23 | (0.17) | 0.06 | (0.25) | (0.15) | (0.40) | 13.13 | 0.51 | 0.62 | 0.61 | 1.77 | 1,615 | 363 | ||||
| 1. Based on average daily shares outstanding. 2. Total returns would have been lower had certain expenses not been reduced during the applicable periods. | ||||||||||||||||||
| Health Sciences Fund | ||||||||||||||||||
| Class NAV | ||||||||||||||||||
| 08-31-2021 | 5.60 | (0.02) | 1.71 | 1.69 | — | (0.38) | (0.38) | 6.91 | 31.27 | 1.02 | 0.97 | (0.38) | 427 | 35 | ||||
| 08-31-2020 | 4.53 | (0.01) | 1.27 | 1.26 | — | (0.19) | (0.19) | 5.60 | 28.39 | 1.11 | 1.05 | (0.28) | 428 | 47 | ||||
| 08-31-2019 | 5.10 | (0.01) | (0.28) | (0.29) | — | (0.28) | (0.28) | 4.53 | (4.87) | 1.11 | 1.05 | (0.17) | 272 | 42 | ||||
| 08-31-2018 | 5.01 | (0.01) | 0.95 | 0.94 | — | (0.85) | (0.85) | 5.10 | 22.04 | 1.10 | 1.04 | (0.30) | 309 | 46 | ||||
| 08-31-2017 | 5.59 | (0.01) | 0.74 | 0.73 | — | (1.31) | (1.31) | 5.01 | 18.48 | 1.14 | 1.07 | (0.27) | 320 | 131 | ||||
| 1. Based on average daily shares outstanding. 2. Total returns would have been lower had certain expenses not been reduced during the applicable periods. | ||||||||||||||||||
| High Yield Fund | ||||||||||||||||||
| Class 1 | ||||||||||||||||||
| 08-31-2021 | 7.86 | 0.40 | 0.46 | 0.86 | (0.41) | — | (0.41) | 8.31 | 11.30 | 0.84 | 0.83 | 4.91 | 279 | 82 | ||||
| 08-31-2020 | 8.04 | 0.43 | (0.14) | 0.29 | (0.47) | — | (0.47) | 7.86 | 4.01 | 0.85 | 0.84 | 5.54 | 202 | 81 | ||||
| 08-31-2019 | 8.17 | 0.46 | (0.10) | 0.36 | (0.49) | — | (0.49) | 8.04 | 4.32 | 0.82 | 0.81 | 5.77 | 250 | 51 | ||||
| 08-31-2018 | 8.30 | 0.47 | (0.12) | 0.35 | (0.48) | — | (0.48) | 8.17 | 4.81 | 0.79 | 0.79 | 5.69 | 282 | 60 | ||||
| 08-31-2017 | 8.17 | 0.49 | 0.17 | 0.66 | (0.53) | — | (0.53) | 8.30 | 8.31 | 0.79 | 0.78 | 5.89 | 339 | 56 | ||||
| 1. Based on average daily shares outstanding. 2. Total returns would have been lower had certain expenses not been reduced during the applicable periods. | ||||||||||||||||||
| The accompanying notes are an integral part of the financial statements. | 122 |
| Per share operating performance for a share outstanding throughout each period | Ratios and supplemental data | |||||||||||||||||
| Income (loss) from investment operations | Less distributions | Ratios to average net assets | ||||||||||||||||
| Period ended | Net asset value, beginning of period ($) | Net investment income (loss) ($)1 | Net realized and unrealized gain (loss) on investments ($) | Total from investment operations ($) | From net investment income ($) | From net realized gain ($) | Total distributions ($) | Net asset value, end of period ($) | Total return (%)2 | Expenses before reductions (%) | Expenses including reductions (%) | Net investment income (loss) (%) | Net assets, end of period (in millions) | Portfolio turnover (%) | ||||
| International Strategic Equity Allocation Fund | ||||||||||||||||||
| Class NAV | ||||||||||||||||||
| 08-31-2021 | 9.55 | 0.19 | 1.92 | 2.11 | (0.18) | — | (0.18) | 11.48 | 22.25 | 0.69 | 0.56 | 1.81 | 1,729 | 63 | ||||
| 08-31-2020 | 9.01 | 0.19 | 0.62 | 0.81 | (0.27) | — | (0.27) | 9.55 | 8.98 | 0.69 | 0.56 | 2.07 | 1,714 | 76 | ||||
| 08-31-2019 | 11.21 | 0.26 | (0.85) | (0.59) | (0.26) | (1.35) | (1.61) | 9.01 | (3.97) | 0.69 | 0.56 | 2.74 | 1,634 | 57 | ||||
| 08-31-2018 | 11.78 | 0.25 | (0.01) | 0.24 | (0.29) | (0.52) | (0.81) | 11.21 | 1.81 | 0.68 | 0.55 | 2.15 | 1,832 | 94 | ||||
| 08-31-20173 | 10.00 | 0.23 | 1.59 | 1.82 | (0.03) | (0.01) | (0.04) | 11.78 | 18.264 | 0.695 | 0.565 | 2.435 | 2,049 | 112 | ||||
| 1. Based on average daily shares outstanding. 2. Total returns would have been lower had certain expenses not been reduced during the applicable periods. 3. Period from 10-17-16 (commencement of operations) to 8-31-17. 4. Not annualized. 5. Annualized. | ||||||||||||||||||
| Mid Cap Stock Fund | ||||||||||||||||||
| Class 1 | ||||||||||||||||||
| 08-31-2021 | 27.74 | (0.20) | 8.88 | 8.68 | — | (7.61) | (7.61) | 28.81 | 33.87 | 0.92 | 0.91 | (0.72) | 631 | 91 | ||||
| 08-31-2020 | 22.24 | (0.11) | 8.38 | 8.27 | — | (2.77) | (2.77) | 27.74 | 41.40 | 0.92 | 0.92 | (0.51) | 547 | 86 | ||||
| 08-31-2019 | 25.90 | (0.12) | 0.28 | 0.16 | — | (3.82) | (3.82) | 22.24 | 5.71 | 0.92 | 0.92 | (0.54) | 438 | 613 | ||||
| 08-31-2018 | 22.14 | (0.10) | 6.01 | 5.91 | — | (2.15) | (2.15) | 25.90 | 28.68 | 0.92 | 0.91 | (0.44) | 447 | 67 | ||||
| 08-31-2017 | 18.86 | (0.03) | 3.40 | 3.37 | — | (0.09) | (0.09) | 22.14 | 17.86 | 0.92 | 0.91 | (0.16) | 365 | 89 | ||||
| Class NAV | ||||||||||||||||||
| 08-31-2021 | 28.15 | (0.19) | 9.03 | 8.84 | — | (7.61) | (7.61) | 29.38 | 33.91 | 0.87 | 0.86 | (0.67) | 1,515 | 91 | ||||
| 08-31-2020 | 22.52 | (0.10) | 8.50 | 8.40 | — | (2.77) | (2.77) | 28.15 | 41.47 | 0.87 | 0.87 | (0.46) | 1,294 | 86 | ||||
| 08-31-2019 | 26.16 | (0.11) | 0.29 | 0.18 | — | (3.82) | (3.82) | 22.52 | 5.74 | 0.87 | 0.87 | (0.49) | 1,153 | 613 | ||||
| 08-31-2018 | 22.33 | (0.09) | 6.07 | 5.98 | — | (2.15) | (2.15) | 26.16 | 28.75 | 0.87 | 0.86 | (0.39) | 1,258 | 67 | ||||
| 08-31-2017 | 19.01 | (0.02) | 3.43 | 3.41 | — | (0.09) | (0.09) | 22.33 | 17.99 | 0.87 | 0.86 | (0.12) | 1,245 | 89 | ||||
| 1. Based on average daily shares outstanding. 2. Total returns would have been lower had certain expenses not been reduced during the applicable periods. 3. Excludes merger activity. | ||||||||||||||||||
| Mid Value Fund | ||||||||||||||||||
| Class NAV | ||||||||||||||||||
| 08-31-2021 | 14.91 | 0.13 | 4.70 | 4.83 | (0.21) | (0.38) | (0.59) | 19.15 | 33.10 | 0.99 | 0.93 | 0.76 | 1,847 | 41 | ||||
| 08-31-2020 | 14.27 | 0.17 | 0.90 | 1.07 | (0.26) | (0.17) | (0.43) | 14.91 | 7.40 | 0.99 | 0.94 | 1.18 | 1,322 | 45 | ||||
| 08-31-2019 | 17.08 | 0.22 | (1.81) | (1.59) | (0.15) | (1.07) | (1.22) | 14.27 | (8.82) | 0.99 | 0.94 | 1.48 | 1,231 | 42 | ||||
| 08-31-2018 | 16.00 | 0.12 | 1.90 | 2.02 | (0.13) | (0.81) | (0.94) | 17.08 | 12.96 | 0.99 | 0.94 | 0.72 | 1,439 | 39 | ||||
| 08-31-2017 | 15.88 | 0.16 | 1.52 | 1.68 | (0.14) | (1.42) | (1.56) | 16.00 | 10.83 | 0.99 | 0.94 | 0.98 | 1,224 | 55 | ||||
| 1. Based on average daily shares outstanding. 2. Total returns would have been lower had certain expenses not been reduced during the applicable periods. | ||||||||||||||||||
| Science & Technology Fund | ||||||||||||||||||
| Class NAV | ||||||||||||||||||
| 08-31-2021 | 5.22 | (0.03) | 1.47 | 1.44 | (0.01) | (1.12) | (1.13) | 5.53 | 30.29 | 1.10 | 1.04 | (0.57) | 217 | 86 | ||||
| 08-31-2020 | 3.87 | 0.023 | 1.69 | 1.71 | — | (0.36) | (0.36) | 5.22 | 47.55 | 1.10 | 1.06 | 0.403 | 363 | 116 | ||||
| 08-31-2019 | 5.99 | (0.01) | (0.32) | (0.33) | — | (1.79) | (1.79) | 3.87 | 3.19 | 1.10 | 1.06 | (0.36) | 284 | 110 | ||||
| 08-31-2018 | 13.85 | (0.03) | 2.33 | 2.30 | — | (10.16) | (10.16) | 5.99 | 30.59 | 1.10 | 1.05 | (0.47) | 252 | 108 | ||||
| 08-31-2017 | 11.75 | (0.02) | 3.17 | 3.15 | (0.02) | (1.03) | (1.05) | 13.85 | 29.39 | 1.07 | 1.03 | (0.13) | 355 | 93 | ||||
| 1. Based on average daily shares outstanding. 2. Total returns would have been lower had certain expenses not been reduced during the applicable periods. 3. Net investment income (loss) per share and ratio of net investment income (loss) to average net assets reflect a special dividend received by the fund, which amounted to $0.04 and 1.00%, respectively. | ||||||||||||||||||
| Strategic Equity Allocation Fund | ||||||||||||||||||
| Class NAV | ||||||||||||||||||
| 08-31-2021 | 12.36 | 0.16 | 3.27 | 3.43 | (0.20) | (0.62) | (0.82) | 14.97 | 28.84 | 0.66 | 0.53 | 1.20 | 8,511 | 79 | ||||
| 08-31-2020 | 11.14 | 0.20 | 1.41 | 1.61 | (0.26) | (0.13) | (0.39) | 12.36 | 14.54 | 0.67 | 0.54 | 1.77 | 7,582 | 96 | ||||
| 08-31-2019 | 13.46 | 0.24 | (0.75) | (0.51) | (0.23) | (1.58) | (1.81) | 11.14 | (1.78) | 0.67 | 0.54 | 2.12 | 7,329 | 80 | ||||
| 08-31-2018 | 13.99 | 0.22 | 1.42 | 1.64 | (0.26) | (1.91) | (2.17) | 13.46 | 12.48 | 0.66 | 0.54 | 1.64 | 7,690 | 115 | ||||
| 08-31-2017 | 13.14 | 0.24 | 1.85 | 2.09 | (0.24) | (1.00) | (1.24) | 13.99 | 17.12 | 0.66 | 0.53 | 1.78 | 7,636 | 67 | ||||
| 1. Based on average daily shares outstanding. 2. Total returns would have been lower had certain expenses not been reduced during the applicable periods. | ||||||||||||||||||
| U.S. Sector Rotation Fund | ||||||||||||||||||
| Class NAV | ||||||||||||||||||
| 08-31-2021 | 10.76 | 0.10 | 2.93 | 3.03 | (0.17) | (1.00) | (1.17) | 12.62 | 30.62 | 0.67 | 0.53 | 0.87 | 1,208 | 91 | ||||
| 08-31-2020 | 9.86 | 0.16 | 1.79 | 1.95 | (0.19) | (0.86) | (1.05) | 10.76 | 20.74 | 0.67 | 0.54 | 1.63 | 1,295 | 113 | ||||
| 08-31-2019 | 13.13 | 0.17 | (0.72) | (0.55) | (0.19) | (2.53) | (2.72) | 9.86 | (0.34) | 0.66 | 0.53 | 1.66 | 1,497 | 92 | ||||
| 08-31-2018 | 11.57 | 0.15 | 2.14 | 2.29 | (0.17) | (0.56) | (0.73) | 13.13 | 20.43 | 0.66 | 0.53 | 1.26 | 1,714 | 128 | ||||
| 08-31-20173 | 10.00 | 0.15 | 1.46 | 1.61 | (0.04) | — | (0.04) | 11.57 | 16.084 | 0.665 | 0.535 | 1.455 | 1,955 | 119 | ||||
| 1. Based on average daily shares outstanding. 2. Total returns would have been lower had certain expenses not been reduced during the applicable periods. 3. Period from 9-26-16 (commencement of operations) to 8-31-17. 4. Not annualized. 5. Annualized. | ||||||||||||||||||
| The accompanying notes are an integral part of the financial statements. | 123 |
The following is a summary of the values by input classification of the funds' investments as of August 31, 2021, by major security category or type:
| Total value at 8-31-21 | Level 1 quoted price | Level 2 significant observable inputs | Level 3 significant unobservable inputs | |
| Capital Appreciation Fund | ||||
| Investments in securities: | ||||
| Assets | ||||
| Common stocks | ||||
| Communication services | $354,716,414 | $354,716,414 | — | — |
| Consumer discretionary | 559,509,896 | 493,246,937 | $66,262,959 | — |
| Consumer staples | 66,841,709 | 66,841,709 | — | — |
| Financials | 28,355,006 | 28,355,006 | — | — |
| Health care | 112,824,972 | 112,824,972 | — | — |
| Industrials | 28,281,781 | 28,281,781 | — | — |
| Information technology | 983,651,575 | 935,467,803 | 48,183,772 | — |
| Short-term investments | 491,873 | 491,873 | — | — |
| Total investments in securities | $2,134,673,226 | $2,020,226,495 | $114,446,731 | — |
| Capital Appreciation Value Fund | ||||
| Investments in securities: | ||||
| Assets | ||||
| Common stocks | $1,007,714,580 | $1,007,714,580 | — | — |
| Preferred securities | 19,598,689 | 19,598,689 | — | — |
| Corporate bonds | 114,181,261 | — | $114,181,261 | — |
| Term loans | 150,511,482 | — | 150,511,482 | — |
| Short-term investments | 139,334,009 | 139,334,009 | — | — |
| Total investments in securities | $1,431,340,021 | $1,166,647,278 | $264,692,743 | — |
| Derivatives: | ||||
| Liabilities | ||||
| Written options | $(30,662,491) | — | $(30,662,491) | — |
| Core Bond Fund | ||||
| Investments in securities: | ||||
| Assets | ||||
| U.S. Government and Agency obligations | $1,045,618,896 | — | $1,045,618,896 | — |
| Foreign government obligations | 19,079,172 | — | 19,079,172 | — |
| Corporate bonds | 529,457,285 | — | 529,457,285 | — |
| Municipal bonds | 5,418,369 | — | 5,418,369 | — |
| Collateralized mortgage obligations | 170,610,544 | — | 170,610,544 | — |
| Asset backed securities | 148,770,077 | — | 148,770,077 | — |
| Short-term investments | 28,387,227 | $28,387,227 | — | — |
| Total investments in securities | $1,947,341,570 | $28,387,227 | $1,918,954,343 | — |
| Health Sciences Fund | ||||
| Investments in securities: | ||||
| Assets | ||||
| Common stocks | ||||
| Consumer discretionary | $733,633 | — | $263,095 | $470,538 |
| Consumer staples | 80,728 | $80,728 | — | — |
| Financials | 3,300,409 | 3,300,409 | — | — |
| Health care | 417,493,799 | 391,066,256 | 26,405,636 | 21,907 |
| Preferred securities | ||||
| Consumer discretionary | 1,050,695 | — | — | 1,050,695 |
| Health care | 2,855,294 | — | 2,855,294 | — |
| Warrants | 19,663 | 19,663 | — | — |
| Short-term investments | 3,099,067 | 3,099,067 | — | — |
| Total investments in securities | $428,633,288 | $397,566,123 | $29,524,025 | $1,543,140 |
| Total value at 8-31-21 | Level 1 quoted price | Level 2 significant observable inputs | Level 3 significant unobservable inputs | |
| High Yield Fund | ||||
| Investments in securities: | ||||
| Assets | ||||
| Foreign government obligations | $1,813,458 | — | $1,813,458 | — |
| Corporate bonds | 229,202,030 | — | 229,202,030 | — |
| Convertible bonds | 5,005,888 | — | 5,005,888 | — |
| Term loans | 19,264,200 | — | 18,801,471 | $462,729 |
| Asset backed securities | 14,002,852 | — | 14,002,852 | — |
| Common stocks | 2,157,540 | $2,143,009 | 1,771 | 12,760 |
| Preferred securities | 1,993,815 | 1,457,025 | 536,790 | — |
| Short-term investments | 4,268,478 | 4,268,478 | — | — |
| Total investments in securities | $277,708,261 | $7,868,512 | $269,364,260 | $475,489 |
| Derivatives: | ||||
| Assets | ||||
| Futures | $24,538 | $24,538 | — | — |
| Forward foreign currency contracts | 7,151 | — | $7,151 | — |
| Swap contracts | 32,219 | — | 32,219 | — |
| Liabilities | ||||
| Forward foreign currency contracts | (5,876) | — | (5,876) | — |
| Swap contracts | (24,748) | — | (24,748) | — |
| Level 3 includes securities valued at $0. Refer to Portfolio of Investments. | ||||
| International Strategic Equity Allocation Fund | ||||
| Investments in securities: | ||||
| Assets | ||||
| Common stocks | ||||
| Australia | $75,593,311 | — | $75,593,311 | — |
| Austria | 3,176,237 | — | 3,176,237 | — |
| Belgium | 11,378,781 | — | 11,378,781 | — |
| Brazil | 17,964,285 | $17,964,285 | — | — |
| Canada | 109,328,794 | 109,328,794 | — | — |
| Chile | 2,403,117 | 1,871,229 | 531,888 | — |
| China | 130,663,895 | 26,139,345 | 104,481,887 | $42,663 |
| Colombia | 1,796,056 | 1,796,056 | — | — |
| Czech Republic | 618,172 | — | 618,172 | — |
| Denmark | 28,729,506 | — | 28,729,506 | — |
| Finland | 16,429,402 | — | 16,429,402 | — |
| France | 118,661,885 | — | 118,661,885 | — |
| Germany | 107,970,113 | — | 107,970,113 | — |
| Hong Kong | 31,142,894 | 507,764 | 30,635,130 | — |
| Hungary | 1,547,224 | — | 1,547,224 | — |
| Indonesia | 6,510,301 | — | 6,510,301 | — |
| Ireland | 12,404,697 | — | 12,404,697 | — |
| Israel | 4,810,706 | 1,988,362 | 2,822,344 | — |
| Italy | 21,531,769 | — | 21,531,769 | — |
| Japan | 228,725,787 | — | 228,725,787 | — |
| Jordan | 409,364 | — | 409,364 | — |
| Luxembourg | 3,664,088 | — | 3,664,088 | — |
| Macau | 370,739 | — | 370,739 | — |
| Malaysia | 6,595,949 | — | 6,595,949 | — |
| Mexico | 11,865,533 | 11,865,533 | — | — |
| Netherlands | 64,640,931 | — | 64,640,931 | — |
| New Zealand | 4,318,017 | — | 4,318,017 | — |
| Norway | 8,872,633 | — | 8,872,633 | — |
| Peru | 1,443,172 | 1,443,172 | — | — |
| Philippines | 3,044,070 | — | 3,044,070 | — |
| Total value at 8-31-21 | Level 1 quoted price | Level 2 significant observable inputs | Level 3 significant unobservable inputs | |
| International Strategic Equity Allocation Fund (continued) | ||||
| Poland | $4,056,310 | — | $4,056,310 | — |
| Portugal | 1,443,204 | — | 1,443,204 | — |
| Romania | 182,107 | — | 182,107 | — |
| Singapore | 6,317,484 | $384,380 | 5,933,104 | — |
| South Africa | 17,793,322 | — | 17,793,322 | — |
| South Korea | 63,428,266 | — | 63,428,266 | — |
| Spain | 21,207,013 | — | 21,207,013 | — |
| Sweden | 39,446,239 | — | 39,446,239 | — |
| Switzerland | 110,588,003 | — | 110,588,003 | — |
| Taiwan | 70,603,742 | — | 70,603,742 | — |
| Thailand | 9,248,533 | — | 9,248,533 | — |
| Turkey | 1,175,984 | — | 1,175,984 | — |
| United Arab Emirates | 1,143 | — | 1,143 | — |
| United Kingdom | 144,132,605 | 723,886 | 143,408,719 | — |
| United States | 838,237 | 838,237 | — | — |
| Preferred securities | ||||
| Brazil | 6,407,175 | 6,407,175 | — | — |
| Chile | 445,694 | 445,694 | — | — |
| Colombia | 705,660 | 705,660 | — | — |
| Germany | 7,420,848 | — | 7,420,848 | — |
| South Korea | 3,750,595 | — | 3,750,595 | — |
| Exchange-traded funds | 107,891,780 | 107,891,780 | — | — |
| Warrants | 51,042 | 44,176 | 6,866 | — |
| Short-term investments | 69,819,126 | 9,920,810 | 59,898,316 | — |
| Total investments in securities | $1,723,565,540 | $300,266,338 | $1,423,256,539 | $42,663 |
| Derivatives: | ||||
| Assets | ||||
| Futures | $170,040 | $170,040 | — | — |
| Liabilities | ||||
| Futures | (976,853) | (976,853) | — | — |
| Level 3 includes securities valued at $0. Refer to Portfolio of Investments. | ||||
| Mid Cap Stock Fund | ||||
| Investments in securities: | ||||
| Assets | ||||
| Common stocks | ||||
| Communication services | $139,474,265 | $139,474,265 | — | — |
| Consumer discretionary | 672,809,993 | 672,809,993 | — | — |
| Consumer staples | 3,246,513 | — | $3,246,513 | — |
| Financials | 80,125,542 | 80,125,542 | — | — |
| Health care | 423,784,554 | 423,784,554 | — | — |
| Industrials | 189,876,538 | 189,876,538 | — | — |
| Information technology | 539,748,236 | 539,748,236 | — | — |
| Preferred securities | 14,269,445 | — | — | $14,269,445 |
| Exchange-traded funds | 37,947,735 | 37,947,735 | — | — |
| Short-term investments | 101,271,652 | 60,471,652 | 40,800,000 | — |
| Total investments in securities | $2,202,554,473 | $2,144,238,515 | $44,046,513 | $14,269,445 |
| Mid Value Fund | ||||
| Investments in securities: | ||||
| Assets | ||||
| Common stocks | ||||
| Communication services | $81,105,881 | $81,105,881 | — | — |
| Consumer discretionary | 48,500,748 | 39,601,350 | $8,899,398 | — |
| Total value at 8-31-21 | Level 1 quoted price | Level 2 significant observable inputs | Level 3 significant unobservable inputs | |
| Mid Value Fund (continued) | ||||
| Consumer staples | $153,677,474 | $142,005,137 | $11,672,337 | — |
| Energy | 208,734,218 | 200,489,152 | 8,245,066 | — |
| Financials | 324,248,799 | 303,877,355 | 20,371,444 | — |
| Health care | 292,980,499 | 272,702,215 | 20,278,284 | — |
| Industrials | 118,695,686 | 107,852,093 | 10,843,593 | — |
| Information technology | 38,842,964 | 38,842,964 | — | — |
| Materials | 182,124,536 | 165,985,573 | 16,138,963 | — |
| Real estate | 120,475,654 | 120,475,654 | — | — |
| Utilities | 136,112,113 | 136,112,113 | — | — |
| Preferred securities | 2,428,449 | 2,428,449 | — | — |
| Corporate bonds | 3,550,910 | — | 3,550,910 | — |
| Short-term investments | 142,794,701 | 142,794,701 | — | — |
| Total investments in securities | $1,854,272,632 | $1,754,272,637 | $99,999,995 | — |
| Science & Technology Fund | ||||
| Investments in securities: | ||||
| Assets | ||||
| Common stocks | ||||
| Communication services | $35,198,442 | $31,560,624 | $3,637,818 | — |
| Consumer discretionary | 50,039,000 | 35,180,180 | 14,858,820 | — |
| Health care | 1,013,551 | 1,013,551 | — | — |
| Industrials | 1,226,420 | 701,257 | 525,163 | — |
| Information technology | 119,905,699 | 109,733,138 | 10,172,561 | — |
| Short-term investments | 13,782,183 | 6,174,183 | 7,608,000 | — |
| Total investments in securities | $221,165,295 | $184,362,933 | $36,802,362 | — |
| Strategic Equity Allocation Fund | ||||
| Investments in securities: | ||||
| Assets | ||||
| Common stocks | ||||
| Communication services | $649,272,604 | $493,190,073 | $156,082,531 | — |
| Consumer discretionary | 989,282,372 | 658,501,528 | 330,780,844 | — |
| Consumer staples | 452,052,643 | 227,836,780 | 224,215,863 | — |
| Energy | 220,224,422 | 146,355,007 | 73,869,415 | — |
| Financials | 1,091,462,399 | 682,152,073 | 409,240,038 | $70,288 |
| Health care | 1,116,004,455 | 839,963,934 | 275,958,007 | 82,514 |
| Industrials | 825,650,892 | 490,065,760 | 335,585,132 | — |
| Information technology | 1,622,057,590 | 1,275,146,675 | 346,910,915 | — |
| Materials | 378,959,238 | 185,958,913 | 193,000,325 | — |
| Real estate | 352,109,088 | 286,752,032 | 65,357,056 | — |
| Utilities | 175,927,850 | 99,940,717 | 75,955,729 | 31,404 |
| Preferred securities | ||||
| Consumer discretionary | 9,535,469 | 348,754 | 9,186,715 | — |
| Consumer staples | 2,458,058 | — | 2,458,058 | — |
| Energy | 2,764,501 | 2,764,501 | — | — |
| Financials | 8,027,415 | 8,027,415 | — | — |
| Health care | 2,286,739 | — | 2,286,739 | — |
| Information technology | 5,884,666 | — | 5,884,666 | — |
| Materials | 2,810,627 | 2,084,438 | 726,189 | — |
| Utilities | 675,115 | 675,115 | — | — |
| Exchange-traded funds | 200,507,285 | 200,507,285 | — | — |
| Rights | 28,916 | 28,916 | — | — |
| Warrants | 91,742 | 81,068 | 10,674 | — |
| Short-term investments | 415,606,497 | 67,092,842 | 348,513,655 | — |
| Total investments in securities | $8,523,680,583 | $5,667,473,826 | $2,856,022,551 | $184,206 |
| Total value at 8-31-21 | Level 1 quoted price | Level 2 significant observable inputs | Level 3 significant unobservable inputs | |
| Strategic Equity Allocation Fund (continued) | ||||
| Derivatives: | ||||
| Assets | ||||
| Futures | $10,278,919 | $10,278,919 | — | — |
| Liabilities | ||||
| Futures | (628,397) | (628,397) | — | — |
| Level 3 includes securities valued at $0. Refer to Portfolio of Investments. | ||||
| U.S. Sector Rotation Fund | ||||
| Investments in securities: | ||||
| Assets | ||||
| Common stocks | ||||
| Communication services | $127,577,384 | $127,577,384 | — | — |
| Consumer discretionary | 137,705,169 | 137,700,171 | $4,998 | — |
| Consumer staples | 49,867,383 | 49,867,383 | — | — |
| Energy | 25,692,125 | 25,692,125 | — | — |
| Financials | 128,795,479 | 128,795,244 | — | $235 |
| Health care | 200,179,338 | 200,179,338 | — | — |
| Industrials | 84,721,462 | 84,721,462 | — | — |
| Information technology | 314,784,955 | 314,784,955 | — | — |
| Materials | 26,985,571 | 26,985,571 | — | — |
| Real estate | 56,599,168 | 56,599,168 | — | — |
| Utilities | 16,855,544 | 16,855,544 | — | — |
| Rights | 10,464 | 10,464 | — | — |
| Short-term investments | 40,553,821 | 96,923 | 40,456,898 | — |
| Total investments in securities | $1,210,327,863 | $1,169,865,732 | $40,461,896 | $235 |
| Derivatives: | ||||
| Assets | ||||
| Futures | $1,248,892 | $1,248,892 | — | — |
| Level 3 includes securities valued at $0. Refer to Portfolio of Investments. | ||||
| Mid Cap Stock Fund | Common stocks | Preferred securities | Total |
| Balance as of 8-31-20 | $1,411,074 | $43,144,127 | $44,555,201 |
| Realized gain (loss) | 775,330 | 1,005,522 | 1,780,852 |
| Change in unrealized appreciation (depreciation) | (775,330) | (10,396,957) | (11,172,287) |
| Purchases | — | — | — |
| Sales1 | (1,411,074) | (19,483,247) | (20,894,321) |
| Transfers into Level 3 | — | — | — |
| Transfers out of Level 3 | — | — | — |
| Balance as of 8-31-21 | — | $14,269,445 | $14,269,445 |
| Change in unrealized at period end2 | — | $680,505 | $680,505 |
| 1 | Sales attributable to corporate actions. |
| 2 | Change in unrealized appreciation (depreciation) attributable to Level 3 securities held at period end. This balance is included in change in unrealized appreciation (depreciation) on the Statements of operations. |
Agreement (collectively, MRA). Upon an event of default, the non-defaulting party may close out all transactions traded under the MRA and net amounts owed. Absent an event of default, assets and liabilities resulting from repurchase agreements are not offset in the Statements of assets and liabilities. In the event of a default by the counterparty, realization of the collateral proceeds could be delayed, during which time the collateral value may decline or the counterparty may have insufficient assets to pay claims resulting from close-out of the transactions.
| Fund | Counterparty | Collateral Paid/ (Received) |
| Core Bond Fund | Goldman Sachs | $(250,000) |
interest has become doubtful. Capital gain distributions from underlying funds are recorded on ex-date. Dividend income is recorded on ex-date, except for dividends of certain foreign securities where the dividend may not be known until after the ex-date. In those cases, dividend income, net of withholding taxes, is recorded when the fund becomes aware of the dividends. Non-cash dividends, if any, are recorded at the fair market value of the securities received. Distributions received on securities that represent a tax return of capital and/or capital gain, if any, are recorded as a reduction of cost of investments and/or as a realized gain, if amounts are estimable. Gains and losses on securities sold are determined on the basis of identified cost and may include proceeds from litigation. Return of capital distributions from underlying funds, if any, are treated as a reduction of cost.
| Fund | Market value of securities on loan | Cash collateral received | Non-cash collateral |
| High Yield Fund | $3,580,953 | $3,833,260 | — |
| International Strategic Equity Allocation Fund | 11,798,303 | 9,917,527 | $3,056,016 |
| Mid Cap Stock Fund | 93,843,498 | 60,366,856 | 37,177,826 |
| Mid Value Fund | 9,456,560 | 8,314,135 | 1,479,747 |
| Science & Technology Fund | 2,704,391 | 1,823,187 | 990,163 |
| Strategic Equity Allocation Fund | 71,376,136 | 67,050,009 | 7,504,979 |
| U.S. Sector Rotation Fund | 94,801 | 96,844 | — |
asset coverage and other limitations as specified in the agreement. Prior to June 24, 2021, a fund could borrow up to an aggregate commitment amount of $850 million.
| Fund | Commitment fee |
| Capital Appreciation Fund | $15,095 |
| Capital Appreciation Value Fund | 12,459 |
| Core Bond Fund | 24,412 |
| Health Sciences Fund | 7,684 |
| High Yield Fund | 6,611 |
| International Strategic Equity Allocation Fund | 13,662 |
| Mid Cap Stock Fund | 14,469 |
| Mid Value Fund | 12,486 |
| Science & Technology Fund | 7,043 |
| Strategic Equity Allocation Fund | 41,487 |
| U.S. Sector Rotation Fund | 11,289 |
| No Expiration Date | ||
| Fund | Short Term | Long Term |
| High Yield Fund | $— | $83,773,699 |
| Fund | Aggregate cost | Unrealized appreciation | Unrealized (depreciation) | Net unrealized appreciation/ (depreciation) |
| Capital Appreciation Fund | $719,432,199 | $1,417,459,637 | $(2,218,610) | $1,415,241,027 |
| Capital Appreciation Value Fund | 1,102,875,159 | 314,672,414 | (16,870,043) | 297,802,371 |
| Core Bond Fund | 1,931,777,083 | 22,274,384 | (6,709,897) | 15,564,487 |
| Health Sciences Fund | 255,592,664 | 178,161,914 | (5,121,290) | 173,040,624 |
| High Yield Fund | 293,763,815 | 11,726,451 | (27,748,721) | (16,022,270) |
| International Strategic Equity Allocation Fund | 1,439,034,573 | 323,508,087 | (39,783,933) | 283,724,154 |
| Mid Cap Stock Fund | 1,604,144,149 | 649,562,036 | (51,151,712) | 598,410,324 |
| Mid Value Fund | 1,447,849,969 | 445,330,300 | (38,907,637) | 406,422,663 |
| Science & Technology Fund | 166,812,923 | 58,986,151 | (4,633,779) | 54,352,372 |
| Strategic Equity Allocation Fund | 6,869,604,313 | 1,764,472,096 | (100,745,304) | 1,663,726,792 |
| U.S. Sector Rotation Fund | 954,701,122 | 260,528,564 | (3,652,931) | 256,875,633 |
| Fund | Ordinary Income | Long Term Capital Gains | Total |
| Capital Appreciation Fund | $30,976,236 | $324,304,086 | $355,280,322 |
| Capital Appreciation Value Fund | 44,122,327 | 200,481,606 | 244,603,933 |
| Core Bond Fund | 145,020,150 | 16,361,626 | 161,381,776 |
| Health Sciences Fund | 3,190,821 | 24,997,462 | 28,188,283 |
| High Yield Fund | 11,176,548 | — | 11,176,548 |
| International Strategic Equity Allocation Fund | 29,611,689 | — | 29,611,689 |
| Mid Cap Stock Fund | 221,835,590 | 235,145,438 | 456,981,028 |
| Mid Value Fund | 17,117,510 | 31,841,101 | 48,958,611 |
| Science & Technology Fund | 10,633,659 | 52,198,623 | 62,832,282 |
| Strategic Equity Allocation Fund | 113,149,830 | 355,213,201 | 468,363,031 |
| U.S. Sector Rotation Fund | 20,686,562 | 106,841,077 | 127,527,639 |
| Fund | Ordinary Income | Long Term Capital Gains | Total |
| Capital Appreciation Fund | $178,388 | $174,635,781 | $174,814,169 |
| Capital Appreciation Value Fund | 25,746,373 | 138,158,592 | 163,904,965 |
| Core Bond Fund | 86,689,645 | 3,617,696 | 90,307,341 |
| Health Sciences Fund | — | 10,491,735 | 10,491,735 |
| High Yield Fund | 13,263,417 | — | 13,263,417 |
| International Strategic Equity Allocation Fund | 48,976,734 | — | 48,976,734 |
| Mid Cap Stock Fund | — | 191,109,164 | 191,109,164 |
| Mid Value Fund | 20,551,466 | 14,266,431 | 34,817,897 |
| Science & Technology Fund | — | 25,176,071 | 25,176,071 |
| Strategic Equity Allocation Fund | 162,822,804 | 80,772,608 | 243,595,412 |
| U.S. Sector Rotation Fund | 23,166,684 | 104,676,601 | 127,843,285 |
| Fund | Undistributed Ordinary Income | Undistributed Long Term Capital Gains | Post-October Deferral | |
| Capital Appreciation Fund | $14,295,370 | $458,453,858 | — | |
| Capital Appreciation Value Fund | 58,869,571 | 157,418,068 | — | |
| Core Bond Fund | 15,365,830 | — | $1,054,032 | |
| Health Sciences Fund | 1,296,422 | 48,517,257 | — | |
| High Yield Fund | 3,041,571 | — | — | |
| International Strategic Equity Allocation Fund | 28,072,325 | 34,304,894 | — | |
| Mid Cap Stock Fund | 263,596,968 | 215,429,530 | — | |
| Mid Value Fund | 44,514,871 | 89,316,938 | — | |
| Science & Technology Fund | 37,185,480 | 79,291,618 | — | |
| Strategic Equity Allocation Fund | 204,872,952 | 840,417,386 | — | |
| U.S. Sector Rotation Fund | 39,020,305 | 168,655,539 | — |
Derivatives which are typically traded through the OTC market are regulated by the Commodity Futures Trading Commission (the CFTC). Derivative counterparty risk is managed through an ongoing evaluation of the creditworthiness of all potential counterparties and, if applicable, designated clearing organizations. The funds attempt to reduce their exposure to counterparty risk for derivatives traded in the OTC market, whenever possible, by entering into an International Swaps and Derivatives Association (ISDA) Master Agreement with each of their OTC counterparties. The ISDA gives each party to the agreement the right to terminate all transactions traded under the agreement if there is certain deterioration in the credit quality or contractual default of the other party, as defined in the ISDA. Upon an event of default or a termination of the ISDA, the non-defaulting party has the right to close out all transactions and to net amounts owed.
| Fund | Reason | USD Notional range |
| High Yield Fund | To manage duration of the fund. | $19.3 million to $24.7 million |
| International Strategic Equity Allocation Fund | To manage against changes in foreign currency exchange rates, manage against change in certain securities markets and gain exposure to certain securities markets. | $20.0 million to $89.2 million |
| Strategic Equity Allocation Fund | To manage against changes in foreign currency exchange rates, manage against change in certain securities markets and gain exposure to certain securities markets. | $148.0 million to $412.7 million |
| U.S. Sector Rotation Fund | To manage against change in certain securities markets and gain exposure to certain securities markets. | $31.6 million to $48.9 million |
| Fund | Reason | USD Notional range |
| High Yield Fund | To manage against changes in foreign currency exchange rates and to gain exposure to foreign currencies. | $1.8 million to $7.3 million |
| Fund | Reason | USD Notional range |
| Strategic Equity Allocation Fund | To manage against changes in foreign currency exchange rates and to gain exposure to foreign currencies. At August 31, 2021, there were no open forward foreign currency contracts. | Up to $93.6 million |
| Fund | Reason | Market value range |
| Capital Appreciation Value Fund | To manage against changes in certain securities markets, to gain exposure to certain securities markets and to generate potential income from options premiums. | $13.6 million to $30.7 million |
| Fund | Reason | USD Notional range |
| High Yield Fund | To gain credit exposure to an issuer or index. | $0.6 million to $1.5 million |
Fair value of derivative instruments by risk category
| Fund | Risk | Statements of assets and liabilities location | Financial instruments location | Assets derivatives fair value | Liabilities derivatives fair value |
| Capital Appreciation Value Fund | Equity | Written options, at value | Written options | — | $(30,662,491) |
| — | $(30,662,491) | ||||
| High Yield Fund | Interest rate | Receivable/payable for futures variation margin1 | Futures | $24,538 | — |
| Currency | Unrealized appreciation (depreciation) on forward foreign currency contracts | Forward foreign currency contracts | 7,151 | $(5,876) | |
| Credit | Swap contracts, at value2 | Credit default swaps | 32,219 | (24,748) | |
| $63,908 | $(30,624) | ||||
| International Strategic Equity Allocation Fund | Currency | Receivable/payable for futures variation margin1 | Futures | — | $(153,551) |
| Equity | Receivable/payable for futures variation margin1 | Futures | $170,040 | (823,302) | |
| $170,040 | $(976,853) | ||||
| Strategic Equity Allocation Fund | Currency | Receivable/payable for futures variation margin1 | Futures | — | $(119,742) |
| Equity | Receivable/payable for futures variation margin1 | Futures | $10,278,919 | (508,655) | |
| $10,278,919 | $(628,397) | ||||
| U.S. Sector Rotation Fund | Equity | Receivable/payable for futures variation margin1 | Futures | $1,248,892 | — |
| $1,248,892 | — |
| 1 | Reflects cumulative appreciation/depreciation on open futures as disclosed in the Derivatives section of the Portfolio of investments. Only the year end variation margin receivable/payable is separately reported on the Statements of assets and liabilities. |
| 2 | Reflects cumulative value of swap contracts. Receivable/payable for centrally cleared swaps, which includes value and margin, are shown separately on the Statements of assets and liabilities. |
| Statements of operations location - Net realized gain (loss) on: | ||||||
| Fund | Risk | Futures contracts | Forward foreign currency contracts | Written options | Swap contracts | Total |
| Capital Appreciation Value Fund | Equity | — | — | $5,981,954 | — | $5,981,954 |
| High Yield Fund | Interest rate | $(123,167) | — | — | — | $(123,167) |
| Currency | — | $(70,250) | — | — | (70,250) | |
| Credit | — | — | — | $126,508 | 126,508 | |
| Total | $(123,167) | $(70,250) | — | $126,508 | $(66,909) | |
| International Strategic Equity Allocation Fund | Currency | $328,117 | — | — | — | $328,117 |
| Equity | 13,082,506 | — | — | — | 13,082,506 | |
| Total | $13,410,623 | — | — | — | $13,410,623 | |
| Strategic Equity Allocation Fund | Currency | $(232,050) | $(818,026) | — | — | $(1,050,076) |
| Equity | 91,969,191 | — | — | — | 91,969,191 | |
| Total | $91,737,141 | $(818,026) | — | — | $90,919,115 | |
| U.S. Sector Rotation Fund | Equity | $13,582,472 | — | — | — | $13,582,472 |
| Statements of operations location - Change in net unrealized appreciation (depreciation) of: | ||||||
| Fund | Risk | Futures contracts | Forward foreign currency contracts | Written options | Swap contracts | Total |
| Capital Appreciation Value Fund | Equity | — | — | $(5,526,694) | — | $(5,526,694) |
| Statements of operations location - Change in net unrealized appreciation (depreciation) of: | ||||||
| Fund | Risk | Futures contracts | Forward foreign currency contracts | Written options | Swap contracts | Total |
| High Yield Fund | Interest rate | $(4,582) | — | — | — | $(4,582) |
| Currency | — | $123,664 | — | — | 123,664 | |
| Credit | — | — | — | $(29,353) | (29,353) | |
| Total | $(4,582) | $123,664 | — | $(29,353) | $89,729 | |
| International Strategic Equity Allocation Fund | Currency | $(180,959) | — | — | — | $(180,959) |
| Equity | (2,219,025) | — | — | — | (2,219,025) | |
| Total | $(2,399,984) | — | — | — | $(2,399,984) | |
| Strategic Equity Allocation Fund | Currency | $(165,087) | $912,300 | — | — | $747,213 |
| Equity | (5,590,449) | — | — | — | (5,590,449) | |
| Total | $(5,755,536) | $912,300 | — | — | $(4,843,236) | |
| U.S. Sector Rotation Fund | Equity | $(951,824) | — | — | — | $(951,824) |
| Fund | Subadvisor(s) |
| Science & Technology Fund | Allianz Global Investors U.S. LLC; T. Rowe Price Associates, Inc. |
| Capital Appreciation Fund | Jennison Associates LLC |
| International Strategic Equity Allocation Fund Strategic Equity Allocation Fund U.S. Sector Rotation Fund | Manulife Investment Management (US) LLC1 |
| Capital Appreciation Value Fund Health Sciences Fund Mid Value Fund | T. Rowe Price Associates, Inc. |
| Mid Cap Stock Fund | Wellington Management Company LLP |
| Core Bond Fund | Wells Capital Management, Incorporated |
| High Yield Fund | Western Asset Management Company, LLC |
| Fund | Expense limitation as a percentage of average net assets |
| Capital Appreciation Fund | 0.20% |
| Capital Appreciation Value Fund | 0.20% |
| Core Bond Fund | 0.15% |
| Health Sciences Fund | 0.20% |
| High Yield Fund | 0.15% |
| International Strategic Equity Allocation Fund | 0.25% |
| Fund | Expense limitation as a percentage of average net assets |
| Mid Cap Stock Fund | 0.20% |
| Mid Value Fund | 0.20% |
| Science & Technology Fund | 0.20% |
| Strategic Equity Allocation Fund | 0.20% |
| U.S. Sector Rotation Fund | 0.20% |
| Expense Reimbursement by Class | |||
| Fund | Class 1 | Class NAV | Total |
| Capital Appreciation Fund | $69,513 | $105,952 | $175,465 |
| Capital Appreciation Value Fund | — | 629,166 | 629,166 |
| Core Bond Fund | 16,633 | 197,887 | 214,520 |
| Health Sciences Fund | — | 248,280 | 248,280 |
| High Yield Fund | 19,686 | — | 19,686 |
| International Strategic Equity Allocation Fund | — | 2,301,879 | 2,301,879 |
| Mid Cap Stock Fund | 52,959 | 116,947 | 169,906 |
| Mid Value Fund | — | 843,470 | 843,470 |
| Science & Technology Fund | — | 154,276 | 154,276 |
| Strategic Equity Allocation Fund | — | 10,537,381 | 10,537,381 |
| U.S. Sector Rotation Fund | — | 1,627,925 | 1,627,925 |
| Fund | Net Annual Effective Rate |
| Capital Appreciation Fund | 0.69% |
| Capital Appreciation Value Fund | 0.78% |
| Core Bond Fund | 0.56% |
| Health Sciences Fund | 0.91% |
| High Yield Fund | 0.69% |
| International Strategic Equity Allocation Fund | 0.49% |
| Fund | Net Annual Effective Rate |
| Mid Cap Stock Fund | 0.82% |
| Mid Value Fund | 0.90% |
| Science & Technology Fund | 0.96% |
| Strategic Equity Allocation Fund | 0.49% |
| U.S. Sector Rotation Fund | 0.49% |
| Class | Rule 12b-1 Fee |
| Class 1 | 0.05% |
| Fund | Class | Distribution and service fees |
| Capital Appreciation Fund | Class 1 | $411,320 |
| Core Bond Fund | Class 1 | $99,139 |
| High Yield Fund | Class 1 | $115,805 |
| Mid Cap Stock Fund | Class 1 | $313,562 |
| Fund | Borrower or Lender | Weighted Average Loan Balance | Days Outstanding | Weighted Average Interest Rate | Interest Income (Expense) |
| Capital Appreciation Fund | Borrower | $19,492,768 | 12 | 0.590% | $(3,836) |
| International Strategic Equity Allocation Fund | Borrower | 6,300,000 | 2 | 0.670% | (235) |
| U.S. Sector Rotation Fund | Borrower | 36,000,000 | 1 | 0.670% | (670) |
| Capital Appreciation Fund | Lender | 1,756,833 | 3 | 0.635% | 93 |
| Capital Appreciation Value Fund | Lender | 35,033,333 | 3 | 0.662% | 1,933 |
| Health Sciences Fund | Lender | 2,451,014 | 5 | 0.619% | 211 |
| Mid Cap Stock Fund | Lender | 3,209,594 | 6 | 0.666% | 356 |
| Mid Value Fund | Lender | 4,260,833 | 6 | 0.650% | 462 |
| Science & Technology Fund | Lender | 4,060,000 | 5 | 0.669% | 377 |
| Strategic Equity Allocation Fund | Lender | 4,977,014 | 3 | 0.614% | 255 |
| Capital Appreciation Fund | Year Ended 8-31-21 | Year Ended 8-31-20 | ||
| Shares | Amount | Shares | Amount | |
| Class 1 shares | ||||
| Sold | 2,361,771 | $52,401,542 | 2,789,335 | $50,640,671 |
| Distributions reinvested | 6,648,819 | 137,564,075 | 3,644,168 | 56,812,578 |
| Repurchased | (6,478,193) | (139,724,050) | (8,528,160) | (134,517,859) |
| Net increase (decrease) | 2,532,397 | $50,241,567 | (2,094,657) | $(27,064,610) |
| Class NAV shares | ||||
| Sold | 3,812,777 | $81,891,483 | 4,999,054 | $80,082,988 |
| Distributions reinvested | 10,471,881 | 217,710,396 | 7,540,038 | 118,001,591 |
| Repurchased | (22,918,208) | (510,559,023) | (26,447,455) | (473,357,228) |
| Net decrease | (8,633,550) | $(210,957,144) | (13,908,363) | $(275,272,649) |
| Total net decrease | (6,101,153) | $(160,715,577) | (16,003,020) | $(302,337,259) |
| Capital Appreciation Value Fund | Year Ended 8-31-21 | Year Ended 8-31-20 | ||
| Shares | Amount | Shares | Amount | |
| Class NAV shares | ||||
| Sold | 4,498,712 | $51,090,253 | 2,451,623 | $26,674,762 |
| Distributions reinvested | 22,564,938 | 244,603,933 | 14,779,528 | 163,904,965 |
| Repurchased | (36,954,905) | (440,687,059) | (33,016,784) | (373,991,287) |
| Net decrease | (9,891,255) | $(144,992,873) | (15,785,633) | $(183,411,560) |
| Total net decrease | (9,891,255) | $(144,992,873) | (15,785,633) | $(183,411,560) |
| Core Bond Fund | Year Ended 8-31-21 | Year Ended 8-31-20 | ||
| Shares | Amount | Shares | Amount | |
| Class 1 shares | ||||
| Sold | 2,023,821 | $27,309,168 | 4,100,406 | $55,671,502 |
| Distributions reinvested | 895,305 | 11,967,506 | 427,345 | 5,663,456 |
| Repurchased | (3,744,848) | (49,711,159) | (2,636,573) | (35,391,823) |
| Net increase (decrease) | (825,722) | $(10,434,485) | 1,891,178 | $25,943,135 |
| Class NAV shares | ||||
| Sold | 33,541,791 | $449,989,308 | 20,516,036 | $275,267,732 |
| Distributions reinvested | 11,195,021 | 149,414,270 | 6,402,984 | 84,643,885 |
| Repurchased | (102,776,586) | (1,337,882,890) | (47,015,195) | (627,363,940) |
| Net decrease | (58,039,774) | $(738,479,312) | (20,096,175) | $(267,452,323) |
| Total net decrease | (58,865,496) | $(748,913,797) | (18,204,997) | $(241,509,188) |
| Health Sciences Fund | Year Ended 8-31-21 | Year Ended 8-31-20 | ||
| Shares | Amount | Shares | Amount | |
| Class NAV shares | ||||
| Sold | 6,768,418 | $40,804,362 | 25,414,746 | $117,089,257 |
| Distributions reinvested | 4,690,230 | 28,188,283 | 2,106,774 | 10,491,735 |
| Repurchased | (26,128,757) | (162,843,489) | (11,107,953) | (54,424,464) |
| Net increase (decrease) | (14,670,109) | $(93,850,844) | 16,413,567 | $73,156,528 |
| Total net increase (decrease) | (14,670,109) | $(93,850,844) | 16,413,567 | $73,156,528 |
| High Yield Fund | Year Ended 8-31-21 | Year Ended 8-31-20 | ||
| Shares | Amount | Shares | Amount | |
| Class 1 shares | ||||
| Sold | 11,098,590 | $90,700,508 | 1,929,866 | $15,076,870 |
| Distributions reinvested | 1,401,309 | 11,176,548 | 1,769,163 | 13,263,417 |
| Repurchased | (4,627,139) | (37,531,238) | (9,101,936) | (69,556,464) |
| Net increase (decrease) | 7,872,760 | $64,345,818 | (5,402,907) | $(41,216,177) |
| Total net increase (decrease) | 7,872,760 | $64,345,818 | (5,402,907) | $(41,216,177) |
| International Strategic Equity Allocation Fund | Year Ended 8-31-21 | Year Ended 8-31-20 | ||
| Shares | Amount | Shares | Amount | |
| Class NAV shares | ||||
| Sold | 840,413 | $8,995,358 | 10,655,190 | $92,421,757 |
| Distributions reinvested | 2,820,161 | 29,611,689 | 5,043,948 | 48,976,734 |
| Repurchased | (32,504,516) | (346,968,836) | (17,456,302) | (163,434,136) |
| Net decrease | (28,843,942) | $(308,361,789) | (1,757,164) | $(22,035,645) |
| Total net decrease | (28,843,942) | $(308,361,789) | (1,757,164) | $(22,035,645) |
| Mid Cap Stock Fund | Year Ended 8-31-21 | Year Ended 8-31-20 | ||
| Shares | Amount | Shares | Amount | |
| Class 1 shares | ||||
| Sold | 1,286,989 | $36,936,063 | 1,627,719 | $37,366,386 |
| Distributions reinvested | 5,689,286 | 149,685,105 | 2,537,043 | 51,552,722 |
| Repurchased | (4,822,216) | (132,632,186) | (4,142,181) | (87,074,848) |
| Net increase | 2,154,059 | $53,988,982 | 22,581 | $1,844,260 |
| Class NAV shares | ||||
| Sold | 9,615,843 | $265,194,414 | 4,541,586 | $91,200,433 |
| Distributions reinvested | 11,457,715 | 307,295,923 | 6,771,298 | 139,556,442 |
| Repurchased | (15,469,646) | (446,807,321) | (16,538,736) | (391,437,265) |
| Net increase (decrease) | 5,603,912 | $125,683,016 | (5,225,852) | $(160,680,390) |
| Total net increase (decrease) | 7,757,971 | $179,671,998 | (5,203,271) | $(158,836,130) |
| Mid Value Fund | Year Ended 8-31-21 | Year Ended 8-31-20 | ||
| Shares | Amount | Shares | Amount | |
| Class NAV shares | ||||
| Sold | 17,670,301 | $334,527,757 | 12,211,063 | $151,259,098 |
| Distributions reinvested | 3,007,286 | 48,958,611 | 2,274,193 | 34,817,897 |
| Repurchased | (12,891,043) | (219,617,768) | (12,044,058) | (180,875,357) |
| Net increase | 7,786,544 | $163,868,600 | 2,441,198 | $5,201,638 |
| Total net increase | 7,786,544 | $163,868,600 | 2,441,198 | $5,201,638 |
| Science & Technology Fund | Year Ended 8-31-21 | Year Ended 8-31-20 | ||
| Shares | Amount | Shares | Amount | |
| Class NAV shares | ||||
| Sold | 2,781,512 | $14,493,127 | 5,874,600 | $23,646,809 |
| Distributions reinvested | 12,770,789 | 62,832,282 | 6,590,594 | 25,176,071 |
| Repurchased | (45,770,020) | (243,415,711) | (16,383,638) | (65,788,097) |
| Net decrease | (30,217,719) | $(166,090,302) | (3,918,444) | $(16,965,217) |
| Total net decrease | (30,217,719) | $(166,090,302) | (3,918,444) | $(16,965,217) |
| Strategic Equity Allocation Fund | Year Ended 8-31-21 | Year Ended 8-31-20 | ||
| Shares | Amount | Shares | Amount | |
| Class NAV shares | ||||
| Sold | 32,991,623 | $453,334,380 | 59,137,203 | $614,062,153 |
| Distributions reinvested | 36,705,567 | 468,363,031 | 20,435,857 | 243,595,412 |
| Repurchased | (114,513,496) | (1,554,047,766) | (124,168,522) | (1,426,663,039) |
| Net decrease | (44,816,306) | $(632,350,355) | (44,595,462) | $(569,005,474) |
| Total net decrease | (44,816,306) | $(632,350,355) | (44,595,462) | $(569,005,474) |
| U.S. Sector Rotation Fund | Year Ended 8-31-21 | Year Ended 8-31-20 | ||
| Shares | Amount | Shares | Amount | |
| Class NAV shares | ||||
| Sold | 1,045,094 | $11,832,132 | 6,354,741 | $58,504,318 |
| Distributions reinvested | 12,417,492 | 127,527,639 | 13,005,421 | 127,843,285 |
| Repurchased | (38,046,945) | (430,904,218) | (50,884,883) | (507,668,716) |
| Net decrease | (24,584,359) | $(291,544,447) | (31,524,721) | $(321,321,113) |
| Total net decrease | (24,584,359) | $(291,544,447) | (31,524,721) | $(321,321,113) |
| Purchases | Sales | |||
| Fund | U.S. Government | Other issuers | U.S. Government | Other issuers |
| Capital Appreciation Fund | — | $940,044,466 | — | $1,477,208,091 |
| Capital Appreciation Value Fund | — | 767,948,831 | — | 1,117,552,802 |
| Core Bond Fund | $5,854,446,472 | 2,141,478,372 | $5,669,892,321 | 2,962,524,444 |
| Health Sciences Fund | — | 157,236,401 | — | 277,663,994 |
| High Yield Fund | — | 249,044,181 | — | 188,357,063 |
| International Strategic Equity Allocation Fund | — | 1,048,912,119 | — | 1,398,703,263 |
| Purchases | Sales | |||
| Fund | U.S. Government | Other issuers | U.S. Government | Other issuers |
| Mid Cap Stock Fund | — | $1,787,849,972 | — | $2,081,286,023 |
| Mid Value Fund | — | 624,930,340 | — | 608,455,921 |
| Science & Technology Fund | — | 237,494,617 | — | 458,608,548 |
| Strategic Equity Allocation Fund | — | 6,006,901,956 | — | 7,189,828,440 |
| U.S. Sector Rotation Fund | $10,999,022 | 1,065,862,838 | — | 1,479,937,380 |
| Dividends and distributions | |||||||||
| Affiliate | Ending share amount | Beginning value | Cost of purchases | Proceeds from shares sold | Realized gain (loss) | Change in unrealized appreciation (depreciation) | Income distributions received | Capital gain distributions received | Ending value |
| Capital Appreciation Fund | |||||||||
| John Hancock Collateral Trust* | — | $40,120,111 | $172,193,335 | $(212,301,603) | $(10,487) | $(1,356) | $38,717 | — | — |
| Capital Appreciation Value Fund | |||||||||
| John Hancock Collateral Trust* | — | $75,323 | $2,837,245 | $(2,912,404) | $(91) | $(73) | $1,800 | — | — |
| Core Bond Fund | |||||||||
| John Hancock Collateral Trust* | — | — | $3,067,344 | $(3,067,322) | $(22) | — | $110 | — | — |
| High Yield Fund | |||||||||
| John Hancock Collateral Trust* | 383,079 | $272,666 | $9,738,896 | $(6,178,289) | $(453) | $693 | $10,848 | — | $3,833,513 |
| International Strategic Equity Allocation Fund | |||||||||
| John Hancock Collateral Trust* | 991,377 | $77,852,096 | $337,477,879 | $(405,369,152) | $7,554 | $(47,567) | $464,250 | — | $9,920,810 |
| Mid Cap Stock Fund | |||||||||
| John Hancock Collateral Trust* | 6,042,875 | $38,560,759 | $507,624,317 | $(485,703,179) | $23,204 | $(33,449) | $203,418 | — | $60,471,652 |
| Mid Value Fund | |||||||||
| John Hancock Collateral Trust* | 830,566 | $37,748,016 | $199,931,378 | $(229,361,313) | $19,799 | $(26,327) | $128,982 | — | $8,311,553 |
| Science & Technology Fund | |||||||||
| John Hancock Collateral Trust* | 182,290 | $7,383,356 | $55,880,297 | $(61,438,723) | $1,303 | $(2,043) | $31,048 | — | $1,824,190 |
| Strategic Equity Allocation Fund | |||||||||
| John Hancock Collateral Trust* | 6,704,524 | $144,125,146 | $814,517,626 | $(891,497,013) | $88,340 | $(141,257) | $1,955,304 | — | $67,092,842 |
| U.S. Sector Rotation Fund | |||||||||
| John Hancock Collateral Trust* | 9,685 | $947,987 | $6,423,670 | $(7,274,227) | $899 | $(1,406) | $7,410 | — | $96,923 |
| * | Refer to the Securities lending note within Note 2 for details regarding this investment. |
| Fund | Affiliated Concentration |
| Capital Appreciation Fund | 40.6% |
| Fund | Affiliated Concentration |
| Capital Appreciation Value Fund | 98.6% |
| Core Bond Fund | 53.3% |
| Health Sciences Fund | 99.9% |
| International Strategic Equity Allocation Fund | 100.0% |
| Mid Cap Stock Fund | 70.2% |
| Mid Value Fund | 100.0% |
| Science & Technology Fund | 100.0% |
| Strategic Equity Allocation Fund | 100.0% |
| U.S. Sector Rotation Fund | 100.0% |
| Fund | Purchases | Sales |
| Capital Appreciation Value Fund | — | $1,468,490 |
| Issuer, Description | Original acquisition date | Acquisition cost | Beginning share amount | Shares purchased | Shares sold | Ending share amount | Value as a percentage of net assets | Ending value |
| Health Sciences Fund | ||||||||
| Doximity, Inc., Class B | 4-10-14 | $307,268 | 127,4761 | — | — | 127,476 | 2.6% | $11,182,351 |
| JAND, Inc., Class A | 4-23-15 | 194,538 | 16,938 | — | — | 16,938 | 0.1% | 470,538 |
| JAND, Inc., Series D | 4-23-15 | 434,397 | 37,822 | — | — | 37,822 | 0.2% | 1,050,695 |
| $12,703,584 | ||||||||
| High Yield Fund | ||||||||
| KCAD Holdings I, Ltd. | 3-21-11 | $6,150,520 | 752,218,031 | — | — | 752,218,031 | 0.0%2 | $752 |
| MWO Holdings LLC | 8-30-16 | 1,116,559 | 1,134 | — | — | 1,134 | 0.0%2 | 8,584 |
| New Cotai, Inc., Class B | 4-12-13 | — | 11 | — | — | 11 | 0.0% | — |
| $9,336 | ||||||||
| Mid Cap Stock Fund | ||||||||
| Essence Group Holdings Corp. | 5-1-14 | $5,083,384 | 2,958,957 | — | — | 2,958,957 | 0.4% | $8,758,513 |
| Lookout, Inc., Series F | 7-31-14 | 4,276,874 | 392,767 | — | — | 392,767 | 0.2% | 3,640,950 |
| The Honest Company, Inc. | 8-20-14 | 4,457,180 | 327,2761 | — | — | 327,276 | 0.1% | 3,246,513 |
| WeWork Companies, Inc., Series D1 | 12-8-14 | 1,466,734 | 184,328 | — | (96,242) | 88,086 | 0.0%2 | 659,225 |
| WeWork Companies, Inc., Series D2 | 12-8-14 | 3,472,011 | 161,782 | — | — | 161,782 | 0.1% | 1,210,757 |
| $17,515,958 | ||||||||
| Science & Technology Fund | ||||||||
| DiDi Chuxing, Inc. | 10-19-15 | $460,705 | 16,798 | — | — | 16,798 | 0.3% | $525,163 |
| 1 | Two-for-one stock split and/or share conversion. |
| 2 | Less than 0.05%. |
adoption of alternative rates such as the Secured Overnight Financing Rate (“SOFR”), which is a broad measure of secured overnight US Treasury repo rates, but there is no definitive information regarding the future utilization of any particular replacement rate.
| Fund | Foreign sourced income | Foreign tax credit |
| International Strategic Equity Allocation Fund | $43,923,263 | $3,655,014 |
| Fund | Long term capital gains |
| Capital Appreciation Fund | $324,304,086 |
| Capital Appreciation Value Fund | 200,481,606 |
| Core Bond Fund | 16,361,626 |
| Health Sciences Fund | 24,997,462 |
| Mid Cap Stock Fund | 235,145,438 |
| Mid Value Fund | 31,841,101 |
| Science & Technology Fund | 52,198,623 |
| Strategic Equity Allocation Fund | 355,213,201 |
| U.S. Sector Rotation Fund | 106,841,077 |
| (1) | information relating to each Subadvisor’s business, including current subadvisory services to the Trust (and other funds in the John Hancock family of funds); |
| (2) | the historical and current performance of each Fund and comparative performance information relating to the Fund’s benchmark and comparable funds; |
| (3) | the subadvisory fee for each Fund, and comparative fee information, where available, prepared by an independent third party provider of fund data; and |
| (4) | information relating to the nature and scope of any material relationships and their significance to the Trust’s Advisor and unaffiliated Subadvisors. |
| (1) | each Subadvisor has extensive experience and demonstrated skills as a manager; |
| (2) | although not without variation, the performance of each Fund managed by a Subadvisor generally has been in line with or outperformed the historical performance of comparable funds and/or each Fund’s respective benchmark, with the exceptions noted in Appendix A (with respect to such exceptions, the Board concluded that performance is being monitored and reasonably addressed); |
| (3) | the subadvisory fees are reasonable in relation to the level and quality of services being provided under the Subadvisory Agreements; and |
| (4) | the subadvisory fees are paid by the Advisor and not the Funds, and that the fee structure for the Funds contains breakpoints, breakpoints are reflected as breakpoints in the advisory fees for the Funds in order to permit shareholders to benefit from economies of scale if those Funds grow. |
| Portfolio (subadvisors) | Performance of fund, as of 12.31.2020 | Fees and expenses | Comments |
| JHF II Capital Appreciation Fund(Jennison Associates LLC) | Benchmark Index — The fund outperformed for the one-, three-, five- and ten-year periods.Lipper Category — The fund outperformed the median for the one-, three-, five- and ten-year periods. | Subadvisory fee comparative data not provided due to limited size of Lipper peer group for this purpose.Net management fees for this fund are equal to the peer group median.Total expenses for this fund are lower than the peer group median. | The Board took into account management’s discussion of the fund’s performance, including the favorable performance relative to benchmark index and to the peer group median for the one-, three-, five- and ten-year periods.The Board took into account management’s discussion of the fund’s expenses. |
| JHF II Capital Appreciation Value Fund(T. Rowe Price Associates, Inc.) | Benchmark Index — The fund outperformed for the one-, three- and five-year periods.Lipper Category — The fund outperformed the median for the one-, three- and five-year periods. | Subadvisory fee comparative data not provided due to limited size of Lipper peer group for this purpose.Net management fees for this fund are higher than the peer group median.Total expenses for this fund are higher than the peer group median. | The Board took into account management’s discussion of the fund’s performance, including the favorable performance relative to the benchmark index and peer group median for the one-, three- and five-year periods.The Board took into account management’s discussion of the fund’s expenses. |
| JHF II Core Bond Fund(Wells Capital Management, Inc.) | Benchmark Index — The fund outperformed for the one- and ten-year periods and underperformed for the three- and five-year periods.Lipper Category — The fund outperformed the median for the one-, three- and ten-year periods and underperformed the median for the five-year period. | Subadvisory fee comparative data not provided due to limited size of Lipper peer group for this purpose.Net management fees for this fund are higher than the peer group median.Total expenses for this fund are lower than the peer group median. | The Board took into account management’s discussion of the fund’s performance, including the favorable performance relative to the benchmark index for the one- and ten-year periods and peer group median for the one-, three- and ten-year periods. The Board took into account management’s discussion of the factors that contributed to the fund’s performance for the benchmark index for the three- and five-year periods including the impact of past and current market conditions on the fund’s strategy and management’s outlook for the fund.The Board concluded that the fund's performance is being monitored and reasonably addressed, where appropriate.The Board took into account management’s discussion of the fund’s expenses. |
| Portfolio (subadvisors) | Performance of fund, as of 12.31.2020 | Fees and expenses | Comments |
| JHF II Health Sciences Fund(T. Rowe Price Associates, Inc.) | Benchmark Index — The fund underperformed for the one-, three- and five-year periods.Lipper Category — The fund outperformed the median for the one-, three- and five-year periods. | Subadvisor fee comparative data not provided due to limited size of Lipper peer group for this purpose.Net management fees for this fund are higher than the peer group median.Total expenses for this fund are higher than the peer group median. | The Board took into account management’s discussion of the fund’s performance,including the favorable performance relative to the peer group median for the one-, three- and five-year periods.The Board took into account management’s discussion of the factors that contributed to the fund’s performance for the benchmark index for the one-, three- and five-year periods.The Board took into account management’s discussion of the fund’s expenses. |
| JHF II High Yield Fund(Western Asset Management) | Benchmark Index — The fund underperformed for the one-, three-, five- and ten-year periods.Lipper Category — The fund outperformed the median for the one-, three-, five- and ten-year periods. | Subadvisory fee comparative data not provided due to limited size of Lipper peer group for this purpose.Net management fees for this fund are higher than the peer group median.Total expenses for this fund are lower than the peer group median. | The Board took into account management’s discussion of the fund’s performance, including the favorable performance relative to the peer group median for the one-, three-, five-, and ten-year periods.The Board took into account management’s discussion of the factors that contributed to the fund’s performance relative to the benchmark index for the one-, three-, five- and ten-year periods including the impact of past and current market conditions on the fund’s strategy and management’s outlook for the fund.The Board took into account management’s discussion of the fund’s expenses. |
| JHF II International Strategic Equity Allocation Fund(Manulife Investment Management (United States)) | Benchmark Index — The fund underperformed for the one- and three-year periods.Lipper Category — The fund outperformed the median for the one-year period and underperformed the median for the three-year period. | Subadvisor fee comparative data not provided due to limited size of Lipper peer group for this purpose.Net management fees for this fund are lower than the peer group median.Total expenses for this fund are lower than the peer group median. | The Board took into account management’s discussion of the factors that contributed to the fund’s performance relative to the benchmark index for the one- and three-year periods and peer group median for the three-year period including the impact of past and current market conditions on the fund’s strategy and management’s outlook for the fund.The Board concluded that the fund's performance is being monitored and reasonably addressed, where appropriate. |
| Portfolio (subadvisors) | Performance of fund, as of 12.31.2020 | Fees and expenses | Comments |
| JHF II Mid Cap Stock Fund(Wellington Management Company, LLP) | Benchmark Index — The fund outperformed for the one-, three-, five- and ten-year periods.Lipper Category — The fund outperformed the median for the one-, three-, five- and ten-year periods. | Subadvisor fee comparative data not provided due to limited size of Lipper peer group for this purpose.Net management fees for this fund are higher than the peer group median.Total expenses for this fund are lower than the peer group median. | The Board took into account management’s discussion of the fund’s performance, including the favorable performance relative to the benchmark and peer group median for the one-, three-, five- and ten-year periods.The Board took into account management’s discussion of the fund’s expenses. |
| JHF II Mid Value Fund(T. Rowe Price Associates, Inc.) | Benchmark Index — The fund outperformed for the one- and five-year periods and underperformed for the three- and ten-year periods.Lipper Category — The fund outperformed the median for the one-, three-, five- and ten-year periods. | Subadvisor fee comparative data not provided due to limited size of Lipper peer group for this purpose.Net management fees for this fund are higher than the peer group median.Total expenses for this fund are higher than the peer group median. | The Board took into account management’s discussion of the fund’s performance,including the favorable performance relative to the benchmark index for the one- and five-year periods and the peer group median for the one-, three-, five- and ten year periods.The Board took into account management’s discussion of the factors that contributed to the fund’s performance for the benchmark index for the three- and ten-year periods.The Board took into account management’s discussion of the fund’s expenses. |
| JHF II Science & Technology Fund(Allianz Global Investors U.S. LLC)(T. Rowe Price Associates, Inc.) | Benchmark Index — The fund outperformed for the one-, three- and five-year periods.Lipper Category — The fund outperformed the median for the one-, three- and five-year periods. | Subadvisor fee comparative data not provided due to limited size of Lipper peer group for this purpose.Net management fees for this fund are higher than the peer group median.Total expenses for this fund are higher than the peer group median. | The Board took into account management’s discussion of the fund’s performance, including the favorable performance relative to the benchmark index and to the peer group median for the one-, three- and five-year periods.The Board took into account management’s discussion of the fund’s expenses. |
| Portfolio (subadvisors) | Performance of fund, as of 12.31.2020 | Fees and expenses | Comments |
| JHF II Strategic Equity Allocation Fund(Manulife Investment Management (United States)) | Benchmark Index — The fund underperformed for the one-, three- and five-year periods.Lipper Category — The fund outperformed the median for the five-year period and underperformed for the one- and three-year periods. | Subadvisor fee comparative data not provided due to limited size of Lipper peer group for this purpose.Net management fees for this fund are lower than the peer group median.Total expenses for this fund are lower than the peer group median. | The Board took into account management’s discussion of the factors that contributed to the fund’s performance relative to the benchmark index for the one-, three-, and five-year periods and peer group median for the one- and three-year periods including the impact of past and current market conditions on the fund’s strategy and management’s outlook for the fund.The Board concluded that the fund's performance is being monitored and reasonably addressed, where appropriate.The Board took into account management’s discussion of the fund’s expenses. |
| JHF II U.S. Sector Rotation Fund(Manulife Investment Management (United States)) | Benchmark Index — The fund underperformed for the one- and three-year periods.Lipper Category — The fund outperformed the median for the one- and three-year periods. | Subadvisor fee comparative data not provided due to limited size of Lipper peer group for this purpose.Net management fees for this fund are lower than the peer group median.Total expenses for this fund are lower than the peer group median. | The Board took into account management’s discussion of the fund’s performance, including the favorable performance relative to the peer group median for the one- and three-year periods. |
| • | The Fund’s investment strategy remained appropriate for an open-end fund structure; |
| • | The Fund was able to meet requests for redemption without significant dilution of remaining investors’ interests in the Fund; |
| • | The Fund did not report any breaches of the 15% limit on illiquid investments that would require reporting to the Securities and Exchange Commission; |
| • | The Fund continued to qualify as a Primarily Highly Liquid Fund under the Liquidity Rule and therefore is not required to establish a HLIM; and |
| • | The Chief Compliance Officer’s office performed audit testing of the LRMP which resulted in an assessment that the LRMP’s control environment was deemed to be operating effectively and in compliance with the Board approved procedures.Adequacy and Effectiveness |
| Name, Year of Birth | Position with the Trust1 | Principal Occupation(s) and Other Directorships During Past Five Years |
| Hassell H. McClellan Born: 1945 | Trustee (since 2005) and Chairperson of the Board (since 2017) | Director/Trustee, Virtus Funds (since 2008); Director, The Barnes Group (since 2010); Associate Professor, The Wallace E. Carroll School of Management, Boston College (retired 2013).Trustee (since 2005) and Chairperson of the Board (since 2017) of various trusts within the John Hancock Fund Complex. |
| Charles L. Bardelis2 Born: 1941 | Trustee (since 2005) | Director, Island Commuter Corp. (marine transport). Trustee, John Hancock Collateral Trust (since 2014).Trustee of various trusts within the John Hancock Fund Complex (since 1988). |
| James R. Boyle Born: 1959 | Trustee (since 2015) | Chief Executive Officer, Foresters Financial (since 2018); Chairman and Chief Executive Officer, Zillion Group, Inc. (formerly HealthFleet, Inc.) (healthcare) (2014-2018); Executive Vice President and Chief Executive Officer, U.S. Life Insurance Division of Genworth Financial, Inc.(insurance) (January 2014–July 2014); Senior Executive Vice President, Manulife Financial, President and Chief Executive Officer, John Hancock (1999–2012); Chairman and Director, John Hancock Investment Management LLC, John Hancock Investment Management Distributors LLC, and John Hancock Variable Trust Advisers LLC (2005–2010).Trustee of various trusts within the John Hancock Fund Complex (2005–2014 and since 2015). |
| Peter S. Burgess2 Born: 1942 | Trustee (since 2005) | Consultant (financial, accounting, and auditing matters) (since 1999); Certified Public Accountant; Partner, Arthur Andersen (independent public accounting firm) (prior to 1999); Director, Lincoln Educational Services Corporation (since 2004); Director, Symetra Financial Corporation (2010–2016); Director, PMA Capital Corporation (2004–2010).Trustee of various trusts within the John Hancock Fund Complex (since 2005). |
| William H. Cunningham Born: 1944 | Trustee (since 2012 and 2005-2006) | Professor, University of Texas, Austin, Texas (since 1971); former Chancellor, University of Texas System and former President of the University of Texas, Austin, Texas; Chairman (since 2009) and Director (since 2006), Lincoln National Corporation (insurance); Director, Southwest Airlines (since 2000); former Director, LIN Television (2009–2014).Trustee of various trusts within the John Hancock Fund Complex (since 1986). |
| Grace K. Fey Born: 1946 | Trustee (since 2008) | Chief Executive Officer, Grace Fey Advisors (since 2007); Director and Executive Vice President, Frontier Capital Management Company (1988–2007); Director, Fiduciary Trust (since 2009).Trustee of various trusts within the John Hancock Fund Complex (since 2008). |
| Deborah C. Jackson Born: 1952 | Trustee (since 2012) | President, Cambridge College, Cambridge, Massachusetts (since 2011); Board of Directors, National Association of Corporate Directors/New England (since 2015); Board of Directors, Association of Independent Colleges and Universities of Massachusetts (since 2014); Chief Executive Officer, American Red Cross of Massachusetts Bay (2002–2011); Board of Directors of Eastern Bank Corporation (since 2001); Board of Directors of Eastern Bank Charitable Foundation (since 2001); Board of Directors of American Student Assistance Corporation (1996–2009); Board of Directors of Boston Stock Exchange (2002–2008); Board of Directors of Harvard Pilgrim Healthcare (health benefits company) (2007–2011).Trustee of various trusts within the John Hancock Fund Complex (since 2008). |
| Name, Year of Birth | Position with the Trust1 | Principal Occupation(s) and Other Directorships During Past Five Years |
| Steven R. Pruchansky Born: 1944 | Trustee and Vice Chairperson of the Board (since 2012) | Managing Director, Pru Realty (since 2017); Chairman and Chief Executive Officer, Greenscapes of Southwest Florida, Inc. (2000-2014); Director and President, Greenscapes of Southwest Florida, Inc. (until 2000); Member, Board of Advisors, First American Bank (until 2010); Managing Director, Jon James, LLC (real estate) (since 2000); Partner, Right Funding, LLC (2014-2017); Director, First Signature Bank & Trust Company (until 1991); Director, Mast Realty Trust (until 1994); President, Maxwell Building Corp. (until 1991).Trustee (since 1992), Chairperson of the Board (2011–2012), and Vice Chairperson of the Board (since 2012) of various trusts within the John Hancock Fund Complex. |
| Frances G. Rathke2* Born: 1960 | Trustee (since 2020) | Director, Northern New England Energy Corporation (since 2017); Director, Audit Committee Chair and Compensation Committee Member, Green Mountain Power Corporation (since 2016); Director, Treasurer and Finance & Audit Committee Chair, Flynn Center for Performing Arts (since 2016); Director, Audit Committee Chair and Compensation Committee Member, Planet Fitness (since 2016); Director, Citizen Cider, Inc. (high-end hard cider and hard seltzer company) (since 2016); Chief Financial Officer and Treasurer, Keurig Green Mountain, Inc. (2003-retired 2015); Independent Financial Consultant, Frances Rathke Consulting (strategic and financial consulting services) (2001-2003); Chief Financial Officer and Secretary, Ben & Jerry’s Homemade, Inc. (1989-2000, including prior positions); Senior Manager, Coopers & Lybrand, LLC (independent public accounting firm) (1982-1989).Trustee of various trusts within the John Hancock Fund Complex (since 2020). |
| Gregory A Russo Born: 1949 | Trustee (since 2012) | Director and Audit Committee Chairman (since 2012), and Member, Audit Committee and Finance Committee (since 2011), NCH Healthcare System, Inc. (holding company for multi-entity healthcare system); Director and Member (2012-2018) and Finance Committee Chairman (2014-2018), The Moorings, Inc. (nonprofit continuing care community); Vice Chairman, Risk & Regulatory Matters, KPMG LLP (KPMG) (2002–2006);Vice Chairman, Industrial Markets, KPMG (1998–2002); Chairman and Treasurer,Westchester County, New York, Chamber of Commerce (1986–1992); Director, Treasurer, and Chairman of Audit and Finance Committees, Putnam Hospital Center (1989–1995); Director and Chairman of Fundraising Campaign, United Way of Westchester and Putnam Counties, New York (1990–1995).Trustee of various trusts within the John Hancock Fund Complex (since 2008). |
| Name, Year of Birth | Position with the Trust1 | Principal Occupation(s) and Other Directorships During Past Five Years |
| Andrew G. Arnott Born: 1971 | President and Non-Independent Trustee (Since 2017) | Head of Wealth and Asset Management, United States and Europe, for John Hancock and Manulife (since 2018); Executive Vice President, John Hancock Financial Services (since 2009, including prior positions); Director and Executive Vice President, John Hancock Investment Management LLC (since 2005, including prior positions); Director and Executive Vice President, John Hancock Variable Trust Advisers LLC (since 2006, including prior positions); President, John Hancock Investment Management Distributors LLC (since 2004, including prior positions); President of various trusts within the John Hancock Fund Complex (since 2007, including prior positions).Trustee of various trusts within the John Hancock Fund Complex (since 2017). |
| Marianne Harrison Born: 1963 | Non-Independent Trustee (since 2018) | President and CEO, John Hancock (since 2017); President and CEO, Manulife Canadian Division (2013–2017); Member, Board of Directors, CAE Inc. (since 2019); Member, Board of Directors, MA Competitive Partnership Board (since 2018); Member, Board of Directors, American Council of Life Insurers (ACLI) (since 2018); Member, Board of Directors, Communitech, an industry-led innovation center that fosters technology companies in Canada (since 2017);Member, Board of Directors, Manulife Assurance Canada (2015–2017); Board Member, St. Mary’s General Hospital Foundation (2014–2017); Member, Board of Directors, Manulife Bank of Canada (2013–2017); Member, Standing Committee of the Canadian Life & Health Assurance Association (2013–2017); Member, Board of Directors, John Hancock USA, John Hancock Life & Health, John Hancock New York (2012–2013).Trustee of various trusts within the John Hancock Fund Complex (since 2018). |
| Name, Year of Birth | Position with the Trust | Principal Occupation(s) and Other Directorships During Past Five Years |
| Charles A. Rizzo Born: 1957 | Chief Financial Officer (since 2007) | Vice President, John Hancock Financial Services (since 2008); Senior Vice President, John Hancock Investment Management LLC and John Hancock Variable Trust Advisers LLC (since 2008); Chief Financial Officer of various trusts within the John Hancock Fund Complex (since 2007). |
| Salvatore Schiavone Born: 1965 | Treasurer (2007-2009 and since 2010, including prior positions) | Assistant Vice President, John Hancock Financial Services (since 2007); Vice President, John Hancock Investment Management LLC and John Hancock Variable Trust Advisers LLC (since 2007); Treasurer of various trusts within the John Hancock Fund Complex (since 2007, including prior positions). |
| Christopher (Kit) Sechler Born: 1973 | Chief Legal Officer and Secretary (since 2018) | Vice President and Deputy Chief Counsel, John Hancock Investment Management (since 2015); Assistant Vice President and Senior Counsel (2009–2015), John Hancock Investment Management; Chief Legal Officer and Secretary of various trusts within the John Hancock Fund Complex (since 2018); Assistant Secretary of John Hancock Investment Management LLC and John Hancock Variable Trust Advisers LLC (since 2009). |
| Name, Year of Birth | Position with the Trust | Principal Occupation(s) and Other Directorships During Past Five Years |
| Trevor Swanberg Born: 1979 | Chief Compliance Officer (since 2020) | Chief Compliance Officer, various trusts within the John Hancock Fund Complex, John Hancock Investment Management LLC, and John Hancock Variable Trust Advisers LLC (since 2020); Deputy Chief Compliance Officer, various trusts within the John Hancock Fund Complex (2018–2020); Deputy Chief Compliance Officer, John Hancock Investment Management LLC and John Hancock Variable Trust Advisers LLC (2019–2020); Assistant Chief Compliance Officer, various trusts within the John Hancock Fund Complex (2016–2018); Assistant Chief Compliance Officer, John Hancock Investment Management LLC and John Hancock Variable Trust Advisers LLC (2016–2019); Vice President, State Street Global Advisors (2015–2016). |
| 1 | Each Trustee holds office until his or her successor is elected and qualified, or until the Trustee’s death, retirement, resignation, or removal.Mr. Boyle has served as Trustee at various times prior to the date listed in the table. |
| 2 | Member of the Audit Committee. |
| 3 | The Trustee is a Non-Independent Trustee due to current or former positions with the Advisor and certain affiliates. |
| * | Appointed as Independent Trustee effective as of September 15, 2020. |
Steven R. Pruchansky, Vice Chairperson
Andrew G. Arnott†
Charles L. Bardelis*
James R. Boyle
Peter S. Burgess*
William H. Cunningham
Grace K. Fey
Marianne Harrison†
Deborah C. Jackson
Frances G. Rathke*,1
Gregory A. Russo
Management Distributors LLC
State Street Bank and Trust Company
Charles A. Rizzo, Chief Financial Officer
Salvatore Schiavone, Treasurer
Christopher (Kit) Sechler, Secretary and Chief Legal Officer
Trevor Swanberg, Chief Compliance Officer
Boston, Massachusetts


| JHF2A | 8/21 10/21 |


President and CEO,
John Hancock Investment Management
Head of Wealth and Asset Management,
United States and Europe
| ANNUAL REPORT | JOHN HANCOCK GLOBAL EQUITY FUND | 1 |

| 2 | JOHN HANCOCK GLOBAL EQUITY FUND | ANNUAL REPORT |

| ANNUAL REPORT | JOHN HANCOCK GLOBAL EQUITY FUND | 3 |
| TOP 10 HOLDINGS AS OF 8/31/2021 (% of net assets) | |
| Alphabet, Inc., Class A | 5.4 |
| Facebook, Inc., Class A | 4.7 |
| Philip Morris International, Inc. | 4.2 |
| Microsoft Corp. | 4.1 |
| Apple, Inc. | 3.6 |
| Stellantis NV | 2.9 |
| AutoZone, Inc. | 2.8 |
| Sanofi | 2.8 |
| Bank of America Corp. | 2.8 |
| Roche Holding AG | 2.7 |
| TOTAL | 36.0 |
| Cash and cash equivalents are not included. | |
| COUNTRY COMPOSITION AS OF 8/31/2021 (% of net assets) | |
| United States | 55.6 |
| United Kingdom | 11.0 |
| France | 10.1 |
| Netherlands | 9.2 |
| Japan | 4.8 |
| Switzerland | 4.4 |
| South Korea | 1.8 |
| Ireland | 1.8 |
| Germany | 1.3 |
| TOTAL | 100.0 |
| 4 | JOHN HANCOCK GLOBAL EQUITY FUND | ANNUAL REPORT |

| ANNUAL REPORT | JOHN HANCOCK GLOBAL EQUITY FUND | 5 |
| Average annual total returns (%) with maximum sales charge | Cumulative total returns (%) with maximum sales charge | ||||
| 1-year | 5-year | Since inception (5-16-13) | 5-year | Since inception (5-16-13) | |
| Class A | 20.94 | 10.50 | 8.73 | 64.73 | 100.30 |
| Class C1 | 25.48 | 10.88 | 8.83 | 67.58 | 101.74 |
| Class I2 | 27.78 | 11.98 | 9.73 | 76.06 | 116.11 |
| Class R21,2 | 27.23 | 11.60 | 9.40 | 73.10 | 110.70 |
| Class R41,2 | 27.71 | 11.93 | 9.63 | 75.71 | 114.41 |
| Class R61,2 | 27.90 | 12.11 | 9.76 | 77.10 | 116.53 |
| Class NAV2 | 27.91 | 12.12 | 9.87 | 77.19 | 118.36 |
| Index† | 29.76 | 14.83 | 11.26 | 99.67 | 142.38 |
| Class A | Class C | Class I | Class R2 | Class R4 | Class R6 | Class NAV | |
| Gross (%) | 1.32 | 2.02 | 1.02 | 1.40 | 1.25 | 0.90 | 0.89 |
| Net (%) | 1.31 | 2.01 | 1.01 | 1.39 | 1.14 | 0.89 | 0.88 |
| 6 | JOHN HANCOCK GLOBAL EQUITY FUND | ANNUAL REPORT |

| Start date | With maximum sales charge ($) | Without sales charge ($) | Index ($) | |
| Class C1,3 | 5-16-13 | 20,174 | 20,174 | 24,238 |
| Class I2 | 5-16-13 | 21,611 | 21,611 | 24,238 |
| Class R21,2 | 5-16-13 | 21,070 | 21,070 | 24,238 |
| Class R41,2 | 5-16-13 | 21,441 | 21,441 | 24,238 |
| Class R61,2 | 5-16-13 | 21,653 | 21,653 | 24,238 |
| Class NAV2 | 5-16-13 | 21,836 | 21,836 | 24,238 |
| 1 | Class C, Class R2, Class R4, and Class R6 shares were first offered on 3-27-15. Returns prior to this date are those of Class A shares that have not been adjusted for class-specific expenses; otherwise, returns would vary. |
| 2 | For certain types of investors, as described in the fund’s prospectuses. |
| 3 | The contingent deferred sales charge is not applicable. |
| ANNUAL REPORT | JOHN HANCOCK GLOBAL EQUITY FUND | 7 |
| 8 | JOHN HANCOCK GLOBAL EQUITY FUND | ANNUAL REPORT |
| Account value on 3-1-2021 | Ending value on 8-31-2021 | Expenses paid during period ended 8-31-20211 | Annualized expense ratio | ||
| Class A | Actual expenses/actual returns | $1,000.00 | $1,170.70 | $6.95 | 1.27% |
| Hypothetical example | 1,000.00 | 1,018.80 | 6.46 | 1.27% | |
| Class C | Actual expenses/actual returns | 1,000.00 | 1,167.20 | 10.76 | 1.97% |
| Hypothetical example | 1,000.00 | 1,015.30 | 10.01 | 1.97% | |
| Class I | Actual expenses/actual returns | 1,000.00 | 1,173.00 | 5.31 | 0.97% |
| Hypothetical example | 1,000.00 | 1,020.30 | 4.94 | 0.97% | |
| Class R2 | Actual expenses/actual returns | 1,000.00 | 1,170.30 | 7.44 | 1.36% |
| Hypothetical example | 1,000.00 | 1,018.30 | 6.92 | 1.36% | |
| Class R4 | Actual expenses/actual returns | 1,000.00 | 1,172.10 | 5.64 | 1.03% |
| Hypothetical example | 1,000.00 | 1,020.00 | 5.24 | 1.03% | |
| Class R6 | Actual expenses/actual returns | 1,000.00 | 1,173.00 | 4.77 | 0.87% |
| Hypothetical example | 1,000.00 | 1,020.80 | 4.43 | 0.87% | |
| Class NAV | Actual expenses/actual returns | 1,000.00 | 1,173.00 | 4.71 | 0.86% |
| Hypothetical example | 1,000.00 | 1,020.90 | 4.38 | 0.86% |
| 1 | Expenses are equal to the annualized expense ratio, multiplied by the average account value over the period, multiplied by 184/365 (to reflect the one-half year period). |
| ANNUAL REPORT | JOHN HANCOCK GLOBAL EQUITY FUND | 9 |
| Shares | Value | ||||
| Common stocks 97.3% | $902,425,545 | ||||
| (Cost $679,038,072) | |||||
| France 10.1% | 93,878,723 | ||||
| Air Liquide SA | 106,959 | 19,171,566 | |||
| Capgemini SE | 83,814 | 18,840,316 | |||
| Cie Generale des Etablissements Michelin SCA | 83,751 | 13,558,933 | |||
| Sanofi | 252,680 | 26,187,384 | |||
| TotalEnergies SE | 364,449 | 16,120,524 | |||
| Germany 1.3% | 12,422,205 | ||||
| Deutsche Post AG | 176,680 | 12,422,205 | |||
| Ireland 1.8% | 16,540,063 | ||||
| CRH PLC | 310,889 | 16,540,063 | |||
| Japan 4.8% | 44,808,641 | ||||
| FANUC Corp. | 84,904 | 18,497,275 | |||
| Mitsubishi Estate Company, Ltd. | 508,378 | 7,959,356 | |||
| Sumitomo Mitsui Financial Group, Inc. | 531,700 | 18,352,010 | |||
| Netherlands 9.2% | 85,414,172 | ||||
| Akzo Nobel NV | 92,813 | 11,438,199 | |||
| ING Groep NV | 1,363,632 | 18,810,443 | |||
| Koninklijke Ahold Delhaize NV | 564,689 | 19,051,145 | |||
| Koninklijke Philips NV | 209,243 | 9,642,567 | |||
| Stellantis NV | 1,323,325 | 26,471,818 | |||
| Switzerland 4.4% | 41,111,425 | ||||
| Chubb, Ltd. | 85,384 | 15,703,825 | |||
| Roche Holding AG | 63,273 | 25,407,600 | |||
| United Kingdom 11.0% | 101,468,817 | ||||
| Associated British Foods PLC | 646,185 | 17,618,909 | |||
| AstraZeneca PLC | 205,974 | 24,087,378 | |||
| Ferguson PLC | 99,019 | 14,312,078 | |||
| RELX PLC | 546,518 | 16,401,693 | |||
| Tesco PLC | 4,409,182 | 15,479,018 | |||
| Unilever PLC | 243,709 | 13,569,741 | |||
| United States 54.7% | 506,781,499 | ||||
| Alphabet, Inc., Class A (A) | 17,399 | 50,351,837 | |||
| Apple, Inc. | 222,397 | 33,766,537 | |||
| Arthur J. Gallagher & Company | 132,584 | 19,041,714 | |||
| AutoZone, Inc. (A) | 16,973 | 26,293,723 | |||
| Bank of America Corp. | 618,806 | 25,835,151 | |||
| Comcast Corp., Class A | 318,518 | 19,327,672 | |||
| 10 | JOHN HANCOCK GLOBAL EQUITY FUND | ANNUAL REPORT | SEE NOTES TO FINANCIAL STATEMENTS |
| Shares | Value | ||||
| United States (continued) | |||||
| Corteva, Inc. | 414,584 | $18,229,258 | |||
| Electronic Arts, Inc. | 81,266 | 11,800,636 | |||
| Facebook, Inc., Class A (A) | 115,785 | 43,926,513 | |||
| Huntington Bancshares, Inc. | 1,077,815 | 16,738,467 | |||
| Johnson & Johnson | 107,336 | 18,583,082 | |||
| Johnson Controls International PLC | 220,965 | 16,528,182 | |||
| Kimberly-Clark Corp. | 71,684 | 9,878,772 | |||
| Lennar Corp., A Shares | 131,259 | 14,085,403 | |||
| Microsoft Corp. | 124,318 | 37,529,118 | |||
| Northrop Grumman Corp. | 63,538 | 23,362,923 | |||
| Oracle Corp. | 153,963 | 13,722,722 | |||
| Philip Morris International, Inc. | 377,510 | 38,883,530 | |||
| Stanley Black & Decker, Inc. | 75,520 | 14,595,750 | |||
| T-Mobile US, Inc. (A) | 129,479 | 17,741,213 | |||
| Waste Management, Inc. | 132,699 | 20,582,942 | |||
| Wells Fargo & Company | 349,592 | 15,976,354 | |||
| Preferred securities 1.8% | $16,567,393 | ||||
| (Cost $10,492,869) | |||||
| South Korea 1.8% | 16,567,393 | ||||
| Samsung Electronics Company, Ltd. | 271,746 | 16,567,393 | |||
| Yield (%) | Shares | Value | |||
| Short-term investments 0.8% | $7,218,044 | ||||
| (Cost $7,218,044) | |||||
| Short-term funds 0.8% | 7,218,044 | ||||
| JPMorgan U.S. Treasury Plus Money Market Fund, Institutional Class | 0.0100(B) | 7,218,044 | 7,218,044 | ||
| Total investments (Cost $696,748,985) 99.9% | $926,210,982 | ||||
| Other assets and liabilities, net 0.1% | 1,259,218 | ||||
| Total net assets 100.0% | $927,470,200 | ||||
| The percentage shown for each investment category is the total value of the category as a percentage of the net assets of the fund. | |
| Security Abbreviations and Legend | |
| (A) | Non-income producing security. |
| (B) | The rate shown is the annualized seven-day yield as of 8-31-21. |
| SEE NOTES TO FINANCIAL STATEMENTS | ANNUAL REPORT | JOHN HANCOCK GLOBAL EQUITY FUND | 11 |
| Assets | |
| Unaffiliated investments, at value (Cost $696,748,985) | $926,210,982 |
| Foreign currency, at value (Cost $187,113) | 187,257 |
| Dividends and interest receivable | 1,721,365 |
| Receivable for fund shares sold | 33,458 |
| Other assets | 54,576 |
| Total assets | 928,207,638 |
| Liabilities | |
| Payable for fund shares repurchased | 544,969 |
| Payable to affiliates | |
| Accounting and legal services fees | 35,874 |
| Transfer agent fees | 9,311 |
| Distribution and service fees | 23 |
| Trustees’ fees | 239 |
| Other liabilities and accrued expenses | 147,022 |
| Total liabilities | 737,438 |
| Net assets | $927,470,200 |
| Net assets consist of | |
| Paid-in capital | $779,228,047 |
| Total distributable earnings (loss) | 148,242,153 |
| Net assets | $927,470,200 |
| Net asset value per share | |
| Based on net asset value and shares outstanding - the fund has an unlimited number of shares authorized with no par value | |
| Class A ($57,599,248 ÷ 3,732,151 shares)1 | $15.43 |
| Class C ($2,746,595 ÷ 178,839 shares)1 | $15.36 |
| Class I ($19,824,955 ÷ 1,282,387 shares) | $15.46 |
| Class R2 ($102,761 ÷ 6,646 shares) | $15.46 |
| Class R4 ($75,291 ÷ 4,871 shares) | $15.46 |
| Class R6 ($233,560,993 ÷ 15,105,731 shares) | $15.46 |
| Class NAV ($613,560,357 ÷ 39,687,822 shares) | $15.46 |
| Maximum offering price per share | |
| Class A (net asset value per share ÷ 95%)2 | $16.24 |
| 1 | Redemption price per share is equal to net asset value less any applicable contingent deferred sales charge. |
| 2 | On single retail sales of less than $50,000. On sales of $50,000 or more and on group sales the offering price is reduced. |
| 12 | JOHN HANCOCK Global Equity Fund | ANNUAL REPORT | SEE NOTES TO FINANCIAL STATEMENTS |
| Investment income | |
| Dividends | $23,867,358 |
| Less foreign taxes withheld | (1,030,924) |
| Total investment income | 22,836,434 |
| Expenses | |
| Investment management fees | 7,102,368 |
| Distribution and service fees | 188,857 |
| Accounting and legal services fees | 129,203 |
| Transfer agent fees | 104,775 |
| Trustees’ fees | 15,772 |
| Custodian fees | 237,052 |
| State registration fees | 94,421 |
| Printing and postage | 35,442 |
| Professional fees | 80,694 |
| Other | 41,780 |
| Total expenses | 8,030,364 |
| Less expense reductions | (75,263) |
| Net expenses | 7,955,101 |
| Net investment income | 14,881,333 |
| Realized and unrealized gain (loss) | |
| Net realized gain (loss) on | |
| Unaffiliated investments and foreign currency transactions | 115,910,283 |
| Forward foreign currency contracts | (3,059,278) |
| Redemptions in kind | 18,269,807 |
| 131,120,812 | |
| Change in net unrealized appreciation (depreciation) of | |
| Unaffiliated investments and translation of assets and liabilities in foreign currencies | 71,797,726 |
| Forward foreign currency contracts | 2,511,533 |
| 74,309,259 | |
| Net realized and unrealized gain | 205,430,071 |
| Increase in net assets from operations | $220,311,404 |
| SEE NOTES TO FINANCIAL STATEMENTS | ANNUAL REPORT | JOHN HANCOCK Global Equity Fund | 13 |
| Year ended 8-31-21 | Year ended 8-31-20 | |
| Increase (decrease) in net assets | ||
| From operations | ||
| Net investment income | $14,881,333 | $10,140,763 |
| Net realized gain | 131,120,812 | 9,356,939 |
| Change in net unrealized appreciation (depreciation) | 74,309,259 | 81,418,107 |
| Increase in net assets resulting from operations | 220,311,404 | 100,915,809 |
| Distributions to shareholders | ||
| From earnings | ||
| Class A | (968,204) | (930,247) |
| Class C | (41,089) | (132,508) |
| Class I | (364,900) | (352,089) |
| Class R2 | (1,413) | (2,544) |
| Class R4 | (1,357) | (1,244) |
| Class R6 | (4,755,224) | (330,603) |
| Class NAV | (13,459,075) | (15,698,858) |
| Total distributions | (19,591,262) | (17,448,093) |
| From fund share transactions | (101,475,067) | 32,766,072 |
| Total increase | 99,245,075 | 116,233,788 |
| Net assets | ||
| Beginning of year | 828,225,125 | 711,991,337 |
| End of year | $927,470,200 | $828,225,125 |
| 14 | JOHN HANCOCK Global Equity Fund | ANNUAL REPORT | SEE NOTES TO FINANCIAL STATEMENTS |
| CLASS A SHARES Period ended | 8-31-21 | 8-31-20 | 8-31-19 | 8-31-18 | 8-31-17 |
| Per share operating performance | |||||
| Net asset value, beginning of period | $12.36 | $11.47 | $11.92 | $12.03 | $10.94 |
| Net investment income1 | 0.18 | 0.12 | 0.18 | 0.16 | 0.15 |
| Net realized and unrealized gain (loss) on investments | 3.15 | 1.02 | 0.08 | 0.72 | 1.11 |
| Total from investment operations | 3.33 | 1.14 | 0.26 | 0.88 | 1.26 |
| Less distributions | |||||
| From net investment income | (0.07) | (0.19) | (0.20) | (0.17) | (0.17) |
| From net realized gain | (0.19) | (0.06) | (0.51) | (0.82) | — |
| Total distributions | (0.26) | (0.25) | (0.71) | (0.99) | (0.17) |
| Net asset value, end of period | $15.43 | $12.36 | $11.47 | $11.92 | $12.03 |
| Total return (%)2,3 | 27.30 | 9.99 | 3.23 | 7.50 | 11.64 |
| Ratios and supplemental data | |||||
| Net assets, end of period (in millions) | $58 | $45 | $42 | $44 | $46 |
| Ratios (as a percentage of average net assets): | |||||
| Expenses before reductions | 1.28 | 1.31 | 1.30 | 1.28 | 1.29 |
| Expenses including reductions | 1.28 | 1.30 | 1.29 | 1.27 | 1.28 |
| Net investment income | 1.28 | 1.01 | 1.60 | 1.36 | 1.34 |
| Portfolio turnover (%) | 634 | 74 | 18 | 43 | 46 |
| 1 | Based on average daily shares outstanding. |
| 2 | Total returns would have been lower had certain expenses not been reduced during the applicable periods. |
| 3 | Does not reflect the effect of sales charges, if any. |
| 4 | Excludes in-kind transactions. |
| SEE NOTES TO FINANCIAL STATEMENTS | ANNUAL REPORT | JOHN HANCOCK Global Equity Fund | 15 |
| CLASS C SHARES Period ended | 8-31-21 | 8-31-20 | 8-31-19 | 8-31-18 | 8-31-17 |
| Per share operating performance | |||||
| Net asset value, beginning of period | $12.32 | $11.44 | $11.87 | $11.99 | $10.91 |
| Net investment income1 | 0.05 | 0.03 | 0.10 | 0.08 | 0.08 |
| Net realized and unrealized gain (loss) on investments | 3.18 | 1.03 | 0.10 | 0.71 | 1.09 |
| Total from investment operations | 3.23 | 1.06 | 0.20 | 0.79 | 1.17 |
| Less distributions | |||||
| From net investment income | — | (0.12) | (0.12) | (0.09) | (0.09) |
| From net realized gain | (0.19) | (0.06) | (0.51) | (0.82) | — |
| Total distributions | (0.19) | (0.18) | (0.63) | (0.91) | (0.09) |
| Net asset value, end of period | $15.36 | $12.32 | $11.44 | $11.87 | $11.99 |
| Total return (%)2,3 | 26.48 | 9.22 | 2.59 | 6.69 | 10.83 |
| Ratios and supplemental data | |||||
| Net assets, end of period (in millions) | $3 | $6 | $10 | $13 | $17 |
| Ratios (as a percentage of average net assets): | |||||
| Expenses before reductions | 1.98 | 2.01 | 2.00 | 1.98 | 1.98 |
| Expenses including reductions | 1.98 | 2.00 | 1.99 | 1.97 | 1.98 |
| Net investment income | 0.41 | 0.27 | 0.89 | 0.66 | 0.69 |
| Portfolio turnover (%) | 634 | 74 | 18 | 43 | 46 |
| 1 | Based on average daily shares outstanding. |
| 2 | Total returns would have been lower had certain expenses not been reduced during the applicable periods. |
| 3 | Does not reflect the effect of sales charges, if any. |
| 4 | Excludes in-kind transactions. |
| 16 | JOHN HANCOCK Global Equity Fund | ANNUAL REPORT | SEE NOTES TO FINANCIAL STATEMENTS |
| CLASS I SHARES Period ended | 8-31-21 | 8-31-20 | 8-31-19 | 8-31-18 | 8-31-17 |
| Per share operating performance | |||||
| Net asset value, beginning of period | $12.37 | $11.48 | $11.94 | $12.05 | $10.96 |
| Net investment income1 | 0.21 | 0.15 | 0.21 | 0.19 | 0.21 |
| Net realized and unrealized gain (loss) on investments | 3.17 | 1.03 | 0.07 | 0.72 | 1.08 |
| Total from investment operations | 3.38 | 1.18 | 0.28 | 0.91 | 1.29 |
| Less distributions | |||||
| From net investment income | (0.10) | (0.23) | (0.23) | (0.20) | (0.20) |
| From net realized gain | (0.19) | (0.06) | (0.51) | (0.82) | — |
| Total distributions | (0.29) | (0.29) | (0.74) | (1.02) | (0.20) |
| Net asset value, end of period | $15.46 | $12.37 | $11.48 | $11.94 | $12.05 |
| Total return (%)2 | 27.78 | 10.28 | 3.52 | 7.80 | 11.95 |
| Ratios and supplemental data | |||||
| Net assets, end of period (in millions) | $20 | $16 | $14 | $19 | $26 |
| Ratios (as a percentage of average net assets): | |||||
| Expenses before reductions | 0.98 | 1.01 | 1.01 | 0.98 | 0.97 |
| Expenses including reductions | 0.98 | 1.00 | 1.00 | 0.97 | 0.97 |
| Net investment income | 1.57 | 1.32 | 1.86 | 1.61 | 1.83 |
| Portfolio turnover (%) | 633 | 74 | 18 | 43 | 46 |
| 1 | Based on average daily shares outstanding. |
| 2 | Total returns would have been lower had certain expenses not been reduced during the applicable periods. |
| 3 | Excludes in-kind transactions. |
| SEE NOTES TO FINANCIAL STATEMENTS | ANNUAL REPORT | JOHN HANCOCK Global Equity Fund | 17 |
| CLASS R2 SHARES Period ended | 8-31-21 | 8-31-20 | 8-31-19 | 8-31-18 | 8-31-17 |
| Per share operating performance | |||||
| Net asset value, beginning of period | $12.38 | $11.49 | $11.93 | $12.05 | $10.96 |
| Net investment income1 | 0.17 | 0.10 | 0.16 | 0.13 | 0.16 |
| Net realized and unrealized gain (loss) on investments | 3.16 | 1.03 | 0.10 | 0.74 | 1.10 |
| Total from investment operations | 3.33 | 1.13 | 0.26 | 0.87 | 1.26 |
| Less distributions | |||||
| From net investment income | (0.06) | (0.18) | (0.19) | (0.17) | (0.17) |
| From net realized gain | (0.19) | (0.06) | (0.51) | (0.82) | — |
| Total distributions | (0.25) | (0.24) | (0.70) | (0.99) | (0.17) |
| Net asset value, end of period | $15.46 | $12.38 | $11.49 | $11.93 | $12.05 |
| Total return (%)2 | 27.23 | 9.87 | 3.21 | 7.43 | 11.69 |
| Ratios and supplemental data | |||||
| Net assets, end of period (in millions) | $—3 | $—3 | $—3 | $—3 | $—3 |
| Ratios (as a percentage of average net assets): | |||||
| Expenses before reductions | 1.37 | 1.39 | 1.39 | 1.30 | 1.23 |
| Expenses including reductions | 1.37 | 1.39 | 1.39 | 1.29 | 1.22 |
| Net investment income | 1.21 | 0.86 | 1.40 | 1.10 | 1.44 |
| Portfolio turnover (%) | 634 | 74 | 18 | 43 | 46 |
| 1 | Based on average daily shares outstanding. |
| 2 | Total returns would have been lower had certain expenses not been reduced during the applicable periods. |
| 3 | Less than $500,000. |
| 4 | Excludes in-kind transactions. |
| 18 | JOHN HANCOCK Global Equity Fund | ANNUAL REPORT | SEE NOTES TO FINANCIAL STATEMENTS |
| CLASS R4 SHARES Period ended | 8-31-21 | 8-31-20 | 8-31-19 | 8-31-18 | 8-31-17 |
| Per share operating performance | |||||
| Net asset value, beginning of period | $12.37 | $11.48 | $11.93 | $12.04 | $10.95 |
| Net investment income1 | 0.21 | 0.15 | 0.21 | 0.16 | 0.19 |
| Net realized and unrealized gain (loss) on investments | 3.17 | 1.02 | 0.08 | 0.75 | 1.09 |
| Total from investment operations | 3.38 | 1.17 | 0.29 | 0.91 | 1.28 |
| Less distributions | |||||
| From net investment income | (0.10) | (0.22) | (0.23) | (0.20) | (0.19) |
| From net realized gain | (0.19) | (0.06) | (0.51) | (0.82) | — |
| Total distributions | (0.29) | (0.28) | (0.74) | (1.02) | (0.19) |
| Net asset value, end of period | $15.46 | $12.37 | $11.48 | $11.93 | $12.04 |
| Total return (%)2 | 27.71 | 10.21 | 3.54 | 7.74 | 11.91 |
| Ratios and supplemental data | |||||
| Net assets, end of period (in millions) | $—3 | $—3 | $—3 | $—3 | $—3 |
| Ratios (as a percentage of average net assets): | |||||
| Expenses before reductions | 1.15 | 1.16 | 1.16 | 1.13 | 1.13 |
| Expenses including reductions | 1.04 | 1.05 | 1.05 | 1.02 | 1.02 |
| Net investment income | 1.51 | 1.27 | 1.84 | 1.33 | 1.67 |
| Portfolio turnover (%) | 634 | 74 | 18 | 43 | 46 |
| 1 | Based on average daily shares outstanding. |
| 2 | Total returns would have been lower had certain expenses not been reduced during the applicable periods. |
| 3 | Less than $500,000. |
| 4 | Excludes in-kind transactions. |
| SEE NOTES TO FINANCIAL STATEMENTS | ANNUAL REPORT | JOHN HANCOCK Global Equity Fund | 19 |
| CLASS R6 SHARES Period ended | 8-31-21 | 8-31-20 | 8-31-19 | 8-31-18 | 8-31-17 |
| Per share operating performance | |||||
| Net asset value, beginning of period | $12.37 | $11.48 | $11.94 | $12.04 | $10.95 |
| Net investment income1 | 0.23 | 0.20 | 0.22 | 0.22 | 0.24 |
| Net realized and unrealized gain (loss) on investments | 3.17 | 0.99 | 0.07 | 0.72 | 1.06 |
| Total from investment operations | 3.40 | 1.19 | 0.29 | 0.94 | 1.30 |
| Less distributions | |||||
| From net investment income | (0.12) | (0.24) | (0.24) | (0.22) | (0.21) |
| From net realized gain | (0.19) | (0.06) | (0.51) | (0.82) | — |
| Total distributions | (0.31) | (0.30) | (0.75) | (1.04) | (0.21) |
| Net asset value, end of period | $15.46 | $12.37 | $11.48 | $11.94 | $12.04 |
| Total return (%)2 | 27.90 | 10.38 | 3.63 | 7.99 | 12.09 |
| Ratios and supplemental data | |||||
| Net assets, end of period (in millions) | $234 | $197 | $7 | $7 | $5 |
| Ratios (as a percentage of average net assets): | |||||
| Expenses before reductions | 0.88 | 0.89 | 0.90 | 0.88 | 0.88 |
| Expenses including reductions | 0.87 | 0.89 | 0.89 | 0.87 | 0.87 |
| Net investment income | 1.68 | 1.76 | 1.99 | 1.88 | 2.11 |
| Portfolio turnover (%) | 633 | 74 | 18 | 43 | 46 |
| 1 | Based on average daily shares outstanding. |
| 2 | Total returns would have been lower had certain expenses not been reduced during the applicable periods. |
| 3 | Excludes in-kind transactions. |
| 20 | JOHN HANCOCK Global Equity Fund | ANNUAL REPORT | SEE NOTES TO FINANCIAL STATEMENTS |
| CLASS NAV SHARES Period ended | 8-31-21 | 8-31-20 | 8-31-19 | 8-31-18 | 8-31-17 |
| Per share operating performance | |||||
| Net asset value, beginning of period | $12.37 | $11.48 | $11.93 | $12.04 | $10.95 |
| Net investment income1 | 0.23 | 0.16 | 0.22 | 0.21 | 0.21 |
| Net realized and unrealized gain (loss) on investments | 3.17 | 1.03 | 0.09 | 0.72 | 1.09 |
| Total from investment operations | 3.40 | 1.19 | 0.31 | 0.93 | 1.30 |
| Less distributions | |||||
| From net investment income | (0.12) | (0.24) | (0.25) | (0.22) | (0.21) |
| From net realized gain | (0.19) | (0.06) | (0.51) | (0.82) | — |
| Total distributions | (0.31) | (0.30) | (0.76) | (1.04) | (0.21) |
| Net asset value, end of period | $15.46 | $12.37 | $11.48 | $11.93 | $12.04 |
| Total return (%)2 | 27.91 | 10.39 | 3.73 | 7.92 | 12.09 |
| Ratios and supplemental data | |||||
| Net assets, end of period (in millions) | $614 | $564 | $638 | $713 | $747 |
| Ratios (as a percentage of average net assets): | |||||
| Expenses before reductions | 0.87 | 0.88 | 0.88 | 0.87 | 0.87 |
| Expenses including reductions | 0.86 | 0.87 | 0.88 | 0.86 | 0.86 |
| Net investment income | 1.71 | 1.42 | 2.00 | 1.78 | 1.82 |
| Portfolio turnover (%) | 633 | 74 | 18 | 43 | 46 |
| 1 | Based on average daily shares outstanding. |
| 2 | Total returns would have been lower had certain expenses not been reduced during the applicable periods. |
| 3 | Excludes in-kind transactions. |
| SEE NOTES TO FINANCIAL STATEMENTS | ANNUAL REPORT | JOHN HANCOCK Global Equity Fund | 21 |
| 22 | JOHN HANCOCK Global Equity Fund | ANNUAL REPORT |
| Total value at 8-31-21 | Level 1 quoted price | Level 2 significant observable inputs | Level 3 significant unobservable inputs | |
| Investments in securities: | ||||
| Assets | ||||
| Common stocks | ||||
| France | $93,878,723 | — | $93,878,723 | — |
| Germany | 12,422,205 | — | 12,422,205 | — |
| Ireland | 16,540,063 | — | 16,540,063 | — |
| Japan | 44,808,641 | — | 44,808,641 | — |
| Netherlands | 85,414,172 | — | 85,414,172 | — |
| Switzerland | 41,111,425 | $15,703,825 | 25,407,600 | — |
| United Kingdom | 101,468,817 | — | 101,468,817 | — |
| United States | 506,781,499 | 506,781,499 | — | — |
| Preferred securities | 16,567,393 | — | 16,567,393 | — |
| Short-term investments | 7,218,044 | 7,218,044 | — | — |
| Total investments in securities | $926,210,982 | $529,703,368 | $396,507,614 | — |
| ANNUAL REPORT | JOHN HANCOCK Global Equity Fund | 23 |
| 24 | JOHN HANCOCK Global Equity Fund | ANNUAL REPORT |
| August 31, 2021 | August 31, 2020 | |
| Ordinary income | $17,266,541 | $17,448,093 |
| Long-term capital gains | 2,324,721 | — |
| Total | $19,591,262 | $17,448,093 |
| ANNUAL REPORT | JOHN HANCOCK Global Equity Fund | 25 |
| Statement of operations location - Net realized gain (loss) on: | |
| Risk | Forward foreign currency contracts |
| Currency | $(3,059,278) |
| Statement of operations location - Change in net unrealized appreciation (depreciation) of: | |
| Risk | Forward foreign currency contracts |
| Currency | $2,511,533 |
| 26 | JOHN HANCOCK Global Equity Fund | ANNUAL REPORT |
| Class | Expense reduction |
| Class A | $4,366 |
| Class C | 277 |
| Class I | 1,458 |
| Class R2 | 7 |
| Class | Expense reduction |
| Class R4 | $6 |
| Class R6 | 18,398 |
| Class NAV | 50,685 |
| Total | $75,197 |
| ANNUAL REPORT | JOHN HANCOCK Global Equity Fund | 27 |
| Class | Rule 12b-1 Fee | Service fee |
| Class A | 0.30% | — |
| Class C | 1.00% | — |
| Class R2 | 0.25% | 0.25% |
| Class R4 | 0.25% | 0.10% |
| Class | Distribution and service fees | Transfer agent fees |
| Class A | $154,490 | $59,269 |
| Class C | 33,766 | 3,884 |
| Class I | — | 19,803 |
| Class R2 | 424 | 8 |
| 28 | JOHN HANCOCK Global Equity Fund | ANNUAL REPORT |
| Class | Distribution and service fees | Transfer agent fees |
| Class R4 | $177 | $7 |
| Class R6 | — | 21,804 |
| Total | $188,857 | $104,775 |
| Year Ended 8-31-21 | Year Ended 8-31-20 | |||
| Shares | Amount | Shares | Amount | |
| Class A shares | ||||
| Sold | 566,814 | $7,519,344 | 579,074 | $6,608,799 |
| Distributions reinvested | 71,702 | 929,976 | 73,170 | 900,721 |
| Repurchased | (552,556) | (7,492,737) | (709,867) | (8,108,593) |
| Net increase (decrease) | 85,960 | $956,583 | (57,623) | $(599,073) |
| Class C shares | ||||
| Sold | 16,513 | $233,210 | 42,940 | $506,043 |
| Distributions reinvested | 3,168 | 41,089 | 10,012 | 123,450 |
| Repurchased | (338,957) | (4,364,554) | (427,779) | (4,882,746) |
| Net decrease | (319,276) | $(4,090,255) | (374,827) | $(4,253,253) |
| Class I shares | ||||
| Sold | 253,016 | $3,455,704 | 425,889 | $4,494,372 |
| Distributions reinvested | 27,468 | 355,979 | 28,299 | 348,073 |
| Repurchased | (274,031) | (3,652,965) | (416,254) | (4,570,576) |
| Net increase | 6,453 | $158,718 | 37,934 | $271,869 |
| Class R2 shares | ||||
| Sold | 2,274 | $30,165 | 1,882 | $22,487 |
| Distributions reinvested | 109 | 1,413 | 206 | 2,544 |
| Repurchased | (2,039) | (26,011) | (6,452) | (65,440) |
| Net increase (decrease) | 344 | $5,567 | (4,364) | $(40,409) |
| Class R4 shares | ||||
| Sold | 87 | $1,188 | 351 | $3,968 |
| Distributions reinvested | 18 | 237 | 11 | 133 |
| Repurchased | (6) | (78) | (1) | (18) |
| Net increase | 99 | $1,347 | 361 | $4,083 |
| ANNUAL REPORT | JOHN HANCOCK Global Equity Fund | 29 |
| Year Ended 8-31-21 | Year Ended 8-31-20 | |||
| Shares | Amount | Shares | Amount | |
| Class R6 shares | ||||
| Sold | 6,045,952 | $74,085,977 | 16,544,198 | $174,275,838 |
| Distributions reinvested | 366,915 | 4,755,224 | 26,878 | 330,603 |
| Repurchased | (7,211,540) | (90,405,942) | (1,263,093) | (14,123,557) |
| Net increase (decrease) | (798,673) | $(11,564,741) | 15,307,983 | $160,482,884 |
| Class NAV shares | ||||
| Sold | 2,683,881 | $36,176,527 | 2,538,046 | $27,312,010 |
| Distributions reinvested | 1,039,311 | 13,459,075 | 1,277,368 | 15,698,858 |
| Repurchased | (9,648,950) | (136,577,888) | (13,815,716) | (166,110,897) |
| Net decrease | (5,925,758) | $(86,942,286) | (10,000,302) | $(123,100,029) |
| Total net increase (decrease) | (6,950,851) | $(101,475,067) | 4,909,162 | $32,766,072 |
| Fund | Affiliated Concentration |
| John Hancock Funds II Multimanager Lifestyle Balanced Portfolio | 22.2% |
| John Hancock Funds II Multimanager Lifestyle Growth Portfolio | 19.7% |
| John Hancock Funds II Multimanager Lifestyle Moderate Portfolio | 7.2% |
| 30 | JOHN HANCOCK Global Equity Fund | ANNUAL REPORT |
| ANNUAL REPORT | JOHN HANCOCK GLOBAL EQUITY FUND | 31 |
| 32 | JOHN HANCOCK GLOBAL EQUITY FUND | ANNUAL REPORT |
| ANNUAL REPORT | JOHN HANCOCK GLOBAL EQUITY FUND | 33 |
| (a) | the skills and competency with which the Advisor has in the past managed the Trust’s affairs and its subadvisory relationship, the Advisor’s oversight and monitoring of the Subadvisor’s investment performance and compliance programs, such as the Subadvisor’s compliance with fund policies and objectives, review of brokerage matters, including with respect to trade allocation and best execution and the Advisor’s timeliness in responding to performance issues; |
| (b) | the background, qualifications and skills of the Advisor’s personnel; |
| (c) | the Advisor’s compliance policies and procedures and its responsiveness to regulatory changes and fund industry developments; |
| 34 | JOHN HANCOCK GLOBAL EQUITY FUND | ANNUAL REPORT |
| (d) | the Advisor’s administrative capabilities, including its ability to supervise the other service providers for the fund, as well as the Advisor’s oversight of any securities lending activity, its monitoring of class action litigation and collection of class action settlements on behalf of the fund, and bringing loss recovery actions on behalf of the fund; |
| (e) | the financial condition of the Advisor and whether it has the financial wherewithal to provide a high level and quality of services to the fund; |
| (f) | the Advisor’s initiatives intended to improve various aspects of the Trust’s operations and investor experience with the fund; and |
| (g) | the Advisor’s reputation and experience in serving as an investment advisor to the Trust and the benefit to shareholders of investing in funds that are part of a family of funds offering a variety of investments. |
| (a) | reviewed information prepared by management regarding the fund’s performance; |
| (b) | considered the comparative performance of an applicable benchmark index; |
| (c) | considered the performance of comparable funds, if any, as included in the report prepared by an independent third-party provider of fund data; and |
| (d) | took into account the Advisor’s analysis of the fund’s performance and its plans and recommendations regarding the Trust’s subadvisory arrangements generally. |
| ANNUAL REPORT | JOHN HANCOCK GLOBAL EQUITY FUND | 35 |
| (a) | reviewed financial information of the Advisor; |
| (b) | reviewed and considered information presented by the Advisor regarding the net profitability to the Advisor and its affiliates with respect to the fund; |
| (c) | received and reviewed profitability information with respect to the John Hancock Fund Complex as a whole and with respect to the fund; |
| (d) | received information with respect to the Advisor’s allocation methodologies used in preparing the profitability data and considered that the Advisor hired an independent third-party consultant to provide an analysis of the Advisor’s allocation methodologies; |
| (e) | considered that the John Hancock insurance companies that are affiliates of the Advisor, as shareholders of the Trust directly or through their separate accounts, receive certain tax credits or deductions relating to foreign taxes paid and dividends received by certain funds of the Trust and noted that these tax benefits, which are not available to participants in qualified retirement plans under applicable income tax law, are reflected in the profitability information reviewed by the Board; |
| (f) | considered that the Advisor also provides administrative services to the fund on a cost basis pursuant to an administrative services agreement; |
| (g) | noted that affiliates of the Advisor provide transfer agency services and distribution services to the fund, and that the fund’s distributor also receives Rule 12b-1 payments to support distribution of the fund; |
| (h) | noted that the fund’s Subadvisor is an affiliate of the Advisor; |
| (i) | noted that the Advisor also derives reputational and other indirect benefits from providing advisory services to the fund; |
| (j) | noted that the subadvisory fee for the fund is paid by the Advisor; |
| (k) | considered the Advisor’s ongoing costs and expenditures necessary to improve services, meet new regulatory and compliance requirements, and adapt to other challenges impacting the fund industry; and |
| (l) | considered that the Advisor should be entitled to earn a reasonable level of profits in exchange for the level of services it provides to the fund and the risks that it assumes as Advisor, including entrepreneurial, operational, reputational, litigation and regulatory risk. |
| 36 | JOHN HANCOCK GLOBAL EQUITY FUND | ANNUAL REPORT |
| (a) | considered that the Advisor has contractually agreed to waive a portion of its management fee for certain funds of the John Hancock Fund Complex, including the fund (the participating portfolios) or otherwise reimburse the expenses of the participating portfolios (the reimbursement). This waiver is based upon aggregate net assets of all the participating portfolios. The amount of the reimbursement is calculated daily and allocated among all the participating portfolios in proportion to the daily net assets of each fund; |
| (b) | reviewed the fund’s advisory fee structure and concluded that: (i) the fund’s fee structure contains breakpoints at the subadvisory fee level and that such breakpoints are reflected as breakpoints in the advisory fees for the fund; and (ii) although economies of scale cannot be measured with precision, these arrangements permit shareholders of the fund to benefit from economies of scale if the fund grows. The Board also took into account management’s discussion of the fund’s advisory fee structure; and |
| (c) | the Board also considered the effect of the fund’s growth in size on its performance and fees. The Board also noted that if the fund’s assets increase over time, the fund may realize other economies of scale. |
| (1) | information relating to the Subadvisor’s business, including current subadvisory services to the Trust (and other funds in the John Hancock Fund Complex); |
| (2) | the historical and current performance of the fund and comparative performance information relating to an applicable benchmark index and comparable funds; and |
| (3) | the subadvisory fee for the fund, including any breakpoints, and to the extent available, comparable fee information prepared by an independent third party provider of fund data. |
| ANNUAL REPORT | JOHN HANCOCK GLOBAL EQUITY FUND | 37 |
| (1) | the Subadvisor has extensive experience and demonstrated skills as a manager; |
| (2) | the Board concluded that the fund’s performance is being monitored and reasonably addressed, where appropriate; |
| (3) | the subadvisory fee is reasonable in relation to the level and quality of services being provided under the Subadvisory Agreement; and |
| (4) | noted that the subadvisory fees are paid by the Advisor not the fund and that the subadvisory fee breakpoints are reflected as breakpoints in the advisory fees for the fund in order to permit shareholders to benefit from economies of scale if the fund grows. |
| 38 | JOHN HANCOCK GLOBAL EQUITY FUND | ANNUAL REPORT |
| • | The Fund’s investment strategy remained appropriate for an open-end fund structure; |
| • | The Fund was able to meet requests for redemption without significant dilution of remaining investors’ interests in the Fund; |
| • | The Fund did not report any breaches of the 15% limit on illiquid investments that would require reporting to the Securities and Exchange Commission; |
| • | The Fund continued to qualify as a Primarily Highly Liquid Fund under the Liquidity Rule and therefore is not required to establish a HLIM; and |
| • | The Chief Compliance Officer’s office performed audit testing of the LRMP which resulted in an assessment that the LRMP’s control environment was deemed to be operating effectively and in compliance with the Board approved procedures. |
| ANNUAL REPORT | JOHN HANCOCK GLOBAL EQUITY FUND | 39 |
| 40 | JOHN HANCOCK GLOBAL EQUITY FUND | ANNUAL REPORT |
| Independent Trustees | ||
| Name, year of birth Position(s) held with Trust Principal occupation(s) and other directorships during past 5 years | Trustee of the Trust since1 | Number of John Hancock funds overseen by Trustee |
| Hassell H. McClellan, Born: 1945 | 2005 | 190 |
| Trustee and Chairperson of the Board | ||
| Director/Trustee, Virtus Funds (2008-2020); Director, The Barnes Group (2010-2021); Associate Professor, The Wallace E. Carroll School of Management, Boston College (retired 2013). Trustee (since 2005) and Chairperson of the Board (since 2017) of various trusts within the John Hancock Fund Complex. | ||
| Charles L. Bardelis,2 Born: 1941 | 2005 | 190 |
| Trustee | ||
| Director, Island Commuter Corp. (marine transport). Trustee of various trusts within the John Hancock Fund Complex (since 1988). | ||
| James R. Boyle, Born: 1959 | 2015 | 190 |
| Trustee | ||
| Chief Executive Officer, Foresters Financial (since 2018); Chairman and Chief Executive Officer, Zillion Group, Inc. (formerly HealthFleet, Inc.) (healthcare) (2014-2018); Executive Vice President and Chief Executive Officer, U.S. Life Insurance Division of Genworth Financial, Inc. (insurance) (January 2014–July 2014); Senior Executive Vice President, Manulife Financial, President and Chief Executive Officer, John Hancock (1999–2012); Chairman and Director, John Hancock Investment Management LLC, John Hancock Investment Management Distributors LLC, and John Hancock Variable Trust Advisers LLC (2005–2010). Trustee of various trusts within the John Hancock Fund Complex (2005–2014 and since 2015). | ||
| Peter S. Burgess,2 Born: 1942 | 2005 | 190 |
| Trustee | ||
| Consultant (financial, accounting, and auditing matters) (since 1999); Certified Public Accountant; Partner, Arthur Andersen (independent public accounting firm) (prior to 1999); Director, Lincoln Educational Services Corporation (2004-2021); Director, Symetra Financial Corporation (2010–2016); Director, PMA Capital Corporation (2004–2010). Trustee of various trusts within the John Hancock Fund Complex (since 2005). | ||
| William H. Cunningham, Born: 1944 | 2012 | 190 |
| Trustee | ||
| Professor, University of Texas, Austin, Texas (since 1971); former Chancellor, University of Texas System and former President of the University of Texas, Austin, Texas; Chairman (since 2009) and Director (since 2006), Lincoln National Corporation (insurance); Director, Southwest Airlines (since 2000); former Director, LIN Television (2009–2014). Trustee of various trusts within the John Hancock Fund Complex (since 1986). | ||
| Grace K. Fey, Born: 1946 | 2008 | 190 |
| Trustee | ||
| Chief Executive Officer, Grace Fey Advisors (since 2007); Director and Executive Vice President, Frontier Capital Management Company (1988–2007); Director, Fiduciary Trust (since 2009). Trustee of various trusts within the John Hancock Fund Complex (since 2008). | ||
| ANNUAL REPORT | JOHN HANCOCK GLOBAL EQUITY FUND | 41 |
| Independent Trustees (continued) | ||
| Name, year of birth Position(s) held with Trust Principal occupation(s) and other directorships during past 5 years | Trustee of the Trust since1 | Number of John Hancock funds overseen by Trustee |
| Deborah C. Jackson, Born: 1952 | 2012 | 190 |
| Trustee | ||
| President, Cambridge College, Cambridge, Massachusetts (since 2011); Board of Directors, Amwell Corporation (since 2020); Board of Directors, Massachusetts Women’s Forum (2018-2020); Board of Directors, National Association of Corporate Directors/New England (2015-2020); Board of Directors, Association of Independent Colleges and Universities of Massachusetts (2014-2017); Chief Executive Officer, American Red Cross of Massachusetts Bay (2002–2011); Board of Directors of Eastern Bank Corporation (since 2001); Board of Directors of Eastern Bank Charitable Foundation (since 2001); Board of Directors of American Student Assistance Corporation (1996–2009); Board of Directors of Boston Stock Exchange (2002–2008); Board of Directors of Harvard Pilgrim Healthcare (health benefits company) (2007–2011). Trustee of various trusts within the John Hancock Fund Complex (since 2008). | ||
| Steven R. Pruchansky, Born: 1944 | 2012 | 190 |
| Trustee and Vice Chairperson of the Board | ||
| Managing Director, Pru Realty (since 2017); Chairman and Chief Executive Officer, Greenscapes of Southwest Florida, Inc. (2014-2020); Director and President, Greenscapes of Southwest Florida, Inc. (until 2000); Member, Board of Advisors, First American Bank (until 2010); Managing Director, Jon James, LLC (real estate) (since 2000); Partner, Right Funding, LLC (2014-2017); Director, First Signature Bank & Trust Company (until 1991); Director, Mast Realty Trust (until 1994); President, Maxwell Building Corp. (until 1991). Trustee (since 1992), Chairperson of the Board (2011–2012), and Vice Chairperson of the Board (since 2012) of various trusts within the John Hancock Fund Complex. | ||
| Frances G. Rathke,2,* Born: 1960 | 2020 | 190 |
| Trustee | ||
| Board Member, Oatly Group AB (plant-based drink company) (since 2021): Director, Northern New England Energy Corporation (since 2017); Director, Audit Committee Chair and Compensation Committee Member, Green Mountain Power Corporation (since 2016); Director, Treasurer and Finance & Audit Committee Chair, Flynn Center for Performing Arts (since 2016); Director, Audit Committee Chair and Compensation Committee Member, Planet Fitness (since 2016); Director, Citizen Cider, Inc. (high-end hard cider and hard seltzer company) (since 2016); Chief Financial Officer and Treasurer, Keurig Green Mountain, Inc. (2003-retired 2015); Independent Financial Consultant, Frances Rathke Consulting (strategic and financial consulting services) (2001-2003); Chief Financial Officer and Secretary, Ben & Jerry’s Homemade, Inc. (1989-2000, including prior positions); Senior Manager, Coopers & Lybrand, LLC (independent public accounting firm) (1982-1989). Trustee of various trusts within the John Hancock Fund Complex (since 2020). | ||
| Gregory A. Russo, Born: 1949 | 2012 | 190 |
| Trustee | ||
| Director and Audit Committee Chairman (2012-2020), and Member, Audit Committee and Finance Committee (2011-2020), NCH Healthcare System, Inc. (holding company for multi-entity healthcare system); Director and Member (2012-2018) and Finance Committee Chairman (2014-2018), The Moorings, Inc. (nonprofit continuing care community); Vice Chairman, Risk & Regulatory Matters, KPMG LLP (KPMG) (2002–2006); Vice Chairman, Industrial Markets, KPMG (1998–2002); Chairman and Treasurer, Westchester County, New York, Chamber of Commerce (1986–1992); Director, Treasurer, and Chairman of Audit and Finance Committees, Putnam Hospital Center (1989–1995); Director and Chairman of Fundraising Campaign, United Way of Westchester and Putnam Counties, New York (1990–1995). Trustee of various trusts within the John Hancock Fund Complex (since 2008). | ||
| 42 | JOHN HANCOCK GLOBAL EQUITY FUND | ANNUAL REPORT |
| Non-Independent Trustees3 | ||
| Name, year of birth Position(s) held with Trust Principal occupation(s) and other directorships during past 5 years | Trustee of the Trust since1 | Number of John Hancock funds overseen by Trustee |
| Andrew G. Arnott, Born: 1971 | 2017 | 190 |
| President and Non-Independent Trustee | ||
| Head of Wealth and Asset Management, United States and Europe, for John Hancock and Manulife (since 2018); Director and Executive Vice President, John Hancock Investment Management LLC (since 2005, including prior positions); Director and Executive Vice President, John Hancock Variable Trust Advisers LLC (since 2006, including prior positions); President, John Hancock Investment Management Distributors LLC (since 2004, including prior positions); President of various trusts within the John Hancock Fund Complex (since 2007, including prior positions). Trustee of various trusts within the John Hancock Fund Complex (since 2017). | ||
| Marianne Harrison, Born: 1963 | 2018 | 190 |
| Non-Independent Trustee | ||
| President and CEO, John Hancock (since 2017); President and CEO, Manulife Canadian Division (2013–2017); Member, Board of Directors, Boston Medical Center (since 2021); Member, Board of Directors, CAE Inc. (since 2019); Member, Board of Directors, MA Competitive Partnership Board (since 2018); Member, Board of Directors, American Council of Life Insurers (ACLI) (since 2018); Member, Board of Directors, Communitech, an industry-led innovation center that fosters technology companies in Canada (2017-2019); Member, Board of Directors, Manulife Assurance Canada (2015-2017); Board Member, St. Mary’s General Hospital Foundation (2014-2017); Member, Board of Directors, Manulife Bank of Canada (2013- 2017); Member, Standing Committee of the Canadian Life & Health Assurance Association (2013-2017); Member, Board of Directors, John Hancock USA, John Hancock Life & Health, John Hancock New York (2012–2013). Trustee of various trusts within the John Hancock Fund Complex (since 2018). | ||
| Principal officers who are not Trustees | |
| Name, year of birth Position(s) held with Trust Principal occupation(s) during past 5 years | Current Position(s) with the Trust since |
| Charles A. Rizzo, Born: 1957 | 2007 |
| Chief Financial Officer | |
| Vice President, John Hancock Financial Services (since 2008); Senior Vice President, John Hancock Investment Management LLC and John Hancock Variable Trust Advisers LLC (since 2008); Chief Financial Officer of various trusts within the John Hancock Fund Complex (since 2007). | |
| Salvatore Schiavone, Born: 1965 | 2009 |
| Treasurer | |
| Assistant Vice President, John Hancock Financial Services (since 2007); Vice President, John Hancock Investment Management LLC and John Hancock Variable Trust Advisers LLC (since 2007); Treasurer of various trusts within the John Hancock Fund Complex (since 2007, including prior positions). | |
| Christopher (Kit) Sechler, Born: 1973 | 2018 |
| Secretary and Chief Legal Officer | |
| Vice President and Deputy Chief Counsel, John Hancock Investment Management (since 2015); Assistant Vice President and Senior Counsel (2009–2015), John Hancock Investment Management; Assistant Secretary of John Hancock Investment Management LLC and John Hancock Variable Trust Advisers LLC (since 2009); Chief Legal Officer and Secretary of various trusts within the John Hancock Fund Complex (since 2009, including prior positions). | |
| ANNUAL REPORT | JOHN HANCOCK GLOBAL EQUITY FUND | 43 |
| Principal officers who are not Trustees (continued) | |
| Name, year of birth Position(s) held with Trust Principal occupation(s) during past 5 years | Current Position(s) with the Trust since |
| Trevor Swanberg, Born: 1979 | 2020 |
| Chief Compliance Officer | |
| Chief Compliance Officer, John Hancock Investment Management LLC and John Hancock Variable Trust Advisers LLC (since 2020); Deputy Chief Compliance Officer, John Hancock Investment Management LLC and John Hancock Variable Trust Advisers LLC (2019–2020); Assistant Chief Compliance Officer, John Hancock Investment Management LLC and John Hancock Variable Trust Advisers LLC (2016–2019); Vice President, State Street Global Advisors (2015–2016); Chief Compliance Officer of various trusts within the John Hancock Fund Complex (since 2016, including prior positions). | |
| 1 | Each Trustee holds office until his or her successor is elected and qualified, or until the Trustee’s death, retirement, resignation, or removal. Mr. Boyle has served as Trustee at various times prior to the date listed in the table. |
| 2 | Member of the Audit Committee. |
| 3 | The Trustee is a Non-Independent Trustee due to current or former positions with the Advisor and certain affiliates. |
| * | Appointed as Independent Trustee effective as of September 15, 2020. |
| 44 | JOHN HANCOCK GLOBAL EQUITY FUND | ANNUAL REPORT |
Steven R. Pruchansky, Vice Chairperson
Andrew G. Arnott†
Charles L. Bardelis*
James R. Boyle
Peter S. Burgess*
William H. Cunningham
Grace K. Fey
Marianne Harrison†
Deborah C. Jackson
Frances G. Rathke*,1
Gregory A. Russo
President
Chief Financial Officer
Treasurer
Secretary and Chief Legal Officer
Chief Compliance Officer
Stephen G. Hermsdorf
| You can also contact us: | ||
| 800-225-5291 | Regular mail: | Express mail: |
| jhinvestments.com | John Hancock Signature Services, Inc. P.O. Box 219909 Kansas City, MO 64121-9909 | John Hancock Signature Services, Inc. 430 W 7th Street Suite 219909 Kansas City, MO 64105-1407 |
| ANNUAL REPORT | JOHN HANCOCK GLOBAL EQUITY FUND | 45 |
GOVERNANCE FUNDS
with a heritage of financial stewardship dating back to 1862. Helping
our shareholders pursue their financial goals is at the core of everything
we do. It’s why we support the role of professional financial advice
and operate with the highest standards of conduct and integrity.
We search the world to find proven portfolio teams with specialized
expertise for every strategy we offer, then we apply robust investment
oversight to ensure they continue to meet our uncompromising
standards and serve the best interests of our shareholders.
a diverse set of investments backed by some of the world’s best
managers, along with strong risk-adjusted returns across asset classes.
200 Berkeley Street, Boston, MA 02116-5010, 800-225-5291, jhinvestments.com
| MF1823001 | 425A 8/21 |


President and CEO,
John Hancock Investment Management
Head of Wealth and Asset Management,
United States and Europe
| ANNUAL REPORT | JOHN HANCOCK STRATEGIC INCOME OPPORTUNITIES FUND | 1 |

| 2 | JOHN HANCOCK STRATEGIC INCOME OPPORTUNITIES FUND | ANNUAL REPORT |

| ANNUAL REPORT | JOHN HANCOCK STRATEGIC INCOME OPPORTUNITIES FUND | 3 |

| 4 | JOHN HANCOCK STRATEGIC INCOME OPPORTUNITIES FUND | ANNUAL REPORT |
| NET CURRENCY EXPOSURE AS OF 8/31/2021 (% of net assets) | |
| United States Dollar | 78.5 |
| Euro | 5.6 |
| Canadian Dollar | 3.9 |
| Indonesian Rupiah | 2.0 |
| Norwegian Krone | 1.6 |
| Mexican Peso | 1.4 |
| Australian Dollar | 1.2 |
| Malaysian Ringgit | 1.2 |
| Other Currencies | 4.6 |
| TOTAL | 100.0 |
| Net currency exposure, after taking into account the effects of forward foreign currency exchange contracts. | |
| COUNTRY COMPOSITION AS OF 8/31/2021 (% of net assets) | |
| United States | 56.8 |
| Canada | 6.6 |
| Indonesia | 3.6 |
| Luxembourg | 3.4 |
| United Kingdom | 2.4 |
| Australia | 2.0 |
| Mexico | 1.8 |
| Brazil | 1.8 |
| Supranational | 1.7 |
| France | 1.6 |
| Other countries | 18.3 |
| TOTAL | 100.0 |
| ANNUAL REPORT | JOHN HANCOCK STRATEGIC INCOME OPPORTUNITIES FUND | 5 |

| 6 | JOHN HANCOCK STRATEGIC INCOME OPPORTUNITIES FUND | ANNUAL REPORT |
| Average annual total returns (%) with maximum sales charge | Cumulative total returns (%) with maximum sales charge | SEC 30-day yield (%) subsidized | SEC 30-day yield (%) unsubsidized† | |||||
| 1-year | 5-year | 10-year | 5-year | 10-year | as of 8-31-21 | as of 8-31-21 | ||
| Class A | 1.62 | 2.93 | 3.84 | 15.53 | 45.72 | 1.70 | 1.65 | |
| Class C | 4.04 | 3.06 | 3.55 | 16.25 | 41.70 | 1.08 | 1.03 | |
| Class I1 | 6.10 | 4.07 | 4.59 | 22.07 | 56.62 | 2.07 | 2.02 | |
| Class R21,2 | 5.79 | 3.69 | 4.23 | 19.84 | 51.40 | 1.67 | 1.62 | |
| Class R61 | 6.30 | 4.20 | 4.69 | 22.83 | 58.12 | 2.17 | 2.12 | |
| Class NAV1 | 6.31 | 4.21 | 4.73 | 22.92 | 58.68 | 2.17 | 2.13 | |
| Index†† | -0.08 | 3.11 | 3.18 | 16.55 | 36.71 | — | — | |
| Class A | Class C | Class I | Class R2 | Class R6 | Class NAV | |
| Gross (%) | 1.12 | 1.82 | 0.82 | 1.20 | 0.70 | 0.69 |
| Net (%) | 1.07 | 1.77 | 0.77 | 1.15 | 0.65 | 0.64 |
| ANNUAL REPORT | JOHN HANCOCK STRATEGIC INCOME OPPORTUNITIES FUND | 7 |

| Start date | With maximum sales charge ($) | Without sales charge ($) | Index ($) | |
| Class C3 | 8-31-11 | 14,170 | 14,170 | 13,671 |
| Class I1 | 8-31-11 | 15,662 | 15,662 | 13,671 |
| Class R21,2 | 8-31-11 | 15,140 | 15,140 | 13,671 |
| Class R61 | 8-31-11 | 15,812 | 15,812 | 13,671 |
| Class NAV1 | 8-31-11 | 15,868 | 15,868 | 13,671 |
| 1 | For certain types of investors, as described in the fund’s prospectuses. |
| 2 | Class R2 shares were first offered on 3-1-12. The returns prior to this date are those of Class NAV shares that have not been adjusted for class-specific expenses; otherwise, returns would vary. |
| 3 | The contingent deferred sales charge is not applicable. |
| 8 | JOHN HANCOCK STRATEGIC INCOME OPPORTUNITIES FUND | ANNUAL REPORT |

| ANNUAL REPORT | JOHN HANCOCK STRATEGIC INCOME OPPORTUNITIES FUND | 9 |
| Account value on 3-1-2021 | Ending value on 8-31-2021 | Expenses paid during period ended 8-31-20211 | Annualized expense ratio | ||
| Class A | Actual expenses/actual returns | $1,000.00 | $1,019.00 | $5.45 | 1.07% |
| Hypothetical example | 1,000.00 | 1,019.80 | 5.45 | 1.07% | |
| Class C | Actual expenses/actual returns | 1,000.00 | 1,015.40 | 8.99 | 1.77% |
| Hypothetical example | 1,000.00 | 1,016.30 | 9.00 | 1.77% | |
| Class I | Actual expenses/actual returns | 1,000.00 | 1,020.60 | 3.92 | 0.77% |
| Hypothetical example | 1,000.00 | 1,021.30 | 3.92 | 0.77% | |
| Class R2 | Actual expenses/actual returns | 1,000.00 | 1,018.50 | 5.95 | 1.17% |
| Hypothetical example | 1,000.00 | 1,019.30 | 5.95 | 1.17% | |
| Class R6 | Actual expenses/actual returns | 1,000.00 | 1,021.10 | 3.36 | 0.66% |
| Hypothetical example | 1,000.00 | 1,021.90 | 3.36 | 0.66% | |
| Class NAV | Actual expenses/actual returns | 1,000.00 | 1,022.10 | 3.31 | 0.65% |
| Hypothetical example | 1,000.00 | 1,021.90 | 3.31 | 0.65% |
| 1 | Expenses are equal to the annualized expense ratio, multiplied by the average account value over the period, multiplied by 184/365 (to reflect the one-half year period). |
| 10 | JOHN HANCOCK STRATEGIC INCOME OPPORTUNITIES FUND | ANNUAL REPORT |
| Rate (%) | Maturity date | Par value^ | Value | ||
| U.S. Government and Agency obligations 4.7% | $229,162,896 | ||||
| (Cost $206,958,131) | |||||
| U.S. Government 4.7% | 229,162,896 | ||||
| U.S. Treasury | |||||
| Bond | 2.000 | 02-15-50 | 18,000,000 | 18,289,688 | |
| Bond | 2.750 | 11-15-42 | 10,200,000 | 11,802,117 | |
| Bond | 3.000 | 02-15-49 | 62,535,000 | 77,176,984 | |
| Bond | 4.375 | 02-15-38 | 40,125,000 | 56,389,731 | |
| Note | 0.250 | 06-30-25 | 11,500,000 | 11,352,656 | |
| Note | 0.375 | 11-30-25 | 12,000,000 | 11,852,813 | |
| Note | 2.000 | 11-15-26 | 3,745,000 | 3,972,480 | |
| Note | 2.375 | 02-29-24 | 3,515,000 | 3,696,379 | |
| Note | 2.375 | 04-30-26 | 5,420,000 | 5,829,676 | |
| Note | 2.625 | 02-15-29 | 7,895,000 | 8,747,413 | |
| Treasury Inflation Protected Security | 0.125 | 01-15-30 | 17,989,128 | 20,052,959 | |
| Foreign government obligations 19.4% | $946,450,988 | ||||
| (Cost $943,257,284) | |||||
| Australia 1.0% | 47,043,378 | ||||
| Commonwealth of Australia | 0.250 | 11-21-24 | AUD | 17,845,000 | 13,058,867 |
| Commonwealth of Australia | 0.500 | 09-21-26 | AUD | 8,025,000 | 5,835,291 |
| Commonwealth of Australia | 2.250 | 11-21-22 | AUD | 4,010,000 | 3,013,742 |
| New South Wales Treasury Corp. | 1.000 | 02-08-24 | AUD | 24,925,000 | 18,557,412 |
| Queensland Treasury Corp. (A) | 4.250 | 07-21-23 | AUD | 8,355,000 | 6,578,066 |
| Austria 0.2% | 8,876,793 | ||||
| Republic of Austria (A) | 0.500 | 02-20-29 | EUR | 7,075,000 | 8,876,793 |
| Brazil 1.0% | 47,012,788 | ||||
| Federative Republic of Brazil | 10.000 | 01-01-23 | BRL | 100,220,000 | 20,027,440 |
| Federative Republic of Brazil | 10.000 | 01-01-25 | BRL | 135,530,000 | 26,985,348 |
| Canada 3.0% | 144,465,995 | ||||
| Canada Housing Trust No. 1 (A) | 1.250 | 06-15-26 | CAD | 16,100,000 | 12,852,564 |
| Canada Housing Trust No. 1 (A) | 1.950 | 12-15-25 | CAD | 17,175,000 | 14,152,205 |
| Government of Canada | 1.500 | 09-01-24 | CAD | 7,863,000 | 6,399,216 |
| Province of Ontario | 1.350 | 12-02-30 | CAD | 83,435,000 | 63,502,920 |
| Province of Ontario | 2.900 | 06-02-28 | CAD | 13,400,000 | 11,589,861 |
| Province of Ontario | 3.450 | 06-02-45 | CAD | 11,995,000 | 11,039,887 |
| Province of Quebec | 0.200 | 04-07-25 | EUR | 9,160,000 | 11,047,562 |
| Province of Quebec | 1.500 | 12-15-23 | GBP | 5,130,000 | 7,226,432 |
| Province of Quebec | 3.000 | 09-01-23 | CAD | 8,000,000 | 6,655,348 |
| China 0.9% | 42,610,395 | ||||
| People’s Republic of China | 1.990 | 04-09-25 | CNY | 128,240,000 | 19,357,428 |
| SEE NOTES TO FINANCIAL STATEMENTS | ANNUAL REPORT | JOHN HANCOCK STRATEGIC INCOME OPPORTUNITIES FUND | 11 |
| Rate (%) | Maturity date | Par value^ | Value | ||
| China (continued) | |||||
| People’s Republic of China | 2.880 | 11-05-23 | CNY | 149,230,000 | $23,252,967 |
| Colombia 1.0% | 46,917,175 | ||||
| Republic of Colombia | 3.250 | 04-22-32 | 9,615,000 | 9,382,894 | |
| Republic of Colombia | 4.500 | 03-15-29 | 2,450,000 | 2,661,117 | |
| Republic of Colombia | 5.625 | 02-26-44 | 2,450,000 | 2,735,376 | |
| Republic of Colombia | 6.250 | 11-26-25 | COP | 39,010,000,000 | 10,578,723 |
| Republic of Colombia | 7.500 | 08-26-26 | COP | 40,050,000,000 | 11,284,455 |
| Republic of Colombia | 10.000 | 07-24-24 | COP | 34,094,500,000 | 10,274,610 |
| Greece 0.8% | 37,788,399 | ||||
| Republic of Greece (A) | 1.500 | 06-18-30 | EUR | 10,675,000 | 13,552,992 |
| Republic of Greece (A) | 2.000 | 04-22-27 | EUR | 8,435,000 | 11,041,725 |
| Republic of Greece | 4.200 | 01-30-42 | EUR | 7,100,000 | 13,193,682 |
| India 0.1% | 7,426,673 | ||||
| Republic of India | 6.450 | 10-07-29 | INR | 373,000,000 | 5,162,786 |
| Republic of India | 7.270 | 04-08-26 | INR | 156,200,000 | 2,263,887 |
| Indonesia 3.0% | 145,321,900 | ||||
| Perusahaan Penerbit SBSN Indonesia III (A) | 4.150 | 03-29-27 | 10,060,000 | 11,328,063 | |
| Republic of Indonesia | 1.100 | 03-12-33 | EUR | 2,709,000 | 3,154,307 |
| Republic of Indonesia (A) | 2.150 | 07-18-24 | EUR | 6,000,000 | 7,484,024 |
| Republic of Indonesia (A) | 2.625 | 06-14-23 | EUR | 11,010,000 | 13,588,492 |
| Republic of Indonesia | 3.050 | 03-12-51 | 5,655,000 | 5,624,031 | |
| Republic of Indonesia | 3.850 | 10-15-30 | 4,480,000 | 5,066,995 | |
| Republic of Indonesia | 6.500 | 06-15-25 | IDR | 289,886,000,000 | 21,482,950 |
| Republic of Indonesia | 6.625 | 05-15-33 | IDR | 93,981,000,000 | 6,664,735 |
| Republic of Indonesia | 7.000 | 05-15-27 | IDR | 72,700,000,000 | 5,492,180 |
| Republic of Indonesia | 7.000 | 09-15-30 | IDR | 243,389,000,000 | 18,072,334 |
| Republic of Indonesia | 7.500 | 08-15-32 | IDR | 23,093,000,000 | 1,751,790 |
| Republic of Indonesia | 7.500 | 06-15-35 | IDR | 61,272,000,000 | 4,618,223 |
| Republic of Indonesia | 7.500 | 05-15-38 | IDR | 62,856,000,000 | 4,653,534 |
| Republic of Indonesia | 8.125 | 05-15-24 | IDR | 45,206,000,000 | 3,473,849 |
| Republic of Indonesia | 8.250 | 05-15-29 | IDR | 57,894,000,000 | 4,622,036 |
| Republic of Indonesia | 8.375 | 03-15-24 | IDR | 83,418,000,000 | 6,409,887 |
| Republic of Indonesia | 8.375 | 09-15-26 | IDR | 81,815,000,000 | 6,539,345 |
| Republic of Indonesia | 8.750 | 05-15-31 | IDR | 111,458,000,000 | 9,236,366 |
| Republic of Indonesia | 9.000 | 03-15-29 | IDR | 73,235,000,000 | 6,058,759 |
| Ireland 0.3% | 16,787,206 | ||||
| Republic of Ireland | 3.400 | 03-18-24 | EUR | 12,890,000 | 16,787,206 |
| Italy 0.7% | 32,223,273 | ||||
| Republic of Italy | 1.250 | 02-17-26 | 7,595,000 | 7,536,670 | |
| Republic of Italy (A) | 1.850 | 07-01-25 | EUR | 19,430,000 | 24,686,603 |
| 12 | JOHN HANCOCK STRATEGIC INCOME OPPORTUNITIES FUND | ANNUAL REPORT | SEE NOTES TO FINANCIAL STATEMENTS |
| Rate (%) | Maturity date | Par value^ | Value | ||
| Japan 0.8% | $40,224,495 | ||||
| Government of Japan | 0.100 | 06-20-25 | JPY | 4,387,750,000 | 40,224,495 |
| Malaysia 1.2% | 58,025,568 | ||||
| Government of Malaysia | 3.733 | 06-15-28 | MYR | 24,975,000 | 6,250,564 |
| Government of Malaysia | 3.828 | 07-05-34 | MYR | 22,120,000 | 5,319,863 |
| Government of Malaysia | 3.844 | 04-15-33 | MYR | 48,536,000 | 11,933,145 |
| Government of Malaysia | 3.882 | 03-14-25 | MYR | 36,535,000 | 9,183,878 |
| Government of Malaysia | 3.900 | 11-30-26 | MYR | 18,960,000 | 4,824,106 |
| Government of Malaysia | 4.059 | 09-30-24 | MYR | 37,710,000 | 9,520,134 |
| Government of Malaysia, Inflation Linked Bond | 3.899 | 11-16-27 | MYR | 43,417,000 | 10,993,878 |
| Mexico 1.3% | 63,338,442 | ||||
| Government of Mexico | 5.750 | 03-05-26 | MXN | 253,970,000 | 12,265,269 |
| Government of Mexico | 6.750 | 03-09-23 | MXN | 231,360,000 | 11,725,358 |
| Government of Mexico | 7.500 | 06-03-27 | MXN | 452,090,000 | 23,345,753 |
| Government of Mexico | 7.750 | 05-29-31 | MXN | 304,940,000 | 16,002,062 |
| New Zealand 0.0% | 2,820,488 | ||||
| Dominion of New Zealand | 5.500 | 04-15-23 | NZD | 3,730,000 | 2,820,488 |
| Norway 0.7% | 34,385,771 | ||||
| Kingdom of Norway (A) | 2.000 | 05-24-23 | NOK | 292,280,000 | 34,385,771 |
| Philippines 0.6% | 30,139,195 | ||||
| Republic of the Philippines | 0.875 | 05-17-27 | EUR | 17,540,000 | 21,197,710 |
| Republic of the Philippines | 6.250 | 01-14-36 | PHP | 373,000,000 | 8,941,485 |
| Portugal 0.6% | 31,701,068 | ||||
| Republic of Portugal (A) | 0.475 | 10-18-30 | EUR | 21,270,000 | 26,033,503 |
| Republic of Portugal (A) | 0.700 | 10-15-27 | EUR | 4,525,000 | 5,667,565 |
| Qatar 0.4% | 17,903,712 | ||||
| State of Qatar (A) | 4.000 | 03-14-29 | 6,955,000 | 8,011,186 | |
| State of Qatar (A) | 4.817 | 03-14-49 | 7,575,000 | 9,892,526 | |
| Singapore 0.4% | 19,221,428 | ||||
| Republic of Singapore | 1.750 | 04-01-22 | SGD | 25,635,000 | 19,221,428 |
| Spain 0.4% | 22,317,585 | ||||
| Kingdom of Spain (A) | 0.250 | 07-30-24 | EUR | 9,125,000 | 11,013,362 |
| Kingdom of Spain (A) | 0.800 | 07-30-27 | EUR | 9,040,000 | 11,304,223 |
| Sweden 0.3% | 15,930,587 | ||||
| Kingdom of Sweden (A) | 0.125 | 04-24-23 | EUR | 13,340,000 | 15,930,587 |
| United Arab Emirates 0.5% | 23,253,557 | ||||
| Government of Abu Dhabi (A) | 1.700 | 03-02-31 | 9,705,000 | 9,535,163 | |
| Government of Abu Dhabi (A) | 3.125 | 04-16-30 | 7,880,000 | 8,677,740 | |
| Government of Abu Dhabi (A) | 3.875 | 04-16-50 | 4,315,000 | 5,040,654 |
| SEE NOTES TO FINANCIAL STATEMENTS | ANNUAL REPORT | JOHN HANCOCK STRATEGIC INCOME OPPORTUNITIES FUND | 13 |
| Rate (%) | Maturity date | Par value^ | Value | ||
| United Kingdom 0.2% | $10,715,117 | ||||
| Government of United Kingdom | 0.500 | 07-22-22 | GBP | 7,765,000 | 10,715,117 |
| Corporate bonds 54.7% | $2,664,388,833 | ||||
| (Cost $2,557,060,855) | |||||
| Communication services 7.4% | 359,933,548 | ||||
| Diversified telecommunication services 0.8% | |||||
| Cellnex Telecom SA | 1.875 | 06-26-29 | EUR | 5,400,000 | 6,527,437 |
| GCI LLC (A) | 4.750 | 10-15-28 | 4,545,000 | 4,766,569 | |
| Kenbourne Invest SA (A)(B) | 4.700 | 01-22-28 | 4,775,000 | 4,835,977 | |
| Radiate Holdco LLC (A) | 4.500 | 09-15-26 | 12,100,000 | 12,598,883 | |
| Total Play Telecomunicaciones SA de CV (A) | 7.500 | 11-12-25 | 8,945,000 | 9,504,063 | |
| Entertainment 0.7% | |||||
| Lions Gate Capital Holdings LLC (A) | 5.500 | 04-15-29 | 10,180,000 | 10,394,289 | |
| Netflix, Inc. (B) | 4.375 | 11-15-26 | 6,690,000 | 7,568,063 | |
| Netflix, Inc. | 4.875 | 04-15-28 | 2,890,000 | 3,377,688 | |
| Netflix, Inc. (A) | 5.375 | 11-15-29 | 9,335,000 | 11,480,463 | |
| Interactive media and services 0.5% | |||||
| ANGI Group LLC (A) | 3.875 | 08-15-28 | 6,920,000 | 6,798,900 | |
| Match Group Holdings II LLC (A) | 4.125 | 08-01-30 | 7,915,000 | 8,290,963 | |
| TripAdvisor, Inc. (A) | 7.000 | 07-15-25 | 8,295,000 | 8,772,792 | |
| Media 3.8% | |||||
| Altice Financing SA (A) | 5.000 | 01-15-28 | 515,000 | 514,588 | |
| Cable One, Inc. (A) | 4.000 | 11-15-30 | 4,450,000 | 4,502,065 | |
| CCO Holdings LLC (A) | 4.250 | 02-01-31 | 1,700,000 | 1,744,625 | |
| CCO Holdings LLC (A) | 4.500 | 08-15-30 | 8,205,000 | 8,573,076 | |
| CCO Holdings LLC (A) | 4.500 | 06-01-33 | 5,245,000 | 5,435,131 | |
| CCO Holdings LLC (A) | 4.750 | 03-01-30 | 11,565,000 | 12,236,695 | |
| CCO Holdings LLC (A) | 5.125 | 05-01-27 | 14,650,000 | 15,306,467 | |
| Charter Communications Operating LLC | 2.800 | 04-01-31 | 2,350,000 | 2,407,852 | |
| Charter Communications Operating LLC | 5.125 | 07-01-49 | 15,905,000 | 19,099,003 | |
| Charter Communications Operating LLC | 5.750 | 04-01-48 | 7,045,000 | 9,061,264 | |
| LCPR Senior Secured Financing DAC (A) | 5.125 | 07-15-29 | 8,000,000 | 8,280,000 | |
| LCPR Senior Secured Financing DAC (A) | 6.750 | 10-15-27 | 15,810,000 | 16,896,938 | |
| News Corp. (A) | 3.875 | 05-15-29 | 17,435,000 | 17,927,539 | |
| Sirius XM Radio, Inc. (A) | 4.125 | 07-01-30 | 1,005,000 | 1,028,834 | |
| Townsquare Media, Inc. (A) | 6.875 | 02-01-26 | 3,950,000 | 4,187,000 | |
| Virgin Media Finance PLC (A) | 5.000 | 07-15-30 | 7,640,000 | 7,910,838 | |
| 14 | JOHN HANCOCK STRATEGIC INCOME OPPORTUNITIES FUND | ANNUAL REPORT | SEE NOTES TO FINANCIAL STATEMENTS |
| Rate (%) | Maturity date | Par value^ | Value | ||
| Communication services (continued) | |||||
| Media (continued) | |||||
| Virgin Media Secured Finance PLC (A) | 4.500 | 08-15-30 | 5,145,000 | $5,218,574 | |
| Virgin Media Secured Finance PLC (A) | 5.500 | 05-15-29 | 14,030,000 | 15,029,638 | |
| VTR Comunicaciones SpA (A) | 4.375 | 04-15-29 | 4,495,000 | 4,536,804 | |
| VTR Comunicaciones SpA (A) | 5.125 | 01-15-28 | 3,333,000 | 3,482,985 | |
| VTR Finance NV (A) | 6.375 | 07-15-28 | 5,360,000 | 5,689,640 | |
| WMG Acquisition Corp. (A) | 3.000 | 02-15-31 | 19,595,000 | 19,301,075 | |
| Wireless telecommunication services 1.6% | |||||
| Millicom International Cellular SA (A)(B) | 4.500 | 04-27-31 | 5,685,000 | 5,926,613 | |
| Sprint Capital Corp. | 8.750 | 03-15-32 | 9,845,000 | 15,076,830 | |
| Sprint Corp. | 7.125 | 06-15-24 | 1,655,000 | 1,903,250 | |
| T-Mobile USA, Inc. | 2.625 | 04-15-26 | 2,415,000 | 2,481,413 | |
| T-Mobile USA, Inc. | 2.625 | 02-15-29 | 4,405,000 | 4,460,063 | |
| T-Mobile USA, Inc. | 2.875 | 02-15-31 | 4,070,000 | 4,181,925 | |
| T-Mobile USA, Inc. | 3.375 | 04-15-29 | 4,865,000 | 5,140,164 | |
| T-Mobile USA, Inc. | 3.500 | 04-15-31 | 3,440,000 | 3,662,740 | |
| T-Mobile USA, Inc. (A) | 3.500 | 04-15-31 | 4,670,000 | 4,972,383 | |
| T-Mobile USA, Inc. | 4.750 | 02-01-28 | 1,665,000 | 1,777,721 | |
| VMED O2 UK Financing I PLC (A) | 3.250 | 01-31-31 | EUR | 7,750,000 | 9,294,415 |
| VMED O2 UK Financing I PLC (A) | 4.250 | 01-31-31 | 17,725,000 | 17,769,313 | |
| Consumer discretionary 5.6% | 274,656,517 | ||||
| Automobiles 1.6% | |||||
| BMW Finance NV | 1.000 | 11-14-24 | EUR | 4,785,000 | 5,870,727 |
| Ford Motor Company | 7.450 | 07-16-31 | 1,665,000 | 2,190,990 | |
| Ford Motor Company | 8.500 | 04-21-23 | 9,865,000 | 10,906,991 | |
| Ford Motor Credit Company LLC | 2.748 | 06-14-24 | GBP | 3,354,000 | 4,691,976 |
| Ford Motor Credit Company LLC | 2.900 | 02-16-28 | 3,620,000 | 3,606,425 | |
| Ford Motor Credit Company LLC | 2.979 | 08-03-22 | 4,400,000 | 4,456,100 | |
| Ford Motor Credit Company LLC | 3.087 | 01-09-23 | 2,905,000 | 2,959,469 | |
| Ford Motor Credit Company LLC | 3.350 | 11-01-22 | 5,755,000 | 5,881,610 | |
| Ford Motor Credit Company LLC | 3.370 | 11-17-23 | 7,345,000 | 7,580,040 | |
| Ford Motor Credit Company LLC | 3.625 | 06-17-31 | 12,890,000 | 13,276,700 | |
| Ford Motor Credit Company LLC | 3.813 | 10-12-21 | 3,365,000 | 3,366,582 | |
| Ford Motor Credit Company LLC | 4.000 | 11-13-30 | 2,575,000 | 2,716,625 | |
| Ford Motor Credit Company LLC | 4.125 | 08-17-27 | 1,665,000 | 1,781,550 | |
| Ford Motor Credit Company LLC | 4.250 | 09-20-22 | 3,320,000 | 3,415,450 | |
| Ford Motor Credit Company LLC | 4.542 | 08-01-26 | 4,455,000 | 4,839,244 | |
| Hotels, restaurants and leisure 3.8% | |||||
| Aramark Services, Inc. (A) | 6.375 | 05-01-25 | 1,625,000 | 1,720,144 | |
| Boyd Gaming Corp. (A) | 4.750 | 06-15-31 | 8,960,000 | 9,253,261 | |
| SEE NOTES TO FINANCIAL STATEMENTS | ANNUAL REPORT | JOHN HANCOCK STRATEGIC INCOME OPPORTUNITIES FUND | 15 |
| Rate (%) | Maturity date | Par value^ | Value | ||
| Consumer discretionary (continued) | |||||
| Hotels, restaurants and leisure (continued) | |||||
| Carnival Corp. (A) | 5.750 | 03-01-27 | 11,850,000 | $12,114,611 | |
| Hilton Domestic Operating Company, Inc. (A) | 3.625 | 02-15-32 | 4,920,000 | 4,883,100 | |
| Hilton Domestic Operating Company, Inc. | 4.875 | 01-15-30 | 2,950,000 | 3,171,250 | |
| Hilton Grand Vacations Borrower Escrow LLC (A) | 5.000 | 06-01-29 | 6,110,000 | 6,186,375 | |
| Hyatt Hotels Corp. | 5.750 | 04-23-30 | 7,696,000 | 9,238,579 | |
| MGM Resorts International | 4.750 | 10-15-28 | 1,060,000 | 1,113,000 | |
| New Red Finance, Inc. (A) | 3.500 | 02-15-29 | 5,802,000 | 5,772,990 | |
| New Red Finance, Inc. (A) | 3.875 | 01-15-28 | 8,793,000 | 8,902,913 | |
| New Red Finance, Inc. (A) | 4.000 | 10-15-30 | 22,370,000 | 22,246,518 | |
| Premier Entertainment Sub LLC (A) | 5.625 | 09-01-29 | 3,480,000 | 3,568,079 | |
| Premier Entertainment Sub LLC (A) | 5.875 | 09-01-31 | 5,220,000 | 5,350,500 | |
| Royal Caribbean Cruises, Ltd. (A) | 4.250 | 07-01-26 | 7,280,000 | 7,098,000 | |
| Royal Caribbean Cruises, Ltd. (A) | 5.500 | 04-01-28 | 12,760,000 | 12,853,276 | |
| Travel + Leisure Company (A) | 6.625 | 07-31-26 | 12,745,000 | 14,517,830 | |
| Wyndham Hotels & Resorts, Inc. (A) | 4.375 | 08-15-28 | 6,920,000 | 7,160,055 | |
| Yum! Brands, Inc. | 3.625 | 03-15-31 | 18,845,000 | 19,360,034 | |
| Yum! Brands, Inc. | 4.625 | 01-31-32 | 9,070,000 | 9,858,473 | |
| Yum! Brands, Inc. (A) | 4.750 | 01-15-30 | 19,625,000 | 21,661,094 | |
| Household durables 0.0% | |||||
| Newell Brands, Inc. | 4.700 | 04-01-26 | 1,625,000 | 1,815,938 | |
| Internet and direct marketing retail 0.2% | |||||
| MercadoLibre, Inc. | 2.375 | 01-14-26 | 5,950,000 | 5,972,670 | |
| MercadoLibre, Inc. (B) | 3.125 | 01-14-31 | 3,340,000 | 3,297,348 | |
| Consumer staples 3.6% | 172,713,497 | ||||
| Food products 3.3% | |||||
| BRF SA (A) | 4.875 | 01-24-30 | 1,750,000 | 1,808,135 | |
| JBS Finance Luxembourg Sarl (A) | 3.625 | 01-15-32 | 10,670,000 | 11,041,423 | |
| JBS USA Food Company (A) | 7.000 | 01-15-26 | 11,145,000 | 11,716,181 | |
| Kraft Heinz Foods Company | 3.000 | 06-01-26 | 7,061,000 | 7,487,611 | |
| Kraft Heinz Foods Company | 3.875 | 05-15-27 | 3,905,000 | 4,304,112 | |
| Kraft Heinz Foods Company | 4.250 | 03-01-31 | 16,095,000 | 18,578,725 | |
| Kraft Heinz Foods Company | 4.375 | 06-01-46 | 2,935,000 | 3,403,023 | |
| Kraft Heinz Foods Company | 4.625 | 10-01-39 | 11,120,000 | 13,266,491 | |
| Kraft Heinz Foods Company | 6.875 | 01-26-39 | 12,485,000 | 18,654,091 | |
| Kraft Heinz Foods Company (A) | 7.125 | 08-01-39 | 1,675,000 | 2,542,484 | |
| MARB BondCo PLC (A) | 3.950 | 01-29-31 | 9,696,000 | 9,457,721 | |
| NBM US Holdings, Inc. (A) | 7.000 | 05-14-26 | 2,929,000 | 3,116,749 | |
| 16 | JOHN HANCOCK STRATEGIC INCOME OPPORTUNITIES FUND | ANNUAL REPORT | SEE NOTES TO FINANCIAL STATEMENTS |
| Rate (%) | Maturity date | Par value^ | Value | ||
| Consumer staples (continued) | |||||
| Food products (continued) | |||||
| Post Holdings, Inc. (A) | 4.500 | 09-15-31 | 14,765,000 | $14,894,194 | |
| Post Holdings, Inc. (A) | 5.500 | 12-15-29 | 3,230,000 | 3,460,138 | |
| Post Holdings, Inc. (A) | 5.625 | 01-15-28 | 14,510,000 | 15,271,775 | |
| Post Holdings, Inc. (A) | 5.750 | 03-01-27 | 19,660,000 | 20,578,122 | |
| Personal products 0.3% | |||||
| Natura Cosmeticos SA (A) | 4.125 | 05-03-28 | 8,030,000 | 8,242,795 | |
| Oriflame Investment Holding PLC (A) | 5.125 | 05-04-26 | 4,770,000 | 4,889,727 | |
| Energy 6.7% | 327,251,613 | ||||
| Oil, gas and consumable fuels 6.7% | |||||
| Aker BP ASA (A) | 3.750 | 01-15-30 | 12,930,000 | 13,980,170 | |
| Cenovus Energy, Inc. | 3.500 | 02-07-28 | CAD | 5,175,000 | 4,329,502 |
| Cenovus Energy, Inc. | 5.250 | 06-15-37 | 2,074,000 | 2,475,670 | |
| Cenovus Energy, Inc. | 5.400 | 06-15-47 | 8,203,000 | 10,103,524 | |
| Cenovus Energy, Inc. | 6.750 | 11-15-39 | 21,993,000 | 29,698,393 | |
| Cheniere Energy Partners LP (A) | 4.000 | 03-01-31 | 13,025,000 | 13,708,813 | |
| Cheniere Energy Partners LP | 4.500 | 10-01-29 | 4,045,000 | 4,358,488 | |
| Continental Resources, Inc. (A) | 5.750 | 01-15-31 | 22,560,000 | 27,495,000 | |
| Ecopetrol SA | 5.375 | 06-26-26 | 2,445,000 | 2,696,835 | |
| Ecopetrol SA | 5.875 | 05-28-45 | 2,485,000 | 2,664,554 | |
| Ecopetrol SA | 6.875 | 04-29-30 | 4,970,000 | 5,990,192 | |
| Enbridge, Inc. | 3.125 | 11-15-29 | 10,080,000 | 10,809,429 | |
| EQM Midstream Partners LP (A) | 4.750 | 01-15-31 | 6,445,000 | 6,557,788 | |
| EQT Corp. (A) | 3.125 | 05-15-26 | 1,990,000 | 2,044,725 | |
| EQT Corp. (A) | 3.625 | 05-15-31 | 23,315,000 | 24,648,618 | |
| EQT Corp. | 3.900 | 10-01-27 | 3,283,000 | 3,544,261 | |
| Inversiones Latin America Power Ltda (A) | 5.125 | 06-15-33 | 6,240,000 | 6,224,400 | |
| Kinder Morgan, Inc. (B) | 2.000 | 02-15-31 | 3,020,000 | 2,945,733 | |
| MC Brazil Downstream Trading SARL (A) | 7.250 | 06-30-31 | 10,290,000 | 10,708,803 | |
| Medco Oak Tree Pte, Ltd. (A) | 7.375 | 05-14-26 | 6,590,000 | 7,092,488 | |
| Occidental Petroleum Corp. | 3.200 | 08-15-26 | 1,560,000 | 1,609,109 | |
| Occidental Petroleum Corp. | 3.400 | 04-15-26 | 2,417,000 | 2,483,468 | |
| Occidental Petroleum Corp. | 6.125 | 01-01-31 | 7,895,000 | 9,546,634 | |
| Occidental Petroleum Corp. | 6.625 | 09-01-30 | 11,815,000 | 14,739,213 | |
| Occidental Petroleum Corp. | 7.500 | 05-01-31 | 3,470,000 | 4,540,252 | |
| Ovintiv, Inc. | 6.500 | 08-15-34 | 7,620,000 | 10,127,794 | |
| Ovintiv, Inc. | 6.500 | 02-01-38 | 1,635,000 | 2,259,022 | |
| Pertamina Persero PT (A) | 3.100 | 01-21-30 | 2,700,000 | 2,818,798 | |
| Pertamina Persero PT (A) | 3.650 | 07-30-29 | 3,440,000 | 3,745,974 | |
| Petrobras Global Finance BV (B) | 6.900 | 03-19-49 | 11,065,000 | 13,128,623 | |
| Petrorio Luxembourg Sarl (A) | 6.125 | 06-09-26 | 5,350,000 | 5,489,100 | |
| SEE NOTES TO FINANCIAL STATEMENTS | ANNUAL REPORT | JOHN HANCOCK STRATEGIC INCOME OPPORTUNITIES FUND | 17 |
| Rate (%) | Maturity date | Par value^ | Value | ||
| Energy (continued) | |||||
| Oil, gas and consumable fuels (continued) | |||||
| Qatar Petroleum (A) | 2.250 | 07-12-31 | 3,925,000 | $3,957,829 | |
| Qatar Petroleum (A) | 3.300 | 07-12-51 | 3,105,000 | 3,206,844 | |
| Saudi Arabian Oil Company (A) | 2.250 | 11-24-30 | 3,890,000 | 3,861,167 | |
| Saudi Arabian Oil Company (A) | 3.500 | 04-16-29 | 9,115,000 | 9,915,333 | |
| Saudi Arabian Oil Company (A) | 4.250 | 04-16-39 | 7,050,000 | 8,092,822 | |
| Saudi Arabian Oil Company (A) | 4.375 | 04-16-49 | 5,805,000 | 6,782,446 | |
| Southwestern Energy Company | 6.450 | 01-23-25 | 658,000 | 717,148 | |
| The Williams Companies, Inc. | 3.500 | 11-15-30 | 865,000 | 949,350 | |
| TransCanada PipeLines, Ltd. | 4.100 | 04-15-30 | 13,295,000 | 15,223,647 | |
| Transcontinental Gas Pipe Line Company LLC | 3.250 | 05-15-30 | 875,000 | 947,249 | |
| Western Midstream Operating LP | 5.300 | 02-01-30 | 9,845,000 | 11,032,405 | |
| Financials 11.0% | 534,471,560 | ||||
| Banks 6.6% | |||||
| Asian Development Bank | 5.000 | 03-09-22 | AUD | 11,300,000 | 8,478,508 |
| Banco Actinver SA (A) | 4.800 | 12-18-32 | 2,360,000 | 1,864,400 | |
| Banco Actinver SA (A) | 9.500 | 12-18-32 | MXN | 138,600,000 | 5,037,741 |
| Banco Santander SA (4.750% to 11-12-26, then 5 Year CMT + 3.753%) (C) | 4.750 | 11-12-26 | 8,200,000 | 8,389,420 | |
| Barclays PLC (4.375% to 3-15-28, then 5 Year CMT + 3.410%) (C) | 4.375 | 03-15-28 | 5,490,000 | 5,560,272 | |
| BNG Bank NV | 0.250 | 06-07-24 | EUR | 3,800,000 | 4,581,312 |
| BNP Paribas SA (4.500% to 2-25-30, then 5 Year CMT + 2.944%) (A)(B)(C) | 4.500 | 02-25-30 | 8,095,000 | 8,217,558 | |
| BNP Paribas SA (4.625% to 2-25-31, then 5 Year CMT + 3.340%) (A)(B)(C) | 4.625 | 02-25-31 | 14,782,000 | 15,375,349 | |
| Citigroup, Inc. (Greater of 3 month EURIBOR + 0.500% or 0.000%) (D) | 0.000 | 03-21-23 | EUR | 10,835,000 | 12,875,744 |
| Credit Agricole SA (6.875% to 9-23-24, then 5 Year U.S. Swap Rate + 4.319%) (A)(B)(C) | 6.875 | 09-23-24 | 1,926,000 | 2,145,083 | |
| Credit Agricole SA (7.875% to 1-23-24, then 5 Year U.S. Swap Rate + 4.898%) (A)(C) | 7.875 | 01-23-24 | 8,335,000 | 9,366,456 | |
| European Investment Bank (SONIA + 0.350%) (D) | 0.400 | 06-29-23 | GBP | 6,180,000 | 8,535,216 |
| European Investment Bank | 1.500 | 05-12-22 | NOK | 117,270,000 | 13,571,125 |
| European Investment Bank | 1.750 | 03-13-25 | NOK | 15,470,000 | 1,811,683 |
| First Horizon Bank | 5.750 | 05-01-30 | 4,743,000 | 5,873,962 | |
| 18 | JOHN HANCOCK STRATEGIC INCOME OPPORTUNITIES FUND | ANNUAL REPORT | SEE NOTES TO FINANCIAL STATEMENTS |
| Rate (%) | Maturity date | Par value^ | Value | ||
| Financials (continued) | |||||
| Banks (continued) | |||||
| ING Groep NV (5.750% to 11-16-26, then 5 Year CMT + 4.342%) (C) | 5.750 | 11-16-26 | 9,554,000 | $10,521,343 | |
| International Bank for Reconstruction & Development | 1.900 | 01-16-25 | CAD | 15,730,000 | 12,901,181 |
| International Bank for Reconstruction & Development | 3.375 | 01-25-22 | NZD | 13,998,000 | 9,970,616 |
| International Bank for Reconstruction & Development | 4.625 | 10-06-21 | NZD | 12,620,000 | 8,928,154 |
| International Finance Corp. | 0.375 | 09-10-25 | NZD | 12,980,000 | 8,678,314 |
| Intesa Sanpaolo SpA (A) | 4.198 | 06-01-32 | 7,674,000 | 7,898,762 | |
| Intesa Sanpaolo SpA (7.700% to 9-17-25, then 5 Year U.S. Swap Rate + 5.462%) (A)(C) | 7.700 | 09-17-25 | 7,875,000 | 8,989,628 | |
| Lloyds Banking Group PLC (7.500% to 9-27-25, then 5 Year U.S. Swap Rate + 4.496%) (C) | 7.500 | 09-27-25 | 9,344,000 | 10,810,583 | |
| NatWest Group PLC (4.600% to 6-28-31, then 5 Year CMT + 3.100%) (C) | 4.600 | 06-28-31 | 4,400,000 | 4,477,000 | |
| NatWest Group PLC (6.000% to 12-29-25, then 5 Year CMT + 5.625%) (C) | 6.000 | 12-29-25 | 8,590,000 | 9,617,794 | |
| Nordea Eiendomskreditt AS (3 month NIBOR + 0.300%) (D) | 0.500 | 06-21-23 | NOK | 88,000,000 | 10,171,633 |
| Nordea Eiendomskreditt AS (3 month NIBOR + 0.340%) (D) | 0.540 | 06-19-24 | NOK | 110,000,000 | 12,736,429 |
| Nordic Investment Bank | 1.500 | 01-24-22 | NOK | 11,000,000 | 1,270,401 |
| Nordic Investment Bank | 1.875 | 04-10-24 | NOK | 46,090,000 | 5,405,217 |
| Popular, Inc. | 6.125 | 09-14-23 | 17,095,000 | 18,419,863 | |
| QNB Finance, Ltd. | 3.500 | 03-28-24 | 4,285,000 | 4,555,630 | |
| QNB Finance, Ltd. | 4.350 | 01-29-22 | CNY | 18,860,000 | 2,933,220 |
| Shinhan Financial Group Company, Ltd. (2.875% to 5-12-26, then 5 Year CMT + 2.064%) (A)(C) | 2.875 | 05-12-26 | 9,105,000 | 9,019,231 | |
| Societe Generale SA (4.750% to 5-26-26, then 5 Year CMT + 3.931%) (A)(C) | 4.750 | 05-26-26 | 3,665,000 | 3,800,165 | |
| Societe Generale SA (6.750% to 4-6-28, then 5 Year U.S. Swap Rate + 3.929%) (A)(C) | 6.750 | 04-06-28 | 4,155,000 | 4,723,736 | |
| SEE NOTES TO FINANCIAL STATEMENTS | ANNUAL REPORT | JOHN HANCOCK STRATEGIC INCOME OPPORTUNITIES FUND | 19 |
| Rate (%) | Maturity date | Par value^ | Value | ||
| Financials (continued) | |||||
| Banks (continued) | |||||
| Societe Generale SA (8.000% to 9-29-25, then 5 Year ICE Swap Rate + 5.873%) (A)(C) | 8.000 | 09-29-25 | 6,640,000 | $7,844,164 | |
| U.S. Bancorp | 0.850 | 06-07-24 | EUR | 18,550,000 | 22,521,997 |
| UniCredit SpA (5.459% to 6-30-30, then 5 Year CMT + 4.750%) (A) | 5.459 | 06-30-35 | 1,625,000 | 1,795,969 | |
| UniCredit SpA (8.000% to 6-3-24, then 5 Year U.S. Swap Rate + 5.180%) (C) | 8.000 | 06-03-24 | 3,624,000 | 4,004,520 | |
| Wells Fargo & Company | 3.250 | 04-27-22 | AUD | 12,300,000 | 9,176,720 |
| Capital markets 2.2% | |||||
| Credit Suisse Group AG (4.500% to 9-3-30, then 5 Year CMT + 3.554%) (A)(C) | 4.500 | 09-03-30 | 8,035,000 | 7,964,694 | |
| Credit Suisse Group AG (5.100% to 1-24-30, then 5 Year CMT + 3.293%) (A)(B)(C) | 5.100 | 01-24-30 | 3,965,000 | 4,079,589 | |
| Credit Suisse Group AG (6.375% to 8-21-26, then 5 Year CMT + 4.822%) (A)(C) | 6.375 | 08-21-26 | 8,715,000 | 9,624,672 | |
| Deutsche Bank AG (6.000% to 10-30-25, then 5 Year CMT + 4.524%) (C) | 6.000 | 10-30-25 | 8,800,000 | 9,174,000 | |
| MSCI, Inc. (A) | 3.250 | 08-15-33 | 4,130,000 | 4,259,063 | |
| MSCI, Inc. (A) | 3.625 | 09-01-30 | 16,020,000 | 16,876,269 | |
| MSCI, Inc. (A) | 3.625 | 11-01-31 | 8,740,000 | 9,274,888 | |
| MSCI, Inc. (A) | 3.875 | 02-15-31 | 7,940,000 | 8,475,950 | |
| The Goldman Sachs Group, Inc. | 1.375 | 05-15-24 | EUR | 7,713,000 | 9,338,015 |
| The Goldman Sachs Group, Inc. | 2.000 | 11-01-28 | EUR | 2,510,000 | 3,291,241 |
| The Goldman Sachs Group, Inc. | 3.375 | 03-27-25 | EUR | 1,960,000 | 2,588,951 |
| UBS Group AG (3.875% to 6-2-26, then 5 Year CMT + 3.098%) (A)(C) | 3.875 | 06-02-26 | 5,800,000 | 5,869,078 | |
| UBS Group AG (4.375% to 2-10-31, then 5 Year CMT + 3.313%) (A)(C) | 4.375 | 02-10-31 | 10,145,000 | 10,385,944 | |
| UBS Group AG (5.125% to 7-29-26, then 5 Year CMT + 4.855%) (C) | 5.125 | 07-29-26 | 4,672,000 | 5,104,160 | |
| Consumer finance 0.0% | |||||
| Capital One Financial Corp. | 0.800 | 06-12-24 | EUR | 1,100,000 | 1,326,158 |
| Diversified financial services 1.1% | |||||
| Berkshire Hathaway Finance Corp. | 2.375 | 06-19-39 | GBP | 7,150,000 | 10,776,072 |
| Berkshire Hathaway, Inc., Zero Coupon | 0.000 | 03-12-25 | EUR | 10,945,000 | 12,988,806 |
| 20 | JOHN HANCOCK STRATEGIC INCOME OPPORTUNITIES FUND | ANNUAL REPORT | SEE NOTES TO FINANCIAL STATEMENTS |
| Rate (%) | Maturity date | Par value^ | Value | ||
| Financials (continued) | |||||
| Diversified financial services (continued) | |||||
| European Financial Stability Facility | 1.875 | 05-23-23 | EUR | 2,500,000 | $3,079,176 |
| Mexico Remittances Funding Fiduciary Estate Management Sarl (A) | 4.875 | 01-15-28 | 6,450,000 | 6,353,250 | |
| Swiss Insured Brazil Power Finance Sarl (A) | 9.850 | 07-16-32 | BRL | 93,788,412 | 18,228,776 |
| Insurance 1.1% | |||||
| American International Group, Inc. (8.175% to 5-15-38, then 3 month LIBOR + 4.195%) | 8.175 | 05-15-58 | 15,170,000 | 22,603,300 | |
| Chubb INA Holdings, Inc. | 0.300 | 12-15-24 | EUR | 9,990,000 | 11,927,915 |
| DB Insurance Company, Ltd. | 3.512 | 05-25-24 | KRW | 10,000,000,000 | 8,892,062 |
| DB Insurance Company, Ltd. | 3.865 | 05-25-27 | KRW | 10,000,000,000 | 9,133,432 |
| Health care 4.0% | 195,136,182 | ||||
| Health care equipment and supplies 0.7% | |||||
| Becton Dickinson Euro Finance Sarl | 1.208 | 06-04-26 | EUR | 8,910,000 | 11,020,485 |
| DH Europe Finance II Sarl | 0.450 | 03-18-28 | EUR | 18,445,000 | 22,125,693 |
| Health care providers and services 2.6% | |||||
| Centene Corp. | 2.500 | 03-01-31 | 9,265,000 | 9,241,096 | |
| Centene Corp. | 3.000 | 10-15-30 | 18,720,000 | 19,402,718 | |
| Centene Corp. | 3.375 | 02-15-30 | 18,780,000 | 19,625,100 | |
| Centene Corp. | 4.625 | 12-15-29 | 2,625,000 | 2,879,336 | |
| HCA, Inc. | 3.500 | 09-01-30 | 33,251,000 | 35,679,653 | |
| HCA, Inc. | 4.125 | 06-15-29 | 13,845,000 | 15,663,811 | |
| HCA, Inc. | 5.375 | 02-01-25 | 16,935,000 | 19,073,044 | |
| Rede D’or Finance Sarl (A) | 4.500 | 01-22-30 | 4,134,000 | 4,216,680 | |
| Rede D’or Finance Sarl (A) | 4.950 | 01-17-28 | 555,000 | 591,686 | |
| Life sciences tools and services 0.4% | |||||
| Thermo Fisher Scientific, Inc. | 0.500 | 03-01-28 | EUR | 6,585,000 | 7,923,099 |
| Thermo Fisher Scientific, Inc. | 0.750 | 09-12-24 | EUR | 3,288,000 | 3,984,246 |
| Thermo Fisher Scientific, Inc. | 1.400 | 01-23-26 | EUR | 4,947,000 | 6,192,122 |
| Pharmaceuticals 0.3% | |||||
| Allergan Funding SCS | 1.250 | 06-01-24 | EUR | 6,760,000 | 8,054,626 |
| Allergan Funding SCS | 2.625 | 11-15-28 | EUR | 3,795,000 | 4,891,705 |
| Bausch Health Companies, Inc. (A) | 5.250 | 02-15-31 | 2,440,000 | 2,275,788 | |
| Jazz Securities DAC (A) | 4.375 | 01-15-29 | 2,215,000 | 2,295,294 | |
| Industrials 5.4% | 261,773,950 | ||||
| Aerospace and defense 1.2% | |||||
| Airbus SE | 1.625 | 06-09-30 | EUR | 2,740,000 | 3,552,588 |
| SEE NOTES TO FINANCIAL STATEMENTS | ANNUAL REPORT | JOHN HANCOCK STRATEGIC INCOME OPPORTUNITIES FUND | 21 |
| Rate (%) | Maturity date | Par value^ | Value | ||
| Industrials (continued) | |||||
| Aerospace and defense (continued) | |||||
| DAE Funding LLC (A) | 3.375 | 03-20-28 | 6,635,000 | $6,860,842 | |
| Spirit AeroSystems, Inc. (A) | 7.500 | 04-15-25 | 1,705,000 | 1,805,169 | |
| The Boeing Company | 5.040 | 05-01-27 | 11,170,000 | 12,877,222 | |
| The Boeing Company | 5.150 | 05-01-30 | 27,030,000 | 31,980,919 | |
| Air freight and logistics 0.2% | |||||
| Hidrovias International Finance SARL (A) | 4.950 | 02-08-31 | 3,515,000 | 3,538,691 | |
| Simpar Europe SA (A) | 5.200 | 01-26-31 | 3,245,000 | 3,329,110 | |
| Simpar Finance Sarl (A) | 10.750 | 02-12-28 | BRL | 30,765,000 | 5,293,974 |
| Airlines 2.3% | |||||
| American Airlines Group, Inc. (A) | 5.000 | 06-01-22 | 8,485,000 | 8,559,244 | |
| American Airlines, Inc. (A) | 5.500 | 04-20-26 | 9,940,000 | 10,476,760 | |
| American Airlines, Inc. (A) | 5.750 | 04-20-29 | 8,095,000 | 8,741,507 | |
| Delta Air Lines 2020-1 Class A Pass Through Trust | 2.500 | 06-10-28 | 5,494,232 | 5,577,030 | |
| Delta Air Lines, Inc. | 2.900 | 10-28-24 | 7,330,000 | 7,470,378 | |
| Delta Air Lines, Inc. (A) | 4.500 | 10-20-25 | 3,390,000 | 3,635,775 | |
| Delta Air Lines, Inc. (A) | 4.750 | 10-20-28 | 30,093,000 | 33,553,591 | |
| Delta Air Lines, Inc. (A) | 7.000 | 05-01-25 | 6,848,000 | 8,010,925 | |
| Delta Air Lines, Inc. | 7.375 | 01-15-26 | 1,655,000 | 1,948,436 | |
| Mileage Plus Holdings LLC (A) | 6.500 | 06-20-27 | 8,520,000 | 9,255,702 | |
| United Airlines 2020-1 Class A Pass Through Trust | 5.875 | 10-15-27 | 12,525,550 | 13,933,598 | |
| Building products 0.1% | |||||
| Johnson Controls International PLC | 0.375 | 09-15-27 | EUR | 2,590,000 | 3,089,566 |
| Commercial services and supplies 0.2% | |||||
| GFL Environmental, Inc. (A) | 4.750 | 06-15-29 | 8,030,000 | 8,250,825 | |
| Prime Security Services Borrower LLC (A) | 3.375 | 08-31-27 | 1,055,000 | 1,018,028 | |
| Construction and engineering 0.2% | |||||
| AECOM | 5.125 | 03-15-27 | 8,062,000 | 9,005,093 | |
| Professional services 0.1% | |||||
| CoStar Group, Inc. (A) | 2.800 | 07-15-30 | 5,780,000 | 5,937,538 | |
| Road and rail 0.5% | |||||
| Indian Railway Finance Corp., Ltd. (A) | 3.249 | 02-13-30 | 7,580,000 | 7,771,110 | |
| Movida Europe SA (A) | 5.250 | 02-08-31 | 2,480,000 | 2,518,936 | |
| Uber Technologies, Inc. (A) | 7.500 | 05-15-25 | 1,640,000 | 1,748,650 | |
| Uber Technologies, Inc. (A) | 8.000 | 11-01-26 | 10,975,000 | 11,688,375 | |
| Trading companies and distributors 0.5% | |||||
| United Rentals North America, Inc. | 3.875 | 02-15-31 | 11,355,000 | 11,753,447 | |
| 22 | JOHN HANCOCK STRATEGIC INCOME OPPORTUNITIES FUND | ANNUAL REPORT | SEE NOTES TO FINANCIAL STATEMENTS |
| Rate (%) | Maturity date | Par value^ | Value | ||
| Industrials (continued) | |||||
| Trading companies and distributors (continued) | |||||
| United Rentals North America, Inc. | 4.000 | 07-15-30 | 7,265,000 | $7,610,088 | |
| United Rentals North America, Inc. | 4.875 | 01-15-28 | 6,470,000 | 6,858,200 | |
| Transportation infrastructure 0.1% | |||||
| Adani Ports & Special Economic Zone, Ltd. (A) | 4.200 | 08-04-27 | 3,885,000 | 4,122,633 | |
| Information technology 1.7% | 84,217,162 | ||||
| IT services 0.9% | |||||
| Fidelity National Information Services, Inc. | 1.000 | 12-03-28 | EUR | 4,800,000 | 5,893,872 |
| Fidelity National Information Services, Inc. | 1.500 | 05-21-27 | EUR | 9,625,000 | 12,139,683 |
| Fiserv, Inc. | 1.125 | 07-01-27 | EUR | 3,495,000 | 4,340,426 |
| Gartner, Inc. (A) | 3.750 | 10-01-30 | 5,220,000 | 5,462,208 | |
| Square, Inc. (A) | 3.500 | 06-01-31 | 3,325,000 | 3,458,000 | |
| Twilio, Inc. | 3.625 | 03-15-29 | 4,795,000 | 4,949,399 | |
| Twilio, Inc. | 3.875 | 03-15-31 | 6,440,000 | 6,729,800 | |
| Semiconductors and semiconductor equipment 0.1% | |||||
| SK Hynix, Inc. (A) | 1.500 | 01-19-26 | 4,935,000 | 4,910,952 | |
| Software 0.1% | |||||
| Camelot Finance SA (A) | 4.500 | 11-01-26 | 4,330,000 | 4,518,572 | |
| j2 Global, Inc. (A) | 4.625 | 10-15-30 | 3,555,000 | 3,764,425 | |
| Technology hardware, storage and peripherals 0.6% | |||||
| Apple, Inc. | 0.875 | 05-24-25 | EUR | 9,831,000 | 12,072,972 |
| Atento Luxco 1 SA (A) | 8.000 | 02-10-26 | 4,968,000 | 5,466,290 | |
| CDW LLC | 4.250 | 04-01-28 | 1,655,000 | 1,733,613 | |
| Dell International LLC | 8.350 | 07-15-46 | 5,348,000 | 8,776,950 | |
| Materials 6.0% | 292,011,799 | ||||
| Chemicals 0.7% | |||||
| Braskem Netherlands Finance BV (A) | 4.500 | 01-10-28 | 5,509,000 | 5,975,612 | |
| Braskem Netherlands Finance BV (A) | 5.875 | 01-31-50 | 6,055,000 | 7,001,094 | |
| Ecolab, Inc. | 1.000 | 01-15-24 | EUR | 4,270,000 | 5,172,514 |
| FS Luxembourg Sarl (A) | 10.000 | 12-15-25 | 6,390,000 | 7,188,814 | |
| SCIH Salt Holdings, Inc. (A) | 4.875 | 05-01-28 | 9,535,000 | 9,604,606 | |
| Construction materials 0.4% | |||||
| Cemex SAB de CV (A) | 3.875 | 07-11-31 | 7,770,000 | 7,993,465 | |
| St. Mary’s Cement, Inc. (A)(B) | 5.750 | 01-28-27 | 7,505,000 | 8,747,565 | |
| Standard Industries, Inc. (A) | 3.375 | 01-15-31 | 2,575,000 | 2,481,656 | |
| SEE NOTES TO FINANCIAL STATEMENTS | ANNUAL REPORT | JOHN HANCOCK STRATEGIC INCOME OPPORTUNITIES FUND | 23 |
| Rate (%) | Maturity date | Par value^ | Value | ||
| Materials (continued) | |||||
| Containers and packaging 2.0% | |||||
| Ardagh Metal Packaging Finance USA LLC (A) | 3.250 | 09-01-28 | 9,710,000 | $9,782,825 | |
| Ardagh Metal Packaging Finance USA LLC (A) | 4.000 | 09-01-29 | 10,505,000 | 10,707,221 | |
| Ball Corp. | 2.875 | 08-15-30 | 5,485,000 | 5,498,713 | |
| Ball Corp. | 4.875 | 03-15-26 | 8,590,000 | 9,642,275 | |
| Ball Corp. | 5.250 | 07-01-25 | 13,700,000 | 15,481,000 | |
| Berry Global, Inc. (A) | 5.625 | 07-15-27 | 6,805,000 | 7,162,263 | |
| Crown Americas LLC | 4.250 | 09-30-26 | 1,490,000 | 1,605,475 | |
| Crown Americas LLC | 4.500 | 01-15-23 | 10,709,000 | 11,222,497 | |
| Crown Cork & Seal Company, Inc. | 7.375 | 12-15-26 | 10,748,000 | 13,273,780 | |
| Reynolds Group Issuer, Inc. (A) | 4.000 | 10-15-27 | 13,505,000 | 13,499,733 | |
| Metals and mining 2.9% | |||||
| ArcelorMittal SA | 4.550 | 03-11-26 | 995,000 | 1,126,917 | |
| ArcelorMittal SA | 6.750 | 03-01-41 | 4,985,000 | 7,120,923 | |
| ArcelorMittal SA | 7.000 | 10-15-39 | 1,275,000 | 1,832,813 | |
| Cleveland-Cliffs, Inc. (A)(B) | 4.625 | 03-01-29 | 14,925,000 | 15,708,563 | |
| Cleveland-Cliffs, Inc. (A) | 4.875 | 03-01-31 | 8,180,000 | 8,793,500 | |
| Cleveland-Cliffs, Inc. (A) | 6.750 | 03-15-26 | 3,835,000 | 4,113,038 | |
| FMG Resources August 2006 Pty, Ltd. (A) | 4.375 | 04-01-31 | 47,590,000 | 51,291,074 | |
| Freeport-McMoRan, Inc. | 4.125 | 03-01-28 | 1,430,000 | 1,497,925 | |
| Freeport-McMoRan, Inc. | 4.625 | 08-01-30 | 10,030,000 | 11,058,075 | |
| Freeport-McMoRan, Inc. | 5.450 | 03-15-43 | 19,505,000 | 24,940,653 | |
| Indonesia Asahan Aluminium Persero PT (A) | 4.750 | 05-15-25 | 11,455,000 | 12,487,210 | |
| Real estate 1.3% | 64,881,549 | ||||
| Equity real estate investment trusts 1.3% | |||||
| American Tower Corp. | 0.500 | 01-15-28 | EUR | 2,845,000 | 3,367,602 |
| American Tower Corp. | 1.950 | 05-22-26 | EUR | 3,650,000 | 4,656,772 |
| Crown Castle International Corp. | 2.250 | 01-15-31 | 2,550,000 | 2,530,193 | |
| Host Hotels & Resorts LP | 3.375 | 12-15-29 | 2,565,000 | 2,669,722 | |
| Host Hotels & Resorts LP | 3.500 | 09-15-30 | 2,575,000 | 2,712,434 | |
| SBA Communications Corp. (A) | 3.125 | 02-01-29 | 9,770,000 | 9,599,025 | |
| SBA Communications Corp. | 3.875 | 02-15-27 | 22,055,000 | 22,921,320 | |
| SBA Communications Corp. | 4.875 | 09-01-24 | 1,067,000 | 1,083,005 | |
| VICI Properties LP (A) | 4.125 | 08-15-30 | 9,945,000 | 10,616,288 | |
| VICI Properties LP (A) | 4.625 | 12-01-29 | 4,345,000 | 4,725,188 | |
| Utilities 2.0% | 97,341,456 | ||||
| Electric utilities 1.1% | |||||
| Chile Electricity PEC SpA (A)(B)(E) | 3.284 | 01-25-28 | 2,925,000 | 2,371,298 | |
| 24 | JOHN HANCOCK STRATEGIC INCOME OPPORTUNITIES FUND | ANNUAL REPORT | SEE NOTES TO FINANCIAL STATEMENTS |
| Rate (%) | Maturity date | Par value^ | Value | ||
| Utilities (continued) | |||||
| Electric utilities (continued) | |||||
| EDP Finance BV | 0.375 | 09-16-26 | EUR | 1,315,000 | $1,577,114 |
| FirstEnergy Corp. | 4.400 | 07-15-27 | 9,045,000 | 10,152,197 | |
| FirstEnergy Corp. | 7.375 | 11-15-31 | 15,800,000 | 22,066,756 | |
| Israel Electric Corp., Ltd. (A) | 6.875 | 06-21-23 | 4,565,000 | 5,048,734 | |
| Perusahaan Perseroan Persero PT Perusahaan Listrik Negara (A) | 4.125 | 05-15-27 | 12,660,000 | 13,886,501 | |
| Independent power and renewable electricity producers 0.7% | |||||
| Adani Green Energy UP, Ltd. (A) | 6.250 | 12-10-24 | 5,330,000 | 5,803,837 | |
| DPL, Inc. | 4.125 | 07-01-25 | 13,920,000 | 14,901,360 | |
| Greenko Dutch BV (A) | 3.850 | 03-29-26 | 6,350,000 | 6,485,763 | |
| Greenko Solar Mauritius, Ltd. (A) | 5.550 | 01-29-25 | 5,260,000 | 5,385,667 | |
| The AES Corp. (A) | 3.950 | 07-15-30 | 1,650,000 | 1,839,585 | |
| Multi-utilities 0.2% | |||||
| E.ON SE | 0.375 | 09-29-27 | EUR | 3,200,000 | 3,850,202 |
| Engie SA | 0.375 | 06-21-27 | EUR | 3,300,000 | 3,972,442 |
| Convertible bonds 2.5% | $122,440,462 | ||||
| (Cost $112,004,530) | |||||
| Communication services 0.8% | 41,269,331 | ||||
| Diversified telecommunication services 0.1% | |||||
| Cellnex Telecom SA | 0.750 | 11-20-31 | EUR | 6,000,000 | 7,064,029 |
| Media 0.7% | |||||
| DISH Network Corp. | 3.375 | 08-15-26 | 5,520,000 | 5,757,933 | |
| Liberty Broadband Corp. (A) | 1.250 | 09-30-50 | 12,375,000 | 13,079,162 | |
| Liberty Broadband Corp. (A) | 2.750 | 09-30-50 | 8,550,000 | 9,483,899 | |
| Liberty Media Corp. (A) | 0.500 | 12-01-50 | 5,085,000 | 5,884,308 | |
| Consumer discretionary 0.4% | 16,962,146 | ||||
| Household durables 0.2% | |||||
| Sony Group Corp., Zero Coupon | 0.000 | 09-30-22 | JPY | 356,000,000 | 7,395,701 |
| Specialty retail 0.2% | |||||
| Burlington Stores, Inc. | 2.250 | 04-15-25 | 6,365,000 | 9,566,445 | |
| Energy 0.2% | 11,593,950 | ||||
| Oil, gas and consumable fuels 0.2% | |||||
| BP Capital Markets PLC | 1.000 | 04-28-23 | GBP | 8,300,000 | 11,593,950 |
| Industrials 1.1% | 52,615,035 | ||||
| Airlines 0.9% | |||||
| Air Canada | 4.000 | 07-01-25 | 5,160,000 | 7,715,778 | |
| American Airlines Group, Inc. | 6.500 | 07-01-25 | 14,450,000 | 21,621,535 | |
| Southwest Airlines Company | 1.250 | 05-01-25 | 9,450,000 | 13,773,375 | |
| SEE NOTES TO FINANCIAL STATEMENTS | ANNUAL REPORT | JOHN HANCOCK STRATEGIC INCOME OPPORTUNITIES FUND | 25 |
| Rate (%) | Maturity date | Par value^ | Value | ||
| Industrials (continued) | |||||
| Road and rail 0.2% | |||||
| Uber Technologies, Inc. (A)(E) | 1.613 | 12-15-25 | 10,190,000 | $9,504,347 | |
| Capital preferred securities 0.2% | $9,043,251 | ||||
| (Cost $8,130,510) | |||||
| Financials 0.2% | 9,043,251 | ||||
| Banks 0.2% | |||||
| USB Capital IX (Greater of 3 month LIBOR + 1.020% or 3.500%) (B)(C)(D) | 3.500 | 10-01-21 | 9,107,000 | 9,043,251 | |
| Term loans (F) 6.1% | $299,911,447 | ||||
| (Cost $300,623,985) | |||||
| Communication services 0.6% | 29,238,864 | ||||
| Media 0.4% | |||||
| AP Core Holdings II LLC, Term Loan B (G) | TBD | 07-21-27 | 5,215,000 | 5,162,850 | |
| AP Core Holdings II LLC, Term Loan B (G) | TBD | 07-21-27 | 7,535,000 | 7,462,815 | |
| Univision Communications, Inc., 2021 First Lien Term Loan B (1 month LIBOR + 3.250%) | 4.000 | 03-15-26 | 8,400,000 | 8,372,448 | |
| Wireless telecommunication services 0.2% | |||||
| SBA Senior Finance II LLC, 2018 Term Loan B (1 month LIBOR + 1.750%) | 1.840 | 04-11-25 | 8,325,000 | 8,240,751 | |
| Consumer discretionary 1.7% | 81,312,603 | ||||
| Diversified consumer services 0.2% | |||||
| APX Group, Inc., 2021 Term Loan B (1 month LIBOR + 3.500%) | 4.000 | 07-10-28 | 3,845,000 | 3,830,581 | |
| Whatabrands LLC, 2021 Term Loan B (1 month LIBOR + 3.250%) | 3.750 | 07-12-28 | 6,868,000 | 6,844,374 | |
| Hotels, restaurants and leisure 1.5% | |||||
| Aramark Services, Inc., 2018 Term Loan B3 (1 month LIBOR + 1.750%) | 1.835 | 03-11-25 | 10,760,000 | 10,544,800 | |
| Bally’s Corp., 2021 Term Loan B (G) | TBD | 08-06-28 | 5,325,000 | 5,312,646 | |
| Carnival Corp., USD Term Loan B (1 month LIBOR + 3.000%) | 3.750 | 06-30-25 | 3,137,078 | 3,115,903 | |
| Hilton Grand Vacations Borrower LLC, 2021 Term Loan B (1 month LIBOR + 3.000%) | 3.500 | 08-02-28 | 4,395,000 | 4,385,111 | |
| Hilton Worldwide Finance LLC, 2019 Term Loan B (1 month LIBOR + 1.750%) | 1.834 | 06-22-26 | 8,560,000 | 8,462,844 | |
| 26 | JOHN HANCOCK STRATEGIC INCOME OPPORTUNITIES FUND | ANNUAL REPORT | SEE NOTES TO FINANCIAL STATEMENTS |
| Rate (%) | Maturity date | Par value^ | Value | ||
| Consumer discretionary (continued) | |||||
| Hotels, restaurants and leisure (continued) | |||||
| KFC Holding Company, 2021 Term Loan B (1 month LIBOR + 1.750%) | 1.839 | 03-15-28 | 14,400,700 | $14,372,475 | |
| Marriott Ownership Resorts, Inc., 2019 Term Loan B (1 month LIBOR + 1.750%) | 1.835 | 08-29-25 | 8,170,000 | 7,986,175 | |
| New Red Finance, Inc., Term Loan B4 (1 month LIBOR + 1.750%) | 1.835 | 11-19-26 | 16,757,997 | 16,457,694 | |
| Energy 0.3% | 16,538,549 | ||||
| Oil, gas and consumable fuels 0.3% | |||||
| Pilot Travel Centers LLC, 2021 Term Loan B (G) | TBD | 07-28-28 | 16,660,000 | 16,538,549 | |
| Financials 0.2% | 11,655,252 | ||||
| Insurance 0.2% | |||||
| Asurion LLC, 2021 Second Lien Term Loan B4 (1 month LIBOR + 5.250%) | 5.335 | 01-20-29 | 6,760,000 | 6,722,009 | |
| Asurion LLC, 2021 Term Loan B9 (1 month LIBOR + 3.250%) | 3.335 | 07-31-27 | 5,035,000 | 4,933,243 | |
| Health care 1.0% | 48,764,972 | ||||
| Life sciences tools and services 0.4% | |||||
| Avantor Funding, Inc. 2021 Term Loan B4 (1 month LIBOR + 2.000%) | 2.500 | 11-21-24 | 6,315,000 | 6,296,560 | |
| ICON Luxembourg Sarl, LUX Term Loan (3 month LIBOR + 2.500%) | 3.000 | 07-03-28 | 14,026,530 | 14,011,942 | |
| Pharmaceuticals 0.6% | |||||
| Jazz Financing Lux Sarl, USD Term Loan (1 month LIBOR + 3.500%) | 4.000 | 05-05-28 | 12,915,000 | 12,915,000 | |
| Organon & Company, USD Term Loan (3 month LIBOR + 3.000%) | 3.500 | 06-02-28 | 7,885,000 | 7,908,024 | |
| Padagis LLC, Term Loan B (3 month LIBOR + 4.750%) | 5.250 | 07-06-28 | 7,643,000 | 7,633,446 | |
| Industrials 1.4% | 68,492,848 | ||||
| Air freight and logistics 0.0% | |||||
| Worldwide Express, Inc., 2021 1st Lien Term Loan (2 month LIBOR + 4.250%) | 5.000 | 07-26-28 | 3,335,000 | 3,331,865 | |
| Airlines 0.6% | |||||
| Air Canada, 2021 Term Loan B (3 month LIBOR + 3.500%) | 4.250 | 08-11-28 | 11,490,000 | 11,471,501 | |
| SEE NOTES TO FINANCIAL STATEMENTS | ANNUAL REPORT | JOHN HANCOCK STRATEGIC INCOME OPPORTUNITIES FUND | 27 |
| Rate (%) | Maturity date | Par value^ | Value | ||
| Industrials (continued) | |||||
| Airlines (continued) | |||||
| United Airlines, Inc., 2021 Term Loan B (3 month LIBOR + 3.750%) | 4.500 | 04-21-28 | 16,639,388 | $16,656,360 | |
| Building products 0.1% | |||||
| JELD-WEN, Inc., 2021 Term Loan B (3 month LIBOR + 2.250%) | 2.381 | 07-14-28 | 3,530,000 | 3,524,705 | |
| Commercial services and supplies 0.2% | |||||
| Herman Miller, Inc., Term Loan B (1 month LIBOR + 2.000%) | 2.063 | 07-19-28 | 8,690,000 | 8,657,413 | |
| Construction and engineering 0.2% | |||||
| AECOM, 2021 Term Loan B (1 month LIBOR + 1.750%) | 1.835 | 04-13-28 | 10,727,508 | 10,708,735 | |
| Machinery 0.1% | |||||
| Brown Group Holding LLC, Term Loan B (3 month LIBOR + 2.750%) | 3.250 | 06-07-28 | 5,485,443 | 5,455,712 | |
| Road and rail 0.2% | |||||
| The Hertz Corp., 2021 Term Loan B (G) | TBD | 06-30-28 | 7,343,200 | 7,309,128 | |
| The Hertz Corp., 2021 Term Loan C (G) | TBD | 06-30-28 | 1,383,850 | 1,377,429 | |
| Information technology 0.7% | 33,044,759 | ||||
| IT services 0.1% | |||||
| Sabre GLBL, Inc., 2021 Term Loan B1 (1 month LIBOR + 3.500%) | 4.000 | 12-17-27 | 1,607,380 | 1,594,923 | |
| Sabre GLBL, Inc., 2021 Term Loan B2 (1 month LIBOR + 3.500%) | 4.000 | 12-17-27 | 2,562,350 | 2,542,492 | |
| Technology hardware, storage and peripherals0.6% | |||||
| Dell International LLC, 2021 Term Loan B (1 month LIBOR + 1.750%) | 2.000 | 09-19-25 | 28,920,648 | 28,907,344 | |
| Materials 0.2% | 10,863,600 | ||||
| Chemicals 0.2% | |||||
| SCIH Salt Holdings, Inc., 2021 Incremental Term Loan B (3 month LIBOR + 4.000%) | 4.750 | 03-16-27 | 9,433,080 | 9,443,174 | |
| Construction materials 0.0% | |||||
| Standard Industries, Inc., 2021 Term Loan B (G) | TBD | 08-05-28 | 1,425,000 | 1,420,426 | |
| 28 | JOHN HANCOCK STRATEGIC INCOME OPPORTUNITIES FUND | ANNUAL REPORT | SEE NOTES TO FINANCIAL STATEMENTS |
| Rate (%) | Maturity date | Par value^ | Value | ||
| Collateralized mortgage obligations 0.6% | $28,275,326 | ||||
| (Cost $27,839,805) | |||||
| Commercial and residential 0.6% | 27,454,950 | ||||
| Arroyo Mortgage Trust | |||||
| Series 2019-1, Class A1 (A)(H) | 3.805 | 01-25-49 | 6,204,739 | 6,316,176 | |
| BX Commercial Mortgage Trust | |||||
| Series 2019-XL, Class A (1 month LIBOR + 0.920%) (A)(D) | 1.026 | 10-15-36 | 16,885,892 | 16,912,988 | |
| CSMC Trust | |||||
| Series 2019-NQM1, Class A1 (A) | 2.656 | 10-25-59 | 2,896,977 | 2,938,310 | |
| HarborView Mortgage Loan Trust | |||||
| Series 2007-3, Class ES IO (A) | 0.350 | 05-19-47 | 4,207,982 | 43,981 | |
| Series 2007-4, Class ES IO | 0.350 | 07-19-47 | 4,456,664 | 59,718 | |
| Series 2007-6, Class ES IO (A) | 0.343 | 08-19-37 | 4,364,100 | 62,143 | |
| Morgan Stanley Mortgage Loan Trust | |||||
| Series 2004-9, Class 1A (H) | 5.429 | 11-25-34 | 1,039,347 | 1,121,634 | |
| U.S. Government Agency 0.0% | 820,376 | ||||
| Federal Home Loan Mortgage Corp. | |||||
| Series 2017-DNA3, Class M1 (1 month LIBOR + 0.750%) (D) | 0.859 | 03-25-30 | 820,376 | 820,376 | |
| Asset backed securities 1.5% | $73,400,735 | ||||
| (Cost $70,998,114) | |||||
| Asset backed securities 1.5% | 73,400,735 | ||||
| Bravo Mortgage Asset Trust | |||||
| Series 2006-1A, Class A2 (1 month LIBOR + 0.240%) (A)(D) | 0.349 | 07-25-36 | 699,189 | 699,026 | |
| DB Master Finance LLC | |||||
| Series 2017-1A, Class A2I (A) | 3.629 | 11-20-47 | 7,599,375 | 7,649,835 | |
| Series 2019-1A, Class A2I (A) | 3.787 | 05-20-49 | 10,299,800 | 10,372,723 | |
| Series 2019-1A, Class A2II (A) | 4.021 | 05-20-49 | 5,737,900 | 6,025,484 | |
| Domino’s Pizza Master Issuer LLC | |||||
| Series 2015-1A, Class A2II (A) | 4.474 | 10-25-45 | 5,781,675 | 6,030,229 | |
| FirstKey Homes Trust | |||||
| Series 2020-SFR2, Class A (A) | 1.266 | 10-19-37 | 3,676,867 | 3,681,635 | |
| Home Partners of America Trust | |||||
| Series 2018-1, Class D (1 month LIBOR + 1.450%) (A)(D) | 1.558 | 07-17-37 | 7,715,000 | 7,710,669 | |
| Series 2019-1, Class B (A) | 3.157 | 09-17-39 | 4,523,176 | 4,635,963 | |
| Jack in the Box Funding LLC | |||||
| Series 2019-1A, Class A2II (A) | 4.476 | 08-25-49 | 6,962,388 | 7,367,529 | |
| MVW Owner Trust | |||||
| Series 2018-1A, Class A (A) | 3.450 | 01-21-36 | 3,015,088 | 3,123,803 | |
| Taco Bell Funding LLC | |||||
| SEE NOTES TO FINANCIAL STATEMENTS | ANNUAL REPORT | JOHN HANCOCK STRATEGIC INCOME OPPORTUNITIES FUND | 29 |
| Rate (%) | Maturity date | Par value^ | Value | ||
| Asset backed securities (continued) | |||||
| Series 2016-1A, Class A23 (A) | 4.970 | 05-25-46 | 14,975,300 | $16,103,839 | |
| Shares | Value | ||||
| Common stocks 3.0% | $148,240,558 | ||||
| (Cost $161,929,476) | |||||
| Communication services 0.0% | 0 | ||||
| Media 0.0% | |||||
| Vertis Holdings, Inc. (I)(J) | 110,794 | 0 | |||
| Consumer discretionary 0.3% | 12,727,358 | ||||
| Automobiles 0.3% | |||||
| General Motors Company (J) | 259,689 | 12,727,358 | |||
| Financials 1.2% | 59,542,869 | ||||
| Banks 1.1% | |||||
| CIT Group, Inc. | 184,570 | 10,228,869 | |||
| Credit Agricole SA | 695,120 | 10,033,164 | |||
| Societe Generale SA | 315,860 | 9,941,412 | |||
| Synovus Financial Corp. | 205,010 | 8,835,931 | |||
| U.S. Bancorp | 233,203 | 13,383,520 | |||
| Capital markets 0.1% | |||||
| Credit Suisse Group AG, ADR (B) | 673,602 | 7,119,973 | |||
| Industrials 0.6% | 31,230,973 | ||||
| Aerospace and defense 0.4% | |||||
| The Boeing Company (J) | 94,328 | 20,704,967 | |||
| Airlines 0.2% | |||||
| Delta Air Lines, Inc. (J) | 260,287 | 10,526,006 | |||
| Real estate 0.3% | 13,724,043 | ||||
| Equity real estate investment trusts 0.3% | |||||
| Americold Realty Trust | 373,545 | 13,724,043 | |||
| Utilities 0.6% | 31,015,315 | ||||
| Multi-utilities 0.6% | |||||
| Algonquin Power & Utilities Corp. | 264,450 | 13,354,725 | |||
| Dominion Energy, Inc. | 176,500 | 17,660,590 | |||
| Preferred securities 3.7% | $178,792,043 | ||||
| (Cost $163,012,720) | |||||
| Communication services 0.1% | 5,918,376 | ||||
| Media 0.1% | |||||
| 2020 Cash Mandatory Exchangeable Trust, 5.250% (A) | 4,970 | 5,918,376 | |||
| 30 | JOHN HANCOCK STRATEGIC INCOME OPPORTUNITIES FUND | ANNUAL REPORT | SEE NOTES TO FINANCIAL STATEMENTS |
| Shares | Value | ||||
| Financials 0.7% | $34,062,949 | ||||
| Banks 0.5% | |||||
| U.S. Bancorp (Greater of 3 month LIBOR + 1.020% or 3.500%), 3.500% (D) | 12,425 | 11,934,834 | |||
| Valley National Bancorp (5.500% to 9-30-22, then 3 month LIBOR + 3.578%) | 272,325 | 7,121,299 | |||
| Wells Fargo & Company (5.850% to 9-15-23, then 3 month LIBOR + 3.090%) (B) | 228,245 | 6,119,248 | |||
| Capital markets 0.2% | |||||
| Stifel Financial Corp., 4.500% | 347,850 | 8,887,568 | |||
| Health care 0.4% | 19,616,735 | ||||
| Health care equipment and supplies 0.4% | |||||
| Becton, Dickinson and Company, 6.000% (B) | 113,050 | 6,178,183 | |||
| Danaher Corp., 4.750% | 6,190 | 13,438,552 | |||
| Industrials 0.3% | 12,095,251 | ||||
| Machinery 0.3% | |||||
| Stanley Black & Decker, Inc., 5.250% (B) | 105,700 | 12,095,251 | |||
| Information technology 0.3% | 16,660,686 | ||||
| IT services 0.1% | |||||
| Sabre Corp., 6.500% | 24,800 | 3,592,776 | |||
| Semiconductors and semiconductorequipment 0.2% | |||||
| Broadcom, Inc., 8.000% | 8,280 | 13,067,910 | |||
| Utilities 1.9% | 90,438,046 | ||||
| Electric utilities 1.6% | |||||
| American Electric Power Company, Inc., 6.125% | 288,950 | 15,210,328 | |||
| NextEra Energy, Inc., 4.872% | 278,050 | 17,172,368 | |||
| NextEra Energy, Inc., 5.279% | 329,050 | 17,535,075 | |||
| NextEra Energy, Inc., 6.219% | 183,350 | 9,877,065 | |||
| The Southern Company, 6.750% | 336,250 | 17,757,363 | |||
| Multi-utilities 0.3% | |||||
| DTE Energy Company, 6.250% | 249,050 | 12,885,847 | |||
| Contracts/ Notional amount | Value | ||||
| Purchased options 0.0% | $906,449 | ||||
| (Cost $2,008,438) | |||||
| Puts 0.0% | 906,449 | ||||
| Over the Counter Option on the USD vs. CAD (Expiration Date: 10-7-21; Strike Price: $1.22; Counterparty: Canadian Imperial Bank of Commerce) (J)(K) | 79,445,000 | 45,045 | |||
| SEE NOTES TO FINANCIAL STATEMENTS | ANNUAL REPORT | JOHN HANCOCK STRATEGIC INCOME OPPORTUNITIES FUND | 31 |
| Contracts/ Notional amount | Value | ||||
| Puts (continued) | |||||
| Over the Counter Option on the USD vs. CAD (Expiration Date: 4-11-22; Strike Price: $1.22; Counterparty: Canadian Imperial Bank of Commerce) (J)(K) | 129,515,000 | $861,404 | |||
| Yield (%) | Shares | Value | |||
| Short-term investments 4.2% | $203,691,253 | ||||
| (Cost $203,699,015) | |||||
| Short-term funds 0.6% | 29,012,253 | ||||
| John Hancock Collateral Trust (L) | 0.0356(M) | 2,899,167 | 29,012,253 | ||
| Par value^ | Value | ||||
| Repurchase agreement 3.6% | 174,679,000 | ||||
| Barclays Tri-Party Repurchase Agreement dated 8-31-21 at 0.050% to be repurchased at $55,612,077 on 9-1-21, collateralized by $45,534,000 U.S. Treasury Bonds, 3.000% - 3.625% due 2-15-44 to 2-15-47 (valued at $56,724,420) | 55,612,000 | 55,612,000 | |||
| Repurchase Agreement with State Street Corp. dated 8-31-21 at 0.000% to be repurchased at $119,067,000 on 9-1-21, collateralized by $121,638,400 U.S. Treasury Notes, 0.125% due 8-31-23 (valued at $121,448,401) | 119,067,000 | 119,067,000 | |||
| Total investments (Cost $4,757,522,863) 100.6% | $4,904,704,241 | ||||
| Other assets and liabilities, net (0.6%) | (31,053,122) | ||||
| Total net assets 100.0% | $4,873,651,119 | ||||
| The percentage shown for each investment category is the total value of the category as a percentage of the net assets of the fund. | |
| ^All par values are denominated in U.S. dollars unless otherwise indicated. | |
| Currency Abbreviations | |
| AUD | Australian Dollar |
| BRL | Brazilian Real |
| CAD | Canadian Dollar |
| CNY | Chinese Yuan Renminbi |
| COP | Colombian Peso |
| EUR | Euro |
| GBP | Pound Sterling |
| IDR | Indonesian Rupiah |
| INR | Indian Rupee |
| JPY | Japanese Yen |
| KRW | Korean Won |
| MXN | Mexican Peso |
| MYR | Malaysian Ringgit |
| NOK | Norwegian Krone |
| NZD | New Zealand Dollar |
| 32 | JOHN HANCOCK STRATEGIC INCOME OPPORTUNITIES FUND | ANNUAL REPORT | SEE NOTES TO FINANCIAL STATEMENTS |
| PHP | Philippine Peso |
| SGD | Singapore Dollar |
| Security Abbreviations and Legend | |
| ADR | American Depositary Receipt |
| CMT | Constant Maturity Treasury |
| EURIBOR | Euro Interbank Offered Rate |
| ICE | Intercontinental Exchange |
| IO | Interest-Only Security - (Interest Tranche of Stripped Mortgage Pool). Rate shown is the annualized yield at the end of the period. |
| LIBOR | London Interbank Offered Rate |
| NIBOR | Norwegian Interbank Offered Rate |
| SONIA | Sterling Overnight Interbank Average Rate |
| (A) | These securities are exempt from registration under Rule 144A of the Securities Act of 1933. Such securities may be resold, normally to qualified institutional buyers, in transactions exempt from registration. Rule 144A securities amounted to $1,715,873,495 or 35.2% of the fund’s net assets as of 8-31-21. |
| (B) | All or a portion of this security is on loan as of 8-31-21. |
| (C) | Perpetual bonds have no stated maturity date. Date shown as maturity date is next call date. |
| (D) | Variable rate obligation. The coupon rate shown represents the rate at period end. |
| (E) | Zero coupon bonds are issued at a discount from their principal amount in lieu of paying interest periodically. Rate shown is the effective yield at period end. |
| (F) | Term loans are variable rate obligations. The coupon rate shown represents the rate at period end. |
| (G) | This position represents an unsettled loan commitment at period end. Certain details associated with this purchase are not known prior to the settlement date, including coupon rate, which is disclosed as TBD (To Be Determined). |
| (H) | Variable or floating rate security, the interest rate of which adjusts periodically based on a weighted average of interest rates and prepayments on the underlying pool of assets. The interest rate shown is the current rate as of period end. |
| (I) | Security is valued using significant unobservable inputs and is classified as Level 3 in the fair value hierarchy. Refer to Note 2 to the financial statements. |
| (J) | Non-income producing security. |
| (K) | For this type of option, notional amounts are equivalent to number of contracts. |
| (L) | Investment is an affiliate of the fund, the advisor and/or subadvisor. This security represents the investment of cash collateral received for securities lending. |
| (M) | The rate shown is the annualized seven-day yield as of 8-31-21. |
| SEE NOTES TO FINANCIAL STATEMENTS | ANNUAL REPORT | JOHN HANCOCK STRATEGIC INCOME OPPORTUNITIES FUND | 33 |
| Open contracts | Number of contracts | Position | Expiration date | Notional basis^ | Notional value^ | Unrealized appreciation (depreciation) |
| Euro-BTP Italian Government Bond Futures | 238 | Long | Sep 2021 | $43,054,715 | $43,077,343 | $22,628 |
| 10-Year U.S. Treasury Note Futures | 244 | Short | Dec 2021 | (32,450,077) | (32,562,563) | (112,486) |
| Euro-Buxl Futures | 37 | Short | Sep 2021 | (8,865,391) | (9,284,524) | (419,133) |
| German Euro BUND Futures | 299 | Short | Sep 2021 | (61,493,647) | (61,941,467) | (447,820) |
| U.S. Treasury Long Bond Futures | 2,848 | Short | Dec 2021 | (462,803,950) | (464,135,000) | (1,331,050) |
| Ultra U.S. Treasury Bond Futures | 81 | Short | Dec 2021 | (11,943,027) | (11,989,266) | (46,239) |
| $(2,334,100) |
| Contract to buy | Contract to sell | Counterparty (OTC) | Contractual settlement date | Unrealized appreciation | Unrealized depreciation | ||
| AUD | 18,000,917 | USD | 13,125,351 | JPM | 9/15/2021 | $44,213 | — |
| AUD | 23,000,912 | USD | 16,780,244 | MSCS | 9/15/2021 | 47,342 | — |
| AUD | 14,154,149 | USD | 10,358,289 | SSB | 9/15/2021 | — | $(3,041) |
| BRL | 199,504,931 | USD | 37,959,692 | SSB | 9/15/2021 | 562,329 | — |
| CAD | 45,195,628 | EUR | 30,317,376 | HUS | 9/15/2021 | 15,555 | — |
| CAD | 89,959,768 | EUR | 60,785,876 | RBC | 9/15/2021 | — | (489,370) |
| CAD | 44,874,861 | EUR | 30,468,500 | SSB | 9/15/2021 | — | (417,167) |
| CAD | 14,448,999 | EUR | 9,701,560 | UBS | 9/15/2021 | — | (5,803) |
| CAD | 26,023,275 | GBP | 15,171,250 | MSCS | 9/15/2021 | — | (233,006) |
| CAD | 25,939,652 | GBP | 15,171,250 | RBC | 9/15/2021 | — | (299,286) |
| CAD | 15,042,500 | JPY | 1,353,343,640 | ANZ | 9/15/2021 | — | (380,152) |
| CAD | 15,042,500 | JPY | 1,349,208,457 | RBC | 9/15/2021 | — | (342,561) |
| CAD | 114,672,731 | USD | 91,190,000 | BARC | 9/15/2021 | — | (301,238) |
| CAD | 39,027,886 | USD | 30,463,333 | CIBC | 9/15/2021 | 469,882 | — |
| CAD | 37,212,805 | USD | 30,377,500 | CITI | 9/15/2021 | — | (882,905) |
| CAD | 37,660,280 | USD | 30,400,000 | GSI | 9/15/2021 | — | (550,739) |
| CAD | 37,563,678 | USD | 30,345,000 | HUS | 9/15/2021 | — | (572,305) |
| CAD | 96,137,894 | USD | 77,969,771 | JPM | 9/15/2021 | — | (1,771,584) |
| CAD | 114,028,172 | USD | 91,316,667 | MSCS | 9/15/2021 | — | (938,777) |
| CAD | 56,508,443 | USD | 45,588,750 | RBC | 9/15/2021 | — | (800,574) |
| CAD | 38,510,763 | USD | 30,460,833 | SCB | 9/15/2021 | 62,514 | — |
| CAD | 39,475,473 | USD | 31,565,000 | TD | 9/15/2021 | — | (277,031) |
| CAD | 58,335,300 | USD | 45,693,750 | UBS | 9/15/2021 | 542,380 | — |
| EUR | 15,235,000 | CAD | 22,581,393 | ANZ | 9/15/2021 | 95,366 | — |
| EUR | 85,570,562 | CAD | 126,315,580 | RBC | 9/15/2021 | 945,835 | — |
| EUR | 30,342,748 | GBP | 26,100,589 | SSB | 9/15/2021 | — | (49,415) |
| EUR | 45,515,625 | NOK | 482,541,612 | UBS | 9/15/2021 | — | (1,746,882) |
| 34 | JOHN HANCOCK STRATEGIC INCOME OPPORTUNITIES FUND | ANNUAL REPORT | SEE NOTES TO FINANCIAL STATEMENTS |
| Contract to buy | Contract to sell | Counterparty (OTC) | Contractual settlement date | Unrealized appreciation | Unrealized depreciation | ||
| EUR | 43,456,242 | USD | 50,945,274 | GSI | 9/15/2021 | $378,478 | — |
| EUR | 21,728,121 | USD | 25,391,700 | JPM | 9/15/2021 | 270,176 | — |
| EUR | 51,993,536 | USD | 61,483,132 | MSCS | 9/15/2021 | — | $(76,458) |
| EUR | 30,257,500 | USD | 35,925,970 | SCB | 9/15/2021 | — | (190,519) |
| EUR | 20,839,214 | USD | 24,627,409 | SSB | 9/15/2021 | — | (15,373) |
| EUR | 21,720,605 | USD | 25,694,433 | UBS | 9/15/2021 | — | (41,434) |
| GBP | 30,342,500 | CAD | 51,897,508 | JPM | 9/15/2021 | 584,143 | — |
| GBP | 26,168,557 | EUR | 30,342,748 | UBS | 9/15/2021 | 142,863 | — |
| GBP | 21,059,500 | USD | 29,184,750 | BARC | 9/15/2021 | — | (230,167) |
| GBP | 15,042,500 | USD | 20,583,931 | GSI | 9/15/2021 | 97,914 | — |
| GBP | 21,059,500 | USD | 29,735,469 | SSB | 9/15/2021 | — | (780,885) |
| GBP | 9,780,469 | USD | 13,428,476 | UBS | 9/15/2021 | 18,633 | — |
| JPY | 2,720,810,082 | CAD | 30,085,000 | CIBC | 9/15/2021 | 888,690 | — |
| JPY | 1,678,410,783 | USD | 15,235,500 | CIBC | 9/15/2021 | 22,288 | — |
| JPY | 1,678,498,082 | USD | 15,235,500 | SSB | 9/15/2021 | 23,081 | — |
| NOK | 157,878,531 | EUR | 15,171,875 | BARC | 9/15/2021 | 240,831 | — |
| NOK | 312,365,724 | EUR | 30,343,750 | CIBC | 9/15/2021 | 91,585 | — |
| NOK | 12,297,357 | USD | 1,385,591 | MSCS | 9/15/2021 | 28,875 | — |
| NZD | 10,550,870 | USD | 7,311,953 | HUS | 9/15/2021 | 122,720 | — |
| NZD | 37,997,101 | USD | 26,582,808 | UBS | 9/15/2021 | 191,854 | — |
| SGD | 76,764,883 | USD | 56,907,386 | BARC | 9/15/2021 | 188,220 | — |
| SGD | 2,277,350 | USD | 1,693,977 | CITI | 9/15/2021 | — | (146) |
| SGD | 41,503,235 | USD | 30,552,610 | GSI | 9/15/2021 | 316,353 | — |
| SGD | 55,067,680 | USD | 40,575,224 | MSCS | 9/15/2021 | 382,600 | — |
| SGD | 14,039,079 | USD | 10,264,998 | UBS | 9/15/2021 | 176,882 | — |
| USD | 31,858,191 | AUD | 42,448,723 | CITI | 9/15/2021 | 802,487 | — |
| USD | 13,408,194 | AUD | 18,090,262 | UBS | 9/15/2021 | 173,266 | — |
| USD | 66,881,416 | BRL | 339,876,635 | CITI | 9/15/2021 | 1,255,294 | — |
| USD | 8,367,540 | BRL | 41,427,689 | SSB | 9/15/2021 | 368,347 | — |
| USD | 30,463,333 | CAD | 38,932,384 | BARC | 9/15/2021 | — | (394,187) |
| USD | 15,241,250 | CAD | 19,160,874 | CIBC | 9/15/2021 | 54,482 | — |
| USD | 76,031,678 | CAD | 94,915,053 | GSI | 9/15/2021 | 802,706 | — |
| USD | 77,288,750 | CAD | 97,614,962 | HUS | 9/15/2021 | — | (80,150) |
| USD | 182,322,089 | CAD | 225,586,869 | MSCS | 9/15/2021 | 3,523,597 | — |
| USD | 46,986,125 | CAD | 58,244,114 | RBC | 9/15/2021 | 822,269 | — |
| USD | 15,231,667 | CAD | 19,433,459 | SCB | 9/15/2021 | — | (171,150) |
| USD | 46,911,333 | CAD | 57,000,278 | SSB | 9/15/2021 | 1,733,332 | — |
| USD | 31,674,269 | CAD | 39,754,532 | UBS | 9/15/2021 | 165,120 | — |
| USD | 15,300,192 | EUR | 13,051,051 | CIBC | 9/15/2021 | — | (113,679) |
| USD | 25,799,490 | EUR | 21,728,320 | CITI | 9/15/2021 | 137,379 | — |
| USD | 113,874,893 | EUR | 95,727,255 | GSI | 9/15/2021 | 816,754 | — |
| USD | 138,566,408 | EUR | 117,170,781 | MSCS | 9/15/2021 | 182,513 | — |
| SEE NOTES TO FINANCIAL STATEMENTS | ANNUAL REPORT | JOHN HANCOCK STRATEGIC INCOME OPPORTUNITIES FUND | 35 |
| Contract to buy | Contract to sell | Counterparty (OTC) | Contractual settlement date | Unrealized appreciation | Unrealized depreciation | ||
| USD | 102,001,704 | EUR | 87,007,004 | SSB | 9/15/2021 | — | $(757,431) |
| USD | 49,336,683 | GBP | 36,299,500 | BARC | 9/15/2021 | — | (571,287) |
| USD | 42,869,310 | GBP | 30,808,976 | CIBC | 9/15/2021 | $510,230 | — |
| USD | 13,562,396 | GBP | 9,749,476 | HUS | 9/15/2021 | 157,898 | — |
| USD | 30,471,000 | JPY | 3,344,216,627 | GSI | 9/15/2021 | 70,011 | — |
| USD | 10,894,806 | JPY | 1,191,302,392 | UBS | 9/15/2021 | 65,134 | — |
| USD | 7,856,317 | NZD | 11,304,477 | ANZ | 9/15/2021 | — | (109,384) |
| USD | 18,149,687 | NZD | 25,781,345 | GSI | 9/15/2021 | — | (17,141) |
| USD | 16,175,462 | NZD | 22,824,137 | UBS | 9/15/2021 | 92,431 | — |
| USD | 20,288,461 | SGD | 27,474,289 | CITI | 9/15/2021 | — | (146,159) |
| USD | 20,311,391 | SGD | 27,251,794 | HUS | 9/15/2021 | 42,257 | — |
| USD | 20,311,391 | SGD | 27,275,050 | JPM | 9/15/2021 | 24,960 | — |
| USD | 40,622,783 | SGD | 54,601,083 | MSCS | 9/15/2021 | 12,001 | — |
| USD | 40,655,739 | SGD | 53,840,070 | SSB | 9/15/2021 | 610,977 | — |
| USD | 40,576,923 | SGD | 54,788,746 | UBS | 9/15/2021 | — | (173,438) |
| $19,375,047 | $(13,930,824) | ||||||
| Foreign currency options | |||||||
| Description | Counterparty (OTC) | Currency | Exercise price | Expiration date | Notional amount* | Premium | Value |
| Puts | |||||||
| U.S. Dollar vs. Canadian Dollar | GSI | USD | 1.22 | Oct 2021 | 79,445,000 | $1,801,813 | $(45,046) |
| $1,801,813 | $(45,046) | ||||||
| * For this type of option, notional amounts are equivalent to number of contracts. | |||||||
| Derivatives Currency Abbreviations | |
| AUD | Australian Dollar |
| BRL | Brazilian Real |
| CAD | Canadian Dollar |
| EUR | Euro |
| GBP | Pound Sterling |
| JPY | Japanese Yen |
| NOK | Norwegian Krone |
| NZD | New Zealand Dollar |
| SGD | Singapore Dollar |
| USD | U.S. Dollar |
| Derivatives Abbreviations | |
| ANZ | Australia and New Zealand Banking Group Limited |
| BARC | Barclays Bank PLC |
| CIBC | Canadian Imperial Bank of Commerce |
| 36 | JOHN HANCOCK STRATEGIC INCOME OPPORTUNITIES FUND | ANNUAL REPORT | SEE NOTES TO FINANCIAL STATEMENTS |
| CITI | Citibank, N.A. |
| GSI | Goldman Sachs International |
| HUS | HSBC Bank USA, N.A. |
| JPM | JPMorgan Chase Bank, N.A. |
| MSCS | Morgan Stanley Capital Services LLC |
| OTC | Over-the-counter |
| RBC | Royal Bank of Canada |
| SCB | Standard Chartered Bank |
| SSB | State Street Bank and Trust Company |
| TD | The Toronto-Dominion Bank |
| UBS | UBS AG |
| SEE NOTES TO FINANCIAL STATEMENTS | ANNUAL REPORT | JOHN HANCOCK STRATEGIC INCOME OPPORTUNITIES FUND | 37 |
| Assets | |
| Unaffiliated investments, at value (Cost $4,728,502,848) including $28,338,726 of securities loaned | $4,875,691,988 |
| Affiliated investments, at value (Cost $29,020,015) | 29,012,253 |
| Total investments, at value (Cost $4,757,522,863) | 4,904,704,241 |
| Unrealized appreciation on forward foreign currency contracts | 19,375,047 |
| Receivable for futures variation margin | 1,648,978 |
| Cash | 2,342,912 |
| Foreign currency, at value (Cost $5,145,902) | 5,134,519 |
| Collateral held at broker for futures contracts | 12,252,712 |
| Collateral segregated at custodian for OTC derivative contracts | 5,600,000 |
| Dividends and interest receivable | 41,829,114 |
| Receivable for fund shares sold | 4,116,505 |
| Receivable for investments sold | 603,539 |
| Receivable for securities lending income | 7,688 |
| Other assets | 230,769 |
| Total assets | 4,997,846,024 |
| Liabilities | |
| Unrealized depreciation on forward foreign currency contracts | 13,930,824 |
| Written options, at value (Premiums received $1,801,813) | 45,046 |
| Distributions payable | 228,633 |
| Payable for investments purchased | 75,588,584 |
| Payable for fund shares repurchased | 3,987,865 |
| Payable upon return of securities loaned | 29,003,803 |
| Payable to affiliates | |
| Accounting and legal services fees | 187,261 |
| Transfer agent fees | 238,272 |
| Distribution and service fees | 1,180 |
| Trustees’ fees | 1,253 |
| Other liabilities and accrued expenses | 982,184 |
| Total liabilities | 124,194,905 |
| Net assets | $4,873,651,119 |
| Net assets consist of | |
| Paid-in capital | $4,818,714,945 |
| Total distributable earnings (loss) | 54,936,174 |
| Net assets | $4,873,651,119 |
| 38 | JOHN HANCOCK Strategic Income Opportunities Fund | ANNUAL REPORT | SEE NOTES TO FINANCIAL STATEMENTS |
| Net asset value per share | |
| Based on net asset value and shares outstanding - the fund has an unlimited number of shares authorized with no par value | |
| Class A ($395,695,886 ÷ 34,799,118 shares)1 | $11.37 |
| Class C ($77,773,947 ÷ 6,838,591 shares)1 | $11.37 |
| Class I ($2,009,268,016 ÷ 176,692,429 shares) | $11.37 |
| Class R2 ($5,510,419 ÷ 484,249 shares) | $11.38 |
| Class R6 ($226,002,108 ÷ 19,859,775 shares) | $11.38 |
| Class NAV ($2,159,400,743 ÷ 189,976,534 shares) | $11.37 |
| Maximum offering price per share | |
| Class A (net asset value per share ÷ 96%)2 | $11.84 |
| 1 | Redemption price per share is equal to net asset value less any applicable contingent deferred sales charge. |
| 2 | On single retail sales of less than $100,000. On sales of $100,000 or more and on group sales the offering price is reduced. |
| SEE NOTES TO FINANCIAL STATEMENTS | ANNUAL REPORT | JOHN HANCOCK Strategic Income Opportunities Fund | 39 |
| Investment income | |
| Interest | $139,705,176 |
| Dividends | 13,756,806 |
| Securities lending | 109,540 |
| Less foreign taxes withheld | (1,580,804) |
| Total investment income | 151,990,718 |
| Expenses | |
| Investment management fees | 30,070,646 |
| Distribution and service fees | 2,197,971 |
| Accounting and legal services fees | 679,345 |
| Transfer agent fees | 2,780,789 |
| Trustees’ fees | 83,572 |
| Custodian fees | 793,459 |
| State registration fees | 127,787 |
| Printing and postage | 194,786 |
| Professional fees | 256,782 |
| Other | 248,976 |
| Total expenses | 37,434,113 |
| Less expense reductions | (1,503,236) |
| Net expenses | 35,930,877 |
| Net investment income | 116,059,841 |
| Realized and unrealized gain (loss) | |
| Net realized gain (loss) on | |
| Unaffiliated investments and foreign currency transactions | 163,546,019 |
| Affiliated investments | (21,990) |
| Futures contracts | 13,493,485 |
| Forward foreign currency contracts | 17,944,919 |
| Written options | 5,845,771 |
| 200,808,204 | |
| Change in net unrealized appreciation (depreciation) of | |
| Unaffiliated investments and translation of assets and liabilities in foreign currencies | (36,193,157) |
| Affiliated investments | (2,941) |
| Futures contracts | (4,800,975) |
| Forward foreign currency contracts | 593,553 |
| Written options | 1,756,767 |
| (38,646,753) | |
| Net realized and unrealized gain | 162,161,451 |
| Increase in net assets from operations | $278,221,292 |
| 40 | JOHN HANCOCK Strategic Income Opportunities Fund | ANNUAL REPORT | SEE NOTES TO FINANCIAL STATEMENTS |
| Year ended 8-31-21 | Year ended 8-31-20 | |
| Increase (decrease) in net assets | ||
| From operations | ||
| Net investment income | $116,059,841 | $135,458,287 |
| Net realized gain | 200,808,204 | 33,169,397 |
| Change in net unrealized appreciation (depreciation) | (38,646,753) | 47,146,554 |
| Increase in net assets resulting from operations | 278,221,292 | 215,774,238 |
| Distributions to shareholders | ||
| From earnings | ||
| Class A | (8,739,583) | (6,241,408) |
| Class C | (1,586,626) | (2,151,856) |
| Class I | (50,118,857) | (47,650,876) |
| Class R2 | (128,293) | (183,293) |
| Class R6 | (6,064,777) | (9,228,322) |
| Class NAV | (57,117,467) | (47,150,108) |
| Total distributions | (123,755,603) | (112,605,863) |
| From fund share transactions | 58,533,080 | (911,850,896) |
| Total increase (decrease) | 212,998,769 | (808,682,521) |
| Net assets | ||
| Beginning of year | 4,660,652,350 | 5,469,334,871 |
| End of year | $4,873,651,119 | $4,660,652,350 |
| SEE NOTES TO FINANCIAL STATEMENTS | ANNUAL REPORT | JOHN HANCOCK Strategic Income Opportunities Fund | 41 |
| CLASS A SHARES Period ended | 8-31-21 | 8-31-20 | 8-31-19 | 8-31-18 | 8-31-17 |
| Per share operating performance | |||||
| Net asset value, beginning of period | $10.99 | $10.67 | $10.36 | $10.93 | $10.72 |
| Net investment income1 | 0.24 | 0.25 | 0.32 | 0.32 | 0.29 |
| Net realized and unrealized gain (loss) on investments | 0.40 | 0.28 | 0.30 | (0.55) | 0.17 |
| Total from investment operations | 0.64 | 0.53 | 0.62 | (0.23) | 0.46 |
| Less distributions | |||||
| From net investment income | (0.26) | (0.21) | (0.31) | (0.34) | (0.25) |
| Net asset value, end of period | $11.37 | $10.99 | $10.67 | $10.36 | $10.93 |
| Total return (%)2,3 | 5.88 | 5.01 | 6.10 | (2.28) | 4.44 |
| Ratios and supplemental data | |||||
| Net assets, end of period (in millions) | $396 | $332 | $331 | $429 | $543 |
| Ratios (as a percentage of average net assets): | |||||
| Expenses before reductions | 1.10 | 1.12 | 1.11 | 1.09 | 1.10 |
| Expenses including reductions | 1.07 | 1.09 | 1.08 | 1.06 | 1.07 |
| Net investment income | 2.16 | 2.40 | 3.09 | 2.99 | 2.73 |
| Portfolio turnover (%) | 71 | 73 | 84 | 63 | 42 |
| 1 | Based on average daily shares outstanding. |
| 2 | Total returns would have been lower had certain expenses not been reduced during the applicable periods. |
| 3 | Does not reflect the effect of sales charges, if any. |
| 42 | JOHN HANCOCK Strategic Income Opportunities Fund | ANNUAL REPORT | SEE NOTES TO FINANCIAL STATEMENTS |
| CLASS C SHARES Period ended | 8-31-21 | 8-31-20 | 8-31-19 | 8-31-18 | 8-31-17 |
| Per share operating performance | |||||
| Net asset value, beginning of period | $10.99 | $10.67 | $10.36 | $10.93 | $10.72 |
| Net investment income1 | 0.16 | 0.18 | 0.25 | 0.25 | 0.22 |
| Net realized and unrealized gain (loss) on investments | 0.40 | 0.27 | 0.29 | (0.56) | 0.16 |
| Total from investment operations | 0.56 | 0.45 | 0.54 | (0.31) | 0.38 |
| Less distributions | |||||
| From net investment income | (0.18) | (0.13) | (0.23) | (0.26) | (0.17) |
| Net asset value, end of period | $11.37 | $10.99 | $10.67 | $10.36 | $10.93 |
| Total return (%)2,3 | 5.04 | 4.38 | 5.36 | (2.97) | 3.72 |
| Ratios and supplemental data | |||||
| Net assets, end of period (in millions) | $78 | $147 | $202 | $284 | $375 |
| Ratios (as a percentage of average net assets): | |||||
| Expenses before reductions | 1.80 | 1.82 | 1.81 | 1.79 | 1.80 |
| Expenses including reductions | 1.77 | 1.79 | 1.78 | 1.76 | 1.77 |
| Net investment income | 1.42 | 1.71 | 2.40 | 2.29 | 2.07 |
| Portfolio turnover (%) | 71 | 73 | 84 | 63 | 42 |
| 1 | Based on average daily shares outstanding. |
| 2 | Total returns would have been lower had certain expenses not been reduced during the applicable periods. |
| 3 | Does not reflect the effect of sales charges, if any. |
| SEE NOTES TO FINANCIAL STATEMENTS | ANNUAL REPORT | JOHN HANCOCK Strategic Income Opportunities Fund | 43 |
| CLASS I SHARES Period ended | 8-31-21 | 8-31-20 | 8-31-19 | 8-31-18 | 8-31-17 |
| Per share operating performance | |||||
| Net asset value, beginning of period | $10.99 | $10.67 | $10.36 | $10.93 | $10.73 |
| Net investment income1 | 0.28 | 0.29 | 0.35 | 0.35 | 0.33 |
| Net realized and unrealized gain (loss) on investments | 0.40 | 0.27 | 0.30 | (0.55) | 0.15 |
| Total from investment operations | 0.68 | 0.56 | 0.65 | (0.20) | 0.48 |
| Less distributions | |||||
| From net investment income | (0.30) | (0.24) | (0.34) | (0.37) | (0.28) |
| Net asset value, end of period | $11.37 | $10.99 | $10.67 | $10.36 | $10.93 |
| Total return (%)2 | 6.10 | 5.42 | 6.41 | (2.00) | 4.67 |
| Ratios and supplemental data | |||||
| Net assets, end of period (in millions) | $2,009 | $1,961 | $2,315 | $3,441 | $3,873 |
| Ratios (as a percentage of average net assets): | |||||
| Expenses before reductions | 0.80 | 0.82 | 0.82 | 0.79 | 0.79 |
| Expenses including reductions | 0.77 | 0.79 | 0.79 | 0.76 | 0.76 |
| Net investment income | 2.45 | 2.70 | 3.38 | 3.28 | 3.10 |
| Portfolio turnover (%) | 71 | 73 | 84 | 63 | 42 |
| 1 | Based on average daily shares outstanding. |
| 2 | Total returns would have been lower had certain expenses not been reduced during the applicable periods. |
| 44 | JOHN HANCOCK Strategic Income Opportunities Fund | ANNUAL REPORT | SEE NOTES TO FINANCIAL STATEMENTS |
| CLASS R2 SHARES Period ended | 8-31-21 | 8-31-20 | 8-31-19 | 8-31-18 | 8-31-17 |
| Per share operating performance | |||||
| Net asset value, beginning of period | $11.00 | $10.68 | $10.37 | $10.94 | $10.73 |
| Net investment income1 | 0.23 | 0.25 | 0.31 | 0.31 | 0.29 |
| Net realized and unrealized gain (loss) on investments | 0.40 | 0.27 | 0.30 | (0.55) | 0.16 |
| Total from investment operations | 0.63 | 0.52 | 0.61 | (0.24) | 0.45 |
| Less distributions | |||||
| From net investment income | (0.25) | (0.20) | (0.30) | (0.33) | (0.24) |
| Net asset value, end of period | $11.38 | $11.00 | $10.68 | $10.37 | $10.94 |
| Total return (%)2 | 5.79 | 4.92 | 6.01 | (2.36) | 4.32 |
| Ratios and supplemental data | |||||
| Net assets, end of period (in millions) | $6 | $6 | $12 | $16 | $19 |
| Ratios (as a percentage of average net assets): | |||||
| Expenses before reductions | 1.19 | 1.19 | 1.19 | 1.19 | 1.20 |
| Expenses including reductions | 1.16 | 1.17 | 1.17 | 1.16 | 1.17 |
| Net investment income | 2.07 | 2.34 | 3.01 | 2.89 | 2.68 |
| Portfolio turnover (%) | 71 | 73 | 84 | 63 | 42 |
| 1 | Based on average daily shares outstanding. |
| 2 | Total returns would have been lower had certain expenses not been reduced during the applicable periods. |
| SEE NOTES TO FINANCIAL STATEMENTS | ANNUAL REPORT | JOHN HANCOCK Strategic Income Opportunities Fund | 45 |
| CLASS R6 SHARES Period ended | 8-31-21 | 8-31-20 | 8-31-19 | 8-31-18 | 8-31-17 |
| Per share operating performance | |||||
| Net asset value, beginning of period | $11.00 | $10.67 | $10.37 | $10.94 | $10.73 |
| Net investment income1 | 0.29 | 0.30 | 0.37 | 0.36 | 0.35 |
| Net realized and unrealized gain (loss) on investments | 0.40 | 0.28 | 0.28 | (0.55) | 0.15 |
| Total from investment operations | 0.69 | 0.58 | 0.65 | (0.19) | 0.50 |
| Less distributions | |||||
| From net investment income | (0.31) | (0.25) | (0.35) | (0.38) | (0.29) |
| Net asset value, end of period | $11.38 | $11.00 | $10.67 | $10.37 | $10.94 |
| Total return (%)2 | 6.30 | 5.54 | 6.42 | (1.89) | 4.87 |
| Ratios and supplemental data | |||||
| Net assets, end of period (in millions) | $226 | $232 | $543 | $1,464 | $998 |
| Ratios (as a percentage of average net assets): | |||||
| Expenses before reductions | 0.70 | 0.70 | 0.70 | 0.69 | 0.69 |
| Expenses including reductions | 0.67 | 0.68 | 0.68 | 0.66 | 0.66 |
| Net investment income | 2.55 | 2.82 | 3.55 | 3.42 | 3.32 |
| Portfolio turnover (%) | 71 | 73 | 84 | 63 | 42 |
| 1 | Based on average daily shares outstanding. |
| 2 | Total returns would have been lower had certain expenses not been reduced during the applicable periods. |
| 46 | JOHN HANCOCK Strategic Income Opportunities Fund | ANNUAL REPORT | SEE NOTES TO FINANCIAL STATEMENTS |
| CLASS NAV SHARES Period ended | 8-31-21 | 8-31-20 | 8-31-19 | 8-31-18 | 8-31-17 |
| Per share operating performance | |||||
| Net asset value, beginning of period | $10.99 | $10.66 | $10.36 | $10.93 | $10.72 |
| Net investment income1 | 0.29 | 0.30 | 0.36 | 0.36 | 0.34 |
| Net realized and unrealized gain (loss) on investments | 0.40 | 0.28 | 0.29 | (0.55) | 0.16 |
| Total from investment operations | 0.69 | 0.58 | 0.65 | (0.19) | 0.50 |
| Less distributions | |||||
| From net investment income | (0.31) | (0.25) | (0.35) | (0.38) | (0.29) |
| Net asset value, end of period | $11.37 | $10.99 | $10.66 | $10.36 | $10.93 |
| Total return (%)2 | 6.31 | 5.56 | 6.54 | (1.89) | 4.79 |
| Ratios and supplemental data | |||||
| Net assets, end of period (in millions) | $2,159 | $1,982 | $2,067 | $1,720 | $1,847 |
| Ratios (as a percentage of average net assets): | |||||
| Expenses before reductions | 0.69 | 0.69 | 0.69 | 0.68 | 0.68 |
| Expenses including reductions | 0.66 | 0.66 | 0.66 | 0.65 | 0.65 |
| Net investment income | 2.57 | 2.83 | 3.45 | 3.41 | 3.20 |
| Portfolio turnover (%) | 71 | 73 | 84 | 63 | 42 |
| 1 | Based on average daily shares outstanding. |
| 2 | Total returns would have been lower had certain expenses not been reduced during the applicable periods. |
| SEE NOTES TO FINANCIAL STATEMENTS | ANNUAL REPORT | JOHN HANCOCK Strategic Income Opportunities Fund | 47 |
| 48 | JOHN HANCOCK Strategic Income Opportunities Fund | ANNUAL REPORT |
| Total value at 8-31-21 | Level 1 quoted price | Level 2 significant observable inputs | Level 3 significant unobservable inputs | |
| Investments in securities: | ||||
| Assets | ||||
| U.S. Government and Agency obligations | $229,162,896 | — | $229,162,896 | — |
| Foreign government obligations | 946,450,988 | — | 946,450,988 | — |
| Corporate bonds | 2,664,388,833 | — | 2,664,388,833 | — |
| Convertible bonds | 122,440,462 | — | 122,440,462 | — |
| Capital preferred securities | 9,043,251 | — | 9,043,251 | — |
| Term loans | 299,911,447 | — | 299,911,447 | — |
| Collateralized mortgage obligations | 28,275,326 | — | 28,275,326 | — |
| Asset backed securities | 73,400,735 | — | 73,400,735 | — |
| Common stocks | 148,240,558 | $128,265,982 | 19,974,576 | — |
| Preferred securities | 178,792,043 | 172,873,667 | 5,918,376 | — |
| ANNUAL REPORT | JOHN HANCOCK Strategic Income Opportunities Fund | 49 |
| Total value at 8-31-21 | Level 1 quoted price | Level 2 significant observable inputs | Level 3 significant unobservable inputs | |
| Purchased options | $906,449 | — | $906,449 | — |
| Short-term investments | 203,691,253 | $29,012,253 | 174,679,000 | — |
| Total investments in securities | $4,904,704,241 | $330,151,902 | $4,574,552,339 | — |
| Derivatives: | ||||
| Assets | ||||
| Futures | $22,628 | $22,628 | — | — |
| Forward foreign currency contracts | 19,375,047 | — | $19,375,047 | — |
| Liabilities | ||||
| Futures | (2,356,728) | (2,356,728) | — | — |
| Forward foreign currency contracts | (13,930,824) | — | (13,930,824) | — |
| Written options | (45,046) | — | (45,046) | — |
| Level 3 includes securities valued at $0. Refer to Fund’s investments. | ||||
| 50 | JOHN HANCOCK Strategic Income Opportunities Fund | ANNUAL REPORT |
| ANNUAL REPORT | JOHN HANCOCK Strategic Income Opportunities Fund | 51 |
| 52 | JOHN HANCOCK Strategic Income Opportunities Fund | ANNUAL REPORT |
| August 31, 2021 | August 31, 2020 | |
| Ordinary income | $123,755,603 | $112,605,863 |
| ANNUAL REPORT | JOHN HANCOCK Strategic Income Opportunities Fund | 53 |
| 54 | JOHN HANCOCK Strategic Income Opportunities Fund | ANNUAL REPORT |
| Risk | Statement of assets and liabilities location | Financial instruments location | Assets derivatives fair value | Liabilities derivatives fair value |
| Interest rate | Receivable/payable for futures variation margin1 | Futures | $22,628 | $(2,356,728) |
| Currency | Unrealized appreciation (depreciation) on forward foreign currency contracts | Forward foreign currency contracts | 19,375,047 | (13,930,824) |
| Currency | Unaffiliated investments, at value2 | Purchased options | 906,449 | — |
| Currency | Written options, at value | Written options | — | (45,046) |
| $20,304,124 | $(16,332,598) |
| 1 | Reflects cumulative appreciation/depreciation on open futures as disclosed in the Derivatives section of Fund’s investments. Only the year end variation margin receivable/payable is separately reported on the Statement of assets and liabilities. |
| 2 | Purchased options are included in Fund’s investments. |
| ANNUAL REPORT | JOHN HANCOCK Strategic Income Opportunities Fund | 55 |
| Statement of operations location - Net realized gain (loss) on: | |||||
| Risk | Unaffiliated investments and foreign currency transactions1 | Futures contracts | Forward foreign currency contracts | Written options | Total |
| Interest rate | — | $13,493,485 | — | — | $13,493,485 |
| Currency | $359,815 | — | $17,944,919 | $5,845,771 | 24,150,505 |
| Total | $359,815 | $13,493,485 | $17,944,919 | $5,845,771 | $37,643,990 |
| 1 | Realized gain (loss) associated with purchased options is included in this caption on the Statement of operations. |
| Statement of operations location - Change in net unrealized appreciation (depreciation) of: | |||||
| Risk | Unaffiliated investments and translation of assets and liabilities in foreign currencies1 | Futures contracts | Forward foreign currency contracts | Written options | Total |
| Interest rate | — | $(4,800,975) | — | — | $(4,800,975) |
| Currency | $(3,128,441) | — | $593,553 | $1,756,767 | (778,121) |
| Total | $(3,128,441) | $(4,800,975) | $593,553 | $1,756,767 | $(5,579,096) |
| 1 | Change in unrealized appreciation (depreciation) associated with purchased options is included in this caption on the Statement of operations. |
| 56 | JOHN HANCOCK Strategic Income Opportunities Fund | ANNUAL REPORT |
| Class | Expense reduction |
| Class A | $119,776 |
| Class C | 32,302 |
| Class I | 612,085 |
| Class R2 | 1,825 |
| Class | Expense reduction |
| Class R6 | $71,209 |
| Class NAV | 666,039 |
| Total | $1,503,236 |
| ANNUAL REPORT | JOHN HANCOCK Strategic Income Opportunities Fund | 57 |
| Class | Rule 12b-1 Fee | Service fee |
| Class A | 0.30% | — |
| Class C | 1.00% | — |
| Class R2 | 0.25% | 0.25% |
| Class | Distribution and service fees | Transfer agent fees |
| Class A | $1,121,885 | $430,508 |
| Class C | 1,047,756 | 120,623 |
| Class I | — | 2,206,606 |
| Class R2 | 28,330 | 576 |
| Class R6 | — | 22,476 |
| Total | $2,197,971 | $2,780,789 |
| 58 | JOHN HANCOCK Strategic Income Opportunities Fund | ANNUAL REPORT |
| Year Ended 8-31-21 | Year Ended 8-31-20 | |||
| Shares | Amount | Shares | Amount | |
| Class A shares | ||||
| Sold | 10,390,012 | $117,213,057 | 7,143,144 | $75,179,043 |
| Distributions reinvested | 743,907 | 8,413,617 | 576,452 | 6,105,141 |
| Repurchased | (6,579,606) | (74,328,915) | (8,524,745) | (89,163,661) |
| Net increase (decrease) | 4,554,313 | $51,297,759 | (805,149) | $(7,879,477) |
| Class C shares | ||||
| Sold | 629,905 | $7,115,323 | 782,619 | $8,256,876 |
| Distributions reinvested | 135,385 | 1,528,761 | 186,464 | 1,973,633 |
| Repurchased | (7,336,553) | (82,617,698) | (6,482,601) | (68,556,342) |
| Net decrease | (6,571,263) | $(73,973,614) | (5,513,518) | $(58,325,833) |
| Class I shares | ||||
| Sold | 47,372,958 | $535,296,737 | 67,764,666 | $690,452,016 |
| Distributions reinvested | 4,277,578 | 48,337,200 | 4,360,853 | 46,177,842 |
| Repurchased | (53,337,366) | (597,731,824) | (110,727,871) | (1,146,930,538) |
| Net decrease | (1,686,830) | $(14,097,887) | (38,602,352) | $(410,300,680) |
| Class R2 shares | ||||
| Sold | 94,092 | $1,061,591 | 180,062 | $1,907,117 |
| Distributions reinvested | 11,082 | 125,328 | 17,079 | 180,808 |
| Repurchased | (164,275) | (1,838,769) | (764,400) | (8,032,530) |
| Net decrease | (59,101) | $(651,850) | (567,259) | $(5,944,605) |
| Class R6 shares | ||||
| Sold | 5,191,452 | $58,694,573 | 8,742,964 | $93,074,444 |
| Distributions reinvested | 534,096 | 6,038,269 | 865,534 | 9,185,612 |
| Repurchased | (6,974,882) | (78,799,326) | (39,399,144) | (396,465,795) |
| Net decrease | (1,249,334) | $(14,066,484) | (29,790,646) | $(294,205,739) |
| Class NAV shares | ||||
| Sold | 14,252,748 | $161,275,955 | 12,344,916 | $130,658,405 |
| Distributions reinvested | 5,055,706 | 57,117,467 | 4,451,376 | 47,150,108 |
| Repurchased | (9,686,548) | (108,368,266) | (30,272,485) | (313,003,075) |
| Net increase (decrease) | 9,621,906 | $110,025,156 | (13,476,193) | $(135,194,562) |
| Total net increase (decrease) | 4,609,691 | $58,533,080 | (88,755,117) | $(911,850,896) |
| ANNUAL REPORT | JOHN HANCOCK Strategic Income Opportunities Fund | 59 |
| Portfolio | Affiliated Concentration |
| John Hancock Funds II Multimanager Lifestyle Balanced Portfolio | 15.9% |
| John Hancock Funds II Multimanager Lifestyle Growth Portfolio | 7.2% |
| John Hancock Funds II Multimanager Lifestyle Moderate Portfolio | 5.4% |
| John Hancock Funds II Multimanager Lifestyle Conservative Portfolio | 5.1% |
| Dividends and distributions | |||||||||
| Affiliate | Ending share amount | Beginning value | Cost of purchases | Proceeds from shares sold | Realized gain (loss) | Change in unrealized appreciation (depreciation) | Income distributions received | Capital gain distributions received | Ending value |
| John Hancock Collateral Trust* | 2,899,167 | $40,443,487 | $347,740,573 | $(359,146,876) | $(21,990) | $(2,941) | $109,540 | — | $29,012,253 |
| * | Refer to the Securities lending note within Note 2 for details regarding this investment. |
| 60 | JOHN HANCOCK Strategic Income Opportunities Fund | ANNUAL REPORT |
| ANNUAL REPORT | JOHN HANCOCK Strategic Income Opportunities Fund | 61 |
| 62 | JOHN HANCOCK STRATEGIC INCOME OPPORTUNITIES FUND | ANNUAL REPORT |
| ANNUAL REPORT | JOHN HANCOCK STRATEGIC INCOME OPPORTUNITIES FUND | 63 |
| 64 | JOHN HANCOCK STRATEGIC INCOME OPPORTUNITIES FUND | ANNUAL REPORT |
| (a) | the skills and competency with which the Advisor has in the past managed the Trust’s affairs and its subadvisory relationship, the Advisor’s oversight and monitoring of the Subadvisor’s investment performance and compliance programs, such as the Subadvisor’s compliance with fund policies and objectives, review of brokerage matters, including with respect to trade allocation and best execution and the Advisor’s timeliness in responding to performance issues; |
| (b) | the background, qualifications and skills of the Advisor’s personnel; |
| (c) | the Advisor’s compliance policies and procedures and its responsiveness to regulatory changes and fund industry developments; |
| ANNUAL REPORT | JOHN HANCOCK STRATEGIC INCOME OPPORTUNITIES FUND | 65 |
| (d) | the Advisor’s administrative capabilities, including its ability to supervise the other service providers for the fund, as well as the Advisor’s oversight of any securities lending activity, its monitoring of class action litigation and collection of class action settlements on behalf of the fund, and bringing loss recovery actions on behalf of the fund; |
| (e) | the financial condition of the Advisor and whether it has the financial wherewithal to provide a high level and quality of services to the fund; |
| (f) | the Advisor’s initiatives intended to improve various aspects of the Trust’s operations and investor experience with the fund; and |
| (g) | the Advisor’s reputation and experience in serving as an investment advisor to the Trust and the benefit to shareholders of investing in funds that are part of a family of funds offering a variety of investments. |
| (a) | reviewed information prepared by management regarding the fund’s performance; |
| (b) | considered the comparative performance of an applicable benchmark index; |
| (c) | considered the performance of comparable funds, if any, as included in the report prepared by an independent third-party provider of fund data; and |
| (d) | took into account the Advisor’s analysis of the fund’s performance and its plans and recommendations regarding the Trust’s subadvisory arrangements generally. |
| 66 | JOHN HANCOCK STRATEGIC INCOME OPPORTUNITIES FUND | ANNUAL REPORT |
| (a) | reviewed financial information of the Advisor; |
| (b) | reviewed and considered information presented by the Advisor regarding the net profitability to the Advisor and its affiliates with respect to the fund; |
| (c) | received and reviewed profitability information with respect to the John Hancock Fund Complex as a whole and with respect to the fund; |
| (d) | received information with respect to the Advisor’s allocation methodologies used in preparing the profitability data and considered that the Advisor hired an independent third-party consultant to provide an analysis of the Advisor’s allocation methodologies; |
| (e) | considered that the John Hancock insurance companies that are affiliates of the Advisor, as shareholders of the Trust directly or through their separate accounts, receive certain tax credits or deductions relating to foreign taxes paid and dividends received by certain funds of the Trust and noted that these tax benefits, which are not available to participants in qualified retirement plans under applicable income tax law, are reflected in the profitability information reviewed by the Board; |
| (f) | considered that the Advisor also provides administrative services to the fund on a cost basis pursuant to an administrative services agreement; |
| (g) | noted that affiliates of the Advisor provide transfer agency services and distribution services to the fund, and that the fund’s distributor also receives Rule 12b-1 payments to support distribution of the fund; |
| (h) | noted that the fund’s Subadvisor is an affiliate of the Advisor; |
| (i) | noted that the Advisor also derives reputational and other indirect benefits from providing advisory services to the fund; |
| (j) | noted that the subadvisory fee for the fund is paid by the Advisor; |
| ANNUAL REPORT | JOHN HANCOCK STRATEGIC INCOME OPPORTUNITIES FUND | 67 |
| (k) | considered the Advisor’s ongoing costs and expenditures necessary to improve services, meet new regulatory and compliance requirements, and adapt to other challenges impacting the fund industry; and |
| (l) | considered that the Advisor should be entitled to earn a reasonable level of profits in exchange for the level of services it provides to the fund and the risks that it assumes as Advisor, including entrepreneurial, operational, reputational, litigation and regulatory risk. |
| (a) | considered that the Advisor has contractually agreed to waive a portion of its management fee for certain funds of the John Hancock Fund Complex, including the fund (the participating portfolios) or otherwise reimburse the expenses of the participating portfolios (the reimbursement). This waiver is based upon aggregate net assets of all the participating portfolios. The amount of the reimbursement is calculated daily and allocated among all the participating portfolios in proportion to the daily net assets of each fund; |
| (b) | reviewed the fund’s advisory fee structure and concluded that: (i) the fund’s fee structure contains breakpoints at the subadvisory fee level and that such breakpoints are reflected as breakpoints in the advisory fees for the fund; and (ii) although economies of scale cannot be measured with precision, these arrangements permit shareholders of the fund to benefit from economies of scale if the fund grows. The Board also took into account management’s discussion of the fund’s advisory fee structure; and |
| (c) | the Board also considered the effect of the fund’s growth in size on its performance and fees. The Board also noted that if the fund’s assets increase over time, the fund may realize other economies of scale. |
| (1) | information relating to the Subadvisor’s business, including current subadvisory services to the Trust (and other funds in the John Hancock Fund Complex); |
| (2) | the historical and current performance of the fund and comparative performance information relating to an applicable benchmark index and comparable funds; and |
| (3) | the subadvisory fee for the fund, including any breakpoints, and to the extent available, comparable fee information prepared by an independent third party provider of fund data; |
| 68 | JOHN HANCOCK STRATEGIC INCOME OPPORTUNITIES FUND | ANNUAL REPORT |
| (1) | the Subadvisor has extensive experience and demonstrated skills as a manager; |
| (2) | the performance of the fund is being monitored and reasonably addressed, where appropriate; |
| (3) | the subadvisory fee is reasonable in relation to the level and quality of services being provided under the Subadvisory Agreement; and |
| (4) | noted that the subadvisory fees are paid by the Advisor not the fund and that the subadvisory fee breakpoints are reflected as breakpoints in the advisory fees for the fund in order to permit shareholders to benefit from economies of scale if the fund grows. |
| ANNUAL REPORT | JOHN HANCOCK STRATEGIC INCOME OPPORTUNITIES FUND | 69 |
| 70 | JOHN HANCOCK STRATEGIC INCOME OPPORTUNITIES FUND | ANNUAL REPORT |
| • | The Fund’s investment strategy remained appropriate for an open-end fund structure; |
| • | The Fund was able to meet requests for redemption without significant dilution of remaining investors’ interests in the Fund; |
| • | The Fund did not report any breaches of the 15% limit on illiquid investments that would require reporting to the Securities and Exchange Commission; |
| • | The Fund continued to qualify as a Primarily Highly Liquid Fund under the Liquidity Rule and therefore is not required to establish a HLIM; and |
| • | The Chief Compliance Officer’s office performed audit testing of the LRMP which resulted in an assessment that the LRMP’s control environment was deemed to be operating effectively and in compliance with the Board approved procedures. |
| ANNUAL REPORT | JOHN HANCOCK STRATEGIC INCOME OPPORTUNITIES FUND | 71 |
| 72 | JOHN HANCOCK STRATEGIC INCOME OPPORTUNITIES FUND | ANNUAL REPORT |
| Independent Trustees | ||
| Name, year of birth Position(s) held with Trust Principal occupation(s) and other directorships during past 5 years | Trustee of the Trust since1 | Number of John Hancock funds overseen by Trustee |
| Hassell H. McClellan, Born: 1945 | 2005 | 190 |
| Trustee and Chairperson of the Board | ||
| Director/Trustee, Virtus Funds (2008-2020); Director, The Barnes Group (2010-2021); Associate Professor, The Wallace E. Carroll School of Management, Boston College (retired 2013). Trustee (since 2005) and Chairperson of the Board (since 2017) of various trusts within the John Hancock Fund Complex. | ||
| Charles L. Bardelis,2 Born: 1941 | 2005 | 190 |
| Trustee | ||
| Director, Island Commuter Corp. (marine transport). Trustee of various trusts within the John Hancock Fund Complex (since 1988). | ||
| James R. Boyle, Born: 1959 | 2015 | 190 |
| Trustee | ||
| Chief Executive Officer, Foresters Financial (since 2018); Chairman and Chief Executive Officer, Zillion Group, Inc. (formerly HealthFleet, Inc.) (healthcare) (2014-2018); Executive Vice President and Chief Executive Officer, U.S. Life Insurance Division of Genworth Financial, Inc. (insurance) (January 2014–July 2014); Senior Executive Vice President, Manulife Financial, President and Chief Executive Officer, John Hancock (1999–2012); Chairman and Director, John Hancock Investment Management LLC, John Hancock Investment Management Distributors LLC, and John Hancock Variable Trust Advisers LLC (2005–2010). Trustee of various trusts within the John Hancock Fund Complex (2005–2014 and since 2015). | ||
| Peter S. Burgess,2 Born: 1942 | 2005 | 190 |
| Trustee | ||
| Consultant (financial, accounting, and auditing matters) (since 1999); Certified Public Accountant; Partner, Arthur Andersen (independent public accounting firm) (prior to 1999); Director, Lincoln Educational Services Corporation (2004-2021); Director, Symetra Financial Corporation (2010–2016); Director, PMA Capital Corporation (2004–2010). Trustee of various trusts within the John Hancock Fund Complex (since 2005). | ||
| William H. Cunningham, Born: 1944 | 2012 | 190 |
| Trustee | ||
| Professor, University of Texas, Austin, Texas (since 1971); former Chancellor, University of Texas System and former President of the University of Texas, Austin, Texas; Chairman (since 2009) and Director (since 2006), Lincoln National Corporation (insurance); Director, Southwest Airlines (since 2000); former Director, LIN Television (2009–2014). Trustee of various trusts within the John Hancock Fund Complex (since 1986). | ||
| Grace K. Fey, Born: 1946 | 2008 | 190 |
| Trustee | ||
| Chief Executive Officer, Grace Fey Advisors (since 2007); Director and Executive Vice President, Frontier Capital Management Company (1988–2007); Director, Fiduciary Trust (since 2009). Trustee of various trusts within the John Hancock Fund Complex (since 2008). | ||
| ANNUAL REPORT | JOHN HANCOCK STRATEGIC INCOME OPPORTUNITIES FUND | 73 |
| Independent Trustees (continued) | ||
| Name, year of birth Position(s) held with Trust Principal occupation(s) and other directorships during past 5 years | Trustee of the Trust since1 | Number of John Hancock funds overseen by Trustee |
| Deborah C. Jackson, Born: 1952 | 2012 | 190 |
| Trustee | ||
| President, Cambridge College, Cambridge, Massachusetts (since 2011); Board of Directors, Amwell Corporation (since 2020); Board of Directors, Massachusetts Women’s Forum (2018-2020); Board of Directors, National Association of Corporate Directors/New England (2015-2020); Board of Directors, Association of Independent Colleges and Universities of Massachusetts (2014-2017); Chief Executive Officer, American Red Cross of Massachusetts Bay (2002–2011); Board of Directors of Eastern Bank Corporation (since 2001); Board of Directors of Eastern Bank Charitable Foundation (since 2001); Board of Directors of American Student Assistance Corporation (1996–2009); Board of Directors of Boston Stock Exchange (2002–2008); Board of Directors of Harvard Pilgrim Healthcare (health benefits company) (2007–2011). Trustee of various trusts within the John Hancock Fund Complex (since 2008). | ||
| Steven R. Pruchansky, Born: 1944 | 2012 | 190 |
| Trustee and Vice Chairperson of the Board | ||
| Managing Director, Pru Realty (since 2017); Chairman and Chief Executive Officer, Greenscapes of Southwest Florida, Inc. (2014-2020); Director and President, Greenscapes of Southwest Florida, Inc. (until 2000); Member, Board of Advisors, First American Bank (until 2010); Managing Director, Jon James, LLC (real estate) (since 2000); Partner, Right Funding, LLC (2014-2017); Director, First Signature Bank & Trust Company (until 1991); Director, Mast Realty Trust (until 1994); President, Maxwell Building Corp. (until 1991). Trustee (since 1992), Chairperson of the Board (2011–2012), and Vice Chairperson of the Board (since 2012) of various trusts within the John Hancock Fund Complex. | ||
| Frances G. Rathke,2,* Born: 1960 | 2020 | 190 |
| Trustee | ||
| Board Member, Oatly Group AB (plant-based drink company) (since 2021): Director, Northern New England Energy Corporation (since 2017); Director, Audit Committee Chair and Compensation Committee Member, Green Mountain Power Corporation (since 2016); Director, Treasurer and Finance & Audit Committee Chair, Flynn Center for Performing Arts (since 2016); Director, Audit Committee Chair and Compensation Committee Member, Planet Fitness (since 2016); Director, Citizen Cider, Inc. (high-end hard cider and hard seltzer company) (since 2016); Chief Financial Officer and Treasurer, Keurig Green Mountain, Inc. (2003-retired 2015); Independent Financial Consultant, Frances Rathke Consulting (strategic and financial consulting services) (2001-2003); Chief Financial Officer and Secretary, Ben & Jerry’s Homemade, Inc. (1989-2000, including prior positions); Senior Manager, Coopers & Lybrand, LLC (independent public accounting firm) (1982-1989). Trustee of various trusts within the John Hancock Fund Complex (since 2020). | ||
| Gregory A. Russo, Born: 1949 | 2012 | 190 |
| Trustee | ||
| Director and Audit Committee Chairman (2012-2020), and Member, Audit Committee and Finance Committee (2011-2020), NCH Healthcare System, Inc. (holding company for multi-entity healthcare system); Director and Member (2012-2018) and Finance Committee Chairman (2014-2018), The Moorings, Inc. (nonprofit continuing care community); Vice Chairman, Risk & Regulatory Matters, KPMG LLP (KPMG) (2002–2006); Vice Chairman, Industrial Markets, KPMG (1998–2002); Chairman and Treasurer, Westchester County, New York, Chamber of Commerce (1986–1992); Director, Treasurer, and Chairman of Audit and Finance Committees, Putnam Hospital Center (1989–1995); Director and Chairman of Fundraising Campaign, United Way of Westchester and Putnam Counties, New York (1990–1995). Trustee of various trusts within the John Hancock Fund Complex (since 2008). | ||
| 74 | JOHN HANCOCK STRATEGIC INCOME OPPORTUNITIES FUND | ANNUAL REPORT |
| Non-Independent Trustees3 | ||
| Name, year of birth Position(s) held with Trust Principal occupation(s) and other directorships during past 5 years | Trustee of the Trust since1 | Number of John Hancock funds overseen by Trustee |
| Andrew G. Arnott, Born: 1971 | 2017 | 190 |
| President and Non-Independent Trustee | ||
| Head of Wealth and Asset Management, United States and Europe, for John Hancock and Manulife (since 2018); Director and Executive Vice President, John Hancock Investment Management LLC (since 2005, including prior positions); Director and Executive Vice President, John Hancock Variable Trust Advisers LLC (since 2006, including prior positions); President, John Hancock Investment Management Distributors LLC (since 2004, including prior positions); President of various trusts within the John Hancock Fund Complex (since 2007, including prior positions). Trustee of various trusts within the John Hancock Fund Complex (since 2017). | ||
| Marianne Harrison, Born: 1963 | 2018 | 190 |
| Non-Independent Trustee | ||
| President and CEO, John Hancock (since 2017); President and CEO, Manulife Canadian Division (2013–2017); Member, Board of Directors, Boston Medical Center (since 2021); Member, Board of Directors, CAE Inc. (since 2019); Member, Board of Directors, MA Competitive Partnership Board (since 2018); Member, Board of Directors, American Council of Life Insurers (ACLI) (since 2018); Member, Board of Directors, Communitech, an industry-led innovation center that fosters technology companies in Canada (2017-2019); Member, Board of Directors, Manulife Assurance Canada (2015-2017); Board Member, St. Mary’s General Hospital Foundation (2014-2017); Member, Board of Directors, Manulife Bank of Canada (2013- 2017); Member, Standing Committee of the Canadian Life & Health Assurance Association (2013-2017); Member, Board of Directors, John Hancock USA, John Hancock Life & Health, John Hancock New York (2012–2013). Trustee of various trusts within the John Hancock Fund Complex (since 2018). | ||
| Principal officers who are not Trustees | |
| Name, year of birth Position(s) held with Trust Principal occupation(s) during past 5 years | Current Position(s) with the Trust since |
| Charles A. Rizzo, Born: 1957 | 2007 |
| Chief Financial Officer | |
| Vice President, John Hancock Financial Services (since 2008); Senior Vice President, John Hancock Investment Management LLC and John Hancock Variable Trust Advisers LLC (since 2008); Chief Financial Officer of various trusts within the John Hancock Fund Complex (since 2007). | |
| Salvatore Schiavone, Born: 1965 | 2009 |
| Treasurer | |
| Assistant Vice President, John Hancock Financial Services (since 2007); Vice President, John Hancock Investment Management LLC and John Hancock Variable Trust Advisers LLC (since 2007); Treasurer of various trusts within the John Hancock Fund Complex (since 2007, including prior positions). | |
| Christopher (Kit) Sechler, Born: 1973 | 2018 |
| Secretary and Chief Legal Officer | |
| Vice President and Deputy Chief Counsel, John Hancock Investment Management (since 2015); Assistant Vice President and Senior Counsel (2009–2015), John Hancock Investment Management; Assistant Secretary of John Hancock Investment Management LLC and John Hancock Variable Trust Advisers LLC (since 2009); Chief Legal Officer and Secretary of various trusts within the John Hancock Fund Complex (since 2009, including prior positions). | |
| ANNUAL REPORT | JOHN HANCOCK STRATEGIC INCOME OPPORTUNITIES FUND | 75 |
| Principal officers who are not Trustees (continued) | |
| Name, year of birth Position(s) held with Trust Principal occupation(s) during past 5 years | Current Position(s) with the Trust since |
| Trevor Swanberg, Born: 1979 | 2020 |
| Chief Compliance Officer | |
| Chief Compliance Officer, John Hancock Investment Management LLC and John Hancock Variable Trust Advisers LLC (since 2020); Deputy Chief Compliance Officer, John Hancock Investment Management LLC and John Hancock Variable Trust Advisers LLC (2019–2020); Assistant Chief Compliance Officer, John Hancock Investment Management LLC and John Hancock Variable Trust Advisers LLC (2016–2019); Vice President, State Street Global Advisors (2015–2016); Chief Compliance Officer of various trusts within the John Hancock Fund Complex (since 2016, including prior positions). | |
| 1 | Each Trustee holds office until his or her successor is elected and qualified, or until the Trustee’s death, retirement, resignation, or removal. Mr. Boyle has served as Trustee at various times prior to the date listed in the table. |
| 2 | Member of the Audit Committee. |
| 3 | The Trustee is a Non-Independent Trustee due to current or former positions with the Advisor and certain affiliates. |
| * | Appointed as Independent Trustee effective as of September 15, 2020. |
| 76 | JOHN HANCOCK STRATEGIC INCOME OPPORTUNITIES FUND | ANNUAL REPORT |
Steven R. Pruchansky, Vice Chairperson
Andrew G. Arnott†
Charles L. Bardelis*
James R. Boyle
Peter S. Burgess*
William H. Cunningham
Grace K. Fey
Marianne Harrison†
Deborah C. Jackson
Frances G. Rathke*,1
Gregory A. Russo
President
Chief Financial Officer
Treasurer
Secretary and Chief Legal Officer
Chief Compliance Officer
Thomas C. Goggins
Daniel S. Janis III
Kisoo Park
| You can also contact us: | ||
| 800-225-5291 | Regular mail: | Express mail: |
| jhinvestments.com | John Hancock Signature Services, Inc. P.O. Box 219909 Kansas City, MO 64121-9909 | John Hancock Signature Services, Inc. 430 W 7th Street Suite 219909 Kansas City, MO 64105-1407 |
| ANNUAL REPORT | JOHN HANCOCK STRATEGIC INCOME OPPORTUNITIES FUND | 77 |
GOVERNANCE FUNDS
with a heritage of financial stewardship dating back to 1862. Helping
our shareholders pursue their financial goals is at the core of everything
we do. It’s why we support the role of professional financial advice
and operate with the highest standards of conduct and integrity.
We search the world to find proven portfolio teams with specialized
expertise for every strategy we offer, then we apply robust investment
oversight to ensure they continue to meet our uncompromising
standards and serve the best interests of our shareholders.
a diverse set of investments backed by some of the world’s best
managers, along with strong risk-adjusted returns across asset classes.
200 Berkeley Street, Boston, MA 02116-5010, 800-225-5291, jhinvestments.com
| MF1823054 | 356A 8/21 |


President and CEO,
John Hancock Investment Management
Head of Wealth and Asset Management,
United States and Europe
| ANNUAL REPORT | JOHN HANCOCK FLOATING RATE INCOME FUND | 1 |

| 2 | JOHN HANCOCK FLOATING RATE INCOME FUND | ANNUAL REPORT |

| ANNUAL REPORT | JOHN HANCOCK FLOATING RATE INCOME FUND | 3 |


| 4 | JOHN HANCOCK FLOATING RATE INCOME FUND | ANNUAL REPORT |
| COUNTRY COMPOSITION AS OF 8/31/2021 (% of total investments) | |
| United States | 82.0 |
| Luxembourg | 4.4 |
| United Kingdom | 2.9 |
| Cayman Islands | 1.8 |
| Netherlands | 1.6 |
| France | 1.5 |
| Canada | 1.2 |
| Other countries | 4.6 |
| TOTAL | 100.0 |
ANNUAL REPORT | JOHN HANCOCK FLOATING RATE INCOME FUND | 5 |

| 6 | JOHN HANCOCK FLOATING RATE INCOME FUND | ANNUAL REPORT |
| Average annual total returns (%) with maximum sales charge | Cumulative total returns (%) with maximum sales charge | SEC 30-day yield (%) subsidized | SEC 30-day yield (%) unsubsidized† | |||||
| 1-year | 5-year | 10-year | 5-year | 10-year | as of 8-31-21 | as of 8-31-21 | ||
| Class A | 5.73 | 3.43 | 3.68 | 18.38 | 43.60 | 3.28 | 3.21 | |
| Class C | 6.58 | 3.17 | 3.20 | 16.91 | 37.05 | 2.61 | 2.54 | |
| Class I1 | 8.52 | 4.20 | 4.25 | 22.81 | 51.62 | 3.59 | 3.54 | |
| Class R61 | 8.77 | 4.33 | 4.34 | 23.60 | 52.89 | 3.70 | 3.64 | |
| Class 11 | 8.74 | 4.29 | 4.33 | 23.38 | 52.72 | 3.66 | 3.60 | |
| Class NAV1 | 8.78 | 4.34 | 4.38 | 23.66 | 53.46 | 3.70 | 3.65 | |
| Index†† | 8.39 | 4.63 | 4.89 | 25.39 | 61.22 | — | — | |
| Class A | Class C | Class I | Class R6 | Class 1 | Class NAV | |
| Gross (%) | 1.19 | 1.94 | 0.94 | 0.83 | 0.87 | 0.82 |
| Net (%) | 1.01 | 1.76 | 0.78 | 0.67 | 0.71 | 0.67 |
| ANNUAL REPORT | JOHN HANCOCK FLOATING RATE INCOME FUND | 7 |

| Start date | With maximum sales charge ($) | Without sales charge ($) | Index ($) | |
| Class C2 | 8-31-11 | 13,705 | 13,705 | 16,122 |
| Class I1 | 8-31-11 | 15,162 | 15,162 | 16,122 |
| Class R61 | 8-31-11 | 15,289 | 15,289 | 16,122 |
| Class 11 | 8-31-11 | 15,272 | 15,272 | 16,122 |
| Class NAV1 | 8-31-11 | 15,346 | 15,346 | 16,122 |
| 1 | For certain types of investors, as described in the fund’s prospectuses. |
| 2 | The contingent deferred sales charge is not applicable. |
| 8 | JOHN HANCOCK FLOATING RATE INCOME FUND | ANNUAL REPORT |

| ANNUAL REPORT | JOHN HANCOCK FLOATING RATE INCOME FUND | 9 |
| Account value on 3-1-2021 | Ending value on 8-31-2021 | Expenses paid during period ended 8-31-20211 | Annualized expense ratio | ||
| Class A | Actual expenses/actual returns | $1,000.00 | $1,018.10 | $5.09 | 1.00% |
| Hypothetical example | 1,000.00 | 1,020.20 | 5.09 | 1.00% | |
| Class C | Actual expenses/actual returns | 1,000.00 | 1,014.20 | 8.88 | 1.75% |
| Hypothetical example | 1,000.00 | 1,016.40 | 8.89 | 1.75% | |
| Class I | Actual expenses/actual returns | 1,000.00 | 1,019.30 | 3.92 | 0.77% |
| Hypothetical example | 1,000.00 | 1,021.30 | 3.92 | 0.77% | |
| Class R6 | Actual expenses/actual returns | 1,000.00 | 1,019.90 | 3.36 | 0.66% |
| Hypothetical example | 1,000.00 | 1,021.90 | 3.36 | 0.66% | |
| Class 1 | Actual expenses/actual returns | 1,000.00 | 1,019.60 | 3.56 | 0.70% |
| Hypothetical example | 1,000.00 | 1,021.70 | 3.57 | 0.70% | |
| Class NAV | Actual expenses/actual returns | 1,000.00 | 1,019.80 | 3.36 | 0.66% |
| Hypothetical example | 1,000.00 | 1,021.90 | 3.36 | 0.66% |
| 1 | Expenses are equal to the annualized expense ratio, multiplied by the average account value over the period, multiplied by 184/365 (to reflect the one-half year period). |
| 10 | JOHN HANCOCK FLOATING RATE INCOME FUND | ANNUAL REPORT |
| Rate (%) | Maturity date | Par value^ | Value | ||
| Term loans (A) 86.4% | $1,513,077,893 | ||||
| (Cost $1,511,715,492) | |||||
| Communication services 12.4% | 216,937,121 | ||||
| Diversified telecommunication services 3.1% | |||||
| Cablevision Lightpath LLC, Term Loan B (1 month LIBOR + 3.250%) | 3.750 | 11-30-27 | 2,612,507 | 2,607,282 | |
| Cincinnati Bell, Inc., 2017 Term Loan (1 month LIBOR + 3.250%) | 4.250 | 10-02-24 | 4,799,405 | 4,792,541 | |
| Connect Finco SARL, 2021 Term Loan B (1 month LIBOR + 3.500%) | 4.500 | 12-11-26 | 2,320,575 | 2,318,161 | |
| Cyxtera DC Holdings, Inc., Incremental Term Loan (6 month LIBOR + 4.000%) | 5.000 | 05-01-24 | 507,495 | 498,614 | |
| Cyxtera DC Holdings, Inc., Term Loan B (6 month LIBOR + 3.000%) | 4.000 | 05-01-24 | 9,454,592 | 9,281,762 | |
| Frontier Communications Holdings LLC, 2021 DIP Term Loan B (1 month LIBOR + 3.750%) | 4.500 | 05-01-28 | 2,426,597 | 2,422,060 | |
| Gridiron Fiber Corp., 2021 Term Loan (B) | TBD | 08-17-28 | 2,849,920 | 2,707,424 | |
| Intelsat Jackson Holdings SA, 2017 Term Loan B5 (C) | 0.000 | 01-02-24 | 4,606,230 | 4,678,917 | |
| Level 3 Financing, Inc., 2019 Term Loan B (1 month LIBOR + 1.750%) | 1.835 | 03-01-27 | 4,498,066 | 4,430,595 | |
| Lumen Technologies, Inc., 2020 Term Loan B (1 month LIBOR + 2.250%) | 2.335 | 03-15-27 | 3,483,083 | 3,438,082 | |
| Metronet Systems Holdings LLC, 2021 1st Lien Term Loan (1 month LIBOR + 3.750%) | 4.500 | 05-26-28 | 3,257,706 | 3,252,005 | |
| Radiate Holdco LLC, 2020 Term Loan (1 month LIBOR + 3.500%) | 4.250 | 09-25-26 | 7,502,623 | 7,482,141 | |
| Telesat LLC, Term Loan B5 (2 month LIBOR + 2.750%) | 2.860 | 12-07-26 | 1,217,961 | 1,123,472 | |
| Zayo Group Holdings, Inc., USD Term Loan (1 month LIBOR + 3.000%) | 3.085 | 03-09-27 | 5,824,571 | 5,745,474 | |
| Entertainment 0.6% | |||||
| Playtika Holding Corp., 2021 Term Loan (1 month LIBOR + 2.750%) | 2.835 | 03-13-28 | 1,552,633 | 1,546,112 | |
| SEE NOTES TO FINANCIAL STATEMENTS | ANNUAL REPORT | JOHN HANCOCK FLOATING RATE INCOME FUND | 11 |
| Rate (%) | Maturity date | Par value^ | Value | ||
| Communication services (continued) | |||||
| Entertainment (continued) | |||||
| Technicolor SA, 2020 EUR Delayed Draw Term Loan B2 (6 month EURIBOR + 6.000% or 6.000% PIK) | 6.000 | 06-30-24 | EUR | 330,379 | $433,981 |
| Technicolor SA, 2020 EUR Super Senior Term Loan (3 month EURIBOR + 6.000% or 6.000% PIK) | 6.000 | 06-30-24 | EUR | 298,947 | 382,985 |
| Technicolor SA, 2020 EUR Term Loan B1 (6 month EURIBOR + 3.000% or 3.000% PIK) | 3.000 | 12-31-24 | EUR | 246,926 | 280,989 |
| Technicolor SA, 2020 USD Term Loan B2 (3 month LIBOR + 2.750% or 3.000% PIK) | 2.954 | 12-31-24 | 1,777,483 | 1,713,050 | |
| Technicolor USA, Inc., 2020 PIK USD New Money Term Loan (6 month LIBOR + 6.000% or 6.000% PIK) | 6.153 | 06-30-24 | 90,188 | 96,952 | |
| William Morris Endeavor Entertainment LLC, 2018 1st Lien Term Loan (1 month LIBOR + 2.750%) | 2.840 | 05-18-25 | 5,898,005 | 5,731,210 | |
| Interactive media and services 2.4% | |||||
| Adevinta ASA, USD Term Loan B (3 month LIBOR + 3.000%) | 3.750 | 06-26-28 | 3,412,552 | 3,406,580 | |
| Arches Buyer, Inc., 2021 Term Loan B (1 month LIBOR + 3.250%) | 3.750 | 12-06-27 | 7,335,423 | 7,262,069 | |
| Endurance International Group Holdings, Inc., Term Loan (3 month LIBOR + 3.500%) | 4.250 | 02-10-28 | 4,890,818 | 4,852,621 | |
| Knot Worldwide, Inc., 1st Lien Term Loan (2 and 3 month LIBOR + 4.500%) | 4.628 | 12-19-25 | 8,817,509 | 8,799,168 | |
| MH Sub I LLC, 2017 1st Lien Term Loan (1 month LIBOR + 3.500%) | 3.585 | 09-13-24 | 10,254,322 | 10,189,104 | |
| MH Sub I LLC, 2020 Incremental Term Loan (1 month LIBOR + 3.750%) | 4.750 | 09-13-24 | 2,779,456 | 2,782,430 | |
| ZoomInfo LLC, 2021 Term Loan B (1 month LIBOR + 3.000%) | 3.085 | 02-02-26 | 4,620,279 | 4,617,414 | |
| Media 5.9% | |||||
| Altice Financing SA, 2017 USD Term Loan B (1 month LIBOR + 2.750%) | 2.876 | 07-15-25 | 4,124,653 | 4,043,314 | |
| Altice France SA, USD Term Loan B12 (3 month LIBOR + 3.688%) | 3.814 | 01-31-26 | 4,475,691 | 4,432,053 | |
| AppLovin Corp., 2018 Term Loan B (1 month LIBOR + 3.250%) | 3.335 | 08-15-25 | 7,017,711 | 6,991,395 | |
| 12 | JOHN HANCOCK FLOATING RATE INCOME FUND | ANNUAL REPORT | SEE NOTES TO FINANCIAL STATEMENTS |
| Rate (%) | Maturity date | Par value^ | Value | ||
| Communication services (continued) | |||||
| Media (continued) | |||||
| CMI Marketing, Inc., 2021 Term Loan B (1 month LIBOR + 4.750%) | 5.500 | 03-23-28 | 2,456,876 | $2,463,018 | |
| CSC Holdings LLC, 2017 Term Loan B1 (1 month LIBOR + 2.250%) | 2.345 | 07-17-25 | 2,176,581 | 2,143,149 | |
| CSC Holdings LLC, 2018 Incremental Term Loan (1 month LIBOR + 2.250%) | 2.345 | 01-15-26 | 1,533,735 | 1,508,259 | |
| CSC Holdings LLC, 2019 Term Loan B5 (1 month LIBOR + 2.500%) | 2.595 | 04-15-27 | 5,756,948 | 5,679,863 | |
| Digital Media Solutions LLC, Term Loan B (1 month LIBOR + 4.750%) | 5.750 | 05-25-26 | 2,543,627 | 2,523,482 | |
| Directv Financing LLC, Term Loan (1 month LIBOR + 5.000%) | 5.750 | 07-22-27 | 2,405,387 | 2,404,016 | |
| Hunter US Bidco, Inc., USD Term Loan B (3 month LIBOR + 4.250%) | 4.750 | 08-04-28 | 6,521,872 | 6,521,872 | |
| Lorca Finco PLC, EUR New Money Term Loan B2 (6 month EURIBOR + 4.250%) | 4.250 | 09-17-27 | EUR | 6,264,279 | 7,413,637 |
| Magnite, Inc., Term Loan (3 and 6 month LIBOR + 5.000%) | 5.750 | 04-28-28 | 1,009,211 | 1,001,642 | |
| Mediaocean LLC, Term Loan B (1 month LIBOR + 4.000%) | 4.092 | 08-18-25 | 1,958,837 | 1,958,837 | |
| National CineMedia LLC, 2018 Term Loan B (1 month LIBOR + 4.000%) | 5.000 | 06-20-25 | 382,313 | 334,287 | |
| National CineMedia LLC, 2021 Incremental Term Loan (1 month LIBOR + 8.000%) | 9.000 | 12-20-24 | 158,708 | 159,501 | |
| Recorded Books, Inc., 2021 Term Loan (1 month LIBOR + 4.000%) | 4.096 | 08-29-25 | 5,276,151 | 5,265,176 | |
| Research Now Group LLC, 2017 1st Lien Term Loan (6 month LIBOR + 5.500%) | 6.500 | 12-20-24 | 9,775,582 | 9,610,668 | |
| Research Now Group LLC, 2017 2nd Lien Term Loan (6 month LIBOR + 9.500%) | 10.500 | 12-20-25 | 629,484 | 620,042 | |
| Springer Nature Deutschland GmbH, 2021 USD Term Loan B18 (1 month LIBOR + 3.000%) | 3.750 | 08-14-26 | 790,525 | 788,976 | |
| Telenet Financing USD LLC, 2020 USD Term Loan AR (1 month LIBOR + 2.000%) | 2.096 | 04-30-28 | 6,882,883 | 6,773,514 | |
| Trader Interactive LLC, 2021 Term Loan B (B) | TBD | 07-21-28 | 1,301,231 | 1,297,977 | |
| SEE NOTES TO FINANCIAL STATEMENTS | ANNUAL REPORT | JOHN HANCOCK FLOATING RATE INCOME FUND | 13 |
| Rate (%) | Maturity date | Par value^ | Value | ||
| Communication services (continued) | |||||
| Media (continued) | |||||
| United Talent Agency LLC, Term Loan B (3 month LIBOR + 4.000%) | 4.750 | 07-07-28 | 2,673,059 | $2,653,011 | |
| UPC Broadband Holding BV, 2020 EUR Term Loan AU (6 month EURIBOR + 2.500%) | 2.500 | 04-30-29 | EUR | 663,626 | 773,429 |
| UPC Financing Partnership, 2020 USD Term Loan AT (1 month LIBOR + 2.250%) | 2.346 | 04-30-28 | 1,153,790 | 1,137,567 | |
| UPC Financing Partnership, 2021 USD Term Loan AX (1 month LIBOR + 3.000%) | 3.096 | 01-31-29 | 2,104,677 | 2,091,902 | |
| Virgin Media Bristol LLC, 2020 USD Term Loan Q (1 month LIBOR + 3.250%) | 3.346 | 01-31-29 | 8,046,999 | 8,030,663 | |
| Virgin Media Ireland, Ltd., EUR Term Loan (3 month EURIBOR + 3.500%) | 3.500 | 06-17-29 | EUR | 2,900,851 | 3,404,938 |
| WideOpenWest Finance LLC, 2017 Term Loan B (1 month LIBOR + 3.250%) | 4.250 | 08-18-23 | 5,780,435 | 5,768,065 | |
| Ziggo Financing Partnership, USD Term Loan I (1 month LIBOR + 2.500%) | 2.596 | 04-30-28 | 5,753,885 | 5,690,765 | |
| Wireless telecommunication services 0.4% | |||||
| Crown Subsea Communications Holding, Inc., 2021 Term Loan (1 month LIBOR + 5.000%) | 5.750 | 04-20-27 | 3,185,479 | 3,202,745 | |
| Eagle Broadband Investments LLC, Term Loan (3 month LIBOR + 3.000%) | 3.750 | 11-12-27 | 1,125,790 | 1,124,383 | |
| Matterhorn Telecom SA, 2020 EUR Term Loan B (3 month EURIBOR + 2.625%) | 2.625 | 09-15-26 | EUR | 1,921,971 | 2,251,780 |
| Consumer discretionary 14.0% | 244,985,059 | ||||
| Auto components 0.5% | |||||
| IXS Holdings, Inc., 2020 Term Loan B (3 month LIBOR + 4.250%) | 5.000 | 03-05-27 | 3,806,466 | 3,790,289 | |
| Truck Hero, Inc., 2021 Term Loan B (1 month LIBOR + 3.250%) | 4.500 | 01-31-28 | 4,235,087 | 4,214,970 | |
| Automobiles 1.1% | |||||
| Constellation Automotive, Ltd., GBP 2nd Lien Term Loan B (B) | TBD | 06-30-29 | GBP | 1,063,679 | 1,475,195 |
| Drive Chassis Holdco LLC, 2019 2nd Lien Term Loan (3 month LIBOR + 7.000%) | 7.119 | 04-10-26 | 6,265,950 | 6,330,552 | |
| 14 | JOHN HANCOCK FLOATING RATE INCOME FUND | ANNUAL REPORT | SEE NOTES TO FINANCIAL STATEMENTS |
| Rate (%) | Maturity date | Par value^ | Value | ||
| Consumer discretionary (continued) | |||||
| Automobiles (continued) | |||||
| OEConnection LLC, 2019 Term Loan B (1 month LIBOR + 4.000%) | 4.086 | 09-25-26 | 3,985,841 | $3,954,273 | |
| RVR Dealership Holdings LLC, Term Loan B (3 month LIBOR + 4.000%) | 4.750 | 02-08-28 | 3,176,617 | 3,168,676 | |
| Thor Industries, Inc., 2021 EUR Term Loan (1 month EURIBOR + 3.000%) | 3.000 | 02-01-26 | EUR | 748,191 | 881,775 |
| Thor Industries, Inc., 2021 USD Term Loan (1 month LIBOR + 3.000%) | 3.125 | 02-01-26 | 530,090 | 529,427 | |
| Wheel Pros, Inc., 2021 Term Loan (1 month LIBOR + 4.500%) | 5.250 | 05-11-28 | 2,972,475 | 2,972,475 | |
| Distributors 0.7% | |||||
| Northwest Fiber LLC, 2021 Term Loan (1 month LIBOR + 3.750%) | 3.847 | 04-30-27 | 4,350,914 | 4,342,212 | |
| Polyconcept North America Holdings, Inc., USD 2016 Term Loan B (3 month LIBOR + 4.500%) | 5.500 | 08-16-23 | 7,574,988 | 7,366,676 | |
| Diversified consumer services 1.9% | |||||
| Foundational Education Group, Inc., Term Loan (B) | TBD | 08-17-28 | 3,976,390 | 3,946,567 | |
| Midas Intermediate Holdco II LLC, 2020 Term Loan B (3 month LIBOR + 6.750%) | 7.500 | 12-22-25 | 6,936,914 | 6,712,575 | |
| PCI Gaming Authority, Term Loan (1 month LIBOR + 2.500%) | 2.585 | 05-29-26 | 3,059,337 | 3,034,740 | |
| Safe Fleet Holdings LLC, 2018 1st Lien Term Loan (6 month LIBOR + 3.000%) | 4.000 | 02-03-25 | 5,000,091 | 4,939,390 | |
| SRS Distribution, Inc., 2021 Term Loan B (3 month LIBOR + 3.750%) | 4.250 | 06-02-28 | 6,677,391 | 6,652,350 | |
| Verisure Holding AB, 2020 EUR Term Loan B (3 month EURIBOR + 3.250%) | 3.250 | 07-20-26 | EUR | 1,706,977 | 2,003,884 |
| Verisure Holding AB, 2021 EUR Term Loan (3 month EURIBOR + 3.250%) | 3.250 | 03-27-28 | EUR | 1,819,895 | 2,134,810 |
| Whatabrands LLC, 2021 Term Loan B (1 month LIBOR + 3.250%) | 3.750 | 07-12-28 | 3,188,847 | 3,177,877 | |
| Hotels, restaurants and leisure 5.0% | |||||
| Aimbridge Acquisition Company, Inc., 2019 Term Loan B (1 month LIBOR + 3.750%) | 3.835 | 02-02-26 | 8,536,978 | 8,266,612 | |
| SEE NOTES TO FINANCIAL STATEMENTS | ANNUAL REPORT | JOHN HANCOCK FLOATING RATE INCOME FUND | 15 |
| Rate (%) | Maturity date | Par value^ | Value | ||
| Consumer discretionary (continued) | |||||
| Hotels, restaurants and leisure (continued) | |||||
| Aimbridge Acquisition Company, Inc., 2020 Incremental Term Loan B (1 month LIBOR + 4.750%) | 5.500 | 02-02-26 | 114,265 | $112,980 | |
| Aristocrat International Pty, Ltd., 2018 1st Lien Term Loan (3 month LIBOR + 1.750%) | 1.884 | 10-19-24 | 2,380,635 | 2,358,329 | |
| Aristocrat International Pty, Ltd., 2020 Incremental Term Loan B (3 month LIBOR + 3.750%) | 4.750 | 10-19-24 | 302,791 | 302,942 | |
| Awaze, Ltd., EUR Incremental Term Loan B1 (6 month EURIBOR + 4.000%) | 4.000 | 05-09-25 | EUR | 698,925 | 827,319 |
| Bally’s Corp., 2021 Term Loan B (B) | TBD | 08-06-28 | 3,769,231 | 3,760,486 | |
| Caesars Resort Collection LLC, 2017 1st Lien Term Loan B (1 month LIBOR + 2.750%) | 2.835 | 12-23-24 | 5,571,460 | 5,521,428 | |
| Caesars Resort Collection LLC, 2020 Term Loan B1 (1 month LIBOR + 4.500%) | 4.585 | 07-21-25 | 1,645,406 | 1,647,627 | |
| Carrols Restaurant Group, Inc., Term Loan B (1 month LIBOR + 3.250%) | 3.340 | 04-30-26 | 2,430,635 | 2,392,669 | |
| Casablanca US Holdings, Inc., 2018 1st Lien Term Loan (1 month LIBOR + 4.000%) | 4.085 | 03-29-24 | 9,663,106 | 9,638,948 | |
| Compass III, Ltd. EUR Term Loan B2 (6 month EURIBOR + 4.000%) | 4.000 | 05-09-25 | EUR | 518,650 | 613,315 |
| Global Business Travel Holdings, Ltd., 2018 Term Loan B (1 month LIBOR + 2.500%) | 2.589 | 08-13-25 | 4,856,185 | 4,419,128 | |
| HNVR Holdco, Ltd., EUR Term Loan B (6 month EURIBOR + 4.250%) | 4.250 | 09-12-25 | EUR | 1,446,327 | 1,533,680 |
| HNVR Holdco, Ltd., EUR Term Loan C (6 month EURIBOR + 4.500%) | 4.500 | 09-12-27 | EUR | 2,352,406 | 2,487,928 |
| Hurtigruten Group AS, 2020 EUR Term Loan C (3 month EURIBOR + 8.000%) | 8.000 | 06-11-23 | EUR | 1,777,599 | 2,044,686 |
| Hurtigruten Group AS, EUR Term Loan B (6 month EURIBOR + 4.000%) | 4.000 | 02-24-25 | EUR | 2,124,041 | 2,315,551 |
| IRB Holding Corp., 2020 4th Amendment Incremental Term Loan (3 month LIBOR + 3.250%) | 4.250 | 12-15-27 | 2,918,925 | 2,915,276 | |
| IRB Holding Corp., 2020 Term Loan B (3 month LIBOR + 2.750%) | 3.750 | 02-05-25 | 5,892,932 | 5,869,007 | |
| 16 | JOHN HANCOCK FLOATING RATE INCOME FUND | ANNUAL REPORT | SEE NOTES TO FINANCIAL STATEMENTS |
| Rate (%) | Maturity date | Par value^ | Value | ||
| Consumer discretionary (continued) | |||||
| Hotels, restaurants and leisure (continued) | |||||
| Lakeland Holdings LLC, 2020 HoldCo Term Loan (0.000% Cash or 13.250% PIK) | 13.250 | 09-25-27 | 405,838 | $254,327 | |
| Lakeland Tours LLC, 2020 Priority Exit PIK Term Loan (3 month LIBOR + 6.000% or 6.000% PIK) | 7.250 | 09-25-23 | 169,133 | 169,471 | |
| Lakeland Tours LLC, 2020 Second Out Term Loan (3 month LIBOR + 1.500% or 6.000% PIK) | 2.750 | 09-25-25 | 312,560 | 301,230 | |
| Lakeland Tours LLC, 2020 Third Out Term Loan (3 month LIBOR + 1.500% or 6.000% PIK) | 2.750 | 09-25-25 | 392,373 | 336,786 | |
| MIC Glen LLC, 2021 Term Loan (B) | TBD | 07-21-28 | 915,251 | 909,366 | |
| New Red Finance, Inc., Term Loan B4 (1 month LIBOR + 1.750%) | 1.835 | 11-19-26 | 5,309,075 | 5,213,937 | |
| Scientific Games International, Inc., 2018 Term Loan B5 (1 month LIBOR + 2.750%) | 2.835 | 08-14-24 | 7,257,821 | 7,188,509 | |
| Stars Group Holdings BV, Term Loan (B) | TBD | 07-21-26 | EUR | 1,620,943 | 1,910,465 |
| Travel Leaders Group LLC, 2018 Term Loan B (1 month LIBOR + 4.000%) | 4.085 | 01-25-24 | 9,195,285 | 8,505,638 | |
| Vue International Bidco PLC, 2019 EUR Term Loan B (6 month EURIBOR + 4.750%) | 4.750 | 07-03-26 | EUR | 4,389,732 | 4,777,958 |
| Wyndham Hotels & Resorts, Inc., Term Loan B (1 month LIBOR + 1.750%) | 1.835 | 05-30-25 | 1,815,136 | 1,794,716 | |
| Household durables 0.2% | |||||
| LSFX Flavum Bidco SA, 2020 EUR Term Loan (6 month EURIBOR + 4.500%) | 4.500 | 02-12-27 | EUR | 1,410,972 | 1,669,471 |
| LSFX Flavum Bidco SA, 2021 EUR Incremental Term Loan B4 (3 month EURIBOR + 4.500%) | 4.500 | 02-28-28 | EUR | 1,146,988 | 1,353,182 |
| Leisure products 1.6% | |||||
| Abe Investment Holdings, Inc., 2019 EUR Term Loan B (1 month EURIBOR + 5.000%) | 5.000 | 02-19-26 | EUR | 1,854,055 | 2,191,913 |
| Abe Investment Holdings, Inc., 2019 USD Term Loan B (1 month LIBOR + 4.500%) | 4.625 | 02-19-26 | 4,945,632 | 4,934,307 | |
| ABG Intermediate Holdings 2 LLC, 2021 Term Loan B (3 month LIBOR + 3.250%) | 4.000 | 09-27-24 | 1,962,101 | 1,952,899 | |
| Amer Sports Holding Oy, EUR Term Loan B (6 month EURIBOR + 4.500%) | 4.500 | 03-30-26 | EUR | 4,291,351 | 5,069,143 |
| SEE NOTES TO FINANCIAL STATEMENTS | ANNUAL REPORT | JOHN HANCOCK FLOATING RATE INCOME FUND | 17 |
| Rate (%) | Maturity date | Par value^ | Value | ||
| Consumer discretionary (continued) | |||||
| Leisure products (continued) | |||||
| Hayward Industries, Inc., 2021 Term Loan (1 month LIBOR + 2.500%) | 3.000 | 05-12-28 | 3,971,696 | $3,951,003 | |
| J&J Ventures Gaming LLC, Term Loan (1 month LIBOR + 4.000%) | 4.750 | 04-07-28 | 1,454,074 | 1,457,709 | |
| PlayPower, Inc., 2019 Term Loan (3 month LIBOR + 5.500%) | 5.647 | 05-08-26 | 2,785,463 | 2,753,263 | |
| Recess Holdings, Inc. 2017 1st Lien Term Loan (3 and 6 month LIBOR + 3.750%) | 4.750 | 09-30-24 | 3,851,779 | 3,833,483 | |
| SRAM LLC, 2021 Term Loan B (1, 3 and 6 month LIBOR + 2.750%) | 3.250 | 05-12-28 | 2,475,336 | 2,461,920 | |
| Specialty retail 2.4% | |||||
| Ascena Retail Group, Inc., 2015 Term Loan B (C) | 0.000 | 08-21-22 | 2,333,303 | 55,439 | |
| At Home Group, Inc., Term Loan B (3 month LIBOR + 4.250%) | 4.750 | 07-24-28 | 3,475,338 | 3,465,190 | |
| CWGS Group LLC, 2021 Term Loan B (1 month LIBOR + 2.500%) | 3.250 | 06-03-28 | 5,889,351 | 5,832,931 | |
| Eyemart Express LLC, 2021 Term Loan (3 month LIBOR + 3.000%) | 4.000 | 08-05-27 | 5,313,224 | 5,293,299 | |
| Harbor Freight Tools USA, Inc., 2021 Term Loan B (1 month LIBOR + 2.750%) | 3.250 | 10-19-27 | 9,678,388 | 9,638,803 | |
| Mavis Tire Express Services TopCo LP, 2021 Term Loan B (3 month LIBOR + 4.000%) | 4.750 | 05-04-28 | 6,143,622 | 6,140,182 | |
| Parfuemerie Douglas International GmbH, 2021 EUR Term Loan B (B) | TBD | 03-26-26 | EUR | 689,829 | 807,731 |
| Petco Health & Wellness Company, Inc., 2021 Term Loan B (3 month LIBOR + 3.250%) | 4.000 | 03-03-28 | 3,729,935 | 3,720,610 | |
| The Michaels Companies, Inc., 2021 Term Loan B (1 month LIBOR + 4.250%) | 5.000 | 04-15-28 | 3,760,379 | 3,760,379 | |
| Winterfell Financing Sarl, EUR Term Loan B (3 month EURIBOR + 3.500%) | 3.500 | 05-04-28 | EUR | 2,973,402 | 3,483,637 |
| Textiles, apparel and luxury goods 0.6% | |||||
| Calceus Acquisition, Inc., Term Loan B (3 month LIBOR + 5.500%) | 5.621 | 02-12-25 | 3,192,812 | 3,033,171 | |
| New Trojan Parent, Inc., Term Loan (3 month LIBOR + 3.250%) | 3.750 | 01-06-28 | 3,731,203 | 3,705,569 | |
| Tory Burch LLC, Term Loan B (1 month LIBOR + 3.500%) | 4.000 | 04-14-28 | 4,416,432 | 4,400,798 | |
| 18 | JOHN HANCOCK FLOATING RATE INCOME FUND | ANNUAL REPORT | SEE NOTES TO FINANCIAL STATEMENTS |
| Rate (%) | Maturity date | Par value^ | Value | ||
| Consumer staples 2.8% | $49,105,219 | ||||
| Beverages 0.5% | |||||
| Refresco Holding BV, EUR Term Loan B1 (3 month EURIBOR + 3.000%) | 3.000 | 03-28-25 | EUR | 1,425,082 | 1,675,011 |
| Refresco Holding BV, GBP Term Loan B2 (3 month GBP LIBOR + 3.750%) | 3.818 | 03-28-25 | GBP | 5,300,000 | 7,249,398 |
| Food and staples retailing 0.9% | |||||
| H-Food Holdings LLC, 2018 Term Loan B (1 month LIBOR + 3.688%) | 3.772 | 05-23-25 | 7,431,932 | 7,354,120 | |
| L1R HB Finance, Ltd., GBP Term Loan B (3 month GBP LIBOR + 5.250%) | 5.329 | 09-02-24 | GBP | 6,000,000 | 7,923,261 |
| Food products 0.7% | |||||
| Biscuit Holding SASU, EUR Term Loan (6 month EURIBOR + 4.000%) | 4.000 | 02-15-27 | EUR | 4,043,211 | 4,624,167 |
| Froneri Lux FinCo SARL, 2020 EUR Term Loan B1 (6 month EURIBOR + 2.375%) | 2.375 | 01-29-27 | EUR | 1,752,602 | 2,026,715 |
| Froneri US, Inc., 2020 USD Term Loan (1 month LIBOR + 2.250%) | 2.335 | 01-29-27 | 615,243 | 605,417 | |
| Upfield BV, 2018 EUR Term Loan B1 (1 and 6 month EURIBOR + 3.500%) | 3.500 | 07-02-25 | EUR | 1,083,347 | 1,246,391 |
| Upfield BV, 2018 GBP Term Loan B4 (1 week GBP LIBOR + 4.000%) | 4.105 | 07-02-25 | GBP | 3,000,000 | 3,987,079 |
| Household products 0.5% | |||||
| Conair Holdings LLC, Term Loan B (3 month LIBOR + 3.750%) | 4.250 | 05-17-28 | 1,765,425 | 1,762,847 | |
| Kronos Acquisition Holdings, Inc., 2021 Term Loan B (3 month LIBOR + 3.750%) | 4.250 | 12-22-26 | 5,131,325 | 4,999,861 | |
| Reynolds Consumer Products LLC, Term Loan (1 month LIBOR + 1.750%) | 1.835 | 02-04-27 | 806,090 | 800,189 | |
| Spectrum Brands, Inc., 2021 Term Loan (3 month LIBOR + 2.000%) | 2.500 | 03-03-28 | 407,271 | 405,491 | |
| Personal products 0.2% | |||||
| Groupe Nocibe SASU, 2021 EUR Term Loan B4 (B) | TBD | 03-26-26 | EUR | 1,198,946 | 1,403,864 |
| Kirk Beauty Netherlands BV, 2021 EUR Term Loan B2 (B) | TBD | 03-26-26 | EUR | 363,343 | 425,444 |
| Kirk Beauty One GmbH, 2021 EUR Term Loan B3 (B) | TBD | 03-26-26 | EUR | 393,336 | 460,563 |
| SEE NOTES TO FINANCIAL STATEMENTS | ANNUAL REPORT | JOHN HANCOCK FLOATING RATE INCOME FUND | 19 |
| Rate (%) | Maturity date | Par value^ | Value | ||
| Consumer staples (continued) | |||||
| Personal products (continued) | |||||
| Nocibe France SAS, 2021 EUR Term Loan B5 (B) | TBD | 03-26-26 | EUR | 271,291 | $317,659 |
| Sunshine Luxembourg VII Sarl, 2021 Term Loan B3 (3 month LIBOR + 3.750%) | 4.500 | 10-01-26 | 1,836,823 | 1,837,742 | |
| Energy 0.3% | 5,130,167 | ||||
| Oil, gas and consumable fuels 0.3% | |||||
| Delek US Holdings, Inc., 2018 Term Loan B (1 month LIBOR + 2.250%) | 2.335 | 03-31-25 | 2,309,355 | 2,247,765 | |
| Northriver Midstream Finance LP, 2018 Term Loan B (3 month LIBOR + 3.250%) | 3.395 | 10-01-25 | 2,879,303 | 2,862,401 | |
| Quicksilver Resources, Inc., New 2nd Lien Term Loan (C)(D) | 0.000 | 06-21-22 | 20,001,303 | 20,001 | |
| Financials 6.6% | 115,866,813 | ||||
| Capital markets 1.0% | |||||
| Hightower Holding LLC, 2021 Term Loan B (3 month LIBOR + 4.000%) | 4.750 | 04-21-28 | 2,973,688 | 2,972,945 | |
| Jane Street Group LLC, 2021 Term Loan (1 month LIBOR + 2.750%) | 2.835 | 01-26-28 | 8,304,843 | 8,180,270 | |
| Jump Financial LLC, Term Loan B (1 month LIBOR + 3.500%) | 4.000 | 08-02-28 | 4,058,121 | 3,987,104 | |
| Sequa Mezzanine Holdings LLC, 2020 Extended Term Loan (3 month LIBOR + 6.750%) | 7.750 | 11-28-23 | 2,619,103 | 2,653,492 | |
| Consumer finance 0.1% | |||||
| Tegra118 Wealth Solutions, Inc., 2020 Term Loan B (3 month LIBOR + 4.000%) | 4.155 | 02-18-27 | 1,679,418 | 1,677,319 | |
| Diversified financial services 3.2% | |||||
| Advisor Group Holdings, Inc., 2021 Term Loan (1 month LIBOR + 4.500%) | 4.585 | 07-31-26 | 4,221,412 | 4,218,542 | |
| Atlas CC Acquisition Corp., Term Loan B (3 month LIBOR + 4.250%) | 5.000 | 05-25-28 | 4,794,446 | 4,805,089 | |
| Atlas CC Acquisition Corp., Term Loan C (3 month LIBOR + 4.250%) | 5.000 | 05-25-28 | 975,141 | 977,306 | |
| Citadel Securities LP, 2021 Term Loan B (1 month LIBOR + 2.500%) | 2.585 | 02-02-28 | 7,922,164 | 7,811,809 | |
| 20 | JOHN HANCOCK FLOATING RATE INCOME FUND | ANNUAL REPORT | SEE NOTES TO FINANCIAL STATEMENTS |
| Rate (%) | Maturity date | Par value^ | Value | ||
| Financials (continued) | |||||
| Diversified financial services (continued) | |||||
| CPC Acquisition Corp., Second Lien Term Loan (3 month LIBOR + 7.750%) | 8.500 | 12-29-28 | 1,623,176 | $1,631,292 | |
| CPC Acquisition Corp., Term Loan (3 month LIBOR + 3.750%) | 4.500 | 12-29-27 | 2,041,402 | 2,036,299 | |
| Cross Financial Corp., 2021 Term Loan B (1 month LIBOR + 4.000%) | 4.750 | 09-15-27 | 1,745,093 | 1,746,541 | |
| Crown Finance US, Inc., 2018 USD Term Loan (6 month LIBOR + 2.500%) | 3.500 | 02-28-25 | 6,070,409 | 4,723,203 | |
| Crown Finance US, Inc., 2020 Term Loan B1 (3 month LIBOR + 7.000% or 6.000% PIK) | 7.000 | 05-23-24 | 338,585 | 416,016 | |
| Crown Finance US, Inc., 2021 Incremental Term Loan B1 (3 month LIBOR + 8.250%) | 9.250 | 05-23-24 | 386,814 | 412,440 | |
| DRW Holdings LLC, 2021 Term Loan (1 month LIBOR + 3.750%) | 3.835 | 03-01-28 | 3,985,642 | 3,963,242 | |
| Hudson River Trading LLC, 2021 Term Loan (1 month LIBOR + 3.000%) | 3.085 | 03-20-28 | 4,868,922 | 4,793,259 | |
| Marnix SAS, 2021 USD Term Loan (B) | TBD | 07-29-28 | 2,427,304 | 2,415,167 | |
| Mercury Merger Sub, Inc., Term Loan (3 month LIBOR + 3.500%) | 4.000 | 08-02-28 | 9,203,975 | 9,156,299 | |
| Nexus Buyer LLC, Term Loan B (1 month LIBOR + 3.750%) | 3.839 | 11-09-26 | 4,139,528 | 4,127,689 | |
| Raptor Acquisition Corp., 2021 Term Loan (B) | TBD | 11-01-26 | 2,800,542 | 2,804,743 | |
| Insurance 1.4% | |||||
| Alliant Holdings Intermediate LLC, 2018 Term Loan B (1 month LIBOR + 3.250%) | 3.335 | 05-09-25 | 6,138,134 | 6,069,080 | |
| Alliant Holdings Intermediate LLC, 2020 Term Loan B3 (1 month LIBOR + 3.750%) | 4.250 | 11-05-27 | 1,331,460 | 1,331,300 | |
| Alliant Holdings Intermediate LLC, Term Loan B (1 month LIBOR + 3.250%) | 3.335 | 05-09-25 | 1,014,154 | 1,002,177 | |
| Amerilife Holdings LLC, 2020 Term Loan (1 month LIBOR + 4.000%) | 4.096 | 03-18-27 | 5,547,815 | 5,520,075 | |
| Asurion LLC, 2018 Term Loan B6 (1 month LIBOR + 3.125%) | 3.210 | 11-03-23 | 3,223,134 | 3,187,550 | |
| Asurion LLC, 2021 Term Loan B9 (1 month LIBOR + 3.250%) | 3.335 | 07-31-27 | 588,338 | 576,447 | |
| SEE NOTES TO FINANCIAL STATEMENTS | ANNUAL REPORT | JOHN HANCOCK FLOATING RATE INCOME FUND | 21 |
| Rate (%) | Maturity date | Par value^ | Value | ||
| Financials (continued) | |||||
| Insurance (continued) | |||||
| Baldwin Risk Partners LLC, 2021 Term Loan B (1 month LIBOR + 3.500%) | 4.000 | 10-14-27 | 4,118,550 | $4,100,552 | |
| HUB International, Ltd., 2018 Term Loan B (3 month LIBOR + 2.750%) | 2.875 | 04-25-25 | 3,112,678 | 3,075,575 | |
| Mortgage real estate investment trusts 0.9% | |||||
| Apollo Commercial Real Estate Finance, Inc., 2021 Incremental Term Loan B1 (1 month LIBOR + 3.500%) | 4.000 | 03-06-28 | 2,762,459 | 2,741,740 | |
| Apollo Commercial Real Estate Finance, Inc., Term Loan B (1 month LIBOR + 2.750%) | 2.839 | 05-15-26 | 526,405 | 517,193 | |
| Blackstone Mortgage Trust, Inc., 2019 Term Loan B (1 month LIBOR + 2.250%) | 2.335 | 04-23-26 | 619,886 | 612,138 | |
| Blackstone Mortgage Trust, Inc., 2021 Term Loan B2 (1 month LIBOR + 2.750%) | 3.250 | 04-23-26 | 1,833,780 | 1,822,319 | |
| Claros Mortgage Trust, Inc., Term Loan B (1 month LIBOR + 5.000%) | 6.000 | 08-09-26 | 7,376,139 | 7,376,139 | |
| KREF Holdings X LLC, Term Loan B (3 month LIBOR + 4.750%) | 5.750 | 08-05-27 | 1,356,413 | 1,353,021 | |
| Starwood Property Mortgage LLC, 2020 Incremental Term Loan B2 (3 month LIBOR + 3.500%) | 4.250 | 07-26-26 | 1,071,441 | 1,071,441 | |
| Health care 11.6% | 203,625,581 | ||||
| Biotechnology 0.1% | |||||
| Grifols Worldwide Operations USA, Inc., USD 2019 Term Loan B (1 week LIBOR + 2.000%) | 2.082 | 11-15-27 | 1,219,627 | 1,202,552 | |
| Health care equipment and supplies 1.5% | |||||
| ASP Navigate Acquisition Corp., Term Loan (1 and 3 month LIBOR + 4.500%) | 5.500 | 10-06-27 | 1,712,641 | 1,682,670 | |
| Auris Luxembourg III Sarl, 2019 USD Term Loan B2 (1 month LIBOR + 3.750%) | 3.835 | 02-27-26 | 2,442,899 | 2,403,202 | |
| Bayou Intermediate II LLC, Term Loan B (3 month LIBOR + 4.500%) | 5.250 | 05-13-28 | 1,700,550 | 1,701,622 | |
| Gloves Buyer, Inc., 2021 Term Loan (1 month LIBOR + 4.000%) | 4.750 | 01-20-28 | 2,214,020 | 2,207,112 | |
| Golden State Buyer, Inc., Term Loan (1 month LIBOR + 4.750%) | 5.500 | 06-21-26 | 4,586,120 | 4,574,655 | |
| 22 | JOHN HANCOCK FLOATING RATE INCOME FUND | ANNUAL REPORT | SEE NOTES TO FINANCIAL STATEMENTS |
| Rate (%) | Maturity date | Par value^ | Value | ||
| Health care (continued) | |||||
| Health care equipment and supplies (continued) | |||||
| Ortho-Clinical Diagnostics SA, 2018 Term Loan B (1 month LIBOR + 3.000%) | 3.091 | 06-30-25 | 3,441,033 | $3,436,009 | |
| Ortho-Clinical Diagnostics SA, EUR Term Loan B (3 month EURIBOR + 3.500%) | 3.500 | 06-30-25 | EUR | 1,315,212 | 1,549,054 |
| Solenis Holdings LLC, 2018 1st Lien Term Loan (1 month LIBOR + 4.000%) | 4.085 | 06-26-25 | 6,984,454 | 6,974,466 | |
| Solenis International LLC, 2018 2nd Lien Term Loan (1 month LIBOR + 8.500%) | 8.585 | 06-26-26 | 2,473,934 | 2,465,696 | |
| Health care providers and services 5.6% | |||||
| AHP Health Partners, Inc., 2021 Term Loan B (B) | TBD | 08-04-28 | 4,960,941 | 4,967,142 | |
| Da Vinci Purchaser Corp., 2019 Term Loan (1 month LIBOR + 4.000%) | 5.000 | 01-08-27 | 2,298,389 | 2,302,228 | |
| Ensemble RCM LLC, Term Loan (3 month LIBOR + 3.750%) | 3.879 | 08-03-26 | 4,839,634 | 4,834,456 | |
| Envision Healthcare Corp., 2018 1st Lien Term Loan (1 month LIBOR + 3.750%) | 3.835 | 10-10-25 | 4,348,655 | 3,813,249 | |
| eResearchTechnology, Inc., 2020 1st Lien Term Loan (1 month LIBOR + 4.500%) | 5.500 | 02-04-27 | 6,786,614 | 6,805,684 | |
| Genesiscare USA Holdings, Inc., 2020 EUR Term Loan B4 (3 month EURIBOR + 4.750%) | 4.750 | 05-14-27 | EUR | 1,782,202 | 2,112,669 |
| Genesiscare USA Holdings, Inc., 2020 USD Term Loan B5 (3 month LIBOR + 5.000%) | 6.000 | 05-14-27 | 2,072,807 | 2,057,261 | |
| Lancet Merger Sub, Inc., 2021 Term Loan (3 month LIBOR + 4.250%) | 5.000 | 08-04-28 | 2,670,052 | 2,663,377 | |
| MED ParentCo LP, 1st Lien Term Loan (1 month LIBOR + 4.250%) | 4.335 | 08-31-26 | 6,357,004 | 6,330,177 | |
| National Mentor Holdings, Inc., 2021 2nd Lien Term Loan (3 month LIBOR + 7.250%) | 8.250 | 03-02-29 | 2,136,611 | 2,171,331 | |
| National Mentor Holdings, Inc., 2021 Term Loan (1 and 3 month LIBOR + 3.750%) | 4.500 | 02-18-28 | 7,711,351 | 7,687,292 | |
| National Mentor Holdings, Inc., 2021 Term Loan C (3 month LIBOR + 3.750%) | 4.500 | 03-02-28 | 241,022 | 240,270 | |
| Option Care Health, Inc., Term Loan B (1 month LIBOR + 3.750%) | 3.835 | 08-06-26 | 6,184,115 | 6,170,201 | |
| SEE NOTES TO FINANCIAL STATEMENTS | ANNUAL REPORT | JOHN HANCOCK FLOATING RATE INCOME FUND | 23 |
| Rate (%) | Maturity date | Par value^ | Value | ||
| Health care (continued) | |||||
| Health care providers and services (continued) | |||||
| Pathway Vet Alliance LLC, 2021 Term Loan (1 month LIBOR + 3.750%) | 3.835 | 03-31-27 | 3,896,181 | $3,869,999 | |
| PetVet Care Centers LLC, 2018 1st Lien Term Loan (1 month LIBOR + 2.750%) | 2.835 | 02-14-25 | 5,231,274 | 5,157,147 | |
| PetVet Care Centers LLC, 2021 Term Loan B3 (1 month LIBOR + 3.500%) | 4.250 | 02-14-25 | 1,892,789 | 1,889,628 | |
| Phoenix Newco, Inc., 2021 1st Lien Term Loan (B) | TBD | 08-11-28 | 4,586,450 | 4,584,157 | |
| Precision Medicine Group LLC, 2021 Term Loan (3 month LIBOR + 3.000%) | 3.750 | 11-18-27 | 5,382,985 | 5,349,341 | |
| Radnet Management, Inc., 2021 Term Loan (Prime rate + 2.000% and 3 month LIBOR + 3.000%) | 3.754 | 04-22-28 | 1,555,184 | 1,548,698 | |
| Select Medical Corp., 2017 Term Loan B (1 month LIBOR + 2.250%) | 2.340 | 03-06-25 | 2,311,885 | 2,294,545 | |
| Team Health Holdings, Inc., 1st Lien Term Loan (1 month LIBOR + 2.750%) | 3.750 | 02-06-24 | 7,494,277 | 7,277,767 | |
| U.S. Anesthesia Partners, Inc., 2017 Term Loan (3 month LIBOR + 3.000%) | 4.000 | 06-23-24 | 4,764,831 | 4,721,137 | |
| Upstream Newco, Inc., 2021 Term Loan (1 month LIBOR + 4.250%) | 4.346 | 11-20-26 | 3,643,534 | 3,629,871 | |
| US Radiology Specialists, Inc., 2020 Term Loan (3 month LIBOR + 5.500%) | 6.250 | 12-10-27 | 3,727,174 | 3,739,995 | |
| VetCor Professional Practices LLC, 2018 1st Lien Term Loan (1 and 6 month LIBOR + 3.000%) | 3.158 | 07-02-25 | 2,029,842 | 1,998,278 | |
| Health care technology 1.0% | |||||
| Athenahealth, Inc., 2021 Term Loan B1 (1 and 3 month LIBOR + 4.250%) | 4.377 | 02-11-26 | 7,333,702 | 7,352,036 | |
| Change Healthcare Holdings LLC, 2017 Term Loan B (1 and 3 month LIBOR + 2.500%) | 3.500 | 03-01-24 | 5,504,581 | 5,490,820 | |
| GHX Ultimate Parent Corp., 2017 1st Lien Term Loan (3 month LIBOR + 3.000%) | 4.000 | 06-28-24 | 4,542,624 | 4,526,997 | |
| Imprivata, Inc., Term Loan (3 month LIBOR + 3.500%) | 4.000 | 12-01-27 | 1,046,929 | 1,045,128 | |
| 24 | JOHN HANCOCK FLOATING RATE INCOME FUND | ANNUAL REPORT | SEE NOTES TO FINANCIAL STATEMENTS |
| Rate (%) | Maturity date | Par value^ | Value | ||
| Health care (continued) | |||||
| Life sciences tools and services 0.5% | |||||
| Cambrex Corp., 2021 Term Loan (1 month LIBOR + 3.500%) | 4.250 | 12-04-26 | 1,588,177 | $1,585,001 | |
| ICON Luxembourg Sarl, LUX Term Loan (3 month LIBOR + 2.500%) | 3.000 | 07-03-28 | 3,131,188 | 3,127,931 | |
| Indigo Merger Sub, Inc., US Term Loan (3 month LIBOR + 2.500%) | 3.000 | 07-03-28 | 780,137 | 779,326 | |
| Maravai Intermediate Holdings LLC, 2020 Term Loan B (1 month LIBOR + 3.750%) | 4.750 | 10-19-27 | 925,765 | 927,506 | |
| Packaging Coordinators Midco, Inc., 2020 1st Lien Term Loan (1 month LIBOR + 3.500%) | 4.250 | 11-30-27 | 2,236,356 | 2,233,001 | |
| Pharmaceuticals 2.9% | |||||
| AI Sirona Luxembourg Acquisition Sarl, 2021 EUR Term Loan B (1 month EURIBOR + 3.750%) | 3.750 | 09-29-25 | EUR | 2,440,813 | 2,870,896 |
| Amneal Pharmaceuticals LLC, 2018 Term Loan B (1 month LIBOR + 3.500%) | 3.625 | 05-04-25 | 8,299,641 | 8,162,199 | |
| Bausch Health Americas, Inc., 2018 Term Loan B (1 month LIBOR + 3.000%) | 3.085 | 06-02-25 | 8,177,689 | 8,145,715 | |
| Curium Bidco Sarl, 2020 USD 2nd Lien Term Loan (3 month LIBOR + 7.750%) | 8.500 | 10-27-28 | 1,887,300 | 1,901,454 | |
| Curium Bidco Sarl, 2020 USD Term Loan (3 month LIBOR + 4.250%) | 5.000 | 12-02-27 | 1,545,524 | 1,542,634 | |
| Curium Bidco Sarl, USD Term Loan B (3 month LIBOR + 4.000%) | 4.147 | 07-09-26 | 2,505,788 | 2,499,524 | |
| Elanco Animal Health, Inc., Term Loan B (1 month LIBOR + 1.750%) | 1.846 | 08-02-27 | 1,174,958 | 1,153,762 | |
| Endo Luxembourg Finance Company I Sarl, 2021 Term Loan (3 month LIBOR + 5.000%) | 5.750 | 03-27-28 | 6,946,697 | 6,734,405 | |
| Horizon Therapeutics USA, Inc., 2021 Term Loan B (1 month LIBOR + 2.000%) | 2.500 | 03-15-28 | 1,561,859 | 1,554,049 | |
| Jazz Financing Lux Sarl, USD Term Loan (1 month LIBOR + 3.500%) | 4.000 | 05-05-28 | 2,906,864 | 2,906,864 | |
| McAfee LLC, 2018 USD Term Loan B (1 month LIBOR + 3.750%) | 3.835 | 09-30-24 | 4,256,977 | 4,256,466 | |
| Organon & Company, USD Term Loan (3 month LIBOR + 3.000%) | 3.500 | 06-02-28 | 4,921,012 | 4,935,381 | |
| SEE NOTES TO FINANCIAL STATEMENTS | ANNUAL REPORT | JOHN HANCOCK FLOATING RATE INCOME FUND | 25 |
| Rate (%) | Maturity date | Par value^ | Value | ||
| Health care (continued) | |||||
| Pharmaceuticals (continued) | |||||
| Padagis LLC, Term Loan B (3 month LIBOR + 4.750%) | 5.250 | 07-06-28 | 3,485,905 | $3,481,548 | |
| Industrials 14.3% | 250,158,309 | ||||
| Aerospace and defense 1.5% | |||||
| Bleriot US Bidco, Inc., 2021 Term Loan B (3 month LIBOR + 4.000%) | 4.147 | 10-31-26 | 2,139,864 | 2,136,119 | |
| Jazz Acquisition, Inc., 2019 1st Lien Term Loan (1 month LIBOR + 4.250%) | 4.330 | 06-19-26 | 652,332 | 627,870 | |
| Maxar Technologies, Ltd., Term Loan B (1 month LIBOR + 2.750%) | 2.840 | 10-04-24 | 3,749,192 | 3,704,351 | |
| Spirit AeroSystems, Inc., 2020 Term Loan B (1 month LIBOR + 5.250%) | 6.000 | 01-15-25 | 839,989 | 843,836 | |
| Standard Aero, Ltd., 2020 CAD Term Loan B2 (3 month LIBOR + 3.500%) | 3.647 | 04-06-26 | 2,284,287 | 2,221,104 | |
| The NORDAM Group, Inc., Term Loan B (1 month LIBOR + 5.500%) | 5.625 | 04-09-26 | 2,027,743 | 1,901,009 | |
| TransDigm, Inc., 2020 Term Loan E (1 month LIBOR + 2.250%) | 2.335 | 05-30-25 | 940,796 | 925,056 | |
| TransDigm, Inc., 2020 Term Loan F (1 month LIBOR + 2.250%) | 2.335 | 12-09-25 | 1,871,940 | 1,841,184 | |
| TransDigm, Inc., 2020 Term Loan G (1 month LIBOR + 2.250%) | 2.335 | 08-22-24 | 3,077,545 | 3,033,321 | |
| WP CPP Holdings LLC, 2018 Term Loan (1 and 3 month LIBOR + 3.750%) | 4.750 | 04-30-25 | 9,201,174 | 8,823,557 | |
| Air freight and logistics 0.9% | |||||
| AIT Worldwide Logistics Holdings, Inc., 2021 Term Loan (3 month LIBOR + 4.750%) | 5.500 | 03-31-28 | 2,278,213 | 2,279,648 | |
| Bahia De Las Isletas SL, 2021 EUR Term Loan C (1 month EURIBOR + 2.500% or 7.500% PIK) (D) | 2.500 | 10-31-21 | EUR | 354,823 | 418,957 |
| First Student Bidco, Inc., Term Loan B (2 month LIBOR + 3.000%) | 3.500 | 07-21-28 | 3,768,701 | 3,738,325 | |
| First Student Bidco, Inc., Term Loan C (2 month LIBOR + 3.000%) | 3.500 | 07-21-28 | 1,391,131 | 1,379,919 | |
| MRO Holdings, Inc., 2019 Term Loan B (3 month LIBOR + 5.000%) | 5.147 | 06-04-26 | 3,001,990 | 2,985,479 | |
| Worldwide Express, Inc., 2021 1st Lien Term Loan (2 month LIBOR + 4.250%) | 5.000 | 07-26-28 | 4,670,911 | 4,666,520 | |
| 26 | JOHN HANCOCK FLOATING RATE INCOME FUND | ANNUAL REPORT | SEE NOTES TO FINANCIAL STATEMENTS |
| Rate (%) | Maturity date | Par value^ | Value | ||
| Industrials (continued) | |||||
| Airlines 0.3% | |||||
| Air Canada, 2021 Term Loan B (3 month LIBOR + 3.500%) | 4.250 | 08-11-28 | 1,979,286 | $1,976,099 | |
| United Airlines, Inc., 2021 Term Loan B (3 month LIBOR + 3.750%) | 4.500 | 04-21-28 | 2,539,378 | 2,541,968 | |
| Building products 1.8% | |||||
| Cornerstone Building Brands, Inc., 2021 Term Loan B (1 month LIBOR + 3.250%) | 3.750 | 04-12-28 | 2,941,029 | 2,928,177 | |
| CPG International LLC, 2017 Term Loan (3 month LIBOR + 2.500%) | 3.250 | 05-05-24 | 4,329,221 | 4,319,307 | |
| LEB Holdings USA, Inc., Term Loan B (1 month LIBOR + 3.750%) | 4.500 | 11-02-27 | 1,637,524 | 1,636,165 | |
| LSF10 XL Bidco SCA, 2021 EUR Term Loan (3 month EURIBOR + 4.250%) | 4.250 | 04-12-28 | EUR | 6,700,000 | 7,902,801 |
| LSF11 Skyscraper Holdco Sarl, 2021 USD Term Loan B (3 month LIBOR + 3.750%) | 4.500 | 09-29-27 | 1,318,344 | 1,316,696 | |
| Resideo Funding, Inc., 2021 Term Loan (1 and 3 month LIBOR + 2.250%) | 2.750 | 02-08-28 | 1,479,425 | 1,464,631 | |
| Tamko Building Products LLC, Term Loan B (2 and 3 month LIBOR + 3.000%) | 3.108 | 06-01-26 | 2,212,992 | 2,196,395 | |
| Wilsonart LLC, 2021 Term Loan E (3 month LIBOR + 3.500%) | 4.500 | 12-19-26 | 10,236,827 | 10,209,085 | |
| Commercial services and supplies 2.9% | |||||
| AEA International Holdings Luxembourg Sarl, Term Loan B (B) | TBD | 08-05-28 | 1,463,503 | 1,461,673 | |
| AVSC Holding Corp., 2020 Term Loan B1 (3 month LIBOR + 3.250% or 0.250% PIK) | 4.500 | 03-03-25 | 4,927,040 | 4,264,649 | |
| AVSC Holding Corp., 2020 Term Loan B2 (3 month LIBOR + 4.500%) | 5.500 | 10-15-26 | 1,661,720 | 1,478,465 | |
| AVSC Holding Corp., 2020 Term Loan B3 (3 month LIBOR + 5.000% or 10.000% PIK) | 5.000 | 10-15-26 | 1,942,765 | 2,273,035 | |
| Camelot Finance SA, Term Loan B (1 month LIBOR + 3.000%) | 3.085 | 10-30-26 | 3,404,071 | 3,385,349 | |
| Cimpress USA, Inc., USD Term Loan B (1 month LIBOR + 3.500%) | 4.000 | 05-17-28 | 2,103,185 | 2,099,672 | |
| Comet Bidco, Ltd., 2018 USD Term Loan B (6 month LIBOR + 5.000%) | 6.000 | 09-30-24 | 7,638,630 | 7,182,069 | |
| SEE NOTES TO FINANCIAL STATEMENTS | ANNUAL REPORT | JOHN HANCOCK FLOATING RATE INCOME FUND | 27 |
| Rate (%) | Maturity date | Par value^ | Value | ||
| Industrials (continued) | |||||
| Commercial services and supplies (continued) | |||||
| Holding Socotec SAS, 2021 USD Term Loan (B) | TBD | 06-02-28 | 1,824,684 | $1,821,272 | |
| MHI Holdings LLC, Term Loan B (1 month LIBOR + 5.000%) | 5.085 | 09-21-26 | 3,007,378 | 3,014,897 | |
| Nielsen Finance LLC, USD Term Loan B4 (1 month LIBOR + 2.000%) | 2.096 | 10-04-23 | 1,332,209 | 1,330,171 | |
| PODS LLC, 2021 Term Loan B (1 month LIBOR + 3.000%) | 3.750 | 03-31-28 | 3,830,822 | 3,815,269 | |
| Revint Intermediate II LLC, 2020 Term Loan B (1 month LIBOR + 5.000%) | 5.750 | 10-15-27 | 4,715,723 | 4,736,378 | |
| Sterling Midco Holdings, Inc., 1st Lien Term Loan (3 month LIBOR + 3.500%) | 4.500 | 06-19-24 | 3,739,126 | 3,725,104 | |
| Tempo Acquisition LLC, 2020 Extended Term Loan (1 month LIBOR + 3.250%) | 3.750 | 11-02-26 | 6,528,708 | 6,527,337 | |
| Viad Corp., Initial Term Loan (3 month LIBOR + 5.000%) | 5.500 | 07-30-28 | 2,250,000 | 2,216,250 | |
| Win Waste Innovations Holdings, Inc., 2021 Term Loan B (3 month LIBOR + 2.750%) | 3.250 | 03-24-28 | 1,141,509 | 1,137,434 | |
| Construction and engineering 1.2% | |||||
| Aegion Corp., Term Loan (3 month LIBOR + 4.750%) | 5.500 | 05-17-28 | 3,222,613 | 3,246,783 | |
| Amentum Government Services Holdings LLC, Term Loan B (1 month LIBOR + 3.500%) | 3.585 | 01-29-27 | 2,059,402 | 2,040,517 | |
| DG Investment Intermediate Holdings 2, Inc., 2021 Delayed Draw Term Loan (1 and 3 month LIBOR + 3.750%) | 4.338 | 03-31-28 | 795,447 | 794,361 | |
| DG Investment Intermediate Holdings 2, Inc., 2021 Term Loan (1 month LIBOR + 3.750%) | 4.500 | 03-31-28 | 4,846,380 | 4,841,194 | |
| Osmose Utilities Services, Inc., Term Loan (1 month LIBOR + 3.250%) | 3.750 | 06-23-28 | 2,571,625 | 2,554,472 | |
| PowerTeam Services LLC, Incremental Term Loan (3 month LIBOR + 3.500%) | 4.500 | 03-06-25 | 2,003,866 | 1,980,080 | |
| Refficiency Holdings LLC, 2020 Term Loan (1 month LIBOR + 4.000%) | 4.750 | 12-16-27 | 1,065,564 | 1,065,564 | |
| Tiger Acquisition LLC, 2021 Term Loan (3 month LIBOR + 3.250%) | 3.750 | 06-01-28 | 1,163,107 | 1,155,350 | |
| 28 | JOHN HANCOCK FLOATING RATE INCOME FUND | ANNUAL REPORT | SEE NOTES TO FINANCIAL STATEMENTS |
| Rate (%) | Maturity date | Par value^ | Value | ||
| Industrials (continued) | |||||
| Construction and engineering (continued) | |||||
| USIC Holdings, Inc., 2021 Term Loan (1 month LIBOR + 3.500%) | 4.250 | 05-12-28 | 3,907,676 | $3,889,115 | |
| Electrical equipment 0.7% | |||||
| Array Technologies, Inc., Term Loan B (3 month LIBOR + 3.250%) | 3.750 | 10-14-27 | 2,246,272 | 2,223,809 | |
| Brookfield WEC Holdings, Inc., 2021 Term Loan (1 month LIBOR + 2.750%) | 3.250 | 08-01-25 | 4,888,289 | 4,844,735 | |
| Illuminate Merger Sub Corp., Term Loan (3 month LIBOR + 3.500%) | 4.000 | 07-21-28 | 1,729,625 | 1,723,675 | |
| Infinite Bidco LLC, 1st Lien Term Loan (1 month LIBOR + 3.750%) | 4.250 | 03-02-28 | 2,135,700 | 2,124,125 | |
| Infinity Bidco 1, Ltd., 2021 EUR Term Loan (3 month EURIBOR + 3.500%) | 3.500 | 05-21-28 | EUR | 1,338,977 | 1,576,650 |
| Machinery 2.7% | |||||
| Alliance Laundry Systems LLC, Term Loan B (2 month LIBOR + 3.500%) | 4.250 | 10-08-27 | 3,199,460 | 3,198,116 | |
| Arcline FM Holdings LLC, 2021 1st Lien Term Loan (3 month LIBOR + 4.750%) | 5.500 | 06-23-28 | 2,446,437 | 2,421,973 | |
| Brown Group Holding LLC, Term Loan B (3 month LIBOR + 2.750%) | 3.250 | 06-07-28 | 4,266,561 | 4,243,436 | |
| Columbus McKinnon Corp., 2021 Term Loan B (3 month LIBOR + 2.750%) | 3.250 | 05-14-28 | 654,835 | 654,016 | |
| Crosby US Acquisition Corp., Term Loan B (1 month LIBOR + 4.750%) | 4.838 | 06-26-26 | 5,124,786 | 5,118,380 | |
| Engineered Components & Systems LLC, Term Loan (3 month LIBOR + 6.000%) | 6.500 | 06-08-28 | 1,966,966 | 1,957,131 | |
| Gardner Denver, Inc., 2020 USD Term Loan B2 (1 month LIBOR + 1.750%) | 1.835 | 03-01-27 | 813,879 | 799,197 | |
| Granite US Holdings Corp., 2021 Term Loan B (3 month LIBOR + 4.000%) | 4.147 | 09-30-26 | 3,348,219 | 3,352,404 | |
| Ingersoll-Rand Services Company, 2020 USD Spinco Term Loan (1 month LIBOR + 1.750%) | 1.835 | 03-01-27 | 2,057,773 | 2,020,650 | |
| Innio North America Holding, Inc., 2018 USD Term Loan B (3 month LIBOR + 2.750%) | 2.888 | 10-31-25 | 4,357,943 | 4,245,378 | |
| SEE NOTES TO FINANCIAL STATEMENTS | ANNUAL REPORT | JOHN HANCOCK FLOATING RATE INCOME FUND | 29 |
| Rate (%) | Maturity date | Par value^ | Value | ||
| Industrials (continued) | |||||
| Machinery (continued) | |||||
| Lummus Technology Holdings V LLC, 2021 Term Loan (1 month LIBOR + 3.500%) | 3.585 | 06-30-27 | 584,683 | $581,152 | |
| Pro Mach Group, Inc., 2021 Term Loan B (B) | TBD | 08-13-28 | 4,185,130 | 4,187,766 | |
| Shape Technologies Group, Inc., Term Loan (1 month LIBOR + 3.000%) | 3.085 | 04-21-25 | 5,028,038 | 4,650,935 | |
| Star US Bidco LLC, Term Loan B (1 month LIBOR + 4.250%) | 5.250 | 03-17-27 | 3,693,825 | 3,693,825 | |
| Titan Acquisitionco New Zealand, Ltd., 2020 Term Loan (3 month LIBOR + 4.000%) | 4.147 | 05-01-26 | 5,614,475 | 5,600,439 | |
| Marine 0.0% | |||||
| Naviera Armas SA, 2021 EUR PIK Term Loan B2 (3 month EURIBOR + 2.500% or 7.500% PIK) (D) | 4.333 | 10-31-21 | EUR | 42,702 | 59,520 |
| Naviera Armas SA, EUR PIK Term Loan A (1 month EURIBOR + 2.500% or 7.500% PIK) (D) | 2.500 | 10-31-21 | EUR | 220,295 | 260,114 |
| Naviera Armas SA, EUR PIK Term Loan B (1 month EURIBOR + 2.500% or 7.500% PIK) (D) | 2.500 | 10-31-21 | EUR | 51,628 | 60,960 |
| Professional services 1.0% | |||||
| Cast & Crew Payroll LLC, 2019 1st Lien Term Loan (1 month LIBOR + 3.750%) | 3.835 | 02-09-26 | 5,770,934 | 5,733,653 | |
| First Advantage Holdings LLC, 2021 Term Loan B (1 month LIBOR + 2.750%) | 2.835 | 01-31-27 | 3,078,995 | 3,065,140 | |
| Greenrock Finance, Inc., 2017 USD Term Loan B (3 month LIBOR + 3.500%) | 4.500 | 06-28-24 | 4,045,733 | 4,017,939 | |
| Indy US Bidco LLC, 2021 USD Term Loan B (1 month LIBOR + 4.000%) | 4.096 | 03-06-28 | 1,161,114 | 1,158,699 | |
| Stiphout Finance LLC, 2020 USD Term Loan B (1 month LIBOR + 3.750%) | 4.750 | 10-27-25 | 2,543,037 | 2,543,037 | |
| Road and rail 0.5% | |||||
| Genesee & Wyoming, Inc., Term Loan (3 month LIBOR + 2.000%) | 2.147 | 12-30-26 | 2,395,668 | 2,368,716 | |
| Uber Technologies, Inc., 2021 1st Lien Term Loan B (1 month LIBOR + 3.500%) | 3.585 | 04-04-25 | 6,952,054 | 6,933,562 | |
| 30 | JOHN HANCOCK FLOATING RATE INCOME FUND | ANNUAL REPORT | SEE NOTES TO FINANCIAL STATEMENTS |
| Rate (%) | Maturity date | Par value^ | Value | ||
| Industrials (continued) | |||||
| Trading companies and distributors 0.6% | |||||
| ASP Unifrax Holdings, Inc., EUR Term Loan B (3 month EURIBOR + 3.750%) | 3.750 | 12-12-25 | EUR | 6,141,487 | $6,995,946 |
| ASP Unifrax Holdings, Inc., Term Loan B (3 month LIBOR + 3.750%) | 3.897 | 12-12-25 | 3,660,431 | 3,557,939 | |
| Transportation infrastructure 0.2% | |||||
| Dynasty Acquisition Company, Inc., 2020 Term Loan B1 (3 month LIBOR + 3.500%) | 3.647 | 04-06-26 | 4,248,774 | 4,131,253 | |
| Information technology 17.0% | 297,578,127 | ||||
| Communications equipment 0.4% | |||||
| CommScope, Inc., 2019 Term Loan B (1 month LIBOR + 3.250%) | 3.335 | 04-06-26 | 5,533,331 | 5,465,548 | |
| Plantronics, Inc., 2018 Term Loan B (1 month LIBOR + 2.500%) | 2.592 | 07-02-25 | 1,337,805 | 1,305,203 | |
| Electronic equipment, instruments and components 1.7% | |||||
| C&D Technologies, Inc., Term Loan B (1 month LIBOR + 5.750%) | 5.835 | 12-20-25 | 4,364,602 | 4,295,511 | |
| Everest Bidco SASU, 2018 EUR Term Loan (3 month EURIBOR + 3.250%) | 3.250 | 07-04-25 | EUR | 5,674,985 | 6,568,804 |
| Excelitas Technologies Corp., 2018 Add On Term Loan B (3 month LIBOR + 3.500%) | 4.500 | 12-02-24 | 2,326,626 | 2,314,993 | |
| Excelitas Technologies Corp., USD 2017 1st Lien Term Loan (3 month LIBOR + 3.500%) | 4.500 | 12-02-24 | 4,847,928 | 4,829,748 | |
| Ingram Micro, Inc., 2021 Term Loan B (1 month LIBOR + 3.500%) | 4.000 | 06-30-28 | 2,895,760 | 2,900,104 | |
| Mirion Technologies, Inc., 2019 Term Loan B (3 month LIBOR + 4.000%) | 4.147 | 03-06-26 | 1,988,243 | 1,985,141 | |
| Robertshaw US Holding Corp., 2018 1st Lien Term Loan (1 month LIBOR + 3.500%) | 4.500 | 02-28-25 | 7,742,238 | 7,430,148 | |
| IT services 2.6% | |||||
| Gainwell Acquisition Corp., Term Loan B (3 month LIBOR + 4.000%) | 4.750 | 10-01-27 | 7,426,446 | 7,445,012 | |
| Genuine Financial Holdings LLC, 2018 1st Lien Term Loan (1 month LIBOR + 3.750%) | 3.835 | 07-11-25 | 8,085,048 | 7,930,542 | |
| Go Daddy Operating Company LLC, 2017 Repriced Term Loan (1 month LIBOR + 1.750%) | 1.835 | 02-15-24 | 5,186,025 | 5,137,432 | |
| GTT Communications BV, 2020 Delayed Draw Term Loan (C) | 0.000 | 12-31-21 | 305,979 | 308,580 | |
| SEE NOTES TO FINANCIAL STATEMENTS | ANNUAL REPORT | JOHN HANCOCK FLOATING RATE INCOME FUND | 31 |
| Rate (%) | Maturity date | Par value^ | Value | ||
| Information technology (continued) | |||||
| IT services (continued) | |||||
| GTT Communications BV, 2020 Term Loan (C) | 0.000 | 12-31-21 | 269,634 | $271,926 | |
| GTT Communications, Inc., 2018 USD Term Loan B (C) | 0.000 | 05-31-25 | 3,019,342 | 2,371,693 | |
| Masergy Holdings, Inc., 2017 1st Lien Term Loan (3 month LIBOR + 3.250%) | 4.250 | 12-15-23 | 1,056,683 | 1,053,713 | |
| Rackspace Technology Global, Inc., 2021 Term Loan (3 month LIBOR + 2.750%) | 3.500 | 02-15-28 | 2,844,442 | 2,812,727 | |
| Sabre GLBL, Inc., 2021 Term Loan B1 (1 month LIBOR + 3.500%) | 4.000 | 12-17-27 | 1,677,844 | 1,664,841 | |
| Sabre GLBL, Inc., 2021 Term Loan B2 (1 month LIBOR + 3.500%) | 4.000 | 12-17-27 | 2,674,583 | 2,653,855 | |
| TGG TS Acquisition Company, 2018 Term Loan B (1 month LIBOR + 6.500%) | 6.586 | 12-14-25 | 1,248,297 | 1,248,297 | |
| Travelport Finance Luxembourg Sarl, 2020 Super Priority Term Loan (3 month LIBOR + 2.500% or 6.500% PIK) | 3.500 | 02-28-25 | 230,442 | 234,762 | |
| Verscend Holding Corp., 2021 Term Loan B (1 month LIBOR + 4.000%) | 4.085 | 08-27-25 | 6,438,482 | 6,423,996 | |
| WEX, Inc., 2021 Term Loan (1 month LIBOR + 2.250%) | 2.335 | 03-31-28 | 5,187,132 | 5,136,713 | |
| Semiconductors and semiconductor equipment 0.0% | |||||
| Allegro MicroSystems, Inc., Term Loan (3 month LIBOR + 3.750%) | 4.250 | 09-30-27 | 35,901 | 35,812 | |
| Cohu, Inc., 2018 Term Loan B (3 month LIBOR + 3.000%) | 4.500 | 10-01-25 | 248,343 | 246,016 | |
| Software 11.7% | |||||
| Acuris Finance US, Inc., 2021 USD Term Loan B (3 month LIBOR + 4.000%) | 4.500 | 02-16-28 | 1,207,572 | 1,206,823 | |
| AQA Acquisition Holding, Inc., 2021 1st Lien Term Loan (3 month LIBOR + 4.250%) | 4.750 | 03-03-28 | 2,126,232 | 2,126,232 | |
| Azalea TopCo, Inc., Term Loan (1 and 3 month LIBOR + 3.500%) | 3.628 | 07-24-26 | 1,184,272 | 1,171,245 | |
| Barracuda Networks, Inc., 1st Lien Term Loan (3 month LIBOR + 3.750%) | 4.500 | 02-12-25 | 6,961,410 | 6,963,916 | |
| Barracuda Networks, Inc., 2020 2nd Lien Term Loan (3 month LIBOR + 6.750%) | 7.500 | 10-30-28 | 1,968,264 | 1,992,867 | |
| 32 | JOHN HANCOCK FLOATING RATE INCOME FUND | ANNUAL REPORT | SEE NOTES TO FINANCIAL STATEMENTS |
| Rate (%) | Maturity date | Par value^ | Value | ||
| Information technology (continued) | |||||
| Software (continued) | |||||
| Boxer Parent Company, Inc., 2021 EUR Term Loan (3 month EURIBOR + 4.000%) | 4.000 | 10-02-25 | EUR | 2,249,612 | $2,659,550 |
| Boxer Parent Company, Inc., 2021 USD Term Loan (1 month LIBOR + 3.750%) | 3.835 | 10-02-25 | 5,744,349 | 5,704,253 | |
| BY Crown Parent LLC, Term Loan B1 (1 month LIBOR + 3.000%) | 4.000 | 02-02-26 | 4,359,773 | 4,348,874 | |
| Castle US Holding Corp., USD Term Loan B (3 month LIBOR + 3.750%) | 3.897 | 01-29-27 | 5,790,369 | 5,705,135 | |
| Constant Contact, Inc., Term Loan (3 month LIBOR + 4.000%) | 4.750 | 02-10-28 | 4,965,577 | 4,940,749 | |
| Cornerstone OnDemand, Inc., 2021 Term Loan B (1 month LIBOR + 3.250%) | 3.338 | 04-22-27 | 5,041,964 | 5,035,157 | |
| Dcert Buyer, Inc., 2019 Term Loan B (1 month LIBOR + 4.000%) | 4.085 | 10-16-26 | 4,213,047 | 4,203,694 | |
| Dcert Buyer, Inc., 2021 2nd Lien Term Loan (1 month LIBOR + 7.000%) | 7.085 | 02-16-29 | 2,681,022 | 2,700,164 | |
| Epicor Software Corp., 2020 Term Loan (1 month LIBOR + 3.250%) | 4.000 | 07-30-27 | 6,385,996 | 6,376,033 | |
| Grab Holdings, Inc., Term Loan B (3 month LIBOR + 4.500%) | 5.500 | 01-29-26 | 3,960,924 | 3,987,343 | |
| Greeneden US Holdings II LLC, 2020 USD Term Loan B4 (1 month LIBOR + 4.000%) | 4.750 | 12-01-27 | 7,347,582 | 7,359,853 | |
| Helios Software Holdings, Inc., 2021 USD Term Loan B (3 month LIBOR + 3.750%) | 3.917 | 03-11-28 | 1,664,729 | 1,656,822 | |
| IGT Holding IV AB, 2021 USD Term Loan (3 month LIBOR + 3.750%) | 4.250 | 03-31-28 | 1,813,416 | 1,812,292 | |
| ION Trading Finance, Ltd., 2021 USD Term Loan (3 month LIBOR + 4.750%) | 4.917 | 04-01-28 | 4,897,291 | 4,896,066 | |
| Ivanti Software, Inc., 2020 Term Loan B (3 month LIBOR + 4.750%) | 5.750 | 12-01-27 | 3,765,649 | 3,768,021 | |
| Ivanti Software, Inc., 2021 Add On Term Loan B (3 month LIBOR + 4.000%) | 4.750 | 12-01-27 | 2,243,061 | 2,243,061 | |
| Liftoff Mobile, Inc., Term Loan (3 month LIBOR + 3.500%) | 4.250 | 03-17-28 | 1,051,211 | 1,047,269 | |
| MA FinanceCo LLC, 2020 USD Term Loan B (3 month LIBOR + 4.250%) | 5.250 | 06-05-25 | 1,714,844 | 1,719,131 | |
| SEE NOTES TO FINANCIAL STATEMENTS | ANNUAL REPORT | JOHN HANCOCK FLOATING RATE INCOME FUND | 33 |
| Rate (%) | Maturity date | Par value^ | Value | ||
| Information technology (continued) | |||||
| Software (continued) | |||||
| MA FinanceCo LLC, USD Term Loan B3 (1 month LIBOR + 2.750%) | 2.835 | 06-21-24 | 1,094,897 | $1,079,163 | |
| Magenta Buyer LLC, 2021 USD 1st Lien Term Loan (3 month LIBOR + 5.000%) | 5.750 | 07-27-28 | 4,794,819 | 4,779,860 | |
| Mavenir Systems, Inc., 2021 Term Loan B (3 month LIBOR + 4.750%) | 5.250 | 08-13-28 | 2,763,840 | 2,755,770 | |
| Mitchell International, Inc., 2020 Add-On Term Loan (1 month LIBOR + 4.250%) | 4.750 | 11-29-24 | 4,152,932 | 4,152,932 | |
| Monotype Imaging Holdings, Inc., 2021 Add On Term Loan B1 (3 month LIBOR + 6.000%) | 7.000 | 10-09-26 | 414,100 | 414,100 | |
| Monotype Imaging Holdings, Inc., Term Loan (3 month LIBOR + 5.500%) | 6.500 | 10-09-26 | 2,159,784 | 2,150,345 | |
| Orion Advisor Solutions, Inc., 2021 Term Loan (3 month LIBOR + 3.750%) | 4.500 | 09-24-27 | 736,613 | 736,429 | |
| Peraton Corp., 2nd Lien Term Loan B1 (1 month LIBOR + 7.750%) | 8.500 | 02-01-29 | 1,567,728 | 1,567,728 | |
| Peraton Corp., Term Loan B (1 month LIBOR + 3.750%) | 4.500 | 02-01-28 | 8,996,394 | 8,994,505 | |
| Planview Parent, Inc., Term Loan (3 month LIBOR + 4.000%) | 4.750 | 12-17-27 | 1,123,124 | 1,124,528 | |
| Project Alpha Intermediate Holding, Inc., 2021 Term Loan B (1 month LIBOR + 4.000%) | 4.090 | 04-26-24 | 7,439,187 | 7,432,566 | |
| Project Boost Purchaser LLC, 2019 Term Loan B (1 month LIBOR + 3.500%) | 3.585 | 06-01-26 | 6,604,277 | 6,549,263 | |
| Project Ruby Ultimate Parent Corp., 2021 Term Loan (1 month LIBOR + 3.250%) | 4.000 | 03-03-28 | 806,301 | 802,270 | |
| Project Sky Merger Sub, Inc., 2021 2nd Lien Term Loan (B) | TBD | 08-09-29 | 1,984,112 | 1,979,151 | |
| Project Sky Merger Sub, Inc., 2021 Term Loan (B) | TBD | 08-09-28 | 4,785,337 | 4,755,429 | |
| Proofpoint, Inc., 1st Lien Term Loan (B) | TBD | 06-09-28 | 3,299,513 | 3,278,429 | |
| Quest Software US Holdings, Inc., 2018 1st Lien Term Loan (3 month LIBOR + 4.250%) | 4.379 | 05-16-25 | 5,711,082 | 5,701,259 | |
| Seattle SpinCo, Inc., USD Term Loan B3 (1 month LIBOR + 2.750%) | 2.835 | 06-21-24 | 7,394,108 | 7,287,854 | |
| Skillsoft Finance II, Inc., 2021 Term Loan B (3 month LIBOR + 4.750%) | 5.500 | 06-30-28 | 3,235,896 | 3,241,979 | |
| 34 | JOHN HANCOCK FLOATING RATE INCOME FUND | ANNUAL REPORT | SEE NOTES TO FINANCIAL STATEMENTS |
| Rate (%) | Maturity date | Par value^ | Value | ||
| Information technology (continued) | |||||
| Software (continued) | |||||
| SolarWinds Holdings, Inc., 2018 Term Loan B (1 month LIBOR + 2.750%) | 2.835 | 02-05-24 | 9,199,661 | $9,071,233 | |
| Sophia LP, 2020 1st Lien Term Loan (3 month LIBOR + 3.750%) | 4.500 | 10-07-27 | 3,924,201 | 3,933,187 | |
| Sovos Compliance LLC, 2021 Term Loan (1 month LIBOR + 4.500%) | 5.000 | 07-29-28 | 1,535,699 | 1,540,306 | |
| SS&C Technologies, Inc., 2018 Term Loan B3 (1 month LIBOR + 1.750%) | 1.835 | 04-16-25 | 1,760,081 | 1,732,272 | |
| SS&C Technologies, Inc., 2018 Term Loan B4 (1 month LIBOR + 1.750%) | 1.835 | 04-16-25 | 1,355,466 | 1,334,050 | |
| SS&C Technologies, Inc., 2018 Term Loan B5 (1 month LIBOR + 1.750%) | 1.835 | 04-16-25 | 3,157,949 | 3,112,380 | |
| Surf Holdings LLC, USD Term Loan (3 month LIBOR + 3.500%) | 3.628 | 03-05-27 | 2,427,455 | 2,405,317 | |
| Symplr Software, Inc., 2020 Term Loan (3 month LIBOR + 4.500%) | 5.250 | 12-22-27 | 3,342,659 | 3,341,824 | |
| ThoughtWorks, Inc. 2021 Term Loan B (1 month LIBOR + 3.000%) | 3.750 | 03-23-28 | 1,190,571 | 1,185,369 | |
| UKG, Inc., 2021 Incremental Term Loan (3 month LIBOR + 3.250%) | 4.000 | 05-04-26 | 3,015,381 | 3,015,381 | |
| UKG, Inc., Term Loan B (1 month LIBOR + 3.750%) | 3.835 | 05-04-26 | 1,659,444 | 1,659,793 | |
| Upland Software, Inc., 2019 Term Loan (1 month LIBOR + 3.750%) | 3.835 | 08-06-26 | 3,188,451 | 3,175,506 | |
| Vision Solutions, Inc., 2021 1st Lien Term Loan (3 month LIBOR + 4.250%) | 5.000 | 04-24-28 | 5,790,794 | 5,772,206 | |
| Voyage Australia Pty, Ltd., USD Term Loan B (3 month LIBOR + 3.500%) | 4.000 | 07-20-28 | 2,106,247 | 2,100,981 | |
| VS Buyer LLC, Term Loan B (1 month LIBOR + 3.000%) | 3.085 | 02-28-27 | 2,188,613 | 2,172,198 | |
| Weld North Education LLC, 2020 Term Loan B (1 month LIBOR + 4.000%) | 4.750 | 12-21-27 | 7,656,050 | 7,665,620 | |
| Technology hardware, storage and peripherals 0.6% | |||||
| Dell International LLC, 2021 Term Loan B (1 month LIBOR + 1.750%) | 2.000 | 09-19-25 | 3,366,015 | 3,364,467 | |
| SEE NOTES TO FINANCIAL STATEMENTS | ANNUAL REPORT | JOHN HANCOCK FLOATING RATE INCOME FUND | 35 |
| Rate (%) | Maturity date | Par value^ | Value | ||
| Information technology (continued) | |||||
| Technology hardware, storage and peripherals (continued) | |||||
| Electronics For Imaging, Inc., Term Loan (1 month LIBOR + 5.000%) | 5.085 | 07-23-26 | 6,877,899 | $6,516,810 | |
| Materials 7.0% | 121,966,899 | ||||
| Chemicals 2.9% | |||||
| Ascend Performance Materials Operations LLC, 2021 Term Loan B (3 month LIBOR + 4.750%) | 5.500 | 08-27-26 | 5,618,181 | 5,691,048 | |
| Geon Performance Solutions LLC, 2021 Term Loan (B) | TBD | 08-09-28 | 2,053,772 | 2,057,633 | |
| Groupe Solmax, Inc., Term Loan (B) | TBD | 06-28-28 | 1,137,896 | 1,135,996 | |
| Hyperion Materials & Technologies, Inc., 2021 Term Loan B (B) | TBD | 08-28-28 | 2,721,057 | 2,721,057 | |
| INEOS US Petrochem LLC, 2021 USD Term Loan B (1 month LIBOR + 2.750%) | 3.250 | 01-29-26 | 1,116,429 | 1,112,801 | |
| Innophos Holdings, Inc., 2020 Term Loan B (1 month LIBOR + 3.750%) | 3.835 | 02-07-27 | 1,987,436 | 1,978,334 | |
| Jadex, Inc., Term Loan (1 month LIBOR + 4.750%) | 5.500 | 02-18-28 | 7,181,752 | 7,100,957 | |
| Meridian Adhesives Group, Inc., Term Loan B (3 month LIBOR + 4.000%) | 4.750 | 07-14-28 | 3,390,479 | 3,373,527 | |
| Nouryon USA LLC, 2018 USD Term Loan B (1 month LIBOR + 2.750%) | 2.838 | 10-01-25 | 6,917,107 | 6,833,134 | |
| Petrochoice Holdings, Inc., 1st Lien Term Loan (2 and 3 month LIBOR + 5.000%) | 6.000 | 08-20-22 | 3,756,285 | 3,610,729 | |
| Plaskolite PPC Intermediate II LLC, 2021 Term Loan (3 month LIBOR + 4.000%) | 4.138 | 12-15-25 | 4,360,883 | 4,339,078 | |
| Root Bidco Sarl, EUR Term Loan B (3 month EURIBOR + 3.750%) | 3.750 | 08-13-27 | EUR | 2,748,062 | 3,238,707 |
| Sparta US HoldCo LLC, 2021 Term Loan (3 month LIBOR + 3.500%) | 4.250 | 08-02-28 | 1,807,578 | 1,806,458 | |
| Technimark Holdings LLC, 2021 Term Loan (3 month LIBOR + 3.750%) | 4.750 | 06-30-28 | 1,225,318 | 1,214,596 | |
| Tronox Finance LLC, 2021 Term Loan B (1 month LIBOR + 2.000% and 3 month LIBOR + 2.250%) | 2.542 | 03-13-28 | 1,286,321 | 1,272,454 | |
| Univar Solutions USA, Inc., 2019 USD Term Loan B5 (1 month LIBOR + 2.000%) | 2.085 | 07-01-26 | 821,088 | 814,486 | |
| 36 | JOHN HANCOCK FLOATING RATE INCOME FUND | ANNUAL REPORT | SEE NOTES TO FINANCIAL STATEMENTS |
| Rate (%) | Maturity date | Par value^ | Value | ||
| Materials (continued) | |||||
| Chemicals (continued) | |||||
| WR Grace Holdings LLC, 2021 Term Loan B (B) | TBD | 08-12-28 | 1,525,633 | $1,528,181 | |
| Construction materials 0.5% | |||||
| Foundation Building Materials, Inc., 2021 Term Loan (1 and 3 month LIBOR + 3.250%) | 3.750 | 02-03-28 | 1,355,588 | 1,342,317 | |
| Potters Borrower LP, Term Loan B (3 month LIBOR + 4.000%) | 4.750 | 12-14-27 | 792,019 | 792,019 | |
| Quikrete Holdings, Inc., 2016 1st Lien Term Loan (1 month LIBOR + 2.500%) | 2.585 | 02-01-27 | 2,852,998 | 2,817,707 | |
| Quikrete Holdings, Inc., 2021 Term Loan B1 (B) | TBD | 02-21-28 | 4,072,040 | 4,037,061 | |
| Containers and packaging 3.3% | |||||
| Charter Next Generation, Inc., 2021 Term Loan (1 month LIBOR + 3.750%) | 4.500 | 12-01-27 | 2,226,876 | 2,226,520 | |
| Fort Dearborn Holding Company, Inc., 2016 1st Lien Term Loan (1 and 3 month LIBOR + 4.000%) | 5.000 | 10-19-23 | 2,174,077 | 2,172,729 | |
| Graham Packaging Company, Inc., 2021 Term Loan (1 month LIBOR + 3.000%) | 3.750 | 08-04-27 | 5,799,407 | 5,771,164 | |
| LABL, Inc., 2021 EUR Term Loan B (1 month EURIBOR + 4.250%) | 4.250 | 07-01-26 | EUR | 2,723,600 | 3,219,108 |
| LTI Holdings, Inc., 2018 Add On 1st Lien Term Loan (1 month LIBOR + 3.500%) | 3.585 | 09-06-25 | 6,899,588 | 6,764,494 | |
| LTI Holdings, Inc., 2019 Term Loan (1 month LIBOR + 4.750%) | 4.835 | 07-24-26 | 3,107,985 | 3,092,445 | |
| LTI Holdings, Inc., 2021 Term Loan (1 month LIBOR + 4.750%) | 4.835 | 07-24-26 | 824,069 | 819,949 | |
| MAR Bidco Sarl, USD Term Loan (B) | TBD | 07-06-28 | 1,853,786 | 1,846,834 | |
| Mauser Packaging Solutions Holding Company, 2017 Term Loan B (1 month LIBOR + 3.250%) | 3.342 | 04-03-24 | 8,565,516 | 8,335,360 | |
| Plaze, Inc., 2019 Term Loan B (1 month LIBOR + 3.500%) | 3.586 | 08-03-26 | 6,763,349 | 6,695,715 | |
| Proampac PG Borrower LLC, 2020 Term Loan (1 and 3 month LIBOR + 3.750%) | 4.500 | 11-03-25 | 5,618,392 | 5,614,908 | |
| TricorBraun Holdings, Inc., 2021 Delayed Draw Term Loan (3 month LIBOR + 3.250%) | 3.325 | 03-03-28 | 138,549 | 129,915 | |
| TricorBraun Holdings, Inc., 2021 Term Loan (3 month LIBOR + 3.250%) | 3.750 | 03-03-28 | 3,888,905 | 3,850,521 | |
| SEE NOTES TO FINANCIAL STATEMENTS | ANNUAL REPORT | JOHN HANCOCK FLOATING RATE INCOME FUND | 37 |
| Rate (%) | Maturity date | Par value^ | Value | ||
| Materials (continued) | |||||
| Containers and packaging (continued) | |||||
| Trident TPI Holdings, Inc., 2017 USD Term Loan B1 (3 month LIBOR + 3.000%) | 4.000 | 10-17-24 | 6,257,833 | $6,243,189 | |
| Trident TPI Holdings, Inc., 2021 Incremental Term Loan (B) | TBD | 07-28-28 | 465,018 | 464,669 | |
| Metals and mining 0.2% | |||||
| WireCo WorldGroup, Inc., 1st Lien Term Loan (6 month LIBOR + 5.000%) | 6.000 | 09-30-23 | 3,828,300 | 3,823,515 | |
| Paper and forest products 0.1% | |||||
| Flex Acquisition Company, Inc., 2021 Term Loan (3 month LIBOR + 3.500%) | 4.000 | 02-23-28 | 2,091,030 | 2,077,584 | |
| Real estate 0.3% | 5,716,212 | ||||
| Equity real estate investment trusts 0.3% | |||||
| Iron Mountain, Inc., 2018 Term Loan B (1 month LIBOR + 1.750%) | 1.835 | 01-02-26 | 1,605,952 | 1,587,210 | |
| VICI Properties 1 LLC, Replacement Term Loan B (1 month LIBOR + 1.750%) | 1.838 | 12-20-24 | 4,154,511 | 4,129,002 | |
| Utilities 0.1% | 2,008,386 | ||||
| Independent power and renewable electricity producers 0.1% | |||||
| Esdec Solar Group BV, Term Loan B (B) | TBD | 08-17-28 | 2,038,971 | 2,008,386 | |
| Corporate bonds 10.6% | $185,717,207 | ||||
| (Cost $188,460,627) | |||||
| Communication services 1.5% | 26,165,286 | ||||
| Diversified telecommunication services 0.5% | |||||
| Connect Finco SARL (E) | 6.750 | 10-01-26 | 3,956,000 | 4,104,350 | |
| Frontier Communications Holdings LLC (E) | 5.000 | 05-01-28 | 1,121,000 | 1,171,445 | |
| Frontier Communications Holdings LLC (E) | 6.750 | 05-01-29 | 2,440,000 | 2,611,288 | |
| Zayo Group Holdings, Inc. (E) | 6.125 | 03-01-28 | 836,000 | 850,630 | |
| Entertainment 0.1% | |||||
| Lions Gate Capital Holdings LLC (E) | 5.500 | 04-15-29 | 1,341,000 | 1,369,228 | |
| Media 0.9% | |||||
| DIRECTV Holdings LLC (E) | 5.875 | 08-15-27 | 1,545,000 | 1,614,525 | |
| Getty Images, Inc. (E) | 9.750 | 03-01-27 | 2,800,000 | 2,996,000 | |
| National CineMedia LLC (E) | 5.875 | 04-15-28 | 5,435,000 | 4,742,038 | |
| Townsquare Media, Inc. (E) | 6.875 | 02-01-26 | 2,111,000 | 2,237,660 | |
| 38 | JOHN HANCOCK FLOATING RATE INCOME FUND | ANNUAL REPORT | SEE NOTES TO FINANCIAL STATEMENTS |
| Rate (%) | Maturity date | Par value^ | Value | ||
| Communication services (continued) | |||||
| Media (continued) | |||||
| United Group BV (Greater of 3 month EURIBOR + 3.250% or 3.250%) (E)(F) | 3.250 | 02-15-26 | EUR | 734,000 | $846,087 |
| United Group BV (E) | 3.625 | 02-15-28 | EUR | 1,680,000 | 1,913,528 |
| United Group BV | 3.625 | 02-15-28 | EUR | 1,500,000 | 1,708,507 |
| Consumer discretionary 3.7% | 64,001,042 | ||||
| Automobiles 0.2% | |||||
| Constellation Automotive Financing PLC (E) | 4.875 | 07-15-27 | GBP | 2,813,000 | 3,851,625 |
| Distributors 0.2% | |||||
| Northwest Fiber LLC (E) | 6.000 | 02-15-28 | 3,136,000 | 3,120,320 | |
| Diversified consumer services 0.4% | |||||
| SRS Distribution, Inc. (E) | 4.625 | 07-01-28 | 1,336,000 | 1,376,748 | |
| SRS Distribution, Inc. (E) | 6.125 | 07-01-29 | 1,015,000 | 1,053,063 | |
| WW International, Inc. (E) | 4.500 | 04-15-29 | 5,128,000 | 5,070,310 | |
| Hotels, restaurants and leisure 1.5% | |||||
| Caesars Entertainment, Inc. (E) | 6.250 | 07-01-25 | 2,105,000 | 2,224,880 | |
| Caesars Resort Collection LLC (E) | 5.750 | 07-01-25 | 1,000,000 | 1,050,750 | |
| Deuce Finco PLC (E) | 5.500 | 06-15-27 | GBP | 2,979,000 | 4,115,416 |
| International Game Technology PLC (E) | 4.125 | 04-15-26 | 959,000 | 995,969 | |
| Premier Entertainment Sub LLC (E) | 5.625 | 09-01-29 | 3,004,000 | 3,080,031 | |
| Premier Entertainment Sub LLC (E) | 5.875 | 09-01-31 | 3,004,000 | 3,079,100 | |
| Punch Finance PLC (E) | 6.125 | 06-30-26 | GBP | 1,598,000 | 2,309,776 |
| Stonegate Pub Company Financing 2019 PLC | 8.000 | 07-13-25 | GBP | 667,000 | 948,168 |
| Stonegate Pub Company Financing 2019 PLC | 8.000 | 07-13-25 | GBP | 3,439,000 | 4,888,681 |
| Stonegate Pub Company Financing 2019 PLC (E) | 8.250 | 07-31-25 | GBP | 1,355,000 | 1,958,633 |
| Stonegate Pub Company Financing 2019 PLC | 8.250 | 07-31-25 | GBP | 1,153,000 | 1,666,645 |
| Specialty retail 0.9% | |||||
| F-Brasile SpA (E) | 7.375 | 08-15-26 | 6,445,000 | 6,644,022 | |
| Maxeda DIY Holding BV (E) | 5.875 | 10-01-26 | EUR | 785,000 | 955,955 |
| Maxeda DIY Holding BV | 5.875 | 10-01-26 | EUR | 1,237,000 | 1,506,418 |
| Specialty Building Products Holdings LLC (E) | 6.375 | 09-30-26 | 3,927,000 | 4,133,168 | |
| The Michaels Companies, Inc. (E) | 5.250 | 05-01-28 | 1,486,000 | 1,525,008 | |
| Textiles, apparel and luxury goods 0.5% | |||||
| Brunello Bidco SpA (E) | 3.500 | 02-15-28 | EUR | 292,000 | 343,944 |
| SEE NOTES TO FINANCIAL STATEMENTS | ANNUAL REPORT | JOHN HANCOCK FLOATING RATE INCOME FUND | 39 |
| Rate (%) | Maturity date | Par value^ | Value | ||
| Consumer discretionary (continued) | |||||
| Textiles, apparel and luxury goods (continued) | |||||
| Brunello Bidco SpA (Greater of 3 month EURIBOR + 3.750% or 3.750%) (E)(F) | 3.750 | 02-15-28 | EUR | 448,000 | $528,712 |
| Wolverine Escrow LLC (E) | 8.500 | 11-15-24 | 646,000 | 613,700 | |
| Wolverine Escrow LLC (E) | 9.000 | 11-15-26 | 7,250,000 | 6,960,000 | |
| Consumer staples 0.2% | 3,505,327 | ||||
| Household products 0.1% | |||||
| Kronos Acquisition Holdings, Inc. (E) | 5.000 | 12-31-26 | 1,966,000 | 1,956,170 | |
| Personal products 0.1% | |||||
| Douglas GmbH (E) | 6.000 | 04-08-26 | EUR | 1,299,000 | 1,549,157 |
| Energy 0.1% | 1,362,046 | ||||
| Oil, gas and consumable fuels 0.1% | |||||
| New Fortress Energy, Inc. (E) | 6.500 | 09-30-26 | 1,355,000 | 1,362,046 | |
| Financials 1.1% | 20,054,765 | ||||
| Capital markets 0.5% | |||||
| AG Issuer LLC (E) | 6.250 | 03-01-28 | 6,549,000 | 6,696,354 | |
| Hightower Holding LLC (E) | 6.750 | 04-15-29 | 1,584,000 | 1,627,560 | |
| Consumer finance 0.1% | |||||
| Encore Capital Group, Inc. (E) | 4.250 | 06-01-28 | GBP | 2,070,000 | 2,845,713 |
| Diversified financial services 0.2% | |||||
| Garfunkelux Holdco 3 SA (E) | 6.750 | 11-01-25 | EUR | 1,645,000 | 2,032,171 |
| Garfunkelux Holdco 3 SA | 6.750 | 11-01-25 | EUR | 1,400,000 | 1,729,507 |
| Thrifts and mortgage finance 0.3% | |||||
| Ladder Capital Finance Holdings LLLP (E) | 4.250 | 02-01-27 | 3,639,000 | 3,657,195 | |
| Ladder Capital Finance Holdings LLLP (E) | 4.750 | 06-15-29 | 1,434,000 | 1,466,265 | |
| Health care 1.0% | 18,215,219 | ||||
| Health care providers and services 0.3% | |||||
| US Acute Care Solutions LLC (E) | 6.375 | 03-01-26 | 5,641,000 | 5,866,640 | |
| Pharmaceuticals 0.7% | |||||
| Cheplapharm Arzneimittel GmbH (E) | 5.500 | 01-15-28 | 5,027,000 | 5,140,108 | |
| Jazz Securities DAC (E) | 4.375 | 01-15-29 | 2,316,000 | 2,399,955 | |
| Organon & Company (E) | 4.125 | 04-30-28 | 2,730,000 | 2,816,541 | |
| Organon & Company (E) | 5.125 | 04-30-31 | 1,899,000 | 1,991,975 | |
| 40 | JOHN HANCOCK FLOATING RATE INCOME FUND | ANNUAL REPORT | SEE NOTES TO FINANCIAL STATEMENTS |
| Rate (%) | Maturity date | Par value^ | Value | ||
| Industrials 1.2% | $21,814,980 | ||||
| Aerospace and defense 0.2% | |||||
| Spirit AeroSystems, Inc. (E) | 7.500 | 04-15-25 | 3,237,000 | 3,427,174 | |
| TransDigm, Inc. (E) | 6.250 | 03-15-26 | 202,000 | 212,100 | |
| Air freight and logistics 0.1% | |||||
| First Student Bidco, Inc. (E) | 4.000 | 07-31-29 | 1,450,000 | 1,438,922 | |
| Airlines 0.0% | |||||
| United Airlines, Inc. (E) | 4.625 | 04-15-29 | 644,000 | 668,150 | |
| Commercial services and supplies 0.2% | |||||
| VistaJet Malta Finance PLC (E) | 10.500 | 06-01-24 | 2,424,000 | 2,630,040 | |
| Construction and engineering 0.1% | |||||
| Novafives SAS (Greater of 3 month EURIBOR + 4.500% or 4.500%) (F) | 4.500 | 06-15-25 | EUR | 1,332,000 | 1,427,279 |
| Machinery 0.2% | |||||
| SRM Escrow Issuer LLC (E) | 6.000 | 11-01-28 | 3,692,000 | 3,913,520 | |
| Marine 0.1% | |||||
| Naviera Armas SA (Greater of 3 month EURIBOR + 4.250% or 4.250%) (F) | 4.250 | 11-15-24 | EUR | 1,811,000 | 1,625,138 |
| Road and rail 0.2% | |||||
| Uber Technologies, Inc. (E) | 4.500 | 08-15-29 | 4,165,000 | 4,098,693 | |
| Trading companies and distributors 0.1% | |||||
| Beacon Roofing Supply, Inc. (E) | 4.125 | 05-15-29 | 2,371,000 | 2,373,964 | |
| Information technology 1.2% | 20,132,364 | ||||
| IT services 0.2% | |||||
| Paysafe Finance PLC (E) | 4.000 | 06-15-29 | 2,584,000 | 2,488,986 | |
| Rackspace Technology Global, Inc. (E) | 3.500 | 02-15-28 | 1,099,000 | 1,055,040 | |
| Software 1.0% | |||||
| Avaya, Inc. (E) | 6.125 | 09-15-28 | 6,100,000 | 6,435,500 | |
| Castle US Holding Corp. (E) | 9.500 | 02-15-28 | 1,548,000 | 1,617,660 | |
| Helios Software Holdings, Inc. (E) | 4.625 | 05-01-28 | 5,437,000 | 5,380,890 | |
| ION Trading Technologies Sarl (E) | 5.750 | 05-15-28 | 3,055,000 | 3,154,288 | |
| Materials 0.6% | 10,466,178 | ||||
| Chemicals 0.3% | |||||
| Venator Finance Sarl (E) | 9.500 | 07-01-25 | 2,341,000 | 2,598,510 | |
| WR Grace Holdings LLC (E) | 5.625 | 08-15-29 | 2,125,000 | 2,212,656 | |
| Containers and packaging 0.3% | |||||
| Intelligent Packaging, Ltd. Finco, Inc. (E) | 6.000 | 09-15-28 | 2,878,000 | 3,007,510 | |
| Kleopatra Holdings 2 SCA | 6.500 | 09-01-26 | EUR | 861,000 | 968,336 |
| LABL, Inc. (E) | 6.750 | 07-15-26 | 1,591,000 | 1,670,550 | |
| SEE NOTES TO FINANCIAL STATEMENTS | ANNUAL REPORT | JOHN HANCOCK FLOATING RATE INCOME FUND | 41 |
| Rate (%) | Maturity date | Par value^ | Value | ||
| Materials (continued) | |||||
| Metals and mining 0.0% | |||||
| Midwest Vanadium Pty, Ltd. (C)(E) | 11.500 | 02-15-18 | 5,668,325 | $8,616 | |
| Asset backed securities 1.9% | $32,794,478 | ||||
| (Cost $32,893,800) | |||||
| Asset backed securities 1.9% | 32,794,478 | ||||
| Atlas Senior Loan Fund X, Ltd. Series 2018-10A, Class D (3 month LIBOR + 2.750%) (E)(F) | 2.876 | 01-15-31 | 4,900,000 | 4,565,129 | |
| Cedar Funding VIII CLO, Ltd. Series 2017-8A, Class DR (3 month LIBOR + 3.500%) (E)(F) | 3.620 | 10-17-34 | 850,000 | 850,000 | |
| Hayfin US XIV, Ltd. Series 2021-14A, Class D (3 month LIBOR + 3.650%) (E)(F) | 3.379 | 07-20-34 | 3,000,000 | 2,976,309 | |
| Jamestown CLO IX, Ltd. Series 2016-9A, Class CRR (3 month LIBOR + 3.900%) (E)(F) | 4.002 | 07-25-34 | 3,450,000 | 3,450,000 | |
| Jamestown CLO XVI, Ltd. Series 2021-16A, Class D (3 month LIBOR + 3.650%) (E)(F) | 3.795 | 07-25-34 | 3,100,000 | 3,102,220 | |
| Marble Point CLO XI, Ltd. Series 2017-2A, Class D (3 month LIBOR + 2.800%) (E)(F) | 2.989 | 12-18-30 | 2,500,000 | 2,327,238 | |
| Northwoods Capital XVII, Ltd. Series 2018-17A, Class D (3 month LIBOR + 2.850%) (E)(F) | 3.033 | 04-22-31 | 1,350,000 | 1,266,172 | |
| Parallel, Ltd. Series 2020-1A, Class CR (3 month LIBOR + 3.400%) (E)(F) | 3.457 | 07-20-34 | 1,350,000 | 1,349,972 | |
| Sculptor CLO XXVII, Ltd. Series 27A, Class D (3 month LIBOR + 3.700%) (E)(F) | 3.819 | 07-20-34 | 3,550,000 | 3,553,639 | |
| Shackleton XIV CLO, Ltd. Series 2019-14A, Class DR (3 month LIBOR + 3.700%) (E)(F) | 3.835 | 07-20-34 | 2,950,000 | 2,952,095 | |
| TCW CLO, Ltd. Series 2020-1A, Class DRR (3 month LIBOR + 3.400%) (E)(F) | 3.586 | 04-20-34 | 1,300,000 | 1,300,176 | |
| Wellfleet CLO, Ltd. | |||||
| Series 2020-2A, Class DR (3 month LIBOR + 3.800%) (E)(F) | 3.929 | 07-15-34 | 2,900,000 | 2,899,988 | |
| Series 2021-2A, Class D (3 month LIBOR + 3.600%) (E)(F) | 3.729 | 07-15-34 | 2,200,000 | 2,201,540 | |
| 42 | JOHN HANCOCK FLOATING RATE INCOME FUND | ANNUAL REPORT | SEE NOTES TO FINANCIAL STATEMENTS |
| Shares | Value | ||||
| Common stocks 0.4% | $7,970,761 | ||||
| (Cost $16,050,173) | |||||
| Communication services 0.1% | 2,115,876 | ||||
| Entertainment 0.1% | |||||
| Cineworld Group PLC (G) | 105,512 | 42,504 | |||
| Technicolor SA (G) | 586,571 | 2,073,372 | |||
| Consumer discretionary 0.0% | 311,912 | ||||
| Hotels, restaurants and leisure 0.0% | |||||
| NPC International, Inc. (D)(G) | 245,600 | 311,912 | |||
| Energy 0.3% | 5,542,973 | ||||
| Energy equipment and services 0.0% | |||||
| Hercules Offshore, Inc. (D)(G) | 196,736 | 5,613 | |||
| Oil, gas and consumable fuels 0.3% | |||||
| Murray Energy Corp. (G) | 12,315 | 299,661 | |||
| Ultra Petroleum Corp. (G) | 37,155 | 1,379,379 | |||
| Ultra Resources, Inc. (G) | 103,928 | 3,858,320 | |||
| Exchange-traded funds 1.7% | $29,179,678 | ||||
| (Cost $29,360,186) | |||||
| Invesco Senior Loan ETF (H) | 866,586 | 19,186,214 | |||
| SPDR Blackstone Senior Loan ETF | 217,391 | 9,993,464 | |||
| Yield (%) | Shares | Value | |||
| Short-term investments 3.9% | $67,107,217 | ||||
| (Cost $67,103,825) | |||||
| Short-term funds 3.9% | 67,107,217 | ||||
| John Hancock Collateral Trust (I) | 0.0356(J) | 1,942,482 | 19,438,612 | ||
| State Street Institutional U.S. Government Money Market Fund, Premier Class | 0.0250(J) | 47,668,605 | 47,668,605 | ||
| Total investments (Cost $1,845,584,103) 104.9% | $1,835,847,234 | ||||
| Other assets and liabilities, net (4.9%) | (85,538,837) | ||||
| Total net assets 100.0% | $1,750,308,397 | ||||
| The percentage shown for each investment category is the total value of the category as a percentage of the net assets of the fund. | |
| ^All par values are denominated in U.S. dollars unless otherwise indicated. | |
| Currency Abbreviations | |
| EUR | Euro |
| GBP | Pound Sterling |
| Security Abbreviations and Legend | |
| EURIBOR | Euro Interbank Offered Rate |
| LIBOR | London Interbank Offered Rate |
| SEE NOTES TO FINANCIAL STATEMENTS | ANNUAL REPORT | JOHN HANCOCK FLOATING RATE INCOME FUND | 43 |
| PIK | Pay-in-Kind Security - Represents a payment-in-kind which may pay interest in additional par and/or cash. Rates shown are the current rate and most recent payment rate. |
| (A) | Term loans are variable rate obligations. The coupon rate shown represents the rate at period end. |
| (B) | This position represents an unsettled loan commitment at period end. Certain details associated with this purchase are not known prior to the settlement date, including coupon rate, which is disclosed as TBD (To Be Determined). |
| (C) | Non-income producing - Issuer is in default. |
| (D) | Security is valued using significant unobservable inputs and is classified as Level 3 in the fair value hierarchy. Refer to Note 2 to the financial statements. |
| (E) | These securities are exempt from registration under Rule 144A of the Securities Act of 1933. Such securities may be resold, normally to qualified institutional buyers, in transactions exempt from registration. Rule 144A securities amounted to $202,043,006 or 11.5% of the fund’s net assets as of 8-31-21. |
| (F) | Variable rate obligation. The coupon rate shown represents the rate at period end. |
| (G) | Non-income producing security. |
| (H) | All or a portion of this security is on loan as of 8-31-21. |
| (I) | Investment is an affiliate of the fund, the advisor and/or subadvisor. This security represents the investment of cash collateral received for securities lending. |
| (J) | The rate shown is the annualized seven-day yield as of 8-31-21. |
| 44 | JOHN HANCOCK FLOATING RATE INCOME FUND | ANNUAL REPORT | SEE NOTES TO FINANCIAL STATEMENTS |
| Contract to buy | Contract to sell | Counterparty (OTC) | Contractual settlement date | Unrealized appreciation | Unrealized depreciation | ||
| USD | 109,848,704 | EUR | 92,370,000 | CITI | 10/6/2021 | $709,368 | — |
| USD | 32,978,193 | GBP | 23,870,000 | CITI | 10/6/2021 | 157,573 | — |
| $866,941 | — | ||||||
| Derivatives Currency Abbreviations | |
| EUR | Euro |
| GBP | Pound Sterling |
| USD | U.S. Dollar |
| Derivatives Abbreviations | |
| CITI | Citibank, N.A. |
| OTC | Over-the-counter |
| SEE NOTES TO FINANCIAL STATEMENTS | ANNUAL REPORT | JOHN HANCOCK FLOATING RATE INCOME FUND | 45 |
| Assets | |
| Unaffiliated investments, at value (Cost $1,826,148,883) including $18,985,770 of securities loaned | $1,816,408,622 |
| Affiliated investments, at value (Cost $19,435,220) | 19,438,612 |
| Total investments, at value (Cost $1,845,584,103) | 1,835,847,234 |
| Unrealized appreciation on forward foreign currency contracts | 866,941 |
| Cash | 2,520,427 |
| Foreign currency, at value (Cost $19,121,793) | 19,182,461 |
| Interest receivable | 9,041,547 |
| Receivable for fund shares sold | 3,099,676 |
| Receivable for investments sold | 25,082,653 |
| Receivable for securities lending income | 4,588 |
| Receivable from affiliates | 696 |
| Other assets | 84,249 |
| Total assets | 1,895,730,472 |
| Liabilities | |
| Distributions payable | 22,745 |
| Payable for collateral on OTC derivatives | 712,007 |
| Payable for investments purchased | 124,125,083 |
| Payable for fund shares repurchased | 777,859 |
| Payable upon return of securities loaned | 19,430,992 |
| Payable to affiliates | |
| Accounting and legal services fees | 65,583 |
| Transfer agent fees | 38,694 |
| Trustees’ fees | 440 |
| Other liabilities and accrued expenses | 248,672 |
| Total liabilities | 145,422,075 |
| Net assets | $1,750,308,397 |
| Net assets consist of | |
| Paid-in capital | $2,103,315,056 |
| Total distributable earnings (loss) | (353,006,659) |
| Net assets | $1,750,308,397 |
| 46 | JOHN HANCOCK Floating Rate Income Fund | ANNUAL REPORT | SEE NOTES TO FINANCIAL STATEMENTS |
| Net asset value per share | |
| Based on net asset value and shares outstanding - the fund has an unlimited number of shares authorized with no par value | |
| Class A ($117,859,853 ÷ 14,207,447 shares)1 | $8.30 |
| Class C ($21,678,249 ÷ 2,602,728 shares)1 | $8.33 |
| Class I ($252,007,180 ÷ 30,403,062 shares) | $8.29 |
| Class R6 ($341,828,348 ÷ 41,191,830 shares) | $8.30 |
| Class 1 ($15,489,239 ÷ 1,869,362 shares) | $8.29 |
| Class NAV ($1,001,445,528 ÷ 120,685,447 shares) | $8.30 |
| Maximum offering price per share | |
| Class A (net asset value per share ÷ 97.5%)2 | $8.51 |
| 1 | Redemption price per share is equal to net asset value less any applicable contingent deferred sales charge. |
| 2 | On single retail sales of less than $100,000. On sales of $100,000 or more and on group sales the offering price is reduced. |
| SEE NOTES TO FINANCIAL STATEMENTS | ANNUAL REPORT | JOHN HANCOCK Floating Rate Income Fund | 47 |
| Investment income | |
| Interest | $53,558,681 |
| Dividends | 876,068 |
| Securities lending | 10,381 |
| Total investment income | 54,445,130 |
| Expenses | |
| Investment management fees | 7,807,907 |
| Distribution and service fees | 540,016 |
| Line of credit fees | 360,370 |
| Accounting and legal services fees | 171,602 |
| Transfer agent fees | 294,219 |
| Trustees’ fees | 16,275 |
| Custodian fees | 130,546 |
| State registration fees | 84,359 |
| Printing and postage | 39,768 |
| Professional fees | 125,479 |
| Other | 64,989 |
| Total expenses | 9,635,530 |
| Less expense reductions | (1,147,176) |
| Net expenses | 8,488,354 |
| Net investment income | 45,956,776 |
| Realized and unrealized gain (loss) | |
| Net realized gain (loss) on | |
| Unaffiliated investments and foreign currency transactions | (1,529,681) |
| Affiliated investments | 4,188 |
| Forward foreign currency contracts | (3,102,167) |
| (4,627,660) | |
| Change in net unrealized appreciation (depreciation) of | |
| Unaffiliated investments and translation of assets and liabilities in foreign currencies | 34,440,601 |
| Affiliated investments | 3,392 |
| Forward foreign currency contracts | 5,009,349 |
| 39,453,342 | |
| Net realized and unrealized gain | 34,825,682 |
| Increase in net assets from operations | $80,782,458 |
| 48 | JOHN HANCOCK Floating Rate Income Fund | ANNUAL REPORT | SEE NOTES TO FINANCIAL STATEMENTS |
| Year ended 8-31-21 | Year ended 8-31-20 | |
| Increase (decrease) in net assets | ||
| From operations | ||
| Net investment income | $45,956,776 | $35,811,840 |
| Net realized loss | (4,627,660) | (26,934,402) |
| Change in net unrealized appreciation (depreciation) | 39,453,342 | (3,476,223) |
| Increase in net assets resulting from operations | 80,782,458 | 5,401,215 |
| Distributions to shareholders | ||
| From earnings | ||
| Class A | (3,042,478) | (4,729,634) |
| Class B1 | (6,414) | (136,316) |
| Class C | (643,345) | (2,280,483) |
| Class I | (3,210,075) | (2,862,988) |
| Class R6 | (3,506,958) | (110,598) |
| Class 1 | (511,178) | (1,084,098) |
| Class NAV | (24,702,509) | (28,237,238) |
| Total distributions | (35,622,957) | (39,441,355) |
| From fund share transactions | 925,360,279 | (113,248,087) |
| Total increase (decrease) | 970,519,780 | (147,288,227) |
| Net assets | ||
| Beginning of year | 779,788,617 | 927,076,844 |
| End of year | $1,750,308,397 | $779,788,617 |
| 1 | Share class was redesignated during the year. Refer to Note 6 for further details. |
| SEE NOTES TO FINANCIAL STATEMENTS | ANNUAL REPORT | JOHN HANCOCK Floating Rate Income Fund | 49 |
| CLASS A SHARES Period ended | 8-31-21 | 8-31-20 | 8-31-19 | 8-31-18 | 8-31-17 |
| Per share operating performance | |||||
| Net asset value, beginning of period | $7.89 | $8.28 | $8.43 | $8.45 | $8.48 |
| Net investment income1 | 0.30 | 0.36 | 0.40 | 0.34 | 0.37 |
| Net realized and unrealized gain (loss) on investments | 0.36 | (0.36) | (0.16) | —2 | — |
| Total from investment operations | 0.66 | — | 0.24 | 0.34 | 0.37 |
| Less distributions | |||||
| From net investment income | (0.25) | (0.39) | (0.39) | (0.36) | (0.40) |
| Net asset value, end of period | $8.30 | $7.89 | $8.28 | $8.43 | $8.45 |
| Total return (%)3,4 | 8.41 | 0.11 | 2.96 | 4.05 | 4.46 |
| Ratios and supplemental data | |||||
| Net assets, end of period (in millions) | $118 | $89 | $109 | $117 | $138 |
| Ratios (as a percentage of average net assets): | |||||
| Expenses before reductions | 1.12 | 1.175 | 1.16 | 1.13 | 1.17 |
| Expenses including reductions | 1.00 | 0.995 | 1.06 | 1.13 | 1.16 |
| Net investment income | 3.71 | 4.49 | 4.77 | 4.03 | 4.31 |
| Portfolio turnover (%) | 59 | 81 | 120 | 71 | 66 |
| 1 | Based on average daily shares outstanding. |
| 2 | Less than $0.005 per share. |
| 3 | Total returns would have been lower had certain expenses not been reduced during the applicable periods. |
| 4 | Does not reflect the effect of sales charges, if any. |
| 5 | Includes reimbursement of legal fees of 0.01%. |
| 50 | JOHN HANCOCK Floating Rate Income Fund | ANNUAL REPORT | SEE NOTES TO FINANCIAL STATEMENTS |
| CLASS C SHARES Period ended | 8-31-21 | 8-31-20 | 8-31-19 | 8-31-18 | 8-31-17 |
| Per share operating performance | |||||
| Net asset value, beginning of period | $7.92 | $8.32 | $8.47 | $8.49 | $8.52 |
| Net investment income1 | 0.25 | 0.30 | 0.33 | 0.28 | 0.31 |
| Net realized and unrealized gain (loss) on investments | 0.34 | (0.37) | (0.15) | (0.01) | 0.01 |
| Total from investment operations | 0.59 | (0.07) | 0.18 | 0.27 | 0.32 |
| Less distributions | |||||
| From net investment income | (0.18) | (0.33) | (0.33) | (0.29) | (0.35) |
| Net asset value, end of period | $8.33 | $7.92 | $8.32 | $8.47 | $8.49 |
| Total return (%)2,3 | 7.58 | (0.74) | 2.20 | 3.28 | 3.73 |
| Ratios and supplemental data | |||||
| Net assets, end of period (in millions) | $22 | $39 | $71 | $102 | $128 |
| Ratios (as a percentage of average net assets): | |||||
| Expenses before reductions | 1.87 | 1.924 | 1.91 | 1.88 | 1.88 |
| Expenses including reductions | 1.75 | 1.744 | 1.81 | 1.88 | 1.87 |
| Net investment income | 3.00 | 3.77 | 3.99 | 3.29 | 3.60 |
| Portfolio turnover (%) | 59 | 81 | 120 | 71 | 66 |
| 1 | Based on average daily shares outstanding. |
| 2 | Total returns would have been lower had certain expenses not been reduced during the applicable periods. |
| 3 | Does not reflect the effect of sales charges, if any. |
| 4 | Includes reimbursement of legal fees of 0.01%. |
| SEE NOTES TO FINANCIAL STATEMENTS | ANNUAL REPORT | JOHN HANCOCK Floating Rate Income Fund | 51 |
| CLASS I SHARES Period ended | 8-31-21 | 8-31-20 | 8-31-19 | 8-31-18 | 8-31-17 |
| Per share operating performance | |||||
| Net asset value, beginning of period | $7.89 | $8.28 | $8.43 | $8.45 | $8.48 |
| Net investment income1 | 0.31 | 0.38 | 0.41 | 0.36 | 0.39 |
| Net realized and unrealized gain (loss) on investments | 0.35 | (0.36) | (0.15) | —2 | 0.01 |
| Total from investment operations | 0.66 | 0.02 | 0.26 | 0.36 | 0.40 |
| Less distributions | |||||
| From net investment income | (0.26) | (0.41) | (0.41) | (0.38) | (0.43) |
| Net asset value, end of period | $8.29 | $7.89 | $8.28 | $8.43 | $8.45 |
| Total return (%)3 | 8.52 | 0.34 | 3.19 | 4.31 | 4.78 |
| Ratios and supplemental data | |||||
| Net assets, end of period (in millions) | $252 | $49 | $66 | $152 | $166 |
| Ratios (as a percentage of average net assets): | |||||
| Expenses before reductions | 0.87 | 0.924 | 0.92 | 0.89 | 0.87 |
| Expenses including reductions | 0.77 | 0.764 | 0.83 | 0.88 | 0.85 |
| Net investment income | 3.84 | 4.72 | 4.94 | 4.29 | 4.57 |
| Portfolio turnover (%) | 59 | 81 | 120 | 71 | 66 |
| 1 | Based on average daily shares outstanding. |
| 2 | Less than $0.005 per share. |
| 3 | Total returns would have been lower had certain expenses not been reduced during the applicable periods. |
| 4 | Includes reimbursement of legal fees of 0.01%. |
| 52 | JOHN HANCOCK Floating Rate Income Fund | ANNUAL REPORT | SEE NOTES TO FINANCIAL STATEMENTS |
| CLASS R6 SHARES Period ended | 8-31-21 | 8-31-20 | 8-31-19 | 8-31-18 | 8-31-17 |
| Per share operating performance | |||||
| Net asset value, beginning of period | $7.89 | $8.29 | $8.43 | $8.45 | $8.48 |
| Net investment income1 | 0.32 | 0.39 | 0.42 | 0.37 | 0.40 |
| Net realized and unrealized gain (loss) on investments | 0.36 | (0.37) | (0.14) | —2 | 0.01 |
| Total from investment operations | 0.68 | 0.02 | 0.28 | 0.37 | 0.41 |
| Less distributions | |||||
| From net investment income | (0.27) | (0.42) | (0.42) | (0.39) | (0.44) |
| Net asset value, end of period | $8.30 | $7.89 | $8.29 | $8.43 | $8.45 |
| Total return (%)3 | 8.77 | 0.33 | 3.44 | 4.41 | 4.88 |
| Ratios and supplemental data | |||||
| Net assets, end of period (in millions) | $342 | $2 | $3 | $6 | $—4 |
| Ratios (as a percentage of average net assets): | |||||
| Expenses before reductions | 0.77 | 0.815 | 0.81 | 0.79 | 0.77 |
| Expenses including reductions | 0.66 | 0.655 | 0.71 | 0.78 | 0.76 |
| Net investment income | 3.93 | 4.88 | 5.06 | 4.45 | 4.66 |
| Portfolio turnover (%) | 59 | 81 | 120 | 71 | 66 |
| 1 | Based on average daily shares outstanding. |
| 2 | Less than $0.005 per share. |
| 3 | Total returns would have been lower had certain expenses not been reduced during the applicable periods. |
| 4 | Less than $500,000. |
| 5 | Includes reimbursement of legal fees of 0.01%. |
| SEE NOTES TO FINANCIAL STATEMENTS | ANNUAL REPORT | JOHN HANCOCK Floating Rate Income Fund | 53 |
| CLASS 1 SHARES Period ended | 8-31-21 | 8-31-20 | 8-31-19 | 8-31-18 | 8-31-17 |
| Per share operating performance | |||||
| Net asset value, beginning of period | $7.88 | $8.28 | $8.42 | $8.44 | $8.47 |
| Net investment income1 | 0.33 | 0.38 | 0.42 | 0.37 | 0.40 |
| Net realized and unrealized gain (loss) on investments | 0.35 | (0.36) | (0.14) | (0.01) | — |
| Total from investment operations | 0.68 | 0.02 | 0.28 | 0.36 | 0.40 |
| Less distributions | |||||
| From net investment income | (0.27) | (0.42) | (0.42) | (0.38) | (0.43) |
| Net asset value, end of period | $8.29 | $7.88 | $8.28 | $8.42 | $8.44 |
| Total return (%)2 | 8.74 | 0.29 | 3.39 | 4.37 | 4.84 |
| Ratios and supplemental data | |||||
| Net assets, end of period (in millions) | $15 | $16 | $27 | $30 | $30 |
| Ratios (as a percentage of average net assets): | |||||
| Expenses before reductions | 0.81 | 0.853 | 0.84 | 0.83 | 0.81 |
| Expenses including reductions | 0.70 | 0.693 | 0.75 | 0.82 | 0.80 |
| Net investment income | 4.04 | 4.82 | 5.07 | 4.36 | 4.63 |
| Portfolio turnover (%) | 59 | 81 | 120 | 71 | 66 |
| 1 | Based on average daily shares outstanding. |
| 2 | Total returns would have been lower had certain expenses not been reduced during the applicable periods. |
| 3 | Includes reimbursement of legal fees of 0.01%. |
| 54 | JOHN HANCOCK Floating Rate Income Fund | ANNUAL REPORT | SEE NOTES TO FINANCIAL STATEMENTS |
| CLASS NAV SHARES Period ended | 8-31-21 | 8-31-20 | 8-31-19 | 8-31-18 | 8-31-17 |
| Per share operating performance | |||||
| Net asset value, beginning of period | $7.89 | $8.29 | $8.44 | $8.45 | $8.48 |
| Net investment income1 | 0.33 | 0.38 | 0.42 | 0.37 | 0.40 |
| Net realized and unrealized gain (loss) on investments | 0.35 | (0.36) | (0.15) | 0.01 | 0.01 |
| Total from investment operations | 0.68 | 0.02 | 0.27 | 0.38 | 0.41 |
| Less distributions | |||||
| From net investment income | (0.27) | (0.42) | (0.42) | (0.39) | (0.44) |
| Net asset value, end of period | $8.30 | $7.89 | $8.29 | $8.44 | $8.45 |
| Total return (%)2 | 8.78 | 0.34 | 3.32 | 4.55 | 4.89 |
| Ratios and supplemental data | |||||
| Net assets, end of period (in millions) | $1,001 | $583 | $648 | $865 | $1,202 |
| Ratios (as a percentage of average net assets): | |||||
| Expenses before reductions | 0.76 | 0.803 | 0.79 | 0.78 | 0.76 |
| Expenses including reductions | 0.66 | 0.653 | 0.71 | 0.77 | 0.75 |
| Net investment income | 4.03 | 4.80 | 5.08 | 4.41 | 4.71 |
| Portfolio turnover (%) | 59 | 81 | 120 | 71 | 66 |
| 1 | Based on average daily shares outstanding. |
| 2 | Total returns would have been lower had certain expenses not been reduced during the applicable periods. |
| 3 | Includes reimbursement of legal fees of 0.01%. |
| SEE NOTES TO FINANCIAL STATEMENTS | ANNUAL REPORT | JOHN HANCOCK Floating Rate Income Fund | 55 |
| 56 | JOHN HANCOCK Floating Rate Income Fund | ANNUAL REPORT |
| Total value at 8-31-21 | Level 1 quoted price | Level 2 significant observable inputs | Level 3 significant unobservable inputs | |
| Investments in securities: | ||||
| Assets | ||||
| Term loans | $1,513,077,893 | — | $1,512,258,341 | $819,552 |
| Corporate bonds | 185,717,207 | — | 185,717,207 | — |
| Asset backed securities | 32,794,478 | — | 32,794,478 | — |
| Common stocks | 7,970,761 | — | 7,653,236 | 317,525 |
| Exchange-traded funds | 29,179,678 | $29,179,678 | — | — |
| Short-term investments | 67,107,217 | 67,107,217 | — | — |
| Total investments in securities | $1,835,847,234 | $96,286,895 | $1,738,423,262 | $1,137,077 |
| Derivatives: | ||||
| Assets | ||||
| Forward foreign currency contracts | $866,941 | — | $866,941 | — |
| ANNUAL REPORT | JOHN HANCOCK Floating Rate Income Fund | 57 |
| 58 | JOHN HANCOCK Floating Rate Income Fund | ANNUAL REPORT |
| ANNUAL REPORT | JOHN HANCOCK Floating Rate Income Fund | 59 |
| August 31, 2021 | August 31, 2020 | |
| Ordinary income | $35,622,957 | $39,441,355 |
| 60 | JOHN HANCOCK Floating Rate Income Fund | ANNUAL REPORT |
| Risk | Statement of assets and liabilities location | Financial instruments location | Assets derivatives fair value | Liabilities derivatives fair value |
| Currency | Unrealized appreciation (depreciation) on forward foreign currency contracts | Forward foreign currency contracts | $866,941 | — |
| Statement of operations location - Net realized gain (loss) on: | |
| Risk | Forward foreign currency contracts |
| Currency | $(3,102,167) |
| Statement of operations location - Change in net unrealized appreciation (depreciation) of: | |
| Risk | Forward foreign currency contracts |
| Currency | $5,009,349 |
| ANNUAL REPORT | JOHN HANCOCK Floating Rate Income Fund | 61 |
| 62 | JOHN HANCOCK Floating Rate Income Fund | ANNUAL REPORT |
| Class | Expense reduction |
| Class A | $127,714 |
| Class B | 335 |
| Class C | 35,113 |
| Class I | 104,639 |
| Class | Expense reduction |
| Class R6 | $116,659 |
| Class 1 | 17,197 |
| Class NAV | 745,519 |
| Total | $1,147,176 |
| Class | Rule 12b-1 Fee |
| Class A | 0.25% |
| Class B | 1.00% |
| Class C | 1.00% |
| Class 1 | 0.05% |
| ANNUAL REPORT | JOHN HANCOCK Floating Rate Income Fund | 63 |
| Class | Distribution and service fees | Transfer agent fees |
| Class A | $256,872 | $118,276 |
| Class B | 2,187 | 229 |
| Class C | 273,266 | 31,454 |
| Class I | — | 131,881 |
| Class R6 | — | 12,379 |
| Class 1 | 7,691 | — |
| Total | $540,016 | $294,219 |
| Year Ended 8-31-21 | Year Ended 8-31-20 | |||
| Shares | Amount | Shares | Amount | |
| Class A shares | ||||
| Sold | 6,859,380 | $56,094,739 | 3,491,651 | $27,784,410 |
| Distributions reinvested | 343,695 | 2,804,607 | 559,074 | 4,433,509 |
| Repurchased | (4,218,044) | (34,506,914) | (5,933,098) | (46,722,649) |
| Net increase (decrease) | 2,985,031 | $24,392,432 | (1,882,373) | $(14,504,730) |
| Class B shares | ||||
| Sold | 45 | $354 | 978 | $7,761 |
| Distributions reinvested | 503 | 3,982 | 15,354 | 122,476 |
| Repurchased | (239,238) | (1,903,818) | (329,442) | (2,611,589) |
| Net decrease | (238,690) | $(1,899,482) | (313,110) | $(2,481,352) |
| Class C shares | ||||
| Sold | 370,023 | $3,065,141 | 169,972 | $1,384,517 |
| Distributions reinvested | 77,706 | 633,059 | 263,617 | 2,104,192 |
| Repurchased | (2,810,979) | (22,872,097) | (3,977,415) | (31,493,230) |
| Net decrease | (2,363,250) | $(19,173,897) | (3,543,826) | $(28,004,521) |
| 64 | JOHN HANCOCK Floating Rate Income Fund | ANNUAL REPORT |
| Year Ended 8-31-21 | Year Ended 8-31-20 | |||
| Shares | Amount | Shares | Amount | |
| Class I shares | ||||
| Sold | 28,912,821 | $238,039,224 | 3,104,591 | $24,247,908 |
| Distributions reinvested | 380,816 | 3,126,902 | 345,976 | 2,746,502 |
| Repurchased | (5,081,504) | (41,389,729) | (5,174,641) | (40,552,509) |
| Net increase (decrease) | 24,212,133 | $199,776,397 | (1,724,074) | $(13,558,099) |
| Class R6 shares | ||||
| Sold | 42,926,197 | $353,304,450 | 45,202 | $359,918 |
| Distributions reinvested | 418,380 | 3,464,169 | 13,895 | 110,598 |
| Repurchased | (2,348,101) | (19,008,996) | (234,624) | (1,865,442) |
| Net increase (decrease) | 40,996,476 | $337,759,623 | (175,527) | $(1,394,926) |
| Class 1 shares | ||||
| Sold | 961,072 | $7,863,511 | 515,103 | $3,991,150 |
| Distributions reinvested | 62,794 | 511,178 | 136,543 | 1,084,098 |
| Repurchased | (1,224,731) | (9,968,715) | (1,784,909) | (13,847,295) |
| Net decrease | (200,865) | $(1,594,026) | (1,133,263) | $(8,772,047) |
| Class NAV shares | ||||
| Sold | 46,644,623 | $384,523,749 | 12,819,970 | $97,112,499 |
| Distributions reinvested | 3,020,730 | 24,702,509 | 3,562,889 | 28,237,238 |
| Repurchased | (2,882,076) | (23,127,026) | (20,688,357) | (169,882,149) |
| Net increase (decrease) | 46,783,277 | $386,099,232 | (4,305,498) | $(44,532,412) |
| Total net increase (decrease) | 112,174,112 | $925,360,279 | (13,077,671) | $(113,248,087) |
| Redesignation | Effective date | Amount | |||||
| Class B shares as Class A shares | October 14, 2020 | $1,780,295 |
| ANNUAL REPORT | JOHN HANCOCK Floating Rate Income Fund | 65 |
| Fund | Affiliated Concentration |
| JHF II Multimanager Lifestyle Balanced Portfolio | 21.4% |
| JHF II Multimanager Lifestyle Growth Portfolio | 12.5% |
| JHF II Multimanager Lifestyle Conservative Portfolio | 9.8% |
| JHF II Multimanager Lifestyle Moderate Portfolio | 9.0% |
| Dividends and distributions | |||||||||
| Affiliate | Ending share amount | Beginning value | Cost of purchases | Proceeds from shares sold | Realized gain (loss) | Change in unrealized appreciation (depreciation) | Income distributions received | Capital gain distributions received | Ending value |
| John Hancock Collateral Trust* | 1,942,482 | — | $115,990,980 | $(96,559,948) | $4,188 | $3,392 | $10,381 | — | $19,438,612 |
| * | Refer to the Securities lending note within Note 2 for details regarding this investment. |
| 66 | JOHN HANCOCK Floating Rate Income Fund | ANNUAL REPORT |
| ANNUAL REPORT | JOHN HANCOCK Floating Rate Income Fund | 67 |
| 68 | JOHN HANCOCK FLOATING RATE INCOME FUND | ANNUAL REPORT |
| ANNUAL REPORT | JOHN HANCOCK FLOATING RATE INCOME FUND | 69 |
| 70 | JOHN HANCOCK FLOATING RATE INCOME FUND | ANNUAL REPORT |
| (a) | the skills and competency with which the Advisor has in the past managed the Trust’s affairs and its subadvisory relationship, the Advisor’s oversight and monitoring of the Subadvisor’s investment performance and compliance programs, such as the Subadvisor’s compliance with fund policies and objectives, review of brokerage matters, including with respect to trade allocation and best execution and the Advisor’s timeliness in responding to performance issues; |
| (b) | the background, qualifications and skills of the Advisor’s personnel; |
| (c) | the Advisor’s compliance policies and procedures and its responsiveness to regulatory changes and fund industry developments; |
| ANNUAL REPORT | JOHN HANCOCK FLOATING RATE INCOME FUND | 71 |
| (d) | the Advisor’s administrative capabilities, including its ability to supervise the other service providers for the fund, as well as the Advisor’s oversight of any securities lending activity, its monitoring of class action litigation and collection of class action settlements on behalf of the fund, and bringing loss recovery actions on behalf of the fund; |
| (e) | the financial condition of the Advisor and whether it has the financial wherewithal to provide a high level and quality of services to the fund; |
| (f) | the Advisor’s initiatives intended to improve various aspects of the Trust’s operations and investor experience with the fund; and |
| (g) | the Advisor’s reputation and experience in serving as an investment advisor to the Trust and the benefit to shareholders of investing in funds that are part of a family of funds offering a variety of investments. |
| (a) | reviewed information prepared by management regarding the fund’s performance; |
| (b) | considered the comparative performance of an applicable benchmark index; |
| (c) | considered the performance of comparable funds, if any, as included in the report prepared by an independent third-party provider of fund data; and |
| (d) | took into account the Advisor’s analysis of the fund’s performance and its plans and recommendations regarding the Trust’s subadvisory arrangements generally. |
| 72 | JOHN HANCOCK FLOATING RATE INCOME FUND | ANNUAL REPORT |
| (a) | reviewed financial information of the Advisor; |
| (b) | reviewed and considered information presented by the Advisor regarding the net profitability to the Advisor and its affiliates with respect to the fund; |
| (c) | received and reviewed profitability information with respect to the John Hancock Fund Complex as a whole and with respect to the fund; |
| (d) | received information with respect to the Advisor’s allocation methodologies used in preparing the profitability data and considered that the Advisor hired an independent third-party consultant to provide an analysis of the Advisor’s allocation methodologies; |
| (e) | considered that the John Hancock insurance companies that are affiliates of the Advisor, as shareholders of the Trust directly or through their separate accounts, receive certain tax credits or deductions relating to foreign taxes paid and dividends received by certain funds of the Trust and noted that these tax benefits, which are not available to participants in qualified retirement plans under applicable income tax law, are reflected in the profitability information reviewed by the Board; |
| (f) | considered that the Advisor also provides administrative services to the fund on a cost basis pursuant to an administrative services agreement; |
| (g) | noted that affiliates of the Advisor provide transfer agency services and distribution services to the fund, and that the fund’s distributor also receives Rule 12b-1 payments to support distribution of the fund; |
| (h) | noted that the Advisor also derives reputational and other indirect benefits from providing advisory services to the fund;considered the Advisor’s ongoing costs and expenditures necessary to improve services, meet new regulatory and compliance requirements, and adapt to other challenges impacting the fund industry; and |
| (i) | considered that the Advisor should be entitled to earn a reasonable level of profits in exchange for the level of services it provides to the fund and the risks that it assumes as Advisor, including entrepreneurial, operational, reputational, litigation and regulatory risk. |
| ANNUAL REPORT | JOHN HANCOCK FLOATING RATE INCOME FUND | 73 |
| (a) | considered that the Advisor has contractually agreed to waive a portion of its management fee for certain funds of the John Hancock Fund Complex, including the fund (the participating portfolios) or otherwise reimburse the expenses of the participating portfolios (the reimbursement). This waiver is based upon aggregate net assets of all the participating portfolios. The amount of the reimbursement is calculated daily and allocated among all the participating portfolios in proportion to the daily net assets of each fund; |
| (b) | reviewed the fund’s advisory fee structure and concluded that: (i) the fund’s fee structure contains breakpoints at the subadvisory fee level and that such breakpoints are reflected as breakpoints in the advisory fees for the fund; and (ii) although economies of scale cannot be measured with precision, these arrangements permit shareholders of the fund to benefit from economies of scale if the fund grows. The Board also took into account management’s discussion of the fund’s advisory fee structure; and |
| (c) | the Board also considered the effect of the fund’s growth in size on its performance and fees. The Board also noted that if the fund’s assets increase over time, the fund may realize other economies of scale. |
| (1) | information relating to the Subadvisor’s business, including current subadvisory services to the Trust (and other funds in the John Hancock Fund Complex); |
| (2) | the historical and current performance of the fund and comparative performance information relating to an applicable benchmark index and comparable funds; |
| (3) | the subadvisory fee for the fund, including any breakpoints, and to the extent available, comparable fee information prepared by an independent third party provider of fund data; and |
| (4) | information relating to the nature and scope of any material relationships and their significance to the Trust’s Advisor and Subadvisor. |
| 74 | JOHN HANCOCK FLOATING RATE INCOME FUND | ANNUAL REPORT |
| (1) | the Subadvisor has extensive experience and demonstrated skills as a manager; |
| ANNUAL REPORT | JOHN HANCOCK FLOATING RATE INCOME FUND | 75 |
| (2) | the performance of the fund has generally been in line with or outperformed the historical performance of comparable funds; |
| (3) | the subadvisory fee is reasonable in relation to the level and quality of services being provided under the Subadvisory Agreement; and |
| (4) | noted that the subadvisory fees are paid by the Advisor not the fund and that the subadvisory fee breakpoints are reflected as breakpoints in the advisory fees for the fund in order to permit shareholders to benefit from economies of scale if the fund grows. |
| 76 | JOHN HANCOCK FLOATING RATE INCOME FUND | ANNUAL REPORT |
| • | The Fund’s investment strategy remained appropriate for an open-end fund structure; |
| • | The Fund was able to meet requests for redemption without significant dilution of remaining investors’ interests in the Fund; |
| • | The Fund did not report any breaches of the 15% limit on illiquid investments that would require reporting to the Securities and Exchange Commission; |
| • | The Chief Compliance Officer’s office performed audit testing of the LRMP which resulted in an assessment that the LRMP’s control environment was deemed to be operating effectively and in compliance with the Board approved procedures. |
| ANNUAL REPORT | JOHN HANCOCK FLOATING RATE INCOME FUND | 77 |
| 78 | JOHN HANCOCK FLOATING RATE INCOME FUND | ANNUAL REPORT |
| Independent Trustees | ||
| Name, year of birth Position(s) held with Trust Principal occupation(s) and other directorships during past 5 years | Trustee of the Trust since1 | Number of John Hancock funds overseen by Trustee |
| Hassell H. McClellan, Born: 1945 | 2005 | 190 |
| Trustee and Chairperson of the Board | ||
| Director/Trustee, Virtus Funds (2008-2020); Director, The Barnes Group (2010-2021); Associate Professor, The Wallace E. Carroll School of Management, Boston College (retired 2013). Trustee (since 2005) and Chairperson of the Board (since 2017) of various trusts within the John Hancock Fund Complex. | ||
| Charles L. Bardelis,2 Born: 1941 | 2005 | 190 |
| Trustee | ||
| Director, Island Commuter Corp. (marine transport). Trustee of various trusts within the John Hancock Fund Complex (since 1988). | ||
| James R. Boyle, Born: 1959 | 2015 | 190 |
| Trustee | ||
| Chief Executive Officer, Foresters Financial (since 2018); Chairman and Chief Executive Officer, Zillion Group, Inc. (formerly HealthFleet, Inc.) (healthcare) (2014-2018); Executive Vice President and Chief Executive Officer, U.S. Life Insurance Division of Genworth Financial, Inc. (insurance) (January 2014–July 2014); Senior Executive Vice President, Manulife Financial, President and Chief Executive Officer, John Hancock (1999–2012); Chairman and Director, John Hancock Investment Management LLC, John Hancock Investment Management Distributors LLC, and John Hancock Variable Trust Advisers LLC (2005–2010). Trustee of various trusts within the John Hancock Fund Complex (2005–2014 and since 2015). | ||
| Peter S. Burgess,2 Born: 1942 | 2005 | 190 |
| Trustee | ||
| Consultant (financial, accounting, and auditing matters) (since 1999); Certified Public Accountant; Partner, Arthur Andersen (independent public accounting firm) (prior to 1999); Director, Lincoln Educational Services Corporation (2004-2021); Director, Symetra Financial Corporation (2010–2016); Director, PMA Capital Corporation (2004–2010). Trustee of various trusts within the John Hancock Fund Complex (since 2005). | ||
| William H. Cunningham, Born: 1944 | 2012 | 190 |
| Trustee | ||
| Professor, University of Texas, Austin, Texas (since 1971); former Chancellor, University of Texas System and former President of the University of Texas, Austin, Texas; Chairman (since 2009) and Director (since 2006), Lincoln National Corporation (insurance); Director, Southwest Airlines (since 2000); former Director, LIN Television (2009–2014). Trustee of various trusts within the John Hancock Fund Complex (since 1986). | ||
| Grace K. Fey, Born: 1946 | 2008 | 190 |
| Trustee | ||
| Chief Executive Officer, Grace Fey Advisors (since 2007); Director and Executive Vice President, Frontier Capital Management Company (1988–2007); Director, Fiduciary Trust (since 2009). Trustee of various trusts within the John Hancock Fund Complex (since 2008). | ||
| ANNUAL REPORT | JOHN HANCOCK FLOATING RATE INCOME FUND | 79 |
| Independent Trustees (continued) | ||
| Name, year of birth Position(s) held with Trust Principal occupation(s) and other directorships during past 5 years | Trustee of the Trust since1 | Number of John Hancock funds overseen by Trustee |
| Deborah C. Jackson, Born: 1952 | 2012 | 190 |
| Trustee | ||
| President, Cambridge College, Cambridge, Massachusetts (since 2011); Board of Directors, Amwell Corporation (since 2020); Board of Directors, Massachusetts Women’s Forum (2018-2020); Board of Directors, National Association of Corporate Directors/New England (2015-2020); Board of Directors, Association of Independent Colleges and Universities of Massachusetts (2014-2017); Chief Executive Officer, American Red Cross of Massachusetts Bay (2002–2011); Board of Directors of Eastern Bank Corporation (since 2001); Board of Directors of Eastern Bank Charitable Foundation (since 2001); Board of Directors of American Student Assistance Corporation (1996–2009); Board of Directors of Boston Stock Exchange (2002–2008); Board of Directors of Harvard Pilgrim Healthcare (health benefits company) (2007–2011). Trustee of various trusts within the John Hancock Fund Complex (since 2008). | ||
| Steven R. Pruchansky, Born: 1944 | 2012 | 190 |
| Trustee and Vice Chairperson of the Board | ||
| Managing Director, Pru Realty (since 2017); Chairman and Chief Executive Officer, Greenscapes of Southwest Florida, Inc. (2014-2020); Director and President, Greenscapes of Southwest Florida, Inc. (until 2000); Member, Board of Advisors, First American Bank (until 2010); Managing Director, Jon James, LLC (real estate) (since 2000); Partner, Right Funding, LLC (2014-2017); Director, First Signature Bank & Trust Company (until 1991); Director, Mast Realty Trust (until 1994); President, Maxwell Building Corp. (until 1991). Trustee (since 1992), Chairperson of the Board (2011–2012), and Vice Chairperson of the Board (since 2012) of various trusts within the John Hancock Fund Complex. | ||
| Frances G. Rathke,2,* Born: 1960 | 2020 | 190 |
| Trustee | ||
| Board Member, Oatly Group AB (plant-based drink company) (since 2021): Director, Northern New England Energy Corporation (since 2017); Director, Audit Committee Chair and Compensation Committee Member, Green Mountain Power Corporation (since 2016); Director, Treasurer and Finance & Audit Committee Chair, Flynn Center for Performing Arts (since 2016); Director, Audit Committee Chair and Compensation Committee Member, Planet Fitness (since 2016); Director, Citizen Cider, Inc. (high-end hard cider and hard seltzer company) (since 2016); Chief Financial Officer and Treasurer, Keurig Green Mountain, Inc. (2003-retired 2015); Independent Financial Consultant, Frances Rathke Consulting (strategic and financial consulting services) (2001-2003); Chief Financial Officer and Secretary, Ben & Jerry’s Homemade, Inc. (1989-2000, including prior positions); Senior Manager, Coopers & Lybrand, LLC (independent public accounting firm) (1982-1989). Trustee of various trusts within the John Hancock Fund Complex (since 2020). | ||
| Gregory A. Russo, Born: 1949 | 2012 | 190 |
| Trustee | ||
| Director and Audit Committee Chairman (2012-2020), and Member, Audit Committee and Finance Committee (2011-2020), NCH Healthcare System, Inc. (holding company for multi-entity healthcare system); Director and Member (2012-2018) and Finance Committee Chairman (2014-2018), The Moorings, Inc. (nonprofit continuing care community); Vice Chairman, Risk & Regulatory Matters, KPMG LLP (KPMG) (2002–2006); Vice Chairman, Industrial Markets, KPMG (1998–2002); Chairman and Treasurer, Westchester County, New York, Chamber of Commerce (1986–1992); Director, Treasurer, and Chairman of Audit and Finance Committees, Putnam Hospital Center (1989–1995); Director and Chairman of Fundraising Campaign, United Way of Westchester and Putnam Counties, New York (1990–1995). Trustee of various trusts within the John Hancock Fund Complex (since 2008). | ||
| 80 | JOHN HANCOCK FLOATING RATE INCOME FUND | ANNUAL REPORT |
| Non-Independent Trustees3 | ||
| Name, year of birth Position(s) held with Trust Principal occupation(s) and other directorships during past 5 years | Trustee of the Trust since1 | Number of John Hancock funds overseen by Trustee |
| Andrew G. Arnott, Born: 1971 | 2017 | 190 |
| President and Non-Independent Trustee | ||
| Head of Wealth and Asset Management, United States and Europe, for John Hancock and Manulife (since 2018); Director and Executive Vice President, John Hancock Investment Management LLC (since 2005, including prior positions); Director and Executive Vice President, John Hancock Variable Trust Advisers LLC (since 2006, including prior positions); President, John Hancock Investment Management Distributors LLC (since 2004, including prior positions); President of various trusts within the John Hancock Fund Complex (since 2007, including prior positions). Trustee of various trusts within the John Hancock Fund Complex (since 2017). | ||
| Marianne Harrison, Born: 1963 | 2018 | 190 |
| Non-Independent Trustee | ||
| President and CEO, John Hancock (since 2017); President and CEO, Manulife Canadian Division (2013–2017); Member, Board of Directors, Boston Medical Center (since 2021); Member, Board of Directors, CAE Inc. (since 2019); Member, Board of Directors, MA Competitive Partnership Board (since 2018); Member, Board of Directors, American Council of Life Insurers (ACLI) (since 2018); Member, Board of Directors, Communitech, an industry-led innovation center that fosters technology companies in Canada (2017-2019); Member, Board of Directors, Manulife Assurance Canada (2015-2017); Board Member, St. Mary’s General Hospital Foundation (2014-2017); Member, Board of Directors, Manulife Bank of Canada (2013- 2017); Member, Standing Committee of the Canadian Life & Health Assurance Association (2013-2017); Member, Board of Directors, John Hancock USA, John Hancock Life & Health, John Hancock New York (2012–2013). Trustee of various trusts within the John Hancock Fund Complex (since 2018). | ||
| Principal officers who are not Trustees | |
| Name, year of birth Position(s) held with Trust Principal occupation(s) during past 5 years | Current Position(s) with the Trust since |
| Charles A. Rizzo, Born: 1957 | 2007 |
| Chief Financial Officer | |
| Vice President, John Hancock Financial Services (since 2008); Senior Vice President, John Hancock Investment Management LLC and John Hancock Variable Trust Advisers LLC (since 2008); Chief Financial Officer of various trusts within the John Hancock Fund Complex (since 2007). | |
| Salvatore Schiavone, Born: 1965 | 2009 |
| Treasurer | |
| Assistant Vice President, John Hancock Financial Services (since 2007); Vice President, John Hancock Investment Management LLC and John Hancock Variable Trust Advisers LLC (since 2007); Treasurer of various trusts within the John Hancock Fund Complex (since 2007, including prior positions). | |
| Christopher (Kit) Sechler, Born: 1973 | 2018 |
| Secretary and Chief Legal Officer | |
| Vice President and Deputy Chief Counsel, John Hancock Investment Management (since 2015); Assistant Vice President and Senior Counsel (2009–2015), John Hancock Investment Management; Assistant Secretary of John Hancock Investment Management LLC and John Hancock Variable Trust Advisers LLC (since 2009); Chief Legal Officer and Secretary of various trusts within the John Hancock Fund Complex (since 2009, including prior positions). | |
| ANNUAL REPORT | JOHN HANCOCK FLOATING RATE INCOME FUND | 81 |
| Principal officers who are not Trustees (continued) | |
| Name, year of birth Position(s) held with Trust Principal occupation(s) during past 5 years | Current Position(s) with the Trust since |
| Trevor Swanberg, Born: 1979 | 2020 |
| Chief Compliance Officer | |
| Chief Compliance Officer, John Hancock Investment Management LLC and John Hancock Variable Trust Advisers LLC (since 2020); Deputy Chief Compliance Officer, John Hancock Investment Management LLC and John Hancock Variable Trust Advisers LLC (2019–2020); Assistant Chief Compliance Officer, John Hancock Investment Management LLC and John Hancock Variable Trust Advisers LLC (2016–2019); Vice President, State Street Global Advisors (2015–2016); Chief Compliance Officer of various trusts within the John Hancock Fund Complex (since 2016, including prior positions). | |
| 1 | Each Trustee holds office until his or her successor is elected and qualified, or until the Trustee’s death, retirement, resignation, or removal. Mr. Boyle has served as Trustee at various times prior to the date listed in the table. |
| 2 | Member of the Audit Committee. |
| 3 | The Trustee is a Non-Independent Trustee due to current or former positions with the Advisor and certain affiliates. |
| * | Appointed as Independent Trustee effective as of September 15, 2020. |
| 82 | JOHN HANCOCK FLOATING RATE INCOME FUND | ANNUAL REPORT |
Steven R. Pruchansky, Vice Chairperson
Andrew G. Arnott†
Charles L. Bardelis*
James R. Boyle
Peter S. Burgess*
William H. Cunningham
Grace K. Fey
Marianne Harrison†
Deborah C. Jackson
Frances G. Rathke*,1
Gregory A. Russo
President
Chief Financial Officer
Treasurer
Secretary and Chief Legal Officer
Chief Compliance Officer
Kim Harris
Nate Whittier
| You can also contact us: | ||
| 800-225-5291 | Regular mail: | Express mail: |
| jhinvestments.com | John Hancock Signature Services, Inc. P.O. Box 219909 Kansas City, MO 64121-9909 | John Hancock Signature Services, Inc. 430 W 7th Street Suite 219909 Kansas City, MO 64105-1407 |
| ANNUAL REPORT | JOHN HANCOCK FLOATING RATE INCOME FUND | 83 |
GOVERNANCE FUNDS
with a heritage of financial stewardship dating back to 1862. Helping
our shareholders pursue their financial goals is at the core of everything
we do. It’s why we support the role of professional financial advice
and operate with the highest standards of conduct and integrity.
We search the world to find proven portfolio teams with specialized
expertise for every strategy we offer, then we apply robust investment
oversight to ensure they continue to meet our uncompromising
standards and serve the best interests of our shareholders.
a diverse set of investments backed by some of the world’s best
managers, along with strong risk-adjusted returns across asset classes.
200 Berkeley Street, Boston, MA 02116-5010, 800-225-5291, jhinvestments.com
| MF1822990 | 328A 8/21 |


President and CEO,
John Hancock Investment Management
Head of Wealth and Asset Management,
United States and Europe
| ANNUAL REPORT | JOHN HANCOCK OPPORTUNISTIC FIXED INCOME FUND | 1 |

| 2 | JOHN HANCOCK OPPORTUNISTIC FIXED INCOME FUND | ANNUAL REPORT |
| ANNUAL REPORT | JOHN HANCOCK OPPORTUNISTIC FIXED INCOME FUND | 3 |

| 4 | JOHN HANCOCK OPPORTUNISTIC FIXED INCOME FUND | ANNUAL REPORT |
| COUNTRY COMPOSITION AS OF 8/31/2021 (% of total investments) | |
| United States | 54.7 |
| South Korea | 6.4 |
| Japan | 4.5 |
| Germany | 2.9 |
| Canada | 2.8 |
| Brazil | 2.7 |
| Russia | 2.4 |
| Norway | 2.3 |
| Mexico | 2.2 |
| Israel | 1.9 |
| Other countries | 17.2 |
| TOTAL | 100.0 |
ANNUAL REPORT | JOHN HANCOCK OPPORTUNISTIC FIXED INCOME FUND | 5 |

| 6 | JOHN HANCOCK OPPORTUNISTIC FIXED INCOME FUND | ANNUAL REPORT |
| Average annual total returns (%) with maximum sales charge | Cumulative total returns (%) with maximum sales charge | ||||
| 1-year | 5-year | 10-year | 5-year | 10-year | |
| Class A1 | -2.40 | 2.44 | 2.32 | 12.79 | 25.75 |
| Class C1 | 1.64 | 3.46 | 2.83 | 18.57 | 32.20 |
| Class I1,2 | 2.84 | 3.51 | 2.85 | 18.83 | 32.49 |
| Class R61,2 | 2.91 | 3.53 | 2.86 | 18.91 | 32.58 |
| Class 12 | 2.84 | 3.51 | 2.85 | 18.83 | 32.49 |
| Index 1† | 0.76 | 3.09 | 3.73 | 16.42 | 44.28 |
| Index 2† | 0.52 | 2.47 | 1.81 | 12.98 | 19.63 |
| Class A | Class C | Class I | Class R6 | Class 1 | |
| Gross (%) | 1.98 | 2.73 | 1.73 | 1.61 | 1.65 |
| Net (%) | 1.29 | 2.04 | 1.04 | 0.92 | 0.96 |
| ANNUAL REPORT | JOHN HANCOCK OPPORTUNISTIC FIXED INCOME FUND | 7 |

| Start date | With maximum sales charge ($) | Without sales charge ($) | Index 1 ($) | Index 2 ($) | |
| Class C1,3 | 8-31-11 | 13,220 | 13,220 | 14,428 | 11,963 |
| Class I1,2 | 8-31-11 | 13,249 | 13,249 | 14,428 | 11,963 |
| Class R61,2 | 8-31-11 | 13,258 | 13,258 | 14,428 | 11,963 |
| Class 12 | 8-31-11 | 13,249 | 13,249 | 14,428 | 11,963 |
| 1 | Class A, Class C, Class I, and Class R6 shares were first offered on 6-4-21. Returns prior to this date are those of Class 1 shares that have not been adjusted for class-specific expenses; otherwise, returns would vary. |
| 2 | For certain types of investors, as described in the fund’s prospectuses. |
| 3 | The contingent deferred sales charge is not applicable. |
| 8 | JOHN HANCOCK OPPORTUNISTIC FIXED INCOME FUND | ANNUAL REPORT |

| ANNUAL REPORT | JOHN HANCOCK OPPORTUNISTIC FIXED INCOME FUND | 9 |
| Account value on 3-1-2021 | Ending value on 8-31-2021 | Expenses paid during period ended 8-31-20211 | Annualized expense ratio | ||
| Class A | Actual expenses/actual returns2 | $1,000.00 | $1,020.20 | $2.73 | 1.16% |
| Hypothetical example | 1,000.00 | 1,019.40 | 5.90 | 1.16% | |
| Class C | Actual expenses/actual returns2 | 1,000.00 | 1,018.70 | 4.49 | 1.91% |
| Hypothetical example | 1,000.00 | 1,015.60 | 9.70 | 1.91% | |
| Class I | Actual expenses/actual returns2 | 1,000.00 | 1,020.90 | 2.14 | 0.91% |
| Hypothetical example | 1,000.00 | 1,020.60 | 4.63 | 0.91% | |
| Class R6 | Actual expenses/actual returns2 | 1,000.00 | 1,021.70 | 1.91 | 0.81% |
| Hypothetical example | 1,000.00 | 1,021.10 | 4.13 | 0.81% | |
| Class 1 | Actual expenses/actual returns | 1,000.00 | 1,020.90 | 4.33 | 0.85% |
| Hypothetical example | 1,000.00 | 1,020.90 | 4.33 | 0.85% |
| 1 | Expenses are equal to the annualized expense ratio, multiplied by the average account value over the period, multiplied by 184/365 (to reflect the one-half year period). |
| 2 | The inception date for Class A, Class C, Class I, and Class R6 shares is 6-4-21. Actual Expenses are equal to the class’ annualized expense ratio, multiplied by the average account value over the period, multiplied by 89/365 (to reflect the period). |
| 10 | JOHN HANCOCK OPPORTUNISTIC FIXED INCOME FUND | ANNUAL REPORT |
| Rate (%) | Maturity date | Par value^ | Value | ||
| U.S. Government and Agency obligations 17.2% | $14,947,833 | ||||
| (Cost $14,724,814) | |||||
| U.S. Government 10.1% | 8,813,369 | ||||
| U.S. Treasury | |||||
| Note | 1.625 | 05-15-31 | 4,680,000 | 4,825,519 | |
| Treasury Inflation Protected Security | 0.125 | 04-15-26 | 1,532,851 | 1,674,580 | |
| Treasury Inflation Protected Security (A) | 0.125 | 02-15-51 | 1,669,216 | 1,891,104 | |
| Treasury Inflation Protected Security (A) | 0.250 | 02-15-50 | 274,685 | 319,167 | |
| Treasury Inflation Protected Security | 0.750 | 02-15-45 | 34,604 | 43,641 | |
| Treasury Inflation Protected Security (A) | 0.875 | 02-15-47 | 45,008 | 59,358 | |
| U.S. Government Agency 7.1% | 6,134,464 | ||||
| Federal National Mortgage Association | |||||
| 30 Yr Pass Thru (B) | 2.000 | TBA | 4,062,000 | 4,119,853 | |
| 30 Yr Pass Thru (B) | 2.000 | TBA | 1,990,000 | 2,014,611 | |
| Foreign government obligations 46.7% | $40,512,591 | ||||
| (Cost $41,283,900) | |||||
| Argentina 0.1% | 83,325 | ||||
| Republic of Argentina | |||||
| Bond | 1.000 | 07-09-29 | 7,467 | 3,057 | |
| Bond (1.125% to 7-9-22, then 1.500% to 7-9-23, then 3.625% to 7-9-24, then 4.125% to 7-9-27, then 4.750% to 7-9-28, then 5.000% thereafter) | 1.125 | 07-09-35 | 229,987 | 80,268 | |
| Australia 0.7% | 638,455 | ||||
| Commonwealth of Australia | |||||
| Bond | 3.000 | 03-21-47 | AUD | 725,000 | 638,455 |
| Brazil 2.9% | 2,540,890 | ||||
| Federative Republic of Brazil | |||||
| Note | 6.000 | 05-15-55 | BRL | 716,000 | 602,331 |
| Note | 10.000 | 01-01-25 | BRL | 1,601,000 | 318,775 |
| Note | 10.000 | 01-01-29 | BRL | 8,303,000 | 1,619,784 |
| Bulgaria 0.3% | 270,952 | ||||
| Republic of Bulgaria | |||||
| Bond | 1.375 | 09-23-50 | EUR | 230,000 | 270,952 |
| Canada 2.8% | 2,470,098 | ||||
| Government of Canada | |||||
| SEE NOTES TO FINANCIAL STATEMENTS | ANNUAL REPORT | JOHN HANCOCK OPPORTUNISTIC FIXED INCOME FUND | 11 |
| Rate (%) | Maturity date | Par value^ | Value | ||
| Canada (continued) | |||||
| Bond | 0.500 | 12-01-50 | CAD | 522,178 | $456,941 |
| Bond | 1.500 | 12-01-44 | CAD | 195,691 | 203,215 |
| Bond | 3.000 | 12-01-36 | CAD | 411,840 | 484,800 |
| Bond | 4.000 | 12-01-31 | CAD | 1,129,456 | 1,325,142 |
| Chile 1.9% | 1,680,726 | ||||
| Republic of Chile | |||||
| Bond | 1.900 | 09-01-30 | CLP | 898,052,400 | 1,215,747 |
| Bond | 5.000 | 03-01-35 | CLP | 65,000,000 | 85,836 |
| CPI Linked Bond | 1.250 | 01-22-51 | EUR | 350,000 | 379,143 |
| Colombia 0.4% | 365,906 | ||||
| Republic of Colombia | |||||
| Bond | 3.875 | 03-22-26 | EUR | 145,000 | 190,042 |
| Bond | 6.000 | 04-28-28 | COP | 685,100,000 | 175,864 |
| Croatia 0.1% | 126,504 | ||||
| Republic of Croatia | |||||
| Bond | 1.500 | 06-17-31 | EUR | 100,000 | 126,504 |
| Czech Republic 0.2% | 164,999 | ||||
| Czech Republic | |||||
| Bond | 2.500 | 08-25-28 | CZK | 3,400,000 | 164,999 |
| Egypt 0.2% | 198,540 | ||||
| Arab Republic of Egypt | |||||
| Bond | 7.903 | 02-21-48 | 200,000 | 198,540 | |
| Germany 3.1% | 2,728,032 | ||||
| Federal Republic of Germany | |||||
| Inflation Linked Bond | 0.100 | 04-15-26 | EUR | 1,995,725 | 2,602,014 |
| Inflation Linked Bond | 0.500 | 04-15-30 | EUR | 86,531 | 126,018 |
| Greece 0.4% | 366,030 | ||||
| Republic of Greece | |||||
| GDP-Linked Note (C) | 4.484* | 10-15-42 | EUR | 119,230,000 | 366,030 |
| Hungary 1.0% | 839,018 | ||||
| Republic of Hungary | |||||
| Bond | 1.625 | 04-28-32 | EUR | 110,000 | 140,105 |
| Bond | 1.750 | 06-05-35 | EUR | 430,000 | 548,253 |
| Bond | 2.750 | 12-22-26 | HUF | 43,870,000 | 150,660 |
| Iceland 2.0% | 1,700,439 | ||||
| The Republic of Iceland | |||||
| Bond | 5.000 | 11-15-28 | ISK | 195,110,000 | 1,700,439 |
| Indonesia 1.4% | 1,189,885 | ||||
| Republic of Indonesia | |||||
| Bond | 9.000 | 03-15-29 | IDR | 4,565,000,000 | 377,664 |
| Inflation Linked Bond | 1.400 | 10-30-31 | EUR | 670,000 | 812,221 |
| 12 | JOHN HANCOCK OPPORTUNISTIC FIXED INCOME FUND | ANNUAL REPORT | SEE NOTES TO FINANCIAL STATEMENTS |
| Rate (%) | Maturity date | Par value^ | Value | ||
| Israel 2.1% | $1,790,517 | ||||
| State of Israel | |||||
| Bond | 3.750 | 03-31-47 | ILS | 3,745,000 | 1,556,233 |
| CPI Linked Bond | 0.500 | 11-30-51 | ILS | 720,000 | 234,284 |
| Ivory Coast 0.1% | 120,310 | ||||
| Republic of Ivory Coast | |||||
| Bond | 4.875 | 01-30-32 | EUR | 100,000 | 120,310 |
| Japan 5.0% | 4,326,166 | ||||
| Government of Japan | |||||
| CPI Linked Bond | 0.100 | 03-10-28 | JPY | 229,355,103 | 2,137,715 |
| CPI Linked Bond | 0.100 | 03-10-29 | JPY | 234,090,864 | 2,188,451 |
| Macedonia 0.2% | 187,332 | ||||
| Republic of Macedonia | |||||
| Bond | 2.750 | 01-18-25 | EUR | 150,000 | 187,332 |
| Malaysia 0.3% | 298,795 | ||||
| Government of Malaysia | |||||
| Inflation Linked Bond | 3.899 | 11-16-27 | MYR | 1,180,000 | 298,795 |
| Mexico 2.4% | 2,069,193 | ||||
| Government of Mexico | |||||
| Bond | 2.125 | 10-25-51 | EUR | 300,000 | 307,319 |
| Bond | 4.000 | 11-15-40 | MXN | 11,766,769 | 641,659 |
| Bond | 7.500 | 06-03-27 | MXN | 6,751,300 | 348,635 |
| Bond | 8.000 | 11-07-47 | MXN | 11,012,100 | 570,634 |
| Inflation Linked Bond | 3.625 | 04-09-29 | EUR | 145,000 | 200,946 |
| Morocco 0.9% | 806,584 | ||||
| Kingdom of Morocco | |||||
| Bond | 1.500 | 11-27-31 | EUR | 620,000 | 689,254 |
| Bond | 2.000 | 09-30-30 | EUR | 100,000 | 117,330 |
| New Zealand 2.0% | 1,762,643 | ||||
| Government of New Zealand | |||||
| Inflation Linked Bond | 1.500 | 05-15-31 | NZD | 145,000 | 99,884 |
| Inflation Linked Bond | 2.711 | 09-20-40 | NZD | 380,000 | 375,763 |
| Inflation Linked Bond | 2.739 | 09-20-35 | NZD | 210,000 | 210,522 |
| Inflation Linked Bond | 3.338 | 09-20-30 | NZD | 1,075,000 | 1,076,474 |
| Norway 2.5% | 2,184,877 | ||||
| Kingdom of Norway | |||||
| Bond (D) | 1.375 | 08-19-30 | NOK | 8,860,000 | 1,028,666 |
| Bond (D) | 1.750 | 09-06-29 | NOK | 9,670,000 | 1,156,211 |
| Panama 0.3% | 228,632 | ||||
| Republic of Panama | |||||
| Bond | 4.500 | 04-01-56 | 200,000 | 228,632 |
| SEE NOTES TO FINANCIAL STATEMENTS | ANNUAL REPORT | JOHN HANCOCK OPPORTUNISTIC FIXED INCOME FUND | 13 |
| Rate (%) | Maturity date | Par value^ | Value | ||
| Peru 0.1% | $75,176 | ||||
| Republic of Peru | |||||
| Bond | 6.950 | 08-12-31 | PEN | 290,000 | 75,176 |
| Philippines 0.5% | 395,514 | ||||
| Republic of the Philippines | |||||
| Bond | 1.750 | 04-28-41 | EUR | 330,000 | 395,514 |
| Poland 0.4% | 335,774 | ||||
| Republic of Poland | |||||
| Bond | 2.500 | 07-25-26 | PLN | 1,210,000 | 335,774 |
| Romania 1.0% | 829,557 | ||||
| Republic of Romania | |||||
| Bond (D) | 2.625 | 12-02-40 | EUR | 120,000 | 139,590 |
| Bond (D) | 2.750 | 04-14-41 | EUR | 360,000 | 419,764 |
| Bond | 3.875 | 10-29-35 | EUR | 110,000 | 152,035 |
| Bond | 4.750 | 02-24-25 | RON | 470,000 | 118,168 |
| Russia 2.6% | 2,247,633 | ||||
| Government of Russia | |||||
| Bond | 5.900 | 03-12-31 | RUB | 57,470,000 | 732,946 |
| Bond | 6.900 | 05-23-29 | RUB | 71,950,000 | 987,275 |
| Bond | 7.050 | 01-19-28 | RUB | 3,775,000 | 52,335 |
| Bond | 8.150 | 02-03-27 | RUB | 13,990,000 | 202,571 |
| Inflation Linked Bond | 7.650 | 04-10-30 | RUB | 18,970,000 | 272,506 |
| Saudi Arabia 0.7% | 569,208 | ||||
| Kingdom of Saudi Arabia | |||||
| CPI Linked Bond (D) | 2.250 | 02-02-33 | 200,000 | 197,038 | |
| Inflation Linked Bond | 2.000 | 07-09-39 | EUR | 300,000 | 372,170 |
| Serbia 0.2% | 128,531 | ||||
| Republic of Serbia | |||||
| Bond | 1.650 | 03-03-33 | EUR | 110,000 | 128,531 |
| South Africa 0.4% | 304,906 | ||||
| Republic of South Africa | |||||
| Bond | 7.000 | 02-28-31 | ZAR | 5,110,000 | 304,906 |
| South Korea 7.0% | 6,067,521 | ||||
| Republic of Korea | |||||
| Bond | 1.375 | 12-10-29 | KRW | 5,440,840,000 | 4,507,302 |
| Bond | 1.375 | 06-10-30 | KRW | 265,560,000 | 218,575 |
| Inflation Linked Bond | 1.125 | 06-10-30 | KRW | 1,175,553,328 | 1,044,283 |
| Inflation Linked Bond | 1.750 | 06-10-28 | KRW | 322,406,444 | 297,361 |
| Thailand 0.4% | 336,736 | ||||
| Kingdom of Thailand | |||||
| Bond | 2.875 | 12-17-28 | THB | 9,730,000 | 336,736 |
| 14 | JOHN HANCOCK OPPORTUNISTIC FIXED INCOME FUND | ANNUAL REPORT | SEE NOTES TO FINANCIAL STATEMENTS |
| Rate (%) | Maturity date | Par value^ | Value | ||
| Turkey 0.1% | $79,524 | ||||
| Republic of Turkey | |||||
| Bond | 9.000 | 07-24-24 | TRY | 810,000 | 79,524 |
| Uruguay 0.0% | 3,663 | ||||
| Republic of Uruguay | |||||
| Bond | 8.500 | 03-15-28 | UYU | 150,000 | 3,663 |
| Corporate bonds 8.2% | $7,125,592 | ||||
| (Cost $6,922,153) | |||||
| Canada 0.1% | 64,969 | ||||
| goeasy, Ltd. (D) | 4.375 | 05-01-26 | 63,000 | 64,969 | |
| Cayman Islands 0.0% | 28,313 | ||||
| Spirit Loyalty Cayman, Ltd. (D) | 8.000 | 09-20-25 | 25,000 | 28,313 | |
| Finland 0.3% | 265,048 | ||||
| Nokia OYJ | 6.625 | 05-15-39 | 190,012 | 265,048 | |
| Luxembourg 0.1% | 94,595 | ||||
| Codere Finance 2 Luxembourg SA (4.500% Cash and 6.250% PIK) | 10.750 | 11-01-23 | EUR | 113,438 | 94,595 |
| United Kingdom 0.1% | 60,596 | ||||
| British Airways 2021-1 Class A Pass Through Trust (D) | 2.900 | 03-15-35 | 60,000 | 60,596 | |
| United States 7.6% | 6,612,071 | ||||
| Acrisure LLC (D) | 6.000 | 08-01-29 | 32,000 | 31,520 | |
| Acrisure LLC (D) | 7.000 | 11-15-25 | 61,000 | 62,144 | |
| Alliant Holdings Intermediate LLC (D) | 6.750 | 10-15-27 | 60,000 | 62,400 | |
| Altria Group, Inc. | 3.125 | 06-15-31 | EUR | 170,000 | 233,550 |
| Ambience Merger Sub, Inc. (D) | 7.125 | 07-15-29 | 63,000 | 63,079 | |
| American Airlines, Inc. (D) | 5.750 | 04-20-29 | 50,000 | 53,993 | |
| AmWINS Group, Inc. (D) | 4.875 | 06-30-29 | 30,000 | 30,488 | |
| Antero Midstream Partners LP (D) | 5.375 | 06-15-29 | 43,000 | 44,020 | |
| Antero Resources Corp. (D) | 8.375 | 07-15-26 | 25,000 | 28,313 | |
| Apache Corp. | 4.375 | 10-15-28 | 11,000 | 11,869 | |
| APX Group, Inc. (D) | 5.750 | 07-15-29 | 18,000 | 18,045 | |
| Aramark Services, Inc. (D) | 6.375 | 05-01-25 | 80,000 | 84,684 | |
| Arches Buyer, Inc. (D) | 6.125 | 12-01-28 | 85,000 | 87,731 | |
| AssuredPartners, Inc. (D) | 5.625 | 01-15-29 | 33,000 | 33,214 | |
| Bath & Body Works, Inc. | 7.500 | 06-15-29 | 27,000 | 31,354 | |
| Bausch Health Companies, Inc. (D) | 4.875 | 06-01-28 | 30,000 | 30,825 | |
| Bausch Health Companies, Inc. (D) | 5.000 | 01-30-28 | 33,000 | 31,474 | |
| BCPE Ulysses Intermediate, Inc. (7.750% Cash or 8.500% PIK) (D) | 7.750 | 04-01-27 | 42,000 | 41,588 | |
| Black Knight InfoServ LLC (D) | 3.625 | 09-01-28 | 140,000 | 141,750 | |
| SEE NOTES TO FINANCIAL STATEMENTS | ANNUAL REPORT | JOHN HANCOCK OPPORTUNISTIC FIXED INCOME FUND | 15 |
| Rate (%) | Maturity date | Par value^ | Value | ||
| United States (continued) | |||||
| Blue Racer Midstream LLC (D) | 7.625 | 12-15-25 | 30,000 | $32,438 | |
| Boyd Gaming Corp. (D) | 8.625 | 06-01-25 | 65,000 | 70,512 | |
| Broadcom, Inc. | 4.300 | 11-15-32 | 75,000 | 85,830 | |
| Builders FirstSource, Inc. (D) | 5.000 | 03-01-30 | 94,000 | 100,580 | |
| Caesars Entertainment, Inc. (D) | 8.125 | 07-01-27 | 65,000 | 71,845 | |
| Carnival Corp. (D) | 7.625 | 03-01-26 | 50,000 | 53,130 | |
| Carnival Corp. (D) | 11.500 | 04-01-23 | 15,000 | 16,842 | |
| CCO Holdings LLC (D) | 5.375 | 06-01-29 | 79,000 | 86,308 | |
| Citigroup, Inc. (4.700% to 1-30-25, then SOFR + 3.234%) (E) | 4.700 | 01-30-25 | 79,000 | 82,437 | |
| Community Health Systems, Inc. (D) | 4.750 | 02-15-31 | 30,000 | 30,603 | |
| Community Health Systems, Inc. (D) | 6.000 | 01-15-29 | 30,000 | 31,988 | |
| Compass Group Diversified Holdings LLC (D) | 5.250 | 04-15-29 | 83,000 | 86,884 | |
| Consolidated Communications, Inc. (D) | 6.500 | 10-01-28 | 79,000 | 86,406 | |
| Dave & Buster’s, Inc. (D) | 7.625 | 11-01-25 | 25,000 | 26,500 | |
| Diamondback Energy, Inc. | 4.750 | 05-31-25 | 5,000 | 5,598 | |
| DISH DBS Corp. | 5.125 | 06-01-29 | 45,000 | 44,774 | |
| Enact Holdings, Inc. (D) | 6.500 | 08-15-25 | 78,000 | 84,240 | |
| EnLink Midstream LLC (D) | 5.625 | 01-15-28 | 62,000 | 64,790 | |
| FirstCash, Inc. (D) | 4.625 | 09-01-28 | 173,000 | 179,904 | |
| Flex, Ltd. | 4.875 | 05-12-30 | 60,000 | 69,828 | |
| Freedom Mortgage Corp. (D) | 7.625 | 05-01-26 | 85,000 | 85,219 | |
| Frontier Communications Holdings LLC (D) | 5.875 | 10-15-27 | 30,000 | 32,069 | |
| Frontier Communications Holdings LLC (D) | 6.750 | 05-01-29 | 110,000 | 117,722 | |
| Genworth Holdings, Inc. | 6.500 | 06-15-34 | 30,000 | 30,375 | |
| Gray Oak Pipeline LLC (D) | 3.450 | 10-15-27 | 60,000 | 63,692 | |
| Hawaiian Brand Intellectual Property, Ltd. (D) | 5.750 | 01-20-26 | 83,000 | 87,410 | |
| Hightower Holding LLC (D) | 6.750 | 04-15-29 | 84,000 | 86,310 | |
| Home Point Capital, Inc. (D) | 5.000 | 02-01-26 | 155,000 | 134,075 | |
| HUB International, Ltd. (D) | 7.000 | 05-01-26 | 60,000 | 62,076 | |
| JPMorgan Chase & Co. (4.600% to 2-1-25, then SOFR + 3.125%) (E) | 4.600 | 02-01-25 | 100,000 | 104,070 | |
| Ladder Capital Finance Holdings LLLP (D) | 4.250 | 02-01-27 | 88,000 | 88,440 | |
| LBM Acquisition LLC (D) | 6.250 | 01-15-29 | 43,000 | 43,247 | |
| LD Holdings Group LLC (D) | 6.500 | 11-01-25 | 30,000 | 30,600 | |
| Lennar Corp. | 4.750 | 11-29-27 | 60,000 | 69,823 | |
| LGI Homes, Inc. (D) | 4.000 | 07-15-29 | 86,000 | 86,432 | |
| M/I Homes, Inc. (D) | 3.950 | 02-15-30 | 65,000 | 65,684 | |
| M/I Homes, Inc. | 4.950 | 02-01-28 | 30,000 | 31,425 | |
| Macy’s Retail Holdings LLC (D) | 5.875 | 04-01-29 | 58,000 | 63,371 |
| 16 | JOHN HANCOCK OPPORTUNISTIC FIXED INCOME FUND | ANNUAL REPORT | SEE NOTES TO FINANCIAL STATEMENTS |
| Rate (%) | Maturity date | Par value^ | Value | ||
| United States (continued) | |||||
| Matador Resources Company | 5.875 | 09-15-26 | 85,000 | $85,502 | |
| MGIC Investment Corp. | 5.250 | 08-15-28 | 15,000 | 16,077 | |
| Mileage Plus Holdings LLC (D) | 6.500 | 06-20-27 | 30,000 | 32,591 | |
| MSCI, Inc. (D) | 3.875 | 02-15-31 | 70,000 | 74,725 | |
| NMI Holdings, Inc. (D) | 7.375 | 06-01-25 | 25,000 | 28,281 | |
| Novelis Corp. (D) | 4.750 | 01-30-30 | 61,000 | 64,965 | |
| Occidental Petroleum Corp. | 3.000 | 02-15-27 | 45,000 | 45,113 | |
| Occidental Petroleum Corp. | 4.400 | 08-15-49 | 35,000 | 35,273 | |
| Par Pharmaceutical, Inc. (D) | 7.500 | 04-01-27 | 30,000 | 30,375 | |
| PDC Energy, Inc. | 5.750 | 05-15-26 | 100,000 | 103,835 | |
| Penn National Gaming, Inc. (D) | 4.125 | 07-01-29 | 63,000 | 62,921 | |
| PennyMac Financial Services, Inc. (D) | 4.250 | 02-15-29 | 80,000 | 77,000 | |
| Post Holdings, Inc. (D) | 4.625 | 04-15-30 | 70,000 | 71,475 | |
| Post Holdings, Inc. (D) | 5.625 | 01-15-28 | 83,000 | 87,358 | |
| Presidio Holdings, Inc. (D) | 8.250 | 02-01-28 | 140,000 | 151,872 | |
| Range Resources Corp. (D) | 8.250 | 01-15-29 | 25,000 | 27,752 | |
| Reynolds American, Inc. | 5.850 | 08-15-45 | 130,000 | 160,782 | |
| Royal Caribbean Cruises, Ltd. (D) | 5.500 | 08-31-26 | 45,000 | 45,619 | |
| Scripps Escrow II, Inc. (D) | 5.375 | 01-15-31 | 45,000 | 44,538 | |
| Signal Parent, Inc. (D) | 6.125 | 04-01-29 | 44,000 | 42,460 | |
| Specialty Building Products Holdings LLC (D) | 6.375 | 09-30-26 | 81,000 | 85,253 | |
| Spirit AeroSystems, Inc. (D) | 5.500 | 01-15-25 | 30,000 | 31,388 | |
| SRM Escrow Issuer LLC (D) | 6.000 | 11-01-28 | 81,000 | 85,860 | |
| SRS Distribution, Inc. (D) | 6.125 | 07-01-29 | 72,000 | 74,700 | |
| STL Holding Company LLC (D) | 7.500 | 02-15-26 | 45,000 | 47,700 | |
| Sysco Corp. | 6.600 | 04-01-40 | 50,000 | 74,682 | |
| Sysco Corp. | 6.600 | 04-01-50 | 10,000 | 16,005 | |
| Targa Resources Partners LP | 5.375 | 02-01-27 | 42,000 | 43,523 | |
| Terex Corp. (D) | 5.000 | 05-15-29 | 102,000 | 107,228 | |
| The Dun & Bradstreet Corp. (D) | 10.250 | 02-15-27 | 39,000 | 42,315 | |
| The Michaels Companies, Inc. (D) | 7.875 | 05-01-29 | 83,000 | 85,527 | |
| The William Carter Company (D) | 5.625 | 03-15-27 | 84,000 | 87,780 | |
| TopBuild Corp. (D) | 3.625 | 03-15-29 | 20,000 | 20,020 | |
| TransDigm, Inc. (D) | 6.250 | 03-15-26 | 80,000 | 84,000 | |
| United Natural Foods, Inc. (D) | 6.750 | 10-15-28 | 79,000 | 85,320 | |
| United States Steel Corp. | 6.875 | 03-01-29 | 80,000 | 87,400 | |
| United Wholesale Mortgage LLC (D) | 5.500 | 11-15-25 | 30,000 | 30,750 | |
| United Wholesale Mortgage LLC (D) | 5.500 | 04-15-29 | 80,000 | 78,400 | |
| Victoria’s Secret & Company (D) | 4.625 | 07-15-29 | 86,000 | 86,128 | |
| Victors Merger Corp. (D) | 6.375 | 05-15-29 | 86,000 | 85,355 | |
| Viper Energy Partners LP (D) | 5.375 | 11-01-27 | 140,000 | 146,846 | |
| Wabtec Corp. | 3.200 | 06-15-25 | 20,000 | 21,332 |
| SEE NOTES TO FINANCIAL STATEMENTS | ANNUAL REPORT | JOHN HANCOCK OPPORTUNISTIC FIXED INCOME FUND | 17 |
| Rate (%) | Maturity date | Par value^ | Value | ||
| United States (continued) | |||||
| Wells Fargo & Company (5.875% to 6-15-25, then 3 month LIBOR + 3.990%) (E) | 5.875 | 06-15-25 | 51,000 | $57,431 | |
| Yum! Brands, Inc. (D) | 7.750 | 04-01-25 | 40,000 | 43,096 | |
| Convertible bonds 1.0% | $888,059 | ||||
| (Cost $856,064) | |||||
| Canada 0.1% | 89,225 | ||||
| IMAX Corp. (D) | 0.500 | 04-01-26 | 100,000 | 89,225 | |
| China 0.1% | 124,500 | ||||
| NIO, Inc. (D) | 0.500 | 02-01-27 | 150,000 | 124,500 | |
| Israel 0.0% | 12,861 | ||||
| SolarEdge Technologies, Inc., Zero Coupon (D) | 0.000 | 09-15-25 | 10,000 | 12,861 | |
| United States 0.8% | 661,473 | ||||
| Bandwidth, Inc. | 0.250 | 03-01-26 | 12,000 | 15,540 | |
| Bloomin’ Brands, Inc. | 5.000 | 05-01-25 | 4,000 | 9,575 | |
| Cracker Barrel Old Country Store, Inc. (D) | 0.625 | 06-15-26 | 90,000 | 92,212 | |
| DraftKings, Inc. (D)(F) | 0.650 | 03-15-28 | 10,000 | 9,579 | |
| Etsy, Inc. | 0.125 | 10-01-26 | 5,000 | 12,543 | |
| FTI Consulting, Inc. | 2.000 | 08-15-23 | 10,000 | 14,397 | |
| JetBlue Airways Corp. (D) | 0.500 | 04-01-26 | 10,000 | 9,831 | |
| John Bean Technologies Corp. (D) | 0.250 | 05-15-26 | 17,000 | 18,161 | |
| MicroStrategy, Inc. (D)(F) | 4.282 | 02-15-27 | 50,000 | 39,637 | |
| NuVasive, Inc. | 0.375 | 03-15-25 | 30,000 | 29,226 | |
| Pebblebrook Hotel Trust | 1.750 | 12-15-26 | 99,000 | 109,421 | |
| Penn National Gaming, Inc. | 2.750 | 05-15-26 | 4,000 | 14,194 | |
| Pioneer Natural Resources Company | 0.250 | 05-15-25 | 30,000 | 44,754 | |
| Royal Caribbean Cruises, Ltd. | 4.250 | 06-15-23 | 40,000 | 53,850 | |
| Southwest Airlines Company | 1.250 | 05-01-25 | 7,000 | 10,203 | |
| Splunk, Inc. | 1.125 | 06-15-27 | 20,000 | 19,938 | |
| Square, Inc. | 0.125 | 03-01-25 | 10,000 | 22,444 | |
| The Middleby Corp. (D) | 1.000 | 09-01-25 | 48,000 | 72,429 | |
| Uber Technologies, Inc. (D)(F) | 1.613 | 12-15-25 | 18,000 | 16,789 | |
| Workday, Inc. | 0.250 | 10-01-22 | 25,000 | 46,750 | |
| Municipal bonds 1.6% | $1,354,138 | ||||
| (Cost $1,273,816) | |||||
| Chicago Transit Authority (Illinois) | 3.552 | 12-01-34 | 95,000 | 107,929 | |
| Chicago Transit Authority (Illinois) | 3.912 | 12-01-40 | 10,000 | 11,743 | |
| Chicago Transit Authority, Series A (Illinois) | 6.899 | 12-01-40 | 10,000 | 14,468 | |
| 18 | JOHN HANCOCK OPPORTUNISTIC FIXED INCOME FUND | ANNUAL REPORT | SEE NOTES TO FINANCIAL STATEMENTS |
| Rate (%) | Maturity date | Par value^ | Value | ||
| City & County of Denver Company Airport System Revenue (Colorado) | 2.717 | 11-15-34 | 20,000 | $21,100 | |
| City & County of Denver Company Airport System Revenue (Colorado) | 2.867 | 11-15-37 | 15,000 | 15,658 | |
| City of Austin Airport System Revenue (Texas) | 5.000 | 11-15-32 | 25,000 | 32,212 | |
| City of Austin Airport System Revenue (Texas) | 5.000 | 11-15-44 | 60,000 | 75,123 | |
| City of Houston Airport System Revenue (Texas) | 2.385 | 07-01-31 | 50,000 | 51,549 | |
| City of Tampa (Florida) (F) | 2.773 | 09-01-36 | 20,000 | 13,189 | |
| Commonwealth of Massachusetts, GO | 2.514 | 07-01-41 | 130,000 | 131,984 | |
| County of Broward Port Facilities Revenue (Florida) | 5.000 | 09-01-28 | 30,000 | 38,397 | |
| County of Broward Port Facilities Revenue (Florida) | 5.000 | 09-01-29 | 20,000 | 26,240 | |
| County of Broward Port Facilities Revenue (Florida) | 5.000 | 09-01-33 | 20,000 | 25,761 | |
| County of Miami-Dade Aviation Revenue (Florida) | 3.270 | 10-01-41 | 10,000 | 10,432 | |
| County of Miami-Dade Aviation Revenue (Florida) | 4.000 | 10-01-35 | 30,000 | 36,111 | |
| Dallas Fort Worth International Airport (Texas) | 3.089 | 11-01-40 | 30,000 | 31,196 | |
| District of Columbia | 3.432 | 04-01-42 | 85,000 | 91,655 | |
| Greater Orlando Aviation Authority (Florida) | 5.000 | 10-01-28 | 35,000 | 41,024 | |
| Iowa Finance Authority | 3.250 | 07-01-50 | 10,000 | 10,987 | |
| Metropolitan Transportation Authority (New York) | 5.000 | 11-15-29 | 15,000 | 19,401 | |
| Metropolitan Transportation Authority (New York) | 5.000 | 11-15-50 | 25,000 | 30,538 | |
| New Jersey Transportation Trust Fund Authority | 4.000 | 06-15-45 | 10,000 | 11,615 | |
| New York City Transitional Finance Authority | 4.000 | 05-01-45 | 20,000 | 23,537 | |
| Orange County Convention Center (Florida) | 5.000 | 10-01-31 | 15,000 | 17,561 | |
| Port Authority of New York & New Jersey | 4.000 | 03-15-30 | 50,000 | 59,646 | |
| Port Authority of New York & New Jersey | 5.000 | 09-15-33 | 30,000 | 37,057 | |
| Port of Seattle (Washington) | 5.000 | 10-01-31 | 30,000 | 35,594 | |
| Port of Seattle (Washington) | 5.000 | 04-01-39 | 40,000 | 49,525 | |
| San Francisco City & County Airport Commission (California) | 2.958 | 05-01-51 | 20,000 | 20,053 | |
| SEE NOTES TO FINANCIAL STATEMENTS | ANNUAL REPORT | JOHN HANCOCK OPPORTUNISTIC FIXED INCOME FUND | 19 |
| Rate (%) | Maturity date | Par value^ | Value | ||
| San Francisco City & County Airport Commission (California) | 4.000 | 05-01-39 | 15,000 | $17,584 | |
| San Francisco City & County Airport Commission (California) | 5.000 | 05-01-50 | 75,000 | 91,913 | |
| State of Hawaii Airports System Revenue | 4.000 | 07-01-35 | 20,000 | 23,946 | |
| State of Hawaii Airports System Revenue | 5.000 | 07-01-33 | 70,000 | 90,982 | |
| Triborough Bridge & Tunnel Authority (New York) | 5.000 | 11-15-54 | 30,000 | 38,428 | |
| Term loans (G) 9.0% | $7,831,656 | ||||
| (Cost $7,767,179) | |||||
| Canada 0.1% | 99,839 | ||||
| Air Canada, 2021 Term Loan B (3 month LIBOR + 3.500%) | 4.250 | 08-11-28 | 100,000 | 99,839 | |
| Luxembourg 0.2% | 199,575 | ||||
| Delta 2 Lux Sarl, 2018 USD Term Loan (1 month LIBOR + 2.500%) | 3.500 | 02-01-24 | 100,000 | 99,575 | |
| Jazz Financing Lux Sarl, USD Term Loan (1 month LIBOR + 3.500%) | 4.000 | 05-05-28 | 100,000 | 100,000 | |
| Netherlands 0.1% | 98,411 | ||||
| Telenet Financing USD LLC, 2020 USD Term Loan AR (1 month LIBOR + 2.000%) | 2.096 | 04-30-28 | 100,000 | 98,411 | |
| United States 8.6% | 7,433,831 | ||||
| Acrisure LLC, 2020 Term Loan B (2 month LIBOR + 3.500%) | 3.607 | 02-15-27 | 98,750 | 97,208 | |
| ADMI Corp., 2021 Term Loan B2 (1 month LIBOR + 3.125%) | 3.625 | 12-23-27 | 99,750 | 98,275 | |
| AHP Health Partners, Inc., 2021 Term Loan B (H) | TBD | 08-04-28 | 110,000 | 110,138 | |
| APX Group, Inc., 2021 Term Loan B (1 month LIBOR + 3.500%) | 4.000 | 07-10-28 | 100,000 | 99,625 | |
| Asurion LLC, 2020 Term Loan B8 (1 month LIBOR + 3.250%) | 3.335 | 12-23-26 | 98,551 | 96,596 | |
| Asurion LLC, 2021 2nd Lien Term Loan B3 (1 month LIBOR + 5.250%) | 5.335 | 01-31-28 | 200,000 | 198,928 | |
| Berlin Packaging LLC, 2021 First Lien Term Loan B (H) | TBD | 03-11-28 | 150,000 | 148,913 | |
| Blackhawk Network Holdings, Inc., 2018 1st Lien Term Loan (1 month LIBOR + 3.000%) | 3.085 | 06-15-25 | 99,743 | 98,546 | |
| Boyd Gaming Corp., Term Loan B3 (1 week LIBOR + 2.250%) | 2.332 | 09-15-23 | 97,543 | 97,271 | |
| Brand Industrial Services, Inc., 2017 Term Loan (3 month LIBOR + 4.250%) | 5.250 | 06-21-24 | 99,740 | 98,341 | |
| 20 | JOHN HANCOCK OPPORTUNISTIC FIXED INCOME FUND | ANNUAL REPORT | SEE NOTES TO FINANCIAL STATEMENTS |
| Rate (%) | Maturity date | Par value^ | Value | ||
| United States (continued) | |||||
| Caesars Resort Collection LLC, 2017 1st Lien Term Loan B (H) | TBD | 12-23-24 | 100,000 | $99,102 | |
| Caesars Resort Collection LLC, 2020 Term Loan B1 (1 month LIBOR + 4.500%) | 4.585 | 07-21-25 | 109,175 | 109,322 | |
| Core & Main LP, 2021 Term Loan B (1 month LIBOR + 2.500%) | 2.588 | 07-27-28 | 248,721 | 247,097 | |
| Crown Finance US, Inc., 2018 USD Term Loan (6 month LIBOR + 2.500%) | 3.500 | 02-28-25 | 124,613 | 96,957 | |
| Crown Finance US, Inc., 2021 Incremental Term Loan B1 (3 month LIBOR + 8.250%) | 9.250 | 05-23-24 | 5,411 | 5,769 | |
| Dcert Buyer, Inc., 2019 Term Loan B (1 month LIBOR + 4.000%) | 4.085 | 10-16-26 | 98,750 | 98,531 | |
| Deerfield Dakota Holding LLC, 2020 USD Term Loan B (1 month LIBOR + 3.750%) | 4.750 | 04-09-27 | 217,800 | 217,902 | |
| Diamond BC BV, USD Term Loan (1 month LIBOR + 3.000%) | 3.085 | 09-06-24 | 163,553 | 162,462 | |
| E2open LLC, 2020 Term Loan B (H) | TBD | 02-04-28 | 100,000 | 99,594 | |
| Elanco Animal Health, Inc., Term Loan B (1 month LIBOR + 1.750%) | 1.846 | 08-02-27 | 96,840 | 95,093 | |
| Flex Acquisition Company, Inc., 2021 Term Loan (3 month LIBOR + 3.500%) | 4.000 | 02-23-28 | 199,750 | 198,466 | |
| Frontier Communications Holdings LLC, 2021 DIP Term Loan B (1 month LIBOR + 3.750%) | 4.500 | 05-01-28 | 99,750 | 99,563 | |
| Go Daddy Operating Company LLC, 2021 Term Loan B4 (1 month LIBOR + 2.000%) | 2.085 | 08-10-27 | 99,000 | 98,041 | |
| Golden Entertainment, Inc., 2017 1st Lien Term Loan (1 month LIBOR + 3.000%) | 3.750 | 10-21-24 | 117,925 | 116,893 | |
| Gray Television, Inc., 2018 Term Loan C (1 month LIBOR + 2.500%) | 2.596 | 01-02-26 | 100,000 | 99,263 | |
| Great Outdoors Group LLC, 2021 Term Loan B (6 month LIBOR + 4.250%) | 5.000 | 03-06-28 | 114,425 | 114,806 | |
| Harbor Freight Tools USA, Inc., 2021 Term Loan B (1 month LIBOR + 2.750%) | 3.250 | 10-19-27 | 99,250 | 98,844 | |
| Heartland Dental LLC, 2021 Incremental Term Loan (1 month LIBOR + 4.000%) | 4.096 | 04-30-25 | 120,000 | 119,600 | |
| HUB International, Ltd., 2018 Term Loan B (3 month LIBOR + 2.750%) | 2.875 | 04-25-25 | 98,477 | 97,303 |
| SEE NOTES TO FINANCIAL STATEMENTS | ANNUAL REPORT | JOHN HANCOCK OPPORTUNISTIC FIXED INCOME FUND | 21 |
| Rate (%) | Maturity date | Par value^ | Value | ||
| United States (continued) | |||||
| HUB International, Ltd., 2021 Term Loan B (3 month LIBOR + 3.250%) | 4.000 | 04-25-25 | 98,752 | $98,621 | |
| Hyland Software, Inc., 2018 1st Lien Term Loan (1 month LIBOR + 3.500%) | 4.250 | 07-01-24 | 99,235 | 99,246 | |
| IRB Holding Corp., 2020 4th Amendment Incremental Term Loan (3 month LIBOR + 3.250%) | 4.250 | 12-15-27 | 99,500 | 99,376 | |
| Mauser Packaging Solutions Holding Company, 2017 Term Loan B (H) | TBD | 04-03-24 | 124,675 | 121,325 | |
| MPH Acquisition Holdings LLC, 2021 Term Loan B (H) | TBD | 08-17-28 | 225,000 | 223,200 | |
| NEP Group, Inc., 2018 1st Lien Term Loan (1 month LIBOR + 3.250%) | 3.335 | 10-20-25 | 163,568 | 155,435 | |
| Peraton Corp., Term Loan B (1 month LIBOR + 3.750%) | 4.500 | 02-01-28 | 99,750 | 99,729 | |
| Phoenix Newco, Inc., 2021 1st Lien Term Loan (H) | TBD | 08-11-28 | 135,000 | 134,933 | |
| Prestige Brands, Inc., 2021 Term Loan B5 (H) | TBD | 07-03-28 | 100,000 | 99,536 | |
| Proofpoint, Inc., 1st Lien Term Loan (H) | TBD | 06-09-28 | 100,000 | 99,361 | |
| Quikrete Holdings, Inc., 2016 1st Lien Term Loan (1 month LIBOR + 2.500%) | 2.585 | 02-01-27 | 98,500 | 97,282 | |
| Quikrete Holdings, Inc., 2021 Term Loan B1 (H) | TBD | 02-21-28 | 125,000 | 123,926 | |
| Savage Enterprises LLC, 2021 Term Loan B (H) | TBD | 08-11-28 | 135,000 | 135,169 | |
| Scientific Games International, Inc., 2018 Term Loan B5 (1 month LIBOR + 2.750%) | 2.835 | 08-14-24 | 224,678 | 222,532 | |
| Sedgwick Claims Management Services, Inc., 2018 Term Loan B (1 month LIBOR + 3.250%) | 3.335 | 12-31-25 | 198,485 | 195,905 | |
| Signal Parent, Inc., Term Loan B (1 month LIBOR + 3.500%) | 4.250 | 04-03-28 | 250,000 | 245,105 | |
| Solera LLC, USD Term Loan B (6 month LIBOR + 4.000%) | 4.500 | 06-02-28 | 100,000 | 99,880 | |
| SRS Distribution, Inc., 2021 Term Loan B (3 month LIBOR + 3.750%) | 4.250 | 06-02-28 | 210,000 | 209,213 | |
| SS&C Technologies, Inc., 2018 Term Loan B3 (1 month LIBOR + 1.750%) | 1.835 | 04-16-25 | 100,121 | 98,539 | |
| SS&C Technologies, Inc., 2018 Term Loan B4 (1 month LIBOR + 1.750%) | 1.835 | 04-16-25 | 75,313 | 74,124 | |
| Standard Industries, Inc., 2021 Term Loan B (H) | TBD | 08-05-28 | 165,000 | 164,470 |
| 22 | JOHN HANCOCK OPPORTUNISTIC FIXED INCOME FUND | ANNUAL REPORT | SEE NOTES TO FINANCIAL STATEMENTS |
| Rate (%) | Maturity date | Par value^ | Value | ||
| United States (continued) | |||||
| Surgery Center Holdings, Inc., 2021 Term Loan (1 month LIBOR + 3.750%) | 4.500 | 08-31-26 | 139,650 | $139,672 | |
| The Dun & Bradstreet Corp., Term Loan (1 month LIBOR + 3.250%) | 3.338 | 02-06-26 | 98,754 | 97,952 | |
| TransDigm, Inc., 2020 Term Loan E (1 month LIBOR + 2.250%) | 2.335 | 05-30-25 | 198,500 | 195,179 | |
| TricorBraun Holdings, Inc., 2021 Delayed Draw Term Loan (H) | TBD | 03-03-28 | 18,363 | 18,181 | |
| TricorBraun Holdings, Inc., 2021 Term Loan (H) | TBD | 03-03-28 | 81,637 | 80,832 | |
| UKG, Inc., 2021 Incremental Term Loan (3 month LIBOR + 3.250%) | 4.000 | 05-04-26 | 99,251 | 99,251 | |
| US Foods, Inc., 2016 Term Loan B (1 month LIBOR + 1.750%) | 1.835 | 06-27-23 | 191,932 | 189,602 | |
| VICI Properties 1 LLC, Replacement Term Loan B (1 month LIBOR + 1.750%) | 1.838 | 12-20-24 | 100,000 | 99,386 | |
| WW International, Inc., 2021 Term Loan B (H) | TBD | 04-13-28 | 100,000 | 99,500 | |
| Zelis Payments Buyer, Inc., 2021 Term Loan (1 month LIBOR + 3.500%) | 3.596 | 09-30-26 | 99,500 | 98,920 | |
| Collateralized mortgage obligations 8.7% | $7,561,444 | ||||
| (Cost $7,371,760) | |||||
| Commercial and residential 6.1% | 5,279,783 | ||||
| Angel Oak Mortgage Trust | |||||
| Series 2020-3, Class M1 (D)(I) | 3.809 | 04-25-65 | 50,000 | 51,211 | |
| BANK | |||||
| Series 2019-BN16, Class B (I) | 4.438 | 02-15-52 | 50,000 | 57,692 | |
| Series 2021-BN31, Class C (I) | 2.545 | 02-15-54 | 30,000 | 29,541 | |
| BFLD Trust | |||||
| Series 2020-OBRK, Class A (1 month LIBOR + 2.050%) (D)(J) | 2.143 | 11-15-28 | 10,000 | 10,109 | |
| BRAVO Residential Funding Trust | |||||
| Series 2020-NQM1, Class M1 (D)(I) | 3.181 | 05-25-60 | 129,000 | 130,428 | |
| Series 2021-A, Class A1 (D) | 1.991 | 04-25-31 | 93,299 | 93,349 | |
| BSREP Commercial Mortgage Trust | |||||
| Series 2021-DC, Class A (1 month LIBOR + 0.950%) (D)(J) | 1.050 | 08-15-38 | 40,000 | 40,012 | |
| BX Commercial Mortgage Trust | |||||
| Series 2019-XL, Class C (1 month LIBOR + 1.250%) (D)(J) | 1.343 | 10-15-36 | 89,367 | 89,479 | |
| BX Trust | |||||
| Series 2021-MFM1, Class C (1 month LIBOR + 1.200%) (D)(J) | 1.293 | 01-15-34 | 50,000 | 50,031 | |
| Series 2021-MFM1, Class D (1 month LIBOR + 1.500%) (D)(J) | 1.593 | 01-15-34 | 10,000 | 10,006 | |
| SEE NOTES TO FINANCIAL STATEMENTS | ANNUAL REPORT | JOHN HANCOCK OPPORTUNISTIC FIXED INCOME FUND | 23 |
| Rate (%) | Maturity date | Par value^ | Value | ||
| Commercial and residential (continued) | |||||
| Series 2021-MFM1, Class E (1 month LIBOR + 2.250%) (D)(J) | 2.343 | 01-15-34 | 10,000 | $10,006 | |
| Series 2021-VIEW, Class B (1 month LIBOR + 1.800%) (D)(J) | 1.893 | 06-15-23 | 30,000 | 30,000 | |
| CFCRE Commercial Mortgage Trust | |||||
| Series 2011-C2, Class C (D)(I) | 5.776 | 12-15-47 | 100,000 | 100,220 | |
| CIM Trust | |||||
| Series 2021-NR2, Class A1 (D) | 2.568 | 07-25-59 | 88,784 | 89,236 | |
| Series 2021-R4, Class A1 (D)(I) | 2.000 | 05-01-61 | 94,854 | 95,454 | |
| COLT Mortgage Loan Trust | |||||
| Series 2021-1, Class A3 (D)(I) | 1.373 | 06-25-66 | 110,615 | 110,228 | |
| Commercial Mortgage Trust (Cantor Fitzgerald/Deutsche Bank AG) | |||||
| Series 2014-CR16, Class AM | 4.278 | 04-10-47 | 45,000 | 48,540 | |
| Series 2014-CR20, Class AM | 3.938 | 11-10-47 | 50,000 | 53,445 | |
| Commercial Mortgage Trust (Deutsche Bank AG) | |||||
| Series 2020-SBX, Class C (D)(I) | 2.056 | 01-10-38 | 100,000 | 101,399 | |
| Credit Suisse Mortgage Trust | |||||
| Series 2020-NET, Class D (D)(I) | 3.828 | 08-15-37 | 100,000 | 105,190 | |
| Series 2020-RPL6, Class A2 (D)(I) | 3.276 | 03-25-59 | 100,000 | 99,342 | |
| Deephaven Residential Mortgage Trust | |||||
| Series 2020-2, Class M1 (D)(I) | 4.112 | 05-25-65 | 100,000 | 103,027 | |
| Flagstar Mortgage Trust | |||||
| Series 2021-5INV, Class A5 (D)(I) | 2.500 | 07-25-51 | 98,092 | 100,725 | |
| FREMF Mortgage Trust | |||||
| Series 2015-K45, Class C (D)(I) | 3.589 | 04-25-48 | 25,000 | 26,293 | |
| Series 2015-K49, Class B (D)(I) | 3.721 | 10-25-48 | 75,000 | 81,209 | |
| Series 2016-K55, Class B (D)(I) | 4.163 | 04-25-49 | 25,000 | 27,875 | |
| Series 2016-K60, Class B (D)(I) | 3.536 | 12-25-49 | 11,000 | 11,952 | |
| Series 2017-K63, Class C (D)(I) | 3.872 | 02-25-50 | 35,000 | 37,617 | |
| Series 2017-K65, Class B (D)(I) | 4.073 | 07-25-50 | 40,000 | 44,734 | |
| Series 2018-K72, Class B (D)(I) | 3.992 | 12-25-50 | 15,000 | 16,807 | |
| Series 2019-K735, Class B (D)(I) | 4.018 | 05-25-26 | 80,000 | 88,574 | |
| Series 2019-K95, Class C (D)(I) | 3.919 | 08-25-52 | 43,000 | 46,788 | |
| Series 2019-K99, Class B (D)(I) | 3.646 | 10-25-52 | 40,000 | 44,122 | |
| Series 2020-K104, Class C (D)(I) | 3.539 | 02-25-52 | 25,000 | 26,319 | |
| GS Mortgage Securities Trust | |||||
| Series 2018-HULA, Class A (1 month LIBOR + 0.920%) (D)(J) | 1.016 | 07-15-25 | 93,550 | 93,553 | |
| Series 2018-HULA, Class C (1 month LIBOR + 1.450%) (D)(J) | 1.546 | 07-15-25 | 140,326 | 140,161 | |
| Series 2019-BOCA, Class A (1 month LIBOR + 1.200%) (D)(J) | 1.293 | 06-15-38 | 100,000 | 100,003 | |
| Hawaii Hotel Trust | |||||
| Series 2019-MAUI, Class A (1 month LIBOR + 1.150%) (D)(J) | 1.243 | 05-15-38 | 100,000 | 100,162 | |
| 24 | JOHN HANCOCK OPPORTUNISTIC FIXED INCOME FUND | ANNUAL REPORT | SEE NOTES TO FINANCIAL STATEMENTS |
| Rate (%) | Maturity date | Par value^ | Value | ||
| Commercial and residential (continued) | |||||
| JPMorgan Chase Commercial Mortgage Securities Trust | |||||
| Series 2020-NNN, Class BFX (D) | 3.065 | 01-16-37 | 45,000 | $46,899 | |
| Series 2021-MHC, Class C (1 month LIBOR + 1.300%) (D)(J) | 1.393 | 04-15-38 | 100,000 | 100,311 | |
| JPMorgan Mortgage Trust | |||||
| Series 2019-7, Class A11 (1 month LIBOR + 0.900%) (D)(J) | 0.989 | 02-25-50 | 23,576 | 23,591 | |
| KKR Industrial Portfolio Trust | |||||
| Series 2020-AIP, Class A (1 month LIBOR + 1.037%) (D)(J) | 1.130 | 03-15-37 | 96,421 | 96,451 | |
| Series 2021-KDIP, Class C (1 month LIBOR + 1.000%) (D)(J) | 1.093 | 12-15-37 | 50,000 | 50,000 | |
| Series 2021-KDIP, Class D (1 month LIBOR + 1.250%) (D)(J) | 1.343 | 12-15-37 | 10,000 | 9,981 | |
| KNDL Mortgage Trust | |||||
| Series 2019-KNSQ, Class E (1 month LIBOR + 1.800%) (D)(J) | 1.893 | 05-15-36 | 100,000 | 100,062 | |
| LoanCore Issuer, Ltd. | |||||
| Series 2021-CRE4, Class A (SOFR + 0.914%) (D)(J) | 0.959 | 07-15-35 | 87,272 | 87,081 | |
| MHC Commercial Mortgage Trust | |||||
| Series 2021-MHC, Class A (1 month LIBOR + 0.801%) (D)(J) | 0.894 | 04-15-38 | 200,000 | 200,119 | |
| Series 2021-MHC, Class C (1 month LIBOR + 1.351%) (D)(J) | 1.444 | 04-15-38 | 100,000 | 100,249 | |
| Morgan Stanley Bank of America Merrill Lynch Trust | |||||
| Series 2013-C8, Class B (I) | 3.558 | 12-15-48 | 45,000 | 46,267 | |
| Series 2013-C8, Class C (I) | 4.055 | 12-15-48 | 65,000 | 66,043 | |
| Morgan Stanley Capital I Trust | |||||
| Series 2017-CLS, Class F (1 month LIBOR + 2.600%) (D)(J) | 2.693 | 11-15-34 | 40,000 | 40,036 | |
| Series 2018-SUN, Class B (1 month LIBOR + 1.200%) (D)(J) | 1.293 | 07-15-35 | 25,000 | 24,971 | |
| New Residential Mortgage Loan Trust | |||||
| Series 2015-1A, Class B3 (D)(I) | 5.326 | 05-28-52 | 56,732 | 60,395 | |
| Series 2015-2A, Class B4 (D)(I) | 5.481 | 08-25-55 | 67,769 | 72,554 | |
| NYMT Loan Trust I | |||||
| Series 2021-BPL1, Class A1 (D) | 2.239 | 05-25-26 | 100,000 | 100,214 | |
| Pretium Mortgage Credit Partners LLC | |||||
| Series 2021-RN1, Class A2 (D) | 3.598 | 02-25-61 | 100,000 | 99,776 | |
| PRPM LLC | |||||
| Series 2019-GS1, Class A1 (D)(I) | 3.500 | 10-25-24 | 75,864 | 76,147 | |
| Series 2019-GS1, Class A2 (D)(I) | 4.750 | 10-25-24 | 151,728 | 152,583 | |
| Series 2020-2, Class A1 (D) | 3.671 | 08-25-25 | 83,514 | 84,096 | |
| Series 2020-3, Class A1 (D) | 2.857 | 09-25-25 | 80,500 | 80,684 | |
| Series 2021-1, Class A1 (D)(I) | 2.115 | 01-25-26 | 93,953 | 94,210 | |
| Series 2021-2, Class A1 (D)(I) | 2.115 | 03-25-26 | 91,559 | 91,776 | |
| SEE NOTES TO FINANCIAL STATEMENTS | ANNUAL REPORT | JOHN HANCOCK OPPORTUNISTIC FIXED INCOME FUND | 25 |
| Rate (%) | Maturity date | Par value^ | Value | ||
| Commercial and residential (continued) | |||||
| Series 2021-6, Class A1 (D) | 1.793 | 07-25-26 | 97,604 | $97,531 | |
| ReadyCap Commercial Mortgage Trust | |||||
| Series 2021-FL6, Class AS (1 month LIBOR + 1.200%) (D)(J) | 1.300 | 07-25-36 | 65,000 | 65,061 | |
| Starwood Mortgage Residential Trust | |||||
| Series 2021-2, Class A3 (D)(I) | 1.431 | 05-25-65 | 78,686 | 78,633 | |
| STWD Trust | |||||
| Series 2021-FLWR, Class B (1 month LIBOR + 0.926%) (D)(J) | 1.026 | 07-15-36 | 100,000 | 99,880 | |
| Toorak Mortgage Corp. | |||||
| Series 2019-2, Class A2 | 4.213 | 09-25-22 | 100,000 | 100,493 | |
| TTAN | |||||
| Series 2021-MHC, Class B (1 month LIBOR + 1.100%) (D)(J) | 1.189 | 03-15-38 | 100,000 | 100,160 | |
| Verus Securitization Trust | |||||
| Series 2020-1, Class A3 (D) | 2.724 | 01-25-60 | 94,980 | 96,087 | |
| Wells Fargo Commercial Mortgage Trust | |||||
| Series 2020-C58, Class B | 2.704 | 07-15-53 | 65,000 | 67,582 | |
| Wells Fargo Mortgage Backed Securities Trust | |||||
| Series 2019-3, Class A1 (D)(I) | 3.500 | 07-25-49 | 17,428 | 17,586 | |
| WF-RBS Commercial Mortgage Trust | |||||
| Series 2011-C4, Class C (D)(I) | 4.964 | 06-15-44 | 57,729 | 57,569 | |
| Series 2011-C5, Class C (D)(I) | 5.679 | 11-15-44 | 100,000 | 99,866 | |
| U.S. Government Agency 2.6% | 2,281,661 | ||||
| Federal Home Loan Mortgage Corp. | |||||
| Series 2013-DN2, Class M2 (1 month LIBOR + 4.250%) (J) | 4.339 | 11-25-23 | 115,814 | 118,428 | |
| Series 2017-DNA2, Class M1 (1 month LIBOR + 1.200%) (J) | 1.289 | 10-25-29 | 30,833 | 30,833 | |
| Series 2018-DNA1, Class M2 (1 month LIBOR + 1.800%) (J) | 1.889 | 07-25-30 | 84,587 | 85,070 | |
| Series 2018-DNA1, Class M2B (1 month LIBOR + 1.800%) (J) | 1.889 | 07-25-30 | 100,000 | 100,135 | |
| Series 2018-HQA1, Class M2 (1 month LIBOR + 2.300%) (J) | 2.389 | 09-25-30 | 27,017 | 27,363 | |
| Series 2020-DNA5, Class M2 (SOFR + 2.800%) (D)(J) | 2.850 | 10-25-50 | 25,000 | 25,283 | |
| Series 2020-DNA6, Class M2 (SOFR + 2.000%) (D)(J) | 2.050 | 12-25-50 | 20,000 | 20,150 | |
| Series 2020-HQA2, Class M2 (1 month LIBOR + 3.100%) (D)(J) | 3.189 | 03-25-50 | 67,096 | 67,998 | |
| Series 2020-HQA3, Class B1 (1 month LIBOR + 5.750%) (D)(J) | 5.839 | 07-25-50 | 45,000 | 47,935 | |
| Series 2020-HQA4, Class M2 (1 month LIBOR + 3.150%) (D)(J) | 3.239 | 09-25-50 | 45,390 | 45,712 | |
| Series 2021-DNA1, Class M2 (SOFR + 1.800%) (D)(J) | 1.850 | 01-25-51 | 25,000 | 25,078 | |
| 26 | JOHN HANCOCK OPPORTUNISTIC FIXED INCOME FUND | ANNUAL REPORT | SEE NOTES TO FINANCIAL STATEMENTS |
| Rate (%) | Maturity date | Par value^ | Value | ||
| U.S. Government Agency (continued) | |||||
| Series 2021-DNA3, Class M2 (SOFR + 2.100%) (D)(J) | 2.150 | 10-25-33 | 10,000 | $10,204 | |
| Series 2021-HQA2, Class M2 (SOFR + 2.050%) (D)(J) | 2.100 | 12-25-33 | 100,000 | 100,438 | |
| Series K031, Class X3 IO | 1.663 | 07-25-41 | 260,000 | 7,119 | |
| Series K066, Class X1 IO | 0.749 | 06-25-27 | 285,034 | 11,091 | |
| Series K103, Class X1 IO | 0.638 | 11-25-29 | 224,734 | 10,819 | |
| Series K104, Class X3 IO | 1.896 | 02-25-52 | 100,000 | 13,782 | |
| Series K105, Class X1 IO | 1.523 | 03-25-53 | 169,835 | 19,127 | |
| Series K106, Class X1 IO | 1.355 | 01-25-30 | 139,716 | 14,089 | |
| Series K112, Class X1 IO | 1.433 | 05-25-30 | 99,909 | 11,066 | |
| Series K113, Class X1 IO | 1.387 | 06-25-30 | 99,994 | 10,708 | |
| Series K115, Class X3 IO | 2.958 | 09-25-48 | 100,000 | 22,073 | |
| Series K123, Class X1 IO | 0.775 | 12-25-30 | 69,949 | 4,402 | |
| Series K124, Class X1 IO | 0.721 | 12-25-30 | 99,936 | 5,987 | |
| Series K-1515, Class X1 IO | 1.513 | 02-25-35 | 99,832 | 15,934 | |
| Series K737, Class X1 IO | 0.637 | 10-25-26 | 113,654 | 3,234 | |
| Series K740, Class X1 IO | 0.759 | 09-25-27 | 99,823 | 4,130 | |
| Federal National Mortgage Association | |||||
| Series 2014-C02, Class 1M2 (1 month LIBOR + 2.600%) (J) | 2.689 | 05-25-24 | 81,589 | 82,305 | |
| Series 2014-C03, Class 1M2 (1 month LIBOR + 3.000%) (J) | 3.089 | 07-25-24 | 39,625 | 40,120 | |
| Series 2014-C04, Class 1M2 (1 month LIBOR + 4.900%) (J) | 4.989 | 11-25-24 | 53,964 | 55,533 | |
| Series 2017-C02, Class 2M2 (1 month LIBOR + 3.650%) (J) | 3.739 | 09-25-29 | 73,226 | 75,745 | |
| Series 2017-C02, Class 2M2C (1 month LIBOR + 3.650%) (J) | 3.739 | 09-25-29 | 150,000 | 156,383 | |
| Series 2017-C03, Class 1M2 (1 month LIBOR + 3.000%) (J) | 3.089 | 10-25-29 | 53,124 | 54,547 | |
| Series 2017-C04, Class 2M2 (1 month LIBOR + 2.850%) (J) | 2.939 | 11-25-29 | 63,268 | 64,674 | |
| Series 2017-C05, Class 1B1 (1 month LIBOR + 3.600%) (J) | 3.689 | 01-25-30 | 25,000 | 26,114 | |
| Series 2017-C05, Class 1M2 (1 month LIBOR + 2.200%) (J) | 2.289 | 01-25-30 | 42,599 | 43,531 | |
| Series 2017-C06, Class 2B1 (1 month LIBOR + 4.450%) (J) | 4.539 | 02-25-30 | 10,000 | 10,439 | |
| Series 2017-C06, Class 2M2 (1 month LIBOR + 2.800%) (J) | 2.889 | 02-25-30 | 60,740 | 61,979 | |
| Series 2017-C07, Class 1B1 (1 month LIBOR + 4.000%) (J) | 4.089 | 05-25-30 | 67,000 | 69,417 | |
| Series 2018-C01, Class 1B1 (1 month LIBOR + 3.550%) (J) | 3.639 | 07-25-30 | 185,912 | 190,328 | |
| Series 2018-C02, Class 2B1 (1 month LIBOR + 4.000%) (J) | 4.089 | 08-25-30 | 15,000 | 15,565 | |
| SEE NOTES TO FINANCIAL STATEMENTS | ANNUAL REPORT | JOHN HANCOCK OPPORTUNISTIC FIXED INCOME FUND | 27 |
| Rate (%) | Maturity date | Par value^ | Value | ||
| U.S. Government Agency (continued) | |||||
| Series 2018-C03, Class 1B1 (1 month LIBOR + 3.750%) (J) | 3.839 | 10-25-30 | 100,000 | $103,955 | |
| Series 2018-C03, Class 1M2 (1 month LIBOR + 2.150%) (J) | 2.239 | 10-25-30 | 54,208 | 54,870 | |
| Series 2018-R07, Class 1B1 (1 month LIBOR + 4.350%) (D)(J) | 4.439 | 04-25-31 | 115,000 | 119,136 | |
| Series 2019-HRP1, Class M2 (1 month LIBOR + 2.150%) (D)(J) | 2.239 | 11-25-39 | 51,168 | 50,942 | |
| Series 2019-R03, Class 1B1 (1 month LIBOR + 4.100%) (D)(J) | 4.189 | 09-25-31 | 20,000 | 20,511 | |
| Series 2020-R01, Class 1B1 (1 month LIBOR + 3.250%) (D)(J) | 3.339 | 01-25-40 | 75,000 | 74,925 | |
| Series 2020-R01, Class 1M2 (1 month LIBOR + 2.050%) (D)(J) | 2.139 | 01-25-40 | 37,171 | 37,352 | |
| Series 2020-R02, Class 2M2 (1 month LIBOR + 2.000%) (D)(J) | 2.089 | 01-25-40 | 15,031 | 15,102 | |
| Asset backed securities 5.9% | $5,150,832 | ||||
| (Cost $5,148,016) | |||||
| Asset backed securities 5.9% | 5,150,832 | ||||
| Ajax Mortgage Loan Trust | |||||
| Series 2021-B, Class A (D) | 2.239 | 06-25-66 | 89,217 | 89,108 | |
| Aligned Data Centers Issuer LLC | |||||
| Series 2021-1A, Class A2 (D) | 1.937 | 08-15-46 | 180,000 | 180,541 | |
| AmeriCredit Automobile Receivables Trust | |||||
| Series 2020-3, Class D | 1.490 | 09-18-26 | 40,000 | 40,485 | |
| AMMC CLO, Ltd. | |||||
| Series 2014-15A, Class ARR (3 month LIBOR + 1.260%) (D)(J) | 1.386 | 01-15-32 | 149,635 | 149,673 | |
| Bain Capital Credit CLO LLC | |||||
| Series 2020-4A, Class B (3 month LIBOR + 1.950%) (D)(J) | 2.084 | 10-20-33 | 250,000 | 250,852 | |
| Bayview Opportunity Master Fund IVa Trust | |||||
| Series 2016-SPL1, Class A (D) | 4.000 | 04-28-55 | 52,819 | 53,194 | |
| Series 2017-RT5, Class A (D)(I) | 3.500 | 05-28-69 | 221,726 | 225,927 | |
| Series 2017-SPL1, Class A (D)(I) | 4.000 | 10-28-64 | 168,983 | 172,503 | |
| Bayview Opportunity Master Fund IVb Trust | |||||
| Series 2017-RT6, Class B2 (D)(I) | 4.000 | 10-28-57 | 100,000 | 103,725 | |
| Bojangles Issuer LLC | |||||
| Series 2020-1A, Class A2 (D) | 3.832 | 10-20-50 | 30,000 | 31,289 | |
| BSPRT Issuer, Ltd. | |||||
| Series 2018-FL4, Class A (1 month LIBOR + 1.050%) (D)(J) | 1.143 | 09-15-35 | 50,814 | 50,814 | |
| Series 2021-FL6, Class A (1 month LIBOR + 1.100%) (D)(J) | 1.193 | 03-15-36 | 115,000 | 115,000 | |
| CarMax Auto Owner Trust | |||||
| Series 2021-1, Class C | 0.940 | 12-15-26 | 10,000 | 9,986 | |
| Series 2021-2, Class D | 1.550 | 10-15-27 | 15,000 | 15,021 | |
| 28 | JOHN HANCOCK OPPORTUNISTIC FIXED INCOME FUND | ANNUAL REPORT | SEE NOTES TO FINANCIAL STATEMENTS |
| Rate (%) | Maturity date | Par value^ | Value | ||
| Asset backed securities (continued) | |||||
| Columbia Cent CLO, Ltd. | |||||
| Series 2020-29A, Class D1 (3 month LIBOR + 4.090%) (D)(J) | 4.224 | 07-20-31 | 100,000 | $100,337 | |
| DataBank Issuer | |||||
| Series 2021-1A, Class B (D) | 2.650 | 02-27-51 | 40,000 | 40,701 | |
| DB Master Finance LLC | |||||
| Series 2017-1A, Class A2II (D) | 4.030 | 11-20-47 | 48,250 | 51,210 | |
| Domino’s Pizza Master Issuer LLC | |||||
| Series 2017-1A, Class A23 (D) | 4.118 | 07-25-47 | 53,075 | 57,188 | |
| Drive Auto Receivables Trust | |||||
| Series 2021-1, Class D | 1.450 | 01-16-29 | 90,000 | 90,515 | |
| Series 2021-2, Class D | 1.390 | 03-15-29 | 115,000 | 115,020 | |
| Exeter Automobile Receivables Trust | |||||
| Series 2021-3A, Class C | 0.960 | 10-15-26 | 95,000 | 95,071 | |
| First Investors Auto Owner Trust | |||||
| Series 2021-2A, Class D (D) | 1.660 | 12-15-27 | 190,000 | 189,970 | |
| FirstKey Homes Trust | |||||
| Series 2021-SFR2, Class E2 (D) | 2.358 | 09-17-38 | 115,000 | 115,148 | |
| Flagship Credit Auto Trust | |||||
| Series 2021-3, Class C (D) | 1.460 | 09-15-27 | 255,000 | 255,466 | |
| Series 2021-3, Class D (D) | 1.650 | 09-15-27 | 51,000 | 51,121 | |
| Greystone Commercial Real Estate Notes | |||||
| Series 2021-FL3, Class B (1 month LIBOR + 1.650%) (D)(J) | 1.737 | 07-15-39 | 100,000 | 100,063 | |
| Palmer Square Loan Funding | |||||
| Series 2021-3A, Class A2 (3 month LIBOR + 1.400%) (D)(J) | 1.547 | 07-20-29 | 250,000 | 250,141 | |
| Progress Residential Trust | |||||
| Series 2019-SFR1, Class E (D) | 4.466 | 08-17-35 | 115,000 | 116,365 | |
| Series 2020-SFR3, Class E (D) | 2.296 | 10-17-27 | 100,000 | 99,606 | |
| Series 2021-SFR2, Class E1 (D) | 2.547 | 04-19-38 | 100,000 | 100,548 | |
| Series 2021-SFR3, Class D (D) | 2.288 | 05-17-26 | 100,000 | 100,914 | |
| Series 2021-SFR5, Class B (D) | 1.658 | 07-17-38 | 100,000 | 99,779 | |
| Series 2021-SFR8, Class E2 (D) | 2.532 | 09-17-38 | 125,000 | 125,155 | |
| SCF Equipment Leasing LLC | |||||
| Series 2021-1A, Class A3 (D) | 0.830 | 08-21-28 | 100,000 | 99,919 | |
| Sonic Capital LLC | |||||
| Series 2020-1A, Class A2I (D) | 3.845 | 01-20-50 | 44,513 | 47,498 | |
| Series 2021-1A, Class A2I (D) | 2.190 | 08-20-51 | 30,000 | 29,993 | |
| Taco Bell Funding LLC | |||||
| Series 2021-1A, Class A2I (D) | 1.946 | 08-25-51 | 70,000 | 70,160 | |
| Taconic Park CLO, Ltd. | |||||
| Series 2016-1A, Class BR (3 month LIBOR + 1.900%) (D)(J) | 2.034 | 01-20-29 | 250,000 | 250,148 | |
| Textainer Marine Containers LLC | |||||
| Series 2021-3A, Class A (D) | 1.940 | 08-20-46 | 270,000 | 269,143 | |
| Towd Point Mortgage Trust | |||||
| Series 2019-3, Class M1 (D)(I) | 4.250 | 02-25-59 | 150,000 | 162,780 | |
| Tricon American Homes Trust | |||||
| SEE NOTES TO FINANCIAL STATEMENTS | ANNUAL REPORT | JOHN HANCOCK OPPORTUNISTIC FIXED INCOME FUND | 29 |
| Rate (%) | Maturity date | Par value^ | Value | ||
| Asset backed securities (continued) | |||||
| Series 2020-SFR2, Class E1 (D) | 2.730 | 11-17-39 | 100,000 | $100,322 | |
| Vantage Data Centers LLC | |||||
| Series 2019-1A, Class A2 (D) | 3.188 | 07-15-44 | 34,300 | 35,518 | |
| Venture CDO, Ltd. | |||||
| Series 2013-13A, Class DR (3 month LIBOR + 3.300%) (D)(J) | 3.428 | 09-10-29 | 175,000 | 174,767 | |
| Series 2018-34A, Class A (3 month LIBOR + 1.230%) (D)(J) | 1.356 | 10-15-31 | 200,000 | 200,014 | |
| VOLT XCV LLC | |||||
| Series 2021-NPL4, Class A1 (D) | 2.240 | 03-27-51 | 67,992 | 68,134 | |
| Shares | Value | ||||
| Preferred securities 0.0% | $27,029 | ||||
| (Cost $26,571) | |||||
| United States 0.0% | 27,029 | ||||
| Becton, Dickinson and Company, 6.000% | 476 | 26,013 | |||
| Fluor Corp., 6.500% (D) | 1 | 1,016 | |||
| Exchange-traded funds 7.1% | $6,180,213 | ||||
| (Cost $5,993,309) | |||||
| iShares JP Morgan USD Emerging Markets Bond ETF | 34,800 | 3,945,972 | |||
| SPDR Blackstone Senior Loan ETF | 19,900 | 914,803 | |||
| SPDR Bloomberg Barclays Convertible Securities ETF | 15,100 | 1,319,438 | |||
| Yield (%) | Shares | Value | |||
| Short-term investments 4.5% | $3,886,138 | ||||
| (Cost $3,886,138) | |||||
| Short-term funds 4.5% | 3,886,138 | ||||
| State Street Institutional U.S. Government Money Market Fund, Premier Class | 0.0250(K) | 3,886,138 | 3,886,138 | ||
| Total investments (Cost $95,253,720) 109.9% | $95,465,525 | ||||
| Other assets and liabilities, net (9.9%) | (8,595,511) | ||||
| Total net assets 100.0% | $86,870,014 | ||||
| The percentage shown for each investment category is the total value of the category as a percentage of the net assets of the fund. | |
| ^All par values are denominated in U.S. dollars unless otherwise indicated. | |
| Currency Abbreviations | |
| AUD | Australian Dollar |
| BRL | Brazilian Real |
| CAD | Canadian Dollar |
| CLP | Chilean Peso |
| COP | Colombian Peso |
| CZK | Czech Republic Koruna |
| 30 | JOHN HANCOCK OPPORTUNISTIC FIXED INCOME FUND | ANNUAL REPORT | SEE NOTES TO FINANCIAL STATEMENTS |
| EUR | Euro |
| HUF | Hungarian Forint |
| IDR | Indonesian Rupiah |
| ILS | Israeli New Shekel |
| ISK | Icelandic Krona |
| JPY | Japanese Yen |
| KRW | Korean Won |
| MXN | Mexican Peso |
| MYR | Malaysian Ringgit |
| NOK | Norwegian Krone |
| NZD | New Zealand Dollar |
| PEN | Peruvian Nuevo Sol |
| PLN | Polish Zloty |
| RON | Romanian New Leu |
| RUB | Russian Ruble |
| THB | Thai Bhat |
| TRY | Turkish Lira |
| UYU | Uruguayan Peso |
| ZAR | South African Rand |
| Security Abbreviations and Legend | |
| CPI | Consumer Price Index |
| GO | General Obligation |
| IO | Interest-Only Security - (Interest Tranche of Stripped Mortgage Pool). Rate shown is the annualized yield at the end of the period. |
| LIBOR | London Interbank Offered Rate |
| PIK | Pay-in-Kind Security - Represents a payment-in-kind which may pay interest in additional par and/or cash. Rates shown are the current rate and most recent payment rate. |
| SOFR | Secured Overnight Financing Rate |
| TBA | To Be Announced. A forward mortgage-backed securities trade issued by a U.S. Government Agency, to be delivered at an agreed-upon future settlement date. |
| (A) | All or a portion of this security is segregated at the custodian as collateral for certain derivatives. |
| (B) | Security purchased or sold on a when-issued or delayed delivery basis. |
| (C) | Non-income producing security. |
| (D) | These securities are exempt from registration under Rule 144A of the Securities Act of 1933. Such securities may be resold, normally to qualified institutional buyers, in transactions exempt from registration. Rule 144A securities amounted to $18,901,250 or 21.8% of the fund’s net assets as of 8-31-21. |
| (E) | Perpetual bonds have no stated maturity date. Date shown as maturity date is next call date. |
| (F) | Zero coupon bonds are issued at a discount from their principal amount in lieu of paying interest periodically. Rate shown is the effective yield at period end. |
| (G) | Term loans are variable rate obligations. The coupon rate shown represents the rate at period end. |
| (H) | This position represents an unsettled loan commitment at period end. Certain details associated with this purchase are not known prior to the settlement date, including coupon rate, which is disclosed as TBD (To Be Determined). |
| (I) | Variable or floating rate security, the interest rate of which adjusts periodically based on a weighted average of interest rates and prepayments on the underlying pool of assets. The interest rate shown is the current rate as of period end. |
| (J) | Variable rate obligation. The coupon rate shown represents the rate at period end. |
| (K) | The rate shown is the annualized seven-day yield as of 8-31-21. |
| * | Yield represents either the annualized yield at the date of purchase, the stated coupon rate or, for floating rate securities, the rate at period end. |
| SEE NOTES TO FINANCIAL STATEMENTS | ANNUAL REPORT | JOHN HANCOCK OPPORTUNISTIC FIXED INCOME FUND | 31 |
| Open contracts | Number of contracts | Position | Expiration date | Notional basis^ | Notional value^ | Unrealized appreciation (depreciation) |
| 10-Year Australian Treasury Bond Futures | 21 | Long | Sep 2021 | $2,186,866 | $2,232,774 | $45,908 |
| 10-Year U.S. Treasury Note Futures | 23 | Long | Dec 2021 | 3,067,651 | 3,069,422 | 1,771 |
| 10-Year Canada Government Bond Futures | 4 | Short | Dec 2021 | (465,352) | (463,298) | 2,054 |
| 10-Year Mini Japan Government Bond Futures | 6 | Short | Sep 2021 | (827,494) | (829,850) | (2,356) |
| 2-Year U.S. Treasury Note Futures | 6 | Short | Dec 2021 | (1,320,981) | (1,321,969) | (988) |
| 5-Year U.S. Treasury Note Futures | 23 | Short | Dec 2021 | (2,839,818) | (2,845,531) | (5,713) |
| Euro-BTP Italian Government Bond Futures | 3 | Short | Sep 2021 | (549,412) | (542,992) | 6,420 |
| Euro-Buxl Futures | 5 | Short | Sep 2021 | (1,289,964) | (1,254,665) | 35,299 |
| German Euro BUND Futures | 33 | Short | Sep 2021 | (6,810,581) | (6,836,368) | (25,787) |
| U.K. Long Gilt Bond Futures | 2 | Short | Dec 2021 | (355,066) | (352,622) | 2,444 |
| U.S. Treasury Long Bond Futures | 5 | Short | Dec 2021 | (817,374) | (814,844) | 2,530 |
| Ultra U.S. Treasury Bond Futures | 11 | Short | Dec 2021 | (2,178,410) | (2,170,094) | 8,316 |
| $69,898 |
| Contract to buy | Contract to sell | Counterparty (OTC) | Contractual settlement date | Unrealized appreciation | Unrealized depreciation | ||
| AUD | 295,000 | USD | 213,904 | MSI | 9/30/2021 | $1,937 | — |
| BRL | 12,113,000 | USD | 2,308,029 | GSI | 9/2/2021 | 34,548 | — |
| BRL | 12,113,000 | USD | 2,355,103 | MSI | 9/2/2021 | — | $(12,525) |
| BRL | 1,000 | USD | 189 | CITI | 9/30/2021 | 3 | — |
| BRL | 885,000 | USD | 169,119 | GSI | 10/4/2021 | 1,317 | — |
| CAD | 1,220,000 | USD | 963,161 | MSI | 9/29/2021 | 3,783 | — |
| CHF | 48,000 | USD | 52,613 | GSI | 9/30/2021 | — | (160) |
| CLP | 1,203,887,000 | USD | 1,535,100 | MSI | 9/30/2021 | 18,951 | — |
| COP | 2,201,871,000 | USD | 567,288 | MSI | 9/30/2021 | 16,082 | — |
| EUR | 1,845,000 | USD | 2,169,287 | CITI | 9/30/2021 | 10,404 | — |
| GBP | 1,885,000 | USD | 2,588,574 | JPM | 9/30/2021 | 3,214 | — |
| HUF | 319,200,000 | USD | 1,080,799 | BOA | 9/30/2021 | — | (1,580) |
| IDR | 21,938,000,000 | USD | 1,514,741 | MSI | 9/30/2021 | 24,993 | — |
| INR | 113,077,000 | USD | 1,518,118 | JPM | 9/30/2021 | 26,766 | — |
| JPY | 396,987,000 | USD | 3,616,317 | JPM | 9/30/2021 | — | (6,973) |
| MXN | 30,258,000 | USD | 1,480,840 | CITI | 9/30/2021 | 20,154 | — |
| NOK | 5,200,000 | USD | 589,317 | MSI | 9/30/2021 | 8,801 | — |
| NZD | 2,859,000 | USD | 1,987,005 | MSI | 9/30/2021 | 27,590 | — |
| PLN | 5,778,000 | USD | 1,486,360 | MSI | 9/30/2021 | 22,290 | — |
| 32 | JOHN HANCOCK OPPORTUNISTIC FIXED INCOME FUND | ANNUAL REPORT | SEE NOTES TO FINANCIAL STATEMENTS |
| Contract to buy | Contract to sell | Counterparty (OTC) | Contractual settlement date | Unrealized appreciation | Unrealized depreciation | ||
| RUB | 118,188,000 | USD | 1,593,206 | BARC | 9/30/2021 | $14,469 | — |
| SGD | 1,135,000 | USD | 838,771 | MSI | 9/30/2021 | 5,399 | — |
| THB | 17,277,000 | USD | 527,420 | JPM | 9/30/2021 | 8,554 | — |
| TRY | 5,664,000 | USD | 662,130 | BARC | 9/30/2021 | 8,934 | — |
| USD | 1,920,790 | AUD | 2,649,000 | MSI | 9/30/2021 | — | $(17,400) |
| USD | 2,355,103 | BRL | 12,113,000 | GSI | 9/2/2021 | 12,525 | — |
| USD | 2,336,422 | BRL | 12,113,000 | MSI | 9/2/2021 | — | (6,155) |
| USD | 2,298,220 | BRL | 12,113,000 | GSI | 10/4/2021 | — | (34,545) |
| USD | 3,948,962 | CAD | 5,002,000 | MSI | 9/29/2021 | — | (15,510) |
| USD | 1,531,269 | CHF | 1,397,000 | GSI | 9/30/2021 | 4,665 | — |
| USD | 1,177,662 | CLP | 923,570,000 | MSI | 9/30/2021 | — | (14,538) |
| USD | 498,703 | COP | 1,903,800,000 | GSI | 9/30/2021 | — | (5,695) |
| USD | 1,514,169 | CZK | 32,886,000 | BARC | 9/30/2021 | — | (12,855) |
| USD | 9,101,123 | EUR | 7,740,594 | CITI | 9/30/2021 | — | (43,649) |
| USD | 658,295 | EUR | 558,000 | JPM | 9/30/2021 | — | (929) |
| USD | 189,508 | GBP | 138,000 | JPM | 9/30/2021 | — | (235) |
| USD | 210,299 | HUF | 62,239,000 | BARC | 9/30/2021 | — | (132) |
| USD | 1,770,639 | ILS | 5,710,000 | BARC | 9/30/2021 | — | (9,640) |
| USD | 4,285,066 | JPY | 470,400,000 | JPM | 9/30/2021 | 8,262 | — |
| USD | 6,935,850 | KRW | 8,095,801,000 | BOA | 9/30/2021 | — | (48,142) |
| USD | 1,201,047 | MXN | 24,541,000 | CITI | 9/30/2021 | — | (16,346) |
| USD | 3,692,073 | NOK | 32,578,000 | MSI | 9/30/2021 | — | (55,137) |
| USD | 1,754,180 | NZD | 2,524,000 | MSI | 9/30/2021 | — | (24,357) |
| USD | 1,941,361 | RUB | 144,015,000 | BARC | 9/30/2021 | — | (17,631) |
| USD | 1,479,557 | SEK | 12,856,000 | BOA | 9/30/2021 | — | (10,529) |
| USD | 1,488,357 | SGD | 2,014,000 | MSI | 9/30/2021 | — | (9,581) |
| USD | 2,239,897 | ZAR | 33,654,000 | JPM | 9/30/2021 | — | (68,202) |
| $283,641 | $(432,446) | ||||||
| Interest rate swaps | ||||||||||
| Counterparty (OTC)/ Centrally cleared | Notional amount | Currency | Payments made | Payments received | Fixed payment frequency | Floating payment frequency | Maturity date | Unamortized upfront payment paid (received) | Unrealized appreciation (depreciation) | Value |
| BARC | 390,000 | USD | USA CPI All Urban Consumers | Fixed 2.614% | At Maturity | At Maturity | Jun 2026 | — | $(8,297) | $(8,297) |
| BOA | 4,070,000 | CNY | CNY CNREPOFIX Reuters | Fixed 2.340% | Quarterly | Quarterly | Sep 2025 | $(591) | (63) | (654) |
| BOA | 810,000 | USD | USA CPI All Urban Consumers | Fixed 2.402% | At Maturity | At Maturity | Mar 2026 | — | (31,899) | (31,899) |
| BOA | 147,300,000 | INR | Fixed 5.340% | INR MIBOR Compounded OIS | Semi-Annual | Semi-Annual | Dec 2026 | (2,270) | (1,651) | (3,921) |
| SEE NOTES TO FINANCIAL STATEMENTS | ANNUAL REPORT | JOHN HANCOCK OPPORTUNISTIC FIXED INCOME FUND | 33 |
| Interest rate swaps (continued) | ||||||||||
| Counterparty (OTC)/ Centrally cleared | Notional amount | Currency | Payments made | Payments received | Fixed payment frequency | Floating payment frequency | Maturity date | Unamortized upfront payment paid (received) | Unrealized appreciation (depreciation) | Value |
| BOA | 810,000 | USD | Fixed 2.354% | USA CPI All Urban Consumers | At Maturity | At Maturity | Mar 2031 | — | $37,556 | $37,556 |
| CITI | 9,190,000 | CNY | CNY CNREPOFIX Reuters | Fixed 2.340% | Quarterly | Quarterly | Sep 2025 | $(16,894) | 15,412 | (1,482) |
| CITI | 6,100,000 | CNY | CNY CNREPOFIX Reuters | Fixed 2.340% | Quarterly | Quarterly | Sep 2025 | (9,248) | 8,273 | (975) |
| CITI | 13,410,000 | CNY | CNY CNREPOFIX Reuters | Fixed 2.340% | Quarterly | Quarterly | Sep 2025 | (35,957) | 30,174 | (5,783) |
| CITI | 5,220,000 | CNY | CNY CNREPOFIX Reuters | Fixed 2.635% | Quarterly | Quarterly | Sep 2026 | — | 8,419 | 8,419 |
| CITI | 9,680,000 | CNY | CNY CNREPOFIX Reuters | Fixed 2.560% | Quarterly | Quarterly | Sep 2026 | 3,432 | 6,929 | 10,361 |
| CITI | 210,000 | USD | Fixed 2.289% | USA CPI All Urban Consumers | At Maturity | At Maturity | Jul 2030 | — | 13,676 | 13,676 |
| JPM | 210,000 | GBP | UK RPI | Fixed 3.399% | At Maturity | At Maturity | Aug 2051 | — | (17,136) | (17,136) |
| $(61,528) | $61,393 | $(135) | ||||||||
| Centrally cleared | 510,000 | CAD | CAD CORRA Compounded OIS | Fixed 0.013% | Semi-Annual | Semi-Annual | Sep 2026 | — | 4,558 | 4,558 |
| Centrally cleared | 510,000 | CAD | CAD CORRA Compounded OIS | Fixed 0.013% | Semi-Annual | Semi-Annual | Sep 2026 | — | 4,410 | 4,410 |
| Centrally cleared | 1,290,000 | CAD | CAD BA CDOR | Fixed 1.269% | Semi-Annual | Semi-Annual | Sep 2026 | — | (2,860) | (2,860) |
| Centrally cleared | 880,000 | CAD | CAD BA CDOR | Fixed 1.283% | Semi-Annual | Semi-Annual | Nov 2026 | — | 6,245 | 6,245 |
| Centrally cleared | 720,000 | CAD | CAD BA CDOR | Fixed 1.266% | Semi-Annual | Semi-Annual | Nov 2026 | — | 4,643 | 4,643 |
| Centrally cleared | 29,886,600 | MXN | MXN TIIE Banxico | Fixed 7.130% | Monthly | Monthly | Jun 2031 | 25,500 | 2,935 | 28,435 |
| Centrally cleared | 1,330,000 | USD | USD LIBOR BBA | Fixed 2.250% | Semi-Annual | Quarterly | Jun 2031 | (1,821) | 30,144 | 28,323 |
| Centrally cleared | 34,270,000 | MXN | MXN TIIE Banxico | Fixed 6.910% | Monthly | Monthly | Sep 2031 | 1,933 | (3,754) | (1,821) |
| Centrally cleared | 230,000 | GBP | Fixed 0.590% | GBP SONIA Compounded OIS | Annual | Annual | Dec 2051 | 638 | 8,134 | 8,772 |
| Centrally cleared | 70,000 | GBP | Fixed 0.800% | GBP SONIA Compounded OIS | Annual | Annual | Jun 2071 | — | (10,855) | (10,855) |
| Centrally cleared | 180,000 | GBP | Fixed 0.840% | GBP SONIA Compounded OIS | Annual | Annual | Sep 2071 | (7,832) | (24,133) | (31,965) |
| Centrally cleared | 140,000 | GBP | Fixed 0.710% | GBP SONIA Compounded OIS | Annual | Annual | Sep 2071 | (54) | (14,103) | (14,157) |
| Centrally cleared | 160,000 | GBP | Fixed 0.500% | GBP SONIA Compounded OIS | Annual | Annual | Sep 2071 | (6,001) | 9,584 | 3,583 |
| $12,363 | $14,948 | $27,311 | ||||||||
| $(49,165) | $76,341 | $27,176 | ||||||||
| 34 | JOHN HANCOCK OPPORTUNISTIC FIXED INCOME FUND | ANNUAL REPORT | SEE NOTES TO FINANCIAL STATEMENTS |
| Credit default swaps - Buyer | ||||||||||
| Counterparty (OTC)/ Centrally cleared | Reference obligation | Notional amount | Currency | USD notional amount | Pay fixed rate | Fixed payment frequency | Maturity date | Unamortized upfront payment paid (received) | Unrealized appreciation (depreciation) | Value |
| BOA | People’s Republic of China | 40,000 | USD | $40,000 | 1.000% | Quarterly | Jun 2026 | $(1,218) | $(138) | $(1,356) |
| BOA | Republic of Indonesia | 40,000 | USD | 40,000 | 1.000% | Quarterly | Jun 2026 | (489) | (194) | (683) |
| CITI | People’s Republic of China | 90,000 | USD | 90,000 | 1.000% | Quarterly | Jun 2026 | (2,647) | (404) | (3,051) |
| CITI | Republic of Indonesia | 75,000 | USD | 75,000 | 1.000% | Quarterly | Jun 2026 | (734) | (547) | (1,281) |
| GSI | People’s Republic of China | 850,000 | USD | 850,000 | 1.000% | Quarterly | Dec 2024 | (15,887) | (8,120) | (24,007) |
| GSI | Government of Malaysia | 40,000 | USD | 40,000 | 1.000% | Quarterly | Jun 2026 | (1,064) | (62) | (1,126) |
| GSI | Government of Malaysia | 10,000 | USD | 10,000 | 1.000% | Quarterly | Jun 2026 | (260) | (21) | (281) |
| GSI | CMBX.NA.AAA.11 | 600,000 | USD | 600,000 | 0.500% | Monthly | Nov 2054 | (4,821) | 106 | (4,715) |
| GSI | CMBX.NA.AAA.10 | 600,000 | USD | 600,000 | 0.500% | Monthly | Nov 2059 | (6,854) | 1,006 | (5,848) |
| GSI | CMBX.NA.AAA.10 | 600,000 | USD | 600,000 | 0.500% | Monthly | Nov 2059 | (5,287) | (553) | (5,840) |
| GSI | CMBX.NA.AAA.12 | 610,000 | USD | 610,000 | 0.500% | Monthly | Aug 2061 | (4,127) | 573 | (3,554) |
| GSI | CMBX.NA.AAA.13 | 620,000 | USD | 620,000 | 0.500% | Monthly | Dec 2072 | (1,435) | (46) | (1,481) |
| JPM | Republic of Korea | 2,110,000 | USD | 2,110,000 | 1.000% | Quarterly | Dec 2024 | (47,816) | (17,509) | (65,325) |
| MSI | Government of Japan | 2,090,000 | USD | 2,090,000 | 1.000% | Quarterly | Dec 2024 | (50,447) | (15,205) | (65,652) |
| MSI | Government of Malaysia | 400,000 | USD | 400,000 | 1.000% | Quarterly | Dec 2025 | (11,004) | 122 | (10,882) |
| MSI | Government of Malaysia | 40,000 | USD | 40,000 | 1.000% | Quarterly | Jun 2026 | (997) | (129) | (1,126) |
| MSI | People’s Republic of China | 65,000 | USD | 65,000 | 1.000% | Quarterly | Jun 2026 | (1,902) | (302) | (2,204) |
| MSI | Republic of Indonesia | 50,000 | USD | 50,000 | 1.000% | Quarterly | Jun 2026 | (347) | (507) | (854) |
| MSI | CMBX.NA.BBB-.7 | 440,000 | USD | 440,000 | 3.000% | Monthly | Jan 2047 | 9,621 | 67,086 | 76,707 |
| MSI | CMBX.NA.AAA.11 | 600,000 | USD | 600,000 | 0.500% | Monthly | Nov 2054 | (4,944) | 221 | (4,723) |
| MSI | CMBX.NA.AAA.11 | 960,000 | USD | 960,000 | 0.500% | Monthly | Nov 2054 | (8,729) | 1,172 | (7,557) |
| MSI | CMBX.NA.BBB-.8 | 460,000 | USD | 460,000 | 3.000% | Monthly | Oct 2057 | 21,489 | 38,220 | 59,709 |
| MSI | CMBX.NA.AAA.10 | 960,000 | USD | 960,000 | 0.500% | Monthly | Nov 2059 | (8,916) | (441) | (9,357) |
| MSI | CMBX.NA.AAA.12 | 610,000 | USD | 610,000 | 0.500% | Monthly | Aug 2061 | (461) | (3,102) | (3,563) |
| MSI | CMBX.NA.AAA.12 | 950,000 | USD | 950,000 | 0.500% | Monthly | Aug 2061 | (7,173) | 1,625 | (5,548) |
| MSI | CMBX.NA.AAA.13 | 610,000 | USD | 610,000 | 0.500% | Monthly | Dec 2072 | 4,249 | (5,715) | (1,466) |
| MSI | CMBX.NA.AAA.13 | 950,000 | USD | 950,000 | 0.500% | Monthly | Dec 2072 | (5,205) | 2,922 | (2,283) |
| $15,470,000 | $(157,405) | $60,058 | $(97,347) | |||||||
| Centrally cleared | iTraxx Europe Crossover Series 35 Version 1 | 255,000 | EUR | 304,883 | 5.000% | Quarterly | Jun 2026 | (35,232) | (4,704) | (39,936) |
| $304,883 | $(35,232) | $(4,704) | $(39,936) | |||||||
| $15,774,883 | $(192,637) | $55,354 | $(137,283) | |||||||
| Credit default swaps - Seller | |||||||||||
| Counterparty (OTC)/ Centrally cleared | Reference obligation | Implied credit spread | Notional amount | Currency | USD notional amount | Received fixed rate | Fixed payment frequency | Maturity date | Unamortized upfront payment paid (received) | Unrealized appreciation (depreciation) | Value |
| BARC | Republic of Panama | 0.693% | 25,000 | USD | $25,000 | 1.000% | Quarterly | Jun 2026 | $233 | $180 | $413 |
| SEE NOTES TO FINANCIAL STATEMENTS | ANNUAL REPORT | JOHN HANCOCK OPPORTUNISTIC FIXED INCOME FUND | 35 |
| Credit default swaps - Seller (continued) | |||||||||||
| Counterparty (OTC)/ Centrally cleared | Reference obligation | Implied credit spread | Notional amount | Currency | USD notional amount | Received fixed rate | Fixed payment frequency | Maturity date | Unamortized upfront payment paid (received) | Unrealized appreciation (depreciation) | Value |
| CITI | Republic of Colombia | 1.322% | 55,000 | USD | $55,000 | 1.000% | Quarterly | Jun 2026 | $(632) | $(82) | $(714) |
| CITI | Republic of Panama | 0.693% | 25,000 | USD | 25,000 | 1.000% | Quarterly | Jun 2026 | 292 | 121 | 413 |
| GSI | Republic of Colombia | 1.322% | 45,000 | USD | 45,000 | 1.000% | Quarterly | Jun 2026 | (516) | (68) | (584) |
| GSI | Republic of Colombia | 1.322% | 45,000 | USD | 45,000 | 1.000% | Quarterly | Jun 2026 | (516) | (68) | (584) |
| GSI | Republic of Colombia | 1.322% | 50,000 | USD | 50,000 | 1.000% | Quarterly | Jun 2026 | (585) | (64) | (649) |
| GSI | Republic of Colombia | 1.322% | 25,000 | USD | 25,000 | 1.000% | Quarterly | Jun 2026 | (255) | (69) | (324) |
| GSI | Republic of Colombia | 1.322% | 30,000 | USD | 30,000 | 1.000% | Quarterly | Jun 2026 | (214) | (175) | (389) |
| GSI | Republic of Colombia | 1.322% | 50,000 | USD | 50,000 | 1.000% | Quarterly | Jun 2026 | (323) | (326) | (649) |
| GSI | Republic of Panama | 0.693% | 20,000 | USD | 20,000 | 1.000% | Quarterly | Jun 2026 | 196 | 135 | 331 |
| JPM | Republic of Colombia | 1.322% | 45,000 | USD | 45,000 | 1.000% | Quarterly | Jun 2026 | (353) | (231) | (584) |
| MSI | Republic of Panama | 0.693% | 25,000 | USD | 25,000 | 1.000% | Quarterly | Jun 2026 | 245 | 168 | 413 |
| $440,000 | $(2,428) | $(479) | $(2,907) | ||||||||
| Centrally cleared | CDX.NA.HY.36 | 2.770% | 155,000 | USD | 155,000 | 5.000% | Quarterly | Jun 2026 | 13,885 | 2,838 | 16,723 |
| Centrally cleared | CDX.NA.IG.36 | 0.463% | 120,000 | USD | 120,000 | 1.000% | Quarterly | Jun 2026 | 2,858 | 431 | 3,289 |
| Centrally cleared | iTraxx Europe Series 35 Version 1 | 0.448% | 1,105,000 | EUR | 1,321,232 | 1.000% | Quarterly | Jun 2026 | 32,746 | 4,811 | 37,557 |
| $1,596,232 | $49,489 | $8,080 | $57,569 | ||||||||
| $2,036,232 | $47,061 | $7,601 | $54,662 | ||||||||
| Total return swaps | ||||||||||
| Pay/ receive total return* | Reference entity | Floating/ fixed rate | Payment frequency | Currency | Notional amount | Maturity date | Counterparty (OTC) | Unamortized upfront payment paid (received) | Unrealized appreciation (depreciation) | Value |
| Pay | iBoxx $ Liquid High Yield Index | 3-Month USD LIBOR | At Maturity | USD | 1,435,000 | Dec 2021 | GSI | — | $(22,425) | $(22,425) |
| Pay | iBoxx $ Liquid High Yield Index | 3-Month USD LIBOR | At Maturity | USD | 630,000 | Dec 2021 | GSI | — | (5,533) | (5,533) |
| Pay | iBoxx $ Liquid Investment Grade Index | 3-Month USD LIBOR | At Maturity | USD | 1,620,000 | Dec 2021 | GSI | — | (40,423) | (40,423) |
| Pay | iBoxx $ Liquid High Yield Index | 3-Month USD LIBOR | At Maturity | USD | 225,000 | Dec 2021 | JPM | — | (3,516) | (3,516) |
| Pay | iBoxx $ Liquid Investment Grade Index | 3-Month USD LIBOR | At Maturity | USD | 180,000 | Sep 2021 | MSI | — | (11,329) | (11,329) |
| Pay | iBoxx $ Liquid Investment Grade Index | 3-Month USD LIBOR | At Maturity | USD | 1,620,000 | Dec 2021 | MSI | — | (38,495) | (38,495) |
| Receive | iBoxx $ Liquid Leveraged Loan Index | 3-Month USD LIBOR | At Maturity | USD | 945,000 | Sep 2021 | JPM | — | 7,856 | 7,856 |
| 36 | JOHN HANCOCK OPPORTUNISTIC FIXED INCOME FUND | ANNUAL REPORT | SEE NOTES TO FINANCIAL STATEMENTS |
| Total return swaps (continued) | ||||||||||
| Pay/ receive total return* | Reference entity | Floating/ fixed rate | Payment frequency | Currency | Notional amount | Maturity date | Counterparty (OTC) | Unamortized upfront payment paid (received) | Unrealized appreciation (depreciation) | Value |
| Receive | iBoxx $ Liquid Leveraged Loan Index | 3-Month USD LIBOR | At Maturity | USD | 525,000 | Sep 2021 | MSI | — | $1,455 | $1,455 |
| — | $(112,410) | $(112,410) | ||||||||
| Derivatives Currency Abbreviations | |
| AUD | Australian Dollar |
| BRL | Brazilian Real |
| CAD | Canadian Dollar |
| CHF | Swiss Franc |
| CLP | Chilean Peso |
| CNY | Chinese Yuan Renminbi |
| COP | Colombian Peso |
| CZK | Czech Republic Koruna |
| EUR | Euro |
| GBP | Pound Sterling |
| HUF | Hungarian Forint |
| IDR | Indonesian Rupiah |
| ILS | Israeli New Shekel |
| INR | Indian Rupee |
| JPY | Japanese Yen |
| KRW | Korean Won |
| MXN | Mexican Peso |
| NOK | Norwegian Krone |
| NZD | New Zealand Dollar |
| PLN | Polish Zloty |
| RUB | Russian Ruble |
| SEK | Swedish Krona |
| SGD | Singapore Dollar |
| THB | Thai Bhat |
| TRY | Turkish Lira |
| USD | U.S. Dollar |
| ZAR | South African Rand |
| Derivatives Abbreviations | |
| BARC | Barclays Bank PLC |
| BBA | The British Banker’s Association |
| BOA | Bank of America, N.A. |
| CDOR | Canadian Dollar Offered Rate |
| SEE NOTES TO FINANCIAL STATEMENTS | ANNUAL REPORT | JOHN HANCOCK OPPORTUNISTIC FIXED INCOME FUND | 37 |
| CITI | Citibank, N.A. |
| CNREPOFIX | China Fixing Repo Rate |
| CORRA | Canadian Overnight Repo Rate Average |
| CPI | Consumer Price Index |
| GSI | Goldman Sachs International |
| JPM | JPMorgan Chase Bank, N.A. |
| LIBOR | London Interbank Offered Rate |
| MIBOR | Mumbai Interbank Offered Rate |
| MSI | Morgan Stanley & Co. International PLC |
| OIS | Overnight Index Swap |
| OTC | Over-the-counter |
| RPI | Retail Price Index |
| SONIA | Sterling Overnight Interbank Average Rate |
| TIIE | Tasa de Interes Interbancario de Equilibrio (Interbank Equilibrium Interest Rate) |
| 38 | JOHN HANCOCK OPPORTUNISTIC FIXED INCOME FUND | ANNUAL REPORT | SEE NOTES TO FINANCIAL STATEMENTS |
| Assets | |
| Unaffiliated investments, at value (Cost $95,253,720) | $95,465,525 |
| Swap contracts, at value (net unamortized upfront payment of $35,508) | 217,309 |
| Receivable for centrally cleared swaps | 21,040 |
| Unrealized appreciation on forward foreign currency contracts | 283,641 |
| Receivable for futures variation margin | 57,217 |
| Foreign currency, at value (Cost $14,275) | 13,262 |
| Collateral segregated at custodian for OTC derivative contracts | 40,000 |
| Dividends and interest receivable | 477,605 |
| Receivable for investments sold | 164,534 |
| Receivable for delayed delivery securities sold | 2,769,466 |
| Receivable from affiliates | 808 |
| Other assets | 79,526 |
| Total assets | 99,589,933 |
| Liabilities | |
| Unrealized depreciation on forward foreign currency contracts | 432,446 |
| Swap contracts, at value (net unamortized upfront payment of $256,869) | 430,108 |
| Payable for collateral on OTC derivatives | 20,000 |
| Payable for investments purchased | 2,382,828 |
| Payable for delayed delivery securities purchased | 8,913,320 |
| Payable for fund shares repurchased | 365,811 |
| Payable to affiliates | |
| Accounting and legal services fees | 2,635 |
| Transfer agent fees | 385 |
| Trustees’ fees | 16 |
| Other liabilities and accrued expenses | 172,370 |
| Total liabilities | 12,719,919 |
| Net assets | $86,870,014 |
| Net assets consist of | |
| Paid-in capital | $91,547,384 |
| Total distributable earnings (loss) | (4,677,370) |
| Net assets | $86,870,014 |
| SEE NOTES TO FINANCIAL STATEMENTS | ANNUAL REPORT | JOHN HANCOCK Opportunistic Fixed Income Fund | 39 |
| Net asset value per share | |
| Based on net asset value and shares outstanding - the fund has an unlimited number of shares authorized with no par value | |
| Class A ($79,427 ÷ 5,813 shares)1 | $13.66 |
| Class C ($50,442 ÷ 3,698 shares)1 | $13.64 |
| Class I ($223,556 ÷ 16,354 shares) | $13.67 |
| Class R6 ($50,149,173 ÷ 3,666,840 shares) | $13.68 |
| Class 1 ($36,367,416 ÷ 2,660,499 shares) | $13.67 |
| Maximum offering price per share | |
| Class A (net asset value per share ÷ 95%)2 | $14.38 |
| 1 | Redemption price per share is equal to net asset value less any applicable contingent deferred sales charge. |
| 2 | On single retail sales of less than $50,000. On sales of $50,000 or more and on group sales the offering price is reduced. |
| 40 | JOHN HANCOCK Opportunistic Fixed Income Fund | ANNUAL REPORT | SEE NOTES TO FINANCIAL STATEMENTS |
| Investment income | |
| Interest | $1,566,056 |
| Dividends | 95,879 |
| Less foreign taxes withheld | (22,375) |
| Total investment income | 1,639,560 |
| Expenses | |
| Investment management fees | 309,571 |
| Distribution and service fees | 20,039 |
| Accounting and legal services fees | 6,857 |
| Transfer agent fees | 734 |
| Trustees’ fees | 795 |
| Custodian fees | 72,243 |
| State registration fees | 19,186 |
| Printing and postage | 14,294 |
| Professional fees | 117,556 |
| Other | 17,555 |
| Total expenses | 578,830 |
| Less expense reductions | (176,889) |
| Net expenses | 401,941 |
| Net investment income | 1,237,619 |
| Realized and unrealized gain (loss) | |
| Net realized gain (loss) on | |
| Unaffiliated investments and foreign currency transactions | 539,113 |
| Futures contracts | (344,169) |
| Forward foreign currency contracts | 49,700 |
| Swap contracts | 536,832 |
| 781,476 | |
| Change in net unrealized appreciation (depreciation) of | |
| Unaffiliated investments and translation of assets and liabilities in foreign currencies | (260,191) |
| Futures contracts | 95,234 |
| Forward foreign currency contracts | (41,558) |
| Swap contracts | (412,793) |
| (619,308) | |
| Net realized and unrealized gain | 162,168 |
| Increase in net assets from operations | $1,399,787 |
| SEE NOTES TO FINANCIAL STATEMENTS | ANNUAL REPORT | JOHN HANCOCK Opportunistic Fixed Income Fund | 41 |
| Year ended 8-31-21 | Year ended 8-31-20 | |
| Increase (decrease) in net assets | ||
| From operations | ||
| Net investment income | $1,237,619 | $733,960 |
| Net realized gain | 781,476 | 2,995,541 |
| Change in net unrealized appreciation (depreciation) | (619,308) | (298,662) |
| Increase in net assets resulting from operations | 1,399,787 | 3,430,839 |
| Distributions to shareholders | ||
| From earnings | ||
| Class 1 | (2,057,556) | (1,410,083) |
| Total distributions | (2,057,556) | (1,410,083) |
| From fund share transactions | 46,368,145 | (8,155,522) |
| Total increase | 45,710,376 | (6,134,766) |
| Net assets | ||
| Beginning of year | 41,159,638 | 47,294,404 |
| End of year | $86,870,014 | $41,159,638 |
| 42 | JOHN HANCOCK Opportunistic Fixed Income Fund | ANNUAL REPORT | SEE NOTES TO FINANCIAL STATEMENTS |
| CLASS A SHARES Period ended | 8-31-211 |
| Per share operating performance | |
| Net asset value, beginning of period | $13.52 |
| Net investment income2 | 0.07 |
| Net realized and unrealized gain (loss) on investments | 0.07 |
| Total from investment operations | 0.14 |
| Net asset value, end of period | $13.66 |
| Total return (%)3,4 | 1.045 |
| Ratios and supplemental data | |
| Net assets, end of period (in millions) | $—6 |
| Ratios (as a percentage of average net assets): | |
| Expenses before reductions | 1.537 |
| Expenses including reductions | 1.167 |
| Net investment income | 2.227 |
| Portfolio turnover (%) | 618 |
| 1 | The inception date for Class A shares is 6-4-21. |
| 2 | Based on average daily shares outstanding. |
| 3 | Total returns would have been lower had certain expenses not been reduced during the period. |
| 4 | Does not reflect the effect of sales charges, if any. |
| 5 | Not annualized. |
| 6 | Less than $500,000. |
| 7 | Annualized. |
| 8 | Portfolio turnover is shown for the period from 9-1-20 to 8-31-21. |
| SEE NOTES TO FINANCIAL STATEMENTS | ANNUAL REPORT | JOHN HANCOCK Opportunistic Fixed Income Fund | 43 |
| CLASS C SHARES Period ended | 8-31-211 |
| Per share operating performance | |
| Net asset value, beginning of period | $13.52 |
| Net investment income2 | 0.05 |
| Net realized and unrealized gain (loss) on investments | 0.07 |
| Total from investment operations | 0.12 |
| Net asset value, end of period | $13.64 |
| Total return (%)3,4 | 0.895 |
| Ratios and supplemental data | |
| Net assets, end of period (in millions) | $—6 |
| Ratios (as a percentage of average net assets): | |
| Expenses before reductions | 2.287 |
| Expenses including reductions | 1.917 |
| Net investment income | 1.527 |
| Portfolio turnover (%) | 618 |
| 1 | The inception date for Class C shares is 6-4-21. |
| 2 | Based on average daily shares outstanding. |
| 3 | Total returns would have been lower had certain expenses not been reduced during the period. |
| 4 | Does not reflect the effect of sales charges, if any. |
| 5 | Not annualized. |
| 6 | Less than $500,000. |
| 7 | Annualized. |
| 8 | Portfolio turnover is shown for the period from 9-1-20 to 8-31-21. |
| 44 | JOHN HANCOCK Opportunistic Fixed Income Fund | ANNUAL REPORT | SEE NOTES TO FINANCIAL STATEMENTS |
| CLASS I SHARES Period ended | 8-31-211 |
| Per share operating performance | |
| Net asset value, beginning of period | $13.52 |
| Net investment income2 | 0.07 |
| Net realized and unrealized gain (loss) on investments | 0.08 |
| Total from investment operations | 0.15 |
| Net asset value, end of period | $13.67 |
| Total return (%)3 | 1.114 |
| Ratios and supplemental data | |
| Net assets, end of period (in millions) | $—5 |
| Ratios (as a percentage of average net assets): | |
| Expenses before reductions | 1.286 |
| Expenses including reductions | 0.916 |
| Net investment income | 2.116 |
| Portfolio turnover (%) | 617 |
| 1 | The inception date for Class I shares is 6-4-21. |
| 2 | Based on average daily shares outstanding. |
| 3 | Total returns would have been lower had certain expenses not been reduced during the period. |
| 4 | Not annualized. |
| 5 | Less than $500,000. |
| 6 | Annualized. |
| 7 | Portfolio turnover is shown for the period from 9-1-20 to 8-31-21. |
| SEE NOTES TO FINANCIAL STATEMENTS | ANNUAL REPORT | JOHN HANCOCK Opportunistic Fixed Income Fund | 45 |
| CLASS R6 SHARES Period ended | 8-31-211 |
| Per share operating performance | |
| Net asset value, beginning of period | $13.52 |
| Net investment income2 | 0.08 |
| Net realized and unrealized gain (loss) on investments | 0.08 |
| Total from investment operations | 0.16 |
| Net asset value, end of period | $13.68 |
| Total return (%)3 | 1.184 |
| Ratios and supplemental data | |
| Net assets, end of period (in millions) | $50 |
| Ratios (as a percentage of average net assets): | |
| Expenses before reductions | 1.185 |
| Expenses including reductions | 0.815 |
| Net investment income | 2.495 |
| Portfolio turnover (%) | 616 |
| 1 | The inception date for Class R6 shares is 6-4-21. |
| 2 | Based on average daily shares outstanding. |
| 3 | Total returns would have been lower had certain expenses not been reduced during the period. |
| 4 | Not annualized. |
| 5 | Annualized. |
| 6 | Portfolio turnover is shown for the period from 9-1-20 to 8-31-21. |
| 46 | JOHN HANCOCK Opportunistic Fixed Income Fund | ANNUAL REPORT | SEE NOTES TO FINANCIAL STATEMENTS |
| CLASS 1 SHARES Period ended | 8-31-21 | 8-31-20 | 8-31-19 | 8-31-18 | 8-31-17 |
| Per share operating performance | |||||
| Net asset value, beginning of period | $13.98 | $13.27 | $12.72 | $12.84 | $13.09 |
| Net investment income1 | 0.36 | 0.23 | 0.24 | 0.26 | 0.18 |
| Net realized and unrealized gain (loss) on investments | 0.03 | 0.94 | 0.48 | (0.38) | (0.08) |
| Total from investment operations | 0.39 | 1.17 | 0.72 | (0.12) | 0.10 |
| Less distributions | |||||
| From net investment income | (0.70) | (0.46) | (0.17) | — | (0.31) |
| From net realized gain | — | — | — | — | (0.04) |
| Total distributions | (0.70) | (0.46) | (0.17) | — | (0.35) |
| Net asset value, end of period | $13.67 | $13.98 | $13.27 | $12.72 | $12.84 |
| Total return (%)2 | 2.84 | 9.15 | 5.75 | (0.93) | 1.05 |
| Ratios and supplemental data | |||||
| Net assets, end of period (in millions) | $36 | $41 | $47 | $51 | $59 |
| Ratios (as a percentage of average net assets): | |||||
| Expenses before reductions | 1.22 | 1.663 | 1.203 | 0.86 | 0.83 |
| Expenses including reductions | 0.85 | 0.963 | 1.163 | 0.85 | 0.82 |
| Net investment income | 2.62 | 1.77 | 2.05 | 2.04 | 1.48 |
| Portfolio turnover (%) | 61 | 2244 | 53 | 31 | 56 |
| 1 | Based on average daily shares outstanding. |
| 2 | Total returns would have been lower had certain expenses not been reduced during the applicable periods. |
| 3 | Includes interest expense of 0.09% and 0.26% for the year ended August 31, 2020 and the year ended August 31, 2019, respectively. |
| 4 | Increase in portfolio turnover rate resulted from repositioning of the portfolio during the period in accordance with investment policy changes approved by the Board of Trustees. |
| SEE NOTES TO FINANCIAL STATEMENTS | ANNUAL REPORT | JOHN HANCOCK Opportunistic Fixed Income Fund | 47 |
| 48 | JOHN HANCOCK Opportunistic Fixed Income Fund | ANNUAL REPORT |
| Total value at 8-31-21 | Level 1 quoted price | Level 2 significant observable inputs | Level 3 significant unobservable inputs | |
| Investments in securities: | ||||
| Assets | ||||
| U.S. Government and Agency obligations | $14,947,833 | — | $14,947,833 | — |
| Foreign government obligations | 40,512,591 | — | 40,512,591 | — |
| Corporate bonds | 7,125,592 | — | 7,125,592 | — |
| Convertible bonds | 888,059 | — | 888,059 | — |
| Municipal bonds | 1,354,138 | ��� | 1,354,138 | — |
| Term loans | 7,831,656 | — | 7,831,656 | — |
| Collateralized mortgage obligations | 7,561,444 | — | 7,561,444 | — |
| Asset backed securities | 5,150,832 | — | 5,150,832 | — |
| Preferred securities | 27,029 | $26,013 | 1,016 | — |
| Exchange-traded funds | 6,180,213 | 6,180,213 | — | — |
| Short-term investments | 3,886,138 | 3,886,138 | — | — |
| Total investments in securities | $95,465,525 | $10,092,364 | $85,373,161 | — |
| Derivatives: | ||||
| Assets | ||||
| Futures | $104,742 | $104,742 | — | — |
| Forward foreign currency contracts | 283,641 | — | $283,641 | — |
| Swap contracts | 363,847 | — | 363,847 | — |
| Liabilities |
| ANNUAL REPORT | JOHN HANCOCK Opportunistic Fixed Income Fund | 49 |
| Total value at 8-31-21 | Level 1 quoted price | Level 2 significant observable inputs | Level 3 significant unobservable inputs | |
| Futures | $(34,844) | $(34,844) | — | — |
| Forward foreign currency contracts | (432,446) | — | $(432,446) | — |
| Swap contracts | (531,702) | — | (531,702) | — |
| 50 | JOHN HANCOCK Opportunistic Fixed Income Fund | ANNUAL REPORT |
| ANNUAL REPORT | JOHN HANCOCK Opportunistic Fixed Income Fund | 51 |
| August 31, 2021 | August 31, 2020 | |
| Ordinary income | $2,057,556 | $1,410,083 |
| 52 | JOHN HANCOCK Opportunistic Fixed Income Fund | ANNUAL REPORT |
| ANNUAL REPORT | JOHN HANCOCK Opportunistic Fixed Income Fund | 53 |
| 54 | JOHN HANCOCK Opportunistic Fixed Income Fund | ANNUAL REPORT |
| ANNUAL REPORT | JOHN HANCOCK Opportunistic Fixed Income Fund | 55 |
| Risk | Statement of assets and liabilities location | Financial instruments location | Assets derivatives fair value | Liabilities derivatives fair value |
| Interest rate | Receivable/payable for futures variation margin1 | Futures | $104,742 | $(34,844) |
| Currency | Unrealized appreciation (depreciation) on forward foreign currency contracts | Forward foreign currency contracts | 283,641 | (432,446) |
| Credit | Swap contracts, at value2 | Credit default swaps | 195,555 | (278,176) |
| Interest rate | Swap contracts, at value | Total return swaps | 9,311 | (121,721) |
| 56 | JOHN HANCOCK Opportunistic Fixed Income Fund | ANNUAL REPORT |
| Risk | Statement of assets and liabilities location | Financial instruments location | Assets derivatives fair value | Liabilities derivatives fair value |
| Interest rate | Swap contracts, at value2 | Interest rate swaps | $158,981 | $(131,805) |
| $752,230 | $(998,992) |
| 1 | Reflects cumulative appreciation/depreciation on open futures as disclosed in the Derivatives section of Fund’s investments. Only the year end variation margin receivable/payable is separately reported on the Statement of assets and liabilities. |
| 2 | Reflects cumulative value of swap contracts. Receivable/payable for centrally cleared swaps, which includes value and margin, and swap contracts at value, which represents OTC swaps, are shown separately on the Statement of assets and liabilities. |
| Statement of operations location - Net realized gain (loss) on: | |||||
| Risk | Unaffiliated investments and foreign currency transactions1 | Futures contracts | Forward foreign currency contracts | Swap contracts | Total |
| Interest rate | $(25,873) | $(344,169) | — | $186,358 | $(183,684) |
| Currency | — | — | $49,700 | — | 49,700 |
| Credit | — | — | — | 350,474 | 350,474 |
| Total | $(25,873) | $(344,169) | $49,700 | $536,832 | $216,490 |
| 1 | Realized gain (loss) associated with purchased options is included in this caption on the Statement of operations. |
| Statement of operations location - Change in net unrealized appreciation (depreciation) of: | ||||
| Risk | Futures contracts | Forward foreign currency contracts | Swap contracts | Total |
| Interest rate | $95,234 | — | $(93,246) | $1,988 |
| Currency | — | $(41,558) | — | (41,558) |
| Credit | — | — | (319,547) | (319,547) |
| Total | $95,234 | $(41,558) | $(412,793) | $(359,117) |
| ANNUAL REPORT | JOHN HANCOCK Opportunistic Fixed Income Fund | 57 |
| Class | Expense reduction |
| Class A | $52 |
| Class C | 46 |
| Class I | 108 |
| Class | Expense reduction |
| Class R6 | $32,415 |
| Class 1 | 144,268 |
| Total | $176,889 |
| 58 | JOHN HANCOCK Opportunistic Fixed Income Fund | ANNUAL REPORT |
| Class | Rule 12b-1 Fee |
| Class A | 0.25% |
| Class C | 1.00% |
| Class 1 | 0.05% |
| Class | Distribution and service fees | Transfer agent fees |
| Class A | $30 | $14 |
| Class C | 117 | 13 |
| Class I | — | 28 |
| Class R6 | — | 679 |
| Class 1 | 19,892 | — |
| Total | $20,039 | $734 |
| ANNUAL REPORT | JOHN HANCOCK Opportunistic Fixed Income Fund | 59 |
| Borrower or Lender | Weighted Average Loan Balance | Days Outstanding | Weighted Average Interest Rate | Interest Income (Expense) |
| Lender | $1,631,389 | 2 | 0.663% | $60 |
| Year Ended 8-31-21 | Year Ended 8-31-20 | |||
| Shares | Amount | Shares | Amount | |
| Class A shares1 | ||||
| Sold | 5,813 | $78,745 | — | — |
| Net increase | 5,813 | $78,745 | — | — |
| Class C shares1 | ||||
| Sold | 3,698 | $50,000 | — | — |
| Net increase | 3,698 | $50,000 | — | — |
| Class I shares1 | ||||
| Sold | 16,354 | $223,000 | — | — |
| Net increase | 16,354 | $223,000 | — | — |
| Class R6 shares1 | ||||
| Sold | 3,666,840 | $49,850,000 | — | — |
| Net increase | 3,666,840 | $49,850,000 | — | — |
| Class 1 shares | ||||
| Sold | 407,153 | $5,580,071 | 848,596 | $11,202,825 |
| Distributions reinvested | 151,737 | 2,057,556 | 110,682 | 1,410,083 |
| Repurchased | (842,587) | (11,471,227) | (1,579,659) | (20,768,430) |
| Net decrease | (283,697) | $(3,833,600) | (620,381) | $(8,155,522) |
| Total net increase (decrease) | 3,409,008 | $46,368,145 | (620,381) | $(8,155,522) |
| 1 | The inception date for Class A, Class C, Class I, and Class R6 shares is 6-4-21. |
| 60 | JOHN HANCOCK Opportunistic Fixed Income Fund | ANNUAL REPORT |
| ANNUAL REPORT | JOHN HANCOCK Opportunistic Fixed Income Fund | 61 |
| 62 | JOHN HANCOCK OPPORTUNISTIC FIXED INCOME FUND | ANNUAL REPORT |
| ANNUAL REPORT | JOHN HANCOCK OPPORTUNISTIC FIXED INCOME FUND | 63 |
| 64 | JOHN HANCOCK OPPORTUNISTIC FIXED INCOME FUND | ANNUAL REPORT |
| (a) | the skills and competency with which the Advisor has in the past managed the Trust’s affairs and its subadvisory relationship, the Advisor’s oversight and monitoring of the Subadvisor’s investment performance and compliance programs, such as the Subadvisor’s compliance with fund policies and objectives, review of brokerage matters, including with respect to trade allocation and best execution and the Advisor’s timeliness in responding to performance issues; |
| (b) | the background, qualifications and skills of the Advisor’s personnel; |
| (c) | the Advisor’s compliance policies and procedures and its responsiveness to regulatory changes and fund industry developments; |
| ANNUAL REPORT | JOHN HANCOCK OPPORTUNISTIC FIXED INCOME FUND | 65 |
| (d) | the Advisor’s administrative capabilities, including its ability to supervise the other service providers for the fund, as well as the Advisor’s oversight of any securities lending activity, its monitoring of class action litigation and collection of class action settlements on behalf of the fund, and bringing loss recovery actions on behalf of the fund; |
| (e) | the financial condition of the Advisor and whether it has the financial wherewithal to provide a high level and quality of services to the fund; |
| (f) | the Advisor’s initiatives intended to improve various aspects of the Trust’s operations and investor experience with the fund; and |
| (g) | the Advisor’s reputation and experience in serving as an investment advisor to the Trust and the benefit to shareholders of investing in funds that are part of a family of funds offering a variety of investments. |
| (a) | reviewed information prepared by management regarding the fund’s performance; |
| (b) | considered the comparative performance of an applicable benchmark index; |
| (c) | considered the performance of comparable funds, if any, as included in the report prepared by an independent third-party provider of fund data; and |
| (d) | took into account the Advisor’s analysis of the fund’s performance and its plans and recommendations regarding the Trust’s subadvisory arrangements generally. |
| 66 | JOHN HANCOCK OPPORTUNISTIC FIXED INCOME FUND | ANNUAL REPORT |
| (a) | reviewed financial information of the Advisor; |
| (b) | reviewed and considered information presented by the Advisor regarding the net profitability to the Advisor and its affiliates with respect to the fund; |
| (c) | received and reviewed profitability information with respect to the John Hancock Fund Complex as a whole and with respect to the fund; |
| (d) | received information with respect to the Advisor’s allocation methodologies used in preparing the profitability data and considered that the Advisor hired an independent third-party consultant to provide an analysis of the Advisor’s allocation methodologies; |
| (e) | considered that the John Hancock insurance companies that are affiliates of the Advisor, as shareholders of the Trust directly or through their separate accounts, receive certain tax credits or deductions relating to foreign taxes paid and dividends received by certain funds of the Trust and noted that these tax benefits, which are not available to participants in qualified retirement plans under applicable income tax law, are reflected in the profitability information reviewed by the Board; |
| (f) | considered that the Advisor also provides administrative services to the fund on a cost basis pursuant to an administrative services agreement; |
| (g) | noted that affiliates of the Advisor provide transfer agency services and distribution services to the fund, and that the fund’s distributor also receives Rule 12b-1 payments to support distribution of the fund; |
| (h) | noted that the Advisor also derives reputational and other indirect benefits from providing advisory services to the fund; |
| (i) | noted that the subadvisory fee for the fund is paid by the Advisor and is negotiated at arm’s length; |
| (j) | considered the Advisor’s ongoing costs and expenditures necessary to improve services, meet new regulatory and compliance requirements, and adapt to other challenges impacting the fund industry; and |
| ANNUAL REPORT | JOHN HANCOCK OPPORTUNISTIC FIXED INCOME FUND | 67 |
| (k) | considered that the Advisor should be entitled to earn a reasonable level of profits in exchange for the level of services it provides to the fund and the risks that it assumes as Advisor including entrepreneurial, operational, reputational, litigation and regulatory risk. |
| (a) | considered that the Advisor has contractually agreed to waive a portion of its management fee for certain funds of the John Hancock Fund Complex, including the fund (the participating portfolios) or otherwise reimburse the expenses of the participating portfolios (the reimbursement). This waiver is based upon aggregate net assets of all the participating portfolios. The amount of the reimbursement is calculated daily and allocated among all the participating portfolios in proportion to the daily net assets of each fund; |
| (b) | reviewed the fund’s advisory fee structure and concluded that: (i) the fund’s fee structure contains breakpoints at the subadvisory fee level and that such breakpoints are reflected as breakpoints in the advisory fees for the fund; and (ii) although economies of scale cannot be measured with precision, these arrangements permit shareholders of the fund to benefit from economies of scale if the fund grows. The Board also took into account management’s discussion of the fund’s advisory fee structure; and |
| (c) | the Board also considered the effect of the fund’s growth in size on its performance and fees. The Board also noted that if the fund’s assets increase over time, the fund may realize other economies of scale |
| (1) | information relating to the Subadvisor’s business, including current subadvisory services to the Trust (and other funds in the John Hancock Fund Complex); |
| (2) | the historical and current performance of the fund and comparative performance information relating to an applicable benchmark index and comparable funds; |
| (3) | the subadvisory fee for the fund, including any breakpoints, and to the extent available, comparable fee information prepared by an independent third party provider of fund data; and |
| (4) | information relating to the nature and scope of any material relationships and their significance to the Trust’s Advisor and Subadvisor. |
| 68 | JOHN HANCOCK OPPORTUNISTIC FIXED INCOME FUND | ANNUAL REPORT |
| (1) | the Subadvisor has extensive experience and demonstrated skills as a manager; |
| ANNUAL REPORT | JOHN HANCOCK OPPORTUNISTIC FIXED INCOME FUND | 69 |
| (2) | the performance of the fund has generally been in line with or outperformed the historical performance of comparable funds and the fund’s benchmark index; |
| (3) | the subadvisory fees are reasonable in relation to the level and quality of services being provided under the Subadvisory Agreement; and |
| (4) | the subadvisory fees are paid by the Advisor not the fund and that the subadvisory fee breakpoints are reflected as breakpoints in the advisory fees for the fund in order to permit shareholders to benefit from economies of scale if the fund grows. |
| 70 | JOHN HANCOCK OPPORTUNISTIC FIXED INCOME FUND | ANNUAL REPORT |
| • | The Fund’s investment strategy remained appropriate for an open-end fund structure; |
| • | The Fund was able to meet requests for redemption without significant dilution of remaining investors’ interests in the Fund; |
| • | The Fund did not report any breaches of the 15% limit on illiquid investments that would require reporting to the Securities and Exchange Commission; |
| • | The Fund continued to qualify as a Primarily Highly Liquid Fund under the Liquidity Rule and therefore is not required to establish a HLIM; and |
| • | The Chief Compliance Officer’s office performed audit testing of the LRMP which resulted in an assessment that the LRMP’s control environment was deemed to be operating effectively and in compliance with the Board approved procedures. |
| ANNUAL REPORT | JOHN HANCOCK OPPORTUNISTIC FIXED INCOME FUND | 71 |
| 72 | JOHN HANCOCK OPPORTUNISTIC FIXED INCOME FUND | ANNUAL REPORT |
| Independent Trustees | ||
| Name, year of birth Position(s) held with Trust Principal occupation(s) and other directorships during past 5 years | Trustee of the Trust since1 | Number of John Hancock funds overseen by Trustee |
| Hassell H. McClellan, Born: 1945 | 2005 | 190 |
| Trustee and Chairperson of the Board | ||
| Director/Trustee, Virtus Funds (2008-2020); Director, The Barnes Group (2010-2021); Associate Professor, The Wallace E. Carroll School of Management, Boston College (retired 2013). Trustee (since 2005) and Chairperson of the Board (since 2017) of various trusts within the John Hancock Fund Complex. | ||
| Charles L. Bardelis,2 Born: 1941 | 2005 | 190 |
| Trustee | ||
| Director, Island Commuter Corp. (marine transport). Trustee of various trusts within the John Hancock Fund Complex (since 1988). | ||
| James R. Boyle, Born: 1959 | 2015 | 190 |
| Trustee | ||
| Chief Executive Officer, Foresters Financial (since 2018); Chairman and Chief Executive Officer, Zillion Group, Inc. (formerly HealthFleet, Inc.) (healthcare) (2014-2018); Executive Vice President and Chief Executive Officer, U.S. Life Insurance Division of Genworth Financial, Inc. (insurance) (January 2014–July 2014); Senior Executive Vice President, Manulife Financial, President and Chief Executive Officer, John Hancock (1999–2012); Chairman and Director, John Hancock Investment Management LLC, John Hancock Investment Management Distributors LLC, and John Hancock Variable Trust Advisers LLC (2005–2010). Trustee of various trusts within the John Hancock Fund Complex (2005–2014 and since 2015). | ||
| Peter S. Burgess,2 Born: 1942 | 2005 | 190 |
| Trustee | ||
| Consultant (financial, accounting, and auditing matters) (since 1999); Certified Public Accountant; Partner, Arthur Andersen (independent public accounting firm) (prior to 1999); Director, Lincoln Educational Services Corporation (2004-2021); Director, Symetra Financial Corporation (2010–2016); Director, PMA Capital Corporation (2004–2010). Trustee of various trusts within the John Hancock Fund Complex (since 2005). | ||
| William H. Cunningham, Born: 1944 | 2012 | 190 |
| Trustee | ||
| Professor, University of Texas, Austin, Texas (since 1971); former Chancellor, University of Texas System and former President of the University of Texas, Austin, Texas; Chairman (since 2009) and Director (since 2006), Lincoln National Corporation (insurance); Director, Southwest Airlines (since 2000); former Director, LIN Television (2009–2014). Trustee of various trusts within the John Hancock Fund Complex (since 1986). | ||
| Grace K. Fey, Born: 1946 | 2008 | 190 |
| Trustee | ||
| Chief Executive Officer, Grace Fey Advisors (since 2007); Director and Executive Vice President, Frontier Capital Management Company (1988–2007); Director, Fiduciary Trust (since 2009). Trustee of various trusts within the John Hancock Fund Complex (since 2008). | ||
| ANNUAL REPORT | JOHN HANCOCK OPPORTUNISTIC FIXED INCOME FUND | 73 |
| Independent Trustees (continued) | ||
| Name, year of birth Position(s) held with Trust Principal occupation(s) and other directorships during past 5 years | Trustee of the Trust since1 | Number of John Hancock funds overseen by Trustee |
| Deborah C. Jackson, Born: 1952 | 2012 | 190 |
| Trustee | ||
| President, Cambridge College, Cambridge, Massachusetts (since 2011); Board of Directors, Amwell Corporation (since 2020); Board of Directors, Massachusetts Women’s Forum (2018-2020); Board of Directors, National Association of Corporate Directors/New England (2015-2020); Board of Directors, Association of Independent Colleges and Universities of Massachusetts (2014-2017); Chief Executive Officer, American Red Cross of Massachusetts Bay (2002–2011); Board of Directors of Eastern Bank Corporation (since 2001); Board of Directors of Eastern Bank Charitable Foundation (since 2001); Board of Directors of American Student Assistance Corporation (1996–2009); Board of Directors of Boston Stock Exchange (2002–2008); Board of Directors of Harvard Pilgrim Healthcare (health benefits company) (2007–2011). Trustee of various trusts within the John Hancock Fund Complex (since 2008). | ||
| Steven R. Pruchansky, Born: 1944 | 2012 | 190 |
| Trustee and Vice Chairperson of the Board | ||
| Managing Director, Pru Realty (since 2017); Chairman and Chief Executive Officer, Greenscapes of Southwest Florida, Inc. (2014-2020); Director and President, Greenscapes of Southwest Florida, Inc. (until 2000); Member, Board of Advisors, First American Bank (until 2010); Managing Director, Jon James, LLC (real estate) (since 2000); Partner, Right Funding, LLC (2014-2017); Director, First Signature Bank & Trust Company (until 1991); Director, Mast Realty Trust (until 1994); President, Maxwell Building Corp. (until 1991). Trustee (since 1992), Chairperson of the Board (2011–2012), and Vice Chairperson of the Board (since 2012) of various trusts within the John Hancock Fund Complex. | ||
| Frances G. Rathke,2,* Born: 1960 | 2020 | 190 |
| Trustee | ||
| Board Member, Oatly Group AB (plant-based drink company) (since 2021): Director, Northern New England Energy Corporation (since 2017); Director, Audit Committee Chair and Compensation Committee Member, Green Mountain Power Corporation (since 2016); Director, Treasurer and Finance & Audit Committee Chair, Flynn Center for Performing Arts (since 2016); Director, Audit Committee Chair and Compensation Committee Member, Planet Fitness (since 2016); Director, Citizen Cider, Inc. (high-end hard cider and hard seltzer company) (since 2016); Chief Financial Officer and Treasurer, Keurig Green Mountain, Inc. (2003-retired 2015); Independent Financial Consultant, Frances Rathke Consulting (strategic and financial consulting services) (2001-2003); Chief Financial Officer and Secretary, Ben & Jerry’s Homemade, Inc. (1989-2000, including prior positions); Senior Manager, Coopers & Lybrand, LLC (independent public accounting firm) (1982-1989). Trustee of various trusts within the John Hancock Fund Complex (since 2020). | ||
| Gregory A. Russo, Born: 1949 | 2012 | 190 |
| Trustee | ||
| Director and Audit Committee Chairman (2012-2020), and Member, Audit Committee and Finance Committee (2011-2020), NCH Healthcare System, Inc. (holding company for multi-entity healthcare system); Director and Member (2012-2018) and Finance Committee Chairman (2014-2018), The Moorings, Inc. (nonprofit continuing care community); Vice Chairman, Risk & Regulatory Matters, KPMG LLP (KPMG) (2002–2006); Vice Chairman, Industrial Markets, KPMG (1998–2002); Chairman and Treasurer, Westchester County, New York, Chamber of Commerce (1986–1992); Director, Treasurer, and Chairman of Audit and Finance Committees, Putnam Hospital Center (1989–1995); Director and Chairman of Fundraising Campaign, United Way of Westchester and Putnam Counties, New York (1990–1995). Trustee of various trusts within the John Hancock Fund Complex (since 2008). | ||
| 74 | JOHN HANCOCK OPPORTUNISTIC FIXED INCOME FUND | ANNUAL REPORT |
| Non-Independent Trustees3 | ||
| Name, year of birth Position(s) held with Trust Principal occupation(s) and other directorships during past 5 years | Trustee of the Trust since1 | Number of John Hancock funds overseen by Trustee |
| Andrew G. Arnott, Born: 1971 | 2017 | 190 |
| President and Non-Independent Trustee | ||
| Head of Wealth and Asset Management, United States and Europe, for John Hancock and Manulife (since 2018); Director and Executive Vice President, John Hancock Investment Management LLC (since 2005, including prior positions); Director and Executive Vice President, John Hancock Variable Trust Advisers LLC (since 2006, including prior positions); President, John Hancock Investment Management Distributors LLC (since 2004, including prior positions); President of various trusts within the John Hancock Fund Complex (since 2007, including prior positions). Trustee of various trusts within the John Hancock Fund Complex (since 2017). | ||
| Marianne Harrison, Born: 1963 | 2018 | 190 |
| Non-Independent Trustee | ||
| President and CEO, John Hancock (since 2017); President and CEO, Manulife Canadian Division (2013–2017); Member, Board of Directors, Boston Medical Center (since 2021); Member, Board of Directors, CAE Inc. (since 2019); Member, Board of Directors, MA Competitive Partnership Board (since 2018); Member, Board of Directors, American Council of Life Insurers (ACLI) (since 2018); Member, Board of Directors, Communitech, an industry-led innovation center that fosters technology companies in Canada (2017-2019); Member, Board of Directors, Manulife Assurance Canada (2015-2017); Board Member, St. Mary’s General Hospital Foundation (2014-2017); Member, Board of Directors, Manulife Bank of Canada (2013- 2017); Member, Standing Committee of the Canadian Life & Health Assurance Association (2013-2017); Member, Board of Directors, John Hancock USA, John Hancock Life & Health, John Hancock New York (2012–2013). Trustee of various trusts within the John Hancock Fund Complex (since 2018). | ||
| Principal officers who are not Trustees | |
| Name, year of birth Position(s) held with Trust Principal occupation(s) during past 5 years | Current Position(s) with the Trust since |
| Charles A. Rizzo, Born: 1957 | 2007 |
| Chief Financial Officer | |
| Vice President, John Hancock Financial Services (since 2008); Senior Vice President, John Hancock Investment Management LLC and John Hancock Variable Trust Advisers LLC (since 2008); Chief Financial Officer of various trusts within the John Hancock Fund Complex (since 2007). | |
| Salvatore Schiavone, Born: 1965 | 2009 |
| Treasurer | |
| Assistant Vice President, John Hancock Financial Services (since 2007); Vice President, John Hancock Investment Management LLC and John Hancock Variable Trust Advisers LLC (since 2007); Treasurer of various trusts within the John Hancock Fund Complex (since 2007, including prior positions). | |
| Christopher (Kit) Sechler, Born: 1973 | 2018 |
| Secretary and Chief Legal Officer | |
| Vice President and Deputy Chief Counsel, John Hancock Investment Management (since 2015); Assistant Vice President and Senior Counsel (2009–2015), John Hancock Investment Management; Assistant Secretary of John Hancock Investment Management LLC and John Hancock Variable Trust Advisers LLC (since 2009); Chief Legal Officer and Secretary of various trusts within the John Hancock Fund Complex (since 2009, including prior positions). | |
| ANNUAL REPORT | JOHN HANCOCK OPPORTUNISTIC FIXED INCOME FUND | 75 |
| Principal officers who are not Trustees (continued) | |
| Name, year of birth Position(s) held with Trust Principal occupation(s) during past 5 years | Current Position(s) with the Trust since |
| Trevor Swanberg, Born: 1979 | 2020 |
| Chief Compliance Officer | |
| Chief Compliance Officer, John Hancock Investment Management LLC and John Hancock Variable Trust Advisers LLC (since 2020); Deputy Chief Compliance Officer, John Hancock Investment Management LLC and John Hancock Variable Trust Advisers LLC (2019–2020); Assistant Chief Compliance Officer, John Hancock Investment Management LLC and John Hancock Variable Trust Advisers LLC (2016–2019); Vice President, State Street Global Advisors (2015–2016); Chief Compliance Officer of various trusts within the John Hancock Fund Complex (since 2016, including prior positions). | |
| 1 | Each Trustee holds office until his or her successor is elected and qualified, or until the Trustee’s death, retirement, resignation, or removal. Mr. Boyle has served as Trustee at various times prior to the date listed in the table. |
| 2 | Member of the Audit Committee. |
| 3 | The Trustee is a Non-Independent Trustee due to current or former positions with the Advisor and certain affiliates. |
| * | Appointed as Independent Trustee effective as of September 15, 2020. |
| 76 | JOHN HANCOCK OPPORTUNISTIC FIXED INCOME FUND | ANNUAL REPORT |
Steven R. Pruchansky, Vice Chairperson
Andrew G. Arnott†
Charles L. Bardelis*
James R. Boyle
Peter S. Burgess*
William H. Cunningham
Grace K. Fey
Marianne Harrison†
Deborah C. Jackson
Frances G. Rathke*,1
Gregory A. Russo
President
Chief Financial Officer
Treasurer
Secretary and Chief Legal Officer
Chief Compliance Officer
Brij S. Khurana
| You can also contact us: | ||
| 800-225-5291 | Regular mail: | Express mail: |
| jhinvestments.com | John Hancock Signature Services, Inc. P.O. Box 219909 Kansas City, MO 64121-9909 | John Hancock Signature Services, Inc. 430 W 7th Street Suite 219909 Kansas City, MO 64105-1407 |
| ANNUAL REPORT | JOHN HANCOCK OPPORTUNISTIC FIXED INCOME FUND | 77 |
GOVERNANCE FUNDS
with a heritage of financial stewardship dating back to 1862. Helping
our shareholders pursue their financial goals is at the core of everything
we do. It’s why we support the role of professional financial advice
and operate with the highest standards of conduct and integrity.
We search the world to find proven portfolio teams with specialized
expertise for every strategy we offer, then we apply robust investment
oversight to ensure they continue to meet our uncompromising
standards and serve the best interests of our shareholders.
a diverse set of investments backed by some of the world’s best
managers, along with strong risk-adjusted returns across asset classes.
200 Berkeley Street, Boston, MA 02116-5010, 800-225-5291, jhinvestments.com
| MF1823034 | 476A 8/21 |
ITEM 2. CODE OF ETHICS.
(a)As of the end of the fiscal year August 31, 2021 the registrant has adopted a code of ethics, as defined in Item 2 of Form N-CSR, that applies to its Chief Executive Officer, Chief Financial Officer and Treasurer (respectively, the principal executive officer, the principal financial officer and the principal accounting officer, the "Covered Officers"). A copy of the code of ethics is filed as an exhibit to this Form N-CSR.
ITEM 3. AUDIT COMMITTEE FINANCIAL EXPERT.
Peter S. Burgess is the audit committee financial expert and is "independent", pursuant to general instructions on Form N-CSR Item 3.
ITEM 4. PRINCIPAL ACCOUNTANT FEES AND SERVICES.
(a) Audit fees:
The aggregate fees billed for professional services rendered by the principal accountant for the audits of the registrant's annual financial statements or services that are normally provided by the accountant in connection with statutory and regulatory filings or engagements amounted to the following for the fiscal years ended August 31, 2021 and 2020. These fees were billed to the registrant and were approved by the registrant's audit committee:
2021: $715,074
2020: $832,435
(b) Audit-related services
Audit-related fees for assurance and related services by the principal accountant are billed to the registrant or to the registrant's investment adviser (not including any sub-adviser whose role is primarily portfolio management and is subcontracted with or overseen by another investment adviser), and any entity controlling, controlled by, or under common control with the adviser ("control affiliates") that provides ongoing services to the registrant. The nature of the services provided was affiliated service provider internal controls reviews and reviews related to supplemental regulatory filings. Amounts billed to the registrant were as follows:
2021: $6,336
2020: $20,708
Amounts billed to control affiliates were $116,000 and $216,467 for the fiscal years ended August 31, 2021 and 2020, respectively.
(c) Tax Fees
The aggregate fees billed for professional services rendered by the principal accountant for tax compliance, tax advice and tax planning ("tax fees") amounted to the following for the fiscal years ended August 31, 2021 and 2020. The nature of the services comprising the tax fees was review of tax distribution requirements and ownership changes. These fees were billed to the registrant and were approved by the registrant's audit committee.
2021:$1,250
2020: $4,000
(d) All Other Fees
The nature of the services comprising all other fees is advisory services provided to the investment manager. Other fees amounted to the following for the fiscal years ended August 31, 2021 and 2020:
2021: $1,360
2020: $2,312
(e)(1) Audit Committee Pre-Approval Policies and Procedures:
The trust's Audit Committee must pre-approve all audit and non-audit services provided by the independent registered public accounting firm (the "Auditor") relating to the operations or financial reporting of the funds. Prior to the commencement of any audit or non-audit services to a fund, the Audit Committee reviews the services to determine whether they are appropriate and permissible under applicable law.
The trust's Audit Committee has adopted policies and procedures to, among other purposes, provide a framework for the Committee's consideration of audit-related and non-audit services by the Auditor. The policies and procedures require that any audit-related and non-audit service provided by the Auditor and any non-audit service provided by the Auditor to a fund service provider that relates directly to the operations and financial reporting of a fund are subject to approval by the Audit Committee before such service is provided. Audit-related services provided by the Auditor that are expected to exceed $25,000 per year/per fund are subject to specific pre-approval by the Audit Committee. Tax services provided by the Auditor that are expected to exceed $30,000 per year/per fund are subject to specific pre-approval by the Audit Committee.
All audit services, as well as the audit-related and non-audit services that are expected to exceed the amounts stated above, must be approved in advance of provision of the service by formal resolution of the Audit Committee. At the regularly scheduled Audit Committee meetings, the Committee reviews a report summarizing the services, including fees, provided by the Auditor.
(e)(2) Services approved pursuant to paragraph (c)(7)(i)(C) of Rule 2-01 of Regulation S-X:
Audit-Related Fees, Tax Fees and All Other Fees:
There were no amounts that were approved by the Audit Committee pursuant to the de minimis exception under Rule 2-01 of Regulation S-X.
(f)According to the registrant's principal accountant for the fiscal year ended August 31, 2021, the percentage of hours spent on the audit of the registrant's financial statements for the most recent fiscal year that were attributed to work performed by persons who were not full-time, permanent employees of principal accountant was less than 50%.
(g)The aggregate non-audit fees billed by the registrant's principal accountant for non-audit services rendered to the registrant and rendered to the registrant's control affiliates were $1,068,978 for the fiscal year ended August 31, 2021 and $1,275,806 for the fiscal year ended August 31, 2020.
(h)The audit committee of the registrant has considered the non-audit services provided by the registrant's principal accountant to the control affiliates and has determined that the services that were not pre- approved are compatible with maintaining the principal accountant's independence.
ITEM 5. AUDIT COMMITTEE OF LISTED REGISTRANTS
The registrant has a separately-designated standing audit committee comprised of independent trustees. The members of the audit committee are as follows:
Peter S. Burgess - Chairman
Charles L. Bardelis
Frances G. Rathke
ITEM 6. SCHEDULE OF INVESTMENTS.
(a)Not applicable.
(b)Not applicable.
ITEM 7. DISCLOSURE OF PROXY VOTING POLICIES AND PROCEDURES FOR CLOSED-END MANAGEMENT INVESTMENT COMPANIES.
Not applicable.
ITEM 8. PORTFOLIO MANAGERS OF CLOSED-END MANAGEMENT INVESTMENT COMPANIES.
Not applicable.
ITEM 9. PURCHASES OF EQUITY SECURITIES BY CLOSED-END MANAGEMENT INVESTMENT COMPANY AND AFFILIATED PURCHASERS.
Not applicable.
ITEM 10. SUBMISSION OF MATTERS TO A VOTE OF SECURITY HOLDERS.
The registrant has adopted procedures by which shareholders may recommend nominees to the registrant's Board of Trustees. A copy of the procedures is filed as an exhibit to this Form
N-CSR. See attached "John Hancock Funds – Nominating, Governance and Administration Committee Charter".
ITEM 11. CONTROLS AND PROCEDURES.
(a)Based upon their evaluation of the registrant's disclosure controls and procedures as conducted within 90 days of the filing date of this Form N-CSR, the registrant's principal executive officer and principal financial officer have concluded that those disclosure controls and procedures provide reasonable assurance that the material information required to be disclosed by the registrant on this report is recorded, processed, summarized and reported within the time periods specified in the Securities and Exchange Commission's rules and forms.
(b)There were no changes in the registrant's internal control over financial reporting that occurred during the period covered by this report that have materially affected, or are reasonably likely to materially affect, the registrant's internal control over financial reporting.
ITEM 12. DISCLOSURE OF SECURITIES LENDING ACTIVITIES FOR CLOSED-END MANAGEMENT INVESTMENT COMPANIES.
Not applicable.
ITEM 13. EXHIBITS.

SIGNATURES
Pursuant to the requirements of the Securities Exchange Act of 1934 and the Investment Company Act of 1940, the registrant has duly caused this report to be signed on its behalf by the undersigned, thereunto duly authorized.
JOHN HANCOCK FUNDS II
/s/ Andrew Arnott
Andrew Arnott
President
Date: October 22, 2021
Pursuant to the requirements of the Securities Exchange Act of 1934 and the Investment Company Act of 1940, this report has been signed below by the following persons on behalf of the registrant and in the capacities and on the dates indicated.
/s/ Andrew Arnott
Andrew Arnott
President
Date: October 22, 2021
/s/ Charles A. Rizzo
Charles A. Rizzo
Chief Financial Officer
Date: October 22, 2021