UNITED STATES
SECURITIES AND EXCHANGE COMMISSION
Washington, D.C. 20549
FORM N-CSR
CERTIFIED SHAREHOLDER REPORT OF REGISTERED MANAGEMENT INVESTMENT COMPANIES
Investment Company Act file number 811-21779
JOHN HANCOCK FUNDS II
---------------------------------------------------------
(Exact name of registrant as specified in charter)
200 BERKELEY STREET, BOSTON, MA 02116
-------------------------------------------------------------
(Address of principal executive offices) (Zip code)
SALVATORE SCHIAVONE, 200 BERKELEY STREET, BOSTON, MA 02116
------------------------------------------------------------------------------------------
(Name and address of agent for service)
Registrant's telephone number, including area code: (617) 543-9634
--------------
Date of fiscal year end: 12/31
------
Date of reporting period: 12/31/21
-------
ITEM 1. REPORTS TO STOCKHOLDERS.
The Registrant prepared two annual reports to shareholders for the period ended December 31, 2021. The first report applies to the John Hancock Retirement Income 2040 Fund and the second report applies to John Hancock Multimanager Lifestyle Portfolios which includes 5 of the Registrant's Funds.


President and CEO,
John Hancock Investment Management
Head of Wealth and Asset Management,
United States and Europe
| ANNUAL REPORT | JOHN HANCOCK RETIREMENT INCOME 2040 FUND | 1 |

| 2 | JOHN HANCOCK RETIREMENT INCOME 2040 FUND | ANNUAL REPORT |

| ANNUAL REPORT | JOHN HANCOCK RETIREMENT INCOME 2040 FUND | 3 |

| 4 | JOHN HANCOCK RETIREMENT INCOME 2040 FUND | ANNUAL REPORT |
| ANNUAL REPORT | JOHN HANCOCK RETIREMENT INCOME 2040 FUND | 5 |

| 6 | JOHN HANCOCK RETIREMENT INCOME 2040 FUND | ANNUAL REPORT |
| Average annual total returns (%) | Cumulative total returns (%) | ||
| 1-year | Since inception (7-6-17) | Since inception (7-6-17) | |
| Class R61 | -0.62 | 5.42 | 26.76 |
| Index† | -1.54 | 3.49 | 16.64 |
| Class R6 | |
| Gross (%) | 1.04 |
| Net (%) | 0.49 |
| ANNUAL REPORT | JOHN HANCOCK RETIREMENT INCOME 2040 FUND | 7 |

| 1 | For certain types of investors, as described in the fund’s prospectus. |
| 8 | JOHN HANCOCK RETIREMENT INCOME 2040 FUND | ANNUAL REPORT |
| ANNUAL REPORT | JOHN HANCOCK RETIREMENT INCOME 2040 FUND | 9 |
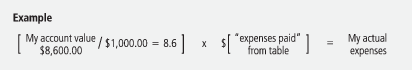
| Account value on 7-1-2021 | Ending value on 12-31-2021 | Expenses paid during period ended 12-31-20211 | Annualized expense ratio | ||
| Class R6 | Actual expenses/actual returns | $1,000.00 | $1,008.50 | $2.13 | 0.42% |
| Hypothetical example | 1,000.00 | 1,023.10 | 2.14 | 0.42% |
| 1 | Expenses are equal to the annualized expense ratio, multiplied by the average account value over the period, multiplied by 184/365 (to reflect the one-half year period). |
| 10 | JOHN HANCOCK RETIREMENT INCOME 2040 FUND | ANNUAL REPORT |
| Rate (%) | Maturity date | Par value^ | Value | ||
| U.S. Government and Agency obligations 50.8% | $12,922,145 | ||||
| (Cost $12,550,585) | |||||
| U.S. Government 50.8% | 12,922,145 | ||||
| U.S. Treasury | |||||
| Bond | 1.375 | 11-15-40 | 310,000 | 282,512 | |
| Bond | 3.500 | 02-15-39 | 494,000 | 619,738 | |
| Bond | 3.875 | 08-15-40 | 320,000 | 421,763 | |
| Bond | 4.250 | 05-15-39 | 280,000 | 383,884 | |
| Bond | 4.250 | 11-15-40 | 230,000 | 318,137 | |
| Bond | 4.375 | 02-15-38 | 336,000 | 462,998 | |
| Bond | 4.375 | 11-15-39 | 555,000 | 773,510 | |
| Bond | 4.500 | 02-15-36 | 1,060,000 | 1,456,837 | |
| Bond | 4.500 | 05-15-38 | 740,000 | 1,034,757 | |
| Bond | 4.625 | 02-15-40 | 115,000 | 165,173 | |
| Bond | 4.750 | 02-15-37 | 545,000 | 773,048 | |
| Bond | 5.000 | 05-15-37 | 475,000 | 691,403 | |
| Bond | 5.375 | 02-15-31 | 555,000 | 742,724 | |
| Bond | 5.500 | 08-15-28 | 275,000 | 345,855 | |
| Bond | 6.125 | 08-15-29 | 25,000 | 33,538 | |
| Bond | 6.250 | 05-15-30 | 6,000 | 8,284 | |
| Bond | 6.500 | 11-15-26 | 70,000 | 87,347 | |
| Bond | 6.625 | 02-15-27 | 135,000 | 170,712 | |
| Note | 0.125 | 07-15-23 | 16,000 | 15,884 | |
| Note | 0.125 | 12-15-23 | 155,000 | 153,220 | |
| Note | 0.250 | 10-31-25 | 80,000 | 77,322 | |
| Note | 0.375 | 12-31-25 | 50,000 | 48,465 | |
| Note | 0.375 | 09-30-27 | 230,000 | 217,700 | |
| Note | 0.500 | 03-31-25 | 70,000 | 68,838 | |
| Note | 0.625 | 12-31-27 | 115,000 | 110,036 | |
| Note | 0.625 | 08-15-30 | 25,000 | 23,314 | |
| Note | 0.750 | 01-31-28 | 130,000 | 125,186 | |
| Note | 1.125 | 02-15-31 | 145,000 | 140,724 | |
| Note | 1.500 | 01-15-23 | 50,000 | 50,545 | |
| Note | 1.500 | 11-30-24 | 155,000 | 157,434 | |
| Note | 1.625 | 08-15-29 | 145,000 | 147,101 | |
| Note | 1.750 | 12-31-26 | 280,000 | 286,563 | |
| Note | 1.750 | 11-15-29 | 230,000 | 235,750 | |
| Note | 1.875 | 06-30-26 | 185,000 | 190,174 | |
| Note | 2.000 | 10-31-22 | 25,000 | 25,337 | |
| Note | 2.000 | 02-15-25 | 320,000 | 329,600 | |
| Note | 2.250 | 12-31-23 | 450,000 | 463,482 | |
| Note | 2.250 | 03-31-26 | 45,000 | 46,925 | |
| Note | 2.250 | 11-15-27 | 135,000 | 141,734 | |
| SEE NOTES TO FINANCIAL STATEMENTS | ANNUAL REPORT | JOHN HANCOCK RETIREMENT INCOME 2040 FUND | 11 |
| Rate (%) | Maturity date | Par value^ | Value | ||
| U.S. Government (continued) | |||||
| Note | 2.375 | 01-31-23 | 70,000 | $71,444 | |
| Note | 2.500 | 02-15-22 | 225,000 | 225,644 | |
| Note | 2.625 | 02-15-29 | 180,000 | 194,590 | |
| Note | 2.750 | 02-15-24 | 330,000 | 343,703 | |
| Note | 2.750 | 02-15-28 | 125,000 | 135,098 | |
| Note | 2.875 | 11-30-25 | 50,000 | 53,295 | |
| Note | 2.875 | 05-15-28 | 65,000 | 70,817 | |
| Corporate bonds 35.7% | $9,101,617 | ||||
| (Cost $8,121,797) | |||||
| Communication services 5.9% | 1,501,077 | ||||
| Diversified telecommunication services 2.6% | |||||
| AT&T, Inc. | 2.550 | 12-01-33 | 97,000 | 94,870 | |
| AT&T, Inc. | 4.500 | 05-15-35 | 90,000 | 103,968 | |
| AT&T, Inc. | 5.350 | 09-01-40 | 50,000 | 63,343 | |
| Deutsche Telekom International Finance BV | 9.250 | 06-01-32 | 50,000 | 79,740 | |
| Verizon Communications, Inc. | 4.400 | 11-01-34 | 80,000 | 93,183 | |
| Verizon Communications, Inc. | 4.500 | 08-10-33 | 115,000 | 135,200 | |
| Verizon Communications, Inc. | 5.250 | 03-16-37 | 75,000 | 97,460 | |
| Entertainment 0.3% | |||||
| Activision Blizzard, Inc. | 1.350 | 09-15-30 | 90,000 | 83,014 | |
| Media 2.6% | |||||
| Charter Communications Operating LLC | 5.375 | 04-01-38 | 75,000 | 89,500 | |
| Charter Communications Operating LLC | 6.384 | 10-23-35 | 80,000 | 103,340 | |
| Comcast Corp. | 4.250 | 01-15-33 | 130,000 | 152,132 | |
| Comcast Corp. | 6.500 | 11-15-35 | 55,000 | 78,957 | |
| Comcast Corp. | 7.050 | 03-15-33 | 75,000 | 107,899 | |
| ViacomCBS, Inc. | 5.500 | 05-15-33 | 105,000 | 130,603 | |
| Wireless telecommunication services 0.4% | |||||
| T-Mobile USA, Inc. | 3.000 | 02-15-41 | 90,000 | 87,868 | |
| Consumer discretionary 2.0% | 519,959 | ||||
| Auto components 0.3% | |||||
| Magna International, Inc. | 2.450 | 06-15-30 | 65,000 | 65,952 | |
| Automobiles 0.3% | |||||
| General Motors Company | 6.600 | 04-01-36 | 55,000 | 74,390 | |
| Hotels, restaurants and leisure 0.6% | |||||
| Expedia Group, Inc. | 3.250 | 02-15-30 | 80,000 | 81,640 | |
| McDonald’s Corp. | 6.300 | 03-01-38 | 60,000 | 85,262 | |
| Internet and direct marketing retail 0.5% | |||||
| Amazon.com, Inc. | 4.800 | 12-05-34 | 50,000 | 63,856 | |
| eBay, Inc. | 3.450 | 08-01-24 | 70,000 | 73,521 | |
| 12 | JOHN HANCOCK RETIREMENT INCOME 2040 FUND | ANNUAL REPORT | SEE NOTES TO FINANCIAL STATEMENTS |
| Rate (%) | Maturity date | Par value^ | Value | ||
| Consumer discretionary (continued) | |||||
| Specialty retail 0.3% | |||||
| Lowe’s Companies, Inc. | 5.000 | 04-15-40 | 60,000 | $75,338 | |
| Consumer staples 2.1% | 521,887 | ||||
| Beverages 1.4% | |||||
| Anheuser-Busch Companies LLC | 4.700 | 02-01-36 | 85,000 | 102,579 | |
| Anheuser-Busch InBev Worldwide, Inc. | 8.200 | 01-15-39 | 35,000 | 56,831 | |
| Diageo Capital PLC | 2.000 | 04-29-30 | 100,000 | 98,944 | |
| PepsiCo, Inc. | 1.625 | 05-01-30 | 100,000 | 96,976 | |
| Food and staples retailing 0.4% | |||||
| Costco Wholesale Corp. | 1.750 | 04-20-32 | 100,000 | 97,156 | |
| Household products 0.3% | |||||
| The Procter & Gamble Company | 3.550 | 03-25-40 | 60,000 | 69,401 | |
| Energy 4.0% | 1,020,947 | ||||
| Oil, gas and consumable fuels 4.0% | |||||
| Canadian Natural Resources, Ltd. | 6.250 | 03-15-38 | 45,000 | 59,207 | |
| Canadian Natural Resources, Ltd. | 6.450 | 06-30-33 | 55,000 | 70,701 | |
| ConocoPhillips | 5.900 | 10-15-32 | 80,000 | 104,490 | |
| Energy Transfer LP | 3.900 | 07-15-26 | 60,000 | 64,520 | |
| Energy Transfer LP | 6.050 | 06-01-41 | 50,000 | 61,178 | |
| Energy Transfer LP | 7.500 | 07-01-38 | 45,000 | 62,021 | |
| EOG Resources, Inc. | 3.900 | 04-01-35 | 85,000 | 96,348 | |
| Exxon Mobil Corp. | 3.043 | 03-01-26 | 55,000 | 58,185 | |
| Kinder Morgan Energy Partners LP | 5.800 | 03-15-35 | 75,000 | 94,073 | |
| Kinder Morgan Energy Partners LP | 6.500 | 09-01-39 | 45,000 | 59,895 | |
| Shell International Finance BV | 4.125 | 05-11-35 | 55,000 | 64,183 | |
| Suncor Energy, Inc. | 5.950 | 05-15-35 | 50,000 | 64,282 | |
| TransCanada PipeLines, Ltd. | 4.625 | 03-01-34 | 85,000 | 99,788 | |
| Valero Energy Corp. | 7.500 | 04-15-32 | 45,000 | 62,076 | |
| Financials 5.4% | 1,384,479 | ||||
| Banks 2.8% | |||||
| Bank of Montreal (3.803% to 12-15-27, then 5 Year U.S. Swap Rate + 1.432%) | 3.803 | 12-15-32 | 110,000 | 117,986 | |
| Citigroup, Inc. | 6.000 | 10-31-33 | 85,000 | 109,603 | |
| Citigroup, Inc. | 6.625 | 06-15-32 | 80,000 | 106,128 | |
| HSBC Holdings PLC | 7.625 | 05-17-32 | 75,000 | 103,243 | |
| JPMorgan Chase & Co. | 5.500 | 10-15-40 | 80,000 | 108,824 | |
| JPMorgan Chase & Co. | 6.400 | 05-15-38 | 60,000 | 87,296 | |
| U.S. Bancorp | 2.950 | 07-15-22 | 70,000 | 70,829 | |
| Capital markets 1.1% | |||||
| Morgan Stanley | 3.125 | 07-27-26 | 100,000 | 105,932 | |
| Morgan Stanley | 7.250 | 04-01-32 | 70,000 | 99,745 | |
| SEE NOTES TO FINANCIAL STATEMENTS | ANNUAL REPORT | JOHN HANCOCK RETIREMENT INCOME 2040 FUND | 13 |
| Rate (%) | Maturity date | Par value^ | Value | ||
| Financials (continued) | |||||
| Capital markets (continued) | |||||
| S&P Global, Inc. | 1.250 | 08-15-30 | 90,000 | $83,971 | |
| Insurance 1.5% | |||||
| American International Group, Inc. | 3.875 | 01-15-35 | 95,000 | 105,032 | |
| Lincoln National Corp. | 3.800 | 03-01-28 | 50,000 | 54,855 | |
| MetLife, Inc. | 6.500 | 12-15-32 | 50,000 | 69,534 | |
| Prudential Financial, Inc. | 3.905 | 12-07-47 | 63,000 | 73,148 | |
| The Travelers Companies, Inc. | 6.750 | 06-20-36 | 60,000 | 88,353 | |
| Health care 3.9% | 1,002,644 | ||||
| Biotechnology 1.6% | |||||
| AbbVie, Inc. | 4.500 | 05-14-35 | 60,000 | 71,773 | |
| AbbVie, Inc. | 4.550 | 03-15-35 | 90,000 | 108,215 | |
| Amgen, Inc. | 2.000 | 01-15-32 | 80,000 | 77,465 | |
| Biogen, Inc. | 2.250 | 05-01-30 | 100,000 | 98,459 | |
| GlaxoSmithKline Capital, Inc. | 5.375 | 04-15-34 | 45,000 | 59,529 | |
| Health care providers and services 1.1% | |||||
| CVS Health Corp. | 4.780 | 03-25-38 | 100,000 | 121,725 | |
| CVS Health Corp. | 4.875 | 07-20-35 | 65,000 | 79,472 | |
| UnitedHealth Group, Inc. | 4.625 | 07-15-35 | 60,000 | 74,973 | |
| Pharmaceuticals 1.2% | |||||
| Johnson & Johnson | 4.375 | 12-05-33 | 85,000 | 104,898 | |
| Merck & Company, Inc. | 3.900 | 03-07-39 | 60,000 | 70,424 | |
| Pfizer, Inc. | 3.400 | 05-15-24 | 55,000 | 58,254 | |
| Wyeth LLC | 5.950 | 04-01-37 | 55,000 | 77,457 | |
| Industrials 3.2% | 806,192 | ||||
| Aerospace and defense 1.1% | |||||
| Lockheed Martin Corp. | 4.500 | 05-15-36 | 60,000 | 73,220 | |
| Raytheon Technologies Corp. | 4.450 | 11-16-38 | 50,000 | 60,260 | |
| The Boeing Company | 2.950 | 02-01-30 | 60,000 | 61,129 | |
| The Boeing Company | 3.600 | 05-01-34 | 80,000 | 83,809 | |
| Air freight and logistics 0.2% | |||||
| FedEx Corp. | 4.900 | 01-15-34 | 50,000 | 60,290 | |
| Building products 0.4% | |||||
| Johnson Controls International PLC | 2.000 | 09-16-31 | 95,000 | 91,994 | |
| Industrial conglomerates 0.2% | |||||
| General Electric Company | 6.750 | 03-15-32 | 38,000 | 51,823 | |
| Road and rail 0.6% | |||||
| Canadian Pacific Railway Company | 2.050 | 03-05-30 | 95,000 | 93,632 | |
| CSX Corp. | 6.000 | 10-01-36 | 45,000 | 60,776 | |
| Trading companies and distributors 0.7% | |||||
| GATX Corp. | 4.000 | 06-30-30 | 80,000 | 89,059 | |
| 14 | JOHN HANCOCK RETIREMENT INCOME 2040 FUND | ANNUAL REPORT | SEE NOTES TO FINANCIAL STATEMENTS |
| Rate (%) | Maturity date | Par value^ | Value | ||
| Industrials (continued) | |||||
| Trading companies and distributors (continued) | |||||
| International Lease Finance Corp. | 8.625 | 01-15-22 | 80,000 | $80,200 | |
| Information technology 3.1% | 781,085 | ||||
| Communications equipment 0.4% | |||||
| Motorola Solutions, Inc. | 2.750 | 05-24-31 | 90,000 | 90,162 | |
| IT services 0.3% | |||||
| Fidelity National Information Services, Inc. | 2.250 | 03-01-31 | 70,000 | 68,456 | |
| Semiconductors and semiconductor equipment 0.9% | |||||
| Broadcom, Inc. | 4.300 | 11-15-32 | 80,000 | 89,902 | |
| Micron Technology, Inc. | 4.663 | 02-15-30 | 65,000 | 74,911 | |
| NVIDIA Corp. | 2.850 | 04-01-30 | 65,000 | 69,039 | |
| Software 1.1% | |||||
| Microsoft Corp. | 2.525 | 06-01-50 | 22,000 | 21,454 | |
| Microsoft Corp. | 3.500 | 02-12-35 | 65,000 | 74,233 | |
| Microsoft Corp. | 4.100 | 02-06-37 | 38,000 | 46,016 | |
| Microsoft Corp. | 4.200 | 11-03-35 | 55,000 | 67,296 | |
| ServiceNow, Inc. | 1.400 | 09-01-30 | 75,000 | 69,810 | |
| Technology hardware, storage and peripherals 0.4% | |||||
| Dell International LLC | 6.020 | 06-15-26 | 95,000 | 109,806 | |
| Materials 1.9% | 486,491 | ||||
| Chemicals 0.8% | |||||
| Ecolab, Inc. | 2.125 | 02-01-32 | 75,000 | 74,377 | |
| Linde, Inc. | 3.200 | 01-30-26 | 45,000 | 47,895 | |
| The Dow Chemical Company | 2.100 | 11-15-30 | 75,000 | 73,731 | |
| Containers and packaging 0.3% | |||||
| International Paper Company | 7.300 | 11-15-39 | 50,000 | 76,610 | |
| Metals and mining 0.5% | |||||
| Newmont Corp. | 2.250 | 10-01-30 | 70,000 | 69,014 | |
| Rio Tinto Alcan, Inc. | 5.750 | 06-01-35 | 50,000 | 67,591 | |
| Paper and forest products 0.3% | |||||
| Georgia-Pacific LLC | 8.875 | 05-15-31 | 50,000 | 77,273 | |
| Real estate 1.4% | 354,225 | ||||
| Equity real estate investment trusts 1.4% | |||||
| Crown Castle International Corp. | 4.300 | 02-15-29 | 120,000 | 133,955 | |
| Duke Realty LP | 1.750 | 07-01-30 | 70,000 | 66,505 | |
| Equinix, Inc. | 2.150 | 07-15-30 | 85,000 | 82,628 | |
| Regency Centers LP | 3.700 | 06-15-30 | 65,000 | 71,137 | |
| Utilities 2.8% | 722,631 | ||||
| Electric utilities 2.3% | |||||
| Duke Energy Carolinas LLC | 6.450 | 10-15-32 | 75,000 | 99,439 | |
| SEE NOTES TO FINANCIAL STATEMENTS | ANNUAL REPORT | JOHN HANCOCK RETIREMENT INCOME 2040 FUND | 15 |
| Rate (%) | Maturity date | Par value^ | Value | ||
| Utilities (continued) | |||||
| Electric utilities (continued) | |||||
| Florida Power & Light Company | 5.950 | 02-01-38 | 60,000 | $83,532 | |
| MidAmerican Energy Company | 5.750 | 11-01-35 | 70,000 | 92,819 | |
| Oncor Electric Delivery Company LLC | 5.250 | 09-30-40 | 45,000 | 59,663 | |
| PacifiCorp | 5.250 | 06-15-35 | 55,000 | 69,155 | |
| Virginia Electric & Power Company | 6.350 | 11-30-37 | 85,000 | 120,845 | |
| Xcel Energy, Inc. | 6.500 | 07-01-36 | 45,000 | 62,940 | |
| Multi-utilities 0.5% | |||||
| CenterPoint Energy, Inc. | 4.250 | 11-01-28 | 50,000 | 55,552 | |
| Dominion Energy, Inc. | 6.300 | 03-15-33 | 60,000 | 78,686 | |
| Shares | Value | ||||
| Affiliated investment companies (A) 12.7% | $3,225,880 | ||||
| (Cost $2,787,454) | |||||
| Equity 12.7% | 3,225,880 | ||||
| Strategic Equity Allocation, Class NAV, JHF II (MIM US) (B) | 248,145 | 3,225,880 | |||
| Yield (%) | Shares | Value | |||
| Short-term investments 1.1% | $274,588 | ||||
| (Cost $274,588) | |||||
| Short-term funds 1.1% | 274,588 | ||||
| State Street Institutional U.S. Government Money Market Fund, Premier Class | 0.0250(C) | 274,588 | 274,588 | ||
| Total investments (Cost $23,734,424) 100.3% | $25,524,230 | ||||
| Other assets and liabilities, net (0.3%) | (67,372) | ||||
| Total net assets 100.0% | $25,456,858 | ||||
| The percentage shown for each investment category is the total value of the category as a percentage of the net assets of the fund. | |
| ^All par values are denominated in U.S. dollars unless otherwise indicated. | |
| Security Abbreviations and Legend | |
| JHF II | John Hancock Funds II |
| MIM US | Manulife Investment Management (US) LLC |
| (A) | The underlying funds’ subadvisor is shown parenthetically. |
| (B) | The subadvisor is an affiliate of the advisor. |
| (C) | The rate shown is the annualized seven-day yield as of 12-31-21. |
| 16 | JOHN HANCOCK RETIREMENT INCOME 2040 FUND | ANNUAL REPORT | SEE NOTES TO FINANCIAL STATEMENTS |
| Assets | |
| Unaffiliated investments, at value (Cost $20,946,970) | $22,298,350 |
| Affiliated investments, at value (Cost $2,787,454) | 3,225,880 |
| Total investments, at value (Cost $23,734,424) | 25,524,230 |
| Interest receivable | 179,818 |
| Receivable for investments sold | 254,172 |
| Receivable from affiliates | 46 |
| Other assets | 18,813 |
| Total assets | 25,977,079 |
| Liabilities | |
| Distributions payable | 259,877 |
| Payable for investments purchased | 220,179 |
| Payable to affiliates | |
| Accounting and legal services fees | 546 |
| Transfer agent fees | 198 |
| Other liabilities and accrued expenses | 39,421 |
| Total liabilities | 520,221 |
| Net assets | $25,456,858 |
| Net assets consist of | |
| Paid-in capital | $24,421,103 |
| Total distributable earnings (loss) | 1,035,755 |
| Net assets | $25,456,858 |
| Net asset value per share | |
| Based on net asset value and shares outstanding - the fund has an unlimited number of shares authorized with no par value | |
| Class R6 ($25,456,858 ÷ 500,920 shares) | $50.82 |
| SEE NOTES TO FINANCIAL STATEMENTS | ANNUAL REPORT | JOHN HANCOCK Retirement Income 2040 Fund | 17 |
| Investment income | |
| Interest | $557,619 |
| Dividends from affiliated investments | 43,491 |
| Total investment income | 601,110 |
| Expenses | |
| Investment management fees | 102,805 |
| Accounting and legal services fees | 3,188 |
| Transfer agent fees | 2,384 |
| Trustees’ fees | 562 |
| Custodian fees | 30,079 |
| State registration fees | 26,715 |
| Printing and postage | 14,893 |
| Professional fees | 55,132 |
| Other | 10,843 |
| Total expenses | 246,601 |
| Less expense reductions | (142,043) |
| Net expenses | 104,558 |
| Net investment income | 496,552 |
| Realized and unrealized gain (loss) | |
| Net realized gain (loss) on | |
| Unaffiliated investments | 193,609 |
| Affiliated investments | 108,423 |
| Capital gain distributions received from affiliated investments | 432,256 |
| 734,288 | |
| Change in net unrealized appreciation (depreciation) of | |
| Unaffiliated investments | (1,356,401) |
| Affiliated investments | (59,307) |
| (1,415,708) | |
| Net realized and unrealized loss | (681,420) |
| Decrease in net assets from operations | $(184,868) |
| 18 | JOHN HANCOCK Retirement Income 2040 Fund | ANNUAL REPORT | SEE NOTES TO FINANCIAL STATEMENTS |
| Year ended 12-31-21 | Year ended 12-31-20 | |
| Increase (decrease) in net assets | ||
| From operations | ||
| Net investment income | $496,552 | $548,237 |
| Net realized gain | 734,288 | 177,938 |
| Change in net unrealized appreciation (depreciation) | (1,415,708) | 1,860,484 |
| Increase (decrease) in net assets resulting from operations | (184,868) | 2,586,659 |
| Distributions to shareholders | ||
| From earnings | ||
| Class R6 | (1,022,636) | (738,766) |
| From tax return of capital | ||
| Class R6 | (20,660) | (286,300) |
| Total distributions | (1,043,296) | (1,025,066) |
| From fund share transactions | 3,175 | 74,234 |
| Total increase (decrease) | (1,224,989) | 1,635,827 |
| Net assets | ||
| Beginning of year | 26,681,847 | 25,046,020 |
| End of year | $25,456,858 | $26,681,847 |
| SEE NOTES TO FINANCIAL STATEMENTS | ANNUAL REPORT | JOHN HANCOCK Retirement Income 2040 Fund | 19 |
| CLASS R6 SHARES Period ended | 12-31-21 | 12-31-20 | 12-31-19 | 12-31-18 | 12-31-171 |
| Per share operating performance | |||||
| Net asset value, beginning of period | $53.27 | $50.15 | $45.97 | $51.19 | $50.00 |
| Net investment income2,3 | 0.99 | 1.10 | 1.19 | 1.24 | 0.69 |
| Net realized and unrealized gain (loss) on investments | (1.36) | 4.07 | 5.70 | (3.31) | 1.56 |
| Total from investment operations | (0.37) | 5.17 | 6.89 | (2.07) | 2.25 |
| Less distributions | |||||
| From net investment income | (2.04) | (1.48) | (2.03) | (1.76) | (0.98) |
| From net realized gain | — | — | (0.68) | (1.39) | (0.08) |
| From tax return of capital | (0.04) | (0.57) | — | — | — |
| Total distributions | (2.08) | (2.05) | (2.71) | (3.15) | (1.06) |
| Net asset value, end of period | $50.82 | $53.27 | $50.15 | $45.97 | $51.19 |
| Total return (%)4 | (0.62) | 10.45 | 15.14 | (4.08) | 4.535 |
| Ratios and supplemental data | |||||
| Net assets, end of period (in millions) | $25 | $27 | $25 | $26 | $25 |
| Ratios (as a percentage of average net assets): | |||||
| Expenses before reductions6 | 0.96 | 0.97 | 0.86 | 1.54 | 0.887 |
| Expenses including reductions6 | 0.41 | 0.38 | 0.38 | 0.36 | 0.347 |
| Net investment income3 | 1.93 | 2.10 | 2.43 | 2.53 | 2.297 |
| Portfolio turnover (%) | 17 | 26 | 18 | 25 | 17 |
| 1 | Period from 7-6-17 (commencement of operations) to 12-31-17. |
| 2 | Based on average daily shares outstanding. |
| 3 | Net investment income is affected by the timing and frequency of the declaration of dividends by the underlying funds in which the fund invests. |
| 4 | Total returns would have been lower had certain expenses not been reduced during the applicable periods. |
| 5 | Not annualized. |
| 6 | Ratios do not include fees and expenses indirectly incurred by the underlying funds and can vary based on mixed of underlying funds held by the fund. |
| 7 | Annualized. Certain income and expenses are presented unannualized. |
| 20 | JOHN HANCOCK Retirement Income 2040 Fund | ANNUAL REPORT | SEE NOTES TO FINANCIAL STATEMENTS |
| ANNUAL REPORT | JOHN HANCOCK Retirement Income 2040 Fund | 21 |
| Total value at 12-31-21 | Level 1 quoted price | Level 2 significant observable inputs | Level 3 significant unobservable inputs | |
| Investments in securities: | ||||
| Assets | ||||
| U.S. Government and Agency obligations | $12,922,145 | — | $12,922,145 | — |
| Corporate bonds | 9,101,617 | — | 9,101,617 | — |
| Affiliated investment companies | 3,225,880 | $3,225,880 | — | — |
| Short-term investments | 274,588 | 274,588 | — | — |
| Total investments in securities | $25,524,230 | $3,500,468 | $22,023,762 | — |
| 22 | JOHN HANCOCK Retirement Income 2040 Fund | ANNUAL REPORT |
| December 31, 2021 | December 31, 2020 | |
| Ordinary income | $740,091 | $738,766 |
| Long-term capital gains | 282,545 | — |
| Return of capital | 20,660 | 286,300 |
| Total | $1,043,296 | $1,025,066 |
| ANNUAL REPORT | JOHN HANCOCK Retirement Income 2040 Fund | 23 |
| 24 | JOHN HANCOCK Retirement Income 2040 Fund | ANNUAL REPORT |
| Year Ended 12-31-21 | Year Ended 12-31-20 | |||
| Shares | Amount | Shares | Amount | |
| Class R6 shares | ||||
| Sold | 529 | $27,030 | 2,378 | $124,454 |
| Distributions reinvested | 75 | 3,787 | 20 | 1,037 |
| Repurchased | (529) | (27,642) | (950) | (51,257) |
| Net increase | 75 | $3,175 | 1,448 | $74,234 |
| Total net increase | 75 | $3,175 | 1,448 | $74,234 |
| Dividends and distributions | |||||||||
| Affiliate | Ending share amount | Beginning value | Cost of purchases | Proceeds from shares sold | Realized gain (loss) | Change in unrealized appreciation (depreciation) | Income distributions received | Capital gain distributions received | Ending value |
| Strategic Equity Allocation | 248,145 | $2,882,900 | $991,242 | $(697,378) | $108,423 | $(59,307) | $43,491 | $432,256 | $3,225,880 |
| ANNUAL REPORT | JOHN HANCOCK Retirement Income 2040 Fund | 25 |
| 26 | JOHN HANCOCK RETIREMENT INCOME 2040 FUND | ANNUAL REPORT |
| ANNUAL REPORT | JOHN HANCOCK RETIREMENT INCOME 2040 FUND | 27 |
| Independent Trustees | ||
| Name, year of birth Position(s) held with Trust Principal occupation(s) and other directorships during past 5 years | Trustee of the Trust since1 | Number of John Hancock funds overseen by Trustee |
| Hassell H. McClellan, Born: 1945 | 2005 | 191 |
| Trustee and Chairperson of the Board | ||
| Director/Trustee, Virtus Funds (2008-2020); Director, The Barnes Group (2010-2021); Associate Professor, The Wallace E. Carroll School of Management, Boston College (retired 2013). Trustee (since 2005) and Chairperson of the Board (since 2017) of various trusts within the John Hancock Fund Complex. | ||
| James R. Boyle, Born: 1959 | 2015 | 191 |
| Trustee | ||
| Foresters Financial, Chief Executive Officer (since 2018) and board member (since 2017). Manulife Financial and John Hancock, more than 20 years, retiring in 2012 as Chief Executive Officer, John Hancock and Senior Executive Vice President, Manulife Financial. Trustee of various trusts within the John Hancock Fund Complex (2005–2014 and since 2015). | ||
| Peter S. Burgess,2 Born: 1942 | 2005 | 191 |
| Trustee | ||
| Consultant (financial, accounting, and auditing matters) (since 1999); Certified Public Accountant; Partner, Arthur Andersen (independent public accounting firm) (prior to 1999); Director, Lincoln Educational Services Corporation (2004-2021); Director, Symetra Financial Corporation (2010–2016); Director, PMA Capital Corporation (2004–2010). Trustee of various trusts within the John Hancock Fund Complex (since 2005). | ||
| William H. Cunningham,2 Born: 1944 | 2012 | 191 |
| Trustee | ||
| Professor, University of Texas, Austin, Texas (since 1971); former Chancellor, University of Texas System and former President of the University of Texas, Austin, Texas; Chairman (since 2009) and Director (since 2006), Lincoln National Corporation (insurance); Director, Southwest Airlines (since 2000). Trustee of various trusts within the John Hancock Fund Complex (since 1986). | ||
| Grace K. Fey, Born: 1946 | 2008 | 191 |
| Trustee | ||
| Chief Executive Officer, Grace Fey Advisors (since 2007); Director and Executive Vice President, Frontier Capital Management Company (1988–2007); Director, Fiduciary Trust (since 2009). Trustee of various trusts within the John Hancock Fund Complex (since 2008). | ||
| Deborah C. Jackson, Born: 1952 | 2012 | 191 |
| Trustee | ||
| President, Cambridge College, Cambridge, Massachusetts (since 2011); Board of Directors, Amwell Corporation (since 2020); Board of Directors, Massachusetts Women’s Forum (2018-2020); Board of Directors, National Association of Corporate Directors/New England (2015-2020); Board of Directors, Association of Independent Colleges and Universities of Massachusetts (2014-2017); Chief Executive Officer, American Red Cross of Massachusetts Bay (2002–2011); Board of Directors of Eastern Bank Corporation (since 2001); Board of Directors of Eastern Bank Charitable Foundation (since 2001); Board of Directors of American Student Assistance Corporation (1996–2009); Board of Directors of Boston Stock Exchange (2002–2008); Board of Directors of Harvard Pilgrim Healthcare (health benefits company) (2007–2011). Trustee of various trusts within the John Hancock Fund Complex (since 2008). | ||
| 28 | JOHN HANCOCK RETIREMENT INCOME 2040 FUND | ANNUAL REPORT |
| Independent Trustees (continued) | ||
| Name, year of birth Position(s) held with Trust Principal occupation(s) and other directorships during past 5 years | Trustee of the Trust since1 | Number of John Hancock funds overseen by Trustee |
| Steven R. Pruchansky, Born: 1944 | 2012 | 191 |
| Trustee and Vice Chairperson of the Board | ||
| Managing Director, Pru Realty (since 2017); Chairman and Chief Executive Officer, Greenscapes of Southwest Florida, Inc. (2014-2020); Director and President, Greenscapes of Southwest Florida, Inc. (until 2000); Member, Board of Advisors, First American Bank (until 2010); Managing Director, Jon James, LLC (real estate) (since 2000); Partner, Right Funding, LLC (2014-2017); Director, First Signature Bank & Trust Company (until 1991); Director, Mast Realty Trust (until 1994); President, Maxwell Building Corp. (until 1991). Trustee (since 1992), Chairperson of the Board (2011–2012), and Vice Chairperson of the Board (since 2012) of various trusts within the John Hancock Fund Complex. | ||
| Frances G. Rathke,2 Born: 1960 | 2020 | 191 |
| Trustee | ||
| Director, Audit Committee Chair, Oatly Group AB (plant-based drink company) (since 2021); Director, Audit Committee Chair and Compensation Committee Member, Green Mountain Power Corporation (since 2016); Director, Treasurer and Finance & Audit Committee Chair, Flynn Center for Performing Arts (since 2016); Director, Audit Committee Chair and Compensation Committee Member, Planet Fitness (since 2016); Chief Financial Officer and Treasurer, Keurig Green Mountain, Inc. (2003-retired 2015). Trustee of various trusts within the John Hancock Fund Complex (since 2020). | ||
| Gregory A. Russo, Born: 1949 | 2012 | 191 |
| Trustee | ||
| Director and Audit Committee Chairman (2012-2020), and Member, Audit Committee and Finance Committee (2011-2020), NCH Healthcare System, Inc. (holding company for multi-entity healthcare system); Director and Member (2012-2018) and Finance Committee Chairman (2014-2018), The Moorings, Inc. (nonprofit continuing care community); Vice Chairman, Risk & Regulatory Matters, KPMG LLP (KPMG) (2002–2006); Vice Chairman, Industrial Markets, KPMG (1998–2002); Chairman and Treasurer, Westchester County, New York, Chamber of Commerce (1986–1992); Director, Treasurer, and Chairman of Audit and Finance Committees, Putnam Hospital Center (1989–1995); Director and Chairman of Fundraising Campaign, United Way of Westchester and Putnam Counties, New York (1990–1995). Trustee of various trusts within the John Hancock Fund Complex (since 2008). | ||
| Non-Independent Trustees3 | ||
| Name, year of birth Position(s) held with Trust Principal occupation(s) and other directorships during past 5 years | Trustee of the Trust since1 | Number of John Hancock funds overseen by Trustee |
| Andrew G. Arnott, Born: 1971 | 2017 | 191 |
| President and Non-Independent Trustee | ||
| Head of Wealth and Asset Management, United States and Europe, for John Hancock and Manulife (since 2018); Director and Executive Vice President, John Hancock Investment Management LLC (since 2005, including prior positions); Director and Executive Vice President, John Hancock Variable Trust Advisers LLC (since 2006, including prior positions); President, John Hancock Investment Management Distributors LLC (since 2004, including prior positions); President of various trusts within the John Hancock Fund Complex (since 2007, including prior positions). Trustee of various trusts within the John Hancock Fund Complex (since 2017). | ||
| ANNUAL REPORT | JOHN HANCOCK RETIREMENT INCOME 2040 FUND | 29 |
| Non-Independent Trustees3 (continued) | ||
| Name, year of birth Position(s) held with Trust Principal occupation(s) and other directorships during past 5 years | Trustee of the Trust since1 | Number of John Hancock funds overseen by Trustee |
| Marianne Harrison, Born: 1963 | 2018 | 191 |
| Non-Independent Trustee | ||
| President and CEO, John Hancock (since 2017); President and CEO, Manulife Canadian Division (2013–2017); Member, Board of Directors, Boston Medical Center (since 2021); Member, Board of Directors, CAE Inc. (since 2019); Member, Board of Directors, MA Competitive Partnership Board (since 2018); Member, Board of Directors, American Council of Life Insurers (ACLI) (since 2018); Member, Board of Directors, Communitech, an industry-led innovation center that fosters technology companies in Canada (2017-2019); Member, Board of Directors, Manulife Assurance Canada (2015-2017); Board Member, St. Mary’s General Hospital Foundation (2014-2017); Member, Board of Directors, Manulife Bank of Canada (2013- 2017); Member, Standing Committee of the Canadian Life & Health Assurance Association (2013-2017); Member, Board of Directors, John Hancock USA, John Hancock Life & Health, John Hancock New York (2012–2013). Trustee of various trusts within the John Hancock Fund Complex (since 2018). | ||
| Principal officers who are not Trustees | |
| Name, year of birth Position(s) held with Trust Principal occupation(s) during past 5 years | Current Position(s) with the Trust since |
| Charles A. Rizzo, Born: 1957 | 2007 |
| Chief Financial Officer | |
| Vice President, John Hancock Financial Services (since 2008); Senior Vice President, John Hancock Investment Management LLC and John Hancock Variable Trust Advisers LLC (since 2008); Chief Financial Officer of various trusts within the John Hancock Fund Complex (since 2007). | |
| Salvatore Schiavone, Born: 1965 | 2009 |
| Treasurer | |
| Assistant Vice President, John Hancock Financial Services (since 2007); Vice President, John Hancock Investment Management LLC and John Hancock Variable Trust Advisers LLC (since 2007); Treasurer of various trusts within the John Hancock Fund Complex (since 2007, including prior positions). | |
| Christopher (Kit) Sechler, Born: 1973 | 2018 |
| Secretary and Chief Legal Officer | |
| Vice President and Deputy Chief Counsel, John Hancock Investment Management (since 2015); Assistant Vice President and Senior Counsel (2009–2015), John Hancock Investment Management; Assistant Secretary of John Hancock Investment Management LLC and John Hancock Variable Trust Advisers LLC (since 2009); Chief Legal Officer and Secretary of various trusts within the John Hancock Fund Complex (since 2009, including prior positions). | |
| Trevor Swanberg, Born: 1979 | 2020 |
| Chief Compliance Officer | |
| Chief Compliance Officer, John Hancock Investment Management LLC and John Hancock Variable Trust Advisers LLC (since 2020); Deputy Chief Compliance Officer, John Hancock Investment Management LLC and John Hancock Variable Trust Advisers LLC (2019–2020); Assistant Chief Compliance Officer, John Hancock Investment Management LLC and John Hancock Variable Trust Advisers LLC (2016–2019); Vice President, State Street Global Advisors (2015–2016); Chief Compliance Officer of various trusts within the John Hancock Fund Complex (since 2016, including prior positions). | |
| 30 | JOHN HANCOCK RETIREMENT INCOME 2040 FUND | ANNUAL REPORT |
| 1 | Each Trustee holds office until his or her successor is elected and qualified, or until the Trustee’s death, retirement, resignation, or removal. Mr. Boyle has served as Trustee at various times prior to the date listed in the table. |
| 2 | Member of the Audit Committee. |
| 3 | The Trustee is a Non-Independent Trustee due to current or former positions with the Advisor and certain affiliates. |
| ANNUAL REPORT | JOHN HANCOCK RETIREMENT INCOME 2040 FUND | 31 |
Steven R. Pruchansky, Vice Chairperson
Andrew G. Arnott†
James R. Boyle
Peter S. Burgess*
William H. Cunningham*
Grace K. Fey
Marianne Harrison†
Deborah C. Jackson
Frances G. Rathke*
Gregory A. Russo
President
Chief Financial Officer
Treasurer
Secretary and Chief Legal Officer
Chief Compliance Officer
Jean-François Giroux, MSc, FRM, CFA
Serge Lapierre, BSc, FCIA, FSA
Nadia Live, Msca, CFA
Nicholas Scipio Del Campo, Bsc, Msc, CFA
| You can also contact us: | ||
| 800-225-5291 | Regular mail: | Express mail: |
| jhinvestments.com | John Hancock Signature Services, Inc. P.O. Box 219909 Kansas City, MO 64121-9909 | John Hancock Signature Services, Inc. 430 W 7th Street Suite 219909 Kansas City, MO 64105-1407 |
| 32 | JOHN HANCOCK RETIREMENT INCOME 2040 FUND | ANNUAL REPORT |
GOVERNANCE FUNDS
with a heritage of financial stewardship dating back to 1862. Helping
our shareholders pursue their financial goals is at the core of everything
we do. It’s why we support the role of professional financial advice
and operate with the highest standards of conduct and integrity.
We search the world to find proven portfolio teams with specialized
expertise for every strategy we offer, then we apply robust investment
oversight to ensure they continue to meet our uncompromising
standards and serve the best interests of our shareholders.
a diverse set of investments backed by some of the world’s best
managers, along with strong risk-adjusted returns across asset classes.
200 Berkeley Street, Boston, MA 02116-5010, 800-225-5291, jhinvestments.com
| MF1976916 | 621A 12/21 |


President and CEO,
John Hancock Investment Management
Head of Wealth and Asset Management,
United States and Europe
| ANNUAL REPORT | JOHN HANCOCK MULTIMANAGER LIFESTYLE PORTFOLIOS | 1 |


| 2 | JOHN HANCOCK MULTIMANAGER LIFESTYLE PORTFOLIOS | ANNUAL REPORT |


| ANNUAL REPORT | JOHN HANCOCK MULTIMANAGER LIFESTYLE PORTFOLIOS | 3 |


| 4 | JOHN HANCOCK MULTIMANAGER LIFESTYLE PORTFOLIOS | ANNUAL REPORT |
| ANNUAL REPORT | JOHN HANCOCK MULTIMANAGER LIFESTYLE PORTFOLIOS | 5 |

| 6 | JOHN HANCOCK MULTIMANAGER LIFESTYLE PORTFOLIOS | ANNUAL REPORT |

| ASSET ALLOCATION (% of net assets) | |
| Affiliated investment companies | 99.0 |
| Equity | 90.5 |
| U.S. large cap | 31.2 |
| International equity | 23.5 |
| U.S. mid cap | 12.6 |
| U.S. small cap | 8.4 |
| Emerging-market equity | 8.2 |
| Large blend | 5.1 |
| Sector equity | 1.5 |
| Fixed income | 0.7 |
| Emerging-market debt | 0.5 |
| High yield bond | 0.2 |
| Alternative and specialty | 7.8 |
| Sector equity | 6.8 |
| Absolute return | 1.0 |
| U.S. Government | 1.0 |
| Class A | Class C | Class I1,2 | Class R21,2 | Class R42 | Class R52 | Class R62 | Class 12 | Index 1 | Index 2 | Index 3 | Index 4 | Index 5 | ||
| Average annual total returns | ||||||||||||||
| 1 year | 11.10 | 14.51 | 16.66 | 16.19 | 16.53 | 16.76 | 16.77 | 16.70 | 19.69 | 18.95 | 28.71 | 11.26 | 20.11 | |
| 5 year | 12.71 | 12.97 | 14.10 | 13.64 | 13.93 | 14.16 | 14.21 | 14.16 | 15.01 | 14.47 | 18.47 | 9.55 | 15.46 | |
| 10-year | 11.28 | 11.00 | 11.75 | 11.66 | 11.90 | 12.15 | 12.26 | 12.21 | 13.24 | 12.68 | 16.55 | 8.03 | 13.59 | |
| Cumulative returns | ||||||||||||||
| 5 year | 81.93 | 83.96 | 93.37 | 89.48 | 91.98 | 93.91 | 94.29 | 93.93 | 101.22 | 96.51 | 133.41 | 57.77 | 105.21 | |
| 10-year | 191.07 | 183.88 | 203.66 | 201.40 | 207.74 | 214.76 | 217.95 | 216.49 | 246.82 | 229.85 | 362.57 | 116.50 | 257.70 | |
| Class A | Class C | Class I | Class R2 | Class R4 | Class R5 | Class R6 | Class 1 | |
| Gross (%) | 1.45 | 2.15 | 1.15 | 1.54 | 1.39 | 1.09 | 1.04 | 1.07 |
| Net (%) | 1.44 | 2.15 | 1.14 | 1.54 | 1.29 | 1.09 | 1.04 | 1.07 |
| 1 | Class I shares were first offered on 5-1-15; Class R2 shares were first offered on 3-1-12. Returns prior to these dates are those of Class C shares that have not been adjusted for class-specific expenses; otherwise, returns would vary. |
| 2 | For certain types of investors, as described in the portfolio’s prospectuses. |
| ANNUAL REPORT | JOHN HANCOCK MULTIMANAGER LIFESTYLE PORTFOLIOS | 7 |

| ASSET ALLOCATION (% of net assets) | |
| Affiliated investment companies | 96.0 |
| Equity | 75.2 |
| U.S. large cap | 26.3 |
| International equity | 20.9 |
| U.S. mid cap | 10.3 |
| U.S. small cap | 6.5 |
| Emerging-market equity | 5.9 |
| Large blend | 4.0 |
| Sector equity | 1.3 |
| Fixed income | 13.8 |
| Intermediate bond | 5.4 |
| Multi-sector bond | 3.0 |
| Bank loan | 1.9 |
| Emerging-market debt | 1.9 |
| High yield bond | 1.6 |
| Alternative and specialty | 7.0 |
| Sector equity | 5.6 |
| Absolute return | 1.4 |
| U.S. Government | 4.0 |
| Class A | Class C | Class I1,2 | Class R21,2 | Class R42 | Class R52 | Class R62 | Class 12 | Class 52 | Index 1 | Index 2 | Index 3 | Index 4 | Index 5 | |
| Average annual total returns | ||||||||||||||
| 1 year | 8.82 | 12.10 | 14.24 | 13.85 | 14.13 | 14.31 | 14.33 | 14.29 | 14.37 | 15.65 | 15.85 | 28.71 | -1.54 | 15.84 |
| 5 year | 11.01 | 11.24 | 12.37 | 11.93 | 12.21 | 12.43 | 12.48 | 12.44 | 12.50 | 13.05 | 12.94 | 18.47 | 3.57 | 13.29 |
| 10-year | 10.01 | 9.72 | 10.46 | 10.38 | 10.66 | 10.89 | 10.96 | 10.92 | 10.97 | 11.51 | 11.31 | 16.55 | 2.90 | 11.69 |
| Cumulative returns | ||||||||||||||
| 5 year | 68.57 | 70.33 | 79.17 | 75.70 | 77.88 | 79.66 | 80.01 | 79.70 | 80.17 | 84.66 | 83.75 | 133.41 | 19.16 | 86.61 |
| 10-year | 159.58 | 152.80 | 170.43 | 168.48 | 175.26 | 181.15 | 183.00 | 181.85 | 183.21 | 197.21 | 192.03 | 362.57 | 33.07 | 201.97 |
| Class A | Class C | Class I | Class R2 | Class R4 | Class R5 | Class R6 | Class 1 | Class 5 | |
| Gross (%) | 1.38 | 2.08 | 1.08 | 1.47 | 1.32 | 1.02 | 0.97 | 1.01 | 0.96 |
| Net (%) | 1.37 | 2.08 | 1.07 | 1.47 | 1.22 | 1.02 | 0.97 | 1.01 | 0.96 |
| 1 | Class I shares were first offered on 5-1-15; Class R2 shares were first offered on 3-1-12. Returns prior to these dates are those of Class C shares that have not been adjusted for class-specific expenses; otherwise, returns would vary. |
| 2 | For certain types of investors, as described in the portfolio’s prospectuses. |
| 8 | JOHN HANCOCK MULTIMANAGER LIFESTYLE PORTFOLIOS | ANNUAL REPORT |

| ASSET ALLOCATION (% of net assets) | |
| Affiliated investment companies | 91.9 |
| Equity | 56.3 |
| U.S. large cap | 18.9 |
| International equity | 16.5 |
| U.S. mid cap | 7.4 |
| U.S. small cap | 4.8 |
| Large blend | 3.9 |
| Emerging-market equity | 3.8 |
| Sector equity | 1.0 |
| Fixed income | 28.9 |
| Intermediate bond | 9.7 |
| Multi-sector bond | 7.2 |
| Bank loan | 3.5 |
| Emerging-market debt | 3.5 |
| High yield bond | 3.2 |
| Short-term bond | 1.8 |
| Alternative and specialty | 6.7 |
| Sector equity | 4.2 |
| Absolute return | 2.0 |
| Multi-asset income | 0.5 |
| U.S. Government | 8.1 |
| Class A | Class C | Class I1,2 | Class R21,2 | Class R42 | Class R52 | Class R62 | Class 12 | Class 52 | Index 1 | Index 2 | Index 3 | Index 4 | Index 5 | |
| Average annual total returns | ||||||||||||||
| 1 year | 6.06 | 9.27 | 11.43 | 11.01 | 11.28 | 11.47 | 11.54 | 11.50 | 11.55 | 12.37 | 11.74 | 28.71 | -1.54 | 11.69 |
| 5 year | 9.12 | 9.35 | 10.47 | 10.04 | 10.30 | 10.51 | 10.57 | 10.51 | 10.58 | 11.21 | 11.00 | 18.47 | 3.57 | 11.06 |
| 10-year | 8.32 | 8.04 | 8.78 | 8.70 | 8.98 | 9.19 | 9.26 | 9.22 | 9.28 | 9.88 | 9.55 | 16.55 | 2.90 | 9.74 |
| Cumulative returns | ||||||||||||||
| 5 year | 54.74 | 56.32 | 64.50 | 61.31 | 63.27 | 64.85 | 65.26 | 64.84 | 65.32 | 70.11 | 68.50 | 133.41 | 19.16 | 68.99 |
| 10-year | 122.29 | 116.79 | 131.94 | 130.34 | 136.23 | 140.87 | 142.47 | 141.51 | 142.81 | 156.67 | 149.02 | 362.57 | 33.07 | 153.25 |
| Class A | Class C | Class I | Class R2 | Class R4 | Class R5 | Class R6 | Class 1 | Class 5 | |
| Gross (%) | 1.34 | 2.04 | 1.04 | 1.42 | 1.27 | 0.97 | 0.92 | 0.96 | 0.91 |
| Net (%) | 1.33 | 2.04 | 1.03 | 1.42 | 1.17 | 0.97 | 0.92 | 0.96 | 0.91 |
| 1 | Class I shares were first offered on 5-1-15; Class R2 shares were first offered on 3-1-12. Returns prior to these dates are those of Class C shares that have not been adjusted for class-specific expenses; otherwise, returns would vary. |
| 2 | For certain types of investors, as described in the portfolio’s prospectuses. |
| ANNUAL REPORT | JOHN HANCOCK MULTIMANAGER LIFESTYLE PORTFOLIOS | 9 |

| ASSET ALLOCATION (% of net assets) | |
| Affiliated investment companies | 91.5 |
| Equity | 38.0 |
| U.S. large cap | 13.5 |
| International equity | 12.8 |
| U.S. mid cap | 4.9 |
| U.S. small cap | 2.6 |
| Large blend | 2.4 |
| Emerging-market equity | 1.8 |
| Fixed income | 47.3 |
| Intermediate bond | 20.3 |
| Multi-sector bond | 8.5 |
| Bank loan | 5.1 |
| Emerging-market debt | 5.1 |
| High yield bond | 4.7 |
| Short-term bond | 3.6 |
| Alternative and specialty | 6.2 |
| Absolute return | 2.4 |
| Sector equity | 1.8 |
| Multi-asset income | 1.5 |
| Infrastructure | 0.5 |
| U.S. Government | 8.5 |
| Class A | Class C | Class I1,2 | Class R21,2 | Class R42 | Class R52 | Class R62 | Class 12 | Class 52 | Index 1 | Index 2 | Index 3 | Index 4 | Index 5 | |
| Average annual total returns | ||||||||||||||
| 1 year | 2.61 | 5.69 | 7.77 | 7.39 | 7.68 | 7.82 | 7.89 | 7.83 | 7.90 | 7.19 | 7.77 | 28.71 | -1.54 | 7.63 |
| 5 year | 6.74 | 6.97 | 8.05 | 7.64 | 7.91 | 8.11 | 8.17 | 8.12 | 8.18 | 8.36 | 8.67 | 18.47 | 3.57 | 8.79 |
| 10-year | 6.36 | 6.09 | 6.81 | 6.74 | 6.98 | 7.19 | 7.29 | 7.26 | 7.31 | 7.36 | 7.53 | 16.55 | 2.90 | 7.75 |
| Cumulative returns | ||||||||||||||
| 5 year | 38.57 | 40.06 | 47.29 | 44.52 | 46.36 | 47.67 | 48.08 | 47.76 | 48.17 | 49.40 | 51.58 | 133.41 | 19.16 | 52.38 |
| 10-year | 85.29 | 80.65 | 93.30 | 92.00 | 96.36 | 100.23 | 102.16 | 101.51 | 102.48 | 103.45 | 106.68 | 362.57 | 33.07 | 111.01 |
| Class A | Class C | Class I | Class R2 | Class R4 | Class R5 | Class R6 | Class 1 | Class 5 | |
| Gross (%) | 1.28 | 1.98 | 0.98 | 1.37 | 1.22 | 0.92 | 0.87 | 0.91 | 0.86 |
| Net (%) | 1.27 | 1.98 | 0.97 | 1.37 | 1.12 | 0.92 | 0.87 | 0.91 | 0.86 |
| 1 | Class I shares were first offered on 5-1-15; Class R2 shares were first offered on 3-1-12. Returns prior to these dates are those of Class C shares that have not been adjusted for class-specific expenses; otherwise, returns would vary. |
| 2 | For certain types of investors, as described in the portfolio’s prospectuses. |
| 10 | JOHN HANCOCK MULTIMANAGER LIFESTYLE PORTFOLIOS | ANNUAL REPORT |

| ASSET ALLOCATION (% of net assets) | |
| Affiliated investment companies | 90.8 |
| Equity | 18.4 |
| International equity | 7.1 |
| U.S. large cap | 4.8 |
| U.S. mid cap | 2.5 |
| U.S. small cap | 1.9 |
| Large blend | 1.2 |
| Emerging-market equity | 0.9 |
| Fixed income | 65.9 |
| Intermediate bond | 31.0 |
| Multi-sector bond | 10.0 |
| Bank loan | 6.8 |
| Emerging-market debt | 6.8 |
| High yield bond | 6.3 |
| Short-term bond | 5.0 |
| Alternative and specialty | 6.5 |
| Absolute return | 2.8 |
| Multi-asset income | 2.0 |
| Infrastructure | 1.7 |
| U.S. Government | 9.2 |
| Class A | Class C | Class I1,2 | Class R21,2 | Class R42 | Class R52 | Class R62 | Class 12 | Index 1 | Index 2 | Index 3 | Index 4 | Index 5 | ||
| Average annual total returns | ||||||||||||||
| 1 year | -1.45 | 1.55 | 3.56 | 3.18 | 3.33 | 3.61 | 3.67 | 3.55 | 3.61 | 4.01 | 28.71 | -1.54 | 3.67 | |
| 5 year | 4.42 | 4.64 | 5.70 | 5.28 | 5.53 | 5.76 | 5.81 | 5.76 | 6.21 | 6.22 | 18.47 | 3.57 | 6.47 | |
| 10-year | 4.35 | 4.10 | 4.80 | 4.73 | 4.94 | 5.18 | 5.27 | 5.23 | 5.37 | 5.43 | 16.55 | 2.90 | 5.74 | |
| Cumulative returns | ||||||||||||||
| 5 year | 24.14 | 25.45 | 31.97 | 29.31 | 30.89 | 32.29 | 32.65 | 32.29 | 35.14 | 35.23 | 133.41 | 19.16 | 36.83 | |
| 10-year | 53.05 | 49.48 | 59.86 | 58.81 | 62.02 | 65.74 | 67.11 | 66.52 | 68.68 | 69.68 | 362.57 | 33.07 | 74.67 | |
| Class A | Class C | Class I | Class R2 | Class R4 | Class R5 | Class R6 | Class 1 | |
| Gross (%) | 1.26 | 1.96 | 0.96 | 1.34 | 1.19 | 0.89 | 0.84 | 0.88 |
| Net (%) | 1.25 | 1.96 | 0.95 | 1.34 | 1.09 | 0.89 | 0.84 | 0.88 |
| 1 | Class I shares were first offered on 5-1-15; Class R2 shares were first offered on 3-1-12. Returns prior to these dates are those of Class C shares that have not been adjusted for class-specific expenses; otherwise, returns would vary. |
| 2 | For certain types of investors, as described in the portfolio’s prospectuses. |
| ANNUAL REPORT | JOHN HANCOCK MULTIMANAGER LIFESTYLE PORTFOLIOS | 11 |
| Account value on 7-1-2021 | Ending value on 12-31-2021 | Expenses paid during period ended 12-31-20211 | Annualized expense ratio2 | ||
| Multimanager Lifestyle Aggressive Portfolio | |||||
| Class A | Actual expenses/actual returns | $1,000.00 | $1,023.90 | $2.55 | 0.50% |
| Hypothetical example | 1,000.00 | 1,022.70 | 2.55 | 0.50% | |
| Class C | Actual expenses/actual returns | 1,000.00 | 1,020.30 | 6.11 | 1.20% |
| Hypothetical example | 1,000.00 | 1,019.20 | 6.11 | 1.20% | |
| Class I | Actual expenses/actual returns | 1,000.00 | 1,025.20 | 1.02 | 0.20% |
| Hypothetical example | 1,000.00 | 1,024.20 | 1.02 | 0.20% | |
| Class R2 | Actual expenses/actual returns | 1,000.00 | 1,023.20 | 2.96 | 0.58% |
| Hypothetical example | 1,000.00 | 1,022.30 | 2.96 | 0.58% | |
| Class R4 | Actual expenses/actual returns | 1,000.00 | 1,025.00 | 1.79 | 0.35% |
| Hypothetical example | 1,000.00 | 1,023.40 | 1.79 | 0.35% | |
| Class R5 | Actual expenses/actual returns | 1,000.00 | 1,025.70 | 0.77 | 0.15% |
| Hypothetical example | 1,000.00 | 1,024.40 | 0.77 | 0.15% | |
| Class R6 | Actual expenses/actual returns | 1,000.00 | 1,025.70 | 0.51 | 0.10% |
| Hypothetical example | 1,000.00 | 1,024.70 | 0.51 | 0.10% | |
| Class 1 | Actual expenses/actual returns | 1,000.00 | 1,025.30 | 0.71 | 0.14% |
| Hypothetical example | 1,000.00 | 1,024.50 | 0.71 | 0.14% | |
| 12 | JOHN HANCOCK MULTIMANAGER LIFESTYLE PORTFOLIOS | ANNUAL REPORT |
| Account value on 7-1-2021 | Ending value on 12-31-2021 | Expenses paid during period ended 12-31-20211 | Annualized expense ratio2 | ||
| Multimanager Lifestyle Growth Portfolio | |||||
| Class A | Actual expenses/actual returns | $1,000.00 | $1,023.60 | $2.65 | 0.52% |
| Hypothetical example | 1,000.00 | 1,022.60 | 2.65 | 0.52% | |
| Class C | Actual expenses/actual returns | 1,000.00 | 1,019.50 | 6.21 | 1.22% |
| Hypothetical example | 1,000.00 | 1,019.10 | 6.21 | 1.22% | |
| Class I | Actual expenses/actual returns | 1,000.00 | 1,024.40 | 1.12 | 0.22% |
| Hypothetical example | 1,000.00 | 1,024.10 | 1.12 | 0.22% | |
| Class R2 | Actual expenses/actual returns | 1,000.00 | 1,022.90 | 3.06 | 0.60% |
| Hypothetical example | 1,000.00 | 1,022.20 | 3.06 | 0.60% | |
| Class R4 | Actual expenses/actual returns | 1,000.00 | 1,023.90 | 1.84 | 0.36% |
| Hypothetical example | 1,000.00 | 1,023.40 | 1.84 | 0.36% | |
| Class R5 | Actual expenses/actual returns | 1,000.00 | 1,025.30 | 0.87 | 0.17% |
| Hypothetical example | 1,000.00 | 1,024.30 | 0.87 | 0.17% | |
| Class R6 | Actual expenses/actual returns | 1,000.00 | 1,025.30 | 0.61 | 0.12% |
| Hypothetical example | 1,000.00 | 1,024.60 | 0.61 | 0.12% | |
| Class 1 | Actual expenses/actual returns | 1,000.00 | 1,024.90 | 0.82 | 0.16% |
| Hypothetical example | 1,000.00 | 1,024.40 | 0.82 | 0.16% | |
| Class 5 | Actual expenses/actual returns | 1,000.00 | 1,024.90 | 0.56 | 0.11% |
| Hypothetical example | 1,000.00 | 1,024.70 | 0.56 | 0.11% | |
| Multimanager Lifestyle Balanced Portfolio | |||||
| Class A | Actual expenses/actual returns | $1,000.00 | $1,021.80 | $2.80 | 0.55% |
| Hypothetical example | 1,000.00 | 1,022.40 | 2.80 | 0.55% | |
| Class C | Actual expenses/actual returns | 1,000.00 | 1,018.20 | 6.36 | 1.25% |
| Hypothetical example | 1,000.00 | 1,018.90 | 6.36 | 1.25% | |
| Class I | Actual expenses/actual returns | 1,000.00 | 1,023.60 | 1.28 | 0.25% |
| Hypothetical example | 1,000.00 | 1,023.90 | 1.28 | 0.25% | |
| Class R2 | Actual expenses/actual returns | 1,000.00 | 1,022.20 | 3.16 | 0.62% |
| Hypothetical example | 1,000.00 | 1,022.10 | 3.16 | 0.62% | |
| Class R4 | Actual expenses/actual returns | 1,000.00 | 1,023.30 | 1.99 | 0.39% |
| Hypothetical example | 1,000.00 | 1,023.20 | 1.99 | 0.39% | |
| Class R5 | Actual expenses/actual returns | 1,000.00 | 1,023.60 | 0.97 | 0.19% |
| Hypothetical example | 1,000.00 | 1,024.20 | 0.97 | 0.19% | |
| Class R6 | Actual expenses/actual returns | 1,000.00 | 1,024.10 | 0.71 | 0.14% |
| Hypothetical example | 1,000.00 | 1,024.50 | 0.71 | 0.14% | |
| Class 1 | Actual expenses/actual returns | 1,000.00 | 1,023.80 | 0.97 | 0.19% |
| Hypothetical example | 1,000.00 | 1,024.20 | 0.97 | 0.19% | |
| Class 5 | Actual expenses/actual returns | 1,000.00 | 1,024.10 | 0.71 | 0.14% |
| Hypothetical example | 1,000.00 | 1,024.50 | 0.71 | 0.14% | |
| ANNUAL REPORT | JOHN HANCOCK MULTIMANAGER LIFESTYLE PORTFOLIOS | 13 |
| Account value on 7-1-2021 | Ending value on 12-31-2021 | Expenses paid during period ended 12-31-20211 | Annualized expense ratio2 | ||
| Multimanager Lifestyle Moderate Portfolio | |||||
| Class A | Actual expenses/actual returns | $1,000.00 | $1,015.90 | $2.85 | 0.56% |
| Hypothetical example | 1,000.00 | 1,022.40 | 2.85 | 0.56% | |
| Class C | Actual expenses/actual returns | 1,000.00 | 1,012.30 | 6.44 | 1.27% |
| Hypothetical example | 1,000.00 | 1,018.80 | 6.46 | 1.27% | |
| Class I | Actual expenses/actual returns | 1,000.00 | 1,017.60 | 1.32 | 0.26% |
| Hypothetical example | 1,000.00 | 1,023.90 | 1.33 | 0.26% | |
| Class R2 | Actual expenses/actual returns | 1,000.00 | 1,015.50 | 3.20 | 0.63% |
| Hypothetical example | 1,000.00 | 1,022.00 | 3.21 | 0.63% | |
| Class R4 | Actual expenses/actual returns | 1,000.00 | 1,017.50 | 2.08 | 0.41% |
| Hypothetical example | 1,000.00 | 1,023.10 | 2.09 | 0.41% | |
| Class R5 | Actual expenses/actual returns | 1,000.00 | 1,017.80 | 1.07 | 0.21% |
| Hypothetical example | 1,000.00 | 1,024.10 | 1.07 | 0.21% | |
| Class R6 | Actual expenses/actual returns | 1,000.00 | 1,018.10 | 0.81 | 0.16% |
| Hypothetical example | 1,000.00 | 1,024.40 | 0.82 | 0.16% | |
| Class 1 | Actual expenses/actual returns | 1,000.00 | 1,017.90 | 1.02 | 0.20% |
| Hypothetical example | 1,000.00 | 1,024.20 | 1.02 | 0.20% | |
| Class 5 | Actual expenses/actual returns | 1,000.00 | 1,018.20 | 0.76 | 0.15% |
| Hypothetical example | 1,000.00 | 1,024.40 | 0.77 | 0.15% | |
| Multimanager Lifestyle Conservative Portfolio | |||||
| Class A | Actual expenses/actual returns | $1,000.00 | $1,005.60 | $2.98 | 0.59% |
| Hypothetical example | 1,000.00 | 1,022.20 | 3.01 | 0.59% | |
| Class C | Actual expenses/actual returns | 1,000.00 | 1,002.80 | 6.51 | 1.29% |
| Hypothetical example | 1,000.00 | 1,018.70 | 6.56 | 1.29% | |
| Class I | Actual expenses/actual returns | 1,000.00 | 1,007.90 | 1.47 | 0.29% |
| Hypothetical example | 1,000.00 | 1,023.70 | 1.48 | 0.29% | |
| Class R2 | Actual expenses/actual returns | 1,000.00 | 1,005.40 | 3.18 | 0.63% |
| Hypothetical example | 1,000.00 | 1,022.00 | 3.21 | 0.63% | |
| Class R4 | Actual expenses/actual returns | 1,000.00 | 1,006.40 | 2.23 | 0.44% |
| Hypothetical example | 1,000.00 | 1,023.00 | 2.24 | 0.44% | |
| Class R5 | Actual expenses/actual returns | 1,000.00 | 1,008.10 | 1.21 | 0.24% |
| Hypothetical example | 1,000.00 | 1,024.00 | 1.22 | 0.24% | |
| Class R6 | Actual expenses/actual returns | 1,000.00 | 1,008.40 | 0.96 | 0.19% |
| Hypothetical example | 1,000.00 | 1,024.20 | 0.97 | 0.19% | |
| Class 1 | Actual expenses/actual returns | 1,000.00 | 1,007.40 | 1.16 | 0.23% |
| Hypothetical example | 1,000.00 | 1,024.00 | 1.17 | 0.23% | |
| 1 | Expenses are equal to the annualized expense ratio, multiplied by the average account value over the period, multiplied by 184/365 (to reflect the one-half year period). |
| 2 | Ratios do not include expenses indirectly incurred by the underlying funds and can vary based on the mix of underlying funds held by the portfolios. |
| 14 | JOHN HANCOCK MULTIMANAGER LIFESTYLE PORTFOLIOS | ANNUAL REPORT |
| Subadvisors of Affiliated Underlying Funds | |
| Allianz Global Investors U.S. LLC | (Allianz) |
| Axiom International Investors LLC | (Axiom) |
| BCSF Advisors, LP (Bain Capital Credit) | (Bain Capital) |
| Boston Partners Global Investors, Inc. | (Boston Partners) |
| Dimensional Fund Advisors LP | (DFA) |
| Epoch Investment Partners, Inc. | (Epoch) |
| First Quadrant, L.P. | (First Quadrant) |
| Graham Capital Management, L.P. | (Graham) |
| Jennison Associates LLC | (Jennison) |
| Manulife Investment Management (North America) Limited | (MIM NA) |
| Manulife Investment Management (US) LLC | (MIM US) |
| Pictet Asset Management SA | (Pictet) |
| Redwood Investments, LLC | (Redwood) |
| T. Rowe Price Associates, Inc. | (T. Rowe Price) |
| Wellington Management Company, LLP | (Wellington) |
| Wells Capital Management, Incorporated | (Wells Capital) |
| Shares or Principal Amount | Value | |
| AFFILIATED INVESTMENT COMPANIES (A) - 99.0% | ||
| Equity - 90.5% | ||
| Blue Chip Growth, Class NAV, JHF II (T. Rowe Price) | 4,493,260 | $252,700,922 |
| Capital Appreciation, Class NAV, JHF II (Jennison) | 6,872,396 | 118,548,828 |
| Capital Appreciation Value, Class NAV, JHF II (T. Rowe Price) | 7,693,076 | 80,546,510 |
| Disciplined Value, Class NAV, JHF III (Boston Partners) | 8,107,847 | 190,615,484 |
| Disciplined Value International, Class NAV, JHIT (Boston Partners) | 14,423,455 | 203,514,944 |
| Emerging Markets Equity, Class NAV, JHIT (MIM US) (B) | 20,750,430 | 253,570,261 |
| Equity Income, Class NAV, JHF II (T. Rowe Price) | 14,329,057 | 304,205,878 |
| Financial Industries, Class NAV, JHIT II (MIM US) (B) | 3,137,950 | 60,468,288 |
| Fundamental Large Cap Core, Class NAV, JHIT (MIM US) (B) | 3,940,384 | 298,287,076 |
| Global Equity, Class NAV, JHF II (MIM US) (B) | 3,102,879 | 40,399,481 |
| Global Thematic Opportunities, Class NAV, JHIT (Pictet) | 6,338,785 | 90,898,171 |
| International Dynamic Growth, Class NAV, JHIT (Axiom) | 3,811,531 | 50,045,401 |
| International Growth, Class NAV, JHF III (Wellington) | 3,286,118 | 114,422,617 |
| International Small Company, Class NAV, JHF II (DFA) | 10,154,133 | 121,037,263 |
| International Strategic Equity Allocation, Class NAV, JHF II (MIM US) (B) | 30,215,669 | 321,192,561 |
| Mid Cap Growth, Class NAV, JHIT (Wellington) | 10,617,992 | 216,607,037 |
| Mid Value, Class NAV, JHF II (T. Rowe Price) | 15,341,520 | 286,733,007 |
| Multifactor Emerging Markets ETF, JHETF (DFA) | 2,587,889 | 75,152,297 |
| Small Cap Core, Class NAV, JHIT (MIM US) (B) | 7,898,303 | 134,113,181 |
| Small Cap Growth, Class NAV, JHF II (Redwood) | 4,433,473 | 91,905,889 |
| Small Cap Value, Class NAV, JHF II (Wellington) | 4,791,240 | 107,994,555 |
| U.S. Sector Rotation, Class NAV, JHF II (MIM US) (B) | 19,926,605 | 205,244,029 |
| Fixed income - 0.7% | ||
| Emerging Markets Debt, Class NAV, JHF II (MIM US) (B) | 2,204,204 | 19,815,790 |
| High Yield, Class NAV, JHBT (MIM US) (B) | 2,907,658 | 9,973,268 |
| Alternative and specialty - 7.8% | ||
| Diversified Macro, Class NAV, JHIT (Graham) | 4,378,382 | 38,792,465 |
| Diversified Real Assets, Class NAV, JHIT (MIM NA/Wellington) (B) | 15,187,664 | 181,796,341 |
| Health Sciences, Class NAV, JHF II (T. Rowe Price) | 10,508,435 | 60,003,165 |
| Science & Technology, Class NAV, JHF II (T. Rowe Price/Allianz) | 14,632,649 | 29,118,971 |
| SEE NOTES TO FINANCIAL STATEMENTS | ANNUAL REPORT | JOHN HANCOCK MULTIMANAGER LIFESTYLE PORTFOLIOS | 15 |
| Shares or Principal Amount | Value | |
| TOTAL AFFILIATED INVESTMENT COMPANIES (Cost $2,954,195,031) | $3,957,703,680 | |
| COMMON STOCKS - 0.0% | ||
| Energy - 0.0% | ||
| Sakari Resources, Ltd. (C)(D)(E) | 215,623 | $152,005 |
| TOTAL COMMON STOCKS (Cost $91,719) | $152,005 | |
| U.S. GOVERNMENT AND AGENCY OBLIGATIONS - 1.0% | ||
| U.S. Government - 1.0% | ||
| U.S. Treasury STRIPS, PO, 1.893%, 11/15/2048 | $19,389,000 | 11,628,138 |
| U.S. Treasury STRIPS, PO, 1.901%, 08/15/2051 | 3,388,000 | 1,924,005 |
| U.S. Treasury STRIPS, PO, 1.937%, 05/15/2050 | 26,864,000 | 15,464,647 |
| U.S. Treasury STRIPS, PO, 1.938%, 05/15/2047 | 15,898,000 | 9,699,060 |
| TOTAL U.S. GOVERNMENT AND AGENCY OBLIGATIONS (Cost $34,572,465) | $38,715,850 | |
| SHORT-TERM INVESTMENTS - 0.0% | ||
| Short-term funds - 0.0% | ||
| State Street Institutional U.S. Government Money Market Fund, Premier Class, 0.0250% (F) | 1,023 | 1,023 |
| TOTAL SHORT-TERM INVESTMENTS (Cost $1,023) | $1,023 | |
| Total investments (Cost $2,988,860,238) - 100.0% | $3,996,572,558 | |
| Other assets and liabilities, net - 0.0% | 147,002 | |
| TOTAL NET ASSETS - 100.0% | $3,996,719,560 | |
| Shares or Principal Amount | Value | |
| AFFILIATED INVESTMENT COMPANIES (A) - 96.0% | ||
| Equity - 75.2% | ||
| Blue Chip Growth, Class NAV, JHF II (T. Rowe Price) | 10,223,723 | $574,982,157 |
| Capital Appreciation, Class NAV, JHF II (Jennison) | 17,461,624 | 301,213,018 |
| Capital Appreciation Value, Class NAV, JHF II (T. Rowe Price) | 37,551,927 | 393,168,678 |
| Disciplined Value, Class NAV, JHF III (Boston Partners) | 18,885,895 | 444,007,403 |
| Disciplined Value International, Class NAV, JHIT (Boston Partners) | 32,710,320 | 461,542,617 |
| Emerging Markets Equity, Class NAV, JHIT (MIM US) (B) | 37,860,778 | 462,658,711 |
| Equity Income, Class NAV, JHF II (T. Rowe Price) | 32,711,889 | 694,473,406 |
| Financial Industries, Class NAV, JHIT II (MIM US) (B) | 7,317,930 | 141,016,506 |
| Shares or Principal Amount | Value | |
| Equity - (continued) | ||
| Fundamental Global Franchise, Class NAV, JHF II (MIM US) (B) | 10,457,981 | $140,973,580 |
| Fundamental Large Cap Core, Class NAV, JHIT (MIM US) (B) | 7,122,955 | 539,207,700 |
| Global Equity, Class NAV, JHF II (MIM US) (B) | 13,408,756 | 174,581,998 |
| Global Thematic Opportunities, Class NAV, JHIT (Pictet) | 13,761,620 | 197,341,635 |
| International Dynamic Growth, Class NAV, JHIT (Axiom) | 8,509,923 | 111,735,289 |
| International Growth, Class NAV, JHF III (Wellington) | 6,671,757 | 232,310,573 |
| International Small Company, Class NAV, JHF II (DFA) | 22,704,694 | 270,639,957 |
| International Strategic Equity Allocation, Class NAV, JHF II (MIM US) (B) | 68,940,416 | 732,836,619 |
| Mid Cap Growth, Class NAV, JHIT (Wellington) | 23,893,044 | 487,418,096 |
| Mid Value, Class NAV, JHF II (T. Rowe Price) | 34,973,001 | 653,645,385 |
| Multifactor Emerging Markets ETF, JHETF (DFA) | 6,838,376 | 198,586,439 |
| Small Cap Core, Class NAV, JHIT (MIM US) (B) | 18,586,574 | 315,600,020 |
| Small Cap Growth, Class NAV, JHF II (Redwood) | 8,749,331 | 181,373,630 |
| Small Cap Value, Class NAV, JHF II (Wellington) | 10,251,304 | 231,064,382 |
| U.S. Sector Rotation, Class NAV, JHF II (MIM US) (B) | 43,026,498 | 443,172,929 |
| Fixed income - 13.8% | ||
| Bond, Class NAV, JHSB (MIM US) (B) | 37,041,225 | 598,586,202 |
| Emerging Markets Debt, Class NAV, JHF II (MIM US) (B) | 23,898,635 | 214,848,726 |
| Floating Rate Income, Class NAV, JHF II (Bain Capital) | 26,209,534 | 215,966,563 |
| High Yield, Class NAV, JHBT (MIM US) (B) | 51,827,482 | 177,768,262 |
| Strategic Income Opportunities, Class NAV, JHF II (MIM US) (B) | 29,984,796 | 334,030,626 |
| Alternative and specialty - 7.0% | ||
| Absolute Return Currency, Class NAV, JHF II (First Quadrant) (E) | 8,006,828 | 81,509,511 |
| Diversified Macro, Class NAV, JHIT (Graham) | 9,226,846 | 81,749,858 |
| Diversified Real Assets, Class NAV, JHIT (MIM NA/Wellington) (B) | 33,914,782 | 405,959,935 |
| Health Sciences, Class NAV, JHF II (T. Rowe Price) | 24,306,943 | 138,792,645 |
| Science & Technology, Class NAV, JHF II (T. Rowe Price/Allianz) | 35,224,356 | 70,096,469 |
| TOTAL AFFILIATED INVESTMENT COMPANIES (Cost $8,336,121,335) | $10,702,859,525 | |
| COMMON STOCKS - 0.0% | ||
| Energy - 0.0% | ||
| Sakari Resources, Ltd. (C)(D)(E) | 489,868 | 345,335 |
| TOTAL COMMON STOCKS (Cost $212,393) | $345,335 | |
| 16 | JOHN HANCOCK MULTIMANAGER LIFESTYLE PORTFOLIOS | ANNUAL REPORT | SEE NOTES TO FINANCIAL STATEMENTS |
| Shares or Principal Amount | Value | |
| U.S. GOVERNMENT AND AGENCY OBLIGATIONS - 4.0% | ||
| U.S. Government - 4.0% | ||
| U.S. Treasury Inflation Protected Security, 0.125%, 01/15/2023 | $25,093,788 | $25,915,218 |
| U.S. Treasury Inflation Protected Security, 0.125%, 07/15/2024 | 67,954,286 | 72,435,130 |
| U.S. Treasury Inflation Protected Security, 0.125%, 04/15/2025 | 82,031,485 | 87,744,485 |
| U.S. Treasury Inflation Protected Security, 0.125%, 04/15/2026 | 19,076,837 | 20,586,315 |
| U.S. Treasury STRIPS, PO, 1.893%, 11/15/2048 | 119,708,000 | 71,792,310 |
| U.S. Treasury STRIPS, PO, 1.901%, 08/15/2051 | 20,982,000 | 11,915,430 |
| U.S. Treasury STRIPS, PO, 1.937%, 05/15/2050 | 165,863,000 | 95,481,415 |
| U.S. Treasury STRIPS, PO, 1.938%, 05/15/2047 | 98,160,000 | 59,885,505 |
| TOTAL U.S. GOVERNMENT AND AGENCY OBLIGATIONS (Cost $423,845,075) | $445,755,808 | |
| SHORT-TERM INVESTMENTS - 0.0% | ||
| Short-term funds - 0.0% | ||
| State Street Institutional U.S. Government Money Market Fund, Premier Class, 0.0250% (F) | 1,023 | 1,023 |
| TOTAL SHORT-TERM INVESTMENTS (Cost $1,023) | $1,023 | |
| Total investments (Cost $8,760,179,826) - 100.0% | $11,148,961,691 | |
| Other assets and liabilities, net - 0.0% | 492,270 | |
| TOTAL NET ASSETS - 100.0% | $11,149,453,961 | |
| Shares or Principal Amount | Value | |
| AFFILIATED INVESTMENT COMPANIES (A) - 91.9% | ||
| Equity - 56.3% | ||
| Blue Chip Growth, Class NAV, JHF II (T. Rowe Price) | 6,484,698 | $364,699,430 |
| Capital Appreciation, Class NAV, JHF II (Jennison) | 9,668,202 | 166,776,486 |
| Capital Appreciation Value, Class NAV, JHF II (T. Rowe Price) | 39,985,039 | 418,643,356 |
| Disciplined Value, Class NAV, JHF III (Boston Partners) | 11,629,803 | 273,416,674 |
| Disciplined Value International, Class NAV, JHIT (Boston Partners) | 25,290,884 | 356,854,372 |
| Emerging Markets Equity, Class NAV, JHIT (MIM US) (B) | 22,327,358 | 272,840,317 |
| Equity Income, Class NAV, JHF II (T. Rowe Price) | 20,143,456 | 427,645,572 |
| Financial Industries, Class NAV, JHIT II (MIM US) (B) | 5,424,105 | 104,522,509 |
| Shares or Principal Amount | Value | |
| Equity - (continued) | ||
| Fundamental Global Franchise, Class NAV, JHF II (MIM US) (B) | 9,745,784 | $131,373,171 |
| Fundamental Large Cap Core, Class NAV, JHIT (MIM US) (B) | 4,174,060 | 315,976,324 |
| Global Equity, Class NAV, JHF II (MIM US) (B) | 15,292,849 | 199,112,895 |
| Global Shareholder Yield, Class NAV, JHF III (Epoch) | 4,458,391 | 52,118,587 |
| Global Thematic Opportunities, Class NAV, JHIT (Pictet) | 7,270,434 | 104,258,026 |
| International Dynamic Growth, Class NAV, JHIT (Axiom) | 6,287,618 | 82,556,422 |
| International Growth, Class NAV, JHF III (Wellington) | 5,249,431 | 182,785,172 |
| International Small Company, Class NAV, JHF II (DFA) | 12,245,070 | 145,961,237 |
| International Strategic Equity Allocation, Class NAV, JHF II (MIM US) (B) | 43,124,376 | 458,412,116 |
| Mid Cap Growth, Class NAV, JHIT (Wellington) | 15,797,108 | 322,261,002 |
| Mid Value, Class NAV, JHF II (T. Rowe Price) | 24,037,132 | 449,254,006 |
| Multifactor Emerging Markets ETF, JHETF (DFA) | 4,093,292 | 118,869,200 |
| Small Cap Core, Class NAV, JHIT (MIM US) (B) | 11,926,431 | 202,510,790 |
| Small Cap Growth, Class NAV, JHF II (Redwood) | 6,085,490 | 126,152,212 |
| Small Cap Value, Class NAV, JHF II (Wellington) | 7,442,463 | 167,753,123 |
| U.S. Sector Rotation, Class NAV, JHF II (MIM US) (B) | 38,916,586 | 400,840,834 |
| Fixed income - 28.9% | ||
| Bond, Class NAV, JHSB (MIM US) (B) | 55,596,631 | 898,441,560 |
| Core Bond, Class NAV, JHF II (Wells Capital) | 8,068,204 | 103,515,062 |
| Emerging Markets Debt, Class NAV, JHF II (MIM US) (B) | 40,130,119 | 360,769,769 |
| Floating Rate Income, Class NAV, JHF II (Bain Capital) | 44,158,931 | 363,869,595 |
| High Yield, Class NAV, JHBT (MIM US) (B) | 95,747,167 | 328,412,783 |
| Short Duration Bond, Class NAV, JHBT (MIM US) (B) | 19,380,130 | 192,250,889 |
| Strategic Income Opportunities, Class NAV, JHF II (MIM US) (B) | 67,596,662 | 753,026,811 |
| Alternative and specialty - 6.7% | ||
| Absolute Return Currency, Class NAV, JHF II (First Quadrant) (E) | 9,949,613 | 101,287,060 |
| Diversified Macro, Class NAV, JHIT (Graham) | 11,539,373 | 102,238,848 |
| Diversified Real Assets, Class NAV, JHIT (MIM NA/Wellington) (B) | 23,516,848 | 281,496,671 |
| Health Sciences, Class NAV, JHF II (T. Rowe Price) | 18,088,966 | 103,287,998 |
| Multi-Asset High Income, Class NAV, JHF II (MIM US) (B) | 5,022,063 | 52,129,013 |
| Science & Technology, Class NAV, JHF II (T. Rowe Price/Allianz) | 25,092,803 | 49,934,677 |
| SEE NOTES TO FINANCIAL STATEMENTS | ANNUAL REPORT | JOHN HANCOCK MULTIMANAGER LIFESTYLE PORTFOLIOS | 17 |
| Shares or Principal Amount | Value | |
| TOTAL AFFILIATED INVESTMENT COMPANIES (Cost $7,810,133,872) | $9,536,254,569 | |
| COMMON STOCKS - 0.0% | ||
| Energy - 0.0% | ||
| Sakari Resources, Ltd. (C)(D)(E) | 303,543 | $213,986 |
| TOTAL COMMON STOCKS (Cost $136,611) | $213,986 | |
| U.S. GOVERNMENT AND AGENCY OBLIGATIONS - 8.1% | ||
| U.S. Government - 8.1% | ||
| U.S. Treasury Inflation Protected Security, 0.125%, 01/15/2023 | $46,539,548 | 48,062,991 |
| U.S. Treasury Inflation Protected Security, 0.125%, 07/15/2024 | 126,029,430 | 134,339,696 |
| U.S. Treasury Inflation Protected Security, 0.125%, 04/15/2025 | 152,137,057 | 162,732,489 |
| U.S. Treasury Inflation Protected Security, 0.125%, 04/15/2026 | 35,380,287 | 38,179,794 |
| U.S. Treasury STRIPS, PO, 1.893%, 11/15/2048 | 229,250,000 | 137,487,779 |
| U.S. Treasury STRIPS, PO, 1.901%, 08/15/2051 | 40,280,000 | 22,874,537 |
| U.S. Treasury STRIPS, PO, 1.937%, 05/15/2050 | 317,639,000 | 182,853,442 |
| U.S. Treasury STRIPS, PO, 1.938%, 05/15/2047 | 187,984,000 | 114,685,378 |
| TOTAL U.S. GOVERNMENT AND AGENCY OBLIGATIONS (Cost $799,088,101) | $841,216,106 | |
| SHORT-TERM INVESTMENTS - 0.0% | ||
| Short-term funds - 0.0% | ||
| State Street Institutional U.S. Government Money Market Fund, Premier Class, 0.0250% (F) | 1,023 | 1,023 |
| TOTAL SHORT-TERM INVESTMENTS (Cost $1,023) | $1,023 | |
| Total investments (Cost $8,609,359,607) - 100.0% | $10,377,685,684 | |
| Other assets and liabilities, net - 0.0% | 1,498,672 | |
| TOTAL NET ASSETS - 100.0% | $10,379,184,356 | |
| Shares or Principal Amount | Value | |
| AFFILIATED INVESTMENT COMPANIES (A) - 91.5% | ||
| Equity - 38.0% | ||
| Blue Chip Growth, Class NAV, JHF II (T. Rowe Price) | 1,086,167 | $61,086,022 |
| Capital Appreciation, Class NAV, JHF II (Jennison) | 1,623,278 | 28,001,539 |
| Capital Appreciation Value, Class NAV, JHF II (T. Rowe Price) | 12,003,863 | 125,680,445 |
| Disciplined Value, Class NAV, JHF III (Boston Partners) | 2,193,418 | 51,567,255 |
| Shares or Principal Amount | Value | |
| Equity - (continued) | ||
| Disciplined Value International, Class NAV, JHIT (Boston Partners) | 4,362,207 | $61,550,743 |
| Emerging Markets Equity, Class NAV, JHIT (MIM US) (B) | 2,420,910 | 29,583,520 |
| Equity Income, Class NAV, JHF II (T. Rowe Price) | 3,799,321 | 80,659,574 |
| Fundamental Global Franchise, Class NAV, JHF II (MIM US) (B) | 2,808,119 | 37,853,443 |
| Fundamental Large Cap Core, Class NAV, JHIT (MIM US) (B) | 803,097 | 60,794,430 |
| Global Equity, Class NAV, JHF II (MIM US) (B) | 5,005,573 | 65,172,558 |
| Global Shareholder Yield, Class NAV, JHF III (Epoch) | 3,101,766 | 36,259,642 |
| International Growth, Class NAV, JHF III (Wellington) | 1,538,154 | 53,558,513 |
| International Small Company, Class NAV, JHF II (DFA) | 2,154,691 | 25,683,913 |
| International Strategic Equity Allocation, Class NAV, JHF II (MIM US) (B) | 9,913,129 | 105,376,564 |
| Mid Cap Growth, Class NAV, JHIT (Wellington) | 3,315,019 | 67,626,393 |
| Mid Value, Class NAV, JHF II (T. Rowe Price) | 4,310,298 | 80,559,468 |
| Multifactor Emerging Markets ETF, JHETF (DFA) | 818,828 | 23,778,765 |
| Small Cap Core, Class NAV, JHIT (MIM US) (B) | 667,323 | 11,331,138 |
| Small Cap Growth, Class NAV, JHF II (Redwood) | 1,547,384 | 32,077,262 |
| Small Cap Value, Class NAV, JHF II (Wellington) | 1,484,097 | 33,451,557 |
| U.S. Sector Rotation, Class NAV, JHF II (MIM US) (B) | 7,127,836 | 73,416,711 |
| Fixed income - 47.3% | ||
| Bond, Class NAV, JHSB (MIM US) (B) | 22,849,259 | 369,244,025 |
| Core Bond, Class NAV, JHF II (Wells Capital) | 18,837,507 | 241,685,214 |
| Emerging Markets Debt, Class NAV, JHF II (MIM US) (B) | 16,973,600 | 152,592,661 |
| Floating Rate Income, Class NAV, JHF II (Bain Capital) | 18,610,203 | 153,348,071 |
| High Yield, Class NAV, JHBT (MIM US) (B) | 41,623,708 | 142,769,320 |
| Short Duration Bond, Class NAV, JHBT (MIM US) (B) | 11,062,176 | 109,736,786 |
| Strategic Income Opportunities, Class NAV, JHF II (MIM US) (B) | 23,043,372 | 256,703,159 |
| Alternative and specialty - 6.2% | ||
| Absolute Return Currency, Class NAV, JHF II (First Quadrant) (E) | 3,651,126 | 37,168,460 |
| Diversified Macro, Class NAV, JHIT (Graham) | 4,184,186 | 37,071,886 |
| Diversified Real Assets, Class NAV, JHIT (MIM NA/Wellington) (B) | 4,543,815 | 54,389,463 |
| Infrastructure, Class NAV, JHIT (Wellington) | 1,051,758 | 15,029,622 |
| Multi-Asset High Income, Class NAV, JHF II (MIM US) (B) | 4,366,527 | 45,324,553 |
| TOTAL AFFILIATED INVESTMENT COMPANIES (Cost $2,424,422,540) | $2,760,132,675 | |
| 18 | JOHN HANCOCK MULTIMANAGER LIFESTYLE PORTFOLIOS | ANNUAL REPORT | SEE NOTES TO FINANCIAL STATEMENTS |
| Shares or Principal Amount | Value | |
| COMMON STOCKS - 0.0% | ||
| Energy - 0.0% | ||
| Sakari Resources, Ltd. (C)(D)(E) | 50,910 | $35,891 |
| TOTAL COMMON STOCKS (Cost $24,355) | $35,891 | |
| U.S. GOVERNMENT AND AGENCY OBLIGATIONS - 8.5% | ||
| U.S. Government - 8.5% | ||
| U.S. Treasury Inflation Protected Security, 0.125%, 01/15/2023 | $20,116,025 | 20,774,510 |
| U.S. Treasury Inflation Protected Security, 0.125%, 07/15/2024 | 54,474,503 | 58,066,502 |
| U.S. Treasury Inflation Protected Security, 0.125%, 04/15/2025 | 65,759,046 | 70,338,767 |
| U.S. Treasury Inflation Protected Security, 0.125%, 04/15/2026 | 15,295,548 | 16,505,827 |
| U.S. Treasury STRIPS, PO, 1.893%, 11/15/2048 | 44,453,000 | 26,659,735 |
| U.S. Treasury STRIPS, PO, 1.901%, 08/15/2051 | 7,811,000 | 4,435,775 |
| U.S. Treasury STRIPS, PO, 1.937%, 05/15/2050 | 61,592,000 | 35,456,317 |
| U.S. Treasury STRIPS, PO, 1.938%, 05/15/2047 | 36,451,000 | 22,238,045 |
| TOTAL U.S. GOVERNMENT AND AGENCY OBLIGATIONS (Cost $247,939,223) | $254,475,478 | |
| SHORT-TERM INVESTMENTS - 0.0% | ||
| Short-term funds - 0.0% | ||
| State Street Institutional U.S. Government Money Market Fund, Premier Class, 0.0250% (F) | 1,023 | 1,023 |
| TOTAL SHORT-TERM INVESTMENTS (Cost $1,023) | $1,023 | |
| Total investments (Cost $2,672,387,141) - 100.0% | $3,014,645,067 | |
| Other assets and liabilities, net - 0.0% | 1,246,812 | |
| TOTAL NET ASSETS - 100.0% | $3,015,891,879 | |
| Shares or Principal Amount | Value | |
| AFFILIATED INVESTMENT COMPANIES (A) - 90.8% | ||
| Equity - 18.4% | ||
| Blue Chip Growth, Class NAV, JHF II (T. Rowe Price) | 404,235 | $22,734,164 |
| Capital Appreciation Value, Class NAV, JHF II (T. Rowe Price) | 4,856,283 | 50,845,281 |
| Disciplined Value, Class NAV, JHF III (Boston Partners) | 552,883 | 12,998,278 |
| Disciplined Value International, Class NAV, JHIT (Boston Partners) | 1,638,527 | 23,119,609 |
| Emerging Markets Equity, Class NAV, JHIT (MIM US) (B) | 1,770,769 | 21,638,793 |
| Shares or Principal Amount | Value | |
| Equity - (continued) | ||
| Equity Income, Class NAV, JHF II (T. Rowe Price) | 957,596 | $20,329,771 |
| Fundamental Global Franchise, Class NAV, JHF II (MIM US) (B) | 1,343,916 | 18,115,986 |
| Fundamental Large Cap Core, Class NAV, JHIT (MIM US) (B) | 159,594 | 12,081,236 |
| Global Equity, Class NAV, JHF II (MIM US) (B) | 1,854,776 | 24,149,181 |
| Global Shareholder Yield, Class NAV, JHF III (Epoch) | 1,345,391 | 15,727,625 |
| International Growth, Class NAV, JHF III (Wellington) | 602,060 | 20,963,715 |
| International Strategic Equity Allocation, Class NAV, JHF II (MIM US) (B) | 6,112,138 | 64,972,031 |
| Mid Cap Growth, Class NAV, JHIT (Wellington) | 1,341,000 | 27,356,390 |
| Mid Value, Class NAV, JHF II (T. Rowe Price) | 1,788,970 | 33,435,850 |
| Small Cap Growth, Class NAV, JHF II (Redwood) | 1,105,649 | 22,920,111 |
| Small Cap Value, Class NAV, JHF II (Wellington) | 1,125,637 | 25,371,849 |
| U.S. Sector Rotation, Class NAV, JHF II (MIM US) (B) | 2,880,070 | 29,664,721 |
| Fixed income - 65.9% | ||
| Bond, Class NAV, JHSB (MIM US) (B) | 26,864,234 | 434,126,017 |
| Core Bond, Class NAV, JHF II (Wells Capital) | 24,748,733 | 317,526,241 |
| Emerging Markets Debt, Class NAV, JHF II (MIM US) (B) | 18,436,594 | 165,744,976 |
| Floating Rate Income, Class NAV, JHF II (Bain Capital) | 20,114,682 | 165,744,976 |
| High Yield, Class NAV, JHBT (MIM US) (B) | 44,442,270 | 152,436,986 |
| Short Duration Bond, Class NAV, JHBT (MIM US) (B) | 12,195,739 | 120,981,735 |
| Strategic Income Opportunities, Class NAV, JHF II (MIM US) (B) | 21,709,379 | 241,842,487 |
| Alternative and specialty - 6.5% | ||
| Absolute Return Currency, Class NAV, JHF II (First Quadrant) (E) | 6,549,947 | 66,678,463 |
| Infrastructure, Class NAV, JHIT (Wellington) | 2,941,321 | 42,031,474 |
| Multi-Asset High Income, Class NAV, JHF II (MIM US) (B) | 4,662,109 | 48,392,694 |
| TOTAL AFFILIATED INVESTMENT COMPANIES (Cost $2,062,133,163) | $2,201,930,640 | |
| U.S. GOVERNMENT AND AGENCY OBLIGATIONS - 9.2% | ||
| U.S. Government - 9.2% | ||
| U.S. Treasury Inflation Protected Security, 0.125%, 01/15/2023 | $27,047,062 | 27,932,431 |
| U.S. Treasury Inflation Protected Security, 0.125%, 07/15/2024 | 73,241,298 | 78,070,762 |
| U.S. Treasury Inflation Protected Security, 0.125%, 04/15/2025 | 88,416,281 | 94,573,943 |
| U.S. Treasury Inflation Protected Security, 0.125%, 04/15/2026 | 20,564,069 | 22,191,225 |
| TOTAL U.S. GOVERNMENT AND AGENCY OBLIGATIONS (Cost $226,784,306) | $222,768,361 | |
| SEE NOTES TO FINANCIAL STATEMENTS | ANNUAL REPORT | JOHN HANCOCK MULTIMANAGER LIFESTYLE PORTFOLIOS | 19 |
| Shares or Principal Amount | Value | |
| SHORT-TERM INVESTMENTS - 0.0% | ||
| Short-term funds - 0.0% | ||
| State Street Institutional U.S. Government Money Market Fund, Premier Class, 0.0250% (F) | 1,023 | $1,023 |
| TOTAL SHORT-TERM INVESTMENTS (Cost $1,023) | $1,023 | |
| Total investments (Cost $2,288,918,492) - 100.0% | $2,424,700,024 | |
| Other assets and liabilities, net - 0.0% | 1,130,684 | |
| TOTAL NET ASSETS - 100.0% | $2,425,830,708 | |
| JHBT | John Hancock Bond Trust |
| JHETF | John Hancock Exchange-Traded Fund Trust |
| JHF II | John Hancock Funds II |
| JHF III | John Hancock Funds III |
| JHIT | John Hancock Investment Trust |
| JHIT II | John Hancock Investment Trust II |
| JHSB | John Hancock Sovereign Bond Fund |
| PO | Principal-Only Security - (Principal Tranche of Stripped Security). Rate shown is the annualized yield on date of purchase. |
| STRIPS | Separate Trading of Registered Interest and Principal Securities |
| (A) | The underlying funds’ subadvisor is shown parenthetically. |
| (B) | The subadvisor is an affiliate of the advisor. |
| (C) | Restricted security as to resale. |
| (D) | Security is valued using significant unobservable inputs and is classified as Level 3 in the fair value hierarchy. Refer to Note 2 to the financial statements. |
| (E) | Non-income producing. |
| (F) | The rate shown is the annualized seven-day yield as of 12-31-21. |
| 20 | JOHN HANCOCK MULTIMANAGER LIFESTYLE PORTFOLIOS | ANNUAL REPORT | SEE NOTES TO FINANCIAL STATEMENTS |
| Multimanager Lifestyle Aggressive Portfolio | Multimanager Lifestyle Growth Portfolio | Multimanager Lifestyle Balanced Portfolio | Multimanager Lifestyle Moderate Portfolio | Multimanager Lifestyle Conservative Portfolio | |
| Assets | |||||
| Unaffiliated investments, at value | $38,868,878 | $446,102,166 | $841,431,115 | $254,512,392 | $222,769,384 |
| Affiliated investments, at value | 3,957,703,680 | 10,702,859,525 | 9,536,254,569 | 2,760,132,675 | 2,201,930,640 |
| Total investments, at value | 3,996,572,558 | 11,148,961,691 | 10,377,685,684 | 3,014,645,067 | 2,424,700,024 |
| Cash | — | — | 50 | — | — |
| Dividends and interest receivable | 207,161 | 8,231,350 | 14,203,317 | 5,836,870 | 6,392,154 |
| Receivable for fund shares sold | 1,023,991 | 1,977,824 | 3,627,873 | 2,364,102 | 2,280,535 |
| Receivable for investments sold | 27,930,176 | 70,523,456 | 64,067,228 | 12,209,643 | 9,365,697 |
| Other assets | 122,810 | 261,577 | 258,489 | 114,474 | 119,994 |
| Total assets | 4,025,856,696 | 11,229,955,898 | 10,459,842,641 | 3,035,170,156 | 2,442,858,404 |
| Liabilities | |||||
| Due to custodian | 1,557 | 6,352 | — | — | — |
| Payable for investments purchased | 2,586,154 | 13,216,441 | 15,817,902 | 6,027,104 | 6,487,422 |
| Payable for fund shares repurchased | 26,300,352 | 66,615,558 | 64,199,694 | 13,009,028 | 10,319,820 |
| Payable to affiliates | |||||
| Investment management fees | 9 | 31 | 32 | 12 | 12 |
| Accounting and legal services fees | 88,289 | 245,060 | 226,904 | 65,378 | 52,580 |
| Transfer agent fees | 69,223 | 228,952 | 234,815 | 89,966 | 89,594 |
| Distribution and service fees | 6,244 | 13,298 | 12,568 | 4,953 | 3,473 |
| Other liabilities and accrued expenses | 85,308 | 176,245 | 166,370 | 81,836 | 74,795 |
| Total liabilities | 29,137,136 | 80,501,937 | 80,658,285 | 19,278,277 | 17,027,696 |
| Net assets | $3,996,719,560 | $11,149,453,961 | $10,379,184,356 | $3,015,891,879 | $2,425,830,708 |
| Net assets consist of | |||||
| Paid-in capital | $2,654,284,040 | $8,000,264,270 | $8,079,114,766 | $2,575,888,900 | $2,262,118,153 |
| Total distributable earnings (loss) | 1,342,435,520 | 3,149,189,691 | 2,300,069,590 | 440,002,979 | 163,712,555 |
| Net assets | $3,996,719,560 | $11,149,453,961 | $10,379,184,356 | $3,015,891,879 | $2,425,830,708 |
| Unaffiliated investments, at cost | $34,665,207 | $424,058,491 | $799,225,735 | $247,964,601 | $226,785,329 |
| Affiliated investments, at cost | 2,954,195,031 | 8,336,121,335 | 7,810,133,872 | 2,424,422,540 | 2,062,133,163 |
| Total investments, at cost | 2,988,860,238 | 8,760,179,826 | 8,609,359,607 | 2,672,387,141 | 2,288,918,492 |
| Net asset value per share | |||||
| The portfolios have an unlimited number of shares authorized with no par value. Net asset value is calculated by dividing the net assets of each class of shares by the number of outstanding shares in the class. | |||||
| Class A1 | |||||
| Net assets | $671,281,445 | $2,213,246,364 | $2,281,461,293 | $867,361,211 | $865,751,425 |
| Shares outstanding | 39,505,421 | 134,656,229 | 146,500,876 | 61,736,936 | 65,068,970 |
| Net asset value and redemption price per share | $16.99 | $16.44 | $15.57 | $14.05 | $13.31 |
| Class C1 | |||||
| Net assets | $57,332,121 | $186,946,008 | $169,602,575 | $71,725,127 | $60,616,247 |
| Shares outstanding | 3,366,414 | 11,368,223 | 10,898,319 | 5,074,788 | 4,555,233 |
| Net asset value, offering price and redemption price per share | $17.03 | $16.44 | $15.56 | $14.13 | $13.31 |
| Class I | |||||
| Net assets | $10,725,368 | $41,267,173 | $43,380,130 | $14,958,373 | $23,346,863 |
| Shares outstanding | 633,786 | 2,529,415 | 2,808,368 | 1,072,937 | 1,758,024 |
| Net asset value, offering price and redemption price per share | $16.92 | $16.31 | $15.45 | $13.94 | $13.28 |
| Class R2 | |||||
| Net assets | $14,613,050 | $30,708,812 | $25,979,196 | $10,095,165 | $8,300,396 |
| Shares outstanding | 868,580 | 1,887,420 | 1,680,845 | 721,072 | 624,904 |
| Net asset value, offering price and redemption price per share | $16.82 | $16.27 | $15.46 | $14.00 | $13.28 |
| Class R4 | |||||
| Net assets | $2,914,995 | $5,233,309 | $7,887,076 | $3,033,022 | $2,324,917 |
| Shares outstanding | 172,632 | 318,913 | 507,939 | 217,330 | 175,179 |
| Net asset value, offering price and redemption price per share | $16.89 | $16.41 | $15.53 | $13.96 | $13.27 |
| Class R5 | |||||
| Net assets | $2,627,106 | $7,009,325 | $17,174,015 | $8,411,474 | $3,174,781 |
| Shares outstanding | 155,106 | 425,886 | 1,103,608 | 602,948 | 239,100 |
| Net asset value, offering price and redemption price per share | $16.94 | $16.46 | $15.56 | $13.95 | $13.28 |
| Class R6 | |||||
| Net assets | $59,592,800 | $135,112,188 | $119,343,800 | $28,384,432 | $18,353,594 |
| Shares outstanding | 3,521,358 | 8,271,435 | 7,731,003 | 2,039,382 | 1,383,218 |
| Net asset value, offering price and redemption price per share | $16.92 | $16.33 | $15.44 | $13.92 | $13.27 |
| Class 1 | |||||
| Net assets | $3,177,632,675 | $8,113,763,008 | $7,529,077,844 | $1,941,513,855 | $1,443,962,485 |
| Shares outstanding | 188,197,549 | 496,708,042 | 487,844,219 | 139,179,332 | 108,799,894 |
| Net asset value, offering price and redemption price per share | $16.88 | $16.34 | $15.43 | $13.95 | $13.27 |
| SEE NOTES TO FINANCIAL STATEMENTS | ANNUAL REPORT | JOHN HANCOCK MULTIMANAGER LIFESTYLE PORTFOLIOS | 21 |
| Multimanager Lifestyle Aggressive Portfolio | Multimanager Lifestyle Growth Portfolio | Multimanager Lifestyle Balanced Portfolio | Multimanager Lifestyle Moderate Portfolio | Multimanager Lifestyle Conservative Portfolio | |
| Class 5 | |||||
| Net assets | — | $416,167,774 | $185,278,427 | $70,409,220 | — |
| Shares outstanding | — | 25,526,470 | 11,997,590 | 5,057,552 | — |
| Net asset value, offering price and redemption price per share | — | $16.30 | $15.44 | $13.92 | — |
| Maximum offering price per share | |||||
| Class A (net asset value per share ÷ 95.5%)2 | $17.79 | $17.21 | $16.30 | $14.71 | $13.94 |
| 1 | Redemption price per share is equal to net asset value less any applicable contingent deferred sales charge. |
| 2 | On single retail sales of less than $50,000. On sales of $50,000 or more and on group sales the offering price is reduced. |
| 22 | JOHN HANCOCK MULTIMANAGER LIFESTYLE PORTFOLIOS | ANNUAL REPORT | SEE NOTES TO FINANCIAL STATEMENTS |
| Multimanager Lifestyle Aggressive Portfolio | Multimanager Lifestyle Growth Portfolio | Multimanager Lifestyle Balanced Portfolio | Multimanager Lifestyle Moderate Portfolio | Multimanager Lifestyle Conservative Portfolio | |
| Investment income | |||||
| Dividends from affiliated investments | $43,827,520 | $158,228,613 | $186,973,673 | $67,089,280 | $60,768,152 |
| Interest | 545,127 | 12,215,777 | 22,896,929 | 8,429,052 | 9,601,605 |
| Dividends from unaffiliated investments | — | 3,050 | 14,443 | 28,889 | 15,762 |
| Total investment income | 44,372,647 | 170,447,440 | 209,885,045 | 75,547,221 | 70,385,519 |
| Expenses | |||||
| Investment management fees | 8,215,131 | 23,135,622 | 22,665,063 | 6,431,262 | 5,684,610 |
| Distribution and service fees | 4,285,840 | 13,038,629 | 12,803,008 | 4,447,049 | 3,988,360 |
| Accounting and legal services fees | 514,751 | 1,441,738 | 1,337,215 | 387,380 | 310,851 |
| Transfer agent fees | 831,804 | 2,761,739 | 2,824,565 | 1,065,069 | 1,037,416 |
| Trustees’ fees | 68,877 | 195,016 | 183,251 | 53,448 | 42,869 |
| Custodian fees | 31,547 | 34,643 | 34,640 | 34,540 | 33,532 |
| State registration fees | 122,187 | 149,228 | 149,474 | 133,802 | 156,716 |
| Printing and postage | 36,507 | 59,001 | 57,026 | 38,892 | 39,009 |
| Professional fees | 127,620 | 289,157 | 271,073 | 111,005 | 98,401 |
| Other | 78,302 | 187,519 | 183,094 | 62,368 | 60,938 |
| Total expenses | 14,312,566 | 41,292,292 | 40,508,409 | 12,764,815 | 11,452,702 |
| Less expense reductions | (5,661,827) | (13,985,009) | (11,667,109) | (2,782,580) | (2,194,593) |
| Net expenses | 8,650,739 | 27,307,283 | 28,841,300 | 9,982,235 | 9,258,109 |
| Net investment income | 35,721,908 | 143,140,157 | 181,043,745 | 65,564,986 | 61,127,410 |
| Realized and unrealized gain (loss) | |||||
| Net realized gain (loss) on | |||||
| Unaffiliated investments and foreign currency transactions | 1,189,686 | 20,256,235 | 46,600,018 | 21,050,961 | 21,098,618 |
| Affiliated investments | 159,607,625 | 421,024,017 | 388,873,786 | 78,530,004 | 28,158,686 |
| Capital gain distributions received from affiliated investments | 440,402,580 | 1,044,174,800 | 757,570,146 | 144,061,884 | 60,454,042 |
| 601,199,891 | 1,485,455,052 | 1,193,043,950 | 243,642,849 | 109,711,346 | |
| Change in net unrealized appreciation (depreciation) of | |||||
| Unaffiliated investments and translation of assets and liabilities in foreign currencies | 4,187,707 | 9,607,101 | 11,709,905 | (9,821,064) | (23,175,551) |
| Affiliated investments | (21,543,712) | (126,056,016) | (238,234,476) | (69,247,381) | (63,915,860) |
| (17,356,005) | (116,448,915) | (226,524,571) | (79,068,445) | (87,091,411) | |
| Net realized and unrealized gain | 583,843,886 | 1,369,006,137 | 966,519,379 | 164,574,404 | 22,619,935 |
| Increase in net assets from operations | $619,565,794 | $1,512,146,294 | $1,147,563,124 | $230,139,390 | $83,747,345 |
| SEE NOTES TO FINANCIAL STATEMENTS | ANNUAL REPORT | JOHN HANCOCK MULTIMANAGER LIFESTYLE PORTFOLIOS | 23 |
| Multimanager Lifestyle Aggressive Portfolio | Multimanager Lifestyle Growth Portfolio | Multimanager Lifestyle Balanced Portfolio | ||||
| Year ended 12-31-21 | Year ended 12-31-20 | Year ended 12-31-21 | Year ended 12-31-20 | Year ended 12-31-21 | Year ended 12-31-20 | |
| Increase (decrease) in net assets | ||||||
| From operations | ||||||
| Net investment income | $35,721,908 | $30,470,761 | $143,140,157 | $123,382,211 | $181,043,745 | $148,703,963 |
| Net realized gain | 601,199,891 | 219,043,695 | 1,485,455,052 | 595,523,261 | 1,193,043,950 | 509,750,214 |
| Change in net unrealized appreciation (depreciation) | (17,356,005) | 368,036,335 | (116,448,915) | 918,394,846 | (226,524,571) | 723,409,727 |
| Increase in net assets resulting from operations | 619,565,794 | 617,550,791 | 1,512,146,294 | 1,637,300,318 | 1,147,563,124 | 1,381,863,904 |
| Distributions to shareholders | ||||||
| From earnings | ||||||
| Class A | (64,702,777) | (32,717,730) | (206,632,761) | (113,123,342) | (211,529,315) | (110,861,734) |
| Class B | — | — | — | — | — | (1,944)1 |
| Class C | (5,168,936) | (3,189,432) | (16,332,268) | (12,602,299) | (14,684,938) | (11,604,224) |
| Class I | (1,086,293) | (448,712) | (4,046,840) | (2,094,976) | (4,222,507) | (2,123,231) |
| Class R1 | — | — | — | — | — | (19,569)1 |
| Class R2 | (1,408,050) | (627,482) | (2,863,967) | (1,520,869) | (2,404,614) | (1,155,648) |
| Class R3 | — | — | — | — | — | (42,904)1 |
| Class R4 | (290,114) | (226,503) | (494,938) | (323,461) | (741,486) | (431,209) |
| Class R5 | (261,287) | (149,978) | (673,106) | (454,553) | (1,648,465) | (906,893) |
| Class R6 | (5,964,748) | (3,029,935) | (13,118,125) | (7,801,107) | (11,523,850) | (7,517,224) |
| Class 1 | (320,286,070) | (180,624,181) | (791,838,506) | (495,197,048) | (737,160,592) | (448,254,151) |
| Class 5 | — | — | (40,550,453) | (22,510,588) | (17,992,698) | (9,760,567) |
| Total distributions | (399,168,275) | (221,013,953) | (1,076,550,964) | (655,628,243) | (1,001,908,465) | (592,679,298) |
| Portfolio share transactions | ||||||
| From portfolio share transactions | (76,862,439) | (244,344,067) | (335,908,907) | (777,015,824) | (271,296,818) | (838,943,480) |
| Total increase (decrease) | 143,535,080 | 152,192,771 | 99,686,423 | 204,656,251 | (125,642,159) | (49,758,874) |
| Net assets | ||||||
| Beginning of year | 3,853,184,480 | 3,700,991,709 | 11,049,767,538 | 10,845,111,287 | 10,504,826,515 | 10,554,585,389 |
| End of year | $3,996,719,560 | $3,853,184,480 | $11,149,453,961 | $11,049,767,538 | $10,379,184,356 | $10,504,826,515 |
| 1 | Share class was redesignated during the year. Refer to Note 5 for further details. |
| 24 | JOHN HANCOCK MULTIMANAGER LIFESTYLE PORTFOLIOS | ANNUAL REPORT | SEE NOTES TO FINANCIAL STATEMENTS |
| Multimanager Lifestyle Moderate Portfolio | Multimanager Lifestyle Conservative Portfolio | |||
| Year ended 12-31-21 | Year ended 12-31-20 | Year ended 12-31-21 | Year ended 12-31-20 | |
| Increase (decrease) in net assets | ||||
| From operations | ||||
| Net investment income | $65,564,986 | $52,125,049 | $61,127,410 | $48,529,173 |
| Net realized gain | 243,642,849 | 117,074,362 | 109,711,346 | 62,705,889 |
| Change in net unrealized appreciation (depreciation) | (79,068,445) | 159,973,630 | (87,091,411) | 107,732,878 |
| Increase in net assets resulting from operations | 230,139,390 | 329,173,041 | 83,747,345 | 218,967,940 |
| Distributions to shareholders | ||||
| From earnings | ||||
| Class A | (66,961,519) | (35,830,513) | (48,129,639) | (29,776,585) |
| Class B | — | (9,853)1 | — | (32,791)1 |
| Class C | (5,116,701) | (4,348,770) | (3,059,334) | (3,521,540) |
| Class I | (1,188,507) | (554,322) | (1,379,787) | (742,118) |
| Class R1 | — | (22,460)1 | — | (64,126)1 |
| Class R2 | (766,308) | (358,927) | (463,184) | (250,345) |
| Class R3 | — | (30,889)1 | — | (49,718)1 |
| Class R4 | (240,574) | (156,719) | (137,913) | (135,331) |
| Class R5 | (684,494) | (421,145) | (187,011) | (146,306) |
| Class R6 | (2,370,213) | (1,952,366) | (1,106,440) | (1,046,980) |
| Class 1 | (159,818,494) | (104,269,552) | (88,420,244) | (71,703,124) |
| Class 5 | (5,747,962) | (3,299,848) | — | — |
| Total distributions | (242,894,772) | (151,255,364) | (142,883,552) | (107,468,964) |
| Portfolio share transactions | ||||
| From portfolio share transactions | (44,651,061) | (190,472,993) | (21,275,737) | 8,264,408 |
| Total increase (decrease) | (57,406,443) | (12,555,316) | (80,411,944) | 119,763,384 |
| Net assets | ||||
| Beginning of year | 3,073,298,322 | 3,085,853,638 | 2,506,242,652 | 2,386,479,268 |
| End of year | $3,015,891,879 | $3,073,298,322 | $2,425,830,708 | $2,506,242,652 |
| 1 | Share class was redesignated during the year. Refer to Note 5 for further details. |
| SEE NOTES TO FINANCIAL STATEMENTS | ANNUAL REPORT | JOHN HANCOCK MULTIMANAGER LIFESTYLE PORTFOLIOS | 25 |
| Per share operating performance for a share outstanding throughout each period | Ratios and supplemental data | |||||||||||||||||||
| Income (loss) from investment operations | Less distributions | Ratios to average net assets | ||||||||||||||||||
| Period ended | Net asset value, beginning of period ($) | Net investment income (loss) ($)1, 2 | Net realized and unrealized gain (loss) on investments ($) | Total from investment operations ($) | From net investment income ($) | From net realized gain ($)3 | Total distributions ($) | Net asset value, end of period ($) | Total return (%)4, 5 | Expenses before reductions (%)6 | Expenses including reductions (%)6 | Net investment income (loss) (%)2 | Net assets, end of period (in millions) | Portfolio turnover (%) | ||||||
| Multimanager Lifestyle Aggressive Portfolio | ||||||||||||||||||||
| Class A | ||||||||||||||||||||
| 12-31-2021 | 16.16 | 0.11 | 2.53 | 2.64 | (0.12) | (1.69) | (1.81) | 16.99 | 16.33 | 0.64 | 0.50 | 0.63 | 671 | 21 | ||||||
| 12-31-2020 | 14.39 | 0.09 | 2.61 | 2.70 | (0.10) | (0.83) | (0.93) | 16.16 | 18.84 | 0.65 | 0.50 | 0.66 | 599 | 11 | ||||||
| 12-31-2019 | 13.10 | 0.15 | 3.12 | 3.27 | (0.16) | (1.82) | (1.98) | 14.39 | 24.92 | 0.64 | 0.49 | 1.03 | 521 | 29 | ||||||
| 12-31-2018 | 16.52 | 0.12 | (1.82) | (1.70) | (0.12) | (1.60) | (1.72) | 13.10 | (10.19) | 0.56 | 0.48 | 0.72 | 439 | 22 | ||||||
| 12-31-2017 | 14.72 | 0.13 | 3.23 | 3.36 | (0.13) | (1.43) | (1.56) | 16.52 | 22.79 | 0.55 | 0.48 | 0.79 | 499 | 23 | ||||||
| Class C | ||||||||||||||||||||
| 12-31-2021 | 16.20 | (0.03) | 2.54 | 2.51 | — | (1.68) | (1.68) | 17.03 | 15.51 | 1.34 | 1.20 | (0.16) | 57 | 21 | ||||||
| 12-31-2020 | 14.44 | (0.04) | 2.64 | 2.60 | (0.01) | (0.83) | (0.84) | 16.20 | 18.05 | 1.35 | 1.21 | (0.32) | 65 | 11 | ||||||
| 12-31-2019 | 13.15 | 0.03 | 3.14 | 3.17 | (0.06) | (1.82) | (1.88) | 14.44 | 24.03 | 1.34 | 1.20 | 0.21 | 89 | 29 | ||||||
| 12-31-2018 | 16.57 | (0.02) | (1.80) | (1.82) | —7 | (1.60) | (1.60) | 13.15 | (10.87) | 1.26 | 1.18 | (0.14) | 91 | 22 | ||||||
| 12-31-2017 | 14.76 | —7 | 3.25 | 3.25 | (0.01) | (1.43) | (1.44) | 16.57 | 22.03 | 1.25 | 1.18 | (0.03) | 148 | 23 | ||||||
| Class I | ||||||||||||||||||||
| 12-31-2021 | 16.10 | 0.18 | 2.50 | 2.68 | (0.17) | (1.69) | (1.86) | 16.92 | 16.66 | 0.34 | 0.20 | 1.02 | 11 | 21 | ||||||
| 12-31-2020 | 14.33 | 0.10 | 2.64 | 2.74 | (0.14) | (0.83) | (0.97) | 16.10 | 19.20 | 0.35 | 0.20 | 0.69 | 8 | 11 | ||||||
| 12-31-2019 | 13.04 | 0.20 | 3.11 | 3.31 | (0.20) | (1.82) | (2.02) | 14.33 | 25.38 | 0.34 | 0.19 | 1.35 | 11 | 29 | ||||||
| 12-31-2018 | 16.47 | 0.15 | (1.81) | (1.66) | (0.17) | (1.60) | (1.77) | 13.04 | (9.98) | 0.28 | 0.18 | 0.91 | 10 | 22 | ||||||
| 12-31-2017 | 14.67 | 0.22 | 3.19 | 3.41 | (0.18) | (1.43) | (1.61) | 16.47 | 23.20 | 0.24 | 0.17 | 1.33 | 10 | 23 | ||||||
| Class R2 | ||||||||||||||||||||
| 12-31-2021 | 16.02 | 0.11 | 2.49 | 2.60 | (0.11) | (1.69) | (1.80) | 16.82 | 16.19 | 0.72 | 0.58 | 0.62 | 15 | 21 | ||||||
| 12-31-2020 | 14.27 | 0.21 | 2.46 | 2.67 | (0.09) | (0.83) | (0.92) | 16.02 | 18.77 | 0.73 | 0.59 | 1.47 | 12 | 11 | ||||||
| 12-31-2019 | 13.00 | 0.13 | 3.11 | 3.24 | (0.15) | (1.82) | (1.97) | 14.27 | 24.76 | 0.72 | 0.59 | 0.88 | 5 | 29 | ||||||
| 12-31-2018 | 16.42 | 0.08 | (1.79) | (1.71) | (0.11) | (1.60) | (1.71) | 13.00 | (10.28) | 0.68 | 0.59 | 0.49 | 4 | 22 | ||||||
| 12-31-2017 | 14.64 | 0.07 | 3.25 | 3.32 | (0.11) | (1.43) | (1.54) | 16.42 | 22.67 | 0.64 | 0.57 | 0.41 | 6 | 23 | ||||||
| Class R4 | ||||||||||||||||||||
| 12-31-2021 | 16.07 | 0.14 | 2.52 | 2.66 | (0.15) | (1.69) | (1.84) | 16.89 | 16.53 | 0.59 | 0.35 | 0.79 | 3 | 21 | ||||||
| 12-31-2020 | 14.31 | 0.10 | 2.61 | 2.71 | (0.12) | (0.83) | (0.95) | 16.07 | 19.02 | 0.59 | 0.35 | 0.70 | 3 | 11 | ||||||
| 12-31-2019 | 13.03 | 0.17 | 3.11 | 3.28 | (0.18) | (1.82) | (2.00) | 14.31 | 25.16 | 0.58 | 0.34 | 1.14 | 5 | 29 | ||||||
| 12-31-2018 | 16.45 | 0.11 | (1.78) | (1.67) | (0.15) | (1.60) | (1.75) | 13.03 | (10.08) | 0.52 | 0.33 | 0.69 | 4 | 22 | ||||||
| 12-31-2017 | 14.66 | 0.16 | 3.21 | 3.37 | (0.15) | (1.43) | (1.58) | 16.45 | 22.98 | 0.50 | 0.33 | 1.00 | 8 | 23 | ||||||
| Class R5 | ||||||||||||||||||||
| 12-31-2021 | 16.11 | 0.18 | 2.52 | 2.70 | (0.18) | (1.69) | (1.87) | 16.94 | 16.76 | 0.29 | 0.15 | 1.01 | 3 | 21 | ||||||
| 12-31-2020 | 14.33 | 0.14 | 2.62 | 2.76 | (0.15) | (0.83) | (0.98) | 16.11 | 19.31 | 0.29 | 0.15 | 0.97 | 3 | 11 | ||||||
| 12-31-2019 | 13.05 | 0.17 | 3.15 | 3.32 | (0.22) | (1.82) | (2.04) | 14.33 | 25.36 | 0.27 | 0.13 | 1.17 | 3 | 29 | ||||||
| 12-31-2018 | 16.48 | 0.11 | (1.76) | (1.65) | (0.18) | (1.60) | (1.78) | 13.05 | (9.91) | 0.22 | 0.13 | 0.66 | 3 | 22 | ||||||
| 12-31-2017 | 14.68 | 0.17 | 3.24 | 3.41 | (0.18) | (1.43) | (1.61) | 16.48 | 23.25 | 0.20 | 0.13 | 1.04 | 7 | 23 | ||||||
| Class R6 | ||||||||||||||||||||
| 12-31-2021 | 16.10 | 0.19 | 2.51 | 2.70 | (0.19) | (1.69) | (1.88) | 16.92 | 16.77 | 0.24 | 0.10 | 1.08 | 60 | 21 | ||||||
| 12-31-2020 | 14.32 | 0.13 | 2.64 | 2.77 | (0.16) | (0.83) | (0.99) | 16.10 | 19.36 | 0.24 | 0.10 | 0.90 | 52 | 11 | ||||||
| 12-31-2019 | 13.04 | 0.24 | 3.08 | 3.32 | (0.22) | (1.82) | (2.04) | 14.32 | 25.41 | 0.23 | 0.10 | 1.60 | 50 | 29 | ||||||
| 12-31-2018 | 16.47 | 0.22 | (1.86) | (1.64) | (0.19) | (1.60) | (1.79) | 13.04 | (9.87) | 0.17 | 0.08 | 1.31 | 33 | 22 | ||||||
| 12-31-2017 | 14.67 | 0.25 | 3.17 | 3.42 | (0.19) | (1.43) | (1.62) | 16.47 | 23.32 | 0.15 | 0.08 | 1.51 | 29 | 23 | ||||||
| Class 1 | ||||||||||||||||||||
| 12-31-2021 | 16.07 | 0.17 | 2.52 | 2.69 | (0.19) | (1.69) | (1.88) | 16.88 | 16.70 | 0.28 | 0.14 | 0.95 | 3,178 | 21 | ||||||
| 12-31-2020 | 14.30 | 0.14 | 2.61 | 2.75 | (0.15) | (0.83) | (0.98) | 16.07 | 19.30 | 0.27 | 0.14 | 0.97 | 3,113 | 11 | ||||||
| 12-31-2019 | 13.02 | 0.20 | 3.11 | 3.31 | (0.21) | (1.82) | (2.03) | 14.30 | 25.41 | 0.27 | 0.13 | 1.31 | 3,001 | 29 | ||||||
| 12-31-2018 | 16.45 | 0.17 | (1.82) | (1.65) | (0.18) | (1.60) | (1.78) | 13.02 | (9.92) | 0.20 | 0.12 | 1.03 | 2,815 | 22 | ||||||
| 12-31-2017 | 14.65 | 0.18 | 3.24 | 3.42 | (0.19) | (1.43) | (1.62) | 16.45 | 23.31 | 0.19 | 0.12 | 1.08 | 3,548 | 23 | ||||||
| 1 Based on average daily shares outstanding. |
| 2 Net investment income is affected by the timing and frequency of the declaration of dividends by the underlying funds in which the portfolio invests. |
| 3 Capital gain distributions may vary between classes due to expense differences applied to ordinary income distributions from underlying funds. |
| 4 Total returns would have been lower had certain expenses not been reduced during the applicable periods. |
| 5 Does not reflect the effect of sales charges, if any. |
| 6 Ratios do not include expenses indirectly incurred from underlying funds and can vary based on the mix of underlying funds held by the portfolio. |
| 7 Less than $0.005 per share. |
| 26 | JOHN HANCOCK MULTIMANAGER LIFESTYLE PORTFOLIOS | ANNUAL REPORT | SEE NOTES TO FINANCIAL STATEMENTS |
| Per share operating performance for a share outstanding throughout each period | Ratios and supplemental data | |||||||||||||||||||
| Income (loss) from investment operations | Less distributions | Ratios to average net assets | ||||||||||||||||||
| Period ended | Net asset value, beginning of period ($) | Net investment income (loss) ($)1, 2 | Net realized and unrealized gain (loss) on investments ($) | Total from investment operations ($) | From net investment income ($) | From net realized gain ($) | Total distributions ($) | Net asset value, end of period ($) | Total return (%)3, 4 | Expenses before reductions (%)5 | Expenses including reductions (%)5 | Net investment income (loss) (%)2 | Net assets, end of period (in millions) | Portfolio turnover (%) | ||||||
| Multimanager Lifestyle Growth Portfolio | ||||||||||||||||||||
| Class A | ||||||||||||||||||||
| 12-31-2021 | 15.91 | 0.18 | 2.04 | 2.22 | (0.19) | (1.50) | (1.69) | 16.44 | 13.95 | 0.64 | 0.51 | 1.02 | 2,213 | 24 | ||||||
| 12-31-2020 | 14.40 | 0.15 | 2.32 | 2.47 | (0.15) | (0.81) | (0.96) | 15.91 | 17.17 | 0.63 | 0.51 | 1.02 | 1,992 | 13 | ||||||
| 12-31-2019 | 13.23 | 0.21 | 2.69 | 2.90 | (0.21) | (1.52) | (1.73) | 14.40 | 21.89 | 0.62 | 0.51 | 1.39 | 1,714 | 29 | ||||||
| 12-31-2018 | 16.16 | 0.20 | (1.62) | (1.42) | (0.20) | (1.31) | (1.51) | 13.23 | (8.70) | 0.55 | 0.48 | 1.22 | 1,502 | 20 | ||||||
| 12-31-2017 | 14.77 | 0.19 | 2.59 | 2.78 | (0.20) | (1.19) | (1.39) | 16.16 | 18.84 | 0.54 | 0.48 | 1.17 | 1,719 | 24 | ||||||
| Class C | ||||||||||||||||||||
| 12-31-2021 | 15.92 | 0.03 | 2.06 | 2.09 | (0.07) | (1.50) | (1.57) | 16.44 | 13.10 | 1.34 | 1.21 | 0.17 | 187 | 24 | ||||||
| 12-31-2020 | 14.43 | —6 | 2.35 | 2.35 | (0.05) | (0.81) | (0.86) | 15.92 | 16.33 | 1.34 | 1.22 | 0.02 | 245 | 13 | ||||||
| 12-31-2019 | 13.27 | 0.08 | 2.71 | 2.79 | (0.11) | (1.52) | (1.63) | 14.43 | 21.05 | 1.32 | 1.21 | 0.57 | 384 | 29 | ||||||
| 12-31-2018 | 16.18 | 0.06 | (1.57) | (1.51) | (0.09) | (1.31) | (1.40) | 13.27 | (9.34) | 1.25 | 1.18 | 0.38 | 414 | 20 | ||||||
| 12-31-2017 | 14.80 | 0.06 | 2.60 | 2.66 | (0.09) | (1.19) | (1.28) | 16.18 | 17.97 | 1.24 | 1.18 | 0.40 | 629 | 24 | ||||||
| Class I | ||||||||||||||||||||
| 12-31-2021 | 15.80 | 0.23 | 2.02 | 2.25 | (0.24) | (1.50) | (1.74) | 16.31 | 14.24 | 0.34 | 0.21 | 1.35 | 41 | 24 | ||||||
| 12-31-2020 | 14.30 | 0.18 | 2.32 | 2.50 | (0.19) | (0.81) | (1.00) | 15.80 | 17.50 | 0.33 | 0.21 | 1.29 | 35 | 13 | ||||||
| 12-31-2019 | 13.15 | 0.25 | 2.67 | 2.92 | (0.25) | (1.52) | (1.77) | 14.30 | 22.21 | 0.33 | 0.21 | 1.66 | 33 | 29 | ||||||
| 12-31-2018 | 16.07 | 0.24 | (1.60) | (1.36) | (0.25) | (1.31) | (1.56) | 13.15 | (8.37) | 0.26 | 0.18 | 1.47 | 32 | 20 | ||||||
| 12-31-2017 | 14.69 | 0.29 | 2.53 | 2.82 | (0.25) | (1.19) | (1.44) | 16.07 | 19.20 | 0.23 | 0.17 | 1.78 | 38 | 24 | ||||||
| Class R2 | ||||||||||||||||||||
| 12-31-2021 | 15.76 | 0.17 | 2.01 | 2.18 | (0.17) | (1.50) | (1.67) | 16.27 | 13.85 | 0.72 | 0.60 | 0.97 | 31 | 24 | ||||||
| 12-31-2020 | 14.27 | 0.25 | 2.18 | 2.43 | (0.13) | (0.81) | (0.94) | 15.76 | 17.09 | 0.71 | 0.60 | 1.71 | 27 | 13 | ||||||
| 12-31-2019 | 13.13 | 0.19 | 2.67 | 2.86 | (0.20) | (1.52) | (1.72) | 14.27 | 21.72 | 0.71 | 0.60 | 1.28 | 11 | 29 | ||||||
| 12-31-2018 | 16.05 | 0.17 | (1.59) | (1.42) | (0.19) | (1.31) | (1.50) | 13.13 | (8.78) | 0.64 | 0.57 | 1.06 | 11 | 20 | ||||||
| 12-31-2017 | 14.68 | 0.14 | 2.61 | 2.75 | (0.19) | (1.19) | (1.38) | 16.05 | 18.71 | 0.64 | 0.58 | 0.86 | 13 | 24 | ||||||
| Class R4 | ||||||||||||||||||||
| 12-31-2021 | 15.89 | 0.21 | 2.02 | 2.23 | (0.21) | (1.50) | (1.71) | 16.41 | 14.13 | 0.58 | 0.36 | 1.18 | 5 | 24 | ||||||
| 12-31-2020 | 14.37 | 0.16 | 2.34 | 2.50 | (0.17) | (0.81) | (0.98) | 15.89 | 17.34 | 0.57 | 0.36 | 1.11 | 5 | 13 | ||||||
| 12-31-2019 | 13.21 | 0.24 | 2.67 | 2.91 | (0.23) | (1.52) | (1.75) | 14.37 | 22.03 | 0.56 | 0.35 | 1.60 | 6 | 29 | ||||||
| 12-31-2018 | 16.14 | 0.16 | (1.55) | (1.39) | (0.23) | (1.31) | (1.54) | 13.21 | (8.56) | 0.50 | 0.33 | 1.00 | 5 | 20 | ||||||
| 12-31-2017 | 14.75 | 0.19 | 2.62 | 2.81 | (0.23) | (1.19) | (1.42) | 16.14 | 19.03 | 0.48 | 0.32 | 1.19 | 11 | 24 | ||||||
| Class R5 | ||||||||||||||||||||
| 12-31-2021 | 15.93 | 0.24 | 2.04 | 2.28 | (0.25) | (1.50) | (1.75) | 16.46 | 14.31 | 0.28 | 0.16 | 1.38 | 7 | 24 | ||||||
| 12-31-2020 | 14.40 | 0.18 | 2.35 | 2.53 | (0.19) | (0.81) | (1.00) | 15.93 | 17.63 | 0.27 | 0.16 | 1.27 | 8 | 13 | ||||||
| 12-31-2019 | 13.23 | 0.25 | 2.70 | 2.95 | (0.26) | (1.52) | (1.78) | 14.40 | 22.28 | 0.27 | 0.16 | 1.65 | 8 | 29 | ||||||
| 12-31-2018 | 16.16 | 0.18 | (1.54) | (1.36) | (0.26) | (1.31) | (1.57) | 13.23 | (8.35) | 0.21 | 0.14 | 1.12 | 8 | 20 | ||||||
| 12-31-2017 | 14.77 | 0.24 | 2.60 | 2.84 | (0.26) | (1.19) | (1.45) | 16.16 | 19.22 | 0.18 | 0.13 | 1.46 | 22 | 24 | ||||||
| Class R6 | ||||||||||||||||||||
| 12-31-2021 | 15.82 | 0.25 | 2.02 | 2.27 | (0.26) | (1.50) | (1.76) | 16.33 | 14.33 | 0.23 | 0.11 | 1.42 | 135 | 24 | ||||||
| 12-31-2020 | 14.31 | 0.18 | 2.34 | 2.52 | (0.20) | (0.81) | (1.01) | 15.82 | 17.65 | 0.22 | 0.11 | 1.28 | 130 | 13 | ||||||
| 12-31-2019 | 13.15 | 0.28 | 2.67 | 2.95 | (0.27) | (1.52) | (1.79) | 14.31 | 22.39 | 0.22 | 0.11 | 1.92 | 127 | 29 | ||||||
| 12-31-2018 | 16.08 | 0.28 | (1.63) | (1.35) | (0.27) | (1.31) | (1.58) | 13.15 | (8.34) | 0.15 | 0.08 | 1.75 | 88 | 20 | ||||||
| 12-31-2017 | 14.70 | 0.33 | 2.51 | 2.84 | (0.27) | (1.19) | (1.46) | 16.08 | 19.30 | 0.14 | 0.08 | 2.00 | 78 | 24 | ||||||
| Class 1 | ||||||||||||||||||||
| 12-31-2021 | 15.82 | 0.23 | 2.04 | 2.27 | (0.25) | (1.50) | (1.75) | 16.34 | 14.29 | 0.27 | 0.15 | 1.33 | 8,114 | 24 | ||||||
| 12-31-2020 | 14.31 | 0.19 | 2.32 | 2.51 | (0.19) | (0.81) | (1.00) | 15.82 | 17.61 | 0.26 | 0.15 | 1.32 | 8,235 | 13 | ||||||
| 12-31-2019 | 13.16 | 0.25 | 2.68 | 2.93 | (0.26) | (1.52) | (1.78) | 14.31 | 22.26 | 0.25 | 0.15 | 1.69 | 8,188 | 29 | ||||||
| 12-31-2018 | 16.08 | 0.25 | (1.60) | (1.35) | (0.26) | (1.31) | (1.57) | 13.16 | (8.31) | 0.19 | 0.12 | 1.53 | 7,935 | 20 | ||||||
| 12-31-2017 | 14.70 | 0.24 | 2.59 | 2.83 | (0.26) | (1.19) | (1.45) | 16.08 | 19.26 | 0.17 | 0.12 | 1.50 | 9,997 | 24 | ||||||
| SEE NOTES TO FINANCIAL STATEMENTS | ANNUAL REPORT | JOHN HANCOCK MULTIMANAGER LIFESTYLE PORTFOLIOS | 27 |
| Per share operating performance for a share outstanding throughout each period | Ratios and supplemental data | |||||||||||||||||||
| Income (loss) from investment operations | Less distributions | Ratios to average net assets | ||||||||||||||||||
| Period ended | Net asset value, beginning of period ($) | Net investment income (loss) ($)1, 2 | Net realized and unrealized gain (loss) on investments ($) | Total from investment operations ($) | From net investment income ($) | From net realized gain ($) | Total distributions ($) | Net asset value, end of period ($) | Total return (%)3, 4 | Expenses before reductions (%)5 | Expenses including reductions (%)5 | Net investment income (loss) (%)2 | Net assets, end of period (in millions) | Portfolio turnover (%) | ||||||
| Class 5 | ||||||||||||||||||||
| 12-31-2021 | 15.79 | 0.25 | 2.02 | 2.27 | (0.26) | (1.50) | (1.76) | 16.30 | 14.37 | 0.22 | 0.10 | 1.43 | 416 | 24 | ||||||
| 12-31-2020 | 14.28 | 0.20 | 2.32 | 2.52 | (0.20) | (0.81) | (1.01) | 15.79 | 17.70 | 0.21 | 0.10 | 1.40 | 373 | 13 | ||||||
| 12-31-2019 | 13.13 | 0.27 | 2.67 | 2.94 | (0.27) | (1.52) | (1.79) | 14.28 | 22.36 | 0.20 | 0.10 | 1.81 | 335 | 29 | ||||||
| 12-31-2018 | 16.06 | 0.26 | (1.61) | (1.35) | (0.27) | (1.31) | (1.58) | 13.13 | (8.34) | 0.14 | 0.07 | 1.63 | 284 | 20 | ||||||
| 12-31-2017 | 14.68 | 0.26 | 2.58 | 2.84 | (0.27) | (1.19) | (1.46) | 16.06 | 19.34 | 0.12 | 0.07 | 1.63 | 314 | 24 | ||||||
| 1 Based on average daily shares outstanding. |
| 2 Net investment income is affected by the timing and frequency of the declaration of dividends by the underlying funds in which the portfolio invests. |
| 3 Total returns would have been lower had certain expenses not been reduced during the applicable periods. |
| 4 Does not reflect the effect of sales charges, if any. |
| 5 Ratios do not include expenses indirectly incurred from underlying funds and can vary based on the mix of underlying funds held by the portfolio. |
| 6 Less than $0.005 per share. |
| 28 | JOHN HANCOCK MULTIMANAGER LIFESTYLE PORTFOLIOS | ANNUAL REPORT | SEE NOTES TO FINANCIAL STATEMENTS |
| Per share operating performance for a share outstanding throughout each period | Ratios and supplemental data | |||||||||||||||||||
| Income (loss) from investment operations | Less distributions | Ratios to average net assets | ||||||||||||||||||
| Period ended | Net asset value, beginning of period ($) | Net investment income (loss) ($)1, 2 | Net realized and unrealized gain (loss) on investments ($) | Total from investment operations ($) | From net investment income ($) | From net realized gain ($) | Total distributions ($) | Net asset value, end of period ($) | Total return (%)3, 4 | Expenses before reductions (%)5 | Expenses including reductions (%)5 | Net investment income (loss) (%)2 | Net assets, end of period (in millions) | Portfolio turnover (%) | ||||||
| Multimanager Lifestyle Balanced Portfolio | ||||||||||||||||||||
| Class A | ||||||||||||||||||||
| 12-31-2021 | 15.44 | 0.24 | 1.47 | 1.71 | (0.26) | (1.32) | (1.58) | 15.57 | 11.07 | 0.65 | 0.53 | 1.47 | 2,281 | 30 | ||||||
| 12-31-2020 | 14.20 | 0.19 | 1.91 | 2.10 | (0.18) | (0.68) | (0.86) | 15.44 | 14.95 | 0.64 | 0.52 | 1.31 | 2,085 | 15 | ||||||
| 12-31-2019 | 13.06 | 0.25 | 2.17 | 2.42 | (0.25) | (1.03) | (1.28) | 14.20 | 18.57 | 0.62 | 0.52 | 1.73 | 1,805 | 33 | ||||||
| 12-31-2018 | 15.29 | 0.26 | (1.30) | (1.04) | (0.27) | (0.92) | (1.19) | 13.06 | (6.79) | 0.56 | 0.49 | 1.74 | 1,604 | 18 | ||||||
| 12-31-2017 | 14.32 | 0.24 | 1.88 | 2.12 | (0.25) | (0.90) | (1.15) | 15.29 | 14.79 | 0.54 | 0.48 | 1.57 | 1,841 | 27 | ||||||
| Class C | ||||||||||||||||||||
| 12-31-2021 | 15.44 | 0.10 | 1.48 | 1.58 | (0.14) | (1.32) | (1.46) | 15.56 | 10.27 | 1.35 | 1.24 | 0.62 | 170 | 30 | ||||||
| 12-31-2020 | 14.20 | 0.05 | 1.95 | 2.00 | (0.08) | (0.68) | (0.76) | 15.44 | 14.15 | 1.34 | 1.24 | 0.34 | 244 | 15 | ||||||
| 12-31-2019 | 13.06 | 0.13 | 2.19 | 2.32 | (0.15) | (1.03) | (1.18) | 14.20 | 17.76 | 1.32 | 1.23 | 0.90 | 417 | 33 | ||||||
| 12-31-2018 | 15.30 | 0.14 | (1.29) | (1.15) | (0.17) | (0.92) | (1.09) | 13.06 | (7.48) | 1.26 | 1.19 | 0.92 | 479 | 18 | ||||||
| 12-31-2017 | 14.33 | 0.13 | 1.88 | 2.01 | (0.14) | (0.90) | (1.04) | 15.30 | 13.99 | 1.24 | 1.19 | 0.81 | 718 | 27 | ||||||
| Class I | ||||||||||||||||||||
| 12-31-2021 | 15.33 | 0.30 | 1.45 | 1.75 | (0.31) | (1.32) | (1.63) | 15.45 | 11.43 | 0.35 | 0.23 | 1.81 | 43 | 30 | ||||||
| 12-31-2020 | 14.10 | 0.22 | 1.91 | 2.13 | (0.22) | (0.68) | (0.90) | 15.33 | 15.33 | 0.34 | 0.22 | 1.55 | 37 | 15 | ||||||
| 12-31-2019 | 12.97 | 0.28 | 2.18 | 2.46 | (0.30) | (1.03) | (1.33) | 14.10 | 18.97 | 0.33 | 0.22 | 1.97 | 41 | 33 | ||||||
| 12-31-2018 | 15.20 | 0.31 | (1.30) | (0.99) | (0.32) | (0.92) | (1.24) | 12.97 | (6.55) | 0.27 | 0.19 | 2.05 | 40 | 18 | ||||||
| 12-31-2017 | 14.24 | 0.35 | 1.80 | 2.15 | (0.29) | (0.90) | (1.19) | 15.20 | 15.15 | 0.23 | 0.18 | 2.25 | 45 | 27 | ||||||
| Class R2 | ||||||||||||||||||||
| 12-31-2021 | 15.34 | 0.23 | 1.45 | 1.68 | (0.24) | (1.32) | (1.56) | 15.46 | 11.01 | 0.72 | 0.61 | 1.42 | 26 | 30 | ||||||
| 12-31-2020 | 14.11 | 0.27 | 1.81 | 2.08 | (0.17) | (0.68) | (0.85) | 15.34 | 14.95 | 0.70 | 0.60 | 1.90 | 23 | 15 | ||||||
| 12-31-2019 | 12.98 | 0.22 | 2.18 | 2.40 | (0.24) | (1.03) | (1.27) | 14.11 | 18.42 | 0.72 | 0.62 | 1.52 | 10 | 33 | ||||||
| 12-31-2018 | 15.20 | 0.25 | (1.29) | (1.04) | (0.26) | (0.92) | (1.18) | 12.98 | (6.85) | 0.66 | 0.59 | 1.62 | 12 | 18 | ||||||
| 12-31-2017 | 14.25 | 0.22 | 1.86 | 2.08 | (0.23) | (0.90) | (1.13) | 15.20 | 14.61 | 0.64 | 0.58 | 1.45 | 14 | 27 | ||||||
| Class R4 | ||||||||||||||||||||
| 12-31-2021 | 15.40 | 0.27 | 1.46 | 1.73 | (0.28) | (1.32) | (1.60) | 15.53 | 11.28 | 0.59 | 0.38 | 1.61 | 8 | 30 | ||||||
| 12-31-2020 | 14.17 | 0.20 | 1.91 | 2.11 | (0.20) | (0.68) | (0.88) | 15.40 | 15.08 | 0.57 | 0.37 | 1.41 | 8 | 15 | ||||||
| 12-31-2019 | 13.03 | 0.26 | 2.18 | 2.44 | (0.27) | (1.03) | (1.30) | 14.17 | 18.79 | 0.57 | 0.37 | 1.82 | 8 | 33 | ||||||
| 12-31-2018 | 15.26 | 0.27 | (1.29) | (1.02) | (0.29) | (0.92) | (1.21) | 13.03 | (6.66) | 0.51 | 0.35 | 1.79 | 7 | 18 | ||||||
| 12-31-2017 | 14.29 | 0.23 | 1.91 | 2.14 | (0.27) | (0.90) | (1.17) | 15.26 | 14.99 | 0.48 | 0.33 | 1.49 | 13 | 27 | ||||||
| Class R5 | ||||||||||||||||||||
| 12-31-2021 | 15.43 | 0.30 | 1.46 | 1.76 | (0.31) | (1.32) | (1.63) | 15.56 | 11.47 | 0.29 | 0.18 | 1.80 | 17 | 30 | ||||||
| 12-31-2020 | 14.19 | 0.23 | 1.92 | 2.15 | (0.23) | (0.68) | (0.91) | 15.43 | 15.36 | 0.27 | 0.17 | 1.65 | 16 | 15 | ||||||
| 12-31-2019 | 13.05 | 0.30 | 2.17 | 2.47 | (0.30) | (1.03) | (1.33) | 14.19 | 18.99 | 0.26 | 0.17 | 2.07 | 14 | 33 | ||||||
| 12-31-2018 | 15.28 | 0.30 | (1.29) | (0.99) | (0.32) | (0.92) | (1.24) | 13.05 | (6.47) | 0.21 | 0.14 | 1.98 | 13 | 18 | ||||||
| 12-31-2017 | 14.31 | 0.30 | 1.87 | 2.17 | (0.30) | (0.90) | (1.20) | 15.28 | 15.19 | 0.19 | 0.14 | 1.95 | 19 | 27 | ||||||
| Class R6 | ||||||||||||||||||||
| 12-31-2021 | 15.32 | 0.31 | 1.45 | 1.76 | (0.32) | (1.32) | (1.64) | 15.44 | 11.54 | 0.24 | 0.13 | 1.91 | 119 | 30 | ||||||
| 12-31-2020 | 14.10 | 0.22 | 1.92 | 2.14 | (0.24) | (0.68) | (0.92) | 15.32 | 15.37 | 0.22 | 0.13 | 1.56 | 126 | 15 | ||||||
| 12-31-2019 | 12.97 | 0.32 | 2.15 | 2.47 | (0.31) | (1.03) | (1.34) | 14.10 | 19.09 | 0.22 | 0.13 | 2.24 | 130 | 33 | ||||||
| 12-31-2018 | 15.20 | 0.35 | (1.33) | (0.98) | (0.33) | (0.92) | (1.25) | 12.97 | (6.45) | 0.16 | 0.09 | 2.29 | 84 | 18 | ||||||
| 12-31-2017 | 14.24 | 0.35 | 1.82 | 2.17 | (0.31) | (0.90) | (1.21) | 15.20 | 15.27 | 0.14 | 0.08 | 2.29 | 73 | 27 | ||||||
| Class 1 | ||||||||||||||||||||
| 12-31-2021 | 15.31 | 0.29 | 1.46 | 1.75 | (0.31) | (1.32) | (1.63) | 15.43 | 11.50 | 0.28 | 0.17 | 1.79 | 7,529 | 30 | ||||||
| 12-31-2020 | 14.09 | 0.23 | 1.90 | 2.13 | (0.23) | (0.68) | (0.91) | 15.31 | 15.33 | 0.26 | 0.16 | 1.61 | 7,795 | 15 | ||||||
| 12-31-2019 | 12.96 | 0.29 | 2.17 | 2.46 | (0.30) | (1.03) | (1.33) | 14.09 | 19.06 | 0.26 | 0.16 | 2.03 | 7,928 | 33 | ||||||
| 12-31-2018 | 15.19 | 0.31 | (1.29) | (0.98) | (0.33) | (0.92) | (1.25) | 12.96 | (6.50) | 0.20 | 0.13 | 2.07 | 7,931 | 18 | ||||||
| 12-31-2017 | 14.24 | 0.29 | 1.86 | 2.15 | (0.30) | (0.90) | (1.20) | 15.19 | 15.14 | 0.17 | 0.12 | 1.90 | 9,797 | 27 | ||||||
| SEE NOTES TO FINANCIAL STATEMENTS | ANNUAL REPORT | JOHN HANCOCK MULTIMANAGER LIFESTYLE PORTFOLIOS | 29 |
| Per share operating performance for a share outstanding throughout each period | Ratios and supplemental data | |||||||||||||||||||
| Income (loss) from investment operations | Less distributions | Ratios to average net assets | ||||||||||||||||||
| Period ended | Net asset value, beginning of period ($) | Net investment income (loss) ($)1, 2 | Net realized and unrealized gain (loss) on investments ($) | Total from investment operations ($) | From net investment income ($) | From net realized gain ($) | Total distributions ($) | Net asset value, end of period ($) | Total return (%)3, 4 | Expenses before reductions (%)5 | Expenses including reductions (%)5 | Net investment income (loss) (%)2 | Net assets, end of period (in millions) | Portfolio turnover (%) | ||||||
| Class 5 | ||||||||||||||||||||
| 12-31-2021 | 15.32 | 0.31 | 1.45 | 1.76 | (0.32) | (1.32) | (1.64) | 15.44 | 11.55 | 0.23 | 0.12 | 1.88 | 185 | 30 | ||||||
| 12-31-2020 | 14.10 | 0.24 | 1.90 | 2.14 | (0.24) | (0.68) | (0.92) | 15.32 | 15.39 | 0.21 | 0.11 | 1.68 | 170 | 15 | ||||||
| 12-31-2019 | 12.97 | 0.30 | 2.17 | 2.47 | (0.31) | (1.03) | (1.34) | 14.10 | 19.10 | 0.21 | 0.11 | 2.12 | 160 | 33 | ||||||
| 12-31-2018 | 15.20 | 0.32 | (1.30) | (0.98) | (0.33) | (0.92) | (1.25) | 12.97 | (6.44) | 0.15 | 0.08 | 2.14 | 143 | 18 | ||||||
| 12-31-2017 | 14.24 | 0.31 | 1.86 | 2.17 | (0.31) | (0.90) | (1.21) | 15.20 | 15.27 | 0.12 | 0.07 | 2.00 | 165 | 27 | ||||||
| 1 Based on average daily shares outstanding. |
| 2 Net investment income is affected by the timing and frequency of the declaration of dividends by the underlying funds in which the portfolio invests. |
| 3 Total returns would have been lower had certain expenses not been reduced during the applicable periods. |
| 4 Does not reflect the effect of sales charges, if any. |
| 5 Ratios do not include expenses indirectly incurred from underlying funds and can vary based on the mix of underlying funds held by the portfolio. |
| 30 | JOHN HANCOCK MULTIMANAGER LIFESTYLE PORTFOLIOS | ANNUAL REPORT | SEE NOTES TO FINANCIAL STATEMENTS |
| Per share operating performance for a share outstanding throughout each period | Ratios and supplemental data | |||||||||||||||||||
| Income (loss) from investment operations | Less distributions | Ratios to average net assets | ||||||||||||||||||
| Period ended | Net asset value, beginning of period ($) | Net investment income (loss) ($)1, 2 | Net realized and unrealized gain (loss) on investments ($) | Total from investment operations ($) | From net investment income ($) | From net realized gain ($) | Total distributions ($) | Net asset value, end of period ($) | Total return (%)3, 4 | Expenses before reductions (%)5 | Expenses including reductions (%)5 | Net investment income (loss) (%)2 | Net assets, end of period (in millions) | Portfolio turnover (%) | ||||||
| Multimanager Lifestyle Moderate Portfolio | ||||||||||||||||||||
| Class A | ||||||||||||||||||||
| 12-31-2021 | 14.16 | 0.29 | 0.76 | 1.05 | (0.28) | (0.88) | (1.16) | 14.05 | 7.46 | 0.65 | 0.56 | 1.93 | 867 | 31 | ||||||
| 12-31-2020 | 13.29 | 0.21 | 1.34 | 1.55 | (0.21) | (0.47) | (0.68) | 14.16 | 11.83 | 0.64 | 0.55 | 1.61 | 778 | 15 | ||||||
| 12-31-2019 | 12.27 | 0.28 | 1.57 | 1.85 | (0.25) | (0.58) | (0.83) | 13.29 | 15.12 | 0.63 | 0.55 | 2.07 | 661 | 37 | ||||||
| 12-31-2018 | 13.83 | 0.30 | (1.01) | (0.71) | (0.31) | (0.54) | (0.85) | 12.27 | (5.19) | 0.56 | 0.50 | 2.19 | 601 | 14 | ||||||
| 12-31-2017 | 13.30 | 0.27 | 1.14 | 1.41 | (0.27) | (0.61) | (0.88) | 13.83 | 10.64 | 0.55 | 0.49 | 1.90 | 693 | 28 | ||||||
| Class C | ||||||||||||||||||||
| 12-31-2021 | 14.24 | 0.16 | 0.79 | 0.95 | (0.18) | (0.88) | (1.06) | 14.13 | 6.68 | 1.35 | 1.26 | 1.08 | 72 | 31 | ||||||
| 12-31-2020 | 13.36 | 0.09 | 1.38 | 1.47 | (0.12) | (0.47) | (0.59) | 14.24 | 11.05 | 1.34 | 1.26 | 0.69 | 105 | 15 | ||||||
| 12-31-2019 | 12.27 | 0.17 | 1.58 | 1.75 | (0.08) | (0.58) | (0.66) | 13.36 | 14.31 | 1.33 | 1.26 | 1.26 | 176 | 37 | ||||||
| 12-31-2018 | 13.83 | 0.19 | (1.00) | (0.81) | (0.21) | (0.54) | (0.75) | 12.27 | (5.86) | 1.26 | 1.20 | 1.36 | 202 | 14 | ||||||
| 12-31-2017 | 13.30 | 0.16 | 1.15 | 1.31 | (0.17) | (0.61) | (0.78) | 13.83 | 9.87 | 1.25 | 1.20 | 1.12 | 299 | 28 | ||||||
| Class I | ||||||||||||||||||||
| 12-31-2021 | 14.06 | 0.34 | 0.75 | 1.09 | (0.33) | (0.88) | (1.21) | 13.94 | 7.77 | 0.35 | 0.26 | 2.31 | 15 | 31 | ||||||
| 12-31-2020 | 13.20 | 0.24 | 1.34 | 1.58 | (0.25) | (0.47) | (0.72) | 14.06 | 12.17 | 0.34 | 0.25 | 1.83 | 11 | 15 | ||||||
| 12-31-2019 | 12.22 | 0.30 | 1.58 | 1.88 | (0.32) | (0.58) | (0.90) | 13.20 | 15.54 | 0.33 | 0.25 | 2.30 | 13 | 37 | ||||||
| 12-31-2018 | 13.78 | 0.37 | (1.04) | (0.67) | (0.35) | (0.54) | (0.89) | 12.22 | (5.00) | 0.28 | 0.20 | 2.70 | 15 | 14 | ||||||
| 12-31-2017 | 13.25 | 0.35 | 1.10 | 1.45 | (0.31) | (0.61) | (0.92) | 13.78 | 11.01 | 0.24 | 0.19 | 2.54 | 14 | 28 | ||||||
| Class R2 | ||||||||||||||||||||
| 12-31-2021 | 14.11 | 0.28 | 0.76 | 1.04 | (0.27) | (0.88) | (1.15) | 14.00 | 7.39 | 0.73 | 0.64 | 1.87 | 10 | 31 | ||||||
| 12-31-2020 | 13.24 | 0.29 | 1.25 | 1.54 | (0.20) | (0.47) | (0.67) | 14.11 | 11.77 | 0.72 | 0.64 | 2.15 | 9 | 15 | ||||||
| 12-31-2019 | 12.22 | 0.26 | 1.57 | 1.83 | (0.23) | (0.58) | (0.81) | 13.24 | 15.10 | 0.71 | 0.64 | 1.93 | 2 | 37 | ||||||
| 12-31-2018 | 13.78 | 0.26 | (0.99) | (0.73) | (0.29) | (0.54) | (0.83) | 12.22 | (5.39) | 0.67 | 0.61 | 1.91 | 3 | 14 | ||||||
| 12-31-2017 | 13.25 | 0.22 | 1.18 | 1.40 | (0.26) | (0.61) | (0.87) | 13.78 | 10.57 | 0.64 | 0.59 | 1.60 | 4 | 28 | ||||||
| Class R4 | ||||||||||||||||||||
| 12-31-2021 | 14.07 | 0.30 | 0.77 | 1.07 | (0.30) | (0.88) | (1.18) | 13.96 | 7.68 | 0.59 | 0.40 | 2.05 | 3 | 31 | ||||||
| 12-31-2020 | 13.21 | 0.23 | 1.33 | 1.56 | (0.23) | (0.47) | (0.70) | 14.07 | 12.00 | 0.58 | 0.40 | 1.70 | 3 | 15 | ||||||
| 12-31-2019 | 12.21 | 0.29 | 1.58 | 1.87 | (0.29) | (0.58) | (0.87) | 13.21 | 15.33 | 0.58 | 0.40 | 2.20 | 3 | 37 | ||||||
| 12-31-2018 | 13.78 | 0.29 | (0.99) | (0.70) | (0.33) | (0.54) | (0.87) | 12.21 | (5.14) | 0.52 | 0.36 | 2.11 | 3 | 14 | ||||||
| 12-31-2017 | 13.24 | 0.25 | 1.19 | 1.44 | (0.29) | (0.61) | (0.90) | 13.78 | 10.93 | 0.49 | 0.34 | 1.78 | 5 | 28 | ||||||
| Class R5 | ||||||||||||||||||||
| 12-31-2021 | 14.07 | 0.33 | 0.76 | 1.09 | (0.33) | (0.88) | (1.21) | 13.95 | 7.82 | 0.29 | 0.20 | 2.24 | 8 | 31 | ||||||
| 12-31-2020 | 13.21 | 0.27 | 1.32 | 1.59 | (0.26) | (0.47) | (0.73) | 14.07 | 12.22 | 0.28 | 0.20 | 2.00 | 9 | 15 | ||||||
| 12-31-2019 | 12.23 | 0.31 | 1.58 | 1.89 | (0.33) | (0.58) | (0.91) | 13.21 | 15.53 | 0.28 | 0.20 | 2.37 | 6 | 37 | ||||||
| 12-31-2018 | 13.79 | 0.32 | (0.99) | (0.67) | (0.35) | (0.54) | (0.89) | 12.23 | (4.87) | 0.21 | 0.15 | 2.37 | 6 | 14 | ||||||
| 12-31-2017 | 13.26 | 0.32 | 1.14 | 1.46 | (0.32) | (0.61) | (0.93) | 13.79 | 11.05 | 0.19 | 0.14 | 2.26 | 10 | 28 | ||||||
| Class R6 | ||||||||||||||||||||
| 12-31-2021 | 14.04 | 0.32 | 0.78 | 1.10 | (0.34) | (0.88) | (1.22) | 13.92 | 7.89 | 0.24 | 0.15 | 2.20 | 28 | 31 | ||||||
| 12-31-2020 | 13.18 | 0.26 | 1.33 | 1.59 | (0.26) | (0.47) | (0.73) | 14.04 | 12.30 | 0.23 | 0.15 | 1.93 | 38 | 15 | ||||||
| 12-31-2019 | 12.21 | 0.33 | 1.56 | 1.89 | (0.34) | (0.58) | (0.92) | 13.18 | 15.65 | 0.23 | 0.15 | 2.47 | 34 | 37 | ||||||
| 12-31-2018 | 13.77 | 0.36 | (1.02) | (0.66) | (0.36) | (0.54) | (0.90) | 12.21 | (4.91) | 0.17 | 0.10 | 2.64 | 24 | 14 | ||||||
| 12-31-2017 | 13.24 | 0.31 | 1.16 | 1.47 | (0.33) | (0.61) | (0.94) | 13.77 | 11.14 | 0.15 | 0.09 | 2.20 | 25 | 28 | ||||||
| Class 1 | ||||||||||||||||||||
| 12-31-2021 | 14.07 | 0.33 | 0.76 | 1.09 | (0.33) | (0.88) | (1.21) | 13.95 | 7.83 | 0.28 | 0.20 | 2.23 | 1,942 | 31 | ||||||
| 12-31-2020 | 13.21 | 0.25 | 1.34 | 1.59 | (0.26) | (0.47) | (0.73) | 14.07 | 12.23 | 0.27 | 0.19 | 1.92 | 2,056 | 15 | ||||||
| 12-31-2019 | 12.23 | 0.31 | 1.58 | 1.89 | (0.33) | (0.58) | (0.91) | 13.21 | 15.65 | 0.26 | 0.19 | 2.37 | 2,113 | 37 | ||||||
| 12-31-2018 | 13.79 | 0.34 | (1.01) | (0.67) | (0.35) | (0.54) | (0.89) | 12.23 | (4.94) | 0.20 | 0.14 | 2.51 | 2,162 | 14 | ||||||
| 12-31-2017 | 13.26 | 0.31 | 1.15 | 1.46 | (0.32) | (0.61) | (0.93) | 13.79 | 11.07 | 0.18 | 0.13 | 2.23 | 2,657 | 28 | ||||||
| SEE NOTES TO FINANCIAL STATEMENTS | ANNUAL REPORT | JOHN HANCOCK MULTIMANAGER LIFESTYLE PORTFOLIOS | 31 |
| Per share operating performance for a share outstanding throughout each period | Ratios and supplemental data | |||||||||||||||||||
| Income (loss) from investment operations | Less distributions | Ratios to average net assets | ||||||||||||||||||
| Period ended | Net asset value, beginning of period ($) | Net investment income (loss) ($)1, 2 | Net realized and unrealized gain (loss) on investments ($) | Total from investment operations ($) | From net investment income ($) | From net realized gain ($) | Total distributions ($) | Net asset value, end of period ($) | Total return (%)3, 4 | Expenses before reductions (%)5 | Expenses including reductions (%)5 | Net investment income (loss) (%)2 | Net assets, end of period (in millions) | Portfolio turnover (%) | ||||||
| Class 5 | ||||||||||||||||||||
| 12-31-2021 | 14.04 | 0.34 | 0.76 | 1.10 | (0.34) | (0.88) | (1.22) | 13.92 | 7.90 | 0.23 | 0.15 | 2.33 | 70 | 31 | ||||||
| 12-31-2020 | 13.18 | 0.26 | 1.34 | 1.60 | (0.27) | (0.47) | (0.74) | 14.04 | 12.32 | 0.22 | 0.14 | 1.98 | 65 | 15 | ||||||
| 12-31-2019 | 12.21 | 0.33 | 1.57 | 1.90 | (0.35) | (0.58) | (0.93) | 13.18 | 15.59 | 0.21 | 0.14 | 2.47 | 60 | 37 | ||||||
| 12-31-2018 | 13.77 | 0.35 | (1.01) | (0.66) | (0.36) | (0.54) | (0.90) | 12.21 | (4.82) | 0.15 | 0.09 | 2.60 | 53 | 14 | ||||||
| 12-31-2017 | 13.24 | 0.33 | 1.14 | 1.47 | (0.33) | (0.61) | (0.94) | 13.77 | 11.14 | 0.13 | 0.08 | 2.33 | 62 | 28 | ||||||
| 1 Based on average daily shares outstanding. |
| 2 Net investment income is affected by the timing and frequency of the declaration of dividends by the underlying funds in which the portfolio invests. |
| 3 Total returns would have been lower had certain expenses not been reduced during the applicable periods. |
| 4 Does not reflect the effect of sales charges, if any. |
| 5 Ratios do not include expenses indirectly incurred from underlying funds and can vary based on the mix of underlying funds held by the portfolio. |
| 32 | JOHN HANCOCK MULTIMANAGER LIFESTYLE PORTFOLIOS | ANNUAL REPORT | SEE NOTES TO FINANCIAL STATEMENTS |
| Per share operating performance for a share outstanding throughout each period | Ratios and supplemental data | |||||||||||||||||||
| Income (loss) from investment operations | Less distributions | Ratios to average net assets | ||||||||||||||||||
| Period ended | Net asset value, beginning of period ($) | Net investment income (loss) ($)1, 2 | Net realized and unrealized gain (loss) on investments ($) | Total from investment operations ($) | From net investment income ($) | From net realized gain ($) | Total distributions ($) | Net asset value, end of period ($) | Total return (%)3, 4 | Expenses before reductions (%)5 | Expenses including reductions (%)5 | Net investment income (loss) (%)2 | Net assets, end of period (in millions) | Portfolio turnover (%) | ||||||
| Multimanager Lifestyle Conservative Portfolio | ||||||||||||||||||||
| Class A | ||||||||||||||||||||
| 12-31-2021 | 13.65 | 0.32 | 0.12 | 0.44 | (0.32) | (0.46) | (0.78) | 13.31 | 3.17 | 0.67 | 0.58 | 2.29 | 866 | 32 | ||||||
| 12-31-2020 | 13.02 | 0.25 | 0.95 | 1.20 | (0.31) | (0.26) | (0.57) | 13.65 | 9.43 | 0.68 | 0.58 | 1.90 | 769 | 20 | ||||||
| 12-31-2019 | 12.10 | 0.30 | 1.09 | 1.39 | (0.23) | (0.24) | (0.47) | 13.02 | 11.57 | 0.65 | 0.58 | 2.31 | 585 | 47 | ||||||
| 12-31-2018 | 13.06 | 0.31 | (0.79) | (0.48) | (0.32) | (0.16) | (0.48) | 12.10 | (3.67) | 0.57 | 0.51 | 2.44 | 526 | 11 | ||||||
| 12-31-2017 | 12.60 | 0.27 | 0.62 | 0.89 | (0.27) | (0.16) | (0.43) | 13.06 | 7.11 | 0.55 | 0.50 | 2.05 | 611 | 26 | ||||||
| Class C | ||||||||||||||||||||
| 12-31-2021 | 13.65 | 0.20 | 0.14 | 0.34 | (0.22) | (0.46) | (0.68) | 13.31 | 2.52 | 1.37 | 1.28 | 1.46 | 61 | 32 | ||||||
| 12-31-2020 | 13.03 | 0.13 | 0.97 | 1.10 | (0.22) | (0.26) | (0.48) | 13.65 | 8.65 | 1.38 | 1.29 | 0.98 | 84 | 20 | ||||||
| 12-31-2019 | 12.10 | 0.19 | 1.12 | 1.31 | (0.14) | (0.24) | (0.38) | 13.03 | 10.80 | 1.35 | 1.28 | 1.51 | 156 | 47 | ||||||
| 12-31-2018 | 13.06 | 0.21 | (0.78) | (0.57) | (0.23) | (0.16) | (0.39) | 12.10 | (4.35) | 1.27 | 1.21 | 1.64 | 180 | 11 | ||||||
| 12-31-2017 | 12.61 | 0.17 | 0.62 | 0.79 | (0.18) | (0.16) | (0.34) | 13.06 | 6.27 | 1.25 | 1.21 | 1.28 | 261 | 26 | ||||||
| Class I | ||||||||||||||||||||
| 12-31-2021 | 13.62 | 0.36 | 0.12 | 0.48 | (0.36) | (0.46) | (0.82) | 13.28 | 3.56 | 0.37 | 0.28 | 2.62 | 23 | 32 | ||||||
| 12-31-2020 | 13.00 | 0.29 | 0.94 | 1.23 | (0.35) | (0.26) | (0.61) | 13.62 | 9.69 | 0.38 | 0.28 | 2.23 | 18 | 20 | ||||||
| 12-31-2019 | 12.08 | 0.33 | 1.10 | 1.43 | (0.27) | (0.24) | (0.51) | 13.00 | 11.92 | 0.36 | 0.28 | 2.56 | 14 | 47 | ||||||
| 12-31-2018 | 13.04 | 0.37 | (0.81) | (0.44) | (0.36) | (0.16) | (0.52) | 12.08 | (3.39) | 0.28 | 0.21 | 2.89 | 15 | 11 | ||||||
| 12-31-2017 | 12.58 | 0.32 | 0.61 | 0.93 | (0.31) | (0.16) | (0.47) | 13.04 | 7.44 | 0.24 | 0.20 | 2.42 | 15 | 26 | ||||||
| Class R2 | ||||||||||||||||||||
| 12-31-2021 | 13.62 | 0.30 | 0.13 | 0.43 | (0.31) | (0.46) | (0.77) | 13.28 | 3.18 | 0.71 | 0.63 | 2.18 | 8 | 32 | ||||||
| 12-31-2020 | 13.01 | 0.33 | 0.84 | 1.17 | (0.30) | (0.26) | (0.56) | 13.62 | 9.26 | 0.75 | 0.67 | 2.53 | 9 | 20 | ||||||
| 12-31-2019 | 12.08 | 0.28 | 1.11 | 1.39 | (0.22) | (0.24) | (0.46) | 13.01 | 11.49 | 0.75 | 0.67 | 2.17 | 3 | 47 | ||||||
| 12-31-2018 | 13.04 | 0.30 | (0.79) | (0.49) | (0.31) | (0.16) | (0.47) | 12.08 | (3.77) | 0.68 | 0.63 | 2.37 | 3 | 11 | ||||||
| 12-31-2017 | 12.59 | 0.23 | 0.64 | 0.87 | (0.26) | (0.16) | (0.42) | 13.04 | 6.91 | 0.63 | 0.58 | 1.73 | 2 | 26 | ||||||
| Class R4 | ||||||||||||||||||||
| 12-31-2021 | 13.62 | 0.32 | 0.13 | 0.45 | (0.34) | (0.46) | (0.80) | 13.27 | 3.33 | 0.62 | 0.43 | 2.35 | 2 | 32 | ||||||
| 12-31-2020 | 12.99 | 0.26 | 0.96 | 1.22 | (0.33) | (0.26) | (0.59) | 13.62 | 9.61 | 0.62 | 0.43 | 1.97 | 3 | 20 | ||||||
| 12-31-2019 | 12.07 | 0.33 | 1.08 | 1.41 | (0.25) | (0.24) | (0.49) | 12.99 | 11.76 | 0.60 | 0.43 | 2.48 | 3 | 47 | ||||||
| 12-31-2018 | 13.03 | 0.32 | (0.78) | (0.46) | (0.34) | (0.16) | (0.50) | 12.07 | (3.54) | 0.52 | 0.36 | 2.46 | 2 | 11 | ||||||
| 12-31-2017 | 12.58 | 0.27 | 0.63 | 0.90 | (0.29) | (0.16) | (0.45) | 13.03 | 7.20 | 0.49 | 0.35 | 2.09 | 4 | 26 | ||||||
| Class R5 | ||||||||||||||||||||
| 12-31-2021 | 13.62 | 0.37 | 0.12 | 0.49 | (0.37) | (0.46) | (0.83) | 13.28 | 3.61 | 0.32 | 0.23 | 2.66 | 3 | 32 | ||||||
| 12-31-2020 | 13.00 | 0.29 | 0.94 | 1.23 | (0.35) | (0.26) | (0.61) | 13.62 | 9.74 | 0.31 | 0.23 | 2.24 | 3 | 20 | ||||||
| 12-31-2019 | 12.08 | 0.34 | 1.10 | 1.44 | (0.28) | (0.24) | (0.52) | 13.00 | 11.97 | 0.30 | 0.23 | 2.63 | 4 | 47 | ||||||
| 12-31-2018 | 13.04 | 0.36 | (0.79) | (0.43) | (0.37) | (0.16) | (0.53) | 12.08 | (3.34) | 0.22 | 0.16 | 2.80 | 4 | 11 | ||||||
| 12-31-2017 | 12.58 | 0.30 | 0.64 | 0.94 | (0.32) | (0.16) | (0.48) | 13.04 | 7.49 | 0.20 | 0.16 | 2.33 | 5 | 26 | ||||||
| Class R6 | ||||||||||||||||||||
| 12-31-2021 | 13.61 | 0.37 | 0.12 | 0.49 | (0.37) | (0.46) | (0.83) | 13.27 | 3.67 | 0.27 | 0.18 | 2.65 | 18 | 32 | ||||||
| 12-31-2020 | 12.99 | 0.28 | 0.96 | 1.24 | (0.36) | (0.26) | (0.62) | 13.61 | 9.80 | 0.27 | 0.18 | 2.15 | 21 | 20 | ||||||
| 12-31-2019 | 12.07 | 0.35 | 1.10 | 1.45 | (0.29) | (0.24) | (0.53) | 12.99 | 12.04 | 0.25 | 0.18 | 2.74 | 26 | 47 | ||||||
| 12-31-2018 | 13.03 | 0.40 | (0.83) | (0.43) | (0.37) | (0.16) | (0.53) | 12.07 | (3.30) | 0.17 | 0.11 | 3.13 | 21 | 11 | ||||||
| 12-31-2017 | 12.57 | 0.33 | 0.62 | 0.95 | (0.33) | (0.16) | (0.49) | 13.03 | 7.56 | 0.15 | 0.10 | 2.53 | 16 | 26 | ||||||
| Class 1 | ||||||||||||||||||||
| 12-31-2021 | 13.62 | 0.36 | 0.12 | 0.48 | (0.37) | (0.46) | (0.83) | 13.27 | 3.55 | 0.31 | 0.22 | 2.58 | 1,444 | 32 | ||||||
| 12-31-2020 | 12.99 | 0.29 | 0.96 | 1.25 | (0.36) | (0.26) | (0.62) | 13.62 | 9.85 | 0.30 | 0.22 | 2.20 | 1,599 | 20 | ||||||
| 12-31-2019 | 12.07 | 0.34 | 1.10 | 1.44 | (0.28) | (0.24) | (0.52) | 12.99 | 11.99 | 0.29 | 0.22 | 2.63 | 1,583 | 47 | ||||||
| 12-31-2018 | 13.03 | 0.36 | (0.79) | (0.43) | (0.37) | (0.16) | (0.53) | 12.07 | (3.33) | 0.21 | 0.15 | 2.78 | 1,573 | 11 | ||||||
| 12-31-2017 | 12.58 | 0.31 | 0.62 | 0.93 | (0.32) | (0.16) | (0.48) | 13.03 | 7.43 | 0.18 | 0.14 | 2.37 | 1,931 | 26 | ||||||
| 1 Based on average daily shares outstanding. |
| 2 Net investment income is affected by the timing and frequency of the declaration of dividends by the underlying funds in which the portfolio invests. |
| 3 Total returns would have been lower had certain expenses not been reduced during the applicable periods. |
| 4 Does not reflect the effect of sales charges, if any. |
| 5 Ratios do not include expenses indirectly incurred from underlying funds and can vary based on the mix of underlying funds held by the portfolio. |
| SEE NOTES TO FINANCIAL STATEMENTS | ANNUAL REPORT | JOHN HANCOCK MULTIMANAGER LIFESTYLE PORTFOLIOS | 33 |
| 34 | JOHN HANCOCK MULTIMANAGER LIFESTYLE PORTFOLIOS | ANNUAL REPORT |
| Total value at 12-31-21 | Level 1 quoted price | Level 2 significant observable inputs | Level 3 significant unobservable inputs | |
| Multimanager Lifestyle Aggressive Portfolio | ||||
| Investments in securities: | ||||
| Assets | ||||
| Affiliated investment companies | $3,957,703,680 | $3,957,703,680 | — | — |
| Common stocks | 152,005 | — | — | $152,005 |
| U.S. Government and Agency obligations | 38,715,850 | — | $38,715,850 | — |
| Short-term investments | 1,023 | 1,023 | — | — |
| Total investments in securities | $3,996,572,558 | $3,957,704,703 | $38,715,850 | $152,005 |
| Multimanager Lifestyle Growth Portfolio | ||||
| Investments in securities: | ||||
| Assets | ||||
| Affiliated investment companies | $10,702,859,525 | $10,702,859,525 | — | — |
| Common stocks | 345,335 | — | — | $345,335 |
| U.S. Government and Agency obligations | 445,755,808 | — | $445,755,808 | — |
| Short-term investments | 1,023 | 1,023 | — | — |
| Total investments in securities | $11,148,961,691 | $10,702,860,548 | $445,755,808 | $345,335 |
| Multimanager Lifestyle Balanced Portfolio | ||||
| Investments in securities: | ||||
| Assets | ||||
| Affiliated investment companies | $9,536,254,569 | $9,536,254,569 | — | — |
| Common stocks | 213,986 | — | — | $213,986 |
| U.S. Government and Agency obligations | 841,216,106 | — | $841,216,106 | — |
| Short-term investments | 1,023 | 1,023 | — | — |
| Total investments in securities | $10,377,685,684 | $9,536,255,592 | $841,216,106 | $213,986 |
| Multimanager Lifestyle Moderate Portfolio | ||||
| Investments in securities: | ||||
| Assets | ||||
| Affiliated investment companies | $2,760,132,675 | $2,760,132,675 | — | — |
| Common stocks | 35,891 | — | — | $35,891 |
| U.S. Government and Agency obligations | 254,475,478 | — | $254,475,478 | — |
| Short-term investments | 1,023 | 1,023 | — | — |
| Total investments in securities | $3,014,645,067 | $2,760,133,698 | $254,475,478 | $35,891 |
| Multimanager Lifestyle Conservative Portfolio | ||||
| Investments in securities: | ||||
| Assets |
| ANNUAL REPORT | JOHN HANCOCK MULTIMANAGER LIFESTYLE PORTFOLIOS | 35 |
| Total value at 12-31-21 | Level 1 quoted price | Level 2 significant observable inputs | Level 3 significant unobservable inputs | |
| Multimanager Lifestyle Conservative Portfolio (continued) | ||||
| Affiliated investment companies | $2,201,930,640 | $2,201,930,640 | — | — |
| U.S. Government and Agency obligations | 222,768,361 | — | $222,768,361 | — |
| Short-term investments | 1,023 | 1,023 | — | — |
| Total investments in securities | $2,424,700,024 | $2,201,931,663 | $222,768,361 | — |
| Portfolio | Commitment fee |
| Multimanager Lifestyle Aggressive Portfolio | $19,382 |
| Multimanager Lifestyle Growth Portfolio | 46,419 |
| Multimanager Lifestyle Balanced Portfolio | 43,777 |
| Multimanager Lifestyle Moderate Portfolio | 15,987 |
| Multimanager Lifestyle Conservative Portfolio | 13,770 |
| 36 | JOHN HANCOCK MULTIMANAGER LIFESTYLE PORTFOLIOS | ANNUAL REPORT |
| Portfolio | Aggregate cost | Unrealized appreciation | Unrealized (depreciation) | Net unrealized appreciation/ (depreciation) |
| Multimanager Lifestyle Aggressive Portfolio | $3,030,048,562 | $976,853,570 | $(10,329,574) | $966,523,996 |
| Multimanager Lifestyle Growth Portfolio | 8,901,263,736 | 2,280,609,281 | (32,911,326) | 2,247,697,955 |
| Multimanager Lifestyle Balanced Portfolio | 8,734,389,055 | 1,684,360,011 | (41,063,382) | 1,643,296,629 |
| Multimanager Lifestyle Moderate Portfolio | 2,699,879,538 | 325,895,092 | (11,129,563) | 314,765,529 |
| Multimanager Lifestyle Conservative Portfolio | 2,310,035,183 | 123,104,566 | (8,439,725) | 114,664,841 |
| Portfolio | Ordinary Income | Long Term Capital Gains | Total |
| Multimanager Lifestyle Aggressive Portfolio | $133,690,999 | $265,477,276 | $399,168,275 |
| Multimanager Lifestyle Growth Portfolio | 381,891,494 | 694,659,470 | 1,076,550,964 |
| Multimanager Lifestyle Balanced Portfolio | 375,654,306 | 626,254,159 | 1,001,908,465 |
| Multimanager Lifestyle Moderate Portfolio | 102,030,347 | 140,864,425 | 242,894,772 |
| Multimanager Lifestyle Conservative Portfolio | 76,422,647 | 66,460,905 | 142,883,552 |
| Portfolio | Ordinary Income | Long Term Capital Gains | Total |
| Multimanager Lifestyle Aggressive Portfolio | $71,894,814 | $149,119,139 | $221,013,953 |
| Multimanager Lifestyle Growth Portfolio | 253,110,857 | 402,517,386 | 655,628,243 |
| Multimanager Lifestyle Balanced Portfolio | 276,188,743 | 316,490,555 | 592,679,298 |
| Multimanager Lifestyle Moderate Portfolio | 93,313,951 | 57,941,413 | 151,255,364 |
| Multimanager Lifestyle Conservative Portfolio | 97,756,283 | 9,712,681 | 107,468,964 |
| Portfolio | Undistributed Ordinary Income | Undistributed Long Term Capital Gains |
| Multimanager Lifestyle Aggressive Portfolio | $2,512,684 | $373,398,840 |
| Multimanager Lifestyle Growth Portfolio | 7,364,880 | 894,126,856 |
| Multimanager Lifestyle Balanced Portfolio | 10,345,064 | 646,427,897 |
| Multimanager Lifestyle Moderate Portfolio | 1,650,735 | 123,586,715 |
| Multimanager Lifestyle Conservative Portfolio | — | 49,047,714 |
| ANNUAL REPORT | JOHN HANCOCK MULTIMANAGER LIFESTYLE PORTFOLIOS | 37 |
| First $7.5 billion of aggregate net assets | Excess over $7.5 billion of aggregate net assets | |
| JHF II or JHF III fund assets | 0.050% | 0.040% |
| Other assets | 0.500% | 0.490% |
| Expense reimbursement by class | ||||||||||
| Portfolio | Class A | Class C | Class I | Class R2 | Class R4 | Class R5 | Class R6 | Class 1 | Class 5 | Total |
| Multimanager Lifestyle Aggressive Portfolio | $935,422 | $84,991 | $14,189 | $18,528 | $3,949 | $3,420 | $78,151 | $4,520,325 | — | $5,658,975 |
| Multimanager Lifestyle Growth Portfolio | 2,715,665 | 263,878 | 49,959 | 35,130 | 6,155 | 8,226 | 160,888 | 10,244,661 | $495,400 | 13,979,962 |
| Multimanager Lifestyle Balanced Portfolio | 2,510,871 | 219,910 | 46,199 | 26,929 | 8,425 | 18,747 | 120,863 | 8,510,270 | 197,157 | 11,659,371 |
| Multimanager Lifestyle Moderate Portfolio | 773,640 | 76,156 | 12,046 | 8,334 | 2,686 | 7,597 | 28,932 | 1,809,107 | 61,065 | 2,779,563 |
| Multimanager Lifestyle Conservative Portfolio | 741,300 | 61,169 | 19,151 | 7,501 | 2,262 | 2,574 | 16,009 | 1,342,023 | — | 2,191,989 |
| 38 | JOHN HANCOCK MULTIMANAGER LIFESTYLE PORTFOLIOS | ANNUAL REPORT |
| Portfolio | Net Annual Effective Rate |
| Multimanager Lifestyle Aggressive Portfolio | 0.06% |
| Multimanager Lifestyle Growth Portfolio | 0.08% |
| Multimanager Lifestyle Balanced Portfolio | 0.10% |
| Portfolio | Net Annual Effective Rate |
| Multimanager Lifestyle Moderate Portfolio | 0.12% |
| Multimanager Lifestyle Conservative Portfolio | 0.14% |
| Class | Rule 12b-1 Fee | Service fee |
| Class A | 0.30% | — |
| Class C | 1.00% | — |
| Class R2 | 0.25% | 0.25% |
| Class R4 | 0.25% | 0.10% |
| Class R5 | — | 0.05% |
| Class 1 | 0.05% | — |
| Portfolio | Class R4 |
| Multimanager Lifestyle Aggressive Portfolio | $2,852 |
| Multimanager Lifestyle Growth Portfolio | 5,047 |
| Multimanager Lifestyle Balanced Portfolio | 7,738 |
| Portfolio | Class R4 |
| Multimanager Lifestyle Moderate Portfolio | $3,017 |
| Multimanager Lifestyle Conservative Portfolio | 2,604 |
| Multimanager Lifestyle Aggressive Portfolio | Multimanager Lifestyle Growth Portfolio | Multimanager Lifestyle Balanced Portfolio | Multimanager Lifestyle Moderate Portfolio | Multimanager Lifestyle Conservative Portfolio | |
| Total sales charges | $265,765 | $887,046 | $727,920 | $379,983 | $385,022 |
| Retained for printing prospectus, advertising and sales literature | 28,635 | 99,310 | 79,648 | 33,527 | 40,682 |
| Sales commission to unrelated broker-dealers | 237,130 | 787,736 | 648,272 | 346,456 | 344,340 |
| Portfolio | Class A | Class C |
| Multimanager Lifestyle Aggressive Portfolio | $4,975 | $4,285 |
| Multimanager Lifestyle Growth Portfolio | 25,716 | 15,357 |
| Multimanager Lifestyle Balanced Portfolio | 28,823 | 9,628 |
| Multimanager Lifestyle Moderate Portfolio | 14,076 | 6,391 |
| Multimanager Lifestyle Conservative Portfolio | 60,031 | 1,903 |
| ANNUAL REPORT | JOHN HANCOCK MULTIMANAGER LIFESTYLE PORTFOLIOS | 39 |
| Portfolio | Class | Distribution and service fees | Transfer agent fees |
| Multimanager Lifestyle Aggressive Portfolio | Class A | $1,968,737 | $744,171 |
| Class C | 613,493 | 69,507 | |
| Class I | — | 11,229 | |
| Class R2 | 64,639 | 1,228 | |
| Class R4 | 9,987 | 263 | |
| Class R5 | 1,212 | 228 | |
| Class R6 | — | 5,178 | |
| Class 1 | 1,627,772 | — | |
| Total | $4,285,840 | $831,804 | |
| Multimanager Lifestyle Growth Portfolio | Class A | $6,493,585 | $2,454,077 |
| Class C | 2,177,365 | 246,640 | |
| Class I | — | 45,080 | |
| Class R2 | 140,143 | 2,661 | |
| Class R4 | 17,516 | 467 | |
| Class R5 | 3,375 | 622 | |
| Class R6 | — | 12,192 | |
| Class 1 | 4,206,645 | — | |
| Total | $13,038,629 | $2,761,739 | |
| Multimanager Lifestyle Balanced Portfolio | Class A | $6,703,613 | $2,533,025 |
| Class C | 2,033,430 | 230,206 | |
| Class I | — | 46,533 | |
| Class R2 | 118,057 | 2,282 | |
| Class R4 | 27,081 | 719 | |
| Class R5 | 8,481 | 1,599 | |
| Class R6 | — | 10,201 | |
| Class 1 | 3,912,346 | — | |
| Total | $12,803,008 | $2,824,565 | |
| Multimanager Lifestyle Moderate Portfolio | Class A | $2,509,390 | $947,991 |
| Class C | 860,479 | 97,381 | |
| Class I | — | 14,725 | |
| Class R2 | 45,182 | 864 | |
| Class R4 | 10,549 | 280 | |
| Class R5 | 4,191 | 792 | |
| Class R6 | — | 3,036 | |
| Class 1 | 1,017,258 | — | |
| Total | $4,447,049 | $1,065,069 | |
| Multimanager Lifestyle Conservative Portfolio | Class A | $2,463,867 | $930,723 |
| Class C | 703,621 | 79,626 | |
| Class I | — | 24,043 | |
| Class R2 | 38,394 | 801 | |
| Class R4 | 9,125 | 242 | |
| Class R5 | 1,481 | 273 | |
| Class R6 | — | 1,708 | |
| Class 1 | 771,872 | — | |
| Total | $3,988,360 | $1,037,416 |
| 40 | JOHN HANCOCK MULTIMANAGER LIFESTYLE PORTFOLIOS | ANNUAL REPORT |
| Multimanager Lifestyle Aggressive Portfolio | Year Ended 12-31-21 | Year Ended 12-31-20 | ||
| Shares | Amount | Shares | Amount | |
| Class A shares | ||||
| Sold | 3,947,945 | $70,351,101 | 6,086,715 | $85,704,177 |
| Distributions reinvested | 3,776,820 | 64,243,198 | 2,024,949 | 32,479,983 |
| Repurchased | (5,263,600) | (93,926,019) | (7,267,080) | (100,404,825) |
| Net increase | 2,461,165 | $40,668,280 | 844,584 | $17,779,335 |
| Class B shares | ||||
| Sold | — | — | 2,473 | $26,621 |
| Repurchased | — | — | (241,424) | (3,373,144) |
| Net decrease | — | — | (238,951) | $(3,346,523) |
| Class C shares | ||||
| Sold | 390,579 | $6,973,832 | 537,503 | $7,230,838 |
| Distributions reinvested | 302,361 | 5,155,251 | 197,540 | 3,176,435 |
| Repurchased | (1,311,577) | (23,287,703) | (2,894,100) | (42,118,060) |
| Net decrease | (618,637) | $(11,158,620) | (2,159,057) | $(31,710,787) |
| Class I shares | ||||
| Sold | 428,512 | $7,734,164 | 272,837 | $3,861,658 |
| Distributions reinvested | 56,401 | 955,433 | 24,976 | 399,117 |
| Repurchased | (329,764) | (5,986,087) | (602,711) | (8,226,902) |
| Net increase (decrease) | 155,149 | $2,703,510 | (304,898) | $(3,966,127) |
| Class R1 shares | ||||
| Sold | — | — | 39,411 | $533,386 |
| Repurchased | — | — | (366,818) | (5,479,027) |
| Net decrease | — | — | (327,407) | $(4,945,641) |
| Class R2 shares | ||||
| Sold | 192,221 | $3,427,944 | 560,266 | $8,472,180 |
| Distributions reinvested | 77,638 | 1,307,416 | 35,455 | 563,739 |
| Repurchased | (123,808) | (2,199,263) | (222,982) | (3,241,296) |
| Net increase | 146,051 | $2,536,097 | 372,739 | $5,794,623 |
| Class R3 shares | ||||
| Sold | — | — | 110,013 | $1,490,697 |
| Repurchased | — | — | (696,983) | (8,697,718) |
| Net decrease | — | — | (586,970) | $(7,207,021) |
| Class R4 shares | ||||
| Sold | 21,528 | $379,061 | 109,807 | $1,545,287 |
| Distributions reinvested | 17,167 | 290,114 | 14,201 | 226,503 |
| Repurchased | (22,197) | (393,084) | (304,257) | (4,474,787) |
| Net increase (decrease) | 16,498 | $276,091 | (180,249) | $(2,702,997) |
| Class R5 shares | ||||
| Sold | 24,461 | $447,525 | 93,372 | $1,249,256 |
| Distributions reinvested | 15,415 | 261,287 | 9,378 | 149,960 |
| Repurchased | (46,500) | (799,950) | (117,354) | (1,536,515) |
| Net decrease | (6,624) | $(91,138) | (14,604) | $(137,299) |
| ANNUAL REPORT | JOHN HANCOCK MULTIMANAGER LIFESTYLE PORTFOLIOS | 41 |
| Multimanager Lifestyle Aggressive Portfolio , Cont’d | Year Ended 12-31-21 | Year Ended 12-31-20 | ||
| Shares | Amount | Shares | Amount | |
| Class R6 shares | ||||
| Sold | 1,119,457 | $19,992,916 | 1,105,352 | $15,585,767 |
| Distributions reinvested | 343,025 | 5,810,839 | 184,821 | 2,953,440 |
| Repurchased | (1,201,842) | (20,951,538) | (1,538,381) | (23,034,395) |
| Net increase (decrease) | 260,640 | $4,852,217 | (248,208) | $(4,495,188) |
| Class 1 shares | ||||
| Sold | 1,465,686 | $26,276,932 | 1,992,399 | $25,313,596 |
| Distributions reinvested | 18,951,839 | 320,286,070 | 11,331,504 | 180,624,181 |
| Repurchased | (25,997,280) | (463,211,878) | (29,428,069) | (415,344,219) |
| Net decrease | (5,579,755) | $(116,648,876) | (16,104,166) | $(209,406,442) |
| Total net decrease | (3,165,513) | $(76,862,439) | (18,947,187) | $(244,344,067) |
| Multimanager Lifestyle Growth Portfolio | Year Ended 12-31-21 | Year Ended 12-31-20 | ||
| Shares | Amount | Shares | Amount | |
| Class A shares | ||||
| Sold | 13,694,823 | $237,184,360 | 20,358,969 | $295,912,809 |
| Distributions reinvested | 12,424,385 | 204,256,277 | 7,066,372 | 111,719,426 |
| Repurchased | (16,679,890) | (289,580,408) | (21,235,684) | (299,054,108) |
| Net increase | 9,439,318 | $151,860,229 | 6,189,657 | $108,578,127 |
| Class B shares | ||||
| Sold | — | — | 4,630 | $61,457 |
| Repurchased | — | — | (966,647) | (13,549,599) |
| Net decrease | — | — | (962,017) | $(13,488,142) |
| Class C shares | ||||
| Sold | 1,028,838 | $17,762,572 | 1,312,187 | $18,278,392 |
| Distributions reinvested | 990,396 | 16,291,925 | 795,003 | 12,576,118 |
| Repurchased | (6,058,779) | (104,489,617) | (13,295,611) | (194,693,844) |
| Net decrease | (4,039,545) | $(70,435,120) | (11,188,421) | $(163,839,334) |
| Class I shares | ||||
| Sold | 1,144,187 | $19,866,733 | 1,242,338 | $17,646,647 |
| Distributions reinvested | 233,090 | 3,804,022 | 125,089 | 1,963,899 |
| Repurchased | (1,062,520) | (18,426,902) | (1,438,527) | (20,109,083) |
| Net increase (decrease) | 314,757 | $5,243,853 | (71,100) | $(498,537) |
| Class R1 shares | ||||
| Sold | — | — | 51,066 | $720,942 |
| Repurchased | — | — | (976,934) | (14,548,178) |
| Net decrease | — | — | (925,868) | $(13,827,236) |
| Class R2 shares | ||||
| Sold | 283,892 | $4,918,580 | 1,169,880 | $17,597,129 |
| Distributions reinvested | 162,637 | 2,647,734 | 89,270 | 1,398,866 |
| Repurchased | (262,356) | (4,454,393) | (353,908) | (4,993,345) |
| Net increase | 184,173 | $3,111,921 | 905,242 | $14,002,650 |
| Class R3 shares | ||||
| Sold | — | — | 76,339 | $1,005,047 |
| Repurchased | — | — | (907,250) | (12,291,606) |
| Net decrease | — | — | (830,911) | $(11,286,559) |
| 42 | JOHN HANCOCK MULTIMANAGER LIFESTYLE PORTFOLIOS | ANNUAL REPORT |
| Multimanager Lifestyle Growth Portfolio , Cont’d | Year Ended 12-31-21 | Year Ended 12-31-20 | ||
| Shares | Amount | Shares | Amount | |
| Class R4 shares | ||||
| Sold | 41,332 | $729,694 | 31,752 | $445,481 |
| Distributions reinvested | 30,142 | 494,938 | 20,498 | 323,461 |
| Repurchased | (45,763) | (810,561) | (164,890) | (2,514,990) |
| Net increase (decrease) | 25,711 | $414,071 | (112,640) | $(1,746,048) |
| Class R5 shares | ||||
| Sold | 43,307 | $746,560 | 73,255 | $1,079,425 |
| Distributions reinvested | 40,893 | 673,106 | 28,713 | 454,533 |
| Repurchased | (134,586) | (2,217,611) | (202,220) | (3,010,093) |
| Net decrease | (50,386) | $(797,945) | (100,252) | $(1,476,135) |
| Class R6 shares | ||||
| Sold | 1,937,607 | $33,342,345 | 3,154,048 | $44,348,877 |
| Distributions reinvested | 749,646 | 12,249,215 | 451,327 | 7,094,853 |
| Repurchased | (2,631,338) | (44,618,664) | (4,297,731) | (62,987,243) |
| Net increase (decrease) | 55,915 | $972,896 | (692,356) | $(11,543,513) |
| Class 1 shares | ||||
| Sold | 1,257,038 | $21,682,937 | 1,376,173 | $19,126,698 |
| Distributions reinvested | 48,460,129 | 791,838,506 | 31,501,085 | 495,197,048 |
| Repurchased | (73,569,726) | (1,269,931,314) | (84,565,466) | (1,200,817,960) |
| Net decrease | (23,852,559) | $(456,409,871) | (51,688,208) | $(686,494,214) |
| Class 5 shares | ||||
| Sold | 750,012 | $12,968,948 | 531,380 | $7,337,172 |
| Distributions reinvested | 2,486,233 | 40,550,453 | 1,434,709 | 22,510,588 |
| Repurchased | (1,344,604) | (23,388,342) | (1,759,595) | (25,244,643) |
| Net increase | 1,891,641 | $30,131,059 | 206,494 | $4,603,117 |
| Total net decrease | (16,030,975) | $(335,908,907) | (59,270,380) | $(777,015,824) |
| Multimanager Lifestyle Balanced Portfolio | Year Ended 12-31-21 | Year Ended 12-31-20 | ||
| Shares | Amount | Shares | Amount | |
| Class A shares | ||||
| Sold | 17,393,567 | $285,892,058 | 24,299,951 | $349,843,636 |
| Distributions reinvested | 13,424,407 | 209,694,558 | 7,231,570 | 109,771,249 |
| Repurchased | (19,366,911) | (318,870,122) | (23,591,061) | (330,237,925) |
| Net increase | 11,451,063 | $176,716,494 | 7,940,460 | $129,376,960 |
| Class B shares | ||||
| Sold | — | — | 6,737 | $92,800 |
| Distributions reinvested | — | — | 133 | 1,892 |
| Repurchased | — | — | (1,046,587) | (14,559,808) |
| Net decrease | — | — | (1,039,717) | $(14,465,116) |
| Class C shares | ||||
| Sold | 720,710 | $11,848,726 | 982,496 | $13,650,873 |
| Distributions reinvested | 941,452 | 14,657,422 | 755,164 | 11,590,741 |
| Repurchased | (6,585,451) | (107,882,108) | (15,291,770) | (220,829,022) |
| Net decrease | (4,923,289) | $(81,375,960) | (13,554,110) | $(195,587,408) |
| ANNUAL REPORT | JOHN HANCOCK MULTIMANAGER LIFESTYLE PORTFOLIOS | 43 |
| Multimanager Lifestyle Balanced Portfolio , Cont’d | Year Ended 12-31-21 | Year Ended 12-31-20 | ||
| Shares | Amount | Shares | Amount | |
| Class I shares | ||||
| Sold | 1,052,354 | $17,224,808 | 968,377 | $13,616,537 |
| Distributions reinvested | 255,678 | 3,964,550 | 131,630 | 1,972,681 |
| Repurchased | (908,185) | (14,802,293) | (1,596,542) | (22,115,621) |
| Net increase (decrease) | 399,847 | $6,387,065 | (496,535) | $(6,526,403) |
| Class R1 shares | ||||
| Sold | — | — | 30,893 | $423,672 |
| Distributions reinvested | — | — | 1,447 | 19,435 |
| Repurchased | — | — | (638,082) | (9,237,984) |
| Net decrease | — | — | (605,742) | $(8,794,877) |
| Class R2 shares | ||||
| Sold | 353,687 | $5,833,371 | 1,205,477 | $17,926,311 |
| Distributions reinvested | 136,582 | 2,116,375 | 65,726 | 1,001,253 |
| Repurchased | (317,913) | (5,183,971) | (485,261) | (6,759,643) |
| Net increase | 172,356 | $2,765,775 | 785,942 | $12,167,921 |
| Class R3 shares | ||||
| Sold | — | — | 125,779 | $1,724,711 |
| Distributions reinvested | — | — | 3,189 | 42,253 |
| Repurchased | — | — | (1,408,170) | (19,358,923) |
| Net decrease | — | — | (1,279,202) | $(17,591,959) |
| Class R4 shares | ||||
| Sold | 63,251 | $1,045,228 | 53,055 | $742,487 |
| Distributions reinvested | 47,600 | 741,486 | 28,567 | 431,209 |
| Repurchased | (114,577) | (1,887,729) | (100,824) | (1,391,254) |
| Net decrease | (3,726) | $(101,015) | (19,202) | $(217,558) |
| Class R5 shares | ||||
| Sold | 121,144 | $1,964,525 | 242,367 | $3,400,120 |
| Distributions reinvested | 105,457 | 1,648,465 | 60,074 | 906,860 |
| Repurchased | (168,913) | (2,788,616) | (249,797) | (3,438,301) |
| Net increase | 57,688 | $824,374 | 52,644 | $868,679 |
| Class R6 shares | ||||
| Sold | 2,809,050 | $45,698,889 | 4,090,616 | $57,193,226 |
| Distributions reinvested | 719,028 | 11,144,604 | 468,812 | 6,984,457 |
| Repurchased | (4,052,806) | (64,188,473) | (5,515,427) | (80,672,438) |
| Net decrease | (524,728) | $(7,344,980) | (955,999) | $(16,494,755) |
| Class 1 shares | ||||
| Sold | 1,799,823 | $29,446,376 | 2,359,124 | $32,096,135 |
| Distributions reinvested | 47,548,229 | 737,160,592 | 29,964,589 | 448,254,151 |
| Repurchased | (70,543,999) | (1,150,051,991) | (85,815,722) | (1,198,083,171) |
| Net decrease | (21,195,947) | $(383,445,023) | (53,492,009) | $(717,732,885) |
| Class 5 shares | ||||
| Sold | 651,202 | $10,647,912 | 471,283 | $6,491,845 |
| Distributions reinvested | 1,159,842 | 17,992,698 | 652,455 | 9,760,567 |
| Repurchased | (876,519) | (14,364,158) | (1,435,002) | (20,198,491) |
| Net increase (decrease) | 934,525 | $14,276,452 | (311,264) | $(3,946,079) |
| Total net decrease | (13,632,211) | $(271,296,818) | (62,974,734) | $(838,943,480) |
| 44 | JOHN HANCOCK MULTIMANAGER LIFESTYLE PORTFOLIOS | ANNUAL REPORT |
| Multimanager Lifestyle Moderate Portfolio | Year Ended 12-31-21 | Year Ended 12-31-20 | ||
| Shares | Amount | Shares | Amount | |
| Class A shares | ||||
| Sold | 10,851,331 | $159,702,120 | 12,677,036 | $170,088,947 |
| Distributions reinvested | 4,600,189 | 64,952,906 | 2,511,977 | 34,876,204 |
| Repurchased | (8,630,262) | (127,042,478) | (10,037,105) | (131,970,595) |
| Net increase | 6,821,258 | $97,612,548 | 5,151,908 | $72,994,556 |
| Class B shares | ||||
| Sold | — | — | 3,321 | $36,755 |
| Distributions reinvested | — | — | 772 | 9,837 |
| Repurchased | — | — | (430,315) | (5,718,499) |
| Net decrease | — | — | (426,222) | $(5,671,907) |
| Class C shares | ||||
| Sold | 663,818 | $9,842,735 | 684,948 | $9,227,609 |
| Distributions reinvested | 360,274 | 5,104,939 | 308,673 | 4,331,462 |
| Repurchased | (3,307,719) | (48,822,326) | (6,815,481) | (92,603,221) |
| Net decrease | (2,283,627) | $(33,874,652) | (5,821,860) | $(79,044,150) |
| Class I shares | ||||
| Sold | 503,093 | $7,364,807 | 384,470 | $5,122,725 |
| Distributions reinvested | 80,575 | 1,129,238 | 37,729 | 517,056 |
| Repurchased | (287,047) | (4,199,886) | (598,558) | (7,796,518) |
| Net increase (decrease) | 296,621 | $4,294,159 | (176,359) | $(2,156,737) |
| Class R1 shares | ||||
| Sold | — | — | 22,017 | $288,305 |
| Distributions reinvested | — | — | 1,737 | 22,221 |
| Repurchased | — | — | (346,166) | (4,721,370) |
| Net decrease | — | — | (322,412) | $(4,410,844) |
| Class R2 shares | ||||
| Sold | 193,946 | $2,865,121 | 527,144 | $7,275,988 |
| Distributions reinvested | 50,868 | 715,347 | 23,467 | 328,824 |
| Repurchased | (156,864) | (2,304,128) | (103,941) | (1,409,115) |
| Net increase | 87,950 | $1,276,340 | 446,670 | $6,195,697 |
| Class R3 shares | ||||
| Sold | — | — | 42,092 | $538,025 |
| Distributions reinvested | — | — | 2,450 | 30,889 |
| Repurchased | — | — | (519,232) | (6,747,319) |
| Net decrease | — | — | (474,690) | $(6,178,405) |
| Class R4 shares | ||||
| Sold | 44,609 | $653,967 | 59,890 | $806,258 |
| Distributions reinvested | 17,136 | 240,574 | 11,406 | 156,719 |
| Repurchased | (62,788) | (917,487) | (98,238) | (1,317,813) |
| Net decrease | (1,043) | $(22,946) | (26,942) | $(354,836) |
| Class R5 shares | ||||
| Sold | 68,678 | $1,000,116 | 297,174 | $3,943,214 |
| Distributions reinvested | 48,757 | 684,494 | 30,613 | 421,145 |
| Repurchased | (125,469) | (1,824,594) | (177,623) | (2,366,943) |
| Net increase (decrease) | (8,034) | $(139,984) | 150,164 | $1,997,416 |
| ANNUAL REPORT | JOHN HANCOCK MULTIMANAGER LIFESTYLE PORTFOLIOS | 45 |
| Multimanager Lifestyle Moderate Portfolio , Cont’d | Year Ended 12-31-21 | Year Ended 12-31-20 | ||
| Shares | Amount | Shares | Amount | |
| Class R6 shares | ||||
| Sold | 1,042,171 | $14,974,192 | 1,292,098 | $16,697,725 |
| Distributions reinvested | 156,013 | 2,187,489 | 115,302 | 1,576,143 |
| Repurchased | (1,849,145) | (26,847,203) | (1,322,419) | (17,791,096) |
| Net increase (decrease) | (650,961) | $(9,685,522) | 84,981 | $482,772 |
| Class 1 shares | ||||
| Sold | 2,234,127 | $32,592,680 | 2,606,193 | $34,300,215 |
| Distributions reinvested | 11,382,109 | 159,818,494 | 7,601,568 | 104,269,552 |
| Repurchased | (20,610,599) | (302,394,765) | (24,037,423) | (313,709,998) |
| Net decrease | (6,994,363) | $(109,983,591) | (13,829,662) | $(175,140,231) |
| Class 5 shares | ||||
| Sold | 396,634 | $5,804,117 | 540,064 | $7,075,084 |
| Distributions reinvested | 410,312 | 5,747,962 | 241,052 | 3,299,848 |
| Repurchased | (387,560) | (5,679,492) | (718,444) | (9,561,256) |
| Net increase | 419,386 | $5,872,587 | 62,672 | $813,676 |
| Total net decrease | (2,312,813) | $(44,651,061) | (15,181,752) | $(190,472,993) |
| Multimanager Lifestyle Conservative Portfolio | Year Ended 12-31-21 | Year Ended 12-31-20 | ||
| Shares | Amount | Shares | Amount | |
| Class A shares | ||||
| Sold | 19,709,182 | $272,465,204 | 23,990,678 | $316,532,440 |
| Distributions reinvested | 3,427,203 | 45,937,248 | 2,146,288 | 28,380,722 |
| Repurchased | (14,400,061) | (198,955,758) | (14,707,724) | (192,080,180) |
| Net increase | 8,736,324 | $119,446,694 | 11,429,242 | $152,832,982 |
| Class B shares | ||||
| Sold | — | — | 4,612 | $57,678 |
| Distributions reinvested | — | — | 2,569 | 31,608 |
| Repurchased | — | — | (396,676) | (5,156,676) |
| Net decrease | — | — | (389,495) | $(5,067,390) |
| Class C shares | ||||
| Sold | 608,717 | $8,390,651 | 1,055,730 | $13,735,646 |
| Distributions reinvested | 227,416 | 3,043,914 | 251,510 | 3,298,036 |
| Repurchased | (2,439,461) | (33,657,679) | (7,135,990) | (94,484,536) |
| Net decrease | (1,603,328) | $(22,223,114) | (5,828,750) | $(77,450,854) |
| Class I shares | ||||
| Sold | 983,037 | $13,607,805 | 664,063 | $8,786,630 |
| Distributions reinvested | 97,454 | 1,305,138 | 51,924 | 686,069 |
| Repurchased | (672,168) | (9,265,784) | (460,241) | (5,952,395) |
| Net increase | 408,323 | $5,647,159 | 255,746 | $3,520,304 |
| Class R1 shares | ||||
| Sold | — | — | 92,959 | $1,219,083 |
| Distributions reinvested | — | — | 5,121 | 63,842 |
| Repurchased | — | — | (481,357) | (6,375,608) |
| Net decrease | — | — | (383,277) | $(5,092,683) |
| 46 | JOHN HANCOCK MULTIMANAGER LIFESTYLE PORTFOLIOS | ANNUAL REPORT |
| Multimanager Lifestyle Conservative Portfolio , Cont’d | Year Ended 12-31-21 | Year Ended 12-31-20 | ||
| Shares | Amount | Shares | Amount | |
| Class R2 shares | ||||
| Sold | 163,819 | $2,262,874 | 614,770 | $8,237,467 |
| Distributions reinvested | 33,189 | 444,269 | 17,628 | 238,499 |
| Repurchased | (253,726) | (3,503,008) | (154,786) | (2,027,840) |
| Net increase (decrease) | (56,718) | $(795,865) | 477,612 | $6,448,126 |
| Class R3 shares | ||||
| Sold | — | — | 57,730 | $734,832 |
| Distributions reinvested | — | — | 3,960 | 49,589 |
| Repurchased | — | — | (341,692) | (4,461,237) |
| Net decrease | — | — | (280,002) | $(3,676,816) |
| Class R4 shares | ||||
| Sold | 17,088 | $233,906 | 62,886 | $820,685 |
| Distributions reinvested | 10,298 | 137,913 | 10,337 | 135,331 |
| Repurchased | (45,567) | (631,147) | (101,371) | (1,348,439) |
| Net decrease | (18,181) | $(259,328) | (28,148) | $(392,423) |
| Class R5 shares | ||||
| Sold | 56,746 | $787,207 | 141,491 | $1,846,801 |
| Distributions reinvested | 13,968 | 186,998 | 11,087 | 146,174 |
| Repurchased | (85,002) | (1,162,579) | (182,231) | (2,396,186) |
| Net decrease | (14,288) | $(188,374) | (29,653) | $(403,211) |
| Class R6 shares | ||||
| Sold | 393,829 | $5,427,392 | 694,714 | $9,052,102 |
| Distributions reinvested | 77,007 | 1,030,730 | 73,878 | 962,696 |
| Repurchased | (614,383) | (8,442,316) | (1,222,616) | (16,167,780) |
| Net decrease | (143,547) | $(1,984,194) | (454,024) | $(6,152,982) |
| Class 1 shares | ||||
| Sold | 4,099,722 | $56,561,762 | 9,668,795 | $126,606,472 |
| Distributions reinvested | 6,600,865 | 88,420,244 | 5,463,722 | 71,703,124 |
| Repurchased | (19,313,158) | (265,900,721) | (19,518,559) | (254,610,241) |
| Net decrease | (8,612,571) | $(120,918,715) | (4,386,042) | $(56,300,645) |
| Total net increase (decrease) | (1,303,986) | $(21,275,737) | 383,209 | $8,264,408 |
| Portfolio | Class | % by Class |
| Multimanager Lifestyle Aggressive Portfolio | Class R6 | 2% |
| Multimanager Lifestyle Aggressive Portfolio | Class 1 | 100% |
| Multimanager Lifestyle Growth Portfolio | Class 1 | 100% |
| Multimanager Lifestyle Growth Portfolio | Class 5 | 100% |
| Multimanager Lifestyle Balanced Portfolio | Class 1 | 100% |
| Multimanager Lifestyle Balanced Portfolio | Class 5 | 100% |
| Multimanager Lifestyle Moderate Portfolio | Class 1 | 100% |
| Multimanager Lifestyle Moderate Portfolio | Class 5 | 100% |
| Multimanager Lifestyle Conservative Portfolio | Class 1 | 100% |
| ANNUAL REPORT | JOHN HANCOCK MULTIMANAGER LIFESTYLE PORTFOLIOS | 47 |
| Redesignation | Effective date | Multimanager Lifestyle Aggressive Portfolio Amount | Multimanager Lifestyle Growth Portfolio Amount | Multimanager Lifestyle Balanced Portfolio Amount | Multimanager Lifestyle Moderate Portfolio Amount | Multimanager Lifestyle Conservative Portfolio Amount |
| Class R3 shares as Class R2 shares | October 9, 2020 | $3,017,450 | $6,201,685 | $10,183,188 | $3,650,239 | $3,493,263 |
| Class B shares as Class A shares | October 14, 2020 | $1,453,049 | $4,675,112 | $4,551,534 | $1,936,872 | $1,610,552 |
| Class R1 shares as Class R2 shares | October 23, 2020 | $4,533,878 | $10,081,744 | $6,509,654 | $3,181,165 | $4,463,202 |
| Purchases | Sales | |||
| Portfolio | U.S. Government | Other issuers | U.S. Government | Other issuers |
| Multimanager Lifestyle Aggressive Portfolio | $48,411,833 | $810,810,883 | $15,498,629 | $845,219,461 |
| Multimanager Lifestyle Growth Portfolio | 527,147,323 | 2,186,497,244 | 122,073,534 | 2,832,425,308 |
| Multimanager Lifestyle Balanced Portfolio | 1,011,476,877 | 2,147,342,953 | 248,383,549 | 3,270,915,306 |
| Multimanager Lifestyle Moderate Portfolio | 295,777,948 | 644,413,804 | 58,442,569 | 969,446,923 |
| Multimanager Lifestyle Conservative Portfolio | 246,729,963 | 552,425,877 | 29,202,774 | 821,541,134 |
| Portfolio | Affiliated Class NAV | Percentage of underlying fund net assets |
| Multimanager Lifestyle Aggressive Portfolio | ||
| JHF Global Thematic Opportunities Fund | 23.0% | |
| JHF II International Strategic Equity Allocation Fund | 19.1% | |
| JHF II U.S. Sector Rotation Fund | 17.8% | |
| JHF II Mid Value Fund | 15.5% | |
| JHF Diversified Real Assets Fund | 15.0% | |
| JHF International Dynamic Growth Fund | 14.9% | |
| JHF II Health Sciences Fund | 14.8% | |
| JHF II Science & Technology Fund | 14.5% | |
| JHF II Small Cap Growth Fund | 14.4% | |
| JHF II International Small Company Fund | 14.0% | |
| JHF II Small Cap Value Fund | 13.8% | |
| JHF II Equity Income Fund | 13.8% | |
| JHF Mid Cap Growth Fund | 11.1% | |
| JHF Emerging Markets Equity Fund | 10.6% | |
| JHF Disciplined Value International Fund | 9.2% | |
| JHF Small Cap Core Fund | 8.0% | |
| JHF Diversified Macro Fund | 7.8% | |
| JHF Financial Industries Fund | 7.8% | |
| JHF II Capital Appreciation Value Fund | 5.9% | |
| JHF II Capital Appreciation Fund | 5.9% | |
| Multimanager Lifestyle Growth Portfolio | ||
| JHF Global Thematic Opportunities Fund | 49.9% | |
| JHF II International Strategic Equity Allocation Fund | 43.5% | |
| JHF II U.S. Sector Rotation Fund | 38.4% | |
| JHF II Mid Value Fund | 35.3% | |
| JHF II Science & Technology Fund | 34.9% | |
| JHF II Health Sciences Fund | 34.1% | |
| JHF Diversified Real Assets Fund | 33.6% | |
| JHF International Dynamic Growth Fund | 33.3% | |
| JHF II Equity Income Fund | 31.5% | |
| JHF II International Small Company Fund | 31.3% | |
| JHF II Small Cap Value Fund | 29.5% |
| 48 | JOHN HANCOCK MULTIMANAGER LIFESTYLE PORTFOLIOS | ANNUAL REPORT |
| Portfolio | Affiliated Class NAV | Percentage of underlying fund net assets |
| JHF II Capital Appreciation Value Fund | 28.8% | |
| JHF II Small Cap Growth Fund | 28.5% | |
| JHF II Fundamental Global Franchise Fund | 27.5% | |
| JHF Mid Cap Growth Fund | 25.0% | |
| JHF II Global Equity Fund | 21.2% | |
| JHF Disciplined Value International Fund | 20.9% | |
| JHF Emerging Markets Equity Fund | 19.4% | |
| JHF Small Cap Core Fund | 18.9% | |
| JHF II Emerging Markets Debt Fund | 18.6% | |
| JHF Financial Industries Fund | 18.2% | |
| JHF Diversified Macro Fund | 16.4% | |
| JHF II Capital Appreciation Fund | 15.0% | |
| JHF II Absolute Return Currency Fund | 13.9% | |
| JHF High Yield Fund | 12.2% | |
| JHF II Floating Rate Income Fund | 11.3% | |
| JHF II Blue Chip Growth Fund | 10.8% | |
| JHF Fundamental Large Cap Core Fund | 8.5% | |
| JHF II Strategic Income Opportunities Fund | 7.1% | |
| Multimanager Lifestyle Balanced Portfolio | ||
| JHF II U.S. Sector Rotation Fund | 34.8% | |
| JHF II Multi-Asset High Income Fund | 34.2% | |
| JHF Short Duration Bond Fund | 34.0% | |
| JHF II Emerging Markets Debt Fund | 31.3% | |
| JHF II Capital Appreciation Value Fund | 30.7% | |
| JHF II International Strategic Equity Allocation Fund | 27.2% | |
| JHF Global Thematic Opportunities Fund | 26.3% | |
| JHF II Fundamental Global Franchise Fund | 25.6% | |
| JHF II Health Sciences Fund | 25.4% | |
| JHF II Science & Technology Fund | 24.9% | |
| JHF International Dynamic Growth Fund | 24.6% | |
| JHF II Mid Value Fund | 24.3% | |
| JHF II Global Equity Fund | 24.2% | |
| JHF Diversified Real Assets Fund | 23.3% | |
| JHF High Yield Fund | 22.5% | |
| JHF II Small Cap Value Fund | 21.4% | |
| JHF Diversified Macro Fund | 20.5% | |
| JHF II Small Cap Growth Fund | 19.8% | |
| JHF II Equity Income Fund | 19.4% | |
| JHF II Floating Rate Income Fund | 19.1% | |
| JHF II Absolute Return Currency Fund | 17.2% | |
| JHF II International Small Company Fund | 16.9% | |
| JHF Mid Cap Growth Fund | 16.5% | |
| JHF Disciplined Value International Fund | 16.1% | |
| JHF II Strategic Income Opportunities Fund | 16.0% | |
| JHF Financial Industries Fund | 13.5% | |
| JHF Small Cap Core Fund | 12.1% | |
| JHF Emerging Markets Equity Fund | 11.4% | |
| JHF II Capital Appreciation Fund | 8.3% | |
| JHF II Blue Chip Growth Fund | 6.9% | |
| JHF II Core Bond Fund | 5.9% | |
| JHF Fundamental Large Cap Core Fund | 5.0% | |
| Multimanager Lifestyle Moderate Portfolio | ||
| JHF II Multi-Asset High Income Fund | 29.8% | |
| JHF Short Duration Bond Fund | 19.4% | |
| JHF II Core Bond Fund | 13.9% | |
| JHF II Emerging Markets Debt Fund | 13.2% |
| ANNUAL REPORT | JOHN HANCOCK MULTIMANAGER LIFESTYLE PORTFOLIOS | 49 |
| Portfolio | Affiliated Class NAV | Percentage of underlying fund net assets |
| JHF High Yield Fund | 9.8% | |
| JHF II Capital Appreciation Value Fund | 9.2% | |
| JHF II Floating Rate Income Fund | 8.0% | |
| JHF II Global Equity Fund | 7.9% | |
| JHF Diversified Macro Fund | 7.4% | |
| JHF II Fundamental Global Franchise Fund | 7.4% | |
| JHF II U.S. Sector Rotation Fund | 6.4% | |
| JHF II Absolute Return Currency Fund | 6.3% | |
| JHF II International Strategic Equity Allocation Fund | 6.3% | |
| JHF II Strategic Income Opportunities Fund | 5.4% | |
| JHF II Small Cap Growth Fund | 5.0% | |
| Multimanager Lifestyle Conservative Portfolio | ||
| JHF II Multi-Asset High Income Fund | 31.8% | |
| JHF Short Duration Bond Fund | 21.4% | |
| JHF II Core Bond Fund | 18.3% | |
| JHF II Emerging Markets Debt Fund | 14.4% | |
| JHF II Absolute Return Currency Fund | 11.4% | |
| JHF High Yield Fund | 10.4% | |
| JHF II Floating Rate Income Fund | 8.7% | |
| JHF Infrastructure Fund | 5.8% | |
| JHF II Strategic Income Opportunities Fund | 5.1% |
| Dividends and distributions | |||||||||
| Affiliate | Ending share amount | Beginning value | Cost of purchases | Proceeds from shares sold | Realized gain (loss) | Change in unrealized appreciation (depreciation) | Income distributions received | Capital gain distributions received | Ending value |
| Multimanager Lifestyle Aggressive Portfolio | |||||||||
| Blue Chip Growth | 4,493,260 | $241,435,972 | $42,544,485 | $(36,990,792) | $8,392,745 | $(2,681,488) | — | $35,537,339 | $252,700,922 |
| Capital Appreciation | 6,872,396 | 140,710,394 | 32,653,910 | (42,634,524) | 13,585,994 | (25,766,946) | — | 31,940,663 | 118,548,828 |
| Capital Appreciation Value | 7,693,076 | 145,578,445 | 23,584,389 | (92,873,772) | 12,122,211 | (7,864,763) | $827,052 | 14,665,808 | 80,546,510 |
| Disciplined Value | 8,107,847 | 154,064,763 | 44,541,389 | (29,891,482) | 1,891,524 | 20,009,290 | 1,808,786 | 23,065,425 | 190,615,484 |
| Disciplined Value International | 14,423,455 | 186,899,252 | 29,347,769 | (31,419,359) | 1,993,127 | 16,694,155 | 6,850,718 | — | 203,514,944 |
| Diversified Macro | 4,378,382 | 36,346,348 | 5,462,608 | (771,552) | (51,902) | (2,193,037) | 1,342,735 | — | 38,792,465 |
| Diversified Real Assets | 15,187,664 | 110,630,304 | 49,032,886 | (15,220,456) | 442,468 | 36,911,139 | 4,583,534 | — | 181,796,341 |
| Emerging Markets Debt | 2,204,204 | — | 23,060,848 | (2,645,541) | 17,327 | (616,844) | 531,053 | — | 19,815,790 |
| Emerging Markets Equity | 20,750,430 | 263,314,414 | 57,269,291 | (23,134,562) | 5,219,962 | (49,098,844) | 828,910 | 24,570,469 | 253,570,261 |
| Equity Income | 14,329,057 | 253,856,305 | 47,904,554 | (35,720,340) | 2,309,341 | 35,856,018 | 5,003,569 | 21,923,383 | 304,205,878 |
| Financial Industries | 3,137,950 | 56,126,273 | 14,099,073 | (13,955,678) | 2,954,477 | 1,244,143 | 1,267,421 | 10,164,510 | 60,468,288 |
| Fundamental Global Franchise | — | 30,957,680 | 683,831 | (34,929,834) | 9,144,840 | (5,856,517) | — | — | — |
| 50 | JOHN HANCOCK MULTIMANAGER LIFESTYLE PORTFOLIOS | ANNUAL REPORT |
| Dividends and distributions | |||||||||
| Affiliate | Ending share amount | Beginning value | Cost of purchases | Proceeds from shares sold | Realized gain (loss) | Change in unrealized appreciation (depreciation) | Income distributions received | Capital gain distributions received | Ending value |
| Fundamental Large Cap Core | 3,940,384 | $259,177,694 | $27,355,643 | $(41,136,899) | $13,952,237 | $38,938,401 | $695,411 | $20,340,715 | $298,287,076 |
| Global Equity | 3,102,879 | 65,619,026 | 8,744,641 | (38,016,926) | 11,142,388 | (7,089,648) | 691,372 | 6,567,199 | 40,399,481 |
| Global Shareholder Yield | — | 37,199,522 | — | (38,506,562) | 8,689,374 | (7,382,334) | — | — | — |
| Global Thematic Opportunities | 6,338,785 | 86,536,417 | 8,568,302 | (9,498,434) | 1,387,174 | 3,904,712 | 109,123 | 8,355,014 | 90,898,171 |
| Health Sciences | 10,508,435 | 64,741,730 | 12,182,227 | (15,722,678) | 1,958,130 | (3,156,244) | — | 8,317,002 | 60,003,165 |
| High Yield | 2,907,658 | — | 11,149,709 | (1,151,708) | 5,399 | (30,132) | 254,845 | — | 9,973,268 |
| International Dynamic Growth | 3,811,531 | 43,785,768 | 20,433,009 | (11,390,634) | 849,103 | (3,631,845) | — | 11,448,577 | 50,045,401 |
| International Growth | 3,286,118 | 143,109,614 | 15,327,282 | (42,516,098) | 17,886,809 | (19,384,990) | 952,623 | 14,374,659 | 114,422,617 |
| International Small Company | 10,154,133 | 116,091,299 | 12,973,047 | (11,160,408) | 2,343,680 | 789,645 | 3,125,805 | 9,708,772 | 121,037,263 |
| International Strategic Equity Allocation | 30,215,669 | 311,341,384 | 17,994,179 | (10,046,479) | 1,010,426 | 893,051 | 8,335,726 | 9,072,379 | 321,192,561 |
| Mid Cap Growth | 10,617,992 | — | 186,951,176 | (4,935,227) | 455,579 | 34,135,509 | — | 57,906,538 | 216,607,037 |
| Mid Cap Stock | — | 200,257,491 | 34,755,807 | (150,781,197) | 329,479 | (84,561,580) | — | — | — |
| Mid Value | 15,341,520 | 215,038,872 | 65,687,399 | (24,207,045) | (536,097) | 30,749,878 | 2,202,442 | 20,950,825 | 286,733,007 |
| Multifactor Emerging Markets ETF | 2,587,889 | 77,903,352 | 4,277,770 | (6,825,716) | 958,606 | (1,161,715) | 2,021,082 | — | 75,152,297 |
| Multifactor Mid Cap ETF | — | 39,079,470 | 1,226 | (41,895,156) | 10,431,242 | (7,616,782) | — | — | — |
| Multifactor Small Cap ETF | — | 29,087,786 | 1,145 | (32,107,461) | 7,648,290 | (4,629,760) | — | — | — |
| Science & Technology | 14,632,649 | 49,911,519 | 18,778,485 | (25,330,653) | 4,665,573 | (18,905,953) | — | 17,719,026 | 29,118,971 |
| Small Cap Core | 7,898,303 | 99,517,037 | 39,531,956 | (15,642,302) | 842,050 | 9,864,440 | 77,316 | 14,656,296 | 134,113,181 |
| Small Cap Growth | 4,433,473 | 90,551,213 | 23,784,173 | (19,845,387) | 6,821,518 | (9,405,628) | — | 22,922,590 | 91,905,889 |
| Small Cap Value | 4,791,240 | 108,582,256 | 14,140,562 | (29,327,613) | 3,743,547 | 10,855,803 | 618,587 | 12,085,441 | 107,994,555 |
| U.S. Sector Rotation | 19,926,605 | 196,596,745 | 45,865,265 | (42,864,139) | 7,001,004 | (1,354,846) | 1,699,410 | 44,109,950 | 205,244,029 |
| $159,607,625 | $(21,543,712) | $43,827,520 | $440,402,580 | $3,957,703,680 | |||||
| Multimanager Lifestyle Growth Portfolio | |||||||||
| Absolute Return Currency | 8,006,828 | $52,116,377 | $33,102,049 | $(1,951,038) | $(18,256) | $(1,739,621) | — | — | $81,509,511 |
| Blue Chip Growth | 10,223,723 | 588,825,566 | 84,965,599 | (115,134,881) | 34,287,770 | (17,961,897) | — | $80,797,568 | 574,982,157 |
| Bond | 37,041,225 | 432,795,788 | 190,901,322 | (5,370,401) | (205,518) | (19,534,989) | $18,492,225 | 3,413,964 | 598,586,202 |
| Capital Appreciation | 17,461,624 | 351,624,404 | 88,526,565 | (108,644,473) | 33,179,681 | (63,473,159) | — | 81,155,955 | 301,213,018 |
| ANNUAL REPORT | JOHN HANCOCK MULTIMANAGER LIFESTYLE PORTFOLIOS | 51 |
| Dividends and distributions | |||||||||
| Affiliate | Ending share amount | Beginning value | Cost of purchases | Proceeds from shares sold | Realized gain (loss) | Change in unrealized appreciation (depreciation) | Income distributions received | Capital gain distributions received | Ending value |
| Capital Appreciation Value | 37,551,927 | $446,043,343 | $91,161,935 | $(141,775,000) | $15,855,689 | $(18,117,289) | $4,053,269 | $71,875,169 | $393,168,678 |
| Core Bond | — | 310,245,640 | 41,997,081 | (343,457,501) | 2,211,321 | (10,996,541) | 112,845 | — | — |
| Disciplined Value | 18,885,895 | 391,279,444 | 71,392,870 | (75,836,994) | 13,824,610 | 43,347,473 | 4,227,684 | 53,910,916 | 444,007,403 |
| Disciplined Value International | 32,710,320 | 433,849,147 | 62,355,528 | (78,102,586) | 5,479,132 | 37,961,396 | 15,641,675 | — | 461,542,617 |
| Diversified Macro | 9,226,846 | 79,957,657 | 8,390,406 | (1,974,443) | (129,080) | (4,494,682) | 2,829,631 | — | 81,749,858 |
| Diversified Real Assets | 33,914,782 | 280,515,171 | 80,510,455 | (44,896,065) | 840,294 | 88,990,080 | 10,233,405 | — | 405,959,935 |
| Emerging Markets Debt | 23,898,635 | 223,545,800 | 25,496,612 | (19,874,445) | (1,088,952) | (13,230,289) | 9,641,181 | — | 214,848,726 |
| Emerging Markets Equity | 37,860,778 | 482,773,036 | 110,690,249 | (50,827,269) | 15,357,259 | (95,334,564) | 1,531,859 | 45,407,233 | 462,658,711 |
| Equity Income | 32,711,889 | 624,156,090 | 76,080,426 | (100,271,400) | 13,698,899 | 80,809,391 | 11,664,066 | 50,220,243 | 694,473,406 |
| Financial Industries | 7,317,930 | 136,776,946 | 27,871,537 | (34,452,806) | 8,931,926 | 1,888,903 | 2,955,720 | 23,704,388 | 141,016,506 |
| Floating Rate Income | 26,209,534 | 127,989,497 | 91,850,566 | (5,147,588) | (687) | 1,274,775 | 7,501,941 | — | 215,966,563 |
| Fundamental Global Franchise | 10,457,981 | 106,122,740 | 42,752,719 | (17,886,537) | 688,631 | 9,296,027 | 38,246 | 11,966,292 | 140,973,580 |
| Fundamental Large Cap Core | 7,122,955 | 485,352,680 | 53,346,948 | (96,905,800) | 33,628,450 | 63,785,422 | 1,243,135 | 36,361,631 | 539,207,700 |
| Global Equity | 13,408,756 | 194,444,822 | 38,896,786 | (65,315,060) | 15,520,060 | (8,964,610) | 3,003,722 | 28,531,717 | 174,581,998 |
| Global Shareholder Yield | — | 133,527,265 | — | (138,205,488) | 30,907,215 | (26,228,992) | — | — | — |
| Global Thematic Opportunities | 13,761,620 | 188,928,182 | 21,049,038 | (24,005,756) | 3,221,325 | 8,148,846 | 236,865 | 18,135,620 | 197,341,635 |
| Health Sciences | 24,306,943 | 172,460,729 | 26,855,498 | (58,294,456) | 7,906,880 | (10,136,006) | — | 19,237,964 | 138,792,645 |
| High Yield | 51,827,482 | 183,504,014 | 54,329,150 | (60,185,509) | 6,245 | 114,362 | 9,980,852 | — | 177,768,262 |
| International Dynamic Growth | 8,509,923 | 87,540,372 | 57,848,443 | (26,718,780) | 2,603,446 | (9,538,192) | — | 25,567,498 | 111,735,289 |
| International Growth | 6,671,757 | 312,795,742 | 31,430,030 | (111,086,830) | 49,895,162 | (50,723,531) | 1,934,481 | 29,190,464 | 232,310,573 |
| International Small Company | 22,704,694 | 268,014,917 | 29,266,749 | (34,517,574) | 7,064,059 | 811,806 | 7,024,069 | 21,816,807 | 270,639,957 |
| International Strategic Equity Allocation | 68,940,416 | 777,109,249 | 40,290,264 | (92,637,729) | 9,763,058 | (1,688,223) | 19,170,506 | 20,833,451 | 732,836,619 |
| Mid Cap Growth | 23,893,044 | — | 419,380,294 | (6,376,889) | 648,339 | 73,766,352 | — | 130,343,457 | 487,418,096 |
| Mid Cap Stock | — | 485,777,037 | 67,708,373 | (369,034,783) | 2,798,779 | (187,249,406) | — | — | — |
| Mid Value | 34,973,001 | 513,676,960 | 130,188,710 | (62,872,088) | (776,890) | 73,428,693 | 5,036,639 | 47,911,238 | 653,645,385 |
| Multifactor Emerging Markets ETF | 6,838,376 | 203,091,928 | 12,126,112 | (15,768,808) | 2,816,215 | (3,679,008) | 5,343,254 | — | 198,586,439 |
| 52 | JOHN HANCOCK MULTIMANAGER LIFESTYLE PORTFOLIOS | ANNUAL REPORT |
| Dividends and distributions | |||||||||
| Affiliate | Ending share amount | Beginning value | Cost of purchases | Proceeds from shares sold | Realized gain (loss) | Change in unrealized appreciation (depreciation) | Income distributions received | Capital gain distributions received | Ending value |
| Multifactor Mid Cap ETF | — | $85,149,076 | $6,884 | $(91,243,220) | $22,516,077 | $(16,428,817) | — | — | — |
| Multifactor Small Cap ETF | — | 72,531,534 | 17,299 | (80,067,637) | 19,180,496 | (11,661,692) | — | — | — |
| Science & Technology | 35,224,356 | 118,138,742 | 43,860,873 | (57,508,982) | 9,598,663 | (43,992,827) | — | $42,654,018 | $70,096,469 |
| Short Duration Credit Opportunities | — | 87,735,193 | 337,196 | (87,997,217) | 2,221,149 | (2,296,321) | $337,196 | — | — |
| Small Cap Core | 18,586,574 | 237,748,294 | 93,457,508 | (41,780,617) | 2,594,007 | 23,580,828 | 181,809 | 34,464,254 | 315,600,020 |
| Small Cap Growth | 8,749,331 | 185,365,817 | 47,494,559 | (47,383,700) | 16,523,811 | (20,626,857) | — | 45,237,072 | 181,373,630 |
| Small Cap Value | 10,251,304 | 234,612,335 | 29,593,763 | (65,320,051) | 9,037,587 | 23,140,748 | 1,318,936 | 25,768,274 | 231,064,382 |
| Strategic Income Opportunities | 29,984,796 | 320,346,735 | 36,583,773 | (15,619,075) | (208,838) | (7,071,969) | 10,660,805 | — | 334,030,626 |
| U.S. High Yield Bond | — | 36,109,268 | 146,764 | (36,559,606) | 5,928,443 | (5,624,869) | 146,764 | — | — |
| U.S. Sector Rotation | 43,026,498 | 494,733,202 | 99,355,440 | (170,026,506) | 24,717,560 | (5,606,767) | 3,685,833 | 95,669,607 | 443,172,929 |
| $421,024,017 | $(126,056,016) | $158,228,613 | $1,044,174,800 | $10,702,859,525 | |||||
| Multimanager Lifestyle Balanced Portfolio | |||||||||
| Absolute Return Currency | 9,949,613 | $50,392,278 | $57,434,088 | $(4,394,175) | $(27,845) | $(2,117,286) | — | — | $101,287,060 |
| Asia Pacific Total Return Bond | — | 86,137,167 | — | (85,445,931) | 5,985,826 | (6,677,062) | — | — | — |
| Blue Chip Growth | 6,484,698 | 421,375,291 | 51,611,205 | (120,601,781) | 45,110,673 | (32,795,958) | — | $51,188,627 | 364,699,430 |
| Bond | 55,596,631 | 895,539,428 | 89,439,470 | (51,284,523) | (991,901) | (34,260,914) | $30,272,592 | 5,128,040 | 898,441,560 |
| Capital Appreciation | 9,668,202 | 236,039,135 | 45,017,571 | (97,907,770) | 43,824,555 | (60,197,005) | — | 44,934,662 | 166,776,486 |
| Capital Appreciation Value | 39,985,039 | 450,889,439 | 90,847,982 | (118,194,555) | 12,854,247 | (17,753,757) | 4,321,480 | 76,631,212 | 418,643,356 |
| Core Bond | 8,068,204 | 634,988,865 | 46,135,252 | (558,967,465) | 6,915,393 | (25,556,983) | 2,051,390 | — | 103,515,062 |
| Disciplined Value | 11,629,803 | 271,604,213 | 39,016,037 | (78,179,193) | 20,451,276 | 20,524,341 | 2,622,929 | 33,447,273 | 273,416,674 |
| Disciplined Value International | 25,290,884 | 294,961,646 | 60,346,460 | (25,206,386) | (49,968) | 26,802,620 | 12,203,758 | — | 356,854,372 |
| Diversified Macro | 11,539,373 | 52,401,800 | 57,941,557 | (1,836,937) | (114,157) | (6,153,415) | 3,538,822 | — | 102,238,848 |
| Diversified Real Assets | 23,516,848 | 219,049,178 | 33,996,113 | (39,732,688) | 1,775,965 | 66,408,103 | 7,186,484 | — | 281,496,671 |
| Emerging Markets Debt | 40,130,119 | 392,180,680 | 53,616,627 | (60,449,400) | (2,883,216) | (21,694,922) | 16,543,541 | — | 360,769,769 |
| Emerging Markets Equity | 22,327,358 | 282,489,538 | 74,294,378 | (36,607,650) | 11,707,324 | (59,043,273) | 911,317 | 27,013,184 | 272,840,317 |
| Equity Income | 20,143,456 | 437,764,830 | 41,964,141 | (119,422,843) | 25,778,864 | 41,560,580 | 7,376,251 | 31,157,054 | 427,645,572 |
| Financial Industries | 5,424,105 | 97,819,831 | 27,261,647 | (27,686,858) | 5,117,589 | 2,010,300 | 2,190,802 | 17,569,873 | 104,522,509 |
| ANNUAL REPORT | JOHN HANCOCK MULTIMANAGER LIFESTYLE PORTFOLIOS | 53 |
| Dividends and distributions | |||||||||
| Affiliate | Ending share amount | Beginning value | Cost of purchases | Proceeds from shares sold | Realized gain (loss) | Change in unrealized appreciation (depreciation) | Income distributions received | Capital gain distributions received | Ending value |
| Floating Rate Income | 44,158,931 | $229,653,216 | $146,913,116 | $(15,240,560) | $(49,043) | $2,592,866 | $13,288,252 | — | $363,869,595 |
| Fundamental Global Franchise | 9,745,784 | 114,047,323 | 34,752,068 | (28,883,988) | 2,387,940 | 9,069,828 | 35,671 | $11,160,793 | 131,373,171 |
| Fundamental Large Cap Core | 4,174,060 | 337,191,208 | 33,242,751 | (118,956,768) | 42,232,549 | 22,266,584 | 716,910 | 20,969,567 | 315,976,324 |
| Global Equity | 15,292,849 | 171,584,044 | 62,776,241 | (37,791,307) | 3,061,687 | (517,770) | 3,429,728 | 32,578,257 | 199,112,895 |
| Global Shareholder Yield | 4,458,391 | 120,045,359 | 5,687,721 | (79,138,095) | 16,787,938 | (11,264,336) | 1,533,554 | 4,125,360 | 52,118,587 |
| Global Thematic Opportunities | 7,270,434 | 99,068,099 | 12,503,360 | (12,995,866) | 1,221,208 | 4,461,225 | 126,735 | 9,703,522 | 104,258,026 |
| Health Sciences | 18,088,966 | 129,169,642 | 16,228,536 | (40,656,756) | 6,831,312 | (8,284,736) | — | 14,316,687 | 103,287,998 |
| High Yield | 95,747,167 | 333,070,843 | 116,557,817 | (121,569,967) | (549,396) | 903,486 | 18,569,907 | — | 328,412,783 |
| International Dynamic Growth | 6,287,618 | 72,346,688 | 36,517,621 | (21,936,018) | 2,954,727 | (7,326,596) | — | 18,877,750 | 82,556,422 |
| International Growth | 5,249,431 | 222,625,537 | 24,429,746 | (59,916,850) | 26,161,914 | (30,515,175) | 1,518,360 | 22,911,386 | 182,785,172 |
| International Small Company | 12,245,070 | 148,099,668 | 16,249,854 | (22,807,921) | 4,976,056 | (556,420) | 3,795,350 | 11,788,384 | 145,961,237 |
| International Strategic Equity Allocation | 43,124,376 | 496,863,808 | 25,814,321 | (69,751,195) | 7,083,928 | (1,598,746) | 11,905,784 | 13,052,222 | 458,412,116 |
| Mid Cap Growth | 15,797,108 | — | 278,112,255 | (3,201,519) | 304,210 | 47,046,056 | — | 84,878,922 | 322,261,002 |
| Mid Cap Stock | — | 300,617,443 | 72,195,288 | (254,194,158) | 2,024,230 | (120,642,803) | — | — | — |
| Mid Value | 24,037,132 | 322,054,109 | 148,973,601 | (65,534,032) | (1,359,001) | 45,119,329 | 3,471,644 | 33,024,157 | 449,254,006 |
| Multi-Asset High Income | 5,022,063 | 52,451,443 | 6,221,027 | (5,253,547) | 26,108 | (1,316,018) | 2,376,471 | 2,611,502 | 52,129,013 |
| Multifactor Emerging Markets ETF | 4,093,292 | 120,972,359 | 10,597,195 | (12,221,758) | 1,919,461 | (2,398,057) | 3,176,980 | — | 118,869,200 |
| Multifactor Mid Cap ETF | — | 68,969,680 | 1,633 | (73,904,514) | 18,625,991 | (13,692,790) | — | — | — |
| Multifactor Small Cap ETF | — | 51,838,180 | 2,567 | (57,199,110) | 14,210,715 | (8,852,352) | — | — | — |
| Science & Technology | 25,092,803 | 79,994,978 | 30,721,350 | (36,034,311) | 6,492,126 | (31,239,466) | — | 30,385,477 | 49,934,677 |
| Short Duration Bond | 19,380,130 | — | 197,086,356 | (2,055,528) | (25,496) | (2,754,443) | 4,244,793 | 132,183 | 192,250,889 |
| Short Duration Credit Opportunities | — | 227,641,588 | 877,972 | (228,314,072) | 4,818,827 | (5,024,315) | 877,972 | — | — |
| Small Cap Core | 11,926,431 | 152,855,198 | 67,582,950 | (34,981,838) | 1,805,989 | 15,248,491 | 117,942 | 22,357,519 | 202,510,790 |
| Small Cap Growth | 6,085,490 | 133,289,701 | 33,204,143 | (37,660,020) | 12,683,469 | (15,365,081) | — | 31,867,056 | 126,152,212 |
| Small Cap Value | 7,442,463 | 174,280,718 | 25,382,274 | (55,529,024) | 7,554,628 | 16,064,527 | 945,312 | 18,468,717 | 167,753,123 |
| 54 | JOHN HANCOCK MULTIMANAGER LIFESTYLE PORTFOLIOS | ANNUAL REPORT |
| Dividends and distributions | |||||||||
| Affiliate | Ending share amount | Beginning value | Cost of purchases | Proceeds from shares sold | Realized gain (loss) | Change in unrealized appreciation (depreciation) | Income distributions received | Capital gain distributions received | Ending value |
| Strategic Income Opportunities | 67,596,662 | $751,291,801 | $47,759,694 | $(29,754,456) | $(282,235) | $(15,987,993) | $23,986,564 | — | $753,026,811 |
| U.S. High Yield Bond | — | 66,851,401 | 273,355 | (67,686,380) | 10,248,076 | (9,686,452) | 273,354 | — | — |
| U.S. Sector Rotation | 38,916,586 | 444,785,617 | 90,992,125 | (151,169,463) | 21,271,243 | (5,038,688) | 3,363,024 | $87,290,760 | 400,840,834 |
| $388,873,786 | $(238,234,476) | $186,973,673 | $757,570,146 | $9,536,254,569 | |||||
| Multimanager Lifestyle Moderate Portfolio | |||||||||
| Absolute Return Currency | 3,651,126 | $23,323,640 | $16,306,484 | $(1,666,817) | $(10,290) | $(784,557) | — | — | $37,168,460 |
| Alternative Risk Premia | — | 25,084,783 | — | (25,274,608) | (5,140,588) | 5,330,413 | $8,562 | — | — |
| Asia Pacific Total Return Bond | — | 53,534,256 | — | (53,107,046) | 3,761,539 | (4,188,749) | — | — | — |
| Blue Chip Growth | 1,086,167 | 82,171,678 | 8,926,747 | (32,740,157) | 10,473,566 | (7,745,812) | — | $8,567,989 | 61,086,022 |
| Bond | 22,849,259 | 372,621,266 | 33,266,471 | (22,203,383) | (465,908) | (13,974,421) | 12,428,476 | 2,111,827 | 369,244,025 |
| Capital Appreciation | 1,623,278 | 43,215,941 | 7,830,165 | (20,622,483) | 9,195,866 | (11,617,950) | — | 7,528,374 | 28,001,539 |
| Capital Appreciation Value | 12,003,863 | 138,039,616 | 33,541,799 | (45,106,855) | 4,753,492 | (5,547,607) | 1,295,105 | 22,965,629 | 125,680,445 |
| Core Bond | 18,837,507 | 388,354,018 | 26,150,170 | (159,664,256) | (660,567) | (12,494,151) | 4,377,691 | — | 241,685,214 |
| Disciplined Value | 2,193,418 | 55,155,100 | 8,009,192 | (20,059,520) | 4,224,167 | 4,238,316 | 492,319 | 6,277,994 | 51,567,255 |
| Disciplined Value International | 4,362,207 | 48,200,277 | 16,210,165 | (7,124,659) | 141,935 | 4,123,025 | 2,093,497 | — | 61,550,743 |
| Diversified Macro | 4,184,186 | — | 41,294,859 | (1,793,853) | (8,498) | (2,420,622) | 1,283,180 | — | 37,071,886 |
| Diversified Real Assets | 4,543,815 | 50,723,105 | 4,255,427 | (15,787,955) | 1,596,107 | 13,602,779 | 1,371,580 | — | 54,389,463 |
| Emerging Markets Debt | 16,973,600 | 145,484,129 | 48,324,745 | (31,089,890) | (1,495,669) | (8,630,654) | 6,994,847 | — | 152,592,661 |
| Emerging Markets Equity | 2,420,910 | 29,908,222 | 9,711,110 | (4,942,054) | 1,445,158 | (6,538,916) | 98,856 | 2,930,269 | 29,583,520 |
| Equity Income | 3,799,321 | 88,279,879 | 8,461,299 | (29,770,215) | 4,981,310 | 8,707,301 | 1,394,572 | 5,848,433 | 80,659,574 |
| Floating Rate Income | 18,610,203 | 102,219,166 | 58,052,926 | (8,031,175) | (411,241) | 1,518,395 | 5,572,271 | — | 153,348,071 |
| Fundamental Global Franchise | 2,808,119 | 34,777,219 | 8,596,262 | (8,892,902) | 856,926 | 2,515,938 | 10,208 | 3,193,781 | 37,853,443 |
| Fundamental Large Cap Core | 803,097 | 66,703,083 | 7,924,113 | (26,500,345) | 9,381,941 | 3,285,638 | 135,765 | 3,971,114 | 60,794,430 |
| Global Equity | 5,005,573 | 49,669,344 | 33,177,919 | (16,622,826) | 2,244,614 | (3,296,493) | 1,119,408 | 10,633,020 | 65,172,558 |
| Global Shareholder Yield | 3,101,766 | 35,765,771 | 5,353,665 | (7,145,567) | 1,349,276 | 936,497 | 1,069,415 | 2,856,300 | 36,259,642 |
| High Yield | 41,623,708 | 123,242,484 | 39,982,099 | (20,510,953) | (557,169) | 612,859 | 7,477,215 | — | 142,769,320 |
| Infrastructure | 1,051,758 | 15,415,906 | 1,379,820 | (2,870,983) | 613,481 | 491,398 | 491,047 | 502,344 | 15,029,622 |
| International Dynamic Growth | — | 15,105,977 | 1,228,187 | (17,528,935) | 5,902,803 | (4,708,032) | — | — | — |
| ANNUAL REPORT | JOHN HANCOCK MULTIMANAGER LIFESTYLE PORTFOLIOS | 55 |
| Dividends and distributions | |||||||||
| Affiliate | Ending share amount | Beginning value | Cost of purchases | Proceeds from shares sold | Realized gain (loss) | Change in unrealized appreciation (depreciation) | Income distributions received | Capital gain distributions received | Ending value |
| International Growth | 1,538,154 | $37,743,246 | $27,784,170 | $(8,641,229) | $2,712,525 | $(6,040,199) | $446,373 | $6,735,578 | $53,558,513 |
| International Small Company | 2,154,691 | 26,344,030 | 3,091,785 | (4,542,568) | 997,162 | (206,496) | 668,390 | 2,076,022 | 25,683,913 |
| International Strategic Equity Allocation | 9,913,129 | 115,833,149 | 6,974,581 | (18,823,027) | 2,339,877 | (948,016) | 2,721,588 | 2,983,657 | 105,376,564 |
| Mid Cap Growth | 3,315,019 | — | 56,738,905 | (1,612,222) | 145,064 | 12,354,646 | — | 17,738,589 | 67,626,393 |
| Mid Cap Stock | — | 58,421,698 | 18,671,311 | (50,229,432) | 736,219 | (27,599,796) | — | — | — |
| Mid Value | 4,310,298 | 65,085,250 | 26,701,089 | �� (19,579,102) | 2,497,968 | 5,854,263 | 617,239 | 5,871,508 | 80,559,468 |
| Multi-Asset High Income | 4,366,527 | 46,489,464 | 4,423,888 | (4,506,617) | 133,571 | (1,215,753) | 2,072,008 | 2,258,767 | 45,324,553 |
| Multifactor Emerging Markets ETF | 818,828 | 24,260,353 | 2,695,886 | (3,138,891) | 414,946 | (453,529) | 637,133 | — | 23,778,765 |
| Short Duration Bond | 11,062,176 | 51,646,395 | 63,414,431 | (3,586,623) | (41,882) | (1,695,535) | 2,844,976 | 75,525 | 109,736,786 |
| Short Duration Credit Opportunities | — | 71,727,267 | 275,852 | (71,941,052) | 1,537,383 | (1,599,450) | 275,852 | — | — |
| Small Cap Core | 667,323 | 8,018,018 | 5,592,495 | (3,464,269) | 227,410 | 957,484 | 6,802 | 1,289,445 | 11,331,138 |
| Small Cap Growth | 1,547,384 | 34,092,274 | 9,749,254 | (11,273,211) | 3,651,378 | (4,142,433) | — | 8,000,509 | 32,077,262 |
| Small Cap Value | 1,484,097 | 41,855,870 | 6,100,508 | (19,658,238) | 3,141,827 | 2,011,590 | 192,239 | 3,755,800 | 33,451,557 |
| Strategic Income Opportunities | 23,043,372 | 258,567,798 | 11,405,316 | (7,735,429) | (79,256) | (5,455,270) | 8,182,124 | — | 256,703,159 |
| U.S. High Yield Bond | — | 25,070,917 | 98,376 | (25,379,339) | 3,618,823 | (3,408,777) | 98,376 | — | — |
| U.S. Sector Rotation | 7,127,836 | 85,218,287 | 16,788,765 | (31,840,374) | 4,324,738 | (1,074,705) | 612,166 | 15,889,410 | 73,416,711 |
| $78,530,004 | $(69,247,381) | $67,089,280 | $144,061,884 | $2,760,132,675 | |||||
| Multimanager Lifestyle Conservative Portfolio | |||||||||
| Absolute Return Currency | 6,549,947 | $24,838,236 | $50,370,748 | $(7,381,648) | $(19,506) | $(1,129,367) | — | — | $66,678,463 |
| Alternative Risk Premia | — | 26,087,771 | — | (26,285,186) | (5,283,627) | 5,481,042 | $8,904 | — | — |
| Asia Pacific Total Return Bond | — | 45,552,542 | — | (45,188,789) | 2,859,196 | (3,222,949) | — | — | — |
| Blue Chip Growth | 404,235 | 16,706,036 | 13,705,525 | (7,925,362) | 518,383 | (270,418) | — | $3,227,736 | 22,734,164 |
| Bond | 26,864,234 | 450,530,627 | 30,921,507 | (29,828,356) | (829,071) | (16,668,690) | 14,695,334 | 2,497,473 | 434,126,017 |
| Capital Appreciation | — | 7,186,037 | 861,866 | (8,185,267) | 2,130,203 | (1,992,839) | — | — | — |
| Capital Appreciation Value | 4,856,283 | 72,044,623 | 10,710,754 | (31,734,407) | 3,594,514 | (3,770,203) | 525,593 | 9,320,154 | 50,845,281 |
| Core Bond | 24,748,733 | 464,617,634 | 21,371,806 | (152,369,459) | (1,836,220) | (14,257,520) | 5,764,372 | — | 317,526,241 |
| Disciplined Value | 552,883 | 14,217,582 | 3,299,439 | (6,671,578) | 1,111,353 | 1,041,482 | 124,403 | 1,586,377 | 12,998,278 |
| 56 | JOHN HANCOCK MULTIMANAGER LIFESTYLE PORTFOLIOS | ANNUAL REPORT |
| Dividends and distributions | |||||||||
| Affiliate | Ending share amount | Beginning value | Cost of purchases | Proceeds from shares sold | Realized gain (loss) | Change in unrealized appreciation (depreciation) | Income distributions received | Capital gain distributions received | Ending value |
| Disciplined Value International | 1,638,527 | $9,986,458 | $16,470,995 | $(4,301,925) | $3,496 | $960,585 | $797,868 | — | $23,119,609 |
| Diversified Real Assets | — | 37,178,651 | 167,484 | (44,994,413) | 6,961,652 | 686,626 | — | — | — |
| Emerging Markets Debt | 18,436,594 | 132,063,813 | 59,760,802 | (16,491,514) | (642,958) | (8,945,167) | 6,512,781 | — | 165,744,976 |
| Emerging Markets Equity | 1,770,769 | 15,643,860 | 15,885,186 | (5,622,623) | 290,741 | (4,558,371) | 73,549 | $2,180,126 | 21,638,793 |
| Equity Income | 957,596 | 20,475,127 | 5,066,649 | (8,263,741) | 908,351 | 2,143,385 | 344,162 | 1,477,712 | 20,329,771 |
| Floating Rate Income | 20,114,682 | 110,046,900 | 65,327,573 | (10,745,888) | (756,397) | 1,872,788 | 5,907,955 | — | 165,744,976 |
| Fundamental Global Franchise | 1,343,916 | 16,662,713 | 4,221,293 | (4,220,861) | 200,390 | 1,252,451 | 4,954 | 1,549,948 | 18,115,986 |
| Fundamental Large Cap Core | 159,594 | 10,581,578 | 3,685,175 | (4,291,450) | 674,108 | 1,431,825 | 29,440 | 861,109 | 12,081,236 |
| Global Equity | 1,854,776 | 22,699,920 | 8,833,642 | (7,492,948) | 1,167,385 | (1,058,818) | 417,957 | 3,970,081 | 24,149,181 |
| Global Shareholder Yield | 1,345,391 | 16,271,624 | 2,920,146 | (4,448,774) | 905,950 | 78,679 | 461,145 | 1,241,987 | 15,727,625 |
| High Yield | 44,442,270 | 127,303,553 | 40,166,738 | (15,000,105) | (26,261) | (6,939) | 7,650,363 | — | 152,436,986 |
| Infrastructure | 2,941,321 | 43,619,502 | 7,611,348 | (12,263,508) | 1,621,230 | 1,442,902 | 1,378,016 | 1,415,818 | 42,031,474 |
| International Dynamic Growth | — | 5,205,413 | 631,349 | (6,320,849) | 2,124,955 | (1,640,868) | — | — | — |
| International Growth | 602,060 | 14,071,941 | 14,992,834 | (6,610,419) | 1,210,259 | (2,700,900) | 178,235 | 2,689,489 | 20,963,715 |
| International Strategic Equity Allocation | 6,112,138 | 69,937,850 | 10,460,368 | (16,187,371) | 1,290,779 | (529,595) | 1,707,614 | 1,872,044 | 64,972,031 |
| Mid Cap Growth | 1,341,000 | — | 28,024,077 | (2,490,409) | (120,606) | 1,943,328 | — | 6,944,221 | 27,356,390 |
| Mid Cap Stock | — | 21,261,097 | 11,685,860 | (25,609,679) | 331,892 | (7,669,170) | — | — | — |
| Mid Value | 1,788,970 | 23,855,004 | 16,437,553 | (9,630,645) | 878,618 | 1,895,320 | 255,728 | 2,432,619 | 33,435,850 |
| Multi-Asset High Income | 4,662,109 | 50,221,061 | 4,984,620 | (5,628,597) | 149,061 | (1,333,451) | 2,213,373 | 2,419,612 | 48,392,694 |
| Multifactor Emerging Markets ETF | — | 33,230 | 90 | (36,643) | 16,549 | (13,226) | — | — | — |
| Short Duration Bond | 12,195,739 | 64,031,853 | 64,416,075 | (5,509,571) | (73,639) | (1,882,983) | 3,191,728 | 83,693 | 120,981,735 |
| Short Duration Credit Opportunities | — | 74,262,810 | 283,682 | (74,487,614) | 1,443,052 | (1,501,930) | 283,682 | — | — |
| Small Cap Growth | 1,105,649 | 15,068,829 | 18,267,481 | (9,215,503) | 1,252,597 | (2,453,293) | — | 5,624,859 | 22,920,111 |
| Small Cap Value | 1,125,637 | 16,324,356 | 15,361,995 | (7,809,294) | 699,260 | 795,532 | 133,583 | 2,609,840 | 25,371,849 |
| Strategic Income Opportunities | 21,709,379 | 250,477,541 | 12,342,541 | (15,698,239) | 150,994 | (5,430,350) | 7,780,261 | — | 241,842,487 |
| U.S. High Yield Bond | — | 20,587,773 | 78,688 | (20,840,272) | 3,592,318 | (3,418,507) | 78,688 | — | — |
| ANNUAL REPORT | JOHN HANCOCK MULTIMANAGER LIFESTYLE PORTFOLIOS | 57 |
| Dividends and distributions | |||||||||
| Affiliate | Ending share amount | Beginning value | Cost of purchases | Proceeds from shares sold | Realized gain (loss) | Change in unrealized appreciation (depreciation) | Income distributions received | Capital gain distributions received | Ending value |
| U.S. Sector Rotation | 2,880,070 | $33,294,052 | $8,164,143 | $(12,966,908) | $1,659,685 | $(486,251) | $248,464 | $6,449,144 | $29,664,721 |
| $28,158,686 | $(63,915,860) | $60,768,152 | $60,454,042 | $2,201,930,640 | |||||
| 58 | JOHN HANCOCK MULTIMANAGER LIFESTYLE PORTFOLIOS | ANNUAL REPORT |
| ANNUAL REPORT | JOHN HANCOCK MULTIMANAGER LIFESTYLE PORTFOLIOS | 59 |
| Portfolio | Foreign sourced income | Foreign tax credit |
| Multimanager Lifestyle Aggressive Portfolio | $24,099,406 | $2,551,101 |
| Multimanager Lifestyle Growth Portfolio | 54,961,488 | 5,639,569 |
| Multimanager Lifestyle Balanced Portfolio | 36,421,444 | 3,641,681 |
| Multimanager Lifestyle Moderate Portfolio | 7,479,427 | 695,172 |
| Multimanager Lifestyle Conservative Portfolio | 3,773,805 | 328,877 |
| Portfolio | Long term capital gains |
| Multimanager Lifestyle Aggressive Portfolio | $265,477,276 |
| Multimanager Lifestyle Growth Portfolio | 694,659,470 |
| Multimanager Lifestyle Balanced Portfolio | 626,254,159 |
| Multimanager Lifestyle Moderate Portfolio | 140,864,425 |
| Multimanager Lifestyle Conservative Portfolio | 66,460,905 |
| 60 | JOHN HANCOCK MULTIMANAGER LIFESTYLE PORTFOLIOS | ANNUAL REPORT |
| Independent Trustees | ||
| Name, year of birth Position(s) held with Trust Principal occupation(s) and other directorships during past 5 years | Trustee of the Trust since1 | Number of John Hancock funds overseen by Trustee |
| Hassell H. McClellan, Born: 1945 | 2005 | 191 |
| Trustee and Chairperson of the Board | ||
| Director/Trustee, Virtus Funds (2008-2020); Director, The Barnes Group (2010-2021); Associate Professor, The Wallace E. Carroll School of Management, Boston College (retired 2013). Trustee (since 2005) and Chairperson of the Board (since 2017) of various trusts within the John Hancock Fund Complex. | ||
| James R. Boyle, Born: 1959 | 2015 | 191 |
| Trustee | ||
| Foresters Financial, Chief Executive Officer (since 2018) and board member (since 2017). Manulife Financial and John Hancock, more than 20 years, retiring in 2012 as Chief Executive Officer, John Hancock and Senior Executive Vice President, Manulife Financial. Trustee of various trusts within the John Hancock Fund Complex (2005–2014 and since 2015). | ||
| Peter S. Burgess,2 Born: 1942 | 2005 | 191 |
| Trustee | ||
| Consultant (financial, accounting, and auditing matters) (since 1999); Certified Public Accountant; Partner, Arthur Andersen (independent public accounting firm) (prior to 1999); Director, Lincoln Educational Services Corporation (2004-2021); Director, Symetra Financial Corporation (2010–2016); Director, PMA Capital Corporation (2004–2010). Trustee of various trusts within the John Hancock Fund Complex (since 2005). | ||
| William H. Cunningham,2 Born: 1944 | 2012 | 191 |
| Trustee | ||
| Professor, University of Texas, Austin, Texas (since 1971); former Chancellor, University of Texas System and former President of the University of Texas, Austin, Texas; Chairman (since 2009) and Director (since 2006), Lincoln National Corporation (insurance); Director, Southwest Airlines (since 2000). Trustee of various trusts within the John Hancock Fund Complex (since 1986). | ||
| Grace K. Fey, Born: 1946 | 2008 | 191 |
| Trustee | ||
| Chief Executive Officer, Grace Fey Advisors (since 2007); Director and Executive Vice President, Frontier Capital Management Company (1988–2007); Director, Fiduciary Trust (since 2009). Trustee of various trusts within the John Hancock Fund Complex (since 2008). | ||
| Deborah C. Jackson, Born: 1952 | 2012 | 191 |
| Trustee | ||
| President, Cambridge College, Cambridge, Massachusetts (since 2011); Board of Directors, Amwell Corporation (since 2020); Board of Directors, Massachusetts Women’s Forum (2018-2020); Board of Directors, National Association of Corporate Directors/New England (2015-2020); Board of Directors, Association of Independent Colleges and Universities of Massachusetts (2014-2017); Chief Executive Officer, American Red Cross of Massachusetts Bay (2002–2011); Board of Directors of Eastern Bank Corporation (since 2001); Board of Directors of Eastern Bank Charitable Foundation (since 2001); Board of Directors of American Student Assistance Corporation (1996–2009); Board of Directors of Boston Stock Exchange (2002–2008); Board of Directors of Harvard Pilgrim Healthcare (health benefits company) (2007–2011). Trustee of various trusts within the John Hancock Fund Complex (since 2008). | ||
| Steven R. Pruchansky, Born: 1944 | 2012 | 191 |
| Trustee and Vice Chairperson of the Board | ||
| Managing Director, Pru Realty (since 2017); Chairman and Chief Executive Officer, Greenscapes of Southwest Florida, Inc. (2014-2020); Director and President, Greenscapes of Southwest Florida, Inc. (until 2000); Member, Board of Advisors, First American Bank (until 2010); Managing Director, Jon James, LLC (real estate) (since 2000); Partner, Right Funding, LLC (2014-2017); Director, First Signature Bank & Trust Company (until 1991); Director, Mast Realty Trust (until 1994); President, Maxwell Building Corp. (until 1991). Trustee (since 1992), Chairperson of the Board (2011–2012), and Vice Chairperson of the Board (since 2012) of various trusts within the John Hancock Fund Complex. | ||
| Frances G. Rathke,2 Born: 1960 | 2020 | 191 |
| Trustee | ||
| Director, Audit Committee Chair, Oatly Group AB (plant-based drink company) (since 2021); Director, Audit Committee Chair and Compensation Committee Member, Green Mountain Power Corporation (since 2016); Director, Treasurer and Finance & Audit Committee Chair, Flynn Center for Performing Arts (since 2016); Director, Audit Committee Chair and Compensation Committee Member, Planet Fitness (since 2016); Chief Financial Officer and Treasurer, Keurig Green Mountain, Inc. (2003-retired 2015). Trustee of various trusts within the John Hancock Fund Complex (since 2020). | ||
| ANNUAL REPORT | JOHN HANCOCK MULTIMANAGER LIFESTYLE PORTFOLIOS | 61 |
| Independent Trustees (continued) | ||
| Name, year of birth Position(s) held with Trust Principal occupation(s) and other directorships during past 5 years | Trustee of the Trust since1 | Number of John Hancock funds overseen by Trustee |
| Gregory A. Russo, Born: 1949 | 2012 | 191 |
| Trustee | ||
| Director and Audit Committee Chairman (2012-2020), and Member, Audit Committee and Finance Committee (2011-2020), NCH Healthcare System, Inc. (holding company for multi-entity healthcare system); Director and Member (2012-2018) and Finance Committee Chairman (2014-2018), The Moorings, Inc. (nonprofit continuing care community); Vice Chairman, Risk & Regulatory Matters, KPMG LLP (KPMG) (2002–2006); Vice Chairman, Industrial Markets, KPMG (1998–2002); Chairman and Treasurer, Westchester County, New York, Chamber of Commerce (1986–1992); Director, Treasurer, and Chairman of Audit and Finance Committees, Putnam Hospital Center (1989–1995); Director and Chairman of Fundraising Campaign, United Way of Westchester and Putnam Counties, New York (1990–1995). Trustee of various trusts within the John Hancock Fund Complex (since 2008). | ||
| Non-Independent Trustees3 | ||
| Name, year of birth Position(s) held with Trust Principal occupation(s) and other directorships during past 5 years | Trustee of the Trust since1 | Number of John Hancock funds overseen by Trustee |
| Andrew G. Arnott, Born: 1971 | 2017 | 191 |
| President and Non-Independent Trustee | ||
| Head of Wealth and Asset Management, United States and Europe, for John Hancock and Manulife (since 2018); Director and Executive Vice President, John Hancock Investment Management LLC (since 2005, including prior positions); Director and Executive Vice President, John Hancock Variable Trust Advisers LLC (since 2006, including prior positions); President, John Hancock Investment Management Distributors LLC (since 2004, including prior positions); President of various trusts within the John Hancock Fund Complex (since 2007, including prior positions). Trustee of various trusts within the John Hancock Fund Complex (since 2017). | ||
| Marianne Harrison, Born: 1963 | 2018 | 191 |
| Non-Independent Trustee | ||
| President and CEO, John Hancock (since 2017); President and CEO, Manulife Canadian Division (2013–2017); Member, Board of Directors, Boston Medical Center (since 2021); Member, Board of Directors, CAE Inc. (since 2019); Member, Board of Directors, MA Competitive Partnership Board (since 2018); Member, Board of Directors, American Council of Life Insurers (ACLI) (since 2018); Member, Board of Directors, Communitech, an industry-led innovation center that fosters technology companies in Canada (2017-2019); Member, Board of Directors, Manulife Assurance Canada (2015-2017); Board Member, St. Mary’s General Hospital Foundation (2014-2017); Member, Board of Directors, Manulife Bank of Canada (2013- 2017); Member, Standing Committee of the Canadian Life & Health Assurance Association (2013-2017); Member, Board of Directors, John Hancock USA, John Hancock Life & Health, John Hancock New York (2012–2013). Trustee of various trusts within the John Hancock Fund Complex (since 2018). | ||
| Principal officers who are not Trustees | |
| Name, year of birth Position(s) held with Trust Principal occupation(s) during past 5 years | Current Position(s) with the Trust since |
| Charles A. Rizzo, Born: 1957 | 2007 |
| Chief Financial Officer | |
| Vice President, John Hancock Financial Services (since 2008); Senior Vice President, John Hancock Investment Management LLC and John Hancock Variable Trust Advisers LLC (since 2008); Chief Financial Officer of various trusts within the John Hancock Fund Complex (since 2007). | |
| Salvatore Schiavone, Born: 1965 | 2009 |
| Treasurer | |
| Assistant Vice President, John Hancock Financial Services (since 2007); Vice President, John Hancock Investment Management LLC and John Hancock Variable Trust Advisers LLC (since 2007); Treasurer of various trusts within the John Hancock Fund Complex (since 2007, including prior positions). | |
| Christopher (Kit) Sechler, Born: 1973 | 2018 |
| Secretary and Chief Legal Officer | |
| Vice President and Deputy Chief Counsel, John Hancock Investment Management (since 2015); Assistant Vice President and Senior Counsel (2009–2015), John Hancock Investment Management; Assistant Secretary of John Hancock Investment Management LLC and John Hancock Variable Trust Advisers LLC (since 2009); Chief Legal Officer and Secretary of various trusts within the John Hancock Fund Complex (since 2009, including prior positions). | |
| 62 | JOHN HANCOCK MULTIMANAGER LIFESTYLE PORTFOLIOS | ANNUAL REPORT |
| Principal officers who are not Trustees (continued) | |
| Name, year of birth Position(s) held with Trust Principal occupation(s) during past 5 years | Current Position(s) with the Trust since |
| Trevor Swanberg, Born: 1979 | 2020 |
| Chief Compliance Officer | |
| Chief Compliance Officer, John Hancock Investment Management LLC and John Hancock Variable Trust Advisers LLC (since 2020); Deputy Chief Compliance Officer, John Hancock Investment Management LLC and John Hancock Variable Trust Advisers LLC (2019–2020); Assistant Chief Compliance Officer, John Hancock Investment Management LLC and John Hancock Variable Trust Advisers LLC (2016–2019); Vice President, State Street Global Advisors (2015–2016); Chief Compliance Officer of various trusts within the John Hancock Fund Complex (since 2016, including prior positions). | |
| 1 | Each Trustee holds office until his or her successor is elected and qualified, or until the Trustee’s death, retirement, resignation, or removal. Mr. Boyle has served as Trustee at various times prior to the date listed in the table. |
| 2 | Member of the Audit Committee. |
| 3 | The Trustee is a Non-Independent Trustee due to current or former positions with the Advisor and certain affiliates. |
| ANNUAL REPORT | JOHN HANCOCK MULTIMANAGER LIFESTYLE PORTFOLIOS | 63 |
Steven R. Pruchansky, Vice Chairperson
Andrew G. Arnott†
James R. Boyle
Peter S. Burgess*
William H. Cunningham*
Grace K. Fey
Marianne Harrison†
Deborah C. Jackson
Frances G. Rathke*
Gregory A. Russo
President
Chief Financial Officer
Treasurer
Secretary and Chief Legal Officer
Chief Compliance Officer
Nathan W. Thooft, CFA
| You can also contact us: | ||
| 800-225-5291 | Regular mail: | Express mail: |
| jhinvestments.com | John Hancock Signature Services, Inc. P.O. Box 219909 Kansas City, MO 64121-9909 | John Hancock Signature Services, Inc. 430 W 7th Street Suite 219909 Kansas City, MO 64105-1407 |
| 64 | JOHN HANCOCK MULTIMANAGER LIFESTYLE PORTFOLIOS | ANNUAL REPORT |
GOVERNANCE FUNDS
with a heritage of financial stewardship dating back to 1862. Helping
our shareholders pursue their financial goals is at the core of everything
we do. It’s why we support the role of professional financial advice
and operate with the highest standards of conduct and integrity.
We search the world to find proven portfolio teams with specialized
expertise for every strategy we offer, then we apply robust investment
oversight to ensure they continue to meet our uncompromising
standards and serve the best interests of our shareholders.
a diverse set of investments backed by some of the world’s best
managers, along with strong risk-adjusted returns across asset classes.

200 Berkeley Street, Boston, MA 02116-5010, 800-225-5291, jhinvestments.com

| MF1976911 | LSA 12/21 |
ITEM 2. CODE OF ETHICS.
As of the end of the period, December 31, 2021, the registrant has adopted a code of ethics, as defined in Item 2 of Form N-CSR, that applies to its Chief Executive Officer, Chief Financial Officer and Treasurer (respectively, the principal executive officer, the principal financial officer and the principal accounting officer, the "Covered Officers"). A copy of the code of ethics is filed as an exhibit to this Form N-CSR.
ITEM 3. AUDIT COMMITTEE FINANCIAL EXPERT.
Peter S. Burgess is the audit committee financial expert and is "independent", pursuant to general instructions on Form N-CSR Item 3.
ITEM 4. PRINCIPAL ACCOUNTANT FEES AND SERVICES.
(a) AUDIT FEES:
These fees represent aggregate fees billed for the last two fiscal years (the "Reporting Periods") for professional services rendered by the principal accountant for the audits of the Registrant's annual financial statements or services that are normally provided by the accountant in connection with statutory and regulatory filing or engagements for such Reporting Periods.
2021: $187,876
2020: $183,236
(b) AUDIT RELATED FEES:
These fees represent the aggregate fees billed for the Reporting Periods for assurance and related services by the principal accountant that are reasonably related to the performance of the audit of the Registrant's financial statements and are not reported under paragraph (a) of this Item. Such fees relate to professional services rendered by PwC for separate audit reports in connection with security counts pursuant to Rule 17f-2 under the Investment Company Act of 1940 and affiliated service provider internal controls reviews. In addition, amounts billed to control affiliates for service provider internal controls reviews were $119,500 and $116,000 for the fiscal years ended December 31, 2021 and 2020, respectively.
2021: $35,779
2020: $34,138
(c) TAX FEES:
These fees represent aggregate fees billed for the Reporting Periods for professional services rendered by the principal accountant for tax compliance, tax advice and tax planning.
2021: $3,914
2020: $3,837
(d) ALL OTHER FEES:
These fees represent other fees for John Hancock Funds II billed to the registrant or to control affiliates.
2021: $1,731
2020: $533
The nature of the services comprising all other fees is advisory services provided to the investment manager.
(e) (1) Audit Committee Pre-Approval Policies and Procedures:
The Trust's Audit Committee must pre-approve all audit and non-audit services provided by the independent registered public accounting firm (the "Auditor") relating to the operations or financial reporting of the funds. Prior to the commencement of any audit or non-audit services to a fund, the Audit Committee reviews the services to determine whether they are appropriate and permissible under applicable law.
The Trust's Audit Committee has adopted policies and procedures to, among other purposes, provide a framework for the Committee's consideration of audit-related and non-audit services by the Auditor. The policies and procedures require that any audit-related and non-audit service provided by the Auditor and any non-audit service provided by the Auditor to a fund service provider that relates directly to the operations and financial reporting of a fund are subject to approval by the Audit Committee before such service is provided. Audit-related services provided by the Auditor that are expected to exceed $25,000 per instance/per fund are subject to specific pre-approval by the Audit Committee. Tax services provided by the Auditor that are expected to exceed $30,000 per instance/per fund are subject to specific pre- approval by the Audit Committee.
All audit services, as well as the audit-related and non-audit services that are expected to exceed the amounts stated above, must be approved in advance of provision of the service by formal resolution of the Audit Committee. At the regularly scheduled Audit Committee meetings, the Committee reviews a report summarizing the services, including fees, provided by the Auditor.
(2)Amount approved by the Audit Committee pursuant paragraph (c) (7) (i) (C) of Rule 2-01 of Regulation S-X: None.
(f)According to the registrant's principal accountant, for the fiscal period ended December 31, 2021, the percentage of hours spent on the audit of the registrant's financial statements for the most recent fiscal year that were attributed to work performed by persons who were not full-time, permanent employees of principal accountant was less than 50%.
(g)The aggregate non-audit fees billed by PwC for services rendered to the registrant and rendered to the registrant's control affiliates for each of the last two fiscal years of the registrant were $988,890 for the fiscal year ended December 31, 2021 and $1,260,533 for the fiscal year ended December 31, 2020.
(h)The Registrant's audit committee of the Board of Trustees has considered the provision of non-audit services that were rendered to the Registrant's investment adviser and service affiliates that were not pre-approved pursuant to paragraph (c) (7ii) of Rule 2-01 of Regulation S-X, to be compatible with maintaining PwC's independence.
ITEM 5. AUDIT COMMITTEE OF LISTED REGISTRANTS
Peter S. Burgess - Chairman
William H. Cunningham
Frances G. Rathke
ITEM 6. SCHEDULE OF INVESTMENTS.
(a)Included with Item 1.
(b)Not Applicable.
ITEM 7. DISCLOSURE OF PROXY VOTING POLICIES AND PROCEDURES FOR CLOSED-END MANAGEMENT INVESTMENT COMPANIES.
Not Applicable.
ITEM 8. PORTFOLIO MANAGERS OF CLOSED-END MANAGEMENT INVESTMENT COMPANIES.
Not Applicable.
ITEM 9. PURCHASE OF EQUITY SECURITIES BY CLOSED-END MANAGEMENT INVESTMENT COMPANIES AND AFFILIATED PURCHASERS.
Not Applicable.
ITEM 10. SUBMISSION OF MATTERS TO VOTE OF SECURITY HOLDERS.
There were no material changes to previously disclosed John Hancock Funds – Nominating and Governance Committee Charter.
ITEM 11. CONTROLS AND PROCEDURES.
(a)Based upon their evaluation of the registrant's disclosure controls and procedures as conducted within
90 days of the filing date of this Form N-CSR, the registrant's principal executive officer and principal financial officer have concluded that those disclosure controls and procedures provide reasonable assurance that the material information required to be disclosed by the registrant on this report is recorded, processed, summarized and reported within the time periods specified in the Securities and Exchange Commission's rules and forms.
(b)There were no changes in the registrant's internal control over financial reporting that occurred during the period covered by this report that have materially affected, or are reasonably likely to materially affect, the registrant's internal control over financial reporting.
ITEM 12. DISCLOSURE OF SECURITIES LENDING ACTIVITIES FOR CLOSED-END MANAGEMENT INVESTMENT COMPANIES.
Not applicable.
ITEM 13. EXHIBITS.
SIGNATURES
Pursuant to the requirements of the Securities Exchange Act of 1934 and the Investment Company Act of 1940, the registrant has duly caused this report to be signed on its behalf by the undersigned, thereunto duly authorized.
JOHN HANCOCK FUNDS II
/s/ Andrew Arnott
_______________________
Andrew Arnott
President
Date: February 9, 2022
Pursuant to the requirements of the Securities Exchange Act of 1934 and the Investment Company Act of 1940, this report has been signed below by the following persons on behalf of the registrant and in the capacities and on the dates indicated.
/s/ Andrew Arnott
_______________________
Andrew Arnott
President
Date: February 9, 2022
/s/ Charles A. Rizzo
_______________________
Charles A. Rizzo
Chief Financial Officer
Date: February 9, 2022