
Exhibit 99.2 Supplemental Information 2nd Quarter 2019
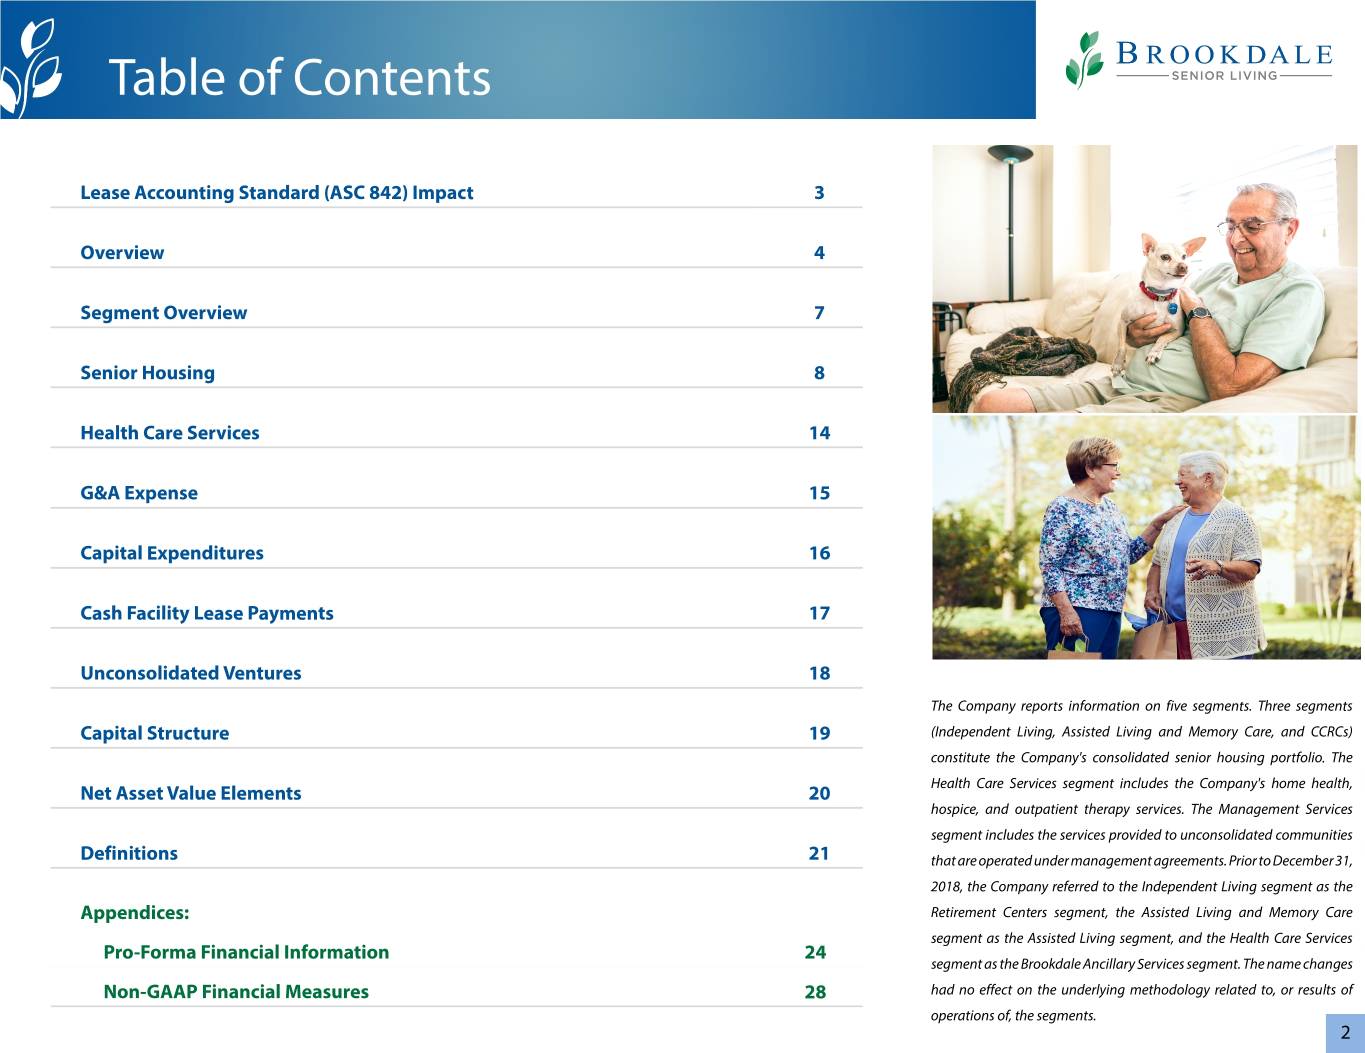
Table of Contents Lease Accounting Standard (ASC 842) Impact 3 Overview 4 Segment Overview 7 Senior Housing 8 Health Care Services 14 G&A Expense 15 Capital Expenditures 16 Cash Facility Lease Payments 17 Unconsolidated Ventures 18 The Company reports information on five segments. Three segments Capital Structure 19 (Independent Living, Assisted Living and Memory Care, and CCRCs) constitute the Company's consolidated senior housing portfolio. The Health Care Services segment includes the Company's home health, Net Asset Value Elements 20 hospice, and outpatient therapy services. The Management Services segment includes the services provided to unconsolidated communities Definitions 21 that are operated under management agreements. Prior to December 31, 2018, the Company referred to the Independent Living segment as the Appendices: Retirement Centers segment, the Assisted Living and Memory Care segment as the Assisted Living segment, and the Health Care Services Pro-Forma Financial Information 24 segment as the Brookdale Ancillary Services segment. The name changes Non-GAAP Financial Measures 28 had no effect on the underlying methodology related to, or results of operations of, the segments. 2

Lease Accounting Standard (ASC 842) Impact The Company’s adoption of the new lease accounting standard, effective January 1, 2019, impacted the timing of the revenue and cost recognition associated with its residency agreements. For the full year 2019, the Company expects the adoption and application to its residency agreements to have a negative, non-recurring net impact of approximately $27 million to net income (loss) and Adjusted EBITDA, with no impact to net cash provided by (used in) operating activities or Adjusted Free Cash Flow. To aid in comparability between periods, the following presentations in this Supplement exclude the impact of adoption of the new lease accounting standard: (i) the Company’s results on a Same Community basis, (ii) RevPAR and RevPOR (other than as noted on this page), (iii) Interest Coverage, (iv) Lease Coverage, and (v) annualized leverage. All other presentations of the Company's 2019 results in this Supplement include the impact of the new lease accounting standard. Prior year amounts reflect the accounting under the former lease standard. The following table presents the impact of adoption of the new lease accounting standard to the Company’s current quarter and year to date results from its application to the Company's residency agreements and costs related thereto for the senior housing portfolio. ($ in 000s, except RevPAR and RevPOR) 2Q 2019 YTD 2019 Assisted Assisted Total Senior Independent Living and Total Senior Independent Living and Housing Living Memory Care CCRCs Housing Living Memory Care CCRCs Resident fee revenue $ 5,299 $ 1,914 $ 2,718 $ 667 $ 8,079 $ 3,302 $ 3,634 $ 1,143 Facility operating expense 11,826 3,095 7,391 1,340 21,036 5,738 12,809 2,489 Net income (loss) and Adjusted EBITDA (6,527) (1,181) (4,673) (673) (12,957) (2,436) (9,175) (1,346) Foregoing impact is offset within working capital 6,527 1,181 4,673 673 12,957 2,436 9,175 1,346 Adjusted Free Cash Flow $ — $ — $ — $ — $ — $ — $ — $ — RevPAR - Including impact of ASC 842 $ 4,129 $ 3,643 $ 4,117 $ 5,115 $ 4,124 $ 3,641 $ 4,097 $ 5,185 RevPAR - Excluding impact of ASC 842 4,097 3,592 4,092 5,081 4,100 3,597 4,081 5,156 RevPOR - Including impact of ASC 842 $ 4,948 $ 4,090 $ 5,017 $ 6,347 $ 4,938 $ 4,072 $ 5,007 $ 6,344 RevPOR - Excluding impact of ASC 842 4,909 4,033 4,987 6,305 4,909 4,023 4,987 6,308 3
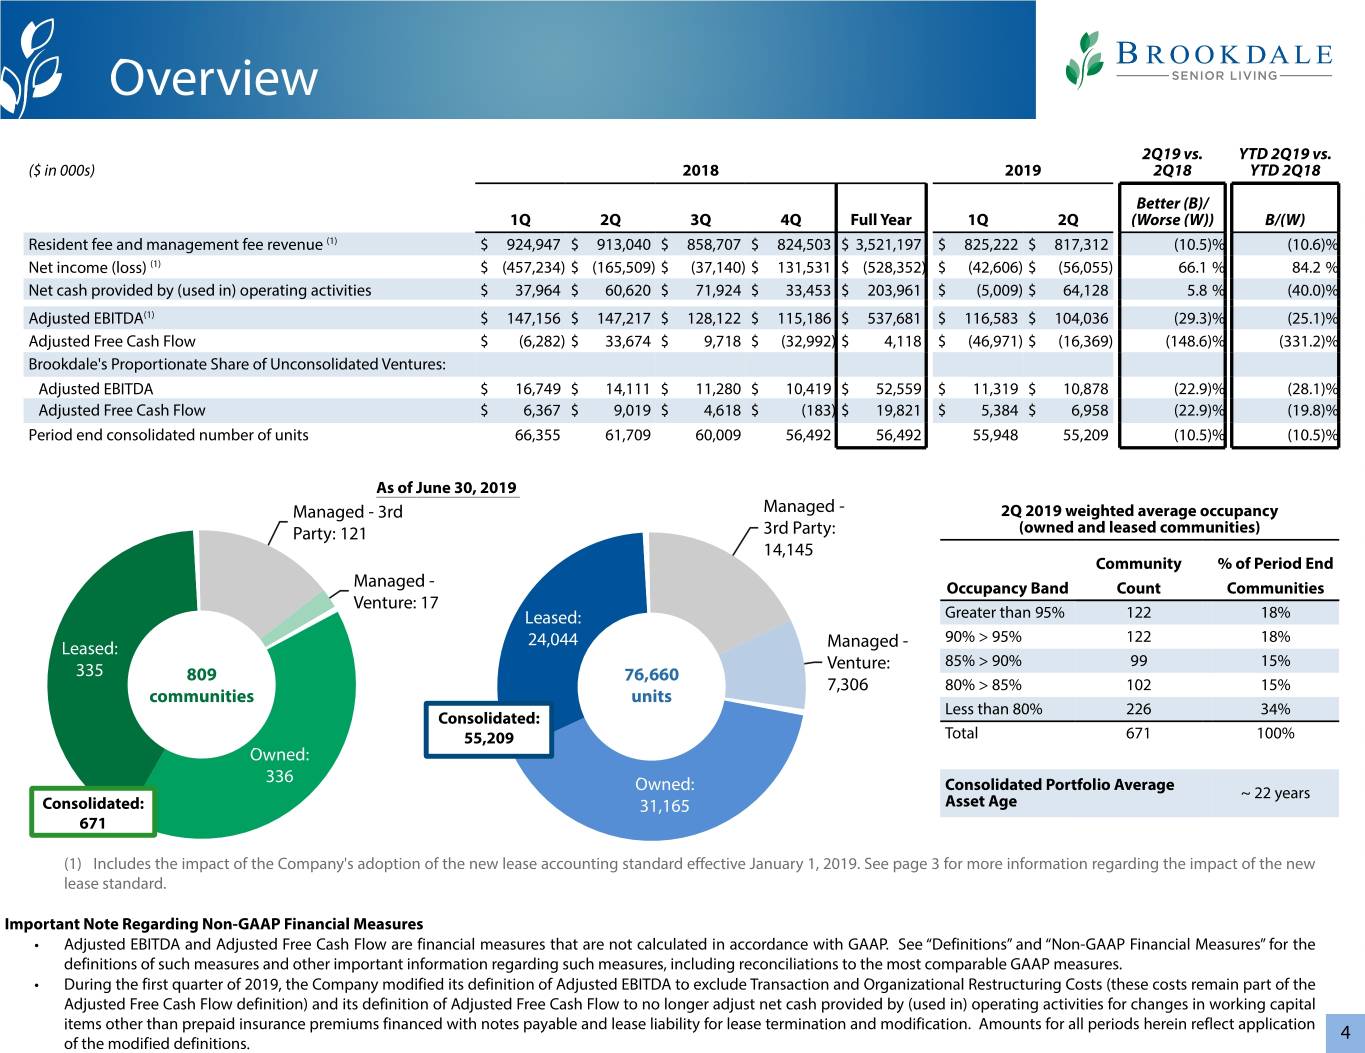
Overview 2Q19 vs. YTD 2Q19 vs. ($ in 000s) 2018 2019 2Q18 YTD 2Q18 Better (B)/ 1Q 2Q 3Q 4Q Full Year 1Q 2Q (Worse (W)) B/(W) Resident fee and management fee revenue (1) $ 924,947 $ 913,040 $ 858,707 $ 824,503 $ 3,521,197 $ 825,222 $ 817,312 (10.5)% (10.6)% Net income (loss) (1) $ (457,234) $ (165,509) $ (37,140) $ 131,531 $ (528,352) $ (42,606) $ (56,055) 66.1 % 84.2 % Net cash provided by (used in) operating activities $ 37,964 $ 60,620 $ 71,924 $ 33,453 $ 203,961 $ (5,009) $ 64,128 5.8 % (40.0)% Adjusted EBITDA(1) $ 147,156 $ 147,217 $ 128,122 $ 115,186 $ 537,681 $ 116,583 $ 104,036 (29.3)% (25.1)% Adjusted Free Cash Flow $ (6,282) $ 33,674 $ 9,718 $ (32,992) $ 4,118 $ (46,971) $ (16,369) (148.6)% (331.2)% Brookdale's Proportionate Share of Unconsolidated Ventures: Adjusted EBITDA $ 16,749 $ 14,111 $ 11,280 $ 10,419 $ 52,559 $ 11,319 $ 10,878 (22.9)% (28.1)% Adjusted Free Cash Flow $ 6,367 $ 9,019 $ 4,618 $ (183) $ 19,821 $ 5,384 $ 6,958 (22.9)% (19.8)% Period end consolidated number of units 66,355 61,709 60,009 56,492 56,492 55,948 55,209 (10.5)% (10.5)% As of June 30, 2019 Managed - 3rd Managed - 2Q 2019 weighted average occupancy Party: 121 3rd Party: (owned and leased communities) 14,145 Community % of Period End Managed - Occupancy Band Count Communities Venture: 17 Leased: Greater than 95% 122 18% 90% > 95% 122 18% Leased: 24,044 Managed - Venture: 85% > 90% 99 15% 335 809 76,660 7,306 80% > 85% 102 15% communities units Less than 80% 226 34% Consolidated: 55,209 Total 671 100% Owned: 336 Owned: Consolidated Portfolio Average ~ 22 years Consolidated: 31,165 Asset Age 671 (1) Includes the impact of the Company's adoption of the new lease accounting standard effective January 1, 2019. See page 3 for more information regarding the impact of the new lease standard. Important Note Regarding Non-GAAP Financial Measures • Adjusted EBITDA and Adjusted Free Cash Flow are financial measures that are not calculated in accordance with GAAP. See “Definitions” and “Non-GAAP Financial Measures” for the definitions of such measures and other important information regarding such measures, including reconciliations to the most comparable GAAP measures. • During the first quarter of 2019, the Company modified its definition of Adjusted EBITDA to exclude Transaction and Organizational Restructuring Costs (these costs remain part of the Adjusted Free Cash Flow definition) and its definition of Adjusted Free Cash Flow to no longer adjust net cash provided by (used in) operating activities for changes in working capital items other than prepaid insurance premiums financed with notes payable and lease liability for lease termination and modification. Amounts for all periods herein reflect application 4 of the modified definitions.
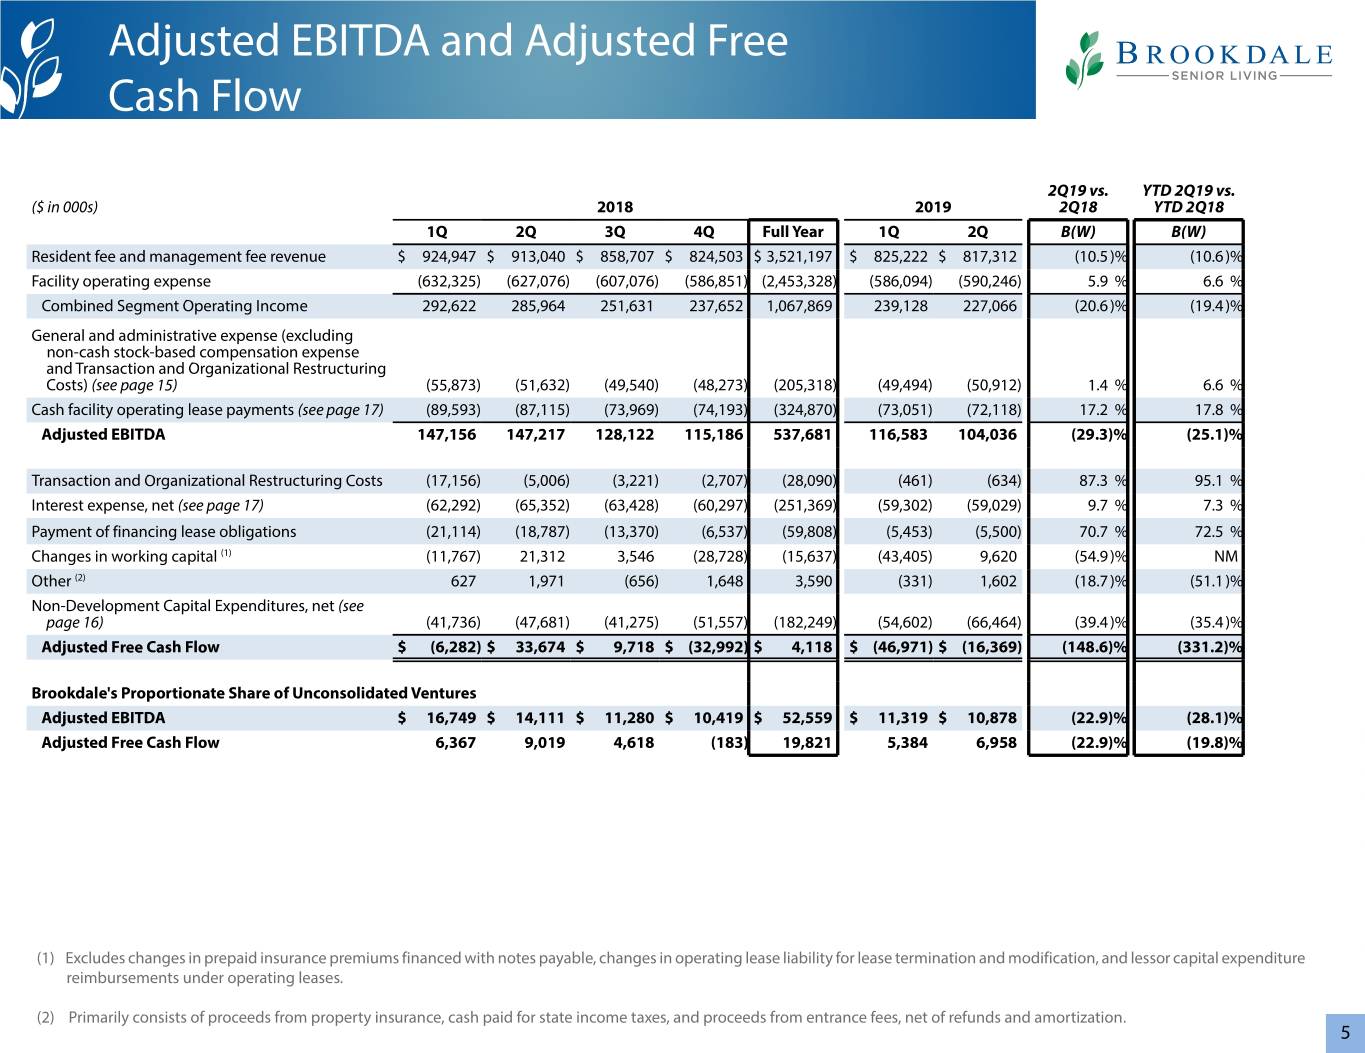
Adjusted EBITDA and Adjusted Free Cash Flow 2Q19 vs. YTD 2Q19 vs. ($ in 000s) 2018 2019 2Q18 YTD 2Q18 1Q 2Q 3Q 4Q Full Year 1Q 2Q B(W) B(W) Resident fee and management fee revenue $ 924,947 $ 913,040 $ 858,707 $ 824,503 $ 3,521,197 $ 825,222 $ 817,312 (10.5)% (10.6)% Facility operating expense (632,325) (627,076) (607,076) (586,851) (2,453,328) (586,094) (590,246) 5.9 % 6.6 % Combined Segment Operating Income 292,622 285,964 251,631 237,652 1,067,869 239,128 227,066 (20.6)% (19.4)% General and administrative expense (excluding non-cash stock-based compensation expense and Transaction and Organizational Restructuring Costs) (see page 15) (55,873) (51,632) (49,540) (48,273) (205,318) (49,494) (50,912) 1.4 % 6.6 % Cash facility operating lease payments (see page 17) (89,593) (87,115) (73,969) (74,193) (324,870) (73,051) (72,118) 17.2 % 17.8 % Adjusted EBITDA 147,156 147,217 128,122 115,186 537,681 116,583 104,036 (29.3)% (25.1)% Transaction and Organizational Restructuring Costs (17,156) (5,006) (3,221) (2,707) (28,090) (461) (634) 87.3 % 95.1 % Interest expense, net (see page 17) (62,292) (65,352) (63,428) (60,297) (251,369) (59,302) (59,029) 9.7 % 7.3 % Payment of financing lease obligations (21,114) (18,787) (13,370) (6,537) (59,808) (5,453) (5,500) 70.7 % 72.5 % Changes in working capital (1) (11,767) 21,312 3,546 (28,728) (15,637) (43,405) 9,620 (54.9)% NM Other (2) 627 1,971 (656) 1,648 3,590 (331) 1,602 (18.7)% (51.1)% Non-Development Capital Expenditures, net (see page 16) (41,736) (47,681) (41,275) (51,557) (182,249) (54,602) (66,464) (39.4)% (35.4)% Adjusted Free Cash Flow $ (6,282) $ 33,674 $ 9,718 $ (32,992) $ 4,118 $ (46,971) $ (16,369) (148.6)% (331.2)% Brookdale's Proportionate Share of Unconsolidated Ventures Adjusted EBITDA $ 16,749 $ 14,111 $ 11,280 $ 10,419 $ 52,559 $ 11,319 $ 10,878 (22.9)% (28.1)% Adjusted Free Cash Flow 6,367 9,019 4,618 (183) 19,821 5,384 6,958 (22.9)% (19.8)% (1) Excludes changes in prepaid insurance premiums financed with notes payable, changes in operating lease liability for lease termination and modification, and lessor capital expenditure reimbursements under operating leases. (2) Primarily consists of proceeds from property insurance, cash paid for state income taxes, and proceeds from entrance fees, net of refunds and amortization. 5
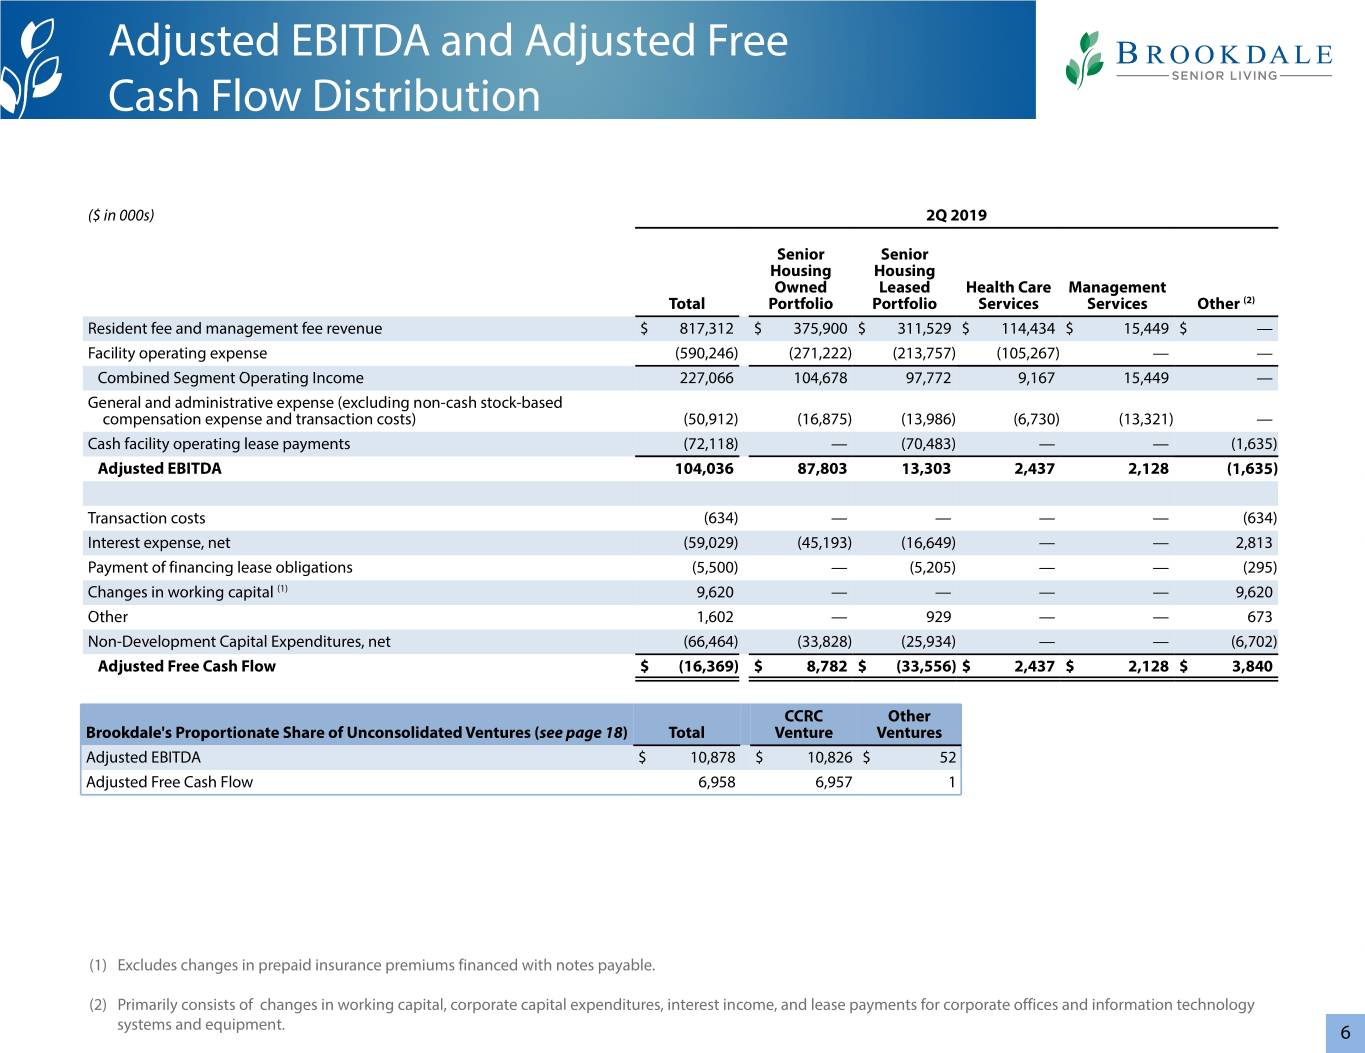
Adjusted EBITDA and Adjusted Free Cash Flow Distribution ($ in 000s) 2Q 2019 Senior Senior Housing Housing Owned Leased Health Care Management Total Portfolio Portfolio Services Services Other (2) Resident fee and management fee revenue $ 817,312 $ 375,900 $ 311,529 $ 114,434 $ 15,449 $ — Facility operating expense (590,246) (271,222) (213,757) (105,267) — — Combined Segment Operating Income 227,066 104,678 97,772 9,167 15,449 — General and administrative expense (excluding non-cash stock-based compensation expense and transaction costs) (50,912) (16,875) (13,986) (6,730) (13,321) — Cash facility operating lease payments (72,118) — (70,483) — — (1,635) Adjusted EBITDA 104,036 87,803 13,303 2,437 2,128 (1,635) Transaction costs (634) — — — — (634) Interest expense, net (59,029) (45,193) (16,649) — — 2,813 Payment of financing lease obligations (5,500) — (5,205) — — (295) Changes in working capital (1) 9,620 — — — — 9,620 Other 1,602 — 929 — — 673 Non-Development Capital Expenditures, net (66,464) (33,828) (25,934) — — (6,702) Adjusted Free Cash Flow $ (16,369) $ 8,782 $ (33,556) $ 2,437 $ 2,128 $ 3,840 CCRC Other Brookdale's Proportionate Share of Unconsolidated Ventures (see page 18) Total Venture Ventures Adjusted EBITDA $ 10,878 $ 10,826 $ 52 Adjusted Free Cash Flow 6,958 6,957 1 (1) Excludes changes in prepaid insurance premiums financed with notes payable. (2) Primarily consists of changes in working capital, corporate capital expenditures, interest income, and lease payments for corporate offices and information technology systems and equipment. 6
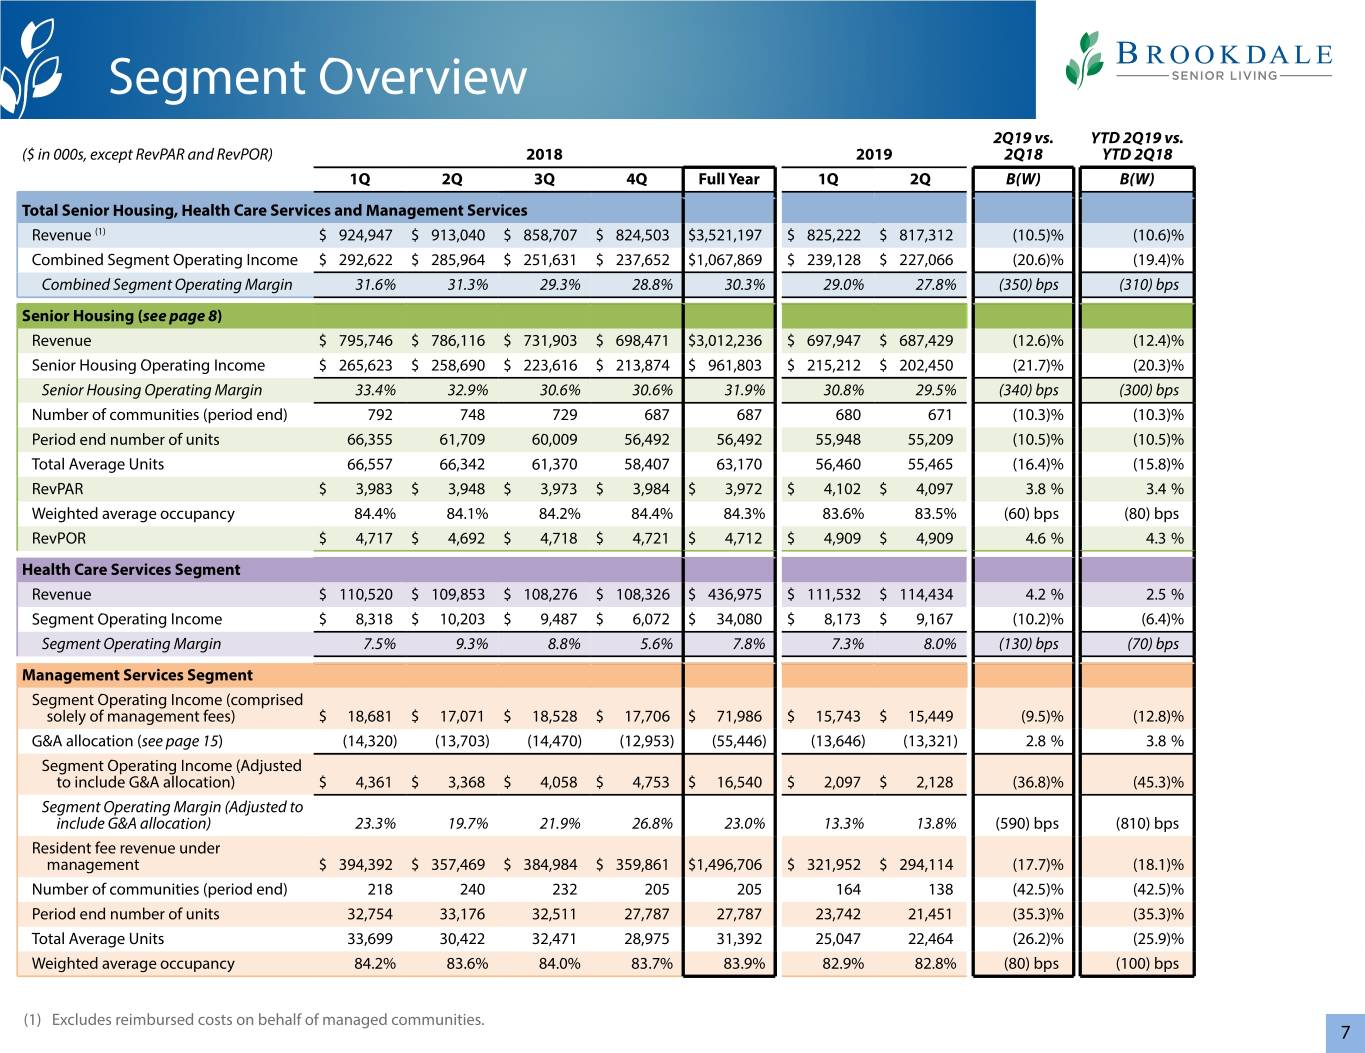
Segment Overview 2Q19 vs. YTD 2Q19 vs. ($ in 000s, except RevPAR and RevPOR) 2018 2019 2Q18 YTD 2Q18 1Q 2Q 3Q 4Q Full Year 1Q 2Q B(W) B(W) Total Senior Housing, Health Care Services and Management Services Revenue (1) $ 924,947 $ 913,040 $ 858,707 $ 824,503 $3,521,197 $ 825,222 $ 817,312 (10.5)% (10.6)% Combined Segment Operating Income $ 292,622 $ 285,964 $ 251,631 $ 237,652 $1,067,869 $ 239,128 $ 227,066 (20.6)% (19.4)% Combined Segment Operating Margin 31.6% 31.3% 29.3% 28.8% 30.3% 29.0% 27.8% (350) bps (310) bps Senior Housing (see page 8) Revenue $ 795,746 $ 786,116 $ 731,903 $ 698,471 $3,012,236 $ 697,947 $ 687,429 (12.6)% (12.4)% Senior Housing Operating Income $ 265,623 $ 258,690 $ 223,616 $ 213,874 $ 961,803 $ 215,212 $ 202,450 (21.7)% (20.3)% Senior Housing Operating Margin 33.4% 32.9% 30.6% 30.6% 31.9% 30.8% 29.5% (340) bps (300) bps Number of communities (period end) 792 748 729 687 687 680 671 (10.3)% (10.3)% Period end number of units 66,355 61,709 60,009 56,492 56,492 55,948 55,209 (10.5)% (10.5)% Total Average Units 66,557 66,342 61,370 58,407 63,170 56,460 55,465 (16.4)% (15.8)% RevPAR $ 3,983 $ 3,948 $ 3,973 $ 3,984 $ 3,972 $ 4,102 $ 4,097 3.8 % 3.4 % Weighted average occupancy 84.4% 84.1% 84.2% 84.4% 84.3% 83.6% 83.5% (60) bps (80) bps RevPOR $ 4,717 $ 4,692 $ 4,718 $ 4,721 $ 4,712 $ 4,909 $ 4,909 4.6 % 4.3 % Health Care Services Segment Revenue $ 110,520 $ 109,853 $ 108,276 $ 108,326 $ 436,975 $ 111,532 $ 114,434 4.2 % 2.5 % Segment Operating Income $ 8,318 $ 10,203 $ 9,487 $ 6,072 $ 34,080 $ 8,173 $ 9,167 (10.2)% (6.4)% Segment Operating Margin 7.5% 9.3% 8.8% 5.6% 7.8% 7.3% 8.0% (130) bps (70) bps Management Services Segment Segment Operating Income (comprised solely of management fees) $ 18,681 $ 17,071 $ 18,528 $ 17,706 $ 71,986 $ 15,743 $ 15,449 (9.5)% (12.8)% G&A allocation (see page 15) (14,320) (13,703) (14,470) (12,953) (55,446) (13,646) (13,321) 2.8 % 3.8 % Segment Operating Income (Adjusted to include G&A allocation) $ 4,361 $ 3,368 $ 4,058 $ 4,753 $ 16,540 $ 2,097 $ 2,128 (36.8)% (45.3)% Segment Operating Margin (Adjusted to include G&A allocation) 23.3% 19.7% 21.9% 26.8% 23.0% 13.3% 13.8% (590) bps (810) bps Resident fee revenue under management $ 394,392 $ 357,469 $ 384,984 $ 359,861 $1,496,706 $ 321,952 $ 294,114 (17.7)% (18.1)% Number of communities (period end) 218 240 232 205 205 164 138 (42.5)% (42.5)% Period end number of units 32,754 33,176 32,511 27,787 27,787 23,742 21,451 (35.3)% (35.3)% Total Average Units 33,699 30,422 32,471 28,975 31,392 25,047 22,464 (26.2)% (25.9)% Weighted average occupancy 84.2% 83.6% 84.0% 83.7% 83.9% 82.9% 82.8% (80) bps (100) bps (1) Excludes reimbursed costs on behalf of managed communities. 7
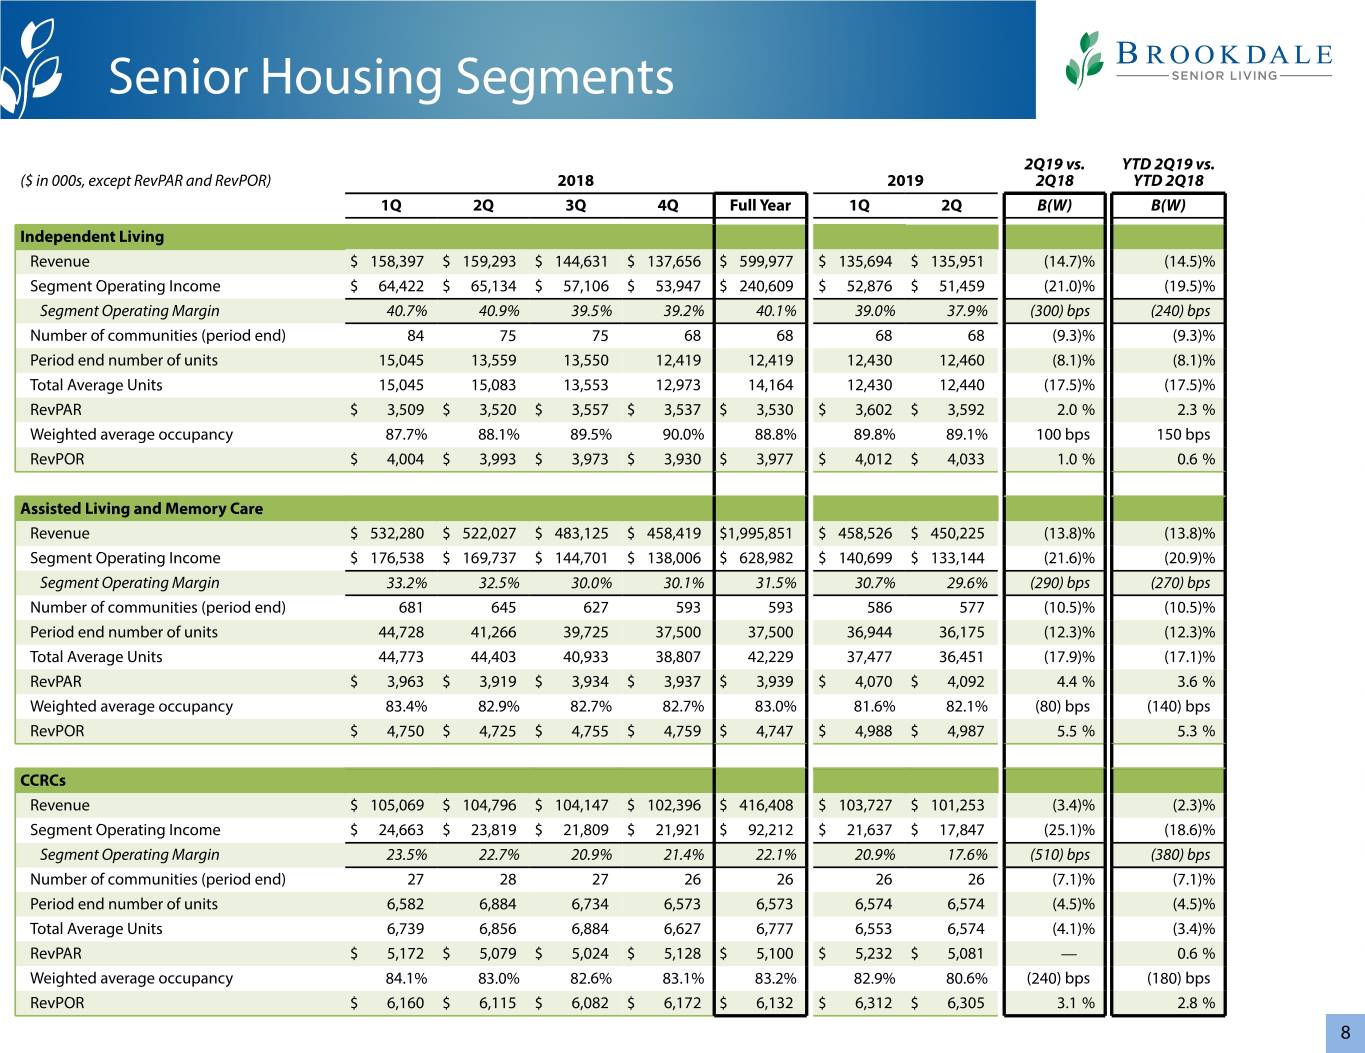
Senior Housing Segments 2Q19 vs. YTD 2Q19 vs. ($ in 000s, except RevPAR and RevPOR) 2018 2019 2Q18 YTD 2Q18 1Q 2Q 3Q 4Q Full Year 1Q 2Q B(W) B(W) Independent Living Revenue $ 158,397 $ 159,293 $ 144,631 $ 137,656 $ 599,977 $ 135,694 $ 135,951 (14.7)% (14.5)% Segment Operating Income $ 64,422 $ 65,134 $ 57,106 $ 53,947 $ 240,609 $ 52,876 $ 51,459 (21.0)% (19.5)% Segment Operating Margin 40.7% 40.9% 39.5% 39.2% 40.1% 39.0% 37.9% (300) bps (240) bps Number of communities (period end) 84 75 75 68 68 68 68 (9.3)% (9.3)% Period end number of units 15,045 13,559 13,550 12,419 12,419 12,430 12,460 (8.1)% (8.1)% Total Average Units 15,045 15,083 13,553 12,973 14,164 12,430 12,440 (17.5)% (17.5)% RevPAR $ 3,509 $ 3,520 $ 3,557 $ 3,537 $ 3,530 $ 3,602 $ 3,592 2.0 % 2.3 % Weighted average occupancy 87.7% 88.1% 89.5% 90.0% 88.8% 89.8% 89.1% 100 bps 150 bps RevPOR $ 4,004 $ 3,993 $ 3,973 $ 3,930 $ 3,977 $ 4,012 $ 4,033 1.0 % 0.6 % Assisted Living and Memory Care Revenue $ 532,280 $ 522,027 $ 483,125 $ 458,419 $1,995,851 $ 458,526 $ 450,225 (13.8)% (13.8)% Segment Operating Income $ 176,538 $ 169,737 $ 144,701 $ 138,006 $ 628,982 $ 140,699 $ 133,144 (21.6)% (20.9)% Segment Operating Margin 33.2% 32.5% 30.0% 30.1% 31.5% 30.7% 29.6% (290) bps (270) bps Number of communities (period end) 681 645 627 593 593 586 577 (10.5)% (10.5)% Period end number of units 44,728 41,266 39,725 37,500 37,500 36,944 36,175 (12.3)% (12.3)% Total Average Units 44,773 44,403 40,933 38,807 42,229 37,477 36,451 (17.9)% (17.1)% RevPAR $ 3,963 $ 3,919 $ 3,934 $ 3,937 $ 3,939 $ 4,070 $ 4,092 4.4 % 3.6 % Weighted average occupancy 83.4% 82.9% 82.7% 82.7% 83.0% 81.6% 82.1% (80) bps (140) bps RevPOR $ 4,750 $ 4,725 $ 4,755 $ 4,759 $ 4,747 $ 4,988 $ 4,987 5.5 % 5.3 % CCRCs Revenue $ 105,069 $ 104,796 $ 104,147 $ 102,396 $ 416,408 $ 103,727 $ 101,253 (3.4)% (2.3)% Segment Operating Income $ 24,663 $ 23,819 $ 21,809 $ 21,921 $ 92,212 $ 21,637 $ 17,847 (25.1)% (18.6)% Segment Operating Margin 23.5% 22.7% 20.9% 21.4% 22.1% 20.9% 17.6% (510) bps (380) bps Number of communities (period end) 27 28 27 26 26 26 26 (7.1)% (7.1)% Period end number of units 6,582 6,884 6,734 6,573 6,573 6,574 6,574 (4.5)% (4.5)% Total Average Units 6,739 6,856 6,884 6,627 6,777 6,553 6,574 (4.1)% (3.4)% RevPAR $ 5,172 $ 5,079 $ 5,024 $ 5,128 $ 5,100 $ 5,232 $ 5,081 — 0.6 % Weighted average occupancy 84.1% 83.0% 82.6% 83.1% 83.2% 82.9% 80.6% (240) bps (180) bps RevPOR $ 6,160 $ 6,115 $ 6,082 $ 6,172 $ 6,132 $ 6,312 $ 6,305 3.1 % 2.8 % 8
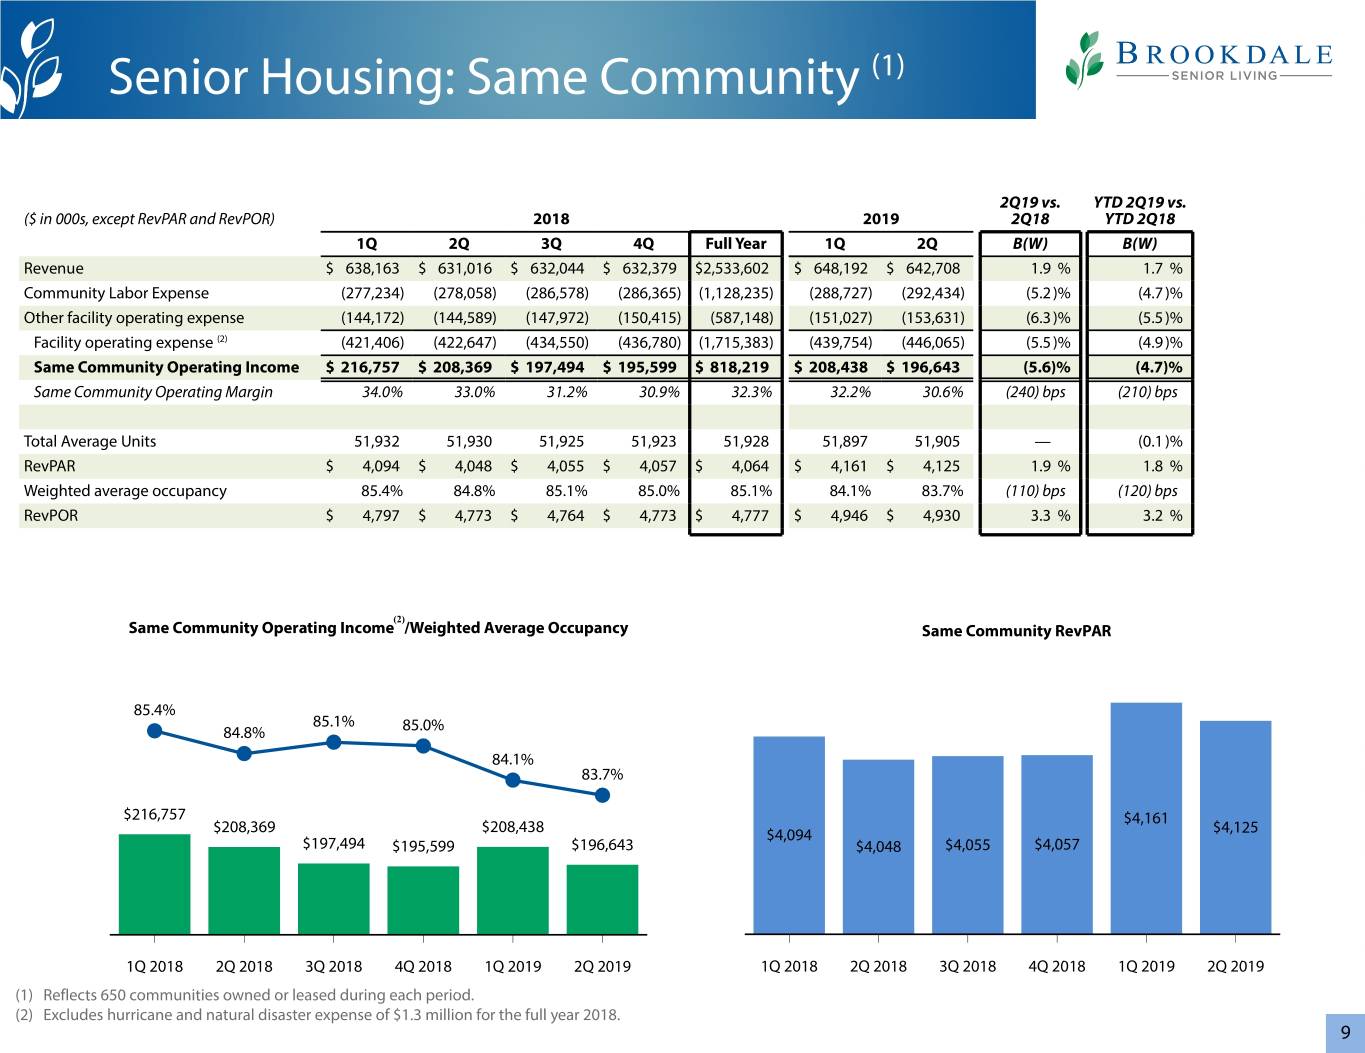
Senior Housing: Same Community (1) 2Q19 vs. YTD 2Q19 vs. ($ in 000s, except RevPAR and RevPOR) 2018 2019 2Q18 YTD 2Q18 1Q 2Q 3Q 4Q Full Year 1Q 2Q B(W) B(W) Revenue $ 638,163 $ 631,016 $ 632,044 $ 632,379 $2,533,602 $ 648,192 $ 642,708 1.9 % 1.7 % Community Labor Expense (277,234) (278,058) (286,578) (286,365) (1,128,235) (288,727) (292,434) (5.2)% (4.7)% Other facility operating expense (144,172) (144,589) (147,972) (150,415) (587,148) (151,027) (153,631) (6.3)% (5.5)% Facility operating expense (2) (421,406) (422,647) (434,550) (436,780) (1,715,383) (439,754) (446,065) (5.5)% (4.9)% Same Community Operating Income $ 216,757 $ 208,369 $ 197,494 $ 195,599 $ 818,219 $ 208,438 $ 196,643 (5.6)% (4.7)% Same Community Operating Margin 34.0% 33.0% 31.2% 30.9% 32.3% 32.2% 30.6% (240) bps (210) bps Total Average Units 51,932 51,930 51,925 51,923 51,928 51,897 51,905 — (0.1)% RevPAR $ 4,094 $ 4,048 $ 4,055 $ 4,057 $ 4,064 $ 4,161 $ 4,125 1.9 % 1.8 % Weighted average occupancy 85.4% 84.8% 85.1% 85.0% 85.1% 84.1% 83.7% (110) bps (120) bps RevPOR $ 4,797 $ 4,773 $ 4,764 $ 4,773 $ 4,777 $ 4,946 $ 4,930 3.3 % 3.2 % (2) Same Community Operating Income /Weighted Average Occupancy Same Community RevPAR 85.4% 85.1% 84.8% 85.0% 84.1% 83.7% $216,757 $4,161 $208,369 $208,438 $4,094 $4,125 $197,494 $195,599 $196,643 $4,048 $4,055 $4,057 1Q 2018 2Q 2018 3Q 2018 4Q 2018 1Q 2019 2Q 2019 1Q 2018 2Q 2018 3Q 2018 4Q 2018 1Q 2019 2Q 2019 (1) Reflects 650 communities owned or leased during each period. (2) Excludes hurricane and natural disaster expense of $1.3 million for the full year 2018. 9
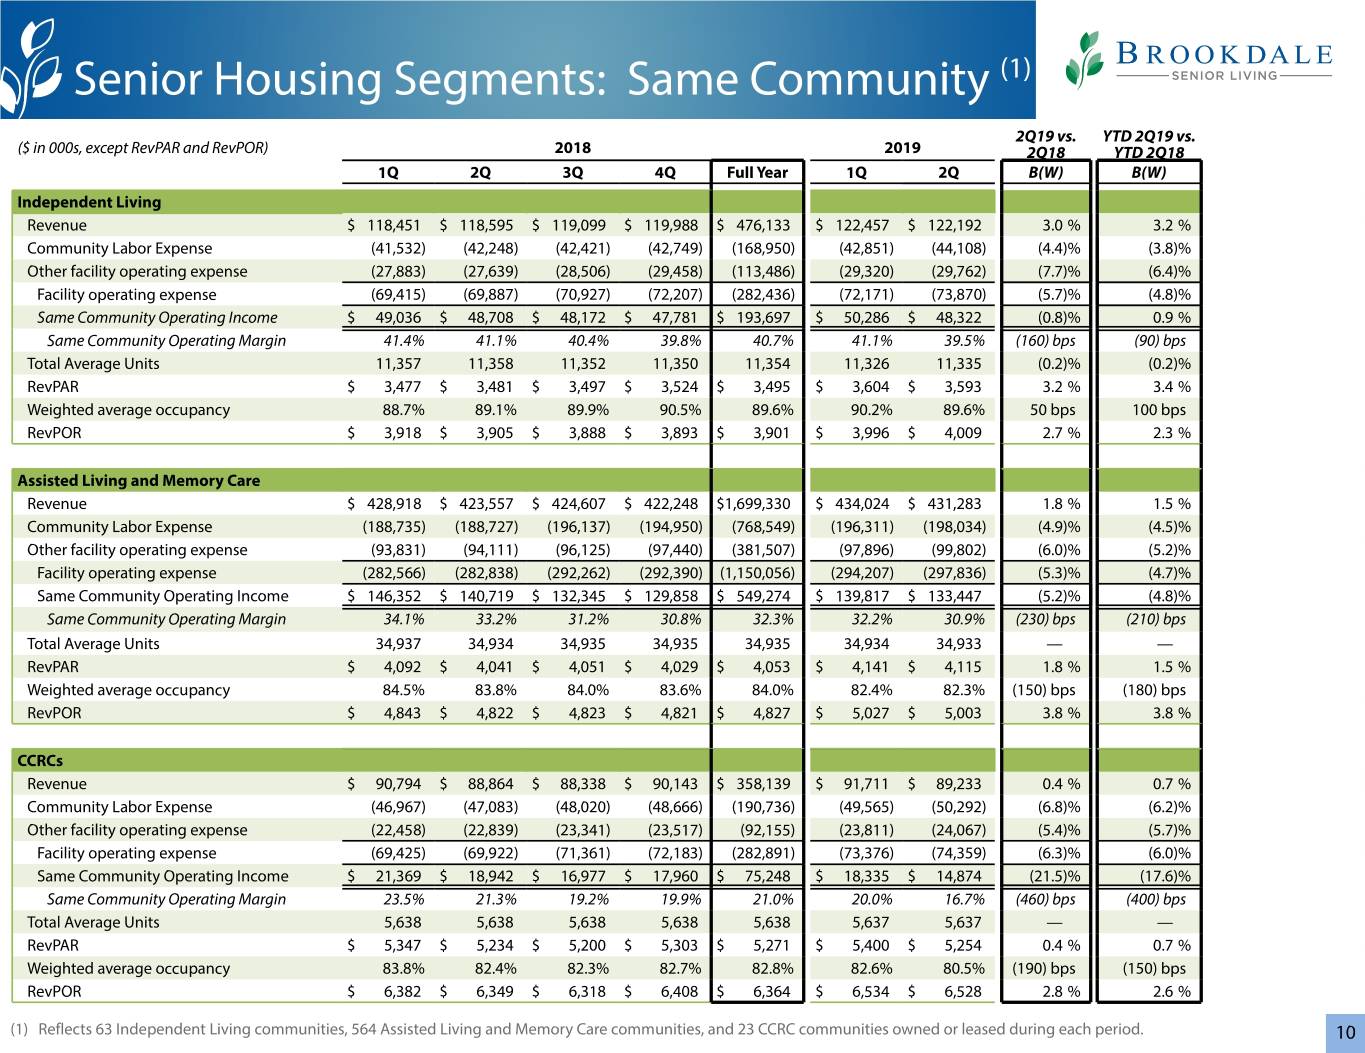
Senior Housing Segments: Same Community (1) 2Q19 vs. YTD 2Q19 vs. ($ in 000s, except RevPAR and RevPOR) 2018 2019 2Q18 YTD 2Q18 1Q 2Q 3Q 4Q Full Year 1Q 2Q B(W) B(W) Independent Living Revenue $ 118,451 $ 118,595 $ 119,099 $ 119,988 $ 476,133 $ 122,457 $ 122,192 3.0 % 3.2 % Community Labor Expense (41,532) (42,248) (42,421) (42,749) (168,950) (42,851) (44,108) (4.4)% (3.8)% Other facility operating expense (27,883) (27,639) (28,506) (29,458) (113,486) (29,320) (29,762) (7.7)% (6.4)% Facility operating expense (69,415) (69,887) (70,927) (72,207) (282,436) (72,171) (73,870) (5.7)% (4.8)% Same Community Operating Income $ 49,036 $ 48,708 $ 48,172 $ 47,781 $ 193,697 $ 50,286 $ 48,322 (0.8)% 0.9 % Same Community Operating Margin 41.4% 41.1% 40.4% 39.8% 40.7% 41.1% 39.5% (160) bps (90) bps Total Average Units 11,357 11,358 11,352 11,350 11,354 11,326 11,335 (0.2)% (0.2)% RevPAR $ 3,477 $ 3,481 $ 3,497 $ 3,524 $ 3,495 $ 3,604 $ 3,593 3.2 % 3.4 % Weighted average occupancy 88.7% 89.1% 89.9% 90.5% 89.6% 90.2% 89.6% 50 bps 100 bps RevPOR $ 3,918 $ 3,905 $ 3,888 $ 3,893 $ 3,901 $ 3,996 $ 4,009 2.7 % 2.3 % Assisted Living and Memory Care Revenue $ 428,918 $ 423,557 $ 424,607 $ 422,248 $1,699,330 $ 434,024 $ 431,283 1.8 % 1.5 % Community Labor Expense (188,735) (188,727) (196,137) (194,950) (768,549) (196,311) (198,034) (4.9)% (4.5)% Other facility operating expense (93,831) (94,111) (96,125) (97,440) (381,507) (97,896) (99,802) (6.0)% (5.2)% Facility operating expense (282,566) (282,838) (292,262) (292,390) (1,150,056) (294,207) (297,836) (5.3)% (4.7)% Same Community Operating Income $ 146,352 $ 140,719 $ 132,345 $ 129,858 $ 549,274 $ 139,817 $ 133,447 (5.2)% (4.8)% Same Community Operating Margin 34.1% 33.2% 31.2% 30.8% 32.3% 32.2% 30.9% (230) bps (210) bps Total Average Units 34,937 34,934 34,935 34,935 34,935 34,934 34,933 — — RevPAR $ 4,092 $ 4,041 $ 4,051 $ 4,029 $ 4,053 $ 4,141 $ 4,115 1.8 % 1.5 % Weighted average occupancy 84.5% 83.8% 84.0% 83.6% 84.0% 82.4% 82.3% (150) bps (180) bps RevPOR $ 4,843 $ 4,822 $ 4,823 $ 4,821 $ 4,827 $ 5,027 $ 5,003 3.8 % 3.8 % CCRCs Revenue $ 90,794 $ 88,864 $ 88,338 $ 90,143 $ 358,139 $ 91,711 $ 89,233 0.4 % 0.7 % Community Labor Expense (46,967) (47,083) (48,020) (48,666) (190,736) (49,565) (50,292) (6.8)% (6.2)% Other facility operating expense (22,458) (22,839) (23,341) (23,517) (92,155) (23,811) (24,067) (5.4)% (5.7)% Facility operating expense (69,425) (69,922) (71,361) (72,183) (282,891) (73,376) (74,359) (6.3)% (6.0)% Same Community Operating Income $ 21,369 $ 18,942 $ 16,977 $ 17,960 $ 75,248 $ 18,335 $ 14,874 (21.5)% (17.6)% Same Community Operating Margin 23.5% 21.3% 19.2% 19.9% 21.0% 20.0% 16.7% (460) bps (400) bps Total Average Units 5,638 5,638 5,638 5,638 5,638 5,637 5,637 — — RevPAR $ 5,347 $ 5,234 $ 5,200 $ 5,303 $ 5,271 $ 5,400 $ 5,254 0.4 % 0.7 % Weighted average occupancy 83.8% 82.4% 82.3% 82.7% 82.8% 82.6% 80.5% (190) bps (150) bps RevPOR $ 6,382 $ 6,349 $ 6,318 $ 6,408 $ 6,364 $ 6,534 $ 6,528 2.8 % 2.6 % (1) Reflects 63 Independent Living communities, 564 Assisted Living and Memory Care communities, and 23 CCRC communities owned or leased during each period. 10
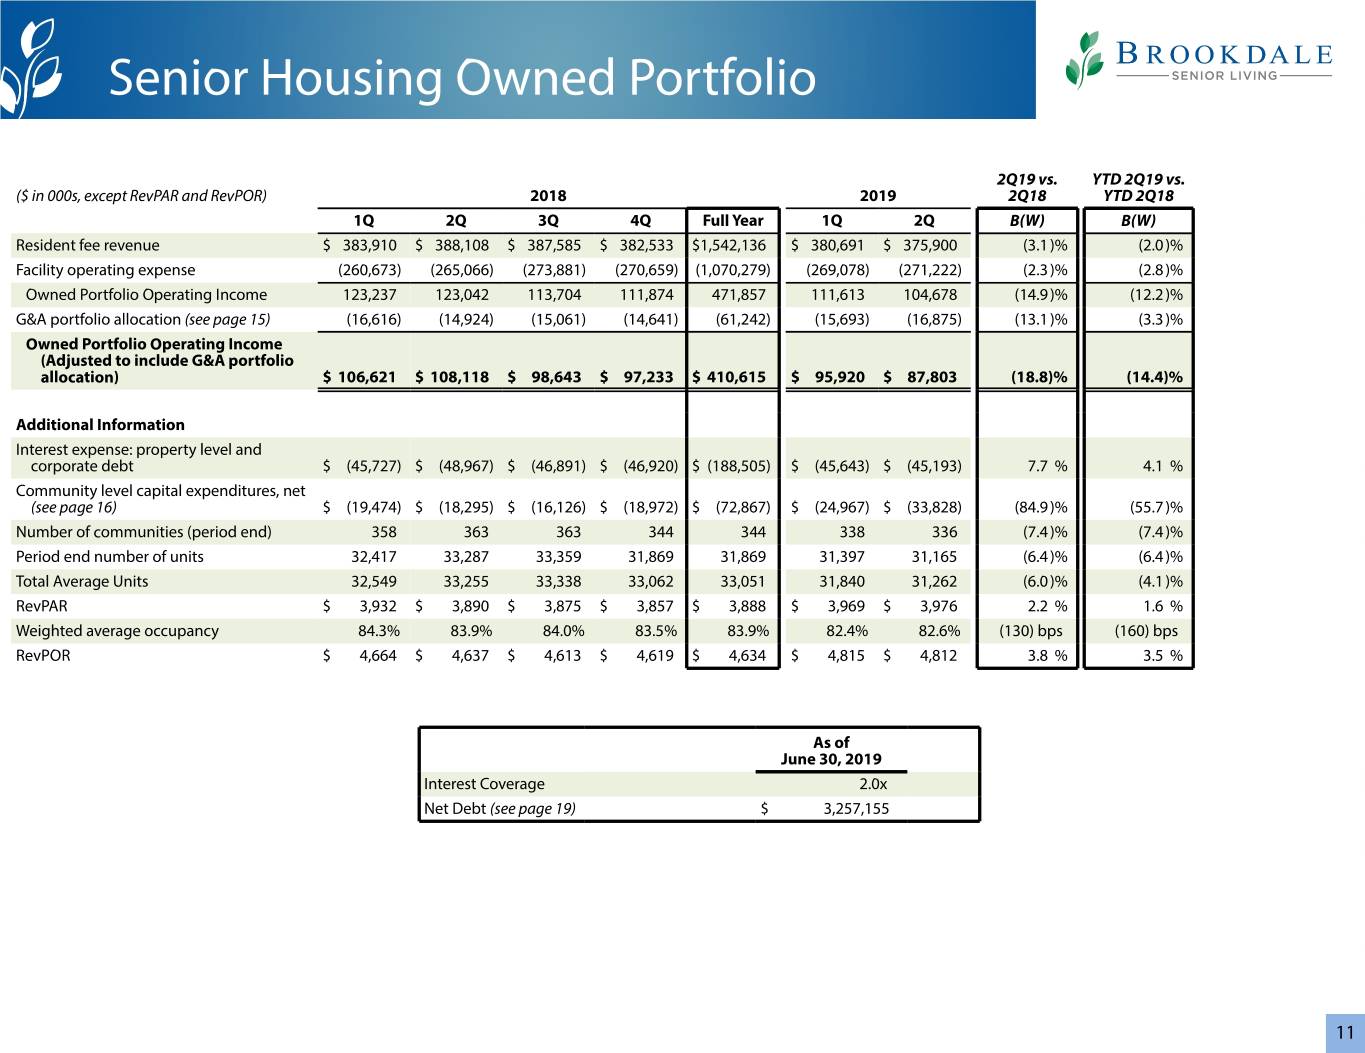
Senior Housing Owned Portfolio 2Q19 vs. YTD 2Q19 vs. ($ in 000s, except RevPAR and RevPOR) 2018 2019 2Q18 YTD 2Q18 1Q 2Q 3Q 4Q Full Year 1Q 2Q B(W) B(W) Resident fee revenue $ 383,910 $ 388,108 $ 387,585 $ 382,533 $1,542,136 $ 380,691 $ 375,900 (3.1)% (2.0)% Facility operating expense (260,673) (265,066) (273,881) (270,659) (1,070,279) (269,078) (271,222) (2.3)% (2.8)% Owned Portfolio Operating Income 123,237 123,042 113,704 111,874 471,857 111,613 104,678 (14.9)% (12.2)% G&A portfolio allocation (see page 15) (16,616) (14,924) (15,061) (14,641) (61,242) (15,693) (16,875) (13.1)% (3.3)% Owned Portfolio Operating Income (Adjusted to include G&A portfolio allocation) $ 106,621 $ 108,118 $ 98,643 $ 97,233 $ 410,615 $ 95,920 $ 87,803 (18.8)% (14.4)% Additional Information Interest expense: property level and corporate debt $ (45,727) $ (48,967) $ (46,891) $ (46,920) $ (188,505) $ (45,643) $ (45,193) 7.7 % 4.1 % Community level capital expenditures, net (see page 16) $ (19,474) $ (18,295) $ (16,126) $ (18,972) $ (72,867) $ (24,967) $ (33,828) (84.9)% (55.7)% Number of communities (period end) 358 363 363 344 344 338 336 (7.4)% (7.4)% Period end number of units 32,417 33,287 33,359 31,869 31,869 31,397 31,165 (6.4)% (6.4)% Total Average Units 32,549 33,255 33,338 33,062 33,051 31,840 31,262 (6.0)% (4.1)% RevPAR $ 3,932 $ 3,890 $ 3,875 $ 3,857 $ 3,888 $ 3,969 $ 3,976 2.2 % 1.6 % Weighted average occupancy 84.3% 83.9% 84.0% 83.5% 83.9% 82.4% 82.6% (130) bps (160) bps RevPOR $ 4,664 $ 4,637 $ 4,613 $ 4,619 $ 4,634 $ 4,815 $ 4,812 3.8 % 3.5 % As of June 30, 2019 Interest Coverage 2.0x Net Debt (see page 19) $ 3,257,155 11
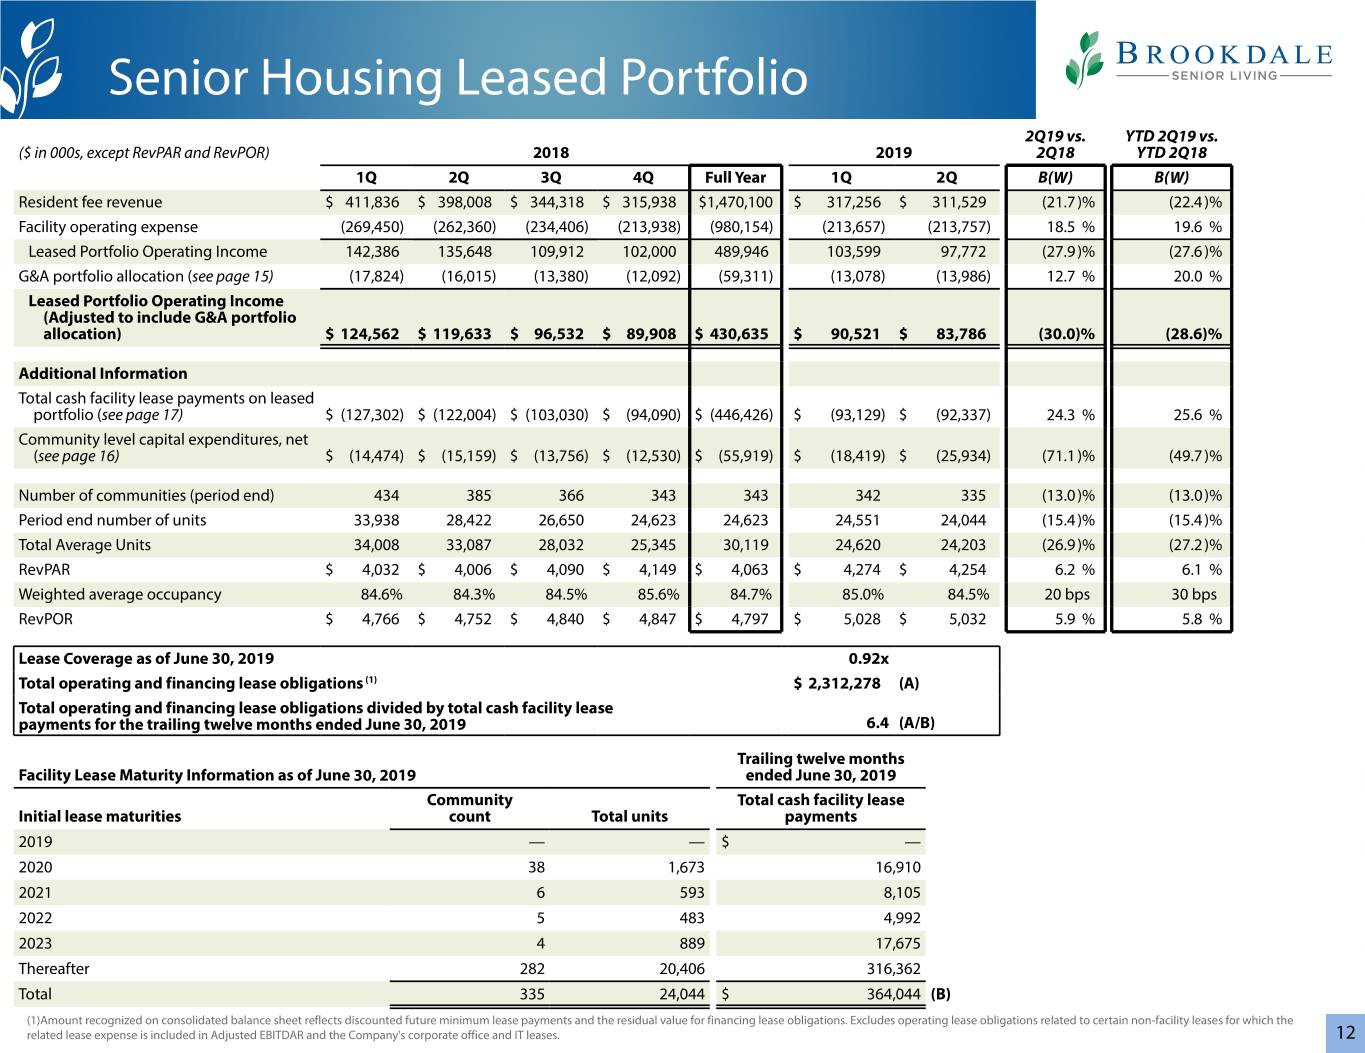
Senior Housing Leased Portfolio 2Q19 vs. YTD 2Q19 vs. ($ in 000s, except RevPAR and RevPOR) 2018 2019 2Q18 YTD 2Q18 1Q 2Q 3Q 4Q Full Year 1Q 2Q B(W) B(W) Resident fee revenue $ 411,836 $ 398,008 $ 344,318 $ 315,938 $1,470,100 $ 317,256 $ 311,529 (21.7)% (22.4)% Facility operating expense (269,450) (262,360) (234,406) (213,938) (980,154) (213,657) (213,757) 18.5 % 19.6 % Leased Portfolio Operating Income 142,386 135,648 109,912 102,000 489,946 103,599 97,772 (27.9)% (27.6)% G&A portfolio allocation (see page 15) (17,824) (16,015) (13,380) (12,092) (59,311) (13,078) (13,986) 12.7 % 20.0 % Leased Portfolio Operating Income (Adjusted to include G&A portfolio allocation) $ 124,562 $ 119,633 $ 96,532 $ 89,908 $ 430,635 $ 90,521 $ 83,786 (30.0)% (28.6)% Additional Information Total cash facility lease payments on leased portfolio (see page 17) $ (127,302) $ (122,004) $ (103,030) $ (94,090) $ (446,426) $ (93,129) $ (92,337) 24.3 % 25.6 % Community level capital expenditures, net (see page 16) $ (14,474) $ (15,159) $ (13,756) $ (12,530) $ (55,919) $ (18,419) $ (25,934) (71.1)% (49.7)% Number of communities (period end) 434 385 366 343 343 342 335 (13.0)% (13.0)% Period end number of units 33,938 28,422 26,650 24,623 24,623 24,551 24,044 (15.4)% (15.4)% Total Average Units 34,008 33,087 28,032 25,345 30,119 24,620 24,203 (26.9)% (27.2)% RevPAR $ 4,032 $ 4,006 $ 4,090 $ 4,149 $ 4,063 $ 4,274 $ 4,254 6.2 % 6.1 % Weighted average occupancy 84.6% 84.3% 84.5% 85.6% 84.7% 85.0% 84.5% 20 bps 30 bps RevPOR $ 4,766 $ 4,752 $ 4,840 $ 4,847 $ 4,797 $ 5,028 $ 5,032 5.9 % 5.8 % Lease Coverage as of June 30, 2019 0.92x Total operating and financing lease obligations (1) $ 2,312,278 (A) Total operating and financing lease obligations divided by total cash facility lease payments for the trailing twelve months ended June 30, 2019 6.4 (A/B) Trailing twelve months Facility Lease Maturity Information as of June 30, 2019 ended June 30, 2019 Community Total cash facility lease Initial lease maturities count Total units payments 2019 — — $ — 2020 38 1,673 16,910 2021 6 593 8,105 2022 5 483 4,992 2023 4 889 17,675 Thereafter 282 20,406 316,362 Total 335 24,044 $ 364,044 (B) (1)Amount recognized on consolidated balance sheet reflects discounted future minimum lease payments and the residual value for financing lease obligations. Excludes operating lease obligations related to certain non-facility leases for which the related lease expense is included in Adjusted EBITDAR and the Company's corporate office and IT leases. 12
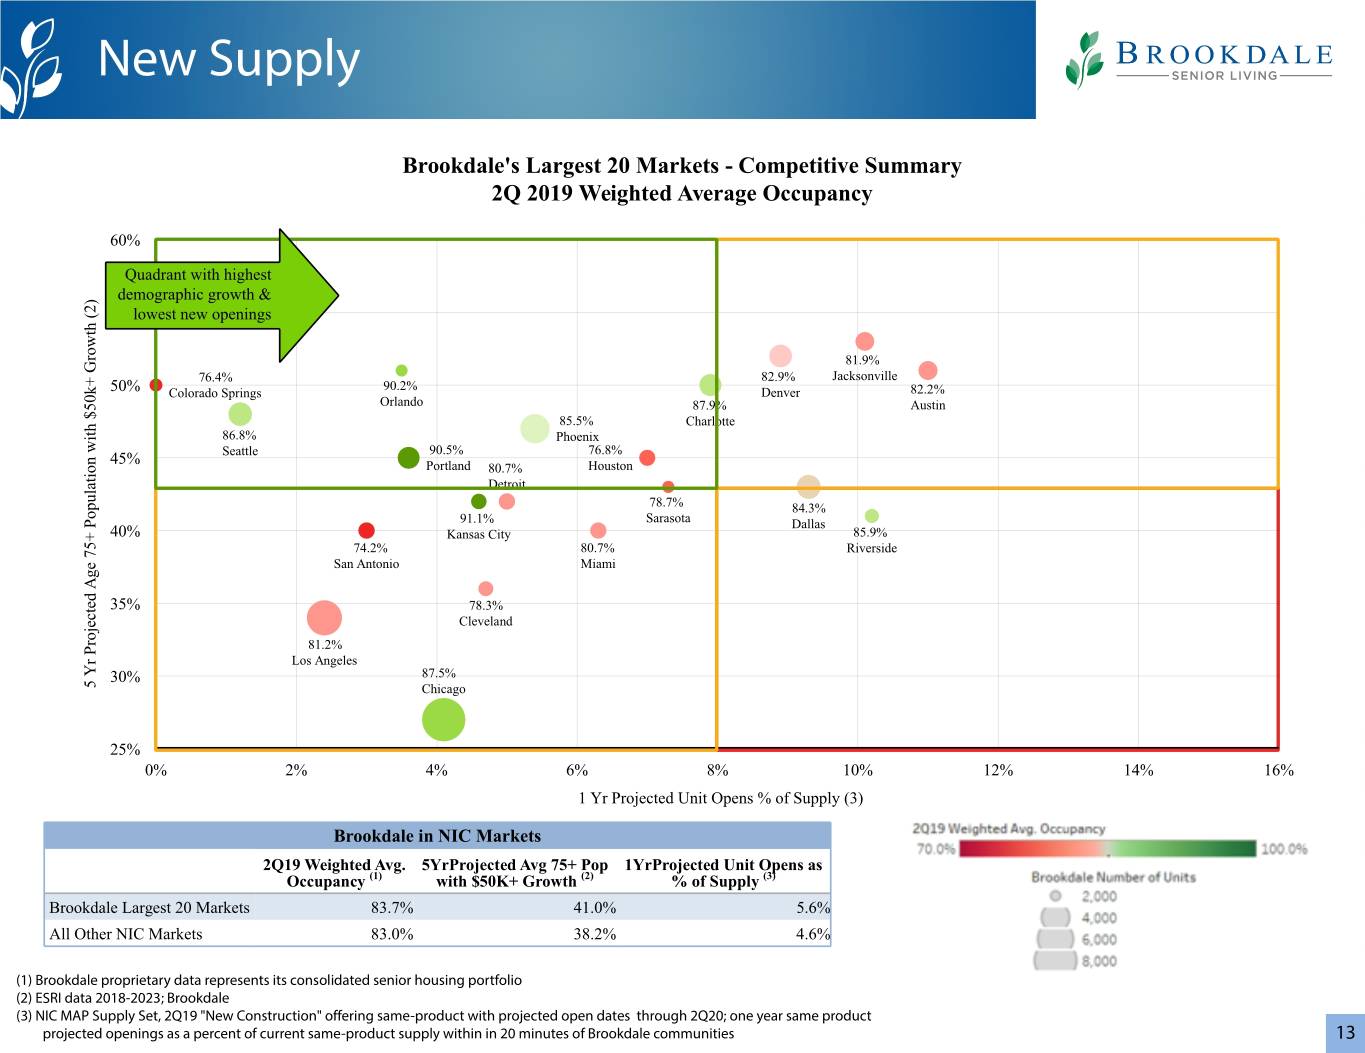
New Supply Brookdale's Largest 20 Markets - Competitive Summary 2Q 2019 Weighted Average Occupancy 60% Quadrant with highest demographic growth & ) 2 ( 55%lowest new openings h t w o r 81.9% G 76.4% 82.9% Jacksonville + 90.2% k 50% Colorado Springs Denver 82.2% 0 Orlando 5 87.9% Austin $ 85.5% Charlotte h t i 86.8% Phoenix w Seattle 90.5% 76.8% n 45% Portland Houston o 80.7% i t a Detroit l u 78.7% p 84.3% o 91.1% Sarasota P Dallas 40% Kansas City 85.9% + 5 74.2% 80.7% Riverside 7 e San Antonio Miami g A d e 35% 78.3% t c e Cleveland j o r 81.2% P r Los Angeles Y 30% 87.5% 5 Chicago 25% 0% 2% 4% 6% 8% 10% 12% 14% 16% 1 Yr Projected Unit Opens % of Supply (3) Brookdale in NIC Markets 2Q19 Weighted Avg. 5YrProjected Avg 75+ Pop 1YrProjected Unit Opens as Occupancy (1) with $50K+ Growth (2) % of Supply (3) Brookdale Largest 20 Markets 83.7% 41.0% 5.6% All Other NIC Markets 83.0% 38.2% 4.6% (1) Brookdale proprietary data represents its consolidated senior housing portfolio (2) ESRI data 2018-2023; Brookdale (3) NIC MAP Supply Set, 2Q19 "New Construction" offering same-product with projected open dates through 2Q20; one year same product projected openings as a percent of current same-product supply within in 20 minutes of Brookdale communities 13
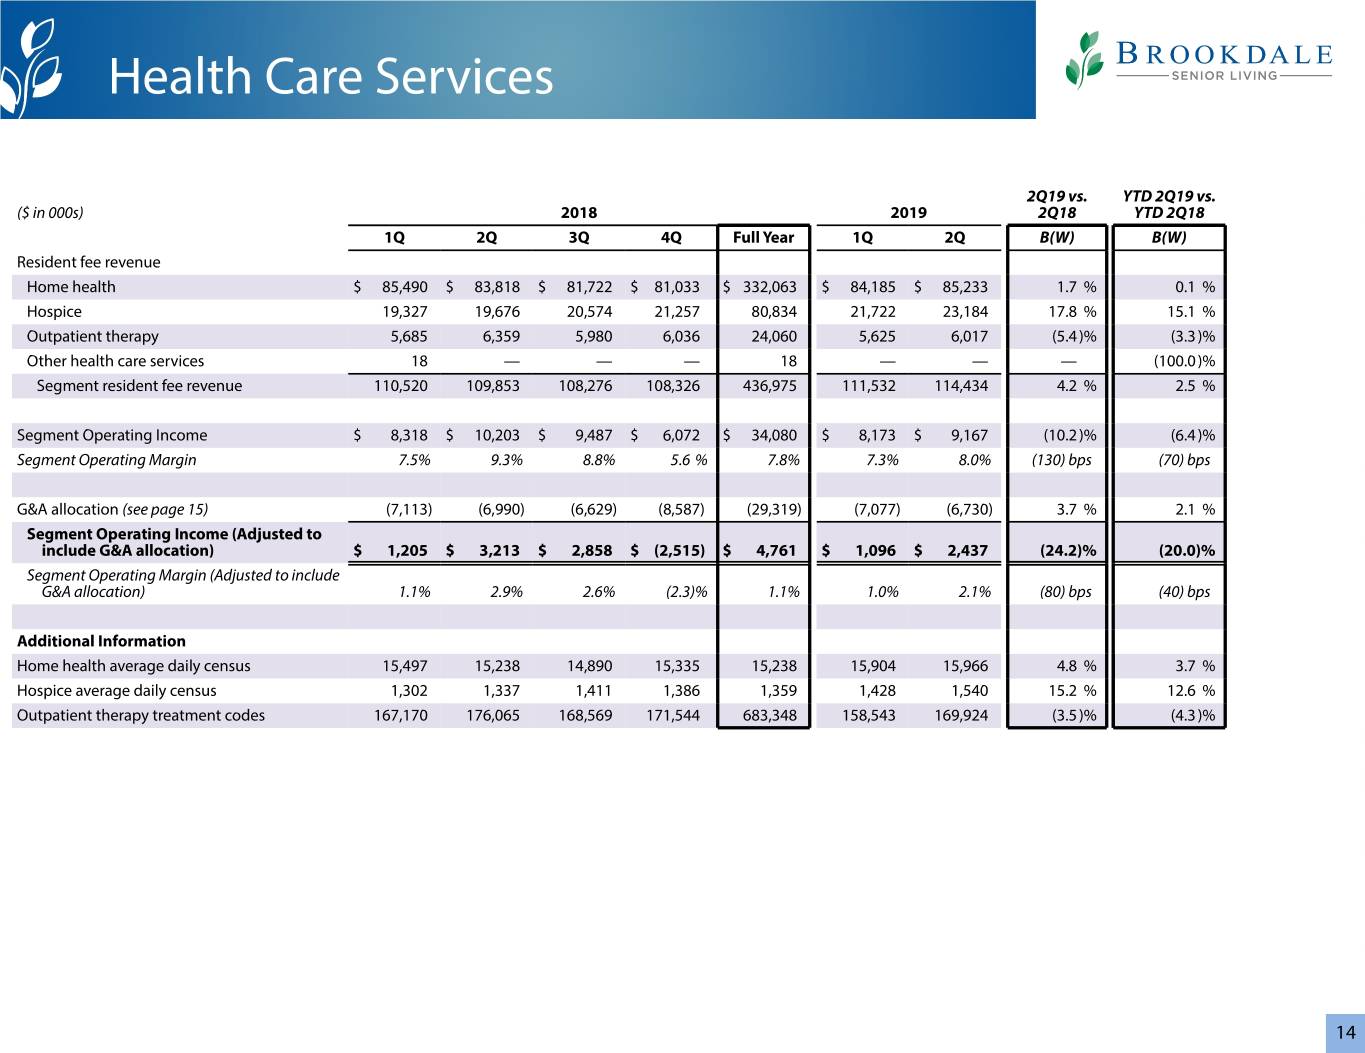
Health Care Services 2Q19 vs. YTD 2Q19 vs. ($ in 000s) 2018 2019 2Q18 YTD 2Q18 1Q 2Q 3Q 4Q Full Year 1Q 2Q B(W) B(W) Resident fee revenue Home health $ 85,490 $ 83,818 $ 81,722 $ 81,033 $ 332,063 $ 84,185 $ 85,233 1.7 % 0.1 % Hospice 19,327 19,676 20,574 21,257 80,834 21,722 23,184 17.8 % 15.1 % Outpatient therapy 5,685 6,359 5,980 6,036 24,060 5,625 6,017 (5.4)% (3.3)% Other health care services 18 — — — 18 — — — (100.0)% Segment resident fee revenue 110,520 109,853 108,276 108,326 436,975 111,532 114,434 4.2 % 2.5 % Segment Operating Income $ 8,318 $ 10,203 $ 9,487 $ 6,072 $ 34,080 $ 8,173 $ 9,167 (10.2)% (6.4)% Segment Operating Margin 7.5% 9.3% 8.8% 5.6 % 7.8% 7.3% 8.0% (130) bps (70) bps G&A allocation (see page 15) (7,113) (6,990) (6,629) (8,587) (29,319) (7,077) (6,730) 3.7 % 2.1 % Segment Operating Income (Adjusted to include G&A allocation) $ 1,205 $ 3,213 $ 2,858 $ (2,515) $ 4,761 $ 1,096 $ 2,437 (24.2)% (20.0)% Segment Operating Margin (Adjusted to include G&A allocation) 1.1% 2.9% 2.6% (2.3)% 1.1% 1.0% 2.1% (80) bps (40) bps Additional Information Home health average daily census 15,497 15,238 14,890 15,335 15,238 15,904 15,966 4.8 % 3.7 % Hospice average daily census 1,302 1,337 1,411 1,386 1,359 1,428 1,540 15.2 % 12.6 % Outpatient therapy treatment codes 167,170 176,065 168,569 171,544 683,348 158,543 169,924 (3.5)% (4.3)% 14
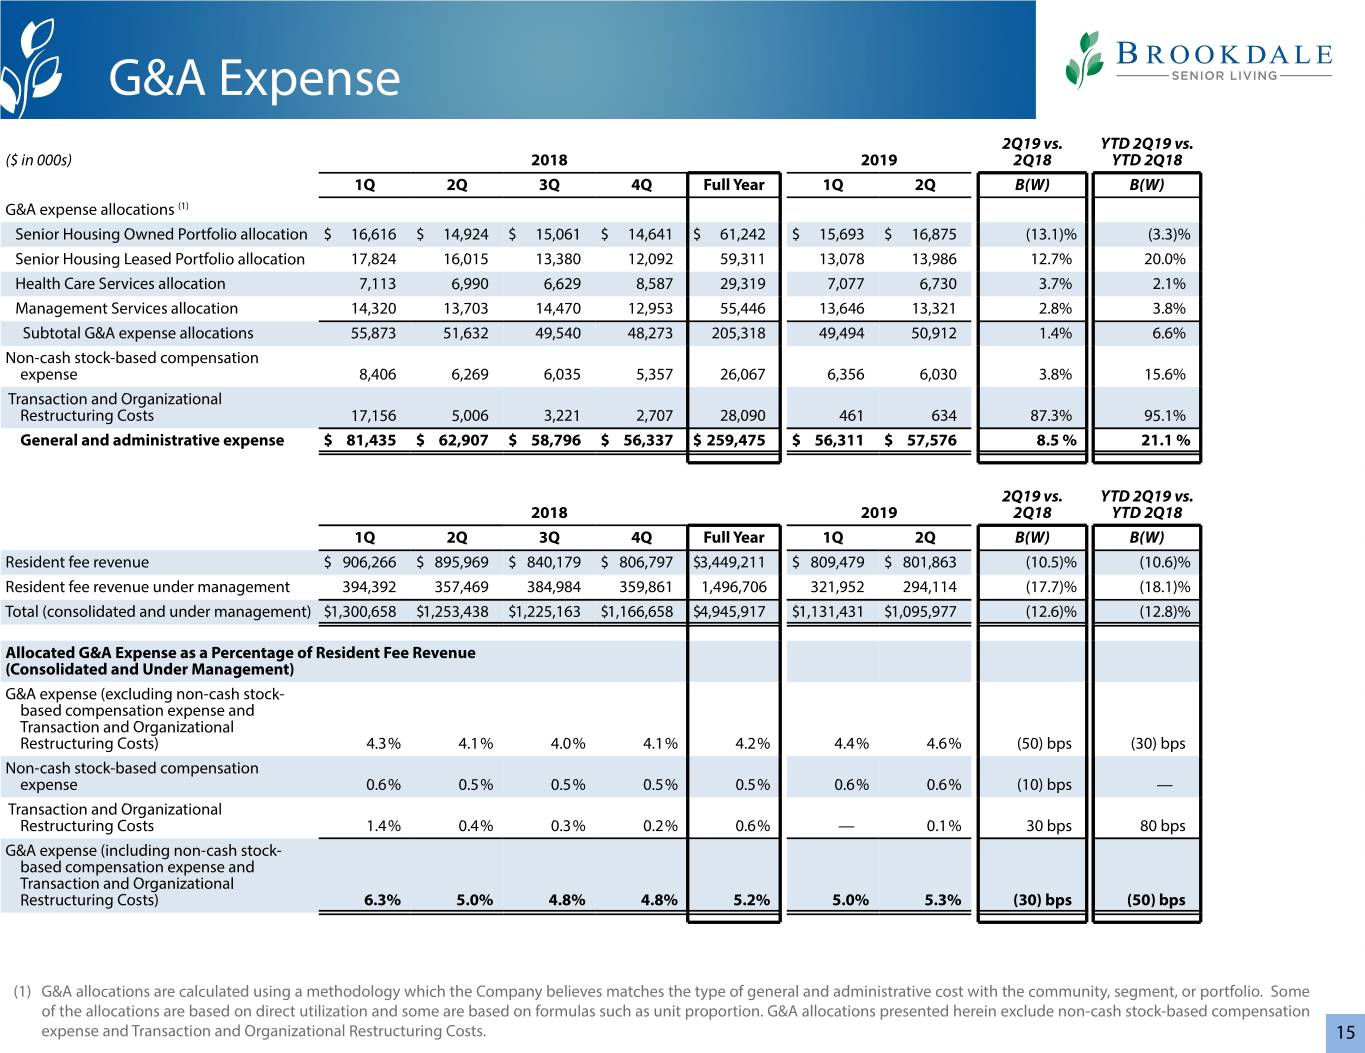
G&A Expense 2Q19 vs. YTD 2Q19 vs. ($ in 000s) 2018 2019 2Q18 YTD 2Q18 1Q 2Q 3Q 4Q Full Year 1Q 2Q B(W) B(W) G&A expense allocations (1) Senior Housing Owned Portfolio allocation $ 16,616 $ 14,924 $ 15,061 $ 14,641 $ 61,242 $ 15,693 $ 16,875 (13.1)% (3.3)% Senior Housing Leased Portfolio allocation 17,824 16,015 13,380 12,092 59,311 13,078 13,986 12.7% 20.0% Health Care Services allocation 7,113 6,990 6,629 8,587 29,319 7,077 6,730 3.7% 2.1% Management Services allocation 14,320 13,703 14,470 12,953 55,446 13,646 13,321 2.8% 3.8% Subtotal G&A expense allocations 55,873 51,632 49,540 48,273 205,318 49,494 50,912 1.4% 6.6% Non-cash stock-based compensation expense 8,406 6,269 6,035 5,357 26,067 6,356 6,030 3.8% 15.6% Transaction and Organizational Restructuring Costs 17,156 5,006 3,221 2,707 28,090 461 634 87.3% 95.1% General and administrative expense $ 81,435 $ 62,907 $ 58,796 $ 56,337 $ 259,475 $ 56,311 $ 57,576 8.5 % 21.1 % 2Q19 vs. YTD 2Q19 vs. 2018 2019 2Q18 YTD 2Q18 1Q 2Q 3Q 4Q Full Year 1Q 2Q B(W) B(W) Resident fee revenue $ 906,266 $ 895,969 $ 840,179 $ 806,797 $3,449,211 $ 809,479 $ 801,863 (10.5)% (10.6)% Resident fee revenue under management 394,392 357,469 384,984 359,861 1,496,706 321,952 294,114 (17.7)% (18.1)% Total (consolidated and under management) $1,300,658 $1,253,438 $1,225,163 $1,166,658 $4,945,917 $1,131,431 $1,095,977 (12.6)% (12.8)% Allocated G&A Expense as a Percentage of Resident Fee Revenue (Consolidated and Under Management) G&A expense (excluding non-cash stock- based compensation expense and Transaction and Organizational Restructuring Costs) 4.3% 4.1% 4.0% 4.1% 4.2% 4.4% 4.6% (50) bps (30) bps Non-cash stock-based compensation expense 0.6% 0.5% 0.5% 0.5% 0.5% 0.6% 0.6% (10) bps — Transaction and Organizational Restructuring Costs 1.4% 0.4% 0.3% 0.2% 0.6% — 0.1% 30 bps 80 bps G&A expense (including non-cash stock- based compensation expense and Transaction and Organizational Restructuring Costs) 6.3% 5.0% 4.8% 4.8% 5.2% 5.0% 5.3% (30) bps (50) bps (1) G&A allocations are calculated using a methodology which the Company believes matches the type of general and administrative cost with the community, segment, or portfolio. Some of the allocations are based on direct utilization and some are based on formulas such as unit proportion. G&A allocations presented herein exclude non-cash stock-based compensation expense and Transaction and Organizational Restructuring Costs. 15
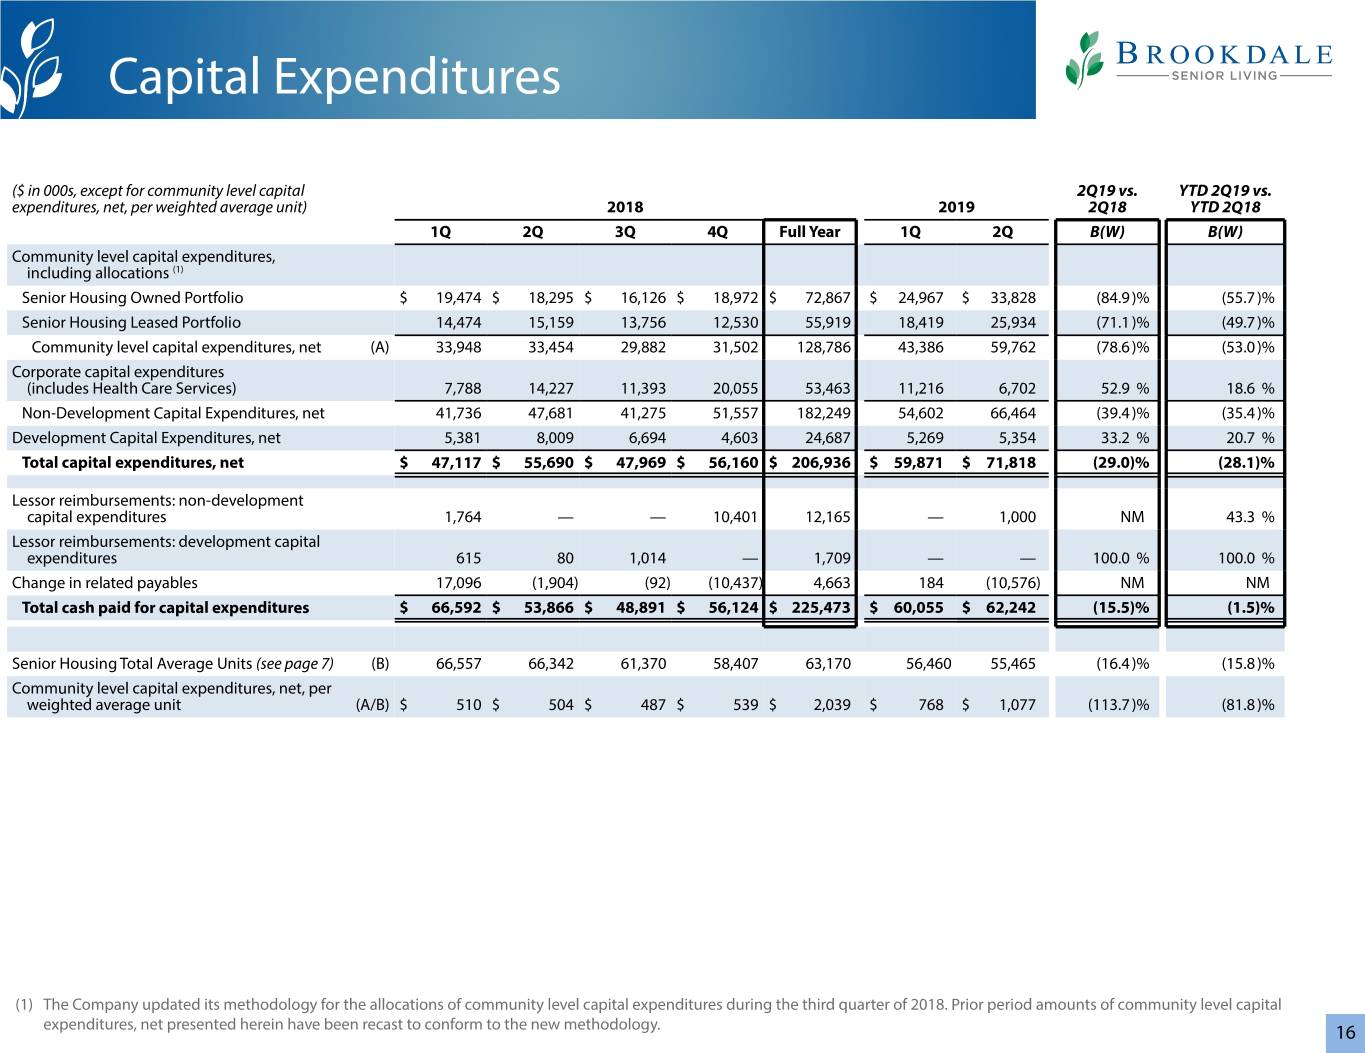
Capital Expenditures ($ in 000s, except for community level capital 2Q19 vs. YTD 2Q19 vs. expenditures, net, per weighted average unit) 2018 2019 2Q18 YTD 2Q18 1Q 2Q 3Q 4Q Full Year 1Q 2Q B(W) B(W) Community level capital expenditures, including allocations (1) Senior Housing Owned Portfolio $ 19,474 $ 18,295 $ 16,126 $ 18,972 $ 72,867 $ 24,967 $ 33,828 (84.9)% (55.7)% Senior Housing Leased Portfolio 14,474 15,159 13,756 12,530 55,919 18,419 25,934 (71.1)% (49.7)% Community level capital expenditures, net (A) 33,948 33,454 29,882 31,502 128,786 43,386 59,762 (78.6)% (53.0)% Corporate capital expenditures (includes Health Care Services) 7,788 14,227 11,393 20,055 53,463 11,216 6,702 52.9 % 18.6 % Non-Development Capital Expenditures, net 41,736 47,681 41,275 51,557 182,249 54,602 66,464 (39.4)% (35.4)% Development Capital Expenditures, net 5,381 8,009 6,694 4,603 24,687 5,269 5,354 33.2 % 20.7 % Total capital expenditures, net $ 47,117 $ 55,690 $ 47,969 $ 56,160 $ 206,936 $ 59,871 $ 71,818 (29.0)% (28.1)% Lessor reimbursements: non-development capital expenditures 1,764 — — 10,401 12,165 — 1,000 NM 43.3 % Lessor reimbursements: development capital expenditures 615 80 1,014 — 1,709 — — 100.0 % 100.0 % Change in related payables 17,096 (1,904) (92) (10,437) 4,663 184 (10,576) NM NM Total cash paid for capital expenditures $ 66,592 $ 53,866 $ 48,891 $ 56,124 $ 225,473 $ 60,055 $ 62,242 (15.5)% (1.5)% Senior Housing Total Average Units (see page 7) (B) 66,557 66,342 61,370 58,407 63,170 56,460 55,465 (16.4)% (15.8)% Community level capital expenditures, net, per weighted average unit (A/B) $ 510 $ 504 $ 487 $ 539 $ 2,039 $ 768 $ 1,077 (113.7)% (81.8)% (1) The Company updated its methodology for the allocations of community level capital expenditures during the third quarter of 2018. Prior period amounts of community level capital expenditures, net presented herein have been recast to conform to the new methodology. 16
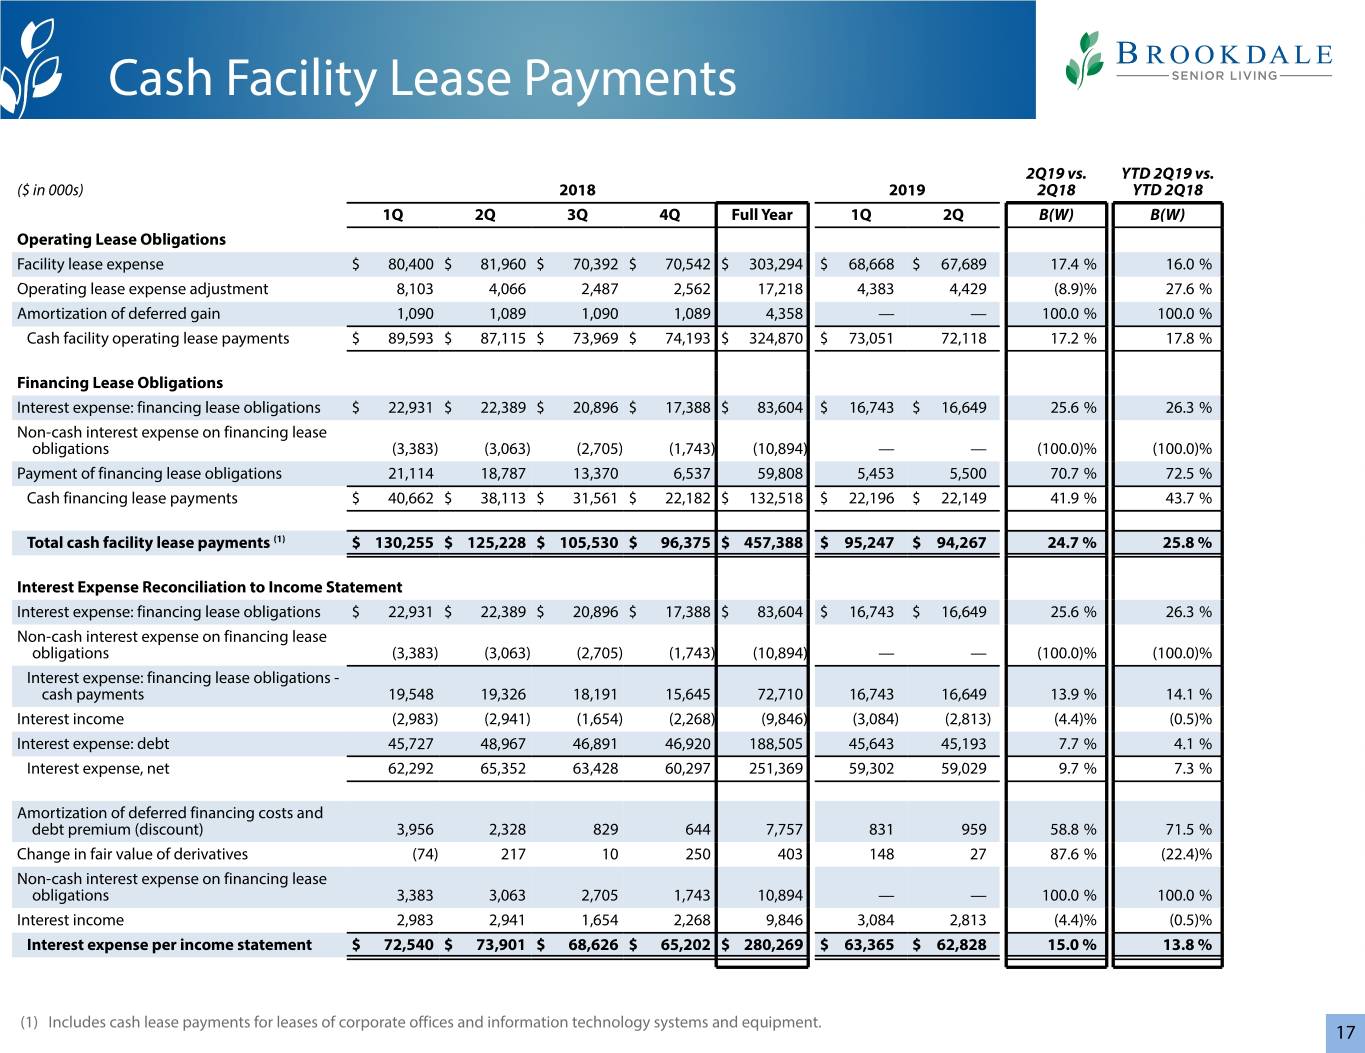
Cash Facility Lease Payments 2Q19 vs. YTD 2Q19 vs. ($ in 000s) 2018 2019 2Q18 YTD 2Q18 1Q 2Q 3Q 4Q Full Year 1Q 2Q B(W) B(W) Operating Lease Obligations Facility lease expense $ 80,400 $ 81,960 $ 70,392 $ 70,542 $ 303,294 $ 68,668 $ 67,689 17.4 % 16.0 % Operating lease expense adjustment 8,103 4,066 2,487 2,562 17,218 4,383 4,429 (8.9)% 27.6 % Amortization of deferred gain 1,090 1,089 1,090 1,089 4,358 — — 100.0 % 100.0 % Cash facility operating lease payments $ 89,593 $ 87,115 $ 73,969 $ 74,193 $ 324,870 $ 73,051 72,118 17.2 % 17.8 % Financing Lease Obligations Interest expense: financing lease obligations $ 22,931 $ 22,389 $ 20,896 $ 17,388 $ 83,604 $ 16,743 $ 16,649 25.6 % 26.3 % Non-cash interest expense on financing lease obligations (3,383) (3,063) (2,705) (1,743) (10,894) — — (100.0)% (100.0)% Payment of financing lease obligations 21,114 18,787 13,370 6,537 59,808 5,453 5,500 70.7 % 72.5 % Cash financing lease payments $ 40,662 $ 38,113 $ 31,561 $ 22,182 $ 132,518 $ 22,196 $ 22,149 41.9 % 43.7 % Total cash facility lease payments (1) $ 130,255 $ 125,228 $ 105,530 $ 96,375 $ 457,388 $ 95,247 $ 94,267 24.7 % 25.8 % Interest Expense Reconciliation to Income Statement Interest expense: financing lease obligations $ 22,931 $ 22,389 $ 20,896 $ 17,388 $ 83,604 $ 16,743 $ 16,649 25.6 % 26.3 % Non-cash interest expense on financing lease obligations (3,383) (3,063) (2,705) (1,743) (10,894) — — (100.0)% (100.0)% Interest expense: financing lease obligations - cash payments 19,548 19,326 18,191 15,645 72,710 16,743 16,649 13.9 % 14.1 % Interest income (2,983) (2,941) (1,654) (2,268) (9,846) (3,084) (2,813) (4.4)% (0.5)% Interest expense: debt 45,727 48,967 46,891 46,920 188,505 45,643 45,193 7.7 % 4.1 % Interest expense, net 62,292 65,352 63,428 60,297 251,369 59,302 59,029 9.7 % 7.3 % Amortization of deferred financing costs and debt premium (discount) 3,956 2,328 829 644 7,757 831 959 58.8 % 71.5 % Change in fair value of derivatives (74) 217 10 250 403 148 27 87.6 % (22.4)% Non-cash interest expense on financing lease obligations 3,383 3,063 2,705 1,743 10,894 — — 100.0 % 100.0 % Interest income 2,983 2,941 1,654 2,268 9,846 3,084 2,813 (4.4)% (0.5)% Interest expense per income statement $ 72,540 $ 73,901 $ 68,626 $ 65,202 $ 280,269 $ 63,365 $ 62,828 15.0 % 13.8 % (1) Includes cash lease payments for leases of corporate offices and information technology systems and equipment. 17
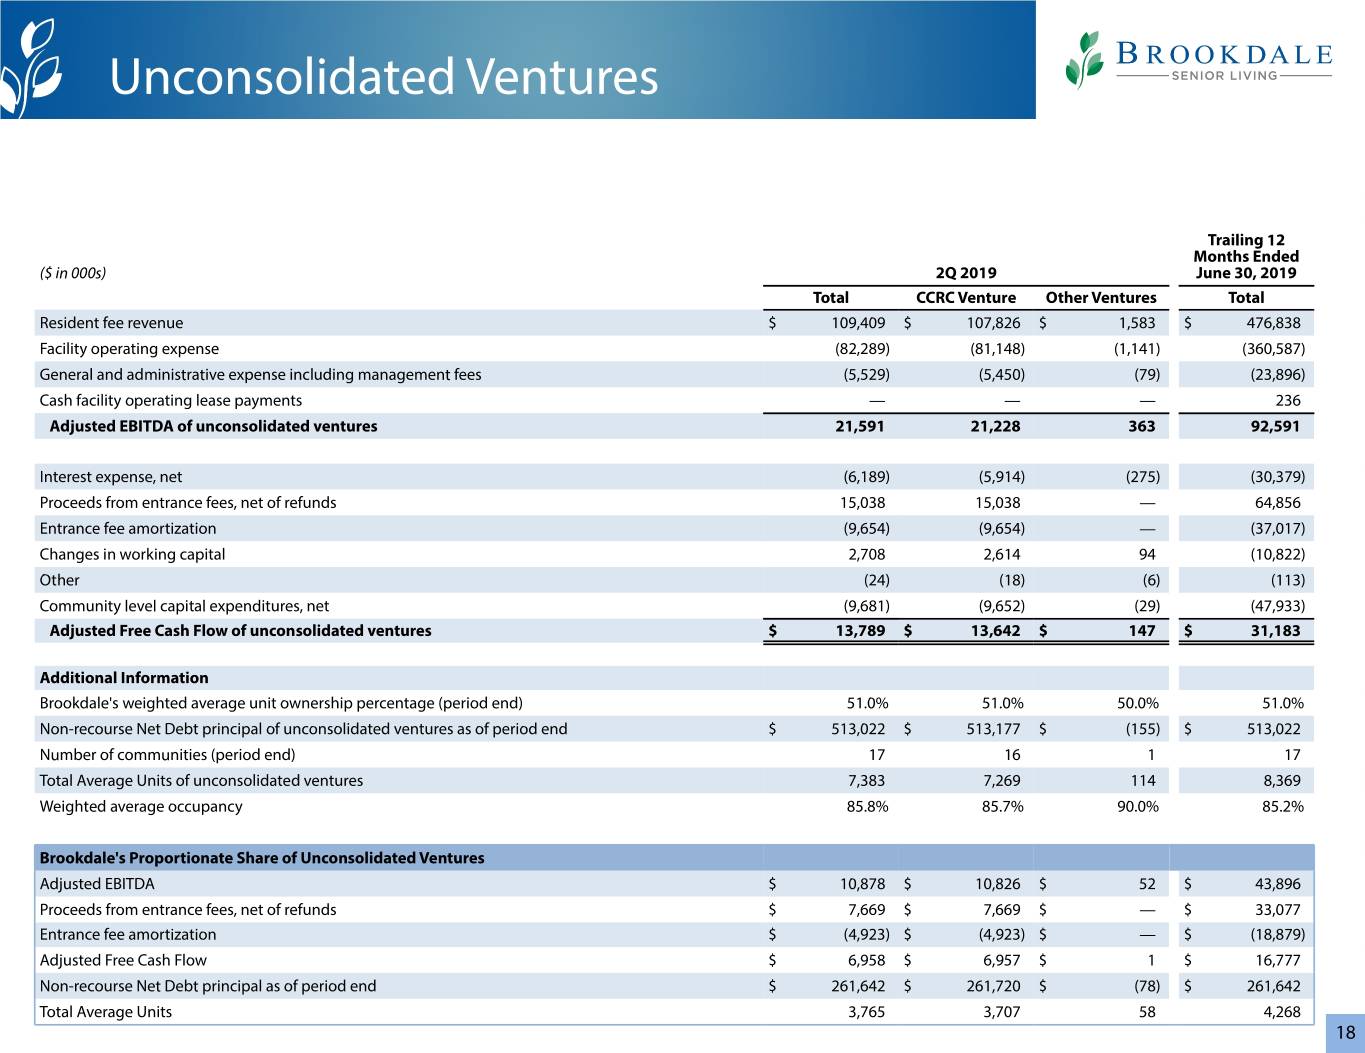
Unconsolidated Ventures Trailing 12 Months Ended ($ in 000s) 2Q 2019 June 30, 2019 Total CCRC Venture Other Ventures Total Resident fee revenue $ 109,409 $ 107,826 $ 1,583 $ 476,838 Facility operating expense (82,289) (81,148) (1,141) (360,587) General and administrative expense including management fees (5,529) (5,450) (79) (23,896) Cash facility operating lease payments — — — 236 Adjusted EBITDA of unconsolidated ventures 21,591 21,228 363 92,591 Interest expense, net (6,189) (5,914) (275) (30,379) Proceeds from entrance fees, net of refunds 15,038 15,038 — 64,856 Entrance fee amortization (9,654) (9,654) — (37,017) Changes in working capital 2,708 2,614 94 (10,822) Other (24) (18) (6) (113) Community level capital expenditures, net (9,681) (9,652) (29) (47,933) Adjusted Free Cash Flow of unconsolidated ventures $ 13,789 $ 13,642 $ 147 $ 31,183 Additional Information Brookdale's weighted average unit ownership percentage (period end) 51.0% 51.0% 50.0% 51.0% Non-recourse Net Debt principal of unconsolidated ventures as of period end $ 513,022 $ 513,177 $ (155) $ 513,022 Number of communities (period end) 17 16 1 17 Total Average Units of unconsolidated ventures 7,383 7,269 114 8,369 Weighted average occupancy 85.8% 85.7% 90.0% 85.2% Brookdale's Proportionate Share of Unconsolidated Ventures Adjusted EBITDA $ 10,878 $ 10,826 $ 52 $ 43,896 Proceeds from entrance fees, net of refunds $ 7,669 $ 7,669 $ — $ 33,077 Entrance fee amortization $ (4,923) $ (4,923) $ — $ (18,879) Adjusted Free Cash Flow $ 6,958 $ 6,957 $ 1 $ 16,777 Non-recourse Net Debt principal as of period end $ 261,642 $ 261,720 $ (78) $ 261,642 Total Average Units 3,765 3,707 58 4,268 18
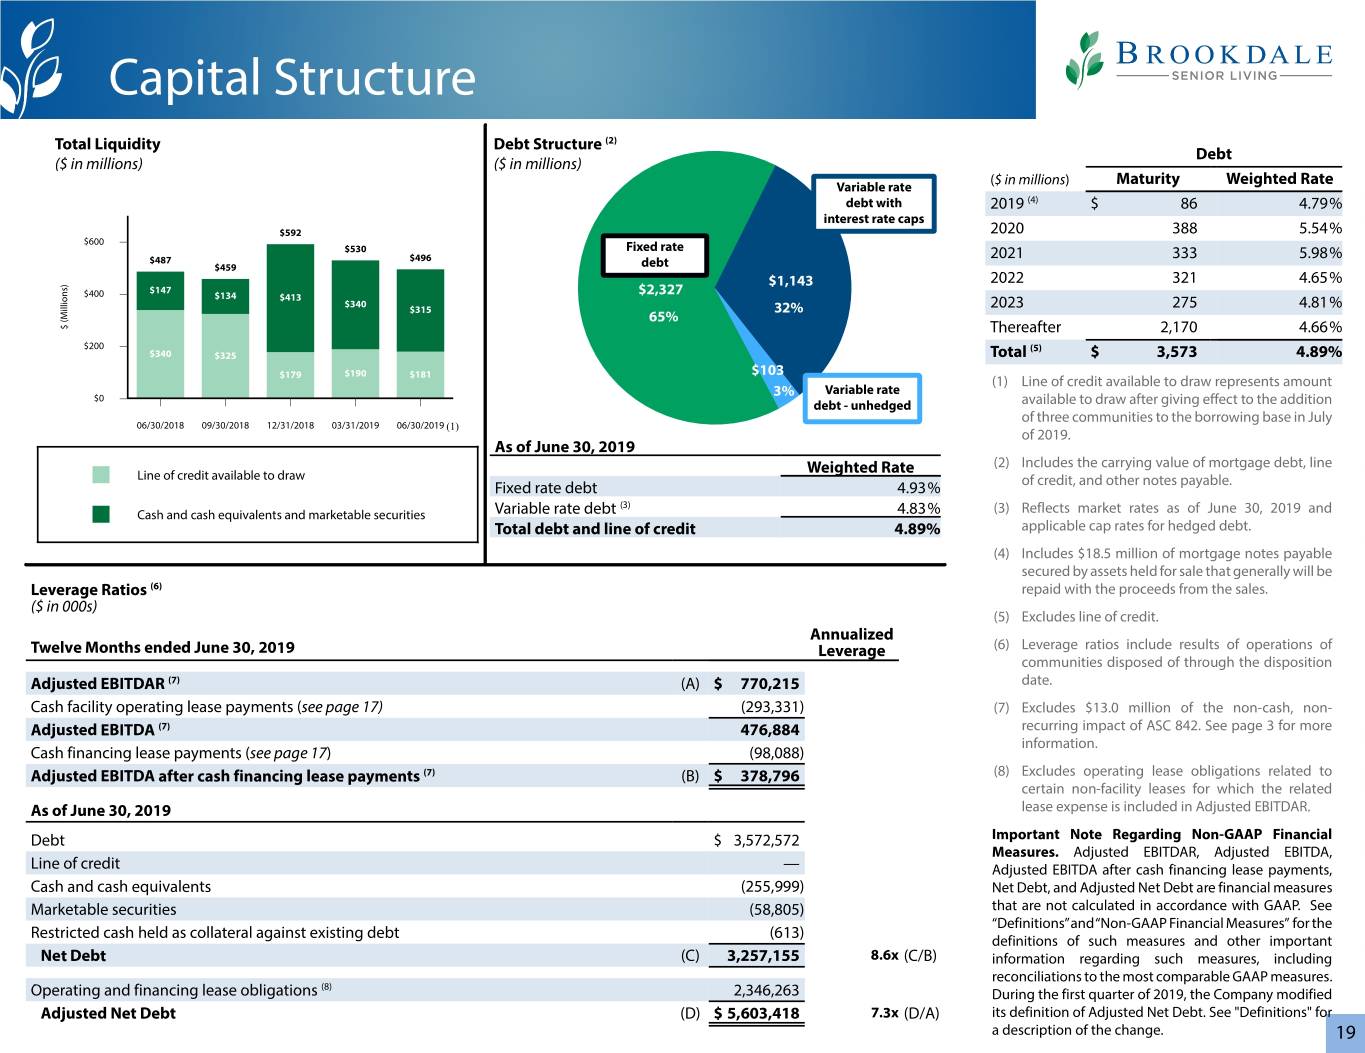
Capital Structure Total Liquidity Debt Structure (2) Debt ($ in millions) ($ in millions) ($ in millions) Maturity Weighted Rate Variable rate debt with 2019 (4) $ 86 4.79% interest rate caps $592 2020 388 5.54% $600 $530 Fixed rate $487 $496 2021 333 5.98% $459 debt 2022 321 4.65% ) $1,143 s $147 n $400 $134 $2,327 o $413 i l l $340 i $315 32% 2023 275 4.81% M ( 65% $ Thereafter 2,170 4.66% $200 (5) $340 $325 Total $ 3,573 4.89% $190 $103 $179 $181 (1) Line of credit available to draw represents amount Variable rate $0 3% debt - unhedged available to draw after giving effect to the addition of three communities to the borrowing base in July 06/30/2018 09/30/2018 12/31/2018 03/31/2019 06/30/2019 (1) of 2019. As of June 30, 2019 (2) Includes the carrying value of mortgage debt, line Line of credit available to draw Weighted Rate Fixed rate debt 4.93% of credit, and other notes payable. (3) Cash and cash equivalents and marketable securities Variable rate debt 4.83% (3) Reflects market rates as of June 30, 2019 and Total debt and line of credit 4.89% applicable cap rates for hedged debt. (4) Includes $18.5 million of mortgage notes payable secured by assets held for sale that generally will be Leverage Ratios (6) repaid with the proceeds from the sales. ($ in 000s) (5) Excludes line of credit. Annualized Twelve Months ended June 30, 2019 Leverage (6) Leverage ratios include results of operations of communities disposed of through the disposition Adjusted EBITDAR (7) (A) $ 770,215 date. Cash facility operating lease payments (see page 17) (293,331) (7) Excludes $13.0 million of the non-cash, non- Adjusted EBITDA (7) 476,884 recurring impact of ASC 842. See page 3 for more information. Cash financing lease payments (see page 17) (98,088) Adjusted EBITDA after cash financing lease payments (7) (B) $ 378,796 (8) Excludes operating lease obligations related to certain non-facility leases for which the related As of June 30, 2019 lease expense is included in Adjusted EBITDAR. Debt $ 3,572,572 Important Note Regarding Non-GAAP Financial Measures. Adjusted EBITDAR, Adjusted EBITDA, Line of credit — Adjusted EBITDA after cash financing lease payments, Cash and cash equivalents (255,999) Net Debt, and Adjusted Net Debt are financial measures Marketable securities (58,805) that are not calculated in accordance with GAAP. See “Definitions” and “Non-GAAP Financial Measures” for the Restricted cash held as collateral against existing debt (613) definitions of such measures and other important Net Debt (C) 3,257,155 8.6x (C/B) information regarding such measures, including reconciliations to the most comparable GAAP measures. (8) Operating and financing lease obligations 2,346,263 During the first quarter of 2019, the Company modified Adjusted Net Debt (D) $ 5,603,418 7.3x (D/A) its definition of Adjusted Net Debt. See "Definitions" for a description of the change. 19
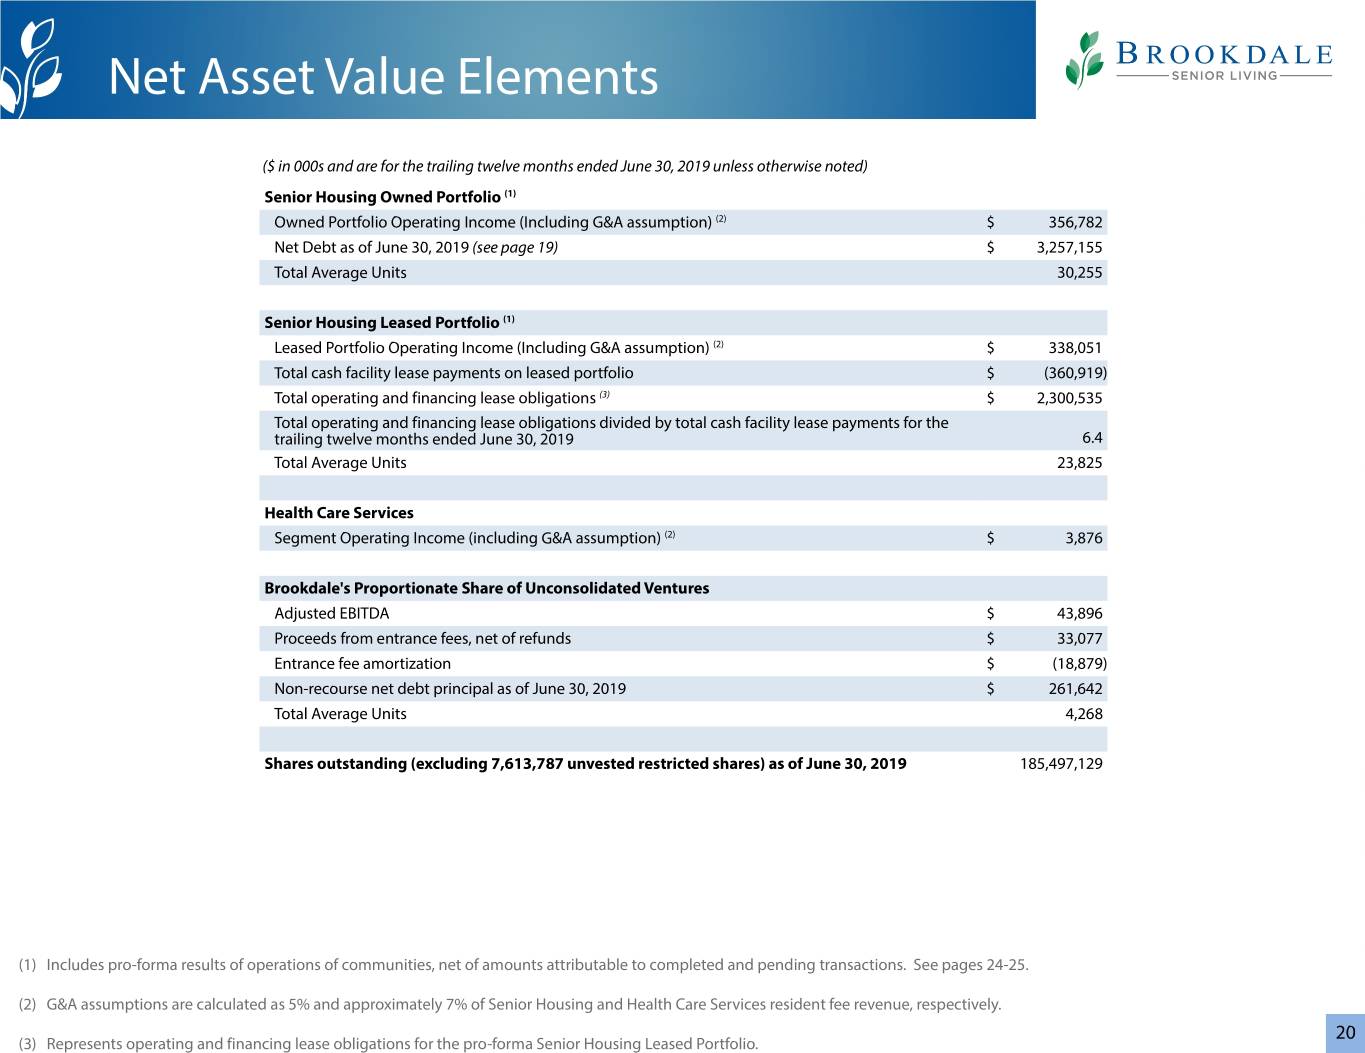
Net Asset Value Elements ($ in 000s and are for the trailing twelve months ended June 30, 2019 unless otherwise noted) Senior Housing Owned Portfolio (1) Owned Portfolio Operating Income (Including G&A assumption) (2) $ 356,782 Net Debt as of June 30, 2019 (see page 19) $ 3,257,155 Total Average Units 30,255 Senior Housing Leased Portfolio (1) Leased Portfolio Operating Income (Including G&A assumption) (2) $ 338,051 Total cash facility lease payments on leased portfolio $ (360,919) Total operating and financing lease obligations (3) $ 2,300,535 Total operating and financing lease obligations divided by total cash facility lease payments for the trailing twelve months ended June 30, 2019 6.4 Total Average Units 23,825 Health Care Services Segment Operating Income (including G&A assumption) (2) $ 3,876 Brookdale's Proportionate Share of Unconsolidated Ventures Adjusted EBITDA $ 43,896 Proceeds from entrance fees, net of refunds $ 33,077 Entrance fee amortization $ (18,879) Non-recourse net debt principal as of June 30, 2019 $ 261,642 Total Average Units 4,268 Shares outstanding (excluding 7,613,787 unvested restricted shares) as of June 30, 2019 185,497,129 (1) Includes pro-forma results of operations of communities, net of amounts attributable to completed and pending transactions. See pages 24-25. (2) G&A assumptions are calculated as 5% and approximately 7% of Senior Housing and Health Care Services resident fee revenue, respectively. 20 (3) Represents operating and financing lease obligations for the pro-forma Senior Housing Leased Portfolio.

Definitions Adjusted EBITDA is a non-GAAP performance measure that the Company defines as net Brookdale’s Proportionate Share of Adjusted EBITDA of Unconsolidated Ventures income (loss) excluding: benefit/provision for income taxes, non-operating income/ is calculated based on the Company’s equity ownership percentage and in a manner expense items, and depreciation and amortization; and further adjusted to exclude consistent with the Company’s definition of Adjusted EBITDA for its consolidated entities. income/expense associated with non-cash, non-operational, transactional, cost The Company’s investments in unconsolidated ventures are accounted for under the reduction or organizational restructuring items that management does not consider as equity method of accounting and, therefore, the Company’s proportionate share of part of the Company’s underlying core operating performance and that management Adjusted EBITDA of unconsolidated ventures does not represent the Company’s equity believes impact the comparability of performance between periods. For the periods in earnings or loss of unconsolidated ventures on its consolidated statement of presented herein, such other items include non-cash impairment charges, gain/loss on operations. facility lease termination and modification, operating lease expense adjustment, amortization of deferred gain, change in future service obligation, non-cash stock-based Brookdale’s Proportionate Share of Adjusted Free Cash Flow of Unconsolidated compensation expense, and Transaction and Organizational Restructuring Costs. During Ventures is calculated based on the Company’s equity ownership percentage and in a the first quarter of 2019, the Company modified its definition of Adjusted EBITDA to manner consistent with the Company’s definition of Adjusted Free Cash Flow for its exclude Transaction and Organizational Restructuring Costs, and amounts for all periods consolidated entities. The Company’s investments in its unconsolidated ventures are herein reflect application of the modified definition. accounted for under the equity method of accounting and, therefore, the Company’s proportionate share of Adjusted Free Cash Flow of unconsolidated ventures does not represent cash available to the Company’s consolidated business except to the extent it Adjusted EBITDAR is a non-GAAP financial measure that the Company defines as is distributed to the Company. Adjusted EBITDA before cash facility operating lease payments. Combined Segment Operating Income is defined by the Company as resident fee and Adjusted Free Cash Flow is a non-GAAP liquidity measure that the Company defines as management fee revenue of the Company, less facility operating expense. Combined net cash provided by (used in) operating activities before: distributions from Segment Operating Income does not include general and administrative expense or unconsolidated ventures from cumulative share of net earnings, changes in operating depreciation and amortization. lease liability for lease termination and modification, cash paid/received for gain/loss on facility lease termination and modification, and lessor capital expenditure Community Labor Expense is a component of facility operating expense that includes reimbursements under operating leases; plus: property insurance proceeds and regular and overtime salaries and wages, bonuses, paid-time-off and holiday wages, proceeds from refundable entrance fees, net of refunds; less: Non-Development Capital payroll taxes, contract labor, employee benefits, and workers compensation. Expenditures and payment of financing lease obligations. During the first quarter of 2019, Development Capital Expenditures means capital expenditures for community the Company modified its definition of Adjusted Free Cash Flow to no longer adjust net expansions and major community redevelopment and repositioning projects, including cash provided by (used in) operating activities for changes in working capital items other the Company’s Program Max initiative, and the development of new communities. than prepaid insurance premiums financed with notes payable and lease liability for lease Amounts of Development Capital Expenditures are presented net of lessor termination and modification. Amounts for all periods herein reflect application of the reimbursements. modified definition. Interest Coverage is calculated based on the trailing-twelve months Owned Portfolio Adjusted Net Debt is a non-GAAP financial measure that the Company defines as Net Operating Income adjusted for an implied 5% management fee and capital expenditures Debt, plus operating and financing lease obligations. Operating and financing lease at $350/unit, divided by the trailing-twelve months property level and corporate debt obligations exclude operating lease obligations related to certain non-facility leases for interest expense. For any trailing-twelve month period that includes one or more periods which the related lease expense is included in Adjusted EBITDAR. During the first quarter from 2019, an adjustment was made to exclude the impact of applying the new lease of 2019, the Company modified its definition of Adjusted Net Debt to no longer adjust accounting standard under ASC 842 for residency agreements. Net Debt by cash operating, capital, and financing lease payments multiplied by 8 and Lease Coverage is calculated based on the trailing-twelve months Leased Portfolio instead utilizes operating and financing lease obligations for facility leases recorded on Operating Income, excluding resident fee revenue and facility operating expense of the Company's balance sheet to derive Adjusted Net Debt. communities disposed during such period adjusted for an implied 5% management fee and capital expenditures at $350/unit, divided by the trailing-twelve months cash facility lease payments for both operating leases and financing leases, excluding cash lease payments for leases of communities disposed during such period, corporate offices, and information technology systems and equipment, vehicles and other equipment. For any trailing-twelve month period that includes one or more periods from 2019, an adjustment was made to exclude the impact of applying the new lease accounting standard under ASC 842 for residency agreements. 21
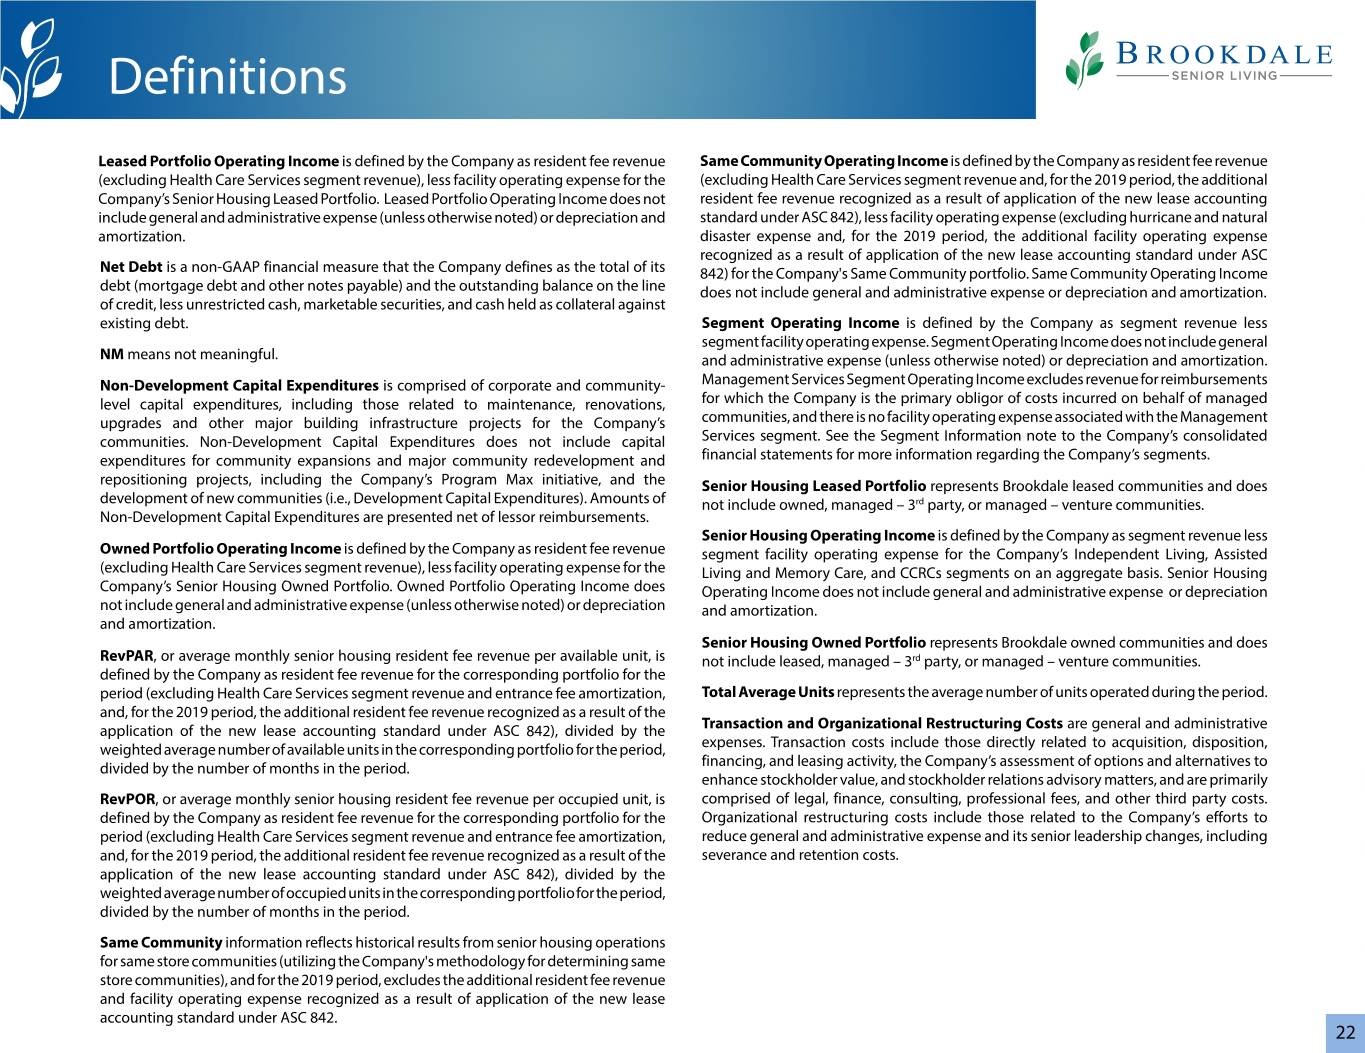
Definitions Leased Portfolio Operating Income is defined by the Company as resident fee revenue Same Community Operating Income is defined by the Company as resident fee revenue (excluding Health Care Services segment revenue), less facility operating expense for the (excluding Health Care Services segment revenue and, for the 2019 period, the additional Company’s Senior Housing Leased Portfolio. Leased Portfolio Operating Income does not resident fee revenue recognized as a result of application of the new lease accounting include general and administrative expense (unless otherwise noted) or depreciation and standard under ASC 842), less facility operating expense (excluding hurricane and natural amortization. disaster expense and, for the 2019 period, the additional facility operating expense recognized as a result of application of the new lease accounting standard under ASC Net Debt is a non-GAAP financial measure that the Company defines as the total of its 842) for the Company's Same Community portfolio. Same Community Operating Income debt (mortgage debt and other notes payable) and the outstanding balance on the line does not include general and administrative expense or depreciation and amortization. of credit, less unrestricted cash, marketable securities, and cash held as collateral against existing debt. Segment Operating Income is defined by the Company as segment revenue less segment facility operating expense. Segment Operating Income does not include general NM means not meaningful. and administrative expense (unless otherwise noted) or depreciation and amortization. Non-Development Capital Expenditures is comprised of corporate and community- Management Services Segment Operating Income excludes revenue for reimbursements level capital expenditures, including those related to maintenance, renovations, for which the Company is the primary obligor of costs incurred on behalf of managed upgrades and other major building infrastructure projects for the Company’s communities, and there is no facility operating expense associated with the Management communities. Non-Development Capital Expenditures does not include capital Services segment. See the Segment Information note to the Company’s consolidated expenditures for community expansions and major community redevelopment and financial statements for more information regarding the Company’s segments. repositioning projects, including the Company’s Program Max initiative, and the Senior Housing Leased Portfolio represents Brookdale leased communities and does development of new communities (i.e., Development Capital Expenditures). Amounts of not include owned, managed – 3rd party, or managed – venture communities. Non-Development Capital Expenditures are presented net of lessor reimbursements. Senior Housing Operating Income is defined by the Company as segment revenue less Owned Portfolio Operating Income is defined by the Company as resident fee revenue segment facility operating expense for the Company’s Independent Living, Assisted (excluding Health Care Services segment revenue), less facility operating expense for the Living and Memory Care, and CCRCs segments on an aggregate basis. Senior Housing Company’s Senior Housing Owned Portfolio. Owned Portfolio Operating Income does Operating Income does not include general and administrative expense or depreciation not include general and administrative expense (unless otherwise noted) or depreciation and amortization. and amortization. Senior Housing Owned Portfolio represents Brookdale owned communities and does RevPAR, or average monthly senior housing resident fee revenue per available unit, is not include leased, managed – 3rd party, or managed – venture communities. defined by the Company as resident fee revenue for the corresponding portfolio for the period (excluding Health Care Services segment revenue and entrance fee amortization, Total Average Units represents the average number of units operated during the period. and, for the 2019 period, the additional resident fee revenue recognized as a result of the application of the new lease accounting standard under ASC 842), divided by the Transaction and Organizational Restructuring Costs are general and administrative weighted average number of available units in the corresponding portfolio for the period, expenses. Transaction costs include those directly related to acquisition, disposition, divided by the number of months in the period. financing, and leasing activity, the Company’s assessment of options and alternatives to enhance stockholder value, and stockholder relations advisory matters, and are primarily RevPOR, or average monthly senior housing resident fee revenue per occupied unit, is comprised of legal, finance, consulting, professional fees, and other third party costs. defined by the Company as resident fee revenue for the corresponding portfolio for the Organizational restructuring costs include those related to the Company’s efforts to period (excluding Health Care Services segment revenue and entrance fee amortization, reduce general and administrative expense and its senior leadership changes, including and, for the 2019 period, the additional resident fee revenue recognized as a result of the severance and retention costs. application of the new lease accounting standard under ASC 842), divided by the weighted average number of occupied units in the corresponding portfolio for the period, divided by the number of months in the period. Same Community information reflects historical results from senior housing operations for same store communities (utilizing the Company's methodology for determining same store communities), and for the 2019 period, excludes the additional resident fee revenue and facility operating expense recognized as a result of application of the new lease accounting standard under ASC 842. 22

Appendices Pro-Forma Financial Information 24 Non-GAAP Financial Measures 28 23
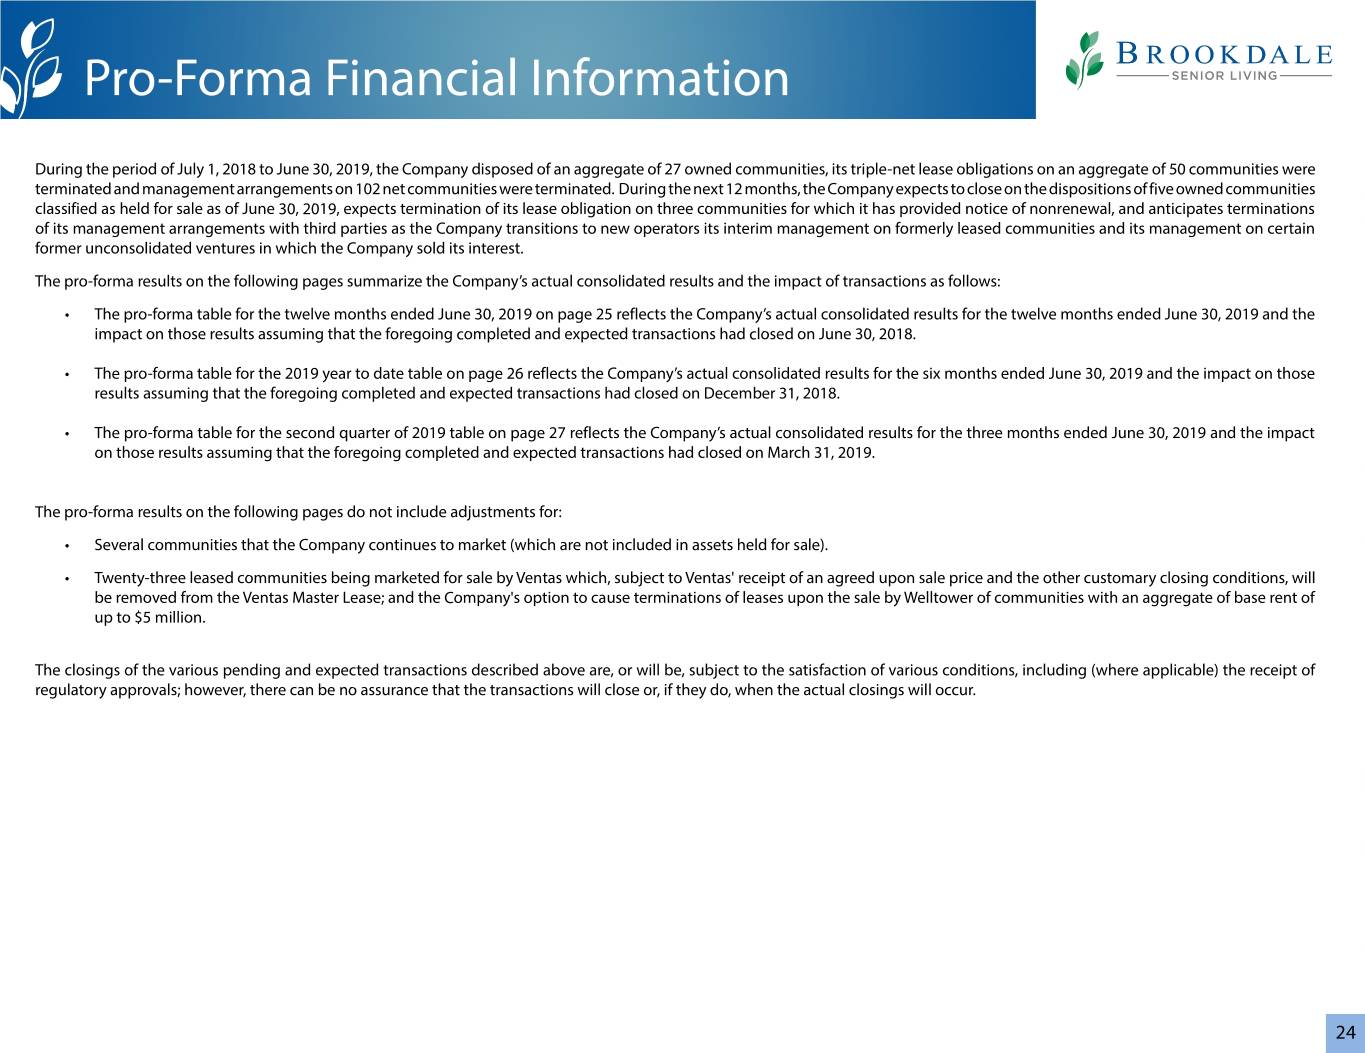
Pro-Forma Financial Information During the period of July 1, 2018 to June 30, 2019, the Company disposed of an aggregate of 27 owned communities, its triple-net lease obligations on an aggregate of 50 communities were terminated and management arrangements on 102 net communities were terminated. During the next 12 months, the Company expects to close on the dispositions of five owned communities classified as held for sale as of June 30, 2019, expects termination of its lease obligation on three communities for which it has provided notice of nonrenewal, and anticipates terminations of its management arrangements with third parties as the Company transitions to new operators its interim management on formerly leased communities and its management on certain former unconsolidated ventures in which the Company sold its interest. The pro-forma results on the following pages summarize the Company’s actual consolidated results and the impact of transactions as follows: • The pro-forma table for the twelve months ended June 30, 2019 on page 25 reflects the Company’s actual consolidated results for the twelve months ended June 30, 2019 and the impact on those results assuming that the foregoing completed and expected transactions had closed on June 30, 2018. • The pro-forma table for the 2019 year to date table on page 26 reflects the Company’s actual consolidated results for the six months ended June 30, 2019 and the impact on those results assuming that the foregoing completed and expected transactions had closed on December 31, 2018. • The pro-forma table for the second quarter of 2019 table on page 27 reflects the Company’s actual consolidated results for the three months ended June 30, 2019 and the impact on those results assuming that the foregoing completed and expected transactions had closed on March 31, 2019. The pro-forma results on the following pages do not include adjustments for: • Several communities that the Company continues to market (which are not included in assets held for sale). • Twenty-three leased communities being marketed for sale by Ventas which, subject to Ventas' receipt of an agreed upon sale price and the other customary closing conditions, will be removed from the Ventas Master Lease; and the Company's option to cause terminations of leases upon the sale by Welltower of communities with an aggregate of base rent of up to $5 million. The closings of the various pending and expected transactions described above are, or will be, subject to the satisfaction of various conditions, including (where applicable) the receipt of regulatory approvals; however, there can be no assurance that the transactions will close or, if they do, when the actual closings will occur. 24
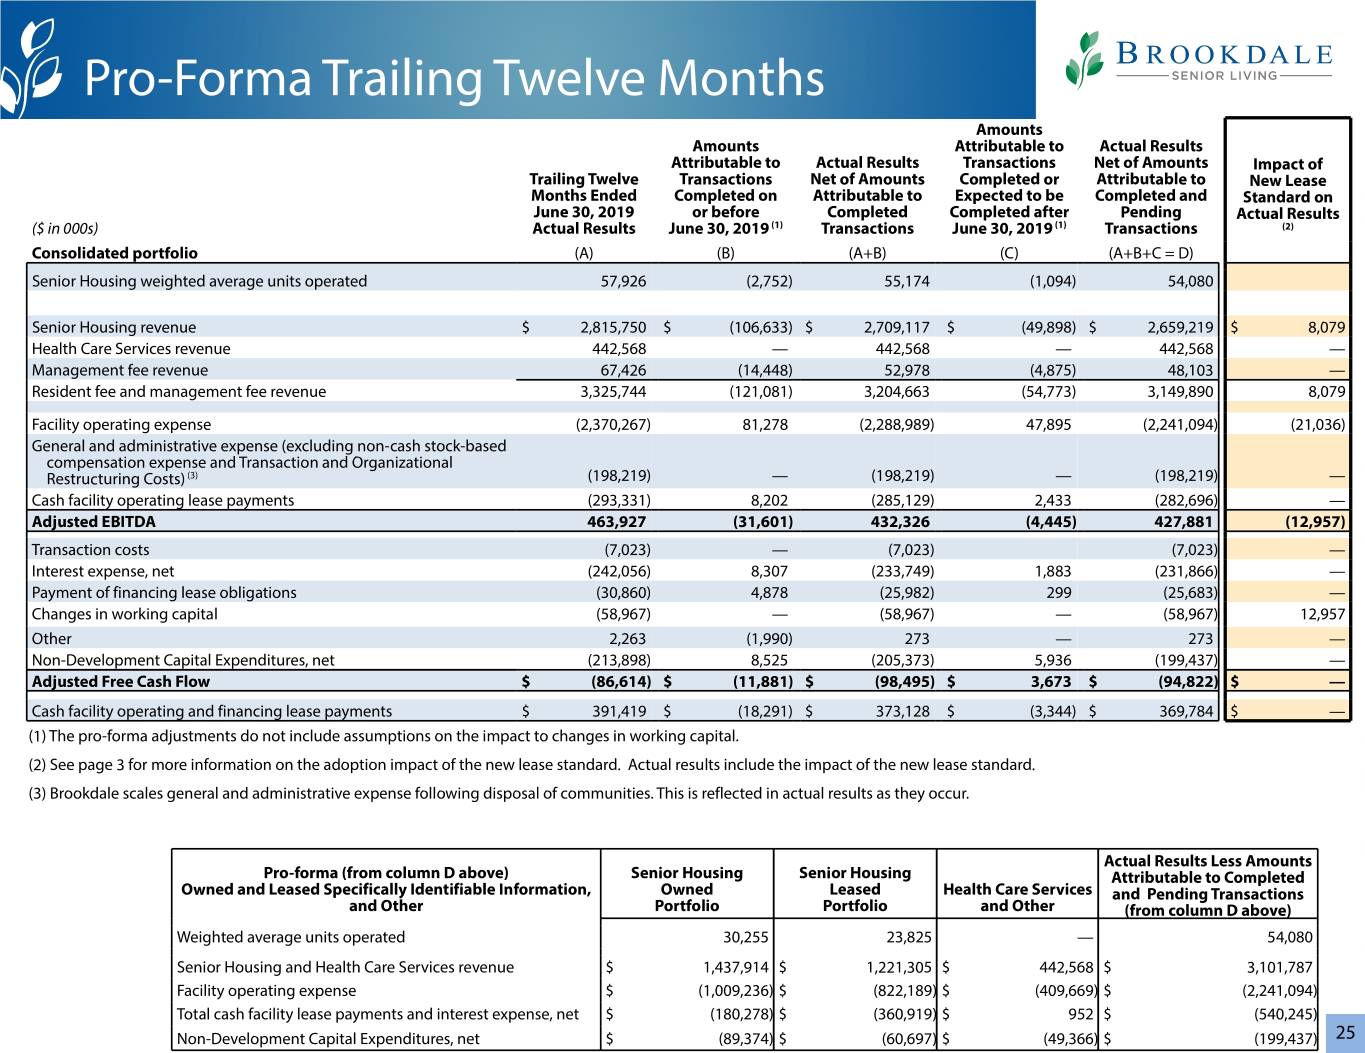
Pro-Forma Trailing Twelve Months Amounts Amounts Attributable to Actual Results Attributable to Actual Results Transactions Net of Amounts Impact of Trailing Twelve Transactions Net of Amounts Completed or Attributable to New Lease Months Ended Completed on Attributable to Expected to be Completed and Standard on June 30, 2019 or before Completed Completed after Pending Actual Results ($ in 000s) Actual Results June 30, 2019 (1) Transactions June 30, 2019 (1) Transactions (2) Consolidated portfolio (A) (B) (A+B) (C) (A+B+C = D) Senior Housing weighted average units operated 57,926 (2,752) 55,174 (1,094) 54,080 Senior Housing revenue $ 2,815,750 $ (106,633) $ 2,709,117 $ (49,898) $ 2,659,219 $ 8,079 Health Care Services revenue 442,568 — 442,568 — 442,568 — Management fee revenue 67,426 (14,448) 52,978 (4,875) 48,103 — Resident fee and management fee revenue 3,325,744 (121,081) 3,204,663 (54,773) 3,149,890 8,079 Facility operating expense (2,370,267) 81,278 (2,288,989) 47,895 (2,241,094) (21,036) General and administrative expense (excluding non-cash stock-based compensation expense and Transaction and Organizational Restructuring Costs) (3) (198,219) — (198,219) — (198,219) — Cash facility operating lease payments (293,331) 8,202 (285,129) 2,433 (282,696) — Adjusted EBITDA 463,927 (31,601) 432,326 (4,445) 427,881 (12,957) Transaction costs (7,023) — (7,023) (7,023) — Interest expense, net (242,056) 8,307 (233,749) 1,883 (231,866) — Payment of financing lease obligations (30,860) 4,878 (25,982) 299 (25,683) — Changes in working capital (58,967) — (58,967) — (58,967) 12,957 Other 2,263 (1,990) 273 — 273 — Non-Development Capital Expenditures, net (213,898) 8,525 (205,373) 5,936 (199,437) — Adjusted Free Cash Flow $ (86,614) $ (11,881) $ (98,495) $ 3,673 $ (94,822) $ — Cash facility operating and financing lease payments $ 391,419 $ (18,291) $ 373,128 $ (3,344) $ 369,784 $ — (1) The pro-forma adjustments do not include assumptions on the impact to changes in working capital. (2) See page 3 for more information on the adoption impact of the new lease standard. Actual results include the impact of the new lease standard. (3) Brookdale scales general and administrative expense following disposal of communities. This is reflected in actual results as they occur. Actual Results Less Amounts Pro-forma (from column D above) Senior Housing Senior Housing Attributable to Completed Owned and Leased Specifically Identifiable Information, Owned Leased Health Care Services and Pending Transactions and Other Portfolio Portfolio and Other (from column D above) Weighted average units operated 30,255 23,825 — 54,080 Senior Housing and Health Care Services revenue $ 1,437,914 $ 1,221,305 $ 442,568 $ 3,101,787 Facility operating expense $ (1,009,236) $ (822,189) $ (409,669) $ (2,241,094) Total cash facility lease payments and interest expense, net $ (180,278) $ (360,919) $ 952 $ (540,245) Non-Development Capital Expenditures, net $ (89,374) $ (60,697) $ (49,366) $ (199,437) 25

Pro-Forma Second Quarter 2019 YTD Amounts Amounts Attributable to Actual Results Attributable to Actual Results Transactions Net of Amounts Transactions Net of Amounts Completed or Attributable to Impact of Completed Attributable to Expected to be Completed and New Lease YTD 2Q19 during Completed Completed after Pending Standard on ($ in 000s) Actual Results YTD2Q19 (1) Transactions June 30, 2019 (1) Transactions Actual Results (2) Consolidated portfolio (A) (B) (A+B) (C) (A+B+C) Senior Housing weighted average units operated 55,963 (789) 55,174 (1,094) 54,080 Senior Housing revenue $ 1,385,376 $ (12,282) $ 1,373,094 $ (25,516) $ 1,347,578 $ 8,079 Health Care Services revenue 225,966 — 225,966 — 225,966 — Management fee revenue 31,192 (3,931) 27,261 (3,017) 24,244 — Resident fee and management fee revenue 1,642,534 (16,213) 1,626,321 (28,533) 1,597,788 8,079 Facility operating expense (1,176,340) 10,100 (1,166,240) 24,452 (1,141,788) (21,036) General and administrative expense (excluding non-cash stock- based compensation expense and transaction costs) (3) (100,406) — (100,406) — (100,406) — Cash facility operating lease payments (145,169) 1,451 (143,718) 1,223 (142,495) — Adjusted EBITDA 220,619 (4,662) 215,957 (2,858) 213,099 (12,957) Transaction costs (1,095) — (1,095) — (1,095) — Interest expense, net (118,331) 52 (118,279) 806 (117,473) — Payment of financing lease obligations (10,953) — (10,953) 154 (10,799) — Changes in working capital (33,785) — (33,785) — (33,785) 12,957 Other 1,271 54 1,325 — 1,325 — Non-Development Capital Expenditures, net (121,066) (487) (121,553) 3,861 (117,692) — Adjusted Free Cash Flow $ (63,340) $ (5,043) $ (68,383) $ 1,963 $ (66,420) $ — (1) The pro-forma adjustments do not include assumptions on the impact to changes in working capital. (2) See page 3 for more information on the adoption impact of the new lease standard. Actual results include the impact of the new lease standard. (3) Brookdale scales general and administrative expense following disposal of communities. This is reflected in actual results as they occur. 26
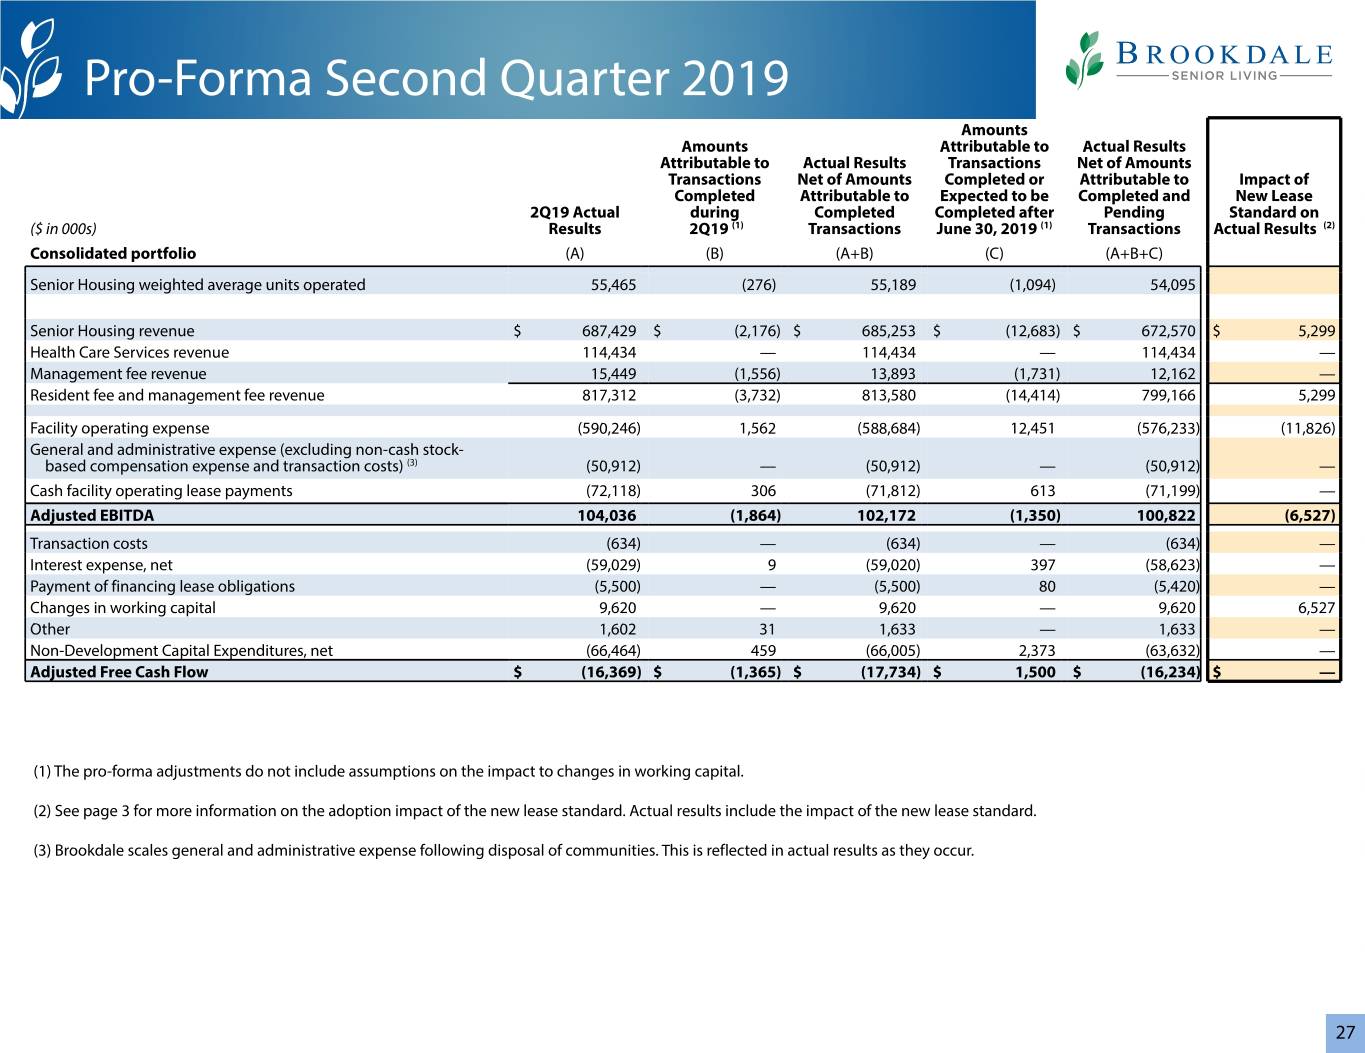
Pro-Forma Second Quarter 2019 Amounts Amounts Attributable to Actual Results Attributable to Actual Results Transactions Net of Amounts Transactions Net of Amounts Completed or Attributable to Impact of Completed Attributable to Expected to be Completed and New Lease 2Q19 Actual during Completed Completed after Pending Standard on ($ in 000s) Results 2Q19 (1) Transactions June 30, 2019 (1) Transactions Actual Results (2) Consolidated portfolio (A) (B) (A+B) (C) (A+B+C) Senior Housing weighted average units operated 55,465 (276) 55,189 (1,094) 54,095 Senior Housing revenue $ 687,429 $ (2,176) $ 685,253 $ (12,683) $ 672,570 $ 5,299 Health Care Services revenue 114,434 — 114,434 — 114,434 — Management fee revenue 15,449 (1,556) 13,893 (1,731) 12,162 — Resident fee and management fee revenue 817,312 (3,732) 813,580 (14,414) 799,166 5,299 Facility operating expense (590,246) 1,562 (588,684) 12,451 (576,233) (11,826) General and administrative expense (excluding non-cash stock- based compensation expense and transaction costs) (3) (50,912) — (50,912) — (50,912) — Cash facility operating lease payments (72,118) 306 (71,812) 613 (71,199) — Adjusted EBITDA 104,036 (1,864) 102,172 (1,350) 100,822 (6,527) Transaction costs (634) — (634) — (634) — Interest expense, net (59,029) 9 (59,020) 397 (58,623) — Payment of financing lease obligations (5,500) — (5,500) 80 (5,420) — Changes in working capital 9,620 — 9,620 — 9,620 6,527 Other 1,602 31 1,633 — 1,633 — Non-Development Capital Expenditures, net (66,464) 459 (66,005) 2,373 (63,632) — Adjusted Free Cash Flow $ (16,369) $ (1,365) $ (17,734) $ 1,500 $ (16,234) $ — (1) The pro-forma adjustments do not include assumptions on the impact to changes in working capital. (2) See page 3 for more information on the adoption impact of the new lease standard. Actual results include the impact of the new lease standard. (3) Brookdale scales general and administrative expense following disposal of communities. This is reflected in actual results as they occur. 27
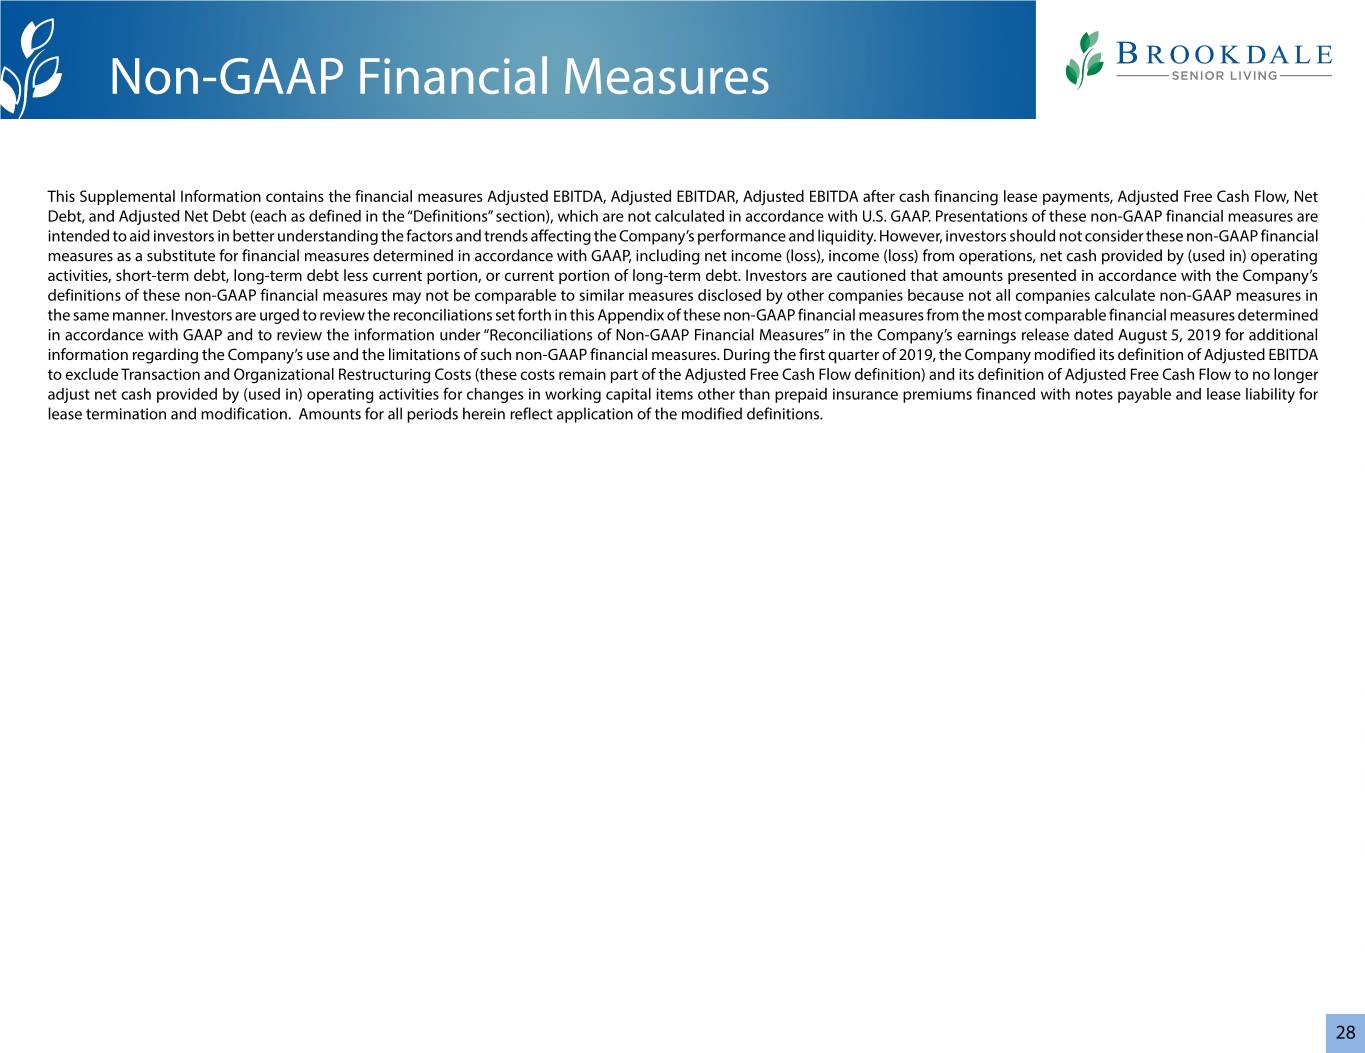
Non-GAAP Financial Measures This Supplemental Information contains the financial measures Adjusted EBITDA, Adjusted EBITDAR, Adjusted EBITDA after cash financing lease payments, Adjusted Free Cash Flow, Net Debt, and Adjusted Net Debt (each as defined in the “Definitions” section), which are not calculated in accordance with U.S. GAAP. Presentations of these non-GAAP financial measures are intended to aid investors in better understanding the factors and trends affecting the Company’s performance and liquidity. However, investors should not consider these non-GAAP financial measures as a substitute for financial measures determined in accordance with GAAP, including net income (loss), income (loss) from operations, net cash provided by (used in) operating activities, short-term debt, long-term debt less current portion, or current portion of long-term debt. Investors are cautioned that amounts presented in accordance with the Company’s definitions of these non-GAAP financial measures may not be comparable to similar measures disclosed by other companies because not all companies calculate non-GAAP measures in the same manner. Investors are urged to review the reconciliations set forth in this Appendix of these non-GAAP financial measures from the most comparable financial measures determined in accordance with GAAP and to review the information under “Reconciliations of Non-GAAP Financial Measures” in the Company’s earnings release dated August 5, 2019 for additional information regarding the Company’s use and the limitations of such non-GAAP financial measures. During the first quarter of 2019, the Company modified its definition of Adjusted EBITDA to exclude Transaction and Organizational Restructuring Costs (these costs remain part of the Adjusted Free Cash Flow definition) and its definition of Adjusted Free Cash Flow to no longer adjust net cash provided by (used in) operating activities for changes in working capital items other than prepaid insurance premiums financed with notes payable and lease liability for lease termination and modification. Amounts for all periods herein reflect application of the modified definitions. 28
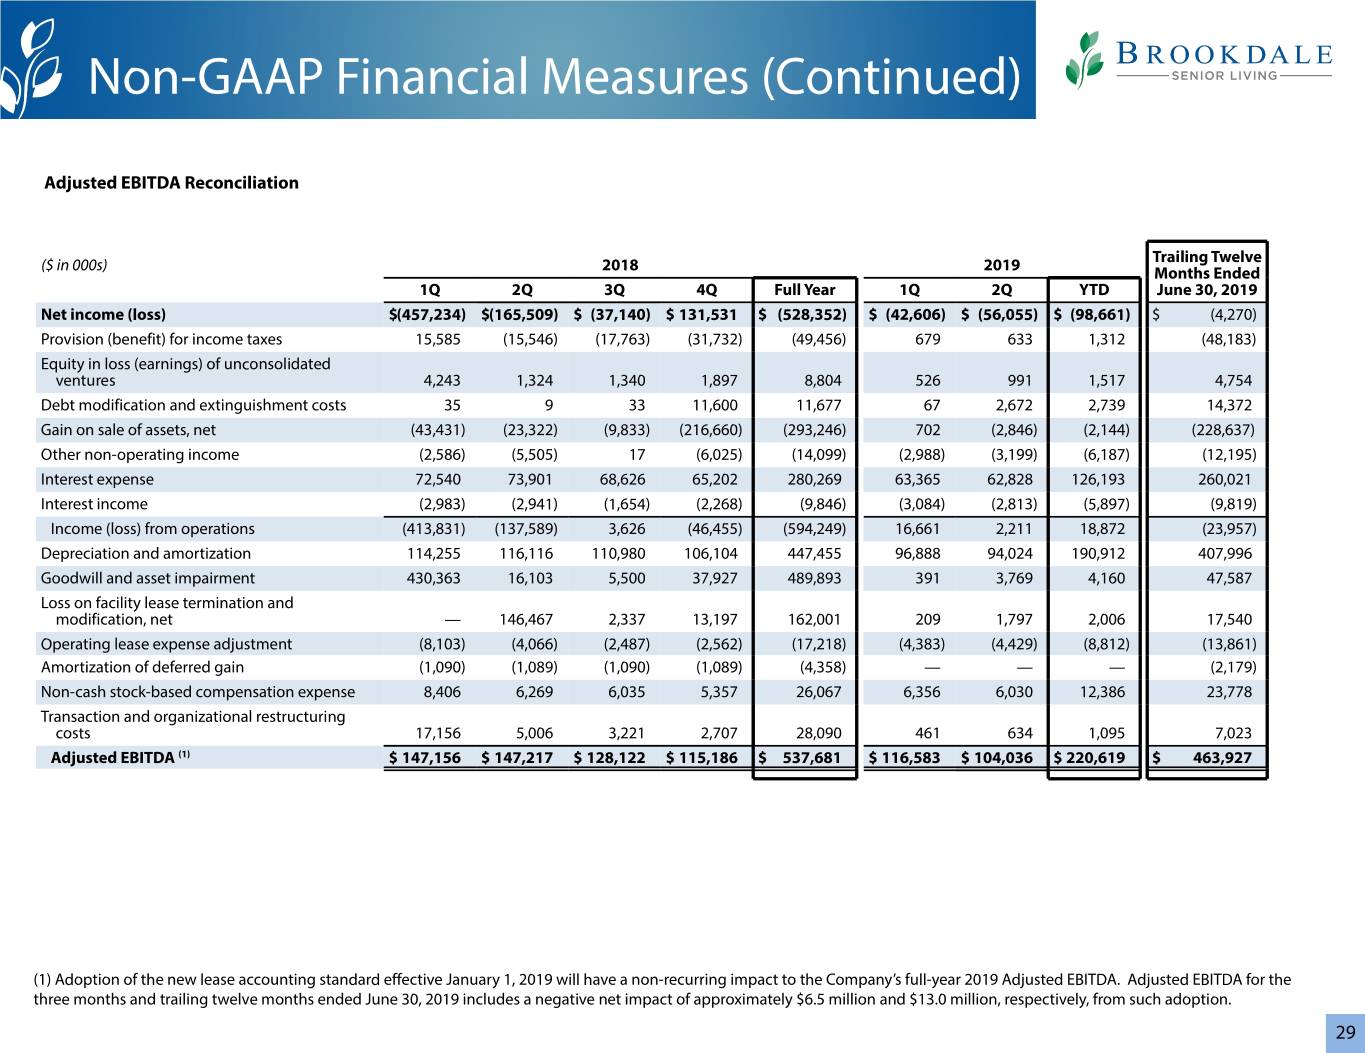
Non-GAAP Financial Measures (Continued) Adjusted EBITDA Reconciliation Trailing Twelve ($ in 000s) 2018 2019 Months Ended 1Q 2Q 3Q 4Q Full Year 1Q 2Q YTD June 30, 2019 Net income (loss) $(457,234) $(165,509) $ (37,140) $ 131,531 $ (528,352) $ (42,606) $ (56,055) $ (98,661) $ (4,270) Provision (benefit) for income taxes 15,585 (15,546) (17,763) (31,732) (49,456) 679 633 1,312 (48,183) Equity in loss (earnings) of unconsolidated ventures 4,243 1,324 1,340 1,897 8,804 526 991 1,517 4,754 Debt modification and extinguishment costs 35 9 33 11,600 11,677 67 2,672 2,739 14,372 Gain on sale of assets, net (43,431) (23,322) (9,833) (216,660) (293,246) 702 (2,846) (2,144) (228,637) Other non-operating income (2,586) (5,505) 17 (6,025) (14,099) (2,988) (3,199) (6,187) (12,195) Interest expense 72,540 73,901 68,626 65,202 280,269 63,365 62,828 126,193 260,021 Interest income (2,983) (2,941) (1,654) (2,268) (9,846) (3,084) (2,813) (5,897) (9,819) Income (loss) from operations (413,831) (137,589) 3,626 (46,455) (594,249) 16,661 2,211 18,872 (23,957) Depreciation and amortization 114,255 116,116 110,980 106,104 447,455 96,888 94,024 190,912 407,996 Goodwill and asset impairment 430,363 16,103 5,500 37,927 489,893 391 3,769 4,160 47,587 Loss on facility lease termination and modification, net — 146,467 2,337 13,197 162,001 209 1,797 2,006 17,540 Operating lease expense adjustment (8,103) (4,066) (2,487) (2,562) (17,218) (4,383) (4,429) (8,812) (13,861) Amortization of deferred gain (1,090) (1,089) (1,090) (1,089) (4,358) — — — (2,179) Non-cash stock-based compensation expense 8,406 6,269 6,035 5,357 26,067 6,356 6,030 12,386 23,778 Transaction and organizational restructuring costs 17,156 5,006 3,221 2,707 28,090 461 634 1,095 7,023 Adjusted EBITDA (1) $ 147,156 $ 147,217 $ 128,122 $ 115,186 $ 537,681 $ 116,583 $ 104,036 $ 220,619 $ 463,927 (1) Adoption of the new lease accounting standard effective January 1, 2019 will have a non-recurring impact to the Company’s full-year 2019 Adjusted EBITDA. Adjusted EBITDA for the three months and trailing twelve months ended June 30, 2019 includes a negative net impact of approximately $6.5 million and $13.0 million, respectively, from such adoption. 29
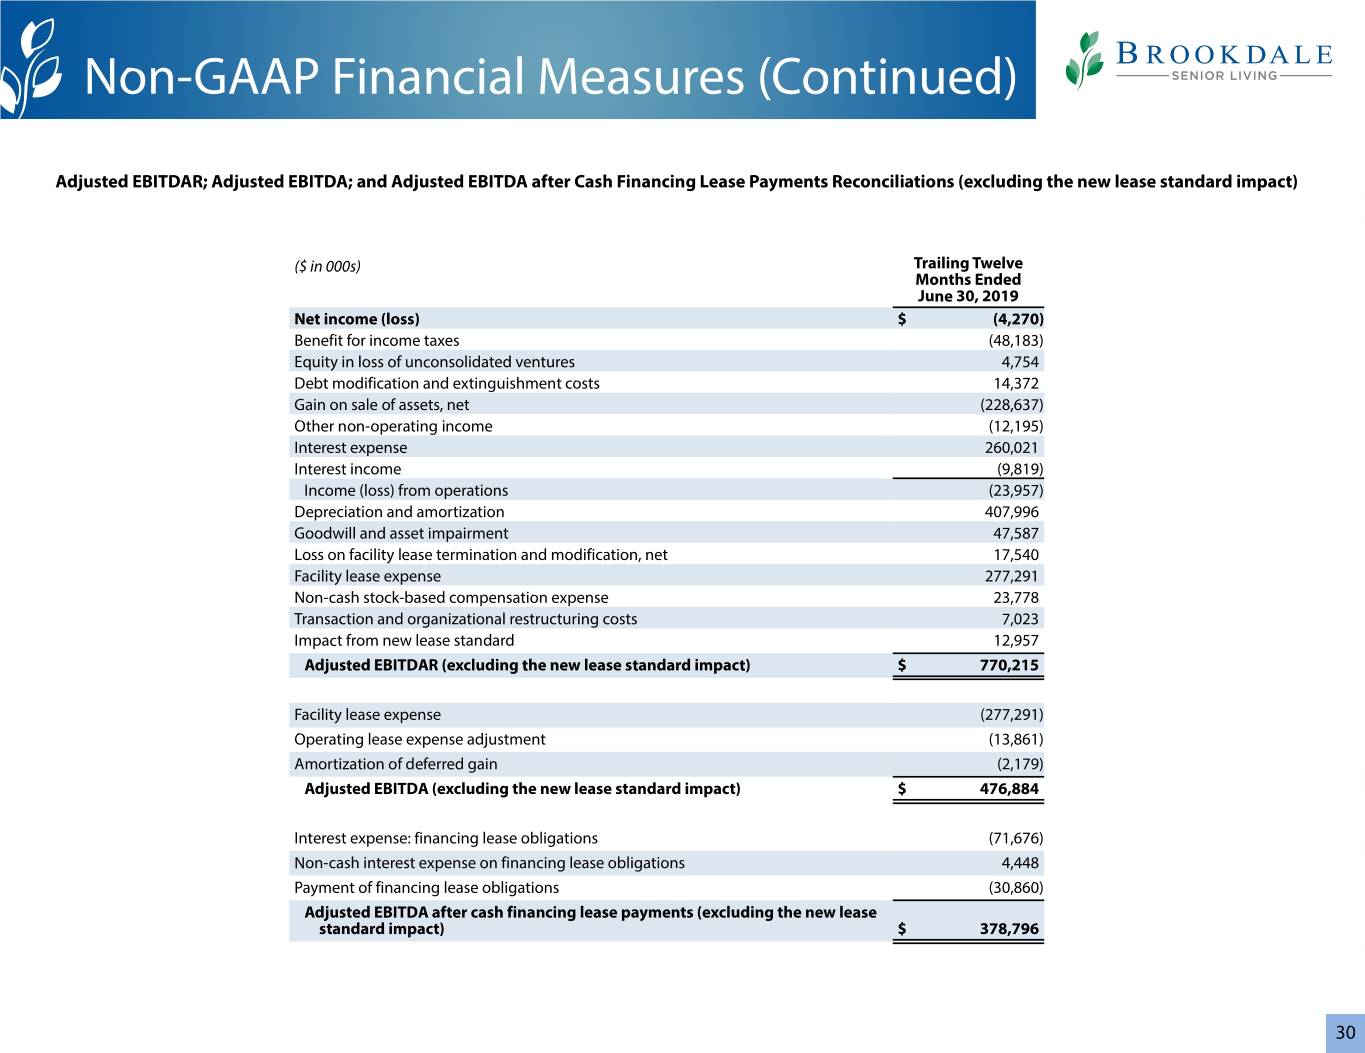
Non-GAAP Financial Measures (Continued) Adjusted EBITDAR; Adjusted EBITDA; and Adjusted EBITDA after Cash Financing Lease Payments Reconciliations (excluding the new lease standard impact) ($ in 000s) Trailing Twelve Months Ended June 30, 2019 Net income (loss) $ (4,270) Benefit for income taxes (48,183) Equity in loss of unconsolidated ventures 4,754 Debt modification and extinguishment costs 14,372 Gain on sale of assets, net (228,637) Other non-operating income (12,195) Interest expense 260,021 Interest income (9,819) Income (loss) from operations (23,957) Depreciation and amortization 407,996 Goodwill and asset impairment 47,587 Loss on facility lease termination and modification, net 17,540 Facility lease expense 277,291 Non-cash stock-based compensation expense 23,778 Transaction and organizational restructuring costs 7,023 Impact from new lease standard 12,957 Adjusted EBITDAR (excluding the new lease standard impact) $ 770,215 Facility lease expense (277,291) Operating lease expense adjustment (13,861) Amortization of deferred gain (2,179) Adjusted EBITDA (excluding the new lease standard impact) $ 476,884 Interest expense: financing lease obligations (71,676) Non-cash interest expense on financing lease obligations 4,448 Payment of financing lease obligations (30,860) Adjusted EBITDA after cash financing lease payments (excluding the new lease standard impact) $ 378,796 30

Non-GAAP Financial Measures (Continued) Net Debt and Adjusted Net Debt Reconciliations ($ in 000s) As of June 30, 2019 Long-term debt (including current portion) $ 3,572,572 Line of credit — Cash and cash equivalents (255,999) Marketable securities (58,805) Cash held as collateral against existing debt (613) Net Debt 3,257,155 Operating and financing lease obligations(1) 2,346,263 Adjusted Net Debt $ 5,603,418 Adjusted Net Debt to Adjusted EBITDAR 7.3x Net Debt to Adjusted EBITDA after cash financing lease payments 8.6x (1) Excludes operating lease obligations related to certain non-facility leases for which the related lease expense is included in Adjusted EBITDAR. 31
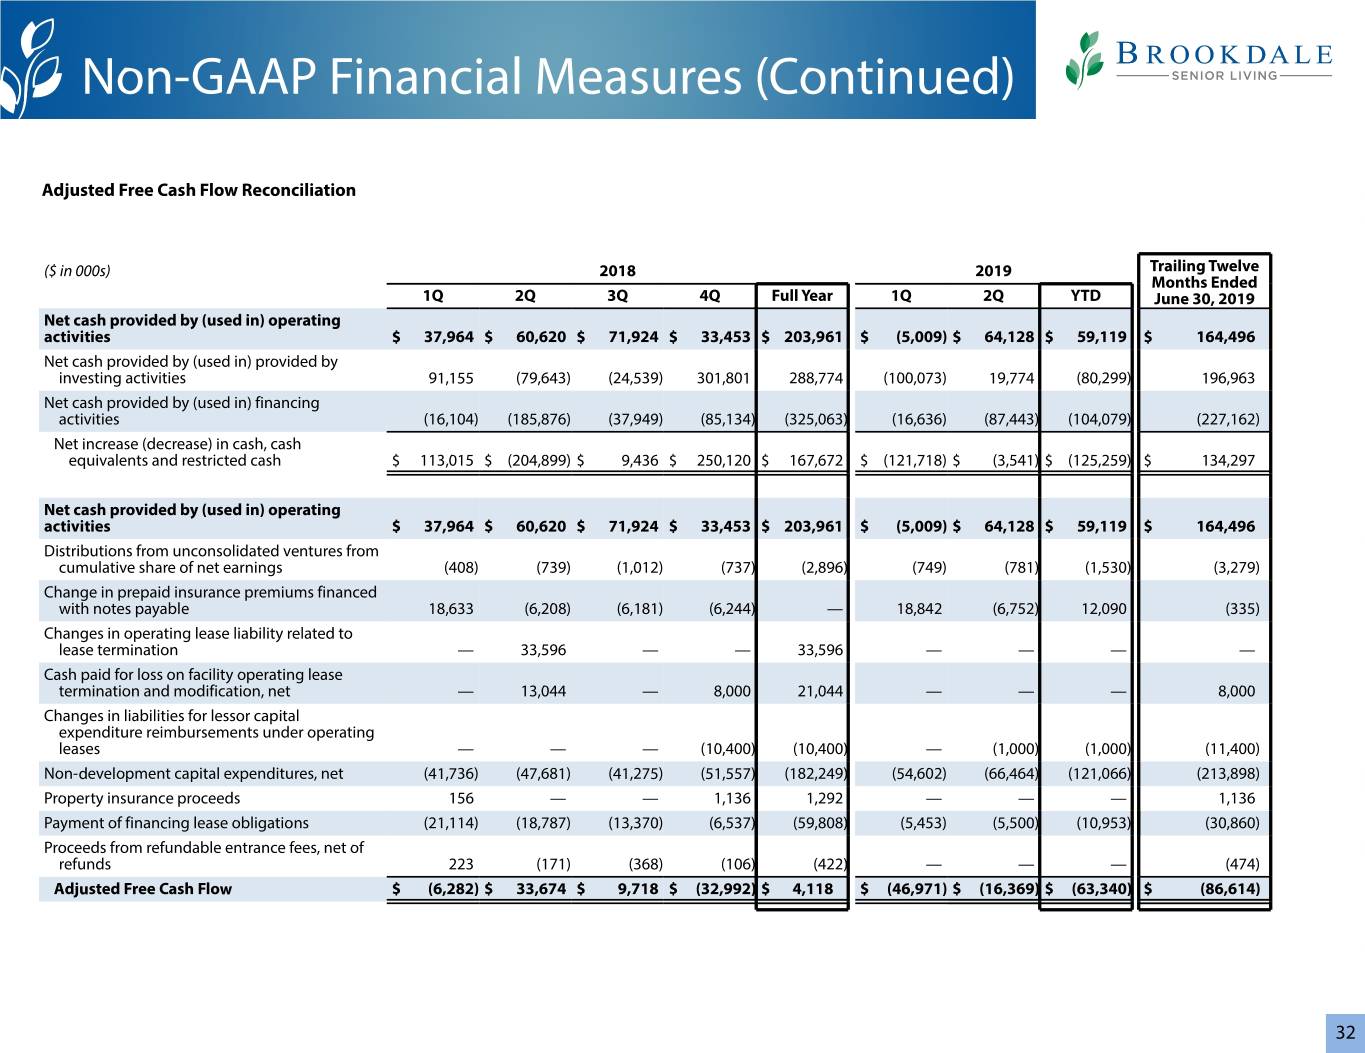
Non-GAAP Financial Measures (Continued) Adjusted Free Cash Flow Reconciliation ($ in 000s) 2018 2019 Trailing Twelve Months Ended 1Q 2Q 3Q 4Q Full Year 1Q 2Q YTD June 30, 2019 Net cash provided by (used in) operating activities $ 37,964 $ 60,620 $ 71,924 $ 33,453 $ 203,961 $ (5,009) $ 64,128 $ 59,119 $ 164,496 Net cash provided by (used in) provided by investing activities 91,155 (79,643) (24,539) 301,801 288,774 (100,073) 19,774 (80,299) 196,963 Net cash provided by (used in) financing activities (16,104) (185,876) (37,949) (85,134) (325,063) (16,636) (87,443) (104,079) (227,162) Net increase (decrease) in cash, cash equivalents and restricted cash $ 113,015 $ (204,899) $ 9,436 $ 250,120 $ 167,672 $ (121,718) $ (3,541) $ (125,259) $ 134,297 Net cash provided by (used in) operating activities $ 37,964 $ 60,620 $ 71,924 $ 33,453 $ 203,961 $ (5,009) $ 64,128 $ 59,119 $ 164,496 Distributions from unconsolidated ventures from cumulative share of net earnings (408) (739) (1,012) (737) (2,896) (749) (781) (1,530) (3,279) Change in prepaid insurance premiums financed with notes payable 18,633 (6,208) (6,181) (6,244) — 18,842 (6,752) 12,090 (335) Changes in operating lease liability related to lease termination — 33,596 — — 33,596 — — — — Cash paid for loss on facility operating lease termination and modification, net — 13,044 — 8,000 21,044 — — — 8,000 Changes in liabilities for lessor capital expenditure reimbursements under operating leases — — — (10,400) (10,400) — (1,000) (1,000) (11,400) Non-development capital expenditures, net (41,736) (47,681) (41,275) (51,557) (182,249) (54,602) (66,464) (121,066) (213,898) Property insurance proceeds 156 — — 1,136 1,292 — — — 1,136 Payment of financing lease obligations (21,114) (18,787) (13,370) (6,537) (59,808) (5,453) (5,500) (10,953) (30,860) Proceeds from refundable entrance fees, net of refunds 223 (171) (368) (106) (422) — — — (474) Adjusted Free Cash Flow $ (6,282) $ 33,674 $ 9,718 $ (32,992) $ 4,118 $ (46,971) $ (16,369) $ (63,340) $ (86,614) 32

Non-GAAP Financial Measures (Continued) Brookdale's Proportionate Share of Adjusted EBITDA of Unconsolidated Ventures For purposes of this presentation, amounts for each line item represent the aggregate amounts of such line items for all the Company's unconsolidated ventures. ($ in 000s) 2018 2019 Trailing Twelve Months Ended 1Q 2Q 3Q 4Q Full Year 1Q 2Q June 30, 2019 Net income (loss) $ (22,662) $ (13,417) $ (6,674) $ (3,810) $ (46,563) $ (1,050) $ (1,983) $ (13,517) Benefit for income taxes 234 209 64 6 513 24 23 117 Debt modification and extinguishment costs (17) 135 13 1 132 21 — 35 (Gain) loss on sale of assets, net (1,045) 3,885 — — 2,840 — (23) (23) Other non-operating income (903) (967) (5) — (1,875) — — (5) Interest expense 26,827 23,182 12,849 7,555 70,413 7,380 7,348 35,132 Interest income (757) (809) (830) (949) (3,345) (812) (865) (3,456) Income (loss) from operations 1,677 12,218 5,417 2,803 22,115 5,563 4,500 18,283 Depreciation and amortization 67,885 33,237 22,135 16,532 139,789 16,747 17,082 72,496 Asset impairment 155 118 63 1,445 1,781 295 7 1,810 Operating lease expense adjustment 4 4 — — 8 — — — Adjusted EBITDA of unconsolidated ventures $ 69,721 $ 45,577 $ 27,615 $ 20,780 $ 163,693 $ 22,605 $ 21,589 $ 92,589 Brookdale's Proportionate Share of Adjusted EBITDA of Unconsolidated Ventures $ 16,749 $ 14,111 $ 11,280 $ 10,419 $ 52,559 $ 11,319 $ 10,878 $ 43,896 33

Non-GAAP Financial Measures (Continued) Brookdale's Proportionate Share of Adjusted Free Cash Flow of Unconsolidated Ventures For purposes of this presentation, amounts for each line item represent the aggregate amounts of such line items for all the Company's unconsolidated ventures. ($ in 000s) 2018 2019 Trailing Twelve Months Ended 1Q 2Q 3Q 4Q Full Year 1Q 2Q June 30, 2019 Net cash provided by (used in) operating activities $ 50,262 $ 47,510 $ 24,497 $ 22,818 $ 145,087 $ 24,122 $ 31,259 $ 102,696 Net cash provided by (used in) investing activities (14,642) (15,746) (14,623) (15,478) (60,489) (8,011) (9,419) (47,531) Net cash provided by (used in) financing activities (23,279) (29,380) (9,702) (15,625) (77,986) (8,788) (16,449) (50,564) Net increase (decrease) in cash, cash equivalents and restricted cash $ 12,341 $ 2,384 $ 172 $ (8,285) $ 6,612 $ 7,323 $ 5,391 $ 4,601 Net cash provided by (used in) operating activities $ 50,262 $ 47,510 $ 24,497 $ 22,818 $ 145,087 $ 24,122 $ 31,259 $ 102,696 Non-development capital expenditures, net (20,061) (18,867) (14,822) (15,430) (69,180) (8,000) (9,681) (47,933) Property insurance proceeds 901 634 — — 1,535 — — — Proceeds from refundable entrance fees, net of refunds (6,712) (3,323) (2,500) (7,448) (19,983) (5,843) (7,790) (23,581) Adjusted Free Cash Flow of unconsolidated ventures $ 24,390 $ 25,954 $ 7,175 $ (60) $ 57,459 $ 10,279 $ 13,788 $ 31,182 Brookdale’s Proportionate Share of Adjusted Free Cash Flow of Unconsolidated Ventures $ 6,367 $ 9,019 $ 4,618 $ (183) $ 19,821 $ 5,384 $ 6,958 $ 16,777 34

Brookdale Senior Living Inc. 111 Westwood Place, Suite 400 Brentwood, TN 37027 (615) 221-2250 www.brookdale.com


