Exhibit 99.3
MANAGEMENT’S DISCUSSION AND ANALYSIS
FOR THE YEAR ENDED DECEMBER 31, 2010
TABLE OF CONTENTS
| INTRODUCTION | | | 1 | |
| | | | | |
| CORE BUSINESS | | | 1 | |
| | | | | |
| OUTLOOK AND OBJECTIVES | | | 2 | |
| | | | | |
| OPERATING MINES AND DEVELOPMENT PROJECTS | | | 3 | |
| | | | | |
| EXPLORATION | | | 8 | |
| | | | | |
| MINERAL RESOURCES AND RESERVES ESTIMATES | | | 9 | |
| | | | | |
| FINANCIAL REVIEW | | | 10 | |
| | | | | |
| FINANCIAL CONDITION, CASH FLOW, LIQUIDITY AND CAPITAL RESOURCES | | | 13 | |
| | | | | |
| INCOME TAXES | | | 17 | |
| | | | | |
| RELATED PARTY TRANSACTIONS | | | 17 | |
| | | | | |
| SUBSEQUENT EVENTS | | | 18 | |
| | | | | |
| CRITICAL ACCOUNTING ESTIMATES | | | 18 | |
| | | | | |
| CHANGES IN ACCOUNTING POLICIES INCLUDING INITIAL ADOPTION | | | 19 | |
| | | | | |
| INTERNATIONAL FINANCIAL REPORTING STANDARDS (“IFRS”) | | | 20 | |
| | | | | |
| NON-GAAP PERFORMANCE MEASURES | | | 23 | |
| | | | | |
| DISCLOSURE CONTROLS AND PROCEDURES AND INTERNAL CONTROL OVER FINANCIAL REPORTING | | | 27 | |
| | | | | |
| OUTSTANDING SHARE DATA | | | 27 | |
| | | | | |
| FORWARD-LOOKING STATEMENTS | | | 27 | |
| | | | | |
| CAUTIONARY NOTE TO U.S. INVESTORS | | | 28 | |
| | | | | |
| GLOSSARY OF MINING TERMS | | | 29 | |
MANAGEMENT’S DISCUSSION AND ANALYSIS OF OPERATING RESULTS AND FINANCIAL CONDITION FOR THE YEAR ENDED DECEMBER 31, 2010
All figures are in U.S. dollars unless otherwise indicated. Cautionary notes regarding forward-looking statements and estimates of inferred and measured and indicated resources to U.S. investors follows this Management’s Discussion and Analysis (“MD&A”).
INTRODUCTION
The following discussion and analysis of operating results and financial condition of Jaguar Mining Inc. (“Jaguar” or the “Company”) contained in this MD&A should be read in conjunction with the annual audited consolidated financial statements and the notes thereto of the Company for the years ended 2010 and 2009. The financial statements have been prepared in accordance with accounting principles generally accepted in Canada (“Canadian GAAP”) and the annual audited financial statements have been reconciled to U.S. generally accepted accounting principles (“U.S. GAAP”). The Company reports its financial statements in US dollars (“US$”), however a significant portion of the Company’s expenses are incurred in either Canadian dollars (“Cdn.$”) or Brazilian reais (“R$”).
The discussion and analysis contained in this MD&A are as of March 21, 2011.
CORE BUSINESS
Jaguar is an Ontario chartered gold producer engaged in the acquisition, exploration, development and operation of gold producing properties in Brazil. The Company controls 38,220 hectares in the Iron Quadrangle mining district of Brazil, a greenstone belt located near the city of Belo Horizonte in the state of Minas Gerais, which hosts the Company’s operating facilities. In addition, Jaguar holds mineral concessions totaling 166,513 hectares in the state of Maranhão, which hosts the Company’s Gurupi Project currently under development. The Company may consider the acquisition and subsequent exploration, development and operation of other gold properties, primarily focused in Brazil.
Jaguar was formed in 2002. In 2004, the Company constructed and began operations of a small open pit mine, the Sabará operation. Sabará provided cash flow to enable Jaguar to develop its first underground mining operation, Turmalina, where construction of a mill and processing facility was completed in 2006. In 2007, the Company completed the construction of its second underground mining operation and processing facility, Paciência. Between 2007 and today, Jaguar built four additional underground mines and completed construction of its third integrated processing facility, the Caeté Plant, which was commissioned in May 2010.
The Company is currently producing gold at its Turmalina, Paciência and Caeté operations, and recently completed the Gurupi Project feasibility study, which was filed on January 31, 2011.
Given the location of the senior management team headquartered in Belo Horizonte to the Company’s nearby operating assets, significant operating flexibility and oversight of the operations is achieved. Moreover, as the Company’s operations are in close proximity to one another, significant synergies amongst operations are realized.
The Company recently consolidated its corporate management, engineering, exploration, supply, logistics and maintenance teams into a central location in Belo Horizonte, which is expected to produce additional efficiencies and future cost savings.
As of December 31, 2010, the Company had 1,788 employees, 1,778 of which are based in Brazil. The remaining 10 employees are based in the Company’s corporate office in New Hampshire, USA.
Jaguar is listed on the Toronto Stock Exchange and on the New York Stock Exchange under the symbol “JAG”.
OUTLOOK AND OBJECTIVES
The Company intends to become a mid-size gold producer with sustainable production of approximately 400,000 ounces of gold per year by 2013.
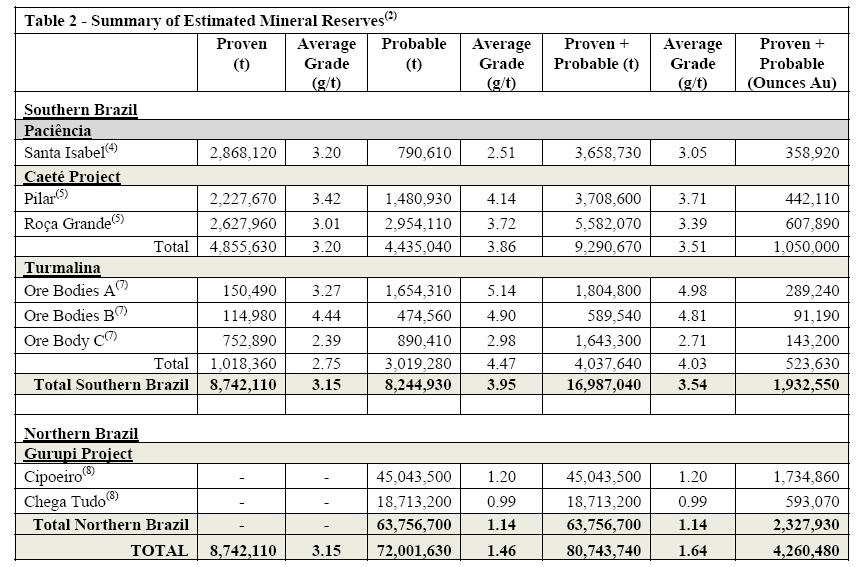
At its southern operations in Minas Gerais, Jaguar has an estimated 3,407,930 ounces of measured and indicated gold resources based on 26,931,890 tonnes with an average grade of 3.94 grams per tonne and 835,230 ounces of inferred gold resources based on 6,040,440 tonnes with an average grade of 4.30 grams per tonne. Estimated proven and probable reserves, which are included in the measured and indicated resources, total 1,932,550 ounces of gold based on 16,987,040 tonnes with an average grade of 3.54 grams per tonne.
At its Gurupi Project in northern Brazil, Jaguar has an estimated 2,518,170 ounces of indicated gold resources based on 69,887,500 tonnes with an average grade of 1.12 grams per tonne and 616,630 ounces of inferred gold resources based on 18,676,700 tonnes with an average grade of 1.03 grams per tonne. Estimated probable reserves, which are included in the indicated resources, total 2,327,930 ounces of gold based on 63,756,700 tonnes with an average grade of 1.14 grams per tonne.
In total, Jaguar has an estimated 5,926,100 ounces of measured and indicated gold resources based on 96,819,390 tonnes with an average grade of 1.90 grams per tonne and 1,451,860 ounces of inferred gold resources based on 24,717,140 tonnes with an average grade of 1.83 grams per tonne. Estimated proven and probable reserves, which are included in the measured and indicated resources, total 4,260,480 ounces of gold based on 80,743,740 tonnes with an average grade of 1.64 grams per tonne.
All of Jaguar’s primary ore bodies and development targets remain open at depth and along strike. The Company has confirmed the on-going delineation of additional gold resources, a result of planned forward mine development, as well as intensive surface and underground drilling programs to establish the foundations to achieve production targets. This belief is based on the Company’s development initiatives as of December 31, 2010, which includes nearly 65 km of underground development at its properties in Minas Gerais and management’s experience operating in the Iron Quadrangle, including the geological characteristics of other gold operations in the district.
Through its brownfield exploration programs, the Company continues to add gold resources to its mineral inventory, primarily at its operations in Minas Gerais. As an example, during underground exploration at the Turmalina underground mine, the Company discovered a new zone approximately 100 meters to the west of Ore Body A. Through additional drilling and analysis, these lower grade resources, in what is today Ore Body C, have been included in updated mineral resource calculations for the Turmalina operation. The effect of blending these lower grade resources into the Turmalina resource base, did not impact the in-situ grades in Ore Bodies A or B. Based on the evaluation of gold production to-date compared to the Company’s initial resource estimates (Ore Bodies A and B), the figures reconcile and long-term resource model grades remain intact.
The Company’s objective is to enhance shareholder value by building, operating and expanding cost-effective gold mines, by adding resources and reserves to its existing mineral inventory and by accretive transactions to support the Company’s production targets. The Company plans to achieve this objective by completing the development of its Gurupi Project and expanding overall production at its three underground operations. The Company continues to explore and develop its resources in Brazil. Management believes there is an opportunity to expand current operations beyond the present targets as additional mineralized zones in close proximity to its existing mines are discovered and evaluated.
Jaguar’s well-developed infrastructure, resource base, experienced personnel and rigorous health, safety and environmental programs favorably position the Company to achieve attractive growth at relatively lower risk compared to peers.
Based on cash on hand and assumptions concerning production costs, foreign exchange rates, forward gold prices and available borrowing capability, the Company believes internally-generated cash flow from operations will allow it to execute on its plans.
2011-2015 Estimated Production and Cash Operating Costs
The Company’s 2011-2015 gold production estimates are as follows:
| | |
| Year | Gold Production (ounces) |
| 2011 | 195,000 - 205,000 |
| 2012 | 240,000 - 255,000 |
| 2013 | 400,000 - 420,000 |
| 2014 | 435,000 - 460,000 |
| 2015 | 390,000 - 425,000 |
The significant increase in gold production in 2013 is due to the scheduled commissioning of the Gurupi Project, which is expected to begin producing in early-2013.
The Company’s 2011-2015 average cash operating costs estimates are as follows (based on $1.00 = R$1.70 exchange rate):
| | |
| Year | Cash Operating Cost ($) |
| 2011 | 660 - 700 |
| 2012 | 590 - 630 |
| 2013 | 550 - 590 |
| 2014 | 560 - 600 |
| 2015 | 570 - 610 |
OPERATING MINES AND DEVELOPMENT PROJECTS
Production and Operating Performance
The following tables set forth certain operating data for Turmalina, Paciência and Caeté for the three and twelve months ended December 31, 2010 and 2009.
| Quarter Ended December 31, 2010 Operating Data | |
| | | | | | | | | | | | | | | | | | | |
| | | Ore Processed (t 000) | | | Feed grade (g/t) | | | Plant Recovery rate | | | Production (ounces) | | | Cash Operating cost/t | | | Cash Operating cost/ounce | |
| Turmalina | | | 143 | | | | 2.89 | | | | 88 | % | | | 10,275 | | | $ | 66.70 | | | $ | 899 | |
| Paciência | | | 135 | | | | 3.57 | | | | 94 | % | | | 13,808 | | | | 61.80 | | | | 628 | |
| Caeté | | | 156 | | | | 2.84 | | | | 88 | % | | | 10,599 | | | | 63.40 | | | | 804 | |
| Total | | | 434 | | | | 3.09 | | | | 92 | % | | | 34,682 | | | $ | 64.00 | | | $ | 762 | |
| Year Ended December 31, 2010 Operating Data | |
| | | | | | | | | | | | | | | | | | | |
| | | Ore Processed (t 000) | | | Feed grade (g/t) | | | Plant Recovery rate | | | Production (ounces) | | | Cash Operating cost/t | | | Cash Operating cost/ounce | |
| Turmalina | | | 692 | | | | 3.20 | | | | 87 | % | | | 59,481 | | | $ | 64.50 | | | $ | 774 | |
| Paciência | | | 626 | | | | 3.32 | | | | 93 | % | | | 59,287 | | | | 60.90 | | | | 670 | |
| Caeté | | | 258 | | | | 2.85 | | | | 91 | % | | | 19,099 | | | | 63.10 | | | | 792 | |
| Total | | | 1,576 | | | | 3.19 | | | | 90 | % | | | 137,867 | | | $ | 62.80 | | | $ | 732 | |
| Quarter Ended December 31, 2009 Operating Data | |
| | | | | | | | | | | | | | | | | | | |
| | | Ore Processed (t 000) | | | Feed grade (g/t) | | | Plant Recovery rate | | | Production (ounces) | | | Cash Operating cost/t | | | Cash Operating cost/ounce | |
| Turmalina | | | 179 | | | | 3.93 | | | | 89 | % | | | 21,184 | | | $ | 63.00 | | | $ | 523 | |
| Paciência | | | 178 | | | | 3.41 | | | | 93 | % | | | 18,707 | | | | 59.30 | | | | 556 | |
| Caeté | | | - | | | | - | | | | - | | | | - | | | | - | | | | - | |
| Total | | | 357 | | | | 3.67 | | | | 91 | % | | | 39,891 | | | $ | 61.20 | | | $ | 539 | |
| Year Ended December 31, 2009 Operating Data | |
| | | | | | | | | | | | | | | | | | | |
| | | Ore Processed (t 000) | | | Feed grade (g/t) | | | Plant Recovery rate | | | Production (ounces) | | | Cash Operating cost/t | | | Cash Operating cost/ounce | |
| Turmalina | | | 588 | | | | 4.81 | | | | 89 | % | | | 82,071 | | | $ | 59.60 | | | $ | 424 | |
| Paciência | | | 646 | | | | 3.42 | | | | 93 | % | | | 66,671 | | | | 51.20 | | | | 502 | |
| Caeté | | | - | | | | - | | | | - | | | | - | | | | - | | | | - | |
| Total | | | 1,234 | | | | 4.14 | | | | 91 | % | | | 148,742 | | | $ | 55.50 | | | $ | 462 | |
During the three months ended December 31, 2010, the Company produced a total of 34,682 ounces of gold at Turmalina, Paciência and Caeté at an average cash operating cost of $762 per ounce compared to 39,891 ounces at an average cash operating cost of $539 per ounce for the same period last year (see Non-GAAP Performance Measures).
During the twelve months ended December 31, 2010, the Company produced a total of 137,867 ounces of gold at Turmalina, Paciência and Caeté at an average cash operating cost of $732 per ounce compared to 148,742 ounces at an average cash operating cost of $462 per ounce (exclusive of Sabará 2009 gold production of 6,360 ounces at an average cash operating costs of $680 per ounce) for the same period last year (see Non-GAAP Performance Measures).
The decrease in gold production for the three months and twelve months ended December 31, 2010 compared to the previous year largely stemmed from geo-mechanical problems at Turmalina and increased dilution, which is described below under Turmalina. Average cash operating costs were higher than those recorded in 2009 due to several factors: (i) lower gold production, (ii) significantly stronger R$ against the US$, (iii) geo-mechanical issues encountered in Ore Body A at the Turmalina operation, which elevated dilution and significantly reduced feed grades into the processing plant, and (iv) start-up issues at the Company’s new Caeté operation, where lower grade ore was utilized during the commissioning phase.
Jaguar sold 34,134 ounces of gold at an average realized price of $1,306 per ounce in the quarter ended December 31, 2010 compared to 35,944 ounces of gold at an average realized price of $1,099 per ounce in the quarter ended December 31, 2009. Gold sales generated a cash operating margin of $544 per ounce for the quarter ended December 31, 2010 compared to a cash operating margin of $560 per ounce in the quarter ended December 31, 2009.
During the twelve months ended December 31, 2010, the Company sold 140,530 ounces of gold at an average realized price of $1,215, compared to 143,698 ounces at an average realized price of $979 per ounce in 2009. This produced an average cash operating margin of $483 per ounce in 2010, a decrease of $28 per ounce or approximately 5% from the average cash operating margin of $511 per ounce in 2009.
Consolidated underground mine development totaled 4.9 kilometers for the three months ended December 31, 2010 and 18.8 kilometers for the twelve months ended December 31, 2010.
Turmalina
Prior to 2011, Turmalina was an underground mine utilizing the “sublevel stoping” mining method in Ore Body A and the “cut and fill” mining method at Ore Bodies B and C with paste fill at all stopes. As of early-2011, all ore bodies are being mined using cut-and-fill and ore produced at the Turmalina Mine is transported to the adjacent 1,800 tonnes per day (“tpd”) carbon-in-pulp (“CIP”) processing plant (the “Turmalina Plant”).
During the three months ended December 31, 2010, Turmalina produced 10,275 ounces of gold at an average cash operating cost of $899 per ounce compared to 21,184 ounces at an average cash operating cost of $523 per ounce during the three months ended December 31, 2009. Cash operating costs for the quarter ended December 31, 2010 were primarily impacted by lower-than-planned tonnage and lower run-of-mine (“ROM”) grades, which averaged 2.92 grams per tonne in the fourth quarter of 2010 compared to 2.91 grams per tonne in the previous quarter. Tonnage into the mill during the quarter ended December 31, 2010 was 142,765 tonnes, a 28% decrease from 199,608 tonnes in the previous quarter, primarily as a consequence of geo-mechanical problems that caused increased dilution and delayed mining of pillars, and diverted focus to forward development at the expense of ore production in Ore Body A.
For the twelve months ended December 31, 2010, Turmalina produced 59,481 ounces of gold compared to 82,071 ounces in 2009 at a cash operating cost of $774 per ounce compared to $424 per ounce in 2009.
At the beginning of the quarter ended December 31, 2010, the Company appointed a new general manager and a new mine superintendent at the Turmalina operation. The Company also elected to deploy additional personnel and equipment to prioritize forward development in Ore Body A. In order to ensure structural integrity and improve safety underground, the backfilling process of all previously mined openings by the selective stoping method in Ore Body A was completed during the quarter. The backfilling operation had delayed mining of the high-grade temporary support pillars that had been left in place in Ore Body A. These pillars will be selectively mined throughout 2011.
As part of its previously announced efforts to convert the mining method at Turmalina from selective stoping to cut-and-fill in Ore Body A, the Company accelerated forward underground development during the three months ended December 31, 2010. The mining team achieved 1.7 kilometers of new development during the quarter, which represents the highest quarterly rate in the history of the Turmalina operation and was over 25% higher than the rate of development achieved on a quarterly basis during the first half of 2010. In 2010, underground mine development at Turmalina totaled 5.9 kilometers. Management continues to believe that the conversion of mining methods should be essentially completed during the first quarter of 2011. Actual mining of the panels in Ore Body A has already demonstrated a significant improvement in dilution control, which is now averaging below 15% as compared to much higher rates during 2010 when the selective sublevel stoping method was used.
As of the date of this MD&A, Turmalina has 14 fully developed stopes and 31 workable faces across all three ore bodies, a 10% increase since the end of 2010. This represents 10 months of developed ore reserves. The Company’s goal is to have 18 months of developed ore reserves at the Turmalina Mine by year-end.
Paciência
Paciência’s mining complex is composed of three underground mines (Santa Isabel, Palmital and NW1) that utilize the “cut and fill” mining method and a treated tailings backfill system. Ore produced from these mines is transported to the adjacent 1,800 tpd CIP processing plant (the “Paciência Plant”).
During the three months ended December 31, 2010, Paciência produced 13,808 ounces of gold at an average cash operating cost of $628 per ounce compared to 18,707 ounces at an average cash operating cost of $556 per ounce during the three months ended December 31, 2009. During the previous quarter, the Company produced 16,526 ounces of gold at a cash operating cost of $695 per ounce. The primary reason for the decrease in Paciência’s gold output from the previous quarter is tied to the Company’s decision to cease ore shipments from the Pilar Mine to the Paciência Plant in the fourth quarter and instead divert its tonnage to the new Caeté Plant, which completed the commissioning phase. Cash operating costs for the quarter ended December 31, 2010 declined by $67 per ounce or an improvement of approximately 10% compared to the previous quarter.
The average feed grade into the Paciência Plant during the quarter was 3.57 grams per tonne, the highest of any quarter in 2010. Cash operating costs were the lowest recorded of any quarter during the year. The average ROM grade from the Santa Isabel Mine was 3.69 grams per tonne in the quarter ended December 31, 2010 compared to an average of 2.97 grams per tonne during the first nine months of 2010, an improvement of approximately 24%.
Combined underground development for the mines supplying the Paciência Plant totaled 1.5 kilometers during the quarter and nearly 7.0 kilometers in 2010. Efforts to bring the new Ouro Fino Mine into production in 2011 continued on plan with completion of the main access ramp.
The Company has taken delivery of a fleet of new, smaller mining equipment to access the narrower sections of high grade zones in order to improve selectivity in the Santa Isabel Mine. Additional units are expected to be received and integrated into mining operations during the first half of 2011. Management believes this fleet of new equipment, along with the existing development at Santa Isabel, and the added tonnage from Ouro Fino, should largely offset the shifting of the tonnage from Pilar in meeting Paciência’s forward production targets.
During the twelve months ended December 31, 2010, Paciência produced 59,287 ounces of gold at an average cash operating cost of $670 per ounce compared to 66,671 ounces at an average cash operating cost of $502 per ounce in 2009. The decline in production resulted from a slight decline in feed grades as well as the Company’s decision to re-direct ore from Pilar to the new Caeté processing plant during November 2010.
As of the date of this MD&A, there are 13 fully developed stopes and 16 workable faces in the Santa Isabel Mine, over 25% more than in-place at the end of 2010. This represents 10 months of developed ore reserves. The Company’s goal is to have 18 months of developed ore reserves at the Santa Isabel Mine by year- end.
Caeté
Caeté’s mining complex has two underground mines (Roça Grande and Pilar) that primarily utilize the “cut and fill” mining method as well as some “sublevel stoping”. Ore produced from these mines is transported to the 2,200 tpd capacity CIP processing plant (the “Caeté Plant”) adjacent to the Roça Grande Mine. The Company declared “commercial production” at the Caeté Plant during the third quarter of 2010.
During the three months ended December 31, 2010, Caeté completed its first full quarter of operations and produced 10,599 ounces of gold at an average cash operating cost of $804 per ounce. Operations at the Caeté Plant were temporarily suspended in October 2010 in order to replace the tailings discharge pump system, which had failed during commissioning. Tonnage into the mill during the quarter totaled 156,344 tonnes at an average feed grade of 2.84 grams per tonne. Feed grades into the Caeté Plant continued to be influenced by the large stockpile of low-grade development grade ore from the adjacent Roça Grande Mine.
During the twelve months ended December 31, 2010, Caeté produced 19,099 ounces of gold at an average cash operating cost of $792 per ounce.
Underground development at the Pilar and Roça Grande mines totaled 1.6 kilometers during the three months ended December 31, 2010 and 5.9 kilometers in 2010.
As of the date of this MD&A, the Pilar and Roça Grande mines had a total of 14 open stopes and 16 workable faces, five additional faces since the close of 2010. This represents over 18 months of developed ore reserves at the Roça Grande and Pilar mines.
Sabará
During the three months ended December 31, 2010, the Company continued to leave the Sabará operation idle. No ore was produced or shipped to the plant during the quarter. The Company continues to evaluate the strategic alternatives for this idled operation and will likely dispose of the assets during the next 12 months. During the three months ended December 31, 2010, the Company recorded a $0.3 million charge to further reduce the estimated fair value of the Sabará facility to zero.
Gurupi Project
During the three months ended December 31, 2010, the Company continued its work on the Gurupi Project feasibility study, which was completed and filed on January 31, 2011. The NI 43-101 compliant feasibility study was prepared for Jaguar by TechnoMine Services, LLC (“TechnoMine”) under the supervision of Ivan C. Machado, M.Sc., P.E., P.Eng., Principal of TechnoMine. Mr. Machado is a Qualified Person as defined in NI 43-101.
The feasibility study confirmed an estimated 69,887,500 tonnes of indicated mineral resources at an average grade of 1.12 grams per tonne totaling 2,518,170 ounces of gold and 18,676,700 tonnes of inferred mineral resources at an average grade of 1.03 grams per tonne totaling 616,630 ounces of gold. Probable gold reserves, which are included in the reported mineral resource estimate, are estimated at 63,756,700 tonnes at an average grade of 1.14 grams per tonne totaling 2,327,930 ounces. The average stripping ratio is estimated at 3.94.
The feasibility study includes a technical review of a well-tested process route that provides proven advantages over traditional semi-autogenous grinding and ball milling. Power consumption of the comminution stage of the process route was minimized by incorporating a secondary cone crusher and a high pressure grinding roll ("HPGR"), followed by energy-saving vertical mills as opposed to ball mills. In addition, power costs have been reduced to an average of $0.075/kWh, based on an option to utilize an approximate 40 kilometer, 230-kV transmission line to supply the Project’s main substation. The processing circuit incorporates intensive concentration, by flotation and continuous discharge gravity concentration plant which reduces ore feed into the mill wherein approximately 26% of processed ore flows into the leaching circuit, thus reducing environmental liabilities, operating expenses and capital expenditures.
A summary of the feasibility study economic results is as follows:
| Assumed average gold price: | $1,066 per ounce |
| Average mill feed grade: | 1.10 grams per tonne of gold |
| ROM total tonnage: | 63,756,700 tonnes |
| Estimated mining rate: | 5 million tonnes per year over the life-of-mine |
| Metallurgical recovery: | 85.6% |
| Total gold production: | 1,932,920 ounces |
| Annual average production: | 148,690 gold ounces |
| Mine life: | 13 years |
| Start production: | 2013 |
| Capital cost: | $278 million (pre-operational); $345.7 million (life-of-mine) |
| Average cash operating cost: | $445 per ounce of gold |
| Average total cash cost: | $676 per ounce of gold |
| Assumed exchange rate: | R$1.80 per $1.00 through 2012; R$1.90 per $1.00 2013 through 2030 |
| NPV @ 6%: | $337.0 million |
| After-tax IRR: | 29.1% |
| Cumulative Cash Flow: | $639.3 million after tax |
| Payback: | 3.1 years |
A sensitivity analysis is included in the feasibility study to measure the impact of key factors such as capital cost, operating expenses, gold price, exchange rate and metallurgical recovery on the NPV and IRR. For current gold prices in excess of $1,300 per ounce, the NPV @ 6% would be over $550 million with an after-tax IRR of approximately 42%.
The Company is continuing with the work necessary to receive the appropriate environmental licenses for the Gurupi Project. A public hearing in connection with the Previous License (“LP”) was held on March 16, 2011 and the outcome was positive. As a result of this meeting, Jaguar expects to receive the LP in mid-April 2011. After the LP is granted, Jaguar will start the process of obtaining the Installation License.
In April 2011, the Company intends to initiate a 30,000-meter drill program on targets in close proximity to the main ore bodies identified in the feasibility study. Based on existing drilling results from these nearby targets, management believes the mineral resource base for the Gurupi Project could significantly increase. Management estimates the cost of this additional program will total approximately $12 million, including infrastructure, development, drilling, metallurgical testing and technical analysis.
At the conclusion of this drilling program, and prior to the construction commitment, the Company will determine whether to proceed with the development as outlined in the recently completed feasibility study, or if warranted, to increase the scope and scale of the project. This decision could include a two-phase approach, which allows the project to proceed as planned and subsequently expand the processing circuit to accommodate additional ore from the nearby targets.
EXPLORATION
Turmalina
During the three months ended December 31, 2010, Jaguar continued to conduct underground exploration with a goal of increasing resources and reserves and expanding Turmalina’s annual production. The exploration effort was focused on Zone D and Faina and Pontal targets. The latter two targets contain higher-grade refractory ore. The Company drilled a total of 1,018 meters in 19 surface drill holes to evaluate these targets during the quarter. In addition, the Company drilled 557 meters in four underground drill holes into Ore Bodies A and B, where preliminary results confirmed the extension of the mineralization to a depth 400 meters from surface.
During twelve months ended December 31, 2010, exploration activities at the Turmalina mining complex consisted of geological detailing and in-fill drilling at the Faina, Pontal and Zone D targets. Jaguar also conducted surface and underground drilling at Ore Bodies A, B and C to assist with mining activities as well as to test the continuity of the ore bodies at depth. A total of 20,210 meters in 122 surface drill holes and 557 meters in four underground drill holes were completed in 2010 at these targets.
During the second quarter of 2011, Jaguar expects to report the results of these exploration campaigns and provide an updated NI 43-101 resource estimate for the Faina and Pontal targets.
Paciência
During the three months ended December 31, 2010, Jaguar focused its exploration program at the Paciência mining complex on the Ore Body NW1. The Company drilled a total of 997 meters in 29 underground drill holes in this target during the quarter.
During twelve months ended December 31, 2010, exploration activities at the Paciência mining complex were concentrated on Ore Body NW1 and the NW3 Target, which are located two kilometers and four kilometers from the Santa Isabel Mine, respectively. A total of 19,023 meters in 175 surface and underground drill holes were completed on these targets in 2010. These targets are located on the same shear zone and possess similar geological and mineralization characteristics.
During the second quarter of 2011, Jaguar expects to report the results of these exploration campaigns.
Caeté
During twelve months ended December 31, 2010, exploration activities at the Caeté mining complex were concentrated at the Roça Grande 3 and 6, Serra Paraíso, Água de Sapo and Boa Vista II targets. A total of 9,649 meters in 84 surface drill holes were completed at these targets in 2010. In December 2010, the Company started an underground drilling program to investigate the down plunge continuity of the mineralization between levels 4 and 10 at the Pilar Mine. As part of this program, Jaguar plans to complete 8,000 meters of drilling during 2011.
Pedra Branca
In March 2007, Jaguar entered into a joint venture agreement with Xstrata to explore the Pedra Branca Project in the State of Ceará in northeastern Brazil. The Pedra Branca Project has mineral concessions totaling 51,568 hectares located in and around municipal areas with good infrastructure.
Since 2007, Jaguar has been carrying out geological reconnaissance, trenching and soil geochemistry in the concession area, as well as conducting an exploration drill program to test the continuity of the mineralization at depth and laterally.
During twelve months ended December 31, 2010, Jaguar continued with an exploration program at the Pedra Branca Project, including extensive geological mapping, drainage and soil geochemistry, detailing of anomalous zones and trenching.
MINERAL RESOURCES AND RESERVES ESTIMATES
In March 2011, the Company completed an internal reconciliation of its mineral resources and reserves. Ivan C. Machado, M.Sc., P.E., P.Eng., audited the internal reconciliation. Mr. Machado is an independent Qualified Person as such term is defined in NI 43-101. The tables below set forth mineral resource and reserve estimates for the Turmalina, Paciência and Caeté operations as of December 31, 2010 and mineral resource and reserve estimates for the Gurupi Project as of January 31, 2011.
Notes
(1) Mineral resources listed include mineral reserves.
(2) Some columns and rows may not total due to rounding.
(3) TechnoMine NI 43-101 Technical Report on the Quadrilátero Gold Project dated December 20, 2004.
(4) TechnoMine NI 43-101 Technical Report on the Paciência Gold Project Feasibility Study dated August 7, 2007.
(5) TechnoMine NI 43-101 Technical Report on the Caeté Gold Project Amended Feasibility Study dated October 29, 2010.
(6) TechnoMine NI 43-101 Technical Report on the Turmalina Gold Project dated December 20, 2004.
(7) TechnoMine NI 43-101 Technical Report on the Turmalina Expansion Feasibility Study dated September 9, 2008.
(8) TechnoMine NI 43-101 Technical Report on the Gurupi Project Feasibility Study dated January 31, 2011.
Although Jaguar has carefully prepared and verified the mineral resource and reserve figures presented herein, such figures are estimates, which are, in part, based on forward-looking information, and no assurance can be given that the indicated level of gold will be produced. Estimated reserves may have to be recalculated based on actual production experience. Market price fluctuations of gold as well as increased production costs or reduced recovery rates, and other factors may render the present proven and probable reserves unprofitable to develop at a particular site or sites for periods of time. See “Risk Factors” and “Cautionary Note Regarding Forward-Looking Statements” in the Company’s 2010 Annual Information Form dated March 21, 2011 and available on SEDAR and EDGAR at www.sedar.com and www.sec.gov, respectively.
FINANCIAL REVIEW
During the three months ended December 31, 2010, the market price of gold (London PM Fix) traded in a range of $1,313 to $1,421, and averaged $1,367. This was approximately 24% higher than the average price for the three months ended December 31, 2009. Gold prices were highly volatile during the three months ended December 31, 2010. Gold prices have continued to be influenced by interest rates, uncertainty in the credit and financial markets, political unrest throughout northern Africa, investment and physical demand and inflation expectations. A 10% change in the average market price of gold during the three months ended December 31, 2010 would have changed the Company’s income after income taxes by approximately $2.9 million.
As previously stated, the Company reports its financial statements in US$, however a significant portion of the Company’s expenses are incurred in either Cdn.$ or R$. The average rates of exchange for the Cdn.$ per US$1.00 for the three months ended December 31, 2010 and the three months ended December 31, 2009 were 1.01 and 1.06 respectively. The average rates of exchange for the R$ per US$1.00 for the three months ended December 31, 2010 and the three months ended December 31, 2009 were 1.70 and 1.74 respectively. While the Company’s costs were negatively impacted during the quarter as a result of the strong R$ relative to the US$, the Company’s treasury management program resulted in a significant foreign exchange benefit to offset the increase in cash operating costs. A 10% change in the average R$ exchange rate during the three months ended December 31, 2010 would have changed operating income by approximately $5.4 million.
Summary of Quarterly Results
The following chart summarizes the Company’s quarterly results of operations for the previous eight quarters:
| | | | |
| | | Three Months Ended | |
| (unaudited) | | 31-Dec | | | 30-Sep | | | 30-Jun | | | 31-Mar | | | 31-Dec | | | 30-Sep | | | 30-Jun | | | 31-Mar | |
| ($ in 000s, except per share amounts) | | 2010 | | | 2010 | | | 2010 | | | 2010 | | | 2009 | | | 2009 | | | 2009 | | | 2009 | |
| Net sales | | $ | 44,554 | | | $ | 48,712 | | | $ | 36,853 | | | $ | 40,670 | | | $ | 39,497 | | | $ | 35,165 | | | $ | 32,786 | | | $ | 33,285 | |
| Net income (loss) | | | (9,474 | ) | | | (3,800 | ) | | | (5,913 | ) | | | (4,605 | ) | | | (29,381 | ) | | | 6,906 | | | | 9,724 | | | | 4,758 | |
| Basic and diluted income (loss) per share | | | (0.11 | ) | | | (0.05 | ) | | | (0.07 | ) | | | (0.05 | ) | | | (0.36 | ) | | | 0.09 | | | | 0.12 | | | | 0.07 | |
Net sales over the periods shown above generally trended higher due to an increase in ounces of gold sold and an increase in the average realized gold price. Net sales declined during the quarter ended December 31, 2010 due to lower production and higher operating costs. The decline in production was principally due to the need to change the mining method to lower dilution at Turmalina. Operating costs were higher due to a stronger R$ against the US$, as well as geo-mechanical issues encountered in Ore Body A at the Turmalina operation and the use of lower grade ore at the new Caeté operation during the commissioning phase.
Summary of Key Operating Results
| | | | | | | |
| | | Three Months Ended | | | Year Ended | |
| | | December 31 | | | December 31 | |
| | | 2010 | | | 2009 | | | 2010 | | | 2009 | |
| (unaudited) | | | | | | | | | | | | |
| ($ in 000s, except per share amounts) | | | | | | | | | | | | |
| Gold sales | | $ | 44,554 | | | $ | 39,497 | | | $ | 170,788 | | | $ | 140,734 | |
| Ounces sold | | | 34,134 | | | | 35,944 | | | | 140,530 | | | | 143,698 | |
| Average sales price $ / ounce | | | 1,306 | | | | 1,099 | | | | 1,215 | | | | 979 | |
| Gross profit | | | 2,777 | | | | 10,363 | | | | 12,420 | | | | 42,583 | |
| Net income (loss) | | | (9,474 | ) | | | (29,381 | ) | | | (23,792 | ) | | | (7,992 | ) |
| Basic income (loss) per share | | | (0.11 | ) | | | (0.36 | ) | | | (0.28 | ) | | | (0.10 | ) |
| Diluted income (loss) per share | | | (0.11 | ) | | | (0.36 | ) | | | (0.28 | ) | | | (0.10 | ) |
| Weighted avg. # of shares outstanding - basic | | | 84,259,191 | | | | 80,738,919 | | | | 84,152,914 | | | | 76,410,916 | |
| Weighted avg. # of shares outstanding - diluted | | | 84,259,191 | | | | 80,738,919 | | | | 84,152,914 | | | | 76,410,916 | |
Quarter and Year ended December 31, 2010 compared to December 31, 2009
Sales in the three months ended December 31, 2010 increased $5.1 million or 13% from the three months ended December 31, 2009, primarily due to an increase in the average realized gold price. The number of ounces of gold sold decreased 5% to 34,134 ounces in the three months ended December 31, 2010 compared to 35,944 ounces in the three months ended December 31, 2009. The average realized gold price increased to $1,306 per ounce from $1,099 per ounce in the same quarter last year.
Sales in the year ended December 31, 2010 increased $30.1 million or 21% from the year ended December 31, 2009, primarily due to an increase in the average realized gold price. The number of ounces of gold sold decreased 2% to 140,530 ounces in the year ended December 31, 2010 compared to 143,698 ounces in the year ended December 31, 2009. The average realized gold price increased to $1,206 per ounce from $979 per ounce in the year ended December 31, 2009.
Gross profit for the three months ended December 31, 2010 decreased to $2.8 million from $10.4 million for the three months ended December 31, 2009. For the year ended December 31, 2010 gross profit decreased to $12.4 million from $42.6 million for the year ended December 31, 2009 due primarily to significantly higher operating costs caused by higher than planned dilution. The Company recognized net losses of $9.5 million and $29.4 million for the three months ended December 31, 2010 and 2009 respectively. For the year ended December 31, 2010 the Company recognized a net loss of $23.8 million versus a net loss of $8.0 million for the year ended December 31, 2009.
Review of Certain Operating Expenses and Other Income and Expenses
| | | | | | | |
| | | Three Months Ended | | | Year Ended | |
| | | December 31 | | | December 31 | |
| | | 2010 | | | 2009 | | | 2010 | | | 2009 | |
| (unaudited) | | | | | | | | | | | | |
| ($ in 000s) | | | | | | | | | | | | |
| Stock based compensation | | $ | 1,108 | | | $ | 7,038 | | | $ | (1,571 | ) | | $ | 11,244 | |
| Administration | | | 6,351 | | | | 5,792 | | | | 20,600 | | | | 16,411 | |
| Forward derivative (gain) loss | | | (816 | ) | | | - | | | | 686 | | | | - | |
| Forward derivative loss | | | - | | | | - | | | | - | | | | - | |
| Forward fx derivative (gain) loss | | | (208 | ) | | | (707 | ) | | | (1,391 | ) | | | (2,642 | ) |
| Foreign exchange (gain) loss | | | (643 | ) | | | (1,235 | ) | | | (1,697 | ) | | | (17,307 | ) |
| Interest expense | | | 4,283 | | | | 22,459 | | | | 16,638 | | | | 28,847 | |
| Interest income | | | (718 | ) | | | (1,405 | ) | | | (3,870 | ) | | | (4,203 | ) |
Stock based compensation expense varies depending upon when stock options, deferred share units, restricted share units, and stock appreciation rights vest and Jaguar’s share price. The stock based compensation expense for the three months ended December 31, 2010 includes $42,000 for Deferred Share Units, $692,000 for Restricted Stock Units, $362,000 for Share Appreciation Rights and $12,000 for stock options.
Administrative costs increased from $5.8 million during the three months ended December 31, 2009 to $6.4 million during the three months ended December 31, 2010 and increased from $16.4 million during the year ended December 31, 2009 to $20.6 million for the year ended December 31, 2010. Administration costs include legal and accounting costs, costs to maintain offices and required personnel and costs associated with being a publicly-traded company. Given the Company’s development stage, administration costs are on-track with other South American gold producers on a unit of production basis and are viewed by management as appropriate to achieve the Company’s growth targets.
During July 2010, the Company entered into a limited gold collar program, which is a financial contract implemented to mitigate gold price risk in the event of an unforeseen significant global financial event during the commissioning phase of the Caeté operation. The Company purchased gold puts for 59,600 ounces with a strike price range of $1,050 to $1,117 per ounce. The put contracts expired out of the money with no resulting gain or loss. The Company sold calls for 60,000 ounces with a strike price range of $1,300 to $1,475 per ounce. During the year ended December 31, 2010, 37,500 ounces of the sold call contracts with a strike price of $1,300 per ounce were settled with the combined delivery of the Company’s inventory and the purchase of 6,129 ounces of gold at a net cost to the Company of $686,000. The Company recognized an unrealized gain of $816,000 for the three months ended December 31, 2010, and a realized loss of 686,000 for the year ended December 31, 2010. The remaining sold call contracts expired out of the money with no resulting gain or loss to the Company. These collar facilities were measured at fair value on a recurring basis using significant observable inputs (fair value hierarchy level 2). At December 31, 2010, no put or call gold option contracts were outstanding.
The Company recognized an unrealized loss of $509,000 for the three months ended December 31, 2010 versus an unrealized gain of $172,000 for the three months ended December 31, 2009 on forward foreign exchange contracts used to manage currency exposure on the R$. The Company also recognized a realized gain of $717,000 for the three months ended December 31, 2010 versus a realized gain of $535,000 for the three months ended December 31, 2009 on forward foreign exchange contracts. For the year ended December 31, 2010 the Company recognized an unrealized loss of $1.1 million and a realized gain of $2.5 million compared to an unrealized gain of $3.7 million and a realized loss of $1.1 million for the year ended December 31, 2009. (See Risk Management Policies - Hedging).
A foreign exchange gain of $643,000 was recognized during the three months ended December 31, 2010 (gain of $1.7 million for the year ended December 31, 2010) versus a gain of $1.2 million during the three months ended December 31, 2009 (gain of $17.3 million for the year ended December 31, 2009) primarily due to volatility of the R$ and Cdn.$. During the year ended December 31, 2010, foreign exchange gains were incurred primarily due to cash on hand held in Brazil and Canada and prepaid taxes recoverable from the Brazilian tax authorities. The foreign exchange gains were offset by foreign exchange losses on future tax liabilities and deferred compensation liabilities. The foreign exchange gains and losses are due to changes in the R$ and Cdn.$ versus the US$.
Interest expense decreased from $22.5 million during the three months ended December 31, 2009 to $4.3 million during the three months ended December 31, 2010. During September 2009, the Company issued $165 million of 4.5% unsecured convertible notes which bear interest at a rate of 4.5% per annum, payable semi-annually in arrears on May 1 and November 1 of each year, beginning on May 1, 2010, and maturing on November 1, 2014. During November 2009, the Company redeemed Cdn.$85,372,000 of the outstanding principal of the private placement notes at 105% of the principal amount, and the redemption price of the remaining Cdn.$878,000 of outstanding principal was 102% of the principal amount, plus accrued and unpaid interest. The interest expense for the three months ended December 31, 2009 includes a total of $18.5 million for the redemption of the private placement notes related to the amortization of the remaining discount ($9.2 million), write-down of the private placement call option ($4.0 million) and premium ($4.1 million) and interest ($1.2 million) (See Cash Flow Highlights)
Interest income decreased from $1.4 million during the three months ended December 31, 2009 (year ended December 31, 2009 - $4.2 million) to $718,000 during the three months ended December 31, 2010 (year ended December 31, 2010 - $3.9 million). Interest income was earned on deposits held in banks in Canada, the U.S. and Brazil.
FINANCIAL CONDITION, CASH FLOW, LIQUIDITY AND CAPITAL RESOURCES
Cash Flow Highlights
($ in 000s)
| | | | | | | |
| | | Three Months Ended | | | Year Ended | |
| | | December 31 | | | December 31 | |
| | | 2010 | | | 2009 | | | 2010 | | | 2009 | |
| Operating activities | | $ | 24 | | | $ | 1,189 | | | $ | 19,631 | | | $ | 31,923 | |
| Financing activities | | | 13,209 | | | | (74,957 | ) | | | 29,499 | | | | 151,620 | |
| Investing activities | | | (22,628 | ) | | | (26,944 | ) | | | (130,114 | ) | | | (85,500 | ) |
| Effect of foreign exchange on non-U.S. dollar denominated cash and cash equivalents | | | (559 | ) | | | (3,614 | ) | | | (1,049 | ) | | | 2,653 | |
| Increase (decrease) in cash for the period | | | (9,954 | ) | | | (104,326 | ) | | | (82,033 | ) | | | 100,696 | |
| Beginning cash balance | | | 49,177 | | | | 225,582 | | | | 121,256 | | | | 20,560 | |
Ending cash balance1 | | $ | 39,223 | | | $ | 121,256 | | | $ | 39,223 | | | $ | 121,256 | |
1Cash balance excludes $908,000 of restricted cash on December 31, 2010 and $108,000 at December 31, 2009.
At December 31, 2010 and December 31, 2009, the Company had cash and cash equivalents of $39.2 million and $121.3 million, respectively.
Cash flow from operating activities generated $24,000 of cash during the three months ended December 31, 2010 versus $1.2 million generated during the three months ended December 31, 2009. Cash flow from operating activities generated $19.6 million of cash during the year ended December 31, 2010 versus $31.9 million generated during the year ended December 31, 2009.
Cash flow from financing activities generated $13.2 million of cash during the three months ended December 31, 2010 and consumed $75.0 million during the three months ended December 31, 2009. During the year ended December 31, 2010, financing activities generated $29.5 million primarily as a result of proceeds from bank credit facilities and during the year ended December 31, 2009, financing activities generated $151.6 million primarily as a result of an equity financing in March 2009 that generated gross proceeds of Cdn.$ 86.3 million ($66.9 million) and the issuance of $165 million of 4.50% senior convertible notes in September 2009.
Investing activities consumed $22.6 million of cash during the three months ended December 31, 2010 ($130.1 million for the year ended December 31, 2010) versus $26.9 million for the three months ended December 31, 2009 ($85.5 million for the year ended December 31, 2009). The funds were primarily used for the build-out of the Caeté Project as well as underground development at other operations.
The effect of foreign exchange on non-US$ denominated cash and cash equivalents was a $559,000 loss during the three months ended December 31, 2010 ($1 million loss for the year ended December 31, 2010) compared to a $3.6 million loss for the three months ended December 31, 2009 ($2.7 million gain for the year ended December 31, 2009). This reflects the changes of the R$ and Cdn.$ versus the US$ during the respective periods.
Cash Requirements - 2010 Capital Spending Program
($ in 000s)
| | | | | | | | | | |
| | | Three Months Ended Dec 31, 2010 | | | Year Ended Dec 31, 2010 | | | Estimate for 2011 | |
| Turmalina | | $ | 4,463 | | | $ | 25,785 | | | $ | 17,299 | |
| Paciência | | | 6,893 | | | | 29,932 | | | | 27,266 | |
| Caeté | | | 10,157 | | | | 66,017 | | | | 26,485 | |
| Gurupi | | | 937 | | | | 4,481 | | | | 48,138 | |
Other Spending 1 | | | 178 | | | | 5,654 | | | | 450 | |
| Total capital spending | | $ | 22,628 | | | $ | 131,869 | | | $ | 119,638 | |
1 Includes construction of the central spare parts room, purchase of maintenance equipment, other improvements, replacements and operating management office facility spending. |
The Company believes that its cash held in accounts, cash flow generated by operations, debt, and other identified sources of capital is sufficient to finance its operations and expansions to execute on its plan.
Total Capital Spending during the Period
($ in 000s)
| | | | | | | |
| | | Three Months Ended Dec 31, 2010 | | | Year Ended Dec 31, 2010 | |
| Capital spending - excluding exploration | | $ | 17,463 | | | $ | 115,860 | |
| Capital spending - exploration | | | 5,165 | | | | 16,009 | |
| Total capital spending | | $ | 22,628 | | | $ | 131,869 | |
| | | | | | | | | |
| Amount paid in cash | | | 22,628 | | | | 131,364 | |
| Amount financed | | | - | | | | 505 | |
| Total capital spending | | $ | 22,628 | | | $ | 131,869 | |
The Company has identified the following primary uses of capital during 2011:
| | (a) | Gurupi exploration and pre-development; |
| | (b) | sustaining capital to maintain existing operations; and |
| | (c) | exploration at brownfield properties in the Iron Quadrangle. |
Contractual Obligations
The Company’s contractual obligations as at December 31, 2010 are summarized as follows ($ in 000s):
| | | | | | | | | | | | | | | | |
| Contractual Obligations | | Less than 1 year | | | 1 - 3 years | | | 3 - 5 years | | | More than 5 years | | | Total | |
| Notes payable | | | | | | | | | | | | | | | |
| Principal | | $ | 26,391 | | | $ | 13,622 | | | $ | 165,375 | | | $ | - | | | $ | 205,388 | |
| Interest | | | 9,355 | | | | 15,499 | | | | 7,462 | | | | - | | | | 32,316 | |
| Forward sales derivative liabilities | | | | | | | | | | | | | | | | | | | | |
| Operating lease agreements | | | 201 | | | | - | | | | - | | | | - | | | | 201 | |
Management agreements1 | | | | | | | | | | | | | | | | | | | | |
| Operations | | | 595 | | | | - | | | | - | | | | - | | | | 595 | |
| Suppliers agreements | | | | | | | | | | | | | | | | | | | | |
Mine operations2 | | | 541 | | | | - | | | | - | | | | - | | | | 541 | |
Drilling3 | | | 450 | | | | - | | | | - | | | | - | | | | 450 | |
Asset retirement obligations4 | | | 2,335 | | | | 1,506 | | | | 1,649 | | | | 30,970 | | | | 36,460 | |
| Total | | $ | 39,868 | | | $ | 30,627 | | | $ | 174,486 | | | $ | 30,970 | | | $ | 275,951 | |
1 The remaining term of the management agreement is one year. (See Note 16(a) to the Company’s annual financial statements for the years ended December 31, 2010 and 2009.) |
2 The Company has the right to cancel the mine operations contract with 60 days advance notice. The amount included in the contractual obligations table represents the amount due within 60 days. |
3 The Company has the right to cancel the drilling contract with 10 days to four months advance notice. The amount included in the contractual obligations table represents the amount due within this period. |
4 The asset retirement obligations are not adjusted for inflation and are not discounted.
Balance Sheet Highlights
($ in 000s)
| | | | | | | |
| | | December 31 | | | December 31 | |
| | | 2010 | | | 2009 | |
| Current assets | | $ | 95,409 | | | $ | 178,572 | |
| Long term assets | | | 483,867 | | | | 372,023 | |
| Total assets | | $ | 579,276 | | | $ | 550,595 | |
| | | | | | | | | |
| Current liabilities | | $ | 75,967 | | | $ | 44,409 | |
| Long term liabilities | | | 178,099 | | | | 160,290 | |
| Total liabilities | | $ | 254,066 | | | $ | 204,699 | |
Working capital decreased $114.7 million from $134.2 million at December 31, 2009 to $19.4 million at December 31, 2010. During September 2009, the Company sold 4.50% senior convertible notes due in 2014 for gross proceeds of $165 million. (See Financial Condition, Cash Flow, Liquidity and Capital Resources) The Company purchased its outstanding 10.5% Secured Notes due March 23, 2012 during November 2009. (See Cash Flow Highlights) During the three months ended December 31, 2010, the Company paid $22.6 million for capital expenditures. (See Total Capital Spending during the Period) The Company took deliberate steps to reign in non-essential spending to increase the cash position and fully expects an improvement in the operating cash flow in early 2011. During February 2011 the Company issued $103.5 million of 5.5% senior unsecured convertible notes. (See Subsequent Events)
Risk Management Policies - Hedging
Forward Foreign Exchange Contracts - Derivative Financial Instruments
The Company manages its exposure to changes in foreign exchange rates through the use of forward foreign exchange contracts to hedge certain future transactions denominated in foreign currencies. The Company hedges anticipated but not yet committed foreign currency transactions when they are probable and the significant characteristics and expected terms are identified.
As at December 31, 2010, the Company has forward foreign exchange contracts to purchase R$ at weighted average of R$1.7550 per $1.00 as follows:
| | | | | | | |
| Settlement Date | | Amount in thousands of US$ | | | Settlement amount in thousands of R$ | |
| 28-Jan-11 | | $ | 1,000 | | | R$ | 1,746 | |
| 25-Feb-11 | | | 1,000 | | | | 1,735 | |
| 25-Feb-11 | | | 1,000 | | | | 1,769 | |
| 30-Mar-11 | | | 1,000 | | | | 1,745 | |
| 30-Mar-11 | | | 1,000 | | | | 1,780 | |
| | | $ | 5,000 | | | R$ | 8,775 | |
The statement of operations includes the following amounts of unrealized and realized gains or losses on foreign exchange derivatives:
| | | | | | | |
| | | Three Months Ended | | | Year Ended | |
| | | December 31 | | | December 31 | |
| | | 2010 | | | 2009 | | | 2010 | | | 2009 | |
| Unrealized (gain) loss | | $ | 509 | | | $ | (172 | ) | | $ | 1,111 | | | $ | (3,701 | ) |
| Realized (gain) loss | | | (717 | ) | | | (535 | ) | | | (2,502 | ) | | | 1,059 | |
| Total | | $ | (208 | ) | | $ | (707 | ) | | $ | (1,391 | ) | | $ | (2,642 | ) |
The forward exchange contracts are considered derivative financial instruments and are used for risk management purposes and not for generating trading profits. The Company closely monitors exchange rates and, as deemed appropriate by management, will continue to enter into forward currency contracts with the aim of minimizing adverse changes in the R$ and US$ relationship.
The Company is exposed to credit-related losses in the event of non-performance by two major international financial institutions handling the derivative financial instruments, but does not expect these highly rated counterparties to fail to meet their obligations.
Hedge accounting is not applied to these derivative financial instruments. The unrealized gains and losses are recognized in the operating income of the Company and are primarily a result of the difference between the spot price of the R$ and the forward currency contract price as at the balance sheet date.
Off-Balance Sheet Arrangements
The Company does not have any off-balance sheet investment or debt arrangements.
INCOME TAXES
The Company recorded an income tax expense of $1.8 million for the year ended December 31, 2010 compared to an income tax expense of $8.8 million for the year ended December 31, 2009. The current income tax provision reflects a current income tax expense of $1.6 million and a future income tax expense of $172,000. This compares to a current income tax of $5.0 million and a future income tax expense of $3.8 million for the year ended December 31, 2009. The income tax expense reflects the current taxes incurred in Brazil. The Company has net operating losses (“NOLs”) which can be applied to future periods.
The consolidated balance sheet reflects a current tax liability of $16.7 million at December 31, 2010 and $15.6 million at December 31, 2009; and a future tax liability of $12.6 million at December 31, 2010 and $11.8 million at December 31, 2009.
The Company has approximately $48.8 million of tax losses available for carry forward in Canada and $54.5 million of tax losses available for carry forward in Brazil which can be carried forward indefinitely; however, only 30% of taxable income in one year can be applied against the loss carry-forward balance. Approximately $20.6 million of the Brazilian non-capital loss carry forwards has not been recognized in future tax assets.
RELATED PARTY TRANSACTIONS
The Company incurred fees of $1.1 million for the year ended December 31, 2010 (2009 - $1.6 million, 2008 - $719,000) from IMS Engenharia Mineral Ltda. ("IMSE"), a company held by two officers of the Company with which the Company entered into a service agreement to render senior management services. The fees are included in management fees in the statement of operations. The agreement will expire on December 31, 2011.
The Company incurred occupancy fees of $180,000 for the year ended December 31, 2010 (2009 - $180,000, 2008 - $180,000) to Brazilian Resources Inc. (“BZI”), a corporate shareholder, for use of administrative offices. As at December 31, 2010 prepaid expenses and sundry assets includes $70,000 from BZI relating to leasehold improvements paid by the Company (December 31, 2009 - $126,000).
In September 2010, the Company’s offices in Belo Horizonte moved to a new location. The Company recognized rental income of $29,000 from BZI for the use of administrative offices for the year ended December 31, 2010 (2009 - $nil, 2008 - $nil). As at December 31, 2010 prepaid expenses and sundry assets includes $29,000 from BZI relating to rental income (December 31, 2009 - $nil). The Company also incurred consulting fees and administrative service charges of $140,000 from BZI for the year ended December 31, 2010 (2009 - $603,000, 2008 - $344,000). The occupancy costs, consulting fees and administrative service fees are included in the statement of operations. As at December 31, 2010 accounts payable and accrued liabilities includes $nil due to BZI (December 31, 2009 - $58,000).
The Company recognized rental income of $nil from Prometálica Mineração Ltda. (“PML”) and $nil from Prometálica Centro Oeste Ltda. (“PCO”) for the years ended December 31, 2010 and December 31, 2009 (2008 - $9,000 from PML and $34,000 from PCO) for temporarily idle equipment and the use of administrative offices. PCO is controlled by IMS, a founding shareholder of the Company. As at December 31, 2010 prepaid expenses and sundry assets includes $nil from PML and $16,000 from PCO (December 31, 2009 - $nil from PML and $15,000 from PCO). During 2010 and 2009 the Company received $nil (2008 - $30,000) of royalty income relating to the NSR.
On August 11, 2008, PML filed a judicial restructuring in Belo Horizonte, state of Minas Gerais, Brazil. The primary shareholders of PML, BZI and IMS, provided a guarantee of PML’s obligation to Mineração Serras do Oeste Ltda (“MSOL”), a 100% owned subsidiary of the Company. This guarantee will ensure the recovery of the NSR due from PML if PML is unable to pay the Company. As at December 31, 2010 the amount of the obligation is approximately $1.0 million.
The Company’s subsidiaries MSOL and Mineração Turmalina Ltda. were required to pay an employment claim of a former employee who performed work for MSOL, then owned by BZI, and other BZI companies. BZI has guaranteed the amount owed to the Company of R$378,000 ($227,000). As at December 31, 2010, prepaid expenses and sundry assets include $227,000 receivable from BW Mineração Ltda., a wholly owned subsidiary of BZI (December 31, 2009 - $217,000).
The above related party transactions are in the normal course of operations and have been measured at the exchange amount agreed upon between the related parties.
SUBSEQUENT EVENTS
On February 9, 2011, the Company closed a $103.5 million offering of 5.5% senior unsecured convertible notes.
The Company received net proceeds of approximately $99.3 million. The notes bear interest at a rate of 5.5% per annum, payable semi-annually in arrears on March 31 and September 30 each year, beginning on September 30, 2011 and maturing on March 31, 2016. The notes will have an initial conversion rate of 132.4723 Jaguar common shares per $1,000 principal amount of converted notes, representing an initial conversion price of approximately US$7.55 per common share, which is approximately 137.5% of the closing price of Jaguar common shares on the New York Stock Exchange on February 3, 2011. The conversion rate is subject to certain anti-dilution adjustments and adjustments in connection with specified corporate events. The notes will be convertible any time prior to maturity. Upon conversion, the Company may, in lieu of delivering its common shares, elect to pay or deliver, as the case may be, cash or a combination of cash and common shares, in respect of the converted notes. Jaguar will be required to make an offer to repurchase the notes for cash upon the occurrence of certain fundamental changes.
CRITICAL ACCOUNTING ESTIMATES
The preparation of its consolidated financial statements requires the Company to use estimates and assumptions that affect the reported amounts of assets and liabilities as well as revenues and expenses. The Company’s accounting policies are described in Note 2 to its consolidated financial statements for the year ended December 31, 2010. The Company’s accounting policies relating to work-in-progress inventory valuation and amortization of property, plant and equipment, mineral exploration projects, and site reclamation and closure accruals are critical accounting estimates that are subject to assumptions regarding reserves, recoveries, future gold prices and future mining activities.
Gold in process and ore in stockpiles are stated at the lower of average production cost and net realizable value. Production costs include labor, benefits, material and other product costs. These costs are charged to earnings and are included in cost of sales. The assumptions used in the impairment assessment of gold in process inventories include estimates of gold contained in the ore stacked, assumptions of the amount of gold stacked that is expected to be recovered and an assumption of the gold price expected to be realized when the gold is recovered. If these estimates or assumptions prove to be inaccurate, the Company could be required to write-down the recorded value of its work-in-progress inventories, which would reduce the Company’s earnings and working capital.
In addition, GAAP requires the Company to consider, at the end of each accounting period, whether or not there has been an impairment of the capitalized mineral exploration projects, property, plant and equipment. For producing properties, this assessment is based on expected future cash flows to be generated from the location. For non-producing properties, this assessment is based on whether factors that may indicate the need for a write-down are present. If the Company determines there has been an impairment because its prior estimates of future cash flows have proven to be inaccurate, due to reductions in the price of gold, increases in the costs of production, reductions in the amount of reserves expected to be recovered or otherwise, or because the Company has determined that the deferred costs of non-producing properties may not be recovered based on current economics or permitting considerations, the Company would be required to write-down the recorded value of its mineral exploration projects, property, plant and equipment, which would reduce the Company’s earnings and net assets.
The Company’s mining and exploration activities are subject to various laws and regulations governing the protection of the environment. In general, these laws and regulations are continually changing and, over time, becoming more restrictive which impacts the cost of retiring assets at the end of their useful life. The Company recognizes management’s estimate of the fair value of liabilities for asset retirement obligations in the period in which they are incurred. A corresponding increase to the carrying amount of the related asset (where one is identifiable) is recorded and depreciated over the life of the asset. Where a related asset is not easily identifiable with a liability, the change in fair value over the course of the year is expensed. Over time, the liability will be increased each period to reflect the interest element (accretion) reflected in its initial measurement at fair value, and will also be adjusted for changes in the estimate of the amount, timing and cost of the work to be carried out. Additionally, future changes to environmental laws and regulations could increase the extent of reclamation and remediation work required to be performed by the Company.
The Company’s mining properties are depleted and depreciated on a unit-of-production basis, which bases its calculations on the expected amount of recoverable reserves. If these estimates of reserves prove to be inaccurate, or if the Company revises its mine plan due to reductions in the price of gold or unexpected production cost increases, and as a result the amount of reserves expected to be recovered are reduced, then the Company would be required to write-down the recorded value of its mining properties and to increase the amount of future depletion and amortization expense, both of which would reduce the Company’s earnings and net assets.
CHANGES IN ACCOUNTING POLICIES INCLUDING INITIAL ADOPTION
The Company’s audited financial statements for the year ended December 31, 2010 were prepared following accounting policies consistent with the Company’s audited and consolidated financial statements and notes thereto for the year ended December 31, 2010.
| | (a) | Accounting Principles Issued but not yet Implemented: |
| | (i) | Business combinations: |
In January 2009, the CICA issued Section 1582, “Business Combinations,” effective for fiscal years beginning on or after January 1, 2011. Earlier adoption of Section 1582 is permitted. This pronouncement further aligns Canadian GAAP with US GAAP and International Financial Reporting Standards (“IFRS”) and changes the accounting for business combinations in a number of areas. It establishes principles and requirements governing how an acquiring company recognizes and measures in its financial statements identifiable assets acquired, liabilities assumed, any non-controlling interest in the acquiree, and goodwill acquired. The section also establishes disclosure requirements that will enable users of the acquiring company’s financial statements to evaluate the nature and financial effects of its business combinations.
| | (ii) | Consolidated financial statements and non-controlling interests: |
In January 2009, the CICA issued Section 1601, “Consolidated Financial Statements,” and Section 1602, “Non-Controlling Interests,” effective for fiscal years beginning on or after January 1, 2011. Earlier adoption of these recommendations is permitted. These pronouncements further align Canadian GAAP with US GAAP and IFRS. Sections 1601 and 1602 change the accounting and reporting for ownership interests in subsidiaries held by parties other than the parent. Non-controlling interests are to be presented in the consolidated balance sheet within shareholders’ equity but separate from the parent’s equity. The amount of consolidated net income attributable to the parent and to the non-controlling interest is to be clearly identified and presented on the face of the consolidated statement of income. In addition, these pronouncements establish standards for a change in a parent’s ownership interest in a subsidiary and the valuation of retained non-controlling equity investments when a subsidiary is deconsolidated. They also establish reporting requirements for providing sufficient disclosures that clearly identify and distinguish between the interests of the parent and the interest of the non-controlling owners.
| | (iii) | Financial instruments - recognition and measurement: |
On July 1, 2009 the CICA amended Section 3855 with regard to determining when a prepayment option in a host debt instrument is closely related to the host instrument and the amendment is effective for fiscal years beginning on or after January 1, 2011. The amendment states that if the exercise price of a prepayment option compensates the lender for an amount equivalent to the present value of the lost interest for the remaining term of the host instrument, the feature is considered closely related to the host contract in which it is embedded.
INTERNATIONAL FINANCIAL REPORTING STANDARDS (“IFRS”)
On February 13, 2008, the CICA Accounting Standards Board (AcSB) confirmed that the changeover to IFRS from Canadian GAAP will be required for publicly accountable enterprises for interim and annual financial statements effective for fiscal years beginning on or after January 1, 2011, including comparatives for 2010. The objective is to improve financial reporting by having one single set of accounting standards that are comparable with other entities on an international basis.
The Company commenced its IFRS conversion project during 2008 and established a formal project governance structure to monitor the progress and critical decisions to IFRS. Regular reporting is provided by the project team to the Audit Committee of the Board of Directors.
The Company’s conversion plan is comprehensive and consists of four phases: preliminary study, evaluation, development, and implementation.
The preliminary study involved a high level review of the major differences between current Canadian GAAP and IFRS as related to the Company’s accounting policies.
The Evaluation and Development phases involve the development of a detailed project plan, the completion of site visits, the completion of analyses of the differences between the Company’s accounting policies and IFRS to provide a basis for accounting policy recommendations, the establishment of an IFRS Policy Committee, impact analysis of IT systems, development of a strategy for dual Canadian GAAP and IFRS reporting during 2010 and changeover to IFRS in 2011, the assessment of the impact of accounting and other business process changes on internal controls, the review of compensation plans, debt agreements and other contractual arrangements, and the delivery of detailed IFRS training to key finance and other personnel.
The Implementation phase involves the implementation of changes to our information systems and business processes as identified through the evaluation and development phases of the changeover plan. Significant implementation phase milestones include the development of IFRS compliant financial models, budgeting and reporting processes, the implementation of our 2010 dual reporting systems strategy, the amendment and testing of internal controls over financial reporting and disclosure controls and procedures impacted by accounting policy changes, the implementation of our internal and external communication plans, and the preparation of a January 1, 2010 opening balance sheet and 2010 comparative data under IFRS, with reconciliations to Canadian GAAP. The implementation phase will culminate in the preparation of our financial reporting under IFRS beginning in 2011.
The Company has identified the areas noted below as those expected to have the most significant impact on our financial statements. These areas do not represent a complete list of expected changes. As changes to Canadian GAAP and IFRS standards may occur prior to the changeover date, the differences and impacts described below may be subject to change.
The Company performed the evaluation and assessment of IFRS 1, “First-time Adoption of International Financial Reporting Standards” (“IFRS 1”) with the purpose of selecting optional exemptions allowed to the Company upon transition to IFRS. IFRS 1 generally requires that an entity apply all IFRS effective at the end of its first IFRS reporting period retrospectively, with specific mandatory exemptions and a limited number of optional exemptions. The Company expects to elect the following optional exemptions which may have significant impact on the Company’s results:
| | to apply IFRS 3 Business Combinations prospectively from January 1, 2010 (the “Transition Date”); |
| | to apply the borrowing cost exemption and apply IAS 23 Borrowing Costs prospectively from the Transition Date; |
| | other available exemptions continue to be evaluated including the exemption related to decommissioning liabilities (asset retirement obligations). |
Property, plant and equipment - Separate accounting for components of property, plant and equipment is applied more broadly under IFRS. Costs are allocated to significant parts of an asset if the useful lives differ, and each part is then separately depreciated.
Impairment of property, plant and equipment - Under Canadian GAAP, whenever the estimated future cash flows on an undiscounted basis of a property is less than the carrying amount of the property, an impairment loss is measured and recorded based on fair values. Under IFRS, IAS 36 Impairment of Assets (“IAS 36”) requires an impairment charge to be recognized if the recoverable amount, determined as the higher of the estimated fair value less costs to sell or value in use, is less than the carrying amount. The impairment charge under IFRS is equal to the amount by which the carrying amount exceeds the recoverable amount. The difference in testing and determining an impairment may result in more frequent charges, where carrying values of assets may have been supported under Canadian GAAP on an undiscounted cash flow basis, but cannot be supported on a discounted cash flow basis.
IAS 36 also requires the reversal of any impairment losses where circumstances requiring the impairment charge have been changed and reversed. Canadian GAAP does not permit the reversal of impairment losses in any circumstance.
Exploration and evaluation - IFRS 6, Exploration for and Evaluation of Mineral Resources, allows us to either develop a new policy for exploration and evaluation expenditures consistent with IFRS requirements or continue to follow the Company’s existing policy.
Decommissioning liabilities (asset retirement obligations) - Under IFRS, a liability must be recognized at a time when the entity becomes legally or constructively obliged to rehabilitate a disturbance resulting from mining activities, while under Canadian GAAP, a liability is only recognized when the entity is legally bound. Discount rates used should reflect the risks specific to the decommissioning provision. Unlike IFRS, under Canadian GAAP discount rates for asset retirement obligations are based on the entity’s credit-adjusted risk-free rate. IFRS requires re-measurement of the liability at each reporting date whereas Canadian GAAP requires re-measurement of the liability in the event of changes in the amount or timing of cash flows required to settle the obligation. Over and above this, IAS 37, Provisions, Contingent Liabilities and Contingent Assets, requires the re-measurement of the provision for reclamation and rehabilitation if there is a change in the current market-based discount rate. However, under Canadian GAAP HB 3110 Asset Retirement Obligations, the provision for reclamation and rehabilitation is not adjusted for changes in the discount rate.
Share-based payments - In certain circumstances, IFRS requires a different measurement of stock-based compensation related to cash-settled share-based compensation than current Canadian GAAP. While there is a convergence in that share-based payments are recognized as an expense, there are a number of measurement differences. IFRS requires that cash-settled share-based payments be accounted for using a fair value method, as opposed to an intrinsic value under Canadian GAAP.
IFRS 2, Share Based Payments is applied for applicable liabilities arising from cash-settled share-based payment transactions that existed at January 1, 2010. Under Canadian GAAP, the liability for cash-settled share-based payments is accrued based upon the intrinsic value (mark-to-market) of the award. However under IFRS the liability for cash-settled share-based awards is measured at fair value of the vested awards using the Black-Scholes valuation model. Changes in fair value are recognized in the period of change until the liability is settled.
Financial instruments - Under IFRS, IAS 39, Financial Instruments: Recognition and Measurement, the conversion option component of the convertible notes is treated as a derivative liability carried at fair value with changes in fair value recorded in the statement of operations and comprehensive loss. The remaining portion of the net proceeds is allocated to the notes payable component of the convertible note issuance and is measured at amortized cost using the effective interest rate method.
Under Canadian GAAP, the notes payable component of the convertible note issuance was measured at fair value and the remaining portion of the net proceeds was allocated to contributed surplus.
Income taxes - IAS 12, Taxes contains different guidance to the recognition and measurement of future income taxes. It requires the recognition of future taxes in situations not required under Canadian GAAP. Specifically, a future tax liability (asset) is recognized for exchange gains and losses relating to foreign non-monetary assets and liabilities that are re-measured into the functional currency using historical exchange rates.
Canadian GAAP requires that the current and long-term portions of future income tax assets, and future income tax liabilities, be shown separately on the financial statements, whereas IFRS does not.
Preliminary Unaudited Impact of Adopting IFRS
Standards under IFRS are based on a conceptual framework similar to Canadian GAAP; however, significant differences exist in certain matters of recognition, measurement and disclosure. The adoption of IFRS will have an impact on the consolidated balance sheet and statement of income. The Company’s opening balance sheet will reflect the fair value for decommissioning liabilities (asset retirement obligation), measurement and classification of the notes payable components and the adjusted liability resulting from cash-settled share-based compensation. All of the changes to the opening balance sheet will require that a corresponding tax asset or liability be established based on the resultant differences between the carrying value of assets and liabilities and their associated tax bases. Certain income statement items such as amortization expense, accretion and share-based compensation expense are also expected to be impacted.
The Company’s estimate of the preliminary unaudited impact of the conversion to IFRS on the opening balance sheet at January 1, 2010 will decrease opening retained earnings by approximately $29.8 million. The following summarizes the preliminary quantitative impact of differences between Canadian GAAP and IFRS in the Company’s more significant accounting policies and from its transition elections from Canadian GAAP to IFRS as of January 1, 2010.
| Unaudited | | Summary of Opening Balance Sheet Impact | |
| | | Assets | | | Liabilities | | | Contributed Surplus | | | Opening R/E | |
| | | Dr (Cr) | | | Dr (Cr) | | | Dr (Cr) | | | Dr (Cr) | |
| Provision for reclamation | | $ | (1,758 | ) | | $ | 2,323 | | | $ | - | | | $ | (565 | ) |
| Share-based compensation | | | - | | | | (260 | ) | | | - | | | | 260 | |
| Notes payable | | | - | | | | (74,055 | ) | | | 40,861 | | | | 33,194 | |
| Income taxes | | | (8,330 | ) | | | 11,371 | | | | - | | | | (3,041 | ) |
| | | $ | (10,088 | ) | | $ | (60,621 | ) | | $ | 40,861 | | | $ | 29,848 | |
The Company continues to monitor standards development as issued by the International Accounting Standards Board and the AcSB, as well as regulatory developments as issued by the Canadian Securities Administrators, which may affect the timing, nature or disclosure of the Company’s adoption of IFRS.
Information Systems - In order to facilitate the compilation of financial information required for IFRS reporting and disclosures, management has made appropriate modifications to its consolidation system and processes. Those changes, which have been implemented, generally required minor changes to reports or data analysis to ensure that additional information required for disclosures under IFRS which were not currently collected under Canadian GAAP were appropriately tracked for IFRS purposes.
Financial Disclosures - Annual IFRS-compliant financial statement notes disclosures were drafted and reviewed with the Company’s audit committee during the fourth quarter of 2010. The Company does not anticipate a significant increase in disclosure resulting from the adoption of IFRS and is continuing to assess the level of disclosure required as well as any further systems changes that may be necessary to gather and process the information.
Training - Training of IFRS requirements with all management levels concerned continued during 2010 including training of Directors and other concerned parties. Management training will continue during 2011. IFRS training program requirements for other stakeholders of the Company are being assessed.
NON-GAAP PERFORMANCE MEASURES
The Company has included the non-GAAP performance measures Cash Operating Cost per tonne processed, Cash Operating Cost per ounce processed and Cash Operating Margin per ounce of gold in this document. These non-GAAP performance measures do not have any standardized meaning prescribed by GAAP and, therefore, may not be comparable to similar measures presented by other companies. The Company believes that, in addition to conventional measures prepared in accordance with GAAP, certain investors use this information to evaluate the Company’s performance. Accordingly, they are intended to provide additional information and should not be considered in isolation or as a substitute for measures of performance prepared in accordance with GAAP. More specifically, management believes that these figures are a useful indicator to investors and management of a mine’s performance as they provide: (1) a measure of the mine’s cash margin per tonne/ounce, by comparison of the cash operating costs per tonne/ounce to the price of gold, (2) the trend in costs as the mine matures and, (3) an internal benchmark of performance to allow for comparison against other mines. The definitions for these performance measures and reconciliation of the non-GAAP measures to reported GAAP measures are as follows:
| | | | | | | |
| Cash Operating Margin per oz of gold | | Three Months | | | Year | |
| | | Ended | | | Ended | |
| | | December 31, | | | December 31, | |
| | | 2010 | | | 2010 | |
| Average sales price per oz of gold | | $ | 1,306 | | | $ | 1,215 | |
less | | | | | | | | |
| Cash operating cost per oz of gold produced | | | 762 | | | | 732 | |
equals | | | | | | | | |
| Cash operating margin per oz of gold | | $ | 544 | | | $ | 483 | |
[The remainder of this page has been left intentionally blank]
| | | | | | | |
| Summary of Cash Operating Cost per tonne processed | | Three Months | | | Year | |
| | | Ended | | | Ended | |
| | | December 31, | | | December 31, | |
| | | 2010 | | | 2010 | |
Production costs per statement of operations1 | | $ | 25,485,000 | | | $ | 101,289,000 | |
Change in inventory 2 | | | 1,715,000 | | | | (2,881,000 | ) |
Operational cost of gold produced 3 | | | 27,200,000 | | | | 98,408,000 | |
divided by | | | | | | | | |
| Tonnes processed | | | 425,000 | | | | 1,567,000 | |
equals | | | | | | | | |
| Cost per tonne processed | | $ | 64.00 | | | $ | 62.80 | |
| | | | | | | |
| Turmalina Cash Operating Cost per tonne processed | | Three Months | | | Year | |
| | | Ended | | | Ended | |
| | | December 31, | | | December 31, | |
| | | 2010 | | | 2010 | |
| Production costs | | $ | 9,236,000 | | | $ | 47,526,000 | |
Change in inventory 2 | | | 301,000 | | | | (2,917,000 | ) |
Operational cost of gold produced 3 | | | 9,537,000 | | | | 44,609,000 | |
divided by | | | | �� | | | | |
| Tonnes processed | | | 143,000 | | | | 692,000 | |
equals | | | | | | | | |
| Cost per tonne processed | | $ | 66.70 | | | $ | 64.50 | |
| | | | | | | |
| Paciência Cash Operating Cost per tonne processed | | Three Months | | | Year | |
| | | Ended | | | Ended | |
| | | December 31, | | | December 31, | |
| | | 2010 | | | 2010 | |
| Production costs | | $ | 8,239,000 | | | $ | 40,349,000 | |
Change in inventory 2 | | | 104,000 | | | | (2,251,000 | ) |
Operational cost of gold produced 3 | | | 8,343,000 | | | | 38,098,000 | |
divided by | | | | | | | | |
| Tonnes processed | | | 135,000 | | | | 626,000 | |
equals | | | | | | | | |
| Cost per tonne processed | | $ | 61.80 | | | $ | 60.90 | |
| | | | | | | |
| Caeté Cash Operating Cost per tonne processed | | Three Months | | | Year | |
| | | Ended | | | Ended | |
| | | December 31, | | | December 31, | |
| | | 2010 | | | 2010 | |
| Production costs | | $ | 8,010,000 | | | $ | 13,414,000 | |
Change in inventory 2 | | | 1,310,000 | | | | 2,287,000 | |
Operational cost of gold produced 3 | | | 9,320,000 | | | | 15,701,000 | |
divided by | | | | | | | | |
| Tonnes processed | | | 147,000 | | | | 249,000 | |
equals | | | | | | | | |
| Cost per tonne processed | | $ | 63.40 | | | $ | 63.10 | |
| | | | | | | |
| Summary of Cash Operating Cost per oz of gold produced | | Three Months | | | Year | |
| | | Ended | | | Ended | |
| | | December 31, | | | December 31, | |
| | | 2010 | | | 2010 | |
Production costs per statement of operations1 | | $ | 25,485,000 | | | $ | 101,289,000 | |
Change in inventory 2 | | | 943,000 | | | | (370,000 | ) |
Operational cost of gold produced 3 | | | 26,428,000 | | | | 100,919,000 | |
divided by | | | | | | | | |
| Gold produced (oz) | | | 34,682 | | | | 137,867 | |
equals | | | | | | | | |
| Cost per oz of gold produced | | $ | 762 | | | $ | 732 | |
| | | | | | | |
| Turmalina Plant Cash Operating Cost per oz produced | | Three Months | | | Year | |
| | | Ended | | | Ended | |
| | | December 31, | | | December 31, | |
| | | 2010 | | | 2010 | |
| Production costs | | $ | 9,236,000 | | | $ | 47,526,000 | |
Change in inventory 2 | | | 1,000 | | | | (1,473,000 | ) |
Operational cost of gold produced 3 | | | 9,237,000 | | | | 46,053,000 | |
divided by | | | | | | | | |
| Gold produced (oz) | | | 10,275 | | | | 59,481 | |
equals | | | | | | | | |
| Cost per oz of gold produced | | $ | 899 | | | $ | 774 | |
| | | | | | | |
| Paciência Plant Cash Operating Cost per oz produced | | Three Months | | | Year | |
| | | Ended | | | Ended | |
| | | December 31, | | | December 31, | |
| | | 2010 | | | 2010 | |
| Production costs | | $ | 8,239,000 | | | $ | 40,349,000 | |
Change in inventory 2 | | | 430,000 | | | | (617,000 | ) |
Operational cost of gold produced 3 | | | 8,669,000 | | | | 39,732,000 | |
divided by | | | | | | | | |
| Gold produced (oz) | | | 13,808 | | | | 59,287 | |
equals | | | | | | | | |
| Cost per oz of gold produced | | $ | 628 | | | $ | 670 | |
| | | | | | | |
| Caeté Cash Operating Cost per oz produced | | Three Months | | | Year | |
| | | Ended | | | Ended | |
| | | December 31, | | | December 31, | |
| | | 2010 | | | 2010 | |
| Production costs | | $ | 8,010,000 | | | $ | 13,414,000 | |
Change in inventory 2 | | | 512,000 | | | | 1,720,000 | |
Operational cost of gold produced 3 | | | 8,522,000 | | | | 15,134,000 | |
divided by | | | | | | | | |
| Gold produced (oz) | | | 10,599 | | | | 19,099 | |
equals | | | | | | | | |
| Cost per oz of gold produced | | $ | 804 | | | $ | 792 | |
1 Production costs do not include cost of goods sold adjustment of approximately $4.0 million, royalties of $1.2 million and CFEM tax of $458,000 for the three months ended December 31, 2010; and cost of goods sold adjustment of approximately $11.0 million, royalties of $5.1 million and CFEM tax of $ 1.7 million for the year ended December 31, 2010. The cost of goods sold adjustment includes idle capacity costs of $3.4 million for the three months ended December 31, 2010 and $8.4 million for the year ended December 31, 2010. |
2 Under the Company’s revenue recognition policy, revenue is recognized when legal title passes. Since total cash operating costs are calculated on a production basis, this change reflects the portion of gold production for which revenue has not been recognized in the period. |
3 The basis for calculating cost per ounce produced includes the change to gold in process inventory, whereas the cost per tonne processed does not. |
DISCLOSURE CONTROLS AND PROCEDURES AND INTERNAL CONTROL OVER FINANCIAL REPORTING
Management of the Company is responsible for establishing and maintaining a system of disclosure control and procedures to provide reasonable assurance that all material information relating to the Company is gathered and reported to senior management on a timely basis so that appropriate decisions can be made regarding public disclosure.
Management is also responsible for establishing and maintaining adequate internal controls over financial reporting to provide reasonable assurance regarding the reliability of financial reporting and the preparation of financial statements for external purposes in accordance with GAAP.
As of December 31, 2010, the Company evaluated its disclosure controls and procedures and internal control over financial reporting. Based on that evaluation, the President and Chief Executive Officer and the Chief Financial Officer have concluded that the design and operation of these disclosure controls and procedures over financial reporting were effective. There have not been any significant changes in internal controls for 2010.
OUTSTANDING SHARE DATA
The Company’s common shares are listed on the Toronto Stock Exchange and the New York Stock Exchange.
At March 21, 2011, the Company has 84,373,648 issued and outstanding common shares, as well as 3,777,500 stock options outstanding.
FORWARD-LOOKING STATEMENTS
Certain statements in this MD&A constitute “Forward-Looking Statements” within the meaning of the U.S. Private Securities Litigation Reform Act of 1995 and Canadian securities legislation. These Forward-Looking Statements include, among others, statements concerning the Company’s future objectives, measured and indicated resources and proven and probable reserves, their average grade, the commencement period of production, cash operating costs per ounce and completion dates of feasibility studies, gold production and sales targets, capital expenditure costs, future profitability and growth in reserves. Forward-Looking Statements can be identified by the use of words, such as “are expected”, “is forecast”, “is targeted”, “approximately” or variations of such words and phrases or statements that certain actions, events or results “may”, “could”, “would”, “might”, or “will” be taken, occur or be achieved. Forward-Looking Statements involve known and unknown risks, uncertainties and other factors, which may cause the actual results, or performance to be materially different from any future results or performance expressed or implied by the Forward-Looking Statements.
These factors include the inherent risks involved in the exploration and development of mineral properties, the uncertainties involved in interpreting drilling results and other geological data, fluctuating gold prices and monetary exchange rates, the possibility of project cost delays and overruns or unanticipated costs and expenses, uncertainties relating to the availability and costs of financing needed in the future, uncertainties related to production rates, timing of production and the cash and total costs of production, changes in applicable laws including laws related to mining development, environmental protection, and the protection of the health and safety of mine workers, the availability of labor and equipment, the possibility of labor strikes and work stoppages and changes in general economic conditions. Although the Company has attempted to identify important factors that could cause actual actions, events or results to differ materially from those described in Forward-Looking Statements, there may be other factors that could cause actions, events or results to differ from those anticipated, estimated or intended.
These Forward-Looking Statements represent the Company’s views as of the date of this MD&A. The Company anticipates that subsequent events and developments may cause the Company’s views to change. The Company does not undertake to update any Forward-Looking Statements, either written or oral, that may be made from time to time by, or on behalf of the Company, subsequent to the date of this discussion, other than as required by law. For a discussion of important factors affecting the Company, including fluctuations in the price of gold and exchange rates, uncertainty in the calculation of mineral resources, competition, uncertainty concerning geological conditions and governmental regulations and assumptions underlying the Company’s Forward-Looking Statements, see the “CAUTIONARY NOTE REGARDING FORWARD LOOKING STATEMENTS” and “RISK FACTORS” as filed in the Company’s Annual Information Form for the year ended December 31, 2010, filed on SEDAR and available at www.sedar.com, and its filings, including the Company’s Annual Report on Form 40-F for the year ended December 31, 2010, filed with the U.S. Securities and Exchange Commission, which are available on EDGAR at www.sec.gov. Further information about the Company is available on its corporate website www.jaguarmining.com.
CAUTIONARY NOTE TO U.S. INVESTORS CONCERNING ESTIMATES OF INFERRED AND MEASURED AND INDICATED RESOURCES
This document includes the term “inferred resources” and “measured and indicated resources”. The Company advises U.S. investors that while such terms are recognized and permitted under Canadian regulations, the U.S. Securities and Exchange Commission does not recognize them. U.S. Investors are cautioned not to assume that any part of all of the mineral deposits in these categories will ever be converted into proven or probable reserves.
“Inferred resources” have a great amount of uncertainty as to their existence, and great uncertainty as to their economic and legal feasibility. It cannot be assumed that all or any part of an inferred mineral resource will ever be upgraded to a higher category. Under Canadian rules, estimates of inferred mineral resources may not form the basis of feasibility or other economic studies. U.S. investors are cautioned not to assume that any part or all of an inferred resource exists or is economically or legally mineable.
[The remainder of this page has been left intentionally blank]
GLOSSARY OF MINING TERMS
Carbon-in-leach
A gold recovery process in which a slurry of gold-bearing ore, carbon and cyanide are mixed together. The cyanide leaches the gold, which is then immediately adsorbed and in a separated operation (elution), separated from the carbon in stripping vessels.
Carbon-in-pulp
Similar to carbon-in-leach process, but initially the slurry is subjected to cyanide leaching on separate tanks followed by carbon-in-pulp. Carbon-in-leach is a simultaneous process.
Conversion factors
The mass, area and grade below are commonly used in the gold industry. Their conversion factors are also provided below:
| To Convert | | To SI | | Multiply By |
| Imperial Measurement Units | | Measurement Units | | |
| Acres | | Hectares | | 0.404686 |
| Feet | | Metres | | 0.30480 |
| Miles | | Kilometres | | 1.609344 |
| Ounces (troy) | | Grams | | 31.1035 |
| Pounds | | Kilograms | | 0.454 |
| Short tons | | Tonnes | | 0.907185 |
| Troy ounces per ton | | Grams per tonne | | 34.2857 |
Cut-off grade
The minimum metal grade at which a tonne of rock can be processed on an economic basis.
Deposit
A mineralized body which has been physically delineated by sufficient drilling, trenching and/or underground work and found to contain a sufficient average grade of metal or metals to warrant further exploration and/or development expenditures; such a deposit does not qualify as a commercially mineable ore body or as containing mineral reserves until final legal, technical and economic factors have been resolved.
Development or mine development
Driving openings to access the mineral reserve in an underground mine.
Diamond or core drill
A type of rotary drill in which the cutting is done by abrasion rather than percussion. The cutting bit is set with diamonds and is attached to the end of long hollow rods through which water is pumped to the cutting face. The drill cuts a core of rock, which is recovered in long cylindrical sections, an inch or more in diameter.
Dilution
The effect of waste or low-grade ore being included unavoidably in the mined ore, lowering the recovered grade.
Doré
The precious metals product of the smelter, containing mainly gold and silver, which requires additional refining to high purity gold.
Drifting
Driving of tunnels through rock usually on a horizontal basis.
Feasibility study
A detailed report showing the feasibility of placing a prospective ore body or deposit of minerals within a mineral property into production. This report typically includes, inter alia, the specific portion or portions of the property that should be included in a development block, conclusions and recommendations regarding any adjustments that should be made to the boundaries of a development block, a description of the work to be performed in order to develop the mineral resources within the development block and to construct a mine or mines, mineral processing plant or plants and their (mine/plant) related facilities on the development block, the estimated capital and operating costs thereof, a proposed schedule for the timing of development and mine construction, and an assessment of the impact of the operation and the information obtained and evaluations made in respect thereof.
Grade
The concentrations of metal or valuable mineral in a body of rock, usually expressed as a percentage or in grams per tonne or ounces per tonne.
Heap leaching
A process whereby gold is extracted by “heaping” broken ore on sloping impermeable pads and repeatedly spraying the heaps with a weak cyanide solution which leaches the gold content. The gold-laden solution is collected for gold recovery.
Indicated mineral resource
An indicated mineral resource is that part of a mineral resource for which quantity, grade or quality, density, shape, and physical characteristics can be estimated with a level of confidence sufficient to allow the appropriate application of technical and economic parameters, to support mine planning and evaluation of the economic viability of the deposit. The estimate is based on detailed and reliable exploration and testing information gathered through appropriate techniques from locations such as outcrops, trenches, pits, workings and drill holes that are spaced closely enough for geological and grade continuity to be reasonably assumed.
Inferred mineral resource
An inferred mineral resource is that part of a mineral resource for which quantity and grade or quality can be estimated on the basis of geological evidence and limited sampling and reasonably assumed but not verified, geological and grade continuity. The estimate is based on limited information and sampling gathered through appropriate techniques from locations such as outcrops, trenches, pits, workings and drill holes.
Measured mineral resource
A measured mineral resource is that part of a mineral resource for which quantity, grade or quality, density, shape and physical characteristics are so well established that they can be estimated with confidence sufficient to allow the appropriate application of technical and economic parameters, to support production planning and evaluation of the economic viability of the deposit. The estimate is based on detailed and reliable exploration, sampling and testing information gathered through appropriate techniques from locations such as outcrops, trenches, pits, workings and drill holes that are spaced closely enough to confirm both geological and grade continuity.
Mineralization
Mineral-bearing rock; the minerals may have been either part of the original rock unit or injected at a later time.
Mineral reserve
A mineral reserve is the economically mineable part of a measured or indicated mineral resource demonstrated by at least a preliminary feasibility study. This study must include adequate information on mining, processing, metallurgical, economic and other relevant factors that demonstrate, at the time of reporting, that economic extraction can be justified. A mineral reserve including diluting materials and allowances for losses that may occur when the material is mined.
Mineral resource
A mineral resource is a concentration or occurrence of natural, solid, inorganic or fossilized organic material in or on the earth’s crust in such form or quantity and of such a grade or quality that has reasonable prospects for economic extraction. The location, quantity, grade, geological characteristics and continuity of a mineral resource are known, estimated or interpreted from specific geological evidence and knowledge.
NI 43-101
Canadian National Instrument 43-101, Standards of Disclosure for Mineral Projects of the Canadian Securities Regulators.
Ore
Rock mass, generally containing metallic and non-metallic minerals that can be mined and processed at a profit.
Ounce (troy)
All ounces referred herein are troy ounces. Despite the world’s gradual conversion to the metric system, the troy ounce remains a fixture of the gold industry and the most important basis for expressing quotations of most gold markets. One troy ounce equals approximately 31.1 grams in mass. There are 32.15 troy ounces in a kilogram.
Probable mineral reserve
A probable mineral reserve is the economically mineable part of an indicated, and in some circumstances a measured mineral resource, demonstrated by at least a preliminary feasibility study. This study must include adequate information on mining, processing, metallurgical, economic and other relevant factors that demonstrate, at the time of reporting, that economic extraction can be justified.
Proven mineral reserve
A proven mineral reserve is the economically mineable part of a measured mineral resource demonstrated by at least a preliminary feasibility study. This study must include adequate information on mining, processing, metallurgical, economic and other relevant factors that demonstrate, at the time of reporting, that economic extraction is justified.
Qualified Person or QP
An individual who, in accordance with NI 43-101: (a) is an engineer or geoscientist with at least five years of experience in mineral exploration, mine development or operation mineral project assessment, or any combination of these; (b) has experience relevant to the subject matter of the mineral project and the technical report; and (c) is a member in good standing of a recognized professional association.
Ramp
An inclined underground tunnel that provides access to a mineralized body for exploration, ventilation and/or mining purposes in underground exploratory works or mine.
Reclamation
The process by which lands disturbed as a result of mining activity are reclaimed back to a beneficial land use. Reclamation activity includes the removal of buildings, equipment, machinery and other physical remnants of mining, closure of tailings impoundments, leach pads and other mine features, and contouring, covering and revegetation of waste rock piles and other disturbed areas.
Recoverable Reserves
Recoverable reserves represent the quantity of gold that can be recovered (i.e. mined) from existing gold resources.
Plant Recovery Rate (Metallurgical Recovery)
The percentage of valuable metal in the mill feed ore that is recovered by metallurgical treatment process.
Refractory Ore
Mineralization in which much of the gold is encapsulated in sulfides and/or other minerals and is not readily amenable to dissolution (leaching) by cyanide solutions (unlike oxidized ore), even with fine grinding.
Reserves and Resources
The Company’s classification of mineral reserves and resources and the subcategories of each conforms with definitions adopted by the Canadian Institute of Mining, Metallurgy and Petroleum Council on August 20, 2000, which are in accordance with Canadian Securities Administrators’ National Instrument 43-101 dated November 17, 2000.
Stockpile
Broken ore heaped on surface or prepared areas underground, pending treatment or shipment.
Stope
Working place in an underground mine where ore is extracted.
Tailings
The material that remains after all economically recoverable metals or minerals of economic interest has been removed from the ore through milling and processing.
Ton
A ton or short ton is a British imperial measure of weight equivalent to 2,000 pounds.
Tonne
A tonne or metric tonne is about 10% greater in weight than a short ton and equivalent in weight to 1,000 kilograms or 2,205 pounds.
Waste
Barren rock in a mine, or mineralized material that is too low in grade to be mined and milled at a profit.
CORPORATE DIRECTORY
Jaguar Mining Inc. is incorporated under the laws of Ontario. DIRECTORS Andrew C. Burns1 Gil Clausen3, 4 William E. Dow3 Gary E. German1,2,4 Chairman Anthony F. Griffiths1, 2, 3 Daniel R. Titcomb 1 Audit Committee 2 Compensation Committee 3 Corporate Governance Committee 4 Health, Safety and Environmental Committee OFFICERS Daniel R. Titcomb President & CEO James M. Roller Chief Financial Officer & Treasurer Lúcio Cardoso Chief Operating Officer Adriano L. Nascimento VP Exploration & Engineering Robert Zwerneman VP Corporate Development, Director of IR Robert J. Lloyd Secretary ADMINISTRATIVE OFFICE 125 North State Street Concord, NH 03301 - USA Phone: (603) 224-4800 Fax: (603) 228-8045 E-mail: ir@jaguarmining.com Website: www.jaguarmining.com | REGISTERED OFFICE 100 King Street West, Suite 4400 1 First Canadian Place Toronto, Ontario M5X 1B1 - Canada OPERATING OFFICE Rua Levindo Lopes 323 - Funcionários CEP 30140-170 - Belo Horizonte - MG Brazil AUDITORS KPMG LLP Toronto, Ontario Belo Horizonte, Brazil LEGAL COUNSEL Davies Ward Phillips & Vineberg LLP Toronto, Ontario New York, New York Azevedo Sette Advogados Belo Horizonte, Brazil BANKS Bank of America Boston, Massachusetts HSBC Toronto, Ontario Royal Bank of Canada Toronto, Ontario STOCK TRANSFER AGENT Computershare Investor Services Inc. 100 University Avenue, 9th Floor Toronto, ON M5J 2Y1 Phone: 1-800-564-6253 Fax: 1-866-249-7775 Email: service@computershare.com EXCHANGE LISTINGS TSX/NYSE: “JAG” |