UNITED STATES
SECURITIES AND EXCHANGE COMMISSION
WASHINGTON, D.C. 20549
FORM 8-K
Current Report
Pursuant to Section 13 or 15(d) of the Securities Exchange Act of 1934
Date Of Report (Date Of Earliest Event Reported): November 30, 2006
Highbury Financial Inc.
(Exact name of Registrant as Specified in its Charter)
Commission File Number: 000-51682
| | |
Delaware | 20-3187008 |
(State of Other Jurisdiction Of Incorporation or Organization) | (I.R.S. Employer Identification No.) |
999 Eighteenth Street, Suite 3000
Denver, CO 80202
(Address of Principal Executive Offices, Including Zip Code)
(303) 357-4802
(Registrant’s Telephone Number, Including Area Code)
Check the appropriate box below if the Form 8-K filing is intended to simultaneously satisfy the filing obligation of the registrant under any of the following provisions:
| ¨ | Written communications pursuant to Rule 425 under the Securities Act (17 CFR 230.425) |
| ¨ | Soliciting material pursuant to Rule 14a-12 under the Exchange Act (17 CFR 240.14a-12) |
| ¨ | Pre-commencement communications pursuant to Rule 14d-2(b) under the Exchange Act (17 CFR 240.14d-2(b)) |
| ¨ | Pre-commencement communications pursuant to Rule 13e-4(c) under the Exchange Act (17 CFR 240.13e-4(c)) |
ITEM 1.01 ENTRY INTO A MATERIAL DEFINITIVE AGREEMENT
On November 30, 2006, in connection with the closing (the “Closing”) of the acquisition by Highbury Financial Inc. (“Highbury”) of substantially all of the business of ABN AMRO Asset Management Holdings, Inc., ABN AMRO Investment Fund Services, Inc., ABN AMRO Asset Management, Inc., Montag & Caldwell, Inc., Tamro Capital Partners LLC, Veredus Asset Management LLC, and River Road Asset Management, LLC (the “Sellers”) of providing investment advisory, administration, distribution and related services to the U.S. mutual funds specified in the Asset Purchase Agreement (defined below) Highbury entered into the agreement described below.
Office Service Agreement with Berkshire Capital Securities LLC
Highbury entered into an office service agreement with Berkshire Capital Securities LLC (“Berkshire Capital”), an affiliate of Highbury, on November 30, 2006, pursuant to which Berkshire Capital will provide office space and certain general administrative services to Highbury. The Office Service Agreement replaces the Office Service Agreement entered into between Berkshire Capital and Highbury on December 21, 2005. The Office Service Agreement provides for a monthly fixed fee for office services of $7,500 and includes the use of the facilities located at 999 Eighteenth Street, Suite 3000, Denver, Colorado 80202 as well as such other office facilities maintained by Berkshire Capital as Highbury may reasonably require. Under the Office Service Agreement, Highbury will be provided with the non-exclusive use of the facilities and shall have access to these facilities at all times. The term of the Office Service Agreement is indefinite, with no established termination date. Either party may terminate the Office Service Agreement at any time with six months’ notice to the other party. The Agreement is included in this Current Report on Form 8-K as Exhibit 10.2 and is incorporated by reference herein.
ITEM 2.01 COMPLETION OF ACQUISITION OR DISPOSITION OF ASSETS
Highbury was formed in July 2005 for the purpose of acquiring or acquiring control of, through a merger, capital stock exchange, asset acquisition, stock purchase or other similar business combination, one or more financial services businesses.
Pursuant to the Asset Purchase Agreement, dated as of April 20, 2006, among Highbury, Aston and the Sellers (the “Asset Purchase Agreement”), on November 30, 2006, Highbury acquired, through its subsidiary Aston Asset Management LLC (“Aston”), substantially all of the Sellers’ business of providing investment advisory, administration, distribution and related services to the U.S. mutual funds (the “Acquired Business”) specified in the Asset Purchase Agreement, as defined below (the “Acquisition”).
At the closing of the Acquisition, Highbury made a payment of $38.6 million to Sellers to pay the purchase price under the Asset Purchase Agreement. Highbury then contributed the Acquired Business to Aston.
On November 30, 2006, Highbury issued a press release announcing the closing of the Acquisition (the “Closing”).
In connection with the approval of the above described transaction, the Highbury stockholders adopted an amendment to the Certificate of Incorporation of Highbury to remove the preamble and Sections A through G, inclusive, of Article Fifth from the Certificate of Incorporation from and after the closing of the Acquisition.
References to “the Company”, “we”, “us” and “our” refer to Highbury and its subsidiaries, including Aston and the Acquired Business. References to Highbury refer solely to Highbury and references to Aston refer to Aston, including the Acquired Business.
FORWARD-LOOKING STATEMENTS
We believe that some of the information in this Current Report on Form 8-K constitutes forward-looking statements within the definition of the Private Securities Litigation Reform Act of 1995. You can identify these statements by forward-looking words such as “may”, “expect”, “anticipate”, “contemplate”, “believe”, “estimate”, “intends”, and “continue” or similar words. You should read statements that contain these words carefully because they:
| | · | discuss future expectations; |
| | �� | contain projections of future results of operations or financial condition; or |
| | · | state other “forward-looking” information. |
We believe it is important to communicate our expectations to our stockholders. However, there may be events in the future that we are not able to predict accurately or over which we have no control. The risk factors and cautionary language discussed in this Current Report on Form 8-K provide examples of risks, uncertainties and events that may cause actual results to differ materially from the expectations described by us or Aston in such forward-looking statements, including among other things:
| | · | the impact of legislative and regulatory actions and reforms and regulatory, supervisory or enforcement actions of government actions relating to Highbury and Aston; |
| | · | changes in political, economic or industry conditions, the interest rate environment or financial and capital markets, which could result in changes in demand for products or services or in the value of assets under management; |
| | · | terrorist activities and international hostilities, which may adversely affect the general economy, financial and capital markets, specific industries, and Highbury and Aston; |
| | · | changing conditions in global financial markets generally and in the equity markets particularly, and decline or lack of sustained growth in these markets; |
| | · | Aston’s and Highbury’s business strategy and plans; |
| | · | the introduction, withdrawal, success and timing of business initiatives and strategies; |
| | · | harm to Aston’s or Highbury’s reputation; |
| | · | fluctuations in customer demand; |
| | · | management of rapid growth; |
| | · | the impact of fund performance on redemptions; |
| | · | changes in investors’ preference of investing styles; |
| | · | changes in or loss of sub-advisers; |
| | · | the impact of increased competition; |
| | · | the results of future financing efforts; |
| | · | the impact of capital improvement projects; |
| | · | the impact of future acquisitions or divestitures; |
| | · | the relative and absolute investment performance of Aston’s investment products; |
| | · | investment advisory agreements subject to termination or non-renewal; |
| | · | a substantial reduction in fees received from third parties; |
| | · | our success in finding or investing in additional investment management firms on favorable terms and consummating announced investments in new investment management firms; |
| | · | the ability to retain major clients; |
| | · | the ability to attract and retain highly talented professionals; |
| | · | significant limitations or failure of software applications; |
| | · | expenses subject to significant fluctuations; and |
| | · | the impact, extent and timing of technological changes and the adequacy of intellectual property protection. |
You are cautioned not to place undue reliance on these forward-looking statements, which speak only as of the date of this Current Report on Form 8-K.
All forward-looking statements included herein attributable to any of us, Aston, the Acquired Business or any person acting on either party’s behalf are expressly qualified in their entirety by the cautionary statements contained or referred to in this section. Except to the extent required by applicable laws and regulations, Highbury and Aston undertake no obligations to update these forward-looking statements to reflect events or circumstances after the date of this Current Report on Form 8-K or to reflect the occurrence of unanticipated events.
BUSINESS
General
Highbury is an investment management holding company providing permanent capital solutions to mid-sized investment management firms. Aston is a platform for internal growth and add-on acquisitions. We intend to continue to pursue acquisition opportunities and will seek to establish other accretive partnerships with high quality investment management firms over time. We will seek to provide permanent equity capital to fund buyouts from corporate parents, buyouts of founding or departing partners, growth initiatives or exit strategies for private equity funds. We intend to leave material equity interests with management teams to align the interests of management and our shareholders and, in general, will not integrate our acquisitions, although we may work with potential future affiliates to execute add-on acquisitions. We will seek to augment and diversify our sources of revenue by investment style, asset class, distribution channel, client type and management team. We intend to fund future acquisitions with retained net income or the issuance of debt or equity.
Business Strategy
Aston provides investment advisory services to a family of 19 no-load, open-end mutual funds which managed approximately $5.4 billion in client assets as of September 30, 2006. The business has historically grown internally, through market appreciation and net positive asset flows, from approximately $100 million in assets under management in 1993 to $7.3 billion at its peak in 2004, although since 2004 cumulative net redemptions have reduced the size of the business to approximately $5.4 billion.
Aston’s mutual fund platform is built upon providing advisory, sales, marketing, compliance and operating resources to mutual funds using sub-advisers that produce institutional quality investment products. In managing historical growth and planning for future growth, the Acquired Business has been, and Aston will continue to be, guided by the following business strategies.
Maintain and Improve Investment Performance
The Acquired Business has a long-term record of achieving competitive, risk-adjusted returns on the mutual funds managed by its sub-advisers. As of September 30, 2006, 11 of Aston’s 19 funds carried at least a three star rating from Morningstar. These ratings and rankings are based on past performance, which may not be predictive of future results. Aston’s key strategy is to maintain and improve its investment performance by actively monitoring its sub-advisers to ensure consistent application of the specifically mandated investment philosophy and process while the sub-advisers actively manage Aston’s portfolios to achieve distinct balances of risk and reward. In terms of improving performance, Aston will seek to partner with additional investment managers with proven track records as well as provide additional support to its current sub-advisers in order to improve the sub-advisers’ ability to generate competitive returns while maintaining acceptable levels of risk for clients.
Morningstar RatingsTM are a standard performance measure used in the mutual fund industry to evaluate the relative performance of similar mutual funds. The management of Aston believes that many investors rely heavily on Morningstar RatingsTM to select mutual funds in which to invest. As a result, management of Aston regularly uses Morningstar RatingsTM to evaluate the relative performance of its mutual funds. For each fund with at least a three-year history, Morningstar calculates a Morningstar RatingTM based on a Morningstar risk-adjusted return measure that accounts for variation in a fund’s monthly performance (including the effects of sales charges, loads and redemption fees), placing more emphasis on downward variations and rewarding consistent performance. The top 10% of funds in each category receive five stars, the next 22.5% receive four stars, the next 35% receive three stars, the next 22.5% receive two stars and the bottom 10% receive one star. (Each share class is counted as a fraction of one fund within this scale and rated separately, which may cause slight variations in the distribution percentages.) The overall Morningstar RatingTM for a fund is derived from a weighted-average of the performance figures associated with its 3-, 5- and 10-year (if applicable) Morningstar RatingTM metrics.
Selectively Expand Aston’s Investment Strategies
Since the introduction of its first equity funds in 1993, the Acquired Business has expanded its product offerings to include multiple strategies within the equity and fixed income asset classes. Historically, management of the Acquired Business has entered into sub-advisory agreements with qualified sub-advisers to create new products in response to demand in the market. Aston intends to continue to selectively expand its investment strategies where it believes the application of its core competencies and process can produce attractive risk-adjusted returns. Aston believes that by doing so it can enhance its ability to increase assets under management as well as augment and further diversify its sources of revenue.
Selectively Expand Aston’s Products and Distribution Relationships
Aston strives to develop investment products and distribution channels that best deliver its strategies to its clients. It seeks continued opportunities to expand its investment products and relationships for the delivery of these products. The combination of capacity and established investment performance track records creates potential to drive future growth. For example, Aston’s institutional client relationship management team continues to identify sources of demand for the funds working closely with a broad network of consultants and financial planners and providing information regarding Aston’s investment strategies and performance. Aston also continues to expand existing relationships and initiate new ones within a variety of channels for mutual funds, including 401(k) platforms, fund supermarkets, broker dealers and financial planners. These third party distribution resources support a variety of defined contribution plans and independent financial advisers with demand for the institutional quality institutional investment styles of Aston.
Aston’s current sales force includes 18 wholesalers which provides Aston with national distribution for new and existing products. Aston’s status as an independent, open-architecture platform enables it to incubate new products with a variety of investment management firms, regardless of their affiliations. Open-architecture refers to an investment platform that can distribute investment products that are advised or sub-advised by other firms. Previously, the Sellers had generally limited new advisory relationships to affiliates of the Sellers. Aston’s flexibility should allow Aston to establish additional mutual funds and new product lines with a broader range of existing and new sub-advisers.
Aston is currently developing additional business lines that offer opportunities for growth. For example, the Sellers maintained a separately managed account platform that had $174 million of assets under management as of September 30, 2006 acquired by Aston in the Acquisition. In addition, Aston and the Sellers are together exploring a line of principal-protected funds to be distributed on a joint-venture basis with a major international insurance company. Aston intends to use its family of investment products and distribution resources to leverage any such additional initiatives.
Build Aston as a Brand Name
The growth of the Acquired Business occurred under the Alleghany and the Sellers’ brands. With the addition of the Aston brand, co-branded with outstanding institutional sub-advisers, Aston intends to build upon the historical success of the Acquired Business’ strategy to enhance the credibility, reputation and acceptance of the Aston brand name.
Selectively Pursue Accretive Acquisitions
We expect that prudent, accretive acquisitions will be a source of growth for Aston’s business in the future. The management team has substantial experience acquiring, integrating and managing investment management firms. In his former role as Executive Vice President of CT&T and the President and Chief Executive Officer of Alleghany Asset Management, Inc., Stuart Bilton was involved in the acquisition or founding of six investment management firms over ten years and also founded the Acquired Business. These initiatives helped fuel the growth of Alleghany’s investment businesses from Mr. Bilton’s arrival in 1986 until its sale to ABN AMRO in 2001. In Aston’s efforts to pursue accretive acquisitions in the future, the Aston management team and Highbury may elect to finance transactions using one or more of the following sources: capital from Highbury, external debt, seller financing or contingent payments. The members of Aston are not required to make capital contributions to fund additional acquisitions. If Highbury elects to fund acquisitions by Aston, it will only do so if the terms of such acquisitions, including any modifications to the Aston limited liability company agreement and specifically the allocation of revenue between Highbury and Aston, are considered by the board of directors of Highbury to be favorable to Highbury and its stockholders. Highbury also intends to seek acquisitions independent of Aston which may be funded by its revolving credit facility, other external borrowings, retained earnings (if any), raising of additional equity, and other sources of capital, including seller financing and contingent payments.
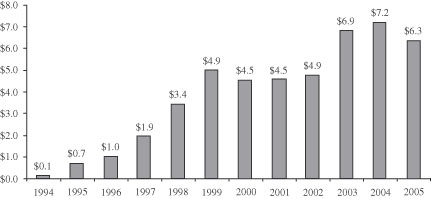
Assets Under Management
The Acquired Business’ funds have grown significantly over the past 13 years. As of September 30, 2006, the U.S. mutual funds specified in the Asset Purchase Agreement (the “Target Funds”) had $5.4 billion of client assets under management. On April 20, 2006, the date the Asset Purchase Agreement was entered into, the Target Funds had $6.1 billion of client assets under management. The largest amount of client assets under management of the Acquired Business at the end of any calendar quarter was $7.3 billion at the end of the second quarter of 2004. Assets under management have continued to decrease as a result of net asset outflows. Future net outflows and declines in the prices of securities would result in further decreases in assets under management. The following chart displays the historical growth since inception of the Acquired Business’ assets under management (in billions) as of December 31 for each calendar year.
Investment Strategies
The following table describes the Acquired Business’ investment strategies within the equity and fixed income asset classes:
Asset Class | | Assets Under Management at September 30, 2006 (in millions) | | Description |
| Equity | | $5,155 | | Invests in a range of U.S. and global companies of various market capitalizations under both growth and value disciplines. |
| Fixed Income | | 214 | | Invests primarily in corporate and government bonds |
| Total | | $5,369 | | |
Investment Products
Aston markets its investment services to its clients through a variety of funds designed to suit a client’s individual investment needs. The Acquired Business introduced its first mutual fund in 1993 and today Aston manages 19 no-load, open-end mutual funds, including 15 equity funds and four fixed income funds, with approximately $5.4 billion of assets under management as of September 30, 2006. The open-architecture platform currently utilizes nine different entities to manage the funds. Most recently, Aston entered into sub-advisory agreements in November 2006 with Taplin, Canida & Habacht, Inc. and McDonnell Investment Management, LLC acting as advisors to three of Aston’s fixed income funds. In addition, the funds’ Board of Trustees has approved the creation of two new mutual funds to be managed in the EAFE and Large Cap Core investment styles. The following table sets forth the assets under management, and overall Morningstar RatingTM for each mutual fund managed as of September 30, 2006.
Fund | | Inception | | Assets Under Management ($m) | | Morningstar Category | | Rating |
| Equity Funds: | | | | | | | | |
| Montag & Caldwell Growth | | 1994 | | $2,070 | | Large-Cap Growth | | **** |
| Growth | | 1993 | | 918 | | Large-Cap Growth | | *** |
| Mid-Cap | | 1994 | | 644 | | Mid-Cap Blend | | *** |
| Veredus Aggressive Growth | | 1998 | | 550 | | Small-Cap Growth | | * |
| Value | | 1993 | | 342 | | Large-Cap Value | | *** |
| TAMRO Small-Cap | | 2000 | | 212 | | Small-Cap Blend | | **** |
| River Road Small-Cap Value | | 2005 | | 143 | | Small-Cap Value | | — |
| Real Estate | | 1997 | | 111 | | Specialty-Real Estate | | *** |
| Balanced | | 1995 | | 65 | | Moderate Allocation | | ** |
| Veredus Select Growth | | 2001 | | 34 | | Large-Cap Growth | | ***** |
| Montag & Caldwell Balanced | | 1994 | | 32 | | Moderate Allocation | | ** |
| TAMRO Large-Cap Value | | 2000 | | 16 | | Large-Cap Value | | **** |
| River Road Dynamic Equity | | 2005 | | 13 | | Mid-Cap Value | | — |
| Veredus Science Technology | | 2000 | | 4 | | Specialty-Technology | | ** |
| Mid-Cap Growth | | 2005 | | 1 | | Mid-Cap Growth | | — |
| Total Equity Funds | | | | 5,155 | | | | |
| | | | | | | | | |
| Fixed Income Funds: | | | | | | | | |
| Bond | | 1993 | | 124 | | Intermediate-Term Bond | | *** |
| Municipal Bond | | 1993 | | 40 | | Muni National Interim | | *** |
| Investment Grade Bond | | 1995 | | 29 | | Short-Term Bond | | **** |
| High Yield | | 2003 | | 21 | | High Yield Bond | | ** |
| | | | | | | | | |
| Total Fixed Income Funds | | | | 214 | | | | |
| | | | | | | | | |
Total Funds | | | | $5,369 | | | | |
| | | | | | | | | |
Fees and Revenues
Aston generates revenue by charging mutual funds an advisory fee and an administrative fee based on a percentage of invested assets. A portion of the fees are paid to the sub-advisers, to a third-party sub-administrator, and to third-party distribution partners. Each fund typically bears all expenses associated with its operation and the issuance and redemption of its securities. In particular, each fund pays investment advisory fees (to Aston), shareholder servicing fees and expenses, fund accounting fees and expenses, transfer agent fees, custodian fees and expenses, legal and auditing fees, expenses of preparing, printing and mailing prospectuses and shareholder reports, registration fees and expenses, proxy and annual meeting expenses and independent trustee fees and expenses. Aston usually guarantees to newly organized funds that their expenses will not exceed a specified percentage of their net assets during an initial operating period. Aston absorbs all advisory fees and other mutual fund expenses in excess of these self-imposed limits in the form of expense reimbursements or fee waivers. Aston collects as revenue the advisory fee less reimbursements and waivers. As of September 30, 2006, the Acquired Business was reimbursing 12 mutual funds whose expenses exceed the applicable expense cap for the Fund. These Funds are Value; TAMRO Small Cap; Real Estate; Veredus Select Growth; TAMRO Large Cap Value; River Road Dynamic Equity; Veredus Science Technology; Mid-Cap Growth; Bond; Municipal Bond; Investment Grade Bond; and High Yield.
Investment Performance
The following chart displays the annualized return of each fund for a one-, three-, five- and ten-year period as applicable for the periods ended September 30, 2006.
| | | | | Annualized Return | |
Fund | | 1-Year | | 3-Year | | 5-Year | | 10-Year | |
| Equity Funds: | | | | | | | | | |
| Montag & Caldwell Growth | | | 2.19 | % | | 7.15 | % | | 2.49 | % | | 6.64 | % |
| Growth | | | 4.67 | % | | 5.97 | % | | 4.13 | % | | 7.58 | % |
| Mid-Cap | | | 8.04 | % | | 13.21 | % | | 13.77 | % | | 11.75 | % |
| Veredus Aggressive Growth | | | -5.24 | % | | 8.67 | % | | 0.25 | % | | — | |
| Value | | | 14.42 | % | | 16.27 | % | | 9.68 | % | | 7.83 | % |
| TAMRO Small-Cap | | | 14.37 | % | | 15.56 | % | | 16.65 | % | | — | |
| River Road Small-Cap Value | | | 22.43 | % | | — | | | — | | | — | |
| Real Estate | | | 27.20 | % | | 27.17 | % | | 22.51 | % | | — | |
| Balanced | | | 4.13 | % | | 5.03 | % | | 4.20 | % | | 7.19 | % |
| Veredus Select Growth | | | 4.74 | % | | 13.19 | % | | — | | | — | |
| Montag & Caldwell Balanced | | | 2.03 | % | | 4.68 | % | | 2.49 | % | | 6.08 | % |
| TAMRO Large-Cap Value | | | 9.31 | % | | 12.32 | % | | 7.95 | % | | — | |
| River Road Dynamic Equity | | | 17.78 | % | | — | | | — | | | — | |
| Veredus Science Technology | | | 1.11 | % | | 3.12 | % | | 1.67 | % | | — | |
| Mid-Cap Growth | | | — | | | — | | | — | | | — | |
| Fixed Income Funds: | | | | | | | | | | | | | |
| Bond | | | 2.79 | % | | 2.96 | % | | 3.78 | % | | 5.62 | % |
| Municipal Bond | | | 3.28 | % | | 2.51 | % | | 3.84 | % | | 4.54 | % |
| Investment Grade Bond | | | 3.46 | % | | 2.43 | % | | 3.65 | % | | 5.19 | % |
| High Yield | | | 5.07 | % | | 6.98 | % | | — | | | — | |
| | | | | | | | | | | | | | |
Distribution
Each of the funds has a distinct investment objective that has been developed as part of Aston’s strategy to provide a broad, comprehensive selection of investment opportunities. This strategy gives Aston access to many possible customers and distribution channels. Aston distributes its products to individuals and institutions. While institutions may invest directly through Aston, individuals generally purchase shares through retail financial intermediaries. All Aston funds are sold exclusively on a no-load basis, i.e., without a sales commission. No-load mutual funds offer investors a low-cost and relatively easy method of investing in a variety of stock and bond portfolios. Aston’s “N” class of fund shares is sold through financial intermediaries. Those “N” class shares incur an additional annual expense equal to 0.25% of the Fund’s assets under management which is payable to the financial intermediaries for distribution and recordkeeping. The institutional “I” class of fund shares, however, bears no such fee.
Aston bears all advertising and promotion expenses for the funds. Its costs include advertising and direct mail communications to potential fund shareholders as well as a substantial staff and communications capability to respond to investor inquiries. Marketing efforts have traditionally been focused on fee based intermediaries, including due diligence teams, brokers, advisers, financial planners and consultants. The independent registered advisory channel as well as the 401(k) channel are a specific focus. In addition, Aston has a significant focus on marketing efforts toward participant-directed defined contribution plans such as 401(k) plans that invest in mutual funds. Advertising and promotion expenditures vary over time based on investor interest, market conditions, new investment offerings and the development and expansion of new marketing initiatives.
Technology and Intellectual Property
The day-to-day mutual fund technology of Aston is outsourced to PFPC, Inc., including fund accounting, sub-administration, custody and transfer agency functions. Sub-administration is the provision of services related to the administration of a mutual fund on an out-sourced basis. The business also utilizes a web based CRM system, which maintains contact information of both clients and prospects and is hosted by interlink ONE, Inc. The website of Aston is hosted by Sysys Corporation.
Competition
The Company faces substantial competition in every aspect of its business. Competitive factors affecting its business include brand recognition, business reputation, investment performance, quality of service and the continuity of client relationships. Fee competition also affects the business, as do compensation, administration, commissions and other expenses paid to intermediaries.
Performance and price are the principal methods of competition for Aston. Prospective clients and mutual fund shareholders will typically base their decisions on a fund’s ability to generate returns that exceed a market or benchmark index, i.e. its performance, and on its fees, or price. Individual mutual fund investors may also base their decision on the ability to access the mutual funds Aston manages through a particular distribution channel. Institutional clients are often advised by consultants who may include other factors in their decisions for these clients.
The Company competes with a large number of global and U.S. investment advisers, commercial banks, brokerage firms and broker-dealers, insurance companies and other financial institutions. There are approximately 900 domestic investment advisers that manage assets in excess of $1 billion according to Money Market Directories and, according to the Investment Company Institute, mutual fund managers in the United States manage more than $8.1 trillion in over 8,000 funds. Aston is considered a small to mid-sized investment advisory firm. Many competing firms are parts of larger financial services companies and attract business through numerous means including retail bank offices, investment banking and underwriting contacts, insurance agencies and broker-dealers. U.S. banks and insurance companies can now affiliate with securities firms. This has accelerated consolidation within the investment advisory and financial services businesses. It has also increased the variety of competition for traditional investment advisory firms with businesses limited to investing assets on behalf of institutional and individual clients. Foreign banks and investment firms have also entered the U.S. investment advisory business, either directly or through partnerships or acquisitions. A number of factors serve to increase the Company’s competitive risks:
| | • | some of Aston’s competitors have greater capital and other resources, and offer more comprehensive lines of products and services than Aston does; |
| | • | consolidation within the investment management industry, and the securities industry in general, has served to increase the size and strength of a number of its competitors; |
| | • | there are relatively few barriers to entry by new investment management firms, and the successful efforts of new entrants, including major banks, insurance companies and other financial institutions, have resulted in increased competition; and |
| | • | other industry participants will from time to time seek to recruit Aston’s investment professionals and other employees away from the business. |
These and other factors could reduce Aston’s revenues and earnings and materially adversely affect its business. If the funds have poor performance relative to their peers, they could lose existing clients and may be unable to attract new clients. These factors may place Aston at a competitive disadvantage, reduce its earnings and revenues, and materially adversely affect its business. Aston cannot be sure that its strategies and efforts to maintain its existing assets and attract new business will be successful.
In order to grow the business, Highbury must be able to compete effectively for assets under management. Specifically, the Acquired Business has historically competed principally on the basis of:
| | • | quality of service provided to clients; |
| | • | brand recognition and business reputation; |
| | • | continuity of client relationships and of assets under management; |
| | • | continuity of its selling arrangements with intermediaries; |
| | • | continuity of advisory or sub-advisory agreements with excellent managers; |
| | • | the range of products offered; |
| | • | level of fees and commissions charged for services; and |
| | • | level of expenses paid to financial intermediaries related to administration and/or distribution. |
The Acquired Business has succeeded in growing aggregate assets under management, and the Company believes that it will continue to be able to do so by focusing on investment performance and client service and by developing new products and new distribution capabilities.
Employees
Upon the consummation of the Acquisition, Aston hired 36 full-time employees, including four in senior management and administration, six in marketing and communications, 18 in sales and sales management and eight in operations and compliance. All of these employees were employed by the Acquired Business or AAAMHI prior to the consummation of the Acquisition.
Regulation
Virtually all aspects of the Company are subject to extensive regulation in the United States at both the federal and state level. These laws and regulations are primarily intended to protect investment advisory clients and shareholders of registered investment companies. Under these laws and regulations, agencies that regulate investment advisers, such as the Company, have broad administrative powers, including the power to limit, restrict or prohibit an investment adviser from carrying on its business in the event that it fails to comply with such laws and regulations. Possible sanctions that may be imposed include the suspension of individual employees, limitations on engaging in certain lines of business for specified periods of time, revocation of investment adviser and other registrations, censures, and fines.
Aston is registered as an investment adviser with the SEC. As a registered investment adviser, it is subject to the requirements of the Investment Advisers Act of 1940, or the Investment Advisers Act, and the SEC’s regulations thereunder, as well as to examination by the SEC’s staff. The Investment Advisers Act imposes substantive regulation on virtually all aspects of the Company’s advisory business and its relationship with its clients. Applicable requirements relate to, among other things, fiduciary duties to clients, engaging in transactions with clients, maintaining an effective compliance program, performance fees, solicitation arrangements, conflicts of interest, advertising, and recordkeeping, reporting and disclosure requirements. The Target Funds are registered with the SEC under the Investment Company Act. The Investment Company Act imposes additional obligations, including detailed operational requirements on both the funds and their advisers. Moreover, an investment adviser’s contract with a registered fund may be terminated by the fund on not more than 60 days’ notice, and is subject to annual renewal by the fund’s board after an initial term of up to two years. The SEC is authorized to institute proceedings and impose sanctions for violations of the Investment Advisers Act and the Investment Company Act, ranging from fines and censures to termination of an investment adviser’s registration. The failure of Aston or registered funds advised by Aston to comply with the requirements of the SEC could have a material adverse effect on the Company. Under the rules and regulations of the SEC promulgated pursuant to the federal securities laws, Aston is subject to periodic examination by the SEC.
In response to recent scandals in the financial services industry regarding late trading, market timing and selective disclosure of portfolio information, various legislative and regulatory proposals are pending in or before, or have been adopted by, the U.S. Congress and the various regulatory agencies that supervise our operations, including the SEC. Additionally, the SEC, the NASD and other regulators, as well as Congress, are investigating certain practices within the mutual fund industry.
The SEC has also adopted new rules requiring every registered fund to adopt and implement written policies and procedures designed to detect and prevent violations of federal securities law, to review these policies annually for adequacy and effectiveness, and to designate a chief compliance officer reporting directly to the fund’s board of directors or trustees. Registered advisers must also adopt a written compliance program to ensure compliance with the Investment Advisers Act and appoint a chief compliance officer. These compliance programs were required to be in place by October 5, 2004. Some of these compliance rules, as well as other new disclosure requirements that have recently been adopted, are intended to deal with abuses in areas of late trading and market timing of mutual funds. These new rules require additional and more explicit disclosure of market timing policies and procedures, as well as that funds have formal procedures in place to comply with their representations regarding market timing policies.
These regulatory and legislative initiatives, to the extent enacted or adopted, could have a substantial impact on the regulation and operation of mutual funds and investment advisers and could adversely affect the Acquired Business’ manner of operation and profitability. See “Risk Factors — Risks Related to the Financial Services Industry and Aston” in Highbury’s Definitive Revised Proxy Statement (No. 000-51682), dated November 3, 2006, for more information about how these proposals may materially adversely affect the Company’s business.
The Company is subject to the Employee Retirement Income Security Act of 1974, as amended, or ERISA, and to regulations promulgated thereunder, insofar as the Sellers are “fiduciaries” under ERISA with respect to benefit plan clients. ERISA and applicable provisions of the Internal Revenue Code of 1986, as amended, impose certain duties on persons who are fiduciaries under ERISA, prohibit certain transactions involving ERISA plan clients and provide monetary penalties for violations of these prohibitions. The Company’s failure to comply with these requirements could have a material adverse effect on its business.
RISK FACTORS
The risks associated with Highbury’s business are described in the Definitive Revised Proxy Statement (No. 000-51682), dated November 3, 2006, in the Section entitled “Risk Factors” beginning on page 54, and the description is incorporated herein by reference.
FINANCIAL INFORMATION
Reference is made to the disclosure set forth under Items 2.02 and 9.01 of this Current Report on Form 8-K concerning the financial information of Highbury.
EMPLOYEES
Reference is made to the disclosure set forth under Item 2.01 in the “Business” section of this Current Report on Form 8-K concerning the information relating to the employees of Highbury.
PROPERTIES
The facilities of Aston are maintained at 120 North LaSalle Street, Chicago, Illinois, Suite 2500. Reference is made to the disclosure set forth under Item 1.01 of this Current Report on Form 8-K concerning the facilities of Highbury.
SECURITY OWNERSHIP OF CERTAIN BENEFICIAL OWNERS AND MANAGEMENT
Ownership of Common Stock
The following table sets forth information regarding the beneficial ownership of our common stock as of November 20, 2006 by officers and directors and known 5% holders:
Name and address of beneficial owner(1) | | Amount and Nature of Beneficial Ownership | | Approximate Percentage of Outstanding Common Stock | |
| R. Bruce Cameron(2)(3) | | | 1,087,855 | | | 11.3 | % |
| Richard S. Foote(3) | | | 567,500 | | | 5.9 | % |
| R. Bradley Forth(3)(4) | | | 94,583 | | | 1.0 | % |
| Russell L. Appel(3)(5)(6) | | | 189,167 | | | 2.0 | % |
| Broad Hollow LLC(2)(3) | | | 898,688 | | | 9.3 | % |
| Wellington Management Company, LLP(7) | | | 986,000 | | | 10.2 | % |
| Potomac Capital Management LLC(8) | | | 936,500 | | | 9.7 | % |
| Context Capital Management, LLC(9) | | | 813,500 | | | 8.4 | % |
| All executive officers and directors as a group (four individuals) | | | 1,891,667 | | | 19.6 | % |
_______________________
| (1) | Unless otherwise noted, the business address of each of stockholders listed in this table is c/o Berkshire Capital Securities LLC, 535 Madison Avenue, 19th Floor, New York, New York 10022. |
| (2) | This number includes 851,250 shares owned of record by Broad Hollow LLC and 47,438 shares that Broad Hollow has the right to call during the 30-day period following the Acquisition that are attributed to Mr. Cameron, according to Section 13(d) of the Securities Exchange Act of 1934, due to his position as the managing member of Broad Hollow LLC. These share numbers do not include 86,250 shares held by Mr. Forth, which are subject to a call in favor of Broad Hollow LLC, exercisable if Mr. Forth’s employment by Berkshire Capital is terminated for certain reasons before the second anniversary of our initial business combination. |
| (3) | These numbers exclude 333,334 shares of common stock issuable to the initial stockholders upon exercise of warrants that are not currently exercisable and will not become exercisable within 60 days of November 20, 2006. |
| (4) | The business address of Mr. Forth is c/o Berkshire Capital Securities LLC, 999 Eighteenth Street, Suite 3000, Denver, CO 80202. |
| (5) | These shares are owned of record by the Hillary Appel Trust and the Catey Lauren Appel Trust, of which Mr. Appel’s wife is the trustee. Mr. Appel disclaims beneficial ownership of all such shares. |
| (6) | The business address of Mr. Appel is c/o The Praedium Group LLC, 825 Third Avenue, 36th Floor, New York, NY 10022. |
| (7) | As reported in a Schedule 13G dated January 31, 2006 and filed with the Securities and Exchange Commission on February 21, 2006. The business address of Wellington Management Company, LLP is 75 State Street, Boston, MA 02109. The Schedule 13G does not disclose the natural persons that would be deemed the control persons of Wellington Management Company, LLP. Based on a Form ADV filed by Wellington Management Company, LLP, with the SEC on August 4, 2006 the control persons of Wellington Management Company, LLP are Nicholas Adams, Laurie Gabriel, Paul Hamel, Saul Pannell, John Ryan, Perry Traquina and Phillip Perelmuter. |
| (8) | As reported in a Schedule 13G dated November 20, 2006 and filed with the SEC on November 20, 2006. The business address of Potomac Capital Management LLC is 825 Third Avenue, 33rd Floor, New York, New York 10022. Potomac Capital Management LLC, Potomac Capital Management Inc. and Paul J. Solit have shared voting power and shared dispositive power with respect to these shares. |
| (9) | As reported in a Schedule 13G dated January 26, 2006 and filed with the SEC on February 6, 2006. The business address of Context Capital Management, LLC is 12626 High Bluff Drive, Suite 440, San Diego, CA 92130. Michael S. Rosen and William D. Fertig have shared voting power and shared dispositive power with respect to these shares. |
Broad Hollow LLC, which is the record owner of 851,250 shares of our common stock, has the right to call, on a ratable basis, up to 5% of the shares of our common stock held prior to our initial public offering and the private placement by Messrs. Cameron, Foote and Forth and the Appel trusts at a price per share of approximately $0.61, exercisable during the 30-day period following the closing of the Acquisition or until December 30, 2006. If the call option is exercised, Broad Hollow, in the discretion of its managing member, may grant bonuses in cash, Broad Hollow membership interests or shares of our common stock owned by Broad Hollow to any party in connection with the Acquisition or any other acquisition made by us. This arrangement is intended to compensate those parties, if any, who participate in the due diligence, structuring and negotiation of the Acquisition. Broad Hollow will use its own funds to exercise the call option and grant cash bonuses, if any. We will make no payments or issue any of our shares in connection with this arrangement. Messrs. Foote and Cameron and eight other equity owners and employees of Berkshire Capital are the members of Broad Hollow. Broad Hollow is an affiliate of ours due to its ownership interest in us.
DIRECTORS AND EXECUTIVE OFFICERS
The directors and executive officers of Highbury upon the consummation of the Acquisition are described in the Definitive Revised Proxy Statement (No. 000-51682), dated November 3, 2006, in the Section entitled “Executive Officers of Highbury Following the Acquisition” beginning on page 147 and the description is incorporated herein by reference.
EXECUTIVE COMPENSATION
The executive compensation of Highbury’s executive officers and directors is described in the Definitive Revised Proxy Statement (No. 000-51682), dated November 3, 2006, in the Section entitled “Executive and Director Compensation” beginning on page 149 and the description is incorporated herein by reference.
CERTAIN RELATIONSHIPS AND RELATED TRANSACTIONS
The certain relationships and related party transactions are described in the Definitive Revised Proxy Statement (No. 000-51682), dated November 3, 2006, in the Section entitled “Certain Relationships and Related Transactions” beginning on page 153 and the description is incorporated herein by reference.
On November 30, 2006, Highbury advanced $600,000 to Aston in return for a note. The note is due and payable to Highbury in full on the one year anniversary of its issuance. Aston will use the proceeds from the note to cover certain operating expenses of the business incurred in December.
LEGAL PROCEEDINGS
The legal proceedings of Highbury are described in the Definitive Revised Proxy Statement (No. 000-51682), dated November 3, 2006, in the Sections entitled “Other Information Related to Highbury--Legal Proceedings” and “Acquired Business--Legal Proceedings” on pages 122 and 135, respectively, and the description is incorporated herein by reference. Currently, there are no legal proceedings pending against Highbury or Aston.
MARKET PRICE OF AND DIVIDENDS ON THE REGISTRANT’S COMMON EQUITY AND RELATED STOCKHOLDER MATTERS
The market price of and dividends of Highbury’s common equity and related stockholder matters are described in the Definitive Revised Proxy Statement (No. 000-51682), dated November 3, 2006, in the Section entitled “Market Price and Dividend Date for Highbury Securities” on page 157 and the description is incorporated herein by reference.
INDEMNIFICATION OF DIRECTORS AND OFFICERS
The Restated Certificate of Incorporation provides that all directors, officers, employees and agents of the registrant shall be entitled to be indemnified by us to the fullest extent permitted by Section 145 of the Delaware General Corporation Law.
Paragraph B of Article Seventh of Highbury’s Restated Certificate of Incorporation provides:
“The Corporation, to the full extent permitted by Section 145 of the DGCL, as amended from time to time, shall indemnify all persons whom it may indemnify pursuant thereto. Expenses (including attorneys’ fees) incurred by an officer or director in defending any civil, criminal, administrative or investigative action, suit or proceeding or which such officer or director may be entitled to indemnification hereunder shall be paid by the Corporation in advance of the final disposition of such action, suit or proceeding upon receipt of an undertaking by or on behalf of such director or officer to repay such amount if it shall ultimately be determined that he or she is not entitled to be indemnified by the Corporation as authorized hereby.”
Section 145 of the Delaware General Corporation Law concerning indemnification of officers, directors, employees and agents is set forth below.
§ 145. Indemnification of officers, directors, employees and agents; insurance.
(a) A corporation shall have power to indemnify any person who was or is a party or is threatened to be made a party to any threatened, pending or completed action, suit or proceeding, whether civil, criminal, administrative or investigative (other than an action by or in the right of the corporation) by reason of the fact that the person is or was a director, officer, employee or agent of the corporation, or is or was serving at the request of the corporation as a director, officer, employee or agent of another corporation, partnership, joint venture, trust or other enterprise, against expenses (including attorneys’ fees), judgments, fines and amounts paid in settlement actually and reasonably incurred by the person in connection with such action, suit or proceeding if the person acted in good faith and in a manner the person reasonably believed to be in or not opposed to the best interests of the corporation, and, with respect to any criminal action or proceeding, had no reasonable cause to believe the person’s conduct was unlawful. The termination of any action, suit or proceeding by judgment, order, settlement, conviction, or upon a plea of nolo contendere or its equivalent, shall not, of itself, create a presumption that the person did not act in good faith and in a manner which the person reasonably believed to be in or not opposed to the best interests of the corporation, and, with respect to any criminal action or proceeding, had reasonable cause to believe that the person’s conduct was unlawful.
(b) A corporation shall have power to indemnify any person who was or is a party or is threatened to be made a party to any threatened, pending or completed action or suit by or in the right of the corporation to procure a judgment in its favor by reason of the fact that the person is or was a director, officer, employee or agent of the corporation, or is or was serving at the request of the corporation as a director, officer, employee or agent of another corporation, partnership, joint venture, trust or other enterprise against expenses (including attorneys’ fees) actually and reasonably incurred by the person in connection with the defense or settlement of such action or suit if the person acted in good faith and in a manner the person reasonably believed to be in or not opposed to the best interests of the corporation and except that no indemnification shall be made in respect of any claim, issue or matter as to which such person shall have been adjudged to be liable to the corporation unless and only to the extent that the Court of Chancery or the court in which such action or suit was brought shall determine upon application that, despite the adjudication of liability but in view of all the circumstances of the case, such person is fairly and reasonably entitled to indemnity for such expenses which the Court of Chancery or such other court shall deem proper.
(c) To the extent that a present or former director or officer of a corporation has been successful on the merits or otherwise in defense of any action, suit or proceeding referred to in subsections (a) and (b) of this section, or in defense of any claim, issue or matter therein, such person shall be indemnified against expenses (including attorneys’ fees) actually and reasonably incurred by such person in connection therewith.
(d) Any indemnification under subsections (a) and (b) of this section (unless ordered by a court) shall be made by the corporation only as authorized in the specific case upon a determination that indemnification of the present or former director, officer, employee or agent is proper in the circumstances because the person has met the applicable standard of conduct set forth in subsections (a) and (b) of this section. Such determination shall be made, with respect to a person who is a director or officer at the time of such determination, (1) by a majority vote of the directors who are not parties to such action, suit or proceeding, even though less than a quorum, or (2) by a committee of such directors designated by majority vote of such directors, even though less than a quorum, or (3) if there are no such directors, or if such directors so direct, by independent legal counsel in a written opinion, or (4) by the stockholders.
(e) Expenses (including attorneys’ fees) incurred by an officer or director in defending any civil, criminal, administrative or investigative action, suit or proceeding may be paid by the corporation in advance of the final disposition of such action, suit or proceeding upon receipt of an undertaking by or on behalf of such director or officer to repay such amount if it shall ultimately be determined that such person is not entitled to be indemnified by the corporation as authorized in this section. Such expenses (including attorneys’ fees) incurred by former directors and officers or other employees and agents may be so paid upon such terms and conditions, if any, as the corporation deems appropriate.
(f) The indemnification and advancement of expenses provided by, or granted pursuant to, the other subsections of this section shall not be deemed exclusive of any other rights to which those seeking indemnification or advancement of expenses may be entitled under any bylaw, agreement, vote of stockholders or disinterested directors or otherwise, both as to action in such person’s official capacity and as to action in another capacity while holding such office.
(g) A corporation shall have power to purchase and maintain insurance on behalf of any person who is or was a director, officer, employee or agent of the corporation, or is or was serving at the request of the corporation as a director, officer, employee or agent of another corporation, partnership, joint venture, trust or other enterprise against any liability asserted against such person and incurred by such person in any such capacity, or arising out of such person’s status as such, whether or not the corporation would have the power to indemnify such person against such liability under this section.
(h) For purposes of this section, references to “the corporation” shall include, in addition to the resulting corporation, any constituent corporation (including any constituent of a constituent) absorbed in a consolidation or merger which, if its separate existence had continued, would have had power and authority to indemnify its directors, officers, and employees or agents, so that any person who is or was a director, officer, employee or agent of such constituent corporation, or is or was serving at the request of such constituent corporation as a director, officer, employee or agent of another corporation, partnership, joint venture, trust or other enterprise, shall stand in the same position under this section with respect to the resulting or surviving corporation as such person would have with respect to such constituent corporation if its separate existence had continued.
(i) For purposes of this section, references to “other enterprises” shall include employee benefit plans; references to “fines” shall include any excise taxes assessed on a person with respect to any employee benefit plan; and references to “serving at the request of the corporation” shall include any service as a director, officer, employee or agent of the corporation which imposes duties on, or involves services by, such director, officer, employee or agent with respect to an employee benefit plan, its participants or beneficiaries; and a person who acted in good faith and in a manner such person reasonably believed to be in the interest of the participants and beneficiaries of an employee benefit plan shall be deemed to have acted in a manner “not opposed to the best interests of the corporation” as referred to in this section.
(j) The indemnification and advancement of expenses provided by, or granted pursuant to, this section shall, unless otherwise provided when authorized or ratified, continue as to a person who has ceased to be a director, officer, employee or agent and shall inure to the benefit of the heirs, executors and administrators of such a person.
(k) The Court of Chancery is hereby vested with exclusive jurisdiction to hear and determine all actions for advancement of expenses or indemnification brought under this section or under any bylaw, agreement, vote of stockholders or disinterested directors, or otherwise. The Court of Chancery may summarily determine a corporation’s obligation to advance expenses (including attorneys’ fees).
Insofar as indemnification for liabilities arising under the Securities Act may be permitted to the Company’s directors, officers and controlling persons pursuant to the foregoing provisions, or otherwise, the Company has been advised that in the opinion of the SEC such indemnification is against public policy as expressed in the Securities Act and is, therefore, unenforceable. In the event that a claim for indemnification against such liabilities (other than the payment of expenses incurred or paid by a director, officer or controlling person in a successful defense of any action, suit or proceeding) is asserted by such director, officer or controlling person in connection with the securities being registered, the Company will, unless in the opinion of its counsel the matter has been settled by controlling precedent, submit to the court of its appropriate jurisdiction the question whether such indemnification by it is against public policy as expressed in the Securities Act and will be governed by the final adjudication of such issue.
FINANCIAL STATEMENTS AND SUPPLEMENTARY DATA
Reference is made to the disclosure set forth under Item 9.01 of this Current Report concerning the financial statements and supplementary data of the Company.
FINANCIAL STATEMENTS AND EXHIBITS
Reference is made to the disclosure set forth under Item 9.01 of this Current Report concerning the financial statements of the Company.
ITEM 2.02 RESULTS OF OPERATIONS AND FINANCIAL CONDITION
Reference is made to the disclosure contained in Item 9.01 of this Current Report on Form 8-K concerning the Results of Operations and Financial Condition of Highbury.
ITEM 3.03 MATERIAL MODIFICATION TO RIGHTS OF SECURITY HOLDERS
Reference is made to the disclosure described in the Definitive Revised Proxy Statement (No. 000-51682), dated November 3, 2006, in the Section entitled “The Article Fifth Amendment Proposal” on page 117, and the description is incorporated herein by reference. Highbury’s Restated Certificate of Incorporation is included in the Current Report on Form 8-K as Exhibit 3.1 and is incorporated herein by reference.
ITEM 5.06 CHANGE IN SHELL COMPANY STATUS
Reference is made to the disclosure set forth under Item 2.01 of this Current Report on Form 8-K concerning the shell company status of Highbury.
On November 30, 2006, Highbury and its subsidiary, Aston (together with Highbury, the “Highbury Entities”), entered into a letter agreement (the “Agreement”) with Montag & Caldwell, Inc. (“Montag”) in connection with that certain Asset Purchase Agreement which was filed as Exhibit 10.1 to Highbury's Current Report on Form 8-K on April 21, 2006. The Agreement supersedes and replaces in its entirety the letter agreement, dated April 20, 2006, between Montag and the Highbury Entities, which was filed as Exhibit 10.4 to Highbury's Current Report on Form 8-K on April 21, 2006. The Agreement is included in this Current Report on Form 8-K as Exhibit 10.1 and is incorporated by reference herein.
ITEM 9.01 FINANCIAL STATEMENTS, PRO FORMA FINANCIAL INFORMATION AND EXHIBITS.
MANAGEMENT’S DISCUSSION AND ANALYSIS
OF FINANCIAL CONDITION AND
RESULTS OF OPERATIONS OF THE ACQUIRED BUSINESS
You should read this discussion and analysis of our financial condition and results of operations in conjunction with our “Unaudited Pro Forma Condensed Combined Financial Statements,” our “Supplemental Financial Information” and the combined financial statements of the Acquired Business and the related notes appearing elsewhere in this Current Report on Form 8-K. The information in this section contains forward-looking statements (see “Forward-Looking Statements”). The Acquired Business’ actual results may differ significantly from the results suggested by these forward-looking statements and from the Acquired Business’ historical results. Some factors that may cause our results to differ are described in the “Risk Factors” section of this Current Report on Form 8-K.
This discussion summarizes the significant factors affecting the combined operating results, financial conditions, liquidity and cash flows of the Acquired Business for the years ended December 31, 2005, 2004 and 2003 and for the nine months ended September 30, 2006 and September 30, 2005. This discussion should be read in conjunction with the Acquired Business’ fiscal 2005 audited combined financial statements, incorporated by reference herein, and September 30, 2006 unaudited financial statements, included elsewhere in this Current Report on Form 8-K, and the notes thereto.
Overview
The Acquired Business was founded within Alleghany Asset Management, Inc. by Stuart Bilton and Kenneth Anderson in 1993 to manage open-end investment funds for retail and institutional clients in the United States. Originally, the Acquired Business employed investment advisers affiliated with its parent to manage the assets of the funds, while it centralized the distribution, marketing, reporting and other operations of the fund family. As the business developed, the Acquired Business created new mutual funds managed by experienced independent investment advisers. As of September 30, 2006, the Acquired Business managed 19 no-load mutual funds, comprised of 15 equity funds and four fixed income funds, with approximately $5.4 billion of assets under management. Historically, the Acquired Business utilized seven different entities to manage the equity funds, of which five are affiliates of the Sellers and two are independent. Upon consummation of the Acquisition, Aston entered into long-term contracts with each of these entities pursuant to which they will sub-advise the funds. The contracts with the Sellers’ affiliates will not be terminable by the sub-advisers for five years. One existing fixed income manager will be retained and two new managers have been retained to manage three fixed income funds. Aston’s relationship with the sub-advisers will also be supported by limited non-compete provisions and certain capacity guarantees in certain products to benefit Aston. This arrangement is intended to ensure that the investment philosophy and process guiding the mutual funds in the future are consistent with the historical investment philosophy and process, and we expect that it will help to ensure a stable ownership transition for the Target Funds.
As of September 30, 2006, 11 of the mutual funds carried an overall Morningstar Rating of three stars or better, including four four-star funds and one five-star fund. Three funds are relatively new and are not currently rated by Morningstar. The 15 equity funds are classified in seven of the nine Morningstar style boxes, giving Aston wide coverage of the public equity investment spectrum and diversified sources of revenue. Aston intends to expand its assets under management with a combination of internal growth, new product development and accretive acquisitions. The Company believes the development of new products will provide growth in the future. New products may include:
| | • | Additional open-end mutual funds with current or new sub-advisers; |
| | • | An expanded separate account management program. |
A fund of funds is a fund that invests in other commingled investment funds. Closed-end funds are funds that do not offer daily liquidity for investor purchases and sales at net asset value, but rather are typically listed on an exchange in the secondary market. Wrap accounts are accounts offered by retail distribution firms that provide access to institutional investment management services without the use of a registered investment company. A separate account is an account managed for a single investor not commingled with the assets of other investors.
In addition, Aston may be able to develop new distribution channels including:
| | • | Arrangements with banks and insurance companies which, like ABN AMRO, elect to divest their mutual fund operations but enter into agreements with Aston to service their customers; or |
| | • | Wholesalers focused on the traditional retail broker channel. |
Key Operating Measures
We use the following key measures to evaluate and assess the business:
| | • | Assets Under Management. Aston is the investment manager for 19 open-end mutual funds, comprised of 15 equity and four fixed income funds. Aston generates revenues by charging each fund investment advisory and administrative fees (collected in monthly installments), each of which are equal to a percentage of the daily weighted average assets under management of the fund. Assets under management change on a daily basis as a result of client investments and withdrawals and changes in the market value of securities held in the mutual funds. As such, we carefully review net asset flows into the mutual funds, trends in the equity markets and the investment performance of the mutual funds, both absolutely and relative to their peers, to monitor their effects on the overall level of assets under management. |
| | • | Total Revenue. Total revenue is equal to the sum of the advisory fees and the administrative fees earned by the business in a given period. After the consummation of the Acquisition, we will operate Aston under a revenue sharing structure through which Highbury will receive a fixed percentage of the total revenue and interest income earned by Aston. |
| | • | Weighted Average Fee Basis. The weighted average fee basis is equal to the total revenue earned in a specific period divided by the weighted average assets under management for that period. Since each fund has a different fee schedule, the weighted average fee basis provides management with a single indicator of the business’ ability to generate fees on its total assets under management across all funds. |
| | • | Total Operating Expenses. The total operating expenses represent the fixed operating expenses of the Acquired Business. Except for marginal changes in staffing, which lead to changes in the compensation expense, the majority of these expenses do not adjust proportionately with total assets under management. We monitor total operating expenses relative to the net revenue (our total revenue less distribution and sub-advisory fees we pay) of the Acquired Business to ensure we have sufficient operating margin to cover the fixed expenses of the operation. After the consummation of the Acquisition, we expect total operating expenses (including distribution and sub-advisory costs) to equal 72% of the total revenue of Aston, as provided in Aston’s limited liability company agreement. |
Description of Certain Line Items
Following is a description of additional components of certain line items from the consolidated financial statements of the Acquired Business:
| | • | Advisory Fees, Net. The Acquired Business generates advisory fees based on a fixed percentage of the daily weighted-average assets under management for each fund, and receives these fees on a quarterly basis. For many funds, the Acquired Business provides an expense cap which guarantees to investors that the total expenses of a fund will not exceed a fixed percentage of the total assets under management. For small funds, the fixed expenses for fund accounting, client reporting, printing and other expenses, when combined with the investment advisory fees and administrative fees, cause a fund’s total expenses to exceed the expense cap. In such cases, the Acquired Business reimburses the funds for the excess fixed expenses or waives a portion of the investment advisory fee, so as to keep the total expenses of the fund at or below the expense cap. The advisory fees of the Acquired Business include investment advisory fees from all of the funds, net of all fee waivers and expense reimbursements. |
| | • | Total Distribution and Advisory Costs. The Acquired Business has contracted on a non-exclusive basis with nearly 400 different institutions to sell its mutual funds, in exchange for a distribution fee, to retail and institutional investors. These distribution fees are generally equal to a fixed percentage of the assets invested by the retail or institutional investor. In addition, the Acquired Business employs third-party investment managers to perform the security research and investment selection processes for each of its mutual funds. Under this arrangement, the Acquired Business pays the third-party investment manager a sub-advisory fee, generally equal to 50% of the advisory fees for the mutual fund, net of fee waivers, expense reimbursements, and applicable distribution fees paid under the distribution agreements discussed above. Total distribution and advisory fees represent the largest component of expenses for the Acquired Business. Since these fees are generally based on total assets under management, they increase or decrease proportionately with total assets under management. |
| | • | Compensation and Related Expenses. The Acquired Business employed 36 full-time employees prior to the Acquisition whom Aston hired upon the consummation of the Acquisition. The compensation and related expenses of the Acquired Business include the base salaries, incentive compensation, health insurance, retirement benefits and other costs related to the employees of the Acquired Business. These expenses increase and decrease with the addition or termination of employees. |
| | • | Related Party Expense Allocations. The most significant components of related party expense allocations include human resources, office space, data processing, accounting, operational, and other support services. |
| | • | Other Operating Expenses. The most significant components of other operating expenses include professional fees, occupancy, marketing and advertising, voice and data communication and travel and entertainment expenses. |
Impact of Inflation
The total revenue generated by the Acquired Business is directly linked to the total assets under management within the Acquired Business’ 19 mutual funds. The total assets under management increase or decrease on a daily basis as a result of appreciation or depreciation in the financial markets and net asset flow from investors. While long-term returns in the financial markets have historically exceeded the rate of inflation, this may not be the case going forward. The total operating expenses of the Acquired Business are likely to be directly affected by inflation.
Liquidity and Capital Resources
Historically, the Acquired Business has funded its business activities almost exclusively with operating cash flow. The Acquired Business has occasionally used capital from its parent company to finance the development of new mutual funds. These capital commitments have been used primarily to fund an initial capital investment in the new mutual funds. Because the Acquired Business, like most investment management businesses, does not require a high level of capital expenditures, such as for purchases of inventory, property, plant or equipment, liquidity is less of a concern than for a company that sells physical assets. Additionally, from time to time the Acquired Business has engaged in discussions relating to potential acquisitions of other companies in the investment management business. We have no present agreement, commitment or understanding with respect to any material acquisitions. Any future acquisitions may require that we obtain additional financing that will depend upon financing arrangements available at the time, if any.
As of September 30, 2006, the Acquired Business had cash and equivalents of $7.2 million and advisory and administrative fees receivable of $3.3 million. At this time, the Acquired Business also had accounts payable to affiliates of $1.5 million, accrued compensation and benefits of $0.3 million and other accrued liabilities of $0.9 million. Because the Acquired Business is able to finance its day-to-day operations with operating cash flow, it does not need to retain a significant amount of cash on its balance sheet. Historically, the amount of cash and cash equivalents held on the balance sheet of the Acquired Business has been primarily influenced by the motivations of its parent, ABN AMRO Asset Management Holdings, Inc., or AAAMHI. Prior to the Acquisition, AAAMHI owned 100% of the Acquired Business and continues to own several other affiliates which also have low capital requirements. As such, cash balances tend to build up in the affiliates until AAAMHI decides to transfer them. These periodic cash transfers cause the value of cash and equivalents held by the business to fluctuate widely and without correlation to the underlying operations of the Acquired Business. Going forward, we expect Aston will distribute all of its excess cash on a quarterly basis to its owners, so we do not expect large cash balances to accrue within Aston.
Cash Flows from Operating Activities. The cash flows from operating activities of the Acquired Business are comprised of two main items: net income (loss) and changes in assets and liabilities. For the nine months ended September 30, 2006, the Acquired Business produced net income of $2.8 million, as compared to net loss of $0.2 million for the same period in 2005. For the first nine months of 2006, total changes in assets and liabilities were $(0.5) million leading to net cash flows from operating activities of $2.3 million. This compares to $0.3 million of total changes in assets and liabilities and $0.1 million of cash flows from operating activities in the first nine months of 2005. For the year ended December 31, 2005, the Acquired Business produced a net loss of $23.6 million, as compared with net income of $1.5 million for the year ended December 31, 2004 and $0.6 million for the year ended December 31, 2003. The net loss for 2005 resulted primarily from a $13.3 million charge for goodwill impairment and a $10.4 million charge for intangible asset impairment. Changes in assets and liabilities were $(0.3) million leading to overall cash flows from operating activities of $(0.1) million for 2005. In 2004, the Acquired Business produced net income of $1.5 million and changes in assets and liabilities of $(0.1) million leading to net cash flows from operating activities of $1.4 million. For 2003, the Acquired Business produced net income of $0.6 million and changes in assets and liabilities of $(0.3) million leading to net cash flows from operating activities of $0.3 million. The increase in net cash flows from operating activities in 2004, relative to 2003, primarily resulted from an increase in net income.
Cash Flow from Financing Activities. For the nine months ended September 30, 2006, the Acquired Business transferred $0.3 million to its parent, AAAMHI, on a net basis, and received $0.7 million from AAAMHI during the nine months ended September 30, 2005. For the year ended December 31, 2005, net cash generated by the financing activities of the Acquired Business was $2.2 million, compared to a use of $0.8 million during the year ended December 31, 2004 and receipts of $1.4 million in 2003. The cash provided in 2005 and 2003 was the result of net transfers of $2.2 million and $1.4 million from AAAMHI, respectively. Cash used in 2004 included $2.5 million of dividends paid less $1.7 million of net transfers from AAAMHI.
Contractual Obligations
As of September 30, 2006, the Acquired Business did not have any contractual obligations.
Off Balance Sheet Items
As of September 30, 2006, the Acquired Business did not have any off-balance sheet arrangements.
Quantitative and Qualitative Disclosures about Market Risk
The investment management business is, by its nature, subject to numerous and substantial risks, including volatile trading markets and fluctuations in the volume of market activity. Consequently, net income and revenues of the Acquired Business are likely to be subject to wide fluctuations, reflecting the effect of many factors, including: general economic conditions; securities market conditions; the level and volatility of interest rates and equity prices; competitive conditions; liquidity of global markets; international and regional political conditions; regulatory and legislative developments; monetary and fiscal policy; investor sentiment; availability and cost of capital; technological changes and events; outcome of legal proceedings; changes in currency values; inflation; credit ratings; and the size, volume and timing of transactions. These and other factors could affect the stability and liquidity of securities and future markets, and the ability of the Acquired Business and other securities firms and counterparties to perform their obligations.
Critical Accounting Policies
The Acquired Business’ discussion and analysis of its financial condition and results of operations for the purposes of this document are based upon its consolidated financial statements, which have been prepared in accordance with accounting principles generally accepted in the United States of America.
The Acquired Business’ significant accounting policies are presented in Note 2 to its audited combined financial statements, and the following summaries should be read in conjunction with the financial statements and the related notes incorporated by reference herein. While all accounting policies affect the financial statements, certain policies may be viewed as critical. Critical accounting policies are those that are both most important to the portrayal of the financial statements and results of operations and that require management’s most subjective or complex judgments and estimates. The Acquired Business’ management believes the policies that fall within this category are the policies related to principles of combination, goodwill, intangible assets and income taxes.
Principles of Combination. The combined statements of operations, cash flows and owner’s equity for the years ended December 31, 2003, 2004, and 2005 have been prepared on a carve-out basis. The combined financial statements have been prepared from AAAMHI’s historical accounting records on a carve-out basis to include the historical financial position, results of operations and cash flows applicable to the Acquired Business. The combined financial statements have been prepared as if the business had been a stand-alone operation, though they are not necessarily representative of results had the Acquired Business operated as a stand-alone operation. Revenues, expenses, assets and liabilities were derived from amounts associated with the Acquired Business in the AAAMHI financial records. The financial results include allocations based on methodologies that management believes are reasonable of corporate expenses from AAAMHI and allocations of other corporate expenses from AAAMHI’s parent company that may be different from comparable expenses that would have been incurred if the Acquired Business operated as a stand-alone business. Specifically, ABN AMRO Services Company, Inc., a wholly-owned subsidiary of ABN AMRO North America Holding Company, or AANAHC, provides the Acquired Business with certain IT, infrastructure and e-mail services. LaSalle Bank Corporation, also a wholly-owned subsidiary of AANAHC, provides the Acquired Business with payroll, benefits, general ledger maintenance, internal audit and accounts payable services. These services are charged based upon utilized quantities (typically number of employees, number of transactions processed, hours worked). AAAMHI provides the Acquired Business with executive management, finance, human resources and personal trade compliance services. These services are charged based upon employee count or management time incurred. AAAMHI’s parent and its parent companies provide other executive management, technology, sales support, finance, compliance and human resources support services. These services are charged out on a formula basis that considers assets under management, number of employees and non-interest expense. The cost of these services is included under the caption “Related-party expense allocations” in the accompanying combined statements of operations. Certain cash receipts and cash payments related to the Acquired Business were handled through AAAMHI and affiliate cash accounts which are not included in the carve-out financial statements. “Net transfers from AAAMHI” in the combined statements of changes in owner’s equity reflects these cash transactions.
Goodwill and Intangible Assets. The Acquired Business has adopted the provisions of SFAS No. 142, “Goodwill and Other Intangible Assets”. Intangible assets, comprising the estimated value of investment management contracts and goodwill included in the combined financial statements of the Acquired Business, relate to the acquisition of certain AAAMHI affiliates including the Acquired Business. These amounts reflect management’s best estimate of a reasonable allocation to the Acquired Business of such amounts included in the financial records of AAAMHI. The provisions of SFAS No. 142 require that goodwill and other intangible assets with indefinite lives no longer be amortized, but instead be tested at least annually for impairment and require reporting units to be identified for the purpose of assessing potential future impairments of goodwill. The Acquired Business’ acquired intangible management contract asset related to the Target Funds is considered to be of an indefinite life as there is no foreseeable limit on the contract period. The Acquired Business conducts its annual testing of goodwill and intangible assets for impairment in the fourth quarter unless events warrant more frequent testing.
Recently Issued Pronouncements
Stock-Based Compensation. On December 16, 2004, FASB issued amended SFAS 123, “Accounting for Share-Based Payment,” or SFAS 123(R). SFAS 123(R) requires all companies to use the fair-value based method of accounting for stock-based compensation, and is in effect for the Acquired Business for its fiscal period beginning on January 1, 2006. SFAS 123(R) requires that all companies adopt either the modified prospective transition, or MPT, or modified retrospective transition, or MRT, method. Stock compensation expense calculated using the MPT approach would be recognized on a prospective basis in the financial statements over the requisite service period, while the MRT method allows a restatement of prior periods for amounts previously recorded as pro forma expense. The Acquired Business does not expect that the adoption of this standard to have a significant impact on its consolidated financial statements.
Results of Operations
Nine months ended September 30, 2006 compared to nine months ended September 30, 2005
In the first nine months of 2006, the Acquired Business’ assets under management declined $962 million (15.2%) to $5.4 billion. In comparison, assets under management declined $413 million (5.7%) during the first nine months of 2005 to $6.8 billion. While the S&P 500 and the Russell Large Cap Growth Index increased the first nine months of 2006 (8.5% and 3.0%, respectively), assets under management declined primarily as a result of net client redemptions of approximately $1.1 billion. Management believes the net redemptions in the first nine months are the result of investor concerns about recent relative performance trends in some of the Acquired Business’ large funds. In the first nine months of 2005, the Acquired Business experienced net redemptions of $629 million.
As a result of lower average asset levels and continued net asset redemptions, net advisory fees declined from $35.8 million in the first nine months of 2005 to $30.6 million in the first nine months of 2006, a drop of 14.4%, and administrative fees decreased from $1.1 million to $1.0 million. Total revenues for the first nine months of 2006 decreased by $5.3 million, or 14.3%, to $31.6 million from $36.9 million in the first nine months of 2005 as a direct result of the decline in net advisory fees. As a result of a shift in the composition of assets under management away from fixed income and into equities, the Acquired Business’ weighted average fee basis increased from 0.70% to 0.72%.
Distribution and advisory costs declined by $7.8 million, or 25.3% in the first nine months of 2006 from $30.9 million in the first nine months of 2005 to $23.1 million. A 21.7% decline in payments to affiliates ($22.3 million in the first nine months of 2005 to $17.5 million in the first nine months of 2006) was augmented by a 34.3% decrease in payments to non-affiliates ($8.6 million in the first nine months of 2005 to $5.6 million in the first nine months of 2006). Continued net redemptions in two of the Acquired Business’ large funds reduced advisory costs paid to affiliates, which are based on assets under management, by approximately $4.8 million relative to the prior period. The Acquired Business also paid approximately $3.2 million less for third-party distribution fees, relative to the first nine months of 2005, as a result of lower average asset balances and the postponement of certain marketing activities during the sale process.
All other operating expenses declined $0.2 million in aggregate or 3.8% during the first nine months of 2006 to $6.0 million from $6.2 million in the first nine months of 2005. Over this period, compensation expense decreased by $0.6 million from $3.8 million to $3.2 million and related party expense allocations increased only marginally. Other operating expenses in the first nine months of 2006 rose by $0.3 million relative to the first nine months of 2005.
Interest income rose to $242,878 in the first nine months of 2006 from $83,893 in the first nine months of 2005, an increase of $158,985, as a result of higher interest rates earned on cash balances and higher overall cash balances.
In the first nine months of 2006, net income was $2.8 million as compared to net loss of $0.2 million in the first nine months of 2005.
Year ended December 31, 2005 compared to Year ended December 31, 2004
In 2005, the assets under management of the Acquired Business declined $900 million (12.4%) from $7.2 billion at the end of 2004 to $6.3 billion. During this period the Acquired Business experienced net client redemptions of $1.0 billion balanced by $100 million of positive market appreciation. Positive market appreciation means that the total net asset value of a fund, when excluding the effects of net client contributions, increased over a given period as a result of changes in the market value of securities held by the fund. The high level of redemptions resulted primarily from concerns about relative investment performance in one of the Acquired Business’ large funds. Furthermore, the equity markets only posted moderate gains for the year with the S&P 500 advancing 4.9% and the Russell Large Cap Growth Index rising 5.3%. In 2004, for comparison, the S&P 500 advanced 10.9% and the Russell Large Cap Growth Index grew 6.7%.
As a result of lower average asset levels, net advisory fees declined in 2005 from $47.8 million in 2004 to $47.4 million. The effect of the net redemptions was balanced by an increase in the weighted average fee basis earned by the Acquired Business on its assets under management. The weighted average fee basis increased from 0.70% in 2004 to 0.72% in 2005 as a result of a shift in assets under management away from lower fee fixed income funds to higher fee equity funds. Administrative fees increased marginally from $1.4 million to $1.5 million. The Acquired Business negotiated lower sub-administration fee payments from a service provided in 2005 which increased the administrative fee margin earned. This renegotiation of fees more than offset the effect of the decline in total assets under management. For the year, total revenues decreased by $0.3 million, or 0.7%, to $48.9 million from $49.2 million in 2004.
Distribution and advisory costs declined by $0.5 million, or 1.3% in 2005 from $40.9 million in 2004 to $40.4 million. A 14.9% decline in payments to affiliates ($34.4 million in 2004 to $29.3 million in 2005) was offset by a 70.8% increase in payments to non-affiliates ($6.5 million in 2004 to $11.1 million in 2005). ABN AMRO sold its 401(k) business to Principal Financial on December 31, 2004. As a result of this divestiture, distribution fees paid by the Acquired Business to the 401(k) business were reclassified as payments to non-affiliates in 2005, whereas these payments were included in payments to affiliates in 2004. This is the primary reason for the shift in payments away from affiliates to non-affiliates relative to the prior period. In addition, the two funds sub-advised by non-affiliates experienced positive net sales in 2005 while the funds managed by affiliates experienced net redemptions.
All other operating expenses rose by $25.5 million in 2005 to $32.3 million from $6.8 million in 2004, largely as a result of a $13.3 million charge for goodwill impairment and a $10.4 million charge for intangible asset impairment.
The Acquired Business has adopted the provisions of SFAS No. 142, “Goodwill and Other Intangible Assets” (FAS 142). Intangible assets, comprising the estimated value of investment management contracts, and goodwill, included in the combined financial statements of the Acquired Business relate to the acquisition of certain AAAMHI affiliates including the Acquired Business in 2001. These amounts reflect management’s best estimate of a reasonable allocation to the Acquired Business of such amounts included in the financial records of AAAMHI. The provisions of SFAS No. 142 require that goodwill and other intangible assets with indefinite lives no longer be amortized, but instead be tested at least annually for impairment and require reporting units to be identified for the purpose of assessing potential future impairments of goodwill. The Acquired Business’ acquired intangible management contract asset relates to the provision of investment advisory services to the Target Funds in exchange for fees that are based on a percentage of the average daily net assets of the funds. These management contracts were acquired in 2001 as part of the acquisition of certain AAAMHI affiliates. The management contracts are subject to annual renewal by the Target Funds board of trustees which is expected to continue indefinitely since this has been the experience for the Funds as well as for the mutual fund industry as a whole. Accordingly, the Acquired Business’ acquired intangible assets related to the Target Funds are considered to be of an indefinite life as there is no foreseeable limit on the contract period. The Acquired Business conducts its annual testing of goodwill and intangible assets for impairment annually in the fourth quarter, unless events warrant more frequent testing.
The facts and circumstances leading to the impairment charges to goodwill and intangible assets relate to management’s assessment of declines in net assets in the Target Funds resulting from net share redemptions and unfavorable investment performance trends in 2005. The fair value of the Acquired Business used to determine the impairment of goodwill was determined with reference to the expected proceeds to be received upon the sale of the Acquired Business to Highbury. The fair value of the intangible asset related to the investment management contracts used to determine the amount of impairment of the intangible asset, was determined based on a discounted cash flow analysis of the acquired contracts. No impairment of goodwill or intangibles was determined to be required for periods prior to 2005.
Over this period, compensation expense increased by $0.8 million from $4.4 million to $5.2 million (17.6%). The Acquired Business hired three employees at the end of 2004 and two more employees in the summer of 2005. These hires increased the compensation expense. ABN AMRO also decided to reclassify certain sales incentives, previously recorded in distribution and sub-advisory costs, as compensation in 2005. Related party expense allocations increased by $0.6 million from $1.9 million to $2.5 million (32.1%) as a result of a change in ABN AMRO’s internal expense allocation philosophy. Other operating expenses increased by $0.3 million to $0.8 million in 2005 from $0.5 million in 2004, an increase of 6.2%. This increase resulted primarily from increased legal fees related to the formation of three new funds in 2005 and a significant increase in international travel as a result of changes in ABN AMRO’s internal reporting structure.
Interest income rose to $133,524 in 2005 from $31,140 in 2004, an increase of $120,384, as a result of higher cash balances held by Highbury and higher interest rates earned on those balances. The cash balances held by the Acquired Business are controlled by ABN AMRO. In 2005, ABN AMRO elected to allow cash to build in the Acquired Business’ accounts. Since the Acquired Business’s operating cash flow is sufficient to sustain its operations, it needs to retain very little capital. After the Acquisition, management does not expect to retain significant levels of cash in the Acquired Business.
Net loss for 2005 was $23.6 million as compared to net income of $1.5 million in 2004.
Year ended December 31, 2004 compared to year ended December 31, 2003
The assets under management of the Acquired Business increased $300 million (4.6%) in 2004 to $7.2 billion from $6.9 billion at the end of 2003. During this period the Acquired Business had net asset outflow of $100 million while market appreciation of $400 million fueled growth of $300 million in total assets under management. Net asset redemptions in one of the Target Funds balanced net sales in the rest of the Target funds in 2004. These results followed an excellent year for the Acquired Business in 2003 wherein net sales ($1.0 billion) and positive market appreciation ($1.0 billion) led growth in total assets under management from $4.9 billion to $6.9 billion. In 2003, the S&P 500 advanced 28.7% and the Russell Large Cap Growth Index gained 29.7%.
As a result of higher average assets under management, net advisory fees increased by $9.3 million from $38.5 million in 2003 to $47.8 million while administrative fees increased by $0.2 million from $1.2 million in 2003 to $1.4 million. The Acquired Business also benefited from an increase in the weighted average fee basis from 0.67% in 2003 to 0.70% in 2004. This shift resulted from a decline in fixed income assets under management relative to equity assets under management. As a result, total revenues in 2004 increased by $9.5 million, or 24.1%, to $49.2 million from $39.7 million in 2003.
Distribution and advisory costs increased by $7.4 million, or 22.0%, in 2004 from $33.5 million in 2003 to $40.9 million. This increase was driven by a 16.2% increase in payments to affiliates ($29.6 million in 2003 to $34.4 million in 2004) and a 66.8% increase in payments to non-affiliates ($3.9 million in 2003 to $6.5 million in 2004). These increased expenses were directly driven by increased level of assets under management in 2004 relative to 2003.
All other operating expenses rose by $1.3 million or 22.9%, in 2004 to $6.8 million from $5.5 million in 2003. Over this period, compensation expense increased by $0.5 million from $3.9 million to $4.4 million (12.6%) as a result of increased expenses for employee benefits and four employees hired during 2004. Related party expense allocations increased by $0.7 million from $1.2 million to $1.9 million (54.1%). Other operating expenses increased by $0.1 million from $0.4 million in 2003 to $0.5 million in 2004. In 2004, increased expenses for travel and entertainment were partially offset by a decline in legal fees, as the Acquired Business did not create any new funds in 2004.
Interest income increased 52.4% in 2004 to $31,140 from $20,432 in 2003 as a result of higher average cash balances.
Net income for 2004 was $1.5 million as compared to $0.6 million in 2003.
Management’s Discussion and Analysis of Financial Condition and Result of Operations of Highbury, included in the Definitive Revised Proxy Statement (No. 000-51682), dated November 3, 2006 and Highbury’s Quarterly Report filed on Form 10-QSB on October 13, 2006 with the Securities and Exchange Commission are incorporated herein by reference.
UNAUDITED PRO FORMA CONDENSED
COMBINED FINANCIAL STATEMENTS
The following unaudited pro forma condensed combined balance sheets combine the historical balance sheets of the Acquired Business and Highbury as of September 30, 2006, giving effect to the Acquisition as if it had occurred on September 30, 2006.
The following unaudited pro forma condensed combined statements of operations combine (i) the historical statement of operations of Highbury for the period beginning July 13, 2005, the date of Highbury’s inception, to December 31, 2005 and the historical combined statement of operations of the Acquired Business for its fiscal year ended December 31, 2005, giving effect to the Acquisition as if it had occurred on January 1, 2005, (ii) the historical statement of operations of Highbury and the historical combined statement of operations of the Acquired Business each, for the nine months ended September 30, 2006, giving effect to the Acquisition as if it had occurred on January 1, 2006 and (iii) the historical statement of operations of Highbury for the period beginning July 13, 2005, the date of Highbury’s inception, to September 30, 2005 and the historical statement of operations of the Acquired Business, for the nine months ended September 30, 2005, giving effect to the Acquisition as if it had occurred on January 1, 2005. In all cases, the unaudited pro forma condensed combined statements of operations assume Highbury’s initial public offering was consummated on the first day of the reporting period. We have adopted this convention so that the presentation of shares outstanding is consistent across all periods presented.
We are providing this information to aid you in your analysis of the financial aspects of the Acquisition. The unaudited pro forma condensed combined financial statements described above should be read in conjunction with the historical financial statements of Highbury and the historical combined statement of the Acquired Business and the related notes thereto. The pro forma adjustments are preliminary, and the unaudited pro forma information is not necessarily indicative of the financial position or results of operations that may have actually occurred had the Acquisition taken place on the dates noted, or the future financial position or operating results of Highbury. In addition, the allocation of the Acquisition purchase price shown in the pro forma adjustments is preliminary and will be subject to a final determination after the Acquisition. The final determination of the purchase price allocation may result in material allocation differences when compared to this preliminary allocation and the impact of the revised allocation may have a material effect on the actual results of the operation and financial position of the combined entities.
UNAUDITED PRO FORMA CONDENSED COMBINED BALANCE SHEET
SEPTEMBER 30, 2006
| | | Acquired Business | | Highbury Financial Inc. | | Pro Forma Adjustments | | | | Pro Forma Combined | |
| Assets | | | | | | | | | | | |
| Current assets: | | | | | | | | | | | |
| Cash and cash equivalents | | $ | 7,218,817 | | $ | 470,088 | | $ | 44,424,493 | | | (a) | | $ | 6,887,832 | |
| | | | | | | | | | (3,718,817 | ) | | (b) | | | | |
| | | | | | | | | | (38,600,000 | ) | | (c) | | | | |
| | | | | | | | | | (2,000,000 | ) | | (c) | | | | |
| | | | | | | | | | 384,041 | | | (d) | | | | |
| | | | | | | | | | (673,333 | ) | | (e) | | | | |
| | | | | | | | | | (13,363 | ) | | (f) | | | | |
| | | | | | | | | | 11,669 | | | (g) | | | | |
| | | | | | | | | | (603,780 | ) | | (h) | | | | |
| | | | | | | | | | (11,983 | ) | | (i) | | | | |
| | | | | | | | | | | | | | | | | |
| Cash and cash equivalents, held in trust | | | - | | | 44,424,493 | | | (44,424,493 | ) | | (a) | | | - | |
| Advisory and administrative fees receivable | | | 3,284,200 | | | - | | | (3,284,200 | ) | | (j) | | | - | |
| Prepaid expenses and other current assets | | | - | | | 78,795 | | | - | | | | | | 78,795 | |
| Total current assets | | | 10,503,017 | | | 44,973,376 | | | (48,509,766 | ) | | | | | 6,966,627 | |
| | | | | | | | | | | | | | | | | |
| Goodwill | | | 10,518,750 | | | - | | | (10,518,750 | ) | | (k) | | | 23,618,000 | |
| | | | | | | | | | 23,618,000 | | | (c) | | | | |
| Other intangible assets, net | | | 22,045,000 | | | - | | | (22,045,000 | ) | | (k) | | | - | |
| Identifiable intangibles | | | - | | | - | | | 13,032,000 | | | (c) | | | 13,032,000 | |
| Deferred acquisition costs | | | - | | | 1,136,422 | | | (1,136,422 | ) | | (d) | | | - | |
| Deferred tax assets, net | | | - | | | 204,018 | | | (204,018 | ) | | (l) | | | - | |
| Other assets | | | 1,635 | | | - | | | 448,365 | | | (c) | | | 450,000 | |
| Total assets | | $ | 43,068,402 | | $ | 46,313,816 | | $ | (45,315,591 | ) | | | | $ | 44,066,627 | |
| | | | | | | | | | | | | | | | | |
| Liabilities and Stockholders’ Equity | | | | | | | | | | | | | | | | |
| Current liabilities: | | | | | | | | | | | | | | | | |
| Accounts payable and accrued liabilities | | $ | - | | $ | 894,445 | | $ | (752,381 | ) | | (d) | | $ | 142,064 | |
| Accounts payable - affiliates | | | 1,459,012 | | | - | | | (1,459,012 | ) | | (j) | | | - | |
| Accrued compensation and benefits | | | 288,511 | | | - | | | (288,511 | ) | | (j) | | | - | |
| Income taxes payable | | | - | | | 262,366 | | | (144,786 | ) | | (l) | | | 117,580 | |
| Common stock warrants | | | - | | | 14,079,800 | | | - | | | | | | 14,079,800 | |
| Underwriters’ purchase option | | | - | | | 688,000 | | | - | | | | | | 688,000 | |
| Deferred underwriting fees | | | - | | | 673,333 | | | (673,333 | ) | | (e) | | | - | |
| Deferred investment income | | | - | | | 185,192 | | | (13,363 | ) | | (f) | | | - | |
| | | | | | | | | | (11,983 | ) | | (i) | | | | |
| | | | | | | | | | (159,846 | ) | | (m) | | | | |
| Total current liabilities | | | 1,747,523 | | | 16,783,136 | | | (3,503,215 | ) | | | | | 15,027,444 | |
| Other accrued liabilities | | | 875,143 | | | - | | | (875,143 | ) | | (j) | | | - | |
| Total liabilities | | | 2,622,666 | | | 16,783,136 | | | (4,378,358 | ) | | | | | 15,027,444 | |
| | | | | | | | | | | | | | | | | |
| Common stock, subject to possible conversion | | | - | | | 8,657,910 | | | (603,780 | ) | | (h) | | | - | |
| | | | | | | | | | (8,054,130 | ) | | (n) | | | | |
| Stockholders’ equity: | | | | | | | | | | | | | | | | |
| Common stock | | | | | | 964 | | | (11 | ) | | (h) | | | 953 | |
| Additional paid-in capital | | | 40,445,736 | | | 25,834,808 | | | (3,718,817 | ) | | (b) | | | 33,900,618 | |
| | | | | | | | | | (1,501,635 | ) | | (c) | | | | |
| | | | | | | | | | (2,000,000 | ) | | (c) | | | | |
| | | | | | | | | | (661,534 | ) | | (j) | | | | |
| | | | | | | | | | (10,518,750 | ) | | (k) | | | | |
| | | | | | | | | | (22,045,000 | ) | | (k) | | | | |
| | | | | | | | | | 11,669 | | | (g) | | | | |
| | | | | | | | | | 11 | | | (h) | | | | |
| | | | | | | | | | 8,054,130 | | | (n) | | | | |
| Income (deficit) accumulated | | | | | | (4,963,002 | ) | | (59,232 | ) | | (l) | | | (4,862,388 | ) |
| | | | | | | | | | 159,846 | | | (m) | | | | |
| Total stockholders’ equity | | | 40,445,736 | | | 20,872,770 | | | (32,439,169 | ) | | | | | 29,039,183 | |
| Total liabilities and stockholders’ equity | | $ | 43,068,402 | | $ | 46,313,816 | | $ | (37,421,307 | ) | | | | $ | 44,066,627 | |
See notes to unaudited pro forma condensed combined financial statements.
UNAUDITED PRO FORMA CONDENSED COMBINED
STATEMENT OF OPERATIONS
JULY 13, 2005 (INCEPTION) - DECEMBER 31, 2005 (HIGHBURY)
JANUARY 1, 2005 - DECEMBER 31, 2005 (ACQUIRED BUSINESS)
| | | Acquired Business | | Highbury Financial Inc. | | Pro Forma Adjustments | | | | Pro Forma Combined | | | |
| | | | | | | | | | | | | | |
| Revenue | | $ | 48,927,074 | | $ | - | | $ | - | | | | | $ | 48,927,074 | | | | |
| Distribution and sub-advisory fees | | | 40,405,752 | | | - | | | - | | | | | | 40,405,752 | | | | |
| | | | 8,521,322 | | | - | | | - | | | | | | 8,521,322 | | | | |
| Operating expenses: | | | | | | | | | | | | | | | | | | | |
| Compensation and related expenses | | | 5,194,449 | | | - | | | - | | | | | | 5,194,449 | | | | |
| Other operating expenses | | | 3,318,263 | | | 2,452 | | | - | | | | | | 3,320,715 | | | | |
| Goodwill impairment | | | 13,344,050 | | | - | | | - | | | | | | 13,344,050 | | | | |
| Intangible asset impairment | | | 10,425,533 | | | - | | | - | | | | | | 10,425,533 | | | | |
| Depreciation and other amortization | | | - | | | - | | | 71,477 | | | (o) | | | 71,477 | | | | |
| | | | 32,282,295 | | | 2,452 | | | 71,477 | | | | | | 32,356,224 | | | | |
| Operating income (loss) | | | (23,760,973 | ) | | (2,452 | ) | | (71,477 | ) | | | | | (23,834,902 | ) | | | |
| Non-operating income: | | | | | | | | | | | | | | | | | | | |
| Interest income (expense) | | | 133,524 | | | - | | | - | | | (p) | | | 133,524 | | | | |
| Income (loss) before minority interest and income taxes | | | (23,627,449 | ) | | (2,452 | ) | | (71,477 | ) | | | | | (23,701,378 | ) | | | |
| Minority interest | | | - | | | - | | | (8,341,358 | ) | | (q) | | | (8,341,358 | ) | | | |
| Income (loss) before income taxes | | | (23,627,449 | ) | | (2,452 | ) | | 8,269,881 | | | | | | (15,360,020 | ) | | | |
| Income taxes—current | | | - | | | - | | | (871,969 | ) | | (r) | | | (871,969 | ) | | | |
| Income taxes—intangible-related deferred | | | - | | | - | | | 905,397 | | | (r) | | | 905,397 | | | | |
| Net income (loss) | | $ | (23,627,449 | ) | $ | (2,452 | ) | $ | 8,236,453 | | | | | $ | (15,393,448 | ) | | | |
| | | | | | | | | | | | | | | | | | | | |
| Weighted average shares outstanding - basic | | | | | | 1,725,000 | | | | | | | | | 9,527,000 | | | | |
| Net income (loss) per share - basic | | | | | $ | (0.00 | ) | | | | | | | $ | (1.62 | ) | | | |
| Weighted average shares outstanding - diluted | | | | | | 1,725,000 | | | | | | | | | 9,527,000 | | | (s) | |
| Net income (loss) per share - diluted | | | | | $ | (0.00 | ) | | | | | | | $ | (1.62 | ) | | | |
See notes to unaudited pro forma condensed combined financial statements.
UNAUDITED PRO FORMA CONDENSED COMBINED
STATEMENT OF OPERATIONS
NINE MONTHS ENDED SEPTEMBER 30, 2006
| | | Acquired Business | | Highbury Financial Inc. | | Pro Forma Adjustments | | | | Pro Forma Combined | | | |
| | | | | | | | | | | | | | | | | | | | |
| Revenue | | $ | 31,629,982 | | $ | - | | $ | - | | | | | $ | 31,629,982 | | | | |
| Distribution and sub-advisory fees | | | 23,108,195 | | | - | | | - | | | | | | 23,108,195 | | | | |
| | | | 8,521,787 | | | - | | | - | | | | | | 8,521,787 | | | | |
| Operating expenses: | | | | | | | | | | | | | | | | | | | |
| Compensation and related expenses | | | 3,248,940 | | | - | | | - | | | | | | 3,248,940 | | | | |
| Other operating expenses | | | 2,762,360 | | | 408,323 | | | - | | | | | | 3,170,683 | | | | |
| Depreciation and other amortization | | | - | | | - | | | 53,608 | | | (o) | | | 53,608 | | | | |
| | | | 6,011,300 | | | 408,323 | | | 53,608 | | | | | | 6,473,231 | | | | |
| Operating income (loss) | | | 2,510,487 | | | (408,323 | ) | | (53,608 | ) | | | | | 2,048,556 | | | | |
| Non-operating income: | | | | | | | | | | | | | | | | | | | |
| Interest income (expense) | | | 242,878 | | | 1,188,923 | | | (1,188,923 | ) | | (p) | | | 242,878 | | | | |
| Loss from common stock warrants | | | - | | | (5,378,800 | ) | | - | | | | | | (5,378,800 | ) | | | |
| Loss from underwriters’ purchase option | | | - | | | (74,000 | ) | | | | | | | | (74,000 | ) | | | |
| Income (loss) before minority interest and income taxes | | | 2,753,365 | | | (4,672,200 | ) | | (1,242,531 | ) | | | | | (3,161,366 | ) | | | |
| Minority interest | | | - | | | - | | | 859,908 | | | (q) | | | 859,908 | | | | |
| Income (loss) before income taxes | | | 2,753,365 | | | (4,672,200 | ) | | (2,102,439 | ) | | | | | (4,021,274 | ) | | | |
| Income taxes—current | | | - | | | 492,366 | | | (492,366 | ) | | (t) | | | (148,584 | ) | | | |
| | | | | | | | | | (148,584 | ) | | (r) | | | | | | | |
| Income taxes—intangible-related deferred | | | - | | | - | | | 679,048 | | | (r) | | | 679,048 | | | | |
| Income taxes—other deferred | | | - | | | (204,016 | ) | | 204,016 | | | (t) | | | - | | | | |
| Net income (loss) | | $ | 2,753,365 | | $ | (4,960,550 | ) | $ | (2,344,553 | ) | | | | $ | (4,551,738 | ) | | | |
| | | | | | | | | | | | | | | | | | | | |
| Weighted average shares outstanding - basic | | | | | | 8,859,469 | | | | | | | | | 9,527,000 | | | | |
| Net income (loss) per share - basic | | | | | $ | (0.56 | ) | | | | | | | $ | (0.48 | ) | | | |
| Weighted average shares outstanding - diluted | | | | | | 8,859,469 | | | | | | | | | 9,527,000 | | | (s) | |
| Net income (loss) per share - diluted | | | | | $ | (0.56 | ) | | | | | | | $ | (0.48 | ) | | | |
See notes to unaudited pro forma condensed combined financial statements.
UNAUDITED PRO FORMA CONDENSED
STATEMENT OF OPERATIONS
NINE MONTHS ENDED SEPTEMBER 30, 2005
| | | Acquired Business | | Highbury Financial Inc. | | Pro Forma Adjustments | | | | Pro Forma Combined | | | |
| | | | | | | | | | | | | | |
| Revenue | | $ | 36,896,527 | | $ | - | | $ | - | | | | | $ | 36,896,527 | | | | |
| Distribution and sub-advisory fees | | | 30,913,968 | | | - | | | - | | | | | | 30,913,968 | | | | |
| | | | 5,982,559 | | | - | | | - | | | | | | 5,982,559 | | | | |
| Operating expenses: | | | | | | | | | | | | | | | | | | | |
| Compensation and related expenses | | | 3,830,626 | | | - | | | - | | | | | | 3,830,626 | | | | |
| Other operating expenses | | | 2,420,094 | | | 456 | | | - | | | | | | 2,420,550 | | | | |
| Depreciation and other amortization | | | - | | | - | | | 53,608 | | | (o) | | | 53,608 | | | | |
| | | | 6,250,720 | | | 456 | | | 53,608 | | | | | | 6,304,784 | | | | |
| Operating income (loss) | | | (268,161 | ) | | (456 | ) | | (53,608 | ) | | | | | (322,225 | ) | | | |
| Non-operating income: | | | | | | | | | | | | | | | | | | | |
| Interest income (expense) | | | 83,893 | | | - | | | - | | | (p) | | | 83,893 | | | | |
| Income (loss) before minority interest and income taxes | | | (184,268 | ) | | (456 | ) | | (53,608 | ) | | | | | (238,332 | ) | | | |
| Minority interest | | | - | | | - | | | (112,619 | ) | | (q) | | | (112,619 | ) | | | |
| Income (loss) before income taxes | | | (184,268 | ) | | (456 | ) | | 59,011 | | | | | | (125,713 | ) | | | |
| Income taxes—current | | | - | | | - | | | (725,631 | ) | | (r) | | | (725,631 | ) | | | |
| Income taxes—intangible-related deferred | | | - | | | - | | | 679,047 | | | (r) | | | 679,047 | | | | |
| Net income (loss) | | $ | (184,268 | ) | $ | (456 | ) | $ | 105,595 | | | | | $ | (79,129 | ) | | | |
| | | | | | | | | | | | | | | | | | | | |
| Weighted average shares outstanding - basic | | | | | | 1,725,000 | | | | | | | | | 9,527,000 | | | | |
| Net income (loss) per share - basic | | | | | $ | (0.00 | ) | | | | | | | $ | (0.01 | ) | | | |
| Weighted average shares outstanding - diluted | | | | | | 1,725,000 | | | | | | | | | 9,527,000 | | | (s) | |
| Net income (loss) per share - diluted | | | | | $ | (0.00 | ) | | | | | | | $ | (0.01 | ) | | | |
| | | | | | | | | | | | | | | | | | | | |
See notes to unaudited pro forma condensed combined financial statements.
NOTES TO UNAUDITED PRO FORMA CONDENSED
COMBINED FINANCIAL STATEMENTS
PRO FORMA ADJUSTMENTS
Adjustments included in the column under the heading “Pro forma Adjustments” include the following:
| | a. | To reflect the funds held in the trust account by Highbury released in connection with the Acquisition. |
| | b. | To reflect the difference between the Acquired Business’ cash of $7,218,817 and the acquired cash of $3,500,000. |
| | c. | To reflect the purchase price, the costs of the Acquisition and the related allocation thereof to the fair values of assets and liabilities acquired: |
| Purchase price | | $ | 38,600,000 | |
| Costs of the acquisition | | | 2,000,000 | |
| | | $ | 40,600,000 | |
| | | | | |
| Working capital | | $ | 3,500,000 | |
| Fixed assets | | | 450,000 | |
| Goodwill | | | 23,618,000 | |
| Identifiable intangibles | | | 13,032,000 | |
| | | $ | 40,600,000 | |
The purchase price (i) excludes up to $3.8 million that would be payable if the annualized investment advisory fee revenue generated under investment advisory contracts for the six months prior to the second anniversary of the closing of the Acquisition exceeds $41.8 million and (ii) includes up to $3.8 million that would be refundable if the annualized investment advisory fee revenue generated under investment advisory contracts for the six months prior to the second anniversary of the closing of the Acquisition is less than $34.2 million. This increase or decrease in consideration will be recorded when the contingency is resolved and additional consideration is receivable or refundable. Highbury will record any additional consideration issued as an additional cost of the acquired entity and such amount will increase the allocation to goodwill. If Highbury receives a refund of amounts paid, the amount refunded will be recorded as a decrease in the cost of the acquired entity and such amount will decrease the allocation to goodwill.
Highbury currently believes the total costs of the Acquisition will be approximately $2,000,000 including, but not limited to, legal fees and expenses, accounting fees, proxy solicitation costs and printing fees. These costs will be paid from the funds available to Highbury. As of September 30, 2006, $1,136,422 of such costs have been accrued and recorded as deferred acquisition costs on Highbury’s balance sheet. As of September 30, 2006, $384,041 of such costs have been paid.
The purchase price and the other costs of the Acquisition are allocated based on the fair value of net assets acquired. Highbury will acquire $3.5 million of cash and approximately $450,000 of fixed assets, including furniture and equipment, information technology resources and other assets. In connection with this Acquisition, AAAMHI has committed to pay Highbury or Aston up to $250,000 for the purchase of new furniture and equipment and up to $175,000 for the purchase of new information technology systems and infrastructure. These assets are not reflected on the balance sheet of the Acquired Business as of September 30, 2006 but will be in place after the closing of the Acquisition. Highbury estimates that the fair market value of all other fixed assets acquired is approximately $25,000. See Note (o) for additional information about the fixed assets acquired.
A substantial amount of the purchase price is allocated to identifiable intangibles, which are the acquired mutual fund advisory contracts. In determining the allocation of the purchase price to the acquired mutual fund advisory contracts, Highbury has analyzed the present value of the Acquired Business’ existing mutual fund advisory contracts based on a number of factors including: the Acquired Business’ historical and potential future operating performance; the historical and potential future rates of new business from new and existing clients and attrition among existing clients; the stability and longevity of existing advisory and sub-advisory relationships; the Acquired Business’ recent, as well as long-term, investment performance; the characteristics of the Acquired Business’ products and investment styles; the stability and depth of the management team; and the Acquired Business’ history and perceived franchise or brand value.
Highbury has determined that the acquired mutual fund advisory contracts of the Acquired Business meet the indefinite life criteria outlined in FAS No. 142, “Goodwill and Other Intangible Assets”, because Highbury assumes there is no foreseeable limit on the contract period due to the likelihood of continued renewal at little or no cost and therefore expects the cash flows generated by these assets to continue indefinitely.
The Target Funds represent 19 separate series of a single Delaware business trust which is an indefinite life vehicle. The terms of Aston’s advisory contracts with the Target Funds provide for the periodic review and renewal of the advisory contracts. Since the formation of the Target Funds, their advisory contracts with their adviser have typically been continually renewed at little or no cost to the Acquired Business.
Highbury has no basis to believe these contracts will not be renewed continually in the future. Highbury expects that new funds may be created within the business trust in the future to satisfy demand in the market and understands that mutual funds may be merged or closed over time, although there are no such plans now. As a result, Highbury believes that Aston’s mutual funds may change over time but expects that revenues under investment advisory contracts with the mutual funds will continue to generate cash flows for Aston. Accordingly, Highbury does not intend to amortize these intangible assets, but instead will review these assets at least annually for impairment.
Aston’s advisory agreements with the Target Funds give the Funds’ trustees the authority to terminate the advisory contracts at any time. Such a termination event might occur if, for example, Aston fails to maintain adequate compliance functions, has insufficient resources to manage the Target Funds or engages in fraudulent activities. In the event of such a termination, Highbury may determine that the intangible assets have been impaired and recognize an impairment charge to reduce the carrying value of the intangible assets to their then-fair value. Each reporting period, Highbury will assess whether events or circumstances have occurred which indicate that the indefinite life criteria are no longer met. If the indefinite life criteria are no longer met, Highbury will assess whether the carrying value of the assets exceeds their fair value, and an impairment loss will be recorded in an amount equal to any such excess.
The excess of purchase price for the Acquisition over the fair value of net assets acquired, including acquired mutual fund advisory contracts, is reported as goodwill. Goodwill will not be amortized, but will instead be reviewed for impairment. Highbury will assess goodwill for impairment at least annually, or more frequently whenever events or circumstances occur indicating that the recorded goodwill may be impaired. If the carrying amount of goodwill exceeds the fair value, an impairment loss will be recorded in an amount equal to that excess.
In addition to a termination of Aston’s advisory contracts as discussed above, there are many risks related to the financial services industry and Aston which could negatively impact Aston in the future and potentially lead to impairment charges. The financial services industry faces regulatory risk and Aston may experience reduced revenues and profitability if its services are not regarded as compliant with regulatory statutes. In addition, downward pressure on Aston’s fees as a result of price competition in the mutual fund industry or a market or general economic downturn could lead to losses of revenue and profitability. For more information on risks which may cause the goodwill or intangible assets to be impaired and lead to an impairment charge, please see “Risk Factors — Risks Related to the Financial Services Industry and Aston” in the Definitive Revised Proxy Statement (No. 000-51682), dated November 3, 2006.
This purchase price allocation is preliminary and will be subject to a final determination after the closing of the Acquisition. The final determination of the purchase price allocation may result in material allocation differences when compared to this preliminary allocation and the impact of the revised allocation may have a material effect on the actual results of operation and financial position of the combined entities.
| | d. | To reverse accrual of deferred Acquisition costs (a portion of the $2,000,000 of estimated costs of Acquisition described in Note (c) above) and adjust for amounts paid prior to the Acquisition. |
| | e. | To reflect payment of the underwriters’ deferred compensation of $673,333. |
| | f. | To reflect payment of accrued interest on the underwriters’ deferred compensation. |
| | g. | To reflect reduction in payment of underwriters’ deferred compensation by approximately $0.11 per share that the shareholders elect to convert in connection with the Acquisition. |
| | h. | To reflect conversion of 108,000 shares by owners of Highbury’s common stock into cash upon consummation of the Acquisition. These shares are no longer outstanding and have been retired. |
| | i. | To reflect payment of pro rata interest earned on the trust account (net of taxes payable) to holders of Highbury’s common stock who elected to convert their shares into cash upon consummation of the Acquisition. |
| | j. | To remove assets and liabilities of the Acquired Business that Highbury did not acquire. |
| | k. | Goodwill and other intangibles of the Acquired Business will be eliminated under purchase accounting. As explained in Note (c), Highbury has established new values for the goodwill and other intangibles as of the closing of the Acquisition. |
| | l. | To reflect deductibility of expenses previously deferred and tax effect of recognition or return of income in Note (m) or Note (i). |
| | m. | To reflect recognition of deferred investment income. |
| | n. | After the consummation of the Acquisition no common stock will be subject to potential conversion. |
| | o. | To reflect depreciation of fixed assets of the Acquired Business according to the following schedule: |
Type of Asset | | Fair Value of Assets | | Useful Life (years) | |
| | | | | | |
| Information technology | | $ | 175,000 | | | 4 | |
| Furniture and equipment | | | 250,000 | | | 11 | |
| Other | | | 25,000 | | | 5 | |
| | | $ | 450,000 | | | | |
| | p. | To reflect pro forma interest income incurred by the combined business for the period presented. After the Acquisition, Highbury’s cash balances may be eligible to earn interest. However, given the uncertainty regarding the use of cash after the Acquisition, interest income earned by Highbury in the period ended September 30, 2006 has been excluded and no interest income (in excess of interest income earned by the Acquired Business in the applicable period) has been included in the pro forma financial statements. |
| | q. | Equal to Aston management’s 35% share of the income (loss) before minority interest and income taxes of the Acquired Business. Upon consummation of the Acquisition, as a result of the amendment to the limited liability company amendment to admit the Aston management members, Highbury will incur a one-time, non-cash compensation charge of approximately $20.8 million. Since this is a non-recurring item, it has not been included in the accompanying pro forma statements of operations. |
To establish the $20.8 million compensation charge for financial reporting purposes, Highbury used an asset-based approach. Based on the purchase price of $38.6 million, our management team determined that the minimum value of Highbury’s 65% manager membership interest in Aston was $38.6 million, and therefore the minimum valuation for 100% of Aston was approximately $59.4 million. Our management team then concluded that the value of the Aston management members’ 35% interest was equal to the difference between these two values, or approximately $20.8 million.
| | r. | Highbury’s estimated income tax liabilities for both GAAP and cash purposes are based on assumed federal and Colorado state income tax rates of 34.00% and 4.63%, respectively. Since Colorado state income taxes are deductible for federal income tax purposes, Highbury’s estimated effective tax rate is 37.06%. On the statement of operations, income taxes - current are equal to the total tax liability calculated on a cash basis. These calculations are shown in the following tables, and the results are indicated in the line entitled “total tax liability - current.” On the statement of operations, income taxes - deferred are equal to the difference between total tax liability calculated for GAAP purposes and the total tax liability calculated on a cash basis. These calculations are also shown in the following tables. The results of the calculations of the total tax liability calculated for GAAP purposes are indicated in the line entitled “Total tax liability (benefit) - GAAP” and the difference between these first two calculations is indicated in the line entitled “deferred tax liability (benefit).” |
This deferred tax liability is created as a result of the anticipated amortization of intangibles for cash tax purposes going forward. The goodwill impairment and intangible asset impairment charges taken by the Acquired Business in 2005 will not create current or future income tax benefits for the combined company. Highbury will record goodwill and intangible assets to the balance sheet of the Acquired Business to reflect the value of the assets acquired in the Acquisition. As explained in footnote (c) above, Highbury intends to amortize the intangible assets for cash tax purposes which will reduce Highbury’s annual cash income taxes and create a recurring tax benefit. Furthermore, Highbury has determined that the acquired mutual fund client relationships meet the indefinite life criteria outlined in FAS No. 142, “Goodwill and Other Intangible Assets,” and as such, Highbury will not amortize these intangible assets for GAAP purposes, but will instead review these assets at least annually for impairment. Highbury expects this difference in amortization schedules will create an annual deferred tax liability for GAAP purposes. Because Highbury does not anticipate impairment of the acquired assets in the future, Highbury does not expect this recurring tax benefit to reverse. Although the Acquired Business has historically provided a full valuation allowance for its deferred tax asset, Highbury does not believe that it will make such a provision after the Acquisition as a result of the increased profitability of the Acquired Business on a pro forma basis.
RECONCILIATION OF CURRENT AND DEFERRED INCOME TAXES
FOR THE INDICATED PERIODS
| | | Nine Months Ended September 30, | | Year Ended December 31, | |
| | | 2006 | | 2005 | | 2005 | |
| | | | | | | | |
| Income (loss) before income taxes - GAAP | | $ | (4,021,274 | ) | $ | (125,713 | ) | $ | (15,360,020 | ) |
| | | | | | | | | | | |
| Permanent differences: | | | | | | | | | | |
| Goodwill impairment | | | - | | | - | | | 13,344,050 | |
| Intangible asset impairment | | | - | | | - | | | 10,425,533 | |
| Minority interest adjustment | | | - | | | - | | | (8,319,354 | ) |
| Loss from derivative liabilities | | | 5,452,800 | | | - | | | - | |
| Taxable income - GAAP | | | 1,431,526 | | | (125,713 | ) | | 90,209 | |
| | | | | | | | | | | |
| Colorado state income tax liability | | | 66,280 | | | (5,821 | ) | | 4,177 | |
| Federal income tax liability | | | 464,184 | | | (40,763 | ) | | 29,251 | |
| Total tax liability - GAAP | | | 530,464 | | | (46,584 | ) | | 33,428 | |
| | | | | | | | | | | |
| Net income (loss) - GAAP | | $ | (4,551,738 | ) | $ | (79,129 | ) | $ | (15,393,448 | ) |
| | | | | | | | | | | |
| | | | | | | | | | | |
| Income (loss) before income taxes - GAAP | | $ | (4,021,274 | ) | $ | (125,713 | ) | $ | (15,360,020 | ) |
| Addback: goodwill impairment | | | - | | | - | | | 13,344,050 | |
| Addback: intangible asset impairment | | | - | | | - | | | 10,425,533 | |
| Less: minority interest adjustment | | | - | | | - | | | (8,319,354 | ) |
| Addback: Loss from derivative liabilities | | | 5,452,800 | | | - | | | - | |
| Less: goodwill amortization | | | (1,832,500 | ) | | (1,832,500 | ) | | (2,443,333 | ) |
| Cash taxable income | | | (400,974 | ) | | (1,958,213 | ) | | (2,353,124 | ) |
| | | | | | | | | | | |
| Colorado state income tax liability | | | (18,565 | ) | | (90,665 | ) | | (108,950 | ) |
| Federal income tax liability | | | (130,019 | ) | | (634,966 | ) | | (763,019 | ) |
| Total tax liability - current | | | (148,584 | ) | | (725,631 | ) | | (871,969 | ) |
| | | | | | | | | | | |
| Deferred tax liability for goodwill amortization | | | 679,048 | | | 679,047 | | | 905,397 | |
| Total tax liability - GAAP | | $ | 530,464 | | $ | (46,584 | ) | $ | 33,428 | |
| | s. | Uses treasury stock method based on weighted average common stock price of $5.59 for the period from March 1, 2006 through September 30, 2006. Highbury has 15,820,000 warrants outstanding, all of which are exercisable for $5.00 per share, as of September 30, 2006. The effect of the 336,667 units included in the underwriters purchase option has not been considered in diluted income per share calculations since the option is out-of-the money based on Highbury’s weighted average common stock price for the period. |
| | t. | To remove income taxes of Highbury as a stand-alone entity. |
SUPPLEMENTAL FINANCIAL INFORMATION
As supplemental information, we provide below a non-GAAP performance measure that we refer to as “Supplemental Adjusted Operating Results”. The Supplemental Adjusted Operating Results apply the adjustments described below to our unaudited pro forma condensed combined statements of operations included in this Form 8-K under the heading “Unaudited Pro Forma Condensed Combined Financial Statements,” which are derived from (i) the historical statement of operations of Highbury for the period beginning July 13, 2005, the date of Highbury’s inception, to December 31, 2005, and the historical combined statement of operations of the Acquired Business for its fiscal year ended December 31, 2005, giving effect to the Acquisition as if it had occurred on January 1, 2005, (ii) the historical statement of operations of Highbury and the historical combined statement of operations of the Acquired Business, each for the nine months ended September 30, 2006, giving effect to the Acquisition as if it had occurred on January 1, 2006 and (iii) the historical statement of operations of Highbury for the period beginning July 13, 2005, the date of Highbury’s inception, to September 30, 2005 and the historical statement of operations of the Acquired Business, for the nine months ended September 30, 2005, giving effect to the Acquisition as if it had occurred on January 1, 2005. The Supplemental Adjusted Operating Results are not pro forma financial information and are not included in the historical financial statements of Highbury, the historical combined financial statements of the Acquired Business or the Unaudited Pro Forma Condensed Combined Financial Statements. Because the contractual provisions supporting the adjustments described in the footnotes to the Supplemental Adjusted Operating Results take effect upon the closing of the Acquisition, the supplemental non-GAAP financial information provided below constitutes forward-looking statements based upon certain management assumptions. The contractual provisions supporting the adjustments will not necessarily produce the Supplemental Adjusted Operating Results shown below.
The Supplemental Adjusted Operating Results reflect adjustments to our Unaudited Pro Forma Condensed Combined Results of Operations for (i) Highbury for the period beginning July 13, 2005, the date of Highbury’s inception, to December 31, 2005, and the Acquired Business for the period ended December 31, 2005, as if the following agreements had been entered into on January 1, 2005, (ii) Highbury and the Acquired Business, for the nine months ended September 30, 2006, as if such agreements had been entered into on January 1, 2006 and (iii) the historical statement of operations of Highbury for the period beginning July 13, 2005, the date of Highbury’s inception, to September 30, 2005 and the Acquired Business for the nine months ended September 30, 2005, as if such agreements had been entered into on January 1, 2005: (a) the Administrative, Compliance and Marketing Services Agreement entered into between AAAMI and Aston as of September 1, 2006 (described further in footnote (a) below), (ii) new fee-sharing agreements with investment sub-advisers affiliated with the Sellers to be entered into upon consummation of the Acquisition (as described further in footnote (b) below, the execution of these agreements on the pricing terms reflected in the Proxy Statement was a condition to the closing of the Acquisition), and (iii) Aston’s limited liability company agreement, whereby 72% of gross revenues are allocated to cover the operating expenses of the Acquired Business (described further in footnote (c) below). In addition, the Supplemental Adjusted Operating Results reflect adjustments to minority interest and income taxes related to the foregoing adjustments (described further in footnotes (d) and (e), respectively, below).
The Supplemental Adjusted Operating Results should be read in conjunction with the historical financial statements of Highbury, the historical combined financial statements of the Acquired Business and the related notes thereto, the unaudited condensed combined financial statements and “Management’s Discussion and Analysis of Financial Condition and Results of Operations of the Acquired Business.” This supplemental non-GAAP financial information is provided in addition to, but not as a substitute for, our operating results and those of the Acquired Business calculated and presented in accordance with GAAP and our Pro Forma Condensed Combined Statements of Operations prepared in accordance with Article 11 of Regulation S-X.
We are providing this information to aid you in your analysis of the financial aspects of the acquisition because we believe that these agreements will have a substantial effect on the results of operations of the combined company and because we considered the impact of the limited liability company agreement and the new sub-advisory fee arrangements, and related minority interest and income tax impacts, in connection with our entering into the Asset Purchase Agreement. The information is intended to provide you with an estimate of the effect these agreements would have had on the results of operations of the combined company for the periods presented. The Supplemental Adjusted Operating Results presented are not meant to estimate or project future results of operations, should not be considered in isolation and have limitations as an analytic tool. Some of these limitations are that had these agreements been in effect during the periods presented, the actual results of operations may have been different, and that the Supplemental Adjusted Operating Results are not necessarily indicative of the financial results that may have actually occurred.
SUPPLEMENTAL ADJUSTED OPERATING RESULTS
JULY 13, 2005 (INCEPTION) - DECEMBER 31, 2005 (HIGHBURY)
JANUARY 1, 2005 - DECEMBER 31, 2005 (ACQUIRED BUSINESS)
| | | Pro Forma Combined | | Supplemental Adjustments | | | | Supplemental Combined | |
| | | | | | | | | | |
| Revenue | | $ | 48,927,074 | | $ | 1,298,437 | | | (a) | | $ | 50,225,511 | |
| Distribution and sub-advisory fees | | | 40,405,752 | | | (14,082,567 | ) | | (b) | | | 26,323,185 | |
| | | | 8,521,322 | | | 15,381,004 | | | | | | 23,902,326 | |
| Operating expenses: | | | | | | | | | | | | | |
| Compensation and related expenses | | | 5,194,449 | | | 1,254,994 | | | (c) | | | 6,449,443 | |
| Other operating expenses | | | 3,320,715 | | | - | | | | | | 3,320,715 | |
| Goodwill impairment | | | 13,344,050 | | | - | | | | | | 13,344,050 | |
| Intangible asset impairment | | | 10,425,533 | | | - | | | | | | 10,425,533 | |
| Depreciation and other amortization | | | 71,477 | | | - | | | | | | 71,477 | |
| | | | 32,356,224 | | | 1,254,994 | | | | | | 33,611,218 | |
| Operating income (loss) | | | (23,834,902 | ) | | 14,126,010 | | | | | | (9,708,892 | ) |
| Non-operating income: | | | | | | | | | | | | | |
| Interest income (expense) | | | 133,524 | | | - | | | | | | 133,524 | |
| Income (loss) before minority interest and income taxes | | | (23,701,378 | ) | | 14,126,010 | | | | | | (9,575,368 | ) |
| Minority interest | | | (8,341,358 | ) | | 4,944,104 | | | | | | (3,397,254 | ) |
| Income (loss) before income taxes | | | (15,360,020 | ) | | 9,181,906 | | | | | | (6,178,114 | ) |
| Income taxes—current | | | (871,969 | ) | | 3,402,429 | | | | | | 2,530,460 | |
| Income taxes—intangible-related deferred | | | 905,397 | | | 1 | | | | | | 905,396 | |
| Net income (loss) | | $ | (15,393,448 | ) | $ | 5,779,478 | | | | | $ | (9,613,970 | ) |
| | | | | | | | | | | | | | |
| Weighted average shares outstanding - basic | | | 9,527,000 | | | | | | | | | 9,527,000 | |
| Net income (loss) per share - basic | | $ | (1.62 | ) | | | | | | | $ | (1.01 | ) |
| Weighted average shares outstanding - diluted | | | 9,527,000 | | | | | | | | | 9,527,000 | |
| Net income (loss) per share - diluted | | $ | (1.62 | ) | | | | | | | $ | (1.01 | ) |
SUPPLEMENTAL ADJUSTED OPERATING RESULTS
NINE MONTHS ENDED SEPTEMBER 30, 2006
| | | Pro Forma Combined | | Supplemental Adjustments | | | | Supplemental Combined | |
| | | | | | | | | | |
| Revenue | | $ | 31,629,982 | | $ | 858,208 | | | (a) | | $ | 32,488,190 | |
| Distribution and sub-advisory fees | | | 23,108,195 | | | (7,114,497 | ) | | (b) | | | 15,993,698 | |
| | | | 8,521,787 | | | 7,972,705 | | | | | | 16,494,492 | |
| Operating expenses: | | | | | | | | | | | | | |
| Compensation and related expenses | | | 3,248,940 | | | 1,332,891 | | | (c) | | | 4,581,831 | |
| Other operating expenses | | | 3,170,683 | | | - | | | | | | 3,170,683 | |
| Depreciation and other amortization | | | 53,608 | | | - | | | | | | 53,608 | |
| | | | 6,473,231 | | | 1,332,891 | | | | | | 7,806,122 | |
| Operating income (loss) | | | 2,048,556 | | | 6,639,814 | | | | | | 8,688,370 | |
| Non-operating income: | | | | | | | | | | | | | |
| Interest income (expense) | | | 242,878 | | | - | | | | | | 242,878 | |
| Loss from common stock warrants | | | (5,378,800 | ) | | - | | | | | | (5,378,800 | ) |
| Loss from underwriters’ purchase option | | | (74,000 | ) | | - | | | | | | (74,000 | ) |
| Income (loss) before minority interest and income taxes | | | (3,161,366 | ) | | 6,639,814 | | | | | | 3,478,448 | |
| Minority interest | | | 859,908 | | | 2,323,935 | | | | | | 3,183,843 | |
| Income (loss) before income taxes | | | (4,021,274 | ) | | 4,315,879 | | | | | | 294,605 | |
| Income taxes—current | | | (148,584 | ) | | 1,599,283 | | | | | | 1,450,699 | |
| Income taxes—intangible-related deferred | | | 679,048 | | | - | | | | | | 679,048 | |
| Income taxes—other deferred | | | - | | | - | | | | | | - | |
| Net income (loss) | | $ | (4,551,738 | ) | $ | 2,716,596 | | | | | $ | (1,835,142 | ) |
| | | | | | | | | | | | | | |
| Weighted average shares outstanding - basic | | | 9,527,000 | | | | | | | | | 9,527,000 | |
| Net income (loss) per share - basic | | $ | (0.48 | ) | | | | | | | $ | (0.19 | ) |
| Weighted average shares outstanding - diluted | | | 9,527,000 | | | | | | | | | 9,527,000 | |
| Net income (loss) per share - diluted | | $ | (0.48 | ) | | | | | | | $ | (0.19 | ) |
SUPPLEMENTAL ADJUSTED OPERATING RESULTS
NINE MONTHS ENDED SEPTEMBER 30, 2005
| | | Pro Forma Combined | | Supplemental Adjustments | | | | Supplemental Combined | |
| | | | | | | | | | |
| Revenue | | $ | 36,896,527 | | $ | 804,468 | | | (a) | | $ | 37,700,995 | |
| Distribution and sub-advisory fees | | | 30,913,968 | | | (11,687,589 | ) | | (b) | | | 19,226,379 | |
| | | | 5,982,559 | | | 12,492,057 | | | | | | 18,474,616 | |
| Operating expenses: | | | | | | | | | | | | | |
| Compensation and related expenses | | | 3,830,626 | | | 1,614,009 | | | (c) | | | 5,444,635 | |
| Other operating expenses | | | 2,420,550 | | | - | | | | | | 2,420,550 | |
| Depreciation and other amortization | | | 53,608 | | | - | | | | | | 53,608 | |
| | | | 6,304,784 | | | 1,614,009 | | | | | | 7,918,793 | |
| Operating income (loss) | | | (322,225 | ) | | 10,878,048 | | | | | | 10,555,823 | |
| Non-operating income: | | | | | | | | | | | | | |
| Interest income (expense) | | | 83,893 | | | - | | | | | | 83,893 | |
| Income (loss) before minority interest and income taxes | | | (238,332 | ) | | 10,878,048 | | | | | | 10,639,716 | |
| Minority interest | | | (112,619 | ) | | 3,807,317 | | | | | | 3,694,698 | |
| Income (loss) before income taxes | | | (125,713 | ) | | 7,070,731 | | | | | | 6,945,018 | |
| Income taxes—current | | | (725,631 | ) | | 2,620,116 | | | | | | 1,894,485 | |
| Income taxes—intangible-related deferred | | | 679,047 | | | - | | | | | | 679,047 | |
| Net income (loss) | | $ | (79,129 | ) | $ | 4,450,615 | | | | | $ | 4,371,486 | |
| | | | | | | | | | | | | | |
| Weighted average shares outstanding - basic | | | 9,527,000 | | | | | | | | | 9,527,000 | |
| Net income (loss) per share - basic | | $ | (0.01 | ) | | | | | | | $ | 0.46 | |
| Weighted average shares outstanding - diluted | | | 9,527,000 | | | | | | | | | 11,208,953 | |
| Net income (loss) per share - diluted | | $ | (0.01 | ) | | | | | | | $ | 0.39 | |
NOTES TO SUPPLEMENTAL
FINANCIAL INFORMATION
1. SUPPLEMENTAL ADJUSTMENTS
Adjustments included in the column under the heading “Supplemental Adjustments” include the following:
| | a. | To reflect revenue to be earned by the Acquired Business according to an Administrative, Compliance and Marketing Services Agreement entered into between AAAMI and Aston as of September 1, 2006. Pursuant to the terms of Aston’s limited liability company agreement, 72% of the revenue generated under this agreement will be retained by Aston in the operating allocation to cover any costs associated with providing services under this new agreement. This increase in the operating allocation, and hence the operating expenses of Aston, is one component of the overall increase in compensation and related expenses detailed in the supplemental adjustment reflected in footnote (c). Highbury does not expect any actual additional costs to be material. The adjustment is factually supportable because the economic terms are outlined in the agreement and in the funds’ prospectus and directly attributable to the Acquisition because, although the Sellers are divesting the Acquired Business, they wish to have the Acquired Business continue to provide the services to the money market funds, other than the Target Funds after the consummation of the business combination. The agreement has a five-year term, with certain termination provisions, but management expects to retain this relationship and the related revenues for an indefinite period after the consummation of the Acquisition, consistent with the expectations related to the advisory contracts of the Target Funds. For a description of the material terms of the Administrative, Compliance and Marketing Services Agreement, please see the section entitled “The Acquisition — Administrative, Compliance and Marketing Services Agreement” in the Definitive Revised Proxy Statement (No. 000-51682), dated November 3, 2006. |
| | b. | To reflect new fee-sharing agreements with investment sub-advisers affiliated with the Sellers entered into upon consummation of the Acquisition. Pursuant to the sub-advisory agreements that the Acquired Business has entered into with ABN AMRO and its affiliated advisers, the Acquired Business and the affiliated managers will share net advisory fees equally after payment of third-party distribution fees. The following tables reconcile the historical advisory fees paid to affiliates to the fees that would be payable under the new sub-advisory agreements. The supporting calculation only incorporates advisory fee revenues and distribution and sub-advisory fees for the Target Funds for which affiliates of the Sellers will serve as sub-advisers after the consummation of the Acquisition. All advisory fee revenues and distribution and sub-advisory fees related to the two Target Funds for which MFS and Optimum serve as sub-advisers have been excluded from this analysis because there will be no change in the sub-advisory agreements and, therefore, no change in the fee-sharing arrangements on these funds. |
| | | Nine Months Ended September 30, | | Year Ended December 31, | |
| | | 2006 | | 2005 | | 2005 | |
Distribution and sub-advisory fees, after adjustment to sub-advisor fee sharing arrangement | | | |
| Net advisory fees from funds managed by affiliates | | $ | 4,995,891 | | $ | 31,214,486 | | $ | 41,078,847 | |
| Less: third party distribution fees for funds managed by affiliates | | | (2,778,264 | ) | | (3,912,329 | ) | | (5,290,395 | ) |
| Subtotal | | | 22,217,627 | | | 27,302,157 | | | 35,788,452 | |
| Less: sub-advisory fees paid to affiliates | | | (11,108,814 | ) | | (13,651,078 | ) | | (17,894,226 | ) |
| Net revenue to the acquired business | | | 11,108,813 | | | 13,651,079 | | | 17,894,226 | |
Distribution and sub-advisory fees, before adjustment to sub-advisor fee sharing arrangement | | | |
| Net advisory fees from funds managed by affiliates | | | 24,995,891 | | | 31,214,486 | | | 41,078,847 | |
| Less: third party distribution fees for funds managed by affiliates | | | (2,778,264 | ) | | (3,912,329 | ) | | (5,290,395 | ) |
| Subtotal | | | 22,217,627 | | | 27,302,157 | | | 35,788,452 | |
| Less: sub-advisory fees paid to affiliates | | | (18,223,311 | ) | | (25,338,667 | ) | | (31,976,793 | ) |
| Net revenue to the acquired business | | | 3,994,316 | | | 1,963,490 | | | 3,811,659 | |
| | | | | | | | | | | |
| Supplemental adjustment | | $ | 7,114,497 | | $ | 11,687,589 | | $ | 14,082,567 | |
The Acquired Business entered into the new sub-advisory agreements with the Sellers at the time of the closing of the Acquisition. Historically, the Acquired Business received a portion of the investment advisory fees that the Target Funds paid to the investment advisers by the Target Funds.
The sub-advisory services to be provided by the affiliates of the Sellers following the Acquisition are the same investment management services historically provided to the Target Funds by such affiliates. The continuity of such investment management services was a principal reason for ABN AMRO and the mutual fund shareholders and trustees to approve the Acquisition. The sub-advisers received $18.2 million, $25.3 million and $32.0 million in fees for their services during the nine months ending September 30, 2006 and 2005 and during the year ended December 31, 2005, respectively. Had the new sub-advisory agreements with these affiliates been in place during those historical time periods, the sub-advisers would have received $11.1 million, $13.7 million and $17.9 million, respectively, for providing the same services.
Aston entered into Investment Advisory Agreements with each of the Target Funds that provide that Aston, as the investment adviser to the Target Funds, shall:
| | (i) | manage the investment and reinvestment of the assets of each Target Fund; |
| | (ii) | continuously review, supervise and administer the investment program of each Target Fund; |
| | (iii) | determine in its discretion, the assets to be held uninvested; |
| | (iv) | provide the Trust with records concerning the Adviser’s activities which are required to be maintained by the Trust; |
| | (v) | render regular reports to the Trust’s officers and Board of Trustees concerning the Adviser’s discharge of the foregoing responsibilities; |
| | (vi) | determine from time to time what securities and other investments will be purchased, retained, sold or exchanged by each Fund and what portion of the assets of the Fund’s portfolio will be held in the various securities and other investments in which the Fund invests, and shall implement those decisions, all subject to the provisions of the Trust’s Declaration of Trust and By-Laws, as amended from time to time, the 1940 Act, and the applicable rules and regulations promulgated thereunder by the SEC and interpretive guidance issued thereunder by the SEC staff and any other applicable federal and state law, as well as the investment objectives, policies and restrictions of the Fund referred to above, and any other specific policies adopted by the Board and communicated to the Adviser; |
| | (vii) | provide advice and recommendations with respect to other aspects of the business and affairs of the Funds; |
| | (viii) | exercise voting rights, rights to consent to corporate action and any other rights pertaining to a Fund’s portfolio securities subject to such direction as the Board may provide; and |
| | (ix) | perform such other functions of investment management and supervision as may be directed by the Board. |
These duties are substantially the same as the duties outlined in the current investment advisory agreements between each of the Target Funds and its investment adviser. The “Form of Sub-Investment Advisory Agreement” included as Exhibit I to the Asset Purchase Agreement in the Definitive Revised Proxy Statement (No. 000-51682), dated November 3, 2006 outlines the delegation of certain of these duties of the investment adviser to the investment sub-adviser after the consummation of the business combination. With reference to the list above, the table below outlines the current allocation of responsibilities between the investment advisers and the Acquired Business and the allocation of responsibilities according to the new sub-advisory agreements. For further clarity, the table also outlines the current allocation of responsibilities between the investment advisers to the Target Funds and the Acquired Business. This illustration is included to show that the services to be provided after the consummation of the Acquisition are identical to the services provided on a historical basis. The reference in the column “Service” refers to the services listed above.
| | | Provider of Services |
Service | | Currently | | After Consummation of the Business Combination |
| (i) | | Investment advisor, with oversight from Acquired Business | | Investment sub-advisor, with oversight from Aston |
| (ii) | | Acquired Business | | Aston |
| (iii) | | Investment advisor, with oversight from Acquired Business | | Investment sub-advisor, with oversight from Aston |
| (iv) | | Acquired Business | | Aston |
| (v) | | Acquired Business | | Aston |
| (vi) | | Investment advisor, with oversight from Acquired Business | | Investment sub-advisor, with oversight from Aston |
| (vii) | | Acquired Business | | Aston |
| (viii) | | Investment advisor, with oversight from Acquired Business | | Investment sub-advisor, with oversight from Aston |
| (ix) | | Acquired Business | | Aston |
After the consummation of the Acquisition, Aston will provide all of the services that the Acquired Business has historically provided to the Target Funds. As such, Highbury does not expect Aston to incur any additional or different types of costs than those incurred on a historical basis by the Acquired Business.
The affiliates of the Sellers will be performing the same investment management services for the Target Funds after the consummation of the Acquisition as they currently provide. However, as a result of the new sub-advisory agreements, they will receive a smaller share of the net advisory fees after payments of third-party distribution fees than they currently receive. Highbury believes the sub-advisers are willing to perform the services for lower fees because: (i) the new fee arrangements continue to provide sources of revenue to the sub-advisers, (ii) the new fee arrangements are consistent with fee levels charged by the sub-advisers to other clients not affiliated with the Sellers or the Acquired Business, (iii) the new fee arrangements are consistent with fee arrangements Aston could obtain from other sub-advisers not affiliated with the Sellers, (iv) the historical share of advisory revenues received by the affiliates of the Sellers was not determined based on arm’s-length negotiation as the Acquired Business and the affiliates of the Sellers were part of a commonly controlled corporate group and (v) the new sub-advisory agreements were determined based on arm’s length negotiation between Highbury and the sub-advisers affiliated with the Sellers.
Because the Target Funds were introduced over a period of 13 years and are managed by five different affiliates of the Sellers, the historical fee sharing agreements between the Acquired Business and each investment adviser with respect to each Target Fund varied among the funds and over time. In addition, since the Acquired Business and the investment advisers were part of a commonly controlled corporate entity, the historical fee sharing arrangements were not reflective of market terms but rather internal allocations that have also varied. As a result, the data required to perform a fund-by-fund comparison of the historical fee sharing arrangements and the new sub-advisory agreements is not available.
Highbury determined the supplemental adjustment reflected in footnote (b) based on a comparison of the aggregate historical advisory fees paid to the affiliates of the Sellers (but excluding the sub-advisers who are not affiliates of the Sellers) and the aggregate sub-advisory fees that would have been paid to the affiliates of the Sellers in the same periods under the new sub-advisory agreements. The difference between the two aggregate payments is the amount of the supplemental adjustment in each of the periods. Because the contractual payments to the sub-advisers can be calculated based on the new sub-advisory agreements to be executed upon the consummation of the Acquisition this adjustment is factually supportable. The adjustment is also directly attributable to the Acquisition because it is through the Acquisition that Aston will become the investment adviser to the Target Funds and enter into the new sub-advisory agreements with the affiliates of the Seller. Finally, consistent with the disclosure in footnote (c) within the Section “Unaudited Pro Forma Condensed Combined Financial Statements” regarding the indefinite-lived intangible assets, Highbury expects these sub-advisory contracts to continue indefinitely. However, if any such sub-advisory contract is terminated, Highbury and the Aston management team are confident that the sub-adviser could be replaced on economic terms no less favorable to Aston than the sub-advisory contract to be put in place upon consummation of the Acquisition.
| | c. | Under the terms of Aston’s limited liability company agreement, 72% of gross revenues are allocated to cover the operating expenses of the Acquired Business. If actual cash operating expenses are less than the full 72% allocation would provide, the excess allocation may be applied as the Aston management members determine. Based on the contractual expenses of the Acquired Business, there is additional operating allocation available. For this analysis, Highbury has assumed these funds will be paid as compensation. |
| | d. | Equal to Aston management’s 35% share of the income (loss) before minority interest and income taxes of the Acquired Business. |
| | e. | Highbury’s estimated income tax liabilities for both accrual and cash purposes are based on assumed federal and Colorado state income tax rates of 34.00% and 4.63%, respectively. Since Colorado state income taxes are deductible for federal income tax purposes, Highbury’s estimated effective tax rate is 37.06%. On the statement of operations, income taxes - current are equal to the total tax liability calculated on a cash basis. On the statement of operations, income taxes - deferred are equal to the difference between total tax liability calculated on an accrual basis and the total tax liability calculated on a cash basis. |
Highbury’s audited financial statements for the periods ending January 31, 2006 and December 31, 2005, are set forth in Highbury’s Annual Report filed on Form 10-KSB/A on November 2, 2006 with the Securities and Exchange Commission and Highbury’s unaudited financial statements for the quarter ending September 30, 2006, are set forth in Highbury’s Quarterly Report filed on Form 10-QSB on October 13, 2006 with the Securities and Exchange Commission are incorporated by reference herein.
The Acquired Business’ audited financial statements for the three years ending December 31, 2005, 2004, and 2003 are set forth in the section of the Definitive Revised Proxy Statement (No. 000-51682), dated November 3, 2006, entitled “U.S. Mutual Fund Business of ABN AMRO Asset Management Holdings, Inc. Combined Financial Statements” and are incorporated by reference herein.
The unaudited financial statements of the Acquired Business for the quarter ending September 30, 2006 are set forth below.
COMBINED FINANCIAL STATEMENTS - UNAUDITED
U.S. Mutual Fund Business of ABN AMRO Asset Management Holdings, Inc.
Nine Months Ended September 30, 2006 and 2005
U.S. Mutual Fund Business of
ABN AMRO Asset Management Holdings, Inc.
Combined Financial Statements
(Unaudited)
Nine Months Ended September 30, 2006 and 2005
Contents
Combined Financial Statements (Unaudited)
| Combined Statements of Financial Condition | 1 |
| Combined Statements of Operations | 2 |
| Combined Statements of Changes in Owner’s Equity | 3 |
| Combined Statements of Cash Flows | 4 |
| Notes to Combined Financial Statements | 5 |
U.S. Mutual Fund Business of
ABN AMRO Asset Management Holdings, Inc.
Combined Statements of Financial Condition
| | | September 30 2006 | | December 31 2005 | |
| | | (Unaudited) | | | | |
Assets | | | | | |
| Cash and cash equivalents | | $ | 7,218,817 | | $ | 5,239,747 | |
| Advisory and administrative fees receivable | | | 3,284,200 | | | 4,074,486 | |
| Goodwill | | | 10,518,750 | | | 10,518,750 | |
| Other intangible assets | | | 22,045,000 | | | 22,045,000 | |
| Other assets | | | 1,635 | | | 1,635 | |
| Total assets | | $ | 43,068,402 | | | 41,879,618 | |
| | | | | | | | |
Liabilities and owner’s equity | | | | | | | |
| Accounts payable - affiliates | | $ | 1,459,012 | | | 2,266,559 | |
| Accrued compensation and benefits | | | 288,511 | | | 648,625 | |
| Other accrued liabilities | | | 875,143 | | | 954,318 | |
| Total liabilities | | | 2,622,666 | | | 3,869,502 | |
| | | | | | | | |
| Owner’s equity | | | 40,445,736 | | | 38,010,116 | |
| Total liabilities and owner’s equity | | $ | 43,068,402 | | $ | 41,879,618 | |
See accompanying notes.
U.S. Mutual Fund Business of
ABN AMRO Asset Management Holdings, Inc.
Combined Statements of Operations
(Unaudited)
Nine Months Ended September 30, 2006 and 2005
| | | 2006 | | 2005 | |
Revenues | | | | | |
| Advisory fees, net | | $ | 30,594,808 | | $ | 35,753,511 | |
| Administration fees | | | 1,035,174 | | | 1,143,016 | |
| Total revenues | | | 31,629,982 | | | 36,896,527 | |
| | | | | | | | |
Operating expenses | | | | | | | |
| Distribution and advisory costs: | | | | | | | |
| Affiliates | | | 17,462,705 | | | 22,315,324 | |
| Other | | | 5,645,490 | | | 8,598,644 | |
| Total distribution and advisory costs | | | 23,108,195 | | | 30,913,968 | |
| | | | | | | | |
| Compensation and related expenses | | | 3,248,940 | | | 3,830,626 | |
| Related party expense allocations | | | 1,910,933 | | | 1,870,326 | |
| Other operating expenses | | | 851,427 | | | 549,768 | |
| Total operating expenses | | | 29,119,495 | | | 37,164,688 | |
| | | | | | | | |
| Operating income (loss) | | | 2,510,487 | | | (268,161 | ) |
| Interest income | | | 242,878 | | | 83,893 | |
| Net income (loss) before taxes | | | 2,753,365 | | | (184,268 | ) |
| Income tax provision | | | - | | | - | |
| Net income (loss) | | $ | 2,753,365 | | $ | (184,268 | ) |
See accompanying notes.
U.S. Mutual Fund Business of
ABN AMRO Asset Management Holdings, Inc.
Combined Statements of Changes in Owner’s Equity
(Unaudited)
Nine Months Ended September 30, 2006 and 2005
| Owner’s equity at January 1, 2005 | | $ | 59,421,138 | |
| Net loss | | | (184,268 | ) |
| Net transfers from AAAMHI | | | 678,715 | |
| Owner’s equity at September 30, 2005 | | $ | 59,915,585 | |
| | | | | |
| Owner’s equity at January 1, 2006 | | $ | 38,010,116 | |
| Net income | | | 2,753,365 | |
| Net transfers to AAAMHI | | | (317,745 | ) |
| Owner’s equity at September 30, 2006 | | $ | 40,445,736 | |
See accompanying notes.
U.S. Mutual Fund Business of
ABN AMRO Asset Management Holdings, Inc.
Combined Statements of Cash Flows
(Unaudited)
Nine Months Ended September 30, 2006 and 2005
| | | 2006 | | 2005 | |
Operating activities | | | | | |
| Net income (loss) | | $ | 2,753,365 | | $ | (184,268 | ) |
| Adjustments to reconcile net income (loss) to net cash flow provided by operating activities: | | | | | | | |
| Changes in assets and liabilities: | | | | | | | |
| (Increase) decrease in advisory and administrative fees receivable | | | 790,286 | | | 90,768 | |
| (Increase) decrease in other assets | | | - | | | 1,524 | |
| Increase (decrease) in accounts payable - affiliates | | | (807,547 | ) | | (779,311 | ) |
| Increase (decrease) in accrued compensations and benefits | | | (360,114 | ) | | 389,417 | |
| Increase (decrease) in other accrued liabilities | | | (79,175 | ) | | 552,328 | |
| Net cash flow provided by operating activities | | | 2,296,815 | | | 70,458 | |
| | | | | | | | |
Financing activities | | | | | | | |
| Transfers (to) from AAAMHI, net | | | (317,745 | ) | | 678,715 | |
| Net cash provided by (used in) financing activities | | | (317,745 | ) | | 678,715 | |
| | | | | | | | |
| Net increase in cash and cash equivalents | | | 1,979,070 | | | 749,173 | |
| Cash and cash equivalents at beginning of period | | | 5,239,747 | | | 3,158,266 | |
| Cash and cash equivalents at end of period | | $ | 7,218,817 | | $ | 3,907,439 | |
See accompanying notes.
U.S. Mutual Fund Business of
ABN AMRO Asset Management Holdings, Inc.
Notes to Combined Financial Statements
(unaudited)
1. Basis of Presentation
The accompanying combined financial statements include the U.S. Mutual Fund Business of ABN AMRO Asset Management Holdings, Inc. (AAAMHI) (the Business). The principal operations of the Business relate to investment advisory, administrative and distribution services provided to certain registered investment companies comprising ABN AMRO Funds (the Funds) and a small number of managed accounts of AAAMHI. The Business is included in the consolidated financial statements of AAAMHI, a wholly owned subsidiary of ABN AMRO Asset Management Holding N.V. (AAAMHNV), which is a wholly owned subsidiary of ABN AMRO Bank N.V. (ABN AMRO). Pursuant to an Asset Purchase Agreement (the Agreement), dated as of April 20, 2006, AAAMHI and its wholly-owned subsidiaries and certain other affiliated entities (ABN AMRO Investment Fund Services, Inc., ABN AMRO Asset Management, Inc. (AAAM), Montag & Caldwell, Inc. (Montag), TAMRO Capital Partners LLC (TAMRO), Veredus Asset Management LLC (Veredus) and River Road Asset Management, LLC (River Road)) agreed to sell the Business to Highbury Financial Inc. (Highbury) for an aggregate cash purchase price of $38.6 million. Upon completion of the sale transaction, certain members of the Business’ management and staff will join Highbury. Additionally, a newly formed subsidiary of Highbury, Aston Asset Management LLC, will become adviser to the Funds, which will be re-named the Aston Funds. AAAMHI and certain affiliates who are currently the advisers to the Funds will continue to provide advisory services to the Funds after completion of the sale but in a sub-advisory capacity. A senior officer of AAAMHI and three other individuals not involved in the Business have also agreed to join Highbury in connection with the Acquisition of the Business.
The combined financial statements have been prepared from AAAMHI’s historical accounting records on a carve-out basis to include the historical financial position, results of operations, and cash flows applicable to the Business. The combined financial statements exclude all continuing operations of AAAMHI and its affiliated entities listed in the preceding paragraph that will be retained by the sellers. The combined financial statements have been prepared as if the Business had been a stand-alone operation, though they are not necessarily representative of results had the Business operated as a stand-alone operation, and it is not practicable to estimate what those expenses would have been on a stand-alone basis. Revenues, expenses, assets, and liabilities were derived from amounts associated with the Business in the AAAMHI financial records. The financial results include allocations based on methodologies that management believes are reasonable of corporate expenses from AAAMHI and allocations of other corporate expenses from AAAMHI’s parent company that may be different from comparable expenses that would have been incurred if the Business operated as a stand-alone business. Specifically, ABN AMRO Services Company, Inc., a wholly-owned subsidiary of AANAHC (see Note 7), provides the Business with certain IT, infrastructure and e-mail services. LaSalle Bank Corporation, also a wholly-owned subsidiary of AANAHC, provides the Business with payroll, benefits, general ledger maintenance, internal audit and accounts payable services. These services are charged based upon utilized quantities (typically number of employees, number of transactions processed, hours worked). AAAMHI provides the Business with executive management, finance, human resources and personal trade compliance services. These services are charged based upon employee count or management time incurred. AAAMHI’s parent and its parent companies provide other executive management, technology, sales support, finance, compliance and human resources support services. These services are charged out on a formula basis that considers Assets Under Management, number of employees and non-interest expense. The cost of these services is included under the caption “Related-party expense allocations” in the accompanying combined statements of operations. Certain cash receipts and cash payments related to the Business were handled through AAAMHI and affiliate cash accounts, which are not included in the carve-out financial statements. These amounts have been accounted for as net capital contributions or distributions to or from the Business and are reflected as “Net transfers (to) from AAAMHI” in the combined statements of changes in owner’s equity and the combined statements of cash flows reflects these cash transactions.
Preparation of the combined financial statements in conformity with accounting principles generally accepted in the United States (GAAP) requires management to make estimates and assumptions that affect the reported financial statement amounts and accompanying notes. Management believes that the estimates utilized in preparing its financial statements are reasonable and prudent. Actual results could differ from those estimates.
U.S. Mutual Fund Business of
ABN AMRO Asset Management Holdings, Inc.
Notes to Combined Financial Statements
(unaudited)
2. Summary of Significant Accounting Policies
Principles of Combination
The accompanying combined statements of financial condition, operations, cash flows and owner's equity of the Business for the nine months ended September 30, 2006 and 2005 have been prepared on a carve-out basis (see Note 1).
Cash and Cash Equivalents
Cash and cash equivalents represent cash in banks and investments in money market mutual funds.
Goodwill and Intangible Assets
The Business has adopted the provisions of SFAS No. 142, “Goodwill and Other Intangible Assets” (FAS 142). Intangible assets, comprising the estimated value of investment management contracts, and goodwill, included in the combined financial statements of the Business relate to the acquisition of certain AAAMHI affiliates including the Business. These amounts reflect management’s best estimate of a reasonable allocation to the Business of such amounts included in the financial records of AAAMHI. The provisions of SFAS No. 142 require that goodwill and other intangible assets with indefinite lives no longer be amortized, but instead be tested at least annually for impairment and require reporting units to be identified for the purpose of assessing potential future impairments of goodwill. The Business’ acquired intangible management contract asset relate to the provision of investment advisory services to the Funds in exchange for fees that are based on a percentage of the average daily net assets of the funds. These management contracts were acquired in 2001 as part of the acquisition of certain AAAMHI affiliates. The management contracts are subject to annual renewal by the Funds’ board of trustees which is expected to continue indefinitely since this has been the experience for the Funds as well as for the mutual fund industry as a whole. Accordingly, the Business’ acquired intangible assets related to the Funds are considered to be of an indefinite life as there is no foreseeable limit on the contract period. The Business conducts its annual testing of goodwill and intangible assets for impairment annually in the fourth quarter, unless events warrant more frequent testing.
Revenue Recognition
The Business derives its revenues from investment advisory and administrative services provided to the Funds and a limited number of managed accounts of AAAMHI. Based on the terms of the advisory and administrative agreements in place that set out fees to be earned as a stated percentage of assets under management, advisory and administrative fees are recognized in revenue in the period such services are performed unless facts and circumstances would indicate that collectibility of the fees are not reasonably assured. Expense reimbursements to certain of the Funds in accordance with agreements are reported as an offset to investment advisory fees. Such reimbursements totaled $1,733,234 and $1,558,315 for the nine months ended September 30, 2006 and September 30, 2005, respectively.
Distribution and Advisory Costs
Included in distribution and advisory costs in the accompanying financial statements are fees paid to AAAMHI and its affiliates and other non-affiliated entities pursuant to contracts related to the management and distribution of the Funds and managed account assets. Such costs are recorded in the period incurred.
The Funds pay five affiliates of AAAMHI (Montag, AAAM, TAMRO, Veredus and River Road) investment advisory fees pursuant to management contracts with these entities under which the affiliates provide investment advisory services to the Funds. AAAM also pays two third-party investment management firms, MFS Institutional Advisors, Inc. and Optimum Investment Advisors, LLC, investment sub-advisory fees pursuant to management contracts with these entities under which these independent firms provide investment sub-advisory services to two of the Funds. The Business, generally through ABN AMRO Distribution Services (USA) Inc. (the Distributor), has entered into nearly 400 selling/service agreements through which independent third parties sell the Business’ Funds and/or provide other services to their clients in exchange for certain payments. Unless paid by the Distributor pursuant to the Funds’ Rule 12b-1 Plan, these payments, as well as certain sales and marketing costs, are included within distribution and advisory costs.
U.S. Mutual Fund Business of
ABN AMRO Asset Management Holdings, Inc.
Notes to Combined Financial Statements
(unaudited)
Income Taxes
The Business is a component of AAAMHI, and as such was a component of the consolidated income tax return of AAAMHI, or an affiliate of AAAMHI, for the periods presented in these financial statements. However, for the purpose of the preparation of these financial statements, the Business is considered a stand-alone entity and any required provision for federal and state income taxes has been determined accordingly. The provision for federal and state income taxes is comprised of two components, current and deferred income taxes. Deferred tax assets and liabilities are determined based on temporary differences between the financial and tax reporting bases of assets and liabilities and are measured using currently enacted rates and laws. Deferred tax assets are recognized subject to management’s judgment that realization is more likely than not.
Fair Value of Financial Instruments
The carrying value of financial assets and liabilities included in the accompanying combined statements of financial condition approximate fair values due to their short-term nature.
3. Goodwill and Intangible Assets
Goodwill and intangible assets at September 30, 2006 and December 31, 2005 included in the accompanying combined statements of financial condition are shown net of accumulated amortization of $1,553,200 and $2,113,467 recorded prior to 2002 and the adoption of FAS 142. Impairment charges of approximately $10.4 million of intangible assets and $13.3 million of goodwill were recorded by the Business in 2005 in accordance with FAS 142.
The facts and circumstances leading to the impairment charges to goodwill and intangible assets relate to management’s assessment of declines in net assets in the Funds resulting from net share redemptions and unfavorable investment performance trends. The fair value of the Business used to determine the impairment of goodwill was determined with reference to the expected proceeds to be received upon the sale of the Business. The fair value of the intangible asset related to the investment management contracts used to determine the amount of impairment of the intangible asset, was determined based on a discounted cash flow analysis of the acquired contracts. No impairment of goodwill or intangibles was determined to be required for periods prior to 2005.
4. Distribution and Advisory Costs
Distribution and advisory costs in the accompanying combined statement of operations consist of the following:
| | | Nine Months Ended September 30 | |
| | | 2006 | | 2005 | |
| Advisory costs: | | | | | |
| AAAMHI affiliates | | | 16,993,344 | | | 21,829,187 | |
| Third party sub-advisers | | | 2,115,662 | | | 1,865,924 | |
| Total advisory costs | | | 19,109,006 | | | 23,695,111 | |
| | | | | | | | |
| Distribution costs: | | | | | | | |
| AAAMHI affiliates | | | 515,572 | | | 486,137 | |
| Non-affiliates | | | 3,483,617 | | | 6,732,720 | |
| Total distribution costs | | | 3,999,190 | | | 7,218,857 | |
| Total distribution and advisory costs | | | 23,108,195 | | | 30,913,968 | |
U.S. Mutual Fund Business of
ABN AMRO Asset Management Holdings, Inc.
Notes to Combined Financial Statements
(unaudited)
5. Income Taxes
A reconciliation of the differences between the total income tax provision (benefit) and the amounts computed at the statutory federal tax rate of 35% for the nine month periods ended September 30, 2006 and 2005, is as follows:
| | | 2006 | | 2005 | |
| Income tax provision (benefit) at statutory federal income tax rate | | $ | 963,678 | | $ | (64,494 | ) |
| Increase (decrease) in taxes resulting from: | | | | | | | |
| State income taxes, net of federal benefit | | | 137,668 | | | (9,213 | ) |
| Valuation allowance adjustment | | | (1,101,346 | ) | | 73,707 | |
| Provision for income taxes | | $ | - | | $ | - | |
The current and deferred portion of the total provision for income taxes was $0 for each of the respective periods.
The components of the net deferred tax balances as of September 30, 2006 and December 31, 2005, are as follows:
| | | September 30 2006 | | December 31 2005 | |
| Deferred tax assets: | | | | | |
| Net operating loss carryforwards | | $ | 6,696,036 | | $ | 6,560,728 | |
| Goodwill and intangibles | | | 1,907,833 | | | 3,107,833 | |
| Other | | | - | | | 36,654 | |
| Less valuation allowance | | | (8,603,869 | ) | | (9,705,215 | ) |
| Net deferred taxes | | $ | - | | $ | - | |
The need for a valuation allowance to reduce federal and state deferred tax assets and net operating losses has been determined as if the Business was a stand-alone entity. As such, management believes it is more likely than not that these items will not be realized.
6. Benefit Plans
Pension Plans
ABN AMRO Bank sponsors a non-contributory defined benefit pension plan covering substantially all U.S. salaried employees. Assets held by the plan consist primarily of shares of registered investment companies and pooled trust funds. The allocated expense of the Business totaled $61,365 and $158,227 for the nine months ended September 30, 2006 and 2005, respectively.
Profit Sharing and Savings Plan
ABN AMRO Bank sponsors a profit sharing and savings plan under Section 401(k) of the Internal Revenue Code, covering substantially all U.S. salaried employees. Under the plan, employee contributions are partially matched by the respective ABN AMRO Bank subsidiary. In addition, the respective ABN AMRO Bank subsidiary may allocate a portion of its net profits to employees’ accounts in the plan. The allocated expense of the Business totaled $97,035 and $106,962 for the nine months ended September 30, 2006 and 2005, respectively.
Group Welfare Plan
ABN AMRO Bank provides welfare and life insurance benefits to substantially all U.S. salaried employees and their dependents. The amount charged to expense includes welfare benefits paid to participants, net of participant contributions, and administrative costs. Life insurance premiums paid to insurance companies are recognized as an expense when paid. The allocated expense of the Business totaled $142,358 and $183,093 for the nine months ended September 30, 2006 and 2005, respectively.
U.S. Mutual Fund Business of
ABN AMRO Asset Management Holdings, Inc.
Notes to Combined Financial Statements
(unaudited)
7. Related Party Transactions
ABN AMRO is a Dutch bank with operations around the world. With respect to its asset management business in the United States, ABN AMRO has two primary wholly-owned subsidiaries, ABN AMRO North America Holding Company (AANAHC) and AAAMHNV. AAAMHNV owns 100% of AAAMHI, and the assets of the Business are owned in their entirety by AAAMHI.
In the ordinary course of business, the Business utilizes investment advisory services provided by several affiliated entities. Five subsidiaries of AAAMHI, including Montag (100% owned), AAAM (100% owned), TAMRO (100% owned), Veredus (50% owned) and River Road (45% owned), currently serve as investment advisors to the Funds. The Funds pay the investment advisors an advisory fee, net of any fee waivers and expense reimbursements, and the advisors pay the Business a fixed percentage of the net advisory fees for administrative and distribution services. The payments made to affiliated entities, which provide advisory and distribution services to certain mutual funds and separate account assets of AAAMHI are included under the caption “Distribution and advisory costs” in the accompanying combined statements of operations (See Note 4).
The Business also utilizes operational and support services provided by several affiliated entities. ABN AMRO Services Company, Inc., a wholly-owned subsidiary of AANAHC, provides the Business with certain IT, infrastructure and e-mail services. LaSalle Bank Corporation, also a wholly-owned subsidiary of AANAHC, provides the Business with payroll, benefits, general ledger maintenance, internal audit and accounts payable services. AAAMHI provides the Business with executive management, finance, human resources and personal trade compliance services. The cost of these services is included under the caption “Related-party expense allocations” in the accompanying combined statements of operations. Payables to affiliates related to distribution, advisory or other services provided to the Business are included in “Accounts payable - affiliates” in the accompanying combined statements of financial condition.
| Exhibit | | Description |
| | | |
| 3.1 | | Restated Certificate of Incorporation, dated November 30, 2006 |
| | | |
| 10.1 | | Side Letter Agreement among Highbury, Aston and Montag, dated November 30, 2006 |
| | | |
| 10.2 | | Office Service Agreement, between Highbury and Berkshire Capital, dated November 30, 2006 |
| | | |
| 10.3 | | Promissory Note issued by Aston in favor of Highbury, dated November 30, 2006. |
Signature(s)
Pursuant to the requirements of the Securities Exchange Act of 1934, the Registrant has duly caused this Report to be signed on its behalf by the undersigned hereunto duly authorized on.
| | HIGHBURY FINANCIAL INC. |
| | | |
| | | |
| | By: | /s/ Richard S. Foote |
| | | Richard S. Foote |
| | | President and Chief Executive Officer |
Date: December 6, 2006
EXHIBIT INDEX
| Exhibit | | Description |
| | | |
| 3.1 | | Restated Certificate of Incorporation, dated November 30, 2006 |
| | | |
| 10.1 | | Side Letter Agreement among Highbury, Aston and Montag, dated November 30, 2006 |
| | | |
| 10.2 | | Office Service Agreement, between Highbury and Berkshire Capital, dated November 30, 2006 |
| | | |
| 10.3 | | Promissory Note issued by Aston in favor of Highbury, dated November 30, 2006. |