Table of Contents
As filed with the Securities and Exchange Commission on December 22, 2006
Securities Act File No. 333-127272
UNITED STATES
SECURITIES AND EXCHANGE COMMISSION
Washington, D.C. 20549
POST-EFFECTIVE AMENDMENT NO. 1
TO
REGISTRATION STATEMENT ON
FORM S-1
UNDER
THE SECURITIES ACT OF 1933
Highbury Financial Inc.
(Exact name of registrant as specified in its charter)
| Delaware | 6282 | 20-3187008 | ||
(State or other jurisdiction of incorporation) | (Primary Standard Industrial Classification Code Number) | (I.R.S. Employer Identification Number) |
999 Eighteenth Street, Suite 3000
Denver, CO 80202
303-357-4802
(Address, including zip code, and telephone number, including area code, of registrant’s principal executive offices)
Richard S. Foote, President and Chief Executive Officer
Highbury Financial Inc.
999 Eighteenth Street, Suite 3000
Denver, CO 80202
303-357-4802
(Name, address, including zip code, and telephone number, including area code, of agent for service)
Ann F. Chamberlain
Floyd I. Wittlin
Bingham McCutchen LLP
399 Park Avenue
New York, NY 10022-4689
(212) 705-7000
(212) 752-5378—Facsimile
Approximate date of commencement of proposed sale to the public: From time to time after the effective date of this Registration Statement.
If any of the securities being registered on this Form are to be offered on a delayed or continuous basis pursuant to Rule 415 under the Securities Act of 1933 check the following box: x
If this Form is filed to register additional securities for an offering pursuant to Rule 462(b) under the Securities Act, please check the following box and list the Securities Act registration statement number of the earlier effective registration statement for the same offering: ¨
If this Form is a post-effective amendment filed pursuant to Rule 462(c) under the Securities Act, check the following box and list the Securities Act registration statement number of the earlier effective registration statement for the same offering: ¨
If this Form is a post-effective amendment filed pursuant to Rule 462(d) under the Securities Act, check the following box and list the Securities Act registration statement number of the earlier effective registration statement for the same offering: ¨
The Registrant hereby amends this Registration Statement on such date or dates as may be necessary to delay its effective date until the Registrant shall file a further amendment which specifically states that this Registration Statement shall thereafter become effective in accordance with Section 8(a) of the Securities Act of 1933 or until the Registration Statement shall become effective on such date as the Commission, acting pursuant to said Section 8(a), may determine.
EXPLANATORY NOTE
This post-effective Amendment No. 1 to Form S-1 relates to 15,486,666 shares of common stock issuable upon the exercise of outstanding warrants, 336,667 units underlying the unit purchase option issued to the underwriters of our initial public offering, 336,667 shares of common stock underlying the 336,667 units, 673,334 warrants underlying the 336,667 units and the 673,334 shares of common stock issuable upon the exercise of the 673,334 warrants.
Table of Contents
The information in this prospectus is not complete and may be changed. We may not sell these securities until the registration statement filed with the Securities and Exchange Commission is effective. This prospectus is not an offer to sell these securities and it is not soliciting an offer to buy these securities in any state where the offer or sale is not permitted.
SUBJECT TO COMPLETION, DATED DECEMBER 22, 2006
PRELIMINARY PROSPECTUS
Highbury Financial Inc.
15,486,666 Shares
Common Stock
This prospectus relates to an aggregate of 15,486,666 shares of common stock, $0.0001 par value per share of Highbury, that may be issued upon the exercise of outstanding warrants. The warrants entitle the holders hereof, upon exercise, to purchase one share of our common stock at a price of $5.00 per share.
Our common stock is quoted on the OTC Bulletin Board under the trading symbol “HBRF.” OnDecember 6, 2006, the last reported sale price of our common stock was $5.85.
Investing in our common stock involves a high degree of risk. See “Risk Factors” beginning on page 3 of this prospectus for a discussion of information that should be considered in connection with an investment in our common stock.
Public Offering Price | Underwriting Discount and Commission | Proceeds, Before to Us | |||||||||
Per unit | $ | 5.00 | (2) | �� | $ | 0.00 | $ | 5.00 | (2) | ||
Total (1)(3) | $ | 77,433,330.00 | (2) | $ | 0.00 | $ | 77,433,330.00 | (2) | |||
| (1) | These amounts assume that all of our outstanding warrants are exercised. |
| (2) | The per share public offering price and proceeds to us for 15,486,666 shares is $5.00. |
| (3) | These amounts do not include the unit purchase option issued to the underwriters of our initial public offering. |
Neither the Securities and Exchange Commission, or the SEC, nor any state securities commission has approved or disapproved of these securities or determined if this prospectus is truthful or complete. Any representation to the contrary is a criminal offense.
, 2006
Table of Contents
| Page | ||
| 1 | ||
| 3 | ||
| 12 | ||
| 14 | ||
| 14 | ||
| 14 | ||
| 15 | ||
| 16 | ||
| 26 | ||
| 35 | ||
MANAGEMENT’S DISCUSSION AND ANALYSIS AND PLAN OF OPERATION OF HIGHBURY FINANCIAL INC | 36 | |
| 39 | ||
| 48 | ||
| 56 | ||
| 59 | ||
| 59 | ||
| 62 | ||
| 70 | ||
| 70 | ||
| 70 | ||
i
Table of Contents
You should rely only on the information contained or incorporated by reference in this prospectus and in an applicable prospectus supplement, if any, or in any amendment to this prospectus. We have not authorized any other person to provide you with different information, and if anyone provides, or has provided, you with different or inconsistent information, you should not rely on it. We will not make an offer to sell our common stock in any jurisdiction where the offer or sale is not permitted. You should assume that the information appearing in this prospectus is accurate only as of the date of the document containing the information.
In this prospectus, references to “the Company,” “we,” “us,” “our,” and “registrant” refer to Highbury Financial, Inc. and its subsidiary. References to Highbury refer solely to Highbury and references to Aston refer solely to Aston Asset Management LLC, a subsidiary of Highbury.
This prospectus relates to an aggregate of 15,486,666 shares of common stock, $0.0001 par value per share, of Highbury that may be issued upon the exercise of outstanding warrants. The warrants entitle the holders thereof, upon exercise, to purchase one share of our common stock at a price of $5.00 per share.
Highbury is an investment management holding company providing permanent capital solutions to mid-sized investment management firms. Aston is a platform for internal growth and add-on acquisitions. We intend to pursue acquisition opportunities and will seek to establish other accretive partnerships with high quality investment management firms over time. We will seek to provide permanent equity capital to fund buyouts from corporate parents, buyouts of founding or departing partners, growth initiatives, or exit strategies for private equity funds. We intend to leave material equity interests with management teams to align the interests of management and our shareholders and, in general, will not integrate our acquisitions, although we may work with potential future affiliates to execute add-on acquisitions. We will seek to augment and diversify our sources of revenue by investment style, asset class, distribution channel, client type and management team. We intend to fund future acquisitions with retained net income or the issuance of debt or equity.
Highbury was formed in July 2005 for the purpose of acquiring or acquiring control of, through a merger, capital stock exchange, asset acquisition, stock purchase or other similar business combination, one or more financial services businesses. Pursuant to the asset purchase agreement, dated as of April 20, 2006, referred to in this prospectus as the asset purchase agreement, among Highbury, Aston and ABN AMRO Asset Management Holdings, Inc., ABN AMRO Investment Fund Services, Inc., ABN AMRO Asset Management, Inc., Montag & Caldwell, Inc., Tamro Capital Partners LLC, Veredus Asset Management LLC, and River Road Asset Management, LLC, collectively referred to herein as the sellers, on November 30, 2006, Highbury acquired substantially all of the sellers’ business of providing investment advisory, administration, distribution and related services to the U.S. mutual funds, referred to throughout this prospectus as the acquired business, specified in the asset purchase agreement. This transaction is referred to throughout this prospectus as the acquisition. The U.S. mutual funds specified in the asset purchase agreement, or the target funds, were rebranded the “Aston Funds” upon consummation of the acquisition.
At the closing of the acquisition, Highbury made a payment of $38.6 million to the sellers of the acquired business to pay the purchase price under the asset purchase agreement. Highbury then contributed the acquired business to Aston.
OUR CORPORATE INFORMATION
Our principal executive offices are located at 999 Eighteenth Street, Suite 3000, Denver, Colorado 80202. Our telephone number is (303) 357-4802.
Table of Contents
THE OFFERING
| Securities Offered: | 15,486,666 shares of common stock issuable upon exercise of the warrants. | |
Number of shares of common stock outstanding before this offering: | 9,527,000 | |
| Warrants: | ||
Number of warrants outstanding before this offering: | 15,820,000 | |
Number of warrants to be outstanding after this offering: | 15,820,000 | |
Exercisability: | Each warrant is exercisable for one share of common stock. | |
Exercise price: | $5.00 | |
Exercise period: | The warrants will become exercisable on January 25, 2007. | |
| The warrants will expire at 5:00 p.m., New York City time, on January 25, 2010, or earlier upon redemption. | ||
Redemption: | We may redeem the outstanding warrants: | |
• at any time after the warrants become exercisable; | ||
• in whole and not in part; | ||
• at a price of $0.01 per warrant; | ||
• upon a minimum of 30 days prior written notice of redemption; and | ||
• only if the last sales price of our common stock equals or exceeds $8.50 per share for any 20 trading days within a 30 trading day period ending three business days before we send the notice of redemption. | ||
| We have established these redemption criteria to provide warrant holders with a reasonable premium to the initial warrant exercise price as well as a reasonable cushion against a negative market reaction, if any, to our redemption call. If the foregoing conditions are satisfied and we call the warrants for redemption, each warrant holder will then be entitled to exercise his or her warrant prior to the date scheduled for redemption. There can be no assurance, however, that the price of the common stock will exceed the price at which the warrants may be called for redemption or the warrant exercise price after the redemption call is made. | ||
OTC Bulletin Board symbols for our securities: | ||
Units: | HBRFU | |
Common Stock: | HBRF | |
Warrants: | HBRFW | |
Proceeds: | We intend to use the net proceeds for working capital, or for other general corporate purposes. We may also use a portion of the net proceeds to fund acquisitions of investment management firms or to repurchase securities, if appropriate. | |
2
Table of Contents
An investment in our securities involves a high degree of risk. You should consider carefully all of the risks described below, together with the other information contained in this prospectus, before making a decision to invest in our common stock. If any of the following risks occur, our business, financial condition and results of operations may be materially adversely affected. In that event, the trading price of our securities could decline, and you could lose all or a part of your investment.
Risks Related to the Financial Services Industry and Aston
The financial services industry faces substantial regulatory risks and we may experience reduced revenues and profitability if our services are not regarded as compliant with the regulatory regime.
The financial services industry is subject to extensive regulation. Many regulators, including U.S. government agencies and self-regulatory organizations, as well as state securities commissions and attorneys general, are empowered to conduct administrative proceedings and investigations that can result in, among other things, censure, fine, the issuance of cease-and-desist orders, prohibitions against engaging in some lines of business or the suspension or expulsion of an investment adviser. The requirements imposed by regulators are designed to ensure the integrity of the financial markets and not to protect our stockholders.
Governmental and self-regulatory organizations, including the SEC, the NASD and national securities exchanges such as the New York Stock Exchange, impose and enforce regulations on financial services companies. The types of regulations to which investment advisers and managers are subject are extensive and include, among other things: recordkeeping, fee arrangements, client disclosure, custody of customer assets, and the conduct of officers and employees.
The regulatory environment in which we operate is also subject to modifications and further regulations. New laws or regulations or changes in the enforcement of existing laws or regulations applicable to us also may adversely affect our business, and our ability to function in this environment depends on our ability to constantly monitor and react to these changes. For example, the growing trend of separating the fees mutual fund managers pay brokerage firms for investment research from brokerage commissions may trigger restrictions under the Investment Advisers Act of 1940, or the Investment Advisers Act.
We may face legal liability that may result in reduced revenues and profitability.
In recent years, the volume of claims and amount of damages claimed in litigation and regulatory proceedings against financial services firms has been increasing. Aston’s investment advisory contracts include provisions designed to limit its and our exposure to legal claims relating to services, but these provisions may not protect us or may not be adhered to in all cases. We may also be subject to claims arising from disputes with employees for alleged discrimination or harassment, among other things. The risk of significant legal liability is often difficult to assess or quantify and its existence and magnitude often remain unknown for substantial periods of time. As a result, we may incur significant legal expenses in defending against litigation. Substantial legal liability or significant regulatory action against us or Aston could materially adversely affect our business, financial condition or results of operations or cause significant harm to the reputation of Aston, which could seriously harm our business.
There have been a number of highly publicized cases involving fraud or other misconduct by employees in the financial services industry in recent years, and we run the risk that employee misconduct could occur. It is not always possible to deter or prevent employee misconduct and the precautions we take to prevent and detect this activity may not be effective in all cases.
3
Table of Contents
We face strong competition from financial services firms, many of whom have the ability to offer clients a wider range of products and services than we offer, which could lead to pricing pressures that could have a material adverse affect on our revenue and profitability.
We compete with other firms – both domestic and foreign – in a number of areas, including the quality of our employees, transaction execution, products and services, innovation, reputation and price. We may fail to attract new business and may lose clients if, among other reasons, we are not able to compete effectively. We also face significant competition as a result of a recent trend toward consolidation in the investment management industry. In the past several years, there has been substantial consolidation and convergence among companies in this industry. In particular, a number of large commercial banks, insurance companies and other broad-based financial services firms have established or acquired broker-dealers or have merged with other financial institutions. Many of these firms have the ability to offer a wide range of products such as loans, deposit-taking and insurance, brokerage, investment management and investment banking services, which may enhance their competitive positions. They also have the ability to support investment management activity with commercial banking, investment banking, insurance and other financial services revenue in an effort to gain market share, which could result in pricing pressure on Aston’s business. The passage of the Gramm-Leach-Bliley Act in 1999 reduced barriers to large institutions’ providing a wide range of financial services products and services. We believe, in light of increasing industry consolidation and the regulatory overhaul of the financial services industry, that competition will continue to increase from providers of financial services products.
The investment advisory fees we receive may decrease in a market or general economic downturn, which would decrease our revenues and net income.
Because we are the holding company for an investment advisory business, our net income and revenues are likely to be subject to wide fluctuations, reflecting the effect of many factors on our assets under management, including: general economic conditions; securities market conditions; the level and volatility of interest rates and equity prices; competitive conditions; liquidity of global markets; international and regional political conditions; regulatory and legislative developments; monetary and fiscal policy; investor sentiment; availability and cost of capital; technological changes and events; outcome of legal proceedings; changes in currency values; inflation; credit ratings; and the size, volume and timing of transactions. These and other factors subject Aston to an increased risk of asset volatility.
As an investment management firm, our business could be expected to generate lower revenue in a market or general economic downturn. The investment advisory fees we receive are based on the market value of the assets under management. Accordingly, a decline in the prices of securities would be expected to cause our revenue and income to decline by:
| • | causing the value of the assets under management to decrease, which would result in lower investment advisory fees; or |
| • | causing some of our clients to withdraw funds from our investment management business in favor of investments they perceive as offering greater opportunity and lower risk, which also would result in lower investment advisory fees. |
Aston’s investment advisory contracts are subject to termination on short notice. Termination of a significant number of investment advisory contracts will have a material impact on our results of operations.
Aston derives almost all of its revenue from investment advisory contracts with the Aston Funds. These contracts are typically terminable by the target fund trustees without penalty upon relatively short notice (generally not longer than 60 days). We cannot be certain that Aston’s management will be able to retain the target funds as clients. Because the Aston Funds all have the same trustees, it is possible that all the contracts with them could be terminated simultaneously. If the trustees of the Aston Funds terminate Aston’s investment advisory contracts, Aston, and consequently Highbury, would lose substantially all of its revenues.
4
Table of Contents
To the extent Aston is forced to compete on the basis of price, it may not be able to maintain its current fee structure.
The investment management business is highly competitive and has relatively low barriers to entry. To the extent Aston is forced to compete on the basis of price, it may not be able to maintain its current fee structure. Although Aston’s investment management fees vary from product to product, historically the acquired business competed primarily on the performance of its products and not on the level of its investment management fees relative to those of its competitors. In recent years, however, there has been a trend toward lower fees in the investment management industry. In order to maintain its fee structure in a competitive environment, Aston must be able to continue to provide clients with investment returns and services that make investors willing to pay its fees. In addition, the board of trustees of the mutual funds managed by Aston must make certain findings as to the reasonableness of these fees. We cannot be certain that Aston will succeed in providing investment returns and service that will allow it to maintain its current fee structure. Fee reductions on existing or future new business could have an adverse effect on our profit margins and results of operations.
Termination of Aston’s sub-advisory contracts could have a material adverse impact on the Aston Funds’ performance, and consequently, on Aston’s revenues and operating results.
As of December 12, 2006, Aston managed 19 no-load mutual funds, comprised of 15 equity funds and four fixed income funds, with approximately $5.5 billion of assets under management. Aston currently utilizes nine different entities to manage the equity funds, of which five are affiliates of the sellers and four are independent. The sub-advisory contracts with the sellers’ affiliates, which are not terminable by the sub-advisers for five years from the consummation of the acquisition, include limited non-compete provisions and certain capacity guarantees in appropriate products to benefit the acquired business. While this arrangement is intended to ensure that the investment philosophy and process guiding the mutual funds in the future are consistent with their historical investment philosophy and process, there can be no assurances that there will be a stable ownership transition for the Aston Funds. In addition, if one or more of these sub-advisory contracts is terminated, it could have a material adverse impact on the Aston Funds’ performance and on Aston’s revenues and operating results.
Aston depends on third-party distribution channels to market its investment products and access its client base. A substantial reduction in fees generated by third-party intermediaries could have a material adverse effect on its business.
The potential investor base for mutual funds and managed accounts is limited, and Aston’s ability to distribute mutual funds and access clients for managed accounts is highly dependent on access to the distribution systems and client bases of national and regional securities firms, banks, insurance companies, defined contribution plan administrators and other intermediaries, which generally offer competing internally and externally managed investment products. For open-end funds, such intermediaries are paid for their services to fund shareholders, in part, through Rule 12b-1 fees. Rule 12b-1 fees are those fees designated for promotions, sales, or any other activity connected with the distribution of the fund’s shares. In the case of no-load funds, Rule 12b-1 fees are usually, but not always, 0.25% of net assets and are used to cover advertising and marketing costs. Access to such distribution systems and client bases is substantially dependent upon our ability to charge Rule 12b-1 fees to our funds. To the extent that recent regulatory initiatives prohibit or limit the imposition of Rule 12b-1 or similar fees, our access to these distribution systems and client bases may be foreclosed in the future. To a lesser extent, the managed account business depends on referrals from financial planners and other professional advisers, as well as from existing clients. We cannot assure you that these channels and client bases will continue to be accessible to Aston. The inability to have such access could have a material adverse effect on our earnings.
While we expect Aston to continue to diversify and add new distribution channels for its mutual funds and managed accounts, a significant portion of the growth in the acquired business’ assets under management in recent years has been accessed through intermediaries. As of December 12, 2006, substantially all of the assets under management of the acquired business were attributable to accounts that it accessed through third-party intermediaries. These intermediaries generally may terminate their relationships on short notice. Loss of any of the distribution channels afforded by these intermediaries, and the inability to access clients through new distribution channels, could decrease assets under management and adversely affect our results of operations and growth. In addition, in the case of managed accounts offered through intermediaries to their customers, such intermediaries may reduce the fees that they remit to us as part of the arrangements they have with Aston. A substantial reduction in fees received from third-party intermediaries could have a material adverse affect on our business.
5
Table of Contents
A change of control of our company would automatically terminate our investment management agreements with our clients, unless our managed account clients consent and, in the case of fund clients, the funds’ board of trustees and shareholders voted to continue the agreements.
Under the Investment Company Act, an investment management agreement with a fund must provide for its automatic termination in the event of its assignment. Under the Investment Advisers Act, a client’s investment management agreement may not be “assigned” by the investment adviser without the client’s consent. An investment management agreement is considered under both acts to be assigned to another party when a controlling block of the adviser’s securities is transferred. An assignment of our investment management agreements may occur if, among other things, we sell or issue a certain number of additional common shares in the future. We cannot be certain that our clients will consent to assignments of our investment management agreements or approve new agreements with us if a change of control occurs. This restriction may discourage potential purchasers from considering an acquisition of a controlling interest in Highbury.
If the adviser’s advisory contracts are assigned, the selling adviser may receive a benefit in connection with its sale of its business only if certain conditions are met.
If an adviser sells its business and, as a result, the adviser’s advisory contracts with registered investment companies are assigned, the selling adviser may receive a benefit in connection with its sale of its business only if certain conditions are met following the sale and assignment of the advisory contracts. Among these conditions is a requirement that no “unfair burden” be imposed on the investment companies as a result of the transaction. An unfair burden will be deemed to exist if, during the two years after the transaction, the predecessor or successor adviser or any interested person thereof is entitled to compensation from any person engaged in transactions with Highbury or from Highbury or its shareholders for other than bona fide advisory or administrative services. This restriction may discourage potential purchasers from considering an acquisition of a controlling interest in Highbury.
Investors in open-end funds can redeem their investments in these funds at any time without prior notice, which could adversely affect Aston’s earnings.
Open-end fund investors may redeem their investments in those funds at any time without prior notice. Investors may reduce the aggregate amount of assets under management for any number of reasons, including investment performance, changes in prevailing interest rates and financial market performance. Poor performance relative to other asset management firms tends to result in decreased purchases of mutual fund shares and increased redemptions of mutual fund shares. Cumulative net redemptions have reduced the assets under management by the acquired business from $7.3 billion in 2004 to approximately $5.5 billion as of December 12, 2006, principally as a result of the net asset outflows in the Montag & Caldwell Growth Fund, whose assets under management represent approximately 38% of the aggregate Aston Funds’ assets as of December 12, 2006. In a declining stock market, the pace of mutual fund redemptions could accelerate. The redemption of investments in mutual funds managed by the acquired business would adversely affect our revenues, which are substantially dependent upon the assets under management in our funds. If net redemptions of investments in the acquired business’ mutual funds increase, it would cause our revenues to decline, which would have a material adverse effect on our earnings.
A decline in the prices of securities, the performance of the Aston Funds or changes in investors’ preference of investing styles could lead to a decline in Aston’s assets under management, revenues and earnings.
Substantially all of our revenues are determined by the amount of assets under management. Under Aston’s investment advisory contracts with the Aston Funds, the investment management fee is typically based on the market value of assets under management. In addition, Aston receives asset-based distribution or service fees with respect to the open-end funds pursuant to distribution plans adopted under provisions of Rule 12b-1 under the Investment Company Act. Accordingly, a decline in the prices of securities generally may cause our revenues and net income to decline by either causing the value of our assets under management to decrease, which would result in lower investment advisory and Rule 12b-1 fees, or causing clients to withdraw funds in favor of investments or investment styles they perceive to offer greater opportunity or lower risk, which would also result in lower fees. For example,
6
Table of Contents
investors have withdrawn funds from the Montag & Caldwell Growth Fund as a result of its performance and changes in investors’ preferences for investing strategies. In addition, while the revenues of the acquired business are diversified across investment styles, the large capitalization growth style of investing accounts for approximately 54% of assets under management as of December 12, 2006. Large capitalization style implies a restriction imposed on the portfolio manager to select for investment by the fund predominantly equity securities of companies that have an average market capitalization of more than $10 billion and companies whose earnings are expected to grow at a rate that is above average for its industry or the overall market. The securities markets are highly volatile, and securities prices may increase or decrease for many reasons, including economic and political events and acts of terrorism beyond our control. If a decline in securities prices, fund performance or change in investors’ preference of investment styles were to cause our revenues to decline, it could have a material adverse effect on our earnings.
Loss of key employees could lead to the loss of clients and a decline in revenue.
Aston’s ability to attract and retain personnel is important to attracting and retaining its clients. The market for qualified wholesalers, senior managers, compliance professionals, marketing professionals, key managers at the sub-advisers and other professionals is competitive. Aston and the sub-advisers may not be successful in their efforts to recruit and retain the required personnel to maintain or grow the acquired business. Loss of a significant number of key personnel could have an adverse effect on Aston and Highbury.
Any significant limitation or failure of Aston’s software applications and other technology systems that are critical to its operations could constrain its operations.
Aston is highly dependent upon the use of various proprietary and third-party software applications and other technology systems to operate the business. Aston uses its technology to, among other things, provide reports and other customer services to its clients. Any inaccuracies, delays or systems failures in these and other processes could subject Aston to client dissatisfaction and losses. Although Aston takes protective measures, its technology systems may be vulnerable to unauthorized access, computer viruses or other events that have a security impact, such as an authorized employee or vendor inadvertently causing Aston to release confidential information, which could materially damage Aston’s operations or cause the disclosure or modification of sensitive or confidential information. Moreover, loss of confidential customer identification information could cause harm to Aston’s reputation. Aston relies heavily on software and technology that are licensed from, and supported, upgraded and maintained by, third-party vendors. A suspension or termination of certain of these licenses or the related support, upgrades and maintenance could cause temporary system delays or interruption. Potential system failures or breaches and the cost necessary to correct them could result in material financial loss, regulatory action, breach of client contracts, reputational harm or legal claims and liability, which in turn could negatively impact our revenues and income.
Aston could suffer losses in earnings or revenue if its reputation is harmed or the Aston brand name is not recognized.
Aston’s reputation is important to the success of its business and the success of Highbury. The management of Aston has strong relationships with intermediaries and their continued relationship is based on their trust and confidence in Aston. If Aston’s reputation is harmed, existing clients of Aston may reduce amounts held in, or withdraw entirely from, funds that Aston advises or funds may terminate their investment advisory contracts which could reduce the amount of assets under management of Aston and cause Aston to suffer a corresponding loss in earnings or revenues. Reputational harm may also cause Aston to lose employees and it may be unable to continue to attract new ones with similar qualifications, motivations or skills. If Aston fails to address, or appears to fail to address, successfully and promptly the underlying causes of any reputational harm, Aston may be unsuccessful in repairing any existing harm to its reputation and its future business prospects would likely be affected.
Highbury plans to co-brand the Aston Funds with the names of the sub-advisers. For example, the ABN AMRO Montag & Caldwell Growth Fund has been re-named the Aston Montag & Caldwell Growth Fund. If investors and intermediaries fail to recognize the target funds with the Aston co-branding, Aston may suffer losses, which would impact its revenues and financial results.
7
Table of Contents
We rely on a few major clients for a significant majority of our business, and the loss of any of these clients, or adverse developments with respect to the financial condition of any of our major clients could reduce our revenue.
Relationships with a limited number of clients have accounted for a significant majority of the revenue of the acquired business. We expect that Aston’s relationships with these clients will continue to account for a substantial portion of our total revenue in future periods. Aston’s client, the Aston Funds, a Delaware business trust, which accounts for approximately 97% of our assets under management, is comprised of 19 mutual funds that are currently managed by Aston. Because all these funds have the same trustees, it is possible that the contracts with them could be terminated simultaneously. Of these 19 funds, Aston Growth, Montag & Caldwell Growth, Aston Optimum Mid-Cap and Aston Veredus Aggressive Growth each account for more than 10% of the revenues of Aston. ABN AMRO and its subsidiaries have investment discretion over approximately 18% of the assets under management in the Aston Funds. Additionally, the assets under management that Aston sources through independent financial advisers using Schwab and Fidelity, as custodians, each generate more than 10% of revenues received by Aston. These various client concentrations leave Aston vulnerable to any adverse change in the financial condition of any of its major clients. The loss of any of these relationships may have a material adverse impact on our revenues.
Risks Related To The Structure of our Business
The agreed-upon expense allocation under our revenue sharing arrangement with Aston may not be large enough to pay for all of Aston’s operating expenses.
Pursuant to the limited liability company agreement of Aston, we receive a specified percentage of Aston’s gross revenue, and a percentage of revenue is retained for use in paying Aston’s operating expenses. We may not have anticipated and reflected in the agreement possible changes in Aston’s revenue and expense base, and the agreed-upon expense allocation may not be large enough to pay for all of Aston’s operating expenses. We may elect to defer the receipt of our share of Aston’s revenue to permit Aston to fund such operating expenses, or we may restructure our relationship with Aston with the aim of maximizing the long-term benefits to us. We cannot be certain, however, that any such deferral or restructured relationship would be of any greater benefit to us. Such a deferral or restructured relationship might have an adverse effect on our near-term or long-term profitability and financial condition.
The failure to receive regular distributions from Aston will adversely affect us and our holding company structure will result in substantial structural subordination that may affect our ability to make payments on our obligations.
Because we are a holding company, we receive substantially all of our cash from distributions made to us by Aston. Aston’s payment of distributions to us may be subject to claims by Aston’s creditors and to limitations applicable to Aston under federal and state laws, including securities and bankruptcy laws. Additionally, Aston may default on some or all of the distributions that are payable to us. As a result, we cannot guarantee that we will always receive these distributions from Aston. The failure to receive the distributions to which we are entitled under our limited liability company agreement with Aston and the Aston management team would adversely affect us, and may affect our ability to make payments on our obligations.
Our right to receive any assets of Aston upon its liquidation or reorganization, and thus the right of our stockholders to participate in those assets, typically would be subordinated to the claims of Aston’s creditors. In addition, even if we were a creditor of Aston, our rights as a creditor would be subordinated to any security interest and indebtedness of Aston that is senior to us.
Aston’s autonomy limits our ability to alter its management practices and policies, and we may be held responsible for liabilities it incurs.
Although our limited liability company agreement with Aston gives us the authority to control or vote with respect to certain of Aston’s business activities, we generally are not directly involved in managing its day-to-day activities, including investment
8
Table of Contents
management policies and fee levels, product development, client relationships, compensation programs and compliance activities. As a consequence, our financial condition and results of operations may be adversely affected by problems stemming from the day-to-day operations of Aston.
In addition, we may be held liable in some circumstances as a control person for the acts of Aston or its employees. For example, if Highbury exercises or refuses to exercise its approval right as the manager member to settle potential litigation or Aston issues securities in violation of laws and does not use due care in exercising this authority, Highbury may be exposed to liability related to Aston’s actions. While Highbury maintains directors’ and officers’ insurance and Aston maintains errors and omissions and general liability insurance in amounts believed to be adequate to cover certain potential liabilities, we may have claims that exceed the limits of available insurance coverage. Furthermore, insurers may not remain solvent, meet their obligations to provide coverage, or coverage may not continue to be available with sufficient limits and at a reasonable cost. A judgment against us or Aston in excess of available insurance coverage could have a material adverse effect on us.
Risks Relating to Ownership of our Warrants.
If we are unable to maintain a current prospectus relating to the common stock underlying our warrants, our warrants may have little or no value and the market for our warrants may be limited.
No warrants will be exercisable and we will not be obligated to issue shares of common stock unless at the time a holder seeks to exercise such warrant, a prospectus relating to the common stock issuable upon exercise of the warrants is current and the common stock has been registered or qualified or deemed to be exempt under the securities laws of the state of residence of the holder of the warrants. Under the terms of the warrant agreement between Continental Stock Transfer & Trust Company, as warrant agent, and us, we have agreed to use our best efforts to maintain a current prospectus relating to the common stock issuable upon exercise of our warrants until the expiration of our warrants. However, we cannot assure you that we will be able to do so. If the prospectus relating to the common stock issuable upon exercise of the warrants is not current or if the common stock is not qualified or exempt from qualification in the jurisdictions in which the holders of the warrants reside, our warrants may not be exercisable before they expire and we will not net-cash settle the warrants. Thus, our warrants may be deprived of any value. The market for our warrants may be limited, and the warrants may expire worthless. Even if warrant holders are not able to exercise their warrants because there is no current prospectus or the common stock is not qualified or exempt from qualification in the jurisdictions in which the holders of the warrants reside, we can exercise our redemption rights.
We may choose to redeem our outstanding warrants when a prospectus relating to the common stock issuable upon exercise of such warrants is not current and the warrants are not exercisable.
We may redeem the warrants issued as a part of our units (including warrants issued and outstanding as a result of the exercise of the option to purchase units granted to ThinkEquity Partners LLC, or TEP, and EarlyBirdCapital Inc., or EBC, the underwriters of our initial public offering, and the warrants sold in the private placement to insiders of Highbury simultaneously with our initial public offering, referred to throughout this prospectus as the private placement) at any time after the warrants become exercisable in whole and not in part, at a price of $0.01 per warrant, upon a minimum of 30 days’ prior written notice of redemption, if and only if, the last sales price of our common stock equals or exceeds $8.50 per share for any 20 trading days within a 30 trading day period ending three business days before we send the notice of redemption. Redemption of the warrants could force the warrant holders (i) to exercise the warrants and pay the exercise price therefor at a time when it may be disadvantageous for the holders to do so, (ii) to sell the warrants at the then current market price when they might otherwise wish to hold the warrants or (iii) to accept the nominal redemption price which, at the time the warrants are called for redemption, is likely to be substantially less than the market value of the warrants. In addition, we may exercise our right to redeem outstanding warrants when a prospectus relating to the common stock issuable upon the exercise of such warrants is not current, thus rendering the warrants unexercisable.
9
Table of Contents
Our outstanding warrants may be exercised in the future, which would increase the number of shares eligible for future resale in the public market and result in dilution to our stockholders. This might have an adverse effect on the market price of the common stock.
Outstanding redeemable warrants to purchase an aggregate of 15,820,000 shares of common stock will become exercisable on January 25, 2007. To the extent they are exercised, additional shares of our common stock will be issued, which will result in dilution to our stockholders and increase the number of shares eligible for resale in the public market. Sales of substantial numbers of such shares in the public market could adversely affect the market price of our shares.
Risks Related to Ownership of our Common Stock
If our stockholders who acquired their shares prior to our initial public offering exercise their registration rights, it may have an adverse effect on the market price of our common stock.
Our stockholders who acquired their shares prior to our initial public offering, or our initial stockholders, are entitled to demand that we register the resale of their shares of common stock owned prior to our initial public offering. The holders of the majority of these shares may elect to exercise these registration rights at any time after the date on which their shares of common stock are released from escrow, which is January 31, 2009. The shares of our initial stockholders purchased in the private placement were subject to a lock-up agreement and became eligible for registration upon consummation of the acquisition. If all these shares are registered, there will be an additional 1,891,667 shares of common stock eligible for trading in the public market (and potentially another 333,334 shares of common stock issuable to our existing stockholders upon exercise of warrants). The presence of this additional number of shares of common stock eligible for trading in the public market may have an adverse effect on the market price of our common stock.
Our securities are quoted on the OTC Bulletin Board, which limits the liquidity and price of our securities more than if our securities were quoted or listed on The Nasdaq Stock Market or a national exchanged.
Our securities are traded in the over-the-counter market. They are quoted on the OTC Bulletin Board, an inter-dealer automated quotation system for equity securities sponsored and operated by the National Association of Securities Dealers, Inc., or NASD, but not included in The Nasdaq Stock Market. Quotation of our securities on the OTC Bulletin Board limits the liquidity and price of our securities more than if our securities were quoted or listed on The Nasdaq Stock Market or a national exchange. Lack of liquidity limits the price at which you are able to sell our securities or your ability to sell our securities at all.
The market price for our common stock could be volatile and could decline, resulting in a substantial or complete loss of your investment.
The stock markets on which we list our common stock have experienced significant price and volume fluctuations. As a result, the market price of our common stock could be similarly volatile and investors in our common stock may experience a decrease in the value of their shares, including decreases unrelated to our operating performance or prospects. The price of our common stock could be subject to wide fluctuations in response to a number of factors, including:
| • | our operating performance and the performance of other similar companies; |
| • | actual or anticipated differences in our operating results; |
| • | changes in our revenues or earnings estimates or recommendations by securities analysts; |
| • | publication of research reports about us or our industry by securities analysts; |
| • | additions and departures of key personnel; |
10
Table of Contents
| • | speculation in the press or investment community; |
| • | actions by institutional or other shareholders; |
| • | changes in accounting principles; |
| • | terrorist acts; and |
| • | general market conditions, including factors unrelated to our performance. |
Future sales of our common stock may depress the price of our common stock.
As of November 30, 2006, there were 9,527,000 shares of our common stock outstanding. If the unit purchase option is exercised for cash, there will be 336,667 additional shares of our common stock outstanding. If the warrants underlying the units underlying the unit purchase option are exercised, there be 673,334 additional shares of our common stock outstanding. On January 25, 2007, 15,820,000 warrants will become exercisable. If all 15,820,000 warrants are exercised, 15,820,000 additional shares of our common stock may be issued. Sales of a substantial number of these shares in the public market could decrease the market price of our common stock. In addition, the perception that such sales might occur may cause the market price of our common stock to decline. Future issuances or sales of our common stock could have an adverse defect on the market price of our common stock.
11
Table of Contents
CAUTIONARY NOTE REGARDING FORWARD LOOKING STATEMENTS
We believe that some of the information in this prospectus constitutes forward-looking statements within the definition of the Private Securities Litigation Reform Act of 1995. You can identify these statements by forward-looking words such as “may,” “expect,” “anticipate,” “contemplate,” “believe,” “estimate,” “intends,” and “continue” or similar words. You should read statements that contain these words carefully because they:
| • | discuss future expectations; |
| • | contain projections of future results of operations or financial condition; or |
| • | state other “forward-looking” information. |
We believe it is important to communicate our expectations to our stockholders. However, there may be events in the future that we are not able to predict accurately or over which we have no control. The risk factors and cautionary language discussed in this prospectus provide examples of risks, uncertainties and events that may cause actual results to differ materially from the expectations described by us or Aston in such forward-looking statements, including among other things:
| • | the impact of legislative and regulatory actions and reforms and regulatory, supervisory or enforcement actions of government actions relating to Highbury and Aston; |
| • | changes in political, economic or industry conditions, the interest rate environment or financial and capital markets, which could result in changes in demand for products or services or in the value of assets under management; |
| • | terrorist activities and international hostilities, which may adversely affect the general economy, financial and capital markets, specific industries, and Highbury and Aston; |
| • | changing conditions in global financial markets generally and in the equity markets particularly, and decline or lack of sustained growth in these markets; |
| • | Aston’s and Highbury’s business strategy and plans; |
| • | the introduction, withdrawal, success and timing of business initiatives and strategies; |
| • | harm to Aston’s or Highbury’s reputation; |
| • | fluctuations in customer demand; |
| • | management of rapid growth; |
| • | the impact of fund performance on redemptions; |
| • | changes in investors’ preference of investing styles; |
| • | changes in or loss of sub-advisers; |
| • | the impact of increased competition; |
| • | the results of future financing efforts; |
| • | the impact of capital improvement projects; |
| • | the impact of future acquisitions or divestitures; |
12
Table of Contents
| • | the relative and absolute investment performance of Aston’s investment products; |
| • | investment advisory agreements subject to termination or non-renewal; |
| • | a substantial reduction in fees received from third parties; |
| • | our success in finding or acquiring additional investment management firms on favorable terms and consummating acquisitions of new investment management firms; |
| • | the ability to retain major clients; |
| • | the ability to attract and retain highly talented professionals; |
| • | significant limitations or failure of software applications; |
| • | expenses subject to significant fluctuations; and |
| • | the impact, extent and timing of technological changes and the adequacy of intellectual property protection. |
You are cautioned not to place undue reliance on these forward-looking statements, which speak only as of the date of this prospectus.
All forward-looking statements included herein are expressly qualified in their entirety by the cautionary statements contained or referred to in this section. Except to the extent required by applicable laws and regulations, Highbury and Aston undertake no obligation to update these forward-looking statements to reflect events or circumstances after the date of this prospectus or to reflect the occurrence of unanticipated events.
13
Table of Contents
The amount of the proceeds we will receive from the shares covered by this prospectus depends on the number of warrants covered by this prospectus that are exercised. If all of the warrants are exercised, our gross proceeds from the sale of the shares of common stock pursuant to the exercise of the warrants will be $77,433,330. We expect net proceeds, which are what we will receive after paying the estimated expenses of this offering, to be approximately $77,333,330. For the purpose of estimating net proceeds, we estimate that our offering expenses in this offering will be approximately zero. See “Plan of Distribution,” below. We intend to use the net proceeds for working capital, or for other general corporate purposes. We may also use a portion of the net proceeds to fund acquisitions of investment management firms over time or to repurchase securities, if appropriate.
DETERMINATION OF OFFERING PRICE
The offering price for the shares covered by this prospectus is the exercise price of the warrants, which was determined at the time the warrants were issued. The exercise price of the warrants exercisable for the shares of common stock is $5.00 per share.
The securities covered by this prospectus will be distributed solely to existing warrantholders upon exercise of their warrants. The warrants are immediately exercisable as of the effective date of the registration statement. The shares of common stock issued upon exercise of the warrants will be freely tradable, except that sales by warrantholders who are our affiliates will be subject to Rule 144 as promulgated under the Securities Act.
We do not know if or when the warrants will be exercised. We also do not know whether any of the shares acquired upon exercise will be sold.
14
Table of Contents
The following table sets forth our capitalization at September 30, 2006 and as adjusted to give effect to the sale of our common stock and the application of the estimated net proceeds delivered from the sale of our common stock in this offering.
| September 30, 2006 | ||||||
| Actual | As Adjusted | |||||
| (unaudited) | ||||||
Total liabilities | $ | 2,015,336 | $ | 2,015,336 | ||
Common stock, subject to possible conversion | 8,657,910 | 8,657,910 | ||||
Stockholders’ equity | ||||||
Preferred stock, $0.0001 par value, 1,000,000 shares authorized; none issued and outstanding | ||||||
Common stock, $0.0001 par value, 50,000,000 shares authorized; 9,635,000 shares issued and outstanding, 25,121,666 shares issued and outstanding, as adjusted | 964 | 2,512 | ||||
Additional paid-in capital | 35,149,808 | 112,581,590 | ||||
Deficit accumulated during the development stage | 489,798 | 489,798 | ||||
Total stockholders’ equity | 35,640,570 | 113,073,900 | ||||
Total capitalization | $ | 46,313,816 | $ | 123,747,146 | ||
15
Table of Contents
COMBINED FINANCIAL STATEMENTS
The following unaudited pro forma condensed combined balance sheets combine the historical balance sheets of the acquired business and Highbury as of September 30, 2006, giving effect to the acquisition as if it had occurred on September 30, 2006.
The following unaudited pro forma condensed combined statements of operations combine (i) the historical statement of operations of Highbury for the period beginning July 13, 2005, the date of Highbury’s inception, to December 31, 2005 and the historical combined statement of operations of the acquired business for its fiscal year ended December 31, 2005, giving effect to the acquisition as if it had occurred on January 1, 2005, (ii) the historical statement of operations of Highbury and the historical combined statement of operations of the acquired business each, for the nine months ended September 30, 2006, giving effect to the acquisition as if it had occurred on January 1, 2006 and (iii) the historical statement of operations of Highbury for the period beginning July 13, 2005, the date of Highbury’s inception, to September 30, 2005 and the historical statement of operations of the acquired business, for the nine months ended September 30, 2005, giving effect to the acquisition as if it had occurred on January 1, 2005. In all cases, the unaudited pro forma condensed combined statements of operations assume Highbury’s initial public offering was consummated on the first day of the reporting period. We have adopted this convention so that the presentation of shares outstanding is consistent across all periods presented.
We are providing this information to aid you in your analysis of the financial aspects of our business. The unaudited pro forma condensed combined financial statements described above should be read in conjunction with the historical financial statements of Highbury and the historical combined statement of the acquired business and the related notes thereto. The pro forma adjustments are preliminary, and the unaudited pro forma information is not necessarily indicative of the financial position or results of operations that may have actually occurred had the acquisition taken place on the dates noted, or the future financial position or operating results of Highbury. In addition, the allocation of the acquisition purchase price shown in the pro forma adjustments is preliminary and will be subject to a final determination after the acquisition. The final determination of the purchase price allocation may result in material allocation differences when compared to this preliminary allocation and the impact of the revised allocation may have a material effect on the actual results of the operation and financial position of the combined entities.
16
Table of Contents
UNAUDITED PRO FORMA CONDENSED COMBINED BALANCE SHEET
SEPTEMBER 30, 2006
| Acquired Business | Highbury Financial Inc. | Pro Forma Adjustments | Pro Forma Combined | ||||||||||
Assets | |||||||||||||
Current assets: | |||||||||||||
Cash and cash equivalents | $ | 7,218,817 | $ | 470,088 | $ | 44,424,493 | (a) | $ | 6,887,832 | ||||
| (3,718,817 | )(b) | ||||||||||||
| (38,600,000 | )(c) | ||||||||||||
| (2,000,000 | )(c) | ||||||||||||
| 384,041 | (d) | ||||||||||||
| (673,333 | )(e) | ||||||||||||
| (13,363 | )(f) | ||||||||||||
| 11,669 | (g) | ||||||||||||
| (603,780 | )(h) | ||||||||||||
| (11,983 | )(i) | ||||||||||||
Cash and cash equivalents, held in trust | — | 44,424,493 | (44,424,493 | )(a) | — | ||||||||
Advisory and administrative fees receivable | 3,284,200 | — | (3,284,200 | )(j) | — | ||||||||
Prepaid expenses and other current assets | — | 78,795 | — | 78,795 | |||||||||
Total current assets | 10,503,017 | 44,973,376 | (48,509,766 | ) | 6,966,627 | ||||||||
Goodwill | 10,518,750 | — | (10,518,750 | )(k) | 23,618,000 | ||||||||
| 23,618,000 | (c) | ||||||||||||
Other intangible assets, net | 22,045,000 | — | (22,045,000 | )(k) | — | ||||||||
Identifiable intangibles | — | — | 13,032,000 | (c) | 13,032,000 | ||||||||
Deferred acquisition costs | — | 1,136,422 | (1,136,422 | )(d) | — | ||||||||
Deferred tax assets, net | — | 204,018 | (204,018 | )(l) | — | ||||||||
Other assets | 1,635 | — | 448,365 | (c) | 450,000 | ||||||||
Total assets | $ | 43,068,402 | $ | 46,313,816 | $ | (45,315,591 | ) | $ | 44,066,627 | ||||
Liabilities and Stockholders’ Equity | |||||||||||||
Current liabilities: | |||||||||||||
Accounts payable and accrued liabilities | $ | — | $ | 894,445 | $ | (752,381 | )(d) | $ | 142,064 | ||||
Accounts payable – affiliates | 1,459,012 | — | (1,459,012 | )(j) | — | ||||||||
Accrued compensation and benefits | 288,511 | — | (288,511 | )(j) | — | ||||||||
Income taxes payable | — | 262,366 | (144,786 | )(l) | 117,580 | ||||||||
Deferred underwriting fees | — | 673,333 | (673,333 | )(e) | — | ||||||||
Deferred investment income | — | 185,192 | (13,363 | )(f) | — | ||||||||
| (11,983 | )(i) | ||||||||||||
| (159,846 | )(m) | ||||||||||||
Total current liabilities | 1,747,523 | 2,015,336 | (3,503,215 | ) | 259,644 | ||||||||
Other accrued liabilities | 875,143 | — | (875,143 | )(j) | — | ||||||||
Total liabilities | 2,622,666 | 2,015,336 | (4,378,358 | ) | 259,644 | ||||||||
Common stock, subject to possible conversion | — | 8,657,910 | (603,780 | )(h) | — | ||||||||
| (8,054,130 | )(n) | ||||||||||||
Stockholders’ equity: | |||||||||||||
Common stock | 964 | (11 | )(h) | 953 | |||||||||
Additional paid-in capital | 40,445,736 | 35,149,808 | (3,718,817 | )(b) | 43,215,618 | ||||||||
| (1,501,635 | )(c) | ||||||||||||
| (2,000,000 | )(c) | ||||||||||||
| (661,534 | )(j) | ||||||||||||
| (10,518,750 | )(k) | ||||||||||||
| (22,045,000 | )(k) | ||||||||||||
| 11,669 | (g) | ||||||||||||
| 11 | (h) | ||||||||||||
| 8,054,130 | (n) | ||||||||||||
Income (deficit) accumulated | 489,798 | (59,232 | )(l) | 590,412 | |||||||||
| 159,846 | (m) | ||||||||||||
Total stockholders’ equity | 40,445,736 | 35,640,570 | (32,439,169 | ) | 43,806,983 | ||||||||
Total liabilities and stockholders’ equity | $ | 43,068,402 | $ | 46,313,816 | $ | (37,421,307 | ) | $ | 44,066,627 | ||||
See notes to unaudited pro forma condensed combined financial statements.
17
Table of Contents
UNAUDITED PRO FORMA CONDENSED COMBINED
STATEMENT OF OPERATIONS
JULY 13, 2005 (INCEPTION) - DECEMBER 31, 2005 (HIGHBURY)
JANUARY 1, 2005 - DECEMBER 31, 2005 (ACQUIRED BUSINESS)
| Acquired Business | Highbury Financial Inc. | Pro Forma Adjustments | Pro Forma Combined | |||||||||||||
Revenue | $ | 48,927,074 | $ | — | $ | — | $ | 48,927,074 | ||||||||
Distribution and sub-advisory fees | 40,405,752 | — | — | 40,405,752 | ||||||||||||
| 8,521,322 | — | — | 8,521,322 | |||||||||||||
Operating expenses: | ||||||||||||||||
Compensation and related expenses | 5,194,449 | — | — | 5,194,449 | ||||||||||||
Other operating expenses | 3,318,263 | 2,452 | — | 3,320,715 | ||||||||||||
Goodwill impairment | 13,344,050 | — | — | 13,344,050 | ||||||||||||
Intangible asset impairment | 10,425,533 | — | — | 10,425,533 | ||||||||||||
Depreciation and other amortization | — | — | 71,477 | (o) | 71,477 | |||||||||||
| 32,282,295 | 2,452 | 71,477 | 32,356,224 | |||||||||||||
Operating income (loss) | (23,760,973 | ) | (2,452 | ) | (71,477 | ) | (23,834,902 | ) | ||||||||
Non-operating income: | ||||||||||||||||
Interest income (expense) | 133,524 | — | — | (p) | 133,524 | |||||||||||
Income (loss) before minority interest and income taxes | (23,627,449 | ) | (2,452 | ) | (71,477 | ) | (23,701,378 | ) | ||||||||
Minority interest | — | — | (8,341,358 | )(q) | (8,341,358 | ) | ||||||||||
Income (loss) before income taxes | (23,627,449 | ) | (2,452 | ) | 8,269,881 | (15,360,020 | ) | |||||||||
Income taxes—current | — | — | (871,969 | )(r) | (871,969 | ) | ||||||||||
Income taxes—intangible-related deferred | — | — | 905,397 | (r) | 905,397 | |||||||||||
Net income (loss) | $ | (23,627,449 | ) | $ | (2,452 | ) | $ | 8,236,453 | $ | (15,393,448 | ) | |||||
Weighted average shares outstanding - basic | 1,725,000 | 9,527,000 | ||||||||||||||
Net income (loss) per share - basic | $ | (0.00 | ) | $ | (1.62 | ) | ||||||||||
Weighted average shares outstanding - diluted | 1,725,000 | 9,527,000 | (s) | |||||||||||||
Net income (loss) per share - diluted | $ | (0.00 | ) | $ | (1.62 | ) | ||||||||||
See notes to unaudited pro forma condensed combined financial statements.
18
Table of Contents
UNAUDITED PRO FORMA CONDENSED COMBINED
STATEMENT OF OPERATIONS
NINE MONTHS ENDED SEPTEMBER 30, 2006
| Acquired Business | Highbury Financial Inc. | Pro Forma Adjustments | Pro Forma Combined | ||||||||||||
Revenue | $ | 31,629,982 | $ | — | $ | — | $ | 31,629,982 | |||||||
Distribution and sub-advisory fees | 23,108,195 | — | — | 23,108,195 | |||||||||||
| 8,521,787 | — | — | 8,521,787 | ||||||||||||
Operating expenses: | |||||||||||||||
Compensation and related expenses | 3,248,940 | — | — | 3,248,940 | |||||||||||
Other operating expenses | 2,762,360 | 408,323 | — | 3,170,683 | |||||||||||
Depreciation and other amortization | — | — | 53,608 | (o) | 53,608 | ||||||||||
| 6,011,300 | 408,323 | 53,608 | 6,473,231 | ||||||||||||
Operating income (loss) | 2,510,487 | (408,323 | ) | (53,608 | ) | 2,048,556 | |||||||||
Non-operating income: | |||||||||||||||
Interest income (expense) | 242,878 | 1,188,923 | (1,188,923 | )(p) | 242,878 | ||||||||||
Income (loss) before minority interest and income taxes | 2,753,365 | 780,600 | (1,242,531 | ) | 2,291,434 | ||||||||||
Minority interest | — | — | 859,908 | (q) | 859,908 | ||||||||||
Income (loss) before income taxes | 2,753,365 | 780,600 | (2,102,439 | ) | 1,431,526 | ||||||||||
Income taxes - current | — | 492,366 | (492,366 | )(t) | (148,584 | ) | |||||||||
| (148,584 | )(r) | ||||||||||||||
Income taxes—intangible-related deferred | — | — | 679,048 | (r) | 679,048 | ||||||||||
Income taxes—other deferred | — | (204,016 | ) | 204,016 | (t) | — | |||||||||
Net income (loss) | $ | 2,753,365 | $ | 492,250 | $ | (2,344,553 | ) | $ | 901,062 | ||||||
Weighted average shares outstanding - basic | 8,859,469 | 9,527,000 | |||||||||||||
Net income (loss) per share - basic | $ | 0.06 | $ | 0.09 | |||||||||||
Weighted average shares outstanding - diluted | 8,859,469 | 11,208,953 | (s) | ||||||||||||
Net income (loss) per share - diluted | $ | 0.06 | $ | 0.08 | |||||||||||
See notes to unaudited pro forma condensed combined financial statements.
19
Table of Contents
UNAUDITED PRO FORMA CONDENSED
STATEMENT OF OPERATIONS
NINE MONTHS ENDED SEPTEMBER 30, 2005
| Acquired Business | Highbury Financial Inc. | Pro Forma Adjustments | Pro Forma Combined | |||||||||||||
Revenue | $ | 36,896,527 | $ | — | $ | — | $ | 36,896,527 | ||||||||
Distribution and sub-advisory fees | 30,913,968 | — | — | 30,913,968 | ||||||||||||
| 5,982,559 | — | — | 5,982,559 | |||||||||||||
Operating expenses: | ||||||||||||||||
Compensation and related expenses | 3,830,626 | — | — | 3,830,626 | ||||||||||||
Other operating expenses | 2,420,094 | 456 | — | 2,420,550 | ||||||||||||
Depreciation and other amortization | — | — | 53,608 | (o) | 53,608 | |||||||||||
| 6,250,720 | 456 | 53,608 | 6,304,784 | |||||||||||||
Operating income (loss) | (268,161 | ) | (456 | ) | (53,608 | ) | (322,225 | ) | ||||||||
Non-operating income: | ||||||||||||||||
Interest income (expense) | 83,893 | — | — | (p) | 83,893 | |||||||||||
Income (loss) before minority interest and income taxes | (184,268 | ) | (456 | ) | (53,608 | ) | (238,332 | ) | ||||||||
Minority interest | — | — | (112,619 | )(q) | (112,619 | ) | ||||||||||
Income (loss) before income taxes | (184,268 | ) | (456 | ) | 59,011 | (125,713 | ) | |||||||||
Income taxes—current | — | — | (725,631 | )(r) | (725,631 | ) | ||||||||||
Income taxes—intangible-related deferred | — | — | 679,047 | (r) | 679,047 | |||||||||||
Net income (loss) | $ | (184,268 | ) | $ | (456 | ) | $ | 105,595 | $ | (79,129 | ) | |||||
Weighted average shares outstanding - basic | 1,725,000 | 9,527,000 | ||||||||||||||
Net income (loss) per share - basic | $ | (0.00 | ) | $ | (0.01 | ) | ||||||||||
Weighted average shares outstanding - diluted | 1,725,000 | 9,527,000 | (s) | |||||||||||||
Net income (loss) per share - diluted | $ | (0.00 | ) | $ | (0.01 | ) | ||||||||||
See notes to unaudited pro forma condensed combined financial statements.
20
Table of Contents
NOTES TO UNAUDITED PRO FORMA CONDENSED
COMBINED FINANCIAL STATEMENTS
PRO FORMA ADJUSTMENTS
Adjustments included in the column under the heading “Pro Forma Adjustments” include the following:
| a. | To reflect the funds held in the trust account by Highbury released in connection with the acquisition. |
| b. | To reflect the difference between the acquired business’ cash of $7,218,817 and the acquired cash of $3,500,000. |
| c. | To reflect the purchase price, the costs of the acquisition and the related allocation thereof to the fair values of assets and liabilities acquired: |
Purchase price | $ | 38,600,000 | |
Costs of the acquisition | 2,000,000 | ||
| $ | 40,600,000 | ||
Working capital | $ | 3,500,000 | |
Fixed assets | 450,000 | ||
Goodwill | 23,618,000 | ||
Identifiable intangibles | 13,032,000 | ||
| $ | 40,600,000 | ||
The purchase price (i) excludes up to $3.8 million that would be payable if the annualized investment advisory fee revenue generated under investment advisory contracts for the six months prior to the second anniversary of the closing of the acquisition exceeds $41.8 million and (ii) includes up to $3.8 million that would be refundable if the annualized investment advisory fee revenue generated under investment advisory contracts for the six months prior to the second anniversary of the closing of the acquisition is less than $34.2 million. This increase or decrease in consideration will be recorded when the contingency is resolved and additional consideration is receivable or refundable. Highbury will record any additional consideration issued as an additional cost of the acquired entity and such amount will increase the allocation to goodwill. If Highbury receives a refund of amounts paid, the amount refunded will be recorded as a decrease in the cost of the acquired entity and such amount will decrease the allocation to goodwill.
Highbury currently believes the total costs of the acquisition will be approximately $2,000,000 including, but not limited to, legal fees and expenses, accounting fees, proxy solicitation costs and printing fees. These costs will be paid from the funds available to Highbury. As of September 30, 2006, $1,136,422 of such costs have been accrued and recorded as deferred acquisition costs on Highbury’s balance sheet. As of September 30, 2006, $384,041 of such costs have been paid.
The purchase price and the other costs of the acquisition are allocated based on the fair value of net assets acquired. Highbury will acquire $3.5 million of cash and approximately $450,000 of fixed assets, including furniture and equipment, information technology resources and other assets. In connection with the acquisition, ABN AMRO Asset Management Holdings, Inc., or AAAMHI, has committed to pay Highbury or Aston up to $250,000 for the purchase of new furniture and equipment and up to $175,000 for the purchase of new information technology systems and infrastructure. These assets are not reflected on the balance sheet of the acquired business as of September 30, 2006 but will be in place after the closing of the acquisition. Highbury estimates that the fair market value of all other fixed assets acquired is approximately $25,000. See Note (o) for additional information about the fixed assets acquired.
21
Table of Contents
A substantial amount of the purchase price is allocated to identifiable intangibles, which are the acquired mutual fund advisory contracts. In determining the allocation of the purchase price to the acquired mutual fund advisory contracts, Highbury has analyzed the present value of the acquired business’ existing mutual fund advisory contracts as of the closing based on a number of factors including: the acquired business’ historical and potential future operating performance; the historical and potential future rates of new business from new and existing clients and attrition among existing clients; the stability and longevity of existing advisory and sub-advisory relationships; the acquired business’ recent, as well as long-term, investment performance; the characteristics of the acquired business’ products and investment styles; the stability and depth of the management team; and the acquired business’ history and perceived franchise or brand value.
Highbury has determined that the acquired mutual fund advisory contracts of the acquired business meet the indefinite life criteria outlined in FAS No. 142, “Goodwill and Other Intangible Assets”, because Highbury assumes there is no foreseeable limit on the contract period due to the likelihood of continued renewal at little or no cost and therefore expects the cash flows generated by these assets to continue indefinitely.
The Aston Funds represent 19 separate series of a single Delaware business trust, referred to throughout this prospectus as the business trust, which is an indefinite life vehicle. The terms of Aston’s advisory contracts with the Aston Funds provide for the periodic review and renewal of the advisory contracts. Since the formation of the target funds, their advisory contracts with their adviser have typically been continually renewed at little or no cost to the acquired business.
Highbury has no basis to believe these contracts will not be renewed continually in the future. Highbury expects that new funds may be created within the business trust in the future to satisfy demand in the market and understands that mutual funds may be merged or closed over time, although there are no such plans now. As a result, Highbury believes that Aston’s mutual funds may change over time but expects that revenues under investment advisory contracts with the mutual funds will continue to generate cash flows for Aston. Accordingly, Highbury does not intend to amortize these intangible assets, but instead will review these assets at least annually for impairment.
Aston’s advisory agreements with the Aston Funds give the Aston Funds’ trustees the authority to terminate the advisory contracts at any time. Such a termination event might occur if, for example, Aston fails to maintain adequate compliance functions, has insufficient resources to manage the target funds or engages in fraudulent activities. In the event of such a termination, Highbury may determine that the intangible assets have been impaired and recognize an impairment charge to reduce the carrying value of the intangible assets to their then-fair value. Each reporting period, Highbury will assess whether events or circumstances have occurred which indicate that the indefinite life criteria are no longer met. If the indefinite life criteria are no longer met, Highbury will assess whether the carrying value of the assets exceeds their fair value, and an impairment loss will be recorded in an amount equal to any such excess.
The excess of purchase price for the acquisition over the fair value of net assets acquired, including acquired mutual fund advisory contracts, is reported as goodwill. Goodwill will not be amortized, but will instead be reviewed for impairment. Highbury will assess goodwill for impairment at least annually, or more frequently whenever events or circumstances occur indicating that the recorded goodwill may be impaired. If the carrying amount of goodwill exceeds the fair value, an impairment loss will be recorded in an amount equal to that excess.
In addition to a termination of Aston’s advisory contracts as discussed above, there are many risks related to the financial services industry and Aston which could negatively impact Aston in the future and potentially lead to impairment charges. The financial services industry faces regulatory risk and Aston may experience reduced revenues and profitability if its services are not regarded as compliant with regulatory statutes. In addition, downward pressure on Aston’s fees as a result of price competition in the mutual fund industry or a market or general economic downturn could lead to losses of revenue and
22
Table of Contents
profitability. For more information on risks which may cause the goodwill or intangible assets to be impaired and lead to an impairment charge, please see “Risk Factors — Risks Related to the Financial Services Industry and Aston.”
This purchase price allocation is preliminary and will be subject to a final determination after the closing of the acquisition. The final determination of the purchase price allocation may result in material allocation differences when compared to this preliminary allocation and the impact of the revised allocation may have a material effect on the actual results of operation and financial position of the combined entities.
| d. | To reverse accrual of deferred acquisition costs (a portion of the $2,000,000 of estimated costs of acquisition described in Note (c)) and adjust for amounts paid prior to the acquisition. |
| e. | To reflect payment of the underwriters’ deferred compensation of $673,333. |
| f. | To reflect payment of accrued interest on the underwriters’ deferred compensation. |
| g. | To reflect reduction in payment of underwriters’ deferred compensation by approximately $0.11 per share that the shareholders elected to convert in connection with the acquisition. |
| h. | To reflect conversion of 108,000 shares by owners of Highbury’s common stock into cash upon consummation of the acquisition. These shares are no longer outstanding and have been retired. |
| i. | To reflect payment of pro rata interest earned on the trust account (net of taxes payable) to holders of Highbury’s common stock who elected to convert their shares into cash upon consummation of the acquisition. |
| j. | To remove assets and liabilities of the acquired business that Highbury did not acquire. |
| k. | Goodwill and other intangibles of the acquired business will be eliminated under purchase accounting. As explained in Note (c), Highbury has established new values for the goodwill and other intangibles as of the closing of the acquisition. |
| l. | To reflect deductibility of expenses previously deferred and tax effect of recognition or return of income in Note (m) or Note (i). |
| m. | To reflect recognition of deferred investment income. |
| n. | After the consummation of the acquisition no common stock is subject to potential conversion. |
| o. | To reflect depreciation of fixed assets of the acquired business according to the following schedule: |
Type of Asset | Fair Value of Assets | Useful Life (years) | |||
Information technology | $ | 175,000 | 4 | ||
Furniture and equipment | 250,000 | 11 | |||
Other | 25,000 | 5 | |||
| $ | 450,000 | ||||
| p. | To reflect pro forma interest income incurred by the combined business for the period presented. After the acquisition, Highbury’s cash balances may be eligible to earn interest. However, given the uncertainty regarding the use of cash after the acquisition, interest income earned by Highbury in the period ended September 30, 2006 has been excluded and no interest income (in excess of interest income earned by the acquired business in the applicable period) has been included in the pro forma financial statements. |
23
Table of Contents
| q. | Equal to Aston management’s 35% share of the income (loss) before minority interest and income taxes of the acquired business. Upon consummation of the acquisition, as a result of the amendment to the limited liability company amendment to admit the Aston management members, Highbury incurred a one-time, non-cash compensation charge of approximately $20.8 million. Since this is a non-recurring item, it has not been included in the accompanying pro forma statements of operations. |
To establish the $20.8 million compensation charge for financial reporting purposes, Highbury used an asset-based approach. Based on the purchase price of $38.6 million, our management team determined that the minimum value of Highbury’s 65% manager membership interest in Aston was $38.6 million, and therefore the minimum valuation for 100% of Aston was approximately $59.4 million. Our management team then concluded that the value of the Aston management members’ 35% interest was equal to the difference between these two values, or approximately $20.8 million.
| r. | Highbury’s estimated income tax liabilities for both GAAP and cash purposes are based on assumed federal and Colorado state income tax rates of 34.00% and 4.63%, respectively. Since Colorado state income taxes are deductible for federal income tax purposes, Highbury’s estimated effective tax rate is 37.06%. On the statement of operations, income taxes – current are equal to the total tax liability calculated on a cash basis. These calculations are shown in the following tables, and the results are indicated in the line entitled “total tax liability – current.” On the statement of operations, income taxes – deferred are equal to the difference between total tax liability calculated for GAAP purposes and the total tax liability calculated on a cash basis. These calculations are also shown in the following tables. The results of the calculations of the total tax liability calculated for GAAP purposes are indicated in the line entitled “Total tax liability (benefit) – GAAP” and the difference between these first two calculations is indicated in the line entitled “deferred tax liability (benefit).” |
This deferred tax liability is created as a result of the anticipated amortization of intangibles for cash tax purposes going forward. The goodwill impairment and intangible asset impairment charges taken by the acquired business in 2005 will not create current or future income tax benefits for the combined company. Highbury will record goodwill and intangible assets to the balance sheet of the acquired business to reflect the value of the assets acquired in the acquisition. As explained in note (c), Highbury intends to amortize the intangible assets for cash tax purposes which will reduce Highbury’s annual cash income taxes and create a recurring tax benefit. Furthermore, Highbury has determined that the acquired mutual fund client relationships meet the indefinite life criteria outlined in FAS No. 142, “Goodwill and Other Intangible Assets,” and as such, Highbury will not amortize these intangible assets for GAAP purposes, but will instead review these assets at least annually for impairment. Highbury expects this difference in amortization schedules will create an annual deferred tax liability for GAAP purposes. Because Highbury does not anticipate impairment of the acquired assets in the future, Highbury does not expect this recurring tax benefit to reverse. Although the acquired business has historically provided a full valuation allowance for its deferred tax asset, Highbury does not believe that it will make such a provision after the acquisition as a result of the increased profitability of the acquired business on a pro forma basis.
24
Table of Contents
RECONCILIATION OF CURRENT AND DEFERRED INCOME TAXES
FOR THE INDICATED PERIODS
| Nine Months Ended September 30, | Year Ended December 31, | |||||||||||
| 2006 | 2005 | 2005 | ||||||||||
Income (loss) before income taxes - GAAP | $ | 1,431,526 | $ | (125,713 | ) | $ | (15,360,020 | ) | ||||
Permanent differences: | ||||||||||||
Goodwill impairment | — | — | 13,344,050 | |||||||||
Intangible asset impairment | — | — | 10,425,533 | |||||||||
Minority interest adjustment | — | — | (8,319,354 | ) | ||||||||
Taxable income - GAAP | 1,431,526 | (125,713 | ) | 90,209 | ||||||||
Colorado state income tax liability | 66,280 | (5,821 | ) | 4,177 | ||||||||
Federal income tax liability | 464,184 | (40,763 | ) | 29,251 | ||||||||
Total tax liability - GAAP | 530,464 | (46,584 | ) | 33,428 | ||||||||
Net income (loss) - GAAP | $ | 901,062 | $ | (79,129 | ) | $ | (15,393,448 | ) | ||||
Income (loss) before income taxes - GAAP | $ | 1,431,526 | $ | (125,713 | ) | $ | (15,360,020 | ) | ||||
Addback: goodwill impairment | — | — | 13,344,050 | |||||||||
Addback: intangible asset impairment | — | — | 10,425,533 | |||||||||
Less: minority interest adjustment | — | — | (8,319,354 | ) | ||||||||
Less: goodwill amortization | (1,832,500 | ) | (1,832,500 | ) | (2,443,333 | ) | ||||||
Cash taxable income | (400,974 | ) | (1,958,213 | ) | (2,353,124 | ) | ||||||
Colorado state income tax liability | (18,565 | ) | (90,665 | ) | (108,950 | ) | ||||||
Federal income tax liability | (130,019 | ) | (634,966 | ) | (763,019 | ) | ||||||
Total tax liability - current | (148,584 | ) | (725,631 | ) | (871,969 | ) | ||||||
Deferred tax liability for goodwill amortization | 679,048 | 679,047 | 905,397 | |||||||||
Total tax liability - GAAP | $ | 530,464 | $ | (46,584 | ) | $ | 33,428 | |||||
| s. | Uses treasury stock method based on weighted average common stock price of $5.59 for the period from March 1, 2006 through September 30, 2006. Highbury has 15,820,000 warrants outstanding, all of which are exercisable for $5.00 per share, as of September 30, 2006. The effect of the 336,667 units included in the underwriters purchase option has not been considered in diluted income per share calculations since the option is out-of-the money based on Highbury’s weighted average common stock price for the period. |
| t. | To remove income taxes of Highbury as a stand-alone entity. |
25
Table of Contents
SUPPLEMENTAL FINANCIAL INFORMATION
As supplemental information, we provide below a non-GAAP performance measure that we refer to as “Supplemental Adjusted Operating Results”. The Supplemental Adjusted Operating Results apply the adjustments described below to our unaudited pro forma condensed combined statements of operations included in this prospectus under the heading “Unaudited Pro Forma Condensed Combined Financial Statements,” which are derived from (i) the historical statement of operations of Highbury for the period beginning July 13, 2005, the date of Highbury’s inception, to December 31, 2005, and the historical combined statement of operations of the acquired business for its fiscal year ended December 31, 2005, giving effect to the acquisition as if it had occurred on January 1, 2005, (ii) the historical statement of operations of Highbury and the historical combined statement of operations of the acquired business, each for the nine months ended September 30, 2006, giving effect to the acquisition as if it had occurred on January 1, 2006 and (iii) the historical statement of operations of Highbury for the period beginning July 13, 2005, the date of Highbury’s inception, to September 30, 2005 and the historical statement of operations of the acquired business, for the nine months ended September 30, 2005, giving effect to the acquisition as if it had occurred on January 1, 2005. The Supplemental Adjusted Operating Results are not pro forma financial information and are not included in the historical financial statements of Highbury, the historical combined financial statements of the acquired business or the Unaudited Pro Forma Condensed Combined Financial Statements. Because the contractual provisions supporting the adjustments described in the footnotes to the Supplemental Adjusted Operating Results take effect upon the closing of the acquisition, the supplemental non-GAAP financial information provided below constitutes forward-looking statements based upon certain management assumptions. The contractual provisions supporting the adjustments will not necessarily produce the Supplemental Adjusted Operating Results shown below.
The Supplemental Adjusted Operating Results reflect adjustments to our Unaudited Pro Forma Condensed Combined Results of Operations for (i) Highbury for the period beginning July 13, 2005, the date of Highbury’s inception, to December 31, 2005, and the acquired business for the period ended December 31, 2005, as if the following agreements had been entered into on January 1, 2005, (ii) Highbury and the acquired business, for the nine months ended September 30, 2006, as if such agreements had been entered into on January 1, 2006 and (iii) the historical statement of operations of Highbury for the period beginning July 13, 2005, the date of Highbury’s inception, to September 30, 2005 and the acquired business for the nine months ended September 30, 2005, as if such agreements had been entered into on January 1, 2005: (a) the Administrative, Compliance and Marketing Services Agreement entered into between AAAMI and Aston as of September 1, 2006 (described further in footnote (a) below), (ii) new fee-sharing agreements with investment sub-advisers affiliated with the sellers to be entered into upon consummation of the acquisition (as described further in footnote (b) below, the execution of these agreements on the pricing terms reflected in the Definitive Revised Proxy Statement, dated November 3, 2006 (No. 000-51682) was a condition to the closing of the acquisition), and (iii) Aston’s limited liability company agreement, whereby 72% of gross revenues are allocated to cover the operating expenses of the acquired business (described further in footnote (c) below). In addition, the Supplemental Adjusted Operating Results reflect adjustments to minority interest and income taxes related to the foregoing adjustments (described further in footnotes (d) and (e), respectively, below).
The Supplemental Adjusted Operating Results should be read in conjunction with the historical financial statements of Highbury, the historical combined financial statements of the acquired business and the related notes thereto, the unaudited condensed combined financial statements and “Management’s Discussion and Analysis of Financial Condition and Results of Operations of the Acquired Business.” This supplemental non-GAAP financial information is provided in addition to, but not as a substitute for, our operating results and those of the acquired business calculated and presented in accordance with GAAP and our Pro Forma Condensed Combined Statements of Operations prepared in accordance with Article 11 of Regulation S-X.
We are providing this information to aid you in your analysis of the financial aspects of our business because we believe that these agreements will have a substantial effect on the results of our operations of the combined company and because we considered the impact of the limited liability company agreement and the new sub-advisory fee arrangements, and related minority interest and income tax impacts, in connection with our entering into the asset purchase agreement. The information is intended to provide you with an estimate of the effect these agreements would have had on the results of operations of the combined company for the periods presented. The Supplemental Adjusted Operating Results presented are not meant to estimate or project future results of operations, should not be considered in isolation and have limitations as an analytic tool. Some of these limitations are that had these agreements been in effect during the periods presented, the actual results of operations may have been different, and that the Supplemental Adjusted Operating Results are not necessarily indicative of the financial results that may have actually occurred.
26
Table of Contents
SUPPLEMENTAL ADJUSTED OPERATING RESULTS
JULY 13, 2005 (INCEPTION) - DECEMBER 31, 2005 (HIGHBURY)
JANUARY 1, 2005 - DECEMBER 31, 2005 (ACQUIRED BUSINESS)
| Pro Forma Combined | Supplemental Adjustments | Supplemental Combined | ||||||||||
Revenue | $ | 48,927,074 | $ | 1,298,437 | (a) | $ | 50,225,511 | |||||
Distribution and sub-advisory fees | 40,405,752 | (14,082,567 | )(b) | 26,323,185 | ||||||||
| 8,521,322 | 15,381,004 | 23,902,326 | ||||||||||
Operating expenses: | ||||||||||||
Compensation and related expenses | 5,194,449 | 1,254,994 | (c) | 6,449,443 | ||||||||
Other operating expenses | 3,320,715 | — | 3,320,715 | |||||||||
Goodwill impairment | 13,344,050 | — | 13,344,050 | |||||||||
Intangible asset impairment | 10,425,533 | — | 10,425,533 | |||||||||
Depreciation and other amortization | 71,477 | — | 71,477 | |||||||||
| 32,356,224 | 1,254,994 | 33,611,218 | ||||||||||
Operating income (loss) | (23,834,902 | ) | 14,126,010 | (9,708,892 | ) | |||||||
Non-operating income: | ||||||||||||
Interest income (expense) | 133,524 | — | 133,524 | |||||||||
Income (loss) before minority interest and income taxes | (23,701,378 | ) | 14,126,010 | (9,575,368 | ) | |||||||
Minority interest | (8,341,358 | ) | 4,944,104 | (d) | (3,397,254 | ) | ||||||
Income (loss) before income taxes | (15,360,020 | ) | 9,181,906 | (6,178,114 | ) | |||||||
Income taxes—current | (871,969 | ) | 3,402,429 | (e) | 2,530,460 | |||||||
Income taxes—intangible-related deferred | 905,397 | (1 | )(e) | 905,396 | ||||||||
Net income (loss) | $ | (15,393,448 | ) | $ | 5,779,478 | $ | (9,613,970 | ) | ||||
Weighted average shares outstanding - basic | 9,527,000 | 9,527,000 | ||||||||||
Net income (loss) per share - basic | $ | (1.62 | ) | $ | (1.01 | ) | ||||||
Weighted average shares outstanding - diluted | 9,527,000 | 9,527,000 | ||||||||||
Net income (loss) per share - diluted | $ | (1.62 | ) | $ | (1.01 | ) | ||||||
27
Table of Contents
SUPPLEMENTAL ADJUSTED OPERATING RESULTS
NINE MONTHS ENDED SEPTEMBER 30, 2006
| Pro Forma Combined | Supplemental Adjustments | Supplemental Combined | |||||||||
Revenue | $ | 31,629,982 | $ | 858,208 | (a) | $ | 32,488,190 | ||||
Distribution and sub-advisory fees | 23,108,195 | (7,114,497 | )(b) | 15,993,698 | |||||||
| 8,521,787 | 7,972,705 | 16,494,492 | |||||||||
Operating expenses: | |||||||||||
Compensation and related expenses | 3,248,940 | 1,332,891 | (c) | 4,581,831 | |||||||
Other operating expenses | 3,170,683 | — | 3,170,683 | ||||||||
Depreciation and other amortization | 53,608 | — | 53,608 | ||||||||
| 6,473,231 | 1,332,891 | 7,806,122 | |||||||||
Operating income (loss) | 2,048,556 | 6,639,814 | 8,688,370 | ||||||||
Non-operating income: | |||||||||||
Interest income (expense) | 242,878 | — | 242,878 | ||||||||
Income (loss) before minority interest and Income taxes | 2,291,434 | 6,639,814 | 8,931,248 | ||||||||
Minority interest | 859,908 | 2,323,935 | 3,183,843 | ||||||||
Income (loss) before income taxes | 1,431,526 | 4,315,879 | 5,747,405 | ||||||||
Income taxes—current | (148,584 | ) | 1,599,283 | 1,450,699 | |||||||
Income taxes—intangible-related deferred | 679,048 | — | 679,048 | ||||||||
Net income (loss) | $ | 901,062 | $ | 2,716,596 | $ | 3,617,658 | |||||
Weighted average shares outstanding - basic | 9,527,000 | 9,527,000 | |||||||||
Net income (loss) per share - basic | $ | 0.09 | $ | 0.38 | |||||||
Weighted average shares outstanding - diluted | 11,208,953 | 11,208,953 | |||||||||
Net income (loss) per share - diluted | $ | 0.08 | $ | 0.32 | |||||||
28
Table of Contents
SUPPLEMENTAL ADJUSTED OPERATING RESULTS
NINE MONTHS ENDED SEPTEMBER 30, 2005
| Pro Forma Combined | Supplemental Adjustments | Supplemental Combined | |||||||||
Revenue | $ | 36,896,527 | $ | 804,468 | (a) | $ | 37,700,995 | ||||
Distribution and sub-advisory fees | 30,913,968 | (11,687,589 | )(b) | 19,226,379 | |||||||
| 5,982,559 | 12,492,057 | 18,474,616 | |||||||||
Operating expenses: | |||||||||||
Compensation and related expenses | 3,830,626 | 1,614,009 | (c) | 5,444,635 | |||||||
Other operating expenses | 2,420,550 | — | 2,420,550 | ||||||||
Depreciation and other amortization | 53,608 | — | 53,608 | ||||||||
| 6,304,784 | 1,614,009 | 7,918,793 | |||||||||
Operating income (loss) | (322,225 | ) | 10,878,048 | 10,555,823 | |||||||
Non-operating income: | |||||||||||
Interest income (expense) | 83,893 | — | 83,893 | ||||||||
Income (loss) before minority interest and income taxes | (238,332 | ) | 10,878,048 | 10,639,716 | |||||||
Minority interest | (112,619 | ) | 3,807,317 | (d) | 3,694,698 | ||||||
Income (loss) before income taxes | (125,713 | ) | 7,070,731 | 6,945,018 | |||||||
Income taxes—current | (725,631 | ) | 2,620,116 | (e) | 1,894,485 | ||||||
Income taxes—intangible-related deferred | 679,047 | — | 679,047 | ||||||||
Net income (loss) | $ | (79,129 | ) | $ | 4,450,615 | $ | 4,371,486 | ||||
Weighted average shares outstanding - basic | 9,527,000 | 9,527,000 | |||||||||
Net income (loss) per share - basic | $ | (0.01 | ) | $ | 0.46 | ||||||
Weighted average shares outstanding - diluted | 9,527,000 | 11,208,953 | |||||||||
Net income (loss) per share - diluted | $ | (0.01 | ) | $ | 0.39 | ||||||
29
Table of Contents
NOTES TO SUPPLEMENTAL
FINANCIAL INFORMATION
1. SUPPLEMENTAL ADJUSTMENTS
Adjustments included in the column under the heading “Supplemental Adjustments” include the following:
| a. | To reflect revenue to be earned by Aston according to an Administrative, Compliance and Marketing Services Agreement entered into between AAAMI and Aston as of September 1, 2006. Pursuant to the terms of Aston’s limited liability company agreement, 72% of the revenue generated under this agreement will be retained by Aston in the operating allocation to cover any costs associated with providing services under this new agreement. This increase in the operating allocation, and hence the operating expenses of Aston, is one component of the overall increase in compensation and related expenses detailed in the supplemental adjustment reflected in note (c). Highbury does not expect any actual additional costs to be material. The adjustment is factually supportable because the economic terms are outlined in the agreement and in the funds’ prospectus and directly attributable to the acquisition because, although the sellers are divesting the acquired business, they wish to have the acquired business continue to provide the services to the money market funds, other than the target funds, after the consummation of the business combination. The agreement has a five-year term, with certain termination provisions, but management expects to retain this relationship and the related revenues for an indefinite period after the consummation of the acquisition, consistent with the expectations related to the advisory contracts of the Aston funds. The Administrative, Compliance & Marketing Services Agreement is included in the registration statement of which this prospectus is a part as Exhibit 10.21. |
30
Table of Contents
| b. | To reflect new fee-sharing agreements with investment sub-advisers affiliated with the sellers entered into upon consummation of the acquisition. Pursuant to the sub-advisory agreements that Aston entered into with ABN AMRO and its affiliated advisers, Aston and the ABN AMRO affiliated managers will share net advisory fees equally after payment of third-party distribution fees. The following tables reconcile the historical advisory fees paid to ABN AMRO affiliates to the fees that are payable under the new sub-advisory agreements. The supporting calculation only incorporates advisory fee revenues and distribution and sub-advisory fees for the Aston Funds for which affiliates of the sellers will serve as sub-advisers after the consummation of the acquisition. All advisory fee revenues and distribution and sub-advisory fees related to the two Aston Funds for which MFS and Optimum serve as sub-advisers have been excluded from this analysis because there is no change in the sub-advisory agreements and, therefore, no change in the fee-sharing arrangements for these funds. |
| Nine Months Ended September 30, | Year Ended December 31, | |||||||||||
| 2006 | 2005 | 2005 | ||||||||||
Distribution and sub-advisory fees, after adjustment to sub-advisor fee sharing arrangement | ||||||||||||
Net advisory fees from funds managed by affiliates | $ | 4,995,891 | $ | 31,214,486 | $ | 41,078,847 | ||||||
Less: third party distribution fees for funds managed by affiliates | (2,778,264 | ) | (3,912,329 | ) | (5,290,395 | ) | ||||||
Subtotal | 22,217,627 | 27,302,157 | 35,788,452 | |||||||||
Less: sub-advisory fees paid to affiliates | (11,108,814 | ) | (13,651,078 | ) | (17,894,226 | ) | ||||||
Net revenue to the acquired business | 11,108,813 | 13,651,079 | 17,894,226 | |||||||||
Distribution and sub-advisory fees, before adjustment to sub-advisor fee sharing arrangement | ||||||||||||
Net advisory fees from funds managed by affiliates | 24,995,891 | 31,214,486 | 41,078,847 | |||||||||
Less: third party distribution fees for funds managed by affiliates | (2,778,264 | ) | (3,912,329 | ) | (5,290,395 | ) | ||||||
Subtotal | 22,217,627 | 27,302,157 | 35,788,452 | |||||||||
Less: sub-advisory fees paid to affiliates | (18,223,311 | ) | (25,338,667 | ) | (31,976,793 | ) | ||||||
Net revenue to the acquired business | 3,994,316 | 1,963,490 | 3,811,659 | |||||||||
Supplemental adjustment | $ | 7,114,497 | $ | 11,687,589 | $ | 14,082,567 | ||||||
Aston entered into the new sub-advisory agreements with the sellers at the time of the closing of the acquisition. Historically, the acquired business received a portion of the investment advisory fees that the target funds paid to the investment advisers by the target funds.
The sub-advisory services to be provided by the affiliates of the sellers following the acquisition are the same investment management services historically provided to the target funds by such affiliates. The sub-advisers received $18.2 million, $25.3 million and $32.0 million in fees for their services during the nine months ending September 30, 2006 and 2005 and during the year ended December 31, 2005, respectively. Had the new sub-advisory agreements with these affiliates been in place during those historical time periods, the sub-advisers would have received $11.1 million, $13.7 million and $17.9 million, respectively, for providing the same services.
31
Table of Contents
Aston entered into investment advisory agreements with each of the Aston Funds that provide that Aston, as the investment adviser to the Aston Funds, shall:
| (i) | manage the investment and reinvestment of the assets of each Aston Fund; |
| (ii) | continuously review, supervise and administer the investment program of each Aston Fund; |
| (iii) | determine in its discretion, the assets to be held uninvested; |
| (iv) | provide the Aston Funds with records concerning the investment adviser’s activities which are required to be maintained by the business trust; |
| (v) | render regular reports to the business trust’s officers and Board of Trustees concerning the investment adviser’s discharge of the foregoing responsibilities; |
| (vi) | determine from time to time what securities and other investments will be purchased, retained, sold or exchanged by each Aston Fund and what portion of the assets of the Aston Fund’s portfolio will be held in the various securities and other investments in which the Aston Fund invests, and shall implement those decisions, all subject to the provisions of the business trust’s Declaration of Trust and By-Laws, as amended from time to time, the 1940 Act, and the applicable rules and regulations promulgated thereunder by the SEC and interpretive guidance issued thereunder by the SEC staff and any other applicable federal and state law, as well as the investment objectives, policies and restrictions of the Aston Fund referred to above, and any other specific policies adopted by the Board and communicated to Aston; |
| (vii) | provide advice and recommendations with respect to other aspects of the business and affairs of the Aston Funds; |
| (viii) | exercise voting rights, rights to consent to corporate action and any other rights pertaining to an Aston Fund’s portfolio securities subject to such direction as the Board may provide; and |
| (ix) | perform such other functions of investment management and supervision as may be directed by the Board. |
These duties are substantially the same as the duties outlined in the investment advisory agreements in effect between each of the target funds and its investment adviser prior to the acquisition. The “Form of Sub-Investment Advisory Agreement”, included as Exhibit 10.22 to the registration statement of which this prospectus is a part, outlines the delegation of certain of these duties of the investment adviser to the investment sub-adviser after the acquisition. With reference to the list above, the table below outlines the pre-acquisition allocation of responsibilities between the investment advisers and the acquired business and the allocation of responsibilities according to the new sub-advisory agreements. For further clarity, the table also outlines the allocation of responsibilities between the investment advisers to the target funds and the acquired business. This illustration is included to show that the services to be provided after the consummation of the acquisition are identical to the services provided on a historical basis. The reference in the column “Service” refers to the services listed above.
32
Table of Contents
Provider of Services | ||||
Service | Pre-Acquisition | Currently | ||
| (i) | Investment advisor, with oversight from acquired business | Investment sub-advisor, with oversight from Aston | ||
| (ii) | Acquired business | Aston | ||
| (iii) | Investment advisor, with oversight from acquired business | Investment sub-advisor, with oversight from Aston | ||
| (iv) | Acquired business | Aston | ||
| (v) | Acquired business | Aston | ||
| (vi) | Investment advisor, with oversight from acquired business | Investment sub-advisor, with oversight from Aston | ||
| (vii) | Acquired business | Aston | ||
| (viii) | Investment advisor, with oversight from acquired business | Investment sub-advisor, with oversight from Aston | ||
| (ix) | Acquired business | Aston | ||
Beginning upon consummation of the acquisition, Aston provides all of the services that the acquired business has historically provided to the target funds. As such, Highbury does not expect Aston to incur any additional or different types of costs than those incurred on a historical basis by the acquired business.
The affiliates of the sellers are now performing the same investment management services for the Aston Funds as they provided prior to the acquisition. However, as a result of the new sub-advisory agreements, they will receive a smaller share of the net advisory fees after payments of third-party distribution fees than they currently receive.
Because the target funds were introduced over a period of 13 years and are managed by five different affiliates of the sellers, the historical fee sharing agreements between the acquired business and each investment adviser with respect to each target fund varied among the funds and over time. In addition, since the acquired business and the investment advisers were part of a commonly controlled corporate entity, the historical fee sharing arrangements were not reflective of market terms but rather internal allocations that have also varied. As a result, the data required to perform a fund-by-fund comparison of the historical fee sharing arrangements and the new sub-advisory agreements is not available.
Highbury determined the supplemental adjustment reflected in note (b) based on a comparison of the aggregate historical advisory fees paid to the affiliates of the sellers (but excluding the sub-advisers who are not affiliates of the sellers) and the aggregate sub-advisory fees that would have been paid to the affiliates of the sellers in the same periods under the new sub-advisory agreements. The difference between the two aggregate payments is the amount of the supplemental adjustment in each of the periods. Because the contractual payments to the sub-advisers can be calculated based on the new sub-advisory agreements executed upon the consummation of the acquisition, this adjustment is factually supportable. The adjustment is also directly attributable to the acquisition because it is through the acquisition that Aston became the investment adviser to the target funds and entered into the new sub-advisory agreements with the affiliates of the seller. Finally, consistent with the disclosure in note (c) within the Section “Unaudited Pro Forma Condensed Combined Financial Statements” regarding the indefinite-lived intangible assets, Highbury expects these sub-advisory contracts to continue indefinitely. However, if any such sub-advisory contract is terminated, Highbury and the Aston management team are confident that the sub-adviser could be replaced on economic terms no less favorable to Aston than the sub-advisory contract put in place upon consummation of the acquisition.
33
Table of Contents
| c. | Under the terms of Aston’s limited liability company agreement, 72% of gross revenues are allocated to cover the operating expenses of the acquired business. If actual cash operating expenses are less than the full 72% allocation would provide, the excess allocation may be applied as the Aston management members determine. Based on the contractual expenses of the acquired business, there is additional operating allocation available. For this analysis, Highbury has assumed these funds will be paid as compensation. |
| d. | Equal to Aston management’s 35% share of the income (loss) before minority interest and income taxes of the acquired business. |
| e. | Highbury’s estimated income tax liabilities for both accrual and cash purposes are based on assumed federal and Colorado state income tax rates of 34.00% and 4.63%, respectively. Since Colorado state income taxes are deductible for federal income tax purposes, Highbury’s estimated effective tax rate is 37.06%. On the statement of operations, income taxes – current are equal to the total tax liability calculated on a cash basis. On the statement of operations, income taxes – deferred are equal to the difference between total tax liability calculated on an accrual basis and the total tax liability calculated on a cash basis. |
34
Table of Contents
SELECTED HISTORICAL CONSOLIDATED FINANCIAL OPERATING DATA
The following table sets forth our selected historical consolidated financial operating data as of the dates and for the periods indicated. The selected historical consolidated statement of income and balance sheet as of and for each of the fiscal years ended December 31, 2003, 2004 and 2005 and for each of the nine-month periods ended September 30, 2005 and 2006 for the acquired business and for the fiscal year ended December 31, 2005 and for each of the nine months ended September 30, 2005 and 2006 for Highbury are derived from, and are qualified in their entirety by, the historical financial statements of the acquired business and Highbury. Historical results are not necessarily indicative of the results to be expected in the future. You should read the following data together with “Business,” “Unaudited Pro Form Condensed Combined Financial Statements,” “Supplemental Financial Information,” “Management’s Discussion and Analysis and Plan of Operation of Highbury Financial Inc.,” “Management’s Discussion and Analysis of Financial Condition and Results of Operations of the Acquired Business” and the historical financial statements of the acquired business and Highbury and the related notes.
| The Acquired Business | Highbury Financial Inc. | |||||||||||||||||||
| For the Year ended December 31, | Nine Months ended September 30, | July 13, 2005 December 31, | July 13, 2005 (inception) to September 30, | Nine Months ended September 30, | ||||||||||||||||
| 2003 | 2004 | 2005 | 2005 | 2006 | 2005 | 2005 | 2006 | |||||||||||||
Operating Results | ||||||||||||||||||||
Revenue | 39,677,535 | 49,247,963 | 48,927,074 | 36,896,527 | 31,629,982 | — | — | — | ||||||||||||
Net income | 620,095 | 1,545,166 | (23,627,449 | ) | (184,268 | ) | 2,753,365 | (2,452 | ) | (456 | ) | 492,250 | ||||||||
Earnings per share – basic and diluted | n/a | n/a | n/a | n/a | n/a | (0.00 | ) | (0.00 | ) | 0.06 | ||||||||||
Balance Sheet Data | ||||||||||||||||||||
Total assets | n/a | 63,688,128 | 41,879,618 | n/a | 43,068,402 | 520,394 | 251,635 | 46,313,816 | ||||||||||||
Long term debt | n/a | — | — | n/a | — | — | — | — | ||||||||||||
Redeemable preferred stock | n/a | — | — | n/a | — | — | — | — | ||||||||||||
Stockholders’ equity | n/a | 59,421,138 | 38,010,116 | n/a | 40,445,736 | 22,548 | 24,544 | 35,640,570 | ||||||||||||
Other Financial Data | ||||||||||||||||||||
Assets under management (end of period, in millions) | 6,906 | 7,223 | 6,329 | 6,810 | 5,369 | n/a | n/a | n/a | ||||||||||||
Average shares outstanding – basic and diluted | n/a | n/a | n/a | n/a | n/a | 1,725,000 | 1,725,000 | 8,859,469 | ||||||||||||
35
Table of Contents
MANAGEMENT’S DISCUSSION AND ANALYSIS AND PLAN OF OPERATION
OF HIGHBURY FINANCIAL INC.
You should read this discussion and analysis of our financial condition and results of operations in conjunction with our “Unaudited Pro Forma Condensed Combined Financial Statement,” our “Supplemental Financial Information” and the combined financial statements of Highbury and the related notes appearing elsewhere in this prospectus. The information in this section contains forward-looking statements (see “Forward-Looking Statements”). Highbury’s actual results may differ significantly from the results suggested by these forward-looking statements and Highbury’s historical results. Some factors that may cause our results to differ are described in the “Risk Factors” section of this prospectus.
Restatement
In consultation with our independent registered accounting firm, Goldstein Golub Kessler LLP, we determined on October 10, 2006 that we needed to reclassify certain amounts in our financial statements to report as liabilities the warrants issued as part of the units issued in our initial public offering and the private placement immediately prior to our initial public offering and the unit purchase option issued to the underwriters in our initial public offering, or UPO. The issue arose as a result of comments received from the SEC on the preliminary Proxy Statement originally filed by us on May 31, 2006 in connection with the acquisition. We arrived at our conclusions after further consideration of the accounting for warrants and other derivative securities under Emerging Issues Task Force No. 00-19,“Accounting for Derivative Financial Instruments Indexed to, and Potentially Settled in, a Company’s Own Stock”, or EITF No. 00-19. Subsequently on December 18, 2006, we determined in consultation with our independent registered accounting firm, Goldstein Golub Kessler LLP, and the SEC, that our original accounting treatment of the warrants and the UPO was correct. As a result, we have restated the previously issued financial statements, where appropriate, to remove these liabilities. The accompanying financial statements reflect this reclassification.
For a more complete discussion of the accounting treatment of the warrants and UPO under EITF No. 00-19, see “Critical Accounting Policies” and Note 3 to our Financial Statements included elsewhere herein.
Recent Developments
Business Combination
On April 20, 2006 we and Aston entered into an asset purchase agreement with the sellers. Pursuant to the asset purchase agreement, Highbury and Aston acquired substantially all of the sellers’ business of providing investment advisory, administration, distribution and related services to target funds specified in the asset purchase agreement on November 30, 2006. In connection with the consummation of the acquisition, Aston entered into agreements with each of the sellers that managed the target funds prior to the acquisition, pursuant to which each such seller now acts as a sub-advisor to the applicable target fund, now rebranded an “Aston Fund”. Pursuant to the asset purchase agreement the sellers have agreed not to terminate these agreements for a period of five years following the consummation of the acquisition.
Pursuant to the asset purchase agreement, Highbury and Aston paid $38.6 million in cash to AAAMHI. On the second anniversary of the date of the closing of the acquisition, the asset purchase agreement provides for a contingent adjustment payment in cash as follows: in the event the annualized investment advisory fee revenue generated under investment advisory contracts between Aston and the sellers applicable to the target funds for the six months prior to the second anniversary of the date of the closing of the acquisition, or the target revenue, (x) exceeds $41.8 million, we will pay to AAAMHI the difference between the target revenue and $41.8 million, up to a total aggregate payment of $3.8 million, or (y) is less than $34.2 million, AAAMHI will pay to us the difference between the $34.2 million and the target revenue, up to a total aggregate payment of $3.8 million.
Highbury formed Aston on April 19, 2006 and became the sole member of Aston. In connection with Highbury and Aston entering into the asset purchase agreement, the limited liability company agreement of Aston was amended and eight senior management employees of the acquired business were admitted as members of Aston.
36
Table of Contents
Highbury owns 65% of the membership interests of Aston, and the Aston management members own 35% of the membership interests of Aston. Upon the consummation of the acquisition we incurred a one-time non-cash compensation expense of approximately $20.8 million for the value of such ownership interests. Since none of the Aston management members have any ownership interest in the acquired business, the value of the ownership grant was deemed to be compensatory in nature and not purchase price consideration. To establish the $20.8 million compensation charge for financial reporting purposes, we used an asset-based approach. Based on the purchase price of $38.6 million, we determined that the minimum value of Highbury’s 65% manager membership interest in Aston was $38.6 million, and therefore the minimum valuation for 100% of Aston was approximately $59.4 million. We concluded that the value of the Aston management members’ 35% interest was equal to the difference between these two values, or approximately $20.8 million.
The acquisition was consummated on November 30, 2006.
Credit Facility
We entered into a credit agreement with City National Bank on August 21, 2006, which provides for a revolving line of credit of up to $12.0 million. On November 9, 2006, we entered into a new credit agreement with City National Bank which amended and restated our initial credit agreement to amend the definitions of debt and net worth to exclude the effects of the temporary reclassification of the values of our outstanding common stock warrants and the underwriters’ unit purchase option as liabilities. The credit facility will be used for working capital, general corporate purposes and repurchases of our outstanding securities.
Our borrowings under our credit facility will bear interest, at our option, at either the fluctuating prime rate minus one-half of one percent (0.50%) per year or LIBOR plus one and one-half percent (1.50%) per year. In addition, we will be required to pay annually a fee of one quarter of one percent (0.25%) on the average daily balance of the unused portion of the credit facility. We will have to make interest payments monthly for any prime rate borrowings. For any LIBOR borrowings, interest payments will be made at the end of any LIBOR contract or quarterly, whichever is sooner. Any outstanding principal is due at maturity on October 31, 2007. As of December 12, 2006, we have no borrowings outstanding.
Our credit facility is secured by all of our assets. Our credit facility contains customary and appropriate affirmative and negative covenants for financings of its type (subject to customary exceptions). The financial covenants include: maximum total leverage ratio; and minimum net worth. Other covenants will, among other things, limit our ability to incur liens or other encumbrances, make capital expenditures, distributions, dividends, and divestitures, enter into mergers or acquisitions and incur indebtedness.
Plan of Operation
Highbury is an investment management holding company providing permanent capital solutions to mid-sized investment management firms. Aston is a platform for internal growth and add-on acquisitions. We intend to pursue acquisition opportunities and will seek to establish other accretive partnerships with high quality investment management firms over time. We will seek to provide permanent equity capital to fund buyouts from corporate parents, buyouts of founding or departing partners, growth initiatives, or exit strategies for private equity funds. We intend to leave material equity interests with management teams to align the interests of management and our shareholders and, in general, will not integrate our acquisitions, although we may work with potential future affiliates to execute add-on acquisitions. We will seek to augment and diversify our sources of revenue by investment style, asset class, distribution channel, client type and management team. We intend to fund future acquisitions with retained net income or the issuance of debt or equity.
We were formed on July 13, 2005, for the purpose of acquiring or acquiring control of, through a merger, capital stock exchange, asset acquisition, stock purchase or other similar business combination, one or more financial services businesses. We closed our initial public offering on January 31, 2006. After deducting the underwriting discounts and commissions and the offering expenses, the total net proceeds to us from the offering and the private placement were approximately $43,783,582. We deposited $42,616,234 of the net proceeds and the non-accountable expense allowance of $673,333, which the underwriters agreed to defer until consummation of our initial business combination, into a trust account at Lehman Brothers, Inc., or the trust account, maintained by Continental Stock Transfer & Trust Company acting as trustee, for an initial total of $43,289,567 in the trust account. On November 30, 2006, upon consummation of the acquisition, the trust account was liquidated.
Net loss of $456 reported for the period from July 13, 2005 (inception) through September 30, 2005 resulted from expenses incurred in the formation of Highbury. During this period, Highbury’s activities were limited to organizational activities.
Net income of $201,013 reported for the quarter ended September 30, 2006 resulted primarily from our investment income. We incurred $60,619 expense for professional fees, including legal, accounting and investor relations services, $22,958 expense for director and officer liability insurance, $22,500 expense for a monthly administrative services agreement, $15,375 expense for
37
Table of Contents
franchise taxes, $7,810 expense for travel and entertainment, $18,388 for other expenses and $118,339 of income taxes. Investment income on the trust account during the period was $461,190. This excludes $72,397 of investment income we deferred in connection with our common stock subject to conversion and the deferred underwriting fees. Interest income on the cash balance held outside the trust account was $5,812.
Net income of $492,250 reported for the nine month period ended September 30, 2006 resulted primarily from the investment income in our trust account. We incurred $169,573 expense for professional fees, including legal, accounting and investor relations services, $62,703 expense for director and officer liability insurance, $61,452 expense for a monthly administrative services agreement, $45,399 expense for franchise taxes, $33,296 expense for travel and entertainment, $35,900 for other expenses and $288,350 of income taxes. Investment income on the trust account during the period was $1,179,735. This excludes $185,192 of investment income we deferred in connection with our common stock subject to conversion and the deferred underwriting fees. Interest income on the cash balance held outside the trust account was $9,188.
Net income of $489,798 reported for the period from July 13, 2005 (inception) through September 30, 2006 resulted primarily from the investment income on our trust account. We incurred $169,573 expense for professional fees, including legal, accounting and investor relations services, $62,703 expense for director and officer liability insurance, $61,452 expense for a monthly administrative services agreement, $47,395 expense for franchise taxes, $33,296 expense for travel and entertainment, $36,356 for other expenses and $288,350 of income taxes. Investment income on the trust account during the period was $1,179,735. This excludes $185,192 of investment income we deferred in connection with our common stock subject to conversion and the deferred underwriting fees. Interest income on the cash balance held outside the trust account was $9,188.
Highbury presently occupies office space provided by Berkshire Capital Securities LLC, or Berkshire Capital, an affiliate of several of our stockholders who acquired common stock prior to our initial public offering and in a private placement which occurred simultaneously with our initial public offering. Such affiliate has agreed that it will make such office space, as well as certain office and secretarial services, available to Highbury, as may be required by Highbury from time to time. Highbury has agreed to pay such affiliate $7,500 per month for such services indefinitely. The agreement is terminable by either party upon six months’ prior notice. The statements of operations for the three-month and nine-month periods ended September 30, 2006 include $22,500 and $61,452 related to this agreement, respectively.
Critical Accounting Policies
Our financial statements have been prepared in accordance with accounting principles generally accepted in the United States. The preparation of these financial statements requires management to make estimates and assumptions that affect the reported amounts of assets, liabilities, revenues, expenses and related disclosures. Actual results could differ from those estimates.
Off-Balance Sheet Arrangements
Options and warrants issued in conjunction with our initial public offering are equity linked derivatives and accordingly represent off balance sheet arrangements. The options and warrants meet the scope exception in paragraph 11(a) of FAS 133 and are accordingly not accounted for as derivatives for purposes of FAS 133, but instead are accounted for as equity. See Footnote 3 to the financial statements for a discussion of the options and warrants.
38
Table of Contents
MANAGEMENT’S DISCUSSION AND ANALYSIS
OF FINANCIAL CONDITION AND RESULTS OF OPERATIONS
OF THE ACQUIRED BUSINESS
You should read this discussion and analysis of our financial condition and results of operations in conjunction with our “Unaudited Pro Forma Condensed Combined Financial Statement,” our “Supplemental Financial Information” and the combined financial statements of the acquired business and the related notes appearing elsewhere in this prospectus. The information in this section contains forward-looking statements (see “Forward-Looking Statements”). The acquired business’ actual results may differ significantly from the results suggested by these forward-looking statements and from the acquired business’ historical results. Some factors that may cause our results to differ are described in the “Risk Factors” section of this prospectus.
This discussion summarizes the significant factors affecting the combined operating results, financial conditions, liquidity and cash flows of the acquired business for the years ended December 31, 2005, 2004 and 2003 and for the nine months ended September 30, 2006 and 2005. This discussion should be read in conjunction with the acquired business’ fiscal 2005 audited combined financial statements and its September 30, 2006 unaudited financial statements and the notes thereto included elsewhere in this prospectus.
Overview
The acquired business was founded within Alleghany Asset Management, Inc. by Stuart Bilton and Kenneth Anderson in 1993 to manage open-end investment funds for retail and institutional clients in the United States. Originally, the acquired business employed investment advisers affiliated with its parent to manage the assets of the funds, while it centralized the distribution, marketing, reporting and other operations of the fund family. As the business developed, the acquired business created new mutual funds managed by experienced independent investment advisers. As of September 30, 2006, the acquired business managed 19 no-load mutual funds, comprised of 15 equity funds and four fixed income funds, with approximately $5.4 billion of assets under management. Historically, the acquired business utilized seven different entities to manage the equity funds, of which five are affiliates of the sellers and two are independent. Upon consummation of the acquisition, Aston entered into long-term contracts with each of these entities pursuant to which they will sub-advise the funds. The contracts with the sellers’ affiliates will not be terminable by the sub-advisers for five years. One existing fixed income manager and two new managers have been retained to manage three fixed income funds. Aston’s relationship with the sub-advisers will also be supported by limited non-compete provisions and certain capacity guarantees in certain products to benefit Aston. This arrangement is intended to ensure that the investment philosophy and process guiding the mutual funds in the future are consistent with the historical investment philosophy and process, and we expect that it will help to ensure a stable ownership transition for the Aston Funds.
As of September 30, 2006, 11 of the mutual funds carried an overall Morningstar Rating of three stars or better, including four four-star funds and one five-star fund. Three funds are relatively new and are not currently rated by Morningstar. The 15 equity funds are classified in seven of the nine Morningstar style boxes, giving Aston wide coverage of the public equity investment spectrum and diversified sources of revenue. Aston intends to expand its assets under management with a combination of internal growth, new product development and accretive acquisitions. The Company believes the development of new products will provide growth in the future. New products may include:
| • | additional open-end mutual funds with current or new sub-advisers; |
| • | funds of funds; |
| • | closed-end funds; |
| • | wrap accounts; or |
| • | an expanded separate account management program. |
39
Table of Contents
A fund of funds is a fund that invests in other commingled investment funds. Closed-end funds are funds that do not offer daily liquidity for investor purchases and sales at net asset value, but rather are typically listed on an exchange in the secondary market. Wrap accounts are accounts offered by retail distribution firms that provide access to institutional investment management services without the use of a registered investment company. A separate account is an account managed for a single investor not commingled with the assets of other investors.
In addition, Aston may be able to develop new distribution channels including:
| • | arrangements with banks and insurance companies which, like ABN AMRO, elect to divest their mutual fund operations but enter into agreements with Aston to service their customers; or |
| • | wholesalers focused on the traditional retail broker channel. |
Key Operating Measures
We use the following key measures to evaluate and assess the business:
| • | Assets Under Management. Aston is the investment manager for 19 open-end mutual funds, comprised of 15 equity and four fixed income funds. Aston generates revenues by charging each fund investment advisory and administrative fees (collected in monthly installments), each of which are equal to a percentage of the daily weighted average assets under management of the fund. Assets under management change on a daily basis as a result of client investments and withdrawals and changes in the market value of securities held in the mutual funds. As such, we carefully review net asset flows into the mutual funds, trends in the equity markets and the investment performance of the mutual funds, both absolutely and relative to their peers, to monitor their effects on the overall level of assets under management. |
| • | Total Revenue. Total revenue is equal to the sum of the advisory fees and the administrative fees earned by the business in a given period. We operate Aston under a revenue sharing structure through which Highbury receives a fixed percentage of the total revenue and interest income earned by Aston. |
| • | Weighted Average Fee Basis. The weighted average fee basis is equal to the total revenue earned in a specific period divided by the weighted average assets under management for that period. Since each fund has a different fee schedule, the weighted average fee basis provides management with a single indicator of the business’ ability to generate fees on its total assets under management across all funds. |
| • | Total Operating Expenses. The total operating expenses represent the fixed operating expenses of the acquired business. Except for marginal changes in staffing, which lead to changes in the compensation expense, the majority of these expenses do not adjust proportionately with total assets under management. We monitor total operating expenses relative to the net revenue (our total revenue less distribution and sub-advisory fees we pay) of the acquired business to ensure we have sufficient operating margin to cover the fixed expenses of the operation. We expect total operating expenses (including distribution and sub-advisory costs) to equal 72% of the total revenue of Aston, as provided in Aston’s limited liability company agreement. |
Description of Certain Line Items
Following is a description of additional components of certain line items from the consolidated financial statements of the acquired business:
| • | Advisory Fees, Net. The acquired business generates advisory fees based on a fixed percentage of the daily weighted-average assets under management for each fund and receives these fees on a quarterly basis. For many funds, the acquired business provides an expense cap which guarantees to investors that the total expenses of a fund will not exceed a fixed percentage of the total assets under management. For small funds, the fixed expenses for fund accounting, client reporting, printing and other expenses, when combined with the investment advisory fees and administrative fees, cause a fund’s total expenses to exceed the expense cap. In such cases, the acquired business reimburses the funds for the excess fixed expenses |
40
Table of Contents
or waives a portion of the investment advisory fee, so as to keep the total expenses of the fund at or below the expense cap. The advisory fees of the acquired business include investment advisory fees from all of the funds, net of all fee waivers and expense reimbursements.
| • | Total Distribution and Advisory Costs. The acquired business has contracted on a non-exclusive basis with nearly 400 different institutions to sell its mutual funds, in exchange for a distribution fee, to retail and institutional investors. These distribution fees are generally equal to a fixed percentage of the assets invested by the retail or institutional investor. In addition, the acquired business employs third-party investment managers to perform the security research and investment selection processes for each of its mutual funds. Under this arrangement, the acquired business pays the third-party investment manager a sub-advisory fee, generally equal to 50% of the advisory fees for the mutual fund, net of fee waivers, expense reimbursements, and applicable distribution fees paid under the distribution agreements discussed above. Total distribution and advisory fees represent the largest component of expenses for the acquired business. Since these fees are generally based on total assets under management, they increase or decrease proportionately with total assets under management. |
| • | Compensation and Related Expenses. The acquired business of AAAMHI employed 36 full-time employees prior to the acquisition whom Aston hired upon the consummation of the acquisition. The compensation and related expenses of the acquired business include the base salaries, incentive compensation, health insurance, retirement benefits and other costs related to the employees of the acquired business. These expenses increase and decrease with the addition or termination of employees. |
| • | Related Party Expense Allocations. The most significant components of related party expense allocations include human resources, office space, data processing, accounting, operational, and other support services. |
| • | Other Operating Expenses. The most significant components of other operating expenses include professional fees, occupancy, marketing and advertising, voice and data communication and travel and entertainment expenses. |
Impact of Inflation
The total revenue generated by the acquired business is directly linked to the total assets under management within the acquired business’ 19 mutual funds. The total assets under management increase or decrease on a daily basis as a result of appreciation or depreciation in the financial markets and net asset flows from investors. While long-term returns in the financial markets have historically exceeded the rate of inflation, this may not be the case going forward. The total operating expenses of the acquired business are likely to be directly affected by inflation.
Liquidity and Capital Resources
Historically, the acquired business funded its business activities almost exclusively with operating cash flow. The acquired business had occasionally used capital from its parent company to finance the development of new mutual funds. These capital commitments have been used primarily to fund an initial capital investment in the new mutual funds. Because the acquired business, like most investment management businesses, does not require a high level of capital expenditures, such as for purchases of inventory, property, plant or equipment, liquidity is less of a concern than for a company that sells physical assets. Additionally, from time to time the acquired business engaged in discussions relating to potential acquisitions of other companies in the investment management business. We have no present agreement, commitment or understanding with respect to any material acquisitions. Any future acquisitions may require that we obtain additional financing that will depend upon financing arrangements available at the time, if any.
As of September 30, 2006, the acquired business had cash and equivalents of $7.2 million and advisory and administrative fees receivable of $3.3 million. At September 30, 2006, the acquired business also had accounts payable to affiliates of $1.5 million, accrued compensation and benefits of $0.3 million and other accrued liabilities of $0.9 million. Because the acquired business is able to finance its day-to-day operations with operating cash flow, it does not need to retain a significant amount of cash on its balance
41
Table of Contents
sheet. Historically, the amount of cash and cash equivalents held on the balance sheet of the acquired business has been primarily influenced by the motivations of its parent, AAAMHI. Prior to the acquisition, AAAMHI owned 100% of the acquired business and continues to own several other affiliates which also have low capital requirements. As such, cash balances tend to build up in the affiliates until AAAMHI decides to transfer them. These periodic cash transfers cause the value of cash and equivalents held by the business to fluctuate widely and without correlation to the underlying operations of the acquired business. Going forward, we expect Aston will distribute all of its excess cash on a quarterly basis to its owners, so we do not expect large cash balances to accrue within Aston.
Cash Flows from Operating Activities. The cash flows from operating activities of the acquired business are comprised of two main items: net income (loss) and changes in assets and liabilities. For the nine months ended September 30, 2006, the acquired business produced net income of $2.8 million, as compared to net loss of $0.2 million for the same period in 2005. For the first nine months of 2006, total changes in assets and liabilities were $(0.5) million leading to net cash flows from operating activities of $2.3 million. This compares to $0.3 million of total changes in assets and liabilities and $0.1 million of cash flows from operating activities in the first nine months of 2005. For the year ended December 31, 2005, the acquired business produced a net loss of $23.6 million, as compared with net income of $1.5 million for the year ended December 31, 2004 and $0.6 million for the year ended December 31, 2003. The net loss for 2005 resulted primarily from a $13.3 million charge for goodwill impairment and a $10.4 million charge for intangible asset impairment. Changes in assets and liabilities were $(0.3) million leading to overall cash flows from operating activities of $(0.1) million for 2005. In 2004, the acquired business produced net income of $1.5 million and changes in assets and liabilities of $(0.1) million leading to net cash flows from operating activities of $1.4 million. For 2003, the acquired business produced net income of $0.6 million and changes in assets and liabilities of $(0.3) million leading to net cash flows from operating activities of $0.3 million. The increase in net cash flows from operating activities in 2004, relative to 2003, primarily resulted from an increase in net income.
Cash Flow from Financing Activities. For the nine months ended September 30, 2006, the acquired business transferred $0.3 million to its parent, AAAMHI, on a net basis, and received $0.7 million from AAAMHI during the nine months ended September 30, 2005. For the year ended December 31, 2005, net cash generated by the financing activities of the acquired business was $2.2 million, compared to a use of $0.8 million during the year ended December 31, 2004 and receipts of $1.4 million in 2003. The cash provided in 2005 and 2003 was the result of net transfers of $2.2 million and $1.4 million from AAAMHI, respectively. Cash used in 2004 included $2.5 million of dividends paid less $1.7 million of net transfers from AAAMHI.
Contractual Obligations
As of September 30, 2006, the acquired business did not have any contractual obligations.
Off Balance Sheet Items
As of September 30, 2006, the acquired business did not have any off-balance sheet arrangements.
Quantitative and Qualitative Disclosures about Market Risk
The investment management business is, by its nature, subject to numerous and substantial risks, including volatile trading markets and fluctuations in the volume of market activity. Consequently, net income and revenues of the acquired business are likely to be subject to wide fluctuations, reflecting the effect of many factors, including: general economic conditions; securities market conditions; the level and volatility of interest rates and equity prices; competitive conditions; liquidity of global markets; international and regional political conditions; regulatory and legislative developments; monetary and fiscal policy; investor sentiment; availability and cost of capital; technological changes and events; outcome of legal proceedings; changes in currency values; inflation; credit ratings; and the size, volume and timing of transactions. These and other factors could affect the stability and liquidity of securities and future markets, and the ability of the acquired business and other securities firms and counterparties to perform their obligations.
42
Table of Contents
Critical Accounting Policies
The acquired business’ discussion and analysis of its financial condition and results of operations for the purposes of this document are based upon its consolidated financial statements, which have been prepared in accordance with accounting principles generally accepted in the United States of America.
The acquired business’ significant accounting policies are presented in Note 2 to its audited combined financial statements included elsewhere herein, and the following summaries should be read in conjunction with the financial statements and the related notes included in this prospectus. While all accounting policies affect the financial statements, certain policies may be viewed as critical. Critical accounting policies are those that are both most important to the portrayal of the financial statements and results of operations and that require management’s most subjective or complex judgments and estimates. The acquired business’ management believes the policies that fall within this category are the policies related to principles of combination, goodwill, intangible assets and income taxes.
Principles of Combination. The accompanying combined statements of operations, cash flows and owner’s equity for the years ended December 31, 2003, 2004, and 2005 have been prepared on a carve-out basis. The combined financial statements have been prepared from AAAMHI’s historical accounting records on a carve-out basis to include the historical financial position, results of operations and cash flows applicable to the acquired business. The combined financial statements have been prepared as if the business had been a stand-alone operation, though they are not necessarily representative of results had the acquired business operated as a stand-alone operation. Revenues, expenses, assets and liabilities were derived from amounts associated with the acquired business in the AAAMHI financial records. The financial results include allocations based on methodologies that management believes are reasonable of corporate expenses from AAAMHI and allocations of other corporate expenses from AAAMHI’s parent company that may be different from comparable expenses that would have been incurred if the acquired business operated as a stand-alone business. Specifically, ABN AMRO Services Company, Inc., a wholly-owned subsidiary of ABN AMRO North America Holding Company, or AANAHC, provided the acquired business with certain IT, infrastructure and e-mail services. LaSalle Bank Corporation, also a wholly-owned subsidiary of AANAHC, provided the acquired business with payroll, benefits, general ledger maintenance, internal audit and accounts payable services. These services were charged based upon utilized quantities (typically number of employees, number of transactions processed, hours worked). AAAMHI provided the acquired business with executive management, finance, human resources and personal trade compliance services. These services were charged based upon employee count or management time incurred. AAAMHI’s parent and its parent companies provided other executive management, technology, sales support, finance, compliance and human resources support services. These services were charged out on a formula basis that considers assets under management, number of employees and non-interest expense. The cost of these services is included under the caption “Related-party expense allocations” in the accompanying combined statements of operations. Certain cash receipts and cash payments related to the acquired business were handled through AAAMHI and affiliate cash accounts which are not included in the carve-out financial statements. “Net transfers from AAAMHI” in the combined statements of changes in owner’s equity reflects these cash transactions.
Goodwill and Intangible Assets. The acquired business has adopted the provisions of SFAS No. 142, “Goodwill and Other Intangible Assets”. Intangible assets, comprising the estimated value of investment management contracts and goodwill included in the combined financial statements of the acquired business, relate to the acquisition of certain AAAMHI affiliates including the acquired business. These amounts reflect management’s best estimate of a reasonable allocation to the acquired business of such amounts included in the financial records of AAAMHI. The provisions of SFAS No. 142 require that goodwill and other intangible assets with indefinite lives no longer be amortized, but instead be tested at least annually for impairment and require reporting units to be identified for the purpose of assessing potential future impairments of goodwill. The acquired business’ acquired intangible management contract asset related to the target funds is considered to be of an indefinite life as there is no foreseeable limit on the contract period. The acquired business conducts its annual testing of goodwill and intangible assets for impairment in the fourth quarter unless events warrant more frequent testing.
43
Table of Contents
Recently Issued Pronouncements
The Financial Accounting Standards Board, or FASB, has issued interpretation No. 48, “Accounting for Uncertainty in Income Taxes – an Interpretation of FASB Statement No. 109,” or FIN 48, regarding accounting for, and disclosure of, uncertain tax positions. FIN 48 clarifies the accounting for uncertainty in income taxes recognized in an enterprise’s financial statements in accordance with FASB Statement No. 109, “Accounting for Income Taxes.” FIN 48 prescribes a recognition threshold and measurement attribute for the financial statement recognition and measurement of a tax position taken or expected to be taken in a tax return. FIN 48 also provides guidance on derecognition, classification, interest and penalties, accounting in interim periods, disclosure, and transition. FIN 48 is effective for fiscal years beginning after December 15, 2006. We are currently evaluating the impact FIN 48 will have on Highbury’s results of operations and financial position. The cumulative effect of applying the provisions of FIN 48, if any, will be reported as an adjustment to the opening balance of retained earnings accumulated during the development stage on January 1, 2007.
Management does not believe that any other recently issued, but not yet effective, accounting standards if currently adopted would have a material effect on the accompanying financial statements.
Results of Operations
Nine months ended September 30, 2006 compared to nine months ended September 30, 2005
In the first nine months of 2006, the acquired business’ assets under management declined $962 million (15.2%) to $5.4 billion. In comparison, assets under management declined $413 million (5.7%) during the first nine months of 2005 to $6.8 billion. While the S&P 500 and the Russell Large Cap Growth Index increased the first nine months of 2006 (8.5% and 3.0%, respectively), assets under management declined primarily as a result of net client redemptions of approximately $1.1 billion. Management believes the net redemptions in the first nine months are the result of investor concerns about recent relative performance trends in some of the acquired business’ large funds. In the first nine months of 2005, the acquired business experienced net redemptions of $629 million.
As a result of lower average asset levels and continued net asset redemptions, net advisory fees declined from $35.8 million in the first nine months of 2005 to $30.6 million in the first nine months of 2006, a drop of 14.4%, and administrative fees decreased from $1.1 million to $1.0 million. Total revenues for the first nine months of 2006 decreased by $5.3 million, or 14.3%, to $31.6 million from $36.9 million in the first nine months of 2005 as a direct result of the decline in net advisory fees. As a result of a shift in the composition of assets under management away from fixed income and into equities, the acquired business’ weighted average fee basis increased from 0.70% to 0.72%.
Distribution and advisory costs declined by $7.8 million, or 25.3% in the first nine months of 2006 from $30.9 million in the first nine months of 2005 to $23.1 million. A 21.7% decline in payments to affiliates ($22.3 million in the first nine months of 2005 to $17.5 million in the first nine months of 2006) was augmented by a 34.3% decrease in payments to non-affiliates ($8.6 million in the first nine months of 2005 to $5.6 million in the first nine months of 2006). Continued net redemptions in two of the acquired business’ large funds reduced advisory costs paid to affiliates, which are based on assets under management, by approximately $4.8 million relative to the prior period. The acquired business also paid approximately $3.2 million less for third-party distribution fees, relative to the first nine months of 2005, as a result of lower average asset balances and the postponement of certain marketing activities during the sale process.
All other operating expenses declined $0.2 million in aggregate or 3.8% during the first nine months of 2006 to $6.0 million from $6.2 million in the first nine months of 2005. Over this period, compensation expense decreased by $0.6 million from $3.8 million to $3.2 million and related party expense allocations increased only marginally. Other operating expenses in the first nine months of 2006 rose by $0.3 million relative to the first nine months of 2005.
44
Table of Contents
Interest income rose to $242,878 in the first nine months of 2006 from $83,893 in the first nine months of 2005, an increase of $158,985, as a result of higher interest rates earned on cash balances and higher overall cash balances.
In the first nine months of 2006, net income was $2.8 million as compared to net loss of $0.2 million in the first nine months of 2005.
Year ended December 31, 2005 compared to year ended December 31, 2004
In 2005, the assets under management of the acquired business declined $900 million (12.4%) from $7.2 billion at the end of 2004 to $6.3 billion. During this period the acquired business experienced net client redemptions of $1.0 billion balanced by $100 million of positive market appreciation. Positive market appreciation means that the total net asset value of a fund, when excluding the effects of net client contributions, increased over a given period as a result of changes in the market value of securities held by the fund. The high level of redemptions resulted primarily from concerns about relative investment performance in one of the acquired business’ large funds. Furthermore, the equity markets only posted moderate gains for the year with the S&P 500 advancing 4.9% and the Russell Large Cap Growth Index rising 5.3%. In 2004, for comparison, the S&P 500 advanced 10.9% and the Russell Large Cap Growth Index grew 6.7%.
As a result of lower average asset levels, net advisory fees declined in 2005 from $47.8 million in 2004 to $47.4 million. The effect of the net redemptions was balanced by an increase in the weighted average fee basis earned by the acquired business on its assets under management. The weighted average fee basis increased from 0.70% in 2004 to 0.72% in 2005 as a result of a shift in assets under management away from lower fee fixed income funds to higher fee equity funds. Administrative fees increased marginally from $1.4 million to $1.5 million. The acquired business negotiated lower sub-administration fee payments from a service provided in 2005 which increased the administrative fee margin earned. This renegotiation of fees more than offset the effect of the decline in total assets under management. For the year, total revenues decreased by $0.3 million, or 0.7%, to $48.9 million from $49.2 million in 2004.
Distribution and advisory costs declined by $0.5 million, or 1.3% in 2005 from $40.9 million in 2004 to $40.4 million. A 14.9% decline in payments to affiliates ($34.4 million in 2004 to $29.3 million in 2005) was offset by a 70.8% increase in payments to non-affiliates ($6.5 million in 2004 to $11.1 million in 2005). ABN AMRO sold its 401(k) business to Principal Financial on December 31, 2004. As a result of this divestiture, distribution fees paid by the acquired business to the 401(k) business were reclassified as payments to non-affiliates in 2005, whereas these payments were included in payments to affiliates in 2004. This is the primary reason for the shift in payments away from affiliates to non-affiliates relative to the prior period. In addition, the two funds sub-advised by non-affiliates experienced positive net sales in 2005 while the funds managed by affiliates experienced net redemptions.
All other operating expenses rose by $25.5 million in 2005 to $32.3 million from $6.8 million in 2004, largely as a result of a $13.3 million charge for goodwill impairment and a $10.4 million charge for intangible asset impairment.
The acquired business has adopted the provisions of SFAS No. 142, “Goodwill and Other Intangible Assets”. Intangible assets, comprising the estimated value of investment management contracts, and goodwill, included in the combined financial statements of the acquired business relate to the acquisition of certain AAAMHI affiliates including the acquired business in 2001. These amounts reflect management’s best estimate of a reasonable allocation to the acquired business of such amounts included in the financial records of AAAMHI. The provisions of SFAS No. 142 require that goodwill and other intangible assets with indefinite lives no longer be amortized, but instead be tested at least annually for impairment and require reporting units to be identified for the purpose of assessing potential future impairments of goodwill. The acquired business’ acquired intangible management contract asset relates to the provision of investment advisory services to the target funds in exchange for fees that are based on a percentage of the average daily net assets of the funds. These management contracts were acquired in 2001 as part of the acquisition of certain AAAMHI affiliates. The management contracts are subject to annual renewal by the target funds board of trustees which is expected to continue indefinitely since this has been the experience for the target funds as well as for the mutual fund industry as a whole. Accordingly, the acquired business’ acquired intangible assets related to the target funds are considered to be of an indefinite life as there is no foreseeable limit on the contract period. The acquired business conducts its annual testing of goodwill and intangible assets for impairment annually in the fourth quarter, unless events warrant more frequent testing.
45
Table of Contents
The facts and circumstances leading to the impairment charges to goodwill and intangible assets relate to management’s assessment of declines in net assets in the target funds resulting from net share redemptions and unfavorable investment performance trends in 2005. The fair value of the acquired business used to determine the impairment of goodwill was determined with reference to the expected proceeds to be received upon the sale of the acquired business to Highbury. The fair value of the intangible asset related to the investment management contracts used to determine the amount of impairment of the intangible asset, was determined based on a discounted cash flow analysis of the acquired contracts. No impairment of goodwill or intangibles was determined to be required for periods prior to 2005.
Over this period, compensation expense increased by $0.8 million from $4.4 million to $5.2 million (17.6%). The acquired business hired three employees at the end of 2004 and two more employees in the summer of 2005. These hires increased the compensation expense. ABN AMRO also decided to reclassify certain sales incentives, previously recorded in distribution and sub-advisory costs, as compensation in 2005. Related party expense allocations increased by $0.6 million from $1.9 million to $2.5 million (32.1%) as a result of a change in ABN AMRO’s internal expense allocation philosophy. Other operating expenses increased by $0.3 million to $0.8 million in 2005 from $0.5 million in 2004, an increase of 6.2%. This increase resulted primarily from increased legal fees related to the formation of three new funds in 2005 and a significant increase in international travel as a result of changes in ABN AMRO’s internal reporting structure.
Interest income rose to $133,524 in 2005 from $31,140 in 2004, an increase of $120,384, as a result of higher cash balances held by Highbury and higher interest rates earned on those balances. The cash balances held by the acquired business are controlled by ABN AMRO. In 2005, ABN AMRO elected to allow cash to build in the acquired business’ accounts. Since the acquired business’s operating cash flow is sufficient to sustain its operations, it needs to retain very little capital. After the acquisition, management does not expect to retain significant levels of cash in the acquired business.
Net loss for 2005 was $23.6 million as compared to net income of $1.5 million in 2004.
Year ended December 31, 2004 compared to year ended December 31, 2003
The assets under management of the acquired business increased $300 million (4.6%) in 2004 to $7.2 billion from $6.9 billion at the end of 2003. During this period the acquired business had net asset outflows of $100 million while market appreciation of $400 million fueled growth of $300 million in total assets under management. Net asset redemptions in one of the target funds balanced net sales in the rest of the target funds in 2004. These results followed an excellent year for the acquired business in 2003 wherein net sales ($1.0 billion) and positive market appreciation ($1.0 billion) led growth in total assets under management from $4.9 billion to $6.9 billion. In 2003, the S&P 500 advanced 28.7% and the Russell Large Cap Growth Index gained 29.7%.
As a result of higher average assets under management, net advisory fees increased by $9.3 million from $38.5 million in 2003 to $47.8 million while administrative fees increased by $0.2 million from $1.2 million in 2003 to $1.4 million. The acquired business also benefited from an increase in the weighted average fee basis from 0.67% in 2003 to 0.70% in 2004. This shift resulted from a decline in fixed income assets under management relative to equity assets under management. As a result, total revenues in 2004 increased by $9.5 million, or 24.1%, to $49.2 million from $39.7 million in 2003.
Distribution and advisory costs increased by $7.4 million, or 22.0%, in 2004 from $33.5 million in 2003 to $40.9 million. This increase was driven by a 16.2% increase in payments to affiliates ($29.6 million in 2003 to $34.4 million in 2004) and a 66.8% increase in payments to non-affiliates ($3.9 million in 2003 to $6.5 million in 2004). These increased expenses were directly driven by increased level of assets under management in 2004 relative to 2003.
46
Table of Contents
All other operating expenses rose by $1.3 million or 22.9%, in 2004 to $6.8 million from $5.5 million in 2003. Over this period, compensation expense increased by $0.5 million from $3.9 million to $4.4 million (12.6%) as a result of increased expenses for employee benefits and four employees hired during 2004. Related party expense allocations increased by $0.7 million from $1.2 million to $1.9 million (54.1%). Other operating expenses increased by $0.1 million from $0.4 million in 2003 to $0.5 million in 2004. In 2004, increased expenses for travel and entertainment were partially offset by a decline in legal fees, as the acquired business did not create any new funds in 2004.
Interest income increased 52.4% in 2004 to $31,140 from $20,432 in 2003 as a result of higher average cash balances.
Net income for 2004 was $1.5 million as compared to $0.6 million in 2003.
47
Table of Contents
General
Highbury is an investment management holding company providing permanent capital solutions to mid-sized investment management firms. Aston is a platform for internal growth and add-on acquisitions. We intend to pursue acquisition opportunities and will seek to establish other accretive partnerships with high quality investment management firms over time. We will seek to provide permanent equity capital to fund buyouts from corporate parents, buyouts of founding or departing partners, growth initiatives, or exit strategies for private equity funds. We intend to leave material equity interests with management teams to align the interests of management and our shareholders and, in general, will not integrate our acquisitions, although we may work with potential future affiliates to execute add-on acquisitions. We will seek to augment and diversify our sources of revenue by investment style, asset class, distribution channel, client type and management team. We intend to fund future acquisitions with retained net income or the issuance of debt or equity.
Business Strategy
Aston provides investment advisory services to a family of 19 no-load, open-end mutual funds which managed approximately $5.5 billion in client assets as of December 12, 2006. The business has historically grown internally, through market appreciation and net positive asset flows, from approximately $100 million in assets under management in 1993 to $7.3 billion at its peak in 2004, although since 2004 cumulative net redemptions have reduced the size of the business to approximately $5.5 billion.
Aston’s mutual fund platform is built upon providing advisory, sales, marketing, compliance and operating resources to mutual funds using sub-advisers that produce institutional quality investment products. In managing historical growth and planning for future growth, the acquired business has been, and Aston will continue to be, guided by the following business strategies.
Maintain and Improve Investment Performance
The acquired business has a long-term record of achieving competitive, risk-adjusted returns on the mutual funds managed by its sub-advisers. As of September 30, 2006, 11 of the 19 funds carried at least a three star rating from Morningstar. These ratings and rankings are based on past performance, which may not be predictive of future results. Aston’s key strategy is to maintain and improve its investment performance by actively monitoring its sub-advisers to ensure consistent application of the specifically mandated investment philosophy and process while the sub-advisers actively manage Aston’s portfolios to achieve distinct balances of risk and reward. In terms of improving performance, Aston will seek to partner with additional investment managers with proven track records as well as provide additional support to its current sub-advisers in order to improve the sub-advisers’ ability to generate competitive returns while maintaining acceptable levels of risk for clients.
Morningstar RatingsTM are a standard performance measure used in the mutual fund industry to evaluate the relative performance of similar mutual funds. The management of Aston believes that many investors rely heavily on Morningstar RatingsTM to select mutual funds in which to invest. As a result, management of Aston regularly uses Morningstar RatingsTM to evaluate the relative performance of its mutual funds. For each fund with at least a three-year history, Morningstar calculates a Morningstar RatingTM based on a Morningstar risk-adjusted return measure that accounts for variation in a fund’s monthly performance (including the effects of sales charges, loads and redemption fees), placing more emphasis on downward variations and rewarding consistent performance. The top 10% of funds in each category receive five stars, the next 22.5% receive four stars, the next 35% receive three stars, the next 22.5% receive two stars and the bottom 10% receive one star. (Each share class is counted as a fraction of one fund within this scale and rated separately, which may cause slight variations in the distribution percentages.) The overall Morningstar RatingTM for a fund is derived from a weighted-average of the performance figures associated with its 3-, 5- and 10-year (if applicable) Morningstar RatingTM metrics.
48
Table of Contents
Selectively Expand Aston’s Investment Strategies
Since the introduction of its first equity funds in 1993, the acquired business has expanded its product offerings to include multiple strategies within the equity and fixed income asset classes. Historically, management of the acquired business has entered into sub-advisory agreements with qualified sub-advisers to create new products in response to demand in the market. Aston intends to continue to expand selectively its investment strategies where it believes the application of its core competencies and process can produce attractive risk-adjusted returns. Aston believes that by doing so it can enhance its ability to increase assets under management as well as augment and further diversify its sources of revenue.
Selectively Expand Aston’s Products and Distribution Relationships
Aston strives to develop investment products and distribution channels that best deliver its strategies to its clients. It seeks continued opportunities to expand its investment products and relationships for the delivery of these products. The combination of capacity and established investment performance track records creates potential to drive future growth. For example, Aston’s institutional client relationship management team continues to identify sources of demand for the funds working closely with a broad network of consultants and financial planners and providing information regarding Aston’s investment strategies and performance. Aston also continues to expand existing relationships and initiate new ones within a variety of channels for mutual funds, including 401(k) platforms, fund supermarkets, broker dealers and financial planners. These third party distribution resources support a variety of defined contribution plans and independent financial advisers with demand for the institutional quality institutional investment styles of Aston.
Aston’s current sales force includes 18 wholesalers which provide Aston with national distribution for new and existing products. Aston’s status as an independent, open-architecture platform enables it to incubate new products with a variety of investment management firms, regardless of their affiliations. Open-architecture refers to an investment platform that can distribute investment products that are advised or sub-advised by other firms. Previously, the sellers had generally limited new advisory relationships to affiliates of the sellers. Aston’s flexibility should allow Aston to establish additional mutual funds and new product lines with a broader range of existing and new sub-advisers.
Aston is currently developing additional business lines that offer opportunities for growth. For example, the sellers maintained a separately managed account platform that had $174 million of assets under management as of September 30, 2006, which was acquired by Aston in the acquisition. In addition, Aston and the sellers are together exploring a line of principal-protected funds to be distributed on a joint-venture basis with a major international insurance company. Aston intends to use its family of investment products and distribution resources to leverage any such additional initiatives.
Build Aston as a Brand Name
The growth of the acquired business occurred under the Alleghany and the sellers’ brands. With the addition of the Aston brand, co-branded with outstanding institutional sub-advisers, Aston intends to build upon the historical success of the acquired business’ strategy to enhance the credibility, reputation and acceptance of the Aston brand name.
Selectively Pursue Accretive Acquisitions
We expect that prudent, accretive acquisitions will be a source of growth for Aston’s business in the future. The management team has substantial experience acquiring, integrating and managing investment management firms. In his former role as Executive Vice President of CT&T and the President and Chief Executive Officer of Alleghany Asset Management, Inc., Stuart Bilton was involved in the acquisition or founding of six investment management firms over ten years and also founded the acquired business. These initiatives helped fuel the growth of Alleghany’s investment businesses from Mr. Bilton’s arrival in 1986 until its sale to ABN AMRO in 2001. In Aston’s efforts to pursue accretive acquisitions in the future, the Aston management team and Highbury may elect to finance transactions using one or more of the following sources: capital from Highbury, external debt, seller financing
49
Table of Contents
or contingent payments. The members of Aston are not required to make capital contributions to fund additional acquisitions. If Highbury elects to fund acquisitions by Aston, it will only do so if the terms of such acquisitions, including any modifications to the Aston limited liability company agreement and specifically the allocation of revenue between Highbury and Aston, are considered by the board of directors of Highbury to be favorable to Highbury and its stockholders. Highbury also intends to seek acquisitions independent of Aston which may be funded by its revolving credit facility, other external borrowings, retained earnings (if any), raising of additional equity, and other sources of capital, including seller financing and contingent payments.
Assets Under Management
The acquired business’ funds have grown significantly over the past 13 years. On April 20, 2006, the date the asset purchase agreement was entered into, the target funds had $6.1 billion of client assets under management. The largest amount of client assets under management of the acquired business at the end of any calendar quarter was $7.3 billion at the end of the second quarter of 2004. Assets under management have continued to decrease as a result of net asset outflows. Future net outflows and declines in the prices of securities would result in further decreases in assets under management. The following chart displays the historical growth since inception of the acquired business’ assets under management (in billions) as of December 31 for each calendar year. As of September 30, 2006, the target funds had $5.4 billion of client assets under management.
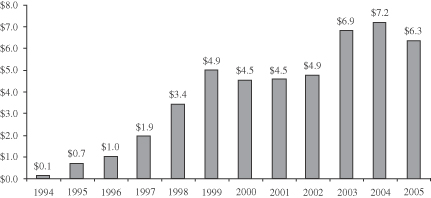
Investment Strategies
The following table describes the acquired business’ investment strategies within the equity and fixed income asset classes:
Asset Class | Assets Under Management at September 30, 2006 (in millions) | Description | |||
Equity | $ | 5,155 | Invests in a range of U.S. and global companies of various market capitalizations under both growth and value disciplines. | ||
Fixed Income | 214 | Invests primarily in corporate and government bonds | |||
Total | $ | 5,369 | |||
Investment Products
Aston markets its investment services to its clients through a variety of funds designed to suit a client’s individual investment needs. The acquired business introduced its first mutual fund in 1993 and today Aston manages 19 no-load, open-end mutual funds, including 15 equity funds and four fixed income funds, with approximately $5.4 billion of assets under management as of September 30, 2006. The open-architecture platform currently utilizes nine different entities to manage the funds. Most recently, Aston entered into sub-advisory agreements in November 2006 with Taplin, Canida & Habacht, Inc. and McDonnell Investment
50
Table of Contents
Management, LLC acting as advisors to three of Aston’s fixed income funds. In addition, the funds’ Board of Trustees has approved the creation of two new mutual funds to be managed in the EAFE and Large Cap Core investment styles. EAFE refers to investments in common stocks of companies located in Europe, Australia and the Far East. The following table sets forth the assets under management, and overall Morningstar RatingTM for each mutual fund managed as of September 30, 2006.
Fund | Inception | Assets Under Management ($m) | Morningstar Category | Rating | |||||
Equity Funds: | |||||||||
Montag & Caldwell Growth | 1994 | $ | 2,070 | Large-Cap Growth | **** | ||||
Growth | 1993 | 918 | Large-Cap Growth | *** | |||||
Mid-Cap | 1994 | 644 | Mid-Cap Blend | *** | |||||
Veredus Aggressive Growth | 1998 | 550 | Small-Cap Growth | * | |||||
Value | 1993 | 342 | Large-Cap Value | *** | |||||
TAMRO Small-Cap | 2000 | 212 | Small-Cap Blend | **** | |||||
River Road Small-Cap Value | 2005 | 143 | Small-Cap Value | — | |||||
Real Estate | 1997 | 111 | Specialty-Real Estate | *** | |||||
Balanced | 1995 | 65 | Moderate Allocation | ** | |||||
Veredus Select Growth | 2001 | 34 | Large-Cap Growth | ***** | |||||
Montag & Caldwell Balanced | 1994 | 32 | Moderate Allocation | ** | |||||
TAMRO Large-Cap Value | 2000 | 16 | Large-Cap Value | **** | |||||
River Road Dynamic Equity | 2005 | 13 | Mid-Cap Value | — | |||||
Veredus Science Technology | 2000 | 4 | Specialty-Technology | ** | |||||
Mid-Cap Growth | 2005 | 1 | Mid-Cap Growth | — | |||||
Total Equity Funds | 5,155 | ||||||||
Fixed Income Funds: | |||||||||
Bond | 1993 | 124 | Intermediate-Term Bond | *** | |||||
Municipal Bond | 1993 | 40 | Muni National Interim | *** | |||||
Investment Grade Bond | 1995 | 29 | Short-Term Bond | **** | |||||
High Yield | 2003 | 21 | High Yield Bond | ** | |||||
Total Fixed Income Funds | 214 | ||||||||
Total Funds | $ | 5,369 | |||||||
Fees and Revenues
Aston generates revenue by charging mutual funds an advisory fee and an administrative fee based on a percentage of invested assets. A portion of the fees are paid to the sub-advisers, to a third-party sub-administrator, and to third-party distribution partners. Each fund typically bears all expenses associated with its operation and the issuance and redemption of its securities. In particular, each fund pays investment advisory fees (to Aston), shareholder servicing fees and expenses, fund accounting fees and expenses, transfer agent fees, custodian fees and expenses, legal and auditing fees, expenses of preparing, printing and mailing prospectuses and shareholder reports, registration fees and expenses, proxy and annual meeting expenses and independent trustee fees and expenses. The acquired business has guaranteed newly organized funds that their expenses would not exceed a specified
51
Table of Contents
percentage of their net assets during an initial operating period. The acquired business absorbed all advisory fees and other mutual fund expenses in excess of these self-imposed limits in the form of expense reimbursements or fee waivers and collected as revenue the advisory fee less reimbursements and waivers. As of September 30, 2006, the acquired business was reimbursing 12 mutual funds whose expenses exceed the applicable expense cap for the Fund. These Funds are Value; TAMRO Small Cap; Real Estate; Veredus Select Growth; TAMRO Large Cap Value; River Road Dynamic Equity; Veredus Science Technology; Mid-Cap Growth; Bond; Municipal Bond; Investment Grade Bond; and High Yield.
Investment Performance
The following chart displays the annualized return of each fund for a one-, three-, five- and ten-year period as applicable for the periods ended September 30, 2006.
| Annualized Return | ||||||||||||
Fund | 1-Year | 3-Year | 5-Year | 10-Year | ||||||||
Equity Funds: | ||||||||||||
Montag & Caldwell Growth | 2.19 | % | 7.15 | % | 2.49 | % | 6.64 | % | ||||
Growth | 4.67 | % | 5.97 | % | 4.13 | % | 7.58 | % | ||||
Mid-Cap | 8.04 | % | 13.21 | % | 13.77 | % | 11.75 | % | ||||
Veredus Aggressive Growth | -5.24 | % | 8.67 | % | 0.25 | % | — | |||||
Value | 14.42 | % | 16.27 | % | 9.68 | % | 7.83 | % | ||||
TAMRO Small-Cap | 14.37 | % | 15.56 | % | 16.65 | % | — | |||||
River Road Small-Cap Value | 22.43 | % | — | — | — | |||||||
Real Estate | 27.20 | % | 27.17 | % | 22.51 | % | — | |||||
Balanced | 4.13 | % | 5.03 | % | 4.20 | % | 7.19 | % | ||||
Veredus Select Growth | 4.74 | % | 13.19 | % | — | — | ||||||
Montag & Caldwell Balanced | 2.03 | % | 4.68 | % | 2.49 | % | 6.08 | % | ||||
TAMRO Large-Cap Value | 9.31 | % | 12.32 | % | 7.95 | % | — | |||||
River Road Dynamic Equity | 17.78 | % | — | — | — | |||||||
Veredus Science Technology | 1.11 | % | 3.12 | % | 1.67 | % | — | |||||
Mid-Cap Growth | — | — | — | — | ||||||||
Fixed Income Funds: | ||||||||||||
Bond | 2.79 | % | 2.96 | % | 3.78 | % | 5.62 | % | ||||
Municipal Bond | 3.28 | % | 2.51 | % | 3.84 | % | 4.54 | % | ||||
Investment Grade Bond | 3.46 | % | 2.43 | % | 3.65 | % | 5.19 | % | ||||
High Yield | 5.07 | % | 6.98 | % | — | — | ||||||
Distribution
Each of the funds has a distinct investment objective that has been developed to provide a broad, comprehensive selection of investment opportunities. This strategy gives Aston access to many possible customers and distribution channels. Aston distributes its products to individuals and institutions. While institutions may invest directly through Aston, individuals generally purchase shares through retail financial intermediaries. All Aston Funds are sold exclusively on a no-load basis, i.e., without a sales commission. No-load mutual funds offer investors a low-cost and relatively easy method of investing in a variety of stock and bond portfolios. Aston’s “N” class of fund shares is sold through financial intermediaries. Those “N” class shares incur an additional annual expense equal to 0.25% of the Fund’s assets under management which is payable to the financial intermediaries for distribution and recordkeeping. The institutional “I” class of fund shares, however, bears no such fee.
52
Table of Contents
Aston bears all advertising and promotion expenses for the funds. Its costs include advertising and direct mail communications to potential fund shareholders as well as a substantial staff and communications capability to respond to investor inquiries. Marketing efforts have traditionally been focused on fee based intermediaries, including due diligence teams, brokers, advisers, financial planners and consultants. The independent registered advisory channel as well as the 401(k) channel are a specific focus. In addition, Aston has a significant focus on marketing efforts toward participant-directed defined contribution plans such as 401(k) plans that invest in mutual funds. Advertising and promotion expenditures vary over time based on investor interest, market conditions, new investment offerings and the development and expansion of new marketing initiatives.
Technology and Intellectual Property
The day-to-day mutual fund technology of Aston is outsourced to PFPC, Inc., including fund accounting, sub-administration, custody and transfer agency functions. Sub-administration is the provision of services related to the administration of a mutual fund on an out-sourced basis. The business also utilizes a web based CRM system, which maintains contact information of both clients and prospects and is hosted by interlink ONE, Inc. The website of Aston is hosted by Sysys Corporation.
Competition
We face substantial competition in every aspect of our business. Competitive factors affecting our business include brand recognition, business reputation, investment performance, quality of service and the continuity of client relationships. Fee competition also affects the business, as do compensation, administration, commissions and other expenses paid to intermediaries.
Performance and price are the principal methods of competition for Aston. Prospective clients and mutual fund shareholders will typically base their decisions on a fund’s ability to generate returns that exceed a market or benchmark index, i.e. its performance, and on its fees, or price. Individual mutual fund investors may also base their decision on the ability to access the mutual funds Aston manages through a particular distribution channel. Institutional clients are often advised by consultants who may include other factors in their decisions for these clients.
We compete with a large number of global and U.S. investment advisers, commercial banks, brokerage firms and broker-dealers, insurance companies and other financial institutions. There are approximately 900 domestic investment advisers that manage assets in excess of $1 billion according to Money Market Directories and, according to the Investment Company Institute, mutual fund managers in the United States manage more than $8.1 trillion in over 8,000 funds. Aston is considered a small to mid-sized investment advisory firm. Many competing firms are parts of larger financial services companies and attract business through numerous means including retail bank offices, investment banking and underwriting contacts, insurance agencies and broker-dealers. U.S. banks and insurance companies can now affiliate with securities firms. This has accelerated consolidation within the investment advisory and financial services businesses. It has also increased the variety of competition for traditional investment advisory firms with businesses limited to investing assets on behalf of institutional and individual clients. Foreign banks and investment firms have also entered the U.S. investment advisory business, either directly or through partnerships or acquisitions. A number of factors serve to increase our competitive risks:
| • | some of Aston’s competitors have greater capital and other resources, and offer more comprehensive lines of products and services than Aston does; |
| • | consolidation within the investment management industry, and the securities industry in general, has served to increase the size and strength of a number of our competitors; |
| • | there are relatively few barriers to entry by new investment management firms, and the successful efforts of new entrants, including major banks, insurance companies and other financial institutions, have resulted in increased competition; and |
53
Table of Contents
| • | other industry participants will from time to time seek to recruit Aston’s investment professionals and other employees away from the business. |
These and other factors could reduce Aston’s revenues and earnings and materially adversely affect its business. If the funds have poor performance relative to their peers, they could lose existing clients and may be unable to attract new clients. These factors may place Aston at a competitive disadvantage, reduce its earnings and revenues, and materially adversely affect its business. Aston cannot be sure that its strategies and efforts to maintain its existing assets and attract new business will be successful.
In order to grow the business, we must be able to compete effectively for assets under management. Specifically, the acquired business has historically competed principally on the basis of:
| • | investment performance; |
| • | quality of service provided to clients; |
| • | brand recognition and business reputation; |
| • | continuity of client relationships and of assets under management; |
| • | continuity of its selling arrangements with intermediaries; |
| • | continuity of advisory or sub-advisory agreements with excellent managers; |
| • | the range of products offered; |
| • | level of fees and commissions charged for services; and |
| • | level of expenses paid to financial intermediaries related to administration and/or distribution. |
The acquired business has succeeded in growing aggregate assets under management, and we believe that we will continue to be able to do so by focusing on investment performance and client service and by developing new products and new distribution capabilities.
Employees
Upon the consummation of the acquisition, Aston hired 36 full-time employees, including four in senior management and administration, six in marketing and communications, 18 in sales and sales management and eight in operations and compliance. All of these employees were employed by the acquired business or AAAMHI prior to the consummation of the acquisition.
Regulation
Virtually all aspects of our company are subject to extensive regulation in the United States at both the federal and state level. These laws and regulations are primarily intended to protect investment advisory clients and shareholders of registered investment companies. Under these laws and regulations, agencies that regulate investment advisers, such as us, have broad administrative powers, including the power to limit, restrict or prohibit an investment adviser from carrying on its business in the event that it fails to comply with such laws and regulations. Possible sanctions that may be imposed include the suspension of individual employees, limitations on engaging in certain lines of business for specified periods of time, revocation of investment adviser and other registrations, censures, and fines.
Aston is registered as an investment adviser with the SEC. As a registered investment adviser, it is subject to the requirements of the Investment Advisers Act of 1940, or the Investment Advisers Act, and the SEC’s regulations thereunder, as well as to examination by the SEC’s staff. The Investment Advisers Act imposes substantive regulation on virtually all aspects of our
54
Table of Contents
advisory business and our relationship with our clients. Applicable requirements relate to, among other things, fiduciary duties to clients, engaging in transactions with clients, maintaining an effective compliance program, performance fees, solicitation arrangements, conflicts of interest, advertising, and recordkeeping, reporting and disclosure requirements. The target funds are registered with the SEC under the Investment Company Act. The Investment Company Act imposes additional obligations, including detailed operational requirements on both the funds and their advisers. Moreover, an investment adviser’s contract with a registered fund may be terminated by the fund on not more than 60 days’ notice, and is subject to annual renewal by the fund’s board after an initial term of up to two years. The SEC is authorized to institute proceedings and impose sanctions for violations of the Investment Advisers Act and the Investment Company Act, ranging from fines and censures to termination of an investment adviser’s registration. The failure of Aston or registered funds advised by Aston to comply with the requirements of the SEC could have a material adverse effect on us. Under the rules and regulations of the SEC promulgated pursuant to the federal securities laws, Aston is subject to periodic examination by the SEC.
In response to recent scandals in the financial services industry regarding late trading, market timing and selective disclosure of portfolio information, various legislative and regulatory proposals are pending in or before, or have been adopted by, the U.S. Congress and the various regulatory agencies that supervise our operations, including the SEC. Additionally, the SEC, the NASD and other regulators, as well as Congress, are investigating certain practices within the mutual fund industry.
The SEC has also adopted new rules requiring every registered fund to adopt and implement written policies and procedures designed to detect and prevent violations of federal securities law, to review these policies annually for adequacy and effectiveness, and to designate a chief compliance officer reporting directly to the fund’s board of directors or trustees. Registered advisers must also adopt a written compliance program to ensure compliance with the Investment Advisers Act and appoint a chief compliance officer. These compliance programs were required to be in place by October 5, 2004. Some of these compliance rules, as well as other new disclosure requirements that have recently been adopted, are intended to deal with abuses in areas of late trading and market timing of mutual funds. These new rules require additional and more explicit disclosure of market timing policies and procedures, as well as that funds have formal procedures in place to comply with their representations regarding market timing policies.
These regulatory and legislative initiatives, to the extent enacted or adopted, could have a substantial impact on the regulation and operation of mutual funds and investment advisers and could adversely affect our manner of operation and profitability. See “Risk Factors — Risks Related to the Financial Services Industry and Aston,” for more information about how these proposals may materially adversely affect our business.
We are subject to the Employee Retirement Income Security Act of 1974, as amended, or ERISA, and to regulations promulgated thereunder, insofar as the sellers are “fiduciaries” under ERISA with respect to benefit plan clients. ERISA and applicable provisions of the Internal Revenue Code of 1986, as amended, impose certain duties on persons who are fiduciaries under ERISA, prohibit certain transactions involving ERISA plan clients and provide monetary penalties for violations of these prohibitions. Our failure to comply with these requirements could have a material adverse effect on its business.
Properties
The facilities of Highbury are maintained at 999 Eighteenth Street, Suite 3000, Denver, Colorado 80202. Berkshire Capital has agreed that, commencing on January 25, 2006, it will make available to us such office space and certain general and administrative services as we may require from time to time. We have agreed to pay Berkshire Capital $7,500 per month for these services. We believe, based on rents and fees for similar services in the Denver, Colorado metropolitan area, that the fee charged by Berkshire Capital is at least as favorable as we could have obtained from an unaffiliated third party. However, as our directors may not be deemed “independent,” we did not have the benefit of disinterested directors approving this transaction or the extension of the agreement. The agreement is terminable by either party upon six months’ prior notice.
The facilities of Aston are currently maintained at 161 North Clark Street, 12th Floor, Chicago, Illinois 60601. On January 19, 2007, Aston will relocate to 120 North LaSalle Street, Suite 2500, Chicago, Illinois 60602.
Legal Proceedings
Currently there are no legal proceedings pending against Highbury or Aston.
55
Table of Contents
DIRECTORS AND EXECUTIVE OFFICERS
Our current executive officers are as follows:
Name | Age | Position | ||
R. Bruce Cameron | 50 | Chairman of the Board | ||
Richard S. Foote | 43 | President, Chief Executive Officer and Director | ||
R. Bradley Forth | 27 | Executive Vice President, Chief Financial Officer and Secretary | ||
Russell L. Appel | 45 | Director |
R. Bruce Cameron, CFAhas been our chairman of the board since our inception. Mr. Cameron has been the president and chief executive officer of Berkshire Capital Securities LLC, a New York-based investment banking firm, since its formation in May 2004. Mr. Cameron co-founded Berkshire Capital Corporation, the predecessor firm to Berkshire Capital Securities LLC, in 1983 as the first independent investment bank covering the financial services industry, with a focus on investment management and capital markets firms. Mr. Cameron is responsible for the overall development and direction of the firm and is actively involved in working with the firm’s major clients. Mr. Cameron heads the firm’s management committee and is a frequent speaker at industry conferences and events. Mr. Cameron and his partners have advised on approximately 207 mergers and acquisitions of financial services companies, including high net worth managers, institutional investment managers, mutual fund managers, real estate managers, brokerage firms, investment banks and capital markets firms with aggregate client assets under management of nearly $390 billion and aggregate transaction value in excess of $9.3 billion. Mr. Cameron is the managing member of Broad Hollow LLC, which owns 776,250 shares of our common stock and 75,000 of our units. Prior to forming Berkshire Capital Corporation, Mr. Cameron was an associate director of Paine Webber Group Inc.’s Strategic Planning Group from 1982 through 1983. At Paine Webber, Mr. Cameron executed several internal acquisitions for the company. Mr. Cameron began his career at Prudential Insurance Company from 1978 through 1980, working first in the Comptroller’s Department and then in the Planning & Coordination Group. Mr. Cameron was graduated from Trinity College, where he received a B.A. in Economics, and from Harvard Business School, where he received an M.B.A. Mr. Cameron also attended the London School of Economics. Mr. Cameron is a CFA charterholder and is on the membership committee of the New York Society of Security Analysts. Mr. Cameron is a director of Capital Counsel LLC in New York City, a high net worth investment management firm he advised when it was established. Mr. Cameron is a Fellow of the Life Management Institute. He is also a past trustee of the Securities Industry Institute.
Richard S. Foote, CFAhas been our president and chief executive officer and a member of our board of directors since our inception. Mr. Foote has been a managing director of Berkshire Capital Securities LLC since its formation in May 2004 and a managing director, principal and vice president of Berkshire Capital Corporation, the predecessor firm to Berkshire Capital Securities LLC, since 1994. Throughout his career, Mr. Foote has specialized in providing investment banking services to the financial services industry, including mergers and acquisitions, public offerings and private placements of debt and equity securities, and negotiation and implementation of private equity capital coinvestment commitments. At Berkshire Capital Securities LLC and its predecessor, Mr. Foote has advised owners of institutional equity and fixed income managers, high net worth managers, mutual fund managers and capital markets firms in mergers and acquisitions. Mr. Foote has developed the firm’s alternative investment management industry practice, with the dominant market share in mergers and acquisitions of real estate investment management and services firms and operating companies. Since 1994, Mr. Foote has advised on 27 completed mergers and acquisitions of financial services companies, including high net worth managers, institutional investment managers, mutual fund managers, real estate managers, brokerage firms, investment banks and capital markets firms with aggregate client assets under management of approximately $113 billion and aggregate transaction value of $2.0 billion. Mr. Foote is a director of Berkshire Capital and serves on its compensation committee, commitment committee and technology committee. From 1991 through 1994, Mr. Foote was a co-founder and partner of Knightsbridge Capital Partners, a partnership engaged in investment banking and merchant banking activities. From 1985 to 1991, Mr. Foote was a vice president, an associate, and an analyst in the investment banking division of PaineWebber Incorporated, primarily working on mergers, acquisitions and the issuance of equity and debt securities. Mr. Foote was graduated from Harvard College, cum laude, in 1985 with an A.B. in Economics. Mr. Foote is a CFA charterholder and a member of the CFA Institute, the New York Society of Security Analysts, the Pension Real Estate Association and the National Council of Real Estate Investment Fiduciaries.
56
Table of Contents
R. Bradley Forth, CFAhas been our executive vice president, chief financial officer and secretary since our inception. Mr. Forth has been an associate at Berkshire Capital Securities LLC since its formation in May 2004 and an associate and analyst at Berkshire Capital Corporation, the predecessor firm to Berkshire Capital Securities LLC, since 2001. Mr. Forth has specialized in merger, acquisition and valuation advisory activities for institutional investment managers, high net worth managers, multi–family offices, mutual fund managers, hedge fund of funds managers, retail brokerage firms and real estate investment management and services firms. Mr. Forth has advised on 17 mergers and acquisitions of financial services companies with aggregate transaction value of $1.3 billion. He was graduated from Duke University in 2001 with a B.S. in Economics and a B.A. in Chemistry. Mr. Forth is a CFA charterholder and a member of the CFA Institute and the New York Society of Security Analysts.
Russell L. Appelhas been a member of our board of directors since our inception. Mr. Appel is a founder and the president of The Praedium Group LLC, a private equity real estate investment firm focusing on underperforming and undervalued assets throughout North America that began operations as a part of Credit Suisse First Boston, now known as Credit Suisse. In 1991, Mr. Appel established a team at Credit Suisse to acquire distressed real estate assets for Credit Suisse’s proprietary account. As a result of this group’s achievements, Praedium was formed in 1994 as a third–party investment management group affiliated with Credit Suisse. Since 1991, Praedium has overseen more than $6 billion of real estate transactions in a series of private equity vehicles. The firm’s clients include public and corporate pension plan sponsors, foundations, endowments, and other institutional and high net worth individual investors. In 1999, Praedium separated from Credit Suisse and presently operates as an independent investment firm. In addition to his responsibilities with Praedium, Mr. Appel ran Credit Suisse’s Commercial Mortgage Finance business from 1991 to 1994, where he became a managing director. At Credit Suisse, Mr. Appel supervised the execution of numerous commercial and multi–family asset securitization and sale advisory assignments. Prior to joining Credit Suisse in 1991 and his association with Praedium, Mr. Appel was a vice president in the Real Estate Department of Goldman Sachs & Co. from 1986 to 1991. At Goldman Sachs, he was involved in real estate–related sales, financings, mergers and acquisitions and capital markets transactions. Mr. Appel holds a B.S. in Economics, magna cum laude, and an M.B.A. with distinction from the Wharton School of the University of Pennsylvania. Mr. Appel is the treasurer of the Pension Real Estate Association and serves on its board of directors.
Our board of directors has three directors and is divided into three classes with only one class of directors being elected in each year and each class serving a three–year term. The term of office of the first class of directors, consisting of Russell L. Appel, expired at our annual meeting held on November 27, 2006. Mr. Appel was re-elected for a three-year term. The term of office of the second class of directors, consisting of R. Bruce Cameron, will expire at the second annual meeting. The term of office of the third class of directors, consisting of Richard S. Foote, will expire at the third annual meeting. Each of our current directors has served on our board since our inception on July 13, 2005.
Aston’s current directors and executive officers are as follows:
Name | Age | Position | ||
Stuart D. Bilton | 60 | Chairman of the Management Committee and Chief Executive Officer of Aston | ||
Kenneth C. Anderson | 42 | President and Member of the Management Committee of Aston | ||
Gerald F. Dillenburg | 39 | Chief Financial Officer, Chief Compliance Officer and Member of the Management Committee of Aston | ||
Christine R. Dragon | 36 | Chief Administrative Officer of Aston |
Stuart D. Bilton, CFA serves as Chairman and Chief Executive Officer of Aston. In 1993, he was responsible for founding the CT&T Funds with Kenneth Anderson. These funds were later rebranded as the Alleghany Funds. Mr. Bilton was associated with ABN AMRO Asset Management and its predecessors and/or affiliates from 1972 until consummation of the acquisition. He served as President and Chief Executive Officer of ABN AMRO Asset Management Holdings Inc. (AAAMHI) from 2001 to 2003 and as Vice Chairman of AAAMHI from 2003 until consummation of the acquisition. Mr. Bilton was President and Chief Executive Officer of Alleghany Asset Management, Inc. prior to its acquisition by ABN AMRO. Alleghany Asset Management, Inc. was the parent company of Blairlogie Capital Management, Chicago Capital Management, Chicago Deferred Exchange Corporation, Chicago Trust
57
Table of Contents
Company, Montag & Caldwell, TAMRO Capital Partners and Veredus Asset Management. He is currently President and Chairman of the Aston Funds and is a Director of Veredus, TAMRO, River Road Asset Management, and Baldwin & Lyons, Inc. He earned a B.Sc. (Econ) from the London School of Economics in 1967 and an M.S. degree from the University of Wisconsin in 1970.
Kenneth C. Anderson, CPA serves as President of Aston. Mr. Anderson was President and Chief Executive Officer of the fund business and Executive Vice President and Director of Mutual Funds for AAAMHI through the consummation of the acquisition. Mr. Anderson served on the executive committee of AAAMHI and the boards of Veredus Asset Management and TAMRO Capital Partners, subsidiaries of AAAMHI. He is a member of the Investment Company Institute’s International and Sales Force Committees and a past Chairman of the Board of Governors for the Mutual Fund Education Alliance. Prior to launching the Alleghany Funds in 1993, Mr. Anderson specialized in the Financial Services Practice at KPMG. He received a B.B.A. degree in Accounting from Loyola University of Chicago. He holds a series 6 and 63 license with the NASD. Mr. Anderson spent six years serving as a director for his community United Way board and four years as a founding director of The Caring Place near Loyola University, a Ronald McDonald House.
Gerald F. Dillenburg, CPAserves as Chief Financial Officer and Chief Compliance Officer of Aston. He is responsible for the preparation of financial statements of Aston and compliance for both Aston and the funds. Mr. Dillenburg was with ABN AMRO Investment Fund Services, Inc. (AAIFS) and its predecessors from 1996 through the consummation of the acquisition where he was the Chief Compliance Officer and Director of Operations of the ABN AMRO Funds. In addition, he was the Chief Financial Officer, Secretary and Treasurer of the Funds. He was a Senior Managing Director of AAIFS, which is the Administrator to the Funds, as well as a Senior Managing Director of ABN AMRO Asset Management Holdings, Inc. and ABN AMRO Asset Management, Inc. He is a member of the Investment Company Institute’s Chief Compliance Officer and Operations Committees. Prior to 1996, he was at KPMG LLP since 1989 in the audit division specializing in investment companies and mutual funds. He had just been promoted to senior manager at the time of his departure in June of 1996. He is a graduate with high honors from the University of Illinois at Champaign with a B.S. degree in Accountancy in 1989.
Christine R. Dragon serves as the Chief Administrative Officer of Aston. Prior to joining Aston, Christine had been with ABN AMRO Asset Management from 1993 through the consummation of the acquisition. Prior to the acquisition of Alleghany in 2001, she worked as a portfolio assistant in the equity group and then later in the money market area assisting the portfolio manager with investing funds in the short-term market. In this role she was also a back-up to the fixed income trader where she established relationship with brokers and learned the bond trading business. From 2001 to 2004 she worked in the finance area of AAAMHI, and since December, 2004 she has worked with Stuart Bilton on acquisitions and divestitures. Prior to joining AAAMHI, Christine financed her education by working at DePaul University as a project manager of the Kellstadt Center for Marketing Analysis and Planning. She earned a B.S. degree in Finance from DePaul University in 1993.
Independence of Directors
Highbury currently is not required to have a majority of independent directors. Highbury currently does not have a majority of independent directors. Should Highbury decide to list on a securities exchange, it will be required to adhere to the independence requirements of that exchange.
Code of Ethics
Our Board of Directors has adopted a Code of Business Conduct and Ethics, which applies to all our officers, directors and employees, if any.
Information Regarding our Board of Directors and its Committees
Our Board of Directors acted by written consent during fiscal 2005. Although Highbury does not have any formal policy regarding director attendance at annual stockholder meetings, Highbury will attempt to schedule its annual meetings so that all of its directors can attend. Highbury expects its directors to attend all board and committee meetings and to spend the time needed and meet as frequently as necessary to properly discharge their responsibilities.
58
Table of Contents
Audit Committee. We have not established an audit committee. Our entire Board of Directors currently carries out the functions customarily undertaken by the Audit Committee.
Compensation Committee. Our entire Board of Directors currently carries out the functions customarily undertaken by the Compensation Committee.
Nominating Committee. Our Board of Directors does not have a formal policy for selection of nominees. The members of Board of Directors make recommendations on the basis of our best interests. Our Board of Directors has not utilized any third parties in the selection of nominees. No candidates have been nominated during fiscal 2005 by a stockholder holding 5% or more of our common stock.
EXECUTIVE AND DIRECTOR COMPENSATION
No executive officer has received any compensation for services rendered. No compensation of any kind, including finder’s and consulting fees, has been paid by us to any of our initial stockholders, including our officers and directors, or any of their respective affiliates, for services rendered prior to or in connection with the acquisition. However, these individuals were reimbursed for out–of–pocket expenses incurred in connection with activities on our behalf such as identifying potential target businesses and performing due diligence on suitable business combinations and Berkshire Capital received $7,500 per month for office space and general and administrative services commencing on January 25, 2006.
During the fiscal year ended December 31, 2005, our directors did not receive any cash compensation for their service as members of the Board of Directors. Highbury currently has no intention to pay any compensation or fees to any of our officers or directors, although our board may elect to do so in the future. Highbury cannot provide a time frame for which this intention extends because the board of directors cannot predict possible future requirements of Highbury (such as substantially increased business operations) or future personal career decisions of each officer or director (such as relocation or retirement decisions). The current officers and directors are motivated toward the success of Highbury due to their significant ownership interests in Highbury, which will appreciate in the event of success. In addition, Highbury believes that its officers and directors view the success of Highbury as having a positive impact on their reputations in the marketplace. In light of the amount of consideration paid by Highbury’s officers and directors, they will likely benefit even if an event, including the acquisition, causes the market price of Highbury’s securities to significantly decrease.
Our Restated Certificate of Incorporation provides that all directors, officers, employees and agents of the registrant shall be entitled to be indemnified by us to the fullest extent permitted by Section 145 of the Delaware General Corporation Law.
Paragraph B of Article Seventh of Highbury’s Restated Certificate of Incorporation provides:
The Corporation, to the full extent permitted by Section 145 of the DGCL, as amended from time to time, shall indemnify all persons whom it may indemnify pursuant thereto. It further provides that expenses (including attorneys’ fees) incurred by an officer or director in defending any civil, criminal, administrative or investigative action, suit or proceeding or which such officer or director may be entitled to indemnification hereunder shall be paid by the Company in advance of the final disposition of such action, suit or proceeding upon receipt of an undertaking by or on behalf of such director or officer to repay such amount if it shall ultimately be determined that he or she is not entitled to be indemnified by the Company as authorized hereby.
Insofar as indemnification for liabilities arising under the Securities Act may be permitted to the Company’s directors, officers and controlling persons pursuant to the foregoing provisions, or otherwise, the Company has been advised that in the opinion of the SEC such indemnification is against public policy as expressed in the Securities Act and is, therefore, unenforceable. In the
59
Table of Contents
event that a claim for indemnification against such liabilities (other than the payment of expenses incurred or paid by a director, officer or controlling person in a successful defense of any action, suit or proceeding) is asserted by such director, officer or controlling person in connection with the securities being registered, the Company will, unless in the opinion of its counsel the matter has been settled by controlling precedent, submit to the court of its appropriate jurisdiction the question whether such indemnification by it is against public policy as expressed in the Securities Act and will be governed by the final adjudication of such issue.
60
Table of Contents
SECTION 16(A) BENEFICIAL OWNERSHIP AND REPORTING COMPLIANCE
The Form 3 filed by R. Bradley Forth, our Executive Vice President, Chief Financial Officer and Secretary, in connection with our initial public offering, which was required to be filed no later than January 25, 2006, the day of the effectiveness of our initial public offering, was not electronically transmitted to the SEC until after 10:00 p.m. on January 25, and therefore has a filing date of January 26, 2006.
AUDIT FEES
The firm of Goldstein Golub Kessler LLP , or GGK, acts as our principal accountant. Through September 30, 2005 GGK had a continuing relationship with American Express Tax and Business Services Inc., or TBS, from which it leased auditing staff who were full time, permanent employees of TBS and through which its partners provide non-audit services. Subsequent to September 30, 2005, this relationship ceased and the firm established a similar relationship with RSM McGladrey, Inc., or RSM. GGK has no full time employees and therefore, none of the audit services performed were performed by permanent full-time employees of GGK. GGK manages and supervises the audit and audit staff, and is exclusively responsible for the opinion rendered in connection with its examination. We did not pay any fees to GGK or RSM for services that fall under the categories “Audit Related Fees,” “Tax Fees,” or “All Other Fees,” as such categories are defined in the rules promulgated by the SEC. The following is a summary of fees paid or to be paid to GGK and RSM for services rendered.
Fees incurred in connection with our initial public offering including related amounts totaled $42,500. In addition, as of September 30, 2006 we incurred approximately $57,763 in fees for services provided in connection with our Annual Report on Form 10-KSB, our Quarterly Reports on Form 10-QSB and our investigation and pursuit of the transaction with the sellers.
Pre-Approval of Fees
Our full Board of Directors is responsible for appointing, setting compensation, and overseeing the work of the independent auditor. In recognition of this responsibility, the Board of Directors has established a policy to pre-approve all audit and permissible non-audit services provided by the independent auditor.
61
Table of Contents
CERTAIN RELATIONSHIPS AND RELATED TRANSACTIONS
Ownership of Common Stock
The following table sets forth information regarding the beneficial ownership of our common stock as of December 6, 2006 by officers and directors and known 5% holders. The percentages of common stock beneficially owned are based on 9,527,000 shares of common stock outstanding as of December 6, 2006.
Name and address of beneficial owner(1) | Amount and Nature of Beneficial Ownership | Approximate Percentage of Outstanding Common Stock | |||
R. Bruce Cameron(2) | 1,223,751 | 12.8 | % | ||
Richard S. Foote(3) | 667,500 | 7.0 | % | ||
R. Bradley Forth(4) | 111,249 | 1.2 | % | ||
Russell L. Appel(5)(6) | 222,501 | 2.3 | % | ||
Broad Hollow LLC(2) | 1,001,250 | 10.5 | % | ||
Wellington Management Company, LLP(7) | 986,000 | 10.3 | % | ||
Potomac Capital Management LLC(8) | 936,500 | 9.8 | % | ||
Context Capital Management, LLC(9) | 813,500 | 8.5 | % | ||
Talon Opportunity Partners, L.P.(10)(11) | 558,000 | 5.9 | % | ||
All executive officers and directors as a group (four individuals)(2)(12) | 2,225,001 | 23.4 | % |
| (1) | Unless otherwise noted, the business address of each stockholder listed in this table is c/o Berkshire Capital Securities LLC, 535 Madison Avenue, 19th Floor, New York, New York 10022. |
| (2) | Includes 851,250 shares owned of record by Broad Hollow LLC that are attributed to Mr. Cameron, according to Section 13(d) of the Securities Exchange Act of 1934, due to his position as the managing member of Broad Hollow LLC, and 183,334 shares issuable upon exercise of warrants that become exercisable on January 25, 2007. These share numbers do not include 86,250 shares held by Mr. Forth, which are subject to a call in favor of Broad Hollow LLC, exercisable if Mr. Forth’s employment by Berkshire Capital is terminated for certain reasons before the second anniversary of our initial business combination. |
| (3) | Includes 100,000 shares issuable upon exercise of warrants that become exercisable on January 25, 2007. |
| (4) | The business address of Mr. Forth is c/o Berkshire Capital Securities LLC, 999 Eighteenth Street, Suite 3000, Denver, CO 80202. Includes 16,666 shares issuable upon exercise of warrants that become exercisable on January 25, 2007. |
| (5) | These shares are owned of record by the Hillary Appel Trust and the Catey Lauren Appel Trust, of which Mr. Appel’s wife is the trustee. Mr. Appel disclaims beneficial ownership of all such shares. Includes 33,334 shares issuable upon exercise of warrants that become exercisable on January 25, 2007. |
| (6) | The business address of Mr. Appel is c/o The Praedium Group LLC, 825 Third Avenue, 36th Floor, New York, NY 10022. |
| (7) | As reported in a Schedule 13G dated January 31, 2006 and filed with the Securities and Exchange Commission on February 21, 2006. The business address of Wellington Management Company, LLP is 75 State Street, Boston, MA 02109. The Schedule 13G does not disclose the natural persons that would be deemed the control persons of Wellington Management Company, LLP. Based on a Form ADV filed by Wellington Management Company, LLP, with the SEC on August 4, 2006 the control persons of |
62
Table of Contents
Wellington Management Company, LLP are Nicholas Adams, Laurie Gabriel, Paul Hamel, Saul Pannell, John Ryan, Perry Traquina and Phillip Perelmuter.
| (8) | As reported in a Schedule 13G dated November 20, 2006 and filed with the SEC on November 20, 2006. The business address of Potomac Capital Management LLC is 825 Third Avenue, 33rd Floor, New York, New York 10022. Potomac Capital Management LLC, Potomac Capital Management Inc. and Paul J. Solit have shared voting power and shared dispositive power with respect to these shares. |
| (9) | As reported in a Schedule 13G dated January 26, 2006 and filed with the SEC on February 6, 2006. The business address of Context Capital Management, LLC is 12626 High Bluff Drive, Suite 440, San Diego, CA 92130. Michael S. Rosen and William D. Fertig have shared voting power and shared dispositive power with respect to these shares. |
| (10) | As reported in a Schedule 13G dated December 6, 2006 and filed with the SEC on December 6, 2006, the business address of Talon Opportunity Partners, L.P. is One North Franklin, Suite 900, Chicago, Illinois 60606. Talon Opportunity Partners, L.P., Talon Opportunity Managers, L.L.C., the general partner of Talon Opportunity Partners, L.P. and Talon Asset Management, LLC, the Manager of Talon Opportunity Managers. L.L.C., have shared voting power and shared dispositive power with respect to these shares. The shares reported herein by Talon Asset Management, LLC are held on behalf of Talon Opportunity Partners, L.P., as manager of Talon Opportunity Managers, L.L.C., the general partner of Talon Opportunity Partners, L.P. From time to time, Talon Opportunity Partners, L.P. may make distributions of partnership income to limited partners, none of which has an interest relating to more than 5% of the class. The Schedule 13G does not disclose the natural persons that would be deemed the control persons of Talon Opportunity Partners, L.P. Based on a Form ADV filed by Talon Asset Management, LLC with the SEC on May 10, 2006, the control persons of Talon Asset Management, LLC are Terry Diamond, Alan Wilson, Barbara Rumminger, William Wolf, Bruce Beerbower, Talon Asset Management Inc. and Diamond JJJD Enterprises, LLC. |
| (11) | Includes 80,000 shares issuable upon exercise of warrants that become exercisable on January 25, 2007. |
| (12) | Includes 333,334 shares issuable upon exercise of warrants that become exercisable on January 25, 2007. |
We consider Messrs. Appel, Cameron, Foote and Forth to be our promoters, as such term is defined within the rules promulgated by the SEC under the Securities Act of 1933.
Conflicts of Interest
Our public stockholders should be aware of the following potential conflicts of interest:
| • | Our officers and directors are not required to commit their full time to our affairs and, accordingly, they may have conflicts of interest in allocating management time among various business activities. |
| • | R. Bruce Cameron, our chairman of the board, Richard S. Foote, our president, chief executive officer and director, and R. Bradley Forth, our executive vice president, chief financial officer and secretary are employees or equity owners of Berkshire Capital, a registered broker–dealer that provides financial advisory services to clients in connection with mergers and acquisitions in the financial services industry. Berkshire Capital’s clients may compete with us for acquisitions in the financial services industry, and Berkshire Capital may have a duty to present certain acquisition opportunities to its clients before it presents them to us. |
| • | Berkshire Capital agreed that, commencing on January 25, 2006, it would make available to us such office space and certain general and administrative services as we may require from time to time. We agreed to pay Berkshire Capital $7,500 per month for these services. On November 30, 2006, we replaced this agreement with an office services agreement with Berkshire Capital. The office services agreement provides for a monthly fixed fee for office services of $7,500. Either party |
63
Table of Contents
may terminate the office service agreement at any time with six months’ notice to the other party. Messrs. Cameron, Foote and Forth, our key executives, are affiliated with Berkshire Capital. As a result of these affiliations, these individuals will benefit from the transaction to the extent of their interest in Berkshire Capital. However, this arrangement is solely for our benefit and is not intended to provide any of our executive officers compensation in lieu of a salary. We believe, based on rents and fees for similar services in the Denver, Colorado metropolitan area, that the fee charged by Berkshire Capital is at least as favorable as we could have obtained from an unaffiliated third party. However, as our directors may not be deemed “independent,” we did not have the benefit of disinterested directors approving this transaction or the extension of the agreement.
All ongoing and future transactions between us and any of our officers and directors or their respective affiliates, including loans by our officers and directors, will be on terms believed by us to be no less favorable than are available from unaffiliated third parties and such transactions or loans, including any forgiveness of loans, will require prior approval in each instance by a majority of our uninterested “independent” directors (to the extent we have any) or the members of our board who do not have an interest in the transaction, in either case who had access, at our expense, to our attorneys or independent legal counsel. We will base our determination as to whether a transaction is no less favorable to us that would be available from any affiliated third parties on proposals we solicit from third parties, taking into account in addition to price the quality of the third parties and scope of the transactions described in such proposals, and our knowledge of the financial services industry.
Our board of directors will adopt policies and procedures for the review, approval and ratification of related party transactions.
64
Table of Contents
DESCRIPTION OF SECURITIES
General
We are authorized to issue 50,000,000 shares of common stock, par value $0.0001 per share, and 1,000,000 shares of preferred stock, par value $0.0001 per share. As of the date of this prospectus, 9,527,000 shares of common stock are outstanding.
Units
Each unit consists of one share of common stock and two warrants. Each warrant entitles the holder to purchase one share of common stock. The common stock and warrants began separate trading on March 1, 2006.
Common Stock
Our stockholders are entitled to one vote for each share held of record on all matters to be voted on by stockholders.
Our board of directors is divided into three classes, each of which serves for a term of three years with only one class of directors being elected in each year.
Our stockholders have no conversion, preemptive or other subscription rights and there are no sinking fund or redemption provisions applicable to the common stock.
Preferred Stock
Our certificate of incorporation authorizes the issuance of 1,000,000 shares of preferred stock with such designation, rights and preferences as may be determined from time to time by our board of directors. No shares of preferred stock are being issued or registered in this offering. Accordingly, our board of directors is empowered, without stockholder approval, to issue preferred stock with dividend, liquidation, conversion, voting or other rights which could adversely affect the voting power or other rights of the holders of common stock. We may issue some or all of the preferred stock to effect a business combination. In addition, the preferred stock could be utilized as a method of discouraging, delaying or preventing a change in control of us. Although we do not currently intend to issue any shares of preferred stock, we cannot assure you that we will not do so in the future.
Warrants
There are currently 15,820,000 warrants outstanding. Each warrant entitles the registered holder to purchase one share of our common stock at a price of $5.00 per share, subject to adjustment as discussed below, at any time on or after January 25, 2007.
The warrants will expire at 5:00 p.m., New York City time on January 25, 2010. We may call the warrants for redemption (including the warrants issued and outstanding as a result of the exercise of the purchase option sold to TEP and EBC),
| • | at any time after the warrants become exercisable; |
| • | in whole and not in part; |
| • | at a price of $0.01 per warrant; |
| • | upon not less than 30 days’ prior written notice of redemption to each warrant holder; and |
65
Table of Contents
| • | only if the reported last sale price of the common stock equals or exceeds $8.50 per share, for any 20 trading days within a 30 trading day period ending on the third business day before we send the notice of redemption to warrant holders. |
The right to exercise the warrants will be forfeited unless they are exercised before the date specified in the notice of redemption. From and after the redemption date, the record holder of a warrant will have no further rights except to receive, upon surrender of the warrants, the redemption price.
The warrants were issued in registered form under a warrant agreement between Continental Stock Transfer & Trust Company, as warrant agent, and us. You should review a copy of the warrant agreement, which has been included as an exhibit to this prospectus, for a complete description of the terms and conditions applicable to the warrants.
The exercise price and number of shares of common stock issuable on exercise of the warrants may be adjusted in certain circumstances including in the event of a stock dividend, or our recapitalization, reorganization, merger or consolidation. However, the warrants will not be adjusted for issuances of common stock at a price below their respective exercise prices.
The warrants may be exercised upon surrender of the warrant certificate on or prior to the expiration date at the offices of the warrant agent, with the exercise form on the reverse side of the warrant certificate completed and executed as indicated, accompanied by full payment of the exercise price, by certified check payable to us, for the number of warrants being exercised. The warrant holders do not have the rights or privileges of holders of common stock and any voting rights until they exercise their warrants and receive shares of common stock. After the issuance of shares of common stock upon exercise of the warrants, each holder will be entitled to one vote for each share held of record on all matters to be voted on by stockholders.
No warrants will be exercisable unless at the time of exercise a prospectus relating to common stock issuable upon exercise of the warrants is current and the common stock has been registered or qualified or deemed to be exempt under the securities laws of the state of residence of the holder of the warrants. Under the terms of the warrant agreement, we have agreed to meet these conditions and use our best efforts to maintain a current prospectus relating to common stock issuable upon exercise of the warrants until the expiration of the warrants. However, we cannot assure you that we will be able to do so. The warrants may be deprived of any value and the market for the warrants may be limited if the prospectus relating to the common stock issuable upon the exercise of the warrants is not current or if the common stock is not qualified or exempt from qualification in the jurisdictions in which the holders of the warrants reside.
No fractional shares will be issued upon exercise of the warrants. If, upon exercise of the warrants, a holder would be entitled to receive a fractional interest in a share, we will, upon exercise, round up to the nearest whole number the number of shares of common stock to be issued to the warrant holder.
Our Transfer Agent and Warrant Agent
The transfer agent for our securities and warrant agent for our warrants is Continental Stock Transfer & Trust Company.
Shares Eligible for Future Sale
Our initial stockholders purchased an aggregate of 166,667 units in a private placement, which they agreed with us and the underwriters not to sell or otherwise transfer until after the acquisition. These units, and the common stock, warrants and common stock issuable upon exercise of the warrants comprising these units, are restricted securities under Rule 144 in that they were acquired in a private transaction not involving a public offering. None of these securities will be eligible for resale under Rule 144. All of the remaining 1,725,000 shares held by our initial stockholders are restricted securities under Rule 144, in that they were issued in private transactions not involving a public offering.
66
Table of Contents
Rule 144
In general, under Rule 144 as currently in effect, a person who has beneficially owned restricted shares of our common stock for at least one year would be entitled to sell within any three-month period a number of shares that does not exceed the greater of either of the following:
| • | 1% of the number of shares of common stock then outstanding, which equals 95,270 shares as of November 30, 2006; and |
| • | the average weekly trading volume of the common stock during the four calendar weeks preceding the filing of a notice on Form 144 with respect to the sale. |
Sales under Rule 144 are also limited by manner of sale provisions and notice requirements and to the availability of current public information about us.
Rule 144(k)
Under Rule 144(k), a person who is not deemed to have been one of our affiliates at the time of or at any time during the three months preceding a sale, and who has beneficially owned the restricted shares proposed to be sold for at least two years, including the holding period of any prior owner other than an affiliate, is entitled to sell their shares without complying with the manner of sale, public information, volume limitation or notice provisions of Rule 144.
SEC position on Rule 144 sales
The SEC has taken the position that promoters or affiliates of a blank check company and their transferees, both before and after a business combination, would act as an “underwriter” under the Securities Act of 1933 when reselling the securities of a blank check company acquired prior to the consummation of its initial public offering. Accordingly, the SEC believes that those securities can be resold only through a registered offering and that Rule 144 would not be available for those resale transactions despite technical compliance with the requirements of Rule 144.
Registration rights
The holders of our 1,725,000 issued and outstanding shares of common stock prior to the date of our initial public offering prospectus are entitled to registration rights pursuant to an agreement signed in connection with our initial public offering. The holders of the majority of these shares are entitled to make up to two demands that we register these shares as well as any other of our warrants or shares owned by them. The holders of the majority of these shares can elect to exercise these registration rights at any time after the date on which the shares are released from escrow. In addition, these stockholders have certain “piggy-back” registration rights on registration statements filed subsequent to such date. We have granted the holders of the 166,667 units purchased in the private placement demand and “piggy-back” registration rights, with respect to the shares, the warrants and the shares underlying the warrants comprising such units exercisable at any time. The demand registration may be exercised by the holders of a majority of such units. We will bear the expenses incurred in connection with the filing of any of the foregoing registration statements.
Global Clearance and Settlement
We will issue the securities upon exercise of our warrants in the form of global securities registered in the name of Cede & Co., as nominee of the Depository Trust Company, or DTC. Each global security will be issued only in fully registered form.
You may hold your beneficial interests in a global security directly through DTC if you have an account at DTC, or indirectly through organizations that have accounts at DTC.
67
Table of Contents
Definition of a global security
A global security is a special type of indirectly held security in the form of a certificate held by a depositary for the investors in a particular issue of securities. Since we choose to issue our securities in the form of global securities, the ultimate beneficial owners can only be indirect holders. This is done by requiring that our global securities be registered in the name of a financial institution selected by us, as appropriate, and by requiring that the securities underlying our global securities not be transferred to the name of any direct holder except in certain circumstances.
The financial institution that acts as the sole direct holder of a global security is called the “Depositary.” Any person wishing to own our securities must do so indirectly by virtue of an account with a broker, bank or other financial institution that in turn has an account with the Depositary. In the case of our securities, DTC will act as depositary and Cede & Co. will act as its nominee.
Except under limited circumstances or upon the issuance of securities in definitive form, a global security may be transferred, in whole and not in part, only to DTC, to another nominee of DTC or to a successor of DTC or its nominee. Beneficial interests in a global security will be represented, and transfers of such beneficial interests will be made, through accounts of financial institutions acting on behalf of beneficial owners either directly as account holders, or indirectly through account holders, at DTC.
Special investor considerations for global securities
As an indirect holder, an investor’s rights relating to the global security will be governed by the account rules of the investor’s financial institution and of the Depositary, DTC, as well as general laws relating to securities transfers. We will not recognize this type of investor as a holder of our securities and instead will deal only with DTC, the Depositary that holds the global securities.
An investor in our securities should be aware that because these securities will be issued only in the form of global securities:
| • | except in certain limited circumstances, the investor cannot get our securities registered in his or her own name; |
| • | except in certain limited circumstances, the investor cannot receive physical certificates for his or her securities; |
| • | the investor will be a “street name” holder and must look to his or her own bank or broker for payments on our securities and protection of his or her legal rights relating to our securities; |
| • | the investor may not be able to sell interests in our securities to some insurance companies and other institutions that are required by law to own their securities in the form of physical certificates; and |
| • | DTC’s policies will govern payments, transfers, exchanges and other matters relating to the investor’s interest in the global securities. We have no responsibility for any aspect of DTC’s actions or for its records of ownership interests in the global securities. We do not supervise DTC in any way. |
Description of DTC
DTC has informed us that:
| • | DTC is a limited purpose trust company organized under the laws of the State of New York, a member of the Federal Reserve System, a “clearing corporation” within the meaning of the Uniform Commercial Code and a “clearing agency” registered pursuant to the provisions of Section 17A of the Exchange Act; |
68
Table of Contents
| • | DTC was created to hold securities for financial institutions that have accounts with it, and to facilitate the clearance and settlement of securities transactions between the account holders through electronic book-entry changes in their accounts, thereby eliminating the need for physical movement of certificates. DTC account holders include securities brokers and dealers, banks, trust companies and clearing corporations. Indirect access to the DTC system is also available to banks, brokers, dealers and trust companies that clear through, or maintain a custodial relationship with, a DTC account holder, either directly or indirectly; |
| • | DTC’s rules are on file with the SEC; and |
| • | DTC’s records reflect only the identity of its participants to whose accounts beneficial interest in the Global Securities are credited. These participants may or may not be the owners of the beneficial interests so recorded. The participants will be responsible for keeping account of their holdings on behalf of their beneficial owners. |
Market Price and Dividend Data for Highbury Securities
Highbury consummated its initial public offering on January 31, 2006. In the initial public offering, Highbury sold 7,743,333 units. Each unit consists of one share of common stock and two redeemable common stock purchase warrants, each to purchase one share of Highbury common stock. Highbury common stock, warrants and units are quoted on the OTCBB under the symbols HBRF, HBRFW and HBRFU, respectively. Highbury units commenced public trading on January 25, 2006, and its common stock and warrants commenced separate public trading on March 1, 2006. The over-the-counter market quotations reflect inter-dealer prices, without retail mark-up, mark-down or commission and may not necessarily reflect actual transactions. Prior to January 26, 2006, there was no established public trading market for our units. Prior to March 1, 2006, there was no established public trading market for our common stock or warrants.
| Units | Common Stock | Warrants | ||||||||||||||||
| High | Low | High | Low | High | Low | |||||||||||||
Quarter ended March 31, 2006 | $ | 6.75 | $ | 6.00 | $ | 5.59 | $ | 5.32 | $ | 0.66 | $ | 0.53 | ||||||
Quarter ended June 30, 2006 | $ | 8.72 | $ | 6.79 | $ | 6.05 | $ | 5.95 | $ | 1.31 | $ | 0.69 | ||||||
Quarter ended September 30, 2006 | $ | 7.40 | $ | 6.70 | $ | 5.65 | $ | 5.46 | $ | 0.83 | $ | 0.61 | ||||||
Holders
As of December 6, 2006, there was one holder of record of the units, seven holders of record of the common stock and one holder of record of the warrants. Highbury believes the beneficial holders of the units, common stock and warrants to be in excess of 25 persons each.
Dividends
Highbury has not paid any cash dividends on its common stock to date. The payment of dividends in the future will be contingent upon our revenues and earnings, if any, capital requirements and general financial condition. It is the present intention of the board of directors to retain all earnings, if any, for use in business operations or to fund acquisitions or repurchases of securities, if appropriate, and accordingly the board does not anticipate declaring any dividends.
69
Table of Contents
The validity of the common stock offered hereby will be passed upon for us by Bingham McCutchen LLP.
The consolidated financial statements of Highbury as of December 31, 2005 and January 31, 2006 appearing in this prospectus and in the registration statement have been included herein in reliance upon the report of Goldstein Golub Kessler LLP, independent registered public accounting firm, given on the authority of such firm as experts in accounting, auditing and in giving said reports.
The combined financial statements of the acquired business as of December 31, 2005 and for the three fiscal years in the period then ended appearing in this prospectus and in the registration statement have been included herein in reliance upon the report of Ernst & Young LLP, Independent Auditors, given on the authority of such firm as experts in accounting, auditing and in giving said reports.
WHERE YOU CAN FIND ADDITIONAL INFORMATION
We have filed with the SEC a registration statement on Form S-1, which includes exhibits, schedules and amendments, under the Securities Act of 1933, with respect to this offering of our securities. Although this prospectus, which forms a part of the registration statement, contains all material information included in the registration statement, parts of the registration statement have been omitted as permitted by rules and regulations of the SEC. We refer you to the registration statement and its exhibits for further information about us, our securities and this offering. The registration statement and its exhibits, as well as our other reports filed with the SEC, can be inspected and copied at the SEC’s public reference room at 100 F Street, N.E., Washington, D.C. 20549. The public may obtain information about the operation of the public reference room by calling the SEC at 1-800-SEC-0330. In addition, the SEC maintains a web site at http://www.sec.gov which contains the Form S-1 and other reports, proxy and information statements and information regarding issuers that file electronically with the SEC.
70
Table of Contents
U.S. MUTUAL FUND BUSINESS OF ABN AMRO ASSET MANAGEMENT HOLDINGS, INC.
COMBINED FINANCIAL STATEMENTS
Audited Combined Financial Statements | ||
Report of Independent Auditors | F-1 | |
Combined Statements of Financial Condition as of December 31, 2005 and 2004 | F-2 | |
Combined Statements of Operations for years ended December 31, 2005, 2004 and 2003 | F-3 | |
Combined Statements of Changes in Owner’s Equity for years ended December 31, 2005, 2004 and 2003 | F-4 | |
Combined Statements of Cash Flows for years ended December 31, 2005, 2004 and 2003 | F-5 | |
Notes to Combined Financial Statements | F-6 | |
Unaudited Combined Financial Statements | ||
Combined Statements of Financial Condition as of September 30, 2006 and December 31, 2005 | F-13 | |
Combined Statements of Operations for the nine months ended September 30, 2006 and 2005 | F-14 | |
Combined Statements of Changes in Owner’s Equity for the nine months ended September 30, 2006 and 2005 | F-15 | |
Combined Statements of Cash Flows for the nine months ended September 30, 2006 and 2005 | F-16 | |
Notes to Unaudited Combined Financial Statements | F-17 | |
| HIGHBURY FINANCIAL INC. | ||
Audited Financial Statements | ||
Report of Independent Auditors | F-22 | |
Balance Sheets as of January 31, 2006 and December 31, 2005 | F-23 | |
Statements of Operations for periods from July 13, 2005 (inception) to December 31, 2005, from January 1, 2006 to January 31, 2006, and from July 13, 2005 (inception) to January 31, 2006 | F-24 | |
Statements of Stockholders’ Equity from December 31, 2005 to January 31, 2006 | F-25 | |
Statements of Cash Flows for periods from July 13, 2005 (inception) to December 31, 2005, from January 1, 2006 to January 31, 2006, and from July 13, 2005 (inception) to January 31, 2006 | F-26 | |
Notes to Financial Statements | F-27 | |
Unaudited Combined Financial Statements | ||
Condensed Balance Sheets as of September 30, 2006 and December 31, 2005 | F-33 | |
Condensed Statements of Operations for periods from January 1, 2006 to September 30, 2006 and from July 13, 2005 (inception) to September 30, 2006 | F-34 | |
Condensed Statements of Stockholders’ Equity from December 31, 2005 to September 30, 2006 | F-35 | |
Condensed Statements of Cash Flows for periods from January 1, 2006 to September 30, 2006 and from July 13, 2005 (inception) to September 30, 2006 | F-36 | |
Notes to Unaudited Condensed Financial Statements | F-37 | |
Table of Contents
Report of Independent Auditors
The Board of Directors
ABN AMRO Asset Management Holdings, Inc.
We have audited the accompanying combined statements of financial condition of the U.S. Mutual Fund Business of ABN AMRO Asset Management Holdings, Inc. (the Business) as of December 31, 2005 and 2004, and the related combined statements of operations, changes in owner’s equity and cash flows for each of the three years in the period ended December 31, 2005. These financial statements are the responsibility of the Business’ management. Our responsibility is to express an opinion on these financial statements based on our audits.
We conducted our audits in accordance with auditing standards generally accepted in the United States. Those standards require that we plan and perform the audit to obtain reasonable assurance about whether the financial statements are free of material misstatement. We were not engaged to perform an audit of the Business’ internal control over financial reporting. Our audit included consideration of internal control over financial reporting as a basis for designing audit procedures that are appropriate in the circumstances, but not for the purpose of expressing an opinion on the effectiveness of the Business’ internal control over financial reporting. Accordingly, we express no such opinion. An audit also includes examining, on a test basis, evidence supporting the amounts and disclosures in the financial statements, assessing the accounting principles used and significant estimates made by management, and evaluating the overall financial statement presentation. We believe that our audits provide a reasonable basis for our opinion.
In our opinion, the combined financial statements referred to above present fairly, in all material respects, the financial position of the U.S. Mutual Fund Business of ABN AMRO Asset Management Holdings, Inc. at December 31, 2005 and 2004, and the combined results of its operations, changes in its owner’s equity and its cash flows for each of the three years in the period ended December 31, 2005, in conformity with accounting principles generally accepted in the United States.
/s/ Ernst & Young LLP
Ernst & Young LLP
Chicago, Illinois
May 25, 2006
F-1
Table of Contents
U.S. Mutual Fund Business of
ABN AMRO Asset Management Holdings, Inc.
Combined Statements of Financial Condition
December 31, 2005 and 2004
| 2005 | 2004 | |||||
Assets | ||||||
Cash and cash equivalents | $ | 5,239,747 | $ | 3,158,266 | ||
Advisory and administrative fees receivable | 4,074,486 | 4,193,370 | ||||
Goodwill | 10,518,750 | 23,862,800 | ||||
Other intangible assets | 22,045,000 | 32,470,533 | ||||
Other assets | 1,635 | 3,159 | ||||
Total assets | $ | 41,879,618 | $ | 63,688,128 | ||
Liabilities and owner’s equity | ||||||
Accounts payable—affiliates | $ | 2,266,559 | $ | 2,844,195 | ||
Accrued compensation and benefits | 648,625 | 943,836 | ||||
Other accrued liabilities | 954,318 | 478,959 | ||||
Total liabilities | 3,869,502 | 4,266,990 | ||||
Owner’s equity | 38,010,116 | 59,421,138 | ||||
Total liabilities and owner’s equity | $ | 41,879,618 | $ | 63,688,128 | ||
See accompanying notes.
F-2
Table of Contents
U.S. Mutual Fund Business of
ABN AMRO Asset Management Holdings, Inc.
Combined Statements of Operations
Years Ended December 31, 2005, 2004, and 2003
| 2005 | 2004 | 2003 | ||||||||
Revenues | ||||||||||
Advisory fees, net | $ | 47,380,780 | $ | 47,808,972 | $ | 38,499,123 | ||||
Administration fees | 1,546,294 | 1,438,991 | 1,178,412 | |||||||
Total revenues | 48,927,074 | 49,247,963 | 39,677,535 | |||||||
Operating expenses | ||||||||||
Distribution and advisory costs: | ||||||||||
Affiliates | 29,313,775 | 34,426,160 | 29,637,704 | |||||||
Other | 11,091,977 | 6,492,457 | 3,893,365 | |||||||
Total distribution and advisory costs | 40,405,752 | 40,918,617 | 33,531,069 | |||||||
Compensation and related expenses | 5,194,449 | 4,416,624 | 3,920,966 | |||||||
Related-party expense allocations | 2,493,741 | 1,888,156 | 1,225,238 | |||||||
Goodwill impairment | 13,344,050 | — | — | |||||||
Intangible asset impairment | 10,425,533 | — | — | |||||||
Other | 824,522 | 510,540 | 400,599 | |||||||
Total operating expenses | 72,688,047 | 47,733,937 | 39,077,872 | |||||||
Operating income (loss) | (23,760,973 | ) | 1,514,026 | 599,663 | ||||||
Interest income | 133,524 | 31,140 | 20,432 | |||||||
Net income (loss) before taxes | (23,627,449 | ) | 1,545,166 | 620,095 | ||||||
Income tax provision (benefit) | — | — | — | |||||||
Net income (loss) | $ | (23,627,449 | ) | $ | 1,545,166 | $ | 620,095 | |||
See accompanying notes.
F-3
Table of Contents
U.S. Mutual Fund Business of
ABN AMRO Asset Management Holdings, Inc.
Combined Statements of Changes in Owner’s Equity
December 31, 2005, 2004, and 2003
Owner’s equity at January 1, 2003 | $ | 56,681,718 | ||
Net income | 620,095 | |||
Net transfers from AAAMHI | 1,407,219 | |||
Owner’s equity at December 31, 2003 | 58,709,032 | |||
Net income | 1,545,166 | |||
Dividends to parent | (2,500,000 | ) | ||
Net transfers from AAAMHI | 1,666,940 | |||
Owner’s equity at December 31, 2004 | 59,421,138 | |||
Net loss | (23,627,449 | ) | ||
Net transfers from AAAMHI | 2,216,427 | |||
Owner’s equity at December 31, 2005 | $ | 38,010,116 | ||
See accompanying notes.
F-4
Table of Contents
U.S. Mutual Fund Business of
ABN AMRO Asset Management Holdings, Inc.
Combined Statements of Cash Flows
Years Ended December 31, 2005, 2004, and 2003
| 2005 | 2004 | 2003 | ||||||||||
Operating activities | ||||||||||||
Net income (loss) | $ | (23,627,449 | ) | $ | 1,545,166 | $ | 620,095 | |||||
Adjustments to reconcile net income (loss) to net cash flow provided by (used in) operating activities: | ||||||||||||
Goodwill impairment | 13,344,050 | — | — | |||||||||
Intangible asset impairment | 10,425,533 | — | — | |||||||||
Changes in assets and liabilities: | ||||||||||||
(Increase) decrease in advisory and administrative fees receivable | 118,884 | (314,046 | ) | (486,119 | ) | |||||||
(Increase) decrease in other assets | 1,524 | 2,797 | 3,657 | |||||||||
Increase (decrease) in accounts payable—affiliates | (577,636 | ) | 56,767 | 582,552 | ||||||||
Increase (decrease) in accrued compensations and benefits | (295,211 | ) | 165,019 | 10,526 | ||||||||
Increase (decrease) in other accrued liabilities | 475,359 | (35,007 | ) | (450,697 | ) | |||||||
Net cash flow provided by (used in) operating activities | (134,946 | ) | 1,420,696 | 280,014 | ||||||||
Financing activities | ||||||||||||
Dividends paid | — | (2,500,000 | ) | — | ||||||||
Transfers from AAAMHI, net | 2,216,427 | 1,666,940 | 1,407,219 | |||||||||
Net cash provided by (used in) financing activities | 2,216,427 | (833,060 | ) | 1,407,219 | ||||||||
Net increase in cash and cash equivalents | 2,081,481 | 587,636 | 1,687,233 | |||||||||
Cash and cash equivalents at beginning of year | 3,158,266 | 2,570,630 | 883,397 | |||||||||
Cash and cash equivalents at end of year | $ | 5,239,747 | $ | 3,158,266 | $ | 2,570,630 | ||||||
See accompanying notes.
F-5
Table of Contents
U.S. Mutual Fund Business of
ABN AMRO Asset Management Holdings, Inc.
Notes to Combined Financial Statements
1. Basis of Presentation
The accompanying combined financial statements include the U.S. Mutual Fund Business of ABN AMRO Asset Management Holdings, Inc. (AAAMHI) (the Business). The principal operations of the Business relate to investment advisory, administrative and distribution services provided to certain registered investment companies comprising ABN AMRO Funds (the Funds) and a small number of managed accounts of AAAMHI. The Business is included in the consolidated financial statements of AAAMHI, a wholly owned subsidiary of ABN AMRO Asset Management Holding N.V. (AAAMHNV), which is a wholly owned subsidiary of ABN AMRO Bank N.V. (ABN AMRO). Pursuant to an Asset Purchase Agreement (the Agreement), dated as of April 20, 2006, AAAMHI and its wholly owned subsidiaries and certain other affiliated entities (ABN AMRO Investment Fund Services, Inc., ABN AMRO Asset Management Inc. (AAAM), Montag & Caldwell, Inc. (Montag), TAMRO Capital Partners LLC (TAMRO), Veredus Asset Management LLC (Veredus), and River Road Asset Management, LLC (River Road)) agreed to sell the Business to Highbury Financial Inc. (Highbury) for an aggregate cash purchase price of $38.6 million. Upon completion of the sale transaction, certain members of the Business’ management and staff will join Highbury. Additionally, a newly formed subsidiary of Highbury, Aston Asset Management LLC, will become adviser to the Funds, which will be re-named the Aston Funds. AAAMHI and certain affiliates who are currently the advisers to the Funds will continue to provide advisory services to the Funds after completion of the sale but in a sub-advisory capacity. A senior officer of AAAMHI and two other individuals not involved in the Business have also agreed to join Highbury in connection with the acquisition of the Business.
The combined financial statements have been prepared from AAAMHI’s historical accounting records on a carve-out basis to include the historical financial position, results of operations, and cash flows applicable to the Business. The combined financial statements exclude all continuing operations of AAAMHI and its affiliated entities listed in the preceding paragraph that will be retained by the sellers. The combined financial statements have been prepared as if the Business had been a stand-alone operation, though they are not necessarily representative of results had the Business operated as a stand-alone operation, and it is not practicable to estimate what those expenses would have been on a stand-alone basis. Revenues, expenses, assets, and liabilities were derived from amounts associated with the Business in the AAAMHI financial records. The financial results include allocations based on methodologies management believes are reasonable of corporate expenses from AAAMHI and other U.S. affiliates and allocations of other corporate expenses from AAAMHI’s parent company that may be different from comparable expenses that would have been incurred if the Business operated as a stand-alone business. Specifically, ABN AMRO Services Company, Inc., a wholly-owned subsidiary of AANAHC (see note 7), provides the Business with certain IT, infrastructure and e-mail services. LaSalle Bank Corporation, also a wholly-owned subsidiary of AANAHC, provides the Business with payroll, benefits, general ledger maintenance, internal audit and accounts payable services. These services are charged based upon utilized quantities (typically number of employees, number of transactions processed, hours worked). AAAMHI provides the Business with executive management, finance, human resources and personal trade compliance services. These services are charged based upon employee count or management time incurred. AAAMHI’s parent and its parent companies provide other executive management, technology, sales support, finance, compliance and human resources support services. These services are charged out on a formula basis that considers Assets Under Management, number of employees and non-interest expense. The cost of these services is included under the caption “Related-party expense allocations” in the accompanying combined statements of operations. Certain cash receipts and cash payments related to the Business were handled through AAAMHI and affiliate cash accounts, which are not included in the carve-out financial statements. These amounts have been accounted for as net capital contributions to the Business and are reflected as “Net transfers from AAAMHI” in the combined statements of changes in owner’s equity and the combined statements of cash flows reflects these cash transactions.
F-6
Table of Contents
U.S. Mutual Fund Business of
ABN AMRO Asset Management Holdings, Inc.
Notes to Combined Financial Statements (continued)
Preparation of the combined financial statements in conformity with accounting principles generally accepted in the United States (GAAP) requires management to make estimates and assumptions that affect the reported financial statement amounts and accompanying notes. Management believes that the estimates utilized in preparing its financial statements are reasonable and prudent. Actual results could differ from those estimates.
2. Summary of Significant Accounting Policies
Principles of Combination
The accompanying combined statements of financial condition, operations, cash flows, and owner’s equity of the Business for the years ended December 31, 2005, 2004, and 2003 have been prepared on a carve-out basis (see Note 1).
Cash and Cash Equivalents
Cash and cash equivalents represent cash in banks and investments in money market mutual funds.
Goodwill and Intangible Assets
The Business has adopted the provisions of SFAS No. 142,Goodwill and Other Intangible Assets (FAS 142). Intangible assets, comprising the estimated value of investment management contracts, and goodwill, included in the combined financial statements of the Business relate to the acquisition of certain AAAMHI affiliates including the Business. These amounts reflect management’s best estimate of a reasonable allocation to the Business of such amounts included in the financial records of AAAMHI. The provisions of SFAS No. 142 require that goodwill and other intangible assets with indefinite lives no longer be amortized, but instead be tested at least annually for impairment and require reporting units to be identified for the purpose of assessing potential future impairments of goodwill. The Business’ acquired intangible management contract asset relate to the provision of investment advisory services to the Funds in exchange for fees that are based on a percentage of the average daily net assets of the funds. These management contracts were acquired in 2001 as part of the acquisition of certain AAAMHI affiliates. The management contracts are subject to annual renewal by the Funds’ board of trustees which is expected to continue indefinitely since this has been the experience for the Funds as well as for the mutual fund industry as a whole. Accordingly, the Business’ acquired intangible assets related to the Funds are considered to be of an indefinite life as there is no foreseeable limit on the contract period. The Business conducts its annual testing of goodwill and intangible assets for impairment annually in the fourth quarter unless events warrant more frequent testing.
Revenue Recognition
The Business derives its revenues from investment advisory and administrative services provided to the Funds and a limited number of managed accounts of AAAMHI. Based on the terms of the advisory and administrative agreements in place that set out fees to be earned as a stated percentage of assets under management, advisory and administrative fees are recognized in revenue in the period such services are performed unless facts and circumstances would indicate that collectibility of the fees are not reasonably assured. Expense reimbursements to certain of the Funds in accordance with agreements are reported as an offset to investment advisory fees. Such reimbursements totaled $2,106,263, $2,126,553, and $2,337,713 in 2005, 2004, and 2003, respectively.
F-7
Table of Contents
U.S. Mutual Fund Business of
ABN AMRO Asset Management Holdings, Inc.
Notes to Combined Financial Statements (continued)
Distribution and Advisory Costs
Included in distribution and advisory costs in the accompanying financial statements are fees paid to AAAMHI and its affiliates and other nonaffiliated entities pursuant to contracts related to the management and distribution of the Funds and managed account assets. Such costs are recorded in the period incurred.
The Funds pay five affiliates of AAAMHI (Montag, AAAM, TAMRO, Veredus and River Road) investment advisory fees pursuant to management contracts with these entities under which the affiliates provide investment advisory services to the Funds. AAAM also pays two third-party investment management firms, MFS Institutional Advisors, Inc. and Optimum Investment Advisors, LLC, investment sub-advisory fees pursuant to management contracts with these entities under which these independent firms provide investment sub-advisory services to two of the Funds. The Business, generally through ABN AMRO Distribution Services (USA) Inc. (the Distributor), has entered into nearly 400 selling/service agreements through which independent third parties sell the Business’ Funds and/or provide other services to their clients in exchange for certain payments. Unless paid by the Distributor pursuant to the Funds’ Rule 12b-1 Plan, these payments, as well as certain sales and marketing costs, are included within distribution and advisory costs.
Income Taxes
The Business is a component of AAAMHI and as such was a component of the consolidated income tax return of AAAMHI or an affiliate of AAAMHI for the years presented in these financial statements. However, for the purpose of the preparation of these financial statements, the Business is considered a stand-alone entity, and any required provision for federal and state income taxes has been determined accordingly. The provision for federal and state income taxes is comprised of two components, current and deferred income taxes. Deferred tax assets and liabilities are determined based on temporary differences between the financial and tax reporting bases of assets and liabilities and are measured using currently enacted rates and laws. Deferred tax assets are recognized subject to management’s judgment that realization is more likely than not.
Fair Value of Financial Instruments
The carrying value of financial assets and liabilities included in the accompanying combined statements of financial condition approximate fair values due to their short-term nature.
3. Goodwill and Intangible Assets
Goodwill and intangible assets at December 31, 2005 and 2004, included in the accompanying combined statements of financial condition are shown net of accumulated amortization of $1,553,200 and $2,113,467 recorded prior to 2002 and the adoption of FAS 142. Impairment charges of approximately $10.4 million of intangible assets and $13.3 million of goodwill were recorded by the Business in 2005 in accordance with FAS 142.
The facts and circumstances leading to the impairment charges to goodwill and intangible assets relate to management’s assessment of declines in net assets in the Funds resulting from net share redemptions and unfavorable investment performance trends. The fair value of the Business used to determine the impairment of goodwill was determined with reference to the expected proceeds to be received upon the sale of the Business. The fair value of the intangible asset related to the investment management contracts used to determine the amount of impairment of the intangible asset, was determined based on a discounted cash flow analysis of the acquired contracts. No impairment of goodwill or intangibles was determined to be required for periods prior to 2005.
F-8
Table of Contents
U.S. Mutual Fund Business of
ABN AMRO Asset Management Holdings, Inc.
Notes to Combined Financial Statements (continued)
4. Distribution and Advisory Costs
Distribution and advisory costs in the accompanying combined statement of operations consist of the following:
| Years Ended December 31 | |||||||||
| 2005 | 2004 | 2003 | |||||||
Advisory costs: | |||||||||
AAAMHI affiliates | $ | 28,666,296 | $ | 29,602,273 | $ | 24,955,320 | |||
Third party sub-advisers | 2,541,836 | 1,819,916 | 1,312,058 | ||||||
Total advisory costs | 31,208,132 | 31,422,189 | 26,267,378 | ||||||
Distribution costs: | |||||||||
AAAMHI affiliates | 647,479 | 4,823,887 | 4,682,384 | ||||||
Nonaffiliates | 8,550,141 | 4,672,541 | 2,581,307 | ||||||
Total distribution costs | 9,197,620 | 9,496,428 | 7,263,691 | ||||||
Total distribution and advisory costs | $ | 40,405,752 | $ | 40,918,617 | $ | 33,531,069 | |||
5. Income Taxes
A reconciliation of the differences between the total income tax provision (benefit) and the amounts computed at the statutory federal tax rate of 35% for the years ended December 31, 2005, 2004, and 2003 is as follows:
| Years Ended December 31 | ||||||||||||
| 2005 | 2004 | 2003 | ||||||||||
Income tax provision (benefit) at statutory federal income tax rate | $ | (8,269,608 | ) | $ | 540,808 | $ | 217,033 | |||||
Increase (decrease) in taxes resulting from: | ||||||||||||
State income taxes, net of federal benefit | (1,181,372 | ) | 77,258 | 31,005 | ||||||||
Valuation allowance adjustment | 9,450,980 | (618,066 | ) | (248,038 | ) | |||||||
Provision for income taxes | $ | — | $ | — | $ | — | ||||||
The current and deferred portion of the total provision for income taxes above was $0 for each of the respective years.
The components of the net deferred tax balances as of December 31, 2005 and 2004, are as follows:
| 2005 | 2004 | |||||||
Deferred tax assets: | ||||||||
Net operating loss carryforwards | $ | 6,560,728 | $ | 5,020,085 | ||||
Goodwill and intangibles | 3,107,833 | — | ||||||
Other | 36,654 | 34,150 | ||||||
Less valuation allowance | (9,705,215 | ) | (254,235 | ) | ||||
Deferred tax asset, net of valuation allowance | — | 4,800,000 | ||||||
Deferred tax liabilities: | ||||||||
Goodwill and intangibles | — | 4,800,000 | ||||||
Net deferred taxes | $ | — | $ | — | ||||
F-9
Table of Contents
U.S. Mutual Fund Business of
ABN AMRO Asset Management Holdings, Inc.
Notes to Combined Financial Statements (continued)
The need for a valuation allowance to reduce federal and state deferred tax assets and net operating losses has been determined as if the Business was a stand-alone entity. As such, management believes it is more likely than not that these items will not be realized.
6. Benefit Plans
Pension Plans
ABN AMRO Bank sponsors a noncontributory, defined-benefit pension plan covering substantially all U.S. salaried employees. Assets held by the plan consist primarily of shares of registered investment companies and pooled trust funds. The allocated expense of the Business totaled $158,252, $184,799, and $125,552 for the years ended December 31, 2005, 2004, and 2003, respectively.
Profit-Sharing and Savings Plan
ABN AMRO Bank sponsors a profit-sharing and savings plan under Section 401(k) of the Internal Revenue Code, covering substantially all U.S. salaried employees. Under the plan, employee contributions are partially matched by the respective ABN AMRO Bank subsidiary. In addition, the respective ABN AMRO Bank subsidiary may allocate a portion of its net profits to employees’ accounts in the plan. The allocated expense of the Business totaled $135,344, $186,598, and $221,785 for the years ended December 31, 2005, 2004, and 2003, respectively.
Group Welfare Plan
ABN AMRO Bank provides welfare and life insurance benefits to substantially all U.S. salaried employees and their dependents. The amount charged to expense includes welfare benefits paid to participants, net of participant contributions, and administrative costs. Life insurance premiums paid to insurance companies are recognized as an expense when paid. The allocated expense of the Business totaled $201,441, $233,458, and $207,356 for the years ended December 31, 2005, 2004, and 2003.
7. Related-Party Transactions
ABN AMRO is a Dutch bank with operations around the world. With respect to its asset management business in the United States, ABN AMRO has two primary wholly-owned subsidiaries, ABN AMRO North America Holding Company (AANAHC) and AAAMHNV. AAAMHNV owns 100% of AAAMHI, and the assets of the Business are owned in their entirety by AAAMHI. In the ordinary course of business, the Business utilizes investment advisory services provided by several affiliated entities. Five subsidiaries of AAAMHI, including Montag (100% owned), AAAM (100% owned), TAMRO (100% owned), Veredus (50% owned) and River Road (45% owned), currently serve as investment advisors to the Funds. The Funds pay the investment advisors an advisory fee, net of any fee waivers and expense reimbursements, and the advisors pay the Business a fixed percentage of the net advisory fees for administrative and distribution services. The payments made to affiliated entities, which provide advisory and distribution services to certain mutual funds and separate account assets of AAAMHI are included under the caption “Distribution and advisory costs” in the accompanying combined statements of operations (See Note 4).
The Business also utilizes operational and support services provided by several affiliated entities. ABN AMRO Services Company, Inc., a wholly-owned subsidiary of AANAHC, provides the Business with certain IT,
F-10
Table of Contents
U.S. Mutual Fund Business of
ABN AMRO Asset Management Holdings, Inc.
Notes to Combined Financial Statements (continued)
infrastructure and e-mail services. LaSalle Bank Corporation, also a wholly-owned subsidiary of AANAHC, provides the Business with payroll, benefits, general ledger maintenance, internal audit and accounts payable services. AAAMHI provides the Business with executive management, finance, human resources and personal trade compliance services. The cost of these services is included under the caption “Related-party expense allocations” in the accompanying combined statements of operations. Payables to affiliates related to distribution, advisory or other services provided to the Business are included in “Accounts payable—affiliates” in the accompanying combined statements of financial condition.
F-11
Table of Contents
COMBINED FINANCIAL STATEMENTS – UNAUDITED
U.S. Mutual Fund Business of ABN AMRO Asset Management Holdings, Inc.
Nine Months Ended September 30, 2006 and 2005
U.S. Mutual Fund Business of
ABN AMRO Asset Management Holdings, Inc.
Combined Financial Statements
(Unaudited)
Nine Months Ended September 30, 2006 and 2005
Combined Financial Statements (Unaudited)
F-12
Table of Contents
U.S. Mutual Fund Business of
ABN AMRO Asset Management Holdings, Inc.
Combined Statements of Financial Condition
| September 30 2006 | December 31 2005 | |||||
| (Unaudited) | ||||||
Assets | ||||||
| Cash and cash equivalents | $ | 7,218,817 | $ | 5,239,747 | ||
| Advisory and administrative fees receivable | 3,284,200 | 4,074,486 | ||||
| Goodwill | 10,518,750 | 10,518,750 | ||||
| Other intangible assets | 22,045,000 | 22,045,000 | ||||
| Other assets | 1,635 | 1,635 | ||||
| Total assets | $ | 43,068,402 | 41,879,618 | |||
Liabilities and owner’s equity | ||||||
| Accounts payable – affiliates | $ | 1,459,012 | 2,266,559 | |||
| Accrued compensation and benefits | 288,511 | 648,625 | ||||
| Other accrued liabilities | 875,143 | 954,318 | ||||
| Total liabilities | 2,622,666 | 3,869,502 | ||||
| Owner’s equity | 40,445,736 | 38,010,116 | ||||
| Total liabilities and owner’s equity | $ | 43,068,402 | $ | 41,879,618 | ||
See accompanying notes.
F-13
Table of Contents
U.S. Mutual Fund Business of
ABN AMRO Asset Management Holdings, Inc.
Combined Statements of Operations
(Unaudited)
Nine Months Ended September 30, 2006 and 2005
| 2006 | 2005 | ||||||
Revenues | |||||||
Advisory fees, net | $ | 30,594,808 | $ | 35,753,511 | |||
Administration fees | 1,035,174 | 1,143,016 | |||||
Total revenues | 31,629,982 | 36,896,527 | |||||
Operating expenses | |||||||
Distribution and advisory costs: | |||||||
Affiliates | 17,462,705 | 22,315,324 | |||||
Other | 5,645,490 | 8,598,644 | |||||
Total distribution and advisory costs | 23,108,195 | 30,913,968 | |||||
Compensation and related expenses | 3,248,940 | 3,830,626 | |||||
Related party expense allocations | 1,910,933 | 1,870,326 | |||||
Other operating expenses | 851,427 | 549,768 | |||||
Total operating expenses | 29,119,495 | 37,164,688 | |||||
Operating income (loss) | 2,510,487 | (268,161 | ) | ||||
Interest income | 242,878 | 83,893 | |||||
Net income (loss) before taxes | 2,753,365 | (184,268 | ) | ||||
Income tax provision | — | — | |||||
Net income (loss) | $ | 2,753,365 | $ | (184,268 | ) | ||
See accompanying notes.
F-14
Table of Contents
U.S. Mutual Fund Business of
ABN AMRO Asset Management Holdings, Inc.
Combined Statements of Changes in Owner’s Equity
(Unaudited)
Nine Months Ended September 30, 2006 and 2005
Owner’s equity at January 1, 2005 | $ | 59,421,138 | ||
Net loss | (184,268 | ) | ||
Net transfers from AAAMHI | 678,715 | |||
Owner’s equity at September 30, 2005 | $ | 59,915,585 | ||
Owner’s equity at January 1, 2006 | $ | 38,010,116 | ||
Net income | 2,753,365 | |||
Net transfers to AAAMHI | (317,745 | ) | ||
Owner’s equity at September 30, 2006 | $ | 40,445,736 | ||
See accompanying notes.
F-15
Table of Contents
U.S. Mutual Fund Business of
ABN AMRO Asset Management Holdings, Inc.
Combined Statements of Cash Flows
(Unaudited)
Nine Months Ended September 30, 2006 and 2005
| 2006 | 2005 | |||||||
| Operating activities | ||||||||
| Net income (loss) | $ | 2,753,365 | $ | (184,268 | ) | |||
| Adjustments to reconcile net income (loss) to net cash flow provided by operating activities: | ||||||||
Changes in assets and liabilities: | ||||||||
(Increase) decrease in advisory and administrative fees receivable | 790,286 | 90,768 | ||||||
(Increase) decrease in other assets | — | 1,524 | ||||||
Increase (decrease) in accounts payable – affiliates | (807,547 | ) | (779,311 | ) | ||||
Increase (decrease) in accrued compensations and benefits | (360,114 | ) | 389,417 | |||||
Increase (decrease) in other accrued liabilities | (79,175 | ) | 552,328 | |||||
| Net cash flow provided by operating activities | 2,296,815 | 70,458 | ||||||
| Financing activities | ||||||||
| Transfers (to) from AAAMHI, net | (317,745 | ) | 678,715 | |||||
| Net cash provided by (used in) financing activities | (317,745 | ) | 678,715 | |||||
| Net increase in cash and cash equivalents | 1,979,070 | 749,173 | ||||||
| Cash and cash equivalents at beginning of period | 5,239,747 | 3,158,266 | ||||||
| Cash and cash equivalents at end of period | $ | 7,218,817 | $ | 3,907,439 | ||||
See accompanying notes.
F-16
Table of Contents
U.S. Mutual Fund Business of ABNAMRO Asset Management Holdings, Inc.
Notes to Combined Financial Statements (Unaudited)
1. Basis of Presentation
The accompanying combined financial statements include the U.S. Mutual Fund Business of ABN AMRO Asset Management Holdings, Inc. (AAAMHI) (the Business). The principal operations of the Business relate to investment advisory, administrative and distribution services provided to certain registered investment companies comprising ABN AMRO Funds (the Funds) and a small number of managed accounts of AAAMHI. The Business is included in the consolidated financial statements of AAAMHI, a wholly owned subsidiary of ABN AMRO Asset Management Holding N.V. (AAAMHNV), which is a wholly owned subsidiary of ABN AMRO Bank N.V. (ABN AMRO). Pursuant to an asset purchase agreement (the Agreement), dated as of April 20, 2006, AAAMHI and its wholly-owned subsidiaries and certain other affiliated entities (ABN AMRO Investment Fund Services, Inc., ABN AMRO Asset Management, Inc. (AAAM), Montag & Caldwell, Inc. (Montag), TAMRO Capital Partners LLC (TAMRO), Veredus Asset Management LLC (Veredus) and River Road Asset Management, LLC (River Road)) agreed to sell the Business to Highbury Financial Inc. (Highbury) for an aggregate cash purchase price of $38.6 million. Upon completion of the sale transaction, certain members of the Business’ management and staff will join Highbury. Additionally, a newly formed subsidiary of Highbury, Aston Asset Management LLC, will become adviser to the Funds, which will be re-named the Aston Funds. AAAMHI and certain affiliates who are currently the advisers to the Funds will continue to provide advisory services to the Funds after completion of the sale but in a sub-advisory capacity. A senior officer of AAAMHI and three other individuals not involved in the Business have also agreed to join Highbury in connection with the Acquisition of the Business.
The combined financial statements have been prepared from AAAMHI’s historical accounting records on a carve-out basis to include the historical financial position, results of operations, and cash flows applicable to the Business. The combined financial statements exclude all continuing operations of AAAMHI and its affiliated entities listed in the preceding paragraph that will be retained by the sellers. The combined financial statements have been prepared as if the Business had been a stand-alone operation, though they are not necessarily representative of results had the Business operated as a stand-alone operation, and it is not practicable to estimate what those expenses would have been on a stand-alone basis. Revenues, expenses, assets, and liabilities were derived from amounts associated with the Business in the AAAMHI financial records. The financial results include allocations based on methodologies that management believes are reasonable of corporate expenses from AAAMHI and allocations of other corporate expenses from AAAMHI’s parent company that may be different from comparable expenses that would have been incurred if the Business operated as a stand-alone business. Specifically, ABN AMRO Services Company, Inc., a wholly-owned subsidiary of AANAHC (see Note 7), provides the Business with certain IT, infrastructure and e-mail services. LaSalle Bank Corporation, also a wholly-owned subsidiary of AANAHC, provides the Business with payroll, benefits, general ledger maintenance, internal audit and accounts payable services. These services are charged based upon utilized quantities (typically number of employees, number of transactions processed, hours worked). AAAMHI provides the Business with executive management, finance, human resources and personal trade compliance services. These services are charged based upon employee count or management time incurred. AAAMHI’s parent and its parent companies provide other executive management, technology, sales support, finance, compliance and human resources support services. These services are charged out on a formula basis that considers Assets Under Management, number of employees and non-interest expense. The cost of these services is included under the caption “Related-party expense allocations” in the accompanying combined statements of operations. Certain cash receipts and cash payments related to the Business were handled through AAAMHI and affiliate cash accounts, which are not included in the carve-out financial statements. These amounts have been accounted for as net capital contributions or distributions to or from the Business and are reflected as “Net transfers (to) from AAAMHI” in the combined statements of changes in owner’s equity and the combined statements of cash flows reflects these cash transactions.
Preparation of the combined financial statements in conformity with accounting principles generally accepted in the United States (GAAP) requires management to make estimates and assumptions that affect the reported financial statement amounts and accompanying notes. Management believes that the estimates utilized in preparing its financial statements are reasonable and prudent. Actual results could differ from those estimates.
F-17
Table of Contents
U.S. Mutual Fund Business of ABNAMRO Asset Management Holdings, Inc.
Notes to Combined Financial Statements (Unaudited)
2. Summary of Significant Accounting Policies
Principles of Combination
The accompanying combined statements of financial condition, operations, cash flows and owner’s equity of the Business for the nine months ended September 30, 2006 and 2005 have been prepared on a carve-out basis (see Note 1).
Cash and Cash Equivalents
Cash and cash equivalents represent cash in banks and investments in money market mutual funds.
Goodwill and Intangible Assets
The Business has adopted the provisions of SFAS No. 142, “Goodwill and Other Intangible Assets” (FAS 142). Intangible assets, comprising the estimated value of investment management contracts, and goodwill, included in the combined financial statements of the Business relate to the acquisition of certain AAAMHI affiliates including the Business. These amounts reflect management’s best estimate of a reasonable allocation to the Business of such amounts included in the financial records of AAAMHI. The provisions of SFAS No. 142 require that goodwill and other intangible assets with indefinite lives no longer be amortized, but instead be tested at least annually for impairment and require reporting units to be identified for the purpose of assessing potential future impairments of goodwill. The Business’ acquired intangible management contract asset relate to the provision of investment advisory services to the Funds in exchange for fees that are based on a percentage of the average daily net assets of the funds. These management contracts were acquired in 2001 as part of the acquisition of certain AAAMHI affiliates. The management contracts are subject to annual renewal by the Funds’ board of trustees which is expected to continue indefinitely since this has been the experience for the Funds as well as for the mutual fund industry as a whole. Accordingly, the Business’ acquired intangible assets related to the Funds are considered to be of an indefinite life as there is no foreseeable limit on the contract period. The Business conducts its annual testing of goodwill and intangible assets for impairment annually in the fourth quarter, unless events warrant more frequent testing.
Revenue Recognition
The Business derives its revenues from investment advisory and administrative services provided to the Funds and a limited number of managed accounts of AAAMHI. Based on the terms of the advisory and administrative agreements in place that set out fees to be earned as a stated percentage of assets under management, advisory and administrative fees are recognized in revenue in the period such services are performed unless facts and circumstances would indicate that collectibility of the fees are not reasonably assured. Expense reimbursements to certain of the Funds in accordance with agreements are reported as an offset to investment advisory fees. Such reimbursements totaled $1,733,234 and $1,558,315 for the nine months ended September 30, 2006 and September 30, 2005, respectively.
Distribution and Advisory Costs
Included in distribution and advisory costs in the accompanying financial statements are fees paid to AAAMHI and its affiliates and other non-affiliated entities pursuant to contracts related to the management and distribution of the Funds and managed account assets. Such costs are recorded in the period incurred.
The Funds pay five affiliates of AAAMHI (Montag, AAAM, TAMRO, Veredus and River Road) investment advisory fees pursuant to management contracts with these entities under which the affiliates provide investment advisory services to the Funds. AAAM also pays two third-party investment management firms, MFS Institutional Advisors, Inc. and Optimum Investment Advisors, LLC, investment sub-advisory fees pursuant to management contracts with these entities under which these independent firms provide investment sub-advisory services to two of the Funds. The Business, generally through ABN AMRO Distribution Services (USA) Inc. (the Distributor), has entered into nearly 400 selling/service agreements through which independent third parties sell the Business’ Funds and/or provide other services to their clients in exchange for certain payments. Unless paid by the Distributor pursuant to the
F-18
Table of Contents
U.S. Mutual Fund Business of ABNAMRO Asset Management Holdings, Inc.
Notes to Combined Financial Statements (Unaudited)
Funds’ Rule 12b-1 Plan, these payments, as well as certain sales and marketing costs, are included within distribution and advisory costs.
Income Taxes
The Business is a component of AAAMHI, and as such was a component of the consolidated income tax return of AAAMHI, or an affiliate of AAAMHI, for the periods presented in these financial statements. However, for the purpose of the preparation of these financial statements, the Business is considered a stand-alone entity and any required provision for federal and state income taxes has been determined accordingly. The provision for federal and state income taxes is comprised of two components, current and deferred income taxes. Deferred tax assets and liabilities are determined based on temporary differences between the financial and tax reporting bases of assets and liabilities and are measured using currently enacted rates and laws. Deferred tax assets are recognized subject to management’s judgment that realization is more likely than not.
Fair Value of Financial Instruments
The carrying value of financial assets and liabilities included in the accompanying combined statements of financial condition approximate fair values due to their short-term nature.
3. Goodwill and Intangible Assets
Goodwill and intangible assets at September 30, 2006 and December 31, 2005 included in the accompanying combined statements of financial condition are shown net of accumulated amortization of $1,553,200 and $2,113,467 recorded prior to 2002 and the adoption of FAS 142. Impairment charges of approximately $10.4 million of intangible assets and $13.3 million of goodwill were recorded by the Business in 2005 in accordance with FAS 142.
The facts and circumstances leading to the impairment charges to goodwill and intangible assets relate to management’s assessment of declines in net assets in the Funds resulting from net share redemptions and unfavorable investment performance trends. The fair value of the Business used to determine the impairment of goodwill was determined with reference to the expected proceeds to be received upon the sale of the Business. The fair value of the intangible asset related to the investment management contracts used to determine the amount of impairment of the intangible asset, was determined based on a discounted cash flow analysis of the acquired contracts. No impairment of goodwill or intangibles was determined to be required for periods prior to 2005.
4. Distribution and Advisory Costs
Distribution and advisory costs in the accompanying combined statement of operations consist of the following:
| Nine Months Ended September 30 | ||||
| 2006 | 2005 | |||
| Advisory costs: | ||||
AAAMHI affiliates | 16,993,344 | 21,829,187 | ||
Third party sub-advisers | 2,115,662 | 1,865,924 | ||
| Total advisory costs | 19,109,006 | 23,695,111 | ||
| Distribution costs: | ||||
AAAMHI affiliates | 515,572 | 486,137 | ||
Non-affiliates | 3,483,617 | 6,732,720 | ||
| Total distribution costs | 3,999,190 | 7,218,857 | ||
| Total distribution and advisory costs | 23,108,195 | 30,913,968 | ||
F-19
Table of Contents
U.S. Mutual Fund Business of ABNAMRO Asset Management Holdings, Inc.
Notes to Combined Financial Statements (Unaudited)
5. Income Taxes
A reconciliation of the differences between the total income tax provision (benefit) and the amounts computed at the statutory federal tax rate of 35% for the nine month periods ended September 30, 2006 and 2005, is as follows:
| 2006 | 2005 | |||||||
| Income tax provision (benefit) at statutory federal income tax rate | $ | 963,678 | $ | (64,494 | ) | |||
| Increase (decrease) in taxes resulting from: | ||||||||
| State income taxes, net of federal benefit | 137,668 | (9,213 | ) | |||||
| Valuation allowance adjustment | (1,101,346 | ) | 73,707 | |||||
| Provision for income taxes | $ | — | $ | — | ||||
The current and deferred portion of the total provision for income taxes was $0 for each of the respective periods.
The components of the net deferred tax balances as of September 30, 2006 and December 31, 2005, are as follows:
| September 30 2006 | December 31 2005 | |||||||
| Deferred tax assets: | ||||||||
| Net operating loss carryforwards | $ | 6,696,036 | $ | 6,560,728 | ||||
| Goodwill and intangibles | 1,907,833 | 3,107,833 | ||||||
| Other | — | 36,654 | ||||||
| Less valuation allowance | (8,603,869 | ) | (9,705,215 | ) | ||||
| Net deferred taxes | $ | — | $ | — | ||||
The need for a valuation allowance to reduce federal and state deferred tax assets and net operating losses has been determined as if the Business was a stand-alone entity. As such, management believes it is more likely than not that these items will not be realized.
6. Benefit Plans
Pension Plans
ABN AMRO Bank sponsors a non-contributory defined benefit pension plan covering substantially all U.S. salaried employees. Assets held by the plan consist primarily of shares of registered investment companies and pooled trust funds. The allocated expense of the Business totaled $61,365 and $158,227 for the nine months ended September 30, 2006 and 2005, respectively.
Profit Sharing and Savings Plan
ABN AMRO Bank sponsors a profit sharing and savings plan under Section 401(k) of the Internal Revenue Code, covering substantially all U.S. salaried employees. Under the plan, employee contributions are partially matched by the respective ABN AMRO Bank subsidiary. In addition, the respective ABN AMRO Bank subsidiary may allocate a portion of its net profits to employees’ accounts in the plan. The allocated expense of the Business totaled $97,035 and $106,962 for the nine months ended September 30, 2006 and 2005, respectively.
Group Welfare Plan
ABN AMRO Bank provides welfare and life insurance benefits to substantially all U.S. salaried employees and their dependents. The amount charged to expense includes welfare benefits paid to participants, net of participant contributions, and administrative costs. Life insurance premiums paid to insurance companies are recognized as an expense when paid. The allocated expense of the Business totaled $142,358 and $183,093 for the nine months ended September 30, 2006 and 2005, respectively.
F-20
Table of Contents
U.S. Mutual Fund Business of ABNAMRO Asset Management Holdings, Inc.
Notes to Combined Financial Statements (Unaudited)
7. Related Party Transactions
ABN AMRO is a Dutch bank with operations around the world. With respect to its asset management business in the United States, ABN AMRO has two primary wholly-owned subsidiaries, ABN AMRO North America Holding Company (AANAHC) and AAAMHNV. AAAMHNV owns 100% of AAAMHI, and the assets of the Business are owned in their entirety by AAAMHI.
In the ordinary course of business, the Business utilizes investment advisory services provided by several affiliated entities. Five subsidiaries of AAAMHI, including Montag (100% owned), AAAM (100% owned), TAMRO (100% owned), Veredus (50% owned) and River Road (45% owned), currently serve as investment advisors to the Funds. The Funds pay the investment advisors an advisory fee, net of any fee waivers and expense reimbursements, and the advisors pay the Business a fixed percentage of the net advisory fees for administrative and distribution services. The payments made to affiliated entities, which provide advisory and distribution services to certain mutual funds and separate account assets of AAAMHI are included under the caption “Distribution and advisory costs” in the accompanying combined statements of operations (See Note 4).
The Business also utilizes operational and support services provided by several affiliated entities. ABN AMRO Services Company, Inc., a wholly-owned subsidiary of AANAHC, provides the Business with certain IT, infrastructure and e-mail services. LaSalle Bank Corporation, also a wholly-owned subsidiary of AANAHC, provides the Business with payroll, benefits, general ledger maintenance, internal audit and accounts payable services. AAAMHI provides the Business with executive management, finance, human resources and personal trade compliance services. The cost of these services is included under the caption “Related-party expense allocations” in the accompanying combined statements of operations. Payables to affiliates related to distribution, advisory or other services provided to the Business are included in “Accounts payable – affiliates” in the accompanying combined statements of financial condition.
F-21
Table of Contents
Report of Independent Registered Public Accounting Firm
To the Board of Directors
Highbury Financial Inc.
We have audited the accompanying balance sheet of Highbury Financial Inc. (a company in the development stage) as of January 31, 2006 and December 31, 2005, and the related statements of operations, stockholders’ equity and cash flows for the periods from July 13, 2005 (inception) to January 31, 2006, January 1, 2006 to January 31, 2006 and July 13, 2005 (inception) to December 31, 2005. These financial statements are the responsibility of the Company’s management. Our responsibility is to express an opinion on these financial statements based on our audit.
We conducted our audits in accordance with the standards of the Public Company Accounting Oversight Board (United States). Those standards require that we plan and perform the audit to obtain reasonable assurance about whether the financial statements are free of material misstatement. An audit includes examining, on a test basis, evidence supporting the amounts and disclosures in the financial statements. An audit also includes assessing the accounting principles used and significant estimates made by management, as well as evaluating the overall financial statement presentation. We believe that our audits provide a reasonable basis for our opinion.
In our opinion, the financial statements referred to above present fairly, in all material respects, the financial position of Highbury Financial Inc. as of January 31, 2006 and December 31, 2005, and the results of its operations and its cash flows for the periods from July 13, 2005 (inception) to January 31, 2006, January 1, 2006 to January 31, 2006 and July 13, 2005 (inception) to December 31, 2005, in conformity with United States generally accepted accounting principles.
As discussed in Note 2, the accompanying balance sheet at January 31, 2006 and statements of stockholders’ equity for the periods then ended have been restated to reflect the warrants and the unit purchase option issued in connection with Highbury’s initial public offering and the warrants issued in the private placement immediately preceding the initial public offering as equity.
/s/ Goldstein Golub Kessler LLP
GOLDSTEIN GOLUB KESSLER LLP
New York, New York
January 31, 2006, except for Note 2, as to which the date is December 18, 2006
F-22
Table of Contents
Highbury Financial Inc.
(a company in the development stage)
Balance Sheets
Restated January 31, 2006 | December 31, 2005 | |||||||
Current assets | ||||||||
Cash | $ | 1,300,109 | $ | 36,902 | ||||
Cash in Trust Fund (Note 1) | 37,542,667 | — | ||||||
Prepaid expenses | 148,869 | — | ||||||
Total current assets | 38,991,645 | 36,902 | ||||||
Deferred registration costs | — | 483,492 | ||||||
Total assets | $ | 38,991,645 | $ | 520,394 | ||||
Current liabilities | ||||||||
Accounts payable and accrued expenses | $ | 261,637 | $ | 427,846 | ||||
Notes payable, stockholders (Note 3) | — | 70,000 | ||||||
Deferred underwriting fees | 673,333 | — | ||||||
Total current liabilities | 934,970 | 497,846 | ||||||
Common stock, subject to possible conversion, 1,346,666 shares at conversion value (Note 1) | 7,508,530 | — | ||||||
Stockholders’ equity (Notes 1, 2, 4, 5, 6, 7) | ||||||||
Preferred stock, $.0001 par value, authorized 1,000,000 shares; none issued | — | — | ||||||
Common stock, $.0001 par value, authorized 50,000,000 shares; issued and outstanding 8,625,000 shares (which includes 1,346,666 subject to possible conversion) and 1,725,000, respectively | 863 | 173 | ||||||
Additional paid-in capital | 30,552,667 | 24,827 | ||||||
Deficit accumulated during the development stage | (5,385 | ) | (2,452 | ) | ||||
Total stockholders’ equity | 30,548,145 | 22,548 | ||||||
Total liabilities and stockholders’ equity | $ | 38,991,645 | $ | 520,394 | ||||
See notes to financial statements
F-23
Table of Contents
Highbury Financial Inc.
(a company in the development stage)
Statements of Operations
| Period from July 13, 2005 (inception) to January 31, 2006 | Period from January 1, 2006 to January 31, 2006 | Period from July 13, 2005 (inception) to December 31, 2005 | ||||||||||
Expenses | ||||||||||||
Formation costs | $ | (456 | ) | $ | — | $ | (456 | ) | ||||
Franchise taxes | (1,996 | ) | — | (1,996 | ) | |||||||
D&O insurance | (1,481 | ) | (1,481 | ) | — | |||||||
Administrative fees | (1,452 | ) | (1,452 | ) | — | |||||||
Net loss for the period | $ | (5,385 | ) | $ | (2,933 | ) | $ | (2,452 | ) | |||
Weighted average shares outstanding, basic and diluted | 1,928,941 | 3,060,484 | 1,725,000 | |||||||||
Net loss per share, basic and diluted | $ | (0.00 | ) | $ | (0.00 | ) | $ | (0.00 | ) | |||
See notes to financial statements
F-24
Table of Contents
Highbury Financial Inc.
(a company in the development stage)
Statements of Stockholders’ Equity
(as restated)
Common Stock | Additional Capital | Deficit Development | Total | ||||||||||||||
| Shares | Amount | ||||||||||||||||
Sale of 1,725,000 shares of common stock to initial stockholders on August 1, 2005 at $0.0145 per share (Note 7) | 1,725,000 | $ | 173 | $ | 24,827 | $ | — | $ | 25,000 | ||||||||
Net loss for the period | (2,452 | ) | (2,452 | ) | |||||||||||||
Balance at December 31, 2005 | 1,725,000 | $ | 173 | $ | 24,827 | $ | (2,452 | ) | $ | 22,548 | |||||||
Sale of 166,667 units in a private placement | 166,667 | 17 | 999,985 | — | 1,000,002 | ||||||||||||
Sale of 6,733,333 units, net of underwriters’ discount and offering expenses (includes 1,346,666 shares subject to possible conversion) | 6,733,333 | 673 | 37,036,285 | — | 37,036,958 | ||||||||||||
Proceeds subject to possible conversion of 1,346,666 shares | — | — | (7,508,530 | ) | — | (7,508,530 | ) | ||||||||||
Proceeds from issuance of option | — | — | 100 | — | 100 | ||||||||||||
Net loss for the period | — | — | — | (2,933 | ) | (2,933 | ) | ||||||||||
Balance at January 31, 2006 | 8,625,000 | $ | 863 | $ | 30,552,667 | $ | (5,385 | ) | $ | 30,548,145 | |||||||
See notes to financial statements
F-25
Table of Contents
Highbury Financial Inc.
(a company in the development stage)
Statements of Cash Flows
| Period from July 13, 2005 (inception) to January 31, 2006 | Period from January 1, 2006 to January 31, 2006 | Period from July 13, 2005 (inception) to December 31, 2005 | ||||||||||
Cash flows from operating activities | ||||||||||||
Net loss for the period | $ | (5,385 | ) | $ | (2,933 | ) | $ | (2,452 | ) | |||
Increase in prepaid expenses | (12,600 | ) | (12,600 | ) | — | |||||||
Increase in accrued expenses | 5,385 | 2,933 | 2,452 | |||||||||
Net cash used in operating activities | (12,600 | ) | (12,600 | ) | — | |||||||
Cash flows from investing activities | ||||||||||||
Cash held in trust fund | (37,542,667 | ) | (37,542,667 | ) | — | |||||||
Net cash used in investing activities | (37,542,667 | ) | (37,542,667 | ) | — | |||||||
Cash flows from financing activities | ||||||||||||
Proceeds from sale of shares of common stock | 41,425,000 | 41,400,000 | 25,000 | |||||||||
Proceeds from issuance of option | 100 | 100 | — | |||||||||
Proceeds from notes payable, stockholders | 70,000 | — | 70,000 | |||||||||
Payments of notes payable, stockholders | (70,000 | ) | (70,000 | ) | — | |||||||
Payment of costs of public offering | (2,569,724 | ) | (2,511,626 | ) | (58,098 | ) | ||||||
Net cash from financing activities | 38,855,375 | 38,818,474 | 36,902 | |||||||||
Net increase in cash | 1,300,109 | 1,263,207 | 36,902 | |||||||||
Cash at beginning of period | — | 36,902 | — | |||||||||
Cash at end of period | $ | 1,300,109 | $ | 1,300,109 | $ | 36,902 | ||||||
Supplemental schedule of non-cash financing activities: | ||||||||||||
Accrual of costs of public offering | $ | 119,983 | $ | 46,707 | $ | 425,394 | ||||||
Accrual of deferred underwriting fees | $ | 673,333 | $ | 673,333 | $ | — | ||||||
See notes to financial statements
F-26
Table of Contents
Highbury Financial Inc.
(a company in the development stage)
Notes to Financial Statements
1. Summary of Significant Accounting Policies
Organization and Business Operations
Highbury Financial Inc. (the “Company”) was incorporated in Delaware on July 13, 2005 as a blank check company whose objective is to acquire, or acquire control of, one or more operating businesses in the financial services industry that may provide significant opportunities for growth, with a particular focus on investment management and securities firms.
All activity from July 13, 2005 (inception) through January 31, 2006 relates to the Company’s formation and initial public offering described below. The Company has selected December 31 as its fiscal year-end.
The registration statement for the Company’s initial public offering (“Offering”) was declared effective January 25, 2006. The Company consummated the Offering on January 31, 2006. Immediately preceding the Offering, all of the Company’s stockholders prior to the Offering, including all of the officers and directors of the Company (the “Initial Stockholders”) purchased an aggregate of 166,667 units from the Company in a private placement (the “Private Placement”). The units sold in the Private Placement were identical to the units sold in the Offering, but the purchasers in the Private Placement have waived their rights to conversion and receipt of distribution on liquidation in the event the Company does not complete a business combination (as described below). The Company received proceeds from the Private Placement and the Offering, net of the underwriters’ discount, of approximately $38,037,000 (Note 2).
The Company’s management has broad discretion with respect to the specific application of the net proceeds of this Offering and the Private Placement, although substantially all of the net proceeds are intended to be generally applied toward consummating a business combination, or series of business combinations, with an operating business in the financial services industry (“Business Combination”). Furthermore, there is no assurance that the Company will be able to successfully affect a Business Combination. An amount of $37,542,667 of the net proceeds of the Offering and the Private Placement, including approximately $673,333 which will be paid to the underwriters of the Offering if a business combination is consummated (net of approximately $0.12 for each share of common stock converted in connection with the Business Combination as described below) but which will be forfeited if a business combination is not consummated, is being held in an interest-bearing trust account (“Trust Account”) until the earlier of (i) the consummation of a Business Combination or (ii) liquidation of the Company. Under the agreement governing the Trust Account, funds will only be invested in United States “government securities” within the meaning of Section 2(a)(16) of the Investment Company Act of 1940 with a maturity of 180 days or less. The remaining net proceeds (not held in the Trust Account) may be used to pay for business, legal and accounting due diligence on prospective acquisitions and continuing general and administrative expenses.
F-27
Table of Contents
Highbury Financial Inc.
(a company in the development stage)
Notes to Financial Statements
The Company, after signing a definitive agreement for the acquisition of a target business, will submit such transaction for stockholder approval. In the event that stockholders owning 20% or more of the shares sold in the Offering vote against the Business Combination and exercise their conversion rights described below, the Business Combination will not be consummated.
The Initial Stockholders, have agreed to vote their 1,725,000 founding shares of common stock (Note 7) as well as the 166,667 shares of common stock included in the units they purchased in the Private Placement in accordance with the vote of the majority in interest of all other stockholders of the Company (“Public Stockholders”) with respect to any Business Combination. After consummation of a Business Combination, these voting safeguards will no longer be applicable.
With respect to a Business Combination which is approved and consummated, any Public Stockholder who voted against the Business Combination may demand that the Company convert his shares. The per share conversion price will equal the amount in the Trust Account, calculated as of two business days prior to the consummation of the proposed Business Combination, divided by the number of shares of common stock held by Public Stockholders at the consummation of the Offering. Accordingly, Public Stockholders holding 19.99% of the aggregate number of shares owned by all Public Stockholders may seek conversion of their shares in the event of a Business Combination. Such Public Stockholders are entitled to receive their per-share interest in the Trust Account computed without regard to the shares held by Initial Stockholders. Accordingly, a portion of the net proceeds from the offering (19.99% of the amount held in the Trust Account) has been classified as common stock subject to possible conversion in the accompanying January 31, 2006 balance sheet.
The Company’s Certificate of Incorporation, as amended, provides for mandatory liquidation of the Company in the event that the Company does not consummate a Business Combination within 18 months from the date of the consummation of the Offering, or 24 months from the consummation of the Offering if certain extension criteria have been satisfied. In the event of liquidation, it is likely that the per share value of the residual assets remaining available for distribution (including Trust Account assets) will be less than the initial public offering price per share in the Offering due to costs related to the Offering and since no value would be attributed to the Warrants contained in the Units sold (Note 2).
F-28
Table of Contents
Highbury Financial Inc.
(a company in the development stage)
Notes to Financial Statements
Use of Estimates
The preparation of financial statements in conformity with accounting principles generally accepted in the United States of America requires management to make estimates and assumptions that affect the reported amounts of assets and liabilities and disclosure of contingent assets and liabilities at the date of the financial statements and the reported amounts of revenue and expenses during the reporting period. Actual results could differ from those estimates.
Cash and Cash Equivalents
For financial statement purposes, the Company considers all highly liquid debt instruments with a maturity of three months or less when purchased to be cash equivalents. The Company maintains its cash in bank deposit accounts in the United States of America which, at times, may exceed applicable insurance limits. The Company has not experienced any losses in such accounts. The Company believes it is not exposed to any significant credit risk on cash and cash equivalents.
Deferred Income Taxes
Deferred income taxes are provided for the differences between the bases of assets and liabilities for financial reporting and income tax purposes. A valuation allowance is established when necessary to reduce deferred tax assets to the amount expected to be realized.
The Company recorded a deferred income tax asset aggregating approximately $834 and $1,831 at December 31, 2005 and January 31, 2006, respectively, for the tax effect of net operating loss carryforwards and temporary differences. In recognition of the uncertainty regarding the ultimate amount of income tax benefits to be derived, the Company has recorded a full valuation allowance at December 31, 2005 and January 31, 2006. The net operating loss carryforward at January 31, 2006 amounts to approximately $5,385 and expires in 2026.
The effective tax rate differs from the statutory rate of 34% due to the increase in the valuation allowance.
F-29
Table of Contents
Highbury Financial Inc.
(a company in the development stage)
Notes to Financial Statements
Loss Per Common Share
Loss per share is computed by dividing net loss by the weighted-average number of shares of common stock outstanding during the period. The effect of the 13,466,666 outstanding warrants issued in connection with the initial public offering, the 333,334 outstanding warrants issued in connection with the private placement and the 336,667 units included in the underwriters purchase option has not been considered in diluted loss per share calculations since the effect of such warrants and options would be antidilutive.
Deferred Registration Costs
Deferred registration costs consist of legal, accounting and other fees incurred through the balance sheet data that are related to the Offering and that have been charged to capital upon the consummation of the Offering.
Recent Accounting Pronouncements
Management does not believe that any recently issued, but not yet effective, accounting standards if currently adopted would have a material effect on the accompanying financial statements.
2. Initial Public Offering
On January 26, 2006, the Company sold 6,733,333 units (“Units”) in the Offering. Each Unit consists of one share of the Company’s common stock, $.0001 par value, and two redeemable common stock purchase warrants (“Warrants”). Each Warrant entitles the holder to purchase from the Company one share of common stock at an exercise price of $5.00 commencing the later of the completion of a Business Combination or one year from the effective date of the Offering and expiring four years from the effective date of the Offering. The Warrants will be redeemable, at the Company’s option, at a price of $.01 per Warrant upon 30 days’ notice after the Warrants become exercisable, only in the event that the last sale price of the common stock is at least $8.50 per share for any 20 trading days within a 30 trading day period ending on the third day prior to the date on which notice of redemption is given. In connection with the Offering, the Company paid the underwriters an underwriting discount of approximately 5.2% of the gross proceeds of the Offering. Immediately preceding the Offering, all of the Company’s stockholders prior to the Offering, including all of the officers and directors of the Company (the “Initial Stockholders”) purchased an aggregate of 166,667 units from the Company in a private placement (the “Private Placement”). The units sold in the Private Placement were identical to the units sold in the Offering, but the purchasers in the Private Placement have waived their rights to conversion and receipt of distribution on liquidation in the event the Company does not complete a business combination.
In connection with this Offering, the Company issued an option, pursuant to underwriting agreement, to the underwriters to purchase up to an additional 1,010,000 units from the Company for $6.00 with an underwriting discount of $0.31 per unit. On January 30, 2006, the underwriters notified the Company that they intend to exercise the option in its entirety. The closing of this sale took place on February 3, 2006.
Under the terms of the Warrants, the Company is required to use its best efforts to maintain the effectiveness of the registration statement covering the Warrants. However, the Company is not obligated to deliver securities, and there are no contractual penalties for failure to deliver securities, if a registration statement is not effective at the time of exercise. In the event that a registration statement is not effective at the time of exercise, the holder of such Warrant is not entitled to exercise such Warrant. Additionally, the Company entered into the Amended and Restated Clarification Agreement on December 15, 2006 which clarified that in no event (whether in the case of a registration statement not being effective or otherwise) is the Company required to net cash settle the warrant exercise. Consequently, the Warrants will expire unexercised and unredeemed if there is no effective registration statement covering the shares of the Company’s common stock issuable upon exercise of the Warrants.
F-30
Table of Contents
Highbury Financial Inc.
(a company in the development stage)
Notes to Financial Statements
In connection with this Offering, the Company issued an option, for $100, to the underwriters to purchase 336,667 Units at an exercise price of $7.50 per Unit. The Company has accounted for the fair value of the option, inclusive of the receipt of the $100 cash payment, as an expense of the public offering resulting in a charge directly to stockholders’ equity. The Company estimates that the fair value of this option is approximately $423,000 ($1.26 per Unit) using a Black-Scholes option pricing model. The fair value of the option granted to the Representative is estimated as of the date of grant using the following assumptions: (1) expected volatility of 29.0%, (2) risk-free interest rate of 4.34% and (3) expected life of four years. The option may be exercised for cash or on a “cashless” basis, at the holder’s option, such that the holder may use the appreciated value of the option (the difference between the exercise prices of the option and the underlying warrants and the market price of the units and underlying securities) to exercise the option without the payment of any cash. In addition, the warrants underlying such Units are exercisable at $6.25 per share.
The holder of the unit purchase option will not be entitled to exercise the unit purchase option or the Warrants underlying the unit purchase option unless a registration statement covering the securities underlying the unit purchase option is effective or an exemption from registration is available. Accordingly, the option and underlying Warrants may expire unexercised and unredeemed if there is no effective registration statement covering the securities issuable upon exercise. In addition, on December 15, 2006, the Company entered into amendments to the unit purchase options which clarified that there are no circumstances under which the Company is required to net cash settle the purchase option or the underlying Warrants.
Based on its interpretation of Emerging Issues Task Force No. 00-19, “Accounting for Derivative Financial Instruments Indexed to, and Potentially Settled in, a Company’s Own Stock” (“EITF No. 00-19”), the Company had previously issued financial statements which presented the fair value of the Warrants and the underwriters’ purchase option as liabilities. Upon further review and after entering into the Amended and Restated Clarification Agreement and the amendments to the unit purchase options, the Company has determined that the Warrants and the underwriters’ purchase option should be categorized as equity rather than liabilities. The accompanying audited financial statements as of January 31, 2006 have been restated to account for the Warrants and the underwriters’ purchase option as equity. The impact of the restatement on previously reported balance sheets and statements of stockholders’ equity is as follows:
| January 31, 2006 | ||||||
As Previously Reported | As Restated | |||||
Assets | $ | 38,991,645 | $ | 38,991,645 | ||
Liabilities | $ | 9,138,970 | $ | 934,970 | ||
Common stock subject to conversion | $ | 7,508,530 | $ | 7,508,530 | ||
Stockholders’ equity | $ | 22,344,145 | $ | 30,548,145 | ||
3. Notes Payable, Stockholders
The Company issued unsecured promissory notes in the aggregate amount of $70,000 to all of its Initial Stockholders. The notes were non-interest-bearing and were repaid immediately following the consummation of the Offering from the net proceeds of such Offering.
F-31
Table of Contents
Highbury Financial Inc.
(a company in the development stage)
Notes to Financial Statements
4. Commitments
The Company presently occupies office space provided by an affiliate of four Initial Stockholders. Such affiliate has agreed that, until the acquisition of a target business by the Company, it will make such office space, as well as certain office and secretarial services, available to the Company, as may be required by the Company from time to time. The Company has agreed to pay such affiliate $7,500 per month for such services commencing on January 26, 2006. The statement of operations for the period ended January 31, 2006 includes $1,452 related to this agreement.
In connection with the Offering, the Company has agreed to pay the underwriters upon completion of its initial business combination approximately $673,333, plus accrued interest on such amount, net of taxes payable, less approximately $0.12 for each share of common stock that the Public Stockholders elect to convert in connection with the Company’s initial business combination. The Company has recorded the deferred underwriting fees payable to the underwriters as an expense of the public offering resulting in a charge directly to stockholders’ equity.
Pursuant to letter agreements dated January 25, 2006 with the Company and the underwriters, the Initial Stockholders have waived their rights to participate in any liquidation distribution occurring upon our failure to complete a business combination, with respect to those shares of common stock acquired by them prior to the Offering and with respect to the shares included in the 166,667 units they purchased in the Private Placement.
The Initial Stockholders will be entitled to registration rights with respect to their founding shares and the shares they purchased in the private placement pursuant to an agreement signed on January 25, 2006. The holders of the majority of these shares are entitled to make up to two demands that the Company register these shares at any time commencing three months prior to the third anniversary of the effective date of the Offering. In addition, the Initial Stockholders have certain “piggy-back” registration rights on registration statements filed subsequent to the third anniversary of the effective date of the Offering.
The Company has also agreed to pay the fees and issue the securities to the underwriters in the Offering as described above in Note 2.
5. Preferred Stock
The Company is authorized to issue 1,000,000 shares of preferred stock with such designations, voting and other rights and preferences as may be determined from time to time by the Board of Directors.
6. Common Stock
At January 31, 2006, 14,810,001 shares of common stock were reserved for issuance upon exercise of redeemable warrants and underwriters’ unit purchase option.
7. Stock Dividend
Effective January 13, 2006, the Company’s Board of Directors authorized a stock dividend of 0.15 shares of common stock for each outstanding share of common stock. All references in the accompanying financial statements to the number of shares of common stock have been retroactively restated to reflect this transaction.
F-32
Table of Contents
Highbury Financial Inc. and Subsidiary
(a company in the development stage)
Condensed Consolidated Balance Sheets
| December 31, 2005 | Restated September 30, 2006 | ||||||
| (unaudited) | |||||||
Current assets: | |||||||
Cash | $ | 36,902 | $ | 470,088 | |||
Cash in Trust Account (Notes 2, 4) | — | 44,424,493 | |||||
Prepaid expenses | — | 78,795 | |||||
Total current assets | 36,902 | 44,973,376 | |||||
Deferred registration costs (Note 2) | 483,492 | — | |||||
Deferred acquisition costs (Note 2) | — | 1,136,422 | |||||
Deferred income taxes (Notes 2, 8) | — | 204,018 | |||||
Total assets | $ | 520,394 | $ | 46,313,816 | |||
Current liabilities: | |||||||
Accounts payable and accrued expenses | $ | 427,846 | $ | 894,445 | |||
Income taxes payable | — | 262,366 | |||||
Deferred underwriting fees (Note 6) | — | 673,333 | |||||
Deferred investment income (Note 2) | — | 185,192 | |||||
Notes payable, stockholders (Note 7) | 70,000 | — | |||||
Total current liabilities | 497,846 | 2,015,336 | |||||
Common stock, subject to possible conversion, 1,548,666 shares at conversion value (Note 2) | — | 8,657,910 | |||||
Stockholders’ equity (Notes 2, 3, 4, 5, 6, 9): | |||||||
Preferred stock, $0.0001 par value, authorized 1,000,000 shares; none issued | — | — | |||||
Common stock, $0.0001 par value, authorized 50,000,000 shares; issued and outstanding 9,635,000 shares (which includes 1,548,666 subject to possible conversion) and 1,725,000, respectively | 173 | 964 | |||||
Additional paid-in capital | 24,827 | 35,149,808 | |||||
Income (deficit) accumulated during the development stage | (2,452 | ) | 489,798 | ||||
Total stockholders’ equity | 22,548 | 35,640,570 | |||||
Total liabilities and stockholders’ equity | $ | 520,394 | $ | 46,313,816 | |||
See Notes to unaudited condensed consolidated financial statements
F-33
Table of Contents
Highbury Financial Inc. and Subsidiary
(a company in the development stage)
Condensed Consolidated Statements of Operations
| Period from July 13, 2005 (inception) to September 30, 2005 | Restated Three Months Ended September 30, 2006 | Restated Nine Months | Restated Period from July 13, 2005 (inception) to September 30, 2006 | |||||||||||||
| (unaudited) | (unaudited) | (unaudited) | (unaudited) | |||||||||||||
Operating expenses: | ||||||||||||||||
Professional fees | $ | — | $ | (60,619 | ) | $ | (169,573 | ) | $ | (169,573 | ) | |||||
D&O insurance | — | (22,958 | ) | (62,703 | ) | (62,703 | ) | |||||||||
Administrative fees | — | (22,500 | ) | (61,452 | ) | (61,452 | ) | |||||||||
Franchise taxes | — | (15,374 | ) | (45,399 | ) | (47,395 | ) | |||||||||
Travel and entertainment | — | (7,810 | ) | (33,296 | ) | (33,296 | ) | |||||||||
Other expenses | (456 | ) | (18,388 | ) | (35,900 | ) | (36,356 | ) | ||||||||
Total expenses | (456 | ) | (147,649 | ) | (408,323 | ) | (410,775 | ) | ||||||||
Operating loss | (456 | ) | (147,649 | ) | (408,323 | ) | (410,775 | ) | ||||||||
Non-operating income: | ||||||||||||||||
Interest income | — | 5,812 | 9,188 | 9,188 | ||||||||||||
Investment income | — | 461,190 | 1,179,735 | 1,179,735 | ||||||||||||
Total non-operating income | — | 467,002 | 1,188,923 | 1,188,923 | ||||||||||||
Income before provision for income taxes | (456 | ) | 319,353 | 780,600 | 778,148 | |||||||||||
(Provision)/benefit for income taxes (Note 8): | ||||||||||||||||
Current | — | (194,181 | ) | (492,366 | ) | (492,366 | ) | |||||||||
Deferred | — | 75,841 | 204,016 | 204,016 | ||||||||||||
Net income / (loss) for the period | $ | (456 | ) | $ | 201,013 | $ | 492,250 | $ | 489,798 | |||||||
Weighted average shares outstanding, basic and diluted | 1,725,000 | 9,635,000 | 8,859,469 | 6,111,734 | ||||||||||||
Net income / (loss) per share, basic and diluted | $ | (0.00 | ) | $ | 0.02 | $ | 0.06 | $ | 0.08 | |||||||
See Notes to unaudited condensed consolidated financial statements
F-34
Table of Contents
Highbury Financial Inc. and Subsidiary
(a company in the development stage)
Condensed Consolidated Statement of Stockholders’ Equity
(as restated)
Common Stock | Additional Capital | Income Phase | Total | ||||||||||||||
| Shares | Amount | ||||||||||||||||
Sale of 1,725,000 shares of common stock to initial stockholders on August 1, 2005 at $0.0145 per share (Note 5) | 1,725,000 | $ | 173 | $ | 24,827 | $ | — | $ | 25,000 | ||||||||
Net loss for the period | — | — | — | (2,452 | ) | (2,452 | ) | ||||||||||
Balance at December 31, 2005 | 1,725,000 | $ | 173 | $ | 24,827 | $ | (2,452 | ) | $ | 22,548 | |||||||
Unaudited: | |||||||||||||||||
Sale of 166,667 units in a private placement | 166,667 | 17 | 999,985 | — | 1,000,002 | ||||||||||||
Sale of 7,743,333 units, net of underwriters’ discount and offering expenses (includes 1,548,666 shares subject to possible conversion) | 7,743,333 | 774 | 42,782,806 | — | 42,783,580 | ||||||||||||
Proceeds subject to possible conversion of 1,548,666 shares | — | — | (8,657,910 | ) | — | (8,657,910 | ) | ||||||||||
Proceeds from issuance of option | — | — | 100 | — | 100 | ||||||||||||
Net income for the period | — | — | — | 492,250 | 492,250 | ||||||||||||
Balance at September 30, 2006 | 9,635,000 | $ | 964 | $ | 35,149,808 | $ | 489,798 | $ | 35,640,570 | ||||||||
See Notes to unaudited condensed consolidated financial statements
F-35
Table of Contents
Highbury Financial Inc. and Subsidiary
(a company in the development stage)
Condensed Consolidated Statements of Cash Flows
| Period from July 13, 2005 (inception) to September 30, 2005 | Restated Nine Months | Restated Period from July 13, 2005 (inception) to September 30, 2006 | ||||||||||
| (unaudited) | (unaudited) | (unaudited) | ||||||||||
Cash flows from operating activities: | ||||||||||||
Net income / (loss) for the period | $ | (456 | ) | $ | 492,250 | $ | 489,798 | |||||
Adjustments to reconcile net income to net cash used in operating activities: | ||||||||||||
(Increase) / decrease in deferred taxes | — | (204,018 | ) | (204,018 | ) | |||||||
Changes in operating assets and liabilities: | ||||||||||||
(Increase) / decrease in trust account | — | (1,134,926 | ) | (1,134,926 | ) | |||||||
(Increase) / decrease in prepaid expenses | — | (78,795 | ) | (78,795 | ) | |||||||
Increase / (decrease) in accounts payable and accrued expenses | 456 | 139,612 | 142,064 | |||||||||
Increase / (decrease) in deferred investment income | — | 185,192 | 185,192 | |||||||||
Increase / (decrease) in income taxes payable | — | 262,366 | 262,366 | |||||||||
Net cash used in operating activities | — | (338,319 | ) | (338,319 | ) | |||||||
Cash flows from investing activities: | ||||||||||||
Cash held in trust fund | — | (43,289,567 | ) | (43,289,567 | ) | |||||||
Payment of costs of the acquisition | — | (384,041 | ) | (384,041 | ) | |||||||
Net cash used in investing activities | — | (43,673,608 | ) | (43,673,608 | ) | |||||||
Cash flows from financing activities: | ||||||||||||
Proceeds from sale of shares of common stock | 25,000 | 47,460,000 | 47,485,000 | |||||||||
Proceeds from issuance of option | — | 100 | 100 | |||||||||
Proceeds from notes payable, stockholders | 70,000 | — | 70,000 | |||||||||
Payments of notes payable, stockholders | — | (70,000 | ) | (70,000 | ) | |||||||
Payment of costs of public offering | (48,748 | ) | (2,944,987 | ) | (3,003,085 | ) | ||||||
Net cash provided by financing activities | 46,252 | 44,445,113 | 44,482,015 | |||||||||
Net increase in cash | 46,252 | 433,186 | 470,088 | |||||||||
Cash at beginning of period | — | 36,902 | — | |||||||||
Cash at end of period | $ | 46,252 | $ | 470,088 | $ | 470,088 | ||||||
Supplemental schedule of non-cash investing activities: | ||||||||||||
Accrual of costs of acquisition | $ | — | $ | 752,381 | $ | 752,381 | ||||||
Supplemental schedule of non-cash financing activities: | ||||||||||||
Accrual of costs of public offering | $ | 156,635 | $ | — | $ | — | ||||||
Accrual of deferred underwriting fees | — | 673,333 | 673,333 | |||||||||
Supplemental disclosure of cash flow information: | ||||||||||||
Cash paid for taxes | $ | — | $ | 232,146 | $ | 232,146 | ||||||
See Notes to unaudited condensed consolidated financial statements
F-36
Table of Contents
Highbury Financial Inc. and Subsidiary
(a company in the development stage)
Notes to Unaudited Condensed Consolidated Financial Statements
Note 1. Basis of Presentation
The financial statements at September 30, 2006, for the three months and nine months ended September 30, 2006, for the period from July 13, 2005 (inception) to September 30, 2005 and for the period from July 13, 2005 (inception) to September 30, 2006 are unaudited and include the accounts of Highbury Financial Inc. (a corporation in the development stage) (“the Company”) and its 65%-owned subsidiary, Aston Asset Management LLC (“Aston”). To date, Aston’s efforts have been limited to organizational activities.
In the opinion of management, all adjustments (consisting of normal accruals) have been made that are necessary to present fairly the financial position of the Company as of September 30, 2006 and the results of its operations and its cash flows for the nine months ended September 30, 2006, for the period from July 13, 2005 (inception) to September 30, 2005 and the period from July 13, 2005 (inception) to September 30, 2006. Operating results for the interim periods presented are not necessarily indicative of the results to be expected for a full year. The accompanying December 31, 2005 balance sheet has been derived from the audited financial statements. The Company has selected December 31 as its fiscal year end.
The statements and related notes have been prepared pursuant to the rules and regulations of the U.S. Securities and Exchange Commission. Accordingly, certain information and footnote disclosures normally included in financial statements prepared in accordance with generally accepted accounting principles have been omitted pursuant to such rules and regulations.
Note 2. Organization and Business Operations
Highbury Financial Inc. was incorporated in Delaware on July 13, 2005 as a blank check company whose objective is to acquire, or acquire control of, one or more operating businesses in the financial services industry that may provide significant opportunities for growth, with a particular focus on investment management and securities firms.
The registration statement for the Company’s initial public offering (“Offering”) was declared effective January 25, 2006. The Company consummated the Offering, including full exercise of the over-allotment option, on January 31, 2006 and February 3, 2006, respectively. Immediately preceding the Offering, all of the Company’s stockholders prior to the Offering (the “Initial Stockholders”), including all of the officers and directors of the Company, purchased an aggregate of 166,667 units from the Company in a private placement (the “Private Placement”). The units sold in the Private Placement were identical to the units sold in the Offering, but the purchasers in the Private Placement have waived their rights to conversion and their rights to receipt of distribution on liquidation in the event the Company does not complete a business combination (as described below). The Company received proceeds from the Private Placement and the Offering, net of the underwriters’ discount and commissions and offering expenses, of approximately $43,783,582 (Note 3).
The Company’s management has broad discretion with respect to the specific application of the net proceeds of this Offering and the Private Placement, although substantially all of the net proceeds are intended to be generally applied toward consummating a business combination, or series of business combinations, with an operating business or businesses in the financial services industry (“Business Combination”). However, there is no assurance that the Company will be able to successfully affect a Business Combination. An amount of $42,616,234 of the net proceeds of the Offering and the Private Placement and approximately $673,333 which will be paid to the underwriters of the Offering if a business combination is consummated (net of approximately $0.11 for each share of common stock converted in connection with the Business Combination as described below) but which will be forfeited if a business combination is not consummated, is being held in an interest-bearing trust account (“Trust Account”) until the earlier of (i) the consummation of a Business Combination or (ii) liquidation of the Company. Under the agreement governing the Trust Account, funds will only be invested in United States “government securities” within the meaning of Section 2(a)(16) of the Investment Company Act of 1940 with a maturity of 180 days or less. The remaining net proceeds (not held in the Trust Account) may be used to pay for business, legal and accounting due diligence on prospective acquisitions and continuing general and administrative expenses.
F-37
Table of Contents
Highbury Financial Inc. and Subsidiary
(a company in the development stage)
Notes to Unaudited Condensed Consolidated Financial Statements
The Company, after signing a definitive agreement for the acquisition of a target business, will submit such transaction for stockholder approval. In the event that stockholders owning 20% or more of the shares sold in the Offering vote against the Business Combination and exercise their conversion rights described below, the Business Combination will not be consummated.
The Initial Stockholders have agreed to vote their 1,725,000 founding shares of common stock (Note 5), as well as the 166,667 shares of common stock included in the units they purchased in the Private Placement, in accordance with the vote of the majority in interest of all other stockholders of the Company (“Public Stockholders”) with respect to any Business Combination. After consummation of a Business Combination, these voting safeguards will no longer be applicable.
With respect to a Business Combination which is approved and consummated, any Public Stockholder who voted against the Business Combination may demand that the Company convert his shares. The per share conversion price will equal the amount in the Trust Account, net of taxes payable, calculated as of two business days prior to the consummation of the proposed Business Combination, divided by the number of shares of common stock held by Public Stockholders at the consummation of the Offering. Accordingly, Public Stockholders holding up to 20% of the aggregate number of shares owned by all Public Stockholders may seek conversion of their shares in the event of a Business Combination. Such Public Stockholders are entitled to receive their per-share interest, net of taxes payable, in the Trust Account computed without regard to the shares held by Initial Stockholders. Accordingly, a portion of the net proceeds from the offering (20% of the amount originally placed in the Trust Account, excluding the portion relating to the deferred underwriting fees) has been classified as common stock subject to possible conversion in the accompanying September 30, 2006 balance sheet and approximately 20% of the interest earned on the Trust Account, net of related income taxes, has been recorded as deferred investment income.
The Company’s Certificate of Incorporation, as amended, provides for mandatory liquidation of the Company in the event that the Company does not consummate a Business Combination within 18 months from the date of the consummation of the Offering (July 31, 2007), or 24 months from the consummation of the Offering (January 31, 2008) if certain extension criteria have been satisfied. In the event of liquidation, it is likely that the per share value of the residual assets remaining available for distribution (including Trust Account assets) will be less than the initial public offering price per share in the Offering due to costs related to the Offering, and general and administrative expenses incurred prior to the liquidation event and since no value would be attributed to the warrants contained in the units sold (see Note 3).
Deferred Income Taxes
Deferred income taxes are provided for the differences between the bases of assets and liabilities for financial reporting and income tax purposes. Because the Company is currently in the development stage, many of its expenses are not currently deductible for income tax purposes. A valuation allowance may be established when necessary to reduce deferred tax assets to the amount expected to be realized.
Income / (Loss) Per Common Share
Income / (loss) per share is computed by dividing net income / (loss) by the weighted average number of shares of common stock outstanding during the period. The effect of the 15,486,666 outstanding warrants issued in connection with the Offering and the 333,334 outstanding warrants issued in connection with the Private Placement has not been considered in diluted income / (loss) per share calculations since the warrants cannot be exercised until the later of the completion of the Company’s initial Business Combination and January 25, 2007 and since, in some periods, the Company has a net loss and the effect would be anti-dilutive. Furthermore, the effect of the 336,667 units included in the underwriters purchase option has not been considered in diluted income per share calculations since the option is out-of-the money based on the Company’s weighted average common stock price for the periods and since, in some periods, the Company has a net loss and the effect would be anti-dilutive.
F-38
Table of Contents
Highbury Financial Inc. and Subsidiary
(a company in the development stage)
Notes to Unaudited Condensed Consolidated Financial Statements
Deferred Registration Costs
Deferred registration costs consist of legal, accounting and other fees incurred through the balance sheet date that were related to the Offering and that were charged to capital upon the consummation of the Offering.
Deferred Acquisition Costs
Deferred acquisition costs consist of legal, accounting and other fees incurred through the balance sheet date that are related to the potential acquisition of the U.S. mutual fund business of ABN AMRO Asset Management Holdings, Inc. (see Note 9). These costs will be included in the cost of the acquisition if the business combination is consummated or expensed if it is not. There is no assurance that this business combination will be consummated.
Recent Accounting Pronouncements
The Financial Accounting Standards Board (“FASB”) has issued interpretation No. 48, “Accounting for Uncertainty in Income Taxes—An Interpretation of FASB Statement No. 109” (“FIN 48”), regarding accounting for, and disclosure of, uncertain tax positions. FIN 48 clarifies the accounting for uncertainty in income taxes recognized in an enterprise’s financial statements in accordance with FASB Statement No. 109, “Accounting for Income Taxes.” FIN 48 prescribes a recognition threshold and measurement attribute for the financial statement recognition and measurement of a tax position taken or expected to be taken in a tax return. FIN 48 also provides guidance on derecognition, classification, interest and penalties, accounting in interim periods, disclosure, and transition. FIN 48 is effective for fiscal years beginning after December 15, 2006. We are currently evaluating the impact FIN 48 will have on its results of operations and financial position. The cumulative effect of applying the provisions of FIN 48, if any, will be reported as an adjustment to the opening balance of retained earnings accumulated during the development stage on January 1, 2007.
Management does not believe that any other recently issued, but not yet effective, accounting standards if currently adopted would have a material effect on the accompanying financial statements.
Note 3. Initial Public Offering
The Company sold 7,910,000 units (“Units”) in the Private Placement and the Offering, which included all of the 1,010,000 Units subject to the underwriters’ over-allotment option. Each Unit consists of one share of the Company’s common stock, $0.0001 par value, and two redeemable common stock purchase warrants (“Warrants”). Each Warrant entitles the holder to purchase from the Company one share of common stock at an exercise price of $5.00 commencing the later of the completion of a Business Combination or one year from the effective date of the Offering (January 25, 2007) and expiring four years from the effective date of the Offering (January 25, 2010). The Warrants will be redeemable, at the Company’s option, at a price of $0.01 per Warrant upon 30 days’ notice after the Warrants become exercisable, only in the event that the last sale price of the common stock is at least $8.50 per share for any 20 trading days within a 30 trading day period ending on the third day prior to the date on which notice of redemption is given. Separate trading of the Common Stock and Warrants underlying the Company’s Units commenced on February 21, 2006.
Under the terms of the Warrants, the Company is required to use its best efforts to maintain the effectiveness of the registration statement covering the Warrants. However, the Company is not obligated to deliver securities, and there are no contractual penalties for failure to deliver securities, if a registration statement is not effective at the time of exercise. Additionally, in the event that a registration statement is not effective at the time of exercise, the holder of such Warrant shall not be entitled to exercise such Warrant and the Company entered into the Amended and Restated Clarification Agreement on December 15, 2006 which clarifies that in no event (whether in the case of a registration statement not being effective or otherwise) is the Company required to net cash settle the warrant exercise. Consequently, the Warrants will expire unexercised and unredeemed if there is no effective registration statement covering the shares of the Company’s common stock issuable upon exercise of the Warrants.
F-39
Table of Contents
Highbury Financial Inc. and Subsidiary
(a company in the development stage)
Notes to Unaudited Condensed Consolidated Financial Statements
In connection with this Offering, the Company issued an option, for $100, to the underwriters to purchase 336,667 Units at an exercise price of $7.50 per Unit. The Company has accounted for the fair value of the option, inclusive of the receipt of the $100 cash payment, as an expense of the public offering resulting in a charge directly to stockholders’ equity. The Company estimates that the fair value of this option is approximately $423,000 ($1.26 per Unit) using a Black-Scholes option pricing model. The fair value of the option granted to the underwriters is estimated as of the date of grant using the following assumptions: (1) expected volatility of 29.0%, (2) risk-free interest rate of 4.34% and (3) expected life of four years. The option may be exercised for cash or on a “cashless” basis, at the holder’s option, such that the holder may use the appreciated value of the option (the difference between the exercise prices of the option and the underlying Warrants and the market price of the units and underlying securities) to exercise the option without the payment of any cash. In addition, the Warrants underlying such Units are exercisable at $6.25 per share.
The holder of the unit purchase option is not entitled to exercise the unit purchase option or the Warrants underlying the unit purchase option unless a registration statement covering the securities underlying the unit purchase option is effective or an exemption from registration is available. On December 15, 2006, the Company entered into Amended Unit Purchase Options which clarifies that the option and underlying Warrants will expire unexercised and unredeemed if there is no effective registration statement covering the securities issuable upon exercise. In addition, there are no circumstances under which the Company is required to net cash settle the purchase option or the underlying Warrants.
The previously issued unaudited September 30, 2006 financial statements presented the fair value of the Warrants and the unit purchase option as liabilities and the related changes in valuations were included in operations. The financial statements as of September 30, 2006 have been restated to account for the Warrants and the unit purchase option as equity. The changes to the September 30, 2006 financial statements were as follows:
| September 30, 2006 | ||||||
| As Previously Reported | As Restated | |||||
Assets | $ | 46,313,816 | $ | 46,313,816 | ||
Liabilities | $ | 16,783,136 | $ | 2,015,336 | ||
Common stock subject to conversion | $ | 8,657,910 | $ | 8,657,910 | ||
Stockholders’ equity | $ | 20,872,770 | $ | 35,640,570 | ||
| Three Months Ended September 30, 2006 | Nine Months Ended September 30, 2006 | Period from July 13, 2005 September 30, 2006 | |||||||||||||||||||||
| As Previously Reported | As Restated | As Previously | As Restated | As Previously | As Restated | ||||||||||||||||||
Gain / (Loss) from derivative liabilities: | |||||||||||||||||||||||
Warrants | $ | 158,200 | $ | — | $ | (5,378,800 | ) | $ | — | $ | (5,378,800 | ) | $ | — | |||||||||
Underwriters’ purchase option | $ | 100,000 | $ | — | $ | (74,000 | ) | $ | — | $ | (74,000 | ) | $ | — | |||||||||
Pre-tax income (loss) | $ | 577,553 | $ | 319,353 | $ | (4,672,200 | ) | $ | 780,600 | $ | (4,674,652 | ) | $ | 778,148 | |||||||||
Provision for income taxes | $ | (118,340 | ) | $ | (118,340 | ) | $ | (288,350 | ) | $ | (288,350 | $ | (288,350 | ) | $ | (288,350 | ) | ||||||
Net income (loss) | $ | 459,213 | $ | 201,013 | $ | (4,960,550 | ) | $ | 492,250 | $ | (4,963,002 | ) | $ | 489,798 | |||||||||
Weighted average shares | |||||||||||||||||||||||
Basic | 9,635,000 | 9,635,000 | 8,859,469 | 8,859,469 | 6,111,734 | 6,111,734 | |||||||||||||||||
Earnings (loss) per share | |||||||||||||||||||||||
Basic | $ | 0.05 | $ | 0.02 | $ | (0.56 | ) | $ | 0.06 | $ | (0.81 | ) | $ | 0.08 | |||||||||
Note 4. Investments Held in Trust
Investments held in trust at September 30, 2006 consist of money market obligations in the aggregate of $44,424,493.
F-40
Table of Contents
Highbury Financial Inc. and Subsidiary
(a company in the development stage)
Notes to Unaudited Condensed Consolidated Financial Statements
There were no investments held in trust at December 31, 2005.
Note 5. Stockholders’ Equity
Common Stock
The Company’s initial stockholders purchased 1,500,000 common shares for $25,000 on August 1, 2005. On January 13, 2006, the Board of Directors authorized a stock dividend of 0.15 shares of common stock for each share of common stock outstanding, bringing the initial outstanding shares to 1,725,000. All references in the accompanying financial statements to the number of shares of stock outstanding have been retroactively restated to reflect the stock dividend.
Preferred Stock
The Company is authorized to issue 1,000,000 shares of preferred stock, par value $.0001 per share, with such designations, voting and other rights and preferences as may be determined from time to time by the Board of Directors. As of September 30, 2006, no shares of preferred stock have been issued.
Common Stock Commitments
At September 30, 2006, 15,820,000 shares of common stock were reserved for issuance upon exercise of redeemable Warrants and 1,010,001 shares of common stock were reserved for issuance upon exercise of the underwriters’ unit purchase option.
Note 6. Commitments
The Company presently occupies office space provided by an affiliate of several of our Initial Stockholders. Such affiliate has agreed that, until the acquisition of a target business by the Company, it will make such office space, as well as certain office and secretarial services, available to the Company, as may be required by the Company from time to time. The Company has agreed to pay such affiliate $7,500 per month for such services commencing on January 26, 2006. The statements of operations for the three month and nine month periods ended September 30, 2006 include $22,500 and $61,452 related to this agreement, respectively. The Company and such affiliate intend to amend this agreement upon consummation of the acquisition to extend the agreement upon the same terms. If extended, the agreement will be terminable by either party upon six months’ prior notice.
In connection with the Offering, the Company has agreed to pay the underwriters upon completion of its initial Business Combination approximately $673,333, plus accrued interest on such amount, net of taxes payable, less approximately $0.11 for each share of common stock that the Public Stockholders elect to convert in connection with the Company’s initial Business Combination. The Company has recorded the deferred underwriting fees payable to the underwriters as an expense of the public offering resulting in a charge directly to stockholders’ equity. The interest earned on the deferred underwriting fees held in the Trust Account, net of taxes payable, has been recorded as deferred investment income.
Pursuant to letter agreements dated January 25, 2006 with the Company and the underwriters, the Initial Stockholders have waived their rights to participate in any liquidation distribution occurring upon our failure to complete a business combination, with respect to those shares of common stock acquired by them prior to the Offering and with respect to the shares included in the 166,667 units they purchased in the Private Placement.
The Initial Stockholders are entitled to registration rights with respect to the shares of common stock and warrants of the Company owned by them. The holders of the majority of the founding shares are entitled to make up to two demands that the Company register these shares and any other warrants or shares of the Company owned by them (excluding the shares purchased in the Private Placement) at any time commencing on the date the founding shares are released from escrow. In addition, the Initial Stockholders have certain “piggy-back” registration rights with respect to such securities on registration statements filed subsequent to the date the founding shares are released from escrow. The holders of a majority of the units purchased in the Private Placement are entitled to make up to two demands that the Company register the shares, warrants and shares underlying the warrants comprising such units at any time commencing on the date the Company consummates a Business Combination. In addition, the Initial Stockholders have certain “piggy-back” registration rights with respect to such securities on registration statements filed subsequent to the date the Company consummates a Business Combination. The Company will bear the expenses incurred in connection with the filing of any of the foregoing registration statements.
F-41
Table of Contents
Highbury Financial Inc. and Subsidiary
(a company in the development stage)
Notes to Unaudited Condensed Consolidated Financial Statements
The founding shares have been placed in escrow until the earliest of: (1) January 25, 2009; (2) the Company’s liquidation; and (3) the consummation of a liquidation, merger or stock exchange, stock purchase or other similar transaction which results in all of the Company’s stockholders having the right to exchange their shares of common stock for cash, securities or other property subsequent to our consummating a Business Combination with a target business. During the escrow period, the Initial Stockholders may not sell or transfer their founding shares except among the Initial Stockholders (including upon exercise by Broad Hollow of its call options), to their spouses and children or trusts established for their benefit, by virtue of the laws of decent and distribution, upon the death of any Initial Stockholder or pursuant to a qualified domestic relations order but retain all other rights as stockholders, including, without limitation, the right to vote their shares and receive cash dividends, if declared. In addition, the units purchased by the Initial Stockholders in the Private Placement and the shares and warrants comprising such units may not be sold, assigned or transferred by the Initial Stockholders until after the consummation of a Business Combination.
The Company also paid fees and issued securities to the underwriters in the Offering as described above in Note 3.
Note 7. Notes Payable, Stockholders
The Company issued unsecured promissory notes in the aggregate amount of $70,000 to all of its Initial Stockholders. The notes were non-interest-bearing and were repaid immediately following the consummation of the Offering from the net proceeds of such Offering.
Note 8. Income Taxes
The provisions for income taxes for the three month and nine month periods ended September 30, 2006 consist of the following:
| Three Months Ended September 30, 2006 | Nine Months Ended September 30, 2006 | |||||||
Current | ||||||||
Federal | $ | 169,919 | $ | 430,847 | ||||
State | 24,262 | 61,519 | ||||||
Deferred | ||||||||
Federal | (66,366 | ) | (177,730 | ) | ||||
State | (9,476 | ) | (25,377 | ) | ||||
Reversal of Valuation Allowance | — | (909 | ) | |||||
| $ | 118,339 | $ | 288,350 | |||||
The total provision for income taxes differs from that amount which would be computed by applying the U.S. Federal income tax rate to income before provision for income taxes for the nine months ended September 30, 2006 is as follows:
Statutory federal income tax rate | 34.0 | % | |
State tax net of federal benefit | 3.1 | ||
Reversal of valuation allowance | (0.2 | ) | |
Effective income tax rate | 36.9 | % | |
F-42
Table of Contents
Highbury Financial Inc. and Subsidiary
(a company in the development stage)
Notes to Unaudited Condensed Consolidated Financial Statements
The tax effect of temporary differences that give rise to the net deferred tax asset is as follows:
| September 30, 2006 | December 31, 2005 | ||||||
Interest income deferred for reporting purposes | $ | 68,624 | $ | — | |||
Expenses deferred for income tax purposes | 135,393 | 909 | |||||
Valuation allowance | — | (909 | ) | ||||
Net deferred tax asset | $ | 204,017 | $ | — | |||
During 2006, the Company began to generate taxable income and therefore is no longer recording a valuation allowance against its deferred tax assets.
Note 9. Recent Developments
On April 20, 2006 the Company and Aston Asset Management LLC, a newly formed Delaware limited liability company (“Aston”, and together with Highbury the “Highbury Entities”), entered into an Asset Purchase Agreement (“Asset Purchase Agreement”) with ABN AMRO Asset Management Holdings, Inc. (“AAAMHI”), ABN AMRO Investment Fund Services, Inc. (“AAIFS”), ABN AMRO Asset Management, Inc., (“AAAMI”), Montag & Caldwell, Inc., (“Montag”), Tamro Capital Partners LLC, (“TAMRO”), Veredus Asset Management LLC, (“Veredus”), and River Road Asset Management, LLC, (“River Road” and together with AAAMHI, AAIFS, AAAMI, Montag, TAMRO and Veredus individually referred to as a “Seller” and collectively as “Sellers”). Pursuant to the Asset Purchase Agreement, and subject to the satisfaction of the conditions set forth therein, the Highbury Entities will acquire substantially all of the Sellers’ business of providing investment advisory, administration, distribution and related services to the U.S. mutual funds (the “Target Funds”) specified in the Asset Purchase Agreement (collectively, the “Business”). In connection with the consummation of the sale of the Business (the “Closing”), Aston will enter into agreements with each of the Sellers that currently manage the Target Funds pursuant to which each such Seller will act as a sub-advisor to the applicable Target Fund. Pursuant to the Asset Purchase Agreement the Sellers have agreed not to terminate these agreements for a period of five years following the consummation of the sale of the Business.
Pursuant to the Asset Purchase Agreement, at the Closing the Highbury Entities will pay $38.6 million in cash to AAAMHI. On the second anniversary of the date of the Closing, the Asset Purchase Agreement provides for a contingent adjustment payment in cash as follows: in the event the annualized investment advisory fee revenue generated under investment advisory contracts between Aston and the Sellers applicable to the Target Funds for the six months prior to the second anniversary of the date of the Closing (“Target Revenue”) (x) exceeds $41.8 million, the Highbury Entities will pay to AAAMHI the difference between the Target Revenue and $41.8 million, up to a total aggregate payment of $3.8 million, or (y) is less than $34.2 million, AAAMHI will pay to the Highbury Entities the difference between the $34.2 million and the Target Revenue, up to a total aggregate payment of $3.8 million.
The Company formed Aston on April 19, 2006 and became the sole member of Aston. In connection with the Highbury Entities entering into the Asset Purchase Agreement, the limited liability company agreement of Aston was amended and eight senior management employees of the Business (the “Aston management members”) were admitted as members of Aston. The Company owns 65% of the membership interests of Aston, and the Aston management members own 35% of the membership interests of Aston. If the acquisition of the Business is consummated, as a result of this amendment to the limited liability company agreement to admit the new members, the Company will incur a one-time non-cash compensation expense of approximately $20.8 million for the value of such ownership interests. Since none of the Aston management members have any ownership interest in the acquired business, the value of the ownership grant was deemed to be compensatory in nature and not purchase price consideration. To establish the $20.8 million compensation charge for financial reporting purposes, the Company used an asset-based approach. Based on the purchase price of $38.6 million, the Company determined that the minimum value of its 65% manager membership interest in Aston was $38.6 million, and therefore the minimum valuation for 100% of Aston was approximately $59.4 million. The Company concluded that the value of the Aston management members’ 35% interest was equal to the difference between these two values, or approximately $20.8 million.
The sale of the Business currently is expected to be consummated in the fourth quarter of 2006, after receipt of requisite approvals from (i) our stockholders, (ii) the stockholders of the Target Funds and (iii) the trustees of the Target Funds. As of September 20, 2006, the approval of the sale of the Business by the stockholders of all of the Target Funds had been obtained. The trustees of the Target Funds voted to approve the sale of the Business on May 9, 2006. Our stockholders will vote on the sale of the Business on November 27, 2006.
F-43
Table of Contents
PART II
INFORMATION NOT REQUIRED IN PROSPECTUS
Item 13. Other Expenses of Issuance and Distribution.
The following table sets forth the estimated expenses payable by the registrant in connection with the sale and distribution of the securities registered hereby. All amounts other than the SEC registration fee are estimated.
| SEC Registration Fee | $ | 0 | |
| Accounting Fees and Expenses | $ | 15,000 | |
| Legal Fees and Expenses | $ | 75,000 | |
| Printing Fees and Expenses | $ | 10,000 | |
| Miscellaneous | $ | 0 | |
| Total: | $ | 100,000 |
Item 14. Indemnification of Directors and Officers.
Our certificate of incorporation provides that the Company, to the full extent permitted by Section 145 of the Delaware General Corporation Law, as amended from time to time, shall indemnify all persons whom it may indemnify pursuant thereto. It further provides that expenses (including attorneys’ fees) incurred by an officer or director in defending any civil, criminal, administrative, or investigative action, suit or proceeding for which such officer or director may be entitled to indemnification hereunder shall be paid by the Company in advance of the final disposition of such action, suit or proceeding upon receipt of an undertaking by or on behalf of such director or officer to repay such amount if it shall ultimately be determined that he is not entitled to be indemnified by the Company as authorized thereby.
Insofar as indemnification for liabilities arising under the Securities Act may be permitted to the Registrant’s directors, officers, and controlling persons pursuant to the foregoing provisions, or otherwise, the Registrant has been advised that in the opinion of the Commission such indemnification is against public policy as expressed in the Securities Act and is, therefore, unenforceable. In the event that a claim for indemnification against such liabilities (other than the payment of expenses incurred or paid by a director, officer or controlling person in a successful defense of any action, suit or proceeding) is asserted by such director, officer or controlling person in connection with the securities being registered, the Registrant will, unless in the opinion of its counsel the matter has been settled by controlling precedent, submit to the court of appropriate jurisdiction the question whether such indemnification by it is against public policy as expressed in the Securities Act and will be governed by the final adjudication of such issue.
Item 16. Exhibits and Financial Statements Schedules
| Exhibit No. | Description | |
| 3.1(1) | Restated certificate of incorporation. | |
| 3.2(2) | By-laws. | |
| 4.1(2) | Specimen Unit Certificate. | |
| 4.2(2) | Specimen Common Stock Certificate. | |
| 4.3(2) | Specimen Warrant Certificate. | |
| 4.4(2) | Warrant Agreement between Continental Stock Transfer & Trust Company and the Company. | |
| 4.5(2) | Unit Purchase Option. | |
| 5.1(2) | Opinion of Bingham McCutchen LLP | |
| 10.1(2) | Subscription Agreement between the Registrant and R. Bruce Cameron. | |
| 10.2(2) | Subscription Agreement between the Registrant and Richard S. Foote. | |
| 10.3(2) | Subscription Agreement between the Registrant and R. Bradley Forth. | |
| 10.4(2) | Subscription Agreement between the Registrant and The Hillary Appel Trust. | |
Table of Contents
| 10.5(2) | Subscription Agreement between the Registrant and The Catey Lauren Appel Trust. | |
| 10.6(2) | Subscription Agreement between the Registrant and Broad Hollow LLC. | |
| 10.7(2) | Form of Letter Agreement between the Registrant and each of the initial stockholders. | |
| 10.8 | [Intentionally omitted]. | |
| 10.9(2) | Form of Stock Escrow Agreement between the Registrant and Continental Stock Transfer and Trust Company. | |
| 10.10(2) | Registration Rights Agreement between the Registrant and the initial stockholders. | |
| 10.11(2) | Form of Placement Unit Purchase Agreement among the Registrant, ThinkEquity Partners LLC, and the initial stockholders. | |
| 10.12(4) | Asset Purchase Agreement, dated as of April 20, 2006, by and among the Registrant, ABN AMRO Asset Management Holdings, Inc., ABN AMRO Investment Fund Services, Inc., ABN AMRO Asset Management, Inc., Montag & Caldwell, Inc., Tamro Capital Partners LLC, Veredus Asset Management LLC, River Road Asset Management LLC and Aston Asset Management LLC. | |
| 10.13(4) | Side Letter Agreement, dated as of April 20, 2006, by and among Registrant, Aston Asset Management LLC and Veredus Asset Management LLC. | |
| 10.14(4) | Side Letter Agreement, dated as of April 20, 2006, by and among Registrant, Aston Asset Management LLC and River Road Asset Management LLC. | |
| 10.15(1) | Side Letter Agreement, dated as of November 30, 2006, by and among Registrant, Aston Asset Management LLC and Montag & Caldwell, Inc. | |
| 10.16(4) | Side Letter Agreement, dated as of April 20, 2006, by and among Registrant, Aston Asset Management LLC and ABN AMRO Asset Management Holdings, Inc. | |
| 10.17(4) | Amended and Restated Limited Liability Company Agreement of Aston Asset Management LLC, dated as of April 20, 2006. | |
| 10.18(5) | Credit Agreement, dated as of November 9, 2006, between City National Bank and Registrant. | |
| 10.19(1) | Office Service Agreement, between Registrant and Berkshire Capital, dated November 30, 2006. | |
| 10.20(1) | Promissory Note issued by Aston in favor of Registrant, dated November 30, 2006. | |
| 10.21 | Administrative, Compliance and Marketing Services Agreement, dated as of September 1, 2006, between ABN AMRO Asset Management, Inc., and Aston Asset Management LLC. | |
| 10.22 | Form of Investment Advisory Agreement, between the Aston Funds and Aston Asset Management LLC. | |
| 14(3) | Code of Ethics. | |
| 21.1 | Subsidiaries of Registrant | |
| 23.1 | Consent of Ernst & Young LLP | |
| 23.2 | Consent of Goldstein Golub Kessler LLP | |
| 24.1(6) | Power of Attorney |
| (1) | Incorporated by reference from our Current Report on Form 8-K filed with the SEC on December 6, 2006. |
| (2) | Incorporated by reference from our Registration Statement on Form S-1 (SEC File No. 333-127272). |
| (3) | Incorporated by reference from our Annual Report on Form 10-KSB filed with the SEC on April 10, 2006. |
| (4) | Incorporated by reference from our Current Report on Form 8-K filed with the SEC on April 21, 2006. |
| (5) | Incorporated by reference from our Quarterly Report on Form 10-QSB filed with the SEC on November 14, 2006. |
| (6) | Included on the signature page thereto. |
Item 17. Undertakings.
| (A) | The undersigned registrant hereby undertakes: |
2
Table of Contents
(1) To file, during the period in which offers or sales are being made, a post—effective amendment to this registration statement:
(i) To include any prospectus required by Section 10(a)(3) of the Securities Act;
(ii) To reflect in the prospectus any facts or events arising after the effective date of the registration statement (or the most recent post—effective amendment thereof) which, individually or in the aggregate, represent a fundamental change in the information set forth in the registration statement. Notwithstanding the foregoing, any increase or decrease in volume of securities offered (if the total dollar value of securities offered would not exceed that which was registered) and any deviation from the low or high end of the estimated maximum offering range may be reflected in the form of prospectus filed with the Commission pursuant to Rule 424(b) if, in the aggregate, the changes in volume and price represent no more than a 20 percent change in the maximum aggregate offering price set forth in the “Calculation of Registration Fee” table in the effective registration statement;
(iii) To include any material information with respect to the plan of distribution not previously disclosed in the registration statement or any material change to such information in the registration statement;
(2) That, for the purpose of determining any liability under the Securities Act, each such post—effective amendment shall be deemed to be a new registration statement relating to the securities offered therein, and the offering of such securities at that time shall be deemed to be the initialbona fideoffering thereof.
(3) To remove from registration by means of a post—effective amendment any of the securities being registered which remain unsold at the termination of the offering.
3
Table of Contents
SIGNATURES
Pursuant to the requirements of the Securities Act of 1933, the registrant has duly caused this registration statement to be signed on its behalf by the undersigned, thereunto duly authorized, in the city of New York, state of New York on December 22, 2006.
| HIGHBURY FINANCIAL, INC. | ||
By: | /s/ Richard S. Foote | |
| Richard S. Foote | ||
| President & Chief Executive Officer | ||
Pursuant to the requirements of the Securities Act of 1933, this Registration Statement has been signed by the following:
Signature | Title | Date | ||
/s/ R. Bruce Cameron R. Bruce Cameron | Chairman of the Board | December 22, 2006 | ||
/s/ Richard S. Foote Richard S. Foote | President and Chief Executive Officer and Director (principal executive officer) | December 22, 2006 | ||
/s/ R. Bradley Forth R. Bradley Forth | Executive Vice President, Chief Financial Officer and Secretary (principal financial and accounting officer) | December 22, 2006 | ||
/s/ Russell L. Appel Russell L. Appel | Director | December 22, 2006 | ||
4