UNITED STATES
SECURITIES AND EXCHANGE COMMISSION
Washington, D.C. 20549
FORM 10-Q
(Mark one)
[X]QUARTERLY REPORT PURSUANT TO SECTION 13 OR 15(d) OF THE SECURITIES EXCHANGE ACT OF 1934
For the quarterly period ended:March 31, 2011
OR
[ ]TRANSITION REPORT PURSUANT TO SECTION 13 OR 15(d) OF THE SECURITIES EXCHANGE ACT OF 1934
For the transition period from _______________to ________________
Commission File Number:0-51527
CHINA GENGSHENG MINERALS, INC.
(Exact Name of Registrant as Specified in Its Charter)
| NEVADA | 91-0541437 |
| (State or Other jurisdiction of Incorporation or Organization) | (I.R.S. Employer Identification No.) |
| CHINA GENGSHENG MINERALS, INC. | |
| No. 88 Gengsheng Road, Dayugou Town, Gongyi, Henan Province P.R. China | 451271 |
| (Address of Principal Executive Offices) | (Zip Code) |
(86) 371-64059818
(Registrant’s Telephone Number, Including Area Code)
N/A
(Former Name, Former Address and Former Fiscal Year, if Changed Since Last Report)
Indicate by check mark whether the registrant (1) has filed all reports required to be filed by Section 13 or 15(d) of the Securities Exchange Act of 1934 during the preceding 12 months (or for such shorter period that the registrant was required to file such reports), and (2) has been subject to such filing requirements for the past 90 days.
Yes [X] No [ ]
Indicate by check mark whether the registrant has submitted electronically and posted on its corporate Web site, if any, every Interactive Data File required to be submitted and posted pursuant to Rule 405 of Regulation S-T (232.405 of this chapter) during the preceding 12 months (or for such shorter period that the registrant was required to submit and post such files).
Yes [ ] No [ ]
Indicate by check mark whether the registrant is a large accelerated filer, an accelerated filer, a non-accelerated filer, or a smaller reporting company. See definitions of “large accelerated filer”, “accelerated filer” and “smaller reporting company” in Rule 12b-2 of the Exchange Act. (Check one)
| Large accelerated filer [ ] | Accelerated filer [ ] | Non-accelerated filer [ ] | Smaller reporting company [X] |
Indicate by check mark whether the registrant is a shell company (as defined in Rule 12b-2 of the Exchange Act).
Yes [ ] No [X]
As of May 15, 2011, there were 26,794,386 shares of Common Stock of the Company, $0.001 par value,outstanding.
| Table of Contents |
| | |
| | Page |
| PART I - FINANCIAL INFORMATION | |
| Item 1. Financial Statements. | 1 |
| Condensed Consolidated Balance Sheets as of March 31, 2011(Unaudited) and December 31, 2010 | 1 |
| Condensed Consolidated Statements of Income and Other Comprehensive Income (Unaudited) for the Three Months Ended March 31, 2011(Unaudited) and March 31, 2010(Unaudited) | 3 |
| Condensed Consolidated Statements of Cash Flows (Unaudited) for the Three Months Ended March 31, 2011 and 2010 | 5 |
| Notes to Condensed Consolidated Financial Statements (Unaudited) | 8 |
| Item 2. Management's Discussion and Analysis of Financial Condition and Results of Operations. | 21 |
| Item 3. Quantitative and Qualitative Disclosure About Market Risk. | 34 |
| Item 4. Controls and Procedures. | 34 |
| | |
| PART II - OTHER INFORMATION | |
| Item 1. Legal Proceedings. | 35 |
| Item 1A. Risks Factors. | 35 |
| Item 2. Unregistered Sales of Equity Securities and Use of Proceeds. | 35 |
| Item 3. Defaults Upon Senior Securities. | 35 |
| Item 4. Other Information. | 35 |
| Item 5. Exhibits. | 35 |
| | |
| SIGNATURES | 36 |
PART I
ITEM 1. FINANCIAL STATEMENTS
China GengSheng Minerals, Inc.
Condensed Consolidated Balance Sheets
| | As of | | | As of | |
| | March 31, | | | December 31, | |
| | 2011 | | | 2010 | |
| | (Unaudited) | | | (Audited) | |
ASSETS | | | | | | |
Current assets: | | | | | | |
Cash and cash equivalents | $ | 11,472,049 | | $ | 925,052 | |
Restricted cash - Note 5 | | 35,769,329 | | | 21,693,100 | |
Trade receivables, net | | 39,890,194 | | | 43,240,996 | |
Bills receivable | | 3,357,868 | | | 3,074,156 | |
Other receivables, prepayments and payment in advance | | 11,608,422 | | | 7,024,142 | |
Advances to senior management | | - | | | 51,449 | |
Inventories - Note 6 | | 18,167,161 | | | 15,679,492 | |
Deferred tax assets | | 63,170 | | | 244,046 | |
| | | | | | |
Total current assets | | 120,328,193 | | | 91,932,433 | |
| | | | | | |
Deposits for acquisition of a non-consolidated affiliate | | 2,283,000 | | | 2,275,500 | |
Deposits for acquisition of land use right, property, plant and equipment | | 2,573,149 | | | 1,061,502 | |
Goodwill - Note 7 | | 460,135 | | | 441,089 | |
Intangible assets, net - Note 7 | | 361,475 | | | 379,250 | |
Property, plant and equipment, net - Note 8 | | 27,622,441 | | | 26,188,235 | |
Land use rights, net | | 941,763 | | | 944,166 | |
| | | | | | |
TOTAL ASSETS | $ | 154,570,156 | | $ | 123,222,175 | |
| | | | | | |
LIABILITIES AND EQUITY | | | | | | |
| | | | | | |
Current liabilities: | | | | | | |
Trade payables | $ | 16,491,247 | | $ | 14,279,568 | |
Bills payable - Note 5 | | 15,334,150 | | | 8,495,200 | |
Other payables and accrued expenses | | 6,162,236 | | | 5,198,131 | |
Deferred revenue - Government grants | | 350,060 | | | 394,420 | |
Provision for warranty | | 69,968 | | | 69,739 | |
Income taxes payable | | 467,728 | | | 606,877 | |
Non-interest-bearing loans - Note 9 | | 587,599 | | | 1,062,114 | |
Collateralized bank loans - Note 10 | | 54,534,287 | | | 41,641,650 | |
Deferred tax liabilities | | 130,458 | | | 149,578 | |
Warrant liabilities - Note 11 | | 710,000 | | | - | |
| | | | | | |
TOTAL LIABILITIES | | 94,837,733 | | | 71,897,277 | |
| | | | | | |
COMMITMENTS AND CONTINGENCIES - Note 16 | | | | | | |
1
China GengSheng Minerals, Inc.
Condensed Consolidated Balance Sheets (Cont’d)
| | As of | | | As of | |
| | March 31, | | | December 31, | |
| | 2011 | | | 2010 | |
| | (Unaudited) | | | (Audited) | |
STOCKHOLDERS' EQUITY | | | | | | |
Preferred stock - $0.001 par value per share; authorized 50,000,000 shares in 2011 and 2010, none issued and outstanding | $ | - | | $ | - | |
Common stock - $0.001 par value per share; authorized 100,000,000 shares in 2011 and 2010, issued and outstanding 26,794,386 shares in 2011 and 24,294,386 in 2010 - Note 12 | | 26,794 | | | 24,294 | |
Additional paid-in capital | | 28,189,354 | | | 19,903,388 | |
Statutory and other reserves | | 7,521,114 | | | 7,521,114 | |
Accumulated other comprehensive income | | 6,154,299 | | | 5,949,455 | |
Retained earnings | | 17,556,796 | | | 17,636,730 | |
| | | | | | |
Total China GengSheng Minerals, Inc. (the “Company”) stockholders' equity | | 59,448,357 | | | 51,034,981 | |
NONCONTROLLING INTEREST | | 284,066 | | | 289,917 | |
| | | | | | |
TOTAL EQUITY | | 59,732,423 | | | 51,324,898 | |
| | | | | | |
TOTAL LIABILITIES AND EQUITY | $ | 154,570,156 | | $ | 123,222,175 | |
The accompanying notes are an integral part of these condensed consolidated financial statements
2
China GengSheng Minerals, Inc.
Condensed Consolidated Statements of Operations and Comprehensive Income
| | Three months ended | |
| | March 31, | |
| | 2011 | | | 2010 | |
| | (Unaudited) | | | (Unaudited) | |
| | | | | | |
Sales revenue | $ | 16,183,829 | | $ | 11,861,352 | |
Cost of goods sold | | 11,896,194 | | | 7,888,058 | |
| | | | | | |
Gross profit | | 4,287,635 | | | 3,973,294 | |
| | | | | | |
Operating expenses | | | | | | |
General and administrative expenses | | 1,504,218 | | | 1,428,972 | |
Research and development expenses | | 141,327 | | | 184,233 | |
Selling expenses | | 1,971,935 | | | 1,494,949 | |
| | | | | | |
Total operating expenses | | 3,617,480 | | | 3,108,154 | |
| | | | | | |
Net operating income | | 670,155 | | | 865,140 | |
| | | | | | |
Other income (expenses) | | | | | | |
Government grant income | | 883 | | | 71,032 | |
Guarantee income | | 87,296 | | | - | |
Guarantee expenses | | (87,515 | ) | | - | |
Interest income | | 119,488 | | | 34,726 | |
Change in fair value of warrant liabilities - Note 11 | | 260,000 | | | - | |
Other (expenses) income | | (34,189 | ) | | 609 | |
Finance costs - Note 13 | | (965,732 | ) | | (405,196 | ) |
| | | | | | |
Total other expenses | | (619,769 | ) | | (298,829 | ) |
| | | | | | |
Income before income taxes and noncontrolling interest | | 50,386 | | | 566,311 | |
Income taxes - Note 14 | | (136,171 | ) | | (163,115 | ) |
| | | | | | |
Net (loss) income before noncontrolling interest | | (85,785 | ) | | 403,196 | |
Net loss (income) attributable to noncontrolling interest | | 5,851 | | | (15,914 | ) |
| | | | | | |
Net (loss) income attributable to Company’s stockholders | $ | (79,934 | ) | $ | 387,282 | |
| | | | | | |
Net (loss) income before noncontrolling interest | $ | (85,785 | ) | $ | 403,196 | |
Other comprehensive income | | | | | | |
Foreign currency translation adjustment | | 204,844 | | | 440 | |
| | | | | | |
Comprehensive income | | 119,059 | | | 403,636 | |
Comprehensive loss (income) attributable to noncontrolling interest | | 5,851 | | | (15,914 | ) |
| | | | | | |
Comprehensive (loss) income attributable to Company’s common stockholders | $ | 124,910 | | $ | 387,722 | |
3
China GengSheng Minerals, Inc.
Condensed Consolidated Statements of Operations and Comprehensive Income (Cont’d)
| | Three months ended | |
| | March 31, | |
| | 2011 | | | 2010 | |
| | (Unaudited) | | | (Unaudited) | |
(Loss) earnings per share - Note 15 - Basic and diluted attributable to Company’s common stockholders | $ | (0.003 | ) | $ | 0.02 | |
Weighted average number of shares - Basic and diluted | | 26,627,719 | | | 24,108,646 | |
The accompanying notes are an integral part of these condensed consolidated financial statements
4
China GengSheng Minerals, Inc.
Condensed Consolidated Statements ofCash Flows
| | Three months ended March 31, | |
| | 2011 | | | 2010 | |
| | (Unaudited) | | | (Unaudited) | |
Cash flows from operating activities | | | | | | |
Net (loss) income before noncontrolling interest | $ | (85,785 | ) | $ | 403,196 | |
Adjustments to reconcile net (loss) income before noncontrolling interest to net cash used in operating activities: | | | | | | |
Depreciation | | 500,644 | | | 357,883 | |
Amortization of land use right | | 5,514 | | | 5,990 | |
Amortization of intangible assets | | 19,025 | | | 13,336 | |
Deferred taxes | | 162,168 | | | (20,494 | ) |
Provision for doubtful debts | | 250,783 | | | (4,251 | ) |
Share-based compensation | | - | | | 261,200 | |
Deferred revenue amortized | | (45,660 | ) | | - | |
Change in fair value of warrant liabilities | | (260,000 | ) | | - | |
Changes in operating assets and liabilities: | | | | | | |
Restricted cash | | (6,810,950 | ) | | 733,500 | |
Trade receivables | | 3,242,541 | | | (1,280,270 | ) |
Bills receivable | | (273,579 | ) | | 540,059 | |
Other receivables and prepayments | | (4,509,546 | ) | | (210,350 | ) |
Inventories | | (2,435,941 | ) | | (946,938 | ) |
Other payables and accrued expenses | | 946,972 | | | 1,251,547 | |
Trade payables | | 2,164,614 | | | (653,019 | ) |
Bills payable | | 6,810,950 | | | (1,512,200 | ) |
Income taxes payable | | (141,148 | ) | | 509,756 | |
| | | | | | |
Net cash flows used in operating activities | | (459,398 | ) | | (551,055 | ) |
| | | | | | |
Cash flows from investing activities | | | | | | |
Payments for deposits of acquisition of land use right, property, plant and equipment | | (1,508,148 | ) | | - | |
Payments for acquisition of property, plant and equipment | | (1,849,334 | ) | | (812,953 | ) |
| | | | | | |
Net cash flows used in investing activities | | (3,357,482 | ) | | (812,953 | ) |
| | | | | | |
Cash flows from financing activities | | | | | | |
Net proceeds from issue of shares | | 9,258,466 | | | - | |
Restricted cash | | (7,193,779 | ) | | 733,500 | |
Proceeds from bank loans | | 19,299,987 | | | 6,601,500 | |
Repayment of bank loans | | (6,544,600 | ) | | (8,802,000 | ) |
Proceeds from non-interest-bearing loans | | - | | | 2,204,167 | |
Repayment of non-interest-bearing loans | | (478,016 | ) | | (23,391 | ) |
Government grant received | | - | | | 178,974 | |
| | | | | | |
Net cash flows provided by financing activities | | 14,342,058 | | | 892,750 | |
| | | | | | |
Effect of foreign currency translation on cash and cash equivalents | | 21,819 | | | (19 | ) |
| | | | | | |
Net increase (decrease) in cash and cash equivalents | | 10,546,997 | | | (471,277 | ) |
Cash and cash equivalents - beginning of period | | 925,052 | | | 992,204 | |
| | | | | | |
Cash and cash equivalents - end of period | $ | 11,472,049 | | $ | 520,927 | |
5
China GengSheng Minerals, Inc.
Condensed Consolidated Statements of Cash Flows (Cont’d)
| | Three months ended March 31, | |
| | 2011 | | | 2010 | |
| | (Unaudited) | | | (Unaudited) | |
| | | | | | |
Supplemental disclosure of cash flow information: | | | | | | |
Cash paid for: | | | | | | |
Interest | $ | 965,732 | | $ | 239,514 | |
Income taxes | $ | 114,639 | | $ | - | |
The accompanying notes are an integral part of these condensed consolidated financial statements
6
ChinaGengShengMinerals, Inc.
ConsolidatedStatements of Equity
| | China GengSheng Minerals, Inc. stockholders | | | | | | | |
| | | | | | | | | | | | | | Accumulated | | | | | | | | | | |
| | Common stock | | | | | | | | | other | | | | | | | | | | |
| | Number of | | | | | | Additional | | | Statutory and | | | comprehensive | | | Retained | | | Noncontrolling | | | | |
| | shares | | | Amount | | | paid-in capital | | | other reserves | | | income | | | earnings | | | interest | | | Total | |
| | | | | | | | | | | | | | | | | | | | | | | | |
Balance, December 31, 2010 | | 24,294,386 | | $ | 24,294 | | $ | 19,903,388 | | $ | 7,521,114 | | $ | 5,949,455 | | $ | 17,636,730 | | $ | 289,917 | | $ | 51,324,898 | |
Share issued for proceeds of $10 million (Note 12) | | 2,500,000 | | | 2,500 | | | 9,027,500 | | | - | | | - | | | - | | | - | | | 9,030,000 | |
Cost of raising capital | | - | | | - | | | (741,534 | ) | | - | | | - | | | - | | | - | | | (741,534 | ) |
Net loss | | - | | | - | | | - | | | - | | | - | | | (79,934 | ) | | (5,851 | ) | | (85,785 | ) |
Foreign currency translation adjustments | | - | | | - | | | - | | | - | | | 204,844 | | | - | | | - | | | 204,844 | |
| | | | | | | | | | | | | | | | | | | | | | | | |
Balance, March 31, 2011 | | 26,794,386 | | $ | 26,794 | | $ | 28,189,354 | | $ | 7,521,114 | | $ | 6,154,299 | | $ | 17,556,796 | | $ | 284,066 | | $ | 59,732,423 | |
The accompanying notes are an integral part of these condensed consolidated financial statements.
7
China GengSheng Minerals, Inc.
Notes to Condensed Consolidated Financial Statements
| 1. | Basis of presentation and change of accounting estimate |
| | |
| Basis of presentation |
| | |
| These unaudited condensed consolidated financial statements of the Company and its subsidiaries have been prepared in accordance with the rules and regulations of the Securities and Exchange Commission (the “SEC”) including the instructions to Form 10-Q and Regulation S-X. Certain information and note disclosures normally included in financial statements prepared in accordance with accounting principles generally accepted in the United States of America (the “US GAAP”) have been condensed or omitted from these statements pursuant to such rules and regulation and, accordingly, they do not include all the information and notes necessary for comprehensive consolidated financial statements and should be read in conjunction with our audited consolidated financial statements for the year ended December 31, 2010, included in our Annual Report on Form 10-K for the year ended December 31, 2010. |
| | |
| In the opinion of the management of the Company, all adjustments, which are of a normal recurring nature, necessary for a fair statement of the results for the three-month periods have been made. Results for the interim period presented are not necessarily indicative of the results that might be expected for the entire fiscal year. |
| | |
| Change of accounting estimate |
| | |
| During the first quarter of 2011, the Company completed a review of the estimated useful life of its unpatented technology. Based on historical useful life information, as well as forecasted product life cycles and demand expectations, the remaining useful life of that unpatented technology is five years. In accordance with authoritative guidance, this was accounted for as a change in accounting estimate and was made on a prospective basis effective January 1, 2011. For the three months ended March 31, 2011, amortization expense, which is included in administrative expenses, was $19,025. The effect of this change on basic and diluted loss per share for the three months ended March 31, 2011 was $0.0007 per share. |
| | |
| 2. | Corporate information |
| | |
| The Company was originally incorporated on November 13, 1947, in accordance with the laws of the State of Washington as Silver Mountain Mining Company. On August 20, 1979, the Articles of Incorporation were amended to change the corporate name of the Company to Leadpoint Consolidated Mines Company. On August 15, 2006, the Company changed its state of incorporation from Washington to Nevada by means of a merger with and into a Nevada corporation formed on May 23, 2006, solely for the purpose of effecting the reincorporation and changed its name to Point Acquisition Corporation. On June 11, 2007, the Company changed its name to China Minerals Technologies, Inc. and on July 26, 2007, the Company changed its name to China GengSheng Minerals, Inc. On March 4, 2010, the Company’s common stock began trading on the NYSE Amex stock exchange (formerly the American Stock Exchange) under the symbol “CHGS.” Prior to March 4, 2010, the Company’s common stock traded over-the-counter bulletin board under the symbol CHGS.OB. |
| | |
| Currently the Company has seven subsidiaries |
| | Company name | Place/date of | The Company's | Common stock/ | Principal activities |
| | | incorporation or | effective ownership | registered capital | |
| | | establishment | interest | | |
| | | | | | |
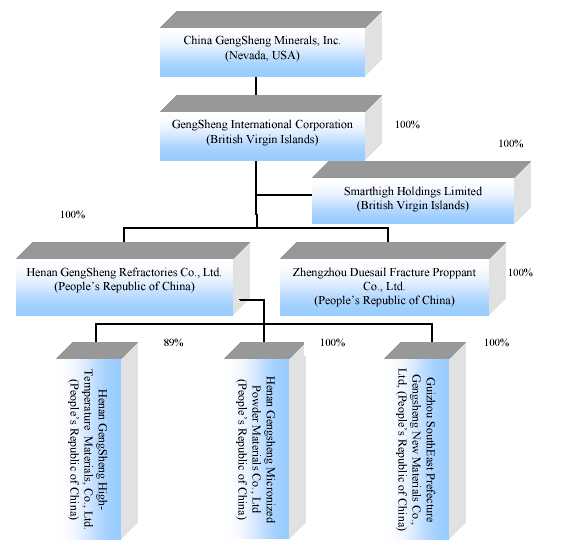
| | GengSheng International Corporation
(“GengSheng International”) | The British Virgin Islands (the “BVI”)/
November 3, 2004 | 100% | Ordinary shares :-
Authorized: 50,000 shares of $1 each
Paid up: 100 shares of $1 each | Investment holding |
| | Henan GengSheng Refractories Co., Ltd. (“Refractories”) | The People's Republic of China (the “PRC”)/
December 20, 1996 | 100% | Registered capital of $12,089,879 fully paid up | Manufacturing and selling of refractory products |
8
China GengSheng Minerals, Inc.
Notes to Condensed Consolidated Financial Statements
| 2. | Corporate information (Cont’d) |
| | Henan GengSheng
High-Temperature
Materials Co., Ltd.
(“High-Temperature”) | PRC/
September 4, 2002 | 89.33% | Registered capital
of $1,246,300
fully paid up | Manufacturing
and selling
of functional
ceramic products |
| | Smarthigh Holdings
Limited
(“Smarthigh”) | BVI/
November 5, 2004 | 100% | Ordinary shares :-
Authorized: 50,000
shares of $1 each
Paid up: 100 shares
of $1 each | Investment
holding |
| | ZhengZhou Duesail
Fracture Proppant
Co., Ltd.
(“Duesail”) | PRC/
August 14, 2006 | 100% | Registered capital of
$2,800,000 fully
paid up | Manufacturing
and selling
of fracture
proppant products |
| | Henan GengSheng
Micronized Powder
Materials Co., Ltd.
(“Micronized”) | PRC/
March 31, 2008 | 100% | Registered capital of
$5,823,000 fully
paid up | Manufacturing
and selling
of fine
precision abrasives |
| | Guizhou Southeast
Prefecture GengSheng
New Materials Co., Ltd.
( “Prefecture” ) | PRC/
April 13, 2004 | 100% | Registered capital of
$141,840 fully
paid up | Manufacturing
and selling
of corundum
materials |
| 3. | Description of business |
| | |
| The Company is a holding company whose primary business operations are conducted through its subsidiaries located in the PRC’s Henan Province. Prefecture is located in Guizhou Province and is manufacturing corundum materials, a major raw material for monolithic refractory. Through its operating subsidiaries, the Company produces and markets a broad range of monolithic refractory, industrial ceramics, fracture proppants, fine precision abrasives, and corundum materials. |
| | |
| The principal raw materials used in the products are several forms of aluminum oxide, including bauxite, processed AI2O3and calcium aluminates cement, and other materials, such as corundum, magnesia, resin and silica, which are primarily sourced from suppliers located in the PRC. The production facilities of the Company, other than the Prefecture’s sub-processing factory located in Guizhou, are also located in Henan Province. |
| | |
| Refractories products allow steel makers and other customers to improve the productivity and longevity of their equipment and machinery. Functional ceramic products mainly include abrasive balls and tiles, valves, electronic ceramics and structural ceramics. Fracture proppant products are used to reach trapped pockets of oil and natural gas deposits, which lead to higher productivities of oil and natural gas wells. Due to their heat-resistant qualities and ability to function under thermal stress, refractories serve as components in industrial furnaces and other heavy industrial machinery. Corundum materials are major raw material for producing monolithic refractory. Fine precision abrasive is the Company’s new product that was commercially launched in the fourth quarter of 2009, and is used for slicing the solar-silicon bar and polishing the equipment surface. The Company’s customers include some of the largest steel and iron producers located in 25 provinces in the PRC, as well as in the United States and other countries in Asia, and Europe. |
| | |
| 4. | Summary of significant accounting policies |
| | |
| Basis of consolidation |
| | |
| The condensed consolidated financial statements include the accounts of the Company and its subsidiaries. All significant inter-company accounts and transactions have been eliminated in consolidation. |
9
China GengSheng Minerals, Inc.
Notes to Condensed Consolidated Financial Statements
| 4. | Summary of significant accounting policies (Cont’d) |
| | |
| Concentrations of credit risk |
| | |
| Financial instruments that potentially subject the Company to significant concentrations of credit risk consist principally of cash and cash equivalents, trade, bills and other receivables. As of March 31, 2011 and December 31, 2010, substantially all of the Company’s cash and cash equivalents and restricted cash were held by major financial institutions located in the PRC, which management believes are of high credit quality. With respect to trade and other receivables, the Company extends credit based on an evaluation of the customer’s financial condition. The Company generally does not require collateral for trade and other receivables and maintains an allowance for doubtful accounts of trade and other receivables. |
| | |
| Regarding bills receivable, they are undertaken by the banks to honor the payments at maturity and the customers are required to place deposits with the banks equivalent to a certain percentage of the bills amount as collateral. These bills receivable can be sold to any third party at a discount before maturity. The Company does not maintain allowance for bills receivable in the absence of bad debt experience and the payments are undertaken by the banks. |
| | |
| During the reporting periods, customers represented 10% or more of the Company’s condensed consolidated sales are: |
| | | | Three months ended | |
| | | | March 31, | |
| | | | (Unaudited) | |
| | | | 2011 | | | 2010 | |
| | | | | | | | |
| | Shangdong Steel Co., Ltd. | $ | 1,795,952 | | $ | 1,850,313 | |
| | AMSAT International Limited | | 2,671,222 | | | - | |
| | | | | | | | |
| | | $ | 4,467,174 | | $ | 1,850,313 | |
| | Fair value of financial instruments |
| | |
| | ASC 820 requires the disclosure of the estimated fair value of financial instruments including those financial instruments for which fair value option was not elected. The Company’s financial instruments carried at fair value include warrant liabilities only. The required disclosure is set out in Note 11. |
| | |
| | Except for the warrant liabilities, the carrying amount of financial assets and liabilities approximate their fair value due to short maturities. |
| | |
| | Recently issued accounting pronouncements |
| | |
| | The Financial Accounting Standards Board (“the FASB”) issued Accounting Standards Update (ASU) No. 2011-01, “Receivables (Topic 310): Deferral of the Effective Date of Disclosures about Troubled Debt Restructurings in Update No. 2010-20”. The amendments in this Update temporarily delay the effective date of the disclosure about troubled debt restructurings in ASU 2010-20 for public entities. The delay is intended to allow the Board time to complete its deliberations on what constitutes a troubled debt restructuring. The effective date of the new disclosures about troubled debt restructuring for public entities and the guidance for determining what constitutes a troubled debt restructuring will then be coordinated. Currently, that guidance is anticipated to be effective for interim and annual periods ending after June 15, 2011. The adoption of this ASU update has no material impact on the Company’s financial statements. |
| | |
| | In April 2011, the FASB issued ASU 2011-02,A Creditor’s Determination of Whether a Restructuring is a Troubled DebtRestructuring(Topic 310). ASU 2011-02 clarifies the criteria for a restructuring to be classified as a TDR. The effective date of ASU 2011-02 will be the first interim or annual period beginning after June 15, 2011 and should be applied retrospectively to the beginning of the annual period of adoption. The management is in the process of evaluating the impact of adopting this ASU on the Company’s financial statements. |
10
China GengSheng Minerals, Inc.
Notes to Condensed Consolidated Financial Statements
| 4. | Summary of significant accounting policies (Cont’d) |
| | |
| Recently issued accounting pronouncements |
| | |
| In December 2010, the FASB issued ASU 2010-28 which amend “Intangibles - Goodwill and Other” (Topic 350). The ASU modifies Step 1 of the goodwill impairment test for reporting units with zero or negative carrying amounts. For those reporting entities, they are required to perform Step 2 of the goodwill impairment test if it is more likely than not that a goodwill impairment exists. An entity should consider whether there are any adverse qualitative factors indicating that impairment may exist. The qualitative factors are consistent with the existing guidance in Topic 350, which requires that goodwill of a reporting unit be tested for impairment between annual tests if an event occurs or circumstances changes that would more likely than not reduce the faire value of a reporting unit below its carrying amount. ASU 2010-28 is effective for fiscal years, and interim periods within those years beginning after December 15, 2010. Early adoption is not permitted. The adoption of this ASU update has no material impact on the Company’s financial statements. |
| | |
| In April 2010, the FASB issued ASU 2010-13, “Compensation-Stock Compensation (Topic 718): Effect of Denominating the Exercise Price of a Share-Based Payment Award in the Currency of the Market in Which the Underlying Equity Security Trades,” or ASU 2010-13. ASU 2010-13 provides amendments to Topic 718 to clarify that an employee share-based payment award with an exercise price denominated in currency of a market in which a substantial porting of the entity’s equity securities trades should not be considered to contain a condition that is not a market, performance, or service condition. Therefore, an entity would not classify such an award as a liability if it otherwise qualifies as equity. The amendments in this Update are effective for fiscal years, and interim periods within those fiscal years, beginning on or after December 15, 2010. The adoption of this ASU update has no material impact on the Company’s financial statements. |
| | |
| 5. | Restricted cash and bills payable |
| | | | As of | | | As of | |
| | | | March 31, | | | December 31, | |
| | | | 2011 | | | 2010 | |
| | | | (Unaudited) | | | (Audited) | |
| | | | | | | | |
| | Bank deposits held as collateral for bills payable (Note 5a) | $ | 15,334,150 | | $ | 8,495,200 | |
| | Bank deposits held as collateral for bank loans | | 20,435,179 | | | 13,197,900 | |
| | | | | | | | |
| | | $ | 35,769,329 | | $ | 21,693,100 | |
| | Note :- |
| | | |
| a) | The Company is requested by certain of its suppliers to settle amounts owed to such suppliers by the issuance of bills through banks for which the banks undertake to guarantee the Company’s settlement of these amounts at maturity. These bills are interest free and would be matured within six months from the date of issuance. As collateral security for the banks’ undertakings, the Company is required to pay the bank charges as well as maintaining deposits with such banks amounts equal to 50% to 100% of the bills’ amounts issued. |
|
|
|
|
11
China GengSheng Minerals, Inc.
Notes to Condensed Consolidated Financial Statements
| | | | As of | | | As of | |
| | | | March 31, | | | December 31, | |
| | | | 2011 | | | 2010 | |
| | | (Unaudited) | | | (Audited) | |
| | | | | | | | |
| | Raw materials | $ | 7,580,101 | | $ | 7,699,321 | |
| | Work-in-progress | | 1,911,997 | | | 1,796,236 | |
| | Finished goods | | 8,700,623 | | | 6,209,411 | |
| | | | | | | | |
| | | | 18,192,721 | | | 15,704,968 | |
| | Provision for obsolete inventories | | (25,560 | ) | | (25,476 | ) |
| | | | | | | | |
| | | $ | 18,167,161 | | $ | 15,679,492 | |
| No provision for obsolete inventories was recognized in the cost of goods sold during the three months ended March 31, 2011. |
| | |
| 7. | Goodwill and intangible assets, net |
| | | | As of | | | As of | |
| | | | March 31, | | | December 31, | |
| | | | 2011 | | | 2010 | |
| | | | (Unaudited) | | | (Audited) | |
| | Costs: | | | | | | |
| | Unpatented technology - Note a | $ | 380,500 | | $ | 379,250 | |
| | Accumulated amortization | | (19,025 | ) | | - | |
| | | | | | | | |
| | Net | $ | 361,475 | | $ | 379,250 | |
| | | | | | | | |
| | Goodwill - Note c | $ | 460,135 | | $ | 441,089 | |
| | Notes :- |
| | | |
| a) | During 2007, Refractories entered into a contract with an independent third party to purchase unpatented technical technology in relation to the production of mortar, at a cash consideration of $342,750. This consideration was mutually agreed between Refractories and such third party and this unpatented technology can be used for an unlimited period of time. Since its acquisition, an annual impairment review was performed by management and no impairment was identified and accordingly, it is stated at cost in 2008. In 2011, the expected useful life of the unpatented technology was reviewed and can be used up to 2015. |
| | | |
| b) | During 2008, GengSheng International, entered into a contract with an individual third party (the “Licensor”) for a patented technology license for use up to 2021. This patented technology represents “know-how” on methods and installation for removal particles from the powder for Abrasives. Amortization started form January 1, 2010, when the production commenced. On December 30, 2010, the Company entered into an agreement with the Licensor pursuant to which the Company agreed to dispose of the patented technology license with carrying amount of $552,982 back to the Licensor for a consideration of $606,800 and resulting in a gain of $53,818. |
| | | |
| c) | The goodwill was identified upon the acquisition of 100% equity interest in Prefecture, which represented the excess of the purchase price of $875,400 over the fair value of acquired identified net assets of Prefecture of $434,311 at the time of acquisition on June 12, 2008. Since its acquisition, annual impairment reviews have been performed by management and no impairment was identified. |
During the periods ended March 31, 2011 and 2010, amortization charge was $19,025 and $13,336 respectively.
12
China GengSheng Minerals, Inc.
Notes to Condensed Consolidated Financial Statements
| 8. | Property, plant and equipment, net |
| | | | As of | | | As of | |
| | | | March 31, | | | December 31, | |
| | | | 2011 | | | 2010 | |
| | | | (Unaudited) | | | (Audited) | |
| | Costs: | | | | | | |
| | Buildings | $ | 19,617,749 | | $ | 19,737,372 | |
| | Plant and machinery | | 9,081,888 | | | 9,070,723 | |
| | Furniture, fixture and equipment | | 808,176 | | | 675,398 | |
| | Motor vehicles | | 2,005,936 | | | 2,093,928 | |
| | | | | | | | |
| | | | 31,513,749 | | | 31,577,421 | |
| | Accumulated depreciation | | (6,095,985 | ) | | (5,589,635 | ) |
| | Construction in progress | | 2,204,677 | | | 200,449 | |
| | | | | | | | |
| | Net | $ | 27,622,441 | | $ | 26,188,235 | |
| Note: | |
| | | |
| (i) | Construction in progress |
| | | |
| | Construction in progress mainly comprises capital expenditure for construction of the Company’s new office and factories. |
| | | |
| 9. | Non-interest-bearing loans |
| | | |
| The loans represent interest-free and unsecured loans from third parties and government authority and are repayable on demand. |
| | | |
| 10. | Collateralized bank loans |
| | | | As of | | | As of | |
| | | | March 31, | | | December 31, | |
| | | | 2011 | | | 2010 | |
| | | | (Unaudited) | | | (Audited) | |
| | | | | | | | |
| | Bank loans repayable within 1 year | $ | 54,534,287 | | $ | 41,641,650 | |
The above bank loans are denominated in RMB and carry average interest rates at 5.59% per annum with maturity dates ranging from four months to eight months.
The bank loans as of March 31, 2011 were secured by the followings:
(a) Guarantee executed by Mr. Shunqing Zhang, a director and a shareholder of the Company;
(b) Guarantee executed by business associates (Note 16(b)); and
(c) Bank deposits of $20,435,179 (Note 5).
During the reporting periods, there was no covenant requirement under the banking facilities granted to the Company.
13
China GengSheng Minerals, Inc.
Notes to Condensed Consolidated Financial Statements
| 11. | Warrant liabilities |
| | | |
| In accordance with ASC 815, the one year warrants, which were issued in a private placement completed as of January 7, 2011 as stated in Note 12(a), to purchase up to 1,000,000 common shares are not considered indexed to the Company’s own equity and should be classified as derivative financial liability at fair value for each reporting period. Accordingly, a part of the net proceed from the private placement amounting to $970,000 representing the fair value at initial recognition, was allocated to warrant liabilities. |
| | | |
| The fair value of these warrants was calculated using trinomial model. The assumptions that were used to calculate fair value of the warrants as of March 31, 2011 are as follows:- |
| | | |
| | Expected volatility of 82.07% |
| | Expected dividend yield of 0% |
| | Risk-free interest rate of 0.07% |
| | Expected lives of 1 years |
| | Exercise price of $4 per share |
| | | |
| As of March 31, 2011, the fair value of warrant liabilities was $710,000, and corresponding gain on change in fair value of warrant liabilities of $260,000 was recognized in the condensed consolidated statement of operations and comprehensive income for the three months ended March 31, 2011. |
| | | |
| Fair value accounting : ASC 820 establishes a valuation hierarchy for disclosure of the inputs to fair value measurement. This hierarchy prioritizes the inputs into three broad levels as follows :- |
| | | |
| Level 1 - Quoted prices in active markets for identical assets or liabilities. |
| | | |
| Level 2 - Observable inputs other than quoted prices in active markets for identical assets or liabilities. |
| | | |
| Level 3 - Unobservable inputs to the valuation methodology that are significant to the measurement of fair value of assets or liabilities. |
| | | |
| The warrant liabilities are determined by using Level 3 inputs. The following tables summarize the changes in Level 3 items measured at fair value on a recurring basis on our balance sheet during the period ended March 31, 2011 :- |
| | | | Warrant | |
| | | | liabilities | |
| | | | | |
| | Balance, January 1, 2011 | $ | - | |
| | Purchase, issuances and settlements | | 970,000 | |
| | Total gains (realized/unrealized) | | (260,000 | ) |
| | Transfer in and/or out of Level 3 | | - | |
| | | | | |
| | Balance, March 31, 2011 | $ | 710,000 | |
14
China GengSheng Minerals, Inc.
Notes to Condensed Consolidated Financial Statements
| 12. | Common stock and additional paid-in capital |
| | | | | | | | | | Additional | |
| | | | Number of | | | | | | paid-in | |
| | | | shares | | | Amount | | | capital | |
| | | | | | | | | | | |
| | Balance, January 1, 2011 | | 24,294,386 | | $ | 24,294 | | $ | 19,903,388 | |
| | Share issued for proceeds of $10 million - Note 12(a) | | 2,500,000 | | | 2,500 | | | 9,027,500 | |
| | Cost of raising capital | | - | | | - | | | (741,534 | ) |
| | | | | | | | | | | |
| | Balance, March 31, 2011 | | 26,794,386 | | $ | 26,794 | | $ | 28,189,354 | |
| Note:- | |
| | | |
| (a) | As of January 7, 2011, the Company completed a private placement of 2,500,000 common shares and warrants to purchase up to 1,000,000 common shares at an exercise price of $4 per share for a gross proceeds of $10,000,000 with related issuance expenses of $741,534. Because the warrants are denominated in U.S. dollars and the Company’s functional currency is Renminbi, they do not meet the requirements of the accounting standard to be indexed only to the Company’s stock. Accordingly, they are accounted for at fair value as derivative liabilities and marked to market in each period. |
| | | |
| 13. | Finance costs |
| | | | Three months ended | |
| | | | March 31, | |
| | | | (Unaudited) | |
| | | | 2011 | | | 2010 | |
| | | | | | | | |
| | Interest expenses | $ | 813,726 | | $ | 230,690 | |
| | Bills discounting charges | | 152,006 | | | 170,560 | |
| | Bank charges | | - | | | 3,946 | |
| | | | | | | | |
| | | $ | 965,732 | | $ | 405,196 | |
| 14. | Income taxes |
| | |
| UNITED STATES |
| | |
| The Company is incorporated in the United States of America (“U.S.”) and is subject to U.S. tax law. No provisions for income taxes have been made as the Company has no U.S. taxable income for reporting periods. The applicable income tax rate for the reporting periods is 34%. The Company has not provided deferred tax on undistributed earnings of its non-U.S. subsidiaries as of March 31, 2011, as it is the Company's current policy to reinvest these earnings in non-U.S. operations. |
| | |
| BVI |
| | |
| GengSheng International and Smarthigh were incorporated in the BVI and are not subject to income taxes under the current laws of the BVI. |
15
China GengSheng Minerals, Inc.
Notes to Condensed Consolidated Financial Statements
| 14. | Income taxes (Cont’d) |
| | |
| PRC |
| | |
| The PRC’s legislative body, the National People’s Congress, adopted the unified Corporate Income Tax Law (“CIT Law”) on March 16, 2007. This new tax law replaces the existing separate income tax laws for domestic enterprises and foreign-invested enterprises and became effective on January 1, 2008. Under the new tax law, an unified income tax rate is set at 25% for both domestic enterprises and foreign-invested enterprises. However, there will be a transition period for enterprises, whether foreign-invested or domestic, that are currently receiving preferential tax treatments granted by relevant tax authorities. Enterprises that are subject to an enterprise income tax rate lower than 25% may continue to enjoy the lower rate and will transit into the new tax rate over a five year period beginning on the effective date of the CIT Law. Enterprises that are currently entitled to exemptions for a fixed term will continue to enjoy such treatment until the exemption term expires. Preferential tax treatment will continue to be granted to industries and projects that qualify for such preferential treatments under the new tax law. |
| | |
| Pursuant to the income tax rules and regulations of the PRC, provision for PRC income tax of the PRC subsidiaries is calculated based on the following rates : - |
| | | | Period ended March 31, |
| | | Note | 2011 | 2010 |
| | | | | |
| | Refractories | (a) | 15% | 15% |
| | High-Temperature | | 25% | 25% |
| | Duesail | (a) | 12.5% | 12.5% |
| | Prefecture | | 25% | 25% |
| | Micronized | | 25% | 25% |
| | Note:- |
| | | |
| (a) | Entities entitled to a tax holiday in which they are fully exempted from the PRC enterprise income tax for 2 years starting from their first profit-making year after netting off accumulated tax losses, followed by a 50% reduction in the PRC enterprise income tax for the next 3 years (“tax holidays”). Any unutilised tax holidays will continue until expiry while tax holidays were deemed to start from January 1, 2008, even if the entity was not yet making profit after netting off its accumulated tax losses. Duesail is in the third year of tax holidays in 2010. Refractories is in the third year of tax holidays in 2009 and starting from the fiscal year 2010, Refractories is subject to enterprise income tax at unified rate of 15% for three years due to its engagement in an advance technology industry and has passed the inspection of the provincial high-tech item. The relevant authority granted it a certificate at end of 2008. |
In July 2006, the FASB issued ASC 740-10-25. This interpretation requires recognition and measurement of uncertain income tax positions using a “more-likely-than-not” approach. The Company adopted this ASC 740-10-25 on January 1, 2007. Under the new CIT Law which became effective on January 1, 2008, the Company may be deemed to be a resident enterprise by the PRC tax authorities. If the Company was deemed to be resident enterprise, the Company may be subject to the CIT at 25% on the worldwide taxable income and dividends paid from the PRC subsidiaries to their overseas holding companies may be exempted from 10% PRC withholding tax. Except for certain immaterial interest income from bank deposits placed with financial institutions outside the PRC, all of the Company’s income is generated from the PRC operation. Given the immaterial amount of income generated from outside the PRC and the PRC subsidiaries do not intend to pay dividends for the foreseeable future, the management considers that the impact arising from resident enterprise on the Company’s financial position is not significant. The management evaluated the Company's tax positions and considered no provision for uncertainty in income taxes is necessary as of March 31, 2011 and 2010.
16
China GengSheng Minerals, Inc.
Notes to Consolidated Financial Statements
| 15. | (Loss) earnings per share |
| | | |
| During the reporting periods, certain share-based awards and warrants were not included in the computation of diluted (loss) earnings per share because they were anti-dilutive. Accordingly, the basic and diluted (loss) earnings per share are the same. |
| | | |
| 16. | Commitments and contingencies |
| | | |
| (a) | The Company’s operations are subject to the laws and regulations in the PRC relating to the generation, storage, handling, emission, transportation and discharge of certain materials, substances and waste into the environment, and various other health and safety matters. Governmental authorities have the power to enforce compliance with their regulations, and violators may be subject to fines, injunctions or both. The Company must devote substantial financial resources to ensure compliance and believes that it is in substantial compliance with all the applicable laws and regulations. |
| | | |
| | The Company is currently not involved in any environmental remediation and has not accrued any amounts for environmental remediation relating to its operations. Under existing legislation, management believes that there are no probable liabilities that will have a material adverse effect on the financial position, operating results or cash flows of the Company. |
| | | |
| (b) | The Company guaranteed the following debts of third parties, which is summarized as follows:- |
| | | | As of | | | As of | |
| | | | March 31, | | | December 31, | |
| | | | 2011 | | | 2010 | |
| | | | (Unaudited) | | | (Audited) | |
| | | | | | | | |
| | Guaranteed amount | $ | 43,072,600 | | $ | 34,587,600 | |
In 2010, the Company, in accordance with ASC 460, commenced to recognize the liability arising from guarantees given for the debts granted to third parties by financial institutions.
An analysis of the guarantee liability is as follows:
| | | | Three months | | | | |
| | | | ended | | | Year ended | |
| | | | March 31, | | | December 31, | |
| | | | 2011 | | | 2010 | |
| | | | | | | | |
| | Balance at beginning of period/year | $ | 392,978 | | $ | - | |
| | Recognized as expenses for the period / year | | 87,515 | | | 622,192 | |
| | Recognized as income for the period / year | | (87,296 | ) | | (238,798 | ) |
| | Translation adjustments | | 1,296 | | | 9,584 | |
| | | | | | | | |
| | Balance at end of period/year | $ | 394,493 | | $ | 392,978 | |
The fair value of such guarantees is determined by reference to fees charged in an arm’s length transaction for similar services.
17
China GengSheng Minerals, Inc.
Notes to Condensed Consolidated Financial Statements
| 16. | Commitments and contingencies (Cont’d) |
| | |
| Guarantees as of March 31, 2011 are further analyzed as below:- |
| | | | | | | | | | | | | | | | | | | | | | Outstanding | | | | |
| | | | Term loan | | | | | | Interest | | | | | | Principal repaid | | | Outstanding as of | | | interest as of | | | Estimated | |
| | | | draw down | | | | | | rate (per | | | | | | up to March 31, | | | March 31, | | | March 31, | | | maximum | |
| | Guarantee | | date | | | Expiry date | | | annum) | | | Loan principal | | | 2011 | | | 2011 | | | 2011 | | | exposure | |
| | | | | | | | | | | | | | | | | | | | | | | | | | |
| | Local government
authorities and their
controlled entity
(Note i) | | 6/21/2010 | | | 6/20/2011 | | | 5.31% | | $ | 3,805,000 | | $ | - | | $ | 3,805,000 | | $ | 50,511 | | $ | 3,855,511 | |
| | | | 12/30/2009 | | | 12/29/2012 | | | 7.56% | | | 7,610,000 | | | - | | | 7,610,000 | | | 1,006,803 | | | 8,616,803 | |
| | | | | | | | | | | | | | | | | | | | | | | | | | |
| | Business associates
(Note ii) | | 8/13/2010 | | | 8/12/2011 | | | 5.31% | | | 1,522,000 | | | - | | | 1,522,000 | | | 26,939 | | | 1,548,939 | |
| | | | 7/29/2010 | | | 7/28/2011 | | | 6.37% | | | 3,044,000 | | | - | | | 3,044,000 | | | 64,654 | | | 3,108,654 | |
| | | | 9/27/2010 | | | 9/26/2011 | | | 5.31% | | | 3,044,000 | | | - | | | 3,044,000 | | | 67,348 | | | 3,111,348 | |
| | | | 10/29/2010 | | | 10/28/2011 | | | 5.31% | | | 3,044,000 | | | - | | | 3,044,000 | | | 80,818 | | | 3,124,818 | |
| | | | 12/8/2010 | | | 12/7/2011 | | | 5.56% | | | 3,044,000 | | | - | | | 3,044,000 | | | 112,831 | | | 3,156,831 | |
| | | | 12/22/2010 | | | 12/21/2011 | | | 5.56% | | | 3,044,000 | | | - | | | 3,044,000 | | | 126,935 | | | 3,170,935 | |
| | | | 1/12/2011 | | | 1/23/2012 | | | 5.83% | | | 7,610,000 | | | - | | | 7,610,000 | | | 369,719 | | | 7,979,719 | |
| | | | 3/8/2011 | | | 3/8/2012 | | | 6.43% | | | 1,978,600 | | | - | | | 1,978,600 | | | 169,503 | | | 2,148,103 | |
| | | | 3/22/2011 | | | 3/21/2012 | | | 5.84% | | | 4,566,000 | | | - | | | 4,566,000 | | | 266,700 | | | 4,832,700 | |
| | | | 12/25/2010 | | | 12/24/2011 | | | 8.41% | | | 761,000 | | | - | | | 761,000 | | | 48,011 | | | 809,011 | |
| | | | | | | | | | | | | | | | | | | | | | | | | | |
| | | | | | | | | | | | $ | 43,072,600 | | $ | - | | $ | 43,072,600 | | $ | 2,390,772 | | $ | 45,463,372 | |
| | | Notes:- | |
| | | i) | To maintain a good relationship with the local government of Gongyi City, the Company has been so requested to act as guarantor for bank loans granted to certain local government authorities and their controlled entity. |
| | | | |
| | | ii) | During the period, the Company has acted as guarantor for bank loans granted to certain business associates. Certain of these associates also provided guarantees for bank loans to the Company. (Note 10b). None of our directors, director nominees or executive officers is involved in normal operation or investing in the business of the guaranteed business associates. All the business associates have a healthy record to pay back loans on a timely manner, in the People’s Bank of China’s (Central Bank of China) credit rating system. |
| | | | |
| | | All the above guarantees have no recourse provision that would enable the Company to recover from third parties of any amounts paid under the guarantees and any assets held either as collateral or by third parties that the Company can obtain or liquidate to recover all or a portion of the amounts paid under the guarantees. |
| | | | |
| | | If the third parties fail to perform under their contractual obligation, the Company will make future payments including the contractual principal amounts, related interest and penalties. |
| | | | |
| | (c) | As of March 31, 2011, the Company had capital commitments in respect of the acquisition of property, plant and equipment amounting to $1,823,613, which was contracted for but not provided in these financial statements. |
| | | | |
| | (d) | As of March 31, 2011, the Company had capital commitments in respect of the acquisition of land use right amounting to $821,933, which was not contracted for and provided in these financial statements. |
18
China GengSheng Minerals, Inc.
Notes to Condensed Consolidated Financial Statements
| 16. | Commitments and contingencies (Cont’d) |
| | | |
| (e) | In accordance with the PRC tax regulations, the Company’s sales are subject to value added tax (“VAT”) at 17% upon the issuance of VAT invoices to its customers. When preparing these condensed consolidated financial statements, the Company recognized revenue when the significant risks and rewards of ownership have been transferred to the buyer at the time when the products are delivered to and accepted by customers, and made full tax provision in accordance with relevant national and local laws and regulations of the PRC. |
| | | |
| | The Company follows the practice of reporting its revenue for PRC tax purposes when invoices are issued. In the local statutory financial statements prepared under PRC GAAP, the Company recognized revenue on an “invoice basis” instead of when the significant risks and rewards of ownership have been transferred to the buyer at the time when the products are delivered to and accepted by customers. Accordingly, despite the fact that the Company has made full tax provision in the condensed consolidated financial statements, the Company may be subject to a penalty for the deferred reporting of tax obligations. The exact amount of penalty cannot be estimated with any reasonable degree of certainty. The director considers it is very unlikely that the tax penalty will be imposed. |
| | | |
| 17. | Defined contribution plan |
| | | |
| The Company has a defined contribution plan for all qualified employees in the PRC. The employer and its employees are each required to make contributions to the plan at the rates specified in the plan. The only obligation of the Company with respect to the retirement plan is to make the required contributions under the plan. No forfeited contribution is available to reduce the contribution payable in the future years. The defined contribution plan contributions were charged to the condensed consolidated statements of income and comprehensive income. The Company contributed $94,997 and $59,303 for the three months ended March 31, 2011 and 2010, respectively. |
| | | |
| 18. | Segment information |
| | | |
| The Company uses the “management approach” in determining reportable operating segments. The management approach considers the internal organization and reporting used by the Company's chief operating decision maker for making operating decisions and assessing performance as the source for determining the Company's reportable segments. Management, including the chief operating decision maker, reviews operating results solely by the revenue of monolithic refractory products, industrial ceramic products, fracture proppant products, fine precision abrasives and operating results of the Company. As such, the Company has determined that it has four operating segments as defined by ASC 280, “Segment Reporting”: refractories, industrial ceramic, fracture proppant and fine precision abrasives. |
| | | |
| Adjustments and eliminations of inter-company transactions were not included in determining segment profit (loss), as they are not used by the chief operating decision maker. |
Three months ended March 31, (Unaudited)
| | | | Refractories | | | Industrial ceramic | | | Fracture proppant | | | Fine precision abrasives | | | Total | |
| | | | 2011 | | | 2010 | | | 2011 | | | 2010 | | | 2011 | | | 2010 | | | 2011 | | | 2010 | | | 2011 | | | 2010 | |
| | | | | | | | | | | | | | | | | | | | | | | | | | | | | | | | |
| | Revenue from external customers | $ | 9,934,926 | | $ | 10,383,562 | | $ | 229,602 | | $ | 276,097 | | $ | 5,199,855 | | $ | 1,201,693 | | $ | 819,446 | | $ | - | | $ | 16,183,829 | | $ | 11,861,352 | |
| | Segment profit (loss) | $ | (553,787 | ) | $ | 654,865 | | $ | (54,839 | ) | $ | 190,646 | | $ | 560,268 | | $ | 204,375 | | $ | (157,209 | ) | $ | (221,445 | ) | $ | (205,567 | ) | $ | 828,441 | |
| | | | | | | | | | | | | | | | | | | | | | | | | | | | | | | | |
| | | | March | | | December | | | March | | | December | | | March | | | December | | | March | | | December | | | March | | | December | |
| | | | 31, | | | 31, | | | 31, | | | 31, | | | 31, | | | 31, | | | 31, | | | 31, | | | 31, | | | 31, | |
| | | | 2011 | | | 2010 | | | 2011 | | | 2010 | | | 2011 | | | 2010 | | | 2011 | | | 2010 | | | 2011 | | | 2010 | |
| | | | (Unaudited) | | | (Audited) | | | (Unaudited) | | | (Audited) | | | (Unaudited) | | | (Audited) | | | (Unaudited) | | | (Audited) | | | (Unaudited) | | | (Audited) | |
| | | | | | | | | | | | | | | | | | | | | | | | | | | | | | | | |
| | Segment assets | $ | 77,459,056 | | $ | 77,755,761 | | $ | 3,879,942 | | $ | 3,919,714 | | $ | 48,685,580 | | $ | 22,978,666 | | $ | 21,052,620 | | $ | 18,533,348 | | $ | 151,077,198 | | $ | 123,187,489 | |
19
China GengSheng Minerals, Inc.
Notes to Condensed Consolidated Financial Statements
| 18. | Segment information (Cont'd) |
| | |
| Segment information by products for the three months ended March 31, 2011 and 2010 |
| | | | | | | | | | | | | | | | | | | | | | | | | Fine | | | | |
| | | | Monolithic | | | | | | Pre-cast | | | Ceramic | | | Ceramic | | | Wearable | | | Fracture | | | precision | | | | |
| | | | materials1 | | | Mortar | | | roofs | | | tubes2 | | | cylinders3 | | | ceramic valves | | | proppant | | | abrasives | | | Total | |
| | Three months ended March 31, 2011 (Unaudited) | | | | | | | | | | | | | | | | | | | | | | |
| | | | | | | | | | | | | | | | | | | | | | | | | | | | | |
| | Revenue | $ | 5,296,790 | | $ | - | | $ | 4,638,135 | | $ | - | | $ | 224,856 | | $ | 4,747 | | $ | 5,199,855 | | $ | 819,446 | | $ | 16,183,829 | |
| | Three months ended March 31, 2010 (Unaudited) | | | | | | | | | | | | | | | | | | | | | | |
| | Revenue | $ | 6,403,944 | | $ | 80,628 | | $ | 3,898,990 | | $ | 25,507 | | $ | 242,089 | | $ | 8,500 | | $ | 1,201,694 | | $ | - | | $ | 11,861,352 | |
1Castable, coating, and dry mix materials & low-cement and non-cement castables general refer as Monolithic materials.
2Ceramic plates, tubes, elbows, and rollers generally refer as Ceramic tubes.
3Ceramic cylinders and plugs comprehensively refer to Ceramic cylinders.
Reconciliation is provided for unallocated amounts relating to corporate operations which are not included in the segment information.
| | | | Three months ended March 31, | |
| | | | 2011 | | | 2010 | |
| | | | (Unaudited) | | | (Unaudited) | |
| | | | | | | | |
| | Total (loss) profit for reportable segments | $ | (205,567 | ) | $ | 828,441 | |
| | Unallocated amounts relating to operations: | | | | | | |
| | General and administrative expenses | | (4,047 | ) | | (262,130 | ) |
| | Change in fair value of warrant liabilities | | 260,000 | | | - | |
| | | | | | | | |
| | Income before income taxes and noncontrolling interest | $ | 50,386 | | $ | 566,311 | |
20
China GengSheng Minerals, Inc.
Notes to Condensed Consolidated Financial Statements
| 18. | Segment information (Cont'd) |
| | | | As of | | | As of | |
| | | | March 31, | | | December 31, | |
| | | | 2011 | | | 2010 | |
| | | | (Unaudited) | | | (Audited) | |
| | | | | | | | |
| | Assets | | | | | | |
| | Total assets for reportable segments | $ | 151,077,198 | | $ | 123,187,489 | |
| | Cash and cash equivalents | | 3,485,416 | | | 27,132 | |
| | Other receivables | | 7,542 | | | 7,554 | |
| | | | | | | | |
| | | $ | 154,570,156 | | $ | 123,222,175 | |
All of the Company's long-lived assets are located in the PRC. Geographic information about the revenues, which are classified based on customers, is set out as follows:
| | | | Three months ended March 31, | |
| | | | 2011 | | | 2010 | |
| | | | (Unaudited) | | | (Unaudited) | |
| | PRC | $ | 13,250,099 | | $ | 11,445,970 | |
| | United States of America | | 2,729,101 | | | 23,930 | |
| | Others - Note | | 204,629 | | | 391,452 | |
| | | | | | | | |
| | Total | $ | 16,183,829 | | $ | 11,861,352 | |
| Note: They include Asia and Europe and are not further analyzed as none of them contributed more than 10% of the total revenue. |
| | |
| 19. | Related party transactions |
| | |
| Apart from the information as disclosed in elsewhere in the condensed consolidated financial statements, the Company had no material transactions carried out with related parties during the reporting periods. |
| | |
| 20. | Subsequent events |
| | |
| The Company evaluated all events or transactions that occurred after March 31, 2011 and through the date the financial statements were issued and have determined that there is no material recognizable nor subsequent events or transactions which require recognition or disclosure in the financial statements, other than noted herein. |
ITEM 2. MANAGEMENT’S DISCUSSION AND ANALYSIS OF FINANCIAL CONDITION AND RESULTS OF OPERATIONS.
Forward-Looking Statements:
The following discussion of the financial condition and results of operations should be read in conjunction with the consolidated financial statements and related notes thereto. The following discussion contains forward-looking statements. China GengSheng Minerals, Inc. is referred to herein as “we” or “our.” The words or phrases “would be,” “will allow,” “expect to”, “intends to,” “will likely result,” “are expected to,” “will continue,” “is anticipated,” “estimate,” or similar expressions are intended to identify forward-looking statements. Such statements include those concerning our expected financial performance, our corporate strategy and operational plans. Actual results could differ materially from those projected in the forward-looking statements as a result of a number of risks and uncertainties, including: (a) those risks and uncertainties related to general economic conditions in China, including regulatory factors that may affect such economic conditions; (b) whether we are able to manage our planned growth efficiently and operate profitable operations, including whether our management will be able to identify, hire, train, retain, motivate and manage required personnel or that management will be able to successfully manage and exploit existing and potential market opportunities; (c) whether we are able to generate sufficient revenues or obtain financing to sustain and grow our operations; and (d) whether we are able to successfully fulfill our primary requirements for cash which are explained below under “Liquidity and Capital Resources. Unless otherwise required by applicable law, we do not undertake, and we specifically disclaim any obligation, to update any forward-looking statements to reflect occurrences, developments, unanticipated events or circumstances after the date of such statement.
21
Conventions
In this Form 10-Q, unless indicated otherwise, references to:
“China GengSheng Minerals”, “we”, “us”, “our”, the “Registrant” or the “Company” refer to the combined business of China GengSheng Minerals, Inc., a Nevada corporation (formerly, China Minerals Technologies, Inc.) and its direct, wholly-owned BVI subsidiary, Gengsheng International Corporation, or International, and International 's direct and wholly-owned Chinese subsidiary, ZhengZhou Duesail Fracture Proppant Co. Ltd., or Duesail, and its wholly-owned Chinese subsidiary Henan Gengsheng Refractories Co., Ltd., or Refractories, and Refractories’s direct majority-owned subsidiary, Henan Gengsheng High-Temperature Materials Co., Ltd., or High Temperature and Refractories’s direct and wholly-owned subsidiary, Henan Gengsheng Micronized Powder Materials Co., Ltd., or Micronized and Henan Gengsheng's direct and wholly-owned subsidiary, Gengsheng Shunda New Materials Co., Ltd, SouthEast Prefecture, Guizhou or Shunda;
“Powersmart” or “Gengsheng International” refer to Gengsheng International Corporation, a BVI company (formerly, Powersmart Holdings Limited) that is wholly-owned by China GengSheng Minerals;
“Securities Act” refers to the Securities Act of 1933, as amended, and “Exchange Act” refer to Securities Exchange Act of 1934, as amended;
“China” and “PRC” refer to the People's Republic of China, and “BVI” refers to the British Virgin Islands;
“RMB” refers to Renminbi, the legal currency of China; and
“U.S. dollar,” “$” and “US$” refers to the legal currency of the United States. For all U.S. dollar amounts reported, the dollar amount has been calculated on the basis that RMB1 = $0.1517 for its December 31, 2010 audited balance sheet, and RMB1 = $0.1522 for its March 31, 2011 unaudited balance sheet, which were determined based on the currency conversion rate at the end of each respective period. The conversion rates of RMB1 = $0.1522 is used for the condensed consolidated statement of income and comprehensive income and consolidated statement of cash flows for the first fiscal quarter of 2011, and RMB1 = $0.1480 is used for the condensed consolidated statement of income and comprehensive income and consolidated statement of cash flows for the first fiscal quarter of 2010; both of which were based on the average currency conversion rate for each respective quarter
Overview of Company
We are a Nevada holding company operating in the materials technology industry through our direct and indirect subsidiaries in China. We develop, manufacture and sell a broad range of mineral-based, heat-resistant products capable of withstanding high temperatures, saving energy and boosting productivity in industries such as steel and oil. Our products include refractory products, industrial ceramics, fracture proppants and fine precision abrasives.
Currently, we conduct our operations in China through our wholly owned subsidiaries, Henan GengSheng Refractories Co., Ltd. (“Refractories”), ZhengZhou Duesail Fracture Proppant Co., Ltd. (“Duesail”), Henan GengSheng Micronized Powder Materials Co., Ltd. (“Micronized”), and Guizhou Southeast Prefecture GengSheng New Materials Co., Ltd. (“Prefecture”), and through our majority owned subsidiary, Henan GengSheng High-Temperature Materials Co., Ltd. (“High-Temperature”). Through our direct, wholly owned BVI subsidiary, GengSheng International, and its direct and wholly owned Chinese subsidiary, Refractories, which has an annual production capacity of approximately 127,000 tons, we manufacture refractories products. We manufacture fracture proppant products through Duesail, which has an annual production capacity of approximately 66,000 tons. We manufacture fine precision abrasives products through Micronized, which has designed annual production capacity of approximately 22,000 tons. Through our majority owned subsidiary, High-Temperature, which has an annual production capacity of approximately 150,000 units, we manufacture industrial and functional ceramic products.
We sell our products to over 200 customers in the iron, steel, oil, glass, cement, aluminum and chemical businesses located in China and other countries in Asia, Europe and North America. Our refractory customers are companies in the steel, iron, petroleum, chemical, coal, glass and mining industries. Our fracture proppant products are sold to oil and gas companies. Our industrial ceramics are used in the utilities and petrochemical industries. Our fine precision abrasives are marketed to solar companies and optical equipment manufacturers. Our largest customers, measured by percentage of our revenue, mainly operate in the steel industry. Currently, most of our revenues are derived from the sale of our monolithic refractory products to customers in China.
Our principal executive offices are located at No. 88 Gengsheng Road, Dayugou Town, Gongyi, Henan, People’s Republic of China 451271 and our telephone number is (86) 371-6405-9818.
22
Corporate Structure
We conduct our operations in China through our wholly owned subsidiaries Refractories, Duesail, Micronized and Prefecture and through our majority owned subsidiary, High-Temperature.
The following chart reflects our organizational structure as of the date of this report.
Corporate Background
We were originally incorporated under the laws of the State of Washington, on November 13, 1947, under the name Silver Mountain Mining Company. From our inception until 2001, we operated various unpatented mining claims and deeded mineral rights in the State of Washington, but we abandoned these operations entirely by 2001. On August 15, 2006, we changed our domicile from Washington to Nevada when we merged with and into Point Acquisition Corporation, a Nevada corporation. From about 2001 until our reverse acquisition of Powersmart on April 25, 2007, which is discussed in the next section entitled "Acquisition of Powersmart and Related Financing," we were a blank check company and had no active business operations. On June 11, 2007, we changed our corporate name from "Point Acquisition Corporation" to "China Minerals Technologies, Inc." and subsequently changed our name again to "China GengSheng Minerals, Inc." on July 26, 2007 as we found a Delaware company with a similar corporate name.
Acquisition of Powersmart and Related Financing
On April 25, 2007, we completed a reverse acquisition transaction through a share exchange with Powersmart Holdings Limited whereby we issued to the sole shareholder of Powersmart Holdings Limited, Shunqing Zhang, 16,887,815 shares of China GengSheng Minerals, Inc. common stock, in exchange for all of the issued and outstanding capital stock of Powersmart Holdings Limited. By this transaction, Powersmart Holdings Limited became our wholly owned subsidiary and Mr. Zhang became our controlling stockholder.
23
On April 25, 2007, we also completed a private placement financing transaction pursuant to which we issued and sold 5,347,594 shares of our common stock to certain accredited investors for $10 million in gross proceeds. In connection with this private placement, we paid a fee of $683,618 to Brean Murray Carret & Co., LL, or Brean Murray, and Civilian Capital, Inc. for services as placement agents for the private placement. We also issued to Brean Murray Carret & Co., LLC and Civilian Capital, Inc. warrants for the purchase of 374,331 shares of our common stock in the aggregate. The warrants are immediately exercisable, have piggyback registration rights and have a three-year term, expiring on April 26, 2010. On March 10, 2010, Brean Murray Carret & Co., LLC exercised the warrant cashlessly, which was converted to 108,349 shares of the Corporation’s common stock, and on April 21, 2010, Civilian Capital, Inc. exercised the warrant cashlessly, which was converted to 27,869 shares of the Corporation’s common stock.
Also, on April 25, 2007, our majority stockholder, Shunqing Zhang, entered into an escrow agreement with the private placement investors, pursuant to which, Mr. Zhang agreed to deposit in an escrow account a total of 2,673,796 shares of the Company's common stock owned by him, to be held for the benefit of the investors. Mr. Zhang agreed that if the Company does not attain a minimum after-tax net income threshold of $8,200,000 for the fiscal year ended December 31, 2007 and $13,500,000 for the fiscal year ending December 31, 2008, the escrow agent may deliver his escrowed shares to the investors, based upon a pre-defined formula agreed to between the investors and Mr. Zhang. However, if the after-tax net income threshold is met, the shares in escrow will be returned to Mr. Zhang. In addition, on April 25, 2007, Mr. Zhang entered into a similar escrow agreement with HFG International, Limited. Under such agreement, Mr. Zhang placed into escrow a total of 638,338 shares of the Company's common stock to cover the same minimum net income thresholds as described above with respect to the investor make-good. Similarly, if the thresholds are not achieved in either year, the escrow agent must release certain amounts of the make-good shares that were put into escrow. As a result, we met the after-tax net income threshold of $8,200,000 for the fiscal year ended December 31, 2007 and the pro rata shares in escrow were returned to Mr. Zhang, while we did not meet the after-tax net income threshold of $13,500,000 for the fiscal year ended December 31, 2008, and the pro rata shares in escrow were transferred to the investors on March 8, 2010.
Our Products
The following table set forth sales information about our product mix in each of the first quarter of 2011 and 2010.
| | (All amounts, other than percentages, in thousands of U.S. dollars) | |
| | | | | | | Three Months Ended March 31, | | | | |
| | | | 2011 | | | 2010 | |
| | | | Revenue | | | percentage of | | | Revenue | | | percentage of | |
| | | | | | | net revenues | | | | | | net revenues | |
| | Refractories | $ | 9,935 | | | 61.4% | | $ | 10,383 | | | 87.5% | |
| | Industrial Ceramics | | 230 | | | 1.4% | | | 276 | | | 2.4% | |
| | Fracture Proppants | | 5,200 | | | 32.1% | | | 1,202 | | | 10.1% | |
| | Fine Precision Abrasives | | 819 | | | 5.1% | | | 0 | | | 0% | |
| | | $ | 16,184 | | | 100% | | $ | 11,861 | | | 100% | |
Refractories
Our largest product segment is the refractories segment, which accounted for approximately 61.4% of total revenue in the first quarter of 2011. Our refractory products have high-temperature resistant qualities and can function under thermal stress that is common in many heavy industrial production environments. Because of their unique high-temperature resistant qualities, the refractory products are used as linings and key components in many industrial furnaces, such as steel production furnaces, ladles, vessels, and other high-temperature processing machines that must operate at high temperatures for a long period of time without interruption. The majority of our customers are in the iron, steel, cement, chemical, coal, glass, petro-chemical and nonferrous industries.
24
We provide a customized solution for each order of our monolithic refractory materials based on customer-specific formulas. Upon delivery to customers, the monolithic materials are applied to the inner surfaces of our customers’ furnaces, ladles or other vessels to improve the productivity of that equipment. The product is beneficial because it lowers the overall cost of production and improves financial performance for our customers. The reasons that the monolithic materials can help our customers improve productivity, lower production costs and achieve stronger financial performance include the following: (i) monolithic refractory castables can be cast into complex shapes which are unavailable or difficult to achieve by alternative products such as shaped bricks; (ii) monolithic refractory linings can be repaired, and in some cases, even reinstalled, without furnace cool-down periods or steel-production interruptions, and therefore improve the steel makers’ productivity; (iii) monolithic refractories can form an integral surface without joints, enhancing resistance to penetration, impact and erosion, and thereby improving the equipment’s operational safety and extending their useful service lives; (iv) monolithic refractories can be installed by specialty equipment either automatically or manually, thus saving construction and maintenance time as well as costs; and (v) monolithic refractories can be customized to specific requirements by adjusting individual formulas without the need to change batches of shaped bricks, which is a costly procedure. Our refractory products and their features are described as follows:
- Castable, coating, and dry mix materials. Offerings within this product line are used as linings in containers such as a tundish used for pouring molten metal into a mold. The primary advantages of these products are speed and ease of installation for heat treatment.
- Low-cement and non-cement castables. Our low-cement and non-cement castable products are typically used in reheating furnaces for producing steel. These castable products are highly durable and can last up to five years.
- Pre-cast roofs. These products are usually used as a component of electric arc furnaces. They are highly durable, and in the case of our corundum-based, pre-cast roof, products, can endure approximately 160 to 220 complete operations of furnace heating.
We also have a production line for pressed bricks, which is a type of “shaped” refractory, for steel production. The annual designed production capacity of our shaped refractory products is approximately 15,000 metric tons. Finally, we provide a full-service option to our steel customers, which include refractory product installation, testing, maintenance, repair and replacement. Refractory product sales are often enhanced by our on-site installation and technical support personnel. Our installation services include applying refractory materials to the walls of steel-making furnaces and other high temperature vessels to maintain and extend their lives. Our technical service staff provides assurances that our customers will achieve their desired productivity objectives. They also measure the refractory wear at our customer sites to improve the quality of maintenance and overall performance of our customers’ equipment. Full-service customers contributed approximately 58.3% of the Company’s total sales in the first quarter of 2011, compared with 46.5% in 2010. We believe that these services together with our refractory products provide us with a strategic advantage to secure our profits.
Industrial Ceramics
Industrial Ceramics accounted for approximately 1.4% of the total revenue in the first quarter of 2011. Our industrial ceramic products, including abrasive balls and tiles, valves, electronic ceramics and structural ceramics, are components for a variety of end products such as fuses, vacuum interrupters, electrical components, mud slurry pumps, and high-pressure pumps. Such end use products are used in the electric power, electronic component, industrial pump, and metallurgy industries. We install and maintain some of these products.
Some of our products and their benefits are introduced as follows:
- Ceramic plates, tubes, elbows, and rollers. These products are used in heavy machines for steel production, power generation, and mining. They are highly resistant to heat, erosion, abrasion, and impact.
- Ceramic cylinders and plugs.Our ceramic cylinders and plugs are often used in plug pumps for drilling crude oil. They are highly resistant to pressure.
- Wearable ceramic valves. Our wearable ceramic valves are used for transferring gas and liquid products. They are highly resistant to wash out, erosion, abrasion, and impact.
We signed a five-year collaboration agreement with the Ceramics Research Institute of Zhengzhou University (the "CRI") in Henan province of China in 2008, to research and develop innovative ways of improving the manufacturing process and functionality of an array of bauxite-based materials. Specifically, we will work with CRI to optimize and reduce costs for the production of fine precision abrasives, which are bauxite-based, ultra-fine, grain-like materials used to polish fine-metal or optical equipment surfaces, including solar panels. CRI will also help us develop next-generation industrial ceramics that can reduce energy use and pollution. In addition, we and CRI will jointly apply for government grants for bauxite-based materials research.
Fracture Proppants
Fracture Proppants accounted for approximately 32.1% of the total revenue in the first quarter of 2011. Our fracture proppants are very fine ball-like pellets, used to reach pockets of oil and natural gas deposits that are trapped in the fractures under the ground. Oil drillers inject the pellets into those fractures, squeezing out the trapped oil or natural gas, which leads to higher yield. Our fracture proppant products are available in several different particle sizes (measured in millimeters). They are typically used to extract crude oil and natural gas, which increases the productivity of crude oil and natural gas wells. These products are highly resistant to pressure. In October 2007, our fracture proppant products were recognized by China National Petroleum Corporation (CNPC), China Petroleum & Chemical Corporation (the “Sinopec”) and the China National Offshore Oil Corporation (the “CNOOC”) as their supplier of fracture proppants for their oil and gas-drilling operation.
On April 27th, 2009, Duesail finished construction of its second production line for fracture proppants, and successfully doubled its capacity for fracture proppants, from 33,000 tons per year to 66,000 tons per year. The newly completed production line ("Phase II") adopts a so-called Revolving Kiln technology which cuts down production time and costs by up to 10%. The Phase II improvements also include the ability to produce a wider range of proppants catering to oil wells with different underground pressures.
25
Fine precision abrasives
Fine precision abrasives are used for producing a super-fine, super-consistent finish on certain products. A high-strength polyester backing provides a uniform base for a coating of micron-graded mineral particles that are uniformly dispersed for greater finishing efficiency. Our fine precision abrasives are made from silicon carbide (“SiC”). They are ultra-fine, high-strength pellets with uniform shape, and they are used for surface-polishing and slicing of precision instruments such as solar panels. Currently, the type of abrasives that we produce is in high demand among solar-energy companies. Solar energy companies use fine precision abrasives to cut silicon bars and to polish equipment surfaces so that they can be smooth and reflective. Our products can be utilized in a broad range of areas including machinery manufacturing, electronics, optical glass, architecture industry development, semiconductor, silicon chip, plastic and lens. A description of its features is as follows:
Ultrafine precision abrasives.This product is a fine alumina or silicon carbide powder whose size is measured in microns. This product has characteristics suitable for wire slicing and specific polishing.
First Quarter of 2011 Highlights
In the first quarter of 2011, revenue from fracture proppant products reached approximately $5.2 million, a 333.3% increase compared with approximately $1.2 million during the same period of 2010. The revenue growth is driven mainly by significant demand from our US customers who use our products in their new exploration technologies for natural gas.
Meanwhile, in our fine precision abrasives segment, we realized sales of 202 ton in 2011, for revenue of approximately $0.8 million.
Our financial performance in the first quarter is summarized as follows:
- Sales revenue increased by approximately $4.3 million, or 36.4%, to $16.2 million for the first quarter of 2011, from approximately $11.9 million for the same period in 2010.
- Gross profit increased by approximately $0.3 million, or 7.9%, to approximately $4.3 million for the three months ended March 31, 2011, from approximately $4.0 million for the same period in 2010. Gross margin was 26.5% for the first quarter of 2011, compared with 33.5% for the same period in 2010. The decrease in gross margin was largely attributed to the decrease in average sales price and mix of larger portion of middle and lower-end products sold compared with the same period in 2010.Net income decreased by approximately $0.5 million, or 120.6%, to a net loss of $79,934 for the first quarter of 2011, from net income of approximately $0.4 million for the same period in 2010.
- Our consolidated balance sheet (unaudited) as of March 31, 2011 included current assets of approximately $120.3 million and total assets of approximately $154.6 million, with working capital of $25.5 million.
Uncertainties that Affect our Financial Condition
Industry Consolidation of Steel Millers
The Chinese steel industry achieved record raw steel output of approximately $570 million metric tons in 2010, an increase of 2.6% over 2009, Despite this record output, the industry is facing challenges related to overcapacity and the global economic recession. In addition, the PRC government’s policy aimed at improving the operational and energy efficiency of the Chinese steel industry is expected to squeeze out small to mid-sized steel makers, which may reduce market demand for refractories. To address these potential challenges, we plan to focus on providing high-efficiency, low-carbon, environmentally friendly monolithic refractories.
Considerable Increase of Raw Material Prices and Decreasing Gross Margin
Along with most Chinese companies, we are faced higher raw material, fuel and utilities prices during the first quarter of 2010, as inflation and upstream pricing pressure continued. Due to the fragmented nature of our market, we did not increase the average selling prices of our products in line with the market increases in raw material prices, but did raise average selling prices to pass through some of these costs to our customers. Although soaring materials costs and slower sales growth have impacted us less than some of our competitors, our gross margin and net income were impacted by the continued global economic distress. We will continue to optimize our products offering in an effort to ensure the most efficient resource allocation.
Longer payment term and significant receivables
Currently, the payment term of our receivables has cast certain concerns of the adequacy of our cash flow used in operating activities time by time. The payment term of receivables from our main steel customers is approximately 120-180 days. We have attempted [are attempting] to negotiate purchase agreements with our steel customers that call for either shortened payment terms or down payments to maintain sufficient cash flow for us to purchase raw materials and support our operations. We have successfully obtained down payments from certain customers in the second quarter. We have continued to receive the form of bankers’ acceptance drafts from some customers, allowing us to settle some trade debts among our suppliers. The maturity dates of these bankers’ acceptance drafts are 60 to 90 days, and we expect that our customers will pay off these drafts upon maturity. We expect to reach agreements with our major customers on shortened payment terms, which will relieve these capital constraints.
26
Recent Development
On May 5, 2011, the Company announced plans to construct a new fracture proppant manufacturing facility in Gongyi, Henan Province , which will increase the Company’s annual proppant manufacturing capacity by 60,000 tons to 150,000 tons. Construction on this new facility began in the second quarter of 2011, with production expected to commence during the second half of the year.
Results of Operations
Comparison of Three Months ended March 31, 2011 and 2010
The following table summarizes the results of our operations during the three month periods ended March 31, 2011 and March 31, 2010, and provides information regarding the dollar and percentage increase or (decrease) during the three month periods ended March 31, 2011 and March 31, 2010.
| (All amounts, other than percentages, in U.S. dollars) | |
| | | Three Months | | | Three Months | |
| | | Ended on March 31, 2011 | | | Ended on March 31, 2010 | |
| | | | | | As a percentage | | | | | | As a percentage | |
| | | Dollars | | | of | | | Dollars | | | of | |
| Statement of operations data: | | in thousands | | | net revenues | | | in thousands | | | net revenues | |
| | | | | | | | | | | | | |
| Net Sales | | 16,184 | | | 100.0% | | | 11,861 | | | 100.0% | |
| Cost of sales | | 11,896 | | | 73.5% | | | 7,888 | | | 66.5% | |
| Gross profit | | 4,288 | | | 26.5% | | | 3,973 | | | 33.5% | |
| | | | | | | | | | | | | |
| Operating expenses | | | | | | | | | | | | |
| General & administrative expenses | | 1,504 | | | 9.3% | | | 1,429 | | | 12.0% | |
| Research and development cost | | 141 | | | 0.9% | | | 184 | | | 1.6% | |
| Selling expenses | | 1,972 | | | 12.2% | | | 1,495 | | | 12.6% | |
| Total operating expenses | | 3,617 | | | 22.4% | | | 3,108 | | | 26.2% | |
| | | | | | | | | | | | | |
| Income (loss) from operations | | 670 | | | 4.1% | | | 864 | | | 7.3% | |
| Government grant income | | 1 | | | 0.0% | | | 71 | | | 0.6% | |
| Guarantee income | | 87 | | | 0.5% | | | 0 | | | 0.0% | |
| Guarantee expenses | | (88 | ) | | -0.5% | | | 0 | | | 0.0% | |
| Interest income | | 119 | | | 0.7% | | | 35 | | | 0.3% | |
| Change in fair value warranty liability | | 260 | | | 1.6% | | | 0 | | | 0.0% | |
| Other (income) expenses | | (34 | ) | | -0.2% | | | 1 | | | 0.0% | |
| Finance costs | | (966 | ) | | -6.0% | | | (405 | ) | | -3.4% | |
| | | | | | | | | | | | | |
| Income (loss) before income taxes and | | | | | | | | | | | | |
| noncontrolling interest | | 50 | | | 0.3% | | | 566 | | | 4.8% | |
| Income taxes | | (136 | ) | | -0.8% | | | (163 | ) | | - 1.4% | |
| Noncontrolling interest | | 6 | | | 0.0% | | | (16 | ) | | 0.1% | |
| | | | | | | | | | | | | |
| Net income (loss) attributable to Company’s common stockholders | | (80 | ) | | -0.5% | | | 387 | | | 3.3% | |
27
| | | Three Months | | | Three Months | | | Dollar ($) | | | Percentage | |
| | | Ended on | | | Ended on | | | Increase | | | Increase | |
| | | March 31, 2011 | | | March 31, 2010 | | | (Decrease) | | | (Decrease) | |
| Dollars in thousands | | | | | | | | | | | | |
| | | | | | | | | | | | | |
| Net Sales | | 16,184 | | | 11,861 | | | 4,323 | | | 36.4% | |
| Cost of sales | | 11,896 | | | 7,888 | | | 4,008 | | | 50.8% | |
| Gross profit | | 4,288 | | | 3,973 | | | 314 | | | 7.9% | |
| | | | | | | | | | | | | |
| Operating expenses | | | | | | | | | | | | |
| General & administrative expenses | | 1,504 | | | 1,429 | | | 75 | | | 5.3% | |
| Research and development cost | | 141 | | | 185 | | | (42 | ) | | -23.3% | |
| Selling expenses | | 1,972 | | | 1,495 | | | 477 | | | 31.9% | |
| Total operating expenses | | 3,617 | | | 3,108 | | | 509 | | | 16.4% | |
| | | | | | | | | | | | | |
| Income (loss) from operations | | 671 | | | 865 | | | (195 | ) | | -22.3% | |
| Government grant income | | 1 | | | 71 | | | (70 | ) | | -98.6% | |
| Guarantee income | | 87 | | | | | | 87 | | | 100.0% | |
| Guarantee expenses | | (88 | ) | | | | | (88 | ) | | 100.0% | |
| Interest income | | 119 | | | 35 | | | 85 | | | 244.1% | |
| Change in fair value warranty liability | | 260 | | | 0 | | | 260 | | | 100.0% | |
| Other (income) expenses | | (34 | ) | | 1 | | | (35 | ) | | -5174.0% | |
| Finance costs | | (966 | ) | | (405 | ) | | (561 | ) | | 138.3% | |
| | | | | | | | | | | | | |
| Income (loss) before income taxes and | | | | | | | | | | | | |
| noncontrolling interest | | 50 | | | 566 | | | (516 | ) | | -91.1% | |
| Income taxes | | (136 | ) | | (163 | ) | | 27 | | | -16.5% | |
| Noncontrolling interest | | 6 | | | (16 | ) | | 22 | | | -136.8% | |
| | | | | | | | | | | | | |
| Net income (loss) attributable to Company’s common stockholders | | (80 | ) | | 387 | | | (466 | ) | | -120.4% | |
Sales revenues.Sales revenues increased approximately $4.3 million, or approximately 36.4%, to approximately $16.2 million for the three months ended March 31, 2011 from approximately $11.9 million for the three months ended March 31, 2010. Our sales revenue is currently generated from sales of our mineral-based refractory products, primarily our refractory products, industrial ceramic products and fracture proppant products. The increase was mainly attributable to increased sales from our fracture proppant segment, particularly increased export sales compared with the same period in 2010.
In our refractory segment, we sold 20,205 metric tons of refractory products in the first quarter of 2011, a 1.9% decrease compared with 20,600 metric tons sold in the same period of 2010. The revenue from our refractory products decreased to approximately $9.9 million in the first quarter of 2011 from approximately $10.4 million in the same period of 2010. The sales decrease was primarily due to a decrease in average selling prices, which reached $492 per metric ton in the first quarter of 2011, representing a 1.6% decrease compared with $500 per metric ton in the same period of 2010.
In our fracture proppant segment, we sold 12,513 metric tons of fracture proppant products in the first quarter of 2011, compared with the 2,600 metric tons in the same period of 2010. The dramatic increase in sales volume was primarily driven by strong demand from our US customers who use our proppant products in their new natural gas exploration technologies. Revenue from fracture proppant products was approximately $5.2 million in the first quarter of 2011, an increase of 333.3% compared with approximately $1.2 million in the first quarter of 2010. Average selling price decreased to $415 per metric ton in the first quarter of 2011, compared with $450 per metric ton in the same period of 2010. The decrease in average selling price lies in the fact that we sold primarily lower-end products during the first quarter of 2011 compared with 41% higher-end products sales in the same period of 2010.
In our industrial ceramics segment, revenue was $229,602 in the first quarter of 2011 compared with $276,097 in the same period of 2010.
28
In our fine precision abrasives segment, we realized sales of 202 ton in 2011, for revenue of approximately $0.8 million
Cost of goods sold. Our cost of goods sold is primarily comprised of the cost of our raw materials, components, labor and overhead. Our cost of goods sold increased approximately $4.0 million, or 50.8%, to approximately $11.9 million for the three months ended March 31, 2011 from approximately $7.9 million during the three months ended March 31, 2010. As a percentage of net revenues, the cost of goods sold increased by 7.0% to 73.5% in the three months ended March 31, 2011 from 66.5% during the three months ended March 31, 2010.
Gross profit. Our gross profit increased approximately $0.3 million, or approximately 7.9%, to approximately $4.3 million for the three months ended March 31, 2011 from approximately $4.0 million for the three months ended March 31, 2010. Gross profit as a percentage of net revenues was 26.5% for the three months ended March 31, 2011, as compared with 33.5% for the three months ended March 31, 2010. The percentage decrease was mainly due to the decrease in average sales price and larger proportion of middle and lower-end products sold compared with the same period in 2010.
General administrative expenses.Our general administrative expenses consist of the costs associated with staff and support personnel who manage our business activities and professional fees paid to third parties. Our general administrative expenses slightly increased 5.2%, to approximately $1.5 million for the three months ended March 31, 2011, from approximately $1.4 million for the same period in 2010. The increase is mainly due to approximately $0.1 million increase in consulting fees. As a percentage of net revenues, administrative expenses decreased to 9.3% for the three months ended March 31, 2011 as compared with 12.0% for the three months ended March 31, 2010.
Selling expenses.Our selling expenses include sales commissions, the cost of advertising and promotional materials, transportation expenses, benefits of sales personnel, after-sale support services and other sales related costs. Selling expenses increased by approximately $0.5 million to approximately $2.0 million compared with approximately $1.5 million in the three months ended March 31, 2010. As a percentage of net revenues, our selling expenses decreased slightly, to 12.2% for the three months ended March 31, 2011, as compared to 12.6% for the same period in 2010.
Research and development cost.Our research and development cost increased to $141,327 for the three months ended March 31, 2011, compared with approximately $184,000 for the same period in 2010. The decrease in R&D is mainly due to less research projects in progress during the three months ended March 31, 2011 compared to the same period in 2010.
Government grant income. Our government grant income decreased by $70,149, to approximately $883 in the first three months in 2011, compared with $71,032 in the same period in 2010. The decrease was primarily due to the absence of one time government loan subsidy in the amount of $70,000 to Refractories business we were awarded in 2010.
Finance costst.Our finance costs increased by approximately $0.6 million, or 138.3%, to approximately $1.0 million in the three months end March 31, 2011, from approximately $0.4 million in the same period in 2010. As a percentage of net revenues, our finance cost was 6.0% in the first quarter in 2011 and 3.4% in the same period in 2010. This significant increase was primarily due to an increase of approximately $0.2 million in discounted interest cost, due to the discounting of an increased number of receivables in an effort to accelerate turnover rate, and an increase of approximately $0.3 million in bank charges, due to an increase in short-term bank loans from domestic commercial banks in order to meet our working capital needs.
Income (loss) before income taxes and non-controlling interests.Income before income taxes and non-controlling interest was $50,386 for the three months ended March 31, 2011, a decrease of 91.2% from approximately $0.6 million for the same period in 2010. The decrease was primarily attributable to lower operating income and higher finance cost during the quarter.
Income taxes.Our income taxes were $136,171 for the three months ended March 31, 2011, an increase of approximately $27,000 or 16.5% from approximately $163,000 for the three months ended March 31, 2010, and the increase was primarily attributable to tax benefit of $186,708 from Refractories net our deferred tax liability of $50,537.
Net income.Our net income decreased approximately $0.5 million, or 120.6%, to a net loss of approximately $79,934 for the three months ended March 31, 2011 from net income of approximately $0.4 million for the same period of 2010. The decrease was attributable to the factors described above.
Liquidity and Capital Resources
As of March 31, 2011, we had cash and cash equivalents of approximately $0.5 million. The following table sets forth a summary of our cash flows for the periods indicated:
29
| | | | Three months ended March 31, | |
| | | | 2011 | | | 2010 | |
| | | | (Dollars in thousands) | |
| | Net cash used in operating activities | | (459 | ) | | (551 | ) |
| | Net cash used in investing activities | | (3,357 | ) | | (813 | ) |
| | Net cash provided by financing activities | | 14,342 | | | 893 | |
| | Net cash inflow/ (outflow) | | 10,547 | | | (471 | ) |
Operating Activities
Net cash used in operating activities in the first three months ended March 31, 2011 totaled $0.5 million approximately the same as that of the same period in 2010.
Investing Activities
Net cash used in investing activities during the three months ended March 31, 2011 was approximately $3.4million, which is an increase of approximately $2.6 million from net cash used in investing activities of $813,000 during the same period in 2010. The increase in net cash used in investing activities for the first three months of 2011 was primarily due to expansion of our proppant production lines and renovation of our office building.
Financing Activities
Net cash provided by financing activities was approximately $14.3 million during the three months ended March 31, 2011, compared with net cash provided by financing activities of approximately $0.9 million during the same period of 2010. The shift in cash flow from financing activities was mainly due to the repayment of domestic bank loans of approximately $6.5 million, and an approximately $8.9 million decrease in restricted cash for financing activities with domestic commercial banks, partially offset by cash provided by our January 2011 equity financing in the amount of net proceeds $9.2 million.
Loan Facilities
In the first three months ended March 31, 2011, we secured new loans totaling $19.3 million from banks for the working capital needs, and we repaid $6.5 million in other loans during the period. As a result, the balance of all bank loans and borrowing as of March 31, 2011 was approximately $54.5 million, which includes $30.1 million short-term bank loans and $24.4 million of bank borrowing secured by bank deposits. We might need additional credit facilities for to fund new production line construction.
As of March 31, 2011, the maturities for all our bank loans are as follows:
30
| All amounts, other than percentages, are in U.S. dollars | |
| | | | | | | | | | | | | | | | |
| No | | Type | | | Contracting Party | | | Valid Date | | | Duration | | | Amount | |
| 1 | | Facility Bank Loan | | | City Credit Cooperatives in Gongyi | | | 2010-04-27 to 2011-04-26 | | | 1 year | | $ | 761,000 | |
| 2 | | Facility Bank Loan | | | China CITIC Bank | | | 2010-05-14 to 2011-05-13 | | | 1 year | | $ | 2,283,000 | |
| 3 | | Facility Bank Loan | | | Agricultural Bank of China | | | 2010-05-24 to 2011-05-23 | | | 1 year | | $ | 6,088,000 | |
| 4 | | Facility Bank Loan | | | Zhengzhou Bank | | | 2010-12-17 to 2011-12-16 | | | 1 year | | $ | 4,566,000 | |
| 5 | | Facility Bank Loan | | | Zhengzhou Bank | | | 2010-12-17 to 2011-12-16 | | | 1 year | | $ | 3,044,000 | |
| 6 | | Facility Bank Loan | | | China Merchants Bank | | | 2010-06-24 to 2011-06-23 | | | 1 year | | $ | 1,522,000 | |
| 7 | | Facility Bank Loan | | | Shanghai Pudong Development Bank Village Bank | | | 2010-09-16 to 2011-09-15 | | | 1 year | | $ | 761,000 | |
| 8 | | Facility Bank Loan | | | Shanghai Pudong Development Bank Village Bank | | | 2010-09-16 to 2011-09-15 | | | 1 year | | $ | 380,500 | |
| 9 | | Facility Bank Loan | | | Kaifeng Commercial Bank | | | 2010-09-28 to 2011-09-27 | | | 1 year | | $ | 4,566,000 | |
| 10 | | Facility Bank Loan | | | Shanghai Pudong Development Bank | | | 2011-01-06 to 2012-01-05 | | | 1 year | | $ | 3,044,000 | |
| 11 | | Facility Bank Loan | | | Bank of China | | | 2011-03-29 to 2012-03-28 | | | 1 year | | $ | 76,100 | |
| 12 | | Facility Bank Loan | | | Industrial and Commercial Bank of China | | | 2011-01-18 to 2012-01-09 | | | 1 year | | $ | 3,044,000 | |
| 13 | | Bank borrowing | | | Kaifeng Bank | | | 2010-10-18 to 2011-04-17 | | | 6 months | | $ | 1,416,487 | |
| 14 | | Bank borrowing | | | Zhengzhou Bank | | | 2010-12-29 to 2011-06-29 | | | 6 months | | $ | 3,044,000 | |
| 15 | | Bank borrowing | | | Guangdong Development Bank | | | 2011-01-12 to 2011-07-12 | | | 6 months | | $ | 2,891,800 | |
| 16 | | Bank borrowing | | | Guangdong Development Bank | | | 2011-01-13 to 2011-07-13 | | | 6 months | | $ | 1,522,000 | |
| 17 | | Bank borrowing | | | China CITIC Bank | | | 2011-01-17 to 2011-07-17 | | | 6 months | | $ | 1,522,000 | |
| 18 | | Bank borrowing | | | Industrial and Commercial Bank of China | | | 2011-01-21 to 2011-07-21 | | | 6 months | | $ | 761,000 | |
| 19 | | Bank borrowing | | | Zhengzhou Bank | | | 2011-02-25 to 2011-08-25 | | | 6 months | | $ | 1,522,000 | |
| 20 | | Bank borrowing | | | Guangdong Development Bank | | | 2011-02-28 to 2011-08-28 | | | 6 months | | $ | 1,522,000 | |
| 21 | | Bank borrowing | | | China Merchants Bank | | | 2011-03-04 to 2011-09-04 | | | 6 months | | $ | 1,522,000 | |
| 22 | | Bank borrowing | | | Guangdong Development Bank | | | 2011-03-02 to 2011-09-02 | | | 6 months | | $ | 1,522,000 | |
| 23 | | Bank borrowing | | | Agricultural Bank of China | | | 2011-03-09 to 2011-09-09 | | | 6 months | | $ | 1,522,000 | |
| 24 | | Bank borrowing | | | Luoyang Bank | | | 2011-03-11 to 2011-09-11 | | | 6 months | | $ | 1,522,000 | |
| 25 | | Bank borrowing | | | Bank of China | | | 2011-03-22 to 2011-09-21 | | | 6 months | | $ | 1,369,800 | |
| 26 | | Bank borrowing | | | Agricultural Bank of China | | | 2011-03-23 to 2011-09-23 | | | 6 months | | $ | 1,217,600 | |
| 27 | | Bank borrowing | | | Luoyang Bank | | | 2011-03-18 to 2011-09-18 | | | 6 months | | $ | 1,522,000 | |
We have approximately $54.5 million of collateralized bank loans, which includes approximately $30.1 million of facility bank loans, maturing on April 26, May 13, May 23, June 23, September 15, September 27, December 16, 2011, January 5, January 9 and March 28, 2012 respectively, and approximately $24.4 million of bank borrowing secured by bank deposits. We will also consider refinancing debt. However, we cannot provide assurance that we will be able to refinance any of our debt on terms favorable to us in a timely manner.
Below is a brief summary of the payment obligations under material contacts to which we are a party:
On April 27, 2010, our subsidiary, Duesail ,entered into a short term working capital loan agreement, with City Credit Cooperatives in Gongyi whereby City Credit Cooperatives agreed to loan approximately $761,000 at 10.51% for a term of one year, at an interest of per year on all outstanding principle.
On May 14, 2010, our subsidiary, Refractories, entered into a short-term working capital loan agreement with China CITIC Bank (“CITIC”), whereby CITIC has agreed to loan approximately $2.3 million (RMB 15 million) to Refractories for a term of one year, at an interest rate of 5.310% per year on all outstanding principal.
On May 24, 2010, our subsidiary, Refractories, entered into a short-term working capital loan agreement with Agricultural Bank of China (“ABC”), whereby ABC has agreed to loan approximately $6.1 million (RMB 40 million) to Refractories for a term of one year, at an interest rate of 5.841% per year on all outstanding principal.
On December 17, 2010, our subsidiary Refractories entered into a short-term working capital loan agreement with Zhengzhou Bank , whereby Zhengzhou Bank has agreed to loan approximately $7.6 million (RMB 50 million) to for a term of one year, at an interest rate of 6.672% per year on all outstanding principal.
On June 24, 2010, our subsidiary, Refractories, entered into a short-term working capital loan agreement with China Merchants Bank (“CMB”), whereby CMB has agreed to loan approximately $1.5 million (RMB 10 million) to Refractories for a term of one year, at an interest rate of 5.841% per year on all outstanding principal.
On September 16, 2010, our subsidiary, Refractories, entered into a short-term working capital loan agreement with Shanghai Pudong Development Bank Village Bank of Gongyi (“SPDVB”), whereby SPDVB has agreed to loan approximately $0.8 (RMB 5 million) to Refractories for a term of one year, at an interest rate of 5.310% per year on all outstanding principal.
31
On September 16, 2010, our subsidiary, Duesail, entered into a short-term working capital loan agreement with Shanghai Pudong Development Bank Village Bank of Gongyi (“SPDVB”), whereby SPDVB has agreed to loan approximately $0.4 (RMB 2.5 million) to Duesail for a term of one year, at an interest rate of 5.310% per year on all outstanding principal.
On September 28, 2011, our subsidiary, Refractories, entered into a short-term working capital loan agreement with Kaifeng Commercial Bank (“KCB”), whereby KCB has agreed to loan approximately $4.6 million (RMB 30 million) to Refractories for a term of one year, at an interest rate of 5.31% per year on all outstanding principal.
On January 6, 2011, our subsidiary, Refractories, entered into a short-term working capital loan agreement with Shanghai Pudong Development Bank (“SPDB”), whereby SPDB has agreed to loan approximately $0.7 milion (RMB 20 million) to Refractories for a term of one year, at an interest rate of 5.81% per year on all outstanding principal.
On March 29, 2011, our subsidiary, Duesail, entered into a short-term working capital loan agreement with Bank of China of Gongyi (“BC”), whereby BC has agreed to loan approximately $76,100 (RMB 0.5 million) to Duesail for a term of one year, at an interest rate of 7.61% per year on all outstanding principal.
On January 18, 2011, our subsidiary, Refractories, entered into a short-term working capital loan agreement with Industrial and Commercial Bank of China (“ICBC”), whereby ICBC has agreed to loan approximately $3.0 million (RMB 20 million) to Refractories for a term of one year, at an interest rate of 5.81% per year on all outstanding principal.
Critical Accounting Policies
Basis of consolidation
The accompanying consolidated financial statements of the Company have been prepared in accordance with accounting principles generally accepted in the United States of America.
The consolidated financial statements include the accounts of the Company and its subsidiaries. All significant inter-company accounts and transactions have been eliminated in consolidation.
Use of estimates
In preparing financial statements in conformity with accounting principles generally accepted in the United States of America, management makes estimates and assumptions that affect the reported amounts of assets and liabilities and disclosures of contingent assets and liabilities at the dates of the financial statements, as well as the reported amounts of revenues and expenses during the reporting periods. These accounts and estimates include, but are not limited to, the valuation of trade receivables, other receivables, inventories, deferred income taxes, provision of warranty, the estimation on useful lives of property, plant and equipment and the impairment of goodwill and know-how. Actual results could differ from those estimates.
Allowance for doubtful accounts
The Company establishes an allowance for doubtful accounts based on management’s assessment of the collectibility of trade receivables. A considerable amount of judgment is required in assessing the amount of the allowance. The Company considers the historical level of credit losses and applies percentages to aged receivable categories. The Company makes judgments about the creditworthiness of each customer based on ongoing credit evaluations, and monitors current economic trends that might impact the level of credit losses in the future. If the financial condition of the customers were to deteriorate, resulting in their inability to make payments, a larger allowance may be required.
Based on the above assessment, during the reporting periods, the management established the general provisioning policy to make allowance equivalent to 1% of trade receivables due over 6 months but within 1 year, 5% of trade receivables due from 1 to 2 years, 40% of trade receivables due from 2 to 3 years and 70% of trade receivables due over 3 years. Additional specific provision is made against trade receivables to the extent which they are considered to be doubtful.
Bad debts are written off when identified. The Company does not accrue interest on trade receivables.
Historically, losses from uncollectible accounts have not significantly deviated from the general allowance estimated by the management and no significant additional bad debts have been written off directly to the profit and loss. This general provisioning policy has not changed in the past since establishment and the management considers that the aforementioned general provisioning policy is adequate and not too excessive and they do not expect to change this established policy in the near future.
32
Impairment of long-lived assets
Long-lived assets are tested for impairment whenever events or changes in circumstances indicate that the carrying amount of the assets may not be recoverable. The Company recognizes impairment of long-lived assets in the event that the net book values of such assets exceed the future undiscounted cash flows attributable to such assets. During the reporting periods, the Company has not identified any indicators that would require testing for impairment.
Financial guarantee issued
The Company has acted as guarantor for bank loans granted to certain local authorities and certain business associates. The Company assessed its obligation under this guarantee pursuant to the provision of ASC 460 “Guarantee”. The Company recognized in its consolidated financial statements a liability for that guarantee at fair value at the date of inception and recognized as an expense in profit or loss immediately. The amount of guarantee liability is amortized in profit or loss over the term of the guarantee as income from financial guarantees issued.
Revenue recognition
Pure products sales - Sales revenue is recognized when the significant risks and rewards of ownership have been transferred to the buyer at the time when the products are delivered to and accepted by customers, the sales price is fixed or determinable and collection is reasonably assured.
Products sales with installation, testing, maintenance, repair and replacement - This kind of contract is signed as a whole such that all of these services are provided for one fixed fee, and it does not separate the components of products, installation, testing, maintenance, repair and replacement. After delivery of products/materials to customers, the Company will do the installation and testing works, which takes one to two days, before acceptance and usage by customers. The product life cycle is very short and can normally be used for 80 cycles of production by customers (about two to three days). Thereafter the customers will need maintenance, repair and replacement of the Company’s materials. For each maintenance, repair and replacement, the Company will supply materials and do the installation and testing works again, which are regarded as separate sales by the Company. In other words, the Company will have sales to this kind of customers every couple of days. This kind of sales revenue is recognized when the significant risks and rewards of ownership have been transferred to the buyer at the time when the installation and testing works are completed and after acceptance by customers, the sales price is fixed or determinable and collection is reasonably assured.
Stock-based compensation
The Company adopted the provisions of ASC 718, which requires the use of the fair value method of accounting for share-based compensation. Under the fair value based method, compensation cost related to employee stock options or similar equity instruments which are equity-classified awards, is measured at the grant date based on the value of the award and is recognized over the requisite service period, which is usually the vesting period. ASC 718 also requires measurement of cost of a liability-classified award based on its current fair value.
Recently issued accounting pronouncements
The Financial Accounting Standards Board (“the FASB”) issued Accounting Standards Update (ASU) No. 2011-01, “Receivables (Topic 310): Deferral of the Effective Date of Disclosures about Troubled Debt Restructurings in Update No. 2010-20”. The amendments in this Update temporarily delay the effective date of the disclosure about troubled debt restructurings in ASU 2010-20 for public entities. The delay is intended to allow the Board time to complete its deliberations on what constitutes a troubled debt restructuring. The effective date of the new disclosures about troubled debt restructuring for public entities and the guidance for determining what constitutes a troubled debt restructuring will then be coordinated. Currently, that guidance is anticipated to be effective for interim and annual periods ending after June 15, 2011. The adoption of this ASU update has no material impact on the Company’s financial statements.
In April 2011, the FASB issued ASU 2011-02,A Creditor’s Determination of Whether a Restructuring is a Troubled Debt Restructuring (Topic 310). ASU 2011-02 clarifies the criteria for a restructuring to be classified as a TDR. The effective date of ASU 2011-02 will be the first interim or annual period beginning after June 15, 2011 and should be applied retrospectively to the beginning of the annual period of adoption. The management is in the process of evaluating the impact of adopting this ASU on the Company’s financial statements.
In December 2010, the FASB issued ASU 2010-28 which amend “Intangibles - Goodwill and Other” (Topic 350). The ASU modifies Step 1 of the goodwill impairment test for reporting units with zero or negative carrying amounts. For those reporting entities, they are required to perform Step 2 of the goodwill impairment test if it is more likely than not that a goodwill impairment exists. An entity should consider whether there are any adverse qualitative factors indicating that impairment may exist. The qualitative factors are consistent with the existing guidance in Topic 350, which requires that goodwill of a reporting unit be tested for impairment between annual tests if an event occurs or circumstances changes that would more likely than not reduce the faire value of a reporting unit below its carrying amount. ASU 2010-28 is effective for fiscal years, and interim periods within those years beginning after December 15, 2010. Early adoption is not permitted. The adoption of this ASU update has no material impact on the Company’s financial statements.
33
In April 2010, the FASB issued ASU 2010-13, “Compensation-Stock Compensation (Topic 718): Effect of Denominating the Exercise Price of a Share-Based Payment Award in the Currency of the Market in Which the Underlying Equity Security Trades,” or ASU 2010-13. ASU 2010-13 provides amendments to Topic 718 to clarify that an employee share-based payment award with an exercise price denominated in currency of a market in which a substantial porting of the entity’s equity securities trades should not be considered to contain a condition that is not a market, performance, or service condition. Therefore, an entity would not classify such an award as a liability if it otherwise qualifies as equity. The amendments in this Update are effective for fiscal years, and interim periods within those fiscal years, beginning on or after December 15, 2010. The adoption of this ASU update has no material impact on the Company’s financial statements.
ITEM 3. QUANTITATIVE AND QUALITATIVE DISCLOSURE ABOUT MARKET RISK.
As a “smaller reporting company,” as defined by Item 10 of Regulation S-K, the Company is not required to provide this information.
ITEM 4. CONTROLS AND PROCEDURES.
Evaluation of Disclosure Controls and Procedures
Our management is responsible for establishing and maintaining a system of disclosure controls and procedures (as defined in Rule 13a-15(e) under the Exchange Act) that is designed to ensure that information required to be disclosed by the Company in the reports that we file or submit under the Exchange Act is recorded, processed, summarized and reported, within the time specified in the Commission’s rules and forms. Disclosure controls and procedures include, without limitation, controls and procedures designed to ensure that information required to be disclosed by an issuer in the reports that it files or submits under the Exchange Act is accumulated and communicated to the issuer’s management, including its principal executive officer or officers and principal financial officer or officers, or persons performing similar functions, as appropriate to allow timely decisions regarding required disclosure.
Pursuant to Rule 13a-15(b) under the Exchange Act, the Company carried out an evaluation with the participation of the Company’s management, including our Chairman, Chief Executive Officer and President, Shunqing Zhang, and our interim Chief Financial Officer, Hongfeng Jin, of the effectiveness of the Company’s disclosure controls and procedures (as defined under Rule 13a-15(e) under the Exchange Act) as of March 31, 2011. Based upon that evaluation, our management concluded that the material weakness in our disclosure controls and procedures, lack of sufficient accounting personnel with appropriate understanding of U.S. GAAP and SEC reporting requirements, which was disclosed under Item 9A-"Controls and Procedures- Management's Annual Report on Internal Control Over Financial Reporting" in the Company's Annual Report on Form 10-K filed with the SEC on March 31, 2011, still exists. We are committed to remediating the material weakness identified above. Because this material weakness was related to a lack of sufficient technical accounting expertise and knowledge of U.S. GAAP that are relevant to the Company’s financial reporting requirements, we plan to hire financial consultant knowledgeable of U.S. GAAP to remediate this material weakness. We believe that the hiring of a financial advisor knowledgeable of U.S. GAAP will permit our senior financial management team, led by our interim CFO, to increase its focus on our compliance with U.S. GAAP. In addition, since July 2010, we have conducted several internal training sessions for various members of our accounting staff relating to various subjects including understanding and application of US GAAP and communication skills such as English-language report writing. We believe our greater emphasis on the training of our internal accounting staff and our improved internal audit procedures will also improve the effectiveness and reliability of our internal control over financial reporting.
As a result of the material weakness described above, our CEO and interim CFO concluded that, as of March 31, 2011, our disclosure controls and procedures were not effective to provide reasonable assurance that information required to be disclosed by the Company in the reports that the Company files or submits under the Exchange Act is recorded, processed, summarized and reported within the time periods specified in the SEC’s rules and forms, or that such information is accumulated and communicated to the Company’s management, including our CEO and CFO, as appropriate, to allow timely decisions regarding required disclosure.
Changes in Internal Control Over Financial Reporting
Other than as disclosed above, there were no changes in our internal controls over financial reporting during the quarter ended March 31, 2011 that have materially affected, or are reasonably likely to materially affect, our internal control over financial reporting.
Limitations on the Effectiveness of Controls
34
Our disclosure controls and procedures provide our Chief Executive Officer and interim Chief Financial Officer with reasonable assurances that our disclosure controls and procedures will achieve their objectives. However, our management does not expect that our disclosure controls and procedures or our internal control over financial reporting can or will prevent all human error. A control system, no matter how well designed and implemented, can provide only reasonable, not absolute, assurance that the objectives of the control system are met. Furthermore, the design of a control system must reflect the fact that there are internal resource constraints, and the benefit of controls must be weighed relative to their corresponding costs. Because of the limitations in all control systems, no evaluation of controls can provide complete assurance that all control issues and instances of error, if any, within our company are detected. These inherent limitations include the realities that judgments in decision-making can be faulty, and that breakdowns can occur due to human error or mistake. Additionally, controls, no matter how well designed, could be circumvented by the individual acts of specific persons within the organization. The design of any system of controls is also based in part upon certain assumptions about the likelihood of future events, and there can be no assurance that any design will succeed in achieving its stated objectives under all potential future conditions.
PART II - OTHER INFORMATION
ITEM 1. LEGAL PROCEEDINGS.
None for the period covered by this report.
ITEM 1A. RISK FACTORS.
As a “smaller reporting company,” as defined by Item 10 of Regulation S-K, the Company is not required to provide this information.
ITEM 2. UNREGISTERED SALES OF EQUITY SECURITIES AND USE OF PROCEEDS.
We have not sold any equity securities during the fiscal quarter ended March 31, 2011 that were not previously disclosed in a current report on Form 8-K that was filed during that period.
ITEM 3. DEFAULTS UPON SENIOR SECURITIES.
There were no defaults upon senior securities during the fiscal quarter ended March 31, 2011.
ITEM 4. OTHER INFORMATION.
Not applicable.
ITEM 5. EXHIBITS.
(a) Exhibits
35
SIGNATURES
Pursuant to the requirements of the Securities Exchange Act of 1934, the registrant has duly caused this report to be signed on its behalf by the undersigned hereunto duly authorized.
| | CHINA GENGSHENG MINERALS, INC. |
| | |
| Date: May 15, 2011 | By: /s/ Shunqing Zhang |
| | Shunqing Zhang |
| | Chief Executive Officer and Chairman |
| | |
| Date: May 15, 2011 | By: /s/ Hongfeng Jin |
| | Hongfeng Jin |
| | Interim Chief Financial Officer |
| | (On behalf of the Registrant and as its Principal Financial Officer) |
36