United States
Securities and Exchange Commission
Washington, D.C. 20549
Form N-CSR
Certified Shareholder Report of Registered Management Investment Companies
811-1
(Investment Company Act File Number)
Federated Global Allocation Fund
_______________________________________________________________
(Exact Name of Registrant as Specified in Charter)
Federated Investors Funds
4000 Ericsson Drive
Warrendale, Pennsylvania 15086-7561
(Address of Principal Executive Offices)
(412) 288-1900
(Registrant's Telephone Number)
John W. McGonigle, Esquire
Federated Investors Tower
1001 Liberty Avenue
Pittsburgh, Pennsylvania 15222-3779
(Name and Address of Agent for Service)
(Notices should be sent to the Agent for Service)
Date of Fiscal Year End: 11/30/14
Date of Reporting Period: 11/30/14
Item 1. Reports to Stockholders

Annual Shareholder Report
November 30, 2014
| Share Class | Ticker |
| A | FSTBX |
| B | FSBBX |
| C | FSBCX |
| R | FSBKX |
| Institutional | SBFIX |
Federated Global Allocation Fund
Fund Established 1934
Dear Valued Shareholder,
I am pleased to present the Annual Shareholder Report for your fund covering the period from December 1, 2013 through November 30, 2014. This report includes Management's Discussion of Fund Performance, a complete listing of your fund's holdings, performance information and financial statements along with other important fund information.
In addition, our website, FederatedInvestors.com, offers easy access to Federated resources that include timely fund updates, economic and market insights from our investment strategists, and financial planning tools. We invite you to register to take full advantage of its capabilities.
Thank you for investing with Federated. I hope you find this information useful and look forward to keeping you informed.
Sincerely,
J. Christopher Donahue, President
Not FDIC Insured • May Lose Value • No Bank Guarantee
CONTENTS
| 1 |
| 8 |
| 10 |
| 37 |
| 42 |
| 44 |
| 46 |
| 47 |
| 64 |
| 65 |
| 67 |
| 73 |
| 79 |
| 79 |
Management's Discussion of Fund Performance (unaudited)
The total return of Federated Global Allocation Fund (the “Fund”), based on net asset value, for the 12-month reporting period ended November 30, 2014, was 6.53%, 5.67%, 5.70%, 6.06% and 6.85% for the Fund's Class A Shares, Class B Shares, Class C Shares, Class R Shares and Institutional Shares, respectively. The total return of the Fund's Blended Index1,2 was 5.10%, and the total return of the Morningstar World Allocation Funds Average (MWAFA)3 was 4.40% for the same period. The Fund's Blended Index was composed of 60% of the return of the MSCI All Country World Index (MSCI ACWI) and 40% of the return of the Barclays Global Aggregate Index. The Fund's total return for the most recently completed fiscal year reflected actual cash flows, transaction costs and other expenses, which were not reflected in the total return of any index.
The following discussion will focus on the performance of the Fund's Institutional Shares.
MARKET OVERVIEW
Equities
Equity markets once again enjoyed solid returns for the 12-month reporting period, as the MSCI ACWI4 returned 8.04%, in U.S. dollars. That said, global equity markets experienced increased volatility versus the prior year, and there were significant divergences in equity performance across regions.
The U.S. equity market was among the world's strongest, with the MSCI US Index5 up 16.07%. Equity markets ultimately clawed higher over the course of the year, having to digest a series of challenges. In January, markets had to contend with brutally cold winter weather and the resulting negative impact on consumer activity around the holiday season. At the same time, investors also had to adjust to a change of leadership at the Federal Reserve (the “Fed”), as Janet Yellen was confirmed as the Fed's first female Chair. During the fall, markets once again grew skittish in response to uncertainty around the mid-term congressional elections, softer global economic data, declining oil prices and the completion of the Fed's most recent round of quantitative easing. This resulted in the most significant pull-back of the year. Ultimately, solid earnings results and strong domestic economic data won the day, as U.S. equities hit new highs in the final weeks of the year.
Annual Shareholder Report
International developed markets,6 however, had a much more challenging year. For the reporting period, the MSCI World ex USA Index7 returned only 0.46%. Despite signs of an economic recovery in Europe coming out of last year, economic growth ultimately stalled, and geopolitical tension between Russia and Ukraine served as an overhang throughout the year. Key European economies like Germany, France and the UK all had negative returns for the year. In Japan, optimism around Prime Minister Abe's “Three Arrows” platform was tempered by slowing growth in response to a significant consumption tax hike. For the reporting period, Japan, as measured by the MSCI Japan,8 was down 1.85%.
Emerging markets9 were also quite mixed. While the MSCI Emerging Markets Index10 produced a positive 1.06% return for the year, there was significant divergence in key markets. An end-of-the-period rally, sparked by signs of policy accommodation, helped China equities finish the year up 3.07%.11 On the other hand, emerging markets throughout Eastern Europe struggled in response to geopolitical turmoil, with Russia down 28.89%, Greece down 27.98%, and Poland down 10.04%. Weaker growth and disappointing election results also pushed Brazil down 7.75%.
On the currency front, the U.S. dollar, as measured by the U.S. Dollar Index,12 rose to an eight-year high, gaining 15.80% against the yen, 9.17% against the euro and 4.57% against the pound sterling.
Fixed-Income
It was a challenging year in financial markets, as many asset prices moved in the opposite direction to consensus views. At the start of the year, the consensus was that core bond yields would drift higher, oil prices would stay supported by geopolitical risks and faster global growth, and risk assets would have to adjust to the end of the Fed's quantitative easing. Instead, developed market bond yields rallied around the world, oil prices dropped sharply, inflation expectations moved down across markets, and U.S. equities outperformed. These asset price moves were driven by a number of factors: growth disappointed in most major economies outside the U.S.; deflationary pressures rose steadily in Europe; and investors repeatedly lowered their medium-term inflation and growth outlooks, as well as their forecasts of terminal policy rates.
Annual Shareholder Report
Over the 12 month reporting period, global disinflation, a Fed anxious to avoid premature policy tightening, and yield levels that are much higher than most other developed markets were all factors that supported longer U.S. rates. The 10-year U.S. Treasury yield dropped by more than 40 basis points (bps) during the one-year period ended of November 30th. On the other hand, short rates (from the front end to 5-7 year part of the yield curve) actually went up, with the 2-year Treasury yield rising from 0.28% to 0.47% over the same one-year period. Therefore, the yield curve flattened significantly.
Within the fixed-income market, emerging market bonds and securitized products such as commercial mortgage-backed securities (CMBS), asset-backed securities (ABS) and mortgage-backed securities (MBS) did well over the 12 month period, while investment-grade corporates and high-yield bonds barely outperformed U.S. Treasuries with comparable maturities. For example, based on data from Barclays, the investment-grade corporate bond spread over Treasuries finished at 126 bps at the end of the reporting period, exactly the same as it was one year ago.13 However, high-yield14 bond spreads actually widened from 440 bps to 487 bps over the same period.
Fund Performance
During the reporting period, the stock versus bond allocation and the international country selection were the most significant contributors to Fund performance. The Fund benefited from a significant stock overweighting at the beginning of the period. Allocation decisions in Germany, the Netherlands and Japan boosted returns. International country exposures were achieved through equity index futures. During the reporting period, these futures positions, on balance, contributed positively to the Fund's overall performance. Stock selection in Japan, France and Sweden also helped Fund performance.
The domestic industry group strategy was also a major contributor to Fund performance, benefiting most significantly from allocation decisions in Energy, Transportation and Tech Hardware & Equipment. Stock selection in Automobiles & Components, Transportation and Food, Beverage & Tobacco also helped.
For most of the reporting period, the Fund was underweight emerging markets versus the U.S. This allocation proved to be quite beneficial, as the S&P 500 outperformed the MSCI Emerging Markets index by 15.80% over the reporting period. The emerging markets versus U.S. allocation was achieved through the use of equity index futures. During the reporting period, these futures positions, on balance, contributed to the Fund's overall performance.
Within fixed-income, security selection within the international fixed-income strategy was the most significant contributor to Fund performance, driven primarily by successful currency calls. In general, the Fund was underweight the euro and the yen in favor of the U.S. dollar. The use of these derivatives added to Fund performance.15
Annual Shareholder Report
The most significant detractor to Fund performance was the Fund's allocation to the Federated InterContinental Fund, which was hurt by overweight positions in Germany, Korea, Austria and South Africa, underweight positions in Canada and stock selection in Norway, South Africa and Japan.
The Fund was also negatively affected by the cash versus bond allocation. The Fund was overweight cash relative to bonds for most of the period, which negatively affected Fund performance as bond yields generally fell over the reporting period.
| 1 | Please see the footnotes to the line graphs under “Fund Performance and Growth of a $10,000 Investment” below for the definition of, and more information about, the Blended Index. |
| 2 | The Fund's broad-based security market indexes are the S&P 500 Index and the Barclays U.S. Aggregate Bond Index, which had total returns of 16.86% and 5.27%, respectively. Please see the footnotes to the line graphs under “Fund Performance and Growth of a $10,000 Investment” below for the definition of, and more information about, the S&P 500 Index and the Barclays U.S. Aggregate Bond Index. |
| 3 | Please see the footnotes to the line graphs under “Fund Performance and Growth of a $10,000 Investment” below for the definition of, and more information about, the MWAFA. |
| 4 | The MSCI All Country World Index captures large- and mid-cap representation across 23 developed markets countries and 21 emerging markets countries. The index covers approximately 85% of the global investable equity opportunity set. The index is unmanaged, and it is not possible to invest directly in an index. |
| 5 | The MSCI USA Index is a free float adjusted market capitalization index that is designed to measure large- and mid-cap U.S. equity market performance. The index is unmanaged, and it is not possible to invest directly in an index. |
| 6 | International investing involves special risks including currency risk, increased volatility, political risks, and differences in auditing and other financial standards. |
| 7 | The MSCI World ex USA Index captures large- and mid-cap representation across 22 of 23 developed markets countries, excluding the United States. The index covers approximately 85% of the free float-adjusted market capitalization in each country. The index is unmanaged, and it is not possible to invest directly in an index. |
| 8 | The MSCI Japan Index is designed to measure the performance of the large- and mid-cap segments of the Japanese market. The index covers approximately 85% of the free float-adjusted market capitalization in Japan. The index is unmanaged, and it is not possible to invest directly in an index. |
| 9 | Prices of emerging markets securities can be significantly more volatile than the prices of securities in developed countries, and currency risk and political risks are accentuated in emerging markets. |
| 10 | The MSCI Emerging Markets Index captures large- and mid-cap representation across 21 Emerging Markets (EM) countries. The index covers approximately 85% of the free float-adjusted market capitalization in each country. The index is unmanaged, and it is not possible to invest directly in an index. |
| 11 | The MSCI country indexes are constructed by identifying every listed security in the market. Securities are free float adjusted, classified in accordance with the Global Industry Classification Standard (GICS®), and screened by size, liquidity and minimum free float. The indices are unmanaged, and it is not possible to invest directly in an index. |
| 12 | The U.S. Dollar Index indicates the general international value of the U.S. dollar by averaging the exchange rates between the U.S. dollar and six major world currencies. The index is unmanaged, and it is not possible to invest directly in an index. |
| 13 | Bond prices are sensitive to changes in interest rates, and a rise in interest rates can cause a decline in their prices. |
| 14 | High-yield, lower-rated securities generally entail greater market, credit and liquidity risks than investment-grade securities and may include higher volatility and higher risk of default. |
| 15 | The Fund's use of derivative instruments involves risks different from, or possibly greater than, the risks associated with investing directly in securities or other traditional instruments. |
Annual Shareholder Report
FUND PERFORMANCE AND GROWTH OF A $10,000 INVESTMENT
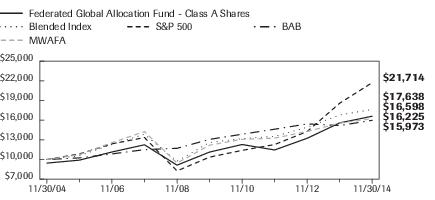
The graph below illustrates the hypothetical investment of $10,0001 in the Federated Global Allocation Fund from November 30, 2004 to November 30, 2014, compared to a blend of indexes comprised of 60% of the MSCI All Country World Index (MSCI ACWI) and 40% of the Barclays Global Aggregate Index (BGA) (the “Blended Index”),2 the Standard and Poor's 500 Index (S&P 500),3 the Barclays U.S. Aggregate Bond Index (BAB)4 and the Morningstar World Allocation Funds Average (MWAFA).5 The Average Annual Total Return table below shows returns for each class averaged over the stated periods.
Growth of a $10,000 Investment
Growth of $10,000 as of November 30, 2014
| Federated Global Allocation Fund - | Class A Shares | Blended Index | S&P 500 | BAB | MWAFA |
| F | I | I | I | I |
| 11/30/2004 | 9,450 | 10,000 | 10,000 | 10,000 | 10,000 |
| 11/30/2005 | 9,899 | 10,565 | 10,844 | 10,240 | 10,727 |
| 11/30/2006 | 11,141 | 12,290 | 12,388 | 10,848 | 12,569 |
| 11/30/2007 | 12,242 | 13,853 | 13,344 | 11,504 | 14,249 |
| 11/30/2008 | 9,135 | 9,729 | 8,261 | 11,704 | 9,456 |
| 11/30/2009 | 11,130 | 12,589 | 10,358 | 13,065 | 12,177 |
| 11/30/2010 | 12,283 | 13,183 | 11,388 | 13,852 | 13,076 |
| 11/30/2011 | 11,452 | 13,525 | 12,280 | 14,616 | 13,248 |
| 11/30/2012 | 13,234 | 14,913 | 14,261 | 15,422 | 14,277 |
| 11/30/2013 | 15,581 | 16,782 | 18,581 | 15,174 | 15,546 |
| 11/30/2014 | 16,598 | 17,638 | 21,714 | 15,973 | 16,225 |
41 graphic description end -->
| ■ | Total returns shown include the maximum sales charge of 5.50% ($10,000 investment minus $550 sales charge = $9,450). |
The Fund offers multiple share classes whose performance may be greater than or less than its other share class(es) due to difference in sales charges and expenses. See the Average Annual Return table below for the returns of additional classes not shown in the line graph above.
Annual Shareholder Report
Average Annual Total Returns for the Period Ended 11/30/2014
(returns reflect all applicable sales charges and contingent deferred sales charges as specified below in footnote #1)
| | 1 Year | 5 Years | 10 Years |
| Class A Shares | 0.67% | 7.68% | 5.48% |
| Class B Shares | 0.51% | 7.73% | 5.40% |
| Class C Shares | 4.76% | 8.07% | 5.26% |
| Class R Shares | 6.06% | 8.43% | 5.60% |
| Institutional Shares6 | 6.85% | 9.22% | 6.11% |
| Blended Index | 5.10% | 6.98% | 5.84% |
| S&P 500 | 16.86% | 15.96% | 8.06% |
| BAB | 5.27% | 4.10% | 4.79% |
| MWAFA | 4.40% | 7.80% | 5.97% |
Performance data quoted represents past performance which is no guarantee of future results. Investment return and principal value will fluctuate so that an investor's shares, when redeemed, may be worth more or less than their original cost. Mutual fund performance changes over time and current performance may be lower or higher than what is stated. For current to the most recent month-end performance and after-tax returns, visit FederatedInvestors.com or call 1-800-341-7400. Returns shown do not reflect the deduction of taxes that a shareholder would pay on Fund distributions or the redemption of Fund shares. Mutual funds are not obligations of or guaranteed by any bank and are not federally insured.
| 1 | Represents a hypothetical investment of $10,000 in the Fund after deducting applicable sales charges: For Class A Shares, the maximum sales charge of 5.50% ($10,000 investment minus $550 sales charge = $9,450); for Class B Shares, the maximum contingent deferred sales charge is 5.50% on any redemption of shares held up to one year from the purchase date; for Class C Shares, the maximum contingent deferred sales charge is 1.00% on any redemption less than one year from the purchase date. The Fund's performance assumes the reinvestment of all dividends and distributions. The Blended Index, S&P 500, BAB and MWAFA have been adjusted to reflect reinvestment of dividends on securities in the indexes and the average. |
| 2 | The Blended Index is a custom blended index comprised of 60% of the MSCI ACWI and 40% of the BGA. The MSCI ACWI captures large- and mid-cap representation across 23 developed markets countries and 23 emerging markets countries. The index covers approximately 85% of the global investable equity opportunity set. The BGA is a measure of global investment grade debt from twenty-four different local currency markets. This multi-currency benchmark includes fixed-rate treasury, government-related, corporate and securitized bonds from both developed and emerging markets issuers. The indexes are not adjusted to reflect sales loads, expenses or other fees that the Securities and Exchange Commission (SEC) requires to be reflected in the Fund's performance. The indexes are unmanaged and, unlike the Fund, are not affected by cash flows. It is not possible to invest directly in an index. |
| 3 | The S&P 500 is an unmanaged, capitalization-weighted index of 500 stocks designed to measure performance of the broad domestic economy through changes in the aggregate market value of 500 stocks representing all major industries. The index is not adjusted to reflect sales loads, expenses or other fees that the SEC requires to be reflected in the Fund's performance. The index is unmanaged and, unlike the Fund, is not affected by cash flows. It is not possible to invest directly in an index. |
Annual Shareholder Report
| 4 | The BAB is a broad-based benchmark that measures the investment grade, U.S. dollar-denominated, fixed-rate taxable bond market, including Treasuries, government-related and corporate securities, mortgage-backed securities (agency fixed-rate and hybrid ARM pass-throughs), asset-backed securities and commercial mortgage-backed securities. The index is not adjusted to reflect sales loads, expenses or other fees that the SEC requires to be reflected in the Fund's performance. The index is unmanaged and, unlike the Fund, is not affected by cash flows. It is not possible to invest directly in an index. |
| 5 | Morningstar figures represent the average of the total returns reported by all the mutual funds designated by Morningstar as falling into the respective category indicated. They do not reflect sales charges. |
| 6 | The Fund's Institutional Shares commenced operation on June 12, 2009. The Fund offers four other classes of shares: Class A Shares, Class B Shares, Class C Shares and Class R Shares. For the period prior to the commencement of operations of Institutional Shares, the performance information shown is for the Fund's Class A Shares. The performance of Class A Shares has not been adjusted to reflect the expenses of Institutional Shares since Institutional Shares have a lower expense ratio than the expense ratio of the Class A Shares. The performance of Class A Shares has been adjusted to remove any voluntary waiver of Fund expenses related to the Class A Shares that may have occurred during the period prior to the commencement of operations of Institutional Shares. Additionally, the performance information shown below has been adjusted to reflect the absence of sales charges applicable to Class A Shares. |
Annual Shareholder Report
Portfolio of Investments Summary Tables (unaudited)
At November 30, 2014, the Fund's portfolio composition1 was as follows:
| Portfolio Composition | Percentage of
Total Net Assets2 |
| Domestic Equity Securities | 27.9% |
| International Equity Securities | 24.7% |
| Corporate Debt Securities | 10.8% |
| Foreign Debt Securities | 7.6% |
| Mortgage-Backed Securities3 | 1.3% |
| Trade Finance Agreements | 1.1% |
| Collateralized Mortgage-Backed Obligations | 0.3% |
| Asset-Backed Securities | 0.1% |
| U.S. Treasury and Agency Securities | 0.1% |
| Municipal Securities4 | 0.0% |
| Other Security Type5 | 9.1% |
| Derivative Contracts6 | 1.1% |
| Cash Equivalents7 | 13.3% |
| Other Assets and Liabilities—Net8 | 2.6% |
| TOTAL | 100.0% |
| 1 | See the Fund's Prospectus and Statement of Additional Information for a description of these security types. |
| 2 | As of the date specified above, the Fund owned shares of one or more affiliated investment companies. For purposes of this table, the affiliated investment company (other than an affiliated money market mutual fund) is not treated as a single portfolio security, but rather the Fund is treated as owning a pro rata portion of each security and each other asset and liability owned by the affiliated investment company. Accordingly, the percentages of total net assets shown in the table will differ from those presented on the Portfolio of Investments. |
| 3 | For purposes of this table, Mortgage-Backed Securities include mortgage-backed securities guaranteed by Government Sponsored Entities. |
| 4 | Represents less than 0.1%. |
| 5 | Other Security Type consists of exchange-traded funds, purchased put and call options. |
| 6 | Based upon net unrealized appreciation (depreciation) or value of the derivative contracts as applicable. Derivative contracts may consist of futures, forwards, options and swaps. The impact of a derivative contract on the Fund's performance may be larger than its unrealized appreciation (depreciation) or value may indicate. In many cases, the notional value or amount of a derivative contract may provide a better indication of the contract's significance to the portfolio. More complete information regarding the Fund's direct investments in derivative contracts, including unrealized appreciation (depreciation), value and notional values or amounts of such contracts, can be found in the table at the end of the Portfolio of Investments included in this Report. |
| 7 | Cash Equivalents include any investments in money market mutual funds and/or overnight repurchase agreements. |
| 8 | Assets, other than investments in securities and derivative contracts, less liabilities. See Statement of Assets and Liabilities. |
Annual Shareholder Report
At November 30, 2014, the sector composition9 of the Fund's equity holdings was as follows:
Sector Composition
of Equity Holdings | Percentage of
Equity Securities |
| Financials | 22.7% |
| Consumer Discretionary | 20.3% |
| Industrials | 13.4% |
| Health Care | 12.6% |
| Information Technology | 9.4% |
| Consumer Staples | 6.6% |
| Utilities | 5.3% |
| Energy | 4.5% |
| Telecommunication Services | 3.0% |
| Materials | 2.2% |
| TOTAL | 100.0% |
| 9 | Sector classifications are based upon, and individual portfolio securities are assigned to, the classifications of the Global Industry Classification Standard (GICS) except that the Adviser assigns a classification to securities not classified by the GICS and to securities for which the Adviser does not have access to the classification made by the GICS. |
Annual Shareholder Report
Portfolio of Investments
November 30, 2014
Shares or Principal
Amount | | | Value in
U.S. Dollars |
| | | COMMON STOCKS—52.6% | |
| | | Consumer Discretionary—10.7% | |
| 21,800 | | Aisin Seiki Co. | $779,522 |
| 800 | 1 | Amazon.com, Inc. | 270,912 |
| 8,503 | | Bayerische Motoren Werke AG (BMW) | 972,193 |
| 13,200 | | Benesse Corp. | 401,954 |
| 10,900 | | Bridgestone Corp. | 374,566 |
| 7,600 | | CBS Corp. - Class B | 417,088 |
| 44,500 | | Comcast Corp., Class A | 2,538,280 |
| 12,519 | | Compagnie Financiere Richemont SA | 1,177,078 |
| 5,113 | | Continental Ag | 1,075,733 |
| 21,000 | | Daihatsu Motor Co. Ltd. | 287,807 |
| 3,937 | | Daimler AG | 331,912 |
| 3,105 | | Delphi Automotive PLC | 226,510 |
| 17,059 | 1 | DirecTV | 1,496,245 |
| 17,106 | | Dollarama, Inc. | 807,804 |
| 19,379 | | Flight Centre Travel Group Ltd. | 666,674 |
| 9,767 | 1 | Fossil Group, Inc. | 1,091,169 |
| 6,800 | | Gannett Co., Inc. | 221,340 |
| 1,200 | | Gap (The), Inc. | 47,520 |
| 3,200 | | General Motors Co. | 106,976 |
| 16,420 | | Hakuhodo DY Holdings, Inc. | 159,615 |
| 19,600 | | Home Depot, Inc. | 1,948,240 |
| 310,304 | | ITV PLC | 1,038,216 |
| 10,600 | | Johnson Controls, Inc. | 530,000 |
| 166,991 | | Kingfisher PLC | 813,820 |
| 300 | | Las Vegas Sand Corp. | 19,107 |
| 38,000 | | Li & Fung Ltd. | 42,286 |
| 1,437 | 1 | Liberty Broadband Corp.- C | 78,173 |
| 5,750 | 1 | Liberty Media Corp. - C | 210,048 |
| 5,600 | 1 | Live Nation | 150,080 |
| 5,400 | | Macy's, Inc. | 350,514 |
| 10,767 | | Magna International, Inc. | 1,160,878 |
| 16,286 | 1 | Michael Kors Holdings Ltd. | 1,249,299 |
| 10,328 | | Michelin, Class B | 949,692 |
| 700 | 1 | NVR, Inc. | 881,069 |
Annual Shareholder Report
Shares or Principal
Amount | | | Value in
U.S. Dollars |
| | | COMMON STOCKS—continued | |
| | | Consumer Discretionary—continued | |
| 87,000 | | Nhk Spring Co. | $753,367 |
| 10,800 | | Nike, Inc., Class B | 1,072,332 |
| 26,098 | | Persimmon PLC | 624,928 |
| 2,800 | | PetSmart, Inc. | 220,528 |
| 4,400 | | Polaris Industries, Inc. | 689,524 |
| 13,354 | | Realestate.com.au Ltd. | 516,104 |
| 67,474 | | Reed Elsevier PLC | 1,173,039 |
| 9,800 | | Ross Stores, Inc. | 896,504 |
| 800 | | Sands China Ltd. | 4,792 |
| 5,578 | | Scripps Networks Interactive | 436,032 |
| 54,300 | | Sony Corp. | 1,189,235 |
| 2,400 | | Stanley Black & Decker, Inc. | 226,656 |
| 4,900 | | Starbucks Corp. | 397,929 |
| 5,012 | 1 | Starz Series A | 165,346 |
| 27,900 | | Sumitomo Rubber Industries, Ltd. | 424,910 |
| 22,800 | | TJX Cos., Inc. | 1,508,448 |
| 7,900 | 1 | TRW Automotive Holdings Corp. | 816,860 |
| 10,100 | | Target Corp. | 747,400 |
| 1,082 | 1 | Taylor Morrison Home Corp - A | 20,926 |
| 5,069 | 1 | Tesla Motors, Inc. | 1,239,472 |
| 5,592 | | Time Warner Cable, Inc. | 834,774 |
| 9,800 | | Time Warner, Inc. | 834,176 |
| 3,600 | | Toyoda Gosei Co., Ltd. | 70,475 |
| 14,000 | | Toyota Motor Corp. | 862,536 |
| 144,707 | | Tui Travel PLC | 1,005,166 |
| 11,300 | | Tupperware Brands Corp. | 759,925 |
| 6,563 | | Twenty-First Century Fox, Inc. | 241,518 |
| 57,000 | | USS Co. Ltd. | 822,482 |
| 1,300 | | V.F. Corp. | 97,721 |
| 15,200 | | Viacom, Inc., Class B - New | 1,149,576 |
| 1,721 | | Volkswagen AG | 389,262 |
| 18,200 | | Walt Disney Co. | 1,683,682 |
| 2,600 | | Whirlpool Corp. | 484,042 |
| 14,509 | | Whitbread PLC | 1,039,554 |
| 36,500 | | Wynn Macau Ltd. | 119,545 |
| | | TOTAL | 46,391,086 |
Annual Shareholder Report
Shares or Principal
Amount | | | Value in
U.S. Dollars |
| | | COMMON STOCKS—continued | |
| | | Consumer Staples—3.5% | |
| 2,700 | | Alimentation Couche-Tard, Inc., Class B | $95,651 |
| 30,000 | | Altria Group, Inc. | 1,507,800 |
| 22,300 | | Archer-Daniels-Midland Co. | 1,174,764 |
| 8,100 | | CVS Health Corp. | 740,016 |
| 3,600 | | Church and Dwight, Inc. | 276,156 |
| 154 | | Coca-Cola Enterprises, Inc. | 6,767 |
| 5,700 | | Colgate-Palmolive Co. | 396,663 |
| 6,177 | | ConAgra Foods, Inc. | 225,584 |
| 13,200 | | Herbalife Ltd. | 570,900 |
| 3,100 | | Japan Tobacco, Inc. | 99,295 |
| 6,900 | | Kimberly-Clark Corp. | 804,471 |
| 10,000 | | Kao Corp. | 370,299 |
| 9,200 | | Kellogg Co. | 609,500 |
| 63,098 | | Koninklijke Ahold NV | 1,114,513 |
| 5,000 | | Molson Coors Brewing Co., Class B | 386,750 |
| 21,000 | 1 | NH Foods Ltd. | 421,539 |
| 9,186 | | Nestle SA | 689,722 |
| 1,415 | | PepsiCo, Inc. | 141,642 |
| 19,650 | | Philip Morris International, Inc. | 1,708,174 |
| 15,300 | | Procter & Gamble Co. | 1,383,579 |
| 182,722 | | Sainsbury (J) PLC | 666,151 |
| 18,400 | | Swedish Match AB | 635,414 |
| 22,200 | | The Coca-Cola Co. | 995,226 |
| | | TOTAL | 15,020,576 |
| | | Energy—2.4% | |
| 57,250 | 1 | Amec Foster Wheeler PLC | 835,672 |
| 1,743 | 1 | Amec Foster Wheeler PLC - SPON ADR | 25,221 |
| 204,540 | | BP PLC | 1,342,503 |
| 1,600 | | Canadian Natural Resources Ltd. | 53,380 |
| 480 | | Delek Group Ltd. | 162,585 |
| 4,300 | | Devon Energy Corp. | 253,571 |
| 4,800 | | Exxon Mobil Corp. | 434,592 |
| 36,886 | | Fugro NV- CVA, GDR | 845,309 |
| 4,100 | | Halliburton Co. | 173,020 |
| 20,700 | | Husky Energy, Inc. | 441,153 |
| 31,600 | | Idemitsu Kosan Co. Ltd. | 539,022 |
| 14,000 | | Inpex Corp. | 148,296 |
Annual Shareholder Report
Shares or Principal
Amount | | | Value in
U.S. Dollars |
| | | COMMON STOCKS—continued | |
| | | Energy—continued | |
| 5,003 | 1 | Kosmos Energy LLC | $41,725 |
| 5,300 | | Nabors Industries Ltd. | 69,536 |
| 6,144 | | Neste Oil Oyj | 145,767 |
| 538 | | OMV AG | 15,560 |
| 52,089 | | Royal Dutch Shell PLC, Class B | 1,808,700 |
| 6,200 | | Schlumberger Ltd. | 532,890 |
| 43,500 | | Showa Shell Sekiyu K.K. | 362,393 |
| 44,100 | | Suncor Energy, Inc. | 1,394,925 |
| 477 | | Tenaris SA | 7,889 |
| 5,094 | | Total SA | 284,973 |
| 4,109 | | Valero Energy Corp. | 199,738 |
| 2,900 | 1 | Whiting Petroleum Corp. | 121,133 |
| | | TOTAL | 10,239,553 |
| | | Financials—11.9% | |
| 23,400 | | AEON Credit Service Ltd. | 504,998 |
| 38,468 | | AXA | 928,678 |
| 1,900 | | Ace, Ltd. | 217,246 |
| 42,278 | | Admiral Group PLC | 818,874 |
| 17,900 | | Aflac, Inc. | 1,069,167 |
| 7,328 | | Allianz SE | 1,261,557 |
| 7,200 | | Allstate Corp. | 490,680 |
| 500 | | American Express Co. | 46,210 |
| 7,435 | | American Tower Corp. | 780,749 |
| 7,900 | | Ameriprise Financial, Inc. | 1,040,983 |
| 60,000 | | Aozora Bank Ltd. | 195,089 |
| 700 | | Assured Guaranty Ltd. | 17,892 |
| 23,066 | | Australia & New Zealand Banking Group, Melbourne | 626,489 |
| 2,766 | | Avalonbay Communities, Inc. | 444,745 |
| 7,485 | | BNP Paribas SA | 479,880 |
| 318,500 | | BOC Hong Kong (Holdings) Ltd. | 1,127,343 |
| 231 | | Banco Bilbao Vizcaya Argentaria SA | 2,481 |
| 162,386 | | Banco Santander, SA | 1,463,710 |
| 805 | | Bank Hapoalim Ltd. | 4,010 |
| 74,804 | 1 | Bank Leumi Le-Israel | 263,640 |
| 97,800 | | Bank of America Corp. | 1,666,512 |
| 2,700 | | Bank of Montreal | 198,976 |
| 4,772 | | Bank of Nova Scotia | 296,127 |
Annual Shareholder Report
Shares or Principal
Amount | | | Value in
U.S. Dollars |
| | | COMMON STOCKS—continued | |
| | | Financials—continued | |
| 72,000 | | Bank of Yokohama Ltd. | $405,745 |
| 41,752 | 1 | Bankia SA | 73,202 |
| 41,416 | | Barclays PLC | 158,592 |
| 3,091 | 1 | Berkshire Hathaway, Inc., - Class B | 459,601 |
| 16,400 | | BioMed Realty Trust, Inc. | 351,780 |
| 600 | | Blackrock, Inc. | 215,448 |
| 2,900 | | Boston Properties, Inc. | 375,956 |
| 8,720 | | CNP Assurances | 161,451 |
| 11,900 | | Canadian Imperial Bank of Commerce | 1,112,054 |
| 5,400 | | Capital One Financial Corp. | 449,280 |
| 1,300 | | Citigroup, Inc. | 70,161 |
| 4,490 | | Commonwealth Bank of Australia, Sydney | 308,394 |
| 256,152 | | Corp Mapfre Sa | 939,930 |
| 28,300 | | Cousins Properties, Inc. | 346,392 |
| 5,603 | | Credit Agricole SA | 78,763 |
| 27,896 | | CubeSmart, REIT | 600,880 |
| 10,000 | | DBS Group Holdings Ltd. | 152,053 |
| 4,725 | | DCT Industrial Trust, Inc. | 161,264 |
| 47,000 | | Daiwa Securities Group, Inc. | 377,655 |
| 8,400 | | Discover Financial Services | 550,620 |
| 13,908 | | DnB ASA | 230,959 |
| 23,900 | 1 | E*Trade Financial Corp. | 545,159 |
| 3,300 | | Equity Residential Properties Trust | 233,772 |
| 2,700 | | Essex Property Trust, Inc. | 546,507 |
| 1,700 | | Federal Realty Investment Trust | 225,522 |
| 19,400 | | Fifth Third Bancorp | 390,328 |
| 8,000 | | Fulton Financial Corp. | 95,520 |
| 3,300 | 1 | Genworth Financial, Inc., Class A | 29,997 |
| 23,479 | | Gjensidige Forsikring ASA | 402,615 |
| 1,600 | | Great-West Lifeco, Inc. | 47,503 |
| 3,360 | | Groupe Bruxelles Lambert SA | 303,949 |
| 118,001 | | HSBC Holdings PLC | 1,174,103 |
| 33,000 | | Hang Seng Bank Ltd. | 549,770 |
| 10,450 | | Hannover Rueck SE | 932,453 |
| 43,762 | | Hargreaves Lansdown PLC | 666,815 |
| 5,200 | | Hartford Financial Services Group, Inc. | 214,760 |
| 64,400 | | Hersha Hospitality Trust | 477,204 |
Annual Shareholder Report
Shares or Principal
Amount | | | Value in
U.S. Dollars |
| | | COMMON STOCKS—continued | |
| | | Financials—continued | |
| 2,304 | | Intesa Sanpaolo | $7,099 |
| 28,400 | | Investor AB, Class B | 1,066,826 |
| 11,140 | | J.P. Morgan Chase & Co. | 670,182 |
| 72,600 | | KeyCorp | 980,100 |
| 1,300 | | Kinnevik Investment AB | 45,103 |
| 13,775 | | Kite Realty Group Trust | 375,782 |
| 3,603 | | Lazard Ltd., Class A | 185,627 |
| 299,551 | | Legal & General Group PLC | 1,154,306 |
| 62,146 | | Lend Lease Corp. Ltd. | 810,651 |
| 3,700 | | Lincoln National Corp. | 209,531 |
| 360,178 | 1 | Lloyds TSB Group PLC | 452,047 |
| 6,403 | | London Stock Exchange Group PLC | 225,533 |
| 5,363 | | Macquarie Group Ltd. | 266,638 |
| 23,200 | | Manulife Financial Corp. | 462,174 |
| 18,500 | | MetLife, Inc. | 1,028,785 |
| 28,400 | | Mitsubishi UFJ Financial Group, Inc. | 164,206 |
| 227,400 | | Mizuho Financial Group, Inc. | 391,722 |
| 5,868 | | Muenchener Rueckversicherungs-Gesellschaft AG - REG | 1,208,676 |
| 1,700 | | National Bank of Canada, Montreal | 79,105 |
| 2,000 | | Oversea-Chinese Banking Corp. Ltd. | 16,072 |
| 4,300 | | PNC Financial Services Group | 376,121 |
| 3,418 | | Partners Group Holding AG | 981,625 |
| 8,651 | | Pebblebrook Hotel Trust | 373,464 |
| 402 | | Raiffeisen Bank International AG | 8,318 |
| 9,100 | | Regions Financial Corp. | 91,637 |
| 4,800 | | RenaissanceRe Holdings Ltd. | 470,016 |
| 20,400 | | Royal Bank of Canada, Montreal | 1,492,848 |
| 3,200 | | SL Green Realty Corp. | 371,648 |
| 12,971 | | Sampo Oyj, Class A | 639,829 |
| 23,052 | | Schroders PLC | 970,394 |
| 13,658 | | Scor Regroupe | 426,105 |
| 3,300 | | Simon Property Group, Inc. | 596,640 |
| 35,819 | | Sprit Realty Capital, Inc. | 419,441 |
| 67,185 | | Standard Life PLC | 444,958 |
| 34,400 | 1 | Strategic Hotels & Resorts, Inc. | 456,832 |
| 20,800 | | Sumitomo Mitsui Financial Group, Inc. | 784,063 |
| 9,000 | | Sumitomo Mitsui Trust Holdings, Inc. | 37,406 |
Annual Shareholder Report
Shares or Principal
Amount | | | Value in
U.S. Dollars |
| | | COMMON STOCKS—continued | |
| | | Financials—continued | |
| 500 | | Sun Life Financial Services of Canada | $18,706 |
| 5,300 | | TCF Financial Corp. | 82,256 |
| 3,500 | | Tokio Marine Holdings, Inc. | 114,406 |
| 17,200 | | Toronto-Dominion Bank | 869,100 |
| 900 | | U.S. Bancorp | 39,780 |
| 1,900 | 1 | United Mizrahi Bank Ltd. | 20,122 |
| 975 | | Validus Holdings Ltd. | 40,463 |
| 802 | | Vienna Insurance Group | 39,895 |
| 3,300 | | Vornado Realty Trust | 368,148 |
| 54,400 | | Wells Fargo & Co. | 2,963,712 |
| 726 | | Westpac Banking Corp. Ltd. | 20,108 |
| | | TOTAL | 51,680,399 |
| | | Health Care—6.6% | |
| 7,243 | | AbbVie, Inc. | 501,216 |
| 1,706 | 1 | Actavis PLC | 461,661 |
| 8,498 | 1 | Actelion Ltd. | 1,010,525 |
| 14,100 | | Aetna, Inc. | 1,230,084 |
| 9,616 | | Amgen, Inc | 1,589,621 |
| 700 | 1 | Bio Rad Laboratories, Inc., Class A | 83,153 |
| 65,300 | 1 | Boston Scientific Corp. | 840,411 |
| 5,200 | | Bristol-Myers Squibb Co. | 307,060 |
| 1,000 | | CIGNA Corp. | 102,890 |
| 17,265 | | CSL Ltd. | 1,213,019 |
| 10,500 | | Cardinal Health, Inc. | 862,995 |
| 2,787 | | Celesio AG | 92,875 |
| 2,549 | 1 | Celgene Corp. | 289,796 |
| 4,000 | 1 | Centene Corp. | 395,080 |
| 14,931 | | Cochlear Ltd. | 883,618 |
| 2,650 | | Coloplast, Class B | 229,628 |
| 7,955 | 1 | Community Health Systems, Inc. | 374,521 |
| 15,269 | 1 | Express Scripts Holding Co. | 1,269,617 |
| 13,000 | 1 | Gilead Sciences, Inc. | 1,304,160 |
| 862 | 1 | Halyard Health, Inc. | 33,799 |
| 38,000 | 1 | Hologic, Inc. | 1,018,400 |
| 22,900 | | Johnson & Johnson | 2,478,925 |
| 18,200 | | Lilly (Eli) & Co. | 1,239,784 |
| 38,600 | | Medipal Holdings Corp. | 428,871 |
Annual Shareholder Report
Shares or Principal
Amount | | | Value in
U.S. Dollars |
| | | COMMON STOCKS—continued | |
| | | Health Care—continued | |
| 7,600 | | Medtronic, Inc. | $561,412 |
| 9,300 | | Merck & Co., Inc. | 561,720 |
| 5,000 | 1 | Mylan, Inc. | 293,050 |
| 16,985 | | Novo Nordisk A/S, Class B | 774,639 |
| 5,578 | | Novartis AG - REG | 539,760 |
| 1,711 | | Orion Oyj | 58,678 |
| 74,522 | | Pfizer, Inc. | 2,321,360 |
| 28,713 | 1 | Premier, Inc. | 976,816 |
| 2,770 | 1 | Qiagen NV | 66,286 |
| 7,443 | | Ramsay Health Care Ltd. | 342,945 |
| 700 | 1 | Regeneron Pharmaceuticals, Inc. | 291,277 |
| 9,352 | | Roche Holding AG-GENUSSCHEIN | 2,801,003 |
| 4,367 | | Sanofi | 422,791 |
| 21 | | Shire PLC | 1,495 |
| 15,000 | | Sumitomo Dainippon Pharma Co., Ltd. | 155,035 |
| 1,700 | | Wellpoint, Inc. | 217,447 |
| | | TOTAL | 28,627,423 |
| | | Industrials—7.0% | |
| 55 | | 3M Co. | 8,805 |
| 15 | | A P Moller-Maersk A/S | 31,285 |
| 1,585 | | Abertis Infraestructuras SA | 33,919 |
| 4,609 | | Alaska Air Group, Inc. | 272,069 |
| 9,174 | | Allegion PLC | 494,020 |
| 20,787 | | Allison Transmission Holdings, Inc. | 683,684 |
| 81,401 | | Aurizon Hldgs. Ltd. | 319,308 |
| 148,989 | | BAE Systems PLC | 1,119,620 |
| 7,700 | | Boeing Co. | 1,034,572 |
| 16,914 | | Bouygues SA | 636,315 |
| 712 | | Bunzl PLC | 19,863 |
| 3,700 | | CP Railway Ltd. | 715,409 |
| 6,500 | | CSX Corp. | 237,185 |
| 10,523 | | Canadian National Railway, Co. | 748,435 |
| 200 | 1 | Copart, Inc. | 7,268 |
| 7,925 | | DSV, De Sammensluttede Vognmad AS | 248,198 |
| 4,700 | | Danaher Corp. | 392,732 |
| 27,500 | | Delta Air Lines, Inc. | 1,283,425 |
| 30,312 | | Deutsche Post AG | 1,006,927 |
Annual Shareholder Report
Shares or Principal
Amount | | | Value in
U.S. Dollars |
| | | COMMON STOCKS—continued | |
| | | Industrials—continued | |
| 8,200 | | Dover Corp. | $631,318 |
| 29,734 | | Edenred | 857,398 |
| 7,800 | | FedEx Corp. | 1,389,804 |
| 24,000 | | Fuji Electric Co. | 105,328 |
| 2,282 | | Geberit International AG | 794,951 |
| 5,300 | | General Dynamics Corp. | 770,408 |
| 9,335 | | General Electric Co. | 247,284 |
| 1,419 | | Huntington Ingalls Industries, Inc. | 154,628 |
| 356,000 | | Hutchison Port Holdings TR-U | 243,860 |
| 12,200 | | IDEX Corp. | 937,082 |
| 8,000 | | Ingersoll-Rand PLC | 504,480 |
| 174 | | Kone Corp. OYJ, Class B | 8,005 |
| 2,900 | | L-3 Communications Holdings, Inc. | 361,340 |
| 3,821 | | Leighton Holdings Ltd. | 65,448 |
| 6,200 | | Lockheed Martin Corp. | 1,187,672 |
| 79,000 | | Marubeni Corp. | 497,963 |
| 14,600 | | Mitsui & Co., Ltd. | 201,386 |
| 8,772 | | Nielsen NV | 366,406 |
| 7,800 | | Norfolk Southern Corp. | 870,792 |
| 6,900 | | Northrop Grumman Corp. | 972,417 |
| 15,332 | | Randstad Holdings N.V. | 756,578 |
| 7,700 | | Raytheon Co. | 821,590 |
| 10,400 | | Securitas AB, Class B | 125,597 |
| 38,000 | | Singapore Technologies Engineering Ltd. | 98,194 |
| 3,283 | | Societe BIC SA | 437,617 |
| 37,600 | | Southwest Airlines Co. | 1,572,432 |
| 39,293 | | TNT Express NV | 264,815 |
| 5,574 | | The ADT Corp. | 194,756 |
| 20,000 | | Toto Ltd. | 238,723 |
| 23,744 | | Union Pacific Corp. | 2,772,587 |
| 12,700 | | United Parcel Service, Inc. | 1,395,984 |
| 1,200 | 1 | Vestas Wind Systems A/S | 44,200 |
| 21,780 | | West Japan Railway Co. | 1,039,510 |
| 9,271 | | Xylem, Inc. | 355,450 |
| 31,000 | | Yangzijiang Shipbuilding Holdings Ltd. | 29,119 |
| | | TOTAL | 30,608,161 |
Annual Shareholder Report
Shares or Principal
Amount | | | Value in
U.S. Dollars |
| | | COMMON STOCKS—continued | |
| | | Information Technology—4.9% | |
| 1 | | ASML Holding N.V. | $106 |
| 1,700 | 1 | Alliance Data Systems Corp. | 485,979 |
| 53,467 | | Apple, Inc. | 6,358,830 |
| 10,100 | | Applied Materials, Inc. | 242,905 |
| 3,198 | 1 | Arris Group, Inc. | 95,205 |
| 36,913 | | Brocade Communications Systems, Inc. | 417,486 |
| 6,485 | | CDW Corp. | 227,494 |
| 14,700 | | Canon, Inc. | 470,724 |
| 65,200 | | Cisco Systems, Inc. | 1,802,128 |
| 23,925 | 1 | CommScope Holdings Co., Inc. | 531,135 |
| 4,700 | | Corning, Inc. | 98,794 |
| 6,000 | 1 | eBay, Inc. | 329,280 |
| 6,975 | | Ericsson LM - B | 87,836 |
| 18,879 | 1 | Facebook, Inc. | 1,466,898 |
| 923 | 1 | Google, Inc., Class A | 506,801 |
| 48,700 | | Hewlett-Packard Co. | 1,902,222 |
| 1,800 | | Hoya Corp. | 63,985 |
| 6,300 | 1 | Ingram Micro, Inc., Class A | 172,809 |
| 1,400 | | Intel Corp. | 52,150 |
| 6,900 | 1 | Micron Technology, Inc. | 248,055 |
| 7,300 | | Microsoft Corp. | 349,013 |
| 3,000 | | Murata Manufacturing Co. Ltd. | 324,096 |
| 10,600 | | NVIDIA Corp. | 222,282 |
| 2,643 | | Nokia Oyj | 21,986 |
| 9,700 | | Omron Corp. | 451,030 |
| 16,620 | | Oracle Corp. | 704,854 |
| 15,100 | | Otsuka Corp. | 519,593 |
| 6,500 | | Qualcomm, Inc. | 473,850 |
| 1,605 | | STMicroelectronics N.V. | 12,028 |
| 8,700 | 1 | Tech Data Corp. | 542,271 |
| 24,000 | 1 | Trimble Navigation Ltd. | 675,000 |
| 9,854 | | United Internet AG | 434,061 |
| 3,400 | 1 | VMware, Inc., Class A | 299,064 |
| 7,500 | | Western Digital Corp. | 774,525 |
| | | TOTAL | 21,364,475 |
| | | Materials—1.2% | |
| 32,000 | | Asahi Kasei Corp. | 278,179 |
Annual Shareholder Report
Shares or Principal
Amount | | | Value in
U.S. Dollars |
| | | COMMON STOCKS—continued | |
| | | Materials—continued | |
| 2,067 | | EMS-Chemie Holdings AG | $766,903 |
| 2,300 | | Eagle Materials, Inc. | 189,497 |
| 233,112 | | Fortescue Metals Group Ltd. | 583,164 |
| 164,808 | | Glencore Xstrata PLC | 824,806 |
| 80,500 | | Kuraray Co. Ltd. | 979,847 |
| 2,248 | | LyondellBasell Industries NV, Class A | 177,277 |
| 1,700 | | Martin Marietta Materials | 204,068 |
| 9,400 | | Nitto Denko Corp. | 495,912 |
| 1,000 | | Sherwin-Williams Co. | 244,860 |
| 69 | | Sika AG | 262,646 |
| 2,109 | | Voest-alpine Stahl | 87,589 |
| 94 | | Yara International ASA | 3,997 |
| | | TOTAL | 5,098,745 |
| | | Telecommunication Services—1.6% | |
| 20,909 | | Belgacom | 825,348 |
| 60,600 | | Deutsche Telekom AG | 1,032,337 |
| 525,095 | | HKT Trust and HKT Ltd. | 657,448 |
| 6,000 | | KDDI Corp. | 384,315 |
| 17,200 | | Nippon Telegraph and Telephone Corp. | 920,163 |
| 10,222 | | Orange SA | 180,045 |
| 193,000 | | PCCW Ltd. | 128,663 |
| 260,000 | | StarHub Ltd. | 825,365 |
| 4,342 | | TDC AS | 35,194 |
| 67,075 | | Tele2 AB, Class B | 868,510 |
| 98,707 | | Telecom Italia S.p.A | 111,200 |
| 33,691 | | Telstra Corp. Ltd. | 163,119 |
| 11,400 | | Verizon Communications | 576,726 |
| 6,338 | | Vivendi SA | 161,403 |
| | | TOTAL | 6,869,836 |
| | | Utilities—2.8% | |
| 49,200 | | AES Corp. | 682,404 |
| 15,400 | | Ameren Corp. | 663,894 |
| 8,200 | | American Electric Power Co., Inc. | 471,910 |
| 7,200 | | CMS Energy Corp. | 238,320 |
| 14,200 | 1 | Calpine Corp. | 326,032 |
| 3,000 | | Cheung Kong Infrastructure Holdings Ltd. | 22,243 |
| 1,389 | | E.On AG | 24,620 |
Annual Shareholder Report
Shares or Principal
Amount | | | Value in
U.S. Dollars |
| | | COMMON STOCKS—continued | |
| | | Utilities—continued | |
| 27,108 | | Electricite De France | $811,507 |
| 18,927 | | Enagas SA | 633,792 |
| 203,188 | | Enel S.p.A | 980,298 |
| 400 | | Entergy Corp. | 33,560 |
| 28,400 | | FirstEnergy Corp. | 1,047,392 |
| 47,170 | | GDF Suez | 1,162,220 |
| 28,000 | | Power Assets Holdings Ltd. | 267,354 |
| 26,600 | | Public Service Enterprises Group, Inc. | 1,111,348 |
| 1,820 | | Red Electrica de Espana | 166,721 |
| 30,355 | | SSE PLC | 777,598 |
| 4,200 | | Sempra Energy | 469,266 |
| 50,335 | | Snam Rete Gas S.p.A | 266,880 |
| 54,501 | | Suez Environment SA | 966,390 |
| 152,136 | | Terna S.p.A | 734,750 |
| 8,550 | | UGI Corp. | 322,420 |
| | | TOTAL | 12,180,919 |
| | | TOTAL COMMON STOCKS
(IDENTIFIED COST $197,855,616) | 228,081,173 |
| | | ASSET-BACKED SECURITIES—0.1% | |
| $150,000 | | American Express Credit Account Master Trust 2014-1, A, 0.524%, 12/15/2021 | 149,596 |
| 150,000 | | Navient Student Loan Trust 2014-1, A2, 0.462%, 03/27/2023 | 149,929 |
| | | TOTAL ASSET-BACKED SECURITIES
(IDENTIFIED COST $300,000) | 299,525 |
| | | COLLATERALIZED MORTGAGE OBLIGATIONS—0.0% | |
| 50,000 | | WF-RBS Commercial Mortgage Trust 2012-C6 B, 4.697%, 4/15/2045 | 54,445 |
| 100,000 | | WF-RBS Commercial Mortgage Trust 2014-C25 B, 4.236%, 11/15/2047 | 103,000 |
| | | TOTAL COLLATERALIZED MORTGAGE OBLIGATIONS
(IDENTIFIED COST $153,497) | 157,445 |
| | | CORPORATE BONDS—2.3% | |
| | | Basic Industry - Chemicals—0.0% | |
| 50,000 | | RPM International, Inc., 6.500%, 02/15/2018 | 56,834 |
| 15,000 | | RPM International, Inc., Sr. Unsecd. Note, 6.125%, 10/15/2019 | 17,251 |
| | | TOTAL | 74,085 |
| | | Basic Industry - Metals & Mining—0.1% | |
| 90,000 | | Allegheny Technologies, Inc., Sr. Note, 9.375%, 06/01/2019 | 104,868 |
| 150,000 | | Barrick Gold Corp., Sr. Unsecd. Note, 4.100%, 5/01/2023 | 147,193 |
Annual Shareholder Report
Shares or Principal
Amount | | | Value in
U.S. Dollars |
| | | CORPORATE BONDS—continued | |
| | | Basic Industry - Metals & Mining—continued | |
| $100,000 | | Reliance Steel & Aluminum Co., Sr. Unsecd. Note, 4.500%, 04/15/2023 | $100,827 |
| | | TOTAL | 352,888 |
| | | Basic Industry - Paper—0.0% | |
| 30,000 | | International Paper Co., Sr. Unsecd. Note, 7.500%, 08/15/2021 | 37,572 |
| 150,000 | 1,2,3 | Pope & Talbot, Inc., 8.375%, 12/01/2099 | 0 |
| | | TOTAL | 37,572 |
| | | Capital Goods - Aerospace & Defense—0.0% | |
| 50,000 | 4,5 | BAE Systems Holdings, Inc., Series 144A, 5.200%, 8/15/2015 | 51,651 |
| | | Capital Goods - Diversified Manufacturing—0.1% | |
| 100,000 | | General Electric Co., Sr. Unsecd. Note, 4.125%, 10/09/2042 | 103,196 |
| 100,000 | | Roper Industries, Inc., Sr. Unsecd. Note, 6.250%, 09/01/2019 | 116,912 |
| 90,000 | 4,5 | Textron Financial Corp., Jr. Sub. Note, Series 144A, 6.000%, 2/15/2067 | 83,025 |
| | | TOTAL | 303,133 |
| | | Capital Goods - Environmental—0.0% | |
| 110,000 | | Republic Services, Inc., Company Guarantee, 5.500%, 9/15/2019 | 125,559 |
| 25,000 | | Waste Management, Inc., 7.375%, 03/11/2019 | 30,275 |
| | | TOTAL | 155,834 |
| | | Communications - Cable & Satellite—0.0% | |
| 20,000 | | Time Warner Cable, Inc., Company Guarantee, 8.250%, 04/01/2019 | 24,776 |
| | | Communications - Media & Entertainment—0.1% | |
| 100,000 | | 21st Century Fox America, Inc., Sr. Unsecd. Note, 5.400%, 10/01/2043 | 117,062 |
| 310,000 | 4,5 | British Sky Broadcasting Group PLC, 3.75%, Series 144A, 9/16/2024 | 315,904 |
| 200,000 | | Viacom, Inc., Sr. Unsecd. Note, 3.875%, 04/01/2024 | 203,020 |
| | | TOTAL | 635,986 |
| | | Communications - Telecom Wirelines—0.1% | |
| 15,000 | | CenturyLink, Inc., Sr. Note, Series Q, 6.150%, 09/15/2019 | 16,350 |
| 200,000 | | Verizon Communications, Inc., Sr. Unsecd. Note, 4.150%, 03/15/2024 | 211,149 |
| | | TOTAL | 227,499 |
| | | Conglomerates—0.0% | |
| 200,000 | 4,5 | Hutchison Whampoa International 14 Ltd., Unsecd. Note, Series 144A, 1.625%, 10/31/2017 | 199,390 |
| | | Consumer Cyclical - Automotive—0.1% | |
| 70,000 | | General Motors Co., Sr. Unsecd. Note, 4.00%, 4/01/2025 | 70,241 |
| 200,000 | | Magna International, Inc., 3.625%, 6/15/2024 | 201,611 |
| 50,000 | 4,5 | RCI Banque SA, Sr. Unsecd. Note, Series 144A, 4.600%, 04/12/2016 | 52,281 |
| | | TOTAL | 324,133 |
Annual Shareholder Report
Shares or Principal
Amount | | | Value in
U.S. Dollars |
| | | CORPORATE BONDS—continued | |
| | | Consumer Cyclical - Retailers—0.1% | |
| $100,000 | | Advance Auto Parts, Inc., 4.500%, 12/01/2023 | $106,887 |
| 140,058 | 4,5 | CVS Caremark Corp., Pass Thru Cert., Series 144A, 5.298%, 1/11/2027 | 152,664 |
| 50,000 | | Wal-Mart Stores, Inc., Sr. Unsecd. Note, 3.300%, 04/22/2024 | 51,930 |
| | | TOTAL | 311,481 |
| | | Consumer Non-Cyclical - Food/Beverage—0.0% | |
| 66,000 | | ConAgra Foods, Inc., Sr. Unsecd. Note, 4.650%, 01/25/2043 | 67,188 |
| | | Consumer Non-Cyclical - Health Care—0.0% | |
| 20,000 | | Express Scripts, Inc., Sr. Unsecd. Note, 7.250%, 06/15/2019 | 24,253 |
| 50,000 | | Thermo Fisher Scientific, Sr. Unsecd. Note, 3.300%, 2/15/2022 | 50,584 |
| | | TOTAL | 74,837 |
| | | Consumer Non-Cyclical - Tobacco—0.1% | |
| 24,000 | | Altria Group, Inc., 9.250%, 08/06/2019 | 31,110 |
| 60,000 | | Altria Group, Inc., Sr. Unsecd. Note, 4.000%, 01/31/2024 | 62,677 |
| 200,000 | | Bat Holdings BV, Sr. Unsecd. Note, Series EMTN, 4.000%, 07/07/2020 | 292,022 |
| | | TOTAL | 385,809 |
| | | Energy - Independent—0.1% | |
| 100,000 | | Apache Corp., 4.25%, 1/15/2044 | 90,476 |
| 100,000 | | Petroleos Mexicanos, 6.500%, 06/02/2041 | 116,250 |
| 150,000 | | Petroleos Mexicanos, Sr. Unsecd. Note, 4.875%, 1/18/2024 | 157,875 |
| 20,000 | | XTO Energy, Inc., 6.750%, 08/01/2037 | 29,243 |
| | | TOTAL | 393,844 |
| | | Energy - Integrated—0.1% | |
| 155,000 | | Husky Energy, Inc., 4.000%, 04/15/2024 | 157,813 |
| 100,000 | | Husky Energy, Inc., Sr. Unsecd. Note, 3.950%, 04/15/2022 | 103,466 |
| 35,000 | | Petro-Canada, Deb., 7.000%, 11/15/2028 | 46,366 |
| | | TOTAL | 307,645 |
| | | Energy - Midstream—0.0% | |
| 100,000 | | Williams Partners LP, 4.900%, 1/15/2045 | 98,832 |
| | | Energy - Oil Field Services—0.1% | |
| 100,000 | | Nabors Industries, Inc., Company Guarantee, 5.000%, 09/15/2020 | 106,012 |
| 50,000 | | Noble Drilling Corp., Sr. Note, 7.500%, 03/15/2019 | 58,042 |
| 100,000 | | Weatherford International Ltd., Sr. Unsecd. Note, 5.950%, 04/15/2042 | 98,270 |
| | | TOTAL | 262,324 |
| | | Energy - Refining—0.0% | |
| 25,000 | | Valero Energy Corp., 9.375%, 03/15/2019 | 31,526 |
| 100,000 | | Valero Energy Corp., Sr. Unsecd. Note, 6.625%, 06/15/2037 | 122,362 |
| | | TOTAL | 153,888 |
Annual Shareholder Report
Shares or Principal
Amount | | | Value in
U.S. Dollars |
| | | CORPORATE BONDS—continued | |
| | | Financial Institution - Banking—0.2% | |
| $140,000 | | Associated Banc-Corp., Sub., 4.25%, 1/15/2025 | $141,364 |
| 100,000 | | Bank of America Corp., Sr. Unsecd. Note, Series MTN, 4.875%, 4/01/2044 | 109,353 |
| 100,000 | | Citigroup, Inc., Sr. Unsecd. Note, 4.950%, 11/07/2043 | 112,401 |
| 5,000 | | Goldman Sachs Group, Inc., Sr. Unsecd. Note, 5.750%, 01/24/2022 | 5,802 |
| 50,000 | | Goldman Sachs Group, Inc., Sr. Unsecd. Note, 6.125%, 02/15/2033 | 61,651 |
| 100,000 | | J.P. Morgan Chase & Co., 6.750%, 1/29/2049 | 107,000 |
| 50,000 | | J.P. Morgan Chase & Co., Sub. Note, 3.375%, 05/01/2023 | 49,340 |
| 100,000 | | Morgan Stanley, Sr. Unsecd. Note, 6.375%, 07/24/2042 | 131,307 |
| 188,658 | 3,4 | Regional Diversified Funding, Series 144A, 9.250%, 03/15/2030 | 115,266 |
| 40,000 | | Wilmington Trust Corp., Sub. Note, 8.500%, 04/02/2018 | 47,403 |
| | | TOTAL | 880,887 |
| | | Financial Institution - Broker/Asset Mgr/Exchange—0.1% | |
| 30,000 | | Janus Capital Group, Inc., Sr. Note, 6.700%, 06/15/2017 | 33,507 |
| 95,000 | | Jefferies Group LLC, Sr. Unsecd. Note, 8.500%, 07/15/2019 | 117,075 |
| 70,000 | 4,5 | TIAA Asset Management Finance Co., LLC, Sr. Unsecd. Note, Series 144A, 4.125%, 11/01/2024 | 71,353 |
| | | TOTAL | 221,935 |
| | | Financial Institution - Finance Companies—0.0% | |
| 30,000 | | General Electric Capital, Note, Series MTNA, 6.75%, 3/15/2032 | 40,425 |
| | | Financial Institution - Insurance - Health—0.0% | |
| 50,000 | | Wellpoint, Inc., 5.850%, 01/15/2036 | 60,738 |
| | | Financial Institution - Insurance - Life—0.3% | |
| 100,000 | | Aflac, Inc., Sr. Unsecd. Note, 6.450%, 08/15/2040 | 128,343 |
| 100,000 | | American International Group, Inc., Sr. Unsecd. Note, 6.250%, 05/01/2036 | 128,015 |
| 10,000 | | MetLife, Inc., Jr. Sub. Note, 10.75%, 8/01/2039 | 16,325 |
| 200,000 | | Prudential Financial, Inc., Sr. Unsecd. Note, Series MTN, 4.600%, 05/15/2044 | 206,401 |
| 750,000 | 4 | Union Central Life Insurance Co., Note, Series 144A, 8.200%, 11/01/2026 | 1,014,840 |
| | | TOTAL | 1,493,924 |
| | | Financial Institution - Insurance - P&C—0.0% | |
| 75,000 | | ACE INA Holdings, Inc., Sr. Unsecd. Note, 3.350%, 05/15/2024 | 76,231 |
| 50,000 | | Horace Mann Educators Corp., Sr. Note, 6.850%, 04/15/2016 | 53,837 |
| 30,000 | 4,5 | Nationwide Mutual Insurance Co., Sub. Note, Series 144A, 9.375%, 08/15/2039 | 47,306 |
| | | TOTAL | 177,374 |
Annual Shareholder Report
Shares or Principal
Amount | | | Value in
U.S. Dollars |
| | | CORPORATE BONDS—continued | |
| | | Financial Institution - REIT - Apartment—0.1% | |
| $45,000 | | Avalonbay Communities, Inc., Sr. Unsecd. Note, Series MTN, 5.700%, 03/15/2017 | $49,549 |
| 300,000 | | Mid-America Apartment Communities LP, Sr. Unsecd. Note, 3.750%, 06/15/2024 | 303,346 |
| | | TOTAL | 352,895 |
| | | Financial Institution - REIT - Healthcare—0.0% | |
| 100,000 | | Health Care REIT, Inc., Sr. Unsecd. Note, 4.125%, 04/01/2019 | 107,331 |
| | | Financial Institution - REIT - Other—0.1% | |
| 40,000 | | Liberty Property LP, 6.625%, 10/01/2017 | 45,255 |
| 100,000 | | ProLogis LP, Sr. Unsecd. Note, 3.350%, 02/01/2021 | 102,012 |
| 160,000 | | WP Carey, Inc., Sr. Unsecd. Note, 4.600%, 04/01/2024 | 168,645 |
| | | TOTAL | 315,912 |
| | | Financial Institution - REIT - Retail—0.0% | |
| 40,000 | | Equity One, Inc., Bond, 6.000%, 09/15/2017 | 44,280 |
| | | Foreign-Local-Government—0.1% | |
| 255,000 | 4,5 | Queensland Treasury Corp., Sr. Unsecd. Note, 4.000%, 6/21/2019 | 227,519 |
| 50,000 | | Quebec, Province of, Note, Series MTNA, 7.035%, 03/10/2026 | 67,325 |
| | | TOTAL | 294,844 |
| | | Municipal Services—0.1% | |
| 140,000 | 4,5 | Army Hawaii Family Housing, Series 144A, 5.524%, 6/15/2050 | 154,232 |
| 100,000 | 4,5 | Camp Pendleton & Quantico Housing LLC, Series 144A, 5.572%, 10/01/2050 | 109,972 |
| | | TOTAL | 264,204 |
| | | Sovereign—0.0% | |
| 20,000,000 | | KfW, 2.050%, 02/16/2026 | 198,460 |
| | | Technology—0.0% | |
| 100,000 | | Fidelity National Information Services, Inc., Sr. Unsecd. Note, 3.875%, 06/05/2024 | 102,736 |
| | | Transportation - Railroads—0.0% | |
| 45,000 | | Union Pacific Corp., Bond, 6.625%, 02/01/2029 | 60,618 |
| | | Transportation - Services—0.1% | |
| 75,000 | 4,5 | Enterprise Rent-A-Car USA Finance Co., Series 144A, 6.375%, 10/15/2017 | 85,071 |
| 62,000 | 4,5 | Enterprise Rent-A-Car USA Finance Co., Sr. Unsecd. Note, Series 144A, 3.850%, 11/15/2024 | 63,323 |
| 100,000 | 4,5 | Penske Truck Leasing Co. LP & PTL Finance Corp., Series 144A, 2.500%, 06/15/2019 | 100,231 |
| 100,000 | | Ryder System, Inc., Sr. Unsecd. Note, Series MTN, 2.450%, 11/15/2018 | 101,274 |
| | | TOTAL | 349,899 |
Annual Shareholder Report
Shares or Principal
Amount | | | Value in
U.S. Dollars |
| | | CORPORATE BONDS—continued | |
| | | Utility - Electric—0.1% | |
| $60,000 | | Appalachian Power Co., Sr. Unsecd. Note, 7.950%, 01/15/2020 | $76,090 |
| 50,000 | | Cleveland Electric Illuminating Co., Sr. Unsecd. Note, 5.950%, 12/15/2036 | 58,558 |
| 29,143 | 4,5 | Great River Energy, 1st Mtg. Note, Series 144A, 5.829%, 7/01/2017 | 31,232 |
| 200,000 | | NextEra Energy Capital Holdings, Inc., Sr. Unsecd. Note, 2.400%, 09/15/2019 | 201,213 |
| 75,000 | | PSEG Power LLC, Sr. Unsecd. Note, 4.300%, 11/15/2023 | 79,175 |
| 40,000 | | Progress Energy, Inc., 7.050%, 03/15/2019 | 47,878 |
| | | TOTAL | 494,146 |
| | | Utility - Natural Gas—0.1% | |
| 300,000 | | Sempra Energy, Sr. Unsecd. Note, 3.550%, 06/15/2024 | 306,144 |
| | | TOTAL CORPORATE BONDS
(IDENTIFIED COST $9,815,245) | 10,209,547 |
| | | MORTGAGE-BACKED SECURITIES—0.1% | |
| 3,398 | | Federal Home Loan Mortgage Corp. Pool C00592, 7.000%, 3/1/2028 | 3,961 |
| 2,466 | | Federal Home Loan Mortgage Corp. Pool C00896, 7.500%, 12/1/2029 | 2,938 |
| 6,260 | | Federal Home Loan Mortgage Corp. Pool C17281, 6.500%, 11/1/2028 | 7,211 |
| 3,334 | | Federal Home Loan Mortgage Corp. Pool C19588, 6.500%, 12/1/2028 | 3,859 |
| 1,866 | | Federal Home Loan Mortgage Corp. Pool C25621, 6.500%, 5/1/2029 | 2,159 |
| 4,011 | | Federal Home Loan Mortgage Corp. Pool C76361, 6.000%, 2/1/2033 | 4,582 |
| 11,067 | | Federal Home Loan Mortgage Corp. Pool E01545, 5.000%,
15 Year, 1/1/2019 | 11,755 |
| 1,954 | | Federal Home Loan Mortgage Corp. Pool E99510, 5.500%, 9/1/2018 | 2,094 |
| 5,256 | | Federal Home Loan Mortgage Corp. Pool G01444, 6.500%, 8/1/2032 | 6,031 |
| 3,984 | | Federal National Mortgage Association Pool 251697, 6.500%,
30 Year, 5/1/2028 | 4,595 |
| 13,912 | | Federal National Mortgage Association Pool 252334, 6.500%,
30 Year, 2/1/2029 | 15,903 |
| 10,805 | | Federal National Mortgage Association Pool 254720, 4.500%, 5/1/2018 | 11,387 |
| 11,926 | | Federal National Mortgage Association Pool 254802, 4.500%, 7/1/2018 | 12,569 |
| 8,937 | | Federal National Mortgage Association Pool 254905, 6.000%, 10/1/2033 | 10,173 |
| 16,332 | | Federal National Mortgage Association Pool 255075, 5.500%, 2/1/2024 | 18,265 |
| 15,667 | | Federal National Mortgage Association Pool 255079, 5.000%, 2/1/2019 | 16,687 |
| 1,458 | | Federal National Mortgage Association Pool 303168, 9.500%,
30 Year, 2/1/2025 | 1,766 |
| 674 | | Federal National Mortgage Association Pool 323159, 7.500%, 4/1/2028 | 795 |
| 5,641 | | Federal National Mortgage Association Pool 323640, 7.500%, 4/1/2029 | 6,648 |
| 4,054 | | Federal National Mortgage Association Pool 428865, 7.000%, 6/1/2028 | 4,385 |
Annual Shareholder Report
Shares or Principal
Amount | | | Value in
U.S. Dollars |
| | | MORTGAGE-BACKED SECURITIES—continued | |
| $522 | | Federal National Mortgage Association Pool 443215, 6.000%, 10/1/2028 | $591 |
| 3 | | Federal National Mortgage Association Pool 514184, 7.500%, 9/1/2029 | 3 |
| 14,278 | | Federal National Mortgage Association Pool 545993, 6.000%, 11/1/2032 | 16,274 |
| 5,923 | | Federal National Mortgage Association Pool 555272, 6.000%, 3/1/2033 | 6,750 |
| 6,150 | | Federal National Mortgage Association Pool 713974, 5.500%, 7/1/2033 | 6,925 |
| 11,989 | | Federal National Mortgage Association Pool 721502, 5.000%, 7/1/2033 | 13,357 |
| 12,003 | | Government National Mortgage Association Pool 2796, 7.000%, 8/20/2029 | 14,085 |
| 6,361 | | Government National Mortgage Association Pool 3040, 7.000%, 2/20/2031 | 7,474 |
| 14,868 | | Government National Mortgage Association Pool 3188, 6.500%, 1/20/2032 | 17,277 |
| 23,564 | | Government National Mortgage Association Pool 3239, 6.500%, 5/20/2032 | 27,416 |
| 681 | | Government National Mortgage Association Pool 352214, 7.000%, 4/15/2023 | 772 |
| 2,477 | | Government National Mortgage Association Pool 451522, 7.500%, 30 Year, 10/15/2027 | 2,939 |
| 2,846 | | Government National Mortgage Association Pool 462556, 6.500%, 2/15/2028 | 3,272 |
| 406 | | Government National Mortgage Association Pool 462739, 7.500%, 5/15/2028 | 481 |
| 227 | | Government National Mortgage Association Pool 464835, 6.500%, 9/15/2028 | 264 |
| 6,846 | | Government National Mortgage Association Pool 469699, 7.000%, 11/15/2028 | 8,019 |
| 5,562 | | Government National Mortgage Association Pool 486760, 6.500%, 12/15/2028 | 6,451 |
| 825 | | Government National Mortgage Association Pool 780339, 8.000%, 30 Year, 12/15/2023 | 960 |
| 7,049 | | Government National Mortgage Association Pool 780453, 7.500%, 30 Year, 12/15/2025 | 8,247 |
| 5,778 | | Government National Mortgage Association Pool 780584, 7.000%, 30 Year, 6/15/2027 | 6,691 |
| | | TOTAL MORTGAGE-BACKED SECURITIES
(IDENTIFIED COST $263,649) | 296,011 |
| | | FOREIGN GOVERNMENTS/AGENCIES—4.2% | |
| | | Sovereign—4.2% | |
| 300,000 | 4,5 | Austria, Government of, Sr. Unsecd. Note, 3.65%, 4/20/2022 | 458,126 |
| 420,000 | | Belgium, Government of, Series 68, 2.250%, 06/22/2023 | 586,371 |
| 1,200,000 | | Bonos Y Oblig Del Estado, 4.100%, 07/30/2018 | 1,673,196 |
Annual Shareholder Report
Shares or Principal
Amount | | | Value in
U.S. Dollars |
| | | FOREIGN GOVERNMENTS/AGENCIES—continued | |
| | | Sovereign—continued | |
| $370,000 | 4,5 | Bonos Y Oblig Del Estado, Sr. Unsecd. Note, 2.75%, 10/31/2024 | $494,564 |
| 400,000 | | Bonos Y Oblig Del Estado, Sr. Unsub., 4.000%, 04/30/2020 | 574,489 |
| 200,000 | | Buoni Poliennali Del Tes, 2.500%, 5/01/2019 | 265,596 |
| 1,100,000 | | Buoni Poliennali Del Tes, 3.500%, 12/01/2018 | 1,509,485 |
| 200,000 | | Canada, Government of, Bond, 3.250%, 06/01/2021 | 193,403 |
| 400,000 | | Canada, Government of, Bond, 4.000%, 06/01/2016 | 365,565 |
| 700,000 | | France, Government of, 3.250%, 10/25/2021 | 1,033,503 |
| 400,000 | | France, Government of, Bond, 3.500%, 04/25/2026 | 620,435 |
| 600,000 | | Germany, Government of, 1.750%, 2/15/2024 | 821,035 |
| 2,850,000 | | Hong Kong, Government of, 1.340%, 6/24/2019 | 371,032 |
| 157,000,000 | | Japan, Government of, Series 105, 0.200%, 06/20/2017 | 1,328,688 |
| 160,000,000 | | Japan, Government of, Series 327, 0.100%, 4/15/2015 | 1,348,453 |
| 60,000,000 | | Japan, Government of, Series 453, 0.00%, 5/20/2015 | 505,502 |
| 70,000,000 | | Japan, Government of, Series 65, 1.900%, 12/20/2023 | 670,001 |
| 120,000,000 | | Japan-313(10 Year Issue), Series 313, 1.300%, 3/20/2021 | 1,082,933 |
| 200,000 | 4,5 | Netherlands, Government of, 1.750%, 07/15/2023 | 270,905 |
| 1,240,000 | | Sweden, Government of, Series 1050, 3.00%, 7/12/2016 | 174,353 |
| 1,410,000 | | United Kingdom, Government of, 1.750%, 09/07/2022 | 2,211,009 |
| 180,000 | | United Kingdom, Government of, 3.250%, 01/22/2044 | 313,943 |
| 670,000 | | United Kingdom, Government, 2.750%, 9/07/2024 | 1,122,833 |
| 75,000 | | United Mexican States, 6.625%, 03/03/2015 | 76,135 |
| 30,000 | | United Mexican States, Series MTNA, 6.750%, 09/27/2034 | 38,775 |
| | | TOTAL FOREIGN GOVERNMENTS/AGENCIES
(IDENTIFIED COST $19,550,037) | 18,110,330 |
| | | MUNICIPAL—0.0% | |
| | | Illinois—0.0% | |
| 90,000 | | Chicago, IL Metropolitan Water Reclamation District, Direct Payment Taxable Limited GO Build America Bonds, 5.720%, 12/01/2038
(IDENTIFIED COST $90,000) | 108,347 |
| | | U.S. TREASURY—0.1% | |
| 86,710 | | U.S. Treasury Inflation-Protected Note, Series A-2024, 0.625%, 1/15/2024 | 88,262 |
| 147,853 | | U.S. Treasury Inflation-Protected Note, Series D-2021, 0.625%, 7/15/2021 | 152,241 |
| 250,000 | | United States Treasury Bond, 3.625%, 2/15/2044 | 285,326 |
| | | TOTAL U.S. TREASURY
(IDENTIFIED COST $503,202) | 525,829 |
Annual Shareholder Report
Shares or Principal
Amount | | | Value in
U.S. Dollars |
| | | EXCHANGE-TRADED FUNDS—9.1% | |
| $569,404 | | iShares Core MSCI Emerging Markets ETF | $28,344,931 |
| 95,127 | | iShares Russell 2000 ETF | 11,107,980 |
| | | TOTAL EXCHANGE-TRADED FUNDS
(IDENTIFIED COST $40,465,066) | 39,452,911 |
| | | INVESTMENT COMPANIES—27.9%6 | |
| 1,389,580 | | Emerging Markets Fixed Income Core Fund | 49,200,680 |
| 676,871 | | Federated Mortgage Core Portfolio | 6,755,176 |
| 656,892 | | Federated Project and Trade Finance Core Fund | 6,279,892 |
| 53,040,222 | 7 | Federated Prime Value Obligations Fund, Institutional Shares, 0.07% | 53,040,222 |
| 873,938 | | High Yield Bond Portfolio | 5,698,075 |
| | | TOTAL INVESTMENT COMPANIES
(IDENTIFIED COST $123,427,808) | 120,974,045 |
| | | TOTAL INVESTMENTS—96.4%
(IDENTIFIED COST $392,424,120)8 | 418,215,163 |
| | | OTHER ASSETS AND LIABILITIES - NET—3.6%9 | 15,758,204 |
| | | TOTAL NET ASSETS—100% | $433,973,367 |
At November 30, 2014, the Fund had the following outstanding futures contracts:
| Description | Number of
Contracts | Notional
Value | Expiration
Date | Unrealized
Appreciation
(Depreciation) |
| 1CAC40 10 Euro Short Futures | 527 | $23,098,410 | December 2014 | $(851,356) |
| 1FTSE 100 Index Short Futures | 190 | $12,788,900 | December 2014 | $(431,571) |
| 1FTSE/JSE Top 40 Short Futures | 121 | $53,634,460 | December 2014 | $125,527 |
| 1Hang Seng Index Short Futures | 44 | $52,756,000 | December 2014 | $(13,792) |
| 1IBEX 35 Index Short Futures | 9 | $968,427 | December 2014 | $(10,811) |
| 1MEX Bolsa Index Short Futures | 581 | $256,668,370 | December 2014 | $159,456 |
| 1Mini MSCI Emerging Market Short Futures | 290 | $14,475,350 | December 2014 | $227,817 |
| 1MSCI Taiwan Index Short Futures | 69 | $2,369,460 | December 2014 | $(12,075) |
| 1OMXS 30 Index Short Futures | 22 | $3,222,450 | December 2014 | $(14,330) |
| 1Russell 2000 Mini Short Futures | 6 | $702,960 | December 2014 | $1,000 |
| 1SGX CNX Nifty Short Futures | 531 | $9,160,281 | December 2014 | $(78,694) |
| 1Swiss Market Index Short Futures | 154 | $14,095,620 | December 2014 | $(311,920) |
| 1United States Long Bond Short Futures | 1 | $142,625 | March 2015 | $(2,507) |
| 1United States Treasury Notes 5-Year Short Futures | 15 | $1,792,383 | March 2015 | $(8,354) |
| 1United States Treasury Notes 10-Year Short Futures | 87 | $11,053,078 | March 2015 | $(88,555) |
Annual Shareholder Report
| Description | Number of
Contracts | Notional
Value | Expiration
Date | Unrealized
Appreciation
(Depreciation) |
| 1Amsterdam Index Long Futures | 166 | $14,143,200 | December 2014 | $571,951 |
| 1BIST 30 Long Futures | 449 | $4,828,995 | December 2014 | $189,208 |
| 1DAX Index Long Futures | 93 | $23,190,713 | December 2014 | $2,773,227 |
| 1Euro STOXX 50 Long Futures | 13 | $421,720 | December 2014 | $34,846 |
| 1FTSE/MIB Index Long Futures | 32 | $3,205,760 | December 2014 | $198,612 |
| 1KOSPI2 Index Long Futures | 100 | $12,700,000,000 | December 2014 | $87,451 |
| 1MSCI Singapore IX ETS Long Futures | 162 | $12,218,040 | December 2014 | $22,582 |
| 1S&P 500 Long Futures | 108 | $55,790,100 | December 2014 | $1,787,149 |
| 1S&P MidCap 400 E-Mini Long Futures | 24 | $3,457,920 | December 2014 | $64,682 |
| 1S&P/TSX 60 Index Long Futures | 69 | $11,894,220 | December 2014 | $26,232 |
| 1SPI 200 Long Futures | 81 | $10,809,450 | December 2014 | $(173,872) |
| 1TOPIX Index Long Futures | 83 | $1,170,715,000 | December 2014 | $288,070 |
| 1United States Treasury Notes 2-Year Long Futures | 67 | $14,682,422 | March 2015 | $21,834 |
| NET UNREALIZED APPRECIATION ON FUTURES CONTRACTS | $4,581,807 |
At November 30, 2014, the Fund had the following outstanding foreign exchange contracts:
| Settlement Date | Counterparty | Foreign Currency
Units to
Deliver/Receive | In
Exchange
For | Unrealized
Appreciation
(Depreciation) |
| Contracts Purchased: |
| 12/3/2014 | JPMorgan Chase | 2,548,000 CHF | $2,629,795 | $7,239 |
| 12/3/2014 | JPMorgan Chase | 2,369,000 GBP | $3,713,397 | $(13,039) |
| 12/3/2014 | JPMorgan Chase | 4,275,500 NZD | $3,361,483 | $(7,680) |
| 12/3/2014 | JPMorgan Chase | 260,800 NOK | $38,481 | $(1,307) |
| 12/3/2014 | JPMorgan Chase | 2,360,000 SGD | $1,809,414 | $178 |
| 12/3/2014 | JPMorgan Chase | 154,500 SEK | $20,739 | $(19) |
| 12/4/2014 | JPMorgan Chase | 1,167,089 CAD | $1,033,350 | $(13,148) |
| 12/5/2014 | JPMorgan Chase | 14,840 AUD | $12,932 | $(302) |
| 12/5/2014 | JPMorgan Chase | 93,359 AUD | $81,359 | $(1,900) |
| 12/5/2014 | JPMorgan Chase | 555,795 AUD | $483,057 | $(10,008) |
| 12/5/2014 | JPMorgan Chase | 681,159 AUD | $593,609 | $(13,860) |
| 12/5/2014 | JPMorgan Chase | 98,200 CAD | $86,691 | $(852) |
| 12/5/2014 | JPMorgan Chase | 1,098,022 CAD | $969,250 | $(9,444) |
| 12/5/2014 | JPMorgan Chase | 1,251,800 CAD | $1,112,638 | $(18,412) |
| 12/5/2014 | JPMorgan Chase | 1,712,786 CHF | $1,777,555 | $(3,956) |
| 12/5/2014 | JPMorgan Chase | 4,253,900 CHF | $4,409,955 | $(5,019) |
| 12/5/2014 | JPMorgan Chase | 4,428,366 EUR | $5,511,353 | $(1,053) |
| 12/5/2014 | JPMorgan Chase | 5,958,931 EUR | $7,445,900 | $(31,090) |
| 12/5/2014 | JPMorgan Chase | 1,375,827 GBP | $2,150,668 | $1,090 |
Annual Shareholder Report
| Settlement Date | Counterparty | Foreign Currency
Units to
Deliver/Receive | In
Exchange
For | Unrealized
Appreciation
(Depreciation) |
| 12/5/2014 | JPMorgan Chase | 1,719,601 GBP | $2,751,268 | $(61,855) |
| 12/5/2014 | JPMorgan Chase | 76,649,496 JPY | $658,973 | $(13,034) |
| 12/5/2014 | JPMorgan Chase | 274,312,611 JPY | $2,358,327 | $(46,645) |
| 12/5/2014 | JPMorgan Chase | 3,381,829 NZD | $2,612,480 | $37,589 |
| 12/5/2014 | JPMorgan Chase | 1,583,515 NZD | $1,251,580 | $(10,705) |
| 12/5/2014 | JPMorgan Chase | 3,878,465 NOK | $572,826 | $(21,555) |
| 12/5/2014 | JPMorgan Chase | 9,910,174 NOK | $1,463,674 | $(55,076) |
| 12/5/2014 | JPMorgan Chase | 1,755,928 SGD | $1,362,193 | $(14,935) |
| 12/5/2014 | JPMorgan Chase | 2,644,738 SGD | $2,037,900 | $(8,692) |
| 12/5/2014 | JPMorgan Chase | 1,007,285 SEK | $136,380 | $(1,269) |
| 12/5/2014 | JPMorgan Chase | 10,918,647 SEK | $1,473,700 | $(9,141) |
| 12/29/2014 | JPMorgan Chase | 2,545,930 AUD | 1,750,000 EUR | $(14,560) |
| 12/29/2014 | Barclays Bank PLC | 1,700,000 AUD | 1,869,507 NZD | $(17,066) |
| 12/29/2014 | Bank of America, N.A. | 3,300,000 AUD | 3,712,731 NZD | $(98,554) |
| 12/29/2014 | Bank of New York Mellon | 1,900,000 AUD | 11,958,980 SEK | $10,224 |
| 12/29/2014 | Barclays Bank PLC | 1,900,000 AUD | 3,736,540 TRY | $(60,566) |
| 12/29/2014 | JPMorgan Chase | 4,000,000 CAD | 372,990,880 JPY | $349,955 |
| 12/29/2014 | Bank of America, N.A. | 2,600,000 CAD | 15,629,900 NOK | $51,756 |
| 12/29/2014 | Bank of New York Mellon | 1,504,857 CAD | 850,000 GBP | $(14,503) |
| 12/29/2014 | Bank of New York Mellon | 1,509,345 CAD | 850,000 GBP | $(10,582) |
| 12/29/2014 | Bank of New York Mellon | 1,600,000 CAD | 10,380,800 SEK | $5,326 |
| 12/29/2014 | Bank of America, N.A. | 1,796,552 CAD | $1,600,000 | $(30,459) |
| 12/29/2014 | Bank of America, N.A. | 1,800,704 CAD | $1,600,000 | $(26,831) |
| 12/29/2014 | Morgan Stanley Capital SE | 2,601,806 CAD | $2,300,000 | $(26,956) |
| 12/29/2014 | Morgan Stanley Capital SE | 2,665,981 CAD | $2,350,000 | $(20,890) |
| 12/29/2014 | JPMorgan Chase | 2,200,000 EUR | 323,335,386 JPY | $11,869 |
| 12/29/2014 | Bank of America, N.A. | 625,000 EUR | 5,284,813 NOK | $27,263 |
| 12/29/2014 | Bank of America, N.A. | 1,075,000 EUR | 9,115,140 NOK | $43,305 |
| 12/29/2014 | Morgan Stanley Capital SE | 1,400,000 EUR | 11,922,848 NOK | $49,017 |
| 12/29/2014 | Morgan Stanley Capital SE | 1,600,000 EUR | 13,803,536 NOK | $30,822 |
| 12/29/2014 | Bank of New York Mellon | 800,000 EUR | 7,387,360 SEK | $4,625 |
| 12/29/2014 | Bank of New York Mellon | 800,000 EUR | 7,430,400 SEK | $(1,149) |
| 12/29/2014 | Bank of New York Mellon | 800,000 EUR | 7,430,400 SEK | $(1,149) |
| 12/29/2014 | JPMorgan Chase | 470,000 EUR | $586,768 | $(1,866) |
| 12/29/2014 | JPMorgan Chase | 1,410,000 EUR | $1,752,849 | $1,859 |
| 12/29/2014 | Barclays Bank PLC | 1,650,000 EUR | $2,107,339 | $(53,957) |
| 12/29/2014 | JPMorgan Chase | 1,800,000 EUR | $2,289,041 | $(48,988) |
| 12/29/2014 | JPMorgan Chase | 3,500,000 EUR | $4,389,209 | $(33,551) |
| 12/29/2014 | Barclays Bank PLC | 7,000,000 EUR | $8,871,030 | $(159,714) |
Annual Shareholder Report
| Settlement Date | Counterparty | Foreign Currency
Units to
Deliver/Receive | In
Exchange
For | Unrealized
Appreciation
(Depreciation) |
| 12/29/2014 | BNP Paribas SA | 275,343,803 JPY | $2,381,805 | $(60,439) |
| 12/29/2014 | BNP Paribas SA | 275,381,912 JPY | $2,381,805 | $(60,117) |
| 12/29/2014 | Morgan Stanley Capital SE | 348,486,600 JPY | $3,300,000 | $(361,982) |
| 12/29/2014 | Bank of America, N.A. | 392,448,400 JPY | $3,400,000 | $(91,349) |
| 12/29/2014 | BNP Paribas SA | 408,644,250 JPY | $3,500,000 | $(54,805) |
| 12/29/2014 | Morgan Stanley Capital SE | 2,800,000 NZD | $2,187,584 | $1,411 |
| 12/29/2014 | BNP Paribas SA | 18,084,600 NOK | 3,400,000 NZD | $(89,746) |
| 12/29/2014 | JPMorgan Chase | 7,800,000 NOK | 8,450,009 SEK | $(25,768) |
| 12/29/2014 | JPMorgan Chase | 14,200,000 NOK | 15,352,037 SEK | $(42,710) |
| 12/29/2014 | JPMorgan Chase | 11,647,043 NOK | $1,700,000 | $(45,924) |
| 12/29/2014 | JPMorgan Chase | 16,039,338 NOK | $2,350,000 | $(72,142) |
| 12/29/2014 | Morgan Stanley Capital SE | 15,562,260 NOK | $2,300,000 | $(89,895) |
| 12/29/2014 | Morgan Stanley Capital SE | 11,447,486 NOK | $1,700,000 | $(74,263) |
| 12/29/2014 | JPMorgan Chase | 1,650,000 GBP | 287,549,807 JPY | $155,955 |
| 12/29/2014 | BNP Paribas SA | 3,000,000 GBP | $4,763,610 | $(72,288) |
| 12/29/2014 | Bank of America, N.A. | 3,759,210 SEK | $525,000 | $(20,733) |
| 1/30/2015 | JPMorgan Chase | 1,100,000 EUR | $1,371,126 | $(1,848) |
| 1/30/2015 | BNP Paribas SA | 84,900,000 INR | $1,367,480 | $(16,168) |
| Contracts Sold: |
| 12/3/2014 | JPMorgan Chase | 295,900 AUD | $255,237 | $3,474 |
| 12/3/2014 | JPMorgan Chase | 5,666,000 EUR | $7,035,267 | $(7,671) |
| 12/3/2014 | JPMorgan Chase | 166,700,000 JPY | $1,409,383 | $5,154 |
| 12/4/2014 | JPMorgan Chase | 1,170,378 CAD | $1,033,350 | $10,273 |
| 12/5/2014 | JPMorgan Chase | 14,988 AUD | $12,932 | $175 |
| 12/5/2014 | JPMorgan Chase | 94,291 AUD | $81,359 | $1,106 |
| 12/5/2014 | JPMorgan Chase | 555,795 AUD | $480,319 | $7,270 |
| 12/5/2014 | JPMorgan Chase | 687,900 AUD | $593,609 | $8,122 |
| 12/5/2014 | JPMorgan Chase | 1,097,977 CAD | $969,250 | $9,484 |
| 12/5/2014 | JPMorgan Chase | 4,411,203 EUR | $5,511,353 | $22,409 |
| 12/5/2014 | JPMorgan Chase | 5,982,087 EUR | $7,445,900 | $2,276 |
| 12/5/2014 | JPMorgan Chase | 268,312,414 JPY | $2,358,327 | $97,210 |
| 12/5/2014 | JPMorgan Chase | 75,587,271 JPY | $658,973 | $21,985 |
| 12/5/2014 | JPMorgan Chase | 1,613,296 NZD | $1,251,580 | $(12,631) |
| 12/5/2014 | JPMorgan Chase | 3,304,160 NZD | $2,612,480 | $23,274 |
| 12/5/2014 | JPMorgan Chase | 3,886,444 NOK | $572,826 | $20,421 |
| 12/5/2014 | JPMorgan Chase | 9,943,834 NOK | $1,463,674 | $50,292 |
| 12/5/2014 | JPMorgan Chase | 1,355,153 GBP | $2,150,668 | $31,242 |
| 12/5/2014 | JPMorgan Chase | 1,760,576 GBP | $2,751,268 | $(2,228) |
| 12/5/2014 | JPMorgan Chase | 2,632,135 SGD | $2,037,900 | $18,361 |
Annual Shareholder Report
| Settlement Date | Counterparty | Foreign Currency
Units to
Deliver/Receive | In
Exchange
For | Unrealized
Appreciation
(Depreciation) |
| 12/5/2014 | JPMorgan Chase | 1,758,046 SGD | $1,361,843 | $12,960 |
| 12/5/2014 | JPMorgan Chase | 10,917,583 SEK | $1,473,700 | $9,283 |
| 12/5/2014 | JPMorgan Chase | 1,009,889 SEK | $136,380 | $919 |
| 12/5/2014 | JPMorgan Chase | 1,717,954 CHF | $1,777,555 | $(1,395) |
| 12/5/2014 | JPMorgan Chase | 4,254,567 CHF | $4,409,955 | $4,328 |
| 12/29/2014 | JPMorgan Chase | 1,269,159 AUD | 875,000 Euro | $10,514 |
| 12/29/2014 | JPMorgan Chase | 1,269,637 AUD | 875,000 Euro | $10,108 |
| 12/29/2014 | Barclays Bank PLC | 1,700,000 AUD | 1,864,560 NZD | $13,198 |
| 12/29/2014 | Bank of America, N.A. | 3,300,000 AUD | 3,692,370 NZD | $82,636 |
| 12/29/2014 | Bank of America, N.A. | 1,140,000 AUD | 7,244,130 SEK | $3,086 |
| 12/29/2014 | Bank of New York Mellon | 760,000 AUD | 4,908,308 SEK | $12,640 |
| 12/29/2014 | Barclays Bank PLC | 1,900,000 AUD | 3,713,740 TRY | $50,346 |
| 12/29/2014 | JPMorgan Chase | 750,000 CAD | 70,428,180 JPY | $(61,465) |
| 12/29/2014 | JPMorgan Chase | 750,000 CAD | 70,897,455 JPY | $(57,509) |
| 12/29/2014 | JPMorgan Chase | 2,500,000 CAD | 236,299,525 JPY | $(191,910) |
| 12/29/2014 | Bank of America, N.A. | 2,600,000 CAD | 15,554,630 NOK | $(62,445) |
| 12/29/2014 | Bank of New York Mellon | 3,007,853 CAD | 1,700,000 GBP | $30,633 |
| 12/29/2014 | Bank of New York Mellon | 1,600,000 CAD | 10,468,800 SEK | $6,479 |
| 12/29/2014 | Morgan Stanley Capital SE | 2,598,862 CAD | $2,300,000 | $29,528 |
| 12/29/2014 | Morgan Stanley Capital SE | 2,664,336 CAD | $2,350,000 | $22,327 |
| 12/29/2014 | Bank of America, N.A. | 3,588,832 CAD | $3,200,000 | $64,649 |
| 12/29/2014 | JPMorgan Chase | 2,200,000 EUR | 325,874,868 JPY | $9,541 |
| 12/29/2014 | Morgan Stanley Capital SE | 1,400,000 EUR | 11,922,540 NOK | $(49,060) |
| 12/29/2014 | Morgan Stanley Capital SE | 1,600,000 EUR | 13,533,424 NOK | $(69,182) |
| 12/29/2014 | Bank of America, N.A. | 1,700,000 EUR | 14,463,090 NOK | $(61,601) |
| 12/29/2014 | Bank of New York Mellon | 800,000 EUR | 7,399,520 SEK | $(2,994) |
| 12/29/2014 | Bank of New York Mellon | 1,600,000 EUR | 14,944,960 SEK | $13,587 |
| 12/29/2014 | Barclays Bank PLC | 1,650,000 EUR | $2,114,112 | $60,730 |
| 12/29/2014 | JPMorgan Chase | 1,800,000 EUR | $2,287,832 | $47,780 |
| 12/29/2014 | JPMorgan Chase | 1,880,000 EUR | $2,348,966 | $9,355 |
| 12/29/2014 | JPMorgan Chase | 7,000,000 EUR | $8,869,330 | $158,014 |
| 12/29/2014 | Barclays Bank PLC | 7,000,000 EUR | $9,006,641 | $295,325 |
| 12/29/2014 | Morgan Stanley Capital SE | 2,873,975 HKD | $370,000 | $(592) |
| 12/29/2014 | JPMorgan Chase | 269,095,344 JPY | $2,400,000 | $131,313 |
| 12/29/2014 | Morgan Stanley Capital SE | 349,166,400 JPY | $3,300,000 | $356,251 |
| 12/29/2014 | Bank of America, N.A. | 394,576,800 JPY | $3,400,000 | $73,405 |
| 12/29/2014 | BNP Paribas SA | 409,822,000 JPY | $3,500,000 | $44,876 |
| 12/29/2014 | BNP Paribas SA | 548,853,617 JPY | $4,763,610 | $136,340 |
| 12/29/2014 | BNP Paribas SA | 4,327,178 NOK | 816,000 NZD | $23,403 |
Annual Shareholder Report
| Settlement Date | Counterparty | Foreign Currency
Units to
Deliver/Receive | In
Exchange
For | Unrealized
Appreciation
(Depreciation) |
| 12/29/2014 | BNP Paribas SA | 4,680,691 NOK | 884,000 NZD | $26,360 |
| 12/29/2014 | BNP Paribas SA | 9,083,952 NOK | 1,700,000 NZD | $38,958 |
| 12/29/2014 | JPMorgan Chase | 3,968,413 NOK | $587,500 | $23,918 |
| 12/29/2014 | JPMorgan Chase | 7,800,000 NOK | 8,510,848 SEK | $33,929 |
| 12/29/2014 | JPMorgan Chase | 14,200,000 NOK | 15,351,100 SEK | $42,584 |
| 12/29/2014 | Morgan Stanley Capital SE | 11,445,956 NOK | $1,700,000 | $74,480 |
| 12/29/2014 | JPMorgan Chase | 11,662,525 NOK | $1,700,000 | $43,724 |
| 12/29/2014 | JPMorgan Chase | 12,009,972 NOK | $1,762,500 | $56,880 |
| 12/29/2014 | Morgan Stanley Capital SE | 15,515,375 NOK | $2,300,000 | $96,554 |
| 12/29/2014 | Morgan Stanley Capital SE | 2,800,000 NZD | $2,211,860 | $22,865 |
| 12/29/2014 | JPMorgan Chase | 1,650,000 GBP | 294,575,325 JPY | $(96,724) |
| 12/29/2014 | BNP Paribas SA | 3,000,000 GBP | $4,731,900 | $40,578 |
| 12/29/2014 | JPMorgan Chase | 3,795,802 SEK | $525,000 | $15,824 |
| 1/30/2015 | JPMorgan Chase | 1,100,000 EUR | $1,362,391 | $(6,887) |
| 1/30/2015 | BNP Paribas SA | 84,900,000 INR | $1,360,141 | $8,829 |
| NET UNREALIZED APPRECIATION ON FOREIGN EXCHANGE CONTRACTS | $511,240 |
Net Unrealized Appreciation on Futures Contracts and Foreign Exchange Contracts is included in “Other Assets and Liabilities—Net.”
| 1 | Non-income-producing security. |
| 2 | Issuer in default. |
| 3 | Market quotations and price evaluations are not available. Fair value determined in accordance with procedures established by and under the general supervision of the Trustees. |
| 4 | Denotes a restricted security that either: (a) cannot be offered for public sale without first being registered, or being able to take advantage of an exemption from registration, under the Securities Act of 1933; or (b) is subject to a contractual restriction on public sales. At November 30, 2014, these restricted securities amounted to $4,098,855, which represented 0.9% of total net assets. |
| 5 | Denotes a restricted security that may be resold without restriction to “qualified institutional buyers” as defined in Rule 144A under the Securities Act of 1933 and that the Fund has determined to be liquid under criteria established by the Fund's Board of Trustees (the “Trustees”). At November 30, 2014, these liquid restricted securities amounted to $2,968,749, which represented 0.7% of total net assets. |
| 6 | Affiliated holdings. |
| 7 | 7-day net yield. |
| 8 | The cost of investments for federal tax purposes amounts to $390,921,201. |
| 9 | Assets, other than investments in securities, less liabilities. See Statement of Assets and Liabilities. |
Note: The categories of investments are shown as a percentage of total net assets at November 30, 2014.
Various inputs are used in determining the value of the Fund's investments. These inputs are summarized in the three broad levels listed below:
Level 1—quoted prices in active markets for identical securities, including investment companies with daily net asset values, if applicable.
Annual Shareholder Report
Level 2—other significant observable inputs (including quoted prices for similar securities, interest rates, prepayment speeds, credit risk, etc.). Also includes securities valued at amortized cost.
Level 3—significant unobservable inputs (including the Fund's own assumptions in determining the fair value of investments).
The inputs or methodology used for valuing securities are not an indication of the risk associated with investing in those securities.
The following is a summary of the inputs used, as of November 30, 2014, in valuing the Fund's assets carried at fair value:
| Valuation Inputs |
| | Level 1—
Quoted
Prices and
Investments in
Certain
Investment
Companies | Level 2—
Other
Significant
Observable
Inputs | Level 3—
Significant
Unobservable
Inputs | Total |
| Equity Securities: | | | | |
| Common Stocks | | | | |
| Domestic | $120,963,139 | $— | $— | $120,963,139 |
| International | 106,667,677 | 450,3571 | — | 107,118,034 |
| Debt Securities: | | | | |
| Asset-Backed Securities | — | 299,525 | — | 299,525 |
| Collateralized Mortgage Obligations | — | 157,445 | — | 157,445 |
| Corporate Bonds | — | 10,094,281 | 115,266 | 10,209,547 |
| Foreign Governments/Agencies | — | 18,110,330 | — | 18,110,330 |
| Mortgage-Backed Securities | — | 296,011 | — | 296,011 |
| Municipal | — | 108,347 | — | 108,347 |
| U.S. Treasury | — | 525,829 | — | 525,829 |
| Exchange-Traded Funds | 39,452,911 | — | — | 39,452,911 |
| Investment Companies2 | 114,694,153 | 6,279,892 | — | 120,974,045 |
| TOTAL SECURITIES | $381,777,880 | $36,322,017 | $115,266 | $418,215,163 |
| OTHER FINANCIAL INSTRUMENTS3 | $4,581,807 | $511,240 | $— | $5,093,047 |
| 1 | Includes $253,875 of common stock securities transferred from Level 1 to Level 2 because fair value factors were applied to equity securities traded primarily in foreign markets to account for significant post market close activity. Transfers shown represent the value of the securities at the beginning of the period. |
| 2 | Emerging Markets Fixed Income Core Fund, Federated Mortgage Core Portfolio, High Yield Bond Portfolio and Federated Project and Trade Finance Core Fund are affiliated holdings offered only to registered investment companies and other accredited investors. Federated Project and Trade Finance Core Fund is classified as Level 2 due to the fact that the price of shares redeemed will be determined as of the closing net asset value (the NAV) of the fund up to twenty-four (24) days after receipt of a shareholder redemption request. |
| 3 | Other financial instruments include futures contracts and foreign exchange contracts. |
Annual Shareholder Report
The following acronyms are used throughout this portfolio:
| ADR | —American Depositary Receipt |
| AUD | —Australian Dollar |
| CAD | —Canadian Dollar |
| CHF | —Swiss Franc |
| EUR | —Euro Currency |
| GBP | —British Pound |
| GO | —General Obligation |
| HKD | —Hong Kong Dollar |
| INR | —Indian Rupee |
| JPY | —Japanese Yen |
| MTN | —Medium Term Note |
| NOK | —Norwegian Krone |
| NZD | —New Zealand Dollar |
| REIT(s) | —Real Estate Investment Trust(s) |
| SEK | —Swedish Krona |
| SGD | —Singapore Dollar |
| TRY | —Turkish Lira |
See Notes which are an integral part of the Financial Statements
Annual Shareholder Report
Financial Highlights–Class A Shares
(For a Share Outstanding Throughout Each Period)
| Year Ended November 30 | 2014 | 2013 | 2012 | 2011 | 2010 |
| Net Asset Value, Beginning of Period | $21.47 | $18.68 | $16.98 | $16.87 | $15.65 |
| Income From Investment Operations: | | | | | |
| Net investment income | 0.181 | 0.171 | 0.181 | 0.201 | 0.191 |
| Net realized and unrealized gain on investments, futures contracts, swap contracts, written options and foreign currency transactions | 1.10 | 3.07 | 1.74 | 0.08 | 1.05 |
| TOTAL FROM INVESTMENT OPERATIONS | 1.28 | 3.24 | 1.92 | 0.28 | 1.24 |
| Less Distributions: | | | | | |
| Distributions from net investment income | (0.12) | (0.16) | (0.22) | (0.17) | (0.02) |
| Distributions from net realized gain on investments, futures contracts, swap contracts, written options and foreign currency transactions | (2.34) | (0.29) | — | — | — |
| TOTAL DISTRIBUTIONS | (2.46) | (0.45) | (0.22) | (0.17) | (0.02) |
| Redemption Fees | 0.002 | — | — | — | — |
| Net Asset Value, End of Period | $20.29 | $21.47 | $18.68 | $16.98 | $16.87 |
| Total Return3 | 6.53% | 17.73% | 11.38% | 1.62% | 7.91% |
| Ratios to Average Net Assets: | | | | | |
| Net expenses | 1.14% | 1.17% | 1.22% | 1.25%4 | 1.25%4 |
| Net investment income | 0.93% | 0.88% | 1.01% | 1.14% | 1.20% |
| Expense waiver/reimbursement5 | 0.10% | 0.10% | 0.07% | 0.10% | 0.21% |
| Supplemental Data: | | | | | |
| Net assets, end of period (000 omitted) | $196,067 | $193,678 | $185,414 | $178,971 | $135,002 |
| Portfolio turnover | 100% | 106% | 85% | 215% | 184% |
| 1 | Per share numbers have been calculated using the average shares method. |
| 2 | Represents less than $0.01. |
| 3 | Based on net asset value, which does not reflect the sales charge, redemption fee or contingent deferred sales charge, if applicable. |
| 4 | The net expense ratio is calculated without reduction for expense offset arrangements. The net expense ratios are 1.25% and 1.24%, for the years ended November 30, 2011 and 2010, respectively, after taking into account these expense reductions. |
| 5 | This expense decrease is reflected in both the net expense and the net investment income ratios shown above. |
See Notes which are an integral part of the Financial Statements
Annual Shareholder Report
Financial Highlights–Class B Shares
(For a Share Outstanding Throughout Each Period)
| Year Ended November 30 | 2014 | 2013 | 2012 | 2011 | 2010 |
| Net Asset Value, Beginning of Period | $21.17 | $18.46 | $16.78 | $16.69 | $15.61 |
| Income From Investment Operations: | | | | | |
| Net investment income | 0.021 | 0.011 | 0.031 | 0.061 | 0.071 |
| Net realized and unrealized gain on investments, futures contracts, swap contracts, written options and foreign currency transactions | 1.07 | 3.04 | 1.72 | 0.08 | 1.03 |
| TOTAL FROM INVESTMENT OPERATIONS | 1.09 | 3.05 | 1.75 | 0.14 | 1.10 |
| Less Distributions: | | | | | |
| Distributions from net investment income | (0.06) | (0.05) | (0.07) | (0.05) | (0.02) |
| Distributions from net realized gain on investments, futures contracts, swap contracts, written options and foreign currency transactions | (2.34) | (0.29) | — | — | — |
| TOTAL DISTRIBUTIONS | (2.40) | (0.34) | (0.07) | (0.05) | (0.02) |
| Redemption Fees | 0.002 | — | — | — | — |
| Net Asset Value, End of Period | $19.86 | $21.17 | $18.46 | $16.78 | $16.69 |
| Total Return3 | 5.67% | 16.82% | 10.39% | 0.80% | 7.03% |
| Ratios to Average Net Assets: | | | | | |
| Net expenses | 1.95% | 1.99% | 2.05% | 2.05%4 | 2.05%4 |
| Net investment income | 0.12% | 0.06% | 0.19% | 0.33% | 0.42% |
| Expense waiver/reimbursement5 | 0.10% | 0.10% | 0.07% | 0.12% | 0.21% |
| Supplemental Data: | | | | | |
| Net assets, end of period (000 omitted) | $26,163 | $30,675 | $28,853 | $30,424 | $14,541 |
| Portfolio turnover | 100% | 106% | 85% | 215% | 184% |
| 1 | Per share numbers have been calculated using the average shares method. |
| 2 | Represents less than $0.01. |
| 3 | Based on net asset value, which does not reflect the sales charge, redemption fee or contingent deferred sales charge, if applicable. |
| 4 | The net expense ratio is calculated without reduction for expense offset arrangements. The net expense ratios are 2.05% and 2.04% for the years ended November 30, 2011 and 2010, respectively, after taking into account these expense reductions. |
| 5 | This expense decrease is reflected in both the net expense and the net investment income ratios shown above. |
See Notes which are an integral part of the Financial Statements
Annual Shareholder Report
Financial Highlights–Class C Shares
(For a Share Outstanding Throughout Each Period)
| Year Ended November 30 | 2014 | 2013 | 2012 | 2011 | 2010 |
| Net Asset Value, Beginning of Period | $21.11 | $18.40 | $16.72 | $16.62 | $15.55 |
| Income From Investment Operations: | | | | | |
| Net investment income | 0.031 | 0.021 | 0.041 | 0.061 | 0.061 |
| Net realized and unrealized gain on investments, futures contracts, swap contracts, written options and foreign currency transactions | 1.07 | 3.03 | 1.71 | 0.09 | 1.03 |
| TOTAL FROM INVESTMENT OPERATIONS | 1.10 | 3.05 | 1.75 | 0.15 | 1.09 |
| Less Distributions: | | | | | |
| Distributions from net investment income | (0.07) | (0.05) | (0.07) | (0.05) | (0.02) |
| Distributions from net realized gain on investments, futures contracts, swap contracts, written options and foreign currency transactions | (2.34) | (0.29) | — | — | — |
| TOTAL DISTRIBUTIONS | (2.41) | (0.34) | (0.07) | (0.05) | (0.02) |
| Redemption Fees | 0.002 | — | — | — | — |
| Net Asset Value, End of Period | $19.80 | $21.11 | $18.40 | $16.72 | $16.62 |
| Total Return3 | 5.70% | 16.89% | 10.51% | 0.90% | 6.99% |
| Ratios to Average Net Assets: | | | | | |
| Net expenses | 1.89% | 1.95% | 1.98% | 2.02%4 | 2.05%4 |
| Net investment income | 0.17% | 0.10% | 0.24% | 0.36% | 0.40% |
| Expense waiver/reimbursement5 | 0.13% | 0.10% | 0.07% | 0.10% | 0.17% |
| Supplemental Data: | | | | | |
| Net assets, end of period (000 omitted) | $81,703 | $71,450 | $60,315 | $52,187 | $36,415 |
| Portfolio turnover | 100% | 106% | 85% | 215% | 184% |
| 1 | Per share numbers have been calculated using the average shares method. |
| 2 | Represents less than $0.01. |
| 3 | Based on net asset value, which does not reflect the sales charge, redemption fee or contingent deferred sales charge, if applicable. |
| 4 | The net expense ratio is calculated without reduction for expense offset arrangements. The net expense ratios are 2.02% and 2.04% for the years ended November 30, 2011 and 2010, respectively, after taking into account these expense reductions. |
| 5 | This expense decrease is reflected in both the net expense and the net investment income ratios shown above. |
See Notes which are an integral part of the Financial Statements
Annual Shareholder Report
Financial Highlights–Class R Shares
(For a Share Outstanding Throughout Each Period)
| Year Ended November 30 | 2014 | 2013 | 2012 | 2011 | 2010 |
| Net Asset Value, Beginning of Period | $21.40 | $18.62 | $16.92 | $16.81 | $15.68 |
| Income From Investment Operations: | | | | | |
| Net investment income | 0.101 | 0.091 | 0.111 | 0.121 | 0.111 |
| Net realized and unrealized gain on investments, futures contracts, swap contracts, written options and foreign currency transactions | 1.08 | 3.07 | 1.73 | 0.09 | 1.04 |
| TOTAL FROM INVESTMENT OPERATIONS | 1.18 | 3.16 | 1.84 | 0.21 | 1.15 |
| Less Distributions: | | | | | |
| Distributions from net investment income | (0.08) | (0.09) | (0.14) | (0.10) | (0.02) |
| Distributions from net realized gain on investments, futures contracts, swap contracts, written options and foreign currency transactions | (2.34) | (0.29) | — | — | — |
| TOTAL DISTRIBUTIONS | (2.42) | (0.38) | (0.14) | (0.10) | (0.02) |
| Redemption Fees | 0.002 | — | — | — | — |
| Net Asset Value, End of Period | $20.16 | $21.40 | $18.62 | $16.92 | $16.81 |
| Total Return3 | 6.06% | 17.29% | 10.90% | 1.23% | 7.32% |
| Ratios to Average Net Assets: | | | | | |
| Net expenses | 1.57% | 1.57% | 1.65% | 1.68%4 | 1.74%4 |
| Net investment income | 0.50% | 0.48% | 0.58% | 0.71% | 0.71% |
| Expense waiver/reimbursement5 | 0.09% | 0.10% | 0.07% | 0.10% | 0.14% |
| Supplemental Data: | | | | | |
| Net assets, end of period (000 omitted) | $67,588 | $67,769 | $62,627 | $54,878 | $53,749 |
| Portfolio turnover | 100% | 106% | 85% | 215% | 184% |
| 1 | Per share numbers have been calculated using the average shares method. |
| 2 | Represents less than $0.01. |
| 3 | Based on net asset value. |
| 4 | The net expense ratio is calculated without reduction for expense offset arrangements. The net expense ratios are 1.68% and 1.73% for the years ended November 30, 2011 and 2010, respectively, after taking into account these expense reductions. |
| 5 | This expense decrease is reflected in both the net expense and the net investment income ratios shown above. |
See Notes which are an integral part of the Financial Statements
Annual Shareholder Report
Financial Highlights–Institutional Shares
(For a Share Outstanding Throughout Each Period)
| Year Ended November 30 | 2014 | 2013 | 2012 | 2011 | 2010 |
| Net Asset Value, Beginning of Period | $21.54 | $18.74 | $17.04 | $16.91 | $15.65 |
| Income From Investment Operations: | | | | | |
| Net investment income | 0.241 | 0.231 | 0.241 | 0.241 | 0.231 |
| Net realized and unrealized gain on investments, futures contracts, swap contracts, written options and foreign currency transactions | 1.10 | 3.08 | 1.74 | 0.10 | 1.05 |
| TOTAL FROM INVESTMENT OPERATIONS | 1.34 | 3.31 | 1.98 | 0.34 | 1.28 |
| Less Distributions: | | | | | |
| Distributions from net investment income | (0.14) | (0.22) | (0.28) | (0.21) | (0.02) |
| Distributions from net realized gain on investments, futures contracts, swap contracts, written options and foreign currency transactions | (2.34) | (0.29) | — | — | — |
| TOTAL DISTRIBUTIONS | (2.48) | (0.51) | (0.28) | (0.21) | (0.02) |
| Redemption Fees | 0.002 | — | — | — | — |
| Net Asset Value, End of Period | $20.40 | $21.54 | $18.74 | $17.04 | $16.91 |
| Total Return3 | 6.85% | 18.07% | 11.69% | 1.99% | 8.16% |
| Ratios to Average Net Assets: | | | | | |
| Net expenses | 0.85% | 0.89% | 0.94% | 0.95%4 | 1.00%4 |
| Net investment income | 1.21% | 1.16% | 1.29% | 1.40% | 1.47% |
| Expense waiver/reimbursement5 | 0.12% | 0.10% | 0.07% | 0.10% | 0.19% |
| Supplemental Data: | | | | | |
| Net assets, end of period (000 omitted) | $62,451 | $48,353 | $35,929 | $33,979 | $12,421 |
| Portfolio turnover | 100% | 106% | 85% | 215% | 184% |
| 1 | Per share numbers have been calculated using the average shares method. |
| 2 | Represents less than $0.01. |
| 3 | Based on net asset value. |
| 4 | The net expense ratio is calculated without reduction for expense offset arrangements. The net expense ratios are 0.95% and 0.99% for the years ended November 30, 2011 and 2010, respectively, after taking into account these expense reductions. |
| 5 | This expense decrease is reflected in both the net expense and the net investment income ratios shown above. |
See Notes which are an integral part of the Financial Statements
Annual Shareholder Report
Statement of Assets and Liabilities
November 30, 2014
| Assets: | | |
| Total investment in securities, at value including $120,974,045 of investment in affiliated holdings (Note 5) (identified cost $392,424,120) | | $418,215,163 |
| Cash | | 180,212 |
| Cash denominated in foreign currencies (identified cost $401,413) | | 393,826 |
| Restricted cash (Note 2) | | 14,023,968 |
| Income receivable | | 889,454 |
| Receivable for shares sold | | 231,126 |
| Unrealized appreciation on foreign exchange contracts | | 3,371,048 |
| Receivable for daily variation margin | | 173,523 |
| Other assets | | 51,999 |
| TOTAL ASSETS | | 437,530,319 |
| Liabilities: | | |
| Payable for investments purchased | $103,127 | |
| Payable for shares redeemed | 151,934 | |
| Unrealized depreciation on foreign exchange contracts | 2,859,808 | |
| Payable for daily variation margin | 24,578 | |
| Payable for transfer agent fee | 148,692 | |
| Payable for distribution services fee (Note 5) | 93,308 | |
| Payable for other service fees (Notes 2 and 5) | 58,835 | |
| Accrued expenses (Note 5) | 116,670 | |
| TOTAL LIABILITIES | | 3,556,952 |
| Net assets for 21,521,510 shares outstanding | | $433,973,367 |
| Net Assets Consist of: | | |
| Paid-in capital | | $374,222,331 |
| Net unrealized appreciation of investments, futures contracts, written options and translation of assets and liabilities in foreign currency | | 30,876,311 |
| Accumulated net realized gain on investments, futures contracts, swap contracts and foreign currency transactions | | 28,453,678 |
| Undistributed net investment income | | 421,047 |
| TOTAL NET ASSETS | | $433,973,367 |
Annual Shareholder Report
Statement of Assets and Liabilities–continued
| Net Asset Value, Offering Price and Redemption Proceeds Per Share | | |
| Class A Shares: | | |
Net asset value per share ($196,067,361 ÷ 9,662,918 shares outstanding),
no par value, unlimited shares authorized | | $20.29 |
| Offering price per share (100/94.50 of $20.29) | | $21.47 |
| Redemption proceeds per share | | $20.29 |
| Class B Shares: | | |
Net asset value per share ($26,163,123 ÷ 1,317,483 shares outstanding),
no par value, unlimited shares authorized | | $19.86 |
| Offering price per share | | $19.86 |
| Redemption proceeds per share (94.50/100 of $19.86) | | $18.77 |
| Class C Shares: | | |
Net asset value per share ($81,703,472 ÷ 4,126,063 shares outstanding),
no par value, unlimited shares authorized | | $19.80 |
| Offering price per share | | $19.80 |
| Redemption proceeds per share (99.00/100 of $19.80) | | $19.60 |
| Class R Shares: | | |
Net asset value per share ($67,588,441 ÷ 3,353,168 shares outstanding),
no par value, unlimited shares authorized | | $20.16 |
| Offering price per share | | $20.16 |
| Redemption proceeds per share | | $20.16 |
| Institutional Shares: | | |
Net asset value per share ($62,450,970 ÷ 3,061,878 shares outstanding),
no par value, unlimited shares authorized | | $20.40 |
| Offering price per share | | $20.40 |
| Redemption proceeds per share | | $20.40 |
See Notes which are an integral part of the Financial Statements
Annual Shareholder Report
Statement of Operations
Year Ended November 30, 2014
| Investment Income: | | | |
| Dividends (including $769,861 received from an affiliated holding (Note 5) and net of foreign taxes withheld of $255,194) | | | $6,218,453 |
| Investment income allocated from affiliated partnership (Note 5) | | | 1,905,519 |
| Interest | | | 615,903 |
| TOTAL INCOME | | | 8,739,875 |
| Expenses: | | | |
| Investment adviser fee (Note 5) | | $2,736,676 | |
| Administrative fee (Note 5) | | 329,607 | |
| Custodian fees | | 144,395 | |
| Transfer agent fee (Note 2) | | 762,582 | |
| Directors'/Trustees' fees (Note 5) | | 8,368 | |
| Auditing fees | | 29,500 | |
| Legal fees | | 13,922 | |
| Portfolio accounting fees | | 159,714 | |
| Distribution services fee (Note 5) | | 1,119,316 | |
| Other service fees (Notes 2 and 5) | | 737,510 | |
| Share registration costs | | 70,965 | |
| Printing and postage | | 69,812 | |
| Miscellaneous (Note 5) | | 18,684 | |
| TOTAL EXPENSES | | 6,201,051 | |
| Waiver and Reimbursements: | | | |
| Waiver/reimbursement of investment adviser fee (Note 5) | $(361,910) | | |
| Reimbursement of transfer agent fee (Note 2) | (84,746) | | |
| TOTAL WAIVER AND REIMBURSEMENTS | | (446,656) | |
| Net expenses | | | 5,754,395 |
| Net investment income | | | 2,985,480 |
Annual Shareholder Report
Statement of Operations–continued
| Realized and Unrealized Gain (Loss) on Investments, Futures Contracts, Written Options and Foreign Currency Transactions: | | | |
| Net realized gain on investments and foreign currency transactions | | | 30,230,285 |
| Net realized gain on futures contracts | | | 8,297,082 |
| Net realized gain on written option contracts | | | 12,347 |
| Net realized gain/loss allocated from affiliated partnership (Note 5) | | | 735,347 |
Realized gain distribution from affiliated investment company
shares (Note 5) | | | 102,958 |
| Net change in unrealized appreciation of investments and translation of assets and liabilities in foreign currency | | | (16,567,490) |
| Net change in unrealized appreciation of futures contracts | | | 15,957 |
| Net realized and unrealized gain on investments, futures contracts and foreign currency transactions | | | 22,826,486 |
| Change in net assets resulting from operations | | | $25,811,966 |
See Notes which are an integral part of the Financial Statements
Annual Shareholder Report
Statement of Changes in Net Assets
| Year Ended November 30 | 2014 | 2013 |
| Increase (Decrease) in Net Assets | | |
| Operations: | | |
| Net investment income | $2,985,480 | $2,516,703 |
| Net realized gain on investments including allocation from affiliated partnerships, futures contracts, written options and foreign currency transactions | 39,378,019 | 46,595,024 |
| Net change in unrealized appreciation/depreciation of investments, futures contracts and translation of assets and liabilities in foreign currency | (16,551,533) | 13,621,105 |
| CHANGE IN NET ASSETS RESULTING FROM OPERATIONS | 25,811,966 | 62,732,832 |
| Distributions to Shareholders: | | |
| Distributions from net investment income | | |
| Class A Shares | (1,122,430) | (1,549,599) |
| Class B Shares | (95,208) | (77,096) |
| Class C Shares | (239,144) | (175,283) |
| Class R Shares | (265,178) | (296,460) |
| Institutional Shares | (394,367) | (471,943) |
| Distributions from net realized gain on investments, futures contracts and foreign currency transactions | | |
| Class A Shares | (21,054,666) | (2,815,132) |
| Class B Shares | (3,369,971) | (449,540) |
| Class C Shares | (7,922,335) | (950,283) |
| Class R Shares | (7,365,552) | (970,113) |
| Institutional Shares | (5,424,526) | (581,958) |
| CHANGE IN NET ASSETS RESULTING FROM DISTRIBUTIONS TO SHAREHOLDERS | (47,253,377) | (8,337,407) |
| Share Transactions: | | |
| Proceeds from sale of shares | 90,680,055 | 69,869,133 |
| Net asset value of shares issued to shareholders in payment of distributions declared | 44,798,299 | 7,938,489 |
| Cost of shares redeemed | (92,043,932) | (93,416,700) |
| CHANGE IN NET ASSETS RESULTING FROM SHARE TRANSACTIONS | 43,434,422 | (15,609,078) |
| Redemption Fees | 55,498 | — |
| Change in net assets | 22,048,509 | 38,786,347 |
| Net Assets: | | |
| Beginning of period | 411,924,858 | 373,138,511 |
| End of period (including undistributed net investment income of $421,047 and $8,741, respectively) | $433,973,367 | $411,924,858 |
See Notes which are an integral part of the Financial Statements
Annual Shareholder Report
Notes to Financial Statements
November 30, 2014
1. ORGANIZATION
Federated Global Allocation Fund (the “Fund”) is registered under the Investment Company Act of 1940, as amended (the “Act”), as a diversified, open-end management investment company. The Fund offers five classes of shares: Class A Shares, Class B Shares, Class C Shares, Class R Shares and Institutional Shares. All shares of the Fund have equal rights with respect to voting, except on class-specific matters. The primary investment objective of the Fund is to provide relative safety of capital with the possibility of long-term growth of capital and income. Consideration is also given to current income.
2. SIGNIFICANT ACCOUNTING POLICIES
The following is a summary of significant accounting policies consistently followed by the Fund in the preparation of its financial statements. These policies are in conformity with U.S. generally accepted accounting principles (GAAP).
Investment Valuation
In calculating its net asset value (NAV), the Fund generally values investments as follows:
| ■ | Equity securities listed on an exchange or traded through a regulated market system are valued at their last reported sale price or official closing price in their principal exchange or market. |
| ■ | Fixed-income securities acquired with remaining maturities greater than 60 days are fair valued using price evaluations provided by a pricing service approved by the Trustees. |
| ■ | Fixed-income securities and repurchase agreements acquired with remaining maturities of 60 days or less are valued at their amortized cost (adjusted for the accretion of any discount or amortization of any premium), unless the issuer's creditworthiness is impaired or other factors indicate that amortized cost is not an accurate estimate of the investment's fair value, in which case it would be valued in the same manner as a longer-term security. |
| ■ | Shares of other mutual funds or non-exchange-traded investment companies are valued based upon their reported NAVs. |
| ■ | Derivative contracts listed on exchanges are valued at their reported settlement or closing price. |
| ■ | Over-the-counter (OTC) derivative contracts are fair valued using price evaluations provided by a pricing service approved by the Trustees. |
| ■ | For securities that are fair valued in accordance with procedures established by and under the general supervision of the Trustees, certain factors may be considered such as: the purchase price of the security, information obtained by contacting the issuer, analysis of the issuer's financial statements or other available documents, fundamental analytical data, the nature and duration of restrictions on disposition, the movement of the market in which the security is normally traded and public trading in similar securities of the issuer or comparable issuers. |
Annual Shareholder Report
If the Fund cannot obtain a price or price evaluation from a pricing service for an investment, the Fund may attempt to value the investment based upon the mean of bid and asked quotations or fair value the investment based on price evaluations, from one or more dealers. If any price, quotation, price evaluation or other pricing source is not readily available when the NAV is calculated, or if the Fund cannot obtain price evaluations from a pricing service or from more than one dealer for an investment within a reasonable period of time as set forth in the Fund's valuation policies and procedures, the Fund uses the fair value of the investment determined in accordance with the procedures described below. There can be no assurance that the Fund could purchase or sell an investment at the price used to calculate the Fund's NAV.
Fair Valuation and Significant Events Procedures
The Trustees have appointed a Valuation Committee comprised of officers of the Fund, Federated Global Investment Management Corp. (“Adviser”) and certain of the Adviser's affiliated companies to determine fair value of securities and in overseeing the calculation of the NAV. The Trustees have also authorized the use of pricing services recommended by the Valuation Committee to provide fair value evaluations of the current value of certain investments for purposes of calculating the NAV. The Valuation Committee employs various methods for reviewing third-party pricing-service evaluations including periodic reviews of third-party pricing services' policies, procedures and valuation methods (including key inputs and assumptions), transactional back-testing, comparisons of evaluations of different pricing services, and review of price challenges by the Adviser based on recent market activity. In the event that market quotations and price evaluations are not available for an investment, the Valuation Committee determines the fair value of the investment in accordance with procedures adopted by the Trustees. The Trustees periodically review and approve the fair valuations made by the Valuation Committee and any changes made to the procedures.
Factors considered by pricing services in evaluating an investment include the yields or prices of investments of comparable quality, coupon, maturity, call rights and other potential prepayments, terms and type, reported transactions, indications as to values from dealers and general market conditions. Some pricing services provide a single price evaluation reflecting the bid-side of the market for an investment (a “bid” evaluation). Other pricing services offer both bid evaluations and price evaluations indicative of a price between the prices bid and asked for the investment (a “mid” evaluation). The Fund normally uses bid evaluations for U.S. Treasury and Agency securities, mortgage-backed securities and municipal securities. The Fund normally uses mid evaluations for other types of fixed-income securities and OTC derivative contracts. In the event that market quotations and price evaluations are not available for an investment, the fair value of the investment is determined in accordance with procedures adopted by the Trustees.
Annual Shareholder Report
The Trustees also have adopted procedures requiring an investment to be priced at its fair value whenever the Adviser determines that a significant event affecting the value of the investment has occurred between the time as of which the price of the investment would otherwise be determined and the time as of which the NAV is computed. An event is considered significant if there is both an affirmative expectation that the investment's value will change in response to the event and a reasonable basis for quantifying the resulting change in value. Examples of significant events that may occur after the close of the principal market on which a security is traded, or after the time of a price evaluation provided by a pricing service or a dealer, include:
| ■ | With respect to securities traded in foreign markets, significant trends in U.S. equity markets or in the trading of foreign securities index futures contracts; |
| ■ | Political or other developments affecting the economy or markets in which an issuer conducts its operations or its securities are traded; and |
| ■ | Announcements concerning matters such as acquisitions, recapitalizations, litigation developments, a natural disaster affecting the issuer's operations or regulatory changes or market developments affecting the issuer's industry. |
The Trustees have approved the use of a pricing service to determine the fair value of equity securities traded principally in foreign markets when the Adviser determines that there has been a significant trend in the U.S. equity markets or in index futures trading. For other significant events, the Fund may seek to obtain more current quotations or price evaluations from alternative pricing sources. If a reliable alternative pricing source is not available, the Fund will determine the fair value of the investment using another method approved by the Trustees.
Repurchase Agreements
The Fund may invest in repurchase agreements for short-term liquidity purposes. It is the policy of the Fund to require the other party to a repurchase agreement to transfer to the Fund's custodian or sub-custodian eligible securities or cash with a market value (after transaction costs) at least equal to the repurchase price to be paid under the repurchase agreement. The eligible securities are transferred to accounts with the custodian or sub-custodian in which the Fund holds a “securities entitlement” and exercises “control” as those terms are defined in the Uniform Commercial Code. The Fund has established procedures for monitoring the market value of the transferred securities and requiring the transfer of additional eligible securities if necessary to equal at least the repurchase price. These procedures also allow the other party to require securities to be transferred from the account to the extent that their market value exceeds the repurchase price or in exchange for other eligible securities of equivalent market value.
Annual Shareholder Report
The insolvency of the other party or other failure to repurchase the securities may delay the disposition of the underlying securities or cause the Fund to receive less than the full repurchase price. Under the terms of the repurchase agreement, any amounts received by the Fund in excess of the repurchase price and related transaction costs must be remitted to the other party.
The Fund may enter into repurchase agreements in which eligible securities are transferred into joint trading accounts maintained by the custodian or sub-custodian for investment companies and other clients advised by the Fund's Adviser and its affiliates. The Fund will participate on a pro rata basis with the other investment companies and clients in its share of the securities transferred under such repurchase agreements and in its share of proceeds from any repurchase or other disposition of such securities.
Investment Income, Gains and Losses, Expenses and Distributions
Investment transactions are accounted for on a trade-date basis. Realized gains and losses from investment transactions are recorded on an identified-cost basis. Interest income and expenses are accrued daily. Dividend income and distributions to shareholders are recorded on the ex-dividend date. Foreign dividends are recorded on the ex-dividend date or when the Fund is informed of the ex-dividend date. Positive or negative inflation adjustments on Treasury Inflation-Protected Securities (TIPS) are included in interest income. Distributions of net investment income are declared and paid quarterly. Non-cash dividends included in dividend income, if any, are recorded at fair value. The Fund invests in Emerging Markets Fixed Income Core Fund (EMCORE), a portfolio of Federated Core Trust II, L.P., which is a limited partnership established under the laws of the state of Delaware. The Fund records daily its proportionate share of income, expenses, realized and unrealized gains and losses from EMCORE. Investment income, realized and unrealized gains and losses and certain fund-level expenses are allocated to each class based on relative average daily net assets, except that Class A Shares, Class B Shares, Class C Shares, Class R Shares and Institutional Shares may bear distribution services fees, other service fees and transfer agent fees unique to those classes. For the year ended November 30, 2014, transfer agent fees for the Fund were as follows:
| | Transfer
Agent Fees
Incurred | Transfer
Agent Fees
Reimbursed |
| Class A Shares | $289,779 | $(31,558) |
| Class B Shares | 59,534 | (4,284) |
| Class C Shares | 135,215 | (30,690) |
| Class R Shares | 208,797 | (1,465) |
| Institutional Shares | 69,257 | (16,749) |
| Total | $762,582 | $(84,746) |
Annual Shareholder Report
Other Service Fees
The Fund may pay other service fees up to 0.25% of the average daily net assets of the Fund's Class A Shares, Class B Shares and Class C Shares to financial intermediaries or to Federated Shareholder Services Company (FSSC) for providing services to shareholders and maintaining shareholder accounts. Financial intermediaries may include a company affiliated with management of Federated Investors, Inc. A financial intermediary affiliated with management of Federated Investors, Inc. received $531 of other service fees for the year ended November 30, 2014. Subject to the terms described in the Expense Limitation note, FSSC may voluntarily reimburse the Fund for other service fees. For the year ended November 30, 2014, other service fees for the Fund were as follows:
| | Other
Service Fees
Incurred |
| Class A Shares | $479,397 |
| Class B Shares | 71,983 |
| Class C Shares | 186,130 |
| Total | $737,510 |
For the year ended November 30, 2014, FSSC received $100,887 of fees paid by the Fund.
For the year ended November 30, 2014, the Fund's Institutional Shares did not incur other service fees; however it may begin to incur this fee upon approval of the Trustees.
Dividends are declared separately for each class. No class has preferential dividend rights; differences in per share dividend rates are generally due to differences in separate class expenses.
Premium and Discount Amortization/Paydown Gains and Losses
All premiums and discounts on fixed-income securities are amortized/accreted using the effective-interest-rate method. Gains and losses realized on principal payment of mortgage-backed securities (paydown gains and losses) are classified as part of investment income.
Federal Taxes
It is the Fund's policy to comply with the Subchapter M provision of the Internal Revenue Code (the “Code”) and to distribute to shareholders each year substantially all of its income. Accordingly, no provision for federal income tax is necessary. As of and during the year ended November 30, 2014, the Fund did not have a liability for any uncertain tax positions. The Fund recognizes interest and penalties, if any, related to tax liabilities as income tax expense in the Statement of Operations. As of November 30, 2014, tax years 2011 through 2014 remain subject to examination by the Fund's major tax jurisdictions, which include the United States of America and the Commonwealth of Massachusetts.
The Fund may be subject to taxes imposed by governments of countries in which it invests. Such taxes are generally based on either income or gains earned or repatriated. The Fund accrues and applies such taxes to net investment income, net realized gains and net unrealized gains as income and/or gains are earned.
Annual Shareholder Report
When-Issued and Delayed-Delivery Transactions
The Fund may engage in when-issued or delayed-delivery transactions. The Fund records when-issued securities on the trade date and maintains security positions such that sufficient liquid assets will be available to make payment for the securities purchased. Securities purchased on a when-issued or delayed-delivery basis are marked to market daily and begin earning interest on the settlement date. Losses may occur on these transactions due to changes in market conditions or the failure of counterparties to perform under the contract.
Swap Contracts
Swap contracts involve two parties that agree to exchange the returns (or the differential in rates of return) earned or realized on particular predetermined investments, instruments, indices or other measures. The gross returns to be exchanged or “swapped” between parties are generally calculated with respect to a “notional amount” for a predetermined period of time. The Fund enters into interest rate, total return, credit default, currency and other swap agreements. Risks may arise upon entering into swap agreements from the potential inability of the counterparties to meet the terms of their contract from unanticipated changes in the value of the swap agreement.
The Fund uses credit default swaps to manage sector/asset class risk. The “buyer” in a credit default swap is obligated to pay the “seller” a periodic stream of payments over the term of the contract provided that no event of default on an underlying reference obligation has occurred. If an event of default occurs, the seller must pay the buyer the full notional value, or the “par value,” of the reference obligation in exchange for the reference obligation. In connection with these agreements, securities may be identified as collateral in accordance with the terms of the respective swap agreements to provide assets of value and recourse in the event of default or bankruptcy/insolvency. Recovery values are assumed by market makers considering either industry standard recovery rates or entity specific factors and considerations until a credit event occurs. If a credit event has occurred, the recovery value is typically determined by a facilitated auction whereby a minimum number of allowable broker bids, together with a specific valuation method, are used to calculate the settlement value. The Fund's maximum risk of loss from counterparty credit risk, either as the protection buyer or as the protection seller, is the fair value of the contract. This risk is mitigated by having a master netting arrangement between the Fund and the counterparty and by the posting of collateral by the counterparty to the Fund to cover the Fund's exposure to the counterparty.
Upfront payments received or paid by the Fund will be reflected as an asset or liability on the Statement of Assets and Liabilities. Changes in the value of swap contracts are included in Swaps, at value on the Statement of Assets and Liabilities and periodic payments are reported as Net realized gain (loss) on swap contracts in the Statement of Operations.
At November 30, 2014, the Fund had no outstanding swap contracts.
Futures Contracts
The Fund purchases and sells financial futures contracts to manage duration risk and yield curve risk. Additionally, the Fund purchases and sells futures contracts to enhance yield and reduce transaction costs. Upon entering into a financial futures contract with a broker, the Fund is required to deposit in a segregated account a specified amount of cash or U.S. government securities which is shown as Restricted Cash. Futures contracts are valued daily and unrealized gains or losses are recorded in a “variation margin” account. Daily, the Fund receives from or pays to the broker a specified amount of cash based upon changes in the variation margin account. When a contract is closed, the Fund recognizes a realized gain
Annual Shareholder Report
or loss. Futures contracts have market risks, including the risk that the change in the value of the contract may not correlate with the changes in the value of the underlying securities. There is minimal counterparty risk to the Fund since futures are exchange traded and the exchange's clearinghouse, as counterparty to all exchange traded futures, guarantees the futures against default.
Futures contracts outstanding at period end are listed after the Fund's Portfolio of Investments.
The average notional value of long and short futures contracts held by the Fund throughout the period was $2,872,680,424 and $4,368,809,382, respectively. This is based on amounts held as of each month-end throughout the fiscal period.
Foreign Exchange Contracts
The Fund enters into foreign exchange contracts for the delayed delivery of securities or foreign currency exchange transactions. The Fund enters into foreign exchange contracts to protect assets against adverse changes in foreign currency exchange rates or exchange control regulations. Purchased contracts are used to acquire exposure to foreign currencies, whereas, contracts to sell are used to hedge the Fund's securities against currency fluctuations. Risks may arise upon entering into these transactions from the potential inability of counterparties to meet the terms of their commitments and from unanticipated movements in security prices or foreign exchange rates. The foreign exchange contracts are adjusted by the daily exchange rate of the underlying currency and any gains or losses are recorded for financial statement purposes as unrealized until the settlement date.
Foreign exchange contracts are subject to Master Netting Agreements which is an agreement between the Fund and its counterparties that provides for the net settlement of all transactions and collateral with the Fund, through a single payment, in the event of default or termination. Amounts presented on the Portfolio of Investments and Statement of Assets and Liabilities are not net settlement amounts but gross.
Foreign exchange contracts outstanding at period end, including net unrealized appreciation/depreciation or net settlement amount, are listed after the Fund's Portfolio of Investments.
The average value at settlement date payable and receivable of foreign exchange contracts purchased and sold by the Fund throughout the period was $675,217 and $771,977, respectively. This is based on the contracts held as of each month-end throughout the fiscal period.
Foreign Currency Translation
The accounting records of the Fund are maintained in U.S. dollars. All assets and liabilities denominated in foreign currencies (FCs) are translated into U.S. dollars based on the rates of exchange of such currencies against U.S. dollars on the date of valuation. Purchases and sales of securities, income and expenses are translated at the rate of exchange quoted on the respective date that such transactions are recorded. The Fund does not isolate that portion of the results of operations resulting from changes in foreign exchange rates on investments from the fluctuations arising from changes in market prices of securities held. Such fluctuations are included with the net realized and unrealized gain or loss from investments.
Annual Shareholder Report
Reported net realized foreign exchange gains or losses arise from sales of portfolio securities, sales and maturities of short-term securities, sales of FCs, currency gains or losses realized between the trade and settlement dates on securities transactions, the difference between the amounts of dividends, interest and foreign withholding taxes recorded on the Fund's books and the U.S. dollar equivalent of the amounts actually received or paid. Net unrealized foreign exchange gains and losses arise from changes in the value of assets and liabilities other than investments in securities at fiscal year end, resulting from changes in the exchange rate.
Option Contracts
The Fund buys or sells put and call options to maintain flexibility and to produce income or hedge. The seller (“writer”) of an option receives a payment or premium, from the buyer, which the writer keeps regardless of whether the buyer exercises the option. When the Fund writes a put or call option, an amount equal to the premium received is recorded as a liability and subsequently marked to market to reflect the current value of the option written. Premiums received from writing options which expire are treated as realized gains. The Fund, as a writer of an option, bears the market risk of an unfavorable change in the price of the underlying reference instrument. When the Fund purchases a put or call option, an amount equal to the premium paid is recorded as an increase to the cost of the investment and subsequently marked to market to reflect the current value of the option purchased. Premiums paid for purchasing options which expire are treated as realized losses. Premiums received/paid for writing/purchasing options which are exercised or closed are added to the proceeds or offset against amounts paid on the underlying reference instrument to determine the realized gain or loss. The risk associated with purchasing put and call options is limited to the premium paid. Options can trade on securities or commodities exchanges. In this case, the exchange sets all the terms of the contract except for the price. Most exchanges require investors to maintain margin accounts through their brokers to cover their potential obligations to the exchange. This protects investors against potential defaults by the counterparty.
The following is a summary of the Fund's written option activity:
| Contracts | Number of
Contracts | Premium |
| Outstanding at 11/30/2013 | — | $— |
| Contracts written | 2,200,000 | 13,698 |
| Contracts bought back | (2,200,000) | (13,698) |
| Outstanding at November 30, 2014 | — | $— |
At November 30, 2014, the Fund had no outstanding written option contracts.
The average market value of written options held by the Fund throughout the period was $948. This is based on amounts held as of each month-end throughout the fiscal period.
The average market value of purchased put and call options held by the Fund throughout the period was $17,908. This is based on amounts held as of each month-end throughout the fiscal period.
Restricted Securities
The Fund may purchase securities which are considered restricted. Restricted securities are securities that either: (a) cannot be offered for public sale without first being registered, or being able to take advantage of an exemption from registration, under the Securities Act of 1933; or (b) are subject to contractual restrictions on public sales. In some cases, when a
Annual Shareholder Report
security cannot be offered for public sale without first being registered, the issuer of the restricted security has agreed to register such securities for resale, at the issuer's expense, either upon demand by the Fund or in connection with another registered offering of the securities. Many such restricted securities may be resold in the secondary market in transactions exempt from registration. Restricted securities may be determined to be liquid under criteria established by the Trustees. The Fund will not incur any registration costs upon such resales. The Fund's restricted securities, like other securities, are priced in accordance with procedures established by and under the general supervision of the Trustees.
Additional information on restricted securities, excluding securities purchased under Rule 144A that have been deemed liquid by the Trustees, if applicable, held at November 30, 2014, is as follows:
| Security | Acquisition
Date | Cost | Market
Value |
| Regional Diversified Funding Series 144A, 9.25%, 03/15/2030 | 3/10/2000 | $183,413 | $115,266 |
| Union Central Life Insurance Co., Note, Series 144A, 8.200%, 11/01/2026 | 3/31/1999 | $790,785 | $1,014,840 |
Additional Disclosure Related to Derivative Instruments
| Fair Value of Derivative Instruments |
| | Asset | Liability |
| | Statement of
Assets and
Liabilities
Location | Fair
Value | Statement of
Assets and
Liabilities
Location | Fair
Value |
Derivatives not accounted
for as hedging instruments
under ASC Topic 815 | | | | |
| Interest rate contracts | Receivable for daily
variation margin | — | Payable for
daily variation
margin | $77,582* |
| Equity contracts | Receivable for daily
variation margin | $4,659,389* | Payable for
daily variation
margin | — |
| Foreign exchange contracts | Receivable for
foreign exchange
contracts | $3,371,048 | Payable for
foreign exchange
contracts | $2,859,808 |
Total derivatives not accounted
for as hedging instruments
under ASC Topic 815 | | $8,030,437 | | $2,937,390 |
| * | Includes cumulative appreciation/depreciation of futures contracts as reported in the footnotes to the Portfolio of Investments. Only the current day's variation margin is reported within the Statement of Assets and Liabilities. |
Annual Shareholder Report
The Effect of Derivative Instruments on the Statement of Operations for the Year Ended November 30, 2014
| Amount of Realized Gain or (Loss) on Derivatives Recognized in Income |
| | Futures | Forward
Currency
Contracts | Written
Option
Contracts | Purchased
Option
Contracts | Total |
| Interest rate contracts | $(511,764) | $— | $— | $— | $(511,764) |
| Foreign exchange contracts | — | 1,161,922 | 12,347 | (212,190) | 962,079 |
| Equity contracts | 8,808,846 | — | — | — | 8,808,846 |
| TOTAL | $8,297,082 | $1,161,922 | $12,347 | $(212,190) | $9,259,161 |
| Change in Unrealized Appreciation or (Depreciation) on Derivatives Recognized in Income |
| | Futures | Forward
Currency
Contracts | Total |
| Interest rate contracts | $(70,140) | $— | $(70,140) |
| Foreign exchange contracts | — | 526,967 | 526,967 |
| Equity contracts | 86,097 | — | 86,097 |
| TOTAL | $15,957 | $526,967 | $542,924 |
As indicated above, certain derivative investments are transacted subject to MNA. These agreements permit the Fund to offset with a counterparty certain derivative payable and/or receivables with collateral held and create one single net payment in the event of default or termination of the agreement by either the Fund or the counterparty. Amounts presented on the Portfolio of Investments and Statement of Assets and Liabilities are not net settlement amounts but gross. As of November 30, 2014, the impact of netting assets and liabilities and the collateral pledged or received based on MNA are detailed below:
| Gross Amounts Not Offset in the Statement of Assets and Liabilities |
| Transaction | Gross Asset
Derivatives
Presented in
Statement of
Assets and
Liabilities | Financial
Instrument | Collateral
Received | Net Amount
(not less
than $0) |
| Foreign Exchange Contracts | $3,371,048 | $(2,770,152) | $— | $600,896 |
| TOTAL | $3,371,048 | $(2,770,152) | $— | $600,896 |
| Transaction | Gross Liability
Derivatives
Presented in
Statement of
Assets and
Liabilities | Financial
Instrument | Collateral
Received | Net Amount
(not less
than $0) |
| Foreign Exchange Contracts | $2,859,808 | $(2,770,152) | $— | $89,656 |
| TOTAL | $2,859,808 | $(2,770,152) | $— | $89,656 |
Annual Shareholder Report
Other
The preparation of financial statements in conformity with GAAP requires management to make estimates and assumptions that affect the amounts of assets, liabilities, expenses and revenues reported in the financial statements. Actual results could differ from those estimated. The Fund applies Investment Company accounting and reporting guidance.
3. SHARES OF BENEFICIAL INTEREST
The following tables summarize share activity:
| Year Ended November 30 | 2014 | 2013 |
| Class A Shares: | Shares | Amount | Shares | Amount |
| Shares sold | 1,271,707 | $24,983,624 | 846,888 | $16,749,013 |
| Shares issued to shareholders in payment of distributions declared | 1,077,269 | 20,848,247 | 219,394 | 4,094,005 |
| Shares redeemed | (1,704,879) | (33,509,425) | (1,973,766) | (38,671,456) |
| NET CHANGE RESULTING FROM CLASS A SHARE TRANSACTIONS | 644,097 | $12,322,446 | (907,484) | $(17,828,438) |
| Year Ended November 30 | 2014 | 2013 |
| Class B Shares: | Shares | Amount | Shares | Amount |
| Shares sold | 144,477 | $2,789,113 | 186,478 | $3,643,775 |
| Shares issued to shareholders in payment of distributions declared | 172,063 | 3,273,298 | 27,470 | 497,862 |
| Shares redeemed | (447,961) | (8,651,857) | (327,759) | (6,353,673) |
| NET CHANGE RESULTING FROM CLASS B SHARE TRANSACTIONS | (131,421) | $(2,589,446) | (113,811) | $(2,212,036) |
| Year Ended November 30 | 2014 | 2013 |
| Class C Shares: | Shares | Amount | Shares | Amount |
| Shares sold | 1,353,586 | $26,117,531 | 1,035,747 | $20,015,809 |
| Shares issued to shareholders in payment of distributions declared | 409,657 | 7,768,862 | 59,376 | 1,073,382 |
| Shares redeemed | (1,022,069) | (19,706,161) | (987,686) | (19,146,194) |
| NET CHANGE RESULTING FROM CLASS C SHARE TRANSACTIONS | 741,174 | $14,180,232 | 107,437 | $1,942,997 |
| Year Ended November 30 | 2014 | 2013 |
| Class R Shares: | Shares | Amount | Shares | Amount |
| Shares sold | 859,978 | $16,854,161 | 892,929 | $17,412,343 |
| Shares issued to shareholders in payment of distributions declared | 395,870 | 7,623,369 | 67,859 | 1,247,698 |
| Shares redeemed | (1,070,155) | (20,977,412) | (1,157,528) | (22,690,199) |
| NET CHANGE RESULTING FROM CLASS R SHARE TRANSACTIONS | 185,693 | $3,500,118 | (196,740) | $(4,030,158) |
Annual Shareholder Report
| Year Ended November 30 | 2014 | 2013 |
| Institutional Shares: | Shares | Amount | Shares | Amount |
| Shares sold | 1,009,592 | $19,935,626 | 605,015 | $12,048,193 |
| Shares issued to shareholders in payment of distributions declared | 271,859 | 5,284,523 | 54,277 | 1,025,542 |
| Shares redeemed | (463,970) | (9,199,077) | (332,402) | (6,555,178) |
| NET CHANGE RESULTING FROM INSTITUTIONAL SHARE TRANSACTIONS | 817,481 | $16,021,072 | 326,890 | $6,518,557 |
| NET CHANGE RESULTING FROM TOTAL FUND SHARE TRANSACTIONS | 2,257,024 | $43,434,422 | (783,708) | $(15,609,078) |
Redemption Fees
For the year ended November 30, 2014, redemption fees of $55,498 were allocated to cover the cost of redemptions.
4. FEDERAL TAX INFORMATION
The timing and character of income and capital gain distributions are determined in accordance with income tax regulations, which may differ from GAAP. These differences are due in part to differing treatments for foreign currency transactions, partnership income reclassifications, passive foreign investment company gains and losses, discount accretion/premium amortization on debt securities and short-term capital gain reclassifications.
For the year ended November 30, 2014, permanent differences identified and reclassified among the components of net assets were as follows:
| Increase (Decrease) |
| Paid-In Capital | Undistributed
Net Investment
Income (Loss) | Accumulated
Net Realized
Gain (Loss) |
| $(1,034) | $(456,847) | $457,881 |
Net investment income (loss), net realized gains (losses) and net assets were not affected by this reclassification.
The tax character of distributions as reported on the Statement of Changes in Net Assets for the years ended November 30, 2014 and 2013, was as follows:
| | 2014 | 2013 |
| Ordinary income1 | $18,488,219 | $3,679,773 |
| Long-term capital gains | $28,765,158 | $4,657,634 |
| 1 | For tax purposes, short-term capital gain distributions are considered ordinary income distributions. |
| | |
Annual Shareholder Report
As of November 30, 2014, the components of distributable earnings on a tax basis were as follows:
| Undistributed ordinary income2 | $8,075,013 |
| Undistributed long-term capital gains | $29,313,561 |
| Net unrealized appreciation | $27,812,855 |
| Capital loss carryforwards and straddle loss deferrals | $(5,450,393) |
| 2 | For tax purposes, short-term capital gains are considered ordinary income in determining distributable earnings. |
| | |
The difference between book-basis and tax-basis net unrealized appreciation/depreciation is attributable in part to differing treatments for passive foreign investment company gains and losses, the deferral of losses on wash sales, partnership adjustments, defaulted bond interest and discount accretion/premium amortization on debt securities.
At November 30, 2014, the cost of investments for federal tax purposes was $390,921,201. The net unrealized appreciation of investments for federal tax purposes excluding: (a) any unrealized appreciation/depreciation resulting from the translation from FCs to U.S. dollars of assets and liabilities other than investments in securities; (b) outstanding foreign currency commitments; and (c) futures contracts was $27,293,962. This consists of net unrealized appreciation from investments for those securities having an excess of value over cost of $40,004,803 and net unrealized depreciation from investments for those securities having an excess of cost over value of $12,710,810.
At November 30, 2014, the Fund had a capital loss carryforward of $5,373,896 which will reduce the Fund's taxable income arising from future net realized gains on investments, if any, to the extent permitted by the Code, thereby reducing the amount of distributions to shareholders which would otherwise be necessary to relieve the Fund of any liability for federal income tax. Pursuant to the Code, a net capital loss incurred in taxable years beginning on or before December 22, 2010, is characterized as short-term and may be carried forward for a maximum of eight tax years (“Carryforward Limit”), whereas a net capital loss incurred in taxable years beginning after December 22, 2010, retains its character as either short-term or long-term, does not expire and is required to be utilized prior to the losses which have a Carryforward Limit.
The following schedule summarizes the Fund's capital loss carryforwards and expiration years:
| Expiration Year | Short-Term | Long-Term | Total |
| 2016 | $490,093 | N/A | $490,093 |
| 2017 | $676,009 | N/A | $676,009 |
| 2018 | $4,207,794 | N/A | $4,207,794 |
The Fund used capital loss carryforwards of $2,551,696 to offset capital gains realized during the year ended November 30, 2014.
Annual Shareholder Report
5. INVESTMENT ADVISER FEE AND OTHER TRANSACTIONS WITH AFFILIATES
Investment Adviser Fee
The advisory agreement between the Fund and the Adviser provides for an annual fee equal to: (a) 0.55% of the average daily net assets of the Fund; and (b) 4.50% of gross income of the Fund, excluding gains or losses. Subject to the terms described in the Expense Limitation note, the Adviser may voluntarily choose to waive any portion of its fee. For the year ended November 30, 2014, the Adviser voluntarily waived $113,342 of its fee.
Certain of the Fund's assets are managed by Federated Investment Management Company (FIMCO) (the “Sub-Adviser”). Under the terms of a sub-advisory agreement between the Adviser and the Sub-Adviser, the Sub-Adviser receives an allocable portion of the Fund's adviser fee. The fee is paid by the Adviser out of its resources and is not an incremental Fund expense. For the year ended November 30, 2014, the Sub-Adviser earned a fee of $419,892.
Administrative Fee
Federated Administrative Services (FAS), under the Administrative Services Agreement, provides the Fund with administrative personnel and services. For purposes of determining the appropriate rate breakpoint, “Investment Complex” is defined as all of the Federated Funds subject to a fee under the Administrative Services Agreement. The fee paid to FAS is based on the average daily net assets of the Investment Complex as specified below, plus certain out-of-pocket expenses:
| Administrative Fee | Average Daily Net Assets
of the Investment Complex |
| 0.150% | on the first $5 billion |
| 0.125% | on the next $5 billion |
| 0.100% | on the next $10 billion |
| 0.075% | on assets in excess of $20 billion |
Subject to the terms described in the Expense Limitation note, FAS may voluntarily choose to waive any portion of its fee. For the year ended November 30, 2014, the annualized fee paid to FAS was 0.078% of average daily net assets of the Fund.
Distribution Services Fee
The Fund has adopted a Distribution Plan (the “Plan”) pursuant to Rule 12b-1 under the Act. Under the terms of the Plan, the Fund will compensate Federated Securities Corp. (FSC), the principal distributor, from the daily net assets of the Fund's Class B Shares, Class C Shares and Class R Shares to finance activities intended to result in the sale of these shares. The Plan provides that the Fund may incur distribution expenses at the following percentages of average daily net assets annually, to compensate FSC:
| Share Class Name | Percentage of Average Daily
Net Assets of Class |
| Class B Shares | 0.75% |
| Class C Shares | 0.75% |
| Class R Shares | 0.50% |
Annual Shareholder Report
Subject to the terms described in the Expense Limitation note, FSC may voluntarily choose to waive any portion of its fee. For the year ended November 30, 2014, distribution services fees for the Fund were as follows:
| | Distribution
Services Fees
Incurred |
| Class B Shares | $215,949 |
| Class C Shares | 567,284 |
| Class R Shares | 336,083 |
| TOTAL | $1,119,316 |
When FSC receives fees, it may pay some or all of them to financial intermediaries whose customers purchase shares. For the year ended November 30, 2014, FSC retained $165,869 of fees paid by the Fund.
Sales Charges
Front-end sales charges and contingent deferred sales charges (CDSC) do not represent expenses of the Fund. They are deducted from the proceeds of sales of Fund shares prior to investment or from redemption proceeds prior to remittance, as applicable. For the year ended November 30, 2014, FSC retained $22,250 in sales charges from the sale of Class A Shares. FSC also retained $48,098 relating to redemptions of Class B Shares and $4,457 relating to redemptions of Class C Shares.
Other Service Fees
For the year ended November 30, 2014, FSSC received $100,887 of the other service fees disclosed in Note 2.
Expense Limitation
The Adviser and certain of its affiliates (which may include FSC, FAS and FSSC) on their own initiative have agreed to waive their respective fees and/or reimburse expenses so that the total annual fund operating expenses (as shown in the financial highlights, but excluding expenses allocated from affiliated partnerships, dividends and other expenses related to short sales, extraordinary expenses and proxy-related expenses paid by the Fund, if any) paid by the Fund's Class A Shares, Class B Shares, Class C Shares, Class R Shares and Institutional Shares (after the voluntary waivers and/or reimbursements) will not exceed 1.14%, 1.95%, 1.89, 1.57% and 0.85% (the “Fee Limit”), respectively, up to but not including the later of (the “Termination Date”): (a) February 1, 2016; or (b) the date of the Fund's next effective Prospectus. While the Adviser and its applicable affiliates currently do not anticipate terminating or increasing these arrangements prior to the Termination Date, these arrangements may only be terminated or the Fee Limit increased prior to the Termination Date with the agreement of the Trustees.
General
Certain Officers and Trustees of the Fund are Officers and Directors or Trustees of certain of the above companies. To efficiently facilitate payment, Directors'/Trustees' fees and certain expenses related to conducting meetings of the Directors/Trustees and other miscellaneous expenses are paid by an affiliate of the Adviser which in due course are reimbursed by the Fund. Such expenses may be included in Accrued and Miscellaneous Expenses on the Statement of Assets and Liabilities and Statement of Operations, respectively.
Annual Shareholder Report
Transactions Involving Affiliated Holdings
Affiliated holdings are investment companies which are managed by the Adviser or an affiliate of the Adviser. The Adviser has agreed to reimburse the Fund for certain investment adviser fees as a result of transactions in other affiliated investment companies. For the year ended November 30, 2014, the Adviser reimbursed $248,568. Transactions involving the affiliated holdings during the year ended November 30, 2014, were as follows:
| | Emerging
Markets
Fixed Income
Core Fund | Federated
InterContinental
Fund,
Institutional
Shares | Federated
Mortgage
Core
Portfolio | Federated
Prime Value
Obligations
Fund,
Institutional
Shares |
Balance of
Shares Held 11/30/2013 | 992,899 | 564,524 | — | 99,036,040 |
| Purchases/Additions | 939,010 | 8,519 | 730,305 | 305,729,506 |
| Sales/Reductions | (542,329) | (573,043) | (53,434) | (351,725,324) |
Balance of
Shares Held 11/30/2014 | 1,389,580 | — | 676,871 | 53,040,222 |
| Value | $49,200,680 | $— | $6,755,176 | $53,040,222 |
Dividend
Income/Allocated
Investment Income | $1,905,519 | $— | $84,988 | $63,929 |
Realized Gain Distribution/Allocated
Net Realized Gain (Loss) | $735,347 | $— | $— | $— |
| | Federated
Project and
Trade Finance
Core Fund | High Yield
Bond Portfolio | Total of
Affiliated
Transactions |
Balance of
Shares Held 11/30/2013 | 535,127 | 1,602,610 | 102,731,200 |
| Purchases/Additions | 121,765 | 420,811 | 307,949,916 |
| Sales/Reductions | — | (1,149,483) | (354,043,613) |
Balance of
Shares Held 11/30/2014 | 656,892 | 873,938 | 56,637,503 |
| Value | $6,279,892 | $5,698,075 | $120,974,045 |
Dividend
Income/Allocated
Investment Income | $232,713 | $388,231 | $2,675,380 |
Realized Gain Distribution/Allocated
Net Realized Gain (Loss) | $12,552 | $90,406 | $838,305 |
Annual Shareholder Report
6. Investment TRANSACTIONS
Purchases and sales of investments, excluding long-term U.S. government securities and short-term obligations, for the year ended November 30, 2014, were as follows:
| Purchases | $352,582,596 |
| Sales | $(298,863,342) |
7. LINE OF CREDIT
The Fund participates in a $100,000,000 unsecured, uncommitted revolving line of credit (LOC) agreement with PNC Bank. The LOC was made available for extraordinary or emergency purposes, primarily for financing redemption payments. Borrowings are charged interest at a rate offered to the Fund by PNC Bank at the time of the borrowing. As of November 30, 2014, there were no outstanding loans. During the year ended November 30, 2014, the Fund did not utilize the LOC.
8. INTERFUND LENDING
Pursuant to an Exemptive Order issued by the Securities and Exchange Commission, the Fund, along with other funds advised by subsidiaries of Federated Investors, Inc., may participate in an interfund lending program. This program provides an alternative credit facility allowing the Fund to borrow from other participating affiliated funds. As of November 30, 2014, there were no outstanding loans. During the year ended November 30, 2014, the program was not utilized.
9. FEDERAL TAX INFORMATION (UNAUDITED)
For the year ended November 30, 2014, the amount of long-term capital gains designated by the Fund was $28,765,158.
For the fiscal year ended November 30, 2014, 32.9% of total income distributions made by the Fund are qualifying dividends which may be subject to a maximum tax rate of 15%, as provided for the by the Jobs and Growth Tax Relief Act of 2003. Complete information is reported in conjunction with the reporting of your distributions on Form 1099-DIV.
Of the ordinary income distributions made by the Fund during the year ended November 30, 2014, 18.2% qualify for the dividend received deduction available to corporate shareholders.
Annual Shareholder Report
Report of Independent Registered Public Accounting Firm
TO THE BOARD OF TRUSTEES AND SHAREHOLDERS OF FEDERATED GLOBAL ALLOCATION FUND:
We have audited the accompanying statement of assets and liabilities, including the portfolio of investments, of the Federated Global Allocation Fund (the “Fund”), as of November 30, 2014, and the related statement of operations for the year then ended, the statements of changes in net assets for each of the years in the two-year period then ended, and the financial highlights for each of the years or periods in the five-year period then ended. These financial statements and financial highlights are the responsibility of the Fund's management. Our responsibility is to express an opinion on these financial statements and financial highlights based on our audits.
We conducted our audits in accordance with the standards of the Public Company Accounting Oversight Board (United States). Those standards require that we plan and perform the audit to obtain reasonable assurance about whether the financial statements and financial highlights are free of material misstatement. An audit includes examining, on a test basis, evidence supporting the amounts and disclosures in the financial statements. Our procedures included confirmation of securities owned as of November 30, 2014, by correspondence with the custodian, transfer agent and brokers or by other appropriate auditing procedures. An audit also includes assessing the accounting principles used and significant estimates made by management, as well as evaluating the overall financial statement presentation. We believe that our audits provide a reasonable basis for our opinion.
In our opinion, the financial statements and financial highlights referred to above present fairly, in all material respects, the financial position of the Federated Global Allocation Fund as of November 30, 2014, the results of its operations for the year then ended, the changes in its net assets for each of the years in the two-year period then ended, and the financial highlights for each of the years or periods in the five-year period then ended, in conformity with U.S. generally accepted accounting principles.
Boston, Massachusetts
January 23, 2015
Annual Shareholder Report
Shareholder Expense Example (unaudited)
As a shareholder of the Fund, you incur two types of costs: (1) transaction costs, including sales charges (loads) on purchase or redemption payments; and (2) ongoing costs, including management fees and to the extent applicable, distribution (12b-1) fees and/or other service fees and other Fund expenses. This Example is intended to help you to understand your ongoing costs (in dollars) of investing in the Fund and to compare these costs with the ongoing costs of investing in other mutual funds. It is based on an investment of $1,000 invested at the beginning of the period and held for the entire period from June 1, 2014 to November 30, 2014.
ACTUAL EXPENSES
The first section of the table below provides information about actual account values and actual expenses. You may use the information in this section, together with the amount you invested, to estimate the expenses that you incurred over the period. Simply divide your account value by $1,000 (for example, an $8,600 account value divided by $1,000 = 8.6), then multiply the result by the number in the first section under the heading entitled “Expenses Paid During Period” to estimate the expenses attributable to your investment during this period.
HYPOTHETICAL EXAMPLE FOR COMPARISON PURPOSES
The second section of the table below provides information about hypothetical account values and hypothetical expenses based on the Fund's actual expense ratio and an assumed rate of return of 5% per year before expenses, which is not the Fund's actual return. Thus, you should not use the hypothetical account values and expenses to estimate the actual ending account balance or your expenses for the period. Rather, these figures are required to be provided to enable you to compare the ongoing costs of investing in the Fund with other funds. To do so, compare this 5% hypothetical example with the 5% hypothetical examples that appear in the shareholder reports of the other funds.
Annual Shareholder Report
Please note that the expenses shown in the table are meant to highlight your ongoing costs only and do not reflect any transaction costs, such as sales charges (loads) on purchase or redemption payments. Therefore, the second section of the table is useful in comparing ongoing costs only, and will not help you determine the relative total costs of owning different funds. In addition, if these transaction costs were included, your costs would have been higher.
| | Beginning
Account Value
6/1/2014 | Ending
Account Value
11/30/2014 | Expenses Paid
During Period1 |
| Actual: | | | |
| Class A Shares | $1,000 | $1,027.90 | $5.80 |
| Class B Shares | $1,000 | $1,023.70 | $9.89 |
| Class C Shares | $1,000 | $1,024.30 | $9.59 |
| Class R Shares | $1,000 | $1,026.10 | $7.97 |
| Institutional Shares | $1,000 | $1,029.60 | $4.32 |
Hypothetical (assuming a 5% return
before expenses): | | | |
| Class A Shares | $1,000 | $1,019.35 | $5.77 |
| Class B Shares | $1,000 | $1,015.29 | $9.85 |
| Class C Shares | $1,000 | $1,015.59 | $9.55 |
| Class R Shares | $1,000 | $1,017.20 | $7.94 |
| Institutional Shares | $1,000 | $1,020.81 | $4.31 |
| 1 | Expenses are equal to the Fund's annualized net expense ratios, multiplied by the average account value over the period, multiplied by 183/365 (to reflect the one-half-year period). The annualized net expense ratios are as follows: |
| | |
| Class A Shares | 1.14% |
| Class B Shares | 1.95% |
| Class C Shares | 1.89% |
| Class R Shares | 1.57% |
| Institutional Shares | 0.85% |
Annual Shareholder Report
Board of Trustees and Trust Officers
The Board of Trustees is responsible for managing the Trust's business affairs and for exercising all the Trust's powers except those reserved for the shareholders. The following tables give information about each Trustee and the senior officers of the Fund. Where required, the tables separately list Trustees who are “interested persons” of the Fund (i.e., “Interested” Trustees) and those who are not (i.e., “Independent” Trustees). Unless otherwise noted, the address of each person listed is Federated Investors Tower, 1001 Liberty Avenue, Pittsburgh, PA 15222. The address of all Independent Trustees listed is 4000 Ericsson Drive, Warrendale, PA 15086-7561; Attention: Mutual Fund Board. As of December 31, 2014, the Trust comprised one portfolio(s), and the Federated Fund Family consisted of 40 investment companies (comprising 131 portfolios). Unless otherwise noted, each Officer is elected annually. Unless otherwise noted, each Trustee oversees all portfolios in the Federated Fund Family and serves for an indefinite term. The Fund's Statement of Additional Information includes additional information about Trust Trustees and is available, without charge and upon request, by calling 1-800-341-7400.
Interested Trustees Background
Name
Birth Date
Positions Held with Trust
Date Service Began | Principal Occupation(s) for Past Five Years,
Other Directorships Held and Previous Position(s) |
John F. Donahue*
Birth Date: July 28, 1924
Trustee
Indefinite Term
Began serving: December 1956 | Principal Occupations: Director or Trustee of the Federated Fund Family; Chairman and Director, Federated Investors, Inc.; Chairman of the Federated Fund Family's Executive Committee.
Previous Positions: Chairman of the Federated Fund Family; Trustee, Federated Investment Management Company; Chairman and Director, Federated Investment Counseling. |
J. Christopher Donahue*
Birth Date: April 11, 1949
President and Trustee
Indefinite Term
Began serving: November 1998 | Principal Occupations: Principal Executive Officer and President of certain of the Funds in the Federated Fund Family; Director or Trustee of the Funds in the Federated Fund Family; President, Chief Executive Officer and Director, Federated Investors, Inc.; Chairman and Trustee, Federated Investment Management Company; Trustee, Federated Investment Counseling; Chairman and Director, Federated Global Investment Management Corp.; Chairman, Federated Equity Management Company of Pennsylvania and Passport Research, Ltd. (investment advisory subsidiary of Federated); Trustee, Federated Shareholder Services Company; Director, Federated Services Company.
Previous Positions: President, Federated Investment Counseling; President and Chief Executive Officer, Federated Investment Management Company, Federated Global Investment Management Corp. and Passport Research, Ltd. |
| * | Family relationships and reasons for “interested” status: John F. Donahue is the father of J. Christopher Donahue; both are “interested” due to their beneficial ownership of shares of Federated Investors, Inc. and the positions they hold with Federated and its subsidiaries. |
Annual Shareholder Report
INDEPENDENT Trustees Background
Name
Birth Date
Positions Held with Trust
Date Service Began | Principal Occupation(s) for Past Five Years,
Other Directorships Held, Previous Position(s) and Qualifications |
John T. Collins
Birth Date: January 24, 1947
Trustee
Indefinite Term
Began serving: October 2013 | Principal Occupations: Director or Trustee of the Federated Fund Family; Chairman and CEO, The Collins Group, Inc. (a private equity firm).
Other Directorships Held: Director, KLX Corp.
Qualifications: Mr. Collins has served in several business and financial management roles and directorship positions throughout his career. Mr. Collins serves as Chairman Emeriti, Bentley University. Mr. Collins previously served as Director, Sterling Suffolk Downs, Inc. (racecourse); Director and Audit Committee Member, Bank of America Corp. and Director, Beth Israel Deaconess Medical Center (Harvard University Affiliate Hospital). |
Maureen Lally-Green
Birth Date: July 5, 1949
Trustee
Indefinite Term
Began serving: August 2009 | Principal Occupations: Director or Trustee of the Federated Fund Family; Associate General Secretary and Director, Office for Church Relations, Diocese of Pittsburgh; Adjunct Professor of Law, Duquesne University School of Law.
Other Directorships Held: Director, CONSOL Energy Inc.
Qualifications: Judge Lally-Green has served in various legal and business roles and directorship positions throughout her career. Judge Lally-Green previously served as Professor of Law, Duquesne University School of Law and was a member of the Superior Court of Pennsylvania. Judge Lally-Green also holds the positions of: Member, Pennsylvania State Board of Education; Director, Saint Vincent College; Director and Chair, UPMC Mercy Hospital; Regent, St. Vincent Seminary; Director, Epilepsy Foundation of Western and Central Pennsylvania; Director, Our Campaign for the Church Alive!, Inc.; Director, Pennsylvania Bar Institute; and Director, Catholic High Schools of the Diocese of Pittsburgh, Inc. Judge Lally-Green has held the positions of: Director, Auberle; Director, Ireland Institute of Pittsburgh; Director, Saint Thomas More Society; and Director Cardinal Wuerl Catholic High School. |
Peter E. Madden
Birth Date: March 16, 1942
Trustee
Indefinite Term
Began serving: August 1991 | Principal Occupation: Director or Trustee, and Chair of the Board of Directors or Trustees, of the Federated Fund Family; Retired.
Other Directorships Held: None.
Qualifications: Mr. Madden has served in several business management, mutual fund services and directorship positions throughout his career. Mr. Madden previously served as President, Chief Operating Officer and Director, State Street Bank and Trust Company (custodian bank) and State Street Corporation (financial services). He was Director, VISA USA and VISA International and Chairman and Director, Massachusetts Bankers Association. Mr. Madden served as Director, Depository Trust Corporation and Director, The Boston Stock Exchange. Mr. Madden also served as a Representative to the Commonwealth of Massachusetts General Court. |
Annual Shareholder Report
Name
Birth Date
Positions Held with Trust
Date Service Began | Principal Occupation(s) for Past Five Years,
Other Directorships Held, Previous Position(s) and Qualifications |
Charles F. Mansfield, Jr.
Birth Date: April 10, 1945
Trustee
Indefinite Term
Began serving: November 1998 | Principal Occupations: Director or Trustee of the Federated Fund Family; Management Consultant.
Other Directorships Held: None.
Qualifications: Mr. Mansfield has served in several banking, business management and educational roles and directorship positions throughout his career. Mr. Mansfield previously served as Chief Executive Officer, PBTC International Bank; Partner, Arthur Young & Company (now Ernst & Young LLP); Chief Financial Officer of Retail Banking Sector, Chase Manhattan Bank; Senior Vice President, HSBC Bank USA (formerly, Marine Midland Bank); Vice President, Citibank; Assistant Professor of Banking and Finance, Frank G. Zarb School of Business, Hofstra University; Executive Vice President DVC Group, Inc. (marketing, communications and technology). |
Thomas M. O'Neill
Birth Date: June 14, 1951
Trustee
Indefinite Term
Began serving: October 2006 | Principal Occupations: Director or Trustee, Vice Chair of the Audit Committee of the Federated Fund Family; Sole Proprietor, Navigator Management Company (investment and strategic consulting).
Other Directorships Held: None.
Qualifications: Mr. O'Neill has served in several business, mutual fund and financial management roles and directorship positions throughout his career. Mr. O'Neill serves as Director, Medicines for Humanity and Director, The Golisano Children's Museum of Naples, Florida. Mr. O'Neill previously served as Chief Executive Officer and President, Managing Director and Chief Investment Officer, Fleet Investment Advisors; President and Chief Executive Officer, Aeltus Investment Management, Inc.; General Partner, Hellman, Jordan Management Co., Boston, MA; Chief Investment Officer, The Putnam Companies, Boston, MA; Credit Analyst and Lending Officer, Fleet Bank; Director and Consultant, EZE Castle Software (investment order management software); and Director, Midway Pacific (lumber). |
P. Jerome Richey
Birth Date: February 23, 1949
Trustee
Indefinite Term
Began serving: October 2013 | Principal Occupations: Director or Trustee of the Federated Fund Family; General Counsel, University of Pittsburgh.
Other Directorships Held: None.
Qualifications: Mr. Richey has served in several business and legal management roles and directorship positions throughout his career. Mr. Richey serves as Board Member, Epilepsy Foundation of Western Pennsylvania and Board member, World Affairs Council of Pittsburgh. Mr. Richey previously served as Chief Legal Officer and Executive Vice President, CONSOL Energy Inc. and Shareholder, Buchanan Ingersoll & Rooney PC (a law firm). |
Annual Shareholder Report
Name
Birth Date
Positions Held with Trust
Date Service Began | Principal Occupation(s) for Past Five Years,
Other Directorships Held, Previous Position(s) and Qualifications |
John S. Walsh
Birth Date: November 28, 1957
Trustee
Indefinite Term
Began serving: November 1998 | Principal Occupations: Director or Trustee, Chair of the Audit Committee of the Federated Fund Family; President and Director, Heat Wagon, Inc. (manufacturer of construction temporary heaters); President and Director, Manufacturers Products, Inc. (distributor of portable construction heaters); President, Portable Heater Parts, a division of Manufacturers Products, Inc.
Other Directorships Held: None.
Qualifications: Mr. Walsh has served in several business management roles and directorship positions throughout his career. Mr. Walsh previously served as Vice President, Walsh & Kelly, Inc. (paving contractors). |
OFFICERS
Name
Birth Date
Address
Positions Held with Trust
Date Service Began | Principal Occupation(s) for Past Five Years
and Previous Position(s) |
John W. McGonigle
Birth Date: October 26, 1938
EXECUTIVE VICE PRESIDENT AND SECRETARY
Officer since: September 1969 | Principal Occupations: Executive Vice President and Secretary of the Federated Fund Family; Vice Chairman, Executive Vice President, Secretary and Director, Federated Investors, Inc.
Previous Positions: Trustee, Federated Investment Management Company and Federated Investment Counseling; Director, Federated Global Investment Management Corp., Federated Services Company and Federated Securities Corp. |
Lori A. Hensler
Birth Date: January 6, 1967
TREASURER
Officer since: April 2013 | Principal Occupations: Principal Financial Officer and Treasurer of the Federated Fund Family; Senior Vice President, Federated Administrative Services; Financial and Operations Principal for Federated Securities Corp. and Edgewood Services, Inc.; and Assistant Treasurer, Federated Investors Trust Company. Ms. Hensler has received the Certified Public Accountant designation.
Previous Positions: Controller of Federated Investors, Inc.; Senior Vice President and Assistant Treasurer, Federated Investors Management Company; Treasurer, Federated Investors Trust Company; Assistant Treasurer, Federated Administrative Services, Federated Administrative Services, Inc., Federated Securities Corp., Edgewood Services, Inc., Federated Advisory Services Company, Federated Equity Management Company of Pennsylvania, Federated Global Investment Management Corp., Federated Investment Counseling, Federated Investment Management Company, Passport Research, Ltd., and Federated MDTA, LLC; Financial and Operations Principal for Federated Securities Corp., Edgewood Services, Inc. and Southpointe Distribution Services, Inc. |
Annual Shareholder Report
Name
Birth Date
Address
Positions Held with Trust
Date Service Began | Principal Occupation(s) for Past Five Years
and Previous Position(s) |
Peter J. Germain
Birth Date: September 3, 1959
CHIEF LEGAL OFFICER
Officer since: January 2005 | Principal Occupations: Mr. Germain is Chief Legal Officer of the Federated Fund Family. He is General Counsel and Vice President, Federated Investors, Inc.; President, Federated Administrative Services and Federated Administrative Services, Inc.; Vice President, Federated Securities Corp.; Secretary, Federated Private Asset Management, Inc.; and Secretary, Retirement Plan Service Company of America. Mr. Germain joined Federated in 1984 and is a member of the Pennsylvania Bar Association.
Previous Positions: Deputy General Counsel, Special Counsel, Managing Director of Mutual Fund Services, Federated Investors, Inc.; Senior Vice President, Federated Services Company; and Senior Corporate Counsel, Federated Investors, Inc. |
Richard B. Fisher
Birth Date: May 17, 1923
VICE PRESIDENT
Officer since: May 1976 | Principal Occupations: Vice Chairman or Vice President of some of the Funds in the Federated Fund Family; Vice Chairman, Federated Investors, Inc.; Chairman, Federated Securities Corp.
Previous Positions: President and Director or Trustee of some of the Funds in the Federated Fund Family; Executive Vice President, Federated Investors, Inc.; Director and Chief Executive Officer, Federated Securities Corp. |
Brian P. Bouda
Birth Date: February 28, 1947
CHIEF COMPLIANCE OFFICER AND SENIOR VICE PRESIDENT
Officer since: August 2004 | Principal Occupations: Senior Vice President and Chief Compliance Officer of the Federated Fund Family; Vice President and Chief Compliance Officer of Federated Investors, Inc. and Chief Compliance Officer of certain of its subsidiaries. Mr. Bouda joined Federated in 1999 and is a member of the American Bar Association and the State Bar Association of Wisconsin.
Previous Positions: Served in Senior Management positions with a large regional banking organization. |
Stephen F. Auth
Birth Date: September 3, 1956
101 Park Avenue
41st Floor
New York, NY 10178
CHIEF INVESTMENT OFFICER
Officer since: November 2002 | Principal Occupations: Stephen F. Auth is Chief Investment Officer of various Funds in the Federated Fund Family; Executive Vice President, Federated Investment Counseling, Federated Global Investment Management Corp. and Federated Equity Management Company of Pennsylvania.
Previous Positions: Executive Vice President, Federated Investment Management Company and Passport Research, Ltd. (investment advisory subsidiary of Federated); Senior Vice President, Global Portfolio Management Services Division; Senior Vice President, Federated Investment Management Company and Passport Research, Ltd.; Senior Managing Director and Portfolio Manager, Prudential Investments. |
Annual Shareholder Report
Name
Birth Date
Address
Positions Held with Trust
Date Service Began | Principal Occupation(s) for Past Five Years
and Previous Position(s) |
Philip Orlando
Birth Date: June 22, 1958
450 Lexington Avenue
Suite 3700
New York, NY 10017-3943
Vice President
Officer since: June 2012
Portfolio Manager since: August 2007 | Principal Occupations: Philip Orlando has been the Fund's Portfolio Manager since August 2007 and is responsible for the asset allocation and equity security selection of the Fund. He is Vice President of the Trust with respect to the Fund. Mr. Orlando joined the Fund's Adviser in March 2003 as a Senior Vice President and Senior Portfolio Manager and currently serves as Chief Equity Market Strategist. From November 1995 to March 2003, Mr. Orlando was the Chief Investment Officer and Senior Equity Portfolio Manager at Value Line Asset Management. Mr. Orlando has received the Chartered Financial Analyst designation and earned his B.A. in Journalism and M.B.A. with a concentration in Economics from New York University. |
Annual Shareholder Report
Evaluation and Approval of Advisory Contract–May 2014
Federated Global Allocation Fund (the “Fund”)
Following a review and recommendation of approval by the Fund's independent trustees, the Fund's Board reviewed and approved at its May 2014 meetings the Fund's investment advisory and subadvisory contracts for an additional one-year term. The Board's decision regarding these contracts reflects the exercise of its business judgment on whether to continue the existing arrangements.
In this connection, the Federated Funds' Board had previously appointed a Senior Officer, whose duties include specified responsibilities relating to the process by which advisory fees are to be charged to a Federated fund. The Senior Officer has the authority to retain consultants, experts, or staff as may be reasonably necessary to assist in the performance of his duties, reports directly to the Board, and may be terminated only with the approval of a majority of the independent members of the Board. The Senior Officer prepared and furnished to the Board an independent, written evaluation that covered topics discussed below (the “Evaluation”). The Board considered that Evaluation, along with other information, in deciding to approve the advisory and subadvisory contracts.
The Board is also familiar with and considered judicial decisions concerning allegedly excessive investment advisory fees, which have indicated that the following factors may be relevant to an Adviser's fiduciary duty with respect to its receipt of compensation from a fund: the nature and quality of the services provided by the Adviser to a fund and its shareholders, including the performance and expenses of the fund and of comparable funds; the Adviser's cost of providing the services, including the profitability to the Adviser of providing advisory services to a fund; the extent to which the Adviser may realize “economies of scale” as a fund grows larger and, if such economies exist, whether they have been shared with a fund and its shareholders or the family of funds; any “fall-out financial benefits” that accrue to the Adviser because of its relationship with a fund (including research services received from brokers that execute fund trades and any fees paid to affiliates of the Adviser for services rendered to a fund); comparative fee structures, including a comparison of fees paid to the Adviser with those paid by similar funds; and the extent of care, conscientiousness and independence with which the Board members perform their duties and their expertise, including whether they are fully informed about all facts the Board deems relevant to its consideration of the Adviser's services and fees. The Board noted that SEC disclosure requirements regarding the basis for the Board's approval of the Fund's advisory contract generally track the factors listed above. Consistent with these judicial decisions and SEC disclosure requirements, the Board also considered management fees charged to institutional and other clients of the Adviser and subadviser for what might be
Annual Shareholder Report
viewed as like services. The Board was aware of these factors and was guided by them in its review of the Fund's advisory and subadvisory contracts to the extent it considered them to be appropriate and relevant, as discussed further below.
The Board considered and weighed these circumstances in light of its substantial accumulated experience in governing the Fund and working with Federated on matters relating to the Federated funds, and was assisted in its deliberations by independent legal counsel. Throughout the year, and in connection with its May meetings, the Board requested and received substantial and detailed information about the Fund and the Federated organization that was in addition to the extensive materials that comprise and accompany the Senior Officer's Evaluation. Federated provided much of this information at each regular meeting of the Board, and furnished additional substantial information in connection with the May meeting at which the Board's formal review of the advisory and subadvisory contracts occurred. At this May meeting, senior management of the Adviser also met with the independent trustees and their counsel to discuss the materials presented and any other matters thought relevant by the Adviser or the trustees. Between regularly scheduled meetings, the Board also received information on particular matters as the need arose. Thus, the Board's consideration of the advisory and subadvisory contracts included review of the Senior Officer's Evaluation, accompanying data and additional information covering such matters as: the Adviser's and subadviser's investment philosophy, revenue, profitability, personnel and processes; investment and operating strategies; the Fund's short- and long-term performance (in absolute terms, both on a gross basis and net of expenses, as well as in relationship to its particular investment program and certain competitor or “peer group” funds and/or other benchmarks, as appropriate), and comments on the reasons for performance; the Fund's investment objectives; the Fund's expenses (including the advisory fee itself and the overall expense structure of the Fund, both in absolute terms and relative to similar and/or competing funds, with due regard for contractual or voluntary expense limitations); the use and allocation of brokerage commissions derived from trading the Fund's portfolio securities (if any); and the nature, quality and extent of the advisory and other services provided to the Fund by the Adviser and its affiliates. The Board also considered the preferences and expectations of Fund shareholders; the entrepreneurial risk assumed by the Adviser in sponsoring the funds; the continuing state of competition in the mutual fund industry and market practices; the range of comparable fees for similar funds in the mutual fund industry; the Fund's relationship to the Federated family of funds which include a comprehensive array of funds with different investment objectives, policies and strategies which are available for exchange without the incurrence of additional sales charges; compliance and audit reports concerning the Federated funds and the Federated companies that service them (including communications from regulatory agencies), as well as Federated's responses to any issues raised therein;
Annual Shareholder Report
and relevant developments in the mutual fund industry and how the Federated funds and/or Federated are responding to them. The Board's evaluation process is evolutionary. The criteria considered and the emphasis placed on relevant criteria change in recognition of changing circumstances in the mutual fund marketplace.
While mindful that courts have cautioned against giving such comparisons too much weight, the Board has found the use of comparisons of the Fund's fees and expenses to other mutual funds with comparable investment programs to be relevant. In this regard, the Board was presented with, and considered, information regarding the contractual advisory fee rates, net advisory fee rates and total expense ratios relative to a fund's peers. The Board focused on comparisons with other similar mutual funds more heavily than non-mutual fund products or services because it is believed that they are more relevant. For example, other mutual funds are the products most like the Fund, they are readily available to Fund shareholders as alternative investment vehicles, and they are the type of investment vehicle in fact chosen and maintained by the Fund's investors. The range of their fees and expenses therefore appears to be a relevant indicator of what consumers have found to be reasonable in the precise marketplace in which the Fund competes.
The Board reviewed the contractual advisory fee rate, net advisory fee rate where partially waived and other expenses of the Fund and noted the position of the Fund's fee rates relative to its peers. In this regard, the Board noted that the contractual advisory fee rate was below the median of the relevant peer group and that it was satisfied that the overall expense structure of the Fund remained competitive.
By contrast, the Senior Officer has reviewed Federated's fees for providing advisory services to products outside the Federated family of funds (e.g., institutional and separate accounts and sub-adviser services). He concluded that mutual funds and institutional accounts are inherently different products. Those differences include, but are not limited to, different types of targeted investors; being subject to different laws and regulations; different legal structures; different average account sizes; and portfolio management techniques made necessary by different cash flows and different associated costs; and the time spent by portfolio managers and their teams, funds financial services, legal, compliance and risk management in reviewing securities pricing, addressing different administrative responsibilities, addressing different degrees of risk associated with management and a variety of different costs. The Senior Officer did not consider these fee schedules to be determinative in judging the appropriateness of mutual fund advisory fees.
Annual Shareholder Report
The Fund's ability to deliver competitive performance when compared to its peer group was also deemed to be relevant by the Board as a useful indicator of how the Adviser is executing the Fund's investment program, which in turn was one of the Board's considerations in reaching a conclusion that the nature, extent, and quality of the Adviser's investment management services were such as to warrant continuation of the advisory and subadvisory contracts.
The Senior Officer reviewed information compiled by Federated, using data supplied by independent fund ranking organizations, regarding the performance of, and fees charged by, other mutual funds, noting his view that comparisons to fund peer groups may be helpful, though not conclusive, in judging the reasonableness of proposed fees. The Board considered, in evaluating such comparisons, that in some cases individual funds may exhibit significant and unique differences in their objectives and management techniques when compared to other funds within an industry peer group.
For the periods covered by the Evaluation, the Fund's performance for the one-year and three-year period was above the median of the relevant peer group, and the Fund's performance fell below the median of the relevant peer group for the five-year period. The Board discussed the Fund's performance with the Adviser and recognized the efforts being undertaken by the Adviser. The Board will continue to monitor these efforts and the performance of the Fund in the context of the other factors considered relevant by the Board.
The Board also received financial information about Federated, including information regarding the compensation and benefits Federated derived from its relationships with the Federated funds. This information covered not only the fees under the advisory contracts, but also fees received by Federated's subsidiaries for providing other services to the Federated funds under separate contracts (e.g., for serving as the Federated funds' administrator). The information also detailed any indirect benefit Federated may derive from its receipt of research services from brokers who execute Federated fund trades. In addition, the Board considered the fact that, in order for a fund to be competitive in the marketplace, Federated and its affiliates frequently waived fees and/or reimbursed expenses and have disclosed to fund investors and/or indicated to the Board their intention to do so in the future, where appropriate. Moreover, the Board receives regular reporting as to the institution, adjustment or elimination of these voluntary waivers. In addition, following discussions regarding the Senior Officer's May 2013 recommendations, Federated made meaningful reductions to gross advisory fees for several funds. At the Board meeting in May 2014, the Senior Officer proposed, and the Board approved, reductions in the contractual advisory fees of certain other funds.
Federated furnished information, requested by the Senior Officer, that reported revenues on a fund-by-fund basis and made estimates of the allocation of expenses on a fund-by-fund basis, using allocation methodologies specified by the Senior Officer. The Senior Officer noted that, while these cost allocation reports apply consistent allocation processes, the inherent difficulties in
Annual Shareholder Report
allocating costs continues to cause the Senior Officer to question the precision of the process and to conclude that such reports may be unreliable, since a single change in an allocation estimate may dramatically alter the resulting estimate of cost and/or profitability of a fund and may produce unintended consequences. The allocation information, including the Senior Officer's view that fund-by-fund estimations may be unreliable, was considered in the analysis by the Board.
The Board and the Senior Officer also reviewed information compiled by Federated comparing profitability information for Federated to other publicly held fund management companies. In this regard, the Senior Officer concluded that Federated's profit margins did not appear to be excessive.
The Senior Officer's Evaluation also discussed the notion of possible realization of “economies of scale” as a fund grows larger. The Board considered in this regard that the Adviser has made significant and long-term investments in areas that support all of the Federated family of funds, such as personnel and processes for the portfolio management, shareholder services, compliance, internal audit, and risk management functions; and systems technology; and that the benefits of these efforts (as well as any economies, should they exist) were likely to be enjoyed by the fund family as a whole. Finally, the Board also noted the absence of any applicable regulatory or industry guidelines on this subject, which (as discussed in the Senior Officer's Evaluation) is compounded by the lack of any common industry practice or general pattern with respect to structuring fund advisory fees with “breakpoints” that serve to reduce the fee as the fund attains a certain size.
The Senior Officer noted that, subject to the comments and recommendations made within his Evaluation, his observations and the information accompanying the Evaluation supported a finding by the Board that the management fees for each of the funds were reasonable. Under these circumstances, no changes were recommended to, and no objection was raised to, the continuation of the Fund's advisory and subadvisory contracts.
In its decision to continue an existing investment advisory contract, the Board was mindful of the potential disruptions of the Fund's operations and various risks, uncertainties and other effects that could occur as a result of a decision to terminate or not renew an advisory contract. In particular, the Board recognized that many shareholders have invested in the Fund on the strength of the Adviser's industry standing and reputation and with the expectation that the Adviser will have a continuing role in providing advisory services to the Fund. Thus, the Board's approval of the advisory contract reflected the fact that it is the shareholders who have effectively selected the Adviser by virtue of having invested in the Fund. The Board concluded that, in light of the factors discussed above, including the nature, quality and scope of the services provided to the Fund by the Adviser and its affiliates, continuation of the advisory contract was appropriate.
Annual Shareholder Report
The Board based its decision to approve the advisory and subadvisory contracts on the totality of the circumstances and relevant factors and with a view to past and future long-term considerations. Not all of the factors and considerations identified above were necessarily relevant to the Fund, nor did the Board consider any one of them to be determinative. With respect to the factors that were relevant, the Board's decision to approve the contract reflects its determination that Federated's performance and actions provided a satisfactory basis to support the decision to continue the existing arrangements.
Annual Shareholder Report
Voting Proxies on Fund Portfolio Securities
A description of the policies and procedures that the Fund uses to determine how to vote proxies, if any, relating to securities held in the Fund's portfolio is available, without charge and upon request, by calling 1-800-341-7400. A report on “Form N-PX” of how the Fund voted any such proxies during the most recent 12-month period ended June 30 is available via the Proxy Voting Record (Form N-PX) link associated with the Fund and share class name at www.FederatedInvestors.com/FundInformation. Form N-PX filings are also available at the SEC's website at www.sec.gov.
Quarterly Portfolio Schedule
The Fund files with the SEC a complete schedule of its portfolio holdings, as of the close of the first and third quarters of its fiscal year, on “Form N-Q.” These filings are available on the SEC's website at www.sec.gov and may be reviewed and copied at the SEC's Public Reference Room in Washington, DC. (Call 1-800-SEC-0330 for information on the operation of the Public Reference Room.) You may also access this information via the link to the Fund and share class name at www.FederatedInvestors.com/FundInformation.
Annual Shareholder Report
Mutual funds are not bank deposits or obligations, are not guaranteed by any bank and are not insured or guaranteed by the U.S. government, the Federal Deposit Insurance Corporation, the Federal Reserve Board or any other government agency. Investment in mutual funds involves investment risk, including the possible loss of principal.
This Report is authorized for distribution to prospective investors only when preceded or accompanied by the Fund's Prospectus, which contains facts concerning its objective and policies, management fees, expenses and other information.
Federated Global Allocation Fund
Federated Investors Funds
4000 Ericsson Drive
Warrendale, PA 15086-7561
Contact us at FederatedInvestors.com
or call 1-800-341-7400.
Federated Securities Corp., Distributor
CUSIP 314183104
CUSIP 314183203
CUSIP 314183302
CUSIP 314183401
CUSIP 314183500
G01454-01 (1/15)
Federated is a registered trademark of Federated Investors, Inc.
2015 ©Federated Investors, Inc.
Item 2. Code of Ethics
(a) As of the end of the period covered by this report, the registrant has adopted a code of ethics (the "Section 406 Standards for Investment Companies - Ethical Standards for Principal Executive and Financial Officers") that applies to the registrant's Principal Executive Officer and Principal Financial Officer; the registrant's Principal Financial Officer also serves as the Principal Accounting Officer.
(c) Not Applicable
(d) Not Applicable
(e) Not Applicable
(f)(3) The registrant hereby undertakes to provide any person, without charge, upon request, a copy of the code of ethics. To request a copy of the code of ethics, contact the registrant at 1-800-341-7400, and ask for a copy of the Section 406 Standards for Investment Companies - Ethical Standards for Principal Executive and Financial Officers.
Item 3. Audit Committee Financial Expert
The registrant's Board has determined that each of the following members of the Board's Audit Committee is an “audit committee financial expert,” and is "independent," for purposes of this Item: John T. Collins, Thomas M. O'Neill and John S. Walsh.
Item 4. Principal Accountant Fees and Services
(a) Audit Fees billed to the registrant for the two most recent fiscal years:
Fiscal year ended 2014 - $30,300
Fiscal year ended 2013 - $29,000
(b) Audit-Related Fees billed to the registrant for the two most recent fiscal years:
Fiscal year ended 2014 - $0
Fiscal year ended 2013 - $0
Amount requiring approval of the registrant’s audit committee pursuant to paragraph (c)(7)(ii) of Rule 2-01 of Regulation S-X, $0 and $0 respectively.
(c) Tax Fees billed to the registrant for the two most recent fiscal years:
Fiscal year ended 2014 - $0
Fiscal year ended 2013 - $0
Amount requiring approval of the registrant’s audit committee pursuant to paragraph (c)(7)(ii) of Rule 2-01 of Regulation S-X, $0 and $0 respectively.
(d) All Other Fees billed to the registrant for the two most recent fiscal years:
Fiscal year ended 2014 - $0
Fiscal year ended 2013 - $0
Amount requiring approval of the registrant’s audit committee pursuant to paragraph (c)(7)(ii) of Rule 2-01 of Regulation S-X, $0 and $0 respectively.
(e)(1) Audit Committee Policies regarding Pre-approval of Services.
The Audit Committee is required to pre-approve audit and non-audit services performed by the independent auditor in order to assure that the provision of such services do not impair the auditor’s independence. Unless a type of service to be provided by the independent auditor has received general pre-approval, it will require specific pre-approval by the Audit Committee. Any proposed services exceeding pre-approved cost levels will require specific pre-approval by the Audit Committee.
Certain services have the general pre-approval of the Audit Committee. The term of the general pre-approval is 12 months from the date of pre-approval, unless the Audit Committee specifically provides for a different period. The Audit Committee will annually review the services that may be provided by the independent auditor without obtaining specific pre-approval from the Audit Committee and may grant general pre-approval for such services. The Audit Committee will revise the list of general pre-approved services from time to time, based on subsequent determinations. The Audit Committee will not delegate its responsibilities to pre-approve services performed by the independent auditor to management.
The Audit Committee has delegated pre-approval authority to its Chairman. The Chairman will report any pre-approval decisions to the Audit Committee at its next scheduled meeting. The Committee will designate another member with such pre-approval authority when the Chairman is unavailable.
AUDIT SERVICES
The annual Audit services engagement terms and fees will be subject to the specific pre-approval of the Audit Committee. The Audit Committee must approve any changes in terms, conditions and fees resulting from changes in audit scope, registered investment company (RIC) structure or other matters.
In addition to the annual Audit services engagement specifically approved by the Audit Committee, the Audit Committee may grant general pre-approval for other Audit Services, which are those services that only the independent auditor reasonably can provide. The Audit Committee has pre-approved certain Audit services, all other Audit services must be specifically pre-approved by the Audit Committee.
AUDIT-RELATED SERVICES
Audit-related services are assurance and related services that are reasonably related to the performance of the audit or review of the Company’s financial statements or that are traditionally performed by the independent auditor. The Audit Committee believes that the provision of Audit-related services does not impair the independence of the auditor, and has pre-approved certain Audit-related services, all other Audit-related services must be specifically pre-approved by the Audit Committee.
TAX SERVICES
The Audit Committee believes that the independent auditor can provide Tax services to the Company such as tax compliance, tax planning and tax advice without impairing the auditor’s independence. However, the Audit Committee will not permit the retention of the independent auditor in connection with a transaction initially recommended by the independent auditor, the purpose of which may be tax avoidance and the tax treatment of which may not be supported in the Internal Revenue Code and related regulations. The Audit Committee has pre-approved certain Tax services, all Tax services involving large and complex transactions must be specifically pre-approved by the Audit Committee.
ALL OTHER SERVICES
With respect to the provision of services other than audit, review or attest services the pre-approval requirement is waived if:
| (1) | The aggregate amount of all such services provided constitutes no more than five percent of the total amount of revenues paid by the registrant, the registrant’s adviser (not including any sub-adviser whose role is primarily portfolio management and is subcontracted with or overseen by another investment adviser), and any entity controlling, controlled by, or under common control with the investment adviser that provides ongoing services to the registrant to its accountant during the fiscal year in which the services are provided; |
| (2) | Such services were not recognized by the registrant, the registrant’s adviser (not including any sub-adviser whose role is primarily portfolio management and is subcontracted with or overseen by another investment adviser), and any entity controlling, controlled by, or under common control with the investment adviser that provides ongoing services to the registrant at the time of the engagement to be non-audit services; |
| (3) | Such services are promptly brought to the attention of the Audit Committee of the issuer and approved prior to the completion of the audit by the Audit Committee or by one or more members of the Audit Committee who are members of the board of directors to whom authority to grant such approvals has been delegated by the Audit Committee. |
The Audit Committee may grant general pre-approval to those permissible non-audit services classified as All Other services that it believes are routine and recurring services, and would not impair the independence of the auditor.
The SEC’s rules and relevant guidance should be consulted to determine the precise definitions of prohibited non-audit services and the applicability of exceptions to certain of the prohibitions.
PRE-APPROVAL FEE LEVELS
Pre-approval fee levels for all services to be provided by the independent auditor will be established annually by the Audit Committee. Any proposed services exceeding these levels will require specific pre-approval by the Audit Committee.
PROCEDURES
Requests or applications to provide services that require specific approval by the Audit Committee will be submitted to the Audit Committee by both the independent auditor and the Principal Accounting Officer and/or Internal Auditor, and must include a joint statement as to whether, in their view, the request or application is consistent with the SEC’s rules on auditor independence.
(e)(2) Percentage of services identified in items 4(b) through 4(d) that were approved by the registrants audit committee pursuant to paragraph (c)(7)(i)(C) of Rule 2-01 of Regulation S-X:
4(b)
Fiscal year ended 2014– 0%
Fiscal year ended 2013- 0%
Percentage of services provided to the registrants investment adviser and any entity controlling, controlled by, or under common control with the investment adviser that provides ongoing services to the registrant that were approved by the registrants audit committee pursuant to paragraph (c)(7)(i)(C) of Rule 2-01 of Regulation S-X, 0% and 0% respectively.
4(c)
Fiscal year ended 2014– 0%
Fiscal year ended 2013– 0%
Percentage of services provided to the registrants investment adviser and any entity controlling, controlled by, or under common control with the investment adviser that provides ongoing services to the registrant that were approved by the registrants audit committee pursuant to paragraph (c)(7)(i)(C) of Rule 2-01 of Regulation S-X, 0% and 0% respectively.
4(d)
Fiscal year ended 2014– 0%
Fiscal year ended 2013– 0%
Percentage of services provided to the registrants investment adviser and any entity controlling, controlled by, or under common control with the investment adviser that provides ongoing services to the registrant that were approved by the registrants audit committee pursuant to paragraph (c)(7)(i)(C) of Rule 2-01 of Regulation S-X, 0% and 0% respectively.
| (g) | Non-Audit Fees billed to the registrant, the registrant’s investment adviser, and certain entities controlling, controlled by or under common control with the investment adviser: |
Fiscal year ended 2014- $20,081
Fiscal year ended 2013- $9,308
(h) The registrant’s Audit Committee has considered that the provision of non-audit services that were rendered to the registrant’s adviser (not including any sub-adviser whose role is primarily portfolio management and is subcontracted with or overseen by another investment adviser), and any entity controlling, controlled by, or under common control with the investment adviser that provides ongoing services to the registrant that were not pre-approved pursuant to paragraph (c)(7)(ii) of Rule 2-01 of Regulation S-X is compatible with maintaining the principal accountant’s independence.
Item 5. Audit Committee of Listed Registrants
Not Applicable
Item 6. Schedule of Investments
(a) The registrant’s Schedule of Investments is included as part of the Report to Stockholders filed under Item 1 of this form.
(b) Not Applicable; Fund had no divestments during the reporting period covered since the previous Form N-CSR filing.
Item 7. Disclosure of Proxy Voting Policies and Procedures for Closed-End Management Investment Companies
Item 8. Portfolio Managers of Closed-End Management Investment Companies
Item 9. Purchases of Equity Securities by Closed-End Management Investment Company and Affiliated Purchasers
Item 10. Submission of Matters to a Vote of Security Holders
No Changes to Report
Item 11. Controls and Procedures
(a) The registrant’s President and Treasurer have concluded that the
registrant’s disclosure controls and procedures (as defined in rule 30a-3(c) under the Act) are effective in design and operation and are sufficient to form the basis of the certifications required by Rule 30a-(2) under the Act, based on their evaluation of these disclosure controls and procedures within 90 days of the filing date of this report on Form N-CSR.
(b) There were no changes in the registrant’s internal control over financial reporting (as defined in rule 30a-3(d) under the Act) during the second fiscal quarter of the period covered by this report that have materially affected, or are reasonably likely to materially affect, the registrant’s internal control over financial reporting.
Item 12. Exhibits
(a)(1) Code of Ethics- Not Applicable to this Report.
(a)(2) Certifications of Principal Executive Officer and Principal Financial Officer.
(a)(3) Not Applicable.
(b) Certifications pursuant to 18 U.S.C. Section 1350.
SIGNATURES
Pursuant to the requirements of the Securities Exchange Act of 1934 and the Investment Company Act of 1940, the registrant has duly caused this report to be signed on its behalf by the undersigned, thereunto duly authorized.
Registrant Federated Global Allocation Fund
By /S/ Lori A. Hensler
Lori A. Hensler, Principal Financial Officer
Date January 21, 2015
Pursuant to the requirements of the Securities Exchange Act of 1934 and the Investment Company Act of 1940, this report has been signed below by the following persons on behalf of the registrant and in the capacities and on the dates indicated.
By /S/ J. Christopher Donahue
J. Christopher Donahue, Principal Executive Officer
Date January 21, 2015
By /S/ Lori A. Hensler
Lori A. Hensler, Principal Financial Officer
Date January 21, 2015