United States
Securities and Exchange Commission
Washington, D.C. 20549
Form N-CSR
Certified Shareholder Report of Registered Management Investment Companies
811-1
(Investment Company Act File Number)
Federated Global Allocation Fund
_______________________________________________________________
(Exact Name of Registrant as Specified in Charter)
Federated Investors Funds
4000 Ericsson Drive
Warrendale, Pennsylvania 15086-7561
(Address of Principal Executive Offices)
(412) 288-1900
(Registrant's Telephone Number)
John W. McGonigle, Esquire
Federated Investors Tower
1001 Liberty Avenue
Pittsburgh, Pennsylvania 15222-3779
(Name and Address of Agent for Service)
(Notices should be sent to the Agent for Service)
Date of Fiscal Year End: 11/30/15
Date of Reporting Period: 11/30/15
Item 1. Reports to Stockholders

Annual Shareholder Report
November 30, 2015
| Share Class | Ticker |
| A | FSTBX |
| B | FSBBX |
| C | FSBCX |
| R | FSBKX |
| Institutional | SBFIX |
Federated Global Allocation Fund
Fund Established 1934
Dear Valued Shareholder,
I am pleased to present the Annual Shareholder Report for your fund covering the period from December 1, 2014 through November 30, 2015. This report includes Management's Discussion of Fund Performance, a complete listing of your fund's holdings, performance information and financial statements along with other important fund information.
In addition, our website, FederatedInvestors.com, offers easy access to Federated resources that include timely fund updates, economic and market insights from our investment strategists, and financial planning tools. We invite you to register to take full advantage of its capabilities.
Thank you for investing with Federated. I hope you find this information useful and look forward to keeping you informed.
Sincerely,
J. Christopher Donahue, President
Not FDIC Insured • May Lose Value • No Bank Guarantee
CONTENTS
| 1 |
| 8 |
| 10 |
| 44 |
| 49 |
| 51 |
| 53 |
| 54 |
| 69 |
| 70 |
| 72 |
| 78 |
| 84 |
| 84 |
Management's Discussion of Fund Performance (unaudited)
The total return of Federated Global Allocation Fund (the “Fund”), based on net asset value for the 12-month reporting period ended November 30, 2015, was -2.80%, -3.59%, -3.55%, -3.26% and -2.51% for the Fund's Class A Shares, Class B Shares, Class C Shares, Class R Shares and Institutional Shares, respectively. The total return of the Fund's Blended Index1,2 was -3.02%, and the total return of the Morningstar World Allocation Funds Average (MWAFA)3 was -4.13% for the same period. The Fund's Blended Index was composed of 60% of the return of the MSCI All Country World Index (MSCI ACWI) and 40% of the return of the Barclays Global Aggregate Index. The Fund's total return for the most recently completed fiscal year reflected actual cash flows, transaction costs and other expenses, which were not reflected in the total return of any index.
The following discussion will focus on the performance of the Fund's Institutional Shares.
MARKET OVERVIEW
The U.S. economy continued to expand at approximately a 2.5% annualized pace during the reporting period, similar to the prior five years. However, the engine of growth shifted more heavily to the consumer, where spending was buoyed by continued job gains, rising home and auto sales, declining gasoline prices and emerging signs of wage growth after years of stagnation. Partially offsetting strength in consumer spending was a significant slowdown in manufacturing, which was hurt by a stronger dollar (making U.S. exports more costly to foreign buyers), weak growth overseas, a severe retrenchment in the domestic fracking industry due to collapsing energy prices, and bloated inventories.
Equities
Equity markets experienced significant volatility during the reporting period. Uncertainty surrounding the Federal Reserve (the “Fed”) policy, the impact of plummeting oil prices and a surging dollar, fears over a potential Greek exit from the eurozone, slowing growth in China and geopolitical fears resulted in a tumultuous year for global equity markets.
The U.S. equity market held up relatively well, with the MSCI USA Index4 up 2.73%. Over the course of the reporting period, this index had 17 daily moves of +/- 3%. In addition, the CBOE Volatility Index® (VIX®)5 experienced a spike of more than 200% during the Chinese growth scare in August 2015. Within the U.S., small-caps generally outperformed large-caps, with the Russell 2000® Index6 up 3.51%. Within the large-cap space, as measured by the S&P 500 Index,7 there was a sharp divergence of returns
Annual Shareholder Report
among sectors. Consumer Discretionary led the way, up 14.36%, while Energy and Materials returned -12.05% and -5.04% respectively. More dividend-sensitive sectors also underperformed, with Telecom and Utilities also negative for the reporting period.
International developed markets8 were mixed, but ultimately lower for the year. For the reporting period, the MSCI EAFE Index9 returned -2.94%. Despite weak economic growth, the Japanese equity market, as measured by the MSCI Japan Index,10 was particularly strong, returning 7.65%. The MSCI Europe Index11 had a return of -4.57% for the reporting period, with Denmark, Belgium and Ireland preforming best, and Greece, Spain and Norway performing worst. The Canadian market, as measured by the MSCI Canada Index,10 was also under pressure, returning -20.02%, as the country was negatively affected by falling energy and material prices.
Emerging markets12 were quite weak. The MSCI Emerging Markets Index13 returned -16.99% for the year. Every country in the MSCI Emerging Markets Index, except for Hungary, finished the reporting period with a negative return. China, as measured by the MSCI China Index, returned -5.53% for the reporting period, and this included a sharp rally into late April, followed by a nearly 30% decline, as the government employed a wide array of stimulus measures in an attempt to avoid a hard landing. Brazil, as measured by the MSCI Brazil Index,10 was under even more pressure, returning -45.10%. Brazil was negatively impacted by plummeting energy and material prices, political discord and high inflation.
On the currency front, the U.S. Dollar, as measured by the U.S. Dollar Index,14 continued to rise, gaining 18.04% against the euro, 4.48% against the pound sterling and 3.98% against the yen.
Fixed Income15
During the reporting period, interest rates were volatile but ultimately little changed in longer maturities, with the yield on the benchmark 10-year Treasury note rising slightly to 2.21% from 2.17%. Interest rates rose more in shorter maturities, as the market anticipated that the Fed would begin hiking the overnight federal funds rate in response to tightening labor market conditions and signs of growing wage pressure that could nudge inflation closer to the Fed's 2% target. Two-year Treasury yields increased from 0.47% to 0.93% during the reporting period.
Treasuries and securitized sectors of the bond market (in particular, residential and commercial mortgage-backed securities) significantly outperformed the pure credit sectors (high-yield,16 emerging markets, and investment-grade corporates). In addition, lower-rated bonds significantly underperformed higher-rated bonds, and longer-maturity bonds underperformed shorter-maturity bonds, even accounting for the difference in duration. The credit sectors struggled for several reasons. First, commodity prices fell almost 40% during the reporting period. That adversely impacted the Energy, Metals and
Annual Shareholder Report
Mining sectors within the domestic high-yield and investment-grade corporate market, as well as emerging market issuers that are large exporters of oil, copper, iron ore and other commodities. The second reason was a burst of supply, as companies issued bonds ahead of the perceived start of the Fed's rate hiking cycle. Because dealer balance sheets have contracted, and a large number of investors were already overweight the credit sectors, spreads were forced to widen to entice buyers. The third reason for the weakness in credit was the correction in stock prices and jump in stock market volatility. The last reason the credit sectors struggled was nervousness over the start of Fed interest rate hikes. Corporate bonds typically correct around the start of Fed tightening cycles, but what made this episode particularly painful was that a substantial segment of the investing public believed that with international growth weak, the dollar strengthening and equity markets struggling, a Fed interest rate hike might constitute a policy error.
Fund Performance
Amongst the Fund's core strategies, the International Stock Selection Strategy was the most significant contributor to performance, driven by successful stock selection in Japan, the UK and Canada. The International Fixed Income Strategy also added to performance, driven primarily by currency calls. Finally, the domestic, bottom-up Best Ideas Strategy helped Fund performance as well, aided by stock selection in Consumer Discretionary, Industrials and Consumer Staples.
On the other side of the ledger, the Domestic Industry Group Strategy was the most significant detractor from Fund performance, driven by an underweight to Software and Services, an overweight and stock selection in Diversified Financials and an overweight in Transportation. The Domestic Fixed Income Strategy also underperformed, primarily due to sector calls.
Among the Fund's tactical allocation strategies, the Global Currency Strategy was the most significant contributor to Fund performance. A short position in the euro and both long and short allocations in the Swiss franc were the most beneficial. The Global Country Fixed Income Strategy also helped Fund performance, with long and short allocations to the German bund being particularly successful.
The Global Country Equity Strategy was a net drag on Fund performance over the reporting period. In particular, allocation decisions in France, Italy and Sweden hurt. The Fund's other tactical allocation strategies were also net detractors, most negatively impacted by allocation decisions in the Russell 2000 and S&P 500.
Annual Shareholder Report
| 1 | Please see the footnotes to the line graphs under “Fund Performance and Growth of a $10,000 Investment” below for the definition of, and more information about, the Blended Index. |
| 2 | The Fund's broad-based security market indexes are the S&P 500 Index and the Barclays U.S. Aggregate Bond Index, which had total returns of 2.75% and 0.97%, respectively. Please see the footnotes to the line graphs under “Fund Performance and Growth of a $10,000 Investment” below for the definition of, and more information about, the S&P 500 Index and the Barclays U.S. Aggregate Bond Index. |
| 3 | Please see the footnotes to the line graphs under “Fund Performance and Growth of a $10,000 Investment” below for the definition of, and more information about, the MWAFA. |
| 4 | The MSCI USA Index is a free float adjusted market capitalization index that is designed to measure large- and mid-cap U.S. equity market performance. The index is unmanaged, and it is not possible to invest directly in an index. |
| 5 | The CBOE Volatility Index® (VIX®) is a key measure of market expectations of near-term volatility conveyed by S&P 500 stock index option prices. The index is unmanaged, and it is not possible to invest directly in an index. |
| 6 | The Russell 2000® Index measures the performance of the small-cap segment of the U.S. equity universe. The Russell 2000® Index is a subset of the Russell 3000® Index representing approximately 10% of the total market capitalization of that index. It includes approximately 2000 of the smallest securities based on a combination of their market cap and current index membership. The Russell 2000® Index is constructed to provide a comprehensive and unbiased small-cap barometer and is completely reconstituted annually to ensure larger stocks do not distort the performance and characteristics of the true small-cap opportunity set. The index is unmanaged, and it is not possible to invest directly in an index. |
| 7 | The S&P 500 Index is a capitalization-weighted index of 500 stocks designed to measure performance of the broad domestic economy through changes in the aggregate market value of 500 stocks representing all major industries. The index is unmanaged, and it is not possible to invest directly in an index. |
| 8 | International investing involves special risks including currency risk, increased volatility, political risks, and differences in auditing and other financial standards. |
| 9 | The MSCI EAFE Index is an equity index which captures large- and mid-cap representation across developed markets countries around the world, excluding the United States and Canada. With 906 constituents, the index covers approximately 85% of the free float-adjusted market capitalization in each country. The index is unmanaged, and it is not possible to invest directly in an index. |
| 10 | The MSCI country indexes are designed to measure the performance of the large- and mid-cap segments of the respective country's market. The index covers approximately 85% of the free float-adjusted market capitalization in each country. The index is unmanaged, and it is not possible to invest directly in an index. |
| 11 | The MSCI Europe Index captures large- and mid-cap representation across 15 developed markets countries in Europe. The index is unmanaged, and it is not possible to invest directly in an index. |
| 12 | Prices of emerging markets securities can be significantly more volatile than the prices of securities in developed countries, and currency risk and political risks are accentuated in emerging markets. |
| 13 | The MSCI Emerging Markets Index captures large- and mid-cap representation across 21 Emerging Markets (EM) countries. The index covers approximately 85% of the free float-adjusted market capitalization in each country. The index is unmanaged, and it is not possible to invest directly in an index. |
| 14 | The U.S. Dollar Index indicates the general international value of the U.S. dollar by averaging the exchange rates between the U.S. dollar and six major world currencies. The index is unmanaged, and it is not possible to invest directly in an index. |
| 15 | Bond prices are sensitive to changes in interest rates, and a rise in interest rates can cause a decline in their prices. |
| 16 | High-yield, lower-rated securities generally entail greater market, credit and liquidity risks than investment-grade securities and may include higher volatility and higher risk of default. |
Annual Shareholder Report
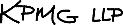
FUND PERFORMANCE AND GROWTH OF A $10,000 INVESTMENT
The graph below illustrates the hypothetical investment of $10,0001 in the Federated Global Allocation Fund from November 30, 2005 to November 30, 2015, compared to a blend of indexes comprised of 60% of the MSCI All Country World Index (MSCI ACWI) and 40% of the Barclays Global Aggregate Index (BGA) (the “Blended Index”),2 the Standard and Poor's 500 Index (S&P 500),3 the Barclays U.S. Aggregate Bond Index (BAB)4 and the Morningstar World Allocation Funds Average (MWAFA).5 The Average Annual Total Return table below shows returns for each class averaged over the stated periods.
Growth of a $10,000 Investment
Growth of $10,000 as of November 30, 2015
| Federated Global Allocation Fund - | Institutional Shares | Class A Shares | Blended Index | S&P 500 | BAB | MWAFA |
| F | F | I | I | I | I |
| 11/30/2005 | 10,000 | 9,450 | 10,000 | 10,000 | 10,000 | 10,000 |
| 11/30/2006 | 11,219 | 10,636 | 11,633 | 11,423 | 10,594 | 11,717 |
| 11/30/2007 | 12,301 | 11,687 | 13,112 | 12,305 | 11,235 | 13,284 |
| 11/30/2008 | 9,149 | 8,720 | 9,209 | 7,618 | 11,430 | 8,815 |
| 11/30/2009 | 11,143 | 10,625 | 11,915 | 9,552 | 12,759 | 11,352 |
| 11/30/2010 | 12,324 | 11,725 | 12,478 | 10,501 | 13,527 | 12,191 |
| 11/30/2011 | 11,852 | 10,933 | 12,802 | 11,324 | 14,274 | 12,350 |
| 11/30/2012 | 13,370 | 12,634 | 14,116 | 13,150 | 15,060 | 13,310 |
| 11/30/2013 | 15,787 | 14,874 | 15,885 | 17,134 | 14,818 | 14,493 |
| 11/30/2014 | 16,868 | 15,845 | 16,695 | 20,023 | 15,599 | 15,126 |
| 11/30/2015 | 16,445 | 15,401 | 16,190 | 20,574 | 15,750 | 14,477 |
41 graphic description end -->
| ■ | Total returns shown for the Class A Shares include the maximum sales charge of 5.50% ($10,000 investment minus $550 sales charge = $9,450). |
The Fund offers multiple share classes whose performance may be greater than or less than its other share class(es) due to difference in sales charges and expenses. See the Average Annual Return table below for the returns of additional classes not shown in the line graph above.
Annual Shareholder Report
Average Annual Total Returns for the Period Ended 11/30/2015
(returns reflect all applicable sales charges and contingent deferred sales charges as specified below in footnote #1)
| | 1 Year | 5 Years | 10 Years |
| Class A Shares | -8.15% | 5.45% | 4.70% |
| Class B Shares | -8.41% | 5.47% | 4.60% |
| Class C Shares | -4.43% | 5.85% | 4.47% |
| Class R Shares | -3.26% | 6.20% | 4.81% |
| Institutional Shares6 | -2.51% | 6.98% | 5.38% |
| Blended Index | -3.02% | 5.35% | 4.94% |
| S&P 500 | 2.75% | 14.40% | 7.48% |
| BAB | 0.97% | 3.09% | 4.65% |
| MWAFA | -4.13% | 4.76% | 4.73% |
Performance data quoted represents past performance which is no guarantee of future results. Investment return and principal value will fluctuate so that an investor's shares, when redeemed, may be worth more or less than their original cost. Mutual fund performance changes over time and current performance may be lower or higher than what is stated. For current to the most recent month-end performance and after-tax returns, visit FederatedInvestors.com or call 1-800-341-7400. Returns shown do not reflect the deduction of taxes that a shareholder would pay on Fund distributions or the redemption of Fund shares. Mutual funds are not obligations of or guaranteed by any bank and are not federally insured.
Annual Shareholder Report
| 1 | Represents a hypothetical investment of $10,000 in the Fund after deducting applicable sales charges: For Class A Shares, the maximum sales charge of 5.50% ($10,000 investment minus $550 sales charge = $9,450); for Class B Shares, the maximum contingent deferred sales charge is 5.50% on any redemption of shares held up to one year from the purchase date; for Class C Shares, the maximum contingent deferred sales charge is 1.00% on any redemption less than one year from the purchase date. The Fund's performance assumes the reinvestment of all dividends and distributions. The Blended Index, S&P 500 and BAB have been adjusted to reflect reinvestment of dividends on securities in the indexes. |
| 2 | The Blended Index is a custom blended index comprised of 60% of the MSCI ACWI and 40% of the BGA. The MSCI ACWI captures large- and mid-cap representation across 23 developed markets countries and 23 emerging markets countries. The index covers approximately 85% of the global investable equity opportunity set. The BGA is a measure of global investment grade debt from 24 different local currency markets. This multi-currency benchmark includes fixed-rate treasury, government-related, corporate and securitized bonds from both developed and emerging markets issuers. The indexes are not adjusted to reflect sales loads, expenses or other fees that the Securities and Exchange Commission (SEC) requires to be reflected in the Fund's performance. The indexes are unmanaged and, unlike the Fund, are not affected by cash flows. It is not possible to invest directly in an index. |
| 3 | The S&P 500 is an unmanaged, capitalization-weighted index of 500 stocks designed to measure performance of the broad domestic economy through changes in the aggregate market value of 500 stocks representing all major industries. The index is not adjusted to reflect sales loads, expenses or other fees that the SEC requires to be reflected in the Fund's performance. The index is unmanaged and, unlike the Fund, is not affected by cash flows. It is not possible to invest directly in an index. |
| 4 | The BAB is a broad-based benchmark that measures the investment grade, U.S. dollar-denominated, fixed-rate taxable bond market, including Treasuries, government-related and corporate securities, mortgage-backed securities (agency fixed-rate and hybrid ARM pass-throughs), asset-backed securities and commercial mortgage-backed securities. The index is not adjusted to reflect sales loads, expenses or other fees that the SEC requires to be reflected in the Fund's performance. The index is unmanaged and, unlike the Fund, is not affected by cash flows. It is not possible to invest directly in an index. |
| 5 | Morningstar figures represent the average of the total returns reported by all the mutual funds designated by Morningstar as falling into the respective category indicated. They do not reflect sales charges. |
| 6 | The Fund's Institutional Shares commenced operation on June 12, 2009. The Fund offers four other classes of shares: Class A Shares, Class B Shares, Class C Shares and Class R Shares. For the period prior to the commencement of operations of Institutional Shares, the performance information shown is for the Fund's Class A Shares. The performance of Class A Shares has not been adjusted to reflect the expenses of Institutional Shares since Institutional Shares have a lower expense ratio than the expense ratio of the Class A Shares. The performance of Class A Shares has been adjusted to remove any voluntary waiver of Fund expenses related to the Class A Shares that may have occurred during the period prior to the commencement of operations of Institutional Shares. Additionally, the performance information shown below has been adjusted to reflect the absence of sales charges applicable to Class A Shares. |
Annual Shareholder Report
Portfolio of Investments Summary Tables (unaudited)
At November 30, 2015, the Fund's portfolio composition1 was as follows:
| Portfolio Composition | Percentage of
Total Net Assets2 |
| Domestic Equity Securities | 28.5% |
| International Equity Securities | 25.8% |
| Corporate Debt Securities | 13.5% |
| Foreign Debt Securities | 9.7% |
| Mortgage-Backed Securities3 | 3.1% |
| Trade Finance Agreements | 2.6% |
| U.S. Treasury and Agency Securities | 1.2% |
| Collateralized Mortgage-Backed Obligations | 1.1% |
| Floating Rate Loan | 0.7% |
| Asset-Backed Securities | 0.3% |
| Municipal Securities4 | 0.0% |
| Other Security Type5 | 6.0% |
| Derivative Contracts6 | 0.3% |
| Cash Equivalents7 | 1.7% |
| Other Assets and Liabilities—Net8 | 5.5% |
| TOTAL | 100.0% |
| 1 | See the Fund's Prospectus and Statement of Additional Information for a description of these security types. |
| 2 | As of the date specified above, the Fund owned shares of one or more affiliated investment companies. For purposes of this table, the affiliated investment company (other than an affiliated money market mutual fund) is not treated as a single portfolio security, but rather the Fund is treated as owning a pro rata portion of each security and each other asset and liability owned by the affiliated investment company. Accordingly, the percentages of total net assets shown in the table will differ from those presented on the Portfolio of Investments. |
| 3 | For purposes of this table, Mortgage-Backed Securities include mortgage-backed securities guaranteed by Government Sponsored Entities and adjustable rate mortgage-backed securities. |
| 4 | Represents less than 0.1%. |
| 5 | Other Security Type consists of exchange-traded funds and purchased put options. |
| 6 | Based upon net unrealized appreciation (depreciation) or value of the derivative contracts as applicable. Derivative contracts may consist of futures, forwards, options and swaps. The impact of a derivative contract on the Fund's performance may be larger than its unrealized appreciation (depreciation) or value may indicate. In many cases, the notional value or amount of a derivative contract may provide a better indication of the contract's significance to the portfolio. More complete information regarding the Fund's direct investments in derivative contracts, including unrealized appreciation (depreciation), value and notional values or amounts of such contracts, can be found in the table at the end of the Portfolio of Investments included in this Report. |
| 7 | Cash Equivalents include any investments in money market mutual funds and/or overnight repurchase agreements. |
| 8 | Assets, other than investments in securities and derivative contracts, less liabilities. See Statement of Assets and Liabilities. |
Annual Shareholder Report
At November 30, 2015, the Fund's sector composition9 of the Fund's equity holdings was as follows:
Sector Composition
of Equity Holdings | Percentage of
Equity Securities |
| Financials | 23.0% |
| Consumer Discretionary | 15.5% |
| Health Care | 13.6% |
| Information Technology | 12.4% |
| Industrials | 12.2% |
| Utilities | 5.5% |
| Energy | 4.9% |
| Consumer Staples | 4.8% |
| Telecommunication Services | 4.6% |
| Materials | 3.5% |
| TOTAL | 100.0% |
| 9 | Sector classifications are based upon, and individual portfolio securities are assigned to, the classifications of the Global Industry Classification Standard (GICS) except that the Adviser assigns a classification to securities not classified by the GICS and to securities for which the Adviser does not have access to the classification made by the GICS. |
Annual Shareholder Report
Portfolio of Investments
November 30, 2015
Shares or
Principal
Amount | | | Value in
U.S. Dollarsi |
| | | COMMON STOCKS—54.3% | |
| | | Consumer Discretionary—8.4% | |
| 800 | 1 | Amazon.com, Inc. | $531,840 |
| 6,030 | 1 | Apollo Education Group, Inc. | 42,572 |
| 5,285 | | Aristocrat Leisure Ltd. | 36,351 |
| 900 | 1 | Asbury Automotive Group, Inc. | 67,590 |
| 1,015 | | Bayerische Motoren Werke AG | 110,753 |
| 4,094 | | Bloomin' Brands, Inc. | 70,867 |
| 13,500 | | Bridgestone Corp. | 480,994 |
| 1,625 | 1 | Burlington Stores, Inc. | 78,179 |
| 6,873 | 1 | Caesars Entertainment Corp. | 58,214 |
| 2,164 | | Caleres, Inc. | 60,808 |
| 1,900 | | Carnival Corp. | 96,007 |
| 10,300 | | Carter's, Inc. | 888,169 |
| 35,100 | | Comcast Corp., Class A | 2,136,186 |
| 4,532 | 1 | Container Store Group, Inc. | 46,544 |
| 5,471 | | Continental Ag | 1,321,663 |
| 5,900 | 1 | CROCs, Inc. | 65,638 |
| 32,587 | | D. R. Horton, Inc. | 1,052,886 |
| 26,700 | | Daihatsu Motor Co. Ltd. | 346,912 |
| 3,866 | | Daimler AG | 345,913 |
| 4,600 | | Dana Holding Corp. | 75,624 |
| 15,200 | | Darden Restaurants, Inc. | 853,784 |
| 4,369 | | Delphi Automotive PLC | 383,948 |
| 6,000 | 1 | Denny's Corp. | 57,840 |
| 16,750 | | Dollarama, Inc. | 1,120,053 |
| 1,100 | 1 | Drew Industries, Inc. | 66,473 |
| 297 | 1 | Express, Inc. | 4,972 |
| 990 | | Extended Stay America, Inc. | 16,939 |
| 63,000 | | Ford Motor Co. | 902,790 |
| 1,221 | 1 | G-III Apparel Group Ltd. | 56,007 |
| 1,626 | | Gannett Co., Inc. | 27,772 |
| 890 | | Gildan Activewear, Inc. | 27,611 |
| 3,200 | 1 | Gray Television, Inc. | 53,600 |
| 1,800 | | Harman International Industries, Inc. | 185,688 |
| 1,971 | | Hilton Worldwide Holdings, Inc. | 45,767 |
Annual Shareholder Report
Shares or
Principal
Amount | | | Value in
U.S. Dollarsi |
| | | COMMON STOCKS—continued | |
| | | Consumer Discretionary—continued | |
| 2,052 | | Home Depot, Inc. | $274,722 |
| 4,200 | | Husqvarna AB, Class B | 27,358 |
| 200 | 1 | IRobot Corp. | 6,618 |
| 306,924 | | ITV PLC | 1,252,719 |
| 50,600 | | Isuzu Motors Ltd. | 569,888 |
| 700 | | Jack in the Box, Inc. | 51,898 |
| 2,900 | | Johnson Controls, Inc. | 133,400 |
| 208,015 | | Kingfisher PLC | 1,107,171 |
| 4,329 | 1 | La Quinta Holdings, Inc. | 64,892 |
| 2,500 | | La-Z-Boy, Inc. | 67,025 |
| 38,000 | | Li & Fung Ltd. | 25,971 |
| 21,613 | 1 | Liberty Media Corp., Class C | 845,068 |
| 3,500 | | Lowe's Cos., Inc. | 268,100 |
| 3,552 | | Luxottica Group S.p.A | 237,282 |
| 56,400 | | MGM China Holdings Ltd. | 74,443 |
| 4,200 | | Macy's, Inc. | 164,136 |
| 23,706 | | Magna International, Inc. | 1,078,215 |
| 1,041 | | Marriott Vacations Worldwide Corp. | 63,324 |
| 6,100 | | McDonald's Corp. | 696,376 |
| 29,448 | 1 | Michael Kors Holdings Ltd. | 1,266,853 |
| 11,754 | | Michelin, Class B | 1,177,205 |
| 800 | 1 | NVR, Inc. | 1,345,984 |
| 5,300 | | New York Times Co., Class A | 74,624 |
| 1,300 | | Nexstar Broadcasting Group, Inc., Class A | 76,167 |
| 19,100 | | Nike, Inc., Class B | 2,526,548 |
| 129,800 | | Nissan Motor Co. Ltd. | 1,387,590 |
| 2,700 | | Nutri/System, Inc. | 61,938 |
| 1,106 | 1 | Ollie's Bargain Outlet Holdings, Inc. | 19,532 |
| 6,300 | | Panasonic Corp. | 71,600 |
| 648 | | Pandora A/S | 76,717 |
| 3,175 | 1 | Party City Holdco, Inc. | 40,323 |
| 33,902 | | Persimmon PLC | 977,795 |
| 700 | 1 | Pinnacle Entertainment, Inc. | 22,953 |
| 11,400 | | Polaris Industries, Inc. | 1,201,902 |
| 2,332 | | ProSiebenSat.1 Media SE | 122,437 |
| 16,509 | | Realestate.com.au Ltd. | 597,557 |
| 3,359 | | Relx PLC | 60,607 |
Annual Shareholder Report
Shares or
Principal
Amount | | | Value in
U.S. Dollarsi |
| | | COMMON STOCKS—continued | |
| | | Consumer Discretionary—continued | |
| 181,000 | | SJM Holdings Ltd. | $134,107 |
| 45,600 | | Sands China Ltd. | 153,266 |
| 4,000 | | Sekisui Chemical Co. Ltd. | 47,716 |
| 2,200 | 1 | Select Comfort Corp. | 51,964 |
| 2,855 | 1 | ServiceMaster Global Holdings, Inc. | 107,005 |
| 262,173 | 1 | Sirius XM Holdings, Inc. | 1,077,531 |
| 2,797 | | Six Flags Entertainment Corp. | 145,164 |
| 9,682 | 1 | Skechers USA, Inc., Class A | 292,396 |
| 3,883 | 1 | Smith & Wesson Holding Corp. | 71,214 |
| 2,400 | | Sonic Corp. | 69,744 |
| 7,289 | | Starbucks Corp. | 447,472 |
| 900 | | Starwood Hotels & Resorts | 64,656 |
| 500 | | Sturm Ruger & Co., Inc. | 26,050 |
| 12,200 | | Suzuki Motor Corp. | 375,479 |
| 5,292 | | TJX Cos., Inc. | 373,615 |
| 14,445 | 1 | Tegna, Inc. | 408,071 |
| 5,000 | | Time Warner, Inc. | 349,900 |
| 17,700 | | Toyota Motor Corp. | 1,097,987 |
| 4,596 | | Travelport Worldwide Ltd. | 61,173 |
| 1,300 | | V.F. Corp. | 84,110 |
| 32,686 | | Vivendi SA | 687,554 |
| 58 | | Volkswagen AG | 8,654 |
| 61,200 | | WPP PLC | 1,414,859 |
| 14,900 | | Walt Disney Co. | 1,690,703 |
| 3,900 | | Whirlpool Corp. | 633,828 |
| 3,300 | | Wynn Macau Ltd. | 4,117 |
| | | TOTAL | 39,712,227 |
| | | Consumer Staples—2.6% | |
| 400 | | Andersons, Inc. | 13,788 |
| 3,100 | | Alimentation Couche-Tard, Inc., Class B | 141,322 |
| 15,723 | | CVS Health Corp. | 1,479,377 |
| 257 | | Cal-Maine Foods, Inc. | 14,009 |
| 1,255 | | Calavo Growers, Inc. | 71,008 |
| 800 | | Casey's General Stores, Inc. | 93,016 |
| 2,349 | 1 | Coca-Cola HBC AG | 56,994 |
| 6,500 | | Colgate-Palmolive Co. | 426,920 |
| 5,877 | | ConAgra Foods, Inc. | 240,546 |
Annual Shareholder Report
Shares or
Principal
Amount | | | Value in
U.S. Dollarsi |
| | | COMMON STOCKS—continued | |
| | | Consumer Staples—continued | |
| 3,900 | | Dean Foods Co. | $73,164 |
| 2,115 | | Delhaize Group | 211,759 |
| 200 | 1 | Diamond Foods, Inc. | 8,096 |
| 1,100 | | FamilyMart Co. Ltd. | 49,103 |
| 700 | | Fresh Del Monte Produce, Inc. | 30,597 |
| 6,600 | 1 | Herbalife Ltd. | 381,018 |
| 45,200 | | Japan Tobacco, Inc. | 1,621,280 |
| 6,117 | | Kimberly-Clark Corp. | 728,841 |
| 5,000 | | Kellogg Co. | 343,850 |
| 60,269 | | Koninklijke Ahold NV | 1,310,034 |
| 11,073 | | Metro, Inc. | 318,894 |
| 5,000 | | Molson Coors Brewing Co., Class B | 460,150 |
| 12,060 | | Nestle SA | 893,666 |
| 5,133 | | Philip Morris International, Inc. | 448,573 |
| 6,400 | | Procter & Gamble Co. | 478,976 |
| 38,176 | | Sainsbury (J) PLC | 145,927 |
| 1,000 | | Sanderson Farms, Inc. | 74,810 |
| 21,200 | | Swedish Match AB | 730,730 |
| 300 | 1 | USANA, Inc. | 40,182 |
| 100 | | WD 40 Co. | 9,877 |
| 17,644 | | Walgreens Boots Alliance, Inc. | 1,482,625 |
| | | TOTAL | 12,379,132 |
| | | Energy—2.7% | |
| 3,717 | | Alon USA Energy, Inc. | 65,382 |
| 272,890 | | BP PLC | 1,583,375 |
| 14,500 | | Baker Hughes, Inc. | 784,015 |
| 10,815 | | California Resources Corp. | 44,342 |
| 14,000 | | Chevron Corp. | 1,278,480 |
| 8,261 | | Columbia Pipeline Group, Inc. | 158,363 |
| 760 | | Delek Group Ltd. | 171,036 |
| 2,500 | | Delek US Holdings, Inc. | 69,225 |
| 2,900 | | Devon Energy Corp. | 133,429 |
| 23,770 | 1 | EP Energy Corp. | 134,538 |
| 37,440 | | Exxon Mobil Corp. | 3,057,350 |
| 9,063 | | Frank's International N.V. | 153,165 |
| 3,143 | | Green Plains, Inc. | 74,458 |
| 5,052 | | Halliburton Co. | 201,322 |
Annual Shareholder Report
Shares or
Principal
Amount | | | Value in
U.S. Dollarsi |
| | | COMMON STOCKS—continued | |
| | | Energy—continued | |
| 800 | | HollyFrontier Corp. | $38,464 |
| 101,000 | | Inpex Corp. | 1,006,597 |
| 40,447 | | Kinder Morgan, Inc. | 953,336 |
| 10,574 | | Marathon Petroleum Corp. | 617,627 |
| 4,368 | | Nordic American Tanker Shipping Ltd. | 64,646 |
| 538 | | OMV AG | 15,349 |
| 1,828 | | Repsol YPF SA | 23,734 |
| 10,093 | | Royal Dutch Shell PLC, Class B | 251,122 |
| 1,800 | | Schlumberger Ltd. | 138,870 |
| 21,102 | | Suncor Energy, Inc. | 583,072 |
| 1,400 | | Teekay Tankers Ltd., Class A | 9,856 |
| 400 | | Tesoro Petroleum Corp. | 46,068 |
| 5,828 | | Total SA | 289,125 |
| 7,685 | | Valero Energy Corp. | 552,244 |
| 1,800 | | Western Refining, Inc. | 81,468 |
| | | TOTAL | 12,580,058 |
| | | Financials—12.5% | |
| 6,569 | | AGEAS | 287,234 |
| 3,114 | | ARMOUR Residential REIT, Inc. | 65,799 |
| 48,756 | | AXA SA | 1,317,251 |
| 1,969 | | Alexander and Baldwin, Inc. | 74,645 |
| 8,858 | | Allianz SE | 1,568,695 |
| 8,100 | | Allstate Corp. | 508,356 |
| 460 | | Altisource Residential Corp. | 6,090 |
| 4,135 | | American Capital Mortgage Investment Corp. | 61,984 |
| 4,000 | | Apollo Commercial Real Estate Finance, Inc. | 70,200 |
| 199 | | Argo Group International Holdings Ltd. | 12,642 |
| 4,099 | | BBCN Bancorp, Inc. | 77,512 |
| 337,000 | | BOC Hong Kong (Holdings) Ltd. | 1,038,741 |
| 233 | | Banco Bilbao Vizcaya Argentaria SA | 1,932 |
| 2,800 | | Bancorpsouth, Inc. | 75,320 |
| 12,705 | | Bank Hapoalim Ltd. | 65,674 |
| 86,713 | 1 | Bank Leumi Le-Israel | 313,218 |
| 120,000 | | Bank of America Corp. | 2,091,600 |
| 1,600 | | Bank of Montreal | 92,385 |
| 5,915 | | Bank of Nova Scotia | 269,695 |
| 96,000 | | Bank Of Yokohama Ltd. | 565,528 |
Annual Shareholder Report
Shares or
Principal
Amount | | | Value in
U.S. Dollarsi |
| | | COMMON STOCKS—continued | |
| | | Financials—continued | |
| 143,165 | | Barclays PLC | $481,228 |
| 17,662 | 1 | Berkshire Hathaway, Inc., Class B | 2,368,298 |
| 900 | | Blackrock, Inc. | 327,348 |
| 2,300 | | Boston Private Financial Holdings | 27,830 |
| 6,468 | | Brookfield Asset Management, Inc., Class A | 222,066 |
| 4,400 | | CNO Financial Group, Inc. | 89,012 |
| 10,001 | | CNP Assurances | 139,198 |
| 4,200 | | CVB Financial Corp. | 77,700 |
| 8,744 | | CYS Investments, Inc. | 66,280 |
| 14,100 | | Canadian Imperial Bank of Commerce | 1,058,780 |
| 4,500 | | Capital One Financial Corp. | 353,295 |
| 6,300 | | Capstead Mortgage Corp. | 59,787 |
| 200 | | Cash America International, Inc. | 6,750 |
| 2,500 | | Cathay Bancorp, Inc. | 85,800 |
| 18,700 | | Chugoku Bank Ltd. | 259,572 |
| 10,700 | | Citigroup, Inc. | 578,763 |
| 31,188 | | Citizens Financial Group, Inc. | 830,536 |
| 3,519 | | Colony Capital, Inc., Class A | 71,999 |
| 51,637 | 1 | Commerzbank AG | 568,452 |
| 249,423 | | Corp Mapfre Sa | 682,324 |
| 700 | 1 | Credit Acceptance Corp. | 140,294 |
| 5,603 | | Credit Agricole SA | 67,527 |
| 12,400 | | Danske Bank | 332,245 |
| 20,331 | | Delta Lloyd NV | 146,201 |
| 2,505 | | Deutsche Wohnen AG | 68,919 |
| 13,130 | 1 | Direct Line Insurance Group PLC | 81,434 |
| 7,100 | | Discover Financial Services | 402,996 |
| 14,756 | | DnB ASA | 194,127 |
| 21,400 | 1 | E*Trade Financial Corp. | 651,202 |
| 3,695 | | EverBank Financial Corp. | 63,776 |
| 5,700 | | FNB Corp. | 82,764 |
| 5,567 | 1 | FNFV Group | 62,295 |
| 1,200 | | First American Financial Corp. | 47,328 |
| 3,900 | | First Midwest Bancorp, Inc. | 76,206 |
| 5,066 | 1 | Four Corners Property Trust, Inc. | 100,307 |
| 157,000 | | Fukuoka Financial Group, Inc. | 762,146 |
| 3,032 | | General Property Trust Group | 10,155 |
Annual Shareholder Report
Shares or
Principal
Amount | | | Value in
U.S. Dollarsi |
| | | COMMON STOCKS—continued | |
| | | Financials—continued | |
| 28,084 | | Gjensidige Forsikring ASA | $453,157 |
| 1,400 | | Goldman Sachs Group, Inc. | 266,028 |
| 2,362 | | Great Western Bancorp, Inc. | 71,380 |
| 1,600 | | Great-West Lifeco, Inc. | 43,479 |
| 2,194 | | Groupe Bruxelles Lambert SA | 180,162 |
| 2,000 | 1 | HFF, Inc. | 68,740 |
| 274,146 | | HSBC Holdings PLC | 2,184,546 |
| 34,000 | | Hang Seng Bank Ltd. | 615,191 |
| 10,068 | | Hannover Rueck SE | 1,178,287 |
| 7,100 | | Hartford Financial Services Group, Inc. | 324,044 |
| 4,377 | | Hatteras Financial Corp. | 61,628 |
| 1,800 | | Home Bancshares, Inc. | 81,216 |
| 3,359 | | ICAP PLC | 25,750 |
| 2,468 | | InfraREIT, Inc. | 49,780 |
| 667 | | Intact Financial Corp. | 44,462 |
| 23,614 | | Intesa Sanpaolo SpA | 80,775 |
| 8,539 | | Invesco Ltd. | 287,679 |
| 5,477 | | Invesco Mortgage Capital, Inc. | 73,501 |
| 39,785 | | Investec PLC | 338,549 |
| 33,000 | | Investor AB, Class B | 1,256,573 |
| 7,178 | | Investors Bancorp, Inc., NEW | 92,022 |
| 5,100 | 1 | iStar Financial, Inc. | 67,320 |
| 44,140 | | JPMorgan Chase & Co. | 2,943,255 |
| 1,700 | | Janus Capital Group, Inc. | 26,843 |
| 4,487 | 1 | Julius Baer Group Ltd. | 214,258 |
| 13,240 | | KBC Groupe | 789,742 |
| 670 | | Kearny Financial Corp. | 8,442 |
| 3,115 | | Kennedy-Wilson Holdings, Inc. | 81,301 |
| 1,300 | | Kinnevik Investment AB | 39,960 |
| 337 | | LegacyTexas Financial Group, Inc. | 10,282 |
| 315,001 | | Legal & General Group PLC | 1,287,104 |
| 80,642 | | LendLease Group | 745,734 |
| 5,400 | | Lincoln National Corp. | 296,946 |
| 53,500 | | Link REIT | 326,975 |
| 8,700 | 1 | MBIA, Inc. | 57,159 |
| 8,700 | 1 | MGIC Investment Corp. | 82,998 |
| 17,300 | | MSCI, Inc., Class A | 1,213,076 |
Annual Shareholder Report
Shares or
Principal
Amount | | | Value in
U.S. Dollarsi |
| | | COMMON STOCKS—continued | |
| | | Financials—continued | |
| 6,483 | | Macquarie Group Ltd. | $380,495 |
| 28,600 | | Manulife Financial Corp. | 470,724 |
| 1,142 | 1 | Marcus & Millichap Co., Inc. | 37,469 |
| 4,000 | | Mitsubishi Estate Co. Ltd. | 84,245 |
| 29,700 | | Morgan Stanley | 1,018,710 |
| 19,863 | | NASDAQ, Inc. | 1,164,369 |
| 1,258 | | NN Group NV | 42,947 |
| 1,700 | | National Bank of Canada, Montreal | 55,718 |
| 5,900 | | National Penn Bancshares, Inc. | 73,691 |
| 4,560 | 1 | Nationstar Mortgage Holdings, Inc. | 62,107 |
| 9,006 | | Natixis | 54,538 |
| 65,355 | | Navient Corp. | 778,378 |
| 6,200 | | New Residential Investment Corp. | 78,864 |
| 6,600 | | Nordea Bank AB | 73,083 |
| 5,203 | | Northwest Bancshares, Inc. | 72,530 |
| 297,664 | | Old Mutual PLC | 936,971 |
| 800 | | Old National Bancorp. | 11,800 |
| 2,000 | | Oversea-Chinese Banking Corp. Ltd. | 12,288 |
| 4,300 | | PNC Financial Services Group | 410,693 |
| 3,105 | | Partners Group Holding AG | 1,120,719 |
| 1,749 | | Pennymac Mortgage Investment Trust | 29,103 |
| 113,647 | | Platinum Asset Management Ltd. | 665,292 |
| 15,300 | | Popular, Inc. | 454,563 |
| 2,100 | | Potlatch Corp. | 70,182 |
| 1,500 | | Primerica, Inc. | 76,860 |
| 1,900 | | PrivateBancorp, Inc. | 83,809 |
| 14,628 | | Prudential Corp. PLC | 339,171 |
| 4,605 | | RSA Insurance Group PLC | 30,491 |
| 5,200 | | Radian Group, Inc. | 74,100 |
| 402 | | Raiffeisen Bank International AG | 6,287 |
| 4,800 | | Redwood Trust, Inc. | 66,144 |
| 600 | | Regions Financial Corp. | 6,084 |
| 24,200 | | Royal Bank of Canada, Montreal | 1,378,663 |
| 5,400 | | SEI Investments Co. | 293,706 |
| 13,631 | | Sampo Oyj, Class A | 674,426 |
| 22,763 | | Santander Consumer USA Holdings, Inc. | 401,539 |
| 25,526 | | Schroders PLC | 1,150,889 |
Annual Shareholder Report
Shares or
Principal
Amount | | | Value in
U.S. Dollarsi |
| | | COMMON STOCKS—continued | |
| | | Financials—continued | |
| 16,575 | | Scor Regroupe | $649,549 |
| 1,800 | | Skand Enskilda BKN, Class A | 19,128 |
| 4,842 | | Societe Generale, Paris | 230,757 |
| 3,400 | 1 | St. Joe Co. | 66,028 |
| 4,599 | | Sterling Bancorp | 80,666 |
| 24,700 | | Sumitomo Mitsui Financial Group, Inc. | 943,418 |
| 9,000 | | Sumitomo Mitsui Trust Holdings, Inc. | 34,414 |
| 500 | | Sun Life Financial Services of Canada | 16,489 |
| 40,500 | | Suntec Real Estate Investment | 44,098 |
| 4,433 | 1 | Svenska Handelsbanken AB - A Shares | 59,626 |
| 1,518 | | Swiss Re AG | 144,431 |
| 7,096 | 1 | Synchrony Financial | 225,866 |
| 807 | | Talmer Bancorp, Inc., Class A | 14,744 |
| 23,700 | | The Bank of New York Mellon Corp. | 1,039,008 |
| 153,148 | | Three I Group | 1,158,147 |
| 4,200 | | Tokio Marine Holdings, Inc. | 155,074 |
| 20,600 | | Toronto-Dominion Bank | 841,307 |
| 1,200 | | Trustmark Corp. | 30,300 |
| 14,431 | | UBS Group AG | 276,470 |
| 11,283 | | United Mizrahi Bank Ltd. | 133,400 |
| 700 | | Universal Insurance Holdings, Inc. | 13,825 |
| 2,662 | | Virtu Financial, Inc., Class A | 59,229 |
| 26,934 | | Voya Financial, Inc. | 1,096,214 |
| 182 | 1 | Walker & Dunlop, Inc. | 5,376 |
| 48,400 | | Wells Fargo & Co. | 2,666,840 |
| 1,549 | | WisdomTree Investments, Inc. | 33,691 |
| | | TOTAL | 58,957,528 |
| | | Health Care—7.4% | |
| 1,700 | 1 | AMAG Pharmaceutical, Inc. | 45,254 |
| 14,199 | | Amgen, Inc. | 2,287,459 |
| 4,857 | | AbbVie, Inc. | 282,435 |
| 8,886 | 1 | Actelion Ltd. | 1,245,939 |
| 4,200 | 1 | Affymetrix, Inc. | 39,774 |
| 31,810 | | Agilent Technologies, Inc. | 1,330,294 |
| 600 | | Alfresa Holdings Corp. | 11,906 |
| 2,082 | 1 | Allergan PLC | 653,519 |
| 1,700 | 1 | Amedisys, Inc. | 69,003 |
Annual Shareholder Report
Shares or
Principal
Amount | | | Value in
U.S. Dollarsi |
| | | COMMON STOCKS—continued | |
| | | Health Care—continued | |
| 398 | 1 | Anacor Pharmaceuticals, Inc. | $46,459 |
| 3,150 | | Anthem, Inc. | 410,697 |
| 5,800 | 1 | Bio Rad Laboratories, Inc., Class A | 810,376 |
| 1,000 | 1 | BioCryst Pharmaceuticals, Inc. | 10,610 |
| 5,400 | | Bristol-Myers Squibb Co. | 361,854 |
| 19,440 | | CSL Ltd. | 1,404,306 |
| 1,500 | 1 | Cambrex Corp. | 80,445 |
| 2,850 | 1 | Catalent, Inc. | 79,372 |
| 2,570 | 1 | Celgene Corp. | 281,286 |
| 16,972 | | Cochlear Ltd. | 1,160,097 |
| 600 | | Coloplast, Class B | 48,640 |
| 1,700 | 1 | Cynosure, Inc., Class A | 71,502 |
| 2,000 | 1 | Emergent Biosolutions, Inc. | 75,340 |
| 2,767 | 1 | FibroGen, Inc. | 82,291 |
| 14,261 | | Fresenius SE & Co. KGaA | 1,046,403 |
| 13,600 | | Gilead Sciences, Inc. | 1,441,056 |
| 2,100 | 1 | Haemonetics Corp. | 67,704 |
| 4,200 | 1 | Halozyme Therapeutics, Inc. | 74,760 |
| 2,232 | 1 | Halyard Health, Inc. | 71,402 |
| 1,300 | 1 | Heartware International, Inc. | 62,218 |
| 1,395 | 1 | INC Research Holdings, Inc., Class A | 65,983 |
| 467 | 1 | INSYS Therapeutics, Inc. | 14,879 |
| 37,600 | | Johnson & Johnson | 3,806,624 |
| 6,091 | 1 | Juno Therapeutics, Inc. | 343,471 |
| 21,200 | | Lilly (Eli) & Co. | 1,739,248 |
| 1,248 | 1 | Magellan Health, Inc. | 65,707 |
| 1,576 | 1 | Mallinckrodt PLC | 107,026 |
| 2,000 | 1 | MedAssets, Inc. | 60,260 |
| 7,200 | | Medtronic PLC | 542,448 |
| 44,000 | | Merck & Co., Inc. | 2,332,440 |
| 300 | 1 | Merit Medical Systems, Inc. | 5,811 |
| 6,569 | 1 | Merrimack Pharmaceuticals, Inc. | 61,814 |
| 6,283 | 1 | MiMedx Group, Inc. | 56,296 |
| 2,100 | | Mitsubishi Tanabe Pharma Corp. | 36,736 |
| 21,840 | 1 | Mylan NV | 1,120,392 |
| 17,895 | | Novo Nordisk A/S, Class B | 983,759 |
| 1,500 | 1 | Natus Medical, Inc. | 73,170 |
Annual Shareholder Report
Shares or
Principal
Amount | | | Value in
U.S. Dollarsi |
| | | COMMON STOCKS—continued | |
| | | Health Care—continued | |
| 6,681 | | Novartis AG - REG | $569,985 |
| 900 | 1 | Omnicell, Inc. | 27,144 |
| 20,500 | | Otsuka Holdings Co., Ltd. | 680,161 |
| 1,583 | 1 | PRA Health Sciences, Inc. | 71,678 |
| 1,300 | 1 | Parexel International Corp. | 88,205 |
| 103,622 | | Pfizer, Inc. | 3,395,693 |
| 2,300 | 1 | PharMerica Corp. | 78,246 |
| 1,270 | 1 | Press Ganey Holdings, Inc. | 41,008 |
| 25,760 | 1 | Qiagen NV | 681,094 |
| 4,700 | | Quality Systems, Inc. | 76,375 |
| 9,412 | | Ramsay Health Care Ltd. | 455,472 |
| 500 | 1 | Regeneron Pharmaceuticals, Inc. | 272,250 |
| 2,000 | 1 | Repligen Corp. | 56,860 |
| 10,003 | | Roche Holding AG-GENUSSCHEIN | 2,674,257 |
| 5,272 | | Sanofi | 468,356 |
| 1,400 | 1 | Sucampo Pharmaceuticals, Inc. | 24,010 |
| 3,673 | 1 | Supernus Pharmaceuticals, Inc. | 59,356 |
| 157 | 1 | Surgical Care Affiliates, Inc. | 5,836 |
| 6,189 | 1 | Wright Medical Group NV | 132,568 |
| 113 | 1 | Zafgen, Inc. | 1,911 |
| | | TOTAL | 34,928,930 |
| | | Industrials—6.6% | |
| 2,800 | | AAR Corp. | 68,768 |
| 2,900 | | Actuant Corp. | 71,804 |
| 2,705 | | Adecco SA | 184,730 |
| 5,100 | 1 | AerCap Holdings NV | 231,744 |
| 16,144 | | Alaska Air Group, Inc. | 1,287,161 |
| 86,500 | | Amada Co. | 852,466 |
| 1,089 | | Andritz AG | 56,950 |
| 2,402 | | ArcBest Corp. | 57,840 |
| 35,062 | | Ashtead Group PLC | 576,725 |
| 180,100 | | BAE Systems PLC | 1,400,998 |
| 2,478 | | Boeing Co. | 360,425 |
| 19,887 | | Bouygues SA | 747,849 |
| 140 | | Brenntag AG | 7,648 |
| 300 | 1 | Builders Firstsource, Inc. | 4,038 |
| 39,674 | | Bunzl PLC | 1,147,257 |
Annual Shareholder Report
Shares or
Principal
Amount | | | Value in
U.S. Dollarsi |
| | | COMMON STOCKS—continued | |
| | | Industrials—continued | |
| 57,300 | | CSX Corp. | $1,629,039 |
| 12,398 | | Canadian National Railway, Co. | 740,009 |
| 3,700 | | Central Japan Railway Co. | 661,437 |
| 5,464 | | Cobham PLC | 24,953 |
| 2,700 | 1 | Continental Building Product, Inc. | 49,248 |
| 6,550 | | DSV, De Sammensluttede Vognmad AS | 254,327 |
| 53,000 | | Dai Nippon Printing Co. Ltd. | 518,661 |
| 3,700 | | Danaher Corp. | 356,643 |
| 26,700 | | Delta Air Lines, Inc. | 1,240,482 |
| 30,766 | | Deutsche Post AG | 899,380 |
| 3,600 | 1 | DigitalGlobe, Inc. | 60,840 |
| 46,185 | | Edenred | 955,831 |
| 5,100 | | Expeditors International Washington, Inc. | 247,554 |
| 24,000 | | Fuji Electric Co. | 110,645 |
| 3,509 | | Geberit International AG | 1,171,625 |
| 2,500 | | General Dynamics Corp. | 366,150 |
| 8,800 | | General Electric Co. | 263,472 |
| 8,086 | | Grupo Ferrovial, S.A. | 191,133 |
| 5,900 | | Harsco Corp. | 61,596 |
| 2,000 | 1 | Hawaiian Holdings, Inc. | 72,400 |
| 2,362 | | Hillenbrand, Inc. | 71,545 |
| 619,000 | | Hutchison Port Holdings TR-U | 333,774 |
| 6,100 | | Ingersoll-Rand PLC | 357,887 |
| 1,457 | | Insperity, Inc. | 62,884 |
| 2,669 | | Interface, Inc. | 53,060 |
| 1,356 | 1 | International Consolidated Airlines Group SA | 11,545 |
| 50,400 | 1 | Jet Blue Airways Corp. | 1,246,896 |
| 2,905 | | Knoll, Inc. | 64,723 |
| 174 | | Kone Corp. OYJ, Class B | 7,410 |
| 2,000 | | Korn/Ferry International | 73,600 |
| 5,555 | 1 | MRC Global, Inc. | 82,158 |
| 3,900 | 1 | Mastec, Inc. | 79,677 |
| 5,803 | 1 | Meritor, Inc. | 62,324 |
| 2,300 | | Miller Herman, Inc. | 72,933 |
| 17,000 | | Mitsubishi Electric Corp. | 188,443 |
| 2,295 | | Mueller Industries, Inc. | 72,270 |
| 7,817 | | Mueller Water Products, Inc. | 72,854 |
Annual Shareholder Report
Shares or
Principal
Amount | | | Value in
U.S. Dollarsi |
| | | COMMON STOCKS—continued | |
| | | Industrials—continued | |
| 1,000 | | NWS Holdings Ltd. | $1,411 |
| 15,453 | | Nielsen Holdings PLC | 721,346 |
| 20,300 | | Nsk Ltd. | 255,698 |
| 13,219 | | Osram Licht AG | 558,107 |
| 16,041 | | Randstad Holdings N.V. | 1,002,169 |
| 20,968 | | Rexel SA | 286,970 |
| 3,872 | 1 | Rexnord Corp. | 79,105 |
| 2,441 | | Sandvik AB | 25,266 |
| 1,223 | | Schindler Holding AG | 200,906 |
| 2,800 | | Securitas AB, Class B | 42,702 |
| 11,900 | | Singapore Technologies Engineering Ltd. | 24,094 |
| 350 | | SkyWest, Inc. | 7,214 |
| 38,200 | | Southwest Airlines Co. | 1,752,616 |
| 2,900 | | Stanley Black & Decker, Inc. | 316,564 |
| 3,700 | | Steelcase, Inc., Class A | 74,000 |
| 90,000 | | Sumitomo Heavy Industries | 427,464 |
| 4,300 | 1 | Swift Transportation Co. | 68,671 |
| 75,764 | | TNT Express NV | 616,783 |
| 2,304 | | The ADT Corp. | 81,723 |
| 500 | | Toto Ltd. | 17,281 |
| 3,170 | 1 | TriMas Corp. | 68,567 |
| 800 | 1 | TrueBlue, Inc. | 23,432 |
| 18,393 | | Union Pacific Corp. | 1,544,092 |
| 25,819 | 1 | United Continental Holdings, Inc. | 1,438,893 |
| 5,200 | | United Parcel Service, Inc. | 535,652 |
| 357 | 1 | Univar, Inc. | 6,762 |
| 2,450 | | Vestas Wind Systems A/S | 159,579 |
| 18,002 | | West Japan Railway Co. | 1,137,918 |
| 1,900 | | Yamato Holdings Co. Ltd. | 36,360 |
| 4,200 | | Yangzijiang Shipbuilding Holdings Ltd. | 3,264 |
| | | TOTAL | 31,360,420 |
| | | Information Technology—6.7% | |
| 3,285 | 1 | ACI Worldwide, Inc. | 77,263 |
| 2,866 | | AVG Technologies NV | 60,444 |
| 2,400 | 1 | Advanced Energy Industries, Inc. | 70,008 |
| 31,900 | 1 | Advanced Micro Devices, Inc. | 75,284 |
| 1,600 | 1 | Alliance Data Systems Corp. | 458,960 |
Annual Shareholder Report
Shares or
Principal
Amount | | | Value in
U.S. Dollarsi |
| | | COMMON STOCKS—continued | |
| | | Information Technology—continued | |
| 867 | 1 | Alphabet, Inc., Class A | $661,391 |
| 10,000 | 1 | Amkor Technology, Inc. | 68,000 |
| 71,049 | | Apple, Inc. | 8,405,097 |
| 6,200 | | Applied Materials, Inc. | 116,374 |
| 5,466 | 1 | Bankrate, Inc. | 79,694 |
| 2,988 | 1 | Benchmark Electronics, Inc. | 64,123 |
| 1,834 | 1 | Benefitfocus, Inc. | 74,314 |
| 7,314 | | CDW Corp. | 315,745 |
| 77,000 | | Cisco Systems, Inc. | 2,098,250 |
| 43 | | Constellation Software, Inc. | 18,455 |
| 2,200 | 1 | Cornerstone OnDemand, Inc. | 79,002 |
| 11,800 | | Corning, Inc. | 221,014 |
| 18,700 | 1 | Cypress Semiconductor Corp. | 202,334 |
| 11,000 | | EMC Corp. Mass | 278,740 |
| 1,700 | | EarthLink Network, Inc. | 15,623 |
| 4,000 | 1 | eBay, Inc. | 118,360 |
| 4,911 | 1 | Endurance International Group Holdings, Inc. | 68,607 |
| 8,925 | | Ericsson LM - B | 86,853 |
| 3,767 | | Evertec, Inc. | 64,717 |
| 4,071 | 1 | Facebook, Inc. | 424,361 |
| 4,400 | 1 | Fairchild Semiconductor International, Inc., Class A | 85,976 |
| 5,900 | 1 | Finisar Corp. | 71,213 |
| 34,000 | 1 | Freescale Semiconductor Ltd. | 1,322,940 |
| 29,000 | | Fujitsu Ltd. | 146,628 |
| 2,343 | 1 | Gigamon, Inc. | 63,472 |
| 226,000 | 1 | GungHo Online Entertainment, Inc. | 698,879 |
| 61,500 | 1 | HP, Inc. | 771,210 |
| 61,500 | | Hewlett Packard Enterprise Co. | 913,890 |
| 35,400 | | Ibiden Co. Ltd. | 555,475 |
| 3,878 | 1 | Infoblox, Inc. | 58,325 |
| 103,700 | | Intel Corp. | 3,605,649 |
| 1,400 | | InterDigital, Inc. | 73,766 |
| 5,362 | 1 | InvenSense, Inc. | 62,146 |
| 34,391 | 1 | Keysight Technologies, Inc. | 1,059,587 |
| 1,500 | | Lam Research Corp. | 117,300 |
| 2,004 | 1 | MA-COM Technology Solutions Holdings, Inc. | 74,048 |
| 2,900 | | Mentor Graphics Corp. | 54,317 |
Annual Shareholder Report
Shares or
Principal
Amount | | | Value in
U.S. Dollarsi |
| | | COMMON STOCKS—continued | |
| | | Information Technology—continued | |
| 6,000 | 1 | Micron Technology, Inc. | $95,580 |
| 11,900 | | NVIDIA Corp. | 377,468 |
| 900 | 1 | Netgear, Inc. | 39,699 |
| 4,500 | | Nexon Co., Ltd. | 71,503 |
| 123,000 | | Nippon Electric Glass Co. Ltd. | 682,945 |
| 25,674 | | Nokia Oyj | 184,965 |
| 104,800 | 1 | ON Semiconductor Corp. | 1,148,608 |
| 12,000 | | Omron Corp. | 441,558 |
| 4,000 | 1 | PMC-Sierra, Inc. | 47,320 |
| 4,000 | 1 | PayPal Holdings, Inc. | 141,040 |
| 5,300 | 1 | Polycom, Inc. | 72,239 |
| 2,500 | 1 | Progress Software Corp. | 59,975 |
| 5,200 | 1 | Qlogic Corp. | 67,080 |
| 2,300 | | Qualcomm, Inc. | 112,217 |
| 1,600 | 1 | Red Hat, Inc. | 130,256 |
| 1,658 | 1 | Rovi Corporation | 19,581 |
| 1,605 | | STMicroelectronics N.V. | 11,650 |
| 1,700 | 1 | Salesforce.com, Inc. | 135,473 |
| 1,630 | | Science Applications International Corp. | 81,891 |
| 5,500 | | Skyworks Solutions, Inc. | 456,610 |
| 3,666 | | TE Connectivity Ltd. | 245,952 |
| 21,800 | | Teradyne, Inc. | 453,004 |
| 14,300 | | Texas Instruments, Inc. | 831,116 |
| 7,300 | 1 | TiVo, Inc. | 65,627 |
| 40,900 | 1 | Trimble Navigation Ltd. | 936,610 |
| 1,986 | 1 | Universal Display Corp. | 104,384 |
| 2,700 | 1 | VMware, Inc., Class A | 165,807 |
| 6,213 | 1 | Vantiv, Inc. | 327,487 |
| 1,700 | 1 | Verint Systems, Inc. | 79,645 |
| 6,500 | | Vishay Intertechnology, Inc. | 77,480 |
| 2,786 | 1 | Web.com Group, Inc. | 67,449 |
| 1,600 | 1 | WebMd Health Corp. | 72,784 |
| 2,800 | | Western Digital Corp. | 174,748 |
| | | TOTAL | 31,917,585 |
| | | Materials—1.9% | |
| 100,344 | | ArcelorMittal | 491,550 |
| 38,000 | | Asahi Kasei Corp. | 260,142 |
Annual Shareholder Report
Shares or
Principal
Amount | | | Value in
U.S. Dollarsi |
| | | COMMON STOCKS—continued | |
| | | Materials—continued | |
| 2,930 | | Ashland, Inc. | $330,064 |
| 2,580 | 1 | Berry Plastics Group, Inc. | 93,809 |
| 1,500 | 1 | Chemtura Corp. | 46,080 |
| 4,885 | | Commercial Metals Corp. | 72,249 |
| 2,458 | | EMS-Chemie Holdings Ag | 1,000,998 |
| 3,100 | | Eagle Materials, Inc. | 214,148 |
| 356 | 1 | Flotek Industries, Inc. | 4,066 |
| 368,155 | | Fortescue Metals Group Ltd. | 519,456 |
| 21 | | Givaudan SA | 37,846 |
| 2,000 | | Greif, Inc., Class A | 70,940 |
| 3,400 | 1 | Headwaters, Inc. | 65,178 |
| 2,100 | | Hitachi Chemical Co. | 35,010 |
| 2,429 | | James Hardie Industries PLC | 28,789 |
| 91,500 | | Kuraray Co. Ltd. | 1,165,748 |
| 6,216 | | LyondellBasell Industries NV, Class A | 595,617 |
| 1,600 | | Martin Marietta Materials | 251,840 |
| 1,500 | | Newmarket Corp. | 619,725 |
| 11,200 | | Nitto Denko Corp. | 755,667 |
| 13,000 | | Potash Corp. of Saskatchewan, Inc. | 263,125 |
| 8,400 | | Sealed Air Corp. | 381,024 |
| 4,000 | | Sherwin-Williams Co. | 1,104,280 |
| 83 | | Sika AG | 280,725 |
| 2,344 | 1 | Summit Materials, Inc., Class A | 53,373 |
| 6,116 | | UPM - Kymmene Oyj | 116,522 |
| 868 | 1 | US Concrete, Inc. | 50,978 |
| 2,109 | | Voest-alpine Stahl | 68,575 |
| 94 | | Yara International ASA | 4,349 |
| | | TOTAL | 8,981,873 |
| | | Telecommunication Services—2.5% | |
| 611 | 1 | 8x8, Inc. | 7,210 |
| 1,900 | | BCE, Inc. | 81,779 |
| 219,192 | | BT Group PLC | 1,638,905 |
| 400 | | Cogent Communications Group | 13,424 |
| 85,526 | | Deutsche Telekom AG | 1,577,668 |
| 35,300 | 1 | Globalstar, Inc. | 76,954 |
| 555,095 | | HKT Trust and HKT Ltd. | 696,356 |
| 238 | | Inteliquent, Inc. | 4,572 |
Annual Shareholder Report
Shares or
Principal
Amount | | | Value in
U.S. Dollarsi |
| | | COMMON STOCKS—continued | |
| | | Telecommunication Services—continued | |
| 24,500 | | KDDI Corp. | $609,141 |
| 66,200 | | NTT DOCOMO, Inc. | 1,257,746 |
| 33,100 | | Nippon Telegraph and Telephone Corp. | 1,230,131 |
| 11,736 | | Orange SA | 202,657 |
| 22,300 | | SoftBank Group Corp. | 1,185,250 |
| 357,300 | | StarHub Ltd. | 918,471 |
| 3,051 | 1 | T-Mobile USA, Inc. | 108,310 |
| 73,690 | | Tele2 AB, Class B | 749,793 |
| 11,000 | | TeliaSonera AB | 53,958 |
| 269,246 | | Telstra Corp. Ltd. | 1,046,001 |
| 10,100 | | Verizon Communications | 459,045 |
| 1,300 | 1 | Vonage Holdings Corp. | 8,385 |
| | | TOTAL | 11,925,756 |
| | | Utilities—3.0% | |
| 86,400 | | AES Corp. | 863,136 |
| 3,422 | | Abengoa Yield PLC | 49,551 |
| 200 | | American States Water Co. | 8,366 |
| 1,600 | | Black Hills Corp. | 68,672 |
| 6,394 | | CMS Energy Corp. | 223,918 |
| 33,874 | | Electricite De France | 504,280 |
| 37,542 | | Enagas SA | 1,116,669 |
| 207,046 | | Enel S.p.A | 912,174 |
| 60,131 | 1 | Engie | 1,046,250 |
| 28,800 | | Exelon Corp. | 786,528 |
| 29,300 | | FirstEnergy Corp. | 919,727 |
| 180,094 | | Iberdrola SA | 1,259,239 |
| 1,200 | | Idacorp, Inc. | 81,648 |
| 4,509 | | NRG Yield, Inc. | 63,757 |
| 77,736 | | National Grid PLC | 1,083,909 |
| 100 | | New Jersey Resources Corp. | 3,005 |
| 1,606 | | ONE Gas, Inc. | 78,292 |
| 14,500 | | Power Assets Holdings Ltd. | 129,681 |
| 15,600 | | Public Service Enterprises Group, Inc. | 609,960 |
| 2,098 | | Red Electrica de Espana | 179,872 |
| 38,648 | | SSE PLC | 834,699 |
| 1,500 | | Sempra Energy | 148,845 |
| 81,848 | | Snam Rete Gas S.p.A | 415,661 |
Annual Shareholder Report
Shares or
Principal
Amount | | | Value in
U.S. Dollarsi |
| | | COMMON STOCKS—continued | |
| | | Utilities—continued | |
| 55,956 | | Suez Environnement SA | $1,059,372 |
| 168,152 | | Terna S.p.A | 827,401 |
| 129,000 | | Tokyo Gas Co. Ltd. | 616,718 |
| 1,300 | | WGL Holdings, Inc. | 80,158 |
| | | TOTAL | 13,971,488 |
| | | TOTAL COMMON STOCKS
(IDENTIFIED COST $237,601,410) | 256,714,997 |
| | | ASSET-BACKED SECURITIES—0.1% | |
| 150,000 | | American Express Credit Account Master Trust 2014-1, A, 0.567%, 12/15/2021 | 149,273 |
| 300,000 | | AmeriCredit Automobile Receivables Trust 2015-1, A3, 1.260%, 11/08/2019 | 299,015 |
| 150,000 | | Navient Student Loan Trust 2014-1, A2, 0.531%, 03/27/2023 | 148,189 |
| | | TOTAL ASSET-BACKED SECURITIES
(IDENTIFIED COST $599,983) | 596,477 |
| | | COLLATERALIZED MORTGAGE OBLIGATIONS—0.3% | |
| 200,000 | | Citigroup Commercial Mortgage Trust 2015-GC33 AS, 4.114%, 9/10/2058 | 206,290 |
| 450,000 | | Commercial Mortgage Trust 2015-DC1 AM, 3.724%, 2/10/2048 | 450,485 |
| 50,000 | | WF-RBS Commercial Mortgage Trust 2012-C6 B, 4.697%, 4/15/2045 | 53,434 |
| 400,000 | | WF-RBS Commercial Mortgage Trust 2014-C25 AS, 3.984%, 11/15/2047 | 409,969 |
| 100,000 | | WF-RBS Commercial Mortgage Trust 2014-C25 B, 4.236%, 11/15/2047 | 102,560 |
| | | TOTAL COLLATERALIZED MORTGAGE OBLIGATIONS
(IDENTIFIED COST $1,254,942) | 1,222,738 |
| | | CORPORATE BONDS—5.3% | |
| | | Basic Industry - Chemicals—0.2% | |
| $300,000 | | Albemarle Corp., Sr. Unsecd. Note, 5.450%, 12/01/2044 | 291,910 |
| 50,000 | | RPM International, Inc., 6.500%, 02/15/2018 | 54,221 |
| 285,000 | | RPM International, Inc., Sr. Unsecd. Note, 5.250%, 6/01/2045 | 268,969 |
| 15,000 | | RPM International, Inc., Sr. Unsecd. Note, 6.125%, 10/15/2019 | 16,591 |
| 250,000 | | Valspar Corp., Sr. Unsecd. Note, 3.300%, 2/01/2025 | 239,763 |
| | | TOTAL | 871,454 |
| | | Basic Industry - Metals & Mining—0.1% | |
| 90,000 | | Allegheny Technologies, Inc., Sr. Note, 9.375%, 06/01/2019 | 90,113 |
| 100,000 | | Reliance Steel & Aluminum Co., Sr. Unsecd. Note, 4.500%, 04/15/2023 | 94,875 |
| 300,000 | | Southern Copper Corp., Note, 6.750%, 04/16/2040 | 269,407 |
| | | TOTAL | 454,395 |
Annual Shareholder Report
Shares or
Principal
Amount | | | Value in
U.S. Dollarsi |
| | | CORPORATE BONDS—continued | |
| | | Basic Industry - Paper—0.0% | |
| $150,000 | 1,2,3 | Pope & Talbot, Inc., 8.375%, 12/01/2099 | $0 |
| | | Capital Goods - Aerospace & Defense—0.1% | |
| 140,000 | | Halliburton Co., Sr. Unsecd. Note, 3.800%, 11/15/2025 | 141,185 |
| 180,000 | | Lockheed Martin Corp., Sr. Unsecd. Note, 3.550%, 01/15/2026 | 182,121 |
| 90,000 | 4,5 | Textron Financial Corp., Jr. Sub. Note, Series 144A, 6.000%, 2/15/2067 | 66,375 |
| | | TOTAL | 389,681 |
| | | Capital Goods - Building Materials—0.1% | |
| 185,000 | | Masco Corp., Unsecd. Note, 4.450%, 4/01/2025 | 181,994 |
| 300,000 | | Valmont Industries, Inc., 5.250%, 10/01/2054 | 258,276 |
| | | TOTAL | 440,270 |
| | | Capital Goods - Diversified Manufacturing—0.1% | |
| 100,000 | | General Electric Co., Sr. Unsecd. Note, 4.125%, 10/09/2042 | 98,042 |
| 200,000 | 4,5 | Hutchison Whampoa International 14 Ltd., Unsecd. Note, Series 144A, 1.625%, 10/31/2017 | 199,570 |
| 100,000 | | Roper Industries, Inc., Sr. Unsecd. Note, 6.250%, 09/01/2019 | 111,685 |
| | | TOTAL | 409,297 |
| | | Capital Goods - Environmental—0.0% | |
| 110,000 | | Republic Services, Inc., Company Guarantee, 5.500%, 9/15/2019 | 121,743 |
| | | Communications - Cable & Satellite—0.1% | |
| 200,000 | 4,5 | CCO Safari II LLC, Series 144A, 4.908%, 7/23/2025 | 203,423 |
| 300,000 | | DIRECTV Holdings LLC, Sr. Unsecd. Note, 5.150%, 03/15/2042 | 288,213 |
| 20,000 | | Time Warner Cable, Inc., Company Guarantee, 8.250%, 04/01/2019 | 23,173 |
| | | TOTAL | 514,809 |
| | | Communications - Media & Entertainment—0.1% | |
| 100,000 | | 21st Century Fox America, Inc., Sr. Unsecd. Note, 5.400%, 10/01/2043 | 107,314 |
| 310,000 | 4,5 | British Sky Broadcasting Group PLC, 3.75%, Series 144A, 9/16/2024 | 308,449 |
| 70,000 | | Grupo Televisa S.A., Sr. Unsecd. Note, 6.125%, 01/31/2046 | 71,639 |
| 200,000 | | Viacom, Inc., Sr. Unsecd. Note, 3.875%, 04/01/2024 | 190,885 |
| | | TOTAL | 678,287 |
| | | Communications - Telecom Wirelines—0.0% | |
| 15,000 | | CenturyLink, Inc., Sr. Note, Series Q, 6.150%, 09/15/2019 | 15,487 |
| 200,000 | | Verizon Communications, Inc., Sr. Unsecd. Note, 4.150%, 03/15/2024 | 209,994 |
| | | TOTAL | 225,481 |
| | | Consumer Cyclical - Automotive—0.1% | |
| 70,000 | | General Motors Co., Sr. Unsecd. Note, 4.000%, 4/01/2025 | 67,690 |
| 200,000 | | General Motors Financial, Sr. Unsecd. Note, 3.100%, 01/15/2019 | 200,300 |
| 200,000 | | Magna International, Inc., 3.625%, 6/15/2024 | 196,677 |
Annual Shareholder Report
Shares or
Principal
Amount | | | Value in
U.S. Dollarsi |
| | | CORPORATE BONDS—continued | |
| | | Consumer Cyclical - Automotive—continued | |
| $50,000 | 4,5 | RCI Banque SA, Sr. Unsecd. Note, Series 144A, 4.600%, 04/12/2016 | $50,579 |
| | | TOTAL | 515,246 |
| | | Consumer Cyclical - Retailers—0.2% | |
| 100,000 | | Advance Auto Parts, Inc., 4.500%, 12/01/2023 | 102,986 |
| 300,000 | | AutoZone, Inc., Sr. Unsecd. Note, 3.250%, 4/15/2025 | 292,801 |
| 131,370 | 4,5 | CVS Caremark Corp., Pass Thru Cert., Series 144A, 5.298%, 1/11/2027 | 141,600 |
| 110,000 | | Dollar General Corp., Sr. Unsecd. Note, 4.150%, 11/01/2025 | 108,865 |
| 300,000 | | Tiffany & Co., Sr. Unsecd. Note, 4.900%, 10/01/2044 | 279,795 |
| 50,000 | | Wal-Mart Stores, Inc., Sr. Unsecd. Note, 3.300%, 04/22/2024 | 51,700 |
| | | TOTAL | 977,747 |
| | | Consumer Non-Cyclical - Food/Beverage—0.2% | |
| 500,000 | 4,5 | HJ Heinz Co., Sr. Unsecd. Note, Series 144A, 3.950%, 7/15/2025 | 511,505 |
| 120,000 | | Mead Johnson Nutrition Co., Sr. Unsecd. Note, 4.125%, 11/15/2025 | 121,630 |
| 150,000 | | PepsiCo, Inc., 2.750%, 4/30/2025 | 146,567 |
| 70,000 | | PepsiCo, Inc., Sr. Unsecd. Note, 4.450%, 4/14/2046 | 72,357 |
| | | TOTAL | 852,059 |
| | | Consumer Non-Cyclical - Pharmaceuticals—0.2% | |
| 300,000 | | AbbVie, Inc., Sr. Unsecd. Note, 2.500%, 5/14/2020 | 298,447 |
| 450,000 | | Eli Lilly & Co., 3.700%, 3/01/2045 | 422,420 |
| 90,000 | | Gilead Sciences, Inc., Sr. Unsecd. Note, 3.650%, 3/01/2026 | 90,851 |
| | | TOTAL | 811,718 |
| | | Consumer Non-Cyclical - Tobacco—0.1% | |
| 24,000 | | Altria Group, Inc., 9.250%, 08/06/2019 | 29,513 |
| 60,000 | | Altria Group, Inc., Sr. Unsecd. Note, 4.000%, 01/31/2024 | 62,790 |
| 400,000 | | Reynolds American, Inc., Sr. Unsecd. Note, 5.850%, 8/15/2045 | 449,643 |
| | | TOTAL | 541,946 |
| | | Energy - Independent—0.1% | |
| 100,000 | | Apache Corp., 4.250%, 1/15/2044 | 90,272 |
| 225,000 | | Marathon Oil Corp., Sr. Unsecd. Note, 3.850%, 6/01/2025 | 202,108 |
| 20,000 | | XTO Energy, Inc., 6.750%, 08/01/2037 | 27,859 |
| | | TOTAL | 320,239 |
| | | Energy - Integrated—0.1% | |
| 155,000 | | Husky Energy, Inc., 4.000%, 04/15/2024 | 147,348 |
| 100,000 | | Husky Energy, Inc., Sr. Unsecd. Note, 3.950%, 04/15/2022 | 96,816 |
| 35,000 | | Petro-Canada, Deb., 7.000%, 11/15/2028 | 43,710 |
| 100,000 | | Petroleos Mexicanos, 6.500%, 06/02/2041 | 95,125 |
Annual Shareholder Report
Shares or
Principal
Amount | | | Value in
U.S. Dollarsi |
| | | CORPORATE BONDS—continued | |
| | | Energy - Integrated—continued | |
| $150,000 | | Petroleos Mexicanos, Sr. Unsecd. Note, 4.875%, 1/18/2024 | $147,705 |
| | | TOTAL | 530,704 |
| | | Energy - Midstream—0.2% | |
| 325,000 | | Energy Transfer Partners , Sr. Unsecd. Note, 4.050%, 3/15/2025 | 279,179 |
| 350,000 | | Energy Transfer Partners , Sr. Unsecd. Note, 5.150%, 3/15/2045 | 265,882 |
| 100,000 | | Kinder Morgan, Inc., 5.05%, 2/15/2046 | 71,832 |
| 100,000 | | Williams Partners LP, 4.9%, 1/15/2045 | 69,711 |
| 300,000 | | Williams Partners LP, 5.1%, 9/15/2045 | 217,117 |
| | | TOTAL | 903,721 |
| | | Energy - Oil Field Services—0.0% | |
| 100,000 | | Nabors Industries, Inc., Company Guarantee, 5.000%, 09/15/2020 | 95,241 |
| 100,000 | | Weatherford International Ltd., Sr. Unsecd. Note, 5.950%, 04/15/2042 | 63,250 |
| | | TOTAL | 158,491 |
| | | Energy - Refining—0.1% | |
| 250,000 | | Marathon Petroleum Corp., Sr. Unsecd. Note, 4.750%, 9/15/2044 | 225,032 |
| 25,000 | | Valero Energy Corp., 9.375%, 03/15/2019 | 30,124 |
| 100,000 | | Valero Energy Corp., Sr. Unsecd. Note, 6.625%, 06/15/2037 | 108,691 |
| | | TOTAL | 363,847 |
| | | Financial Institution - Banking—0.9% | |
| 340,000 | | Associated Banc-Corp., Sub., 4.250%, 1/15/2025 | 342,203 |
| 100,000 | | Bank of America Corp., Sr. Unsecd. Note, Series MTN, 4.875%, 4/01/2044 | 106,407 |
| 355,000 | | Bank of America Corp., Sub. Note, Series L, 3.950%, 4/21/2025 | 351,835 |
| 300,000 | | Bank of America Corp., Sub. Note, Series MTN, 4.000%, 1/22/2025 | 298,370 |
| 180,000 | | Capital One Financial Corp., Sr. Sub., 4.200%, 10/29/2025 | 179,806 |
| 250,000 | | Citigroup, Inc., Sr. Unsecd. Note, 3.300%, 4/27/2025 | 247,685 |
| 100,000 | | Citigroup, Inc., Sr. Unsecd. Note, 4.950%, 11/07/2043 | 105,295 |
| 150,000 | | Citigroup, Inc., Sub. Note, 4.450%, 9/29/2027 | 150,663 |
| 250,000 | | Compass Bank, Birmingham, Sub. Note, Series BKNT, 3.875%, 4/10/2025 | 232,936 |
| 330,000 | | Fifth Third Bancorp, Sr. Unsecd. Note, 2.875%, 7/27/2020 | 331,536 |
| 400,000 | | Goldman Sachs Group, Inc., Sr. Unsecd. Note, 3.500%, 1/23/2025 | 398,286 |
| 5,000 | | Goldman Sachs Group, Inc., Sr. Unsecd. Note, 5.750%, 01/24/2022 | 5,741 |
| 50,000 | | Goldman Sachs Group, Inc., Sr. Unsecd. Note, 6.125%, 02/15/2033 | 60,253 |
| 100,000 | | J.P. Morgan Chase & Co., 6.750%, 1/29/2049 | 108,475 |
| 50,000 | | J.P. Morgan Chase & Co., Sub. Note, 3.375%, 05/01/2023 | 49,675 |
| 300,000 | | Morgan Stanley, Sr. Unsecd. Note, 1.462%, 1/27/2020 | 301,556 |
Annual Shareholder Report
Shares or
Principal
Amount | | | Value in
U.S. Dollarsi |
| | | CORPORATE BONDS—continued | |
| | | Financial Institution - Banking—continued | |
| $100,000 | | Morgan Stanley, Sr. Unsecd. Note, 6.375%, 07/24/2042 | $126,381 |
| 60,000,000 | | Rabobank Nederland NV, Utrecht, 1.850%, Series EMTN, 4/12/2017 | 497,968 |
| 162,039 | 3,4 | Regional Diversified Funding, Series 144A, 9.250%, 03/15/2030 | 83,197 |
| 135,000 | | Wells Fargo & Co., Sub. Note, Series GMTN, 4.900%, 11/17/2045 | 137,797 |
| 40,000 | | Wilmington Trust Corp., Sub. Note, 8.500%, 04/02/2018 | 45,364 |
| | | TOTAL | 4,161,429 |
| | | Financial Institution - Broker/Asset Mgr/Exchange—0.1% | |
| 140,000 | | Invesco Finance PLC, Sr. Unsecd. Note, 3.750%, 1/15/2026 | 142,156 |
| 95,000 | | Jefferies Group LLC, Sr. Unsecd. Note, 8.500%, 07/15/2019 | 111,621 |
| 240,000 | | Stifel Financial Corp., Sr. Unsecd. Note, 3.500%, 12/01/2020 | 239,371 |
| 70,000 | 4,5 | TIAA Asset Management Finance Co., LLC, Sr. Unsecd. Note, Series 144A, 4.125%, 11/01/2024 | 70,890 |
| | | TOTAL | 564,038 |
| | | Financial Institution - Finance Companies—0.0% | |
| 30,000 | | General Electric Capital, Note, Series MTNA, 6.750%, 3/15/2032 | 39,454 |
| | | Financial Institution - Insurance - Health—0.0% | |
| 50,000 | | Wellpoint, Inc., 5.850%, 01/15/2036 | 55,877 |
| | | Financial Institution - Insurance - Life—0.5% | |
| 100,000 | | Aflac, Inc., Sr. Unsecd. Note, 6.450%, 08/15/2040 | 123,242 |
| 100,000 | | American International Group, Inc., Sr. Unsecd. Note, 6.250%, 05/01/2036 | 117,148 |
| 400,000 | | American International Group, Inc., Unsecd. Note, 3.875%, 1/15/2035 | 362,087 |
| 10,000 | | MetLife, Inc., Jr. Sub. Note, 10.750%, 8/01/2039 | 15,825 |
| 330,000 | | MetLife, Inc., Sr. Unsecd. Note, 4.050%, 3/01/2045 | 311,332 |
| 100,000 | 4,5 | Principal Life Global Funding II, Series 144A, 2.200%, 4/08/2020 | 99,274 |
| 200,000 | | Prudential Financial, Inc., Sr. Unsecd. Note, Series MTN, 4.600%, 05/15/2044 | 202,047 |
| 750,000 | 4 | Union Central Life Ins Co, Note, Series 144A, 8.200%, 11/01/2026 | 991,085 |
| | | TOTAL | 2,222,040 |
| | | Financial Institution - Insurance - P&C—0.1% | |
| 160,000 | | ACE INA Holdings, Inc., 3.350%, 5/03/2026 | 159,785 |
| 75,000 | | ACE INA Holdings, Inc., Sr. Unsecd. Note, 3.350%, 05/15/2024 | 75,888 |
| 50,000 | | Horace Mann Educators Corp., Sr. Note, 6.850%, 04/15/2016 | 51,028 |
| 300,000 | 4,5 | Liberty Mutual Group., Inc, Sr. Unsecd. Note, Series 144A, 6.500%, 3/15/2035 | 356,822 |
| 30,000 | 4,5 | Nationwide Mutual Insurance Co., Sub. Note, Series 144A, 9.375%, 08/15/2039 | 45,666 |
| | | TOTAL | 689,189 |
Annual Shareholder Report
Shares or
Principal
Amount | | | Value in
U.S. Dollarsi |
| | | CORPORATE BONDS—continued | |
| | | Financial Institution - REIT - Apartment—0.1% | |
| $220,000 | | Mid-America Apartment Communities LP, 4.000%, 11/15/2025 | $219,870 |
| 300,000 | | Mid-America Apartment Communities LP, Sr. Unsecd. Note, 3.750%, 06/15/2024 | 292,599 |
| | | TOTAL | 512,469 |
| | | Financial Institution - REIT - Healthcare—0.0% | |
| 100,000 | | Health Care REIT, Inc., Sr. Unsecd. Note, 4.125%, 04/01/2019 | 104,945 |
| | | Financial Institution - REIT - Office—0.1% | |
| 300,000 | | Alexandria Real Estate Equities, Inc., Sr. Unsecd. Note, 4.500%, 7/30/2029 | 296,892 |
| | | Financial Institution - REIT - Other—0.1% | |
| 40,000 | | Liberty Property LP, 6.625%, 10/01/2017 | 43,160 |
| 100,000 | | ProLogis LP, Sr. Unsecd. Note, 3.350%, 02/01/2021 | 101,720 |
| 160,000 | | WP Carey, Inc., Sr. Unsecd. Note, 4.600%, 04/01/2024 | 162,539 |
| | | TOTAL | 307,419 |
| | | Financial Institution - REIT - Retail—0.0% | |
| 40,000 | | Equity One, Inc., Bond, 6.000%, 09/15/2017 | 42,537 |
| 30,000 | | Kimco Realty Corp., Sr. Unsecd. Note, 3.400%, 11/01/2022 | 29,929 |
| | | TOTAL | 72,466 |
| | | Financial Institution - REITs—0.0% | |
| 200,000 | | Host Hotels & Resorts LP, Sr. Unsecd. Note, Series E, 4.000%, 6/15/2025 | 193,560 |
| | | Foreign-Local-Government—0.1% | |
| 50,000 | | Quebec, Province of, Note, Series MTNA, 7.035%, 03/10/2026 | 63,910 |
| 255,000 | 4,5 | Queensland Treasury Corp., Sr. Unsecd. Note, 4.000%, 06/21/2019 | 193,993 |
| | | TOTAL | 257,903 |
| | | Municipal Services—0.1% | |
| 140,000 | 4,5 | Army Hawaii Family Housing, Series 144A, 5.524%, 6/15/2050 | 153,938 |
| 100,000 | 4,5 | Camp Pendleton & Quantico Housing LLC, Series 144A, 5.572%, 10/01/2050 | 108,334 |
| | | TOTAL | 262,272 |
| | | Sovereign—0.1% | |
| 30,000,000 | | KfW, 2.050%, 02/16/2026 | 289,061 |
| | | Technology—0.4% | |
| 300,000 | | Adobe Systems, Inc., Sr. Unsecd. Note, 3.250%, 2/01/2025 | 296,767 |
| 250,000 | | Apple, Inc., Sr. Unsecd. Note, 3.450%, 2/09/2045 | 215,561 |
| 50,000 | | Autodesk, Inc., Sr. Unsecd. Note, 4.375%, 6/15/2025 | 49,673 |
| 270,000 | | Automatic Data Processing, Inc., 3.375%, 9/15/2025 | 277,255 |
| 210,000 | | Fidelity National Informa, Sr. Unsecd. Note, 5.000%, 10/15/2025 | 218,074 |
Annual Shareholder Report
Shares or
Principal
Amount | | | Value in
U.S. Dollarsi |
| | | CORPORATE BONDS—continued | |
| | | Technology—continued | |
| $100,000 | | Fidelity National Information Services, Inc., Sr. Unsecd. Note, 3.875%, 06/05/2024 | $96,807 |
| 150,000 | 4,5 | Hewlett Packard Enterprise Co., Sr. Unsecd. Note, Series 144A, 3.600%, 10/15/2020 | 151,355 |
| 300,000 | | Keysight Technologies, Inc., 4.550%, 10/30/2024 | 287,242 |
| 380,000 | 4,5 | Molex Electronics Technologies LLC, Unsecd. Note, Series 144A, 3.900%, 4/15/2025 | 365,645 |
| | | TOTAL | 1,958,379 |
| | | Transportation - Railroads—0.1% | |
| 140,000 | | Burlington Northern Santa Fe Corp., Sr. Unsecd. Note, 4.150%, 4/01/2045 | 129,207 |
| 45,000 | | Union Pacific Corp., Bond, 6.625%, 02/01/2029 | 58,238 |
| 135,000 | | Union Pacific Corp., Sr. Unsecd. Note, 3.875%, 2/01/2055 | 120,935 |
| | | TOTAL | 308,380 |
| | | Transportation - Services—0.1% | |
| 75,000 | 4,5 | Enterprise Rent-A-Car USA Finance Co., Series 144A, 6.375%, 10/15/2017 | 81,102 |
| 62,000 | 4,5 | Enterprise Rent-A-Car USA Finance Co., Sr. Unsecd. Note, Series 144A, 3.850%, 11/15/2024 | 62,636 |
| 100,000 | 4,5 | Penske Truck Leasing Co. LP & PTL Finance Corp., Series 144A, 2.500%, 06/15/2019 | 98,845 |
| 335,000 | 4,5 | Penske Truck Leasing Co. LP & PTL Finance Corp., Sr. Unsecd. Note, Series 144A, 3.375%, 2/01/2022 | 327,887 |
| 100,000 | | Ryder System, Inc., Sr. Unsecd. Note, Series MTN, 2.450%, 11/15/2018 | 100,098 |
| | | TOTAL | 670,568 |
| | | Utility - Electric—0.3% | |
| 130,000 | | Ameren Corp., Sr. Unsecd. Note, 3.650%, 2/15/2026 | 130,361 |
| 300,000 | | Consolidated Edison Co., Sr. Unsecd. Note, 4.500%, 12/01/2045 | 304,842 |
| 19,199 | 4,5 | Great River Energy, 1st Mtg. Note, Series 144A, 5.829%, 7/01/2017 | 19,760 |
| 300,000 | | National Rural Utilities Cooperative Finance Corp., 2.000%, 1/27/2020 | 295,321 |
| 200,000 | | NextEra Energy Capital Holdings, Inc., Sr. Unsecd. Note, 2.400%, 09/15/2019 | 198,192 |
| 400,000 | | Northeast Utilities, Sr. Unsecd. Note, Series H, 3.150%, 1/15/2025 | 394,190 |
| 75,000 | | PSEG Power LLC, Sr. Unsecd. Note, 4.300%, 11/15/2023 | 75,306 |
| 40,000 | | Progress Energy, Inc., 7.050%, 03/15/2019 | 45,737 |
| 125,000 | | Wisconsin Electric Power Co., Sr. Unsecd. Note, 4.300%, 12/15/2045 | 127,441 |
| | | TOTAL | 1,591,150 |
| | | Utility - Natural Gas—0.1% | |
| 200,000 | | Sempra Energy, Sr. Unsecd. Note, 2.850%, 11/15/2020 | 201,113 |
Annual Shareholder Report
Shares or
Principal
Amount | | | Value in
U.S. Dollarsi |
| | | CORPORATE BONDS—continued | |
| | | Utility - Natural Gas—continued | |
| $300,000 | | Sempra Energy, Sr. Unsecd. Note, 3.550%, 06/15/2024 | $302,091 |
| | | TOTAL | 503,204 |
| | | TOTAL CORPORATE BONDS
(IDENTIFIED COST $25,829,109) | 25,141,830 |
| | | MORTGAGE-BACKED SECURITIES—0.1% | |
| 2,834 | | Federal Home Loan Mortgage Corp. Pool C00592, 7.000%, 3/1/2028 | 3,280 |
| 2,067 | | Federal Home Loan Mortgage Corp. Pool C00896, 7.500%, 12/1/2029 | 2,450 |
| 4,105 | | Federal Home Loan Mortgage Corp. Pool C17281, 6.500%, 11/1/2028 | 4,711 |
| 2,942 | | Federal Home Loan Mortgage Corp. Pool C19588, 6.500%, 12/1/2028 | 3,375 |
| 1,290 | | Federal Home Loan Mortgage Corp. Pool C25621, 6.500%, 5/1/2029 | 1,483 |
| 3,856 | | Federal Home Loan Mortgage Corp. Pool C76361, 6.000%, 2/1/2033 | 4,409 |
| 6,859 | | Federal Home Loan Mortgage Corp. Pool E01545, 5.000%,
15 Year, 1/1/2019 | 7,158 |
| 1,004 | | Federal Home Loan Mortgage Corp. Pool E99510, 5.500%, 9/1/2018 | 1,053 |
| 4,288 | | Federal Home Loan Mortgage Corp. Pool G01444, 6.500%, 8/1/2032 | 4,995 |
| 3,214 | | Federal National Mortgage Association Pool 251697, 6.500%,
30 Year, 5/1/2028 | 3,682 |
| 11,249 | | Federal National Mortgage Association Pool 252334, 6.500%,
30 Year, 2/1/2029 | 12,737 |
| 5,963 | | Federal National Mortgage Association Pool 254720, 4.500%, 5/1/2018 | 6,169 |
| 6,902 | | Federal National Mortgage Association Pool 254802, 4.500%, 7/1/2018 | 7,141 |
| 7,337 | | Federal National Mortgage Association Pool 254905, 6.000%, 10/1/2033 | 8,354 |
| 13,134 | | Federal National Mortgage Association Pool 255075, 5.500%, 2/1/2024 | 14,652 |
| 10,057 | | Federal National Mortgage Association Pool 255079, 5.000%, 2/1/2019 | 10,491 |
| 1,214 | | Federal National Mortgage Association Pool 303168, 9.500%,
30 Year, 2/1/2025 | 1,443 |
| 530 | | Federal National Mortgage Association Pool 323159, 7.500%, 4/1/2028 | 619 |
| 4,766 | | Federal National Mortgage Association Pool 323640, 7.500%, 4/1/2029 | 5,556 |
| 2,183 | | Federal National Mortgage Association Pool 428865, 7.000%, 6/1/2028 | 2,338 |
| 482 | | Federal National Mortgage Association Pool 443215, 6.000%, 10/1/2028 | 545 |
| 11,387 | | Federal National Mortgage Association Pool 545993, 6.000%, 11/1/2032 | 12,979 |
| 4,781 | | Federal National Mortgage Association Pool 555272, 6.000%, 3/1/2033 | 5,449 |
| 4,784 | | Federal National Mortgage Association Pool 713974, 5.500%, 7/1/2033 | 5,405 |
| 8,683 | | Federal National Mortgage Association Pool 721502, 5.000%, 7/1/2033 | 9,614 |
| 10,367 | | Government National Mortgage Association Pool 2796, 7.000%, 8/20/2029 | 12,140 |
Annual Shareholder Report
Shares or
Principal
Amount | | | Value in
U.S. Dollarsi |
| | | MORTGAGE-BACKED SECURITIES—continued | |
| $5,389 | | Government National Mortgage Association Pool 3040, 7.000%, 2/20/2031 | $6,325 |
| 12,901 | | Government National Mortgage Association Pool 3188, 6.500%, 1/20/2032 | 14,995 |
| 19,810 | | Government National Mortgage Association Pool 3239, 6.500%, 5/20/2032 | 23,067 |
| 572 | | Government National Mortgage Association Pool 352214, 7.000%, 4/15/2023 | 643 |
| 2,352 | | Government National Mortgage Association Pool 451522, 7.500%,
30 Year, 10/15/2027 | 2,792 |
| 2,209 | | Government National Mortgage Association Pool 462556, 6.500%, 2/15/2028 | 2,510 |
| 385 | | Government National Mortgage Association Pool 462739, 7.500%, 5/15/2028 | 457 |
| 213 | | Government National Mortgage Association Pool 464835, 6.500%, 9/15/2028 | 246 |
| 5,622 | | Government National Mortgage Association Pool 469699, 7.000%, 11/15/2028 | 6,558 |
| 4,557 | | Government National Mortgage Association Pool 486760, 6.500%, 12/15/2028 | 5,250 |
| 659 | | Government National Mortgage Association Pool 780339, 8.000%,30 Year, 12/15/2023 | 755 |
| 6,260 | | Government National Mortgage Association Pool 780453, 7.500%,
30 Year, 12/15/2025 | 7,288 |
| 4,756 | | Government National Mortgage Association Pool 780584, 7.000%,
30 Year, 6/15/2027 | 5,470 |
| | | TOTAL MORTGAGE-BACKED SECURITIES
(IDENTIFIED COST $203,703) | 228,584 |
| | | FOREIGN GOVERNMENTS/AGENCIES—6.3% | |
| | | Sovereign—6.3% | |
| 280,000 | 4,5 | Belgium Kingdom 3.75% Series 46, 9/28/2015, 0.8%, Series 74, 6/22/2025 | 296,272 |
| 500,000 | | Belgium, Government of, Series 68, 2.250%, 06/22/2023 | 600,807 |
| 1,235,000 | | Bonos Y Oblig Del Estado, 2.750%, 04/30/2019 | 1,416,142 |
| 1,360,000 | 4,5 | Bonos Y Oblig Del Estado, Sr. Unsecd. Note, 2.750%, 10/31/2024 | 1,594,867 |
| 400,000 | 4,5 | Bonos Y Oblig Del Estado, Sr. Unsub., 4.000%, 04/30/2020 | 487,872 |
| 600,000 | | Bundesrepublic Deutschland, Unsecd. Note, 1.00%, 8/15/2024 | 671,448 |
| 650,000 | | Buoni Poliennali Del Tes, 2.15%, 12/15/2021 | 743,345 |
| 200,000 | | Buoni Poliennali Del Tes, 2.50%, 5/01/2019 | 227,959 |
| 1,000,000 | | Buoni Poliennali Del Tes, 3.750%, 05/01/2021 | 1,232,794 |
| 220,000 | | Buoni Poliennali Del Tes, 4.250%, 03/01/2020 | 270,974 |
| 2,200,000 | | Buoni Poliennali Del Tes, 4.500%, 05/01/2023 | 2,895,986 |
Annual Shareholder Report
Shares or
Principal
Amount | | | Value in
U.S. Dollarsi |
| | | FOREIGN GOVERNMENTS/AGENCIES—continued | |
| | | Sovereign—continued | |
| $58,000 | 4,5 | Buoni Poliennali Del Tes, Unsecd. Note, 3.25%, 9/01/2046 | $70,203 |
| 200,000 | | Canada, Government of, Bond, 3.250%, 06/01/2021 | 167,454 |
| 400,000 | | Canada, Government of, Bond, 4.000%, 06/01/2016 | 304,898 |
| 536,000 | | France, Government of, 0.50%, 05/25/2025 | 555,405 |
| 1,500,000 | | France, Government of, 3.250%, 10/25/2021 | 1,878,239 |
| 400,000 | | France, Government of, Bond, 4.500%, 04/25/2041 | 663,580 |
| 2,000,000 | | Germany, Government of, 1.75%, 2/15/2024 | 2,375,418 |
| 170,000,000 | | Japan, Government of, Series 65, 1.900%, 12/20/2023 | 1,570,946 |
| 120,000,000 | | Japan, Government of, Series 87, 2.200%, 03/20/2026 | 1,157,488 |
| 247,000,000 | | Japan, Government of, Sr. Unsecd. Note, Series 114, 2.10%, 12/20/2029 | 2,405,832 |
| 320,000,000 | | Japan-313(10 Year Issue), Series 313, 1.30%, 3/20/2021 | 2,770,976 |
| 850,000 | 4,5 | Netherlands, Government of, 1.750%, 07/15/2023 | 995,741 |
| 240,000 | 4,5 | Spain, Government of, Sr. Unsecd. Note, 1.95%, 7/30/2030 | 249,687 |
| 3,950,000 | | Sweden, Government of, Series 1058, 2.50%, 5/12/2025 | 524,584 |
| 1,410,000 | | United Kingdom, Government of, 1.750%, 09/07/2022 | 2,156,622 |
| 180,000 | | United Kingdom, Government of, 3.250%, 01/22/2044 | 310,014 |
| 670,000 | | United Kingdom, Government, 2.75%, 9/07/2024 | 1,092,084 |
| 30,000 | | United Mexican States, Series MTNA, 6.750%, 09/27/2034 | 36,975 |
| | | TOTAL FOREIGN GOVERNMENTS/AGENCIES
(IDENTIFIED COST $31,565,774) | 29,724,612 |
| | | MUNICIPAL BOND—0.0% | |
| | | Illinois—0.0% | |
| 90,000 | | Chicago, IL Metropolitan Water Reclamation District, Direct Payment Taxable Limited GO Build America Bonds, 5.720%, 12/01/2038
(IDENTIFIED COST $90,000) | 102,903 |
| | | U.S. TREASURY—1.1% | |
| 1,016,130 | | U.S. Treasury Inflation-Protected Note, 0.125%, 4/15/2020 | 1,008,126 |
| 2,755,000 | | United States Treasury Note, 1.375%, 10/31/2020 | 2,718,159 |
| 1,650,000 | | United States Treasury Note, 2.250%, 11/15/2025 | 1,655,156 |
| | | TOTAL U.S. TREASURY
(IDENTIFIED COST $5,351,325) | 5,381,441 |
| | | EXCHANGE-TRADED FUND—6.0% | |
| 683,708 | | iShares Core MSCI Emerging Markets ETF
(IDENTIFIED COST $33,518,465) | 28,285,000 |
| | | INVESTMENT COMPANIES—20.2%6 | |
| 1,324,502 | | Emerging Markets Fixed Income Core Fund | 45,557,365 |
| 334,858 | | Federated Bank Loan Core Fund | 3,288,309 |
Annual Shareholder Report
Shares or
Principal
Amount | | | Value in
U.S. Dollarsi |
| | | INVESTMENT COMPANIES—continued6 | |
| $1,919,615 | | Federated Mortgage Core Portfolio | $18,984,988 |
| 1,526,203 | | Federated Project and Trade Finance Core Fund | 14,269,998 |
| 2,220,152 | | High Yield Bond Portfolio | 13,298,709 |
| | | TOTAL INVESTMENT COMPANIES
(IDENTIFIED COST $99,789,893) | 95,399,369 |
| | | TOTAL INVESTMENTS—93.7%
(IDENTIFIED COST $435,804,604)7 | 442,797,951 |
| | | OTHER ASSETS AND LIABILITIES - NET—6.3%8 | 29,746,191 |
| | | TOTAL NET ASSETS—100% | $472,544,142 |
At November 30, 2015, the Fund had the following outstanding futures contracts:
| Description | Number of
Contracts | Notional
Value | Expiration
Date | Unrealized
Appreciation
(Depreciation) |
| 1Amsterdam Index Short Futures | 86 | $8,078,840 | December 2015 | $21,158 |
| 1Australia 10-Year Bond Short Futures | 1 | $126,843 | December 2015 | $141 |
| 1DJIA Mini E-CBOT Short Futures | 52 | $4,605,640 | December 2015 | $11,385 |
| 1Euro BTP Short Futures | 23 | $3,241,620 | December 2015 | $(41,071) |
| 1Euro STOXX 50 Short Futures | 48 | $1,682,400 | December 2015 | $(10,777) |
| 1FTSE 100 Index Short Futures | 326 | $20,709,150 | December 2015 | $(430,832) |
| 1FTSE/MIB Index Short Futures | 78 | $8,852,220 | December 2015 | $(76,415) |
| 1KOSPI2 Index Short Futures | 183 | $22,403,775,000 | December 2015 | $50,512 |
| 1Long GILT Short Futures | 53 | $6,239,690 | March 2016 | $(55,207) |
| 1MSCI Singapore IX ETS Short Futures | 418 | $13,325,840 | December 2015 | $232,054 |
| 1Mini MSCI Emerging Market Short Futures | 122 | $5,002,000 | December 2015 | $(19,496) |
| 1OMXS 30 Index Short Futures | 604 | $92,985,800 | December 2015 | $(163,488) |
| 1S&P 500 E-Mini Short Futures | 111 | $11,542,890 | December 2015 | $54,751 |
| 1SGX Nifty 50 Short Futures | 489 | $7,803,951 | December 2015 | $(30,984) |
| 1SPI 200 Short Futures | 227 | $29,430,550 | December 2015 | $(56,065) |
| 1United States Treasury Notes 10-Year Short Futures | 236 | $29,839,250 | March 2016 | $(73,481) |
| 1BIST 30 Long Futures | 1,039 | $9,725,040 | December 2015 | $(29,191) |
| 1CAC 40 10 Euro Long Futures | 111 | $5,501,160 | December 2015 | $33,031 |
| 1Canada 10-Year Bond Long Futures | 158 | $21,933,560 | March 2016 | $35,129 |
| 1DAX Index Long Futures | 43 | $12,231,888 | December 2015 | $108,354 |
| 1Euro BUND Long Futures | 56 | $8,865,360 | December 2015 | $(8,431) |
| 1FTSE JSE Top 40 Long Futures | 812 | $377,458,200 | December 2015 | $(123,379) |
| 1Hang Seng Index Long Futures | 34 | $37,245,300 | December 2015 | $(32,187) |
Annual Shareholder Report
| Description | Number of
Contracts | Notional
Value | Expiration
Date | Unrealized
Appreciation
(Depreciation) |
| 1IBEX 35 Index Long Futures | 53 | $5,498,538 | December 2015 | $50,888 |
| 1Japan 10-Year Bond Long Futures | 3 | $445,590,000 | December 2015 | $3,161 |
| 1MSCI Taiwan Index Long Futures | 65 | $1,989,000 | December 2015 | $(45,035) |
| 1NIKKEI 225 Long Futures | 29 | $572,750,000 | December 2015 | $(35,869) |
| 1Russell 2000 Mini Long Futures | 14 | $1,674,260 | December 2015 | $74,713 |
| 1S&P 500 E-Mini Long Futures | 546 | $56,778,540 | December 2015 | $1,070,613 |
| 1S&P/TSX 60 Index Long Futures | 169 | $26,745,940 | December 2015 | $524,637 |
| 1Swiss Market Index Long Futures | 148 | $13,330,360 | December 2015 | $472,277 |
| 1TOPIX Index Long Futures | 110 | $1,740,200,000 | December 2015 | $100,764 |
| 1United States Treasury Notes 2-Year Long Futures | 38 | $8,266,781 | March 2016 | $(2,464) |
| 1United States Ultra Bond Long Futures | 25 | $3,960,938 | March 2016 | $44,277 |
| NET UNREALIZED APPRECIATION ON FUTURES CONTRACTS | $1,653,473 |
At November 30, 2015, the Fund had the following outstanding foreign exchange contracts:
| Settlement Date | Counterparty | Foreign Currency
Units to
Deliver/Receive | In
Exchange
For | Unrealized
Gain/Loss |
| Contracts Purchased: |
| 12/01/2015 | JPMorgan Chase | 1,600,000 AUD | $1,131,382 | $25,738 |
| 12/01/2015 | JPMorgan Chase | 1,984,680 CAD | 2,300,000 NZD | $(27,824) |
| 12/01/2015 | JPMorgan Chase | 732,242 CAD | $550,000 | $(1,689) |
| 12/01/2015 | JPMorgan Chase | 733,028 CAD | $550,000 | $(1,100) |
| 12/01/2015 | JPMorgan Chase | 737,802 CAD | $550,000 | $2,475 |
| 12/01/2015 | JPMorgan Chase | 755,632 CAD | $564,650 | $1,176 |
| 12/01/2015 | JPMorgan Chase | 350,000 EUR | $394,064 | $(24,271) |
| 12/01/2015 | JPMorgan Chase | 1,000,000 EUR | $1,123,039 | $(66,489) |
| 12/01/2015 | JPMorgan Chase | 1,000,000 EUR | $1,127,545 | $(70,995) |
| 12/01/2015 | Goldman Sachs | 1,650,000 EUR | $1,822,805 | $(79,497) |
| 12/01/2015 | Bank of America, N.A. | 980,000 GBP | 12,392,786 SEK | $55,079 |
| 12/01/2015 | JPMorgan Chase | 927,000 GBP | $1,411,780 | $(15,627) |
| 12/01/2015 | Goldman Sachs | 264,055,440 JPY | $2,200,000 | $(54,952) |
| 12/03/2015 | JPMorgan Chase | 5,401,000 AUD | $3,898,939 | $6,841 |
| 12/03/2015 | JPMorgan Chase | 14,661,000 CAD | $11,012,849 | $(34,645) |
| 12/03/2015 | JPMorgan Chase | 2,213,000 CHF | $2,170,904 | $(19,887) |
| 12/03/2015 | JPMorgan Chase | 12,054,000 EUR | $12,814,683 | $(78,861) |
| 12/03/2015 | JPMorgan Chase | 240,500 GBP | $365,909 | $(3,695) |
| 12/03/2015 | JPMorgan Chase | 410,003,000 JPY | $3,331,120 | $(447) |
| 12/03/2015 | JPMorgan Chase | 217,162,000 MXN | $13,114,007 | $(15,693) |
| 12/03/2015 | JPMorgan Chase | 58,491,500 NOK | $6,771,825 | $(41,485) |
Annual Shareholder Report
| Settlement Date | Counterparty | Foreign Currency
Units to
Deliver/Receive | In
Exchange
For | Unrealized
Gain/Loss |
| 12/03/2015 | JPMorgan Chase | 7,436,000 NZD | $4,850,779 | $43,616 |
| 12/03/2015 | JPMorgan Chase | 46,934,000 SEK | $5,409,294 | $(27,983) |
| 12/03/2015 | JPMorgan Chase | 7,258,000 SGD | $5,128,836 | $16,498 |
| 12/03/2015 | JPMorgan Chase | 37,309,000 TRY | $13,080,505 | $(281,427) |
| 12/09/2015 | JPMorgan Chase | 257,500 AUD | $185,053 | $1,097 |
| 12/09/2015 | JPMorgan Chase | 17,913,000 CAD | $13,408,996 | $3,973 |
| 12/09/2015 | JPMorgan Chase | 4,988,500 CHF | $4,894,950 | $(45,202) |
| 12/09/2015 | JPMorgan Chase | 12,604,000 EUR | $13,348,388 | $(30,376) |
| 12/09/2015 | JPMorgan Chase | 3,714,000 GBP | $5,639,029 | $(45,638) |
| 12/09/2015 | JPMorgan Chase | 219,474,000 JPY | $1,784,800 | $(1,821) |
| 12/09/2015 | JPMorgan Chase | 222,070,000 MXN | $13,372,217 | $16,624 |
| 12/09/2015 | JPMorgan Chase | 26,339,000 NOK | $3,026,189 | $4,160 |
| 12/09/2015 | JPMorgan Chase | 1,330,000 NZD | $868,325 | $6,708 |
| 12/09/2015 | JPMorgan Chase | 45,078,000 SEK | $5,166,479 | $2,501 |
| 12/09/2015 | JPMorgan Chase | 10,628,000 SGD | $7,516,425 | $16,409 |
| 12/09/2015 | JPMorgan Chase | 19,057,500 TRY | $6,486,706 | $39,565 |
| 12/15/2015 | JPMorgan Chase | 2,060,037 AUD | 1,400,000 EUR | $9,118 |
| 12/15/2015 | JPMorgan Chase | 2,000,000 CAD | 189,431,060 JPY | $(41,779) |
| 12/15/2015 | JPMorgan Chase | 1,200,000 GBP | $1,872,165 | $(64,837) |
| 12/15/2015 | JPMorgan Chase | 1,200,000 GBP | $1,879,463 | $(72,134) |
| 12/15/2015 | JPMorgan Chase | 71,915,802 JPY | $600,000 | $(15,597) |
| 12/15/2015 | JPMorgan Chase | 180,058,200 JPY | $1,500,000 | $(36,809) |
| 12/15/2015 | JPMorgan Chase | 198,379,280 JPY | $1,600,000 | $12,072 |
| 12/16/2015 | JPMorgan Chase | 13,034,000 CAD | $9,747,005 | $12,722 |
| 12/16/2015 | JPMorgan Chase | 2,929,500 CHF | $2,845,316 | $4,604 |
| 12/16/2015 | JPMorgan Chase | 5,846,500 GBP | $8,791,115 | $14,418 |
| 12/30/2015 | JPMorgan Chase | 1,937,052 DKK | 260,000 EUR | $(277) |
| 02/02/2016 | State Street Bank | 2,000,000 GBP | $3,006,320 | $6,398 |
| Contracts Sold: |
| 12/01/2015 | JPMorgan Chase | 1,600,000 AUD | $1,168,799 | $11,678 |
| 12/01/2015 | JPMorgan Chase | 1,977,741 CAD | 2,300,000 NZD | $33,020 |
| 12/01/2015 | JPMorgan Chase | 147,617 CAD | $110,000 | $(537) |
| 12/01/2015 | JPMorgan Chase | 147,617 CAD | $110,000 | $(537) |
| 12/01/2015 | JPMorgan Chase | 147,617 CAD | $110,000 | $(537) |
| 12/01/2015 | JPMorgan Chase | 151,549 CAD | $112,930 | $(551) |
| 12/01/2015 | JPMorgan Chase | 590,850 CAD | $440,000 | $(2,435) |
| 12/01/2015 | JPMorgan Chase | 590,850 CAD | $440,000 | $(2,435) |
| 12/01/2015 | JPMorgan Chase | 590,850 CAD | $440,000 | $(2,435) |
| 12/01/2015 | JPMorgan Chase | 606,588 CAD | $451,720 | $(2,500) |
Annual Shareholder Report
| Settlement Date | Counterparty | Foreign Currency
Units to
Deliver/Receive | In
Exchange
For | Unrealized
Gain/Loss |
| 12/01/2015 | JPMorgan Chase | 2,000,000 EUR | $2,233,760 | $120,661 |
| 12/01/2015 | Goldman Sachs | 2,000,000 EUR | $2,272,126 | $159,027 |
| 12/01/2015 | Bank of America, N.A. | 980,000 GBP | 12,214,230 SEK | $(75,552) |
| 12/01/2015 | JPMorgan Chase | 927,000 GBP | $1,409,189 | $13,035 |
| 12/01/2015 | Goldman Sachs | 130,615,815 JPY | $1,093,439 | $32,385 |
| 12/01/2015 | Goldman Sachs | 132,183,205 JPY | $1,106,561 | $32,773 |
| 12/03/2015 | JPMorgan Chase | 5,401,000 AUD | $3,837,286 | $(68,494) |
| 12/03/2015 | JPMorgan Chase | 14,661,000 CAD | $10,974,908 | $(3,296) |
| 12/03/2015 | JPMorgan Chase | 2,213,000 CHF | $2,201,077 | $50,060 |
| 12/03/2015 | JPMorgan Chase | 12,054,000 EUR | $12,934,357 | $198,534 |
| 12/03/2015 | JPMorgan Chase | 240,500 GBP | $365,171 | $2,957 |
| 12/03/2015 | JPMorgan Chase | 410,003,000 JPY | $3,334,066 | $3,393 |
| 12/03/2015 | JPMorgan Chase | 96,491,000 MXN | $5,759,410 | $(60,528) |
| 12/03/2015 | JPMorgan Chase | 120,671,000 MXN | $7,218,774 | $(59,602) |
| 12/03/2015 | JPMorgan Chase | 58,491,500 NOK | $6,738,382 | $8,042 |
| 12/03/2015 | JPMorgan Chase | 7,436,000 NZD | $4,811,232 | $(83,163) |
| 12/03/2015 | JPMorgan Chase | 46,934,000 SEK | $5,378,468 | $(2,843) |
| 12/03/2015 | JPMorgan Chase | 7,258,000 SGD | $5,100,521 | $(44,813) |
| 12/03/2015 | JPMorgan Chase | 37,309,000 TRY | $12,896,689 | $97,612 |
| 12/09/2015 | JPMorgan Chase | 257,500 AUD | $185,824 | $(325) |
| 12/09/2015 | JPMorgan Chase | 17,913,000 CAD | $13,395,684 | $(17,285) |
| 12/09/2015 | JPMorgan Chase | 4,988,500 CHF | $4,843,933 | $(5,816) |
| 12/09/2015 | JPMorgan Chase | 12,604,000 EUR | $13,400,478 | $82,465 |
| 12/09/2015 | JPMorgan Chase | 3,714,000 GBP | $5,584,766 | $(8,625) |
| 12/09/2015 | JPMorgan Chase | 219,474,000 JPY | $1,787,292 | $4,313 |
| 12/09/2015 | JPMorgan Chase | 222,070,000 MXN | $13,403,627 | $14,786 |
| 12/09/2015 | JPMorgan Chase | 26,339,000 NOK | $3,048,893 | $18,544 |
| 12/09/2015 | JPMorgan Chase | 1,330,000 NZD | $867,225 | $(7,809) |
| 12/09/2015 | JPMorgan Chase | 45,078,000 SEK | $5,157,114 | $(11,866) |
| 12/09/2015 | JPMorgan Chase | 10,628,000 SGD | $7,507,272 | $(25,562) |
| 12/09/2015 | JPMorgan Chase | 19,057,500 TRY | $6,669,606 | $143,336 |
| 12/15/2015 | JPMorgan Chase | 1,058,033 AUD | 700,000 EUR | $(24,805) |
| 12/15/2015 | JPMorgan Chase | 1,118,894 AUD | 700,000 EUR | $(68,789) |
| 12/15/2015 | JPMorgan Chase | 2,000,000 CAD | 188,814,400 JPY | $36,768 |
| 12/15/2015 | JPMorgan Chase | 4,000,000 EUR | $4,486,008 | $258,431 |
| 12/15/2015 | JPMorgan Chase | 1,200,000 GBP | $1,869,810 | $62,481 |
| 12/15/2015 | JPMorgan Chase | 1,200,000 GBP | $1,892,078 | $84,749 |
| 12/15/2015 | JPMorgan Chase | 72,120,828 JPY | $600,000 | $13,931 |
| 12/15/2015 | JPMorgan Chase | 180,562,845 JPY | $1,500,000 | $32,708 |
Annual Shareholder Report
| Settlement Date | Counterparty | Foreign Currency
Units to
Deliver/Receive | In
Exchange
For | Unrealized
Gain/Loss |
| 12/16/2015 | JPMorgan Chase | 6,807,500 AUD | $4,890,292 | $(29,176) |
| 12/16/2015 | JPMorgan Chase | 11,918,000 EUR | $12,623,400 | $26,850 |
| 12/16/2015 | JPMorgan Chase | 353,375,000 JPY | $2,878,095 | $6,357 |
| 12/16/2015 | JPMorgan Chase | 66,326,500 MXN | $3,991,684 | $(5,360) |
| 12/16/2015 | JPMorgan Chase | 30,960,500 NOK | $3,556,637 | $(5,139) |
| 12/16/2015 | JPMorgan Chase | 6,478,500 NZD | $4,227,482 | $(32,900) |
| 12/16/2015 | JPMorgan Chase | 48,243,000 SEK | $5,519,391 | $(14,368) |
| 12/16/2015 | JPMorgan Chase | 17,837,000 SGD | $12,611,064 | $(28,489) |
| 12/16/2015 | JPMorgan Chase | 32,830,500 TRY | $11,150,547 | $(69,954) |
| NET UNREALIZED DEPRECIATION ON FOREIGN EXCHANGE CONTRACTS | $(116,875) |
Net Unrealized Appreciation/ (Depreciation) on Future Contracts and Foreign Exchange Contracts is included in “Other Assets and Liabilities—Net.”
| 1 | Non-income-producing security. |
| 2 | Issuer in default. |
| 3 | Market quotations and price evaluations are not available. Fair value determined in accordance with procedures established by and under the general supervision of the Trustees. |
| 4 | Denotes a restricted security that either: (a) cannot be offered for public sale without first being registered, or being able to take advantage of an exemption from registration, under the Securities Act of 1933; or (b) is subject to a contractual restriction on public sales. At November 30, 2015, these restricted securities amounted to $8,386,572, which represented 1.8% of total net assets. |
| 5 | Denotes a restricted security that may be resold without restriction to “qualified institutional buyers” as defined in Rule 144A under the Securities Act of 1933 and that the Fund has determined to be liquid under criteria established by the Fund's Board of Trustees (the “Trustees”). At November 30, 2015, these liquid restricted securities amounted to $7,312,290, which represented 1.5% of total net assets. |
| 6 | Affiliated holdings. |
| 7 | The cost of investments for federal tax purposes amounts to $436,819,279. |
| 8 | Assets, other than investments in securities, less liabilities. See Statement of Assets and Liabilities. |
Note: The categories of investments are shown as a percentage of total net assets at November 30, 2015.
Various inputs are used in determining the value of the Fund's investments. These inputs are summarized in the three broad levels listed below:
Level 1—quoted prices in active markets for identical securities.
Level 2—other significant observable inputs (including quoted prices for similar securities, interest rates, prepayment speeds, credit risk, etc.). Also includes securities valued at amortized cost.
Level 3—significant unobservable inputs (including the Fund's own assumptions in determining the fair value of investments).
The inputs or methodology used for valuing securities are not an indication of the risk associated with investing in those securities.
Annual Shareholder Report
The following is a summary of the inputs used, as of November 31, 2015, in valuing the Fund's assets carried at fair value:
| Valuation Inputs | | | | |
| | Level 1—
Quoted
Prices | Level 2—
Other
Significant
Observable
Inputs | Level 3—
Significant
Unobservable
Inputs | Total |
| Equity Securities: | | | | |
| Common Stocks | | | | |
| Domestic | $134,860,142 | $— | $— | $134,860,142 |
| International | 16,389,830 | 105,465,0251 | — | 121,854,855 |
| Debt Securities: | | | | |
| Asset-Backed Securities | — | 596,477 | — | 596,477 |
| Collateralized Mortgage Obligations | — | 1,222,738 | — | 1,222,738 |
| Corporate Bonds | — | 25,058,633 | 83,197 | 25,141,830 |
| Foreign Governments/Agencies | — | 29,724,612 | — | 29,724,612 |
| Mortgage-Backed Securities | — | 228,584 | — | 228,584 |
| Municipal | — | 102,903 | — | 102,903 |
| U.S. Treasury | — | 5,381,441 | — | 5,381,441 |
| Exchange-Traded Funds | 28,285,000 | — | — | 28,285,000 |
| Investment Companies2 | — | 95,399,3693 | — | 95,399,369 |
| TOTAL SECURITIES | $179,534,972 | $263,179,782 | $83,197 | $442,797,951 |
| Other Financial Instruments:4 | | | | |
| Assets | $2,887,845 | $1,850,688 | $— | $4,738,533 |
| Liabilities | (1,234,372) | (1,967,563) | — | (3,201,935) |
| TOTAL OTHER FINANCIAL INSTRUMENTS4 | $1,653,473 | $(116,875) | $— | $1,536,598 |
| 1 | Includes $75,817,887 of securities transferred from Level 1 to Level 2 because fair value factors were applied to equity securities traded principally in foreign markets to account for significant post market close activity. Transfers shown represent the value of the investments at the beginning of the period. |
| 2 | Emerging Markets Fixed Income Core Fund, Federated Mortgage Core Portfolio, Federated Project and Trade Finance Core Fund and High Yield Bond Portfolio are affiliated holdings offered only to registered investment companies and other accredited investors. Investments in these funds are deemed Level 2 due to the fact that the net asset value (the NAV) is not publicly available and, with respect to Federated Project and Trade Finance Core Fund, due to the fact that the price of shares redeemed may be determined as of the closing NAV of the fund up to twenty-four days after receipt of a shareholder redemption request. |
| 3 | Includes $68,867,887 of affiliated investment company holdings transferred from Level 1 to Level 2 because the Adviser determined that these investments more appropriately meet the definition of Level 2. Transfers shown represent the value of the investments at the beginning of the period. |
| 4 | Other financial instruments include futures contracts and foreign exchange contracts. |
Annual Shareholder Report
The following acronyms are used throughout this portfolio:
| AUD | —Australian Dollar |
| CAD | —Canadian Dollar |
| CHF | —Swiss Franc |
| DKK | —Danish Krone |
| EUR | —Euro |
| GBP | —British Pound |
| GO | —General Obligation |
| JPY | —Japanese Yen |
MBIA
| —National Public Finance Guarantee Corp. (as restructured from MBIA
Insurance Corp.) |
| MTN | —Medium Term Note |
| MXN | —Mexican Peso |
| NOK | —Norwegian Krone |
| NZD | —New Zealand Dollar |
| REIT(s) | —Real Estate Investment Trust(s) |
| SEK | —Swedish Krona |
| SGD | —Singapore Dollar |
| TRY | —Turkish Lira |
See Notes which are an integral part of the Financial Statements
Annual Shareholder Report
Financial Highlights–Class A Shares
(For a Share Outstanding Throughout Each Period)
| Year Ended November 30 | 2015 | 2014 | 2013 | 2012 | 2011 |
| Net Asset Value, Beginning of Period | $20.29 | $21.47 | $18.68 | $16.98 | $16.87 |
| Income From Investment Operations: | | | | | |
| Net investment income | 0.271 | 0.181 | 0.171 | 0.181 | 0.201 |
| Net realized and unrealized gain (loss) on investments, futures contracts, swap contracts, written options and foreign currency transactions | (0.80) | 1.10 | 3.07 | 1.74 | 0.08 |
| TOTAL FROM INVESTMENT OPERATIONS | (0.53) | 1.28 | 3.24 | 1.92 | 0.28 |
| Less Distributions: | | | | | |
| Distributions from net investment income | (0.17) | (0.12) | (0.16) | (0.22) | (0.17) |
| Distributions from net realized gain on investments, futures contracts, swap contracts, written options and foreign currency transactions | (1.72) | (2.34) | (0.29) | — | — |
| TOTAL DISTRIBUTIONS | (1.89) | (2.46) | (0.45) | (0.22) | (0.17) |
| Redemption Fees | — | 0.002 | — | — | — |
| Net Asset Value, End of Period | $17.87 | $20.29 | $21.47 | $18.68 | $16.98 |
| Total Return3 | (2.80)% | 6.53% | 17.73% | 11.38% | 1.62% |
| Ratios to Average Net Assets: | | | | | |
| Net expenses | 1.16% | 1.14% | 1.17% | 1.22% | 1.25%4 |
| Net investment income | 1.45% | 0.93% | 0.88% | 1.01% | 1.14% |
| Expense waiver/reimbursement5 | 0.13% | 0.10% | 0.10% | 0.07% | 0.10% |
| Supplemental Data: | | | | | |
| Net assets, end of period (000 omitted) | $187,183 | $196,067 | $193,678 | $185,414 | $178,971 |
| Portfolio turnover | 76% | 100% | 106% | 85% | 215% |
| 1 | Per share numbers have been calculated using the average shares method. |
| 2 | Represents less than $0.01. |
| 3 | Based on net asset value, which does not reflect the sales charge, redemption fee or contingent deferred sales charge, if applicable. |
| 4 | The net expense ratio is calculated without reduction for expense offset arrangements. The net expense ratio is 1.25% for the year ended November 30, 2011, after taking into account this expense reduction. |
| 5 | This expense decrease is reflected in both the net expense and the net investment income ratios shown above. |
See Notes which are an integral part of the Financial Statements
Annual Shareholder Report
Financial Highlights–Class B Shares
(For a Share Outstanding Throughout Each Period)
| Year Ended November 30 | 2015 | 2014 | 2013 | 2012 | 2011 |
| Net Asset Value, Beginning of Period | $19.86 | $21.17 | $18.46 | $16.78 | $16.69 |
| Income From Investment Operations: | | | | | |
| Net investment income | 0.121 | 0.021 | 0.011 | 0.031 | 0.061 |
| Net realized and unrealized gain (loss) on investments, futures contracts, swap contracts, written options and foreign currency transactions | (0.78) | 1.07 | 3.04 | 1.72 | 0.08 |
| TOTAL FROM INVESTMENT OPERATIONS | (0.66) | 1.09 | 3.05 | 1.75 | 0.14 |
| Less Distributions: | | | | | |
| Distributions from net investment income | (0.05) | (0.06) | (0.05) | (0.07) | (0.05) |
| Distributions from net realized gain on investments, futures contracts, swap contracts, written options and foreign currency transactions | (1.72) | (2.34) | (0.29) | — | — |
| TOTAL DISTRIBUTIONS | (1.77) | (2.40) | (0.34) | (0.07) | (0.05) |
| Redemption Fees | — | 0.002 | — | — | — |
| Net Asset Value, End of Period | $17.43 | $19.86 | $21.17 | $18.46 | $16.78 |
| Total Return3 | (3.59)% | 5.67% | 16.82% | 10.39% | 0.80% |
| Ratios to Average Net Assets: | | | | | |
| Net expenses | 1.97% | 1.95% | 1.99% | 2.05% | 2.05%4 |
| Net investment income | 0.64% | 0.12% | 0.06% | 0.19% | 0.33% |
| Expense waiver/reimbursement5 | 0.12% | 0.10% | 0.10% | 0.07% | 0.12% |
| Supplemental Data: | | | | | |
| Net assets, end of period (000 omitted) | $21,384 | $26,163 | $30,675 | $28,853 | $30,424 |
| Portfolio turnover | 76% | 100% | 106% | 85% | 215% |
| 1 | Per share numbers have been calculated using the average shares method. |
| 2 | Represents less than $0.01. |
| 3 | Based on net asset value, which does not reflect the sales charge, redemption fee or contingent deferred sales charge, if applicable. |
| 4 | The net expense ratio is calculated without reduction for expense offset arrangements. The net expense ratio is 2.05% for the year ended November 30, 2011, after taking into account this expense reduction. |
| 5 | This expense decrease is reflected in both the net expense and the net investment income ratios shown above. |
See Notes which are an integral part of the Financial Statements
Annual Shareholder Report
Financial Highlights–Class C Shares
(For a Share Outstanding Throughout Each Period)
| Year Ended November 30 | 2015 | 2014 | 2013 | 2012 | 2011 |
| Net Asset Value, Beginning of Period | $19.80 | $21.11 | $18.40 | $16.72 | $16.62 |
| Income From Investment Operations: | | | | | |
| Net investment income | 0.131 | 0.031 | 0.021 | 0.041 | 0.061 |
| Net realized and unrealized gain (loss) on investments, futures contracts, swap contracts, written options and foreign currency transactions | (0.78) | 1.07 | 3.03 | 1.71 | 0.09 |
| TOTAL FROM INVESTMENT OPERATIONS | (0.65) | 1.10 | 3.05 | 1.75 | 0.15 |
| Less Distributions: | | | | | |
| Distributions from net investment income | (0.06) | (0.07) | (0.05) | (0.07) | (0.05) |
| Distributions from net realized gain on investments, futures contracts, swap contracts, written options and foreign currency transactions | (1.72) | (2.34) | (0.29) | — | — |
| TOTAL DISTRIBUTIONS | (1.78) | (2.41) | (0.34) | (0.07) | (0.05) |
| Redemption Fees | — | 0.002 | — | — | — |
| Net Asset Value, End of Period | $17.37 | $19.80 | $21.11 | $18.40 | $16.72 |
| Total Return3 | (3.55)% | 5.70% | 16.89% | 10.51% | 0.90% |
| Ratios to Average Net Assets: | | | | | |
| Net expenses | 1.91% | 1.89% | 1.95% | 1.98% | 2.02%4 |
| Net investment income | 0.70% | 0.17% | 0.10% | 0.24% | 0.36% |
| Expense waiver/reimbursement5 | 0.15% | 0.13% | 0.10% | 0.07% | 0.10% |
| Supplemental Data: | | | | | |
| Net assets, end of period (000 omitted) | $89,640 | $81,703 | $71,450 | $60,315 | $52,187 |
| Portfolio turnover | 76% | 100% | 106% | 85% | 215% |
| 1 | Per share numbers have been calculated using the average shares method. |
| 2 | Represents less than $0.01. |
| 3 | Based on net asset value, which does not reflect the sales charge, redemption fee or contingent deferred sales charge, if applicable. |
| 4 | The net expense ratio is calculated without reduction for expense offset arrangements. The net expense ratio is 2.02% for the year ended November 30, 2011, after taking into account this expense reduction. |
| 5 | This expense decrease is reflected in both the net expense and the net investment income ratios shown above. |
See Notes which are an integral part of the Financial Statements
Annual Shareholder Report
Financial Highlights–Class R Shares
(For a Share Outstanding Throughout Each Period)
| Year Ended November 30 | 2015 | 2014 | 2013 | 2012 | 2011 |
| Net Asset Value, Beginning of Period | $20.16 | $21.40 | $18.62 | $16.92 | $16.81 |
| Income From Investment Operations: | | | | | |
| Net investment income | 0.191 | 0.101 | 0.091 | 0.111 | 0.121 |
| Net realized and unrealized gain (loss) on investments, futures contracts, swap contracts, written options and foreign currency transactions | (0.80) | 1.08 | 3.07 | 1.73 | 0.09 |
| TOTAL FROM INVESTMENT OPERATIONS | (0.61) | 1.18 | 3.16 | 1.84 | 0.21 |
| Less Distributions: | | | | | |
| Distributions from net investment income | (0.09) | (0.08) | (0.09) | (0.14) | (0.10) |
| Distributions from net realized gain on investments, futures contracts, swap contracts, written options and foreign currency transactions | (1.72) | (2.34) | (0.29) | — | — |
| TOTAL DISTRIBUTIONS | (1.81) | (2.42) | (0.38) | (0.14) | (0.10) |
| Redemption Fees | — | 0.002 | — | — | — |
| Net Asset Value, End of Period | $17.74 | $20.16 | $21.40 | $18.62 | $16.92 |
| Total Return3 | (3.26)% | 6.06% | 17.29% | 10.90% | 1.23% |
| Ratios to Average Net Assets: | | | | | |
| Net expenses | 1.59% | 1.57% | 1.57% | 1.65% | 1.68%4 |
| Net investment income | 1.02% | 0.50% | 0.48% | 0.58% | 0.71% |
| Expense waiver/reimbursement5 | 0.14% | 0.09% | 0.10% | 0.07% | 0.10% |
| Supplemental Data: | | | | | |
| Net assets, end of period (000 omitted) | $59,229 | $67,588 | $67,769 | $62,627 | $54,878 |
| Portfolio turnover | 76% | 100% | 106% | 85% | 215% |
| 1 | Per share numbers have been calculated using the average shares method. |
| 2 | Represents less than $0.01. |
| 3 | Based on net asset value. |
| 4 | The net expense ratio is calculated without reduction for expense offset arrangements. The net expense ratio is 1.68% for the year ended November 30, 2011, after taking into account this expense reduction. |
| 5 | This expense decrease is reflected in both the net expense and the net investment income ratios shown above. |
See Notes which are an integral part of the Financial Statements
Annual Shareholder Report
Financial Highlights–Institutional Shares
(For a Share Outstanding Throughout Each Period)
| Year Ended November 30 | 2015 | 2014 | 2013 | 2012 | 2011 |
| Net Asset Value, Beginning of Period | $20.40 | $21.54 | $18.74 | $17.04 | $16.91 |
| Income From Investment Operations: | | | | | |
| Net investment income | 0.321 | 0.241 | 0.231 | 0.241 | 0.241 |
| Net realized and unrealized gain (loss) on investments, futures contracts, swap contracts, written options and foreign currency transactions | (0.80) | 1.10 | 3.08 | 1.74 | 0.10 |
| TOTAL FROM INVESTMENT OPERATIONS | (0.48) | 1.34 | 3.31 | 1.98 | 0.34 |
| Less Distributions: | | | | | |
| Distributions from net investment income | (0.22) | (0.14) | (0.22) | (0.28) | (0.21) |
| Distributions from net realized gain on investments, futures contracts, swap contracts, written options and foreign currency transactions | (1.72) | (2.34) | (0.29) | — | — |
| TOTAL DISTRIBUTIONS | (1.94) | (2.48) | (0.51) | (0.28) | (0.21) |
| Redemption Fees | — | 0.002 | — | — | — |
| Net Asset Value, End of Period | $17.98 | $20.40 | $21.54 | $18.74 | $17.04 |
| Total Return3 | (2.51)% | 6.85% | 18.07% | 11.69% | 1.99% |
| Ratios to Average Net Assets: | | | | | |
| Net expenses | 0.87% | 0.85% | 0.89% | 0.94% | 0.95%4 |
| Net investment income | 1.74% | 1.21% | 1.16% | 1.29% | 1.40% |
| Expense waiver/reimbursement5 | 0.14% | 0.12% | 0.10% | 0.07% | 0.10% |
| Supplemental Data: | | | | | |
| Net assets, end of period (000 omitted) | $115,108 | $62,451 | $48,353 | $35,929 | $33,979 |
| Portfolio turnover | 76% | 100% | 106% | 85% | 215% |
| 1 | Per share numbers have been calculated using the average shares method. |
| 2 | Represents less than $0.01. |
| 3 | Based on net asset value. |
| 4 | The net expense ratio is calculated without reduction for expense offset arrangements. The net expense ratio is 0.95% for the year ended November 30, 2011, after taking into account this expense reduction. |
| 5 | This expense decrease is reflected in both the net expense and the net investment income ratios shown above. |
See Notes which are an integral part of the Financial Statements
Annual Shareholder Report
Statement of Assets and Liabilities
November 30, 2015
| Assets: | | |
| Total investment in securities, at value including $95,399,369 of investment in affiliated holdings (Note 5) (identified cost $435,804,604) | | $442,797,951 |
| Cash | | 13,087,533 |
| Cash denominated in foreign currencies (identified cost $325,233) | | 311,065 |
| Restricted cash (Note 2) | | 17,461,141 |
| Income receivable | | 1,142,820 |
| Receivable for shares sold | | 757,946 |
| Unrealized appreciation on foreign exchange contracts | | 1,850,688 |
| TOTAL ASSETS | | 477,409,144 |
| Liabilities: | | |
| Payable for investments purchased | $239,074 | |
| Payable for shares redeemed | 516,354 | |
| Unrealized depreciation on foreign exchange contracts | 1,967,563 | |
| Payable for daily variation margin on futures | 1,763,313 | |
| Payable to adviser (Note 5) | 7,572 | |
| Payable for transfer agent fee | 105,352 | |
| Payable for auditing fees | 31,180 | |
| Payable for distribution services fee (Note 5) | 92,646 | |
| Payable for other service fees (Notes 2 and 5) | 59,288 | |
| Payable for share registration costs | 31,512 | |
| Accrued expenses (Note 5) | 51,148 | |
| TOTAL LIABILITIES | | 4,865,002 |
| Net assets for 26,602,745 shares outstanding | | $472,544,142 |
| Net Assets Consist of: | | |
| Paid-in capital | | $467,845,085 |
| Net unrealized appreciation of investments, futures contracts and translation of assets and liabilities in foreign currency | | 8,519,820 |
| Accumulated net realized loss on investments, futures contracts, written options and foreign currency transactions | | (5,124,361) |
| Undistributed net investment income | | 1,303,598 |
| TOTAL NET ASSETS | | $472,544,142 |
Annual Shareholder Report
Statement of Assets and Liabilities–continued
| Net Asset Value, Offering Price and Redemption Proceeds Per Share | | |
| Class A Shares: | | |
Net asset value per share ($187,183,329 ÷ 10,474,681 shares outstanding),
no par value, unlimited shares authorized | | $17.87 |
| Offering price per share (100/94.50 of $17.87) | | $18.91 |
| Redemption proceeds per share | | $17.87 |
| Class B Shares: | | |
Net asset value per share ($21,384,086 ÷ 1,227,031 shares outstanding),
no par value, unlimited shares authorized | | $17.43 |
| Offering price per share | | $17.43 |
| Redemption proceeds per share (94.50/100 of $17.43) | | $16.47 |
| Class C Shares: | | |
Net asset value per share ($89,639,802 ÷ 5,159,283 shares outstanding),
no par value, unlimited shares authorized | | $17.37 |
| Offering price per share | | $17.37 |
| Redemption proceeds per share (99.00/100 of $17.37) | | $17.20 |
| Class R Shares: | | |
| Net asset value per share ($59,228,598 ÷ 3,338,132 shares outstanding), no par value, unlimited shares authorized | | $17.74 |
| Offering price per share | | $17.74 |
| Redemption proceeds per share | | $17.74 |
| Institutional Shares: | | |
Net asset value per share ($115,108,327 ÷ 6,403,618 shares outstanding),
no par value, unlimited shares authorized | | $17.98 |
| Offering price per share | | $17.98 |
| Redemption proceeds per share | | $17.98 |
See Notes which are an integral part of the Financial Statements
Annual Shareholder Report
Statement of Operations
Year Ended November 30, 2015
| Investment Income: | | | |
| Dividends (including $2,030,620 received from affiliated holdings (Note 5) and net of foreign taxes withheld of $326,837) | | | $8,499,399 |
| Investment income allocated from affiliated partnership (Note 5) | | | 2,128,788 |
| Interest | | | 1,203,029 |
| TOTAL INCOME | | | 11,831,216 |
| Expenses: | | | |
| Investment adviser fee (Note 5) | | $3,069,354 | |
| Administrative fee (Note 5) | | 354,658 | |
| Custodian fees | | 173,202 | |
| Transfer agent fee (Note 2) | | 790,440 | |
| Directors'/Trustees' fees (Note 5) | | 9,998 | |
| Auditing fees | | 32,480 | |
| Legal fees | | 8,954 | |
| Portfolio accounting fees | | 169,360 | |
| Distribution services fee (Note 5) | | 1,139,942 | |
| Other service fees (Notes 2 and 5) | | 755,235 | |
| Share registration costs | | 94,394 | |
| Printing and postage | | 39,179 | |
| Miscellaneous (Note 5) | | 74,238 | |
| EXPENSES BEFORE ALLOCATION | | 6,711,434 | |
| Expenses allocated from affiliated partnership (Note 2) | | 24,018 | |
| TOTAL EXPENSES | | 6,735,452 | |
| Waivers and Reimbursement: | | | |
| Waiver/reimbursement of investment adviser fee (Note 5) | $(449,199) | | |
| Waiver of other operating expenses (Note 2) | (161,929) | | |
| TOTAL WAIVERS AND REIMBURSEMENT | | (611,128) | |
| Net expenses | | | 6,124,324 |
| Net investment income | | | 5,706,892 |
Annual Shareholder Report
Statement of Operations–continued
| Realized and Unrealized Gain (Loss) on Investments, Futures Contracts and Foreign Currency Transactions: | | | |
| Net realized gain on investments (including realized loss of $(1,323,358) on sales of investments in affiliated holdings (Note 5)) and foreign currency transactions | | | $9,233,178 |
| Net realized loss on futures contracts | | | (4,797,087) |
| Net realized loss on investments and foreign currency transactions allocated from affiliated partnership (Note 5) | | | (2,876,851) |
| Realized gain distribution from affiliated investment company shares (Note 5) | | | 85,779 |
| Net change in unrealized appreciation of investments and translation of assets and liabilities in foreign currency | | | (19,428,157) |
| Net change in unrealized appreciation of futures contracts | | | (2,928,334) |
| Net realized and unrealized loss on investments, futures contracts and foreign currency transactions | | | (20,711,472) |
| Change in net assets resulting from operations | | | $(15,004,580) |
See Notes which are an integral part of the Financial Statements
Annual Shareholder Report
Statement of Changes in Net Assets
| Year Ended November 30 | 2015 | 2014 |
| Increase (Decrease) in Net Assets | | |
| Operations: | | |
| Net investment income | $5,706,892 | $2,985,480 |
| Net realized gain on investments including allocation from affiliated partnerships, futures contracts, written options and foreign currency transactions | 1,645,019 | 39,378,019 |
| Net change in unrealized appreciation/depreciation of investments, futures contracts and translation of assets and liabilities in foreign currency | (22,356,491) | (16,551,533) |
| CHANGE IN NET ASSETS RESULTING FROM OPERATIONS | (15,004,580) | 25,811,966 |
| Distributions to Shareholders: | | |
| Distributions from net investment income | | |
| Class A Shares | (1,712,110) | (1,122,430) |
| Class B Shares | (59,916) | (95,208) |
| Class C Shares | (245,024) | (239,144) |
| Class R Shares | (294,064) | (265,178) |
| Institutional Shares | (930,301) | (394,367) |
| Distributions from net realized gain on investments, futures contracts and foreign currency transactions | | |
| Class A Shares | (16,482,726) | (21,054,666) |
| Class B Shares | (2,242,453) | (3,369,971) |
| Class C Shares | (7,164,821) | (7,922,335) |
| Class R Shares | (5,737,474) | (7,365,552) |
| Institutional Shares | (5,179,616) | (5,424,526) |
| CHANGE IN NET ASSETS RESULTING FROM DISTRIBUTIONS TO SHAREHOLDERS | (40,048,505) | (47,253,377) |
| Share Transactions: | | |
| Proceeds from sale of shares | 173,670,988 | 90,680,055 |
| Net asset value of shares issued to shareholders in payment of distributions declared | 37,916,243 | 44,798,299 |
| Cost of shares redeemed | (117,963,371) | (92,043,932) |
| CHANGE IN NET ASSETS RESULTING FROM SHARE TRANSACTIONS | 93,623,860 | 43,434,422 |
| Redemption Fees | — | 55,498 |
| Change in net assets | 38,570,775 | 22,048,509 |
| Net Assets: | | |
| Beginning of period | 433,973,367 | 411,924,858 |
| End of period (including undistributed net investment income of $1,303,598 and $421,047, respectively) | $472,544,142 | $433,973,367 |
See Notes which are an integral part of the Financial Statements
Annual Shareholder Report
Notes to Financial Statements
November 30, 2015
1. ORGANIZATION
Federated Global Allocation Fund (the “Fund”) is registered under the Investment Company Act of 1940, as amended (the “Act”), as a diversified, open-end management investment company. The Fund offers five classes of shares: Class A Shares, Class B Shares, Class C Shares, Class R Shares and Institutional Shares. All shares of the Fund have equal rights with respect to voting, except on class-specific matters. The primary investment objective of the Fund is to provide relative safety of capital with the possibility of long-term growth of capital and income. Consideration is also given to current income.
2. SIGNIFICANT ACCOUNTING POLICIES
The following is a summary of significant accounting policies consistently followed by the Fund in the preparation of its financial statements. These policies are in conformity with U.S. generally accepted accounting principles (GAAP).
Investment Valuation
In calculating its net asset value (NAV), the Fund generally values investments as follows:
| ■ | Equity securities listed on an exchange or traded through a regulated market system are valued at their last reported sale price or official closing price in their principal exchange or market. |
| ■ | Fixed-income securities acquired with remaining maturities greater than 60 days are fair valued using price evaluations provided by a pricing service approved by the Trustees. |
| ■ | Fixed-income securities and repurchase agreements acquired with remaining maturities of 60 days or less are valued at their cost (adjusted for the accretion of any discount or amortization of any premium), unless the issuer's creditworthiness is impaired or other factors indicate that amortized cost is not an accurate estimate of the investment's fair value, in which case it would be valued in the same manner as a longer-term security. |
| ■ | Shares of other mutual funds or non-exchange-traded investment companies are valued based upon their reported NAVs. |
| ■ | Derivative contracts listed on exchanges are valued at their reported settlement or closing price, except that options are valued at the mean of closing bid and asked quotations. |
| ■ | Over-the-counter (OTC) derivative contracts are fair valued using price evaluations provided by a pricing service approved by the Trustees. |
| ■ | For securities that are fair valued in accordance with procedures established by and under the general supervision of the Trustees, certain factors may be considered such as: the last traded or purchase price of the security, information obtained by contacting the issuer or dealers, analysis of the issuer's financial statements or other available documents, fundamental analytical data, the nature and duration of restrictions on disposition, the movement of the market in which the security is normally traded, public trading in similar securities or derivative contracts of the issuer or comparable issuers, movement of a relevant index, or other factors including but not limited to industry changes and relevant government actions. |
Annual Shareholder Report
If any price, quotation, price evaluation or other pricing source is not readily available when the NAV is calculated, or if the Fund cannot obtain price evaluations from a pricing service or from more than one dealer for an investment within a reasonable period of time as set forth in the Fund's valuation policies and procedures, the Fund uses the fair value of the investment determined in accordance with the procedures described below. There can be no assurance that the Fund could obtain the fair value assigned to an investment if it sold the investment at approximately the time at which the Fund determines its NAV per share.
Fair Valuation and Significant Events Procedures
The Trustees have ultimate responsibility for determining the fair value of investments for which market quotations are not readily available. The Trustees have appointed a valuation committee (“Valuation Committee”) comprised of officers of the Fund, Federated Global Investment Management Corp. (“Adviser”) and certain of the Adviser's affiliated companies to assist in determining fair value and in overseeing the calculation of the NAV. The Trustees have also authorized the use of pricing services recommended by the Valuation Committee to provide fair value evaluations of the current value of certain investments for purposes of calculating the NAV. The Valuation Committee employs various methods for reviewing third-party pricing-service evaluations including periodic reviews of third-party pricing services' policies, procedures and valuation methods (including key inputs, methods, models and assumptions), transactional back-testing, comparisons of evaluations of different pricing services, and review of price challenges by the Adviser based on recent market activity. In the event that market quotations and price evaluations are not available for an investment, the Valuation Committee determines the fair value of the investment in accordance with procedures adopted by the Trustees. The Trustees periodically review and approve the fair valuations made by the Valuation Committee and any changes made to the procedures.
Factors considered by pricing services in evaluating an investment include the yields or prices of investments of comparable quality, coupon, maturity, call rights and other potential prepayments, terms and type, reported transactions, indications as to values from dealers and general market conditions. Some pricing services provide a single price evaluation reflecting the bid-side of the market for an investment (a “bid” evaluation). Other pricing services offer both bid evaluations and price evaluations indicative of a price between the prices bid and asked for the investment (a “mid” evaluation). The Fund normally uses bid evaluations for any U.S. Treasury and Agency securities, mortgage-backed securities and municipal securities. The Fund normally uses mid evaluations for any other types of fixed-income securities and any OTC derivative contracts. In the event that market quotations and price evaluations are not available for an investment, the fair value of the investment is determined in accordance with procedures adopted by the Trustees.
The Trustees also have adopted procedures requiring an investment to be priced at its fair value whenever the Adviser determines that a significant event affecting the value of the investment has occurred between the time as of which the price of the investment would otherwise be determined and the time as of which the NAV is computed. An event is considered significant if there is both an affirmative expectation that the investment's value will change in response to the event and a reasonable basis for quantifying the resulting change in value. Examples of significant events that may occur after the close of the principal market on which a security is traded, or after the time of a price evaluation provided by a pricing service or a dealer, include:
| ■ | With respect to securities traded principally in foreign markets, significant trends in U.S. equity markets or in the trading of foreign securities index futures contracts; |
Annual Shareholder Report
| ■ | Political or other developments affecting the economy or markets in which an issuer conducts its operations or its securities are traded; |
| ■ | Announcements concerning matters such as acquisitions, recapitalizations, litigation developments, or a natural disaster affecting the issuer's operations or regulatory changes or market developments affecting the issuer's industry. |
The Trustees have adopted procedures whereby the Valuation Committee uses a pricing service to determine the fair value of equity securities traded principally in foreign markets when the Adviser determines that there has been a significant trend in the U.S. equity markets or in index futures trading. For other significant events, the Fund may seek to obtain more current quotations or price evaluations from alternative pricing sources. If a reliable alternative pricing source is not available, the Fund will determine the fair value of the investment in accordance with the fair valuation procedures approved by the Trustees. The Trustees have ultimate responsibility for any fair valuations made in response to a significant event.
Repurchase Agreements
The Fund may invest in repurchase agreements for short-term liquidity purposes. It is the policy of the Fund to require the other party to a repurchase agreement to transfer to the Fund's custodian or sub-custodian eligible securities or cash with a market value (after transaction costs) at least equal to the repurchase price to be paid under the repurchase agreement. The eligible securities are transferred to accounts with the custodian or sub-custodian in which the Fund holds a “securities entitlement” and exercises “control” as those terms are defined in the Uniform Commercial Code. The Fund has established procedures for monitoring the market value of the transferred securities and requiring the transfer of additional eligible securities if necessary to equal at least the repurchase price. These procedures also allow the other party to require securities to be transferred from the account to the extent that their market value exceeds the repurchase price or in exchange for other eligible securities of equivalent market value.
The insolvency of the other party or other failure to repurchase the securities may delay the disposition of the underlying securities or cause the Fund to receive less than the full repurchase price. Under the terms of the repurchase agreement, any amounts received by the Fund in excess of the repurchase price and related transaction costs must be remitted to the other party.
The Fund may enter into repurchase agreements in which eligible securities are transferred into joint trading accounts maintained by the custodian or sub-custodian for investment companies and other clients advised by the Fund's Adviser and its affiliates. The Fund will participate on a pro rata basis with the other investment companies and clients in its share of the securities transferred under such repurchase agreements and in its share of proceeds from any repurchase or other disposition of such securities.
Investment Income, Gains and Losses, Expenses and Distributions
Investment transactions are accounted for on a trade-date basis. Realized gains and losses from investment transactions are recorded on an identified-cost basis. Interest income and expenses are accrued daily. Dividend income and distributions to shareholders are recorded on the ex-dividend date. Foreign dividends are recorded on the ex-dividend date or when the Fund is informed of the ex-dividend date. Positive or negative inflation adjustments on Treasury Inflation-Protected Securities (TIPS) are included in interest income. Distributions of net investment income are declared and paid quarterly. Non-cash dividends included in dividend income, if any, are recorded at fair value. The Fund invests in Emerging Markets Fixed Income Core Fund (EMCORE), a portfolio of Federated Core Trust II, L.P., which is a limited partnership
Annual Shareholder Report
established under the laws of the state of Delaware. The Fund records daily its proportionate share of income, expenses, realized and unrealized gains and losses from EMCORE. Investment income, realized and unrealized gains and losses and certain fund-level expenses are allocated to each class based on relative average daily net assets, except that Class A Shares, Class B Shares, Class C Shares, Class R Shares and Institutional Shares may bear distribution services fees, other service fees and transfer agent fees unique to those classes. For the year ended November 30, 2015, transfer agent fees for the Fund were as follows:
| | Transfer
Agent Fees
Incurred | Transfer Agent
Fees Waived
by Unaffiliated
Third Parties |
| Class A Shares | $281,385 | $(50,012) |
| Class B Shares | 47,256 | (4,927) |
| Class C Shares | 148,263 | (47,854) |
| Class R Shares | 213,560 | (23,512) |
| Institutional Shares | 99,976 | (35,624) |
| TOTAL | $790,440 | $(161,929) |
Dividends are declared separately for each class. No class has preferential dividend rights; differences in per share dividend rates are generally due to differences in separate class expenses.
Other Service Fees
The Fund may pay other service fees up to 0.25% of the average daily net assets of the Fund's Class A Shares, Class B Shares and Class C Shares to unaffiliated financial intermediaries or to Federated Shareholder Services Company (FSSC) for providing services to shareholders and maintaining shareholder accounts. Subject to the terms described in the Expense Limitation note, FSSC may voluntarily reimburse the Fund for other service fees. For the year ended November 30, 2015, other service fees for the Fund were as follows:
| | Other Service
Fees
Incurred |
| Class A Shares | $481,543 |
| Class B Shares | 59,307 |
| Class C Shares | 214,385 |
| TOTAL | $755,235 |
Premium and Discount Amortization/ Paydown Gains and Losses
All premiums and discounts on fixed-income securities are amortized/accreted using the effective-interest-rate method. Gains and losses realized on principal payment of mortgage-backed securities (paydown gains and losses) are classified as part of investment income.
Federal Taxes
It is the Fund's policy to comply with the Subchapter M provision of the Internal Revenue Code (the “Code”) and to distribute to shareholders each year substantially all of its income. Accordingly, no provision for federal income tax is necessary. As of and during the year ended November 30, 2015, the Fund did not have a liability for any uncertain tax positions. The Fund
Annual Shareholder Report
recognizes interest and penalties, if any, related to tax liabilities as income tax expense in the Statement of Operations. As of November 30, 2015, tax years 2012 through 2015 remain subject to examination by the Fund's major tax jurisdictions, which include the United States of America and the Commonwealth of Massachusetts.
The Fund may be subject to taxes imposed by governments of countries in which it invests. Such taxes are generally based on either income or gains earned or repatriated. The Fund accrues and applies such taxes to net investment income, net realized gains and net unrealized gains as income and/or gains are earned.
When-Issued and Delayed-Delivery Transactions
The Fund may engage in when-issued or delayed-delivery transactions. The Fund records when-issued securities on the trade date and maintains security positions such that sufficient liquid assets will be available to make payment for the securities purchased. Securities purchased on a when-issued or delayed-delivery basis are marked to market daily and begin earning interest on the settlement date. Losses may occur on these transactions due to changes in market conditions or the failure of counterparties to perform under the contract.
Futures Contracts
The Fund purchases and sells financial futures contracts to manage duration risk and yield curve risk. Additionally, the Fund purchases and sells futures contracts to enhance yield and reduce transaction costs. Upon entering into a financial futures contract with a broker, the Fund is required to deposit in a segregated account a specified amount of cash or U.S. government securities which is shown as Restricted Cash in the Statement of Assets and Liabilities. Futures contracts are valued daily and unrealized gains or losses are recorded in a “variation margin” account. Daily, the Fund receives from or pays to the broker a specified amount of cash based upon changes in the variation margin account. When a contract is closed, the Fund recognizes a realized gain or loss. Futures contracts have market risks, including the risk that the change in the value of the contract may not correlate with the changes in the value of the underlying securities. There is minimal counterparty risk to the Fund since futures are exchange traded and the exchange's clearinghouse, as counterparty to all exchange traded futures, guarantees the futures against default.
Futures contracts outstanding at period end are listed after the Fund's Portfolio of Investments.
The average notional value of long and short futures contracts held by the Fund throughout the period was $8,476,813,786 and $13,138,098,203, respectively. This is based on amounts held as of each month-end throughout the fiscal period.
Foreign Exchange Contracts
The Fund enters into foreign exchange contracts for the delayed-delivery of securities or foreign currency exchange transactions. The Fund enters into foreign exchange contracts to protect assets against adverse changes in foreign currency exchange rates or exchange control regulations. Purchased contracts are used to acquire exposure to foreign currencies, whereas, contracts to sell are used to hedge the Fund's securities against currency fluctuations. Risks may arise upon entering into these transactions from the potential inability of counterparties to meet the terms of their commitments and from unanticipated movements in security prices or foreign exchange rates. The foreign exchange contracts are adjusted by the daily exchange rate of the underlying currency and any gains or losses are recorded for financial statement purposes as unrealized until the settlement date.
Annual Shareholder Report
Foreign exchange contracts are subject to Master Netting Agreements (MNA) which are agreements between the Fund and its counterparties that provides for the net settlement of all transactions and collateral with the Fund, through a single payment, in the event of default or termination. Amounts presented on the Portfolio of Investments and Statement of Assets and Liabilities are not net settlement amounts but gross.
Foreign exchange contracts outstanding at period end, including net unrealized appreciation/depreciation or net settlement amount, are listed after the Fund's Portfolio of Investments.
The average value at settlement date payable and receivable of foreign exchange contracts purchased and sold by the Fund throughout the period was $2,402,532 and $2,542,008, respectively. This is based on the contracts held as of each month-end throughout the fiscal period.
Foreign Currency Translation
The accounting records of the Fund are maintained in U.S. dollars. All assets and liabilities denominated in foreign currencies (FCs) are translated into U.S. dollars based on the rates of exchange of such currencies against U.S. dollars on the date of valuation. Purchases and sales of securities, income and expenses are translated at the rate of exchange quoted on the respective date that such transactions are recorded. The Fund does not isolate that portion of the results of operations resulting from changes in foreign exchange rates on investments from the fluctuations arising from changes in market prices of securities held. Such fluctuations are included with the net realized and unrealized gain or loss from investments.
Reported net realized foreign exchange gains or losses arise from sales of portfolio securities, sales and maturities of short-term securities, sales of FCs, currency gains or losses realized between the trade and settlement dates on securities transactions, the difference between the amounts of dividends, interest and foreign withholding taxes recorded on the Fund's books, and the U.S. dollar equivalent of the amounts actually received or paid. Net unrealized foreign exchange gains and losses arise from changes in the value of assets and liabilities other than investments in securities at fiscal year end, resulting from changes in the exchange rate.
Option Contracts
The Fund buys or sells put and call options to maintain flexibility. The seller (“writer”) of an option receives a payment or premium, from the buyer, which the writer keeps regardless of whether the buyer exercises the option. When the Fund writes a put or call option, an amount equal to the premium received is recorded as a liability and subsequently marked to market to reflect the current value of the option written. Premiums received from writing options which expire are treated as realized gains. The Fund, as a writer of an option, bears the market risk of an unfavorable change in the price of the underlying reference instrument. When the Fund purchases a put or call option, an amount equal to the premium paid is recorded as an increase to the cost of the investment and subsequently marked to market to reflect the current value of the option purchased. Premiums paid for purchasing options which expire are treated as realized losses. Premiums received/paid for writing/purchasing options which are exercised or closed are added to the proceeds or offset against amounts paid on the underlying reference instrument to determine the realized gain or loss. The risk associated with purchasing put and call options is limited to the premium paid. Options can trade on
Annual Shareholder Report
securities or commodities exchanges. In this case, the exchange sets all the terms of the contract except for the price. Most exchanges require investors to maintain margin accounts through their brokers to cover their potential obligations to the exchange. This protects investors against potential defaults by the counterparty.
At November 30, 2015, the Fund had no outstanding written option contracts.
The average notional amount of purchased put options held by the Fund throughout the period was $1,193. This is based on amounts held as of each month-end throughout the fiscal period.
Restricted Securities
The Fund may purchase securities which are considered restricted. Restricted securities are securities that either: (a) cannot be offered for public sale without first being registered, or being able to take advantage of an exemption from registration, under the Securities Act of 1933; or (b) are subject to contractual restrictions on public sales. In some cases, when a security cannot be offered for public sale without first being registered, the issuer of the restricted security has agreed to register such securities for resale, at the issuer's expense, either upon demand by the Fund or in connection with another registered offering of the securities. Many such restricted securities may be resold in the secondary market in transactions exempt from registration. Restricted securities may be determined to be liquid under criteria established by the Trustees. The Fund will not incur any registration costs upon such resales. The Fund's restricted securities, like other securities, are priced in accordance with procedures established by and under the general supervision of the Trustees.
Additional information on restricted securities, excluding securities purchased under Rule 144A that have been deemed liquid by the Trustees, if applicable, held at November 30, 2015, is as follows:
| Security | Acquisition Date | Cost | Market Value |
| Regional Diversified Funding, Series 144A, 9.250%, 03/15/2030 | 3/10/2000 | $157,264 | $83,197 |
| Union Central Life Ins Co, Note, Series 144A, 8.200%, 11/01/2026 | 3/31/1999 | $790,785 | $991,085 |
Additional Disclosure Related to Derivative Instruments
| Fair Value of Derivative Instruments |
| | Asset | Liability |
| | Statement of
Assets and
Liabilities
Location | Fair
Value | Statement of
Assets and
Liabilities
Location | Fair
Value |
Derivatives not accounted for as
hedging instruments under
ASC Topic 815 | | | | |
| Interest rate contracts | — | $— | Payable for daily
variation margin on futures | $97,946* |
Annual Shareholder Report
| Fair Value of Derivative Instruments |
| | Asset | Liability |
| | Statement of
Assets and
Liabilities
Location | Fair
Value | Statement of
Assets and
Liabilities
Location | Fair
Value |
| Equity contracts | — | $— | Payable for
variation margin on futures | $(1,751,419)* |
| Foreign exchange contracts | Unrealized
appreciation on
foreign exchange
contracts | $1,850,688 | Unrealized
depreciation on
foreign exchange
contracts | $1,967,563 |
| Total derivatives not accounted for as hedging instruments under ASC Topic 815 | | $1,850,688 | | $314,090 |
| * | Includes cumulative appreciation/depreciation of futures contracts as reported in the footnotes to the Portfolio of Investments. Only the current day's variation margin is reported within the Statement of Assets and Liabilities. |
The Effect of Derivative Instruments on the Statement of Operations for the Year Ended November 30, 2015
| Amount of Realized Gain or (Loss) on Derivatives Recognized in Income |
| | Futures Contracts | Forward
Exchange
Contracts | Purchased
Option
Contracts | Total |
| Interest rate contracts | $85,926 | $— | $— | $85,926 |
| Foreign exchange contracts | — | 3,947,130 | (97,988) | 3,849,142 |
| Equity contracts | (4,883,013) | — | — | (4,883,013) |
| TOTAL | $(4,797,087) | $3,947,130 | $(97,988) | $(947,945) |
| Change in Unrealized Appreciation or (Depreciation) on Derivatives Recognized in Income |
| | Futures
Contracts | Forward
Exchange
Contracts | Total |
| Interest rate contracts | $(20,363) | $— | $(20,363) |
| Foreign exchange contracts | — | (628,115) | (628,115) |
| Equity contracts | (2,907,971) | — | (2,907,971) |
| TOTAL | $(2,928,334) | $(628,115) | $(3,556,449) |
Annual Shareholder Report
As indicated above, certain derivative investments are transacted subject to MNA. These agreements permit the Fund to offset with a counterparty certain derivative payable and/or receivables with collateral held and create one single net payment in the event of default or termination of the agreement by either the Fund or the counterparty. Amounts presented on the Portfolio of Investments and Statement of Assets and Liabilities are not net settlement amounts but gross. As of November 30, 2015, the impact of netting assets and liabilities and the collateral pledged or received based on MNA are detailed below:
| Gross Amounts Not Offset in the Statement of Assets and Liabilities |
| Transaction | Gross Asset
Derivatives
Presented in
Statement of
Assets and
Liabilities | Financial
Instruments | Collateral
Received | Net Amount
(not less than $0) |
| Foreign exchange contracts | $1,850,688 | $(2,603,697) | $— | $(213,009) |
| TOTAL | $1,850,688 | $(2,603,697) | $— | $(213,009) |
| Transaction | Gross Liability
Derivatives
Presented in
Statement of
Assets and
Liabilities | Financial
Instruments | Collateral
Received | Net Amount
(not less than $0) |
| Foreign exchange contracts | $1,967,563 | $(2,603,697) | $— | $(96,134) |
| TOTAL | $1,967,563 | $(2,603,697) | $— | $(96,134) |
Other
The preparation of financial statements in conformity with GAAP requires management to make estimates and assumptions that affect the amounts of assets, liabilities, expenses and revenues reported in the financial statements. Actual results could differ from those estimated. The Fund applies Investment Company accounting and reporting guidance.
3. SHARES OF BENEFICIAL INTEREST
The following tables summarize share activity:
| Year Ended November 30 | 2015 | 2014 |
| Class A Shares: | Shares | Amount | Shares | Amount |
| Shares sold | 2,138,430 | $39,609,988 | 1,271,707 | $24,983,624 |
| Shares issued to shareholders in payment of distributions declared | 931,229 | 17,079,639 | 1,077,269 | 20,848,247 |
| Shares redeemed | (2,257,896) | (41,553,323) | (1,704,879) | (33,509,425) |
NET CHANGE RESULTING FROM
CLASS A SHARE TRANSACTIONS | 811,763 | $15,136,304 | 644,097 | $12,322,446 |
Annual Shareholder Report
| Year Ended November 30 | 2015 | 2014 |
| Class B Shares: | Shares | Amount | Shares | Amount |
| Shares sold | 166,063 | $3,010,179 | 144,477 | $2,789,113 |
| Shares issued to shareholders in payment of distributions declared | 121,434 | 2,179,856 | 172,063 | 3,273,298 |
| Shares redeemed | (377,949) | (6,851,605) | (447,961) | (8,651,857) |
NET CHANGE RESULTING FROM
CLASS B SHARE TRANSACTIONS | (90,452) | $(1,661,570) | (131,421) | $(2,589,446) |
| Year Ended November 30 | 2015 | 2014 |
| Class C Shares: | Shares | Amount | Shares | Amount |
| Shares sold | 2,094,560 | $37,590,508 | 1,353,586 | $26,117,531 |
| Shares issued to shareholders in payment of distributions declared | 386,550 | 6,915,927 | 409,657 | 7,768,862 |
| Shares redeemed | (1,447,890) | (25,984,851) | (1,022,069) | (19,706,161) |
NET CHANGE RESULTING FROM
CLASS C SHARE TRANSACTIONS | 1,033,220 | $18,521,584 | 741,174 | $14,180,232 |
| Year Ended November 30 | 2015 | 2014 |
| Class R Shares: | Shares | Amount | Shares | Amount |
| Shares sold | 807,794 | $14,882,182 | 859,978 | $16,854,161 |
| Shares issued to shareholders in payment of distributions declared | 327,830 | 5,976,139 | 395,870 | 7,623,369 |
| Shares redeemed | (1,150,660) | (21,202,613) | (1,070,155) | (20,977,412) |
NET CHANGE RESULTING FROM
CLASS R SHARE TRANSACTIONS | (15,036) | $(344,292) | 185,693 | $3,500,118 |
| Year Ended November 30 | 2015 | 2014 |
| Institutional Shares: | Shares | Amount | Shares | Amount |
| Shares sold | 4,247,690 | $78,578,131 | 1,009,592 | $19,935,626 |
| Shares issued to shareholders in payment of distributions declared | 313,172 | 5,764,682 | 271,859 | 5,284,523 |
| Shares redeemed | (1,219,122) | (22,370,979) | (463,970) | (9,199,077) |
NET CHANGE RESULTING FROM
INSTITUTIONAL SHARE TRANSACTIONS | 3,341,740 | $61,971,834 | 817,481 | $16,021,072 |
NET CHANGE RESULTING FROM
TOTAL FUND SHARE TRANSACTIONS | 5,081,235 | $93,623,860 | 2,257,024 | $43,434,422 |
4. FEDERAL TAX INFORMATION
The timing and character of income and capital gain distributions are determined in accordance with income tax regulations, which may differ from GAAP. These differences are due in part to differing treatments for foreign currency transactions, partnership income reclassifications, regulatory settlement proceeds, passive foreign investment company gains and losses, discount accretion/premium amortization on debt securities and short-term capital gain reclassifications.
Annual Shareholder Report
For the year ended November 30, 2015, permanent differences identified and reclassified among the components of net assets were as follows:
| Increase (Decrease) |
| Paid-In Capital | Undistributed
Net Investment
Income (Loss) | Accumulated
Net Realized
Gain (Loss) |
| $(1,106) | $(1,582,926) | $1,584,032 |
Net investment income (loss), net realized gains (losses), and net assets were not affected by this reclassification.
The tax character of distributions as reported on the Statement of Changes in Net Assets for the years ended November 30, 2015 and 2014, was as follows:
| | 2015 | 2014 |
| Ordinary income1 | $10,734,944 | $18,488,219 |
| Long-term capital gains | $29,313,561 | $28,765,158 |
| 1 | For tax purposes, short-term capital gain distributions are considered as ordinary income distributions. |
As of November 30, 2015, the components of distributable earnings on a tax basis were as follows:
| Undistributed ordinary income | $1,576,458 |
| Undistributed long-term capital gains | $156,650 |
| Net unrealized appreciation | $6,362,994 |
| Capital loss carryforwards | $(3,397,045) |
The difference between book-basis and tax-basis net unrealized appreciation/depreciation is attributable in part to differing treatments for passive foreign investment company gains and losses, the deferral of losses on wash sales, partnership adjustments, non-taxable dividends, deflation deferrals on TIPS, defaulted bond interest and discount accretion/premium amortization on debt securities.
At November 30, 2015, the cost of investments for federal tax purposes was $436,819,279. The net unrealized appreciation of investments for federal tax purposes excluding any unrealized appreciation/depreciation resulting from: (a) the translation from FCs to U.S. dollars of assets and liabilities other than investments in securities; (b) outstanding foreign currency commitments; and (c) futures contracts was $5,978,672. This consists of net unrealized appreciation from investments for those securities having an excess of value over cost of $31,992,552 and net unrealized depreciation from investments for those securities having an excess of cost over value of $26,013,880.
At November 30, 2015, the Fund had a capital loss carryforward of $3,397,045 which will reduce the Fund's taxable income arising from future net realized gains on investments, if any, to the extent permitted by the Code, thereby reducing the amount of distributions to shareholders which would otherwise be necessary to relieve the Fund of any liability for federal income tax. Pursuant to the Code, a net capital loss incurred in taxable years beginning on or before December 22, 2010, is characterized as short-term and may be carried forward
Annual Shareholder Report
for a maximum of eight tax years (“Carryforward Limit”), whereas a net capital loss incurred in taxable years beginning after December 22, 2010, retains its character as either short-term or long-term, does not expire and is required to be utilized prior to the losses which have a Carryforward Limit.
The following schedule summarizes the Fund's capital loss carryforwards and expiration year:
| Expiration Year | Short-Term | Long-Term | Total |
| 2018 | $3,397,045 | NA | $3,397,045 |
The Fund used capital loss carryforwards of $1,976,851 to offset capital gains realized during the year ended November 30, 2015.
5. INVESTMENT ADVISER FEE AND OTHER TRANSACTIONS WITH AFFILIATES
Investment Adviser Fee
The advisory agreement between the Fund and the Adviser provides for an annual fee equal to: (a) a maximum of 0.55% of the average daily net assets of the Fund; and (b) 4.50% of gross income of the Fund, excluding gains or losses. Subject to the terms described in the Expense Limitation note, the Adviser may voluntarily choose to waive any portion of its fee. For the year ended November 30, 2015, the Adviser voluntarily waived $415,566 of its fee.
Certain of the Fund's assets are managed by Federated Investment Management Company (FIMCO) (the “Sub-Adviser”). Under the terms of a sub-advisory agreement between the Adviser and the Sub-Adviser, the Sub-Adviser receives an allocable portion of the Fund's adviser fee. The fee is paid by the Adviser out of its resources and is not an incremental Fund expense. For the year ended November 30, 2015, the Sub-Adviser earned a fee of $389,658.
Administrative Fee
Federated Administrative Services (FAS), under the Administrative Services Agreement, provides the Fund with administrative personnel and services. For purposes of determining the appropriate rate breakpoint, “Investment Complex” is defined as all of the Federated Funds subject to a fee under the Administrative Services Agreement. The fee paid to FAS is based on the average daily net assets of the Investment Complex as specified below, plus certain out-of-pocket expenses:
| Administrative Fee | Average Daily Net Assets
of the Investment Complex |
| 0.150% | on the first $5 billion |
| 0.125% | on the next $5 billion |
| 0.100% | on the next $10 billion |
| 0.075% | on assets in excess of $20 billion |
Subject to the terms described in the Expense Limitation note, FAS may voluntarily choose to waive any portion of its fee. For the year ended November 30, 2015, the annualized fee paid to FAS was 0.078% of average daily net assets of the Fund.
Annual Shareholder Report
Distribution Services Fee
The Fund has adopted a Distribution Plan (the “Plan”) pursuant to Rule 12b-1 under the Act. Under the terms of the Plan, the Fund will compensate Federated Securities Corp. (FSC), the principal distributor, from the daily net assets of the Fund's Class B Shares, Class C Shares and Class R Shares to finance activities intended to result in the sale of these shares. The Plan provides that the Fund may incur distribution expenses at the following percentages of average daily net assets annually, to compensate FSC:
| Share Class Name | Percentage of Average Daily
Net Assets of Class |
| Class B Shares | 0.75% |
| Class C Shares | 0.75% |
| Class R Shares | 0.50% |
Subject to the terms described in the Expense Limitation note, FSC may voluntarily choose to waive any portion of its fee. For the year ended November 30, 2015, distribution services fees for the Fund were as follows:
| | Distribution Services
Fees Incurred |
| Class B Shares | $177,922 |
| Class C Shares | 643,155 |
| Class R Shares | 318,865 |
| TOTAL | $1,139,942 |
When FSC receives fees, it may pay some or all of them to financial intermediaries whose customers purchase shares. For the year ended November 30, 2015, FSC retained $217,539 of fees paid by the Fund.
Sales Charges
Front-end sales charges and contingent deferred sales charges (CDSC) do not represent expenses of the Fund. They are deducted from the proceeds of sales of Fund shares prior to investment or from redemption proceeds prior to remittance, as applicable. For the year ended November 30, 2015, FSC retained $36,046 in sales charges from the sale of Class A Shares. FSC also retained $35,965 relating to redemption of Class B Shares and $12,282 relating to redemptions of Class C Shares.
Other Service Fees
For the year ended November 30, 2015, FSSC received $97,996 of the other service fees disclosed in Note 2.
Expense Limitation
The Adviser and certain of its affiliates (which may include FSC, FAS and FSSC) on their own initiative have agreed to waive certain amounts of their respective fees and/or reimburse expenses. Total annual fund operating expenses (as shown in the financial highlights, excluding expenses allocated from affiliated partnerships, interest expense, extraordinary expenses and proxy-related expenses paid by the Fund, if any) paid by the Fund's Class A Shares, Class B Shares, Class C Shares, Class R Shares and Institutional Shares (after the voluntary waivers and/or reimbursements) will not exceed 1.14%, 1.95%, 1.89%, 1.57% and 0.85% (the “Fee Limit”), respectively, up to but not including the later of (the “Termination
Annual Shareholder Report
Date”): (a) February 1, 2017; or (b) the date of the Fund's next effective Prospectus. While the Adviser and its applicable affiliates currently do not anticipate terminating or increasing these arrangements prior to the Termination Date, these arrangements may only be terminated or the Fee Limit increased prior to the Termination Date with the agreement of the Trustees.
General
Certain Officers and Trustees of the Fund are Officers and Directors or Trustees of certain of the above companies. To efficiently facilitate payment, Directors'/Trustees' fees and certain expenses related to conducting meetings of the Directors/Trustees and other miscellaneous expenses are paid by an affiliate of the Adviser which in due course are reimbursed by the Fund. Such expenses may be included in Accrued and Miscellaneous Expenses on the Statement of Assets and Liabilities and Statement of Operations, respectively.
Transactions Involving Affiliated Holdings
Affiliated holdings are investment companies which are managed by the Adviser or an affiliate of the Adviser. The Adviser has agreed to reimburse the Fund for certain investment adviser fees as a result of transactions in other affiliated investment companies. For the year ended November 30, 2015, the Adviser reimbursed $33,633. Transactions involving the affiliated holdings during the year ended November 30, 2015, were as follows:
| | Emerging
Markets
Fixed
Income
Core Fund | Federated
Bank Loan
Core Fund | Federated
Mortgage
Core
Portfolio | Federated
Prime Value
Obligations
Fund,
Institutional
Shares | Federated
Project
and Trade
Finance
Core Fund | High
Yield
Bond
Portfolio | Total of
Affiliated
Transactions |
Balance of Shares Held
11/30/2014 | 1,389,580 | — | 676,871 | 53,040,222 | 656,892 | 873,938 | 56,637,503 |
| Purchases/Additions | 680,365 | 637,277 | 2,183,204 | 201,289,761 | 869,311 | 3,064,269 | 208,724,187 |
Sales/
Reductions | (745,443) | (302,419) | (940,460) | (254,329,983) | — | (1,718,055) | (258,036,360) |
Balance of Shares Held
11/30/2015 | 1,324,502 | 334,858 | 1,919,615 | — | 1,526,203 | 2,220,152 | 7,325,330 |
| Value | $45,557,365 | $3,288,309 | $18,984,988 | $— | $14,269,998 | $13,298,709 | $95,399,369 |
Dividend Income/
Allocated
Investment
Income | $2,128,788 | $113,515 | $520,107 | $28,307 | $487,033 | $881,658 | $4,159,408 |
| Realized Gain Distribution/Allocated Net Realized Gain (Loss) | $(2,876,851) | $— | $— | $— | $— | $85,779 | $(2,791,072) |
Annual Shareholder Report
6. Investment TRANSACTIONS
Purchases and sales of investments, excluding long-term U.S. government securities and short-term obligations, for the year ended November 30, 2015, were as follows:
| Purchases | $376,757,795 |
| Sales | $288,743,198 |
7. LINE OF CREDIT
The Fund participates in a $100,000,000 unsecured, uncommitted revolving line of credit (LOC) agreement with PNC Bank. The LOC was made available for extraordinary or emergency purposes, primarily for financing redemption payments. Borrowings are charged interest at a rate offered to the Fund by PNC Bank at the time of the borrowing. As of November 30, 2015, there were no outstanding loans. During the year ended November 30, 2015, the Fund did not utilize the LOC.
8. INTERFUND LENDING
Pursuant to an Exemptive Order issued by the Securities and Exchange Commission, the Fund, along with other funds advised by subsidiaries of Federated Investors, Inc., may participate in an interfund lending program. This program provides an alternative credit facility allowing the Fund to borrow from other participating affiliated funds. As of November 30, 2015, there were no outstanding loans. During the year ended November 30, 2015, the program was not utilized.
9. FEDERAL TAX INFORMATION (UNAUDITED)
For the year ended November 30, 2015, the amount of long-term capital gains designated by the Fund was $29,313,561.
For the fiscal year ended November 30, 2015, 55.34% of total income (including short-term capital gain) distributions made by the Fund are qualifying dividends which may be subject to a maximum tax rate of 15%, as provided for by the Jobs and Growth Tax Relief Act of 2003. Complete information is reported in conjunction with the reporting of your distributions on Form 1099-DIV.
Of the ordinary income (including short-term capital gain) distributions made by the Fund during the year ended November 30, 2015, 16.83% qualify for the dividend received deduction available to corporate shareholders.
Annual Shareholder Report
Report of Independent Registered Public Accounting Firm
TO THE BOARD OF TRUSTEES AND SHAREHOLDERS OF FEDERATED GLOBAL ALLOCATION FUND:
We have audited the accompanying statement of assets and liabilities, including the portfolio of investments, of the Federated Global Allocation Fund (the “Fund”), as of November 30, 2015, and the related statement of operations for the year then ended, the statements of changes in net assets for each of the years in the two-year period then ended, and the financial highlights for each of the years in the five-year period then ended. These financial statements and financial highlights are the responsibility of the Fund's management. Our responsibility is to express an opinion on these financial statements and financial highlights based on our audits.
We conducted our audits in accordance with the standards of the Public Company Accounting Oversight Board (United States). Those standards require that we plan and perform the audit to obtain reasonable assurance about whether the financial statements and financial highlights are free of material misstatement. An audit includes examining, on a test basis, evidence supporting the amounts and disclosures in the financial statements. Our procedures included confirmation of securities owned as of November 30, 2015, by correspondence with the custodian, transfer agent and brokers or by other appropriate auditing procedures. An audit also includes assessing the accounting principles used and significant estimates made by management, as well as evaluating the overall financial statement presentation. We believe that our audits provide a reasonable basis for our opinion.
In our opinion, the financial statements and financial highlights referred to above present fairly, in all material respects, the financial position of the Federated Global Allocation Fund as of November 30, 2015, the results of its operations for the year then ended, the changes in its net assets for each of the years in the two-year period then ended, and the financial highlights for each of the years in the five-year period then ended, in conformity with U.S. generally accepted accounting principles.
Boston, Massachusetts
January 25, 2016
Annual Shareholder Report
Shareholder Expense Example (unaudited)
As a shareholder of the Fund, you incur two types of costs: (1) transaction costs, including sales charges (loads) on purchase or redemption payments; and (2) ongoing costs, including management fees and to the extent applicable, distribution (12b-1) fees and/or other service fees and other Fund expenses. This Example is intended to help you to understand your ongoing costs (in dollars) of investing in the Fund and to compare these costs with the ongoing costs of investing in other mutual funds. It is based on an investment of $1,000 invested at the beginning of the period and held for the entire period from June 1, 2015 to November 30, 2015.
ACTUAL EXPENSES
The first section of the table below provides information about actual account values and actual expenses. You may use the information in this section, together with the amount you invested, to estimate the expenses that you incurred over the period. Simply divide your account value by $1,000 (for example, an $8,600 account value divided by $1,000 = 8.6), then multiply the result by the number in the first section under the heading entitled “Expenses Paid During Period” to estimate the expenses attributable to your investment during this period.
HYPOTHETICAL EXAMPLE FOR COMPARISON PURPOSES
The second section of the table below provides information about hypothetical account values and hypothetical expenses based on the Fund's actual expense ratio and an assumed rate of return of 5% per year before expenses, which is not the Fund's actual return. Thus, you should not use the hypothetical account values and expenses to estimate the actual ending account balance or your expenses for the period. Rather, these figures are required to be provided to enable you to compare the ongoing costs of investing in the Fund with other funds. To do so, compare this 5% hypothetical example with the 5% hypothetical examples that appear in the shareholder reports of the other funds.
Annual Shareholder Report
Please note that the expenses shown in the table are meant to highlight your ongoing costs only and do not reflect any transaction costs, such as sales charges (loads) on purchase or redemption payments. Therefore, the second section of the table is useful in comparing ongoing costs only, and will not help you determine the relative total costs of owning different funds. In addition, if these transaction costs were included, your costs would have been higher.
| | Beginning
Account Value
6/1/2015 | Ending
Account Value
11/30/2015 | Expenses Paid
During Period1 |
| Actual: | | | |
| Class A Shares | $1,000 | $955.00 | $5.78 |
| Class B Shares | $1,000 | $951.10 | $9.68 |
| Class C Shares | $1,000 | $951.20 | $9.39 |
| Class R Shares | $1,000 | $952.50 | $7.83 |
| Institutional Shares | $1,000 | $956.60 | $4.32 |
Hypothetical (assuming a 5% return
before expenses): | | | |
| Class A Shares | $1,000 | $1,019.15 | $5.97 |
| Class B Shares | $1,000 | $1,015.14 | $10.00 |
| Class C Shares | $1,000 | $1,015.44 | $9.70 |
| Class R Shares | $1,000 | $1,017.05 | $8.09 |
| Institutional Shares | $1,000 | $1,020.66 | $4.46 |
| 1 | Expenses are equal to the Fund's annualized net expense ratios, multiplied by the average account value over the period, multiplied by 183/365 (to reflect the one-half-year period). The annualized net expense ratios are as follows: |
| | |
| Class A Shares | 1.18% |
| Class B Shares | 1.98% |
| Class C Shares | 1.92% |
| Class R Shares | 1.60% |
| Institutional Shares | 0.88% |
Annual Shareholder Report
Board of Trustees and Trust Officers
The Board of Trustees is responsible for managing the Trust's business affairs and for exercising all the Trust's powers except those reserved for the shareholders. The following tables give information about each Trustee and the senior officers of the Fund. Where required, the tables separately list Trustees who are “interested persons” of the Fund (i.e., “Interested” Trustees) and those who are not (i.e., “Independent” Trustees). Unless otherwise noted, the address of each person listed is Federated Investors Tower, 1001 Liberty Avenue, Pittsburgh, PA 15222. The address of all Independent Trustees listed is 4000 Ericsson Drive, Warrendale, PA 15086-7561; Attention: Mutual Fund Board. As of December 31, 2015, the Trust comprised one portfolio(s), and the Federated Fund Family consisted of 38 investment companies (comprising 122 portfolios). Unless otherwise noted, each Officer is elected annually. Unless otherwise noted, each Trustee oversees all portfolios in the Federated Fund Family and serves for an indefinite term. The Fund's Statement of Additional Information includes additional information about Trust Trustees and is available, without charge and upon request, by calling 1-800-341-7400.
Interested Trustees Background
Name
Birth Date
Positions Held with Trust
Date Service Began | Principal Occupation(s) for Past Five Years,
Other Directorships Held and Previous Position(s) |
John F. Donahue*
Birth Date: July 28, 1924
Trustee
Indefinite Term
Began serving: December 1956 | Principal Occupations: Director or Trustee of the Federated Fund Family; Chairman and Director, Federated Investors, Inc.; Chairman of the Federated Fund Family's Executive Committee.
Previous Positions: Chairman of the Federated Fund Family; Trustee, Federated Investment Management Company; Chairman and Director, Federated Investment Counseling. |
J. Christopher Donahue*
Birth Date: April 11, 1949
President and Trustee
Indefinite Term
Began serving: November 1998 | Principal Occupations: Principal Executive Officer and President of certain of the Funds in the Federated Fund Family; Director or Trustee of the Funds in the Federated Fund Family; President, Chief Executive Officer and Director, Federated Investors, Inc.; Chairman and Trustee, Federated Investment Management Company; Trustee, Federated Investment Counseling; Chairman and Director, Federated Global Investment Management Corp.; Chairman, Federated Equity Management Company of Pennsylvania and Passport Research, Ltd. (investment advisory subsidiary of Federated); Trustee, Federated Shareholder Services Company; Director, Federated Services Company.
Previous Positions: President, Federated Investment Counseling; President and Chief Executive Officer, Federated Investment Management Company, Federated Global Investment Management Corp. and Passport Research, Ltd. |
| * | Family relationships and reasons for “interested” status: John F. Donahue is the father of J. Christopher Donahue; both are “interested” due to their beneficial ownership of shares of Federated Investors, Inc. and the positions they hold with Federated and its subsidiaries. |
Annual Shareholder Report
INDEPENDENT Trustees Background
Name
Birth Date
Positions Held with Trust
Date Service Began | Principal Occupation(s) for Past Five Years,
Other Directorships Held, Previous Position(s) and Qualifications |
John T. Collins
Birth Date: January 24, 1947
Trustee
Indefinite Term
Began serving: October 2013 | Principal Occupations: Director or Trustee of the Federated Fund Family; Retired.
Other Directorships Held: Director, Chair of the Compensation Committee, Audit Committee member, KLX Corp.
Qualifications: Mr. Collins has served in several business and financial management roles and directorship positions throughout his career. Mr. Collins previously served as Chairman and CEO, The Collins Group, Inc. (a private equity firm). Mr. Collins serves as Chairman Emeriti, Bentley University. Mr. Collins previously served as Director, FleetBoston Financial Corp.; Director and Audit Committee Member, Bank of America Corp. and Director, Beth Israel Deaconess Medical Center (Harvard University Affiliate Hospital). |
G. Thomas Hough
Birth Date: February 28, 1955
Trustee
Indefinite Term
Began serving: August 2015 | Principal Occupations: Director or Trustee of the Federated Fund Family; Retired.
Other Directorships Held: Director, Chair of the Audit Committee, Governance Committee, Publix Super Markets, Inc.
Qualifications: Mr. Hough has served in accounting, business management and directorship positions throughout his career. Mr. Hough most recently held the position of Americas Vice Chair of Assurance with Ernst & Young LLP. Mr. Hough is an Executive Committee member of the United States Golf Association, he serves on the President's Cabinet and Business School Board of Visitors for the University of Alabama and is on the Business School Board of Visitors for Wake Forest University. |
Maureen Lally-Green
Birth Date: July 5, 1949
Trustee
Indefinite Term
Began serving: August 2009 | Principal Occupations: Director or Trustee of the Federated Fund Family; Adjunct Professor of Law, Duquesne University School of Law.
Other Directorships Held: Director, CONSOL Energy Inc.
Qualifications: Judge Lally-Green has served in various legal and business roles and directorship positions throughout her career. Judge Lally-Green previously served as: Associate General Secretary, Diocese of Pittsburgh; a member of the Superior Court of Pennsylvania; and as a Professor of Law, Duquesne University School of Law. Judge Lally-Green also holds the positions on either a public or not for profit Board of Directors as follows: Member, Pennsylvania State Board of Education (public); Director and Chair, UPMC Mercy Hospital; Regent, St. Vincent Seminary; Director, Epilepsy Foundation of Western and Central Pennsylvania; Director and Vice Chair, Our Campaign for the Church Alive!, Inc.; Director, Saint Vincent College; Director, Pennsylvania Bar Institute; and Director and Chair, Cardinal Wuerl North Catholic High School, Inc. Judge Lally-Green has held the positions of: Director, Auberle; Director, Ireland Institute of Pittsburgh; Director, Saint Thomas More Society; and Director, Catholic High Schools of the Diocese of Pittsburgh, Inc. |
Annual Shareholder Report
Name
Birth Date
Positions Held with Trust
Date Service Began | Principal Occupation(s) for Past Five Years,
Other Directorships Held, Previous Position(s) and Qualifications |
Peter E. Madden
Birth Date: March 16, 1942
Trustee
Indefinite Term
Began serving: August 1991 | Principal Occupation: Director or Trustee, and Chair of the Board of Directors or Trustees, of the Federated Fund Family; Retired.
Other Directorships Held: None.
Qualifications: Mr. Madden has served in several business management, mutual fund services and directorship positions throughout his career. Mr. Madden previously served as President, Chief Operating Officer and Director, State Street Bank and Trust Company (custodian bank) and State Street Corporation (financial services). He was Director, VISA USA and VISA International and Chairman and Director, Massachusetts Bankers Association. Mr. Madden served as Director, Depository Trust Corporation and Director, The Boston Stock Exchange. Mr. Madden also served as a Representative to the Commonwealth of Massachusetts General Court. |
Charles F. Mansfield, Jr.
Birth Date: April 10, 1945
Trustee
Indefinite Term
Began serving: November 1998 | Principal Occupations: Director or Trustee of the Federated Fund Family; Management Consultant.
Other Directorships Held: None.
Qualifications: Mr. Mansfield has served in several banking, business management and educational roles and directorship positions throughout his career. Mr. Mansfield previously served as Chief Executive Officer, PBTC International Bank; Partner, Arthur Young & Company (now Ernst & Young LLP); Chief Financial Officer of Retail Banking Sector, Chase Manhattan Bank; Senior Vice President, HSBC Bank USA (formerly, Marine Midland Bank); Vice President, Citibank; Assistant Professor of Banking and Finance, Frank G. Zarb School of Business, Hofstra University; Executive Vice President DVC Group, Inc. (marketing, communications and technology). |
Thomas M. O'Neill
Birth Date: June 14, 1951
Trustee
Indefinite Term
Began serving: October 2006 | Principal Occupations: Director or Trustee, Chair of the Audit Committee of the Federated Fund Family; Sole Proprietor, Navigator Management Company (investment and strategic consulting).
Other Directorships Held: None.
Qualifications: Mr. O'Neill has served in several business, mutual fund and financial management roles and directorship positions throughout his career. Mr. O'Neill serves as Director, Medicines for Humanity and Director, The Golisano Children's Museum of Naples, Florida. Mr. O'Neill previously served as Chief Executive Officer and President, Managing Director and Chief Investment Officer, Fleet Investment Advisors; President and Chief Executive Officer, Aeltus Investment Management, Inc.; General Partner, Hellman, Jordan Management Co., Boston, MA; Chief Investment Officer, The Putnam Companies, Boston, MA; Credit Analyst and Lending Officer, Fleet Bank; Director and Consultant, EZE Castle Software (investment order management software); and Director, Midway Pacific (lumber). |
Annual Shareholder Report
Name
Birth Date
Positions Held with Trust
Date Service Began | Principal Occupation(s) for Past Five Years,
Other Directorships Held, Previous Position(s) and Qualifications |
P. Jerome Richey
Birth Date: February 23, 1949
Trustee
Indefinite Term
Began serving: October 2013 | Principal Occupations: Director or Trustee of the Federated Fund Family; Management Consultant.
Other Directorships Held: None.
Qualifications: Mr. Richey has served in several business and legal management roles and directorship positions throughout his career. Mr. Richey most recently held the positions of Senior Vice Chancellor and Chief Legal Officer, University of Pittsburgh. Mr. Richey serves as Board Member, Epilepsy Foundation of Western Pennsylvania and Board member, World Affairs Council of Pittsburgh. Mr. Richey previously served as Chief Legal Officer and Executive Vice President, CONSOL Energy Inc. and Shareholder, Buchanan Ingersoll & Rooney PC (a law firm). |
John S. Walsh
Birth Date: November 28, 1957
Trustee
Indefinite Term
Began serving: November 1998 | Principal Occupations: Director or Trustee of the Federated Fund Family; President and Director, Heat Wagon, Inc. (manufacturer of construction temporary heaters); President and Director, Manufacturers Products, Inc. (distributor of portable construction heaters); President, Portable Heater Parts, a division of Manufacturers Products, Inc.
Other Directorships Held: None.
Qualifications: Mr. Walsh has served in several business management roles and directorship positions throughout his career. Mr. Walsh previously served as Vice President, Walsh & Kelly, Inc. (paving contractors). |
OFFICERS
Name
Birth Date
Address
Positions Held with Trust
Date Service Began | Principal Occupation(s) for Past Five Years
and Previous Position(s) |
John W. McGonigle
Birth Date: October 26, 1938
EXECUTIVE VICE PRESIDENT AND SECRETARY
Officer since: September 1969 | Principal Occupations: Executive Vice President and Secretary of the Federated Fund Family; Vice Chairman, Executive Vice President, Secretary and Director, Federated Investors, Inc.
Previous Positions: Trustee, Federated Investment Management Company and Federated Investment Counseling; Director, Federated Global Investment Management Corp., Federated Services Company and Federated Securities Corp. |
Annual Shareholder Report
Name
Birth Date
Address
Positions Held with Trust
Date Service Began | Principal Occupation(s) for Past Five Years
and Previous Position(s) |
Lori A. Hensler
Birth Date: January 6, 1967
TREASURER
Officer since: April 2013 | Principal Occupations: Principal Financial Officer and Treasurer of the Federated Fund Family; Senior Vice President, Federated Administrative Services; Financial and Operations Principal for Federated Securities Corp. and Edgewood Services, Inc.; and Assistant Treasurer, Federated Investors Trust Company. Ms. Hensler has received the Certified Public Accountant designation.
Previous Positions: Controller of Federated Investors, Inc.; Senior Vice President and Assistant Treasurer, Federated Investors Management Company; Treasurer, Federated Investors Trust Company; Assistant Treasurer, Federated Administrative Services, Federated Administrative Services, Inc., Federated Securities Corp., Edgewood Services, Inc., Federated Advisory Services Company, Federated Equity Management Company of Pennsylvania, Federated Global Investment Management Corp., Federated Investment Counseling, Federated Investment Management Company, Passport Research, Ltd., and Federated MDTA, LLC; Financial and Operations Principal for Federated Securities Corp., Edgewood Services, Inc. and Southpointe Distribution Services, Inc. |
Peter J. Germain
Birth Date: September 3, 1959
CHIEF LEGAL OFFICER
Officer since: January 2005 | Principal Occupations: Mr. Germain is Chief Legal Officer of the Federated Fund Family. He is General Counsel and Vice President, Federated Investors, Inc.; President, Federated Administrative Services and Federated Administrative Services, Inc.; Vice President, Federated Securities Corp.; Secretary, Federated Private Asset Management, Inc.; and Secretary, Retirement Plan Service Company of America. Mr. Germain joined Federated in 1984 and is a member of the Pennsylvania Bar Association.
Previous Positions: Deputy General Counsel, Special Counsel, Managing Director of Mutual Fund Services, Federated Investors, Inc.; Senior Vice President, Federated Services Company; and Senior Corporate Counsel, Federated Investors, Inc. |
Richard B. Fisher
Birth Date: May 17, 1923
VICE PRESIDENT
Officer since: May 1976 | Principal Occupations: Vice Chairman or Vice President of some of the Funds in the Federated Fund Family; Vice Chairman, Federated Investors, Inc.; Chairman, Federated Securities Corp.
Previous Positions: President and Director or Trustee of some of the Funds in the Federated Fund Family; Executive Vice President, Federated Investors, Inc.; Director and Chief Executive Officer, Federated Securities Corp. |
Stephen Van Meter
Birth Date: June 5, 1975
CHIEF COMPLIANCE OFFICER AND SENIOR VICE PRESIDENT
Officer since: July 2015 | Principal Occupations: Senior Vice President and Chief Compliance Officer of the Federated Fund Family; Vice President and Chief Compliance Officer of Federated Investors, Inc. and Chief Compliance Officer of certain of its subsidiaries. Mr. Van Meter joined Federated in October 2011. He holds FINRA licenses under Series 3, 7, 24 and 66.
Previous Positions: Mr. Van Meter previously held the position of Compliance Operating Officer, Federated Investors, Inc. Prior to joining Federated, Mr. Van Meter served at the United States Securities and Exchange Commission in the positions of Senior Counsel, Office of Chief Counsel, Division of Investment Management and Senior Counsel, Division of Enforcement. |
Annual Shareholder Report
Name
Birth Date
Address
Positions Held with Trust
Date Service Began | Principal Occupation(s) for Past Five Years
and Previous Position(s) |
Stephen F. Auth
Birth Date: September 3, 1956
101 Park Avenue
41st Floor
New York, NY 10178
CHIEF INVESTMENT OFFICER
Officer since: November 2002 | Principal Occupations: Stephen F. Auth is Chief Investment Officer of various Funds in the Federated Fund Family; Executive Vice President, Federated Investment Counseling, Federated Global Investment Management Corp. and Federated Equity Management Company of Pennsylvania.
Previous Positions: Executive Vice President, Federated Investment Management Company and Passport Research, Ltd. (investment advisory subsidiary of Federated); Senior Vice President, Global Portfolio Management Services Division; Senior Vice President, Federated Investment Management Company and Passport Research, Ltd.; Senior Managing Director and Portfolio Manager, Prudential Investments. |
Annual Shareholder Report
Evaluation and Approval of Advisory Contract–May 2015
Federated Global Allocation Fund (the “Fund”)
Following a review and recommendation of approval by the Fund's independent trustees, the Fund's Board reviewed and approved at its May 2015 meetings the Fund's investment advisory and subadvisory contracts for an additional one-year term. The Board's decision regarding these contracts reflects the exercise of its business judgment on whether to continue the existing arrangements.
In this connection, the Federated Funds' Board had previously appointed a Senior Officer, whose duties include specified responsibilities relating to the process by which advisory fees are to be charged to a Federated fund. The Senior Officer has the authority to retain consultants, experts, or staff as may be reasonably necessary to assist in the performance of his duties, reports directly to the Board, and may be terminated only with the approval of a majority of the independent members of the Board. The Senior Officer prepared and furnished to the Board an independent, written evaluation that covered topics discussed below (the “Evaluation”). The Board considered that Evaluation, along with other information, in deciding to approve the advisory and subadvisory contracts.
The Board is also familiar with and considered judicial decisions concerning allegedly excessive investment advisory fees, which have indicated that the following factors may be relevant to an Adviser's fiduciary duty with respect to its receipt of compensation from a fund: the nature and quality of the services provided by the Adviser to a fund and its shareholders, including the performance and expenses of the fund and of comparable funds; the Adviser's cost of providing the services, including the profitability to the Adviser of providing advisory services to a fund; the extent to which the Adviser may realize “economies of scale” as a fund grows larger and, if such economies of scale exist, whether they have been shared with a fund and its shareholders or the family of funds; any “fall-out financial benefits” that accrue to the Adviser because of its relationship with a fund (including research services received from brokers that execute fund trades and any fees paid to affiliates of the Adviser for services rendered to a fund); comparative fee structures, including a comparison of fees paid to the Adviser with those paid by similar funds; and the extent of care, conscientiousness and independence with which the Board members perform their duties and their expertise, including whether they are fully informed about all facts the Board deems relevant to its consideration of the Adviser's services and fees. The Board noted that SEC disclosure requirements regarding the basis for the Board's approval of the Fund's advisory contract generally track the factors listed above. Consistent with these judicial decisions and SEC disclosure requirements, the Board also considered management fees charged to institutional and other clients of the Adviser and subadviser for what
Annual Shareholder Report
might be viewed as like services. The Board was aware of these factors and was guided by them in its review of the Fund's advisory and subadvisory contracts to the extent it considered them to be appropriate and relevant, as discussed further below.
The Board considered and weighed these circumstances in light of its substantial accumulated experience in governing the Fund and working with Federated on matters relating to the Federated funds, and was assisted in its deliberations by independent legal counsel. Throughout the year, and in connection with its May meetings, the Board requested and received substantial and detailed information about the Fund and the Federated organization that was in addition to the extensive materials that comprise and accompany the Senior Officer's Evaluation. Federated provided much of this information at each regular meeting of the Board, and furnished additional substantial information in connection with the May meeting at which the Board's formal review of the advisory and subadvisory contracts occurred. At this May meeting, senior management of the Adviser also met with the independent trustees and their counsel to discuss the materials presented and any other matters thought relevant by the Adviser or the trustees. Between regularly scheduled meetings, the Board also received information on particular matters as the need arose. Thus, the Board's consideration of the advisory and subadvisory contracts included review of the Senior Officer's Evaluation, accompanying data and additional information covering such matters as: the Adviser's and subadviser's investment philosophy, revenue, profitability, personnel and processes; investment and operating strategies; the Fund's short- and long-term performance (in absolute terms, both on a gross basis and net of expenses, as well as in relationship to its particular investment program and certain competitor or “peer group” funds and/or other benchmarks, as appropriate), and comments on the reasons for performance; the Fund's investment objectives; the Fund's expenses (including the advisory fee itself and the overall expense structure of the Fund, both in absolute terms and relative to similar and/or competing funds, with due regard for contractual or voluntary expense limitations); the use and allocation of brokerage commissions derived from trading the Fund's portfolio securities (if any); and the nature, quality and extent of the advisory and other services provided to the Fund by the Adviser and its affiliates. The Board also considered the preferences and expectations of Fund shareholders; the entrepreneurial risk assumed by the Adviser in sponsoring the funds; the continuing state of competition in the mutual fund industry and market practices; the range of comparable fees for similar funds in the mutual fund industry; the Fund's relationship to the Federated family of funds which include a comprehensive array of funds with different investment objectives, policies and strategies which are available for exchange without the incurrence of additional sales charges; compliance and audit reports concerning the Federated funds and the Federated companies that service them (including communications from regulatory agencies), as well as Federated's responses to any issues raised therein;
Annual Shareholder Report
and relevant developments in the mutual fund industry and how the Federated funds and/or Federated are responding to them. The Board's evaluation process is evolutionary. The criteria considered and the emphasis placed on relevant criteria change in recognition of changing circumstances in the mutual fund marketplace.
While mindful that courts have cautioned against giving such comparisons too much weight, the Board has found the use of comparisons of the Fund's fees and expenses to other mutual funds with comparable investment programs to be relevant. In this regard, the Board was presented with, and considered, information regarding the contractual advisory fee rates, net advisory fee rates and total expense ratios relative to a fund's peers. The Board focused on comparisons with other similar mutual funds more heavily than non-mutual fund products or services because it is believed that they are more relevant. For example, other mutual funds are the products most like the Fund, they are readily available to Fund shareholders as alternative investment vehicles, and they are the type of investment vehicle in fact chosen and maintained by the Fund's investors. The range of their fees and expenses therefore appears to be a relevant indicator of what consumers have found to be reasonable in the precise marketplace in which the Fund competes.
The Board reviewed the contractual advisory fee rate, net advisory fee rate where partially waived and other expenses of the Fund and noted the position of the Fund's fee rates relative to its peers. In this regard, the Board noted that the contractual advisory fee rate was below the median of the relevant peer group and that it was satisfied that the overall expense structure of the Fund remained competitive.
By contrast, the Senior Officer has reviewed Federated's fees for providing advisory services to products outside the Federated family of funds (e.g., institutional and separate accounts and sub-adviser services). He concluded that mutual funds and institutional accounts are inherently different products. Those differences include, but are not limited to, different types of targeted investors; being subject to different laws and regulations; different legal structures; different average account sizes and portfolio management techniques made necessary by different cash flows and different associated costs; and the time spent by portfolio managers and their teams, funds financial services, legal, compliance and risk management in reviewing securities pricing, addressing different administrative responsibilities, addressing different degrees of risk associated with management and a variety of different costs. The Senior Officer did not consider these fee schedules to be determinative in judging the appropriateness of mutual fund advisory fees.
Annual Shareholder Report
The Fund's ability to deliver competitive performance when compared to its peer group was also deemed to be relevant by the Board as a useful indicator of how the Adviser is executing the Fund's investment program, which in turn was one of the Board's considerations in reaching a conclusion that the nature, extent, and quality of the Adviser's investment management services were such as to warrant continuation of the advisory and subadvisory contracts.
The Senior Officer reviewed information compiled by Federated, using data supplied by independent fund ranking organizations, regarding the performance of, and fees charged by, other mutual funds, noting his view that comparisons to fund peer groups may be helpful, though not conclusive, in judging the reasonableness of the proposed fees. The Board considered, in evaluating such comparisons, that in some cases individual funds may exhibit significant and unique differences in their objectives and management techniques when compared to other funds within an industry peer group.
For the one-year, three-year and five-year periods covered by the Evaluation, the Fund's performance was above the median of the relevant peer group.
The Board also received financial information about Federated, including information regarding the compensation and benefits Federated derived from its relationships with the Federated funds. This information covered not only the fees under the advisory contracts, but also fees received by Federated's subsidiaries for providing other services to the Federated funds under separate contracts (e.g., for serving as the Federated funds' administrator). The information also detailed any indirect benefit Federated may derive from its receipt of research services from brokers who execute Federated fund trades. In addition, the Board considered the fact that, in order for a fund to be competitive in the marketplace, Federated and its affiliates frequently waived fees and/or reimbursed expenses and have disclosed to fund investors and/or indicated to the Board their intention to do so in the future, where appropriate. Moreover, the Board receives regular reporting as to the institution, adjustment or elimination of these voluntary waivers.
In addition, over the past two years, following discussions regarding the Senior Officer's recommendations, Federated made meaningful reductions to the contractual advisory fees for several Funds. At the Board meeting in May 2015, following previous recommendations of the Senior Officer, Federated proposed, and the Board approved, reductions in the contractual advisory fees of certain other Funds.
Federated furnished information, requested by the Senior Officer, that reported revenues on a fund-by-fund basis and made estimates of the allocation of expenses on a fund-by-fund basis, using allocation methodologies specified by the Senior Officer. The Senior Officer noted that, while these cost allocation reports apply consistent allocation processes, the inherent difficulties in allocating costs continues to cause the Senior Officer to question the precision of the process and to conclude that such reports may be unreliable, since a single
Annual Shareholder Report
change in an allocation estimate may dramatically alter the resulting estimate of cost and/or profitability of a fund and may produce unintended consequences. The allocation information, including the Senior Officer's view that fund-by-fund estimations may be unreliable, was considered in the analysis by the Board.
The Board and the Senior Officer also reviewed information compiled by Federated comparing profitability information for Federated to other publicly held fund management companies. In this regard, the Senior Officer concluded that Federated's profit margins did not appear to be excessive. The Senior Officer also noted that Federated appeared financially sound, with the resources to fulfill its obligations under its contracts with the Funds.
The Senior Officer's Evaluation also discussed the notion of possible realization of “economies of scale” as a fund grows larger. The Board considered in this regard that the Adviser has made significant and long-term investments in areas that support all of the Federated family of funds, such as personnel and processes for the portfolio management, shareholder services, compliance, internal audit, and risk management functions; and systems technology; and that the benefits of these efforts (as well as any economies of scale, should they exist) were likely to be enjoyed by the fund family as a whole. Federated, as it does throughout the year, and again in connection with the Board's review, furnished information relative to revenue sharing or adviser paid fees. Federated and the Senior Officer noted that this information should be viewed to determine if there was an incentive to either not apply breakpoints or to apply breakpoints at higher levels and should not be viewed to determining the appropriateness of advisory fees, because it would represent marketing and distribution expenses. Finally, the Board also noted the absence of any applicable regulatory or industry guidelines on this subject, which (as discussed in the Senior Officer's Evaluation) is compounded by the lack of any common industry practice or general pattern with respect to structuring fund advisory fees with “breakpoints” that serve to reduce the fee as the fund attains a certain size.
The Senior Officer noted that, subject to the comments and recommendations made within his Evaluation, his observations and the information accompanying the Evaluation supported a finding by the Board that the management fees for each of the funds were reasonable. Under these circumstances, no changes were recommended to, and no objection was raised to, the continuation of the Fund's advisory and subadvisory contracts.
In its decision to continue an existing investment advisory contract, the Board was mindful of the potential disruptions of the Fund's operations and various risks, uncertainties and other effects that could occur as a result of a decision to terminate or not renew an advisory contract. In particular, the Board recognized that many shareholders have invested in the Fund on the strength of the Adviser's industry standing and reputation and with the expectation that the Adviser will have a continuing role in providing advisory services to the Fund. Thus, the Board's approval of the advisory contract reflected the fact that it is the shareholders who have effectively selected the Adviser by virtue of having
Annual Shareholder Report
invested in the Fund. The Board concluded that, in light of the factors discussed above, including the nature, quality and scope of the services provided to the Fund by the Adviser and its affiliates, continuation of the advisory contract was appropriate.
The Board based its decision to approve the advisory and subadvisory contracts on the totality of the circumstances and relevant factors and with a view to past and future long-term considerations. Not all of the factors and considerations identified above were necessarily relevant to the Fund, nor did the Board consider any one of them to be determinative. With respect to the factors that were relevant, the Board's decision to approve the contract reflects its determination that Federated's performance and actions provided a satisfactory basis to support the decision to continue the existing arrangements.
Annual Shareholder Report
Voting Proxies on Fund Portfolio Securities
A description of the policies and procedures that the Fund uses to determine how to vote proxies, if any, relating to securities held in the Fund's portfolio is available, without charge and upon request, by calling 1-800-341-7400. A report on “Form N-PX” of how the Fund voted any such proxies during the most recent 12-month period ended June 30 is available via the Proxy Voting Record (Form N-PX) link associated with the Fund and share class name at www.FederatedInvestors.com/FundInformation. Form N-PX filings are also available at the SEC's website at www.sec.gov.
Quarterly Portfolio Schedule
The Fund files with the SEC a complete schedule of its portfolio holdings, as of the close of the first and third quarters of its fiscal year, on “Form N-Q.” These filings are available on the SEC's website at www.sec.gov and may be reviewed and copied at the SEC's Public Reference Room in Washington, DC. (Call 1-800-SEC-0330 for information on the operation of the Public Reference Room.) You may also access this information via the link to the Fund and share class name at www.FederatedInvestors.com/FundInformation.
Annual Shareholder Report
[PAGE INTENTIONALLY LEFT BLANK]
Mutual funds are not bank deposits or obligations, are not guaranteed by any bank and are not insured or guaranteed by the U.S. government, the Federal Deposit Insurance Corporation, the Federal Reserve Board or any other government agency. Investment in mutual funds involves investment risk, including the possible loss of principal.
This Report is authorized for distribution to prospective investors only when preceded or accompanied by the Fund's Prospectus, which contains facts concerning its objective and policies, management fees, expenses and other information.
Federated Global Allocation Fund
Federated Investors Funds
4000 Ericsson Drive
Warrendale, PA 15086-7561
Contact us at FederatedInvestors.com
or call 1-800-341-7400.
Federated Securities Corp., Distributor
CUSIP 314183104
CUSIP 314183203
CUSIP 314183302
CUSIP 314183401
CUSIP 314183500
G01454-01 (1/16)
Federated is a registered trademark of Federated Investors, Inc.
2016 ©Federated Investors, Inc.
Item 2. Code of Ethics
(a) As of the end of the period covered by this report, the registrant has adopted a code of ethics (the "Section 406 Standards for Investment Companies - Ethical Standards for Principal Executive and Financial Officers") that applies to the registrant's Principal Executive Officer and Principal Financial Officer; the registrant's Principal Financial Officer also serves as the Principal Accounting Officer.
(c) There was no amendment to the registrant’s code of ethics described in Item 2(a) above during the period covered by the report.
(d) There was no waiver granted, either actual or implicit, from a provision to the registrant’s code of ethics described in Item 2(a) above during the period covered by the report.
(e) Not Applicable
(f)(3) The registrant hereby undertakes to provide any person, without charge, upon request, a copy of the code of ethics. To request a copy of the code of ethics, contact the registrant at 1-800-341-7400, and ask for a copy of the Section 406 Standards for Investment Companies - Ethical Standards for Principal Executive and Financial Officers.
Item 3. Audit Committee Financial Expert
The registrant's Board has determined that each of the following members of the Board's Audit Committee is an “audit committee financial expert,” and is "independent," for purposes of this Item: John T. Collins and Thomas M. O'Neill.
Item 4. Principal Accountant Fees and Services
(a) Audit Fees billed to the registrant for the two most recent fiscal years:
Fiscal year ended 2015 - $31,180
Fiscal year ended 2014 - $30,300
(b) Audit-Related Fees billed to the registrant for the two most recent fiscal years:
Fiscal year ended 2015 - $0
Fiscal year ended 2014 - $0
Amount requiring approval of the registrant’s audit committee pursuant to paragraph (c)(7)(ii) of Rule 2-01 of Regulation S-X, $0 and $0 respectively.
(c) Tax Fees billed to the registrant for the two most recent fiscal years:
Fiscal year ended 2015 - $0
Fiscal year ended 2014 - $0
Amount requiring approval of the registrant’s audit committee pursuant to paragraph (c)(7)(ii) of Rule 2-01 of Regulation S-X, $0 and $0 respectively.
(d) All Other Fees billed to the registrant for the two most recent fiscal years:
Fiscal year ended 2015 - $0
Fiscal year ended 2014 - $0
Amount requiring approval of the registrant’s audit committee pursuant to paragraph (c)(7)(ii) of Rule 2-01 of Regulation S-X, $0 and $0 respectively.
(e)(1) Audit Committee Policies regarding Pre-approval of Services.
The Audit Committee is required to pre-approve audit and non-audit services performed by the independent auditor in order to assure that the provision of such services do not impair the auditor’s independence. Unless a type of service to be provided by the independent auditor has received general pre-approval, it will require specific pre-approval by the Audit Committee. Any proposed services exceeding pre-approved cost levels will require specific pre-approval by the Audit Committee.
Certain services have the general pre-approval of the Audit Committee. The term of the general pre-approval is 12 months from the date of pre-approval, unless the Audit Committee specifically provides for a different period. The Audit Committee will annually review the services that may be provided by the independent auditor without obtaining specific pre-approval from the Audit Committee and may grant general pre-approval for such services. The Audit Committee will revise the list of general pre-approved services from time to time, based on subsequent determinations. The Audit Committee will not delegate its responsibilities to pre-approve services performed by the independent auditor to management.
The Audit Committee has delegated pre-approval authority to its Chairman. The Chairman will report any pre-approval decisions to the Audit Committee at its next scheduled meeting. The Committee will designate another member with such pre-approval authority when the Chairman is unavailable.
AUDIT SERVICES
The annual Audit services engagement terms and fees will be subject to the specific pre-approval of the Audit Committee. The Audit Committee must approve any changes in terms, conditions and fees resulting from changes in audit scope, registered investment company (RIC) structure or other matters.
In addition to the annual Audit services engagement specifically approved by the Audit Committee, the Audit Committee may grant general pre-approval for other Audit Services, which are those services that only the independent auditor reasonably can provide. The Audit Committee has pre-approved certain Audit services, all other Audit services must be specifically pre-approved by the Audit Committee.
AUDIT-RELATED SERVICES
Audit-related services are assurance and related services that are reasonably related to the performance of the audit or review of the Company’s financial statements or that are traditionally performed by the independent auditor. The Audit Committee believes that the provision of Audit-related services does not impair the independence of the auditor, and has pre-approved certain Audit-related services, all other Audit-related services must be specifically pre-approved by the Audit Committee.
TAX SERVICES
The Audit Committee believes that the independent auditor can provide Tax services to the Company such as tax compliance, tax planning and tax advice without impairing the auditor’s independence. However, the Audit Committee will not permit the retention of the independent auditor in connection with a transaction initially recommended by the independent auditor, the purpose of which may be tax avoidance and the tax treatment of which may not be supported in the Internal Revenue Code and related regulations. The Audit Committee has pre-approved certain Tax services, all Tax services involving large and complex transactions must be specifically pre-approved by the Audit Committee.
ALL OTHER SERVICES
With respect to the provision of services other than audit, review or attest services the pre-approval requirement is waived if:
| (1) | The aggregate amount of all such services provided constitutes no more than five percent of the total amount of revenues paid by the registrant, the registrant’s adviser (not including any sub-adviser whose role is primarily portfolio management and is subcontracted with or overseen by another investment adviser), and any entity controlling, controlled by, or under common control with the investment adviser that provides ongoing services to the registrant to its accountant during the fiscal year in which the services are provided; |
| (2) | Such services were not recognized by the registrant, the registrant’s adviser (not including any sub-adviser whose role is primarily portfolio management and is subcontracted with or overseen by another investment adviser), and any entity controlling, controlled by, or under common control with the investment adviser that provides ongoing services to the registrant at the time of the engagement to be non-audit services; and |
| (3) | Such services are promptly brought to the attention of the Audit Committee of the issuer and approved prior to the completion of the audit by the Audit Committee or by one or more members of the Audit Committee who are members of the board of directors to whom authority to grant such approvals has been delegated by the Audit Committee. |
The Audit Committee may grant general pre-approval to those permissible non-audit services classified as All Other services that it believes are routine and recurring services, and would not impair the independence of the auditor.
The SEC’s rules and relevant guidance should be consulted to determine the precise definitions of prohibited non-audit services and the applicability of exceptions to certain of the prohibitions.
PRE-APPROVAL FEE LEVELS
Pre-approval fee levels for all services to be provided by the independent auditor will be established annually by the Audit Committee. Any proposed services exceeding these levels will require specific pre-approval by the Audit Committee.
PROCEDURES
Requests or applications to provide services that require specific approval by the Audit Committee will be submitted to the Audit Committee by both the independent auditor and the Principal Accounting Officer and/or Internal Auditor, and must include a joint statement as to whether, in their view, the request or application is consistent with the SEC’s rules on auditor independence.
(e)(2) Percentage of services identified in items 4(b) through 4(d) that were approved by the registrants audit committee pursuant to paragraph (c)(7)(i)(C) of Rule 2-01 of Regulation S-X:
4(b)
Fiscal year ended 2015– 0%
Fiscal year ended 2014- 0%
Percentage of services provided to the registrants investment adviser and any entity controlling, controlled by, or under common control with the investment adviser that provides ongoing services to the registrant that were approved by the registrants audit committee pursuant to paragraph (c)(7)(i)(C) of Rule 2-01 of Regulation S-X, 0% and 0% respectively.
4(c)
Fiscal year ended 2015– 0%
Fiscal year ended 2014– 0%
Percentage of services provided to the registrants investment adviser and any entity controlling, controlled by, or under common control with the investment adviser that provides ongoing services to the registrant that were approved by the registrants audit committee pursuant to paragraph (c)(7)(i)(C) of Rule 2-01 of Regulation S-X, 0% and 0% respectively.
4(d)
Fiscal year ended 2015– 0%
Fiscal year ended 2014– 0%
Percentage of services provided to the registrants investment adviser and any entity controlling, controlled by, or under common control with the investment adviser that provides ongoing services to the registrant that were approved by the registrants audit committee pursuant to paragraph (c)(7)(i)(C) of Rule 2-01 of Regulation S-X, 0% and 0% respectively.
| (g) | Non-Audit Fees billed to the registrant, the registrant’s investment adviser, and certain entities controlling, controlled by or under common control with the investment adviser: |
Fiscal year ended 2015- $0
Fiscal year ended 2014- $20,081
(h) The registrant’s Audit Committee has considered that the provision of non-audit services that were rendered to the registrant’s adviser (not including any sub-adviser whose role is primarily portfolio management and is subcontracted with or overseen by another investment adviser), and any entity controlling, controlled by, or under common control with the investment adviser that provides ongoing services to the registrant that were not pre-approved pursuant to paragraph (c)(7)(ii) of Rule 2-01 of Regulation S-X is compatible with maintaining the principal accountant’s independence.
Item 5. Audit Committee of Listed Registrants
Not Applicable
Item 6. Schedule of Investments
(a) The registrant’s Schedule of Investments is included as part of the Report to Stockholders filed under Item 1 of this form.
(b) Not Applicable; Fund had no divestments during the reporting period covered since the previous Form N-CSR filing.
Item 7. Disclosure of Proxy Voting Policies and Procedures for Closed-End Management Investment Companies
Item 8. Portfolio Managers of Closed-End Management Investment Companies
Item 9. Purchases of Equity Securities by Closed-End Management Investment Company and Affiliated Purchasers
Item 10. Submission of Matters to a Vote of Security Holders
No Changes to Report
Item 11. Controls and Procedures
(a) The registrant’s President and Treasurer have concluded that the
registrant’s disclosure controls and procedures (as defined in rule 30a-3(c) under the Act) are effective in design and operation and are sufficient to form the basis of the certifications required by Rule 30a-(2) under the Act, based on their evaluation of these disclosure controls and procedures within 90 days of the filing date of this report on Form N-CSR.
(b) There were no changes in the registrant’s internal control over financial reporting (as defined in rule 30a-3(d) under the Act) during the second fiscal quarter of the period covered by this report that have materially affected, or are reasonably likely to materially affect, the registrant’s internal control over financial reporting.
Item 12. Exhibits
(a)(1) Code of Ethics- Not Applicable to this Report.
(a)(2) Certifications of Principal Executive Officer and Principal Financial Officer.
(a)(3) Not Applicable.
(b) Certifications pursuant to 18 U.S.C. Section 1350.
SIGNATURES
Pursuant to the requirements of the Securities Exchange Act of 1934 and the Investment Company Act of 1940, the registrant has duly caused this report to be signed on its behalf by the undersigned, thereunto duly authorized.
Registrant Federated Global Allocation Fund
By /S/ Lori A. Hensler
Lori A. Hensler, Principal Financial Officer
Date January 25, 2016
Pursuant to the requirements of the Securities Exchange Act of 1934 and the Investment Company Act of 1940, this report has been signed below by the following persons on behalf of the registrant and in the capacities and on the dates indicated.
By /S/ J. Christopher Donahue
J. Christopher Donahue, Principal Executive Officer
Date January 25, 2016
By /S/ Lori A. Hensler
Lori A. Hensler, Principal Financial Officer
Date January 25, 2016