United States
Securities and Exchange Commission
Washington, D.C. 20549
Form N-CSR
Certified Shareholder Report of Registered Management Investment Companies
811-1
(Investment Company Act File Number)
Federated Global Allocation Fund
_______________________________________________________________
(Exact Name of Registrant as Specified in Charter)
Federated Investors Funds
4000 Ericsson Drive
Warrendale, Pennsylvania 15086-7561
(Address of Principal Executive Offices)
(412) 288-1900
(Registrant's Telephone Number)
Peter J. Germain, Esquire
Federated Investors Tower
1001 Liberty Avenue
Pittsburgh, Pennsylvania 15222-3779
(Name and Address of Agent for Service)
(Notices should be sent to the Agent for Service)
Date of Fiscal Year End:11/30/19
Date of Reporting Period:11/30/19
| Item 1. | Reports to Stockholders |

Annual Shareholder Report
November 30, 2019
| Share Class | Ticker | A | FSTBX | B | FSBBX | C | FSBCX |
| | R | FSBKX | Institutional | SBFIX | R6 | FSBLX |
Federated Global Allocation Fund
Fund Established 1934
IMPORTANT NOTICE REGARDING REPORT DELIVERY
Beginning on January 1, 2021, as permitted by regulations adopted by the Securities and Exchange Commission, paper copies of the Fund's shareholder reports like this one will no longer be sent by mail, unless you specifically request paper copies of the reports from the Fund or from your financial intermediary, such as a broker-dealer or bank. Instead, the reports will be made available on a website, and you will be notified by mail each time a report is posted and provided with a website link to access the report.
If you already elected to receive shareholder reports electronically, you will not be affected by this change and you need not take any action. You may elect to receive shareholder reports and other communications from the Fund or your financial intermediary electronically by contacting your financial intermediary (such as a broker-dealer or bank); other shareholders may call the Fund at 1-800-341-7400, Option 4.
You may elect to receive all future reports in paper free of charge. You can inform the Fund or your financial intermediary that you wish to continue receiving paper copies of your shareholder reports by contacting your financial intermediary (such as a broker-dealer or bank); other shareholders may call the Fund at 1-800-341-7400, Option 4. Your election to receive reports in paper will apply to all funds held with the Fund complex or your financial intermediary.
Not FDIC Insured ■ May Lose Value ■ No Bank Guarantee
J. Christopher
Donahue
President
Federated Global Allocation Fund
Letter from the President
Dear Valued Shareholder,
I am pleased to present the Annual Shareholder Report for your fund covering the period from December 1, 2018 through November 30, 2019. This report includes Management's Discussion of Fund Performance, a complete listing of your fund's holdings, performance information and financial statements along with other important fund information.
In addition, our website, FederatedInvestors.com, offers easy access to Federated resources that include timely fund updates, economic and market insights from our investment strategists, and financial planning tools.
Thank you for investing with Federated. I hope you find this information useful and look forward to keeping you informed.
Sincerely,
J. Christopher Donahue, President
CONTENTS
| 1 |
| 8 |
| 10 |
| 57 |
| 63 |
| 65 |
| 67 |
| 68 |
| 86 |
| 88 |
| 90 |
| 96 |
| 103 |
| 103 |
Management's Discussion of Fund Performance (unaudited)
The total return of Federated Global Allocation Fund (the “Fund”), based on net asset value for the 12-month reporting period ended November 30, 2019, was 9.89%, 8.94%, 9.06%, 10.21%, 9.38%, and 10.26% for the Fund's Class A Shares, Class B Shares, Class C Shares, Institutional Shares, Class R Shares and Class R6 shares, respectively. The total return of the Fund's Blended Index1,2 was 11.88%, and the total return of the Morningstar World Allocation Funds Average (MWAFA)3 was 8.82% for the same period. The Fund's Blended Index was composed of 60% of the return of the MSCI All Country World Index (MSCI ACWI) and 40% of the return of the Bloomberg Barclays Global Aggregate Index. The Fund's and MWAFA's total returns for the most recently completed fiscal year reflect actual cash flows, transaction costs and other expenses, which were not reflected in the total return of any index.
The following discussion will focus on the performance of the Fund's Class R6 Shares.
MARKET OVERVIEW
Equities
Equities began the reporting period in the midst of one of the most significant selloffs since the Great Recession, as central bank policy, slowing economic growth, the U.S.-China trade war and Brexit (the U.K. leaving the European Union) sparked recession fears. After the U.S. Federal Reserve (the “Fed”) delivered the fourth and final rate hike of 2018 in December, it responded to the market's concerns by signaling a pause in hikes in early 2019 before eventually cutting rates three times in the second half of the year. The Fed was not alone in its pivot back to easing, as central banks across the globe eventually participated in a round of global synchronized stimulus. Recession fears were further quelled by a return to the negotiating table by the U.S. and China, as the two countries worked towards a Phase I trade deal that could potentially yield the cancellation of future tariffs and the rollback of existing tariffs.
On the economic data front, amidst a global growth slowdown, the U.S. remained the most resilient economy, with a strong labor market and remarkably unfazed consumers leading the way. Manufacturing, both in the U.S. and across the globe, slowed meaningfully over the period, with Purchasing Managers Index (PMI) readings in many countries falling into contraction territory. Still, the relative strength of the service sector kept all major economies from slipping into recession, and the most recent data suggested that the global manufacturing sector may be finding a bottom before reaccelerating.
Annual Shareholder Report
All told, the U.S. equity market produced a positive total return, with the S&P 500 Index4 up 16.11% for the reporting period. Small-caps underperformed, with the Russell 2000® Index5 up 7.51%. Within the large-cap space, growth outperformed value with the Russell 1000® Growth Index6 producing a 21.01% return compared to an 11.33% return for the Russell 1000® Value Index.7
Returns internationally were positive, but somewhat more muted, with international developed markets8 outperforming emerging markets. For the reporting period, the MSCI EAFE Index9 returned 12.44%. Australia performed particularly well, with the MSCI Australia Index up 19.58%. Canada and Europe also did well, with the MSCI Canada Index Up 14.90% and the MSCI Europe Index up 14.30%. Japan was the laggard, with the MSCI Japan Index returning 9.97%.10
Emerging markets11 lagged both the U.S. and international developed markets, returning 7.28% for the period (MSCI Emerging Markets Index).12 Russia, Egypt and Taiwan were the strongest performers, each producing a total return in excess of 25% for the reporting period, while Chile was the most dramatic underperformer, with the MSCI Chile Index falling 27.74%.10
On the currency front, the U.S. Dollar, as measured by the U.S. Dollar Index,13 strengthened 1.03% for the period.
Fixed Income
During the reporting period, interest rates in the U.S. fell quite significantly, reversing the prior year's ascent.14 The bellwether 10-year U.S. Treasury yield, for example, fell from nearly 3.00% at the start of the reporting period to a low of 1.46% in September, before rebounding modestly and ending the period at 1.78%.
Internationally, while yields followed a similar pattern, the level of yields was significantly lower, as a significant portion of international government bonds fell into negative yielding territory. The German Bund yield started the period in slight positive territory, yielding 0.32%, hit a low of -0.71%, before rebounding to -0.36% to end the period. Likewise, the Japanese Government Bond fell from 0.09% at the start of the period, to a low of -0.29% before rebounding to -0.7%.
The yield curve in the U.S. also did a round trip, remaining mostly flat with a positive slope that fluctuated between 15 basis points (bps) and 30 bps, before a brief and shallow inversion in August. The inversion was short-lived, however, with the yield curve re-steepening back to the 15-30 bps range by the end of the period.
Annual Shareholder Report
The rally in Treasuries has led to strong returns for most U.S. fixed-income sectors during the reporting period. On a total return basis, not surprisingly, longer duration fixed income assets, such as Treasuries, investment-grade (IG) corporates and municipal bonds, have outperformed bonds that have shorter duration, such as asset-backed securities. On the credit side, after widening during the beginning part of the reporting period, spreads then tightened as recession fears waned. Still, investors preferred higher quality bonds during the period. While both IG corporates and high-yield15 (HY) bonds outperformed maturity-matching Treasuries, IG fared even better. Similarly, within the high-yield realm, higher-rated “BB” bonds also significantly outperformed the “CCC”-rated bonds. All told, the Bloomberg Barclays U.S. Corporate Bond Index,16 returned 15.85% over the period compared with a total return of 9.68% for the Bloomberg Barclays U.S. Corporate High Yield 2% Issuer Capped Index.17
Fund Performance
The contributions to relative Fund performance from the Fund's security selection strategies, on balance, added to Fund performance for the reporting period. The Domestic Large Cap, International Developed and Domestic Small Cap equity strategies outperformed, while the Emerging Market equity strategy underperformed. Similarly, the Domestic Bond strategy outperformed, while the International Bond strategy underperformed.
The Fund's systematic macro overlay strategies were mixed, but they collectively detracted from performance. While the Global Interest Rate strategy produced a positive total return, the Global Currency and Global Equity strategies produced negative total returns. The systematic overlay strategies invest in equity index futures, government bond futures and currency forwards to achieve the desired long/short exposures. During the period, the systematic macro overlay strategy, and thus the underlying derivatives positions, detracted -0.54% from total return.
| 1 | Please see the footnotes to the line graphs under “Fund Performance and Growth of a $10,000 Investment” below for the definition of, and more information about, the Blended Index. |
| 2 | The Fund's broad-based security market indexes are the S&P 500 Index and the Bloomberg Barclays U.S. Aggregate Bond Index, which had total returns of 16.11% and 10.79%, respectively. Please see the footnotes to the line graphs under “Fund Performance and Growth of a $10,000 Investment” below for the definition of, and more information about, the S&P 500 Index and the Bloomberg Barclays U.S. Aggregate Bond Index. |
| 3 | Please see the footnotes to the line graphs under “Fund Performance and Growth of a $10,000 Investment” below for the definition of, and more information about, the MWAFA. |
| 4 | The S&P 500 Index is a capitalization-weighted index of 500 stocks designed to measure performance of the broad domestic economy through changes in the aggregate market value of 500 stocks representing all major industries.* |
Annual Shareholder Report
| 5 | The Russell 2000® Index measures the performance of the small-cap segment of the U.S. equity universe.* |
| 6 | The Russell 1000® Growth Index measures the performance of the large-cap growth segment of the U.S. equity universe.* |
| 7 | The Russell 1000® Value Index measures the performance of the large-cap value segment of the U.S. equity universe.* |
| 8 | International investing involves special risks including currency risk, increased volatility, political risks, and differences in auditing and other financial standards. |
| 9 | The MSCI EAFE Index is an equity index which captures large- and mid-cap representation across developed markets countries around the world, excluding the United States and Canada. With 906 constituents, the index covers approximately 85% of the free float-adjusted market capitalization in each country.* |
| 10 | The MSCI country indexes are designed to measure the performance of the large- and mid-cap segments of the respective country's market. The index covers approximately 85% of the free float-adjusted market capitalization in each country.* |
| 11 | Prices of emerging markets securities can be significantly more volatile than the prices of securities in developed countries, and currency risk and political risks are accentuated in emerging markets. |
| 12 | The MSCI Emerging Markets Index captures large- and mid-cap representation across 21 Emerging Markets (EM) countries. The indexes covers approximately 85% of the free float-adjusted market capitalization in each country.* |
| 13 | The U.S. Dollar Index indicates the general international value of the U.S. dollar by averaging the exchange rates between the U.S. dollar and six major world currencies.* |
| 14 | Bond prices are sensitive to changes in interest rates, and a rise in interest rates can cause a decline in their prices. |
| 15 | High-yield, lower-rated securities generally entail greater market, credit and liquidity risks than investment-grade securities and may include higher volatility and higher risk of default. |
| 16 | The Bloomberg Barclays U.S. Corporate Bond Index measures the investment-grade, fixed-rate, taxable corporate bond market.* |
| 17 | Bloomberg Barclays U.S. Corporate High Yield 2% Issuer Capped Index measures the USD-denominated, high yield, fixed-rate corporate bond market.* |
| * | The index is unmanaged, and it is not possible to invest directly in an index. |
Annual Shareholder Report
FUND PERFORMANCE AND GROWTH OF A $10,000 INVESTMENT
The graph below illustrates the hypothetical investment of $10,0001 in the Federated Global Allocation Fund from November 30, 2009 to November 30, 2019, compared to a blend of indexes comprised of 60% of the MSCI All Country World Index (MSCI ACWI) and 40% of the Bloomberg Barclays Global Aggregate Index (BBGA) (the “Blended Index”),2the Standard and Poor's 500 Index (S&P 500),3 the Bloomberg Barclays U.S. Aggregate Bond Index (BBAB)4 and the Morningstar World Allocation Funds Average (MWAFA).5 The Average Annual Total Return table below shows returns for each class averaged over the stated periods.
Growth of a $10,000 Investment
Growth of $10,000 as of November 30, 2019
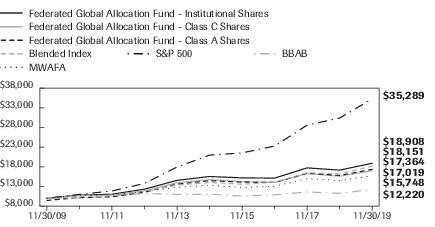
| Federated Global Allocation Fund - | Institutional Shares | Class C Shares | Class A Shares | Blended Index | S&P 500 | BBAB | MWAFA |
| F | F | F | I | I | I | I |
| 11/30/2009 | 10,000 | 10,000 | 9,450 | 10,000 | 10,000 | 10,000 | 10,000 |
| 11/30/2010 | 10,816 | 10,699 | 10,198 | 10,472 | 10,994 | 10,026 | 10,739 |
| 11/30/2011 | 11,031 | 10,795 | 10,363 | 10,744 | 11,855 | 10,659 | 10,880 |
| 11/30/2012 | 12,321 | 11,929 | 11,543 | 11,847 | 13,767 | 11,231 | 11,725 |
| 11/30/2013 | 14,554 | 13,944 | 13,596 | 13,331 | 17,938 | 10,969 | 12,767 |
| 11/30/2014 | 15,545 | 14,739 | 14,478 | 14,011 | 20,963 | 11,043 | 13,325 |
| 11/30/2015 | 15,188 | 14,257 | 14,103 | 13,588 | 21,539 | 10,565 | 12,754 |
| 11/30/2016 | 15,132 | 14,052 | 14,015 | 14,079 | 23,275 | 10,893 | 13,065 |
| 11/30/2017 | 17,725 | 16,289 | 16,368 | 16,487 | 28,599 | 11,604 | 14,992 |
| 11/30/2018 | 17,156 | 15,605 | 15,801 | 16,224 | 30,393 | 11,277 | 14,495 |
| 11/30/2019 | 18,908 | 17,019 | 17,364 | 18,151 | 35,289 | 12,220 | 15,748 |
41 graphic description end -->
| ■ | Total returns shown for the Class A Shares include the maximum sales charge of 5.50% ($10,000 investment minus $550 sales charge = $9,450). |
| ■ | Total returns shown for Class C Shares include the maximum contingent deferred sales charge of 1.00% as applicable. |
The Fund offers multiple share classes whose performance may be greater than or less than its other share class(es) due to difference in sales charges and expenses. See the Average Annual Return table below for the returns of additional classes not shown in the line graph above.
Annual Shareholder Report
Average Annual Total Returnsfor the Period Ended 11/30/2019
(returns reflect all applicable sales charges and contingent deferred sales charges as specified below in footnote #1)
| | 1 Year | 5 Years | 10 Years |
| Class A Shares | 3.85% | 2.54% | 5.67% |
| Class B Shares | 3.44% | 2.51% | 5.58% |
| Class C Shares | 8.06% | 2.92% | 5.46% |
| Class R Shares | 9.38% | 3.25% | 5.81% |
| Institutional Shares | 10.21% | 3.99% | 6.58% |
| Class R6 Shares6 | 10.26% | 3.91% | 6.38% |
| Blended Index | 11.88% | 5.31% | 6.14% |
| S&P 500 | 16.11% | 10.98% | 13.44% |
| BBAB | 10.79% | 2.05% | 2.03% |
| MWAFA | 8.82% | 3.62% | 5.93% |
Performance data quoted represents past performance which is no guarantee of future results. Investment return and principal value will fluctuate so that an investor's shares, when redeemed, may be worth more or less than their original cost. Mutual fund performance changes over time and current performance may be lower or higher than what is stated. For current to the most recent month-end performance and after-tax returns, visit FederatedInvestors.com or call 1-800-341-7400. Returns shown do not reflect the deduction of taxes that a shareholder would pay on Fund distributions or the redemption of Fund shares. Mutual funds are not obligations of or guaranteed by any bank and are not federally insured.
| 1 | Represents a hypothetical investment of $10,000 in the Fund after deducting applicable sales charges: for Class A Shares, the maximum sales charge of 5.50% ($10,000 investment minus $550 sales charge = $9,450); for Class B Shares, the maximum contingent deferred sales charge is 5.50% on any redemption of shares held up to one year from the purchase date; for Class C Shares, the maximum contingent deferred sales charge is 1.00% on any redemption less than one year from the purchase date. The Fund's performance assumes the reinvestment of all dividends and distributions. The Blended Index, S&P 500 and BBAB have been adjusted to reflect reinvestment of dividends on securities in the indexes. |
| 2 | The Blended Index is a custom blended index comprised of 60% of the MSCI ACWI and 40% of the BBGA. The MSCI ACWI captures large- and mid-cap representation across 23 developed markets countries and 23 emerging markets countries. The index covers approximately 85% of the global investable equity opportunity set. The BBGA is a measure of global investment grade debt from 24 different local currency markets. This multi-currency benchmark includes fixed-rate treasury, government-related, corporate and securitized bonds from both developed and emerging markets issuers. The indexes are not adjusted to reflect sales loads, expenses or other fees that the Securities and Exchange Commission (SEC) requires to be reflected in the Fund's performance. The indexes are unmanaged and, unlike the Fund, are not affected by cash flows. It is not possible to invest directly in an index. |
Annual Shareholder Report
| 3 | The S&P 500 is an unmanaged, capitalization-weighted index of 500 stocks designed to measure performance of the broad domestic economy through changes in the aggregate market value of 500 stocks representing all major industries. The index is not adjusted to reflect sales loads, expenses or other fees that the SEC requires to be reflected in the Fund's performance. The index is unmanaged and, unlike the Fund, is not affected by cash flows. It is not possible to invest directly in an index. |
| 4 | The BBAB is a broad-based benchmark that measures the investment grade, U.S. dollar-denominated, fixed-rate taxable bond market, including Treasuries, government-related and corporate securities, mortgage-backed securities (agency fixed-rate and hybrid adjustable rate mortgage pass-throughs), asset-backed securities and commercial mortgage-backed securities. The index is not adjusted to reflect sales loads, expenses or other fees that the SEC requires to be reflected in the Fund's performance. The index is unmanaged and, unlike the Fund, is not affected by cash flows. It is not possible to invest directly in an index. |
| 5 | The Morningstar figures represent the average of the total returns reported by all the funds designated by Morningstar as falling into the respective category indicated. They do not reflect sales charges. The Morningstar figures in the Growth of $10,000 line graph are based on historical return information published by Morningstar and reflect the return of the funds comprising the category in the year of publication. Because the funds designated by Morningstar as falling into the category can change over time, the Morningstar figures in the line graph may not match the Morningstar figures in the Average Annual Total Returns table, which reflect the return of the funds that currently comprise the category. |
| 6 | The Fund's R6 Shares commenced operations on June 29, 2016. For the period prior to the commencement of operations of the R6 Shares, the performance information shown is for the Fund's Class A Shares. The performance of Class A Shares has not been adjusted to reflect the expenses of R6 Shares since R6 Shares have a lower expense ratio than the expense ratio of the Class A Shares. The performance of Class A Shares has been adjusted to remove any voluntary waiver of Fund expenses related to the Class A Shares that may have occurred during the period prior to the commencement of operations of R6 Shares. Additionally, the performance information shown below has been adjusted to reflect the absence of sales charges applicable to Class A Shares. |
Annual Shareholder Report
Portfolio of Investments Summary Tables (unaudited)
At November 30, 2019, the Fund's portfolio composition1 was as follows:
| Portfolio Composition | Percentage of
Total Net Assets |
| International Equity Securities | 31.4% |
| Domestic Equity Securities | 31.0% |
| Emerging Markets Core Fund | 9.8% |
| Foreign Debt Securities | 7.2% |
| Corporate Debt Securities | 6.0% |
| Federated Mortgage Core Portfolio | 5.4% |
| U.S. Treasury and Agency Securities | 3.2% |
| Federated Project and Trade Finance Core Fund | 1.2% |
| High Yield Bond Portfolio | 0.9% |
| Federated Bank Loan Core Fund | 0.5% |
| Collateralized Mortgage-Backed Securities | 0.4% |
| Mortgage-Backed Securities2,3 | 0.0% |
| Asset-Backed Securities3 | 0.0% |
| Cash Equivalent | 0.8% |
| Purchased Options3 | 0.0% |
| Derivative Contracts3,4 | 0.0% |
| Other Assets and Liabilities5 | 2.2% |
| TOTAL | 100.0% |
| 1 | See the Fund's Prospectus and Statement of Additional Information for a description of these security types. |
| 2 | For purposes of this table, Mortgage-Backed Securities include mortgage-backed securities guaranteed by Government Sponsored Entities and adjustable rate mortgage-backed securities. |
| 3 | Represents less than 0.1%. |
| 4 | Based upon net unrealized appreciation (depreciation) or value of the derivative contracts as applicable. Derivative contracts may consist of futures, forwards, options and swaps. The impact of a derivative contract on the Fund's performance may be larger than its unrealized appreciation (depreciation) or value may indicate. In many cases, the notional value or amount of a derivative contract may provide a better indication of the contract's significance to the portfolio. More complete information regarding the Fund's direct investments in derivative contracts, including unrealized appreciation (depreciation), value and notional values or amounts of such contracts, can be found in the table at the end of the Portfolio of Investments included in this Report. |
| 5 | Assets, other than investments in securities and derivative contracts, less liabilities. See Statement of Assets and Liabilities. |
Annual Shareholder Report
At November 30, 2019, the Fund's sector composition7 of the Fund's equity holdings was as follows:
Sector Composition
of Equity Holdings | Percentage of
Equity Securities |
| Financials | 17.3% |
| Information Technology | 15.6% |
| Industrials | 12.8% |
| Consumer Discretionary | 11.8% |
| Health Care | 10.1% |
| Consumer Staples | 8.2% |
| Communication Services | 7.0% |
| Materials | 6.0% |
| Real Estate | 3.9% |
| Utilities | 3.8% |
| Energy | 3.5% |
| TOTAL | 100.0% |
| 7 | Sector classifications are based upon, and individual portfolio securities are assigned to, the classifications of the Global Industry Classification Standard (GICS) except that the Adviser assigns a classification to securities not classified by the GICS and to securities for which the Adviser does not have access to the classification made by the GICS. |
Annual Shareholder Report
Portfolio of Investments
November 30, 2019
Shares,
Principal
Amount or
Contracts | | | Value in
U.S. Dollars |
| | | COMMON STOCKS—62.4% | |
| | | Communication Services—4.4% | |
| 5,060 | 1 | AMC Networks, Inc. | $194,456 |
| 28,147 | | AT&T, Inc. | 1,052,135 |
| 349 | 1 | Alphabet, Inc., Class A | 455,127 |
| 106 | 1 | Alphabet, Inc., Class C | 138,326 |
| 430 | 1 | Anterix, Inc. | 18,262 |
| 51,083 | | Auto Trader Group PLC | 371,136 |
| 360 | 1 | Boingo Wireless, Inc. | 4,144 |
| 3,849 | 1 | Central European Media Enterprises Ltd., Class A | 17,320 |
| 322 | 1 | Charter Communications, Inc. | 151,343 |
| 529 | | Cheil Communications, Inc. | 10,604 |
| 8,000 | | China Mobile Ltd. | 60,378 |
| 1,500 | | Cyber Agent Ltd. | 51,886 |
| 32,998 | | Deutsche Telekom AG, Class REG | 554,008 |
| 2,294 | 1 | Facebook, Inc. | 462,562 |
| 1,363 | 1 | Glu Mobile, Inc. | 7,537 |
| 612 | 1 | Gray Television, Inc. | 12,387 |
| 452,095 | | HKT Trust and HKT Ltd. | 663,046 |
| 6,623 | | Hellenic Telecommunication Organization SA | 99,524 |
| 5,446 | 1 | IAC Interactive Corp. | 1,212,824 |
| 964 | 1 | Imax Corp. | 20,726 |
| 2,100 | | Konami Corp. | 92,412 |
| 4,350 | 1 | Liberty Media Corp. | 196,141 |
| 17,927 | 1 | Liberty Media Group | 772,116 |
| 25,820 | 1 | Lions Gate Entertainment Corp. | 223,859 |
| 6,881 | 1 | Lions Gate Entertainment Corp. | 64,337 |
| 20,422 | 1 | Live Nation Entertainment, Inc. | 1,425,660 |
| 679 | 1 | Loral Space & Communications Ltd. | 22,991 |
| 4,097 | 1 | Match Group, Inc. | 288,757 |
| 400 | | Nintendo Co. Ltd. | 154,826 |
| 2,396 | 1 | Orbcomm, Inc. | 9,608 |
| 20,864 | | Pearson PLC | 174,230 |
| 10,675 | | Rogers Communications, Inc., Class B | 515,949 |
| 27 | | SK Telecom Co. Ltd. | 5,604 |
Annual Shareholder Report
Shares,
Principal
Amount or
Contracts | | | Value in
U.S. Dollars |
| | | COMMON STOCKS—continued | |
| | | Communication Services—continued | |
| 4,498 | | Sinclair Broadcast Group, Inc. | $156,665 |
| 105,500 | | Singapore Press Holdings Ltd. | 169,654 |
| 31,331 | 1 | Sprint Corp. | 185,480 |
| 7,636 | 1 | T-Mobile USA, Inc. | 599,808 |
| 831 | 1 | TechTarget, Inc. | 22,038 |
| 37,374 | | Telefonica Deutschland Holding AG | 114,113 |
| 2,143 | 1 | Telekomunikacja Polska S.A. | 3,495 |
| 5,970 | | Telenet Group Holding NV | 269,319 |
| 183,760 | | Telstra Corp. Ltd. | 480,786 |
| 28,800 | | Tencent Holdings Ltd. | 1,220,963 |
| 81,245 | | Tim Participacoes S.A. | 262,904 |
| 22,717 | 1 | Twitter, Inc. | 702,182 |
| 3,795 | | Verizon Communications, Inc. | 228,611 |
| 22,507 | | Vivendi SA | 617,897 |
| 2,507 | 1 | Vonage Holdings Corp. | 19,830 |
| 801 | 1 | Yelp, Inc. | 27,779 |
| 6,544 | 1 | Zayo Group Holdings, Inc. | 224,067 |
| 10,977 | 1 | Zillow Group, Inc. | 428,762 |
| 29,198 | 1 | Zillow Group, Inc. | 1,143,102 |
| 193,718 | 1 | Zynga, Inc. | 1,206,863 |
| | | TOTAL | 17,588,539 |
| | | Consumer Discretionary—7.3% | |
| 3,200 | | ABC-Mart, Inc. | 213,206 |
| 374 | | Aaron's, Inc. | 21,842 |
| 137 | | Abercrombie & Fitch Co., Class A | 2,188 |
| 4,008 | | Adidas AG | 1,248,729 |
| 39 | 1 | Adtalem Global Education, Inc. | 1,315 |
| 7,261 | 1 | Alibaba Group Holding Ltd., ADR | 1,452,200 |
| 940 | 1 | Altus San Nicolas, Corp. | 9 |
| 2,068 | 1 | Amazon.com, Inc. | 3,724,054 |
| 263 | 1 | America's Car-Mart, Inc. | 28,735 |
| 792 | | American Eagle Outfitters, Inc. | 11,856 |
| 215 | 1 | Asbury Automotive Group, Inc. | 23,831 |
| 3,915 | | BBX Capital Corp. | 17,931 |
| 962 | | Bloomin Brands, Inc. | 23,136 |
| 228 | | Bluegreen Vacations Corp. | 2,250 |
Annual Shareholder Report
Shares,
Principal
Amount or
Contracts | | | Value in
U.S. Dollars |
| | | COMMON STOCKS—continued | |
| | | Consumer Discretionary—continued | |
| 123 | 1 | Booking Holdings, Inc. | $234,196 |
| 505 | 1 | Boot Barn Holdings, Inc. | 20,109 |
| 116 | | Bosch Ltd. | 26,040 |
| 5,487 | 1 | Bright Horizons Family Solutions, Inc. | 825,903 |
| 132 | | Brinker International, Inc. | 5,914 |
| 6,252 | | Burberry Group PLC | 169,663 |
| 6,143 | | Canadian Tire Corp. Ltd. | 713,038 |
| 309 | 1 | Career Education Corp. | 5,154 |
| 890 | | Carriage Services, Inc. | 21,404 |
| 9,400 | | Casio Computer Co. Ltd. | 179,295 |
| 31 | 1 | Cavco Industries, Inc. | 6,200 |
| 6,181 | | Columbia Sportswear Co. | 571,742 |
| 26,560 | | Compass Group PLC | 650,139 |
| 906 | 1 | CROCs, Inc. | 31,619 |
| 5,135 | | D. R. Horton, Inc. | 284,222 |
| 939 | | Dana, Inc. | 15,916 |
| 359 | | Dave & Buster's Entertainment, Inc. | 14,425 |
| 399 | 1 | Deckers Outdoor Corp. | 67,104 |
| 2,208 | 1 | Denny's Corp. | 43,144 |
| 3,400 | | Denso Corp. | 152,133 |
| 384 | | Dine Brands Global, Inc. | 31,826 |
| 14,761 | | Dollarama, Inc. | 540,966 |
| 12,107 | | eBay, Inc. | 430,041 |
| 9,414 | | Extended Stay America, Inc. | 138,951 |
| 3,574 | | Faurecia | 189,272 |
| 10,700 | | Feng Tay Enterprise Co. Ltd. | 67,061 |
| 9,496 | | Fiat Chrysler Automobiles NV | 140,452 |
| 3,052 | | Fila Korea Ltd. | 133,330 |
| 24,953 | | Ford Motor Co. | 226,074 |
| 27,000 | | Formosa Taffeta Co. | 30,104 |
| 2,441 | 1 | Frontdoor, Inc. | 110,480 |
| 19,089 | | Gentex Corp. | 542,128 |
| 16 | 1 | Gentherm, Inc. | 670 |
| 8,639 | | Gildan Activewear, Inc. | 251,372 |
| 263 | | Group 1 Automotive, Inc. | 27,113 |
| 100,600 | | Harvey Norman Holdings Ltd. | 292,960 |
Annual Shareholder Report
Shares,
Principal
Amount or
Contracts | | | Value in
U.S. Dollars |
| | | COMMON STOCKS—continued | |
| | | Consumer Discretionary—continued | |
| 164 | 1 | Helen of Troy Ltd. | $26,473 |
| 9,874 | | Hennes & Mauritz AB, Class B | 190,504 |
| 9,799 | | Hilton Worldwide Holdings, Inc. | 1,028,895 |
| 9,487 | | Home Depot, Inc. | 2,091,978 |
| 15,100 | | Honda Motor Co., Ltd. | 424,693 |
| 274 | | Hyundai Mobis | 56,864 |
| 11,800 | | Iida Group Holdings Co. Ltd. | 210,034 |
| 19,777 | | Industria de Diseno Textil SA | 615,179 |
| 7,028 | | InterContinental Hotels Group PLC | 455,335 |
| 449 | | Jack in the Box, Inc. | 35,601 |
| 182 | | Johnson Outdoors, Inc., Class A | 11,757 |
| 633 | | Kering | 380,824 |
| 2,800 | | Koito Manufacturing Co. Ltd. | 144,635 |
| 599 | | LCI Industries | 63,770 |
| 2,762 | | LVMH Moet Hennessy Louis Vuitton SA | 1,238,219 |
| 1,263 | | La-Z-Boy, Inc. | 39,911 |
| 648 | | Las Vegas Sands Corp. | 40,662 |
| 1,524 | 1 | Laureate Education, Inc. | 26,441 |
| 4,142 | | Lowe's Cos., Inc. | 485,898 |
| 189 | | M.D.C. Holdings, Inc. | 7,479 |
| 9,846 | | Magna International, Inc. | 541,852 |
| 552 | | Marine Products Corp. | 8,352 |
| 17,300 | | Mazda Motor Corp. | 153,655 |
| 400 | | McDonald's Holdings Co. (Japan), Ltd. | 19,777 |
| 420 | 1 | Meritage Corp. | 27,947 |
| 1,925 | | Michelin, Class B | 230,754 |
| 12,600 | | Mitsubishi Motors Corp. | 56,511 |
| 7,493 | | Moncler S.p.A | 328,411 |
| 272 | | Movado Group, Inc. | 5,318 |
| 103 | 1 | NVR, Inc. | 390,565 |
| 973 | | Naspers Ltd., Class N | 139,185 |
| 6,227 | | Next PLC | 544,163 |
| 6,000 | | Nikon Corp. | 82,444 |
| 9,398 | | Office Depot, Inc. | 20,958 |
| 585 | | PVH Corp. | 56,722 |
| 157 | | Page Industries Ltd. | 48,089 |
Annual Shareholder Report
Shares,
Principal
Amount or
Contracts | | | Value in
U.S. Dollars |
| | | COMMON STOCKS—continued | |
| | | Consumer Discretionary—continued | |
| 55,000 | | Panasonic Corp. | $519,370 |
| 1,030 | 1 | Party City Holdco, Inc. | 1,988 |
| 3,470 | | Persimmon PLC | 114,646 |
| 38,171 | | Petrobras Distribuidora SA | 251,907 |
| 18,935 | | Peugeot SA | 456,926 |
| 84,000 | | Pou Chen Corp. | 109,525 |
| 188 | 1 | RH | 38,651 |
| 925 | | Rent-A-Center, Inc. | 24,078 |
| 2,249 | 1 | Rubicon Project, Inc./The | 18,172 |
| 775 | 1 | SeaWorld Entertainment, Inc. | 22,692 |
| 4,500 | | Sega Sammy Holdings, Inc. | 64,941 |
| 12,700 | | Sekisui House Ltd. | 274,721 |
| 7,211 | 1 | ServiceMaster Global Holdings, Inc. | 282,599 |
| 3,700 | | Shimamura Co. Ltd. | 297,141 |
| 294 | | Shoe Carnival, Inc. | 10,437 |
| 8,261 | | Sodexo SA | 962,392 |
| 406 | | Standard Motor Products, Inc. | 20,450 |
| 556 | | Starbucks Corp. | 47,499 |
| 6,000 | | Subaru Corp. | 157,367 |
| 3,000 | | Suzuki Motor Corp. | 133,150 |
| 378 | 1 | Taylor Morrison Home Corp. | 8,777 |
| 14,632 | | Titan Industries Ltd. | 235,920 |
| 615 | | Toll Brothers, Inc. | 24,705 |
| 114 | 1 | TopBuild Corp. | 12,572 |
| 13,700 | | Toyoda Gosei Co. Ltd. | 320,676 |
| 1,038 | | Twin River Worldwide Holdings, Inc. | 25,223 |
| 1,563 | | V.F. Corp. | 138,388 |
| 344 | 1 | Vera Bradley, Inc. | 3,798 |
| 12,535 | 1 | Vipshop Holdings Ltd., ADR | 160,197 |
| 301 | | Volkswagen AG | 57,433 |
| 458 | | Wyndham Destinations, Inc. | 22,213 |
| 29,200 | | Yamada Denki Co. Ltd. | 145,832 |
| 300 | | Yamaha Corp. | 16,568 |
| 14,300 | | Yamaha Motor Co. | 299,405 |
| 5,900 | | Yokohama Rubber Co. Ltd./The | 121,802 |
| 13,000 | | Zhongsheng Group Holdings | 46,089 |
Annual Shareholder Report
Shares,
Principal
Amount or
Contracts | | | Value in
U.S. Dollars |
| | | COMMON STOCKS—continued | |
| | | Consumer Discretionary—continued | |
| 208 | 1 | Zumiez, Inc. | $6,144 |
| | | TOTAL | 29,645,691 |
| | | Consumer Staples—5.1% | |
| 6,100 | | AEON Co. Ltd. | 124,607 |
| 4,320 | | Alimentation Couche-Tard, Inc., Class B | 141,994 |
| 2,777 | | Archer-Daniels-Midland Co. | 119,217 |
| 16,467 | 1 | Atacadao Distribuicao Comercio e Industria Ltda | 72,812 |
| 21,282 | | BIM Birlesik Magazalar AS | 170,138 |
| 359 | 1 | BJ's Wholesale Club Holdings, Inc. | 8,508 |
| 892 | 1 | Beyond Meat, Inc. | 74,000 |
| 269 | | Bid Corp. Ltd. | 5,922 |
| 2,910 | | British American Tobacco PLC | 115,360 |
| 3,274 | | Brown-Forman Corp. | 208,881 |
| 3,344 | | Bunge Ltd. | 178,503 |
| 391 | | Calavo Growers, Inc. | 34,873 |
| 1,600 | | Calbee, Inc. | 51,585 |
| 216 | | Carlsberg A/S, Class B | 31,054 |
| 146,200 | | Charoen Pokphand Foods PCL | 69,679 |
| 15,000 | | China Mengniu Dairy Co. Ltd. | 57,414 |
| 3,122 | | Church and Dwight, Inc. | 219,289 |
| 9,341 | | Clicks Group, Ltd. | 159,767 |
| 27,721 | | Coca-Cola Amatil Ltd. | 213,736 |
| 10 | | Coca-Cola Bottling Co. | 2,702 |
| 241 | | Colgate-Palmolive Co. | 16,345 |
| 57,207 | | Davide Campari - Milano SpA | 522,083 |
| 24,854 | | Diageo PLC | 1,016,060 |
| 712 | 1 | Edgewell Personal Care Co. | 22,186 |
| 2,753 | | Empire Co. Ltd., Class A | 73,846 |
| 1,533 | | Essity Aktiebolag | 48,164 |
| 1,135 | | Estee Lauder Cos., Inc., Class A | 221,858 |
| 12,500 | | Fraser & Neave Holdings Bhd | 103,971 |
| 7,785 | | George Weston Ltd. | 630,689 |
| 25,116 | | Godrej Consumer Products Ltd. | 253,034 |
| 2,800 | | Growell Holdings Co., Ltd. | 171,855 |
| 6,823 | 1 | Herbalife Ltd. | 311,197 |
| 4,450 | | Hindustan Lever Ltd. | 126,160 |
Annual Shareholder Report
Shares,
Principal
Amount or
Contracts | | | Value in
U.S. Dollars |
| | | COMMON STOCKS—continued | |
| | | Consumer Staples—continued | |
| 22,547 | | Imperial Brands PLC | $496,298 |
| 53,600 | | Indofood CBP Sukses Makmur TBK PT | 43,054 |
| 40,527 | | JBS S.A. | 269,848 |
| 1,952 | | Kimberly-Clark Corp. | 266,136 |
| 5,274 | | Kimberly-Clark de Mexico | 10,029 |
| 98 | | Korea Tobacco & Ginseng Corp. | 8,116 |
| 15,071 | | Kraft Heinz Co./The | 459,666 |
| 5,376 | | L'Oreal SA | 1,531,948 |
| 12,300 | | Lion Corp. | 248,268 |
| 16,507 | | Loblaw Cos. Ltd. | 884,938 |
| 43,715 | | Marico Ltd. | 219,197 |
| 7,832 | | Metro, Inc., Class A | 343,339 |
| 4,611 | | MetroWholesale & Food Specialist AG | 74,304 |
| 15,309 | 1 | Monster Beverage Corp. | 915,784 |
| 1,276 | | Nestle India Ltd. | 257,196 |
| 8,279 | | Nestle S.A. | 860,409 |
| 2,213 | | Orkla ASA | 21,422 |
| 48,800 | | PT Gudang Garam Tbk | 174,082 |
| 1,017 | 1 | Performance Food Group Co. | 47,860 |
| 3,300 | | Perlis Plantations Bhd | 14,375 |
| 692 | | Philip Morris International, Inc. | 57,388 |
| 34,783 | �� | Pick'n Pay Stores Ltd. | 161,232 |
| 2,600 | | Pigeon Corp. | 121,103 |
| 40,942 | 1 | Pilgrim's Pride Corp. | 1,289,673 |
| 7,876 | | Procter & Gamble Co. | 961,345 |
| 179 | | Sanfilippo (John B. & Sons), Inc. | 17,495 |
| 1,600 | | Seven & I Holdings Co. Ltd. | 59,688 |
| 5,300 | | Sundrug Co. Ltd. | 186,004 |
| 7,982 | | Sysco Corp. | 642,950 |
| 1,700 | | Toyo Suisan Kaisha Ltd. | 73,335 |
| 10,124 | | Tyson Foods, Inc., Class A | 910,046 |
| 3,975 | 1 | US Foods Holding Corp. | 158,086 |
| 142 | 1 | USANA Health Sciences, Inc. | 10,451 |
| 121,000 | | Uni-President Enterprises Corp. | 287,730 |
| 16,896 | | Unilever PLC | 1,001,851 |
| 243 | | Universal Corp. | 12,689 |
Annual Shareholder Report
Shares,
Principal
Amount or
Contracts | | | Value in
U.S. Dollars |
| | | COMMON STOCKS—continued | |
| | | Consumer Staples—continued | |
| 5,334 | | Vector Group Ltd. | $71,689 |
| 63 | | WD 40 Co. | 12,166 |
| 109,920 | | Wal-Mart de Mexico SAB de C.V. | 302,592 |
| 7,104 | | WalMart, Inc. | 846,015 |
| 10,485 | | Woolworth's Ltd. | 282,628 |
| 29,200 | | Yamazaki Baking Co. Ltd. | 535,708 |
| | | TOTAL | 20,725,622 |
| | | Energy—2.2% | |
| 211 | | Arch Coal, Inc. | 15,637 |
| 10,466 | | BP PLC | 65,045 |
| 525,800 | | Banpu Public Co. Ltd. | 201,844 |
| 1,228 | | CVR Energy, Inc. | 53,283 |
| 665 | | Cactus, Inc. | 20,076 |
| 8,311 | | Chevron Corp. | 973,467 |
| 20,338 | | Coal India Ltd. | 57,937 |
| 959 | 1 | Comstock Resources, Inc. | 6,090 |
| 5,911 | | ConocoPhillips | 354,305 |
| 186 | | DMC Global, Inc. | 8,573 |
| 439 | | Delek US Holdings, Inc. | 15,062 |
| 596 | 1 | Dril-Quip, Inc. | 25,187 |
| 2,193 | | Equinor ASA | 40,364 |
| 1,741 | | Exxaro Resources Ltd. | 15,850 |
| 4,455 | | Exxon Mobil Corp. | 303,519 |
| 348,500 | | IRPC PCL | 40,331 |
| 27,395 | | Imperial Oil Ltd. | 688,433 |
| 161 | | Liberty Oilfield Services, Inc. | 1,423 |
| 6,476 | | Marathon Petroleum Corp. | 392,705 |
| 733 | 1 | Matrix Services Co. | 15,349 |
| 8,845 | | Neste Oyj | 299,115 |
| 590 | | OMV AG | 33,659 |
| 5,232 | | PBF Energy, Inc. | 163,762 |
| 13,300 | | PTT Exploration and Production Public Co. | 52,765 |
| 173,400 | | PTT Public Co. Ltd. | 248,062 |
| 167 | | Peabody Energy Corp. | 1,617 |
| 12,997 | 1 | Petroleo Brasileiro SA | 95,873 |
| 62,963 | | Petronet LNG Ltd. | 238,225 |
Annual Shareholder Report
Shares,
Principal
Amount or
Contracts | | | Value in
U.S. Dollars |
| | | COMMON STOCKS—continued | |
| | | Energy—continued | |
| 14,081 | | Phillips 66 | $1,615,372 |
| 5,637 | | Reliance Industries Ltd. | 122,026 |
| 193 | 1 | Seacor Holdings, Inc. | 8,172 |
| 29,360 | | Tatneft | 338,097 |
| 15,504 | | Tenaris S.A. | 164,824 |
| 19,931 | | Total S.A. | 1,046,414 |
| 365 | | Tupras Turkiye Petrol Rafinerileri A.S. | 7,841 |
| 9,367 | | Valero Energy Corp. | 894,455 |
| 373 | 1 | W&T Offshore, Inc. | 1,596 |
| 1,688 | | World Fuel Services Corp. | 71,571 |
| 26,000 | | Yanzhou Coal Mining Co. Ltd., Class H | 22,999 |
| | | TOTAL | 8,720,925 |
| | | Financials—10.8% | |
| 3,463 | | AXA SA | 94,153 |
| 13,494 | | Admiral Group PLC | 373,141 |
| 14,419 | | Aflac, Inc. | 790,738 |
| 7,638 | | Ageas | 458,258 |
| 758,000 | | Agricultural Bank of China | 307,075 |
| 2,109 | 1 | Alior Bank SA | 15,828 |
| 7,123 | | Allianz SE | 1,705,466 |
| 7,394 | | Allstate Corp. | 823,322 |
| 8,526 | | Ally Financial, Inc. | 271,468 |
| 657 | | Amalgamated Bank | 12,562 |
| 1,769 | | American Equity Investment Life Holding Co. | 52,575 |
| 3,434 | | American Express Co. | 412,492 |
| 3,760 | | Ameriprise Financial, Inc. | 616,151 |
| 447 | | Ares Commercial Real Estate Corp. | 6,991 |
| 2,264 | | Artisan Partners Asset Management, Inc. | 67,173 |
| 752 | 1 | AssetMark Financial Holdings, Inc. | 18,823 |
| 6,188 | | Assicurazioni Generali SpA | 126,360 |
| 7,687 | | Assured Guaranty Ltd. | 381,660 |
| 24,615 | | Australia & New Zealand Banking Group, Melbourne | 414,410 |
| 672 | | B. Riley Financial, Inc. | 19,629 |
| 32,489 | | BB Seguridade Participacoes SA | 263,522 |
| 25,743 | | BS Financial Group, Inc. | 151,737 |
| 32,273 | | B3 SA - Brasil Bolsa Balcao | 362,544 |
Annual Shareholder Report
Shares,
Principal
Amount or
Contracts | | | Value in
U.S. Dollars |
| | | COMMON STOCKS—continued | |
| | | Financials—continued | |
| 533 | | Baloise Holdings AG | $92,619 |
| 96 | | BancFirst Corp. | 5,673 |
| 260,882 | | Banco de Chile | 26,515 |
| 87,690 | | Banco de Oro | 261,949 |
| 22,891 | | Banco Santander Brasil SA | 238,875 |
| 359,188 | | Banco Santander Chile SA | 19,163 |
| 1,090 | 1 | Bancorp, Inc., DE | 12,088 |
| 8,427 | | Bank Hapoalim BM | 67,939 |
| 48,768 | | Bank Leumi Le-Israel | 353,660 |
| 67,643 | | Bank of America Corp. | 2,253,865 |
| 176,000 | | Bank of Communications Ltd. | 115,623 |
| 423 | | Bank of Marin Bancorp | 19,090 |
| 816 | | Bank Zachodni WBK S.A. | 57,263 |
| 1,258 | 1 | Berkshire Hathaway, Inc., Class B | 277,137 |
| 542 | 1 | Blucora, Inc. | 12,759 |
| 885 | 1 | Brighthouse Financial, Inc. | 36,427 |
| 1,602 | | Brightsphere Investment Group, Inc. | 15,427 |
| 14,835 | | CI Financial Corp. | 233,420 |
| 156 | | CNA Financial Corp. | 6,976 |
| 18,873 | | CNP Assurances | 372,466 |
| 190 | 1 | Cannae Holdings, Inc. | 7,123 |
| 6,770 | | Capital One Financial Corp. | 677,068 |
| 222 | | Carolina Financial Corp. | 9,388 |
| 1,115 | | Cathay Bancorp, Inc. | 41,054 |
| 9,742 | | Challenger Financial Sevices Group Ltd. | 53,793 |
| 192,180 | | Chang Hwa Bank | 144,614 |
| 15,202 | | Charles Schwab Corp. | 752,499 |
| 468,000 | | China CITIC Bank Corp. Ltd. | 255,902 |
| 284,000 | | China Construction Bank Corp. | 226,139 |
| 8,000 | 1,2 | China Ding Yi Feng Holdings Ltd. | 622 |
| 67,000 | | China Everbright Bank Co. Ltd. | 28,928 |
| 395,000 | | China Huarong Asset Management Co. Ltd. | 57,516 |
| 89,800 | | China Insurance International Holdings Co. Ltd. | 207,674 |
| 120,000 | | China Life Insurance Co. Ltd. | 303,412 |
| 72,500 | | China Merchants Bank Co. Ltd. | 342,739 |
| 152,500 | | China Minsheng Banking Corp. Ltd. | 106,216 |
Annual Shareholder Report
Shares,
Principal
Amount or
Contracts | | | Value in
U.S. Dollars |
| | | COMMON STOCKS—continued | |
| | | Financials—continued | |
| 35,400 | | China Pacific Insurance Group Co. Ltd. | $125,337 |
| 39,307 | | Commerzbank AG, Frankfurt | 228,022 |
| 35,000 | | Concordia Financial Group Ltd. | 142,274 |
| 1,531 | | ConnectOne Bancorp, Inc. | 38,566 |
| 10,078,555 | | Corpbanca | 49,280 |
| 4,900 | | DBS Group Holdings Ltd. | 90,433 |
| 16,496 | | DNB Bank ASA | 276,557 |
| 4,521 | | Deutsche Boerse AG | 693,837 |
| 2,515 | | Discover Financial Services | 213,448 |
| 13,300 | | E*Trade Financial Corp. | 589,190 |
| 328,698 | | E.Sun Financial Holding Co. Ltd. | 291,652 |
| 655 | | Eagle Bancorp, Inc. | 29,095 |
| 11,791 | | East West Bancorp, Inc. | 540,264 |
| 633 | | Employers Holdings, Inc. | 27,200 |
| 2,510 | 1 | Enova International, Inc. | 57,805 |
| 588 | | Enterprise Financial Services Corp. | 26,578 |
| 1,776 | | Erste Group Bank AG | 63,539 |
| 899 | | Essent Group Ltd. | 49,130 |
| 8,488 | | Exor NV | 649,635 |
| 97,000 | | Far East Horizon | 88,137 |
| 187 | | Federal Agricultural Mortgage Association, Class C | 15,530 |
| 3,328 | | First BanCorp | 34,944 |
| 502 | | First Bancorp, Inc. | 19,628 |
| 109 | | First Commmonwealth Financial Corp. | 1,549 |
| 946 | | First Defiance Financial Corp. | 28,522 |
| 58,505 | | FirstRand Ltd. | 249,747 |
| 10,854 | | Gjensidige Forsikring ASA | 204,159 |
| 155 | | Great Southern Bancorp, Inc. | 9,460 |
| 1,063 | | Great-West Lifeco, Inc. | 26,737 |
| 45,444 | | Grupo Financiero Banorte S.A. de C.V. | 240,263 |
| 2,596 | | HDFC Life Insurance Co. Ltd. | 20,721 |
| 27,176 | | HSBC Holdings PLC | 202,614 |
| 3,435 | | Hana Financial Holdings | 104,021 |
| 1,249 | | Hancock Whitney Corp. | 50,722 |
| 209 | | Hannover Rueckversicherung SE | 38,833 |
| 17,022 | | Hargreaves Lansdown PLC | 407,348 |
Annual Shareholder Report
Shares,
Principal
Amount or
Contracts | | | Value in
U.S. Dollars |
| | | COMMON STOCKS—continued | |
| | | Financials—continued | |
| 988 | | Heritage Commerce Corp. | $12,350 |
| 50 | | Hingham Institution for Savings | 9,588 |
| 58,300 | | Hong Leong Bank Berhad | 235,869 |
| 1,900 | | Hong Leong Credit Berhad | 7,415 |
| 456 | | Houlihan Lokey, Inc. | 21,738 |
| 1,920 | | Housing Development Finance Corp. Ltd. | 61,408 |
| 112,000 | | Hua Nan Financial Holdings Co. Ltd. | 79,662 |
| 5,932 | | Hyundai Marine & Fire Insurance Co. | 140,670 |
| 13,462 | | ICICI Lombard General Insurance Co. Ltd. | 257,084 |
| 29,644 | | IRB Brasil Resserguros S/A | 260,471 |
| 496 | | Iberiabank Corp. | 36,203 |
| 60,000 | | Industrial & Commercial Bank of China | 42,791 |
| 22,142 | | Industrial Bank of Korea | 220,267 |
| 720 | | International Bancshares Corp. | 30,542 |
| 2,557 | | Invesco Mortgage Capital, Inc. | 41,526 |
| 4,649 | | Investors Bancorp, Inc. | 56,067 |
| 10,017 | | JPMorgan Chase & Co. | 1,319,840 |
| 45 | | James River Group Holdings Ltd. | 1,780 |
| 5,757 | | KB Financial Group, Inc. | 224,648 |
| 867 | | KBC Groupe | 63,122 |
| 35 | | Komercni Banka A.S. | 1,198 |
| 62,022 | | Korea Life Insurance Co., Ltd. | 120,248 |
| 18,275 | | L E Lundbergforetagen AB | 723,778 |
| 2,518 | | LPL Investment Holdings, Inc. | 232,537 |
| 1,428 | | Ladder Capital Corp. | 24,690 |
| 82,258 | | Legal & General Group PLC | 298,664 |
| 4,121 | | London Stock Exchange Group PLC | 366,124 |
| 1,682 | 1 | MBIA Insurance Corp. | 15,693 |
| 90,521 | | Medibank Private Ltd. | 199,998 |
| 24,607 | | MetLife, Inc. | 1,228,135 |
| 3,860 | | Mizrahi Tefahot Bank Ltd. | 103,139 |
| 286,100 | | Mizuho Financial Group, Inc. | 442,811 |
| 30,256 | | Morgan Stanley | 1,497,067 |
| 4,947 | | Muenchener Rueckversicherungs-Gesellschaft AG | 1,420,200 |
| 831 | 1 | NMI Holdings, Inc. | 27,897 |
| 31,669 | | NN Group NV | 1,214,813 |
Annual Shareholder Report
Shares,
Principal
Amount or
Contracts | | | Value in
U.S. Dollars |
| | | COMMON STOCKS—continued | |
| | | Financials—continued | |
| 715 | | National Bank Holdings Corp. | $25,626 |
| 968 | | National General Holdings Corp. | 20,609 |
| 67 | | National Western Life Insurance Co., Class A | 16,899 |
| 10,600 | | New China Life Insurance Co. Ltd. | 40,858 |
| 4,763 | | Nordea Bank Abp | 33,702 |
| 692 | | OFG Bancorp. | 14,843 |
| 2,153 | | OTP Bank RT | 101,287 |
| 5,438 | | Onex Corp. | 325,551 |
| 2,542 | | Orange Life Insurance Ltd. | 61,403 |
| 2,800 | | Oversea-Chinese Banking Corp. Ltd. | 22,061 |
| 86,000 | | PICC Property and Casualty Co., Ltd., Class H | 99,551 |
| 5,677 | | PNC Financial Services Group | 869,773 |
| 164,500 | | PT Bank Central Asia | 366,004 |
| 58,400 | | PT Bank Rakyat Indonesia Tbk | 16,926 |
| 618,000 | | People's Insurance, Co. (Group) of China Ltd. | 247,915 |
| 385 | | People's Utah Bancorp | 11,300 |
| 43,000 | | Ping An Insurance (Group) Co. of China Ltd. | 487,323 |
| 421,000 | | Postal Savings Bank of China Co. Ltd. | 273,187 |
| 11,723 | | Power Corp. of Canada | 284,007 |
| 19,730 | | Powszechna Kasa Oszczednosci Bank Polski SA | 181,985 |
| 298 | | Preferred Bank Los Angeles, CA | 16,435 |
| 1,132 | | Provident Financial Services, Inc. | 27,530 |
| 14,500 | | RHB Capital Berhad | 19,648 |
| 50,246 | | RMB Holdings Ltd. | 276,347 |
| 2,600 | | Radian Group, Inc. | 67,184 |
| 3,919 | | Raymond James Financial, Inc. | 352,005 |
| 188 | | Republic Bancorp, Inc. | 8,686 |
| 275 | | Samsung Fire & Marine Insurance | 54,202 |
| 2,992 | | Samsung Life Insurance Co., Ltd. | 181,798 |
| 11,093 | | Scor SA | 476,351 |
| 477 | | Selective Insurance Group, Inc. | 31,587 |
| 779,528 | | Shin Kong Financial Holdings Co. Ltd. | 256,727 |
| 9,313 | | Shinhan Financial Group Co. Ltd. | 343,506 |
| 1,794 | | Simmons 1st National Corp., Class A | 46,483 |
| 6,400 | | Singapore Exchange Ltd. | 41,454 |
| 39,545 | | Skand Enskilda BKN, Class A | 339,073 |
Annual Shareholder Report
Shares,
Principal
Amount or
Contracts | | | Value in
U.S. Dollars |
| | | COMMON STOCKS—continued | |
| | | Financials—continued | |
| 23,784 | | Standard Bank Group Ltd. | $268,800 |
| 1,456 | | Sterling Bancorp, Inc./MI | 14,109 |
| 6,300 | | Sumitomo Mitsui Trust Holdings, Inc. | 241,423 |
| 254 | | Swiss Life Holding AG | 125,894 |
| 7,084 | | Swiss Re AG | 767,094 |
| 8,883 | | Synchrony Financial | 332,313 |
| 4,312 | | TRYG A/S | 123,969 |
| 583,100 | | Taiwan Business Bank | 238,865 |
| 402,401 | | Taiwan Cooperative Financial Holding Co. Ltd. | 273,682 |
| 1,375 | | The Bank of NT Butterfield & Son Ltd. | 47,506 |
| 723 | | The First of Long Island Corp. | 17,518 |
| 812 | | United Community Banks, Inc. | 25,172 |
| 1,775 | | United Community Financial Corp. | 19,720 |
| 29,800 | | United Overseas Bank Ltd. | 562,438 |
| 802 | | Universal Insurance Holdings, Inc. | 23,338 |
| 269 | | Univest Corp. | 7,024 |
| 31,096 | | Wells Fargo & Co. | 1,693,488 |
| 977 | | Wendel SA | 131,600 |
| 1,369 | | Wesbanco, Inc. | 49,941 |
| | | TOTAL | 43,408,229 |
| | | Health Care—6.3% | |
| 9,851 | 1 | Achillion Pharmaceuticals, Inc. | 61,175 |
| 115 | 1 | Addus Homecare Corp. | 10,719 |
| 6,484 | 1 | Akebia Therapeutics, Inc. | 40,784 |
| 12,324 | 1 | Akorn, Inc. | 44,983 |
| 16,200 | | Alfresa Holdings Corp. | 335,143 |
| 463 | 1 | Amedisys, Inc. | 75,450 |
| 8,161 | | AmerisourceBergen Corp. | 717,433 |
| 793 | 1 | Amneal Pharmaceuticals, Inc. | 2,982 |
| 211 | 1 | Amphastar Pharmaceuticals, Inc. | 4,117 |
| 1,860 | | Anthem, Inc. | 536,908 |
| 1,461 | 1 | Apellis Pharmaceuticals, Inc. | 39,272 |
| 6,213 | 1 | Arcus Biosciences, Inc. | 51,381 |
| 2,842 | | AstraZeneca PLC | 274,312 |
| 3,070 | 1 | Athenex, Inc. | 47,831 |
| 1,909 | 1 | Avrobio, Inc. | 30,620 |
Annual Shareholder Report
Shares,
Principal
Amount or
Contracts | | | Value in
U.S. Dollars |
| | | COMMON STOCKS—continued | |
| | | Health Care—continued | |
| 11,583 | | Baxter International, Inc. | $949,458 |
| 2,270 | 1 | BeyondSpring, Inc. | 28,261 |
| 4,220 | 1 | Bio-Rad Laboratories, Inc., Class A | 1,558,784 |
| 160 | 1 | BioTelemetry, Inc. | 7,410 |
| 12,854 | | Bristol-Myers Squibb Co. | 731,907 |
| 12,854 | 1 | Bristol-Myers Squibb Co., Rights | 27,636 |
| 4,057 | | Cardinal Health, Inc. | 223,257 |
| 282 | 1 | Cardiovascular Systems, Inc. | 12,848 |
| 5,057 | 1 | Catalyst Pharmaceutical Partners, Inc. | 23,464 |
| 347 | 1 | Celltrion, Inc. | 51,118 |
| 3,311 | 1 | ChemoCentryx, Inc. | 100,423 |
| 2,206 | | Coloplast A.S., Class B | 260,437 |
| 710 | 1 | Corvel Corp. | 58,582 |
| 3,914 | | Divi's Laboratories Ltd. | 97,365 |
| 4,300 | | Eisai Co. Ltd. | 319,241 |
| 366 | | Ensign Group, Inc. | 15,895 |
| 29 | 1 | Exact Sciences Corp. | 2,349 |
| 18,791 | 1 | Exelixis, Inc. | 312,494 |
| 2,544 | | Fresenius Medical Care AG & Co. KGaA | 186,577 |
| 50,072 | | GlaxoSmithKline PLC | 1,138,610 |
| 410 | 1 | Globus Medical, Inc. | 22,939 |
| 4,141 | | HCA Healthcare, Inc. | 574,191 |
| 358 | 1 | HMS Holdings Corp. | 10,812 |
| 630 | 1 | Haemonetics Corp. | 75,978 |
| 831 | 1 | Halozyme Therapeutics, Inc. | 16,113 |
| 22 | 1 | HealthEquity, Inc. | 1,384 |
| 2,500 | | Hisamitsu Pharmaceutical Co., Inc. | 122,879 |
| 3,324 | | Humana, Inc. | 1,134,248 |
| 14,646 | 1 | Immunogen, Inc. | 52,872 |
| 16,550 | 1 | Incyte Genomics, Inc. | 1,558,348 |
| 92 | 1 | Inogen, Inc. | 6,772 |
| 222 | 1 | Integer Holdings Corp. | 16,839 |
| 242 | 1 | Intrexon Corp. | 1,348 |
| 7,999 | 1 | Ionis Pharmaceuticals, Inc. | 511,616 |
| 11 | | Johnson & Johnson | 1,512 |
| 469 | 1 | LHC Group, Inc. | 62,565 |
Annual Shareholder Report
Shares,
Principal
Amount or
Contracts | | | Value in
U.S. Dollars |
| | | COMMON STOCKS—continued | |
| | | Health Care—continued | |
| 252 | 1 | Livongo Health, Inc. | $7,197 |
| 442 | 1 | MacroGenics, Inc. | 4,186 |
| 544 | 1 | Magellan Health, Inc. | 42,285 |
| 5,585 | 1 | Magenta Therapeutics, Inc. | 73,945 |
| 8,386 | | McKesson Corp. | 1,212,951 |
| 23,500 | | Medipal Holdings Corp. | 504,741 |
| 496 | 1 | Medpace Holdings, Inc. | 38,028 |
| 2,136 | | Merck & Co., Inc. | 186,216 |
| 986 | 1 | Merit Medical Systems, Inc. | 27,608 |
| 11,700 | | Mitsubishi Tanabe Pharma Corp. | 214,409 |
| 1,185 | 1 | Moderna, Inc. | 24,127 |
| 826 | 1 | Molina Healthcare, Inc. | 111,923 |
| 4,624 | 1 | NGM Biopharmaceuticals, Inc. | 76,203 |
| 113 | 1 | Natus Medical, Inc. | 3,615 |
| 8,306 | 1 | Neurocrine Biosciences, Inc. | 968,563 |
| 317 | 1 | NextGen Healthcare, Inc. | 5,839 |
| 19,777 | | Novartis AG | 1,823,240 |
| 10,732 | | Novo Nordisk A/S | 602,671 |
| 412 | 1 | Omnicell, Inc. | 32,956 |
| 36,438 | 1 | Opko Health, Inc. | 57,936 |
| 96 | 1 | OraSure Technologies, Inc. | 778 |
| 2,326 | | Orion Oyj | 101,204 |
| 27 | 1 | Orthofix Medical, Inc. | 1,226 |
| 342 | 1 | PetIQ, Inc. | 7,866 |
| 6,711 | 1 | Precision Biosciences, Inc. | 119,254 |
| 1,737 | 1 | Progenics Pharmaceuticals, Inc. | 9,067 |
| 320 | 1 | Providence Service Corp. | 19,101 |
| 532 | 1 | R1 RCM, Inc. | 6,857 |
| 1,499 | | Recordati SPA | 62,887 |
| 3,173 | 1 | Regeneron Pharmaceuticals, Inc. | 1,170,837 |
| 896 | | Roche Holding AG | 276,058 |
| 3,500 | | Shionogi and Co. | 206,176 |
| 5,223 | 1 | Siga Technologies, Inc. | 25,593 |
| 287 | | Simulations Plus, Inc. | 9,592 |
| 24,000 | | Sinopharm Group Co. Ltd. | 79,261 |
| 618 | 1 | Spectrum Pharmaceuticals, Inc. | 5,550 |
Annual Shareholder Report
Shares,
Principal
Amount or
Contracts | | | Value in
U.S. Dollars |
| | | COMMON STOCKS—continued | |
| | | Health Care—continued | |
| 111 | 1 | Staar Surgical Co. | $4,091 |
| 102 | | Straumann Holding AG | 98,099 |
| 4,100 | | Sumitomo Dainippon Pharma Co., Ltd. | 77,673 |
| 314 | 1 | SurModics, Inc. | 12,887 |
| 6,400 | | Suzuken Co. Ltd. | 280,252 |
| 237 | 1 | Tactile Systems Technology, Inc. | 15,218 |
| 283 | 1 | Tandem Diabetes Care, Inc. | 19,535 |
| 135 | 1 | Tivity Health, Inc. | 3,058 |
| 492 | 1 | Triple-S Management Corp., Class B | 9,422 |
| 370 | | UCB SA | 29,977 |
| 8,151 | | UnitedHealth Group, Inc. | 2,281,220 |
| 215 | 1 | Vanda Pharmaceuticals, Inc. | 3,597 |
| 403 | 1 | Veracyte, Inc. | 11,574 |
| 8,367 | 1 | Vertex Pharmaceuticals, Inc. | 1,855,382 |
| 384 | 1 | Xencor, Inc. | 15,130 |
| | | TOTAL | 25,386,703 |
| | | Industrials—8.0% | |
| 96,915 | | ADT, Inc. | 895,495 |
| 665 | | AZZ, Inc. | 25,317 |
| 12,525 | | Adecco Group AG | 773,973 |
| 1,314 | | Airbus Group SE | 192,959 |
| 118,300 | | Airports of Thailand Public Co. Ltd. | 295,390 |
| 327 | | Alamo Group, Inc. | 37,540 |
| 199 | | Albany International Corp., Class A | 16,652 |
| 50,704 | | Alfa, S.A. de C.V., Class A | 39,636 |
| 11,631 | | Allison Transmission Holdings, Inc. | 562,940 |
| 24,400 | | Amada Holdings Co. Ltd. | 272,540 |
| 62 | 1 | American Woodmark Corp. | 6,380 |
| 6,287 | | Ametek, Inc. | 622,476 |
| 677 | | Andritz AG | 26,394 |
| 676 | | Applied Industrial Technologies, Inc. | 43,163 |
| 496 | | ArcBest Corp. | 14,275 |
| 14,695 | | Ashtead Group PLC | 445,903 |
| 326 | 1 | Astronics Corp. | 9,503 |
| 1,142 | 1 | Atkore International Group, Inc. | 47,644 |
| 103,888 | | Aurizon Holdings Ltd. | 406,835 |
Annual Shareholder Report
Shares,
Principal
Amount or
Contracts | | | Value in
U.S. Dollars |
| | | COMMON STOCKS—continued | |
| | | Industrials—continued | |
| 293 | 1 | Avis Budget Group, Inc. | $8,717 |
| 26,200 | | BOC Aviation Ltd. | 247,510 |
| 109,900 | | BTS Group Holdings PCL | 49,805 |
| 97 | | Barrett Business Services, Inc. | 8,571 |
| 966 | 1 | Builders Firstsource, Inc. | 24,546 |
| 15,315 | | Bunzl PLC | 420,235 |
| 1,081 | 1 | CBIZ, Inc. | 29,036 |
| 896 | | CIMIC Group Ltd. | 20,451 |
| 954 | 1 | CIRCOR International, Inc. | 42,319 |
| 553 | | CSW Industrials, Inc. | 40,828 |
| 8,016 | | CSX Corp. | 573,465 |
| 219 | | Cheil Jedang Corp. | 17,118 |
| 105,500 | 1 | China COSCO Holdings Co. Ltd., Class H | 38,954 |
| 222,000 | | China Railway Construction Corp. Ltd. | 229,138 |
| 323,000 | | China Railway Group Ltd. | 189,082 |
| 213 | 1 | Cimpress NV | 27,294 |
| 211,000 | | Citic Pacific Ltd. | 264,296 |
| 527 | | Comfort Systems USA, Inc. | 26,930 |
| 83 | 1 | Continental Building Products, Inc. | 3,054 |
| 525 | | Cummins, Inc. | 96,001 |
| 1,307 | | Curtiss Wright Corp. | 179,464 |
| 2,926 | | DSV Panalpina A/S | 318,382 |
| 281 | 1 | DXP Enterprises, Inc. | 10,827 |
| 15,700 | | Dai Nippon Printing Co. Ltd. | 420,542 |
| 1,600 | | Daifuku Co. | 93,329 |
| 70 | | Dassault Aviation SA | 95,146 |
| 12,781 | | Delta Air Lines, Inc. | 732,479 |
| 856 | | Eiffage SA | 93,425 |
| 8,361 | 1 | Embraer - Empresa Brasileira de Aeronautica S/A | 35,646 |
| 351 | | Emcor Group, Inc. | 31,214 |
| 169 | | Encore Wire Corp. | 9,859 |
| 13,937 | | Experian PLC | 461,463 |
| 344 | | Exponent, Inc. | 21,861 |
| 247 | 1 | FTI Consulting, Inc. | 26,921 |
| 65,000 | | Far Eastern New Century Corp. | 63,433 |
| 389 | | Federal Signal Corp. | 12,814 |
Annual Shareholder Report
Shares,
Principal
Amount or
Contracts | | | Value in
U.S. Dollars |
| | | COMMON STOCKS—continued | |
| | | Industrials—continued | |
| 4,339 | | Ferguson PLC | $376,970 |
| 1,047 | 1 | Foundation Building Materials, Inc. | 21,401 |
| 7,400 | | Fuji Electric Co. | 228,389 |
| 275 | 1 | GMS, Inc. | 8,514 |
| 11,160 | | Genivar Income Fund | 725,824 |
| 2,275 | 1 | Great Lakes Dredge & Dock Corp. | 24,297 |
| 12,798 | | Grupo Aeroportuario del Pacifico SA, Class B | 129,389 |
| 3,431 | | Grupo Aeroportuario del Sureste SAB de CV, Class B | 58,749 |
| 6,001 | | Han Wha | 125,057 |
| 757 | | Hawaiian Holdings, Inc. | 22,930 |
| 559 | | Heidrick & Struggles International, Inc. | 17,340 |
| 1,064 | | Hillenbrand, Inc. | 33,644 |
| 11,135 | | Honeywell International, Inc. | 1,988,154 |
| 1,700 | | Hoshizaki Electric Co., Ltd. | 148,818 |
| 693 | | Hubbell, Inc. | 101,885 |
| 188 | | ICF International, Inc. | 16,869 |
| 7,685 | | Ingersoll-Rand PLC | 1,007,580 |
| 589 | | Insperity, Inc. | 45,807 |
| 9,197 | | InterGlobe Aviation Ltd. | 185,077 |
| 4,270 | | International Container Terminal Services, Inc. | 10,385 |
| 7,387 | | Intertek Group PLC | 526,708 |
| 12,900 | | JGC Holdings Corp. | 187,892 |
| 18,800 | | JTEKT Corp. | 234,115 |
| 581 | | KForce Com, Inc. | 22,961 |
| 22,400 | | Kajima Corp. | 295,833 |
| 461 | | Koc Holding A.S. | 1,604 |
| 1,115 | | LG Corp. | 67,041 |
| 1,433 | | L3Harris Technologies, Inc. | 288,162 |
| 16,462 | | Latam Airlines Group SA | 173,642 |
| 6,900 | | MISC Bhd | 13,446 |
| 285 | | MOOG, Inc., Class A | 24,473 |
| 1,667 | 1 | MRC Global, Inc. | 22,238 |
| 3,010 | | MTU Aero Engines GmbH | 815,324 |
| 503 | 1 | MYR Group, Inc. | 17,283 |
| 3,630 | | Manpower, Inc. | 336,283 |
| 85,700 | | Marubeni Corp. | 633,741 |
Annual Shareholder Report
Shares,
Principal
Amount or
Contracts | | | Value in
U.S. Dollars |
| | | COMMON STOCKS—continued | |
| | | Industrials—continued | |
| 147 | 1 | Masonite International Corp. | $10,555 |
| 13 | 1 | Mastec, Inc. | 862 |
| 2,114 | 1 | Meritor, Inc. | 53,378 |
| 341 | | Miller Herman, Inc. | 16,293 |
| 4,900 | | Misumi Corp. | 121,590 |
| 64,600 | | Mitsubishi Electric Corp. | 893,997 |
| 1,022 | | Mueller Industries, Inc. | 32,081 |
| 216,000 | | NWS Holdings Ltd. | 289,768 |
| 1,700 | | Nippon Express Co. Ltd. | 107,996 |
| 1,365 | | nVent Electric PLC | 33,729 |
| 16,100 | | Obayashi Corp. | 170,911 |
| 80 | | Park-Ohio Holdings Corp. | 2,530 |
| 4,151 | | Parker-Hannifin Corp. | 825,177 |
| 110 | | Patrick Industries, Inc. | 5,447 |
| 7,800 | | Persol Holdings Co. Ltd. | 143,742 |
| 489 | | Primoris Services Corp. | 10,768 |
| 1,899 | | Quanex Building Products Corp. | 36,955 |
| 14,559 | | Relx PLC | 353,064 |
| 183 | | Resources Connection, Inc. | 2,827 |
| 1,590 | 1 | Rexnord Corp. | 50,228 |
| 4,069 | | Roper Technologies, Inc. | 1,466,346 |
| 176 | | Rush Enterprises, Inc. | 8,064 |
| 6,100 | | SG Holdings Co. Ltd. | 146,403 |
| 50 | | SGS SA | 130,069 |
| 8,251 | | SKF Ab, Class B | 157,444 |
| 507 | 1 | SPX Corp. | 24,224 |
| 106 | 1 | Saia, Inc. | 10,059 |
| 14,474 | | Sandvik AB | 262,995 |
| 7,681 | | Schneider Electric SA | 740,717 |
| 29,900 | | Shimizu Corp. | 286,749 |
| 67,200 | | Sime Darby BHD | 36,194 |
| 22,000 | | Sinotruk Hong Kong Ltd. | 37,174 |
| 13,551 | | Skanska AB, Class B | 299,328 |
| 927 | | SkyWest, Inc. | 58,067 |
| 8,997 | | Southwest Airlines Co. | 518,587 |
| 125 | 1 | Spirit Airlines, Inc. | 4,884 |
Annual Shareholder Report
Shares,
Principal
Amount or
Contracts | | | Value in
U.S. Dollars |
| | | COMMON STOCKS—continued | |
| | | Industrials—continued | |
| 1,096 | | Steelcase, Inc., Class A | $19,860 |
| 12,800 | | Sumitomo Heavy Industries | 366,895 |
| 134,915 | | Sydney Airport | 839,745 |
| 184 | | Systemax, Inc. | 4,261 |
| 3,800 | | Taisei Corp. | 149,370 |
| 2,630 | 1 | Teledyne Technologies, Inc. | 899,434 |
| 615 | | Tetra Tech, Inc. | 54,298 |
| 5,594 | | Thomson Reuters Corp. | 394,566 |
| 145 | 1 | Titan Machinery, Inc. | 1,953 |
| 42,600 | | Toppan Printing Co. Ltd. | 848,719 |
| 4,400 | | Toshiba Corp. | 158,130 |
| 7,800 | | Toto Ltd. | 342,045 |
| 12,000 | | Toyota Tsusho Corp. | 420,096 |
| 183 | 1 | Trex Co., Inc. | 15,749 |
| 1,448 | 1 | TriMas Corp. | 44,859 |
| 111 | 1 | TrueBlue, Inc. | 2,587 |
| 152 | | Unifirst Corp. | 31,350 |
| 1,621 | | Union Pacific Corp. | 285,280 |
| 2,485 | 1 | United Airlines Holdings, Inc. | 230,608 |
| 355 | | Universal Forest Products, Inc. | 17,608 |
| 135 | | Universal Truckload Services, Inc. | 2,692 |
| 476 | | Vestas Wind Systems A/S | 45,260 |
| 12,748 | | Volvo AB, Class B | 196,821 |
| 42,720 | | Weg SA | 299,788 |
| 160,000 | | Weichai Power Co. Ltd., Class H | 273,661 |
| 1,119 | 1 | Wesco Aircraft Holdings, Inc. | 12,264 |
| 12,700 | | Yamato Holdings Co. Ltd. | 217,503 |
| | | TOTAL | 32,161,599 |
| | | Information Technology—9.7% | |
| 112 | 1 | ACI Worldwide, Inc. | 4,200 |
| 2,031 | | ASML Holding N.V. | 551,990 |
| 3,781 | 1 | Adobe, Inc. | 1,170,333 |
| 610 | 1 | Advanced Energy Industries, Inc. | 39,168 |
| 5,500 | | Advantest Corp. | 268,936 |
| 288 | 1 | Adyen BV | 220,777 |
| 550 | | American Software, Inc., Class A | 8,696 |
Annual Shareholder Report
Shares,
Principal
Amount or
Contracts | | | Value in
U.S. Dollars |
| | | COMMON STOCKS—continued | |
| | | Information Technology—continued | |
| 2,886 | 1 | Amkor Technology, Inc. | $34,892 |
| 452 | 1 | Anixter International, Inc. | 38,800 |
| 13,780 | | Apple, Inc. | 3,682,705 |
| 10,420 | | Automatic Data Processing, Inc. | 1,779,528 |
| 794 | 1 | Avalara, Inc. | 61,956 |
| 1,246 | | Benchmark Electronics, Inc. | 42,950 |
| 860 | 1 | Box, Inc. | 15,686 |
| 192 | | Broadcom, Inc. | 60,712 |
| 16,500 | | Brother Industries Ltd. | 327,859 |
| 3,267 | | CDW Corp. | 441,208 |
| 1,840 | 1 | CGI, Inc., Class A | 152,971 |
| 829 | | CSG Systems International, Inc. | 47,411 |
| 10,867 | 1 | Cadence Design Systems, Inc. | 763,407 |
| 146 | | Capgemini SE | 17,256 |
| 625 | 1 | Casa Systems, Inc. | 2,300 |
| 463 | | Cass Information Systems, Inc. | 26,146 |
| 215 | 1 | Cirrus Logic, Inc. | 15,415 |
| 41,365 | | Cisco Systems, Inc. | 1,874,248 |
| 11,176 | 1 | CommScope Holdings Co., Inc. | 151,994 |
| 744 | 1 | Commvault Systems, Inc. | 37,661 |
| 219,000 | | Compal Electronics, Inc. | 135,065 |
| 168 | | Constellation Software, Inc. | 179,473 |
| 166 | 1 | Cornerstone OnDemand, Inc. | 10,237 |
| 178 | | Dassault Systemes SA | 28,022 |
| 70 | 1 | Diodes, Inc. | 3,230 |
| 1,156 | 1 | EPAM Systems, Inc. | 244,899 |
| 345 | 1 | ePlus, Inc. | 28,832 |
| 344 | 1 | Exlservice Holding, Inc. | 24,015 |
| 564 | 1 | Fabrinet | 34,116 |
| 4,419 | 1 | Fortinet, Inc. | 464,481 |
| 4,800 | | Fujitsu Ltd. | 436,542 |
| 23,332 | | Halma PLC | 634,814 |
| 5,668 | | Hewlett Packard Enterprise Co. | 89,724 |
| 1,900 | | Hitachi High-Technologies Corp. | 124,113 |
| 364 | 1 | Ichor Holdings Ltd. | 11,484 |
| 40,595 | | Infosys Ltd. | 396,695 |
Annual Shareholder Report
Shares,
Principal
Amount or
Contracts | | | Value in
U.S. Dollars |
| | | COMMON STOCKS—continued | |
| | | Information Technology—continued | |
| 603 | 1 | Insight Enterprises, Inc. | $39,551 |
| 526 | 1 | Instructure, Inc. | 28,004 |
| 32,289 | | Intel Corp. | 1,874,376 |
| 311 | | InterDigital, Inc. | 17,665 |
| 7,700 | | Itochu Techno-Solutions Corp. | 205,705 |
| 365 | | j2 Global, Inc. | 35,412 |
| 413 | | KBR, Inc. | 12,295 |
| 934 | | Kemet Corp. | 24,956 |
| 670 | 1 | Kimball Electronics, Inc. | 11,752 |
| 1,010 | | Lam Research Corp. | 269,498 |
| 1,803 | 1 | Lattice Semiconductor Corp. | 34,059 |
| 23,700 | | Legend Holdings Corp. | 48,738 |
| 390,000 | | Lenovo Group Ltd. | 257,623 |
| 101,000 | | Lite-On Technology Corp. | 160,232 |
| 749 | | ManTech International Corp., Class A | 58,107 |
| 7,008 | | Mastercard, Inc. | 2,047,948 |
| 424 | | Maximus, Inc. | 31,652 |
| 973 | | Methode Electronics, Inc., Class A | 36,205 |
| 5,246 | 1 | Micron Technology, Inc. | 249,237 |
| 25,787 | | Microsoft Corp. | 3,903,636 |
| 129 | 1 | MicroStrategy, Inc., Class A | 19,393 |
| 1,918 | 1 | Mobile Iron, Inc. | 9,264 |
| 1,560 | | NIC, Inc. | 35,396 |
| 4,300 | | Nippon Electric Glass Co. Ltd. | 91,372 |
| 4,100 | | Omron Corp. | 241,384 |
| 130 | 1 | Onto Innovation, Inc. | 4,363 |
| 9,000 | | Otsuka Corp. | 361,182 |
| 4,810 | 1 | Pagerduty, Inc. | 125,300 |
| 5,111 | | Paychex, Inc. | 440,159 |
| 874 | 1 | Paycom Software, Inc. | 241,932 |
| 712 | 1 | Paylocity Corp. | 87,092 |
| 17,629 | 1 | PayPal Holdings, Inc. | 1,904,108 |
| 176 | 1 | Perficient, Inc. | 7,441 |
| 22 | 1 | Plexus Corp. | 1,670 |
| 137 | | Progress Software Corp. | 5,755 |
| 247 | 1 | Qualys, Inc. | 21,615 |
Annual Shareholder Report
Shares,
Principal
Amount or
Contracts | | | Value in
U.S. Dollars |
| | | COMMON STOCKS—continued | |
| | | Information Technology—continued | |
| 417 | 1 | Rapid7, Inc. | $23,381 |
| 6,681 | | SK Hynix, Inc. | 457,599 |
| 169 | 1 | SMART Global Holdings, Inc. | 5,205 |
| 485 | 1 | SPS Commerce, Inc. | 27,320 |
| 20,355 | | STMicroelectronics N.V. | 499,348 |
| 32,503 | | Samsung Electronics Co. Ltd. | 1,388,065 |
| 998 | | Samsung SDS Co. Ltd. | 165,296 |
| 225 | 1 | Sanmina Corp. | 7,157 |
| 449 | 1 | ScanSource, Inc. | 15,904 |
| 391 | | Science Applications International Corp. | 33,372 |
| 26,000 | | Seiko Epson Corp. | 396,355 |
| 1,030 | 1 | Semtech Corp. | 49,914 |
| 4,658 | | Skyworks Solutions, Inc. | 457,881 |
| 211 | 1 | Synaptics, Inc. | 12,061 |
| 135,000 | | Synnex Technology International Corp. | 163,190 |
| 10,781 | 1 | Synopsys, Inc. | 1,520,552 |
| 6,318 | 1 | TEMENOS Group AG | 957,309 |
| 125,000 | 1 | Taiwan Semiconductor Manufacturing Co. Ltd. | 1,254,944 |
| 8,442 | | Tata Consultancy Services Ltd. | 241,433 |
| 32 | 1 | Tech Data Corp. | 4,636 |
| 917 | 1 | Tenable Holdings, Inc. | 24,897 |
| 13,772 | | Texas Instruments, Inc. | 1,655,532 |
| 1,800 | | Tokyo Electron Ltd. | 372,838 |
| 552 | 1 | Twilio, Inc. | 57,011 |
| 2,636 | | Visa, Inc., Class A | 486,368 |
| 1,093 | | Vishay Intertechnology, Inc. | 21,740 |
| 213 | 1 | Vishay Precision Group, Inc. | 7,329 |
| 8,000 | | Walsin Technology Corp. | 44,581 |
| 316 | 1 | Workiva, Inc. | 13,705 |
| 802 | | XPERI Corp. | 15,872 |
| 25,202 | | Xerox Holdings Corp. | 981,114 |
| 11,981 | | Yageo Corp. | 129,617 |
| 900 | | Yokogawa Electric Corp. | 16,476 |
| 9,000 | 1 | ZTE Corp. | 23,980 |
| 806 | 1 | Zscaler, Inc. | 42,017 |
| | | TOTAL | 39,203,023 |
Annual Shareholder Report
Shares,
Principal
Amount or
Contracts | | | Value in
U.S. Dollars |
| | | COMMON STOCKS—continued | |
| | | Materials—3.8% | |
| 333 | 1 | AdvanSix, Inc. | $6,737 |
| 81,591 | | Alumina Ltd. | 127,450 |
| 12,777 | | Anglo American PLC | 334,960 |
| 3,071 | | Anglogold Ltd. | 58,234 |
| 12,500 | | Anhui Conch Cement Co. Ltd., Class H | 79,932 |
| 17,319 | | ArcelorMittal SA | 295,756 |
| 56,000 | | Asia Cement Corp. | 83,469 |
| 28,481 | | BHP Group PLC | 631,540 |
| 3,848 | 1 | Berry Global Group, Inc. | 179,663 |
| 899 | | Boise Cascade Co. | 34,090 |
| 858 | | CF Industries Holdings, Inc. | 39,648 |
| 228 | | Celanese Corp. | 28,630 |
| 13,353 | | Cherepovets MK Severstal | 188,488 |
| 282,000 | | China National Building Material Co. Ltd. | 272,511 |
| 206,000 | | China Resources Cement Holdings Ltd. | 246,541 |
| 27,575 | 1 | Companhia Siderurgica Nacional SA | 82,718 |
| 16,382 | | Corteva, Inc. | 426,260 |
| 3,337 | | Domtar, Corp. | 124,537 |
| 13,225 | | Dow, Inc | 705,818 |
| 545 | | Ecolab, Inc. | 101,735 |
| 1,210 | | Ems-Chemie Holdings Ag | 750,684 |
| 40,194 | | Evraz PLC | 192,390 |
| 339 | 1 | Ferro Corp. | 4,888 |
| 5,107 | 1,2 | Ferroglobe Representation & Warranty Insurance Trust | 0 |
| 59,000 | | Formosa Plastic Corp. | 188,137 |
| 79,365 | | Fortescue Metals Group Ltd. | 522,535 |
| 244 | | FutureFuel Corp. | 2,738 |
| 43,004 | | Gold Fields Ltd. | 229,026 |
| 30 | | Greif, Inc. | 1,625 |
| 126 | | Hawkins, Inc. | 5,206 |
| 303 | 1 | Ingevity Corp. | 27,364 |
| 206,000 | | Jiangxi Copper Co. Ltd. | 237,699 |
| 1,870 | | KGHM Polska Miedz SA | 42,876 |
| 9,575 | | Koninklijke DSM NV | 1,225,960 |
| 24,738 | | LafargeHolcim Ltd. | 1,274,935 |
| 4,315 | 1,2 | Lithion Energy | 1,470 |
Annual Shareholder Report
Shares,
Principal
Amount or
Contracts | | | Value in
U.S. Dollars |
| | | COMMON STOCKS—continued | |
| | | Materials—continued | |
| 685 | | Louisiana-Pacific Corp. | $20,317 |
| 603 | | Materion Corp. | 35,493 |
| 22,900 | | Mitsubishi Gas Chemical Co., Inc. | 358,927 |
| 8,200 | | Mitsubishi Materials Corp. | 219,447 |
| 1,126 | | Myers Industries, Inc. | 18,635 |
| 25,331 | | Newmont Goldcorp Corp. | 972,710 |
| 4,800 | | Nissan Chemical Industries | 190,445 |
| 5,000 | | Nitto Denko Corp. | 281,020 |
| 1,240 | 1 | Norilsk Nickel | 328,758 |
| 29,367 | | Novolipetski Metallurgicheski Komb OAO | 58,941 |
| 2,635 | | Nutrien Ltd. | 124,956 |
| 21,200 | | PT Indah Kiat Pulp & Paper Corp. | 10,214 |
| 134,700 | | Petronas Chemicals BHD | 227,664 |
| 4,131 | 3 | Phosagro OAO, GDR | 50,893 |
| 719 | | Polyus PJSC | 77,047 |
| 10 | | Quaker Chemical Corp. | 1,492 |
| 16,617 | | Rio Tinto PLC | 905,210 |
| 573 | | Schnitzer Steel Industries, Inc., Class A | 12,348 |
| 3,600 | | Shin-Etsu Chemical Co. Ltd. | 385,883 |
| 5,100 | | Showa Denko KK | 136,512 |
| 19,818 | | Southern Copper Corp. | 753,679 |
| 238 | | Stepan Co. | 23,062 |
| 649 | | SunCoke Energy, Inc. | 3,323 |
| 6,600 | | Taiheiyo Cement Corp. | 191,144 |
| 12,000 | | Taiwan Cement Corp. | 16,296 |
| 7,800 | | Teijin Ltd. | 146,955 |
| 16,000 | | Tosoh Corp. | 238,769 |
| 1,318 | | Tredegar Industries, Inc. | 28,377 |
| 1,160 | | Trinseo SA | 44,068 |
| 12,798 | | UPM - Kymmene Oyj | 427,260 |
| 1,367 | | Va Stahl Ag | 36,189 |
| 1,784 | | Valhi, Inc. | 3,461 |
| 561 | 1 | Verso Corp. | 10,356 |
| 1,042 | | Warrior Met Coal, Inc. | 21,392 |
| 1,260 | | West Fraser Timber Co. Ltd. | 54,980 |
| | | TOTAL | 15,172,473 |
Annual Shareholder Report
Shares,
Principal
Amount or
Contracts | | | Value in
U.S. Dollars |
| | | COMMON STOCKS—continued | |
| | | Real Estate—2.4% | |
| 2,000 | | Agile Group Holdings Ltd. | $2,801 |
| 212 | | American Assets Trust, Inc. | 10,076 |
| 5,237 | | American Tower Corp. | 1,120,875 |
| 33,100 | | Ascendas Real Estate Investment Trust | 72,158 |
| 1,042 | | Avalonbay Communities, Inc. | 223,415 |
| 13,792 | | Brixmor Property Group, Inc. | 302,596 |
| 94,000 | | CIFI Holdings Group Co. Ltd. | 68,462 |
| 3,800 | | CapitaLand Commercial Trust Ltd. | 5,584 |
| 62,300 | | CapitaLand Mall Trust | 114,779 |
| 2,079 | | CareTrust REIT, Inc. | 43,410 |
| 4,671 | | CatchMark Timber Trust, Inc. | 55,445 |
| 52,000 | | China Aoyuan Group Ltd. | 74,418 |
| 4,000 | | China Resources Bejing Land | 17,309 |
| 7,000 | | China Vanke Co. Ltd. | 26,214 |
| 836 | | CoreCivic, Inc. | 12,665 |
| 2,329 | | Corepoint Lodging, Inc. | 23,546 |
| 216,000 | | Country Garden Holdings Co. | 300,832 |
| 2,100 | | Daito Trust Construction Co. Ltd. | 256,894 |
| 1,392 | | DiamondRock Hospitality Co. | 14,338 |
| 15,101 | | Duke Realty Corp. | 531,253 |
| 595 | | EastGroup Properties, Inc. | 81,033 |
| 17,632 | | Equity Residential Properties Trust | 1,500,483 |
| 713 | | Essential Properties Realty Trust, Inc. | 18,602 |
| 139 | | Essex Property Trust, Inc. | 43,393 |
| 102,000 | | Evergrande Real Estate Group Limited | 243,584 |
| 22,041 | | Fibra Uno Administracion SA | 33,784 |
| 713 | | First Industrial Realty Trust | 30,360 |
| 130,000 | | Franshion Properties of China Ltd. | 86,370 |
| 1,038 | | Geo Group, Inc. | 14,387 |
| 51,496 | | H&R Real Estate Investment Trust | 839,335 |
| 91,900 | | Henderson Land Development Co. Ltd. | 442,077 |
| 94,000 | 1 | Kaisa Group Holdings Ltd. | 36,993 |
| 1,100 | | Life Storage, Inc. | 120,472 |
| 24,000 | | Logan Property Holdings Co .Ltd. | 35,141 |
| 3,500 | | Longfor Properties | 14,338 |
| 4,391 | | Mid-American Apartment Communities, Inc. | 597,659 |
Annual Shareholder Report
Shares,
Principal
Amount or
Contracts | | | Value in
U.S. Dollars |
| | | COMMON STOCKS—continued | |
| | | Real Estate—continued | |
| 805 | | Monmouth Real Estate Investment Corp. | $12,341 |
| 690 | | National Storage Affiliates Trust | 23,115 |
| 8,214 | | New Senior Investment Group, Inc. | 64,480 |
| 1,713 | | Newmark Group, Inc. | 22,355 |
| 209 | | PS Business Parks, Inc. | 36,907 |
| 11,081 | | Pennsylvania Real Estate Investment Trust | 63,827 |
| 826 | | RLJ Lodging Trust | 14,116 |
| 240 | | Retail Value, Inc. | 8,522 |
| 1,263 | | Rexford Industrial Realty, Inc. | 60,447 |
| 56,100 | | Robinson's Land Corp., Class B | 28,924 |
| 478 | | STAG Industrial, Inc. | 14,813 |
| 125,134 | | Scentre Group | 333,421 |
| 238,000 | | Seazen Group Ltd. | 253,792 |
| 178,000 | | Shenzhen Investment Ltd. | 70,043 |
| 24,500 | | Shimao Property Holdings Ltd. | 88,789 |
| 244,708 | | Stockland Trust Group | 837,639 |
| 68,000 | | Sunac China Holdings | 331,467 |
| 422 | | Terreno Realty Corp. | 24,358 |
| 758 | | Urban Edge Properties | 15,713 |
| 360,000 | | Yuexiu Property Co., Ltd. | 76,811 |
| | | TOTAL | 9,796,961 |
| | | Utilities—2.4% | |
| 11,363 | | AES Corp. | 214,874 |
| 15,670 | | AGL Energy Ltd. | 216,641 |
| 10,330 | | Ameren Corp. | 767,829 |
| 2,528 | | American Electric Power Co., Inc. | 230,933 |
| 540 | | American States Water Co. | 46,057 |
| 467,595 | | AusNet Services | 550,927 |
| 52 | | Avista Corp. | 2,459 |
| 15,000 | | Beijing Enterprises Holdings Ltd. | 66,304 |
| 1,369 | | CEZ A.S. | 30,312 |
| 51,500 | | CLP Holdings Ltd. | 531,163 |
| 168 | | Chesapeake Utilities Corp. | 15,312 |
| 155,000 | | China Power International Development Ltd. | 32,079 |
| 22,000 | | China Resources Logic Ltd. | 122,542 |
| 4,815 | | DTE Energy Co. | 601,586 |
Annual Shareholder Report
Shares,
Principal
Amount or
Contracts | | | Value in
U.S. Dollars |
| | | COMMON STOCKS—continued | |
| | | Utilities—continued | |
| 372 | | Duke Energy Corp. | $32,799 |
| 10,500 | | ENN Energy Holdings Ltd. | 114,023 |
| 42,181 | | Endesa SA | 1,146,877 |
| 6,829 | | Enel SpA | 51,572 |
| 21,955 | | Gail India Ltd. | 38,566 |
| 778,500 | 3 | HK Electric Investments Ltd. | 762,757 |
| 109,040 | | Hong Kong and China Gas Co. Ltd. | 207,941 |
| 64,537 | | Iberdrola SA | 634,709 |
| 8,860 | | Manila Electric Co. | 55,622 |
| 7,939 | | NextEra Energy, Inc. | 1,856,297 |
| 979 | | Northwestern Corp. | 70,067 |
| 3,775,022 | | OJSC Inter Rao Ues | 261,030 |
| 183 | | ONE Gas, Inc. | 16,263 |
| 2,056 | | Orsted A/S | 189,450 |
| 279 | | Otter Tail Corp. | 13,716 |
| 1,900 | | Petronas Gas | 7,056 |
| 1,393 | | Portland General Electric Co. | 77,325 |
| 12,600 | | Ratchaburi Group PCL | 29,494 |
| 6,667 | | Severn Trent PLC | 193,369 |
| 1,794 | | Southern Co. | 111,210 |
| 5,031 | | Uniper SE | 162,392 |
| 976 | | Unitil Corp. | 59,575 |
| | | TOTAL | 9,521,128 |
| | | TOTAL COMMON STOCKS
(IDENTIFIED COST $210,446,140) | 251,330,893 |
| | | ASSET-BACKED SECURITIES—0.0% | |
| $39,715 | | Santander Drive Auto Receivables Trust 2016-2, Class C, 2.660%, 11/15/2021 | 39,745 |
| 21,997 | | Sofi Consumer Loan Program Trust 2016-3, Class A, 3.050%, 12/26/2025 | 22,043 |
| | | TOTAL ASSET-BACKED SECURITIES
(IDENTIFIED COST $61,703) | 61,788 |
| | | COMMERCIAL MORTGAGE-BACKED SECURITY—0.0% | |
| | | Financials—0.0% | |
| 135,029 | | Federal Home Loan Mortgage Corp. REMIC, Series K055, Class A1, 2.263%, 4/25/2025
(IDENTIFIED COST $137,724) | 135,432 |
Annual Shareholder Report
Shares,
Principal
Amount or
Contracts | | | Value in
U.S. Dollars |
| | | COLLATERALIZED MORTGAGE OBLIGATIONS—0.4% | |
| $255,000 | | Bank, Class A4, 3.488%, 11/15/2050 | $272,632 |
| 200,000 | | Citigroup Commercial Mortgage Trust 2015-GC33, Class AS, 4.114%, 9/10/2058 | 215,518 |
| 450,000 | | Commercial Mortgage Trust 2015-DC1, Class AM, 3.724%, 2/10/2048 | 468,399 |
| 300,000 | | JPMDB Commercial Mortgage Securities Trust 2016-C4, Class A3, 3.141%, 12/15/2049 | 311,600 |
| 50,000 | | WF-RBS Commercial Mortgage Trust 2012-C6, Class B, 4.697%, 4/15/2045 | 52,204 |
| 100,000 | | WF-RBS Commercial Mortgage Trust 2014-C25, Class B, 4.236%, 11/15/2047 | 105,414 |
| | | TOTAL COLLATERALIZED MORTGAGE OBLIGATIONS
(IDENTIFIED COST $1,394,613) | 1,425,767 |
| | | CORPORATE BONDS—6.0% | |
| | | Basic Industry - Metals & Mining—0.0% | |
| 100,000 | | Reliance Steel & Aluminum Co., Sr. Unsecd. Note, 4.500%, 4/15/2023 | 105,999 |
| | | Basic Industry - Paper—0.0% | |
| 150,000 | 1,2,4 | Pope & Talbot, Inc., 8.375%, 12/1/2099 | 0 |
| | | Capital Goods - Aerospace & Defense—0.1% | |
| 180,000 | | Lockheed Martin Corp., Sr. Unsecd. Note, 3.550%, 1/15/2026 | 193,702 |
| 90,000 | 5 | Textron Financial Corp., Jr. Sub. Note, 144A, 3.644% (3-month USLIBOR +1.735%), 2/15/2042 | 71,043 |
| | | TOTAL | 264,745 |
| | | Capital Goods - Building Materials—0.1% | |
| 125,000 | | Allegion PLC, Sr. Unsecd. Note, 3.500%, 10/1/2029 | 127,789 |
| 130,000 | | Masco Corp., Sr. Unsecd. Note, 4.375%, 4/1/2026 | 141,168 |
| 185,000 | | Masco Corp., Unsecd. Note, 4.450%, 4/1/2025 | 200,488 |
| | | TOTAL | 469,445 |
| | | Capital Goods - Diversified Manufacturing—0.1% | |
| 30,000 | | General Electric Capital Corp., Note, Series MTNA, 6.750%, 3/15/2032 | 38,910 |
| 300,000 | | Valmont Industries, Inc., 5.250%, 10/1/2054 | 308,031 |
| | | TOTAL | 346,941 |
| | | Commercial Mortgage—0.0% | |
| 150,000 | | Charter Communications Operating, LLC/Charter Communications Operating Capital Corp., 5.050%, 3/30/2029 | 169,135 |
| | | Communications - Cable & Satellite—0.1% | |
| 200,000 | | CCO Safari II LLC, 4.908%, 7/23/2025 | 219,423 |
| | | Communications - Media & Entertainment—0.2% | |
| 310,000 | | British Sky Broadcasting Group PLC, 144A, 3.750%, 9/16/2024 | 331,743 |
| 20,000 | | Discovery Communications LLC, Sr. Unsecd. Note, 4.900%, 3/11/2026 | 22,375 |
Annual Shareholder Report
Shares,
Principal
Amount or
Contracts | | | Value in
U.S. Dollars |
| | | CORPORATE BONDS—continued | |
| | | Communications - Media & Entertainment—continued | |
| $70,000 | | Grupo Televisa S.A., Sr. Unsecd. Note, 6.125%, 1/31/2046 | $85,144 |
| 350,000 | | Omnicom Group, Inc., Sr. Unsecd. Note, 3.600%, 4/15/2026 | 369,937 |
| | | TOTAL | 809,199 |
| | | Communications - Telecom Wireless—0.1% | |
| 375,000 | | Vodafone Group PLC, Sr. Unsecd. Note, 4.250%, 9/17/2050 | 390,641 |
| 75,000 | | Vodafone Group PLC, Sr. Unsecd. Note, 4.875%, 6/19/2049 | 85,322 |
| | | TOTAL | 475,963 |
| | | Communications - Telecom Wirelines—0.1% | |
| 300,000 | | AT&T, Inc., Sr. Unsecd. Note, 5.150%, 3/15/2042 | 349,598 |
| 200,000 | | Verizon Communications, Inc., Sr. Unsecd. Note, 4.150%, 3/15/2024 | 215,817 |
| | | TOTAL | 565,415 |
| | | Consumer Cyclical - Automotive—0.1% | |
| 275,000 | | Ford Motor Credit Co. LLC, Sr. Unsecd. Note, 3.336%, 3/18/2021 | 276,525 |
| 70,000 | | General Motors Co., Sr. Unsecd. Note, 4.000%, 4/1/2025 | 73,209 |
| | | TOTAL | 349,734 |
| | | Consumer Cyclical - Retailers—0.2% | |
| 100,000 | | Advance Auto Parts, Inc., 4.500%, 12/1/2023 | 107,043 |
| 300,000 | | AutoZone, Inc., Sr. Unsecd. Note, 3.250%, 4/15/2025 | 312,297 |
| 91,638 | | CVS Health Corp., Pass Thru Cert., 144A, 5.298%, 1/11/2027 | 98,174 |
| 120,000 | | Under Armour, Inc., Sr. Unsecd. Note, 3.250%, 6/15/2026 | 115,041 |
| | | TOTAL | 632,555 |
| | | Consumer Cyclical - Services—0.1% | |
| 200,000 | | Alibaba Group Holding Ltd., Sr. Unsecd. Note, 2.800%, 6/6/2023 | 202,629 |
| 130,000 | | Visa, Inc., Sr. Unsecd. Note, 3.150%, 12/14/2025 | 137,835 |
| | | TOTAL | 340,464 |
| | | Consumer Non-Cyclical - Food/Beverage—0.3% | |
| 425,000 | | Anheuser-Busch InBev Worldwide, Inc., Sr. Unsecd. Note, 5.550%, 1/23/2049 | 564,191 |
| 210,000 | | Flowers Foods, Inc., Sr. Unsecd. Note, 3.500%, 10/1/2026 | 216,052 |
| 250,000 | | Kraft Heinz Foods Co., Sr. Unsecd. Note, 3.950%, 7/15/2025 | 262,570 |
| 100,000 | | McCormick & Co., Inc., Sr. Unsecd. Note, 3.400%, 8/15/2027 | 104,950 |
| 120,000 | | Mead Johnson Nutrition Co., Sr. Unsecd. Note, 4.125%, 11/15/2025 | 131,130 |
| 70,000 | | PepsiCo, Inc., Sr. Unsecd. Note, 4.450%, 4/14/2046 | 87,446 |
| | | TOTAL | 1,366,339 |
| | | Consumer Non-Cyclical - Health Care—0.2% | |
| 210,000 | | Agilent Technologies, Inc., Sr. Unsecd. Note, 2.750%, 9/15/2029 | 210,350 |
Annual Shareholder Report
Shares,
Principal
Amount or
Contracts | | | Value in
U.S. Dollars |
| | | CORPORATE BONDS—continued | |
| | | Consumer Non-Cyclical - Health Care—continued | |
| $400,000 | | PerkinElmer, Inc., Sr. Unsecd. Note, 3.300%, 9/15/2029 | $401,095 |
| | | TOTAL | 611,445 |
| | | Consumer Non-Cyclical - Pharmaceuticals—0.1% | |
| 125,000 | | Eli Lilly & Co., Sr. Unsecd. Note, 3.950%, 3/15/2049 | 147,517 |
| 90,000 | | Gilead Sciences, Inc., Sr. Unsecd. Note, 3.650%, 3/1/2026 | 96,786 |
| | | TOTAL | 244,303 |
| | | Consumer Non-Cyclical - Supermarkets—0.1% | |
| 375,000 | | Kroger Co., Sr. Unsecd. Note, 5.400%, 1/15/2049 | 457,410 |
| | | Consumer Non-Cyclical - Tobacco—0.3% | |
| EUR 870,000 | | Philip Morris International, Inc., Sr. Unsecd. Note, 2.875%, 5/14/2029 | 1,120,684 |
| $200,000 | | Reynolds American, Inc., Sr. Unsecd. Note, 5.850%, 8/15/2045 | 226,393 |
| | | TOTAL | 1,347,077 |
| | | Energy - Independent—0.0% | |
| 170,000 | | Occidental Petroleum Corp., Sr. Unsecd. Note, 2.900%, 8/15/2024 | 171,124 |
| | | Energy - Integrated—0.0% | |
| 100,000 | | Husky Energy, Inc., Sr. Unsecd. Note, 3.950%, 4/15/2022 | 103,202 |
| 35,000 | | Petro-Canada, Deb., 7.000%, 11/15/2028 | 44,873 |
| | | TOTAL | 148,075 |
| | | Energy - Midstream—0.2% | |
| 325,000 | | Energy Transfer Partners LP, Sr. Unsecd. Note, 4.050%, 3/15/2025 | 336,708 |
| 100,000 | | Kinder Morgan, Inc., 5.050%, 2/15/2046 | 110,752 |
| 80,000 | | MPLX LP, Sr. Unsecd. Note, 4.125%, 3/1/2027 | 83,067 |
| 100,000 | | Williams Partners LP, Sr. Unsecd. Note, 4.900%, 1/15/2045 | 103,816 |
| | | TOTAL | 634,343 |
| | | Energy - Refining—0.1% | |
| 250,000 | | Marathon Petroleum Corp., Sr. Unsecd. Note, 4.750%, 9/15/2044 | 273,606 |
| | | Financial Institution - Banking—0.6% | |
| 100,000 | | Bank of America Corp., Sr. Unsecd. Note, Series MTN, 4.875%, 4/1/2044 | 127,024 |
| 300,000 | | Bank of America Corp., Sub. Note, Series MTN, 4.000%, 1/22/2025 | 319,392 |
| 300,000 | | Citigroup, Inc., Sr. Unsecd. Note, 2.700%, 3/30/2021 | 302,537 |
| 250,000 | | Citizens Bank N.A., Sr. Unsecd. Note, Series BKNT, 3.750%, 2/18/2026 | 266,913 |
| 250,000 | | Compass Bank, Birmingham, Sub. Note, Series BKNT, 3.875%, 4/10/2025 | 263,179 |
| 5,000 | | Goldman Sachs Group, Inc., Sr. Unsecd. Note, 5.750%, 1/24/2022 | 5,368 |
| 100,000 | | JPMorgan Chase & Co., Series S, 6.750%, 8/1/2068 | 112,697 |
Annual Shareholder Report
Shares,
Principal
Amount or
Contracts | | | Value in
U.S. Dollars |
| | | CORPORATE BONDS—continued | |
| | | Financial Institution - Banking—continued | |
| $50,000 | | JPMorgan Chase & Co., Sub. Note, 3.375%, 5/1/2023 | $51,854 |
| 400,000 | | Morgan Stanley, 4.300%, 1/27/2045 | 472,619 |
| 300,000 | 5 | Morgan Stanley, Sr. Unsecd. Note, Series GMTN, 2.450% (3-month USLIBOR +0.550%), 2/10/2021 | 300,240 |
| 34,904 | 2 | Regional Diversified Funding, 144A, 9.250%, 3/15/2030 | 26,178 |
| 80,000 | | Regions Financial Corp., Sr. Unsecd. Note, 3.200%, 2/8/2021 | 80,968 |
| 230,000 | | SunTrust Banks, Inc., Sr. Unsecd. Note, 2.900%, 3/3/2021 | 232,178 |
| | | TOTAL | 2,561,147 |
| | | Financial Institution - Broker/Asset Mgr/Exchange—0.1% | |
| 140,000 | | Invesco Finance PLC, Sr. Unsecd. Note, 3.750%, 1/15/2026 | 149,064 |
| 240,000 | | Stifel Financial Corp., Sr. Unsecd. Note, 3.500%, 12/1/2020 | 242,648 |
| 70,000 | | TIAA Asset Management Finance Co. LLC, Sr. Unsecd. Note, 144A, 4.125%, 11/1/2024 | 75,729 |
| | | TOTAL | 467,441 |
| | | Financial Institution - Finance Companies—0.1% | |
| 210,000 | | AerCap Ireland Capital Ltd. / AerCap Global Aviation Trust, Sr. Unsecd. Note, 3.950%, 2/1/2022 | 217,069 |
| 325,000 | | GE Capital International Funding, Inc., Sr. Unsecd. Note, 4.418%, 11/15/2035 | 350,277 |
| | | TOTAL | 567,346 |
| | | Financial Institution - Insurance - Life—0.3% | |
| 27,000 | | Aflac, Inc., Sr. Unsecd. Note, 6.450%, 8/15/2040 | 37,922 |
| 400,000 | | American International Group, Inc., Unsecd. Note, 3.875%, 1/15/2035 | 426,798 |
| 325,000 | | Mass Mutual Global Funding II, 144A, 2.000%, 4/15/2021 | 325,434 |
| 10,000 | | MetLife, Inc., Jr. Sub. Note, 10.750%, 8/1/2039 | 16,569 |
| 105,000 | | Northwestern Mutual Life Insurance Co., Sr. Unsecd. Note, 144A, 3.625%, 9/30/2059 | 107,409 |
| 100,000 | | Principal Life Global Funding II, 144A, 2.200%, 4/8/2020 | 100,113 |
| | | TOTAL | 1,014,245 |
| | | Financial Institution - Insurance - P&C—0.1% | |
| 300,000 | | Liberty Mutual Group, Inc., Sr. Unsecd. Note, 144A, 3.951%, 10/15/2050 | 306,921 |
| 30,000 | | Nationwide Mutual Insurance Co., Sub. Note, 144A, 9.375%, 8/15/2039 | 51,881 |
| | | TOTAL | 358,802 |
| | | Financial Institution - REIT - Apartment—0.1% | |
| 300,000 | | Mid-America Apartment Communities LP, Sr. Unsecd. Note, 3.750%, 6/15/2024 | 316,137 |
Annual Shareholder Report
Shares,
Principal
Amount or
Contracts | | | Value in
U.S. Dollars |
| | | CORPORATE BONDS—continued | |
| | | Financial Institution - REIT - Apartment—continued | |
| $140,000 | | UDR, Inc., Sr. Unsecd. Note, Series MTN, 2.950%, 9/1/2026 | $143,207 |
| | | TOTAL | 459,344 |
| | | Financial Institution - REIT - Healthcare—0.1% | |
| 435,000 | | Healthcare Trust of America, Sr. Unsecd. Note, 3.100%, 2/15/2030 | 433,189 |
| | | Financial Institution - REIT - Office—0.1% | |
| 100,000 | | Alexandria Real Estate Equities, Inc., Sr. Unsecd. Note, 3.950%, 1/15/2028 | 108,012 |
| 300,000 | | Alexandria Real Estate Equities, Inc., Sr. Unsecd. Note, 4.500%, 7/30/2029 | 339,282 |
| | | TOTAL | 447,294 |
| | | Financial Institution - REIT - Other—0.1% | |
| 180,000 | | Liberty Property LP, Sr. Unsecd. Note, 4.375%, 2/1/2029 | 205,773 |
| 90,000 | | WP Carey, Inc., Sr. Unsecd. Note, 3.850%, 7/15/2029 | 95,205 |
| 160,000 | | WP Carey, Inc., Sr. Unsecd. Note, 4.600%, 4/1/2024 | 171,312 |
| | | TOTAL | 472,290 |
| | | Financial Institution - REIT - Retail—0.0% | |
| 30,000 | | Kimco Realty Corp., Sr. Unsecd. Note, 3.400%, 11/1/2022 | 30,927 |
| | | Financial Institution - REITs—0.1% | |
| 300,000 | | Boston Properties, Inc., Sr. Unsecd. Note, 3.400%, 6/21/2029 | 314,230 |
| | | Foreign-Local-Government—0.0% | |
| 50,000 | | Quebec, Province of, Note, Series MTNA, 7.035%, 3/10/2026 | 62,972 |
| | | Municipal Services—0.1% | |
| 134,231 | | Army Hawaii Family Housing, 144A, 5.524%, 6/15/2050 | 167,219 |
| 100,000 | | Camp Pendleton & Quantico Housing LLC, 5.572%, 10/1/2050 | 125,000 |
| | | TOTAL | 292,219 |
| | | Sovereign—0.1% | |
| JPY 30,000,000 | | KFW, 2.050%, 2/16/2026 | 315,966 |
| | | Technology—0.7% | |
| $300,000 | | Adobe, Inc., Sr. Unsecd. Note, 3.250%, 2/1/2025 | 315,128 |
| 400,000 | | Apple, Inc., Sr. Unsecd. Note, 2.950%, 9/11/2049 | 389,959 |
| 320,000 | | Diamond 1 Finance Corp./Diamond 2 Finance Corp., Sr. Secd. Note, 144A, 6.020%, 6/15/2026 | 365,947 |
| 28,000 | | Fidelity National Information Services, Inc., Sr. Unsecd. Note, 3.875%, 6/5/2024 | 29,852 |
| 260,000 | | Fiserv, Inc., Sr. Unsecd. Note, 3.500%, 7/1/2029 | 273,572 |
| 150,000 | | Hewlett Packard Enterprise Co., Sr. Unsecd. Note, 3.600%, 10/15/2020 | 151,765 |
| 300,000 | | Keysight Technologies, Inc., 4.550%, 10/30/2024 | 326,542 |
Annual Shareholder Report
Shares,
Principal
Amount or
Contracts | | | Value in
U.S. Dollars |
| | | CORPORATE BONDS—continued | |
| | | Technology—continued | |
| $380,000 | | Molex Electronics Technologies LLC, Unsecd. Note, 144A, 3.900%, 4/15/2025 | $393,549 |
| 70,000 | | Total System Services, Inc., Sr. Unsecd. Note, 4.800%, 4/1/2026 | 78,024 |
| 450,000 | | Verisk Analytics, Inc., Sr. Unsecd. Note, 4.125%, 3/15/2029 | 492,099 |
| | | TOTAL | 2,816,437 |
| | | Transportation - Services—0.1% | |
| 62,000 | | Enterprise Rent-A-Car USA Finance Co., Sr. Unsecd. Note, 144A, 3.850%, 11/15/2024 | 65,981 |
| 335,000 | | Penske Truck Leasing Co. LP & PTL Finance Corp., Sr. Unsecd. Note, 144A, 3.375%, 2/1/2022 | 342,031 |
| | | TOTAL | 408,012 |
| | | Utility - Electric—0.7% | |
| 120,000 | | Duke Energy Corp., Sr. Unsecd. Note, 2.650%, 9/1/2026 | 120,966 |
| 275,000 | | Electricite de France SA, Sr. Unsecd. Note, 144A, 4.500%, 9/21/2028 | 307,738 |
| 190,000 | | Emera US Finance LP, Sr. Unsecd. Note, 4.750%, 6/15/2046 | 222,106 |
| 400,000 | | Enel Finance International NV, Sr. Unsecd. Note, 144A, 2.650%, 9/10/2024 | 400,415 |
| 300,000 | | Exelon Corp., Sr. Unsecd. Note, 3.400%, 4/15/2026 | 313,767 |
| 375,000 | | Metropolitan Edison Co., Sr. Unsecd. Note, 144A, 4.300%, 1/15/2029 | 422,370 |
| 300,000 | | National Rural Utilities Cooperative Finance Corp., 2.000%, 1/27/2020 | 300,044 |
| 140,000 | | National Rural Utilities Cooperative Finance Corp., Sr. Sub. Note, 5.250%, 4/20/2046 | 150,789 |
| 200,000 | | NiSource Finance Corp., Sr. Unsecd. Note, 3.950%, 3/30/2048 | 209,733 |
| 400,000 | | Northeast Utilities, Sr. Unsecd. Note, Series H, 3.150%, 1/15/2025 | 414,117 |
| 125,000 | | Wisconsin Electric Power Co., Sr. Unsecd. Note, 4.300%, 12/15/2045 | 145,005 |
| | | TOTAL | 3,007,050 |
| | | Utility - Natural Gas—0.1% | |
| 200,000 | | Sempra Energy, Sr. Unsecd. Note, 2.850%, 11/15/2020 | 201,336 |
| | | TOTAL CORPORATE BONDS
(IDENTIFIED COST $22,903,758) | 24,232,987 |
| | | MORTGAGE-BACKED SECURITIES—0.0% | |
| 1,310 | | Federal Home Loan Mortgage Corp., Pool C00592, 7.000%, 3/1/2028 | 1,472 |
| 939 | | Federal Home Loan Mortgage Corp., Pool C00896, 7.500%, 12/1/2029 | 1,082 |
| 97 | | Federal Home Loan Mortgage Corp., Pool C17281, 6.500%, 11/1/2028 | 100 |
| 1,049 | | Federal Home Loan Mortgage Corp., Pool C19588, 6.500%, 12/1/2028 | 1,185 |
| 828 | | Federal Home Loan Mortgage Corp., Pool C25621, 6.500%, 5/1/2029 | 932 |
| 1,316 | | Federal Home Loan Mortgage Corp., Pool C76361, 6.000%, 2/1/2033 | 1,494 |
| 1,944 | | Federal Home Loan Mortgage Corp., Pool G01444, 6.500%, 8/1/2032 | 2,235 |
Annual Shareholder Report
Shares,
Principal
Amount or
Contracts | | | Value in
U.S. Dollars |
| | | MORTGAGE-BACKED SECURITIES—continued | |
| $1,161 | | Federal National Mortgage Association, Pool 251697, 6.500%, 5/1/2028 | $1,295 |
| 5,489 | | Federal National Mortgage Association, Pool 252334, 6.500%, 2/1/2029 | 6,031 |
| 3,348 | | Federal National Mortgage Association, Pool 254905, 6.000%, 10/1/2033 | 3,810 |
| 4,041 | | Federal National Mortgage Association, Pool 255075, 5.500%, 2/1/2024 | 4,354 |
| 367 | | Federal National Mortgage Association, Pool 303168, 9.500%, 2/1/2025 | 406 |
| 226 | | Federal National Mortgage Association, Pool 323159, 7.500%, 4/1/2028 | 256 |
| 2,213 | | Federal National Mortgage Association, Pool 323640, 7.500%, 4/1/2029 | 2,496 |
| 5,107 | | Federal National Mortgage Association, Pool 545993, 6.000%, 11/1/2032 | 5,781 |
| 2,142 | | Federal National Mortgage Association, Pool 555272, 6.000%, 3/1/2033 | 2,422 |
| 1,660 | | Federal National Mortgage Association, Pool 713974, 5.500%, 7/1/2033 | 1,852 |
| 3,667 | | Federal National Mortgage Association, Pool 721502, 5.000%, 7/1/2033 | 4,009 |
| 4,969 | | Government National Mortgage Association, Pool 2796, 7.000%, 8/20/2029 | 5,630 |
| 2,973 | | Government National Mortgage Association, Pool 3040, 7.000%, 2/20/2031 | 3,393 |
| 7,536 | | Government National Mortgage Association, Pool 3188, 6.500%, 1/20/2032 | 8,558 |
| 9,686 | | Government National Mortgage Association, Pool 3239, 6.500%, 5/20/2032 | 11,041 |
| 193 | | Government National Mortgage Association, Pool 352214, 7.000%, 4/15/2023 | 205 |
| 1,434 | | Government National Mortgage Association, Pool 451522, 7.500%, 10/15/2027 | 1,620 |
| 883 | | Government National Mortgage Association, Pool 462556, 6.500%, 2/15/2028 | 971 |
| 284 | | Government National Mortgage Association, Pool 462739, 7.500%, 5/15/2028 | 321 |
| 106 | | Government National Mortgage Association, Pool 464835, 6.500%, 9/15/2028 | 117 |
| 2,513 | | Government National Mortgage Association, Pool 469699, 7.000%, 11/15/2028 | 2,805 |
Annual Shareholder Report
Shares,
Principal
Amount or
Contracts | | | Value in
U.S. Dollars |
| | | MORTGAGE-BACKED SECURITIES—continued | |
| $2,194 | | Government National Mortgage Association, Pool 486760, 6.500%, 12/15/2028 | $2,435 |
| 191 | | Government National Mortgage Association, Pool 780339, 8.000%, 12/15/2023 | 204 |
| 2,113 | | Government National Mortgage Association, Pool 780453, 7.500%, 12/15/2025 | 2,323 |
| 2,014 | | Government National Mortgage Association, Pool 780584, 7.000%, 6/15/2027 | 2,211 |
| | | TOTAL MORTGAGE-BACKED SECURITIES
(IDENTIFIED COST $74,572) | 83,046 |
| | | FOREIGN GOVERNMENTS/AGENCIES—7.2% | |
| | | Sovereign—7.2% | |
| AUD 1,000,000 | | Australia, Government of, Sr. Unsecd. Note, Series 148, 2.750%, 11/21/2027 | 768,944 |
| EUR 390,000 | | Belgium, Government of, Series 68, 2.250%, 6/22/2023 | 472,844 |
| EUR 680,000 | | Belgium, Government of, Series 74, 0.800%, 6/22/2025 | 797,557 |
| CAD 800,000 | | Canada, Government of, Bond, 3.250%, 6/1/2021 | 616,782 |
| CAD 480,000 | | Canada, Government of, Series WL43, 5.750%, 6/1/2029 | 498,621 |
| EUR 936,000 | | France, Government of, 0.500%, 5/25/2025 | 1,082,539 |
| EUR 350,000 | | France, Government of, Bond, 4.500%, 4/25/2041 | 703,765 |
| EUR 400,000 | | France, Government of, O.A.T., 5.500%, 4/25/2029 | 675,333 |
| EUR 250,000 | | France, Government of, Unsecd. Note, 1.250%, 5/25/2036 | 316,595 |
| EUR 400,000 | | France, Government of, Unsecd. Note, 1.750%, 6/25/2039 | 550,420 |
| EUR 300,000 | | Germany, Government of, Bond, Series 03, 4.750%, 7/4/2034 | 573,967 |
| EUR 100,000 | | Germany, Government of, Bond, Series 08, 4.750%, 7/4/2040 | 220,027 |
| EUR 540,000 | | Germany, Government of, Unsecd. Note, 1.000%, 8/15/2025 | 648,876 |
| EUR 1,000,000 | | Italy, Government of, 3.750%, 5/1/2021 | 1,161,656 |
| EUR 220,000 | | Italy, Government of, 4.250%, 3/1/2020 | 245,028 |
| EUR 680,000 | | Italy, Government of, Sr. Unsecd. Note, 0.650%, 10/15/2023 | 757,937 |
| EUR 1,000,000 | | Italy, Government of, Sr. Unsecd. Note, 4.750%, 9/1/2028 | 1,434,653 |
| EUR 500,000 | | Italy, Government of, Unsecd. Note, 1.600%, 6/1/2026 | 576,690 |
| EUR 58,000 | | Italy, Government of, Unsecd. Note, 3.250%, 9/1/2046 | 76,843 |
| JPY 100,000,000 | | Japan, Government of, Series 313, 1.300%, 3/20/2021 | 931,091 |
| JPY 60,000,000 | | Japan, Government of, Series 65, 1.900%, 12/20/2023 | 594,774 |
| JPY 142,000,000 | | Japan, Government of, Sr. Unsecd. Note, Series 114, 2.100%, 12/20/2029 | 1,581,700 |
| JPY 205,000,000 | | Japan, Government of, Sr. Unsecd. Note, Series 153, 1.300%, 6/20/2035 | 2,210,841 |
Annual Shareholder Report
Shares,
Principal
Amount or
Contracts | | | Value in
U.S. Dollars |
| | | FOREIGN GOVERNMENTS/AGENCIES—continued | |
| | | Sovereign—continued | |
| JPY 50,000,000 | | Japan, Government of, Sr. Unsecd. Note, Series 351, 0.100%, 6/20/2028 | $466,917 |
| JPY 155,000,000 | | Japan, Government of, Sr. Unsecd. Note, Series 44, 1.700%, 9/20/2044 | 1,875,526 |
| $30,000 | | Mexico, Government of, Series MTNA, 6.750%, 9/27/2034 | 41,100 |
| MXN 30,200,000 | | Mexico, Government of, Sr. Unsecd. Note, Series M, 5.000%, 12/11/2019 | 1,539,540 |
| EUR 350,000 | | Netherlands, Government of, 1.750%, 7/15/2023 | 418,867 |
| EUR 750,000 | | Netherlands, Government of, Unsecd. Note, 2.500%, 1/15/2033 | 1,106,182 |
| EUR 150,000 | | Spain, Government of, 4.200%, 1/31/2037 | 253,940 |
| EUR 590,000 | | Spain, Government of, Sr. Unsecd. Note, 1.950%, 7/30/2030 | 748,536 |
| EUR 880,000 | | Spain, Government of, Sr. Unsecd. Note, 2.750%, 10/31/2024 | 1,104,030 |
| EUR 400,000 | | Spain, Government of, Sr. Unsub., 4.000%, 4/30/2020 | 448,776 |
| GBP 270,000 | | United Kingdom, Government of, 2.750%, 9/7/2024 | 385,829 |
| GBP 430,000 | | United Kingdom, Government of, 3.250%, 1/22/2044 | 793,860 |
| GBP 350,000 | | United Kingdom, Government of, 4.250%, 12/7/2027 | 584,562 |
| GBP 600,000 | | United Kingdom, Government of, Unsecd. Note, 1.500%, 7/22/2047 | 829,383 |
| GBP 430,000 | | United Kingdom, Government of, Unsecd. Note, 4.250%, 6/7/2032 | 781,291 |
| | | TOTAL FOREIGN GOVERNMENTS/AGENCIES
(IDENTIFIED COST $27,414,309) | 28,875,822 |
| | | U.S. TREASURIES—3.2% | |
| $324,993 | | U.S. Treasury Inflation-Protected Notes, 0.125%, 4/15/2021 | 322,819 |
| 26,394 | | U.S. Treasury Inflation-Protected Notes, 0.125%, 4/15/2022 | 26,204 |
| 5,248 | | U.S. Treasury Inflation-Protected Notes, 0.375%, 7/15/2027 | 5,340 |
| 312,474 | | U.S. Treasury Inflation-Protected Notes, 0.750%, 2/15/2042 | 331,199 |
| 78,088 | | U.S. Treasury Inflation-Protected Notes, 1.000%, 2/15/2048 | 88,258 |
| 637,706 | | U.S. Treasury Inflation-Protected Notes, 1.000%, 2/15/2049 | 725,439 |
| 925,000 | | United States Treasury Bond, 2.250%, 8/15/2049 | 934,366 |
| 75,000 | | United States Treasury Bond, 2.500%, 2/15/2045 | 79,249 |
| 81,000 | | United States Treasury Bond, 2.500%, 5/15/2046 | 85,708 |
| 225,000 | | United States Treasury Bond, 2.750%, 8/15/2047 | 250,308 |
| 3,000 | | United States Treasury Bond, 3.000%, 11/15/2045 | 3,476 |
| 55,000 | | United States Treasury Bond, 3.000%, 2/15/2048 | 64,159 |
| 350,000 | | United States Treasury Bond, 3.000%, 8/15/2048 | 408,994 |
| 75,000 | | United States Treasury Bond, 3.000%, 2/15/2049 | 87,838 |
| 100,000 | | United States Treasury Bond, 4.375%, 2/15/2038 | 136,045 |
| 1,300,000 | | United States Treasury Note, 1.375%, 8/31/2026 | 1,271,237 |
| 600,000 | | United States Treasury Note, 1.500%, 10/31/2021 | 598,584 |
Annual Shareholder Report
Shares,
Principal
Amount or
Contracts | | | Value in
U.S. Dollars |
| | | U.S. TREASURIES—continued | |
| $400,000 | | United States Treasury Note, 1.500%, 9/30/2024 | $397,532 |
| 275,000 | | United States Treasury Note, 1.625%, 10/31/2026 | 273,126 |
| 1,000,000 | | United States Treasury Note, 1.750%, 11/15/2029 | 997,553 |
| 600,000 | | United States Treasury Note, 1.875%, 6/30/2026 | 605,691 |
| 3,275,000 | | United States Treasury Note, 2.125%, 5/31/2021 | 3,296,497 |
| 180,000 | | United States Treasury Note, 2.250%, 3/31/2021 | 181,318 |
| 50,000 | | United States Treasury Note, 2.250%, 3/31/2026 | 51,617 |
| 385,000 | | United States Treasury Note, 2.500%, 1/31/2021 | 388,489 |
| 700,000 | | United States Treasury Note, 2.500%, 2/28/2021 | 706,837 |
| 30,000 | | United States Treasury Note, 2.500%, 1/31/2025 | 31,254 |
| 225,000 | | United States Treasury Note, 2.500%, 2/28/2026 | 235,541 |
| 160,000 | | United States Treasury Note, 2.875%, 11/30/2023 | 167,706 |
| 145,000 | | United States Treasury Note, 2.875%, 9/30/2023 | 151,719 |
| | | TOTAL U.S. TREASURIES
(IDENTIFIED COST $12,645,333) | 12,904,103 |
| | | PURCHASED CALL OPTION—0.0% | |
| 3,300,000 | | BNP EUR CALL/JPY PUT, Notional Amount $3,300,000, Exercise Price $122.43, Expiration Date 1/30/2020
(IDENTIFIED COST $27,255) | 10,668 |
| | | PURCHASED PUT OPTION—0.0% | |
| 85,000 | | Morgan Stanley USD PUT/CAD CALL, Notional Amount $85,000, Exercise Price $1.33, Expiration Date 12/4/2019
(IDENTIFIED COST $224) | 107 |
| | | INVESTMENT COMPANIES—18.6% | |
| 3,951,047 | | Emerging Markets Core Fund | 39,273,404 |
| 220,646 | | Federated Bank Loan Core Fund | 2,151,295 |
| 3,049,396 | | Federated Institutional Prime Value Obligations Fund, Institutional Shares, 1.77%6 | 3,050,311 |
| 2,226,677 | | Federated Mortgage Core Portfolio | 21,999,566 |
| 546,931 | | Federated Project and Trade Finance Core Fund | 4,911,439 |
| 566,062 | 7 | High Yield Bond Portfolio | 3,532,228 |
| | | TOTAL INVESTMENT COMPANIES
(IDENTIFIED COST $72,618,208) | 74,918,243 |
| | | TOTAL INVESTMENT IN SECURITIES—97.8%
(IDENTIFIED COST $347,723,839)8 | 393,978,856 |
| | | OTHER ASSETS AND LIABILITIES - NET—2.2%9 | 8,778,869 |
| | | TOTAL NET ASSETS—100% | $402,757,725 |
Annual Shareholder Report
At November 30, 2019, the Fund had the following outstanding foreign exchange contracts:
| Settlement Date | Counterparty | Currency
Units to
Deliver/Receive | In
Exchange
For | Unrealized
Appreciation
(Depreciation) |
| Contracts Purchased: |
| 12/6/2019 | State Street Bank & Trust Co. | 10,069,000 AUD | $6,822,335 | $(11,101) |
| 12/6/2019 | Credit Agricole CIB | 949,000 CAD | $713,023 | $1,423 |
| 12/6/2019 | Credit Agricole CIB | 686,196,000 JPY | $6,303,467 | $(31,331) |
| 12/6/2019 | HSBC BANK USA | 110,102,000 MXN | $5,668,037 | $(45,010) |
| 12/6/2019 | BNP Paribas SA | 1,613,000 NOK | $175,524 | $(591) |
| 12/20/2019 | Barclays Bank PLC Wholesale | 3,021,158,000 KRW | $2,529,415 | $29,501 |
| 12/20/2019 | Barclays Bank PLC Wholesale | 3,621,743,000 KRW | $3,027,378 | $40,232 |
| 12/20/2019 | Barclays Bank PLC Wholesale | 10,167,923,000 KRW | $8,600,703 | $11,510 |
| 12/20/2019 | Barclays Bank PLC Wholesale | 12,137,989,000 KRW | $10,373,374 | $(92,519) |
| 12/20/2019 | Barclays Bank PLC Wholesale | 13,695,569,000 KRW | $11,627,107 | (26,984) |
| 12/20/2019 | Barclays Bank PLC Wholesale | 23,742,197,000 KRW | $20,405,491 | $(295,892) |
| 2/3/2020 | State Street Bank & Trust Co. | 500,000 EUR | 60,559,405 JPY | $(2,552) |
| 2/3/2020 | State Street Bank & Trust Co. | 550,000 EUR | $615,644 | $(6,948) |
| 2/3/2020 | State Street Bank & Trust Co. | 680,000 GBP | $878,048 | $3,421 |
| 2/3/2020 | State Street Bank & Trust Co. | 540,995,700 JPY | $5,000,000 | $(33,866) |
| 2/3/2020 | Morgan Stanley | 13,803,734 NOK | $1,500,000 | $(2,181) |
| 2/3/2020 | Citibank N.A. | 19,986,058 NOK | $2,200,000 | $(31,348) |
| 2/3/2020 | Citibank N.A. | 950,000 NZD | $605,485 | $5,004 |
| 2/4/2020 | Citibank N.A. | 11,653,621 MXN | $600,000 | $(9,719) |
| 2/4/2020 | Goldman Sachs | 11,672,744 MXN | $600,000 | $(8,750) |
| 2/18/2020 | Morgan Stanley | 115,501 AUD | $80,000 | $(1,718) |
| 2/18/2020 | Goldman Sachs | 223,796 CAD | $170,000 | $(1,437) |
| 2/18/2020 | JPMorgan Chase | 73,468 CHF | $75,000 | $(1,058) |
| 2/18/2020 | State Street Bank & Trust Co. | 400,565 EUR | $450,000 | $(6,273) |
| 2/18/2020 | State Street Bank & Trust Co. | 123,109 GBP | $160,000 | $(352) |
| 2/18/2020 | JPMorgan Chase | 29,515,112 JPY | $275,000 | $(3,837) |
| 2/18/2020 | Goldman Sachs | 2,910,516 MXN | $150,000 | $(2,874) |
| 2/28/2020 | Bank of America N.A. | 170,000 AUD | $115,584 | $(335) |
| 2/28/2020 | JPMorgan Chase | 112,219 CAD | $85,000 | $(474) |
| 2/28/2020 | Barclays Bank PLC Wholesale | 13,481,013 MXN | $690,000 | $(9,521) |
| 2/28/2020 | Barclays Bank PLC Wholesale | 1,000,000 NOK | $109,110 | $(600) |
| 2/28/2020 | Morgan Stanley | 180,000 NZD | $115,797 | $(83) |
| 2/28/2020 | Barclays Bank PLC Wholesale | 1,700,000 NZD | $1,092,953 | $(104) |
Annual Shareholder Report
| Settlement Date | Counterparty | Currency
Units to
Deliver/Receive | In
Exchange
For | Unrealized
Appreciation
(Depreciation) |
| Contracts Sold: |
| 12/6/2019 | Bank of America N.A. | 4,689,000 CHF | $4,700,526 | $9,388 |
| 12/6/2019 | BNP Paribas SA | 13,836,000 EUR | $15,257,537 | $10,310 |
| 12/6/2019 | Morgan Stanley | 3,648,000 GBP | $4,697,318 | $(21,014) |
| 12/6/2019 | Bank of New York Mellon | 879,000 NZD | $563,339 | $(1,009) |
| 12/6/2019 | Barclays Bank PLC Wholesale | 85,980,000 SEK | $8,918,158 | $(61,631) |
| 12/6/2019 | Bank of America N.A. | 2,548,000 SGD | $1,866,211 | $3,070 |
| 12/6/2019 | Citibank N.A. | 3,827,000 TRY | $664,409 | $(338) |
| 12/20/2019 | Bank of America N.A. | 5,502,104,000 KRW | $4,653,847 | $(6,425) |
| 12/20/2019 | Barclays Bank PLC Wholesale | 11,474,833,000 KRW | $9,887,750 | $168,587 |
| 12/20/2019 | Barclays Bank PLC Wholesale | 14,540,279,000 KRW | $12,372,494 | $56,904 |
| 12/20/2019 | Barclays Bank PLC Wholesale | 18,184,228,000 KRW | $15,590,178 | $188,169 |
| 12/20/2019 | Barclays Bank PLC Wholesale | 27,397,245,000 KRW | $22,926,565 | $(278,853) |
| 2/3/2020 | Goldman Sachs | 500,000 EUR | 60,407,345 JPY | $1,156 |
| 2/3/2020 | Citibank N.A | 20,089,073 NOK | $2,200,000 | $20,170 |
| 2/3/2020 | BNP Paribas SA | 950,000 NZD | $606,914 | $(3,575) |
| 2/4/2020 | State Street Bank & Trust Co. | 23,308,824 MXN | $1,200,000 | $19,358 |
| NET UNREALIZED DEPRECIATION ON FOREIGN EXCHANGE CONTRACTS | $(432,100) |
At November 30, 2019, the Fund had the following outstanding futures contracts:
| Description | Number of
Contracts | Notional
Value | Expiration
Date | Value and
Unrealized
Appreciation
(Depreciation) |
| 1Amsterdam Index Short Futures | 74 | $9,738,812 | December 2019 | $25,489 |
| 1Australia 10-Year Bond Short Futures | 312 | $31,033,298 | December 2019 | $(196,081) |
| 1Canada 10-Year Bond Short Futures | 424 | $44,711,044 | March 2020 | $(46,618) |
| 1DAX Index Short Futures | 31 | $11,311,117 | December 2019 | $(337,117) |
| 1FTSE 100 Index Short Futures | 164 | $15,621,249 | December 2019 | $(5,180) |
| 1Japan 10-Year Bond Short Futures | 19 | $26,595,138 | December 2019 | $96,072 |
| 1Long GILT Short Futures | 170 | $29,188,739 | March 2020 | $(18,554) |
| 1MSCI Singapore IX ETS Short Futures | 273 | $7,351,996 | December 2019 | $26,833 |
| 1MSCI Taiwan Index Short Futures | 361 | $15,703,500 | December 2019 | $162,537 |
| 1SPI 200 Short Futures | 12 | $1,391,220 | December 2019 | $(22,199) |
| 1S&P/TSX 60 IX Short Futures | 28 | $4,290,537 | December 2019 | $(19,521) |
| 1TOPIX Index Short Futures | 35 | $5,428,167 | December 2019 | $(237,575) |
| 1United States Treasury Ultra Bond Short Futures | 4 | $750,875 | March 2020 | $464 |
| 1CAC 40 10-Year Euro Long Futures | 309 | $20,083,505 | December 2019 | $(38,976) |
| 1Euro BTP Long Futures | 56 | $8,841,105 | March 2020 | $5,213 |
Annual Shareholder Report
| Description | Number of
Contracts | Notional
Value | Expiration
Date | Value and
Unrealized
Appreciation
(Depreciation) |
| 1Euro Bund Long Futures | 181 | $34,514,613 | March 2020 | $(44,155) |
| 1FTSE JSE Top 40 Long Futures | 343 | $11,532,835 | December 2019 | $(237,235) |
| 1FTSE/MIB Index Long Futures | 7 | $897,476 | December 2019 | $(3,833) |
| 1Hang Seng Index Long Futures | 44 | $7,400,501 | December 2019 | $(92,998) |
| 1IBEX 35 Index Long Futures | 7 | $719,207 | December 2019 | $11,303 |
| 1KOSPI2 Index Long Futures | 35 | $2,056,100 | December 2019 | $(15,235) |
| 1S&P 500 E-Mini Long Futures | 142 | $22,320,270 | December 2019 | $284,761 |
| 1United States Treasury Notes 2-Year Long Futures | 70 | $15,091,016 | March 2020 | $(15,267) |
| 1United States Treasury Notes 5-Year Long Futures | 16 | $1,903,500 | March 2020 | $(3,911) |
| 1United States Treasury Notes 10-Year Long Futures | 80 | $10,348,750 | March 2020 | $(16,597) |
| NET UNREALIZED DEPRECIATION ON FUTURES CONTRACTS | $(738,380) |
At November 30, 2019, the Fund had the following outstanding written options contracts:
| Counterparty | Description | Notional
Amount | Expiration
Date | Exercise
Price | Value |
| Call Options: | | | | | |
| Barclays Bank PLC Wholesale | NZD CALL/USD PUT | $605,360 | December 2019 | $0.64 | $(1,403) |
| Put Options: | | | | | |
| Bank of America Merrill Lynch | USD PUT/CAD CALL | $85,000 | December 2019 | $1.30 | $(1) |
| BNP Paribas | EUR PUT/JPY CALL | $3,300,000 | January 2020 | $119.30 | $(18,856) |
| (PREMIUMS RECEIVED $29,382) | $(20,260) |
Net Unrealized Appreciation/Depreciation on Futures Contracts, Foreign Exchange Contracts and the value of Written Options Contracts is included in “Other Assets and Liabilities–Net.”
Annual Shareholder Report
[PAGE INTENTIONALLY LEFT BLANK]
Annual Shareholder Report
Affiliated fund holdings are investment companies which are managed by the Adviser or an affiliate of the Adviser. Transactions with affiliated fund holdings during the period ended November 30, 2019, were as follows:
| | Balance of
Shares Held
11/30/2018 | Purchases/
Additions | Sales/
Reductions |
| Emerging Markets Core Fund | 2,987,593 | 1,573,267 | (609,813) |
| Federated Bank Loan Core Fund | 222,396 | 204,804 | (206,554) |
| Federated Institutional Prime Value Obligations Fund, Institutional Shares | 5,429,001 | 136,850,886 | (139,230,491) |
| Federated Mortgage Core Portfolio | 1,599,256 | 1,599,337 | (971,916) |
| Federated Project and Trade Finance Core Fund | 521,974 | 24,957 | — |
| High Yield Bond Portfolio | 583,842 | 331,107 | (348,887) |
| TOTAL OF AFFILIATED TRANSACTIONS | 11,344,062 | 140,584,358 | (141,367,661) |
Annual Shareholder Report
Balance
of Shares Held
11/30/2019 | Value | Change in
Unrealized
Appreciation/
Depreciation | Net
Realized
Gain/(Loss) | Dividend
Income |
| 3,951,047 | $39,273,404 | $2,836,935 | $(366,033) | $1,836,775 |
| 220,646 | $2,151,295 | $7,991 | $(52,736) | $81,324 |
| 3,049,396 | $3,050,311 | $178 | $1,037 | $78,005 |
| 2,226,677 | $21,999,566 | $789,154 | $(129,058) | $599,181 |
| 546,931 | $4,911,439 | $(47,983) | $— | $225,115 |
| 566,062 | $3,532,228 | $107,976 | $56,144 | $236,356 |
| 10,560,759 | $74,918,243 | $3,694,251 | $(490,646) | $3,056,756 |
| 1 | Non-income-producing security. |
| 2 | Market quotations and price evaluations are not available. Fair value determined using significant unobservable inputs in accordance with procedures established by and under the general supervision of the Fund's Board of Trustees (the "Trustees"). |
| 3 | Denotes a restricted security that either: (a) cannot be offered for public sale without first being registered, or availing of an exemption from registration, under the Securities Act of 1933; or (b) is subject to a contractual restriction on public sales. At November 30, 2019, these restricted securities amounted to $813,650, which represented 0.2% of total net assets. |
| 4 | Issuer in default. |
| 5 | Floating/variable note with current rate and current maturity or next reset date shown. |
| 6 | 7-day net yield. |
| 7 | The High Yield Portfolio is a diversified portfolio of below investment grade bonds. |
| 8 | The cost of investments for federal tax purposes amounts to $380,621,071. |
| 9 | Assets, other than investments in securities, less liabilities. See Statement of Assets and Liabilities. |
Note: The categories of investments are shown as a percentage of total net assets at November 30, 2019.
Various inputs are used in determining the value of the Fund's investments. These inputs are summarized in the three broad levels listed below:
Level 1—quoted prices in active markets for identical securities.
Level 2—other significant observable inputs (including quoted prices for similar securities, interest rates, prepayment speeds, credit risk, etc.). Also includes securities valued at amortized cost.
Level 3—significant unobservable inputs (including the Fund's own assumptions in determining the fair value of investments).
The inputs or methodology used for valuing securities are not an indication of the risk associated with investing in those securities.
Annual Shareholder Report
The following is a summary of the inputs used, as of November 30, 2019, in valuing the Fund's assets carried at fair value:
| Valuation Inputs | | | | |
| | Level 1—
Quoted
Prices | Level 2—
Other
Significant
Observable
Inputs | Level 3—
Significant
Unobservable
Inputs | Total |
| Equity Securities: | | | | |
| Common Stocks | | | | |
| Domestic | $124,760,198 | $— | $— | $124,760,198 |
| International | 15,563,152 | 111,005,451 | 2,092 | 126,570,695 |
| Debt Securities: | | | | |
| Asset-Backed Securities | — | 61,788 | — | 61,788 |
| Commercial Mortgage-Backed Security | — | 135,432 | — | 135,432 |
| Collateralized Mortgage Obligations | — | 1,425,767 | — | 1,425,767 |
| Corporate Bonds | — | 24,206,809 | 26,178 | 24,232,987 |
| Mortgage-Backed Securities | — | 83,046 | — | 83,046 |
| Foreign Governments/Agencies | — | 28,875,822 | — | 28,875,822 |
| U.S. Treasuries | — | 12,904,103 | — | 12,904,103 |
| Purchased Call Options | — | 10,668 | — | 10,668 |
| Purchased Put Options | — | 107 | — | 107 |
| Investment Companies1 | 70,006,804 | — | — | 74,918,243 |
| TOTAL SECURITIES | $210,330,154 | $178,708,993 | $28,270 | $393,978,856 |
| Other Financial Instruments | | | | |
| Assets | | | | |
| Futures Contracts | $612,672 | $— | $— | $612,672 |
| Foreign Exchange Contracts | — | 568,203 | — | 568,203 |
| Written Option Contracts | — | — | — | — |
| Liabilities | | | | |
| Futures Contracts | (1,351,052) | — | — | (1,351,052) |
| Foreign Exchange Contracts | — | (1,000,303) | — | (1,000,303) |
| Written Options Contracts | — | (20,260) | — | (20,260) |
| TOTAL OTHER FINANCIAL INSTRUMENTS | $(738,380) | $(452,360) | $— | $(1,190,740) |
| 1 | As permitted by U.S. generally accepted accounting principles (GAAP), an Investment Company valued at $4,911,439 is measured at fair value using the net asset value (NAV) per share practical expedient and has not been categorized in the chart above but is included in the Total column. The price of shares redeemed of Federated Project and Trade Finance Core Fund may be determined as of the closing NAV of the fund up to twenty-four days after receipt of a shareholder redemption request. |
Annual Shareholder Report
The following acronyms are used throughout this portfolio:
| ADR | —American Depositary Receipt |
| AUD | —Australian Dollar |
| BKNT | —Bank Notes |
| CAD | —Canadian Dollar |
| CHF | —Swiss Franc |
| EUR | —Euro Currency |
| GBP | —British Pound |
| GDR | —Global Depository Receipt |
| GMTN | —Global Medium Term Note |
| JPY | —Japanese Yen |
| KRW | —South Korean Won |
| LIBOR | —London Interbank Offered Rate |
| MTN | —Medium Term Note |
| MXN | —Mexican Peso |
| NOK | —Norwegian Krone |
| NZD | —New Zealand Dollar |
| REIT | —Real Estate Investment Trust |
| REMIC | —Real Estate Mortgage Investment Conduit |
| SEK | —Swedish Krona |
| SGD | —Singapore Dollar |
| TRY | —Turkish New Lira |
See Notes which are an integral part of the Financial Statements
Annual Shareholder Report
Financial Highlights–Class A Shares
(For a Share Outstanding Throughout Each Period)
| Year Ended November 30 | 2019 | 2018 | 2017 | 2016 | 2015 |
| Net Asset Value, Beginning of Period | $19.08 | $20.09 | $17.49 | $17.87 | $20.29 |
| Income From Investment Operations: | | | | | |
| Net investment income1 | 0.31 | 0.31 | 0.28 | 0.29 | 0.27 |
| Net realized and unrealized gain (loss) | 1.44 | (0.99) | 2.63 | (0.37) | (0.80) |
| TOTAL FROM INVESTMENT OPERATIONS | 1.75 | (0.68) | 2.91 | (0.08) | (0.53) |
| Less Distributions: | | | | | |
| Distributions from net investment income | (0.36) | (0.33) | (0.31) | (0.29) | (0.17) |
| Distributions from net realized gain | (0.64) | — | — | (0.01) | (1.72) |
| TOTAL DISTRIBUTIONS | (1.00) | (0.33) | (0.31) | (0.30) | (1.89) |
| Net Asset Value, End of Period | $19.83 | $19.08 | $20.09 | $17.49 | $17.87 |
| Total Return2 | 9.89% | (3.46)% | 16.85% | (0.68)% | (2.80)% |
| Ratios to Average Net Assets: | | | | | |
| Net expenses | 1.15% | 1.15% | 1.14% | 1.14% | 1.16% |
| Net investment income | 1.65% | 1.53% | 1.50% | 1.65% | 1.45% |
| Expense waiver/reimbursement3 | 0.20% | 0.11% | 0.18% | 0.17% | 0.13% |
| Supplemental Data: | | | | | |
| Net assets, end of period (000 omitted) | $181,579 | $146,323 | $169,424 | $169,443 | $187,183 |
| Portfolio turnover | 85% | 66% | 58% | 105% | 76% |
| 1 | Per share numbers have been calculated using the average shares method. |
| 2 | Based on net asset value, which does not reflect the sales charge, redemption fee or contingent deferred sales charge, if applicable. |
| 3 | This expense decrease is reflected in both the net expense and the net investment income ratios shown above. |
See Notes which are an integral part of the Financial Statements
Annual Shareholder Report
Financial Highlights–Class B Shares
(For a Share Outstanding Throughout Each Period)
| Year Ended November 30 | 2019 | 2018 | 2017 | 2016 | 2015 |
| Net Asset Value, Beginning of Period | $18.60 | $19.58 | $17.06 | $17.43 | $19.86 |
| Income From Investment Operations: | | | | | |
| Net investment income1 | 0.16 | 0.14 | 0.13 | 0.14 | 0.12 |
| Net realized and unrealized gain (loss) | 1.39 | (0.96) | 2.55 | (0.35) | (0.78) |
| TOTAL FROM INVESTMENT OPERATIONS | 1.55 | (0.82) | 2.68 | (0.21) | (0.66) |
| Less Distributions: | | | | | |
| Distributions from net investment income | (0.21) | (0.16) | (0.16) | (0.15) | (0.05) |
| Distributions from net realized gain | (0.64) | — | — | (0.01) | (1.72) |
| TOTAL DISTRIBUTIONS | (0.85) | (0.16) | (0.16) | (0.16) | (1.77) |
| Net Asset Value, End of Period | $19.30 | $18.60 | $19.58 | $17.06 | $17.43 |
| Total Return2 | 8.94% | (4.20)% | 15.84% | (1.46)% | (3.59)% |
| Ratios to Average Net Assets: | | | | | |
| Net expenses | 1.96% | 1.96% | 1.95% | 1.95% | 1.97% |
| Net investment income | 0.86% | 0.72% | 0.70% | 0.85% | 0.64% |
| Expense waiver/reimbursement3 | 0.20% | 0.12% | 0.20% | 0.18% | 0.12% |
| Supplemental Data: | | | | | |
| Net assets, end of period (000 omitted) | $7,880 | $9,758 | $14,342 | $16,037 | $21,384 |
| Portfolio turnover | 85% | 66% | 58% | 105% | 76% |
| 1 | Per share numbers have been calculated using the average shares method. |
| 2 | Based on net asset value, which does not reflect the sales charge, redemption fee or contingent deferred sales charge, if applicable. |
| 3 | This expense decrease is reflected in both the net expense and the net investment income ratios shown above. |
See Notes which are an integral part of the Financial Statements
Annual Shareholder Report
Financial Highlights–Class C Shares
(For a Share Outstanding Throughout Each Period)
| Year Ended November 30 | 2019 | 2018 | 2017 | 2016 | 2015 |
| Net Asset Value, Beginning of Period | $18.52 | $19.51 | $17.00 | $17.37 | $19.80 |
| Income From Investment Operations: | | | | | |
| Net investment income1 | 0.16 | 0.15 | 0.14 | 0.15 | 0.13 |
| Net realized and unrealized gain (loss) | 1.40 | (0.96) | 2.55 | (0.35) | (0.78) |
| TOTAL FROM INVESTMENT OPERATIONS | 1.56 | (0.81) | 2.69 | (0.20) | (0.65) |
| Less Distributions: | | | | | |
| Distributions from net investment income | (0.22) | (0.18) | (0.18) | (0.16) | (0.06) |
| Distributions from net realized gain | (0.64) | — | — | (0.01) | (1.72) |
| TOTAL DISTRIBUTIONS | (0.86) | (0.18) | (0.18) | (0.17) | (1.78) |
| Net Asset Value, End of Period | $19.22 | $18.52 | $19.51 | $17.00 | $17.37 |
| Total Return2 | 9.06% | (4.20)% | 15.92% | (1.44)% | (3.55)% |
| Ratios to Average Net Assets: | | | | | |
| Net expenses | 1.92% | 1.90% | 1.89% | 1.89% | 1.91% |
| Net investment income | 0.89% | 0.78% | 0.75% | 0.91% | 0.70% |
| Expense waiver/reimbursement3 | 0.20% | 0.14% | 0.21% | 0.20% | 0.15% |
| Supplemental Data: | | | | | |
| Net assets, end of period (000 omitted) | $64,600 | $64,095 | $78,445 | $82,845 | $89,640 |
| Portfolio turnover | 85% | 66% | 58% | 105% | 76% |
| 1 | Per share numbers have been calculated using the average shares method. |
| 2 | Based on net asset value, which does not reflect the sales charge, redemption fee or contingent deferred sales charge, if applicable. |
| 3 | This expense decrease is reflected in both the net expense and the net investment income ratios shown above. |
See Notes which are an integral part of the Financial Statements
Annual Shareholder Report
Financial Highlights–Class R Shares
(For a Share Outstanding Throughout Each Period)
| Year Ended November 30 | 2019 | 2018 | 2017 | 2016 | 2015 |
| Net Asset Value, Beginning of Period | $18.94 | $19.94 | $17.38 | $17.74 | $20.16 |
| Income From Investment Operations: | | | | | |
| Net investment income1 | 0.24 | 0.22 | 0.20 | 0.21 | 0.19 |
| Net realized and unrealized gain (loss) | 1.41 | (0.98) | 2.61 | (0.36) | (0.80) |
| TOTAL FROM INVESTMENT OPERATIONS | 1.65 | (0.76) | 2.81 | (0.15) | (0.61) |
| Less Distributions: | | | | | |
| Distributions from net investment income | (0.28) | (0.24) | (0.25) | (0.20) | (0.09) |
| Distributions from net realized gain | (0.64) | — | — | (0.01) | (1.72) |
| TOTAL DISTRIBUTIONS | (0.92) | (0.24) | (0.25) | (0.21) | (1.81) |
| Net Asset Value, End of Period | $19.67 | $18.94 | $19.94 | $17.38 | $17.74 |
| Total Return2 | 9.38% | (3.86)% | 16.32% | (1.12)% | (3.26)% |
| Ratios to Average Net Assets: | | | | | |
| Net expenses | 1.56% | 1.58% | 1.57% | 1.56% | 1.59% |
| Net investment income | 1.26% | 1.09% | 1.07% | 1.24% | 1.02% |
| Expense waiver/reimbursement3 | 0.19% | 0.12% | 0.18% | 0.18% | 0.14% |
| Supplemental Data: | | | | | |
| Net assets, end of period (000 omitted) | $42,860 | $43,452 | $51,768 | $52,430 | $59,229 |
| Portfolio turnover | 85% | 66% | 58% | 105% | 76% |
| 1 | Per share numbers have been calculated using the average shares method. |
| 2 | Based on net asset value. |
| 3 | This expense decrease is reflected in both the net expense and the net investment income ratios shown above. |
See Notes which are an integral part of the Financial Statements
Annual Shareholder Report
Financial Highlights–Institutional Shares
(For a Share Outstanding Throughout Each Period)
| Year Ended November 30 | 2019 | 2018 | 2017 | 2016 | 2015 |
| Net Asset Value, Beginning of Period | $19.19 | $20.21 | $17.61 | $17.98 | $20.40 |
| Income From Investment Operations: | | | | | |
| Net investment income1 | 0.37 | 0.37 | 0.33 | 0.34 | 0.32 |
| Net realized and unrealized gain (loss) | 1.45 | (1.00) | 2.65 | (0.37) | (0.80) |
| TOTAL FROM INVESTMENT OPERATIONS | 1.82 | (0.63) | 2.98 | (0.03) | (0.48) |
| Less Distributions: | | | | | |
| Distributions from net investment income | (0.42) | (0.39) | (0.38) | (0.33) | (0.22) |
| Distributions from net realized gain | (0.64) | — | — | (0.01) | (1.72) |
| TOTAL DISTRIBUTIONS | (1.06) | (0.39) | (0.38) | (0.34) | (1.94) |
| Net Asset Value, End of Period | $19.95 | $19.19 | $20.21 | $17.61 | $17.98 |
| Total Return2 | 10.21% | (3.21)% | 17.13% | (0.37)% | (2.51)% |
| Ratios to Average Net Assets: | | | | | |
| Net expenses | 0.86% | 0.86% | 0.85% | 0.85% | 0.87% |
| Net investment income | 1.95% | 1.81% | 1.77% | 1.95% | 1.74% |
| Expense waiver/reimbursement3 | 0.22% | 0.14% | 0.20% | 0.20% | 0.14% |
| Supplemental Data: | | | | | |
| Net assets, end of period (000 omitted) | $99,564 | $95,613 | $105,720 | $91,167 | $115,108 |
| Portfolio turnover | 85% | 66% | 58% | 105% | 76% |
| 1 | Per share numbers have been calculated using the average shares method. |
| 2 | Based on net asset value. |
| 3 | This expense decrease is reflected in both the net expense and the net investment income ratios shown above. |
See Notes which are an integral part of the Financial Statements
Annual Shareholder Report
Financial Highlights–Class R6 Shares
(For a Share Outstanding Throughout Each Period)
| | Year Ended November 30, | Period
Ended
11/30/20161 |
| 2019 | 2018 | 2017 |
| Net Asset Value, Beginning of Period | $19.09 | $20.10 | $17.51 | $16.97 |
| Income From Investment Operations: | | | | |
| Net investment income2 | 0.38 | 0.36 | 0.33 | 0.11 |
| Net realized and unrealized gain (loss) | 1.44 | (0.98) | 2.63 | 0.56 |
| TOTAL FROM INVESTMENT OPERATIONS | 1.82 | (0.62) | 2.96 | 0.67 |
| Less Distributions: | | | | |
| Distributions from net investment income | (0.43) | (0.39) | (0.37) | (0.13) |
| Distributions from net realized gain | (0.64) | — | — | — |
| TOTAL DISTRIBUTIONS | (1.07) | (0.39) | (0.37) | (0.13) |
| Net Asset Value, End of Period | $19.84 | $19.09 | $20.10 | $17.51 |
| Total Return3 | 10.26% | (3.16)% | 17.14% | 3.94% |
| Ratios to Average Net Assets: | | | | |
| Net expenses | 0.84% | 0.84% | 0.83% | 0.84%4 |
| Net investment income | 1.97% | 1.79% | 1.78% | 1.48%4 |
| Expense waiver/reimbursement5 | 0.19% | 0.11% | 0.17% | 0.16%4 |
| Supplemental Data: | | | | |
| Net assets, end of period (000 omitted) | $6,275 | $4,890 | $6,243 | $4,853 |
| Portfolio turnover | 85% | 66% | 58% | 105%6 |
| 1 | Reflects operations for the period from June 29, 2016 (date of initial investment) to November 30, 2016. |
| 2 | Per share numbers have been calculated using the average shares method. |
| 3 | Based on net asset value. Total returns for periods of less than one year are not annualized. |
| 4 | Computed on an annualized basis. |
| 5 | This expense decrease is reflected in both the net expense and the net investment income ratios shown above. |
| 6 | Portfolio turnover is calculated at the Fund level. Percentage indicated was calculated for the year ended November 30, 2016. |
See Notes which are an integral part of the Financial Statements
Annual Shareholder Report
Statement of Assets and Liabilities
November 30, 2019
| Assets: | | |
| Investment in securities, at value including $74,918,243 of investment in affiliated holdings* (identified cost $347,723,839) | | $393,978,856 |
| Cash denominated in foreign currencies (identified cost $721,426) | | 600,179 |
| Due from broker | | 8,766,645 |
| Income receivable | | 1,182,284 |
| Income receivable from affiliated holdings | | 284,944 |
| Receivable for investments sold, net of reserve of $2,695,488 (Note 9) | | 152,398 |
| Receivable for shares sold | | 271,732 |
| Unrealized appreciation on foreign exchange contracts | | 568,203 |
| TOTAL ASSETS | | 405,805,241 |
| Liabilities: | | |
| Payable for investments purchased | $271,479 | |
| Payable for shares redeemed | 215,136 | |
| Written options outstanding (premium $29,382), at value | 20,260 | |
| Unrealized depreciation on foreign exchange contracts | 1,000,303 | |
| Payable for variation margin on futures contracts | 1,023,892 | |
| Payable for investment adviser fee (Note 5) | 11,131 | |
| Payable for administrative fees (Note 5) | 1,745 | |
| Payable for custodian fees | 116,317 | |
| Payable for transfer agent fee | 87,093 | |
| Payable for portfolio accounting fees | 99,466 | |
| Payable for distribution services fee (Note 5) | 62,236 | |
| Payable for other service fees (Notes 2 and 5) | 50,769 | |
| Accrued expenses (Note 5) | 87,689 | |
| TOTAL LIABILITIES | | 3,047,516 |
| Net assets for 20,413,223 shares outstanding | | $402,757,725 |
| Net Assets Consist of: | | |
| Paid-in capital | | $414,145,588 |
| Total distributable earnings (loss) | | (11,387,863) |
| TOTAL NET ASSETS | | $402,757,725 |
Annual Shareholder Report
Statement of Assets and Liabilities–continued
| Net Asset Value, Offering Price and Redemption Proceeds Per Share | | |
| Class A Shares: | | |
| Net asset value per share ($181,579,285 ÷ 9,158,800 shares outstanding), no par value, unlimited shares authorized | | $19.83 |
| Offering price per share (100/94.50 of $19.83) | | $20.98 |
| Redemption proceeds per share | | $19.83 |
| Class B Shares: | | |
| Net asset value per share ($7,879,880 ÷ 408,213 shares outstanding), no par value, unlimited shares authorized | | $19.30 |
| Offering price per share | | $19.30 |
| Redemption proceeds per share (94.50/100 of $19.30) | | $18.24 |
| Class C Shares: | | |
| Net asset value per share ($64,599,831 ÷ 3,360,822 shares outstanding), no par value, unlimited shares authorized | | $19.22 |
| Offering price per share | | $19.22 |
| Redemption proceeds per share (99.00/100 of $19.22) | | $19.03 |
| Class R Shares: | | |
| Net asset value per share ($42,860,262 ÷ 2,178,424 shares outstanding), no par value, unlimited shares authorized | | $19.67 |
| Offering price per share | | $19.67 |
| Redemption proceeds per share | | $19.67 |
| Institutional Shares: | | |
| Net asset value per share ($99,563,764 ÷ 4,990,650 shares outstanding), no par value, unlimited shares authorized | | $19.95 |
| Offering price per share | | $19.95 |
| Redemption proceeds per share | | $19.95 |
| Class R6 Shares: | | |
| Net asset value per share ($6,274,703 ÷ 316,314 shares outstanding), no par value, unlimited shares authorized | | $19.84 |
| Offering price per share | | $19.84 |
| Redemption proceeds per share | | $19.84 |
* See information listed after the Fund's Portfolio of Investments.
See Notes which are an integral part of the Financial Statements
Annual Shareholder Report
Statement of Operations
Year Ended November 30, 2019
| Investment Income: | | | |
| Dividends (including $3,056,756 received from an affiliated holdings* and net of foreign taxes withheld of $387,004) | | | $8,667,147 |
| Interest | | | 1,612,456 |
| TOTAL INCOME | | | 10,279,603 |
| Expenses: | | | |
| Investment adviser fee (Note 5) | | $2,525,872 | |
| Administrative fee (Note 5) | | 309,169 | |
| Custodian fees | | 235,280 | |
| Transfer agent fee (Note 2) | | 587,576 | |
| Directors'/Trustees' fees (Note 5) | | 9,496 | |
| Auditing fees | | 34,570 | |
| Legal fees | | 10,058 | |
| Portfolio accounting fees | | 173,109 | |
| Distribution services fee (Note 5) | | 750,775 | |
| Other service fees (Notes 2 and 5) | | 562,456 | |
| Share registration costs | | 94,537 | |
| Printing and postage | | 41,262 | |
| Miscellaneous (Note 5) | | 70,418 | |
| TOTAL EXPENSES | | 5,404,578 | |
| Waiver and Reimbursements: | | | |
| Waiver/reimbursement of investment adviser fee (Note 5) | $(704,693) | | |
| Reimbursement of other operating expenses (Notes 2 and 5) | (42,980) | | |
| TOTAL WAIVER AND REIMBURSEMENTS | | (747,673) | |
| Net expenses | | | 4,656,905 |
| Net investment income | | | 5,622,698 |
Annual Shareholder Report
Statement of Operations–continued
| Realized and Unrealized Gain (Loss) on Investments, Futures Contracts, Written Options, Swap Contracts, Foreign Exchange Contracts and Foreign Currency Transactions: | | | |
| Net realized gain on investments (including foreign taxes withheld of $(3,272)) (including net realized loss of $(490,646) on sales of investments in affiliated holdings*) | | | $5,482,618 |
| Net realized gain on foreign currency transactions | | | 384,842 |
| Net realized loss on foreign exchange contracts | | | (2,484,070) |
| Net realized gain on futures contracts | | | 841,605 |
| Net realized gain on written options | | | 54,067 |
| Net realized gain on swap contracts | | | 4,727 |
| Net change in unrealized appreciation of investments (including net change in unrealized depreciation of $3,694,251 on investments in affiliated holdings*) | | | 26,262,080 |
| Net change in unrealized appreciation/depreciation of translation of assets and liabilities in foreign currency | | | (78,172) |
| Net change in unrealized appreciation of foreign exchange contracts | | | (133,183) |
| Net change in unrealized appreciation of futures contracts | | | (1,140,245) |
| Net change in unrealized appreciation of written options | | | 9,122 |
| Net realized and unrealized gain on investments, futures contracts, written options, foreign exchange contracts, swap contracts and foreign currency transactions | | | 29,203,391 |
| Change in net assets resulting from operations | | | $34,826,089 |
* See information listed after the Fund's Portfolio of Investments.
See Notes which are an integral part of the Financial Statements
Annual Shareholder Report
Statement of Changes in Net Assets
| Year Ended November 30 | 2019 | 2018 |
| Increase (Decrease) in Net Assets | | |
| Operations: | | |
| Net investment income | $5,622,698 | $5,652,829 |
| Net realized gain | 4,283,789 | 21,252,905 |
| Net change in unrealized appreciation/depreciation | 24,919,602 | (40,526,550) |
| CHANGE IN NET ASSETS RESULTING FROM OPERATIONS | 34,826,089 | (13,620,816) |
| Distributions to Shareholders: | | |
| Class A Shares | (7,774,878) | (2,645,384) |
| Class B Shares | (430,895) | (106,913) |
| Class C Shares | (2,912,985) | (698,290) |
| Class R Shares | (2,130,402) | (598,310) |
| Institutional Shares | (5,014,766) | (1,963,486) |
| Class R6 Shares | (282,719) | (138,061) |
| CHANGE IN NET ASSETS RESULTING FROM DISTRIBUTIONS TO SHAREHOLDERS | (18,546,645) | (6,150,444) |
| Share Transactions: | | |
| Proceeds from sale of shares | 45,310,579 | 81,789,409 |
| Proceeds from shares issued in connection with the tax-free transfer of assets from Federated Absolute Return Fund | 60,593,669 | — |
| Net asset value of shares issued to shareholders in payment of distributions declared | 17,869,165 | 5,852,548 |
| Cost of shares redeemed | (101,425,895) | (129,682,582) |
| CHANGE IN NET ASSETS RESULTING FROM SHARE TRANSACTIONS | 22,347,518 | (42,040,625) |
| Change in net assets | 38,626,962 | (61,811,885) |
| Net Assets: | | |
| Beginning of period | 364,130,763 | 425,942,648 |
| End of period | $402,757,725 | $364,130,763 |
See Notes which are an integral part of the Financial Statements
Annual Shareholder Report
Notes to Financial Statements
November 30, 2019
1. ORGANIZATION
Federated Global Allocation Fund (the “Fund”) is registered under the Investment Company Act of 1940, as amended (the “Act”), as a diversified, open-end management investment company. The Fund offers six classes of shares: Class A Shares, Class B Shares, Class C Shares, Class R Shares, Institutional Shares and Class R6 Shares. All shares of the Fund have equal rights with respect to voting, except on class-specific matters. The primary investment objective of the Fund is to provide relative safety of capital with the possibility of long-term growth of capital and income. Consideration is also given to current income.
On March 30, 2017, the Fund's T Share Class became effective with the Securities and Exchange Commission (SEC), but is not yet offered for sale.
Class B Shares are closed to new accounts, new investors and new purchases by existing shareholders (excluding reinvestment of dividends and capital gains). Class B Shares of the Fund may be exchanged for Class B Shares of any other Federated fund.
Effective August 1, 2018, an automatic conversion feature for Class C Shares was implemented. Pursuant to this automatic conversion feature, after Class C Shares have been held for ten years from the date of purchase, they will automatically convert to Class A Shares on the next monthly conversion processing date.
On August 16, 2019, the Fund acquired all of the net assets of Federated Absolute Return Fund, an open-end investment company, in a tax-free reorganization in exchange for shares of the Fund, pursuant to a plan of reorganization approved by the Federated Absolute Return Fund's shareholders on July 17, 2019. The purpose of the transaction was to combine two portfolios with comparable investment objectives and strategies. For financial reporting purposes, assets received and shares issued by the Fund were recorded at fair value; however, the cost basis of the investments received from the Federated Absolute Return Fund was carried forward to align ongoing reporting of the Fund's realized gains and losses with amounts distributable to shareholders for tax purposes.
For every one share of Federated Absolute Return Fund Class A Shares exchanged, a shareholder received 0.4456 shares of the Fund's Class A Shares.
For every one share of Federated Absolute Return Fund Class B Shares exchanged, a shareholder received 0.4449 shares of the Fund's Class B Shares.
For every one share of Federated Absolute Return Fund Class C Shares exchanged, a shareholder received 0.4438 shares of the Fund's Class C Shares.
For every one share of Federated Absolute Return Fund Institutional Shares exchanged, a shareholder received 0.4487 shares of the Fund's Institutional Shares.
Annual Shareholder Report
The Fund received net assets from Federated Absolute Return Fund as a result of the tax-free reorganization as follows:
Shares of the
Fund Issued | Federated Absolute
Return Fund
Net Assets
Received | Unrealized
Depreciation1 | Net Assets
of the Fund
Immediately
Prior to
Combination | Net Assets
of the Fund
Immediately
After
Combination |
| 3,199,576 | $60,593,669 | $(1,606,835) | $343,566,261 | $404,159,930 |
| 1 | Unrealized Depreciation is included in the Net Assets Received amount shown above. |
| | |
Assuming the acquisition had been completed on December 1, 2018, the beginning of the annual reporting period of the Fund, the Fund's pro forma results of operations for the year ended November 30, 2019, were as follows:
| Net investment income* | $6,157,164 |
| Net realized and unrealized gain on investments | 29,828,020 |
| Net increase in net assets resulting from operations | $35,985,184 |
| * | Net investment income includes $222,230 of pro forma eliminated expenses. |
| | |
Because the combined investment portfolios have been managed as a single integrated portfolio since the acquisition was completed, it is not practicable to separate the amounts of revenue and earnings of the Federated Absolute Return Fund that have been included in the Fund's Statement of Operations as of November 30, 2019.
2. SIGNIFICANT ACCOUNTING POLICIES
The following is a summary of significant accounting policies consistently followed by the Fund in the preparation of its financial statements. These policies are in conformity with GAAP.
Investment Valuation
In calculating its NAV, the Fund generally values investments as follows:
| ■ | Equity securities listed on an exchange or traded through a regulated market system are valued at their last reported sale price or official closing price in their principal exchange or market. |
| ■ | Fixed-income securities are fair valued using price evaluations provided by a pricing service approved by the Trustees. |
| ■ | Shares of other mutual funds or non-exchange-traded investment companies are valued based upon their reported NAVs. |
| ■ | Derivative contracts listed on exchanges are valued at their reported settlement or closing price, except that options are valued at the mean of closing bid and asked quotations. |
| ■ | Over-the-counter (OTC) derivative contracts are fair valued using price evaluations provided by a pricing service approved by the Trustees. |
Annual Shareholder Report
| ■ | For securities that are fair valued in accordance with procedures established by and under the general supervision of the Trustees, certain factors may be considered, such as: the last traded or purchase price of the security, information obtained by contacting the issuer or dealers, analysis of the issuer's financial statements or other available documents, fundamental analytical data, the nature and duration of restrictions on disposition, the movement of the market in which the security is normally traded, public trading in similar securities or derivative contracts of the issuer or comparable issuers, movement of a relevant index, or other factors including but not limited to industry changes and relevant government actions. |
If any price, quotation, price evaluation or other pricing source is not readily available when the NAV is calculated, if the Fund cannot obtain price evaluations from a pricing service or from more than one dealer for an investment within a reasonable period of time as set forth in the Fund's valuation policies and procedures, or if information furnished by a pricing service, in the opinion of the valuation committee (“Valuation Committee”), is deemed not representative of the fair value of such security, the Fund uses the fair value of the investment determined in accordance with the procedures described below. There can be no assurance that the Fund could obtain the fair value assigned to an investment if it sold the investment at approximately the time at which the Fund determines its NAV per share.
Fair Valuation and Significant Events Procedures
The Trustees have ultimate responsibility for determining the fair value of investments for which market quotations are not readily available. The Trustees have appointed a Valuation Committee comprised of officers of the Fund, Federated Global Investment Management Corp. (the “Adviser”) and certain of the Adviser's affiliated companies to assist in determining fair value and in overseeing the calculation of the NAV. The Trustees have also authorized the use of pricing services recommended by the Valuation Committee to provide fair value evaluations of the current value of certain investments for purposes of calculating the NAV. The Valuation Committee employs various methods for reviewing third-party pricing-service evaluations including periodic reviews of third-party pricing services' policies, procedures and valuation methods (including key inputs, methods, models and assumptions), transactional back-testing, comparisons of evaluations of different pricing services, and review of price challenges by the Adviser based on recent market activity. In the event that market quotations and price evaluations are not available for an investment, the Valuation Committee determines the fair value of the investment in accordance with procedures adopted by the Trustees. The Trustees periodically review and approve the fair valuations made by the Valuation Committee and any changes made to the procedures.
Factors considered by pricing services in evaluating an investment include the yields or prices of investments of comparable quality, coupon, maturity, call rights and other potential prepayments, terms and type, reported transactions, indications as to values from dealers and general market conditions. Some pricing services provide a single price evaluation reflecting the bid-side of the market for an investment (a “bid” evaluation). Other pricing services offer both bid evaluations and price evaluations indicative of a price between the prices bid and asked for the investment (a “mid” evaluation). The Fund normally uses bid evaluations for any U.S. Treasury and Agency securities, mortgage-backed securities and municipal securities. The Fund normally uses mid evaluations for any other types of fixed-income securities and any OTC derivative contracts. In the event that market quotations and price evaluations are not available for an investment, the fair value of the investment is determined in accordance with procedures adopted by the Trustees.
Annual Shareholder Report
The Trustees also have adopted procedures requiring an investment to be priced at its fair value whenever the Adviser determines that a significant event affecting the value of the investment has occurred between the time as of which the price of the investment would otherwise be determined and the time as of which the NAV is computed. An event is considered significant if there is both an affirmative expectation that the investment's value will change in response to the event and a reasonable basis for quantifying the resulting change in value. Examples of significant events that may occur after the close of the principal market on which a security is traded, or after the time of a price evaluation provided by a pricing service or a dealer, include:
| ■ | With respect to securities traded principally in foreign markets, significant trends in U.S. equity markets or in the trading of foreign securities index futures contracts; |
| ■ | Political or other developments affecting the economy or markets in which an issuer conducts its operations or its securities are traded; |
| ■ | Announcements concerning matters such as acquisitions, recapitalizations, litigation developments, or a natural disaster affecting the issuer's operations or regulatory changes or market developments affecting the issuer's industry. |
The Trustees have adopted procedures whereby the Valuation Committee uses a pricing service to provide factors to update the fair value of equity securities traded principally in foreign markets from the time of the close of their respective foreign stock exchanges to the pricing time of the Fund. For other significant events, the Fund may seek to obtain more current quotations or price evaluations from alternative pricing sources. If a reliable alternative pricing source is not available, the Fund will determine the fair value of the investment in accordance with the fair valuation procedures approved by the Trustees. The Trustees have ultimate responsibility for any fair valuations made in response to a significant event.
Repurchase Agreements
The Fund may invest in repurchase agreements for short-term liquidity purposes. It is the policy of the Fund to require the other party to a repurchase agreement to transfer to the Fund's custodian or sub-custodian eligible securities or cash with a market value (after transaction costs) at least equal to the repurchase price to be paid under the repurchase agreement. The eligible securities are transferred to accounts with the custodian or sub-custodian in which the Fund holds a “securities entitlement” and exercises “control” as those terms are defined in the Uniform Commercial Code. The Fund has established procedures for monitoring the market value of the transferred securities and requiring the transfer of additional eligible securities if necessary to equal at least the repurchase price. These procedures also allow the other party to require securities to be transferred from the account to the extent that their market value exceeds the repurchase price or in exchange for other eligible securities of equivalent market value.
The insolvency of the other party or other failure to repurchase the securities may delay the disposition of the underlying securities or cause the Fund to receive less than the full repurchase price. Under the terms of the repurchase agreement, any amounts received by the Fund in excess of the repurchase price and related transaction costs must be remitted to the other party.
Annual Shareholder Report
The Fund may enter into repurchase agreements in which eligible securities are transferred into joint trading accounts maintained by the custodian or sub-custodian for investment companies and other clients advised by the Fund's Adviser and its affiliates. The Fund will participate on a pro rata basis with the other investment companies and clients in its share of the securities transferred under such repurchase agreements and in its share of proceeds from any repurchase or other disposition of such securities.
Investment Income, Gains and Losses, Expenses and Distributions
Investment transactions are accounted for on a trade-date basis. Realized gains and losses from investment transactions are recorded on an identified-cost basis. Interest income and expenses are accrued daily. Dividend income and distributions to shareholders are recorded on the ex-dividend date. Foreign dividends are recorded on the ex-dividend date or when the Fund is informed of the ex-dividend date. Positive or negative inflation adjustments on Treasury Inflation-Protected Securities (TIPS) are included in interest income. Distributions of net investment income, if any, are declared and paid quarterly. Non-cash dividends included in dividend income, if any, are recorded at fair value. Amortization/accretion of premium and discount is included in investment income. Gains and losses realized on principal payment of mortgage-backed securities (paydown gains and losses) are classified as part of investment income. Investment income, realized and unrealized gains and losses, and certain fund-level expenses are allocated to each class based on relative average daily net assets, except that select classes will bear certain expenses unique to those classes. The detail of the total fund expense waiver and reimbursements of $747,673 is disclosed in various locations in this Note 2 and Note 5. For the year ended November 30, 2019, transfer agent fees for the Fund were as follows:
| | Transfer Agent
Fees Incurred | Transfer Agent
Fees Reimbursed |
| Class A Shares | $218,077 | $(8,945) |
| Class B Shares | 17,287 | (415) |
| Class C Shares | 102,226 | (4,619) |
| Class R Shares | 131,781 | — |
| Institutional Shares | 114,281 | (29,001) |
| Class R6 Shares | 3,924 | — |
| TOTAL | $587,576 | $(42,980) |
Dividends are declared separately for each class. No class has preferential dividend rights; differences in per share dividend rates are generally due to differences in separate class expenses.
Annual Shareholder Report
Other Service Fees
The Fund may pay other service fees up to 0.25% of the average daily net assets of the Fund's Class A Shares, Class B Shares and Class C Shares to unaffiliated financial intermediaries or to Federated Shareholder Services Company (FSSC) for providing services to shareholders and maintaining shareholder accounts. Subject to the terms described in the Expense Limitation note, FSSC may voluntarily reimburse the Fund for other service fees. For the year ended November 30, 2019, other service fees for the Fund were as follows:
| | Other Service
Fees Incurred |
| Class A Shares | $385,236 |
| Class B Shares | 21,281 |
| Class C Shares | 155,939 |
| TOTAL | $562,456 |
Federal Taxes
It is the Fund's policy to comply with the Subchapter M provision of the Internal Revenue Code (the “Code”) and to distribute to shareholders each year substantially all of its income. Accordingly, no provision for federal income tax is necessary. As of and during the year ended November 30, 2019, the Fund did not have a liability for any uncertain tax positions. The Fund recognizes interest and penalties, if any, related to tax liabilities as income tax expense in the Statement of Operations. As of November 30, 2019, tax years 2016 through 2019 remain subject to examination by the Fund's major tax jurisdictions, which include the United States of America and the Commonwealth of Massachusetts.
The Fund may be subject to taxes imposed by governments of countries in which it invests. Such taxes are generally based on either income or gains earned or repatriated. The Fund accrues and applies such taxes to net investment income, net realized gains and net unrealized gains as income and/or gains are earned.
When-Issued and Delayed-Delivery Transactions
The Fund may engage in when-issued or delayed-delivery transactions. The Fund records when-issued securities on the trade date and maintains security positions such that sufficient liquid assets will be available to make payment for the securities purchased. Securities purchased on a when-issued or delayed-delivery basis are marked to market daily and begin earning interest on the settlement date. Losses may occur on these transactions due to changes in market conditions or the failure of counterparties to perform under the contract.
Swap Contracts
Swap contracts involve two parties that agree to exchange the returns (or the differential in rates of return) earned or realized on particular predetermined investments, instruments, indices or other measures. The gross returns to be exchanged or “swapped” between parties are generally calculated with respect to a “notional amount” for a predetermined period of time. The Fund may enter into interest rate, total return, credit default, currency and other swap agreements. Risks may arise upon entering into swap agreements from the potential inability of the counterparties to meet the terms of their contract from unanticipated changes in the value of the swap agreement. In connection with these agreements, securities or cash may be identified as collateral or margin in accordance with the terms of the respective swap agreements to provide assets of value and recourse in the event of default.
Annual Shareholder Report
The Fund uses credit default swaps to manage sector/asset class risks. The “buyer” in a credit default swap is obligated to pay the “seller” a periodic stream of payments over the term of the contract provided that no event of default on an underlying reference obligation has occurred. If an event of default occurs, the seller must pay the buyer the full notional value, or the “par value”, of the reference obligation in exchange for the reference obligation. In connection with these agreements, securities may be identified as collateral in accordance with the terms of the respective swap agreements to provide assets of value and recourse in the event of default or bankruptcy/insolvency. Recovery values are assumed by market makers considering either industry standard recovery rates or entity specific factors and considerations until a credit event occurs. If a credit event has occurred, the recovery value is typically determined by a facilitated auction whereby a minimum number of allowable broker bids, together with a specific valuation method, are used to calculate the settlement value. The maximum amount of the payment that may occur, as a result of a credit event payable by the protection seller, is equal to the notional amount of the underlying index or security. The Fund's maximum risk of loss from counterparty credit risk, either as the protection buyer or as the protection seller, is the fair value of the contract. This risk is mitigated by having a master netting arrangement between the Fund and the counterparty and by the posting of collateral by the counterparty to the Fund to cover the Fund's exposure to the counterparty.
Upfront payments received or paid by the Fund will be reflected as an asset or liability on the Statement of Assets and Liabilities. Changes in the value of swap contracts are included in “Swaps, at value” on the Statement of Assets and Liabilities, and periodic payments are reported as “Net realized gain (loss) on swap contracts” in the Statement of Operations.
Certain swap contracts are subject to Master Netting Agreements (MNA) which are agreements between the Fund and its counterparties that provide for the net settlement of all transactions and collateral with the Fund, through a single payment, in the event of default or termination. Amounts presented on the Portfolio of Investments and Statement of Assets and Liabilities are not net settlement amounts but gross.
Certain swap contracts may be centrally cleared (“centrally cleared swaps”), whereby all payments made or received by the Fund pursuant to the contract are with a central clearing party (CCP) rather than the counterparty. The CCP guarantees the performance of the parties to the contract. Upon entering into centrally cleared swaps, the Fund is required to deposit with the CCP, either in cash or securities, an amount of initial margin determined by the CCP, which is subject to adjustment. For centrally cleared swaps, the daily change in valuation is recorded as a receivable or payable for variation margin and settled in cash with the CCP daily. In the case of centrally cleared swaps, counterparty risk is minimal due to protections provided by the CCP.
At November 30, 2019, the Fund had no outstanding swap contracts.
The average notional amount of swap contracts held by the Fund throughout the period was $261,538. This is based on amounts held as of each month-end throughout the fiscal period.
Annual Shareholder Report
Futures Contracts
The Fund purchases and sells financial futures contracts to seek to increase return and to manage duration, sector asset class risk and yield curve risks. Futures contracts are valued daily and unrealized gains or losses are recorded in a “variation margin” account. The Fund receives from or pays to the broker a specified amount of cash based upon changes in the variation margin account. When a contract is closed, the Fund recognizes a realized gain or loss. Futures contracts have market risks, including the risk that the change in the value of the contract may not correlate with the changes in the value of the underlying securities. There is minimal counterparty risk to the Fund since futures contracts are exchange traded and the exchange's clearinghouse, as counterparty to all exchange traded futures contracts, guarantees the futures contracts against default.
Futures contracts outstanding at period end are listed after the Fund's Portfolio of Investments.
The average notional value of long and short futures contracts held by the Fund throughout the period was $118,244,309 and $107,987,606, respectively. This is based on amounts held as of each month-end throughout the fiscal period.
Foreign Exchange Contracts
The Fund may enter into foreign exchange contracts to seek to increase returns and to manage currency risk. Purchased contracts are used to acquire exposure to foreign currencies, whereas, contracts to sell are used to hedge the Fund's securities against currency fluctuations. Risks may arise upon entering into these transactions from the potential inability of counterparties to meet the terms of their commitments and from unanticipated movements in security prices or foreign exchange rates. The foreign exchange contracts are adjusted by the daily exchange rate of the underlying currency and any gains or losses are recorded for financial statement purposes as unrealized until the settlement date.
Foreign exchange contracts are subject to Master Netting Agreements (MNA) which are agreements between the Fund and its counterparties that provide for the net settlement of all transactions and collateral with the Fund, through a single payment, in the event of default or termination. Amounts presented on the Portfolio of Investments and Statement of Assets and Liabilities are not net settlement amounts but gross.
Foreign exchange contracts outstanding at period end, including net unrealized appreciation/depreciation or net settlement amount, are listed after the Fund's Portfolio of Investments.
The average value at settlement date receivable and payable of foreign exchange contracts purchased and sold by the Fund throughout the period was $1,151,540 and $1,301,538, respectively. This is based on the contracts held as of each month-end throughout the fiscal period.
Annual Shareholder Report
Foreign Currency Translation
The accounting records of the Fund are maintained in U.S. dollars. All assets and liabilities denominated in foreign currencies are translated into U.S. dollars based on the rates of exchange of such currencies against U.S. dollars on the date of valuation. Purchases and sales of securities, income and expenses are translated at the rate of exchange quoted on the respective date that such transactions are recorded. The Fund does not isolate that portion of the results of operations resulting from changes in foreign exchange rates on investments from the fluctuations arising from changes in market prices of securities held. Such fluctuations are included with the net realized and unrealized gain or loss from investments.
Reported net realized foreign exchange gains or losses arise from sales of foreign currencies, currency gains or losses realized between the trade and settlement dates on securities transactions, the difference between the amounts of dividends, interest and foreign withholding taxes recorded on the Fund's books, and the U.S. dollar equivalent of the amounts actually received or paid. Net unrealized foreign exchange gains and losses arise from changes in the value of assets and liabilities other than investments in securities at fiscal year end, resulting from changes in the exchange rate.
Option Contracts
The Fund buys or sells put and call options to seek to maintain manage sector/asset class risk. The seller (“writer”) of an option receives a payment or premium, from the buyer, which the writer keeps regardless of whether the buyer exercises the option. When the Fund writes a put or call option, an amount equal to the premium received is recorded as a liability and subsequently marked to market to reflect the current value of the option written. Premiums received from writing options which expire are treated as realized gains. The Fund, as a writer of an option, bears the market risk of an unfavorable change in the price of the underlying reference instrument. When the Fund purchases a put or call option, an amount equal to the premium paid is recorded as an increase to the cost of the investment and subsequently marked to market to reflect the current value of the option purchased. Premiums paid for purchasing options which expire are treated as realized losses. Premiums received/paid for writing/purchasing options which are exercised or closed are added to the proceeds or offset against amounts paid on the underlying reference instrument to determine the realized gain or loss. The risk associated with purchasing put and call options is limited to the premium paid. Options can trade on securities or commodities exchanges. In this case, the exchange sets all the terms of the contract except for the price. Most exchanges require investors to maintain margin accounts through their brokers to cover their potential obligations to the exchange. This protects investors against potential defaults by the counterparty.
Purchased option contracts outstanding at period-end are listed in the Fund's Portfolio of Investments and written option contracts outstanding at period end are listed after the Fund's Portfolio of Investments.
The average market value of written put and call options held by the Fund throughout the period was $4,605 and $7,080, respectively. This is based on amounts held as of each month-end throughout the fiscal period.
The average market value of purchased put and call options held by the Fund throughout the period was $2,213 and $5,192, respectively. This is based on amounts held as of each month-end throughout the fiscal period.
Annual Shareholder Report
Restricted Securities
The Fund may purchase securities which are considered restricted. Restricted securities are securities that either: (a) cannot be offered for public sale without first being registered, or being able to take advantage of an exemption from registration, under the Securities Act of 1933; or (b) are subject to contractual restrictions on public sales. In some cases, when a security cannot be offered for public sale without first being registered, the issuer of the restricted security has agreed to register such securities for resale, at the issuer's expense, either upon demand by the Fund or in connection with another registered offering of the securities. Many such restricted securities may be resold in the secondary market in transactions exempt from registration. Restricted securities may be determined to be liquid under criteria established by the Trustees. The Fund will not incur any registration costs upon such resales. The Fund's restricted securities, like other securities, are priced in accordance with procedures established by and under the general supervision of the Trustees.
Additional information on restricted securities held at November 30, 2019, is as follows:
| Security | Acquisition
Date | Cost | Market
Value |
| HK Electric Investments Ltd. | 2/2/16 | $654,353 | $762,757 |
| Phosagro OAO, GDR | 1/3/19 | $45,981 | $50,893 |
Additional Disclosure Related to Derivative Instruments
| Fair Value of Derivative Instruments |
| | Asset | Liability |
| | Statement of
Assets and
Liabilities
Location | Fair
Value | Statement of
Assets and
Liabilities
Location | Fair
Value |
Derivatives not accounted
for as hedging instruments
under ASC Topic 815 | | | | |
| Interest rate contracts | | $— | Payable for
variation
margin on
futures
contracts | $239,433* |
| Equity contracts | | $— | Payable for
variation
margin on
futures
contracts | $498,947* |
| Foreign exchange contracts | Purchased options,
in securities
at value | $10,775 | | $— |
| Foreign exchange contracts | Unrealized
appreciation on
foreign exchange
contracts | $568,203 | Unrealized
depreciation on
foreign exchange
contracts | $1,000,303 |
Annual Shareholder Report
| Fair Value of Derivative Instruments |
| | Asset | Liability |
| | Statement of
Assets and
Liabilities
Location | Fair
Value | Statement of
Assets and
Liabilities
Location | Fair
Value |
| Foreign exchange contracts | | $— | Written
options
outstanding
at value | $20,260 |
Total derivatives not
accounted for as hedging
instruments under
ASC Topic 815 | | $578,978 | | $1,758,943 |
| * | Includes cumulative appreciation/depreciation of futures contracts as reported in the footnotes to the Portfolio of Investments. Only a portion of the variation margin is reported within the Statement of Assets and Liabilities. |
The Effect of Derivative Instruments on the Statement of Operations for the Year Ended November 30, 2019
| Amount of Realized Gain or (Loss) on Derivatives Recognized in Income |
| | OTC
Swaps | Futures
Contracts | Foreign
Exchange
Contracts | Purchased
Options1 | Written
Options | Total |
| Interest rate contracts | $— | $370,262 | $— | $— | $— | $370,262 |
| Equity contracts | — | 473,544 | — | — | — | 473,544 |
| Foreign exchange contracts | — | (2,201) | (2,484,070) | (73,297) | 54,067 | (2,505,501) |
| Credit contracts | 4,727 | — | — | — | — | 4,727 |
| TOTAL | $4,727 | $841,605 | $(2,484,070) | $(73,297) | $54,067 | $(1,656,968) |
| 1 | The net realized gain (loss) on Purchased Option Contracts is found within the Net realized gain on investments on the Statement of Operations. |
| | |
| Change in Unrealized Appreciation or (Depreciation) on Derivatives Recognized in Income |
| | Futures
Contracts | Foreign
Exchange
Contracts | Purchased
Options2 | Written
Options | Total |
| Interest rate contracts | $(334,684) | $— | $— | $— | $(334,684) |
| Equity contracts | (805,561) | — | — | — | (805,561) |
| Foreign exchange contracts | — | (133,183) | (16,704) | 9,122 | (140,765) |
| TOTAL | (1,140,245) | (133,183) | (16,704) | 9,122 | (1,281,010) |
| 2 | The net change in unrealized appreciation of Purchased Options is found within the Net change in unrealized depreciation of investments on the Statement of Operations. |
Annual Shareholder Report
As indicated above, certain derivative investments are transacted subject to MNA. These agreements permit the Fund to offset with a counterparty certain derivative payable and/or receivables with collateral held and create one single net payment in the event of default or termination of the agreement by either the Fund or the counterparty. Amounts presented on the Portfolio of Investments and Statement of Assets and Liabilities are not net settlement amounts but gross. As of November 30, 2019, the impact of netting assets and liabilities and the collateral pledged or received based on MNA are detailed below:
| Gross Amounts Not Offset in the Statement of Assets and Liabilities |
| Transaction | Gross Asset
Derivatives
Presented in
Statement of
Assets and
Liabilities | Financial
Instruments | Collateral
Received | Net Amount
(not less
than $0) |
| Foreign exchange contracts | $568,203 | $(556,361) | $— | $11,842 |
| TOTAL | $568,203 | $(556,361) | $— | $11,842 |
| Transaction | Gross Liability
Derivatives
Presented in
Statement of
Assets and
Liabilities | Financial
Instruments | Collateral
Received | Net Amount
(not less
than $0) |
| Foreign exchange contracts | $1,000,303 | $(556,361) | $— | $443,942 |
| TOTAL | $1,000,303 | $(556,361) | $— | $443,942 |
Other
The preparation of financial statements in conformity with GAAP requires management to make estimates and assumptions that affect the amounts of assets, liabilities, expenses and revenues reported in the financial statements. Actual results could differ from those estimated. The Fund applies investment company accounting and reporting guidance.
3. SHARES OF BENEFICIAL INTEREST
The following table summarizes share activity:
| Year Ended November 30 | 2019 | 2018 |
| Class A Shares: | Shares | Amount | Shares | Amount |
| Shares sold | 704,490 | $13,350,974 | 986,770 | $19,723,211 |
| Proceeds from shares issued in connection with the tax-free transfer of assets from Federated Absolute Return Fund | 1,987,441 | 37,741,567 | — | — |
| Shares issued to shareholders in payment of distributions declared | 412,447 | 7,311,903 | 123,936 | 2,477,745 |
| Shares redeemed | (1,615,912) | (30,642,318) | (1,873,982) | (37,564,015) |
| NET CHANGE RESULTING FROM CLASS A SHARE TRANSACTIONS | 1,488,466 | $27,762,126 | (763,276) | $(15,363,059) |
Annual Shareholder Report
| Year Ended November 30 | 2019 | 2018 |
| Class B Shares: | Shares | Amount | Shares | Amount |
| Shares sold | 2,854 | $50,358 | 7,401 | $190,621 |
| Proceeds from shares issued in connection with the tax-free transfer of assets from Federated Absolute Return Fund | 30,312 | 560,473 | — | — |
| Shares issued to shareholders in payment of distributions declared | 24,083 | 411,432 | 5,231 | 102,141 |
| Shares redeemed | (173,789) | (3,199,758) | (220,288) | (4,305,888) |
| NET CHANGE RESULTING FROM CLASS B SHARE TRANSACTIONS | (116,540) | $(2,177,495) | (207,656) | $(4,013,126) |
| Year Ended November 30 | 2019 | 2018 |
| Class C Shares: | Shares | Amount | Shares | Amount |
| Shares sold | 464,276 | $8,524,764 | 798,562 | $15,639,241 |
| Proceeds from shares issued in connection with the tax-free transfer of assets from Federated Absolute Return Fund | 413,438 | 7,615,504 | — | — |
| Shares issued to shareholders in payment of distributions declared | 165,458 | 2,821,670 | 34,712 | 674,608 |
| Shares redeemed | (1,142,345) | $(20,990,309) | (1,393,090) | $(27,077,891) |
| NET CHANGE RESULTING FROM CLASS C SHARE TRANSACTIONS | (99,173) | (2,028,371) | (559,816) | (10,764,042) |
| Year Ended November 30 | 2019 | 2018 |
| Class R Shares: | Shares | Amount | Shares | Amount |
| Shares sold | 448,896 | $8,451,047 | 465,038 | $9,266,744 |
| Shares issued to shareholders in payment of distributions declared | 118,810 | 2,080,658 | 29,452 | 584,979 |
| Shares redeemed | (683,854) | (12,945,514) | (795,720) | (15,759,686) |
| NET CHANGE RESULTING FROM CLASS R SHARE TRANSACTIONS | (116,148) | $(2,413,809) | (301,230) | $(5,907,963) |
| Year Ended November 30 | 2019 | 2018 |
| Institutional Shares: | Shares | Amount | Shares | Amount |
| Shares sold | 694,953 | $13,283,388 | 1,539,834 | $30,768,641 |
| Proceeds from shares issued in connection with the tax-free transfer of assets from Federated Absolute Return Fund | 768,385 | 14,676,125 | — | — |
| Shares issued to shareholders in payment of distributions declared | 278,079 | 4,962,943 | 93,349 | 1,875,764 |
| Shares redeemed | (1,732,662) | (32,854,408) | (1,882,409) | (37,926,274) |
| NET CHANGE RESULTING FROM INSTITUTIONAL SHARE TRANSACTIONS | 8,755 | $68,048 | (249,226) | $(5,281,869) |
Annual Shareholder Report
| Year Ended November 30 | 2019 | 2018 |
| Class R6 Shares: | Shares | Amount | Shares | Amount |
| Shares sold | 85,869 | $1,650,048 | 310,689 | $6,200,951 |
| Shares issued to shareholders in payment of distributions declared | 15,773 | 280,559 | 6,858 | 137,311 |
| Shares redeemed | (41,431) | (793,588) | (372,014) | (7,048,828) |
| NET CHANGE RESULTING FROM CLASS R6 SHARE TRANSACTIONS | 60,211 | $1,137,019 | (54,467) | $(710,566) |
| NET CHANGE RESULTING FROM TOTAL FUND SHARE TRANSACTIONS | 1,225,571 | $22,347,518 | (2,135,671) | $(42,040,625) |
4. FEDERAL TAX INFORMATION
The accounting treatment of certain items in accordance with income tax regulations may differ from the accounting treatment in accordance with GAAP which may result in permanent differences. In the case of the Fund, such differences primarily result from capital loss carryforwards and defaulted securities from the merger.
For the year ended November 30, 2019, permanent differences identified and reclassified among the components of net assets were as follows:
| Increase (Decrease) |
| Paid-In Capital | Total Distributable
Earnings (Loss) |
| $59,092,846 | $(59,092,846) |
Net investment income (loss), net realized gains (losses), and net assets were not affected by this reclassification.
The tax character of distributions as reported on the Statement of Changes in Net Assets for the years ended November 30, 2019 and 2018, was as follows:
| | 2019 | 2018 |
| Ordinary income | $6,431,981 | $6,150,444 |
| Long-term capital gains | $12,114,664 | $— |
As of November 30, 2019, the components of distributable earnings on a tax-basis were as follows:
| Undistributed ordinary income | $1,946,892 |
| Net unrealized appreciation | $12,575,596 |
| Undistributed long-term capital gains | $3,470,913 |
| Capital loss carryforward | $(29,399,127) |
The difference between book-basis and tax-basis net unrealized appreciation/depreciation is attributable to differing treatments for defaulted securities, deferral of losses on wash sales, deferral of straddle loss, non-taxable dividends, partnership adjustments, mark-to-market on futures contracts and foreign exchange contracts and passive foreign investment company adjustments.
Annual Shareholder Report
At November 30, 2019, the cost of investments for federal tax purposes was $380,621,071. The net unrealized appreciation of investments for federal tax purposes was $12,749,902. This consists of net unrealized appreciation from investments for those securities having an excess of value over cost of $20,285,477 and net unrealized depreciation from investments for those securities having an excess of cost over value of $7,535,575. The amounts presented are inclusive of derivative contracts.
At November 30, 2019, the Fund had a capital loss carryforward of $29,399,127 which will reduce the Fund's taxable income arising from future net realized gains on investments, if any, to the extent permitted by the Code, thereby reducing the amount of distributions to shareholders which would otherwise be necessary to relieve the Fund of any liability for federal income tax. Pursuant to the Code, these net capital losses retains their character as either short-term or long-term and do not expire.
The following schedule summarizes the Fund's capital loss carryforwards:
| Short-Term | Long-Term | Total |
| $29,399,127 | $- | $29,399,127 |
The Fund used capital loss carryforwards of $367,779 to offset capital gains realized during the year ended November 30, 2019.
At November 30, 2019, for federal income tax purposes, the Fund had $32,037 in straddle loss deferrals.
5. INVESTMENT ADVISER FEE AND OTHER TRANSACTIONS WITH AFFILIATES
The advisory agreement between the Fund and the Adviser provides for an annual fee of 0.55% of the average daily net assets of the Fund plus 4.50% of gross income of the Fund, excluding gains or losses. Subject to the terms described in the Expense Limitation note, the Adviser may voluntarily choose to waive any portion of its fee. For the year ended November 30, 2019, the Adviser voluntarily waived $702,311 of its fee and voluntarily reimbursed $42,980 of transfer agent fees. The Adviser has agreed to reimburse the Fund for certain investment adviser fees as a result of transactions in other affiliated investment companies. For the year ended November 30, 2019, the Adviser reimbursed $2,382.
Certain of the Fund's assets are managed by Federated Investment Management Company (FIMCO) (the “Sub-Adviser”). Under the terms of a sub-advisory agreement between the Adviser and the Sub-Adviser, the Sub-Adviser receives an allocable portion of the Fund's adviser fee. The fee is paid by the Adviser out of its resources and is not an incremental Fund expense. For the year ended November 30, 2019, the Sub-Adviser earned a fee of $298,616.
Annual Shareholder Report
Administrative Fee
Federated Administrative Services (FAS), under the Administrative Services Agreement, provides the Fund with administrative personnel and services. For purposes of determining the appropriate rate breakpoint, “Investment Complex” is defined as all of the Federated Funds subject to a fee under the Administrative Services Agreement. The fee paid to FAS is based on the average daily net assets of the Investment Complex as specified below:
| Administrative Fee | Average Daily Net Assets
of the Investment Complex |
| 0.100% | on assets up to $50 billion |
| 0.075% | on assets over $50 billion |
Subject to the terms described in the Expense Limitation note, FAS may voluntarily choose to waive any portion of its fee. For the year ended November 30, 2019, the annualized fee paid to FAS was 0.084% of average daily net assets of the Fund.
In addition, FAS may charge certain out-of-pocket expenses to the Fund.
Distribution Services Fee
The Fund has adopted a Distribution Plan (the “Plan”) pursuant to Rule 12b-1 under the Act. Under the terms of the Plan, the Fund will compensate Federated Securities Corp. (FSC), the principal distributor, from the daily net assets of the Fund's Class B Shares, Class C Shares and Class R Shares to finance activities intended to result in the sale of these shares. The Plan provides that the Fund may incur distribution expenses at the following percentages of average daily net assets annually, to compensate FSC:
| | Percentage of Average Daily
Net Assets of Class |
| Class B Shares | 0.75% |
| Class C Shares | 0.75% |
| Class R Shares | 0.50% |
Subject to the terms described in the Expense Limitation note, FSC may voluntarily choose to waive any portion of its fee. For the year ended November 30, 2019, distribution services fees for the Fund were as follows:
| | Distribution Services
Fees Incurred |
| Class B Shares | $63,842 |
| Class C Shares | 467,815 |
| Class R Shares | 219,118 |
| TOTAL | $750,775 |
When FSC receives fees, it may pay some or all of them to financial intermediaries whose customers purchase shares. For the year ended November 30, 2019, FSC retained $12,320 fees paid by the Fund.
Annual Shareholder Report
Sales Charges
Front-end sales charges and contingent deferred sales charges (CDSC) do not represent expenses of the Fund. They are deducted from the proceeds of sales of Fund shares prior to investment or from redemption proceeds prior to remittance, as applicable. For the year ended November 30, 2019, FSC retained $5,488 in sales charges from the sale of Class A Shares. FSC also retained $11,420 and $2,239 of CDSC relating to redemptions of Class B Shares and Class C Shares, respectively.
Other Service Fees
For the year ended November 30, 2019, FSSC received $75,566 of the other service fees disclosed in Note 2.
Expense Limitation
The Adviser and certain of its affiliates (which may include FSC, FAS and FSSC) on their own initiative have agreed to waive certain amounts of their respective fees and/or reimburse expenses. Total annual fund operating expenses (as shown in the financial highlights, excluding interest expense, dividends and other expenses related to short sales, extraordinary expenses and proxy-related expenses paid by the Fund, if any) paid by the Fund's Class A Shares, Class B Shares, Class C Shares, Class R Shares, Institutional Shares and Class R6 Shares (after the voluntary waivers and/or reimbursements) will not exceed 1.14%, 1.97%, 1.93%, 1.57%, 0.85% and 0.83% (the “Fee Limit”), respectively, up to but not including the later of (the “Termination Date”): (a) February 1, 2021; or (b) the date of the Fund's next effective Prospectus. While the Adviser and its applicable affiliates currently do not anticipate terminating or increasing these arrangements prior to the Termination Date, these arrangements may only be terminated or the Fee Limit increased prior to the Termination Date with the agreement of the Trustees.
Directors'/Trustees' and Miscellaneous Fees
Certain Officers and Trustees of the Fund are Officers and Directors or Trustees of certain of the above companies. To efficiently facilitate payment, Independent Directors'/Trustees' fees and certain expenses related to conducting meetings of the Directors/Trustees and other miscellaneous expenses are paid by an affiliate of the Adviser which in due course are reimbursed by the Fund. These expenses related to conducting meetings of the Directors/Trustees and other miscellaneous expenses may be included in Accrued and Miscellaneous Expenses on the Statement of Assets and Liabilities and Statement of Operations, respectively.
6. INVESTMENT TRANSACTIONS
Purchases and sales of investments, excluding long-term U.S. government securities and short-term obligations, for the year ended November 30, 2019, were as follows:
| Purchases | $286,065,851 |
| Sales | $264,475,840 |
Annual Shareholder Report
7. LINE OF CREDIT
The Fund participates with certain other Federated Funds, on a several basis, in an up to $500,000,000 unsecured, 364-day, committed, revolving line of credit (LOC) agreement. The LOC was made available to finance temporarily the repurchase or redemption of shares of the Fund, failed trades, payment of dividends, settlement of trades and for other short-term, temporary or emergency general business purposes. The Fund cannot borrow under the LOC if an inter-fund loan is outstanding. The Fund's ability to borrow under the LOC also is subject to the limitations of the Act and various conditions precedent that must be satisfied before the Fund can borrow. Loans under the LOC are charged interest at a fluctuating rate per annum equal to the highest, on any day, of (a) (i) the federal funds effective rate, (ii) the one month London Interbank Offered Rate (LIBOR), and (iii) 0.0%, plus (b) a margin. The LOC also requires the Fund to pay, quarterly in arrears and at maturity, its pro rata share of a commitment fee based on the amount of the lenders' commitment that has not been utilized. As of November 30, 2019, the Fund had no outstanding loans. During the year ended November 30, 2019, the Fund did not utilize the LOC.
8. INTERFUND LENDING
Pursuant to an Exemptive Order issued by the SEC, the Fund, along with other funds advised by subsidiaries of Federated Investors, Inc., may participate in an interfund lending program. This program provides an alternative credit facility allowing the Fund to borrow from other participating affiliated funds. As of November 30, 2019, there were no outstanding loans. During the year ended November 30, 2019, the program was not utilized.
9. RECEIVABLE FROM BANKRUPTCY TRUSTEE
The amount presented on the Statement of Assets and Liabilities, under the caption receivables for investments sold, includes net receivable proceeds of $152,398 which represents the estimated amount expected to be received from the bankruptcy trustee for certain security transactions executed through Lehman Brothers in 2008.
10. FEDERAL TAX INFORMATION (UNAUDITED)
For the fiscal year ended November 30, 2019, 85.23% of total ordinary income distributions made by the Fund are qualifying dividends which may be subject to a maximum tax rate of 15%, as provided for by the Jobs and Growth Tax Relief Act of 2003. Complete information is reported in conjunction with the reporting of your distributions on Form 1099-DIV.
For the year ended November 30, 2019, the amount of long-term capital gains designated by the Fund was $12,114,664.
Of the ordinary income (including short-term capital gain) distributions made by the Fund during the year ended November 30, 2019, 29.76% qualify for the dividend received deduction available to corporate shareholders.
Annual Shareholder Report
Report of Independent Registered Public Accounting Firm
TO THE BOARD OF TRUSTEES AND SHAREHOLDERS OF FEDERATED GLOBAL ALLOCATION FUND:
Opinion on the Financial Statements
We have audited the accompanying statement of assets and liabilities, including the portfolio of investments, of the Federated Global Allocation Fund (the “Fund”), as of November 30, 2019, the related statement of operations for the year then ended, the statements of changes in net assets for each of the years in the two - year period then ended, and the related notes (collectively, the “financial statements”) and the financial highlights for each of the years or periods in the five - year period then ended. In our opinion, the financial statements and financial highlights present fairly, in all material respects, the financial position of the Fund as of November 30, 2019, the results of its operations for the year then ended, the changes in its net assets for each of the years in the two - year period then ended, and the financial highlights for each of the years or periods in the five - year period then ended, in conformity with U.S. generally accepted accounting principles.
Basis for Opinion
These financial statements and financial highlights are the responsibility of the Fund's management. Our responsibility is to express an opinion on these financial statements and financial highlights based on our audits. We are a public accounting firm registered with the Public Company Accounting Oversight Board (United States) (“PCAOB”) and are required to be independent with respect to the Fund in accordance with the U.S. federal securities laws and the applicable rules and regulations of the Securities and Exchange Commission and the PCAOB.
Annual Shareholder Report
We conducted our audits in accordance with the standards of the PCAOB. Those standards require that we plan and perform the audit to obtain reasonable assurance about whether the financial statements and financial highlights are free of material misstatement, whether due to error or fraud. Our audits included performing procedures to assess the risks of material misstatement of the financial statements and financial highlights, whether due to error or fraud, and performing procedures that respond to those risks. Such procedures included examining, on a test basis, evidence regarding the amounts and disclosures in the financial statements and financial highlights. Such procedures also included confirmation of securities owned as of November 30, 2019, by correspondence with the custodian and brokers or by other appropriate auditing procedures. Our audits also included evaluating the accounting principles used and significant estimates made by management, as well as evaluating the overall presentation of the financial statements and financial highlights. We believe that our audits provide a reasonable basis for our opinion.
We have served as the auditor of one or more of Federated Investors' investment companies since 2006.
Boston, Massachusetts
January 27, 2020
Annual Shareholder Report
Shareholder Expense Example (unaudited)
As a shareholder of the Fund, you incur two types of costs: (1) transaction costs, including sales charges (loads) on purchase or redemption payments; and (2) ongoing costs, including management fees and to the extent applicable, distribution (12b-1) fees and/or other service fees and other Fund expenses. This Example is intended to help you to understand your ongoing costs (in dollars) of investing in the Fund and to compare these costs with the ongoing costs of investing in other mutual funds. It is based on an investment of $1,000 invested at the beginning of the period and held for the entire period from June 1, 2019 to November 30, 2019.
ACTUAL EXPENSES
The first section of the table below provides information about actual account values and actual expenses. You may use the information in this section, together with the amount you invested, toestimate the expenses that you incurred over the period. Simply divide your account value by $1,000 (for example, an $8,600 account value divided by $1,000 = 8.6), then multiply the result by the number in the first section under the heading entitled “Expenses Paid During Period” to estimate the expenses attributable to your investment during this period.
HYPOTHETICAL EXAMPLE FOR COMPARISON PURPOSES
The second section of the table below provides information about hypothetical account values and hypothetical expenses based on the Fund's actual expense ratio and anassumed rate of return of 5% per year before expenses, which is not the Fund's actual return. Thus, you shouldnot use the hypothetical account values and expenses to estimate the actual ending account balance or your expenses for the period. Rather, these figures are required to be provided to enable you to compare the ongoing costs of investing in the Fund with other funds. To do so, compare this 5% hypothetical example with the 5% hypothetical examples that appear in the shareholder reports of the other funds.
Annual Shareholder Report
Please note that the expenses shown in the table are meant to highlight your ongoing costs only. Therefore, the second section of the table is useful in comparing ongoing costs only, and will not help you determine the relativetotal costs of owning different funds.
| | Beginning
Account Value
6/1/2019 | Ending
Account Value
11/30/2019 | Expenses Paid
During Period1 |
| Actual: | | | |
| Class A Shares | $1,000 | $1,072.60 | $5.98 |
| Class B Shares | $1,000 | $1,067.30 | $10.16 |
| Class C Shares | $1,000 | $1,068.00 | $9.95 |
| Class R Shares | $1,000 | $1,069.80 | $8.04 |
| Institutional Shares | $1,000 | $1,073.70 | $4.47 |
| Class R6 Shares | $1,000 | $1,073.70 | $4.37 |
Hypothetical (assuming a 5% return
before expenses): | | | |
| Class A Shares | $1,000 | $1,019.30 | $5.82 |
| Class B Shares | $1,000 | $1,015.30 | $9.90 |
| Class C Shares | $1,000 | $1,015.50 | $9.70 |
| Class R Shares | $1,000 | $1,017.30 | $7.84 |
| Institutional Shares | $1,000 | $1,020.80 | $4.36 |
| Class R6 Shares | $1,000 | $1,020.70 | $4.23 |
| 1 | Expenses are equal to the Fund's annualized net expense ratios, multiplied by the average account value over the period, multiplied by 183/365 (to reflect the one-half-year period). The annualized net expense ratios are as follows: |
| | |
| Class A Shares | 1.15% |
| Class B Shares | 1.96% |
| Class C Shares | 1.92% |
| Class R Shares | 1.55% |
| Institutional Shares | 0.86% |
| Class R6 Shares | 0.84% |
Annual Shareholder Report
Board of Trustees and Trust Officers
The Board of Trustees is responsible for managing the Trust's business affairs and for exercising all the Trust's powers except those reserved for the shareholders. The following tables give information about each Trustee and the senior officers of the Fund. Where required, the tables separately list Trustees who are “interested persons” of the Fund (i.e., “Interested” Trustees) and those who are not (i.e., “Independent” Trustees). Unless otherwise noted, the address of each person listed is Federated Investors Tower, 1001 Liberty Avenue, Pittsburgh, PA 15222. The address of all Independent Trustees listed is 4000 Ericsson Drive, Warrendale, PA 15086-7561; Attention: Mutual Fund Board. As of December 31, 2019, the Trust comprised one portfolio(s), and the Federated Fund Family consisted of 41 investment companies (comprising 135 portfolios). Unless otherwise noted, each Officer is elected annually. Unless otherwise noted, each Trustee oversees all portfolios in the Federated Fund Family and serves for an indefinite term. The Fund's Statement of Additional Information includes additional information about Trust Trustees and is available, without charge and upon request, by calling 1-800-341-7400.
Interested Trustees Background
Name
Birth Date
Positions Held with Trust
Date Service Began | Principal Occupation(s) for Past Five Years,
Other Directorships Held and Previous Position(s) |
J. Christopher Donahue*
Birth Date: April 11, 1949
President and Trustee
Indefinite Term
Began serving: November 1998 | Principal Occupations: Principal Executive Officer and President of certain of the Funds in the Federated Fund Family; Director or Trustee of the Funds in the Federated Fund Family; President, Chief Executive Officer and Director, Federated Investors, Inc.; Chairman and Trustee, Federated Investment Management Company; Trustee, Federated Investment Counseling; Chairman and Director, Federated Global Investment Management Corp.; Chairman and Trustee, Federated Equity Management Company of Pennsylvania; Trustee, Federated Shareholder Services Company; Director, Federated Services Company.
Previous Positions: President, Federated Investment Counseling; President and Chief Executive Officer, Federated Investment Management Company, Federated Global Investment Management Corp. and Passport Research, Ltd; Chairman, Passport Research, Ltd. |
Annual Shareholder Report
Name
Birth Date
Positions Held with Trust
Date Service Began | Principal Occupation(s) for Past Five Years,
Other Directorships Held and Previous Position(s) |
John B. Fisher*
Birth Date: May 16, 1956
Trustee
Indefinite Term
Began serving: May 2016 | Principal Occupations:Principal Executive Officer and President of certain of the Funds in the Federated Fund Family; Director or Trustee of certain of the Funds in the Federated Fund Family; Vice President, Federated Investors, Inc.; President, Director/Trustee and CEO, Federated Advisory Services Company, Federated Equity Management Company of Pennsylvania, Federated Global Investment Management Corp., Federated Investment Counseling, Federated Investment Management Company; President of some of the Funds in the Federated Fund Complex and Director, Federated Investors Trust Company.
Previous Positions: President and Director of the Institutional Sales Division of Federated Securities Corp.; President and Director of Federated Investment Counseling; President and CEO of Passport Research, Ltd.; Director, Edgewood Securities Corp.; Director, Federated Services Company; Director, Federated Investors, Inc.; Chairman and Director, Southpointe Distribution Services, Inc. and President, Technology, Federated Services Company. |
| * | Reasons for “interested” status: J. Christopher Donahue and John B. Fisher are interested due to their beneficial ownership of shares of Federated Investors, Inc. and due to positions they hold with Federated and its subsidiaries. |
INDEPENDENT Trustees Background
Name
Birth Date
Positions Held with Trust
Date Service Began | Principal Occupation(s) for Past Five Years,
Other Directorships Held, Previous Position(s) and Qualifications |
John T. Collins
Birth Date: January 24, 1947
Trustee
Indefinite Term
Began serving: October 2013 | Principal Occupations: Director or Trustee of the Federated Fund Family; formerly, Chairman and CEO, The Collins Group, Inc. (a private equity firm) (Retired).
Other Directorships Held: Director, Chairman of the Compensation Committee, KLX Energy Services Holdings, Inc. (oilfield services); former Director of KLX Corp. (aerospace).
Qualifications: Mr. Collins has served in several business and financial management roles and directorship positions throughout his career. Mr. Collins previously served as Chairman and CEO of The Collins Group, Inc. (a private equity firm) and as a Director of KLX Corp. Mr. Collins serves as Chairman Emeriti, Bentley University. Mr. Collins previously served as Director and Audit Committee Member, Bank of America Corp.; Director, FleetBoston Financial Corp.; and Director, Beth Israel Deaconess Medical Center (Harvard University Affiliate Hospital). |
Annual Shareholder Report
Name
Birth Date
Positions Held with Trust
Date Service Began | Principal Occupation(s) for Past Five Years,
Other Directorships Held, Previous Position(s) and Qualifications |
G. Thomas Hough
Birth Date: February 28, 1955
Trustee
Indefinite Term
Began serving: August 2015 | Principal Occupations: Director or Trustee, Chair of the Audit Committee of the Federated Fund Family; formerly, Vice Chair, Ernst & Young LLP (public accounting firm) (Retired).
Other Directorships Held: Director, Member of Governance and Compensation Committees, Publix Super Markets, Inc.; Director, Chair of the Audit Committee, Equifax, Inc.; Director, Member of the Audit Committee, Haverty Furniture Companies, Inc.
Qualifications: Mr. Hough has served in accounting, business management and directorship positions throughout his career. Mr. Hough most recently held the position of Americas Vice Chair of Assurance with Ernst & Young LLP (public accounting firm). Mr. Hough serves on the President's Cabinet and Business School Board of Visitors for the University of Alabama. Mr. Hough previously served on the Business School Board of Visitors for Wake Forest University, and he previously served as an Executive Committee member of the United States Golf Association. |
Maureen Lally-Green
Birth Date: July 5, 1949
Trustee
Indefinite Term
Began serving: August 2009 | Principal Occupations: Director or Trustee of the Federated Fund Family; Adjunct Professor of Law, Duquesne University School of Law; formerly, Dean of the Duquesne University School of Law and Professor of Law and Interim Dean of the Duquesne University School of Law; formerly, Associate General Secretary and Director, Office of Church Relations, Diocese of Pittsburgh.
Other Directorships Held: Director, CNX Resources Corporation (formerly known as CONSOL Energy Inc.).
Qualifications: Judge Lally-Green has served in various legal and business roles and directorship positions throughout her career. Judge Lally-Green previously held the position of Dean of the School of Law of Duquesne University (as well as Interim Dean). Judge Lally-Green previously served as a member of the Superior Court of Pennsylvania and as a Professor of Law, Duquesne University School of Law. Judge Lally-Green was appointed by the Supreme Court of Pennsylvania to serve on the Supreme Court's Board of Continuing Judicial Education and the Supreme Court's Appellate Court Procedural Rules Committee. Judge Lally-Green also currently holds the positions on not for profit or for profit boards of directors as follows: Director and Chair, UPMC Mercy Hospital; Director and Vice Chair, Our Campaign for the Church Alive!, Inc.; Regent, Saint Vincent Seminary; Member, Pennsylvania State Board of Education (public); Director, Catholic Charities, Pittsburgh; and Director CNX Resources Corporation (formerly known as CONSOL Energy Inc.). Judge Lally-Green has held the positions of: Director, Auberle; Director, Epilepsy Foundation of Western and Central Pennsylvania; Director, Ireland Institute of Pittsburgh; Director, Saint Thomas More Society; Director and Chair, Catholic High Schools of the Diocese of Pittsburgh, Inc.; Director, Pennsylvania Bar Institute; Director, St. Vincent College; and Director and Chair, North Catholic High School, Inc. |
Annual Shareholder Report
Name
Birth Date
Positions Held with Trust
Date Service Began | Principal Occupation(s) for Past Five Years,
Other Directorships Held, Previous Position(s) and Qualifications |
Charles F. Mansfield, Jr.
Birth Date: April 10, 1945
Trustee
Indefinite Term
Began serving: November 1998 | Principal Occupations: Director or Trustee of the Federated Fund Family; Management Consultant and Author.
Other Directorships Held: None.
Qualifications: Mr. Mansfield has served as a Marine Corps officer and in several banking, business management, educational roles and directorship positions throughout his long career. He remains active as a Management Consultant and Author. |
Thomas M. O'Neill
Birth Date: June 14, 1951
Trustee
Indefinite Term
Began serving: October 2013 | Principal Occupations: Director or Trustee of the Federated Fund Family; Sole Proprietor, Navigator Management Company (investment and strategic consulting).
Other Directorships Held: None.
Qualifications: Mr. O'Neill has served in several business, mutual fund and financial management roles and directorship positions throughout his career. Mr. O'Neill serves as Director, Medicines for Humanity and Director, The Golisano Children's Museum of Naples, Florida. Mr. O'Neill previously served as Chief Executive Officer and President, Managing Director and Chief Investment Officer, Fleet Investment Advisors; President and Chief Executive Officer, Aeltus Investment Management, Inc.; General Partner, Hellman, Jordan Management Co., Boston, MA; Chief Investment Officer, The Putnam Companies, Boston, MA; Credit Analyst and Lending Officer, Fleet Bank; Director and Consultant, EZE Castle Software (investment order management software); and Director, Midway Pacific (lumber). |
P. Jerome Richey
Birth Date: February 23, 1949
Trustee
Indefinite Term
Began serving: October 2013 | Principal Occupations: Director or Trustee of the Federated Fund Family; Management Consultant; Retired; formerly, Senior Vice Chancellor and Chief Legal Officer, University of Pittsburgh and Executive Vice President and Chief Legal Officer, CNX Resources Corporation (formerly known as CONSOL Energy Inc.).
Other Directorships Held: None.
Qualifications: Mr. Richey has served in several business and legal management roles and directorship positions throughout his career. Mr. Richey most recently held the positions of Senior Vice Chancellor and Chief Legal Officer, University of Pittsburgh. Mr. Richey previously served as Chairman of the Board, Epilepsy Foundation of Western Pennsylvania and Chairman of the Board, World Affairs Council of Pittsburgh. Mr. Richey previously served as Chief Legal Officer and Executive Vice President, CNX Resources Corporation (formerly known as CONSOL Energy Inc.); and Board Member, Ethics Counsel and Shareholder, Buchanan Ingersoll & Rooney PC (a law firm). |
Annual Shareholder Report
Name
Birth Date
Positions Held with Trust
Date Service Began | Principal Occupation(s) for Past Five Years,
Other Directorships Held, Previous Position(s) and Qualifications |
John S. Walsh
Birth Date: November 28, 1957
Trustee
Indefinite Term
Began serving: November 1998 | Principal Occupations: Director or Trustee, and Chair of the Board of Directors or Trustees, of the Federated Fund Family; President and Director, Heat Wagon, Inc. (manufacturer of construction temporary heaters); President and Director, Manufacturers Products, Inc. (distributor of portable construction heaters); President, Portable Heater Parts, a division of Manufacturers Products, Inc.
Other Directorships Held: None.
Qualifications: Mr. Walsh has served in several business management roles and directorship positions throughout his career. Mr. Walsh previously served as Vice President, Walsh & Kelly, Inc. (paving contractors). |
OFFICERS
Name
Birth Date
Address
Positions Held with Trust
Date Service Began | Principal Occupation(s) for Past Five Years
and Previous Position(s) |
Lori A. Hensler
Birth Date: January 6, 1967
TREASURER
Officer since: April 2013 | Principal Occupations: Principal Financial Officer and Treasurer of the Federated Fund Family; Senior Vice President, Federated Administrative Services; Financial and Operations Principal for Federated Securities Corp. and Edgewood Services, Inc.; and Assistant Treasurer, Federated Investors Trust Company. Ms. Hensler has received the Certified Public Accountant designation.
Previous Positions: Controller of Federated Investors, Inc.; Senior Vice President and Assistant Treasurer, Federated Investors Management Company; Treasurer, Federated Investors Trust Company; Assistant Treasurer, Federated Administrative Services, Federated Administrative Services, Inc., Federated Securities Corp., Edgewood Services, Inc., Federated Advisory Services Company, Federated Equity Management Company of Pennsylvania, Federated Global Investment Management Corp., Federated Investment Counseling, Federated Investment Management Company, Passport Research, Ltd., and Federated MDTA, LLC; Financial and Operations Principal for Federated Securities Corp., Edgewood Services, Inc. and Southpointe Distribution Services, Inc. |
Annual Shareholder Report
Name
Birth Date
Address
Positions Held with Trust
Date Service Began | Principal Occupation(s) for Past Five Years
and Previous Position(s) |
Peter J. Germain
Birth Date: September 3, 1959
CHIEF LEGAL OFFICER, SECRETARY and EXECUTIVE VICE PRESIDENT
Officer since: January 2005 | Principal Occupations: Mr. Germain is Chief Legal Officer, Secretary and Executive Vice President of the Federated Fund Family. He is General Counsel, Chief Legal Officer, Secretary and Executive Vice President, Federated Investors, Inc.; Trustee and Senior Vice President, Federated Investors Management Company; Trustee and President, Federated Administrative Services; Director and President, Federated Administrative Services, Inc.; Director and Vice President, Federated Securities Corp.; Director and Secretary, Federated Private Asset Management, Inc.; Secretary, Federated Shareholder Services Company; and Secretary, Retirement Plan Service Company of America. Mr. Germain joined Federated in 1984 and is a member of the Pennsylvania Bar Association.
Previous Positions: Deputy General Counsel, Special Counsel, Managing Director of Mutual Fund Services, Federated Investors, Inc.; Senior Vice President, Federated Services Company; and Senior Corporate Counsel, Federated Investors, Inc. |
Stephen Van Meter
Birth Date: June 5, 1975
CHIEF COMPLIANCE OFFICER AND SENIOR VICE PRESIDENT
Officer since: July 2015 | Principal Occupations: Senior Vice President and Chief Compliance Officer of the Federated Fund Family; Vice President and Chief Compliance Officer of Federated Investors, Inc. and Chief Compliance Officer of certain of its subsidiaries. Mr. Van Meter joined Federated in October 2011. He holds FINRA licenses under Series 3, 7, 24 and 66.
Previous Positions: Mr. Van Meter previously held the position of Compliance Operating Officer, Federated Investors, Inc. Prior to joining Federated, Mr. Van Meter served at the United States Securities and Exchange Commission in the positions of Senior Counsel, Office of Chief Counsel, Division of Investment Management and Senior Counsel, Division of Enforcement. |
Stephen F. Auth
Birth Date: September 13, 1956
101 Park Avenue
41st Floor
New York, NY 10178
CHIEF INVESTMENT OFFICER
Officer since: November 2002 | Principal Occupations: Stephen F. Auth is Chief Investment Officer of various Funds in the Federated Fund Family; Executive Vice President, Federated Investment Counseling, Federated Global Investment Management Corp. and Federated Equity Management Company of Pennsylvania.
Previous Positions: Executive Vice President, Federated Investment Management Company and Passport Research, Ltd. (investment advisory subsidiary of Federated); Senior Vice President, Global Portfolio Management Services Division; Senior Vice President, Federated Investment Management Company and Passport Research, Ltd.; Senior Managing Director and Portfolio Manager, Prudential Investments. |
Annual Shareholder Report
Evaluation and Approval of Advisory Contract–May 2019
Federated Global Allocation Fund (the “Fund”)
At its meetings in May 2019, the Fund's Board of Trustees (the “Board”), including a majority of those Trustees who are not “interested persons” of the Fund, as defined in the Investment Company Act of 1940 (the “Independent Trustees”), reviewed and unanimously approved the continuation of the Fund's investment advisory and subadvisory contracts for an additional one-year term. The Board's decision regarding these contracts reflects the exercise of its business judgment after considering all of the information received on whether to continue the existing arrangements.
At the request of the Independent Trustees, the Fund's Chief Compliance Officer (the CCO) furnished to the Board in advance of its May 2019 meetings an independent written evaluation presenting on the topics discussed below. The Board considered the CCO's independent written evaluation (the “CCO Fee Evaluation Report”), along with other information, in evaluating the reasonableness of the Fund's management fee and in deciding to approve the continuation of the investment advisory and subadvisory contracts. The CCO, in preparing the CCO Fee Evaluation Report, has the authority to retain consultants, experts or staff as reasonably necessary to assist in the performance of his duties, reports directly to the Board, and can be terminated only with the approval of a majority of the Independent Trustees. At the request of the Independent Trustees, the CCO Fee Evaluation Report followed the same general approach and covered the same topics as that of the report that had previously been delivered by the CCO in his capacity as “Senior Officer,” prior to the elimination of the Senior Officer position in December 2017.
The Board also considered judicial decisions concerning allegedly excessive investment advisory fees in making its decision. Using these judicial decisions as a guide, the Board observed that the following factors may be relevant to an adviser's fiduciary duty with respect to its receipt of compensation from a fund: (1) the nature and quality of the services provided by an adviser to a fund and its shareholders (including the performance of the fund, its benchmark, and comparable funds); (2) an adviser's cost of providing the services (including the profitability to an adviser of providing advisory services to a fund); (3) the extent to which an adviser may realize “economies of scale” as a fund grows larger and, if such economies of scale exist, whether they have been shared with a fund and its shareholders or the family of funds; (4) any “fall-out” financial benefits that accrue to an adviser because of its relationship with a fund (including research services received from brokers that execute fund trades and any fees paid to affiliates of an adviser for services rendered to a fund); (5) comparative fee and expense structures (including a comparison of fees paid to an adviser with those paid by similar funds both internally and externally as well as management fees charged to institutional and other advisory clients of the
Annual Shareholder Report
adviser for what might be viewed as like services); and (6) the extent of care, conscientiousness and independence with which the fund's board members perform their duties and their expertise (including whether they are fully informed about all facts the board deems relevant to its consideration of an adviser's services and fees). The Board noted that the Securities and Exchange Commission (SEC) disclosure requirements regarding the basis for the Board's approval of the Fund's investment advisory and subadvisory contracts generally align with the factors listed above. The Board was aware of these factors and was guided by them in its review of the Fund's investment advisory and subadvisory contracts to the extent it considered them to be appropriate and relevant, as discussed further below.
The Board considered and weighed these factors in light of its substantial accumulated experience in governing the Fund and working with Federated Global Investment Management Corp. (the “Adviser”) and its affiliates (collectively, “Federated”) on matters relating to the funds advised by Federated (each, a “Federated Fund”). The Independent Trustees were assisted in their deliberations by independent legal counsel.
In addition to the extensive materials that comprise and accompany the CCO Fee Evaluation Report, the Board received detailed information about the Fund and the Federated organization throughout the year, and in connection with its May meetings at which the Board's formal approval of the advisory and subadvisory contracts occurred. In this regard, Federated provided much of this information at each regular meeting of the Board, and furnished additional information specifically in connection with the May meetings. In the months preceding the May meetings, the Board requested and reviewed written materials prepared by Federated in response to requests on behalf of the Independent Trustees encompassing a wide variety of topics. At the May meetings, in addition to meeting in separate sessions of the Independent Trustees without management present, senior management of the Adviser also met with the Independent Trustees and their counsel to discuss the materials presented and such additional matters as the Independent Trustees deemed reasonably necessary to evaluate the advisory and subadvisory contracts. Between regularly scheduled meetings, the Board also received information on particular matters as the need arose.
The Board's consideration of the investment advisory and subadvisory contracts included review of the CCO Fee Evaluation Report, accompanying data and additional information covering the following matters, among others: the Adviser's and sub-adviser's investment philosophy, revenue, profitability, personnel and processes; investment and operating strategies; the Fund's short-term and long-term performance (in absolute terms, both on a gross basis and net of expenses, as well as in terms relative to its particular investment program and certain competitor or “peer group” funds and/or other benchmarks, as appropriate) and comments on the reasons for performance; the Fund's investment objectives; the Fund's expenses, including the advisory fee and the
Annual Shareholder Report
overall expense structure of the Fund (both in absolute terms and relative to similar and/or competing funds), with due regard for contractual or voluntary expense limitations; the use and allocation of brokerage commissions derived from trading the Fund's portfolio securities (if any); and the nature, quality and extent of the advisory and other services provided to the Fund by the Adviser, subadviser and their affiliates. The Board also considered the preferences and expectations of Fund shareholders; the entrepreneurial and other risks assumed by the Adviser in sponsoring the Fund; the continuing state of competition in the mutual fund industry and market practices; the range of comparable fees for similar funds in the mutual fund industry; the Fund's relationship to the Federated Funds which include a comprehensive array of funds with different investment objectives, policies and strategies which are generally available for exchange without the incurrence of additional sales charges; compliance and audit reports concerning the Federated Funds and the Federated companies that service them (including communications from regulatory agencies), as well as Federated's responses to any issues raised therein; and relevant developments in the mutual fund industry and how the Federated Funds and/or Federated are responding to them. The Board's evaluation process is evolutionary. The criteria considered and the emphasis placed on relevant criteria change in recognition of changing circumstances in the mutual fund marketplace.
While mindful that courts have cautioned against giving too much weight to comparative information concerning fees charged by other advisers for managing funds with comparable investment programs, the Board has found the use of such comparisons to be relevant to its deliberations. In this regard, the Board was presented with, and considered, information regarding the contractual advisory fee rates, net advisory fee rates, total expense ratios and each element of the Fund's total expense ratio (i.e., gross and net advisory fees, custody fees, portfolio accounting fees and transfer agency fees) relative to an appropriate group of peer funds compiled by Federated using data supplied by independent fund ranking organizations (the “Peer Group”). The Board received a description of the composition and methodology used to select the Peer Group. The Board focused on comparisons with other similar mutual funds more heavily than non-mutual fund products or services because it is believed that they are more relevant. For example, other mutual funds are the products most like the Fund, in that they are readily available to Fund shareholders as alternative investment vehicles. Also, they are the type of investment vehicle, in fact, chosen and maintained by the Fund's investors. The range of their fees and expenses, therefore, appears to be a relevant indicator of what consumers have found to be reasonable in the marketplace in which the Fund competes.
Annual Shareholder Report
The Board reviewed the contractual advisory fee rate, net advisory fee rate and other expenses of the Fund and noted the position of the Fund's fee rates relative to its Peer Group. In this regard, the Board noted that the contractual advisory fee rate was below the median of the relevant Peer Group and the Board was satisfied that the overall expense structure of the Fund remained competitive.
For comparison, the CCO reviewed the fees charged by Federated for providing advisory services to products other than the Federated Funds (e.g., institutional separate accounts and third-party unaffiliated mutual funds for which Federated serves as sub-adviser) (referenced to as “Comparable Funds/Accounts”). With respect to Comparable Funds/Accounts other than third-party mutual funds, the CCO concluded that they are inherently different products. Those differences include, but are not limited to, different types of targeted investors; different applicable laws and regulations; different legal structures; different average account sizes and portfolio management techniques made necessary by different cash flows and different associated costs; and the time spent by portfolio managers and their teams, as well as personnel in the Funds Financial Services, Legal, Compliance and Risk Management departments, in reviewing securities pricing, addressing different administrative responsibilities, addressing different degrees of risk associated with management and a variety of different costs. The CCO also reviewed the differences in the nature of the services required for Federated to manage its proprietary mutual fund business versus managing a discrete pool of assets as a sub-adviser to another institution's mutual fund, and that Federated generally performs significant additional services and assumes substantially greater risks in managing the Fund and other Federated Funds than in its role as sub-adviser to an unaffiliated third-party mutual fund. The CCO did not consider the fees for providing advisory services to Comparable Funds/Accounts to be determinative in judging the appropriateness of the Federated Funds' advisory fees.
Following such evaluation, and full deliberations, the Board concluded that the fees and expenses of the Fund are reasonable and supported renewal of the Fund's investment advisory and subadvisory contracts.
The Board considered the nature, extent and quality of the services provided to the Fund by the Adviser and the resources of the Adviser and its affiliates dedicated to the Fund. In this regard, the Board evaluated, among other things, the Adviser's personnel, experience, track record, financial resources, overall reputation and willingness to invest in personnel and infrastructure that benefit the Fund. In addition, the Board reviewed the qualifications, backgrounds and responsibilities of the portfolio management team primarily responsible for the day-to-day management of the Fund and the Adviser's ability and experience in attracting and retaining qualified personnel to service the Fund. The Board noted the investment research and company engagement capabilities of the Adviser and its affiliates. The Board also noted the compliance program of the Adviser and the compliance-related resources provided to the Fund by the
Annual Shareholder Report
Adviser, including the Adviser's commitment to respond to rulemaking initiatives of the SEC. The Fund's ability to deliver competitive performance when compared to its Peer Group was also deemed to be relevant by the Board as a useful indicator of how the Adviser is executing the Fund's investment program. The Adviser's ability to execute this program was one of the Board's considerations in reaching a conclusion that the nature, extent and quality of the Adviser's investment management services warrant the continuation of the investment advisory and subadvisory contracts.
In evaluating the Fund's investment performance, the Board considered performance results in light of the Fund's investment objective, strategies and risks, as disclosed in the Fund's prospectus. The Board considered detailed investment reports on the Fund's performance that were provided to the Board throughout the year and in connection with the May meetings. The CCO also reviewed information regarding the performance of other mutual funds in the Peer Group, noting the CCO's view that comparisons to fund peer groups may be helpful, though not conclusive, in evaluating the performance of the Adviser in managing the Fund. The Board considered, in evaluating such comparisons, that in some cases there may be differences in the funds' objectives or investment management techniques, or the costs to implement the funds, even within the same Peer Group.
The Fund's performance fell below the median of the relevant Peer Group for the one-year, three-year and five-year periods covered by the CCO Fee Evaluation Report. The Board discussed the Fund's performance with the Adviser and recognized the efforts being taken by the Adviser in the context of other factors considered relevant by the Board.
Following such evaluation, and full deliberations, the Board concluded that the performance of the Fund supported renewal of the Fund's investment advisory and subadvisory contracts.
The Board also received financial information about Federated, including information regarding the compensation and ancillary (or “fall-out”) benefits Federated derived from its relationships with the Federated Funds. This information covered not only the fees under the investment advisory contracts, but also fees received by Federated's subsidiaries for providing other services to the Federated Funds under separate contracts (e.g., for serving as the Federated funds' administrator and distributor). In this regard, the Board considered that certain Federated subsidiaries provide distribution and shareholder services to the Federated Funds, for which they may be compensated through distribution and servicing fees paid pursuant to Rule 12b-1 plans or otherwise. The information also detailed any indirect benefit Federated may derive from its receipt of research services from brokers who execute Federated Fund trades. In addition, the Board considered the fact that, in order for a Federated fund to be competitive in the marketplace, the Adviser and its affiliates frequently waived
Annual Shareholder Report
fees and/or reimbursed expenses and have disclosed to Federated Fund investors and/or indicated to the Board their intention to do so in the future. Moreover, the Board receives regular reporting as to the institution, adjustment or elimination of these voluntary waivers.
The Board considered Federated's previous reductions in contractual management fees to certain Federated Funds in response to the CCO's recommendations in the prior year's CCO Fee Evaluation Report.
Federated furnished information, requested by the CCO, that reported revenues on a fund-by-fund basis and made estimates of the allocation of expenses on a fund-by-fund basis, using allocation methodologies specified by the CCO. The CCO noted that, while these cost allocation reports apply consistent allocation processes, the inherent difficulties in allocating costs continues to cause the CCO to question the precision of the process and to conclude that such reports may be unreliable, since a single change in an allocation estimate may dramatically alter the resulting estimate of cost and/or profitability of a Federated Fund and may produce unintended consequences. The allocation information, including the CCO's view that fund-by-fund estimations may be unreliable, was considered in the evaluation by the Board.
The Board and the CCO also reviewed information compiled by Federated comparing its profitability information to other publicly held fund management companies, including information regarding profitability trends over time. In this regard, the CCO concluded that Federated's profit margins did not appear to be excessive. The CCO also noted that Federated appeared financially sound, with the resources necessary to fulfill its obligations under its contracts with the Fund.
The CCO Fee Evaluation Report also discussed the notion of possible realization of “economies of scale” as a fund grows larger, the difficulties of calculating economies of scale at an individual fund level, and the extent to which potential scale benefits are shared with shareholders. In this regard, the Board considered that Federated has made significant and long-term investments in areas that support all of the Federated Funds, such as personnel and processes for the portfolio management, shareholder services, compliance, internal audit and risk management functions, as well as systems technology (including technology relating to cybersecurity) and that the benefits of these investments (as well as any economies of scale, should they exist) were likely to be shared with the Federated Fund family as a whole. The Board noted that Federated's investments in these areas are extensive. In addition, the Board considered that the Adviser and its affiliates have frequently waived fees and/or reimbursed expenses and that this has allowed potential economies of scale to be shared with shareholders. The Board also considered that such waivers and reimbursements can provide protection from an increase in expenses if a Federated Fund's assets decline. Federated, as it does throughout the year, and specifically in connection with the Board's review of the advisory and subadvisory contracts, furnished information relative to revenue sharing or
Annual Shareholder Report
adviser-paid fees. Federated and the CCO noted that this information should be viewed to determine if there was an incentive to either not apply breakpoints, or to apply breakpoints at higher levels, and should not be viewed to determine the appropriateness of advisory fees. The Board also noted the absence of any applicable regulatory or industry guidelines on this subject, which (as discussed in the CCO Fee Evaluation Report) is compounded by the lack of any common industry practice or general pattern with respect to structuring fund advisory fees with “breakpoints” that serve to reduce the fee as a fund attains a certain size.
The CCO stated that his observations and the information accompanying the CCO Fee Evaluation Report supported a finding by the Board that the management fee for the Fund was reasonable. Under these circumstances, no changes were recommended to, and no objection was raised to the continuation of, the Fund's investment advisory and subadvisory contracts. The CCO also recognized that the Board's evaluation of the Federated Funds' advisory and subadvisory arrangements is a continuing and on-going process that is informed by the information that the Board requests and receives from management throughout the course of the year and, in this regard, the CCO noted certain items for future reporting to the Board or further consideration by management as the Board continues its on-going oversight of the Federated Funds.
In its decision to continue an existing investment advisory contract, the Board was mindful of the potential disruptions of the Fund's operations and various risks, uncertainties and other effects that could occur as a result of a decision to terminate or not renew an investment advisory contract. In particular, the Board recognized that many shareholders have invested in the Fund on the strength of the Adviser's industry standing and reputation and with the expectation that the Adviser will have a continuing role in providing advisory services to the Fund. Thus, the Board's approval of the investment advisory contract reflected the fact that it is the shareholders who have effectively selected the Adviser by virtue of having invested in the Fund. The Board concluded that, in light of the factors summarized above, including the nature, quality and scope of the services provided to the Fund by the Adviser and its affiliates, continuation of the investment advisory and subadvisory contracts were appropriate.
The Board based its decision to approve the investment advisory and subadvisory contracts on the totality of the circumstances and relevant factors and with a view to past and future long-term considerations. Not all of the factors and considerations identified above were necessarily relevant to the Fund, nor did the Board consider any one of them to be determinative. With respect to the factors that were relevant, the Board's decision to approve the continuation of the contract reflects its view that Federated's performance and actions provided a satisfactory basis to support the decision to continue the existing arrangements.
Annual Shareholder Report
Voting Proxies on Fund Portfolio Securities
A description of the policies and procedures that the Fund uses to determine how to vote proxies, if any, relating to securities held in the Fund's portfolio is available, without charge and upon request, by calling 1-800-341-7400. A report on “Form N-PX” of how the Fund voted any such proxies during the most recent 12-month period ended June 30 is available via the Proxy Voting Record (Form N-PX) link associated with the Fund and share class name at www.FederatedInvestors.com/FundInformation. Form N-PX filings are also available at the SEC's website at www.sec.gov.
Quarterly Portfolio Schedule
Each fiscal quarter, the Fund will file with the SEC a complete schedule of its monthly portfolio holdings on “Form N-PORT.” The Fund's holdings as of the end of the third month of every fiscal quarter, as reported on Form N-PORT, will be publicly available on the SEC's website at www.sec.gov within 60 days of the end of the fiscal quarter upon filing. You may also access this information via the link to the Fund and share class name at www.FederatedInvestors.com.
Annual Shareholder Report
Mutual funds are not bank deposits or obligations, are not guaranteed by any bank and are not insured or guaranteed by the U.S. government, the Federal Deposit Insurance Corporation, the Federal Reserve Board or any other government agency. Investment in mutual funds involves investment risk, including the possible loss of principal.
This Report is authorized for distribution to prospective investors only when preceded or accompanied by the Fund's Prospectus, which contains facts concerning its objective and policies, management fees, expenses and other information.
Federated Global Allocation Fund
Federated Investors Funds
4000 Ericsson Drive
Warrendale, PA 15086-7561
Contact us at FederatedInvestors.com
or call 1-800-341-7400.
Federated Securities Corp., Distributor
CUSIP 314183104
CUSIP 314183203
CUSIP 314183302
CUSIP 314183401
CUSIP 314183500
CUSIP 314183609
G01454-01 (1/20)
Federated is a registered trademark of Federated Investors, Inc.
2020 ©Federated Investors, Inc.
(a) As of the end of the period covered by this report, the registrant has adopted a code of ethics (the "Section 406 Standards for Investment Companies - Ethical Standards for Principal Executive and Financial Officers") that applies to the registrant's Principal Executive Officer and Principal Financial Officer; the registrant's Principal Financial Officer also serves as the Principal Accounting Officer.
(c) There was no amendment to the registrant’s code of ethics described in Item 2(a) above during the period covered by the report.
(d) There was no waiver granted, either actual or implicit, from a provision to the registrant’s code of ethics described in Item 2(a) above during the period covered by the report.
(e) Not Applicable
(f)(3) The registrant hereby undertakes to provide any person, without charge, upon request, a copy of the code of ethics. To request a copy of the code of ethics, contact the registrant at 1-800-341-7400, and ask for a copy of the Section 406 Standards for Investment Companies - Ethical Standards for Principal Executive and Financial Officers.
Item 3. Audit Committee Financial Expert
The registrant's Board has determined that each of the following members of the Board's Audit Committee is an “audit committee financial expert,” and is "independent," for purposes of this Item: John T. Collins, G. Thomas Hough and Thomas M. O'Neill.
| Item 4. | Principal Accountant Fees and Services |
(a) Audit Fees billed to the registrant for the two most recent fiscal years:
Fiscal year ended 2019 - $34,570
Fiscal year ended 2018 - $34,570
(b) Audit-Related Fees billed to the registrant for the two most recent fiscal years:
Fiscal year ended 2019 - $0
Fiscal year ended 2018 - $0
Amount requiring approval of the registrant’s audit committee pursuant to paragraph (c)(7)(ii) of Rule 2-01 of Regulation S-X, $2,087 and $0 respectively. Fiscal year ended 2019- Audit consent fee for N-14 merger document.
(c) Tax Fees billed to the registrant for the two most recent fiscal years:
Fiscal year ended 2019 - $0
Fiscal year ended 2018 - $0
Amount requiring approval of the registrant’s audit committee pursuant to paragraph (c)(7)(ii) of Rule 2-01 of Regulation S-X, $0 and $0 respectively.
(d) All Other Fees billed to the registrant for the two most recent fiscal years:
Fiscal year ended 2019 - $0
Fiscal year ended 2018 - $0
Amount requiring approval of the registrant’s audit committee pursuant to paragraph (c)(7)(ii) of Rule 2-01 of Regulation S-X, $0 and $0 respectively.
(e)(1) Audit Committee Policies regarding Pre-approval of Services.
The Audit Committee is required to pre-approve audit and non-audit services performed by the independent auditor in order to assure that the provision of such services do not impair the auditor’s independence. Unless a type of service to be provided by the independent auditor has received general pre-approval, it will require specific pre-approval by the Audit Committee. Any proposed services exceeding pre-approved cost levels will require specific pre-approval by the Audit Committee.
Certain services have the general pre-approval of the Audit Committee. The term of the general pre-approval is 12 months from the date of pre-approval, unless the Audit Committee specifically provides for a different period. The Audit Committee will annually review the services that may be provided by the independent auditor without obtaining specific pre-approval from the Audit Committee and may grant general pre-approval for such services. The Audit Committee will revise the list of general pre-approved services from time to time, based on subsequent determinations. The Audit Committee will not delegate its responsibilities to pre-approve services performed by the independent auditor to management.
The Audit Committee has delegated pre-approval authority to its Chairman. The Chairman will report any pre-approval decisions to the Audit Committee at its next scheduled meeting. The Committee will designate another member with such pre-approval authority when the Chairman is unavailable.
AUDIT SERVICES
The annual Audit services engagement terms and fees will be subject to the specific pre-approval of the Audit Committee. The Audit Committee must approve any changes in terms, conditions and fees resulting from changes in audit scope, registered investment company (RIC) structure or other matters.
In addition to the annual Audit services engagement specifically approved by the Audit Committee, the Audit Committee may grant general pre-approval for other Audit Services, which are those services that only the independent auditor reasonably can provide. The Audit Committee has pre-approved certain Audit services, all other Audit services must be specifically pre-approved by the Audit Committee.
AUDIT-RELATED SERVICES
Audit-related services are assurance and related services that are reasonably related to the performance of the audit or review of the Company’s financial statements or that are traditionally performed by the independent auditor. The Audit Committee believes that the provision of Audit-related services does not impair the independence of the auditor, and has pre-approved certain Audit-related services, all other Audit-related services must be specifically pre-approved by the Audit Committee.
TAX SERVICES
The Audit Committee believes that the independent auditor can provide Tax services to the Company such as tax compliance, tax planning and tax advice without impairing the auditor’s independence. However, the Audit Committee will not permit the retention of the independent auditor in connection with a transaction initially recommended by the independent auditor, the purpose of which may be tax avoidance and the tax treatment of which may not be supported in the Internal Revenue Code and related regulations. The Audit Committee has pre-approved certain Tax services, all Tax services involving large and complex transactions must be specifically pre-approved by the Audit Committee.
ALL OTHER SERVICES
With respect to the provision of services other than audit, review or attest services the pre-approval requirement is waived if:
| (1) | The aggregate amount of all such services provided constitutes no more than five percent of the total amount of revenues paid by the registrant, the registrant’s adviser (not including any sub-adviser whose role is primarily portfolio management and is subcontracted with or overseen by another investment adviser), and any entity controlling, controlled by, or under common control with the investment adviser that provides ongoing services to the registrant to its accountant during the fiscal year in which the services are provided; |
| (2) | Such services were not recognized by the registrant, the registrant’s adviser (not including any sub-adviser whose role is primarily portfolio management and is subcontracted with or overseen by another investment adviser), and any entity controlling, controlled by, or under common control with the investment adviser that provides ongoing services to the registrant at the time of the engagement to be non-audit services; and |
| (3) | Such services are promptly brought to the attention of the Audit Committee of the issuer and approved prior to the completion of the audit by the Audit Committee or by one or more members of the Audit Committee who are members of the board of directors to whom authority to grant such approvals has been delegated by the Audit Committee. |
The Audit Committee may grant general pre-approval to those permissible non-audit services classified as All Other services that it believes are routine and recurring services, and would not impair the independence of the auditor.
The SEC’s rules and relevant guidance should be consulted to determine the precise definitions of prohibited non-audit services and the applicability of exceptions to certain of the prohibitions.
PRE-APPROVAL FEE LEVELS
Pre-approval fee levels for all services to be provided by the independent auditor will be established annually by the Audit Committee. Any proposed services exceeding these levels will require specific pre-approval by the Audit Committee.
PROCEDURES
Requests or applications to provide services that require specific approval by the Audit Committee will be submitted to the Audit Committee by both the independent auditor and the Principal Accounting Officer and/or Internal Auditor, and must include a joint statement as to whether, in their view, the request or application is consistent with the SEC’s rules on auditor independence.
(e)(2) Percentage of services identified in items 4(b) through 4(d) that were approved by the registrants audit committee pursuant to paragraph (c)(7)(i)(C) of Rule 2-01 of Regulation S-X:
4(b)
Fiscal year ended 2019– 0%
Fiscal year ended 2018- 0%
Percentage of services provided to the registrants investment adviser and any entity controlling, controlled by, or under common control with the investment adviser that provides ongoing services to the registrant that were approved by the registrants audit committee pursuant to paragraph (c)(7)(i)(C) of Rule 2-01 of Regulation S-X, 0% and 0% respectively.
4(c)
Fiscal year ended 2019– 0%
Fiscal year ended 2018– 0%
Percentage of services provided to the registrants investment adviser and any entity controlling, controlled by, or under common control with the investment adviser that provides ongoing services to the registrant that were approved by the registrants audit committee pursuant to paragraph (c)(7)(i)(C) of Rule 2-01 of Regulation S-X, 0% and 0% respectively.
4(d)
Fiscal year ended 2019– 0%
Fiscal year ended 2018– 0%
Percentage of services provided to the registrants investment adviser and any entity controlling, controlled by, or under common control with the investment adviser that provides ongoing services to the registrant that were approved by the registrants audit committee pursuant to paragraph (c)(7)(i)(C) of Rule 2-01 of Regulation S-X, 0% and 0% respectively.
| (g) | Non-Audit Fees billed to the registrant, the registrant’s investment adviser, and certain entities controlling, controlled by or under common control with the investment adviser: |
Fiscal year ended 2019- $30,129
Fiscal year ended 2018- $0
| (h) | The registrant’s Audit Committee has considered that the provision of non-audit services that were rendered to the registrant’s adviser (not including any sub-adviser whose role is primarily portfolio management and is subcontracted with or overseen by another investment adviser), and any entity controlling, controlled by, or under common control with the investment adviser that provides ongoing services to the registrant that were not pre-approved pursuant to paragraph (c)(7)(ii) of Rule 2-01 of Regulation S-X is compatible with maintaining the principal accountant’s independence. |
The registrant’s management and Audit Committee continue to believe that the registrant’s registered public accounting firm, KPMG LLP (“KPMG”), has the ability to exercise objective and impartial judgment on all issues encompassed within its audit services. KPMG is required to make a determination that it satisfies certain independence requirements under the federal securities laws. Like other registrants, there is a risk that activities or relationships of KPMG, or its partners or employees, can prevent a determination from being made that it satisfies such independence requirements with respect to the registrant, which could render it ineligible to serve as the registrant’s independent public accountant.
In its required communications to the Audit Committee of the registrant’s Board, KPMG informed the Audit Committee that KPMG and/or covered person professionals within KPMG maintain lending relationships with certain owners of greater than 10% of the shares of certain investment companies within the “investment company complex” as defined under Rule 2-01(f)(14) of Regulation S-X, which are affiliates of the registrant. KPMG has advised the Audit Committee that these lending relationships implicate Rule 2-01(c)(1)(ii)(A) of Regulation S-X (referred to as the “Loan Rule”). The Loan Rule prohibits an independent public accountant, or covered person professionals at such firm, from having a financial relationship (such as a loan) with a lender that is a record or beneficial owner of more than 10% of an audit client’s equity securities. For purposes of the Loan Rule, audit clients include the registrant, as well as all registered investment companies audited by KPMG (collectively, the “KPMG Funds”).
KPMG informed the Audit Committee that KPMG believes that these lending relationships described above do not and will not impair KPMG’s ability to exercise objective and impartial judgment in connection with financial statement audits of the registrant and a reasonable investor with knowledge of all relevant facts and circumstances would conclude that KPMG has been and is capable of objective and impartial judgment on all issues encompassed within KPMG’s audits.
On June 20, 2016, the Division of Investment Management of the Securities and Exchange Commission (“SEC”) issued a no-action letter to another mutual fund complex (see Fidelity Management & Research Company et al., No-Action Letter) related to similar Loan Rule matters as those described above (the “Letter”). In the Letter, the SEC Staff confirmed that it would not recommend enforcement action against an investment company that relied on the audit services performed by an independent public accountant where the Loan Rule was implicated in certain specified circumstances provided that: (1) the auditor has complied with PCAOB Rule 3526(b)(1) and 3526(b)(2); (2) the Loan Rule is implicated because of lending relationships; and (3) notwithstanding such lending relationships that implicate the Loan Rule, the auditor has concluded that it is objective and impartial with respect to the issues encompassed within its engagement as auditor of the funds. The circumstances described in the Letter are substantially similar to the circumstances that implicated the Loan Rule with respect to EY and the registrant. On September 22, 2017, the SEC extended the expiration of the Letter until the effectiveness of any amendments to the Loan Rule designed to address the concerns in the Letter. On June 18, 2019, the SEC adopted amendments (effective October 3, 2019) to the Loan Rule, which, refocus the analysis that must be conducted to determine whether an auditor is independent when the auditor has a lending relationship with certain shareholders of an audit client at any time during an audit or professional engagement period.
If it were to be determined that the relief available under the Letter was improperly relied upon, or that the independence requirements under the federal securities laws were not complied with regarding the registrant, for certain periods, any of the registrant’s filings with the SEC which contain financial statements of the registrant for such periods may be determined not to be consistent with or comply with applicable federal securities laws, the registrant’s ability to offer shares under its current registration statement may be impacted, andcertain financial reporting and/or other covenants with, and representations and warranties to, the registrant’s lender under its committed line of credit may be impacted. Such eventscould have a material adverse effect on the registrant and the KPMG Funds.
| Item 5. | Audit Committee of Listed Registrants |
Not Applicable
| Item 6. | Schedule of Investments |
(a) The registrant’s Schedule of Investments is included as part of the Report to Stockholders filed under Item 1 of this form.
(b) Not Applicable; Fund had no divestments during the reporting period covered since the previous Form N-CSR filing.
| Item 7. | Disclosure of Proxy Voting Policies and Procedures for Closed-End Management Investment Companies |
Not Applicable
| Item 8. | Portfolio Managers of Closed-End Management Investment Companies |
Not Applicable
| Item 9. | Purchases of Equity Securities by Closed-End Management Investment Company and Affiliated Purchasers |
Not Applicable
| Item 10. | Submission of Matters to a Vote of Security Holders |
No Changes to Report
| Item 11. | Controls and Procedures |
(a) The registrant’s President and Treasurer have concluded that the
registrant’s disclosure controls and procedures (as defined in rule 30a-3(c) under the Act) are effective in design and operation and are sufficient to form the basis of the certifications required by Rule 30a-(2) under the Act, based on their evaluation of these disclosure controls and procedures within 90 days of the filing date of this report on Form N-CSR.
(b) There were no changes in the registrant’s internal control over financial reporting (as defined in rule 30a-3(d) under the Act) during the registrant’s most recent fiscal half-year (the registrant’s second fiscal half-year in the case of an annual report) that have materially affected, or are reasonably likely to materially affect, the registrant’s internal control over financial reporting.
| Item 12. | Disclosure of Securities Lending Activities for Closed-End Management Investment Companies |
Not Applicable
(a)(1) Code of Ethics- Not Applicable to this Report.
(a)(2) Certifications of Principal Executive Officer and Principal Financial Officer.
(a)(3) Not Applicable.
(b) Certifications pursuant to 18 U.S.C. Section 1350.
SIGNATURES
Pursuant to the requirements of the Securities Exchange Act of 1934 and the Investment Company Act of 1940, the registrant has duly caused this report to be signed on its behalf by the undersigned, thereunto duly authorized.
RegistrantFederated Global Allocation Fund
By/S/ Lori A. Hensler
Lori A. Hensler, Principal Financial Officer
DateJanuary 27, 2020
Pursuant to the requirements of the Securities Exchange Act of 1934 and the Investment Company Act of 1940, this report has been signed below by the following persons on behalf of the registrant and in the capacities and on the dates indicated.
By/S/ J. Christopher Donahue
J. Christopher Donahue, Principal Executive Officer
DateJanuary 27, 2020
By/S/ Lori A. Hensler
Lori A. Hensler, Principal Financial Officer
DateJanuary 27, 2020