United States
Securities and Exchange Commission
Washington, D.C. 20549
Form N-CSR
Certified Shareholder Report of Registered Management Investment Companies
811-21822
(Investment Company Act File Number)
Federated Hermes Managed Pool Series
_______________________________________________________________
(Exact Name of Registrant as Specified in Charter)
Federated Hermes Funds
4000 Ericsson Drive
Warrendale, Pennsylvania 15086-7561
(Address of Principal Executive Offices)
(412) 288-1900
(Registrant's Telephone Number)
Peter J. Germain, Esquire
1001 Liberty Avenue
Pittsburgh, Pennsylvania 15222-3779
(Name and Address of Agent for Service)
(Notices should be sent to the Agent for Service)
Date of Fiscal Year End: 12/31/20
Date of Reporting Period: 12/31/20
| Item 1. | Reports to Stockholders |
Annual Shareholder Report
December 31, 2020
Federated Hermes Corporate Bond Strategy Portfolio(formerly, Federated Corporate Bond Strategy Portfolio)
A Portfolio of Federated Hermes Managed Pool Series(formerly, Federated Managed Pool Series)
Not FDIC Insured ▪ May Lose Value ▪ No Bank Guarantee
Management’s Discussion of Fund Performance (unaudited)
The total return of the Federated Hermes Corporate Bond Strategy Portfolio (the “Fund”), based on net asset value for the 12-month reporting period ended December 31, 2020 was 11.88%. The total return of the Bloomberg Barclays U.S. Credit Index (BBUSC),1 the Fund’s broad-based securities market index, was 9.35%, and the total return of the Baa component of the BBUSC (BBUSC-Baa),2 the benchmark against which the Fund is managed, was 9.43% for the same period. The Fund’s total return for the most recently completed fiscal year reflected actual cash flows, transaction costs and other expenses, which were not reflected in the total return of the indexes.
During the reporting period, the most significant factors affecting the Fund’s performance relative to the BBUSC-Baa were: (1) individual security selection; (2) the allocation of the portfolio among securities of similar types of issuers (referred to as “sectors”); (3) rates selection of securities with different maturities (referred to as “yield curve” strategy); and (4) duration,3 which is the sensitivity of the change in price of the portfolio to changes in interest rates.
Market Overview
In 2020, investors were challenged by the unprecedented shock to the global economy from the COVID-19 pandemic. As the virus spread around the world, federal, state and local governments around the globe began implementing policies that restricted individuals’ movements and large public gatherings, which ultimately lead to reduced economic activity. Specifically, the decline in economic activity was reflected in a -5% decline in first quarter gross domestic product (GDP) and an even worse second quarter GDP decline of almost -32%. In addition, the unemployment rate peaked at 14.8% in the second quarter. During this period of turmoil, investors fled to the safety of the U.S. dollar. However, the liquidity in many fixed-income markets was very limited, since there were many more sellers than buyers. As a result, the U.S. Federal Reserve (the “Fed”) had to re-institute several liquidity programs that were first created in the Great Recession of 2008. Specifically, the Fed intervened to provide liquidity to the U.S. Treasury, commercial paper, agency mortgage-backed (MBS) and investment-grade corporate markets. In addition, the Fed cut the fed funds target rate by 100 basis points to a range of 0.0-0.25%. The U.S. Congress also approved a $2 trillion fiscal stimulus package to help combat the negative economic impact from the pandemic. As the year progressed, the monetary and fiscal stimulus took hold, and the initial phase of the pandemic passed as economic activity improved. Third quarter GDP rebounded and increased 33%, and the unemployment rate improved to end the year at 6.7%.
The other major drivers of financial markets in 2020 all occurred in the fourth quarter and included: (1) the November elections; (2) the emergency use approval of two COVID-19 vaccines; and (3) the approval of an additional $900 billion fiscal stimulus plan. As many had expected, the U.S. Presidential election came down to very tight races in several battleground states. However, the results of the election were resolved in short order, and the risk of a prolonged and contested election never came to fruition. Investors viewed the results of the election as a positive for financial markets, as a divided government with a democratic executive branch and a split Senate is expected to lead to grid lock in Washington and a less extensive progressive agenda or other major policy changes. Despite the deteriorating health and economic data at the end of the year, the financial markets looked through these negative events and focused more on the positive news of the emergency use approval of the COVID-19 vaccines and the approval of the $900 billion fiscal stimulus plan. The Fed also remained extremely accommodative with its 0.0-0.25% interest rate target and purchasing $120 billion of U.S. Treasuries and MBS bonds per month.4
As a result of these events, during the first quarter of 2020, investors reduced their exposure to risk and focused on protecting their capital, with U.S. Treasury rates declining materially across all maturities. The Bloomberg Barclays U.S. Treasury Index5 total return on the first quarter was 8.20% compared to -7.39% for the BBUSC-Baa. However, lower-quality fixed-income markets continued to heal throughout the remainder of the year. For the entire year, the BBUSC-Baa total return was 9.43% compared to 8.00% for the Bloomberg Barclays U.S. Treasury Index.
The positive 2020 total return on the BBUSC-Baa was due primarily to lower Treasury rates. There was great Option Adjusted Spread (OAS) volatility in the year. However, the OAS of the BBUSC-Baa was little changed in 2020 after beginning the year at 125 basis points, peaking at 462 basis points in March, and then finishing the year at 124 basis points.
Annual Shareholder Report
Security selection
In total, individual security selection varied widely in terms of relative contribution to the Fund but combined to be the largest positive contributor to the relative performance of the Fund for the year. Some of the best performing bonds for the Fund in 2020 were from issuers such as the Government of Mexico, Occidental Petroleum, Broadcom Inc., Kraft Heinz and General Electric. The worst performing selections were from the following issuers such as CSX Corp, Barclays PLC, Anthem Inc, the Government of Uruguay and McDonald’s Corp., since the Fund did not have any holdings from any of these issuers.
sector
Sector allocation was a large positive contributor to the Fund’s outperformance for the year. Overweight positions in the Automobile and Independent Exploration & Production sectors and an underweight position to the Government Owned No Guarantee sectors were positive contributors to Fund performance. These positives were partially offset by the negative contributions from underweight positions in the Healthcare, Office Real Estate Investment Trusts and Railroad Sectors.
Yield Curve
The yield curve strategy was a slightly positive contributor to the Fund’s performance for the year relative to the BBUSC-Baa. The Fund maintained either a steepening bias or neutral positioning for most of the year.
Duration
The Fund’s duration, which averaged less than the duration of the BUSC-Baa throughout the year, was a negative contributor to the Fund’s performance. During the reporting period, the Fund used U.S. Treasury futures contracts6 to help manage the duration of the Fund. These positions had a negative impact on the Fund’s performance for the reporting period.
1
Please see the footnotes to the line graphs below for definitions of, and further information about the BBUSC.
2
Please see the footnotes to the line graphs below for definitions of, and further information about the BBUSC-Baa.
3
Duration is a measure of a security’s price sensitivity to changes in interest rates. Securities with longer durations are more sensitive to changes in interest rates than securities of shorter durations.
4
Bond prices are sensitive to changes in interest rates, and a rise in interest rates can cause a decline in their prices.
5
The Bloomberg Barclays U.S. Treasury Index measures U.S dollar-denominated, fixed-rate, nominal debt issued by the U.S. Treasury with 10 years or more to maturity. The index is unmanaged, and it is not possible to invest directly in an index.
6
The Fund’s use of derivative instruments involves risks different from, or possibly greater than, the risks associated with investing directly in securities and other traditional instruments.
Annual Shareholder Report
FUND PERFORMANCE AND GROWTH OF A $10,000 INVESTMENT
The graph below illustrates the hypothetical investment of $10,0001 in the Federated Hermes Corporate Bond Strategy Portfolio from December 31, 2010 to December 31, 2020, compared to the Bloomberg Barclays U.S. Credit Index (BBUSC)2 and the Baa component of the Bloomberg Barclays U.S. Credit Index (BBUSC-Baa).3 The Average Annual Total Return table below shows returns averaged over the stated periods.
Growth of a $10,000 Investment
Growth of $10,000 as of December 31, 2020 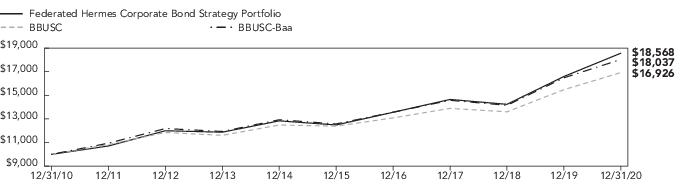
Average Annual Total Returns for the Period Ended 12/31/2020
Performance data quoted represents past performance which is no guarantee of future results. Investment return and principal value will fluctuate so that an investor’s shares, when redeemed, may be worth more or less than their original cost. Mutual fund performance changes over time and current performance may be lower or higher than what is stated. For current to the most recent month-end performance and after-tax returns, call 1-800-341-7400. Returns shown do not reflect the deduction of taxes that a shareholder would pay on Fund distributions or the redemption of Fund shares. Mutual funds are not obligations of or guaranteed by any bank and are not federally insured.
1
The Fund’s performance assumes the reinvestment of all dividends and distributions. The BBUSC and BBUSC-Baa have been adjusted to reflect reinvestment of dividends on securities in an index.
2
The BBUSC is composed of all publicly issued, fixed-rate, nonconvertible, investment-grade corporate debt and a non-corporate component that includes foreign agencies, sovereigns, supranationals and local authorities. Issues are rated at least “Baa” by Moody’s Investors Service or “BBB” by Standard & Poor’s, if unrated by Moody’s. The index is not adjusted to reflect sales loads, expenses or other fees that the Securities and Exchange Commission (SEC) requires to be reflected in the Fund’s performance. The index is unmanaged and, unlike the Fund, is not affected by cash flows. It is not possible to invest directly in an index.
3
The BBUSC-Baa is a component of the BBUSC comprised of corporate bonds or securities represented by the following sectors: industrial, utility and finance, including both U.S. and non-U.S. corporations and non-corporate bonds or securities represented by the following sectors: sovereign, supranational, foreign agencies and foreign local governments. The index is not adjusted to reflect sales loads, expenses or other fees that the SEC requires to be reflected in the Fund’s performance. The index is unmanaged and, unlike the Fund, is not affected by cash flows. It is not possible to invest directly in an index.
Annual Shareholder Report
Portfolio of Investments Summary Table (unaudited)
At December 31, 2020, the Fund’s portfolio composition1 was as follows:
| Percentage of
Total Net Assets |
Corporate Debt Securities | |
Foreign Government/Agency | |
| |
Securities Lending Collateral3 | |
| |
Other Assets and Liabilities—Net6 | |
| |
| See the Fund’s Prospectus and Statement of Additional Information for a description of these security types. |
| Cash Equivalents include any investments in money market mutual funds and/or overnight repurchase agreements. |
| Represents cash collateral received for portfolio securities on loan that may be invested in affiliated money market funds, other money market instruments and/or repurchase agreements. |
| Based upon net unrealized appreciation (depreciation) or value of the derivative contracts as applicable. Derivative contracts may consist of futures, forwards, options and swaps. The impact of a derivative contract on the Fund’s performance may be larger than its unrealized appreciation (depreciation) or value may indicate. In many cases, the notional value or amount of a derivative contract may provide a better indication of the contract’s significance to the portfolio. More complete information regarding the Fund’s direct investments in derivative contracts, including unrealized appreciation (depreciation), value and notional values or amounts of such contracts, can be found in the table at the end of the Portfolio of Investments included in this Report. |
| Represents less than 0.1%. |
| Assets, other than investments in securities and derivative contracts, less liabilities. See Statement of Assets and Liabilities. |
Annual Shareholder Report
Portfolio of Investments
December 31, 2020
| | | |
| | | |
| | Basic Industry - Chemicals—0.9% | |
| | Albemarle Corp., 4.150%, 12/1/2024 | |
| | Albemarle Corp., Sr. Unsecd. Note, 5.450%, 12/1/2044 | |
| | Nutrition & Biosciences, Inc., Sr. Unsecd. Note, 144A, 1.832%, 10/15/2027 | |
| | Nutrition & Biosciences, Inc., Sr. Unsecd. Note, 144A, 2.300%, 11/1/2030 | |
| | RPM International, Inc., Sr. Unsecd. Note, 4.550%, 3/1/2029 | |
| | RPM International, Inc., Sr. Unsecd. Note, 5.250%, 6/1/2045 | |
| | | |
| | Basic Industry - Metals & Mining—0.9% | |
| | Anglogold Ashanti Holdings PLC, Sr. Note, 6.500%, 4/15/2040 | |
| | Carpenter Technology Corp., Sr. Unsecd. Note, 4.450%, 3/1/2023 | |
| | Reliance Steel & Aluminum Co., Sr. Unsecd. Note, 4.500%, 4/15/2023 | |
| | Southern Copper Corp., Sr. Unsecd. Note, 6.750%, 4/16/2040 | |
| | Worthington Industries, Inc., Sr. Unsecd. Note, 4.300%, 8/1/2032 | |
| | Worthington Industries, Inc., Sr. Unsecd. Note, 4.550%, 4/15/2026 | |
| | | |
| | Basic Industry - Paper—0.5% | |
| | International Paper Co., Sr. Unsecd. Note, 3.000%, 2/15/2027 | |
| | International Paper Co., Sr. Unsecd. Note, 4.400%, 8/15/2047 | |
| | Weyerhaeuser Co., Sr. Unsecd. Note, 7.375%, 3/15/2032 | |
| | | |
| | Capital Goods - Aerospace & Defense—4.3% | |
| | BAE Systems Holdings, Inc., Sr. Unsecd. Note, 144A, 3.850%, 12/15/2025 | |
| | BAE Systems PLC, Sr. Unsecd. Note, 144A, 3.000%, 9/15/2050 | |
| | Boeing Co., Sr. Unsecd. Note, 2.700%, 2/1/2027 | |
| | Boeing Co., Sr. Unsecd. Note, 2.950%, 2/1/2030 | |
| | Boeing Co., Sr. Unsecd. Note, 3.950%, 8/1/2059 | |
| | Boeing Co., Sr. Unsecd. Note, 4.508%, 5/1/2023 | |
| | Boeing Co., Sr. Unsecd. Note, 5.705%, 5/1/2040 | |
| | Embraer Netherlands BV, Sr. Unsecd. Note, 5.050%, 6/15/2025 | |
| | Embraer SA, Sr. Unsecd. Note, 5.150%, 6/15/2022 | |
| | Hexcel Corp., Sr. Unsecd. Note, 3.950%, 2/15/2027 | |
| | Huntington Ingalls Industries, Inc., Sr. Unsecd. Note, 3.483%, 12/1/2027 | |
| | Leidos, Inc., Unsecd. Note, 144A, 3.625%, 5/15/2025 | |
| | Leidos, Inc., Unsecd. Note, 144A, 4.375%, 5/15/2030 | |
| | Northrop Grumman Corp., Sr. Unsecd. Note, 3.250%, 1/15/2028 | |
| | Textron Financial Corp., Jr. Sub. Note, 144A, 1.956% (3-month USLIBOR +1.735%), 2/15/2042 | |
| | Textron, Inc., Sr. Unsecd. Note, 2.450%, 3/15/2031 | |
| | Textron, Inc., Sr. Unsecd. Note, 4.300%, 3/1/2024 | |
| | | |
| | Capital Goods - Building Materials—0.6% | |
| | Allegion PLC, Sr. Unsecd. Note, 3.500%, 10/1/2029 | |
| | Allegion US Holdings Co., Inc., Sr. Unsecd. Note, 3.200%, 10/1/2024 | |
| | Allegion US Holdings Co., Inc., Sr. Unsecd. Note, 3.550%, 10/1/2027 | |
| | Carrier Global Corp., Sr. Unsecd. Note, 2.700%, 2/15/2031 | |
| | Masco Corp., Sr. Unsecd. Note, 4.500%, 5/15/2047 | |
| | | |
Annual Shareholder Report
| | | |
| | CORPORATE BONDS—continued | |
| | Capital Goods - Construction Machinery—0.4% | |
| | CNH Industrial NV, Sr. Unsecd. Note, Series MTN, 3.850%, 11/15/2027 | |
| | Capital Goods - Diversified Manufacturing—3.6% | |
| | General Electric Co., Sr. Unsecd. Note, 3.375%, 3/11/2024 | |
| | General Electric Co., Sr. Unsecd. Note, 4.250%, 5/1/2040 | |
| | Lennox International, Inc., Sr. Unsecd. Note, 1.700%, 8/1/2027 | |
| | Otis Worldwide Corp., Sr. Unsecd. Note, Series WI, 2.565%, 2/15/2030 | |
| | Roper Technologies, Inc., Sr. Unsecd. Note, 2.950%, 9/15/2029 | |
| | Roper Technologies, Inc., Sr. Unsecd. Note, 3.850%, 12/15/2025 | |
| | Roper Technologies, Inc., Sr. Unsecd. Note, 4.200%, 9/15/2028 | |
| | United Technologies Corp., Sr. Unsecd. Note, 4.125%, 11/16/2028 | |
| | United Technologies Corp., Sr. Unsecd. Note, 4.150%, 5/15/2045 | |
| | Wabtec Corp., Sr. Unsecd. Note, 3.200%, 6/15/2025 | |
| | Xylem, Inc., Sr. Unsecd. Note, 2.250%, 1/30/2031 | |
| | | |
| | Capital Goods - Packaging—0.6% | |
| | Packaging Corp. of America, Sr. Unsecd. Note, 3.650%, 9/15/2024 | |
| | Packaging Corp. of America, Sr. Unsecd. Note, 4.500%, 11/1/2023 | |
| | Sonoco Products Co., Sr. Unsecd. Note, 5.750%, 11/1/2040 | |
| | WestRock Co., Sr. Unsecd. Note, 4.000%, 3/1/2023 | |
| | WestRock Co., Sr. Unsecd. Note, Series WI, 4.000%, 3/15/2028 | |
| | | |
| | Communications - Cable & Satellite—1.8% | |
| | CCO Safari II LLC, 6.484%, 10/23/2045 | |
| | Charter Communications Operating LLC, 5.375%, 5/1/2047 | |
| | Charter Communications Operating, LLC/Charter Communications Operating Capital Corp., Sec. Fac. Bond, 3.850%, 4/1/2061 | |
| | Charter Communications, Inc., 4.200%, 3/15/2028 | |
| | Cox Communications, Inc., Sr. Unsecd. Note, 144A, 3.350%, 9/15/2026 | |
| | Time Warner Cable, Inc., Company Guarantee, 5.500%, 9/1/2041 | |
| | | |
| | Communications - Media & Entertainment—2.7% | |
| | Discovery Communications LLC, Sr. Unsecd. Note, 4.650%, 5/15/2050 | |
| | Fox Corp, Sr. Unsecd. Note, Series WI, 4.709%, 1/25/2029 | |
| | Fox Corp, Sr. Unsecd. Note, Series WI, 5.576%, 1/25/2049 | |
| | Grupo Televisa S.A., 6.625%, 3/18/2025 | |
| | Grupo Televisa S.A., Sr. Unsecd. Note, 5.000%, 5/13/2045 | |
| | Interpublic Group of Cos., Inc., Sr. Unsecd. Note, 4.000%, 3/15/2022 | |
| | Omnicom Group, Inc., Sr. Unsecd. Note, 3.650%, 11/1/2024 | |
| | Omnicom Group, Inc., Sr. Unsecd. Note, 4.200%, 6/1/2030 | |
| | ViacomCBS, Inc., Sr. Unsecd. Note, 3.700%, 8/15/2024 | |
| | ViacomCBS, Inc., Sr. Unsecd. Note, 4.900%, 8/15/2044 | |
| | ViacomCBS, Inc., Sr. Unsecd. Note, 4.950%, 1/15/2031 | |
| | ViacomCBS, Inc., Sr. Unsecd. Note, Series WI, 3.700%, 6/1/2028 | |
| | | |
| | Communications - Telecom Wireless—4.4% | |
| | American Tower Corp., Sr. Unsecd. Note, 2.100%, 6/15/2030 | |
| | American Tower Corp., Sr. Unsecd. Note, 3.100%, 6/15/2050 | |
| | American Tower Corp., Sr. Unsecd. Note, 3.800%, 8/15/2029 | |
| | American Tower Corp., Sr. Unsecd. Note, 4.400%, 2/15/2026 | |
| | American Tower Corp., Sr. Unsecd. Note, 5.000%, 2/15/2024 | |
| | Bell Canada, Sr. Unsecd. Note, 4.464%, 4/1/2048 | |
Annual Shareholder Report
| | | |
| | CORPORATE BONDS—continued | |
| | Communications - Telecom Wireless—continued | |
| | Crown Castle International Corp., Sr. Unsecd. Note, 2.250%, 1/15/2031 | |
| | Crown Castle International Corp., Sr. Unsecd. Note, 4.450%, 2/15/2026 | |
| | Crown Castle International Corp., Sr. Unsecd. Note, 5.200%, 2/15/2049 | |
| | TELUS Corp., Sr. Unsecd. Note, 2.800%, 2/16/2027 | |
| | T-Mobile USA, Inc., Sec. Fac. Bond, 144A, 3.875%, 4/15/2030 | |
| | T-Mobile USA, Inc., Sec. Fac. Bond, 144A, 4.500%, 4/15/2050 | |
| | T-Mobile USA, Inc., Sr. Sub. Note, 144A, 3.000%, 2/15/2041 | |
| | Vodafone Group PLC, Sr. Unsecd. Note, 4.125%, 5/30/2025 | |
| | Vodafone Group PLC, Sr. Unsecd. Note, 4.250%, 9/17/2050 | |
| | Vodafone Group PLC, Sr. Unsecd. Note, 5.250%, 5/30/2048 | |
| | | |
| | Communications - Telecom Wirelines—6.6% | |
| | AT&T, Inc., Sr. Unsecd. Note, 2.550%, 12/1/2033 | |
| | AT&T, Inc., Sr. Unsecd. Note, 2.750%, 6/1/2031 | |
| | AT&T, Inc., Sr. Unsecd. Note, 3.500%, 6/1/2041 | |
| | AT&T, Inc., Sr. Unsecd. Note, 3.650%, 6/1/2051 | |
| | AT&T, Inc., Sr. Unsecd. Note, 3.850%, 6/1/2060 | |
| | AT&T, Inc., Sr. Unsecd. Note, 4.300%, 2/15/2030 | |
| | AT&T, Inc., Sr. Unsecd. Note, 4.350%, 3/1/2029 | |
| | AT&T, Inc., Sr. Unsecd. Note, 5.450%, 3/1/2047 | |
| | AT&T, Inc., Sr. Unsecd. Note, 6.375%, 3/1/2041 | |
| | AT&T, Inc., Sr. Unsecd. Note, Series WI, 5.300%, 8/15/2058 | |
| | Telefonica Emisiones SAU, Company Guarantee, 5.462%, 2/16/2021 | |
| | Telefonica Emisiones SAU, Sr. Unsecd. Note, 5.213%, 3/8/2047 | |
| | Telefonica Emisiones SAU, Sr. Unsecd. Note, 5.520%, 3/1/2049 | |
| | Telefonica SA, Company Guarantee, 7.045%, 6/20/2036 | |
| | Verizon Communications, Inc., Sr. Unsecd. Note, 1.680%, 10/30/2030 | |
| | Verizon Communications, Inc., Sr. Unsecd. Note, 4.000%, 3/22/2050 | |
| | Verizon Communications, Inc., Sr. Unsecd. Note, 4.125%, 3/16/2027 | |
| | Verizon Communications, Inc., Sr. Unsecd. Note, 4.125%, 8/15/2046 | |
| | Verizon Communications, Inc., Sr. Unsecd. Note, 4.522%, 9/15/2048 | |
| | Verizon Communications, Inc., Sr. Unsecd. Note, 4.672%, 3/15/2055 | |
| | | |
| | Consumer Cyclical - Automotive—3.0% | |
| | Fiat Chrysler Automobiles NV, Sr. Unsecd. Note, 5.250%, 4/15/2023 | |
| | Ford Motor Credit Co. LLC, Sr. Unsecd. Note, 3.336%, 3/18/2021 | |
| | Ford Motor Credit Co. LLC, Sr. Unsecd. Note, 3.339%, 3/28/2022 | |
| | Ford Motor Credit Co. LLC, Sr. Unsecd. Note, 3.350%, 11/1/2022 | |
| | General Motors Co., Sr. Unsecd. Note, 4.000%, 4/1/2025 | |
| | General Motors Co., Sr. Unsecd. Note, 5.200%, 4/1/2045 | |
| | General Motors Co., Sr. Unsecd. Note, 6.750%, 4/1/2046 | |
| | General Motors Financial Co., Inc., Sr. Unsecd. Note, 2.700%, 8/20/2027 | |
| | General Motors Financial Co., Inc., Sr. Unsecd. Note, 3.950%, 4/13/2024 | |
| | General Motors Financial Co., Inc., Sr. Unsecd. Note, 4.300%, 7/13/2025 | |
| | General Motors Financial Co., Inc., Unsecd. Note, 3.500%, 11/7/2024 | |
| | Hyundai Capital America, Sr. Unsecd. Note, 144A, 2.375%, 2/10/2023 | |
| | Hyundai Capital America, Sr. Unsecd. Note, 144A, 2.375%, 10/15/2027 | |
| | Volkswagen Group of America Finance LLC, Sr. Unsecd. Note, 144A, 4.000%, 11/12/2021 | |
| | Volkswagen Group of America Finance LLC, Sr. Unsecd. Note, 144A, 4.250%, 11/13/2023 | |
| | | |
Annual Shareholder Report
| | | |
| | CORPORATE BONDS—continued | |
| | Consumer Cyclical - Retailers—4.5% | |
| | Advance Auto Parts, Inc., Sr. Unsecd. Note, 1.750%, 10/1/2027 | |
| | Advance Auto Parts, Inc., Sr. Unsecd. Note, Series WI, 3.900%, 4/15/2030 | |
| | Alimentation Couche-Tard, Inc., Sr. Unsecd. Note, 144A, 3.800%, 1/25/2050 | |
| | AutoNation, Inc., Sr. Unsecd. Note, 4.500%, 10/1/2025 | |
| | AutoNation, Inc., Sr. Unsecd. Note, 4.750%, 6/1/2030 | |
| | AutoZone, Inc., Sr. Unsecd. Note, 3.125%, 4/21/2026 | |
| | AutoZone, Inc., Sr. Unsecd. Note, 4.000%, 4/15/2030 | |
| | CVS Health Corp., Sr. Unsecd. Note, 3.875%, 7/20/2025 | |
| | CVS Health Corp., Sr. Unsecd. Note, 5.050%, 3/25/2048 | |
| | CVS Health Corp., Sr. Unsecd. Note, 5.125%, 7/20/2045 | |
| | Dollar General Corp., Sr. Unsecd. Note, 4.125%, 5/1/2028 | |
| | Dollar General Corp., Sr. Unsecd. Note, 4.150%, 11/1/2025 | |
| | Dollar Tree, Inc., Sr. Unsecd. Note, 3.700%, 5/15/2023 | |
| | O’Reilly Automotive, Inc., Sr. Unsecd. Note, 1.750%, 3/15/2031 | |
| | O’Reilly Automotive, Inc., Sr. Unsecd. Note, 4.200%, 4/1/2030 | |
| | Tractor Supply Co., Sr. Unsecd. Note, 1.750%, 11/1/2030 | |
| | | |
| | Consumer Cyclical - Services—0.9% | |
| | Booking Holdings, Inc., Sr. Unsecd. Note, 4.625%, 4/13/2030 | |
| | Expedia Group, Inc., Sr. Unsecd. Note, 3.800%, 2/15/2028 | |
| | IHS Markit Ltd., Sr. Unsecd. Note, 4.750%, 8/1/2028 | |
| | | |
| | Consumer Non-Cyclical - Food/Beverage—6.8% | |
| | Anheuser-Busch Cos LLC / Anheuser-Busch InBev Worldwide, Inc., Sr. Unsecd. Note, 3.650%, 2/1/2026 | |
| | Anheuser-Busch Cos LLC / Anheuser-Busch InBev Worldwide, Inc., Sr. Unsecd. Note, 4.900%, 2/1/2046 | |
| | Anheuser-Busch InBev Finance, Inc., 4.900%, 2/1/2046 | |
| | Anheuser-Busch InBev Worldwide, Inc., Sr. Unsecd. Note, 4.350%, 6/1/2040 | |
| | Anheuser-Busch InBev Worldwide, Inc., Sr. Unsecd. Note, 4.439%, 10/6/2048 | |
| | Anheuser-Busch InBev Worldwide, Inc., Sr. Unsecd. Note, 4.750%, 1/23/2029 | |
| | Bacardi Ltd., Sr. Unsecd. Note, 144A, 2.750%, 7/15/2026 | |
| | Conagra Brands, Inc., Sr. Unsecd. Note, 1.375%, 11/1/2027 | |
| | Constellation Brands, Inc., Sr. Unsecd. Note, 5.250%, 11/15/2048 | |
| | Flowers Foods, Inc., Sr. Unsecd. Note, 3.500%, 10/1/2026 | |
| | General Mills, Inc., Sr. Unsecd. Note, 4.550%, 4/17/2038 | |
| | General Mills, Inc., Sr. Unsecd. Note, 4.700%, 4/17/2048 | |
| | Grupo Bimbo S.A.B. de CV, Sr. Unsecd. Note, 144A, 3.875%, 6/27/2024 | |
| | Grupo Bimbo S.A.B. de CV, Sr. Unsecd. Note, 144A, 4.500%, 1/25/2022 | |
| | Heineken NV, Sr. Unsecd. Note, 144A, 4.350%, 3/29/2047 | |
| | Kerry Group Financial Services, Sr. Unsecd. Note, 144A, 3.200%, 4/9/2023 | |
| | Keurig Dr Pepper, Inc., Sr. Unsecd. Note, 4.417%, 5/25/2025 | |
| | Keurig Dr Pepper, Inc., Sr. Unsecd. Note, 5.085%, 5/25/2048 | |
| | McCormick & Co., Inc., Sr. Unsecd. Note, 3.400%, 8/15/2027 | |
| | Smithfield Foods, Inc., Sr. Unsecd. Note, 144A, 2.650%, 10/3/2021 | |
| | Smithfield Foods, Inc., Sr. Unsecd. Note, 144A, 3.000%, 10/15/2030 | |
| | Smithfield Foods, Inc., Sr. Unsecd. Note, 144A, 4.250%, 2/1/2027 | |
| | Smucker (J.M.) Co., Sr. Unsecd. Note, 2.375%, 3/15/2030 | |
| | Smucker (J.M.) Co., Sr. Unsecd. Note, 3.500%, 3/15/2025 | |
| | Tyson Foods, Inc., 3.950%, 8/15/2024 | |
| | Tyson Foods, Inc., Sr. Unsecd. Note, 3.550%, 6/2/2027 | |
| | | |
Annual Shareholder Report
| | | |
| | CORPORATE BONDS—continued | |
| | Consumer Non-Cyclical - Health Care—2.1% | |
| | Agilent Technologies, Inc., Sr. Unsecd. Note, 2.100%, 6/4/2030 | |
| | Agilent Technologies, Inc., Sr. Unsecd. Note, 2.750%, 9/15/2029 | |
| | Agilent Technologies, Inc., Sr. Unsecd. Note, 3.200%, 10/1/2022 | |
| | Alcon Finance Corp., Sr. Unsecd. Note, 144A, 2.600%, 5/27/2030 | |
| | Alcon Finance Corp., Sr. Unsecd. Note, 144A, 3.000%, 9/23/2029 | |
| | Becton Dickinson & Co., Sr. Unsecd. Note, 3.734%, 12/15/2024 | |
| | Becton Dickinson & Co., Sr. Unsecd. Note, 4.669%, 6/6/2047 | |
| | Becton Dickinson & Co., Sr. Unsecd. Note, 4.685%, 12/15/2044 | |
| | Danaher Corp., Sr. Unsecd. Note, 2.600%, 10/1/2050 | |
| | Dentsply Sirona, Inc., Sr. Unsecd. Note, 3.250%, 6/1/2030 | |
| | Laboratory Corp. of America Holdings, Sr. Unsecd. Note, 3.750%, 8/23/2022 | |
| | PerkinElmer, Inc., Sr. Unsecd. Note, 3.300%, 9/15/2029 | |
| | Thermo Fisher Scientific, Inc., Sr. Unsecd. Note, 4.133%, 3/25/2025 | |
| | | |
| | Consumer Non-Cyclical - Pharmaceuticals—5.1% | |
| | AbbVie, Inc., Sr. Unsecd. Note, 3.200%, 11/21/2029 | |
| | AbbVie, Inc., Sr. Unsecd. Note, 4.250%, 11/21/2049 | |
| | Amgen, Inc., Sr. Unsecd. Note, 2.450%, 2/21/2030 | |
| | AstraZeneca PLC, Sr. Unsecd. Note, 2.375%, 6/12/2022 | |
| | AstraZeneca PLC, Sr. Unsecd. Note, 4.000%, 1/17/2029 | |
| | Bayer US Finance II LLC, Sr. Unsecd. Note, 144A, 4.625%, 6/25/2038 | |
| | Bayer US Finance II LLC, Sr. Unsecd. Note, 144A, 4.875%, 6/25/2048 | |
| | Biogen, Inc., Sr. Unsecd. Note, 3.150%, 5/1/2050 | |
| | Royalty Pharma PLC, Sr. Unsecd. Note, 144A, 1.750%, 9/2/2027 | |
| | Shire Acquisitions Investments Ireland DAC, Sr. Unsecd. Note, 2.400%, 9/23/2021 | |
| | Takeda Pharmaceutical Co. Ltd., Sr. Unsecd. Note, 2.050%, 3/31/2030 | |
| | Takeda Pharmaceutical Co. Ltd., Sr. Unsecd. Note, 3.025%, 7/9/2040 | |
| | | |
| | Consumer Non-Cyclical - Supermarkets—0.5% | |
| | Kroger Co., 3.950%, 1/15/2050 | |
| | Kroger Co., Bond, 6.900%, 4/15/2038 | |
| | | |
| | Consumer Non-Cyclical - Tobacco—1.7% | |
| | Altria Group, Inc., Sr. Unsecd. Note, 4.800%, 2/14/2029 | |
| | Altria Group, Inc., Sr. Unsecd. Note, 5.950%, 2/14/2049 | |
| | Bat Capital Corp., Sr. Unsecd. Note, Series WI, 3.557%, 8/15/2027 | |
| | Bat Capital Corp., Sr. Unsecd. Note, Series WI, 4.540%, 8/15/2047 | |
| | Reynolds American, Inc., Sr. Unsecd. Note, 5.850%, 8/15/2045 | |
| | Reynolds American, Inc., Sr. Unsecd. Note, 7.000%, 8/4/2041 | |
| | | |
| | Energy - Independent—1.4% | |
| | Canadian Natural Resources Ltd., Sr. Unsecd. Note, 2.050%, 7/15/2025 | |
| | Canadian Natural Resources Ltd., Sr. Unsecd. Note, 3.800%, 4/15/2024 | |
| | Cimarex Energy Co., Sr. Unsecd. Note, 3.900%, 5/15/2027 | |
| | Cimarex Energy Co., Sr. Unsecd. Note, 4.375%, 3/15/2029 | |
| | Marathon Oil Corp., Sr. Unsecd. Note, 3.850%, 6/1/2025 | |
| | | |
| | | |
| | Husky Energy, Inc., 4.000%, 4/15/2024 | |
| | Husky Energy, Inc., Sr. Unsecd. Note, 4.400%, 4/15/2029 | |
Annual Shareholder Report
| | | |
| | CORPORATE BONDS—continued | |
| | Energy - Integrated—continued | |
| | Petro-Canada, Bond, 5.350%, 7/15/2033 | |
| | Petroleos Mexicanos, Sr. Unsecd. Note, 6.500%, 3/13/2027 | |
| | Suncor Energy, Inc., Sr. Unsecd. Note, 2.800%, 5/15/2023 | |
| | | |
| | | |
| | Boardwalk Pipeline Partners LP, Sr. Unsecd. Note, 3.400%, 2/15/2031 | |
| | Boardwalk Pipeline Partners LP, Sr. Unsecd. Note, 4.800%, 5/3/2029 | |
| | Columbia Pipeline Group, Inc., Sr. Unsecd. Note, 4.500%, 6/1/2025 | |
| | Columbia Pipeline Group, Inc., Sr. Unsecd. Note, 5.800%, 6/1/2045 | |
| | Energy Transfer Operating, Sr. Unsecd. Note, 5.000%, 5/15/2050 | |
| | Energy Transfer Partners LP, Sr. Unsecd. Note, 4.900%, 2/1/2024 | |
| | Energy Transfer Partners LP, Sr. Unsecd. Note, 5.300%, 4/15/2047 | |
| | Energy Transfer Partners LP, Sr. Unsecd. Note, 6.125%, 12/15/2045 | |
| | Enterprise Products Operating LLC, Sr. Unsecd. Note, 3.700%, 1/31/2051 | |
| | Enterprise Products Operating LLC, Sr. Unsecd. Note, 4.250%, 2/15/2048 | |
| | Enterprise Products Operating LLC, Sr. Unsecd. Note, 4.850%, 3/15/2044 | |
| | Kinder Morgan Energy Partners LP, 4.250%, 9/1/2024 | |
| | Kinder Morgan Energy Partners LP, Sr. Unsecd. Note, 6.375%, 3/1/2041 | |
| | Kinder Morgan, Inc., 5.050%, 2/15/2046 | |
| | Kinder Morgan, Inc., Sr. Unsecd. Note, 4.300%, 3/1/2028 | |
| | MPLX LP, Sr. Unsecd. Note, 2.650%, 8/15/2030 | |
| | MPLX LP, Sr. Unsecd. Note, 4.125%, 3/1/2027 | |
| | MPLX LP, Sr. Unsecd. Note, 4.900%, 4/15/2058 | |
| | MPLX LP, Sr. Unsecd. Note, Series WI, 4.250%, 12/1/2027 | |
| | ONEOK, Inc., Sr. Unsecd. Note, 4.950%, 7/13/2047 | |
| | TC Pipelines, LP, Sr. Unsecd. Note, 3.900%, 5/25/2027 | |
| | Texas Eastern Transmission LP, Sr. Unsecd. Note, 144A, 2.800%, 10/15/2022 | |
| | Williams Partners LP, Sr. Unsecd. Note, 3.900%, 1/15/2025 | |
| | Williams Partners LP, Sr. Unsecd. Note, 4.900%, 1/15/2045 | |
| | | |
| | | |
| | Marathon Petroleum Corp., Sr. Unsecd. Note, 3.625%, 9/15/2024 | |
| | Marathon Petroleum Corp., Sr. Unsecd. Note, 6.500%, 3/1/2041 | |
| | Phillips 66, Sr. Unsecd. Note, 1.300%, 2/15/2026 | |
| | Phillips 66, Sr. Unsecd. Note, 4.875%, 11/15/2044 | |
| | Valero Energy Corp., Sr. Unsecd. Note, 4.000%, 4/1/2029 | |
| | Valero Energy Corp., Sr. Unsecd. Note, 4.900%, 3/15/2045 | |
| | | |
| | Financial Institution - Banking—6.1% | |
| | Associated Banc-Corp., Sub. Note, 4.250%, 1/15/2025 | |
| | Bank of America Corp., Sub. Note, Series L, 3.950%, 4/21/2025 | |
| | Bank of America Corp., Sub. Note, Series L, 4.183%, 11/25/2027 | |
| | Bank of America Corp., Sub. Note, Series MTN, 4.000%, 1/22/2025 | |
| | Capital One Financial Corp., Sr. Unsecd. Note, 3.750%, 3/9/2027 | |
| | Capital One Financial Corp., Sr. Unsecd. Note, 3.900%, 1/29/2024 | |
| | Citigroup, Inc., 4.125%, 7/25/2028 | |
| | Citigroup, Inc., 5.500%, 9/13/2025 | |
| | Citigroup, Inc., Sub. Note, 3.875%, 3/26/2025 | |
| | Citizens Financial Group, Inc., Sub. Note, 144A, 2.638%, 9/30/2032 | |
| | Comerica, Inc., 3.800%, 7/22/2026 | |
Annual Shareholder Report
| | | |
| | CORPORATE BONDS—continued | |
| | Financial Institution - Banking—continued | |
| | Compass Bank, Birmingham, Sub. Note, Series BKNT, 3.875%, 4/10/2025 | |
| | Fifth Third Bancorp, Sr. Unsecd. Note, 3.650%, 1/25/2024 | |
| | Fifth Third Bancorp, Sr. Unsecd. Note, 3.950%, 3/14/2028 | |
| | FNB Corp. (PA), Sr. Unsecd. Note, 2.200%, 2/24/2023 | |
| | Goldman Sachs Group, Inc., Sub. Note, 4.250%, 10/21/2025 | |
| | Huntington Bancshares, Inc., Sr. Unsecd. Note, 2.550%, 2/4/2030 | |
| | Morgan Stanley, Sub. Note, 5.000%, 11/24/2025 | |
| | Morgan Stanley, Sub. Note, Series MTN, 4.100%, 5/22/2023 | |
| | Synovus Bank GA, Sr. Unsecd. Note, 2.289%, 2/10/2023 | |
| | Truist Bank, Sub. Note, Series BKNT, 3.300%, 5/15/2026 | |
| | | |
| | Financial Institution - Broker/Asset Mgr/Exchange—1.0% | |
| | Jefferies Group LLC, Sr. Unsecd. Note, 2.750%, 10/15/2032 | |
| | Raymond James Financial, Inc., Sr. Unsecd. Note, 4.650%, 4/1/2030 | |
| | Stifel Financial Corp., 4.250%, 7/18/2024 | |
| | Stifel Financial Corp., Sr. Unsecd. Note, 4.000%, 5/15/2030 | |
| | | |
| | Financial Institution - Finance Companies—1.4% | |
| | Discover Bank, Sr. Unsecd. Note, Series BKNT, 4.650%, 9/13/2028 | |
| | GE Capital Funding LLC, Sr. Unsecd. Note, 144A, 4.400%, 5/15/2030 | |
| | GE Capital International Funding, Inc., Sr. Unsecd. Note, 4.418%, 11/15/2035 | |
| | | |
| | Financial Institution - Insurance - Health—1.0% | |
| | CIGNA Corp., Sr. Unsecd. Note, 3.750%, 7/15/2023 | |
| | CIGNA Corp., Sr. Unsecd. Note, 4.125%, 11/15/2025 | |
| | CIGNA Corp., Sr. Unsecd. Note, 4.900%, 12/15/2048 | |
| | | |
| | Financial Institution - Insurance - Life—1.5% | |
| | American International Group, Inc., 4.500%, 7/16/2044 | |
| | American International Group, Inc., Sr. Unsecd. Note, 4.125%, 2/15/2024 | |
| | American International Group, Inc., Sr. Unsecd. Note, 4.375%, 1/15/2055 | |
| | AXA-UAP, Sub. Note, 8.600%, 12/15/2030 | |
| | Lincoln National Corp., Sr. Note, 7.000%, 6/15/2040 | |
| | Lincoln National Corp., Sr. Unsecd. Note, 3.050%, 1/15/2030 | |
| | MetLife, Inc., Jr. Sub. Note, 10.750%, 8/1/2039 | |
| | Penn Mutual Life Insurance Co., Sr. Note, 144A, 7.625%, 6/15/2040 | |
| | | |
| | Financial Institution - Insurance - P&C—0.9% | |
| | CNA Financial Corp., Sr. Unsecd. Note, 3.900%, 5/1/2029 | |
| | Hartford Financial Services Group, Inc., Sr. Unsecd. Note, 6.625%, 4/15/2042 | |
| | Liberty Mutual Group, Inc., Sr. Unsecd. Note, 144A, 4.250%, 6/15/2023 | |
| | Liberty Mutual Group, Inc., Sr. Unsecd. Note, 144A, 4.569%, 2/1/2029 | |
| | | |
| | Financial Institution - REIT - Apartment—0.8% | |
| | Mid-America Apartment Communities LP, 4.000%, 11/15/2025 | |
| | Mid-America Apartment Communities LP, Sr. Unsecd. Note, 3.750%, 6/15/2024 | |
| | Mid-America Apartment Communities LP, Sr. Unsub. Note, 1.700%, 2/15/2031 | |
| | Post Apartment Homes LP, Sr. Unsecd. Note, 3.375%, 12/1/2022 | |
| | UDR, Inc., Sr. Unsecd. Note, 3.100%, 11/1/2034 | |
| | UDR, Inc., Sr. Unsecd. Note, Series GMTN, 3.500%, 1/15/2028 | |
Annual Shareholder Report
| | | |
| | CORPORATE BONDS—continued | |
| | Financial Institution - REIT - Apartment—continued | |
| | UDR, Inc., Sr. Unsecd. Note, Series MTN, 2.100%, 8/1/2032 | |
| | | |
| | Financial Institution - REIT - Healthcare—1.1% | |
| | Healthcare Trust of America, Sr. Unsecd. Note, 2.000%, 3/15/2031 | |
| | Healthcare Trust of America, Sr. Unsecd. Note, 3.100%, 2/15/2030 | |
| | Physicians Realty Trust, Sr. Unsecd. Note, 3.950%, 1/15/2028 | |
| | Welltower, Inc., Sr. Unsecd. Note, 4.125%, 3/15/2029 | |
| | | |
| | Financial Institution - REIT - Office—0.8% | |
| | Alexandria Real Estate Equities, Inc., Sr. Unsecd. Note, 1.875%, 2/1/2033 | |
| | Alexandria Real Estate Equities, Inc., Sr. Unsecd. Note, 3.950%, 1/15/2027 | |
| | Alexandria Real Estate Equities, Inc., Sr. Unsecd. Note, 3.950%, 1/15/2028 | |
| | Alexandria Real Estate Equities, Inc., Sr. Unsecd. Note, 4.900%, 12/15/2030 | |
| | Boston Properties LP, Sr. Unsecd. Note, 2.900%, 3/15/2030 | |
| | | |
| | Financial Institution - REIT - Other—0.7% | |
| | ProLogis LP, Sr. Unsecd. Note, 4.375%, 2/1/2029 | |
| | WP Carey, Inc., Sr. Unsecd. Note, 2.400%, 2/1/2031 | |
| | WP Carey, Inc., Sr. Unsecd. Note, 3.850%, 7/15/2029 | |
| | WP Carey, Inc., Sr. Unsecd. Note, 4.600%, 4/1/2024 | |
| | | |
| | Financial Institution - REIT - Retail—1.1% | |
| | Kimco Realty Corp., Sr. Unsecd. Note, 2.800%, 10/1/2026 | |
| | Kimco Realty Corp., Sr. Unsecd. Note, 3.400%, 11/1/2022 | |
| | Kimco Realty Corp., Sr. Unsecd. Note, 3.800%, 4/1/2027 | |
| | Regency Centers LP, Sr. Unsecd. Note, 3.700%, 6/15/2030 | |
| | Regency Centers LP, Sr. Unsecd. Note, 4.125%, 3/15/2028 | |
| | Tanger Properties LP, Sr. Unsecd. Note, 3.125%, 9/1/2026 | |
| | Tanger Properties LP, Sr. Unsecd. Note, 3.875%, 12/1/2023 | |
| | | |
| | | |
| | Broadcom, Inc., Sr. Unsecd. Note, 4.110%, 9/15/2028 | |
| | Broadcom, Inc., Sr. Unsecd. Note, 4.150%, 11/15/2030 | |
| | Dell International LLC / EMC Corp., 144A, 4.000%, 7/15/2024 | |
| | Diamond 1 Finance Corp./Diamond 2 Finance Corp., Sr. Secd. Note, 144A, 6.020%, 6/15/2026 | |
| | Equifax, Inc., Sr. Unsecd. Note, 2.600%, 12/1/2024 | |
| | Equifax, Inc., Sr. Unsecd. Note, Series 5Y, 3.950%, 6/15/2023 | |
| | Equifax, Inc., Sr. Unsecd. Note, Series FXD, 3.600%, 8/15/2021 | |
| | Experian Finance PLC., Sr. Unsecd. Note, 144A, 4.250%, 2/1/2029 | |
| | Fidelity National Information Services, Inc., Sr. Unsecd. Note, 3.750%, 5/21/2029 | |
| | Fiserv, Inc., Sr. Unsecd. Note, 3.500%, 7/1/2029 | |
| | Fiserv, Inc., Sr. Unsecd. Note, 3.800%, 10/1/2023 | |
| | Ingram Micro, Inc., Sr. Unsecd. Note, 5.000%, 8/10/2022 | |
| | Ingram Micro, Inc., Sr. Unsecd. Note, 5.450%, 12/15/2024 | |
| | Keysight Technologies, Inc., 4.550%, 10/30/2024 | |
| | Lam Research Corp., Sr. Unsecd. Note, 4.000%, 3/15/2029 | |
| | Micron Technology, Inc., Sr. Unsecd. Note, 4.640%, 2/6/2024 | |
| | Micron Technology, Inc., Sr. Unsecd. Note, 4.975%, 2/6/2026 | |
| | Molex Electronics Technologies LLC, Unsecd. Note, 144A, 3.900%, 4/15/2025 | |
| | Total System Services, Inc., Sr. Unsecd. Note, 4.450%, 6/1/2028 | |
Annual Shareholder Report
| | | |
| | CORPORATE BONDS—continued | |
| | | |
| | Total System Services, Inc., Sr. Unsecd. Note, 4.800%, 4/1/2026 | |
| | Verisk Analytics, Inc., Sr. Unsecd. Note, 4.125%, 9/12/2022 | |
| | Verisk Analytics, Inc., Sr. Unsecd. Note, 4.125%, 3/15/2029 | |
| | | |
| | Transportation - Airlines—0.3% | |
| | Southwest Airlines Co., Sr. Unsecd. Note, 4.750%, 5/4/2023 | |
| | Southwest Airlines Co., Sr. Unsecd. Note, 5.250%, 5/4/2025 | |
| | | |
| | Transportation - Railroads—1.1% | |
| | Canadian Pacific Railway Co., 7.125%, 10/15/2031 | |
| | Canadian Pacific Railway Co., Sr. Unsecd. Note, 2.050%, 3/5/2030 | |
| | Canadian Pacific Railway Co., Sr. Unsecd. Note, 4.450%, 3/15/2023 | |
| | Kansas City Southern Industries, Inc., Sr. Unsecd. Note, 3.000%, 5/15/2023 | |
| | Kansas City Southern Industries, Inc., Sr. Unsecd. Note, 4.700%, 5/1/2048 | |
| | Union Pacific Corp., Sr. Unsecd. Note, 2.400%, 2/5/2030 | |
| | | |
| | Transportation - Services—1.6% | |
| | Enterprise Rent-A-Car USA Finance Co., Sr. Unsecd. Note, 144A, 5.625%, 3/15/2042 | |
| | FedEx Corp., Sr. Unsecd. Note, 3.100%, 8/5/2029 | |
| | FedEx Corp., Sr. Unsecd. Note, 4.050%, 2/15/2048 | |
| | Penske Truck Leasing Co. LP & PTL Finance Corp., Sr. Unsecd. Note, 144A, 3.950%, 3/10/2025 | |
| | Ryder System, Inc., Sr. Unsecd. Note, Series MTN, 2.900%, 12/1/2026 | |
| | Ryder System, Inc., Sr. Unsecd. Note, Series MTN, 3.400%, 3/1/2023 | |
| | | |
| | | |
| | AEP Texas, Inc., Sr. Unsecd. Note, 3.850%, 10/1/2025 | |
| | Ameren Corp., Sr. Unsecd. Note, 3.650%, 2/15/2026 | |
| | American Electric Power Co., Inc., Sr. Unsecd. Note, Series F, 2.950%, 12/15/2022 | |
| | Appalachian Power Co., Sr. Unsecd. Note, 7.000%, 4/1/2038 | |
| | Black Hills Corp., Sr. Unsecd. Note, 2.500%, 6/15/2030 | |
| | Dominion Energy, Inc., Jr. Sub. Note, 3.071%, 8/15/2024 | |
| | Dominion Energy, Inc., Sr. Unsecd. Note, 4.250%, 6/1/2028 | |
| | Duke Energy Corp., Sr. Unsecd. Note, 2.650%, 9/1/2026 | |
| | EDP Finance BV, Sr. Unsecd. Note, 144A, 1.710%, 1/24/2028 | |
| | EDP Finance BV, Sr. Unsecd. Note, 144A, 3.625%, 7/15/2024 | |
| | Emera US Finance LP, Sr. Unsecd. Note, 4.750%, 6/15/2046 | |
| | Enel Finance International NV, Sr. Unsecd. Note, 144A, 4.625%, 9/14/2025 | |
| | Enel Finance International NV, Sr. Unsecd. Note, 144A, 4.875%, 6/14/2029 | |
| | Exelon Corp., Sr. Unsecd. Note, 3.950%, 6/15/2025 | |
| | Exelon Corp., Sr. Unsecd. Note, 4.700%, 4/15/2050 | |
| | FirstEnergy Transmission LLC, Sr. Unsecd. Note, 144A, 4.550%, 4/1/2049 | |
| | Fortis, Inc. / Canada, Sr. Unsecd. Note, 3.055%, 10/4/2026 | |
| | National Rural Utilities Cooperative Finance Corp., Sr. Sub. Note, 5.250%, 4/20/2046 | |
| | NextEra Energy Capital Holdings, Inc., Sr. Unsecd. Note, 3.550%, 5/1/2027 | |
| | NiSource Finance Corp., Sr. Unsecd. Note, 3.950%, 3/30/2048 | |
| | NiSource Finance Corp., Sr. Unsecd. Note, 4.375%, 5/15/2047 | |
| | Northeast Utilities, Sr. Unsecd. Note, Series H, 3.150%, 1/15/2025 | |
| | PPL Capital Funding, Inc., Sr. Unsecd. Note, 3.950%, 3/15/2024 | |
| | PPL WEM Holdings PLC, Sr. Unsecd. Note, 144A, 5.375%, 5/1/2021 | |
Annual Shareholder Report
| | | |
| | CORPORATE BONDS—continued | |
| | Utility - Electric—continued | |
| | Southern Co., Jr. Sub. Note, Series B, 4.000%, 1/15/2051 | |
| | | |
| | Utility - Natural Gas—1.9% | |
| | Dominion Energy Gas Holdings LLC, Sr. Unsecd. Note, Series B, 3.000%, 11/15/2029 | |
| | Dominion Energy Gas Holdings LLC, Sr. Unsecd. Note, Series C, 3.900%, 11/15/2049 | |
| | Enbridge Energy Partners LP, 5.875%, 10/15/2025 | |
| | Enbridge Energy Partners LP, Sr. Unsecd. Note, 5.500%, 9/15/2040 | |
| | Enbridge, Inc., Sr. Unsecd. Note, 3.125%, 11/15/2029 | |
| | National Fuel Gas Co., Sr. Unsecd. Note, 3.750%, 3/1/2023 | |
| | National Fuel Gas Co., Sr. Unsecd. Note, 3.950%, 9/15/2027 | |
| | National Fuel Gas Co., Sr. Unsecd. Note, 4.900%, 12/1/2021 | |
| | National Fuel Gas Co., Sr. Unsecd. Note, 5.500%, 1/15/2026 | |
| | Sempra Energy, Sr. Unsecd. Note, 3.400%, 2/1/2028 | |
| | Sempra Energy, Sr. Unsecd. Note, 3.550%, 6/15/2024 | |
| | Sempra Energy, Sr. Unsecd. Note, 4.000%, 2/1/2048 | |
| | Southern Natural Gas, Sr. Unsecd. Note, 144A, 4.800%, 3/15/2047 | |
| | | |
| | Utility - Natural Gas Distributor—0.1% | |
| | The East Ohio Gas Company, Sr. Unsecd. Note, 144A, 3.000%, 6/15/2050 | |
| | TOTAL CORPORATE BONDS
(IDENTIFIED COST $117,555,730) | |
| | FOREIGN GOVERNMENTS/AGENCIES—4.0% | |
| | | |
| | Colombia, Government of, Sr. Unsecd. Note, 3.000%, 1/30/2030 | |
| | Colombia, Government of, Sr. Unsecd. Note, 3.875%, 4/25/2027 | |
| | Colombia, Government of, Sr. Unsecd. Note, 4.500%, 3/15/2029 | |
| | Mexico, Government of, 3.750%, 1/11/2028 | |
| | Mexico, Government of, Series MTN, 4.750%, 3/8/2044 | |
| | Mexico, Government of, Series MTNA, 6.750%, 9/27/2034 | |
| | Mexico, Government of, Sr. Unsecd. Note, 3.250%, 4/16/2030 | |
| | Mexico, Government of, Sr. Unsecd. Note, 3.600%, 1/30/2025 | |
| | Mexico, Government of, Sr. Unsecd. Note, 4.500%, 1/31/2050 | |
| | Mexico, Government of, Sr. Unsecd. Note, 4.500%, 4/22/2029 | |
| | Peru, Government of, 6.550%, 3/14/2037 | |
| | TOTAL FOREIGN GOVERNMENTS/AGENCIES
(IDENTIFIED COST $5,149,954) | |
| | REPURCHASE AGREEMENT—2.2% | |
| | Interest in $1,000,000,000 joint repurchase agreement 0.08%, dated 12/31/2020 under which Bank of Montreal will repurchase securities provided as collateral for $1,000,008,889 on 1/4/2021. The securities provided as collateral at the end of the period held with BNY Mellon as tri-party agent, were U.S. Government Agency and U.S. Treasury securities with various maturities to 5/20/2069 and the market value of those underlying securities was $1,022,038,963.
(IDENTIFIED COST $3,247,000) | |
| | | |
| | Federated Hermes Government Obligations Fund, Premier Shares, 0.01%3
(IDENTIFIED COST $700,235) | |
| | TOTAL INVESTMENT IN SECURITIES—99.6%
(IDENTIFIED COST $126,652,919)4 | |
| | OTHER ASSETS AND LIABILITIES - NET—0.4%5 | |
| | | |
Annual Shareholder Report
At December 31, 2020, the Fund had the following outstanding futures contracts:
| | | | Value and
Unrealized
Appreciation
(Depreciation) |
| | | | |
6U.S. Treasury Notes 2-Year Long Futures | | | | |
6U.S. Treasury Ultra Bond Long Futures | | | | |
| | | | |
6U.S. Treasury Notes 10-Year Short Futures | | | | |
NET UNREALIZED DEPRECIATION ON FUTURES CONTRACTS | |
Net Unrealized Depreciation on Futures Contracts is included in “Other Assets and Liabilities—Net.”
Affiliated fund holdings are investment companies which are managed by the Adviser or an affiliate of the Adviser. Transactions with the affiliated fund holdings during the period ended December 31, 2020, were as follows:
| Federated Hermes
Government
Obligations Fund,
Premier Shares* |
| |
| |
| |
Change in Unrealized Appreciation/Depreciation | |
| |
| |
Shares Held as of 12/31/2020 | |
| |
| All or a portion of the balance/activity for the fund relates to cash collateral received on securities lending transactions. |
| All or a portion of these securities are temporarily on loan to unaffiliated broker/dealers. |
| Floating/variable note with current rate and current maturity or next reset date shown. |
| |
| Also represents cost for federal tax purposes. |
| Assets, other than investments in securities, less liabilities. See Statement of Assets and Liabilities. |
| Non-income-producing security. |
Note: The categories of investments are shown as a percentage of total net assets at December 31, 2020.
Various inputs are used in determining the value of the Fund’s investments. These inputs are summarized in the three broad levels listed below:
Level 1—quoted prices in active markets for identical securities.
Level 2—other significant observable inputs (including quoted prices for similar securities, interest rates, prepayment speeds, credit risk, etc.). Also includes securities valued at amortized cost.
Level 3—significant unobservable inputs (including the Fund’s own assumptions in determining the fair value of investments).
The inputs or methodology used for valuing securities are not an indication of the risk associated with investing in those securities.
Annual Shareholder Report
The following is a summary of the inputs used, as of December 31, 2020, in valuing the Fund’s assets carried at fair value:
|
| | Level 2—
Other
Significant
Observable
Inputs | Level 3—
Significant
Unobservable
Inputs | |
| | | | |
| | | | |
Foreign Governments/Agencies | | | | |
| | | | |
| | | | |
| | | | |
Other Financial Instruments:1 | | | | |
| | | | |
| | | | |
TOTAL OTHER FINANCIAL INSTRUMENTS | | | | |
| Other financial instruments are futures contracts. |
The following acronym(s) are used throughout this portfolio: | |
| |
| |
| —London Interbank Offered Rate |
| |
| —Real Estate Investment Trust |
See Notes which are an integral part of the Financial Statements
Annual Shareholder Report
Financial Highlights
(For a Share Outstanding Throughout Each Period)
| |
| | | | | |
Net Asset Value, Beginning of Period | | | | | |
Income From Investment Operations: | | | | | |
Net investment income (loss) | | | | | |
Net realized and unrealized gain (loss) | | | | | |
TOTAL FROM INVESTMENT OPERATIONS | | | | | |
| | | | | |
Distributions from net investment income | | | | | |
Distributions from net realized gain | | | | | |
| | | | | |
Net Asset Value, End of Period | | | | | |
| | | | | |
Ratios to Average Net Assets: | | | | | |
| | | | | |
| | | | | |
Expense waiver/reimbursement4 | | | | | |
| | | | | |
Net assets, end of period (000 omitted) | | | | | |
| | | | | |
| Based on net asset value. |
| Federated Investment Management Company (the “Adviser”) has contractually agreed to reimburse all operating expenses, excluding extraordinary expenses, incurred by the Fund. |
| Amount does not reflect net expenses incurred by investment companies in which the Fund may invest. |
| This expense decrease is reflected in both the net expense and the net investment income ratios shown above. Amount does not reflect expense waiver/ reimbursement recorded by investment companies in which the Fund may invest. |
See Notes which are an integral part of the Financial Statements
Annual Shareholder Report
Statement of Assets and LiabilitiesDecember 31, 2020
| |
Investment in securities, at value including $681,912 of securities loaned and $700,235 of investments in an affiliated holding* (identified cost $126,652,919) | |
| |
| |
| |
Receivable for shares sold | |
Receivable for variation margin on futures contracts | |
| |
| |
Payable for shares redeemed | |
Payable for collateral due to broker for securities lending | |
Income distribution payable | |
Payable to adviser (Note 5) | |
Payable for administrative fee (Note 5) | |
Payable for portfolio accounting fees | |
Accrued expenses (Note 5) | |
| |
Net assets for 11,609,815 shares outstanding | |
| |
| |
Total distributable earnings (loss) | |
| |
Net Asset Value, Offering Price and Redemption Proceeds Per Share: | |
$143,775,389 ÷ 11,609,815 shares outstanding, no par value, unlimited shares authorized | |
| See information listed after the Fund’s Portfolio of Investments. |
See Notes which are an integral part of the Financial Statements
Annual Shareholder Report
Statement of OperationsYear Ended December 31, 2020
| |
| |
Net income on securities loaned (includes $18,792 earned from affiliated holdings related to cash collateral balances (Note 2)*) | |
| |
| |
Administrative fee (Note 5) | |
| |
| |
Directors’/Trustees’ fees (Note 5) | |
| |
| |
Portfolio accounting fees | |
| |
| |
| |
| |
| |
Waivers and Reimbursement: | |
Waivers/reimbursement of other operating expenses (Notes 2 and 5) | |
| |
| |
Realized and Unrealized Gain (Loss) on Investments and Futures Contracts: | |
Net realized gain on investments | |
Net realized loss on futures contracts | |
Net change in unrealized appreciation of investments | |
Net change in unrealized appreciation of futures contracts | |
Net realized and unrealized gain (loss) on investments and futures contracts | |
Change in net assets resulting from operations | |
| See information listed after the Fund’s Portfolio of Investments. |
See Notes which are an integral part of the Financial Statements
Annual Shareholder Report
Statement of Changes in Net Assets
| | |
Increase (Decrease) in Net Assets | | |
| | |
Net investment income (loss) | | |
| | |
Net change in unrealized appreciation/depreciation | | |
CHANGE IN NET ASSETS RESULTING FROM OPERATIONS | | |
Distributions to Shareholders | | |
| | |
Proceeds from sale of shares | | |
Net asset value of shares issued to shareholders in payment of distributions declared | | |
| | |
CHANGE IN NET ASSETS RESULTING FROM SHARE TRANSACTIONS | | |
| | |
| | |
| | |
| | |
See Notes which are an integral part of the Financial Statements
Annual Shareholder Report
Notes to Financial Statements
December 31, 2020
1. ORGANIZATION
Federated Hermes Managed Pool Series (the “Trust”) is registered under the Investment Company Act of 1940, as amended (the “Act”), as an open-end management investment company. The Trust consists of five portfolios. The financial statements included herein are only those of Federated Hermes Corporate Bond Strategy Portfolio (the “Fund”), a diversified portfolio. The financial statements of the other portfolios are presented separately. The assets of each portfolio are segregated and a shareholder’s interest is limited to the portfolio in which shares are held. Each portfolio pays its own expenses. The investment objective of the Fund is to provide total return.
Prior to June 29, 2020, the names of the Trust and Fund were Federated Managed Pool Series and Federated Corporate Bond Strategy Portfolio, respectively.
2. SIGNIFICANT ACCOUNTING POLICIES
The following is a summary of significant accounting policies consistently followed by the Fund in the preparation of its financial statements. These policies are in conformity with U.S. generally accepted accounting principles (GAAP).
Investment Valuation
In calculating its net asset value (NAV), the Fund generally values investments as follows:
■
Fixed-income securities are fair valued using price evaluations provided by a pricing service approved by the Fund’s Board of Trustees (the “Trustees”).
■
Shares of other mutual funds or non-exchange-traded investment companies are valued based upon their reported NAVs.
■
Derivative contracts listed on exchanges are valued at their reported settlement or closing price, except that options are valued at the mean of closing bid and asked quotations.
■
Over-the-counter (OTC) derivative contracts are fair valued using price evaluations provided by a pricing service approved by the Trustees.
■
For securities that are fair valued in accordance with procedures established by and under the general supervision of the Trustees, certain factors may be considered, such as: the last traded or purchase price of the security, information obtained by contacting the issuer or dealers, analysis of the issuer’s financial statements or other available documents, fundamental analytical data, the nature and duration of restrictions on disposition, the movement of the market in which the security is normally traded, public trading in similar securities or derivative contracts of the issuer or comparable issuers, movement of a relevant index, or other factors including but not limited to industry changes and relevant government actions.
If any price, quotation, price evaluation or other pricing source is not readily available when the NAV is calculated, if the Fund cannot obtain price evaluations from a pricing service or from more than one dealer for an investment within a reasonable period of time as set forth in the Fund’s valuation policies and procedures, or if information furnished by a pricing service, in the opinion of the valuation committee (“Valuation Committee”), is deemed not representative of the fair value of such security, the Fund uses the fair value of the investment determined in accordance with the procedures described below. There can be no assurance that the Fund could obtain the fair value assigned to an investment if it sold the investment at approximately the time at which the Fund determines its NAV per share, and the actual value obtained could be materially different.
Fair Valuation and Significant Events Procedures
The Trustees have ultimate responsibility for determining the fair value of investments for which market quotations are not readily available. The Trustees have appointed a Valuation Committee comprised of officers of the Fund, the Adviser and certain of the Adviser’s affiliated companies to assist in determining fair value and in overseeing the calculation of the NAV. The Trustees have also authorized the use of pricing services recommended by the Valuation Committee to provide fair value evaluations of the current value of certain investments for purposes of calculating the NAV. The Valuation Committee employs various methods for reviewing third-party pricing-service evaluations including periodic reviews of third-party pricing services’ policies, procedures and valuation methods (including key inputs, methods, models and assumptions), transactional back-testing, comparisons of evaluations of different pricing services, and review of price challenges by the Adviser based on recent market activity. In the event that market quotations and price evaluations are not available for an investment, the Valuation Committee determines the fair value of the investment in accordance with procedures adopted by the Trustees. The Trustees periodically review and approve the fair valuations made by the Valuation Committee and any changes made to the procedures.
Factors considered by pricing services in evaluating an investment include the yields or prices of investments of comparable quality, coupon, maturity, call rights and other potential prepayments, terms and type, reported transactions, indications as to values from dealers and general market conditions. Some pricing services provide a single price evaluation reflecting the bid-side of the market for an investment (a “bid” evaluation). Other pricing services offer both bid evaluations and price evaluations indicative of a price between the prices bid and asked for the investment (a “mid” evaluation). The Fund normally uses bid evaluations for any U.S. Treasury and Agency securities, mortgage-backed securities and municipal securities. The Fund normally uses mid evaluations for any other types of fixed-income securities and any OTC derivative contracts. In the event that market quotations and price evaluations are not available for an investment, the fair value of the investment is determined in accordance with procedures adopted by the Trustees.
The Trustees also have adopted procedures requiring an investment to be priced at its fair value whenever the Adviser determines that a significant event affecting the value of the investment has occurred between the time as of which the price of the investment would otherwise be determined and the time as of which the NAV is computed. An event is considered significant if there is both an affirmative expectation that the investment’s value will change in response to the event and a reasonable basis for quantifying the resulting change in value. Examples of significant events that may occur after the close of the principal market on which a security is traded, or after the time of a price evaluation provided by a pricing service or a dealer, include:
■
With respect to securities traded principally in foreign markets, significant trends in U.S. equity markets or in the trading of foreign securities index futures contracts;
Annual Shareholder Report
■
Political or other developments affecting the economy or markets in which an issuer conducts its operations or its securities are traded;
■
Announcements concerning matters such as acquisitions, recapitalizations, litigation developments, or a natural disaster affecting the issuer’s operations or regulatory changes or market developments affecting the issuer’s industry.
The Trustees have adopted procedures whereby the Valuation Committee uses a pricing service to provide factors to update the fair value of equity securities traded principally in foreign markets from the time of the close of their respective foreign stock exchanges to the pricing time of the Fund. For other significant events, the Fund may seek to obtain more current quotations or price evaluations from alternative pricing sources. If a reliable alternative pricing source is not available, the Fund will determine the fair value of the investment in accordance with the fair valuation procedures approved by the Trustees. The Trustees have ultimate responsibility for any fair valuations made in response to a significant event.
Repurchase Agreements
The Fund may invest in repurchase agreements for short-term liquidity purposes. It is the policy of the Fund to require the other party to a repurchase agreement to transfer to the Fund’s custodian or sub-custodian eligible securities or cash with a market value (after transaction costs) at least equal to the repurchase price to be paid under the repurchase agreement. The eligible securities are transferred to accounts with the custodian or sub-custodian in which the Fund holds a “securities entitlement” and exercises “control” as those terms are defined in the Uniform Commercial Code. The Fund has established procedures for monitoring the market value of the transferred securities and requiring the transfer of additional eligible securities if necessary to equal at least the repurchase price. These procedures also allow the other party to require securities to be transferred from the account to the extent that their market value exceeds the repurchase price or in exchange for other eligible securities of equivalent market value.
The insolvency of the other party or other failure to repurchase the securities may delay the disposition of the underlying securities or cause the Fund to receive less than the full repurchase price. Under the terms of the repurchase agreement, any amounts received by the Fund in excess of the repurchase price and related transaction costs must be remitted to the other party.
The Fund may enter into repurchase agreements in which eligible securities are transferred into joint trading accounts maintained by the custodian or sub-custodian for investment companies and other clients advised by the Adviser and its affiliates. The Fund will participate on a pro rata basis with the other investment companies and clients in its share of the securities transferred under such repurchase agreements and in its share of proceeds from any repurchase or other disposition of such securities.
Repurchase agreements are subject to Master Netting Agreements which are agreements between the Fund and its counterparties that provide for the net settlement of all transactions and collateral with the Fund, through a single payment, in the event of default or termination. Amounts presented on the Portfolio of Investments and Statement of Assets and Liabilities are not net settlement amounts but gross. As indicated above, the cash or securities to be repurchased, as shown on the Portfolio of Investments, exceeds the repurchase price to be paid under the agreement reducing the net settlement amount to zero.
Investment Income, Gains and Losses, Expenses and Distributions
Investment transactions are accounted for on a trade-date basis. Realized gains and losses from investment transactions are recorded on an identified-cost basis. Interest income and expenses are accrued daily. Dividend income and distributions to shareholders are recorded on the ex-dividend date. Distributions of net investment income, if any, are declared daily and paid monthly. Non-cash dividends included in dividend income, if any, are recorded at fair value. Amortization/accretion of premium and discount is included in investment income. Gains and losses realized on principal payment of mortgage-backed securities (paydown gains and losses) are classified as part of investment income. The detail of the total fund expense reimbursement of $319,816 is disclosed in Note 5.
Federal Taxes
It is the Fund’s policy to comply with the Subchapter M provision of the Internal Revenue Code (the “Code”) and to distribute to shareholders each year substantially all of its income. Accordingly, no provision for federal income tax is necessary. As of and during the year ended December 31, 2020, the Fund did not have a liability for any uncertain tax positions. The Fund recognizes interest and penalties, if any, related to tax liabilities as income tax expense in the Statement of Operations. As of December 31, 2020, tax years 2017 through 2020 remain subject to examination by the Fund’s major tax jurisdictions, which include the United States of America and the Commonwealth of Massachusetts.
When-Issued and Delayed-Delivery Transactions
The Fund may engage in when-issued or delayed-delivery transactions. The Fund records when-issued securities on the trade date and maintains security positions such that sufficient liquid assets will be available to make payment for the securities purchased. Securities purchased on a when-issued or delayed-delivery basis are marked to market daily and begin earning interest on the settlement date. Losses may occur on these transactions due to changes in market conditions or the failure of counterparties to perform under the contract.
Futures Contracts
The Fund purchases and sells financial futures contracts to manage duration risk and yield curve risk. Upon entering into a financial futures contract with a broker, the Fund is required to deposit with a broker, either U.S. government securities or a specified amount of cash, which is shown as due from broker in the Statement of Assets and Liabilities. Futures contracts are valued daily and unrealized gains or losses are recorded in a “variation margin” account. The Fund receives from or pays to the broker a specified amount of cash based upon changes in the variation margin account. When a contract is closed, the Fund recognizes a realized gain or loss. Futures contracts have market risks, including the risk that the change in the value of the contract may not correlate with the changes in the value of the underlying securities. There is minimal counterparty risk to the Fund since futures contracts are exchange traded and the exchange’s clearinghouse, as counterparty to all exchange traded futures contracts, guarantees the futures contracts against default.
Futures contracts outstanding at period end are listed after the Fund’s Portfolio of Investments.
The average notional value of long and short futures contracts held by the Fund throughout the period was $17,267,344 and $6,642,728, respectively. This is based on amounts held as of each month-end throughout the fiscal period.
Annual Shareholder Report
Securities Lending
The Fund participates in a securities lending program providing for the lending of corporate bonds and government securities to qualified brokers. The term of the loans within the program is one year or less. The Fund normally receives cash collateral for securities loaned that may be invested in affiliated money market funds, other money market instruments and/or repurchase agreements. Investments in money market funds may include funds with a “floating” NAV that can impose redemption fees and liquidity gates, impose certain operational impediments to investing cash collateral, and, if the investee fund’s NAV decreases, result in the Fund recognizing losses and being required to cover the decrease in the value of the cash collateral. Collateral is maintained at a minimum level of 100% of the market value of investments loaned, plus interest, if applicable. In accordance with the Fund’s securities lending agreement, the market value of securities on loan is determined each day at the close of business and any additional collateral required to cover the value of securities on loan is delivered to the Fund on the next business day. Earnings on collateral are allocated between the borrower of the security, the securities lending agent, as a fee for its services under the program and the Fund, according to agreed-upon rates. The Fund will not have the right to vote on securities while they are on loan. However, the Fund will attempt to terminate a loan in an effort to reacquire the securities in time to vote on matters that are deemed to be material by the Adviser. There can be no assurance that the Fund will have sufficient notice of such matters to be able to terminate the loan in time to vote thereon.
Securities lending transactions are subject to Master Netting Agreements which are agreements between the Fund and its counterparties that provide for the net settlement of all transactions and collateral with the Fund, through a single payment, in the event of default or termination. Amounts presented on the Portfolio of Investments and Statement of Assets and Liabilities are not net settlement amounts but gross. As indicated below, the cash collateral received by the Fund exceeds the market value of the securities loaned reducing the net settlement amount to zero. The chart below identifies the amount of collateral received as well as the market value of securities on loan. Additionally, the securities lending agreement executed by the Fund includes an indemnification clause. This clause stipulates that the borrower will reimburse the Fund for any losses as a result of any failure of the borrower to return equivalent securities to the Fund.
As of December 31, 2020, securities subject to this type of arrangement and related collateral were as follows:
Market Value of
Securities Loaned | |
| |
Restricted Securities
The Fund may purchase securities which are considered restricted. Restricted securities are securities that either: (a) cannot be offered for public sale without first being registered, or being able to take advantage of an exemption from registration, under the Securities Act of 1933; or (b) are subject to contractual restrictions on public sales. In some cases, when a security cannot be offered for public sale without first being registered, the issuer of the restricted security has agreed to register such securities for resale, at the issuer’s expense, either upon demand by the Fund or in connection with another registered offering of the securities. Many such restricted securities may be resold in the secondary market in transactions exempt from registration. Restricted securities may be determined to be liquid under criteria established by the Trustees. The Fund will not incur any registration costs upon such resales. The Fund’s restricted securities, like other securities, are priced in accordance with procedures established by and under the general supervision of the Trustees.
Additional Disclosure Related to Derivative Instruments
Fair Value of Derivative Instruments |
| |
| Statement of
Assets and
Liabilities
Location | |
Derivatives not accounted for as hedging
instruments under ASC Topic 815 | | |
| Receivable for variation
margin on futures contracts | |
| Includes cumulative net depreciation of futures contracts as reported in the footnotes to the Portfolio of Investments. Only the current day’s variation margin is reported within the Statement of Assets and Liabilities. |
The Effect of Derivative Instruments on the Statement of Operations for the Year Ended December 31, 2020
Amount of Realized Gain or (Loss) on Derivatives Recognized in Income |
| |
| |
Change in Unrealized Appreciation or (Depreciation) on Derivatives Recognized in Income |
| |
| |
Annual Shareholder Report
Other
The preparation of financial statements in conformity with GAAP requires management to make estimates and assumptions that affect the amounts of assets, liabilities, expenses and revenues reported in the financial statements. Actual results could differ materially from those estimated. The Fund applies investment company accounting and reporting guidance.
3. SHARES OF BENEFICIAL INTEREST
The following table summarizes share activity:
| | |
| | |
Shares issued to shareholders in payment of distributions declared | | |
| | |
NET CHANGE RESULTING FROM FUND SHARE TRANSACTIONS | | |
4. FEDERAL TAX INFORMATION
The tax character of distributions as reported on the Statement of Changes in Net Assets for the years ended December 31, 2020 and 2019, was as follows:
As of December 31, 2020, the components of distributable earnings on a tax-basis were as follows:
Undistributed ordinary income | |
Net unrealized appreciation | |
Undistributed long-term capital gains | |
The difference between book-basis and tax-basis net unrealized appreciation is attributable to the differing treatments for mark-to-market on futures contracts.
At December 31, 2020, the cost of investments for federal tax purposes was $126,652,919. The net unrealized appreciation of investments for federal tax purposes was $16,607,225. This consists of net unrealized appreciation from investments for those securities having an excess of value over cost of $16,632,737 and net unrealized depreciation from investments for those securities having an excess of cost over value of $25,512. The amounts presented are inclusive of derivative contracts.
The Fund used capital loss carryforwards of $235,812 to offset capital gains realized during the year ended December 31, 2020.
5. INVESTMENT ADVISER FEE AND OTHER TRANSACTIONS WITH AFFILIATES
Investment Adviser Fee
The Adviser provides investment adviser services at no fee because all eligible investors are: (1) in separately managed or wrap fee programs, who often pay a single aggregate fee to the wrap program sponsor for all costs and expenses of the wrap-fee programs; or (2) in certain other separately managed accounts and discretionary investment accounts; or (3) to the extent permitted under applicable law, other Federated Hermes funds. The Adviser has contractually agreed to reimburse all expenses of the Fund, excluding extraordinary expenses. Acquired fund fees and expenses are not direct obligations of the Fund and are not contractual reimbursements under the investment advisory contract. For the year ended December 31, 2020, the Adviser reimbursed $319,816 of operating expenses.
Administrative Fee
Federated Administrative Services (FAS), under the Administrative Services Agreement, provides the Fund with administrative personnel and services. For purposes of determining the appropriate rate breakpoint, “Investment Complex” is defined as all of the Federated Hermes Funds subject to a fee under the Administrative Services Agreement. The fee paid to FAS is based on the average daily net assets of the Investment Complex as specified below:
| Average Daily Net Assets
of the Investment Complex |
| on assets up to $50 billion |
| on assets over $50 billion |
FAS may voluntarily choose to waive any portion of its fee. For the year ended December 31, 2020, the annualized fee paid to FAS was 0.079% of average daily net assets of the Fund.
In addition, FAS may charge certain out-of-pocket expenses to the Fund. For the year ended December 31, 2020, the Fund’s Adviser reimbursed the Fund for any fee paid to FAS.
Annual Shareholder Report
Interfund Transactions
During the year ended December 31, 2020, the Fund engaged in sale transactions with funds that have a common investment adviser (or affiliated investment advisers), common Directors/Trustees and/or common Officers. These sale transactions complied with Rule 17a-7 under the Act and amounted to $762,500. Net realized loss recognized on these transactions was $239,529.
Directors’/Trustees’ and Miscellaneous Fees
Certain Officers and Trustees of the Fund are Officers and Directors or Trustees of certain of the above companies. To efficiently facilitate payment, Independent Directors’/Trustees’ fees and certain expenses related to conducting meetings of the Directors/Trustees and other miscellaneous expenses are paid by an affiliate of the Adviser which in due course are reimbursed by the Fund. These expenses related to conducting meetings of the Directors/Trustees and other miscellaneous expenses may be included in Accrued and Miscellaneous Expenses on the Statement of Assets and Liabilities and Statement of Operations, respectively.
6. INVESTMENT TRANSACTIONS
Purchases and sales of investments, excluding long-term U.S. government securities and short-term obligations, for the year ended December 31, 2020, were as follows:
7. LINE OF CREDIT
The Fund participates with certain other Federated Hermes Funds, on a several basis, in an up to $500,000,000 unsecured, 364-day, committed, revolving line of credit (LOC) agreement dated June 24, 2020. The LOC was made available to temporarily finance the repurchase or redemption of shares of the Fund, failed trades, payment of dividends, settlement of trades and for other short-term, temporary or emergency general business purposes. The Fund cannot borrow under the LOC if an inter-fund loan is outstanding. The Fund’s ability to borrow under the LOC also is subject to the limitations of the Act and various conditions precedent that must be satisfied before the Fund can borrow. Loans under the LOC are charged interest at a fluctuating rate per annum equal to the highest, on any day, of (a) (i) the federal funds effective rate, (ii) the one month London Interbank Offered Rate (LIBOR), or a replacement rate as appropriate, and (iii) 0.0%, plus (b) a margin. Any fund eligible to borrow under the LOC pays its pro rata share of an upfront fee, and its pro rata share of a commitment fee based on the amount of the lenders’ commitment that has not been utilized, quarterly in arrears and at maturity. As of December 31, 2020, the Fund had no outstanding loans. During the year ended December 31, 2020, the Fund did not utilize the LOC.
8. INTERFUND LENDING
Pursuant to an Exemptive Order issued by the Securities and Exchange Commission, the Fund, along with other funds advised by subsidiaries of Federated Hermes, Inc., may participate in an interfund lending program. This program provides an alternative credit facility allowing the Fund to borrow from other participating affiliated funds. As of December 31, 2020, there were no outstanding loans. During the year ended December 31, 2020, the program was not utilized.
9. OTHER MATTERS
An outbreak of respiratory disease caused by a novel coronavirus was first detected in China in late 2019 and subsequently spread globally. As of the date of the issuance of these financial statements, this coronavirus has resulted in closing borders, enhanced health screenings, healthcare service preparation and delivery, quarantines, cancellations, and disruptions to supply chains, workflow operations and consumer activity, as well as general concern and uncertainty. The impact of this coronavirus may be short-term or may last for an extended period of time and has resulted in a substantial economic downturn. Health crises caused by outbreaks, such as the coronavirus outbreak, may exacerbate other pre-existing political, social and economic risks. The impact of this outbreak, and other epidemics and pandemics that may arise in the future, could continue to negatively affect the worldwide economy, as well as the economies of individual countries, individual companies (including certain Fund service providers and issuers of the Fund’s investments) and the markets in general in significant and unforeseen ways. Any such impact could adversely affect the Fund’s performance.
10. FEDERAL TAX INFORMATION (UNAUDITED)
For the year ended December 31, 2020, the amount of long-term capital gains designated by the Fund was $66,513.
For the fiscal year ended December 31, 2020, 83.25% of dividends paid by the Fund are interest-related dividends, as provided by the American Jobs Creation Act of 2004.
Annual Shareholder Report
Report of Independent Registered Public Accounting Firm
TO THE SHAREHOLDERS AND THE BOARD OF TRUSTEES OF FEDERATED HERMES CORPORATE BOND STRATEGY PORTFOLIO:
Opinion on the Financial Statements
We have audited the accompanying statement of assets and liabilities of Federated Hermes Corporate Bond Strategy Portfolio (formerly, Federated Corporate Bond Strategy Portfolio) (the “Fund”) (one of the portfolios constituting the Federated Hermes Managed Pool Series (formerly, Federated Managed Pool Series) (the “Trust”)), including the portfolio of investments, as of December 31, 2020, and the related statement of operations for the year then ended, the statement of changes in net assets for each of the two years in the period then ended, the financial highlights for each of the five years in the period then ended and the related notes (collectively referred to as the “financial statements”). In our opinion, the financial statements present fairly, in all material respects, the financial position of the Fund (one of the portfolios constituting the Federated Hermes Managed Pool Series (formerly, Federated Managed Pool Series)) at December 31, 2020, the results of its operations for the year then ended, the changes in its net assets for each of the two years in the period then ended and its financial highlights for each of the five years in the period then ended, in conformity with U.S. generally accepted accounting principles.
Basis for Opinion
These financial statements are the responsibility of the Trust’s management. Our responsibility is to express an opinion on the Fund’s financial statements based on our audits. We are a public accounting firm registered with the Public Company Accounting Oversight Board (United States) (“PCAOB”) and are required to be independent with respect to the Trust in accordance with the U.S. federal securities laws and the applicable rules and regulations of the Securities and Exchange Commission and the PCAOB.
We conducted our audits in accordance with standards of the PCAOB. Those standards require that we plan and perform the audit to obtain reasonable assurance about whether the financial statements are free of material misstatement, whether due to error or fraud. The Trust is not required to have, nor were we engaged to perform, an audit of the Trust’s internal control over financial reporting. As part of our audits, we are required to obtain an understanding of internal control over financial reporting, but not for the purpose of expressing an opinion on the effectiveness of the Trust’s internal control over financial reporting. Accordingly, we express no such opinion.
Our audits included performing procedures to assess the risks of material misstatement of the financial statements, whether due to error or fraud, and performing procedures that respond to those risks. Such procedures included examining, on a test basis, evidence regarding the amounts and disclosures in the financial statements. Our procedures included confirmation of securities owned as of December 31, 2020, by correspondence with the custodian and others, or by other appropriate auditing procedures where replies from others were not received. Our audits also included evaluating the accounting principles used and significant estimates made by management, as well as evaluating the overall presentation of the financial statements. We believe that our audits provide a reasonable basis for our opinion. 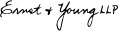
We have served as the auditor of one or more Federated Hermes investment companies since 1979.
Boston, Massachusetts
February 22, 2021
Annual Shareholder Report
Shareholder Expense Example (unaudited)
As a shareholder of the Fund, you incur ongoing costs, including to the extent applicable, management fees, distribution (12b-1) fees and/or other service fees and other Fund expenses. This Example is intended to help you to understand your ongoing costs (in dollars) of investing in the Fund and to compare these costs with the ongoing costs of investing in other mutual funds. It is based on an investment of $1,000 invested at the beginning of the period and held for the entire period from July 1, 2020 to December 31, 2020.
ACTUAL EXPENSES
The first section of the table below provides information about actual account values and actual expenses. You may use the information in this section, together with the amount you invested, to estimate the expenses that you incurred over the period. Simply divide your account value by $1,000 (for example, an $8,600 account value divided by $1,000 = 8.6), then multiply the result by the number in the first section under the heading entitled “Expenses Paid During Period” to estimate the expenses attributable to your investment during this period.
HYPOTHETICAL EXAMPLE FOR COMPARISON PURPOSES
The second section of the table below provides information about hypothetical account values and hypothetical expenses based on the Fund’s actual expense ratio and an assumed rate of return of 5% per year before expenses, which is not the Fund’s actual return. Thus, you should not use the hypothetical account values and expenses to estimate the actual ending account balance or your expenses for the period. Rather, these figures are required to be provided to enable you to compare the ongoing costs of investing in the Fund with other funds. To do so, compare this 5% hypothetical example with the 5% hypothetical examples that appear in the shareholder reports of the other funds.
Please note that the expenses shown in the table are meant to highlight your ongoing costs only. Therefore, the second section of the table is useful in comparing ongoing costs only, and will not help you determine the relative total costs of owning different funds.
| Beginning
Account Value
7/1/2020 | Ending
Account Value
12/31/2020 | Expenses Paid
During Period1 |
| | | |
Hypothetical (assuming a 5% return before expenses) | | | |
| Expenses are equal to the Fund’s annualized net expense ratio of 0.00%, multiplied by the average account value over the period, multiplied by 184/366 (to reflect the one-half-year period). The Adviser has contractually agreed to reimburse all operating expenses, excluding extraordinary expenses, incurred by the Fund. |
Annual Shareholder Report
Board of Trustees and Trust Officers
The Board of Trustees is responsible for managing the Trust’s business affairs and for exercising all the Trust’s powers except those reserved for the shareholders. The following tables give information about each Trustee and the senior officers of the Fund. Where required, the tables separately list Trustees who are “interested persons” of the Fund (i.e., “Interested” Trustees) and those who are not (i.e., “Independent” Trustees). Unless otherwise noted, the address of each person listed is 1001 Liberty Avenue, Pittsburgh, PA 15222-3779. The address of all Independent Trustees listed is 4000 Ericsson Drive, Warrendale, PA 15086-7561; Attention: Mutual Fund Board. As of December 31, 2020, the Trust comprised five portfolio(s), and the Federated Hermes Fund Family consisted of 41 investment companies (comprising 163 portfolios). Unless otherwise noted, each Officer is elected annually. Unless otherwise noted, each Trustee oversees all portfolios in the Federated Hermes Fund Family and serves for an indefinite term. The Fund’s Statement of Additional Information includes additional information about Trust Trustees and is available, without charge and upon request, by calling 1-800-341-7400.
Interested Trustees Background
Name
Birth Date
Positions Held with Trust
Date Service Began | Principal Occupation(s) for Past Five Years,
Other Directorships Held and Previous Position(s) |
J. Christopher Donahue*
Birth Date: April 11, 1949
President and Trustee
Indefinite Term
Began serving:
October 2005 | Principal Occupations: Principal Executive Officer and President of certain of the Funds in the Federated Hermes Fund Family; Director or Trustee of the Funds in the Federated Hermes Fund Family; President, Chief Executive Officer and Director, Federated Hermes, Inc.; Chairman and Trustee, Federated Investment Management Company; Trustee, Federated Investment Counseling; Chairman and Director, Federated Global Investment Management Corp.; Chairman and Trustee, Federated Equity Management Company of Pennsylvania; Trustee, Federated Shareholder Services Company; Director, Federated Services Company.
Previous Positions: President, Federated Investment Counseling; President and Chief Executive Officer, Federated Investment Management Company, Federated Global Investment Management Corp. and Passport Research, Ltd; Chairman, Passport Research, Ltd. |
John B. Fisher*
Birth Date: May 16, 1956
Trustee
Indefinite Term
Began serving: May 2016 | Principal Occupations: Principal Executive Officer and President of certain of the Funds in the Federated Hermes Fund Family; Director or Trustee of certain of the Funds in the Federated Hermes Fund Family; Vice President, Federated Hermes, Inc.; President, Director/Trustee and CEO, Federated Advisory Services Company, Federated Equity Management Company of Pennsylvania, Federated Global Investment Management Corp., Federated Investment Counseling, Federated Investment Management Company; President of some of the Funds in the Federated Hermes Fund Family and Director, Federated Investors Trust Company.
Previous Positions: President and Director of the Institutional Sales Division of Federated Securities Corp.; President and Director of Federated Investment Counseling; President and CEO of Passport Research, Ltd.; Director, Edgewood Securities Corp.; Director, Federated Services Company; Director, Federated Hermes, Inc.; Chairman and Director, Southpointe Distribution Services, Inc. and President, Technology, Federated Services Company. |
*
Reasons for “interested” status: J. Christopher Donahue and John B. Fisher are interested due to their beneficial ownership of shares of Federated Hermes, Inc. and due to positions they hold with Federated Hermes, Inc. and its subsidiaries.
INDEPENDENT Trustees Background
Name
Birth Date
Positions Held with Trust
Date Service Began | Principal Occupation(s) for Past Five Years,
Other Directorships Held, Previous Position(s) and Qualifications |
John T. Collins
Birth Date: January 24, 1947
Trustee
Indefinite Term
Began serving:
October 2013 | Principal Occupations: Director or Trustee, and Chair of the Board of Directors or Trustees, of the Federated Hermes Fund Family; formerly, Chairman and CEO, The Collins Group, Inc. (a private equity firm) (Retired).
Other Directorships Held: Chairman of the Board of Directors, Director, KLX Energy Services Holdings, Inc. (oilfield services); former Director of KLX Corp. (aerospace).
Qualifications: Mr. Collins has served in several business and financial management roles and directorship positions throughout his career. Mr. Collins previously served as Chairman and CEO of The Collins Group, Inc. (a private equity firm) and as a Director of KLX Corp. Mr. Collins serves as Chairman Emeriti, Bentley University. Mr. Collins previously served as Director and Audit Committee Member, Bank of America Corp.; Director, FleetBoston Financial Corp.; and Director, Beth Israel Deaconess Medical Center (Harvard University Affiliate Hospital). |
Annual Shareholder Report
Name Birth Date Positions Held with Trust Date Service Began | Principal Occupation(s) for Past Five Years, Other Directorships Held, Previous Position(s) and Qualifications |
G. Thomas Hough
Birth Date: February 28, 1955
Trustee
Indefinite Term
Began serving: August 2015 | Principal Occupations: Director or Trustee, Chair of the Audit Committee of the Federated Hermes Fund Family; formerly, Vice Chair, Ernst & Young LLP (public accounting firm) (Retired).
Other Directorships Held: Director, Chair of the Audit Committee, Equifax, Inc.; Director, Member of the Audit Committee, Haverty Furniture Companies, Inc.; formerly, Director, Member of Governance and Compensation Committees, Publix Super Markets, Inc.
Qualifications: Mr. Hough has served in accounting, business management and directorship positions throughout his career. Mr. Hough most recently held the position of Americas Vice Chair of Assurance with Ernst & Young LLP (public accounting firm). Mr. Hough serves on the President’s Cabinet and Business School Board of Visitors for the University of Alabama. Mr. Hough previously served on the Business School Board of Visitors for Wake Forest University, and he previously served as an Executive Committee member of the United States Golf Association. |
Maureen Lally-Green
Birth Date: July 5, 1949
Trustee
Indefinite Term
Began serving: August 2009 | Principal Occupations: Director or Trustee of the Federated Hermes Fund Family; Adjunct Professor Emerita of Law, Duquesne University School of Law; formerly, Dean of the Duquesne University School of Law and Professor of Law and Interim Dean of the Duquesne University School of Law; formerly, Associate General Secretary and Director, Office of Church Relations, Diocese of Pittsburgh.
Other Directorships Held: Director, CNX Resources Corporation (formerly known as CONSOL Energy Inc.).
Qualifications: Judge Lally-Green has served in various legal and business roles and directorship positions throughout her career. Judge Lally-Green previously held the position of Dean of the School of Law of Duquesne University (as well as Interim Dean). Judge Lally-Green previously served as a member of the Superior Court of Pennsylvania and as a Professor of Law, Duquesne University School of Law. Judge Lally-Green was appointed by the Supreme Court of Pennsylvania to serve on the Supreme Court’s Board of Continuing Judicial Education and the Supreme Court’s Appellate Court Procedural Rules Committee. Judge Lally-Green also currently holds the positions on not for profit or for profit boards of directors as follows: Director and Chair, UPMC Mercy Hospital; Regent, Saint Vincent Seminary; Member, Pennsylvania State Board of Education (public); Director, Catholic Charities, Pittsburgh; and Director CNX Resources Corporation (formerly known as CONSOL Energy Inc.). Judge Lally-Green has held the positions of: Director, Auberle; Director, Epilepsy Foundation of Western and Central Pennsylvania; Director, Ireland Institute of Pittsburgh; Director, Saint Thomas More Society; Director and Chair, Catholic High Schools of the Diocese of Pittsburgh, Inc.; Director, Pennsylvania Bar Institute; Director, St. Vincent College; Director and Chair, North Catholic High School, Inc.; and Director and Vice Chair, Our Campaign for the Church Alive!, Inc. |
Thomas M. O’Neill
Birth Date: June 14, 1951
Trustee
Indefinite Term
Began serving: August 2006 | Principal Occupations: Director or Trustee of the Federated Hermes Fund Family; Sole Proprietor, Navigator Management Company (investment and strategic consulting).
Other Directorships Held: None.
Qualifications: Mr. O’Neill has served in several business, mutual fund and financial management roles and directorship positions throughout his career. Mr. O’Neill serves as Director, Medicines for Humanity and Director, The Golisano Children’s Museum of Naples, Florida. Mr. O’Neill previously served as Chief Executive Officer and President, Managing Director and Chief Investment Officer, Fleet Investment Advisors; President and Chief Executive Officer, Aeltus Investment Management, Inc.; General Partner, Hellman, Jordan Management Co., Boston, MA; Chief Investment Officer, The Putnam Companies, Boston, MA; Credit Analyst and Lending Officer, Fleet Bank; Director and Consultant, EZE Castle Software (investment order management software); and Director, Midway Pacific (lumber). |
Madelyn A. Reilly
Birth Date: February 2, 1956
Trustee
Indefinite Term
Began serving:
November 2020 | Principal Occupations: Director or Trustee of the Federated Hermes Fund Family; Senior Vice President for Legal Affairs, General Counsel and Secretary of the Board of Trustees, Duquesne University.
Other Directorships Held: None.
Qualifications: Ms. Reilly has served in various business and legal management roles throughout her career. Ms. Reilly previously served as Director of Risk Management and Associate General Counsel, Duquesne University. Prior to her work at Duquesne University, Ms. Reilly served as Assistant General Counsel of Compliance and Enterprise Risk as well as Senior Counsel of Environment, Health and Safety, PPG Industries. |
P. Jerome Richey
Birth Date: February 23, 1949
Trustee
Indefinite Term
Began serving:
October 2013 | Principal Occupations: Director or Trustee of the Federated Hermes Fund Family; Management Consultant; Retired; formerly, Senior Vice Chancellor and Chief Legal Officer, University of Pittsburgh and Executive Vice President and Chief Legal Officer, CONSOL Energy Inc. (now split into two separate publicly traded companies known as CONSOL Energy Inc. and CNX Resources Corp.).
Other Directorships Held: None.
Qualifications: Mr. Richey has served in several business and legal management roles and directorship positions throughout his career. Mr. Richey most recently held the positions of Senior Vice Chancellor and Chief Legal Officer, University of Pittsburgh. Mr. Richey previously served as Chairman of the Board, Epilepsy Foundation of Western Pennsylvania and Chairman of the Board, World Affairs Council of Pittsburgh. Mr. Richey previously served as Chief Legal Officer and Executive Vice President, CONSOL Energy Inc. and CNX Gas Company; and Board Member, Ethics Counsel and Shareholder, Buchanan Ingersoll & Rooney PC (a law firm). |
Annual Shareholder Report
Name Birth Date Positions Held with Trust Date Service Began | Principal Occupation(s) for Past Five Years, Other Directorships Held, Previous Position(s) and Qualifications |
John S. Walsh
Birth Date:
November 28, 1957
Trustee
Indefinite Term
Began serving: November 2005 | Principal Occupations: Director or Trustee of the Federated Hermes Fund Family; President and Director, Heat Wagon, Inc. (manufacturer of construction temporary heaters); President and Director, Manufacturers Products, Inc. (distributor of portable construction heaters); President, Portable Heater Parts, a division of Manufacturers Products, Inc.
Other Directorships Held: None.
Qualifications: Mr. Walsh has served in several business management roles and directorship positions throughout his career. Mr. Walsh previously served as Vice President, Walsh & Kelly, Inc. (paving contractors). |
OFFICERS
Name
Birth Date
Address
Positions Held with Trust
Date Service Began | Principal Occupation(s) for Past Five Years
and Previous Position(s) |
Lori A. Hensler
Birth Date: January 6, 1967
TREASURER
Officer since: April 2013 | Principal Occupations: Principal Financial Officer and Treasurer of the Federated Hermes Fund Family; Senior Vice President, Federated Administrative Services; Financial and Operations Principal for Federated Securities Corp.; and Assistant Treasurer, Federated Investors Trust Company. Ms. Hensler has received the Certified Public Accountant designation.
Previous Positions: Controller of Federated Hermes, Inc.; Senior Vice President and Assistant Treasurer, Federated Investors Management Company; Treasurer, Federated Investors Trust Company; Assistant Treasurer, Federated Administrative Services, Federated Administrative Services, Inc., Federated Securities Corp., Edgewood Services, Inc., Federated Advisory Services Company, Federated Equity Management Company of Pennsylvania, Federated Global Investment Management Corp., Federated Investment Counseling, Federated Investment Management Company, Passport Research, Ltd., and Federated MDTA, LLC; Financial and Operations Principal for Federated Securities Corp., Edgewood Services, Inc. and Southpointe Distribution Services, Inc. |
Peter J. Germain
Birth Date:
September 3, 1959
CHIEF LEGAL OFFICER, SECRETARY and EXECUTIVE VICE PRESIDENT
Officer since: October 2005 | Principal Occupations: Mr. Germain is Chief Legal Officer, Secretary and Executive Vice President of the Federated Hermes Fund Family. He is General Counsel, Chief Legal Officer, Secretary and Executive Vice President, Federated Hermes, Inc.; Trustee and Senior Vice President, Federated Investors Management Company; Trustee and President, Federated Administrative Services; Director and President, Federated Administrative Services, Inc.; Director and Vice President, Federated Securities Corp.; Director and Secretary, Federated Private Asset Management, Inc.; Secretary, Federated Shareholder Services Company; and Secretary, Retirement Plan Service Company of America. Mr. Germain joined Federated Hermes, Inc. in 1984 and is a member of the Pennsylvania Bar Association.
Previous Positions: Deputy General Counsel, Special Counsel, Managing Director of Mutual Fund Services, Federated
Hermes, Inc.; Senior Vice President, Federated Services Company; and Senior Corporate Counsel, Federated Hermes, Inc. |
Stephen Van Meter
Birth Date: June 5, 1975
CHIEF COMPLIANCE OFFICER AND SENIOR VICE PRESIDENT
Officer since: July 2015 | Principal Occupations: Senior Vice President and Chief Compliance Officer of the Federated Hermes Fund Family; Vice President and Chief Compliance Officer of Federated Hermes, Inc. and Chief Compliance Officer of certain of its subsidiaries. Mr. Van Meter joined Federated Hermes, Inc. in October 2011. He holds FINRA licenses under Series 3, 7, 24 and 66.
Previous Positions: Mr. Van Meter previously held the position of Compliance Operating Officer, Federated Hermes, Inc. Prior to joining Federated Hermes, Inc., Mr. Van Meter served at the United States Securities and Exchange Commission in the positions of Senior Counsel, Office of Chief Counsel, Division of Investment Management and Senior Counsel, Division of Enforcement. |
Robert J. Ostrowski
Birth Date: April 26, 1963
Chief Investment Officer
Officer since: September 2006 | Principal Occupations: Robert J. Ostrowski joined Federated Hermes, Inc. in 1987 as an Investment Analyst and became a Portfolio Manager in 1990. He was named Chief Investment Officer of Federated Hermes’ taxable fixed-income products in 2004 and also serves as a Senior Portfolio Manager. Mr. Ostrowski became an Executive Vice President of the Fund’s Adviser in 2009 and served as a Senior Vice President of the Fund’s Adviser from 1997 to 2009. Mr. Ostrowski has received the Chartered Financial Analyst designation. He received his M.S. in Industrial Administration from Carnegie Mellon University. |
Stephen F. Auth
Birth Date: September 13, 1956
101 Park Avenue
41st Floor
New York, NY 10178
CHIEF INVESTMENT OFFICER
Officer since: February 2015 | Principal Occupations: Stephen F. Auth is Chief Investment Officer of various Funds in the Federated Hermes Fund Family; Executive Vice President, Federated Investment Counseling, Federated Global Investment Management Corp. and Federated Equity Management Company of Pennsylvania.
Previous Positions: Executive Vice President, Federated Investment Management Company and Passport Research, Ltd. (investment advisory subsidiary of Federated); Senior Vice President, Global Portfolio Management Services Division; Senior Vice President, Federated Investment Management Company and Passport Research, Ltd.; Senior Managing Director and Portfolio Manager, Prudential Investments. |
Annual Shareholder Report
Evaluation and Approval of Advisory Contract–May 2020
Federated Corporate Bond Strategy Portfolio (the “Fund”)
(EFFECTIVE CLOSE OF BUSINESS ON JUNE 26, 2020, THE FUND’S NAME CHANGED TO FEDERATED HERMES CORPORATE BOND STRATEGY PORTFOLIO)
At its meetings in May 2020 (the “May Meetings”), the Fund’s Board of Trustees (the “Board”), including a majority of those Trustees who are not “interested persons” of the Fund, as defined in the Investment Company Act of 1940 (the “Independent Trustees”), reviewed and unanimously approved the continuation of the investment advisory contract between the Fund and Federated Investment Management Company (the “Adviser”) (the “Contract”) for an additional one-year term. The Board’s determination to approve the continuation of the Contract reflects the exercise of its business judgment after considering all of the information and factors believed to be relevant and appropriate on whether to continue the existing arrangements. The information, factors and conclusions that formed the basis for the Board’s approval are summarized below.
The Fund is distinctive in that it is used to implement particular investment strategies that are offered to investors in certain separately managed or wrap fee accounts or programs, or certain other discretionary investment accounts, and may also be offered to other funds (each, a “Federated Hermes Fund”) advised by the Adviser or its affiliates (collectively, “Federated Hermes”).
In addition, the Board considered that the Adviser does not charge an investment advisory fee for its services, although Federated Hermes may receive compensation for managing assets invested in the Fund.
Information Received and Review Process
At the request of the Independent Trustees, the Fund’s Chief Compliance Officer (the “CCO”) furnished to the Board in advance of its May Meetings an independent written evaluation presenting on the topics discussed below. The Board considered the CCO’s independent written evaluation (the “CCO Fee Evaluation Report”), along with other information, in evaluating the reasonableness of the Fund’s management fee and in determining to approve the continuation of the Contract. The CCO, in preparing the CCO Fee Evaluation Report, has the authority to retain consultants, experts or staff as reasonably necessary to assist in the performance of his duties, reports directly to the Board, and can be terminated only with the approval of a majority of the Independent Trustees. At the request of the Independent Trustees, the CCO Fee Evaluation Report followed the same general approach and covered the same topics as that of the report that had previously been delivered by the CCO in his capacity as “Senior Officer” prior to the elimination of the Senior Officer position in December 2017.
In addition to the extensive materials that comprise and accompany the CCO Fee Evaluation Report, in the months preceding the May Meetings, the Board requested and reviewed written responses and supporting materials prepared by the Adviser or its affiliates (collectively, “Federated Hermes”) in response to requests posed to Federated Hermes on behalf of the Independent Trustees encompassing a wide variety of topics. The Board also considered such additional matters as the Independent Trustees deemed reasonably necessary to evaluate the Contract, which included detailed information about the Fund and Federated Hermes furnished to the Board at its meetings throughout the year and in between regularly scheduled meetings on particular matters as the need arose, as well as information specifically prepared in connection with the approval of the continuation of the Contract that was presented at the May Meetings.
The Board’s consideration of the Contract included review of materials and information covering the following matters, among others: the Adviser’s and sub-adviser’s investment philosophy, revenue, profitability, personnel and processes; investment and operating strategies; the Fund’s short-term and long-term performance (in absolute terms, both on a gross basis and net of expenses, and relative to the Fund’s particular investment program and a group of its peer funds and/or its benchmark, as appropriate) and comments on the reasons for the Fund’s performance; the Fund’s investment objectives; the Fund’s expenses, including the advisory fee and the overall expense structure of the Fund, with due regard for contractual or voluntary expense limitations (if any); the use and allocation of brokerage commissions derived from trading the Fund’s portfolio securities (if any); and the nature, quality and extent of the advisory and other services provided to the Fund by the Adviser and its affiliates. The Board also considered the preferences and expectations of Fund shareholders; the entrepreneurial and other risks assumed by the Adviser in sponsoring and managing the Fund; the continuing state of competition in the mutual fund industry and market practices; the range of comparable fees for similar funds in the mutual fund industry; the Fund’s relationship to the other funds advised by Federated Hermes (each, a “Federated Hermes Fund”), which include a comprehensive array of funds with different investment objectives, policies and strategies which are generally available for exchange without the incurrence of additional sales charges; compliance and audit reports concerning the Federated Hermes Funds and the Federated Hermes’ affiliates that service them (including communications from regulatory agencies), as well as Federated Hermes’ responses to any issues raised therein; and relevant developments in the mutual fund industry and how the Federated Hermes Funds and/or Federated Hermes may be responding to them. In addition, the Board received and considered information furnished by Federated
Annual Shareholder Report
Hermes on the impacts of the coronavirus (COVID-19) outbreak on Federated Hermes generally and the Fund in particular, including, among other information, the current and anticipated impacts on the management, operations and performance of the Fund. The Board noted that its evaluation process is evolutionary and that the criteria considered and the emphasis placed on relevant criteria may change in recognition of changing circumstances in the mutual fund marketplace.
The Board also considered judicial decisions concerning allegedly excessive investment advisory fees in determining to approve the Contract. Using these judicial decisions as a guide, the Board observed that the following factors may be relevant to an adviser’s fiduciary duty with respect to its receipt of compensation from a fund: (1) the nature and quality of the services provided by an adviser to a fund and its shareholders (including the performance of the fund, its benchmark, and comparable funds); (2) an adviser’s cost of providing the services (including the profitability to an adviser of providing advisory services to a fund); (3) the extent to which an adviser may realize “economies of scale” as a fund grows larger and, if such economies of scale exist, whether they have been shared with a fund and its shareholders or the family of funds; (4) any “fall-out” financial benefits that accrue to an adviser because of its relationship with a fund (including research services received from brokers that execute fund trades and any fees paid to affiliates of an adviser for services rendered to a fund); (5) comparative fee and expense structures (including a comparison of fees paid to an adviser with those paid by similar funds both internally and externally as well as management fees charged to institutional and other advisory clients of the adviser for what might be viewed as like services); and (6) the extent of care, conscientiousness and independence with which the fund’s board members perform their duties and their expertise (including whether they are fully informed about all facts the board deems relevant to its consideration of an adviser’s services and fees). The Board noted that the Securities and Exchange Commission (“SEC”) disclosure requirements regarding the basis for a fund board’s approval of the fund’s investment advisory contracts generally align with the factors listed above. The Board was aware of these factors and was guided by them in its review of the Contract to the extent it considered them to be appropriate and relevant, as discussed further below.
The Board considered and weighed these factors in light of its substantial accumulated experience in governing the Fund and working with Federated Hermes on matters relating to the Federated Hermes Funds. While individual members of the Board may have weighed certain factors differently, the Board’s determination to continue the Contract was based on a comprehensive consideration of all information provided to the Board throughout the year and specifically with respect to the continuation of the Contract. The Independent Trustees were assisted throughout the evaluation process by independent legal counsel. In connection with their deliberations at the May Meetings, the Independent Trustees met separately in executive session with their independent legal counsel and without management present to review the relevant materials and consider their responsibilities under applicable laws. In addition, senior management representatives of Federated Hermes also met with the Independent Trustees and their independent legal counsel to discuss the materials and presentations furnished to the Board at the May Meetings. The Board considered the approval of the Contract for the Fund as part of its consideration of agreements for funds across the Federated Hermes Funds family, but its approvals were made on a fund-by-fund basis.
Nature, Extent and Quality of Services
The Board considered the nature, extent and quality of the services provided to the Fund by the Adviser and the resources of the Adviser and its affiliates dedicated to the Fund. In this regard, the Board evaluated, among other things, the Adviser’s personnel, experience and track record, as well as the financial resources and overall reputation of Federated Hermes and its willingness to invest in personnel and infrastructure that benefit the Federated Hermes Funds. The Board noted the significant acquisition of Hermes Fund Managers Limited by Federated Hermes in 2018, which has deepened the organization’s investment management expertise and capabilities and expanded the investment process for all of the Federated Hermes Funds to incorporate environmental, social and governance (“ESG”) factors and issuer engagement on ESG matters.
In addition, the Board reviewed the qualifications, backgrounds and responsibilities of the portfolio management team primarily responsible for the day-to-day management of the Fund and the Adviser’s ability and experience in attracting and retaining qualified personnel to service the Fund. The Board noted the compliance program of the Adviser and the compliance-related resources devoted by the Adviser and its affiliates in support of the Fund’s obligations pursuant to Rule 38a-1 under the Investment Company Act of 1940, including the Adviser’s commitment to respond to rulemaking and other regulatory initiatives of the SEC such as the liquidity risk management program rules. In addition, the Board considered the response by the Adviser to recent market conditions and considered the overall performance of the Adviser in this context. The Fund’s ability to deliver competitive performance when compared to its benchmark index was also deemed to be relevant by the Board as a useful indicator of how the Adviser is executing the Fund’s investment program. The Adviser’s ability to execute this program was one of the Board’s considerations in reaching a conclusion that the nature, extent and quality of the Adviser’s investment management and related services warrant the continuation of the Contract.
Annual Shareholder Report
Fund Investment Performance
For the one-year, three-year and five-year periods ended December 31, 2019, the Fund outperformed its benchmark index.
Following such evaluation, and full deliberations, the Board concluded that the performance of the Fund supported renewal of the Contract.
Fund Expenses
The Board considered that the Adviser does not charge an investment advisory fee to this Fund for its services. However, the Board considered the compensation and benefits received by the Adviser, including fees received for services provided to the Fund by Federated Hermes and research services received by the Adviser from brokers that execute trades for other Federated Hermes Funds.
Because the Adviser does not charge the Fund an investment advisory fee, the Board does not consider fee comparisons to other mutual funds or other institutional or separate accounts to be relevant to its deliberations.
Profitability and Other Benefits
The Board also received financial information about Federated Hermes, including information regarding the compensation and ancillary (or “fall-out”) benefits Federated Hermes derived from its relationships with the Federated Hermes Funds. As the Adviser does not charge an investment advisory fee for its services, this information generally covered fees received by Federated Hermes’ affiliates for providing other services to the Federated Hermes Funds under separate contracts (e.g., for serving as the Federated Hermes Funds’ administrator and distributor). In this regard, the Board considered that certain of Federated Hermes’ affiliates provide distribution and shareholder services to the Federated Hermes Funds, for which they may be compensated through distribution and servicing fees paid pursuant to Rule 12b-1 plans or otherwise. The Board also received and considered information detailing any indirect benefit Federated Hermes may derive from its receipt of research services from brokers who execute portfolio trades for the Federated Hermes Funds. In addition, the Board considered the fact that, in order for the Federated Hermes Funds to be competitive in the marketplace, the Adviser and its affiliates frequently waived fees and/or reimbursed expenses and have disclosed to Federated Hermes Fund shareholders and/or reported to the Board their intention to do so in the future. Moreover, the Board received and considered regular reports from Federated Hermes throughout the year as to the institution, adjustment or elimination of these voluntary waivers and/or reimbursements. The Board considered Federated Hermes’ previous reductions in contractual management fees to certain Federated Hermes Funds during the prior year, including in response to the CCO’s recommendations in the prior year’s CCO Fee Evaluation Report.
The Board also reviewed information compiled by Federated Hermes comparing its profitability information to other publicly held fund management companies, including information regarding profitability trends over time. The Board considered the CCO’s conclusion that, based on such profitability information, Federated Hermes’ profit margins did not appear to be excessive. The Board also considered the CCO’s view that Federated Hermes appeared financially sound, with the resources necessary to fulfill its obligations under its contracts with the Federated Hermes Funds.
Economies of Scale
Because of the unusual nature of the Fund as primarily an internal product with no advisory fee, the Board does not consider the assessment of whether economies of scale would be realized if the Fund were to grow to a sufficient size to be particularly relevant.
Conclusions
The Board considered the CCO’s conclusion that his observations and the information accompanying the CCO Fee Evaluation Report show that the management fee for the Fund was reasonable and the CCO’s recommendation that the Board approve the management fee. The Board noted that, under these circumstances, no changes were recommended to, and no objection was raised to the continuation of, the Contract by the CCO. The CCO also recognized that the Board’s evaluation of the Federated Hermes Funds’ advisory and subadvisory arrangements is a continuing and on-going process that is informed by the information that the Board requests and receives from management throughout the course of the year and, in this regard, the CCO noted certain items for future reporting to the Board or further consideration by management as the Board continues its on-going oversight of the Federated Hermes Funds.
The Board based its determination to approve the Contract on the totality of the circumstances and relevant factors and with a view to past and future long-term considerations. Not all of the factors and considerations identified above were necessarily deemed to be relevant to the Fund, nor did the Board consider any one of them to be determinative. With respect to the factors that were deemed to be relevant, the Board’s determination to approve the continuation of the Contract reflects its view that Federated Hermes’ performance and actions provided a satisfactory basis to support the determination to continue the existing arrangement.
Annual Shareholder Report
Liquidity Risk Management Program–
Annual Evaluation of Adequacy and Effectiveness
In accordance with Rule 22e-4 under the Investment Company Act of 1940, as amended (the “Liquidity Rule”), Federated Hermes Managed Pool Series (the “Trust”) has adopted and implemented a liquidity risk management program (the “Program”) for Federated Hermes Corporate Bond Strategy Portfolio (the “Fund” and, collectively with the Federated Hermes funds, the “Federated Hermes Funds”). The Program seeks to assess and manage the Fund’s liquidity risk. “Liquidity risk” is defined under the Liquidity Rule as the risk that the Fund is unable to meet redemption requests without significantly diluting remaining investors’ interests in the Fund. The Board of Trustees of the Trust (the “Board”) has approved the designation of the Fund’s investment adviser as the administrator for the Program for the Fund. Each affiliated Federated Hermes advisory subsidiary (including the Fund’s investment adviser) that serves as investment adviser to a Federated Hermes Fund (including the Fund) has been approved as the administrator of the Program for each Federated Hermes Fund they manage (each an “Administrator”). The Administrator in turn has delegated daily responsibility for the administration of the Program to multiple Liquidity Risk Management Committees (the “Committees”). The Committees, which are comprised of representatives of Enterprise Risk Management, Compliance, Investment Management and Trading, must review and assess certain information related to the liquidity of the Federated Hermes Funds, including the Fund.
The Program is comprised of various components designed to support the assessment and/or management of liquidity risk, including: (1) the periodic assessment (no less frequently than annually) of certain factors that influence the Fund’s liquidity risk; (2) the periodic classification (no less frequently than monthly) of the Fund’s investments into one of four liquidity categories that reflect an estimate of their liquidity under current market conditions; (3) a 15% limit on the acquisition of “illiquid investments” (as defined under the Liquidity Rule); (4) to the extent a Fund does not invest primarily in “highly liquid investments” (as defined under the Liquidity Rule), the determination of a minimum percentage of the Fund’s assets that generally will be invested in highly liquid investments (an “HLIM”); (5) if a Fund has established an HLIM, the periodic review (no less frequently than annually) of the HLIM and the adoption of policies and procedures for responding to a shortfall of the Fund’s highly liquid investments below its HLIM; and (6) periodic reporting to the Board.
At its meetings in May 2020, the Board received and reviewed a written report (the “Report”) from the Federated Hermes Funds’ Chief Compliance Officer and Chief Risk Officer, on behalf of the Administrator, concerning the operation of the Program for the period from the Program’s inception on December 1, 2018 through March 31, 2020 (the “Period”). The Report addressed the operation of the Program and assessed its adequacy and effectiveness, including, where applicable, the operation of any HLIM established for a Federated Hermes Fund and each Federated Hermes Fund’s access to other available funding sources such as the Federated Hermes Funds’ interfund lending facility, redemptions in-kind and committed lines of credit. There were no material changes to the Program during the Period. The Report summarized the operation of the Program and the information and factors considered by the Administrator in assessing whether the Program has been adequately and effectively implemented with respect to the Federated Hermes Funds. Such information and factors included, among other things:
■ confirmation that the Fund did not utilize alternative funding sources during the Period;
■ the periodic classifications of the Fund’s investments into one of four liquidity categories and the methodologies and inputs used to classify the investments, including the Fund’s reasonably anticipated trade size;
■ the analysis received from a third-party liquidity assessment vendor that is taken into account in the process of determining the liquidity classifications of the Fund’s investments and the results of an evaluation of the services performed by the vendor in support of this process;
■ the fact that the Fund invested primarily in highly liquid investments during the Period and, therefore, was not required to establish, and has not established, an HLIM and the procedures for monitoring the status of the Fund as investing primarily in highly liquid investments;
■ the fact that the Fund invested no more than 15% of its assets in illiquid investments during the Period and the procedures for monitoring this limit; and
■ liquidity events during the Period, including the impact on liquidity caused by extended non-U.S. market closures and the market disruptions resulting from the novel coronavirus outbreak, and the fact that there were no specific liquidity events during the Period that materially affected the Fund’s liquidity risk.
Based on this review, the Fund’s investment adviser, in its role as Administrator, collectively with the other investment advisers to the Federated Hermes Funds, concluded that the Program is operating effectively to assess and manage the Fund’s liquidity risk, and that the Program has been and continues to be adequately and effectively implemented to monitor and, as applicable, respond to the Fund’s liquidity developments.
Annual Shareholder Report
Voting Proxies on Fund Portfolio Securities
A description of the policies and procedures that the Fund uses to determine how to vote proxies, if any, relating to securities held in the Fund’s portfolio, as well as a report on “Form N-PX” of how the Fund voted any such proxies during the most recent 12-month period ended June 30, are available, without charge and upon request, by calling 1-800-341-7400. A report on “Form N-PX” of how the Fund voted any such proxies during the most recent 12-month period ended June 30 is available via the Proxy Voting Record Report (Form N-PX) link associated with the Fund at FederatedInvestors.com/FundInformation. Select a product name, then click “Documents” and click on “Proxy Voting Record Report.” Form N-PX filings are also available at the SEC’s website at sec.gov.
Quarterly Portfolio Schedule
Each fiscal quarter, the Fund will file with the SEC a complete schedule of its monthly holds on “Form N-PORT.” The Fund’s holdings as of the end of the third month of every fiscal quarter, as reported on Form N-PORT, will be publicly available on the SEC’s website at sec.gov within 60 days of the end of the fiscal quarter upon filing. You may also access this information at FederatedInvestors.com. Select a product name, then click “Documents” and select “Form N-PORT.”
Annual Shareholder Report
Mutual funds are not bank deposits or obligations, are not guaranteed by any bank and are not insured or guaranteed by the U.S. government, the Federal Deposit Insurance Corporation, the Federal Reserve Board or any other government agency. Investment in mutual funds involves investment risk, including the possible loss of principal.
This Report is authorized for distribution to prospective investors only when preceded or accompanied by the Fund’s Prospectus, which contains facts concerning its objective and policies, management fees, expenses and other information. 
Federated Hermes Corporate Bond Strategy Portfolio
Federated Hermes Funds
4000 Ericsson Drive
Warrendale, PA 15086-7561
Contact us at FederatedInvestors.com
or call 1-800-341-7400.
Federated Securities Corp., Distributor
CUSIP 31421P100
36217 (2/21)
© 2021 Federated Hermes, Inc.
Annual Shareholder Report
December 31, 2020
Federated Hermes High Yield Strategy Portfolio(formerly, Federated High-Yield Strategy Portfolio)
A Portfolio of Federated Hermes Managed Pool Series(formerly, Federated Managed Pool Series)
Not FDIC Insured ▪ May Lose Value ▪ No Bank Guarantee
Management’s Discussion of Fund Performance (unaudited)
The total return of the Federated Hermes High Yield Strategy Portfolio (the “Fund”), based on net asset value for the 12-month reporting period ended December 31, 2020, was 6.04%. The total return of the Fund’s shares consisted of 6.19% current income and -0.15% of depreciation in the net asset value of the Fund’s shares. The total return of the Bloomberg Barclays U.S. Corporate High Yield 2% Issuer Capped Index (BBHY2%ICI),1 a broad-based securities market index, was 7.05% during the same period. The Fund’s total return for the most recently completed fiscal year reflected actual cash flows, transaction costs and other expenses which were not reflected in the total return of the BBHY2%ICI.
During the reporting period, the most significant factors affecting the Fund’s performance relative to the BBHY2%ICI were: (1) the allocation among industry sectors and (2) the selection of individual securities.
MARKET OVERVIEW
The dominant theme impacting the high-yield2 market during the period under review was COVID-19 and its impact on the U.S. and global economies. As the seriousness of the virus became apparent in the early part of 2020, riskier assets such as high-yield bonds plummeted in value especially in the early part of March.3 As protective measures were put in place leading to a reduction in cases and deaths, the high-yield market began a powerful recovery rally aided by substantial monetary and fiscal policy stimulus. While virus cases surged as the reporting period came to an end, the financial markets continued to rally as vaccines were approved late in the period and distribution had begun. The virus and its economic impact led to tremendous economic volatility with the 2nd calendar quarter seeing a record GDP decline followed by a record surge in activity in the 3rd calendar quarter. Also, the reduction in economic activity and disagreements among global producers resulted in lower oil prices which pressured the energy sector of the high-yield market especially in the first half of the year. Overall, default rates spiked higher in response with energy issuers experiencing the greatest uptick in distress. The impact of these factors can be seen in the movement of the yield spread between the Credit Suisse High Yield Bond Index4 and U.S. Treasury securities of comparable maturities, which began the period at 414 basis points (bp), declined to 388 bp in mid-January 2020, skyrocketed to over 1,400 bp in late March 2020 before declining to end the period at 431 bp on December 31, 2020.
Within the high-yield market, major industry sectors that substantially outperformed the overall BBHY2%ICI during the reporting period included: Midstream, Banking, Home Construction, Wireless Communications and Food & Beverage. Major industry sectors that substantially underperformed the overall BBHY2%ICI during the reporting period included: Oil Field Services, Leisure, Independent Energy, Cable & Satellite and Restaurants. From a credit quality perspective, the “BB”-rated sector led the way during the reporting period with a total return of 10.03% followed by the “B”-rated sector with a total return of 4.59% and the “CCC”-rated sector with a total return of 2.27%.
Sector Allocation
The Fund was negatively impacted by its sector allocation relative to the BBHY2%ICI. This was mainly the result of being in an underweight position to the Independent and Integrated Energy sectors in the second quarter of 2020. While Independent Energy was an underperformer across the entire period under review, it was a major outperformer in the second quarter led by several companies that were downgraded from investment-grade at the end of March and entered the BBHY2%ICI at very depressed prices. These issuers substantially rebounded in early April after entering the high-yield index and were not owned by the Fund during that period of substantial outperformance. The Fund was also negatively impacted by its cash position especially in the April rally. The Fund also had an underweight position to the strong-performing Food & Beverage and Banking sectors. The Fund was positively impacted by its underweight position to the poor-performing Service sector and its overweight positions to the outperforming Technology and Healthcare sectors.
Annual Shareholder Report
Security Selection
The Fund’s security selection had a modest negative impact on performance relative to the BBHY2%ICI. Security selection in the Independent Energy, Retail, Media & Entertainment, Food & Beverage, Automotive and Chemicals negatively impacted performance. Specific high-yield issuers held by the Fund that negatively impacted performance relative to the BBHY2%ICI included: Party City, Callon Petroleum, SESI LLC, Oasis Petroleum and EP Energy. While the Fund did purchase securities of Occidental Petroleum, Continental Resources and Western Midstream during the period, it had underweight positions to these issuers when they had the substantial recovery early in April mentioned above. The Fund did benefit from positive security selection in the Oil Field Services, Aerospace & Defense, Cable & Satellite and Packaging industry sectors. Specific high-yield issuers held by the Fund that positively impacted performance relative to the BBHY2%ICI included: Endo Pharmaceutical, Team Health, Antero Midstream, Infor and Rackspace Technology.
1
Please see the footnotes to the line graphs below for definitions of, and further information about, the BBHY2%ICI.
2
High-yield, lower-rated securities generally entail greater market, credit and liquidity risks than investment-grade securities and may include higher volatility and a higher risk of default.
3
Bond prices are sensitive to changes in interest rates, and a rise in interest rates can cause a decline in their prices.
4
Credit Suisse High Yield Bond Index serves as a benchmark to evaluate the performance of low-quality bonds. Low-quality is defined as those bonds in the range from “BB” to “CCC” and defaults. The index is unmanaged, and it is not possible to invest directly in an index.
Annual Shareholder Report
FUND PERFORMANCE AND GROWTH OF A $10,000 INVESTMENT
The graph below illustrates the hypothetical investment of $10,0001 in the Federated Hermes High Yield Strategy Portfolio from December 31, 2010 to December 31, 2020, compared to the Bloomberg Barclays U.S. Corporate High Yield 2% Issuer Capped Index (BBHY2%ICI).2 The Average Annual Total Return table below shows returns averaged over the stated periods.
Growth of a $10,000 Investment
Growth of $10,000 as of December 31, 2020 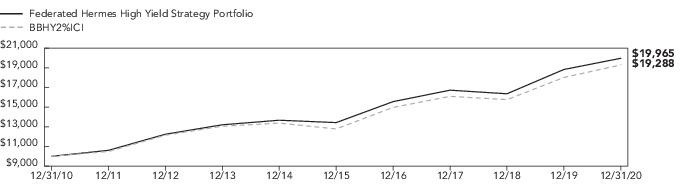
Average Annual Total Returns for the Period Ended 12/31/2020
Performance data quoted represents past performance which is no guarantee of future results. Investment return and principal value will fluctuate so that an investor’s shares, when redeemed, may be worth more or less than their original cost. Mutual fund performance changes over time and current performance may be lower or higher than what is stated. For current to the most recent month-end performance and after-tax returns, call 1-800-341-7400. Returns shown do not reflect the deduction of taxes that a shareholder would pay on Fund distributions or the redemption of Fund shares. Mutual funds are not obligations of or guaranteed by any bank and are not federally insured.
1
The Fund’s performance assumes the reinvestment of all dividends and distributions. The BBHY2%ICI has been adjusted to reflect reinvestment of dividends on securities in the index.
2
The BBHY2%ICI is an issuer-constrained version of the Bloomberg Barclays U.S. Corporate High Yield Index that measures the market of USD-denominated, noninvestment-grade, fixed-rate, taxable corporate bonds. The index follows the same rules as the uncapped index but limits the exposure of each issuer to 2% of the total market value and redistributes any excess market value index-wide on a pro rata basis. The BBHY2%ICI is not adjusted to reflect sales charges, expenses or other fees that the Securities and Exchange Commission requires to be reflected in the Fund’s performance. The index is unmanaged and, unlike the Fund, is not affected by cash flows. It is not possible to invest directly in an index.
Annual Shareholder Report
Portfolio of Investments Summary Table (unaudited)
At December 31, 2020, the Fund’s index classification1 was as follows:
| Percentage of
Total Net Assets2 |
| |
| |
| |
| |
| |
| |
| |
| |
| |
| |
| |
| |
| |
| |
| |
| |
Other Assets and Liabilities—Net5 | |
| |
| Index classifications are based upon, and individual portfolio securities are assigned to, the classifications and sub-classifications of the Bloomberg Barclays U.S. Corporate High Yield 2% Issuer Capped Index (BBHY2%ICI). Individual portfolio securities that are not included in the BBHY2%ICI are assigned to an index classification by the Fund’s Adviser. |
| As of the date specified above, the Fund owned shares of one or more affiliated investment companies. For purposes of this table, the affiliated investment company is not treated as a single portfolio security, but rather the Fund is treated as owning a pro rata portion of each security and each other asset and liability owned by the affiliated investment company. Accordingly, the percentages of total net assets shown in the table will differ from those presented on the Portfolio of Investments. |
| For purposes of this table, index classifications which constitute less than 2.5% of the Fund’s total net assets have been aggregated under the designation “Other.” |
| Cash Equivalents include any investments in money market mutual funds and/or overnight repurchase agreements. |
| Assets, other than investments in securities, less liabilities. See Statement of Assets and Liabilities. |
Annual Shareholder Report
Portfolio of Investments
December 31, 2020
| | | |
| | | |
| | High Yield Bond Portfolio1
(IDENTIFIED COST $92,728,682) | |
| | REPURCHASE AGREEMENT—0.8% | |
| | Interest in $1,000,000,000 joint repurchase agreement 0.08%, dated 12/31/2020 under which Bank of Montreal will repurchase securities provided as collateral for $1,000,008,889 on 1/4/2021. The securities provided as collateral at the end of the period held with BNY Mellon as tri-party agent, were U.S. Government Agency and U.S. Treasury securities with various maturities to 5/20/2069 and the market value of those underlying securities was $1,022,038,963.
(IDENTIFIED COST $747,000) | |
| | TOTAL INVESTMENT IN SECURITIES—100.2%
(IDENTIFIED COST $93,475,682)2 | |
| | OTHER ASSETS AND LIABILITIES - NET—(0.2)%3 | |
| | | |
Affiliated fund holdings are investment companies which are managed by Federated Investment Management Company (the “Adviser”) or an affiliate of the Adviser. Transactions with affiliated fund holdings during the period ended December 31, 2020, were as follows:
| |
| |
| |
| |
Change in Unrealized Appreciation/Depreciation | |
| |
| |
Shares Held as of 12/31/2020 | |
| |
The Fund invests in High Yield Bond Portfolio (HYCORE), a portfolio of Federated Hermes Core Trust (“Core Trust”) which is managed by the Adviser. Core Trust is an open-end management investment company, registered under the Investment Company Act of 1940, as amended (the “Act”), available only to registered investment companies and other institutional investors. The investment objective of HYCORE is to seek high current income. Federated Hermes, Inc. (“Federated Hermes”) receives no advisory or administrative fees from HYCORE. Income distributions from HYCORE are declared daily and paid monthly. All income distributions are recorded by the Fund as dividend income. Capital gain distributions of HYCORE, if any, are declared and paid annually, and are recorded by the Fund as capital gains received. At December 31, 2020, HYCORE represents 99.4% of the Fund’s net assets. Therefore, the performance of the Fund is directly affected by the performance of HYCORE. To illustrate the security holdings, financial condition, results of operations and changes in net assets of HYCORE, its financial statements are included within this report. The financial statements of HYCORE should be read in conjunction with the Fund’s financial statements. The valuation of securities held by HYCORE is discussed in the notes to its financial statements.
| Due to this affiliated holding representing greater than 75% of the Fund’s total net assets, a copy of the affiliated holding’s most recent Annual Report is included with this Report. |
| The cost of investments for federal tax purposes amounts to $94,114,352. |
| Assets, other than investments in securities, less liabilities. See Statement of Assets and Liabilities. |
Note: The categories of investments are shown as a percentage of total net assets at December 31, 2020.
Various inputs are used in determining the value of the Fund’s investments. These inputs are summarized in the three broad levels listed below:
Level 1—quoted prices in active markets for identical securities.
Level 2—other significant observable inputs (including quoted prices for similar securities, interest rates, prepayment speeds, credit risk, etc.). Also includes securities valued at amortized cost.
Level 3—significant unobservable inputs (including the Fund’s own assumptions in determining the fair value of investments).
The inputs or methodology used for valuing securities are not an indication of the risk associated with investing in those securities.
Annual Shareholder Report
The following is a summary of the inputs used, as of December 31, 2020, in valuing the Fund’s assets carried at fair value:
|
| | Level 2—
Other
Significant
Observable
Inputs | Level 3—
Significant
Unobservable
Inputs | |
| | | | |
| | | | |
| | | | |
See Notes which are an integral part of the Financial Statements
Annual Shareholder Report
Financial Highlights
(For a Share Outstanding Throughout Each Period)
| |
| | | | | |
Net Asset Value, Beginning of Period | | | | | |
Income From Investment Operations: | | | | | |
Net investment income (loss) | | | | | |
Net realized and unrealized gain (loss) | | | | | |
TOTAL FROM INVESTMENT OPERATIONS | | | | | |
| | | | | |
Distributions from net investment income | | | | | |
Distributions from net realized gain | | | | | |
| | | | | |
Net Asset Value, End of Period | | | | | |
| | | | | |
Ratios to Average Net Assets: | | | | | |
| | | | | |
| | | | | |
Expense waiver/reimbursement3 | | | | | |
| | | | | |
Net assets, end of period (000 omitted) | | | | | |
| | | | | |
| Based on net asset value. |
| The Adviser has contractually agreed to reimburse all expenses of the Fund, excluding extraordinary expenses. Amount does not reflect net expenses incurred by investment companies in which the Fund may invest. |
| This expense decrease is reflected in both the net expense and the net investment income ratios shown above. Amount does not reflect expense waiver/ reimbursement recorded by investment companies in which the Fund may invest. |
See Notes which are an integral part of the Financial Statements
Annual Shareholder Report
Statement of Assets and LiabilitiesDecember 31, 2020
| |
Investment in securities, at value including $95,108,561 of investments in an affiliated holding* (identified cost $93,475,682) | |
| |
Income receivable from an affiliated holding* | |
Receivable for shares sold | |
| |
| |
Payable for investments purchased | |
Payable for shares redeemed | |
Income distribution payable | |
Payable to adviser (Note 5) | |
Payable for administrative fee (Note 5) | |
Payable for auditing fees | |
Accrued expenses (Note 5) | |
| |
Net assets for 7,261,338 shares outstanding | |
| |
| |
Total distributable earnings (loss) | |
| |
Net Asset Value, Offering Price and Redemption Proceeds Per Share: | |
$95,706,728 ÷ 7,261,338 shares outstanding, no par value, unlimited shares authorized | |
| See information listed after the Fund’s Portfolio of Investments. |
See Notes which are an integral part of the Financial Statements
Annual Shareholder Report
Statement of OperationsYear Ended December 31, 2020
| |
Dividends received from an affiliated holding* | |
| |
| |
| |
Administrative fee (Note 5) | |
| |
| |
Directors’/Trustees’ fees (Note 5) | |
| |
| |
Portfolio accounting fees | |
| |
| |
| |
| |
| |
| |
Reimbursement of other operating expenses (Notes 2 and 5) | |
| |
| |
Realized and Unrealized Gain (Loss) on Investments: | |
Net realized loss on investments in an affiliated holding* | |
Net change in unrealized appreciation of investments in an affiliated holding* | |
Net realized and unrealized gain (loss) on investments | |
Change in net assets resulting from operations | |
| See information listed after the Fund’s Portfolio of Investments. |
See Notes which are an integral part of the Financial Statements
Annual Shareholder Report
Statement of Changes in Net Assets
| | |
Increase (Decrease) in Net Assets | | |
| | |
Net investment income (loss) | | |
| | |
Net change in unrealized appreciation/depreciation | | |
CHANGE IN NET ASSETS RESULTING FROM OPERATIONS | | |
Distributions to Shareholders | | |
| | |
Proceeds from sale of shares | | |
Net asset value of shares issued to shareholders in payment of distributions declared | | |
| | |
CHANGE IN NET ASSETS RESULTING FROM SHARE TRANSACTIONS | | |
| | |
| | |
| | |
| | |
See Notes which are an integral part of the Financial Statements
Annual Shareholder Report
Notes to Financial Statements
December 31, 2020
1. ORGANIZATION
Federated Hermes Managed Pool Series (the “Trust”) is registered under the Act, as an open-end management investment company. The Trust consists of five portfolios. The financial statements included herein are only those of Federated Hermes High Yield Strategy Portfolio (the “Fund”), a non-diversified portfolio. The financial statements of the other portfolios are presented separately. The assets of each portfolio are segregated and a shareholder’s interest is limited to the portfolio in which shares are held. Each portfolio pays its own expenses. The investment objective of the Fund is to seek high current income, by investing primarily in a high yield bond mutual fund and in a portfolio of fixed-income securities.
Prior to June 29, 2020, the names of the Trust and Fund were Federated Managed Pool Series and Federated High-Yield Strategy Portfolio, respectively.
2. SIGNIFICANT ACCOUNTING POLICIES
The following is a summary of significant accounting policies consistently followed by the Fund in the preparation of its financial statements. These policies are in conformity with U.S. generally accepted accounting principles (GAAP).
Investment Valuation
In calculating its net asset value (NAV), the Fund generally values investments as follows:
■
Shares of other mutual funds or non-exchange-traded investment companies are valued based upon their reported NAVs.
■
Equity securities listed on an exchange or traded through a regulated market system are valued at their last reported sale price or official closing price in their principal exchange or market.
■
Fixed-income securities are fair valued using price evaluations provided by a pricing service approved by the Fund’s Board of Trustees (the “Trustees”).
■
Derivative contracts listed on exchanges are valued at their reported settlement or closing price, except that options are valued at the mean of closing bid and asked quotations.
■
Over-the-counter (OTC) derivative contracts are fair valued using price evaluations provided by a pricing service approved by the Trustees.
■
For securities that are fair valued in accordance with procedures established by and under the general supervision of the Trustees, certain factors may be considered, such as: the last traded or purchase price of the security, information obtained by contacting the issuer or dealers, analysis of the issuer’s financial statements or other available documents, fundamental analytical data, the nature and duration of restrictions on disposition, the movement of the market in which the security is normally traded, public trading in similar securities or derivative contracts of the issuer or comparable issuers, movement of a relevant index, or other factors including but not limited to industry changes and relevant government actions.
If any price, quotation, price evaluation or other pricing source is not readily available when the NAV is calculated, if the Fund cannot obtain price evaluations from a pricing service or from more than one dealer for an investment within a reasonable period of time as set forth in the Fund’s valuation policies and procedures, or if information furnished by a pricing service, in the opinion of the valuation committee (“Valuation Committee”), is deemed not representative of the fair value of such security, the Fund uses the fair value of the investment determined in accordance with the procedures described below. There can be no assurance that the Fund could obtain the fair value assigned to an investment if it sold the investment at approximately the time at which the Fund determines its NAV per share, and the actual value obtained could be materially different.
Fair Valuation and Significant Events Procedures
The Trustees have ultimate responsibility for determining the fair value of investments for which market quotations are not readily available. The Trustees have appointed a Valuation Committee comprised of officers of the Fund, the Adviser and certain of the Adviser’s affiliated companies to assist in determining fair value and in overseeing the calculation of the NAV. The Trustees have also authorized the use of pricing services recommended by the Valuation Committee to provide fair value evaluations of the current value of certain investments for purposes of calculating the NAV. The Valuation Committee employs various methods for reviewing third-party pricing-service evaluations including periodic reviews of third-party pricing services’ policies, procedures and valuation methods (including key inputs, methods, models and assumptions), transactional back-testing, comparisons of evaluations of different pricing services, and review of price challenges by the Adviser based on recent market activity. In the event that market quotations and price evaluations are not available for an investment, the Valuation Committee determines the fair value of the investment in accordance with procedures adopted by the Trustees. The Trustees periodically review and approve the fair valuations made by the Valuation Committee and any changes made to the procedures.
Factors considered by pricing services in evaluating an investment include the yields or prices of investments of comparable quality, coupon, maturity, call rights and other potential prepayments, terms and type, reported transactions, indications as to values from dealers and general market conditions. Some pricing services provide a single price evaluation reflecting the bid-side of the market for an investment (a “bid” evaluation). Other pricing services offer both bid evaluations and price evaluations indicative of a price between the prices bid and asked for the investment (a “mid” evaluation). The Fund normally uses bid evaluations for any U.S. Treasury and Agency securities, mortgage-backed securities and municipal securities. The Fund normally uses mid evaluations for any other types of fixed-income securities and any OTC derivative contracts. In the event that market quotations and price evaluations are not available for an investment, the fair value of the investment is determined in accordance with procedures adopted by the Trustees.
Annual Shareholder Report
The Trustees also have adopted procedures requiring an investment to be priced at its fair value whenever the Adviser determines that a significant event affecting the value of the investment has occurred between the time as of which the price of the investment would otherwise be determined and the time as of which the NAV is computed. An event is considered significant if there is both an affirmative expectation that the investment’s value will change in response to the event and a reasonable basis for quantifying the resulting change in value. Examples of significant events that may occur after the close of the principal market on which a security is traded, or after the time of a price evaluation provided by a pricing service or a dealer, include:
■
With respect to securities traded principally in foreign markets, significant trends in U.S. equity markets or in the trading of foreign securities index futures contracts;
■
Political or other developments affecting the economy or markets in which an issuer conducts its operations or its securities are traded;
■
Announcements concerning matters such as acquisitions, recapitalizations, litigation developments, or a natural disaster affecting the issuer’s operations or regulatory changes or market developments affecting the issuer’s industry.
The Trustees have adopted procedures whereby the Valuation Committee uses a pricing service to provide factors to update the fair value of equity securities traded principally in foreign markets from the time of the close of their respective foreign stock exchanges to the pricing time of the Fund. For other significant events, the Fund may seek to obtain more current quotations or price evaluations from alternative pricing sources. If a reliable alternative pricing source is not available, the Fund will determine the fair value of the investment in accordance with the fair valuation procedures approved by the Trustees. The Trustees have ultimate responsibility for any fair valuations made in response to a significant event.
Repurchase Agreements
The Fund may invest in repurchase agreements for short-term liquidity purposes. It is the policy of the Fund to require the other party to a repurchase agreement to transfer to the Fund’s custodian or sub-custodian eligible securities or cash with a market value (after transaction costs) at least equal to the repurchase price to be paid under the repurchase agreement. The eligible securities are transferred to accounts with the custodian or sub-custodian in which the Fund holds a “securities entitlement” and exercises “control” as those terms are defined in the Uniform Commercial Code. The Fund has established procedures for monitoring the market value of the transferred securities and requiring the transfer of additional eligible securities if necessary to equal at least the repurchase price. These procedures also allow the other party to require securities to be transferred from the account to the extent that their market value exceeds the repurchase price or in exchange for other eligible securities of equivalent market value.
The insolvency of the other party or other failure to repurchase the securities may delay the disposition of the underlying securities or cause the Fund to receive less than the full repurchase price. Under the terms of the repurchase agreement, any amounts received by the Fund in excess of the repurchase price and related transaction costs must be remitted to the other party.
The Fund may enter into repurchase agreements in which eligible securities are transferred into joint trading accounts maintained by the custodian or sub-custodian for investment companies and other clients advised by the Adviser and its affiliates. The Fund will participate on a pro rata basis with the other investment companies and clients in its share of the securities transferred under such repurchase agreements and in its share of proceeds from any repurchase or other disposition of such securities.
Repurchase agreements are subject to Master Netting Agreements which are agreements between the Fund and its counterparties that provide for the net settlement of all transactions and collateral with the Fund, through a single payment, in the event of default or termination. Amounts presented on the Portfolio of Investments and Statement of Assets and Liabilities are not net settlement amounts but gross. As indicated above, the cash or securities to be repurchased, as shown on the Portfolio of Investments, exceeds the repurchase price to be paid under the agreement reducing the net settlement amount to zero.
Investment Income, Gains and Losses, Expenses and Distributions
Investment transactions are accounted for on a trade-date basis. Realized gains and losses from investment transactions are recorded on an identified-cost basis. Interest income and expenses are accrued daily. Dividend income and distributions to shareholders are recorded on the ex-dividend date. Distributions of net investment income, if any, are declared daily and paid monthly. Amortization/accretion of premium and discount is included in investment income. The detail of the total fund expense reimbursement of $207,752 is disclosed in Note 5.
Federal Taxes
It is the Fund’s policy to comply with the Subchapter M provision of the Internal Revenue Code (the “Code”) and to distribute to shareholders each year substantially all of its income. Accordingly, no provision for federal income tax is necessary. As of and during the year ended December 31, 2020, the Fund did not have a liability for any uncertain tax positions. The Fund recognizes interest and penalties, if any, related to tax liabilities as income tax expense in the Statement of Operations. As of December 31, 2020, tax years 2017 through 2020 remain subject to examination by the Fund’s major tax jurisdictions, which include the United States of America and the Commonwealth of Massachusetts.
When-Issued and Delayed-Delivery Transactions
The Fund may engage in when-issued or delayed-delivery transactions. The Fund records when-issued securities on the trade date and maintains security positions such that sufficient liquid assets will be available to make payment for the securities purchased. Securities purchased on a when-issued or delayed-delivery basis are marked to market daily and begin earning interest on the settlement date. Losses may occur on these transactions due to changes in market conditions or the failure of counterparties to perform under the contract.
Annual Shareholder Report
Other
The preparation of financial statements in conformity with GAAP requires management to make estimates and assumptions that affect the amounts of assets, liabilities, expenses and revenues reported in the financial statements. Actual results could differ materially from those estimated. The Fund applies investment company accounting and reporting guidance.
3. SHARES OF BENEFICIAL INTEREST
The following table summarizes share activity:
| | |
| | |
Shares issued to shareholders in payment of distributions declared | | |
| | |
NET CHANGE RESULTING FROM FUND SHARE TRANSACTIONS | | |
4. FEDERAL TAX INFORMATION
The tax character of distributions as reported on the Statement of Changes in Net Assets for the years ended December 31, 2020 and 2019, was as follows:
As of December 31, 2020, the components of distributable earnings on a tax-basis were as follows:
Undistributed ordinary income | |
Net unrealized appreciation | |
Capital loss carryforwards | |
The difference between book-basis and tax-basis net unrealized appreciation is attributable to the differing treatments for deferral of losses on wash sales.
At December 31, 2020, the cost of investments for federal tax purposes was $94,114,352. The net unrealized appreciation of investments for federal tax purposes was $1,741,208. This consists entirely of net unrealized appreciation from investments for those securities having an excess of value over cost of $1,741,208.
As of December 31, 2020, the Fund had a capital loss carryforward of $1,177,434 which will reduce the Fund’s taxable income arising from future net realized gains on investments, if any, to the extent permitted by the Code, thereby reducing the amount of distributions to shareholders which would otherwise be necessary to relieve the Fund of any liability for federal income tax. Pursuant to the Code, these net capital losses retain their character as either short-term or long-term and do not expire.
The following schedule summarizes the Fund’s capital loss carryforwards:
5. INVESTMENT ADVISER FEE AND OTHER TRANSACTIONS WITH AFFILIATES
Investment Adviser Fee
The Adviser provides investment adviser services at no fee because all eligible investors are: (1) in separately managed or wrap fee programs, who often pay a single aggregate fee to the wrap program sponsor for all costs and expenses of the wrap fee programs; or (2) in certain other separately managed accounts and discretionary investment accounts. The Adviser has contractually agreed to reimburse all expenses of the Fund, excluding extraordinary expenses. Acquired fund fees and expenses are not direct obligations of the Fund and are not contractual reimbursements under the investment advisory contract.
For the year ended December 31, 2020, the Adviser reimbursed $207,752 of other operating expenses.
Administrative Fee
Federated Administrative Services (FAS), under the Administrative Services Agreement, provides the Fund with administrative personnel and services. For purposes of determining the appropriate rate breakpoint, “Investment Complex” is defined as all of the Federated Hermes Funds subject to a fee under the Administrative Services Agreement. The fee paid to FAS is based on the average daily net assets of the Investment Complex as specified below:
| Average Daily Net Assets
of the Investment Complex |
| on assets up to $50 billion |
| on assets over $50 billion |
Annual Shareholder Report
For the year ended December 31, 2020, the annualized fee paid to FAS was 0.078% of average daily net assets of the Fund. For the year ended December 31, 2020, the Fund’s Adviser reimbursed the Fund for any fee paid to FAS.
In addition, FAS may charge certain out-of-pocket expenses to the Fund.
Directors’/Trustees’ and Miscellaneous Fees
Certain Officers and Trustees of the Fund are Officers and Directors or Trustees of certain of the above companies. To efficiently facilitate payment, Independent Directors’/Trustees’ fees and certain expenses related to conducting meetings of the Directors/Trustees and other miscellaneous expenses are paid by an affiliate of the Adviser which in due course are reimbursed by the Fund. These expenses related to conducting meetings of the Directors/Trustees and other miscellaneous expenses may be included in Accrued and Miscellaneous Expenses on the Statement of Assets and Liabilities and Statement of Operations, respectively.
6. INVESTMENT TRANSACTIONS
Purchases and sales of investments, excluding long-term U.S. government securities and short-term obligations, for the year ended December 31, 2020, were as follows:
7. Line of Credit
The Fund participates with certain other Federated Hermes Funds, on a several basis, in an up to $500,000,000 unsecured, 364-day, committed, revolving line of credit (LOC) agreement dated June 24, 2020. The LOC was made available to temporarily finance the repurchase or redemption of shares of the Fund, failed trades, payment of dividends, settlement of trades and for other short-term, temporary or emergency general business purposes. The Fund cannot borrow under the LOC if an inter-fund loan is outstanding. The Fund’s ability to borrow under the LOC also is subject to the limitations of the Act and various conditions precedent that must be satisfied before the Fund can borrow. Loans under the LOC are charged interest at a fluctuating rate per annum equal to the highest, on any day, of (a) (i) the federal funds effective rate, (ii) the one month London Interbank Offered Rate (LIBOR), or a replacement rate as appropriate, and (iii) 0.0%, plus (b) a margin. Any fund eligible to borrow under the LOC pays its pro rata share of an upfront fee, and its pro rata share of a commitment fee based on the amount of the lenders’ commitment that has not been utilized, quarterly in arrears and at maturity. As of December 31, 2020, the Fund had no outstanding loans. During the year ended December 31, 2020, the Fund did not utilize the LOC.
8. Interfund Lending
Pursuant to an Exemptive Order issued by the Securities and Exchange Commission, the Fund, along with other funds advised by subsidiaries of Federated Hermes, Inc., may participate in an interfund lending program. This program provides an alternative credit facility allowing the Fund to borrow from other participating affiliated funds. As of December 31, 2020, there were no outstanding loans. During the year ended December 31, 2020, the program was not utilized.
9. OTHER MATTERS
An outbreak of respiratory disease caused by a novel coronavirus was first detected in China in late 2019 and subsequently spread globally. As of the date of the issuance of these financial statements, this coronavirus has resulted in closing borders, enhanced health screenings, healthcare service preparation and delivery, quarantines, cancellations, and disruptions to supply chains, workflow operations and consumer activity, as well as general concern and uncertainty. The impact of this coronavirus may be short-term or may last for an extended period of time and has resulted in a substantial economic downturn. Health crises caused by outbreaks, such as the coronavirus outbreak, may exacerbate other pre-existing political, social and economic risks. The impact of this outbreak, and other epidemics and pandemics that may arise in the future, could continue to negatively affect the worldwide economy, as well as the economies of individual countries, individual companies (including certain Fund service providers and issuers of the Fund’s investments) and the markets in general in significant and unforeseen ways. Any such impact could adversely affect the Fund’s performance.
10. FEDERAL TAX INFORMATION (UNAUDITED)
For the fiscal year ended December 31, 2020, 83.86% of dividends paid by the Fund are interest-related dividends, as provided by the American Jobs Creation Act of 2004.
Annual Shareholder Report
Report of Independent Registered Public Accounting Firm
TO THE SHAREHOLDERS AND THE BOARD OF TRUSTEES OF FEDERATED Hermes HIGH YIELD STRATEGY PORTFOLIO:
Opinion on the Financial Statements
We have audited the accompanying statement of assets and liabilities of Federated Hermes High Yield Strategy Portfolio (the “Fund”) (one of the funds constituting the Federated Hermes Managed Pool Series (the “Trust”)), including the portfolio of investments, as of December 31, 2020, and the related statement of operations for the year then ended, the statement of changes in net assets for each of the two years in the period then ended, the financial highlights for each of the five years in the period then ended and the related notes (collectively referred to as the “financial statements”). In our opinion, the financial statements present fairly, in all material respects, the financial position of Federated Hermes High Yield Strategy Portfolio (one of the funds constituting the Federated Hermes Managed Pool Series) at December 31, 2020, the results of its operations for the year then ended, the changes in its net assets for each of the two years in the period then ended and its financial highlights for each of the five years in the period then ended, in conformity with U.S. generally accepted accounting principles.
Basis for Opinion
These financial statements are the responsibility of the Trust’s management. Our responsibility is to express an opinion on the Fund’s financial statements based on our audits. We are a public accounting firm registered with the Public Company Accounting Oversight Board (United States) (“PCAOB”) and are required to be independent with respect to the Trust in accordance with the U.S. federal securities laws and the applicable rules and regulations of the Securities and Exchange Commission and the PCAOB.
We conducted our audits in accordance with standards of the PCAOB. Those standards require that we plan and perform the audit to obtain reasonable assurance about whether the financial statements are free of material misstatement, whether due to error or fraud. The Trust is not required to have, nor were we engaged to perform, an audit of the Trust’s internal control over financial reporting. As part of our audits, we are required to obtain an understanding of internal control over financial reporting, but not for the purpose of expressing an opinion on the effectiveness of the Trust’s internal control over financial reporting. Accordingly, we express no such opinion.
Our audits included performing procedures to assess the risks of material misstatement of the financial statements, whether due to error or fraud, and performing procedures that respond to those risks. Such procedures included examining, on a test basis, evidence regarding the amounts and disclosures in the financial statements. Our procedures included confirmation of securities owned as of December 31, 2020, by correspondence with the custodian and others, or by other appropriate auditing procedures where replies from others were not received. Our audits also included evaluating the accounting principles used and significant estimates made by management, as well as evaluating the overall presentation of the financial statements. We believe that our audits provide a reasonable basis for our opinion. We have served as the auditor of one or more Federated Hermes investment companies since 1979.
Boston, Massachusetts
February 22, 2021
Annual Shareholder Report
Shareholder Expense Example (unaudited)
As a shareholder of the Fund, you incur ongoing costs, including to the extent applicable, management fees, distribution (12b-1) fees and/or other service fees and other Fund expenses. This Example is intended to help you to understand your ongoing costs (in dollars) of investing in the Fund and to compare these costs with the ongoing costs of investing in other mutual funds. It is based on an investment of $1,000 invested at the beginning of the period and held for the entire period from July 1, 2020 to December 31, 2020.
ACTUAL EXPENSES
The first section of the table below provides information about actual account values and actual expenses. You may use the information in this section, together with the amount you invested, to estimate the expenses that you incurred over the period. Simply divide your account value by $1,000 (for example, an $8,600 account value divided by $1,000 = 8.6), then multiply the result by the number in the first section under the heading entitled “Expenses Paid During Period” to estimate the expenses attributable to your investment during this period.
HYPOTHETICAL EXAMPLE FOR COMPARISON PURPOSES
The second section of the table below provides information about hypothetical account values and hypothetical expenses based on the Fund’s actual expense ratio and an assumed rate of return of 5% per year before expenses, which is not the Fund’s actual return. Thus, you should not use the hypothetical account values and expenses to estimate the actual ending account balance or your expenses for the period. Rather, these figures are required to be provided to enable you to compare the ongoing costs of investing in the Fund with other funds. To do so, compare this 5% hypothetical example with the 5% hypothetical examples that appear in the shareholder reports of the other funds.
Please note that the expenses shown in the table are meant to highlight your ongoing costs only. Therefore, the second section of the table is useful in comparing ongoing costs only, and will not help you determine the relative total costs of owning different funds.
| Beginning
Account Value
7/1/2020 | Ending
Account Value
12/31/2020 | Expenses Paid
During Period1 |
| | | |
Hypothetical (assuming a 5% return before expenses) | | | |
| Expenses are equal to the Fund’s annualized net expense ratio of 0.00%, multiplied by the average account value over the period, multiplied by 184/366 (to reflect the one-half-year period). The Adviser has contractually agreed to reimburse all operating expenses, excluding extraordinary expenses incurred by the Fund. This agreement has no fixed term. |
Annual Shareholder Report
High Yield Bond Portfolio
Financial Statements and Notes to Financial Statements
Federated Hermes High Yield Strategy Portfolio invests primarily in High Yield Bond Portfolio. Therefore the High Yield Bond Portfolio financial statements and notes to financial statements are included on pages 18 through 46.
High Yield Bond Portfolio
Annual Shareholder Report
Management’s Discussion of Fund Performance (unaudited)–
High Yield Bond Portfolio
The total return of the High Yield Bond Portfolio (the “Fund”), based on net asset value for the 12-month reporting period ended December 31, 2020, was 6.09%. The total return of the Fund’s shares consisted of 6.25% current income and -0.16% of depreciation in the net asset value of the Fund’s shares. The total return of the Bloomberg Barclays U.S. Corporate High Yield 2% Issuer Capped Index (BBHY2%ICI),1 a broad-based securities market index, was 7.05% during the same period. The Fund’s total return for the most recently completed fiscal year reflected actual cash flows, transaction costs and other expenses which were not reflected in the total return of the BBHY2%ICI.
During the reporting period, the most significant factors affecting the Fund’s performance relative to the BBHY2%ICI were: (1) the allocation among industry sectors and (2) the selection of individual securities.
MARKET OVERVIEW
The dominant theme impacting the high-yield2 market during the period under review was Covid-19 and its impact on the U.S. and global economies. As the seriousness of the virus became apparent in the early part of calendar 2020, riskier assets such as high-yield bonds plummeted in value especially in the early part of March. As protective measures were put in place leading to a reduction in cases and deaths, the high-yield market began a powerful recovery rally aided by substantial monetary and fiscal policy stimulus. While virus cases surged as the reporting period came to an end, the financial markets continued to rally as vaccines were approved late in the period and distribution had begun. The virus and its economic impact led to tremendous economic volatility with the 2nd calendar quarter seeing a record GDP decline followed by a record surge in activity in the 3rd calendar quarter. Also, the reduction in economic activity and disagreements among global producers resulted in lower oil prices which pressured the energy sector of the high-yield market especially in the first half of the year. Overall, default rates spiked higher in response with energy issuers experiencing the greatest uptick in distress.3 The impact of these factors can be seen in the movement of the yield spread between the Credit Suisse High Yield Bond Index4 and U.S. Treasury securities of comparable maturities, which began the period at 414 basis points (bp), declined to 388 bp in mid-January 2020, skyrocketed to over 1,400 bp in late March 2020 before declining to end the period at 431 bp on December 31, 2020.
Within the high-yield market, major industry sectors that substantially outperformed the overall BBHY2%ICI during the reporting period included: Midstream, Banking, Home Construction, Wireless Communications and Food & Beverage. Major industry sectors that substantially underperformed the overall BBHY2%ICI during the reporting period included: Oil Field Services, Leisure, Independent Energy, Cable & Satellite and Restaurants. From a credit quality perspective, the “BB”-rated sector led the way during the reporting period with a total return of 10.03% followed by the “B”-rated sector with a total return of 4.59% and the “CCC”-rated sector with a total return of 2.27%.
Sector Allocation
The Fund was negatively impacted by its sector allocation relative to the BBHY2%ICI. This was mainly the result of being in an underweight position relative to the Independent and Integrated Energy sectors in the second quarter of 2020. While Independent Energy was an underperformer across the entire period under review, it was a major outperformer in the second quarter led by several companies that were downgraded from investment grade at the end of March and entered the BBHY2%ICI at very depressed prices. These issuers substantially rebounded in early April after entering the high yield index and were not owned by the Fund during that period of substantial outperformance. The Fund was also negatively impacted by its cash position especially in the April rally. The Fund was also in an underweight position relative to the strong-performing Food & Beverage and Banking sectors. The Fund was positively impacted by its underweight position to the poor-performing Service sector and its overweight position to the outperforming Technology and Healthcare sectors.
High Yield Bond Portfolio
Annual Shareholder Report
Security Selection
The Fund’s security selection had a modest negative impact on performance relative to the BBHY2%ICI. Security selection in the Independent Energy, Retail, Media & Entertainment, Food & Beverage, Automotive and Chemicals negatively impacted performance. Specific high-yield issuers held by the Fund that negatively impacted performance relative to the BBHY2%ICI included: Party City, Callon Petroleum, SESI LLC, Oasis Petroleum and EP Energy. While the Fund did purchase securities of Occidental Petroleum, Continental Resources and Western Midstream during the period, it was underweight these issuers when they had the substantial recovery early in April mentioned above. The Fund did benefit from positive security selection in the Oil Field Services, Aerospace & Defense, Cable & Satellite and Packaging industry sectors. Specific high-yield issuers held by the Fund that positively impacted performance relative to the BBHY2%ICI included: Endo Pharmaceutical, Team Health, Antero Midstream, Infor and Rackspace Technology.
1
Please see the footnotes to the line graphs below for definitions of, and further information about, the BBHY2%ICI.
2
High-yield, lower-rated securities generally entail greater market, credit and liquidity risks than investment-grade securities and may include higher volatility and a higher risk of default.
3
Bond prices are sensitive to changes in interest rates, and a rise in interest rates can cause a decline in their prices.
4
Credit Suisse High Yield Bond Index serves as a benchmark to evaluate the performance of low-quality bonds. Low-quality is defined as those bonds in the range from “BB” to “CCC” and defaults.*
*
The index is unmanaged, and it is not possible to invest directly in an index.
High Yield Bond Portfolio
Annual Shareholder Report
FUND PERFORMANCE AND GROWTH OF A $10,000 INVESTMENT
The graph below illustrates the hypothetical investment of $10,0001 in the High Yield Bond Portfolio from December 31, 2010 to December 31, 2020, compared to the Bloomberg Barclays U.S. Corporate High Yield 2% Issuer Capped Index (BBHY2%ICI).2 The Average Annual Total Return table below shows returns averaged over the stated periods.
Growth of a $10,000 Investment
Growth of $10,000 as of December 31, 2020 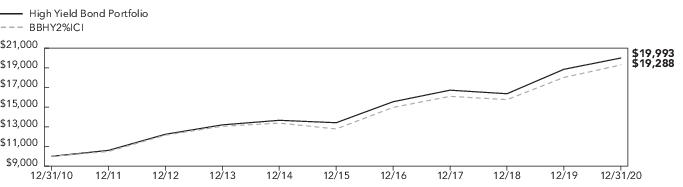
Average Annual Total Returns for the Period Ended 12/31/2020
Performance data quoted represents past performance which is no guarantee of future results. Investment return and principal value will fluctuate so that an investor’s shares, when redeemed, may be worth more or less than their original cost. Mutual fund performance changes over time and current performance may be lower or higher than what is stated. For current to the most recent month-end performance and after-tax returns, call 1-800-341-7400. Returns shown do not reflect the deduction of taxes that a shareholder would pay on Fund distributions or the redemption of Fund shares. Mutual funds are not obligations of or guaranteed by any bank and are not federally insured.
1
The Fund’s performance assumes the reinvestment of all dividends and distributions. The BBHY2%ICI has been adjusted to reflect reinvestment of dividends on securities in the index.
2
The BBHY2%ICI is an issuer-constrained version of the Bloomberg Barclays U.S. Corporate High Yield Index that measures the market of USD-denominated, noninvestment-grade, fixed-rate, taxable corporate bonds. The index follows the same rules as the uncapped index but limits the exposure of each issuer to 2% of the total market value and redistributes any excess market value index-wide on a pro rata basis. The BBHY2%ICI is not adjusted to reflect sales charges, expenses or other fees that the Securities and Exchange Commission requires to be reflected in the Fund’s performance. The index is unmanaged and, unlike the Fund, is not affected by cash flows. It is not possible to invest directly in an index.
High Yield Bond Portfolio
Annual Shareholder Report
Portfolio of Investments Summary Table (unaudited)–High Yield Bond Portfolio
At December 31, 2020, the Fund’s index classification1 was as follows:
| Percentage of
Total Net Assets |
| |
| |
| |
| |
| |
| |
| |
| |
| |
| |
| |
| |
Other Assets and Liabilities - Net4 | |
| |
| Index classifications are based upon, and individual portfolio securities are assigned to, the classifications and sub-classifications of the Bloomberg Barclays U.S. Corporate High Yield 2% Issuer Capped Index (BBHY2%ICI). Individual portfolio securities that are not included in the BBHY2%ICI are assigned to an index classification by the Fund’s Adviser. |
| For purposes of this table, index classifications which constitute less than 3.0% of the Fund’s total net assets have been aggregated under the designation “Other.” |
| Cash Equivalents include any investments in money market mutual funds and/or overnight repurchase agreements. |
| Assets, other than investments in securities, less liabilities. See Statement of Assets and Liabilities. |
High Yield Bond Portfolio
Annual Shareholder Report
Portfolio of Investments–High Yield Bond Portfolio
December 31, 2020
| | | |
| | | |
| | | |
| | TransDigm, Inc., Sec. Fac. Bond, 144A, 6.250%, 3/15/2026 | |
| | TransDigm, Inc., Sr. Sub. Note, 6.500%, 7/15/2024 | |
| | TransDigm, Inc., Sr. Sub., 6.875%, 5/15/2026 | |
| | TransDigm, Inc., Sr. Sub., Series WI, 5.500%, 11/15/2027 | |
| | TransDigm, Inc., Sr. Sub., Series WI, 7.500%, 3/15/2027 | |
| | | |
| | | |
| | Adient Global Holdings Ltd., Sr. Unsecd. Note, 144A, 4.875%, 8/15/2026 | |
| | Adient US LLC, 144A, 7.000%, 5/15/2026 | |
| | Adient US LLC, 144A, 9.000%, 4/15/2025 | |
| | American Axle & Manufacturing, Inc., Sr. Unsecd. Note, Series WI, 6.500%, 4/1/2027 | |
| | Clarios Global LP, Sec. Fac. Bond, 144A, 6.750%, 5/15/2025 | |
| | Dana Financing Lux Sarl, 144A, 6.500%, 6/1/2026 | |
| | Dana Financing Lux Sarl, Sr. Unsecd. Note, 144A, 5.750%, 4/15/2025 | |
| | Dana, Inc., 5.625%, 6/15/2028 | |
| | Ford Motor Credit Co. LLC, Sr. Unsecd. Note, 3.096%, 5/4/2023 | |
| | Ford Motor Credit Co. LLC, Sr. Unsecd. Note, 3.336%, 3/18/2021 | |
| | Ford Motor Credit Co. LLC, Sr. Unsecd. Note, 3.339%, 3/28/2022 | |
| | Ford Motor Credit Co. LLC, Sr. Unsecd. Note, 3.375%, 11/13/2025 | |
| | Ford Motor Credit Co. LLC, Sr. Unsecd. Note, 3.813%, 10/12/2021 | |
| | Ford Motor Credit Co. LLC, Sr. Unsecd. Note, 4.000%, 11/13/2030 | |
| | Ford Motor Credit Co. LLC, Sr. Unsecd. Note, 4.063%, 11/1/2024 | |
| | Ford Motor Credit Co. LLC, Sr. Unsecd. Note, 4.125%, 8/17/2027 | |
| | Ford Motor Credit Co. LLC, Sr. Unsecd. Note, 4.140%, 2/15/2023 | |
| | Ford Motor Credit Co. LLC, Sr. Unsecd. Note, 4.250%, 9/20/2022 | |
| | Ford Motor Credit Co. LLC, Sr. Unsecd. Note, 4.271%, 1/9/2027 | |
| | Ford Motor Credit Co. LLC, Sr. Unsecd. Note, 5.113%, 5/3/2029 | |
| | Ford Motor Credit Co. LLC, Sr. Unsecd. Note, 5.125%, 6/16/2025 | |
| | Ford Motor Credit Co. LLC, Sr. Unsecd. Note, Series GMTN, 4.389%, 1/8/2026 | |
| | Goodyear Tire & Rubber Co., Sr. Unsecd. Note, 4.875%, 3/15/2027 | |
| | Goodyear Tire & Rubber Co., Sr. Unsecd. Note, 5.000%, 5/31/2026 | |
| | IAA Spinco, Inc., Sr. Unsecd. Note, 144A, 5.500%, 6/15/2027 | |
| | IHO Verwaltungs GmbH, Sec. Fac. Bond, 144A, 6.000%, 5/15/2027 | |
| | IHO Verwaltungs GmbH, Sec. Fac. Bond, 144A, 6.375%, 5/15/2029 | |
| | J.B. Poindexter & Co., Inc., Sr. Unsecd. Note, 144A, 7.125%, 4/15/2026 | |
| | KAR Auction Services, Inc., Sr. Unsecd. Note, 144A, 5.125%, 6/1/2025 | |
| | Panther BF Aggregator 2 LP, Sec. Fac. Bond, 144A, 6.250%, 5/15/2026 | |
| | Panther BF Aggregator 2 LP, Sr. Unsecd. Note, 144A, 8.500%, 5/15/2027 | |
| | Schaeffler Verwaltung Zw, 144A, 4.750%, 9/15/2026 | |
| | | |
| | | |
| | American Builders & Contractors Supply Co., Inc., 144A, 4.000%, 1/15/2028 | |
| | American Builders & Contractors Supply Co., Inc., Sr. Unsecd. Note, 144A, 5.875%, 5/15/2026 | |
| | CD&R Waterworks Merger Subsidiary LLC, Sr. Unsecd. Note, 144A, 6.125%, 8/15/2025 | |
| | Cornerstone Building Brands, Sr. Unsecd. Note, 144A, 6.125%, 1/15/2029 | |
| | Cp Atlas Buyer, Inc., Sr. Unsecd. Note, 144A, 7.000%, 12/1/2028 | |
| | Interface, Inc., Sr. Unsecd. Note, 144A, 5.500%, 12/1/2028 | |
High Yield Bond Portfolio
Annual Shareholder Report
| | | |
| | CORPORATE BONDS—continued | |
| | Building Materials—continued | |
| | Masonite International Corp., Sr. Unsecd. Note, 144A, 5.750%, 9/15/2026 | |
| | Pisces Midco, Inc., Sec. Fac. Bond, 144A, 8.000%, 4/15/2026 | |
| | Standard Industries, Inc., Sr. Unsecd. Note, 144A, 3.375%, 1/15/2031 | |
| | Standard Industries, Inc., Sr. Unsecd. Note, 144A, 4.375%, 7/15/2030 | |
| | Standard Industries, Inc., Sr. Unsecd. Note, 144A, 4.750%, 1/15/2028 | |
| | Standard Industries, Inc., Sr. Unsecd. Note, 144A, 5.000%, 2/15/2027 | |
| | White Cap Buyer LLC, Sr. Unsecd. Note, 144A, 6.875%, 10/15/2028 | |
| | | |
| | | |
| | Cablevision Systems Corp., Sr. Unsecd. Note, 5.875%, 9/15/2022 | |
| | CCO Holdings LLC/Cap Corp., 144A, 5.750%, 2/15/2026 | |
| | CCO Holdings LLC/Cap Corp., Sr. Sub. Secd. Note, 144A, 5.500%, 5/1/2026 | |
| | CCO Holdings LLC/Cap Corp., Sr. Unsecd. Note, 144A, 4.000%, 3/1/2023 | |
| | CCO Holdings LLC/Cap Corp., Sr. Unsecd. Note, 144A, 4.250%, 2/1/2031 | |
| | CCO Holdings LLC/Cap Corp., Sr. Unsecd. Note, 144A, 4.500%, 8/15/2030 | |
| | CCO Holdings LLC/Cap Corp., Sr. Unsecd. Note, 144A, 4.750%, 3/1/2030 | |
| | CCO Holdings LLC/Cap Corp., Sr. Unsecd. Note, 144A, 5.000%, 2/1/2028 | |
| | CCO Holdings LLC/Cap Corp., Sr. Unsecd. Note, 144A, 5.375%, 6/1/2029 | |
| | CCO Holdings LLC/Cap Corp., Sr. Unsecd. Note, 144A, 5.875%, 5/1/2027 | |
| | CCO Holdings LLC/CCO Holdings Capital Corp., Sr. Unsecd. Note, 144A, 4.500%, 5/1/2032 | |
| | CSC Holdings LLC, 144A, 5.500%, 5/15/2026 | |
| | CSC Holdings LLC, Sr. Unsecd. Note, 144A, 3.375%, 2/15/2031 | |
| | CSC Holdings LLC, Sr. Unsecd. Note, 144A, 4.125%, 12/1/2030 | |
| | CSC Holdings LLC, Sr. Unsecd. Note, 144A, 4.625%, 12/1/2030 | |
| | CSC Holdings LLC, Sr. Unsecd. Note, 144A, 5.500%, 4/15/2027 | |
| | CSC Holdings LLC, Sr. Unsecd. Note, 144A, 5.750%, 1/15/2030 | |
| | CSC Holdings LLC, Sr. Unsecd. Note, 144A, 6.500%, 2/1/2029 | |
| | CSC Holdings LLC, Sr. Unsecd. Note, 144A, 7.500%, 4/1/2028 | |
| | CSC Holdings LLC, Sr. Unsecd. Note, 6.750%, 11/15/2021 | |
| | DISH DBS Corp., Sr. Unsecd. Note, 5.875%, 11/15/2024 | |
| | DISH DBS Corp., Sr. Unsecd. Note, 7.375%, 7/1/2028 | |
| | DISH DBS Corp., Sr. Unsecd. Note, 7.750%, 7/1/2026 | |
| | Doyla Holdco 18 Designated Activity Co., Sr. Unsecd. Note, 144A, 5.000%, 7/15/2028 | |
| | Intelsat Jackson Holdings S.A., Sr. Unsecd. Note, 144A, 8.500%, 10/15/2024 | |
| | Intelsat Jackson Holdings S.A., Sr. Unsecd. Note, 144A, 9.750%, 7/15/2025 | |
| | Intelsat Jackson Holdings S.A., Sr. Unsecd. Note, 5.500%, 8/1/2023 | |
| | Sirius XM Radio, Inc., Sr. Unsecd. Note, 144A, 3.875%, 8/1/2022 | |
| | Sirius XM Radio, Inc., Sr. Unsecd. Note, 144A, 4.125%, 7/1/2030 | |
| | Sirius XM Radio, Inc., Sr. Unsecd. Note, 144A, 4.625%, 7/15/2024 | |
| | Sirius XM Radio, Inc., Sr. Unsecd. Note, 144A, 5.375%, 7/15/2026 | |
| | Sirius XM Radio, Inc., Sr. Unsecd. Note, 144A, 5.500%, 7/1/2029 | |
| | Telenet Finance Luxembourg, Sec. Fac. Bond, 144A, 5.500%, 3/1/2028 | |
| | Virgin Media Finance PLC, Sr. Unsecd. Note, 144A, 5.000%, 7/15/2030 | |
| | Virgin Media Secured Finance PLC, Sec. Fac. Bond, 144A, 4.500%, 8/15/2030 | |
| | Virgin Media Secured Finance PLC, Sec. Fac. Bond, 144A, 5.500%, 5/15/2029 | |
| | Vmed O2 UK Financing I PLC, Sec. Fac. Bond, 144A, 4.250%, 1/31/2031 | |
| | Ziggo Bond Co. BV, Sr. Unsecd. Note, 144A, 5.125%, 2/28/2030 | |
| | Ziggo Finance BV, Sec. Fac. Bond, 144A, 5.500%, 1/15/2027 | |
| | Ziggo Finance BV, Sr. Unsecd. Note, 144A, 6.000%, 1/15/2027 | |
| | | |
High Yield Bond Portfolio
Annual Shareholder Report
| | | |
| | CORPORATE BONDS—continued | |
| | | |
| | Alpha 2 BV, Sr. Unsecd. Note, 144A, 8.750%, 6/1/2023 | |
| | Alpha 3 BV, Sr. Unsecd. Note, 144A, 6.250%, 2/1/2025 | |
| | Axalta Coat/Dutch Holding BV, Sr. Unsecd. Note, 144A, 4.750%, 6/15/2027 | |
| | Axalta Coating Systems LLC, Sr. Unsecd. Note, 3.375%, 2/15/2029 | |
| | Compass Minerals International, Inc., 144A, 4.875%, 7/15/2024 | |
| | Compass Minerals International, Inc., Sr. Unsecd. Note, 144A, 6.750%, 12/1/2027 | |
| | Element Solutions, Inc., Sr. Unsecd. Note, 144A, 3.875%, 9/1/2028 | |
| | H.B. Fuller Co., Sr. Unsecd. Note, 4.250%, 10/15/2028 | |
| | Hexion, Inc., Sr. Unsecd. Note, 144A, 7.875%, 7/15/2027 | |
| | Illuminate Buyer LLC/Illuminate Holdings IV, Inc., Sr. Unsecd. Note, 144A, 9.000%, 7/1/2028 | |
| | Koppers, Inc., Sr. Unsecd. Note, 144A, 6.000%, 2/15/2025 | |
| | PQ Corp., Sr. Unsecd. Note, 144A, 5.750%, 12/15/2025 | |
| | Starfruit Finco BV, Sr. Unsecd. Note, 144A, 8.000%, 10/1/2026 | |
| | WR Grace & Co-Conn, Sr. Unsecd. Note, 144A, 4.875%, 6/15/2027 | |
| | | |
| | Construction Machinery—0.7% | |
| | H&E Equipment Services, Inc., Sr. Unsecd. Note, 144A, 3.875%, 12/15/2028 | |
| | United Rentals North America, Inc., Sr. Unsecd. Note, 4.875%, 1/15/2028 | |
| | United Rentals North America, Inc., Term Loan - 2nd Lien, 3.875%, 11/15/2027 | |
| | United Rentals, Inc., Sr. Unsecd. Note, 3.875%, 2/15/2031 | |
| | United Rentals, Inc., Sr. Unsecd. Note, 5.500%, 5/15/2027 | |
| | United Rentals, Inc., Sr. Unsecd. Note, 5.875%, 9/15/2026 | |
| | | |
| | Consumer Cyclical Services—1.8% | |
| | Allied Universal Holdco LLC, Sec. Fac. Bond, 144A, 6.625%, 7/15/2026 | |
| | Allied Universal Holdco LLC, Sr. Unsecd. Note, 144A, 9.750%, 7/15/2027 | |
| | Garda World Security Corp., Sec. Fac. Bond, 144A, 4.625%, 2/15/2027 | |
| | Go Daddy Operating Co. LLC / GD Finance Co., Inc., Sr. Unsecd. Note, 144A, 5.250%, 12/1/2027 | |
| | GW B-CR Security Corp., Sr. Unsecd. Note, 144A, 9.500%, 11/1/2027 | |
| | The Brink’s Co., Sr. Unsecd. Note, 144A, 5.500%, 7/15/2025 | |
| | | |
| | | |
| | Edgewell Personal Care Co., Sr. Unsecd. Note, 144A, 5.500%, 6/1/2028 | |
| | Energizer Holdings, Inc., Sr. Unsecd. Note, 144A, 4.375%, 3/31/2029 | |
| | Energizer Holdings, Inc., Sr. Unsecd. Note, 144A, 4.750%, 6/15/2028 | |
| | Energizer Holdings, Inc., Sr. Unsecd. Note, 144A, 7.750%, 1/15/2027 | |
| | Prestige Brands, Inc., Sr. Unsecd. Note, 144A, 5.125%, 1/15/2028 | |
| | Prestige Brands, Inc., Sr. Unsecd. Note, 144A, 6.375%, 3/1/2024 | |
| | | |
| | Diversified Manufacturing—1.4% | |
| | CFX Escrow Corp., Sr. Unsecd. Note, 144A, 6.000%, 2/15/2024 | |
| | CFX Escrow Corp., Sr. Unsecd. Note, 144A, 6.375%, 2/15/2026 | |
| | Gates Global LLC, Sr. Unsecd. Note, 144A, 6.250%, 1/15/2026 | |
| | Titan Acquisition Ltd., Sr. Unsecd. Note, 144A, 7.750%, 4/15/2026 | |
| | WESCO Distribution, Inc., Sr. Unsecd. Note, 144A, 7.125%, 6/15/2025 | |
| | WESCO Distribution, Inc., Sr. Unsecd. Note, 144A, 7.250%, 6/15/2028 | |
| | WESCO Distribution, Inc., Sr. Unsecd. Note, 5.375%, 12/15/2021 | |
| | WESCO Distribution, Inc., Sr. Unsecd. Note, 5.375%, 6/15/2024 | |
| | | |
High Yield Bond Portfolio
Annual Shareholder Report
| | | |
| | CORPORATE BONDS—continued | |
| | | |
| | Navient Corp., Sr. Unsecd. Note, 5.000%, 3/15/2027 | |
| | Navient Corp., Sr. Unsecd. Note, 5.875%, 10/25/2024 | |
| | Navient Corp., Sr. Unsecd. Note, 6.750%, 6/25/2025 | |
| | Navient Corp., Sr. Unsecd. Note, 6.750%, 6/15/2026 | |
| | Navient Corp., Sr. Unsecd. Note, Series MTN, 6.125%, 3/25/2024 | |
| | Quicken Loans Llc / Quicken Loans Co-Issuer, Inc., Sr. Unsecd. Note, 144A, 3.625%, 3/1/2029 | |
| | Quicken Loans Llc / Quicken Loans Co-Issuer, Inc., Sr. Unsecd. Note, 144A, 3.875%, 3/1/2031 | |
| | Quicken Loans, Inc., Sr. Unsecd. Note, 144A, 5.250%, 1/15/2028 | |
| | United Shore Financial Services, Sr. Unsecd. Note, 144A, 5.500%, 11/15/2025 | |
| | | |
| | | |
| | Aramark Services, Inc., Sr. Unsecd. Note, 144A, 5.000%, 4/1/2025 | |
| | Aramark Services, Inc., Sr. Unsecd. Note, 144A, 5.000%, 2/1/2028 | |
| | Aramark Services, Inc., Sr. Unsecd. Note, 144A, 6.375%, 5/1/2025 | |
| | Aramark Services, Inc., Sr. Unsecd. Note, 4.750%, 6/1/2026 | |
| | B&G Foods, Inc., Sr. Unsecd. Note, 5.250%, 4/1/2025 | |
| | Kraft Heinz Foods Co., Sr. Unsecd. Note, 144A, 4.250%, 3/1/2031 | |
| | Kraft Heinz Foods Co., Sr. Unsecd. Note, 4.375%, 6/1/2046 | |
| | Kraft Heinz Foods Co., Sr. Unsecd. Note, 5.200%, 7/15/2045 | |
| | Lamb Weston Holdings, Inc., Sr. Unsecd. Note, 144A, 4.875%, 5/15/2028 | |
| | Post Holdings, Inc., Sr. Unsecd. Note, 144A, 4.625%, 4/15/2030 | |
| | Post Holdings, Inc., Sr. Unsecd. Note, 144A, 5.000%, 8/15/2026 | |
| | Post Holdings, Inc., Sr. Unsecd. Note, 144A, 5.625%, 1/15/2028 | |
| | Post Holdings, Inc., Sr. Unsecd. Note, 144A, 5.750%, 3/1/2027 | |
| | U.S. Foodservice, Inc., Sr. Unsecd. Note, 144A, 5.875%, 6/15/2024 | |
| | | |
| | | |
| | Affinity Gaming LLC, 144A, 6.875%, 12/15/2027 | |
| | Boyd Gaming Corp., Sr. Unsecd. Note, 144A, 8.625%, 6/1/2025 | |
| | Boyd Gaming Corp., Sr. Unsecd. Note, 4.750%, 12/1/2027 | |
| | Boyd Gaming Corp., Sr. Unsecd. Note, 6.375%, 4/1/2026 | |
| | Boyd Gaming Corp., Sr. Unsecd. Note, Series WI, 6.000%, 8/15/2026 | |
| | CCM Merger, Inc., Sr. Unsecd. Note, 144A, 6.375%, 5/1/2026 | |
| | Colt Merger Sub, Inc., Sr. Secd. Note, 144A, 5.750%, 7/1/2025 | |
| | Colt Merger Sub, Inc., Sr. Secd. Note, 144A, 6.250%, 7/1/2025 | |
| | Colt Merger Sub, Inc., Sr. Unsecd. Note, 144A, 8.125%, 7/1/2027 | |
| | CRC Escrow Issuer LLC, Sr. Unsecd. Note, 144A, 5.250%, 10/15/2025 | |
| | MGM Growth Properties LLC, Sr. Unsecd. Note, 144A, 3.875%, 2/15/2029 | |
| | MGM Growth Properties LLC, Sr. Unsecd. Note, 4.500%, 9/1/2026 | |
| | MGM Growth Properties LLC, Sr. Unsecd. Note, 5.750%, 2/1/2027 | |
| | MGM Growth Properties Operating Partnership LP / MGP Finance Co-Issuer, Inc., Sr. Unsecd. Note, 144A, 4.625%, 6/15/2025 | |
| | MGM Resorts International, 6.000%, 3/15/2023 | |
| | MGM Resorts International, Sr. Unsecd. Note, 4.625%, 9/1/2026 | |
| | MGM Resorts International, Sr. Unsecd. Note, 4.750%, 10/15/2028 | |
| | MGM Resorts International, Sr. Unsecd. Note, 5.500%, 4/15/2027 | |
| | MGM Resorts International, Sr. Unsecd. Note, 5.750%, 6/15/2025 | |
| | MGM Resorts International, Sr. Unsecd. Note, 6.750%, 5/1/2025 | |
| | Mohegan Tribal Gaming Authority, Sr. Unsecd. Note, 144A, 7.875%, 10/15/2024 | |
| | Star Group Holdings BV, Sr. Unsecd. Note, 144A, 7.000%, 7/15/2026 | |
High Yield Bond Portfolio
Annual Shareholder Report
| | | |
| | CORPORATE BONDS—continued | |
| | | |
| | Station Casinos, Inc., Sr. Unsecd. Note, 144A, 4.500%, 2/15/2028 | |
| | Station Casinos, Inc., Sr. Unsecd. Note, 144A, 5.000%, 10/1/2025 | |
| | Twin River Worldwide Holdings, Inc., Sr. Unsecd. Note, 144A, 6.750%, 6/1/2027 | |
| | VICI Properties LP/ VICI Note Co., Inc., 144A, 3.500%, 2/15/2025 | |
| | VICI Properties LP/ VICI Note Co., Inc., 144A, 3.750%, 2/15/2027 | |
| | VICI Properties LP/ VICI Note Co., Inc., Sr. Unsecd. Note, 144A, 4.125%, 8/15/2030 | |
| | VICI Properties LP/ VICI Note Co., Inc., Sr. Unsecd. Note, 144A, 4.250%, 12/1/2026 | |
| | VICI Properties LP/ VICI Note Co., Inc., Sr. Unsecd. Note, 144A, 4.625%, 12/1/2029 | |
| | | |
| | | |
| | Acadia Healthcare Co., Inc., Sr. Unsecd. Note, 144A, 5.000%, 4/15/2029 | |
| | Acadia Healthcare Co., Inc., Sr. Unsecd. Note, 144A, 5.500%, 7/1/2028 | |
| | Acadia Healthcare Co., Inc., Sr. Unsecd. Note, 5.625%, 2/15/2023 | |
| | Acadia Healthcare Co., Inc., Sr. Unsecd. Note, 6.500%, 3/1/2024 | |
| | AdaptHealth LLC, Sr. Unsecd. Note, 144A, 4.625%, 8/1/2029 | |
| | Avantor Funding, Inc., Sec. Fac. Bond, 144A, 4.625%, 7/15/2028 | |
| | Charles River Laboratories International, Inc., Sr. Unsecd. Note, 144A, 4.250%, 5/1/2028 | |
| | CHS/Community Health Systems, Inc., Sec. Fac. Bond, 144A, 5.625%, 3/15/2027 | |
| | CHS/Community Health Systems, Inc., Sec. Fac. Bond, 144A, 6.000%, 1/15/2029 | |
| | CHS/Community Health Systems, Inc., Sec. Fac. Bond, 144A, 6.625%, 2/15/2025 | |
| | CHS/Community Health Systems, Inc., Sec. Fac. Bond, 144A, 8.000%, 3/15/2026 | |
| | CHS/Community Health Systems, Inc., Sec. Fac. Bond, 144A, 8.625%, 1/15/2024 | |
| | Global Medical Response, Inc., Sec. Fac. Bond, 144A, 6.500%, 10/1/2025 | |
| | HCA, Inc., 5.875%, 5/1/2023 | |
| | HCA, Inc., 5.875%, 2/15/2026 | |
| | HCA, Inc., Sr. Unsecd. Note, 3.500%, 9/1/2030 | |
| | HCA, Inc., Sr. Unsecd. Note, 5.375%, 2/1/2025 | |
| | HCA, Inc., Sr. Unsecd. Note, 5.375%, 9/1/2026 | |
| | HCA, Inc., Sr. Unsecd. Note, 5.625%, 9/1/2028 | |
| | HCA, Inc., Sr. Unsecd. Note, 5.875%, 2/1/2029 | |
| | IMS Health, Inc., Sr. Unsecd. Note, 144A, 5.000%, 10/15/2026 | |
| | Iqvia, Inc., Sr. Unsecd. Note, 144A, 5.000%, 5/15/2027 | |
| | LifePoint Health, Inc., 144A, 6.750%, 4/15/2025 | |
| | LifePoint Health, Inc., Sec. Fac. Bond, 144A, 4.375%, 2/15/2027 | |
| | LifePoint Health, Inc., Sr. Unsecd. Note, 144A, 5.375%, 1/15/2029 | |
| | LifePoint Health, Inc., Sr. Unsecd. Note, 144A, 9.750%, 12/1/2026 | |
| | MEDNAX, Inc., Sr. Unsecd. Note, 144A, 5.250%, 12/1/2023 | |
| | MEDNAX, Inc., Sr. Unsecd. Note, 144A, 6.250%, 1/15/2027 | |
| | MPH Acquisition Holdings LLC, Sr. Unsecd. Note, 144A, 5.750%, 11/1/2028 | |
| | Team Health Holdings, Inc., Sr. Unsecd. Note, 144A, 6.375%, 2/1/2025 | |
| | Teleflex, Inc., Sr. Unsecd. Note, 144A, 4.250%, 6/1/2028 | |
| | Teleflex, Inc., Sr. Unsecd. Note, 4.625%, 11/15/2027 | |
| | Teleflex, Inc., Sr. Unsecd. Note, 4.875%, 6/1/2026 | |
| | Tenet Healthcare Corp., 144A, 4.625%, 6/15/2028 | |
| | Tenet Healthcare Corp., 144A, 4.875%, 1/1/2026 | |
| | Tenet Healthcare Corp., 144A, 5.125%, 11/1/2027 | |
| | Tenet Healthcare Corp., 144A, 6.250%, 2/1/2027 | |
| | Tenet Healthcare Corp., 144A, 7.500%, 4/1/2025 | |
| | Tenet Healthcare Corp., 5.125%, 5/1/2025 | |
| | Tenet Healthcare Corp., Sr. Secd. Note, 4.625%, 7/15/2024 | |
High Yield Bond Portfolio
Annual Shareholder Report
| | | |
| | CORPORATE BONDS—continued | |
| | | |
| | Tenet Healthcare Corp., Sr. Unsecd. Note, 144A, 6.125%, 10/1/2028 | |
| | Tenet Healthcare Corp., Sr. Unsecd. Note, 6.750%, 6/15/2023 | |
| | Tenet Healthcare Corp., Sr. Unsecd. Note, 7.000%, 8/1/2025 | |
| | Vizient, Inc., Sr. Unsecd. Note, 144A, 6.250%, 5/15/2027 | |
| | West Street Merger Subsidiary, Inc., Sr. Unsecd. Note, 144A, 6.375%, 9/1/2025 | |
| | | |
| | | |
| | Centene Corp., Sr. Unsecd. Note, 144A, 5.375%, 6/1/2026 | |
| | Centene Corp., Sr. Unsecd. Note, 144A, 5.375%, 8/15/2026 | |
| | Centene Corp., Sr. Unsecd. Note, 3.000%, 10/15/2030 | |
| | Centene Corp., Sr. Unsecd. Note, 4.750%, 1/15/2025 | |
| | Centene Corp., Sr. Unsecd. Note, 4.750%, 1/15/2025 | |
| | Centene Corp., Sr. Unsecd. Note, Series WI, 3.375%, 2/15/2030 | |
| | Centene Corp., Sr. Unsecd. Note, Series WI, 4.250%, 12/15/2027 | |
| | Centene Corp., Sr. Unsecd. Note, Series WI, 4.625%, 12/15/2029 | |
| | Molina Healthcare, Inc., Sr. Unsecd. Note, 144A, 3.875%, 11/15/2030 | |
| | Molina Healthcare, Inc., Sr. Unsecd. Note, 144A, 4.375%, 6/15/2028 | |
| | | |
| | | |
| | Antero Resources Corp., Sr. Unsecd. Note, 144A, 8.375%, 7/15/2026 | |
| | Antero Resources Corp., Sr. Unsecd. Note, 5.000%, 3/1/2025 | |
| | Antero Resources Corp., Sr. Unsecd. Note, 5.625%, 6/1/2023 | |
| | Apache Corp., Sr. Unsecd. Note, 4.625%, 11/15/2025 | |
| | Apache Corp., Sr. Unsecd. Note, 4.875%, 11/15/2027 | |
| | Ascent Resources Utica Holdings LLC/ ARU Finance Corp., Sr. Unsecd. Note, 144A, 7.000%, 11/1/2026 | |
| | Ascent Resources Utica Holdings LLC/ ARU Finance Corp., Sr. Unsecd. Note, 144A, 8.250%, 12/31/2028 | |
| | Ascent Resources Utica Holdings LLC/ ARU Finance Corp., Sr. Unsecd. Note, 144A, 9.000%, 11/1/2027 | |
| | Berry Petroleum Co., Sr. Unsecd. Note, 144A, 7.000%, 2/15/2026 | |
| | Callon Petroleum Corp., Sr. Unsecd. Note, 6.125%, 10/1/2024 | |
| | Callon Petroleum Corp., Sr. Unsecd. Note, Series WI, 6.375%, 7/1/2026 | |
| | Carrizo Oil & Gas, Inc., Sr. Unsecd. Note, 6.250%, 4/15/2023 | |
| | Carrizo Oil & Gas, Inc., Sr. Unsecd. Note, 8.250%, 7/15/2025 | |
| | Centennial Resource Production, LLC, Sr. Unsecd. Note, 144A, 6.875%, 4/1/2027 | |
| | Chesapeake Energy Corp., 144A, 11.500%, 1/1/2025 | |
| | Chesapeake Energy Corp., Sr. Unsecd. Note, 7.000%, 10/1/2024 | |
| | Continental Resources, Inc., Sr. Unsecd. Note, 144A, 5.750%, 1/15/2031 | |
| | Continental Resources, Inc., Sr. Unsecd. Note, 4.375%, 1/15/2028 | |
| | Crownrock LP/ Crownrock F, 144A, 5.625%, 10/15/2025 | |
| | Double Eagle Iii Midco, Sr. Unsecd. Note, 144A, 7.750%, 12/15/2025 | |
| | Endeavor Energy Resources LP, Sr. Unsecd. Note, 144A, 5.750%, 1/30/2028 | |
| | Endeavor Energy Resources LP, Sr. Unsecd. Note, 144A, 6.625%, 7/15/2025 | |
| | EQT Corp., Sr. Unsecd. Note, 5.000%, 1/15/2029 | |
| | EQT Corp., Sr. Unsecd. Note, 7.875%, 2/1/2025 | |
| | EQT Corp., Sr. Unsecd. Note, 8.750%, 2/1/2030 | |
| | Gulfport Energy Corp., Sr. Unsecd. Note, 6.000%, 10/15/2024 | |
| | Gulfport Energy Corp., Sr. Unsecd. Note, 6.375%, 5/15/2025 | |
| | Gulfport Energy Corp., Sr. Unsecd. Note, Series WI, 6.375%, 1/15/2026 | |
| | Jagged Peak Energy, Inc., Sr. Unsecd. Note, Series WI, 5.875%, 5/1/2026 | |
| | Occidental Petroleum Corp., Sr. Unsecd. Note, 2.900%, 8/15/2024 | |
| | Occidental Petroleum Corp., Sr. Unsecd. Note, 3.200%, 8/15/2026 | |
High Yield Bond Portfolio
Annual Shareholder Report
| | | |
| | CORPORATE BONDS—continued | |
| | Independent Energy—continued | |
| | Occidental Petroleum Corp., Sr. Unsecd. Note, 3.400%, 4/15/2026 | |
| | Occidental Petroleum Corp., Sr. Unsecd. Note, 3.500%, 6/15/2025 | |
| | Occidental Petroleum Corp., Sr. Unsecd. Note, 4.100%, 2/15/2047 | |
| | Occidental Petroleum Corp., Sr. Unsecd. Note, 4.300%, 8/15/2039 | |
| | Occidental Petroleum Corp., Sr. Unsecd. Note, 4.400%, 8/15/2049 | |
| | Occidental Petroleum Corp., Sr. Unsecd. Note, 4.500%, 7/15/2044 | |
| | Occidental Petroleum Corp., Sr. Unsecd. Note, 5.875%, 9/1/2025 | |
| | Occidental Petroleum Corp., Sr. Unsecd. Note, 6.125%, 1/1/2031 | |
| | Occidental Petroleum Corp., Sr. Unsecd. Note, 6.450%, 9/15/2036 | |
| | Occidental Petroleum Corp., Sr. Unsecd. Note, 6.625%, 9/1/2030 | |
| | Occidental Petroleum Corp., Sr. Unsecd. Note, 7.150%, 5/15/2028 | |
| | Occidental Petroleum Corp., Sr. Unsecd. Note, 8.000%, 7/15/2025 | |
| | Occidental Petroleum Corp., Sr. Unsecd. Note, 8.500%, 7/15/2027 | |
| | Occidental Petroleum Corp., Sr. Unsecd. Note, 8.875%, 7/15/2030 | |
| | Parsley Energy LLC / Parsley Finance Corp., Sr. Unsecd. Note, 144A, 5.625%, 10/15/2027 | |
| | PDC Energy, Inc., Sr. Unsecd. Note, 6.125%, 9/15/2024 | |
| | PDC Energy, Inc., Sr. Unsecd. Note, Series WI, 5.750%, 5/15/2026 | |
| | QEP Resources, Inc., Sr. Unsecd. Note, 5.250%, 5/1/2023 | |
| | QEP Resources, Inc., Sr. Unsecd. Note, 5.625%, 3/1/2026 | |
| | Range Resources Corp., Sr. Unsecd. Note, 4.875%, 5/15/2025 | |
| | Range Resources Corp., Sr. Unsecd. Note, 5.000%, 3/15/2023 | |
| | Range Resources Corp., Sr. Unsecd. Note, Series WI, 9.250%, 2/1/2026 | |
| | SM Energy Co., Sr. Unsecd. Note, 5.625%, 6/1/2025 | |
| | SM Energy Co., Sr. Unsecd. Note, 6.625%, 1/15/2027 | |
| | SM Energy Co., Sr. Unsecd. Note, 6.750%, 9/15/2026 | |
| | Southwestern Energy Co., Sr. Unsecd. Note, 7.750%, 10/1/2027 | |
| | Ultra Resources, Inc., Sr. Unsecd. Note, Series 144A, 7.125%, 04/15/2025 | |
| | WPX Energy, Inc., Sr. Unsecd. Note, 4.500%, 1/15/2030 | |
| | WPX Energy, Inc., Sr. Unsecd. Note, 5.250%, 10/15/2027 | |
| | WPX Energy, Inc., Sr. Unsecd. Note, 5.750%, 6/1/2026 | |
| | WPX Energy, Inc., Sr. Unsecd. Note, 5.875%, 6/15/2028 | |
| | | |
| | | |
| | Booz Allen Hamilton, Inc., Sr. Unsecd. Note, 144A, 3.875%, 9/1/2028 | |
| | Cushman & Wakefield US Borrower LLC, Sec. Fac. Bond, 144A, 6.750%, 5/15/2028 | |
| | Vertical Holdco GmbH, Sr. Unsecd. Note, 144A, 7.625%, 7/15/2028 | |
| | Vertical U.S. Newco, Inc., Sr. Unsecd. Note, 144A, 5.250%, 7/15/2027 | |
| | | |
| | | |
| | Alliant Holdings Intermediate LLC / Alliant Holdings Co-Issuer, Sr. Unsecd. Note, 144A, 6.750%, 10/15/2027 | |
| | AmWINS Group, Inc., Sr. Unsecd. Note, 144A, 7.750%, 7/1/2026 | |
| | Ardonagh Midco 2 PLC, Sr. Unsecd. Note, 144A, 11.500% / 12.750% PIK, 1/15/2027 | |
| | AssuredPartners, Inc., Sr. Unsecd. Note, 144A, 5.625%, 1/15/2029 | |
| | AssuredPartners, Inc., Sr. Unsecd. Note, 144A, 7.000%, 8/15/2025 | |
| | GTCR AP Finance, Inc., Sr. Unsecd. Note, 144A, 8.000%, 5/15/2027 | |
| | Hub International Ltd., Sr. Unsecd. Note, 144A, 7.000%, 5/1/2026 | |
| | NFP Corp., Sec. Fac. Bond, 144A, 7.000%, 5/15/2025 | |
| | NFP Corp., Sr. Unsecd. Note, 144A, 6.875%, 8/15/2028 | |
| | USIS Merger Subsidiary, Inc., Sr. Unsecd. Note, 144A, 6.875%, 5/1/2025 | |
| | | |
High Yield Bond Portfolio
Annual Shareholder Report
| | | |
| | CORPORATE BONDS—continued | |
| | | |
| | Six Flags Entertainment Corp., Sr. Unsecd. Note, 144A, 5.500%, 4/15/2027 | |
| | Six Flags Theme Parks, Sec. Fac. Bond, 144A, 7.000%, 7/1/2025 | |
| | Voc Escrow Ltd., 144A, 5.000%, 2/15/2028 | |
| | | |
| | | |
| | Hilton Domestic Operating Company, Inc., Sr. Unsecd. Note, 144A, 3.750%, 5/1/2029 | |
| | Hilton Domestic Operating Company, Inc., Sr. Unsecd. Note, 144A, 5.750%, 5/1/2028 | |
| | Hilton Domestic Operating Company, Inc., Sr. Unsecd. Note, 5.125%, 5/1/2026 | |
| | Hilton Domestic Operating Company, Inc., Sr. Unsecd. Note, Series WI, 4.875%, 1/15/2030 | |
| | Wyndham Hotels & Resorts, Inc., Sr. Unsecd. Note, 144A, 4.375%, 8/15/2028 | |
| | Wyndham Hotels & Resorts, Inc., Sr. Unsecd. Note, 144A, 5.375%, 4/15/2026 | |
| | | |
| | | |
| | AMC Networks, Inc., Sr. Unsecd. Note, 4.750%, 8/1/2025 | |
| | AMC Networks, Inc., Sr. Unsecd. Note, 5.000%, 4/1/2024 | |
| | CBS Radio, Inc., Sr. Unsecd. Note, 144A, 7.250%, 11/1/2024 | |
| | Cumulus Media News Holdings, Inc., 144A, 6.750%, 7/1/2026 | |
| | Diamond Sports Group LLC / Diamond Sports Finance Co., Sec. Fac. Bond, 144A, 5.375%, 8/15/2026 | |
| | Diamond Sports Group LLC / Diamond Sports Finance Co., Sec. Fac. Bond, 144A, 6.625%, 8/15/2027 | |
| | Entercom Media Corp., 144A, 6.500%, 5/1/2027 | |
| | Gray Escrow, Inc., Sr. Unsecd. Note, 144A, 7.000%, 5/15/2027 | |
| | Gray Television, Inc., Sr. Unsecd. Note, 144A, 4.750%, 10/15/2030 | |
| | Gray Television, Inc., Sr. Unsecd. Note, 144A, 5.875%, 7/15/2026 | |
| | iHeartCommunications, Inc., 144A, 4.750%, 1/15/2028 | |
| | iHeartCommunications, Inc., 144A, 5.250%, 8/15/2027 | |
| | iHeartCommunications, Inc., 6.375%, 5/1/2026 | |
| | iHeartCommunications, Inc., Sr. Unsecd. Note, 8.375%, 5/1/2027 | |
| | Lamar Media Corp., Sr. Unsecd. Note, 4.000%, 2/15/2030 | |
| | Lamar Media Corp., Sr. Unsecd. Note, 4.875%, 1/15/2029 | |
| | Lamar Media Corp., Sr. Unsecd. Note, 5.750%, 2/1/2026 | |
| | Match Group, Inc., Sr. Unsecd. Note, 144A, 4.125%, 8/1/2030 | |
| | Match Group, Inc., Sr. Unsecd. Note, 144A, 4.625%, 6/1/2028 | |
| | Match Group, Inc., Sr. Unsecd. Note, 144A, 5.000%, 12/15/2027 | |
| | Nexstar Broadcasting, Inc., Sr. Unsecd. Note, 144A, 4.750%, 11/1/2028 | |
| | Nexstar Escrow Corp., Sr. Unsecd. Note, 144A, 5.625%, 7/15/2027 | |
| | Nielsen Finance LLC/Nielsen Finance Co., 144A, 5.000%, 4/15/2022 | |
| | Nielsen Finance LLC/Nielsen Finance Co., Sr. Unsecd. Note, 144A, 5.000%, 2/1/2025 | |
| | Nielsen Finance LLC/Nielsen Finance Co., Sr. Unsecd. Note, 144A, 5.625%, 10/1/2028 | |
| | Nielsen Finance LLC/Nielsen Finance Co., Sr. Unsecd. Note, 144A, 5.875%, 10/1/2030 | |
| | Outfront Media Capital LLC / Outfront Media Capital Corp., Sr. Unsecd. Note, 144A, 4.625%, 3/15/2030 | |
| | Outfront Media Capital LLC / Outfront Media Capital Corp., Sr. Unsecd. Note, 144A, 6.250%, 6/15/2025 | |
| | Scripps Escrow II, Inc., Sr. Unsecd. Note, 144A, 3.875%, 1/15/2029 | |
| | Scripps Escrow II, Inc., Sr. Unsecd. Note, 144A, 5.375%, 1/15/2031 | |
| | Scripps Escrow, Inc., Sr. Unsecd. Note, 144A, 5.875%, 7/15/2027 | |
| | Sinclair Television Group, Sr. Unsecd. Note, 144A, 5.125%, 2/15/2027 | |
| | Sinclair Television Group, Sr. Unsecd. Note, 144A, 5.500%, 3/1/2030 | |
| | Sinclair Television Group, Sr. Unsecd. Note, 144A, 5.875%, 3/15/2026 | |
| | Tegna, Inc., Sr. Unsecd. Note, 144A, 4.625%, 3/15/2028 | |
| | Tegna, Inc., Sr. Unsecd. Note, 144A, 5.000%, 9/15/2029 | |
| | Terrier Media Buyer, Inc., Sr. Unsecd. Note, 144A, 8.875%, 12/15/2027 | |
High Yield Bond Portfolio
Annual Shareholder Report
| | | |
| | CORPORATE BONDS—continued | |
| | Media Entertainment—continued | |
| | Townsquare Media, Inc., Sec. Fac. Bond, 144A, 6.875%, 2/1/2026 | |
| | WMG Acquisition Corp., Sec. Fac. Bond, 144A, 3.875%, 7/15/2030 | |
| | WMG Acquisition Corp., Sr. Unsecd. Note, 144A, 3.000%, 2/15/2031 | |
| | | |
| | | |
| | Coeur Mining, Inc., Sr. Unsecd. Note, 5.875%, 6/1/2024 | |
| | Freeport-McMoRan, Inc., Sr. Unsecd. Note, 4.125%, 3/1/2028 | |
| | Freeport-McMoRan, Inc., Sr. Unsecd. Note, 4.250%, 3/1/2030 | |
| | Freeport-McMoRan, Inc., Sr. Unsecd. Note, 4.375%, 8/1/2028 | |
| | Freeport-McMoRan, Inc., Sr. Unsecd. Note, 4.625%, 8/1/2030 | |
| | Freeport-McMoRan, Inc., Sr. Unsecd. Note, 5.000%, 9/1/2027 | |
| | Freeport-McMoRan, Inc., Sr. Unsecd. Note, 5.250%, 9/1/2029 | |
| | Freeport-McMoRan, Inc., Sr. Unsecd. Note, 5.400%, 11/14/2034 | |
| | HudBay Minerals, Inc., Sr. Unsecd. Note, 144A, 7.625%, 1/15/2025 | |
| | | |
| | | |
| | AmeriGas Partners LP, Sr. Unsecd. Note, 5.500%, 5/20/2025 | |
| | AmeriGas Partners LP, Sr. Unsecd. Note, 5.750%, 5/20/2027 | |
| | AmeriGas Partners LP, Sr. Unsecd. Note, 5.875%, 8/20/2026 | |
| | Antero Midstream Partners LP, Sr. Unsecd. Note, 144A, 5.750%, 3/1/2027 | |
| | Antero Midstream Partners LP, Sr. Unsecd. Note, 144A, 5.750%, 1/15/2028 | |
| | Antero Midstream Partners LP, Sr. Unsecd. Note, 144A, 7.875%, 5/15/2026 | |
| | Antero Midstream Partners LP, Sr. Unsecd. Note, 5.375%, 9/15/2024 | |
| | Atlas Pipeline Partners LP, 5.875%, 8/1/2023 | |
| | Buckeye Partners, Sr. Unsecd. Note, 144A, 4.125%, 3/1/2025 | |
| | Buckeye Partners, Sr. Unsecd. Note, 144A, 4.500%, 3/1/2028 | |
| | Cheniere Energy Partners, LP, Series WI, 5.250%, 10/1/2025 | |
| | Cheniere Energy Partners, LP, Sr. Unsecd. Note, 5.625%, 10/1/2026 | |
| | Cheniere Energy Partners, LP, Sr. Unsecd. Note, Series WI, 4.500%, 10/1/2029 | |
| | Cheniere Energy, Inc., Sr. Secd. Note, 144A, 4.625%, 10/15/2028 | |
| | CNX Midstream Partners LP / CNX Midstream Finance Corp., Sr. Unsecd. Note, 144A, 6.500%, 3/15/2026 | |
| | EQM Midstream Partners, LP, Sr. Unsecd. Note, 144A, 6.500%, 7/1/2027 | |
| | EQT Midstream Partners LP, Sr. Unsecd. Note, 144A, 6.000%, 7/1/2025 | |
| | EQT Midstream Partners LP, Sr. Unsecd. Note, 4.750%, 7/15/2023 | |
| | EQT Midstream Partners LP, Sr. Unsecd. Note, 5.500%, 7/15/2028 | |
| | EQT Midstream Partners LP, Sr. Unsecd. Note, 6.500%, 7/15/2048 | |
| | Hess Midstream Operations LP, Sr. Unsecd. Note, 144A, 5.625%, 2/15/2026 | |
| | Hess Midstream Partners LP, Sr. Unsecd. Note, 144A, 5.125%, 6/15/2028 | |
| | Holly Energy Partners LP, Sr. Unsecd. Note, 144A, 5.000%, 2/1/2028 | |
| | NuStar Logistics LP, Sr. Unsecd. Note, 5.625%, 4/28/2027 | |
| | NuStar Logistics LP, Sr. Unsecd. Note, 5.750%, 10/1/2025 | |
| | NuStar Logistics LP, Sr. Unsecd. Note, 6.000%, 6/1/2026 | |
| | NuStar Logistics LP, Sr. Unsecd. Note, 6.375%, 10/1/2030 | |
| | NuStar Logistics LP, Sr. Unsecd. Note, 6.750%, 2/1/2021 | |
| | Rattler Midstream Partners LP, Sr. Unsecd. Note, 144A, 5.625%, 7/15/2025 | |
| | Suburban Propane Partners LP, 5.500%, 6/1/2024 | |
| | Suburban Propane Partners LP, Sr. Unsecd. Note, 5.750%, 3/1/2025 | |
| | Suburban Propane Partners LP, Sr. Unsecd. Note, 5.875%, 3/1/2027 | |
| | Summit Midstream Holdings LLC, Sr. Unsecd. Note, 5.500%, 8/15/2022 | |
| | Summit Midstream Holdings LLC, Sr. Unsecd. Note, 5.750%, 4/15/2025 | |
High Yield Bond Portfolio
Annual Shareholder Report
| | | |
| | CORPORATE BONDS—continued | |
| | | |
| | Sunoco LP/Finance Corp., Sr. Unsecd. Note, Series WI, 5.500%, 2/15/2026 | |
| | Sunoco LP/Finance Corp., Sr. Unsecd. Note, Series WI, 5.875%, 3/15/2028 | |
| | Targa Resources Partners LP / Targa Resources Partners Finance Corp., Sr. Unsecd. Note, 144A, 4.875%, 2/1/2031 | |
| | Targa Resources Partners LP / Targa Resources Partners Finance Corp., Sr. Unsecd. Note, 144A, 5.500%, 3/1/2030 | |
| | Targa Resources Partners LP / Targa Resources Partners Finance Corp., Sr. Unsecd. Note, 5.000%, 1/15/2028 | |
| | Targa Resources Partners LP / Targa Resources Partners Finance Corp., Sr. Unsecd. Note, 5.125%, 2/1/2025 | |
| | Targa Resources Partners LP / Targa Resources Partners Finance Corp., Sr. Unsecd. Note, 5.375%, 2/1/2027 | |
| | Targa Resources Partners LP / Targa Resources Partners Finance Corp., Sr. Unsecd. Note, 5.875%, 4/15/2026 | |
| | Targa Resources Partners LP / Targa Resources Partners Finance Corp., Sr. Unsecd. Note, 6.500%, 7/15/2027 | |
| | TransMontaigne Partners LP/TLP Finance Corp., Sr. Unsecd. Note, 6.125%, 2/15/2026 | |
| | Western Gas Partners LP, Sr. Unsecd. Note, 4.000%, 7/1/2022 | |
| | Western Gas Partners LP, Sr. Unsecd. Note, 4.500%, 3/1/2028 | |
| | Western Gas Partners LP, Sr. Unsecd. Note, 4.650%, 7/1/2026 | |
| | Western Gas Partners LP, Sr. Unsecd. Note, 5.300%, 3/1/2048 | |
| | Western Gas Partners LP, Sr. Unsecd. Note, 5.450%, 4/1/2044 | |
| | Western Gas Partners LP, Sr. Unsecd. Note, 5.500%, 8/15/2048 | |
| | Western Midstream Operating, LP, Sr. Unsecd. Note, 5.050%, 2/1/2030 | |
| | | |
| | | |
| | Archrock Partners LP / Archrock Partners Finance Corp., Sr. Unsecd. Note, 144A, 6.250%, 4/1/2028 | |
| | Archrock Partners LP / Archrock Partners Finance Corp., Sr. Unsecd. Note, 144A, 6.875%, 4/1/2027 | |
| | Nabors Industries Ltd., Sr. Unsecd. Note, 144A, 7.250%, 1/15/2026 | |
| | Nabors Industries Ltd., Sr. Unsecd. Note, 144A, 7.500%, 1/15/2028 | |
| | Precision Drilling Corp., Sr. Unsecd. Note, 144A, 7.125%, 1/15/2026 | |
| | Precision Drilling Corp., Sr. Unsecd. Note, 5.250%, 11/15/2024 | |
| | Sesi LLC, 7.125%, 12/15/2021 | |
| | Sesi LLC, Sr. Unsecd. Note, Series WI, 7.750%, 9/15/2024 | |
| | Shelf Drilling Holdings Ltd., Sr. Unsecd. Note, 144A, 8.250%, 2/15/2025 | |
| | USA Compression Partners LP, Sr. Unsecd. Note, 6.875%, 9/1/2027 | |
| | USA Compression Partners LP, Sr. Unsecd. Note, Series WI, 6.875%, 4/1/2026 | |
| | | |
| | | |
| | ARD Finance SA, Sec. Fac. Bond, 144A, 6.500%, 6/30/2027 | |
| | Ardagh Packaging Finance PLC/Ardagh Holdings, Sec. Fac. Bond, 144A, 5.250%, 8/15/2027 | |
| | Ardagh Packaging Finance PLC/Ardagh Holdings, Sr. Unsecd. Note, 144A, 5.250%, 8/15/2027 | |
| | Ardagh Packaging Finance PLC/Ardagh Holdings, Sr. Unsecd. Note, 144A, 6.000%, 2/15/2025 | |
| | Ball Corp., Sr. Unsecd. Note, 2.875%, 8/15/2030 | |
| | Berry Global Escrow Corp., 144A, 4.875%, 7/15/2026 | |
| | Berry Global Escrow Corp., 144A, 5.625%, 7/15/2027 | |
| | Berry Plastics Corp., 5.125%, 7/15/2023 | |
| | Bway Holding Co., Sec. Fac. Bond, 144A, 5.500%, 4/15/2024 | |
| | Bway Holding Co., Sr. Unsecd. Note, 144A, 7.250%, 4/15/2025 | |
| | Crown Americas LLC / Crown Americas Capital Corp. VI, Sr. Unsecd. Note, 4.750%, 2/1/2026 | |
| | Crown Americas LLC, 4.500%, 1/15/2023 | |
| | Flex Acquisition Co., Inc., Sr. Unsecd. Note, 144A, 6.875%, 1/15/2025 | |
| | Flex Acquisition Co., Inc., Sr. Unsecd. Note, 144A, 7.875%, 7/15/2026 | |
| | Owens-Brockway Glass Container, Inc., 144A, 5.375%, 1/15/2025 | |
| | Owens-Brockway Glass Container, Inc., 144A, 6.375%, 8/15/2025 | |
| | Owens-Brockway Glass Container, Inc., Sr. Unsecd. Note, 144A, 6.625%, 5/13/2027 | |
| | Reynolds Group Issuer, Inc. / LLC / LU, Sec. Fac. Bond, 144A, 4.000%, 10/15/2027 | |
High Yield Bond Portfolio
Annual Shareholder Report
| | | |
| | CORPORATE BONDS—continued | |
| | | |
| | Sealed Air Corp., 144A, 4.875%, 12/1/2022 | |
| | Sealed Air Corp., 144A, 5.250%, 4/1/2023 | |
| | Sealed Air Corp., Sr. Unsecd. Note, 144A, 4.000%, 12/1/2027 | |
| | Silgan Holdings, Inc., Sr. Unsecd. Note, Series WI, 4.125%, 2/1/2028 | |
| | Trident Merger Subsidiary, Inc., Sr. Unsecd. Note, 144A, 6.625%, 11/1/2025 | |
| | Trident Merger Subsidiary, Inc., Sr. Unsecd. Note, 144A, 9.250%, 8/1/2024 | |
| | Trivium Packaging Finance BV, Sec. Fac. Bond, 144A, 5.500%, 8/15/2026 | |
| | Trivium Packaging Finance BV, Sr. Unsecd. Note, 144A, 8.500%, 8/15/2027 | |
| | | |
| | | |
| | Clearwater Paper Corp., Sr. Unsecd. Note, 144A, 4.750%, 8/15/2028 | |
| | Clearwater Paper Corp., Sr. Unsecd. Note, 144A, 5.375%, 2/1/2025 | |
| | Graphic Packaging International, LLC, Sr. Unsecd. Note, 144A, 3.500%, 3/15/2028 | |
| | Graphic Packaging International, LLC, Sr. Unsecd. Note, 144A, 3.500%, 3/1/2029 | |
| | | |
| | | |
| | Bausch Health Cos, Inc., Sec. Fac. Bond, 144A, 5.500%, 11/1/2025 | |
| | Bausch Health Cos, Inc., Sec. Fac. Bond, 144A, 5.750%, 8/15/2027 | |
| | Bausch Health Cos, Inc., Sr. Secd. Note, 144A, 7.000%, 3/15/2024 | |
| | Bausch Health Cos, Inc., Sr. Unsecd. Note, 144A, 5.000%, 1/30/2028 | |
| | Bausch Health Cos, Inc., Sr. Unsecd. Note, 144A, 5.000%, 2/15/2029 | |
| | Bausch Health Cos, Inc., Sr. Unsecd. Note, 144A, 5.250%, 1/30/2030 | |
| | Bausch Health Cos, Inc., Sr. Unsecd. Note, 144A, 5.250%, 2/15/2031 | |
| | Bausch Health Cos, Inc., Sr. Unsecd. Note, 144A, 6.125%, 4/15/2025 | |
| | Bausch Health Cos, Inc., Sr. Unsecd. Note, 144A, 6.250%, 2/15/2029 | |
| | Bausch Health Cos, Inc., Sr. Unsecd. Note, 144A, 7.250%, 5/30/2029 | |
| | Bausch Health Cos, Inc., Sr. Unsecd. Note, 144A, 8.500%, 1/31/2027 | |
| | Bausch Health Cos, Inc., Sr. Unsecd. Note, 144A, 9.000%, 12/15/2025 | |
| | Bausch Health Cos, Inc., Sr. Unsecd. Note, 144A, 9.250%, 4/1/2026 | |
| | Emergent BioSolutions, Inc., Sr. Unsecd. Note, 144A, 3.875%, 8/15/2028 | |
| | Endo Dac / Endo Finance LLC / Endo Finco, Inc., 144A, 6.000%, 6/30/2028 | |
| | Endo Dac / Endo Finance LLC / Endo Finco, Inc., Term Loan - 2nd Lien, 144A, 9.500%, 7/31/2027 | |
| | Jaguar Holding Co. II/Pharmaceutical Product Development LLC, Sr. Unsecd. Note, 144A, 4.625%, 6/15/2025 | |
| | Jaguar Holding Co. II/Pharmaceutical Product Development LLC, Sr. Unsecd. Note, 144A, 5.000%, 6/15/2028 | |
| | Mallinckrodt International Finance SA/Mallinckrodt CB LLC, Sr. Unsecd. Note, 144A, 5.500%, 4/15/2025 | |
| | Mallinckrodt International Finance SA/Mallinckrodt CB LLC, Sr. Unsecd. Note, 144A, 5.625%, 10/15/2023 | |
| | Par Pharmaceutical Cos., Inc., Sec. Fac. Bond, 144A, 7.500%, 4/1/2027 | |
| | Syneos Health, Inc., Sr. Unsecd. Note, 144A, 3.625%, 1/15/2029 | |
| | | |
| | | |
| | 1011778 BC Unltd. Liability Co./New Red Finance, Inc., 144A, 4.375%, 1/15/2028 | |
| | 1011778 BC Unltd. Liability Co./New Red Finance, Inc., Sr. Secd. Note, 144A, 4.250%, 5/15/2024 | |
| | 1011778 BC Unltd. Liability Co./New Red Finance, Inc., Term Loan - 2nd Lien, 144A, 4.000%, 10/15/2030 | |
| | KFC Holding Co./Pizza Hut Holdings LLC/Taco Bell of America LLC, Sr. Unsecd. Note, 144A, 4.750%, 6/1/2027 | |
| | Yum! Brands, Inc., Sr. Unsecd. Note, 144A, 4.750%, 1/15/2030 | |
| | Yum! Brands, Inc., Sr. Unsecd. Note, 144A, 5.250%, 6/1/2026 | |
| | Yum! Brands, Inc., Sr. Unsecd. Note, 144A, 7.750%, 4/1/2025 | |
| | Yum! Brands, Inc., Sr. Unsecd. Note, 3.625%, 3/15/2031 | |
| | | |
High Yield Bond Portfolio
Annual Shareholder Report
| | | |
| | CORPORATE BONDS—continued | |
| | | |
| | Academy Ltd., Sec. Fac. Bond, 144A, 6.000%, 11/15/2027 | |
| | Hanesbrands, Inc., Sr. Unsecd. Note, 144A, 4.875%, 5/15/2026 | |
| | Michaels Stores, Inc., Sr. Unsecd. Note, 144A, 8.000%, 7/15/2027 | |
| | Party City Holdings, Inc., 144A, 5.750% (6-month USLIBOR 0.750% Floor +5.000%), 7/15/2025 | |
| | William Carter Co., Sr. Unsecd. Note, 144A, 5.500%, 5/15/2025 | |
| | | |
| | | |
| | Albertsons Cos. LLC/SAFEW, Sr. Unsecd. Note, 144A, 3.250%, 3/15/2026 | |
| | Albertsons Cos. LLC/SAFEW, Sr. Unsecd. Note, 144A, 3.500%, 3/15/2029 | |
| | Albertsons Cos. LLC/SAFEW, Sr. Unsecd. Note, 144A, 4.875%, 2/15/2030 | |
| | Albertsons Cos. LLC/SAFEW, Sr. Unsecd. Note, 144A, 5.875%, 2/15/2028 | |
| | Albertsons Cos. LLC/SAFEW, Sr. Unsecd. Note, 144A, 7.500%, 3/15/2026 | |
| | Albertsons Cos. LLC/SAFEW, Sr. Unsecd. Note, 5.750%, 3/15/2025 | |
| | | |
| | | |
| | AMS AG, Sr. Unsecd. Note, 144A, 7.000%, 7/31/2025 | |
| | Banff Merger Subsidiary, Inc., Sr. Unsecd. Note, 144A, 9.750%, 9/1/2026 | |
| | Black Knight InfoServ LLC, Sr. Unsecd. Note, 144A, 3.625%, 9/1/2028 | |
| | BY Crown Parent LLC / BY Bond Finance, Inc., 144A, 4.250%, 1/31/2026 | |
| | Cars.com, Inc., Sr. Unsecd. Note, 144A, 6.375%, 11/1/2028 | |
| | CDW LLC/ CDW Finance, Sr. Unsecd. Note, 3.250%, 2/15/2029 | |
| | CDW LLC/ CDW Finance, Sr. Unsecd. Note, 4.250%, 4/1/2028 | |
| | CDW LLC/ CDW Finance, Sr. Unsecd. Note, 5.500%, 12/1/2024 | |
| | Diamond 1 Finance Corp./Diamond 2 Finance Corp., Sr. Unsecd. Note, 144A, 7.125%, 6/15/2024 | |
| | Diebold Nixdorf, Inc., Sr. Secd. Note, 144A, 9.375%, 7/15/2025 | |
| | Fair Isaac & Co., Inc., Sr. Unsecd. Note, 144A, 4.000%, 6/15/2028 | |
| | Financial & Risk US Holdings, Inc., 144A, 6.250%, 5/15/2026 | |
| | Financial & Risk US Holdings, Inc., Sr. Unsecd. Note, 144A, 8.250%, 11/15/2026 | |
| | Gartner, Inc., Sr. Unsecd. Note, 144A, 3.750%, 10/1/2030 | |
| | Gartner, Inc., Sr. Unsecd. Note, 144A, 4.500%, 7/1/2028 | |
| | JDA Escrow LLC / JDA Bond Finance, Inc., 144A, 7.375%, 10/15/2024 | |
| | Logan Merger Sub, Inc., Sr. Secd. Note, 144A, 5.500%, 9/1/2027 | |
| | Microchip Technology, Inc., Sr. Unsecd. Note, 144A, 4.250%, 9/1/2025 | |
| | MSCI, Inc., Sr. Unsecd. Note, 144A, 3.625%, 9/1/2030 | |
| | NCR Corp., Sr. Unsecd. Note, 144A, 5.000%, 10/1/2028 | |
| | NCR Corp., Sr. Unsecd. Note, 144A, 5.250%, 10/1/2030 | |
| | NCR Corp., Sr. Unsecd. Note, 144A, 5.750%, 9/1/2027 | |
| | NCR Corp., Sr. Unsecd. Note, 144A, 6.125%, 9/1/2029 | |
| | NCR Corp., Sr. Unsecd. Note, 144A, 8.125%, 4/15/2025 | |
| | Nuance Communications, Inc., Sr. Unsecd. Note, 5.625%, 12/15/2026 | |
| | ON Semiconductor Corp., Sr. Unsecd. Note, 144A, 3.875%, 9/1/2028 | |
| | Open Text Corp., Sr. Unsecd. Note, 144A, 3.875%, 2/15/2028 | |
| | Open Text Corp., Sr. Unsecd. Note, 144A, 4.125%, 2/15/2030 | |
| | PTC, Inc., Sr. Unsub., 144A, 3.625%, 2/15/2025 | |
| | Qorvo, Inc., Sr. Unsecd. Note, 144A, 3.375%, 4/1/2031 | |
| | Qorvo, Inc., Sr. Unsecd. Note, 4.375%, 10/15/2029 | |
| | Rackspace Technology, Inc., Sr. Unsecd. Note, 144A, 5.375%, 12/1/2028 | |
| | Science Applications International Corp., Sr. Unsecd. Note, 144A, 4.875%, 4/1/2028 | |
| | Seagate HDD Cayman, Sr. Unsecd. Note, 144A, 3.125%, 7/15/2029 | |
| | Seagate HDD Cayman, Sr. Unsecd. Note, 144A, 3.375%, 7/15/2031 | |
High Yield Bond Portfolio
Annual Shareholder Report
| | | |
| | CORPORATE BONDS—continued | |
| | | |
| | Sensata Technologies B.V., 144A, 5.625%, 11/1/2024 | |
| | Sensata Technologies B.V., Sr. Unsecd. Note, 144A, 4.375%, 2/15/2030 | |
| | Sensata Technologies UK Financing Co. PLC, Sr. Unsecd. Note, 144A, 6.250%, 2/15/2026 | |
| | Sensata Technologies, Inc., 144A, 3.750%, 2/15/2031 | |
| | SS&C Technologies, Inc., Sr. Unsecd. Note, 144A, 5.500%, 9/30/2027 | |
| | Star Merger Sub, Inc., 144A, 6.875%, 8/15/2026 | |
| | Star Merger Sub, Inc., Sr. Unsecd. Note, 144A, 10.250%, 2/15/2027 | |
| | Tempo Acquisition LLC, Sr. Unsecd. Note, 144A, 6.750%, 6/1/2025 | |
| | TTM Technologies, Inc., Sr. Unsecd. Note, 144A, 5.625%, 10/1/2025 | |
| | Veritas US, Inc./Veritas Bermuda, Ltd., Sr. Secd. Note, 144A, 7.500%, 9/1/2025 | |
| | | |
| | Transportation Services—0.3% | |
| | Stena International S.A., Sec. Fac. Bond, 144A, 6.125%, 2/1/2025 | |
| | Watco Cos LLC/Finance Co., Sr. Unsecd. Note, 144A, 6.500%, 6/15/2027 | |
| | | |
| | | |
| | Calpine Corp., 144A, 4.500%, 2/15/2028 | |
| | Calpine Corp., 144A, 5.250%, 6/1/2026 | |
| | Calpine Corp., Sr. Secd. Note, 144A, 3.750%, 3/1/2031 | |
| | Calpine Corp., Sr. Unsecd. Note, 144A, 4.625%, 2/1/2029 | |
| | Calpine Corp., Sr. Unsecd. Note, 144A, 5.000%, 2/1/2031 | |
| | Calpine Corp., Sr. Unsecd. Note, 144A, 5.125%, 3/15/2028 | |
| | DPL, Inc., Sr. Unsecd. Note, 144A, 4.125%, 7/1/2025 | |
| | Enviva Partners LP/Enviva Partners Finance Corp., Sr. Unsecd. Note, 144A, 6.500%, 1/15/2026 | |
| | NRG Energy, Inc., Sr. Unsecd. Note, 144A, 3.375%, 2/15/2029 | |
| | NRG Energy, Inc., Sr. Unsecd. Note, 144A, 3.625%, 2/15/2031 | |
| | NRG Energy, Inc., Sr. Unsecd. Note, 144A, 5.250%, 6/15/2029 | |
| | NRG Energy, Inc., Sr. Unsecd. Note, 6.625%, 1/15/2027 | |
| | NRG Energy, Inc., Sr. Unsecd. Note, 7.250%, 5/15/2026 | |
| | NRG Energy, Inc., Sr. Unsecd. Note, Series WI, 5.750%, 1/15/2028 | |
| | Pattern Energy Operations LP / Pattern Energy Operations, Inc., Sr. Unsecd. Note, 144A, 4.500%, 8/15/2028 | |
| | TerraForm Power Operating LLC, Sr. Unsecd. Note, 144A, 4.750%, 1/15/2030 | |
| | TerraForm Power Operating LLC, Sr. Unsecd. Note, 144A, 5.000%, 1/31/2028 | |
| | Vistra Operations Co., LLC, Sr. Unsecd. Note, 144A, 5.000%, 7/31/2027 | |
| | Vistra Operations Co., LLC, Sr. Unsecd. Note, 144A, 5.500%, 9/1/2026 | |
| | Vistra Operations Co., LLC, Sr. Unsecd. Note, 144A, 5.625%, 2/15/2027 | |
| | | |
| | Wireless Communications—2.3% | |
| | Numericable-SFR SAS, 144A, 7.375%, 5/1/2026 | |
| | Sprint Capital Corp., Company Guarantee, 6.875%, 11/15/2028 | |
| | Sprint Corp., 7.125%, 6/15/2024 | |
| | Sprint Corp., Sr. Unsecd. Note, 7.625%, 2/15/2025 | |
| | Sprint Corp., Sr. Unsecd. Note, 7.625%, 3/1/2026 | |
| | Sprint Nextel Corp., Sr. Unsecd. Note, 6.000%, 11/15/2022 | |
| | T-Mobile USA, Inc., Sr. Unsecd. Note, 4.500%, 2/1/2026 | |
| | T-Mobile USA, Inc., Sr. Unsecd. Note, 5.125%, 4/15/2025 | |
| | T-Mobile USA, Inc., Sr. Unsecd. Note, 6.000%, 3/1/2023 | |
High Yield Bond Portfolio
Annual Shareholder Report
| | | |
| | CORPORATE BONDS—continued | |
| | Wireless Communications—continued | |
| | T-Mobile USA, Inc., Sr. Unsecd. Note, 6.500%, 1/15/2026 | |
| | | |
| | TOTAL CORPORATE BONDS
(IDENTIFIED COST $2,079,495,340) | |
| | | |
| | | |
| | | |
| | | |
| | | |
| | | |
| | | |
| | | |
| | | |
| | | |
| | | |
| | TOTAL COMMON STOCKS
(IDENTIFIED COST $13,245,329) | |
| | | |
| | | |
| | Envision Healthcare Corp., 1st Lien PIK Term Loan B, 7.000% (3-month USLIBOR 1.000% Floor +6.000%), 10/10/2025 | |
| | | |
| | Ascent Resources Utica Holdings, LLC, Term Loan - 2nd Lien, 10.000% (1-month USLIBOR 1.000% Floor +9.000%), 11/1/2025 | |
| | TOTAL FLOATING RATE LOANS
(IDENTIFIED COST $7,971,759) | |
| | | |
| | Federated Hermes Institutional Prime Value Obligations Fund, Institutional Shares, 0.08%5
(IDENTIFIED COST $34,472,304) | |
| | TOTAL INVESTMENT IN SECURITIES—99.0%
(IDENTIFIED COST $2,135,184,732)6 | |
| | OTHER ASSETS AND LIABILITIES - NET—1.0%7 | |
| | | |
Affiliated fund holdings are investment companies which are managed by the Adviser or an affiliate of the Adviser. Transactions with the affiliated fund holdings during the period ended December 31, 2020, were as follows:
| Federated Hermes
Institutional
Prime Value
Obligations Fund,
Institutional Shares |
| |
| |
| |
Change in Unrealized Appreciation/Depreciation | |
| |
| |
Shares Held as of 12/31/2020 | |
| |
High Yield Bond Portfolio
Annual Shareholder Report
| |
| Non-income-producing security. |
| Market quotations and price evaluations are not available. Fair value determined using significant unobservable inputs in accordance with procedures established by and under the general supervision of the Fund’s Board of Trustees (the “Trustees”). |
| Floating/variable note with current rate and current maturity or next reset date shown. |
| |
| The cost of investments for federal tax purposes amounts to $2,138,784,345. |
| Assets, other than investments in securities, less liabilities. See Statement of Assets and Liabilities. |
Note: The categories of investments are shown as a percentage of total net assets at December 31, 2020.
Various inputs are used in determining the value of the Fund’s investments. These inputs are summarized in the three broad levels listed below:
Level 1—quoted prices in active markets for identical securities.
Level 2—other significant observable inputs (including quoted prices for similar securities, interest rates, prepayment speeds, credit risk, etc.). Also includes securities valued at amortized cost.
Level 3—significant unobservable inputs (including the Fund’s own assumptions in determining the fair value of investments).
The inputs or methodology used for valuing securities are not an indication of the risk associated with investing in those securities.
The following is a summary of the inputs used, as of December 31, 2020, in valuing the Fund’s assets carried at fair value:
|
| | Level 2—
Other
Significant
Observable
Inputs | Level 3—
Significant
Unobservable
Inputs | |
| | | | |
| | | | |
| | | | |
| | | | |
| | | | |
| | | | |
| | | | |
| | | | |
| Includes $211,750 transferred from Level 2 to Level 3 because fair values were determined using valuation techniques utilizing unobservable market date due to observable market value being unavailable. This transfer represents the value of the security at the beginning of the period. |
The following acronym(s) are used throughout this portfolio: | |
| |
| —London Interbank Offered Rate |
| |
| |
See Notes which are an integral part of the Financial Statements
High Yield Bond Portfolio
Annual Shareholder Report
Financial Highlights–High Yield Bond Portfolio
(For a Share Outstanding Throughout Each Period)
| |
| | | | | |
Net Asset Value, Beginning of Period | | | | | |
Income From Investment Operations: | | | | | |
Net investment income (loss) | | | | | |
Net realized and unrealized gain (loss) | | | | | |
TOTAL FROM INVESTMENT OPERATIONS | | | | | |
| | | | | |
Distributions from net investment income | | | | | |
Net Asset Value, End of Period | | | | | |
| | | | | |
Ratios to Average Net Assets: | | | | | |
| | | | | |
| | | | | |
| | | | | |
Net assets, end of period (000 omitted) | | | | | |
| | | | | |
| Based on net asset value. |
| Amount does not reflect net expenses incurred by investment companies in which the Fund may invest. |
See Notes which are an integral part of the Financial Statements
High Yield Bond Portfolio
Annual Shareholder Report
Statement of Assets and Liabilities–High Yield Bond PortfolioDecember 31, 2020
| |
Investment in securities, at value including $34,452,869 of investments in an affiliated holding* (identified cost $2,135,184,732) | |
| |
| |
Income receivable from an affiliated holding* | |
| |
| |
Payable for investments purchased | |
Income distribution payable | |
Accrued expenses (Note 5) | |
| |
Net assets for 348,555,274 shares outstanding | |
| |
| |
Total distributable earnings (loss) | |
| |
Net Asset Value, Offering Price and Redemption Proceeds Per Share: | |
$2,212,263,333 ÷ 348,555,274 shares outstanding, no par value, unlimited shares authorized | |
| See information listed after the Fund’s Portfolio of Investments. |
See Notes which are an integral part of the Financial Statements
High Yield Bond Portfolio
Annual Shareholder Report
Statement of Operations–High Yield Bond PortfolioYear Ended December 31, 2020
| |
| |
Dividends received from an affiliated holding* | |
| |
| |
Administrative fee (Note 5) | |
| |
| |
Directors’/Trustees’ fees (Note 5) | |
| |
| |
Portfolio accounting fees | |
| |
| |
| |
| |
| |
| |
Realized and Unrealized Gain (Loss) on Investments: | |
Net realized loss on investments (including net realized gain of $25,007 on sales of investments in an affiliated holding*) | |
Net change in unrealized appreciation of investments (including net change in unrealized depreciation of $(13,446) on investments in an affiliated holding*) | |
Net realized and unrealized gain (loss) on investments | |
Change in net assets resulting from operations | |
| See information listed after the Fund’s Portfolio of Investments. |
See Notes which are an integral part of the Financial Statements
High Yield Bond Portfolio
Annual Shareholder Report
Statement of Changes in Net Assets–High Yield Bond Portfolio
| | |
Increase (Decrease) in Net Assets | | |
| | |
Net investment income (loss) | | |
| | |
Net change in unrealized appreciation/depreciation | | |
CHANGE IN NET ASSETS RESULTING FROM OPERATIONS | | |
Distributions to Shareholders | | |
| | |
Proceeds from sale of shares | | |
Net asset value of shares issued to shareholders in payment of distributions declared | | |
| | |
CHANGE IN NET ASSETS RESULTING FROM SHARE TRANSACTIONS | | |
| | |
| | |
| | |
| | |
See Notes which are an integral part of the Financial Statements
High Yield Bond Portfolio
Annual Shareholder Report
Notes to Financial Statements–High Yield Bond Portfolio
December 31, 2020
1. ORGANIZATION
Federated Hermes Core Trust (the “Trust”) is registered under the Investment Company Act of 1940, as amended (the “Act”), as an open-end management investment company. The Trust consists of four portfolios. The financial statements included herein are only those of High Yield Bond Portfolio (the “Fund”), a diversified portfolio. The financial statements of the other portfolios are presented separately. The assets of each portfolio are segregated and a shareholder’s interest is limited to the portfolio in which shares are held. Each portfolio pays its own expenses. The investment objective of the Fund is to seek high current income.
The Fund’s portfolio consists primarily of lower rated corporate debt obligations. These lower rated debt obligations may be more susceptible to real or perceived adverse economic conditions than investment grade bonds. These lower rated debt obligations are regarded as predominately speculative with respect to each issuer’s continuing ability to make interest and principal payments (i.e., the obligations are subject to the risk of default). Currently, shares of the Fund are being offered for investment only to investment companies, insurance company separate accounts, common or commingled trust funds or similar organizations or parties that are “accredited investors” within the meaning of Regulation D of the Securities Act of 1933, as amended (the “1933 Act”).
Prior to April 24, 2020, the name of the Trust was Federated Core Trust. Effective February 25, 2021, the name of the Fund will change to High Yield Bond Core Fund.
2. SIGNIFICANT ACCOUNTING POLICIES
The following is a summary of significant accounting policies consistently followed by the Fund in the preparation of its financial statements. These policies are in conformity with U.S. generally accepted accounting principles (GAAP).
Investment Valuation
In calculating its net asset value (NAV), the Fund generally values investments as follows:
■
Fixed-income securities are fair valued using price evaluations provided by a pricing service approved by the Fund’s Board of Trustees (the “Trustees”).
■
Shares of other mutual funds or non-exchange-traded investment companies are valued based upon their reported NAVs.
■
Derivative contracts listed on exchanges are valued at their reported settlement or closing price, except that options are valued at the mean of closing bid and asked quotations.
■
Over-the-counter (OTC) derivative contracts are fair valued using price evaluations provided by a pricing service approved by the Trustees.
■
For securities that are fair valued in accordance with procedures established by and under the general supervision of the Trustees, certain factors may be considered, such as: the last traded or purchase price of the security, information obtained by contacting the issuer or dealers, analysis of the issuer’s financial statements or other available documents, fundamental analytical data, the nature and duration of restrictions on disposition, the movement of the market in which the security is normally traded, public trading in similar securities or derivative contracts of the issuer or comparable issuers, movement of a relevant index, or other factors including but not limited to industry changes and relevant government actions.
If any price, quotation, price evaluation or other pricing source is not readily available when the NAV is calculated, if the Fund cannot obtain price evaluations from a pricing service or from more than one dealer for an investment within a reasonable period of time as set forth in the Fund’s valuation policies and procedures, or if information furnished by a pricing service, in the opinion of the valuation committee (“Valuation Committee”), is deemed not representative of the fair value of such security, the Fund uses the fair value of the investment determined in accordance with the procedures described below. There can be no assurance that the Fund could obtain the fair value assigned to an investment if it sold the investment at approximately the time at which the Fund determines its NAV per share, and the actual value obtained could be materially different.
Fair Valuation and Significant Events Procedures
The Trustees have ultimate responsibility for determining the fair value of investments for which market quotations are not readily available. The Trustees have appointed a Valuation Committee comprised of officers of the Fund, Federated Investment Management Company (the “Adviser”) and certain of the Adviser’s affiliated companies to assist in determining fair value and in overseeing the calculation of the NAV. The Trustees have also authorized the use of pricing services recommended by the Valuation Committee to provide fair value evaluations of the current value of certain investments for purposes of calculating the NAV. The Valuation Committee employs various methods for reviewing third-party pricing-service evaluations including periodic reviews of third-party pricing services’ policies, procedures and valuation methods (including key inputs, methods, models and assumptions), transactional back-testing, comparisons of evaluations of different pricing services, and review of price challenges by the Adviser based on recent market activity. In the event that market quotations and price evaluations are not available for an investment, the Valuation Committee determines the fair value of the investment in accordance with procedures adopted by the Trustees. The Trustees periodically review and approve the fair valuations made by the Valuation Committee and any changes made to the procedures.
Factors considered by pricing services in evaluating an investment include the yields or prices of investments of comparable quality, coupon, maturity, call rights and other potential prepayments, terms and type, reported transactions, indications as to values from dealers and general market conditions. Some pricing services provide a single price evaluation reflecting the bid-side of the market for an investment (a “bid” evaluation). Other pricing services offer both bid evaluations and price evaluations indicative of a price between
High Yield Bond Portfolio
Annual Shareholder Report
the prices bid and asked for the investment (a “mid” evaluation). The Fund normally uses bid evaluations for any U.S. Treasury and Agency securities, mortgage-backed securities and municipal securities. The Fund normally uses mid evaluations for any other types of fixed-income securities and any OTC derivative contracts. In the event that market quotations and price evaluations are not available for an investment, the fair value of the investment is determined in accordance with procedures adopted by the Trustees.
The Trustees also have adopted procedures requiring an investment to be priced at its fair value whenever the Adviser determines that a significant event affecting the value of the investment has occurred between the time as of which the price of the investment would otherwise be determined and the time as of which the NAV is computed. An event is considered significant if there is both an affirmative expectation that the investment’s value will change in response to the event and a reasonable basis for quantifying the resulting change in value. Examples of significant events that may occur after the close of the principal market on which a security is traded, or after the time of a price evaluation provided by a pricing service or a dealer, include:
■
With respect to securities traded principally in foreign markets, significant trends in U.S. equity markets or in the trading of foreign securities index futures contracts;
■
Political or other developments affecting the economy or markets in which an issuer conducts its operations or its securities are traded;
■
Announcements concerning matters such as acquisitions, recapitalizations, litigation developments, or a natural disaster affecting the issuer’s operations or regulatory changes or market developments affecting the issuer’s industry.
The Trustees have adopted procedures whereby the Valuation Committee uses a pricing service to provide factors to update the fair value of equity securities traded principally in foreign markets from the time of the close of their respective foreign stock exchanges to the pricing time of the Fund. For other significant events, the Fund may seek to obtain more current quotations or price evaluations from alternative pricing sources. If a reliable alternative pricing source is not available, the Fund will determine the fair value of the investment in accordance with the fair valuation procedures approved by the Trustees. The Trustees have ultimate responsibility for any fair valuations made in response to a significant event.
Repurchase Agreements
The Fund may invest in repurchase agreements for short-term liquidity purposes. It is the policy of the Fund to require the other party to a repurchase agreement to transfer to the Fund’s custodian or sub-custodian eligible securities or cash with a market value (after transaction costs) at least equal to the repurchase price to be paid under the repurchase agreement. The eligible securities are transferred to accounts with the custodian or sub-custodian in which the Fund holds a “securities entitlement” and exercises “control” as those terms are defined in the Uniform Commercial Code. The Fund has established procedures for monitoring the market value of the transferred securities and requiring the transfer of additional eligible securities if necessary to equal at least the repurchase price. These procedures also allow the other party to require securities to be transferred from the account to the extent that their market value exceeds the repurchase price or in exchange for other eligible securities of equivalent market value.
The insolvency of the other party or other failure to repurchase the securities may delay the disposition of the underlying securities or cause the Fund to receive less than the full repurchase price. Under the terms of the repurchase agreement, any amounts received by the Fund in excess of the repurchase price and related transaction costs must be remitted to the other party.
The Fund may enter into repurchase agreements in which eligible securities are transferred into joint trading accounts maintained by the custodian or sub-custodian for investment companies and other clients advised by the Adviser and its affiliates. The Fund will participate on a pro rata basis with the other investment companies and clients in its share of the securities transferred under such repurchase agreements and in its share of proceeds from any repurchase or other disposition of such securities.
Investment Income, Gains and Losses, Expenses and Distributions
Investment transactions are accounted for on a trade-date basis. Realized gains and losses from investment transactions are recorded on an identified-cost basis. Interest income and expenses are accrued daily. Dividend income and distributions to shareholders are recorded on the ex-dividend date. Foreign dividends are recorded on the ex-dividend date or when the Fund is informed of the ex-dividend date. Distributions of net investment income, if any, are declared daily and paid monthly. Non-cash dividends included in dividend income, if any, are recorded at fair value. Amortization/accretion of premium and discount is included in investment income.
Federal Taxes
It is the Fund’s policy to comply with the Subchapter M provision of the Internal Revenue Code (the “Code”) and to distribute to shareholders each year substantially all of its income. Accordingly, no provision for federal income tax is necessary. As of and during the year ended December 31, 2020, the Fund did not have a liability for any uncertain tax positions. The Fund recognizes interest and penalties, if any, related to tax liabilities as income tax expense in the Statement of Operations. As of December 31, 2020, tax years 2017 through 2020 remain subject to examination by the Fund’s major tax jurisdictions, which include the United States of America and the Commonwealth of Massachusetts.
When-Issued and Delayed-Delivery Transactions
The Fund may engage in when-issued or delayed-delivery transactions. The Fund records when-issued securities on the trade date and maintains security positions such that sufficient liquid assets will be available to make payment for the securities purchased. Securities purchased on a when-issued or delayed-delivery basis are marked to market daily and begin earning interest on the settlement date. Losses may occur on these transactions due to changes in market conditions or the failure of counterparties to perform under the contract.
High Yield Bond Portfolio
Annual Shareholder Report
Restricted Securities
The Fund may purchase securities which are considered restricted. Restricted securities are securities that either: (a) cannot be offered for public sale without first being registered, or being able to take advantage of an exemption from registration, under the Securities Act of 1933; or (b) are subject to contractual restrictions on public sales. In some cases, when a security cannot be offered for public sale without first being registered, the issuer of the restricted security has agreed to register such securities for resale, at the issuer’s expense, either upon demand by the Fund or in connection with another registered offering of the securities. Many such restricted securities may be resold in the secondary market in transactions exempt from registration. Restricted securities may be determined to be liquid under criteria established by the Trustees. The Fund will not incur any registration costs upon such resales. The Fund’s restricted securities, like other securities, are priced in accordance with procedures established by and under the general supervision of the Trustees.
Other
The preparation of financial statements in conformity with GAAP requires management to make estimates and assumptions that affect the amounts of assets, liabilities, expenses and revenues reported in the financial statements. Actual results could differ materially from those estimated. The Fund applies investment company accounting and reporting guidance.
3. SHARES OF BENEFICIAL INTEREST
The following table summarizes share activity:
| | |
| | |
Shares issued to shareholders in payment of distributions declared | | |
| | |
NET CHANGE RESULTING FROM FUND SHARE TRANSACTIONS | | |
4. FEDERAL TAX INFORMATION
The tax character of distributions as reported on the Statement of Changes in Net Assets for the years ended December 31, 2020 and 2019, was as follows:
As of December 31, 2020, the components of distributable earnings on a tax-basis were as follows:
Undistributed ordinary income | |
Net unrealized appreciation | |
Capital loss carryforwards | |
The difference between book-basis and tax-basis net unrealized appreciation is attributable to the differing treatments for wash sales, defaulted securities and discount accretion/premium amortization on debt securities.
At December 31, 2020, the cost of investments for federal tax purposes was $2,138,784,345. The net unrealized appreciation of investments for federal tax purposes was $51,941,646. This consists of net unrealized appreciation from investments for those securities having an excess of value over cost of $107,575,470 and net unrealized depreciation from investments for those securities having an excess of cost over value of $55,633,824.
As of December 31, 2020, the Fund had a capital loss carryforward of $71,196,758 which will reduce the Fund’s taxable income arising from future net realized gains on investments, if any, to the extent permitted by the Code, thereby reducing the amount of distributions to shareholders which would otherwise be necessary to relieve the Fund of any liability for federal income tax. Pursuant to the Code, these net capital losses retain their character as either short-term or long-term and do not expire.
The following schedule summarizes the Fund’s capital loss carryforwards:
5. INVESTMENT ADVISER FEE AND OTHER TRANSACTIONS WITH AFFILIATES
Investment Adviser Fee
The Adviser provides investment adviser services at no fee, because all investors in the Fund are other Federated Hermes Funds, insurance company separate accounts, common or commingled trust funds or similar organizations or entities that are “accredited investors” within the meaning of Regulation D of the 1933 Act. The Fund pays operating expenses associated with the operation and maintenance of the Fund (excluding fees and expenses that may be charged by the Adviser and its affiliates). Although not contractually obligated to do so, the Adviser intends to voluntarily reimburse operating expenses (excluding extraordinary expenses and proxy-related expenses paid by the Fund, if any) such that the Fund will only bear such expenses in an amount of up to 0.15% of the Fund’s average daily net assets. The Adviser can modify or terminate this voluntary reimbursement at any time at its sole discretion.
High Yield Bond Portfolio
Annual Shareholder Report
Administrative Fee
Federated Administrative Services (FAS), under the Administrative Services Agreement, provides the Fund with administrative personnel and services. FAS does not charge the Fund a fee but is entitled to certain out-of-pocket expenses.
Interfund Transactions
During the year ended December 31, 2020, the Fund engaged in purchase and sale transactions with funds that have a common investment adviser (or affiliated investment advisers), common Directors/Trustees and/or common Officers. These purchase and sale transactions complied with Rule 17a-7 under the Act and amounted to $511,813 and $5,275,438, respectively. Net realized gain recognized on these transactions was $328,231.
Directors’/Trustees’ and Miscellaneous Fees
Certain Officers and Trustees of the Fund are Officers and Directors or Trustees of certain of the above companies. To efficiently facilitate payment, Independent Directors’/Trustees’ fees and certain expenses related to conducting meetings of the Directors/Trustees and other miscellaneous expenses are paid by an affiliate of the Adviser which in due course are reimbursed by the Fund. These expenses related to conducting meetings of the Directors/Trustees and other miscellaneous expenses may be included in Accrued and Miscellaneous Expenses on the Statement of Assets and Liabilities and Statement of Operations, respectively.
Affiliated Shares of Beneficial Interest
As of December 31, 2020, a majority of the shares of beneficial interest outstanding are owned by an affiliate of the Adviser.
6. INVESTMENT TRANSACTIONS
Purchases and sales of investments, excluding long-term U.S. government securities and short-term obligations, for the year ended December 31, 2020, were as follows:
7. LINE OF CREDIT
The Fund participates with certain other Federated Hermes Funds, on a several basis, in an up to $500,000,000 unsecured, 364-day, committed, revolving line of credit (LOC) agreement dated June 24, 2020. The LOC was made available to temporarily finance the repurchase or redemption of shares of the Fund, failed trades, payment of dividends, settlement of trades and for other short-term, temporary or emergency general business purposes. The Fund cannot borrow under the LOC if an inter-fund loan is outstanding. The Fund’s ability to borrow under the LOC also is subject to the limitations of the Act and various conditions precedent that must be satisfied before the Fund can borrow. Loans under the LOC are charged interest at a fluctuating rate per annum equal to the highest, on any day, of (a) (i) the federal funds effective rate, (ii) the one month London Interbank Offered Rate (LIBOR), or a replacement rate as appropriate, and (iii) 0.0%, plus (b) a margin. Any fund eligible to borrow under the LOC pays its pro rata share of an upfront fee, and its pro rata share of a commitment fee based on the amount of the lenders’ commitment that has not been utilized, quarterly in arrears and at maturity. As of December 31, 2020, the Fund had no outstanding loans. During the year ended December 31, 2020, the Fund did not utilize the LOC.
8. Interfund Lending
Pursuant to an Exemptive Order issued by the Securities and Exchange Commission, the Fund, along with other funds advised by subsidiaries of Federated Hermes, Inc., may participate in an interfund lending program. This program provides an alternative credit facility allowing the Fund to borrow from other participating affiliated funds. As of December 31, 2020, there were no outstanding loans. During the year ended December 31, 2020, the program was not utilized.
9. OTHER MATTERS
An outbreak of respiratory disease caused by a novel coronavirus was first detected in China in late 2019 and subsequently spread globally. As of the date of the issuance of these financial statements, this coronavirus has resulted in closing borders, enhanced health screenings, healthcare service preparation and delivery, quarantines, cancellations, and disruptions to supply chains, workflow operations and consumer activity, as well as general concern and uncertainty. The impact of this coronavirus may be short-term or may last for an extended period of time and has resulted in a substantial economic downturn. Health crises caused by outbreaks, such as the coronavirus outbreak, may exacerbate other pre-existing political, social and economic risks. The impact of this outbreak, and other epidemics and pandemics that may arise in the future, could continue to negatively affect the worldwide economy, as well as the economies of individual countries, individual companies (including certain Fund service providers and issuers of the Fund’s investments) and the markets in general in significant and unforeseen ways. Any such impact could adversely affect the Fund’s performance.
10. FEDERAL TAX INFORMATION (UNAUDITED)
For the fiscal year ended December 31, 2020, 83.80% of dividends paid by the Fund are interest-related dividends, as provided by the American Jobs Creation Act of 2004.
High Yield Bond Portfolio
Annual Shareholder Report
Report of Independent Registered Public Accounting Firm–
High Yield Bond Portfolio
TO THE SHAREHOLDERS AND THE BOARD OF TRUSTEES OF HIGH YIELD BOND PORTFOLIO:
Opinion on the Financial Statements
We have audited the accompanying statement of assets and liabilities of High Yield Bond Portfolio (the “Fund”) (one of the portfolios constituting Federated Hermes Core Trust (formerly, Federated Core Trust) (the “Trust”)), including the portfolio of investments, as of December 31, 2020, and the related statement of operations for the year then ended, the statement of changes in net assets for each of the two years in the period then ended, the financial highlights for each of the five years in the period then ended and the related notes (collectively referred to as the “financial statements”). In our opinion, the financial statements present fairly, in all material respects, the financial position of the Fund (one of the portfolios constituting the Federated Hermes Core Trust) at December 31, 2020, the results of its operations for the year then ended, the changes in its net assets for each of the two years in the period then ended and its financial highlights for each of the five years in the period then ended, in conformity with U.S. generally accepted accounting principles.
Basis for Opinion
These financial statements are the responsibility of the Trust’s management. Our responsibility is to express an opinion on the Fund’s financial statements based on our audits. We are a public accounting firm registered with the Public Company Accounting Oversight Board (United States) (“PCAOB”) and are required to be independent with respect to the Trust in accordance with the U.S. federal securities laws and the applicable rules and regulations of the Securities and Exchange Commission and the PCAOB.
We conducted our audits in accordance with standards of the PCAOB. Those standards require that we plan and perform the audit to obtain reasonable assurance about whether the financial statements are free of material misstatement, whether due to error or fraud. The Trust is not required to have, nor were we engaged to perform, an audit of the Trust’s internal control over financial reporting. As part of our audits, we are required to obtain an understanding of internal control over financial reporting, but not for the purpose of expressing an opinion on the effectiveness of the Trust’s internal control over financial reporting. Accordingly, we express no such opinion.
Our audits included performing procedures to assess the risks of material misstatement of the financial statements, whether due to error or fraud, and performing procedures that respond to those risks. Such procedures included examining, on a test basis, evidence regarding the amounts and disclosures in the financial statements. Our procedures included confirmation of securities owned as of December 31, 2020, by correspondence with the custodian and others, or by other appropriate auditing procedures where replies from others were not received. Our audits also included evaluating the accounting principles used and significant estimates made by management, as well as evaluating the overall presentation of the financial statements. We believe that our audits provide a reasonable basis for our opinion. We have served as the auditor of one or more Federated Hermes investment companies since 1979.
Boston, Massachusetts
February 22, 2021
High Yield Bond Portfolio
Annual Shareholder Report
Shareholder Expense Example (unaudited)–High Yield Bond Portfolio
As a shareholder of the Fund, you incur ongoing costs, including to the extent applicable, management fees, distribution (12b-1) fees and/or other service fees and other Fund expenses. This Example is intended to help you to understand your ongoing costs (in dollars) of investing in the Fund and to compare these costs with the ongoing costs of investing in other mutual funds. It is based on an investment of $1,000 invested at the beginning of the period and held for the entire period from July 1, 2020 to December 31, 2020.
ACTUAL EXPENSES
The first section of the table below provides information about actual account values and actual expenses. You may use the information in this section, together with the amount you invested, to estimate the expenses that you incurred over the period. Simply divide your account value by $1,000 (for example, an $8,600 account value divided by $1,000 = 8.6), then multiply the result by the number in the first section under the heading entitled “Expenses Paid During Period” to estimate the expenses attributable to your investment during this period.
HYPOTHETICAL EXAMPLE FOR COMPARISON PURPOSES
The second section of the table below provides information about hypothetical account values and hypothetical expenses based on the Fund’s actual expense ratio and an assumed rate of return of 5% per year before expenses, which is not the Fund’s actual return. Thus, you should not use the hypothetical account values and expenses to estimate the actual ending account balance or your expenses for the period. Rather, these figures are required to be provided to enable you to compare the ongoing costs of investing in the Fund with other funds. To do so, compare this 5% hypothetical example with the 5% hypothetical examples that appear in the shareholder reports of the other funds.
Please note that the expenses shown in the table are meant to highlight your ongoing costs only. Therefore, the second section of the table is useful in comparing ongoing costs only, and will not help you determine the relative total costs of owning different funds.
| Beginning
Account Value
7/1/2020 | Ending
Account Value
12/31/2020 | Expenses Paid
During Period1 |
| | | |
Hypothetical (assuming a 5% return before expenses) | | | |
| Expenses are equal to the Fund’s annualized net expense ratio of 0.02%, multiplied by the average account value over the period, multiplied by 184/366 (to reflect the one-half-year period). |
High Yield Bond Portfolio
Annual Shareholder Report
Board of Trustee and Trust Officers
The Board of Trustee is responsible for managing the Trust’s business affairs and for exercising all the Trust’s powers except those reserved for the shareholders. The following tables give information about each Trustee and the senior officers of the Fund. Where required, the tables separately list Trustee who are “interested persons” of the Fund (i.e., “Interested” Trustee) and those who are not (i.e., “Independent” Trustee). Unless otherwise noted, the address of each person listed is 1001 Liberty Avenue, Pittsburgh, PA 15222-3779. The address of all Independent Trustee listed is 4000 Ericsson Drive, Warrendale, PA 15086-7561; Attention: Mutual Fund Board. As of December 31, 2020, the Trust comprised five portfolio(s), and the Federated Hermes Fund Family consisted of 41 investment companies (comprising 163 portfolios). Unless otherwise noted, each Officer is elected annually. Unless otherwise noted, each Trustee oversees all portfolios in the Federated Hermes Fund Family and serves for an indefinite term. The Fund’s Statement of Additional Information includes additional information about Trust Trustee and is available, without charge and upon request, by calling 1-800-341-7400.
Interested Trustees Background
Name
Birth Date
Positions Held with Trust
Date Service Began | Principal Occupation(s) for Past Five Years,
Other Directorships Held and Previous Position(s) |
J. Christopher Donahue*
Birth Date: April 11, 1949
President and Trustee
Indefinite Term
Began serving:
October 2005 | Principal Occupations: Principal Executive Officer and President of certain of the Funds in the Federated Hermes Fund Family; Director or Trustee of the Funds in the Federated Hermes Fund Family; President, Chief Executive Officer and Director, Federated Hermes, Inc.; Chairman and Trustee, Federated Investment Management Company; Trustee, Federated Investment Counseling; Chairman and Director, Federated Global Investment Management Corp.; Chairman and Trustee, Federated Equity Management Company of Pennsylvania; Trustee, Federated Shareholder Services Company; Director, Federated Services Company.
Previous Positions: President, Federated Investment Counseling; President and Chief Executive Officer, Federated Investment Management Company, Federated Global Investment Management Corp. and Passport Research, Ltd; Chairman, Passport Research, Ltd. |
John B. Fisher*
Birth Date: May 16, 1956
Trustee
Indefinite Term
Began serving: May 2016 | Principal Occupations: Principal Executive Officer and President of certain of the Funds in the Federated Hermes Fund Family; Director or Trustee of certain of the Funds in the Federated Hermes Fund Family; Vice President, Federated Hermes, Inc.; President, Director/Trustee and CEO, Federated Advisory Services Company, Federated Equity Management Company of Pennsylvania, Federated Global Investment Management Corp., Federated Investment Counseling, Federated Investment Management Company; President of some of the Funds in the Federated Hermes Fund Family and Director, Federated Investors Trust Company.
Previous Positions: President and Director of the Institutional Sales Division of Federated Securities Corp.; President and Director of Federated Investment Counseling; President and CEO of Passport Research, Ltd.; Director, Edgewood Securities Corp.; Director, Federated Services Company; Director, Federated Hermes, Inc.; Chairman and Director, Southpointe Distribution Services, Inc. and President, Technology, Federated Services Company. |
*
Reasons for “interested” status: J. Christopher Donahue and John B. Fisher are interested due to their beneficial ownership of shares of Federated Hermes, Inc. and due to positions they hold with Federated Hermes, Inc. and its subsidiaries.
INDEPENDENT Trustees Background
Name
Birth Date
Positions Held with Trust
Date Service Began | Principal Occupation(s) for Past Five Years,
Other Directorships Held, Previous Position(s) and Qualifications |
John T. Collins
Birth Date: January 24, 1947
Trustee
Indefinite Term
Began serving:
October 2013 | Principal Occupations: Director or Trustee, and Chair of the Board of Directors or Trustees, of the Federated Hermes Fund Family; formerly, Chairman and CEO, The Collins Group, Inc. (a private equity firm) (Retired).
Other Directorships Held: Chairman of the Board of Directors, Director, KLX Energy Services Holdings, Inc. (oilfield services); former Director of KLX Corp. (aerospace).
Qualifications: Mr. Collins has served in several business and financial management roles and directorship positions throughout his career. Mr. Collins previously served as Chairman and CEO of The Collins Group, Inc. (a private equity firm) and as a Director of KLX Corp. Mr. Collins serves as Chairman Emeriti, Bentley University. Mr. Collins previously served as Director and Audit Committee Member, Bank of America Corp.; Director, FleetBoston Financial Corp.; and Director, Beth Israel Deaconess Medical Center (Harvard University Affiliate Hospital). |
Annual Shareholder Report
Name Birth Date Positions Held with Trust Date Service Began | Principal Occupation(s) for Past Five Years, Other Directorships Held, Previous Position(s) and Qualifications |
G. Thomas Hough
Birth Date: February 28, 1955
Trustee
Indefinite Term
Began serving: August 2015 | Principal Occupations: Director or Trustee, Chair of the Audit Committee of the Federated Hermes Fund Family; formerly, Vice Chair, Ernst & Young LLP (public accounting firm) (Retired).
Other Directorships Held: Director, Chair of the Audit Committee, Equifax, Inc.; Director, Member of the Audit Committee, Haverty Furniture Companies, Inc.; formerly, Director, Member of Governance and Compensation Committees, Publix Super Markets, Inc.
Qualifications: Mr. Hough has served in accounting, business management and directorship positions throughout his career. Mr. Hough most recently held the position of Americas Vice Chair of Assurance with Ernst & Young LLP (public accounting firm). Mr. Hough serves on the President’s Cabinet and Business School Board of Visitors for the University of Alabama. Mr. Hough previously served on the Business School Board of Visitors for Wake Forest University, and he previously served as an Executive Committee member of the United States Golf Association. |
Maureen Lally-Green
Birth Date: July 5, 1949
Trustee
Indefinite Term
Began serving: August 2009 | Principal Occupations: Director or Trustee of the Federated Hermes Fund Family; Adjunct Professor Emerita of Law, Duquesne University School of Law; formerly, Dean of the Duquesne University School of Law and Professor of Law and Interim Dean of the Duquesne University School of Law; formerly, Associate General Secretary and Director, Office of Church Relations, Diocese of Pittsburgh.
Other Directorships Held: Director, CNX Resources Corporation (formerly known as CONSOL Energy Inc.).
Qualifications: Judge Lally-Green has served in various legal and business roles and directorship positions throughout her career. Judge Lally-Green previously held the position of Dean of the School of Law of Duquesne University (as well as Interim Dean). Judge Lally-Green previously served as a member of the Superior Court of Pennsylvania and as a Professor of Law, Duquesne University School of Law. Judge Lally-Green was appointed by the Supreme Court of Pennsylvania to serve on the Supreme Court’s Board of Continuing Judicial Education and the Supreme Court’s Appellate Court Procedural Rules Committee. Judge Lally-Green also currently holds the positions on not for profit or for profit boards of directors as follows: Director and Chair, UPMC Mercy Hospital; Regent, Saint Vincent Seminary; Member, Pennsylvania State Board of Education (public); Director, Catholic Charities, Pittsburgh; and Director CNX Resources Corporation (formerly known as CONSOL Energy Inc.). Judge Lally-Green has held the positions of: Director, Auberle; Director, Epilepsy Foundation of Western and Central Pennsylvania; Director, Ireland Institute of Pittsburgh; Director, Saint Thomas More Society; Director and Chair, Catholic High Schools of the Diocese of Pittsburgh, Inc.; Director, Pennsylvania Bar Institute; Director, St. Vincent College; Director and Chair, North Catholic High School, Inc.; and Director and Vice Chair, Our Campaign for the Church Alive!, Inc. |
Thomas M. O’Neill
Birth Date: June 14, 1951
Trustee
Indefinite Term
Began serving: August 2006 | Principal Occupations: Director or Trustee of the Federated Hermes Fund Family; Sole Proprietor, Navigator Management Company (investment and strategic consulting).
Other Directorships Held: None.
Qualifications: Mr. O’Neill has served in several business, mutual fund and financial management roles and directorship positions throughout his career. Mr. O’Neill serves as Director, Medicines for Humanity and Director, The Golisano Children’s Museum of Naples, Florida. Mr. O’Neill previously served as Chief Executive Officer and President, Managing Director and Chief Investment Officer, Fleet Investment Advisors; President and Chief Executive Officer, Aeltus Investment Management, Inc.; General Partner, Hellman, Jordan Management Co., Boston, MA; Chief Investment Officer, The Putnam Companies, Boston, MA; Credit Analyst and Lending Officer, Fleet Bank; Director and Consultant, EZE Castle Software (investment order management software); and Director, Midway Pacific (lumber). |
Madelyn A. Reilly
Birth Date: February 2, 1956
Trustee
Indefinite Term
Began serving:
November 2020 | Principal Occupations: Director or Trustee of the Federated Hermes Fund Family; Senior Vice President for Legal Affairs, General Counsel and Secretary of the Board of Trustees, Duquesne University.
Other Directorships Held: None.
Qualifications: Ms. Reilly has served in various business and legal management roles throughout her career. Ms. Reilly previously served as Director of Risk Management and Associate General Counsel, Duquesne University. Prior to her work at Duquesne University, Ms. Reilly served as Assistant General Counsel of Compliance and Enterprise Risk as well as Senior Counsel of Environment, Health and Safety, PPG Industries. |
P. Jerome Richey
Birth Date: February 23, 1949
Trustee
Indefinite Term
Began serving:
October 2013 | Principal Occupations: Director or Trustee of the Federated Hermes Fund Family; Management Consultant; Retired; formerly, Senior Vice Chancellor and Chief Legal Officer, University of Pittsburgh and Executive Vice President and Chief Legal Officer, CONSOL Energy Inc. (now split into two separate publicly traded companies known as CONSOL Energy Inc. and CNX Resources Corp.).
Other Directorships Held: None.
Qualifications: Mr. Richey has served in several business and legal management roles and directorship positions throughout his career. Mr. Richey most recently held the positions of Senior Vice Chancellor and Chief Legal Officer, University of Pittsburgh. Mr. Richey previously served as Chairman of the Board, Epilepsy Foundation of Western Pennsylvania and Chairman of the Board, World Affairs Council of Pittsburgh. Mr. Richey previously served as Chief Legal Officer and Executive Vice President, CONSOL Energy Inc. and CNX Gas Company; and Board Member, Ethics Counsel and Shareholder, Buchanan Ingersoll & Rooney PC (a law firm). |
Annual Shareholder Report
Name Birth Date Positions Held with Trust Date Service Began | Principal Occupation(s) for Past Five Years, Other Directorships Held, Previous Position(s) and Qualifications |
John S. Walsh
Birth Date:
November 28, 1957
Trustee
Indefinite Term
Began serving: November 2005 | Principal Occupations: Director or Trustee of the Federated Hermes Fund Family; President and Director, Heat Wagon, Inc. (manufacturer of construction temporary heaters); President and Director, Manufacturers Products, Inc. (distributor of portable construction heaters); President, Portable Heater Parts, a division of Manufacturers Products, Inc.
Other Directorships Held: None.
Qualifications: Mr. Walsh has served in several business management roles and directorship positions throughout his career. Mr. Walsh previously served as Vice President, Walsh & Kelly, Inc. (paving contractors). |
OFFICERS
Name
Birth Date
Address
Positions Held with Trust
Date Service Began | Principal Occupation(s) for Past Five Years
and Previous Position(s) |
Lori A. Hensler
Birth Date: January 6, 1967
TREASURER
Officer since: April 2013 | Principal Occupations: Principal Financial Officer and Treasurer of the Federated Hermes Fund Family; Senior Vice President, Federated Administrative Services; Financial and Operations Principal for Federated Securities Corp.; and Assistant Treasurer, Federated Investors Trust Company. Ms. Hensler has received the Certified Public Accountant designation.
Previous Positions: Controller of Federated Hermes, Inc.; Senior Vice President and Assistant Treasurer, Federated Investors Management Company; Treasurer, Federated Investors Trust Company; Assistant Treasurer, Federated Administrative Services, Federated Administrative Services, Inc., Federated Securities Corp., Edgewood Services, Inc., Federated Advisory Services Company, Federated Equity Management Company of Pennsylvania, Federated Global Investment Management Corp., Federated Investment Counseling, Federated Investment Management Company, Passport Research, Ltd., and Federated MDTA, LLC; Financial and Operations Principal for Federated Securities Corp., Edgewood Services, Inc. and Southpointe Distribution Services, Inc. |
Peter J. Germain
Birth Date:
September 3, 1959
CHIEF LEGAL OFFICER, SECRETARY and EXECUTIVE VICE PRESIDENT
Officer since: October 2005 | Principal Occupations: Mr. Germain is Chief Legal Officer, Secretary and Executive Vice President of the Federated Hermes Fund Family. He is General Counsel, Chief Legal Officer, Secretary and Executive Vice President, Federated Hermes, Inc.; Trustee and Senior Vice President, Federated Investors Management Company; Trustee and President, Federated Administrative Services; Director and President, Federated Administrative Services, Inc.; Director and Vice President, Federated Securities Corp.; Director and Secretary, Federated Private Asset Management, Inc.; Secretary, Federated Shareholder Services Company; and Secretary, Retirement Plan Service Company of America. Mr. Germain joined Federated Hermes, Inc. in 1984 and is a member of the Pennsylvania Bar Association.
Previous Positions: Deputy General Counsel, Special Counsel, Managing Director of Mutual Fund Services, Federated
Hermes, Inc.; Senior Vice President, Federated Services Company; and Senior Corporate Counsel, Federated Hermes, Inc. |
Stephen Van Meter
Birth Date: June 5, 1975
CHIEF COMPLIANCE OFFICER AND SENIOR VICE PRESIDENT
Officer since: July 2015 | Principal Occupations: Senior Vice President and Chief Compliance Officer of the Federated Hermes Fund Family; Vice President and Chief Compliance Officer of Federated Hermes, Inc. and Chief Compliance Officer of certain of its subsidiaries. Mr. Van Meter joined Federated Hermes, Inc. in October 2011. He holds FINRA licenses under Series 3, 7, 24 and 66.
Previous Positions: Mr. Van Meter previously held the position of Compliance Operating Officer, Federated Hermes, Inc. Prior to joining Federated Hermes, Inc., Mr. Van Meter served at the United States Securities and Exchange Commission in the positions of Senior Counsel, Office of Chief Counsel, Division of Investment Management and Senior Counsel, Division of Enforcement. |
Robert J. Ostrowski
Birth Date: April 26, 1963
Chief Investment Officer
Officer since: September 2006 | Principal Occupations: Robert J. Ostrowski joined Federated Hermes, Inc. in 1987 as an Investment Analyst and became a Portfolio Manager in 1990. He was named Chief Investment Officer of Federated Hermes’ taxable fixed-income products in 2004 and also serves as a Senior Portfolio Manager. Mr. Ostrowski became an Executive Vice President of the Fund’s Adviser in 2009 and served as a Senior Vice President of the Fund’s Adviser from 1997 to 2009. Mr. Ostrowski has received the Chartered Financial Analyst designation. He received his M.S. in Industrial Administration from Carnegie Mellon University. |
Annual Shareholder Report
Evaluation and Approval of Advisory Contract–May 2020
Federated High-Yield Strategy Portfolio (the “Fund”)
(EFFECTIVE CLOSE OF BUSINESS ON JUNE 26, 2020, THE FUND’S NAME CHANGED TO FEDERATED HERMES HIGH YIELD STRATEGY PORTFOLIO)
At its meetings in May 2020 (the “May Meetings”), the Fund’s Board of Trustees (the “Board”), including a majority of those Trustees who are not “interested persons” of the Fund, as defined in the Investment Company Act of 1940 (the “Independent Trustees”), reviewed and unanimously approved the continuation of the investment advisory contract between the Fund and Federated Investment Management Company (the “Adviser”) (the “Contract”) for an additional one-year term. The Board’s determination to approve the continuation of the Contract reflects the exercise of its business judgment after considering all of the information and factors believed to be relevant and appropriate on whether to continue the existing arrangements. The information, factors and conclusions that formed the basis for the Board’s approval are summarized below.
The Fund is distinctive in that it is used to implement particular investment strategies that are offered to investors in certain separately managed or wrap fee accounts or programs, or certain other discretionary investment accounts, and may also be offered to other funds (each, a “Federated Hermes Fund”) advised by the Adviser or its affiliates (collectively, “Federated Hermes”).
In addition, the Board considered that the Adviser does not charge an investment advisory fee for its services, although Federated Hermes may receive compensation for managing assets invested in the Fund.
Information Received and Review Process
At the request of the Independent Trustees, the Fund’s Chief Compliance Officer (the “CCO”) furnished to the Board in advance of its May Meetings an independent written evaluation presenting on the topics discussed below. The Board considered the CCO’s independent written evaluation (the “CCO Fee Evaluation Report”), along with other information, in evaluating the reasonableness of the Fund’s management fee and in determining to approve the continuation of the Contract. The CCO, in preparing the CCO Fee Evaluation Report, has the authority to retain consultants, experts or staff as reasonably necessary to assist in the performance of his duties, reports directly to the Board, and can be terminated only with the approval of a majority of the Independent Trustees. At the request of the Independent Trustees, the CCO Fee Evaluation Report followed the same general approach and covered the same topics as that of the report that had previously been delivered by the CCO in his capacity as “Senior Officer” prior to the elimination of the Senior Officer position in December 2017.
In addition to the extensive materials that comprise and accompany the CCO Fee Evaluation Report, in the months preceding the May Meetings, the Board requested and reviewed written responses and supporting materials prepared by the Adviser or its affiliates (collectively, “Federated Hermes”) in response to requests posed to Federated Hermes on behalf of the Independent Trustees encompassing a wide variety of topics. The Board also considered such additional matters as the Independent Trustees deemed reasonably necessary to evaluate the Contract, which included detailed information about the Fund and Federated Hermes furnished to the Board at its meetings throughout the year and in between regularly scheduled meetings on particular matters as the need arose, as well as information specifically prepared in connection with the approval of the continuation of the Contract that was presented at the May Meetings.
The Board’s consideration of the Contract included review of materials and information covering the following matters, among others: the Adviser’s and sub-adviser’s investment philosophy, revenue, profitability, personnel and processes; investment and operating strategies; the Fund’s short-term and long-term performance (in absolute terms, both on a gross basis and net of expenses, and relative to the Fund’s particular investment program and a group of its peer funds and/or its benchmark, as appropriate) and comments on the reasons for the Fund’s performance; the Fund’s investment objectives; the Fund’s expenses, including the advisory fee and the overall expense structure of the Fund, with due regard for contractual or voluntary expense limitations (if any); the use and allocation of brokerage commissions derived from trading the Fund’s portfolio securities (if any); and the nature, quality and extent of the advisory and other services provided to the Fund by the Adviser and its affiliates. The Board also considered the preferences and expectations of Fund shareholders; the entrepreneurial and other risks assumed by the Adviser in sponsoring and managing the Fund; the continuing state of competition in the mutual fund industry and market practices; the range of comparable fees for similar funds in the mutual fund industry; the Fund’s relationship to the other funds advised by Federated Hermes (each, a “Federated Hermes Fund”), which include a comprehensive array of funds with different investment objectives, policies and strategies which are generally available for exchange without the incurrence of additional sales charges; compliance and audit reports concerning the Federated Hermes Funds and the Federated Hermes’ affiliates that service them (including communications from regulatory agencies), as well as Federated Hermes’ responses to any issues raised therein; and relevant developments in the mutual fund industry and how the Federated Hermes Funds and/or Federated Hermes may be responding to them. In addition, the Board received and considered information furnished by Federated
Annual Shareholder Report
Hermes on the impacts of the coronavirus (COVID-19) outbreak on Federated Hermes generally and the Fund in particular, including, among other information, the current and anticipated impacts on the management, operations and performance of the Fund. The Board noted that its evaluation process is evolutionary and that the criteria considered and the emphasis placed on relevant criteria may change in recognition of changing circumstances in the mutual fund marketplace.
The Board also considered judicial decisions concerning allegedly excessive investment advisory fees in determining to approve the Contract. Using these judicial decisions as a guide, the Board observed that the following factors may be relevant to an adviser’s fiduciary duty with respect to its receipt of compensation from a fund: (1) the nature and quality of the services provided by an adviser to a fund and its shareholders (including the performance of the fund, its benchmark, and comparable funds); (2) an adviser’s cost of providing the services (including the profitability to an adviser of providing advisory services to a fund); (3) the extent to which an adviser may realize “economies of scale” as a fund grows larger and, if such economies of scale exist, whether they have been shared with a fund and its shareholders or the family of funds; (4) any “fall-out” financial benefits that accrue to an adviser because of its relationship with a fund (including research services received from brokers that execute fund trades and any fees paid to affiliates of an adviser for services rendered to a fund); (5) comparative fee and expense structures (including a comparison of fees paid to an adviser with those paid by similar funds both internally and externally as well as management fees charged to institutional and other advisory clients of the adviser for what might be viewed as like services); and (6) the extent of care, conscientiousness and independence with which the fund’s board members perform their duties and their expertise (including whether they are fully informed about all facts the board deems relevant to its consideration of an adviser’s services and fees). The Board noted that the Securities and Exchange Commission (“SEC”) disclosure requirements regarding the basis for a fund board’s approval of the fund’s investment advisory contracts generally align with the factors listed above. The Board was aware of these factors and was guided by them in its review of the Contract to the extent it considered them to be appropriate and relevant, as discussed further below.
The Board considered and weighed these factors in light of its substantial accumulated experience in governing the Fund and working with Federated Hermes on matters relating to the Federated Hermes Funds. While individual members of the Board may have weighed certain factors differently, the Board’s determination to continue the Contract was based on a comprehensive consideration of all information provided to the Board throughout the year and specifically with respect to the continuation of the Contract. The Independent Trustees were assisted throughout the evaluation process by independent legal counsel. In connection with their deliberations at the May Meetings, the Independent Trustees met separately in executive session with their independent legal counsel and without management present to review the relevant materials and consider their responsibilities under applicable laws. In addition, senior management representatives of Federated Hermes also met with the Independent Trustees and their independent legal counsel to discuss the materials and presentations furnished to the Board at the May Meetings. The Board considered the approval of the Contract for the Fund as part of its consideration of agreements for funds across the Federated Hermes Funds family, but its approvals were made on a fund-by-fund basis.
Nature, Extent and Quality of Services
The Board considered the nature, extent and quality of the services provided to the Fund by the Adviser and the resources of the Adviser and its affiliates dedicated to the Fund. In this regard, the Board evaluated, among other things, the Adviser’s personnel, experience and track record, as well as the financial resources and overall reputation of Federated Hermes and its willingness to invest in personnel and infrastructure that benefit the Federated Hermes Funds. The Board noted the significant acquisition of Hermes Fund Managers Limited by Federated Hermes in 2018, which has deepened the organization’s investment management expertise and capabilities and expanded the investment process for all of the Federated Hermes Funds to incorporate environmental, social and governance (“ESG”) factors and issuer engagement on ESG matters.
In addition, the Board reviewed the qualifications, backgrounds and responsibilities of the portfolio management team primarily responsible for the day-to-day management of the Fund and the Adviser’s ability and experience in attracting and retaining qualified personnel to service the Fund. The Board noted the compliance program of the Adviser and the compliance-related resources devoted by the Adviser and its affiliates in support of the Fund’s obligations pursuant to Rule 38a-1 under the Investment Company Act of 1940, including the Adviser’s commitment to respond to rulemaking and other regulatory initiatives of the SEC such as the liquidity risk management program rules. In addition, the Board considered the response by the Adviser to recent market conditions and considered the overall performance of the Adviser in this context. The Fund’s ability to deliver competitive performance when compared to its benchmark index was also deemed to be relevant by the Board as a useful indicator of how the Adviser is executing the Fund’s investment program. The Adviser’s ability to execute this program was one of the Board’s considerations in reaching a conclusion that the nature, extent and quality of the Adviser’s investment management and related services warrant the continuation of the Contract.
Annual Shareholder Report
Fund Investment Performance
For the one-year, three-year and five-year periods ended December 31, 2019, the Fund outperformed its benchmark index.
Following such evaluation, and full deliberations, the Board concluded that the performance of the Fund supported renewal of the Contract.
Fund Expenses
The Board considered that the Adviser does not charge an investment advisory fee to this Fund for its services. However, the Board considered the compensation and benefits received by the Adviser, including fees received for services provided to the Fund by Federated Hermes and research services received by the Adviser from brokers that execute trades for other Federated Hermes Funds.
Because the Adviser does not charge the Fund an investment advisory fee, the Board does not consider fee comparisons to other mutual funds or other institutional or separate accounts to be relevant to its deliberations.
Profitability and Other Benefits
The Board also received financial information about Federated Hermes, including information regarding the compensation and ancillary (or “fall-out”) benefits Federated Hermes derived from its relationships with the Federated Hermes Funds. As the Adviser does not charge an investment advisory fee for its services, this information generally covered fees received by Federated Hermes’ affiliates for providing other services to the Federated Hermes Funds under separate contracts (e.g., for serving as the Federated Hermes Funds’ administrator and distributor). In this regard, the Board considered that certain of Federated Hermes’ affiliates provide distribution and shareholder services to the Federated Hermes Funds, for which they may be compensated through distribution and servicing fees paid pursuant to Rule 12b-1 plans or otherwise. The Board also received and considered information detailing any indirect benefit Federated Hermes may derive from its receipt of research services from brokers who execute portfolio trades for the Federated Hermes Funds. In addition, the Board considered the fact that, in order for the Federated Hermes Funds to be competitive in the marketplace, the Adviser and its affiliates frequently waived fees and/or reimbursed expenses and have disclosed to Federated Hermes Fund shareholders and/or reported to the Board their intention to do so in the future. Moreover, the Board received and considered regular reports from Federated Hermes throughout the year as to the institution, adjustment or elimination of these voluntary waivers and/or reimbursements. The Board considered Federated Hermes’ previous reductions in contractual management fees to certain Federated Hermes Funds during the prior year, including in response to the CCO’s recommendations in the prior year’s CCO Fee Evaluation Report.
The Board also reviewed information compiled by Federated Hermes comparing its profitability information to other publicly held fund management companies, including information regarding profitability trends over time. The Board considered the CCO’s conclusion that, based on such profitability information, Federated Hermes’ profit margins did not appear to be excessive. The Board also considered the CCO’s view that Federated Hermes appeared financially sound, with the resources necessary to fulfill its obligations under its contracts with the Federated Hermes Funds.
Economies of Scale
Because of the unusual nature of the Fund as primarily an internal product with no advisory fee, the Board does not consider the assessment of whether economies of scale would be realized if the Fund were to grow to a sufficient size to be particularly relevant.
Conclusions
The Board considered the CCO’s conclusion that his observations and the information accompanying the CCO Fee Evaluation Report show that the management fee for the Fund was reasonable and the CCO’s recommendation that the Board approve the management fee. The Board noted that, under these circumstances, no changes were recommended to, and no objection was raised to the continuation of, the Contract by the CCO. The CCO also recognized that the Board’s evaluation of the Federated Hermes Funds’ advisory and subadvisory arrangements is a continuing and on-going process that is informed by the information that the Board requests and receives from management throughout the course of the year and, in this regard, the CCO noted certain items for future reporting to the Board or further consideration by management as the Board continues its on-going oversight of the Federated Hermes Funds.
The Board based its determination to approve the Contract on the totality of the circumstances and relevant factors and with a view to past and future long-term considerations. Not all of the factors and considerations identified above were necessarily deemed to be relevant to the Fund, nor did the Board consider any one of them to be determinative. With respect to the factors that were deemed to be relevant, the Board’s determination to approve the continuation of the Contract reflects its view that Federated Hermes’ performance and actions provided a satisfactory basis to support the determination to continue the existing arrangement.
Annual Shareholder Report
Liquidity Risk Management Program–
Annual Evaluation of Adequacy and Effectiveness
In accordance with Rule 22e-4 under the Investment Company Act of 1940, as amended (the “Liquidity Rule”), Federated Hermes Managed Pool Series (the “Trust”) has adopted and implemented a liquidity risk management program (the “Program”) for Federated Hermes High Yield Strategy Portfolio (the “Fund” and, collectively with the Federated Hermes funds, the “Federated Hermes Funds”). The Program seeks to assess and manage the Fund’s liquidity risk. “Liquidity risk” is defined under the Liquidity Rule as the risk that the Fund is unable to meet redemption requests without significantly diluting remaining investors’ interests in the Fund. The Board of Trustee of the Trust (the “Board”) has approved the designation of the Fund’s investment adviser as the administrator for the Program for the Fund. Each affiliated Federated Hermes advisory subsidiary (including the Fund’s investment adviser) that serves as investment adviser to a Federated Hermes Fund (including the Fund) has been approved as the administrator of the Program for each Federated Hermes Fund they manage (each an “Administrator”). The Administrator in turn has delegated daily responsibility for the administration of the Program to multiple Liquidity Risk Management Committees (the “Committees”). The Committees, which are comprised of representatives of Enterprise Risk Management, Compliance, Investment Management and Trading, must review and assess certain information related to the liquidity of the Federated Hermes Funds, including the Fund.
The Program is comprised of various components designed to support the assessment and/or management of liquidity risk, including: (1) the periodic assessment (no less frequently than annually) of certain factors that influence the Fund’s liquidity risk; (2) the periodic classification (no less frequently than monthly) of the Fund’s investments into one of four liquidity categories that reflect an estimate of their liquidity under current market conditions; (3) a 15% limit on the acquisition of “illiquid investments” (as defined under the Liquidity Rule); (4) to the extent a Fund does not invest primarily in “highly liquid investments” (as defined under the Liquidity Rule), the determination of a minimum percentage of the Fund’s assets that generally will be invested in highly liquid investments (an “HLIM”); (5) if a Fund has established an HLIM, the periodic review (no less frequently than annually) of the HLIM and the adoption of policies and procedures for responding to a shortfall of the Fund’s highly liquid investments below its HLIM; and (6) periodic reporting to the Board.
At its meetings in May 2020, the Board received and reviewed a written report (the “Report”) from the Federated Hermes Funds’ Chief Compliance Officer and Chief Risk Officer, on behalf of the Administrator, concerning the operation of the Program for the period from the Program’s inception on December 1, 2018 through March 31, 2020 (the “Period”). The Report addressed the operation of the Program and assessed its adequacy and effectiveness, including, where applicable, the operation of any HLIM established for a Federated Hermes Fund and each Federated Hermes Fund’s access to other available funding sources such as the Federated Hermes Funds’ interfund lending facility, redemptions in-kind and committed lines of credit. There were no material changes to the Program during the Period. The Report summarized the operation of the Program and the information and factors considered by the Administrator in assessing whether the Program has been adequately and effectively implemented with respect to the Federated Hermes Funds. Such information and factors included, among other things:
■ confirmation that the Fund did not utilize alternative funding sources during the Period;
■ the periodic classifications of the Fund’s investments into one of four liquidity categories and the methodologies and inputs used to classify the investments, including the Fund’s reasonably anticipated trade size;
■ the analysis received from a third-party liquidity assessment vendor that is taken into account in the process of determining the liquidity classifications of the Fund’s investments and the results of an evaluation of the services performed by the vendor in support of this process;
■ the fact that the Fund invested primarily in highly liquid investments during the Period and, therefore, was not required to establish, and has not established, an HLIM and the procedures for monitoring the status of the Fund as investing primarily in highly liquid investments;
■ the fact that the Fund invested no more than 15% of its assets in illiquid investments during the Period and the procedures for monitoring this limit; and
■ liquidity events during the Period, including the impact on liquidity caused by extended non-U.S. market closures and the market disruptions resulting from the novel coronavirus outbreak, and the fact that there were no specific liquidity events during the Period that materially affected the Fund’s liquidity risk.
Based on this review, the Fund’s investment adviser, in its role as Administrator, collectively with the other investment advisers to the Federated Hermes Funds, concluded that the Program is operating effectively to assess and manage the Fund’s liquidity risk, and that the Program has been and continues to be adequately and effectively implemented to monitor and, as applicable, respond to the Fund’s liquidity developments.
Annual Shareholder Report
Voting Proxies on Fund Portfolio Securities
A description of the policies and procedures that the Fund uses to determine how to vote proxies, if any, relating to securities held in the Fund’s portfolio, as well as a report on “Form N-PX” of how the Fund voted any such proxies during the most recent 12-month period ended June 30, are available, without charge and upon request, by calling 1-800-341-7400. A report on “Form N-PX” of how the Fund voted any such proxies during the most recent 12-month period ended June 30 is available via the Proxy Voting Record Report (Form N-PX) link associated with the Fund at FederatedInvestors.com/FundInformation. Select a product name, then click “Documents” and click on “Proxy Voting Record Report.” Form N-PX filings are also available at the SEC’s website at sec.gov.
Quarterly Portfolio Schedule
Each fiscal quarter, the Fund will file with the SEC a complete schedule of its monthly holds on “Form N-PORT.” The Fund’s holdings as of the end of the third month of every fiscal quarter, as reported on Form N-PORT, will be publicly available on the SEC’s website at sec.gov within 60 days of the end of the fiscal quarter upon filing. You may also access this information at FederatedInvestors.com. Select a product name, then click “Documents” and select “Form N-PORT.”
Annual Shareholder Report
Mutual funds are not bank deposits or obligations, are not guaranteed by any bank and are not insured or guaranteed by the U.S. government, the Federal Deposit Insurance Corporation, the Federal Reserve Board or any other government agency. Investment in mutual funds involves investment risk, including the possible loss of principal.
This Report is authorized for distribution to prospective investors only when preceded or accompanied by the Fund’s Prospectus, which contains facts concerning its objective and policies, management fees, expenses and other information. Federated Hermes High Yield Strategy Portfolio
Federated Hermes Funds
4000 Ericsson Drive
Warrendale, PA 15086-7561
Contact us at FederatedInvestors.com
or call 1-800-341-7400.
Federated Securities Corp., Distributor
CUSIP 31421P209
40004 (2/21)
© 2021 Federated Hermes, Inc.
Annual Shareholder Report
December 31, 2020
Federated Hermes Mortgage Strategy Portfolio(formerly, Federated Mortgage Strategy Portfolio)
A Portfolio of Federated Hermes Managed Pool Series(formerly, Federated Managed Pool Series)
Not FDIC Insured ▪ May Lose Value ▪ No Bank Guarantee
Management’s Discussion of Fund Performance (unaudited)
The total return of Federated Hermes Mortgage Strategy Portfolio (the “Fund”), based on net asset value for the 12-month reporting period ended December 31, 2020, was 4.77%. The Bloomberg Barclays U.S. Mortgage Backed Securities Index (BBMBS),1 the Fund’s broad-based securities market index, returned 3.87% during the same period. The Fund’s total return for the most recently completed fiscal year reflected actual cash flows, transaction costs and other expenses, which were not reflected in the total return of the BBMBS.
During the reporting period, the Fund’s investment strategy focused on: (a) security selection; (b) sector allocation; and (c) interest rate strategy. These were the most significant factors affecting the Fund’s performance relative to the BBMBS.
MARKET OVERVIEW
Markets experienced unprecedented dislocation and volatility as the COVID-19 pandemic upended the global economy. Monetary and fiscal policy responses designed to stabilize the economy were enacted, however, the economic damage was severe.
The global pandemic dramatically reduced economic activity in the first half of the reporting period. The Federal Reserve (the “Fed”) reacted by easing monetary policy and initiating quantitative easing (QE) programs to stabilize financial markets via lower rates, asset purchases and various lending facilities. On the fiscal policy front, the Coronavirus Aid Relief and Economic Security (CARES) Act was signed into law. This multi-trillion dollar stimulus plan provided funds to a wide range of citizens and organizations via direct consumer payments, increased unemployment benefits and business loans, just to name a few. After dramatic underperformance early in the reporting period, non-Treasury fixed-income sectors rebounded strongly as investors took advantage of the widest yield spreads in over a decade—relative to similar duration Treasuries—to add exposure.
With the federal funds target rate reduced to a range of 0% to 0.25% and QE purchases of Treasuries and agency mortgage-backed securities2 (MBS) totaling $80 and $40 billion per month, respectively, mortgage security performance strongly rebounded from the depths early in the reporting period. Investment-grade corporates, commercial mortgages and asset-backed securities (ABS) bounced back to post positive excess returns for the year while residential MBS and government agency debt were slightly negative. Demand for Treasury securities drove interest rates to record lows as economic activity ground to a halt. Mortgage rates declined to a new all-time low of 2.66% which resulted in a mortgage refinance wave. The Mortgage Banker Association’s Refinance Index increased over 100% during the reporting period as homeowners reduced debt service costs.
During the reporting period, 2- and 10-year U.S. Treasury yields declined 145 and 100 basis points to yield 0.12% and 0.92%, respectively.3
Security selection
Falling market interest rates fueled mortgage prepayments as borrowers acted to reduce debt service costs via lower rate mortgages. In such an environment, mortgage investor demand for loans embedded with factors that reduce refinance risk typically increases. The Fund maintained significant exposure to such securities which experienced slower prepayments attributable to lower loan balances and geographic considerations, for example. Loans with these and other select factors posted relatively slower prepayments, and price premiums for such MBS, relative to generic collateral commonly referred to as “To Be Announced” (TBA) securities, increased substantially. Security selection made a positive impact on Fund performance.
Sector allocation
Holdings of agency residential MBS were tactically adjusted with allocations to commercial mortgage securities, floating-rate collateralized mortgage obligations and ABS. Overall, sector allocation proved beneficial.
Interest rate strategy
As rates fell, the Fund incrementally increased effective duration to benefit from lower yields. The greater sensitivity to interest rates proved beneficial as Treasury yields declined. Interest rate strategy made a positive contribution to Fund performance.
1
Please see the footnotes to the line graph under “Fund Performance and Growth of a $10,000 Investment” below for the definition of, and more information about, the BBMBS.
2
The value of some mortgage-backed securities may be particularly sensitive to changes in prevailing interest rates, and although the securities are generally supported by some form of government or private insurance, there is no assurance that private guarantors or insurers will meet their obligations.
3
Bond prices are sensitive to changes in interest rates, and a rise in interest rates can cause a decline in their prices.
Annual Shareholder Report
FUND PERFORMANCE AND GROWTH OF A $10,000 INVESTMENT
The graph below illustrates the hypothetical investment of $10,0001 in the Federated Hermes Mortgage Strategy Portfolio from December 31, 2010 to December 31, 2020, compared to the Bloomberg Barclays Mortgage Backed Securities Index (BBMBS).2 The Average Annual Total Return table below shows returns averaged over the stated periods.
Growth of a $10,000 Investment
Growth of $10,000 as of December 31, 2020 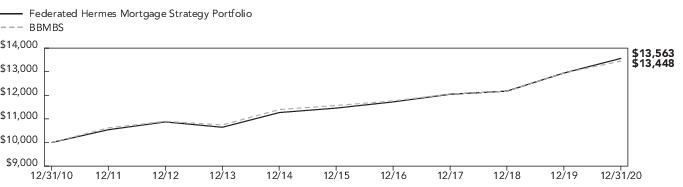
Average Annual Total Returns for the Period Ended 12/31/2020
Performance data quoted represents past performance which is no guarantee of future results. Investment return and principal value will fluctuate so that an investor’s shares, when redeemed, may be worth more or less than their original cost. Mutual fund performance changes over time and current performance may be lower or higher than what is stated. For current to the most recent month-end performance and after-tax returns, call 1-800-341-7400. Returns shown do not reflect the deduction of taxes that a shareholder would pay on Fund distributions or the redemption of Fund shares. Mutual funds are not obligations of or guaranteed by any bank and are not federally insured.
1
The Fund’s performance assumes the reinvestment of all dividends and distributions. The BBMBS has been adjusted to reflect reinvestment of dividends on securities in the index.
2
The BBMBS covers agency mortgage-backed pass-through securities (both fixed-rate and hybrid ARM) issued by Ginnie Mae (GNMA), Fannie Mae (FNMA) and Freddie Mac (FHLMC). The index is not adjusted to reflect sales loads, expenses or other fees that the Securities and Exchange Commission requires to be reflected in the Fund’s performance. The index is unmanaged and, unlike the Fund, is not affected by cash flows. It is not possible to invest directly in an index.
Annual Shareholder Report
Portfolio of Investments Summary Table (unaudited)
At December 31, 2020, the Fund’s portfolio composition1 was as follows:
| Percentage of
Total Net Assets2 |
U.S. Government Agency Mortgage-Backed Securities | |
| |
Collateralized Mortgage Obligations | |
U.S. Government Agency Commercial Mortgage-Backed Securities | |
| |
Other Assets and Liabilities—Net4 | |
| |
| See the Fund’s prospectus and Statement of Additional Information for a description of the types of securities in which the Fund invests. |
| As of the date specified above, the Fund owned shares of one or more affiliated investment companies. For purposes of this table, the affiliated investment company (other than an affiliated money market mutual fund) is not treated as a single portfolio security, but rather the Fund is treated as owning a pro rata portion of each security and each other asset and liability owned by the affiliated investment company. Accordingly, the percentages of total net assets shown in the table will differ from those presented on the Portfolio of Investments. |
| Cash Equivalents include any investments in money market mutual funds and/or overnight repurchase agreements. |
| Assets, other than investments in securities, less liabilities. See Statement of Assets and Liabilities. |
Annual Shareholder Report
Portfolio of Investments
December 31, 2020
| | | |
| | | |
| | 1Federated Mortgage Core Portfolio
(IDENTIFIED COST $122,228,904) | |
| | REPURCHASE AGREEMENT—0.7% | |
| | Interest in $1,000,000,000 joint repurchase agreement 0.08%, dated 12/31/2020 under which Bank of Montreal will repurchase securities provided as collateral for $1,000,008,889 on 1/4/2021. The securities provided as collateral at the end of the period held with BNY Mellon as tri-party agent, were U.S. Government Agency and U.S. Treasury securities with various maturities to 5/20/2069 and the market value of those underlying securities was $1,022,038,963.
(IDENTIFIED COST $871,000) | |
| | TOTAL INVESTMENT IN SECURITIES—99.9%
(IDENTIFIED COST $123,099,904)2 | |
| | OTHER ASSETS AND LIABILITIES - NET—0.1%3 | |
| | | |
| Due to this affiliated holding representing greater than 75% of the Fund’s total net assets, a copy of the affiliated holding’s most recent Annual Report is included with this Report. |
Affiliated fund holdings are investment companies which are managed by Federated Investment Management Company (the “Adviser”) or an affiliate of the Adviser. Transactions with affiliated fund holdings during the period ended December 31, 2020, were as follows:
| Federated Mortgage
Core Portfolio |
| |
| |
| |
Change in Unrealized Appreciation/Depreciation | |
| |
| |
Shares Held as of 12/31/2020 | |
| |
The Fund invests in the Federated Mortgage Core Portfolio (“Mortgage Core”), a portfolio of Federated Hermes Core Trust (“Core Trust”), which is managed by the Adviser. Core Trust is an open-end management investment company, registered under the Investment Company Act of 1940, as amended (the “Act”), available only to registered investment companies and other institutional investors. The investment objective of Mortgage Core is to provide total return. Federated Hermes, Inc. (“Federated Hermes”) receives no advisory or administrative fees from Mortgage Core. Income distributions from Mortgage Core are declared daily and paid monthly. All income distributions are recorded by the Fund as dividend income. Capital gain distributions of Mortgage Core, if any, are declared and paid annually, and are recorded by the Fund as capital gains received. The performance of the Fund is directly affected by the performance of Mortgage Core. The financial statements of Mortgage Core are included within this report to illustrate the security holdings, financial condition, results of operations and changes in net assets of Mortgage Core in which the Fund invested 99.2% of its net assets at December 31, 2020. The financial statements of Mortgage Core should be read in conjunction with the Fund’s financial statements. The valuation of securities held by Mortgage Core is discussed in the notes to its financial statements.
| The cost of investments for federal tax purposes amounts to $124,898,576. |
| Assets, other than investments in securities, less liabilities. See Statement of Assets and Liabilities. |
Note: The categories of investments are shown as a percentage of total net assets at December 31, 2020.
Various inputs are used in determining the value of the Fund’s investments. These inputs are summarized in the three broad levels listed below:
Level 1—quoted prices in active markets for identical securities.
Level 2—other significant observable inputs (including quoted prices for similar securities, interest rates, prepayment speeds, credit risk, etc.). Also includes securities valued at amortized cost.
Level 3—significant unobservable inputs (including the Fund’s own assumptions in determining the fair value of investments).
The inputs or methodology used for valuing securities are not an indication of the risk associated with investing in those securities.
Annual Shareholder Report
The following is a summary of the inputs used, as of December 31, 2020, in valuing the Fund’s assets carried at fair value:
|
| | Level 2—
Other
Significant
Observable
Inputs | Level 3—
Significant
Unobservable
Inputs | |
| | | | |
| | | | |
| | | | |
See Notes which are an integral part of the Financial Statements
Annual Shareholder Report
Financial Highlights
(For a Share Outstanding Throughout Each Period)
| |
| | | | | |
Net Asset Value, Beginning of Period | | | | | |
Income From Investment Operations: | | | | | |
Net investment income (loss) | | | | | |
Net realized and unrealized gain (loss) | | | | | |
TOTAL FROM INVESTMENT OPERATIONS | | | | | |
| | | | | |
Distributions from net investment income | | | | | |
Net Asset Value, End of Period | | | | | |
| | | | | |
Ratios to Average Net Assets: | | | | | |
| | | | | |
| | | | | |
Expense waiver/reimbursement3 | | | | | |
| | | | | |
Net assets, end of period (000 omitted) | | | | | |
| | | | | |
| Based on net asset value. |
| The Adviser has contractually agreed to reimburse all expenses, excluding extraordinary expenses, incurred by the Fund. Amount does not reflect net expenses incurred by investment companies in which the Fund may invest. |
| This expense decrease is reflected in both the net expense and the net investment income ratios shown above. Amount does not reflect expense waiver/ reimbursement recorded by investment companies in which the Fund may invest. |
See Notes which are an integral part of the Financial Statements
Annual Shareholder Report
Statement of Assets and LiabilitiesDecember 31, 2020
| |
Investment in securities, at value including $125,621,962 of investments in an affiliated holding* (identified cost $123,099,904) | |
| |
Income receivable from an affiliated holding | |
Receivable for shares sold | |
| |
| |
Payable for investments purchased | |
Payable for shares redeemed | |
Income distribution payable | |
Payable for investment adviser fee (Note 5) | |
Payable for administrative fee (Note 5) | |
Payable for auditing fees | |
Payable for portfolio accounting fees | |
Accrued expenses (Note 5) | |
| |
Net assets for 12,439,797 shares outstanding | |
| |
| |
Total distributable earnings (loss) | |
| |
Net Asset Value, Offering Price and Redemption Proceeds Per Share: | |
$126,577,817 ÷ 12,439,797 shares outstanding, no par value, unlimited shares authorized | |
| See information listed after the Fund’s Portfolio of Investments. |
See Notes which are an integral part of the Financial Statements
Annual Shareholder Report
Statement of OperationsYear Ended December 31, 2020
| |
Dividends received from an affiliated holding* | |
| |
| |
| |
Administrative fee (Note 5) | |
| |
| |
Directors’/Trustees’ fees (Note 5) | |
| |
| |
Portfolio accounting fees | |
| |
| |
| |
| |
| |
Reimbursement of other operating expenses (Notes 2 and 5) | |
| |
| |
Realized and Unrealized Gain (Loss) on Investments: | |
Net realized gain on investments in an affiliated holding* | |
Net change in unrealized appreciation of investments in an affiliated holding* | |
Net realized and unrealized gain (loss) on investments | |
Change in net assets resulting from operations | |
| See information listed after the Fund’s Portfolio of Investments. |
See Notes which are an integral part of the Financial Statements
Annual Shareholder Report
Statement of Changes in Net Assets
| | |
Increase (Decrease) in Net Assets | | |
| | |
Net investment income (loss) | | |
| | |
Net change in unrealized appreciation/depreciation | | |
CHANGE IN NET ASSETS RESULTING FROM OPERATIONS | | |
Distributions to Shareholders | | |
| | |
Proceeds from sale of shares | | |
Net asset value of shares issued to shareholders in payment of distributions declared | | |
| | |
CHANGE IN NET ASSETS RESULTING FROM SHARE TRANSACTIONS | | |
| | |
| | |
| | |
| | |
See Notes which are an integral part of the Financial Statements
Annual Shareholder Report
Notes to Financial Statements
December 31, 2020
1. ORGANIZATION
Federated Hermes Managed Pool Series (the “Trust”) is registered under the Act, as an open-end management investment company. The Trust consists of five portfolios. The financial statements included herein are only those of Federated Hermes Mortgage Strategy Portfolio (the “Fund”), a non-diversified portfolio. The financial statements of the other portfolios are presented separately. The assets of each portfolio are segregated and a shareholder’s interest is limited to the portfolio in which shares are held. Each portfolio pays its own expenses. The investment objective of the Fund is to provide total return by investing primarily in a mortgage-backed securities mutual fund and individual mortgage-backed securities, including collateralized mortgage obligations.
Prior to June 29, 2020, the names of the Trust and Fund were Federated Managed Pool Series and Federated Mortgage Strategy Portfolio, respectively.
2. SIGNIFICANT ACCOUNTING POLICIES
The following is a summary of significant accounting policies consistently followed by the Fund in the preparation of its financial statements. These policies are in conformity with U.S. generally accepted accounting principles (GAAP).
Investment Valuation
In calculating its net asset value (NAV), the Fund generally values investments as follows:
■
Shares of other mutual funds or non-exchange-traded investment companies are valued based upon their reported NAVs.
■
Fixed-income securities are fair valued using price evaluations provided by a pricing service approved by the Fund’s Board of Trustees (the “Trustees”).
■
Derivative contracts listed on exchanges are valued at their reported settlement or closing price, except that options are valued at the mean of closing bid and asked quotations.
■
Over-the-counter (OTC) derivative contracts are fair valued using price evaluations provided by a pricing service approved by the Trustees.
■
For securities that are fair valued in accordance with procedures established by and under the general supervision of the Trustees, certain factors may be considered, such as: the last traded or purchase price of the security, information obtained by contacting the issuer or dealers, analysis of the issuer’s financial statements or other available documents, fundamental analytical data, the nature and duration of restrictions on disposition, the movement of the market in which the security is normally traded, public trading in similar securities or derivative contracts of the issuer or comparable issuers, movement of a relevant index, or other factors including but not limited to industry changes and relevant government actions.
If any price, quotation, price evaluation or other pricing source is not readily available when the NAV is calculated, if the Fund cannot obtain price evaluations from a pricing service or from more than one dealer for an investment within a reasonable period of time as set forth in the Fund’s valuation policies and procedures, or if information furnished by a pricing service, in the opinion of the valuation committee (“Valuation Committee”), is deemed not representative of the fair value of such security, the Fund uses the fair value of the investment determined in accordance with the procedures described below. There can be no assurance that the Fund could obtain the fair value assigned to an investment if it sold the investment at approximately the time at which the Fund determines its NAV per share, and the actual value obtained could be materially different.
Fair Valuation Procedures
The Trustees have ultimate responsibility for determining the fair value of investments for which market quotations are not readily available. The Trustees have appointed a Valuation Committee comprised of officers of the Fund, the Adviser, and certain of the Adviser’s affiliated companies to assist in determining fair value and in overseeing the calculation of the NAV. The Trustees have also authorized the use of pricing services recommended by the Valuation Committee to provide fair value evaluations of the current value of certain investments for purposes of calculating the NAV. The Valuation Committee employs various methods for reviewing third-party pricing-service evaluations including periodic reviews of third-party pricing services’ policies, procedures and valuation methods (including key inputs, methods, models and assumptions), transactional back-testing, comparisons of evaluations of different pricing services, and review of price challenges by the Adviser based on recent market activity. In the event that market quotations and price evaluations are not available for an investment, the Valuation Committee determines the fair value of the investment in accordance with procedures adopted by the Trustees. The Trustees periodically review and approve the fair valuations made by the Valuation Committee and any changes made to the procedures.
Factors considered by pricing services in evaluating an investment include the yields or prices of investments of comparable quality, coupon, maturity, call rights and other potential prepayments, terms and type, reported transactions, indications as to values from dealers and general market conditions. Some pricing services provide a single price evaluation reflecting the bid-side of the market for an investment (a “bid” evaluation). Other pricing services offer both bid evaluations and price evaluations indicative of a price between the prices bid and asked for the investment (a “mid” evaluation). The Fund normally uses bid evaluations for any U.S. Treasury and Agency securities, mortgage-backed securities and municipal securities. The Fund normally uses mid evaluations for any other types of fixed-income securities and any OTC derivative contracts. In the event that market quotations and price evaluations are not available for an investment, the fair value of the investment is determined in accordance with procedures adopted by the Trustees.
Annual Shareholder Report
Repurchase Agreements
The Fund may invest in repurchase agreements for short-term liquidity purposes. It is the policy of the Fund to require the other party to a repurchase agreement to transfer to the Fund’s custodian or sub-custodian eligible securities or cash with a market value (after transaction costs) at least equal to the repurchase price to be paid under the repurchase agreement. The eligible securities are transferred to accounts with the custodian or sub-custodian in which the Fund holds a “securities entitlement” and exercises “control” as those terms are defined in the Uniform Commercial Code. The Fund has established procedures for monitoring the market value of the transferred securities and requiring the transfer of additional eligible securities if necessary to equal at least the repurchase price. These procedures also allow the other party to require securities to be transferred from the account to the extent that their market value exceeds the repurchase price or in exchange for other eligible securities of equivalent market value.
The insolvency of the other party or other failure to repurchase the securities may delay the disposition of the underlying securities or cause the Fund to receive less than the full repurchase price. Under the terms of the repurchase agreement, any amounts received by the Fund in excess of the repurchase price and related transaction costs must be remitted to the other party.
The Fund may enter into repurchase agreements in which eligible securities are transferred into joint trading accounts maintained by the custodian or sub-custodian for investment companies and other clients advised by the Fund’s Adviser and its affiliates. The Fund will participate on a pro rata basis with the other investment companies and clients in its share of the securities transferred under such repurchase agreements and in its share of proceeds from any repurchase or other disposition of such securities.
Repurchase agreements are subject to Master Netting Agreements which are agreements between the Fund and its counterparties that provide for the net settlement of all transactions and collateral with the Fund, through a single payment, in the event of default or termination. Amounts presented on the Portfolio of Investments and Statement of Assets and Liabilities are not net settlement amounts but gross. As indicated above, the cash or securities to be repurchased, as shown on the Portfolio of Investments, exceeds the repurchase price to be paid under the agreement reducing the net settlement amount to zero.
Investment Income, Gains and Losses, Expenses and Distributions
Investment transactions are accounted for on a trade-date basis. Realized gains and losses from investment transactions are recorded on an identified-cost basis. Interest income and expenses are accrued daily. Dividend income and distributions to shareholders are recorded on the ex-dividend date. Distributions of net investment income, if any, are declared daily and paid monthly. Amortization/accretion of premium and discount is included in investment income. The detail of the total fund expense reimbursement of $310,512 is disclosed in Note 5.
Federal Taxes
It is the Fund’s policy to comply with the Subchapter M provision of the Internal Revenue Code and to distribute to shareholders each year substantially all of its income. Accordingly, no provision for federal income tax is necessary. As of and during the year ended December 31, 2020, the Fund did not have a liability for any uncertain tax positions. The Fund recognizes interest and penalties, if any, related to tax liabilities as income tax expense in the Statement of Operations. As of December 31, 2020, tax years 2017 through 2020 remain subject to examination by the Fund’s major tax jurisdictions, which include the United States of America and the Commonwealth of Massachusetts.
When-Issued and Delayed-Delivery Transactions
The Fund may engage in when-issued or delayed-delivery transactions. The Fund records when-issued securities on the trade date and maintains security positions such that sufficient liquid assets will be available to make payment for the securities purchased. Securities purchased on a when-issued or delayed-delivery basis are marked to market daily and begin earning interest on the settlement date. Losses may occur on these transactions due to changes in market conditions or the failure of counterparties to perform under the contract.
Other
The preparation of financial statements in conformity with GAAP requires management to make estimates and assumptions that affect the amounts of assets, liabilities, expenses and revenues reported in the financial statements. Actual results could differ materially from those estimated. The Fund applies investment company accounting and reporting guidance.
3. SHARES OF BENEFICIAL INTEREST
The following table summarizes share activity:
| | |
| | |
Shares issued to shareholders in payment of distributions declared | | |
| | |
NET CHANGE RESULTING FROM FUND SHARE TRANSACTIONS | | |
Annual Shareholder Report
4. FEDERAL TAX INFORMATION
The tax character of distributions as reported on the Statement of Changes in Net Assets for the years ended December 31, 2020 and 2019, was as follows:
As of December 31, 2020, the components of distributable earnings on a tax-basis were as follows:
Undistributed ordinary income1 | |
Net unrealized appreciation | |
| For tax purposes, short-term capital gains are considered ordinary income in determining distributable earnings. |
The difference between book-basis and tax-basis net unrealized appreciation is attributable to the differing treatments for the deferral of losses on wash sales.
At December 31, 2020, the cost of investments for federal tax purposes was $124,898,576. The net unrealized appreciation of investments for federal tax purposes was $1,594,386. This consists entirely of net unrealized appreciation from investments for those securities having an excess of value over cost of $1,594,386.
The Fund used capital loss carryforwards of $314,789 to offset capital gains realized during the year ended December 31, 2020.
5. INVESTMENT ADVISER FEE AND OTHER TRANSACTIONS WITH AFFILIATES
Investment Adviser Fee
The Adviser provides investment adviser services at no fee because all eligible investors are: (1) in separately managed or wrap fee programs, who often pay a single aggregate fee to the wrap program sponsor for all costs and expenses of the wrap fee programs; or (2) in certain other separately managed accounts and discretionary investment accounts. The Adviser has contractually agreed to reimburse all expenses of the Fund, excluding extraordinary expenses. Acquired fund fees and expenses are not direct obligations of the Fund and are not contractual reimbursements under the investment advisory contract. For the year ended December 31, 2020, the Adviser reimbursed $310,512 of operating expenses.
Administrative Fee
Federated Administrative Services (FAS), under the Administrative Services Agreement, provides the Fund with administrative personnel and services. For purposes of determining the appropriate rate breakpoint, “Investment Complex” is defined as all of the Federated Hermes Funds subject to a fee under the Administrative Services Agreement. The fee paid to FAS is based on the average daily net assets of the Investment Complex as specified below:
| Average Daily Net Assets
of the Investment Complex |
| on assets up to $50 billion |
| on assets over $50 billion |
For the year ended December 31, 2020, the annualized fee paid to FAS was 0.078% of average daily net assets of the Fund. For the year ended December 31, 2020, the Fund’s Adviser reimbursed the Fund for any fee paid to FAS.
In addition, FAS may charge certain out-of-pocket expenses to the Fund.
Directors’/Trustees’ and Miscellaneous Fees
Certain Officers and Trustees of the Fund are Officers and Directors or Trustees of certain of the above companies. To efficiently facilitate payment, Independent Directors’/Trustees’ fees and certain expenses related to conducting meetings of the Directors/Trustees and other miscellaneous expenses are paid by an affiliate of the Adviser which in due course are reimbursed by the Fund. These expenses related to conducting meetings of the Directors/Trustees and other miscellaneous expenses may be included in Accrued and Miscellaneous Expenses on the Statement of Assets and Liabilities and Statement of Operations, respectively.
6. INVESTMENT TRANSACTIONS
Purchases and sales of investments, excluding long-term U.S. government securities and short-term obligations, for the year ended December 31, 2020, were as follows:
Annual Shareholder Report
7. LINE OF CREDIT
The Fund participates with certain other Federated Hermes Funds, on a several basis, in an up to $500,000,000 unsecured, 364-day, committed, revolving line of credit (LOC) agreement dated June 24, 2020. The LOC was made available to temporarily finance the repurchase or redemption of shares of the Fund, failed trades, payment of dividends, settlement of trades and for other short-term, temporary or emergency general business purposes. The Fund cannot borrow under the LOC if an inter-fund loan is outstanding. The Fund’s ability to borrow under the LOC also is subject to the limitations of the Act and various conditions precedent that must be satisfied before the Fund can borrow. Loans under the LOC are charged interest at a fluctuating rate per annum equal to the highest, on any day, of (a) (i) the federal funds effective rate, (ii) the one month London Interbank Offered Rate (LIBOR), or a replacement rate as appropriate, and (iii) 0.0%, plus (b) a margin. Any fund eligible to borrow under the LOC pays its pro rata share of an upfront fee, and its pro rata share of a commitment fee based on the amount of the lenders’ commitment that has not been utilized, quarterly in arrears and at maturity. As of December 31, 2020, the Fund had no outstanding loans. During the year ended December 31, 2020, the Fund did not utilize the LOC.
8. INTERFUND LENDING
Pursuant to an Exemptive Order issued by the Securities and Exchange Commission, the Fund, along with other funds advised by subsidiaries of Federated Hermes, Inc., may participate in an interfund lending program. This program provides an alternative credit facility allowing the Fund to borrow from other participating affiliated funds. As of December 31, 2020, there were no outstanding loans. During the year ended December 31, 2020, the program was not utilized.
9. OTHER MATTERS
An outbreak of respiratory disease caused by a novel coronavirus was first detected in China in late 2019 and subsequently spread globally. As of the date of the issuance of these financial statements, this coronavirus has resulted in closing borders, enhanced health screenings, healthcare service preparation and delivery, quarantines, cancellations, and disruptions to supply chains, workflow operations and consumer activity, as well as general concern and uncertainty. The impact of this coronavirus may be short-term or may last for an extended period of time and has resulted in a substantial economic downturn. Health crises caused by outbreaks, such as the coronavirus outbreak, may exacerbate other pre-existing political, social and economic risks. The impact of this outbreak, and other epidemics and pandemics that may arise in the future, could continue to negatively affect the worldwide economy, as well as the economies of individual countries, individual companies (including certain Fund service providers and issuers of the Fund’s investments) and the markets in general in significant and unforeseen ways. Any such impact could adversely affect the Fund’s performance.
10. FEDERAL TAX INFORMATION (UNAUDITED)
For the fiscal year ended December 31, 2020, 100% of dividends paid by the Fund are interest-related dividends, as provided by the American Jobs Creation Act of 2004.
Annual Shareholder Report
Report of Independent Registered Public Accounting Firm
TO THE SHAREHOLDERS AND THE BOARD OF TRUSTEES OF FEDERATED Hermes MORTGAGE STRATEGY PORTFOLIO:
Opinion on the Financial Statements
We have audited the accompanying statement of assets and liabilities of Federated Hermes Mortgage Strategy Portfolio (formerly, Federated Mortgage Strategy Portfolio) (the “Fund”) (one of the portfolios constituting Federated Hermes Managed Pool Series (formerly, Federated Managed Pool Series) (the “Trust”)), including the portfolio of investments, as of December 31, 2020, and the related statement of operations for the year then ended, the statement of changes in net assets for each of the two years in the period then ended, the financial highlights for each of the five years in the period then ended and the related notes (collectively referred to as the “financial statements”). In our opinion, the financial statements present fairly, in all material respects, the financial position of the Fund (one of the portfolios constituting the Federated Hermes Managed Pool Series (formerly, Federated Managed Pool Series)) at December 31, 2020, the results of its operations for the year then ended, the changes in its net assets for each of the two years in the period then ended and its financial highlights for each of the five years in the period then ended, in conformity with U.S. generally accepted accounting principles.
Basis for Opinion
These financial statements are the responsibility of the Trust’s management. Our responsibility is to express an opinion on the Fund’s financial statements based on our audits. We are a public accounting firm registered with the Public Company Accounting Oversight Board (United States) (“PCAOB”) and are required to be independent with respect to the Trust in accordance with the U.S. federal securities laws and the applicable rules and regulations of the Securities and Exchange Commission and the PCAOB.
We conducted our audits in accordance with standards of the PCAOB. Those standards require that we plan and perform the audit to obtain reasonable assurance about whether the financial statements are free of material misstatement, whether due to error or fraud. The Trust is not required to have, nor were we engaged to perform, an audit of the Trust’s internal control over financial reporting. As part of our audits, we are required to obtain an understanding of internal control over financial reporting, but not for the purpose of expressing an opinion on the effectiveness of the Trust’s internal control over financial reporting. Accordingly, we express no such opinion.
Our audits included performing procedures to assess the risks of material misstatement of the financial statements, whether due to error or fraud, and performing procedures that respond to those risks. Such procedures included examining, on a test basis, evidence regarding the amounts and disclosures in the financial statements. Our procedures included confirmation of securities owned as of December 31, 2020, by correspondence with the custodian and others, or by other appropriate auditing procedures where replies from others were not received. Our audits also included evaluating the accounting principles used and significant estimates made by management, as well as evaluating the overall presentation of the financial statements. We believe that our audits provide a reasonable basis for our opinion. We have served as the auditor of one or more Federated Hermes’ investment companies since 1979.
Boston, Massachusetts
February 22, 2021
Annual Shareholder Report
Shareholder Expense Example (unaudited)
As a shareholder of the Fund, you incur ongoing costs, including to the extent applicable, management fees, distribution (12b-1) fees and/or other service fees and other Fund expenses. This Example is intended to help you to understand your ongoing costs (in dollars) of investing in the Fund and to compare these costs with the ongoing costs of investing in other mutual funds. It is based on an investment of $1,000 invested at the beginning of the period and held for the entire period from July 1, 2020 to December 31, 2020.
ACTUAL EXPENSES
The first section of the table below provides information about actual account values and actual expenses. You may use the information in this section, together with the amount you invested, to estimate the expenses that you incurred over the period. Simply divide your account value by $1,000 (for example, an $8,600 account value divided by $1,000 = 8.6), then multiply the result by the number in the first section under the heading entitled “Expenses Paid During Period” to estimate the expenses attributable to your investment during this period.
HYPOTHETICAL EXAMPLE FOR COMPARISON PURPOSES
The second section of the table below provides information about hypothetical account values and hypothetical expenses based on the Fund’s actual expense ratio and an assumed rate of return of 5% per year before expenses, which is not the Fund’s actual return. Thus, you should not use the hypothetical account values and expenses to estimate the actual ending account balance or your expenses for the period. Rather, these figures are required to be provided to enable you to compare the ongoing costs of investing in the Fund with other funds. To do so, compare this 5% hypothetical example with the 5% hypothetical examples that appear in the shareholder reports of the other funds.
Please note that the expenses shown in the table are meant to highlight your ongoing costs only. Therefore, the second section of the table is useful in comparing ongoing costs only, and will not help you determine the relative total costs of owning different funds.
| Beginning
Account Value
7/1/2020 | Ending
Account Value
12/31/2020 | Expenses Paid
During Period1 |
| | | |
Hypothetical (assuming a 5% return before expenses) | | | |
| Expenses are equal to the Fund’s annualized net expense ratio of 0.00%, multiplied by the average account value over the period, multiplied by 184/366 (to reflect the one-half-year period). The Adviser has contractually agreed to reimburse all expenses, excluding extraordinary expenses, incurred by the Fund. This agreement has no fixed term. |
Annual Shareholder Report
Federated Mortgage Core Portfolio
Financial Statements and Notes to Financial Statements
Federated Hermes Mortgage Strategy Portfolio invests primarily in Federated Mortgage Core Portfolio. Therefore the Federated Mortgage Core Portfolio financial statements and notes to financial statements are included on pages 17 through 40.
Federated Mortgage Core Portfolio
Annual Shareholder Report
Management’s Discussion of Fund Performance (unaudited)–
Federated Mortgage Core Portfolio
The total return of Federated Mortgage Core Portfolio (the “Fund”), based on net asset value for the 12-month reporting period ended December 31, 2020, was 4.70%. The Bloomberg Barclays U.S. Mortgage Backed Securities Index (BBMBS),1 the Fund’s broad-based securities market index, returned 3.87% for the same period. The Fund’s total return for the most recently completed fiscal year reflected actual cash flows, transaction costs and other expenses, which were not reflected in the total return of the BBMBS.
During the reporting period, the Fund’s investment strategy focused on: (a) security selection; (b) sector allocation; and (c) interest rate strategy. These were the most significant factors affecting the Fund’s performance relative to the BBMBS.
MARKET OVERVIEW
Markets experienced unprecedented dislocation and volatility as the COVID-19 pandemic upended the global economy. Monetary and fiscal policy responses designed to stabilize the economy were enacted, however, the economic damage was severe.
The global pandemic dramatically reduced economic activity in the first half of the reporting period. The Federal Reserve (the “Fed”) reacted by easing monetary policy and initiating quantitative easing (QE) programs to stabilize financial markets via lower rates, asset purchases and various lending facilities. On the fiscal policy front, the Coronavirus Aid Relief and Economic Security (CARES) Act was signed into law. This multi-trillion dollar stimulus plan provided funds to a wide range of citizens and organizations via direct consumer payments, increased unemployment benefits and business loans, just to name a few. After dramatic underperformance early in the reporting period, non-Treasury fixed-income sectors rebounded strongly as investors took advantage of the widest yield spreads in over a decade—relative to similar duration Treasuries—to add exposure.
With the federal funds target rate reduced to a range of 0% to 0.25% and QE purchases of Treasuries and agency mortgage-backed securities2 (MBS) totaling $80 and $40 billion per month during the reporting period, respectively, mortgage security performance strongly rebounded from the depths early in the reporting period. Investment-grade corporates, commercial mortgages and asset-backed securities (ABS) bounced back to post positive excess returns for the year while residential MBS and government agency debt were slightly negative. Demand for Treasury securities drove interest rates to record lows as economic activity ground to a halt. Mortgage rates declined to a new all-time low of 2.66% which resulted in a mortgage refinance wave. The Mortgage Banker Association’s Refinance Index increased over 100% during the reporting period as homeowners reduced debt service costs.
The 2- and 10-year U.S. Treasury yields declined 145 and 100 basis points to yield 0.12% and 0.92% during the reporting period, respectively.3
Security selection
Falling market interest rates fueled mortgage prepayments as borrowers acted to reduce debt service costs via lower rate mortgages. In such an environment, mortgage investor demand for loans embedded with factors that reduce refinance risk typically increases. The Fund maintained significant exposure to such securities which experienced slower prepayments attributable to lower loan balances and geographic considerations, for example. Loans with these and other select factors posted relatively slower prepayments and price premiums for such MBS, relative to generic collateral commonly referred to as “To Be Announced” (TBA) securities, increased substantially. Security selection made a positive impact on Fund performance.
Sector allocation
Holdings of agency residential MBS were tactically adjusted with allocations to commercial mortgage securities, floating-rate collateralized mortgage obligations and ABS. Overall, sector allocation proved beneficial.
Interest rate strategy
As rates fell, the Fund incrementally increased effective duration to benefit from lower yields. The greater sensitivity to interest rates proved beneficial as Treasury yields declined. Interest rate strategy made a positive contribution to Fund performance.
1
Please see the footnotes to the line graph under “Fund Performance and Growth of a $10,000 Investment” below for the definition of, and more information about, the BBMBS.
2
The value of some mortgage-backed securities may be particularly sensitive to changes in prevailing interest rates, and although the securities are generally supported by some form of government or private insurance, there is no assurance that private guarantors or insurers will meet their obligations.
3
Bond prices are sensitive to changes in interest rates, and a rise in interest rates can cause a decline in their prices.
Federated Mortgage Core Portfolio
Annual Shareholder Report
FUND PERFORMANCE AND GROWTH OF A $10,000 INVESTMENT
The graph below illustrates the hypothetical investment of $10,0001 in the Federated Mortgage Core Portfolio from December 31, 2010 to December 31, 2020, compared to the Bloomberg Barclays U.S. Mortgage Backed Securities Index (BBMBS).2 The Average Annual Total Return table below shows returns averaged over the stated periods.
Growth of a $10,000 Investment
Growth of $10,000 as of December 31, 2020 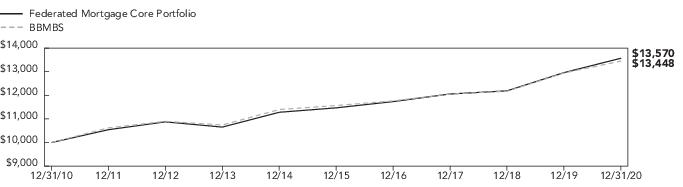
Average Annual Total Returnsfor the Period Ended 12/31/2020
Performance data quoted represents past performance which is no guarantee of future results. Investment return and principal value will fluctuate so that an investor’s shares, when redeemed, may be worth more or less than their original cost. Mutual fund performance changes over time and current performance may be lower or higher than what is stated. For current to the most recent month-end performance and after-tax returns, call 1-800-341-7400. Returns shown do not reflect the deduction of taxes that a shareholder would pay on Fund distributions or the redemption of Fund shares. Mutual funds are not obligations of or guaranteed by any bank and are not federally insured.
1
The Fund’s performance assumes the reinvestment of all dividends and distributions. The BBMBS has been adjusted to reflect reinvestment of dividends on securities in the index.
2
The BBMBS covers agency mortgage-backed pass-through securities (both fixed-rate and hybrid ARM) issued by Ginnie Mae (GNMA), Fannie Mae (FNMA) and Freddie Mac (FHLMC). The index is not adjusted to reflect sales loads, expenses or other fees that the Securities and Exchange Commission requires to be reflected in the Fund’s performance. The index is unmanaged and, unlike the Fund, is not affected by cash flows. It is not possible to invest directly in an index.
Federated Mortgage Core Portfolio
Annual Shareholder Report
Portfolio of Investments Summary Table (unaudited)–Federated Mortgage Core Portfolio
At December 31, 2020, the Fund’s portfolio composition1 was as follows:
| Percentage of
Total Net Assets |
Mortgage-Backed Securities | |
| |
Collateralized Mortgage Obligations | |
Commercial Mortgage-Backed Securities | |
| |
Other Assets and Liabilities—Net3 | |
| |
| See the Fund’s Private Offering Memorandum for a description of the principal types of securities in which the Fund invests. |
| Cash Equivalents include any investments in money market mutual funds and/or overnight repurchase agreements. |
| Assets, other than investments in securities, less liabilities. See Statement of Assets and Liabilities. |
Federated Mortgage Core Portfolio
Annual Shareholder Report
Portfolio of Investments–Federated Mortgage Core Portfolio
December 31, 2020
| | | |
| | MORTGAGE-BACKED SECURITIES—84.9% | |
| | Federal Home Loan Mortgage Corporation—27.6% | |
| | | |
| | | |
| | | |
| | | |
| | | |
| | | |
| | | |
| | | |
| | | |
| | | |
| | | |
| | | |
| | | |
| | | |
| | | |
| | | |
| | | |
| | | |
| | | |
| | | |
| | | |
| | | |
| | | |
| | | |
| | | |
| | | |
| | | |
| | | |
| | | |
| | | |
| | | |
| | | |
| | | |
| | | |
| | | |
| | | |
| | | |
| | | |
| | | |
| | | |
| | | |
| | | |
| | | |
| | | |
| | | |
| | | |
| | | |
Federated Mortgage Core Portfolio
Annual Shareholder Report
| | | |
| | MORTGAGE-BACKED SECURITIES—continued | |
| | Federal Home Loan Mortgage Corporation—continued | |
| | | |
| | | |
| | | |
| | | |
| | | |
| | | |
| | | |
| | | |
| | | |
| | | |
| | | |
| | | |
| | | |
| | | |
| | | |
| | | |
| | | |
| | | |
| | | |
| | | |
| | | |
| | | |
| | | |
| | | |
| | | |
| | | |
| | | |
| | | |
| | | |
| | | |
| | | |
| | | |
| | | |
| | | |
| | | |
| | | |
| | | |
| | | |
| | | |
| | | |
| | | |
| | | |
| | | |
| | | |
| | | |
| | | |
| | | |
| | | |
| | | |
| | | |
Federated Mortgage Core Portfolio
Annual Shareholder Report
| | | |
| | MORTGAGE-BACKED SECURITIES—continued | |
| | Federal Home Loan Mortgage Corporation—continued | |
| | | |
| | | |
| | | |
| | | |
| | Federal National Mortgage Association—31.2% | |
| | | |
| | | |
| | | |
| | | |
| | | |
| | | |
| | | |
| | | |
| | | |
| | | |
| | | |
| | | |
| | | |
| | | |
| | | |
| | | |
| | | |
| | | |
| | | |
| | | |
| | | |
| | | |
| | | |
| | | |
| | | |
| | | |
| | | |
| | | |
| | | |
| | | |
| | | |
| | | |
| | | |
| | | |
| | | |
| | | |
| | | |
| | | |
| | | |
| | | |
| | | |
| | | |
| | | |
| | | |
| | | |
Federated Mortgage Core Portfolio
Annual Shareholder Report
| | | |
| | MORTGAGE-BACKED SECURITIES—continued | |
| | Federal National Mortgage Association—continued | |
| | | |
| | | |
| | | |
| | | |
| | | |
| | | |
| | | |
| | | |
| | | |
| | | |
| | | |
| | | |
| | | |
| | | |
| | | |
| | | |
| | | |
| | | |
| | | |
| | | |
| | | |
| | | |
| | | |
| | | |
| | | |
| | | |
| | | |
| | | |
| | | |
| | | |
| | | |
| | | |
| | | |
| | | |
| | | |
| | | |
| | | |
| | | |
| | | |
| | | |
| | | |
| | | |
| | | |
| | | |
| | | |
| | | |
| | | |
| | | |
| | | |
| | | |
Federated Mortgage Core Portfolio
Annual Shareholder Report
| | | |
| | MORTGAGE-BACKED SECURITIES—continued | |
| | Federal National Mortgage Association—continued | |
| | | |
| | | |
| | | |
| | | |
| | | |
| | | |
| | | |
| | | |
| | | |
| | | |
| | | |
| | | |
| | | |
| | | |
| | | |
| | | |
| | | |
| | | |
| | | |
| | | |
| | | |
| | Government National Mortgage Association—6.4% | |
| | | |
| | | |
| | | |
| | | |
| | | |
| | | |
| | | |
| | | |
| | | |
| | | |
| | | |
| | | |
| | | |
| | | |
| | | |
| | | |
| | | |
| | | |
| | | |
| | | |
| | | |
| | | |
| | | |
| | | |
| | | |
| | | |
| | | |
| | | |
Federated Mortgage Core Portfolio
Annual Shareholder Report
| | | |
| | MORTGAGE-BACKED SECURITIES—continued | |
| | Government National Mortgage Association—continued | |
| | | |
| | | |
| | | |
| | | |
| | | |
| | | |
| | | |
| | | |
| | | |
| | | |
| | | |
| | | |
| | | |
| | | |
| | | |
| | | |
| | | |
| | | |
| | | |
| | | |
| | | |
| | | |
| | | |
| | | |
| | | |
| | | |
| | | |
| | | |
| | | |
| | | |
| | | |
| | | |
| | | |
| | | |
| | | |
| | | |
| | | |
| | | |
| | | |
| | | |
| | | |
| | | |
| | | |
| | Uniform Mortgage-Backed Securities, TBA—19.7% | |
| | | |
| | | |
| | | |
| | | |
| | TOTAL MORTGAGE-BACKED SECURITIES
(IDENTIFIED COST $1,722,497,397) | |
Federated Mortgage Core Portfolio
Annual Shareholder Report
| | | |
| | ASSET-BACKED SECURITIES—13.5% | |
| | | |
| | AmeriCredit Automobile Receivables Trust 2020-2, Class C, 1.480%, 2/18/2026 | |
| | AmeriCredit Automobile Receivables Trust 2020-3, Class C, 1.060%, 8/18/2026 | |
| | Santander Drive Auto Receivables Trust 2020-2, Class D, 2.220%, 9/15/2026 | |
| | Santander Drive Auto Receivables Trust 2020-3, Class C, 1.120%, 1/15/2026 | |
| | Santander Drive Auto Receivables Trust 2020-4, Class D, 1.480%, 1/15/2027 | |
| | Tesla Auto Lease Trust 2020-A, Class A3, 0.680%, 12/20/2023 | |
| | | |
| | | |
| | American Express Credit Account Master Trust 2018-9, Class A, 0.538% (1-month USLIBOR +0.380%), 4/15/2026 | |
| | Capital One Multi-Asset Execute 2017-A5, Class A5, 0.738% (1-month USLIBOR +0.580%), 7/15/2027 | |
| | Chase Issuance Trust 2018-A1, Class A1, 0.358% (1-month USLIBOR +0.200%), 4/17/2023 | |
| | Citibank Credit Card Issuance Trust 2018-A4, Class A4, 0.492% (1-month USLIBOR +0.340%), 6/7/2025 | |
| | Discover Card Execution Note Trust 2017-A5, Class A5, 0.758% (1-month USLIBOR +0.600%), 12/15/2026 | |
| | Discover Card Execution Note Trust 2017-A7, Class A7, 0.518% (1-month USLIBOR +0.360%), 4/15/2025 | |
| | Discover Card Execution Note Trust 2018-A2, Class A2, 0.488% (1-month USLIBOR +0.330%), 8/15/2025 | |
| | | |
| | | |
| | Sofi Consumer Loan Program Trust 2016-1, Class A, 3.260%, 8/25/2025 | |
| | | |
| | Navient Student Loan Trust 2020-FA, Class A, 1.220%, 7/15/2069 | |
| | Navient Student Loan Trust 2020-GA, Class A, 1.170%, 9/16/2069 | |
| | Navient Student Loan Trust 2020-HA, Class A, 1.310%, 1/15/2069 | |
| | SMB Private Education Loan Trust 2018-A, Class A2B, 0.958% (1-month USLIBOR +0.800%), 2/15/2036 | |
| | SMB Private Education Loan Trust 2020-BA, Class A1B, 1.249% (1-month USLIBOR +1.100%), 7/15/2053 | |
| | | |
| | TOTAL ASSET-BACKED SECURITIES
(IDENTIFIED COST $286,144,915) | |
| | COLLATERALIZED MORTGAGE OBLIGATIONS—9.0% | |
| | Federal Home Loan Mortgage Corporation—2.9% | |
| | FHLMC REMIC, Series 3284, Class AF, 0.468% (1-month USLIBOR +0.310%), 3/15/2037 | |
| | FHLMC REMIC, Series 4273, Class PF, 0.558% (1-month USLIBOR +0.400%), 11/15/2043 | |
| | FHLMC REMIC, Series 4856, Class FD, 0.458% (1-month USLIBOR +0.300%), 8/15/2040 | |
| | FHLMC REMIC, Series 4901, Class GF, 0.598% (1-month USLIBOR +0.450%), 7/25/2049 | |
| | | |
| | Federal National Mortgage Association—5.1% | |
| | FNMA REMIC, Series 2017-90, Class WF, 0.498% (1-month USLIBOR +0.350%), 11/25/2047 | |
| | FNMA REMIC, Series 2018-15, Class JF, 0.448% (1-month USLIBOR +0.300%), 3/25/2048 | |
| | FNMA REMIC, Series 2019-27, Class FH, 0.598% (1-month USLIBOR +0.450%), 6/25/2049 | |
| | FNMA REMIC, Series 2019-30, Class FB, 0.548% (1-month USLIBOR +0.400%), 7/25/2049 | |
| | FNMA REMIC, Series 2019-33, Class FB, 0.598% (1-month USLIBOR +0.450%), 7/25/2049 | |
| | FNMA REMIC, Series 2019-39, Class FA, 0.548% (1-month USLIBOR +0.400%), 8/25/2049 | |
| | FNMA REMIC, Series 2019-47, Class FB, 0.548% (1-month USLIBOR +0.400%), 5/25/2040 | |
| | FNMA REMIC, Series 2019-56, Class AF, 0.548% (1-month USLIBOR +0.400%), 10/25/2049 | |
| | | |
| | Government National Mortgage Association—0.2% | |
| | GNMA REMIC, Series 2005-71, Class FA, 0.285% (1-month USLIBOR +0.140%), 9/16/2035 | |
| | Non-Agency Mortgage-Backed Securities—0.8% | |
| | Countrywide Home Loans 2005-21, Class A2, 5.500%, 10/25/2035 | |
| | Credit Suisse Mortgage Trust 2007-4, Class 4A2, 5.500%, 6/25/2037 | |
| | Residential Funding Mortgage Securities I 2005-SA3, Class 3A, 3.151%, 8/25/2035 | |
Federated Mortgage Core Portfolio
Annual Shareholder Report
| | | |
| | COLLATERALIZED MORTGAGE OBLIGATIONS—continued | |
| | Non-Agency Mortgage-Backed Securities—continued | |
| | Sequoia Mortgage Trust 2012-6, Class A2, 1.808%, 12/25/2042 | |
| | Sequoia Mortgage Trust 2013-1, Class 2A1, 1.855%, 2/25/2043 | |
| | Sequoia Mortgage Trust 2013-2, Class A, 1.874%, 2/25/2043 | |
| | | |
| | TOTAL COLLATERALIZED MORTGAGE OBLIGATIONS
(IDENTIFIED COST $192,621,125) | |
| | COMMERCIAL MORTGAGE-BACKED SECURITIES—2.7% | |
| | Agency Commercial Mortgage-Backed Securities—2.7% | |
| | FHLMC REMIC, Series K736, Class A1, 1.895%, 6/25/2025 | |
| | FHLMC REMIC, Series KF90, Class AS, 0.462% (Secured Overnight Financing Rate +0.380%), 9/25/2030 | |
| | TOTAL COMMERCIAL MORTGAGE-BACKED SECURITIES
(IDENTIFIED COST $57,335,635) | |
| | | |
| | Federated Hermes Government Obligations Fund, Premier Shares, 0.01%4
(IDENTIFIED COST $204,435,825) | |
| | TOTAL INVESTMENT IN SECURITIES—119.7%
(IDENTIFIED COST $2,463,034,897)5 | |
| | OTHER ASSETS AND LIABILITIES - NET—(19.7)%6 | |
| | | |
Affiliated fund holdings are investment companies which are managed by the Adviser or an affiliate of the Adviser. Transactions with the affiliated fund holdings during the period ended December 31, 2020, were as follows:
| Federated Hermes
Government
Obligations Fund,
Premier Shares |
| |
| |
| |
Change in Unrealized Appreciation/Depreciation | |
| |
| |
Shares Held as of 12/31/2020 | |
| |
| All or a portion of these To Be Announced Securities (TBAs) are subject to dollar-roll transactions. |
| Floating/variable note with current rate and current maturity or next reset date shown. |
| All or a portion of these securities are segregated pending settlement of dollar-roll transactions. |
| |
| The cost of investments for federal tax purposes amounts to $2,460,000,240. |
| Assets, other than investment in securities, less liabilities. See Statement of Assets and Liabilities. A significant portion of this balance is the result of dollar-roll transactions as of December 31, 2020. |
Note: The categories of investments are shown as a percentage of total net assets at December 31, 2020.
Various inputs are used in determining the value of the Fund’s investments. These inputs are summarized in the three broad levels listed below:
Level 1—quoted prices in active markets for identical securities.
Level 2—other significant observable inputs (including quoted prices for similar securities, interest rates, prepayment speeds, credit risk, etc.). Also includes securities valued at amortized cost.
Level 3—significant unobservable inputs (including the Fund’s own assumptions in determining the fair value of investments).
The inputs or methodology used for valuing securities are not an indication of the risk associated with investing in those securities.
Federated Mortgage Core Portfolio
Annual Shareholder Report
The following is a summary of the inputs used, as of December 31, 2020, in valuing the Fund’s assets carried at fair value:
|
| | Level 2—
Other
Significant
Observable
Inputs | Level 3—
Significant
Unobservable
Inputs | |
| | | | |
Mortgage-Backed Securities | | | | |
| | | | |
Collateralized Mortgage Obligations | | | | |
Commercial Mortgage-Backed Securities | | | | |
| | | | |
| | | | |
The following acronym(s) are used throughout this portfolio: | |
| —Federal Home Loan Mortgage Corporation |
| —Federal National Mortgage Association |
| —Government National Mortgage Association |
| —London Interbank Offered Rate |
| —Real Estate Mortgage Investment Conduit |
See Notes which are an integral part of the Financial Statements
Federated Mortgage Core Portfolio
Annual Shareholder Report
Financial Highlights–Federated Mortgage Core Portfolio
(For a Share Outstanding Throughout Each Period)
| |
| | | | | |
Net Asset Value, Beginning of Period | | | | | |
Income From Investment Operations: | | | | | |
Net investment income (loss)1 | | | | | |
Net realized and unrealized gain (loss) | | | | | |
TOTAL FROM INVESTMENT OPERATIONS | | | | | |
| | | | | |
Distributions from net investment income | | | | | |
Net Asset Value, End of Period | | | | | |
| | | | | |
Ratios to Average Net Assets: | | | | | |
| | | | | |
| | | | | |
Expense waiver/reimbursement5 | | | | | |
| | | | | |
Net assets, end of period (000 omitted) | | | | | |
| | | | | |
Portfolio turnover (excluding purchases and sales from dollar-roll transactions) | | | | | |
| Per share numbers have been calculated using the average shares method. |
| Represents less than $0.01. |
| Based on net asset value. |
| Amount does not reflect net expenses incurred by investment companies in which the Fund may invest. |
| This expense decrease is reflected in both the net expense and the net investment income ratios shown above. Amount does not reflect expense waiver/ reimbursement recorded by investment companies in which the Fund may invest. |
| Represents less than 0.01%. |
See Notes which are an integral part of the Financial Statements
Annual Shareholder Report
Statement of Assets and Liabilities–Federated Mortgage Core PortfolioDecember 31, 2020
| |
Investment in securities, at value including $204,435,825 of investments in an affiliated holding* (identified cost $2,463,034,897) | |
| |
Income receivable from an affiliated holding | |
| |
| |
Payable for investments purchased | |
Income distribution payable | |
Payable for Directors’/Trustees’ fees (Note 5) | |
Accrued expenses (Note 5) | |
| |
Net assets for 212,847,474 shares outstanding | |
| |
| |
Total distributable earnings (loss) | |
| |
Net Asset Value, Offering Price and Redemption Proceeds Per Share: | |
$2,143,118,100 ÷ 212,847,474 shares outstanding, no par value, unlimited shares authorized | |
| See information listed after the Fund’s Portfolio of Investments. |
See Notes which are an integral part of the Financial Statements
Annual Shareholder Report
Statement of Operations–Federated Mortgage Core PortfolioYear Ended December 31, 2020
| |
| |
Dividends received from an affiliated holding* | |
| |
| |
| |
| |
Directors’/Trustees’ fees (Note 5) | |
| |
| |
Portfolio accounting fees | |
| |
| |
| |
| |
| |
Realized and Unrealized Gain (Loss) on Investments: | |
Net realized gain on investments | |
Net change in unrealized appreciation of investments | |
Net realized and unrealized gain (loss) on investments | |
Change in net assets resulting from operations | |
| See information listed after the Fund’s Portfolio of Investments. |
See Notes which are an integral part of the Financial Statements
Annual Shareholder Report
Statement of Changes in Net Assets–Federated Mortgage Core Portfolio
| | |
Increase (Decrease) in Net Assets | | |
| | |
Net investment income (loss) | | |
| | |
Net change in unrealized appreciation/depreciation | | |
CHANGE IN NET ASSETS RESULTING FROM OPERATIONS | | |
Distributions to Shareholders | | |
| | |
Proceeds from sale of shares | | |
Net asset value of shares issued to shareholders in payment of distributions declared | | |
| | |
CHANGE IN NET ASSETS RESULTING FROM SHARE TRANSACTIONS | | |
| | |
| | |
| | |
| | |
See Notes which are an integral part of the Financial Statements
Annual Shareholder Report
Notes to Financial Statements–Federated Mortgage Core Portfolio
December 31, 2020
1. ORGANIZATION
Federated Hermes Core Trust (the “Trust”) is registered under the Investment Company Act of 1940, as amended (the “Act”), as an open-end management investment company. The Trust consists of four portfolios. The financial statements included herein are only those of Federated Mortgage Core Portfolio (the “Fund”), a diversified portfolio. The financial statements of the other portfolios are presented separately. The assets of each portfolio are segregated and a shareholder’s interest is limited to the portfolio in which shares are held. Each portfolio pays its own expenses. The investment objective of the Fund is to provide total return. The Fund is an investment vehicle used by other Federated Hermes funds that invest some of their assets in mortgage-backed securities. Currently, shares of the Fund are being offered for investment only to investment companies, insurance company separate accounts, common or commingled trust funds or similar organizations or parties that are “accredited investors” within the meaning of Regulation D of the Securities Act of 1933, as amended (the “1933 Act”).
Prior to April 24, 2020, the name of the Trust was Federated Core Trust. Effective February 25, 2021, the name of the Fund will change to Mortgage Core Fund.
2. SIGNIFICANT ACCOUNTING POLICIES
The following is a summary of significant accounting policies consistently followed by the Fund in the preparation of its financial statements. These policies are in conformity with U.S. generally accepted accounting principles (GAAP).
Investment Valuation
In calculating its net asset value (NAV), the Fund generally values investments as follows:
■
Fixed-income securities are fair valued using price evaluations provided by a pricing service approved by the Fund’s Board of Trustees (the “Trustees”).
■
Shares of other mutual funds or non-exchange-traded investment companies are valued based upon their reported NAVs.
■
Derivative contracts listed on exchanges are valued at their reported settlement or closing price, except that options are valued at the mean of closing bid and asked quotations.
■
Over-the-counter (OTC) derivative contracts are fair valued using price evaluations provided by a pricing service approved by the Trustees.
■
For securities that are fair valued in accordance with procedures established by and under the general supervision of the Trustees, certain factors may be considered, such as: the last traded or purchase price of the security, information obtained by contacting the issuer or dealers, analysis of the issuer’s financial statements or other available documents, fundamental analytical data, the nature and duration of restrictions on disposition, the movement of the market in which the security is normally traded, public trading in similar securities or derivative contracts of the issuer or comparable issuers, movement of a relevant index, or other factors including but not limited to industry changes and relevant government actions.
If any price, quotation, price evaluation or other pricing source is not readily available when the NAV is calculated, if the Fund cannot obtain price evaluations from a pricing service or from more than one dealer for an investment within a reasonable period of time as set forth in the Fund’s valuation policies and procedures, or if information furnished by a pricing service, in the opinion of the valuation committee (“Valuation Committee”), is deemed not representative of the fair value of such security, the Fund uses the fair value of the investment determined in accordance with the procedures described below. There can be no assurance that the Fund could obtain the fair value assigned to an investment if it sold the investment at approximately the time at which the Fund determines its NAV per share, and the actual value obtained could be materially different.
Fair Valuation Procedures
The Trustees have ultimate responsibility for determining the fair value of investments for which market quotations are not readily available. The Trustees have appointed a Valuation Committee comprised of officers of the Fund, Federated Investment Management Company (the “Adviser”) and certain of the Adviser’s affiliated companies to assist in determining fair value and in overseeing the calculation of the NAV. The Trustees have also authorized the use of pricing services recommended by the Valuation Committee to provide fair value evaluations of the current value of certain investments for purposes of calculating the NAV. The Valuation Committee employs various methods for reviewing third-party pricing-service evaluations including periodic reviews of third-party pricing services’ policies, procedures and valuation methods (including key inputs, methods, models and assumptions), transactional back-testing, comparisons of evaluations of different pricing services, and review of price challenges by the Adviser based on recent market activity. In the event that market quotations and price evaluations are not available for an investment, the Valuation Committee determines the fair value of the investment in accordance with procedures adopted by the Trustees. The Trustees periodically review and approve the fair valuations made by the Valuation Committee and any changes made to the procedures.
Factors considered by pricing services in evaluating an investment include the yields or prices of investments of comparable quality, coupon, maturity, call rights and other potential prepayments, terms and type, reported transactions, indications as to values from dealers and general market conditions. Some pricing services provide a single price evaluation reflecting the bid-side of the market for an investment (a “bid” evaluation). Other pricing services offer both bid evaluations and price evaluations indicative of a price between the prices bid and asked for the investment (a “mid” evaluation). The Fund normally uses bid evaluations for any U.S. Treasury and Agency securities, mortgage-backed securities and municipal securities. The Fund normally uses mid evaluations for any other types of fixed-income securities and any OTC derivative contracts. In the event that market quotations and price evaluations are not available for an investment, the fair value of the investment is determined in accordance with procedures adopted by the Trustees.
Annual Shareholder Report
Repurchase Agreements
The Fund may invest in repurchase agreements for short-term liquidity purposes. It is the policy of the Fund to require the other party to a repurchase agreement to transfer to the Fund’s custodian or sub-custodian eligible securities or cash with a market value (after transaction costs) at least equal to the repurchase price to be paid under the repurchase agreement. The eligible securities are transferred to accounts with the custodian or sub-custodian in which the Fund holds a “securities entitlement” and exercises “control” as those terms are defined in the Uniform Commercial Code. The Fund has established procedures for monitoring the market value of the transferred securities and requiring the transfer of additional eligible securities if necessary to equal at least the repurchase price. These procedures also allow the other party to require securities to be transferred from the account to the extent that their market value exceeds the repurchase price or in exchange for other eligible securities of equivalent market value.
The insolvency of the other party or other failure to repurchase the securities may delay the disposition of the underlying securities or cause the Fund to receive less than the full repurchase price. Under the terms of the repurchase agreement, any amounts received by the Fund in excess of the repurchase price and related transaction costs must be remitted to the other party.
The Fund may enter into repurchase agreements in which eligible securities are transferred into joint trading accounts maintained by the custodian or sub-custodian for investment companies and other clients advised by the Fund’s Adviser and its affiliates. The Fund will participate on a pro rata basis with the other investment companies and clients in its share of the securities transferred under such repurchase agreements and in its share of proceeds from any repurchase or other disposition of such securities.
Investment Income, Gains and Losses, Expenses and Distributions
Investment transactions are accounted for on a trade-date basis. Realized gains and losses from investment transactions are recorded on an identified-cost basis. Interest income and expenses are accrued daily. Dividend income and distributions to shareholders are recorded on the ex-dividend date. Distributions of net investment income, if any, are declared daily and paid monthly. Non-cash dividends included in dividend income, if any, are recorded at fair value. Amortization/accretion of premium and discount is included in investment income. Gains and losses realized on principal payment of mortgage-backed securities (paydown gains and losses) are classified as part of investment income.
Federal Taxes
It is the Fund’s policy to comply with the Subchapter M provision of the Internal Revenue Code (the “Code”) and to distribute to shareholders each year substantially all of its income. Accordingly, no provision for federal income tax is necessary. As of and during the year ended December 31, 2020, the Fund did not have a liability for any uncertain tax positions. The Fund recognizes interest and penalties, if any, related to tax liabilities as income tax expense in the Statement of Operations. As of December 31, 2020, tax years 2017 through 2020 remain subject to examination by the Fund’s major tax jurisdictions, which include the United States of America and the Commonwealth of Massachusetts.
When-Issued and Delayed-Delivery Transactions
The Fund may engage in when-issued or delayed-delivery transactions. The Fund records when-issued securities on the trade date and maintains security positions such that sufficient liquid assets will be available to make payment for the securities purchased. Securities purchased on a when-issued or delayed-delivery basis are marked to market daily and begin earning interest on the settlement date. Losses may occur on these transactions due to changes in market conditions or the failure of counterparties to perform under the contract.
The Fund may transact in To Be Announced Securities (TBAs). As with other delayed-delivery transactions, a seller agrees to issue TBAs at a future date. However, the seller does not specify the particular securities to be delivered. Instead, the Fund agrees to accept any security that meets specified terms such as issuer, interest rate and terms of underlying mortgages. The Fund records TBAs on the trade date utilizing information associated with the specified terms of the transaction as opposed to the specific mortgages. TBAs are marked to market daily and begin earning interest on the settlement date. Losses may occur due to the fact that the actual underlying mortgages received may be less favorable than those anticipated by the Fund.
Dollar-Roll Transactions
The Fund engages in dollar-roll transactions in which the Fund sells mortgage-backed securities with a commitment to buy similar (same type, coupon and maturity), but not identical mortgage-backed securities on a future date. Both securities involved are TBA mortgage-backed securities. The Fund treats dollar-roll transactions as purchases and sales. Dollar-rolls are subject to interest rate risks and credit risks.
Restricted Securities
The Fund may purchase securities which are considered restricted. Restricted securities are securities that either: (a) cannot be offered for public sale without first being registered, or being able to take advantage of an exemption from registration, under the 1933 Act; or (b) are subject to contractual restrictions on public sales. In some cases, when a security cannot be offered for public sale without first being registered, the issuer of the restricted security has agreed to register such securities for resale, at the issuer’s expense, either upon demand by the Fund or in connection with another registered offering of the securities. Many such restricted securities may be resold in the secondary market in transactions exempt from registration. Restricted securities may be determined to be liquid under criteria established by the Trustees. The Fund will not incur any registration costs upon such resales. The Fund’s restricted securities, like other securities, are priced in accordance with procedures established by and under the general supervision of the Trustees.
Other
The preparation of financial statements in conformity with GAAP requires management to make estimates and assumptions that affect the amounts of assets, liabilities, expenses and revenues reported in the financial statements. Actual results could differ materially from those estimated. The Fund applies investment company accounting and reporting guidance.
Annual Shareholder Report
3. SHARES OF BENEFICIAL INTEREST
The following table summarizes share activity:
| | |
| | |
Shares issued to shareholders in payment of distributions declared | | |
| | |
NET CHANGE RESULTING FROM FUND SHARE TRANSACTIONS | | |
4. FEDERAL TAX INFORMATION
The tax character of distributions as reported on the Statement of Changes in Net Assets for the years ended December 31, 2020 and 2019, was as follows:
As of December 31, 2020, the components of distributable earnings on a tax-basis were as follows:
Undistributed ordinary income | |
Net unrealized appreciation | |
Capital loss carryforwards | |
The difference between book-basis and tax-basis net unrealized appreciation is attributable to the differing treatments for dollar-roll transactions and principal loss adjustments.
At December 31, 2020, the cost of investments for federal tax purposes was $2,460,000,240. The net unrealized appreciation of investments for federal tax purposes was $104,552,616. This consists of net unrealized appreciation from investments for those securities having an excess of value over cost of $104,684,006 and net unrealized depreciation from investments for those securities having an excess of cost over value of $131,390.
As of December 31, 2020, the Fund had a capital loss carryforward of $29,971,607 which will reduce the Fund’s taxable income arising from future net realized gains on investments, if any, to the extent permitted by the Code, thereby reducing the amount of distributions to shareholders which would otherwise be necessary to relieve the Fund of any liability for federal income tax. Pursuant to the Code, these net capital losses retain their character as either short-term or long-term and do not expire.
The following schedule summarizes the Fund’s capital loss carryforwards:
The Fund used capital loss carryforwards of $30,380,402 to offset capital gains realized during the year ended December 31, 2020.
5. INVESTMENT ADVISER FEE AND OTHER TRANSACTIONS WITH AFFILIATES
Investment Adviser Fee
The Adviser, subject to the discretion of the Trustees, provides investment adviser services at no fee, because all investors in the Fund are other Federated Hermes Funds, insurance company separate accounts, common or commingled trust funds or similar organizations or entities that are “accredited investors” within the meaning of Regulation D of the 1933 Act. The Fund pays operating expenses associated with the operation and maintenance of the Fund (excluding fees and expenses that may be charged by the Adviser and its affiliates). Although not contractually obligated to do so, the Adviser intends to voluntarily reimburse operating expenses (excluding extraordinary expenses and proxy-related expenses paid by the Fund, if any) such that the Fund will only bear such expenses in an amount of up to 0.15% of the Fund’s average daily net assets. The Adviser can modify or terminate this voluntary reimbursement at any time at its sole discretion.
Administrative Fee
Federated Administrative Services (FAS), under the Administrative Services Agreement, provides the Fund with administrative personnel and services. FAS does not charge the Fund a fee but is entitled to certain out-of-pocket expenses.
Directors’/Trustees’ and Miscellaneous Fees
Certain Officers and Trustees of the Fund are Officers and Directors or Trustees of certain of the above companies. To efficiently facilitate payment, Independent Directors’/Trustees’ fees and certain expenses related to conducting meetings of the Directors/Trustees and other miscellaneous expenses are paid by an affiliate of the Adviser which in due course are reimbursed by the Fund. These expenses related to conducting meetings of the Directors/Trustees and other miscellaneous expenses may be included in Accrued and Miscellaneous Expenses on the Statement of Assets and Liabilities and Statement of Operations, respectively.
Annual Shareholder Report
Affiliated Shares of Beneficial Interest
As of December 31, 2020, a majority of the shares of beneficial interest outstanding are owned by other affiliated investment companies.
6. INVESTMENT TRANSACTIONS
Purchases and sales of investments, excluding long-term U.S. government securities and short-term obligations, for the year ended December 31, 2020, were as follows:
7. LINE OF CREDIT
The Fund participates with certain other Federated Hermes Funds, on a several basis, in an up to $500,000,000 unsecured, 364-day, committed, revolving line of credit (LOC) agreement dated June 24, 2020. The LOC was made available to temporarily finance the repurchase or redemption of shares of the Fund, failed trades, payment of dividends, settlement of trades and for other short-term, temporary or emergency general business purposes. The Fund cannot borrow under the LOC if an inter-fund loan is outstanding. The Fund’s ability to borrow under the LOC also is subject to the limitations of the Act and various conditions precedent that must be satisfied before the Fund can borrow. Loans under the LOC are charged interest at a fluctuating rate per annum equal to the highest, on any day, of (a) (i) the federal funds effective rate, (ii) the one month London Interbank Offered Rate (LIBOR), or a replacement rate as appropriate, and (iii) 0.0%, plus (b) a margin. Any fund eligible to borrow under the LOC pays its pro rata share of an upfront fee, and its pro rata share of a commitment fee based on the amount of the lenders’ commitment that has not been utilized, quarterly in arrears and at maturity. As of December 31, 2020, the Fund had no outstanding loans. During the year ended December 31, 2020, the Fund did not utilize the LOC.
8. INTERFUND LENDING
Pursuant to an Exemptive Order issued by the Securities and Exchange Commission, the Fund, along with other funds advised by subsidiaries of Federated Hermes, Inc., may participate in an interfund lending program. This program provides an alternative credit facility allowing the Fund to borrow from other participating affiliated funds. As of December 31, 2020, there were no outstanding loans. During the year ended December 31, 2020, the program was not utilized.
9. OTHER MATTERS
An outbreak of respiratory disease caused by a novel coronavirus was first detected in China in late 2019 and subsequently spread globally. As of the date of the issuance of these financial statements, this coronavirus has resulted in closing borders, enhanced health screenings, healthcare service preparation and delivery, quarantines, cancellations, and disruptions to supply chains, workflow operations and consumer activity, as well as general concern and uncertainty. The impact of this coronavirus may be short-term or may last for an extended period of time and has resulted in a substantial economic downturn. Health crises caused by outbreaks, such as the coronavirus outbreak, may exacerbate other pre-existing political, social and economic risks. The impact of this outbreak, and other epidemics and pandemics that may arise in the future, could continue to negatively affect the worldwide economy, as well as the economies of individual countries, individual companies (including certain Fund service providers and issuers of the Fund’s investments) and the markets in general in significant and unforeseen ways. Any such impact could adversely affect the Fund’s performance.
Annual Shareholder Report
Report of Independent Registered Public Accounting Firm– Federated Mortgage Core Portfolio
TO THE SHAREHOLDERS AND THE BOARD OF TRUSTEES OF FEDERATED MORTGAGE CORE PORTFOLIO:
Opinion on the Financial Statements
We have audited the accompanying statement of assets and liabilities of Federated Mortgage Core Portfolio (the “Fund”) (one of the funds constituting the Federated Hermes Core Trust (formerly Federated Core Trust) (the “Trust”)), including the portfolio of investments, as of December 31, 2020, and the related statement of operations for the year then ended, the statement of changes in net assets for each of the two years in the period then ended, the financial highlights for each of the five years in the period then ended and the related notes (collectively referred to as the “financial statements”). In our opinion, the financial statements present fairly, in all material respects, the financial position of Federated Mortgage Core Portfolio (one of the funds constituting the Federated Hermes Core Trust) at December 31, 2020, the results of its operations for the year then ended, the changes in its net assets for each of the two years in the period then ended and its financial highlights for each of the five years in the period then ended, in conformity with U.S. generally accepted accounting principles.
Basis for Opinion
These financial statements are the responsibility of the Trust’s management. Our responsibility is to express an opinion on the Fund’s financial statements based on our audits. We are a public accounting firm registered with the Public Company Accounting Oversight Board (United States) (“PCAOB”) and are required to be independent with respect to the Trust in accordance with the U.S. federal securities laws and the applicable rules and regulations of the Securities and Exchange Commission and the PCAOB.
We conducted our audits in accordance with standards of the PCAOB. Those standards require that we plan and perform the audit to obtain reasonable assurance about whether the financial statements are free of material misstatement, whether due to error or fraud. The Trust is not required to have, nor were we engaged to perform, an audit of the Trust’s internal control over financial reporting. As part of our audits, we are required to obtain an understanding of internal control over financial reporting, but not for the purpose of expressing an opinion on the effectiveness of the Trust’s internal control over financial reporting. Accordingly, we express no such opinion.
Our audits included performing procedures to assess the risks of material misstatement of the financial statements, whether due to error or fraud, and performing procedures that respond to those risks. Such procedures included examining, on a test basis, evidence regarding the amounts and disclosures in the financial statements. Our procedures included confirmation of securities owned as of December 31, 2020, by correspondence with the custodian and others, or by other appropriate auditing procedures where replies from others were not received. Our audits also included evaluating the accounting principles used and significant estimates made by management, as well as evaluating the overall presentation of the financial statements. We believe that our audits provide a reasonable basis for our opinion. We have served as the auditor of one or more Federated Hermes’ investment companies since 1979.
Boston, Massachusetts
February 22, 2021
Federated Mortgage Core Portfolio
Annual Shareholder Report
Shareholder Expense Example (unaudited)–Federated Mortgage Core Portfolio
As a shareholder of the Fund, you incur ongoing costs, including to the extent applicable, management fees, distribution (12b-1) fees and/or other service fees and other Fund expenses. This Example is intended to help you to understand your ongoing costs (in dollars) of investing in the Fund and to compare these costs with the ongoing costs of investing in other mutual funds. It is based on an investment of $1,000 invested at the beginning of the period and held for the entire period from July 1, 2020 to December 31, 2020.
ACTUAL EXPENSES
The first section of the table below provides information about actual account values and actual expenses. You may use the information in this section, together with the amount you invested, to estimate the expenses that you incurred over the period. Simply divide your account value by $1,000 (for example, an $8,600 account value divided by $1,000 = 8.6), then multiply the result by the number in the first section under the heading entitled “Expenses Paid During Period” to estimate the expenses attributable to your investment during this period.
HYPOTHETICAL EXAMPLE FOR COMPARISON PURPOSES
The second section of the table below provides information about hypothetical account values and hypothetical expenses based on the Fund’s actual expense ratio and an assumed rate of return of 5% per year before expenses, which is not the Fund’s actual return. Thus, you should not use the hypothetical account values and expenses to estimate the actual ending account balance or your expenses for the period. Rather, these figures are required to be provided to enable you to compare the ongoing costs of investing in the Fund with other funds. To do so, compare this 5% hypothetical example with the 5% hypothetical examples that appear in the shareholder reports of the other funds.
Please note that the expenses shown in the table are meant to highlight your ongoing costs only. Therefore, the second section of the table is useful in comparing ongoing costs only, and will not help you determine the relative total costs of owning different funds.
| Beginning
Account Value
7/1/2020 | Ending
Account Value
12/31/2020 | Expenses Paid
During Period1 |
| | | |
Hypothetical (assuming a 5% return before expenses) | | | |
| Expenses are equal to the Fund’s annualized net expense ratio of 0.02%, multiplied by the average account value over the period, multiplied by 184/366 (to reflect the one-half-year period). |
Annual Shareholder Report
Board of Trustees and Trust Officers
The Board of Trustees is responsible for managing the Trust’s business affairs and for exercising all the Trust’s powers except those reserved for the shareholders. The following tables give information about each Trustee and the senior officers of the Fund. Where required, the tables separately list Trustees who are “interested persons” of the Fund (i.e., “Interested” Trustees) and those who are not (i.e., “Independent” Trustees). Unless otherwise noted, the address of each person listed is 1001 Liberty Avenue, Pittsburgh, PA 15222-3779. The address of all Independent Trustees listed is 4000 Ericsson Drive, Warrendale, PA 15086-7561; Attention: Mutual Fund Board. As of December 31, 2020, the Trust comprised five portfolio(s), and the Federated Hermes Fund Family consisted of 41 investment companies (comprising 163 portfolios). Unless otherwise noted, each Officer is elected annually. Unless otherwise noted, each Trustee oversees all portfolios in the Federated Hermes Fund Family and serves for an indefinite term. The Fund’s Statement of Additional Information includes additional information about Trust Trustees and is available, without charge and upon request, by calling 1-800-341-7400.
Interested Trustees Background
Name
Birth Date
Positions Held with Trust
Date Service Began | Principal Occupation(s) for Past Five Years,
Other Directorships Held and Previous Position(s) |
J. Christopher Donahue*
Birth Date: April 11, 1949
President and Trustee
Indefinite Term
Began serving:
October 2005 | Principal Occupations: Principal Executive Officer and President of certain of the Funds in the Federated Hermes Fund Family; Director or Trustee of the Funds in the Federated Hermes Fund Family; President, Chief Executive Officer and Director, Federated Hermes, Inc.; Chairman and Trustee, Federated Investment Management Company; Trustee, Federated Investment Counseling; Chairman and Director, Federated Global Investment Management Corp.; Chairman and Trustee, Federated Equity Management Company of Pennsylvania; Trustee, Federated Shareholder Services Company; Director, Federated Services Company.
Previous Positions: President, Federated Investment Counseling; President and Chief Executive Officer, Federated Investment Management Company, Federated Global Investment Management Corp. and Passport Research, Ltd; Chairman, Passport Research, Ltd. |
John B. Fisher*
Birth Date: May 16, 1956
Trustee
Indefinite Term
Began serving: May 2016 | Principal Occupations: Principal Executive Officer and President of certain of the Funds in the Federated Hermes Fund Family; Director or Trustee of certain of the Funds in the Federated Hermes Fund Family; Vice President, Federated Hermes, Inc.; President, Director/Trustee and CEO, Federated Advisory Services Company, Federated Equity Management Company of Pennsylvania, Federated Global Investment Management Corp., Federated Investment Counseling, Federated Investment Management Company; President of some of the Funds in the Federated Hermes Fund Family and Director, Federated Investors Trust Company.
Previous Positions: President and Director of the Institutional Sales Division of Federated Securities Corp.; President and Director of Federated Investment Counseling; President and CEO of Passport Research, Ltd.; Director, Edgewood Securities Corp.; Director, Federated Services Company; Director, Federated Hermes, Inc.; Chairman and Director, Southpointe Distribution Services, Inc. and President, Technology, Federated Services Company. |
*
Reasons for “interested” status: J. Christopher Donahue and John B. Fisher are interested due to their beneficial ownership of shares of Federated Hermes, Inc. and due to positions they hold with Federated Hermes, Inc. and its subsidiaries.
INDEPENDENT Trustees Background
Name
Birth Date
Positions Held with Trust
Date Service Began | Principal Occupation(s) for Past Five Years,
Other Directorships Held, Previous Position(s) and Qualifications |
John T. Collins
Birth Date: January 24, 1947
Trustee
Indefinite Term
Began serving:
October 2013 | Principal Occupations: Director or Trustee, and Chair of the Board of Directors or Trustees, of the Federated Hermes Fund Family; formerly, Chairman and CEO, The Collins Group, Inc. (a private equity firm) (Retired).
Other Directorships Held: Chairman of the Board of Directors, Director, KLX Energy Services Holdings, Inc. (oilfield services); former Director of KLX Corp. (aerospace).
Qualifications: Mr. Collins has served in several business and financial management roles and directorship positions throughout his career. Mr. Collins previously served as Chairman and CEO of The Collins Group, Inc. (a private equity firm) and as a Director of KLX Corp. Mr. Collins serves as Chairman Emeriti, Bentley University. Mr. Collins previously served as Director and Audit Committee Member, Bank of America Corp.; Director, FleetBoston Financial Corp.; and Director, Beth Israel Deaconess Medical Center (Harvard University Affiliate Hospital). |
Annual Shareholder Report
Name Birth Date Positions Held with Trust Date Service Began | Principal Occupation(s) for Past Five Years, Other Directorships Held, Previous Position(s) and Qualifications |
G. Thomas Hough
Birth Date: February 28, 1955
Trustee
Indefinite Term
Began serving: August 2015 | Principal Occupations: Director or Trustee, Chair of the Audit Committee of the Federated Hermes Fund Family; formerly, Vice Chair, Ernst & Young LLP (public accounting firm) (Retired).
Other Directorships Held: Director, Chair of the Audit Committee, Equifax, Inc.; Director, Member of the Audit Committee, Haverty Furniture Companies, Inc.; formerly, Director, Member of Governance and Compensation Committees, Publix Super Markets, Inc.
Qualifications: Mr. Hough has served in accounting, business management and directorship positions throughout his career. Mr. Hough most recently held the position of Americas Vice Chair of Assurance with Ernst & Young LLP (public accounting firm). Mr. Hough serves on the President’s Cabinet and Business School Board of Visitors for the University of Alabama. Mr. Hough previously served on the Business School Board of Visitors for Wake Forest University, and he previously served as an Executive Committee member of the United States Golf Association. |
Maureen Lally-Green
Birth Date: July 5, 1949
Trustee
Indefinite Term
Began serving: August 2009 | Principal Occupations: Director or Trustee of the Federated Hermes Fund Family; Adjunct Professor Emerita of Law, Duquesne University School of Law; formerly, Dean of the Duquesne University School of Law and Professor of Law and Interim Dean of the Duquesne University School of Law; formerly, Associate General Secretary and Director, Office of Church Relations, Diocese of Pittsburgh.
Other Directorships Held: Director, CNX Resources Corporation (formerly known as CONSOL Energy Inc.).
Qualifications: Judge Lally-Green has served in various legal and business roles and directorship positions throughout her career. Judge Lally-Green previously held the position of Dean of the School of Law of Duquesne University (as well as Interim Dean). Judge Lally-Green previously served as a member of the Superior Court of Pennsylvania and as a Professor of Law, Duquesne University School of Law. Judge Lally-Green was appointed by the Supreme Court of Pennsylvania to serve on the Supreme Court’s Board of Continuing Judicial Education and the Supreme Court’s Appellate Court Procedural Rules Committee. Judge Lally-Green also currently holds the positions on not for profit or for profit boards of directors as follows: Director and Chair, UPMC Mercy Hospital; Regent, Saint Vincent Seminary; Member, Pennsylvania State Board of Education (public); Director, Catholic Charities, Pittsburgh; and Director CNX Resources Corporation (formerly known as CONSOL Energy Inc.). Judge Lally-Green has held the positions of: Director, Auberle; Director, Epilepsy Foundation of Western and Central Pennsylvania; Director, Ireland Institute of Pittsburgh; Director, Saint Thomas More Society; Director and Chair, Catholic High Schools of the Diocese of Pittsburgh, Inc.; Director, Pennsylvania Bar Institute; Director, St. Vincent College; Director and Chair, North Catholic High School, Inc.; and Director and Vice Chair, Our Campaign for the Church Alive!, Inc. |
Thomas M. O’Neill
Birth Date: June 14, 1951
Trustee
Indefinite Term
Began serving: August 2006 | Principal Occupations: Director or Trustee of the Federated Hermes Fund Family; Sole Proprietor, Navigator Management Company (investment and strategic consulting).
Other Directorships Held: None.
Qualifications: Mr. O’Neill has served in several business, mutual fund and financial management roles and directorship positions throughout his career. Mr. O’Neill serves as Director, Medicines for Humanity and Director, The Golisano Children’s Museum of Naples, Florida. Mr. O’Neill previously served as Chief Executive Officer and President, Managing Director and Chief Investment Officer, Fleet Investment Advisors; President and Chief Executive Officer, Aeltus Investment Management, Inc.; General Partner, Hellman, Jordan Management Co., Boston, MA; Chief Investment Officer, The Putnam Companies, Boston, MA; Credit Analyst and Lending Officer, Fleet Bank; Director and Consultant, EZE Castle Software (investment order management software); and Director, Midway Pacific (lumber). |
Madelyn A. Reilly
Birth Date: February 2, 1956
Trustee
Indefinite Term
Began serving:
November 2020 | Principal Occupations: Director or Trustee of the Federated Hermes Fund Family; Senior Vice President for Legal Affairs, General Counsel and Secretary of the Board of Trustees, Duquesne University.
Other Directorships Held: None.
Qualifications: Ms. Reilly has served in various business and legal management roles throughout her career. Ms. Reilly previously served as Director of Risk Management and Associate General Counsel, Duquesne University. Prior to her work at Duquesne University, Ms. Reilly served as Assistant General Counsel of Compliance and Enterprise Risk as well as Senior Counsel of Environment, Health and Safety, PPG Industries. |
P. Jerome Richey
Birth Date: February 23, 1949
Trustee
Indefinite Term
Began serving:
October 2013 | Principal Occupations: Director or Trustee of the Federated Hermes Fund Family; Management Consultant; Retired; formerly, Senior Vice Chancellor and Chief Legal Officer, University of Pittsburgh and Executive Vice President and Chief Legal Officer, CONSOL Energy Inc. (now split into two separate publicly traded companies known as CONSOL Energy Inc. and CNX Resources Corp.).
Other Directorships Held: None.
Qualifications: Mr. Richey has served in several business and legal management roles and directorship positions throughout his career. Mr. Richey most recently held the positions of Senior Vice Chancellor and Chief Legal Officer, University of Pittsburgh. Mr. Richey previously served as Chairman of the Board, Epilepsy Foundation of Western Pennsylvania and Chairman of the Board, World Affairs Council of Pittsburgh. Mr. Richey previously served as Chief Legal Officer and Executive Vice President, CONSOL Energy Inc. and CNX Gas Company; and Board Member, Ethics Counsel and Shareholder, Buchanan Ingersoll & Rooney PC (a law firm). |
Annual Shareholder Report
Name Birth Date Positions Held with Trust Date Service Began | Principal Occupation(s) for Past Five Years, Other Directorships Held, Previous Position(s) and Qualifications |
John S. Walsh
Birth Date:
November 28, 1957
Trustee
Indefinite Term
Began serving: November 2005 | Principal Occupations: Director or Trustee of the Federated Hermes Fund Family; President and Director, Heat Wagon, Inc. (manufacturer of construction temporary heaters); President and Director, Manufacturers Products, Inc. (distributor of portable construction heaters); President, Portable Heater Parts, a division of Manufacturers Products, Inc.
Other Directorships Held: None.
Qualifications: Mr. Walsh has served in several business management roles and directorship positions throughout his career. Mr. Walsh previously served as Vice President, Walsh & Kelly, Inc. (paving contractors). |
OFFICERS
Name
Birth Date
Address
Positions Held with Trust
Date Service Began | Principal Occupation(s) for Past Five Years
and Previous Position(s) |
Lori A. Hensler
Birth Date: January 6, 1967
TREASURER
Officer since: April 2013 | Principal Occupations: Principal Financial Officer and Treasurer of the Federated Hermes Fund Family; Senior Vice President, Federated Administrative Services; Financial and Operations Principal for Federated Securities Corp.; and Assistant Treasurer, Federated Investors Trust Company. Ms. Hensler has received the Certified Public Accountant designation.
Previous Positions: Controller of Federated Hermes, Inc.; Senior Vice President and Assistant Treasurer, Federated Investors Management Company; Treasurer, Federated Investors Trust Company; Assistant Treasurer, Federated Administrative Services, Federated Administrative Services, Inc., Federated Securities Corp., Edgewood Services, Inc., Federated Advisory Services Company, Federated Equity Management Company of Pennsylvania, Federated Global Investment Management Corp., Federated Investment Counseling, Federated Investment Management Company, Passport Research, Ltd., and Federated MDTA, LLC; Financial and Operations Principal for Federated Securities Corp., Edgewood Services, Inc. and Southpointe Distribution Services, Inc. |
Peter J. Germain
Birth Date:
September 3, 1959
CHIEF LEGAL OFFICER, SECRETARY and EXECUTIVE VICE PRESIDENT
Officer since: October 2005 | Principal Occupations: Mr. Germain is Chief Legal Officer, Secretary and Executive Vice President of the Federated Hermes Fund Family. He is General Counsel, Chief Legal Officer, Secretary and Executive Vice President, Federated Hermes, Inc.; Trustee and Senior Vice President, Federated Investors Management Company; Trustee and President, Federated Administrative Services; Director and President, Federated Administrative Services, Inc.; Director and Vice President, Federated Securities Corp.; Director and Secretary, Federated Private Asset Management, Inc.; Secretary, Federated Shareholder Services Company; and Secretary, Retirement Plan Service Company of America. Mr. Germain joined Federated Hermes, Inc. in 1984 and is a member of the Pennsylvania Bar Association.
Previous Positions: Deputy General Counsel, Special Counsel, Managing Director of Mutual Fund Services, Federated
Hermes, Inc.; Senior Vice President, Federated Services Company; and Senior Corporate Counsel, Federated Hermes, Inc. |
Stephen Van Meter
Birth Date: June 5, 1975
CHIEF COMPLIANCE OFFICER AND SENIOR VICE PRESIDENT
Officer since: July 2015 | Principal Occupations: Senior Vice President and Chief Compliance Officer of the Federated Hermes Fund Family; Vice President and Chief Compliance Officer of Federated Hermes, Inc. and Chief Compliance Officer of certain of its subsidiaries. Mr. Van Meter joined Federated Hermes, Inc. in October 2011. He holds FINRA licenses under Series 3, 7, 24 and 66.
Previous Positions: Mr. Van Meter previously held the position of Compliance Operating Officer, Federated Hermes, Inc. Prior to joining Federated Hermes, Inc., Mr. Van Meter served at the United States Securities and Exchange Commission in the positions of Senior Counsel, Office of Chief Counsel, Division of Investment Management and Senior Counsel, Division of Enforcement. |
Robert J. Ostrowski
Birth Date: April 26, 1963
Chief Investment Officer
Officer since: September 2006 | Principal Occupations: Robert J. Ostrowski joined Federated Hermes, Inc. in 1987 as an Investment Analyst and became a Portfolio Manager in 1990. He was named Chief Investment Officer of Federated Hermes’ taxable fixed-income products in 2004 and also serves as a Senior Portfolio Manager. Mr. Ostrowski became an Executive Vice President of the Fund’s Adviser in 2009 and served as a Senior Vice President of the Fund’s Adviser from 1997 to 2009. Mr. Ostrowski has received the Chartered Financial Analyst designation. He received his M.S. in Industrial Administration from Carnegie Mellon University. |
Stephen F. Auth
Birth Date: September 13, 1956
101 Park Avenue
41st Floor
New York, NY 10178
CHIEF INVESTMENT OFFICER
Officer since: February 2015 | Principal Occupations: Stephen F. Auth is Chief Investment Officer of various Funds in the Federated Hermes Fund Family; Executive Vice President, Federated Investment Counseling, Federated Global Investment Management Corp. and Federated Equity Management Company of Pennsylvania.
Previous Positions: Executive Vice President, Federated Investment Management Company and Passport Research, Ltd. (investment advisory subsidiary of Federated); Senior Vice President, Global Portfolio Management Services Division; Senior Vice President, Federated Investment Management Company and Passport Research, Ltd.; Senior Managing Director and Portfolio Manager, Prudential Investments. |
Annual Shareholder Report
Evaluation and Approval of Advisory Contract–May 2020
Federated Mortgage Strategy Portfolio (the “Fund”)
(EFFECTIVE CLOSE OF BUSINESS ON JUNE 26, 2020, THE FUND’S NAME CHANGED TO FEDERATED HERMES MORTGAGE STRATEGY PORTFOLIO)
At its meetings in May 2020 (the “May Meetings”), the Fund’s Board of Trustees (the “Board”), including a majority of those Trustees who are not “interested persons” of the Fund, as defined in the Investment Company Act of 1940 (the “Independent Trustees”), reviewed and unanimously approved the continuation of the investment advisory contract between the Fund and Federated Investment Management Company (the “Adviser”) (the “Contract”) for an additional one-year term. The Board’s determination to approve the continuation of the Contract reflects the exercise of its business judgment after considering all of the information and factors believed to be relevant and appropriate on whether to continue the existing arrangements. The information, factors and conclusions that formed the basis for the Board’s approval are summarized below.
The Fund is distinctive in that it is used to implement particular investment strategies that are offered to investors in certain separately managed or wrap fee accounts or programs, or certain other discretionary investment accounts, and may also be offered to other funds (each, a “Federated Hermes Fund”) advised by the Adviser or its affiliates (collectively, “Federated Hermes”).
In addition, the Board considered that the Adviser does not charge an investment advisory fee for its services, although Federated Hermes may receive compensation for managing assets invested in the Fund.
Information Received and Review Process
At the request of the Independent Trustees, the Fund’s Chief Compliance Officer (the “CCO”) furnished to the Board in advance of its May Meetings an independent written evaluation presenting on the topics discussed below. The Board considered the CCO’s independent written evaluation (the “CCO Fee Evaluation Report”), along with other information, in evaluating the reasonableness of the Fund’s management fee and in determining to approve the continuation of the Contract. The CCO, in preparing the CCO Fee Evaluation Report, has the authority to retain consultants, experts or staff as reasonably necessary to assist in the performance of his duties, reports directly to the Board, and can be terminated only with the approval of a majority of the Independent Trustees. At the request of the Independent Trustees, the CCO Fee Evaluation Report followed the same general approach and covered the same topics as that of the report that had previously been delivered by the CCO in his capacity as “Senior Officer” prior to the elimination of the Senior Officer position in December 2017.
In addition to the extensive materials that comprise and accompany the CCO Fee Evaluation Report, in the months preceding the May Meetings, the Board requested and reviewed written responses and supporting materials prepared by the Adviser or its affiliates (collectively, “Federated Hermes”) in response to requests posed to Federated Hermes on behalf of the Independent Trustees encompassing a wide variety of topics. The Board also considered such additional matters as the Independent Trustees deemed reasonably necessary to evaluate the Contract, which included detailed information about the Fund and Federated Hermes furnished to the Board at its meetings throughout the year and in between regularly scheduled meetings on particular matters as the need arose, as well as information specifically prepared in connection with the approval of the continuation of the Contract that was presented at the May Meetings.
The Board’s consideration of the Contract included review of materials and information covering the following matters, among others: the Adviser’s and sub-adviser’s investment philosophy, revenue, profitability, personnel and processes; investment and operating strategies; the Fund’s short-term and long-term performance (in absolute terms, both on a gross basis and net of expenses, and relative to the Fund’s particular investment program and a group of its peer funds and/or its benchmark, as appropriate) and comments on the reasons for the Fund’s performance; the Fund’s investment objectives; the Fund’s expenses, including the advisory fee and the overall expense structure of the Fund, with due regard for contractual or voluntary expense limitations (if any); the use and allocation of brokerage commissions derived from trading the Fund’s portfolio securities (if any); and the nature, quality and extent of the advisory and other services provided to the Fund by the Adviser and its affiliates. The Board also considered the preferences and expectations of Fund shareholders; the entrepreneurial and other risks assumed by the Adviser in sponsoring and managing the Fund; the continuing state of competition in the mutual fund industry and market practices; the range of comparable fees for similar funds in the mutual fund industry; the Fund’s relationship to the other funds advised by Federated Hermes (each, a “Federated Hermes Fund”), which include a comprehensive array of funds with different investment objectives, policies and strategies which are generally available for exchange without the incurrence of additional sales charges; compliance and audit reports concerning the Federated Hermes Funds and the Federated Hermes’ affiliates that service them (including communications from regulatory agencies), as well as Federated Hermes’ responses to any issues raised therein; and relevant developments in the mutual fund industry and how the Federated Hermes Funds and/or Federated Hermes may be responding to them. In addition, the Board received and considered information furnished by Federated
Annual Shareholder Report
Hermes on the impacts of the coronavirus (COVID-19) outbreak on Federated Hermes generally and the Fund in particular, including, among other information, the current and anticipated impacts on the management, operations and performance of the Fund. The Board noted that its evaluation process is evolutionary and that the criteria considered and the emphasis placed on relevant criteria may change in recognition of changing circumstances in the mutual fund marketplace.
The Board also considered judicial decisions concerning allegedly excessive investment advisory fees in determining to approve the Contract. Using these judicial decisions as a guide, the Board observed that the following factors may be relevant to an adviser’s fiduciary duty with respect to its receipt of compensation from a fund: (1) the nature and quality of the services provided by an adviser to a fund and its shareholders (including the performance of the fund, its benchmark, and comparable funds); (2) an adviser’s cost of providing the services (including the profitability to an adviser of providing advisory services to a fund); (3) the extent to which an adviser may realize “economies of scale” as a fund grows larger and, if such economies of scale exist, whether they have been shared with a fund and its shareholders or the family of funds; (4) any “fall-out” financial benefits that accrue to an adviser because of its relationship with a fund (including research services received from brokers that execute fund trades and any fees paid to affiliates of an adviser for services rendered to a fund); (5) comparative fee and expense structures (including a comparison of fees paid to an adviser with those paid by similar funds both internally and externally as well as management fees charged to institutional and other advisory clients of the adviser for what might be viewed as like services); and (6) the extent of care, conscientiousness and independence with which the fund’s board members perform their duties and their expertise (including whether they are fully informed about all facts the board deems relevant to its consideration of an adviser’s services and fees). The Board noted that the Securities and Exchange Commission (“SEC”) disclosure requirements regarding the basis for a fund board’s approval of the fund’s investment advisory contracts generally align with the factors listed above. The Board was aware of these factors and was guided by them in its review of the Contract to the extent it considered them to be appropriate and relevant, as discussed further below.
The Board considered and weighed these factors in light of its substantial accumulated experience in governing the Fund and working with Federated Hermes on matters relating to the Federated Hermes Funds. While individual members of the Board may have weighed certain factors differently, the Board’s determination to continue the Contract was based on a comprehensive consideration of all information provided to the Board throughout the year and specifically with respect to the continuation of the Contract. The Independent Trustees were assisted throughout the evaluation process by independent legal counsel. In connection with their deliberations at the May Meetings, the Independent Trustees met separately in executive session with their independent legal counsel and without management present to review the relevant materials and consider their responsibilities under applicable laws. In addition, senior management representatives of Federated Hermes also met with the Independent Trustees and their independent legal counsel to discuss the materials and presentations furnished to the Board at the May Meetings. The Board considered the approval of the Contract for the Fund as part of its consideration of agreements for funds across the Federated Hermes Funds family, but its approvals were made on a fund-by-fund basis.
Nature, Extent and Quality of Services
The Board considered the nature, extent and quality of the services provided to the Fund by the Adviser and the resources of the Adviser and its affiliates dedicated to the Fund. In this regard, the Board evaluated, among other things, the Adviser’s personnel, experience and track record, as well as the financial resources and overall reputation of Federated Hermes and its willingness to invest in personnel and infrastructure that benefit the Federated Hermes Funds. The Board noted the significant acquisition of Hermes Fund Managers Limited by Federated Hermes in 2018, which has deepened the organization’s investment management expertise and capabilities and expanded the investment process for all of the Federated Hermes Funds to incorporate environmental, social and governance (“ESG”) factors and issuer engagement on ESG matters.
In addition, the Board reviewed the qualifications, backgrounds and responsibilities of the portfolio management team primarily responsible for the day-to-day management of the Fund and the Adviser’s ability and experience in attracting and retaining qualified personnel to service the Fund. The Board noted the compliance program of the Adviser and the compliance-related resources devoted by the Adviser and its affiliates in support of the Fund’s obligations pursuant to Rule 38a-1 under the Investment Company Act of 1940, including the Adviser’s commitment to respond to rulemaking and other regulatory initiatives of the SEC such as the liquidity risk management program rules. In addition, the Board considered the response by the Adviser to recent market conditions and considered the overall performance of the Adviser in this context. The Fund’s ability to deliver competitive performance when compared to its benchmark index was also deemed to be relevant by the Board as a useful indicator of how the Adviser is executing the Fund’s investment program. The Adviser’s ability to execute this program was one of the Board’s considerations in reaching a conclusion that the nature, extent and quality of the Adviser’s investment management and related services warrant the continuation of the Contract.
Annual Shareholder Report
Fund Investment Performance
For the periods ended December 31, 2019, the Fund outperformed its benchmark index for the three-year and five-year periods, and the Fund underperformed its benchmark index the one-year period. The Board discussed the Fund’s performance with the Adviser and recognized the efforts being taken by the Adviser in the context of other factors considered relevant by the Board.
Following such evaluation, and full deliberations, the Board concluded that the performance of the Fund supported renewal of the Contract.
Fund Expenses
The Board considered that the Adviser does not charge an investment advisory fee to this Fund for its services. However, the Board considered the compensation and benefits received by the Adviser, including fees received for services provided to the Fund by Federated Hermes and research services received by the Adviser from brokers that execute trades for other Federated Hermes Funds.
Because the Adviser does not charge the Fund an investment advisory fee, the Board does not consider fee comparisons to other mutual funds or other institutional or separate accounts to be relevant to its deliberations.
Profitability and Other Benefits
The Board also received financial information about Federated Hermes, including information regarding the compensation and ancillary (or “fall-out”) benefits Federated Hermes derived from its relationships with the Federated Hermes Funds. As the Adviser does not charge an investment advisory fee for its services, this information generally covered fees received by Federated Hermes’ affiliates for providing other services to the Federated Hermes Funds under separate contracts (e.g., for serving as the Federated Hermes Funds’ administrator and distributor). In this regard, the Board considered that certain of Federated Hermes’ affiliates provide distribution and shareholder services to the Federated Hermes Funds, for which they may be compensated through distribution and servicing fees paid pursuant to Rule 12b-1 plans or otherwise. The Board also received and considered information detailing any indirect benefit Federated Hermes may derive from its receipt of research services from brokers who execute portfolio trades for the Federated Hermes Funds. In addition, the Board considered the fact that, in order for the Federated Hermes Funds to be competitive in the marketplace, the Adviser and its affiliates frequently waived fees and/or reimbursed expenses and have disclosed to Federated Hermes Fund shareholders and/or reported to the Board their intention to do so in the future. Moreover, the Board received and considered regular reports from Federated Hermes throughout the year as to the institution, adjustment or elimination of these voluntary waivers and/or reimbursements. The Board considered Federated Hermes’ previous reductions in contractual management fees to certain Federated Hermes Funds during the prior year, including in response to the CCO’s recommendations in the prior year’s CCO Fee Evaluation Report.
The Board also reviewed information compiled by Federated Hermes comparing its profitability information to other publicly held fund management companies, including information regarding profitability trends over time. The Board considered the CCO’s conclusion that, based on such profitability information, Federated Hermes’ profit margins did not appear to be excessive. The Board also considered the CCO’s view that Federated Hermes appeared financially sound, with the resources necessary to fulfill its obligations under its contracts with the Federated Hermes Funds.
Economies of Scale
Because of the unusual nature of the Fund as primarily an internal product with no advisory fee, the Board does not consider the assessment of whether economies of scale would be realized if the Fund were to grow to a sufficient size to be particularly relevant.
Conclusions
The Board considered the CCO’s conclusion that his observations and the information accompanying the CCO Fee Evaluation Report show that the management fee for the Fund was reasonable and the CCO’s recommendation that the Board approve the management fee. The Board noted that, under these circumstances, no changes were recommended to, and no objection was raised to the continuation of, the Contract by the CCO. The CCO also recognized that the Board’s evaluation of the Federated Hermes Funds’ advisory and subadvisory arrangements is a continuing and on-going process that is informed by the information that the Board requests and receives from management throughout the course of the year and, in this regard, the CCO noted certain items for future reporting to the Board or further consideration by management as the Board continues its on-going oversight of the Federated Hermes Funds.
Annual Shareholder Report
The Board based its determination to approve the Contract on the totality of the circumstances and relevant factors and with a view to past and future long-term considerations. Not all of the factors and considerations identified above were necessarily deemed to be relevant to the Fund, nor did the Board consider any one of them to be determinative. With respect to the factors that were deemed to be relevant, the Board’s determination to approve the continuation of the Contract reflects its view that Federated Hermes’ performance and actions provided a satisfactory basis to support the determination to continue the existing arrangement.
Annual Shareholder Report
Liquidity Risk Management Program–
Annual Evaluation of Adequacy and Effectiveness
In accordance with Rule 22e-4 under the Investment Company Act of 1940, as amended (the “Liquidity Rule”), Federated Hermes Managed Pool Series (the “Trust”) has adopted and implemented a liquidity risk management program (the “Program”) for Federated Hermes Mortgage Strategy Portfolio (the “Fund” and, collectively with the Federated Hermes funds, the “Federated Hermes Funds”). The Program seeks to assess and manage the Fund’s liquidity risk. “Liquidity risk” is defined under the Liquidity Rule as the risk that the Fund is unable to meet redemption requests without significantly diluting remaining investors’ interests in the Fund. The Board of Trustees of the Trust (the “Board”) has approved the designation of the Fund’s investment adviser as the administrator for the Program for the Fund. Each affiliated Federated Hermes advisory subsidiary (including the Fund’s investment adviser) that serves as investment adviser to a Federated Hermes Fund (including the Fund) has been approved as the administrator of the Program for each Federated Hermes Fund they manage (each an “Administrator”). The Administrator in turn has delegated daily responsibility for the administration of the Program to multiple Liquidity Risk Management Committees (the “Committees”). The Committees, which are comprised of representatives of Enterprise Risk Management, Compliance, Investment Management and Trading, must review and assess certain information related to the liquidity of the Federated Hermes Funds, including the Fund.
The Program is comprised of various components designed to support the assessment and/or management of liquidity risk, including: (1) the periodic assessment (no less frequently than annually) of certain factors that influence the Fund’s liquidity risk; (2) the periodic classification (no less frequently than monthly) of the Fund’s investments into one of four liquidity categories that reflect an estimate of their liquidity under current market conditions; (3) a 15% limit on the acquisition of “illiquid investments” (as defined under the Liquidity Rule); (4) to the extent a Fund does not invest primarily in “highly liquid investments” (as defined under the Liquidity Rule), the determination of a minimum percentage of the Fund’s assets that generally will be invested in highly liquid investments (an “HLIM”); (5) if a Fund has established an HLIM, the periodic review (no less frequently than annually) of the HLIM and the adoption of policies and procedures for responding to a shortfall of the Fund’s highly liquid investments below its HLIM; and (6) periodic reporting to the Board.
At its meetings in May 2020, the Board received and reviewed a written report (the “Report”) from the Federated Hermes Funds’ Chief Compliance Officer and Chief Risk Officer, on behalf of the Administrator, concerning the operation of the Program for the period from the Program’s inception on December 1, 2018 through March 31, 2020 (the “Period”). The Report addressed the operation of the Program and assessed its adequacy and effectiveness, including, where applicable, the operation of any HLIM established for a Federated Hermes Fund and each Federated Hermes Fund’s access to other available funding sources such as the Federated Hermes Funds’ interfund lending facility, redemptions in-kind and committed lines of credit. There were no material changes to the Program during the Period. The Report summarized the operation of the Program and the information and factors considered by the Administrator in assessing whether the Program has been adequately and effectively implemented with respect to the Federated Hermes Funds. Such information and factors included, among other things:
■ confirmation that the Fund did not utilize alternative funding sources during the Period;
■ the periodic classifications of the Fund’s investments into one of four liquidity categories and the methodologies and inputs used to classify the investments, including the Fund’s reasonably anticipated trade size;
■ the analysis received from a third-party liquidity assessment vendor that is taken into account in the process of determining the liquidity classifications of the Fund’s investments and the results of an evaluation of the services performed by the vendor in support of this process;
■ the fact that the Fund invested primarily in highly liquid investments during the Period and, therefore, was not required to establish, and has not established, an HLIM and the procedures for monitoring the status of the Fund as investing primarily in highly liquid investments;
■ the fact that the Fund invested no more than 15% of its assets in illiquid investments during the Period and the procedures for monitoring this limit; and
■ liquidity events during the Period, including the impact on liquidity caused by extended non-U.S. market closures and the market disruptions resulting from the novel coronavirus outbreak, and the fact that there were no specific liquidity events during the Period that materially affected the Fund’s liquidity risk.
Based on this review, the Fund’s investment adviser, in its role as Administrator, collectively with the other investment advisers to the Federated Hermes Funds, concluded that the Program is operating effectively to assess and manage the Fund’s liquidity risk, and that the Program has been and continues to be adequately and effectively implemented to monitor and, as applicable, respond to the Fund’s liquidity developments.
Annual Shareholder Report
Voting Proxies on Fund Portfolio Securities
A description of the policies and procedures that the Fund uses to determine how to vote proxies, if any, relating to securities held in the Fund’s portfolio, as well as a report on “Form N-PX” of how the Fund voted any such proxies during the most recent 12-month period ended June 30, are available, without charge and upon request, by calling 1-800-341-7400. A report on “Form N-PX” of how the Fund voted any such proxies during the most recent 12-month period ended June 30 is available via the Proxy Voting Record Report (Form N-PX) link associated with the Fund at FederatedInvestors.com/FundInformation. Select a product name, then click “Documents” and click on “Proxy Voting Record Report.” Form N-PX filings are also available at the SEC’s website at sec.gov.
Quarterly Portfolio Schedule
Each fiscal quarter, the Fund will file with the SEC a complete schedule of its monthly holds on “Form N-PORT.” The Fund’s holdings as of the end of the third month of every fiscal quarter, as reported on Form N-PORT, will be publicly available on the SEC’s website at sec.gov within 60 days of the end of the fiscal quarter upon filing. You may also access this information at FederatedInvestors.com. Select a product name, then click “Documents” and select “Form N-PORT.”
Annual Shareholder Report
Mutual funds are not bank deposits or obligations, are not guaranteed by any bank and are not insured or guaranteed by the U.S. government, the Federal Deposit Insurance Corporation, the Federal Reserve Board or any other government agency. Investment in mutual funds involves investment risk, including the possible loss of principal.
This Report is authorized for distribution to prospective investors only when preceded or accompanied by the Fund’s Prospectus, which contains facts concerning its objective and policies, management fees, expenses and other information. Federated Hermes Mortgage Strategy Portfolio
Federated Hermes Funds
4000 Ericsson Drive
Warrendale, PA 15086-7561
Contact us at FederatedInvestors.com
or call 1-800-341-7400.
Federated Securities Corp., Distributor
CUSIP 31421P407
38011 (2/21)
© 2021 Federated Hermes, Inc.
(a) As of the end of the period covered by this report, the registrant has adopted a code of ethics (the "Section 406 Standards for Investment Companies - Ethical Standards for Principal Executive and Financial Officers") that applies to the registrant's Principal Executive Officer and Principal Financial Officer; the registrant's Principal Financial Officer also serves as the Principal Accounting Officer.
(c) There was no amendment to the registrant’s code of ethics described in Item 2(a) above during the period covered by the report.
(d) There was no waiver granted, either actual or implicit, from a provision to the registrant’s code of ethics described in Item 2(a) above during the period covered by the report.
(e) Not Applicable
(f)(3) The registrant hereby undertakes to provide any person, without charge, upon request, a copy of the code of ethics. To request a copy of the code of ethics, contact the registrant at 1-800-341-7400, and ask for a copy of the Section 406 Standards for Investment Companies - Ethical Standards for Principal Executive and Financial Officers.
Item 3. Audit Committee Financial Expert
The registrant's Board has determined that each of the following members of the Board's Audit Committee is an “audit committee financial expert,” and is "independent," for purposes of this Item: G. Thomas Hough and Thomas M. O'Neill.
| Item 4. | Principal Accountant Fees and Services |
(a) Audit Fees billed to the registrant for the two most recent fiscal years:
Fiscal year ended 2020 – $143,100
Fiscal year ended 2019 - $148,300
(b) Audit-Related Fees billed to the registrant for the two most recent fiscal years:
Fiscal year ended 2020 - $0
Fiscal year ended 2019 - $0
Amount requiring approval of the registrant’s audit committee pursuant to paragraph (c)(7)(ii) of Rule 2-01 of Regulation S-X, $0 and $0 respectively.
(c) Tax Fees billed to the registrant for the two most recent fiscal years:
Fiscal year ended 2020 - $0
Fiscal year ended 2019 - $0
Amount requiring approval of the registrant’s audit committee pursuant to paragraph (c)(7)(ii) of Rule 2-01 of Regulation S-X, $0 and $0 respectively.
(d) All Other Fees billed to the registrant for the two most recent fiscal years:
Fiscal year ended 2020 - $0
Fiscal year ended 2019 - $0
Amount requiring approval of the registrant’s audit committee pursuant to paragraph (c)(7)(ii) of Rule 2-01 of Regulation S-X, $53,434 and $81,675 respectively. Fiscal year ended 2020- Service fees for analysis of potential Passive Foreign Investment Company holdings. Fiscal year ended 2019- Service fees for analysis of potential Passive Foreign Investment Company holdings
(e)(1) Audit Committee Policies regarding Pre-approval of Services.
The Audit Committee is required to pre-approve audit and non-audit services performed by the independent auditor in order to assure that the provision of such services do not impair the auditor’s independence. Unless a type of service to be provided by the independent auditor has received general pre-approval, it will require specific pre-approval by the Audit Committee. Any proposed services exceeding pre-approved cost levels will require specific pre-approval by the Audit Committee.
Certain services have the general pre-approval of the Audit Committee. The term of the general pre-approval is 12 months from the date of pre-approval, unless the Audit Committee specifically provides for a different period. The Audit Committee will annually review the services that may be provided by the independent auditor without obtaining specific pre-approval from the Audit Committee and may grant general pre-approval for such services. The Audit Committee will revise the list of general pre-approved services from time to time, based on subsequent determinations. The Audit Committee will not delegate to management its responsibilities to pre-approve services performed by the independent auditor.
The Audit Committee has delegated pre-approval authority to its Chairman for services that do not exceed a specified dollar threshold. The Chairman or Chief Audit Executive will report any such pre-approval decisions to the Audit Committee at its next scheduled meeting. The Committee will designate another member with such pre-approval authority when the Chairman is unavailable.
AUDIT SERVICES
The annual Audit services engagement terms and fees will be subject to the specific pre-approval of the Audit Committee. The Audit Committee will approve, if necessary, any changes in terms, conditions and fees resulting from changes in audit scope, registered investment company (RIC) structure or other matters.
In addition to the annual Audit services engagement specifically approved by the Audit Committee, the Audit Committee may grant general pre-approval for other Audit services, which are those services that only the independent auditor reasonably can provide. The Audit Committee has pre-approved certain Audit services; with limited exception, all other audit services must be specifically pre-approved by the Audit Committee.
AUDIT-RELATED SERVICES
Audit-related services are assurance and related services that are reasonably related to the performance of the audit or review of the RIC’s financial statements or that are traditionally performed by the independent auditor. The Audit Committee believes that the provision of Audit-related services does not impair the independence of the auditor, and has pre-approved certain audit-related services; all other audit-related services must be specifically pre-approved by the Audit Committee.
TAX SERVICES
The Audit Committee believes that the independent auditor can provide Tax services to the RIC such as tax compliance, tax planning and tax advice without impairing the auditor’s independence. However, the Audit Committee will not permit the retention of the independent auditor in connection with a transaction initially recommended by the independent auditor, the purpose of which may be tax avoidance and the tax treatment of which may not be supported in the Internal Revenue Code and related regulations. The Audit Committee has pre-approved certain Tax services; with limited exception, all tax services involving large and complex transactions must be specifically pre-approved by the Audit Committee.
ALL OTHER SERVICES
With respect to the provision of permissible services other than audit, review or attest services the pre-approval requirement is waived if:
| (1) | With respect to such services rendered to the Funds, the aggregate amount of all such services provided constitutes no more than five percent of the total amount of revenues paid by the audit client to its accountant during the fiscal year in which the services are provided; and, |
| (2) | With respect to such services rendered to the Fund’s investment adviser and any entity controlling, controlled by to under common control with the investment adviser such as affiliated non-U.S. and U.S. funds not under the Audit Committee’s purview and which do not fall within a category of service which has been determined by the Audit Committee not to have a direct impact on the operations or financial reporting of the RIC, the aggregate amount of all services provided constitutes no more than five percent of the total amount of revenues paid to the RIC’s auditor by the RIC, its investment adviser and any entity controlling, controlled by, or under common control with the investment adviser during the fiscal year in which the services are provided; and |
| (3) | Such services were not recognized by the issuer or RIC at the time of the engagement to be non-audit services; and |
| (4) | Such services are promptly brought to the attention of the Audit Committee and approved prior to the completion of the audit by the Audit Committee or by one or more members of the Audit Committee who are members of the Board of Directors to whom authority to grant such approvals has been delegated by the Audit Committee. |
The Audit Committee may grant general pre-approval to those permissible non-audit services which qualify for pre-approval and which it believes are routine and recurring services, and would not impair the independence of the auditor.
The Securities and Exchange Commission’s (the “SEC”) rules and relevant guidance should be consulted to determine the precise definitions of these services and applicability of exceptions to certain of the prohibitions.
PRE-APPROVAL FEE LEVELS
Pre-approval fee levels for all services to be provided by the independent auditor will be established annually by the Audit Committee. Any proposed services exceeding these levels will require specific pre-approval by the Audit Committee.
PROCEDURES
Requests or applications to provide services that require specific approval by the Audit Committee will be submitted to the Audit Committee by the Fund’s Principal Accounting Officer and/or the Chief Audit Executive of Federated Hermes, Inc., only after those individuals have determined that the request or application is consistent with the SEC’s rules on auditor independence.
(e)(2) Percentage of services identified in items 4(b) through 4(d) that were approved by the registrant’s Audit Committee pursuant to paragraph (c)(7)(i)(C) of Rule 2-01 of Regulation S-X:
4(b)
Fiscal year ended 2020 – 0%
Fiscal year ended 2019 - 0%
Percentage of services provided to the registrant’s investment adviser and any entity controlling, controlled by, or under common control with the investment adviser that provides ongoing services to the registrant that were approved by the registrant’s Audit Committee pursuant to paragraph (c)(7)(i)(C) of Rule 2-01 of Regulation S-X, 0% and 0% respectively.
4(c)
Fiscal year ended 2020 – 0%
Fiscal year ended 2019 – 0%
Percentage of services provided to the registrant’s investment adviser and any entity controlling, controlled by, or under common control with the investment adviser that provides ongoing services to the registrant that were approved by the registrant’s Audit Committee pursuant to paragraph (c)(7)(i)(C) of Rule 2-01 of Regulation S-X, 0% and 0% respectively.
4(d)
Fiscal year ended 2020 – 0%
Fiscal year ended 2019 – 0%
Percentage of services provided to the registrant’s investment adviser and any entity controlling, controlled by, or under common control with the investment adviser that provides ongoing services to the registrant that were approved by the registrant’s Audit Committee pursuant to paragraph (c)(7)(i)(C) of Rule 2-01 of Regulation S-X, 0% and 0% respectively.
| (g) | Non-Audit Fees billed to the registrant, the registrant’s investment adviser, and certain entities controlling, controlled by or under common control with the investment adviser: |
Fiscal year ended 2020 - $78,663
Fiscal year ended 2019 - $728,817
| (h) | The registrant’s Audit Committee has considered that the provision of non-audit services that were rendered to the registrant’s adviser (not including any sub-adviser whose role is primarily portfolio management and is subcontracted with or overseen by another investment adviser), and any entity controlling, controlled by, or under common control with the investment adviser that provides ongoing services to the registrant that were not pre-approved pursuant to paragraph (c)(7)(ii) of Rule 2-01 of Regulation S-X is compatible with maintaining the principal accountant’s independence. |
| Item 5. | Audit Committee of Listed Registrants |
Not Applicable
| Item 6. | Schedule of Investments |
(a) The registrant’s Schedule of Investments is included as part of the Report to Stockholders filed under Item 1 of this form.
(b) Not Applicable; Fund had no divestments during the reporting period covered since the previous Form N-CSR filing.
| Item 7. | Disclosure of Proxy Voting Policies and Procedures for Closed-End Management Investment Companies |
Not Applicable
| Item 8. | Portfolio Managers of Closed-End Management Investment Companies |
Not Applicable
| Item 9. | Purchases of Equity Securities by Closed-End Management Investment Company and Affiliated Purchasers |
Not Applicable
| Item 10. | Submission of Matters to a Vote of Security Holders |
No Changes to Report
| Item 11. | Controls and Procedures |
(a) The registrant’s President and Treasurer have concluded that the
registrant’s disclosure controls and procedures (as defined in rule 30a-3(c) under the Act) are effective in design and operation and are sufficient to form the basis of the certifications required by Rule 30a-(2) under the Act, based on their evaluation of these disclosure controls and procedures within 90 days of the filing date of this report on Form N-CSR.
(b) There were no changes in the registrant’s internal control over financial reporting (as defined in rule 30a-3(d) under the Act) during the registrant’s most recent fiscal half-year (the registrant’s second fiscal half-year in the case of an annual report) that have materially affected, or are reasonably likely to materially affect, the registrant’s internal control over financial reporting.
| Item 12. | Disclosure of Securities Lending Activities for Closed-End Management Investment Companies |
Not Applicable
(a)(1) Code of Ethics- Not Applicable to this Report.
(a)(2) Certifications of Principal Executive Officer and Principal Financial Officer.
(a)(3) Not Applicable.
(b) Certifications pursuant to 18 U.S.C. Section 1350.
SIGNATURES
Pursuant to the requirements of the Securities Exchange Act of 1934 and the Investment Company Act of 1940, the registrant has duly caused this report to be signed on its behalf by the undersigned, thereunto duly authorized.
Registrant Federated Hermes Managed Pool Series
By /S/ Lori A. Hensler
Lori A. Hensler, Principal Financial Officer
Date February 22, 2021
Pursuant to the requirements of the Securities Exchange Act of 1934 and the Investment Company Act of 1940, this report has been signed below by the following persons on behalf of the registrant and in the capacities and on the dates indicated.
By /S/ J. Christopher Donahue
J. Christopher Donahue, Principal Executive Officer
Date February 22, 2021
By /S/ Lori A. Hensler
Lori A. Hensler, Principal Financial Officer
Date February 22, 2021