UNITED STATES
SECURITIES AND EXCHANGE COMMISSION
Washington, D.C. 20549
FORM N-CSR
CERTIFIED SHAREHOLDER REPORT OF REGISTERED
MANAGEMENT INVESTMENT COMPANIES
Investment Company Act file number: 811-21839
AARP PORTFOLIOS
(Exact name of registrant as specified in charter)
650 F. Street, N.W.
Washington, DC 20004
(Address of principal executive offices) (Zip code)
| | |
| (Name and Address of Agent for Service) | | Copy to: |
| |
Richard Hisey AARP Financial Incorporated Two Highwood Drive, Suite 202 Tewksbury, MA 01876 | | Gary O. Cohen, Esq. Jorden Burt LLP 1025 Thomas Jefferson Street, NW Suite 400 East Washington, DC 20007-5208 |
Registrant’s telephone number, including area code: (202) 434-3650
Date of fiscal year end: June 30
Date of reporting period: June 30, 2008
Item 1. Report to Shareholders

Annual Report
June 30, 2008
U.S. Bond Market Portfolio
U.S. Stock Market Portfolio
International Stock Market Portfolio
…
A NOTE ABOUT AARP PORTFOLIOS
The series, “Portfolios”, of AARP Portfolios seek to match the performance of market indexes for U.S. stocks, international stocks, and U.S. bonds. They serve as the underlying investments to AARP Funds’ asset allocation funds, which include AARP Conservative Fund, AARP Moderate Fund, AARP Aggressive Fund, and AARP Income Fund, collectively, “Funds”.
Shares of AARP Portfolios are not offered to the public for investment.

An investor should consider the investment objectives, risks, charges and expenses of AARP Funds carefully before investing. To get a prospectus containing this and other information, please call 1-800-958-6457. Read the prospectus carefully before you invest.
AARP Funds are distributed by ALPS Distributors, Inc.
Table of Contents
An investor should consider the investment objectives, risks, charges and expenses of AARP Funds carefully before investing. To get a prospectus containing this and other information, please call 1-800-958-6457. Read the prospectus carefully before you invest.
AARP Funds are distributed by ALPS Distributors, Inc.
AARP Financial, Inc. is not affiliated with ALPS Distributors, Inc.
| | | | |
| U.S. Bond Market Portfolio | | AARP PORTFOLIOS 2008 ANNUAL REPORT | | 1 |
U.S. Bond Market Portfolio
| | | | | | | | |
| |
Portfolio composition (As a percentage of net assets) |
| June 30, 2008 | | | | | | | | |
| | | | | |
Mortgage-backed securities | | 39.7% | | | | Asset-backed securities | | 0.5 % |
| |
U.S. Treasury | | 24.2% | | | | Municipal bonds | | 0.1 % |
| |
Corporate bonds | | 18.6% | | | | Cash equivalents | | 7.3 % |
| |
U.S. Government Agencies | | 9.3% | | | | Other assets and liabilities, net | | (9.5)% |
| |
Commercial mortgage-backed securities | | 5.0% | | | | Total net assets | | 100.0 % |
| | | | | | | |
International debt | | 4.8% | | | | | | |
| | | | | | | |
See Notes to Financial Statements. |
| | |
| |
Performance as of June 30, 2008 |
| | |
| Growth of $10,000 This graph illustrates the
hypothetical investment of
$10,000 in the U.S. Bond
Market Portfolio from
January 1, 2006
(commencement of
operations) through June 30,
2008, compared to the
Lehman Brothers Aggregate
Bond Index®. | | 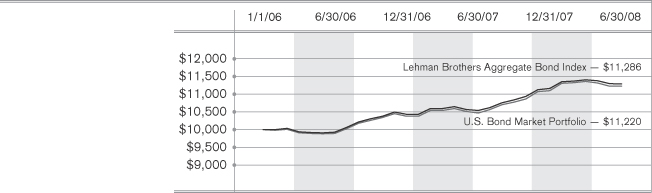 |
| | |
| | | This hypothetical example does not represent the returns of any particular investment. |
| | | | | | |
| | | |
| Performance Summary | | Average Annual Returns as of June 30, 2008 | | 1-Year | | Since
inception |
| | | |
| | | U.S. Bond Market Portfolio | | 7.20% | | 4.71%1 |
| | | |
| | | Lehman Brothers Aggregate Bond Index® | | 7.12% | | 4.96%1 |
| | | |
| | | | |
| |
Performance data quoted represents past performance which is no guarantee of future results. Investment return and principal
value will fluctuate so that an investor’s shares, when redeemed, may be worth more or less than their original cost. Mutual fund
performance changes over time and current performance may be lower or higher than what is stated. Returns shown do not
reflect the deduction of taxes that a shareholder would pay on fund distributions or the redemption of fund shares. Mutual funds
are not obligations of, or guaranteed, by any bank and are not federally insured. The performance of the Portfolios assumes the
reinvestment of all dividends and distributions. The indexes above have been adjusted to reflect reinvestment of dividends on
securities in the indexes. The adviser is waiving a portion of its advisory fee and other operating expenses. Had the fees not been
waived or reimbursed, returns would have been lower. It is not possible to invest directly in an Index. For the most recent month-end performance and after-tax returns, visit www.aarpfunds.com or call 1-800-958-6457. 1 For the period from January 1, 2006 (commencement of operations) to June 30, 2008. Sources: Lehman Brothers, Inc., AARP Financial |
| | | | |
| 2 | | AARP PORTFOLIOS 2008 ANNUAL REPORT | | U.S. Bond Market Portfolio |

Lehman Brothers Aggregate Bond Index
This index serves as the benchmark for the U.S. Bond Market Portfolio. The index includes a large variety of U.S. bonds that are investment grade and taxable, covering three major types of bonds: government and corporate bonds, mortgage-backed securities and asset-backed securities. The index is unmanaged and you cannot directly invest in it. In addition, indexes do not have expenses.
U.S. Bond Market Portfolio
Performance discussion
The Portfolio seeks to replicate the total return of the Lehman Brothers Aggregate Bond Index.
For the 12-month period ended June 30, 2008, the U.S. Bond Market portfolio returned +7.20%, net of fees, versus the benchmark return of +7.12%. The index return reflects all items in terms of income, gain and loss, and the reinvestment of other income.
During the 2nd half of 2007, as the deep and broad impact of subprime residential mortgage distress on the economy and the investment markets became apparent, investor risk aversion increased, non-government credit spreads widened sharply, and a ‘flight to quality’ emerged in government bond markets. U.S. economic reports continued to be mixed, but housing data was distinctly downbeat. After leaving interest rates unchanged for 15 months, the Federal Reserve’s Open Market Committee announced that financial market turbulence had increased the downside risks to growth “appreciably.” At its September meeting, it cut the federal funds target by 50 basis points to 4.75%. In fact, the Fed, demonstrating that it was taking note of what was happening in the markets, lowered its lending rate several times during the last half of 2007 and encouraged borrowing at its discount window. Overall, the increase in volatility due to sub-prime concerns and the mixed economic outlook turned into solid gains for Treasury benchmarks. Treasury yields fell and their prices rose as investors opted for less risky fixed-income alternatives.
In the 1st half of 2008, growing concern about a recessionary environment began to proliferate, driven in part by continued and worsening housing woes resulting in additional write-downs. This activity culminated at the end of the 1st quarter in the forced buyout of Bear Stearns by JP Morgan Chase. All of the larger fixed income sectors posted negative excess returns, relative to similar maturity U.S. Treasury securities, for the 1st quarter and the Lehman Brothers Aggregate Bond Index posted the worst reported excess return number in its 30 year history. Treasury rates continued to decrease in the 1st quarter, particularly in the short end, on the heels of an aggressively easing Federal Reserve. The Fed lowered the Federal Funds rate by 200 basis points in the quarter. Two of the moves were 75 basis points each—the first one in January being the largest in over twenty years. The fixed income markets posted positive returns in April and May; however, fixed income markets were once again buffeted by familiar headwinds in June. Rising oil and food prices and the resultant inflation fears, the probability of continued write-offs on the part of investment banks, and the downgrades of bond insurers MBIA and Ambac were all catalysts for market sentiment turning negative. In addition, declining U.S. equities and rising commodity prices also helped define a more negative tone in the fixed income markets as the 2nd quarter ended.
| | | | |
| U.S. Bond Market Portfolio | | AARP PORTFOLIOS 2008 ANNUAL REPORT | | 3 |
The Portfolio invests in investment-grade bonds, and uses a sampling strategy to gain benchmark exposure. The emphasis of this strategy is to achieve a sampling of a broad array of positions so as to eliminate any excessive over/underweight of individual positions. Our portfolio is built with no active management bias and seeks to match the index in all major characteristics, such as duration, term structure, quality distribution, and issuer and sector exposure. As of June 30, 2008 the Portfolio held 606 of the 9,469 benchmark constituents, or roughly 6.40%. The Portfolio return difference verses its benchmark is expected due to the Portfolio’s sampling strategy. This performance variance will get smaller as the Portfolio continues to grow in asset size.
Sources: Bloomberg, SSgA Performance Group, FactSet
This material is solely for the private use of SSgA clients and is not intended for public dissemination.
The information contained herein does not constitute investment advice and it should not be relied on as such. It should not be considered a solicitation to buy or an offer to sell a security. Past performance is no guarantee of future results. The Lehman Index names are trademarks of Lehman Brothers, Inc. The views expressed are the views of State Street Global Advisors’ Global Fixed Income Group only through the period ended June 30, 2008.
| | | | |
| 4 | | AARP PORTFOLIOS 2008 ANNUAL REPORT | | U.S. Stock Market Portfolio |
U.S. Stock Market Portfolio
| | | | | | | | |
| | |
Portfolio composition (As a percentage of net assets) | | |
| June 30, 2008 | | |
| | | | | |
Information technology | | 15.6% | | | | Materials | | 4.8% |
| |
Financials | | 14.6% | | | | Utilities | | 4.5% |
| |
Energy | | 14.0% | | | | Telecommunications services | | 3.1% |
| |
Industrials | | 12.0% | | | | Cash equivalents | | 0.1% |
| |
Health care | | 11.1% | | | | Other assets and liabilities, net | | 2.9% |
| |
Consumer discretionary | | 9.5% | | | | Total net assets | | 100.0% |
| | | | | | | |
Consumer staples | | 7.8% | | | | | | |
| | | | | | | |
See Notes to Financial Statements. | | | | | | | | |
| | |
| |
Performance as of June 30, 2008 |
| | |
| Growth of $10,000 This graph illustrates the
hypothetical investment of
$10,000 in the U.S. Stock
Market Portfolio from
January 1, 2006
(commencement of
operations) through June 30,
2008, compared to the
MSCI U.S. Investable
Market 2500 Index®. | | 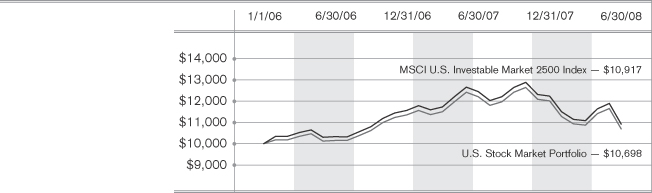 |
| | |
| | | This hypothetical example does not represent the returns of any particular investment. |
| | | | | | |
| | | |
| Performance Summary | | Average Annual Returns as of June 30, 2008 | | 1-Year | | Since
inception |
| | | |
| | | U.S. Stock Market Portfolio | | (12.35)% | | 2.73%1 |
| | | |
| | | MSCI U.S. Investable Market 2500 Index® | | (12.30)% | | 3.58%1 |
| | | |
| | | | |
| |
Performance data quoted represents past performance which is no guarantee of future results. Investment return and principal
value will fluctuate so that an investor’s shares, when redeemed, may be worth more or less than their original cost. Mutual fund
performance changes over time and current performance may be lower or higher than what is stated. Returns shown do not
reflect the deduction of taxes that a shareholder would pay on fund distributions or the redemption of fund shares. Mutual funds
are not obligations of, or guaranteed, by any bank and are not federally insured. The performance of the Portfolios assumes the
reinvestment of all dividends and distributions. The indexes above have been adjusted to reflect reinvestment of dividends on
securities in the indexes. The adviser is waiving a portion of its advisory fee and other operating expenses. Had the fees not been
waived or reimbursed, returns would have been lower. It is not possible to invest directly in an Index. For the most recent month-end performance and after-tax returns, visit www.aarpfunds.com or call 1-800-958-6457. 1 For the period from January 1, 2006 (commencement of operations) to June 30, 2008. Sources: MSCI Barra., AARP Financial |
| | | | |
| U.S. Stock Market Portfolio | | AARP PORTFOLIOS 2008 ANNUAL REPORT | | 5 |
US Stock Market Portfolio
Performance discussion
The Portfolio seeks to replicate the total return of the Morgan Stanley Capital International (“MSCI”) U.S. Investable Market 2500 Index.
For the 12-month period ended June 30, 2008 the U.S. Stock Market Portfolio returned -12.35% versus the benchmark return of -12.30%. The index return reflects all items in terms of income, gain, and loss and the reinvestment of dividends and other income.
During the last year, most of the sectors experienced negative returns. Financials (-38.80%), Consumer Discretionary (-27.70%), and Information Technology (-8%) had the most influence on index performance. Within the Financial sector, Fannie Mae (-69%), Citigroup (-66%), and Bank of America (-48%) had the largest impact. The Consumer Discretionary sector was influenced by Home Depot (-39%), Comcast (-33%), and Time Warner (-29%). Many companies impacted the performance of the Information Technology sector however, Motorola (-58%), Cisco 16%, and Microsoft (-5%) were the largest. The best performing sectors were Energy +28.50% and Materials +8.20%. Within the Energy sector Occidental Petroleum +58%, Chevron Corp +21%, and Exxon Mobil +7% were the largest contributors. Within the Materials sector, Mosaic +270%, Monsanto +89%, and Freeport McMoran +44% were the largest contributors.
The largest contributor to overall index performance was Chevron Corp., while the largest detractor was Citigroup.
The Portfolio invests in equities and futures contracts, and uses a sampling strategy to gain benchmark exposure. Stock level mis-weights tend to be under 2 basis points on a daily basis. Tracking error experienced is within expectations of a sampled portfolio and should continue to improve with asset growth.

MSCI U.S. Investable Market 2500 Index
This index serves as the benchmark for the U.S. Stock Market Portfolio. The index includes about 2,500 securities listed on the New York and American Stock Exchanges and the Nasdaq over-the-counter market. The stocks represent companies of all types and sizes. The index is unmanaged and you cannot directly invest in it. In addition, indexes do not have expenses.
| | | | |
| 6 | | AARP PORTFOLIOS 2008 ANNUAL REPORT | | International Stock Market Portfolio |
International Stock Market Portfolio
| | | | | | | | |
| |
Portfolio composition (As a percentage of net assets) |
| June 30, 2008 | | | | | | | | |
| | | | | |
Financials | | 24.0% | | | | Utilities | | 5.7% |
| |
Industrials | | 11.2% | | | | Telecommunication services | | 5.5% |
| |
Materials | | 11.1% | | | | Information technology | | 5.1% |
| |
Consumer discretionary | | 10.0% | | | | Cash equivalents | | 0.5% |
| |
Energy | | 9.6% | | | | Other assets and liabilities, net | | 3.4% |
| |
Consumer staples | | 7.1% | | | | Total net assets | | 100.0% |
| | | | | | | |
Health care | | 6.8% | | | | | | |
| | | | | | | |
See Notes to Financial Statements. | | | | | | | | |
| | |
| |
Performance as of June 30, 2008 |
| | |
| Growth of $10,000 This graph illustrates the
hypothetical investment of
$10,000 in the International
Stock Market Portfolio from
January 1, 2006
(commencement of
operations) through June 30,
2008, compared to the
MSCI EAFE Index®. | | 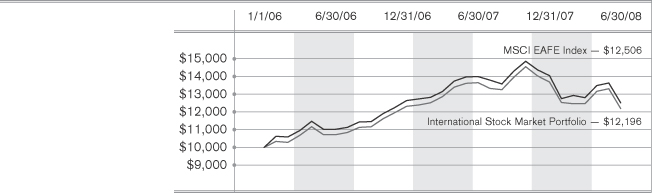 |
| | |
| | | This hypothetical example does not represent the returns of any particular investment. |
| | | | | | |
| | | |
| Performance Summary | | Average Annual Returns as of June 30, 2008 | | 1-Year | | Since
inception |
| | | |
| | | International Stock Market Portfolio | | (10.62)% | | 8.26%1 |
| | | |
| | | MSCI EAFE Index® | | (10.61)% | | 9.37%1 |
| | | |
| |
Performance data quoted represents past performance which is no guarantee of future results. Investment return and principal
value will fluctuate so that an investor’s shares, when redeemed, may be worth more or less than their original cost. Mutual fund
performance changes over time and current performance may be lower or higher than what is stated. Returns shown do not
reflect the deduction of taxes that a shareholder would pay on fund distributions or the redemption of fund shares. Mutual
funds are not obligations of, or guaranteed, by any bank and are not federally insured. The performance of the Portfolios
assumes the reinvestment of all dividends and distributions. The indexes above have been adjusted to reflect reinvestment of
dividends on securities in the indexes. The adviser is waiving a portion of its advisory fee and other operating expenses. Had the
fees not been waived or reimbursed, returns would have been lower. It is not possible to invest directly in an Index. For the most recent month-end performance and after-tax returns, visit www.aarpfunds.com or call 1-800-958-6457. 1 For the period from January 1, 2006 (commencement of operations) to June 30, 2008. Sources: MSCI Barra., AARP Financial |
| | | | |
| International Stock Market Portfolio | | AARP PORTFOLIOS 2008 ANNUAL REPORT | | 7 |
International Stock Market Portfolio
Performance discussion
The Portfolio seeks to replicate the total return of the MSCI EAFE index.
For the 12 month period ending June 30th, 2008 the International Stock Market portfolio returned -10.62% versus the benchmark return of -10.61%. The index return reflects all items in terms of income, gain, and loss and the reinvestment of dividends and other income.
Through the first half of 2007, sector returns in the MSCI EAFE Index were mostly negative (in USD terms). The major contributor was Materials (+11%) with Rio Tinto (+58%) in the U.K., Arcelor Mittal (+51%) in France, and BHP Billiton PLC (+39%) in Australia, contributing the most. Energy also provided significant help, returning over 10% during the period. Woodside Petroleum (+70%) in Australia, BG Group (+59%) in the U.K., and Total (+9%) in France led the way within the sector. Financials (-25%) was the worst performing sector in the index. HBOS (-70%) in the U.K., UBS AG (-61%) in Switzerland and The Royal Bank of Scotland (-57%) in the U.K. had the most impact in this sector.
The largest contributor to overall index performance was Rio Tinto at 0.16%. Rio Tinto is an international mining company. The largest detractor was UBS AG at .53%.
The Portfolio invests in equities and futures contracts, and uses a sampling strategy to gain benchmark exposure. Stock level mis-weights tend to be under 15 basis points on a daily basis. Tracking error experienced is within expectations of a sampled portfolio and should continue to improve with asset growth.
Country allocation
| | |
| | | Percentage
of net assets |
United Kingdom | | 20.9% |
Japan | | 20.5% |
France | | 9.6% |
Germany | | 8.8% |
Switzerland | | 6.8% |
Australia | | 6.6% |
Spain | | 3.9% |
Italy | | 3.6% |
Netherlands | | 2.6% |
Sweden | | 2.0% |
Finland | | 1.5% |
Hong Kong | | 1.7% |
United States | | 0.5% |
Belgium | | 1.0% |
Singapore | | 1.1% |
Norway | | 1.0% |
Denmark | | 1.0% |
Luxembourg | | 0.8% |
Greece | | 0.6% |
Ireland | | 0.6% |
Austria | | 0.6% |
Bermuda | | 0.4% |
Portugal | | 0.3% |
Cayman Islands | | 0.1% |
New Zealand | | 0.1% |
Other assets and liabilities | | 3.4% |
| | | |
Total net assets | | 100.0% |
MSCI EAFE Index
This index serves as the benchmark for the International Stock Market Portfolio. The index includes about 1,000 securities that are listed on the stock exchanges of 21 developed countries, excluding the United States and Canada. The index does not include emerging markets such as Brazil, Russia, India or China. In addition, indexes do not have expenses.
| | | | |
| 8 | | AARP PORTFOLIOS 2008 ANNUAL REPORT | | Understanding Your Expenses |
Understanding Your Expenses (unaudited)
As a shareholder of a Portfolio, you incur ongoing costs, including investment advisory fees, and other expenses of running a fund. It’s important to understand exactly how much you pay to purchase and own a fund and to compare the costs of owning different funds because these costs reduce your returns.
The example in the table on the next page is intended to help you to understand your ongoing costs in dollars of investing in an AARP Portfolio and to compare these costs with the ongoing costs of investing in other mutual funds. It is based on an investment of $1,000 invested at the beginning of the period and held for the entire period from January 1, 2008 to June 30, 2008.
Actual expenses
The first line for each Portfolio in the table on the next page provides information about actual account values and actual expenses. You may use the information in the first line, together with the amount you invested, to estimate the expenses that you incurred over the period. Simply divide your account value by $1,000 (for example, an $8,600 account value divided by $1,000 = 8.6), then multiply the result by the number in the first line under the heading entitled “Expenses paid during period” to estimate the expenses attributable to your investment during this period.
Hypothetical example for comparison purposes
The second line in the table on the next page labeled “Hypothetical”, helps you to compare the costs of an AARP Portfolio to other funds using a 5% return as required by the Securities and Exchange Commission for all mutual funds. It provides information about hypothetical account values and hypothetical expenses based on the Portfolio’s actual expense ratio and an assumed rate of return of 5% per year before expenses, which is not the Portfolio’s actual return. You should not use the hypothetical account values and expenses to estimate the actual ending account balance or your expenses for the period. Rather, these figures are required to be provided to enable you to compare the ongoing costs of investing in the Portfolio with other funds. To do so, compare this 5% hypothetical example with the 5% hypothetical examples that appear in the shareholder reports of the other funds.
| | | | |
| Understanding Your Expenses | | AARP PORTFOLIOS 2008 ANNUAL REPORT | | 9 |
Please note that the expenses shown in the table are meant to highlight your ongoing costs only. Therefore, the second line of the table is useful in comparing ongoing costs only, and will not help you determine the relative total costs of owning different funds. In addition, if these transaction costs were included, your costs would have been higher.
| | | | | | | | | |
| | | | |
| | | Beginning account value
1/1/08 | | Ending account value
6/30/08 | | Expenses paid
during period1 |
| |
U.S. Bond Market Portfolio | | | | | | | | | |
Actual | | $ | 1,000 | | $ | 1,011.40 | | $ | 1.25 |
Hypothetical | | $ | 1,000 | | $ | 1,023.62 | | $ | 1.26 |
(assuming a 5% return before expenses) | | | | | | | | | |
| |
U.S. Stock Market Portfolio | | | | | | | | | |
Actual | | $ | 1,000 | | $ | 890.90 | | $ | 1.18 |
Hypothetical | | $ | 1,000 | | $ | 1,023.62 | | $ | 1.26 |
(assuming a 5% return before expenses) | | | | | | | | | |
| |
International Stock Market Portfolio | | | | | | | | | |
Actual | | $ | 1,000 | | $ | 891.90 | | $ | 1.41 |
Hypothetical | | $ | 1,000 | | $ | 1,023.37 | | $ | 1.51 |
(assuming a 5% return before expenses) | | | | | | | | | |
| |
| |
1 Expenses reflect the Portfolio’s annualized net expense ratio multiplied by the average account value over the period, multiplied by 182/366 (to reflect the one-half year period). The annualized net expense ratios are as follows: U.S. Bond Market Portfolio 0.25%, U.S. Stock Market Portfolio 0.25% and International Stock Market Portfolio 0.30%. |
| | | | |
| 10 | | AARP PORTFOLIOS 2008 ANNUAL REPORT | | U.S. Bond Market Portfolio |
U.S. Bond Market Portfolio
June 30, 2008
| | | | | | |
| Portfolio of investments | | |
| | |
| | | Par amount | | Value |
| | | | | | |
|
Asset-Backed Securities–0.5% |
Capital Auto Receivables | | | | | | |
Asset Trust, 4.680%, 10/15/2012 | | $ | 25,000 | | $ | 25,077 |
Capital One Multi-Asset | | | | | | |
Execution Trust, 4.900%, 12/15/2017 | | | 25,000 | | | 21,116 |
Citibank Credit Card | | | | | | |
Issuance Trust, 4.900%, 12/12/2016 | | | 100,000 | | | 97,618 |
Citibank Credit Card | | | | | | |
Issuance Trust 2003-A10, 4.750%, 12/10/2015 | | | 15,000 | | | 14,729 |
Countrywide Asset-Backed | | | | | | |
Certificates, 4.454%, 10/25/2035 | | | 20,000 | | | 19,791 |
Detroit Edison | | | | | | |
Securitization Funding LLC, 6.190%, 3/1/2013 | | | 25,000 | | | 25,846 |
Ford Credit Auto Owner | | | | | | |
Trust, 5.240%, 7/15/2012 | | | 50,000 | | | 50,643 |
PSE&G Transition Funding | | | | | | |
LLC, 6.750%, 6/15/2016 | | | 10,000 | | | 10,795 |
Residential Asset | | | | | | |
Securities Corp., 3.870%, 5/25/2033 | | | 21,055 | | | 19,084 |
TXU Electric Delivery | | | | | | |
Transition Bond Co. LLC, 5.290%, 5/15/2018 | | | 50,000 | | | 49,967 |
| |
| Total Asset-Backed | | | | | | |
Securities–(Identified Cost $337,713) | | | 334,666 |
| |
| | |
Corporate Bonds–18.6% | | | | | | |
| Consumer Discretionary–2.0% |
Anheuser-Busch Cos., | | | | | | |
Inc., 6.450%, 9/1/2037 | | | 25,000 | | | 23,970 |
CBS Corp., 7.875%, | | | | | | |
7/30/2030 | | | 30,000 | | | 29,143 |
Clorox Co., 5.450%, | | | | | | |
10/15/2012 | | | 50,000 | | | 50,289 |
Coca-Cola Co., 5.350%, | | | | | | |
11/15/2017 | | | 25,000 | | | 25,246 |
| | | | |
| | | | |
Coca-Cola Enterprises, Inc., | | | | |
6.750%, 9/15/2028 | | 25,000 | | 26,643 |
Comcast Corp., | | | | |
5.900%, 3/15/2016 | | 50,000 | | 48,929 |
Comcast Corp., | | | | |
6.450%, 3/15/2037 | | 25,000 | | 23,340 |
Comcast Corp., | | | | |
6.950%, 8/15/2037 | | 50,000 | | 49,331 |
Costco Wholesale Corp., | | | | |
5.500%, 3/15/2017 | | 50,000 | | 50,842 |
COX Communications, | | | | |
Inc., 4.625%, 1/15/2010 | | 50,000 | | 49,742 |
DaimlerChrysler North | | | | |
America Holdings, 7.200%, 9/1/2009 | | 50,000 | | 51,442 |
DaimlerChrysler North | | | | |
America Holdings, 8.500%, 1/18/2031 | | 25,000 | | 28,983 |
DaimlerChrysler North | | | | |
America Holdings Senior Note, 6.500%, 11/15/2013 | | 50,000 | | 51,907 |
1Dr Pepper Snapple Group, | | | | |
Inc., 6.120%, 5/1/2013 | | 100,000 | | 101,467 |
Home Depot, Inc., | | | | |
5.400%, 3/1/2016 | | 50,000 | | 45,983 |
Kohl’s Corp., 6.250%, | | | | |
12/15/2017 | | 25,000 | | 23,876 |
Lowe’s Cos., Inc., 5.800%, | | | | |
10/15/2036 | | 25,000 | | 22,791 |
May Department Stores | | | | |
Co., 6.700%, 7/15/2034 | | 25,000 | | 20,703 |
News America Holdings, | | | | |
Inc., 9.250%, 2/1/2013 | | 60,000 | | 68,811 |
News America, Inc. Senior | | | | |
Note, 6.150%, 3/1/2037 | | 25,000 | | 23,092 |
Target Corp. Note, | | | | |
5.875%, 3/1/2012 | | 50,000 | | 52,152 |
Time Warner Cable, Inc., | | | | |
5.850%, 5/1/2017 | | 50,000 | | 47,570 |
Time Warner, Inc., | | | | |
5.875%, 11/15/2016 | | 25,000 | | 23,612 |
Time Warner, Inc., | | | | |
7.700%, 5/1/2032 | | 50,000 | | 51,331 |
United Parcel Service, Inc., | | | | |
6.200%, 1/15/2038 | | 25,000 | | 25,426 |
Viacom, Inc. Senior Note, | | | | |
5.750%, 4/30/2011 | | 100,000 | | 100,298 |
| | | | |
| U.S. Bond Market Portfolio | | AARP PORTFOLIOS 2008 ANNUAL REPORT | | 11 |
| | | | | | |
| Portfolio of investments | | |
| | |
| | | Par amount | | Value |
| | | | | | |
| |
Corporate Bonds (continued) | | | |
| Consumer Discretionary (continued) |
Wal-Mart Stores, Inc., | | | | | | |
4.125%, 7/1/2010 | | $ | 50,000 | | $ | 50,688 |
Wal-Mart Stores, Inc., | | | | | | |
5.000%, 4/5/2012 | | | 100,000 | | | 103,752 |
Wal-Mart Stores, Inc., | | | | | | |
5.250%, 9/1/2035 | | | 25,000 | | | 21,794 |
| |
Total | | | | | | 1,293,153 |
| |
|
| Consumer Staples–0.9% |
Archer-Daniels-Midland | | | | | | |
Co., 7.000%, 2/1/2031 | | | 25,000 | | | 27,012 |
ConAgra Foods, Inc., | | | | | | |
7.000%, 10/1/2028 | | | 25,000 | | | 25,807 |
CVS Caremark Corp., | | | | | | |
6.250%, 6/1/2027 | | | 25,000 | | | 24,550 |
General Mills, Inc., | | | | | | |
6.000%, 2/15/2012 | | | 50,000 | | | 51,455 |
H.J. Heinz Finance Co., | | | | | | |
6.000%, 3/15/2012 | | | 25,000 | | | 25,747 |
Hershey Co., 4.850%, | | | | | | |
8/15/2015 | | | 25,000 | | | 24,490 |
Kraft Foods, Inc., 6.125%, | | | | | | |
2/1/2018 | | | 25,000 | | | 24,345 |
Kraft Foods, Inc., | | | | | | |
6.250%, 6/1/2012 | | | 50,000 | | | 51,123 |
Kroger Co., 5.500%, | | | | | | |
2/1/2013 | | | 50,000 | | | 50,208 |
McDonald’s Corp., | | | | | | |
6.300%, 3/1/2038 | | | 50,000 | | | 49,696 |
Procter & Gamble Co., | | | | | | |
5.550%, 3/5/2037 | | | 25,000 | | | 24,113 |
Procter & Gamble Co. | | | | | | |
Global Note, 6.875%, 9/15/2009 | | | 100,000 | | | 104,236 |
Xerox Corp., 6.350%, | | | | | | |
5/15/2018 | | | 50,000 | | | 49,444 |
Yum! Brands, Inc., | | | | | | |
6.250%, 3/15/2018 | | | 50,000 | | | 48,842 |
| |
Total | | | | | | 581,068 |
| |
|
| Energy–1.7% |
Alberta Energy Co. Ltd., | | | | | | |
8.125%, 9/15/2030 | | | 25,000 | | | 28,487 |
| | | | |
| | | | |
Anadarko Petroleum Corp., | | | | |
5.950%, 9/15/2016 | | 25,000 | | 25,054 |
Apache Corp., 6.000%, | | | | |
1/15/2037 | | 50,000 | | 49,227 |
Appalachian Power Co., | | | | |
5.000%, 6/1/2017 | | 10,000 | | 9,058 |
Boardwalk Pipelines LLC, | | | | |
5.500%, 2/1/2017 | | 20,000 | | 18,668 |
Canadian Natural Resources | | | | |
Ltd., 5.700%, 5/15/2017 | | 25,000 | | 24,533 |
ConocoPhillips, 4.400%, | | | | |
5/15/2013 | | 100,000 | | 98,212 |
ConocoPhillips Canada | | | | |
Funding Co., 5.625%, 10/15/2016 | | 50,000 | | 51,023 |
ConocoPhillips Canada | | | | |
Funding Co., 5.950%, 10/15/2036 | | 25,000 | | 24,980 |
El Paso Natural Gas Co., | | | | |
5.950%, 4/15/2017 | | 50,000 | | 48,497 |
EnCana Corp., | | | | |
4.750%, 10/15/2013 | | 25,000 | | 24,026 |
Enterprise Products | | | | |
Operating LP, 4.625%, 10/15/2009 | | 50,000 | | 49,836 |
Enterprise Products | | | | |
Operating LP, 6.875%, 3/1/2033 | | 10,000 | | 9,847 |
FirstEnergy Corp., | | | | |
6.450%, 11/15/2011 | | 25,000 | | 25,672 |
FirstEnergy Corp., | | | | |
7.375%, 11/15/2031 | | 20,000 | | 21,811 |
Hess Corp., 7.300%, | | | | |
8/15/2031 | | 25,000 | | 28,003 |
KeySpan Corp., 8.000%, | | | | |
11/15/2030 | | 25,000 | | 27,626 |
Kinder Morgan Energy | | | | |
Partners LP, 5.000%, 12/15/2013 | | 25,000 | | 23,988 |
Kinder Morgan Energy | | | | |
Partners LP, 5.800%, 3/15/2035 | | 100,000 | | 87,034 |
Kinder Morgan Energy | | | | |
Partners LP, 6.000%, 2/1/2017 | | 25,000 | | 24,743 |
Marathon Oil Corp., | | | | |
6.600%, 10/1/2037 | | 25,000 | | 24,725 |
Murphy Oil Corp., | | | | |
6.375%, 5/1/2012 | | 25,000 | | 25,654 |
| | | | |
| 12 | | AARP PORTFOLIOS 2008 ANNUAL REPORT | | U.S. Bond Market Portfolio |
U.S. Bond Market Portfolio (continued)
June 30, 2008
| | | | | | |
| Portfolio of investments | | |
| | |
| | | Par amount | | Value |
| | | | | | |
| |
Corporate Bonds (continued) | | | |
| Energy (continued) |
Pemex Project Funding | | | | | | |
Master Trust, 6.625%, 6/15/2035 | | $ | 25,000 | | $ | 24,790 |
Petro-Canada, 7.000%, | | | | | | |
11/15/2028 | | | 25,000 | | | 25,111 |
Plains All American | | | | | | |
Pipeline LP, 6.650%, 1/15/2037 | | | 25,000 | | | 23,386 |
Progress Energy, Inc., | | | | | | |
6.850%, 4/15/2012 | | | 50,000 | | | 52,794 |
Progress Energy, Inc., | | | | | | |
7.750%, 3/1/2031 | | | 25,000 | | | 28,650 |
TransCanada Pipelines | | | | | | |
Ltd., 6.200%, 10/15/2037 | | | 20,000 | | | 18,392 |
TransCanada Pipelines | | | | | | |
Ltd., 9.875%, 1/1/2021 | | | 25,000 | | | 32,515 |
Transocean, Inc., | | | | | | |
6.000%, 3/15/2018 | | | 25,000 | | | 25,083 |
Valero Energy Corp., | | | | | | |
7.500%, 4/15/2032 | | | 25,000 | | | 25,372 |
Williams Cos, Inc., | | | | | | |
7.125%, 9/1/2011 | | | 50,000 | | | 52,000 |
XTO Energy, Inc., | | | | | | |
6.100%, 4/1/2036 | | | 25,000 | | | 23,889 |
| |
Total | | | | | | 1,082,686 |
| |
|
| Financials–8.4% |
Allstate Corp., 5.950%, | | | | | | |
4/1/2036 | | | 25,000 | | | 22,114 |
American Express Co., | | | | | | |
7.000%, 3/19/2018 | | | 100,000 | | | 101,405 |
American General Finance | | | | | | |
Corp., 5.400%, 12/1/2015 | | | 20,000 | | | 16,998 |
American International | | | | | | |
Group, Inc., 6.250%, 5/1/2036 | | | 25,000 | | | 21,881 |
Ameritech Capital Funding, | | | | | | |
6.550%, 1/15/2028 | | | 20,000 | | | 19,314 |
BAC Capital Trust XI, | | | | | | |
6.625%, 5/23/2036 | | | 25,000 | | | 23,116 |
| | | | |
| | | | |
Bank of America Corp., | | | | |
4.750%, 8/15/2013 | | 100,000 | | 94,957 |
Bank of America Corp., | | | | |
5.625%, 10/14/2016 | | 50,000 | | 47,986 |
Bank of America Corp., | | | | |
7.800%, 2/15/2010 | | 50,000 | | 52,205 |
Bank of America NA, | | | | |
5.300%, 3/15/2017 | | 50,000 | | 45,975 |
Bank of America NA, | | | | |
6.000%, 10/15/2036 | | 25,000 | | 22,229 |
BB&T Corp., 5.250%, | | | | |
11/1/2019 | | 25,000 | | 21,470 |
Bear Stearns Cos., Inc., | | | | |
4.500%, 10/28/2010 | | 50,000 | | 49,401 |
Bear Stearns Cos., Inc., | | | | |
5.300%, 10/30/2015 | | 30,000 | | 28,123 |
Berkshire Hathaway Finance | | | | |
Corp., 4.850%, 1/15/2015 | | 10,000 | | 9,863 |
Capital One Capital IV, | | | | |
6.745%, 2/17/2037 | | 25,000 | | 18,727 |
Chubb Corp., 6.000%, | | | | |
11/15/2011 | | 10,000 | | 10,146 |
Cincinnati Financial Corp., | | | | |
6.920%, 5/15/2028 | | 10,000 | | 9,920 |
CIT Group, Inc., 5.000%, | | | | |
2/1/2015 | | 25,000 | | 17,309 |
Citigroup, Inc., 4.125%, | | | | |
2/22/2010 | | 100,000 | | 99,113 |
Citigroup, Inc., 5.000%, | | | | |
9/15/2014 | | 100,000 | | 92,737 |
Citigroup, Inc., 5.500%, | | | | |
4/11/2013 | | 100,000 | | 97,699 |
Citigroup, Inc., 5.850%, | | | | |
12/11/2034 | | 50,000 | | 42,248 |
Citigroup, Inc., 6.125%, | | | | |
5/15/2018 | | 100,000 | | 95,870 |
Citigroup, Inc. Global Senior | | | | |
Note, 6.500%, 1/18/2011 | | 100,000 | | 102,902 |
CNA Financial Corp., | | | | |
6.000%, 8/15/2011 | | 25,000 | | 25,127 |
Countrywide Financial Corp., | | | | |
4.500%, 6/15/2010 | | 50,000 | | 46,553 |
Countrywide Financial Corp., | | | | |
5.800%, 6/7/2012 | | 25,000 | | 23,665 |
Credit Suisse, 6.000%, | | | | |
2/15/2018 | | 50,000 | | 48,232 |
Credit Suisse USA, Inc., | | | | |
5.125%, 8/15/2015 | | 100,000 | | 96,014 |
| | | | |
| U.S. Bond Market Portfolio | | AARP PORTFOLIOS 2008 ANNUAL REPORT | | 13 |
| | | | | | |
| Portfolio of investments | | |
| | |
| | | Par amount | | Value |
| | | | | | |
| |
Corporate Bonds (continued) | | | |
| Financials (continued) |
Credit Suisse USA, Inc., | | | | | | |
5.250%, 3/2/2011 | | $ | 50,000 | | $ | 50,512 |
Devon Financing Corp. | | | | | | |
ULC, 6.875%, 9/30/2011 | | | 50,000 | | | 53,106 |
Discover Financial | | | | | | |
Services, 6.450%, 6/12/2017 | | | 25,000 | | | 21,163 |
Fifth Third Bancorp, | | | | | | |
8.250%, 3/1/2038 | | | 50,000 | | | 40,601 |
Financing Corp. (FICO), | | | | | | |
9.650%, 11/2/2018 | | | 25,000 | | | 34,755 |
General Electric Capital | | | | | | |
Corp., 5.400%, 2/15/2017 | | | 50,000 | | | 48,614 |
General Electric Capital | | | | | | |
Corp., 5.875%, 2/15/2012 | | | 150,000 | | | 155,748 |
General Electric Capital | | | | | | |
Corp., 5.875%, 1/14/2038 | | | 50,000 | | | 45,463 |
General Electric Capital | | | | | | |
Corp., 6.750%, 3/15/2032 | | | 60,000 | | | 60,595 |
General Electric Insurance | | | | | | |
Solutions Corp., 7.000%, 2/15/2026 | | | 50,000 | | | 50,531 |
Goldman Sachs Group, | | | | | | |
Inc., 5.125%, 1/15/2015 | | | 50,000 | | | 47,925 |
Goldman Sachs Group, | | | | | | |
Inc., 5.450%, 11/1/2012 | | | 100,000 | | | 99,844 |
Goldman Sachs Group, | | | | | | |
Inc., 5.950%, 1/15/2027 | | | 30,000 | | | 25,934 |
Goldman Sachs Group, | | | | | | |
Inc., 6.125%, 2/15/2033 | | | 25,000 | | | 22,461 |
Goldman Sachs Group, | | | | | | |
Inc., 6.150%, 4/1/2018 | | | 50,000 | | | 48,595 |
Goldman Sachs Group, | | | | | | |
Inc., 6.345%, 2/15/2034 | | | 15,000 | | | 12,753 |
Goldman Sachs Group, | | | | | | |
Inc., 6.750%, 10/1/2037 | | | 25,000 | | | 22,938 |
Goldman Sachs Group, | | | | | | |
Inc., 6.875%, 1/15/2011 | | | 50,000 | | | 51,934 |
| | | | |
| | | | |
Goldman Sachs Group, Inc., | | | | |
7.800%, 1/28/2010 | | 10,000 | | 10,453 |
Hartford Financial Services | | | | |
Group, Inc., 6.100%, 10/1/2041 | | 25,000 | | 22,008 |
HSBC Finance Corp., | | | | |
4.750%, 7/15/2013 | | 100,000 | | 95,619 |
HSBC Finance Corp., | | | | |
5.000%, 6/30/2015 | | 25,000 | | 23,665 |
HSBC Finance Corp., | | | | |
6.375%, 11/27/2012 | | 100,000 | | 102,638 |
Inter-American Development | | | | |
Bank, 5.000%, 4/5/2011 | | 100,000 | | 103,724 |
International Lease Finance | | | | |
Corp., 5.450%, 3/24/2011 | | 100,000 | | 94,033 |
International Lease Finance | | | | |
Corp., 5.650%, 6/1/2014 | | 50,000 | | 43,486 |
iStar Financial, Inc., 5.650%, | | | | |
9/15/2011 | | 25,000 | | 21,390 |
JPMorgan Chase Capital XV, | | | | |
5.875%, 3/15/2035 | | 25,000 | | 20,690 |
JPMorgan Chase Capital | | | | |
XVIII, 6.950%, 8/17/2036 | | 25,000 | | 23,128 |
JP Morgan Chase Capital | | | | |
XXV, 6.800%, 10/1/2037 | | 50,000 | | 45,012 |
JPMorgan Chase & Co., | | | | |
6.000%, 1/15/2018 | | 25,000 | | 24,397 |
JPMorgan Chase & Co., | | | | |
6.625%, 3/15/2012 | | 100,000 | | 103,206 |
JPMorgan Chase & Co., | | | | |
7.000%, 11/15/2009 | | 100,000 | | 102,249 |
Keycorp, 6.500%, | | | | |
5/14/2013 | | 100,000 | | 89,376 |
Lazard Group, 6.850%, | | | | |
6/15/2017 | | 50,000 | | 44,170 |
Lehman Brothers Holdings, | | | | |
Inc., 5.500%, 4/4/2016 | | 50,000 | | 45,224 |
Lehman Brothers Holdings, | | | | |
Inc., 6.750%, 12/28/2017 | | 25,000 | | 23,526 |
Lehman Brothers Holdings, | | | | |
Inc., 6.875%, 5/2/2018 | | 65,000 | | 63,037 |
Lehman Brothers Holdings, | | | | |
Inc., 6.875%, 7/17/2037 | | 25,000 | | 21,581 |
Lehman Brothers Holdings, | | | | |
Inc., 7.500%, 5/11/2038 | | 20,000 | | 18,604 |
Lehman Brothers Holdings, | | | | |
Inc., 7.875%, 8/15/2010 | | 25,000 | | 25,734 |
| | | | |
| 14 | | AARP PORTFOLIOS 2008 ANNUAL REPORT | | U.S. Bond Market Portfolio |
U.S. Bond Market Portfolio (continued)
June 30, 2008
| | | | | | |
| Portfolio of investments | | |
| | |
| | | Par amount | | Value |
| | | | | | |
| |
Corporate Bonds (continued) | | | |
| Financials (continued) |
Liberty Property LP, | | | | | | |
6.625%, 10/1/2017 | | $ | 50,000 | | $ | 46,827 |
Marshall & Ilsley Corp., | | | | | | |
5.350%, 4/1/2011 | | | 50,000 | | | 48,321 |
Merrill Lynch & Co., Inc., | | | | | | |
4.500%, 11/4/2010 | | | 100,000 | | | 97,503 |
Merrill Lynch & Co., Inc., | | | | | | |
5.000%, 2/3/2014 | | | 50,000 | | | 45,336 |
Merrill Lynch & Co., Inc., | | | | | | |
5.700%, 5/2/2017 | | | 50,000 | | | 44,095 |
Merrill Lynch & Co., Inc., | | | | | | |
6.150%, 4/25/2013 | | | 100,000 | | | 97,019 |
MetLife, Inc., 5.000%, | | | | | | |
6/15/2015 | | | 50,000 | | | 48,646 |
MetLife, Inc., 5.700%, | | | | | | |
6/15/2035 | | | 10,000 | | | 8,846 |
MetLife, Inc., 6.125%, | | | | | | |
12/1/2011 | | | 10,000 | | | 10,420 |
MetLife, Inc., 6.400%, | | | | | | |
12/15/2036 | | | 25,000 | | | 21,894 |
Morgan Stanley, 5.375%, | | | | | | |
10/15/2015 | | | 100,000 | | | 91,625 |
Morgan Stanley, 5.625%, | | | | | | |
1/9/2012 | | | 100,000 | | | 100,153 |
Morgan Stanley, 5.950%, | | | | | | |
12/28/2017 | | | 100,000 | | | 90,940 |
PNC Bank NA, 4.875%, | | | | | | |
9/21/2017 | | | 50,000 | | | 43,961 |
PNC Funding Corp., | | | | | | |
5.625%, 2/1/2017 | | | 50,000 | | | 46,703 |
Principal Life Income | | | | | | |
Funding Trusts, 5.125%, 3/1/2011 | | | 100,000 | | | 98,700 |
ProLogis, 5.500%, | | | | | | |
4/1/2012 | | | 50,000 | | | 48,868 |
Prudential Financial, Inc., | | | | | | |
4.500%, 7/15/2013 | | | 50,000 | | | 47,384 |
Prudential Financial, Inc., | | | | | | |
6.000%, 12/1/2017 | | | 50,000 | | | 49,536 |
Realty Income Corp., | | | | | | |
5.950%, 9/15/2016 | | | 25,000 | | | 22,534 |
Simon Property Group LP, | | | | | | |
5.100%, 6/15/2015 | | | 25,000 | | | 22,654 |
| | | | |
| | | | |
Simon Property Group LP, | | | | |
5.300%, 5/30/2013 | | 50,000 | | 49,244 |
SLM Corp., 5.400%, | | | | |
10/25/2011 | | 25,000 | | 22,847 |
Sovereign Bank, 5.125%, | | | | |
3/15/2013 | | 25,000 | | 19,950 |
Transatlantic Holdings, Inc., | | | | |
5.750%, 12/14/2015 | | 20,000 | | 18,765 |
Travelers Cos., Inc., | | | | |
5.500%, 12/1/2015 | | 25,000 | | 24,713 |
Travelers Cos., Inc., | | | | |
5.750%, 12/15/2017 | | 25,000 | | 24,308 |
Unilever Capital Corp., | | | | |
7.125%, 11/1/2010 | | 50,000 | | 53,385 |
Vornado Realty LP, | | | | |
5.600%, 2/15/2011 | | 25,000 | | 24,002 |
Wachovia Bank NA, | | | | |
4.875%, 2/1/2015 | | 50,000 | | 45,452 |
Wachovia Bank NA, | | | | |
6.600%, 1/15/2038 | | 25,000 | | 21,850 |
Wachovia Corp., | | | | |
5.625%, 10/15/2016 | | 50,000 | | 45,537 |
Wachovia Corp., | | | | |
5.700%, 8/1/2013 | | 50,000 | | 47,985 |
Washington Mutual Bank, | | | | |
5.500%, 1/15/2013 | | 100,000 | | 80,076 |
Wells Fargo Bank NA, | | | | |
5.750%, 5/16/2016 | | 100,000 | | 99,374 |
Wells Fargo & Co., | | | | |
5.250%, 10/23/2012 | | 50,000 | | 50,328 |
Wells Fargo & Co., | | | | |
5.625%, 12/11/2017 | | 25,000 | | 24,232 |
Western Union Co., | | | | |
5.400%, 11/17/2011 | | 50,000 | | 49,765 |
Western Union Co., | | | | |
5.930%, 10/1/2016 | | 35,000 | | 34,382 |
Willis North America, Inc., | | | | |
5.625%, 7/15/2015 | | 25,000 | | 22,509 |
| |
Total | | | | 5,354,390 |
| |
|
| Health Care–1.2% |
Abbott Laboratories, | | | | |
5.600%, 5/15/2011 | | 50,000 | | 52,321 |
Aetna, Inc., 6.625%, | | | | |
6/15/2036 | | 35,000 | | 33,713 |
AmerisourceBergen Corp., | | | | |
5.875%, 9/15/2015 | | 10,000 | | 9,818 |
| | | | |
| U.S. Bond Market Portfolio | | AARP PORTFOLIOS 2008 ANNUAL REPORT | | 15 |
| | | | | | |
| Portfolio of investments | | |
| | |
| | | Par amount | | Value |
| | | | | | |
| |
Corporate Bonds (continued) | | | |
| Health Care (continued) |
Amgen, Inc., 5.850%, | | | | | | |
6/1/2017 | | $ | 25,000 | | $ | 24,666 |
Amgen, Inc., 6.375%, | | | | | | |
6/1/2037 | | | 25,000 | | | 23,950 |
Baxter International, Inc., | | | | | | |
4.625%, 3/15/2015 | | | 10,000 | | | 9,530 |
Baxter International, Inc., | | | | | | |
5.900%, 9/1/2016 | | | 50,000 | | | 51,280 |
Bristol-Myers Squibb Co., | | | | | | |
5.450%, 5/1/2018 | | | 50,000 | | | 49,416 |
Bristol-Myers Squibb Co., | | | | | | |
5.875%, 11/15/2036 | | | 25,000 | | | 23,399 |
Eli Lilly & Co., 5.200%, | | | | | | |
3/15/2017 | | | 50,000 | | | 50,009 |
GlaxoSmithKline Capital, | | | | | | |
Inc., 5.650%, 5/15/2018 | | | 100,000 | | | 99,805 |
Johnson & Johnson, | | | | | | |
4.950%, 5/15/2033 | | | 10,000 | | | 9,164 |
Rohm & Haas Co., | | | | | | |
7.850%, 7/15/2029 | | | 50,000 | | | 53,976 |
Schering-Plough Corp., | | | | | | |
6.000%, 9/15/2017 | | | 50,000 | | | 49,463 |
Teva Pharmaceutical | | | | | | |
Finance LLC, 5.550%, 2/1/2016 | | | 10,000 | | | 9,786 |
Teva Pharmaceutical | | | | | | |
Finance LLC, 6.150%, 2/1/2036 | | | 10,000 | | | 9,605 |
UnitedHealth Group, Inc., | | | | | | |
5.250%, 3/15/2011 | | | 50,000 | | | 49,799 |
UnitedHealth Group, Inc., | | | | | | |
6.000%, 11/15/2017 | | | 25,000 | | | 24,242 |
WellPoint, Inc., | | | | | | |
6.375%, 1/15/2012 | | | 90,000 | | | 92,151 |
Wyeth, 5.500%, | | | | | | |
2/15/2016 | | | 25,000 | | | 25,165 |
Wyeth, 7.250%, | | | | | | |
3/1/2023 | | | 25,000 | | | 26,912 |
| |
Total | | | | | | 778,170 |
| |
| | |
| Industrials–1.4% | | | | | | |
Boeing Capital Corp. Ltd., | | | | | | |
6.500%, 2/15/2012 | | | 50,000 | | | 53,109 |
| | | | |
| | | | |
Burlington Northern Santa Fe | | | | |
Corp., 5.900%, 7/1/2012 | | 50,000 | | 51,456 |
Canadian Pacific Railway Co., | | | | |
5.950%, 5/15/2037 | | 25,000 | | 20,808 |
Caterpillar Financial Services | | | | |
Corp., 4.250%, 2/8/2013 | | 50,000 | | 48,914 |
Caterpillar Financial Services | | | | |
Corp., 5.125%, 10/12/2011 | | 50,000 | | 51,378 |
Caterpillar, Inc., 6.625%, | | | | |
7/15/2028 | | 10,000 | | 10,644 |
Cooper US, Inc., 6.100%, | | | | |
7/1/2017 | | 25,000 | | 25,423 |
CSX Corp., 6.250%, | | | | |
3/15/2018 | | 25,000 | | 24,109 |
Dover Corp., 5.450%, | | | | |
3/15/2018 | | 25,000 | | 24,528 |
Dun & Bradstreet Corp., | | | | |
5.500%, 3/15/2011 | | 50,000 | | 50,209 |
Emerson Electric Co., | | | | |
5.375%, 10/15/2017 | | 25,000 | | 25,034 |
FedEx Corp., 5.500%, | | | | |
8/15/2009 | | 20,000 | | 20,117 |
Honeywell International, Inc., | | | | |
5.300%, 3/1/2018 | | 50,000 | | 49,346 |
Honeywell International, Inc., | | | | |
5.400%, 3/15/2016 | | 25,000 | | 25,415 |
Honeywell International, Inc., | | | | |
5.700%, 3/15/2036 | | 25,000 | | 23,716 |
Honeywell International, Inc., | | | | |
7.500%, 3/1/2010 | | 50,000 | | 53,223 |
International Business | | | | |
Machines Corp., 6.500%, 1/15/2028 | | 50,000 | | 51,198 |
Lockheed Martin Corp., | | | | |
4.121%, 3/14/2013 | | 25,000 | | 24,301 |
Lockheed Martin Corp., | | | | |
7.750%, 5/1/2026 | | 25,000 | | 28,569 |
Norfolk Southern Corp., | | | | |
7.700%, 5/15/2017 | | 10,000 | | 11,150 |
Norfolk Southern Corp., | | | | |
7.800%, 5/15/2027 | | 15,000 | | 16,881 |
Northrop Grumman Corp., | | | | |
7.750%, 2/15/2031 | | 15,000 | | 17,711 |
Philip Morris International, | | | | |
Inc., 5.650%, 5/16/2018 | | 50,000 | | 48,689 |
Pitney Bowes, Inc., 5.750%, | | | | |
9/15/2017 | | 25,000 | | 24,901 |
| | | | |
| 16 | | AARP PORTFOLIOS 2008 ANNUAL REPORT | | U.S. Bond Market Portfolio |
U.S. Bond Market Portfolio (continued)
June 30, 2008
| | | | | | |
| Portfolio of investments | | |
| | |
| | | Par amount | | Value |
| | | | | | |
| |
Corporate Bonds (continued) | | | |
| Industrials (continued) | | | |
Southwest Airlines Co., | | | | | | |
5.250%, 10/1/2014 | | $ | 50,000 | | $ | 46,006 |
Tyco Electronics Group | | | | | | |
SA, 6.000%, 10/1/2012 | | | 50,000 | | | 50,533 |
Tyco International Group | | | | | | |
SA, 6.000%, 11/15/2013 | | | 25,000 | | | 24,150 |
Waste Management, Inc., | | | | | | |
6.375%, 11/15/2012 | | | 25,000 | | | 25,676 |
| |
Total | | | | | | 927,194 |
| |
|
| Information Technology–0.5% |
Cisco Systems, Inc., | | | | | | |
5.250%, 2/22/2011 | | | 100,000 | | | 103,022 |
Electronic Data Systems | | | | | | |
Corp., 6.500%, 8/1/2013 | | | 25,000 | | | 25,704 |
Hewlett-Packard Co., | | | | | | |
5.250%, 3/1/2012 | | | 25,000 | | | 25,634 |
Oracle Corp. and Ozark | | | | | | |
Holding, Inc., 5.250%, 1/15/2016 | | | 50,000 | | | 49,274 |
Science Applications | | | | | | |
International Corp., 6.250%, 7/1/2012 | | | 20,000 | | | 20,774 |
United Technologies Corp., | | | | | | |
6.050%, 6/1/2036 | | | 25,000 | | | 24,851 |
Xerox Corp., 5.500%, | | | | | | |
5/15/2012 | | | 50,000 | | | 49,465 |
| |
Total | | | | | | 298,724 |
| |
|
| Materials–0.4% |
Alcoa, Inc., 5.900%, | | | | | | |
2/1/2027 | | | 25,000 | | | 22,247 |
Alcoa, Inc., 7.375%, | | | | | | |
8/1/2010 | | | 25,000 | | | 26,385 |
Dow Chemical Co., | | | | | | |
6.000%, 10/1/2012 | | | 50,000 | | | 51,857 |
EI Du Pont de Nemours & | | | | | | |
Co., 5.600%, 12/15/2036 | | | 25,000 | | | 23,465 |
Falconbridge Ltd., | | | | | | |
5.500%, 6/15/2017 | | | 25,000 | | | 23,126 |
| | | | |
| | | | |
Vale Overseas Ltd., | | | | |
6.875%, 11/21/2036 | | 50,000 | | 46,687 |
Weyerhaeuser Co., | | | | |
7.375%, 3/15/2032 | | 50,000 | | 49,731 |
| |
Total | | | | 243,498 |
| |
|
| Telecommunication Services–0.8% |
AT&T Wireless Services, Inc., | | | | |
8.125%, 5/1/2012 | | 50,000 | | 54,810 |
AT&T, Inc., 6.150%, | | | | |
9/15/2034 | | 25,000 | | 23,432 |
AT&T, Inc., 6.300%, | | | | |
1/15/2038 | | 25,000 | | 23,695 |
AT&T, Inc., 6.400%, | | | | |
5/15/2038 | | 50,000 | | 48,019 |
AT&T, Inc., 6.800%, | | | | |
5/15/2036 | | 25,000 | | 25,128 |
BellSouth Capital Funding | | | | |
Corp., 7.875%, 2/15/2030 | | 25,000 | | 27,690 |
BellSouth Corp., 5.200%, | | | | |
9/15/2014 | | 30,000 | | 29,603 |
BellSouth Corp., 6.000%, | | | | |
11/15/2034 | | 10,000 | | 9,187 |
EMBARQ Corp., 6.738%, | | | | |
6/1/2013 | | 50,000 | | 48,294 |
Motorola, Inc., 6.000%, | | | | |
11/15/2017 | | 25,000 | | 21,890 |
SBC Communications, Inc. | | | | |
Global Note, 6.250%, 3/15/2011 | | 50,000 | | 51,733 |
Verizon Communications, | | | | |
Inc., 5.500%, 2/15/2018 | | 50,000 | | 47,653 |
Verizon Communications, | | | | |
Inc., 5.550%, 2/15/2016 | | 50,000 | | 48,777 |
Verizon Global Funding | | | | |
Corp., 5.850%, 9/15/2035 | | 10,000 | | 8,842 |
Verizon Global Funding | | | | |
Corp., 7.750%, 12/1/2030 | | 25,000 | | 26,931 |
Verizon New England, Inc., | | | | |
6.500%, 9/15/2011 | | 30,000 | | 30,856 |
| |
Total | | | | 526,540 |
| |
|
| Utilities–1.3% |
Arizona Public Service Co., | | | | |
6.500%, 3/1/2012 | | 10,000 | | 10,092 |
Carolina Power & Light Co., | | | | |
5.125%, 9/15/2013 | | 10,000 | | 10,074 |
| | | | |
| U.S. Bond Market Portfolio | | AARP PORTFOLIOS 2008 ANNUAL REPORT | | 17 |
| | | | | | |
| Portfolio of investments | | |
| | |
| | | Par amount | | Value |
| | | | | | |
| |
Corporate Bonds (continued) | | | |
| Utilities (continued) |
CenterPoint Energy | | | | | | |
Resources Corp., 6.000%, 5/15/2018 | | $ | 25,000 | | $ | 24,005 |
Cincinnati Gas & Electric, | | | | | | |
5.700%, 9/15/2012 | | | 50,000 | | | 50,851 |
Columbus Southern Power | | | | | | |
Co., 6.600%, 3/1/2033 | | | 25,000 | | | 23,949 |
Commonwealth Edison | | | | | | |
Co., 5.900%, 3/15/2036 | | | 25,000 | | | 22,644 |
Commonwealth Edison | | | | | | |
Co., 6.150%, 9/15/2017 | | | 50,000 | | | 49,949 |
Consolidated Edison Co. | | | | | | |
of New York, 4.875%, 2/1/2013 | | | 50,000 | | | 49,462 |
Consolidated Edison Co. | | | | | | |
of New York, Inc., 6.300%, 8/15/2037 | | | 25,000 | | | 24,482 |
Constellation Energy | | | | | | |
Group, 7.000%, 4/1/2012 | | | 50,000 | | | 51,884 |
Dominion Resources, Inc., | | | | | | |
5.150%, 7/15/2015 | | | 15,000 | | | 14,316 |
Dominion Resources, Inc., | | | | | | |
6.000%, 11/30/2017 | | | 50,000 | | | 49,456 |
Exelon Corp., 4.450%, | | | | | | |
6/15/2010 | | | 25,000 | | | 24,790 |
Exelon Corp., 5.625%, | | | | | | |
6/15/2035 | | | 15,000 | | | 12,970 |
Florida Power & Light Co., | | | | | | |
4.950%, 6/1/2035 | | | 25,000 | | | 21,462 |
MidAmerican Energy Co., | | | | | | |
6.750%, 12/30/2031 | | | 10,000 | | | 10,487 |
MidAmerican Funding | | | | | | |
LLC, 6.927%, 3/1/2029 | | | 25,000 | | | 27,083 |
National Rural Utilities | | | | | | |
Cooperative Finance Corp., 7.250%, 3/1/2012 | | | 100,000 | | | 106,536 |
Nisource Finance Corp., | | | | | | |
6.400%, 3/15/2018 | | | 25,000 | | | 24,171 |
Oneok, Inc., 5.200%, | | | | | | |
6/15/2015 | | | 25,000 | | | 23,668 |
| | | | |
| | | | |
Pacific Gas & Electric Co., | | | | |
6.050%, 3/1/2034 | | 15,000 | | 14,510 |
Public Service Co. of | | | | |
Colorado, 6.250%, 9/1/2037 | | 10,000 | | 10,191 |
Public Service Electric & | | | | |
Gas Co., 5.800%, 5/1/2037 | | 25,000 | | 24,123 |
Puget Sound Energy, Inc., | | | | |
6.274%, 3/15/2037 | | 25,000 | | 23,472 |
Sempra Energy, 7.950%, | | | | |
3/1/2010 | | 25,000 | | 26,365 |
TXU Electric Delivery Co., | | | | |
7.000%, 5/1/2032 | | 25,000 | | 23,997 |
Virginia Electric and Power | | | | |
Co., 5.400%, 1/15/2016 | | 50,000 | | 48,932 |
| |
Total | | | | 803,921 |
| |
| Total Corporate Bonds– | | | | |
(Identified Cost $12,290,023) | | 11,889,344 |
| |
| |
International Debt–4.8% | | |
Abbey National PLC, | | | | |
7.950%, 10/26/2029 | | 25,000 | | 25,492 |
Alcan, Inc., 5.200%, | | | | |
1/15/2014 | | 50,000 | | 48,845 |
America Movil SAB de CV, | | | | |
5.625%, 11/15/2017 | | 50,000 | | 48,405 |
America Movil SA de CV, | | | | |
5.750%, 1/15/2015 | | 15,000 | | 14,916 |
ArcelorMittal, 6.125%, | | | | |
6/1/2018 | | 50,000 | | 48,952 |
Asian Development Bank, | | | | |
5.593%, 7/16/2018 | | 50,000 | | 53,320 |
AstraZeneca PLC, | | | | |
6.450%, 9/15/2037 | | 25,000 | | 25,535 |
BHP Billiton Finance Ltd., | | | | |
5.000%, 12/15/2010 | | 25,000 | | 25,288 |
BHP Billiton Finance Ltd., | | | | |
5.125%, 3/29/2012 | | 25,000 | | 24,950 |
Brazilian Government | | | | |
International Bond, 6.000%, 1/17/2017 | | 100,000 | | 102,200 |
Brazilian Government | | | | |
International Bond, 8.250%, 1/20/2034 | | 50,000 | | 61,600 |
British Telecommunications | | | | |
PLC, 8.625%, 12/15/2010 | | 50,000 | | 53,717 |
British Telecommunications | | | | |
PLC, 9.125%, 12/15/2030 | | 25,000 | | 30,131 |
| | | | |
| 18 | | AARP PORTFOLIOS 2008 ANNUAL REPORT | | U.S. Bond Market Portfolio |
U.S. Bond Market Portfolio (continued)
June 30, 2008
| | | | | | |
| Portfolio of investments | | |
| | |
| | | Par amount | | Value |
| | | | | | |
| |
International Debt (continued) | | | |
Canadian National Railway | | | | | | |
Co., 6.200%, 6/1/2036 | | $ | 25,000 | | $ | 24,263 |
Deutsche Bank AG, | | | | | | |
5.375%, 10/12/2012 | | | 100,000 | | | 101,569 |
Deutsche Bank AG, | | | | | | |
6.000%, 9/1/2017 | | | 50,000 | | | 50,573 |
Deutsche Telekom | | | | | | |
International Finance BV, 8.750%, 6/15/2030 | | | 25,000 | | | 28,759 |
Diageo Finance BV, | | | | | | |
5.300%, 10/28/2015 | | | 50,000 | | | 48,749 |
Eksportfinans ASA, | | | | | | |
5.000%, 2/14/2012 | | | 100,000 | | | 103,122 |
European Investment Bank, | | | | | | |
4.125%, 9/15/2010 | | | 50,000 | | | 51,139 |
European Investment Bank, | | | | | | |
4.625%, 5/15/2014 | | | 200,000 | | | 206,038 |
European Investment Bank, | | | | | | |
4.875%, 2/16/2016 | | | 50,000 | | | 51,839 |
Export-Import Bank Of | | | | | | |
Korea (KEXIM), 5.125%, 2/14/2011 | | | 25,000 | | | 24,860 |
France Telecom SA, | | | | | | |
7.750%, 3/1/2011 | | | 100,000 | | | 105,968 |
HSBC Holdings PLC, | | | | | | |
6.500%, 5/2/2036 | | | 25,000 | | | 23,316 |
HSBC Holdings PLC, | | | | | | |
7.500%, 7/15/2009 | | | 50,000 | | | 51,138 |
Hydro Quebec, 6.300%, | | | | | | |
5/11/2011 | | | 25,000 | | | 26,608 |
International Bank for | | | | | | |
Reconstruction & Development, 7.625%, 1/19/2023 | | | 25,000 | | | 32,267 |
International Finance | | | | | | |
Corp., 3.500%, 5/15/2013 | | | 100,000 | | | 98,379 |
Israel Government | | | | | | |
International Bond, 5.500%, 11/9/2016 | | | 25,000 | | | 25,666 |
Italy Government | | | | | | |
International Bond, 4.500%, 1/21/2015 | | | 100,000 | | | 100,726 |
| | | | |
| | | | |
Italy Government | | | | |
International Bond, 5.625%, 6/15/2012 | | 100,000 | | 106,328 |
Italy, Republic of, | | | | |
6.875%, 9/27/2023 | | 25,000 | | 30,170 |
KfW Bankengruppe, | | | | |
3.250%, 3/15/2013 | | 100,000 | | 97,687 |
KfW Bankengruppe, | | | | |
4.875%, 1/17/2017 | | 100,000 | | 103,688 |
Koninklijke Philips Electronics | | | | |
NV, 6.875%, 3/11/2038 | | 50,000 | | 51,787 |
Kreditanstalt fuer | | | | |
Wiederaufbau, 0.000%, 4/18/2036 | | 50,000 | | 11,947 |
Landwirtschaftliche | | | | |
Rentenbank, 4.875%, 2/14/2011 | | 100,000 | | 103,638 |
Mexico Government | | | | |
International Bond, 6.625%, 3/3/2015 | | 25,000 | | 26,875 |
Mexico Government | | | | |
International Bond, 6.750%, 9/27/2034 | | 20,000 | | 21,270 |
Mexico Government | | | | |
International Bond, 8.125%, 12/30/2019 | | 50,000 | | 60,625 |
Mexico Government | | | | |
International Bond, 8.300%, 8/15/2031 | | 50,000 | | 63,375 |
Nexen, Inc., 5.875%, | | | | |
3/10/2035 | | 25,000 | | 22,398 |
Oesterreichische Kontrollbank | | | | |
AG, 4.875%, 2/16/2016 | | 100,000 | | 103,284 |
Province of Nova Scotia | | | | |
Canada, 5.125%, 1/26/2017 | | 50,000 | | 51,294 |
Province of Ontario Canada, | | | | |
5.000%, 10/18/2011 | | 100,000 | | 103,753 |
Province of Quebec Canada, | | | | |
4.600%, 5/26/2015 | | 50,000 | | 49,901 |
Province of Quebec Canada, | | | | |
7.500%, 9/15/2029 | | 10,000 | | 12,814 |
Region of Lombardy Italy, | | | | |
5.804%, 10/25/2032 | | 50,000 | | 54,515 |
Republic of Korea, | | | | |
4.875%, 9/22/2014 | | 25,000 | | 24,505 |
Royal Bank of Scotland | | | | |
Group PLC, 7.648%, 8/31/2049 | | 25,000 | | 24,387 |
| | | | |
| U.S. Bond Market Portfolio | | AARP PORTFOLIOS 2008 ANNUAL REPORT | | 19 |
| | | | | | |
| Portfolio of investments | | |
| | |
| | | Par amount | | Value |
| | | | | | |
| |
International Debt (continued) | | | |
Telecom Italia Capital SA, | | | | | | |
6.375%, 11/15/2033 | | $ | 50,000 | | $ | 44,644 |
Telefonica Emisiones SAU, | | | | | | |
5.984%, 6/20/2011 | | | 50,000 | | | 50,774 |
Telefonica Emisiones SAU, | | | | | | |
6.221%, 7/3/2017 | | | 25,000 | | | 25,031 |
Thomson Corp. Note, | | | | | | |
5.700%, 10/1/2014 | | | 75,000 | | | 73,938 |
Vodafone Group PLC, | | | | | | |
6.150%, 2/27/2037 | | | 25,000 | | | 22,936 |
Vodafone Group PLC, | | | | | | |
7.875%, 2/15/2030 | | | 25,000 | | | 27,541 |
Weatherford International | | | | | | |
Ltd., 5.500%, 2/15/2016 | | | 25,000 | | | 24,225 |
| |
| Total International Debt– | | | | | | |
(Identified Cost $3,108,120) | | | | | | 3,111,660 |
| |
|
Mortgage-Backed Securities–39.7% |
Federal Home Loan | | | | | | |
Mortgage Corporation GOLD 15 YR, 4.500% | | | 225,000 | | | 217,406 |
Federal Home Loan | | | | | | |
Mortgage Corporation GOLD 30 YR, 5.000% – 6.000% | | | 2,350,000 | | | 2,308,804 |
Government National | | | | | | |
Mortgage Association, 30 YR, 5.000% –6.500% | | | 775,000 | | | 784,527 |
Federal National Mortgage | | | | | | |
Association, 15 YR, 4.500% | | | 400,000 | | | 386,625 |
Federal National Mortgage | | | | | | |
Association, 30 YR, 6.500% – 7.000% | | | 425,000 | | | 441,332 |
Federal Home Loan | | | | | | |
Mortgage Corp., 4.500% – 7.000%, 5/1/2020 – 6/1/2038 | | | 6,517,003 | | | 6,459,083 |
Federal National Mortgage | | | | | | |
Association, 4.000% – 7.000%, 6/1/2019 – 4/1/2038 | | | 13,474,861 | | | 13,436,137 |
| | | | |
| | | | |
Government National | | | | |
Mortgage Association, 4.500% – 6.500%, 4/15/2036 – 8/15/2037 | | 1,408,738 | | 1,401,822 |
| |
| Total Mortgage-Backed | | | | |
Securities–(Identified Cost $25,290,376) | | | | 25,435,736 |
| |
| | |
U.S. Treasury–24.2% | | | | |
| U.S. Treasury Bonds–5.5% | | | | |
4.375%, 2/15/2038 | | 225,000 | | 219,375 |
|
4.750%, 2/15/2037 | | 115,000 | | 118,791 |
|
5.000%, 5/15/2037 | | 100,000 | | 107,500 |
|
5.250%, 2/15/2029 | | 65,000 | | 70,540 |
|
6.125%, 11/15/2027 | | 175,000 | | 209,330 |
|
6.125%, 8/15/2029 | | 75,000 | | 90,486 |
|
6.250%, 8/15/2023 | | 100,000 | | 119,008 |
|
6.250%, 5/15/2030 | | 75,000 | | 92,338 |
|
6.375%, 8/15/2027 | | 170,000 | | 208,303 |
|
6.625%, 2/15/2027 | | 75,000 | | 94,031 |
|
6.750%, 8/15/2026 | | 160,000 | | 202,588 |
|
6.875%, 8/15/2025 | | 200,000 | | 255,063 |
|
7.125%, 2/15/2023 | | 140,000 | | 179,288 |
|
7.250%, 5/15/2016 | | 100,000 | | 122,899 |
|
7.500%, 11/15/2016 | | 50,000 | | 62,473 |
|
8.000%, 11/15/2021 | | 270,000 | | 366,293 |
|
8.500%, 2/15/2020 | | 130,000 | | 179,156 |
|
8.750%, 5/15/2017 | | 215,000 | | 289,729 |
|
8.750%, 8/15/2020 | | 80,000 | | 112,756 |
|
8.875%, 8/15/2017 | | 150,000 | | 204,305 |
|
9.250%, 2/15/2016 | | 135,000 | | 183,790 |
| |
Total | | | | 3,488,042 |
| |
| | |
| U.S. Treasury Notes–18.7% | | | | |
2.625%, 5/31/2010 | | 800,000 | | 800,750 |
|
3.500%, 8/15/2009 | | 450,000 | | 455,871 |
|
3.125%, 11/30/2009 | | 450,000 | | 454,817 |
|
3.125%, 4/30/2013 | | 900,000 | | 892,759 |
|
3.375%, 6/30/2013 | | 250,000 | | 250,528 |
|
3.500%, 2/15/2018 | | 100,000 | | 96,289 |
|
3.625%, 7/15/2009 | | 400,000 | | 405,469 |
|
3.625%, 1/15/2010 | | 380,000 | | 387,303 |
| | | | |
| 20 | | AARP PORTFOLIOS 2008 ANNUAL REPORT | | U.S. Bond Market Portfolio |
U.S. Bond Market Portfolio (continued)
June 30, 2008
| | | | | | |
| Portfolio of investments | | |
| | |
| | | Par amount | | Value |
| | | | | | |
| |
U.S. Treasury (continued) | | | |
| U.S. Treasury Notes (continued) |
3.625%, 12/31/2012 | | $ | 250,000 | | $ | 253,887 |
|
3.875%, 5/15/2018 | | | 150,000 | | | 148,793 |
|
4.000%, 9/30/2009 | | | 250,000 | | | 255,137 |
|
4.000%, 4/15/2010 | | | 550,000 | | | 564,180 |
|
4.000%, 2/15/2015 | | | 400,000 | | | 411,282 |
|
4.125%, 8/31/2012 | | | 200,000 | | | 207,078 |
|
4.250%, 1/15/2011 | | | 650,000 | | | 674,680 |
|
4.250%, 9/30/2012 | | | 200,000 | | | 208,297 |
|
4.500%, 2/28/2011 | | | 100,000 | | | 104,281 |
|
4.500%, 9/30/2011 | | | 100,000 | | | 104,547 |
|
4.500%, 3/31/2012 | | | 400,000 | | | 419,156 |
|
4.500%, 4/30/2012 | | | 250,000 | | | 262,149 |
|
4.625%, 12/31/2011 | | | 500,000 | | | 525,469 |
|
4.625%, 2/29/2012 | | | 150,000 | | | 157,828 |
|
4.625%, 7/31/2012 | | | 100,000 | | | 105,445 |
|
4.625%, 2/15/2017 | | | 910,000 | | | 958,345 |
|
4.750%, 3/31/2011 | | | 200,000 | | | 209,922 |
|
4.750%, 5/31/2012 | | | 100,000 | | | 105,774 |
|
4.750%, 8/15/2017 | | | 425,000 | | | 450,367 |
|
4.875%, 8/15/2009 | | | 500,000 | | | 513,516 |
|
4.875%, 4/30/2011 | | | 250,000 | | | 263,614 |
|
4.875%, 5/31/2011 | | | 250,000 | | | 263,906 |
|
4.875%, 6/30/2012 | | | 175,000 | | | 186,020 |
|
4.875%, 8/15/2016 | | | 150,000 | | | 160,863 |
|
5.125%, 6/30/2011 | | | 250,000 | | | 265,781 |
|
5.125%, 5/15/2016 | | | 150,000 | | | 163,594 |
|
6.000%, 8/15/2009 | | | 300,000 | | | 311,742 |
| |
Total | | | | | | 11,999,439 |
| |
| Total U.S. Treasury– | | | | | | |
(Identified Cost $15,136,310) | | | 15,487,481 |
| |
| |
U.S. Government Agencies–9.3% | | | |
Federal Farm Credit Bank, | | | | | | |
3.875% – 5.375%, 8/3/2009 – 1/17/2017 | | | 575,000 | | | 587,492 |
| | | | |
| | | | |
Federal Home Loan Bank of | | | | |
Chicago, 5.625%, 6/13/2016 | | 50,000 | | 50,923 |
Federal Home Loan Bank | | | | |
System, 4.250% – 5.500%, 7/17/2009 – 7/15/2036 | | 975,000 | | 998,723 |
Federal Home Loan Mortgage | | | | |
Corp., 2.875% – 6.750%, 4/30/2010 – 7/15/2032 | | 2,155,000 | | 2,185,524 |
Federal National Mortgage | | | | |
Association, 2.500% – 7.250%, 4/9/2010 – 7/15/2037 | | 1,960,000 | | 2,030,952 |
Tennessee Valley Authority, | | | | |
5.500% – 6.750%, 7/18/2017 – 1/15/2038 | | 75,000 | | 83,896 |
| |
| Total U.S. Government | | | | |
Agencies–(Identified Cost $5,856,588) | | 5,937,510 |
| |
|
Commercial Mortgage-Backed Securities–5.0% |
Banc of America | | | | |
Commercial Mortgage, Inc., 5.118%, 7/11/2043 | | 60,000 | | 59,256 |
Banc of America | | | | |
Commercial Mortgage, Inc., 5.356%, 10/10/2045 | | 100,000 | | 94,781 |
Banc of America | | | | |
Commercial Mortgage, Inc., 5.400%, 10/10/2045 | | 20,000 | | 19,744 |
Banc of America | | | | |
Commercial Mortgage, Inc., 5.838%, 6/10/2049 | | 125,000 | | 118,422 |
Bear Stearns Commercial | | | | |
Mortgage Securities, 4.740%, 3/13/2040 | | 40,000 | | 38,844 |
Bear Stearns Commercial | | | | |
Mortgage Securities, 4.978%, 7/11/2042 | | 200,000 | | 191,968 |
Bear Stearns Commercial | | | | |
Mortgage Securities, 5.405%, 12/11/2040 | | 50,000 | | 48,572 |
Chase Commercial | | | | |
Mortgage Securities Corp., 7.319%, 10/15/2032 | | 24,694 | | 25,580 |
Citigroup Commercial | | | | |
Mortgage Trust, 5.915%, 3/15/2049 | | 25,000 | | 19,173 |
| | | | |
| U.S. Bond Market Portfolio | | AARP PORTFOLIOS 2008 ANNUAL REPORT | | 21 |
| | | | | | |
| Portfolio of investments | | |
| | |
| | | Par amount | | Value |
| | | | | | |
|
Commercial Mortgage-Backed Securities (continued) |
Citigroup/Deutsche Bank | | | | | | |
Commercial Mortgage Trust, 5.400%, 7/15/2044 | | $ | 50,000 | | $ | 47,384 |
Commercial Mortgage | | | | | | |
Pass Through Certificates, 5.347%, 12/10/2046 | | | 50,000 | | | 45,169 |
Commercial Mortgage | | | | | | |
Pass Through Certificates, 5.899%, 6/10/2046 | | | 50,000 | | | 49,657 |
Credit Suisse Mortgage | | | | | | |
Capital Certificates, 6.021%, 6/15/2038 | | | 100,000 | | | 98,273 |
CS First Boston Mortgage | | | | | | |
Securities Corp., 4.429%, 12/15/2036 | | | 250,000 | | | 248,076 |
CS First Boston Mortgage | | | | | | |
Securities Corp., 4.730%, 7/15/2037 | | | 20,000 | | | 18,456 |
CS First Boston Mortgage | | | | | | |
Securities Corp., 5.230%, 12/15/2040 | | | 50,000 | | | 48,007 |
CS First Boston Mortgage | | | | | | |
Securities Corp., 5.416%, 5/15/2036 | | | 35,000 | | | 34,080 |
CS First Boston Mortgage | | | | | | |
Securities Corp., 6.387%, 8/15/2036 | | | 25,000 | | | 25,623 |
CW Capital Cobalt Ltd., | | | | | | |
5.484%, 4/15/2047 | | | 25,000 | | | 23,308 |
G.E. Capital Commercial | | | | | | |
Mortgage Corp., 5.189%, 7/10/2039 | | | 150,000 | | | 145,975 |
GMAC Commercial | | | | | | |
Mortgage Securities, Inc., 6.465%, 4/15/2034 | | | 24,703 | | | 25,337 |
GMAC Commercial | | | | | | |
Mortgage Securities, Inc., 6.957%, 9/15/2035 | | | 19,911 | | | 20,591 |
Greenwich Capital | | | | | | |
Commercial Funding Corp., 5.224%, 4/10/2037 | | | 100,000 | | | 96,198 |
| | | | |
| | | | |
Greenwich Capital | | | | |
Commercial Funding Corp., 5.736%, 12/10/2049 | | 125,000 | | 118,422 |
GS Mortgage Securities | | | | |
Corp. II, 4.761%, 7/10/2039 | | 15,000 | | 14,098 |
GS Mortgage Securities | | | | |
Corp. II, 5.396%, 8/10/2038 | | 100,000 | | 98,077 |
JPMorgan Chase | | | | |
Commercial Mortgage Securities Corp., Series 2003-CB7, Class A4, 4.879%, 1/12/2038 | | 20,000 | | 19,227 |
JPMorgan Chase | | | | |
Commercial Mortgage Securities Corp., Series 2005-LDP3 Class A4A, 4.936%, 8/15/2042 | | 50,000 | | 47,275 |
JPMorgan Chase | | | | |
Commercial Mortgage Securities Corp., Series 2005-LDP3, Class A3, 4.959%, 8/15/2042 | | 35,000 | | 34,019 |
JPMorgan Chase | | | | |
Commercial Mortgage Securities Corp., Series 2005-LDP4, Class AM, 5.000%, 10/15/2042 | | 15,000 | | 14,011 |
JPMorgan Chase | | | | |
Commercial Mortgage Securities Corp., Series 2005-LDP4, Class A4, 5.038%, 3/15/2046 | | 20,000 | | 19,136 |
JPMorgan Chase | | | | |
Commercial Mortgage Securities Corp., Series 2006-CB15, Class A3, 5.819%, 6/12/2043 | | 100,000 | | 98,998 |
JPMorgan Chase | | | | |
Commercial Mortgage Securities Corp., Series 2006-LDP6, Class A4, 5.475%, 4/15/2043 | | 100,000 | | 95,768 |
JPMorgan Chase | | | | |
Commercial Mortgage Securities Corp., Series 2007-CB18, Class A4, 5.440%, 6/12/2047 | | 50,000 | | 46,605 |
| | | | |
| 22 | | AARP PORTFOLIOS 2008 ANNUAL REPORT | | U.S. Bond Market Portfolio |
U.S. Bond Market Portfolio (continued)
June 30, 2008
| | | | | | |
| Portfolio of investments | | |
| | |
| | | Par amount | | Value |
| | | | | | |
|
Commercial Mortgage-Backed Securities (continued) |
LB-UBS Commercial | | | | | | |
Mortgage Trust, 4.361%, 1/15/2029 | | $ | 50,000 | | $ | 47,754 |
LB-UBS Commercial | | | | | | |
Mortgage Trust, 5.018%, 2/15/2031 | | | 29,820 | | | 29,837 |
LB-UBS Commercial | | | | | | |
Mortgage Trust, 5.084%, 2/15/2031 | | | 25,000 | | | 24,789 |
LB-UBS Commercial | | | | | | |
Mortgage Trust, 5.139%, 2/15/2031 | | | 20,000 | | | 19,244 |
LB-UBS Commercial | | | | | | |
Mortgage Trust, 5.207%, 2/15/2031 | | | 20,000 | | | 19,437 |
LB-UBS Commercial | | | | | | |
Mortgage Trust, 5.430%, 2/15/2040 | | | 100,000 | | | 93,180 |
Merrill Lynch, | | | | | | |
5.378%, 8/12/2048 | | | 100,000 | | | 92,852 |
Merrill Lynch Mortgage | | | | | | |
Trust, 5.416%, 11/12/2037 | | | 50,000 | | | 48,344 |
Morgan Stanley Capital I, | | | | | | |
5.379%, 11/14/2042 | | | 25,000 | | | 24,401 |
Morgan Stanley Capital I, | | | | | | |
5.514%, 11/12/2049 | | | 100,000 | | | 93,946 |
Morgan Stanley Capital I, | | | | | | |
7.108%, 6/3/2030 | | | 150,000 | | | 149,977 |
PG&E Energy Recovery | | | | | | |
Funding LLC, 5.030%, 3/25/2014 | | | 50,000 | | | 50,893 |
Salomon Brothers | | | | | | |
Mortgage Securities VII, 7.455%, 7/18/2033 | | | 21,463 | | | 22,137 |
Wachovia Bank | | | | | | |
Commercial Mortgage Trust, 4.516%, 5/15/2044 | | | 15,000 | | | 14,816 |
Wachovia Bank | | | | | | |
Commercial Mortgage Trust, 4.867%, 2/15/2035 | | | 100,000 | | | 96,834 |
| | | | | | |
| | | | | | |
Wachovia Bank Commercial | | | | | | |
Mortgage Trust, 5.203%, 1/15/2045 | | 62,544 | | | 62,617 | |
Wachovia Bank Commercial | | | | | | |
Mortgage Trust, 5.308%, 11/15/2048 | | 75,000 | | | 70,451 | |
Wachovia Bank Commercial | | | | | | |
Mortgage Trust, 5.416%, 1/15/2045 | | 50,000 | | | 49,795 | |
Wachovia Bank Commercial | | | | | | |
Mortgage Trust, 5.515%, 1/15/2045 | | 50,000 | | | 41,317 | |
| | |
| Total Commercial | | | | |
Mortgage-Backed Securities–(Identified Cost $3,304,825) | | | 3,200,731 | |
| | |
| | |
Municipal Bonds–0.1% | | | | | | |
State of Connecticut, | | | | | | |
5.850%, 3/15/2032 | | 25,000 | | | 26,017 | |
State of Illinois, | | | | | | |
4.950%, 6/1/2023 | | 25,000 | | | 23,670 | |
State of Illinois Taxable, | | | | | | |
5.100%, 6/1/2033 | | 25,000 | | | 23,546 | |
| | |
| Total Municipal Bonds– | | | | | | |
(Identified Cost $74,248) | | | | | 73,233 | |
| | |
| | |
Commercial Paper–5.9% | | | | | | |
Fairway Finance Corp., | | | | | | |
2.600% – 2.730%, 7/14/2008 | | 2,800,000 | | | 2,797,286 | |
Lexington Parker Capital | | | | | | |
Corp., 2.620%, 7/14/2008 | | 1,000,000 | | | 999,054 | |
| | |
| Total Commercial Paper– | | | | | | |
(Identified Cost $3,796,340) | | | 3,796,340 | |
| | |
| | |
Mutual Fund–1.4% | | | | | | |
AIM Prime Fund | | | | | | |
(At Net Asset Value) | | 908,817 | | | 908,817 | |
| | |
| Total Investments–109.5% | | | | | | |
(Identified Cost $70,103,360) | | | 70,175,518 | |
| | |
| Other Assets & Liabilities–Net–(9.5)% | | | (6,066,969 | ) |
| | |
| Total Net Assets–100.0% | | | | $ | 64,108,549 | |
| | |
| | 1 | Denotes a restricted security, including securities purchased under Rule 144A of the Securities Act of 1933. This security may only be sold to qualified institutional investors and is determined to be liquid under criteria established by the Portfolio’s Board of Trustees. At June 30, 2008, these securities amounted to $101,467 which represents 0.2% of total net assets. |
See Notes to Financial Statements.
| | | | |
| U.S. Stock Market Portfolio | | AARP PORTFOLIOS 2008 ANNUAL REPORT | | 23 |
U.S. Stock Market Portfolio
June 30, 2008
| | | | | |
| Portfolio of investments | | | | |
| | |
| | | Shares | | Value |
| | | | | |
|
Common Stocks–97.0% |
| Consumer Discretionary–9.5% |
199 Cents Only Stores | | 200 | | $ | 1,320 |
|
A.H. Belo Corp. | | 50 | | | 285 |
|
Aaron Rents, Inc. | | 121 | | | 2,702 |
|
Abercrombie & Fitch Co. | | 296 | | | 18,553 |
|
1ACCO Brands Corp. | | 160 | | | 1,797 |
|
Advance Auto Parts, Inc. | | 308 | | | 11,960 |
|
1Aeropostale, Inc. | | 255 | | | 7,989 |
|
1AFC Enterprises, Inc. | | 100 | | | 799 |
|
1Amazon.com, Inc. | | 1,160 | | | 85,063 |
|
Ambassadors Group, Inc. | | 100 | | | 1,492 |
|
American Axle & Manufacturing | | | | | |
Holdings, Inc. | | 200 | | | 1,598 |
American Eagle Outfitters, Inc. | | 684 | | | 9,323 |
|
American Greetings Corp. | | 200 | | | 2,468 |
|
Ameristar Casinos, Inc. | | 158 | | | 2,184 |
|
Andersons, Inc. | | 100 | | | 4,071 |
|
1AnnTaylor Stores Corp. | | 169 | | | 4,049 |
|
ArvinMeritor, Inc. | | 200 | | | 2,496 |
|
Asbury Automotive Group, Inc. | | 100 | | | 1,285 |
|
1ATC Technology Corp. | | 100 | | | 2,328 |
|
Autoliv, Inc. | | 300 | | | 13,986 |
|
1AutoNation, Inc. | | 463 | | | 4,639 |
|
1AutoZone, Inc. | | 159 | | | 19,241 |
|
1Avis Budget Group, Inc. | | 288 | | | 2,411 |
|
1Bare Escentuals, Inc. | | 200 | | | 3,746 |
|
Barnes & Noble, Inc. | | 226 | | | 5,614 |
|
1Beacon Roofing Supply, Inc. | | 75 | | | 796 |
|
Beazer Homes USA, Inc. | | 88 | | | 490 |
|
Bebe Stores, Inc. | | 100 | | | 961 |
|
1Bed Bath & Beyond, Inc. | | 979 | | | 27,510 |
|
Belo Corp. | | 250 | | | 1,827 |
|
Best Buy Co., Inc. | | 1,286 | | | 50,926 |
|
Big 5 Sporting Goods Corp. | | 100 | | | 757 |
|
1Big Lots, Inc. | | 370 | | | 11,559 |
|
| | | | |
| | | | |
1BJ’s Wholesale Club, Inc. | | 253 | | 9,791 |
|
Black & Decker Corp. | | 227 | | 13,055 |
|
1Blockbuster, Inc. | | 300 | | 750 |
|
Blyth, Inc. | | 100 | | 1,203 |
|
Bob Evans Farms, Inc. | | 90 | | 2,574 |
|
Borders Group, Inc. | | 100 | | 600 |
|
BorgWarner, Inc. | | 460 | | 20,415 |
|
Boyd Gaming Corp. | | 158 | | 1,984 |
|
1Brightpoint, Inc. | | 105 | | 767 |
|
Brinker International, Inc. | | 385 | | 7,276 |
|
1Brocade Communications | | | | |
Systems, Inc. | | 1,495 | | 12,319 |
|
Brown Shoe Co., Inc. | | 130 | | 1,762 |
|
Brunswick Corp. | | 299 | | 3,169 |
|
Buckle, Inc. | | 100 | | 4,573 |
|
1Buffalo Wild Wings, Inc. | | 100 | | 2,483 |
|
Burger King Holdings, Inc. | | 400 | | 10,716 |
|
1Cabela’s, Inc. | | 94 | | 1,035 |
|
1Cablevision Systems Corp. | | 847 | | 19,142 |
| | | | |
1California Pizza Kitchen, Inc. | | 150 | | 1,679 |
| | | | |
Callaway Golf Co. | | 220 | | 2,603 |
|
1Carmax, Inc. | | 758 | | 10,756 |
|
Carnival Corp. | | 1,600 | | 52,736 |
|
1Carter’s, Inc. | | 160 | | 2,211 |
|
Cato Corp. | | 100 | | 1,424 |
|
CBRL Group, Inc. | | 107 | | 2,623 |
|
CBS Corp. | | 2,157 | | 42,040 |
|
1CEC Entertainment, Inc. | | 150 | | 4,201 |
|
Centex Corp. | | 435 | | 5,816 |
|
1Champion Enterprises, Inc. | | 210 | | 1,229 |
|
1Charlotte Russe Holding, Inc. | | 100 | | 1,776 |
|
1Charming Shoppes, Inc. | | 250 | | 1,148 |
|
1Charter Communications, Inc. | | 1,200 | | 1,260 |
|
1Cheesecake Factory, Inc. | | 270 | | 4,296 |
|
1Chico’s FAS, Inc. | | 499 | | 2,680 |
|
1Childrens Place Retail Stores, | | | | |
Inc. | | 130 | | 4,693 |
1Chipotle Mexican Grill, Inc., | | | | |
Class A | | 42 | | 3,470 |
| | | | |
| 24 | | AARP PORTFOLIOS 2008 ANNUAL REPORT | | U.S. Stock Market Portfolio |
U.S. Stock Market Portfolio (continued)
June 30, 2008
| | | | | |
| Portfolio of investments | | | | |
| | |
| | | Shares | | Value |
| | | | | |
|
Common Stocks (continued) |
| Consumer Discretionary (continued) |
1Chipotle Mexican Grill, Inc., | | | | | |
Class B | | 60 | | $ | 4,522 |
Choice Hotels International, Inc. | | 100 | | | 2,650 |
|
Christopher & Banks Corp. | | 100 | | | 680 |
|
Churchill Downs, Inc. | | 100 | | | 3,487 |
|
Cinemark Holdings, Inc. | | 200 | | | 2,612 |
|
Circuit City Stores, Inc. | | 500 | | | 1,445 |
|
1Citadel Broadcasting Corp. | | 395 | | | 482 |
|
CKE Restaurants, Inc. | | 200 | | | 2,494 |
|
1CKX, Inc. | | 200 | | | 1,750 |
|
Clear Channel | | | | | |
Communications, Inc. | | 1,713 | | | 60,298 |
1Clear Channel Outdoor | | | | | |
Holdings, Inc. | | 100 | | | 1,783 |
1Coach, Inc. | | 1,300 | | | 37,544 |
|
1Coldwater Creek, Inc. | | 175 | | | 924 |
|
1Collective Brands, Inc. | | 180 | | | 2,093 |
|
Columbia Sportswear Co. | | 55 | | | 2,021 |
|
Comcast Corp., Class A | | 7,008 | | | 132,942 |
|
Comcast Corp., Special | | | | | |
Class A | | 3,360 | | | 63,034 |
Cooper Tire & Rubber Co. | | 210 | | | 1,646 |
|
1Copart, Inc. | | 300 | | | 12,846 |
|
Costco Wholesale Corp. | | 1,600 | | | 112,224 |
|
1Cox Radio, Inc. | | 100 | | | 1,180 |
|
1CROCS, Inc. | | 302 | | | 2,419 |
|
1CSK Auto Corp. | | 100 | | | 1,048 |
|
1CTC Media, Inc. | | 200 | | | 4,932 |
|
D.R. Horton, Inc. | | 977 | | | 10,600 |
|
Darden Restaurants, Inc. | | 500 | | | 15,970 |
|
1Deckers Outdoor Corp. | | 37 | | | 5,150 |
|
1Dick’s Sporting Goods, Inc. | | 286 | | | 5,074 |
|
Dillard’s, Inc. | | 243 | | | 2,812 |
|
DineEquity, Inc. | | 30 | | | 1,121 |
|
1DIRECTV Group, Inc. | | 2,576 | | | 66,744 |
|
1DISH Network Corp. | | 809 | | | 23,688 |
| | | | |
| | | | |
1Dolby Laboratories, Inc. | | 200 | | 8,060 |
|
1Dollar Tree, Inc. | | 331 | | 10,820 |
|
1Domino’s Pizza, Inc. | | 152 | | 1,748 |
|
1DreamWorks Animation SKG, | | | | |
Inc. | | 260 | | 7,751 |
1Dress Barn, Inc. | | 200 | | 2,676 |
|
1DSW, Inc. | | 100 | | 1,178 |
|
1DTS, Inc. | | 100 | | 3,132 |
|
E.W. Scripps Co. | | 360 | | 14,954 |
|
Eastman Kodak Co. | | 1,063 | | 15,339 |
|
Entercom Communications | | | | |
Corp. | | 60 | | 421 |
1Entravision Communications | | | | |
Corp. | | 200 | | 804 |
Ethan Allen Interiors, Inc. | | 150 | | 3,690 |
|
1Exide Technologies | | 200 | | 3,352 |
|
1Expedia, Inc. | | 719 | | 13,215 |
|
Family Dollar Stores, Inc. | | 484 | | 9,651 |
|
Federal Signal Corp. | | 100 | | 1,200 |
|
Finish Line, Inc. | | 93 | | 809 |
|
1Fleetwood Enterprises, Inc. | | 200 | | 524 |
|
Foot Locker, Inc. | | 604 | | 7,520 |
|
1Ford Motor Co. | | 6,024 | | 28,975 |
|
Fortune Brands, Inc. | | 500 | | 31,205 |
|
1Fossil, Inc. | | 180 | | 5,233 |
|
Fred’s, Inc. | | 100 | | 1,124 |
|
Furniture Brands International, | | | | |
Inc. | | 80 | | 1,069 |
1GameStop Corp., Class A | | 532 | | 21,493 |
|
Gannett Co., Inc. | | 850 | | 18,419 |
|
Gap, Inc. | | 2,030 | | 33,840 |
|
Garmin Ltd. | | 437 | | 18,721 |
|
GateHouse Media, Inc. | | 100 | | 246 |
|
1Gaylord Entertainment Co. | | 194 | | 4,648 |
|
General Motors Corp. | | 1,619 | | 18,618 |
|
1Genesco, Inc. | | 40 | | 1,235 |
|
Gentex Corp. | | 573 | | 8,274 |
|
1Getty Images, Inc. | | 201 | | 6,820 |
|
1Goodyear Tire & Rubber Co. | | 900 | | 16,047 |
|
Group 1 Automotive, Inc. | | 100 | | 1,987 |
|
| | | | |
| U.S. Stock Market Portfolio | | AARP PORTFOLIOS 2008 ANNUAL REPORT | | 25 |
| | | | | |
| Portfolio of investments | | | | |
| | |
| | | Shares | | Value |
| | | | | |
|
Common Stocks (continued) |
| Consumer Discretionary (continued) |
1GSI Commerce, Inc. | | 100 | | $ | 1,363 |
|
Guess?, Inc. | | 200 | | | 7,490 |
|
1Gymboree Corp. | | 124 | | | 4,969 |
|
1Hanesbrands, Inc. | | 359 | | | 9,743 |
|
Harley-Davidson, Inc. | | 828 | | | 30,023 |
|
Harman International Industries, | | | | | |
Inc. | | 217 | | | 8,982 |
Harte-Hanks, Inc. | | 180 | | | 2,061 |
|
Hasbro, Inc. | | 513 | | | 18,324 |
|
Hearst-Argyle Television, Inc. | | 87 | | | 1,670 |
|
1Helen of Troy Ltd. | | 100 | | | 1,612 |
|
1Hertz Global Holdings, Inc. | | 600 | | | 5,760 |
|
1Hibbett Sports, Inc. | | 60 | | | 1,266 |
|
HNI Corp. | | 108 | | | 1,907 |
|
Home Depot, Inc. | | 6,174 | | | 144,595 |
|
1Hot Topic, Inc. | | 200 | | | 1,082 |
|
1Hovnanian Enterprises, Inc. | | 96 | | | 526 |
|
Idearc, Inc. | | 600 | | | 1,410 |
|
1Insight Enterprises, Inc. | | 180 | | | 2,111 |
|
Interactive Data Corp. | | 170 | | | 4,272 |
|
Interface, Inc. | | 100 | | | 1,253 |
|
1Interline Brands, Inc. | | 100 | | | 1,593 |
|
International Game Technology | | 1,200 | | | 29,976 |
|
International Speedway Corp. | | 150 | | | 5,854 |
|
1Interpublic Group of Cos., Inc. | | 1,800 | | | 15,480 |
|
1inVentiv Health, Inc. | | 100 | | | 2,779 |
|
1J. Crew Group, Inc. | | 200 | | | 6,602 |
|
1Jack in the Box, Inc. | | 262 | | | 5,871 |
|
1Jakks Pacific, Inc. | | 100 | | | 2,185 |
|
JCPenney Co., Inc. | | 767 | | | 27,834 |
|
1Jo-Ann Stores, Inc. | | 100 | | | 2,303 |
|
John Wiley & Sons, Inc. | | 170 | | | 7,655 |
|
Johnson Controls, Inc. | | 2,146 | | | 61,547 |
|
Jones Apparel Group, Inc. | | 322 | | | 4,427 |
|
| | | | |
| | | | |
1Jos A. Bank Clothiers, Inc. | | 100 | | 2,675 |
|
Journal Communications, Inc. | | 200 | | 964 |
|
K-Swiss, Inc. | | 50 | | 735 |
|
KB Home | | 274 | | 4,639 |
|
Kimball International, Inc. | | 100 | | 828 |
|
Knoll, Inc. | | 106 | | 1,288 |
|
1Knology, Inc. | | 100 | | 1,099 |
|
1Kohl’s Corp. | | 1,102 | | 44,124 |
|
1Krispy Kreme Doughnuts, Inc. | | 200 | | 998 |
|
La-Z-Boy, Inc. | | 200 | | 1,530 |
|
1Lamar Advertising Co. | | 284 | | 10,233 |
|
Lancaster Colony Corp. | | 60 | | 1,817 |
|
Landry’s Restaurants, Inc. | | 100 | | 1,797 |
|
1Las Vegas Sands Corp. | | 388 | | 18,407 |
|
1Lear Corp. | | 240 | | 3,403 |
|
Lee Enterprises, Inc. | | 80 | | 319 |
|
Leggett & Platt, Inc. | | 544 | | 9,123 |
|
Lennar Corp. | | 393 | | 4,850 |
|
1Liberty Global, Inc. | | 585 | | 17,761 |
|
1Liberty Media Corp.– | | | | |
Entertainment | | 1,760 | | 42,645 |
1Liberty Media Holding Corp.– | | | | |
Capital | | 440 | | 6,336 |
1Liberty Media Holding Corp.– | | | | |
Interactive | | 2,204 | | 32,531 |
1Life Time Fitness, Inc. | | 100 | | 2,955 |
|
Limited Brands, Inc. | | 1,187 | | 20,001 |
|
1Lions Gate Entertainment | | | | |
Corp. | | 400 | | 4,144 |
1Live Nation, Inc. | | 151 | | 1,598 |
|
Liz Claiborne, Inc. | | 302 | | 4,273 |
|
1LKQ Corp. | | 392 | | 7,083 |
|
Lowe’s Cos., Inc. | | 5,295 | | 109,871 |
|
1Lululemon Athletica, Inc. | | 100 | | 2,906 |
|
1M&F Worldwide Corp. | | 50 | | 1,965 |
|
Macy’s, Inc. | | 1,556 | | 30,218 |
|
Marcus Corp. | | 100 | | 1,495 |
|
Marriott International, Inc. | | 1,015 | | 26,634 |
|
1Marvel Entertainment, Inc. | | 200 | | 6,428 |
|
Mattel, Inc. | | 1,326 | | 22,701 |
|
| | | | |
| 26 | | AARP PORTFOLIOS 2008 ANNUAL REPORT | | U.S. Stock Market Portfolio |
U.S. Stock Market Portfolio (continued)
June 30, 2008
| | | | | |
| Portfolio of investments | | | | |
| | |
| | | Shares | | Value |
| | | | | |
|
Common Stocks (continued) |
| Consumer Discretionary (continued) |
Matthews International Corp. | | 60 | | $ | 2,716 |
|
McClatchy Co. | | 116 | | | 786 |
|
McDonald’s Corp. | | 4,120 | | | 231,626 |
|
McGraw-Hill Cos., Inc. | | 1,232 | | | 49,428 |
|
MDC Holdings, Inc. | | 100 | | | 3,906 |
|
Media General, Inc. | | 40 | | | 478 |
|
1Mediacom Communications | | | | | |
Corp. | | 200 | | | 1,068 |
Men’s Wearhouse, Inc. | | 160 | | | 2,606 |
|
Meredith Corp. | | 189 | | | 5,347 |
|
1Meritage Homes Corp. | | 30 | | | 455 |
|
1MGM Mirage | | 382 | | | 12,946 |
|
Modine Manufacturing Co. | | 60 | | | 742 |
|
1Mohawk Industries, Inc. | | 188 | | | 12,051 |
|
1Morgans Hotel Group Co. | | 100 | | | 1,030 |
|
Movado Group, Inc. | | 100 | | | 1,980 |
|
1Move, Inc. | | 300 | | | 699 |
|
National CineMedia, Inc. | | 200 | | | 2,132 |
|
1NetFlix, Inc. | | 160 | | | 4,171 |
|
New York Times Co. | | 501 | | | 7,710 |
|
Newell Rubbermaid, Inc. | | 958 | | | 16,085 |
|
News Corp., Class A | | 6,500 | | | 97,760 |
|
News Corp., Class B | | 1,603 | | | 24,606 |
|
Nike, Inc. | | 1,360 | | | 81,070 |
|
Nordstrom, Inc. | | 600 | | | 18,180 |
|
1NutriSystem, Inc. | | 111 | | | 1,570 |
|
1NVR, Inc. | | 16 | | | 8,001 |
|
O’Charleys, Inc. | | 100 | | | 1,006 |
|
1O’Reilly Automotive, Inc. | | 413 | | | 9,231 |
|
1Office Depot, Inc. | | 991 | | | 10,842 |
|
OfficeMax, Inc. | | 290 | | | 4,031 |
|
Omnicom Group, Inc. | | 1,182 | | | 53,048 |
|
Orient-Express Hotels Ltd. | | 200 | | | 8,688 |
|
1Overstock.com, Inc. | | 100 | | | 2,595 |
|
| | | | |
| | | | |
Oxford Industries, Inc. | | 42 | | 804 |
|
1Pacific Sunwear of California, Inc. | | 190 | | 1,621 |
|
1Panera Bread Co. | | 100 | | 4,626 |
|
1Papa John’s International, Inc. | | 60 | | 1,595 |
|
1Penn National Gaming, Inc. | | 290 | | 9,323 |
|
Penske Automotive Group, Inc. | | 154 | | 2,270 |
|
PEP Boys-Manny Moe & Jack | | 100 | | 872 |
|
PetSmart, Inc. | | 482 | | 9,616 |
|
1PF Chang’s China Bistro, Inc. | | 40 | | 894 |
|
Phillips-Van Heusen, Corp. | | 208 | | 7,617 |
|
1Pier 1 Imports, Inc. | | 300 | | 1,032 |
|
1Pinnacle Entertainment, Inc. | | 170 | | 1,783 |
|
Polaris Industries, Inc. | | 160 | | 6,461 |
|
Polo Ralph Lauren Corp. | | 200 | | 12,556 |
|
Pool Corp. | | 180 | | 3,197 |
|
1Priceline.com, Inc. | | 127 | | 14,663 |
|
Pulte Homes, Inc. | | 848 | | 8,166 |
|
1Quiksilver, Inc. | | 350 | | 3,437 |
|
1R.H. Donnelley Corp. | | 283 | | 849 |
|
RadioShack Corp. | | 440 | | 5,399 |
|
1RC2 Corp. | | 100 | | 1,856 |
|
1Red Robin Gourmet Burgers, Inc. | | 41 | | 1,137 |
|
Regal Entertainment Group | | 280 | | 4,278 |
|
Regis Corp. | | 160 | | 4,216 |
|
1Rent-A-Center, Inc. | | 200 | | 4,114 |
|
1Retail Ventures, Inc. | | 100 | | 460 |
|
Ross Stores, Inc. | | 493 | | 17,511 |
|
Royal Caribbean Cruises Ltd. | | 485 | | 10,898 |
|
Ruby Tuesday, Inc. | | 200 | | 1,080 |
|
Ryland Group, Inc. | | 206 | | 4,493 |
|
1Saks, Inc. | | 553 | | 6,072 |
|
Sauer-Danfoss, Inc. | | 100 | | 3,115 |
|
1Scholastic Corp. | | 133 | | 3,812 |
|
1School Specialty, Inc. | | 40 | | 1,189 |
|
1Scientific Games Corp. | | 280 | | 8,294 |
|
Sealy Corp. | | 100 | | 574 |
|
1Sears Holdings Corp. | | 277 | | 20,404 |
|
1Select Comfort Corp. | | 175 | | 287 |
|
Sherwin-Williams Co. | | 421 | | 19,337 |
| | | | |
| U.S. Stock Market Portfolio | | AARP PORTFOLIOS 2008 ANNUAL REPORT | | 27 |
| | | | | |
| Portfolio of investments | | | | |
| | |
| | | Shares | | Value |
| | | | | |
|
Common Stocks (continued) |
| Consumer Discretionary (continued) |
|
1Shuffle Master, Inc. | | 60 | | $ | 296 |
|
Sinclair Broadcast Group, Inc. | | 200 | | | 1,520 |
|
1Sirius Satellite Radio, Inc. | | 4,825 | | | 9,264 |
|
1Six Flags, Inc. | | 300 | | | 345 |
|
1Skechers U.S.A., Inc. | | 100 | | | 1,976 |
|
1Smith & Wesson Holding Corp. | | 100 | | | 521 |
|
Snap-On, Inc. | | 229 | | | 11,910 |
|
Sonic Automotive, Inc. | | 100 | | | 1,289 |
|
1Sonic Corp. | | 236 | | | 3,493 |
|
Speedway Motorsports, Inc. | | 100 | | | 2,038 |
|
Stage Stores, Inc. | | 90 | | | 1,050 |
|
Standard-Pacific Corp. | | 183 | | | 619 |
|
Stanley Works | | 290 | | | 13,001 |
|
Staples, Inc. | | 2,582 | | | 61,322 |
|
1Starbucks Corp. | | 2,690 | | | 42,341 |
|
Starwood Hotels & Resorts | | | | | |
Worldwide, Inc. | | 700 | | | 28,049 |
1Steak N Shake Co. | | 100 | | | 633 |
|
1Steven Madden Ltd. | | 54 | | | 993 |
|
Superior Industries International, | | | | | |
Inc. | | 100 | | | 1,688 |
|
Talbots, Inc. | | 100 | | | 1,159 |
|
Target Corp. | | 2,800 | | | 130,172 |
|
Tempur-Pedic International, Inc. | | 200 | | | 1,562 |
|
1Tenneco, Inc. | | 180 | | | 2,435 |
|
1Texas Roadhouse, Inc. | | 152 | | | 1,363 |
|
Thor Industries, Inc. | | 150 | | | 3,189 |
|
Tiffany & Co. | | 500 | | | 20,375 |
|
Tim Hortons, Inc. | | 700 | | | 20,083 |
|
1Timberland Co. | | 170 | | | 2,779 |
|
Time Warner, Inc. | | 12,900 | | | 190,920 |
|
1Titan Machinery, Inc. | | 100 | | | 3,132 |
|
1Tivo, Inc. | | 300 | | | 1,851 |
|
TJX Cos., Inc. | | 1,611 | | | 50,698 |
|
| | | | |
| | | | |
1Toll Brothers, Inc. | | 500 | | 9,365 |
|
Toro Co. | | 200 | | 6,654 |
|
1Tractor Supply Co. | | 179 | | 5,198 |
|
Triarc Cos., Inc. Class A | | 150 | | 960 |
|
Triarc Cos., Inc. Class B | | 200 | | 1,266 |
|
1True Religion Apparel, Inc. | | 100 | | 2,665 |
|
1TRW Automotive Holdings Corp. | | 160 | | 2,955 |
|
Tupperware Brands Corp. | | 280 | | 9,582 |
|
1Tween Brands, Inc. | | 150 | | 2,469 |
|
1Under Armour, Inc. | | 122 | | 3,128 |
|
UniFirst Corp. | | 100 | | 4,466 |
|
1United Rentals, Inc. | | 302 | | 5,922 |
|
1Universal Electronics, Inc. | | 100 | | 2,090 |
|
1Urban Outfitters, Inc. | | 426 | | 13,287 |
|
V.F. Corp. | | 336 | | 23,916 |
|
1Vail Resorts, Inc. | | 78 | | 3,341 |
|
1Viacom, Inc. | | 2,000 | | 61,080 |
|
Virgin Media, Inc. | | 1,069 | | 14,549 |
|
1Visteon Corp. | | 210 | | 552 |
|
1Volcom, Inc. | | 100 | | 2,393 |
|
WABCO Holdings, Inc. | | 200 | | 9,292 |
|
Wabtec Corp. | | 170 | | 8,265 |
|
Wal-Mart Stores, Inc. | | 8,700 | | 488,940 |
|
Walt Disney Co. | | 6,500 | | 202,800 |
|
1Warnaco Group, Inc. | | 180 | | 7,933 |
|
Warner Music Group Corp. | | 80 | | 571 |
|
Washington Post Co. | | 21 | | 12,325 |
|
1WCI Communities, Inc. | | 50 | | 73 |
|
Wendy’s International, Inc. | | 322 | | 8,765 |
|
1WESCO International, Inc. | | 114 | | 4,565 |
|
1Westwood One, Inc. | | 130 | | 161 |
|
Whirlpool Corp. | | 308 | | 19,013 |
|
Williams-Sonoma, Inc. | | 288 | | 5,714 |
|
Winnebago Industries, Inc. | | 40 | | 408 |
|
1WMS Industries, Inc. | | 150 | | 4,465 |
|
Wolverine World Wide, Inc. | | 200 | | 5,334 |
|
Wyndham Worldwide Corp. | | 700 | | 12,537 |
|
Wynn Resorts Ltd. | | 231 | | 18,792 |
|
1XM Satellite Radio Holdings, Inc. | | 1,212 | | 9,502 |
| | | | |
| 28 | | AARP PORTFOLIOS 2008 ANNUAL REPORT | | U.S. Stock Market Portfolio |
U.S. Stock Market Portfolio (continued)
June 30, 2008
| | | | | |
| Portfolio of investments | | | | |
| | |
| | | Shares | | Value |
| | | | | |
|
Common Stocks (continued) |
| Consumer Discretionary (continued) |
Yum! Brands, Inc. | | 1,700 | | $ | 59,653 |
|
1Zale Corp. | | 170 | | | 3,211 |
|
1Zumiez, Inc. | | 100 | | | 1,658 |
| |
Total Consumer Discretionary | | | | | 4,914,771 |
| |
| | |
| Consumer Staples–7.8% | | | | | |
Alberto-Culver Co. | | 313 | | | 8,223 |
|
1Alliance One International, Inc. | | 300 | | | 1,533 |
|
Altria Group, Inc. | | 7,570 | | | 155,639 |
|
Anheuser-Busch Cos., Inc. | | 2,600 | | | 161,512 |
|
Archer-Daniels-Midland Co. | | 2,100 | | | 70,875 |
|
Avon Products, Inc. | | 1,516 | | | 54,606 |
|
1Boston Beer Co., Inc. | | 100 | | | 4,068 |
|
Brown-Forman Corp. | | 200 | | | 15,114 |
|
Bunge Ltd. | | 438 | | | 47,168 |
|
Campbell Soup Co. | | 847 | | | 28,341 |
|
Casey’s General Stores, Inc. | | 180 | | | 4,171 |
|
1Central European Distribution | | | | | |
Corp. | | 100 | | | 7,415 |
1Central Garden and Pet Co. | | 40 | | | 182 |
|
1Central Garden and Pet Co., | | | | | |
Class A (Non-voting) | | 80 | | | 328 |
1Chattem, Inc. | | 51 | | | 3,318 |
|
1Chiquita Brands International, | | | | | |
Inc. | | 178 | | | 2,700 |
Church & Dwight Co., Inc. | | 232 | | | 13,073 |
|
Clorox Co. | | 513 | | | 26,779 |
|
Coca-Cola Co. | | 7,600 | | | 395,048 |
|
Coca-Cola Enterprises, Inc. | | 1,100 | | | 19,030 |
|
Colgate-Palmolive Co. | | 1,880 | | | 129,908 |
|
ConAgra Foods, Inc. | | 1,771 | | | 34,145 |
|
1Constellation Brands, Inc. | | 710 | | | 14,101 |
|
Corn Products International, Inc. | | 251 | | | 12,327 |
|
CVS Corp. | | 5,200 | | | 205,764 |
|
1Dean Foods Co. | | 600 | | | 11,772 |
|
Del Monte Foods Co. | | 760 | | | 5,396 |
| | | | |
| | | | |
1Dr Pepper Snapple Group, Inc. | | 900 | | 18,882 |
|
1Elizabeth Arden, Inc. | | 100 | | 1,518 |
|
Estee Lauder Cos., Inc. | | 330 | | 15,328 |
|
Flowers Foods, Inc. | | 255 | | 7,227 |
|
General Mills, Inc. | | 1,229 | | 74,686 |
|
1Great Atlantic & Pacific Tea Co. | | 112 | | 2,556 |
|
1Green Mountain Coffee Roasters, | | | | |
Inc. | | 100 | | 3,757 |
H.J. Heinz Co. | | 1,149 | | 54,980 |
|
1Hain Celestial Group, Inc. | | 180 | | 4,226 |
|
1Hansen Natural Corp. | | 252 | | 7,263 |
|
Herbalife Ltd. | | 150 | | 5,812 |
|
Hershey Co. | | 597 | | 19,570 |
|
Hormel Foods Corp. | | 289 | | 10,002 |
|
Ingles Markets, Inc. | | 100 | | 2,333 |
|
J&J Snack Foods Corp. | | 100 | | 2,741 |
|
J.M. Smucker Co. | | 228 | | 9,266 |
|
Kellogg Co. | | 999 | | 47,972 |
|
Kimberly-Clark Corp. | | 1,535 | | 91,762 |
|
Kraft Foods, Inc. | | 5,567 | | 158,381 |
|
Kroger Co. | | 2,343 | | 67,642 |
|
Lance, Inc. | | 100 | | 1,877 |
|
Longs Drug Stores Corp. | | 140 | | 5,895 |
|
1Lorillard, Inc. | | 647 | | 44,747 |
|
McCormick & Co., Inc. | | 433 | | 15,441 |
|
Molson Coors Brewing Co. | | 476 | | 25,861 |
|
Nash Finch Co. | | 100 | | 3,427 |
|
1NBTY, Inc. | | 190 | | 6,091 |
|
Nu Skin Enterprises, Inc. | | 300 | | 4,476 |
|
1Pantry, Inc. | | 30 | | 320 |
|
Pepsi Bottling Group, Inc. | | 560 | | 15,635 |
|
PepsiAmericas, Inc. | | 200 | | 3,956 |
|
PepsiCo, Inc. | | 5,800 | | 368,822 |
|
Philip Morris International, Inc. | | 7,600 | | 375,364 |
|
Pilgrim’s Pride Corp. | | 152 | | 1,974 |
|
1Prestige Brands Holdings, Inc. | | 100 | | 1,066 |
|
Procter & Gamble Co. | | 11,100 | | 674,991 |
|
1Ralcorp Holdings, Inc. | | 98 | | 4,845 |
|
Reddy Ice Holdings, Inc. | | 100 | | 1,368 |
|
| | | | |
| U.S. Stock Market Portfolio | | AARP PORTFOLIOS 2008 ANNUAL REPORT | | 29 |
| | | | | |
| Portfolio of investments | | | | |
| | |
| | | Shares | | Value |
| | | | | |
|
Common Stocks (continued) |
| Consumer Staples (continued) |
1Rite Aid Corp. | | 2,350 | | $ | 3,737 |
|
Ruddick Corp. | | 100 | | | 3,431 |
|
Safeway, Inc. | | 1,605 | | | 45,823 |
|
1Sally Beauty Holdings, Inc. | | 190 | | | 1,227 |
|
Sanderson Farms, Inc. | | 100 | | | 3,452 |
|
Sara Lee Corp. | | 2,727 | | | 33,406 |
|
Seaboard Corp. | | 1 | | | 1,551 |
|
Sensient Technologies Corp. | | 161 | | | 4,534 |
|
1Smithfield Foods, Inc. | | 459 | | | 9,125 |
|
Spartan Stores, Inc. | | 100 | | | 2,300 |
|
1Steiner Leisure Ltd. | | 100 | | | 2,835 |
|
SUPERVALU, Inc. | | 764 | | | 23,600 |
|
SYSCO Corp. | | 2,179 | | | 59,944 |
|
1Tejon Ranch Co. | | 100 | | | 3,606 |
|
Terra Industries, Inc. | | 361 | | | 17,815 |
|
Tootsie Roll Industries, Inc. | | 106 | | | 2,664 |
|
1TreeHouse Foods, Inc. | | 100 | | | 2,426 |
|
Tyson Foods, Inc. | | 930 | | | 13,894 |
|
1United Natural Foods, Inc. | | 160 | | | 3,117 |
|
Universal Corp. | | 109 | | | 4,929 |
|
UST, Inc. | | 500 | | | 27,305 |
|
Vector Group Ltd. | | 105 | | | 1,694 |
|
Walgreen Co. | | 3,600 | | | 117,036 |
|
WD-40 Co. | | 100 | | | 2,925 |
|
Whole Foods Market, Inc. | | 489 | | | 11,584 |
|
1Winn-Dixie Stores, Inc. | | 300 | | | 4,806 |
|
Wm. Wrigley Jr. Co. | | 700 | | | 54,446 |
| |
Total Consumer Staples | | | | | 4,057,808 |
| |
| | |
| Energy–14.0% | | | | | |
1Allis-Chalmers Energy, Inc. | | 100 | | | 1,780 |
|
Anadarko Petroleum Corp. | | 1,700 | | | 127,228 |
|
Apache Corp. | | 1,200 | | | 166,800 |
|
1Arena Resources, Inc. | | 100 | | | 5,282 |
|
Atlas America, Inc. | | 100 | | | 4,505 |
|
| | | | |
| | | | |
1ATP Oil & Gas Corp. | | 148 | | 5,842 |
|
1Atwood Oceanics, Inc. | | 100 | | 12,434 |
|
Baker Hughes, Inc. | | 1,149 | | 100,354 |
|
1Basic Energy Services, Inc. | | 100 | | 3,150 |
|
Berry Petroleum Co. | | 160 | | 9,421 |
|
1Bill Barrett Corp. | | 140 | | 8,317 |
|
BJ Services Co. | | 1,115 | | 35,613 |
|
1Bois d’Arc Energy, Inc. | | 100 | | 2,431 |
|
1BPZ Resources, Inc. | | 200 | | 5,880 |
|
1Brigham Exploration Co. | | 200 | | 3,166 |
|
1Bronco Drilling Co., Inc. | | 100 | | 1,838 |
|
Cabot Oil & Gas Corp. | | 359 | | 24,315 |
|
1Cameron International Corp. | | 800 | | 44,280 |
|
CARBO Ceramics, Inc. | | 80 | | 4,668 |
|
1Carrizo Oil & Gas, Inc. | | 100 | | 6,809 |
|
1Cheniere Energy, Inc. | | 160 | | 699 |
|
Chesapeake Energy Corp. | | 1,800 | | 118,728 |
|
Chevron Corp. | | 7,500 | | 743,475 |
|
Cimarex Energy Co. | | 306 | | 21,319 |
|
1CNX Gas Corp. | | 100 | | 4,204 |
|
1Complete Production Services, | | | | |
Inc. | | 200 | | 7,284 |
1Comstock Resources, Inc. | | 160 | | 13,509 |
|
1Concho Resources, Inc. | | 200 | | 7,460 |
|
ConocoPhillips | | 5,400 | | 509,706 |
|
1Contango Oil & Gas Co. | | 66 | | 6,133 |
|
1Continental Resources, Inc. | | 200 | | 13,864 |
|
1Core Laboratories NV | | 78 | | 11,103 |
|
Crosstex Energy, Inc. | | 119 | | 4,125 |
|
1CVR Energy, Inc. | | 100 | | 1,925 |
|
1Dawson Geophysical Co. | | 34 | | 2,022 |
|
1Delta Petroleum Corp. | | 200 | | 5,104 |
|
1Denbury Resources, Inc. | | 936 | | 34,164 |
|
Devon Energy Corp. | | 1,550 | | 186,248 |
|
Diamond Offshore Drilling, Inc. | | 253 | | 35,202 |
|
1Dresser-Rand Group, Inc. | | 305 | | 11,925 |
|
1Dril-Quip, Inc. | | 100 | | 6,300 |
|
El Paso Corp. | | 2,545 | | 55,328 |
|
1Encore Acquisition Co. | | 200 | | 15,038 |
|
| | | | |
| 30 | | AARP PORTFOLIOS 2008 ANNUAL REPORT | | U.S. Stock Market Portfolio |
U.S. Stock Market Portfolio (continued)
June 30, 2008
| | | | | |
| Portfolio of investments | | | | |
| | |
| | | Shares | | Value |
| | | | | |
|
Common Stocks (continued) |
| Energy (continued) |
1Energy Partners Ltd. | | 87 | | $ | 1,298 |
|
ENSCO International, Inc. | | 523 | | | 42,227 |
|
EOG Resources, Inc. | | 900 | | | 118,080 |
|
Equitable Resources, Inc. | | 400 | | | 27,624 |
|
1Evergreen Energy, Inc. | | 90 | | | 157 |
|
1EXCO Resources, Inc. | | 329 | | | 12,143 |
|
1Exterran Holdings, Inc. | | 231 | | | 16,514 |
|
Exxon Mobil Corp. | | 19,300 | | | 1,700,909 |
|
1Flotek Industries, Inc. | | 100 | | | 2,062 |
|
1FMC Technologies, Inc. | | 500 | | | 38,465 |
|
1Forest Oil Corp. | | 300 | | | 22,350 |
|
Frontier Oil Corp. | | 353 | | | 8,440 |
|
General Maritime Corp. | | 140 | | | 3,637 |
|
1Global Industries Ltd. | | 330 | | | 5,917 |
|
1Goodrich Petroleum Corp. | | 90 | | | 7,463 |
|
1Grey Wolf, Inc. | | 540 | | | 4,876 |
|
1GulfMark Offshore, Inc. | | 100 | | | 5,818 |
|
1Gulfport Energy Corp. | | 100 | | | 1,647 |
|
Halliburton Co. | | 3,200 | | | 169,824 |
|
1Harvest Natural Resources, Inc. | | 100 | | | 1,106 |
|
1Helix Energy Solutions Group, | | | | | |
Inc. | | 297 | | | 12,367 |
Helmerich & Payne, Inc. | | 400 | | | 28,808 |
|
1Hercules Offshore, Inc. | | 300 | | | 11,406 |
|
Hess Corp. | | 1,060 | | | 133,761 |
|
Holly Corp. | | 211 | | | 7,790 |
|
1Hornbeck Offshore Services, | | | | | |
Inc. | | 100 | | | 5,651 |
1ION Geophysical Corp. | | 300 | | | 5,235 |
|
Lufkin Industries, Inc. | | 56 | | | 4,664 |
|
Marathon Oil Corp. | | 2,600 | | | 134,862 |
|
1Mariner Energy Inc | | 300 | | | 11,091 |
|
1Matrix Service Co. | | 100 | | | 2,306 |
|
1McMoRan Exploration Co. | | 200 | | | 5,504 |
|
Murphy Oil Corp. | | 651 | | | 63,831 |
|
| | | | |
| | | | |
1Nabors Industries Ltd. | | 1,002 | | 49,328 |
|
1NATCO Group, Inc. | | 100 | | 5,453 |
|
1National Oilwell Varco, Inc. | | 1,502 | | 133,257 |
|
1Newfield Exploration Co. | | 491 | | 32,038 |
|
1Newpark Resources, Inc. | | 300 | | 2,358 |
|
Noble Corp. | | 997 | | 64,765 |
|
Noble Energy, Inc. | | 622 | | 62,548 |
|
Occidental Petroleum Corp. | | 3,000 | | 269,580 |
|
1Oceaneering International, Inc. | | 180 | | 13,869 |
|
1Oil States International, Inc. | | 183 | | 11,610 |
|
1Oilsands Quest, Inc. | | 600 | | 3,900 |
|
1Pacific Ethanol, Inc. | | 100 | | 181 |
|
1Parallel Petroleum Corp. | | 82 | | 1,651 |
|
1Parker Drilling Co. | | 270 | | 2,703 |
|
Patterson-UTI Energy, Inc. | | 577 | | 20,795 |
|
Penn Virginia Corp. | | 160 | | 12,067 |
|
1Petroleum Development Corp. | | 50 | | 3,324 |
|
1PetroQuest Energy, Inc. | | 200 | | 5,380 |
|
1Pioneer Drilling Co. | | 171 | | 3,217 |
|
Pioneer Natural Resources Co. | | 450 | | 35,226 |
|
1Plains Exploration & Production | | | | |
Co. | | 438 | | 31,961 |
1Pride International, Inc. | | 600 | | 28,374 |
|
1Quicksilver Resources, Inc. | | 400 | | 15,456 |
|
Range Resources Corp. | | 552 | | 36,178 |
|
1Rosetta Resources, Inc. | | 208 | | 5,928 |
|
Rowan Cos., Inc. | | 399 | | 18,653 |
|
RPC, Inc. | | 100 | | 1,680 |
|
1SandRidge Energy, Inc. | | 200 | | 12,916 |
|
Schlumberger Ltd. | | 4,300 | | 461,949 |
|
1SEACOR Holdings, Inc. | | 80 | | 7,161 |
|
Smith International, Inc. | | 700 | | 58,198 |
|
St. Mary Land & Exploration Co. | | 216 | | 13,962 |
|
1Stone Energy Corp. | | 140 | | 9,227 |
|
Sunoco, Inc. | | 433 | | 17,619 |
|
1Superior Energy Services, Inc. | | 300 | | 16,542 |
|
1Superior Well Services, Inc. | | 100 | | 3,171 |
|
1Swift Energy Co. | | 140 | | 9,248 |
|
1T-3 Energy Services, Inc. | | 58 | | 4,609 |
|
| | | | |
| U.S. Stock Market Portfolio | | AARP PORTFOLIOS 2008 ANNUAL REPORT | | 31 |
| | | | | |
| Portfolio of investments | | | | |
| | |
| | | Shares | | Value |
| | | | | |
|
Common Stocks (continued) |
| Energy (continued) |
Tesoro Corp. | | 505 | | $ | 9,984 |
|
1Tetra Technologies, Inc. | | 220 | | | 5,216 |
|
Tidewater, Inc. | | 200 | | | 13,006 |
|
1Transocean, Inc. | | 1,180 | | | 179,820 |
|
1Trico Marine Services, Inc. | | 100 | | | 3,642 |
|
1Ultra Petroleum Corp. | | 553 | | | 54,305 |
|
1Unit Corp. | | 212 | | | 17,590 |
|
Valero Energy Corp. | | 2,000 | | | 82,360 |
|
1Venoco, Inc. | | 100 | | | 2,321 |
|
W&T Offshore, Inc. | | 113 | | | 6,612 |
|
1W-H Energy Services, Inc. | | 100 | | | 9,574 |
|
1Warren Resources, Inc. | | 200 | | | 2,936 |
|
1Weatherford International Ltd. | | 2,454 | | | 121,694 |
|
Western Refining, Inc. | | 100 | | | 1,184 |
|
1Whiting Petroleum Corp. | | 150 | | | 15,912 |
|
1Willbros Group, Inc. | | 100 | | | 4,381 |
|
Williams Cos., Inc. | | 2,144 | | | 86,425 |
|
XTO Energy, Inc. | | 1,800 | | | 123,318 |
| |
Total Energy | | | | | 7,233,173 |
| |
| | |
| Financials–14.6% | | | | | |
2Acadia Realty Trust | | 100 | | | 2,315 |
|
ACE Ltd. | | 1,195 | | | 65,833 |
|
Advanta Corp. | | 81 | | | 509 |
|
1Affiliated Managers Group, Inc. | | 140 | | | 12,608 |
|
AFLAC, Inc. | | 1,800 | | | 113,040 |
|
1,2Alexander’s, Inc. | | 8 | | | 2,485 |
|
2Alexandria Real Estate | | | | | |
Equities, Inc. | | 106 | | | 10,318 |
1Alleghany Corp. | | 19 | | | 6,309 |
|
Allied Capital Corp. | | 700 | | | 9,723 |
|
Allied World Assurance Holdings | | | | | |
Ltd. | | 100 | | | 3,962 |
Allstate Corp. | | 1,900 | | | 86,621 |
|
2AMB Property Corp. | | 344 | | | 17,331 |
|
AMBAC Financial Group, Inc. | | 1,089 | | | 1,459 |
|
| | | | |
| | | | |
AMCORE Financial, Inc. | | 111 | | 628 |
|
2American Campus | | | | |
Communities, Inc. | | 112 | | 3,118 |
American Capital Strategies Ltd. | | 702 | | 16,687 |
|
American Equity Investment Life | | | | |
Holding Co. | | 200 | | 1,630 |
American Express Co. | | 3,757 | | 141,526 |
|
American Financial Group, Inc. | | 300 | | 8,025 |
|
American International Group, Inc. | | 8,600 | | 227,556 |
|
1AmeriCredit Corp. | | 364 | | 3,138 |
|
Ameriprise Financial, Inc. | | 842 | | 34,244 |
|
Amtrust Financial Services, Inc. | | 100 | | 1,260 |
|
Anchor BanCorp Wisconsin, Inc. | | 100 | | 701 |
|
Annaly Mortgage Management, | | | | |
Inc. | | 2,000 | | 31,020 |
2Anthracite Capital, Inc. | | 200 | | 1,408 |
|
2Anworth Mortgage Asset Corp. | | 200 | | 1,302 |
|
AON Corp. | | 964 | | 44,286 |
|
2Apartment Investment & | | | | |
Management Co. | | 333 | | 11,342 |
Apollo Investment Corp. | | 476 | | 6,821 |
|
2Arbor Realty Trust, Inc. | | 130 | | 1,166 |
|
1Arch Capital Group Ltd. | | 205 | | 13,596 |
|
Ares Capital Corp. | | 338 | | 3,407 |
|
1Argo Group International | | | | |
Holdings Ltd. | | 145 | | 4,866 |
Arthur J. Gallagher & Co. | | 333 | | 8,025 |
|
2Ashford Hospitality Trust, Inc. | | 300 | | 1,386 |
|
Aspen Insurance Holdings Ltd. | | 300 | | 7,101 |
|
Associated Banc-Corp | | 400 | | 7,716 |
|
Assurant, Inc. | | 350 | | 23,086 |
|
Assured Guaranty Ltd. | | 190 | | 3,418 |
|
Astoria Financial Corp. | | 340 | | 6,827 |
|
2AvalonBay Communities, Inc. | | 290 | | 25,856 |
|
Axis Capital Holdings Ltd. | | 558 | | 16,634 |
|
BancorpSouth, Inc. | | 232 | | 4,058 |
|
Bank Mutual Corp. | | 200 | | 2,008 |
|
Bank of America Corp. | | 16,000 | | 381,920 |
|
Bank of Hawaii Corp. | | 200 | | 9,560 |
|
Bank of New York Mellon Corp. | | 4,148 | | 156,919 |
|
| | | | |
| 32 | | AARP PORTFOLIOS 2008 ANNUAL REPORT | | U.S. Stock Market Portfolio |
U.S. Stock Market Portfolio (continued)
June 30, 2008
| | | | | |
| Portfolio of investments | | | | |
| | |
| | | Shares | | Value |
| | | | | |
|
Common Stocks (continued) |
| Financials (continued) |
BankAtlantic Bancorp, Inc. | | 200 | | $ | 352 |
|
1Bankrate, Inc. | | 100 | | | 3,907 |
|
Banner Corp. | | 21 | | | 186 |
|
BB&T Corp. | | 2,035 | | | 46,337 |
|
1Berkshire Hathaway, Inc. | | 36 | | | 144,432 |
|
2BioMed Realty Trust, Inc. | | 210 | | | 5,151 |
|
BlackRock Kelso Capital Corp. | | 200 | | | 1,892 |
|
BOK Financial Corp. | | 96 | | | 5,131 |
|
Boston Private Financial | | | | | |
Holdings, Inc. | | 160 | | | 907 |
2Boston Properties, Inc. | | 434 | | | 39,155 |
|
2Brandywine Realty Trust | | 240 | | | 3,782 |
|
2BRE Properties, Inc. | | 200 | | | 8,656 |
|
Broadridge Financial Solutions, | | | | | |
Inc. | | 544 | | | 11,451 |
Brookdale Senior Living, Inc. | | 104 | | | 2,117 |
|
Brookline Bancorp, Inc. | | 190 | | | 1,815 |
|
Brown & Brown, Inc. | | 424 | | | 7,373 |
|
Calamos Asset Management, | | | | | |
Inc. | | 76 | | | 1,294 |
2Camden Property Trust | | 230 | | | 10,180 |
|
Capital One Financial Corp. | | 1,400 | | | 53,214 |
|
2Capital Trust, Inc. | | 10 | | | 192 |
|
CapitalSource, Inc. | | 600 | | | 6,648 |
|
Capitol Bancorp Ltd. | | 100 | | | 897 |
|
Capitol Federal Financial | | 60 | | | 2,257 |
|
2CapLease, Inc. | | 100 | | | 749 |
|
2Capstead Mortgage Corp. | | 200 | | | 2,170 |
|
Cascade Bancorp | | 100 | | | 770 |
|
Cash America International, Inc. | | 95 | | | 2,945 |
|
Cathay General Bancorp | | 100 | | | 1,087 |
|
1CB Richard Ellis Group, Inc. | | 700 | | | 13,440 |
|
1CBIZ, Inc. | | 200 | | | 1,590 |
|
2CBL & Associates Properties, | | | | | |
Inc. | | 234 | | | 5,345 |
2Cedar Shopping Centers, Inc. | | 100 | | | 1,172 |
|
| | | | |
| | | | |
Central Pacific Financial Corp. | | 60 | | 640 |
|
Charles Schwab Corp. | | 3,583 | | 73,595 |
|
Chemical Financial Corp. | | 100 | | 2,040 |
|
Chubb Corp. | | 1,298 | | 63,615 |
|
Cincinnati Financial Corp. | | 537 | | 13,640 |
|
CIT Group, Inc. | | 1,128 | | 7,682 |
|
Citigroup, Inc. | | 18,800 | | 315,088 |
|
Citizens Banking Corp. | | 207 | | 584 |
|
City Holding Co. | | 100 | | 4,077 |
|
City National Corp. | | 152 | | 6,395 |
|
CME Group, Inc. | | 177 | | 67,825 |
|
Cohen & Steers, Inc. | | 100 | | 2,597 |
|
Colonial BancGroup, Inc. | | 434 | | 1,918 |
|
2Colonial Properties Trust | | 163 | | 3,263 |
|
Columbia Banking System, Inc. | | 100 | | 1,933 |
|
Comerica, Inc. | | 577 | | 14,789 |
|
Commerce Bancshares, Inc. | | 215 | | 8,527 |
|
Community Bank System, Inc. | | 90 | | 1,856 |
|
Community Trust Bancorp, Inc. | | 80 | | 2,101 |
|
1CompuCredit Corp. | | 100 | | 600 |
|
1Conseco, Inc. | | 699 | | 6,934 |
|
2Corporate Office Properties | | | | |
Trust SBI MD | | 170 | | 5,836 |
1Corrections Corp. of America | | 418 | | 11,482 |
|
Corus Bankshares, Inc. | | 60 | | 250 |
|
Countrywide Financial Corp. | | 1,906 | | 8,100 |
|
2Cousins Properties, Inc. | | 90 | | 2,079 |
|
Crystal River Capital, Inc. | | 100 | | 366 |
|
Cullen/Frost Bankers, Inc. | | 202 | | 10,070 |
|
CVB Financial Corp. | | 137 | | 1,293 |
|
DCT Industrial Trust, Inc. | | 600 | | 4,968 |
|
Delphi Financial Group, Inc. | | 175 | | 4,049 |
|
2Developers Diversified Realty | | | | |
Corp. | | 430 | | 14,925 |
2DiamondRock Hospitality Co. | | 400 | | 4,356 |
|
2Digital Realty Trust, Inc. | | 200 | | 8,182 |
|
Dime Community Bancshares, | | | | |
Inc. | | 180 | | 2,972 |
|
Discover Financial Services | | 1,597 | | 21,032 |
|
Douglas Emmett, Inc. | | 300 | | 6,591 |
|
| | | | |
| U.S. Stock Market Portfolio | | AARP PORTFOLIOS 2008 ANNUAL REPORT | | 33 |
| | | | | |
| Portfolio of investments | | | | |
| | |
| | | Shares | | Value |
| | | | | |
|
Common Stocks (continued) |
| Financials (continued) |
Downey Financial Corp. | | 30 | | $ | 83 |
|
2Duke Realty Corp. | | 551 | | | 12,370 |
|
2DuPont Fabros Technology, Inc. | | 100 | | | 1,864 |
|
1E*Trade Financial Corp. | | 1,800 | | | 5,652 |
|
East West Bancorp, Inc. | | 182 | | | 1,285 |
|
2EastGroup Properties, Inc. | | 80 | | | 3,432 |
|
Eaton Vance Corp. | | 374 | | | 14,870 |
|
Employers Holdings, Inc. | | 200 | | | 4,140 |
|
Endurance Specialty Holdings | | | | | |
Ltd. | | 228 | | | 7,020 |
1Enstar Group Ltd. | | 31 | | | 2,712 |
|
2Entertainment Properties Trust | | 60 | | | 2,966 |
|
2Equity Lifestyle Properties, Inc. | | 100 | | | 4,400 |
|
2Equity One, Inc. | | 90 | | | 1,850 |
|
2Equity Residential | | 1,000 | | | 38,270 |
|
Erie Indemnity Co. | | 108 | | | 4,984 |
|
2Essex Property Trust, Inc. | | 90 | | | 9,585 |
|
1Euronet Worldwide, Inc. | | 88 | | | 1,487 |
|
Everest Re Group Ltd. | | 250 | | | 19,927 |
|
2Extra Space Storage, Inc. | | 300 | | | 4,608 |
|
1EZCORP, Inc. | | 100 | | | 1,275 |
|
Fannie Mae | | 3,900 | | | 76,089 |
|
FBL Financial Group, Inc. | | 100 | | | 1,988 |
|
1FCStone Group, Inc. | | 100 | | | 2,793 |
|
2Federal Realty Investment Trust | | 190 | | | 13,110 |
|
Federated Investors, Inc. | | 321 | | | 11,049 |
|
2FelCor Lodging Trust, Inc. | | 140 | | | 1,470 |
|
Fidelity National Financial, Inc. | | 749 | | | 9,437 |
|
Fidelity National Information | | | | | |
Services, Inc. | | 708 | | | 26,132 |
Fifth Third Bancorp | | 1,853 | | | 18,864 |
|
Financial Federal Corp. | | 75 | | | 1,647 |
|
First American Corp. | | 265 | | | 6,996 |
|
First BanCorp | | 320 | | | 2,029 |
|
First Busey Corp. | | 100 | | | 1,322 |
|
| | | | |
| | | | |
1First Cash Financial Services, Inc. | | 100 | | 1,499 |
|
First Citizens BancShares, Inc. | | 10 | | 1,395 |
|
First Commonwealth Financial | | | | |
Corp. | | 206 | | 1,922 |
First Financial Bankshares, Inc. | | 100 | | 4,581 |
|
First Financial Corp. | | 40 | | 1,224 |
|
First Financial Holdings, Inc. | | 100 | | 1,718 |
|
First Horizon National Corp. | | 800 | | 5,944 |
|
2First Industrial Realty Trust, Inc. | | 171 | | 4,697 |
|
First Marblehead Corp. | | 175 | | 450 |
|
First Merchants Corp. | | 130 | | 2,360 |
|
First Midwest Bancorp, Inc. | | 190 | | 3,543 |
|
First Niagara Financial Group, Inc. | | 300 | | 3,858 |
|
2First Potomac Realty Trust | | 100 | | 1,524 |
|
1FirstFed Financial Corp. | | 30 | | 241 |
|
FirstMerit Corp. | | 219 | | 3,572 |
|
Flagstar Bancorp, Inc. | | 100 | | 301 |
|
Flagstone Reinsurance Holdings | | | | |
Ltd. | | 100 | | 1,179 |
FNB Corp. | | 350 | | 4,123 |
|
Forest City Enterprises, Inc. | | 245 | | 7,894 |
|
1Forestar Real Estate Group, Inc. | | 200 | | 3,810 |
|
Franklin Resources, Inc. | | 621 | | 56,915 |
|
2Franklin Street Properties Corp. | | 261 | | 3,299 |
|
Freddie Mac | | 2,435 | | 39,934 |
|
2Friedman, Billings, Ramsey | | | | |
Group, Inc. | | 200 | | 300 |
Frontier Financial Corp. | | 120 | | 1,022 |
|
Fulton Financial Corp. | | 525 | | 5,276 |
|
1FX Real Estate and | | | | |
Entertainment, Inc. | | 40 | | 76 |
GAMCO Investors, Inc. | | 60 | | 2,977 |
|
2General Growth Properties, Inc. | | 846 | | 29,635 |
|
Genworth Financial, Inc. | | 1,561 | | 27,801 |
|
2Getty Realty Corp. | | 120 | | 1,729 |
|
GFI Group, Inc. | | 256 | | 2,307 |
|
Glacier Bancorp, Inc. | | 190 | | 3,038 |
|
2Glimcher Realty Trust | | 100 | | 1,118 |
|
Goldman Sachs Group, Inc. | | 1,300 | | 227,370 |
|
2Gramercy Capital Corp. | | 136 | | 1,576 |
|
| | | | |
| 34 | | AARP PORTFOLIOS 2008 ANNUAL REPORT | | U.S. Stock Market Portfolio |
U.S. Stock Market Portfolio (continued)
June 30, 2008
| | | | | |
| Portfolio of investments | | | | |
| | |
| | | Shares | | Value |
| | | | | |
|
Common Stocks (continued) |
| Financials (continued) |
Greenhill & Co., Inc. | | 56 | | $ | 3,016 |
|
Greenlight Capital Re Ltd. | | | | | |
Cl A | | 100 | | | 2,286 |
1Guaranty Bancorp | | 100 | | | 360 |
|
1Guaranty Financial Group, Inc. | | 200 | | | 1,074 |
|
Hancock Holding Co. | | 60 | | | 2,357 |
|
Hanmi Financial Corp. | | 100 | | | 521 |
|
Hanover Insurance Group, Inc. | | 216 | | | 9,180 |
|
Harleysville Group, Inc. | | 100 | | | 3,383 |
|
Harleysville National Corp. | | 100 | | | 1,116 |
|
Hartford Financial Services | | | | | |
Group, Inc. | | 1,100 | | | 71,027 |
HCC Insurance Holdings, Inc. | | 430 | | | 9,090 |
|
2Health Care Property | | | | | |
Investors, Inc. | | 893 | | | 28,406 |
2Health Care REIT, Inc. | | 336 | | | 14,952 |
|
2Healthcare Realty Trust, Inc. | | 175 | | | 4,160 |
|
1HealthExtras, Inc. | | 170 | | | 5,124 |
|
2Highwoods Properties, Inc. | | 190 | | | 5,970 |
|
Hilb, Rogal & Hobbs Co. | | 150 | | | 6,519 |
|
1Hilltop Holdings, Inc. | | 100 | | | 1,031 |
|
2Home Properties, Inc. | | 160 | | | 7,690 |
|
Horace Mann Educators Corp. | | 120 | | | 1,682 |
|
2Hospitality Properties Trust | | 378 | | | 9,246 |
|
2Host Hotels & Resorts, Inc. | | 1,812 | | | 24,734 |
|
2HRPT Properties Trust | | 1,000 | | | 6,770 |
|
Hudson City Bancorp, Inc. | | 1,734 | | | 28,923 |
|
Huntington Bancshares, Inc. | | 1,238 | | | 7,143 |
|
IBERIABANK Corp. | | 60 | | | 2,668 |
|
Independent Bank Corp. | | 90 | | | 2,146 |
|
IndyMac Bancorp, Inc. | | 236 | | | 146 |
|
Infinity Property & Casualty | | | | | |
Corp. | | 50 | | | 2,076 |
2Inland Real Estate Corp. | | 150 | | | 2,163 |
|
Integra Bank Corp. | | 33 | | | 258 |
|
1Interactive Brokers Group, Inc. | | 200 | | | 6,426 |
|
| | | | |
| | | | |
1IntercontinentalExchange, Inc. | | 200 | | 22,800 |
|
International Bancshares Corp. | | 200 | | 4,274 |
|
Invesco Ltd. Com | | 1,500 | | 35,970 |
|
1Investment Technology | | | | |
Group, Inc. | | 189 | | 6,324 |
1Investors Bancorp, Inc. | | 200 | | 2,612 |
|
2Investors Real Estate Trust | | 94 | | 897 |
|
IPC Holdings Ltd. | | 180 | | 4,779 |
|
2iStar Financial, Inc. | | 469 | | 6,195 |
|
Jackson Hewitt Tax Service, Inc. | | 60 | | 733 |
|
Janus Capital Group, Inc. | | 600 | | 15,882 |
|
Jefferies Group, Inc. | | 356 | | 5,988 |
|
Jones Lang LaSalle, Inc. | | 140 | | 8,427 |
|
JPMorgan Chase & Co. | | 12,500 | | 428,875 |
|
1KBW, Inc. | | 100 | | 2,058 |
|
KeyCorp | | 1,900 | | 20,862 |
|
2Kilroy Realty Corp. | | 126 | | 5,926 |
|
2Kimco Realty Corp. | | 870 | | 30,032 |
|
2Kite Realty Group Trust | | 100 | | 1,250 |
|
1Knight Capital Group, Inc. | | 270 | | 4,855 |
|
1LaBranche & Co., Inc. | | 300 | | 2,124 |
|
LandAmerica Financial Group, | | | | |
Inc. | | 30 | | 666 |
2LaSalle Hotel Properties | | 159 | | 3,996 |
|
Legg Mason, Inc. | | 468 | | 20,391 |
|
Lehman Brothers Holdings, Inc. | | 2,150 | | 42,591 |
|
Leucadia National Corp. | | 600 | | 28,164 |
|
2Lexington Corporate Properties | | | | |
Trust | | 230 | | 3,135 |
2Liberty Property Trust | | 300 | | 9,945 |
|
Lincoln National Corp. | | 1,005 | | 45,547 |
|
Loews Corp. | | 1,314 | | 61,627 |
|
2LTC Properties, Inc. | | 100 | | 2,556 |
|
M&T Bank Corp. | | 258 | | 18,199 |
|
2Macerich Co. | | 291 | | 18,080 |
|
2Mack-Cali Realty Corp. | | 288 | | 9,841 |
|
2Maguire Properties, Inc. | | 80 | | 974 |
|
1Markel Corp. | | 32 | | 11,744 |
|
Marsh & McLennan Cos., Inc. | | 1,945 | | 51,640 |
|
Marshall & Ilsley Corp. | | 844 | | 12,939 |
|
| | | | |
| U.S. Stock Market Portfolio | | AARP PORTFOLIOS 2008 ANNUAL REPORT | | 35 |
| | | | | |
| Portfolio of investments | | | | |
| | |
| | | Shares | | Value |
| | | | | |
|
Common Stocks (continued) |
| Financials (continued) |
Max Capital Group, Ltd. | | 180 | | $ | 3,839 |
|
MB Financial, Inc. | | 100 | | | 2,247 |
|
MBIA, Inc. | | 727 | | | 3,192 |
|
MCG Capital Corp. | | 200 | | | 796 |
|
2Medical Properties Trust, Inc. | | 300 | | | 3,036 |
|
Mercury General Corp. | | 100 | | | 4,672 |
|
Merrill Lynch & Co., Inc. | | 3,300 | | | 104,643 |
|
MetLife, Inc. | | 2,600 | | | 137,202 |
|
1MF Global Ltd. | | 400 | | | 2,524 |
|
2MFA Mortgage Investments, Inc. | | 600 | | | 3,912 |
|
MGIC Investment Corp. | | 490 | | | 2,994 |
|
2Mid-America Apartment | | | | | |
Communities, Inc. | | 70 | | | 3,573 |
Montpelier Re Holdings Ltd. | | 310 | | | 4,572 |
|
Moody’s Corp. | | 777 | | | 26,760 |
|
Morgan Stanley | | 3,600 | | | 129,852 |
|
1MSCI, Inc. | | 200 | | | 7,258 |
|
1NASDAQ Stock Market, Inc. | | 474 | | | 12,585 |
|
National City Corp. | | 2,192 | | | 10,456 |
|
National Financial Partners Corp. | | 150 | | | 2,973 |
|
2National Health Investors, Inc. | | 100 | | | 2,851 |
|
National Penn Bancshares, Inc. | | 306 | | | 4,064 |
|
2National Retail Properties, Inc. | | 270 | | | 5,643 |
|
National Western Life Insurance | | | | | |
Co. | | 10 | | | 2,185 |
Nationwide Financial Services, | | | | | |
Inc. | | 127 | | | 6,097 |
2Nationwide Health Properties, | | | | | |
Inc. | | 331 | | | 10,423 |
NBT Bancorp, Inc. | | 85 | | | 1,752 |
|
New York Community Bancorp, | | | | | |
Inc. | | 1,094 | | | 19,517 |
NewAlliance Bancshares, Inc. | | 300 | | | 3,744 |
|
2Newcastle Investment Corp. | | 100 | | | 701 |
|
Northern Trust Corp. | | 718 | | | 49,233 |
|
2NorthStar Realty Finance Corp. | | 100 | | | 832 |
|
| | | | |
| | | | |
Northwest Bancorp, Inc. | | 100 | | 2,182 |
|
Nymex Holdings, Inc. | | 300 | | 25,344 |
|
NYSE Euronext, Inc. | | 461 | | 23,354 |
|
1Ocwen Financial Corp. | | 100 | | 465 |
|
Odyssey Re Holdings Corp. | | 100 | | 3,550 |
|
Old National Bancorp | | 228 | | 3,251 |
|
Old Republic International Corp. | | 838 | | 9,922 |
|
Omega Healthcare Investors, Inc. | | 249 | | 4,146 |
|
OneBeacon Insurance Group Ltd. | | 100 | | 1,757 |
|
optionsXpress Holdings, Inc. | | 100 | | 2,234 |
|
Pacific Capital Bancorp | | 100 | | 1,378 |
|
PacWest Bancorp | | 150 | | 2,232 |
|
Park National Corp. | | 20 | | 1,078 |
|
2Parkway Properties, Inc. | | 45 | | 1,518 |
|
PartnerRe Ltd. | | 190 | | 13,135 |
|
2Pennsylvania Real Estate | | | | |
Investment Trust | | 160 | | 3,702 |
People’s United Financial, Inc. | | 1,296 | | 20,218 |
|
1Philadelphia Consolidated Holding | | | | |
Co. | | 187 | | 6,352 |
Phoenix Cos., Inc. | | 280 | | 2,131 |
|
1Pico Holdings, Inc. | | 100 | | 4,345 |
|
1Piper Jaffray Cos. | | 40 | | 1,173 |
|
Platinum Underwriters Holdings | | | | |
Ltd. | | 180 | | 5,870 |
2Plum Creek Timber Co., Inc. | | 650 | | 27,761 |
|
PMI Group, Inc. | | 270 | | 527 |
|
PNC Financial Services Group, | | | | |
Inc. | | 1,270 | | 72,517 |
Popular, Inc. | | 948 | | 6,247 |
|
1Portfolio Recovery Associates, | | | | |
Inc. | | 47 | | 1,763 |
2Post Properties, Inc. | | 172 | | 5,117 |
|
Principal Financial Group, Inc. | | 953 | | 39,997 |
|
PrivateBancorp, Inc. | | 100 | | 3,038 |
|
1ProAssurance Corp. | | 150 | | 7,216 |
|
Progressive Corp. | | 2,400 | | 44,928 |
|
2ProLogis | | 952 | | 51,741 |
|
Prosperity Bancshares, Inc. | | 99 | | 2,646 |
|
Protective Life Corp. | | 200 | | 7,610 |
|
Provident Bankshares Corp. | | 80 | | 510 |
| | | | |
| 36 | | AARP PORTFOLIOS 2008 ANNUAL REPORT | | U.S. Stock Market Portfolio |
U.S. Stock Market Portfolio (continued)
June 30, 2008
| | | | | |
| Portfolio of investments | | | | |
| | |
| | | Shares | | Value |
| | | | | |
|
Common Stocks (continued) |
| Financials (continued) |
Provident Financial Services, Inc. | | 150 | | $ | 2,102 |
|
Provident New York Bancorp | | 230 | | | 2,544 |
|
Prudential Financial, Inc. | | 1,570 | | | 93,792 |
|
2PS Business Parks, Inc. | | 74 | | | 3,818 |
|
2Public Storage, Inc. | | 454 | | | 36,679 |
|
Radian Group, Inc. | | 286 | | | 415 |
|
2RAIT Investment Trust | | 100 | | | 742 |
|
2Ramco-Gershenson Properties | | | | | |
Trust | | 35 | | | 719 |
Raymond James Financial, Inc. | | 318 | | | 8,392 |
|
2Realty Income Corp. | | 408 | | | 9,286 |
|
2Redwood Trust, Inc. | | 140 | | | 3,191 |
|
2Regency Centers Corp. | | 200 | | | 11,824 |
|
Regions Financial Corp. | | 2,545 | | | 27,766 |
|
Reinsurance Group of America, | | | | | |
Inc. | | 66 | | | 2,872 |
RenaissanceRe Holdings Ltd. | | 200 | | | 8,934 |
|
Renasant Corp. | | 100 | | | 1,473 |
|
RLI Corp. | | 100 | | | 4,947 |
|
S&T Bancorp, Inc. | | 100 | | | 2,906 |
|
SAFECO Corp. | | 300 | | | 20,148 |
|
Safety Insurance Group, Inc. | | 100 | | | 3,565 |
|
Sandy Spring Bancorp, Inc. | | 90 | | | 1,492 |
|
2Saul Centers, Inc. | | 54 | | | 2,537 |
|
SEI Investments Co. | | 560 | | | 13,171 |
|
Selective Insurance Group | | 218 | | | 4,090 |
|
2Senior Housing Properties Trust | | 362 | | | 7,070 |
|
1Signature Bank | | 70 | | | 1,803 |
|
2Simon Property Group, Inc. | | 800 | | | 71,912 |
|
2SL Green Realty Corp. | | 230 | | | 19,026 |
|
1SLM Corp. | | 1,700 | | | 32,895 |
|
South Financial Group, Inc. | | 207 | | | 811 |
|
Sovereign Bancorp, Inc. | | 2,000 | | | 14,720 |
|
2Sovran Self Storage, Inc. | | 70 | | | 2,909 |
|
St. Joe Co. | | 305 | | | 10,468 |
|
| | | | |
| | | | |
StanCorp Financial Group, Inc. | | 200 | | 9,392 |
|
3State Street Corp. | | 1,500 | | 95,985 |
|
Sterling Bancshares, Inc. | | 150 | | 1,364 |
|
Sterling Financial Corp. | | 90 | | 373 |
|
Stewart Information Services | | | | |
Corp. | | 40 | | 774 |
1Stifel Financial Corp. | | 50 | | 1,720 |
|
2Strategic Hotels & Resorts, Inc. | | 234 | | 2,193 |
|
Student Loan Corp. | | 10 | | 981 |
|
2Sun Communities, Inc. | | 120 | | 2,188 |
|
2Sunstone Hotel Investors, Inc. | | 190 | | 3,154 |
|
SunTrust Banks, Inc. | | 1,231 | | 44,587 |
|
Susquehanna Bancshares, Inc. | | 428 | | 5,859 |
|
1SVB Financial Group | | 155 | | 7,457 |
|
SWS Group, Inc. | | 100 | | 1,661 |
|
Synovus Financial Corp. | | 1,022 | | 8,922 |
|
T. Rowe Price Group, Inc. | | 908 | | 51,275 |
|
2Tanger Factory Outlet Centers, | | | | |
Inc. | | 90 | | 3,234 |
2Taubman Centers, Inc. | | 210 | | 10,216 |
|
TCF Financial Corp. | | 397 | | 4,776 |
|
1TD Ameritrade Holding Corp. | | 789 | | 14,273 |
|
1Texas Capital Bancshares, Inc. | | 100 | | 1,600 |
|
TFS Financial Corp. | | 500 | | 5,795 |
|
2Thornburg Mortgage, Inc. | | 522 | | 105 |
|
Tompkins Trustco, Inc. | | 77 | | 2,864 |
|
Torchmark Corp. | | 361 | | 21,173 |
|
Tower Group, Inc. | | 100 | | 2,119 |
|
Transatlantic Holdings, Inc. | | 99 | | 5,591 |
|
Travelers Cos., Inc. | | 2,200 | | 95,480 |
|
TrustCo Bank Corp. NY | | 240 | | 1,781 |
|
Trustmark Corp. | | 100 | | 1,765 |
|
2U-Store-It Trust | | 110 | | 1,315 |
|
U.S. Bancorp | | 6,200 | | 172,918 |
|
UCBH Holdings, Inc. | | 430 | | 968 |
|
UMB Financial Corp. | | 80 | | 4,102 |
|
Umpqua Holdings Corp. | | 190 | | 2,305 |
|
Union Bankshares Corp. | | 90 | | 1,340 |
|
UnionBanCal Corp. | | 136 | | 5,497 |
|
1United America Indemnity Ltd. | | 100 | | 1,337 |
| | | | |
| U.S. Stock Market Portfolio | | AARP PORTFOLIOS 2008 ANNUAL REPORT | | 37 |
| | | | | |
| Portfolio of investments | | | | |
| | |
| | | Shares | | Value |
| | | | | |
|
Common Stocks (continued) |
| Financials (continued) |
United Bankshares, Inc. | | 180 | | $ | 4,131 |
|
United Community Banks, Inc. | | 80 | | | 682 |
|
United Dominion Realty Trust, | | | | | |
Inc. | | 504 | | | 11,280 |
United Fire & Casualty Co. | | 100 | | | 2,693 |
|
Unitrin, Inc. | | 200 | | | 5,514 |
|
1Universal American Financial | | | | | |
Corp. | | 100 | | | 1,022 |
2Universal Health Realty Income | | | | | |
Trust | | 30 | | | 900 |
UnumProvident Corp. | | 1,300 | | | 26,585 |
|
2Urstadt Biddle Properties, Inc. | | 180 | | | 2,639 |
|
Valley National Bancorp | | 387 | | | 6,103 |
|
2Ventas, Inc. | | 491 | | | 20,902 |
|
1Visa, Inc. | | 1,500 | | | 121,965 |
|
2Vornado Realty Trust | | 498 | | | 43,824 |
|
W Holding Co., Inc. | | 200 | | | 170 |
|
W.R. Berkley Corp. | | 551 | | | 13,312 |
|
Wachovia Corp. | | 7,800 | | | 121,134 |
|
Waddell & Reed Financial, Inc. | | 320 | | | 11,203 |
|
Walter Industries, Inc. | | 187 | | | 20,340 |
|
Washington Federal, Inc. | | 330 | | | 5,973 |
|
Washington Mutual, Inc. | | 3,330 | | | 16,417 |
|
2Washington Real Estate | | | | | |
Investment Trust | | 200 | | | 6,010 |
Washington Trust Bancorp, Inc. | | 110 | | | 2,167 |
|
Webster Financial Corp. | | 224 | | | 4,166 |
|
2Weingarten Realty Investors | | 295 | | | 8,944 |
|
Wells Fargo & Co. | | 11,500 | | | 273,125 |
|
WesBanco, Inc. | | 100 | | | 1,715 |
|
West Coast Bancorp | | 110 | | | 954 |
|
Westamerica BanCorp. | | 51 | | | 2,682 |
|
Western Union Co. | | 2,790 | | | 68,969 |
|
White Mountains Insurance | | | | | |
Group Ltd. | | 34 | | | 14,586 |
Whitney Holding Corp. | | 190 | | | 3,477 |
|
| | | | |
| | | | |
Willis Group Holdings Ltd. | | 500 | | 15,685 |
|
Wilmington Trust Corp. | | 230 | | 6,081 |
|
Wintrust Financial Corp. | | 50 | | 1,193 |
|
1World Acceptance Corp. | | 45 | | 1,515 |
|
XL Capital Ltd. | | 700 | | 14,392 |
|
Zenith National Insurance Corp. | | 140 | | 4,922 |
|
Zions BanCorp. | | 370 | | 11,651 |
| |
Total Financials | | | | 7,529,617 |
| |
| | |
| Health Care–11.1% | | | | |
1Abaxis, Inc. | | 100 | | 2,413 |
|
Abbott Laboratories | | 5,600 | | 296,632 |
|
1Abiomed, Inc. | | 100 | | 1,775 |
|
1Abraxis Bioscience, Inc. | | 35 | | 2,221 |
|
1Accuray, Inc. | | 195 | | 1,422 |
|
1Acorda Therapeutics, Inc. | | 100 | | 3,283 |
|
1Advanced Medical Optics, Inc. | | 239 | | 4,479 |
|
1Advisory Board Co. | | 40 | | 1,573 |
|
Aetna, Inc. | | 1,860 | | 75,386 |
|
1Affymetrix, Inc. | | 193 | | 1,986 |
|
1Air Methods Corp. | | 100 | | 2,500 |
|
1Alexion Pharmaceuticals, Inc. | | 127 | | 9,207 |
|
1Align Technology, Inc. | | 200 | | 2,098 |
|
1Alkermes, Inc. | | 310 | | 3,832 |
|
Allergan, Inc. | | 1,140 | | 59,337 |
|
1Alnylam Pharmaceuticals, Inc. | | 100 | | 2,673 |
|
1Alpharma, Inc. | | 150 | | 3,379 |
|
1AMAG Pharmaceuticals, Inc. | | 100 | | 3,410 |
|
1Amedisys, Inc. | | 133 | | 6,706 |
|
1American Medical Systems | | | | |
Holdings, Inc. | | 190 | | 2,841 |
1American Oriental Bioengineering, | | | | |
Inc. | | 200 | | 1,974 |
1AMERIGROUP Corp. | | 180 | | 3,744 |
|
AmerisourceBergen Corp. | | 620 | | 24,794 |
|
1Amgen, Inc. | | 3,978 | | 187,602 |
|
1AMN Healthcare Services, Inc. | | 100 | | 1,692 |
|
1AmSurg Corp. | | 100 | | 2,435 |
|
1Amylin Pharmaceuticals, Inc. | | 526 | | 13,355 |
|
1APP Pharmaceuticals, Inc. | | 140 | | 2,341 |
|
| | | | |
| 38 | | AARP PORTFOLIOS 2008 ANNUAL REPORT | | U.S. Stock Market Portfolio |
U.S. Stock Market Portfolio (continued)
June 30, 2008
| | | | | |
| Portfolio of investments | | | | |
| | |
| | | Shares | | Value |
| | | | | |
|
Common Stocks (continued) |
| Health Care (continued) |
Applera Corp.–Applied | | | | | |
Biosystems Group | | 600 | | $ | 20,088 |
1Applera Corp.–Celera Genomics | | | | | |
Group | | 260 | | | 2,954 |
1Apria Healthcare Group, Inc. | | 170 | | | 3,296 |
|
1Arena Pharmaceuticals, Inc. | | 120 | | | 623 |
|
1ArthroCare Corp. | | 140 | | | 5,713 |
|
1Assisted Living Concepts, Inc. | | 200 | | | 1,100 |
|
1Auxilium Pharmaceuticals, Inc. | | 100 | | | 3,362 |
|
1Barr Pharmaceuticals, Inc. | | 418 | | | 18,843 |
|
Baxter International, Inc. | | 2,240 | | | 143,226 |
|
Beckman Coulter, Inc. | | 220 | | | 14,857 |
|
Becton Dickinson & Co. | | 900 | | | 73,170 |
|
1Bio-Rad Laboratories, Inc. | | 70 | | | 5,662 |
|
1Biogen Idec, Inc. | | 1,100 | | | 61,479 |
|
1BioMarin Pharmaceuticals, Inc. | | 352 | | | 10,201 |
|
1Boston Scientific Corp. | | 4,970 | | | 61,081 |
|
Bristol-Myers Squibb Co. | | 7,221 | | | 148,247 |
|
1Bruker BioSciences Corp. | | 200 | | | 2,570 |
|
C.R. Bard, Inc. | | 380 | | | 33,421 |
|
Cardinal Health, Inc. | | 1,313 | | | 67,725 |
|
1Celgene Corp. | | 1,600 | | | 102,192 |
|
1Centene Corp. | | 160 | | | 2,686 |
|
1Cephalon, Inc. | | 248 | | | 16,539 |
|
1Cepheid, Inc. | | 200 | | | 5,624 |
|
1Charles River Laboratories | | | | | |
International, Inc. | | 238 | | | 15,213 |
Cigna Corp. | | 1,019 | | | 36,062 |
|
1Community Health Systems, Inc. | | 379 | | | 12,499 |
|
1Conceptus, Inc. | | 100 | | | 1,849 |
|
1CONMED Corp. | | 100 | | | 2,655 |
|
Cooper Cos., Inc. | | 209 | | | 7,764 |
|
1Cougar Biotechnology, Inc. | | 100 | | | 2,383 |
|
1Covance, Inc. | | 255 | | | 21,935 |
|
1Coventry Health Care, Inc. | | 600 | | | 18,252 |
|
| | | | |
| | | | |
Covidien Ltd. | | 1,790 | | 85,723 |
|
1Cross Country Healthcare, Inc. | | 100 | | 1,441 |
|
1Cubist Pharmaceuticals, Inc. | | 170 | | 3,036 |
|
1CV Therapeutics, Inc. | | 70 | | 576 |
|
1Cyberonics, Inc. | | 100 | | 2,170 |
|
Datascope Corp. | | 62 | | 2,914 |
|
1DaVita, Inc. | | 418 | | 22,208 |
|
1Dendreon Corp. | | 255 | | 1,135 |
|
DENTSPLY International, Inc. | | 560 | | 20,608 |
|
1Edwards Lifesciences Corp. | | 243 | | 15,076 |
|
Eli Lilly & Co. | | 3,700 | | 170,792 |
|
1Emeritus Corp. | | 100 | | 1,462 |
|
1Endo Pharmaceuticals Holdings, | | | | |
Inc. | | 526 | | 12,724 |
1Enzo Biochem, Inc. | | 100 | | 1,122 |
|
1eResearchTechnology, Inc. | | 100 | | 1,744 |
|
1ev3, Inc. | | 262 | | 2,484 |
|
1Exelixis, Inc. | | 250 | | 1,250 |
|
1Express Scripts, Inc. | | 777 | | 48,733 |
|
1Forest Laboratories, Inc. | | 1,186 | | 41,202 |
|
1Gen-Probe, Inc. | | 200 | | 9,496 |
|
1Genentech, Inc. | | 1,750 | | 132,825 |
|
1Gentiva Health Services, Inc. | | 100 | | 1,905 |
|
1Genzyme Corp. | | 974 | | 70,147 |
|
1Geron Corp. | | 300 | | 1,035 |
|
1Gilead Sciences, Inc. | | 3,307 | | 175,106 |
|
1Haemonetics Corp. | | 40 | | 2,218 |
|
1Halozyme Therapeutics, Inc. | | 100 | | 538 |
|
1Health Management Associates, | | | | |
Inc. | | 1,000 | | 6,510 |
1Health Net, Inc. | | 400 | | 9,624 |
|
1HEALTHSOUTH Corp. | | 300 | | 4,989 |
|
1HealthSpring, Inc. | | 200 | | 3,376 |
|
1Healthways, Inc. | | 140 | | 4,144 |
|
1Henry Schein, Inc. | | 364 | | 18,771 |
|
Hill-Rom Holdings, Inc. | | 234 | | 6,313 |
|
Hillenbrand, Inc. | | 234 | | 5,008 |
|
1HLTH Corp. | | 617 | | 6,984 |
|
1Hologic, Inc. | | 916 | | 19,969 |
|
1Hospira, Inc. | | 577 | | 23,143 |
| | | | |
| U.S. Stock Market Portfolio | | AARP PORTFOLIOS 2008 ANNUAL REPORT | | 39 |
| | | | | |
| Portfolio of investments | | | | |
| | |
| | | Shares | | Value |
| | | | | |
|
Common Stocks (continued) |
| Health Care (continued) |
1Human Genome Sciences, Inc. | | 470 | | $ | 2,449 |
|
1Humana, Inc. | | 615 | | | 24,459 |
|
1ICU Medical, Inc. | | 100 | | | 2,288 |
|
1Idexx Laboratories, Inc. | | 200 | | | 9,748 |
|
1Illumina, Inc. | | 220 | | | 19,164 |
|
1ImClone Systems, Inc. | | 260 | | | 10,520 |
|
1Immucor, Inc. | | 269 | | | 6,962 |
|
IMS Health, Inc. | | 732 | | | 17,056 |
|
1Incyte Corp. | | 300 | | | 2,283 |
|
1Integra LifeSciences Holdings | | | | | |
Corp. | | 100 | | | 4,448 |
1InterMune, Inc. | | 100 | | | 1,312 |
|
1Intuitive Surgical, Inc. | | 139 | | | 37,447 |
|
Invacare Corp. | | 50 | | | 1,022 |
|
1Inverness Medical Innovations, | | | | | |
Inc. | | 307 | | | 10,183 |
1Invitrogen Corp. | | 300 | | | 11,778 |
|
1Isis Pharmaceuticals, Inc. | | 300 | | | 4,089 |
|
Johnson & Johnson | | 10,200 | | | 656,268 |
|
1Kendle International, Inc. | | 100 | | | 3,633 |
|
1Kindred Healthcare, Inc. | | 100 | | | 2,876 |
|
1Kinetic Concepts, Inc. | | 228 | | | 9,099 |
|
1King Pharmaceuticals, Inc. | | 860 | | | 9,004 |
|
1KV Pharmaceutical Co. | | 100 | | | 1,933 |
|
1Laboratory Corp. of America | | | | | |
Holdings | | 420 | | | 29,245 |
LCA-Vision, Inc. | | 30 | | | 143 |
|
1LifePoint Hospitals, Inc. | | 214 | | | 6,056 |
|
1Ligand Pharmaceuticals, Inc. | | 100 | | | 260 |
|
1Lincare Holdings, Inc. | | 293 | | | 8,321 |
|
1Luminex Corp. | | 100 | | | 2,055 |
|
1Magellan Health Services, Inc. | | 160 | | | 5,925 |
|
1MannKind Corp. | | 100 | | | 300 |
|
1Martek Biosciences Corp. | | 160 | | | 5,394 |
|
1Masimo Corp. | | 200 | | | 6,870 |
|
| | | | |
| | | | |
MAXIMUS, Inc. | | 100 | | 3,482 |
|
McKesson Corp. | | 1,000 | | 55,910 |
|
1Medarex, Inc. | | 350 | | 2,314 |
|
1MedCath Corp. | | 100 | | 1,798 |
|
1Medco Health Solutions, Inc. | | 1,930 | | 91,096 |
|
1Medicines Co. | | 180 | | 3,568 |
|
Medicis Pharmaceutical Corp. | | 170 | | 3,533 |
|
1Medivation, Inc. | | 100 | | 1,183 |
|
Medtronic, Inc. | | 4,053 | | 209,743 |
|
Mentor Corp. | | 178 | | 4,952 |
|
Merck & Co., Inc. | | 7,800 | | 293,982 |
|
Meridian Bioscience, Inc. | | 150 | | 4,038 |
|
1Merit Medical Systems, Inc. | | 100 | | 1,470 |
|
1Millipore Corp. | | 191 | | 12,961 |
|
Mine Safety Appliances Co. | | 140 | | 5,599 |
|
Mylan Laboratories, Inc. | | 1,066 | | 12,867 |
|
1Myriad Genetics, Inc. | | 170 | | 7,738 |
|
1Natus Medical, Inc. | | 100 | | 2,094 |
|
1Nektar Therapeutics | | 310 | | 1,039 |
|
1Neurocrine Biosciences, Inc. | | 40 | | 168 |
|
1Noven Pharmaceuticals, Inc. | | 100 | | 1,069 |
|
1NuVasive, Inc. | | 100 | | 4,466 |
|
Omnicare, Inc. | | 500 | | 13,110 |
|
1Omnicell, Inc. | | 100 | | 1,318 |
|
1Onyx Pharmaceuticals, Inc. | | 250 | | 8,900 |
|
1OraSure Technologies, Inc. | | 100 | | 374 |
|
1Orthofix International NV | | 30 | | 869 |
|
1OSI Pharmaceuticals, Inc. | | 227 | | 9,380 |
|
Owens & Minor, Inc. | | 160 | | 7,310 |
|
1Palomar Medical Technologies, | | | | |
Inc. | | 35 | | 349 |
1Par Pharmaceutical Cos., Inc. | | 150 | | 2,435 |
|
1Parexel International Corp. | | 218 | | 5,736 |
|
1Patterson Cos., Inc. | | 500 | | 14,695 |
|
PDL BioPharma, Inc. | | 451 | | 4,790 |
|
1Pediatrix Medical Group, Inc. | | 160 | | 7,877 |
|
Perrigo Co. | | 300 | | 9,531 |
|
Pfizer, Inc. | | 24,700 | | 431,509 |
|
Pharmaceutical Product | | | | |
Development, Inc. | | 406 | | 17,417 |
| | | | |
| 40 | | AARP PORTFOLIOS 2008 ANNUAL REPORT | | U.S. Stock Market Portfolio |
U.S. Stock Market Portfolio (continued)
June 30, 2008
| | | | | |
| Portfolio of investments | | | | |
| | |
| | | Shares | | Value |
| | | | | |
|
Common Stocks (continued) |
| Health Care (continued) |
1PharmaNet Development Group, | | | | | |
Inc. | | 100 | | $ | 1,577 |
1PharMerica Corp. | | 64 | | | 1,446 |
|
1Polypore International, Inc. | | 100 | | | 2,533 |
|
1Progenics Pharmaceuticals, Inc. | | 100 | | | 1,587 |
|
1PSS World Medical, Inc. | | 200 | | | 3,260 |
|
1Psychiatric Solutions, Inc. | | 200 | | | 7,568 |
|
Quest Diagnostics, Inc. | | 601 | | | 29,130 |
|
1Quidel Corp. | | 100 | | | 1,652 |
|
1Regeneron Pharmaceuticals, Inc. | | 190 | | | 2,744 |
|
1Res-Care, Inc. | | 100 | | | 1,778 |
|
1ResMed, Inc. | | 280 | | | 10,007 |
|
1Rigel Pharmaceuticals, Inc. | | 133 | | | 3,014 |
|
1RTI Biologics, Inc. | | 200 | | | 1,750 |
|
1Salix Pharmaceuticals Ltd. | | 80 | | | 562 |
|
1Sangamo Biosciences, Inc. | | 100 | | | 995 |
|
1Savient Pharmaceuticals, Inc. | | 200 | | | 5,060 |
|
Schering-Plough Corp. | | 5,800 | | | 114,202 |
|
Sciele Pharma, Inc. | | 100 | | | 1,935 |
|
1Seattle Genetics, Inc. | | 263 | | | 2,225 |
|
1Sepracor, Inc. | | 339 | | | 6,753 |
|
Service Corp. International | | 1,070 | | | 10,550 |
|
1Sirona Dental Systems, Inc. | | 100 | | | 2,592 |
|
1SonoSite, Inc. | | 100 | | | 2,801 |
|
1St Jude Medical, Inc. | | 1,200 | | | 49,056 |
|
STERIS Corp. | | 190 | | | 5,464 |
|
Stewart Enterprises, Inc. | | 300 | | | 2,160 |
|
Stryker Corp. | | 1,070 | | | 67,282 |
|
1Sun Healthcare Group, Inc. | | 189 | | | 2,531 |
|
1Sunrise Senior Living, Inc. | | 150 | | | 3,372 |
|
1SurModics, Inc. | | 100 | | | 4,484 |
|
1Symmetry Medical, Inc. | | 100 | | | 1,622 |
|
1Techne Corp. | | 139 | | | 10,757 |
|
1Tenet Healthcare Corp. | | 1,747 | | | 9,713 |
|
1Theravance, Inc. | | 180 | | | 2,137 |
| | | | |
| | | | |
1Thoratec Corp. | | 170 | | 2,956 |
|
1United Therapeutics Corp. | | 78 | | 7,624 |
|
UnitedHealth Group, Inc. | | 4,600 | | 120,750 |
|
Universal Health Services, Inc. | | 211 | | 13,339 |
|
1Valeant Pharmaceuticals | | | | |
International | | 411 | | 7,032 |
1Varian Medical Systems, Inc. | | 433 | | 22,451 |
|
1VCA Antech, Inc. | | 300 | | 8,334 |
|
1Vertex Pharmaceuticals, Inc. | | 473 | | 15,831 |
|
1Viropharma, Inc. | | 180 | | 1,991 |
|
1Warner Chilcott Ltd. | | 300 | | 5,085 |
|
1Watson Pharmaceuticals, Inc. | | 367 | | 9,971 |
|
1WellCare Health Plans, Inc. | | 206 | | 7,447 |
|
1WellPoint, Inc. | | 1,990 | | 94,843 |
|
West Pharmaceutical Services, | | | | |
Inc. | | 100 | | 4,328 |
1Wright Medical Group, Inc. | | 100 | | 2,841 |
|
Wyeth | | 4,800 | | 230,208 |
|
1XenoPort, Inc. | | 100 | | 3,903 |
|
1Zimmer Holdings, Inc. | | 851 | | 57,911 |
|
1Zoll Medical Corp. | | 100 | | 3,367 |
|
1ZymoGenetics, Inc. | | 100 | | 842 |
| |
Total Health Care | | | | 5,755,475 |
| |
| | |
| Industrials–12.0% | | | | |
3M Co. | | 2,400 | | 167,016 |
|
A.O. Smith Corp. | | 100 | | 3,283 |
|
1AAR Corp. | | 156 | | 2,111 |
|
ABM Industries, Inc. | | 190 | | 4,227 |
|
Actuant Corp. | | 178 | | 5,580 |
|
Acuity Brands, Inc. | | 105 | | 5,048 |
|
Administaff, Inc. | | 130 | | 3,626 |
|
Advance America Cash Advance | | | | |
Centers, Inc. | | 194 | | 986 |
1Aecom Technology Corp. | | 200 | | 6,506 |
|
1AGCO Corp. | | 346 | | 18,134 |
|
1Air Transport Services Group, | | | | |
Inc. | | 200 | | 200 |
Aircastle Ltd. | | 100 | | 841 |
|
1AirTran Holdings, Inc. | | 200 | | 408 |
|
1Alaska Air Group, Inc. | | 104 | | 1,595 |
|
| | | | |
| U.S. Stock Market Portfolio | | AARP PORTFOLIOS 2008 ANNUAL REPORT | | 41 |
| | | | | |
| Portfolio of investments | | | | |
| | |
| | | Shares | | Value |
| | | | | |
|
Common Stocks (continued) |
| Industrials (continued) |
Albany International Corp. | | 140 | | $ | 4,060 |
|
Alexander & Baldwin, Inc. | | 160 | | | 7,288 |
|
1Alliance Data Systems Corp. | | 286 | | | 16,173 |
|
1Alliant Techsystems, Inc. | | 122 | | | 12,405 |
|
1Allied Waste Industries, Inc. | | 1,164 | | | 14,690 |
|
1AMERCO, Inc. | | 37 | | | 1,764 |
|
1American Commercial Lines, Inc. | | 198 | | | 2,164 |
|
American Ecology Corp. | | 100 | | | 2,953 |
|
1American Superconductor Corp. | | 100 | | | 3,585 |
|
Ametek, Inc. | | 370 | | | 17,471 |
|
1AMR Corp. | | 942 | | | 4,823 |
|
Apogee Enterprises, Inc. | | 100 | | | 1,616 |
|
1Apollo Group, Inc. | | 495 | | | 21,909 |
|
Applied Industrial Technologies, | | | | | |
Inc. | | 90 | | | 2,175 |
Arbitron, Inc. | | 50 | | | 2,375 |
|
Arkansas Best Corp. | | 140 | | | 5,130 |
|
Armstrong World Industries, Inc. | | 100 | | | 2,922 |
|
1Astec Industries, Inc. | | 100 | | | 3,214 |
|
1Atlas Air Worldwide Holdings, | | | | | |
Inc. | | 46 | | | 2,275 |
Avery Dennison Corp. | | 300 | | | 13,179 |
|
1Badger Meter, Inc. | | 100 | | | 5,053 |
|
Baldor Electric Co. | | 200 | | | 6,996 |
|
1Bally Technologies, Inc. | | 205 | | | 6,929 |
|
Barnes Group, Inc. | | 200 | | | 4,618 |
|
1BE Aerospace, Inc. | | 387 | | | 9,013 |
|
Belden CDT, Inc. | | 180 | | | 6,098 |
|
1Blount International, Inc. | | 100 | | | 1,161 |
|
Boeing Co. | | 2,600 | | | 170,872 |
|
Bowne & Co., Inc. | | 100 | | | 1,275 |
|
Brady Corp. | | 160 | | | 5,525 |
|
Briggs & Stratton Corp. | | 170 | | | 2,156 |
|
Brink’s Co. | | 182 | | | 11,906 |
|
1Bristow Group, Inc. | | 100 | | | 4,949 |
|
| | | | |
| | | | |
Bucyrus International, Inc. | | 290 | | 21,176 |
|
Burlington Northern Santa Fe | | | | |
Corp. | | 1,300 | | 129,857 |
C.H. Robinson Worldwide, Inc. | | 600 | | 32,904 |
|
1Cal Dive International, Inc. | | 162 | | 2,315 |
|
1Capella Education Co. | | 50 | | 2,982 |
|
1Career Education Corp. | | 289 | | 4,222 |
|
Carlisle Cos., Inc. | | 236 | | 6,844 |
|
Cascade Corp. | | 37 | | 1,566 |
|
Caterpillar, Inc. | | 2,200 | | 162,404 |
|
1Cenveo, Inc. | | 211 | | 2,061 |
|
1Ceradyne, Inc. | | 77 | | 2,641 |
|
1Chart Industries, Inc. | | 100 | | 4,864 |
|
Chemed Corp. | | 140 | | 5,125 |
|
1ChoicePoint, Inc. | | 271 | | 13,062 |
|
Cintas Corp. | | 513 | | 13,600 |
|
CIRCOR International, Inc. | | 100 | | 4,899 |
|
CLARCOR, Inc. | | 182 | | 6,388 |
|
1Clean Harbors, Inc. | | 100 | | 7,106 |
|
1Cogent, Inc. | | 60 | | 682 |
|
1Coinstar, Inc. | | 70 | | 2,290 |
|
1Columbus McKinnon Corp. | | 100 | | 2,408 |
|
Comfort Systems USA, Inc. | | 200 | | 2,688 |
|
Con-way, Inc. | | 117 | | 5,529 |
|
1Consolidated Graphics, Inc. | | 55 | | 2,710 |
|
1Continental Airlines, Inc. | | 300 | | 3,033 |
|
1Convergys Corp. | | 570 | | 8,470 |
|
Cooper Industries Ltd. | | 652 | | 25,754 |
|
1Corinthian Colleges, Inc. | | 230 | | 2,670 |
|
Corporate Executive Board Co. | | 134 | | 5,635 |
|
1CoStar Group, Inc. | | 38 | | 1,689 |
|
1Covanta Holding Corp. | | 442 | | 11,797 |
|
Crane Co. | | 170 | | 6,550 |
|
1CSG Systems International, Inc. | | 170 | | 1,873 |
|
CSX Corp. | | 1,500 | | 94,215 |
|
Cubic Corp. | | 100 | | 2,228 |
|
Cummins, Inc. | | 700 | | 45,864 |
|
Curtiss-Wright Corp. | | 180 | | 8,053 |
|
Danaher Corp. | | 931 | | 71,966 |
|
| | | | |
| 42 | | AARP PORTFOLIOS 2008 ANNUAL REPORT | | U.S. Stock Market Portfolio |
U.S. Stock Market Portfolio (continued)
June 30, 2008
| | | | | |
| Portfolio of investments | | | | |
| | |
| | | Shares | | Value |
| | | | | |
|
Common Stocks (continued) |
| Industrials (continued) |
1Darling International, Inc. | | 400 | | $ | 6,608 |
|
Deere & Co. | | 1,600 | | | 115,408 |
|
1Delta Air Lines, Inc. | | 1,000 | | | 5,700 |
|
Deluxe Corp. | | 210 | | | 3,742 |
|
DeVry, Inc. | | 229 | | | 12,279 |
|
1Dionex Corp. | | 70 | | | 4,646 |
|
1Discovery Holding Co. | | 1,000 | | | 21,960 |
|
1Dollar Financial Corp. | | 100 | | | 1,511 |
|
1Dollar Thrifty Automotive Group, | | | | | |
Inc. | | 40 | | | 378 |
1Domtar Corp. | | 1,881 | | | 10,251 |
|
Donaldson Co., Inc. | | 259 | | | 11,562 |
|
Dover Corp. | | 664 | | | 32,118 |
|
1Drew Industries, Inc. | | 100 | | | 1,595 |
|
DRS Technologies, Inc. | | 152 | | | 11,965 |
|
1DST Systems, Inc. | | 170 | | | 9,358 |
|
Dun & Bradstreet Corp. | | 200 | | | 17,528 |
|
1Dycom Industries, Inc. | | 170 | | | 2,468 |
|
Dynamic Materials Corp. | | 100 | | | 3,295 |
|
1DynCorp International, Inc. | | 100 | | | 1,515 |
|
Eagle Bulk Shipping, Inc. | | 187 | | | 5,530 |
|
Eaton Corp. | | 517 | | | 43,929 |
|
1EMCOR Group, Inc. | | 254 | | | 7,247 |
|
Emerson Electric Co. | | 2,800 | | | 138,460 |
|
Encore Wire Corp. | | 100 | | | 2,119 |
|
1Energizer Holdings, Inc. | | 200 | | | 14,618 |
|
1Energy Conversion Devices, Inc. | | 100 | | | 7,364 |
|
EnergySolutions, Inc. | | 100 | | | 2,235 |
|
1EnerSys, Inc. | | 100 | | | 3,423 |
|
Ennis, Inc. | | 100 | | | 1,565 |
|
1EnPro Industries, Inc. | | 100 | | | 3,734 |
|
Equifax, Inc. | | 450 | | | 15,129 |
|
1ESCO Technologies, Inc. | | 40 | | | 1,877 |
|
1Esterline Technologies Corp. | | 50 | | | 2,463 |
|
1Evergreen Solar, Inc. | | 400 | | | 3,876 |
| | | | |
| | | | |
Expeditors International | | | | |
Washington, Inc. | | 772 | | 33,196 |
FactSet Research Systems, Inc. | | 166 | | 9,356 |
|
Fastenal Co. | | 481 | | 20,760 |
|
FedEx Corp. | | 1,060 | | 83,517 |
|
1Fiserv, Inc. | | 545 | | 24,727 |
|
Flowserve Corp. | | 210 | | 28,707 |
|
1Fluor Corp. | | 321 | | 59,732 |
|
1Force Protection, Inc. | | 300 | | 993 |
|
Forward Air Corp. | | 150 | | 5,190 |
|
1Foster Wheeler Ltd. | | 558 | | 40,818 |
|
Franklin Electric Co., Inc. | | 36 | | 1,396 |
|
FreightCar America, Inc. | | 40 | | 1,420 |
|
1FTI Consulting, Inc. | | 160 | | 10,954 |
|
1Fuel Tech, Inc. | | 100 | | 1,762 |
|
1FuelCell Energy, Inc. | | 200 | | 1,420 |
|
G&K Services, Inc. | | 56 | | 1,706 |
|
1Gardner Denver, Inc. | | 180 | | 10,224 |
|
GATX Corp. | | 175 | | 7,758 |
|
Genco Shipping & Trading Ltd. | | 100 | | 6,520 |
|
1GenCorp, Inc. | | 100 | | 716 |
|
1General Cable Corp. | | 226 | | 13,752 |
|
General Dynamics Corp. | | 1,253 | | 105,503 |
|
General Electric Co. | | 36,100 | | 963,509 |
|
1Genesee & Wyoming, Inc. | | 75 | | 2,551 |
|
1Genpact Ltd. | | 300 | | 4,476 |
|
Genuine Parts Co. | | 629 | | 24,959 |
|
1Geo Group, Inc. | | 224 | | 5,040 |
|
1Global Cash Access Holdings, | | | | |
Inc. | | 100 | | 686 |
Global Payments, Inc. | | 236 | | 10,998 |
|
Goodrich Corp. | | 450 | | 21,357 |
|
Gorman-Rupp Co. | | 100 | | 3,984 |
|
Graco, Inc. | | 200 | | 7,614 |
|
Granite Construction, Inc. | | 177 | | 5,581 |
|
1Griffon Corp. | | 100 | | 876 |
|
1GSI Group, Inc. | | 100 | | 776 |
|
H&R Block, Inc. | | 1,200 | | 25,680 |
|
Harsco Corp. | | 280 | | 15,235 |
|
1Headwaters, Inc. | | 50 | | 589 |
| | | | |
| U.S. Stock Market Portfolio | | AARP PORTFOLIOS 2008 ANNUAL REPORT | | 43 |
| | | | | |
| Portfolio of investments | | | | |
| | |
| | | Shares | | Value |
| | | | | |
|
Common Stocks (continued) |
| Industrials (continued) |
Healthcare Services Group, Inc. | | 150 | | $ | 2,281 |
|
Heartland Express, Inc. | | 320 | | | 4,771 |
|
Heartland Payment Systems, Inc. | | 100 | | | 2,360 |
|
Heico Corp. | | 100 | | | 2,658 |
|
Heidrick & Struggles | | | | | |
International, Inc. | | 100 | | | 2,764 |
Herman Miller, Inc. | | 248 | | | 6,173 |
|
1Hewitt Associates, Inc. | | 343 | | | 13,147 |
|
1Hexcel Corp. | | 336 | | | 6,485 |
|
1HMS Holdings Corp. | | 104 | | | 2,233 |
|
Honeywell International, Inc. | | 2,500 | | | 125,700 |
|
Horizon Lines, Inc. | | 100 | | | 995 |
|
1HUB Group, Inc. | | 158 | | | 5,393 |
|
Hubbell, Inc. | | 216 | | | 8,612 |
|
1Huron Consulting Group, Inc. | | 33 | | | 1,496 |
|
1Iconix Brand Group, Inc. | | 200 | | | 2,416 |
|
IDEX Corp. | | 278 | | | 10,242 |
|
1II-VI, Inc. | | 100 | | | 3,492 |
|
Illinois Tool Works, Inc. | | 1,500 | | | 71,265 |
|
1Infinera Corp. | | 200 | | | 1,764 |
|
Ingersoll-Rand Co. Ltd. | | 1,167 | | | 43,681 |
|
1Insituform Technologies, Inc. | | 100 | | | 1,523 |
|
1Intermec, Inc. | | 198 | | | 4,174 |
|
1Iron Mountain, Inc. | | 682 | | | 18,107 |
|
1ITT Educational Services, Inc. | | 137 | | | 11,320 |
|
ITT Industries, Inc. | | 650 | | | 41,164 |
|
J.B. Hunt Transport Services, | | | | | |
Inc. | | 275 | | | 9,152 |
1Jacobs Engineering Group, Inc. | | 440 | | | 35,508 |
|
1JetBlue Airways Corp. | | 350 | | | 1,306 |
|
Joy Global, Inc. | | 427 | | | 32,379 |
|
Kaman Corp. | | 100 | | | 2,276 |
|
1Kansas City Southern | | 300 | | | 13,197 |
|
Kaydon Corp. | | 100 | | | 5,141 |
|
KBR, Inc. | | 580 | | | 20,248 |
|
| | | | |
| | | | |
Kelly Services, Inc. | | 100 | | 1,933 |
|
1Kenexa Corp. | | 100 | | 1,884 |
|
Kennametal, Inc. | | 268 | | 8,723 |
|
1Kforce, Inc. | | 100 | | 849 |
|
1Kirby Corp. | | 180 | | 8,640 |
|
Knight Transportation, Inc. | | 180 | | 3,294 |
|
Koppers Holdings, Inc. | | 100 | | 4,187 |
|
1Korn/Ferry International | | 180 | | 2,831 |
|
L-3 Communications Holdings, | | | | |
Inc. | | 456 | | 41,437 |
1Ladish Co., Inc. | | 71 | | 1,462 |
|
Landstar System, Inc. | | 200 | | 11,044 |
|
1Layne Christensen Co. | | 100 | | 4,379 |
|
Lennox International, Inc. | | 200 | | 5,792 |
|
Lincoln Electric Holdings, Inc. | | 100 | | 7,870 |
|
Lindsay Corp. | | 55 | | 4,673 |
|
Lockheed Martin Corp. | | 1,280 | | 126,285 |
|
Manitowoc Co., Inc. | | 435 | | 14,151 |
|
Manpower, Inc. | | 234 | | 13,628 |
|
Masco Corp. | | 1,358 | | 21,361 |
|
1MasTec, Inc. | | 200 | | 2,132 |
|
Mastercard, Inc. | | 270 | | 71,690 |
|
1McDermott International, Inc. | | 818 | | 50,626 |
|
McGrath RentCorp | | 100 | | 2,459 |
|
1Middleby Corp. | | 65 | | 2,854 |
|
1Mobile Mini, Inc. | | 81 | | 1,620 |
|
Molex, Inc. | | 280 | | 6,415 |
|
1Monster Worldwide, Inc. | | 446 | | 9,192 |
|
1Moog, Inc. | | 170 | | 6,331 |
|
MSC Industrial Direct Co. | | 124 | | 5,470 |
|
Mueller Industries, Inc. | | 160 | | 5,152 |
|
Mueller Water Products, Inc. | | 100 | | 807 |
|
NACCO Industries, Inc. | | 21 | | 1,561 |
|
1Navigant Consulting, Inc. | | 170 | | 3,325 |
|
1NCI Building Systems, Inc. | | 40 | | 1,469 |
|
1Net 1 UEPS Technologies, Inc. | | 100 | | 2,430 |
|
Nordson Corp. | | 150 | | 10,933 |
|
Norfolk Southern Corp. | | 1,400 | | 87,738 |
|
Northrop Grumman Corp. | | 1,200 | | 80,280 |
|
| | | | |
| 44 | | AARP PORTFOLIOS 2008 ANNUAL REPORT | | U.S. Stock Market Portfolio |
U.S. Stock Market Portfolio (continued)
June 30, 2008
| | | | | |
| Portfolio of investments | | | | |
| | |
| | | Shares | | Value |
| | | | | |
|
Common Stocks (continued) |
| Industrials (continued) |
1Old Dominion Freight Line, Inc. | | 60 | | $ | 1,801 |
|
1Orbital Sciences Corp. | | 261 | | | 6,149 |
|
Oshkosh Truck Corp. | | 235 | | | 4,862 |
|
Overseas Shipholding Group | | 100 | | | 7,952 |
|
1Owens Corning, Inc. | | 300 | | | 6,825 |
|
PACCAR, Inc. | | 1,300 | | | 54,379 |
|
Pacer International, Inc. | | 70 | | | 1,506 |
|
Pall Corp. | | 429 | | | 17,023 |
|
Parker Hannifin Corp. | | 630 | | | 44,932 |
|
Pentair, Inc. | | 389 | | | 13,623 |
|
1Perini Corp. | | 100 | | | 3,305 |
|
1PHH Corp. | | 170 | | | 2,609 |
|
1PHI, Inc. | | 100 | | | 4,017 |
|
Pitney Bowes, Inc. | | 777 | | | 26,496 |
|
Precision Castparts Corp. | | 500 | | | 48,185 |
|
Quanex Building Products Corp. | | 145 | | | 2,155 |
|
1Quanta Services, Inc. | | 642 | | | 21,359 |
|
1Raser Technologies, Inc. | | 200 | | | 1,948 |
|
Raven Industries, Inc. | | 100 | | | 3,278 |
|
Raytheon Co. | | 1,500 | | | 84,420 |
|
1RBC Bearings, Inc. | | 100 | | | 3,332 |
|
Regal-Beloit Corp. | | 160 | | | 6,760 |
|
Reliance Steel & Aluminum Co. | | 273 | | | 21,046 |
|
1Republic Airways Holdings, Inc. | | 100 | | | 866 |
|
Republic Services, Inc. | | 657 | | | 19,513 |
|
Resources Connection, Inc. | | 160 | | | 3,256 |
|
Reynolds American, Inc. | | 643 | | | 30,009 |
|
Robbins & Myers, Inc. | | 100 | | | 4,987 |
|
Robert Half International, Inc. | | 529 | | | 12,680 |
|
Rockwell Automation, Inc. | | 490 | | | 21,428 |
|
Rockwell Collins, Inc. | | 593 | | | 28,440 |
|
Rollins, Inc. | | 150 | | | 2,223 |
|
RR Donnelley & Sons Co. | | 748 | | | 22,208 |
|
1RSC Holdings, Inc. | | 200 | | | 1,852 |
|
| | | | |
| | | | |
Ryder System, Inc. | | 231 | | 15,911 |
|
1Shaw Group, Inc. | | 281 | | 17,363 |
|
Simpson Manufacturing Co., Inc. | | 160 | | 3,798 |
|
SkyWest, Inc. | | 242 | | 3,061 |
|
Sotheby’s | | 300 | | 7,911 |
|
Southwest Airlines Co. | | 2,675 | | 34,882 |
|
1Spherion Corp. | | 200 | | 924 |
|
1Spirit Aerosystems Holdings, Inc. | | 387 | | 7,423 |
|
SPX Corp. | | 200 | | 26,346 |
|
Steelcase, Inc. | | 130 | | 1,304 |
|
1Stericycle, Inc. | | 300 | | 15,510 |
|
Strayer Education, Inc. | | 46 | | 9,617 |
|
Sun Hydraulics Corp. | | 100 | | 3,227 |
|
1SunPower Corp. | | 123 | | 8,854 |
|
1Superior Essex, Inc. | | 100 | | 4,463 |
|
TAL International Group, Inc. | | 100 | | 2,274 |
|
1TBS International Ltd. | | 100 | | 3,995 |
|
1Team, Inc. | | 100 | | 3,432 |
|
1Tecumseh Products Co. | | 100 | | 3,278 |
|
Teleflex, Inc. | | 140 | | 7,783 |
|
1TeleTech Holdings, Inc. | | 109 | | 2,176 |
|
Tennant Co. | | 100 | | 3,007 |
|
1Terex Corp. | | 354 | | 18,185 |
|
1Tetra Tech, Inc. | | 200 | | 4,524 |
|
Textron, Inc. | | 922 | | 44,191 |
|
1Thomas & Betts Corp. | | 170 | | 6,434 |
|
Timken Co. | | 290 | | 9,553 |
|
Titan International, Inc. | | 119 | | 4,239 |
|
Total System Services, Inc. | | 567 | | 12,599 |
|
1TransDigm Group, Inc. | | 100 | | 3,359 |
|
Tredegar Corp. | | 100 | | 1,470 |
|
Trinity Industries, Inc. | | 262 | | 9,089 |
|
Triumph Group, Inc. | | 45 | | 2,120 |
|
1TrueBlue, Inc. | | 170 | | 2,246 |
|
Tyco Electronics Ltd. | | 1,851 | | 66,303 |
|
Tyco International Ltd. | | 1,791 | | 71,712 |
|
UAL Corp. | | 416 | | 2,172 |
|
Union Pacific Corp. | | 1,800 | | 135,900 |
|
United Parcel Service, Inc. | | 2,448 | | 150,479 |
|
| | | | |
| U.S. Stock Market Portfolio | | AARP PORTFOLIOS 2008 ANNUAL REPORT | | 45 |
| | | | | |
| Portfolio of investments | | | | |
| | |
| | | Shares | | Value |
| | | | | |
|
Common Stocks (continued) |
| Industrials (continued) |
1United Stationers, Inc. | | 100 | | $ | 3,695 |
|
United Technologies Corp. | | 3,400 | | | 209,780 |
|
Universal Forest Products, Inc. | | 40 | | | 1,198 |
|
1Universal Technical Institute, Inc. | | 100 | | | 1,246 |
|
1URS Corp. | | 260 | | | 10,912 |
|
1US Airways Group, Inc. | | 220 | | | 550 |
|
1USG Corp. | | 256 | | | 7,570 |
|
UTi Worldwide, Inc. | | 300 | | | 5,985 |
|
1Valassis Communications, Inc. | | 200 | | | 2,504 |
|
Valmont Industries, Inc. | | 68 | | | 7,092 |
|
Viad Corp. | | 57 | | | 1,470 |
|
1VistaPrint Ltd. | | 126 | | | 3,372 |
|
W.W. Grainger, Inc. | | 247 | | | 20,205 |
|
Wabash National Corp. | | 100 | | | 756 |
|
1Waste Connections, Inc. | | 230 | | | 7,344 |
|
Waste Management, Inc. | | 1,830 | | | 69,009 |
|
Watsco, Inc. | | 40 | | | 1,672 |
|
Watson Wyatt Worldwide, Inc. | | 170 | | | 8,991 |
|
Watts Water Technologies, Inc. | | 91 | | | 2,266 |
|
Weight Watchers International, | | | | | |
Inc. | | 109 | | | 3,881 |
Werner Enterprises, Inc. | | 180 | | | 3,344 |
|
Woodward Governor Co. | | 200 | | | 7,132 |
|
World Fuel Services Corp. | | 140 | | | 3,072 |
|
1Wright Express Corp. | | 110 | | | 2,728 |
|
1YRC Worldwide, Inc. | | 136 | | | 2,022 |
| |
Total Industrials | | | | | 6,224,561 |
| |
| | |
| Information Technology–15.6% | | | | | |
|
13Com Corp. | | 1,050 | | | 2,226 |
|
Accenture Ltd. | | 2,217 | | | 90,276 |
|
1ACI Worldwide, Inc. | | 60 | | | 1,055 |
|
1Actel Corp. | | 100 | | | 1,685 |
|
1Activision, Inc. | | 1,100 | | | 37,477 |
|
Acxiom Corp. | | 200 | | | 2,298 |
|
| | | | |
| | | | |
1ADC Telecommunications, Inc. | | 498 | | 7,355 |
|
1Adobe Systems, Inc. | | 2,000 | | 78,780 |
|
ADTRAN, Inc. | | 180 | | 4,291 |
|
1Advanced Energy Industries, Inc. | | 100 | | 1,370 |
|
1Advanced Micro Devices, Inc. | | 2,152 | | 12,546 |
|
1Advent Software, Inc. | | 100 | | 3,608 |
|
1Affiliated Computer Services, Inc. | | 272 | | 14,549 |
|
1Agilent Technologies, Inc. | | 1,316 | | 46,771 |
|
1Akamai Technologies, Inc. | | 591 | | 20,561 |
|
1Allscripts Healthcare Solutions, | | | | |
Inc. | | 100 | | 1,241 |
Altera Corp. | | 1,100 | | 22,770 |
|
1American Reprographics Co. | | 104 | | 1,732 |
|
1Amkor Technology, Inc. | | 336 | | 3,498 |
|
Amphenol Corp. | | 600 | | 26,928 |
|
1Anadigics, Inc. | | 200 | | 1,970 |
|
Analog Devices, Inc. | | 1,098 | | 34,883 |
|
Analogic Corp. | | 37 | | 2,334 |
|
1Anixter International, Inc. | | 100 | | 5,949 |
|
1Ansoft Corp. | | 100 | | 3,640 |
|
1Ansys, Inc. | | 300 | | 14,136 |
|
1Apple Computer, Inc. | | 3,200 | | 535,808 |
|
Applied Materials, Inc. | | 4,900 | | 93,541 |
|
1Applied Micro Circuits Corp. | | 237 | | 2,029 |
|
1Ariba, Inc. | | 300 | | 4,413 |
|
1Arris Group, Inc. | | 642 | | 5,425 |
|
1Arrow Electronics, Inc. | | 430 | | 13,210 |
|
1Art Technology Group, Inc. | | 600 | | 1,920 |
|
1athenahealth, Inc. | | 100 | | 3,076 |
|
1Atheros Communications, Inc. | | 198 | | 5,940 |
|
1Atmel Corp. | | 1,450 | | 5,046 |
|
1ATMI, Inc. | | 100 | | 2,792 |
|
1Autodesk, Inc. | | 847 | | 28,637 |
|
Automatic Data Processing, Inc. | | 1,900 | | 79,610 |
|
1Avid Technology, Inc. | | 150 | | 2,549 |
|
1Avnet, Inc. | | 560 | | 15,277 |
|
1Avocent Corp. | | 170 | | 3,162 |
|
AVX Corp. | | 110 | | 1,244 |
|
1Axcelis Technologies, Inc. | | 400 | | 1,952 |
|
| | | | |
| 46 | | AARP PORTFOLIOS 2008 ANNUAL REPORT | | U.S. Stock Market Portfolio |
U.S. Stock Market Portfolio (continued)
June 30, 2008
| | | | | |
| Portfolio of investments | | | | |
| | |
| | | Shares | | Value |
| | | | | |
|
Common Stocks (continued) |
| Information Technology (continued) |
1BearingPoint, Inc. | | 540 | | $ | 437 |
|
1Benchmark Electronics, Inc. | | 190 | | | 3,105 |
|
Black Box Corp. | | 30 | | | 816 |
|
Blackbaud, Inc. | | 194 | | | 4,152 |
|
1Blackboard, Inc. | | 100 | | | 3,823 |
|
1Blue Coat Systems, Inc. | | 100 | | | 1,411 |
|
1BMC Software, Inc. | | 740 | | | 26,640 |
|
1Broadcom Corp. | | 1,715 | | | 46,802 |
|
1Brooks Automation, Inc. | | 130 | | | 1,075 |
|
CA, Inc. | | 1,500 | | | 34,635 |
|
1Cabot Microelectronics Corp. | | 100 | | | 3,315 |
|
1CACI International, Inc. | | 110 | | | 5,035 |
|
1Cadence Design Systems, Inc. | | 1,100 | | | 11,110 |
|
1Cavium Networks, Inc. | | 100 | | | 2,100 |
|
1Cerner Corp. | | 227 | | | 10,256 |
|
1Checkpoint Systems, Inc. | | 160 | | | 3,341 |
|
1Ciber, Inc. | | 200 | | | 1,242 |
|
1Ciena Corp. | | 274 | | | 6,349 |
|
1Cirrus Logic, Inc. | | 300 | | | 1,668 |
|
1Cisco Systems, Inc. | | 21,500 | | | 500,090 |
|
1Citrix Systems, Inc. | | 670 | | | 19,705 |
|
1CMGI, Inc. | | 150 | | | 1,590 |
|
1Cogent Communications Group, | | | | | |
Inc. | | 100 | | | 1,340 |
Cognex Corp. | | 170 | | | 3,918 |
|
1Cognizant Technology Solutions | | | | | |
Corp. | | 1,054 | | | 34,266 |
1Cogo Group, Inc. | | 100 | | | 911 |
|
Cohu, Inc. | | 100 | | | 1,468 |
|
1CommScope, Inc. | | 198 | | | 10,448 |
|
1Commvault Systems, Inc. | | 100 | | | 1,664 |
|
1Computer Sciences Corp. | | 600 | | | 28,104 |
|
1Compuware Corp. | | 892 | | | 8,510 |
|
1comScore, Inc. | | 100 | | | 2,182 |
|
| | | | |
| | | | |
1Comtech Telecommunications | | | | |
Corp. | | 62 | | 3,038 |
1Concur Technologies, Inc. | | 200 | | 6,646 |
|
1Conexant Systems, Inc. | | 66 | | 297 |
|
Corning, Inc. | | 5,775 | | 133,114 |
|
1Cree, Inc. | | 290 | | 6,615 |
|
CTS Corp. | | 100 | | 1,005 |
|
1Cybersource Corp. | | 200 | | 3,346 |
|
1Cymer, Inc. | | 150 | | 4,032 |
|
1Cypress Semiconductor Corp. | | 536 | | 13,266 |
|
Daktronics, Inc. | | 100 | | 2,017 |
|
1Data Domain, Inc. | | 100 | | 2,333 |
|
1DealerTrack Holdings, Inc. | | 100 | | 1,411 |
|
1Dell, Inc. | | 7,700 | | 168,476 |
|
Diebold, Inc. | | 255 | | 9,073 |
|
1Digital River, Inc. | | 189 | | 7,292 |
|
1Diodes, Inc. | | 144 | | 3,980 |
|
1DSP Group, Inc. | | 100 | | 700 |
|
1Earthlink, Inc. | | 390 | | 3,374 |
|
1eBay, Inc. | | 3,900 | | 106,587 |
|
1Echelon Corp. | | 100 | | 1,090 |
|
1Eclipsys Corp. | | 180 | | 3,305 |
|
1Electro Scientific Industries, Inc. | | 100 | | 1,417 |
|
1Electronic Arts, Inc. | | 1,100 | | 48,873 |
|
Electronic Data Systems Corp. | | 1,867 | | 46,003 |
|
1Electronics for Imaging, Inc. | | 170 | | 2,482 |
|
1EMC Corp. | | 7,560 | | 111,056 |
|
1Emulex Corp. | | 400 | | 4,660 |
|
1Entegris, Inc. | | 600 | | 3,930 |
|
1Epicor Software Corp. | | 100 | | 691 |
|
1EPIQ Systems, Inc. | | 100 | | 1,420 |
|
1Equinix, Inc. | | 110 | | 9,814 |
|
1Exar Corp. | | 100 | | 754 |
|
1Exponent, Inc. | | 100 | | 3,141 |
|
1Extreme Networks | | 300 | | 852 |
|
1F5 Networks, Inc. | | 316 | | 8,981 |
|
Fair Isaac Corp. | | 178 | | 3,697 |
|
1Fairchild Semiconductor | | | | |
International, Inc. | | 370 | | 4,340 |
| | | | |
| U.S. Stock Market Portfolio | | AARP PORTFOLIOS 2008 ANNUAL REPORT | | 47 |
| | | | | |
| Portfolio of investments | | | | |
| | |
| | | Shares | | Value |
| | | | | |
|
Common Stocks (continued) |
| Information Technology (continued) |
1FARO Technologies, Inc. | | 72 | | $ | 1,812 |
|
1FEI Co. | | 100 | | | 2,278 |
|
1Finisar Corp. | | 792 | | | 942 |
|
1First Solar, Inc. | | 142 | | | 38,740 |
|
1Flextronics International Ltd. | | 3,100 | | | 29,140 |
|
1Flir Systems, Inc. | | 480 | | | 19,474 |
|
1FormFactor, Inc. | | 160 | | | 2,949 |
|
1Forrester Research, Inc. | | 100 | | | 3,088 |
|
1Foundry Networks, Inc. | | 419 | | | 4,953 |
|
1Gartner, Inc. | | 210 | | | 4,351 |
|
1Google, Inc. | | 870 | | | 457,985 |
|
1Greatbatch, Inc. | | 100 | | | 1,730 |
|
1Harmonic, Inc. | | 300 | | | 2,853 |
|
Harris Corp. | | 495 | | | 24,993 |
|
Hewlett-Packard Co. | | 9,200 | | | 406,732 |
|
1Hittite Microwave Corp. | | 100 | | | 3,562 |
|
1Hutchinson Technology, Inc. | | 100 | | | 1,344 |
|
1IAC/InteractiveCorp | | 683 | | | 13,168 |
|
1IHS, Inc. | | 161 | | | 11,206 |
|
IKON Office Solutions, Inc. | | 310 | | | 3,497 |
|
Imation Corp. | | 100 | | | 2,292 |
|
1Informatica Corp. | | 320 | | | 4,813 |
|
InfoSpace, Inc. | | 50 | | | 417 |
|
1Ingram Micro, Inc. | | 560 | | | 9,940 |
|
1Innerworkings, Inc. | | 100 | | | 1,196 |
|
1Integrated Device Technology, | | | | | |
Inc. | | 604 | | | 6,004 |
Intel Corp. | | 20,900 | | | 448,932 |
|
1InterDigital Communications, Inc. | | 200 | | | 4,864 |
|
1InterNAP Network Services | | | | | |
Corp. | | 100 | | | 468 |
International Business Machines | | | | | |
Corp. | | 5,000 | | | 592,650 |
1International Rectifier Corp. | | 280 | | | 5,376 |
|
Intersil Corp. | | 470 | | | 11,430 |
|
| | | | |
| | | | |
1Interwoven, Inc. | | 100 | | 1,201 |
|
1Intuit, Inc. | | 1,183 | | 32,615 |
|
1Itron, Inc. | | 100 | | 9,835 |
|
1j2 Global Communications, Inc. | | 160 | | 3,680 |
|
Jabil Circuit, Inc. | | 608 | | 9,977 |
|
Jack Henry & Associates, Inc. | | 246 | | 5,323 |
|
1JDA Software Group, Inc. | | 100 | | 1,810 |
|
1Juniper Networks, Inc. | | 1,900 | | 42,142 |
|
1Kemet Corp. | | 279 | | 904 |
|
KLA-Tencor Corp. | | 673 | | 27,398 |
|
1Knot, Inc. | | 100 | | 978 |
|
1Kulicke & Soffa Industries, Inc. | | 200 | | 1,458 |
|
1L-1 Identity Solutions, Inc. | | 300 | | 3,996 |
|
1Lam Research Corp. | | 459 | | 16,593 |
|
1Lattice Semiconductor Corp. | | 300 | | 939 |
|
1Lawson Software, Inc. | | 400 | | 2,908 |
|
1Lexmark International, Inc. | | 340 | | 11,366 |
|
Linear Technology Corp. | | 804 | | 26,186 |
|
1Littelfuse, Inc. | | 83 | | 2,619 |
|
1LSI Logic Corp. | | 2,520 | | 15,473 |
|
1Macrovision Solutions Corp. | | 521 | | 7,794 |
|
1Magma Design Automation, Inc. | | 100 | | 607 |
|
1Manhattan Associates, Inc. | | 100 | | 2,373 |
|
1ManTech International Corp. | | 100 | | 4,812 |
|
1MarketAxess Holdings, Inc. | | 100 | | 756 |
|
1Marvell Technology Group Ltd. | | 1,900 | | 33,554 |
|
1Mattson Technology, Inc. | | 200 | | 952 |
|
1McAfee, Inc. | | 580 | | 19,737 |
|
1MEMC Electronic Materials, Inc. | | 829 | | 51,017 |
|
1Mentor Graphics Corp. | | 300 | | 4,740 |
|
1MercadoLibre, Inc. | | 100 | | 3,449 |
|
1Metavante Technologies, Inc. | | 348 | | 7,872 |
|
Methode Electronics, Inc. | | 100 | | 1,045 |
|
1Mettler Toledo International, Inc. | | 120 | | 11,383 |
|
Micrel, Inc. | | 208 | | 1,903 |
|
Microchip Technology, Inc. | | 700 | | 21,378 |
|
1Micron Technology, Inc. | | 2,796 | | 16,776 |
|
1MICROS Systems, Inc. | | 284 | | 8,659 |
|
1Microsemi Corp. | | 280 | | 7,050 |
|
| | | | |
| 48 | | AARP PORTFOLIOS 2008 ANNUAL REPORT | | U.S. Stock Market Portfolio |
U.S. Stock Market Portfolio (continued)
June 30, 2008
| | | | | |
| Portfolio of investments | | | | |
| | |
| | | Shares | | Value |
| | | | | |
|
Common Stocks (continued) |
| Information Technology (continued) |
Microsoft Corp. | | 30,300 | | $ | 833,553 |
|
1MicroStrategy, Inc. | | 20 | | | 1,295 |
|
1MKS Instruments, Inc. | | 133 | | | 2,913 |
|
Molex, Inc. | | 191 | | | 4,662 |
|
1Monolithic Power Systems, Inc. | | 100 | | | 2,162 |
|
Motorola, Inc. | | 8,362 | | | 61,377 |
|
1MPS Group, Inc. | | 240 | | | 2,551 |
|
1MSC.Software Corp. | | 200 | | | 2,196 |
|
MTS Systems Corp. | | 100 | | | 3,588 |
|
National Instruments Corp. | | 200 | | | 5,674 |
|
National Semiconductor Corp. | | 999 | | | 20,519 |
|
1NAVTEQ Corp. | | 359 | | | 27,643 |
|
1NCR Corp. | | 700 | | | 17,640 |
|
1NetApp, Inc. | | 1,271 | | | 27,530 |
|
1NetGear, Inc. | | 100 | | | 1,386 |
|
1Netlogic Microsystems, Inc. | | 100 | | | 3,320 |
|
1Newport Corp. | | 100 | | | 1,139 |
|
1Novatel Wireless, Inc. | | 100 | | | 1,113 |
|
1Novell, Inc. | | 1,220 | | | 7,186 |
|
1Novellus Systems, Inc. | | 394 | | | 8,349 |
|
1Nuance Communications, Inc. | | 590 | | | 9,245 |
|
1NVIDIA Corp. | | 2,000 | | | 37,440 |
|
1Omniture, Inc. | | 200 | | | 3,714 |
|
1OmniVision Technologies, Inc. | | 180 | | | 2,176 |
|
1ON Semiconductor Corp. | | 1,530 | | | 14,030 |
|
1Openwave Systems, Inc. | | 110 | | | 164 |
|
1Oracle Corp. | | 14,800 | | | 310,800 |
|
Palm, Inc. | | 220 | | | 1,186 |
|
1Parametric Technology Corp. | | 352 | | | 5,868 |
|
Park Electrochemical Corp. | | 100 | | | 2,431 |
|
Paychex, Inc. | | 1,221 | | | 38,193 |
|
1Perficient, Inc. | | 100 | | | 966 |
|
PerkinElmer, Inc. | | 437 | | | 12,170 |
|
1Perot Systems Corp. | | 420 | | | 6,304 |
|
| | | | |
| | | | |
1Phase Forward, Inc. | | 200 | | 3,594 |
|
1Photronics, Inc. | | 100 | | 704 |
|
Plantronics, Inc. | | 160 | | 3,571 |
|
1Plexus Corp. | | 170 | | 4,706 |
|
1PMC-Sierra, Inc. | | 900 | | 6,885 |
|
1Polycom, Inc. | | 330 | | 8,039 |
|
1Powerwave Technologies, Inc. | | 330 | | 1,403 |
|
1Progress Software Corp. | | 170 | | 4,347 |
|
1QLogic Corp. | | 419 | | 6,113 |
|
QUALCOMM, Inc. | | 5,800 | | 257,346 |
|
Quality Systems, Inc. | | 49 | | 1,435 |
|
1Quantum Corp. | | 800 | | 1,080 |
|
1Quest Software, Inc. | | 200 | | 2,962 |
|
1Rackable Systems, Inc. | | 110 | | 1,474 |
|
1Rambus, Inc. | | 296 | | 5,645 |
|
1RealNetworks, Inc. | | 180 | | 1,188 |
|
1Red Hat, Inc. | | 709 | | 14,669 |
|
1RF Micro Devices, Inc. | | 1,000 | | 2,900 |
|
1Riverbed Technology, Inc. | | 100 | | 1,372 |
|
1Rofin-Sinar Technologies, Inc. | | 120 | | 3,624 |
|
1Rogers Corp. | | 56 | | 2,105 |
|
Roper Industries, Inc. | | 266 | | 17,524 |
|
1Rudolph Technologies, Inc. | | 100 | | 770 |
|
1S1 Corp. | | 200 | | 1,514 |
|
1SAIC, Inc. | | 600 | | 12,486 |
|
1salesforce.com, Inc. | | 350 | | 23,880 |
|
1SanDisk Corp. | | 900 | | 16,830 |
|
1Sanmina-SCI Corp. | | 1,520 | | 1,946 |
|
1Sapient Corp. | | 300 | | 1,926 |
|
1ScanSource, Inc. | | 100 | | 2,676 |
|
Seagate Technology LLC | | 1,888 | | 36,117 |
|
1Secure Computing Corp. | | 200 | | 828 |
|
1Semtech Corp. | | 210 | | 2,955 |
|
1Sigma Designs, Inc. | | 100 | | 1,389 |
|
1Silicon Image, Inc. | | 200 | | 1,450 |
|
1Silicon Laboratories, Inc. | | 150 | | 5,413 |
|
1Sina Corp. | | 200 | | 8,510 |
|
1SiRFTechnology Holdings, Inc. | | 150 | | 648 |
|
1Skyworks Solutions, Inc. | | 480 | | 4,738 |
|
| | | | |
| U.S. Stock Market Portfolio | | AARP PORTFOLIOS 2008 ANNUAL REPORT | | 49 |
| | | | | |
| Portfolio of investments | | | | |
| | |
| | | Shares | | Value |
| | | | | |
|
Common Stocks (continued) |
| Information Technology (continued) |
1Sohu.com, Inc. | | 100 | | $ | 7,044 |
|
1Solera Holdings, Inc. | | 200 | | | 5,532 |
|
1SonicWALL, Inc. | | 300 | | | 1,935 |
|
1Sonus Networks, Inc. | | 700 | | | 2,394 |
|
1Spansion, Inc. | | 200 | | | 450 |
|
1SPSS, Inc. | | 100 | | | 3,637 |
|
1SRA International, Inc. | | 150 | | | 3,369 |
|
1Standard Microsystems Corp. | | 100 | | | 2,715 |
|
1Stratasys, Inc. | | 100 | | | 1,846 |
|
1Sun Microsystems, Inc. | | 2,900 | | | 31,552 |
|
1Sybase, Inc. | | 278 | | | 8,179 |
|
1Sycamore Networks, Inc. | | 360 | | | 1,159 |
|
1SYKES Enterprises, Inc. | | 100 | | | 1,886 |
|
1Symantec Corp. | | 3,017 | | | 58,379 |
|
1Synaptics, Inc. | | 100 | | | 3,773 |
|
1Synchronoss Technologies, Inc. | | 87 | | | 786 |
|
1SYNNEX Corp. | | 100 | | | 2,509 |
|
1Synopsys, Inc. | | 542 | | | 12,959 |
|
Syntel, Inc. | | 100 | | | 3,372 |
|
1Take-Two Interactive Software, | | | | | |
Inc. | | 285 | | | 7,287 |
1Taleo Corp. | | 100 | | | 1,959 |
|
1Taser International, Inc. | | 200 | | | 998 |
|
1Tech Data Corp. | | 180 | | | 6,100 |
|
Technitrol, Inc. | | 100 | | | 1,699 |
|
1Tekelec | | 300 | | | 4,413 |
|
1Teledyne Technologies, Inc. | | 150 | | | 7,318 |
|
1Tellabs, Inc. | | 1,593 | | | 7,407 |
|
1Teradata Corp. | | 685 | | | 15,851 |
|
1Teradyne, Inc. | | 700 | | | 7,749 |
|
1Tessera Technologies, Inc. | | 160 | | | 2,619 |
|
Texas Instruments, Inc. | | 4,800 | | | 135,168 |
|
1Thermo Electron Corp. | | 1,516 | | | 84,487 |
|
1thinkorswim Group, Inc. | | 100 | | | 705 |
|
1THQ, Inc. | | 180 | | | 3,647 |
| | | | |
| | | | |
|
1TIBCO Software, Inc. | | 650 | | 4,972 |
|
1TNS, Inc. | | 100 | | 2,396 |
|
1Trident Microsystems, Inc. | | 180 | | 657 |
|
1Trimble Navigation Ltd. | | 484 | | 17,279 |
|
1Triquint Semiconductor, Inc. | | 600 | | 3,636 |
|
1Trizetto Group, Inc. | | 100 | | 2,138 |
|
1TTM Technologies, Inc. | | 200 | | 2,642 |
|
1Tyler Technologies, Inc. | | 100 | | 1,357 |
|
1Ultimate Software Group, Inc. | | 100 | | 3,563 |
|
1Unisys Corp. | | 1,074 | | 4,242 |
|
United Online, Inc. | | 300 | | 3,009 |
|
1Universal Display Corp. | | 100 | | 1,232 |
|
1UTStarcom, Inc. | | 180 | | 985 |
|
1ValueClick, Inc. | | 312 | | 4,727 |
|
1Varian Semiconductor Equipment | | | | |
Associates, Inc. | | 262 | | 9,123 |
1Varian, Inc. | | 150 | | 7,659 |
|
1Vasco Data Security International, | | | | |
Inc. | | 100 | | 1,053 |
1Veeco Instruments, Inc. | | 100 | | 1,608 |
|
1VeriFone Holdings, Inc. | | 260 | | 3,107 |
|
1Verigy Ltd. | | 200 | | 4,542 |
|
1VeriSign, Inc. | | 810 | | 30,618 |
|
1Viasat, Inc. | | 100 | | 2,021 |
|
1Vignette Corp. | | 100 | | 1,200 |
|
1Vishay Intertechnology, Inc. | | 510 | | 4,524 |
|
1VMware, Inc. | | 100 | | 5,386 |
|
1Vocus, Inc. | | 100 | | 3,217 |
|
1Waters Corp. | | 400 | | 25,800 |
|
1Websense, Inc. | | 160 | | 2,694 |
|
1Western Digital Corp. | | 803 | | 27,728 |
|
1Wind River Systems, Inc. | | 300 | | 3,267 |
|
Xerox Corp. | | 3,327 | | 45,114 |
|
Xilinx, Inc. | | 1,088 | | 27,472 |
|
1Yahoo!, Inc. | | 4,387 | | 90,635 |
|
1Zebra Technologies Corp. | | 285 | | 9,302 |
|
1Zoran Corp. | | 152 | | 1,778 |
| |
Total Information Technology | | | | 8,069,424 |
| |
| | | | |
| 50 | | AARP PORTFOLIOS 2008 ANNUAL REPORT | | U.S. Stock Market Portfolio |
U.S. Stock Market Portfolio (continued)
June 30, 2008
| | | | | |
| Portfolio of investments | | | | |
| | |
| | | Shares | | Value |
| | | | | |
|
Common Stocks (continued) |
| Materials–4.8% |
A.M. Castle & Co. | | 100 | | $ | 2,861 |
|
AbitibiBowater, Inc. | | 193 | | | 1,801 |
|
Air Products & Chemicals, Inc. | | 780 | | | 77,111 |
|
Airgas, Inc. | | 257 | | | 15,006 |
|
AK Steel Holding Corp. | | 390 | | | 26,910 |
|
Albemarle Corp. | | 300 | | | 11,973 |
|
Alcoa, Inc. | | 2,924 | | | 104,153 |
|
Allegheny Technologies, Inc. | | 300 | | | 17,784 |
|
1Alpha Natural Resources, Inc. | | 258 | | | 26,907 |
|
AMCOL International Corp. | | 100 | | | 2,846 |
|
Ameron International Corp. | | 33 | | | 3,959 |
|
1Apex Silver Mines Ltd. | | 119 | | | 584 |
|
AptarGroup, Inc. | | 239 | | | 10,026 |
|
Arch Chemicals, Inc. | | 100 | | | 3,315 |
|
Arch Coal, Inc. | | 534 | | | 40,066 |
|
Ashland, Inc. | | 242 | | | 11,664 |
|
1Aventine Renewable Energy | | | | | |
Holdings, Inc. | | 100 | | | 440 |
Ball Corp. | | 336 | | | 16,041 |
|
Bemis Co. | | 330 | | | 7,399 |
|
1Brush Engineered Materials, Inc. | | 100 | | | 2,442 |
|
1Buckeye Technologies, Inc. | | 200 | | | 1,692 |
|
Cabot Corp. | | 235 | | | 5,713 |
|
1Calgon Carbon Corp. | | 194 | | | 2,999 |
|
1Cambrex Corp. | | 100 | | | 587 |
|
Carpenter Technology Corp. | | 200 | | | 8,730 |
|
Celanese Corp. | | 548 | | | 25,022 |
|
1Century Aluminum Co. | | 100 | | | 6,649 |
|
CF Industries Holdings, Inc. | | 200 | | | 30,560 |
|
Chemtura Corp. | | 930 | | | 5,431 |
|
Cleveland-Cliffs, Inc. | | 340 | | | 40,525 |
|
1Coeur d’Alene Mines Corp. | | 1,620 | | | 4,698 |
|
Commercial Metals Co. | | 420 | | | 15,834 |
|
Compass Minerals International, | | | | | |
Inc. | | 125 | | | 10,070 |
| | | | |
| | | | |
Consol Energy, Inc. | | 675 | | 75,850 |
|
1Crown Holdings, Inc. | | 587 | | 15,256 |
|
Cytec Industries, Inc. | | 138 | | 7,529 |
|
Dow Chemical Co. | | 3,400 | | 118,694 |
|
Eagle Materials, Inc. | | 134 | | 3,394 |
|
Eastman Chemical Co. | | 290 | | 19,969 |
|
Ecolab, Inc. | | 665 | | 28,588 |
|
EI Du Pont de Nemours & Co. | | 3,300 | | 141,537 |
|
1Esmark, Inc. | | 100 | | 1,912 |
|
Ferro Corp. | | 100 | | 1,876 |
|
FMC Corp. | | 264 | | 20,444 |
|
Foundation Coal Holdings, Inc. | | 150 | | 13,287 |
|
Freeport-McMoRan Copper & | | | | |
Gold, Inc. | | 1,400 | | 164,066 |
1General Moly, Inc. | | 300 | | 2,361 |
|
Georgia Gulf Corp. | | 50 | | 145 |
|
Gibraltar Industries, Inc. | | 100 | | 1,597 |
|
1GrafTech International Ltd. | | 400 | | 10,732 |
|
1Graphic Packaging Holding Co. | | 300 | | 606 |
|
Greif, Inc. | | 96 | | 6,147 |
|
1Haynes International, Inc. | | 50 | | 2,877 |
|
HB Fuller Co. | | 238 | | 5,341 |
|
1Hecla Mining Co. | | 500 | | 4,630 |
|
Hercules, Inc. | | 419 | | 7,094 |
|
1Horsehead Holding Corp. | | 200 | | 2,432 |
|
Huntsman Corp. | | 591 | | 6,737 |
|
Innophos Holdings, Inc. | | 100 | | 3,195 |
|
Innospec, Inc. | | 94 | | 1,769 |
|
1International Coal Group, Inc. | | 400 | | 5,220 |
|
International Flavors & | | | | |
Fragrances, Inc. | | 295 | | 11,523 |
International Paper Co. | | 1,467 | | 34,181 |
| | | | |
1James River Coal Co. | | 100 | | 5,869 |
|
1Jarden Corp. | | 282 | | 5,144 |
|
Kaiser Aluminum Corp. | | 50 | | 2,676 |
|
Louisiana-Pacific Corp. | | 330 | | 2,802 |
|
Lubrizol Corp. | | 275 | | 12,741 |
|
Martin Marietta Materials, Inc. | | 143 | | 14,813 |
|
| | | | |
| U.S. Stock Market Portfolio | | AARP PORTFOLIOS 2008 ANNUAL REPORT | | 51 |
| | | | | |
| Portfolio of investments | | | | |
| | |
| | | Shares | | Value |
| | | | | |
|
Common Stocks (continued) |
| Materials (continued) |
Massey Energy Co. | | 300 | | $ | 28,125 |
|
MeadWestvaco Corp. | | 705 | | | 16,807 |
|
Minerals Technologies, Inc. | | 78 | | | 4,960 |
|
Monsanto Co. | | 2,000 | | | 252,880 |
|
1Mosaic Co. | | 560 | | | 81,032 |
|
Myers Industries, Inc. | | 100 | | | 815 |
|
Neenah Paper, Inc. | | 100 | | | 1,671 |
|
NewMarket Corp. | | 60 | | | 3,974 |
|
Newmont Mining Corp. | | 1,600 | | | 83,456 |
|
Nucor Corp. | | 1,100 | | | 82,137 |
|
Olin Corp. | | 300 | | | 7,854 |
|
1OM Group, Inc. | | 106 | | | 3,476 |
|
1Owens-Illinois, Inc. | | 571 | | | 23,805 |
|
P.H. Glatfelter Co. | | 100 | | | 1,351 |
|
Packaging Corp. of America | | 326 | | | 7,012 |
|
1Pactiv Corp. | | 426 | | | 9,044 |
|
1Patriot Coal Corp. | | 100 | | | 15,329 |
|
Peabody Energy Corp. | | 963 | | | 84,792 |
|
1PolyOne Corp. | | 300 | | | 2,091 |
|
Potlatch Corp. | | 181 | | | 8,167 |
|
PPG Industries, Inc. | | 590 | | | 33,848 |
|
Praxair, Inc. | | 1,140 | | | 107,434 |
|
Rayonier, Inc. | | 300 | | | 12,738 |
|
Rock-Tenn Co. | | 100 | | | 2,999 |
|
1Rockwood Holdings, Inc. | | 200 | | | 6,960 |
|
Rohm & Haas Co. | | 492 | | | 22,848 |
|
Royal Gold, Inc. | | 100 | | | 3,136 |
|
RPM International, Inc. | | 500 | | | 10,300 |
|
1RTI International Metals, Inc. | | 88 | | | 3,135 |
|
Schnitzer Steel Industries, Inc. | | 100 | | | 11,460 |
|
Schulman (A.), Inc. | | 100 | | | 2,303 |
|
Scotts Miracle-Gro Co. | | 206 | | | 3,619 |
|
Sealed Air Corp. | | 582 | | | 11,064 |
|
Sigma-Aldrich Corp. | | 494 | | | 26,607 |
|
| | | | |
| | | | |
Silgan Holdings, Inc. | | 40 | | 2,030 |
|
1Smurfit-Stone Container Corp. | | 838 | | 3,411 |
|
Sonoco Products Co. | | 330 | | 10,213 |
|
Spartech Corp. | | 86 | | 811 |
|
Steel Dynamics, Inc. | | 536 | | 20,942 |
|
1Stillwater Mining Co. | | 100 | | 1,183 |
|
1Symyx Technologies | | 60 | | 419 |
|
Temple-Inland, Inc. | | 400 | | 4,508 |
|
Texas Industries, Inc. | | 63 | | 3,536 |
|
Titanium Metals Corp. | | 407 | | 5,694 |
|
United States Steel Corp. | | 428 | | 79,086 |
|
1USEC, Inc. | | 230 | | 1,398 |
|
Valspar Corp. | | 366 | | 6,921 |
|
Vulcan Materials Co. | | 400 | | 23,912 |
|
Wausau Paper Corp. | | 100 | | 771 |
|
Westlake Chemical Corp. | | 100 | | 1,486 |
|
Weyerhaeuser Co. | | 780 | | 39,889 |
|
Worthington Industries, Inc. | | 200 | | 4,100 |
|
1WR Grace & Co. | | 300 | | 7,047 |
|
1Zoltek Cos., Inc. | | 100 | | 2,425 |
| |
Total Materials | | | | 2,501,843 |
| |
|
| Telecommunication Services–3.1% |
Alaska Communications Systems | | | | |
Group, Inc. | | 100 | | 1,194 |
1American Tower Corp. | | 1,462 | | 61,770 |
|
AT&T, Inc. | | 21,800 | | 734,442 |
|
1Cbeyond, Inc. | | 100 | | 1,602 |
|
1Centennial Communications | | | | |
Corp. | | 373 | | 2,607 |
CenturyTel, Inc. | | 340 | | 12,101 |
|
1Cincinnati Bell, Inc. | | 740 | | 2,945 |
|
Citizens Communications Co. | | 1,098 | | 12,451 |
|
1Clearwire Corp. | | 200 | | 2,592 |
|
Consolidated Communications | | | | |
Holdings, Inc. | | 100 | | 1,489 |
1Crown Castle International Corp. | | 981 | | 37,994 |
|
1EchoStar Corp. | | 141 | | 4,402 |
|
Embarq Corp. | | 542 | | 25,620 |
|
Fairpoint Communications, Inc. | | 295 | | 2,127 |
|
1General Communication, Inc. | | 100 | | 687 |
|
| | | | |
| 52 | | AARP PORTFOLIOS 2008 ANNUAL REPORT | | U.S. Stock Market Portfolio |
U.S. Stock Market Portfolio (continued)
June 30, 2008
| | | | | |
| Portfolio of investments | | | | |
| | |
| | | Shares | | Value |
| | | | | |
|
Common Stocks (continued) |
| Telecommunication Services (continued) |
1Global Crossing Ltd. | | 100 | | $ | 1,794 |
|
1Harris Stratex Networks, Inc. | | 300 | | | 2,847 |
|
1ICO Global Communications | | | | | |
Holdings Ltd. | | 500 | | | 1,630 |
1IDT Corp. | | 230 | | | 347 |
|
1IDT Corp., Class B | | 200 | | | 340 |
|
Iowa Telecommunications | | | | | |
Services, Inc. | | 100 | | | 1,761 |
1iPCS, Inc. | | 45 | | | 1,333 |
|
1JDS Uniphase Corp. | | 797 | | | 9,054 |
|
1Leap Wireless International, Inc. | | 239 | | | 10,318 |
|
1Level 3 Communications, Inc. | | 5,454 | | | 16,089 |
|
1Liberty Global, Inc. | | 600 | | | 18,858 |
|
1Loral Space & Communications, | | | | | |
Inc. | | 100 | | | 1,762 |
1MetroPCS Communications, Inc. | | 800 | | | 14,168 |
|
1NeuStar, Inc. | | 246 | | | 5,304 |
|
1NII Holdings, Inc. | | 600 | | | 28,494 |
|
NTELOS Holdings Corp. | | 100 | | | 2,537 |
|
1PAETEC Holding Corp. | | 300 | | | 1,905 |
|
1Premiere Global Services, Inc. | | 200 | | | 2,916 |
|
Qwest Communications | | | | | |
International, Inc. | | 5,631 | | | 22,130 |
1RCN Corp. | | 70 | | | 755 |
|
1Rural Cellular Corp. | | 66 | | | 2,938 |
|
1SAVVIS, Inc. | | 100 | | | 1,291 |
|
1SBA Communications Corp. | | 390 | | | 14,044 |
|
Shenandoah Telecom Co. | | 100 | | | 1,302 |
|
Sprint Nextel Corp. | | 10,000 | | | 95,000 |
|
1Starent Networks Corp. | | 100 | | | 1,258 |
|
1Syniverse Holdings, Inc. | | 200 | | | 3,240 |
|
Telephone & Data Systems, Inc. | | 223 | | | 10,541 |
|
Telephone & Data Systems, Inc. | | | | | |
(Special Shares) | | 200 | | | 8,820 |
1TerreStar Corp. | | 400 | | | 1,592 |
|
1Time Warner Cable, Inc. | | 700 | | | 18,536 |
| | | | |
| | | | |
1Time Warner Telecom, Inc. | | 448 | | 7,182 |
|
1US Cellular Corp. | | 66 | | 3,732 |
|
1USA Mobility, Inc. | | 100 | | 755 |
|
Verizon Communications, Inc. | | 10,400 | | 368,160 |
|
1Vonage Holdings Corp. | | 200 | | 332 |
|
Windstream Corp. | | 1,800 | | 22,212 |
| |
Total Telecommunication Services | | | | 1,609,300 |
| |
|
| Utilities–4.5% |
1AES Corp. | | 2,357 | | 45,278 |
|
AGL Resources, Inc. | | 291 | | 10,063 |
|
Allegheny Energy, Inc. | | 606 | | 30,367 |
|
Allete, Inc. | | 50 | | 2,100 |
|
Alliant Energy Corp. | | 427 | | 14,629 |
|
Ameren Corp. | | 758 | | 32,010 |
|
American Electric Power Co., Inc. | | 1,500 | | 60,345 |
|
American States Water Co. | | 100 | | 3,494 |
|
Aqua America, Inc. | | 494 | | 7,889 |
|
1Aquila, Inc. | | 1,070 | | 4,034 |
|
Atmos Energy Corp. | | 332 | | 9,153 |
|
Avista Corp. | | 130 | | 2,790 |
|
Black Hills Corp. | | 150 | | 4,809 |
|
California Water Service Group | | 100 | | 3,277 |
|
CenterPoint Energy, Inc. | | 1,057 | | 16,965 |
|
CH Energy Group, Inc. | | 70 | | 2,490 |
|
Cleco Corp. | | 200 | | 4,666 |
|
CMS Energy Corp. | | 900 | | 13,410 |
|
Consolidated Edison, Inc. | | 1,010 | | 39,481 |
|
Constellation Energy Group, Inc. | | 654 | | 53,693 |
|
Dominion Resources, Inc. | | 2,100 | | 99,729 |
|
DPL, Inc. | | 380 | | 10,024 |
|
DTE Energy Co. | | 607 | | 25,761 |
|
Duke Energy Corp. | | 4,600 | | 79,948 |
|
1Dynegy, Inc. | | 1,836 | | 15,698 |
|
Edison International | | 1,160 | | 59,601 |
|
El Paso Electric Co. | | 190 | | 3,762 |
|
Empire District Electric Co. | | 150 | | 2,781 |
|
1Enbridge Energy Management | | | | |
LLC | | 90 | | 4,604 |
Energen Corp. | | 280 | | 21,848 |
|
| | | | |
| U.S. Stock Market Portfolio | | AARP PORTFOLIOS 2008 ANNUAL REPORT | | 53 |
| | | | | |
| Portfolio of investments | | | | |
| | |
| | | Shares | | Value |
| | | | | |
|
Common Stocks (continued) |
| Utilities (continued) |
Energy East Corp. | | 587 | | $ | 14,511 |
|
Entergy Corp. | | 700 | | | 84,336 |
|
Exelon Corp. | | 2,420 | | | 217,703 |
|
FirstEnergy Corp. | | 1,130 | | | 93,033 |
|
FPL Group, Inc. | | 1,396 | | | 91,550 |
|
Great Plains Energy, Inc. | | 276 | | | 6,977 |
|
Hawaiian Electric Industries, Inc. | | 321 | | | 7,938 |
|
IDACORP, Inc. | | 175 | | | 5,056 |
|
Integrys Energy Group, Inc. | | 269 | | | 13,673 |
|
ITC Holdings Corp. | | 200 | | | 10,222 |
|
1Kinder Morgan Management | | | | | |
LLC | | 242 | | | 13,032 |
Laclede Group, Inc. | | 120 | | | 4,844 |
|
Macquarie Infrastructure Co. | | | | | |
LLC | | 168 | | | 4,249 |
MDU Resources Group, Inc. | | 608 | | | 21,195 |
|
MGE Energy, Inc. | | 100 | | | 3,262 |
|
1Mirant Corp. | | 800 | | | 31,320 |
|
Mueller Water Products, Inc. | | 243 | | | 2,075 |
|
Nalco Holding Co. | | 510 | | | 10,787 |
|
National Fuel Gas Co. | | 213 | | | 12,669 |
|
New Jersey Resources Corp. | | 140 | | | 4,571 |
|
Nicor, Inc. | | 169 | | | 7,198 |
|
NiSource, Inc. | | 954 | | | 17,096 |
|
Northeast Utilities | | 576 | | | 14,705 |
|
Northwest Natural Gas Co. | | 90 | | | 4,163 |
|
NorthWestern Corp. | | 170 | | | 4,321 |
|
1NRG Energy, Inc. | | 826 | | | 35,435 |
|
NSTAR | | 420 | | | 14,204 |
|
OGE Energy Corp. | | 330 | | | 10,464 |
|
Oneok, Inc. | | 400 | | | 19,532 |
|
Ormat Technologies, Inc. | | 100 | | | 4,918 |
|
Otter Tail Corp. | | 90 | | | 3,495 |
|
Pepco Holdings, Inc. | | 667 | | | 17,109 |
|
1Petrohawk Energy Corp. | | 800 | | | 37,048 |
|
| | | | |
| | | | |
PG&E Corp. | | 1,355 | | 53,780 |
|
Piedmont Natural Gas Co. | | 219 | | 5,729 |
|
Pinnacle West Capital Corp. | | 390 | | 12,000 |
|
PNM Resources, Inc. | | 184 | | 2,201 |
|
Portland General Electric Co. | | 200 | | 4,504 |
|
PPL Corp. | | 1,300 | | 67,951 |
|
Progress Energy, Inc. | | 887 | | 37,103 |
|
Public Service Enterprise Group, | | | | |
Inc. | | 1,800 | | 82,674 |
Puget Energy, Inc. | | 440 | | 10,556 |
|
Questar Corp. | | 629 | | 44,684 |
|
1Reliant Energy, Inc. | | 1,274 | | 27,098 |
|
SCANA Corp. | | 387 | | 14,319 |
|
Sempra Energy | | 938 | | 52,950 |
|
Sierra Pacific Resources | | 786 | | 9,990 |
|
SJW Corp. | | 100 | | 2,640 |
|
South Jersey Industries, Inc. | | 90 | | 3,362 |
|
Southern Co. | | 2,800 | | 97,776 |
|
Southern Union Co. | | 436 | | 11,781 |
|
Southwest Gas Corp. | | 200 | | 5,946 |
|
1Southwestern Energy Co. | | 1,242 | | 59,132 |
|
Spectra Energy Corp. | | 2,300 | | 66,102 |
|
TECO Energy, Inc. | | 749 | | 16,096 |
|
UGI Corp. | | 351 | | 10,077 |
|
UIL Holdings Corp. | | 100 | | 2,941 |
|
UniSource Energy Corp. | | 160 | | 4,962 |
|
Vectren Corp. | | 314 | | 9,800 |
|
1VeraSun Energy Corp. | | 362 | | 1,495 |
|
Westar Energy, Inc. | | 337 | | 7,249 |
|
WGL Holdings, Inc. | | 200 | | 6,948 |
|
Wisconsin Energy Corp. | | 405 | | 18,314 |
|
Xcel Energy, Inc. | | 1,532 | | 30,747 |
| |
Total Utilities | | | | 2,308,297 |
| |
| Total Common Stocks– | | | | |
(Identified Cost $52,702,907) | | 50,204,269 |
| |
| | | | |
| 54 | | AARP PORTFOLIOS 2008 ANNUAL REPORT | | U.S. Stock Market Portfolio |
U.S. Stock Market Portfolio (continued)
June 30, 2008
| | | | | | |
| Portfolio of investments | | | | |
| | |
| | | Par Amount | | Value |
| | | | | | |
| | |
U.S. Treasury–0.1% | | | | | | |
4United States Treasury Bill, | | | | | | |
1.900%, 9/11/2008 | | | | | | |
(At Amortized Cost) | | $ | 35,000 | | $ | 34,867 |
| |
| Total Investments–97.1% | | | 50,239,136 |
(Identified Cost $52,737,774) | | | |
| |
| Other Assets & Liabilities–Net–2.9% | | | 1,501,144 |
| |
| Total Net Assets–100.0% | | $ | 51,740,280 |
| |
| | 1 | Non-income producing security. |
| | 2 | Real Estate Investment Trust (REIT) |
| | 3 | Investments in non-controlled affiliate. The Portfolio owns shares of State Street Corp. with a cost basis of $94,973 at June 30, 2008. |
| | 4 | Pledged as collateral to ensure the Portfolio is able to satisfy the obligation of its outstanding long futures contracts. |
| | | | | | | | | | | |
| At June 30, 2008, the Fund had the following outstanding long futures contracts: | |
| Description | | Number of Contracts | | Notional Value | | Expiration Date | | Unrealized Depreciation | |
| | |
S & P Mini 500 Index Futures | | 6 | | $ | 384,330 | | September
2008 | | $ | (23,663 | ) |
| | |
Russell
2000 E Mini Index Futures | | 3 | | $ | 207,510 | | September
2008 | | $ | (14,092 | ) |
| | |
| Futures contracts are valued at the last sale at the market close or at the mean between the bid and asked price if last sale is not available. | �� |
| | |
| Unrealized appreciation (depreciation) on open futures contracts is required to be treated as realized gain (loss) for tax purposes. | |
| | |
See Notes to Financial Statements.
| | | | |
| International Stock Market Portfolio | | AARP PORTFOLIOS 2008 ANNUAL REPORT | | 55 |
International Stock Market Portfolio
June 30, 2008
| | | | | |
| Portfolio of investments |
| | |
| | | Shares | | Value |
| | | | | |
| | |
Common Stocks–95.6% | | | | | |
| Aerospace & Defense–0.7% | | | | | |
BAE Systems PLC | | 7,587 | | $ | 66,833 |
|
Cobham PLC | | 2,413 | | | 9,501 |
|
European Aeronautic Defence | | | | | |
and Space Co. NV | | 683 | | | 12,949 |
Finmeccanica SpA | | 654 | | | 17,178 |
|
Gamesa Corp. Tecnologica SA | | 390 | | | 19,173 |
|
Meggitt PLC | | 1,398 | | | 5,914 |
|
1Rolls-Royce Group PLC | | 3,989 | | | 27,118 |
|
Safran SA | | 401 | | | 7,780 |
|
Singapore Technologies | | | | | |
Engineering Ltd. | | 3,000 | | | 6,062 |
Smiths Group PLC | | 794 | | | 17,166 |
|
Thales SA | | 189 | | | 10,774 |
|
Zodiac SA | | 70 | | | 3,213 |
| |
Total | | | | | 203,661 |
| |
| | |
| Air Freight & Couriers–0.4% | | | | | |
Deutsche Post AG | | 1,798 | | | 47,000 |
|
Hamburger Hafen und Logistik | | | | | |
AG | | 54 | | | 4,201 |
TNT NV | | 835 | | | 28,559 |
|
Toll Holdings Ltd. | | 1,308 | | | 7,530 |
|
Yamato Holdings Co. Ltd. | | 1,000 | | | 13,956 |
| |
Total | | | | | 101,246 |
| |
| | |
| Airlines–0.2% | | | | | |
Air France-KLM | | 310 | | | 7,440 |
|
All Nippon Airways Co. Ltd. | | 1,000 | | | 3,739 |
|
British Airways PLC | | 1,285 | | | 5,506 |
|
Cathay Pacific Airways Ltd. | | 3,000 | | | 5,717 |
|
Deutsche Lufthansa AG | | 461 | | | 9,945 |
|
Iberia Lineas Aereas de Espana | | | | | |
SA | | 811 | | | 1,941 |
1Japan Airlines Corp. | | 2,000 | | | 4,200 |
|
Qantas Airways Ltd. | | 1,889 | | | 5,492 |
|
Singapore Airlines Ltd. | | 940 | | | 10,154 |
| |
Total | | | | | 54,134 |
| |
| | | | |
| | | | |
| Auto Components–0.7% | | | | |
Aisin Seiki Co. Ltd. | | 400 | | 13,109 |
|
Bridgestone Corp. | | 1,300 | | 19,869 |
|
Compagnie Generale des | | | | |
Etablissements Michelin | | 313 | | 22,495 |
Continental AG | | 336 | | 34,534 |
|
Denso Corp. | | 1,000 | | 34,372 |
|
GKN PLC | | 1,370 | | 6,082 |
|
NOK Corp. | | 200 | | 3,179 |
|
Nokian Renkaat, OYJ | | 230 | | 11,047 |
|
Stanley Electric Co. Ltd. | | 300 | | 7,261 |
|
Sumitomo Rubber Industries, | | | | |
Inc. | | 300 | | 2,238 |
Tokai Rika Co. Ltd. | | 100 | | 2,067 |
|
Toyoda Gosei Co. Ltd. | | 100 | | 2,919 |
|
Toyota Boshoku Corp. | | 100 | | 2,679 |
|
Toyota Industries Corp. | | 400 | | 12,807 |
|
Valeo SA | | 130 | | 4,176 |
| |
Total | | | | 178,834 |
| |
| | |
| Automobiles–3.0% | | | | |
Bayerische Motoren Werke AG | | 704 | | 33,867 |
|
DaimlerChrysler AG | | 1,941 | | 120,059 |
|
Fiat SpA | | 1,466 | | 24,031 |
|
Fuji Heavy Industries Ltd. | | 1,000 | | 4,897 |
|
Honda Motor Co. Ltd. | | 3,500 | | 118,985 |
|
Isuzu Motors Ltd. | | 3,000 | | 14,436 |
|
Mazda Motor Corp. | | 2,000 | | 10,378 |
|
1Mitsubishi Motors Corp. | | 8,000 | | 14,540 |
|
Nissan Motor Co. Ltd. | | 4,700 | | 38,816 |
|
Peugeot SA | | 334 | | 18,140 |
|
Renault SA | | 398 | | 32,653 |
|
Suzuki Motor Corp. | | 800 | | 18,909 |
|
Toyota Motor Corp. | | 5,800 | | 273,642 |
|
Volkswagen AG | | 321 | | 92,644 |
|
Yamaha Motor Co. Ltd. | | 400 | | 7,485 |
| |
Total | | | | 823,482 |
| |
| | |
| Banks–14.0% | | | | |
77 Bank Ltd. | | 1,000 | | 6,281 |
|
Alliance & Leicester PLC | | 805 | | 4,727 |
|
| | | | |
| 56 | | AARP PORTFOLIOS 2008 ANNUAL REPORT | | International Stock Market Portfolio |
International Stock Market Portfolio (continued)
June 30, 2008
| | | | | |
| Portfolio of investments |
| | |
| | | Shares | | Value |
| | | | | |
| | |
Common Stocks (continued) | | | | | |
| Banks (continued) | | | | | |
Allied Irish Banks PLC | | 1,906 | | $ | 29,424 |
|
Alpha Bank AE | | 844 | | | 25,518 |
|
Anglo Irish Bank Corp. PLC | | 1,615 | | | 15,386 |
|
Aozora Bank Ltd. | | 1,000 | | | 2,288 |
|
Australia & New Zealand | | | | | |
Banking Group Ltd. | | 4,085 | | | 73,133 |
Banca Carige SpA | | 1,495 | | | 5,285 |
|
Banca Intesa SpA | | | | | |
(Certificates.–participating cumulative) | | 1,839 | | | 9,535 |
Banca Monte dei Paschi di | | | | | |
Siena SpA | | 4,092 | | | 11,592 |
Banca Popolare di Milano | | | | | |
SCRL | | 825 | | | 7,743 |
Banche Popolari Unite SCPA | | 1,280 | | | 30,013 |
|
Banco Bilbao Vizcaya | | | | | |
Argentaria SA | | 7,572 | | | 145,110 |
Banco Comercial Portugues SA | | 5,203 | | | 11,266 |
|
Banco de Sabadell SA | | 1,952 | | | 16,506 |
|
Banco Espirito Santo SA | | 451 | | | 7,038 |
|
Banco Popolare SCRL | | 1,389 | | | 24,672 |
|
Banco Popular Espanol SA | | 1,764 | | | 24,417 |
|
Banco Santander Central | | | | | |
Hispano SA | | 13,318 | | | 244,741 |
Bank of East Asia Ltd. | | 3,035 | | | 16,485 |
|
Bank of Ireland | | 2,139 | | | 18,613 |
|
Bank of Kyoto Ltd. | | 1,000 | | | 10,444 |
|
Bank of Yokohama Ltd. | | 3,000 | | | 20,736 |
|
Bankinter SA | | 561 | | | 6,387 |
|
Barclays PLC | | 13,985 | | | 81,153 |
|
Barclays PLC–New Shares | | 2,996 | | | 567 |
|
Bendigo Bank Ltd. | | 531 | | | 5,550 |
|
BNP Paribas | | 1,733 | | | 157,024 |
|
BOC Hong Kong Holdings Ltd. | | 8,000 | | | 21,187 |
|
Chiba Bank Ltd. | | 2,000 | | | 14,013 |
|
1CITIC International Financial | | | | | |
Holdings Ltd. | | 4,000 | | | 3,052 |
| | | | |
| | | | |
Commerzbank AG | | 1,352 | | 40,110 |
|
Commonwealth Bank of | | | | |
Australia | | 2,813 | | 108,066 |
Credit Agricole SA | | 1,927 | | 39,387 |
|
Credit Suisse Group | | 2,225 | | 102,266 |
|
Danske Bank A/S | | 1,010 | | 29,217 |
|
DBS Group Holdings Ltd. | | 2,000 | | 27,718 |
|
Deutsche Bank AG | | 1,083 | | 93,541 |
|
Deutsche Postbank AG | | 166 | | 14,576 |
|
Dexia SA | | 1,144 | | 18,303 |
|
DnB NOR ASA | | 1,600 | | 20,363 |
|
EFG Eurobank Ergasias SA | | 705 | | 16,763 |
|
EFG International | | 103 | | 2,821 |
|
Erste Bank der | | | | |
Oesterreichischen Sparkassen
AG | | 413 | | 25,715 |
Fukuoka Financial Group, Inc. | | 2,000 | | 9,022 |
|
Gunma Bank Ltd. | | 1,000 | | 6,658 |
|
Hachijuni Bank Ltd. | | 1,000 | | 6,479 |
|
Hang Seng Bank Ltd. | | 1,600 | | 33,756 |
|
HBOS PLC | | 8,545 | | 46,949 |
|
Hiroshima Bank Ltd. | | 1,000 | | 4,454 |
|
HSBC Holdings PLC | | 25,279 | | 390,380 |
|
Intesa Sanpaolo SpA | | 16,605 | | 94,851 |
|
Investec PLC | | 865 | | 5,304 |
|
Iyo Bank Ltd. | | 1,000 | | 11,705 |
|
Joyo Bank Ltd. | | 1,000 | | 4,859 |
|
Julius Baer Holding AG | | 451 | | 30,497 |
|
1Jyske Bank A/S | | 126 | | 7,516 |
|
KBC Groep NV | | 339 | | 37,651 |
|
Lloyds TSB Group PLC | | 12,056 | | 74,580 |
|
Mediobanca SpA | | 1,077 | | 18,316 |
|
Mitsubishi UFJ Financial Group, | | | | |
Inc. | | 22,000 | | 194,952 |
Mizuho Financial Group, Inc. | | 21 | | 98,088 |
|
National Australia Bank Ltd. | | 3,512 | | 89,006 |
|
National Bank of Greece SA | | 1,053 | | 47,456 |
|
Natixis | | 910 | | 10,102 |
|
Nishi-Nippon City Bank Ltd. | | 1,000 | | 2,976 |
|
Nordea Bank AB | | 4,560 | | 62,899 |
|
| | | | |
| International Stock Market Portfolio | | AARP PORTFOLIOS 2008 ANNUAL REPORT | | 57 |
| | | | | |
| Portfolio of investments |
| | |
| | | Shares | | Value |
| | | | | |
| | |
Common Stocks (continued) | | | | | |
| Banks (continued) | | | | | |
OKO Bank PLC | | 200 | | $ | 3,471 |
|
Oversea-Chinese Banking | | | | | |
Corp. Ltd. | | 5,000 | | | 30,018 |
Piraeus Bank SA | | 711 | | | 19,325 |
|
Raiffeisen International Bank | | | | | |
Holding AG | | 119 | | | 15,210 |
Resona Holdings, Inc. | | 11 | | | 16,885 |
|
Royal Bank of Scotland Group | | | | | |
PLC | | 34,323 | | | 146,903 |
Sapporo Hokuyo Holdings, Inc. | | 1 | | | 6,761 |
|
Shinsei Bank Ltd. | | 2,000 | | | 6,856 |
|
Shizuoka Bank Ltd. | | 1,000 | | | 10,208 |
|
Skandinaviska Enskilda Banken | | | | | |
AB | | 910 | | | 16,918 |
SNS Reaal | | 278 | | | 5,398 |
|
Societe Generale | | 992 | | | 86,369 |
|
St. George Bank Ltd. | | 1,186 | | | 30,749 |
|
Standard Chartered PLC | | 2,998 | | | 85,344 |
|
Sumitomo Mitsui Financial | | | | | |
Group, Inc. | | 14 | | | 105,340 |
Suncorp-Metway Ltd. | | 2,013 | | | 25,104 |
|
Suruga Bank Ltd. | | 1,000 | | | 13,005 |
|
Svenska Handelsbanken | | 950 | | | 22,628 |
|
Swedbank AB | | 800 | | | 15,470 |
|
Sydbank A/S | | 140 | | | 5,336 |
|
UniCredito Italiano SpA | | 24,120 | | | 147,654 |
|
United Overseas Bank Ltd. | | 3,000 | | | 41,048 |
|
Westpac Banking Corp. | | 3,987 | | | 76,259 |
|
Wing Hang Bank Ltd. | | 510 | | | 6,757 |
|
Wing Lung Bank | | 200 | | | 3,922 |
| |
Total | | | | | 3,820,126 |
| |
| | |
| Beverages–1.3% | | | | | |
Asahi Breweries Ltd. | | 800 | | | 14,932 |
|
Carlsberg A/S | | 160 | | | 15,456 |
|
Coca-Cola Amatil Ltd. | | 1,018 | | | 6,825 |
|
| | | | |
| | | | |
Coca-Cola West Holdings Co. | | | | |
Ltd. | | 100 | | 2,331 |
Diageo PLC | | 5,469 | | 100,597 |
|
Foster’s Group Ltd. | | 4,256 | | 20,636 |
|
Fraser and Neave Ltd. | | 2,000 | | 6,658 |
|
Heineken Holding NV | | 234 | | 10,737 |
|
Heineken NV | | 520 | | 26,547 |
|
InBev NV | | 400 | | 27,765 |
|
Ito En Ltd. | | 100 | | 1,574 |
|
Kirin Brewery Co. Ltd. | | 2,000 | | 31,227 |
|
Lion Nathan Ltd. | | 498 | | 4,072 |
|
Pernod-Ricard SA | | 350 | | 35,962 |
|
SABMiller PLC | | 1,971 | | 45,201 |
|
Sapporo Holdings Ltd. | | 1,000 | | 6,997 |
| |
Total | | | | 357,517 |
| |
| | |
| Biotechnology–0.0% | | | | |
Grifols SA | | 272 | | 8,691 |
| |
| | |
| Building Products–0.4% | | | | |
Asahi Glass Co. Ltd. | | 2,000 | | 24,183 |
|
Assa Abloy AB | | 680 | | 9,848 |
|
Cie de Saint-Gobain | | 603 | | 37,735 |
|
Geberit AG | | 88 | | 12,979 |
|
JS Group Corp. | | 600 | | 9,532 |
|
Nippon Sheet Glass Co. Ltd. | | 1,000 | | 4,944 |
|
TOTO Ltd. | | 1,000 | | 7,044 |
|
Wienerberger AG | | 171 | | 7,182 |
| |
Total | | | | 113,447 |
| |
| | |
| Chemicals–3.0% | | | | |
Akzo Nobel NV | | 588 | | 40,426 |
|
Asahi Kasei Corp. | | 2,000 | | 10,472 |
|
BASF AG | | 2,062 | | 142,285 |
|
Bayer AG | | 1,632 | | 137,387 |
|
Daicel Chemical Industries, Ltd. | | 1,000 | | 5,631 |
|
Dainippon Ink and Chemicals, | | | | |
Inc. | | 1,000 | | 2,891 |
Denki Kagaku Kogyo K. K. | | 1,000 | | 3,710 |
|
GEA Group AG | | 322 | | 11,378 |
|
Givaudan SA | | 13 | | 11,632 |
|
Incitec Pivot Ltd. | | 131 | | 23,177 |
|
| | | | |
| 58 | | AARP PORTFOLIOS 2008 ANNUAL REPORT | | International Stock Market Portfolio |
International Stock Market Portfolio (continued)
June 30, 2008
| | | | | |
| Portfolio of investments |
| | |
| | | Shares | | Value |
| | | | | |
| | |
Common Stocks (continued) | | | | | |
| Chemicals (continued) | | | | | |
JSR Corp. | | 400 | | $ | 7,948 |
|
K+S AG | | 81 | | | 46,722 |
|
Kaneka Corp. | | 1,000 | | | 6,809 |
|
Kansai Paint Co. Ltd. | | 1,000 | | | 6,922 |
|
Koninklijke DSM NV | | 288 | | | 16,948 |
|
Kuraray Co. Ltd. | | 500 | | | 5,961 |
|
Lonza Group AG | | 98 | | | 13,609 |
|
Mitsubishi Chemical Holdings | | | | | |
Corp. | | 2,500 | | | 14,549 |
Mitsubishi Gas Chemical Co., | | | | | |
Inc. | | 1,000 | | | 7,213 |
Mitsubishi Rayon Co. Ltd. | | 1,000 | | | 3,155 |
|
Mitsui Chemicals, Inc. | | 1,000 | | | 4,925 |
|
Novozymes A/S | | 110 | | | 9,941 |
|
Orica Ltd. | | 675 | | | 18,914 |
|
Shin-Etsu Chemical Co. Ltd. | | 900 | | | 55,768 |
|
Showa Denko K.K. | | 3,000 | | | 7,967 |
|
Solvay SA | | 131 | | | 17,140 |
|
Sumitomo Chemical Co. Ltd. | | 3,000 | | | 18,900 |
|
Syngenta AG | | 226 | | | 73,587 |
|
Taiyo Nippon Sanso Corp. | | 1,000 | | | 8,334 |
|
Teijin Ltd. | | 2,000 | | | 6,856 |
|
Tokuyama Corp. | | 1,000 | | | 7,440 |
|
Toray Industries, Inc. | | 3,000 | | | 16,075 |
|
Tosoh Corp. | | 1,000 | | | 4,087 |
|
Ube Industries Ltd. | | 2,000 | | | 7,082 |
|
Wacker Chemie AG | | 33 | | | 6,899 |
|
Yara International ASA | | 350 | | | 31,001 |
| |
Total | | | | | 813,741 |
| |
|
| Commercial Services & Supplies–0.8% |
Adecco SA | | 257 | | | 12,769 |
|
Benesse Corp. | | 200 | | | 8,099 |
|
Bureau Veritas SA | | 86 | | | 5,109 |
|
Capita Group PLC | | 1,261 | | | 17,258 |
|
Cargotec Corp. | | 65 | | | 2,263 |
|
| | | | |
| | | | |
Dai Nippon Printing Co. Ltd. | | 1,000 | | 14,738 |
|
Group 4 Securicor PLC | | 2,609 | | 10,517 |
|
Hakuhodo DY Holdings, Inc. | | 50 | | 2,665 |
|
Hays PLC | | 2,836 | | 5,109 |
|
1Invensys PLC | | 1,783 | | 9,246 |
|
Legrand SA | | 202 | | 5,093 |
|
Mitsubishi UFJ Lease & Finance | | | | |
Co. Ltd. | | 140 | | 6,078 |
PagesJaunes Groupe SA | | 300 | | 4,417 |
|
Randstad Holdings NV | | 220 | | 7,691 |
|
Rentokil Initial PLC | | 3,795 | | 7,498 |
|
Secom Co. Ltd. | | 400 | | 19,437 |
|
Securitas AB | | 680 | | 7,901 |
|
Serco Group PLC | | 984 | | 8,771 |
|
SGS SA | | 10 | | 14,328 |
|
Societe BIC SA | | 70 | | 3,660 |
|
Toppan Printing Co. Ltd. | | 1,000 | | 11,009 |
|
WPP Group PLC | | 2,438 | | 23,502 |
| |
Total | | | | 207,158 |
| |
|
| Communications Equipment–1.1% |
Alcatel SA | | 4,902 | | 29,796 |
|
Nokia OYJ | | 8,520 | | 207,821 |
|
Telefonaktiebolaget LM Ericsson | | 6,190 | | 64,525 |
| |
Total | | | | 302,142 |
| |
|
| Computers & Peripherals–0.5% |
1Elpida Memory, Inc. | | 200 | | 6,404 |
|
Fujitsu Ltd. | | 4,000 | | 29,683 |
|
1Logitech International SA | | 381 | | 10,268 |
|
Mitsumi Electric Co. Ltd. | | 200 | | 4,454 |
|
NEC Corp. | | 4,000 | | 20,943 |
|
Toshiba Corp. | | 7,000 | | 51,615 |
| |
Total | | | | 123,367 |
| |
|
| Construction & Engineering–0.9% |
Acciona SA | | 60 | | 14,253 |
|
Actividades de Construction y | | | | |
Servicios SA (ACS) | | 413 | | 20,753 |
Aker Kvaerner ASA | | 374 | | 8,833 |
|
Alstom SA | | 225 | | 51,966 |
|
Amec PLC | | 730 | | 12,934 |
|
| | | | |
| International Stock Market Portfolio | | AARP PORTFOLIOS 2008 ANNUAL REPORT | | 59 |
| | | | | |
| Portfolio of investments |
| | |
| | | Shares | | Value |
| | | | | |
| | |
Common Stocks (continued) | | | | | |
| Construction & Engineering (continued) |
Balfour Beatty PLC | | 1,055 | | $ | 8,926 |
|
Bilfinger Berger AG | | 78 | | | 6,796 |
|
Boart Longyear Group | | 2,691 | | | 5,739 |
|
Eiffage SA | | 79 | | | 5,415 |
|
FLSmidth & Co. A/S | | 100 | | | 10,980 |
|
Fomento de Construcciones y | | | | | |
Contratas SA | | 100 | | | 5,943 |
Grupo Ferrovial SA | | 131 | | | 8,111 |
|
HOCHTIEF AG | | 83 | | | 8,444 |
|
Husqvarna AB, Series B | | 548 | | | 4,798 |
|
Italcementi SpA | | 146 | | | 1,701 |
|
Kajima Corp. | | 2,000 | | | 6,987 |
|
Kurita Water Industries Ltd. | | 200 | | | 7,402 |
|
Leighton Holdings Ltd. | | 276 | | | 13,422 |
|
Obayashi Corp. | | 1,000 | | | 4,530 |
|
SembCorp Industries Ltd. | | 2,000 | | | 6,114 |
|
Shimizu Corp. | | 1,000 | | | 4,737 |
|
Skanska AB | | 580 | | | 8,328 |
|
Strabag SE | | 109 | | | 8,496 |
|
Taisei Corp. | | 2,000 | | | 4,765 |
|
YIT OYJ | | 240 | | | 6,039 |
| |
Total | | | | | 246,412 |
| |
|
| Construction Materials–0.6% |
Boral Ltd. | | 1,193 | | | 6,446 |
|
Cimpor Cimentos de Portugal | | | | | |
SGPS SA | | 466 | | | 3,141 |
CRH PLC | | 1,197 | | | 35,159 |
|
CSR Ltd. | | 2,030 | | | 4,756 |
|
Fletcher Building Ltd. | | 1,074 | | | 5,189 |
|
HeidelbergCement AG | | 53 | | | 7,692 |
|
Holcim Ltd. | | 440 | | | 35,682 |
|
Imerys SA | | 70 | | | 5,072 |
|
Italcementi SpA | | 120 | | | 1,995 |
|
James Hardie Industries NV | | 800 | | | 3,244 |
|
Lafarge SA | | 321 | | | 49,229 |
|
| | | | |
| | | | |
Taiheiyo Cement Corp. | | 2,000 | | 4,012 |
|
Titan Cement Co. SA | | 140 | | 5,556 |
| |
Total | | | | 167,173 |
| |
|
| Containers & Packaging–0.1% |
Amcor Ltd. | | 1,838 | | 8,877 |
|
Rexam PLC | | 1,263 | | 9,743 |
|
Smurfit Kappa Group PLC | | 276 | | 2,282 |
|
Toyo Seikan Kaisha Ltd. | | 300 | | 5,294 |
| |
Total | | | | 26,196 |
| |
|
| Distributors–0.3% |
Li & Fung Ltd. | | 4,200 | | 12,658 |
|
Metcash Ltd. | | 1,626 | | 5,754 |
|
Olam International Ltd. | | 2,100 | | 3,750 |
|
Reckitt Benckiser Group PLC | | 1,296 | | 65,660 |
| |
Total | | | | 87,822 |
| |
|
| Diversified Financials–3.3% |
3i Group PLC | | 837 | | 13,746 |
|
Acom Co. Ltd. | | 100 | | 3,098 |
|
Aeon Credit Service Co. Ltd. | | 100 | | 1,253 |
|
Aiful Corp. | | 100 | | 1,158 |
|
Australian Stock Exchange Ltd. | | 378 | | 11,351 |
|
Babcock & Brown International | | | | |
Property Ltd. | | 463 | | 3,321 |
Banco BPI SA | | 606 | | 2,515 |
|
Cattles PLC | | 22 | | 59 |
|
Chinese Estates Holdings Ltd. | | 2,035 | | 3,132 |
|
Credit Saison Co. Ltd. | | 300 | | 6,300 |
|
Criteria Caixacorp SA | | 1,788 | | 10,727 |
|
Daiwa Securities Group, Inc. | | 3,000 | | 27,573 |
|
Deutsche Boerse AG | | 428 | | 48,317 |
|
E*Trade Securities Co. Ltd. | | 3 | | 2,345 |
|
Eurazeo | | 54 | | 5,764 |
|
Experian Group Ltd. | | 2,098 | | 15,610 |
|
Fortis NV | | 4,504 | | 72,059 |
|
1Fortis NV-Strip VVPR | | 1,664 | | 26 |
|
Groupe Bruxelles Lambert SA | | 177 | | 21,074 |
|
Hokuhoku Financial Group, Inc. | | 2,000 | | 5,801 |
|
Hong Kong Exchanges and | | | | |
Clearing Ltd. | | 2,000 | | 29,242 |
| | | | |
| 60 | | AARP PORTFOLIOS 2008 ANNUAL REPORT | | International Stock Market Portfolio |
International Stock Market Portfolio (continued)
June 30, 2008
| | | | | |
| Portfolio of investments |
| | |
| | | Shares | | Value |
| | | | | |
| | |
Common Stocks (continued) | | | | | |
| Diversified Financials (continued) |
Hypo Real Estate Holding AG | | 297 | | $ | 8,362 |
|
ICAP PLC | | 1,044 | | | 11,264 |
|
IFIL–Investments SpA | | 663 | | | 4,312 |
|
ING Groep NV | | 4,071 | | | 129,847 |
|
Investor AB | | 1,000 | | | 21,122 |
|
Jafco Co. Ltd. | | 100 | | | 3,418 |
|
KBC Ancora | | 67 | | | 5,856 |
|
Keppel Corp. Ltd. | | 3,000 | | | 24,558 |
|
London Stock Exchange Group | | | | | |
PLC | | 301 | | | 4,674 |
Macquarie Group Ltd. | | 571 | | | 26,561 |
|
Man Group PLC | | 3,709 | | | 46,073 |
|
1Marfin Investment Group SA | | 1,412 | | | 11,162 |
|
Mediolanum SpA | | 660 | | | 2,746 |
|
1Mitsubishi UFJ Nicos Co. Ltd. | | 1,000 | | | 3,305 |
|
Mitsui Trust Holdings, Inc. | | 2,000 | | | 11,903 |
|
Mizuho Trust & Banking Co. | | | | | |
Ltd. | | 3,000 | | | 5,170 |
Nomura Holdings, Inc. | | 3,800 | | | 56,290 |
|
ORIX Corp. | | 190 | | | 27,179 |
|
Pargesa Holding SA | | 57 | | | 6,363 |
|
Perpetual Ltd. | | 100 | | | 4,090 |
|
Promise Co. Ltd. | | 150 | | | 4,195 |
|
Schroders PLC | | 261 | | | 4,749 |
|
Shinko Securities Co. Ltd. | | 1,000 | | | 2,948 |
|
Singapore Exchange Ltd. | | 2,000 | | | 10,155 |
|
Sony Financial Holdings, Inc. | | 2 | | | 8,042 |
|
Sumitomo Trust & Banking Co. | | | | | |
Ltd. | | 3,000 | | | 20,962 |
Swire Pacific Ltd. | | 2,000 | | | 20,456 |
|
Takefuji Corp. | | 200 | | | 2,782 |
|
UBS AG | | 6,246 | | | 131,237 |
| |
Total | | | | | 904,252 |
| |
| | | | |
| | | | |
| Diversified Telecommunication Services–3.7% |
Belgacom SA | | 349 | | 15,058 |
|
BT Group PLC | | 16,741 | | 66,619 |
|
Deutsche Telekom AG | | 6,046 | | 99,015 |
|
Elisa OYJ | | 280 | | 5,877 |
|
France Telecom SA | | 3,883 | | 114,403 |
|
Hellenic Telecommunications | | | | |
Organization SA | | 560 | | 14,109 |
1Hutchison Telecommunications | | | | |
International Ltd. | | 3,000 | | 4,255 |
Millicom International Cellular SA | | 149 | | 15,532 |
|
Mobistar SA | | 60 | | 4,861 |
|
Nippon Telegraph & Telephone | | | | |
Corp. | | 11 | | 53,866 |
PCCW Ltd. | | 10,000 | | 6,054 |
|
Portugal Telecom SGPS SA | | 1,418 | | 16,099 |
|
Prysmian SpA | | 272 | | 6,892 |
|
Royal KPN NV | | 3,915 | | 67,198 |
|
Singapore Telecommunications | | | | |
Ltd. | | 17,300 | | 46,020 |
Swisscom AG | | 50 | | 16,697 |
|
Tele2 AB | | 637 | | 12,477 |
|
Telecom Corp. of New Zealand | | | | |
Ltd. | | 3,743 | | 10,167 |
Telecom Italia SpA | | 21,342 | | 43,017 |
|
Telecom Italia SpA | | | | |
(RNC–Participating Cumulative) | | 12,482 | | 20,245 |
Telefonica SA | | 9,148 | | 243,162 |
|
Telekom Austria AG | | 735 | | 15,949 |
|
Telenor ASA | | 1,700 | | 31,985 |
|
TeliaSonera AB | | 4,670 | | 34,573 |
|
Telstra Corp. Ltd. | | 12,218 | | 49,543 |
| |
Total | | | | 1,013,673 |
| |
|
| Electric Utilities–3.7% |
British Energy Group PLC | | 2,266 | | 32,140 |
|
Cheung Kong Infrastructure | | | | |
Holdings Ltd. | | 1,000 | | 4,232 |
Chubu Electric Power Co., Inc. | | 1,400 | | 34,146 |
|
Chugoku Electric Power Co., | | | | |
Inc. | | 600 | | 12,798 |
CLP Holdings Ltd. | | 4,500 | | 38,553 |
| | | | |
| International Stock Market Portfolio | | AARP PORTFOLIOS 2008 ANNUAL REPORT | | 61 |
| | | | | |
| Portfolio of investments |
| | |
| | | Shares | | Value |
| | | | | |
| | |
Common Stocks (continued) | | | | | |
| Electric Utilities (continued) |
Contact Energy Ltd. | | 489 | | $ | 2,973 |
|
E.ON AG | | 1,349 | | | 272,225 |
|
Electric Power Development | | | | | |
Co. | | 300 | | | 11,131 |
Electricite de France | | 426 | | | 40,477 |
|
Enel SpA | | 9,298 | | | 88,435 |
|
Energias de Portugal SA | | 3,838 | | | 20,035 |
|
Hokkaido Electric Power Co., | | | | | |
Inc. | | 400 | | | 8,136 |
Hokuriku Electric Power Co. | | 400 | | | 9,511 |
|
HongKong Electric Holdings | | 3,000 | | | 17,949 |
|
1Iberdrola Renovables | | 1,809 | | | 14,015 |
|
Iberdrola SA | | 7,432 | | | 99,594 |
|
International Power PLC | | 3,112 | | | 26,763 |
|
Kansai Electric Power Co., Inc. | | 1,600 | | | 37,442 |
|
Kyushu Electric Power Co., Inc. | | 800 | | | 16,725 |
|
Public Power Corp. | | 210 | | | 7,275 |
|
Red Electrica de Espana | | 218 | | | 14,195 |
|
Scottish & Southern Energy | | | | | |
PLC | | 1,823 | | | 50,916 |
Shikoku Electric Power Co., | | | | | |
Inc. | | 400 | | | 10,999 |
Solarworld AG | | 167 | | | 7,960 |
|
Terna SpA | | 2,692 | | | 11,403 |
|
Tohoku Electric Power Co., Inc. | | 900 | | | 19,578 |
|
Tokyo Electric Power Co., Inc. | | 2,600 | | | 66,843 |
|
Union Fenosa SA | | 260 | | | 15,157 |
|
Verbund–Oesterreichische | | | | | |
Elektrizitatswirtschafts–AG | | 156 | | | 13,983 |
| |
Total | | | | | 1,005,589 |
| |
|
| Electrical Equipment–2.2% |
1ABB Ltd. | | 4,668 | | | 132,940 |
|
Fanuc Ltd. | | 400 | | | 39,062 |
|
Fuji Electric Holdings Co. Ltd. | | 1,000 | | | 3,532 |
|
Furukawa Electric Co. Ltd. | | 1,000 | | | 4,341 |
|
Matsushita Electric Works Ltd. | | 1,000 | | | 10,199 |
| | | | |
| | | | |
Mitsubishi Electric Corp. | | 4,000 | | 43,130 |
|
Nitto Denko Corp. | | 300 | | 11,527 |
|
Schneider Electric SA | | 480 | | 51,859 |
|
Siemens AG | | 1,847 | | 205,105 |
|
Sumitomo Electric Industries Ltd. | | 1,500 | | 19,041 |
|
Ushio, Inc. | | 200 | | 3,268 |
|
1Vestas Wind Systems A/S | | 470 | | 61,529 |
| |
Total | | | | 585,533 |
| |
|
| Electronic Equipment & Instruments–1.0% |
Alps Electric Co. Ltd. | | 300 | | 3,099 |
|
Citizen Watch Co. Ltd. | | 700 | | 5,333 |
|
Hirose Electric Co. Ltd. | | 100 | | 10,039 |
|
Hitachi Chemical Co. Ltd. | | 200 | | 4,134 |
|
Hitachi Ltd. | | 7,000 | | 50,494 |
|
Hoya Corp. | | 900 | | 20,807 |
|
Ibiden Co. Ltd. | | 300 | | 10,905 |
|
Keyence Corp. | | 100 | | 23,816 |
|
Kingboard Chemical Holdings | | | | |
Ltd. | | 2,000 | | 9,234 |
Kyocera Corp. | | 300 | | 28,251 |
|
Mabuchi Motor Co. Ltd. | | 100 | | 5,424 |
|
Nidec Corp. | | 200 | | 13,316 |
|
Nippon Electric Glass Co. Ltd. | | 1,000 | | 17,299 |
|
Omron Corp. | | 400 | | 8,588 |
|
Rohm Co. Ltd. | | 200 | | 11,508 |
|
Shimadzu Corp. | | 1,000 | | 9,954 |
|
TDK Corp. | | 300 | | 17,968 |
|
Venture Corp. Ltd. | | 1,000 | | 7,209 |
|
Yaskawa Electric Corp. | | 1,000 | | 9,803 |
|
Yokogawa Electric Corp. | | 500 | | 4,572 |
| |
Total | | | | 271,753 |
| |
|
| Energy Equipment & Services–0.5% |
Acergy SA | | 380 | | 8,508 |
|
1Cie Generale de Geophysique- | | | | |
Veritas | | 260 | | 12,303 |
Fugro NV | | 130 | | 11,106 |
|
1Renewable Energy Corp. AS | | 307 | | 7,959 |
|
Saipem SpA | | 563 | | 26,446 |
|
SBM Offshore NV | | 310 | | 11,442 |
|
| | | | |
| 62 | | AARP PORTFOLIOS 2008 ANNUAL REPORT | | International Stock Market Portfolio |
International Stock Market Portfolio (continued)
June 30, 2008
| | | | | |
| Portfolio of investments |
| | |
| | | Shares | | Value |
| | | | | |
| | |
Common Stocks (continued) | | | | | |
| Energy Equipment & Services (continued) |
SeaDrill Ltd. | | 576 | | $ | 17,619 |
|
Technip SA | | 225 | | | 20,830 |
|
WorleyParsons Ltd. | | 340 | | | 12,310 |
| |
Total | | | | | 128,523 |
| |
|
| Food & Drug Retailing–1.7% |
Cadbury PLC | | 2,905 | | | 36,577 |
|
Carrefour SA | | 1,349 | | | 76,389 |
|
Casino Guichard Perrachon SA | | 98 | | | 11,111 |
|
Colruyt SA | | 40 | | | 10,571 |
|
Delhaize Group | | 209 | | | 14,070 |
|
FamilyMart Co. Ltd. | | 100 | | | 4,087 |
|
J Sainsbury PLC | | 2,224 | | | 14,090 |
|
1Kesko OYJ | | 160 | | | 5,183 |
|
1Koninklijke Ahold NV | | 2,535 | | | 34,090 |
|
Lawson, Inc. | | 100 | | | 4,869 |
|
Seven & I Holdings Co. Ltd. | | 1,700 | | | 48,507 |
|
Tesco PLC | | 16,788 | | | 123,419 |
|
WM Morrison Supermarkets | | | | | |
PLC | | 5,176 | | | 27,434 |
Woolworths Ltd. | | 2,641 | | | 61,754 |
| |
Total | | | | | 472,151 |
| |
|
| Food Products–2.4% |
Ajinomoto Co., Inc. | | 1,000 | | | 9,455 |
|
Associated British Foods PLC | | 758 | | | 11,445 |
|
Coca Cola Hellenic Bottling | | | | | |
Co. SA | | 350 | | | 9,535 |
Danisco A | | 90 | | | 5,787 |
|
1Genting International PLC | | 6,000 | | | 2,557 |
|
Golden Agri-Resources Ltd. | | 11,000 | | | 7,275 |
|
Goodman Fielder Ltd. | | 2,138 | | | 2,873 |
|
Groupe DANONE | | 946 | | | 66,439 |
|
Kerry Group PLC | | 260 | | | 7,697 |
|
Lindt & Spruengli AG | | 2 | | | 5,529 |
|
Meiji Dairies Corp. | | 1,000 | | | 5,132 |
|
Nestle SA | | 8,370 | | | 377,405 |
|
| | | | |
| | | | |
Nisshin Seifun Group, Inc. | | 500 | | 6,281 |
|
Nissin Food Products Co. Ltd. | | 200 | | 6,705 |
|
Parmalat SpA | | 3,496 | | 9,139 |
|
Tate & Lyle PLC | | 1,060 | | 8,388 |
|
Unilever NV | | 3,543 | | 100,592 |
|
Wilmar International Ltd. | | 2,000 | | 7,436 |
|
Yakult Honsha Co. Ltd. | | 200 | | 5,631 |
| |
Total | | | | 655,301 |
| |
|
| Gas Utilities–0.6% |
AGL Energy Ltd. | | 958 | | 13,101 |
|
Centrica PLC | | 7,941 | | 49,045 |
|
Enagas | | 373 | | 10,572 |
|
Gas Natural SDG SA | | 220 | | 12,832 |
|
Hong Kong & China Gas Co. | | 8,360 | | 19,878 |
|
Osaka Gas Co. Ltd. | | 4,000 | | 14,653 |
|
Snam Rete Gas SpA | | 1,750 | | 11,967 |
|
Toho Gas Co. Ltd. | | 1,000 | | 5,481 |
|
Tokyo Gas Co. Ltd. | | 5,000 | | 20,153 |
| |
Total | | | | 157,682 |
| |
|
| Health Care Equipment & Supplies–0.9% |
Air Liquide SA | | 531 | | 70,129 |
|
Alfresa Holdings Corp. | | 100 | | 7,138 |
|
Cie Generale d’Optique Essilor | | | | |
International SA | | 431 | | 26,361 |
Cochlear Ltd. | | 130 | | 5,427 |
|
Coloplast A/S | | 60 | | 5,232 |
|
Getinge AB | | 390 | | 9,549 |
|
Luxottica Group SpA | | 258 | | 6,053 |
|
Nobel Biocare Holding AG | | 235 | | 7,683 |
|
Olympus Corp. | | 1,000 | | 33,807 |
|
Phonak Holding AG | | 100 | | 8,301 |
|
Smith & Nephew PLC | | 1,851 | | 20,414 |
|
Straumann Holding AG | | 20 | | 4,798 |
|
Synthes, Inc. | | 128 | | 17,662 |
|
Terumo Corp. | | 400 | | 20,416 |
| |
Total | | | | 242,970 |
| |
| | | | |
| International Stock Market Portfolio | | AARP PORTFOLIOS 2008 ANNUAL REPORT | | 63 |
| | | | | |
| Portfolio of investments |
| | |
| | | Shares | | Value |
| | | | | |
| | |
Common Stocks (continued) | | | | | |
| Health Care Providers & Services–0.2% |
Celesio AG | | 190 | | $ | 6,875 |
|
Fresenius Medical Care AG & | | | | | |
Co. KGaA | | 396 | | | 21,832 |
Fresenius SE | | 58 | | | 5,021 |
|
Mediceo Paltac Holdings Co. | | | | | |
Ltd. | | 300 | | | 5,520 |
Parkway Holdings Ltd. | | 2,467 | | | 4,206 |
|
Sonic Healthcare Ltd. | | 671 | | | 9,337 |
|
Suzuken Co. Ltd. | | 100 | | | 3,692 |
| |
Total | | | | | 56,483 |
| |
|
| Hotels Restaurants & Leisure–0.8% |
Accor SA | | 414 | | | 27,661 |
|
Aristocrat Leisure Ltd. | | 730 | | | 4,482 |
|
Autogrill SpA | | 172 | | | 2,065 |
|
Carnival PLC | | 333 | | | 10,640 |
|
City Developments Ltd. | | 1,000 | | | 7,980 |
|
Compass Group PLC | | 4,139 | | | 31,269 |
|
Crown Ltd. | | 943 | | | 8,378 |
|
Enterprise Inns PLC | | 1,100 | | | 8,890 |
|
Intercontinental Hotels Group | | | | | |
PLC | | 658 | | | 8,816 |
Ladbrokes PLC | | 1,221 | | | 6,241 |
|
Lottomatica SpA | | 146 | | | 4,366 |
|
OPAP SA | | 490 | | | 17,114 |
|
Oriental Land Co. Ltd. | | 100 | | | 5,970 |
|
Punch Taverns PLC | | 502 | | | 3,128 |
|
Shangri-La Asia Ltd. | | 2,000 | | | 4,668 |
|
Sky City Entertainment Group | | | | | |
Ltd. | | 761 | | | 1,772 |
Sodexho Alliance SA | | 418 | | | 27,461 |
|
TABCORP Holdings Ltd. | | 1,191 | | | 11,174 |
|
Thomas Cook Group PLC | | 1,002 | | | 4,668 |
|
TUI AG | | 428 | | | 9,921 |
|
TUI Travel PLC | | 1,275 | | | 5,203 |
|
UOL Group Ltd. | | 1,000 | | | 2,498 |
|
| | | | |
| | | | |
Whitbread PLC | | 394 | | 9,663 |
|
William Hill PLC | | 740 | | 4,718 |
| |
Total | | | | 228,746 |
| |
|
| Household Durables–1.4% |
Casio Computer Co. Ltd. | | 400 | | 4,554 |
|
Daito Trust Construction Co. | | | | |
Ltd. | | 200 | | 9,700 |
Daiwa House Industry Co. Ltd. | | 1,000 | | 9,398 |
|
Electrolux AB | | 532 | | 6,800 |
|
Haseko Corp. | | 2,500 | | 3,343 |
|
Koninklijke Philips Electronics NV | | 2,309 | | 78,574 |
|
Makita Corp. | | 300 | | 12,261 |
|
Matsushita Electric Industrial Co. | | | | |
Ltd. | | 4,000 | | 86,260 |
Persimmon PLC | | 606 | | 3,812 |
|
Pioneer Corp. | | 300 | | 2,415 |
|
1Sanyo Electric Co. Ltd. | | 4,000 | | 9,304 |
|
Sekisui Chemical Co. Ltd. | | 1,000 | | 6,809 |
|
Sekisui House Ltd. | | 1,000 | | 9,332 |
|
Sharp Corp. | | 2,000 | | 32,564 |
|
Sony Corp. | | 2,100 | | 91,760 |
|
Taylor Woodrow PLC | | 2,218 | | 2,738 |
| |
Total | | | | 369,624 |
| |
|
| Household Products–0.2% |
Henkel KGaA | | 276 | | 10,361 |
|
Kao Corp. | | 1,000 | | 26,227 |
|
Uni-Charm Corp. | | 100 | | 7,110 |
| |
Total | | | | 43,698 |
| |
|
| Industrial Conglomerates–0.8% |
Aeon Mall Co. Ltd. | | 100 | | 2,957 |
|
Brambles Ltd. | | 3,066 | | 25,598 |
|
Burberry Group PLC | | 870 | | 7,845 |
|
Hopewell Holdings Ltd. | | 1,000 | | 3,553 |
|
Hutchison Whampoa Ltd. | | 5,000 | | 50,403 |
|
IVG Immobilien AG | | 169 | | 3,332 |
|
Noble Group Ltd. | | 3,400 | | 5,921 |
|
NWS Holdings Ltd. | | 2,022 | | 5,277 |
|
Orkla ASA | | 1,719 | | 22,080 |
|
Pirelli & C SpA | | 5,630 | | 3,879 |
|
| | | | |
| 64 | | AARP PORTFOLIOS 2008 ANNUAL REPORT | | International Stock Market Portfolio |
International Stock Market Portfolio (continued)
June 30, 2008
| | | | | |
| Portfolio of investments |
| | |
| | | Shares | | Value |
| | | | | |
| | |
Common Stocks (continued) | | | | | |
| Industrial Conglomerates (continued) |
Rheinmetall AG | | 72 | | $ | 5,205 |
|
Sonae SGPS SA | | 1,493 | | | 1,798 |
|
Tomkins PLC | | 1,695 | | | 5,095 |
|
Wendel SA | | 59 | | | 6,002 |
|
Wesfarmers Ltd. | | 322 | | | 11,588 |
|
Wesfarmers Ltd.-PPS | | 1,345 | | | 47,979 |
| |
Total | | | | | 208,512 |
| |
|
| Insurance–4.2% |
Aegon NV | | 2,850 | | | 37,757 |
|
Aioi Insurance Co. Ltd. | | 1,000 | | | 5,330 |
|
| | | | | |
Alleanza Assicurazioni SpA | | 825 | | | 8,957 |
|
Allianz AG | | 957 | | | 168,632 |
|
AMP Ltd. | | 3,999 | | | 25,586 |
|
Assicurazioni Generali SpA | | 2,254 | | | 86,498 |
|
Aviva PLC | | 5,633 | | | 56,180 |
|
AXA Asia Pacific Holdings Ltd. | | 1,889 | | | 8,455 |
|
AXA SA | | 3,287 | | | 97,620 |
|
Baloise Holding AG | | 109 | | | 11,494 |
|
CNP Assurances | | 77 | | | 8,701 |
|
Fondiaria-SAI SpA | | 141 | | | 4,672 |
|
Friends Provident PLC | | 4,940 | | | 10,050 |
|
Hannover Rueckversicherung | | | | | |
AG | | 128 | | | 6,319 |
Insurance Australia Group Ltd. | | 4,248 | | | 14,097 |
|
Irish Life & Permanent PLC | | 625 | | | 6,531 |
|
Legal & General Group PLC | | 13,524 | | | 26,976 |
|
Mapfre SA | | 1,300 | | | 6,223 |
|
Millea Holdings, Inc. | | 1,500 | | | 58,480 |
|
Mitsui Sumitomo Insurance | | | | | |
Group Holdings, Inc. | | 800 | | | 27,573 |
Muenchener | | | | | |
Rueckversicherungs AG | | 443 | | | 77,614 |
Nipponkoa Insurance Co. Ltd. | | 1,000 | | | 8,673 |
|
Old Mutual PLC | | 10,816 | | | 19,981 |
|
Prudential PLC | | 5,337 | | | 56,628 |
|
| | | | |
| | | | |
QBE Insurance Group Ltd. | | 1,923 | | 41,195 |
|
Sampo OYJ | | 923 | | 23,328 |
|
SCOR SE | | 355 | | 8,139 |
|
Sompo Japan Insurance, Inc. | | 2,000 | | 18,796 |
|
Standard Life PLC | | 4,934 | | 20,602 |
|
Storebrand ASA | | 909 | | 6,748 |
|
Swiss Life Holding | | 76 | | 20,333 |
|
Swiss Reinsurance | | 764 | | 50,951 |
|
T&D Holdings, Inc. | | 400 | | 24,597 |
|
1Topdanmark A/S | | 50 | | 7,549 |
|
TrygVesta A/S | | 53 | | 3,749 |
|
Unipol Gruppo Finanziario SpA | | 1,422 | | 3,357 |
|
Wiener Staedtische | | | | |
Versicherung AG | | 82 | | 5,416 |
Zurich Financial Services AG | | 313 | | 80,213 |
| |
Total | | | | 1,154,000 |
| |
| | |
| Internet & Catalog Retail–0.1% | | | | |
Dena Co. Ltd. | | 1 | | 5,895 |
|
Rakuten, Inc. | | 15 | | 7,571 |
| |
Total | | | | 13,466 |
| |
| |
| Internet Software & Services–0.2% | | |
SBI Holdings, Inc. | | 21 | | 4,596 |
|
Softbank Corp. | | 1,600 | | 26,970 |
|
United Internet AG | | 267 | | 5,264 |
|
Yahoo! Japan Corp. | | 30 | | 11,555 |
| |
Total | | | | 48,385 |
| |
| | |
| It Consulting & Services–0.3% | | | | |
Atos Origin SA | | 138 | | 7,643 |
|
Cap Gemini SA | | 307 | | 18,100 |
|
Computershare Ltd. | | 1,089 | | 9,592 |
|
CSK Holdings Corp. | | 100 | | 1,968 |
|
Indra Sistemas SA | | 228 | | 5,931 |
|
Itochu Techno-Solutions Corp. | | 100 | | 3,249 |
|
LogicaCMG PLC | | 2,993 | | 6,435 |
|
Nomura Research Institute Ltd. | | 200 | | 4,690 |
|
NTT Data Corp. | | 3 | | 11,724 |
|
Obic Co. Ltd. | | 20 | | 3,358 |
| |
Total | | | | 72,690 |
| |
| | | | |
| International Stock Market Portfolio | | AARP PORTFOLIOS 2008 ANNUAL REPORT | | 65 |
| | | | | |
| Portfolio of investments |
| | |
| | | Shares | | Value |
| | | | | |
| | |
Common Stocks (continued) | | | | | |
| Leisure Equipment & Products–0.3% |
Fuji Photo Film Co. Ltd. | | 1,000 | | $ | 34,372 |
|
Konica Minolta Holdings, Inc. | | 1,000 | | | 16,885 |
|
Namco Bandai Holdings, Inc. | | 400 | | | 4,528 |
|
Sankyo Co. Ltd. | | 100 | | | 6,517 |
|
Shimano, Inc. | | 100 | | | 5,019 |
|
Tattersall’s Ltd. | | 2,237 | | | 5,027 |
|
Yamaha Corp. | | 300 | | | 5,792 |
| |
Total | | | | | 78,140 |
| |
| | |
| Machinery–1.8% | | | | | |
Alfa Laval AB | | 800 | | | 12,449 |
|
Amada Co. Ltd. | | 1,000 | | | 7,882 |
|
Andritz AG | | 73 | | | 4,604 |
|
Atlas Copco AB, Series A | | 1,465 | | | 21,582 |
|
Atlas Copco AB, Series B | | 816 | | | 10,870 |
|
Daikin Industries Ltd. | | 600 | | | 30,285 |
|
Hino Motors Ltd. | | 1,000 | | | 6,196 |
|
Hitachi Construction Machinery | | | | | |
Co. Ltd. | | 200 | | | 5,603 |
IMI PLC | | 700 | | | 6,083 |
|
Ishikawajima-Harima Heavy | | | | | |
Industries Co. Ltd. | | 3,000 | | | 6,074 |
Japan Steel Works Ltd. | | 1,000 | | | 19,446 |
|
JTEKT Corp. | | 400 | | | 6,343 |
|
Kawasaki Heavy Industries Ltd. | | 3,000 | | | 7,995 |
|
Komatsu Ltd. | | 1,900 | | | 52,962 |
|
Kubota Corp. | | 2,000 | | | 14,371 |
|
Linde AG | | 283 | | | 39,796 |
|
MAN AG | | 225 | | | 24,982 |
|
Metso OYJ | | 290 | | | 13,230 |
|
Minebea Co. Ltd. | | 1,000 | | | 5,716 |
|
Mitsubishi Heavy Industries Ltd. | | 7,000 | | | 33,355 |
|
Mitsui Engineering & | | | | | |
Shipbuilding Co. Ltd. | | 1,000 | | | 3,164 |
NGK Insulators Ltd. | | 1,000 | | | 19,446 |
|
| | | | |
| | | | |
NSK Ltd. | | 1,000 | | 8,749 |
|
NTN Corp. | | 1,000 | | 6,658 |
|
Sandvik AB | | 2,144 | | 29,360 |
|
Scania AB | | 800 | | 10,955 |
|
SembCorp Marine Ltd. | | 1,400 | | 4,156 |
|
SMC Corp. | | 100 | | 10,952 |
|
Sulzer AG | | 56 | | 7,118 |
|
Sumitomo Heavy Industries Ltd. | | 1,000 | | 6,771 |
|
THK Co. Ltd. | | 200 | | 3,880 |
|
Volvo AB, Series A | | 2,300 | | 28,251 |
|
Volvo AB, Series B | | 14 | | 166 |
|
Wartsila OYJ | | 200 | | 12,582 |
|
Zardoya Otis SA | | 214 | | 4,441 |
| |
Total | | | | 486,473 |
| |
|
| Marine–0.4% |
A.P. Moller–Maersk A | | 1 | | 12,268 |
|
A.P. Moller-Maersk Group A/S | | 2 | | 24,493 |
|
Cosco Corp. Singapore Ltd. | | 2,000 | | 4,703 |
|
Kamigumi Co. Ltd. | | 1,000 | | 7,562 |
|
Kawasaki Kisen Kaisha Ltd. | | 1,000 | | 9,389 |
|
Mitsui OSK Lines Ltd. | | 2,000 | | 28,496 |
|
Neptune Orient Lines Ltd. | | 1,000 | | 2,374 |
|
Nippon Yusen Kabushiki Kaisha | | 2,000 | | 19,230 |
|
Orient Overseas International | | | | |
Ltd. | | 1,000 | | 5,002 |
Pacific Basin Shipping Ltd. | | 3,000 | | 4,286 |
|
1Prosafe Production Public Ltd. | | 350 | | 2,028 |
|
Shun Tak Holdings Ltd. | | 2,000 | | 1,872 |
| |
Total | | | | 121,703 |
| |
|
| Media–1.3% |
British Sky Broadcasting PLC | | 2,425 | | 22,786 |
|
Daily Mail & General Trust PLC | | 671 | | 4,191 |
|
Dentsu, Inc. | | 4 | | 8,475 |
|
1Eutelsat Communications | | 186 | | 5,181 |
|
Fuji Television Network, Inc. | | 1 | | 1,507 |
|
Gestevision Telecinco SA | | 184 | | 2,353 |
|
ITV PLC | | 7,996 | | 7,115 |
|
JC Decaux SA | | 134 | | 3,416 |
|
John Fairfax Holdings Ltd. | | 2,824 | | 7,913 |
|
| | | | |
| 66 | | AARP PORTFOLIOS 2008 ANNUAL REPORT | | International Stock Market Portfolio |
International Stock Market Portfolio (continued)
June 30, 2008
| | | | | |
| Portfolio of investments |
| | |
| | | Shares | | Value |
| | | | | |
| | |
Common Stocks (continued) | | | | | |
| Media (continued) |
Lagardere SCA | | 267 | | $ | 15,207 |
|
M6-Metropole Television | | 111 | | | 2,409 |
|
Mediaset SpA | | 1,687 | | | 11,124 |
|
Modern Times Group AB | | 100 | | | 5,884 |
|
Pearson PLC | | 1,785 | | | 21,836 |
|
Promotora de Informaciones SA | | 138 | | | 1,478 |
|
Publicis Groupe | | 273 | | | 8,847 |
|
Reed Elsevier NV | | 1,356 | | | 22,869 |
|
Reed Elsevier PLC | | 2,413 | | | 27,668 |
|
Sanoma-WSOY OYJ | | 130 | | | 2,880 |
|
SES-FDR | | 643 | | | 16,302 |
|
Singapore Press Holdings Ltd. | | 3,000 | | | 9,369 |
|
Television Broadcasts Ltd. | | 1,000 | | | 5,771 |
|
Television Francaise 1 (TFI) | | 200 | | | 3,348 |
|
Thomson Reuters PLC | | 426 | | | 11,398 |
|
Toho Co. Ltd. | | 300 | | | 6,131 |
|
Tokyo Broadcasting System, | | | | | |
Inc. | | 100 | | | 1,898 |
United Business Media PLC | | 465 | | | 5,050 |
|
Vivendi SA | | 2,486 | | | 94,344 |
|
Wolters Kluwer NV | | 639 | | | 14,932 |
| |
Total | | | | | 351,682 |
| |
|
| Metals & Mining–7.2% |
Acerinox SA | | 291 | | | 6,704 |
|
Alumina Ltd. | | 2,284 | | | 10,354 |
|
Anglo American PLC | | 2,815 | | | 197,591 |
|
Antofagasta PLC | | 839 | | | 10,990 |
|
ArcelorMittal NPV | | 1,849 | | | 182,850 |
|
BHP Billiton Ltd. | | 7,148 | | | 298,733 |
|
BHP Billiton PLC | | 4,697 | | | 179,526 |
|
BlueScope Steel Ltd. | | 1,630 | | | 17,677 |
|
Boliden AB | | 500 | | | 4,075 |
|
Daido Steel Co. Ltd. | | 1,000 | | | 5,584 |
|
Dowa Mining Co. Ltd. | | 1,000 | | | 7,279 |
|
| | | | |
| | | | |
Eramet | | 11 | | 10,930 |
|
1Eurasian Natural Resources | | | | |
Corp. | | 712 | | 18,894 |
1Fortescue Metals Group Ltd. | | 2,681 | | 30,511 |
|
Husqvarna AB. Series B NPV | | 840 | | 13,176 |
|
JFE Holdings, Inc. | | 1,100 | | 55,420 |
|
Johnson Matthey PLC | | 458 | | 16,831 |
|
Kazakhmys PLC | | 435 | | 13,786 |
|
Kobe Steel Ltd. | | 6,000 | | 17,177 |
|
Kone OYJ | | 342 | | 12,031 |
|
Lonmin PLC | | 332 | | 21,090 |
|
Maruichi Steel Tube Ltd. | | 100 | | 3,126 |
|
Mitsubishi Materials Corp. | | 2,000 | | 8,551 |
|
Mitsui Mining & Smelting Co. | | | | |
Ltd. | | 1,000 | | 2,948 |
Newcrest Mining Ltd. | | 987 | | 27,657 |
|
Nippon Steel Corp. | | 11,000 | | 59,563 |
|
Nisshin Steel Co. Ltd. | | 2,000 | | 6,799 |
|
OneSteel Ltd. | | 1,771 | | 12,601 |
|
Outokumpu OYJ | | 200 | | 7,007 |
|
1Oxiana Ltd. | | 3,081 | | 7,690 |
|
Oxiana Ltd. | | 2,824 | | 7,103 |
|
Rautaruukki OYJ | | 180 | | 8,237 |
|
Rio Tinto Ltd. | | 616 | | 79,825 |
|
Rio Tinto PLC | | 2,124 | | 254,075 |
|
Salzgitter AG | | 91 | | 16,680 |
|
Sims Group Ltd. | | 345 | | 13,755 |
|
SSAB Svenskt Stal AB, Class A | | 312 | | 10,099 |
|
SSAB Svenskt Stal AB, Class B | | 250 | | 7,138 |
|
Sumitomo Metal Industries Ltd. | | 8,000 | | 35,182 |
|
Sumitomo Metal Mining Co. Ltd. | | 1,000 | | 15,331 |
|
The Umicore Group | | 250 | | 12,361 |
|
ThyssenKrupp AG | | 776 | | 48,732 |
|
Toho Titanium Co. Ltd. | | 100 | | 1,963 |
|
Tokyo Steel Manufacturing Co. | | | | |
Ltd. | | 200 | | 2,311 |
Vallourec Group | | 113 | | 39,665 |
|
Vedanta Resources PLC | | 306 | | 13,322 |
|
Voestalpine AG | | 233 | | 19,134 |
|
Xstrata PLC | | 1,357 | | 108,703 |
|
| | | | |
| International Stock Market Portfolio | | AARP PORTFOLIOS 2008 ANNUAL REPORT | | 67 |
| | | | | |
| Portfolio of investments |
| | |
| | | Shares | | Value |
| | | | | |
| | |
Common Stocks (continued) | | | | | |
| Metals & Mining (continued) |
Yamato Kogyo Co. Ltd. | | 100 | | $ | 4,765 |
| |
Total | | | | | 1,965,532 |
| |
|
| Multi-line Retail–0.5% |
Aeon Co. Ltd. | | 1,300 | | | 16,050 |
|
Compagnie Nationale a | | | | | |
Portefeuille | | 84 | | | 6,309 |
Harvey Norman Holdings Ltd. | | 1,080 | | | 3,192 |
|
Home Retail Group | | 1,862 | | | 8,081 |
|
1Isetan Mitsukoshi Holdings Ltd. | | 740 | | | 7,923 |
|
J Front Retailing Co. Ltd. | | 1,000 | | | 5,283 |
|
1KarstadtQuelle AG | | 197 | | | 2,289 |
|
Lifestyle International Holdings | | | | | |
Ltd. | | 1,500 | | | 2,108 |
Marks & Spencer Group PLC | | 3,608 | | | 23,594 |
|
Marui Co. Ltd. | | 500 | | | 3,894 |
|
Metro AG | | 241 | | | 15,385 |
|
Next PLC | | 442 | | | 8,531 |
|
PPR SA | | 169 | | | 18,815 |
|
Takashimaya Co. Ltd. | | 1,000 | | | 9,069 |
| |
Total | | | | | 130,523 |
| |
| | |
| Multi-Utilities–1.3% | | | | | |
AEM SpA | | 2,665 | | | 9,768 |
|
RWE AG | | 950 | | | 120,021 |
|
Suez SA | | 2,225 | | | 151,500 |
|
United Utilities PLC | | 1,919 | | | 26,226 |
|
Veolia Environnement | | 801 | | | 44,941 |
| |
Total | | | | | 352,456 |
| |
| | |
| Office Electronics–0.6% | | | | | |
Brother Industries Ltd. | | 500 | | | 6,870 |
|
Canon Marketing Japan, Inc. | | 200 | | | 3,518 |
|
Canon, Inc. | | 2,300 | | | 118,260 |
|
Neopost SA | | 60 | | | 6,350 |
|
Ricoh Co. Ltd. | | 1,000 | | | 18,043 |
| |
Total | | | | | 153,041 |
| |
| | | | |
| | | | |
| Oil & Gas–9.1% |
Aeroports de Paris | | 65 | | 6,084 |
|
BG Group PLC | | 7,111 | | 185,017 |
|
BP PLC | | 40,209 | | 466,857 |
|
1Cairn Energy PLC | | 278 | | 17,903 |
|
Caltex Australia Ltd. | | 300 | | 3,747 |
|
Cosmo Oil Co. Ltd. | | 1,000 | | 3,616 |
|
ENI SpA | | 5,537 | | 206,643 |
|
Fortum OYJ | | 940 | | 47,752 |
|
Gaz de France SA | | 410 | | 26,354 |
|
Hellenic Petroleum SA | | 230 | | 3,158 |
|
Idemitsu Kosan Co. Ltd. | | 100 | | 8,871 |
|
Inpex Holdings, Inc. | | 2 | | 25,238 |
|
Japan Petroleum Exploration | | | | |
Co. | | 100 | | 7,138 |
1Lundin Petroleum AB | | 530 | | 7,830 |
|
1Mongolia Energy Co. Ltd. | | 7,000 | | 13,556 |
|
National Grid PLC | | 5,368 | | 70,582 |
|
Neste Oil OYJ | | 277 | | 8,166 |
|
Nippon Mining Holdings, Inc. | | 2,000 | | 12,525 |
|
Nippon Oil Corp. | | 3,000 | | 20,143 |
|
Norsk Hydro ASA | | 1,564 | | 22,853 |
|
OMV AG | | 360 | | 28,265 |
|
Origin Energy Ltd. | | 1,849 | | 28,505 |
|
1Paladin Resources Ltd. | | 1,110 | | 6,805 |
|
1Petroleum Geo-Services | | | | |
ASA | | 340 | | 8,347 |
1ProSafe ASA | | 350 | | 3,471 |
|
Repsol YPF SA | | 1,558 | | 61,408 |
|
Royal Dutch Shell PLC | | 7,583 | | 311,420 |
|
Royal Dutch Shell PLC, B | | | | |
shares | | 5,875 | | 236,246 |
Santos Ltd. | | 1,299 | | 26,647 |
|
Showa Shell Sekiyu K.K. | | 400 | | 4,381 |
|
Statoil ASA | | 2,718 | | 101,370 |
|
TonenGeneral Sekiyu K.K. | | 1,000 | | 9,078 |
|
Total SA | | 4,592 | | 391,921 |
|
Tullow Oil PLC | | 1,583 | | 30,095 |
|
Woodside Petroleum Ltd. | | 1,026 | | 66,232 |
| |
Total | | | | 2,478,224 |
| |
| | | | |
| 68 | | AARP PORTFOLIOS 2008 ANNUAL REPORT | | International Stock Market Portfolio |
International Stock Market Portfolio (continued)
June 30, 2008
| | | | | |
| Portfolio of investments |
| | |
| | | Shares | | Value |
| | | | | |
| | |
Common Stocks (continued) | | | | | |
| Paper & Forest Products–0.3% |
Holmen AB | | 130 | | $ | 3,819 |
|
Lee & Man Paper | | | | | |
Manufacturing Ltd. | | 2,000 | | | 2,975 |
Mondi PLC | | 700 | | | 4,132 |
|
Nippon Paper Group, Inc. | | 2 | | | 5,462 |
|
OJI Paper Co. Ltd. | | 2,000 | | | 9,398 |
|
Stora Enso OYJ | | 1,180 | | | 11,075 |
|
Svenska Cellulosa AB | | 1,180 | | | 16,698 |
|
UPM-Kymmene OYJ | | 1,153 | | | 18,882 |
| |
Total | | | | | 72,441 |
| |
| | |
| Personal Products–0.6% | | | | | |
Beiersdorf AG | | 187 | | | 13,772 |
|
L’Oreal SA | | 518 | | | 56,364 |
|
Shiseido Co. Ltd. | | 1,000 | | | 22,884 |
|
Unilever PLC | | 2,820 | | | 80,221 |
| |
Total | | | | | 173,241 |
| |
| | |
| Pharmaceuticals–5.7% | | | | | |
1Actelion Ltd. | | 193 | | | 10,346 |
|
Astellas Pharma, Inc. | | 1,000 | | | 42,377 |
|
AstraZeneca PLC | | 3,100 | | | 132,186 |
|
Chugai Pharmaceutical Co. | | | | | |
Ltd. | | 541 | | | 8,656 |
CSL Ltd. | | 1,156 | | | 39,468 |
|
Daiichi Sankyo Co. Ltd. | | 1,500 | | | 41,317 |
|
Eisai Co. Ltd. | | 500 | | | 17,657 |
|
1Elan Corp. PLC | | 995 | | | 35,075 |
|
GlaxoSmithKline PLC | | 11,648 | | | 258,079 |
|
Hisamitsu Pharmaceutical | | | | | |
Co., Inc. | | 100 | | | 4,351 |
Kyowa Hakko Kogyo Co. Ltd. | | 591 | | | 6,055 |
|
Merck KGaA | | 142 | | | 20,189 |
|
Mitsubishi Tanabe Pharma | | | | | |
Corp. | | 1,000 | | | 13,071 |
Novartis AG | | 4,940 | | | 272,320 |
|
Novo-Nordisk A/S | | 970 | | | 63,493 |
|
Ono Pharmaceutical Co. Ltd. | | 200 | | | 11,018 |
| | | | |
| | | | |
Orion OYJ | | 168 | | 3,349 |
|
Roche Holding AG | | 1,496 | | 269,761 |
|
Sanofi-Aventis | | 2,180 | | 145,656 |
|
Santen Pharmaceutical Co. | | | | |
Ltd. | | 200 | | 5,019 |
Shionogi & Co. Ltd. | | 1,000 | | 19,729 |
|
Shire Ltd. | | 1,189 | | 19,492 |
|
Takeda Pharmaceutical Co. | | | | |
Ltd. | | 1,800 | | 91,534 |
UCB SA | | 224 | | 8,291 |
| |
Total | | | | 1,538,489 |
| |
| | |
| Real Estate–2.4% | | | | |
2Ascendas Real Estate | | | | |
Investment Trust | | 2,000 | | 3,248 |
1Berkeley Group Holdings | | | | |
PLC | | 230 | | 3,123 |
2British Land Co. PLC | | 1,099 | | 15,500 |
|
2CapitaCommercial Trust | | 2,000 | | 2,807 |
|
2CapitaLand Ltd. | | 4,000 | | 16,754 |
|
2CapitaMall Trust | | 2,000 | | 4,394 |
|
2CFS Retail Property Trust | | 2,971 | | 5,256 |
|
Cheung Kong Holdings Ltd. | | 3,000 | | 40,438 |
|
2Corio NV | | 80 | | 6,252 |
|
2DB RREEF Trust | | 5,539 | | 7,310 |
|
2Gecina SA | | 33 | | 4,001 |
|
2GPT Group | | 4,561 | | 9,684 |
|
2Hammerson PLC | | 631 | | 11,211 |
|
Hang Lung Group Ltd. | | 2,000 | | 8,888 |
|
2Hang Lung Properties Ltd. | | 4,000 | | 12,825 |
|
2Henderson Land Development | | | | |
Co. Ltd. | | 2,000 | | 12,466 |
2Hysan Development Co. Ltd. | | 1,111 | | 3,049 |
|
2ICADE EMGP | | 40 | | 4,669 |
|
1IMMOEAST Immobilien Anlagen | | | | |
AG | | 848 | | 7,518 |
2IMMOFINANZ Immobilien | | | | |
Anlagen AG | | 920 | | 9,489 |
2Japan Prime Realty Investment | | | | |
Corp. | | 1 | | 2,957 |
2Japan Real Estate Investment | | | | |
Corp. | | 1 | | 10,547 |
| | | | |
| International Stock Market Portfolio | | AARP PORTFOLIOS 2008 ANNUAL REPORT | | 69 |
| | | | | |
| Portfolio of investments |
| | |
| | | Shares | | Value |
| | | | | |
| | |
Common Stocks (continued) | | | | | |
| Real Estate (continued) |
2Japan Retail Fund Investment | | | | | |
Corp. | | 1 | | $ | 5,763 |
2Keppel Land Ltd. | | 1,000 | | | 3,645 |
|
2Kerry Properties Ltd. | | 1,545 | | | 8,114 |
|
2Klepierre SA | | 143 | | | 7,206 |
|
2Land Securities Group PLC | | 988 | | | 24,231 |
|
Lend Lease Corp. Ltd. | | 768 | | | 7,014 |
|
LEOPALACE21 Corp. | | 300 | | | 4,294 |
|
2Liberty International PLC | | 579 | | | 9,936 |
|
2Link Real Estate Investment | | | | | |
Trust (The Link REIT) | | 4,657 | | | 10,608 |
2Macquarie Goodman Group | | 2,947 | | | 8,709 |
|
2Macquarie Office Trust | | 4,146 | | | 3,093 |
|
2Mirvac Group | | 2,004 | | | 5,673 |
|
2Mitsubishi Estate Co. Ltd. | | 2,000 | | | 45,767 |
|
2Mitsui Fudosan Co. Ltd. | | 2,000 | | | 42,754 |
|
2New World Development Ltd. | | 5,178 | | | 10,546 |
|
2Nippon Building Fund, Inc. | | 1 | | | 11,771 |
|
Nomura Real Estate Holdings, | | | | | |
Inc. | | 100 | | | 2,109 |
2Nomura Real Estate Office | | | | | |
Fund, Inc. | | 1 | | | 7,524 |
2NTT Urban Development Corp. | | 2 | | | 2,618 |
|
Sacyr Vallehermoso SA | | 143 | | | 4,378 |
|
2Segro PLC | | 857 | | | 6,713 |
|
2Sino Land Co. | | 4,109 | | | 8,168 |
|
2Stockland Trust Group | | 3,326 | | | 17,145 |
|
2Sumitomo Realty & Ltd. | | | | | |
Development Co. | | 1,000 | | | 19,870 |
Sun Hung Kai Properties Ltd. | | 3,000 | | | 40,707 |
|
2Tokyo Tatemono Co. Ltd. | | 1,000 | | | 6,470 |
|
2Tokyu Land Corp. | | 1,000 | | | 5,679 |
|
2Unibail Holding | | 174 | | | 40,256 |
|
2Westfield Group | | 3,747 | | | 58,339 |
|
Wharf Holdings Ltd. | | 3,250 | | | 13,609 |
|
Wheelock & Co. Ltd. | | 2,000 | | | 5,361 |
|
| | | | |
| | | | |
Yanlord Land Group Ltd. | | 1,000 | | 1,359 |
| |
Total | | | | 651,815 |
| |
| | |
| Road & Rail–0.8% | | | | |
Central Japan Railway Co. | | 3 | | 33,054 |
|
ComfortDelgro Corp. Ltd. | | 3,000 | | 3,307 |
|
DSV A/S | | 400 | | 9,586 |
|
East Japan Railway Co. | | 7 | | 57,020 |
|
Firstgroup PLC | | 908 | | 9,399 |
|
Hankyu Hanshin Holdings, Inc. | | 3,000 | | 12,600 |
|
Keihin Electric Express Railway | | | | |
Co. Ltd. | | 1,000 | | 6,196 |
Keio Corp. | | 1,000 | | 5,057 |
|
Keisei Electric Railway Co. Ltd. | | 1,000 | | 5,114 |
|
Kintetsu Corp. | | 3,000 | | 9,408 |
|
MTR Corp. | | 3,146 | | 9,905 |
|
National Express Group PLC | | 290 | | 5,496 |
|
Nippon Express Co. Ltd. | | 2,000 | | 9,587 |
|
Odakyu Electric Railway Co. Ltd. | | 1,000 | | 6,498 |
|
Stagecoach Group PLC | | 990 | | 5,518 |
|
Tobu Railway Co. Ltd. | | 2,000 | | 9,474 |
|
Tokyu Corp. | | 2,000 | | 10,378 |
|
West Japan Railway Co. | | 4 | | 19,625 |
| |
Total | | | | 227,222 |
| |
|
| Semiconductor Equipment & Products–0.6% |
Advantest Corp. | | 300 | | 6,314 |
|
ASM Pacific Technology | | 500 | | 3,774 |
|
ASML Holding NV | | 900 | | 22,180 |
|
1Infineon Technologies AG | | 1,665 | | 14,499 |
|
Murata Manufacturing Co. Ltd. | | 500 | | 23,543 |
|
1NEC Electronics Corp. | | 100 | | 2,491 |
|
Nikon Corp. | | 1,000 | | 29,193 |
|
1OC Oerlikon Corp. AG | | 11 | | 3,056 |
|
1Q-Cells AG | | 129 | | 13,110 |
|
Seiko Epson Corp. | | 300 | | 8,249 |
|
Shinko Electric Industries | | 100 | | 1,235 |
|
STMicroelectronics NV | | 1,392 | | 14,491 |
|
Sumco Corp. | | 300 | | 6,639 |
|
Tokyo Electron Ltd. | | 400 | | 23,053 |
| |
Total | | | | 171,827 |
| |
| | | | |
| 70 | | AARP PORTFOLIOS 2008 ANNUAL REPORT | | International Stock Market Portfolio |
International Stock Market Portfolio (continued)
June 30, 2008
| | | | | |
| Portfolio of investments |
| | |
| | | Shares | | Value |
| | | | | |
| | |
Common Stocks (continued) | | | | | |
| Software–0.9% | | | | | |
Dassault Systemes SA | | 137 | | $ | 8,353 |
|
Konami Corp. | | 200 | | | 6,987 |
|
Nintendo Co. Ltd. | | 200 | | | 112,817 |
|
Oracle Corp. Japan | | 100 | | | 4,077 |
|
Sage Group PLC | | 2,714 | | | 11,292 |
|
SAP AG | | 1,855 | | | 97,155 |
|
Square Enix Co. Ltd. | | 100 | | | 2,957 |
|
1TomTom NV | | 140 | | | 4,028 |
| |
Total | | | | | 247,666 |
| |
| | |
| Specialty Retail–0.9% | | | | | |
Billabong International Ltd. | | 277 | | | 2,861 |
|
Compagnie Financiere | | | | | |
Richemont AG | | 1,135 | | | 63,290 |
Esprit Holdings Ltd. | | 2,500 | | | 25,971 |
|
Fast Retailing Co. Ltd. | | 100 | | | 9,474 |
|
Hennes & Mauritz AB | | 1,080 | | | 58,531 |
|
Inchcape PLC | | 1,025 | | | 6,519 |
|
Inditex SA | | 480 | | | 22,116 |
|
Kingfisher PLC | | 5,075 | | | 11,345 |
|
Nitori Co. Ltd. | | 100 | | | 5,142 |
|
Sega Sammy Holdings, Inc. | | 300 | | | 2,616 |
|
Shimamura Co. Ltd. | | 100 | | | 6,159 |
|
USS Co. Ltd. | | 50 | | | 3,301 |
|
Yamada Denki Co. Ltd. | | 180 | | | 12,815 |
|
Yue Yuen Industrial Holdings | | | | | |
Ltd. | | 1,000 | | | 2,375 |
| |
Total | | | | | 232,515 |
| |
| | |
| Textiles & Apparel–0.5% | | | | | |
Adidas AG | | 423 | | | 26,717 |
|
Bulgari SpA | | 400 | | | 4,041 |
|
Christian Dior SA | | 116 | | | 11,965 |
|
Hermes International | | 153 | | | 24,093 |
|
LVMH Moet Hennessy Louis | | | | | |
Vuitton SA | | 533 | | | 55,881 |
| | | | |
| | | | |
Puma AG Rudolf Dassler Sport | | 12 | | 4,028 |
|
Swatch Group AG | | 64 | | 16,009 |
|
Swatch Group AG-Registered | | | | |
Shares | | 98 | | 4,591 |
| |
Total | | | | 147,325 |
| |
| | |
| Tobacco–0.9% | | | | |
British American Tobacco PLC | | 3,219 | | 111,436 |
|
Imperial Tobacco Group PLC | | 2,170 | | 80,824 |
|
Japan Tobacco, Inc. | | 10 | | 42,659 |
|
Swedish Match AB | | 500 | | 10,250 |
| |
Total | | | | 245,169 |
| |
|
| Trading Companies & Distributors–1.1% |
Bunzl PLC | | 675 | | 8,795 |
|
Hitachi High-Technologies Corp. | | 100 | | 2,317 |
|
Itochu Corp. | | 3,000 | | 31,952 |
|
Marubeni Corp. | | 3,000 | | 25,059 |
|
Mitsubishi Corp. | | 2,900 | | 95,583 |
|
Mitsui & Co. Ltd. | | 4,000 | | 88,332 |
|
Sojitz Corp. | | 2,500 | | 8,334 |
|
Sumitomo Corp. | | 2,400 | | 31,528 |
|
Toyota Tsusho Corp. | | 400 | | 9,379 |
|
Wolseley PLC | | 1,385 | | 10,381 |
| |
Total | | | | 311,660 |
| |
|
| Transportation Infrastructure–0.5% |
Abertis Infraestructuras SA | | 614 | | 14,571 |
|
Asciano Group | | 945 | | 3,136 |
|
Auckland International Airport | | | | |
Ltd. | | 1,654 | | 2,454 |
Autostrade SpA | | 520 | | 15,746 |
|
Brisa-Auto Estradas de Portugal | | | | |
SA | | 560 | | 6,472 |
Cintra Concesiones de | | | | |
Infraestructuras de Transporte
SA | | 561 | | 6,290 |
Fraport AG Frankfurt Airport | | | | |
Services Worldwide | | 78 | | 5,294 |
Kuehne & Nagel International | | | | |
AG | | 119 | | 11,318 |
Macquarie Airports | | 1,447 | | 2,851 |
|
Macquarie Infrastructure Group | | 5,490 | | 12,181 |
| | | | |
| International Stock Market Portfolio | | AARP PORTFOLIOS 2008 ANNUAL REPORT | | 71 |
| | | | | |
| Portfolio of investments |
| | |
| | | Shares | | Value |
| | | | | |
| | |
Common Stocks (continued) | | | | | |
| Transportation Infrastructure (continued) |
Transurban Group | | 2,309 | | $ | 9,341 |
|
Vinci SA | | 900 | | | 55,272 |
| |
Total | | | | | 144,926 |
| |
| | |
| Water Utilities–0.0% | | | | | |
Severn Trent PLC | | 496 | | | 12,678 |
| |
|
| Wireless Telecommunication Services–1.7% |
Bouygues SA | | 517 | | | 34,323 |
|
Carphone Warehouse Group | | | | | |
PLC | | 786 | | | 3,097 |
1Foxconn International | | | | | |
Holdings Ltd. | | 4,000 | | | 3,878 |
KDDI Corp. | | 6 | | | 37,066 |
|
NTT DoCoMo, Inc. | | 34 | | | 49,948 |
|
PT Multimedia Servicos de | | | | | |
Telecomunicacoes e
Multimedia SGPS SA | | 418 | | | 3,475 |
Vodafone Group PLC | | 113,152 | | | 335,963 |
| |
Total | | | | | 467,750 |
| |
| Total Common Stocks– | | | | | |
(Identified Cost $24,870,310) | | | 26,030,678 |
| |
| | |
Preferred Stocks–0.5% | | | | | |
| Automobiles–0.2% | | | | | |
Bayerische Motoren Werke AG | | 111 | | | 4,406 |
|
Porsche AG | | 192 | | | 29,596 |
|
Volkswagon AG | | 204 | | | 29,564 |
| |
Total | | | | | 63,566 |
| |
| | |
| Diversified Financials–0.0% | | | | | |
1Istituto Finanziario Industriale | | | | | |
SpA | | 133 | | | 2,649 |
| |
| | |
| Electrical Equipment–0.0% | | | | | |
Schindler Holding AG | | 100 | | | 7,463 |
| |
|
| Health Care Providers & Services–0.1% |
Fresenius SE | | 165 | | | 14,257 |
| |
| | | | | |
| | | | | |
| | |
| Household Products–0.1% | | | | | |
Henkel KGaA | | 367 | | | 14,627 |
| |
| | |
| Insurance–0.0% | | | | | |
Unipol SpA | | 1,787 | | | 3,450 |
| |
| | |
| Media–0.0% | | | | | |
ProSiebenSat.1 Media AG | | 140 | | | 1,404 |
| |
| | |
| Multi-Utilities–0.1% | | | | | |
RWE AG | | 84 | | | 8,459 |
| |
| | |
| Real Estate–0.0% | | | | | |
1Meinl European Land Ltd. | | 571 | | | 6,429 |
| |
|
| Total Preferred Stocks– | | | | | |
(Identified Cost $106,444) | | | | | 122,304 |
| |
| | |
Rights–0.0% | | | | | |
1Dowa Mining Co. Ltd. Rights | | | | | |
Exp. 1/29/10 | | 1,000 | | | 9 |
1HBOS PLC Rights Exp. | | | | | |
7/18/08 | | 3,418 | | | 732 |
1Zardoya Otis Rights Exp. | | | | | |
6/30/08 | | 214 | | | 441 |
| Total Rights– | | | | | |
(Identified Cost $0) | | | | | 1,182 |
| |
| | |
Mutual Fund–0.5% | | | | | |
AIM Prime Fund | | | | | |
(At Net Asset Value) | | 149,506 | | | 149,506 |
| |
| Total Investments–96.6% | | | | | |
(Identified Cost $25,126,260) | | | 26,303,670 |
| Other Assets & Liabilities–Net–3.4% | | | 918,038 |
| |
| Total Net Assets–100.0% | | | | $ | 27,221,708 |
| |
| | 1 | Non-income producing security. |
| | 2 | Real Estate Investment Trust (REIT). |
| | | | |
| 72 | | AARP PORTFOLIOS 2008 ANNUAL REPORT | | International Stock Market Portfolio |
International Stock Market Portfolio (continued)
June 30, 2008
| | | | | | | | | | | |
| At June 30, 2008, the Portfolio had the following outstanding long futures contracts: | |
| Description | | Number of
Contracts | | Notional
Value | | Expiration
Date | | Unrealized
Depreciation | |
| | |
| DJEuro Stoxx 50 Index | | 5 | | $ | 266,124 | | September
2008 | | $ | (16,350 | ) |
| | |
| FTSE 100 Index | | 1 | | $ | 112,435 | | September
2008 | | $ | (3,590 | ) |
| | |
| Topix Index | | 1 | | $ | 124,164 | | September
2008 | | $ | (7,583 | ) |
| | |
| MSCI EAFE Index | | 2 | | $ | 196,940 | | September
2008 | | $ | (7,195 | ) |
| | |
| Futures contracts are valued at the last sale at the market close or at the mean between the bid and asked price if the last sale is not available. | |
| | |
| Unrealized depreciation on open futures contracts is required to be treated as realized loss for tax purposes. | |
| | |
See Notes to Financial Statements.
| | | | |
| Financial Statements | | AARP PORTFOLIOS 2008 ANNUAL REPORT | | 73 |
Financial Statements
| | | | | | | | | | | |
| | | | |
Statements of assets and liabilities | | | | | | | | | | | |
| | | | |
| June 30, 2008 | | | | | | | | | | | |
| | | U.S. Bond
Market
Portfolio | | U.S. Stock
Market
Portfolio | | | International
Stock Market
Portfolio | |
| | | | | | | | | | | | |
Assets: | | | | | | | | | | | |
Investments in securities, at value (identified cost of $70,103,360, $52,737,774 and $25,126,260, respectively) | | $ | 70,175,518 | | $ | 50,239,136 | | | $ | 26,303,670 | |
Cash denominated in foreign currency (identified cost of $485,450) | | | – | | | – | | | | 490,686 | |
Cash | | | – | | | 106,783 | | | | – | |
Interest and dividend receivable | | | 606,567 | | | 65,162 | | | | 77,473 | |
Reimbursement receivable (Note 6) | | | 4,301 | | | 4,071 | | | | 8,919 | |
Receivable for investments sold | | | 65,459 | | | 473,509 | | | | 234,267 | |
Receivable for fund shares sold | | | – | | | 903,562 | | | | 226,168 | |
Receivable for open foreign exchange contracts | | | – | | | – | | | | 6,975 | |
| | |
| Total assets | | $ | 70,851,845 | | $ | 51,792,223 | | | $ | 27,348,158 | |
| | |
| | | | | | | | | | | | |
Liabilities: | | | | | | | | | | | |
Payable for investments purchased | | | 4,861,146 | | | – | | | | 670 | |
Payable for fund shares redeemed | | | 1,834,038 | | | – | | | | – | |
Payable for futures daily variation margin | | | – | | | 1,830 | | | | 68,879 | |
Accrued portfolio accounting fees (Note 6) | | | 6,768 | | | 9,500 | | | | 15,634 | |
Accrued administration fees (Note 6) | | | 1,883 | | | 1,553 | | | | 807 | |
Accrued transfer and dividend disbursing agent fees and expenses (Note 6) | | | 334 | | | 334 | | | | 334 | |
Accrued audit fees | | | 15,344 | | | 15,344 | | | | 15,344 | |
Accrued printing and postage expenses | | | 4,353 | | | 4,353 | | | | 4,353 | |
Accrued legal fees | | | 10,125 | | | 10,125 | | | | 10,125 | |
Accrued miscellaneous expense | | | 9,305 | | | 8,904 | | | | 10,304 | |
| | |
| Total liabilities | | | 6,743,296 | | | 51,943 | | | | 126,450 | |
| | |
| Net assets | | $ | 64,108,549 | | $ | 51,740,280 | | | $ | 27,221,708 | |
| | |
| | | | | | | | | | | | |
Net assets consist of: | | | | | | | | | | | |
Paid-in capital | | $ | 63,981,672 | | $ | 54,389,111 | | | $ | 26,130,358 | |
Undistributed net investment income | | | 12,003 | | | 1,084 | | | | 44,700 | |
Net unrealized appreciation (depreciation) of investments, translation of assets and liabilities in foreign currency and futures contracts | | | 72,158 | | | (2,536,393 | ) | | | 1,156,286 | |
Accumulated net realized gain (loss) on investments, foreign currency and futures contracts | | | 42,716 | | | (113,522 | ) | | | (109,636 | ) |
| | |
| Net assets | | $ | 64,108,549 | | $ | 51,740,280 | | | $ | 27,221,708 | |
| | |
| Shares outstanding | | | 6,423,279 | | | 5,096,179 | | | | 2,456,184 | |
| | |
| Net asset value per share | | $ | 9.98 | | $ | 10.15 | | | $ | 11.08 | |
| | |
| |
SeeNotes to Financial Statements. | |
| | | | |
| 74 | | AARP PORTFOLIOS 2008 ANNUAL REPORT | | Financial Statements |
Financial Statements (continued)
| | | | | | | | | | | | |
| | | | |
Statements of operations | | | | | | | | | | | | |
| | | | |
| Year ended June 30, 2008 | | | | | | | | | | | | |
| | | U.S. Bond
Market
Portfolio | | | U.S. Stock
Market
Portfolio | | | International
Stock Market
Portfolio | |
| | | | | | | | | | | | | |
Investment income: | | | | | | | | | | | | |
Dividends (net of foreign taxes withheld of $0, $64 and $82,552, respectively) | | $ | – | | | $ | 972,653 | | | $ | 875,702 | |
Interest | | | 2,908,293 | | | | 31,412 | | | | 16,071 | |
| | |
| Total investment income | | $ | 2,908,293 | | | $ | 1,004,065 | | | $ | 891,773 | |
| | |
| | | | | | | | | | | | | |
Expenses: | | | | | | | | | | | | |
Investment adviser fee (Note 6) | | | 28,666 | | | | 25,714 | | | | 14,104 | |
Administration fees (Note 6) | | | 20,066 | | | | 18,000 | | | | 9,873 | |
Transfer and dividend disbursing agent fees and expenses (Note 6) | | | 4,000 | | | | 4,000 | | | | 4,000 | |
Trustees’ fees | | | 20,000 | | | | 20,000 | | | | 20,000 | |
Audit fees | | | 18,785 | | | | 18,785 | | | | 18,785 | |
Legal fees | | | 37,351 | | | | 37,351 | | | | 37,351 | |
Portfolio accounting fees (Note 6) | | | 88,714 | | | | 105,117 | | | | 168,519 | |
Printing and postage expenses | | | 8,136 | | | | 8,136 | | | | 8,136 | |
Insurance expense | | | 12,812 | | | | 10,497 | | | | 5,811 | |
Miscellaneous | | | 9,594 | | | | 9,594 | | | | 10,294 | |
| | |
| Total expenses | | $ | 248,124 | | | $ | 257,194 | | | $ | 296,873 | |
| | |
| | | | | | | | | | | | | |
Waivers and reimbursements (Note 6): | | | | | | | | | | | | |
Waiver of investment adviser fee | | | (28,666 | ) | | | (25,714 | ) | | | (14,104 | ) |
Reimbursement of expenses by investment adviser | | | (76,127 | ) | | | (102,907 | ) | | | (198,142 | ) |
| | |
| Total waivers and reimbursement | | $ | (104,793 | ) | | $ | (128,621 | ) | | $ | (212,246 | ) |
| | |
Net expenses | | | 143,331 | | | | 128,573 | | | | 84,627 | |
| | |
Net investment income | | | 2,764,962 | | | | 875,492 | | | | 807,146 | |
| | |
| | | | | | | | | | | | | |
Realized and unrealized gain (loss) on investments: | | | | | | | | | | | | |
Net realized gain on investments and foreign exchange transactions | | | 179,683 | | | | 262,223 | | | | 351,760 | |
Net realized loss on futures contracts | | | – | | | | (71,576 | ) | | | (139,975 | ) |
Net change in unrealized appreciation (depreciation) of investments, translation of assets and liabilities in foreign currency and futures contracts | | | 728,898 | | | | (7,842,779 | ) | | | (4,131,430 | ) |
| | |
Net realized and unrealized gain (loss) on investments, foreign currency and futures contracts | | | 908,581 | | | | (7,652,132 | ) | | | (3,919,645 | ) |
| | |
Change in net assets resulting from operations | | $ | 3,673,543 | | | $ | (6,776,640 | ) | | $ | (3,112,499 | ) |
| | |
| |
| See Notes to Financial Statements. | |
| | | | |
| Financial Statements | | AARP PORTFOLIOS 2008 ANNUAL REPORT | | 75 |
| | | | | | | | |
| | | |
Statements of changes in net assets | | | | | | | | |
| | | U.S. Bond Market Portfolio | |
| | | Year
ended
6/30/08 | | | Year
ended
6/30/07 | |
| | | | | | | | | |
Increase (decrease) in net assets | | | | | | | | |
Operations: | | | | | | | | |
Net investment income | | $ | 2,764,962 | | | $ | 1,821,576 | |
Net realized gain on investments, futures contracts and foreign currency | | | 179,683 | | | | 3,690 | |
Net change in unrealized appreciation (depreciation) of investments, translation of assets and liabilities in foreign currency and futures contracts | | | 728,898 | | | | (87,425 | ) |
| | |
Change in net assets resulting from operations | | | 3,673,543 | | | | 1,737,841 | |
| | |
| | | | | | | | | |
Distributions to shareholders: | | | | | | | | |
From net investment income | | | (2,784,529 | ) | | | (1,822,188 | ) |
From net realized capital gains | | | – | | | | – | |
| | |
Change in net assets resulting from distributions to shareholders | | | (2,784,529 | ) | | | (1,822,188 | ) |
| | |
| | | | | | | | | |
Share transactions (Note 3): | | | | | | | | |
Proceeds from sales of shares | | | 24,505,645 | | | | 20,679,292 | |
Net asset value of shares issued on reinvestment of dividends | | | 2,784,529 | | | | 1,822,188 | |
Cost of shares redeemed | | | (11,830,449 | ) | | | (2,625,043 | ) |
| | |
Change in net assets resulting from share transactions | | | 15,459,725 | | | | 19,876,437 | |
| | |
Change in net assets | | | 16,348,739 | | | | 19,792,090 | |
| | |
| | | | | | | | | |
Net assets: | | | | | | | | |
Beginning of year | | $ | 47,759,810 | | | $ | 27,967,720 | |
| | |
End of year | | $ | 64,108,549 | | | $ | 47,759,810 | |
| | |
Undistributed net investment income included in net assets at end of period | | $ | 12,003 | | | $ | 13,783 | |
| | |
| |
SeeNotes to Financial Statements. | |
| | | | |
| 76 | | AARP PORTFOLIOS 2008 ANNUAL REPORT | | Financial Statements |
Financial Statements (continued)
| | | | | | | | |
| | | |
Statements of changes in net assets | | | | | | | | |
| | | U.S. Stock Market Portfolio | |
| | | Year
ended
6/30/08 | | | Year
ended
6/30/07 | |
| | | | | | | | | |
Increase (decrease) in net assets | | | | | | | | |
Operations: | | | | | | | | |
Net investment income | | $ | 875,492 | | | $ | 577,334 | |
Net realized gain on investments, futures contracts and foreign currency | | | 190,647 | | | | 326,265 | |
Net change in unrealized appreciation (depreciation) of investments, translation of assets and liabilities in foreign currency and futures contracts | | | (7,842,779 | ) | | | 5,367,680 | |
| | |
Change in net assets resulting from operations | | | (6,776,640 | ) | | | 6,271,279 | |
| | |
| | | | | | | | | |
Distributions to shareholders: | | | | | | | | |
From net investment income | | | (860,659 | ) | | | (559,180 | ) |
From net realized capital gains | | | (600,023 | ) | | | (64,598 | ) |
| | |
Change in net assets resulting from distributions to shareholders | | | (1,460,682 | ) | | | (623,778 | ) |
| | |
| | | | | | | | | |
Share transactions (Note 3): | | | | | | | | |
Proceeds from sales of shares | | | 18,476,787 | | | | 16,268,092 | |
Net asset value of shares issued on reinvestment of dividends | | | 1,460,682 | | | | 623,778 | |
Cost of shares redeemed | | | (5,546,673 | ) | | | (2,621,348 | ) |
| | |
Change in net assets resulting from share transactions | | | 14,390,796 | | | | 14,270,522 | |
| | |
Change in net assets | | | 6,153,474 | | | | 19,918,023 | |
| | |
| | | | | | | | | |
Net assets: | | | | | | | | |
Beginning of year | | $ | 45,586,806 | | | $ | 25,668,783 | |
| | |
End of year | | $ | 51,740,280 | | | $ | 45,586,806 | |
| | |
Undistributed net investment income included in net assets at end of period | | $ | 1,084 | | | $ | 12,745 | |
| | |
| |
SeeNotes to Financial Statements. | |
| | | | |
| Financial Statements | | AARP PORTFOLIOS 2008 ANNUAL REPORT | | 77 |
| | | | | | | | |
| | | |
Statements of changes in net assets | | | | | | | | |
| | | International Stock Market Portfolio | |
| | | Year
ended
6/30/08 | | | Year
ended
6/30/07 | |
| | | | | | | | | |
Increase (decrease) in net assets | | | | | | | | |
Operations: | | | | | | | | |
Net investment income | | $ | 807,146 | | | $ | 615,773 | |
Net realized gain on investments, futures contracts and foreign currency | | | 211,785 | | | | 324,999 | |
Net change in unrealized appreciation (depreciation) of investments, translation of assets and liabilities in foreign currency and futures contracts | | | (4,131,430 | ) | | | 4,528,629 | |
| | |
Change in net assets resulting from operations | | | (3,112,499 | ) | | | 5,469,401 | |
| | |
| | | | | | | | | |
Distributions to shareholders: | | | | | | | | |
From net investment income | | | (897,393 | ) | | | (665,642 | ) |
From net realized capital gains | | | (414,219 | ) | | | (81,341 | ) |
| | |
Change in net assets resulting from distributions to shareholders | | | (1,311,612 | ) | | | (746,983 | ) |
| | |
| | | | | | | | | |
Share transactions (Note 3): | | | | | | | | |
Proceeds from sales of shares | | | 5,336,872 | | | | 4,022,936 | |
Net asset value of shares issued on reinvestment of dividends | | | 1,311,612 | | | | 746,983 | |
Cost of shares redeemed | | | (2,281,411 | ) | | | (886,505 | ) |
| | |
Change in net assets resulting from share transactions | | | 4,367,073 | | | | 3,883,414 | |
| | |
Change in net assets | | | (57,038 | ) | | | 8,605,832 | |
| | |
| | | | | | | | | |
Net assets: | | | | | | | | |
Beginning of year | | $ | 27,278,746 | | | $ | 18,672,914 | |
| | |
End of year | | $ | 27,221,708 | | | $ | 27,278,746 | |
| | |
Undistributed net investment income included in net assets at end of period | | $ | 44,700 | | | $ | 12,431 | |
| | |
| |
SeeNotes to Financial Statements. | |
| | | | |
| 78 | | AARP PORTFOLIOS 2008 ANNUAL REPORT | | Financial Statements |
Financial Statements (continued)
| | | | | | | | | | | | |
| | |
Financial Highlights | | | | |
| | |
| (For a share outstanding throughout the period) | | | | |
| | |
| | | U.S. Bond Market Portfolio | |
| | | Year
ended
6/30/08 | | | Year
ended
6/30/07 | | | Period
ended
6/30/061 | |
Net asset value, beginning of period | | $ | 9.77 | | | $ | 9.70 | | | $ | 10.00 | |
Income from investment operations: | | | | | | | | | | | | |
Net investment income | | | 0.48 | | | | 0.49 | | | | 0.19 | |
Net realized and unrealized gain (loss) on investments, futures
and foreign currency transactions | | | 0.22 | | | | 0.07 | | | | (0.30 | ) |
| | |
| Total from investment operations | | | 0.70 | | | | 0.56 | | | | (0.11 | ) |
| | |
| | | | | | | | | | | | | |
Less distributions: | | | | | | | | | | | | |
Distributions from net investment income | | | (0.49 | ) | | | (0.49 | ) | | | (0.19 | ) |
Distributions from net realized gain | | | – | | | | – | | | | – | |
| | |
| Total distributions | | | (0.49 | ) | | | (0.49 | ) | | | (0.19 | ) |
| | |
| Net asset value, end of period | | $ | 9.98 | | | $ | 9.77 | | | $ | 9.70 | |
| | |
| Total return2, 3 | | | 7.20 | % | | | 5.78 | % | | | (1.05 | )% |
| | |
| | | | | | | | | | | | | |
Ratios to average net assets: | | | | | | | | | | | | |
Net expenses | | | 0.25 | % | | | 0.25 | % | | | 0.25 | %4 |
Net investment income | | | 4.82 | % | | | 4.99 | % | | | 4.71 | %4 |
Expense waiver/reimbursement5 | | | (0.18 | )% | | | (0.40 | )% | | | (0.92 | )%4 |
| | | | | | | | | | | | | |
| Supplemental data: | | | | | | | | | | | | |
Net assets, end of period (000 omitted) | | $ | 64,109 | | | $ | 47,760 | | | $ | 27,968 | |
Portfolio turnover | | | 62 | % | | | 91 | % | | | 112 | % |
| |
1 For the period from January 1, 2006 (commencement of operations) to June 30, 2006. 2 Total returns for periods of less than one year are not annualized. 3 Total returns reflect waivers and/or expense reimbursements. Without these waivers and/or reimbursements, total return would be lower. 4 Computed on an annualized basis. 5 This expense decrease is reflected in both the net expense and net investment income (loss) ratios shown above. See Notes to Financial Statements. | |
| | | | |
| Financial Statements | | AARP PORTFOLIOS 2008 ANNUAL REPORT | | 79 |
| | | | | | | | | | | | | | | | | | | | | | |
| | | | | | |
| | | | | | | | | | | | | | | | | | | | | | |
| | | | | |
| | | | | | | | | | | | | | | | | | | | | | |
| |
| U.S. Stock Market Portfolio | | | International Stock Market Portfolio | |
Year
ended
6/30/08 | | | Year
ended
6/30/07 | | | Period
ended
6/30/061 | | | Year
ended
6/30/08 | | | Year
ended
6/30/07 | | | Period
ended
6/30/061 | |
| $ | 11.91 | | | $ | 10.08 | | | $ | 10.00 | | | $ | 13.00 | | | $ | 10.53 | | | $ | 10.00 | |
| | | | | | | | | | | | | | | | | | | | | | |
| | 0.18 | | | | 0.18 | | | | 0.07 | | | | 0.40 | | | | 0.31 | | | | 0.20 | |
| | | | | |
| | (1.63 | ) | | | 1.84 | | | | 0.08 | | | | (1.75 | ) | | | 2.54 | | | | 0.50 | |
| | | |
| | (1.45 | ) | | | 2.02 | | | | 0.15 | | | | (1.35 | ) | | | 2.85 | | | | 0.70 | |
| | | |
| | | | | | | | | | | | | | | | | | | | | | |
| | | | | | | | | | | | | | | | | | | | | | |
| | (0.18 | ) | | | (0.17 | ) | | | (0.07 | ) | | | (0.39 | ) | | | (0.34 | ) | | | (0.17 | ) |
| | (0.13 | ) | | | (0.02 | ) | | | – | | | | (0.18 | ) | | | (0.04 | ) | | | – | |
| | | |
| | (0.31 | ) | | | (0.19 | ) | | | (0.07 | ) | | | (0.57 | ) | | | (0.38 | ) | | | (0.17 | ) |
| | | |
| $ | 10.15 | | | $ | 11.91 | | | $ | 10.08 | | | $ | 11.08 | | | $ | 13.00 | | | $ | 10.53 | |
| | | |
| | (12.35 | )% | | | 20.23 | % | | | 1.52 | % | | | (10.62 | )% | | | 27.41 | % | | | 7.10 | % |
| | | |
| | | | | | | | | | | | | | | | | | | | | | |
| | | | | | | | | | | | | | | | | | | | | | |
| | 0.25 | % | | | 0.25 | % | | | 0.25 | %4 | | | 0.30 | % | | | 0.30 | % | | | 0.30 | %4 |
| | 1.70 | % | | | 1.67 | % | | | 1.69 | %4 | | | 2.86 | % | | | 2.72 | % | | | 4.03 | %4 |
| | (0.25 | )% | | | (0.53 | )% | | | (1.34 | )%4 | | | (0.75 | )% | | | (0.90 | )% | | | (1.59 | )%4 |
| | | | | | | | | | | | | | | | | | | | | | |
| | | | | | | | | | | | | | | | | | | | | | |
| $ | 51,740 | | | $ | 45,587 | | | $ | 25,669 | | | $ | 27,222 | | | $ | 27,279 | | | $ | 18,673 | |
| | 10 | % | | | 5 | % | | | 1 | % | | | 12 | % | | | 4 | % | | | 3 | % |
| | | | | |
| | | | | | | | | | | | | | | | | | | | | | | |
| | | | |
| 80 | | AARP PORTFOLIOS 2008 ANNUAL REPORT | | Notes to Financial Statements |
Notes to Financial Statements
1. Organization
U.S. Bond Market Portfolio, U.S. Stock Market Portfolio and International Stock Market Portfolio (the “Portfolios”) are each a series of AARP Portfolios (the “Trust”). The Trust is organized as a Delaware statutory trust and is registered under the Investment Company Act of 1940, as amended (the “Act”), as an open-end management investment company. The Portfolios commenced operations on January 1, 2006.
The investment objective of the U.S. Bond Market Portfolio is to seek to produce the returns provided by the Lehman Brothers Aggregate Bond Index® as closely as possible, before deduction of expenses of the Portfolio. The investment objective of the U.S. Stock Market Portfolio is to seek to produce the returns provided by the Morgan Stanley Capital International (“MSCI”) U.S. Investable Market 2500 Index® as closely as possible, before deduction of expenses of the Portfolio. The investment objective of the International Stock Market Portfolio is to seek to produce the returns provided by the MSCI Europe, Australasia and the Far East (“EAFE”) Index® as closely as possible, before deduction of expenses of the Portfolio.
The Portfolios are used as investment vehicles for the AARP Funds and are not available to the public. Accordingly, the only shareholders in the Portfolios are AARP Funds and AARP, which provided a $45 million (value of $51.2 million at June 30, 2008) initial investment for the Portfolios. The initial investment was provided to facilitate the efficient operation of the Portfolios; without this funding, it is anticipated that the Portfolios’ operation could be adversely impacted.
2. Significant accounting policies
The financial statements have been prepared in accordance with United
States generally accepted accounting principles (“GAAP”), which require management to make estimates and assumptions that affect the amounts reported herein. Actual results could differ from those estimates. The following is a summary of significant accounting policies consistently followed by the Portfolios in the preparation of their financial statements.
INVESTMENT VALUATION
Securities are valued as of the close of trading on the New York Stock Exchange (generally 4:00 p.m. Eastern Time) on the valuation date. An independent pricing service generally provides these prices. Stock holdings are valued at the latest quoted sales price or official closing price taken from the primary market in which the stock trades. If a security does not trade during the day, it is valued at the average of the latest quotes for buying and selling the security, the bid and ask prices.
| | | | |
| Notes to Financial Statements | | AARP PORTFOLIOS 2008 ANNUAL REPORT | | 81 |
Bond holdings are generally valued as reported by an independent pricing service at what is called an “evaluated average price,” which considers such factors as comparable bond prices, yields, maturities and ratings. Short-term investments with a maturity at issuance, or a remaining maturity at the time of purchase, of 60 days or less are generally valued at amortized cost, which approximates market value. Other open-end regulated investment companies are valued at their net asset value. Foreign securities quoted in foreign currencies are translated into U.S. dollars based upon exchange rates prevailing at the close of trading and as provided by an independent source.
Securities for which market quotations are not readily available, or whose values have been materially affected by events occurring before the Portfolios’ pricing time but after the close of the securities’ primary markets (e.g. foreign securities), are valued by methods deemed by the Board of Trustees of AARP Portfolios to represent fair value. The International Stock Market Portfolio may use a fair valuation model to value international equity securities in order to adjust for events which may occur between the close of foreign exchanges and the close of trading on the New York Stock Exchange in determining net asset value.
The Portfolios adopted Financial Accounting Standards Board Statement of Financial Accounting Standards No. 157, Fair Value Measurements (“FAS 157”), effective for financial statements issued for fiscal years beginning after November 15, 2007 and interim periods within those fiscal years. In accordance with FAS 157, fair value is defined as the price that the Portfolios would receive upon selling an investment in a timely transaction to an independent buyer in the principal or most advantageous market of the investment. FAS 157 established a three-tier hierarchy for measuring fair value and enhancing disclosure. The three-tier hierarchy of inputs is summarized in the three broad Levels listed below.
| | • | | Level 1 – quoted prices in active markets for identical investments |
| | • | | Level 2 – other significant observable inputs (including quoted prices for similar investments, interest rates, prepayment speeds, credit risk, etc.) |
| | • | | Level 3 – significant unobservable inputs (including the Fund’s own assumptions in determining the fair value of investments) |
| | | | |
| 82 | | AARP PORTFOLIOS 2008 ANNUAL REPORT | | Notes to Financial Statements |
Notes to Financial Statements (continued)
The following is a summary of the inputs used as of June 30, 2008 in valuing the Portfolios’ investments carried at value:
| | | |
AARP U.S. Bond Market Portfolio | | | |
| Valuation Inputs | | Investments in Securities |
Level 1 – Quoted Prices | | $ | 22,249,911 |
Level 2 – Other Significant Observable Inputs | | | 47,925,607 |
Level 3 – Significant Unobservable Inputs | | | – |
Total | | $ | 70,175,518 |
| | | | | | | |
AARP U.S. Stock Market Portfolio | | | | | | | |
| Valuation Inputs | | Investments in Securities | | Other
Financial Instruments* | |
Level 1 – Quoted Prices | | $ | 50,239,136 | | $ | (37,755 | ) |
Level 2 – Other Significant Observable Inputs | | | – | | | – | |
Level 3 – Significant Unobservable Inputs | | | – | | | – | |
Total | | $ | 50,239,136 | | $ | (37,755 | ) |
| *Other | financial instruments include futures. |
| | | | | | |
AARP International Stock Market Portfolio | | | |
| Valuation Inputs | | Investments in Securities | | Other
Financial Instruments* |
Level 1 – Quoted Prices | | $ | 26,303,094 | | $ | 28,185 |
Level 2 – Other Significant Observable Inputs | | | 576 | | | – |
Level 3 – Significant Unobservable Inputs | | | – | | | – |
Total | | $ | 26,303,670 | | $ | 28,185 |
| *Other | financial instruments include futures and forwards. |
REPURCHASE AGREEMENTS
The Portfolios may engage in repurchase transactions. Under the terms of a typical repurchase agreement, the custodian, on behalf of a Portfolio takes possession of an underlying debt obligation subject to an obligation of the seller to repurchase, and the Portfolio to resell, the obligation at an agreed-upon price and time. The market value of the collateral must be equal at all times to the total amount of the repurchase obligation, including interest. Generally, in the event of a counterparty default, the Portfolio has the right to use the collateral to offset losses incurred. However, in the event of a counterparty default, retention of the collateral may be subject to legal proceedings. As of June 30, 2008, there were no repurchase agreements held in the Portfolios.
SECURITIES TRANSACTIONS, INCOME AND EXPENSES
Securities transactions are recorded on a trade date basis. Interest income is recorded daily on an accrual basis and includes amortization of premium and accretion of discount on investments. Dividend income is recorded on the ex-dividend date except that certain dividends from
| | | | |
| Notes to Financial Statements | | AARP PORTFOLIOS 2008 ANNUAL REPORT | | 83 |
foreign securities may be recorded after the ex-dividend date based on when the Portfolio was notified of the dividend. Realized gains and losses from securities transactions are recorded on the basis of identified cost. Expenses are accrued daily. Many expenses are directly attributable to one Portfolio and therefore are charged accordingly. Expenses that are not directly attributable to one or more Portfolios are allocated among applicable Portfolios on an equitable and consistent basis considering such things as the nature and type of expenses and the relative net assets of the Portfolios.
FUTURES CONTRACTS
The U.S. Stock Market Portfolio and the International Stock Market Portfolio may purchase and sell stock index futures contracts to fulfill their investment objectives when direct investment would otherwise not be practical, such as when cash positions are small. Upon entering into a stock index futures contract with a broker, the Portfolio is required to deposit in a segregated account a specified amount of cash or U.S. government securities. Futures contracts are valued at the daily quoted settlement price or at the mean between the bid and asked price if the last sale is not available. Unrealized gains or losses are recorded in a “variation margin” account. Daily, the Portfolio receives from or pays to the broker a specified amount of cash based upon changes in the variation margin account. When a contract is closed, the Portfolio recognizes a realized gain or loss. Unrealized appreciation (depreciation) on open futures contracts is required to be treated as realized gain (loss) for tax purposes. Futures contracts have market risks, including the risk that the change in the value of the contract may not correlate with the changes in the value of the underlying securities. For the year ended June 30, 2008, U.S. Stock Market Portfolio and International Stock Market Portfolio had realized net losses on futures contracts of $71,576 and $139,975, respectively.
FOREIGN EXCHANGE CONTRACTS
The International Stock Market Portfolio may enter into foreign currency commitments for the delayed delivery of securities or foreign currency exchange transactions. The Portfolio may enter into foreign currency contract transactions to protect assets against adverse changes in foreign currency exchange rates or exchange control regulations. Purchased contracts are used to acquire exposure to foreign currencies; whereas, contracts to sell are used to hedge the Portfolio’s securities against currency fluctuations. Risks may arise upon entering into these transactions from the potential inability of counterparties to meet the terms of their commitments and from unanticipated movements in security prices or foreign exchange rates. The foreign currency transactions are adjusted by the daily exchange rate of the underlying currency and any gains or losses are recorded for financial statement
| | | | |
| 84 | | AARP PORTFOLIOS 2008 ANNUAL REPORT | | Notes to Financial Statements |
Notes to Financial Statements (continued)
purposes as unrealized until the settlement date. At June 30, 2008, the Portfolio had outstanding foreign currency commitments as follows:
| | | | | | | | | | |
| Settlement Date | | Foreign currency
units to
receive/deliver | | In exchange
for | | Contracts
at value | | Unrealized
appreciation |
| | | | | | | | | | | |
| |
Contracts Purchased: | | | | | | | | | | |
9/30/2008 | | 200,000 EUR | | 310,570 USD | | $ | 313,482 | | $ | 2,912 |
9/30/2008 | | 64,000 GBP | | 125,259 USD | | | 126,520 | | | 1,261 |
9/30/2008 | | 15,200,000 JPY | | 141,494 USD | | | 143,854 | | | 2,360 |
Contracts Sold: | | | | | | | | | | |
7/2/2008 | | 6,596 AUD | | 6,346 USD | | | 6,308 | | | 38 |
7/2/2008 | | 18,741 CHF | | 18,419 USD | | | 18,367 | | | 52 |
7/2/2008 | | 77,211 DKK | | 16,337 USD | | | 16,303 | | | 34 |
7/2/2008 | | 28,465 EUR | | 44,904 USD | | | 44,824 | | | 80 |
7/2/2008 | | 18,012 GBP | | 35,916 USD | | | 35,857 | | | 59 |
7/2/2008 | | 10 578,000 JPY | | 99,746 USD | | | 99,614 | | | 132 |
7/2/2008 | | 31,107 NOK | | 6,139 USD | | | 6,109 | | | 30 |
7/2/2008 | | 14,143 SEK | | 2,365 USD | | | 2,348 | | | 17 |
| | | | | | | | | | | |
Net unrealized appreciation on foreign exchange contracts | | | | | $ | 6,975 |
FOREIGN CURRENCY TRANSLATION
The accounting records of the International Stock Market Portfolio are maintained in U.S. dollars. All assets and liabilities denominated in foreign currencies (FCs) are translated into U.S. dollars based on the rates of exchange of such currencies against U.S. dollars on the date of valuation. Purchases and sales of securities and income and expenses are translated at the rate of exchange quoted on the respective date that such transactions are recorded. The Portfolio does not isolate that portion of the results of operations resulting from changes in foreign exchange rates on investments from the fluctuations arising from changes in market prices of securities held. Such fluctuations are included with the net realized and unrealized gain or loss from investments.
Net realized foreign exchange gains or losses arise from sales of foreign currencies, currency gains or losses realized between the trade and settlement dates on securities transactions, the difference between the amounts of dividends, interest and foreign withholding taxes recorded on the Portfolio’s books, and the U.S. dollar equivalent of the amounts actually received or paid. Net unrealized foreign exchange gains and losses arise from changes in the value of assets and liabilities other than investments in securities at fiscal year end, resulting from changes in the exchange rate.
RESTRICTED SECURITIES
Restricted securities are securities that either: (a) cannot be offered for public sale without first being registered, or being able to take advantage of an exemption from registration, under the Securities Act of 1933; or
| | | | |
| Notes to Financial Statements | | AARP PORTFOLIOS 2008 ANNUAL REPORT | | 85 |
(b) are subject to contractual restrictions on public sales. In some cases, when a security cannot be offered for public sale without first being registered, the issuer of the restricted security has agreed to register such securities for resale, at the issuer’s expense, either upon demand by the Portfolio or in connection with another registered offering of the securities. Many such restricted securities may be resold in the secondary market in transactions exempt from registration. Restricted securities may be determined to be liquid under criteria established by the Portfolios’ Board of Trustees. The Portfolios will not incur any registration costs upon such resales. The Portfolios’ restricted securities are valued at the price provided by dealers in the secondary market or, if no market prices are available, at the fair value as determined in accordance with procedures established by and under the general supervision of the Portfolios’ Board of Trustees.
Additional information on restricted securities, held by the U.S. Bond Market Portfolio at June 30, 2008, is as follows:
| | | | | | | | |
| Security | | Acquisition
date | | Acquisition
cost | | Value |
Dr. Pepper Snapple Group, Inc., 6.120%, 5/1/2013 | | 5/2/2008 | | $ | 102,765 | | $ | 101,467 |
FEDERAL TAXES
The Portfolios intend to comply with the provisions of the Internal Revenue Code (the “Code”) applicable to regulated investment companies and to distribute substantially all of their investment company taxable income, including any net realized gain on investments not offset by capital loss carryforwards, if any, to shareholders; therefore, no federal income or excise tax provision is required. As of June 30, 2008, tax years 2006 through 2008 remain subject to examination by the Portfolios’ major tax jurisdictions, which include the United States of America and the state of Delaware.
In July, 2006, Financial Accounting Standards Board (“FASB”) Interpretation No. 48, Accounting for Uncertainty in Income Taxes – an interpretation of FASB Statement 109 (“FIN 48”), was issued and is effective for years beginning after December 15, 2006. FIN 48 determines a threshold for financial statement recognition, measurement and disclosure of a tax position taken (or expected to be taken) on a tax return. The Portfolios’ financial statements have not been impacted by the adoption of FIN 48.
CUSTODIAN FEES
Custodian fees are included in “Portfolio accounting fees” in the Statements of Operations and may include interest expense incurred by the Portfolios on any cash overdrafts of its custodian account during the period. Such cash overdrafts may result from the effects of failed trades in portfolio securities and from cash outflows resulting from
| | | | |
| 86 | | AARP PORTFOLIOS 2008 ANNUAL REPORT | | Notes to Financial Statements |
Notes to Financial Statements (continued)
unanticipated shareholder redemption activity. The Portfolios pay interest to their custodian on such cash overdrafts to the extent they are not offset by positive cash balances maintained by the Portfolios at a rate equal to the Federal Funds Rate plus 2.00%. For the year ended June 30, 2008, the U.S. Bond Market Portfolio paid $133 in overdraft fees, the U.S. Stock Market Portfolio paid $40 in overdraft fees and the International Stock Market Portfolio paid $112 in overdraft fees.
INDEMNIFICATIONS
The Portfolios’ organizational documents provide current and former trustees and officers with a limited indemnification against liabilities arising in connection with the performance of their duties to the Portfolios. In the normal course of business, the Portfolios may also enter into contracts that provide general indemnifications. The Portfolios’ maximum exposure under these arrangements is unknown as this would be dependent on future claims that may be made against the Portfolios. The risk of material loss from such claims is considered remote.
DIVIDENDS AND DISTRIBUTIONS TO SHAREHOLDERS
Distributions to shareholders from net investment income and net realized gains, if any, are recorded on the ex-dividend date. Such distributions are determined in conformity with income tax regulations, which may differ from generally accepted accounting principles. Income distributions, if any, are declared and paid quarterly by the U.S. Stock Market Portfolio and International Stock Market Portfolio, and are paid monthly by the U.S. Bond Market Portfolio. Capital gains distributions, if any, are declared and paid annually by the Portfolios.
NEW ACCOUNTING PRONOUNCEMENTS
On March 19, 2008, the FASB issued Statement of Financial Accounting Standards No. 161 (“SFAS No. 161”), “Disclosure about Derivative Instruments and Hedging Activities.” This new accounting statement requires enhanced disclosures about an entity’s derivative and hedging activities. Entities are required to provide enhanced disclosures about (a) how and why an entity invests in derivatives, (b) how derivatives are accounted for under Statement 133, and (c) how derivatives affect and entity’s financial position, financial performance and cash flows. SFAS No. 161 also requires enhanced disclosures regarding credit-risk-related contingent features of derivative instruments. SFAS No. 161 is effective for financial statements issued for fiscal years and interim periods beginning after November 15, 2008. As of June 30, 2008, management of the Portfolios is currently assessing the impact of the expanded financial statement disclosures that will result from adopting SFAS No. 161.
| | | | |
| Notes to Financial Statements | | AARP PORTFOLIOS 2008 ANNUAL REPORT | | 87 |
3. Capital share transactions
The Portfolios have authorized an unlimited number of $0.001 par value shares of beneficial interest. Transactions in shares of beneficial interest are as follows:
| | | | | | |
| | | Year
ended
June 30,
2008 | | | Year
ended
June 30,
2007 | |
U.S. Bond Market Portfolio | | | | | | |
Shares sold | | 2,435,604 | | | 2,083,426 | |
Dividends and/or distributions reinvested | | 277,458 | | | 183,994 | |
Shares Redeemed | | (1,175,854 | ) | | (264,559 | ) |
Net increase | | 1,537,208 | | | 2,002,861 | |
| | |
U.S. Stock Market Portfolio | | | | | | |
Shares sold | | 1,639,791 | | | 1,455,017 | |
Dividends and/or distributions reinvested | | 131,224 | | | 55,634 | |
Shares redeemed | | (501,759 | ) | | (229,719 | ) |
Net increase | | 1,269,256 | | | 1,280,932 | |
| | |
International Stock Market Portfolio | | | | | | |
Shares sold | | 432,845 | | | 336,997 | |
Dividends and/or distributions reinvested | | 110,308 | | | 61,901 | |
Shares redeemed | | (185,810 | ) | | (73,131 | ) |
Net increase | | 357,343 | | | 325,767 | |
4. Purchases and sales of securities
The aggregate cost of purchases and proceeds from sales of securities for the year ended June 30, 2008, excluding U.S. Government and short-term obligations were as follows:
| | | | | | |
| Portfolio Name | | Purchases | | Sales |
| | | | | | |
U.S. Bond Market Portfolio | | $ | 7,486,003 | | $ | 1,869,483 |
U.S. Stock Market Portfolio | | $ | 17,961,161 | | $ | 5,053,557 |
International Stock Market Portfolio | | $ | 6,810,156 | | $ | 3,187,664 |
5. Federal income tax information
Net investment income (loss) and net realized gain (loss) may differ for financial statement and tax purposes. The character of dividends and distributions made during the fiscal year from net investment income or net realized gains may differ from their ultimate characterization for federal income tax purposes. These differences are attributable to the differing treatments for the deferral of losses on wash sales, the realization for tax purposes of unrealized gains on investments in passive foreign investment companies and differing treatments for futures and foreign currency transactions. Also, due to timing of dividends and distributions, the fiscal year in which amounts are distributed may differ from the fiscal year in which the income or net realized gain was recorded by a Portfolio. Additionally, short-term capital gains are considered ordinary income for income tax purposes.
| | | | |
| 88 | | AARP PORTFOLIOS 2008 ANNUAL REPORT | | Notes to Financial Statements |
Notes to Financial Statements (continued)
The tax character of distributions paid during the fiscal years ended June 30, 2008 and 2007, was as follows:
| | | | | | | | | | | | | | | | | | |
| |
| Distributions paid from: |
| |
| 2008 | | 2007 |
| |
| Portfolio Name | | Ordinary income | | Long-term capital gains | | Total | | Ordinary income | | Long-term capital gains | | Total |
| | | | | | | | | | | | | | | | | | | |
| |
U.S. Bond Market Portfolio | | $ | 2,784,529 | | $ | – | | $ | 2,784,529 | | $ | 1,822,188 | | $ | – | | $ | 1,822,188 |
U.S. Stock Market Portfolio | | $ | 1,002,945 | | $ | 457,737 | | $ | 1,460,682 | | $ | 608,671 | | $ | 15,107 | | $ | 623,778 |
International Stock Market Portfolio | | $ | 1,005,002 | | $ | 306,610 | | $ | 1,311,612 | | $ | 746,983 | | $ | – | | $ | 746,983 |
The timing and character of income and capital gain distributions are determined in accordance with income tax regulations, which may differ from Generally Accepted Accounting Principles. Reclassifications are made to the Fund’s capital accounts for permanent tax differences to reflect income and gains available for distribution under income tax regulations. During the fiscal year ended June 30, 2008, permanent book and tax basis differences resulting primarily from differing treatments for mortgage paydown gain and losses, foreign currency losses, real estate investment trusts and passive foreign investment companies were identified and reclassified among components of the Funds Net Assets.
| | | | | | | | |
| | | |
| Portfolio Name | | Undistributed
net investment
income (loss) | | | Accumulated
net realized
gains (loss) | |
| | | | | | | | | |
| | |
U.S. Bond Market Portfolio | | $ | 17,787 | | | $ | (17,787 | ) |
U.S. Stock Market Portfolio | | $ | (26,494 | ) | | $ | 26,494 | |
International Stock Market Portfolio | | $ | 122,516 | | | $ | (122,516 | ) |
Net investment income (loss), net realized gains (losses), and net assets were not affected by this reclassification.
The table below represents distribution requirements the Portfolios must satisfy under the income tax regulations. In addition, the table represents losses the Portfolios may be able to offset against income and gains realized in future years and unrealized appreciation or depreciation of securities and other investments for federal income tax purposes. Under current tax law, certain capital and net foreign currency losses realized after October 31 within the taxable year may be deferred and treated as occurring on the first day of the following year.
| | | | |
| Notes to Financial Statements | | AARP PORTFOLIOS 2008 ANNUAL REPORT | | 89 |
| | | | | | | | | | | | | | | | |
| Portfolio Name | | Undistributed
net investment
income | | Undistributed
long-term gain | | Accumulated loss
carryforward | | Post October
losses deferred | | Net unrealized appreciation
(depreciation) based on
cost of securities and
other investments for
federal income tax purposes | |
| | | | | | | | | | | | | | | | | |
| | |
U.S. Bond Market Portfolio | | $ | 28,966 | | $ | 40,710 | | $ | – | | $ | – | | $ | 57,201 | |
U.S. Stock Market Portfolio | | $ | 1,194 | | $ | 154,317 | | $ | – | | $ | – | | $ | (2,804,342 | ) |
International Stock Market Portfolio | | $ | 86,783 | | $ | 15,298 | | $ | – | | $ | – | | $ | 989,269 | |
The aggregate cost of securities and other investments and the composition of unrealized appreciation and depreciation of securities and other investments for federal income tax purposes as of June 30, 2008 are noted below. The primary difference between book and tax appreciation or depreciation of securities and other investments, if applicable, is attributable to the tax deferral of losses or tax realization of financial statement unrealized gain or loss.
| | | | | | | | | | | | | | |
| Portfolio Name | | Federal tax
cost of
securities | | Gross unrealized
appreciation | | Gross unrealized
depreciation | | | Net unrealized
appreciation
(depreciation) | |
| | | | | | | | | | | | | | | |
| | |
U.S. Bond Market Portfolio | | $ | 70,118,317 | | $ | 786,303 | | $ | (729,102 | ) | | $ | 57,201 | |
U.S. Stock Market Portfolio | | $ | 53,043,478 | | $ | 6,137,316 | | $ | (8,941,658 | ) | | $ | (2,804,342 | ) |
International Stock Market Portfolio | | $ | 25,293,531 | | $ | 3,747,494 | | $ | (2,737,355 | ) | | $ | 1,010,139 | |
6. Fees and other transactions with affiliates
MANAGEMENT AND SUB-ADVISER FEES
The Trust has an investment advisory agreement with AARP Financial Incorporated (“AARP Financial”) which delegates to AARP Financial the responsibility to manage the investment activities of the Portfolios, including the overall investment program of the Portfolios. AARP Financial is also responsible for overseeing the Portfolios’ sub-adviser, SSgA Funds Management, Inc. (“SSgA FM”), which manages the day-to-day investments of the Portfolios’ assets. Each Portfolio pays to AARP Financial an annual fee of 0.05% of its average daily net assets. AARP Financial pays SSgA FM for its sub-advisory services out of these fees. For the year ended June 30, 2008, the effective management fee rates are as shown below:
| | | | | | |
| | | |
| Portfolio Name | | Effective management
fee percentage (prior to
waiver/reimbursement
at AARP Funds level | | | Effective management
fee percentage (after
waiver/reimbursement
at AARP Funds level | |
| | | | | | | |
| | |
U.S. Bond Market Portfolio | | 0.05 | % | | 0.00 | % |
U.S. Stock Market Portfolio | | 0.05 | % | | 0.00 | % |
International Stock Market Portfolio | | 0.05 | % | | 0.00 | % |
| | | | |
| 90 | | AARP PORTFOLIOS 2008 ANNUAL REPORT | | Notes to Financial Statements |
Notes to Financial Statements (continued)
For the year ended June 30, 2008, AARP Financial contractually waived/reimbursed the following fees.
| | | | | | |
| Portfolio Name | | Management fee
waiver | | Reimbursement of
other operating
expenses |
| | | | | | |
U.S. Bond Market Portfolio | | $ | 28,666 | | $ | 76,127 |
U.S. Stock Market Portfolio | | $ | 25,714 | | $ | 102,907 |
International Stock Market Portfolio | | $ | 14,104 | | $ | 198,142 |
Had AARP Financial not waived/reimbursed these fees, returns for the Portfolios would have been lower.
ADMINISTRATION FEES
As the Portfolios’ administrator, AARP Financial provides the Portfolios with general administrative duties associated with the day-to-day operations of the Portfolios and monitors and coordinates the activities of the other service providers to the Portfolios. For its administrative services, AARP Financial is entitled to receive an annual fee of .035% of each Portfolio’s average daily net assets.
SUB-ADMINISTRATION AND CUSTODIAN FEES
State Street Bank and Trust Company (“State Street”) acts as the sub-administrator, custodian and fund accounting agent for the Portfolios. State Street is a subsidiary of State Street Corporation and an affiliate of SSgA FM. Under the terms of the sub-administration agreement, AARP Financial pays to State Street an annual fee at the rate of 0.0175% of the first $6 billion of the Portfolios’ average daily net assets and then a decreasing rate for average daily net assets above that level. Under the terms of the custody agreement, (which includes fund accounting services) each Portfolio pays to State Street an annual fee at the rate of 0.0075% of the first $2 billion of the Portfolio’s average daily net assets and 0.0025% of the Portfolio’s average daily net assets over $2 billion, plus out of pocket expenses.
Beginning July 1, 2006, under the terms of a transfer agency agreement, each Portfolio pays to State Street an annual fee at the rate of $4,000. State Street has in turn delegated transfer agency services to its affiliate, Boston Financial Data Services, Inc. For the year ended June 30, 2008, AARP Financial paid all transfer agency fees.
TRUSTEE COMPENSATION
The Trust is supervised by a Board of Trustees, (the “Board”). The Board represents the interests of the Portfolios and their shareholders. The Board meets periodically throughout the year to oversee the Portfolios’ activities. The Board consists of four “Independent Trustees”. The compensation of the Independent Trustees consists of an annual retainer paid quarterly. The Trust’s officers do not receive compensation from the Portfolios for their services. Compensation paid by the Portfolios to the Independent Trustees is included in the Portfolios’ Statements of Operations.
| | | | |
| Report of Independent Registered Public Accounting Firm | | AARP PORTFOLIOS 2008 ANNUAL REPORT | | 91 |
Report of Independent Registered Public Accounting Firm
The Board of Trustees and Shareholders AARP Portfolios:
We have audited the accompanying statements of assets and liabilities of U.S. Stock Market Portfolio, International Stock Market Portfolio, and U.S. Bond Market Portfolio, each a series of AARP Portfolios, including the portfolio of investments, as of June 30, 2008, and the related statements of operations for the year then ended, the statements of changes in net assets for each of the years in the two-year period then ended, and the financial highlights for each of the years or periods in the three-year period then ended. These financial statements and financial highlights are the responsibility of management. Our responsibility is to express an opinion on these financial statements and financial highlights based on our audits.
We conducted our audits in accordance with the standards of the Public Company Accounting Oversight Board (United States). Those standards require that we plan and perform the audit to obtain reasonable assurance about whether the financial statements and financial highlights are free of material misstatement. An audit includes examining, on a test basis, evidence supporting the amounts and disclosures in the financial statements. Our procedures included confirmation of securities owned as of June 30, 2008, by correspondence with custodians and brokers, or by other appropriate auditing procedures. An audit also includes assessing the accounting principles used and significant estimates made by management, as well as evaluating the overall financial statement presentation. We believe that our audits provide a reasonable basis for our opinion.
In our opinion, the financial statements and financial highlights referred to above present fairly, in all material respects, the financial position of U.S. Stock Market Portfolio, International Stock Market Portfolio, and U.S. Bond Market Portfolio as of June 30, 2008, and the results of their operations for the year then ended, the changes in their net assets for each of the years in the two-year period then ended, and the financial highlights for each of the years or periods in the three-year period then ended, in conformity with U.S. generally accepted accounting principles.

Boston, Massachusetts
August 20, 2008
| | | | |
| 92 | | AARP PORTFOLIOS 2008 ANNUAL REPORT | | AARP Portfolios–Supplemental Information |
AARP Portfolios—
Supplemental Information (unaudited)
2008 U.S. Tax Distribution Information to Shareholders
Corporate Dividends Received Deduction. For the year ended June 30, 2008, a percentage of dividends distributed by the Portfolios listed below qualifies for the dividends received deduction for corporate shareholders. These percentages are as follows:
| | | |
| Fund | | Qualifying
Percentages | |
| | | |
U.S. Bond Market Portfolio | | – | % |
U.S. Stock Market Portfolio | | 97.39 | |
International Stock Market Portfolio | | – | |
Qualified Dividend Income. The amount of dividends distributed by the Portfolios during the fiscal year ended June 30, 2008, are considered qualified dividend income, and are eligible for reduced tax rates. These lower rates range from 5% to 15% depending on an individual’s tax bracket. These amounts and corresponding percentage of dividends paid are as follows:
| | | | | | |
| Fund | | Percentage of
Dividends
Paid | | �� | Amounts |
| | | | | | |
U.S. Bond Market Portfolio | | – | % | | $ | – |
U.S. Stock Market Portfolio | | 89.03 | | | | 892,953 |
International Stock Market Portfolio | | 88.83 | | | | 892,753 |
Proxy voting policies, procedures and record
Both a description of the policies and procedures that AARP Financial uses to determine how to vote proxies on behalf of the AARP Portfolios relating to portfolio securities and information regarding how AARP Financial voted proxies related to portfolio securities during the most recent 12-month period ended June 30 is available on our web site at www.aarpfunds.com and, without charge, upon request, by calling us at 1-800-958-6457. Such information for the AARP Portfolios is also available on the Securities and Exchange Commission’s (“SEC”) website at www.sec.gov.
Shareholder statements and reports
When we send financial reports, prospectuses and other regulatory materials to shareholders, we attempt to reduce the volume of mail you receive by sending one copy of these documents to two or more account holders who share the same address. However, if you wish to receive individual copies of materials, please contact us at 1-800-958-6457. Once we have received your instructions, we will begin sending individual copies for each account within 30 days.
| | | | |
| AARP Portfolios–Supplemental Information | | AARP PORTFOLIOS 2008 ANNUAL REPORT | | 93 |
Statement regarding availability of quarterly portfolio schedule
The Portfolios will file complete schedules of investments with the SEC for the quarters ended September 30 and March 31 of each fiscal year (commencing with the quarter ended March 31, 2006) on Form N-Q which will be available on the SEC’s website at www.sec.gov. Additionally, the Portfolios’ Forms N-Q may be reviewed and copied at the SEC’s Public Reference Room in Washington DC. For information on the Public Reference Room, call 1-800-SEC-0330.
| | | | |
| 94 | | AARP PORTFOLIOS 2008 ANNUAL REPORT | | About the Portfolios’ Board of Trustees and Officers |
About the Portfolios’ Board of Trustees
and Officers (unaudited)
The Board of Trustees (“Board”) of the AARP Portfolios oversee the operation and management of the Portfolios.
The Board is comprised of four trustees who are independent, meaning that they are not “interested persons” of AARP Portfolios for purposes of the Investment Company Act. Put simply, this means that they do not have material affiliations with AARP Portfolios, AARP Financial or SSgA FM apart from the personal investments they may have made in AARP Funds as private individuals.
Our independent board members bring distinguished backgrounds in business, academia and public service to their task of working with AARP Portfolios officers to establish policies and oversee the activities of the Portfolios.
The table below shows information for each trustee and executive officer of AARP Portfolios. The mailing address of the trustees and officers is AARP Funds, 650 F Street, N.W., Washington, DC 20004, Attn: Fund Secretary.
Independent trustees
| | |
| |
PETER C. CLAPMAN c/o AARP Financial, Inc. 650 F Street, N.W. Washington, DC 20004 Age: 72 Chairman of the Board and
Trustee since 2005 | | Consultant, governance advisory services (July 2005–present) Head of U.S. operations, Governance for Owners (governance services and
consulting) (June 2005–present) Executive Director, Pace Law School (director education)
(April 2005–September 2006) Member, NASDAQ Listing Council (2005–present) Senior Vice President and Chief Counsel, TIAA-CREF (financial services, pension and investment products) (1972–July 2005). Other trusteeships held: Director, iPass, Inc. (February 2007–present) Director, National Association of Corporate Trustees (non-profit private director education) (January 2005–present) |
| |
RICHARD M. REILLY c/o AARP Financial, Inc., 650 F Street, N.W., Washington, DC 20004 Age: 70 Trustee since 2006 | | Self-Employed Consultant (November 2002–present) Senior Vice President, Allmerica Financial Corp. (financial services holding company) (November 2001–November 2002) President, Allmerica Financial Services (investments/insurance)
(1995–November 2001). Other trusteeships held: Trustee, International Foundation for Retiement Education (InFRE)
(September 2006–present) Trustee, Allmerica Investment Trust (investment company) (1990–November 2002) Trustee, Allmerica Securities Trust (1990–November 2002) |
| |
| | | | |
| About the Portfolios’ Board of Trustees and Officers | | AARP PORTFOLIOS 2008 ANNUAL REPORT | | 95 |
| | |
| |
ELLEN B. SAFIR, CFA c/o AARP Financial, Inc., 650 F Street, N.W., Washington, DC 20004 Age: 64 Trustee since 2006 | | Chief Executive Officer, New Century Advisors, LLC
(registered investment adviser) (2002–present) President, CFA Society of Washington, DC (July 2007–present) Member, Investment Committee, United States Holocaust Memorial Museum
(June 1997–present); Managing Director, Fixed Income and Currencies, Howard Hughes Medical Institute (medical research) (1986–2002). |
| |
LYNN E. TURNER c/o AARP Financial, Inc., 650 F Street, N.W., Washington, DC 20004 Age: 56 Trustee since 2005 | | Self-Employed Consultant (June 2007–present) Managing Director of Research, Glass Lewis & Co. LLC
(financial and proxy research) (July 2003–June 2007) Managing Director/Senior Advisor, Kroll, Inc.
(forensic accounting) (July 2003–present) Professor, Colorado State University (August 2001–June 2003) Chief Accountant, Securities and Exchange Commission (July 1998–August 2001). Other trusteeships held: Director, Guidance Software, Inc. (April 2007–February 2008) Trustee, Colorado Public Employees Retirement Association (COPERA)
(August 2007–present) |
| |
| |
Officers | | |
| |
RICHARD M. HISEY, CFA Two Highwood Drive, 2nd Floor Tewksbury MA 01876 Age: 49 President Treasurer and Chief Financial Officer | | President, AARP Financial (May 2008–present); Chief Investment Officer, AARP Financial (April 2006–present); Executive Vice President and Chief Investment Officer, Cole Management, Incorporated (venture capital firm) (2005–2006); Senior Vice President, MFS Investment Management and Treasurer and Chief Financial Officer, MFS Group of Mutual Funds (2002–2005); Senior Vice President, The Bank of New York (2000–2002). |
| |
| | |
SUSAN KIRKPATRICK Two Highwood Drive 2nd Floor Tewksbury, MA 01876 Age: 42 Chief Compliance Officer | | Chief Compliance Officer, AARP Financial (November 2007–present); Director of Compliance, AARP Financial (December 2005–November 2007); Chief Compliance Officer, Grail Partners (investment banking)
(March 2005–December 2005); Director, Devonshire Financial Group (consulting)
(September 2004–December 2005); NewRiver, Inc. (electronic delivery of compliance documents)
(July 1999–September 2004) |
| |
MARC DUFFY 650 F Street, N.W. Washington, DC 20004 Age: 50 Secretary | | Associate General Counsel, AARP Financial (August 2006–present); Assistant General Counsel, E*TRADE Financial Corporation
(January 2004–August 2006); Assistant General Counsel, Legg Mason Wood Walker, Incorporated
(September 1999–January 2004). |
| |
| | | | |
| 96 | | AARP PORTFOLIOS 2008 ANNUAL REPORT | | About the Portfolios’ Board of Trustees and Officers |
About the Portfolios’ Board of Trustees
and Officers (unaudited) (continued)
| | |
| |
JEFFREY J. GABOURY Two Highwood Drive, 2nd Floor Tewksbury MA 01876 Age: 39 Assistant Treasurer | | Assistant Treasurer, AARP Financial (April 2008–August 2008); Deputy Treasurer, Lord, Abbett & Co. LLC (June 2006–April 2008); Treasurer and Chief Financial Officer of the New York Life Investment Management Group of Mutual Funds (December 2004–December 2005); Director of Compliance, Investors Bank & Trust Company (August 1996–November 2004) |
| |
JULIE TEDESCO State Street Bank and
Trust Company 4 Copley Place 5th Floor Boston, MA 02116 Age: 50 Assistant Secretary | | Senior Vice President and Senior Managing Counsel, State Street Bank and Trust Company (2000–present). |
| |
THERESA DEWAR State Street Bank and Trust Company The John Hancock Tower 14th Floor Boston, MA 02116 Age: 53 Assistant Treasurer | | Senior Vice President, Fund Administration, State Street Bank and Trust Company (1997–present). |
| |
Additional information about AARP Funds’ trustees is provided in the Statement of Additional Information and is available without charge, upon request, by calling 1-800-958-6457.
AARP Portfolios
P.O. Box 909
Tewksbury, MA 01876-0909
©2008 AARP Portfolios
| | |
 | | ARP-AR-002-0808 |
Item 2. Code of Ethics
| (a) | AARP Portfolios (the “Registrant”) has adopted a Code of Ethics that applies to the Registrant’s principal executive officer and senior financial officers, including the principal financial officer, controller or principal accounting officer, or persons performing similar functions, regardless of whether these persons are employed by the Registrant or a third party. |
| (b) | No disclosures are required by this Item 2(b). |
| (c) | There have been no amendments to the Registrant’s Code of Ethics during the reporting period for Form N-CSR. |
| (d) | There have been no waivers granted by the Registrant to individuals covered by the Registrant’s Code of Ethics during the reporting period for Form N-CSR. |
| (f) | A copy of the Registrant’s Code of Ethics is attached as an exhibit to this Form N-CSR. |
Item 3. Audit Committee Financial Expert
(a) | (1) | The Board of Trustees of the Registrant has determined that the Registrant has one member serving on the Registrant’s Audit Committee that possesses the attributes identified in Instruction 2(b) of Item 3 to Form N-CSR to qualify as “audit committee financial expert.” |
| | (2) | For the reporting period, the name of the audit committee financial expert was Lynn Turner. Mr. Turner was deemed to be “independent” as that term is defined in Item 3(a)(2) of Form N-CSR. |
Item 4. Principal Accountant Fees and Services
| (a) | Audit Fees – The aggregate fees billed for professional services rendered by the independent registered public accounting firm for the audit of the Registrant’s annual financial statements or services normally provided in connection with statutory and regulatory filings or engagements for the last two fiscal years ended June 30, 2008 and June 30, 2007 were $58,387.50 and $145,000, respectively. |
| (b) | Audit-Related Fees – The Registrant was not billed any fees by the independent registered public accounting firm for the fiscal years ended June 30, 2008 and June 30, 2007 for assurance and related services rendered by the independent registered public accounting firm to the Registrant that are reasonably related to the performance of the audit of the Registrant’s financial statements and are not reported under paragraph (a) of this Item 4. |
During the fiscal years ended June 30, 2008 and June 30, 2007, no fees for assurance and related services that relate directly to the operations and financial reporting of the Registrant were billed by the independent registered public accounting firm to the Registrant’s investment adviser or any other entity controlling, controlled by, or under common control with the investment adviser that provides ongoing services to the Registrant.
| (c) | Tax Fees – During the fiscal years ended June 30, 2008 and June 30, 2007, no fees for tax compliance, tax advice, tax planning and tax return preparation were billed by the independent registered public accounting firm to the Registrant. |
During the fiscal years ended June 30, 2008 and June 30, 2007, no fees for tax compliance, tax advice or tax planning services that relate directly to the operations and financial reporting of the Registrant were billed by the independent registered public accounting firm to the Registrant’s investment adviser or any other entity controlling, controlled by, or under common control with the investment adviser that provides ongoing services to the Registrant.
During the fiscal years ended June 30, 2008 and June 30, 2007, the Registrant was billed $19,725 and $21,200, respectively by another accounting firm for tax compliance, tax advice, tax planning and tax return preparation.
During the fiscal years ended June 30, 2008 and June 30, 2007, no fees for tax compliance, tax advice or tax planning services that relate directly to the operations and financial reporting of the Registrant were billed by another accounting firm to the Registrant’s investment adviser or any other entity controlling, controlled by, or under common control with the investment adviser that provides ongoing services to the Registrant.
| (d) | All Other Fees – During the fiscal years ended June 30, 2008 and June 30, 2007, there were no fees billed for products and services provided by the independent registered public accounting firm to the Registrant, other than the services reported in paragraph (a) – (c) of this Item 4. |
During the fiscal years ended June 30, 2008 and June 30, 2007, no fees for other services that relate directly to the operations and financial reporting of the Registrant were billed by the independent registered public accounting firm to the Registrant’s investment adviser or any other entity controlling, controlled by, or under common control with the investment adviser that provides ongoing services to the Registrant.
| (e)(1) | Pre-Approval Policies and Procedures |
It is the general policy of the Audit Committee not to approve non-audit services. In considering whether to approve non-audit services, the Audit Committee will consider the following:
| | (a) | whether the service is being performed principally for the Audit Committee; |
| | (b) | the effects of the service, if any, on audit effectiveness or on the quality and timeliness of the Funds financial reporting process; |
| | (c) | whether the service would be performed by specialists (e.g., technology specialists) who ordinarily also provide recurring audit support; |
| | (d) | whether the service would be performed by audit personnel and, if so, whether it will enhance their knowledge of the Funds business and operations; |
| | (e) | whether the role of those performing the service would be inconsistent with the Auditor’s role (e.g., a role where neutrality, impartiality and auditor skepticism are likely to be subverted); |
| | (f) | whether the audit firm’s personnel would be assuming a management role or creating a mutuality of interest with management; |
| | (g) | whether the auditors, in effect, would be auditing their own numbers; |
| | (h) | whether the project must be started and completed very quickly and therefore is not a longer term relationship; |
| | (i) | whether the audit firm has unique service expertise in the service that cannot be obtained from another service provider; and |
| | (j) | the size of the fee(s) for the non-audit service(s). |
| (e)(2) | Percentage of Services. |
One hundred percent of the services described in each of paragraphs (b) through (d) of this Item were approved by the registrant’s Audit Committee pursuant to paragraph (c)(7)(i)(C) of Rule 2-01 of Regulation S-X.
| (f) | No disclosures are required by this Item 4(f). |
| (g) | The independent registered public accounting firm did not bill the Registrant for any other non-audit services for the fiscal years ended June 30, 2008 and June 30, 2007 for the Registrant other than as disclosed above. |
| (h) | No disclosures are required by this Item 4(h). |
Item 5. Audit Committee of Listed Registrants
Not applicable.
Item 6. Schedule of Investments
Schedule of Investments is included as a part of the report to shareholders filed under Item 1 of this Form N-CSR.
Item 7. Disclosure of Proxy Voting Policies and Procedures for Closed-End Management Investment Companies
Not applicable.
Item 8. Portfolio Managers of Closed-End Investment Companies
Not applicable.
Item 9. Purchases of Equity Securities by Closed-End Management Investment Company and Affiliated Purchasers
Not applicable.
Item 10. Submission of Matters to a Vote of Security Holders
The Board of Trustees has adopted procedures by which shareholders may recommend nominees to the Board. There have been no amendments to such procedures during the reporting period for Form N-CSR.
Item 11. Controls and Procedures
| (a) | The Registrant’s principal executive and principal financial officers have concluded that the Registrant’s disclosure controls and procedures (as defined in Rule 30a-3(c) under the Investment Company Act of 1940, as amended (the “1940 Act”) (17 CFR 270.30a-3(c)) are effective, as of a date within 90 days of the filing date of this Form N-CSR based on their evaluation of these controls and procedures required by Rule 30a-3(b) under the 1940 Act (17 CFR 270.30a-3(b)) and Rules 13a-15(b) or 15d-15(b) under the Securities Exchange Act of 1934 (17 CFR 240.13a-15(b) or 240.15d-15(b)). |
| (b) | There were no changes in the Registrant’s internal control over financial reporting (as defined in Rule 30a-3(d) under the 1940 Act (17 CFR 270.30a-3(d)) that occurred during the second fiscal quarter of the period covered by this report that has materially affected, or is reasonably likely to materially affect, the Registrant’s internal control over financial reporting. |
Item 12. Exhibits
| (a)(1) | Code of Ethics is attached hereto. |
| (a)(2) | The certifications required by Rule 30a-2(a) of the 1940 Act are attached hereto. (Ex-99.CERT) |
| (b) | The certifications required by Rule 30a-2(b) of the 1940 Act and Section 906 of the Sarbanes-Oxley Act of 2002 are attached hereto.(Ex-99.906CERT) |
SIGNATURES
Pursuant to the requirements of the Securities Exchange Act of 1934 and the Investment Company Act of 1940, the registrant has duly caused this report to be signed on its behalf by the undersigned, thereunto duly authorized.
| | |
| AARP PORTFOLIOS |
| |
| By: | | /s/ Richard M. Hisey |
| | Richard M. Hisey |
| | President (principal executive officer) of AARP Portfolios |
| |
| Date: | | August 19, 2008 |
Pursuant to the requirements of the Securities Exchange Act of 1934 and the Investment Company Act of 1940, this report has been signed below by the following persons on behalf of the registrant and in the capacities and on the dates indicated.
| | |
| By: | | /s/ Richard M. Hisey |
| | Richard M. Hisey |
| | President (principal executive officer) of AARP Portfolios |
| |
| Date: | | August 19, 2008 |
| |
| By: | | /s/ Richard M. Hisey |
| | Richard M. Hisey |
| | Treasurer (principal financial officer) of AARP Portfolios |
| |
| Date: | | August 19, 2008 |