UNITED STATES
SECURITIES AND EXCHANGE COMMISSION
Washington, D.C. 20549
FORM N-CSR
CERTIFIED SHAREHOLDER REPORT OF REGISTERED
MANAGEMENT INVESTMENT COMPANIES
Investment Company Act file number: 811-21825
AARP FUNDS
(Exact name of registrant as specified in charter)
650 F. Street, N.W.
Washington, DC 20004
(Address of principal executive offices)(Zip code)
| | |
| (Name and Address of Agent for Service) | | Copy to: |
| |
Larry C. Renfro AARP Funds 650 F Street, N.W. Washington, DC 20004 | | Gary O. Cohen, Esq. Jorden Burt LLP 1025 Thomas Jefferson Street, NW Suite 400 East Washington, DC 20007-5208 |
Registrant’s telephone number, including area code: (202) 434-3650
Date of fiscal year end: June 30
Date of reporting period: December 31, 2007
| Item 1. | Report to Shareholders |
A Letter to Shareholders
| | |
| | A LETTER TO SHAREHOLDERS |
| |

Larry C. Renfro President, AARP Funds | | Dear Fellow Shareholder, If you’ve been following the news on the economy and the financial markets, you know that these are challenging times. • A housing downturn, record energy prices, slower job growth and rising unemployment have weakened economic growth and made consumers less confident about the future. In fact, an increasing number of economists now forecast a recession for the U.S. economy. • At the same time, rising mortgage defaults and foreclosures, particularly in the subprime segment of the mortgage market, have led to tighter lending standards. |
We have received many calls about the economy in general and the subprime crisis in particular. While the accompanying Market Commentary discusses the general economy in more detail, the following is our perspective on the subprime mortgage crisis.
THE SUBPRIME CRISIS AND ITS LINK TO THE MARKETS
When the housing market was strong and mortgage rates were generally low, subprime lenders granted mortgages to buyers with lower credit ratings and other real estate investors. These borrowers had to pay higher rates than borrowers with better credit records. To qualify for loans, subprime borrowers often chose adjustable rate mortgages with low introductory interest rates. When these adjustable rate loans reset to higher rates, many homeowners who were already stretched to the limit were unable to make their payments. The increase in homeowner defaults and the subsequent foreclosures has forced some subprime lenders to declare bankruptcy. In addition, some large financial institutions that bought bonds backed by these lower-quality mortgages have also incurred losses. As a result, lenders have tightened their standards and credit market concerns have weighed on the bond and credit markets, in general.
We do not expect a quick resolution to these conditions: There is risk that credit concerns could spread to other segments of the fixed income markets. However, we expect conditions to improve over time. It is also important to keep in mind that subprime mortgages represent only ten percent of the U.S. mortgage market. The vast majority of mortgage loans continue to be repaid on a timely basis. And only seven percent of subprime loans are in foreclosure. Furthermore, the Federal Reserve Board has taken swift action to restore confidence in the credit markets and to stimulate the economy, including significant reductions in short-term interest rates.
MARKET VOLATILITY IN PERSPECTIVE
The deteriorating credit conditions that unsettled the credit markets also contributed to stock market volatility in 2007. In 2007, the markets experienced more volatility than in recent years. Market volatility is unsettling because no one can predict what will happen next. However, it’s easier to ignore short-term market fluctuations if you understand your personal investment time horizon and risk tolerance—and have a plan for achieving your long term goals.
The AARP Funds adhere to five investment principles that can help you stay focused on the long term and avoid mistakes that many investors make in a declining market. They offer low
NOT PART OF THE SEMI-ANNUAL REPORT
A Letter to Shareholders
fees, the benefits of indexing, automatic rebalancing, simple choices and diversification across asset classes, which provides a built in cushion against declining performance in any one segment of the markets.1
In 2007, all five of the AARP Funds performed competitively relative to their peers during the fourth quarter and for the year. The strong relative performance was largely due to the conservative bias in the positioning of the Funds. More specifically, the market environment in the latter part of 2007 favored conservative fixed income investments over other asset classes, including equities.
What should you do now? When the market and economic news is disappointing, it’s important to understand that history is on the side of the patient investor. Quick decisions based on recent market performance—whether it’s up or down—are rarely rewarded. And that is why the AARP Funds have been designed with a long-term focus so that you can weather the storm. In addition, you have access to an independent source of guidance. Our Investment Counselors are salaried professionals, focused on your needs—not on commissions. They are here to provide guidance and help you make informed investment decisions. Many of you have already taken advantage of this unique service, and we appreciate the consistently high ratings you have awarded our Investment Counselors. You can discuss your financial needs with one of these capable and experienced professionals by calling 1-800-958-6457 any time between 8:00 a.m. and 6:00 p.m. Eastern Time, Monday through Friday.
Thank you for investing in AARP Funds. We will continue to work hard to earn your confidence and to help you keep your long-term financial goals on target.
Sincerely,

Larry C. Renfro, President
Performance data quoted represents past performance which is no guarantee of future results. Investment return and principal value will fluctuate so that an investor’s shares, when redeemed, may be worth more or less than their original cost. Mutual fund performance changes over time and current performance may be lower or higher than what is stated. Returns shown do not reflect the deduction of taxes that a shareholder may pay on fund distributions or the redemption of fund shares. Mutual funds are not obligations of or guaranteed by any bank and are not federally insured. The performance of the Funds assumes the reinvestment of all dividends and distributions. The adviser is waiving a portion of its advisory fee and other operating expenses. Had the fees not been waived or reimbursed, returns would have been lower.
For the most recent month-end performance and after-tax returns, visit www.aarpfunds.com or call 1-800-958-6457.
This Letter to Shareholders must be preceded or accompanied by the AARP Funds prospectus for individuals who are not current AARP Funds shareholders. An investor should consider the investment objectives, risks, charges and expenses of AARP Funds carefully before investing. To get an additional prospectus containing this and other information, please call 1-800-958-6457. Read the prospectus carefully before you invest.
While AARP has licensed the use of its name to AARP Funds and endorses the services provided by AARP Financial Inc., AARP does not offer financial products or services itself, and it cannot recommend that you or any specific individual should purchase any particular product or service. AARP Financial Inc. is a registered investment adviser and a subsidiary of AARP.
Investment Counselors are FINRA registered representatives through ALPS Distributors, Inc., a registered broker/dealer, and employed by AARP Financial Inc.
AARP Funds are advised by AARP Financial Inc. and distributed by ALPS Distributors, Inc.
AARP Financial Inc. is not affiliated with ALPS Distributors, Inc.
1 | Diversification reduces risk but does not eliminate it. |
NOT PART OF THE SEMI-ANNUAL REPORT
Market Commentary
Market Commentary December 31, 2007 (unaudited)
Rising energy costs, deteriorating credit markets, and a weak housing market weighed heavily on investors in the fourth quarter as worries about consumer spending, which accounts for more than two-thirds of the U.S. economy, dominated the economic news. Weakened consumer spending has already had an impact on the pace of economic growth: Growth slowed from an annualized rate of 4.9% in the third quarter to an estimated 0.6% in the fourth quarter.
Despite a volatile fourth quarter, equity markets—both here and abroad—posted gains for 2007. The MSCI US Investable Market 2500 Index recorded a 3.25% loss for the quarter, but ended the year with a positive return of 5.80%. International equities, as measured by the MSCI EAFE Index, recorded a 1.75% loss for the quarter, but ended the year with a positive return of 11.17%. The Federal Reserve Board (the Fed) has responded to weak economic news and problems in the credit markets by reducing a key short-term interest rate, the federal funds rate, in an effort to stimulate economic growth. The Fed’s actions helped lift prices on longer-term fixed income securities. Bonds, as measured by the Lehman Aggregate Bond Index, returned 3.00% for the fourth quarter and ended the year with a positive return of 6.97%.
AARP Funds
Despite mixed returns in the fourth quarter, both stock and bond markets gained ground for the year. In the equity markets, sharp gains in the energy and materials sectors helped offset steep losses in the financial sector—the worst-performing sector for the year. Outside the U.S., double digit returns from the Nordic and Pacific markets (ex Japan) helped offset negative performance from Japan as well as Ireland, Belgium and Sweden. These returns, plus strong performance in many smaller developed markets, resulted in strong returns for developed foreign markets for the year, despite the quarter’s losses. Bonds were positive performers for both the quarter and the year. Long-term, high quality securities led the fixed income markets. Against this backdrop, all AARP Funds posted positive returns for 2007. Given the relatively strong performance of bonds during the fourth quarter, the AARP Conservative Fund and Income Fund both posted positive returns for the quarter as well.
As uncertainty over the economy’s prospects continues, the markets are likely to remain volatile. History shows that periods of volatility are not unusual. They call for patience, focus and commitment to a diversified portfolio. An emotional response to short-term fluctuations can result in immediate losses—and missed opportunities down the road. However, a diversified portfolio can be an investor’s best ally during volatile times.1
NOT PART OF THE SEMI-ANNUAL REPORT
Market Commentary
Performance data quoted represents past performance which is no guarantee of future results. Investment return and principal value will fluctuate so that an investor’s shares, when redeemed, may be worth more or less than their original cost. Mutual fund performance changes over time and current performance may be lower or higher than what is stated. Returns shown do not reflect the deduction of taxes that a shareholder may pay on fund distributions or the redemption of fund shares. Mutual funds are not obligations of or guaranteed by any bank and are not federally insured. The performance of the Funds assumes the reinvestment of all dividends and distributions. The indexes above have been adjusted to reflect reinvestment of dividends on securities in the indexes and do not reflect the expenses of managing a fund. It is not possible to invest directly in an Index. The adviser is waiving a portion of its advisory fee and other operating expenses. Had the fees not been waived or reimbursed, returns would have been lower.
For the most recent month-end performance and after-tax returns, visit www.aarpfunds.com or call 1-800-958-6457.
An investment in the AARP Money Market Fund is not insured or guaranteed by the Federal Deposit Insurance Corporation or any other government agency. Although the Fund seeks to preserve the value of your investment at $1.00 per share, it is possible to lose money by investing in the Fund.
The views, forecasts and supporting information contained in this Market Commentary are as of December 31, 2007 and are subject to change. This Market Commentary must be preceded or accompanied by the AARP Funds prospectus for individuals who are not current AARP Funds shareholders. An investor should consider the investment objectives, risks, charges and expenses of AARP Funds carefully before investing. To get an additional prospectus containing this and other information, please call 1-800-958-6457. Read the prospectus carefully before you invest.
While AARP has licensed the use of its name to AARP Funds and endorses the services provided by AARP Financial Inc., AARP does not offer financial products or services itself, and it cannot recommend that you or any specific individual should purchase any particular product or service. AARP Financial Inc. is a registered investment adviser and a subsidiary of AARP.
Investment Counselors are FINRA registered representatives through ALPS Distributors, Inc., a registered broker/dealer, and employed by AARP Financial Inc.
AARP Funds are advised by AARP Financial Inc. and distributed by ALPS Distributors, Inc.
AARP Financial Inc. is not affiliated with ALPS Distributors, Inc.
1 | Diversification reduces risk but does not eliminate it. |
NOT PART OF THE SEMI-ANNUAL REPORT
AARP FUNDS
…
Semi-Annual Report
December 31, 2007 (unaudited)
…
KEEPING YOU INFORMED
This shareholder report for the AARP Funds represents our commitment to providing communications that are clear, concise and informative. One of our highest priorities at AARP Funds is to help you make sense of investment information that is often complex. We hope you find it helpful in evaluating your investment with us.
EXPERTISE AND GUIDANCE
WHEN YOU NEED IT
AARP Financial’s Investment Counselors are ready to help you determine if you are on track financially for retirement and to answer specific questions about AARP Funds. They work on salary, not commission, and are there to help you focus on your goals, take decisive action and feel comfortable with your decisions. Investment Counselors are FINRA registered representatives through ALPS Distributors, Inc., and are employed by AARP Financial.
AARP FUNDS 2007 SEMI-ANNUAL REPORT 1
Table of Contents
This Shareholder Report must be preceded or accompanied by the AARP Funds prospectus for individuals who are not current AARP Funds shareholders. An investor should consider the investment objectives, risks, charges and expenses of AARP Funds carefully before investing. To get an additional prospectus containing this and other information, please call 1-800-958-6457. Read the prospectus carefully before you invest.
While AARP has licensed the use of its name to AARP Funds and endorses the services provided by AARP Financial Inc., AARP cannot recommend that you or any specific individual should purchase shares of a particular fund. AARP is not a registered investment adviser or broker/dealer.
AARP Funds are distributed by ALPS Distributors, Inc.
AARP Financial Inc. is not affiliated with ALPS Distributors, Inc.
2 AARP FUNDS 2007 SEMI-ANNUAL REPORT AARP Funds Overview
AARP Funds Overview
The AARP Funds (excluding the AARP Money Market Fund) are “funds of funds” because they invest substantially all of their assets in the underlying AARP Portfolios (the “AARP Portfolios”), each of which is a separately registered investment company.
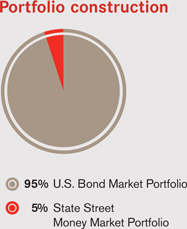
The AARP Funds (excluding the AARP Money Market Fund) invest in one or more of the AARP Portfolios, but in different amounts. In addition to its investment in the U.S. Bond Market Portfolio, the AARP Income Fund also invests a portion of its assets in the State Street Money Market Portfolio (the “State Street Portfolio”), a series of a separately registered investment company called the State Street Master Funds.
The AARP Money Market Fund is a feeder fund, buying shares of the master fund, the State Street Portfolio. This is called a “master-feeder” structure because it allows different feeder funds to pool their assets in an underlying master fund to seek economies of scale.
| | | | | | | | | | | | | | | |
| | | AARP
Aggressive Fund | | | AARP
Moderate Fund | | | AARP
Conservative Fund | | | AARP
Income Fund | | | AARP Money
Market Fund | |
Investment Objective | | Seeks growth of
capital and some
current income | | | Seeks a balance
of growth of
capital and
current income | | | Seeks primarily
current income,
with some growth
of capital | | | Seeks current
income and long-
term preservation
of capital | | | Seeks current
income, liquidity,
preservation of
capital, and a
stable $ 1.00
per share price | |
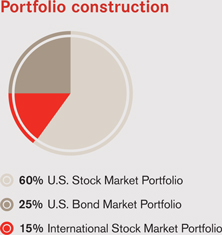
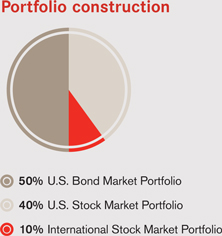
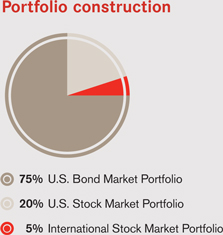
U.S. Stock Market Portfolio | | 60 | % | | 40 | % | | 20 | % | | — | | | — | |
U.S. Bond Market Portfolio | | 25 | % | | 50 | % | | 75 | % | | 95 | % | | — | |
International Stock Market Portfolio | | 15 | % | | 10 | % | | 5 | % | | — | | | — | |
State Street Portfolio | | — | | | — | | | — | | | 5 | % | | 100 | % |
Source: AARP Funds
AARP Portfolios Top 10 Holdings as a percentage of net assets at December 31, 2007 (unaudited)
| | | |
U.S. Stock Market Portfolio | | | |
Exxon Mobil Corp. | | 3.2 | % |
General Electric Co. | | 2.4 | % |
Microsoft Corp. | | 1.9 | % |
AT&T, Inc. | | 1.6 | % |
Procter & Gamble Co. | | 1.4 | % |
Chevron Corp. | | 1.2 | % |
Johnson & Johnson | | 1.2 | % |
Bank of America Corp. | | 1.1 | % |
Apple Computer, Inc. | | 1.1 | % |
Cisco Systems, Inc. | | 1.0 | % |
Total | | 16.1 | % |
| | | |
U.S. Bond Market Portfolio | | | |
FNMA, 7.000%, 8/1/37 | | 1.2 | % |
U.S. Treas. Notes, 4.250%, 11/1/15 | | 1.2 | % |
FNMA, 5.500%, 4/01/35 | | 1.1 | % |
U.S. Treas. Notes, 4.250%, 9/30/12 | | 1.1 | % |
U.S. Treas. Notes, 4.000%, 2/15/15 | | 1.1 | % |
FHLMC, 5.500%, 3/1/36 | | 1.0 | % |
FNMA, 4.750%, 12/15/10 | | 1.0 | % |
U.S. Treas. Notes, 4.500%, 3/31/12 | | 0.9 | % |
FNMA, 4.331%, 6/1/36 | | 0.9 | % |
U.S. Treas. Notes, 4.625%, 12/31/11 | | 0.9 | % |
Total | | 10.4 | % |
| | | |
International Stock Market Portfolio | | | |
BP PLC | | 1.6 | % |
Vodafone Group PLC | | 1.4 | % |
HSBC Holdings PLC | | 1.4 | % |
Nestle SA | | 1.3 | % |
Total SA | | 1.2 | % |
Royal Dutch Shell | | 1.1 | % |
Nokia OYJ | | 1.1 | % |
Toyota Motor Corp. | | 1.0 | % |
GlaxoSmithKline PLC | | 1.0 | % |
Telefonica SA | | 1.0 | % |
Total | | 12.1 | % |
How the Funds Performed AARP FUNDS 2007 SEMI-ANNUAL REPORT 3
How the Funds Performed as of December 31, 2007 (unaudited)
| | | | | | | | | | | | |
| | | 6-months | | | 12 months | | | Average
annual since
inception | | | Cumulative
since
inception | |
AARP Aggressive Fund | | 0.51 | % | | 6.81 | % | | 10.01 | %1 | | 21.08 | %1 |
Aggressive Composite Index | | 0.57 | % | | 7.01 | % | | 10.61 | %1 | | 22.35 | %1 |
MSCI U.S. Investable Market 2500 Index®2 | | -1.66 | % | | 5.80 | % | | 10.64 | %1 | | 22.41 | %1 |
| | | | |
AARP Moderate Fund | | 2.22 | % | | 6.71 | % | | 8.37 | %1 | | 17.50 | %1 |
Moderate Composite Index | | 2.37 | % | | 7.09 | % | | 8.99 | %1 | | 18.78 | %1 |
MSCI U.S. Investable Market 2500 Index®2 | | -1.66 | % | | 5.80 | % | | 10.64 | %1 | | 22.41 | %1 |
Lehman Brothers Aggregate Bond Index®2 | | 5.93 | % | | 6.97 | % | | 5.64 | %1 | | 11.61 | %1 |
| | | | |
AARP Conservative Fund | | 4.12 | % | | 6.76 | % | | 6.84 | %1 | | 14.19 | %1 |
Conservative Composite Index | | 4.16 | % | | 7.04 | % | | 7.32 | %1 | | 15.19 | %1 |
Lehman Brothers Aggregate Bond Index®2 | | 5.93 | % | | 6.97 | % | | 5.64 | %1 | | 11.61 | %1 |
| | | | |
AARP Income Fund | | 5.78 | % | | 6.67 | % | | 6.04 | %3 | | 7.66 | %3 |
Income Composite Index | | 5.74 | % | | 6.83 | % | | 6.46 | %3 | | 8.18 | %3 |
Lehman Brothers Aggregate Bond Index®2 | | 5.93 | % | | 6.97 | % | | 6.57 | %3 | | 2.21 | %3 |
Citigroup 3-Month Treasury Bill Index | | 2.20 | % | | 4.74 | % | | 4.81 | %3 | | 6.07 | %3 |
| | | | |
AARP Money Market Fund | | 2.49 | % | | 5.09 | % | | 5.07 | %4 | | 7.73 | %4 |
Citigroup 3-Month Treasury Bill Index | | 2.20 | % | | 4.74 | % | | 4.84 | %4 | | 7.38 | %4 |
1 | For the period from January 1, 2006 (commencement of operations) to December 31, 2007. |
2 | The MSCI U.S. Investable Market 2500 Index and the Lehman Brothers Aggregate Bond Index serve as broad measures of the U.S equity and taxable bond markets, respectively. Since the Funds invest in differing combinations of these and other markets, Composite Indexes have been constructed utilizing the proportionate weightings of the indexes for each market. These Composite Indexes provide a particularly useful benchmark to measure the performance of the Funds. For more detailed information regarding the Composite Indexes and the Underlying Indexes, please see A Word about Benchmarks below. |
3 | For the period from September 29, 2006 (commencement of operations) to December 31, 2007. |
4 | For the period from July 1, 2006 (commencement of operations) to December 31, 2007. |
Sources: MSCI Barra, Lehman Brothers Inc., Citigroup, AARP Financial Inc.
Total annual fund operating fees and expenses are 1.42% for the Aggressive Fund, 1.00% for the Moderate Fund, 1.86% for the Conservative Fund, 6.84% for the Income Fund and 0.92% for the Money Market Fund. Net annual fund operating fees and expenses for the funds (after contractual waivers and/or reimbursements) are 0.30% for the Money Market Fund and 0.50% for the others through November 1, 2008 and November 1, 2009, respectively.
Performance data quoted represents past performance which is no guarantee of future results. Investment return and principal value will fluctuate so that an investor’s shares, when redeemed, may be worth more or less than their original cost. Mutual fund performance changes over time and current performance may be lower or higher than what is stated. Returns shown do not reflect the deduction of taxes that a shareholder may pay on fund distributions or the redemption of fund shares. Mutual funds are not obligations of or guaranteed by any bank and are not federally insured. The performance of the Funds assumes the reinvestment of all dividends and distributions. The indexes above have been adjusted to reflect reinvestment of dividends on securities in the indexes. The returns of the Funds are net of expenses. Indexes do not have expenses. The adviser is waiving a portion of its advisory fee and other operating expenses. Had the fees not been waived or reimbursed, returns would have been lower. It is not possible to invest directly in an Index.
For the most recent month-end performance and after-tax returns, visit www.aarpfunds.com or call 1-800-958-6457.
An investment in the AARP Money Market Fund is not insured or guaranteed by the Federal Deposit Insurance Corporation or any other government agency. Although the Fund seeks to preserve the value of your investment at $1.00 per share, it is possible to lose money by investing in the Fund.
4 AARP FUNDS 2007 SEMI-ANNUAL REPORT A Word about Benchmarks
A Word about Benchmarks
A useful tool to measure the performance of AARP Funds.
When evaluating how your investment performed, it’s helpful to compare it to an appropriate benchmark. You can think of the benchmark as a handy yardstick for measuring how well the fund did in meeting its investment objectives. For example, the AARP Income Fund tries to produce returns comparable to the Lehman Brothers Aggregate Bond Index.
The AARP Aggressive Fund, AARP Moderate Fund and AARP Conservative Fund are indexed and try to produce the returns of a mixture of three indexes. For these Funds, a particularly useful benchmark is one that combines the three indexes in similar amounts to the target investments of the Funds. When you combine different indexes into one benchmark, it’s called a “composite index”.
We also believe it is useful for you to consider the returns of the overall bond and stock markets when you assess the performance of the AARP Funds. This allows you to see how diversification works in practice. Sometimes the bond and stock markets move in opposite directions, or when the stock market goes down, the bond market doesn’t go quite as far down.
There is one caveat though. Please remember that a benchmark of indexes has a built-in performance advantage over an actual mutual fund. An index is merely a list of securities in a stock or bond market so the returns of indexes do not reflect the real world costs of managing a mutual fund. It is difficult to match the returns of an index because of this difference.

Indexes vs. index funds
Indexes, as opposed to index funds, are a group or list of securities representing a market or part of a market. The returns of the index do not reflect the costs of actually investing in the index and do not include fees, brokerage commissions or other expenses of investing. While you can invest in an index fund – it’s a real investment, you cannot invest directly in an index – it’s just a list.
A Word about Benchmarks AARP FUNDS 2007 SEMI-ANNUAL REPORT 5
Following is a table that shows the make up of the index weightings for each AARP Fund:
| | | | | | | | | | | | | | | |
| | | AARP
Aggressive Fund
Aggressive
Composite Index | | | AARP
Moderate Fund
Moderate
Composite Index | | | AARP
Conservative Fund
Conservative
Composite Index | | | AARP
Income Fund
Income
Composite Index | | | AARP Money
Market Fund | |
Lehman Brothers Aggregate Bond Index® | | 25 | % | | 50 | % | | 75 | % | | 95 | % | | — | |
MSCI U.S. Investable Market 2500 Index® | | 60 | % | | 40 | % | | 20 | % | | — | | | — | |
MSCI EAFE Index® | | 15 | % | | 10 | % | | 5 | % | | — | | | — | |
Citigroup 3-Month Treasury Bill Index | | — | | | — | | | — | | | 5 | % | | 100 | % |
Source: AARP Funds
A description of each index
• | | Lehman Brothers Aggregate Bond Index® — The index includes a large variety of U.S. and foreign bonds traded in U.S. markets that are investment grade and taxable, covering three major types of bonds: government and corporate bonds, mortgage-backed securities and asset-backed securities. |
• | | MSCI U.S. Investable Market 2500 Index®* — The index includes about 2,500 securities listed on the New York and American Stock Exchanges and the Nasdaq over-the-counter market. The stocks include companies of all types and sizes, which represent the investable universe of companies in the U.S. Equity market. |
• | | MSCI EAFE Index®* — The index includes about 1,000 securities that are listed on the stock exchanges of 21 developed countries, excluding the United States and Canada. |
| • | | Citigroup 3-Month Treasury Bill Index — The index is comprised of equal dollar amounts of 3-Month Treasury Bills purchased at the beginning of each of the prior three consecutive months. As each bill matures, all proceeds are reinvested in a new 3-month bill. |
| * | Please note that although the AARP Funds seek to track these MSCI indexes, MSCI does not sponsor, endorse, or promote the AARP Funds. For a more detailed description of our relationship with MSCI please see the statement of additional information for the AARP Funds. |
6 AARP FUNDS 2007 SEMI-ANNUAL REPORT AARP Aggressive Fund Overview
AARP Aggressive Fund Overview
Portfolio of investments
December 31, 2007 (unaudited)
Mutual funds: 99.9%
| | | | | |
| | | Shares | | Value |
U.S. Stock Market Portfolio1 | | 1,419,667 | | $ | 16,311,969 |
U.S. Bond Market Portfolio1 | | 675,241 | | | 6,819,931 |
International Stock Market Portfolio1 | | 316,127 | | | 3,999,003 |
Total investments: 99.9% (Identified cost $26,323,843) | | | | | 27,130,903 |
| | | | | |
Other assets and liabilities, net: 0.1% | | | | | 17,942 |
| | | | | |
Total net assets: 100.0% | | | | $ | 27,148,845 |
See Notes to Financial Statements.
Performance summary
Average Annual Returns as of December 31, 2007 (unaudited)
| | | | | | | | | |
| | | 6-month | | | 1-year | | | Since
inception | |
AARP Aggressive Fund | | 0.51 | % | | 6.81 | % | | 10.01 | %1 |
Aggressive Composite Index | | 0.57 | % | | 7.01 | % | | 10.61 | %1 |
MSCI U.S. Investable Market 2500 Index®2 | | -1.66 | % | | 5.80 | % | | 10.64 | %1 |
Performance data quoted represents past performance which is no guarantee of future results. Investment return and principal value will fluctuate so that an investor’s shares, when redeemed, may be worth more or less than their original cost. Mutual fund performance changes over time and current performance may be lower or higher than what is stated. Returns shown do not reflect the deduction of taxes that a shareholder may pay on fund distributions or the redemption of fund shares. Mutual funds are not obligations of or guaranteed by any bank and are not federally insured. The performance of the Funds assumes the reinvestment of all dividends and distributions. The indexes above have been adjusted to reflect reinvestment of dividends on securities in the indexes. The returns of the Funds are net of expenses. Indexes do not have expenses. The adviser is waiving a portion of its advisory fee and other operating expenses. Had the fees not been waived or reimbursed, returns would have been lower. It is not possible to invest directly in an Index.
For the most recent month-end performance and after-tax returns, visit www.aarpfunds.com or call 1-800-958-6457.
1 | For the period from January 1, 2006 (commencement of operations) to December 31, 2007. |
2 | The MSCI U.S. Investable Market 2500 Index serves as broad measure of the U.S equity market. Since the Fund invests in differing combinations of this and other markets, the Aggressive Composite Index has been constructed utilizing the proportionate weightings of the indexes for each market. This Composite Index provides a particularly useful benchmark to measure the performance of the Fund. For more detailed information regarding the Composite Indexes and the Underlying Indexes, please see “A Word about Benchmarks” on page 4. |
Sources: MSCI Barra, AARP Financial Inc.
AARP Moderate Fund Overview AARP FUNDS 2007 SEMI-ANNUAL REPORT 7
AARP Moderate Fund Overview
Portfolio of investments
December 31, 2007 (unaudited)
Mutual funds: 100.2%
| | | | | | |
| | | Shares | | Value | |
U.S. Bond Market Portfolio1 | | 2,038,280 | | $ | 20,586,623 | |
U.S. Stock Market Portfolio1 | | 1,419,472 | | | 16,309,737 | |
International Stock Market Portfolio1 | | 323,516 | | | 4,092,474 | |
Total investments: 100.2% (Identified cost $39,830,641) | | | | | 40,988,834 | |
| | | | | | |
Other assets and liabilities, net: (0.2)% | | | | | (77,153 | ) |
| | | | | | |
Total net assets: 100.0% | | | | $ | 40,911,681 | |
See Notes to Financial Statements.
Performance summary
Average Annual Returns as of December 31, 2007 (unaudited)
| | | | | | | | | |
| | | 6-month | | | 1-year | | | Since
inception | |
AARP Moderate Fund | | 2.22 | % | | 6.71 | % | | 8.37 | %1 |
Moderate Composite Index | | 2.37 | % | | 7.09 | % | | 8.99 | %1 |
MSCI U.S. Investable Market 2500 Index®2 | | -1.66 | % | | 5.80 | % | | 10.64 | %1 |
Lehman Brothers Aggregate Bond Index®2 | | 5.93 | % | | 6.97 | % | | 5.64 | %1 |
Performance data quoted represents past performance which is no guarantee of future results. Investment return and principal value will fluctuate so that an investor’s shares, when redeemed, may be worth more or less than their original cost. Mutual fund performance changes over time and current performance may be lower or higher than what is stated. Returns shown do not reflect the deduction of taxes that a shareholder may pay on fund distributions or the redemption of fund shares. Mutual funds are not obligations of or guaranteed by any bank and are not federally insured. The performance of the Funds assumes the reinvestment of all dividends and distributions. The indexes above have been adjusted to reflect reinvestment of dividends on securities in the indexes. The returns of the Funds are net of expenses. Indexes do not have expenses. The adviser is waiving a portion of its advisory fee and other operating expenses. Had the fees not been waived or reimbursed, returns would have been lower. It is not possible to invest directly in an Index.
For the most recent month-end performance and after-tax returns, visit www.aarpfunds.com or call 1-800-958-6457.
1 | For the period from January 1, 2006 (commencement of operations) to December 31, 2007. |
2 | The MSCI U.S. Investable Market 2500 Index and the Lehman Brothers Aggregate Bond Index serve as broad measures of the U.S equity and taxable bond markets, respectively. Since the Fund invests in differing combinations of these and other markets, the Moderate Composite Index has been constructed utilizing the proportionate weightings of the indexes for each market. This Composite Index provides a particularly useful benchmark to measure the performance of the Fund. For more detailed information regarding the Composite Indexes and the Underlying Indexes, please see “A Word about Benchmarks” on page 4. |
Sources: MSCI Barra, Lehman Brothers, Inc., AARP Financial Inc.
8 AARP FUNDS 2007 SEMI-ANNUAL REPORT AARP Conservative Fund Overview
AARP Conservative Fund Overview
Portfolio of investments
December 31, 2007 (unaudited)
Mutual funds: 99.2%
| | | | | |
| | | Shares | | Value |
U.S. Bond Market Portfolio1 | | 1,052,124 | | $ | 10,626,449 |
U.S. Stock Market Portfolio1 | | 244,646 | | | 2,810,985 |
International Stock Market Portfolio1 | | 55,290 | | | 699,413 |
Total investments: 99.2% (Identified cost $13,766,093) | | | | | 14,136,847 |
| | | | | |
Other assets and liabilities, net: 0.8% | | | | | 111,059 |
| | | | | |
Total net assets: 100.0% | | | | $ | 14,247,906 |
See Notes to Financial Statements.
Performance summary
Average Annual Returns as of December 31, 2007 (unaudited)
| | | | | | | | | |
| | | 6-month | | | 1-year | | | Since
inception | |
AARP Conservative Fund | | 4.12 | % | | 6.76 | % | | 6.84 | %1 |
Conservative Composite Index | | 4.16 | % | | 7.04 | % | | 7.32 | %1 |
Lehman Brothers Aggregate Bond Index®2 | | 5.93 | % | | 6.97 | % | | 5.64 | %1 |
Performance data quoted represents past performance which is no guarantee of future results. Investment return and principal value will fluctuate so that an investor’s shares, when redeemed, may be worth more or less than their original cost. Mutual fund performance changes over time and current performance may be lower or higher than what is stated. Returns shown do not reflect the deduction of taxes that a shareholder may pay on fund distributions or the redemption of fund shares. Mutual funds are not obligations of or guaranteed by any bank and are not federally insured. The performance of the Funds assumes the reinvestment of all dividends and distributions. The indexes above have been adjusted to reflect reinvestment of dividends on securities in the indexes. The returns of the Funds are net of expenses. Indexes do not have expenses. The adviser is waiving a portion of its advisory fee and other operating expenses. Had the fees not been waived or reimbursed, returns would have been lower. It is not possible to invest directly in an Index.
For the most recent month-end performance and after-tax returns, visit www.aarpfunds.com or call 1-800-958-6457.
1 | For the period from January 1, 2006 (commencement of operations) to December 31, 2007. |
2 | The Lehman Brothers Aggregate Bond Index serves as broad measure of the U.S taxable bond market. Since the Fund invests in differing combinations of this and other markets, the Conservative Composite Index has been constructed utilizing the proportionate weightings of the indexes for each market. This Composite Index provides a particularly useful benchmark to measure the performance of the Fund. For more detailed information regarding the Composite Indexes and the Underlying Indexes, please see “A Word about Benchmarks” on page 4. Sources: Lehman Brothers, Inc., AARP Financial Inc. |
AARP Income Fund Overview AARP FUNDS 2007 SEMI-ANNUAL REPORT 9
AARP Income Fund Overview
Portfolio of investments
December 31, 2007 (unaudited)
Mutual funds: 101.0%
| | | | | | |
| | | Shares | | Value | |
U.S. Bond Market Portfolio1 | | 319,052 | | $ | 3,222,424 | |
State Street Money Market Portfolio2 | | 174,501 | | | 174,501 | |
Total investments: 101.0% (Identified cost $3,346,733) | | | | | 3,396,925 | |
| | | | | | |
Other assets and liabilities, net: (1.0)% | | | | | (34,020 | ) |
| | | | | | |
Total net assets: 100.0% | | | | $ | 3,362,905 | |
2 | Investment in non-controlled affiliate. |
See Notes to Financial Statements.
Performance summary
Average Annual Returns as of December 31, 2007 (unaudited)
| | | | | | | | | |
| | | 6-month | | | 1-year | | | Since
inception | |
AARP Income Fund | | 5.78 | % | | 6.67 | % | | 6.04 | %1 |
Income Composite Index | | 5.74 | % | | 6.83 | % | | 6.46 | %1 |
Lehman Brothers Aggregate Bond Index®2 | | 5.93 | % | | 6.97 | % | | 6.57 | %1 |
Citigroup 3-Month Treasury Bill Index | | 2.20 | % | | 4.74 | % | | 4.81 | %1 |
Performance data quoted represents past performance which is no guarantee of future results. Investment return and principal value will fluctuate so that an investor’s shares, when redeemed, may be worth more or less than their original cost. Mutual fund performance changes over time and current performance may be lower or higher than what is stated. Returns shown do not reflect the deduction of taxes that a shareholder may pay on fund distributions or the redemption of fund shares. Mutual funds are not obligations of or guaranteed by any bank and are not federally insured. The performance of the Funds assumes the reinvestment of all dividends and distributions. The indexes above have been adjusted to reflect reinvestment of dividends on securities in the indexes. The returns of the Funds are net of expenses. Indexes do not have expenses. The adviser is waiving a portion of its advisory fee and other operating expenses. Had the fees not been waived or reimbursed, returns would have been lower. It is not possible to invest directly in an Index.
For the most recent month-end performance and after-tax returns, visit www.aarpfunds.com or call 1-800-958-6457.
1 | For the period from September 29, 2006 (commencement of operations) to December 31, 2007. |
2 | The Lehman Brothers Aggregate Bond Index serves as broad measure of the U.S taxable bond market. Since the Fund invests in differing combinations of this and other markets, the Income Composite Index has been constructed utilizing the proportionate weightings of the indexes for each market. This Composite Index provides a particularly useful benchmark to measure the performance of the Fund. For more detailed information regarding the Composite Indexes and the Underlying Indexes, please see “A Word about Benchmarks” on page 4. |
Sources: Lehman Brothers, Inc., Citigroup, AARP Financial Inc.
10 AARP FUNDS 2007 SEMI-ANNUAL REPORT AARP Money Market Fund Overview
AARP Money Market Fund Overview
Portfolio of investments
December 31, 2007 (unaudited)
Mutual funds: 99.7%
| | | |
| | | Value |
Investment in State Street Money Market Portfolio1 | | $ | 52,506,747 |
Total investments: 99.7% (Identified cost $52,506,747) | | | 52,506,747 |
| | | |
Other assets and liabilities, net: 0.3% | | | 132,535 |
| | | |
Total net assets: 100.0% | | $ | 52,639,282 |
1 | The financial statements of the State Street Money Market Portfolio, including its investment portfolio, are included elsewhere within this report and should be read in conjunction with the AARP Money Market Fund’s financial statements. |
AARP Money Market Fund invests only in State Street Money Market Portfolio. At December 31, 2007, AARP Money Market Fund owned 0.76% of the State Street Money Market Portfolio.
See Notes to Financial Statements.
Performance summary
Average Annual Returns as of December 31, 2007 (unaudited)
| | | | | | | | | |
| | | 6-month | | | 1-year | | | Since
inception | |
AARP Money Market Fund | | 2.49 | % | | 5.09 | % | | 5.07 | %1 |
Citigroup 3-month Treasury Bill Index | | 2.20 | % | | 4.74 | % | | 4.84 | %1 |
Maturity ladder
Maturities as of December 31, 2007 (unaudited)
| | | |
0-3 Days | | 20.3 | % |
4-90 Days | | 55.8 | % |
90+ Days | | 23.9 | % |
Total | | 100.0 | % |
Average Maturity | | 38 Days | |
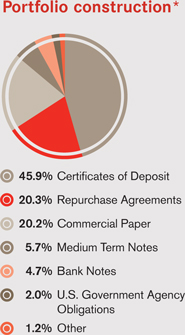
| * | Portfolio construction represents the composition of the underlying holdings in the State Street Money Market Portfolio, whose financial statements are included elsewhere in this report. As a percentage of net assets as of the date indicated. The Portfolio’s composition will vary over time. |
Performance data quoted represents past performance which is no guarantee of future results. Investment return and principal value will fluctuate so that an investor’s shares, when redeemed, may be worth more or less than their original cost. Mutual fund performance changes over time and current performance may be lower or higher than what is stated. Returns shown do not reflect the deduction of taxes that a shareholder may pay on fund distributions or the redemption of fund shares. Mutual funds are not obligations of or guaranteed by any bank and are not federally insured. The performance of the Funds assumes the reinvestment of all dividends and distributions. The indexes above have been adjusted to reflect reinvestment of dividends on securities in the indexes. The returns of the Funds are net of expenses. Indexes do not have expenses. The adviser is waiving a portion of its advisory fee and other operating expenses. Had the fees not been waived or reimbursed, returns would have been lower. It is not possible to invest directly in an Index.
For the most recent month-end performance and after-tax returns, visit www.aarpfunds.com or call 1-800-958-6457.
An investment in the AARP Money Market Fund is not insured or guaranteed by the Federal Deposit Insurance Corporation or any other government agency. Although the Fund seeks to preserve the value of your investment at $1.00 per share, it is possible to lose money by investing in the Fund.
1 | For the period from July 1, 2006 (commencement of operations) to December 31, 2007. |
Sources: Citigroup, AARP Financial Inc.
Understanding Your Expenses AARP FUNDS 2007 SEMI-ANNUAL REPORT 11
Understanding Your Expenses (unaudited)
As a shareholder of a Fund, you incur ongoing costs, including investment advisory fees, distribution (12b-1) fees, shareholder services fees, and other expenses of running a fund. It is important to understand exactly how much you pay to purchase and own a fund and to compare the costs of owning different funds because these costs reduce your returns.
The example in the table on the next page is intended to help you to understand your ongoing costs in dollars of investing in an AARP Fund and to compare these costs with the ongoing costs of investing in other mutual funds. It is based on an investment of $1,000 invested at the beginning of the period and held for the entire period from July 1, 2007 to December 31, 2007.
Actual expenses
The first line for each Fund in the table on the next page, labeled “Actual”, provides information about actual account values and actual expenses. You may use this information, together with the amount you invested, to estimate the expenses that you incurred over the period. Simply divide your account value by $1,000 (for example, an $8,600 account value divided by $1,000 = 8.6), then multiply the result by the number in the line labeled “Actual” under the heading entitled “Expenses Paid During Period” to estimate the expenses attributable to your investment during this period.
Hypothetical example for comparison purposes
The second line for each fund in the table, labeled “Hypothetical”, helps you compare the costs of an AARP Fund to other funds using a 5% return as required by the Securities and Exchange Commission for all mutual funds. It provides information about hypothetical account values and hypothetical expenses based on a Fund’s actual expense ratio and an assumed rate of return of 5% per year before expenses, which is not a Fund’s actual return. You should not use the hypothetical account values and expenses to estimate the actual ending account balance or your expenses for the period. Rather, these figures help you to compare the ongoing costs of investing in an AARP Fund with other funds. To do so, compare this 5% hypothetical example with the 5% hypothetical examples that appear in the shareholder reports of other funds.
Please note that the expenses shown in the table are meant to highlight your ongoing costs only and do not reflect any transaction costs, such as redemption fees, which are charged by some mutual funds. Therefore, the line labeled “Hypothetical” is useful in comparing ongoing costs only, and will not help you determine the relative total costs of owning different funds. If these transaction costs were included, your costs would have been higher.
12 AARP FUNDS 2007 SEMI-ANNUAL REPORT Understanding Your Expenses
In addition to the fees and expenses which the Fund bears directly, the Fund indirectly bears a pro rata share of the fees and expenses of the underlying portfolios in which the Fund invests. Because the underlying portfolios have varied expenses and fee levels and the Fund may own different proportions of the underlying portfolios at different times, the amount of fees and expenses incurred indirectly by the Fund may vary in the future. However AARP Financial has agreed contractually to waive fees and reimburse expenses to keep the net total operating expenses of the AARP Funds, including the indirect fees and expenses of the underlying portfolios, at 0.50% of average daily net assets through at least November 1, 2008. In addition, effective March 1, 2007, AARP Financial has agreed contractually to waive fees and reimburse expenses to keep the net total operating expenses of the AARP Money Market Fund, including its pro-rata allocation of expenses from the State Street Portfolio, at 0.30% of average daily net assets through at least November 1, 2009.
| | | | | | | | | | | | | | | | | | |
| | | Beginning
account
value
7/1/07 | | Ending
account
value
12/31/07 | | Expenses
paid
during
period2 | | Annualized
expense
ratio2 | | | Effective
expenses
paid
during the
period3 | | Effective
annualized
expense
ratio3 | |
AARP Aggressive Fund | | | | | | | | | | | | | | | | | | |
Actual | | $ | 1,000 | | $ | 1,005.10 | | $ | 1.21 | | 0.24 | % | | $ | 2.52 | | 0.50 | % |
Hypothetical1 | | $ | 1,000 | | $ | 1,023.93 | | $ | 1.22 | | | | | $ | 2.54 | | | |
AARP Moderate Fund | | | | | | | | | | | | | | | | | | |
Actual | | $ | 1,000 | | $ | 1,022.20 | | $ | 1.22 | | 0.24 | % | | $ | 2.54 | | 0.50 | % |
Hypothetical1 | | $ | 1,000 | | $ | 1,023.93 | | $ | 1.22 | | | | | $ | 2.54 | | | |
AARP Conservative Fund | | | | | | | | | | | | | | | | | | |
Actual | | $ | 1,000 | | $ | 1,041.20 | | $ | 1.28 | | 0.25 | % | | $ | 2.57 | | 0.50 | % |
Hypothetical1 | | $ | 1,000 | | $ | 1,023.88 | | $ | 1.27 | | | | | $ | 2.54 | | | |
AARP Income Fund | | | | | | | | | | | | | | | | | | |
Actual | | $ | 1,000 | | $ | 1,057.80 | | $ | 1.34 | | 0.26 | % | | $ | 2.59 | | 0.50 | % |
Hypothetical1 | | $ | 1,000 | | $ | 1,023.83 | | $ | 1.32 | | | | | $ | 2.54 | | | |
AARP Money Market Fund | | | | | | | | | | | | | | | | | | |
Actual | | $ | 1,000 | | $ | 1,024.90 | | $ | 1.53 | | 0.30 | % | | $ | 1.53 | | 0.30 | % |
Hypothetical1 | | $ | 1,000 | | $ | 1,023.63 | | $ | 1.53 | | | | | $ | 1.53 | | | |
1 | The Hypothetical example assumes a 5% return before expenses. |
2 | Expenses reflect the Fund’s annualized net expense ratios multiplied by the average account value over the period, multiplied by 184/366 (to reflect the one-half year period). The fees and expenses of the underlying portfolios are not included in these amounts. |
3 | Effective expenses reflect the sum of the expenses borne directly by the Fund plus the Fund’s pro-rata share of the weighted average expense ratio of the underlying portfolios in which it invests. The effective annualized expense ratio combines the Fund’s annualized net expense ratio and the annualized weighted average expense ratios of the underlying portfolios. The annualized weighted average expense ratio includes the annualized expense ratio for each underlying portfolio weighted for the Fund’s relative average investment during the same period. |
How to Read Financial Statements AARP FUNDS 2007 SEMI-ANNUAL REPORT 13
How to Read Financial Statements
Mutual funds are companies that pool money from many investors and invest that money in stocks, bonds and other securities and assets. Mutual fund financial statements show investors where a fund’s money came from, where it went, where it is and what it is worth as of the close of the fund’s most recent fiscal period. The portfolio of investments shows where the money is as of the close of the fund’s most recent fiscal period. The holdings of each AARP Fund as of December 31, 2007 are shown in the individual Fund Overview sections of this annual report. In addition, this section of the annual report contains four additional financial statements:
1. Statements of assets and liabilities.
These statements are the Funds’ balance sheets as of the close of the period (December 31, 2007). They show the value and the cost of what each Fund owned, how much it owed to others and the resulting difference or “net assets”.
| • | | Assets are the stocks, bonds, cash, and other financial instruments that a fund owns and has purchased with monies investors pay when they purchase shares. |
| • | | Liabilities are the amounts of money that a fund owes. Liabilities include payments due for the purchase of financial investments as well as bills that a fund incurs for services that are needed to run a fund, such as legal services and printing. |
| • | | Net assets=total assets–total liabilities. Net assets represent what is left of assets after liabilities are subtracted. This leftover amount belongs to the investors, or shareholders, of the fund. |
2. Statements of operations
These statements provide a summary of the investment income, such as dividends, that a fund has earned as well as gains and losses from its investment activities for the period ended December 31, 2007. Realized gains or losses reflect the difference between purchase price and selling price for transactions that took place during the period. Unrealized gains and losses reflect the difference between purchase price and the value of investments that are still held as of the end of the period. The statements also include specific details of fund expenses.
3. Statements of changes in net assets
These statements describe the changes in net assets during the current and prior period, which result from operations, any distributions of earnings to investors, and any shareholder transactions.
4. Financial highlights
The financial highlights table is intended to help you understand a fund’s financial performance for a share outstanding for the current period and each of the applicable prior periods.

The Notes to Financial Statements provide additional information to help you better understand the financial statements. They include a description of the most important accounting policies used in portraying the company’s financial condition and results, including how a fund records and values its investments, tax information, as well as additional detail on shareholder and investment transactions.
14 AARP FUNDS 2007 SEMI-ANNUAL REPORT Financial Statements
Financial Statements
Statements of assets and liabilities December 31, 2007 (unaudited)
| | | | | | | | | | | | | | | | | | |
| | | AARP
Aggressive
Fund | | | AARP
Moderate
Fund | | AARP
Conservative
Fund | | AARP
Income
Fund | | | AARP
Money Market
Fund | |
Assets: | | | | | | | | | | | | | | | | | | |
Investments in affiliated issuers, at value (identified cost of $26,323,843, $39,830,641 $13,766,093 and $3,172,232, respectively) | | $ | 27,130,903 | | | $ | 40,988,834 | | $ | 14,136,847 | | $ | 3,222,424 | | | $ | — | |
Investments in State Street | | | | | | | | | | | | | | | | | | |
Money Market Portfolio, at value (identified cost of $174,501 and $52,506,747, respectively) | | | — | | | | — | | | — | | | 174,501 | | | | 52,506,747 | |
Cash | | | — | | | | 55 | | | — | | | — | | | | — | |
Reimbursement receivable | | | 33,130 | | | | 31,158 | | | 24,720 | | | 23,122 | | | | 38,902 | |
Receivable for fund shares sold | | | 93,389 | | | | 44,086 | | | 134,848 | | | 11,134 | | | | 241,205 | |
| | | | | | | | | | | | | | | | | | |
Total assets | | $ | 27,257,422 | | | $ | 41,064,133 | | $ | 14,296,415 | | $ | 3,431,181 | | | $ | 52,786,854 | |
| | | | | | | | | | | | | | | | | | |
Liabilities: | | | | | | | | | | | | | | | | | | |
Payable for fund shares redeemed | | | 52,425 | | | | 91,303 | | | 5,135 | | | 33,543 | | | | 79,097 | |
Income distribution payable | | | — | | | | — | | | — | | | — | | | | 6,434 | |
Accrued portfolio acct. fees (Note 6) | | | 1,555 | | | | 1,597 | | | 1,533 | | | 1,422 | | | | 1,305 | |
Accrued administration fees (Note 6) | | | 793 | | | | 1,200 | | | 406 | | | 97 | | | | 1,528 | |
Accrued transfer agent fees (Note 6) | | | 14,856 | | | | 15,160 | | | 6,030 | | | 1,451 | | | | 15,484 | |
Accrued distribution services fee | | | 4,521 | | | | 6,841 | | | 2,315 | | | 555 | | | | 8,716 | |
Accrued audit fees | | | 10,027 | | | | 10,027 | | | 10,027 | | | 10,403 | | | | 10,403 | |
Accrued insurance fees | | | 3,288 | | | | 6,024 | | | 2,081 | | | 211 | | | | 696 | |
Accrued registration fees | | | — | | | | — | | | — | | | — | | | | 989 | |
Accrued printing and postage expenses | | | 9,021 | | | | 9,021 | | | 9,021 | | | 10,241 | | | | 10,241 | |
Accrued legal fees | | | 6,190 | | | | 6,190 | | | 6,190 | | | 6,190 | | | | 6,190 | |
Other accrued expenses and liabilities | | | 5,901 | | | | 5,089 | | | 5,771 | | | 4,163 | | | | 6,489 | |
Total liabilities | | $ | 108,577 | | | $ | 152,452 | | $ | 48,509 | | $ | 68,276 | | | $ | 147,572 | |
| | | | | | | | | | | | | | | | | | |
Net assets | | $ | 27,148,845 | | | $ | 40,911,681 | | $ | 14,247,906 | | $ | 3,362,905 | | | $ | 52,639,282 | |
| | | | | | | | | | | | | | | | | | |
Net assets consist of: | | | | | | | | | | | | | | | | | | |
Paid-in capital | | $ | 26,150,883 | | | $ | 39,573,477 | | $ | 13,850,596 | | $ | 3,324,704 | | | $ | 52,639,286 | |
Net unrealized appreciation of investments | | | 807,060 | | | | 1,158,193 | | | 370,754 | | | 50,192 | | | | — | |
Accumulated net realized gain (loss) on investments | | | 191,020 | | | | 179,958 | | | 26,496 | | | (12,010 | ) | | | (4 | ) |
Undistributed (distributions in excess of) net investment income | | | (118 | ) | | | 53 | | | 60 | | | 19 | | | | — | |
| | | | | | | | | | | | | | | | | | |
Net assets | | $ | 27,148,845 | | | $ | 40,911,681 | | $ | 14,247,906 | | $ | 3,362,905 | | | $ | 52,639,282 | |
| | | | | | | | | | | | | | | | | | |
Shares of beneficial interest outstanding | | | 2,359,136 | | | | 3,710,984 | | | 1,354,371 | | | 331,718 | | | | 52,639,286 | |
| | | | | | | | | | | | | | | | | | |
Net asset value per share | | $ | 11.51 | | | $ | 11.02 | | $ | 10.52 | | $ | 10.14 | | | $ | 1.00 | |
| | | | | | | | | | | | | | | | | | |
See Notes to Financial Statements.
Financial Statements AARP FUNDS 2007 SEMI-ANNUAL REPORT 15
Financial Statements (continued)
Statements of operations Six months ended December 31, 2007 (unaudited)
| | | | | | | | | | | | | | | | | | | | |
| | | AARP
Aggressive
Fund | | | AARP
Moderate
Fund | | | AARP
Conservative
Fund | | | AARP
Income
Fund | | | AARP
Money Market
Fund | |
| Investment income: | | | | | | | | | | | | | | | | | | | | |
Dividends from affiliated issuers | | $ | 398,394 | | | $ | 712,153 | | | $ | 281,836 | | | $ | 64,730 | | | $ | — | |
Interest allocated from State Street | | | | | | | | | | | | | | | | | | | | |
Money Market Portfolio | | | — | | | | — | | | | — | | | | 3,484 | | | | 1,207,577 | |
| | | | | | | | | | | | | | | | | | | | |
Total investment income | | $ | 398,394 | | | $ | 712,153 | | | $ | 281,836 | | | $ | 68,214 | | | $ | 1,207,577 | |
| | | | | | | | | | | | | | | | | | | | |
| Expenses: | | | | | | | | | | | | | | | | | | | | |
Expenses allocated from State Street Money Market Portfolio | | | — | | | | — | | | | — | | | | 68 | | | | 23,364 | |
Investment adviser fee (Note 6) | | | 1,223 | | | | 1,848 | | | | 632 | | | | 131 | | | | — | |
Administration fees (Note 6) | | | 4,281 | | | | 6,468 | | | | 2,211 | | | | 457 | | | | 8,152 | |
Registration fees | | | 12,957 | | | | 14,882 | | | | 13,058 | | | | 12,246 | | | | 11,329 | |
Transfer and dividend disbursing agent fees and expenses (Note 6) | | | 58,306 | | | | 49,180 | | | | 17,398 | | | | 4,369 | | | | 54,522 | |
Trustees’ fees | | | 10,000 | | | | 10,000 | | | | 10,000 | | | | 10,000 | | | | 10,000 | |
Audit fees | | | 9,373 | | | | 9,373 | | | | 9,373 | | | | 8,999 | | | | 8,999 | |
Legal fees | | | 29,386 | | | | 29,385 | | | | 29,386 | | | | 29,385 | | | | 29,385 | |
Portfolio accounting fees (Note 6) | | | 8,600 | | | | 8,778 | | | | 8,524 | | | | 8,498 | | | | 8,395 | |
Distribution service fees | | | 24,461 | | | | 36,959 | | | | 12,633 | | | | 2,613 | | | | 46,580 | |
Printing and postage expenses | | | 7,818 | | | | 7,818 | | | | 7,818 | | | | 8,038 | | | | 8,038 | |
Insurance expense | | | 3,288 | | | | 6,024 | | | | 2,081 | | | | 211 | | | | 695 | |
Miscellaneous | | | 4,331 | | | | 4,331 | | | | 4,331 | | | | 4,334 | | | | 4,331 | |
| | | | | | | | | | | | | | | | | | | | |
Total expenses | | $ | 174,024 | | | $ | 185,046 | | | $ | 117,445 | | | $ | 89,349 | | | $ | 213,790 | |
| | | | | | | | | | | | | | | | | | | | |
| Waivers and reimbursements (Note 6): | | | | | | | | | | | | | | | | | | | | |
Reduction of expenses by investment adviser | | | (144,411 | ) | | | (139,848 | ) | | | (101,869 | ) | | | (85,945 | ) | | | (143,918 | ) |
| | | | | | | | | | | | | | | | | | | | |
Net expenses | | | 29,613 | | | | 45,198 | | | | 15,576 | | | | 3,404 | | | | 69,872 | |
| | | | | | | | | | | | | | | | | | | | |
Net investment income | | | 368,781 | | | | 666,955 | | | | 266,260 | | | | 64,810 | | | | 1,137,705 | |
| | | | | | | | | | | | | | | | | | | | |
| Realized and unrealized gain (loss) on investments: | | | | | | | | | | | | | | | | | | | | |
Net realized gain (loss) on affiliated investments | | | 130,261 | | | | 215,358 | | | | 59,560 | | | | (8,318 | ) | | | — | |
Capital gain distributions from affiliated investments | | | 181,150 | | | | 181,796 | | | | 34,405 | | | | — | | | | — | |
Net change in unrealized appreciation (depreciation) of investments | | | (567,438 | ) | | | (220,903 | ) | | | 143,405 | | | | 86,443 | | | | — | |
| | | | | | | | | | | | | | | | | | | | |
Net realized and unrealized gain (loss) on investments | | | (256,027 | ) | | | 176,251 | | | | 237,370 | | | | 78,125 | | | | — | |
| | | | | | | | | | | | | | | | | | | | |
Change in net assets resulting from operations | | $ | 112,754 | | | $ | 843,206 | | | $ | 503,630 | | | $ | 142,935 | | | $ | 1,137,705 | |
| | | | | | | | | | | | | | | | | | | | |
See Notes to Financial Statements.
16 AARP FUNDS 2007 SEMI-ANNUAL REPORT Financial Statements
Financial Statements (continued)
Statements of changes in net assets
| | | | | | | | | | | | | | | | |
| | | AARP Aggressive Fund | | | AARP Moderate Fund | |
| | | Six months
ended
12/31/07
(unaudited) | | | Year
ended
6/30/07 | | | Six months
ended
12/31/07
(unaudited) | | | Year
ended
6/30/07 | |
Increase (decrease) in net assets | | | | | | | | | | | | | | | | |
Operations: | | | | | | | | | | | | | | | | |
Net investment income | | $ | 368,781 | | | $ | 311,276 | | | $ | 666,955 | | | $ | 706,669 | |
Net realized gain (loss) on affiliated investments | | | 311,411 | | | | 64,523 | | | | 397,154 | | | | 174,252 | |
Net change in unrealized appreciation (depreciation) of investments | | | (567,438 | ) | | | 1,463,167 | | | | (220,903 | ) | | | 1,590,280 | |
| | | | | | | | | | | | | | | | |
Change in net assets resulting from operations | | | 112,754 | | | | 1,838,966 | | | | 843,206 | | | | 2,471,201 | |
| | | | | | | | | | | | | | | | |
Distributions to shareholders: | | | | | | | | | | | | | | | | |
From net investment income | | | (368,959 | ) | | | (326,680 | ) | | | (667,488 | ) | | | (726,251 | ) |
From net realized gains on investments | | | (161,853 | ) | | | (485 | ) | | | (362,860 | ) | | | (448 | ) |
| | | | | | | | | | | | | | | | |
Change in net assets resulting from distributions to shareholders | | | (530,812 | ) | | | (327,165 | ) | | | (1,030,348 | ) | | | (726,699 | ) |
| | | | | | | | | | | | | | | | |
Share transactions: | | | | | | | | | | | | | | | | |
Proceeds from sales of shares | | | 9,096,824 | | | | 14,326,319 | | | | 11,884,700 | | | | 20,156,884 | |
Net asset value of shares issued on reinvestment of dividends | | | 500,976 | | | | 306,759 | | | | 982,357 | | | | 690,077 | |
Cost of shares redeemed | | | (2,252,675 | ) | | | (2,376,776 | ) | | | (3,693,704 | ) | | | (3,798,646 | ) |
| | | | | | | | | | | | | | | | |
Change in net assets resulting from share transactions | | | 7,345,125 | | | | 12,256,302 | | | | 9,173,353 | | | | 17,048,315 | |
| | | | | | | | | | | | | | | | |
Change in net assets | | | 6,927,067 | | | | 13,768,103 | | | | 8,986,211 | | | | 18,792,817 | |
| | | | | | | | | | | | | | | | |
Net assets: | | | | | | | | | | | | | | | | |
Beginning of period | | $ | 20,221,778 | | | $ | 6,453,675 | | | $ | 31,925,470 | | | $ | 13,132,653 | |
| | | | | | | | | | | | | | | | |
End of period | | $ | 27,148,845 | | | $ | 20,221,778 | | | $ | 40,911,681 | | | $ | 31,925,470 | |
| | | | | | | | | | | | | | | | |
Undistributed (distributions in excess of) net investment income included in net assets at end of period | | $ | (118 | ) | | $ | 60 | | | $ | 53 | | | $ | 586 | |
| | | | | | | | | | | | | | | | |
1 | For the period from September 29, 2006 (commencement of operations) through June 30, 2007. |
See Notes to Financial Statements.
Financial Statements AARP FUNDS SEMI-ANNUAL REPORT 17
| | | | | | | | | | |
AARP Conservative Fund | | AARP Income Fund | | AARP Money Market Fund |
Six months ended 12/31/07 (unaudited) | | Year ended 6/30/07 | | Six months ended 12/31/07 (unaudited) | | Year ended 6/30/071 | | Six months ended 12/31/07 (unaudited) | | Year ended 6/30/07 |
$ 266,260 | | $ 342,687 | | $ 64,810 | | $ 38,730 | | $ 1,137,705 | | $ 257,459 |
93,965 | | 34,092 | | (8,318) | | (3,660) | | — | | (4) |
143,405 | | 332,822 | | 86,443 | | (36,251) | | — | | — |
| | | | | | | | | | | |
503,630 | | 709,601 | | 142,935 | | (1,181) | | 1,137,705 | | 257,455 |
| | | | | | | | | | | |
(267,815) | | (346,605) | | (64,880) | | (38,730) | | (1,137,705) | | (257,459) |
(93,875) | | (849) | | (32) | | — | | — | | — |
| | | | | | | | | | | |
(361,690) | | (347,454) | | (64,912) | | (38,730) | | (1,137,705) | | (257,459) |
| | | | | | | | | | | |
3,583,862 | | 6,121,245 | | 1,459,583 | | 2,568,586 | | 31,974,591 | | 38,408,002 |
331,893 | | 313,936 | | 52,450 | | 29,841 | | 1,091,982 | | 246,685 |
(1,431,317) | | (1,756,336) | | (564,916) | | (220,751) | | (16,168,960) | | (2,913,014) |
| | | | | | | | | | | |
2,484,438 | | 4,678,845 | | 947,117 | | 2,377,676 | | 16,897,613 | | 35,741,673 |
| | | | | | | | | | | |
2,626,378 | | 5,040,992 | | 1,025,140 | | 2,337,765 | | 16,897,613 | | 35,741,669 |
| | | | | | | | | | | |
$11,621,528 | | $ 6,580,536 | | 2,337,765 | | $ — | | 35,741,669 | | $ — |
| | | | | | | | | | | |
$14,247,906 | | $11,621,528 | | 3,362,905 | | $2,337,765 | | 52,639,282 | | $35,741,669 |
| | | | | | | | | | | |
$ 60 | | $ 1,615 | | $ 19 | | $ 89 | | $ — | | $ — |
| | | | | | | | | | | |
18 AARP FUNDS 2007 SEMI-ANNUAL REPORT Financial Statements
Financial Statements (continued)
Financial highlights
(For a share outstanding throughout the period)
| | | | | | | | | | | | |
| | | AARP Aggressive Fund | |
| | | Six months
ended 12/31/07
(unaudited) | | | Year
ended
6/30/07 | | | Period
ended
6/30/061 | |
Net asset value, beginning of period | | $ | 11.68 | | | $ | 10.17 | | | $ | 10.00 | |
| | | |
Income from investment operations: | | | | | | | | | | | | |
Net investment income | | | 0.16 | | | | 0.24 | | | | 0.09 | |
Net realized and unrealized gain (loss) on affiliated investments | | | (0.10 | ) | | | 1.52 | | | | 0.17 | |
| | | | | | | | | | | | |
Total from investment operations | | | 0.06 | | | | 1.76 | | | | 0.26 | |
| | | | | | | | | | | | |
Less distributions: | | | | | | | | | | | | |
From net investment income | | | (0.16 | ) | | | (0.25 | ) | | | (0.09 | ) |
From net realized gains on investments | | | (0.07 | ) | | | (0.00 | )2 | | | — | |
| | | | | | | | | | | | |
Total distributions | | | (0.23 | ) | | | (0.25 | ) | | | (0.09 | ) |
| | | | | | | | | | | | |
Net asset value, end of period | | $ | 11.51 | | | $ | 11.68 | | | $ | 10.17 | |
| | | | | | | | | | | | |
Total return3 | | | 0.51 | % | | | 17.41 | % | | | 2.60 | % |
| | | | | | | | | | | | |
Ratios to average net assets: | | | | | | | | | | | | |
Net expenses | | | 0.24 | %4,5 | | | 0.24 | %4 | | | 0.24 | %4,5 |
| | | | | | | | | | | | |
Net investment income | | | 3.02 | %5 | | | 2.55 | % | | | 3.36 | %5 |
| | | | | | | | | | | | |
Expense waiver/reimbursement6 | | | (1.18 | )%5 | | | (2.00 | )% | | | (11.22 | )%5 |
| | | | | | | | | | | | |
Supplemental data: | | | | | | | | | | | | |
Net assets, at end of period (000 omitted) | | $ | 27,149 | | | $ | 20,222 | | | $ | 6,454 | |
| | | | | | | | | | | | |
Portfolio Turnover | | | 6 | % | | | 12 | % | | | 7 | % |
| | | | | | | | | | | | |
1 | For the period from January 1, 2006 (commencement of operations) to June 30, 2006. |
2 | Represents less than $0.01. |
3 | Total returns for periods of less than one year are not annualized. |
4 | In addition to the fees and expenses which the Funds bear directly, the Funds indirectly bear a pro-rata share of the fees and expenses of the underlying portfolios in which the Funds invest. The net expense ratio shown does not include these indirect expenses. If included, the net expense ratio for each fund would be 0.50%. |
5 | Computed on an annualized basis. |
6 | This expense decrease is reflected in both the net expense and net investment income (loss) ratios shown above. |
See Notes to Financial Statements.
Financial Statements AARP FUNDS 2007 SEMI-ANNUAL REPORT 19
Financial Statements (continued)
Financial highlights
(For a share outstanding throughout the period)
| | | | | | | | | | | | |
| | | AARP Moderate Fund | |
| | | Six months
ended 12/31/07
(unaudited) | | | Year
ended
6/30/07 | | | Period
ended
6/30/061 | |
Net asset value, beginning of period | | $ | 11.06 | | | $ | 10.04 | | | $ | 10.00 | |
| | | |
Income from investment operations: | | | | | | | | | | | | |
Net investment income | | | 0.19 | | | | 0.31 | | | | 0.10 | |
Net realized and unrealized gain (loss) on affiliated investments | | | 0.06 | | | | 1.02 | | | | 0.04 | |
| | | | | | | | | | | | |
Total from investment operations | | | 0.25 | | | | 1.33 | | | | 0.14 | |
| | | | | | | | | | | | |
Less distributions: | | | | | | | | | | | | |
From net investment income | | | (0.19 | ) | | | (0.31 | ) | | | (0.10 | ) |
From net realized gains on investments | | | (0.10 | ) | | | (0.00 | )2 | | | — | |
| | | | | | | | | | | | |
Total distributions | | | (0.29 | ) | | | (0.31 | ) | | | (0.10 | ) |
| | | | | | | | | | | | |
Net asset value, end of period | | $ | 11.02 | | | $ | 11.06 | | | $ | 10.04 | |
| | | | | | | | | | | | |
Total return3 | | | 2.22 | % | | | 13.32 | % | | | 1.44 | % |
| | | | | | | | | | | | |
Ratios to average net assets: | | | | | | | | | | | | |
Net expenses | | | 0.24 | %4,5 | | | 0.24 | %4 | | | 0.24 | %4,5 |
| | | | | | | | | | | | |
Net investment income | | | 3.61 | %5 | | | 3.27 | % | | | 4.58 | %5 |
| | | | | | | | | | | | |
Expense waiver/reimbursement6 | | | (0.76 | )%5 | | | (1.11 | )% | | | (6.82 | )%5 |
| | | | | | | | | | | | |
Supplemental data: | | | | | | | | | | | | |
Net assets, at end of period (000 omitted) | | $ | 40,912 | | | $ | 31,925 | | | $ | 13,133 | |
| | | | | | | | | | | | |
Portfolio Turnover | | | 9 | % | | | 13 | % | | | 5 | % |
| | | | | | | | | | | | |
1 | For the period from January 1, 2006 (commencement of operations) to June 30, 2006. |
2 | Represents less than $0.01. |
3 | Total returns for periods of less than one year are not annualized. |
4 | In addition to the fees and expenses which the Funds bear directly, the Funds indirectly bear a pro-rata share of the fees and expenses of the underlying portfolios in which the Funds invest. The net expense ratio shown does not include these indirect expenses. If included, the net expense ratio for each fund would be 0.50%. |
5 | Computed on an annualized basis. |
6 | This expense decrease is reflected in both the net expense and net investment income (loss) ratios shown above. |
See Notes to Financial Statements.
20 AARP FUNDS 2007 SEMI-ANNUAL REPORT Financial Statements
Financial Statements (continued)
Financial highlights
(For a share outstanding throughout the period)
| | | | | | | | | | | | |
| | | AARP Conservative Fund | |
| | | Six months
ended 12/31/07
(unaudited) | | | Year
ended
6/30/07 | | | Period
ended
6/30/061 | |
Net asset value, beginning of period | | $ | 10.38 | | | $ | 9.86 | | | $ | 10.00 | |
| | | |
Income from investment operations: | | | | | | | | | | | | |
Net investment income | | | 0.21 | | | | 0.39 | | | | 0.16 | |
Net realized and unrealized gain (loss) on affiliated investments | | | 0.21 | | | | 0.53 | | | | (0.14 | ) |
| | | | | | | | | | | | |
Total from investment operations | | | 0.42 | | | | 0.92 | | | | 0.02 | |
| | | | | | | | | | | | |
Less distributions: | | | | | | | | | | | | |
From net investment income | | | (0.21 | ) | | | (0.40 | ) | | | (0.16 | ) |
From net realized gains on investments | | | (0.07 | ) | | | (0.00 | )2 | | | – | |
| | | | | | | | | | | | |
Total distributions | | | (0.28 | ) | | | (0.40 | ) | | | (0.16 | ) |
| | | | | | | | | | | | |
Net asset value, end of period | | $ | 10.52 | | | $ | 10.38 | | | $ | 9.86 | |
| | | | | | | | | | | | |
Total return3 | | | 4.12 | % | | | 9.40 | % | | | 0.24 | % |
| | | | | | | | | | | | |
Ratios to average net assets: | | | | | | | | | | | | |
Net expenses | | | 0.25 | %4,5 | | | 0.25 | %4 | | | 0.24 | %4,5 |
| | | | | | | | | | | | |
Net investment income | | | 4.22 | %5 | | | 4.01 | % | | | 5.31 | %5 |
| | | | | | | | | | | | |
Expense waiver/reimbursement6 | | | (1.61 | )%5 | | | (2.16 | )% | | | (11.00 | )%5 |
| | | | | | | | | | | | |
Supplemental data: | | | | | | | | | | | | |
Net assets, at end of period (000 omitted) | | $ | 14,248 | | | $ | 11,622 | | | $ | 6,581 | |
| | | | | | | | | | | | |
Portfolio Turnover | | | 12 | % | | | 17 | % | | | 7 | % |
| | | | | | | | | | | | |
1 | For the period from January 1, 2006 (commencement of operations) to June 30, 2006. |
2 | Represents less than $0.01. |
3 | Total returns for periods of less than one year are not annualized. |
4 | In addition to the fees and expenses which the Funds bear directly, the Funds indirectly bear a pro-rata share of the fees and expenses of the underlying portfolios in which the Funds invest. The net expense ratio shown does not include these indirect expenses. If included, the net expense ratio for each fund would be 0.50%. |
5 | Computed on an annualized basis. |
6 | This expense decrease is reflected in both the net expense and net investment income (loss) ratios shown above. |
See Notes to Financial Statements.
Financial Statements AARP FUNDS 2007 SEMI-ANNUAL REPORT 21
Financial Statements (continued)
Financial highlights
(For a share outstanding throughout the period)
| | | | | | | | | | | | | | | | |
| | | AARP Income Fund | | | AARP Money Market
Fund | |
| | Six months
ended 12/31/07
(unaudited)1 | | | Period
ended
6/30/071,2 | | | Six months
ended 12/31/07
(unaudited) | | | Year
ended
6/30/071 | |
Net asset value, beginning of period | | $ | 9.82 | | | $ | 10.00 | | | $ | 1.00 | | | $ | 1.00 | |
| | | | |
Income from investment operations: | | | | | | | | | | | | | | | | |
Net investment income | | | 0.24 | | | | 0.36 | | | | 0.02 | | | | 0.05 | |
Net realized and unrealized gain (loss) on affiliated investments | | | 0.32 | | | | (0.18 | ) | | | — | | | | — | |
| | | | | | | | | | | | | | | | |
Total from investment operations | | | 0.56 | | | | 0.18 | | | | 0.02 | | | | 0.05 | |
| | | | | | | | | | | | | | | | |
Less distributions: | | | | | | | | | | | | | | | | |
From net investment income | | | (0.24 | ) | | | (0.36 | ) | | | (0.02 | ) | | | (0.05 | ) |
From net realized gains on investments | | | (0.00 | )3 | | | — | | | | — | | | | — | |
| | | | | | | | | | | | | | | | |
Total distributions | | | (0.24 | ) | | | (0.36 | ) | | | (0.02 | ) | | | (0.05 | ) |
| | | | | | | | | | | | | | | | |
Net asset value, end of period | | $ | 10.14 | | | $ | 9.82 | | | $ | 1.00 | | | $ | 1.00 | |
| | | | | | | | | | | | | | | | |
Total return4 | | | 5.78 | % | | | 1.78 | % | | | 2.49 | % | | | 5.11 | % |
| | | | | | | | | | | | | | | | |
Ratios to average net assets: | | | | | | | | | | | | | | | | |
Net expenses | | | 0.26 | %5,6 | | | 0.25 | %5,6 | | | 0.30 | %5,6,7 | | | 0.33 | % |
| | | | | | | | | | | | | | | | |
Net investment income | | | 4.96 | %6 | | | 5.36 | %6 | | | 4.90 | %6 | | | 5.06 | % |
| | | | | | | | | | | | | | | | |
Expense waiver/reimbursement8 | | | (6.58 | )%6 | | | (21.21 | )%6 | | | (0.62 | )%6 | | | (3.91 | )% |
| | | | | | | | | | | | | | | | |
Supplemental data: | | | | | | | | | | | | | | | | |
Net assets, at end of period (000 omitted) | | $ | 3,363 | | | $ | 2,338 | | | $ | 52,639 | | | $ | 35,742 | |
| | | | | | | | | | | | | | | | |
Portfolio Turnover | | | 20 | % | | | 30 | % | | | — | | | | — | |
| | | | | | | | | | | | | | | | |
1 | The per share amounts and percentages include the Fund’s proportionate share of income, expenses and net realized and unrealized gains or losses of the State Street Money Market Portfolio. |
2 | For the period from September 29, 2006 (commencement of operations) to June 30, 2007. |
3 | Represents less than $0.01. |
4 | Total returns for periods of less than one year are not annualized. |
5 | In addition to the fees and expenses which the Funds bear directly, the Funds indirectly bear a pro-rata share of the fees and expenses of the underlying portfolios in which the Funds invest. The net expense ratio shown does not include these indirect expenses. If included, the net expense ratio for each fund would be 0.50%. |
6 | Computed on an annualized basis. |
7 | Effective March 1, 2007, AARP Financial has agreed contractually to waive fees and reimburse expenses to keep the net total operating expenses of the AARP Money Market Fund, including its pro-rata allocation of expenses from the State Street Portfolio, at 0.30% of average daily net assets through November 1, 2009. |
8 | This expense decrease is reflected in both the net expense and net investment income (loss) ratios shown above. |
See Notes to Financial Statements.
22 AARP FUNDS 2007 SEMI-ANNUAL REPORT Notes to Financial Statements
Notes to Financial Statements
1. Business and Organization
AARP Aggressive Fund, AARP Moderate Fund, AARP Conservative Fund, AARP Income Fund and AARP Money Market Fund (each a “Fund” and collectively the “Funds”) are each a series of AARP Funds (the “Trust”). The Trust is organized as a Delaware statutory trust and is registered under the Investment Company Act of 1940, as amended (the “Act”), as an open-end management investment company. The inception dates of the Funds were as follows: December 22, 2005 (AARP Aggressive Fund, AARP Moderate Fund and AARP Conservative Fund), June 30, 2006 (AARP Money Market Fund) and September 29, 2006 (AARP Income Fund); the Funds began operations, including recording income and expenses (“commencement of operations”) on January 1, 2006 (Aggressive, Moderate and Conservative), July 1, 2006 (Money Market Fund) and September 29, 2006 (Income Fund).
The Funds, except for the AARP Money Market Fund are “funds of funds” because they invest substantially all of their assets in the underlying series of “AARP Portfolios”, each a separately registered investment company. Each Fund, with the exception of the AARP Income Fund and the AARP Money Market Fund invests in all three of the AARP Portfolios, but in different amounts. The AARP Income Fund invests the vast majority of its assets in one of the AARP Portfolios, the U.S. Bond Market Portfolio. In addition, the AARP Income Fund also invests a portion of its assets in the State Street Money Market Portfolio (the “State Street Portfolio”), a series of a separately registered investment company called the State Street Master Funds. The AARP Money Market Fund is a feeder fund that invests substantially all of its assets in the State Street Portfolio, the master fund. The investment objective and policies of the State Street Portfolio are substantially similar to those of the AARP Money Market Fund. The value of the AARP Money Market Fund’s investment in the State Street Portfolio reflects the AARP Money Market Fund’s proportionate interest in the net assets of the State Street Portfolio (0.76% at December 31, 2007). The performance of the AARP Money Market Fund is directly affected by the performance of the State Street Portfolio. The financial statements of the State Street Portfolio are included elsewhere in this report and should be read in conjunction with the AARP Money Market Fund’s financial statements.
The investment objective of the AARP Aggressive Fund is to seek growth of capital and some current income. The investment objective of the AARP Moderate Fund is to seek a balance of growth of capital and current income. The investment objective of the AARP Conservative Fund is to primarily seek current income with some growth of capital. The investment objective of the AARP Income Fund is to seek current income and preservation of capital over the long-term.
Notes to Financial Statements AARP FUNDS 2007 SEMI-ANNUAL REPORT 23
Notes to Financial Statements (continued)
The investment objective of the AARP Money Market Fund is to seek to maximize current income while providing liquidity, preservation of capital, and a stable $1.00 per share price.
2. Significant accounting policies
The financial statements have been prepared in accordance with United States generally accepted accounting principles (“GAAP”), which require management to make estimates and assumptions that affect amounts reported herein. Actual results could differ from those estimates. The following is a summary of significant accounting policies consistently followed by the Funds in the preparation of their financial statements.
INVESTMENT VALUATION
Because the Funds, except for AARP Money Market Fund, invest in one or more of the AARP Portfolios, they value their investments in the AARP Portfolios daily at the closing net asset value of the AARP Portfolios.
Securities of the AARP Portfolios are valued as of the close of trading on the New York Stock Exchange (generally 4:00 p.m. Eastern time) on the valuation date. An independent pricing service generally provides these prices. Stock holdings are valued at the latest quoted sales price or official closing price taken from the primary market in which the stock trades. If a security does not trade during the day, it is valued at the average of the latest quotes for buying and selling the security, the bid and asked prices. Bond holdings are generally valued as reported by an independent pricing service at what is called an “evaluated average price,” which considers such factors as comparable bond prices, yields, maturities and ratings.
Short-term investments with a maturity at issuance or a remaining maturity at the time of purchase of 60 days or less are generally valued at amortized cost, which approximates market value. Foreign securities quoted in foreign currencies are translated into U.S. dollars based upon exchange rates prevailing at the close of trading and as provided by an independent source.
Securities for which market quotations are not readily available, or whose values have been materially affected by events occurring before a Fund’s pricing time but after the close of the securities’ primary markets (e.g. foreign securities), are valued by methods deemed by the Board of Trustees of AARP Portfolios to represent fair value.
The AARP Money Market Fund and the AARP Income Fund record their investments in the State Street Portfolio at market value. The valuation policies of the State Street Portfolio are discussed in Note 2 of the State Street Portfolio’s Notes to Financial Statements, which are included elsewhere within this report.
24 AARP FUNDS 2007 SEMI-ANNUAL REPORT Notes to Financial Statements
FEDERAL TAXES
The Funds intend to comply with the provisions of the Internal Revenue Code applicable to regulated investment companies. The Funds plan to distribute substantially all of their investment company taxable income, including any net realized gain on investments not offset by capital loss carryforwards, if any, to shareholders. For these reasons, no federal income or excise tax provision is required.
SECURITIES TRANSACTIONS, DIVIDEND AND INTEREST INCOME AND EXPENSES
Securities transactions are recorded on a trade date basis, the date a Fund agrees to purchase or sell a security. Interest income, if any, is recorded daily on an accrual basis. Dividend income is recorded on the ex-dividend date. Realized gains and losses from securities transactions are recorded on the basis of identified cost. Expenses are accrued daily. Many expenses are directly attributable to one Fund and therefore are charged accordingly. Expenses that are not directly attributable to one or more Funds are allocated among applicable Funds on an equitable and consistent basis considering such things as the nature and type of expenses and the relative net assets of the Funds.
In addition to the accounting policies noted above, the AARP Income Fund and the AARP Money Market Fund also have a pro-rata share in the net investment income and gains or losses of the State Street Portfolio. Net investment income for the Funds consists of each Fund’s pro-rata share of the net investment income of the State Street Portfolio, less all expenses of each Fund. Realized gains and losses from security transactions consist of each Fund’s pro-rata share of the realized gains and losses of the State Street Portfolio.
INDEMNIFICATIONS
The Funds’ organizational documents provide current and former trustees and officers with a limited indemnification against liabilities arising in connection with the performance of their duties to the Funds. In the normal course of business, the Funds may also enter into contracts that provide general indemnifications. The Funds’ maximum exposure under these arrangements is unknown as this would be dependent on future claims that may be made against the Funds. The risk of material loss from such claims is considered remote.
Notes to Financial Statements AARP FUNDS 2007 SEMI-ANNUAL REPORT 25
Notes to Financial Statements (continued)
DISTRIBUTIONS TO SHAREHOLDERS
Distributions to shareholders from net investment income and net realized gains, if any, are recorded on the ex-dividend date. Such distributions are determined in conformity with income tax regulations, which may differ from generally accepted accounting principles. Capital gain distributions, if any, are generally declared and paid annually. Income distributions, if any, are generally declared and paid quarterly for the AARP Conservative Fund, semiannually for the AARP Moderate Fund and the AARP Aggressive Fund, and monthly for the AARP Income Fund. Income distributions are generally declared daily and paid monthly for the AARP Money Market Fund.
INVESTMENTS IN UNDERLYING PORTFOLIOS
In addition to the fees and expenses which the Funds bear directly, the Funds indirectly bear a pro-rata share of the fees and expenses of the AARP Portfolios in which the Funds invest as well as the fees and expenses of the State Street Portfolio, as applicable.
NEW ACCOUNTING PRONOUNCEMENTS
In July, 2006, Financial Accounting Standards Board Interpretation No. 48, Accounting for Uncertainty in Income Taxes – an interpretation of FASB Statement 109 (“FIN 48”), was issued and is effective for years beginning after December 15, 2006. FIN 48 determines a threshold for financial statement recognition, measurement and disclosure of a tax position taken (or expected to be taken) on a tax return. Management has concluded that the adoption of FIN 48 will not result in a material impact on the Funds’ net assets, results of operations and financial statement disclosures.
In September 2006, Statement of Financial Accounting Standards No. 157, Fair Value Measurements (“FAS 157”), was issued and is effective for fiscal years beginning after November 15, 2007. FAS 157 establishes a single authoritative definition of fair value, establishes a framework for measuring fair value and expands disclosures standards about fair value measurements. Management of the Funds does not believe the adoption of FAS 157 will materially impact the financial statement amounts; however, additional disclosures may be required about the inputs used to develop the measurements and the effect of certain of the measurements on changes in net assets for the period.
26 AARP FUNDS 2007 SEMI-ANNUAL REPORT Notes to Financial Statements
3. Capital share transactions
The Funds have authorized an unlimited number of $0.001 par value shares. Transactions in shares were as follows:
| | | | | | |
| | | Six months ended
December 31, 2007 | | | Year ended
June 30, 2007 | |
AARP Aggressive Fund | | | | | | |
Shares sold | | 776,393 | | | 1,280,627 | |
Dividends and/or distributions reinvested | | 43,375 | | | 26,786 | |
Shares redeemed | | (191,755 | ) | | (210,836 | ) |
| | | | | | |
Net increase | | 628,013 | | | 1,096,577 | |
| | |
AARP Moderate Fund | | | | | | |
Shares sold | | 1,065,295 | | | 1,864,210 | |
Dividends and/or distributions reinvested | | 89,143 | | | 63,146 | |
Shares redeemed | | (331,097 | ) | | (348,211 | ) |
| | | | | | |
Net increase | | 823,341 | | | 1,579,145 | |
| | |
AARP Conservative Fund | | | | | | |
Shares sold | | 339,705 | | | 591,217 | |
Dividends and/or distributions reinvested | | 31,587 | | | 30,414 | |
Shares redeemed | | (136,277 | ) | | (169,642 | ) |
| | | | | | |
Net increase | | 235,015 | | | 451,989 | |
| | |
AARP Income Fund | | | | | | |
Shares sold | | 145,505 | | | 257,241 | 1 |
Dividends and/or distributions reinvested | | 5,234 | | | 3,007 | 1 |
Shares redeemed | | (57,067 | ) | | (22,202 | )1 |
| | | | | | |
Net increase | | 93,672 | | | 238,046 | 1 |
| | |
AARP Money Market Fund | | | | | | |
Shares sold | | 31,974,591 | | | 38,408,008 | |
Dividends and/or distributions reinvested | | 1,091,982 | | | 246,679 | |
Shares redeemed | | (16,168,960 | ) | | (2,913,014 | ) |
| | | | | | |
Net increase | | 16,897,613 | | | 35,741,673 | |
1 | For the period from September 29, 2006 (commencement of operations) through June 30, 2007. |
4. Investment transactions
The aggregate cost of purchases and proceeds from sales of securities, other than short-term obligations, for the six months ended December 31, 2007 were as follows:
| | | | | | |
Fund name | | Purchases | | Sales |
AARP Aggressive Fund | | $ | 8,880,285 | | $ | 1,566,187 |
AARP Moderate Fund | | | 12,506,141 | | | 3,474,512 |
AARP Conservative Fund | | | 3,791,263 | | | 1,521,411 |
AARP Income Fund1 | | | 1,401,360 | | | 504,723 |
Increases and decreases in the AARP Money Market Fund’s investment in the State Street Portfolio aggregated $24,950,483 and $8,053,396, respectively, for the six months ended December 31, 2007.
Notes to Financial Statements AARP FUNDS 2007 SEMI-ANNUAL REPORT 27
Notes to Financial Statements (continued)
5. Federal income tax information
The aggregate cost of securities and other investments and the composition of unrealized appreciation and depreciation of securities and other investments for federal income tax purposes as of December 31, 2007 are noted below. The primary difference between book and tax appreciation or depreciation of securities and other investments, if applicable, is attributable to the tax deferral of losses or tax realization of financial statement unrealized gain or loss.
| | | | | | | | | | | | |
Fund name | | Federal tax
cost of securities | | Gross unrealized
appreciation | | Gross unrealized
depreciation | | Net unrealized
appreciation |
AARP Aggressive Fund | | $ | 26,323,843 | | $ | 807,060 | | $ | — | | $ | 807,060 |
AARP Moderate Fund | | | 39,830,641 | | | 1,158,193 | | | — | | | 1,158,193 |
AARP Conservative Fund | | | 13,766,093 | | | 370,754 | | | — | | | 370,754 |
AARP Income Fund | | | 3,346,733 | | | 50,192 | | | — | | | 50,192 |
AARP Money Market Fund | | | 52,506,747 | | | — | | | — | | | — |
6. Fees and other transactions with affiliates
ADVISER AND SUB-ADVISER FEES
The Trust has an investment advisory agreement with AARP Financial, which delegates to AARP Financial the responsibility to manage the investment activities of the Funds, including the overall investment program of the Funds. AARP Financial is also responsible for overseeing the Funds’ (other than the Money Market Fund’s) sub-adviser, SSgA Funds Management, Inc. (“SSgA FM”), which rebalances the applicable Funds under the direction of AARP Financial and manages the day-to-day investments of the AARP Portfolios’ assets. Each Fund (other than the Money Market Fund) pays to AARP Financial an annual fee of 0.01% of its average daily net assets. AARP Financial pays SSgA FM for its subadvisory services out of these fees. For the period from July 1, 2006 through at least November 1, 2008, AARP Financial has contractually agreed to waive its fees and/or reimburse expenses to keep the combined total annual operating expenses of the Funds and the AARP Portfolios and, as appropriate, the State Street Portfolio at 0.50% of average daily net assets. Effective February 6, 2007, AARP Financial has voluntarily agreed to waive its fees and/or reimburse expenses to keep the total annual operating expenses of the AARP Money Market Fund, including its pro-rata allocation of expenses from the State Street Portfolio, at 0.30% of average daily net assets. The Fund’s Board of Trustees approved an amendment, proposed by AARP Financial, to amend the existing contractual agreements to make this voluntary fee waiver/expense reimbursement a contractual obligation of AARP Financial effective March 1, 2007 through at least November 1, 2009. The expense reimbursement amount payable by AARP Financial will be dependent on the actual expenses of the Funds and the Portfolios.
28 AARP FUNDS 2007 SEMI-ANNUAL REPORT Notes to Financial Statements
Notes to Financial Statements (continued)
Under the Money Market Fund’s investment advisory agreement, no fee is payable to AARP Financial at any time the Fund is invested in a master-feeder structure, such as the State Street Portfolio. The State Street Portfolio has retained SSgA FM as the investment adviser to the Portfolio. For its services, SSgA FM receives a fee at the rate of 0.10% of the portfolio’s average daily net assets, which is paid from the assets of the Fund.
For the six months ended December 31, 2007, AARP Financial contractually waived/reimbursed the following fees:
| | | | | | |
Fund name | | Adviser
fee waiver | | Reimbursement of other
operating expenses |
AARP Aggressive Fund | | $ | 1,223 | | $ | 143,188 |
AARP Moderate Fund | | | 1,848 | | | 138,000 |
AARP Conservative Fund | | | 632 | | | 101,237 |
AARP Income Fund | | | 131 | | | 85,814 |
AARP Money Market Fund | | | — | | | 143,918 |
Had AARP Financial not waived/reimbursed these fees, returns for the Funds would have been lower.
ADMINISTRATION FEES
As the Funds’ administrator, AARP Financial provides the Funds with general administrative services associated with the day-to-day operations of the Funds and monitors and coordinates the activities of the other service providers to the Funds. For its administrative services, AARP Financial receives an annual fee of .035% of each Fund’s average daily net assets.
SUB-ADMINISTRATION, TRANSFER AGENCY AND CUSTODIAN FEES
State Street Bank and Trust Company (“State Street”) acts as the subadministrator, transfer agent, custodian and fund accounting agent for the Funds. State Street is a subsidiary of State Street Corporation and an affiliate of SSgA FM. Under the terms of the sub-administration agreement, AARP Financial pays to State Street an annual fee at the rate of 0.0175% of the first $6 billion of the Funds’ average daily net assets and then a decreasing rate for average daily net assets above that level. Under the terms of the transfer agency agreement, each Fund pays to State Street an annual fee at the rate of 0.135% of the first $5 billion of the Funds’ average daily net assets and then a decreasing rate for average daily net assets above that level, plus out-of-pocket expenses. State Street has in turn delegated the provision of transfer agency services to its affiliate, Boston Financial Data Services, Inc. Under the terms of the custody agreement, each Fund pays to State Street an annual fee of $15,000, plus out-of-pocket expenses.
Notes to Financial Statements AARP FUNDS 2007 SEMI-ANNUAL REPORT 29
TRUSTEE COMPENSATION
The Trust is supervised by a Board of Trustees, the “Board.” The Board represents the interests of the Funds and their shareholders. The Board meets periodically throughout the year to oversee the Funds’ activities. The Board consists of four “Independent Trustees” and one “Interested Trustee”, who is the President of AARP Financial Inc. The compensation of the Independent Trustees consists of an annual retainer paid quarterly. Neither the Interested Trustee nor any of the Trust’s officers receives any compensation from the Funds for their services. Compensation paid by the Funds to the Independent Trustees is included in the Funds’ Statements of Operations.
INVESTMENTS IN THE FUNDS
AARP Services, Inc., the parent company of AARP Financial, Inc. (“AARP Financial”), the investment adviser to the Funds, has made investments in the AARP Aggressive Fund, the AARP Moderate Fund and the AARP Conservative Fund, with values at December 31, 2007 of $41,169, $38,776 and $37,683, respectively. AARP Financial has made an investment in the AARP Income Fund, with a value at December 31, 2007 of $80,744.
In addition, to receive an investment return, AARP Financial, in the normal course of business, has made investments in the AARP Money Market Fund, with a value at December 31, 2007 of $10,414,041.
In January 2008, to receive an investment return, AARP Financial, in the normal course of business, made an additional investment in the AARP Money Market Fund of $30 million. Further AARP, the parent company to AARP Services, Inc., in the normal course of business, made investments in the AARP Money Market Fund of $15 million.
If AARP Financial or AARP decide in the future to withdraw all or a portion of these investments, Management of the Funds believes there would be no material impact on the operations or returns of the Money Market Fund.
30 AARP FUNDS 2007 SEMI-ANNUAL REPORT AARP Funds–Supplemental Information
AARP Funds—
Supplemental Information
Proxy voting policies, procedures and record
Both a description of the policies and procedures that AARP Financial uses to determine how to vote proxies on behalf of the Funds and the AARP Portfolios relating to portfolio securities and information regarding how AARP Financial voted proxies related to portfolio securities during the most recent fiscal year ended June 30 are available on our website at www.aarpfunds.com and, without charge, upon request, by calling us at 1-800-958-6457. Such information for the AARP Funds is also available on the Securities and Exchange Commission’s (“SEC”) website at www.sec.gov.
Shareholder statements and reports
When we send financial reports, prospectuses and other regulatory materials to shareholders, we attempt to reduce the volume of mail you receive by sending one copy of these documents to two or more account holders who share the same address. However, if you wish to receive individual copies of materials, please contact us at 1-800-958-6457. Once we have received your instructions, we will begin sending individual copies for each account within 30 days. These materials are also available on our website at www.aarpfunds.com.
Statement regarding availability of quarterly fund schedule
The Funds and the AARP Portfolios file complete schedules of investments with the SEC for the quarters ended September 30 and March 31 of each fiscal year on Form N-Q which are available on the Funds’ website, www.aarpfunds.com and the SEC’s website at www.sec.gov. Additionally, the Funds’ and the AARP Portfolios’ Forms N-Q may be reviewed and copied at the SEC’s Public Reference Room in Washington DC. For information on the Public Reference Room, call 1-800-SEC-0330.
AARP Funds–Supplemental Information AARP FUNDS 2007 SEMI-ANNUAL REPORT 31
AARP FUNDS—
Supplemental Information (continued)
The nature, extent and quality of the services proposed to be provided by AARP Financial and SSgA FM
The Board, at a meeting on November 27, 2007, approved the continuance of the Trust’s Investment Advisory Agreement with AARP Financial and Investment Sub-Advisory Agreement with SSgA FM (collectively, “Agreements”). In approving the Agreements, the Board evaluated, among other things, written and oral information provided by AARP Financial and SSgA FM in response to requests of outside counsel to the Trust and the independent Trustees of the Trust on behalf of the Board.
The Board determined, in its business judgment, that the advisory fee rate and the subadvisory fee rate were each fair and reasonable in light of the services provided and in the best interest of each Fund and its shareholders and approved the continuance of the Agreements. The Board did so based on various factors bearing on the nature, scope, quality, cost and profitability of the services to be provided by the Adviser and the Sub-Adviser and on various conclusions reached regarding those factors.
Special Facts and Circumstances
The Board took particular note of the following factors representing special facts and circumstances:
| • | | AARP, the ultimate parent of AARP Financial and sponsor of the Trust, differs from most fund sponsors in that it is a not-for-profit membership organization. AARP delivers information, advocacy and services to over 39 million members age 50 and older in all states, the District of Columbia, Puerto Rico and the U.S. Virgin Islands. AARP has caused the Trust to be organized as a means of helping people provide for their future and retirement. AARP measures the worth of its products and services not only in terms of dollars spent and received, but also in terms of benefits to members and impact on society. |
| • | | AARP created the Funds (together with the underlying AARP Portfolios) based on principles developed and recommended by a high-level, independent Economic Security Solutions Group, including low fees, index-based investment management, automatic rebalancing and limited choices. |
32 AARP FUNDS 2007 SEMI-ANNUAL REPORT AARP Funds–Supplemental Information
AARP FUNDS—
Supplemental Information (continued)
| • | | AARP Financial has capped the expenses of the AARP Aggressive Fund, AARP Moderate Fund, AARP Conservative Fund and AARP Income Fund at 0.50% through November 2008 and of the AARP Money Market Fund at 0.30% through November 2009. This means, in effect, that AARP Financial has waived the advisory fee payable by each Fund, paid the sub-advisory fee payable to SSgA FM by each Fund and reimbursed a significant portion of the operating expenses of each Fund. AARP Financial advised the Board that it did not earn a profit on the advisory services that it provided, and SSgA FM advised the Board that it did not earn a profit on the sub-advisory services that it provided. |
| • | | Each Fund invests exclusively (or, in the case of the Income Fund, principally) in shares of other mutual funds. The AARP Aggressive Fund, AARP Moderate Fund and AARP Conservative Fund are asset allocation funds that invest in mixes of underlying bond index portfolios of the AARP Portfolios, for which AARP Financial is the investment adviser. The AARP Income Fund invests the vast majority of its assets (at the time, 95%) in an underlying bond index portfolio of the AARP Portfolios. The AARP Money Market Fund is a so-called “feeder” fund that invests its assets in shares of the State Street Money Market Portfolio. Accordingly, a number of factors that would be considered in the context of actively managed funds were not relevant (or, in the case of the Income Fund, of limited relevance). The type of fund that invests in index fund(s), rather than actively managed funds, is not as widespread in the industry. Consequently, the peer group of each Fund that invests in index funds is not wholly comparable and, for example, may have higher expense levels. |
| • | | Each Fund has been in operation for a relatively short period of time, currently has a low level of assets, and has not reached a “break-even point.” |
| • | | Notwithstanding its small size, each Fund, by virtue of its relationship with AARP, has been able to establish favorable arrangements with experienced mutual fund service providers. |
AARP Funds–Supplemental Information AARP FUNDS 2007 SEMI-ANNUAL REPORT 33
AARP FUNDS—
Supplemental Information (continued)
Services, Fees and Benefits
The Board, in the light of these facts and circumstances, considered, and reached conclusions regarding, a range of specific factors, including, among others, the following:
| • | | the nature and scope of the advisory services that AARP Financial provided to the Trust including matters such as the coordination of the advisory services with the services provided o the Trust by AARP Financial pursuant to the Administration Agreement, the Underwriting Agreement and indirectly in connection with the Rule 12b-1 Plan and the sub-advisory services that SSgA FM provided to the Trust. The Board concluded that the nature and scope of the services were adequate and satisfactory and that the benefits the Funds receive in gaining access to favorable service arrangements more than offset any benefits that AARP Financial or AARP may receive from the Funds; |
| • | | the quality of the services that AARP Financial provided to the Trust, on such bases as the investment performance, risk-adjusted performance and expense experience for each Fund, on both absolute and comparative bases, over current and historical periods, including comparisons with a benchmark index and certain industry peer data prepared by an independent vendor, concluding that the quality of the services was adequate and satisfactory; |
| • | | data regarding the advisory fee rate fee rate and sub-advisory fee rate (and expenses) for each Fund, on both an absolute and comparative basis, concluding that while comparative data are not to be relied on exclusively, the advisory and sub-advisory fees (as well as other expenses) of each Fund are within the range paid by funds deemed to be comparable by an independent vendor; |
| • | | advice received from AARP Financial that, while the advisory fee rate and sub-advisory fee rate for each Fund do not have break-points, (i) the Funds had not yet attained asset levels that would result in economies of scale, (ii) the sub-advisory fee rate had break-points, (iii) AARP Financial has advised the Board that it would be willing to consider break-points based on longer operating histories and greater asset levels of the Funds, and (iv) the current investment advisory fee and investment sub-advisory fee rates were competitive, concluding that neither AARP Financial nor SSgA FM was currently in a position to realize economies of scale that could be passed on to Trust shareholders; |
34 AARP FUNDS 2007 SEMI-ANNUAL REPORT AARP Funds–Supplemental Information
AARP FUNDS—
Supplemental Information (continued)
| • | | the fact that AARP Financial or AARP may derive benefits by having the Trust available for marketing in connection with other investment or retirement programs that may be subject to fees and charges payable to AARP Financial or AARP, concluding that such benefits would likely not be available in the immediate future, were consistent with the mission of AARP, at best would be difficult to quantify, and did not appear to be inconsistent with the best interest of each Fund; and |
| • | | information about the processes and procedures of SSgA FM regarding such matters, among others, as code of ethics, trading practices (e.g., brokerage allocation, soft dollars, use of affiliated brokers, trades between Funds, bunching, and allocation of investment opportunities), regulatory compliance, disaster recovery planning, the Sub-Adviser’s D&O/E&O insurance policies, and information set out in the Form ADV filed with SEC by SSgA FM and the most recent Form 10-K filed by SSgA FM’s parent, State Street Bank and Trust Company, concluding that there was no information that appeared inconsistent with the continuance of the subadvisory arrangement with SSgA FM. |
Investment Performance
The Board considered the investment performance of each Fund on a total return basis and on certain risk-adjusted bases for the 12 months ended September 30, 2007 (“year”). The Board also considered the investment performance of each Fund compared to (i) its benchmark index (“benchmark”), on a total return basis and certain risk-adjusted bases for the year, and (ii) comparable funds or peers selected by an independent data vendor for the year. The Board considered the fact that each Fund’s investment performance was net of expenses, while a benchmark does not reflect any expenses. The Board also considered the fact that the asset allocation Funds and the AARP Income Fund, unlike their respective peers, (i) invest in index funds, rather than actively-managed funds, and (ii) have ranges of asset weightings, rather than specific target weightings.
AARP Funds–Supplemental Information AARP FUNDS 2007 SEMI-ANNUAL REPORT 35
AARP Funds—
Supplemental Information (continued)
AARP Aggressive Fund. The Fund outperformed its benchmark and peer group median on a total return basis for the year. The Fund also outperformed its peer group median on a certain risk-adjusted basis for the year.
AARP Moderate Fund. The Fund underperformed its benchmark and peer group median on a total return basis for the year. However, the Board noted that the Fund outperformed its peer group median on certain risk-adjusted bases for the year.
AARP Conservative Fund. The Fund underperformed its benchmark and peer group median on a total return basis for the year. However, the Board noted that the Fund outperformed its peer group median on certain risk-adjusted bases for the year.
AARP Income Fund. The Fund underperformed its benchmark, but outperformed its peer group median, on a total return basis for the year. The Board noted that the Fund outperformed its peer group median on a certain risk-adjusted basis for the year.
AARP Money Market Fund. The Fund outperformed its peer group median as well as the three month T-Bill rate on a total return basis for the year. The Fund also outperformed its peer group median on certain risk-adjusted bases for the year.
Board Consideration
In connection with their deliberation, the Board and the independent Trustees received legal advice from outside counsel to the Trust and the independent Trustees of the Trust regarding the standards and methodology of evaluation articulated by the SEC and the courts, and followed by the industry, for mutual funds selling shares to the public and to other mutual funds.
The foregoing discussion of the material factors considered and conclusions reached by the Trustees is not intended to be all-inclusive. The Trustees reviewed a variety of factors and considered a significant amount of information, including information received on an ongoing basis at meetings of the Board and the Board’s committees throughout the year. In addition: the independent Trustees held a telephone executive session with the AARP Financial President and AARP Financial Chief Investment Officer on October 25, 2007 to discuss
36 AARP FUNDS 2007 SEMI-ANNUAL REPORT AARP Funds–Supplemental Information
AARP Funds—
Supplemental Information (continued)
organizational and leadership aspects of AARP Financial; the Operations Committee and the Investment Management Oversight Committee held a joint telephone meeting on November 21, 2007 to orient their members to the information received from AARP Financial and SSgA FM; and those Committees met, in person and without management, on November 27, 2007 to discuss the proposed continuance of the Agreements. In view of the broad scope and variety of these factors and information, the Board did not find it practicable to, and did not, make specific assessments of, quantify, or otherwise assign relative weights to the specific factors considered in reaching the Board’s conclusions and determinations to continue the Investment Advisory Agreement and Investment Sub-advisory Agreement. The approval determinations were made on the basis of each Trustee’s business judgment after consideration of all of the factors taken as a whole, though individual Trustees may have given different weights to different factors and assigned various degrees of materiality to various conclusions.
STATE STREET MONEY MARKET PORTFOLIO 37
State Street
Money Market Portfolio
Annual Report
December 31, 2007
Table of Contents
38 STATE STREET MONEY MARKET PORTFOLIO Expense Example
Expense Example
As a shareholder of the State Street Money Market Portfolio (the “Portfolio”), you incur ongoing costs, which include costs for portfolio management and administrative services, among others. This example is intended to help you understand your ongoing costs (in dollars) of investing in the Portfolio and to compare these costs with the ongoing costs of investing in other mutual funds.
The example is based on an investment of $1,000 made at the beginning of the period shown and held for the entire period from July 1, 2007 to December 31, 2007.
The table below illustrates your Portfolio’s costs in two ways:
| | • | | Based on actual fund return. This section helps you to estimate the actual expenses that you paid over the period. The “Ending Account Value” shown is derived from the Portfolio’s actual return, and the third column shows the dollar amount that would have been paid by an investor who started with $1,000 in the Portfolio. You may use the information here, together with the amount you invested, to estimate the expenses that you paid over the period. |
To do so, simply divide your account value by $1,000 (for example, an $8,600 account value divided by $1,000 = 8.6), then multiply the result by the number given for the Portfolio under the heading “Expenses Paid During Period”.
| | • | | Based on hypothetical 5% return. This section is intended to help you compare your Portfolio’s costs with those of other mutual funds. It assumes that the Portfolio had a yearly return of 5% before expenses, but that the expense ratio is unchanged. In this case- because the return used is not the Portfolio’s actual return- the results do not apply to your investment. The example is useful in making comparisons because the Securities and Exchange Commission requires all mutual funds to calculate expenses based on a 5% return. You can assess your Portfolio’s costs by comparing this hypothetical example with the hypothetical examples that appear in shareholder reports of other funds. |
| | | | | | | | | |
Six Months Ended December 31, 2007 | | Beginning
Account Value
7/1/07 | | Ending
Account Value
12/31/07 | | Expenses
Paid During
Period* |
Based on Actual Portfolio Return | | $ | 1,000.00 | | $ | 1,025.90 | | $ | 0.51 |
Based on Hypothetical (5% return before expenses) | | $ | 1,000.00 | | $ | 1,024.70 | | $ | 0.51 |
| * | The calculations are based on expenses incurred in the most recent fiscal period of the Portfolio. The Portfolio’s annualized average weighted expense ratio as of December 31, 2007 was 0.100%. The dollar amounts shown as “Expenses Paid” are equal to the annualized average weighted expense ratio multiplied by the average account value over the period, multiplied by the number of days in the most recent six-month period, then divided by the number of days in the most recent 12-month period. |
Portfolio Statistics STATE STREET MONEY MARKET PORTFOLIO 39
Portfolio Statistics (unaudited)
| | | |
Portfolio Composition* | | December 31, 2007 | |
Yankee Certificates of Deposit | | 36.2 | % |
Repurchase Agreements | | 20.2 | |
Commercial Paper | | 20.1 | |
Certificates of Deposit | | 8.7 | |
Medium Term Notes | | 5.6 | |
Bank Notes | | 4.7 | |
U.S. Government Agency Obligations | | 2.0 | |
Promissory Notes | | 1.2 | |
Euro Certificates of Deposit | | 0.7 | |
Other assets less liabilities | | 0.6 | |
Total | | 100.0 | % |
| | | |
Maturity Ladder | | December 31, 2007 | |
3 Days | | 20.3 | % |
4-90 Days | | 55.8 | |
90+ Days | | 23.9 | |
Total | | 100.0 | % |
| |
Average Maturity | | 38 Days | |
| * | As a percentage of net assets as of the date indicated. The Portfolio’s composition will vary over time. |
40 STATE STREET MONEY MARKET PORTFOLIO Portfolio of Investments
Portfolio of Investments December 31, 2007
| | | | | | | | | | | |
| Name of Issuer and Title of Issue | | Interest
Rate | | | Maturity
Date | | Principal
Amount | | Amortized
Cost* |
COMMERCIAL PAPER — 20.1% | | | | | | | | | | | |
Bank Domestic — 3.5% | | | | | | | | | | | |
Bank of America Corp. | | 5.400 | % | | 01/15/2008 | | $ | 125,000,000 | | $ | 124,737,500 |
Bank of America Corp. | | 4.705 | % | | 03/24/2008 | | | 60,000,000 | | | 59,349,141 |
Bank of America Corp. | | 4.665 | % | | 04/24/2008 | | | 60,000,000 | | | 59,113,650 |
| | | | | | | | | | | |
| | | | | | | | | | | 243,200,291 |
| | | | | | | | | | | |
Bank Foreign — 12.3% | | | | | | | | | | | |
Bank of Ireland (b) | | 4.820 | % | | 02/01/2008 | | | 234,500,000 | | | 233,526,695 |
CBA (Delaware) Finance | | 4.990 | % | | 02/29/2008 | | | 223,000,000 | | | 221,176,294 |
Dexia Delaware LLC | | 5.040 | % | | 01/16/2008 | | | 150,000,000 | | | 149,685,000 |
Societe Generale NY | | 4.860 | % | | 04/24/2008 | | | 50,000,000 | | | 49,230,500 |
Westpac Banking Corp. NY | | 4.970 | % | | 02/28/2008 | | | 200,000,000 | | | 198,398,555 |
| | | | | | | | | | | |
| | | | | | | | | | | 852,017,044 |
| | | | | | | | | | | |
Finance Captive Consumer — 4.3% | | | | | | | | | | | |
General Electric Capital Corp. | | 5.170 | % | | 01/25/2008 | | | 50,000,000 | | | 49,827,667 |
General Electric Capital Corp. | | 5.150 | % | | 04/04/2008 | | | 175,000,000 | | | 172,646,736 |
General Electric Capital Corp. | | 4.620 | % | | 04/21/2008 | | | 75,000,000 | | | 73,931,625 |
| | | | | | | | | | | |
| | | | | | | | | | | 296,406,028 |
| | | | | | | | | | | |
TOTAL COMMERCIAL PAPER | | | | | | | | | | | 1,391,623,363 |
| | | | | | | | | | | |
| | | | |
CERTIFICATES OF DEPOSIT — 8.7% | | | | | | | | | | | |
Bank Domestic — 8.7% | | | | | | | | | | | |
Chase Bank USA NA | | 4.700 | % | | 05/06/2008 | | | 100,000,000 | | | 100,000,000 |
Chase Bank USA NA | | 5.150 | % | | 02/12/2008 | | | 200,000,000 | | | 200,000,000 |
Citibank | | 4.760 | % | | 01/29/2008 | | | 200,000,000 | | | 200,000,000 |
Citibank | | 4.900 | % | | 02/15/2008 | | | 100,000,000 | | | 100,000,000 |
| | | | | | | | | | | |
TOTAL CERTIFICATES OF DEPOSIT | | | | | | | | | | | 600,000,000 |
| | | | | | | | | | | |
| | | | |
YANKEE CERTIFICATES OF DEPOSIT — 36.2% | | | | | | | | | | | |
Bank Foreign — 36.2% | | | | | | | | | | | |
Bank of Nova Scotia NY | | 4.750 | % | | 02/08/2008 | | | 100,000,000 | | | 100,000,000 |
Bank Scotland NY | | 4.720 | % | | 04/30/2008 | | | 50,000,000 | | | 50,000,000 |
Bank Scotland NY | | 4.810 | % | | 04/28/2008 | | | 100,000,000 | | | 100,000,000 |
Barclays Bank PLC | | 4.950 | % | | 06/13/2008 | | | 100,000,000 | | | 100,000,000 |
Barclays Bank PLC | | 5.160 | % | | 02/19/2008 | | | 140,000,000 | | | 140,000,000 |
Barclays Bank PLC | | 5.355 | % | | 01/22/2008 | | | 60,000,000 | | | 60,000,000 |
Calyon NY | | 4.750 | % | | 03/26/2008 | | | 100,000,000 | | | 100,001,157 |
Deutsche Bank NY | | 4.680 | % | | 04/01/2008 | | | 75,000,000 | | | 75,000,000 |
Deutsche Bank NY (a) | | 5.025 | % | | 04/29/2008 | | | 200,000,000 | | | 200,000,000 |
Dexia Bank NY | | 4.850 | % | | 01/08/2008 | | | 150,000,000 | | | 150,000,000 |
HBOS Treasury Services NY (a) | | 5.340 | % | | 01/18/2008 | | | 150,000,000 | | | 150,000,000 |
ING Bank Amsterdam | | 5.170 | % | | 01/18/2008 | | | 100,000,000 | | | 100,000,000 |
Landesbank Baden-Wurtt NY | | 5.020 | % | | 01/25/2008 | | | 150,000,000 | | | 150,000,494 |
Rabobank Nederland NY | | 4.750 | % | | 02/08/2008 | | | 250,000,000 | | | 250,001,304 |
Portfolio of Investments STATE STREET MONEY MARKET PORTFOLIO 41
Portfolio of Investments December 31, 2007 (continued)
| | | | | | | | | | | |
| Name of Issuer and Title of Issue | | Interest
Rate | | | Maturity
Date | | Principal
Amount | | Amortized
Cost* |
Societe Generale NY (a) | | 4.815 | % | | 03/26/2008 | | $ | 95,000,000 | | $ | 94,994,527 |
Societe Generale NY | | 5.150 | % | | 02/29/2008 | | | 100,000,000 | | | 100,000,000 |
Svenska Handelsbanken AB (a)(b) | | 5.110 | % | | 01/17/2008 | | | 160,000,000 | | | 160,000,000 |
UBS AG Stamford CT | | 5.095 | % | | 01/16/2008 | | | 125,000,000 | | | 125,000,000 |
UBS AG Stamford CT | | 5.095 | % | | 02/19/2008 | | | 125,000,000 | | | 125,000,000 |
Unicredito Italiano Spa NY | | 5.355 | % | | 01/14/2008 | | | 175,000,000 | | | 175,000,307 |
| | | | | | | | | | | |
TOTAL YANKEE CERTIFICATES OF DEPOSIT | | | | | | | | | | | 2,504,997,789 |
| | | | | | | | | | | |
EURO CERTIFICATES OF DEPOSIT — 0.7% | | | | | | | | | | | |
Bank Foreign — 0.7% | | | | | | | | | | | |
Societe Generale | | 5.375 | % | | 04/14/2008 | | | 50,000,000 | | | 50,000,694 |
| | | | | | | | | | | |
TOTAL EURO CERTIFICATES OF DEPOSIT | | | | | | | | | | | 50,000,694 |
| | | | | | | | | | | |
BANK NOTES — 4.7% | | | | | | | | | | | |
Bank Domestic — 1.4 | | | | | | | | | | | |
Bank of America NA (b) | | 5.090 | % | | 01/17/2008 | | | 100,000,000 | | | 100,000,000 |
| | | | |
Bank Foreign — 3.3% | | | | | | | | | | | |
BNP Paribas (a)(b) | | 4.895 | % | | 08/19/2008 | | | 25,000,000 | | | 25,000,000 |
Lloyds TSB Group PLC (a)(b) | | 5.222 | % | | 09/06/2008 | | | 100,000,000 | | | 100,000,000 |
Svenska Handelsbanken (a)(b) | | 4.922 | % | | 09/19/2008 | | | 100,000,000 | | | 100,000,000 |
| | | | | | | | | | | |
| | | | | | | | | | | 225,000,000 |
| | | | | | | | | | | |
TOTAL BANK NOTES | | | | | | | | | | | 325,000,000 |
| | | | | | | | | | | |
MEDIUM TERM NOTES — 5.6% | | | | | | | | | | | |
Bank Domestic — 2.1% | | | | | | | | | | | |
American Express Credit Corp. (a) | | 4.949 | % | | 08/19/2008 | | | 20,000,000 | | | 20,000,000 |
JPMorgan Chase & Co. (a) | | 5.215 | % | | 09/02/2008 | | | 50,000,000 | | | 50,000,000 |
Wells Fargo Company (a) | | 4.596 | % | | 08/15/2008 | | | 50,000,000 | | | 50,000,000 |
Wells Fargo Company (a) | | 5.076 | % | | 09/17/2008 | | | 30,000,000 | | | 30,000,000 |
| | | | | | | | | | | |
| | | | | | | | | | | 150,000,000 |
| | | | | | | | | | | |
Bank Foreign — 3.5% | | | | | | | | | | | |
Alliance & Leicester PLC (a)(b) | | 4.845 | % | | 08/29/2008 | | | 35,000,000 | | | 35,000,000 |
Bank of Scotland PLC (a)(b) | | 5.233 | % | | 09/08/2008 | | | 25,000,000 | | | 25,000,000 |
Caja de Ahorros y Monte de Piedad de Madrid (a)(b) | | 5.349 | % | | 08/12/2008 | | | 30,000,000 | | | 30,000,000 |
National Australia Bank Ltd. (a)(b) | | 5.240 | % | | 09/05/2008 | | | 20,000,000 | | | 20,000,000 |
UniCredito Italiano Bank Ireland PLC (a) | | 5.048 | % | | 09/12/2008 | | | 15,000,000 | | | 15,000,000 |
Westpac Banking Corp. (a)(b) | | 5.242 | % | | 09/05/2008 | | | 100,000,000 | | | 100,000,000 |
Westpac Banking Corp. (a)(b) | | 5.018 | % | | 09/15/2008 | | | 15,000,000 | | | 15,000,000 |
| | | | | | | | | | | |
| | | | | | | | | | | 240,000,000 |
| | | | | | | | | | | |
TOTAL MEDIUM TERM NOTES | | | | | | | | | | | 390,000,000 |
| | | | | | | | | | | |
continued on next page
42 STATE STREET MONEY MARKET PORTFOLIO Portfolio of Investments
Portfolio of Investments December 31, 2007 (continued)
| | | | | | | | | | | |
| Name of Issuer and Title of Issue | | Interest
Rate | | | Maturity
Date | | Principal
Amount | | Amortized
Cost* |
U.S. GOVERNMENT AGENCY OBLIGATIONS — 2.0% | | | | | | | | | | | |
Federal Home Loan Bank Discount Notes (c) | | 4.360 | % | | 01/24/2008 | | $ | 41,500,000 | | $ | 41,384,400 |
Federal Home Loan Bank Discount Notes (c) | | 4.350 | % | | 01/30/2008 | | | 100,000,000 | | | 99,649,583 |
| | | | | | | | | | | |
TOTAL U.S. GOVERNMENT AGENCY OBLIGATIONS | | | | | | | | | | | 141,033,983 |
| | | | | | | | | | | |
| | | | |
PROMISSORY NOTES — 1.2% | | | | | | | | | | | |
Goldman Sachs Group, Inc. (a)(d) | | 5.280 | % | | 01/15/2008 | | | 50,000,000 | | | 50,000,000 |
Goldman Sachs Group, Inc. (a)(d) | | 5.140 | % | | 01/25/2008 | | | 30,000,000 | | | 30,000,000 |
| | | | | | | | | | | |
TOTAL PROMISSORY NOTES | | | | | | | | | | | 80,000,000 |
| | | | | | | | | | | |
Portfolio of Investments STATE STREET MONEY MARKET PORTFOLIO 43
Portfolio of Investments December 31, 2007 (continued)
| | | | | | | | | | | |
| Name of Issuer and Title of Issue | | Interest
Rate | | | Maturity
Date | | Principal
Amount | | Amortized
Cost* |
REPURCHASE AGREEMENTS — 20.2% ABN AMRO Inc. Tri Party Repo, dated 12/31/07 (collateralized by Corporate Notes, 4.800%—7.875% due 07/15/09—12/15/25 valued at $78,750,000); proceeds $75,019,167 | | 4.600 | % | | 01/02/2008 | | $ | 75,000,000 | | $ | 75,000,000 |
| | | | |
ABN AMRO Inc. Tri Party Repo, dated 12/31/07 (collateralized by Federal National Mortgage Association, 5.000%—6.000% due 08/01/33—02/01/37 and Federal Home Loan Mortgage Corporation 5.000%—5.500% due 12/01/19—12/01/35 valued at $612,000,000); proceeds $600,158,333 | | 4.750 | % | | 01/02/2008 | | | 600,000,000 | | | 600,000,000 |
| | | | |
Bank of America Tri Party Repo, dated 12/31/07 (collateralized by a Federal National Mortgage Association, 5.000% due 03/01/35 valued at $47,482,021); proceeds $46,563,026 | | 4.650 | % | | 01/02/2008 | | | 46,551,000 | | | 46,551,000 |
| | | | |
Credit Suisse First Boston Tri Party Repo, dated 12/31/07 (collateralized by Corporate Notes, 6.850%—10.250% due 04/01/09—05/15/31 valued at $78,752,792); proceeds $75,019,167 | | 4.600 | % | | 01/02/2008 | | | 75,000,000 | | | 75,000,000 |
| | | | |
Deutsche Bank Tri Party Repo, dated 12/31/07 (collateralized by Federal National Mortgage Association, 4.500%—7.000% due 03/01/19—12/01/37 valued at $612,000,000); proceeds $600,158,333 | | 4.750 | % | | 01/02/2008 | | | 600,000,000 | | | 600,000,000 |
| | | | | | | | | | | |
TOTAL REPURCHASE AGREEMENTS | | | | | | | | | | | 1,396,551,000 |
| | | | | | | | | | | |
TOTAL INVESTMENTS — 99.4% | | | | | | | | | | | 6,879,206,829 |
Other Assets in Excess of Liabilities — 0.6% | | | | | | | | | | | 39,056,199 |
| | | | | | | | | | | |
NET ASSETS — 100.0% | | | | | | | | | | $ | 6,918,263,028 |
| | | | | | | | | | | |
(a) | Floating Rate Note- Interest rate shown is rate in effect at December 31, 2007. |
(b) | Security subject to restrictions on resale under federal securities laws, which may only be resold upon registration under the Securities Act of 1933, as amended (“1933 Act”) or in transactions exempt from registration, including sales to qualified institutional buyers pursuant to Rule 144A of the 1933 Act. The Portfolio does not have the right to demand that this security be registered. |
(c) | Discount rate at time of purchase. |
(d) | Security subject to restrictions on resale that has been deemed by the Adviser to be illiquid. The Portfolio may not invest more than 10% of its net assets in illiquid securities. At December 31, 2007, these securities represented 1.2% of net assets. |
| * | See Note 2 to the Notes to Financial Statements. |
See Notes to Financial Statements.
44 STATE STREET MONEY MARKET PORTFOLIO Financial Statements
Statement of Assets and Liabilities December 31, 2007
| | | |
Assets | | | |
Investments in unaffiliated issuers, at amortized cost (Note 2) | | $ | 5,482,655,829 |
Repurchase agreements (cost $1,396,551,000) (Note 2) | | | 1,396,551,000 |
| | | |
| | | 6,879,206,829 |
Cash | | | 579 |
Receivables: | | | |
Interest receivable | | | 39,784,833 |
Receivable from adviser (Note 3) | | | 138,111 |
Prepaid expenses | | | 7 |
| | | |
Total assets | | | 6,919,130,359 |
Liabilities | | | |
Payables: | | | |
Management fee (Note 3) | | | 606,497 |
Administration, custody and transfer agent fees (Note 3) | | | 240,657 |
Professional fees | | | 14,934 |
Accrued expenses and other liabilities | | | 5,243 |
| | | |
Total Liabilities | | | 867,331 |
| | | |
Net Assets | | $ | 6,918,263,028 |
| | | |
Statement of Operations For the Year Ended December 31, 2007
| | | | |
Investment Income | | | | |
Interest | | $ | 300,172,406 | |
| | | | |
Expenses | | | | |
Management fees (Note 3) | | | 5,716,641 | |
Administration, custody and transfer agent fees (Note 3) | | | 1,183,036 | |
Professional fees | | | 47,471 | |
Trustees’ fees | | | 79,354 | |
Other expenses | | | 48,622 | |
| | | | |
Total Expenses | | | 7,075,124 | |
Less: Fee waivers/reimbursements by investment adviser (Note 3) | | | (1,358,482 | ) |
| | | | |
Total Net Expenses | | | 5,716,642 | |
| | | | |
Net Investment Income | | $ | 294,455,764 | |
| | | | |
Realized and Unrealized Gain (Loss) | | | | |
Net realized loss on investments | | | (6,953 | ) |
| | | | |
Net Increase in Net Assets Resulting from Operations | | $ | 294,448,811 | |
| | | | |
See Notes to Financial Statements.
Financial Statements STATE STREET MONEY MARKET PORTFOLIO 45
Statement of Changes in Net Assets
| | | | | | | | |
| | | For the Year Ended
December 31, 2007 | | | For the Year Ended
December 31, 2006 | |
Increase in Net Assets From: | | | | | | | | |
Operations | | | | | | | | |
Net investment income | | $ | 294,455,764 | | | $ | 226,696,506 | |
Net realized loss on investments | | | (6,953 | ) | | | — | |
| | | | | | | | |
Net increase in net assets resulting from operations | | | 294,448,811 | | | | 226,696,506 | |
| | | | | | | | |
Capital Transactions | | | | | | | | |
Proceeds from contributions | | | 14,082,546,440 | | | | 16,774,127,323 | |
Fair value of withdrawals | | | (13,655,849,339 | ) | | | (12,443,577,980 | ) |
| | | | | | | | |
Net increase in net assets from capital transactions | | | 426,697,101 | | | | 4,330,549,343 | |
| | | | | | | | |
Total Net Increase in Net Assets | | | 721,145,912 | | | | 4,557,245,849 | |
| Net Assets | | | | | | | | |
Beginning of period | | | 6,197,117,116 | | | | 1,639,871,267 | |
| | | | | | | | |
End of period | | $ | 6,918,263,028 | | | $ | 6,197,117,116 | |
| | | | | | | | |
Financial Highlights The following table includes selected supplemental data and ratios to average net assets.
| | | | | | | | | | | | | | | | |
| | | Year Ended
12/31/07 | | | Year Ended
12/31/06 | | | Year Ended
12/31/05 | | | Period Ended
12/31/04* | |
| Supplemental Data and Ratios: | | | | | | | | | | | | | | | | |
Net assets, end of period (in thousands) | | $ | 6,918,263 | | | $ | 6,197,117 | | | $ | 1,639,871 | | | $ | 381,716 | |
Ratios to average net assets: | | | | | | | | | | | | | | | | |
Gross operating expenses | | | 0.12 | % | | | 0.13 | % | | | 0.14 | % | | | 0.18 | %** |
Net operating expenses | | | 0.10 | % | | | 0.10 | % | | | 0.10 | % | | | 0.10 | %** |
Net investment income | | | 5.14 | % | | | 5.08 | % | | | 3.33 | % | | | 1.71 | %** |
Total return (a) | | | 5.30 | % | | | 5.09 | % | | | 3.31 | % | | | 0.68 | % |
| * | The Portfolio commenced operations on August 12, 2004. |
| (a) | Results represent past performance and are not indicative of future results. Total return for periods of less than one year are not annualized. |
See Notes to Financial Statements.
46 STATE STREET MONEY MARKET PORTFOLIO Notes to Financial Statements
Notes to Financial Statements
1. Organization
The State Street Master Funds (the “Trust”) is registered under the Investment Company Act of 1940, as amended (the “1940 Act”), as an open-end management investment company, and was organized as a business trust under the laws of The Commonwealth of Massachusetts on July 27, 1999. The Trust comprises eleven investment portfolios: the State Street Equity 500 Index Portfolio, the State Street Equity 400 Index Portfolio, the State Street Equity 2000 Index Portfolio, the State Street Aggregate Bond Index Portfolio, the State Street Money Market Portfolio, the State Street Tax Free Money Market Portfolio, the State Street Limited Duration Bond Portfolio, the State Street Tax Free Limited Duration Bond Portfolio, the State Street Treasury Money Market Portfolio, the State Street Treasury Plus Money Market Portfolio and the State Street U.S. Government Money Market Portfolio. Information presented in these financial statements pertains only to the State Street Money Market Portfolio (the “Portfolio”). At December 31, 2007, only the Portfolio, the State Street Equity 500 Index Portfolio, the State Street Tax Free Money Market Portfolio, the State Street Tax Free Limited Duration Bond Portfolio, the State Street Treasury Money Market Portfolio, the State Street Treasury Plus Money Market Portfolio and the State Street U.S. Government Money Market Portfolio were in operation. The Portfolio commenced operations on August 12, 2004. The Portfolio is authorized to issue an unlimited number of non-transferable beneficial interests.
The Portfolio’s investment objective is to maximize current income to the extent consistent with the preservation of capital and liquidity by investing in dollar denominated securities.
2. Significant Accounting Policies
The following is a summary of the significant accounting policies consistently followed by the Portfolio in the preparation of its financial statements.
SECURITY VALUATION
As permitted under Rule 2a-7 of the 1940 Act and certain conditions therein, securities of the Portfolio are valued initially at cost and thereafter assume a constant amortization to maturity of any discount or premium.
Notes to Financial Statements STATE STREET MONEY MARKET PORTFOLIO 47
SECURITIES TRANSACTIONS, INVESTMENT INCOME AND EXPENSES
Securities transactions are recorded on a trade date basis for financial statement purposes. Interest income is recorded daily on the accrual basis and includes amortization of premium and accretion of discount on investments. Realized gains and losses from securities transactions are recorded on the basis of identified cost. Expenses are accrued daily.
All of the net investment income and realized gains and losses from the security transactions of the Portfolio are allocated pro rata among the partners in the Portfolio based on each partner’s daily ownership percentage.
FEDERAL INCOME TAXES
The Portfolio is not required to pay federal income taxes on its net investment income and net capital gains because it is treated as a partnership for federal income tax purposes. All interest, gains and losses of the Portfolio are deemed to have been “passed through” to the Portfolio’s partners in proportion to their holdings in the Portfolio, regardless of whether such items have been distributed by the Portfolio. Each partner is responsible for tax liability based on its distributive share; therefore, no provision has been made for federal income taxes.
The Portfolio adopted the provisions of Financial Accounting Standards Board Interpretation No. 48 (FIN 48), “Accounting for Uncertainty in Income Taxes”, on June 29, 2007. As of and during the period ended December 31, 2007, the Portfolio did not have a liability for any unrecognized tax expenses. The Portfolio recognizes interest and penalties, if any, related to tax liabilities as income tax expense in the Statement of Operations. As of December 31, 2007, tax years 2004 through 2007 remain subject to examination by the portfolio’s major tax jurisdictions, which include the United States of America and the Commonwealth of Massachusetts.
At December 31, 2007, the cost of investments for federal income tax purposes was the same as the cost for financial reporting purposes.
REPURCHASE AGREEMENTS
A repurchase agreement customarily obligates the seller at the time it sells securities to the Portfolio to repurchase the securities at a mutually agreed upon price and time which, in the case of the Portfolio’s transactions, is within seven days. The total amount received by the Portfolio on repurchase is calculated to exceed the price paid by the Portfolio, reflecting an agreed-upon market rate of interest for the period of time to the settlement date, and is not necessarily related to the interest rate on the underlying securities. The underlying securities are ordinarily United States Government securities, but may consist of other securities in which the Portfolio is permitted to invest. Repurchase agreements are fully collateralized at all times. The use of repurchase agreements involves certain risks. For example, if the seller of securities
48 STATE STREET MONEY MARKET PORTFOLIO Notes to Financial Statements
under a repurchase agreement defaults on its obligation to repurchase the underlying securities (as a result of its bankruptcy or otherwise) the Portfolio will seek to dispose of such securities, which could involve costs; the Portfolio may be delayed or prevented from doing so. In addition, the proceeds of any such disposition may be less than the amount the Portfolio is owed under the repurchase agreement. The Portfolio may enter into repurchase agreements maturing within seven days with domestic dealers, banks and other financial institutions deemed to be creditworthy by SSgA Funds Management, Inc. (“SSgA FM” or the “Adviser”), a subsidiary of State Street Corporation and an affiliate of State Street Bank and Trust Company (“State Street”).
EXPENSE ALLOCATION
Certain expenses are applicable to multiple Portfolios. Expenses directly attributable to a Portfolio are charged to that Portfolio. Expenses of the Trust that are not directly attributed to a Portfolio are allocated among the Portfolios, on the basis of relative net assets, except where a more appropriate allocation of expenses to each of the Portfolios can otherwise be made fairly in the judgement of the Portfolio’s officers.
USE OF ESTIMATES
The Portfolio’s financial statements are prepared in accordance with U.S. generally accepted accounting principles that require the use of management estimates. Actual results could differ from those estimates.
3. Related Party Fees
The Portfolio has entered into an investment advisory agreement with SSgA FM. The Adviser directs the investments of the Portfolio in accordance with its investment objective, policies, and limitations. In compensation for the Adviser’s services as investment adviser, the Portfolio pays the Adviser an annual fee of 0.10% of the Portfolio’s average daily net assets. The Adviser has contractually agreed to cap the total operating expenses of the Portfolio at 0.10% of the Portfolio’s average daily net assets until November 1, 2008. For the year ended December 31, 2007, SSgA FM reimbursed the Portfolio $1,358,482 under this agreement.
State Street is the administrator, custodian and transfer agent for the Portfolio. In compensation for State Street’s services as administrator, custodian and transfer agent, the Portfolio paid State Street, through January 31, 2007, an annual fee, which is accrued daily at the applicable fee rate described below and payable monthly, of the following annual percentages of the Portfolio’s average daily net assets during the month as follows:
Notes to Financial Statements STATE STREET MONEY MARKET PORTFOLIO 49
| | |
| Asset Levels | | Annual percentage of
average daily net assets |
First $200 Million | | 0.04% |
Next $200 Million | | 0.03 |
Thereafter | | 0.02 |
| |
| Minimum annual fee: | | |
Assets of $500 million and less | | $150,000 |
Assets of $500 million - $2 billion | | $200,000 with 0.01% waiver |
State Street has contractually agreed to waive 0.01% of its fees on an annual basis when the Portfolio’s assets are between $500 million and $2 billion. For the year ended December 31, 2007, State Street did not waive any fees under this agreement.
Beginning February 1, 2007, the Trust pays State Street an annual fee, which is accrued daily at the applicable fee rate described below and payable monthly, of the following annual percentages of the Trust’s average aggregate daily net assets during the month as follows:
| | |
| Asset Levels | | Annual percentage of
average aggregate daily net assets |
First $400 Million | | 0.03% |
Thereafter | | 0.02 |
Minimum annual fee per Trust: | | $150,000 |
4. Trustees’ Fees
The Trust pays each trustee who is not an officer or employee of SSgA FM or State Street $2,500 for each meeting of the Board of Trustees and an additional $500 for each telephonic meeting attended. The Trust also pays each trustee an annual retainer of $30,000. Each trustee is reimbursed for out-of-pocket and travel expenses.
5. Indemnifications
The Trust’s organizational documents provide that its officers and trustees are indemnified against certain liabilities arising out of the performance of their duties to the Trust. In addition, both in some of its principal service contracts and in the normal course of its business, the Trust enters into contracts that provide indemnifications to other parties for certain types of losses or liabilities. The Trust’s maximum exposure under these arrangements in unknown as this could involve future claims against the Trust. Management does not expect anything significant.
6. New Accounting Pronouncements
In September 2006, Statement of Accounting Standards No. 157, Fair Value Measurements (SFAS 157), was issued and is effective for fiscal years beginning after November 15, 2007. SFAS 157 defines fair value, establishes a framework for measuring fair value and expands disclosures about fair value measurements. Management has evaluated the application of SFAS 157 to the Portfolio and believes the impact will be limited to expanded disclosures in the Portfolio’s financial statements resulting from adoption of this pronouncement.
50 STATE STREET MONEY MARKET PORTFOLIO Report of Independent Registered Public Accounting Firm
Report of Independent Registered
Public Accounting Firm
To the Board of Trustees of State Street Master Funds and Owners of Beneficial Interest of State Street Money Market Portfolio:
We have audited the accompanying statement of assets and liabilities of the State Street Money Market Portfolio (one of the portfolios constituting State Street Master Funds) (the Portfolio), including the portfolio of investments, as of December 31, 2007, and the related statement of operations for the year then ended, the statement of changes in net assets for each of the two years in the period then ended and the financial highlights for each of the periods indicated therein. These financial statements and this financial highlights are the responsibility of the Portfolio’s management. Our responsibility is to express an opinion on these financial statements and financial highlights based on our audits.
We conducted our audits in accordance with the standards of the Public Company Accounting Oversight Board (United States). Those standards require that we plan and perform the audit to obtain reasonable assurance about whether the financial statements and financial highlights are free of material misstatement. We were not engaged to perform an audit of the Portfolio’s internal control over financial reporting. Our audits included consideration of internal control over financial reporting as a basis for designing audit procedures that are appropriate in the circumstances, but not for the purpose of expressing an opinion on the effectiveness of the Portfolio’s internal control over financial reporting. Accordingly, we express no such opinion. An audit also includes examining, on a test basis, evidence supporting the amounts and disclosures in the financial statements and financial highlights, assessing the accounting principles used and significant estimates made by management, and evaluating the overall financial statement presentation. Our procedures included confirmation of securities owned as of December 31, 2007, by correspondence with the custodian and brokers. We believe that our audits provide a reasonable basis for our opinion.
In our opinion, the financial statements and financial highlights referred to above present fairly, in all material respects, the financial position of State Street Money Market Portfolio of State Street Master Funds at December 31, 2007, the results of its operations for the year then ended, the changes in its net assets for each of the two years in the period then ended and the financial highlights for each of the periods indicated therein, in conformity with U.S. generally accepted accounting principles.

Boston, Massachusetts
February 25, 2008
General Information STATE STREET MONEY MARKET PORTFOLIO 51
General Information (continued)
Proxy Voting Policies and Procedures and Record
The Trust has adopted proxy voting procedures relating to portfolio securities held by the Portfolio. A description of the policies and procedures is available (i) without charge, upon request, by calling (877) 521-4083 or (ii) on the website of the Securities and Exchange Commission (the “SEC”) at www.sec.gov. Information on how the Portfolio voted proxies relating to portfolio securities during the most recent 12-month period ending June 30 is available by August 31 (i) without charge, upon request, by calling (877) 521-4083 or (ii) on the SEC’s website at www.sec.gov.
Quarterly Portfolio Schedule
The Trust files its complete schedule of portfolio holdings with the SEC for the first and third quarters of its fiscal year (as of March and September of each year) on Form N-Q. The Trust’s Forms N-Q are available on the SEC’s website at www.sec.gov. The Trust’s Forms N-Q may be reviewed and copied at the SEC’s Public Reference Room in Washington, D.C. and information on the operation of the Public Reference Room may be obtained by calling 1-800-SEC-0330. The most recent Form N-Q is available without charge, upon request, by calling (877) 521-4083.
Advisory Agreement Renewal
The Board of Trustees of the Trust met on November 29, 2007 (the “Meeting”) to consider the renewal of the investment advisory agreement for the Portfolio (the “Advisory Agreement”). In preparation for considering the Advisory Agreement, the Trustees had thoroughly reviewed the renewal materials provided by the Adviser, which they had requested through independent counsel. In deciding whether to renew the Advisory Agreement, the Trustees considered various factors, including (i) the nature, extent and quality of the services provided by the SSgA Funds Management, Inc. (the “Adviser”) under the Advisory Agreement, (ii) the investment performance of the Portfolio, (iii) the costs to the Adviser of its services and the profits realized by the Adviser and its affiliates from their relationship with the Trust, (iv) the extent to which economies of scale would be realized if and as the Trust grows and whether the fee levels in the Advisory Agreement reflect these economies of scale, and (v) any additional benefits to the Adviser from its relationship with the Trust.
In considering the nature, extent and quality of the services provided by the Adviser, the Trustees relied on their prior direct experience as Trustees of the Trust as well as on the materials provided at the Meeting. The Board reviewed the Adviser’s responsibilities under the Advisory Agreement and noted the experience and expertise that
52 STATE STREET MONEY MARKET PORTFOLIO General Information
would be appropriate to expect of an adviser to the Portfolio, which is a money-market fund. The Trustees reviewed the background and experience of the Adviser’s senior management, including those individuals responsible for the investment and compliance operations relating to the investments of the Portfolio, and the responsibilities of the latter with respect to the Portfolio. They also considered the resources, operational structures and practices of the Adviser in managing the Portfolio’s investments, in monitoring and securing the Portfolio’s compliance with its investment objective and policies with respect to its investments and with applicable laws and regulations, and in seeking best execution of portfolio transactions. The Trustees also considered information about the Adviser’s overall investment management business, noting that the Adviser manages assets for a variety of institutional investors and that the Adviser and its affiliates had over $1.99 trillion in assets under management as of September 30, 2007, including over $140 billion managed by the Adviser. They reviewed information regarding State Street’s business continuity and disaster recovery program. Drawing upon the materials provided and their general knowledge of the business of the Adviser, the Trustees determined that they were satisfied with the experience, resources and strength of the Adviser in the management of money market products. As discussed more fully below, they also determined that the advisory fee for the Portfolio was fair and reasonable and that its performance and expense ratio were satisfactory. On the basis of this review, the Trustees determined that the nature and extent of the services provided by the Adviser to the Portfolio was appropriate, had been of uniformly high quality, and could be expected to remain so.
The Trustees noted that, in view of the investment objective of the Portfolio, the investment performance was satisfactory. The Trustees noted that materials provided by Lipper Inc. at the Meeting indicated that the Portfolio’s performance had been above average for its Lipper peer group for the three-year, one-year and year-to-date periods ending September 30, 2007. They concluded that the performance of the Portfolio was satisfactory.
The Trustees considered the profitability to the Adviser and its affiliate, State Street, of the advisory relationships with the Trust. The Trustees had been provided with data regarding the profitability to the Adviser and its affiliated service providers with respect to the Portfolio individually, and on an aggregate basis, for the year ended June 30, 2007. Having discussed with representatives of the Adviser the methodologies used in computing the costs that formed the bases of the profitability calculations, they concluded that these methodologies were reasonable and turned to the data provided. After discussion and analysis they concluded that, to the extent that the Adviser’s and State Street’s relationships with the Portfolio had been profitable during the period for which information had been provided, the profitability was in no case such as to render the advisory fee excessive.
General Information STATE STREET MONEY MARKET PORTFOLIO 53
In order better to evaluate the Portfolio’s advisory fee, the Trustees had requested comparative information from Lipper Inc. with respect to fees paid by, and expense ratios of, similar funds. The Trustees found that the Portfolio’s advisory fee and total expense ratio were lower than the average for the peer group. The Trustees also considered that to help limit expenses of the Portfolio, the Adviser had reduced its advisory fee or otherwise reimbursed expenses for the Portfolio. The Board determined that the Adviser’s fees were fair and reasonable.
In considering whether the Adviser benefits in other ways from its relationship with the Trust, the Trustees also considered whether the Adviser’s affiliates may benefit from the Trust’s relationship with State Street as fund administrator, custodian and transfer agent and the Portfolio’s use of State Street Global Markets to perform certain brokerage services. They noted that the Adviser utilizes no soft-dollar arrangements in connection with the Portfolio’s brokerage transactions. The Trustees concluded that, to the extent that the Adviser or its affiliates derive other benefits from their relationships with the Trust, those benefits are not so significant as to render the Adviser’s fees excessive.
The Board also considered the extent to which economies of scale may be realized by the Portfolio as assets grow and whether the Portfolio’s fee levels reflect such economies of scale, if any, for the benefit of investors. In considering the matter, the Board determined that, to the extent economies of scale were in fact realized, such economies of scale were shared with the Portfolio by virtue of advisory fees of comparatively low levels that subsumed economies of scale in the fees themselves. The Trustees also recognized, however, that should sustained, substantial asset growth be realized in the future, it might be necessary to consider additional measures.
54 AARP FUNDS 2007 SEMI-ANNUAL REPORT Trustees and Executive Officers
Trustees and Executive Officers (unaudited)
The table below includes information about the Trustees and Executive Officers of the State Street Master Funds, including their:
| | • | | business addresses and ages; |
| | • | | principal occupations during the past five years; and |
| | • | | other directorships of publicly traded companies or funds. |
| | | | | | | | |
Name, Address, and Date of Birth (“DOB”) | | Position(s) with the Trust and Term of Office | | Principal Occupation(s) During Past Five Years | | Number of Funds
in Fund Complex
Overseen by
Trustee* | | Other Directorships
Held by Trustee |
| | | | |
| Independent Trustees | | | | | | | | |
| | | | |
Michael F. Holland Holland & Company, LLC 375 Park Avenue New York, NY 10152 DOB: July 7, 1944 | | Trustee and Chairman of the Board Term: Indefinite Elected: 7/99 | | Chairman, Holland & Company L.L.C. (investment adviser) (1995-present). | | 22 | | Trustee, State Street Institutional Investment Trust; Director, the Holland Series Fund, Inc.; Director, the China Fund, Inc; Chairman and Trustee, Scottish Widows Investment Partnership Trust; and Director, Reaves Utility Income Fund |
| | | | |
William L. Boyan State Street Master Funds P.O. Box 5049 Boston, MA 02206 DOB: January 20, 1937 | | Trustee Term: Indefinite Elected: 7/99 | | Trustee of Old Mutual South Africa Master Trust (investments) (1995-present); Chairman emeritus, Children’s Hospital (1984-present); Director, Boston Plan For Excellence (non-profit) (1994-present); President and Chief Operations Officer, John Hancock Mutual Life Insurance Company (1959-1999). Mr. Boyan retired in 1999. | | 22 | | Trustee, State Street Institutional Investment Trust; and Trustee, Old Mutual South Africa Master Trust |
| | | | |
Rina K. Spence State Street Master Funds P.O. Box 5049 Boston, MA 02206 DOB: October 24, 1948 | | Trustee Term: Indefinite Elected: 7/99 | | President of SpenceCare International LLC (1998-present); Member of the Advisory Board, Ingenium Corp. (technology company) (2001-present); Chief Executive Officer, IEmily.com (internet company) (2000-2001); Chief Executive Officer of Consensus Pharmaceutical, Inc. (1998-1999); Founder, President and Chief Executive Officer of Spence Center for Women’s Health (1994-1998); Trustee, Eastern Enterprise (utilities) (1988-2000). | | 22 | | Trustee, State Street Institutional Investment Trust; Director, Berkshire Life Insurance Company of America; and Director, IEmily.com |
| | | | |
Douglas T. Williams State Street Master Funds P.O. Box 5049 Boston, MA 02206 DOB: December 23, 1940 | | Trustee Term: Indefinite Elected: 7/99 | | Executive Vice President of Chase Manhattan Bank (1987-1999). Mr. Williams retired in 1999. | | 22 | | Trustee, State Street Institutional Investment Trust |
| * | The “Fund Complex” consists of eleven series of the Trust and eleven series of State Street Institutional Investment Trust. |
Trustees and Executive Officers AARP FUNDS SEMI-ANNUAL REPORT 55
| | | | | | | | |
Name, Address, and Date of Birth (“DOB”) | | Position(s) with the Trust and Term of Office | | Principal Occupation(s) During Past Five Years | | Number of Funds
in Fund Complex
Overseen by
Trustee* | | Other Directorships
Held by Trustee |
| | | | |
| Interested Trustees1 | | | | | | | | |
| | | | |
James E. Ross SSgA Funds Management, Inc. State Street Financial Center One Lincoln Street Boston, MA 02111-2900 DOB: June 24, 1965 | | Trustee/President Term: Indefinite Elected Trustee: 2/07 Elected President: 4/05 | | President, SSgA Funds Management, Inc. (2005-present); Principal, SSgA Funds Management, Inc. (2001-2005); Senior Managing Director, State Street Global Advisors (March 2006-present); Principal, State Street Global Advisers (2000-2006). | | 22 | | Trustee, State Street Institutional Investment Trust; Trustee, SPDR® Series Trust; Trustee, SPDR® Index Shares Trust and Trustee, Select Sector SPDR® Trust |
| | | | |
| Officers | | | | | | | | |
| | | | |
Gary L. French State Street Bank and Trust Company 2 Avenue de Lafayette Boston, MA 02111 DOB: July 4, 1951 | | Treasurer Term: Indefinite Elected: 5/05 | | Senior Vice President of State Street Bank and Trust Company (2002-present); Managing Director, Deutsche Bank (including its predecessor, Scudder Investments), Fund Operations Unit (2001-2002); President, UAM Fund Services (1995 to 2001). | | — | | — |
| | | | |
Julie Piatelli SSgA Funds Management, Inc. State Street Financial Center One Lincoln Street Boston, MA 02111 DOB: August 5, 1967 | | Interim Chief Compliance Officer Term: Indefinite Elected: 7/07 | | Principal and Senior Compliance and Risk Management Officer, SSgA Funds Management, Inc. (2004-present), Vice President State Street Global Advisors (2004-present); Manager, PricewaterhouseCoopers LLP (1999-2004). | | — | | — |
| | | | |
Nancy L. Conlin State Street Bank and Trust Company 2 Avenue de Lafayette Boston, MA 02111 DOB: December 11, 1953 | | Secretary Term: Indefinite Elected: 9/07 | | Vice President and Managing Counsel, State Street Bank and Trust Company (2007-present); General Counsel to Plymouth Rock Companies (2004-2007); and U.S. Chief Counsel to Sun Life Financial (2002-2004). | | — | | — |
1 | Mr. Ross is an Interested Trustee because of his employment by SSgA Funds Management, Inc., an affiliate of the Trust. |
The Statement of Additional Information includes additional information about the Trustees and is available, without charge, upon request, by calling (toll free) 877-521-4083.
56 STATE STREET MONEY MARKET PORTFOLIO Trustees and Executive Officers
Trustees
Michael F. Holland
William L. Boyan
Rina K. Spence
Douglas T. Williams
James E. Ross
Investment Adviser
SSgA Funds Management, Inc.
State Street Financial Center
One Lincoln Street
Boston, MA 02111
Administrator, Custodian and Transfer Agent
State Street Bank and Trust Company
State Street Financial Center
One Lincoln Street
Boston, MA 02111
Independent Registered Public Accounting Firm
Ernst & Young LLP
200 Clarendon Street
Boston, MA 02116
Legal Counsel
Ropes & Gray LLP
One International Place
Boston, MA 02110
This report is for shareholder information. This is not a prospectus intended for use in the purchase or sale of shares of beneficial interest.
State Street Money Market Portfolio
State Street Bank and Trust Company
P.O. Box 5049
Boston, MA 02206
How to Contact Us STATE STREET MONEY MARKET PORTFOLIO 57
How to Contact Us
Telephone
Call 1-800-958-6457 weekdays from 8:00 am to 6:00 pm Eastern time, to speak directly with a courteous, knowledgeable representative. The following prompt choices are available when you dial the number above:
| • | | Financial Center investment counselors are available to answer investment questions relating to the AARP Funds. |
| • | | Shareholder Services representatives can handle any account-related questions or transactions. |
| • | | Automated Response System is available 24 hours a day, seven days a week to handle a wide range of account functions (as shown below). |
Financial Center investment counselors
| • | | Speak with specially trained representatives to help you identify your goals, determine if you’re on track financially for retirement and decide if an AARP Fund is right for you. |
Shareholder Services representatives or our 24-hour Automated Response System
| • | | Receive general account information and service from our Shareholder Services representatives |
| • | | Initiate an electronic transfer to buy or sell shares |
| • | | Order duplicate statements |
| • | | Check your account balance or share prices |
| • | | Change your address of record (not available via the Automated Response System) |
Mail
AARP Funds
P.O. Box 8035
Boston, MA 02266-8035
Overnight delivery
AARP Funds
c/o BFDS
30 Dan Road
Canton, MA 02021
| • | | Request to buy, sell or exchange shares in writing |
| • | | Change the name on your account |
| • | | Add a seasonal mailing address |
| • | | Add banking information to your account |
| • | | Add or change an Automatic Investment Program |
| • | | Add or change payroll deduction |
Website
www.aarpfunds.com
| • | | Get a prospectus or fund report |
| • | | Buy, sell or exchange shares |
| • | | View your account balance and share price |
| • | | Change your mailing address |
| • | | Order duplicate statements or copies of your tax forms |
| • | | Get forms to accomplish a variety of tasks |
Not applicable.
| Item 3. | Audit Committee Financial Expert |
Not applicable.
| Item 4. | Principal Accountant Fees and Services |
Not applicable.
| Item 5. | Audit Committee of Listed Registrants |
Not applicable to the registrant.
| Item 6. | Schedule of Investments |
Schedules of Investments are included as part of the report to shareholders filed under Item 1 of this Form N-CSR.
| Item 7. | Disclosure of Proxy Voting Policies and Procedures for Closed-End Management Investment Companies |
Not applicable to the registrant.
| Item 8. | Portfolio Managers of Closed-End Investment Companies |
Not applicable to the registrant.
| Item 9. | Purchases of Equity Securities by Closed-End Management Investment Company and Affiliated Purchasers |
Not applicable to the registrant.
| Item 10. | Submission of Matters to a Vote of Security Holders |
The Board of Trustees has adopted procedures by which shareholders may recommend nominees to the Board. There have been no amendments to such procedures since their adoption during the reporting period for Form N-CSR.
| Item 11. | Controls and Procedures |
| (a) | The registrant’s principal executive and principal financial officers have concluded that the registrant’s disclosure controls and procedures (as defined in Rule 30a-3(c) under the Investment Company Act of 1940, as amended (the “1940 Act”) (17 CFR 270.30a-3(c)) are effective, as of a date within 90 days of the filing date of this Form N-CSR based on their evaluation of these controls and procedures required by Rule 30a-3(b) under the 1940 Act (17 CFR 270.30a-3(b)) and Rules 13a-15(b) or 15d-15(b) under the Securities Exchange Act of 1934 (17 CFR 240.13a-15(b) or 240.15d-15(b)). |
| (b) | There were no changes in the registrant’s internal control over financial reporting (as defined in Rule 30a-3(d) under the 1940 Act (17 CFR 270.30a-3(d)) that occurred during the second fiscal quarter of the period covered by this report that has materially affected, or is reasonably likely to materially affect, the registrant’s internal control over financial reporting. |
| | |
| (a)(1) | | Not applicable. |
| |
| (a)(2) | | The certifications required by Rule 30a-2(a) of the 1940 Act are attached hereto. (Ex-99.CERT) |
| |
| (a)(3) | | Not applicable. |
| |
| (b) | | The certifications required by Rule 30a-2(b) of the 1940 Act and Section 906 of the Sarbanes-Oxley Act of 2002 are attached hereto.(Ex-99.906CERT) |
SIGNATURES
Pursuant to the requirements of the Securities Exchange Act of 1934 and the Investment Company Act of 1940, the registrant has duly caused this report to be signed on its behalf by the undersigned, thereunto duly authorized.
| | |
| AARP FUNDS |
| |
| By: | | /s/ Larry C. Renfro |
| | Larry C. Renfro |
| | President (principal executive officer) of AARP Funds |
Date: February 14, 2008
Pursuant to the requirements of the Securities Exchange Act of 1934 and the Investment Company Act of 1940, this report has been signed below by the following persons on behalf of the registrant and in the capacities and on the dates indicated.
| | |
| By: | | /s/ Larry C. Renfro |
| | Larry C. Renfro |
| | President (principal executive officer) of AARP Funds |
Date: February 14, 2008
| | |
| By: | | /s/ Richard M. Hisey |
| | Richard M. Hisey |
| | Treasurer (principal financial officer) of AARP Funds |
Date: February 14, 2008