UNITED STATES
SECURITIES AND EXCHANGE COMMISSION
Washington, D.C. 20549
FORM N-CSR
CERTIFIED SHAREHOLDER REPORT OF REGISTERED
MANAGEMENT INVESTMENT COMPANIES
Investment Company Act file number: 811-21825
AARP FUNDS
(Exact name of registrant as specified in charter)
650 F Street, NW
Washington, DC 20004-1604
(Address of principal executive offices)(Zip code)
| | |
| (Name and Address of Agent for Service) | | Copy to: |
Richard Hisey AARP Financial Incorporated Two Highwood Drive, Suite 202 Tewksbury, MA 01876 | | Gary O. Cohen, Esq. Jorden Burt LLP 1025 Thomas Jefferson Street, NW Suite 400 East Washington, DC 20007-5208 |
Registrant’s telephone number, including area code: (202) 434-3650
Date of fiscal year end: June 30
Date of reporting period: December 31, 2009
| Item 1. | Report to Shareholders |

Letter to Shareholders
Market Commentary
Semi-Annual Report
December 31, 2009 (unaudited)
AARP Aggressive Fund (AAGSX)
AARP Moderate Fund (AAMDX)
AARP Conservative Fund (AACNX)
AARP Income Fund (AANCX)
AARP Money Market Fund (AARXX)
| | |
A LETTER TO SHAREHOLDERS |

Richard M. Hisey President, AARP Funds | | Dear Fellow Shareholders, Although the financial markets have stabilized and the economy appears to be recovering, many of the problems associated with the recession are still with us. Unemployment remains high, credit is still tight and uncertainty over interest rates continues to cause anxiety among investors. The economy may have ended the year with better than expected Gross Domestic Product (GDP) growth, but many analysts attribute that to one-time stimulus initiatives such as the “Cash for Clunkers” program and the first time homeowners’ tax credit. Some economists believe the real pace of recovery will slow to a crawl until we can improve the three “D’s” – debt, deficit and the dollar. Heavy debt |
continues to weigh on millions of American households as well as on state and federal governments. The U.S. budget deficit is higher than the entire budgets of most countries and the weakening value of the dollar could threaten its position as the world’s reserve currency.
INTERNATIONAL AND EMERGING MARKETS
International markets, especially emerging markets, continue to perform very well. Economically, we believe that pent-up consumer demand in other countries will continue to outpace the U.S. where consumers are still feeling tapped out. Since the consumer has historically been such an important factor in U.S. economic growth, this adds to our conviction that U.S. economic growth could remain fairly muted. You may recall that we anticipated this trend at the beginning of 2009 when we not only increased the allocation to international equities in the AARP Funds, but we also broadened the funds’ international exposure to include emerging markets.
REVISIT YOUR RISK TOLERANCE AND REBALANCE YOUR ASSET ALLOCATION
For shareholders, we have three key messages when it comes to investing in this or any market. First, it is essential to know your risk tolerance and to make sure it is consistent with your asset allocation (proportion of investments in stocks, bonds and cash). Second, keep in mind that asset allocation is critical to anything you do because it is one of the most important factors in explaining investment returns over the long term. And third, while it is always prudent to revisit and rebalance your portfolio on a regular basis, you may now want to do so more often, because of the sharp swings we have seen in the market over the past few months and years. For example, last year at this time, you may have had too much fixed income and you should have rebalanced with a higher percentage of equity. It is also always important to have a cash reserve in any economic environment but especially so in these more volatile times. But now, following a strong run in equities you should be looking to rebalance again.
ARE YOU DIVERSIFIED?
While maintaining a proper asset allocation and rebalancing regularly are critical to successful investing, it is also important to remain diversified* especially in such dynamic economic
NOT PART OF THE SEMI-ANNUAL REPORT
environments. As we move from economic downturn, to economic stability, and then to economic growth, various industrial sectors will perform differently at different times. If you are over weighted in one sector, you could get hit hard, which is why we recommend you have a well-diversified portfolio, across the breadth of industrial sectors. The key is to stay diversified, focus on your long-term goals and have realistic expectations of what the markets will do in the coming years.
3 AARP FUNDS RECEIVE 5 STAR MORNINGSTAR RATING
The AARP Aggressive Fund, the AARP Moderate Fund and the AARP Conservative Fund each maintained their “5 Star” Morningstar Rating for the three years ending December 31, 2009. Five Stars means that each of the funds ranked in the top 10% of its respective category – the highest rating a fund can receive. The AARP Aggressive Fund posted negative performance during this period. The AARP Income Fund received a “3 Star” Morningstar Rating for the three years ending December 31, 2009.
The AARP Aggressive Fund was ranked 107th out of 1757 Large Blend Category Funds for the three year period ending 12/31/09. The AARP Moderate Fund was ranked 71 st out of 953 Moderate Allocation Category Funds for the three year period ending 12/31/09. The AARP Conservative Fund was ranked 26th out of 522 Conservative Allocation Category Funds for the three year period ending 12/31/09. The AARP Income Fund was ranked 378th out of 978 Intermediate Term Bond Category Funds for the three year period ending 12/31/09. Morningstar Ratings are based on a risk adjusted performance.
OUR MISSION
Our mission, as always, is to provide you with objective and trusted advice and guidance and to help simplify your investment decisions by providing access to straightforward financial products. We invite you to call our Financial Advisors with questions about your personal investments as well as any other financially related questions. As you know, our Financial Advisors are highly trained and experienced salaried professionals who do not work on commission. They are available between 8 a.m. and 6 p.m. Eastern Time, Monday through Friday by calling 1-800-958-6457.
Thank you for your trust and confidence and for investing in the AARP Funds.
Sincerely,

Richard M. Hisey
President, AARP Funds
* Diversification reduces risk but does not eliminate it.
NOT PART OF THE SEMI-ANNUAL REPORT
When investing in bonds, you are subject, but not limited to, the same interest rate, inflation, and credit risk associated with the underlying bonds owned by the Fund. The Income Fund’s prospectus allows for investment in non-investment grade securities. All investments involve some risk, including the AARP Funds. Each of the three funds, Conservative, Moderate, and Aggressive, invest in a mix of domestic and international stocks and U.S. bonds.
In addition to the normal risks associated with investing, emerging market investments do involve risk of capital loss from unfavorable fluctuation in currency values, from differences in generally accepted accounting principles, from economic or political instability in other nations or increased volatility and lower trading volume.
This Shareholder Report must be preceded or accompanied by the AARP Funds prospectus for individuals who are not current AARP Funds shareholders. An investor should consider the investment objectives, risks, charges and expenses of AARP Funds carefully before investing. To get an additional prospectus containing this and other information, please call 1-800-958-6457. Read the prospectus carefully before you invest.
Past performance cannot guarantee future results. The Overall Morningstar Rating is derived from a weighted average of the fund’s performance figures for three year Morningstar rating metrics. For each fund with at least a three-year history, Morningstar calculates a Morningstar Rating™ based on a Morningstar Risk-Adjusted Return measure that accounts for variation in a fund’s monthly performance (including the effects of sales charges, loads and redemption fees), placing more emphasis on downward variations and rewarding consistent performance. (Each share class is counted as a fraction of one fund within this scale and rated separately, which may cause slight variations in the distribution percentages.) The top 10% of the funds in an investment category receive 5 stars, the next 22.5% receive 4 stars, the next 35% receive 3 stars, the next 22.5% receive 2 stars, and the bottom 10% receive 1 star.
2009 Morningstar, Inc. All Rights Reserved. The information contained herein: (1) is proprietary to Morningstar and/or its content providers; (2) may not be copied or distributed; and (3) is not warranted to be accurate, complete or timely. Neither Morningstar nor its content providers are responsible for any damages or losses arising from any use of this information.
While AARP has licensed the use of its name to AARP Funds and endorses the services provided by AARP Financial Inc., AARP does not offer financial products or services itself, and it cannot recommend that you or any specific individual should purchase any particular product or service. AARP Financial Inc. is an investment adviser and a subsidiary of AARP.
The AARP Financial, Inc, Financial Advisors are registered as representatives of ALPS Distributors, Inc., a registered broker-dealer, and as investment adviser representatives of AARP Financial Inc an investment adviser.
AARP Financial Inc. offers investment advisory services and is not affiliated with ALPS Distributors, Inc.
AARP Funds are advised by AARP Financial Inc. and distributed by ALPS Distributors, Inc.
NOT PART OF THE SEMI-ANNUAL REPORT
Market Commentary December 31, 2009 (unaudited)
The rally in financial markets that started in March continued through the fourth quarter of 2009. The S&P 500 Index returned 6% in the fourth quarter and finished 2009 with a gain of 24%. Although this advancement helped regain some of the ground lost in 2008, the S&P 500 Index closed the year at a level of 1115, still 29% below its October 2007 peak of 1576. Broader market indices performed well during this time with the Morgan Stanley Capital International (“MSCI”) U.S. Investable Market 2500 Index recording a 6% gain in the fourth quarter and finished 2009 with a gain of 29%.
International markets also performed well and were led by emerging markets. Recall that at the beginning of 2009, the AARP Funds not only increased the allocation to international equities, but also changed international benchmarks from the MSCI EAFE (Europe, Australasia, and Far East) Index (a developed markets index) to the MSCI ACWI (All Country World) ex U.S. Index (a combination of developed and emerging markets). Although this change is long-term and strategic, shareholders were rewarded in 2009 as the MSCI ACWI ex U.S. Index outperformed the MSCI EAFE Index by nearly 1000 basis points or 10%. In fact the MSCI ACWI ex U.S. Index returned 4% during the fourth quarter, and finished 2009 with a gain of 41%. With the exception of Morocco, every country index in the MSCI ACWI ex US Index posted gains in 2009 with returns ranging from +6% in Japan (developed market) to +128% in Brazil (emerging market).
U.S. investment grade bonds, as measured by the Barclays Capital Aggregate Bond Index, were little changed in the fourth quarter, but finished 2009 with a gain of 6%. Indeed, this index recorded its tenth consecutive year of positive performance. The high yield bond segment, as measured by the Barclays Capital U.S. High Yield Very Liquid Index, continued to perform well and returned 6% during the fourth quarter and 63% during 2009. (Recall that performance in the high yield bond market is closely correlated to performance in the equity markets.) Besides improving economic conditions and a more optimistic economic outlook, significant inflows to bond funds in 2009 have contributed to rising prices and falling yields as many income-oriented (and highly risk-averse) investors, who cannot bear or afford the extremely low rates offered in U.S. Treasuries, money market funds and certificates of deposit, have now ventured further out on the risk spectrum seeking additional return.
NOT PART OF THE SEMI-ANNUAL REPORT
In terms of the economic setting, typically, a recovery on Main Street follows a recovery on Wall Street. Despite the robust returns in global equities in 2009, some economists are predicting a tepid recovery for the U.S. economy in 2010 and beyond. Although GDP figures released in the second half of 2009 imply that the economy is on track, encouragement about future GDP growth is tempered by one-time effects of stimulus recorded in those figures. Economists now believe that Cash for Clunkers, homebuyer tax credits (extended to April 2010) and inventory adjustments accounted for most of the increase in GDP in 2009. The U.S. economy still faces many challenges including: weakness in the labor markets, limited credit to consumers and small businesses, higher savings rates and excess capacity (across commercial, residential and industrial sectors). These factors, as well as others, have left both Main Street and Wall Street wondering where the economy will go from here.
Performance data quoted represents past performance which is no guarantee of future results. The indexes above have been adjusted to reflect reinvestment of dividends on securities in the indexes and do not reflect the expenses of managing a fund. It is not possible to invest directly in an Index.
The views, forecasts and supporting information contained in this Market Commentary are as of December 31, 2009 and are subject to change. This Market Commentary must be preceded or accompanied by the AARP Funds prospectus for individuals who are not current AARP Funds shareholders. An investor should consider the investment objectives, risks, charges and expenses of AARP Funds carefully before investing. To get an additional prospectus containing this and other information, please call 1-800-958-6457. Read the prospectus carefully before you invest.
While AARP has licensed the use of its name to AARP Funds and endorses the services provided by AARP Financial Inc., AARP does not offer financial products or services itself, and it cannot recommend that you or any specific individual should purchase any particular product or service. AARP Financial Inc. is a registered investment adviser and a subsidiary of AARP.
Financial Advisors are FINRA registered representatives through ALPS Distributors, Inc., a registered broker/dealer, and employed by AARP Financial Inc. AARP Funds are advised by AARP Financial Inc. and distributed by ALPS Distributors, Inc.
AARP Financial Inc. is not affiliated with ALPS Distributors, Inc.
NOT PART OF THE SEMI-ANNUAL REPORT
S&P 500 Index – The index includes 500 securities that are considered to be widely held. This index provides a broad snapshot of the overall U.S. equity market.
MSCI U.S. Investable Market 2500 Index – The index includes 2500 securities listed on the New York and American Exchanges and the NASDAQ over-the-counter market. The stocks include companies of all types and sizes, which represent the investable universe of companies in the U.S. Equity market.
MSCI ACWI Index ex US Index – The index is a free float adjusted market capitalization weighted index that is designed to measure the equity market performance of developed and emerging markets.
MSCI EAFE Index – The index includes about 1,000 securities that are listed on the stock exchanges of 21 developed countries excluding the United States and Canada.
Barclays High Yield Very Liquid Index – The index includes publicly issued U.S. dollar denominated, non-investment grade, fixed-rate, taxable corporate bonds that have a remaining maturity of at least one year. The High Yield Index includes only corporate sectors.
Barclays Capital Aggregate Bond Index – The index includes a large variety of U.S. and foreign bonds traded in U.S. markets that are investment grade and taxable, covering three major types of bonds: government and corporate bonds, mortgage-backed securities and asset backed securities.
While you can invest in an index fund – it’s a real investment, you cannot invest in an index – it’s just a list.
Sources: SSgA Funds Management, Inc., MSCI Barra, The Portfolio Advisory Group
NOT PART OF THE SEMI-ANNUAL REPORT
AARP FUNDS
…
Semi-Annual Report
December 31, 2009 (unaudited)
…
KEEPING YOU INFORMED
This shareholder report for the AARP Funds represents our commitment to providing communications that are clear, concise and informative. One of our highest priorities at AARP Funds is to help you make sense of investment information that is often complex. We hope you find it helpful in evaluating your investment with us.
EXPERTISE AND GUIDANCE
WHEN YOU NEED IT
AARP Financial’s Financial Advisors are ready to help you determine if you are on track financially for retirement and to answer specific questions about AARP Funds. They work on salary, not commission, and are there to help you focus on your goals, take decisive action and feel comfortable with your decisions. Financial Advisors are FINRA registered representatives through ALPS Distributors, Inc., and are employed by AARP Financial.
| | | | |
| | AARP FUNDS 2009 SEMI-ANNUAL REPORT | | 1 |
Table of Contents
This Shareholder Report must be preceded or accompanied by the AARP Funds prospectus for individuals who are not current AARP Funds shareholders. An investor should consider the investment objectives, risks, charges and expenses of AARP Funds carefully before investing. To get an additional prospectus containing this and other information, please call 1-800-958-6457. Read the prospectus carefully before you invest.
While AARP has licensed the use of its name to AARP Funds and endorses the services provided by AARP Financial Inc., AARP cannot recommend that you or any specific individual should purchase shares of a particular fund. AARP is not a registered investment adviser or broker/dealer.
AARP Funds are distributed by ALPS Distributors, Inc.
AARP Financial Inc. is not affiliated with ALPS Distributors, Inc.
| | | | |
| 2 | | AARP FUNDS 2009 SEMI-ANNUAL REPORT | | AARP Funds Overview |
AARP Funds Overview
Each of the AARP Funds (except for the AARP Money Market Fund) are “fund-of-funds” because they invest substantially all of their assets in of the underlying AARP Portfolios (the “AARP Portfolios”), which are separate registered investment company.
In the fund of funds structure, each fund (except for the AARP Money Market Fund) invests its assets in a mix of asset classes. The AARP Income Fund, in addition to its investment in the U.S. Bond Market Portfolio, also invests a portion of its assets in the State Street Money Market Portfolio (the “State Street Portfolio”), a series of a separate registered investment company called the State Street Master Funds, and the SPDR Barclays Capital High Yield Bond exchange traded fund.
The AARP Money Market Fund is a feeder fund, buying shares of the master fund to the State Street Portfolio. This is called a “master-feeder” structure because it allows different feeder funds to pool their assets in an underlying master fund to seek economies of scale.
Effective January 1, 2009, the target allocations of each AARP Fund among the underlying portfolios are as follows:
| | | | | | | | | | |
| | | | | | |
| | | AARP
Aggressive Fund | | AARP
Moderate Fund | | AARP
Conservative Fund | | AARP
Income Fund | | AARP Money
Market Fund |
| Investment Objective | | Seeks growth of capital and some current income | | Seeks a balance of growth of capital and current income | | Seeks primarily current income, with some growth of capital | | Seeks current income and preservation of capital over the long term | | Seeks to maximize current income, while providing for liquidity, the preservation of capital, and a stable $1.00 per
share price |
U.S. Stock
Market Portfolio | | 60% | | 40% | | 22.5% | | – | | – |
U.S. Bond
Market Portfolio | | 20% | | 45% | | 70% | | 95% | | – |
International Stock
Market Portfolio | | 20% | | 15% | | 7.5% | | – | | – |
State Street
Portfolio | | – | | – | | – | | 2.5% | | 100% |
| SPDR Barclays Capital High Yield Bond ETF | | – | | – | | – | | 2.5% | | – |
Source: AARP Funds
On January 1, 2009, the target allocations of the Conservative, Moderate and Aggressive Funds among the underlying Portfolios were changed to increase the Funds’ exposure to international equities by 5 percentage points.
| | | | |
| AARP Funds Overview | | AARP FUNDS 2009 SEMI-ANNUAL REPORT | | 3 |
The following chart displays the top 10 holdings of each of the underlying AARP Portfolios as of December 31, 2009.
AARP Portfolios Top 10 Holdings as a percentage of net assets at December 31, 2009 (unaudited)
| | | | | | | | | | | | | | | | | | |
| U.S. Stock Market Portfolio | | | | | | U.S. Bond Market Portfolio | | | | | | International Stock Market Portfolio |
| | | | | | | | | |
Exxon Mobil Corp. | | 2.7% | | | | | | FNMA, 4.500%, 5/1/2039 | | 1.2% | | | | | | HSBC Holdings PLC | | 1.3% |
Microsoft Corp. | | 2.0% | | | | | | GNMA, 30 YR, 5.000% | | 1.0% | | | | | | BP PLC | | 1.2% |
Apple Computer, Inc. | | 1.6% | | | | | | U.S. Treasury Notes, 4.500%, 4/30/12 | | 0.7% | | | | | | Nestle SA | | 1.1% |
Johnson & Johnson | | 1.5% | | | | | | U.S. Treasury Notes, 4.625%, 12/31/11 | | 0.7% | | | | | | Total SA | | 0.9% |
Procter & Gamble Co. | | 1.4% | | | | | | FHLMC, 2.125%, 3/23/12 | | 0.6% | | | | | | Banco Santander Central Hispano SA | | 0.9% |
International Business Machines Corp. | | 1.4% | | | | | | FHLMC, 5.000%, 2/1/37 | | 0.6% | | | | | | BHP Billiton Ltd. | | 0.9% |
AT&T, Inc. | | 1.4% | | | | | | FHLMC, 2.500%, 1/7/14 | | 0.6% | | | | | | Toyota Motor Corp. | | 0.8% |
JPMorgan Chase & Co. | | 1.3% | | | | | | U.S. Treasury Notes, 3.750%, 11/15/18 | | 0.6% | | | | | | Vodafone Group PLC | | 0.8% |
General Electric Co. | | 1.3% | | | | | | U.S. Treasury Notes, 1.875%, 2/28/14 | | 0.6% | | | | | | Roche Holdings AG | | 0.8% |
Chevron Corp. | | 1.3% | | | | | | FHLMC, 4.500%, 7/1/39 | | 0.6% | | | | | | Telefonica SA | | 0.8% |
Total | | 15.9% | | | | | | | | 7.2% | | | | | | | | 9.5% |
| | | | |
| 4 | | AARP FUNDS 2009 SEMI-ANNUAL REPORT | | How the Funds Performed |
How the Funds Performed as of December 31, 2009 (unaudited)
| | | | | | | | | | | | | | | | | |
| | | | | | | | | |
| | | | | | | 1 Year | | | | 3 Years | | | | Average
annual since
inception4 | | | |
| | | AARP Aggressive Fund | | | | 25.03% | | | | -1.73% | | | | 1.84% | | | |
| | | Aggressive Composite Index5 | | | | 25.78% | | | | -0.84% | | | | 2.84% | | | |
| | | MSCI U.S. Investable Market 2500 Index®1 | | | | 28.63% | | | | -4.99% | | | | -0.19% | | | |
| | | AARP Moderate Fund | | | | 18.96% | | | | 1.18% | | | | 3.34% | | | |
| | | Moderate Composite Index5 | | | | 19.40% | | | | 2.04% | | | | 4.25% | | | |
| | | MSCI U.S. Investable Market 2500 Index®1 | | | | 28.63% | | | | -4.99% | | | | -0.19% | | | |
| | | Barclays Capital Aggregate Bond Index®1 | | | | 5.93% | | | | 6.04% | | | | 5.61% | | | |
| | | AARP Conservative Fund | | | | 12.59% | | | | 3.75% | | | | 4.54% | | | |
| | | Conservative Composite Index5 | | | | 13.10% | | | | 4.42% | | | | 5.24% | | | |
| | | Barclays Capital Aggregate Bond Index®1 | | | | 5.93% | | | | 6.04% | | | | 5.61% | | | |
| | | AARP Income Fund | | | | 5.90% | | | | 5.64% | | | | 5.48% | 2 | | |
| | | Income Composite Index | | | | 6.95% | | | | 6.05% | | | | 5.97% | | | |
| | | Barclays Capital Aggregate Bond Index®1 | | | | 5.93% | | | | 6.04% | | | | 5.94% | 2 | | |
| | | J.P. Morgan 1-Month LIBOR | | | | 0.36% | | | | 2.98% | | | | 3.31% | | | |
| | | AARP Money Market Fund | | | | 0.33% | | | | 2.67% | | | | 3.00% | 3 | | |
| | | J.P. Morgan 1-Month LIBOR | | | | 0.36% | | | | 2.98% | | | | 3.34% | | | |
| | | AARP Money Market Fund 7-Day Effective Yield | | | | 0.01% | | | | | | | | | | | |
| |
1 The MSCI U.S. Investable Market 2500 Index and the Barclays Capital Aggregate Bond Index serve as broad measures of the U.S equity and taxable bond markets, respectively. Since the Funds invest in differing combinations of these and other markets, Composite Indexes have been constructed utilizing the proportionate weightings of the indexes for each market. These Composite Indexes provide a particularly useful benchmark to measure the performance of the Funds. For more detailed information regarding the Composite Indexes, please see A Word about Benchmarks that follows. 2 For the period from September 29, 2006 (commencement of operations) to December 31, 2009. 3 For the period from July 1, 2006 (commencement of operations) to December 31, 2009. 4 The inception date for the Aggressive, Moderate and Conservative Funds was December 30, 2005. 5 The weightings of these composite indexes were changed to reflect the January 1, 2009 weighting changes for the Conservative, Moderate and Aggressive Funds. The composite performance reflects the new weightings calculations from July 1, 2009 to December 31, 2009. Sources: MSCI Barra, Barclays Capital Inc., J.P. Morgan, AARP Financial Inc. Total returns for period less than one year are not annualized. |
Total annual fund operating fees and expenses are 1.74% for the Aggressive Fund, 1.20% for the Moderate Fund, 1.66% for the Conservative Fund, 2.15% for the Income Fund and 0.85% for the Money Market Fund. Net annual fund operating fees and expenses for the funds (after contractual waivers and/or reimbursements) are 0.30% for the Money Market Fund and 0.50% for the others through November 1, 2010. Total annual operating fees and expenses as of December 31, 2009 can be found on pages 24, 25 of this report.
Performance data quoted represents past performance which is no guarantee of future results. Investment return and principal value will fluctuate so that an investor’s shares, when redeemed, may be worth more or less than their original cost. Mutual fund performance changes over time and current performance may be lower or higher than what is stated. Returns shown do not reflect the deduction of taxes that a shareholder may pay on fund distributions or the redemption of fund shares. Mutual funds are not obligations of or guaranteed by any bank and are not federally insured. The performance of the Funds assumes the reinvestment of all dividends and distributions. The indexes above have been adjusted to reflect reinvestment of dividends on securities in the indexes. The returns of the Funds are net of expenses. Indexes do not have expenses. The adviser is waiving a portion of its advisory fee and other operating expenses. Had the fees not been waived or reimbursed, returns would have been lower. It is not possible to invest directly in an Index.
For the most recent month-end performance and after-tax returns, visit www.aarpfinancial.com or call 1-800-958-6457.
An investment in the AARP Money Market Fund is not insured or guaranteed by the Federal Deposit Insurance Corporation or any other government agency. Although the Fund seeks to preserve the value of your investment at $1.00 per share, it is possible to lose money by investing in the Fund.
| | | | |
| A Word about Benchmarks | | AARP FUNDS 2009 SEMI-ANNUAL REPORT | | 5 |

Indexes vs. index funds
Indexes, as opposed to index funds, are a group or list of securities representing a market or part of a market. The returns of the index do not reflect the costs of actually investing in the index and do not include fees, brokerage commissions or other expenses of investing. While you can invest in an index fund – it’s a real investment, you cannot invest directly in an index – it’s just a list.
A Word about Benchmarks
A useful tool to measure the performance of AARP Funds.
When evaluating how your investment performed, it’s helpful to compare it to an appropriate benchmark. You can think of the benchmark as a handy yardstick for measuring how well the fund did in meeting its investment objectives. For example, the AARP Income Fund tries to produce returns comparable to the Barclays Capital Aggregate Bond Index.
The AARP Aggressive Fund, AARP Moderate Fund and AARP Conservative Fund are indexed and try to produce the returns of a mixture of three indexes. For these Funds, a particularly useful benchmark is one that combines the three indexes in similar amounts to the target investments of the Funds. When you combine different indexes into one benchmark, it’s called a “composite index”.
We also believe it is useful for you to consider the returns of the overall bond and stock markets when you assess the performance of the AARP Funds. This allows you to see how diversification works in practice. Sometimes the bond and stock markets move in opposite directions, or when the stock market goes down, the bond market doesn’t go quite as far down.
There is one caveat though. Please remember that a benchmark of indexes has a built-in performance advantage over an actual mutual fund. An index is merely a list of securities in a stock or bond market, so the returns of indexes do not reflect the real world costs of managing a mutual fund. It is difficult to match the returns of an index because of this difference.
The mix underlying the composite index for the Aggressive, Moderate and Conservative Funds was changed to reflect the January 1, 2009 revised allocations of these funds among the underlying portfolios. Historical composite indexes performance from January 1, 2009 was recalculated to reflect the revised allocations.
| | | | |
| 6 | | AARP FUNDS 2009 SEMI-ANNUAL REPORT | | A Word about Benchmarks |
Following is a table that shows the make up of the index weightings for each AARP Fund:
| | | | | | | | | | | | | | |
| | | | | | | | |
| | | | | AARP
Aggressive Fund1 | | AARP
Moderate Fund1 | | AARP
Conservative
Fund1 | | AARP
Income Fund | | AARP Money
Market Fund | | |
| | | | | Aggressive Composite Index | | Moderate Composite Index | | Conservative Composite Index | | Income Composite Index | | | | |
| | | Barclays Capital
Aggregate Bond Index® | | 20% | | 45% | | 70% | | 95% | | – | | |
| | | MSCI U.S. Investable
Market 2500 Index®* | | 60% | | 40% | | 22.5% | | – | | – | | |
| | | MSCI ACWI ex US
Index®2,* | | 20% | | 15% | | 7.5% | | – | | – | | |
| | | JP Morgan 1 Month
LIBOR | | – | | – | | – | | 2.5% | | 100% | | |
| | | Barclays Capital High
Yield Very Liquid Index | | – | | – | | – | | 2.5% | | – | | |
Source: AARP Funds
A description of each index
| • | | MSCI U.S. Investable Market 2500 Index®* – The index includes about 2,500 securities listed on the New York and American Stock Exchanges and the Nasdaq over-the-counter market. The stocks include companies of all types and sizes, which represent the investable universe of companies in the U.S. Equity market. |
| • | | MSCI ACWI ex US Index®* – The index is a free float adjusted market capitalization weighted index that is designed to measure the equity market performance of developed and emerging markets. As of November 2008, the MSCI ACWI ex US index® consisted of 44 county indices comprised of 22 developed and 22 emerging market country indices. |
| • | | Barclays Capital Aggregate Bond Index® – The index includes a large variety of U.S. and foreign bonds traded in U.S. markets that are investment grade and taxable, covering three major types of bonds: government and corporate bonds, mortgage-backed securities and asset-backed securities. |
| • | | Barclays Capital High Yield Very Liquid Index – This index measures the performance of publicly issued U.S. dollar denominated high yield corporate bonds with above average liquidity. The index includes only corporate sectors like Industrial, Utility, and Financial Institutions. |
| • | | JP Morgan 1-Month LIBOR – This benchmark is the rate for a one month deposit in U.S. Dollars on the last business day of the previous month. LIBOR stands for the “London Interbank Offered Rate” and is produced each business day by the British Bankers Association. |
| 1 | Effective January 1, 2009, the AARP Conservative, Moderate and Aggressive Fund increased their allocation percentages to equities by 5 percentage points. See page 2 for new allocation amounts. |
| 2 | Effective January 1, 2009 the underlying International Portfolio changed its index to the MSCI All Country World Index, excluding U.S. Index (MSCI ACWI ex US index) |
| * | Please note that although the AARP Funds seek to track these MSCI indexes, MSCI does not sponsor, endorse, or promote the AARP Funds. For a more detailed description of our relationship with MSCI please see the statement of additional information for the AARP Funds. |
| | | | |
| AARP Aggressive Fund Overview | | AARP FUNDS 2009 SEMI-ANNUAL REPORT | | 7 |
AARP Aggressive Fund Overview
| | | | | | | | |
| | | |
Portfolio construction 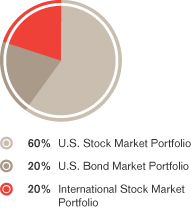
| | Portfolio of investments
December 31, 2009 (unaudited) | | | | |
| | Mutual funds: 100.1% | | | | | | |
| | | | Shares | | Value | |
| | | | | | | | |
| | U.S. Stock Market Portfolio1 – 60.1% | | 2,004,539 | | $ | 17,840,397 | |
| | | |
| | International Stock Market
Portfolio1 – 20.0% | | 636,023 | | | 5,953,178 | |
| | | |
| | U.S. Bond Market Portfolio1 – 20.0% | | 579,610 | | | 5,946,795 | |
| | | |
| | Total investments: 100.1%
(Identified cost $29,327,737) | | | | | 29,740,370 | |
| | | | | | | | |
| | Other assets and liabilities, net: (0.1)% | | | | | (24,218 | ) |
| | | | | | | | |
| | Total net assets: 100.0% | | | | $ | 29,716,152 | |
| | 1 Affiliated issuer. See Notes to Financial Statements. | | | | | | |
| | | | | | | | | | | | | | | |
| |
Affiliated companies |
| |
The fund invests substantially all of its assets in the Portfolios, which are considered affiliated companies. As defined by the Investment Company Act of 1940 (“the Act”), an affiliated company is one in which the fund owns 5% or more of the outstanding voting securities, or of a company which is under common ownership or control. |
| | | | | | |
| Affiliate | | Purchase Cost* | | Sales Proceeds* | | Investment Income | | Value 6/30/09 | | Value 12/31/09 |
| |
| U.S. Bond Market Portfolio | | $ | 1,605,780 | | $ | 399,262 | | $ | 116,592 | | $ | 4,683,019 | | $ | 5,946,795 |
| |
| U.S. Stock Market Portfolio | | | 1,978,925 | | | 1,333,881 | | | 100,035 | | | 13,990,809 | | | 17,840,397 |
| |
| International Stock Market Portfolio | | | 907,055 | | | 654,093 | | | 54,127 | | | 4,657,894 | | | 5,953,178 |
| |
| TOTAL | | $ | 4,491,760 | | $ | 2,387,236 | | $ | 270,754 | | $ | 23,331,722 | | $ | 29,740,370 |
| |
|
| |
* These numbers reflect the purchase and sales volume of each respective Portfolio during the six months ended December 31, 2009. Amounts reflected on the accompanying financial statements include the following amounts related to affiliated companies: |
| | | | |
| Investment in securities, at cost | | $ | 29,327,737 | |
| | |
| Income distributions from underlying AARP Portfolios | | $ | 270,754 | |
| | |
| Realized gain (loss) on sales of underlying AARP Portfolios | | $ | (725,161 | ) |
| | |
| Capital gain distributions from underlying AARP Portfolios | | $ | 5,148 | |
| | |
| | | | |
| 8 | | AARP FUNDS 2009 SEMI-ANNUAL REPORT | | AARP Aggressive Fund Overview |
| | | | | | | | | | | | | |
| | | Performance summary | | Average annual returns as of December 31, 2009 (unaudited) |
| | | | | | | | |
| | | | | | | 1-Year | | 3-Years | | Since
inception | | | |
| | | | | AARP Aggressive Fund1 | | 25.03% | | -1.73% | | 1.84% | | | |
| | | | | Aggressive Composite Index2 | | 25.78% | | -0.84% | | 2.84% | | | |
| | | | | MSCI U.S. Investable Market 2500 Index®2 | | 28.63% | | -4.99% | | -0.19% | | | |
| | | | | | | | |
| | |
| |
Performance data quoted represents past performance which is no guarantee of future results. Investment return and principal value will
fluctuate so that an investor’s shares, when redeemed, may be worth more or less than their original cost. Mutual fund performance changes
over time and current performance may be lower or higher than what is stated. Returns shown do not reflect the deduction of taxes that a
shareholder may pay on fund distributions or the redemption of fund shares. Mutual funds are not obligations of or guaranteed by any bank
and are not federally insured. The performance of the Fund assumes the reinvestment of all dividends and distributions. The index above has
been adjusted to reflect reinvestment of dividends on securities in the index. The returns of the Funds are net of expenses. Indexes do not have
expenses. The adviser is waiving a portion of its advisory fee and other operating expenses. Had the fees not been waived or reimbursed,
returns would have been lower. It is not possible to invest directly in an Index. For the most recent month-end performance and after-tax returns, visit www.aarpfinancial.com or call 1-800-958-6457. 1 Inception date December 30, 2005.
2 The MSCI U.S. Investable Market 2500 Index serves as a broad measure of the U.S. equity market. Since the Fund invests in differing
combinations of this and other markets, the Aggressive Composite Index has been constructed utilizing the proportionate weightings of the
indexes for each market. This Composite Index provides a particularly useful benchmark to measure the performance of the Fund. For more
detailed information regarding the Composite Indexes and the Underlying Indexes, please see “A Word about Benchmarks” on page 5. |
| | | | |
| AARP Moderate Fund Overview | | AARP FUNDS 2009 SEMI-ANNUAL REPORT | | 9 |
AARP Moderate Fund Overview
| | | | | | | | |
| | | |
Portfolio construction 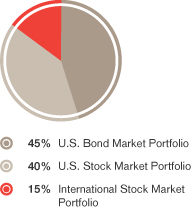
| | Portfolio of investments
December 31, 2009 (unaudited) | | | | |
| | Mutual funds: 100.1% | | | | | | |
| | | | Shares | | Value | |
| | | | | | | | |
| | U.S. Bond Market Portfolio1 – 45.0% | | 2,187,672 | | $ | 22,445,510 | |
| | | |
| | U.S. Stock Market Portfolio1 – 40.0% | | 2,241,749 | | | 19,951,566 | |
| | | |
| | International Stock Market
Portfolio1 – 15.1% | | 800,207 | | | 7,489,937 | |
| | | |
| | Total investments: 100.1%
(Identified cost $47,416,186) | | | | | 49,887,013 | |
| | | | | | | | |
| | Other assets and liabilities, net: (0.1)% | | | | | (27,045 | ) |
| | | | | | | | |
| | Total net assets: 100.0% | | | | $ | 49,859,968 | |
| | 1 Affiliated issuer. See Notes to Financial Statements. | | | | | | |
| | | | | | | | | | | | | | | | |
| |
Affiliated companies The fund invests substantially all of its assets in the Portfolios, which are considered affiliated companies. As defined by the Investment Company Act of 1940 (“the Act”), an affiliated company is one in which the fund owns 5% or more of the outstanding voting securities, or of a company which is under common ownership or control. | |
| | | | | | |
| Affiliate | | Purchase Cost* | | Sales Proceeds* | | Investment Income | | Value 6/30/09 | | Value 12/31/09 | |
| | |
| U.S. Bond Market Portfolio | | $ | 5,532,867 | | $ | 893,991 | | $ | 447,345 | | $ | 17,582,800 | | $ | 22,445,510 | |
| | |
| U.S. Stock Market Portfolio | | | 2,907,424 | | | 2,184,755 | | | 113,674 | | | 15,603,327 | | | 19,951,566 | |
| | |
| International Stock Market Portfolio | | | 1,209,372 | | | 885,685 | | | 69,095 | | | 5,844,330 | | | 7,489,937 | |
| | |
TOTAL | | $ | 9,649,663 | | $ | 3,964,431 | | $ | 630,114 | | $ | 39,030,457 | | $ | 49,887,013 | |
| | |
| |
* These numbers reflect the purchase and sales volume of each respective Portfolio during the six months ended December 31, 2009. Amounts reflected on the accompanying financial statements include the following amounts related to affiliated companies: | |
| Investment in securities, at cost | | $ | 47,416,186 | |
| | |
| Income distributions from underlying AARP Portfolios | | $ | 630,114 | |
| | |
| Realized gain (loss) on sales of underlying AARP Portfolios | | $ | (964,446 | ) |
| | |
| Capital gain distributions from underlying AARP Portfolios | | $ | 19,623 | |
| | | | |
| 10 | | AARP FUNDS 2009 SEMI-ANNUAL REPORT | | AARP Moderate Fund Overview |
| | | | | | | | | | | | | |
| | | Performance summary | | Average annual returns as of December 31, 2009 (unaudited) | | | |
| | | | | | | | |
| | | | | | | 1-Year | | 3-Years | | Since
inception | | | |
| | | | | AARP Moderate Fund1 | | 18.96% | | 1.18% | | 3.34% | | | |
| | | | | Moderate Composite Index2 | | 19.40% | | 2.04% | | 4.25% | | | |
| | | | | MSCI U.S. Investable Market 2500 Index®2 | | 28.63% | | -4.99% | | -0.19% | | | |
| | | | | Barclays Capital Aggregate Bond Index®2 | | 5.93% | | 6.04% | | 5.61% | | | |
| | | | | | | | |
| | |
| |
Performance data quoted represents past performance which is no guarantee of future results. Investment return and principal value will
fluctuate so that an investor’s shares, when redeemed, may be worth more or less than their original cost. Mutual fund performance changes
over time and current performance may be lower or higher than what is stated. Returns shown do not reflect the deduction of taxes that a
shareholder may pay on fund distributions or the redemption of fund shares. Mutual funds are not obligations of or guaranteed by any bank
and are not federally insured. The performance of the Fund assumes the reinvestment of all dividends and distributions. The indexes above
have been adjusted to reflect reinvestment of dividends on securities in the indexes. The returns of the Funds are net of expenses. Indexes do
not have expenses. The adviser is waiving a portion of its advisory fee and other operating expenses. Had the fees not been waived or
reimbursed, returns would have been lower. It is not possible to invest directly in an Index. For the most recent month-end performance and after-tax returns, visit www.aarpfinancial.com or call 1-800-958-6457. 1 Inception date December 30, 2005.
2 The MSCI U.S. Investable Market 2500 Index and the Barclays Capital Aggregate Bond Index serve as broad measures of the U.S. equity
and taxable bond market. Since the Fund invests in differing combinations of this and other markets, the Moderate Composite Index has
been constructed utilizing the proportionate weightings of the indexes for each market. This Composite Index provides a particularly useful
benchmark to measure the performance of the Fund. For more detailed information regarding the Composite Indexes and the Underlying
Indexes, please see “A Word about Benchmarks” on page 5. |
| | | | |
| AARP Conservative Fund Overview | | AARP FUNDS 2009 SEMI-ANNUAL REPORT | | 11 |
AARP Conservative Fund Overview
| | | | | | | | |
| | | |
Portfolio construction 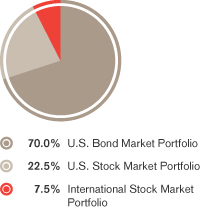
| | Portfolio of investments
December 31, 2009 (unaudited) | | | | |
| | Mutual funds: 100.1% | | | | | | |
| | | | Shares | | Value | |
| | | | | | | | |
| | U.S. Bond Market Portfolio1 – 70.1% | | 1,674,917 | | $ | 17,184,647 | |
| | | |
| | U.S. Stock Market Portfolio1 – 22.5% | | 620,634 | | | 5,523,639 | |
| | | |
| | International Stock Market
Portfolio1 – 7.5% | | 196,923 | | | 1,843,197 | |
| | | |
| | Total investments: 100.1%
(Identified cost $22,929,473) | | | | | 24,551,483 | |
| | | | | | | | |
| | Other assets and liabilities, net: (0.1)% | | | | | (16,776 | ) |
| | | | | | | | |
| | Total net assets: 100.0% | | | | $ | 24,534,707 | |
| | 1 Affiliated issuer. See Notes to Financial Statements. | | | | | | |
| | | | | | | | | | | | | | | | |
| |
Affiliated companies The fund invests substantially all of its assets in the Portfolios, which are considered affiliated companies. As defined by the Investment Company Act of 1940 (“the Act”), an affiliated company is one in which the fund owns 5% or more of the outstanding voting securities, or of a company which is under common ownership or control. | |
| | | | | | |
| Affiliate | | Purchase Cost* | | Sales Proceeds* | | Investment Income | | Value 6/30/09 | | Value 12/31/09 | |
| | |
U.S. Bond Market
Portfolio | | $ | 4,342,835 | | $ | 547,100 | | $ | 334,963 | | $ | 13,225,726 | | $ | 17,184,647 | |
| | |
U.S. Stock Market
Portfolio | | | 1,009,366 | | | 720,694 | | | 30,640 | | | 4,244,540 | | | 5,523,639 | |
| | |
| International Stock Market Portfolio | | | 454,327 | | | 343,802 | | | 16,607 | | | 1,411,278 | | | 1,843,197 | |
| | |
TOTAL | | $ | 5,806,528 | | $ | 1,611,596 | | $ | 382,210 | | $ | 18,881,544 | | $ | 24,551,483 | |
| | |
| |
* These numbers reflect the purchase and sales volume of each respective Portfolio during the six months ended December 31, 2009. Amounts reflected on the accompanying financial statements include the following amounts related to affiliated companies: | |
| Investment in securities, at cost | | | | | $ | 22,929,473 | |
| | |
| Income distributions from underlying AARP Portfolios | | | | | $ | 382,210 | |
| | |
| Realized gain (loss) on sales of underlying AARP Portfolios | | | | | $ | (175,191 | ) |
| | |
| Capital gain distributions from underlying AARP Portfolios | | | | | $ | 14,720 | |
| | | | |
| 12 | | AARP FUNDS 2009 SEMI-ANNUAL REPORT | | AARP Conservative Fund Overview |
| | | | | | | | | | | | |
| | | Performance summary | | Average annual returns as of December 31, 2009 | | |
| | | | | | | |
| | | | | | | 1-Year | | 3-Years | | Since
inception | | |
| | | | | AARP Conservative Fund1 | | 12.59% | | 3.75% | | 4.54% | | |
| | | | | Conservative Composite Index2 | | 13.10% | | 4.42% | | 5.24% | | |
| | | | | MSCI U.S. Investable Market 2500 Index®2 | | 28.63% | | -4.99% | | -0.19% | | |
| | | | | Barclays Capital Aggregate Bond Index®2 | | 5.93% | | 6.04% | | 5.61% | | |
| | | | | | | |
| | |
| |
Performance data quoted represents past performance which is no guarantee of future results. Investment return and principal value will
fluctuate so that an investor’s shares, when redeemed, may be worth more or less than their original cost. Mutual fund performance changes
over time and current performance may be lower or higher than what is stated. Returns shown do not reflect the deduction of taxes that a
shareholder may pay on fund distributions or the redemption of fund shares. Mutual funds are not obligations of or guaranteed by any bank
and are not federally insured. The performance of the Fund assumes the reinvestment of all dividends and distributions. The index above has
been adjusted to reflect reinvestment of dividends on securities in the index. The returns of the Funds are net of expenses. Indexes do not have
expenses. The adviser is waiving a portion of its advisory fee and other operating expenses. Had the fees not been waived or reimbursed,
returns would have been lower. It is not possible to invest directly in an Index. For the most recent month-end performance and after-tax returns, visit www. aarpfinancial.com or call 1-800-958-6457. 1 Inception date December 30, 2005.
2 The Barclays Capital Aggregate Bond Index serves as a broad measure of the U.S. taxable bond market. Since the Fund invests in differing
combinations of this and other markets, the Conservative Composite Index has been constructed utilizing the proportionate weightings of the
indexes for each market. This Composite Index provides a particularly useful benchmark to measure the performance of the Fund. For more
detailed information regarding the Composite Indexes and the Underlying Indexes, please see “A Word about Benchmarks” on page 5.
• MSCI U.S. Investable Market 2500 Index®* – The index includes about 2,500 securities listed on
the New York and American Stock Exchanges and the Nasdaq over-the-counter market. The stocks
include companies of all types and sizes, which represent the investable universe of companies in the
U.S. Equity market. Sources: Barclays Capital, Inc., AARP Financial Inc. |
| | | | |
| AARP Income Fund Overview | | AARP FUNDS 2009 SEMI-ANNUAL REPORT | | 13 |
AARP Income Fund Overview
| | | | | | | | |
| | | |
Portfolio construction 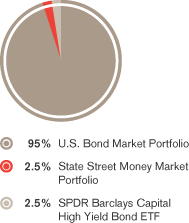
| | Portfolio of investments
December 31, 2009 (unaudited) | | | | |
| | Mutual funds: 100.2% | | | | | | |
| | | | Shares | | Value | |
| | | | | | | | |
| | U.S. Bond Market Portfolio1 – 95.0% | | 1,471,551 | | $ | 15,098,113 | |
| | | |
| | State Street Money Market
Portfolio2 – 2.6% | | 410,597 | | | 410,597 | |
| | | |
| | SPDR Barclays Capital High Yield
Bond ETF2 – 2.6% | | 10,514 | | | 408,890 | |
| | | |
| | Total investments: 100.2%
(Identified cost $15,568,249) | | | | | 15,917,600 | |
| | | | | | | | |
| | Other assets and liabilities, net: (0.2)% | | | | | (26,634 | ) |
| | | | | | | | |
| | Total net assets: 100.0% | | | | $ | 15,890,966 | |
| | 1 Affiliated issuer. 2 Investment in non-controlled affiliate. See Notes to Financial Statements. | | | | | | |
| | | | | | | | | | | | | | | |
Affiliated companies The fund invests substantially all of its assets in the underlying portfolios, and is considered an affiliated company. As defined by the Investment Company Act of 1940 (“the Act”), an affiliated company is one in which the fund owns 5% or more of the outstanding voting securities, or of a company which is under common ownership or control. |
| | | | | | |
| Affiliate | | Purchase Cost* | | Sales Proceeds* | | Investment Income | | Value 6/30/09 | | Value 12/31/09 |
| |
| U.S. Bond Market Portfolio | | $ | 3,392,285 | | $ | 1,297,187 | | $ | 310,869 | | $ | 12,841,346 | | $ | 15,098,113 |
| |
| |
* These numbers reflect the purchase and sales volume of each respective Portfolio during the six months ended December 31, 2009. Amounts reflected on the accompanying financial statements include the following amounts related to affiliated companies: |
| Investment in securities, at cost | | | | | $ | 14,796,681 |
| |
| Income distributions from underlying AARP Portfolios | | | | | $ | 310,869 |
| |
| Realized gain (loss) on sales of underlying AARP Portfolios | | | | | $ | 16,976 |
| |
| Capital gain distributions from underlying AARP Portfolios | | | | | $ | 13,394 |
| | | | |
| 14 | | AARP FUNDS 2009 SEMI-ANNUAL REPORT | | AARP Income Fund Overview |
| | | | | | | | | | | | | | |
| | | Performance summary | | Average annual returns as of December 31, 2009 (unaudited) |
| | | | | | | | | |
| | | | | | | 1-Year | | 3-Years | | Since
inception | | | | |
| | | | | AARP Income Fund1 | | 5.90% | | 5.64% | | 5.48% | | | | |
| | | | | Income Composite Index2 | | 6.95% | | 6.05% | | 5.97% | | | | |
| | | | | Barclays Capital Aggregate Bond Index®2 | | 5.93% | | 6.04% | | 5.94% | | | | |
| | | | | J.P. Morgan 1-Month LIBOR | | 0.36% | | 2.98% | | 3.31% | | | | |
| | | | | | | | | |
| | |
| |
Performance data quoted represents past performance which is no guarantee of future results. Investment return and principal value will
fluctuate so that an investor’s shares, when redeemed, may be worth more or less than their original cost. Mutual fund performance changes
over time and current performance may be lower or higher than what is stated. Returns shown do not reflect the deduction of taxes that a
shareholder may pay on fund distributions or the redemption of fund shares. Mutual funds are not obligations of or guaranteed by any bank
and are not federally insured. The performance of the Fund assumes the reinvestment of all dividends and distributions. The indexes above
have been adjusted to reflect reinvestment of dividends on securities in the indexes. The returns of the Funds are net of expenses. Indexes do
not have expenses. The adviser is waiving a portion of its advisory fee and other operating expenses. Had the fees not been waived or
reimbursed, returns would have been lower. It is not possible to invest directly in an Index. For the most recent month-end performance and after-tax returns, visit www.aarpfinancial.com or call 1-800-958-6457. 1 Inception date September 29, 2006.
2 The Barclays Capital Aggregate Bond Index serves as a broad measure of the U.S. taxable bond market. Since the Fund invests in differing
combinations of this and other markets, the Income Composite Index has been constructed utilizing the proportionate weightings of the
indexes for each market. This Composite Index provides a particularly useful benchmark to measure the performance of the Fund. For more
detailed information regarding the Composite Indexes and the Underlying Indexes, please see “A Word about Benchmarks” on page 5. |
| | | | |
| AARP Money Market Fund Overview | | AARP FUNDS 2009 SEMI-ANNUAL REPORT | | 15 |
AARP Money Market Fund Overview
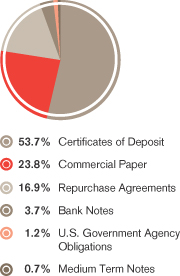
Portfolio construction*
| | | | |
|
Portfolio of investments
December 31, 2009 (unaudited) | |
Mutual funds: 100.1% | | | | |
| | | Value | |
| Investment in State Street Money Market Portfolio1 – 100.1% | | $ | 38,033,905 | |
| | |
| Total investments: 100.1% (Identified cost $38,033,905) | | | 38,033,905 | |
| | | | |
| Other assets and liabilities, net: (0.1)% | | | (39,769 | ) |
| | | | |
| Total net assets: 100.0% | | $ | 37,994,136 | |
1 The financial statements of the State Street Money Market Portfolio, including its investment portfolio, are included elsewhere within this report and should be read in conjunction with the AARP Money Market Fund’s financial statements. AARP Money Market Fund invests only in State Street Money Market Portfolio. At December 31, 2009, AARP Money Market Fund owned 0.25% of the State Street Money Market Portfolio. See Notes to Financial Statements. | |
Performance summary
Maturity ladder
| | | | | | | | | | | | | |
| | | |
| | | Average annual returns as of December 31, 2009 (unaudited) | | | | | |
| | | | | | | |
| | | | | 1-Year | | 3-Years | | Since
inception | | | | | |
| | AARP Money Market Fund | | 0.33% | | 2.67% | | 3.00% | 1 | | | | |
| | J.P. Morgan 1-Month LIBOR | | 0.36% | | 2.98% | | 3.34% | 1 | | | | |
| | AARP Money Market Fund 7-Day Yield
as of 12/31/09 | | 0.01% | | | | | | | | | |
| | | Maturities as of December 31, 2009 (unaudited) | | | | | |
| | | | | | | |
| | 0-3 Days | | | | | | 0.07% | | | | | |
| | 4-90 Days | | | | | | 89.6% | | | | | |
| | 90+ Days | | | | | | 9.7% | | | | | |
| | Total | | | | | | 100% | | | | | |
| | Average Maturity | | | | | | | | | | | |
| | | | | | | |
| | |
|
*Portfolio construction represents the composition of the underlying holdings in the State Street Money Market Portfolio, whose financial
statements are included elsewhere in this report. As a percentage of net assets as of the date indicated. The Portfolio’s composition will vary
over time. Performance data quoted represents past performance which is no guarantee of future results. Investment return and principal value will
fluctuate so that an investor’s shares, when redeemed, may be worth more or less than their original cost. Mutual fund performance changes
over time and current performance may be lower or higher than what is stated. Returns shown do not reflect the deduction of taxes that a
shareholder may pay on fund distributions or the redemption of fund shares. Mutual funds are not obligations of or guaranteed by any bank
and are not federally insured. The performance of the Funds assumes the reinvestment of all dividends and distributions. The indexes above
have been adjusted to reflect reinvestment of dividends on securities in the indexes. The returns of the Funds are net of expenses. Indexes do
not have expenses. The adviser is waiving a portion of its advisory fee and other operating expenses. Had the fees not been waived or
reimbursed, returns would have been lower. It is not possible to invest directly in an Index. For the most recent month-end performance and after-tax returns, visit www.aarpfinancial.com or call 1-800-958-6457. An investment in the AARP Money Market Fund is not insured or guaranteed by the Federal Deposit Insurance Corporation
or any other government agency. Although the Fund seeks to preserve the value of your investment at $1.00 per share, it is
possible to lose money by investing in the Fund. 1 For the period from July 1, 2006 (commencement of operations) to December 31, 2009 (unaudited). Sources: J.P Morgan, AARP Financial Inc. |
| | | | |
| 16 | | AARP FUNDS 2009 SEMI-ANNUAL REPORT | | Understanding Your Expenses |
Understanding Your Expenses (unaudited)
As a shareholder of a Fund, you incur ongoing costs, including investment advisory fees, distribution (12b-1) fees, shareholder services fees, and other expenses of running a fund. It’s important to understand exactly how much you pay to purchase and own a fund and to compare the costs of owning different funds because these costs reduce your returns.
The example in the table on page xx is intended to help you to understand your ongoing costs in dollars of investing in an AARP Fund and to compare these costs with the ongoing costs of investing in other mutual funds. It is based on an investment of $1,000 invested at the beginning of the period and held for the entire period from July 1, 2009 to December 31, 2009.
Actual expenses
The first line for each Fund in the table on the next page, labeled “Actual”, provides information about actual account values and actual expenses. You may use this information, together with the amount you invested, to estimate the expenses that you incurred over the period. Simply divide your account value by $1,000 (for example, an $8,600 account value divided by $1,000 = 8.6), then multiply the result by the number in the line labeled “Actual” under the heading entitled “Expenses paid during period” to estimate the expenses attributable to your investment during this period.
Hypothetical example for comparison purposes
The second line for each fund in the table, labeled “Hypothetical”, helps you compare the costs of an AARP Fund to other funds using a 5% return as required by the Securities and Exchange Commission for all mutual funds. It provides information about hypothetical account values and hypothetical expenses based on an AARP Fund’s actual expense ratio and an assumed rate of return of 5% per year before expenses, which is not an AARP Fund’s actual return. You should not use the hypothetical account values and expenses to estimate the actual ending account balance or your expenses for the period. Rather, these figures help you to compare the ongoing costs of investing in an AARP Fund with other funds. To do so, compare this 5% hypothetical example with the 5% hypothetical examples that appear in the shareholder reports of the other funds.
Please note that the expenses shown in the table are meant to highlight your ongoing costs only and do not reflect any transaction costs. Therefore, the line labeled “Hypothetical” is useful in comparing ongoing costs only, and will not help you determine the relative total costs of owning different funds.
In addition to the fees and expenses which the AARP Fund bears directly, the AARP Fund indirectly bears a pro rata share of the fees and expenses of the underlying portfolios in which the Fund invests. Because
| | | | |
| Understanding Your Expenses | | AARP FUNDS 2009 SEMI-ANNUAL REPORT | | 17 |
the underlying portfolios have varied expenses and fee levels and the Fund may own different proportions of the underlying funds at different times, the amount of fees and expenses incurred indirectly by the AARP Fund may vary in the future. However AARP Financial has agreed contractually to waive fees and reimburse expenses to keep the net total operating expenses of the AARP Funds, including the indirect fees and expenses of the underlying portfolios, at 0.50% of average daily net assets through at least November 1, 2010 (0.30% with respect to the AARP Money Market Fund).
| | | | |
| 18 | | AARP FUNDS 2009 SEMI-ANNUAL REPORT | | Understanding Your Expenses |
| | | | | | | | | | | | | | | | |
| | | | | | | |
| | | Beginning
account
value
7/1/09 | | Ending
account
value
12/31/09 | | Expenses
paid
during
period2 | | Annualized
expense
ratio2 | | Effective
expenses
paid
during
period3 | | Effective
annualized
expense
ratio3 |
| |
| |
| AARP Aggressive Fund | | | | | | | | | | | | | | | | |
Actual | | $ | 1,000 | | $ | 1,189.10 | | $ | 1.32 | | 0.24% | | $ | 2.76 | | 0.50% |
Hypothetical1 | | $ | 1,000 | | $ | 1,024.00 | | $ | 1.22 | | | | $ | 2.55 | | |
| |
| |
| AARP Moderate Fund | | | | | | | | | | | | | | | | |
Actual | | $ | 1,000 | | $ | 1,140.30 | | $ | 1.29 | | 0.24% | | $ | 2.70 | | 0.50% |
Hypothetical1 | | $ | 1,000 | | $ | 1,024.00 | | $ | 1.22 | | | | $ | 2.55 | | |
| |
| |
| AARP Conservative Fund | | | | | | | | | | | | | | | | |
Actual | | $ | 1,000 | | $ | 1,091.20 | | $ | 1.32 | | 0.25% | | $ | 2.64 | | 0.50% |
Hypothetical1 | | $ | 1,000 | | $ | 1,023.95 | | $ | 1.28 | | | | $ | 2.55 | | |
| |
| |
| AARP Income Fund | | | | | | | | | | | | | | | | |
Actual | | $ | 1,000 | | $ | 1,038.50 | | $ | 1.34 | | 0.26% | | $ | 2.57 | | 0.50% |
Hypothetical1 | | $ | 1,000 | | $ | 1,023.89 | | $ | 1.33 | | | | $ | 2.55 | | |
| |
| |
| AARP Money Market Fund | | | | | | | | | | | | | | | | |
Actual | | $ | 1,000 | | $ | 1,000.50 | | $ | 1.51 | | 0.30% | | $ | 1.51 | | 0.30% |
Hypothetical1 | | $ | 1,000 | | $ | 1,023.69 | | $ | 1.53 | | | | $ | 1.53 | | |
| |
| |
| |
1 The Hypothetical example assumes a 5% return before expenses. 2 Expenses reflect the Fund’s annualized net expense ratios multiplied by the average account value over the period, multiplied by 184/365 (to reflect the one-half year period). The fees and expenses of the underlying portfolios are not included in these amounts. 3 Effective expenses reflect the sum of the expenses borne directly by the Fund plus the Fund’s pro-rata share of the weighted average expense ratio of the underlying portfolios in which it invests. The effective annualized expense ratio combines the Fund’s annualized net expense ratio (after applying contractual waivers and/or reimbursements) and the annualized weighted average expense ratios of the underlying portfolios. The annualized weighted average expense ratio includes the annualized expense ratio for each underlying portfolio weighted for the Fund’s relative average investment during the same period. |
| | | | |
| How to Read Financial Statements | | AARP FUNDS 2009 SEMI-ANNUAL REPORT | | 19 |
How to Read Financial Statements
Mutual funds are companies that pool money from many investors and invest that money in stocks, bonds and other securities and assets. Mutual fund financial statements show investors where a fund’s money came from, where it went, where it is and what it is worth as of the close of the fund’s most recent fiscal period. The portfolio of investments shows where the money is as of the close of the fund’s most recent fiscal period. The holdings of each AARP Fund as of June 30, 2009 are shown in the individual Fund Overview sections of this annual report. In addition, this section of the annual report contains four additional financial statements:
1. Statements of assets and liabilities.
These statements are the Funds’ balance sheets as of the close of the period (December 31, 2009). They show the value and the cost of what each Fund owned, how much it owed to others and the resulting difference or “net assets”.
| • | | Assets are the stocks, bonds, cash, and other financial instruments that a fund owns and has purchased with monies investors pay when they purchase shares. |
| • | | Liabilities are the amounts of money that a fund owes. Liabilities include payments due for the purchase of financial investments as well as bills that a fund incurs for services that are needed to run a fund, such as legal services and printing. |
| • | | Net assets = total assets – total liabilities. Net assets represent what is left of assets after liabilities are subtracted. This leftover amount belongs to the investors, or shareholders, of the fund. |
2. Statements of operations
These statements provide a summary of the investment income, such as dividends, that a Fund has earned as well as gains and losses from its investment activities for the period ended December 31, 2009. Realized gains or losses reflect the difference between purchase price and selling price for transactions that took place during the period. Unrealized gains and losses reflect the difference between purchase price and the value of investments that are still held as of the end of the period. The statements also include specific details of fund expenses.
3. Statements of changes in net assets
These statements describe the changes in net assets during the current and prior period, which result from operations, any distributions of earnings to investors, and any shareholder transactions.
4. Financial highlights
The financial highlights table is intended to help you understand a fund’s financial performance for a share outstanding for the current period and each of the applicable prior periods.
The Notes to Financial Statements provide additional information to help you better understand the financial statements. They include a description of the most important accounting policies used in portraying the company’s financial condition and results, including how a fund records and values its investments, tax information, as well as additional detail on shareholder and investment transactions.
| | | | |
| 20 | | AARP FUNDS 2009 SEMI-ANNUAL REPORT | | Financial Statements |
Financial Statements
| | | | | | | | | | | | | | | | | | | | |
| |
Statements of assets and liabilities December 31, 2009 (unaudited) | | | | | |
| | | AARP
Aggressive
Fund | | | AARP
Moderate
Fund | | | AARP
Conservative
Fund | | | AARP
Income
Fund | | | AARP
Money Market
Fund | |
| | | | | | | | | | | | | | | | | | | | |
| Assets: | | | | | | | | | | | | | | | | | | | | |
| Investments in affiliated issuers, at value (identified cost of $29,327,737, $47,416,186, $22,929,473 and $14,796,681, respectively) | | $ | 29,740,370 | | | $ | 49,887,013 | | | $ | 24,551,483 | | | $ | 15,098,113 | | | $ | – | |
| Investments in unaffiliated issuer (identified cost of $360,971) | | | – | | | | – | | | | – | | | | 408,890 | | | | – | |
| Investments in State Street Money Market Portfolio, at value (identified cost of $410,597 and $38,033,905, respectively) | | | – | | | | – | | | | – | | | | 410,597 | | | | 38,033,905 | |
| Dividends and interest receivable | | | – | | | | – | | | | – | | | | 3,803 | | | | – | |
| Receivable from adviser | | | 28,064 | | | | 33,788 | | | | 27,863 | | | | 20,781 | | | | 20,643 | |
| Receivable for investments sold | | | 176,932 | | | | 447,720 | | | | 45,450 | | | | 11,322 | | | | – | |
| Receivable for fund shares sold | | | 5,783 | | | | – | | | | 365,891 | | | | 2,800 | | | | 18,918 | |
| Total assets | | $ | 29,951,149 | | | $ | 50,368,521 | | | $ | 24,990,687 | | | $ | 15,956,306 | | | $ | 38,073,466 | |
| | | | | | | | | | | | | | | | | | | | |
| Liabilities: | | | | | | | | | | | | | | | | | | | | |
| Payable for investments purchased | | | 138,740 | | | | 314,040 | | | | 410,966 | | | | – | | | | – | |
| Payable for fund shares redeemed | | | 43,975 | | | | 133,680 | | | | 375 | | | | 23,363 | | | | 15,683 | |
| Income distribution payable | | | – | | | | – | | | | – | | | | – | | | | 8 | |
| Accrued portfolio acct. fees (Note 6) | | | 2,136 | | | | 2,108 | | | | 2,122 | | | | 1,350 | | | | 1,344 | |
| Accrued administration fees (Note 6) | | | 873 | | | | 1,477 | | | | 710 | | | | 477 | | | | 1,339 | |
| Accrued transfer agent fees (Note 6) | | | 13,777 | | | | 15,867 | | | | 7,294 | | | | 4,873 | | | | 16,050 | |
| Accrued distribution services fee | | | 4,978 | | | | 8,422 | | | | 4,053 | | | | 2,727 | | | | 7,632 | |
| Accrued audit fees | | | 9,018 | | | | 9,018 | | | | 9,018 | | | | 9,518 | | | | 10,518 | |
| Accrued insurance fees | | | 2,250 | | | | 4,237 | | | | 2,063 | | | | 1,705 | | | | 9,005 | |
| Accrued registration fees | | | 945 | | | | 1,399 | | | | 1,074 | | | | 3,022 | | | | 2,684 | |
| Accrued printing and postage expenses | | | 8,750 | | | | 8,750 | | | | 8,750 | | | | 8,750 | | | | 8,750 | |
| Accrued legal fees | | | 2,293 | | | | 2,293 | | | | 2,293 | | | | 2,293 | | | | 2,293 | |
| Accrued miscellaneous expense | | | 7,262 | | | | 7,262 | | | | 7,262 | | | | 7,262 | | | | 4,024 | |
| Total liabilities | | $ | 234,997 | | | $ | 508,553 | | | $ | 455,980 | | | $ | 65,340 | | | $ | 79,330 | |
| | | | | | | | | | | | | | | | | | | | |
| Net assets | | $ | 29,716,152 | | | $ | 49,859,968 | | | $ | 24,534,707 | | | $ | 15,890,966 | | | $ | 37,994,136 | |
| Net assets consist of: | | | | | | | | | | | | | | | | | | | | |
| Paid-in capital | | $ | 32,152,266 | | | $ | 52,219,540 | | | $ | 24,411,830 | | | $ | 15,582,498 | | | $ | 37,992,484 | |
| Net unrealized appreciation of investments | | | 412,633 | | | | 2,470,827 | | | | 1,622,010 | | | | 349,351 | | | | – | |
| Accumulated net realized gain (loss) on investments | | | (2,849,236 | ) | | | (4,830,723 | ) | | | (1,499,374 | ) | | | (40,729 | ) | | | (247 | ) |
| | | | | |
| Undistributed (distributions in excess of) net investment income | | | 489 | | | | 324 | | | | 241 | | | | (154 | ) | | | 1,899 | |
| Net assets | | $ | 29,716,152 | | | $ | 49,859,968 | | | $ | 24,534,707 | | | $ | 15,890,966 | | | $ | 37,994,136 | |
| | | | | | | | | | | | | | | | | | | | |
| Shares of beneficial interest outstanding | | | 3,078,404 | | | | 4,982,799 | | | | 2,399,686 | | | | 1,548,599 | | | | 37,992,484 | |
| Net asset value per share | | $ | 9.65 | | | $ | 10.01 | | | $ | 10.22 | | | $ | 10.26 | | | $ | 1.00 | |
| | | | | |
| See Notes to Financial Statements. | | | | | | | | | | | | | | | | | | | | |
| | | | |
| Financial Statements | | AARP FUNDS 2009 SEMI-ANNUAL REPORT | | 21 |
Financial Statements (continued)
| | | | | | | | | | | | | | | | | | | | |
|
Statements of operations Six months ended December 31, 2009 (unaudited) | |
| | | AARP
Aggressive
Fund | | | AARP
Moderate
Fund | | | AARP
Conservative
Fund | | | AARP
Income
Fund | | | AARP
Money Market
Fund | |
| | | | | | | | | | | | | | | | | | | | |
| Investment income: | | | | | | | | | | | | | | | | | | | | |
| Dividends from affiliated issuers | | $ | 270,753 | | | $ | 630,114 | | | $ | 382,210 | | | $ | 310,869 | | | $ | – | |
| Dividends from an unaffiliated issuer | | | – | | | | – | | | | – | | | | 27,075 | | | | – | |
| Interest allocated from State Street Money Market Portfolio | | | – | | | | – | | | | – | | | | 771 | | | | 97,614 | |
| Total investment income | | $ | 270,753 | | | $ | 630,114 | | | $ | 382,210 | | | $ | 338,715 | | | $ | 97,614 | |
| | | | | | | | | | | | | | | | | | | | |
| Expenses: | | | | | | | | | | | | | | | | | | | | |
| Expenses allocated from State Street Money Market Portfolio | | | – | | | | – | | | | – | | | | 236 | | | | 29,275 | |
| Investment adviser fee (Note 6) | | | 1,362 | | | | 2,307 | | | | 1,101 | | | | 752 | | | | – | |
| Administration fees (Note 6) | | | 4,766 | | | | 8,074 | | | | 3,853 | | | | 2,632 | | | | 8,595 | |
| Registration fees | | | 17,098 | | | | 19,157 | | | | 16,850 | | | | 12,581 | | | | 8,217 | |
| Transfer and dividend disbursing agent fees and expenses (Note 6) | | | 48,308 | | | | 52,258 | | | | 24,145 | | | | 16,767 | | | | 50,804 | |
| Trustees’ fees | | | 10,000 | | | | 10,000 | | | | 10,000 | | | | 10,000 | | | | 10,000 | |
| Audit fees | | | 9,845 | | | | 9,845 | | | | 9,845 | | | | 10,345 | | | | 11,345 | |
| Legal fees | | | 19,030 | | | | 19,030 | | | | 19,030 | | | | 19,030 | | | | 19,030 | |
| Portfolio accounting fees (Note 6) | | | 9,173 | | | | 9,388 | | | | 9,039 | | | | 8,288 | | | | 8,332 | |
| Distribution service fees | | | 27,233 | | | | 46,140 | | | | 22,018 | | | | 15,042 | | | | 49,112 | |
| Printing and postage expenses | | | 7,496 | | | | 7,496 | | | | 7,496 | | | | 7,496 | | | | 7,496 | |
| Insurance expense | | | 2,250 | | | | 4,237 | | | | 2,063 | | | | 1,705 | | | | 9,005 | |
| Miscellaneous | | | 4,229 | | | | 4,229 | | | | 4,229 | | | | 4,229 | | | | 7,467 | |
| Total expenses | | $ | 160,790 | | | $ | 192,161 | | | $ | 129,669 | | | $ | 109,103 | | | $ | 218,678 | |
| | | | | | | | | | | | | | | | | | | | |
| Waivers and reimbursements (Note 6): | | | | | | | | | | | | | | | | | | | | |
| Reduction of expenses by investment adviser | | | (128,170 | ) | | | (136,289 | ) | | | (102,607 | ) | | | (89,340 | ) | | | (145,434 | ) |
| Net expenses | | | 32,620 | | | | 55,872 | | | | 27,062 | | | | 19,763 | | | | 73,244 | |
| Net investment income | | | 238,133 | | | | 574,242 | | | | 355,148 | | | | 318,952 | | | | 24,370 | |
| | | | | | | | | | | | | | | | | | | | |
| Realized and unrealized gain (loss) on investments: | | | | | | | | | | | | | | | | | |
Net realized gain (loss) on affiliated
investments | | | (725,161 | ) | | | (964,446 | ) | | | (175,191 | ) | | | 9,224 | | | | – | |
Net realized gain allocated from
State Street Money Market Portfolio | | | – | | | | – | | | | – | | | | – | | | | 12 | |
| Capital gain distributions from affiliated investments | | | 5,148 | | | | 19,623 | | | | 14,720 | | | | 13,394 | | | | – | |
| Net change in unrealized appreciation (depreciation) of investments | | | 5,029,285 | | | | 6,135,770 | | | | 1,650,198 | | | | 189,206 | | | | – | |
| Net realized and unrealized gain on investments | | | 4,309,272 | | | | 5,190,947 | | | | 1,489,727 | | | | 211,824 | | | | 12 | |
| Change in net assets resulting from operations | | $ | 4,547,405 | | | $ | 5,765,189 | | | $ | 1,844,875 | | | $ | 530,776 | | | $ | 24,382 | |
| See | Notes to Financial Statements. |
| | | | |
| 22 | | AARP FUNDS 2009 SEMI-ANNUAL REPORT | | Financial Statements |
Financial Statements (continued)
| | | | | | | | | | | | | | | | | | |
| | | |
Statements of changes in net assets | | | | | | | | | | | |
| | | AARP Aggressive Fund | | | AARP Moderate Fund | | | |
| | | | | |
| | | Six months
ended
12/31/09
(unaudited) | | | Year
ended
6/30/09 | | | Six months
ended
12/31/09
(unaudited) | | | Year
ended
6/30/09 | | | |
| Increase (decrease) in net assets | | | | | | | | | | | | | | | | | | |
| Operations: | | | | | | | | | | | | | | | | | | |
| Net investment income | | $ | 238,133 | | | $ | 553,796 | | | $ | 574,242 | | | $ | 1,183,882 | | | |
| Net realized gain (loss) on investments | | | (720,013 | ) | | | (1,865,555 | ) | | | (944,823 | ) | | | (3,659,558 | ) | | |
| Net change in unrealized appreciation (depreciation) of investments | | | 5,029,285 | | | | (3,129,597 | ) | | | 6,135,770 | | | | (2,136,252 | ) | | |
| Change in net assets resulting from operations | | | 4,547,405 | | | | (4,441,356 | ) | | | 5,765,189 | | | | (4,611,928 | ) | | |
| | | | | | | | | | | | | | | | | | |
| Distributions to shareholders: | | | | | | | | | | | | | | | | | | |
| From net investment income | | | (237,644 | ) | | | (555,111 | ) | | | (573,939 | ) | | | (1,188,697 | ) | | |
| From net realized gains on investments | | | – | | | | (206,931 | ) | | | – | | | | (267,888 | ) | | |
| Change in net assets resulting from distributions to shareholders | | | (237,644 | ) | | | (762,042 | ) | | | (573,939 | ) | | | (1,456,585 | ) | | |
| | | | | | | | | | | | | | | | | | |
| Share transactions: | | | | | | | | | | | | | | | | | | |
| Proceeds from sales of shares | | | 4,777,952 | | | | 7,802,845 | | | | 8,500,999 | | | | 10,582,167 | | | |
| Net asset value of shares issued on reinvestment of dividends | | | 226,032 | | | | 718,295 | | | | 546,408 | | | | 1,371,216 | | | |
| Cost of shares redeemed | | | (2,867,339 | ) | | | (5,092,490 | ) | | | (3,329,237 | ) | | | (9,257,878 | ) | | |
| Change in net assets resulting from share transactions | | | 2,136,645 | | | | 3,428,650 | | | | 5,718,170 | | | | 2,695,505 | | | |
| Change in net assets | | | 6,446,406 | | | | (1,774,748 | ) | | | 10,909,420 | | | | (3,373,008 | ) | | |
| | | | | | | | | | | | | | | | | | |
| Net assets: | | | | | | | | | | | | | | | | | | |
| Beginning of period | | $ | 23,269,746 | | | $ | 25,044,494 | | | $ | 38,950,548 | | | $ | 42,323,556 | | | |
| End of period | | $ | 29,716,152 | | | $ | 23,269,746 | | | $ | 49,859,968 | | | $ | 38,950,548 | | | |
| Undistributed (distributions in excess of) net investment income included in net assets at end of period | | $ | 489 | | | $ | – | | | $ | 324 | | | $ | 21 | | | |
See Notes to Financial Statements.
| | | | |
| Financial Statements | | AARP FUNDS 2009 SEMI-ANNUAL REPORT | | 23 |
| | | | | | | | | | | | | | | | | | | | | | | | |
| | | | | | |
| | | | | | | | | | | | | | | | | | | | | | | | |
| | | AARP Conservative Fund | | | AARP Income Fund | | | AARP Money Market Fund | |
| | | | | | |
| | | Six months
ended
12/31/09
(unaudited) | | | Year
ended
6/30/09 | | | Six months
ended
12/31/09
(unaudited) | | | Year
ended
6/30/09 | | | Six months
ended
12/31/09
(unaudited) | | | Year
ended
6/30/09 | |
| | | | | | | | | | | | | | | | | | | | | | | | |
| | | | | | | | | | | | | | | | | | | | | | | | |
| | $ | 355,148 | | | $ | 624,142 | | | $ | 318,952 | | | $ | 474,972 | | | $ | 24,370 | | | $ | 930,003 | |
| | | | | | |
| | | (160,471 | ) | | | (1,298,990 | ) | | | 22,618 | | | | (47,406 | ) | | | 12 | | | | (259 | ) |
| | | | | | |
| | | | 1,650,198 | | | | 249,527 | | | | 189,206 | | | | 232,039 | | | | – | | | | – | |
| | | | | | |
| | | | 1,844,875 | | | | (425,321 | ) | | | 530,776 | | | | 659,605 | | | | 24,382 | | | | 929,744 | |
| | | | | | | | | | | | | | | | | | | | | | | | |
| | | | | | | | | | | | | | | | | | | | | | | | |
| | | (354,894 | ) | | | (627,428 | ) | | | (319,112 | ) | | | (477,921 | ) | | | (24,370 | ) | | | (930,003 | ) |
| | | | | | |
| | | | – | | | | (57,930 | ) | | | – | | | | (20,707 | ) | | | – | | | | – | |
| | | | | | |
| | | | (354,894 | ) | | | (685,358 | ) | | | (319,112 | ) | | | (498,628 | ) | | | (24,370 | ) | | | (930,003 | ) |
| | | | | | | | | | | | | | | | | | | | | | | | |
| | | | | | | | | | | | | | | | | | | | | | | | |
| | | 5,670,762 | | | | 7,771,650 | | | | 4,245,465 | | | | 9,865,153 | | | | 4,615,950 | | | | 30,835,385 | |
| | | | | | |
| | | 332,661 | | | | 628,940 | | | | 287,212 | | | | 454,391 | | | | 23,484 | | | | 906,951 | |
| | | | (1,784,234 | ) | | | (6,529,133 | ) | | | (2,334,895 | ) | | | (3,449,368 | ) | | | (18,548,516 | ) | | | (56,914,484 | ) |
| | | | | | |
| | | | 4,219,189 | | | | 1,871,457 | | | | 2,197,782 | | | | 6,870,176 | | | | (13,909,082 | ) | | | (25,172,148 | ) |
| | | | 5,709,170 | | | | 760,778 | | | | 2,409,446 | | | | 7,031,153 | | | | (13,909,070 | ) | | | (25,172,407 | ) |
| | | | | | | | | | | | | | | | | | | | | | | | |
| | | | | | | | | | | | | | | | | | | | | | | | |
| | | $ | 18,825,537 | | | $ | 18,064,759 | | | $ | 13,481,520 | | | $ | 6,450,367 | | | $ | 51,903,206 | | | $ | 77,075,613 | |
| | | $ | 24,534,707 | | | $ | 18,825,537 | | | $ | 15,890,966 | | | $ | 13,481,520 | | | $ | 37,994,136 | | | $ | 51,903,206 | |
| | | | | | |
| | | $ | 241 | | | $ | (13 | ) | | $ | (154 | ) | | $ | 6 | | | $ | 1,899 | | | $ | 1,899 | |
| | | | |
| 24 | | AARP FUNDS 2009 SEMI-ANNUAL REPORT | | Financial Statements |
Financial Statements (continued)
| | | | | | | | | | | | | | | | | | | | |
| | | | | |
Financial highlights | | | | | | | | | | | | | | | | | | | | |
| | | | |
| (For a share outstanding throughout the period) | | | | | | | | | | | | | | | | | |
| | | AARP Aggressive Fund | |
| | | | | |
| | | Six months
ended
12/31/09
(unaudited) | | | Year
ended
6/30/09 | | | Year
ended
6/30/08 | | | Year
ended
6/30/07 | | | Period
ended
6/30/061 | |
| Net asset value, beginning of period | | $ | 8.18 | | | $ | 10.46 | | | $ | 11.68 | | | $ | 10.17 | | | $ | 10.00 | |
| | | | | | | | | | | | | | | | | | | | |
| Income from investment operations: | | | | | | | | | | | | | | | | | | | | |
| Net investment income | | | 0.08 | | | | 0.21 | | | | 0.29 | | | | 0.24 | | | | 0.09 | |
Net realized and unrealized gain
(loss) on affiliated investments | | | 1.47 | | | | (2.19 | ) | | | (1.15 | ) | | | 1.52 | | | | 0.17 | |
| Total from investment operations | | | 1.55 | | | | (1.98 | ) | | | (0.86 | ) | | | 1.76 | | | | 0.26 | |
| | | | | | | | | | | | | | | | | | | | |
| Less distributions: | | | | | | | | | | | | | | | | | | | | |
| From net investment income | | | (0.08 | ) | | | (0.21 | ) | | | (0.29 | ) | | | (0.25 | ) | | | (0.09 | ) |
| From net realized gains on investments | | | – | | | | (0.09 | ) | | | (0.07 | ) | | | (0.00 | )2 | | | – | |
| Total distributions | | | (0.08 | ) | | | (0.30 | ) | | | (0.36 | ) | | | (0.25 | ) | | | (0.09 | ) |
| Net asset value, end of period | | $ | 9.65 | | | $ | 8.18 | | | $ | 10.46 | | | $ | 11.68 | | | $ | 10.17 | |
| Total return3 | | | 18.91 | % | | | (18.81 | )% | | | (7.49 | )% | | | 17.41 | % | | | 2.60 | % |
| | | | | | | | | | | | | | | | | | | | |
| Ratios to average net assets: | | | | | | | | | | | | | | | | | | | | |
| Net expenses4 | | | 0.24 | %5 | | | 0.24 | % | | | 0.24 | % | | | 0.24 | % | | | 0.24 | %5 |
| Net investment income | | | 1.75 | %5 | | | 2.68 | % | | | 2.47 | % | | | 2.55 | % | | | 3.36 | %5 |
| Expense waiver/reimbursement6 | | | (0.94 | )%5 | | | (1.24 | )% | | | (1.09 | )% | | | (2.00 | )% | | | (11.22 | )%5 |
| | | | | | | | | | | | | | | | | | | | |
| Supplemental data: | | | | | | | | | | | | | | | | | | | | |
| Net assets, end of period (000 omitted) | | $ | 29,716 | | | $ | 23,270 | | | $ | 25,044 | | | $ | 20,222 | | | $ | 6,454 | |
| Portfolio turnover | | | 9 | % | | | 36 | % | | | 22 | % | | | 12 | % | | | 7 | % |
| 1 | For the period from December 30, 2005 (commencement of operations) to June 30, 2006. |
| 2 | Represents less than $0.01. |
| 3 | Total returns for periods of less than one year are not annualized. |
| 4 | In addition to the fees and expenses that the Fund bears directly, the Fund indirectly bears a pro-rata share of the fees and expenses of the underlying portfolio in which the Fund invests. The net expense ratio shown does not include these indirect expenses. If included, the net expense ratio for each Fund would be 0.50%. |
| 5 | Computed on an annualized basis. |
| 6 | This expense decrease is reflected in both the net expense and net investment income (loss) ratios shown above. |
See Notes to Financial Statements.
| | | | |
| Financial Statements | | AARP FUNDS 2009 SEMI-ANNUAL REPORT | | 25 |
Financial Statements (continued)
| | | | | | | | | | | | | | | | | | | | |
| | | | | |
Financial highlights | | | | | | | | | | | | | | | | | | | | |
| | | | |
| (For a share outstanding throughout the period) | | | | | | | | | | | | | | | | | |
| | | AARP Moderate Fund | |
| | | | | |
| | | Six months
ended
12/31/09
(unaudited) | | | Year
ended
6/30/09 | | | Year
ended
6/30/08 | | | Year
ended
6/30/07 | | | Period
ended
6/30/061 | |
| Net asset value, beginning of period | | $ | 8.88 | | | $ | 10.32 | | | $ | 11.06 | | | $ | 10.04 | | | $ | 10.00 | |
| | | | | | | | | | | | | | | | | | | | |
| Income from investment operations: | | | | | | | | | | | | | | | | | | | | |
| Net investment income | | | 0.12 | | | | 0.28 | | | | 0.34 | | | | 0.31 | | | | 0.10 | |
Net realized and unrealized gain
(loss) on affiliated investments | | | 1.13 | | | | (1.37 | ) | | | (0.64 | ) | | | 1.02 | | | | 0.04 | |
| Total from investment operations | | | 1.25 | | | | (1.09 | ) | | | (0.30 | ) | | | 1.33 | | | | 0.14 | |
| | | | | | | | | | | | | | | | | | | | |
| Less distributions: | | | | | | | | | | | | | | | | | | | | |
| From net investment income | | | (0.12 | ) | | | (0.28 | ) | | | (0.34 | ) | | | (0.31 | ) | | | (0.10 | ) |
| From net realized gains on investments | | | – | | | | (0.07 | ) | | | (0.10 | ) | | | (0.00 | )2 | | | – | |
| Total distributions | | | (0.12 | ) | | | (0.35 | ) | | | (0.44 | ) | | | (0.31 | ) | | | (0.10 | ) |
| Net asset value, end of period | | $ | 10.01 | | | $ | 8.88 | | | $ | 10.32 | | | $ | 11.06 | | | $ | 10.04 | |
| Total return3 | | | 14.03 | % | | | (10.48 | )% | | | (2.79 | )% | | | 13.32 | % | | | 1.44 | % |
| | | | | | | | | | | | | | | | | | | | |
| Ratios to average net assets: | | | | | | | | | | | | | | | | | | | | |
| Net expenses4 | | | 0.24 | %5 | | | 0.24 | % | | | 0.24 | % | | | 0.24 | % | | | 0.24 | %5 |
| Net investment income | | | 2.49 | %5 | | | 3.20 | % | | | 3.21 | % | | | 3.27 | % | | | 4.58 | %5 |
| Expense waiver/reimbursement6 | | | (0.59 | )%5 | | | (0.70 | )% | | | (0.68 | )% | | | (1.11 | )% | | | (6.82 | )%5 |
| | | | | | | | | | | | | | | | | | | | |
| Supplemental data: | | | | | | | | | | | | | | | | | | | | |
| Net assets, end of period (000 omitted) | | $ | 49,860 | | | $ | 38,951 | | | $ | 42,324 | | | $ | 31,925 | | | $ | 13,133 | |
| Portfolio turnover | | | 9 | % | | | 43 | % | | | 24 | % | | | 13 | % | | | 5 | % |
| 1 | For the period from December 30, 2005 (commencement of operations) to June 30, 2006. |
| 2 | Represents less than $0.01. |
| 3 | Total returns for periods of less than one year are not annualized. |
| 4 | In addition to the fees and expenses that the Fund bears directly, the Fund indirectly bears a pro-rata share of the fees and expenses of the underlying portfolios in which the Fund invests. The net expense ratio shown does not include these indirect expenses. If included, the net expense ratio for each Fund would be 0.50%. |
| 5 | Computed on an annualized basis. |
| 6 | This expense decrease is reflected in both the net expense and net investment income (loss) ratios shown above. |
See Notes to Financial Statements.
| | | | |
| 26 | | AARP FUNDS 2009 SEMI-ANNUAL REPORT | | Financial Statements |
Financial Statements (continued)
| | | | | | | | | | | | | | | | | | | | |
| | | | | |
Financial highlights | | | | | | | | | | | | | | | | | | | | |
| | | | |
| (For a share outstanding throughout the period) | | | | | | | | | | | | | | | | | |
| | | AARP Conservative Fund | |
| | | | | |
| | | Six months
ended
12/31/09
(unaudited) | | | Year
ended
6/30/09 | | | Year
ended
6/30/08 | | | Year
ended
6/30/07 | | | Period
ended
6/30/061 | |
| Net asset value, beginning of period | | $ | 9.51 | | | $ | 10.12 | | | $ | 10.38 | | | $ | 9.86 | | | $ | 10.00 | |
| | | | | | | | | | | | | | | | | | | | |
| Income from investment operations: | | | | | | | | | | | | | | | | | | | | |
| Net investment income | | | 0.16 | | | | 0.34 | | | | 0.40 | | | | 0.39 | | | | 0.16 | |
Net realized and unrealized gain
(loss) on affiliated investments | | | 0.71 | | | | (0.58 | ) | | | (0.19 | ) | | | 0.53 | | | | (0.14 | ) |
| Total from investment operations | | | 0.87 | | | | (0.24 | ) | | | 0.21 | | | | 0.92 | | | | 0.02 | |
| | | | | | | | | | | | | | | | | | | | |
| Less distributions: | | | | | | | | | | | | | | | | | | | | |
| From net investment income | | | (0.16 | ) | | | (0.34 | ) | | | (0.40 | ) | | | (0.40 | ) | | | (0.16 | ) |
| From net realized gains on investments | | | – | | | | (0.03 | ) | | | (0.07 | ) | | | (0.00 | )2 | | | – | |
| Total distributions | | | (0.16 | ) | | | (0.37 | ) | | | (0.47 | ) | | | (0.40 | ) | | | (0.16 | ) |
| Net asset value, end of period | | $ | 10.22 | | | $ | 9.51 | | | $ | 10.12 | | | $ | 10.38 | | | $ | 9.86 | |
| Total return3 | | | 9.12 | % | | | (2.19 | )% | | | 2.04 | % | | | 9.40 | % | | | 0.24 | % |
| | | | | | | | | | | | | | | | | | | | |
| Ratios to average net assets: | | | | | | | | | | | | | | | | | | | | |
| Net expenses4 | | | 0.25 | %5 | | | 0.25 | % | | | 0.25 | % | | | 0.25 | % | | | 0.24 | %5 |
| Net investment income | | | 3.23 | %5 | | | 3.72 | % | | | 3.94 | % | | | 4.01 | % | | | 5.31 | %5 |
| Expense waiver/reimbursement6 | | | (0.93 | )%5 | | | (1.16 | )% | | | (1.34 | )% | | | (2.16 | )% | | | (11.00 | )%5 |
| | | | | | | | | | | | | | | | | | | | |
| Supplemental data: | | | | | | | | | | | | | | | | | | | | |
| Net assets, end of period (000 omitted) | | $ | 24,535 | | | $ | 18,826 | | | $ | 18,065 | | | $ | 11,622 | | | $ | 6,581 | |
| Portfolio turnover | | | 7 | % | | | 48 | % | | | 19 | % | | | 17 | % | | | 7 | % |
| 1 | For the period from December 30, 2005 (commencement of operations) to June 30, 2006. |
| 2 | Represents less than $0.01. |
| 3 | Total returns for periods of less than one year are not annualized. |
| 4 | In addition to the fees and expenses which the Fund bears directly, the Fund indirectly bears a pro-rata share of the fees and expenses of the underlying portfolio in which the Fund invests. The net expense ratio shown does not include these indirect expenses. If included, the net expense ratio for each Fund would be 0.50%. |
| 5 | Computed on an annualized basis. |
| 6 | This expense decrease is reflected in both the net expense and net investment income (loss) ratios shown above. |
See Notes to Financial Statements.
| | | | |
| Financial Statements | | AARP FUNDS 2009 SEMI-ANNUAL REPORT | | 27 |
Financial Statements (continued)
| | | | | | | | | | | | | | | | |
| | | | |
Financial highlights | | | | | | | | | | | | | | | | |
| | | |
| (For a share outstanding throughout the period) | | | | | | | | | | | | | |
| | | AARP Income Fund | |
| | | | |
| | | Six months
ended
12/31/091
(unaudited) | | | Year
ended
6/30/091 | | | Year
ended
6/30/081 | | | Period
ended
6/30/071,2 | |
| Net asset value, beginning of period | | $ | 10.09 | | | $ | 10.02 | | | $ | 9.82 | | | $ | 10.00 | |
| | | | | | | | | | | | | | | | |
| Income from investment operations: | | | | | | | | | | | | | |
| Net investment income | | | 0.22 | | | | 0.44 | | | | 0.46 | | | | 0.36 | |
Net realized and unrealized gain
(loss) on affiliated investments | | | 0.17 | | | | 0.09 | | | | 0.20 | | | | (0.18 | ) |
| Total from investment operations | | | 0.39 | | | | 0.53 | | | | 0.66 | | | | 0.18 | |
| | | | | | | | | | | | | | | | |
| Less distributions: | | | | | | | | | | | | | | | | |
| From net investment income | | | (0.22 | ) | | | (0.44 | ) | | | (0.46 | ) | | | (0.36 | ) |
| From net realized gains on investments | | | – | | | | (0.02 | ) | | | (0.00 | )3 | | | – | |
| Total distributions | | | (0.22 | ) | | | (0.46 | ) | | | (0.46 | ) | | | (0.36 | ) |
| Net asset value, end of period | | $ | 10.26 | | | $ | 10.09 | | | $ | 10.02 | | | $ | 9.82 | |
| Total return4 | | | 3.85 | % | | | 5.38 | % | | | 6.83 | % | | | 1.78 | % |
| | | | | | | | | | | | | | | | |
| Ratios to average net assets: | | | | | | | | | | | | | | | | |
| Net expenses5 | | | 0.26 | %6 | | | 0.26 | % | | | 0.26 | % | | | 0.25 | %6 |
| Net investment income | | | 4.24 | %6 | | | 4.48 | % | | | 4.71 | % | | | 5.36 | %6 |
| Expense waiver/reimbursement7 | | | (1.19 | )%6 | | | (1.65 | )% | | | (4.38 | )% | | | (21.21 | )%6 |
| | | | | | | | | | | | | | | | |
| Supplemental data: | | | | | | | | | | | | | | | | |
| Net assets, end of period (000 omitted) | | $ | 15,891 | | | $ | 13,482 | | | $ | 6,450 | | | $ | 2,338 | |
| Portfolio turnover | | | 9 | % | | | 23 | % | | | 52 | % | | | 30 | % |
| 1 | The per share amounts and percentages include the Fund’s proportionate share of income, expenses and net realized and unrealized gains or losses of the State Street Money Market Portfolio. |
| 2 | For the period from September 29, 2006 (commencement of operations) to June 30, 2007. |
| 3 | Represents less than $0.01. |
| 4 | Total returns for periods of less than one year are not annualized. |
| 5 | In addition to the fees and expenses which the Fund bears directly, the Fund indirectly bears a pro-rata share of the fees and expenses of the underlying portfolio in which the Fund invests. The net expense ratio shown does not include these indirect expenses. If included, the net expense ratio for each Fund would be 0.50%. |
| 6 | Computed on an annualized basis. |
| 7 | This expense decrease is reflected in both the net expense and net investment income (loss) ratios shown above. |
See Notes to Financial Statements.
| | | | |
| 28 | | AARP FUNDS 2009 SEMI-ANNUAL REPORT | | Financial Statements |
Financial Statements (continued)
| | | | | | | | | | | | | | | | |
| | | | |
Financial highlights | | | | | | | | | | | | | | | | |
| | | |
| (For a share outstanding throughout the period) | | | | | | | | | | | | | |
| | | AARP Money Market Fund | |
| | | | |
| | | Six months
ended
12/31/091
(unaudited) | | | Year
ended
6/30/091 | | | Year
ended
6/30/081 | | | Year
ended
6/30/071 | |
| Net asset value, beginning of period | | $ | 1.00 | | | $ | 1.00 | | | $ | 1.00 | | | $ | 1.00 | |
| | | | | | | | | | | | | | | | |
| Income from investment operations: | | | | | | | | | | | | | |
| Net investment income | | | 0.00 | 2 | | | 0.01 | | | | 0.04 | | | | 0.05 | |
Net realized and unrealized gain
(loss) on affiliated investments | | | – | | | | – | | | | – | | | | – | |
| Total from investment operations | | | 0.00 | 2 | | | 0.01 | | | | 0.04 | | | | 0.05 | |
| | | | | | | | | | | | | | | | |
| Less distributions: | | | | | | | | | | | | | | | | |
| From net investment income | | | (0.00 | )2 | | | (0.01 | ) | | | (0.04 | ) | | | (0.05 | ) |
| From net realized gains on investments | | | – | | | | – | | | | – | | | | – | |
| Total distributions | | | (0.00 | )2 | | | (0.01 | ) | | | (0.04 | ) | | | (0.05 | ) |
| Net asset value, end of period | | $ | 1.00 | | | $ | 1.00 | | | $ | 1.00 | | | $ | 1.00 | |
| Total return3 | | | 0.05 | % | | | 1.34 | % | | | 4.09 | % | | | 5.11 | % |
| | | | | | | | | | | | | | | | |
| Ratios to average net assets: | | | | | | | | | | | | | | | | |
| Net expenses4 | | | 0.30 | %5 | | | 0.30 | % | | | 0.30 | % | | | 0.33 | % |
| Net investment income | | | 0.10 | %5 | | | 1.40 | % | | | 3.77 | % | | | 5.06 | % |
| Expense waiver/reimbursement6 | | | (0.59 | )%5 | | | (0.55 | )% | | | (0.53 | )% | | | (3.91 | )% |
| | | | | | | | | | | | | | | | |
| Supplemental data: | | | | | | | | | | | | | | | | |
| Net assets, end of period (000 omitted) | | $ | 37,994 | | | $ | 51,903 | | | $ | 77,076 | | | $ | 35,742 | |
| 1 | The per share amounts and percentages include the Fund’s proportionate share of income, expenses and net realized and unrealized gains or losses of the State Street Money Market Portfolio. |
| 2 | Represents less than $0.01. |
| 3 | Total returns for periods of less than one year are not annualized. |
| 4 | Effective March 1, 2007, AARP Financial has agreed contractually to waive and reimburse expenses to keep the net total operating expenses of the AARP Money Market Fund, including its pro-rata allocation of expenses from the State Street Portfolio, at 0.30% of average daily net assets through November 1, 2010. |
| 5 | Computed on an annualized basis. |
| 6 | This expense decrease is reflected in both the net expense and net investment income (loss) ratios shown above. |
See Notes to Financial Statements.
| | | | |
| Notes to Financial Statements | | AARP FUNDS 2009 SEMI-ANNUAL REPORT | | 29 |
Notes to Financial Statements
(unaudited)
1. Business and Organization
AARP Aggressive Fund, AARP Moderate Fund, AARP Conservative Fund, AARP Income Fund and AARP Money Market Fund (each a “Fund” and collectively the “Funds”) are each a series of AARP Funds (the “Trust”). The Trust is organized as a Delaware statutory trust and is registered under the Investment Company Act of 1940, as amended (the “Act”), as an open-end management investment company. The inception dates of the Funds were as follows: December 30, 2005 (AARP Aggressive Fund, AARP Moderate Fund and AARP Conservative Fund), June 30, 2006 (AARP Money Market Fund) and September 29, 2006 (AARP Income Fund).
The Funds, except for the AARP Money Market Fund are “fund of funds” because they invest substantially all of their assets in the underlying series of “AARP Portfolios”, each a separately registered investment company. Each Fund, with the exception of the AARP Income Fund and the AARP Money Market Fund invests in all three of the AARP Portfolios, but in different amounts. The AARP Income Fund invests the vast majority of its assets in one of the AARP Portfolios, the U.S. Bond Market Portfolio. In addition, the AARP Income Fund also invests a portion of its assets in the State Street Money Market Portfolio (the “State Street Portfolio”), a series of a separate registered investment company called the State Street Master Funds, and the SPDR Barclays Capital High Yield Bond ETF. The AARP Money Market Fund is a feeder fund that invests substantially all of its assets in the State Street Portfolio, the master fund. The investment objective and policies of the State Street Portfolio are substantially similar to those of the AARP Money Market Fund. The value of the AARP Money Market Fund’s investment in the State Street Portfolio reflects the AARP Money Market Fund’s proportionate interest in the net assets of the State Street Portfolio (0.25% at December 31, 2009). The performance of the AARP Money Market Fund is directly affected by the performance of the State Street Portfolio. The financial statements of the State Street Portfolio are included elsewhere in this report and should be read in conjunction with the AARP Money Market Fund’s financial statements.
The investment objective of the AARP Aggressive Fund is to seek growth of capital and some current income. The investment objective of the AARP Moderate Fund is to seek a balance of growth of capital and current income. The investment objective of the AARP Conservative Fund is to primarily seek current income with some growth of capital. The investment objective of the AARP Income Fund is to seek current income and preservation of capital over the long-term.
The investment objective of the AARP Money Market Fund is to seek to maximize current income while providing liquidity, the preservation of capital, and a stable $1.00 per share price.
AARP Financial Inc. (AFI) and AARP Services, Inc. (ASI) are exploring strategic options for the AARP Funds (Funds) with a view of expanding the range of financial services and products available to Fund
| | | | |
| 30 | | AARP FUNDS 2009 SEMI-ANNUAL REPORT | | Notes to Financial Statements |
Notes to Financial Statements (continued)
(unaudited)
shareholders and other AARP members. Such options could include a revised operating structure for the Funds with a continued connection to AARP or the merger of the Funds into other funds with no connection to AARP. No recommendation has been made to the Funds’ Board of Trustees. If and when any such recommendation is made, the Funds’ Trustees would make an independent evaluation of the recommendation. No changes in the daily operations of the Funds are expected while AFI and ASI are evaluating strategic options. One or more of the Funds’ officers could change during that time.
2. Significant accounting policies
The financial statements have been prepared in accordance with United States generally accepted accounting principles (“GAAP”), which require management to make estimates and assumptions that affect that amounts reported herein. Actual results could differ from those estimates. The following is a summary of significant accounting policies consistently followed by the Funds in the preparation of their financial statements.
INVESTMENT VALUATION
The Funds, except for AARP Money Market Fund, invest in one or more of the AARP Portfolios, accordingly, they value their investments in the AARP Portfolios daily at the closing net asset value of the AARP Portfolios.
Securities of the AARP Portfolios are valued as of the close of trading on the New York Stock Exchange (generally 4:00 p.m. Eastern time) on the valuation date. An independent pricing service generally provides these prices. Stock holdings are valued at the latest quoted sales price or official closing price taken from the primary market in which the stock trades. If a security does not trade during the day, it is valued at the average of the latest quotes for buying and selling the security, the bid and asked prices. Bond holdings are generally valued as reported by an independent pricing service at what is called an “evaluated average price,” which considers such factors as comparable bond prices, yields, maturities and ratings.
Short-term investments with a maturity at issuance or a remaining maturity at the time of purchase of 60 days or less are generally valued at amortized cost, which approximates market value. Foreign securities quoted in foreign currencies are translated into U.S. dollars based upon exchange rates prevailing at the close of trading and as provided by an independent source.
Securities for which market quotations are not readily available, or whose values have been materially affected by events occurring before a Fund’s pricing time but after the close of the securities’ primary markets (e.g. foreign securities), are valued by methods deemed by the Board of Trustees of AARP Portfolios to represent fair value.
The AARP Money Market Fund and the AARP Income Fund record their investments in the State Street Portfolio at market value. The valuation policies of the State Street Portfolio are discussed in Note
| | | | |
| Notes to Financial Statements | | AARP FUNDS 2009 SEMI-ANNUAL REPORT | | 31 |
2 of the State Street Portfolio’s Notes to Financial Statements, which are included elsewhere within this report.
The Funds adopted Fair Value Measurements effective for financial statements issued for fiscal years beginning after November 15, 2007 and interim periods within those fiscal years. Fair value is defined as the price that the Funds would receive upon selling an investment in a timely transaction to an independent buyer in the principal or most advantageous market of the investment. A three-tier hierarchy for measuring fair value and enhancing disclosure. The Conservative Fund, Moderate Fund, Aggressive Fund and Income Fund are Registered Investment Companies (“RIC”) as well as fund of funds, which invest all of their investable assets in other RICs, (U.S. Stock Portfolio, U.S. Bond Market Portfolio, International Stock Market Portfolio, State Street Money Market Portfolio and the SPDR Barclays Capital High Yield Bond ETF). The AARP Money Market Fund is a RIC as well as a feeder into the State Street Money Market Portfolio. In regards to investments in other RICs, they are widely considered to be treated as Level 1 securities due to the availability of a daily valued and quoted price for those underlying portfolios. However, in the case of the underlying U.S. Stock Portfolio, U.S. Bond Market Portfolio, International Stock Market Portfolio, State Street Money Market Portfolio and the SPDR Barclays Capital High Yield Bond ETF, certain securities held by the underlying portfolios fall into Level 2 or Level 3 of the pricing hierarchy due to specific valuation circumstances, particularly matrix pricing of bond holdings, amortized cost valuation method used for evaluating short term money market instruments or certain foreign securities that could be fair valued at any particular point in time. In the Portfolio of Investments for the U.S. Stock Portfolio, U.S. Bond Market Portfolio, International Stock Market Portfolio and State Street Money Market Portfolio, the Level 2 and 3 securities held as of December 31, 2009 will be separately identified.
The three tier hierarchy of inputs is summarized in the three broad Levels listed below.
| • | | Level 1 – quoted prices in active markets for identical investments |
| • | | Level 2 – other significant observable inputs (including quoted prices for similar investments, interest rates, prepayment speeds, credit risk, etc.) |
| • | | Level 3 – significant unobservable inputs (including the Fund’s own assumptions in determining the fair value of investments) |
The following is a summary of the inputs used as of December 31, 2009 in valuing the Funds’ investments carried at value:
AARP Aggressive Fund
| | | |
| Valuation Inputs | | Investment
in Securities |
| |
Level 1 – Quoted Prices and Investments in Mutual Funds | | $ | 29,740,370 |
Level 2 – Other Significant Observable Inputs | | | – |
Level 3 – Significant Unobservable Inputs | | | – |
Total | | $ | 29,740,370 |
| | | | |
| 32 | | AARP FUNDS 2009 SEMI-ANNUAL REPORT | | Notes to Financial Statements |
Notes to Financial Statements (continued)
(unaudited)
AARP Moderate Fund
| | | |
| Valuation Inputs | | Investment
in Securities |
| |
Level 1 – Quoted Prices and Investments in Mutual Funds | | $ | 49,887,013 |
Level 2 – Other Significant Observable Inputs | | | – |
Level 3 – Significant Unobservable Inputs | | | – |
Total | | $ | 49,887,013 |
AARP Conservative Fund
| | | |
| Valuation Inputs | | Investment in Securities |
| |
Level 1 – Quoted Prices and Investments in Mutual Funds | | $ | 24,551,483 |
Level 2 – Other Significant Observable Inputs | | | – |
Level 3 – Significant Unobservable Inputs | | | – |
Total | | $ | 24,551,483 |
AARP Income Fund
| | | |
| Valuation Inputs | | Investment in Securities |
| |
Level 1 – Quoted Prices and Investments in Mutual Funds | | $ | 15,917,600 |
Level 2 – Other Significant Observable Inputs | | | – |
Level 3 – Significant Unobservable Inputs | | | – |
Total | | $ | 15,917,600 |
AARP Money Market Fund
| | | |
| Valuation Inputs | | Investment in Securities |
| |
Level 1 – Quoted Prices and Investments in Mutual Funds | | $ | 38,033,905 |
Level 2 – Other Significant Observable Inputs | | | – |
Level 3 – Significant Unobservable Inputs | | | – |
Total | | $ | 38,033,905 |
FEDERAL TAXES
The Funds intend to comply with the provisions of the Internal Revenue Code applicable to regulated investment companies. The Funds plan to distribute substantially all of their investment company taxable income, including any net realized gain on investments not offset by capital loss carryforwards, if any, to shareholders. For these reasons, no federal income or excise tax provision is required.
Management has analyzed the Funds’ tax position taken on federal income tax returns for all open years and has concluded that as of December 31, 2009, no provision for income taxes would be required in the Funds’ financial statements. As of December 31, 2009, tax years 2006 through 2009 remain subject to examination by the Funds’ major tax jurisdictions, which include the United States of America and the state of Delaware.
| | | | |
| Notes to Financial Statements | | AARP FUNDS 2009 SEMI-ANNUAL REPORT | | 33 |
SECURITIES TRANSACTIONS, DIVIDEND AND INTEREST INCOME AND EXPENSES
Securities transactions are recorded on a trade date basis, the date a Fund agrees to purchase or sell a security. Interest income, if any, is recorded daily on an accrual basis. Dividend income is recorded on the ex-dividend date. Realized gains and losses from securities transactions are recorded on the basis of identified cost. Expenses are accrued daily. Many expenses are directly attributable to one Fund and therefore are charged accordingly. Expenses that are not directly attributable to one or more Funds are allocated among applicable Funds on an equitable and consistent basis considering such things as the nature and type of expenses and the relative net assets of the Funds.
In addition to the accounting policies noted above, the AARP Income Fund and the AARP Money Market Fund also have a pro-rata share in the net investment income and gains or losses of the State Street Portfolio. Net investment income for these Funds consists of each Fund’s pro-rata share of the net investment income of the State Street Portfolio, less all expenses of each Fund. Realized gains and losses from security transactions consist of each Fund’s pro-rata share of the realized gains and losses of the State Street Portfolio.
INDEMNIFICATIONS
The Funds’ organizational documents provide current and former trustees and officers with a limited indemnification against liabilities arising in connection with the performance of their duties to the Funds. In the normal course of business, the Funds may also enter into contracts that provide general indemnifications. The Funds’ maximum exposure under these arrangements is unknown as this would be dependent on future claims that may be made against the Funds. The risk of material loss from such claims is considered remote.
DISTRIBUTIONS TO SHAREHOLDERS
Distributions to shareholders from net investment income and net realized gains, if any, are recorded on the ex-dividend date. Such distributions are determined in conformity with income tax regulations, which may differ from generally accepted accounting principles. Capital gain distributions, if any, are generally declared and paid annually. Income distributions, if any, are generally declared and paid quarterly for the AARP Conservative Fund, semiannually for the AARP Moderate Fund and the AARP Aggressive Fund, and monthly for the AARP Income Fund. Income distributions are generally declared daily and paid monthly for the AARP Money Market Fund.
INVESTMENTS IN UNDERLYING PORTFOLIOS
In addition to the fees and expenses which the Funds bear directly, the Funds indirectly bear a pro-rata share of the fees and expenses of the
| | | | |
| 34 | | AARP FUNDS 2009 SEMI-ANNUAL REPORT | | Notes to Financial Statements |
Notes to Financial Statements (continued)
(unaudited)
AARP Portfolios in which the Funds invest as well as the fees and expenses of the State Street Portfolio, as applicable. AARP Financial has agreed contractually to waive fees and reimburse expenses to keep the net total operating expenses of the AARP Funds, including the indirect fees and expenses of the underlying portfolio’s at 0.50% of average daily net assets (at 0.30% with respect to the AARP Money Market Portfolio) through at least November 1, 2010.
SUBSEQUENT EVENTS
The Funds have evaluated the need for disclosures and/or adjustments resulting from subsequent events through February 28, 2010, the date the financial statements were issued. This evaluation did not uncover any subsequent events that necessitated disclosures and/or adjustments.
3. Capital share transactions
The Funds have authorized an unlimited number of $0.001 par value shares. Transactions in shares were as follows:
| | | | | | | | |
| | | | | | | | | |
| | | | | |
| | | | | Six months ended
December 31,
2009 | | | | Year ended
June 30, 2009 |
| |
AARP Aggressive Fund | | | | | | | | |
Shares sold | | | | 516,686 | | | | 955,861 |
Dividends and/or distributions reinvested | | | | 23,278 | | | | 90,250 |
Shares redeemed | | | | (307,876) | | | | (595,045) |
| | | | | | | | | |
Net increase | | | | 232,088 | | | | 451,066 |
| |
AARP Moderate Fund | | | | | | | | |
Shares sold | | | | 879,354 | | | | 1,175,210 |
Dividends and/or distributions reinvested | | | | 54,369 | | | | 157,338 |
Shares redeemed | | | | (339,364) | | | | (1,045,297) |
| | | | | | | | | |
Net increase | | | | 594,359 | | | | 287,251 |
| |
AARP Conservative Fund | | | | | | | | |
Shares sold | | | | 563,769 | | | | 823,960 |
Dividends and/or distributions reinvested | | | | 32,585 | | | | 67,023 |
Shares redeemed | | | | (177,010) | | | | (694,898) |
| | | | | | | | | |
Net increase | | | | 419,344 | | | | 196,085 |
| |
AARP Income Fund | | | | | | | | |
Shares sold | | | | 411,469 | | | | 993,007 |
Dividends and/or distributions reinvested | | | | 27,867 | | | | 45,629 |
Shares redeemed | | | | (226,538) | | | | (346,848) |
| | | | | | | | | |
Net increase | | | | 212,798 | | | | 691,788 |
| |
AARP Money Market Fund | | | | | | | | |
Shares sold | | | | 4,615,950 | | | | 30,835,385 |
Dividends and/or distributions reinvested | | | | 23,484 | | | | 906,951 |
Shares redeemed | | | | (18,548,516) | | | | (56,914,484) |
| | | | | | | | | |
Net increase/decrease | | | | (13,909,082) | | | | (25,172,148) |
| | | | |
| Notes to Financial Statements | | AARP FUNDS 2009 SEMI-ANNUAL REPORT | | 35 |
4. Investment transactions
The aggregate cost of purchases and proceeds from sales of securities, other than short-term obligations, for the six months ended December 31, 2009 were as follows:
| | | | | | |
| Fund name | | Purchases | | Sales |
| | |
AARP Aggressive Fund | | $ | 4,491,760 | | $ | 2,387,236 |
AARP Moderate Fund | | | 9,649,663 | | | 3,964,431 |
AARP Conservative Fund | | | 5,806,528 | | | 1,611,596 |
AARP Income Fund | | | 3,453,107 | | | 1,330,883 |
5. Federal income tax information
The aggregate cost of securities and other investments and the composition of unrealized appreciation and depreciation of securities and other investments for federal income tax purposes as of December 31, 2009 are noted below. The primary difference between book and tax appreciation or depreciation of securities and other investments, if applicable, is attributable to the tax deferral of losses or tax realization of financial statement unrealized gain or loss.
| | | | | | | | | | | | |
| Fund name | | Federal tax
cost of securities | | Gross unrealized
appreciation | | Gross unrealized
depreciation | | Net
unrealized
appreciation
(depreciation) |
| |
| |
| | | | | | | | | | | | | |
AARP Aggressive Fund | | $ | 29,327,737 | | $ | 831,110 | | $ | (418,477) | | $ | 412,633 |
AARP Moderate Fund | | | 47,416,186 | | | 2,470,827 | | | – | | | 2,470,827 |
AARP Conservative Fund | | | 22,929,473 | | | 1,622,010 | | | – | | | 1,622,010 |
AARP Income Fund | | | 15,568,249 | | | 349,351 | | | – | | | 349,351 |
AARP Money Market Fund | | | 38,033,905 | | | – | | | – | | | – |
6. Fees and other transactions with affiliates
ADVISER AND SUB-ADVISER FEES
The Trust has an investment advisory agreement with AARP Financial, which delegates to AARP Financial the responsibility to manage the investment activities of the Funds, including the overall investment program of the Funds. AARP Financial is also responsible for overseeing the Funds’ (other than the Money Market Fund’s) sub-adviser, SSgA Funds Management, Inc. (“SSgA FM”), which rebalances the applicable Funds under the direction of AARP Financial and manages the day-to-day investments of the AARP Portfolios’ assets. Each Fund (other than the Money Market Fund) pays to AARP Financial an annual fee of 0.01% of its average daily net assets. AARP Financial pays SSgA FM for its subadvisory services out of these fees. Through November 1, 2010, AARP Financial has contractually agreed to waive its fees and/or reimburse expenses to keep the total annual operating expenses of the Funds, including the consideration of the Funds’ pro-rata or allocated share of expenses of the AARP Portfolios and, as appropriate, State Street Portfolio at 0.50% of average daily net assets (at 0.30% with respect to AARP Money Market Fund). The expense reimbursement amount payable by AARP Financial will be dependent on the actual expenses of the Funds and the Portfolios.
Under the Money Market Fund’s investment advisory agreement, no fee is payable to AARP Financial at any time the Fund is invested in a master-feeder structure, such as the State Street Portfolio. The State Street
| | | | |
| 36 | | AARP FUNDS 2009 SEMI-ANNUAL REPORT | | Notes to Financial Statements |
Notes to Financial Statements (continued)
(unaudited)
Portfolio has retained SSgA FM as the investment adviser to the Portfolio. For its services, SSgA FM receives a fee at the rate of 0.10% of the portfolio’s average daily net assets, which is paid from the assets of the Fund.
For the six months ended December 31, 2009, AARP Financial contractually waived/reimbursed the following fees for the AARP Funds:
| | | | | | |
| Fund name | | Adviser
fee waiver | | Reimbursement of other
operating expenses |
| | | | | | |
| | |
AARP Aggressive Fund | | $ | 1,362 | | $ | 126,808 |
AARP Moderate Fund | | | 2,307 | | | 133,982 |
AARP Conservative Fund | | | 1,101 | | | 101,506 |
AARP Income Fund | | | 752 | | | 88,588 |
AARP Money Market Fund | | | – | | | 145,434 |
ADMINISTRATION FEES
As the Funds’ administrator, AARP Financial provides the Funds with general administrative services associated with the day-to-day operations of the Funds and monitors and coordinates the activities of the other service providers to the Funds. For its administrative services, AARP Financial receives an annual fee of 0.035% of each Fund’s average daily net assets.
The Administration agreement between AARP Financial and the Funds can be terminated on sixty (60) days prior written notice.
SUB-ADMINISTRATION, TRANSFER AGENCY AND CUSTODIAN FEES
State Street Bank and Trust Company (“State Street”) acts as the subadministrator, transfer agent, custodian and fund accounting agent for the Funds. State Street is a subsidiary of State Street Corporation and an affiliate of SSgA FM. Under the terms of the sub-administration agreement, AARP Financial pays to State Street an annual fee at the rate of 0.0175% of the first $6 billion of the Funds’ average daily net assets and then a decreasing rate for average daily net assets above that level. The Sub-Administration agreement between State Street and AARP Financial can be terminated by either party on sixty (60) days prior written notice. Under the terms of the transfer agency agreement, each Fund pays to State Street an annual fee at the rate of 0.135% of the first $5 billion of the Funds’ average daily net assets and then a decreasing rate for average daily net assets above that level, plus out-of-pocket expenses. State Street has in turn delegated the provision of transfer agency services to its affiliate, Boston Financial Data Services, Inc. Under the terms of the custody agreement, each Fund pays to State Street an annual fee of $15,000, plus out-of-pocket expenses.
| | | | |
| Notes to Financial Statements | | AARP FUNDS 2009 SEMI-ANNUAL REPORT | | 37 |
TRUSTEE COMPENSATION
The Trust is supervised by a Board of Trustees, (the “Board”). The Board represents the interests of the Funds and their shareholders. The Board meets periodically throughout the year to oversee the Funds’ activities. The Board consists of four “Independent Trustees” and one trustee who is affiliated with the Investment Adviser to the Funds (“Interested Trustee”). The Interested Trustee and Officers of the Trust do not receive any compensation from the Funds for their service on the Board. The compensation of the Independent Trustees consists of an annual retainer. Compensation paid by the Funds to the Independent Trustees is included in the Funds’ Statements of Operations. The aggregate compensation paid to the Trustees for both the AARP Funds and Portfolios was $80,000, $50,000 and $30,000 respectively, for the six months ended December 31, 2009.
INVESTMENTS IN THE FUNDS
AARP, the indirect parent company of AARP Financial, Inc. (“AARP Financial”), the investment adviser to the Funds, has made investments in the AARP Aggressive Fund, the AARP Moderate Fund and the AARP Conservative Fund, with values at December 31, 2009 of $36,582, $37,641 and $39,417, respectively. AARP Financial has made an investment in the AARP Income Fund, with a value at December 31, 2009 of $8,698. There were no purchases or sales by AARP Services, Inc., during July 1, 2009 to December 31, 2009.
In addition, to receive an investment return and to manage their working capital, AARP and AARP Financial, in the normal course of business, have made investments in the AARP Money Market Fund, with a value at December 31, 2009 of $16,234,145 and $327,338 respectively. During the six months ended December 31, 2009, AARP Financial had an affiliated redemption from the AARP Money Market Fund for $7,000,000. This transaction occurred in December 2009.
If AARP Financial or AARP decide in the future to withdraw all or a portion of these investments, Management of the Funds believes there would be no material impact on the operations or returns of the Money Market Fund.
| | | | |
| 38 | | AARP FUNDS 2009 SEMI-ANNUAL REPORT | | AARP Funds—Supplemental Information |
AARP Funds –
Supplemental Information
Proxy voting policies, procedures and record
Both a description of the policies and procedures that AARP Financial uses to determine how to vote proxies on behalf of the Funds and the AARP Portfolios relating to portfolios securities and information regarding how AARP Financial voted proxies related to portfolio securities during the most recent fiscal year ended June 30 is available on our web site at www.aarpfinancial.com and, without charge, upon request, by calling us at 1-800-958-6457. Such information for the AARP Funds is also available on the Securities and Exchange Commission’s (“SEC”) website at www.sec.gov.
Shareholder statements and reports
When we send financial reports, prospectuses and other regulatory materials to shareholders, we attempt to reduce the volume of mail you receive by sending one copy of these documents to two or more account holders who share the same address. However, if you wish to receive individual copies of materials, please contact us at 1-800-958-6457. Once we have received your instructions, we will begin sending individual copies for each account within 30 days. These materials are also available on our website at www.aarpfinancial.com.
Statement regarding availability of quarterly fund schedule
The Funds and the AARP Portfolios file complete schedules of investments with the SEC for the quarters ended September 30 and March 31 of each fiscal year on Form N-Q which are available on the Funds’ website, www.aarpfinancial.com and the SEC’s website at www.sec.gov. Additionally, the Funds’ and the AARP Portfolios’ Forms N-Q may be reviewed and copied at the SEC’s Public Reference Room in Washington DC. For information on the Public Reference Room, call 1-800-SEC-0330.
Basis for Board Approval of Continuation of Investment Advisory Contracts
The Board, at a meeting on November 11, 2009, approved the continuance of the Trust’s Investment Advisory Agreement with AARP Financial and Investment Sub-Advisory Agreement with SSgA FM (collectively, “Agreements”). In approving the Agreements, the Board evaluated, among other things, written and oral information provided by AARP Financial and SSgA FM in response to requests of outside counsel to the Trust and the independent Trustees of the Trust on behalf of the Board.
| | | | |
| AARP Funds—Supplemental Information | | AARP FUNDS 2009 SEMI-ANNUAL REPORT | | 39 |
The Board determined, in its business judgment, that the advisory fee rate and the subadvisory fee rate were each fair and reasonable in light of the services provided and in the best interest of each Fund and its shareholders and approved the continuance of the Agreements. The Board did so based on various factors bearing on the nature, scope, quality, cost and profitability of the services to be provided by the Adviser and the Sub-Adviser and on various conclusions reached regarding those factors.
Special Facts and Circumstances
The Board members, including the independent members, considered the following special facts and circumstances relating to the Funds and Portfolios in evaluating the continuance of the respective advisory contracts:
| • | | AARP created the Funds (together with the underlying AARP Portfolios) based on principles developed and recommended by a high-level, independent Economic Security Solutions Group, which principles include low fees, index-based investment management, automatic rebalancing and limited choices; |
| • | | AARP created the Funds to encourage investors to save for retirement by allowing accounts to be opened with very low minimums; |
| • | | each Fund invests exclusively (or in the case of the AARP Income Fund, principally) in shares of other mutual funds, such as index funds or a master fund; |
| • | | each Fund has a low level of assets, and has not reached a “break-even point;” |
| • | | AFI has agreed to cap the expenses of each Fund and each Portfolio, with the result that AFI has waived the investment advisory fee payable by each Fund, paid the investment sub-advisory fee payable to the investment sub-adviser by each Fund and each Portfolio other than the AARP Money Market Fund, and reimbursed a significant portion of the operating expenses of each Fund; |
| • | | AFI is reviewing the operations of the Trusts in order to determine the best course of action for AARP and its members consistent with the best interest of shareholders of the Trusts; |
| • | | the Funds and Portfolios had high gross expenses due to their relatively small asset bases and not due to high fees; and |
| • | | each Fund and Portfolio, by virtue of its relationship with AARP, has been able to establish arrangements with experienced mutual fund service providers. |
| | | | |
| 40 | | AARP FUNDS 2009 SEMI-ANNUAL REPORT | | AARP—Supplemental Information |
AARP Funds –
Supplemental Information (continued)
Services, Fees and Benefits
The Board members, including the independent members, considered the following factors, and reached the following conclusions, relating to the Funds and Portfolios in evaluating the continuance of the advisory agreements:
| • | | the nature and scope of the advisory services that AFI provided to the Trusts and the investment sub-advisory services that SSgA FM provided to the Trusts, concluding that the nature and scope of the services were adequate and satisfactory; |
| • | | the quality of the services that AFI and SSgA FM provided to the Trusts (as evaluated by each Fund’s and each Portfolio’s investment performance and expenses), on both absolute and comparative bases, over current and historical periods, including comparisons with a benchmark index and certain industry peer data from an independent source, concluding that the quality of the services was adequate and satisfactory; |
| • | | data regarding the investment advisory fee rate and investment sub-advisory fee rate (and expenses) for each Fund and each Portfolio, on both an absolute and comparative basis, concluding that the investment advisory and investment sub-advisory fees (as well as other expenses) of each Fund and each Portfolio are within the range paid by funds deemed to be comparable by an independent source; |
| • | | advice received from AFI that, while the investment advisory fee rate for each Fund and each Portfolio does not have break-points, (i) the Funds and Portfolios had not yet attained asset levels that would result in economies of scale, (ii) the investment sub-advisory agreement with SSgA FM for the Funds and Portfolios provides for break-points, and (iii) AFI would be willing to consider break-points based on greater asset levels of the Funds and Portfolios, concluding that neither AFI nor SSgA FM was currently in a position to realize economies of scale that could be passed on to Trusts shareholders; |
| • | | the fact that AFI or AARP may derive benefits by having the Trusts available for marketing in connection with other investment or retirement programs that may be subject to fees and charges payable to AFI or AARP, concluding that such benefits were consistent with the mission of AARP, at best would be difficult to quantify, and did not appear to be inconsistent with the best interests of each Fund and each Portfolio; and |
| • | | information about the processes and procedures of SSgA FM regarding such matters, among others, as code of ethics, trading |
| | | | |
| AARP—Supplemental Information | | AARP FUNDS 2009 SEMI-ANNUAL REPORT | | 41 |
| | practices (e.g., brokerage allocation, soft dollars, use of affiliated brokers, trades between Portfolios, bunching, and allocation of investment opportunities), regulatory compliance, disaster recovery planning, and SSgA FM’s D&O/E&O insurance policies, and information set out in the Form ADV filed with the SEC by SSgA FM and the most recent Form 10K filed by SSgA FM’s parent, State Street Corporation, concluding that there was no information that appeared inconsistent with the continuance of the investment sub-advisory arrangement with SSgA FM. |
Investment Performance
The Board members considered the investment performance of each Fund on an absolute basis and risk adjusted basis for the 12 months ended September 30, 2009. The investment performance of the Portfolios was reviewed on an absolute basis since risk-adjusted metrics for the Portfolios (as well as the Money Market Fund) were not available. The Board also considered the investment performance of each Fund and each Portfolio, as compared to: (i) its benchmark index (“benchmark”) on an absolute basis and (ii) comparable funds or peers. The Board considered the fact that each Fund’s and each Portfolio’s investment performance was net of expenses, while a benchmark does not reflect any expenses. The Board also considered the fact that the AARP Aggressive Fund, AARP Moderate Fund, AARP Conservative Fund and the AARP Income Fund, unlike their respective peers, invest in index funds, rather than actively managed funds.
AARP Aggressive Fund. The Fund underperformed its benchmark, but outperformed both its Morningstar peer group median and its Lipper Growth peer group median on a total return basis for the 12 months ended September 30, 2009. The Board noted that the Fund also outperformed its Morningstar peer group on a certain risk adjusted basis (Sharpe ratio) for this period.
AARP Moderate Fund. The Fund nearly matched its benchmark and outperformed both its Morningstar peer group median and its Lipper Moderate Allocation peer group median on a total return basis for the 12 months ended September 30, 2009. The Board noted that the Fund also outperformed its Morningstar peer group median on a certain risk adjusted basis (Sharpe ratio) for this period.
AARP Conservative Fund. The Fund nearly matched its benchmark and outperformed its Morningstar peer group median on a total return basis for the 12 months ended September 30, 2009. However, the Fund slightly underperformed its Lipper Conservative Allocation peer group median on a total return basis for the 12 months ended September 30,
| | | | |
| 42 | | AARP FUNDS 2009 SEMI-ANNUAL REPORT | | AARP—Supplemental Information |
AARP Funds –
Supplemental Information (continued)
2009. The Board noted that the Fund also outperformed its Morningstar peer group median on a certain risk adjusted basis (Sharpe ratio) for this period.
AARP Income Fund. The Fund slightly underperformed its benchmark, but matched its Morningstar peer group median on a total return basis for the 12 months ended September 30, 2009. The Fund underperformed its Lipper Investment Grade Bond peer group median on a total return basis for the 12 months ended September 30, 2009. The Board noted that the Fund also outperformed its Morningstar peer group median on a certain risk adjusted basis (Sharpe ratio) for this period.
AARP Money Market Fund. The Fund outperformed its Morningstar peer group median and its Lipper Taxable Money Market peer group on a yield basis for the 12 months ended September 30, 2009. The Board noted that risk adjusted performance measures (Sharpe ratio) were not available for the Fund.
U.S. Stock Market Portfolio. The Portfolio nearly matched its benchmark and outperformed its Morningstar peer group median on a total return basis for the 12 months ended September 30, 2009. The Board noted that risk adjusted performance measures (Sharpe ratio) were not available for the Portfolio.
International Stock Market Portfolio. The Portfolio underperformed its benchmark, but outperformed its Morningstar peer group median on a total return basis for the 12 months ended September 30, 2009. The Board noted that risk adjusted performance measures (Sharpe ratio) were not available for the Portfolio.
U.S. Bond Market Portfolio. The Portfolio slightly underperformed its benchmark, but outperformed its Morningstar peer group median on a total return basis for the 12 months ended September 30, 2009. However, the Portfolio underperformed its Lipper Intermediate Investment Grade peer group median for the 12 months ended September 30, 2009. The Board noted that risk adjusted performance measures (Sharpe ratio) were not available for the Portfolio.
Board Consideration
In connection with their deliberation, the Board and the independent Trustees received legal advice from outside counsel to the Trust and the independent Trustees of the Trust regarding the standards and methodology of evaluation articulated by the SEC and the courts, and followed by the industry, for mutual funds selling shares to the public and to other mutual funds.
| | | | |
| AARP—Supplemental Information | | AARP FUNDS 2009 SEMI-ANNUAL REPORT | | 43 |
The foregoing discussion of the material factors considered and conclusions reached by the Trustees is not intended to be all-inclusive. The Trustees reviewed a variety of factors and considered a significant amount of information, including information received on an ongoing basis at meetings of the Board and the Board’s committees throughout the year. In addition, the Operations Committee and the Investment Committee met in person without management, on November 11, 2009 to discuss the proposed continuance of the Agreements. In view of the broad scope and variety of these factors and information, the Board did not find it practicable to, and did not, make specific assessments of, quantify, or otherwise assign relative weights to the specific factors considered in reaching the Board’s conclusions and determinations to continue the Investment Advisory Agreements and Investment Sub-advisory Agreements. The approval determinations were made on the basis of each Trustee’s business judgment after consideration of all of the factors taken as a whole, though individual Trustees may have given different weights to different factors and assigned various degrees of materiality to various conclusions.
| | | | |
| 44 | | AARP FUNDS 2009 SEMI-ANNUAL REPORT | | About the Funds’ Board of Trustees and Officers |
About the Funds’ Board of Trustees and Officers (unaudited)
The Board of Trustees (“Board”) of the AARP Funds oversee the operation and management the Funds.
The Board is comprised of one interested trustee and four trustees who are independent, meaning that they are not “interested persons” of AARP Funds for purposes of the Investment Company Act. Put simply, this means that they do not have material affiliations with AARP Funds, AARP Financial or SSgA FM apart from the personal investments they may have made in AARP Funds as private individuals.
Our independent board members bring distinguished backgrounds in business, academia and public service to their task of working with AARP Funds officers to establish policies and oversee the activities of the Funds.
The table below includes information about the trustees and officers of the Trust, including their:
| • | | principal occupations during the past five years; and |
| • | | other directorships of publicly traded companies or funds. |
Shareholders may communicate with the Board and officers by sending written correspondence to AARP Funds c/o the Funds’ Secretary, 650 F Street NW, Washington, D.C. 20004.
Trustees and Officers
| | | | | | | | |
| |
| Name, Address and Age | | Position(s)
with the
Trust and
Term of
Office(1) | | Principal Occupation(s)
During Past 5 Years | | Number of
Funds and
Portfolios
in Fund
Complex(2)
Overseen
by Trustee | | Other
Directorships
Held by
Trustee |
| |
| Independent Trustees | | | | | | | | |
| |
PETER C. CLAPMAN c/o AARP Financial Incorporated 650 F Street, N.W., Washington, DC 20004 Age: 74 | | Chairman of the Board and Trustee since 2005 | | Consultant, governance advisory services (July 2005–present); Director, National Association of Corporate Directors (non-profit private director education) (January 2005–present); Head of U.S. operations, Governance for Owners (governance services and consulting) (June 2005–present); Member, NASDAQ Listing Council (2005–present); Senior Vice President and Chief Counsel, TIAA-CREF (financial services, pension and investment products) (1972–July 2005). | | 8 | | Director, iPass, Inc. (February 2007–present). |
| |
| | | | |
| About the Funds’ Board of Trustees and Officers | | AARP FUNDS 2009 SEMI-ANNUAL REPORT | | 45 |
| | | | | | | | |
| |
| Name, Address and Age | | Position(s)
with the
Trust and
Term of
Office(1) | | Principal Occupation(s)
During Past 5 Years | | Number of
Funds and
Portfolios
in Fund
Complex(2)
Overseen
by Trustee | | Other
Directorships
Held by
Trustee |
| |
RICHARD M. REILLY c/o AARP Financial Incorporated 650 F Street, N.W., Washington, DC 20004 Age: 72 | | Trustee since 2006 | | Self-Employed Consultant (November 2002–present); Trustee, International Foundation for Retirement Education (InFRE) (September 2006–present); Senior Vice President, Allmerica Financial Corp. (financial services holding company) (November 2001–November 2002); President, Allmerica Financial Services (investments/insurance) (1995–November 2001). | | 8 | | None. |
| |
ELLEN B. SAFIR, CFA c/o AARP Financial Incorporated 650 F Street, N.W., Washington, DC 20004 Age: 65 | | Trustee since 2006 | | Chief Executive Officer, New Century Advisors, LLC (registered investment adviser) (2002 – present); President, CFA Society of Washington, DC (July 2007–June 2008); Member, Investment Committee, United States Holocaust Memorial Museum (June 1997–present); Managing Director, Fixed Income and Currencies, Howard Hughes Medical Institute (medical research) (1986–2002). | | 8 | | None. |
| |
LYNN E. TURNER c/o AARP Financial Incorporated 650 F Street, N.W., Washington, DC 20004 Age: 58 | | Trustee since 2005 | | Trustee, Colorado Public Employees Retirement Association (COPERA) (August 2007–present); Managing Director/Senior Advisor, LECG (forensic accounting) (May 2009–present); Managing Director/Senior Advisor, Kroll Inc. (forensic accounting) (July 200–March 2009); Managing Director of Research, Glass Lewis & Co. LLC (financial and proxy research) (July 2003–June 2007); Professor, Colorado State University (August 2001–June 2003); Chief Accountant, Securities and Exchange Commission (July 1998–August 2001). | | 8 | | Director, Guidance Software, Inc. (April 2007–February 2008); Director, Sun Microsystems, Inc. (November 2003–October 2006). |
| |
| Interested Trustee | | | | | | | | |
| |
ROBERT R. HAGANS, JR.(3) c/o AARP Financial Incorporated 650 F Street, N.W., Washington, DC 20004 Age: 55 | | Trustee since 2008 | | Chief Financial Officer, AARP (2001–present); Director, AARP Financial Inc. (2007–2008); Director, Boys and Girls Club of America (2008–present). | | 8 | | Treasurer and Director, Industrial Bank, NA (2000–present) |
| |
| (1) | Each trustee may serve until his/her death, resignation, removal, retirement or declaration of incompetence by a court of appropriate jurisdiction. |
| (2) | The “Fund Complex” consists of the five AARP Funds discussed in this report, and the three series of the AARP Portfolios, which are not offered to the public for investment. |
| (3) | Mr. Hagans is considered an interested trustee due to his position as Chief Financial Officer of AARP. |
| | | | |
| 46 | | AARP FUNDS 2009 SEMI-ANNUAL REPORT | | About the Funds’ Board of Trustees and Officers |
About the Funds’ Board of Trustees and Officers (continued)
| | | | |
| |
| Name, Address and Age | | Position(s)
with the
Trust and
Term of
Office | | Principal Occupation(s) During Past 5 Years |
| |
| Officers | | | | |
| |
RICHARD M. HISEY, CFA AARP Financial Incorporated Two Highwood Drive, 2nd Floor, Tewksbury MA 01876 Age: 51 | | President | | President, AARP Financial Inc. (May 2008–present); Chief Investment Officer, AARP Financial Inc. (April 2006–present); Executive Vice President and Chief Investment Officer, Cole Management, Incorporated (venture capital firm) (2005–2006); Senior Vice President, MFS Investment Management and Treasurer and Chief Financial Officer, MFS Group of Mutual Funds (2002–2005); Senior Vice President, The Bank of New York (2000–2002). |
| |
JEFFREY J. GABOURY AARP Financial Incorporated Two Highwood Drive, 2nd Floor, Tewksbury MA 01876 Age: 41 | | Treasurer | | Assistant Treasurer, AARP Financial Inc. (May 2008–November 2008); Deputy Treasurer, Lord, Abbett & Co. LLC (June 2006–April 2008); Treasurer and Chief Financial Officer of the New York Life Investment Management Group of Mutual Funds (December 2004–December 2005); Director of Compliance, Investors Bank & Trust Company (August 1996–November 2004). |
| |
SUSAN KIRKPATRICK AARP Financial Incorporated Two Highwood Drive, 2nd Floor, Tewksbury, MA 01876 Age: 44 | | Chief Compliance Officer | | Chief Compliance Officer, AARP Financial Inc. (November 2007–present); Director of Compliance, AARP Financial Inc. (December 2005–November 2007); Chief Compliance Officer, Grail Partners (investment banking) (March 2005–December 2005); Director, Devonshire Financial Group (consulting) (September 2004–December 2005); NewRiver, Inc. (electronic delivery of compliance documents) (July 1999–September 2004). |
| |
MARC DUFFY AARP Financial Incorporated 650 F Street, N.W., Washington, DC 20004 Age: 52 | | Secretary | | Associate General Counsel, AARP Financial Inc. (August 2006–present); Assistant General Counsel, E*TRADE Financial Corporation (January 2004–August 2006); Assistant General Counsel, Legg Mason Wood Walker, Incorporated (September 1999–January 2004). |
| |
JULIE TEDESCO State Street Bank and Trust Company 4 Copley Place, 5th Floor, Boston, MA 02116 Age: 52 | | Assistant Secretary | | Senior Vice President and Senior Managing Counsel, State Street Bank and Trust Company (2000–present). |
| |
Additional information about AARP Funds’ trustees is provided in the Statement of Additional Information and is available without charge, upon request, by calling 1-800-958-6457.
| | | | |
| | STATE STREET MONEY MARKET PORTFOLIO | | 47 |
State Street
Money Market Portfolio
Annual Report
December 31, 2009
| | | | |
| 48 | | STATE STREET MONEY MARKET PORTFOLIO | | Expense Example |
Expense Example
As a shareholder of the State Street Money Market Portfolio (the “Portfolio”), you incur ongoing costs, which include costs for portfolio management and administrative services, among others. This example is intended to help you understand your ongoing costs (in dollars) of investing in the Portfolio and to compare these costs with the ongoing costs of investing in other mutual funds.
The example is based on an investment of $1,000 made at the beginning of the period shown and held for the entire period from July 1, 2009 to December 31, 2009.
The table below illustrates your Portfolio’s costs in two ways:
| • | | Based on actual fund return. This section helps you to estimate the actual expenses that you paid over the period. The “Ending Account Value” shown is derived from the Portfolio’s actual return, and the third column shows the dollar amount that would have been paid by an investor who started with $1,000 in the Portfolio. You may use the information here, together with the amount you invested, to estimate the expenses that you paid over the period. To do so, simply divide your account value by $1,000 (for example, an $8,600 account value divided by $1,000 = 8.6), then multiply the result by the number given for the Portfolio under the heading “Expenses Paid During Period”. |
| • | | Based on hypothetical 5% return. This section is intended to help you compare your Portfolio’s costs with those of other mutual funds. It assumes that the Portfolio had a yearly return of 5% before expenses, but that the expense ratio is unchanged. In this case- because the return used is not the Portfolio’s actual return- the results do not apply to your investment. The example is useful in making comparisons because the Securities and Exchange Commission requires all mutual funds to calculate expenses based on a 5% return. You can assess your Portfolio’s costs by comparing this hypothetical example with the hypothetical examples that appear in shareholder reports of other funds. |
| | | | | | | | | | | | |
Six Months Ended
December 31, 2009 | | | | Beginning
Account Value
7/1/09 | | | | Ending
Account Value
12/31/09 | | | | Expenses
Paid During
Period* |
| Based on Actual Portfolio Return | | | | $1,000.00 | | | | $1,001.40 | | | | $0.61 |
| |
Based on Hypothetical
(5% return before expenses) | | | | $1,000.00 | | | | $1,024.60 | | | | $0.61 |
| * | The calculations are based on expenses incurred in the most recent six month period of the Portfolio. The annualized average weighted expense ratio as of December 31, 2009 was 0.12%. The dollar amounts shown as “Expenses Paid” are equal to the annualized average weighted expense ratio multiplied by the average account value over the period, multiplied by the number of days in the most recent six month period, then divided by the number of days in the most recent 12 month period. |
| | | | |
| Portfolio Statistics | | STATE STREET MONEY MARKET PORTFOLIO | | 49 |
Portfolio Statistics (Unaudited)
| | | |
| Portfolio Composition* | | December 31, 2009 | |
| Yankee Certificates of Deposit | | 42.6 | % |
| Commercial Paper | | 23.8 | |
| Repurchase Agreements | | 16.9 | |
| Euro Certificates of Deposit | | 8.2 | |
| Bank Notes | | 3.7 | |
| Certificates of Deposit | | 2.1 | |
| U.S. Government Agency Obligations | | 1.2 | |
| Time Deposit | | 0.8 | |
| Medium Term Notes | | 0.7 | |
| Other Assets In Excess of Liabilities | | 0.0 | |
| Total | | 100.0 | % |
| |
| Maturity Ladder* | | December 31, 2009 | |
| 0-3 Days | | 0.7 | % |
| 4-90 Days | | 89.6 | |
| 90+ Days | | 9.7 | |
| Total | | 100.0 | % |
| |
| Average days to maturity | | 44 | |
| * | As a percentage of net assets as of the date indicated. The Portfolio’s composition will vary over time. |
See Notes to Financial Statements.
| | | | |
| 50 | | STATE STREET MONEY MARKET PORTFOLIO | | Portfolio of Investments |
Portfolio of Investments December 31, 2009
| | | | | | | | |
| Name of Issuer and Title of Issue | | Interest
Rate | | Maturity
Date | | Principal
Amount | | Amortized Cost |
| | | | | | | | |
| COMMERCIAL PAPER – 23.8% | | | | | | | | |
| Asset Backed Commercial Paper Credit Arbitrage – 4.0% | | | | | | |
| Newport Funding Corp.(a) | | 0.250% | | 01/05/2010 | | $200,000,000 | | $199,994,444 |
| Solitaire Funding LLC(a) | | 0.300% | | 01/11/2010 | | 160,000,000 | | 159,986,667 |
| Solitaire Funding LLC(a) | | 1.000% | | 01/27/2010 | | 70,000,000 | | 69,984,328 |
| Solitaire Funding LLC(a) | | 1.000% | | 02/25/2010 | | 190,000,000 | | 189,918,722 |
| | | | | | | | |
| | | | | | | | 619,884,161 |
| | | | | | | | |
| Asset Backed Commercial Paper Hybrid – 0.6% | | | | | | | | |
| Cancara Asset Securitization LLC(a) | | 0.100% | | 01/14/2010 | | 100,000,000 | | 99,992,056 |
| Asset Backed Commercial Paper Receivables and Securities – 4.5% | | | | |
| Alpine Securitization(a) | | 0.200% | | 01/14/2010 | | 50,000,000 | | 49,996,389 |
| Gemini Securitization Corp.(a) | | 0.230% | | 01/28/2010 | | 75,000,000 | | 74,987,063 |
| Straight-A Funding (Series 1)(a) | | 0.210% | | 01/20/2010 | | 50,045,000 | | 50,039,453 |
| Straight-A Funding (Series 1)(a) | | 0.200% | | 02/01/2010 | | 100,000,000 | | 99,982,778 |
| Straight-A Funding (Series 1)(a) | | 0.200% | | 02/12/2010 | | 225,825,000 | | 225,772,307 |
| Straight-A Funding (Series 1)(a) | | 0.220% | | 02/22/2010 | | 200,000,000 | | 199,948,000 |
| | | | | | | | |
| | | | | | | | 700,725,990 |
| | | | | | | | |
| Bank Domestic – 2.0% | | | | | | | | |
| JPMorgan Chase & Co. | | 0.140% | | 01/07/2010 | | 107,000,000 | | 106,997,503 |
| JPMorgan Chase Funding Inc.(a) | | 0.290% | | 04/06/2010 | | 200,000,000 | | 199,846,945 |
| | | | | | | | |
| | | | | | | | 306,844,448 |
| | | | | | | | |
| Bank Foreign – 10.2% | | | | | | | | |
| Australia & New Zealand Banking Group Ltd.(a)(b) | | 0.282% | | 01/25/2010 | | 45,000,000 | | 45,000,000 |
| Banco Bilbao Vizcaya Argentaria/London(a) | | 0.300% | | 03/18/2010 | | 50,000,000 | | 49,968,333 |
| Banco Bilbao Vizcaya Argentaria/London(a) | | 0.253% | | 03/23/2010 | | 248,000,000 | | 247,859,105 |
| Banco Bilbao Vizcaya Argentaria/London(a) | | 0.240% | | 03/29/2010 | | 185,000,000 | | 184,892,700 |
| CBA Delaware Finance, Inc. | | 0.200% | | 02/22/2010 | | 90,000,000 | | 89,974,000 |
| CBA Delaware Finance, Inc. | | 0.190% | | 03/15/2010 | | 50,000,000 | | 49,980,736 |
| DnB NOR Bank ASA(a) | | 0.215% | | 02/16/2010 | | 100,000,000 | | 99,972,528 |
| Nordea North America, Inc. | | 0.200% | | 01/07/2010 | | 50,000,000 | | 49,998,333 |
| Nordea North America, Inc. | | 0.180% | | 02/24/2010 | | 210,000,000 | | 209,943,300 |
| Svenska Handelsbanken, Inc. | | 0.205% | | 01/19/2010 | | 75,000,000 | | 74,992,312 |
| Svenska Handelsbanken, Inc. | | 0.190% | | 02/26/2010 | | 170,000,000 | | 169,949,756 |
| Westpac Banking Corp.(a) | | 0.200% | | 01/07/2010 | | 50,000,000 | | 49,998,333 |
| Westpac Banking Corp.(a) | | 0.200% | | 01/08/2010 | �� | 50,000,000 | | 49,998,056 |
| Westpac Banking Corp.(a) | | 0.300% | | 04/06/2010 | | 200,000,000 | | 199,841,667 |
| | | | | | | | |
| | | | | | | | 1,572,369,159 |
| | | | | | | | |
| Finance Non-Captive Diversified – 2.5% | | | | | | | | |
| General Electric Capital Corp. | | 0.220% | | 01/20/2010 | | 59,000,000 | | 58,993,149 |
| General Electric Capital Corp. | | 0.240% | | 03/09/2010 | | 100,000,000 | | 99,955,333 |
| General Electric Capital Corp. | | 0.320% | | 03/19/2010 | | 120,000,000 | | 119,917,867 |
| General Electric Capital Corp. | | 0.320% | | 03/23/2010 | | 110,000,000 | | 109,920,800 |
| | | | | | | | |
| | | | | | | | 388,787,149 |
| | | | | | | | |
| TOTAL COMMERCIAL PAPER | | | | | | | | 3,688,602,963 |
| | | | | | | | |
| | | | |
| Portfolio of Investments | | STATE STREET MONEY MARKET PORTFOLIO | | 51 |
Portfolio of Investments December 31, 2009 (continued)
| | | | | | | | |
| Name of Issuer and Title of Issue | | Interest
Rate | | Maturity
Date | | Principal
Amount | | Amortized Cost |
| | | | | | | | |
| CERTIFICATES OF DEPOSIT – 2.1% | | | | | | | | |
| Bank Domestic – 2.1% | | | | | | | | |
| Bank of America NA/Charlotte NC | | 0.650% | | 01/14/2010 | | $75,000,000 | | $75,000,000 |
| Bank of America NA/Charlotte NC | | 0.400% | | 02/10/2010 | | 115,000,000 | | 115,000,000 |
| Bank of America NA/Charlotte NC | | 0.480% | | 03/10/2010 | | 135,000,000 | | 135,000,000 |
| | | | | | | | |
| TOTAL CERTIFICATES OF DEPOSIT | | | | | | | | 325,000,000 |
| | | | | | | | |
| EURO CERTIFICATES OF DEPOSIT – 8.2% | | | | | | | | |
| Bank Foreign – 8.2% | | | | | | | | |
| Australia & New Zealand Banking Group Ltd. | | 0.210% | | 01/11/2010 | | 50,000,000 | | 50,000,000 |
| Australia & New Zealand Banking Group Ltd. | | 0.245% | | 02/04/2010 | | 75,000,000 | | 75,000,354 |
| Commonwealth Bank of Australia | | 0.210% | | 01/26/2010 | | 125,000,000 | | 125,000,434 |
| ING Bank NV | | 0.570% | | 03/03/2010 | | 100,000,000 | | 100,000,000 |
| ING Bank NV | | 0.450% | | 04/12/2010 | | 150,000,000 | | 150,000,000 |
| ING Bank NV | | 0.420% | | 04/19/2010 | | 100,000,000 | | 100,000,000 |
| ING Bank NV | | 0.380% | | 04/27/2010 | | 150,000,000 | | 150,000,000 |
| ING Bank NV | | 0.380% | | 05/18/2010 | | 175,000,000 | | 175,000,000 |
| National Australia Bank Ltd. | | 0.225% | | 01/11/2010 | | 50,000,000 | | 50,000,070 |
| National Australia Bank Ltd. | | 0.213% | | 02/10/2010 | | 200,000,000 | | 200,000,555 |
| National Australia Bank Ltd. | | 0.403% | | 02/22/2010 | | 100,000,000 | | 100,000,360 |
| | | | | | | | |
| TOTAL EURO CERTIFICATES OF DEPOSIT | | | | | | | | 1,275,001,773 |
| | | | | | | | |
| YANKEE CERTIFICATES OF DEPOSIT – 42.6% | | | | | | | | |
| Bank Foreign – 42.6% | | | | | | | | |
| Banco Bilbao Vizcaya Argentaria SA | | 0.275% | | 02/26/2010 | | 100,000,000 | | 100,000,777 |
| Banco Bilbao Vizcaya Argentaria SA | | 0.250% | | 03/18/2010 | | 150,000,000 | | 150,001,582 |
| Bank of Montreal/Chicago | | 0.180% | | 01/08/2010 | | 100,000,000 | | 100,000,000 |
| Bank of Montreal/Chicago | | 0.190% | | 02/16/2010 | | 75,000,000 | | 75,000,000 |
| Bank of Montreal/Chicago | | 0.200% | | 03/11/2010 | | 50,000,000 | | 50,000,000 |
| Bank of Nova Scotia | | 0.210% | | 01/07/2010 | | 50,000,000 | | 50,000,000 |
| Bank of Nova Scotia | | 0.190% | | 03/04/2010 | | 75,000,000 | | 75,000,000 |
| Bank of Nova Scotia | | 0.180% | | 03/15/2010 | | 175,000,000 | | 175,000,000 |
| Bank of Nova Scotia | | 0.330% | | 03/23/2010 | | 100,000,000 | | 100,000,000 |
| Bank of Nova Scotia/Houston(b) | | 0.273% | | 02/16/2010 | | 38,000,000 | | 38,000,000 |
| Barclays Bank PLC(b) | | 0.584% | | 01/18/2010 | | 100,000,000 | | 100,000,000 |
| Barclays Bank PLC | | 0.613% | | 01/19/2010 | | 250,000,000 | | 250,000,000 |
| Barclays Bank PLC(b) | | 0.582% | | 01/22/2010 | | 125,000,000 | | 125,000,000 |
| Barclays Bank PLC NY | | 0.830% | | 01/04/2010 | | 100,000,000 | | 100,000,000 |
| Barclays Bank PLC NY | | 0.655% | | 12/03/2010 | | 100,000,000 | | 100,000,000 |
| BNP Paribas NY | | 0.240% | | 02/05/2010 | | 100,000,000 | | 100,000,000 |
| BNP Paribas NY | | 0.270% | | 02/26/2010 | | 300,000,000 | | 300,000,000 |
| BNP Paribas NY | | 0.220% | | 03/02/2010 | | 200,000,000 | | 200,000,000 |
| BNP Paribas NY | | 0.240% | | 03/15/2010 | | 100,000,000 | | 100,000,000 |
| Calyon NY | | 0.240% | | 02/08/2010 | | 200,000,000 | | 200,000,000 |
| Calyon NY | | 0.545% | | 03/01/2010 | | 200,000,000 | | 200,000,000 |
| | | | |
| 52 | | STATE STREET MONEY MARKET PORTFOLIO | | Portfolio of Investments |
Portfolio Of Investments December 31, 2009 (continued)
| | | | | | | | |
| Name of Issuer and Title of Issue | | Interest
Rate | | Maturity
Date | | Principal
Amount | | Amortized Cost |
| | | | | | | | |
| YANKEE CERTIFICATES OF DEPOSIT (continued) | | | | | | | | |
| Bank Foreign (continued) | | | | | | | | |
| Calyon NY | | 0.250% | | 03/29/2010 | | $300,000,000 | | $300,000,000 |
| Canadian Imperial Bank of Commerce NY | | 0.180% | | 03/11/2010 | | 50,000,000 | | 50,000,000 |
| Deutsche Bank AG NY | | 0.200% | | 01/25/2010 | | 275,000,000 | | 275,000,000 |
| DnB NOR Bank ASA NY | | 0.220% | | 01/29/2010 | | 100,000,000 | | 100,000,000 |
| DnB NOR Bank ASA NY | | 0.180% | | 03/15/2010 | | 175,000,000 | | 175,000,000 |
| Lloyds TSB Bank PLC NY | | 0.720% | | 01/13/2010 | | 100,000,000 | | 100,000,000 |
| Lloyds TSB Bank PLC NY | | 0.515% | | 02/23/2010 | | 100,000,000 | | 100,000,000 |
| Lloyds TSB Bank PLC NY | | 0.270% | | 04/01/2010 | | 300,000,000 | | 300,000,000 |
| National Australia Bank Ltd. | | 0.200% | | 03/09/2010 | | 100,000,000 | | 100,000,000 |
| Nordea Bank Finland PLC NY | | 0.200% | | 03/04/2010 | | 100,000,000 | | 100,000,000 |
| Nordea Bank Finland PLC NY | | 0.190% | | 03/09/2010 | | 200,000,000 | | 200,000,000 |
| Rabobank Nederland NV/NY | | 0.220% | | 01/08/2010 | | 400,000,000 | | 400,000,000 |
| Rabobank Nederland NV/NY | | 0.180% | | 02/26/2010 | | 150,000,000 | | 150,000,000 |
| Rabobank Nederland NV/NY | | 0.240% | | 03/16/2010 | | 75,000,000 | | 75,000,000 |
| Royal Bank of Scotland PLC/Greenwich CT(b) | | 0.610% | | 01/01/2010 | | 100,000,000 | | 100,000,000 |
| Royal Bank of Scotland PLC/Greenwich CT | | 0.170% | | 02/23/2010 | | 200,000,000 | | 200,000,000 |
| Royal Bank of Scotland PLC/Greenwich CT | | 0.510% | | 03/22/2010 | | 75,000,000 | | 75,000,000 |
| Societe Generale NY | | 0.230% | | 01/11/2010 | | 100,000,000 | | 100,000,000 |
| Societe Generale NY | | 0.400% | | 02/26/2010 | | 300,000,000 | | 300,000,000 |
| Societe Generale NY | | 0.350% | | 03/11/2010 | | 200,000,000 | | 200,000,000 |
| Societe Generale NY | | 0.330% | | 04/08/2010 | | 125,000,000 | | 125,000,000 |
| Svenska Handelsbanken NY | | 0.230% | | 01/25/2010 | | 100,000,000 | | 100,000,000 |
| Toronto-Dominion Bank NY(b) | | 0.235% | | 01/05/2010 | | 24,000,000 | | 24,000,000 |
| Toronto-Dominion Bank NY(b) | | 0.235% | | 01/09/2010 | | 30,000,000 | | 30,000,000 |
| Toronto-Dominion Bank NY | | 0.300% | | 02/18/2010 | | 80,000,000 | | 80,000,000 |
| UniCredito Italiano SpA NY | | 0.220% | | 01/15/2010 | | 50,000,000 | | 50,000,000 |
| UniCredito Italiano SpA NY | | 0.220% | | 01/19/2010 | | 100,000,000 | | 100,000,000 |
| | | | | | | | |
| TOTAL YANKEE CERTIFICATES OF DEPOSIT | | | | | | | | 6,597,002,359 |
| | | | | | | | |
| BANK NOTES – 3.7% | | | | | | | | |
| Bank Domestic – 2.5% | | | | | | | | |
| Bank of America NA(b) | | 0.290% | | 01/04/2010 | | 258,000,000 | | 258,000,000 |
| Chase Manhattan Bank USA NA | | 0.190% | | 02/04/2010 | | 135,000,000 | | 135,003,819 |
| | | | | | | | |
| | | | | | | | 393,003,819 |
| | | | | | | | |
| Bank Foreign – 1.2% | | | | | | | | |
| Commonwealth Bank of Australia(b)(c) | | 0.282% | | 01/27/2010 | | 31,000,000 | | 31,000,000 |
| Rabobank Nederland(b)(c) | | 0.273% | | 02/16/2010 | | 107,000,000 | | 107,000,000 |
| Svenska Handelsbanken(b)(c) | | 0.305% | | 02/09/2010 | | 40,000,000 | | 40,000,000 |
| | | | | | | | |
| | | | | | | | 178,000,000 |
| | | | | | | | |
| TOTAL BANK NOTES | | | | | | | | 571,003,819 |
| | | | | | | | |
| | | | |
| Portfolio of Investments | | STATE STREET MONEY MARKET PORTFOLIO | | 53 |
Portfolio of Investments December 31, 2009 (continued)
| | | | | | | | |
| Name of Issuer and Title of Issue | | Interest
Rate | | Maturity
Date | | Principal
Amount | | Amortized Cost |
| | | | | | | | |
| MEDIUM TERM NOTES – 0.7% | | | | | | | | |
| Bank Domestic – 0.3% | | | | | | | | |
| Bank of America NA/Charlotte NC(b) | | 0.657% | | 01/22/2010 | | $44,000,000 | | $44,000,000 |
| | | | | | | | |
| Bank Foreign – 0.2% | | | | | | | | |
| Westpac Banking Corp.(b) | | 0.281% | | 01/28/2010 | | 35,000,000 | | 35,000,000 |
| | | | | | | | |
| Consumer Non-Cyclical – 0.2% | | | | | | | | |
| Procter & Gamble International Funding SCA(b) | | 0.285% | | 02/08/2010 | | 20,000,000 | | 20,000,000 |
| | | | | | | | |
| TOTAL MEDIUM TERM NOTES | | | | | | | | 99,000,000 |
| | | | | | | | |
| U.S. GOVERNMENT AGENCY OBLIGATIONS – 1.2% | | | | | | | | |
| Sovereign – 1.2% | | | | | | | | |
| Federal Home Loan Mortgage Corp.(b) | | 0.084% | | 01/11/2010 | | 80,000,000 | | 80,000,000 |
| Federal National Mortgage Association(b) | | 0.174% | | 01/13/2010 | | 100,000,000 | | 100,000,000 |
| | | | | | | | |
| TOTAL U.S. GOVERNMENT AGENCY OBLIGATIONS | | | | | | | | 180,000,000 |
| | | | | | | | |
| | | | |
| | | | | | | | | Market
Value |
| | | | | | | | |
| REPURCHASE AGREEMENTS – 16.9% | | | | | | | | |
| Agreement with Bank of America and The Bank of New York, Inc. (Tri-Party), dated 12/31/09 (collateralized by Federal National Mortgage Association 5.000% - 6.000% due 05/01/34 - 08/01/38 and Federal Home Loan Mortgage Corporation 4.500% - 5.500% due 03/01/36 - 01/01/40 valued at $759,900,001); proceeds $745,000,828 | | 0.010% | | 01/04/2010 | | 745,000,000 | | 745,000,000 |
| | | | | | | | |
| | | | |
| Agreement with BNP Paribas and The Bank of New York, Inc. (Tri-Party), dated 12/31/09 (collateralized by U.S. Treasury Bonds, 3.500%-5.000% due 05/15/37 - 02/15/39 valued at $77,321,127); proceeds $75,805,000 | | 0.000% | | 01/04/2010 | | 75,805,000 | | 75,805,000 |
| | | | | | | | |
| | | | |
| Agreement with Citigroup and The Bank of New York, Inc. (Tri-Party), dated 12/31/09 (collateralized by Federal National Mortgage Association 0.646% - 6.250% due 01/25/29 -12/25/46 and Federal Home Loan Mortgage Corporation 0.489% - 6.000% due 06/15/18 - 07/15/37 valued at $612,000,000); proceeds $600,000,667 | | 0.010% | | 01/04/2010 | | $600,000,000 | | $600,000,000 |
| | | | | | | | |
| | | | |
| Agreement with Deutsche Bank and The Bank of New York, Inc. (Tri-Party), dated 12/31/09 (collateralized by Federal National Mortgage Association, 5.968% - 6.518% due 10/25/35 - 12/25/39 valued at $102,000,000); proceeds $100,000,111 | | 0.010% | | 01/04/2010 | | 100,000,000 | | 100,000,000 |
| | | | | | | | |
| | | | |
| 54 | | STATE STREET MONEY MARKET PORTFOLIO | | Portfolio of Investments |
PORTFOLIO OF INVESTMENTS December 31, 2009 (continued)
| | | | | | | | |
| Name of Issuer and Title of Issue | | Interest
Rate | | Maturity
Date | | Principal
Amount | | Market
Value |
| | | | | | | | |
| Agreement with JP Morgan Securities, Inc. and JP Morgan Chase & Co. (Tri-Party), dated 12/31/09 (collateralized by Federal Home Loan Mortgage Corporation, 4.000% - 6.500% due 04/01/21-12/01/39 valued at $612,003,845); proceeds $600,000,667 | | 0.010% | | 01/04/2010 | | $600,000,000 | | $600,000,000 |
| | | | | | | | |
| | | | |
| Agreement with Royal Bank of Scotland and JP Morgan Chase & Co. (Tri-Party), dated 12/31/09 (collateralized by Asset Backed Securities, 0.000% - 7.834% due 04/15/11 - 04/15/49 valued at $510,002,271); proceeds $500,000,556 | | 0.010% | | 01/04/2010 | | 500,000,000 | | 500,000,000 |
| | | | | | | | |
| | | | | | | | |
| | | | | | | | |
| TOTAL REPURCHASE AGREEMENTS | | | | | | | | 2,620,805,000 |
| | | | | | | | |
| | | | | | | | |
| TIME DEPOSIT – 0.8% | | | | | | | | |
| | | | |
| | | | | | | Shares | | |
| Bank Domestic – 0.8% | | | | | | | | |
| Citibank NA | | 0.050% | | 01/04/2010 | | 127,555,000 | | 127,555,000 |
| | | | | | | | |
| TOTAL TIME DEPOSIT | | | | | | | | 127,555,000 |
| | | | | | | | |
| | | | | | | | |
| TOTAL INVESTMENTS(d) † – 100.0% | | | | | | | | 15,483,970,914 |
| OTHER ASSETS IN EXCESS OF LIABILITIES – 0.00% | | | | | | 4,110,238 |
| | | | | | | | |
| NET ASSETS – 100.0% | | | | | | | | $15,488,081,152 |
| | | | | | | | |
| (a) | | Rule 144A, Section 4(2) or other security which is restricted as to resale to institutional investors. The Fund’s Portfolio Manager has deemed this security to be liquid based upon procedures approved by the Board of Trustees. These securities represent $2,547,979,874 or 16.45% of net assets as of December 31, 2009. |
| (b) | | Variable Rate Security – Interest Rate is in effect as of December 31, 2009. |
| (c) | | Security subject to restrictions on resale under federal securities laws, which may only be resold upon registration under the Securities Act of 1933, as amended (“1933 Act”) or in transactions exempt from registration, including sales to qualified institutional buyers pursuant to Rule 144A of the 1933 Act. The Portfolio does not have the right to demand that this security be registered. These securities represent $178,000,000, or 1.15% of net assets as of December 31, 2009. |
| (d) | | Unless otherwise indicated, the values of the Securities of the Portfolio are determined based on Level 2 inputs established by provisions surrounding Fair Value Measurements and Disclosures. (Note 2) |
| † | | See Note 2 of the Notes to Financial Statements. |
See Notes to Financial Statements.
| | | | |
| Financial Statements | | STATE STREET MONEY MARKET PORTFOLIO | | 55 |
Statement of Assets and Liabilities December 31, 2009
| | | | | |
| Assets | | | | | |
| Investments in unaffiliated issuers, at amortized cost (Note 2) | | $ | | | 12,863,165,914 |
| Repurchase Agreements, at market value (Note 2) | | | | | 2,620,805,000 |
| | | | | |
| Total investments | | | | | 15,483,970,914 |
| Interest receivable | | | | | 5,605,169 |
| Prepaid expense and other assets | | | | | 6,605 |
| | | | | |
| Total assets | | | | | 15,489,582,688 |
| Liabilities | | | | | |
| Due to custodian | | | | | 9,159 |
| Management fee (Note 3) | | | | | 1,241,991 |
| Administration and custody fees (Note 3) | | | | | 207,883 |
| Professional fees | | | | | 38,708 |
| Accrued expenses and other liabilities | | | | | 3,795 |
| | | | | |
| Total liabilities | | | | | 1,501,536 |
| | | | | |
| Net Assets | | $ | | | 15,488,081,152 |
| | | | | |
Statement of Operations Year Ended December 31, 2009
| | | | | | |
| Investment Income | | | | | | |
| Interest | | $ | | | 61,041,268 | |
| | | | | | |
| Expenses | | | | | | |
| Management fees (Note 3) | | | | | 10,706,387 | |
| Administration and custody fees (Note 3) | | | | | 2,003,150 | |
| Professional fees | | | | | 47,783 | |
| Trustee’s fees (Note 4) | | | | | 53,891 | |
| Printing fees | | | | | 6,195 | |
| Other expenses | | | | | 61,967 | |
| | | | | | |
| Total expenses | | | | | 12,879,373 | |
| Less: Fee waivers by Investment Advisor (Note 3) | | | | | (589,262 | ) |
| | | | | | |
| Total net expenses | | | | | 12,290,111 | |
| | | | | | |
| Net Investment Income | | $ | | | 48,751,157 | |
| | | | | | |
| Realized Gain | | | | | | |
| Net realized gain on investments | | $ | | | 37,660 | |
| | | | | | |
| Net Increase in Net Assets Resulting from Operations | | $ | | | 48,788,817 | |
| | | | | | |
See Notes to Financial Statements.
| | | | |
| 56 | | STATE STREET MONEY MARKET PORTFOLIO | | Financial Statements |
Statements of Changes in Net Assets
| | | | | | | | | | | | |
| | | | | Year Ended
December 31, 2009 | | | | | Year Ended
December 31, 2008 | |
| Increase in Net Assets From Operations: | | | | | | | | | | | | |
| Net investment income | | $ | | | 48,751,157 | | | $ | | | 226,704,311 | |
| Net realized gain on investments | | | | | 37,660 | | | | | | 126,859 | |
| | | | | | | | | | | | |
| Net increase in net assets from operations | | | | | 48,788,817 | | | | | | 226,831,170 | |
| | | | | | | | | | | | |
| Capital Transactions | | | | | | | | | | | | |
| Contributions | | | | | 26,809,693,228 | | | | | | 23,607,267,075 | |
| Withdrawals | | | | | (19,976,306,032 | ) | | | | | (22,146,456,134 | ) |
| | | | | | | | | | | | |
| Net increase in net assets from capital transactions | | | | | 6,833,387,196 | | | | | | 1,460,810,941 | |
| | | | | | | | | | | | |
| Net Increase in Net Assets | | | | | 6,882,176,013 | | | | | | 1,687,642,111 | |
| Net Assets | | | | | | | | | | | | |
| Beginning of year | | | | | 8,605,905,139 | | | | | | 6,918,263,028 | |
| End of year | | $ | | | 15,488,081,152 | | | $ | | | 8,605,905,139 | |
| | | | | | | | | | | | |
Financial Highlights
| | | | | | | | | | | | | |
| | | | | Ratios to Average Net Assets | | | |
| Year Ended December 31, | | Total
Return(a) | | Gross
Operating
Expenses | | Net
Operating
Expenses | | | Net
Investment
Income | | | Net Assets
End of Period
(000s omitted) |
| 2009 | | 0.52% | | 0.12% | | 0.11% | (b) | | 0.46% | (b) | | $ | 15,488,081 |
| 2008 | | 2.75% | | 0.12% | | 0.10% | | | 2.79% | | | | 8,605,905 |
| 2007 | | 5.30% | | 0.12% | | 0.10% | | | 5.14% | | | | 6,918,263 |
| 2006 | | 5.09% | | 0.13% | | 0.10% | | | 5.08% | | | | 6,197,117 |
| 2005 | | 3.31% | | 0.14% | | 0.10% | | | 3.33% | | | | 1,639,871 |
| (a) | Results represent past performance and are not indicative of future results. |
| (b) | Results reflect the effect of expense waivers. Without these waivers, net investment income would have been 0.01% lower. |
See Notes to Financial Statements.
| | | | |
| Notes to Financial Statements | | STATE STREET MONEY MARKET PORTFOLIO | | 57 |
Notes to Financial Statements
1. Organization
The State Street Master Funds (the “Trust”) is registered under the Investment Company Act of 1940, as amended (the “1940 Act”), as an open-end management investment company, and was organized as a business trust under the laws of the Commonwealth of Massachusetts on July 27, 1999. The Trust comprises eleven investment portfolios: the State Street Equity 500 Index Portfolio, the State Street Equity 400 Index Portfolio, the State Street Equity 2000 Index Portfolio, the State Street Aggregate Bond Index Portfolio, the State Street Money Market Portfolio, the State Street Tax Free Money Market Portfolio, the State Street Limited Duration Bond Portfolio, the State Street Short-Term Tax Exempt Bond Portfolio, the State Street U.S. Government Money Market Portfolio, the State Street Treasury Money Market Portfolio and the State Street Treasury Plus Money Market Portfolio. At December 31, 2009, only the State Street Equity 500 Index Portfolio, the State Street Money Market Portfolio, the State Street Tax Free Money Market Portfolio, the State Street Short-Term Tax Free Bond Portfolio, the State Street U.S. Government Money Market Portfolio, the State Street Treasury Money Market Portfolio and the State Street Treasury Plus Money Market Portfolio were in operation. Information presented in these financial statements pertains only to the State Street Money Market Portfolio (the “Portfolio”). The Portfolio commenced operations on August 12, 2004. The Portfolio is authorized to issue an unlimited number of non-transferable beneficial interests.
The Portfolio’s investment objective is to seek to maximize current income, to the extent consistent with the preservation of capital and liquidity by investing in dollar denominated securities.
2. Significant Accounting Policies
The following is a summary of the significant accounting policies consistently followed by the Portfolio in the preparation of its financial statements.
SECURITY VALUATION
As permitted under Rule 2a-7 of the 1940 Act and certain conditions therein, securities of the Portfolio are valued initially at cost and thereafter assume a constant amortization to maturity of any discount or premium.
The Portfolio adopted provisions surrounding Fair Value Measurements and Disclosures that define fair value, establish a framework for measuring fair value in generally accepted accounting principles and expand disclosures about fair value measurements. This applies to fair value measurements that are already required or permitted by other accounting standards and is intended to increase consistency of those measurements and applies broadly to securities and other types of assets and liabilities. In accordance with these provisions, fair value is
| | | | |
| 58 | | STATE STREET MONEY MARKET PORTFOLIO | | Notes to Financial Statements |
Notes to Financial Statements (continued)
defined as the price that a Portfolio would receive upon selling an investment in a timely transaction to an independent buyer in the principal or most advantageous market of the investment. Various inputs are used in determining the value of the Portfolio’s investments.
The three tier hierarchy of inputs is summarized below:
| • | | Level 1 – quoted prices in active markets for identical securities |
| • | | Level 2 – other significant observable inputs (including quoted prices for similar securities, interest rates, prepayment speeds, credit risk, etc.) |
| • | | Level 3 – significant unobservable inputs (including a Portfolio’s own assumptions in determining the fair value of investments) |
The inputs or methodology used for valuing securities are not an indication of the risk associated with investing in those securities.
The following is a summary of the inputs used, as of December 31, 2009, in valuing the Portfolio’s assets carried at fair value:
| | | |
| Valuation Inputs | | Investments in
Securities |
| |
Level 1 — Quoted Prices | | $ | – |
Level 2 — Other Significant Observable Inputs | | | 15,483,970,914 |
Level 3 — Significant Unobservable Inputs | | | – |
Total | | $ | 15,483,970,914 |
The type of inputs used to value each security under the provisions surrounding Fair Value Measurement and Disclosures is identified in each Portfolio of Investments, which also includes a breakdown of the Portfolio’s investments by category.
SECURITIES TRANSACTIONS, INVESTMENT INCOME AND EXPENSES
Securities transactions are recorded on a trade date basis for financial statement purposes. Interest income is recorded daily on the accrual basis and includes amortization of premium and accretion of discount on investments. Realized gains and losses from securities transactions are recorded on the basis of identified cost. Expenses are accrued daily.
All of the net investment income and realized gains and losses from the security transactions of the Portfolio are allocated pro rata among the partners in the Portfolio based on each partner’s daily ownership percentage.
FEDERAL INCOME TAXES
The Portfolio is not required to pay federal income taxes on its net investment income and net capital gains because it is treated as partnerships for federal income tax purposes. All interest, gains and losses of the Portfolio are deemed to have been “passed through” to the Portfolio’s partners in proportion to their holdings in the Portfolio,
| | | | |
| Notes to Financial Statements | | STATE STREET MONEY MARKET PORTFOLIO | | 59 |
regardless of whether such items have been distributed by the Portfolio. Each partner is responsible for tax liability based on its distributive share; therefore, no provision has been made for federal income taxes.
The Portfolio has reviewed the tax positions for open years as of December 31, 2009, and determined it does not have a liability for any unrecognized tax expenses. The Portfolio recognizes interest and penalties, if any, related to tax liabilities as income tax expense in the Statement of Operations. As of December 31, 2009, tax years 2006 through 2009 remain subject to examination by the Portfolio’s major tax jurisdictions, which include the United States of America and the Commonwealth of Massachusetts.
At December 31, 2009, the cost of investments for federal income tax purposes was the same as the cost for financial reporting purposes.
REPURCHASE AGREEMENTS
A repurchase agreement customarily obligates the seller at the time it sells securities to a Portfolio to repurchase the securities at a mutually agreed upon price and time which, in the case of the Portfolio’s transactions, is generally within seven days. The total amount received by the Portfolio on repurchase is calculated to exceed the price paid by the Portfolio, reflecting an agreed-upon market rate of interest for the period of time to the settlement date, and is not necessarily related to the interest rate on the underlying securities. The underlying securities are ordinarily United States Government securities, but may consist of other securities in which the Portfolio is permitted to
invest. Repurchase agreements are fully collateralized at all times. The use of repurchase agreements involves certain risks. For example, if the seller of securities under a repurchase agreement defaults on its obligation to repurchase the underlying securities (as a result of its bankruptcy or otherwise) the Portfolio will seek to dispose of such securities; this action could involve costs or delays. In addition, the proceeds of any such disposition may be less than the amount the Portfolio is owed under the repurchase agreement. The Portfolio may enter into repurchase agreements maturing within seven days with domestic dealers, banks and other financial institutions deemed to be creditworthy by SSgA Funds Management, Inc. (“SSgA FM” or the “Adviser”), a subsidiary of State Street Corporation and an affiliate of State Street Bank and Trust Company (“State Street”).
EXPENSE ALLOCATION
Certain expenses are applicable to multiple Portfolios. Expenses directly attributable to a Portfolio are charged to that Portfolio. Expenses of the Trust that are not directly attributed to a Portfolio are allocated among the Portfolios, on the basis of relative net assets, except where a more appropriate allocation of expenses to each of the Portfolios can otherwise be made fairly.
| | | | |
| 60 | | STATE STREET MONEY MARKET PORTFOLIO | | Notes to Financial Statements |
Notes to Financial Statements (continued)
USE OF ESTIMATES
The Portfolio’s financial statements are prepared in accordance with U.S. generally accepted accounting principles, which require the use of management estimates. Actual results could differ from those estimates.
3. Related Party Fees
The Portfolio has entered into investment advisory agreements with the Adviser. The Adviser directs the investments of the Portfolio in accordance with its investment objectives, policies, and limitations. In compensation for the Adviser’s services as investment adviser, the Portfolio pays the Adviser an annual fee of 0.10% of the Portfolio’s average daily net assets. The Adviser contractually agreed to cap the total operating expenses of the Portfolio at 0.10% of the Portfolio’s average daily net assets through April 30, 2009. For the year ended December 31, 2009, SSgA FM reimbursed the Portfolio $589,262 under this agreement.
State Street is the administrator, custodian and transfer agent for the Portfolio. In compensation for State Street’s services as administrator, custodian and transfer agent beginning February 1, 2007, the Trust pays State Street an annual fee, which is accrued daily and payable monthly at the applicable fee rate described below, of the following annual percentages of the Trust’s average aggregate daily net assets, exclusive of the Equity 500 Index Portfolio, during the month as follows:
| | |
| Asset Levels | | Annual percentage of
average aggregate daily net assets |
| |
| First $400 Million | | 0.03% |
| Thereafter | | 0.02% |
| Minimum annual fee per Portfolio | | $150,000 |
Effective August 1, 2009, the annual fees paid by the Trust to State Street for its services as administrator, custodian, and transfer agent for the Portfolios were revised as follows:
| | |
| Asset Levels | | Annual percentage of average
aggregate daily net assets |
| |
| First $400 million | | 0.03% |
| Next $15 billion | | 0.02% |
| Thereafter | | 0.01% |
| Minimum annual per Portfolio | | $150,000 |
4. Trustees’ Fees
The Trust pays each trustee who is not an officer or employee of SSgA FM or State Street $2,500 for each meeting of the Board of Trustees and an additional $500 for each telephonic meeting attended. The Trust also pays each trustee an annual retainer of $30,000. Each trustee is reimbursed for out-of-pocket and travel expenses.
| | | | |
| Notes to Financial Statements | | STATE STREET MONEY MARKET PORTFOLIO | | 61 |
5. Indemnifications
The Trust’s organizational documents provide that its officers and trustees are indemnified against certain liabilities arising out of the performance of their duties to the Trust. In addition, both in some of its principal service contracts and in the normal course of its business, the Trust enters into contracts that provide indemnifications to other parties for certain types of losses or liabilities. The Trust’s maximum exposure under these arrangements in unknown as this could involve future claims against the Trust. Management does not expect any significant claims.
6. Subsequent Events
In accordance with provisions surrounding Subsequent Events adopted by the Portfolio, management has evaluated the possibility of subsequent events existing in the Portfolio’s financial statements through February 23, 2010, the date the financial statements were issued. Management has determined that there are no material events that would require disclosure in the Portfolio’s financial statements through this date.
| | | | |
| 62 | | STATE STREET MONEY MARKET PORTFOLIO | | Report of Independent Registered Public Accounting Firm |
Report of Independent Registered Public Accounting Firm
To the Board of Trustees of State Street Master Funds and Owners of Beneficial Interest of State Street Money Market Portfolio:
We have audited the accompanying statement of assets and liabilities of the State Street Money Market Portfolio (one of the portfolios constituting State Street Master Funds) (the “Portfolio”), including the portfolio of investments, as of December 31, 2009, and the related statement of operations for the year then ended, the statement of changes in net assets for each of the two years in the period then ended and financial highlights for each of the five years in the period then ended. These financial statements and financial highlights are the responsibility of the Portfolio’s management. Our responsibility is to express an opinion on these financial statements and financial highlights based on our audits.
We conducted our audits in accordance with the standards of the Public Company Accounting Oversight Board (United States). Those standards require that we plan and perform the audit to obtain reasonable assurance about whether the financial statements and financial highlights are free of material misstatement. We were not engaged to perform an audit of the Portfolio’s internal control over financial reporting. Our audits included consideration of internal control over financial reporting as a basis for designing audit procedures that are appropriate in the circumstances, but not for the purpose of expressing an opinion on the effectiveness of the Portfolio’s internal control over financial reporting. Accordingly, we express no such opinion. An audit also includes examining, on a test basis, evidence supporting the amounts and disclosures in the financial statements and financial highlights, assessing the accounting principles used and significant estimates made by management, and evaluating the overall financial statement presentation. Our procedures included confirmation of securities owned as of December 31, 2009, by correspondence with the custodian and brokers. We believe that our audits provide a reasonable basis for our opinion.
In our opinion, the financial statements and financial highlights referred to above present fairly, in all material respects, the financial position of State Street Money Market Portfolio of State Street Master Funds at December 31, 2009, the results of its operations for the year then ended, the changes in its net assets for each of the two years in the period then ended, and the financial highlights for each of the five years in the period then ended, in conformity with U.S. generally accepted accounting principles.

Boston, Massachusetts
February 23, 2010
| | | | |
| General Information | | STATE STREET MONEY MARKET PORTFOLIO | | 63 |
General Information December 31, 2009
(Unaudited)
Proxy Voting Policies and Procedures and Record
The Trust has adopted proxy voting procedures relating to portfolio securities held by the Portfolio. A description of the policies and procedures is available (i) without charge, upon request, by calling (877) 521-4083 or (ii) on the website of the Securities Exchange Commission (the “SEC”) at www.sec.gov. Information on how the Portfolio voted proxies relating to portfolio securities during the most recent 12-month period ending June 30 is available by August 31 (i) without charge, upon request, by calling (877) 521-4083 or (ii) on the SEC’s website at www.sec.gov.
Quarterly Portfolio Schedule
The Trust files its complete schedule of portfolio holdings with the SEC for the first and third quarters of its fiscal year (as of March and September of each year) on Form N-Q. The Trust’s Forms N-Q are available on the SEC’s website at www.sec.gov. The Trust’s Forms N-Q may be reviewed and copied at the SEC’s Public Reference Room in Washington, D.C. and information on the operation of the Public Reference Room may be obtained by calling 1-800-SEC-0330. The most recent Form N-Q is available without charge, upon request, by calling (877) 521-4083.
Advisory Agreement Renewal
The Board of Trustees of the Trust met on November 19, 2009 (the “Meeting”) to consider the approval of the investment advisory agreement (the “Advisory Agreement”) for State Street Money Market Portfolio (the “Portfolio”). In preparation for considering the Advisory Agreement, the Trustees had reviewed the renewal materials provided by the investment adviser, which they had requested through independent counsel. In deciding whether to renew the Advisory Agreement, the Trustees considered various factors, including (i) the nature, extent and quality of the services provided by the SSgA Funds Management, Inc. (the “Adviser”) under the Advisory Agreement, (ii) the investment performance of the Portfolio, (iii) the costs to the Adviser of its services and profits realized by the Adviser and its affiliates from their relationship with the Trust, (iv) the extent to which economies of scale would be realized if and as the Trust grows and whether the fee levels in the Advisory Agreements reflect these economies of scale, and (v) any additional benefits to the Adviser from its relationship with the Trust.
In considering the nature, extent and quality of the services provided by the Adviser, the Trustees relied on their prior direct experience as Trustees of the Trust as well as on the materials provided at the Meeting. The Board reviewed the Adviser’s responsibilities under the
| | | | |
| 64 | | STATE STREET MONEY MARKET PORTFOLIO | | General Information |
General Information December 31, 2009
(Unaudited) (continued)
Advisory Agreement and noted the experience and expertise that would be appropriate to expect of an adviser to the Portfolio, which is a money market fund. The Trustees reviewed the background and experience of the Adviser’s senior management, including those individuals responsible for the investment and compliance operations relating to the investments of the Portfolio, and the responsibilities of the latter with respect to the Portfolio. They also considered the resources, operational structures and practices of the Adviser in managing the Portfolio’s investments, in monitoring and securing the Portfolio’s compliance with their investment objectives and policies with respect to their investments and with applicable laws and regulations, and in seeking best execution of portfolio transactions. The Trustees also considered information about the Adviser’s overall investment management business, noting that the Adviser manages assets for a variety of institutional investors and that the Adviser and its affiliates had over $1.74 trillion in assets under management as of September 30, 2009, including over $163 billion managed by the Adviser. They reviewed information regarding State Street’s business continuity and disaster recovery program. Drawing upon the materials provided and their general knowledge of the business of the Adviser, the Trustees determined that the experience, resources and strength of the Adviser in the management of money market products are exceptional. As discussed more fully below, they also determined that the advisory fee for the Portfolio was fair and reasonable and that its performance and expense ratio were acceptable. On the basis of this review, the Trustees determined that the nature and extent of the services provided by the Adviser to the Portfolio were appropriate and had been of good quality.
The Trustees noted that, in view of the investment objectives of the Portfolio and the available data, the investment performance was acceptable. The Trustees noted that materials provided by Lipper Inc. at the Meeting indicated that the Portfolio’s performance had been above average for its Lipper peer group for the reported (five-year, three-year, one-year and year-to-date) periods ending September 30, 2009.
The Trustees considered the profitability to the Adviser and its affiliate, State Street, of the advisory relationships to the Trust. The Trustees had been provided with data regarding the profitability to the Adviser and its affiliated service provider with respect to the Portfolio individually, and on an aggregate basis, for the year ended June 30, 2009, with additional data relating to prior years. Having discussed with representatives of the Adviser the methodologies used in computing the costs that formed the bases of the profitability calculations, they concluded that these methodologies were reasonable and turned to the data provided. After discussion and analysis they concluded that, to the extent that the Adviser’s and State Street’s relationships with the Trust
| | | | |
| General Information | | STATE STREET MONEY MARKET PORTFOLIO | | 65 |
had been profitable to either or both those entities, the profitability was in no case such as to render the advisory fees excessive.
In order better to evaluate the Portfolio’s advisory fees, the Trustees had requested comparative information from Lipper Inc. with respect to fees paid by, and expense ratios of, similar funds. The Trustees found that the Portfolio’s advisory fee and expense ratio were lower than the average for its peer group, while its total expense ratio was generally lower than average; after discussion, they concluded that the data available provided confirmation of the reasonableness of the Adviser’s fees. The Trustees also considered that to help limit expenses of the Portfolio, the Adviser had reduced its advisory fee or otherwise reimbursed expenses for the Portfolio. The Board determined that the Adviser’s fee was fair and reasonable.
In considering whether the Adviser benefits in other ways from its relationship with the Trust, the Trustees also considered whether the Adviser’s affiliates may benefit from the Trust’s relationship with State Street as fund administrator, custodian and transfer agent. They noted that the Adviser utilizes no soft-dollar arrangements in connection with the Portfolio’s brokerage transactions to obtain third-party (non-proprietary research) services. The Trustees concluded that, to the extent that the Adviser or its affiliates derive other benefits from their relationships with the Trust, those benefits are not so significant as to render the Adviser’s fees excessive.
The Board also considered the extent to which economies of scale may be realized by the Portfolio as assets grow and whether the Portfolio’s fee levels reflect such economies of scale, if any, for the benefit of investors. In considering the matter, the Board determined that, to the extent economies of scale were in fact realized, such economies of scale were shared with the Portfolio by virtue of advisory fees of, comparatively low level that subsumed economies of scale in the fee itself. The Trustees also recognized, however, that should sustained, substantial asset growth be realized in the future, it might be necessary to consider additional measures.
On the basis of the foregoing discussions and determinations, without any one factor being dispositive, the Board decided to approve the continuance of the Advisory Agreement.
| | | | |
| 66 | | STATE STREET MONEY MARKET PORTFOLIO | | Trustees and Executive Officers |
Trustees and Executive Officers (unaudited)
The table below includes information about the Trustees and Executive Officers of the State Street Master Funds, including their:
| | • | | business addresses and ages; |
| | • | | principal occupations during the past five years; and |
| | • | | other directorships of publicly traded companies or funds. |
| | | | | | | | | | |
| |
Name, Address, and
Date of Birth (“DOB”) | | Position(s) Held
with Trust | | Term of Office and
Length of Time
Served | | Principal
Occupation During
Past Five Years | | Number of
Funds in
Fund
Complex
Overseen
by Trustee* | | Other
Directorships Held
by Trustee |
| |
| Independent Trustees | | | | | | | | | | |
| |
Michael F. Holland Holland & Company, LLC 375 Park Avenue New York, NY 10152 DOB: 1944 | | Trustee and Chairman of the Board | | Term: Indefinite Elected: 7/99 | | Chairman, Holland & Company L.L.C. (investment adviser) (1995 - present). | | 22 | | Trustee, State Street Institutional Investment Trust; Director, the Holland Series Fund, Inc.; Director, The China Fund, Inc.; Director, The Taiwan Fund, Inc.; and Director, Reaves Utility Income Fund |
| |
William L. Boyan State Street Master Funds P.O. Box 5049 Boston, MA 02206 DOB: 1937 | | Trustee | | Term: Indefinite Elected: 7/99 | | Trustee of Old Mutual South Africa Master Trust (investments) (1995 - present); Chairman emeritus, Children’s Hospital (1984 - present); Director, Boston Plan For Excellence (non- profit) (1994 - present); President and Chief Operations Officer, John Hancock Mutual Life Insurance Company (1959 - 1999). Mr. Boyan retired in 1999. | | 22 | | Trustee, State Street Institutional Investment Trust; Trustee, Old Mutual South Africa Master Trust; and Trustee, Children’s Hospital, Boston, MA. |
| |
| | | | |
| Trustees and Executive Officers | | STATE STREET MONEY MARKET PORTFOLIO | | 67 |
| | | | | | | | | | |
| |
Name, Address, and
Date of Birth (“DOB”) | | Position(s) Held
with Trust | | Term of Office and
Length of Time
Served | | Principal
Occupation During
Past Five Years | | Number of
Funds in
Fund
Complex
Overseen
by Trustee* | | Other
Directorships Held
by Trustee |
| |
Rina K. Spence State Street Master Funds P.O. Box 5049 Boston, MA 02206 DOB: 1948 | | Trustee | | Term: Indefinite Elected: 7/99 | | President of SpenceCare International LLC (1998 - present); Member of the Advisory Board, Ingenium Corp. (technology company) (2001 - present); Chief Executive Officer, IEmily.com (internet company) (2000 - 2001); Chief Executive Officer of Consensus Pharmaceutical, Inc. (1998 - 1999); Founder, President and Chief Executive Officer of Spence Center for Women’s Health (1994 - 1998); Trustee, Eastern Enterprise (utilities) (1988 - 2000). | | 22 | | Trustee, State Street Institutional Investment Trust; Director, Berkshire Life Insurance Company of America 1993-2009; Director, IEmily.com, Inc. 2000-present; and Trustee, National Osteoporosis Foundation 2005-2008 |
| |
Douglas T. Williams State Street Master Funds P.O. Box 5049 Boston, MA 02206 DOB: 1940 | | Trustee | | Term: Indefinite Elected: 7/99 | | Executive Vice President of Chase Manhattan Bank (1987 - 1999). Mr. Williams retired in 1999. | | 22 | | Trustee, State Street Institutional Investment Trust; Treasurer, Nantucket Educational Trust, 2002-2007 |
| |
| | | | |
| 68 | | STATE STREET MONEY MARKET PORTFOLIO | | Trustees and Executive Officers |
Trustees and Executive Officers (unaudited) (continued)
| | | | | | | | | | |
| |
Name, Address, and
Date of Birth (“DOB”) | | Position(s) Held
with Trust | | Term of Office and
Length of Time
Served | | Principal
Occupation
During Past
Five Years | | Number of
Funds in
Fund
Complex
Overseen
by Trustee* | | Other
Directorships
Held by Trustee |
| |
| Interested Trustees(1) | | | | | | | | | | |
| |
James E. Ross SSgA Funds Management, Inc. State Street Financial Center One Lincoln Street Boston, MA 02111-2900 DOB: 1965 | | Trustee President | | Term: Indefinite Elected Trustee: 2/07 Elected President: 4/05 | | President and Chief Executive Officer from January 2006 to Present; Principal Executive Officer since 2005; 2005 to Present, President (2001 to 2005, Principal), SSgA Funds Management, Inc. (investment adviser); March 2006 to Present, Senior Managing Director (2000 to 2006, Principal), State Street Global Advisors. | | 22 | | Trustee, State Street Institutional Investment Trust; and Trustee, Select Sector SPDR® Trust |
| |
| Officers: | | | | | | | | | | |
| |
Gary L. French
State Street Bank and Trust Company
2 Avenue de Lafayette
Boston, MA 02111 DOB: 1951 | | Treasurer | | Term: Indefinite Elected: 5/05 | | Senior Vice President of State Street Bank and Trust Company (2002 – present). | | – | | – |
| |
Ellen M. Needham SSgA Funds Management, Inc. State Street Financial Center One Lincoln Street Boston, MA 02111-2900 DOB: 1967 | | Vice President | | Term: Indefinite Elected: 9/09 | | Principal, SSgA Funds Management, Inc. (investment adviser); July 2007 to Present, Managing Director (June 2006 to July 2007, Vice President; 2000 to June 2006, Principal), State Street Global Advisors. | | – | | – |
| |
| | | | |
| Trustees and Executive Officers | | STATE STREET MONEY MARKET PORTFOLIO | | 69 |
| | | | | | | | | | |
| |
Name, Address, and
Date of Birth (“DOB”) | | Position(s) Held
with Trust | | Term of Office and
Length of Time
Served | | Principal
Occupation
During Past
Five Years | | Number of
Funds in
Fund
Complex
Overseen
by Trustee* | | Other
Directorships
Held by Trustee |
| |
| Officers: (continued) | | | | | | |
| |
Laura F. Healy State Street Bank and Trust Company 2 Avenue de Lafayette Boston, MA 02111 DOB: 1964 | | Assistant Treasurer | | Term: Indefinite Elected: 11/08 | | Vice President of State Street Bank and Trust Company (prior to July 2, 2008, Investors Financial Corporation) since 2002. | | – | | – |
| |
Brian D. O’Sullivan State Street Bank and Trust Company 801 Pennsylvania Avenue Kansas City, MO 64105 DOB: 1975 | | Assistant Treasurer | | Term: Indefinite Elected: 11/08 | | Vice President of State Street Bank and Trust Company (2007 – present) with which he has been affiliated with since 1997. | | | | – |
| |
Peter T. Sattelmair State Street Bank and Trust Company 801 Pennsylvania Avenue Kansas City, MO 64105 DOB: 1977 | | Assistant Treasurer | | Term: Indefinite Elected: 11/08 | | Director of Fund Administration of State Street Bank and Trust Company (2007 – present) with which he has been affiliated with since 1999. | | – | | – |
| |
Julie Piatelli SSgA Funds Management, Inc. State Street Financial Center One Lincoln Street Boston, MA 02111 DOB: 1967 | | Chief Compliance Officer | | Term: Indefinite Elected: 7/07 | | Principal and Senior Compliance and Risk Management Officer, SSgA Funds Management, Inc. (2004-present), Vice President State Street Global Advisors (2004 – present). | | – | | – |
| |
| | | | |
| 70 | | STATE STREET MONEY MARKET PORTFOLIO | | Trustees and Executive Officers |
Trustees and Executive Officers (unaudited) (continued)
| | | | | | | | | | |
| |
Name, Address, and
Date of Birth (“DOB”) | | Position(s) Held
with Trust | | Term of Office and
Length of Time
Served | | Principal
Occupation
During Past
Five Years | | Number of
Funds in
Fund
Complex
Overseen
by Trustee* | | Other
Directorships
Held by Trustee |
| |
| Officers: (continued) | | | | | | |
| |
David James State Street Bank and Trust Company 4 Copley Place 5th Floor Boston, MA 02116 DOB: 1970 | | Secretary | | Term: Indefinite Elected: 11/09 | | Vice President and Managing Counsel, State Street Bank and Trust Company, 2009 to present; Vice President and Counsel, PNC Global Investment Servicing (US), Inc. 2006 to 2009; Assistant Vice President and Counsel, State Street Bank and Trust Company, October 2000 to December 2004 and was retired in 2005. | | – | | – |
| |
Brian C. Poole State Street Bank and Trust Company 4 Copley Place, 5th Floor Boston, MA 02116 DOB: 1971 | | Assistant Secretary | | Term: Indefinite Elected 9/08 | | Vice President and Counsel (2008 – present) and Associate Counsel (2004 – 2007), State Street Bank and Trust Company (formerly Investors Bank and Trust Company. | | – | | – |
| |
| * | The “Fund Complex” consists of eleven series of the Trust and eleven series of State Street Institutional Investment Trust. |
| (1) | Mr. Ross is an Interested Trustee because of his employment by SSgA Funds Management, Inc., an affiliate of the Trust. |
The Statement of Additional Information includes additional information about the Trustees and is available, without charge, upon request, by calling (toll free) 877-521-4083.
| | | | |
| Trustees and Executive Officers | | STATE STREET MONEY MARKET PORTFOLIO | | 71 |
Trustees
Michael F. Holland
William L. Boyan
Rina K. Spence
Douglas T. Williams
James E. Ross
Investment Adviser
SSgA Funds Management, Inc.
State Street Financial Center
One Lincoln Street
Boston, MA 02111
Custodian
State Street Bank and Trust Company
State Street Financial Center
One Lincoln Street
Boston, MA 02111
Administrator
State Street Bank and Trust Company
801 Pennsylvania Avenue
Kansas City, MO 64105
Independent Registered Public Accounting Firm
Ernst & Young LLP
200 Clarendon Street
Boston, MA 02116
Legal Counsel
Ropes & Gray LLP
One International Place
Boston, MA 02110
This report is for shareholder information. This is not a prospectus intended for use in the purchase or sale of shares of beneficial interest.
State Street Money Market Portfolio
State Street Bank and Trust Company
P.O. Box 5049
Boston, MA 02206
| | | | |
| 72 | | STATE STREET MONEY MARKET PORTFOLIO | | How to Contact Us |
How to Contact Us
Telephone
Call 1-800-958-6457 weekdays from 8:00 am to 6:00 pm Eastern time, to speak directly with a courteous, knowledgeable representative. The following prompt choices are available when you dial the number above:
| • | | Financial Center Financial Advisors are available to answer investment questions relating to the AARP Funds. |
| • | | Shareholder Services representatives can handle any account-related questions or transactions. |
| • | | Automated Response System is available 24 hours a day, seven days a week to handle a wide range of account functions (as shown below). |
Financial Center Financial Advisors
| • | | Speak with specially trained representatives to help you identify your goals, determine if you’re on track financially for retirement and decide if an AARP Fund is right for you. |
Shareholder Services representatives or our 24-hour Automated Response System
| • | | Receive general account information and service from our Shareholder Services representatives |
| • | | Initiate an electronic transfer to buy or sell shares |
| • | | Order duplicate statements |
| • | | Check your account balance or share prices |
| • | | Change your address of record (not available via the Automated Response System) |
Mail
AARP Funds
P.O. Box 8035
Boston, MA 02266-8035
Overnight delivery
AARP Funds
c/o BFDS
30 Dan Road
Canton, MA 02021
| • | | Request to buy, sell or exchange shares in writing |
| • | | Change the name on your account |
| • | | Add a seasonal mailing address |
| • | | Add banking information to your account |
| • | | Add or change an Automatic Investment Program |
| • | | Add or change payroll deduction |
Website
www.aarpfinancial.com
| • | | Get a prospectus or fund report |
| • | | Buy, sell or exchange shares |
| • | | View your account balance and share price |
| • | | Change your mailing address |
| • | | Order duplicate statements or copies of your tax forms |
| • | | Get forms to accomplish a variety of tasks |
| | | | |
| How to Contact Us | | AARP FUNDS 2009 SEMI-ANNUAL REPORT | | 73 |
How to Contact Us
Telephone
Call 1-800-958-6457 weekdays from 8:00 am to 6:00 pm Eastern time, to speak directly with a courteous, knowledgeable representative. The following prompt choices are available when you dial the number above:
| • | | Financial Center Financial Advisors are available to answer investment questions relating to the AARP Funds. |
| • | | Shareholder Services representatives can handle any account-related questions or transactions. |
| • | | Automated Response System is available 24 hours a day, seven days a week to handle a wide range of account functions (as shown below). |
Financial Center Financial Advisors
| • | | Speak with specially trained representatives to help you identify your goals, determine if you’re on track financially for retirement and decide if an AARP Fund is right for you. |
Shareholder Services representatives or our 24-hour Automated Response System
| • | | Receive general account information and service from our Shareholder Services representatives |
| • | | Initiate an electronic transfer to buy or sell shares |
| • | | Order duplicate statements |
| • | | Check your account balance or share prices |
| • | | Change your address of record (not available via the Automated Response System) |
Mail
AARP Funds
P.O. Box 8035
Boston, MA 02266-8035
Overnight delivery
AARP Funds
c/o BFDS
30 Dan Road
Canton, MA 02021
| • | | Request to buy, sell or exchange shares in writing |
| • | | Change the name on your account |
| • | | Add a seasonal mailing address |
| • | | Add banking information to your account |
| • | | Add or change an Automatic Investment Program |
| • | | Add or change payroll deduction |
Website
www.aarpfinancial.com
| • | | Get a prospectus or fund report |
| • | | Buy, sell or exchange shares |
| • | | View your account balance and share price |
| • | | Change your mailing address |
| • | | Order duplicate statements or copies of your tax forms |
| • | | Get forms to accomplish a variety of tasks |
AARP Funds
P.O. Box 8035
Boston, MA 02266-8035
1-800-958-6457
www.aarpfinancial.com
©2009 AARP Funds
| | |

| | ARP000830 02/28/11 ARP-SR-001-0210 |
Not applicable.
| Item 3. | Audit Committee Financial Expert |
Not applicable.
| Item 4. | Principal Accountant Fees and Services |
Not applicable.
| Item 5. | Audit Committee of Listed Registrants |
Not applicable.
| Item 6. | Schedule of Investments |
Schedule of Investments is included as a part of the report to shareholders filed under Item 1 of this Form N-CSR.
| Item 7. | Disclosure of Proxy Voting Policies and Procedures for Closed-End Management Investment Companies |
Not applicable.
| Item 8. | Portfolio Managers of Closed-End Management Investment Companies |
Not applicable.
| Item 9. | Purchases of Equity Securities by Closed-End Management Investment Company and Affiliated Purchasers |
Not applicable.
| Item 10. | Submission of Matters to a Vote of Security Holders |
The Board of Trustees has adopted procedures by which shareholders may recommend nominees to the Board. There have been no amendments to such procedures during the reporting period for Form N-CSR.
| Item 11. | Controls and Procedures |
| (a) | The Registrant’s principal executive and principal financial officers have concluded that the Registrant’s disclosure controls and procedures (as defined in Rule 30a-3(c) under the Investment Company Act of 1940, as amended (the “1940 Act”)) are effective, as of a date within 90 days of the filing date of this Form N-CSR based on their evaluation of these controls and procedures required by Rule 30a-3(b) under the 1940 Act and Rules 13a-15(b) or 15d-15(b) under the Securities Exchange Act of 1934. |
| (b) | There were no changes in the Registrant’s internal control over financial reporting (as defined in Rule 30a-3(d) under the 1940 Act) that occurred during the second fiscal quarter of the period covered by this report that has materially affected, or is reasonably likely to materially affect, the Registrant’s internal control over financial reporting. |
| | |
| (a)(1) | | Not applicable. |
| |
| (a)(2) | | The certifications required by Rule 30a-2(a) of the 1940 Act and Section 302 of the Sarbanes-Oxley Act of 2002 (“Sarbanes-Oxley Act”) are attached hereto. (Ex-99.CERT) |
| |
| (a)(3) | | Not applicable. |
| |
| (b) | | The certifications required by Rule 30a-2(b) of the 1940 Act and Section 906 of the Sarbanes-Oxley Act are attached hereto. (Ex-99.906CERT) |
SIGNATURES
Pursuant to the requirements of the Securities Exchange Act of 1934 and the Investment Company Act of 1940, the registrant has duly caused this report to be signed on its behalf by the undersigned, thereunto duly authorized.
| | |
| AARP FUNDS |
| |
| By: | | /S/ RICHARD M. HISEY |
| | Richard M. Hisey |
| | President (principal executive officer) of AARP Funds |
Date: February 26, 2010
Pursuant to the requirements of the Securities Exchange Act of 1934 and the Investment Company Act of 1940, this report has been signed below by the following persons on behalf of the registrant and in the capacities and on the dates indicated.
| | |
| By: | | /S/ RICHARD M. HISEY |
| | Richard M. Hisey |
| | President (principal executive officer) of AARP Funds |
Date: February 26, 2010
| | |
| By: | | /S/ JEFFREY J. GABOURY |
| | Jeffrey J. Gaboury |
| | Treasurer (principal financial officer) of AARP Funds |
Date: February 26, 2010