Exhibit 99.2
2 Forward-Looking Statements This presentation contains “forward-looking statements” within the meaning of the safe harbor provisions of the U.S. Private Securities Litigation Reform Act of 1995. Forward-looking statements include, without limitation, statements concerning plans, estimates, calculations, forecasts and projections with respect to the anticipated future performance of the Company. These statements are often, but not always, identified by words such as “may”, “might”, “should”, “could”, “predict”, “potential”, “believe”, “expect”, “continue”, “will”, “anticipate”, “seek”, “estimate”, “intend”, “plan”, “projection”, “would”, “annualized”, “target” and “outlook”, or the negative version of those words or other comparable words of a future or forward- looking nature. Forward-looking statements are neither historical facts nor assurances of future performance. Instead, they are based only on our current beliefs, expectations and assumptions regarding our business, future plans and strategies, projections, anticipated events and trends, the economy and other future conditions. Because forward-looking statements relate to the future, they are subject to inherent uncertainties, risks and changes in circumstances that are difficult to predict and many of which are outside of our control. Our actual results and financial condition may differ materially from those indicated in the forward-looking statements. Therefore, you should not rely on any of these forward-looking statements. Important factors that could cause our actual results and financial condition to differ materially from those indicated in the forward-looking statements include, among others, the following: the negative effects of the COVID-19 pandemic, including its effects on the economic environment, our clients and our operations, including due to supply chain disruptions, as well as any changes to federal, state or local government laws, regulations or orders in connection with the pandemic; loan concentrations in our portfolio; the overall health of the local and national real estate market; our ability to successfully manage credit risk; business and economic conditions generally and in the financial services industry, nationally and within our market area; our ability to maintain an adequate level of allowance for loan losses; new or revised accounting standards, including as a result of the future implementation of the Current Expected Credit Loss standard; the concentration of large loans to certain borrowers; the concentration of large deposits from certain clients; our ability to successfully manage liquidity risk; our dependence on non-core funding sources and our cost of funds; our ability to raise additional capital to implement our business plan; our ability to implement our growth strategy and manage costs effectively; developments and uncertainty related to the future use and availability of some reference rates, such as the London Interbank Offered Rate, as well as other alternative reference rates; the composition of our senior leadership team and our ability to attract and retain key personnel; the occurrence of fraudulent activity, breaches or failures of our information security controls or cybersecurity-related incidents; interruptions involving our information technology and telecommunications systems or third-party servicers; competition in the financial services industry; the effectiveness of our risk management framework; the commencement and outcome of litigation and other legal proceedings and regulatory actions against us; the impact of recent and future legislative and regulatory changes, including changes to federal and state corporate tax rates; interest rate risk; fluctuations in the values of the securities held in our securities portfolio; the imposition of tariffs or other governmental policies impacting the value of products produced by our commercial borrowers; severe weather, natural disasters, wide spread disease or pandemics (including the COVID-19 pandemic), acts of war or terrorism or other adverse external events; potential impairment to the goodwill we recorded in connection with our past acquisition; changes to U.S. or state tax laws, regulations and guidance, including recent proposals to increase the federal corporate tax rate; and any other risks described in the “Risk Factors” sections of reports filed by the Company with the Securities and Exchange Commission. Any forward-looking statement made by us in this press release is based only on information currently available to us and speaks only as of the date on which it is made. We undertake no obligation to publicly update any forward-looking statement, whether written or oral, that may be made from time to time, whether as a result of new information, future developments or otherwise. Certain of the information contained in this presentation is derived from information provided by industry sources. Although we believe that such information is accurate and that the sources from which it has been obtained are reliable, we cannot guarantee the accuracy of, and have not independently verified, such information. Use of Non-GAAP financial measures In addition to the results presented in accordance with U.S. General Accepted Accounting Principles (“GAAP”), the Company routinely supplements its evaluation with an analysis of certain non-GAAP financial measures. The Company believes these non-GAAP financial measures, in addition to the related GAAP measures, provide meaningful information to investors to help them understand the Company’s operating performance and trends, and to facilitate comparisons with the performance of peers. These disclosures should not be viewed as a substitute for operating results determined in accordance with GAAP, nor are they necessarily comparable to non-GAAP performance measures that may be presented by other companies. Reconciliations of non-GAAP disclosures to the comparable GAAP measures are provided in this presentation. Disclaimer |
1 Represents a Non-GAAP financial measure. See Appendix for Non-GAAP reconciliation 3 $0.40 Reported • Gross loan balances up $117.8 million, or 18.0% annualized from 2Q21 (25.9% ex. PPP) • Deposit balances up $133.3 million, or 19.4% annualized from 2Q21 • Cash build of $97.3 million, primarily due to 3Q21 sub debt and preferred stock offerings Diluted EPS Efficiency Ratio1 Return on Avg. Tangible Common Equity1 Return on Average Assets • Adjusted efficiency ratio1 of 41.5%, in-line with 2Q21 • Total revenue of $30.1 million, up 7.9% from 2Q21, driven by $2.4 million of net interest income growth • Noninterest expense up $1.8 million, or 15.3% from 2Q21 (adjusted noninterest expense1 up 10.3%) • Annualized net charge-offs to average loans of 0.00% • Growth-driven provision of $1.3 million, bringing allowance to total loans to 1.46% (ex. PPP) • Nonperforming assets to total assets of 0.02%, in-line with 2Q21 • Completed $30 million subordinated debt and $69 million preferred stock offerings • Tangible common equity ratio1 of 8.81%, down 29 bps from 2Q21 • Total risk-based capital ratio of 15.93%, up 244 bps from 2Q21 Robust Balance Sheet Growth Continues Highly Efficient Operating Performance Superb Asset Quality Enhanced Capital Position 3Q21 Earnings Highlights PPNR Return on Average Assets1 $0.41 Adjusted1 1.37% 2.09% 15.47% 41.5% Adjusted1 |
PPNR ROA1 4 Strong Profitability and Revenue Generation Strong PPNR Trends 1 Represents a Non-GAAP financial measure. See Appendix for Non-GAAP reconciliation Dollars in thousands Consistent Revenue Growth $21,679 $24,841 $25,395 $26,288 $28,673 $1,157 $986 $1,008 $1,603 $1,410 $22,836 $25,827 $26,403 $27,891 $30,083 3Q20 4Q20 1Q21 2Q21 3Q21 $13,200 $16,298 $15,598 $15,852 $17,533 $7,174 $4,979 $10,671 $10,993 $11,509 1.94% 2.30% 2.15% 2.07% 2.09% 1.05% 0.70% 1.47% 1.43% 1.37% 3Q20 4Q20 1Q21 2Q21 3Q21 Net Income PPNR1 ROA Noninterest Income Net Interest Income |
$19,308 $21,230 $22,869 $23,498 $25,433 $1,173 $2,097 $1,864 $1,767 $1,753 $1,198 $1,514 $1,202 $1,023 $1,487 $21,679 $24,841 $25,935 $26,288 $28,673 3.28% 3.61% 3.60% 3.52% 3.54% 3.14% 3.29% 3.34% 3.31% 3.22% 3Q20 4Q20 1Q21 2Q21 3Q21 Core Net Interest Margin1,2 Net Interest Margin1 5 1 Amounts calculated on a tax-equivalent basis using statutory federal tax rate of 21% 2 Excludes loan fees and PPP loan balances, interest and fees; represents a Non-GAAP financial measure, see Appendix for Non-GAAP reconciliation 3 Impact of average cash balances from subordinated debt and preferred stock issuances in 3Q21 4 Cash excluding average balances from subordinated debt and preferred stock issuances in 3Q21 Dollars in thousands • 32.3% YoY growth in net interest income • Net interest income (ex. interest income on loan fees and PPP loans) increased 8.2% from 2Q21, despite a 9 bp decline in core net interest margin • Estimated $1.9 million of PPP fees yet to be recognized Net Interest Income Momentum Continues With Robust Loan Growth Net Interest Income (ex. interest income on loan fees and PPP loans) Net Interest Margin Drivers 9 bp decline in core NIM2 primarily due to 6 bp impact of excess cash from 3Q21 capital offerings Interest Income on PPP loans Interest Income on loan fees Net Interest Income and Net Interest Margin 3 4 |
$2,207 $2,301 $2,390 $2,534 $2,655 4.73% 4.89% 4.74% 4.56% 4.65% 4.69% 4.59% 4.50% 4.37% 4.28% 3Q20 4Q20 1Q21 2Q21 3Q21 $1,597 $1,687 $1,836 $1,898 $2,039 1.21% 0.96% 0.81% 0.74% 0.66% 3Q20 4Q20 1Q21 2Q21 3Q21 Loan Yield (ex. Loan Fees and PPP)2 6 1 Excludes loan fees and PPP 2 Represents a Non-GAAP financial measure. See Appendix for Non-GAAP reconciliation Dollars in millions Spot Rate 2.54% Spot Rate 4.17%1 Spot Rate 0.58% Spot Rate 0.56% Steady Investment in Securities Portfolio Market-Related Loan Yield Pressure as Balances Grow Improving Deposit Mix Resulting in Lower Deposit Costs Lower Overall Funding Costs Net Interest Income Components $339 $371 $383 $391 $386 2.68% 2.70% 2.76% 2.55% 2.56% 3Q20 4Q20 1Q21 2Q21 3Q21 $1,597 $1,688 $1,836 $1,898 $2,039 $615 $654 $676 $732 $784 $215 $188 $138 $141 $145 $2,427 $2,530 $2,650 $2,771 $2,968 1.12% 0.92% 0.77% 0.70% 0.65% 3Q20 4Q20 1Q21 2Q21 3Q21 Average Interest-Bearing Deposits Average Noninterest-Bearing Deposits Average Borrowings Cost of Liability Funding Average Investments Investment Yield Average Loans Loan Yield Average Interest-Bearing Deposits Cost of Interest-Bearing Deposits |
$6,550 $6,216 $7,102 $7,512 $8,309 $894 $979 $1,055 $980 $942 $652 $690 $753 $849 $923 $1,576 $1,760 $2,013 $2,136 $2,480 $5,613 $582 $9,672 $15,258 $10,923 $11,477 $13,236 3Q20 4Q20 1Q21 2Q21 3Q21 1.40% 1.34% 1.49% 1.48% 1.49% 0.02% 0.82% 0.02% 0.02% 0.09% 1.42% 2.16% 1.51% 1.50% 1.58% 42.3% 59.0% 41.2% 42.0% 43.9% 41.7% 36.6% 40.7% 41.5% 41.5% 3Q20 4Q20 1Q21 2Q21 3Q21 Adjusted NIE / Avg. Assets2 Adjusted Efficiency Ratio2 Adjustment Factors / Avg. Assets2 Efficiency Ratio2 7 Adjusted Efficiency Ratio Consistently in the Low 40% Range Continued Investments to Support Balance Sheet Growth 1 2Q21 median efficiency ratio for publicly-traded banks with total assets between $1 billion and $10 billion (Source: S&P Global Market Intelligence) 2 Represents a Non-GAAP financial measure. See Appendix for Non-GAAP reconciliation 3 Includes FHLB advance prepayment fees in 4Q20 and debt extinguishment costs related to accelerated sub debt redemption in 3Q21 Dollars in thousands Efficiency Ratio Among Lowest in Industry Industry median efficiency ratio of 60%1 Increase in 3Q21 personnel expenses driven by impact of strategic new hires to support growth Occupancy Personnel Other Technology Non-Core Items3 |
Dollars in millions 8 • 27.9% YoY loan growth, excluding PPP loans • 3Q21 gross loans grew $162.7 million, or 25.9% annualized, excluding PPP loans • Expect near-term annualized loan growth (ex. PPP) in the high teen percent range • Strong brand and service model in the Twin Cities market • M&A-related market disruption resulting in client and banker acquisition opportunities • Expansion of talented lending teams • PPP-related client acquisition opportunities Robust Loan Growth Continues $2,077 $2,188 $2,263 $2,495 $2,658 $182 $138 $163 $99 $54 $2,259 $2,326 $2,426 $2,594 $2,712 3Q20 4Q20 1Q21 2Q21 3Q21 BWB Loan Growth Catalysts PPP Loans Gross Loans (ex. PPP) |
9 Dollars in millions • Despite payoffs and paydowns of $164 million and a net PPP balance reduction of $45 million in 3Q21, gross loan portfolio grew $118 million from 2Q21 • Loan pipeline remains strong and diversified among various asset classes A Proven Loan Growth Engine Down 8% compared to 2Q21 Up 31% compared to 2Q21 Decrease Increase Total |
CRE NOO 29.0% Multifamily 31.9% C&D 9.5% 1-4 Family 10.7% CRE OO 3.8% C&I 12.9% PPP 2.0% Consumer & Other 0.2% 10 Dollars in millions Loan Portfolio Composition Loan Mix by Type $2.71 Billion 3Q21 Loan Growth by Type (vs. 2Q21) Well-Diversified Loan Portfolio • 3Q21 loan growth across all commercial portfolios, led by multifamily • Multifamily continues to be a key growth portfolio due to segment expertise and lower risk characteristics • 59% fixed rate, 22% variable rate, and 19% adjustable rate • Loan modifications of $35 million at September 30, 2021, or 1.3% of gross loans (ex. PPP) $(45) $(1) $6 $13 $14 $28 $29 $75 Multifamily C&I CRE Nonowner Occupied CRE Owner Occupied 1-4 Family Construction & Development Consumer & Other PPP |
$686 $672 $713 $758 $846 $322 $366 $433 $432 $489 $498 $658 $792 $761 $792 $364 $354 $345 $322 $310 $403 $452 $356 $447 $417 $2,273 $2,502 $2,639 $2,721 $2,854 3Q20 4Q20 1Q21 2Q21 3Q21 11 • 23.4% YoY growth in noninterest- bearing deposits • Robust deposit inflows reflect both successful new client and banker acquisition initiatives and pandemic- related accumulation of liquidity by existing clients • Core deposits1 were 83% of total deposits (up from 77% at 3Q20) • Cost of total deposits of 0.48%, down from 0.54% in 2Q21 • $146 million in time deposits maturing over the next five quarters at a blended cost of 1.46% • Expect deposit growth to continue to fund loan growth going forward 1 Total deposits less brokered deposits and certificates of deposit greater than $250,000 Dollars in millions Interest-Bearing Transaction Noninterest-Bearing Transaction Time Savings & Money Market Brokered Deposit Growth Keeping Pace With Loan Growth |
$16,074 $15,164 $6,739 $7,195 $7,742 4.95% 4.54% 1.94% 1.99% 1.93% 3Q20 4Q20 1Q21 2Q21 3Q21 $2 $440 $(46) $(4) $(10) 0.00% 0.08% (0.01)% 0.00% 0.00% 3Q20 4Q20 1Q21 2Q21 3Q21 $433 $775 $770 $761 $734 0.02% 0.03% 0.03% 0.02% 0.02% 3Q20 4Q20 1Q21 2Q21 3Q21 $31,381 $34,841 $35,987 $37,591 $38,901 1.51% 1.59% 1.59% 1.50% 1.46% 1.39% 1.50% 1.48% 1.45% 1.43% 3Q20 4Q20 1Q21 2Q21 3Q21 12 Asset Quality Classified Assets Nonperforming Assets1 Allowance for Loan Losses Net Charge-Offs Superb Asset Quality Despite COVID Impact 2020 increase due to two COVID-related relationships Consistently low NPA levels Current reserves at appropriate levels Cumulative NCOs of $632K since 2017 ¹ Nonaccrual loans, loans 90 days past due and foreclosed assets Dollars in thousands Classified Assets % of Bank Tier 1 Capital + ALLL NPAs % of Assets ALLL % of Gross Loans % of Gross Loans (ex. PPP) Net Charge-offs % of Average Loans (annualized) |
C&I, 37.2% CRE NOO Hotels, 23.3% CRE NOO - Senior Housing, 15.8% CRE NOO Retail, 13.4% CRE OO, 2.4% CRE NOO Other, 6.9% 1-4 Family, 1.0% C&I 15.5% CRE NOO Retail 46.4% CRE NOO Office 8.1% CRE OO 10.9% C&D 1.7% 1-4 Family 17.4% $8 Million 13 Investor Real Estate Secured: CRE Nonowner Occupied (“NOO”) Watch List By Loan Type Classified List By Loan Type $67 Million Dollars in thousands Watch List Characteristics Loan Balance Outstanding $67,377 % of Total Loans, Gross 2.5% Number of Loans 31 Average Loan Size $2,173 Classified List Characteristics Loan Balance Outstanding $7,742 % of Total Loans, Gross 0.3% Number of Loans 18 Average Loan Size $430 % of Bank Tier 1 Capital + ALLL 1.93% Classified Assets Remain at Modest Levels Majority of Watch and Classified loans are pandemic-related Only 4 hotel relationships as of September 30, 2021; with 2 on Watch |
16.8% 18.4% 19.2% 15.4% 17.5% 15.5% 19.8% 22.3% 25.9% 24.4% $894 $1,121 $1,273 $1,305 $1,418 3Q20 4Q20 1Q21 2Q21 3Q21 9.83% 9.28% 9.11% 9.08% 10.70% 11.03% 10.35% 10.34% 9.67% 9.47% 15.45% 14.58% 14.46% 13.49% 15.93% 3Q20 4Q20 1Q21 2Q21 3Q21 14 Dollars in millions On & Off-Balance Sheet Liquidity as % of Total Assets Solid Capital and Liquidity Position • Completed private placement of $30.0M of 3.25% Fixed-to-Floating Rate Subordinated Notes • Completed public offering of $69.0M of 5.875% Non-Cumulative Perpetual Preferred Stock • Repurchased $11.3M of $25.0M of 5.875% Fixed-to-Floating Rate Subordinated Notes issued in 2017 • Repurchased 126,507 shares of common stock ($2.0M) at a weighted average price of $16.11 • $12.5M remaining under the current share repurchase program Focus on utilizing capital to support strong loan growth Investment portfolio completely unencumbered at September 30, 2021 Off-Balance Sheet Liquidity as a % of Assets On-Balance Sheet Liquidity as a % of Assets Total Risk-Based Capital Ratio Common Equity Tier 1 Capital Ratio Tier 1 Leverage Ratio 3Q21 Capital Actions Consolidated Capital Ratios |
$262 $262 $276 $288 $298 9.46% 8.96% 8.99% 9.10% 8.81% 3Q20 4Q20 1Q21 2Q21 3Q21 Tangible Common Equity to Tangible Assets1 $4.53 $5.40 $7.22 $8.33 $9.31 $10.62 2016 2017 2018 2019 2020 3Q21 15 Strong Capital and Liquidity Tangible Book Value Per Share1 Tangible Common Equity 1 Represents a Non-GAAP financial measure. See Appendix for Non-GAAP reconciliation Dollars in millions, except per share data Growing Tangible Book Value Tangible Common Equity1 |
Investor Highlights Investor Highlights Pre-eminent real estate bank in the Twin Cities market with a focus on multifamily lending Operational strategy focused on generating consistently profitable organic growth Superior profitability driven by a highly efficient business model Very experienced and deep group of managers and business producers Primary operations in the growing Twin Cities market, with ample opportunities from bank M&A disruption Proactive risk management approach resulting in continued strong asset quality, despite the pandemic An unconventional culture that is attracting and retaining top talent 1 2 3 4 5 6 7 Core Values Unconventional Responsive Dedicated Growth Accuracy 16 |
18 This presentation includes certain non-GAAP financial measures intended to supplement, not substitute for, comparable GAAP measures. Reconciliations of these non-GAAP financial measures are provided below. The Company believes these non-GAAP financial measures provide useful information to both management and investors to analyze and evaluate the Company’s financial performance. Because not all companies use the same calculations for these measures, the information in this presentation may not be comparable to other similarly titled measures as calculated by other companies. Dollars in thousands Reconciliation of Non-GAAP Financial Measures - Annual Tangible Common Equity & Tangible Common Equity/Tangible Assets 2016 2017 2018 2019 2020 Common Equity 115,366 $ 137,162 $ 220,998 $ 244,794 $ 265,405 $ Less: Intangible Assets (4,060) (3,869) (3,678) (3,487) (3,296) Tangible Common Equity 111,306 $ 133,293 $ 217,320 $ 241,307 $ 262,109 $ Total Assets 1,260,394 $ 1,616,612 $ 1,973,741 $ 2,268,830 $ 2,927,345 $ Less: Intangible Assets (4,060) (3,869) (3,678) (3,487) (3,296) Tangible Assets 1,256,334 $ 1,612,743 $ 1,970,063 $ 2,265,343 $ 2,924,049 $ Tangible Common Equity/Tangible Assets 8.86% 8.26% 11.03% 10.65% 8.96% Tangible Book Value Per Share 2016 2017 2018 2019 2020 Book Value Per Common Share 4.69 $ 5.56 $ 7.34 $ 8.45 $ 9.43 $ Less: Effects of Intangible Assets (0.17) (0.16) (0.12) (0.12) (0.12) Tangible Book Value Per Common Share 4.53 $ 5.40 $ 7.22 $ 8.33 $ 9.31 $ Total Common Shares 24,589,861 24,679,861 30,097,274 28,973,572 28,143,493 As of and for the year ended December 31, |
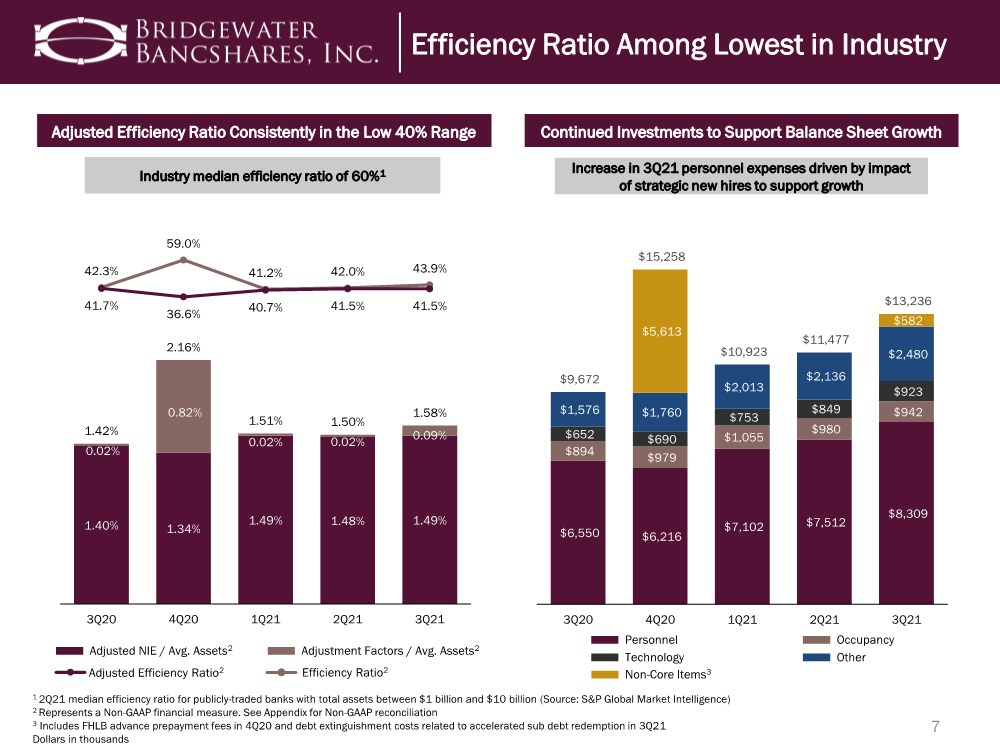
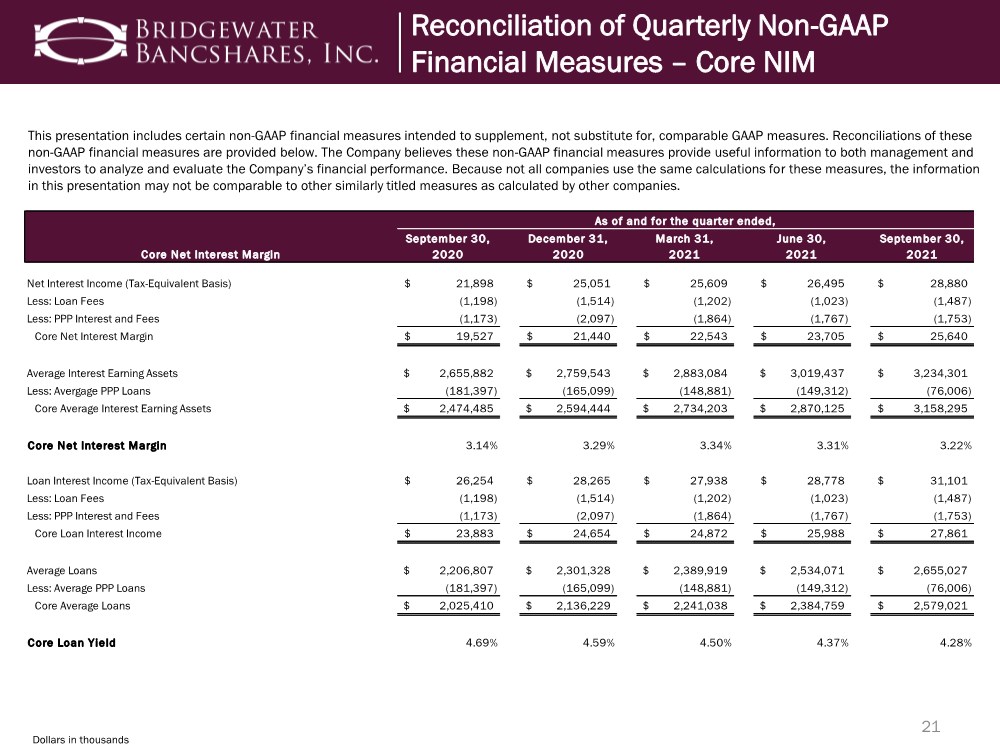
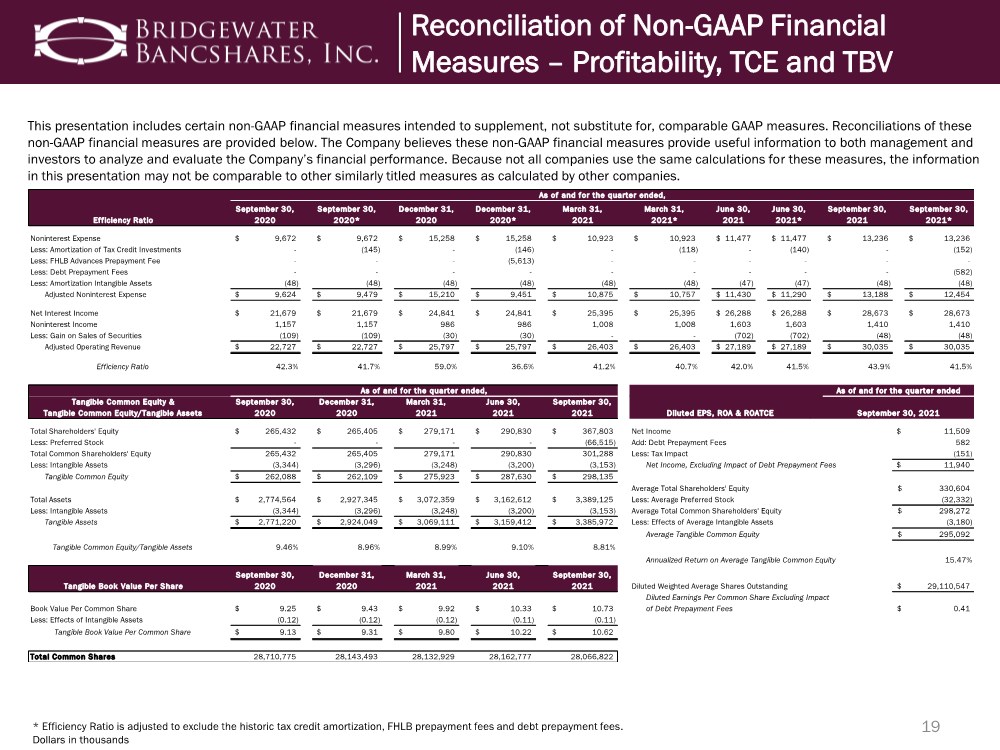
19 This presentation includes certain non-GAAP financial measures intended to supplement, not substitute for, comparable GAAP measures. Reconciliations of these non-GAAP financial measures are provided below. The Company believes these non-GAAP financial measures provide useful information to both management and investors to analyze and evaluate the Company’s financial performance. Because not all companies use the same calculations for these measures, the information in this presentation may not be comparable to other similarly titled measures as calculated by other companies. * Efficiency Ratio is adjusted to exclude the historic tax credit amortization, FHLB prepayment fees and debt prepayment fees. Dollars in thousands Reconciliation of Non-GAAP Financial Measures – Profitability, TCE and TBV Efficiency Ratio September 30, 2020 September 30, 2020* December 31, 2020 December 31, 2020* March 31, 2021 March 31, 2021* June 30, 2021 June 30, 2021* September 30, 2021 September 30, 2021* Noninterest Expense 9,672 $ 9,672 $ 15,258 $ 15,258 $ 10,923 $ 10,923 $ 11,477 $ 11,477 $ 13,236 $ 13,236 $ Less: Amortization of Tax Credit Investments - (145) - (146) - (118) - (140) - (152) Less: FHLB Advances Prepayment Fee - - - (5,613) - - - - - - Less: Debt Prepayment Fees - - - - - - - - - (582) Less: Amortization Intangible Assets (48) (48) (48) (48) (48) (48) (47) (47) (48) (48) Adjusted Noninterest Expense 9,624 $ 9,479 $ 15,210 $ 9,451 $ 10,875 $ 10,757 $ 11,430 $ 11,290 $ 13,188 $ 12,454 $ Net Interest Income 21,679 $ 21,679 $ 24,841 $ 24,841 $ 25,395 $ 25,395 $ 26,288 $ 26,288 $ 28,673 $ 28,673 $ Noninterest Income 1,157 1,157 986 986 1,008 1,008 1,603 1,603 1,410 1,410 Less: Gain on Sales of Securities (109) (109) (30) (30) - - (702) (702) (48) (48) Adjusted Operating Revenue 22,727 $ 22,727 $ 25,797 $ 25,797 $ 26,403 $ 26,403 $ 27,189 $ 27,189 $ 30,035 $ 30,035 $ Efficiency Ratio 42.3% 41.7% 59.0% 36.6% 41.2% 40.7% 42.0% 41.5% 43.9% 41.5% Tangible Common Equity & Tangible Common Equity/Tangible Assets September 30, 2020 December 31, 2020 March 31, 2021 June 30, 2021 September 30, 2021 Total Shareholders' Equity 265,432 $ 265,405 $ 279,171 $ 290,830 $ 367,803 $ Net Income Less: Preferred Stock - - - - (66,515) Add: Debt Prepayment Fees Total Common Shareholders' Equity 265,432 265,405 279,171 290,830 301,288 Less: Tax Impact Less: Intangible Assets (3,344) (3,296) (3,248) (3,200) (3,153) Net Income, Excluding Impact of Debt Prepayment Fees Tangible Common Equity 262,088 $ 262,109 $ 275,923 $ 287,630 $ 298,135 $ Average Total Shareholders' Equity Total Assets 2,774,564 $ 2,927,345 $ 3,072,359 $ 3,162,612 $ 3,389,125 $ Less: Average Preferred Stock Less: Intangible Assets (3,344) (3,296) (3,248) (3,200) (3,153) Average Total Common Shareholders' Equity Tangible Assets 2,771,220 $ 2,924,049 $ 3,069,111 $ 3,159,412 $ 3,385,972 $ Less: Effects of Average Intangible Assets Average Tangible Common Equity Tangible Common Equity/Tangible Assets 9.46% 8.96% 8.99% 9.10% 8.81% Annualized Return on Average Tangiible Common Equity Tangible Book Value Per Share September 30, 2020 December 31, 2020 March 31, 2021 June 30, 2021 September 30, 2021 Diluted Weighted Average Shares Outstanding Diluted Earnings Per Common Share Excluding Impact Book Value Per Common Share 9.25 $ 9.43 $ 9.92 $ 10.33 $ 10.73 $ of Debt Prepayment Fees Less: Effects of Intangible Assets (0.12) (0.12) (0.12) (0.11) (0.11) Tangible Book Value Per Common Share 9.13 $ 9.31 $ 9.80 $ 10.22 $ 10.62 $ Total Common Shares 28,710,775 28,143,493 28,132,929 28,162,777 28,066,822 (32,332) (3,180) 15.47% As of and for the quarter ended, As of and for the quarter ended, As of and for the quarter ended September 30, 2021 Diluted EPS, ROA & ROATCE 295,092 $ 29,110,547 $ 11,509 $ 582 (151) 11,940 $ 330,604 $ 298,272 $ 0.41 $ |
20 This presentation includes certain non-GAAP financial measures intended to supplement, not substitute for, comparable GAAP measures. Reconciliations of these non-GAAP financial measures are provided below. The Company believes these non-GAAP financial measures provide useful information to both management and investors to analyze and evaluate the Company’s financial performance. Because not all companies use the same calculations for these measures, the information in this presentation may not be comparable to other similarly titled measures as calculated by other companies. Dollars in thousands Reconciliation of Non-GAAP Financial Measures – PPNR Pre-Provision Net Revenue September 30, 2020 December 31, 2020 March 31, 2021 June 30, 2021 September 30, 2021 Noninterest Income 1,157 $ 986 $ 1,008 $ 1,603 $ 1,410 $ Less: Gain on sales on Securities (109) (30) - (702) (48) Total Operating Noninterest Income 1,048 956 1,008 901 1,362 Plus: Net Interest Income 21,679 24,841 25,395 26,288 28,673 Net Operating Revenue 22,727 25,797 26,403 27,189 30,035 Noninterest Expense 9,672 $ 15,258 $ 10,923 $ 11,477 $ 13,236 $ Less: Amortization of Tax Credit Investments (145) (146) (118) (140) (152) Less: FHLB Advances Prepayment Fees - (5,613) - - - Less: Debt Prepayment Fee - - - - (582) Total Operating Noninterest Expense 9,527 9,499 10,805 11,337 12,502 Pre-Provision Net Revenue 13,200 $ 16,298 $ 15,598 $ 15,852 $ 17,533 $ Plus: Non-Operating Revenue Adjustments 109 30 - 702 48 Less: Provision for Loan Losses 3,750 3,900 1,100 1,600 1,300 Non-Operating Expense Adjustments 145 5,759 118 140 734 Provision for Income Taxes 2,240 1,690 3,709 3,821 4,038 Net Income 7,174 $ 4,979 $ 10,671 $ 10,993 $ 11,509 $ Average Assets 2,711,755 $ 2,816,032 $ 2,940,262 $ 3,076,712 $ 3,332,301 $ Pre-Provision Net Revenue Return on Average Assets 1.94% 2.30% 2.15% 2.07% 2.09% |
21 This presentation includes certain non-GAAP financial measures intended to supplement, not substitute for, comparable GAAP measures. Reconciliations of these non-GAAP financial measures are provided below. The Company believes these non-GAAP financial measures provide useful information to both management and investors to analyze and evaluate the Company’s financial performance. Because not all companies use the same calculations for these measures, the information in this presentation may not be comparable to other similarly titled measures as calculated by other companies. Dollars in thousands Reconciliation of Quarterly Non-GAAP Financial Measures – Core NIM Core Net Interest Margin September 30, 2020 December 31, 2020 March 31, 2021 June 30, 2021 September 30, 2021 Net Interest Income (Tax-Equivalent Basis) 21,898 $ 25,051 $ 25,609 $ 26,495 $ 28,880 $ Less: Loan Fees (1,198) (1,514) (1,202) (1,023) (1,487) Less: PPP Interest and Fees (1,173) (2,097) (1,864) (1,767) (1,753) Core Net Interest Margin 19,527 $ 21,440 $ 22,543 $ 23,705 $ 25,640 $ Average Interest Earning Assets 2,655,882 $ 2,759,543 $ 2,883,084 $ 3,019,437 $ 3,234,301 $ Less: Avergage PPP Loans (181,397) (165,099) (148,881) (149,312) (76,006) Core Average Interest Earning Assets 2,474,485 $ 2,594,444 $ 2,734,203 $ 2,870,125 $ 3,158,295 $ Core Net Interest Margin 3.14% 3.29% 3.34% 3.31% 3.22% Loan Interest Income (Tax-Equivalent Basis) 26,254 $ 28,265 $ 27,938 $ 28,778 $ 31,101 $ Less: Loan Fees (1,198) (1,514) (1,202) (1,023) (1,487) Less: PPP Interest and Fees (1,173) (2,097) (1,864) (1,767) (1,753) Core Loan Interest Income 23,883 $ 24,654 $ 24,872 $ 25,988 $ 27,861 $ Average Loans 2,206,807 $ 2,301,328 $ 2,389,919 $ 2,534,071 $ 2,655,027 $ Less: Average PPP Loans (181,397) (165,099) (148,881) (149,312) (76,006) Core Average Loans 2,025,410 $ 2,136,229 $ 2,241,038 $ 2,384,759 $ 2,579,021 $ Core Loan Yield 4.69% 4.59% 4.50% 4.37% 4.28% As of and for the quarter ended, |
Existing Client 57.7% New Client 42.3% 22 New vs. Existing Client PPP Origination Summary as of 9/30/2021 Number of Loans Principal Balance Origination Fees Round 1 1,200 $ 181,600 $ 5,706 Round 2 651 78,386 3,544 Total 1,851 $ 259,986 $ 9,250 Dollars in thousands PPP Outstanding Summary As of and for the Three Months Ended 9/30/2021 Program Lifetime # of Loans Principal Balance Net Fees Earned Unrecognized Fees Net Fees Generated Net Fees Earned Round 1 72 $ 6,715 $ 294 $ 82 $ 5,706 $ 5,624 Round 2 301 47,475 1,271 1,775 3,544 1,769 Total 373 $ 54,190 $1,565 $ 1,857 $ 9,250 $ 7,393 PPP Loans |
23 Dollars in thousands Loan Portfolio – Repricing Composition Variable/Adjustable Loans vs. Rate Floors Fixed/Adjustable Years to Maturity/Repricing Loan Portfolio Repricing Fixed, 59.4% Variable, 22.1% Adjustable, 18.5% 80% 72% 64% 78% 70% 85% 20% 28% 36% 22% 30% 15% $321,274 $207,347 $297,471 $281,800 $375,987 $634,501 Less Than 1 Year 1 to 2 Years 2 to 3 Years 3 to 4 Years 4 to 5 Years 5+ Years Adjustable Fixed Index Rate At Floor 0 to -25 bps -26 to -50 bps -51 to -75 bps -76 to -100 bps > -100 bps Total PRIME 334,757 $ 24,587 $ 8,509 $ 16 $ 115 $ 62 $ 368,047 $ Libor 141,560 $ 12,351 $ - $ - $ 10,798 $ - $ 164,709 $ SOFR 2,274 $ - $ - $ - $ - $ - $ 2,274 $ 2 Yr FHLB 9,694 $ - $ - $ - $ - $ - $ 9,694 $ 3 Yr FHLB 85,932 $ - $ - $ - $ - $ - $ 85,932 $ 5 Yr FHLB 73,834 $ - $ - $ - $ - $ - $ 73,834 $ 90 Day T-Bill 10,000 $ - $ - $ - $ - $ - $ 10,000 $ 1 Yr CMT 3,743 $ - $ - $ - $ - $ - $ 3,743 $ 2 Yr CMT 116 $ - $ 8,455 $ - $ - $ - $ 8,571 $ 3 Yr CMT 74,820 $ 3,629 $ 2,358 $ 767 $ 8,843 $ 10,804 $ 101,220 $ 5 Yr CMT 164,511 $ 1,188 $ 2,303 $ 5,401 $ 1,635 $ 11,438 $ 186,475 $ Total 901,240 $ 41,755 $ 21,624 $ 6,184 $ 21,392 $ 22,303 $ 1,014,499 $ |
24 1 Rate indicated assumes renewal into like term at market rates as of October 12, 2021 Dollars in thousands Time Deposit Maturities Time Deposit Repricing Deposit Repricing Opportunities $146 million in time deposits maturing over the next five quarters at a blended cost of 1.46% $23,450 $17,566 $19,576 $22,059 $5,120 $29,183 $11,450 $13,888 $2,946 $699 $52,633 $29,016 $33,464 $25,005 $5,819 4Q21 1Q22 2Q22 3Q22 4Q22 Wholesale Time Deposit Maturities Retail Time Deposit Maturities Maturity Dates Balance Weighted Avg. Yield Implied Repricing Rate1 % of Total Portfolio Oct-21 27,360 $ 1.51% 0.61% 5.20% Nov-21 10,637 1.37% 0.47% 2.02% Dec-21 14,636 1.62% 0.50% 2.78% Jan-22 11,906 1.24% 0.36% 2.26% Feb-22 11,359 1.68% 0.64% 2.16% Mar-22 5,751 1.31% 0.39% 1.09% Apr-22 12,418 1.96% 0.56% 2.36% May-22 10,844 1.58% 0.46% 2.06% Jun-22 10,202 1.71% 0.56% 1.94% Jul-22 9,045 0.76% 0.31% 1.72% Aug-22 7,941 1.10% 0.54% 1.51% Sep-22 8,019 0.75% 0.35% 1.52% Oct-22 1,442 2.37% 0.60% 0.27% Nov-22 2,001 1.59% 0.55% 0.38% Dec-22 2,376 2.26% 0.54% 0.45% Total 145,937 $ 1.46% 0.50% 27.75% |
Dollars in thousands 25 Investor Real Estate Secured: CRE Nonowner Occupied (“NOO”) Portfolio Characteristics – CRE NOO Loan Balance Outstanding $786,271 % of Total Loans, Gross 29.0% Number of Loans 375 Average Loan Size $2,097 Loan-to-Value (Weighted Average) 61.1% 5 Year Net Charge-Offs (%) 0.01% By Property Type Office 26.6% Retail 21.4% Industrial 26.6% Senior Housing 9.5% Hotels 2.6% Restaurant 3.2% Other 10.1% $786 Million 77% 4-6 Month Risk Rating Number of Loans 3Q21 Total Pass 360 $ 742,074 Watch 10 39,979 Classified 5 4,218 Total 375 $ 786,271 Investor Real Estate Secured – CRE Nonowner Occupied (NOO) |
Dollars in thousands 26 Portfolio Characteristics – CRE NOO Office Loan Balance Outstanding $209,329 % of Total Loans, Gross 7.7% Number of Loans 98 Average Loan Size $2,136 Loan-to-Value (Weighted Average) 63.0% Investor Real Estate Secured: CRE NOO Retail 0-50k Sq Ft, 42.8% 50k - 125k Sq Ft, 20.5% 125k - 200k Sq Ft, 20.1% 200k+ Sq Ft, 16.6% $209 Million Risk Rating Number of Loans 3Q21 Total Pass 96 $ 208,705 Watch -- Classified 2 624 Total 98 $ 209,329 Investor Real Estate Secured – CRE NOO Office By Property Square Footage |
Dollars in thousands 27 Portfolio Characteristics – CRE NOO Retail Loan Balance Outstanding $168,380 % of Total Loans, Gross 6.2% Number of Loans 99 Average Loan Size $1,701 Loan-to-Value (Weighted Average) 62.2% Investor Real Estate Secured: CRE NOO Retail 0-25k Sq Ft, 47.8% 25k - 75k Sq Ft, 28.9% 75k - 125k Sq Ft, 12.1% 125k+ Sq Ft, 11.2% $168 Million Risk Rating Number of Loans 3Q21 Total Pass 92 $ 155,756 Watch 4 9,030 Classified 3 3,594 Total 99 $ 168,380 Investor Real Estate Secured – CRE NOO Retail By Property Square Footage |
Dollars in thousands 28 Portfolio Characteristics – CRE NOO Industrial Loan Balance Outstanding $208,981 % of Total Loans, Gross 7.7% Number of Loans 78 Average Loan Size $2,679 Loan-to-Value (Weighted Average) 59.0% Investor Real Estate Secured: CRE NOO Retail 0-50k Sq Ft, 21.0% 50k - 125k Sq Ft, 37.7% 125k+ Sq Ft, 41.3% $209 Million Risk Rating Number of Loans 3Q21 Total Pass 78 $ 208,981 Watch -- Classified -- Total 78 $ 208,981 Investor Real Estate Secured – CRE NOO Industrial By Property Square Footage |
29 1 Based on state of primary real property collateral if available, otherwise borrower address is used Dollars in thousands Investor Real Estate Secured: CRE NOO Hotels Portfolio Characteristics – CRE NOO Hotels Loan Balance Outstanding $20,138 % of Total Loans, Gross 0.7% Number of Loans 6 Average Loan Size $3,356 Loan-to-Value (Weighted Average) 72.3% Twin Cities MSA 82.4% MN 17.6% $20 Million 4-6 Month 100% Risk Rating Number of Loans 3Q21 Total Pass 3 $ 4,451 Watch 3 15,687 Classified -- Total 6 $ 20,138 Investor Real Estate Secured – CRE NOO Hotels By Geography1 |
30 Portfolio Characteristics – CRE NOO Restaurants Loan Balance Outstanding $25,433 % of Total Loans, Gross 0.9% Number of Loans 18 Average Loan Size $1,413 Loan-to-Value (Weighted Average) 61.7% Investor Real Estate Secured: CRE NOO Restaurant Full-Service 53.1% Quick-Service 26.8% Tap Rooms 9.3% Coffee Shops & Bakeries 10.8% $25 Million 96% 4-6 Month Risk Rating Number of Loans 3Q21 Total Pass 18 $ 25,433 Watch -- Classified -- Total 18 $ 25,433 Dollars in thousands Investor Real Estate Secured – CRE NOO Restaurants By Restaurant Type |
5-19 Units 14.6% 20-49 Units 26.5% 50-99 Units 30.4% 100+ Units 28.5% $865 Million 31 Portfolio Characteristics – Multifamily Loan Balance Outstanding $865,172 % of Total Loans, Gross 31.9% Number of Loans 353 Average Loan Size $2,451 Loan-to-Value (Weighted Average) 63.8% 5 Year Net Charge-Offs (%) 0.00% Investor Real Estate Secured: CRE NOO Restaurant 44% 56% 7-12 Month Risk Rating Number of Loans 3Q21 Total Pass 353 $ 865,172 Watch -- Classified -- Total 353 $ 865,172 Dollars in thousands Investor Real Estate Secured – Multifamily By Unit Type |
Twin Cities MSA 98.0% MN 1.1% Other States 0.9% Residential 23.6% Multifamily 39.6% CRE Other 12.3% Land 24.5% $257 Million 32 By Property Type By Geography1 Land Portfolio Composition Investor Real Estate Secured: CRE NOO Restaurant Portfolio Characteristics – C&D Loan Balance Outstanding $257,167 % of Total Loans, Gross 9.5% % Utilization of Commitments 38.1% Number of Loans 343 Average Loan Size $750 Loan-to-Value (Weighted Average) 60.7% 5 Year Net Charge-Offs (%) 0.00% Finished Lots, 31.5% Developed Land, 49.4% Undeveloped Land, 19.1% $63 Million 1 Based on state of primary real property collateral if available, otherwise borrower address is used Dollars in thousands Investor Real Estate Secured – Construction and Development $257 Million |
33 Investor Real Estate Secured: CRE Nonowner Occupied (“NOO”) Portfolio Characteristics – CRE OO Loan Balance Outstanding $101,834 % of Total Loans, Gross 3.8% Number of Loans 150 Average Loan Size $679 Loan-to-Value (Weighted Average) 60.2% 5 Year Net Charge-Offs (%) (0.01)% Office 33.8% Retail 10.4% Industrial 42.0% Restaurant 2.9% Senior Housing 0.9% Other 10.0% $102 Million 4-6 Month Risk Rating Number of Loans 3Q21 Total Pass 144 $ 99,396 Watch 2 1,597 Classified 4 841 Total 150 $ 101,834 Dollars in thousands Real Estate Secured – CRE Owner Occupied By Property Type |
Real Estate and Rental and Leasing, 38.2% Construction, 15.1% Manufacturing, 14.8% Finance & Insurance, 11.2% Other, 6.4% Professional Services, 5.1% Wholesale/Retail Trade, 4.2% Accomodation & Food Services, 5.0% $350 Million 34 1 Distribution by North American Industry Classification System (NAICS). Any industries included in Other category are individually < 3% of total portfolio Dollars in thousands Portfolio Characteristics – C&I Loan Balance Outstanding $350,081 % of Total Loans, Gross 12.9% Number of Loans 761 Average Loan Size $460 Number of Relationships 478 5 Year Net Charge-Offs (%) 0.03% 4-6 Month Risk Rating Number of Loans 3Q21 Total Pass 740 $ 323,787 Watch 17 25,091 Classified 4 1,203 Total 761 $ 350,081 Commercial and Industrial By Industry1 |