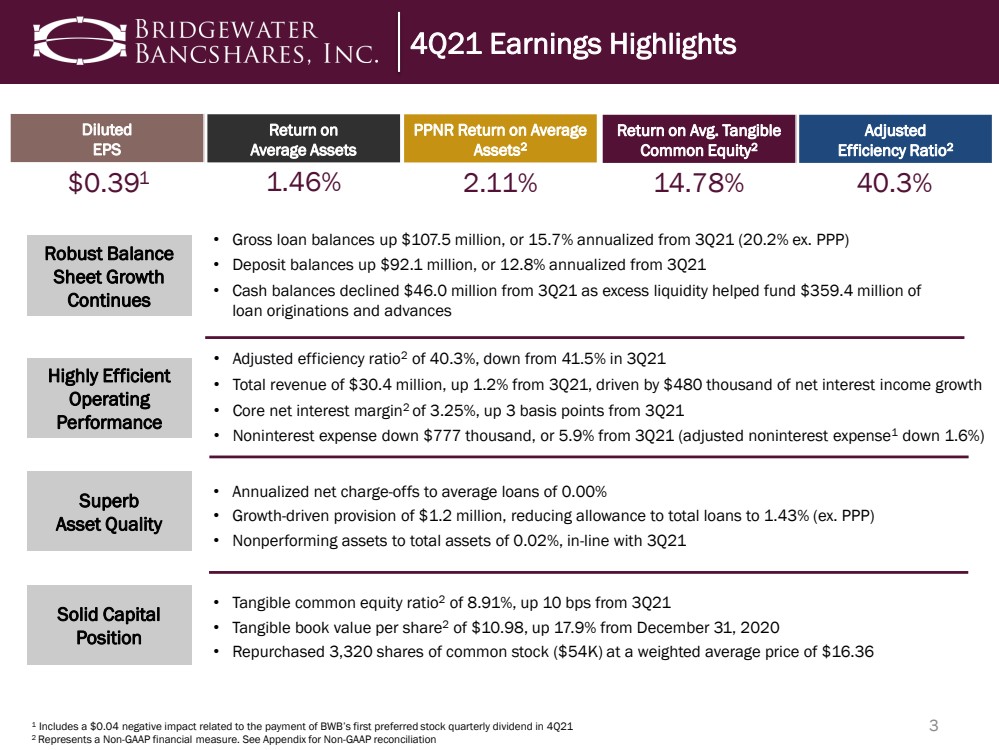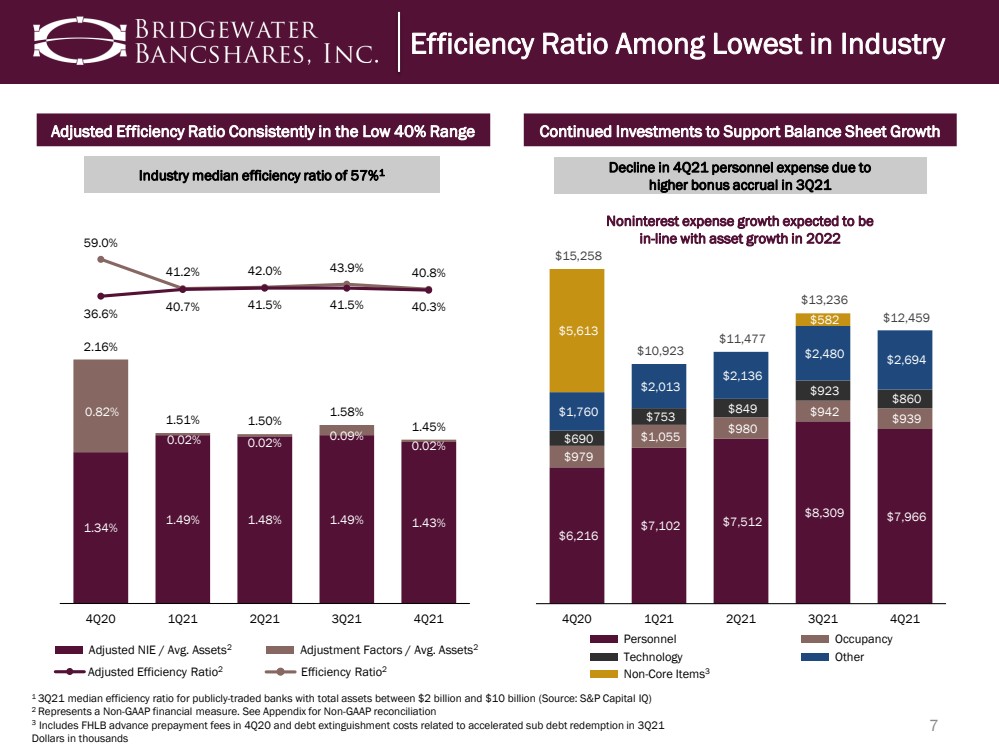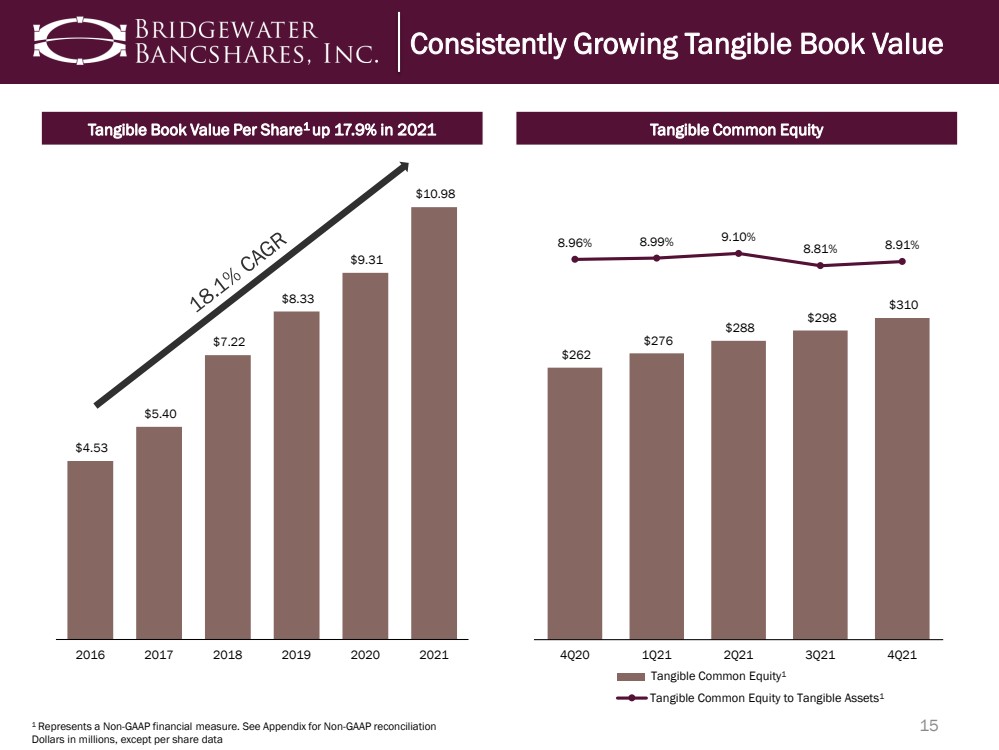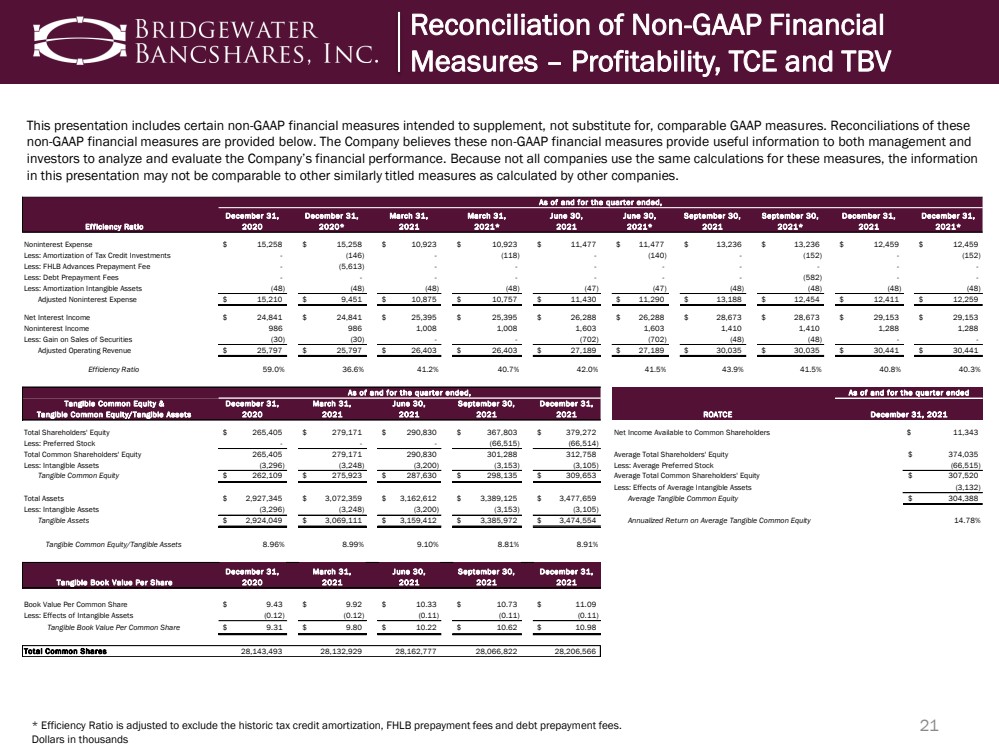
| 21 This presentation includes certain non - GAAP financial measures intended to supplement, not substitute for, comparable GAAP measu res. Reconciliations of these non - GAAP financial measures are provided below. The Company believes these non - GAAP financial measures provide useful informatio n to both management and investors to analyze and evaluate the Company’s financial performance. Because not all companies use the same calculations fo r t hese measures, the information in this presentation may not be comparable to other similarly titled measures as calculated by other companies. * Efficiency Ratio is adjusted to exclude the historic tax credit amortization, FHLB prepayment fees and debt prepayment fees .. Dollars in thousands Reconciliation of Non - GAAP Financial Measures – Profitability, TCE and TBV Efficiency Ratio December 31, 2020 December 31, 2020* March 31, 2021 March 31, 2021* June 30, 2021 June 30, 2021* September 30, 2021 September 30, 2021* December 31, 2021 December 31, 2021* Noninterest Expense 15,258 $ 15,258 $ 10,923 $ 10,923 $ 11,477 $ 11,477 $ 13,236 $ 13,236 $ 12,459 $ 12,459 $ Less: Amortization of Tax Credit Investments - (146) - (118) - (140) - (152) - (152) Less: FHLB Advances Prepayment Fee - (5,613) - - - - - - - - Less: Debt Prepayment Fees - - - - - - - (582) - - Less: Amortization Intangible Assets (48) (48) (48) (48) (47) (47) (48) (48) (48) (48) Adjusted Noninterest Expense 15,210 $ 9,451 $ 10,875 $ 10,757 $ 11,430 $ 11,290 $ 13,188 $ 12,454 $ 12,411 $ 12,259 $ Net Interest Income 24,841 $ 24,841 $ 25,395 $ 25,395 $ 26,288 $ 26,288 $ 28,673 $ 28,673 $ 29,153 $ 29,153 $ Noninterest Income 986 986 1,008 1,008 1,603 1,603 1,410 1,410 1,288 1,288 Less: Gain on Sales of Securities (30) (30) - - (702) (702) (48) (48) - - Adjusted Operating Revenue 25,797 $ 25,797 $ 26,403 $ 26,403 $ 27,189 $ 27,189 $ 30,035 $ 30,035 $ 30,441 $ 30,441 $ Efficiency Ratio 59.0% 36.6% 41.2% 40.7% 42.0% 41.5% 43.9% 41.5% 40.8% 40.3% Tangible Common Equity & Tangible Common Equity/Tangible Assets December 31, 2020 March 31, 2021 June 30, 2021 September 30, 2021 December 31, 2021 Total Shareholders' Equity 265,405 $ 279,171 $ 290,830 $ 367,803 $ 379,272 $ Net Income Available to Common Shareholders Less: Preferred Stock - - - (66,515) (66,514) Total Common Shareholders' Equity 265,405 279,171 290,830 301,288 312,758 Average Total Shareholders' Equity Less: Intangible Assets (3,296) (3,248) (3,200) (3,153) (3,105) Less: Average Preferred Stock Tangible Common Equity 262,109 $ 275,923 $ 287,630 $ 298,135 $ 309,653 $ Average Total Common Shareholders' Equity Less: Effects of Average Intangible Assets Total Assets 2,927,345 $ 3,072,359 $ 3,162,612 $ 3,389,125 $ 3,477,659 $ Average Tangible Common Equity Less: Intangible Assets (3,296) (3,248) (3,200) (3,153) (3,105) Tangible Assets 2,924,049 $ 3,069,111 $ 3,159,412 $ 3,385,972 $ 3,474,554 $ Annualized Return on Average Tangible Common Equity Tangible Common Equity/Tangible Assets 8.96% 8.99% 9.10% 8.81% 8.91% Tangible Book Value Per Share December 31, 2020 March 31, 2021 June 30, 2021 September 30, 2021 December 31, 2021 Book Value Per Common Share 9.43 $ 9.92 $ 10.33 $ 10.73 $ 11.09 $ Less: Effects of Intangible Assets (0.12) (0.12) (0.11) (0.11) (0.11) Tangible Book Value Per Common Share 9.31 $ 9.80 $ 10.22 $ 10.62 $ 10.98 $ Total Common Shares 28,143,493 28,132,929 28,162,777 28,066,822 28,206,566 11,343 $ 374,035 $ 307,520 $ (66,515) (3,132) 14.78% 304,388 $ As of and for the quarter ended, As of and for the quarter ended, As of and for the quarter ended December 31, 2021 ROATCE |