 Investor Information November 9, 2016
 2 Safe Harbor Statement This presentation includes “forward looking statements” within the meaning of the Private Securities Litigation Reform Act of 1995. We intend such forward-looking statements to be covered by the Safe Harbor Provision and are including this statement for the purpose of such Safe Harbor Provision of the Private Securities Litigation Reform Act of 1995. Such forward-looking statements include, but are not limited to, statements concerning future business, revenue and earnings. They often include words such as “believe,” “expect,” “anticipate,” “estimate,” and “intend” or future or conditional verbs, such as “will,” “would,” “should,” “could,” or “may”. These statements are not historical facts or guarantees of future performance, events or results. There are risks, uncertainties and other factors that could cause the actual results of the Company to differ materially from the results expressed or implied by such forward-looking statements. Information on factors that could affect the Company’s business and results is discussed in the Company’s periodic reports filed with the Securities and Exchange Commission. Forward looking statements speak only as of the date they are made. The Company undertakes no obligation to publicly update or revise forward looking information, whether as a result of new, updated information, future events or otherwise.
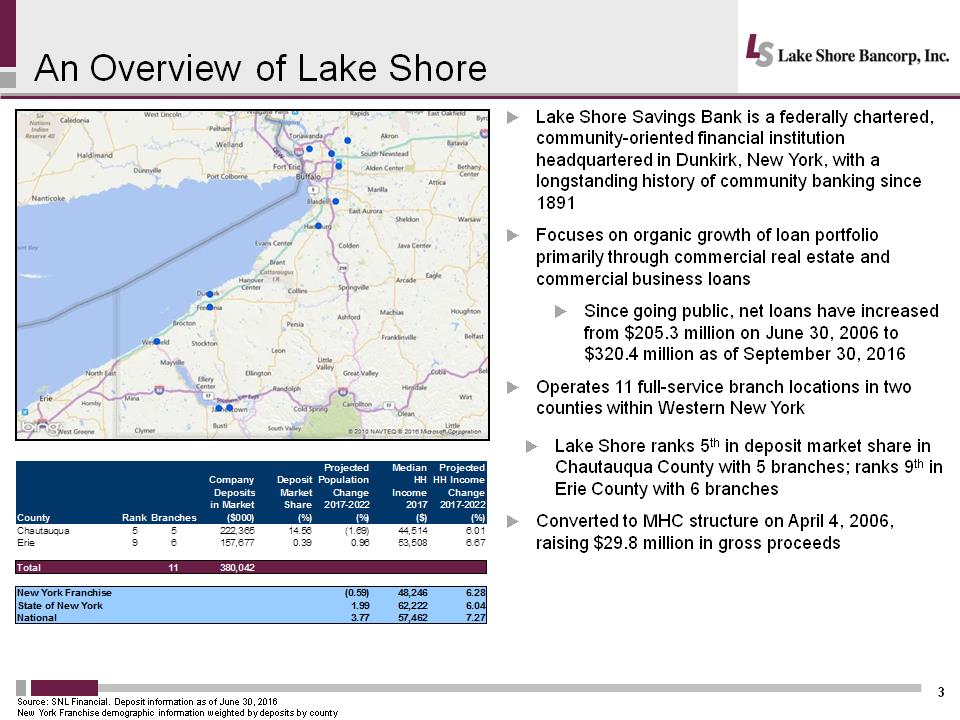 An Overview of Lake Shore 3 .Lake Shore Savings Bank is a federally chartered, community-oriented financial institution headquartered in Dunkirk, New York, with a longstanding history of community banking since 1891 .Focuses on organic growth of loan portfolio primarily through commercial real estate and commercial business loans .Since going public, net loans have increased from $205.3 million on June 30, 2006 to $320.4 million as of September 30, 2016 .Operates 11 full-service branch locations in two counties within Western New York .Lake Shore ranks 5th in deposit market share in Chautauqua County with 5 branches; ranks 9th in Erie County with 6 branches .Converted to MHC structure on April 4, 2006, raising $29.8 million in gross proceeds Source: SNL Financial. Deposit information as of June 30, 2016 New York Franchise demographic information weighted by deposits by county http://www.oritani.com/images/map_locations.gifhttp://www.oritani.com/images/map_locations.gifCountyRankBranchesCompanyDepositsin Market($000)DepositMarketShare(%)ProjectedPopulationChange2017-2022(%)MedianHHIncome2017($)ProjectedHH IncomeChange2017-2022(%)Chautauqua55222,36514.56(1.69)44,5146.01Erie96157,6770.390.9653,5086.67Total11380,042New York Franchise(0.59)48,2466.28State of New York1.9962,2226.04National3.7757,4627.27https://maps.snl.com/arcgisoutput/Utilities/PrintingTools_GPServer/_ags_5648a30321784a39a89ed894a10948f2.jpg
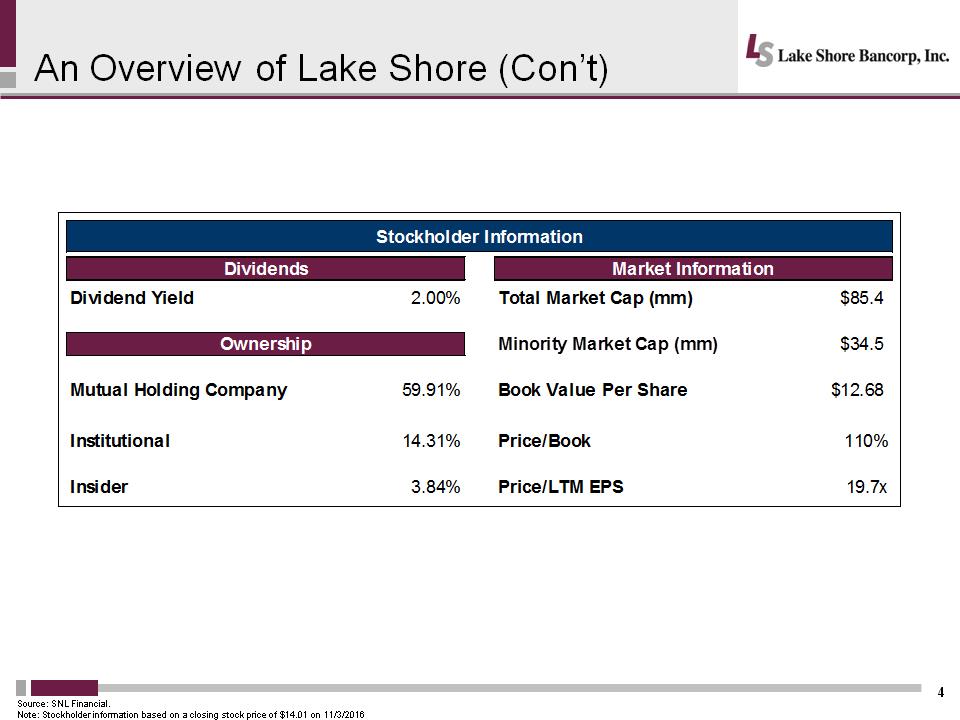 An Overview of Lake Shore (Con’t) 4 Source: SNL Financial. Note: Stockholder information based on a closing stock price of $14.01 on 11/3/2016 Stockholder InformationDividendsMarket InformationDividend Yield2.00%Total Market Cap (mm)$85.4OwnershipMinority Market Cap (mm)$34.5Mutual Holding Company59.91%Book Value Per Share$12.68Institutional14.31%Price/Book110%Insider3.84%Price/LTM EPS19.7x
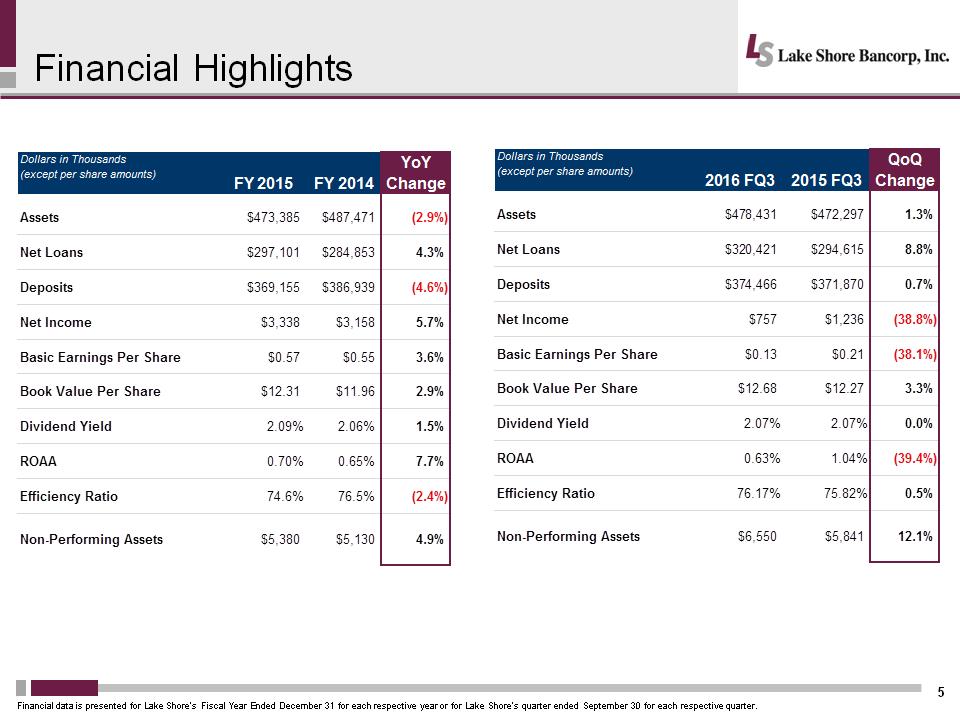 Financial Highlights 5 Financial data is presented for Lake Shore’s Fiscal Year Ended December 31 for each respective year or for Lake Shore’s quarter ended September 30 for each respective quarter. Dollars in Thousands(except per share amounts)2016 FQ32015 FQ3QoQ ChangeAssets$478,431$472,2971.3%Net Loans$320,421$294,6158.8%Deposits$374,466$371,8700.7%Net Income$757$1,236(38.8%)Basic Earnings Per Share $0.13$0.21(38.1%)Book Value Per Share$12.68$12.273.3%Dividend Yield2.07%2.07%0.0%ROAA0.63%1.04%(39.4%)Efficiency Ratio76.17%75.82%0.5%Non-Performing Assets$6,550$5,84112.1%Dollars in Thousands(except per share amounts)FY 2015FY 2014YoY ChangeAssets$473,385$487,471(2.9%)Net Loans$297,101$284,8534.3%Deposits$369,155$386,939(4.6%)Net Income$3,338$3,1585.7%Basic Earnings Per Share $0.57$0.553.6%Book Value Per Share$12.31$11.962.9%Dividend Yield2.09%2.06%1.5%ROAA0.70%0.65%7.7%Efficiency Ratio74.6%76.5%(2.4%)Non-Performing Assets$5,380$5,1304.9%
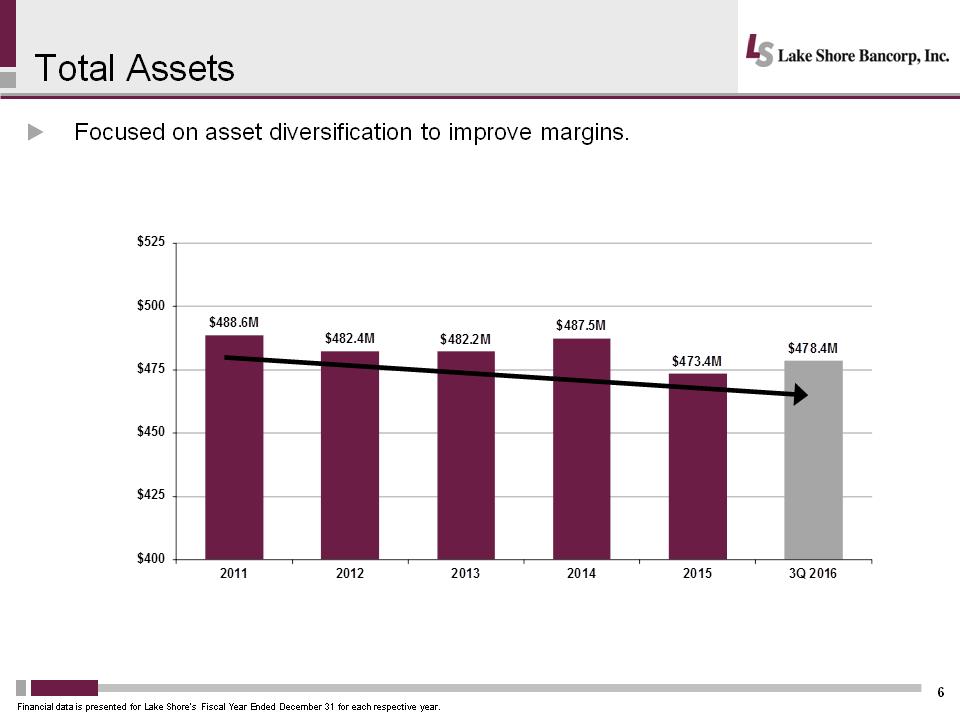 $488.6M$482.4M$482.2M$487.5M$473.4M$478.4M$400$425$450$475$500$525201120122013201420153Q 2016Total Assets 6 .Focused on asset diversification to improve margins. Financial data is presented for Lake Shore’s Fiscal Year Ended December 31 for each respective year.
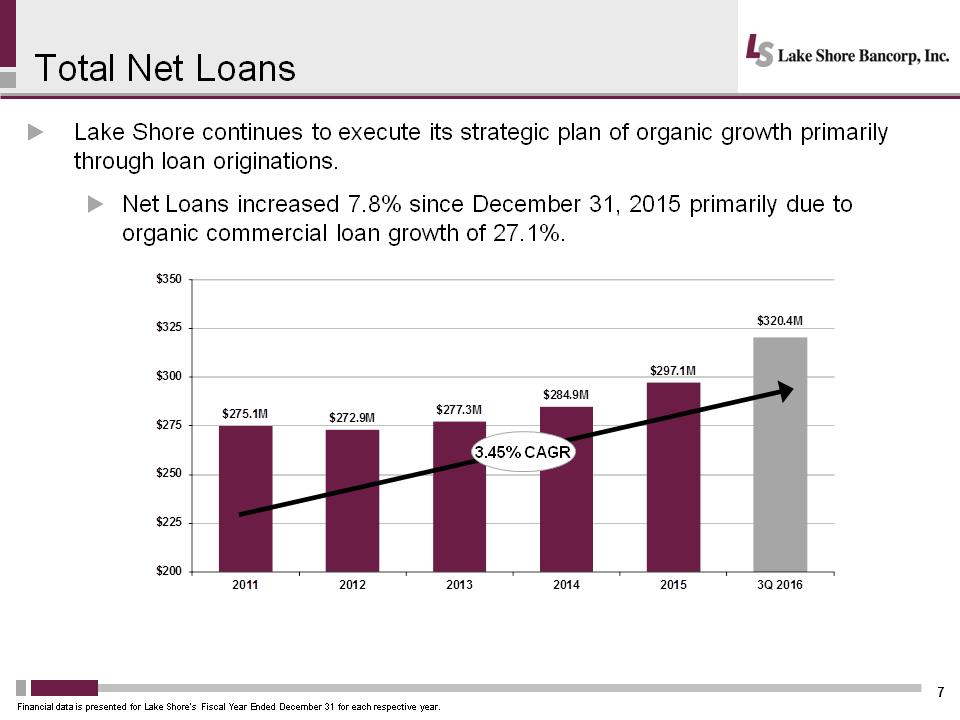 $275.1M$272.9M$277.3M$284.9M$297.1M$320.4M$200$225$250$275$300$325$350201120122013201420153Q 2016Total Net Loans 7 .Lake Shore continues to execute its strategic plan of organic growth primarily through loan originations. .Net Loans increased 7.8% since December 31, 2015 primarily due to organic commercial loan growth of 27.1%. Financial data is presented for Lake Shore’s Fiscal Year Ended December 31 for each respective year. 3.45% CAGR
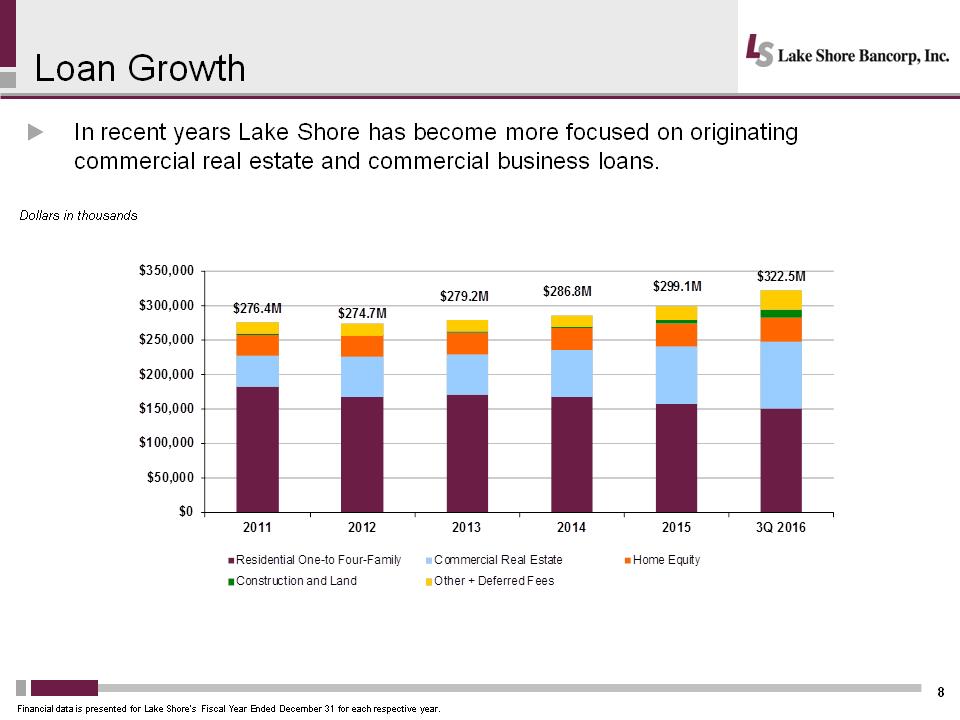 $276.4M$274.7M$279.2M$286.8M$299.1M$322.5M$0$50,000$100,000$150,000$200,000$250,000$300,000$350,000201120122013201420153Q 2016Residential One-to Four-FamilyCommercial Real EstateHome EquityConstruction and LandOther + Deferred FeesLoan Growth 8 .In recent years Lake Shore has become more focused on originating commercial real estate and commercial business loans. Dollars in thousands Financial data is presented for Lake Shore’s Fiscal Year Ended December 31 for each respective year.
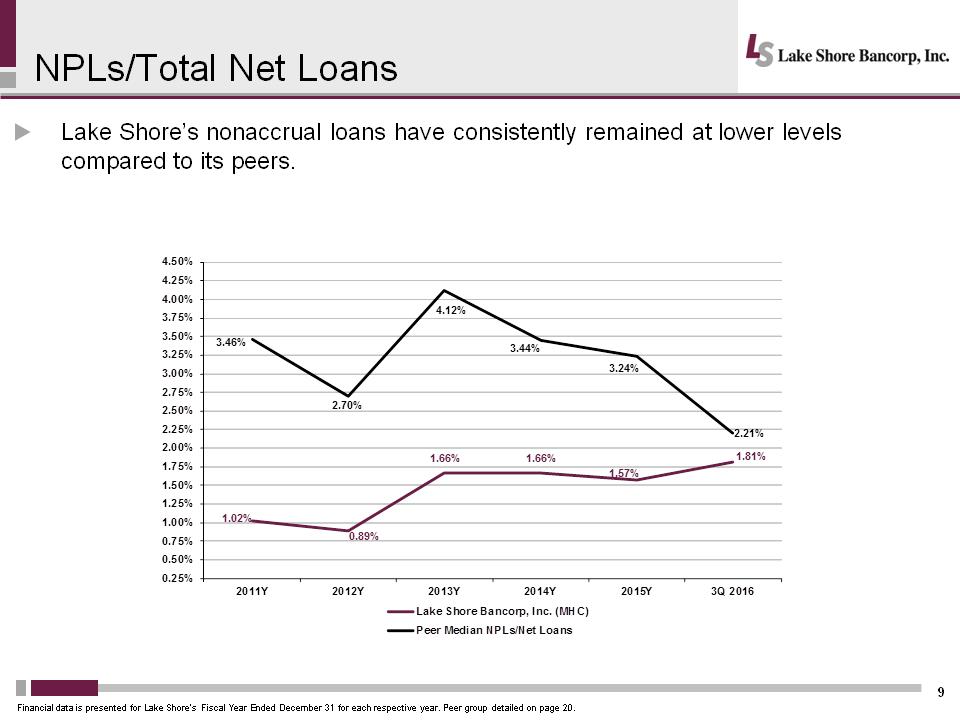 NPLs/Total Net Loans 9 .Lake Shore’s nonaccrual loans have consistently remained at lower levels compared to its peers. Financial data is presented for Lake Shore’s Fiscal Year Ended December 31 for each respective year. Peer group detailed on page 20. 1.02%0.89%1.66%1.66%1.57%1.81%3.46%2.70%4.12%3.44%3.24%2.21%0.25%0.50%0.75%1.00%1.25%1.50%1.75%2.00%2.25%2.50%2.75%3.00%3.25%3.50%3.75%4.00%4.25%4.50%2011Y2012Y2013Y2014Y2015Y3Q 2016Lake Shore Bancorp, Inc. (MHC)Peer Median NPLs/Net Loans
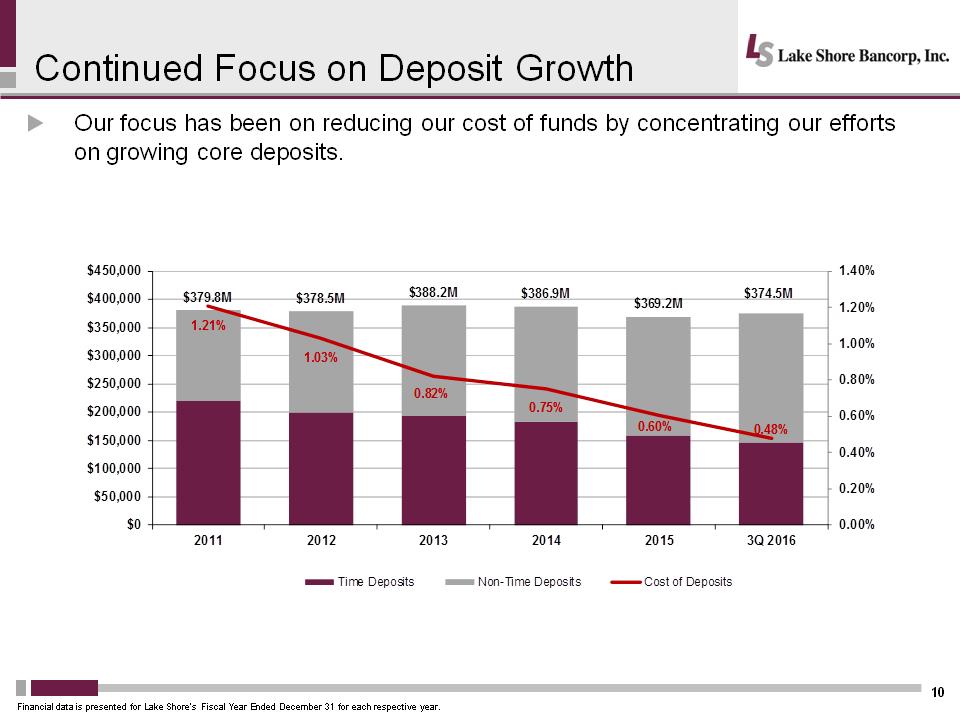 Continued Focus on Deposit Growth 10 .Our focus has been on reducing our cost of funds by concentrating our efforts on growing core deposits. Financial data is presented for Lake Shore’s Fiscal Year Ended December 31 for each respective year. $379.8M$378.5M$388.2M$386.9M$369.2M$374.5M1.21%1.03%0.82%0.75%0.60%0.48%0.00%0.20%0.40%0.60%0.80%1.00%1.20%1.40%$0$50,000$100,000$150,000$200,000$250,000$300,000$350,000$400,000$450,000201120122013201420153Q 2016Time DepositsNon-Time DepositsCost of Deposits
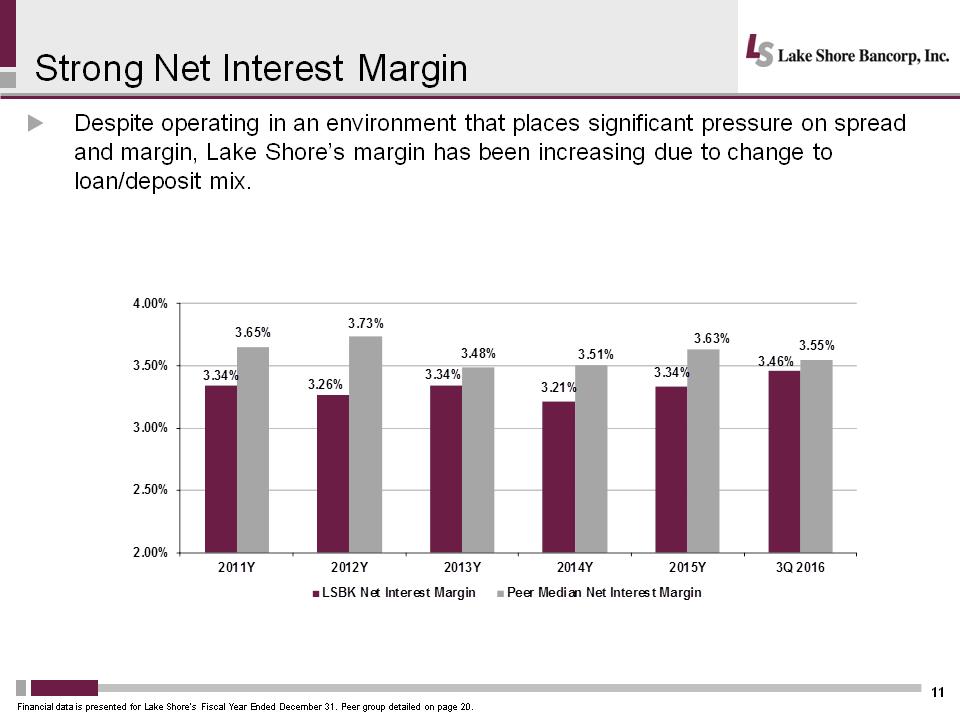 Strong Net Interest Margin 11 .Despite operating in an environment that places significant pressure on spread and margin, Lake Shore’s margin has been increasing due to change to loan/deposit mix. Financial data is presented for Lake Shore’s Fiscal Year Ended December 31. Peer group detailed on page 20. 3.34%3.26%3.34%3.21%3.34%3.46%3.65%3.73%3.48%3.51%3.63%3.55%2.00%2.50%3.00%3.50%4.00%2011Y2012Y2013Y2014Y2015Y3Q 2016LSBK Net Interest MarginPeer Median Net Interest Margin
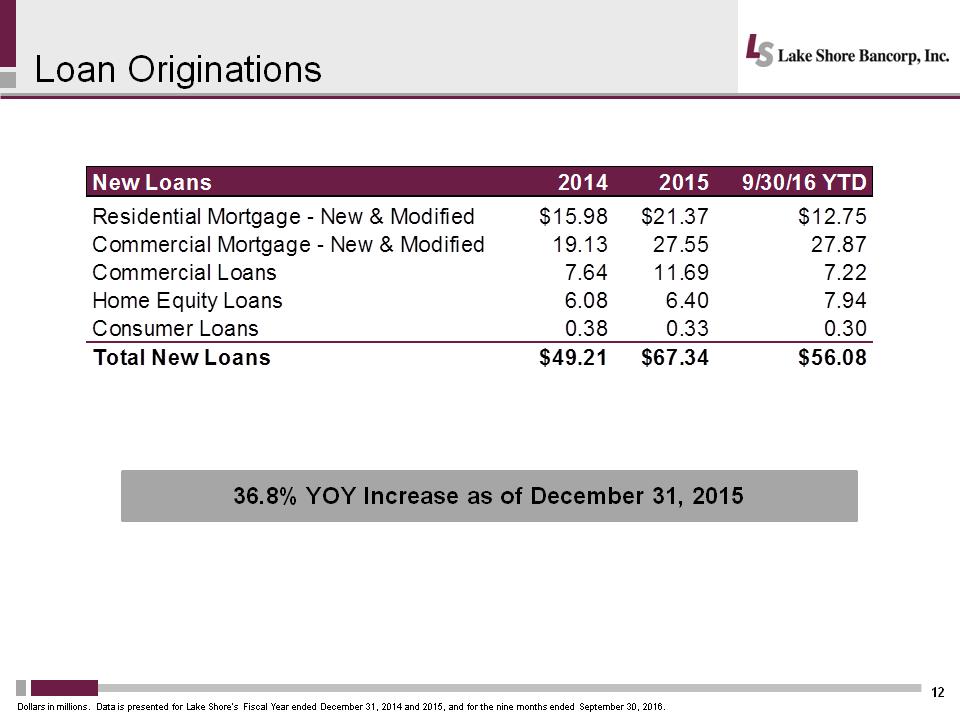 Loan Originations 12 36.8% YOY Increase as of December 31, 2015 New Loans201420159/30/16 YTDResidential Mortgage - New & Modified$15.98$21.37$12.75Commercial Mortgage - New & Modified19.1327.5527.87Commercial Loans7.6411.697.22Home Equity Loans6.086.407.94Consumer Loans0.380.330.30Total New Loans$49.21$67.34$56.08Dollars in millions. Data is presented for Lake Shore’s Fiscal Year ended December 31, 2014 and 2015, and for the nine months ended September 30, 2016.
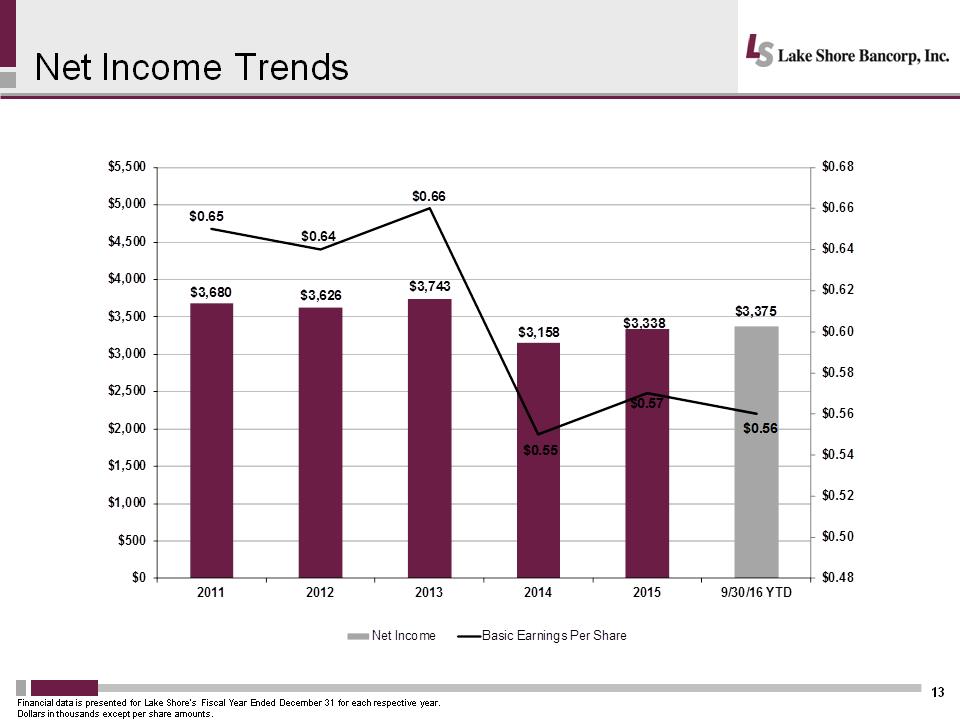 $3,680$3,626$3,743$3,158$3,338$3,375$0.65$0.64$0.66$0.55$0.57$0.56$0.48$0.50$0.52$0.54$0.56$0.58$0.60$0.62$0.64$0.66$0.68$0$500$1,000$1,500$2,000$2,500$3,000$3,500$4,000$4,500$5,000$5,500201120122013201420159/30/16 YTDNet IncomeBasic Earnings Per ShareNet Income Trends 13 Financial data is presented for Lake Shore’s Fiscal Year Ended December 31 for each respective year. Dollars in thousands except per share amounts.
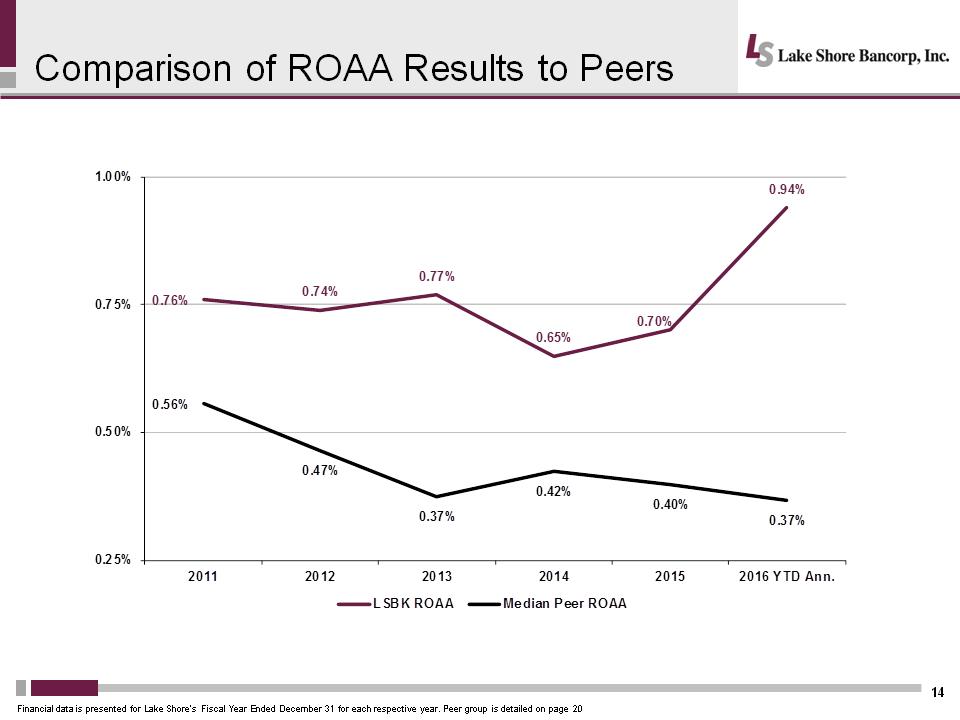 Comparison of ROAA Results to Peers 14 Financial data is presented for Lake Shore’s Fiscal Year Ended December 31 for each respective year. Peer group is detailed on page 20 0.76%0.74%0.77%0.65%0.70%0.94%0.56%0.47%0.37%0.42%0.40%0.37%0.25%0.50%0.75%1.00%201120122013201420152016 YTD Ann.LSBK ROAAMedian Peer ROAA
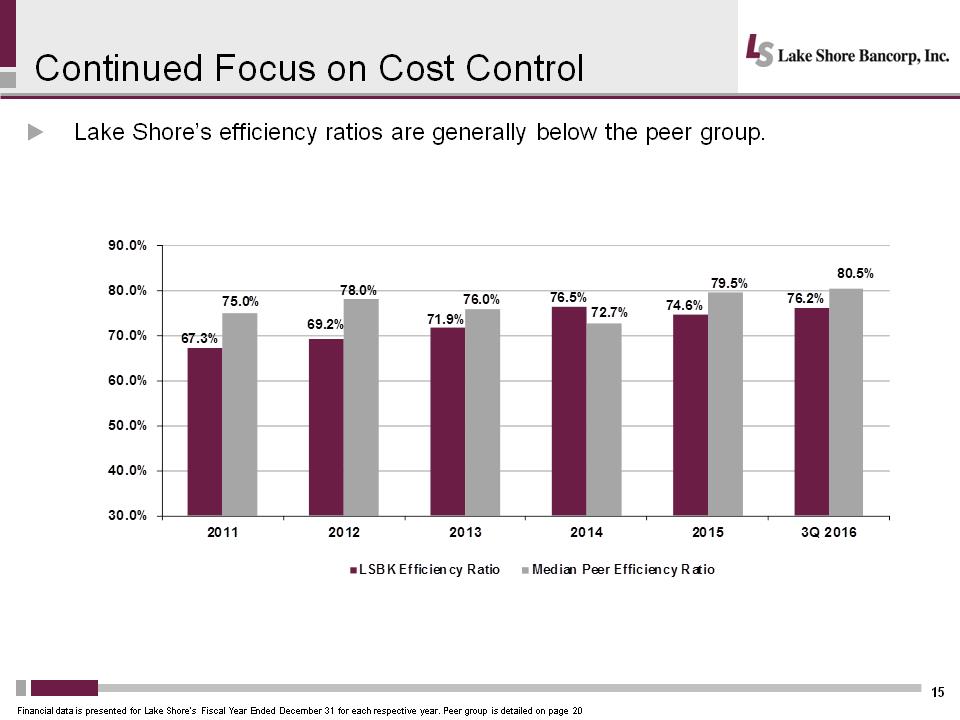 Continued Focus on Cost Control 15 .Lake Shore’s efficiency ratios are generally below the peer group. Financial data is presented for Lake Shore’s Fiscal Year Ended December 31 for each respective year. Peer group is detailed on page 20 67.3%69.2%71.9%76.5%74.6%76.2%75.0%78.0%76.0%72.7%79.5%80.5%30.0%40.0%50.0%60.0%70.0%80.0%90.0%201120122013201420153Q 2016LSBK Efficiency RatioMedian Peer Efficiency Ratio
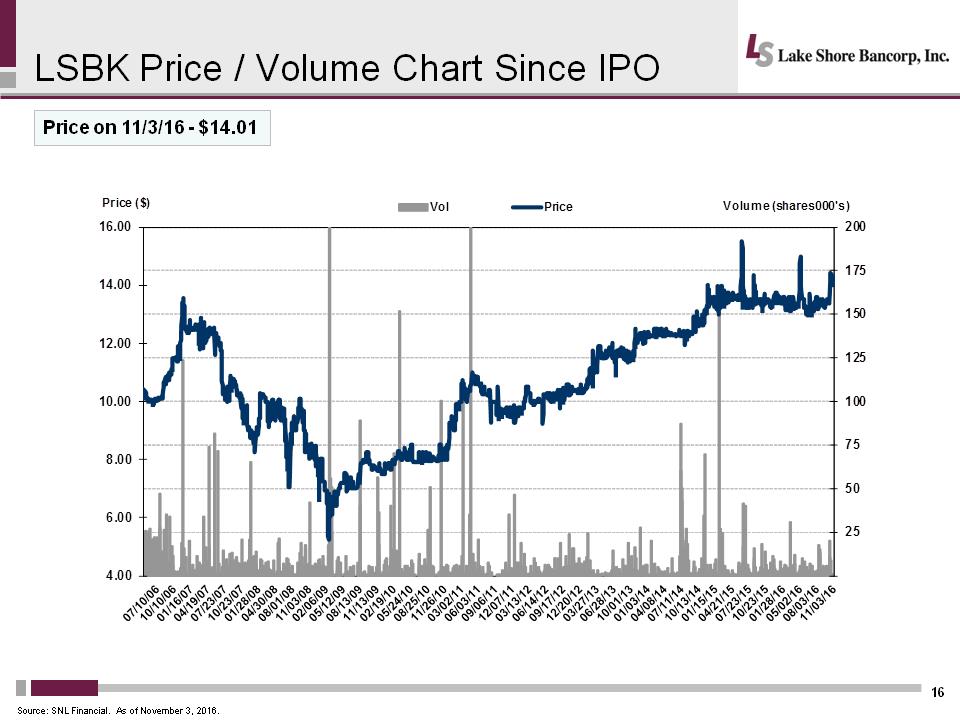 LSBK Price / Volume Chart Since IPO 16 Price on 11/3/16 - $14.01 Source: SNL Financial. As of November 3, 2016. 4.006.008.0010.0012.0014.0016.00255075100125150175200Price ($)Volume (shares 000's)VolPrice
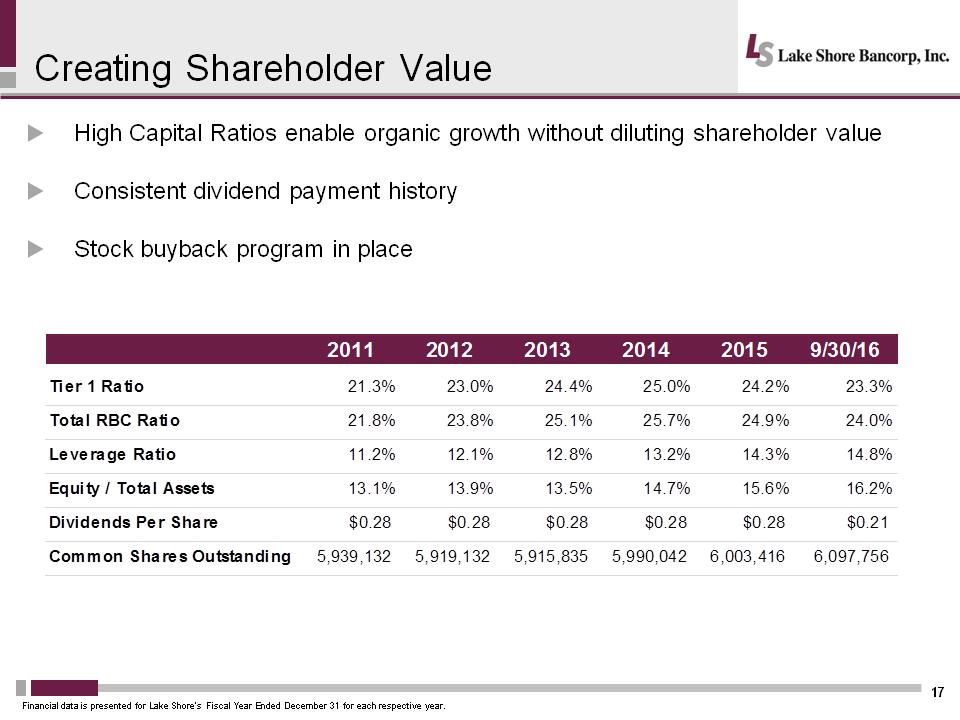 Creating Shareholder Value 17 .High Capital Ratios enable organic growth without diluting shareholder value .Consistent dividend payment history .Stock buyback program in place Financial data is presented for Lake Shore’s Fiscal Year Ended December 31 for each respective year. 201120122013201420159/30/16Tier 1 Ratio21.3%23.0%24.4%25.0%24.2%23.3%Total RBC Ratio21.8%23.8%25.1%25.7%24.9%24.0%Leverage Ratio11.2%12.1%12.8%13.2%14.3%14.8%Equity / Total Assets13.1%13.9%13.5%14.7%15.6%16.2%Dividends Per Share$0.28$0.28$0.28$0.28$0.28$0.21Common Shares Outstanding5,939,1325,919,1325,915,8355,990,0426,003,4166,097,756
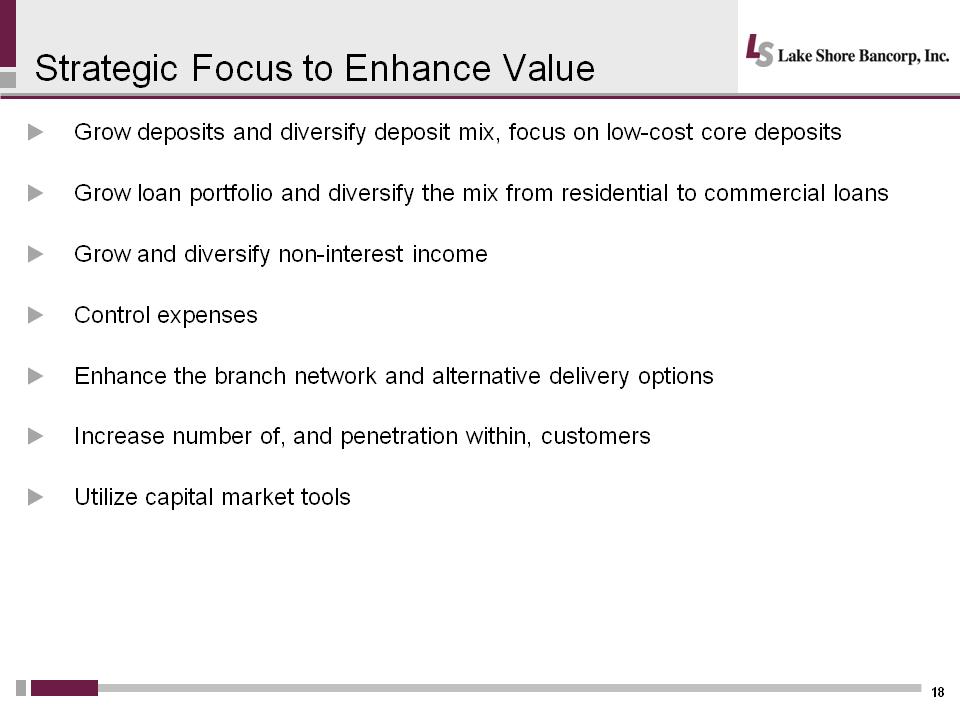 Strategic Focus to Enhance Value 18 .Grow deposits and diversify deposit mix, focus on low-cost core deposits .Grow loan portfolio and diversify the mix from residential to commercial loans .Grow and diversify non-interest income .Control expenses .Enhance the branch network and alternative delivery options .Increase number of, and penetration within, customers .Utilize capital market tools
 QUESTIONS & ANSWERS
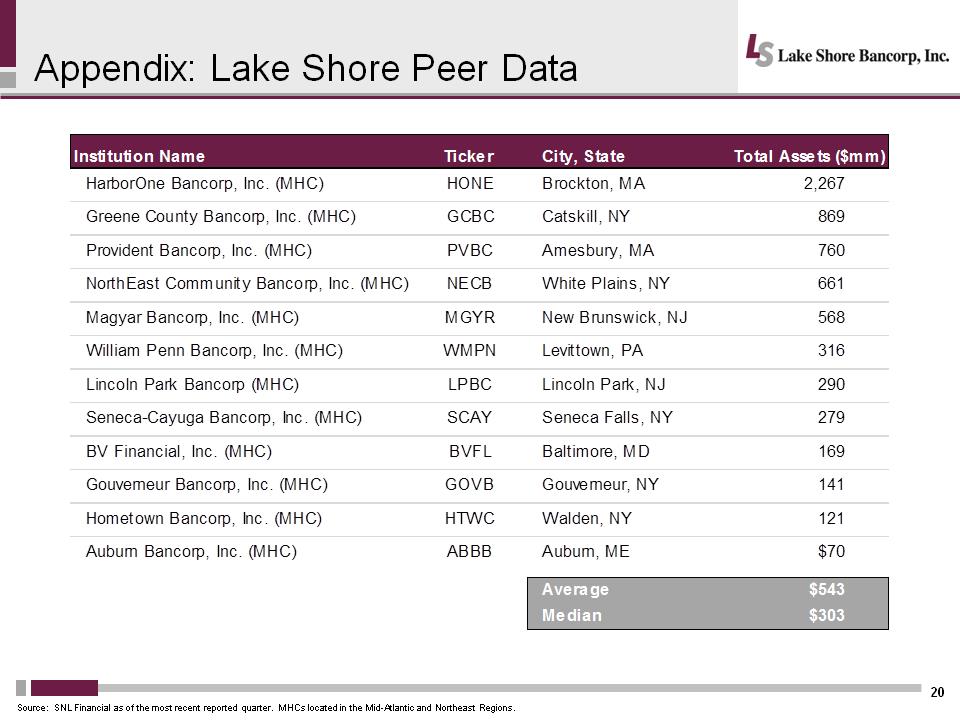 Appendix: Lake Shore Peer Data 20 Source: SNL Financial as of the most recent reported quarter. MHCs located in the Mid-Atlantic and Northeast Regions. Institution Name Ticker City, State Total Assets ($mm)HarborOne Bancorp, Inc. (MHC)HONEBrockton, MA2,267Greene County Bancorp, Inc. (MHC)GCBCCatskill, NY869Provident Bancorp, Inc. (MHC)PVBCAmesbury, MA760NorthEast Community Bancorp, Inc. (MHC)NECBWhite Plains, NY661Magyar Bancorp, Inc. (MHC)MGYRNew Brunswick, NJ568William Penn Bancorp, Inc. (MHC)WMPNLevittown, PA316Lincoln Park Bancorp (MHC)LPBCLincoln Park, NJ290Seneca-Cayuga Bancorp, Inc. (MHC)SCAYSeneca Falls, NY279BV Financial, Inc. (MHC)BVFLBaltimore, MD169Gouverneur Bancorp, Inc. (MHC)GOVBGouverneur, NY141Hometown Bancorp, Inc. (MHC)HTWCWalden, NY121Auburn Bancorp, Inc. (MHC)ABBBAuburn, ME$70Average$543Median$303