 Annual Shareholders MeetingMay 15, 2019LS Bancorp JPG.png
 AgendaLS Bancorp JPG.pngGenerations of Success.Call to Order -Gary W. Winger, Chairman.Introduction of Officers, Directors and Director Nominees.Secretary’s Report.Presentation of Proposals.Executive Management Report to Shareholders.Vote Report.Adjournment
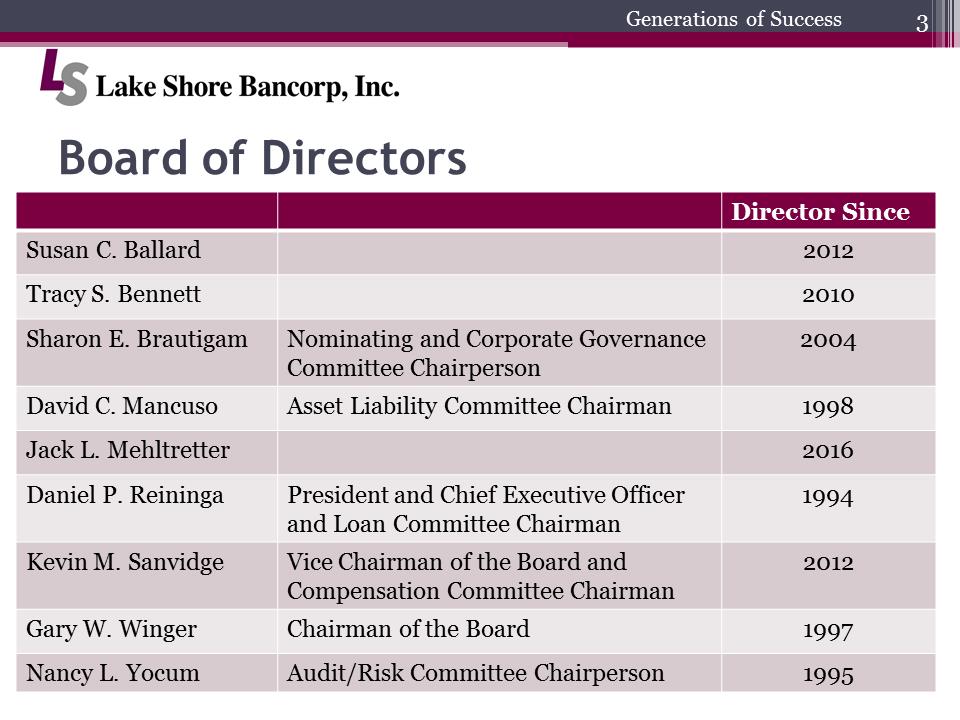 Board of DirectorsLS Bancorp JPG.pngGenerations of SuccessDirector SinceSusan C. Ballard2012Tracy S. Bennett2010Sharon E. BrautigamNominating and Corporate Governance Committee Chairperson2004David C. MancusoAssetLiability Committee Chairman1998JackL. Mehltretter2016Daniel P. ReiningaPresident and Chief Executive Officer and Loan Committee Chairman1994Kevin M. SanvidgeVice Chairmanof the Board and Compensation Committee Chairman2012Gary W. WingerChairman of the Board1997Nancy L. YocumAudit/Risk Committee Chairperson1995
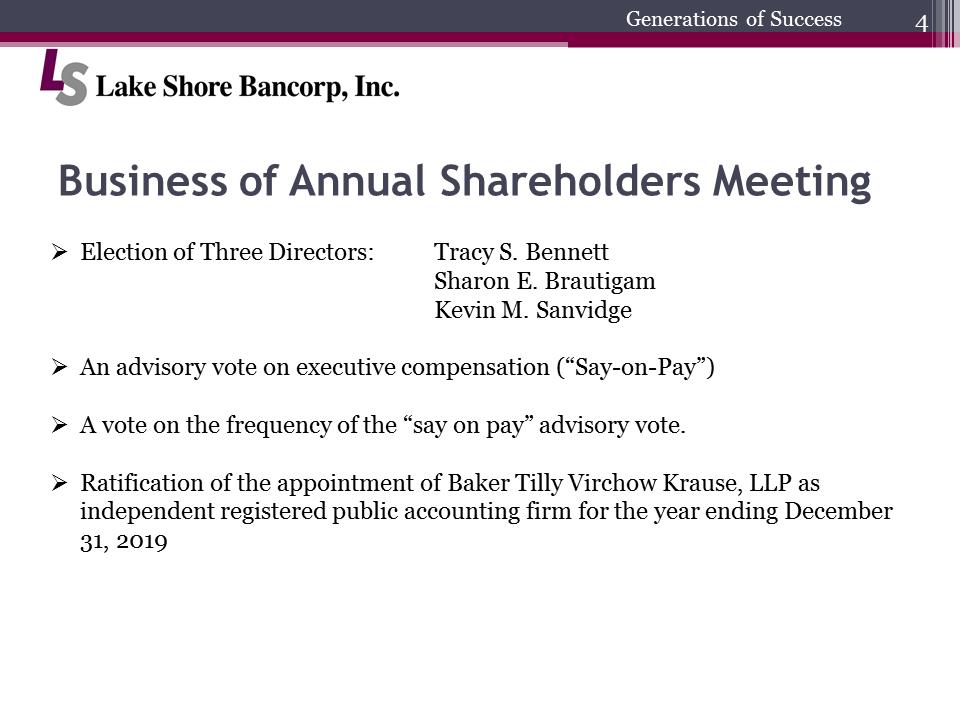 Business of Annual Shareholders MeetingLS Bancorp JPG.pngGenerations of Success.Election of Three Directors: Tracy S. BennettSharon E. BrautigamKevin M. Sanvidge.An advisory vote on executive compensation (“Say-on-Pay”).A vote on the frequency of the “say on pay” advisory vote..Ratification of the appointment of Baker Tilly Virchow Krause, LLP as independent registered public accounting firm for the year ending December 31, 2019
 Executive Management PresentationLS Bancorp JPG.pngGenerations of SuccessDaniel P. Reininga President and Chief Executive Officer
 Safe Harbor StatementLS Bancorp JPG.pngGenerations of SuccessThis presentation includes “forward looking statements” within the meaning of the Private Securities Litigation Reform Act of 1995. We intend such forward-looking statements to be covered by the Safe Harbor Provision and are including this statement for the purpose of such Safe Harbor Provision of the Private Securities Litigation Reform Act of 1995. Such forward-looking statements include, but are not limited to, statements concerning future business, revenue and earnings. They often include words such as “believe,” “expect,” “anticipate,” “estimate,” and “intend” or future or conditional verbs, such as “will,” “would,” “should,” “could,” or “may”. These statements are not historical facts or guarantees of future performance, events or results. There are risks, uncertainties and other factors that could cause the actual results of the Company to differ materially from the results expressed or implied by such forward-looking statements. Information on factors that could affect the Company’s business and results is discussed in the Company’s periodic reports filed with the Securities and Exchange Commission. Forward looking statements speak only as of the date they are made. The Company undertakes no obligation to publicly update or revise forward looking information, whether as a result of new, updated information, future events or otherwise.
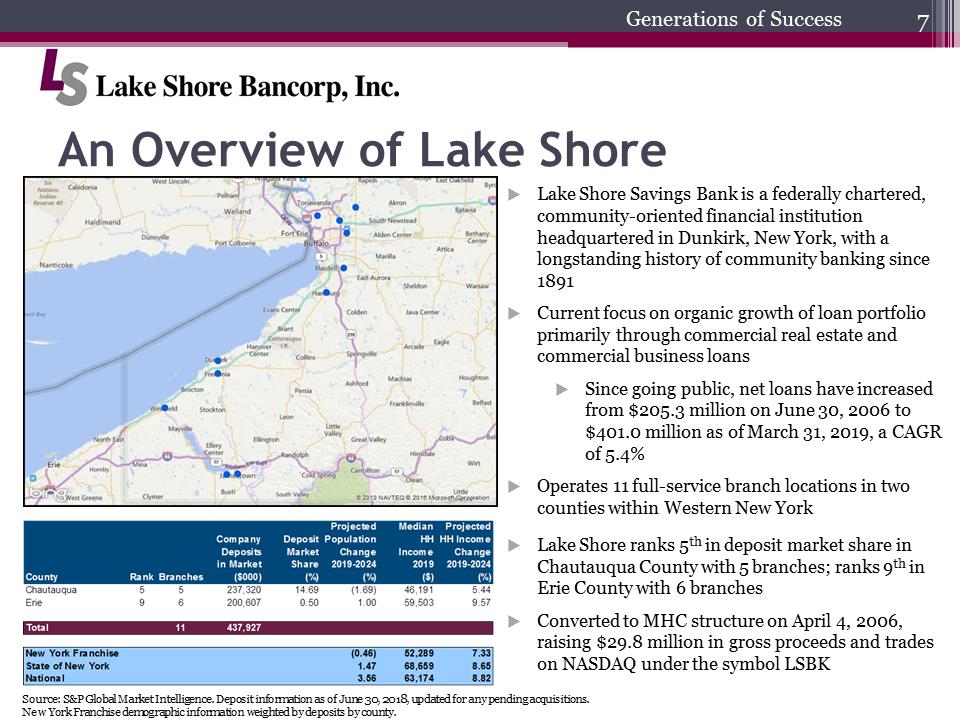 An Overview of Lake ShoreLS Bancorp JPG.pngGenerations of Success.Lake Shore Savings Bank is a federally chartered, community-oriented financial institution headquartered in Dunkirk, New York, with a longstanding history of community banking since 1891.Current focus on organic growth of loan portfolio primarily through commercial real estate and commercial business loans.Since going public, net loans have increased from $205.3 million on June 30, 2006 to $401.0 million as of March 31, 2019, a CAGR of 5.4%.Operates 11 full-service branch locations in two counties within Western New York.Lake Shore ranks 5thin deposit market share in Chautauqua County with 5 branches; ranks 9thin Erie County with 6 branches.Converted to MHC structure on April 4, 2006, raising $29.8 million in gross proceeds and trades on NASDAQ under the symbol LSBKcounty rank branches company deposits in market ($000) deposit market share (%) projected population change 2019-2024 (%) Median HH Income 2019 ($) Projected HH Income Change 2019-2024 (%) Chautauqua 5 5 237,320 14.69 (1.69) 46,191 5.44 Erie 9 6 200,607 0.50 1.00 59,503 9.57 Total 11 437,927 New York Franchise (0.46) 52,289 7.33 State of New York 1.47, 68,659 8.65 National 3.56 63,174 8.82Source: S&P Global Market Intelligence. Deposit information as of June 30, 2018, updated for any pending acquisitions.New York Franchise demographic information weighted by deposits by county.
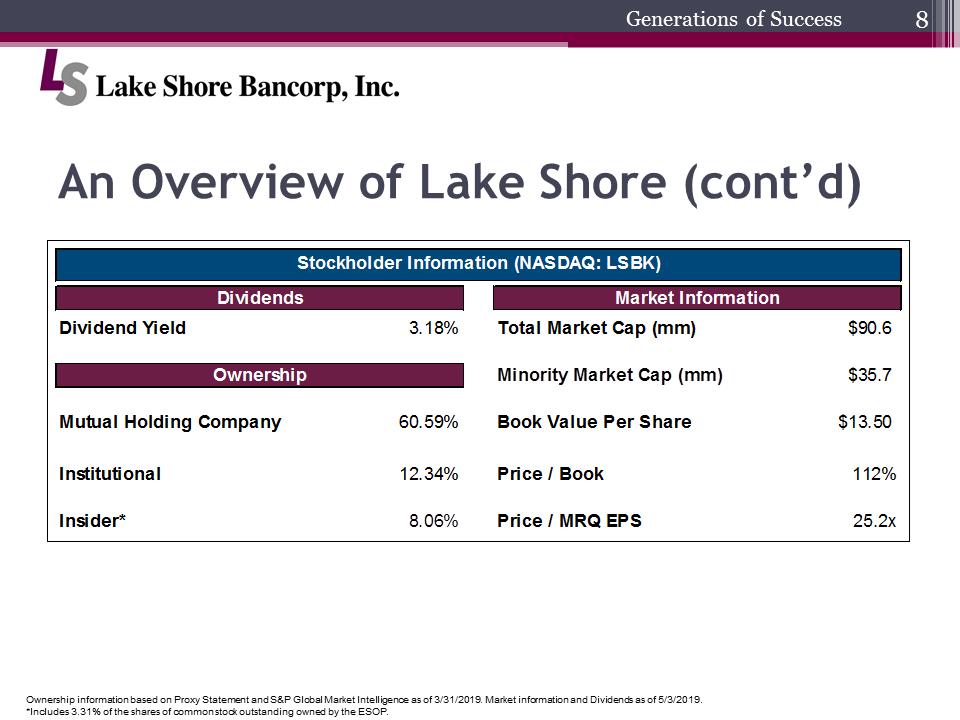 An Overview of Lake Shore (cont’d)LS Bancorp JPG.pngGenerations of SuccessStockholder Information (NASDAQ:LSBK) Dividends Dividend Yield 3.18% Ownership Mutual Holding Company 60.59% Institutional 12.34% Insider* 8.06% Market Information Total Market Cap (mm) $90.6 Minority Market Cap (mm) $35.7 Book Value Per Share $13.50 Price / Book 112% Price / MRQ EPS 25.2xOwnership information based on Proxy Statement and S&P Global Market Intelligence as of 3/31/2019. Market information and Dividends as of 5/3/2019.*Includes 3.31% of the shares of common stock outstanding owned by the ESOP.
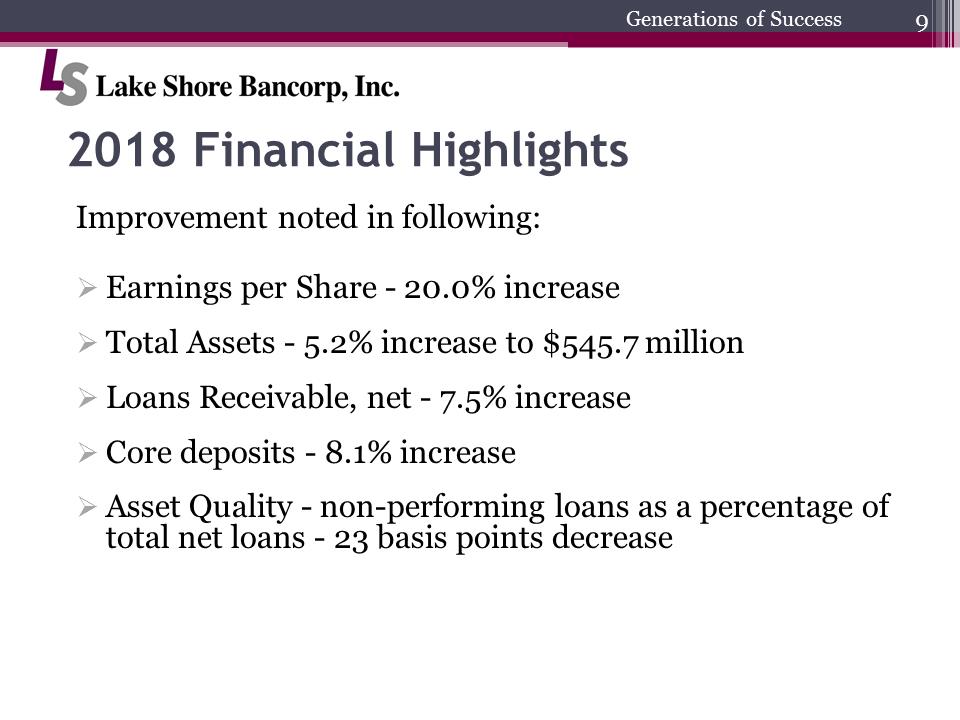 2018 Financial HighlightsLS Bancorp JPG.pngGenerations of SuccessImprovement noted in following:.Earnings per Share -20.0% increase .Total Assets -5.2% increase to $545.7 million.Loans Receivable, net -7.5% increase .Core deposits -8.1% increase .Asset Quality -non-performing loans as a percentage of total net loans -23 basis points decrease
 We have had the honorof serving multiple generations of Western New Yorkers for over 128 Years.LS Bancorp JPG.pngGenerations of Success
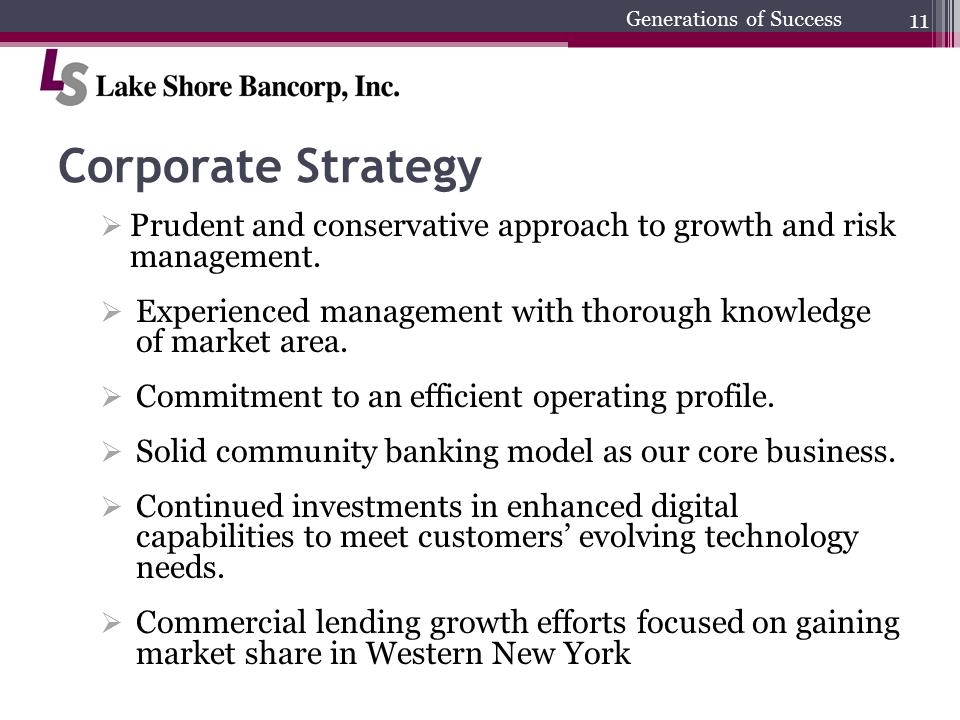 Corporate StrategyLS Bancorp JPG.pngGenerations of Success.Prudent and conservative approach to growth and risk management..Experienced management with thorough knowledge of market area..Commitment to an efficient operating profile..Solid community banking model as our core business..Continued investments in enhanced digital capabilities to meet customers’ evolving technology needs..Commercial lending growth efforts focused on gaining market share in Western New York
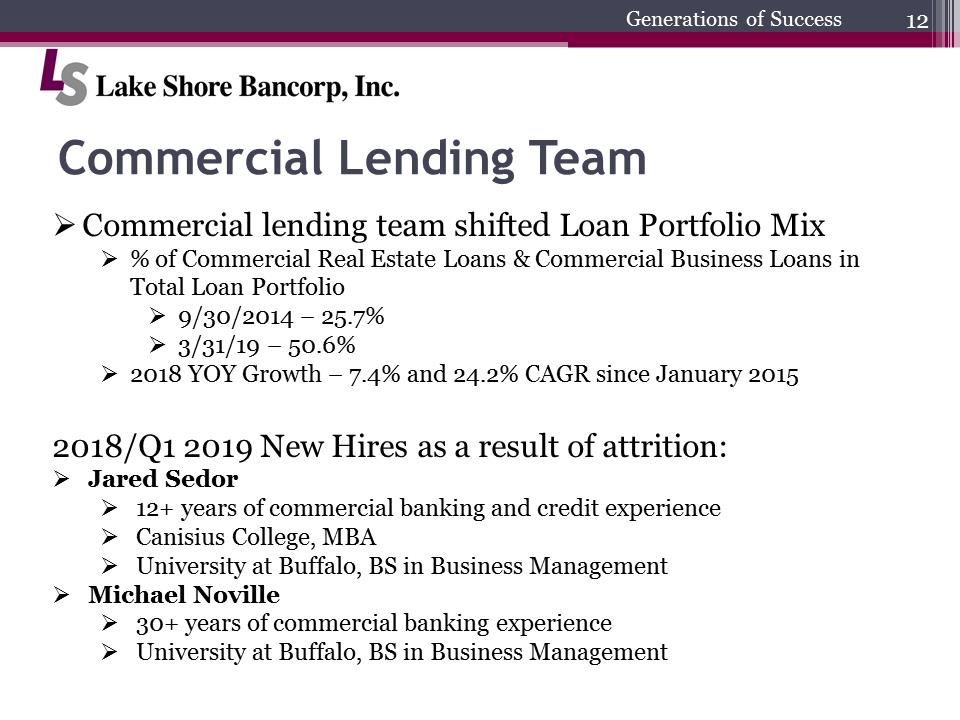 Commercial Lending TeamLS Bancorp JPG.pngGenerations of Success.Commercial lending team shifted Loan Portfolio Mix .% of Commercial Real Estate Loans & Commercial Business Loans in Total Loan Portfolio.9/30/2014 –25.7% .3/31/19 –50.6% .2018 YOY Growth –7.4% and 24.2% CAGR since January 2015 2018/Q1 2019 New Hires as a result of attrition:.Jared Sedor .12+ years of commercial banking and credit experience.CanisiusCollege, MBA.University at Buffalo, BS in Business Management.Michael Noville.30+ years of commercial banking experience.University at Buffalo, BS in Business Management
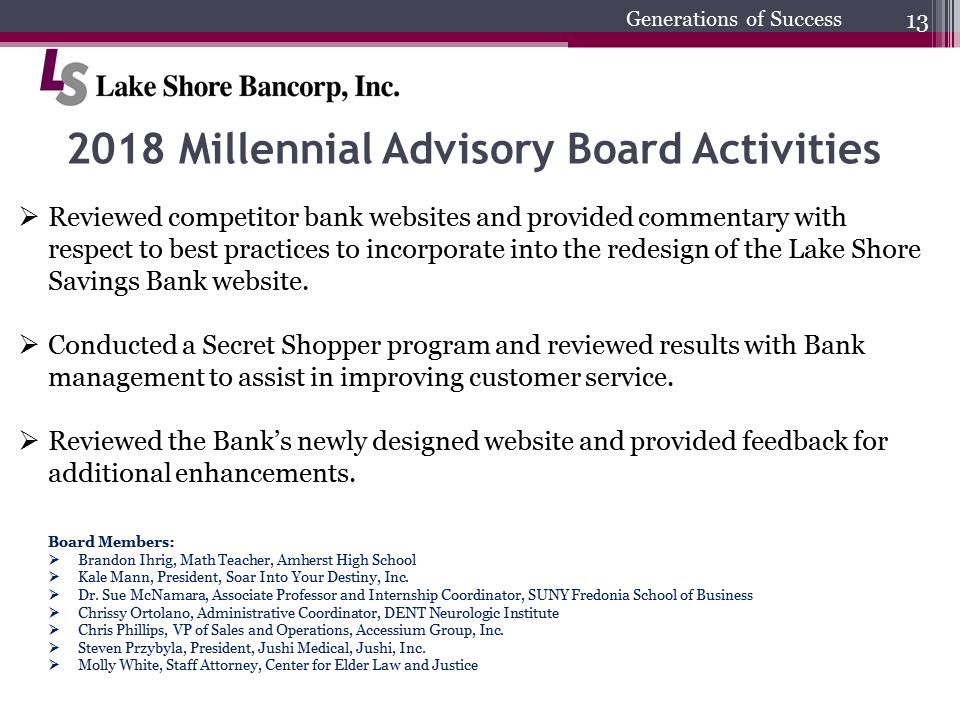 2018 Millennial Advisory Board ActivitiesLS Bancorp JPG.pngGenerations of SuccessBoard Members:.Brandon Ihrig, Math Teacher, Amherst High School.Kale Mann, President, Soar Into Your Destiny, Inc..Dr. Sue McNamara, Associate Professor and Internship Coordinator, SUNY Fredonia School of Business.Chrissy Ortolano, Administrative Coordinator, DENT Neurologic Institute.Chris Phillips, VP of Sales and Operations, AccessiumGroup, Inc..Steven Przybyla, President, JushiMedical, Jushi, Inc..Molly White, Staff Attorney, Center for Elder Law and Justice.Reviewed competitor bank websites and provided commentary with respect to best practices to incorporate into the redesign of the Lake Shore Savings Bank website..Conducted a Secret Shopper program and reviewed results with Bank management to assist in improving customer service..Reviewed the Bank’s newly designed website and provided feedback for additional enhancements.
 Digital Platform and Technology InitiativesLS Bancorp JPG.pngGenerations of Success.Enhanced Online Business Banking (February 2019).Customer customization.Improved functionality.Faster payment processing (via ACH).Enhanced Fraud Protection.Upgraded Retail Loan Origination System.Improved processing and efficiency.Important to keep customer facing technology as “state of the art” as possible.User Friendly interface.Better overall online application .Customer can start an application electronically and finish application in person, or vice versa
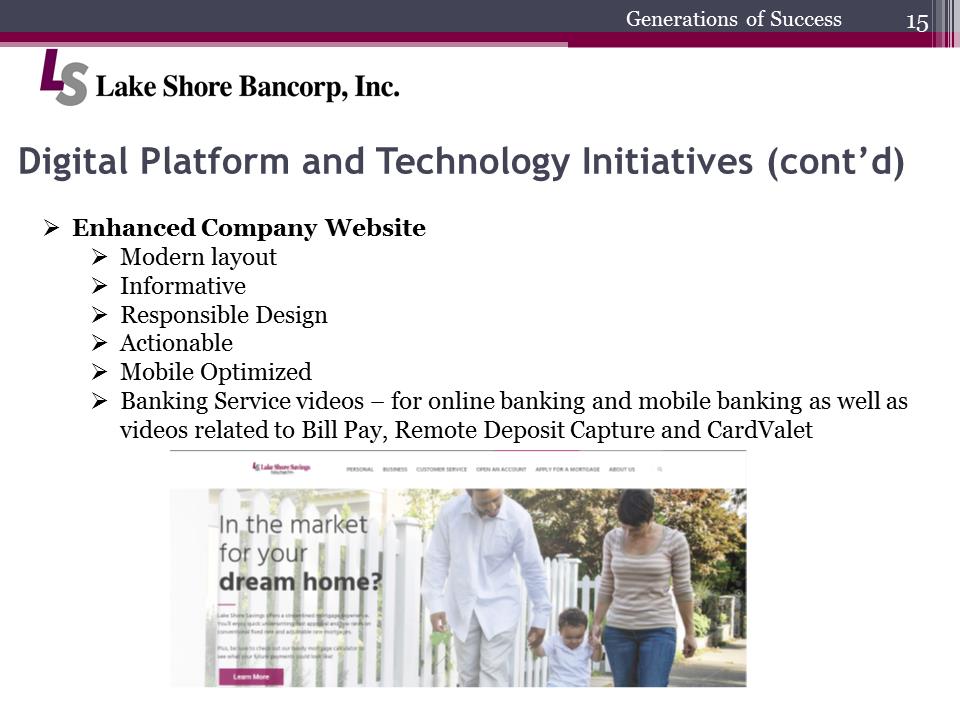 Digital Platform and Technology Initiatives (cont’d)LS Bancorp JPG.pngGenerations of Success.Enhanced Company Website.Modern layout.Informative.Responsible Design.Actionable.Mobile Optimized.Banking Service videos –for online banking and mobile banking as well as videos related to Bill Pay, Remote Deposit Capture and CardValet
 Personal Service is the hallmark of our banking model. It’s all about what we do best.LS Bancorp JPG.pngGenerations of Success.Human Connection and Accessibility.Processing of residential mortgages in each branch, customers are not going to be transferred to someone out of the market area.We service all residential mortgages that we originate.Relationship management is paramount.Knowledgeable support team with the correct strategic guidance for our customer base..We will always do what is right for the customer
 Governance and Diversity in BankingLS Bancorp JPG.pngGenerations of Success.Diverse board with 30% female representation.First female director appointed 23 years ago in 1995.Board member backgrounds are diverse –have directors with Information Security, Legal, Banking, Real Estate, Business and Accounting expertise.Active Millennial Advisory Board.Women make up 60% of Senior Management Team and nearly 75% of our employee population
 Community ContributionsLS Bancorp JPG.pngGenerations of Success
 SummaryLS Bancorp JPG.pngGenerations of SuccessWe are well positioned to achieve continued success and are dedicated to serving the financial needs of consumers and businesses in Western New York..Ample Business Opportunities in Western New York.Strong loan pipelines.Talented, service-oriented team
 Financial HighlightsLS Bancorp JPG.pngGenerations of SuccessRachel A. Foley Chief Financial Officer and Treasurer
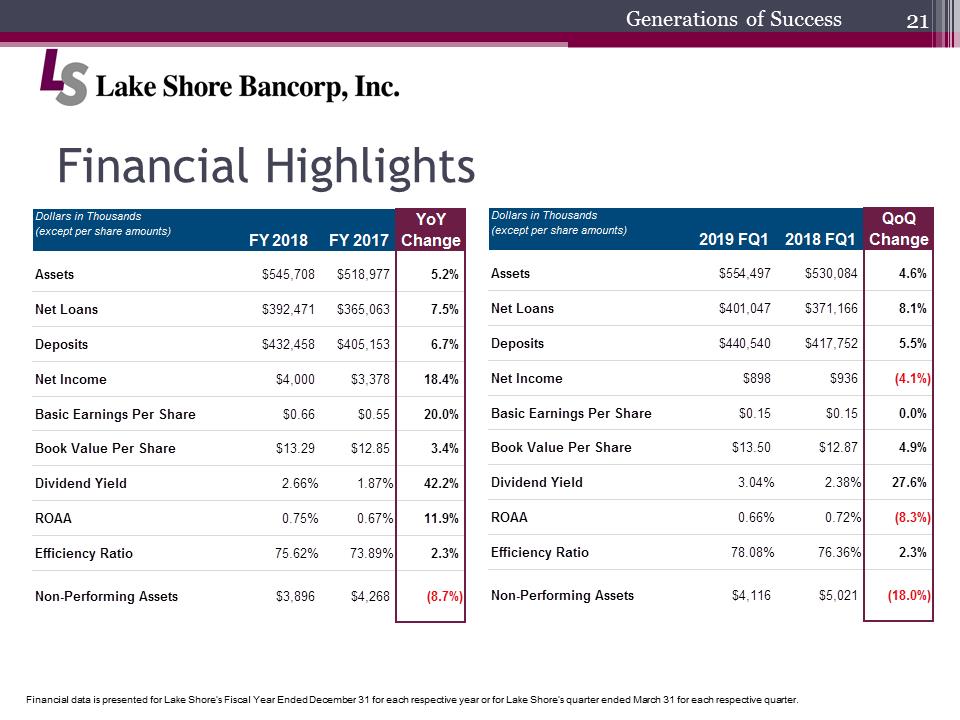 Financial HighlightsDollars in Thousands (except per share amounts) FY 2018 FY 2017 Yoy Change Assets $545,708 $518,977 5.2% Net Loans $392,471 $365,063 7.5% Deposits $432,458 $405,153 6.7% Net Income $4,000 $3,378 18.4% Basic Earnings Per Share $0.66 $0.55 20.0% Book value Per Share $13.29 $12.85 3.4% Dividend Yield 2.66% 1.87% 42.2% ROAA 0.75% 0.67% 11.9% Efficiency Ratio 75.62% 73.89% 2.3% Non-Performing Assets $3,896 $4,268 (8.7%) Dollars in Thousands (except per share amounts) 219 FQ1 2018 FQ1 QoQ Change Assets $554,497 $530,084 4.6% Net Loans $401,047 $371,166 8.1% Deposits $440,540 $417,752 5.5% Net Income $898 $936 (4.1%) Basic Earnings Per Share $0.15 $0.15 0.0% Book value Per Share $13.50 $12.87 4.9% Dividend Yield 3.04% 2.38% 27.6% ROAA 0.66% 0.72% (8.3%) Efficiency Ratio 78.08% 76.36% 2.3% Non-Performing Assets $4,116 $5,021 (18.0%)LS Bancorp JPG.pngGenerations of SuccessFinancial data is presented for Lake Shore’s Fiscal Year Ended December 31 for each respective year or for Lake Shore’s quarter ended March 31 for each respective quarter.
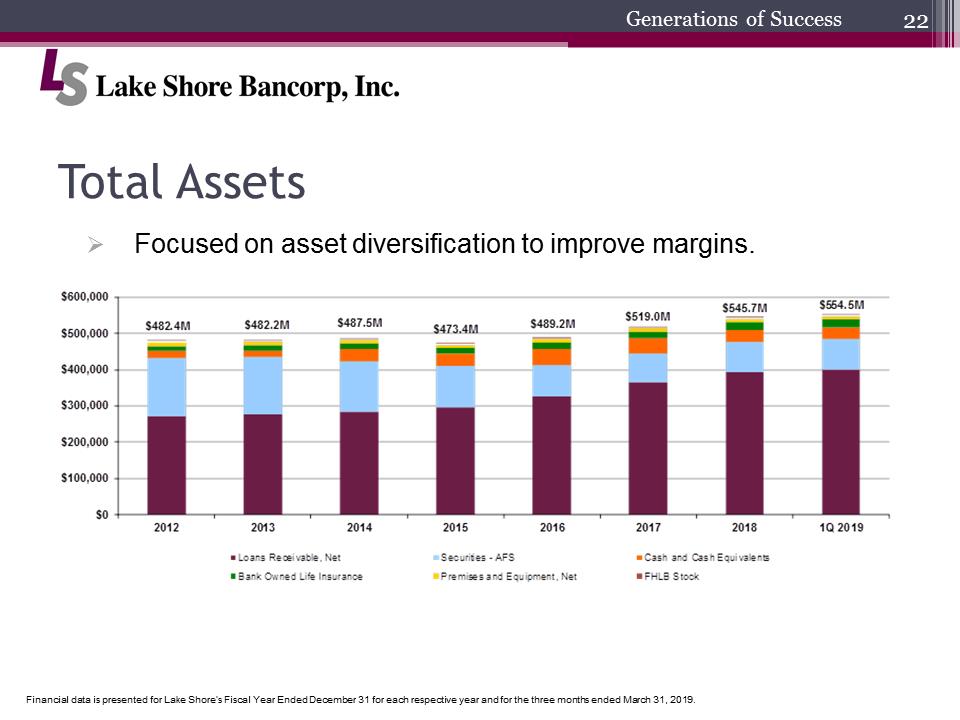 Total Assets$600,000 $500,000 $400,000 $300,000 $200,000 $100,000 $0 $482.4M $482.2M $487.5M $473.4M $489.2M $519.0M $545.7M $554.5M 2012 2013 2014 2015 2016 2017 2018 1Q 2019 Loans Receivable, Net Securities – AFS Cash and Cash Equivalents Bank Owned Life Insurance Premises and Equipment, Net FHLB StockLS Bancorp JPG.pngGenerations of SuccessFinancial data is presented for Lake Shore’s Fiscal Year Ended December 31 for each respective year and for the three months ended March 31, 2019..Focused on asset diversification to improve margins.
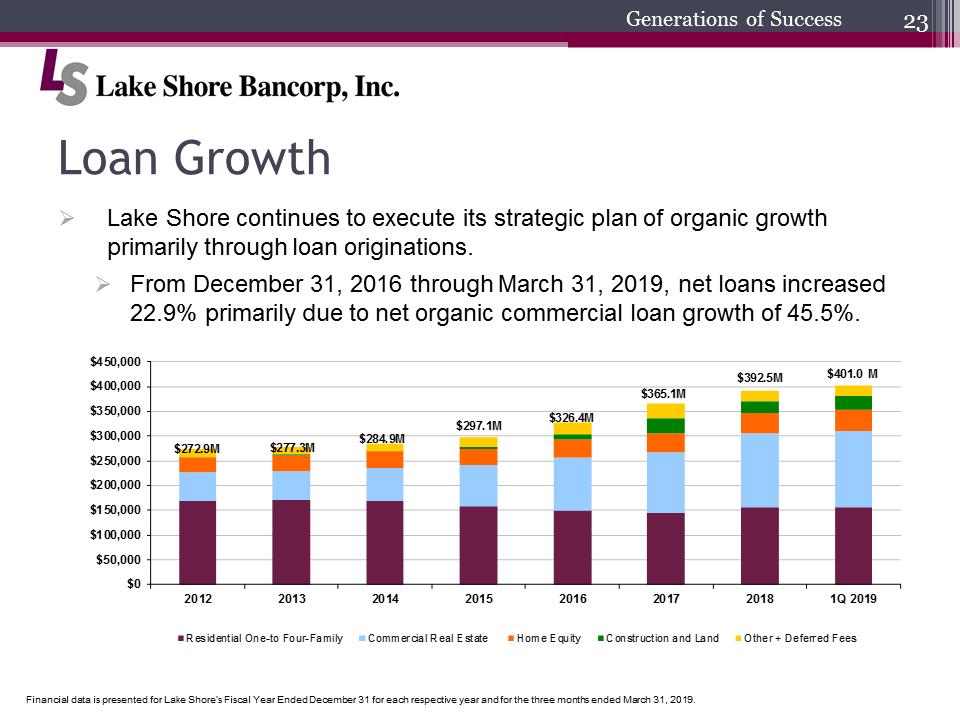 Loan GrowthLS Bancorp JPG.pngGenerations of Success$272.9M$277.3M$284.9M$297.1M$326.4M$365.1M$392.5M$401.0 M$0$50,000$100,000$150,000$200,000$250,000$300,000$350,000$400,000$450,00020122013201420152016201720181Q 2019Residential One-to Four-FamilyCommercial Real EstateHome EquityConstruction and LandOther + Deferred Fees.Lake Shore continues to execute its strategic plan of organic growth primarily through loan originations..From December 31, 2016 through March 31, 2019, net loans increased Financial data is presented for Lake Shore’s Fiscal Year Ended December 31 for each respective year and for the three months ended March 31, 2019.22.9% primarily due to net organic commercial loan growth of 45.5%.
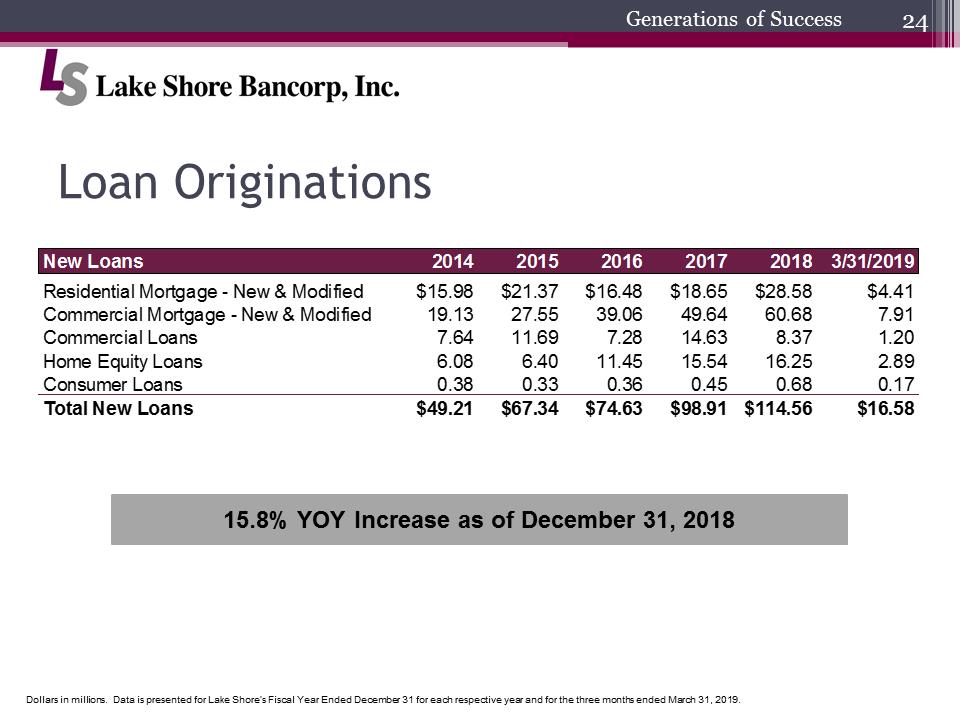 Loan OriginationsLS Bancorp JPG.pngGenerations of SuccessNew Loans201420152016201720183/31/2019Residential Mortgage - New & Modified$15.98$21.37$16.48$18.65$28.58$4.41Commercial Mortgage - New & Modified19.1327.5539.0649.6460.687.91Commercial Loans7.6411.697.2814.638.371.20Home Equity Loans6.086.4011.4515.5416.252.89Consumer Loans0.380.330.360.450.680.17Total New Loans$49.21$67.34$74.63$98.91$114.56$16.5815.8% YOY Increase as of December 31, 2018Dollars in millions. Data is presented for Lake Shore’s Fiscal Year Ended December 31 for each respective year and for the three months ended March 31, 2019.
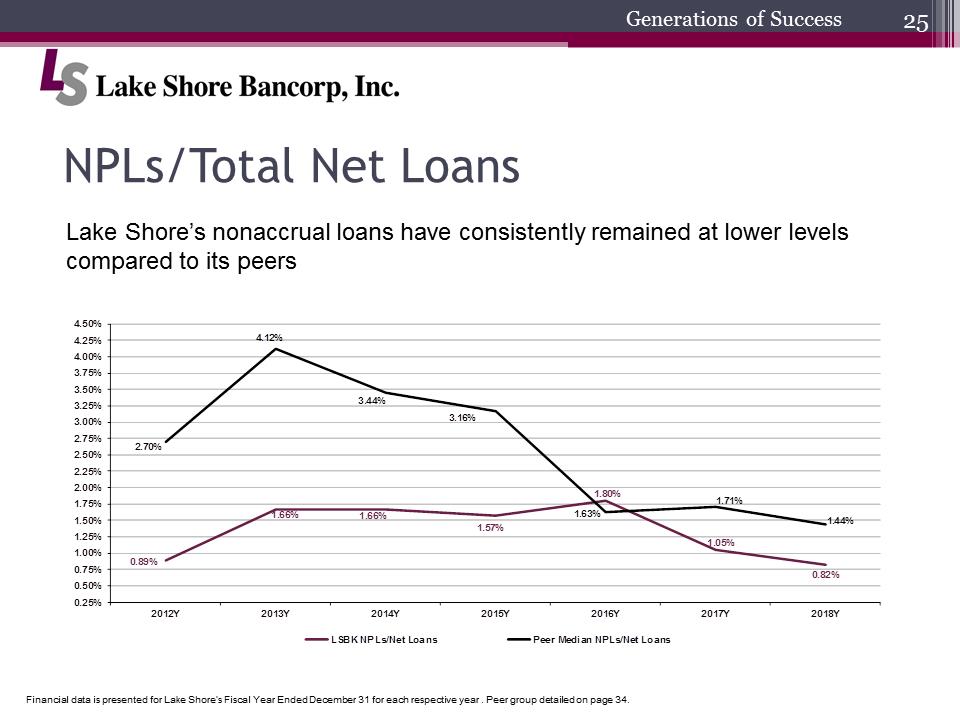 NPLs/Total Net Loans4.50% 4.25% 4.00% 3.75% 3.50% 3.25% 3.00% 2.75% 2.50% 2.25% 2.00% 1.75% 1.50% 1.25% 1.00% 0.75% 0.50% 0.25% 2.70% 4.12% 3.44% 3.16% 1.63% 1.71% 1.44% 0.89% 1.66% 1.66% 1.57% 1.80% 1.05% 0.82% 2012Y 2013Y 2014Y 2015Y 2016Y 2017Y 2018Y LSBK NPLs/Net Loans Peer Median NPLs/Net LoansLS Bancorp JPG.pngGenerations of SuccessLake Shore’s nonaccrual loans have consistently remained at lower levels compared to its peersFinancial data is presented for Lake Shore’s Fiscal Year Ended December 31 for each respective year . Peer group detailed on page 34.
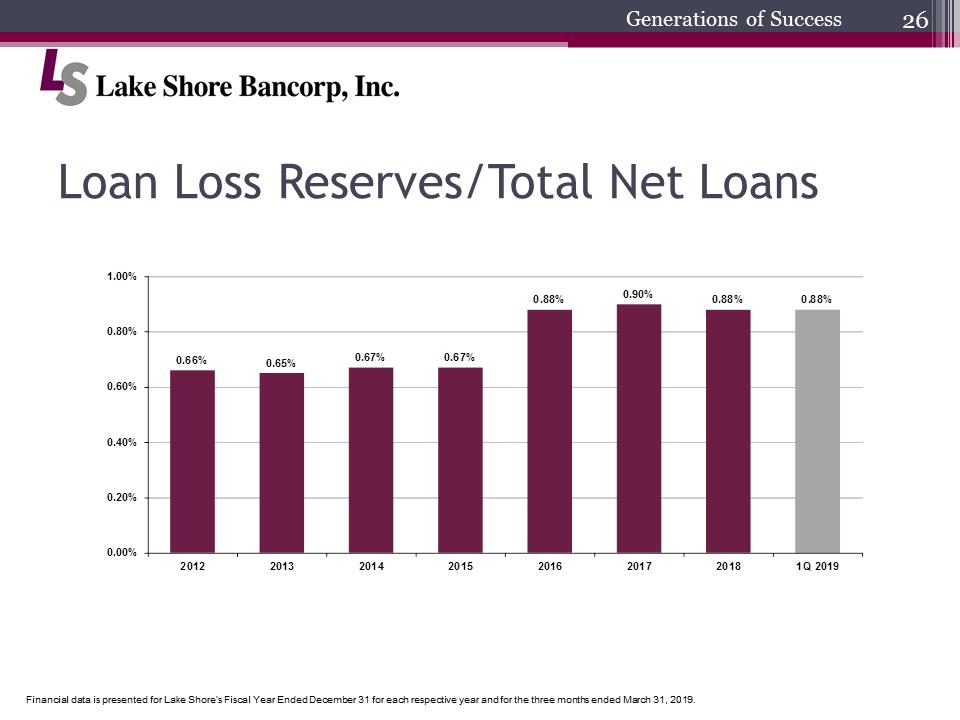 Loan Loss Reserves/Total Net Loans1.00% 0.80% 0.60% 0.40% 0.20% 0.00% 0.66% 0.65% 0.67% 0.67% 0.88% 0.90% 0.88% 0.88% 2012 2013 2014 2015 2016 2017 2018 1Q 2019LS Bancorp JPG.pngGenerations of SuccessFinancial data is presented for Lake Shore’s Fiscal Year Ended December 31 for each respective year and for the three months ended March 31, 2019.
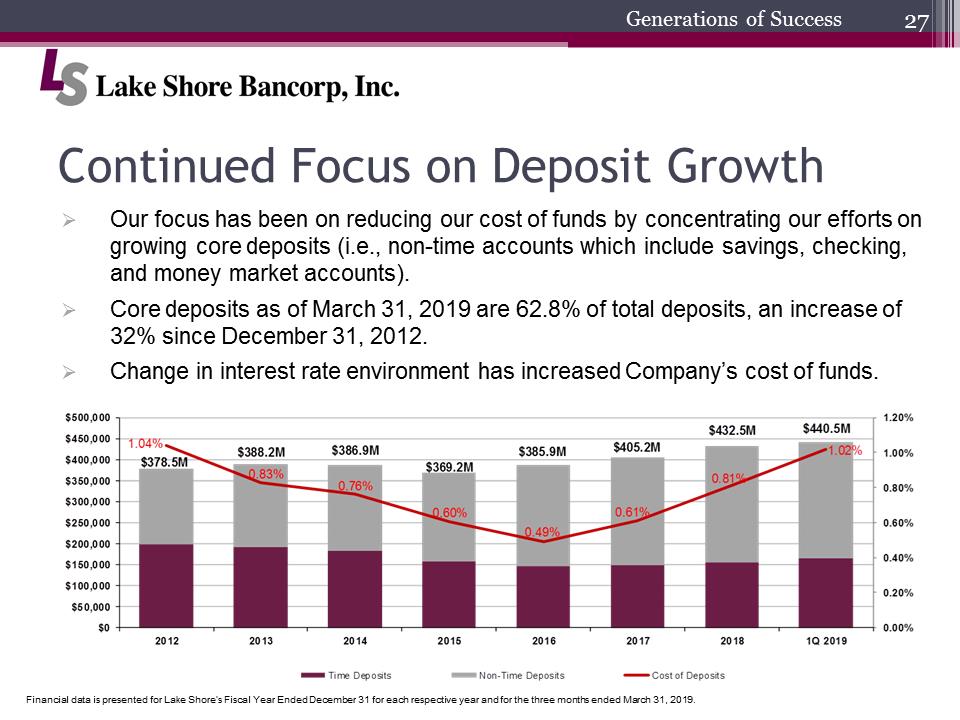 Continued Focus on Deposit Growth$500,000 $450,000 $400,000 $350,000 $300,000 $250,000 $200,000 $150,000 $50,000 1.04% 0.83% 0.76% 0.60% 0.49% 0.61% 0.81% 1.02% $378.4M $388.2M $386.9M $369.2M $385.9M $405.2M $432.5M $440.5M 1.20% 1.00% 0.80% 0.60% 0.40% 0.20% 0.00% 2012 2013 2014 2015 2016 2017 2018 1Q 2019 Time Deposits Non-Time Deposits Cost of DepositsLS Bancorp JPG.pngGenerations of Success.Our focus has been on reducing our cost of funds by concentrating our efforts on growing core deposits (i.e., non-time accounts which include savings, checking, and money market accounts)..Core deposits as of March 31, 2019 are 62.8% of total deposits, an increase of 32% since December 31, 2012..Change in interest rate environment has increased Company’s cost of funds.Financial data is presented for Lake Shore’s Fiscal Year Ended December 31 for each respective year and for the three months ended March 31, 2019.
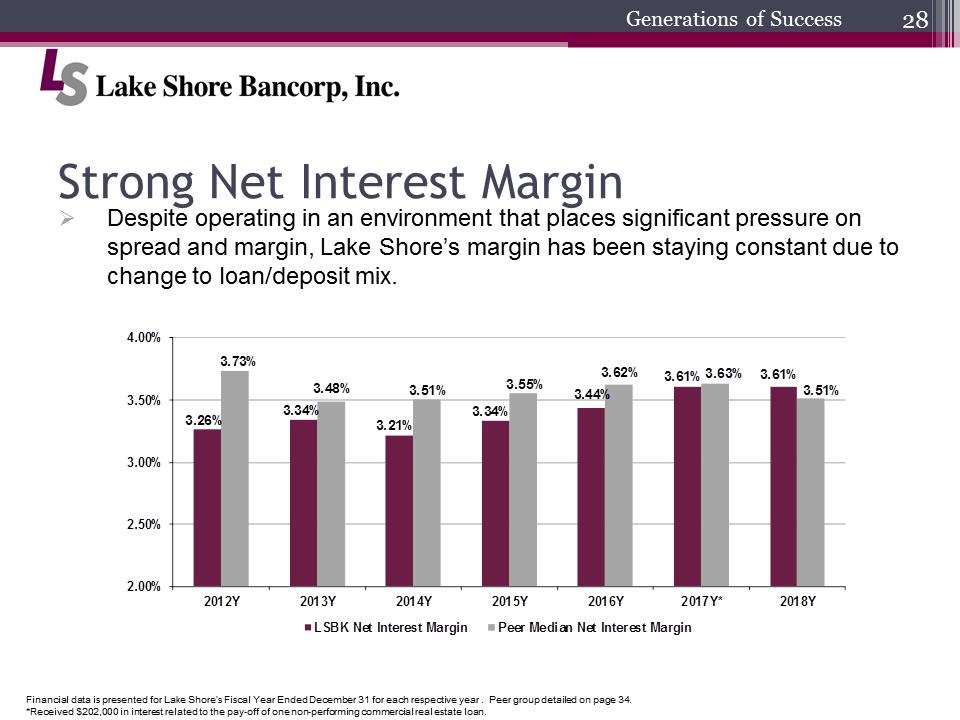 Strong Net Interest Margin4.0% 3.50% 3.00% 2.50% 2.00% 3.26% 3.73% 3.34% 3.48% 3.21% 3.51% 3.34% 3.55% 3.44% 3.62% 3.61% 3.63% 3.61% 3.51% 2012Y 2013Y 2014Y 2015Y 2016Y 2017Y 2018Y LSBK Net Interest margin Peer Median Net Interest MarginLS Bancorp JPG.pngGenerations of Success.Despite operating in an environment that places significant pressure on spread and margin, Lake Shore’s margin has been staying constant due to change to loan/deposit mix.Financial data is presented for Lake Shore’s Fiscal Year Ended December 31 for each respective year . Peer group detailed onpage 34.*Received $202,000 in interest related to the pay-off of one non-performing commercial real estate loan.
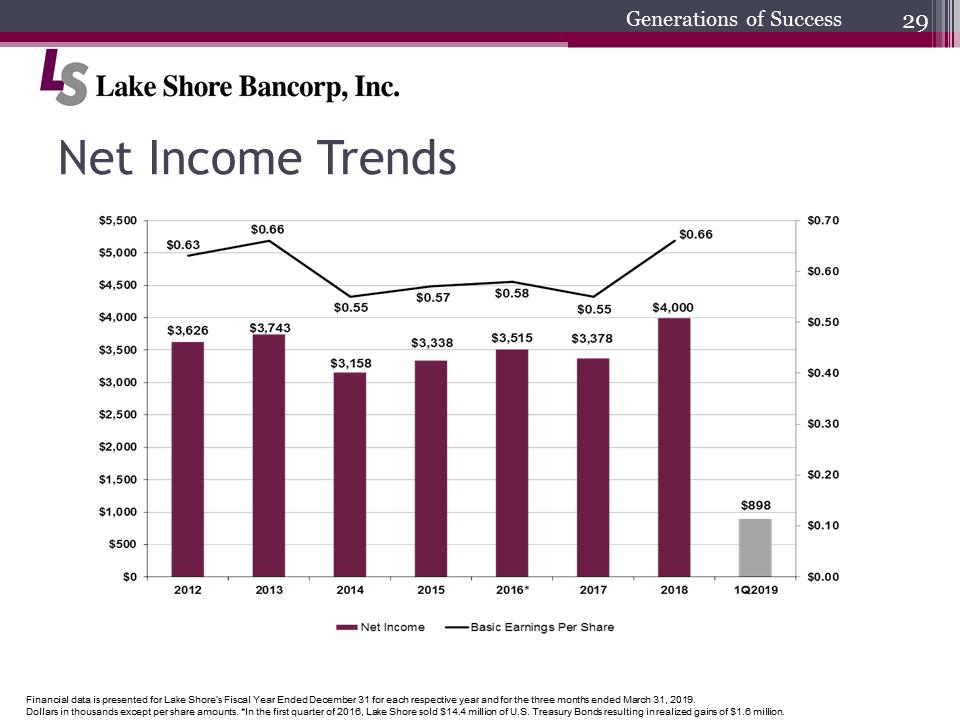 Net Income Trends$5,500 $5,000 $4,500 $4,000 $3,500 $3,000 $2,500 $2,000 $1,500 $1,000 $500 $0 $0.63 $0.66 $0.55 $0.57 $0.58 $0.55 $0.66 $3,626 $3,743 $3,158 $3,338 $3,515 $3,378 $4,000 $898 $0.70 $0.60 $0.50 $0.40 $0.30 $0.20 $0.10 $0.00 2012 2013 2014 2015 2016* 2017 2018 1Q2019 Net Income Basic Earnings Per ShareLS Bancorp JPG.pngGenerations of SuccessFinancial data is presented for Lake Shore’s Fiscal Year Ended December 31 for each respective year and for the three months ended March 31, 2019.Dollars in thousands except per share amounts. *In the first quarter of 2016, Lake Shore sold $14.4 million of U.S. Treasury Bonds resulting in realized gains of $1.6 million.
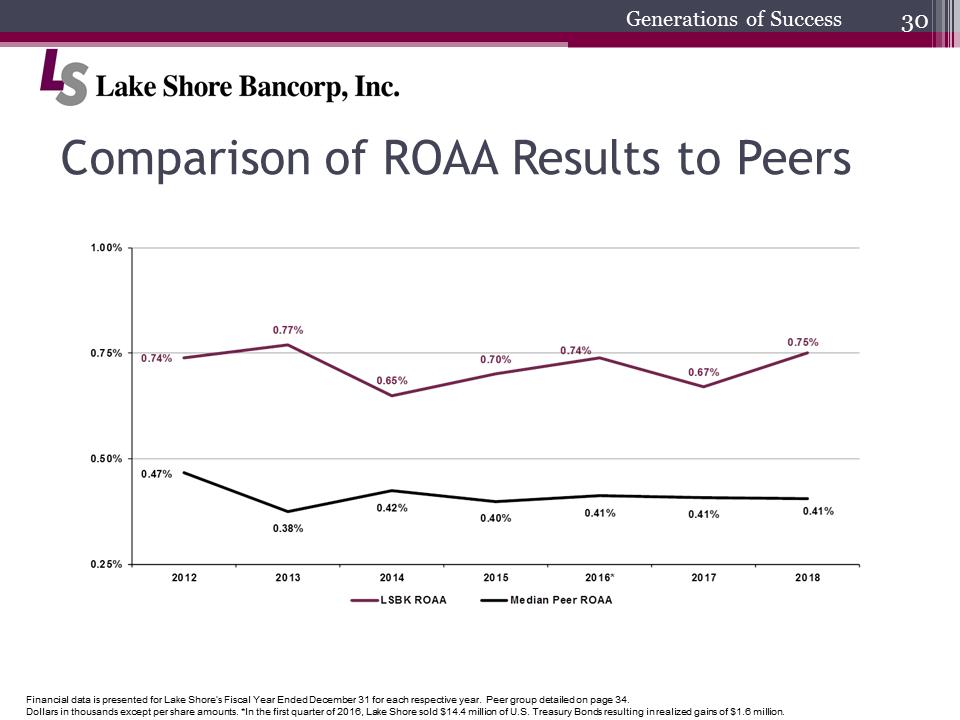 Comparison of ROAA Results to Peers1.00% 0.75% 0.50% 0.25% 0.74% 0.77% 0.65% 0.70% 0.74% 0.67% 0.75% 0.47% 0.38% 0.42% 0.40% 0.41% 0.41% 0.41% 2012 2013 2014 2015 2016* 2017 2018 LSBK ROAA Median Per ROAALS Bancorp JPG.pngGenerations of SuccessFinancial data is presented for Lake Shore’s Fiscal Year Ended December 31 for each respective year. Peer group detailed on page 34.Dollars in thousands except per share amounts. *In the first quarter of 2016, Lake Shore sold $14.4 million of U.S. Treasury Bonds resulting in realized gains of $1.6 million.
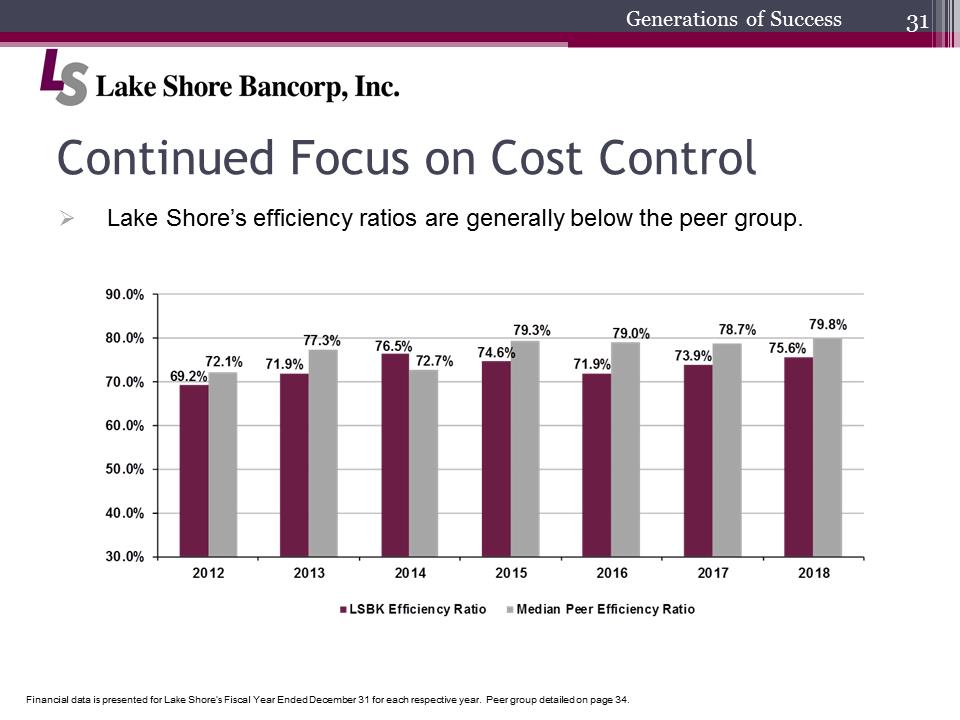 Continued Focus on Cost Control90.0% 80.0% 70.0% 60.0% 50.0% 40.0% 30.0% 69.2.% 72.1% 71.9% 77.3% 76.5% 72.7% 74.6% 79.3% 71.9% 79.0% 73.9% 78.7% 75.6% 79.8% 2012 2013 2014 2015 2016 2017 2018 LSBK Efficiency Ratio Median Peer Efficiency RatioLS Bancorp JPG.pngGenerations of SuccessFinancial data is presented for Lake Shore’s Fiscal Year Ended December 31 for each respective year. Peer group detailed on page 34..Lake Shore’s efficiency ratios are generally below the peer group.
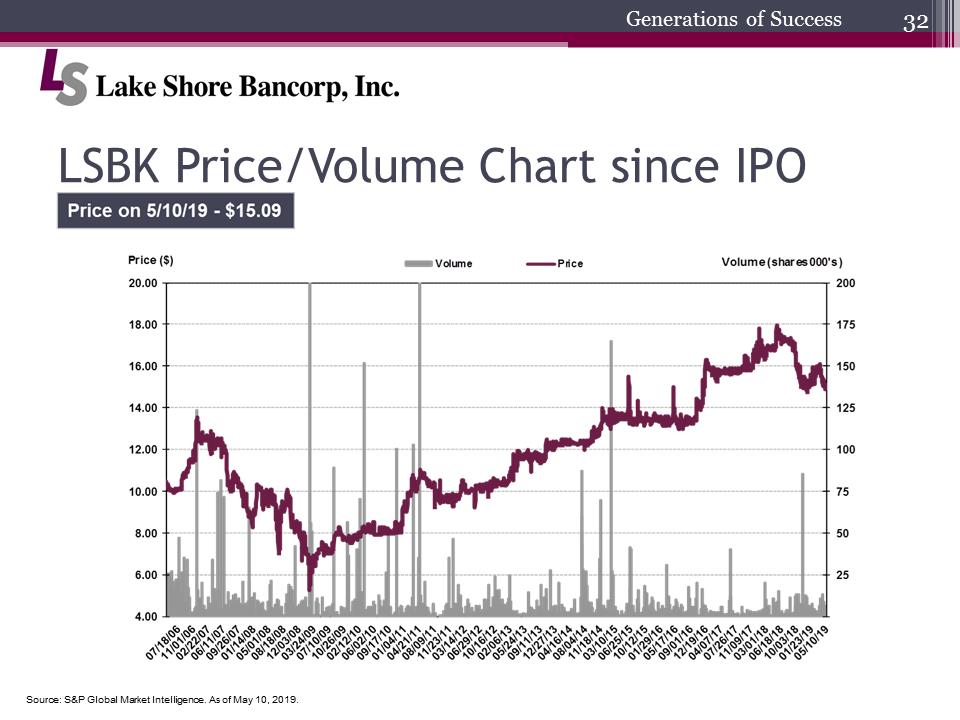 LSBK Price/Volume Chart since IPOPrice on 5/10/19 - $15.09 Price ($) Volume Price Volume (shares 000’s) 20.00 18.00 16.00 14.00 12.00 10.00 8.00 6.00 4.00 200 175 150 125 100 75 50 25 07/18/06 11/01/06 02/22/07 09/26/07 01/14/08 05/01/08 08/18/08 12/03/08 03/24/09 07/10/09 10/26/09 02/12/10 06/02/10 09/17/10 01/04/11 04/21/11 08/09/11 11/23/11 03/14/12 06/29/12 10/16/12 02/06/13 05/24/13 09/11/13 12/27/13 04/16/14 08/04/14 11/18/14 03/10/15 06/25/15 10/12/15 01/29/16 05/17/16 09/01/16 12/19/16 04/07/17 07/26/17 11/09/17 03/01/18 06/18 18 10/03/18 01/23/19 05/10/19LS Bancorp JPG.pngGenerations of SuccessSource: S&P Global Market Intelligence. As of May 10, 2019.
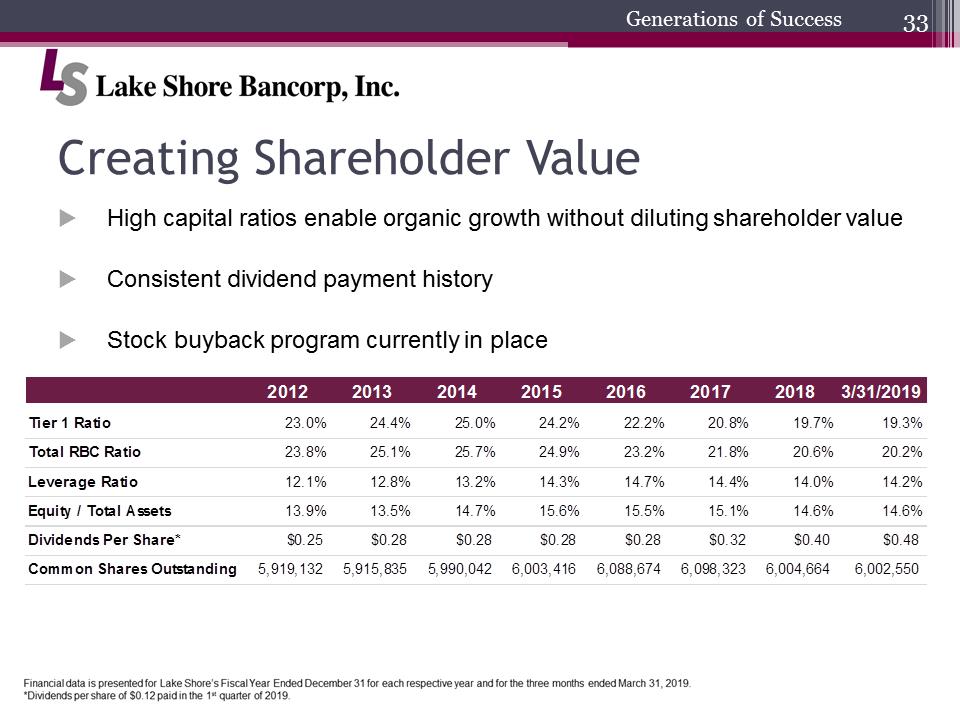 Creating Shareholder Value2012 2013 2014 2015 2016 2017 2018 3/31/2019 Tier 1 Ratio 23.0% 24.4% 25.0% 24.2% 22.2% 20.8% 19.7% 19.3% Total RBC Ratio 23.8% 25.1% 25.7% 24.9% 23.2% 21.8% 20.6% 20.2% Leverage Ratio 12.1% 12.8% 13.2% 14.3% 14.7% 14.4% 14.0% 14.2% Equity / Total Assets 13.9% 13.5% 14.7% 15.6% 15.5% 15.1% 14.6% 14.6% Dividends Per Share* $0.25 $0.28 $0.28 $0.28 $0.28 $0.32 $0.40 $0.48 Common Shares Outstanding 5,919,132 5,915,835 5,990,042 6,003,416 6,088,674 6,098,323 6,004,664 6,002,550LS Bancorp JPG.pngGenerations of Success.High capital ratios enable organic growth without diluting shareholder value.Consistent dividend payment history.Stock buyback program currently in place
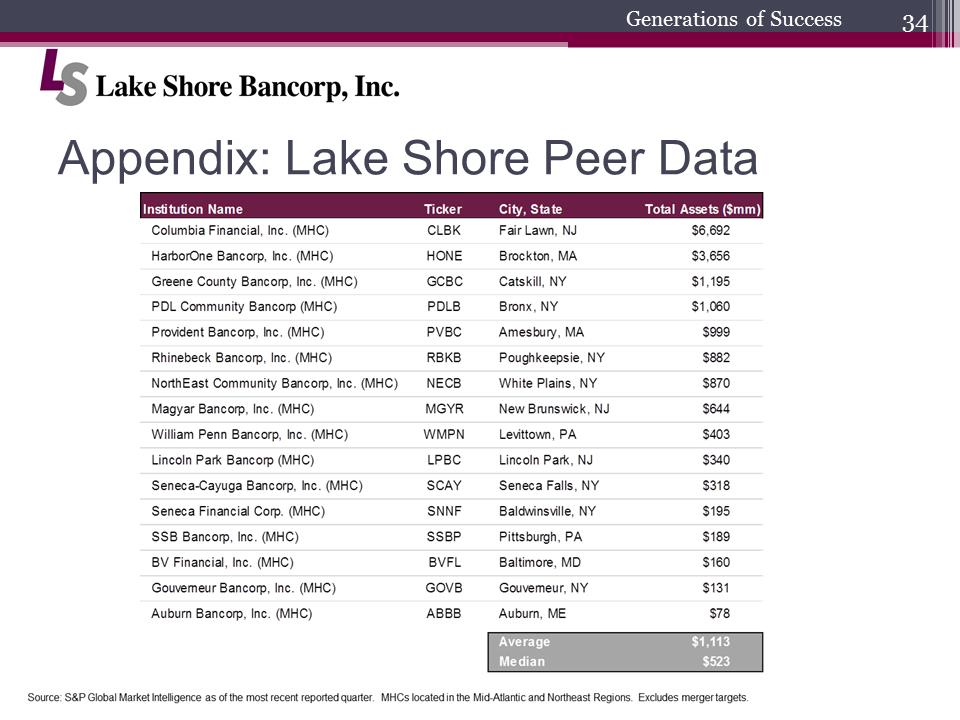 Appendix: Lake Shore Peer DataInstitution Name Ticker City, State Total Assets ($mm) Columbia Financial, Inc (MHC) CLBK Fair Lawn, NJ $6,692 HarborOne Bancorp, Inc. (MHC) HONE Brockton, MA $3,656 Greene County Bancorp, Inc (MHC) GCBC Catskill, NY $1,195 PDL Community Bancorp (MHC) PDLB Bronx, NY $1,060 Provident Bancorp, Inc. (MHC) PVBC Amesbury, MA $999 Rhinebeck Bancorp, Inc. (MHC) RBKB Poughkeepsie, NY $882 NorthEast Community Bancorp, Inc. (MHC) NECB White Plains, NY $870 Magyar Bancorp, Inc. (MHC) MGYR New Brunswick, NJ $644 William Penn Bancorp, Inc (MHC) WMPN Levittown, PA $403 Lincoln Park Bancorp (MHC) LPBC Lincoln Park, NJ $340 Seneca-Cayuga Bancorp, Inc. (MHC) SCAY Seneca Falls, NY $318 Seneca Financial Corp. (MHC) SNNF Baldwinsville, NY $195 SSB Bancorp, Inc. (MHC) SSBP Pittsburgh, PA $189 BV Financial, Inc. (MHC) BVFL Baltimore, MD $160 Gouvemeur Bancorp, Inc. (MHC) GOVB Gouvemeur, NY $131 Auburn Bancorp, Inc. (MHC) ABBB Auburn, ME $78 Average $1,113 Median $523LS Bancorp JPG.pngGenerations of Success
 Appendix: Lake Shore Peer DataLS Bancorp JPG.pngGenerations of Success Questions & Answers
 Lake Shore, MHC Annual Meeting of MembersLS Bancorp JPG.pngGenerations of Success.Call to Order.Introduction of Proposal to Elect Directors.Tabulation of Votes.Adjournment