 Lake Shore Savings Bank Putting People First ANNUAL SHAREHOLDERS’ MEETING May 18, 2022
 Lake Shore Bancorp, Inc. Safe Harbor Statement This presentation contains certain forward-looking statements within the meaning of the Private Securities Litigation Reform Act of 1995, that are based on current expectations, estimates and projections about the Company’s and the Bank’s industry, and management’s beliefs and assumptions. Words such as anticipates, expects, intends, plans, believes, estimates and variations of such words and expressions are intended to identify forward-looking statements. Such statements are not a guarantee of future performance and are subject to certain risks, uncertainties and assumptions that are difficult to forecast. Therefore, actual results may differ materially from those expressed or forecast in such forward-looking statements. The Company and Bank undertake no obligation to update publicly any forward-looking statements, whether as a result of new information or otherwise.There are risks, uncertainties and other factors that could cause the actual results of the Company to differ materially from the results expressed or implied by such forward-looking statements. Information on factors that could affect the Company’s business and results is discussed in the Company’s periodic reports filed with the Securities and Exchange Commission. Forward looking statements speak only as of the date they are made. The Company undertakes no obligation to publicly update or revise forward looking information, whether as a result of new, updated information, future events or otherwise.
 LAKE SHORE BANCORP, INC. Agenda•Call to Order –Kevin M. Sanvidge, Chairman •Introduction of Officers, Directors and Director Nominees•Secretary’s Report•Presentation of Proposals•Executive Management Report to Shareholders•Vote Report•AdjournmentA person in a suit smiling
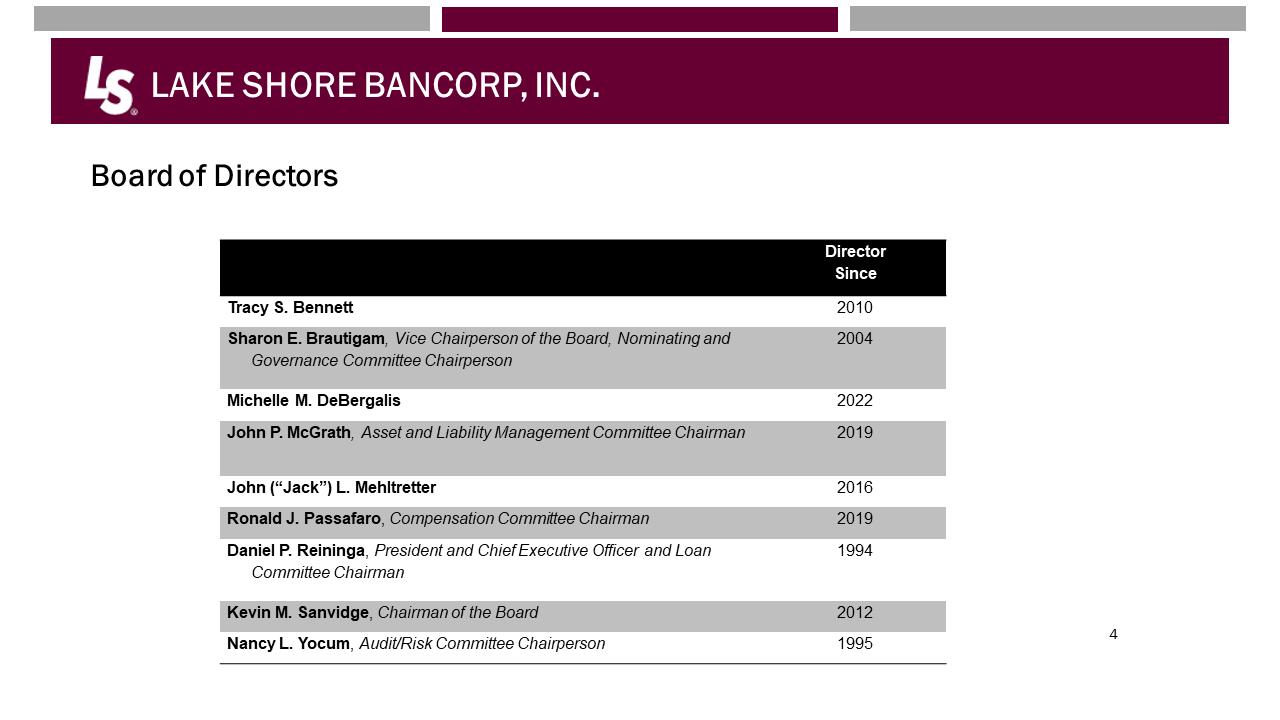 LAKE SHORE BANCORP, INC.Board of DirectorsDirectorSinceTracy S. Bennett2010Sharon E. Brautigam, Vice Chairperson of the Board, Nominating and Governance Committee Chairperson2004Michelle M. DeBergalis2022John P. McGrath, Asset and Liability Management Committee Chairman2019John (“Jack”) L. Mehltretter 2016Ronald J. Passafaro, Compensation Committee Chairman2019Daniel P. Reininga, President and Chief Executive Officer and Loan Committee Chairman1994Kevin M. Sanvidge, Chairman of the Board2012Nancy L. Yocum, Audit/Risk Committee Chairperson1995
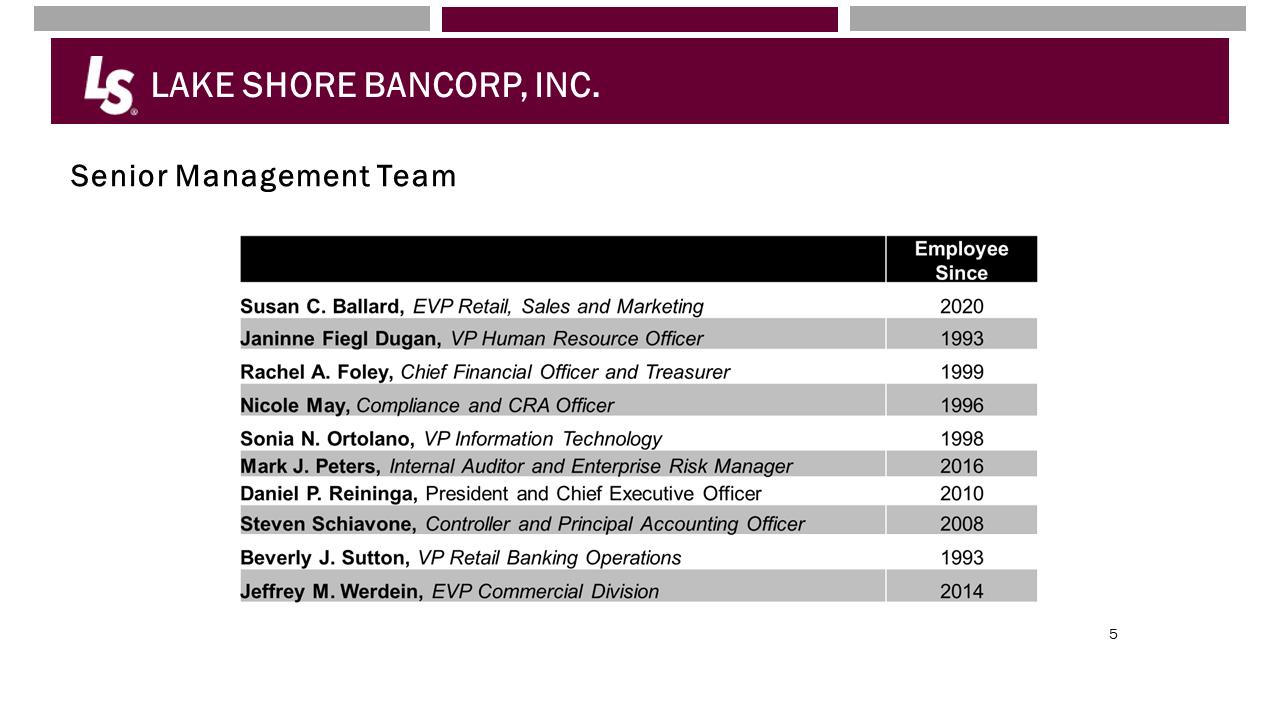 LAKE SHORE BANCORP, INC.Senior Management Team Employee Since Susan C. Ballard, EVP Retail, Sales and Marketing 2020 Janinne Fiegl Dugan, VP Human Resource Officer 1993 Rachel A. Foley, Chief Financial Officer and Treasurer 1999 Nicole May, Compliance and CRA Officer 1996 Sonia N. Ortolano, VP Information Technology 1998 Mark J. Peters, Internal Auditor and Enterprise Risk Manager 2016 Daniel P. Reininga, President and Chief Executive Officer 2010 Steven Schiavone, Controller and Principal Accounting Officer 2008 Beverly J. Sutton, VP Retail Banking Operations 1993 Jeffrey M. Werdein, EVP Commercial Division 2014
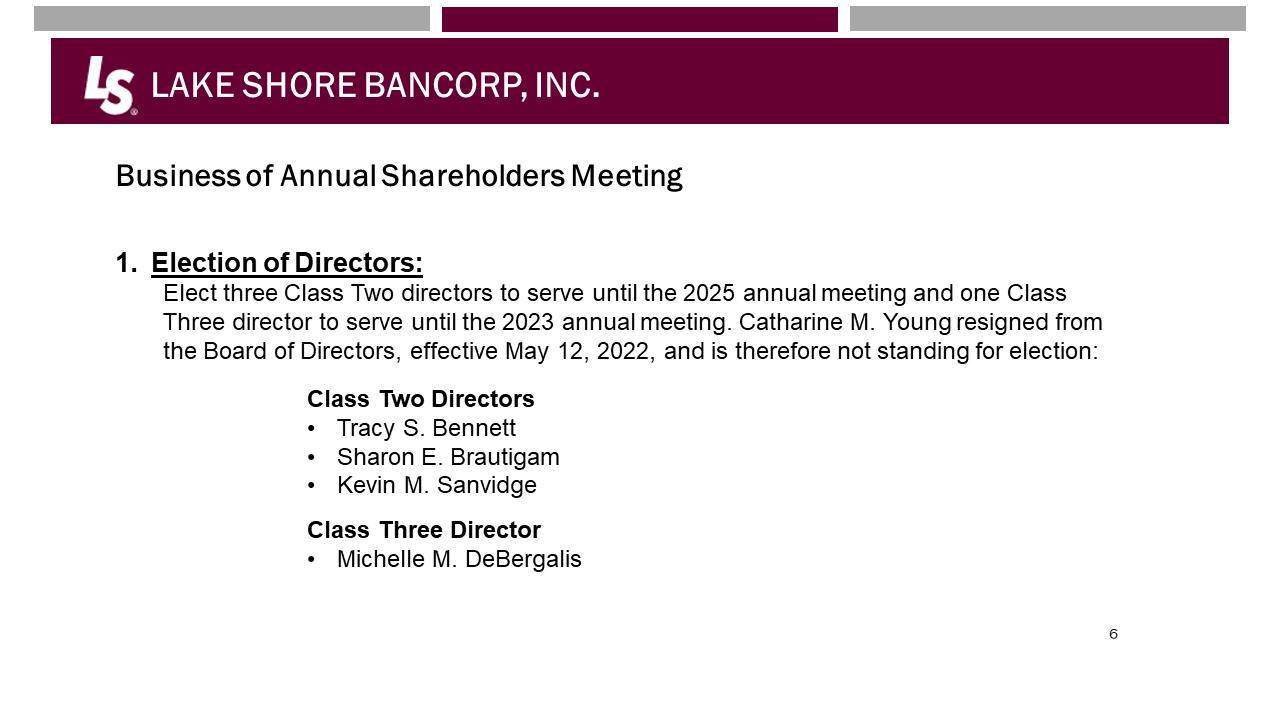 LAKE SHORE BANCORP, INC.Business of Annual Shareholders Meeting1.Election of Directors:Elect three Class Two directors to serve until the 2025 annual meeting and one Class Three director to serve until the 2023 annual meeting. Catharine M. Young resigned from the Board of Directors, effective May 12, 2022, and is therefore not standing for election:Class Two Directors•Tracy S. Bennett•Sharon E. Brautigam•Kevin M. SanvidgeClass Three Director•Michelle M. DeBergalis
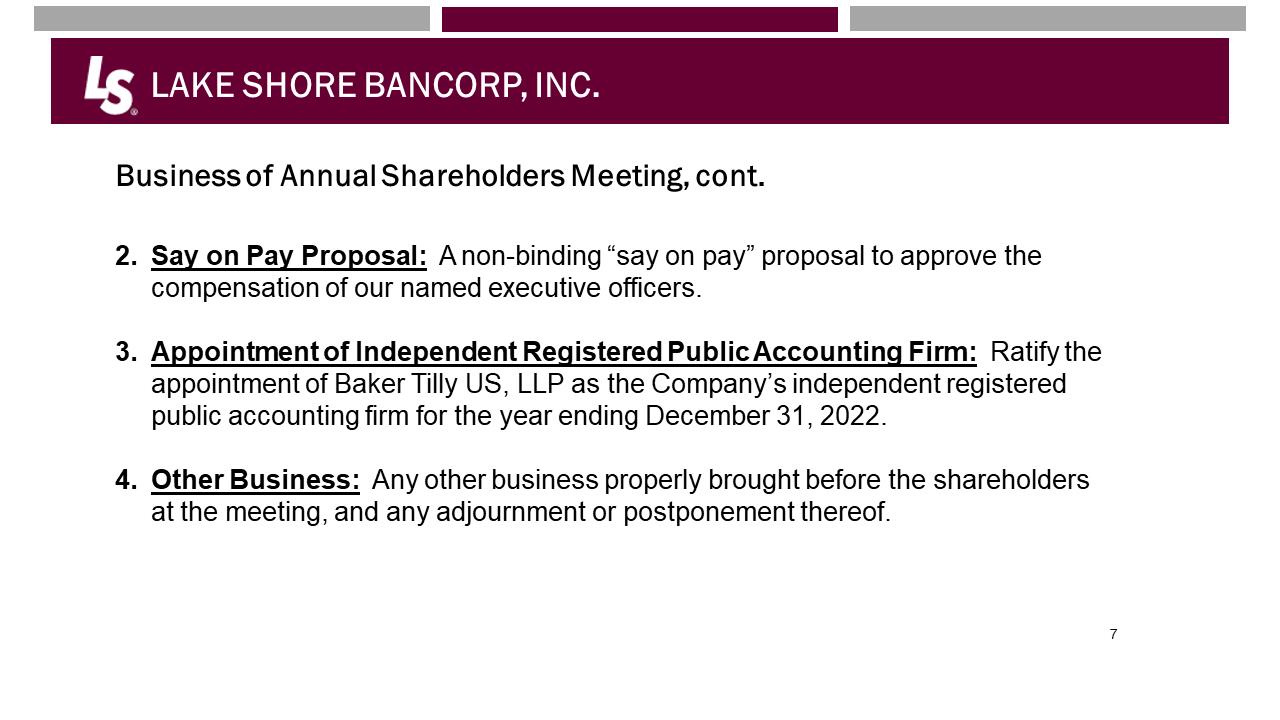 LAKE SHORE BANCORP, INC.Business of Annual Shareholders Meeting, cont.2.Say on Pay Proposal:A non-binding “say on pay” proposal to approve the compensation of our named executive officers.3.Appointment of Independent Registered Public Accounting Firm:Ratify the appointment of Baker Tilly US, LLP as the Company’s independent registered public accounting firm for the year ending December 31, 2022.4.Other Business:Any other business properly brought before the shareholders at the meeting, and any adjournment or postponement thereof.
 LAKE SHORE BANCORP, INC.Executive Management PresentationDaniel P. Reininga, President and Chief Executive OfficerA person in a suit and tie
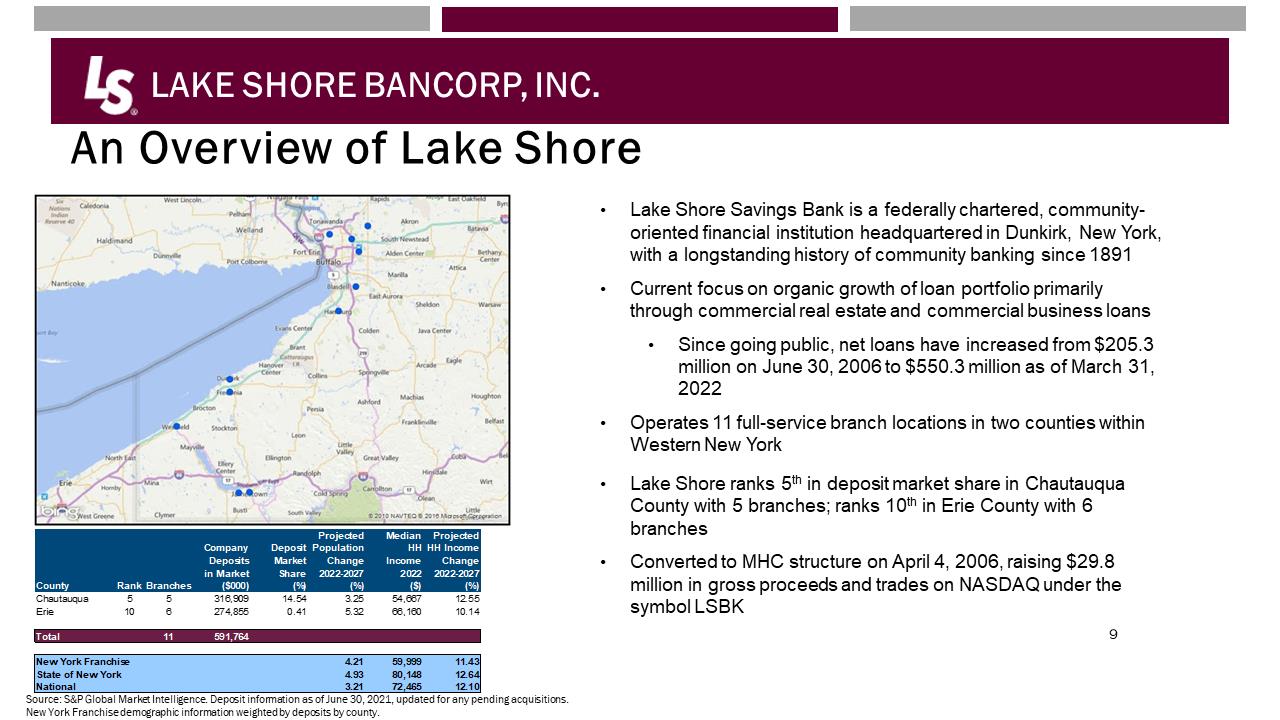 LAKE SHORE BANCORP, INC.An Overview of Lake Shore Source: S&P Global Market Intelligence. Deposit information as of June 30, 2021, updated for any pending acquisitions.New York Franchise demographic information weighted by deposits by county.•Lake Shore Savings Bank is a federally chartered, community-oriented financial institution headquartered in Dunkirk, New York, with a longstanding history of community banking since 1891•Current focus on organic growth of loan portfolio primarily through commercial real estate and commercial business loans•Since going public, net loans have increased from $205.3 million on June 30, 2006 to $550.3 million as of March 31, 2022•Operates 11 full-service branch locations in two counties within Western New York•Lake Shore ranks 5thin deposit market share in Chautauqua County with 5 branches; ranks 10thin Erie County with 6 branches•Converted to MHC structure on April 4, 2006, raising $29.8 million in gross proceeds and trades on NASDAQ under the symbol LSBKCountyRankBranchesCompanyDepositsin Market($000)DepositMarketShare(%)ProjectedPopulationChange2022-2027(%)MedianHHIncome2022($)ProjectedHH IncomeChange2022-2027(%)Chautauqua55316,90914.543.2554,66712.55Erie106274,8550.415.3266,16010.14Total11591,764New York Franchise4.2159,99911.43State of New York4.9380,14812.64National3.2172,46512.10
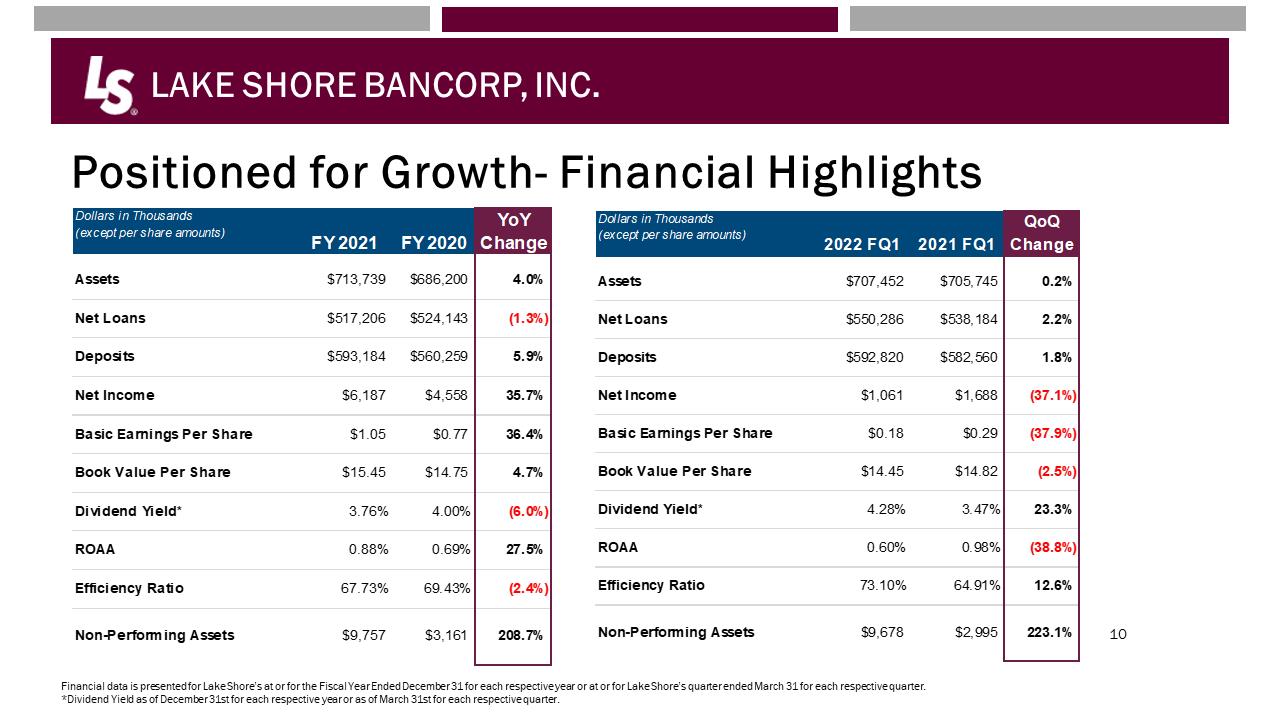 LAKE SHORE BANCORP, INC.Positioned for Growth-Financial HighlightsFinancial data is presented for Lake Shore’s at or for the Fiscal Year Ended December 31 for each respective year or at or for Lake Shore’s quarter ended March 31 for each respective quarter.*Dividend Yield as of December 31st for each respective year or as of March 31st for each respective quarter.Dollars in Thousands(except per share amounts)FY 2021FY 2020YoY ChangeAssets$713,739$686,2004.0%Net Loans$517,206$524,143(1.3%)Deposits$593,184$560,2595.9%Net Income$6,187$4,55835.7%Basic Earnings Per Share $1.05$0.7736.4%Book Value Per Share$15.45$14.754.7%Dividend Yield*3.76%4.00%(6.0%)ROAA0.88%0.69%27.5%Efficiency Ratio67.73%69.43%(2.4%)Non-Performing Assets$9,757$3,161208.7%Dollars in Thousands(except per share amounts)2022 FQ12021 FQ1QoQ ChangeAssets$707,452$705,7450.2%Net Loans$550,286$538,1842.2%Deposits$592,820$582,5601.8%Net Income$1,061$1,688(37.1%)Basic Earnings Per Share $0.18$0.29(37.9%)Book Value Per Share$14.45$14.82(2.5%)Dividend Yield*4.28%3.47%23.3%ROAA0.60%0.98%(38.8%)Efficiency Ratio73.10%64.91%12.6%Non-Performing Assets$9,678$2,995223.1%
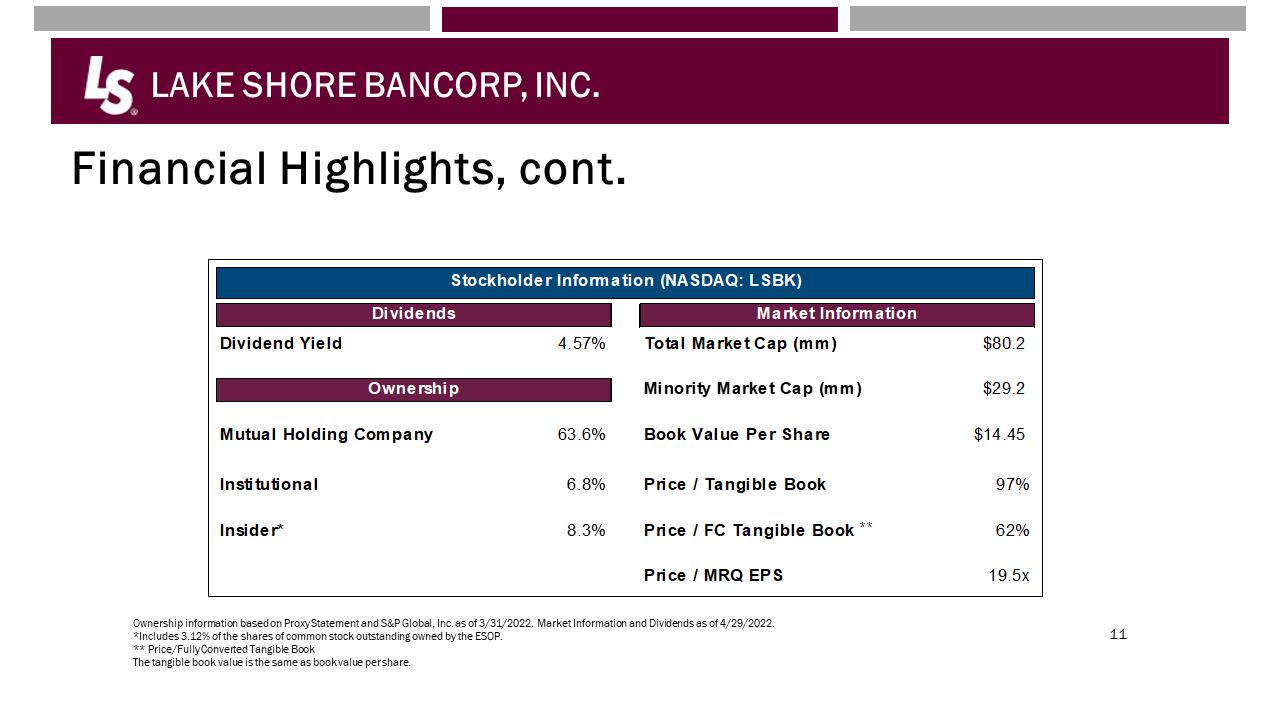 LAKE SHORE BANCORP, INC.Financial Highlights, cont.Ownership information based on Proxy Statement and S&P Global, Inc. as of 3/31/2022. Market Information and Dividends as of 4/29/2022.*Includes 3.12% of the shares of common stock outstanding owned by the ESOP.** Price/Fully Converted Tangible BookThe tangible book value is the same as book value per share.DividendsMarket InformationDividend Yield4.57%Total Market Cap (mm)$80.2OwnershipMinority Market Cap (mm)$29.2Mutual Holding Company 63.6%Book Value Per Share$14.45Institutional6.8%Price / Tangible Book97%Insider*8.3%Price / FC Tangible Book62%Price / MRQ EPS19.5xStockholder Information (NASDAQ: LSBK)
 LAKE SHORE BANCORP, INC.Envisioning a Bright Banking Future•Commercial Business Overview•Retail Business Overview•Core Conversion•Security Enhancements
 LAKE SHORE BANCORP, INC.Envisioning a Bright Banking FutureCommercial Business Overview:Outstanding Success of the Commercial Team:•Helping our Commercial Customers navigate through difficult times•Paycheck Protection Program –Round 2•Originated $11.4 million in 2021 for borrowers in our local market areas•Total PPP Loans Originated in 2020 and 2021•$38.3 million•285 borrowers
 LAKE SHORE BANCORP, INC.Envisioning a Bright Banking FutureRetail Business Overview•Record breaking year in Loan volume•Total Residential Loan Refinances -$23.7 million•Total Residential Loan Purchases -$26.4 million•Total Home Equity Loan Originations -$20.5 million
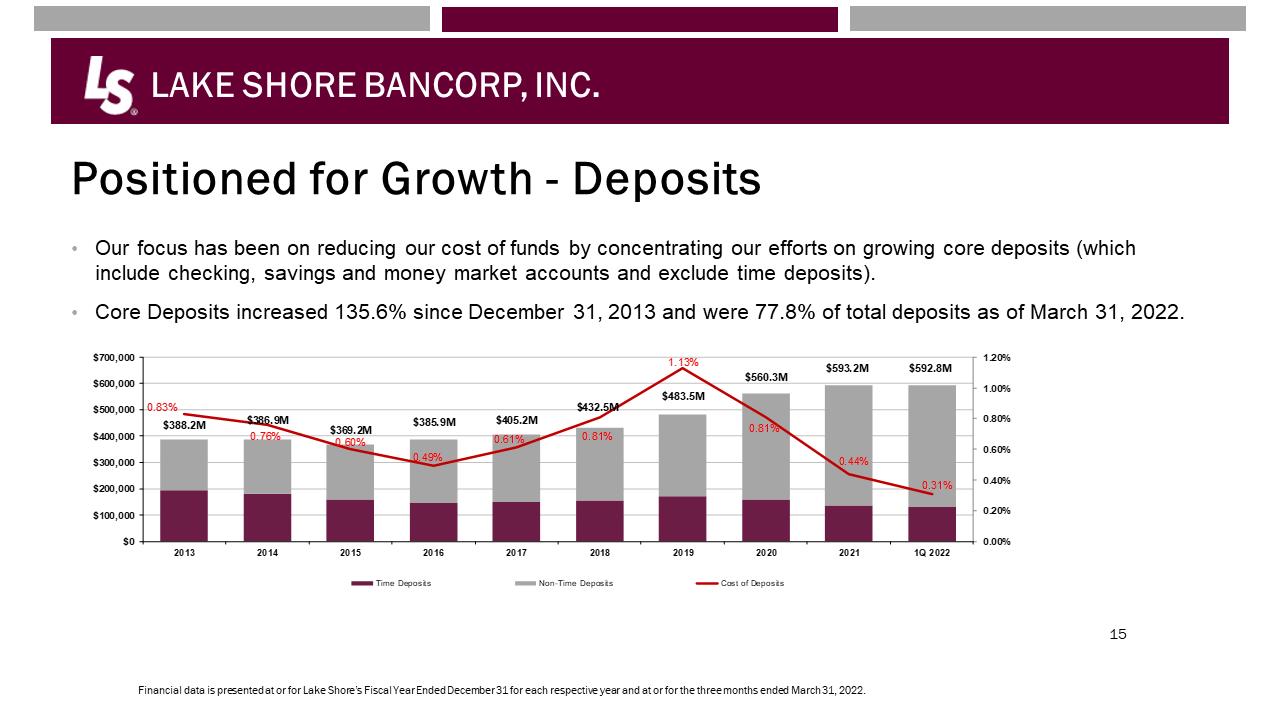 LAKE SHORE BANCORP, INC.Positioned for Growth -Deposits•Our focus has been on reducing our cost of funds by concentrating our efforts on growing core deposits (which include checking, savings and money market accounts and exclude time deposits).•Core Deposits increased 135.6% since December 31, 2013 and were 77.8% of total deposits as of March 31, 2022.Financial data is presented at or for Lake Shore’s Fiscal Year Ended December 31 for each respective year and at or for the three months ended March 31, 2022.$388.2M$386.9M$369.2M$385.9M$405.2M$432.5M$483.5M$560.3M$593.2M$592.8M0.83%0.76%0.60%0.49%0.61%0.81%1.13%0.81%0.44%0.31%0.00%0.20%0.40%0.60%0.80%1.00%1.20%$0$100,000$200,000$300,000$400,000$500,000$600,000$700,0002013201420152016201720182019202020211Q 2022Time Deposits Non-Time Deposits Cost of Deposits
 LAKE SHORE BANCORP, INC.Envisioning a Bright Banking FutureCore Conversion and Security Enhancements•Smooth Transition•Efficiencies•Enhanced Banking Features as we continue to meet the digital banking needs of our customers•Transition to enhanced security profile in the second quarter of 2022
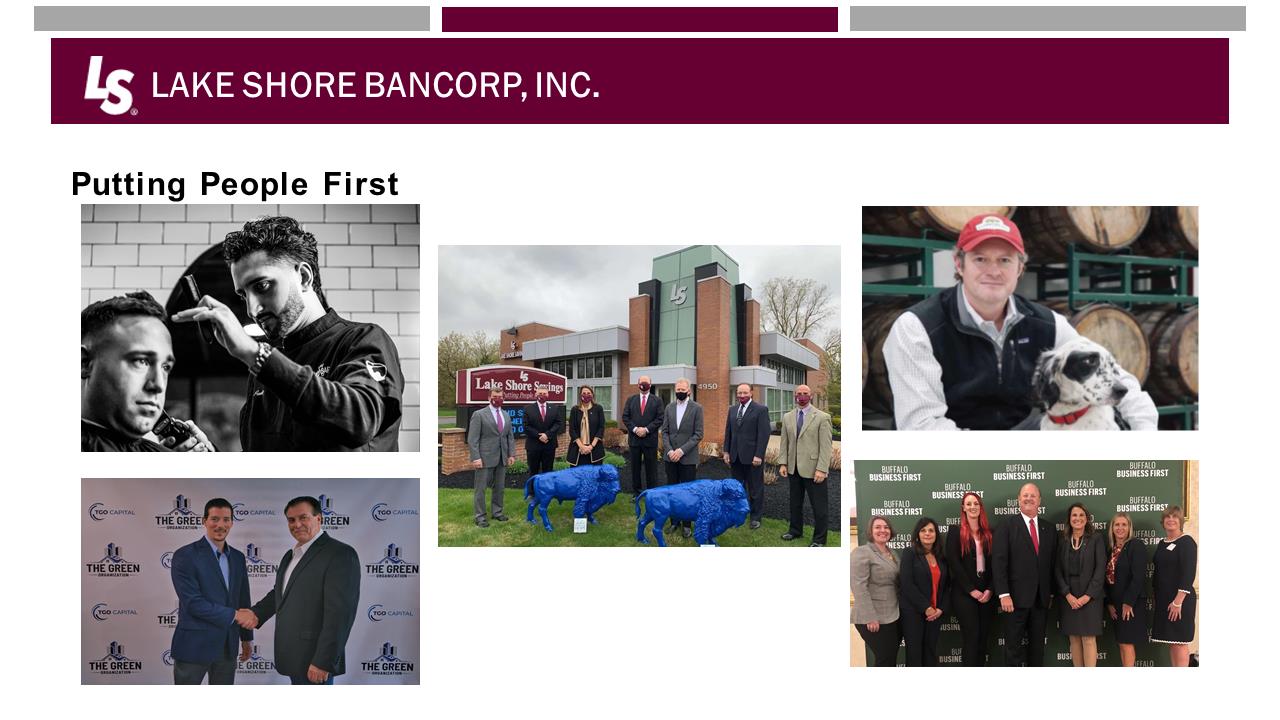 LAKE SHORE BANCORP, INC.Putting People First A picture containing person, personTwo men shaking handsA picture containing person, personA group of people standing in front of a buildingA group of people posing for a photo
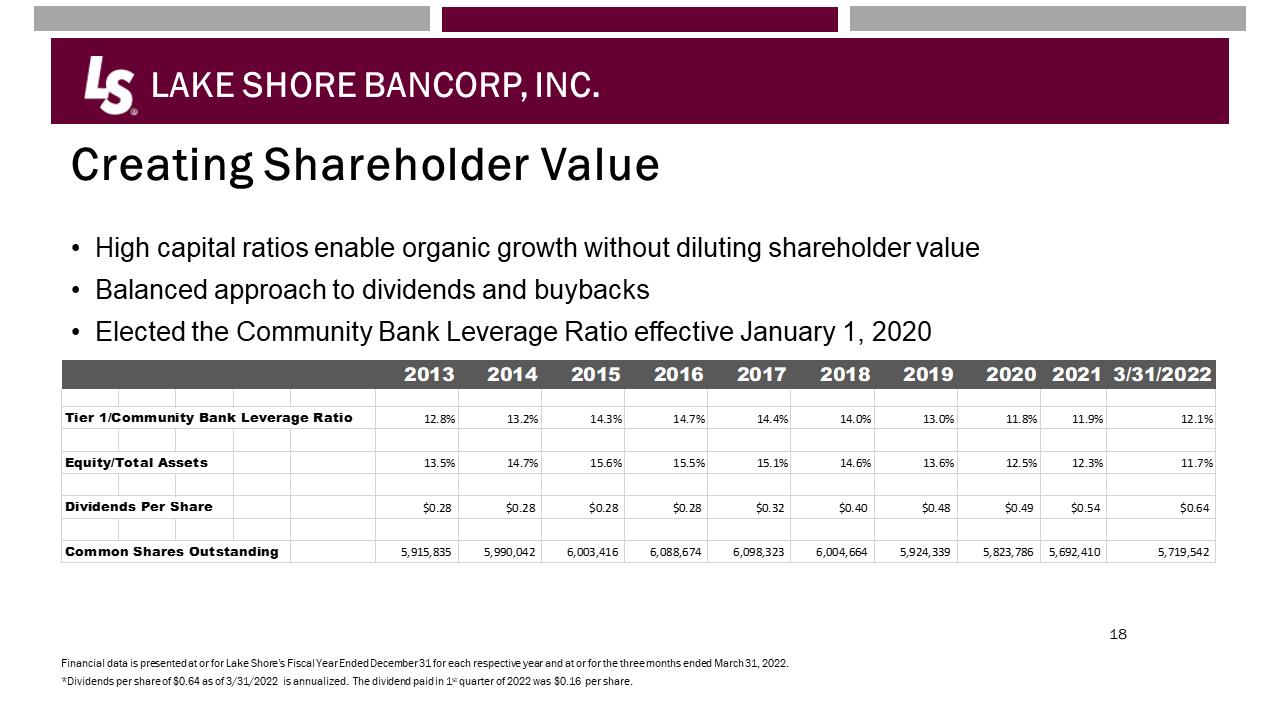 LAKE SHORE BANCORP, INC.Creating Shareholder Value•High capital ratios enable organic growth without diluting shareholder value•Balanced approach to dividends and buybacks•Elected the Community Bank Leverage Ratio effective January 1, 2020Financial data is presented at or for Lake Shore’s Fiscal Year Ended December 31 for each respective year and at or for the three months ended March 31, 2022.*Dividends per share of $0.64 as of 3/31/2022 is annualized. The dividend paid in 1stquarter of 2022 was $0.16 per share.2013201420152016201720182019202020213/31/2022Tier 1/Community Bank Leverage Ratio12.8%13.2%14.3%14.7%14.4%14.0%13.0%11.8%11.9%12.1%Equity/Total Assets13.5%14.7%15.6%15.5%15.1%14.6%13.6%12.5%12.3%11.7%Dividends Per Share $0.28$0.28$0.28$0.28$0.32$0.40$0.48$0.49$0.54$0.64Common Shares Outstanding5,915,835 5,990,042 6,003,416 6,088,674 6,098,323 6,004,664 5,924,339 5,823,786 5,692,410 5,719,542
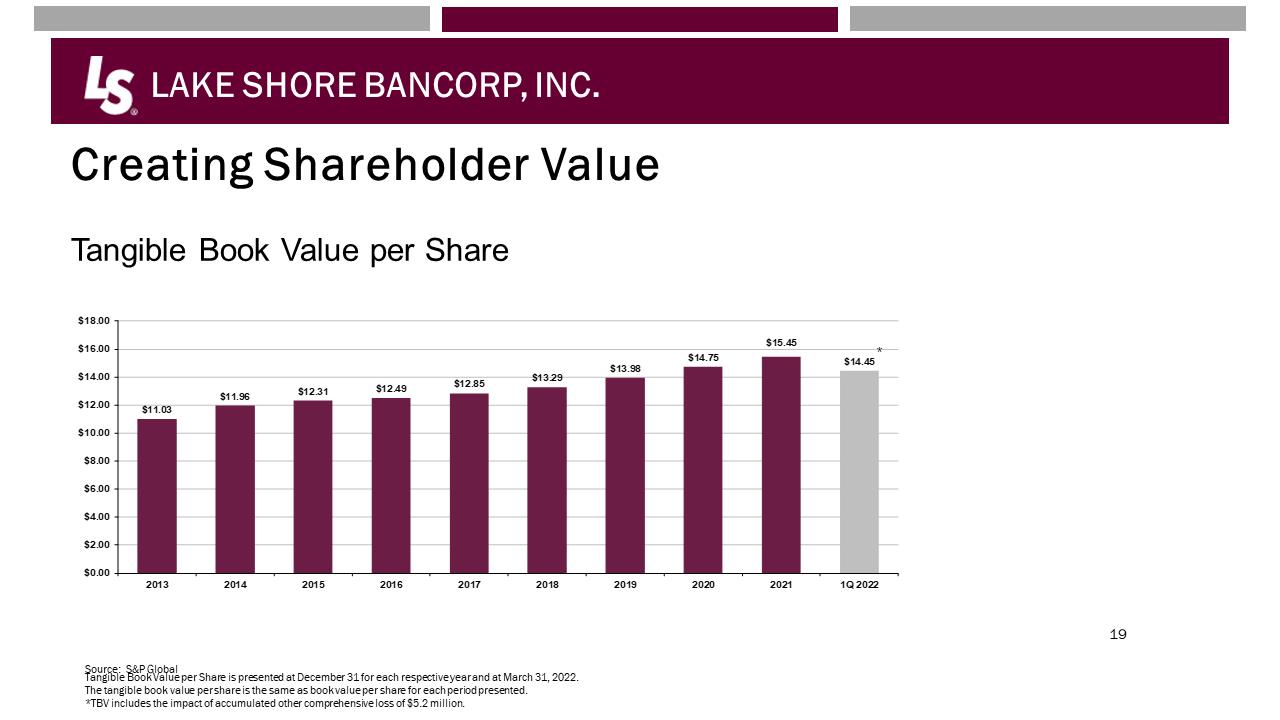 LAKE SHORE BANCORP, INC.Creating Shareholder ValueTangible Book Value per ShareSource: S&P GlobalTangible Book Value per Share is presented at December 31 for each respective year and at March 31, 2022. The tangible book value per share is the same as book value per share for each period presented.*TBV includes the impact of accumulated other comprehensive loss of $5.2 million.$11.03$11.96$12.31$12.49$12.85$13.29$13.98$14.75$15.45$14.45$0.00$2.00$4.00$6.00$8.00$10.00$12.00$14.00$16.00$18.002013201420152016201720182019202020211Q 2022*
 LAKE SHORE BANCORP, INC.Creating Shareholder ValueTreasury Stock Buybacks TrendsTreasury Stock data is presented for Lake Shore’s Fiscal Year Ended December 31 for each respective year. Treasury Stock Purchases $’s in Thousands $2,500 $2,000 $1,500 $1,000 $500 $ 2017 FY 2018 FY 2019 FY 2020 FY 2021 FY 160,000 140,000 120,000 100,000 80,000 60,000 40,000 20,000 $ AMT # of Shares
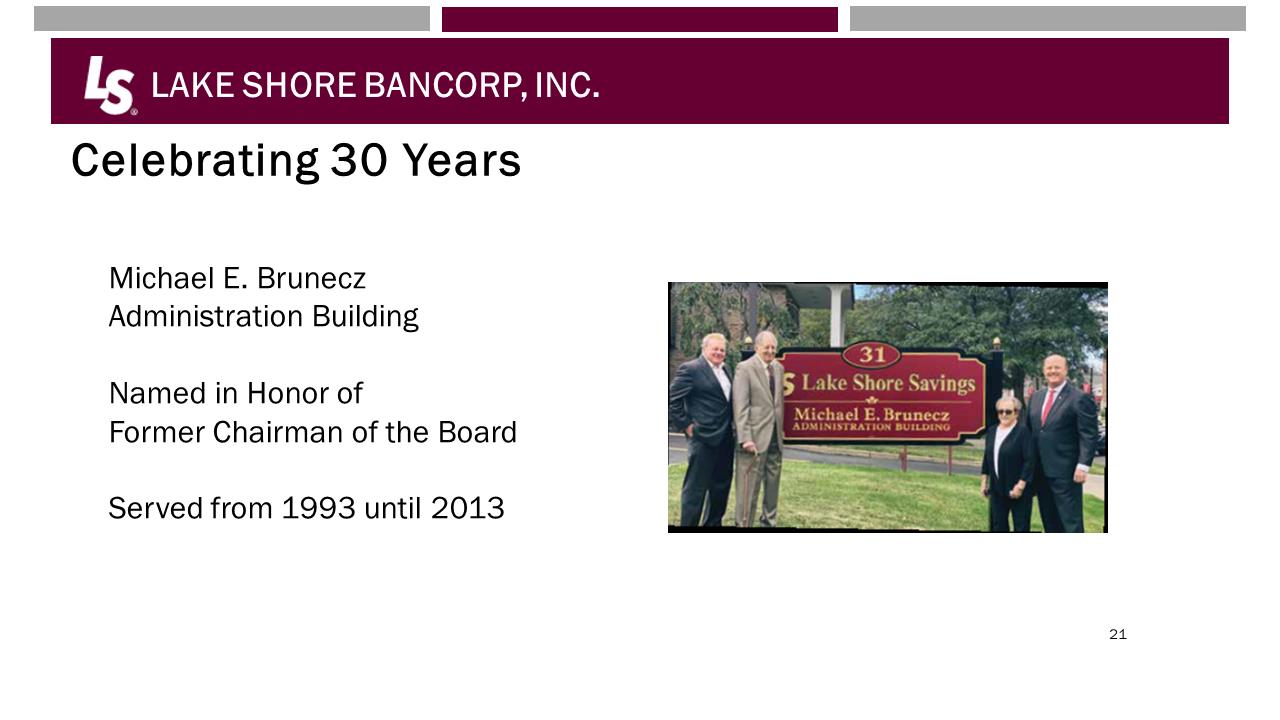 LAKE SHORE BANCORP, INC.Celebrating 30 YearsMichael E. BruneczAdministration Building Named in Honor of Former Chairman of the BoardServed from 1993 until 2013
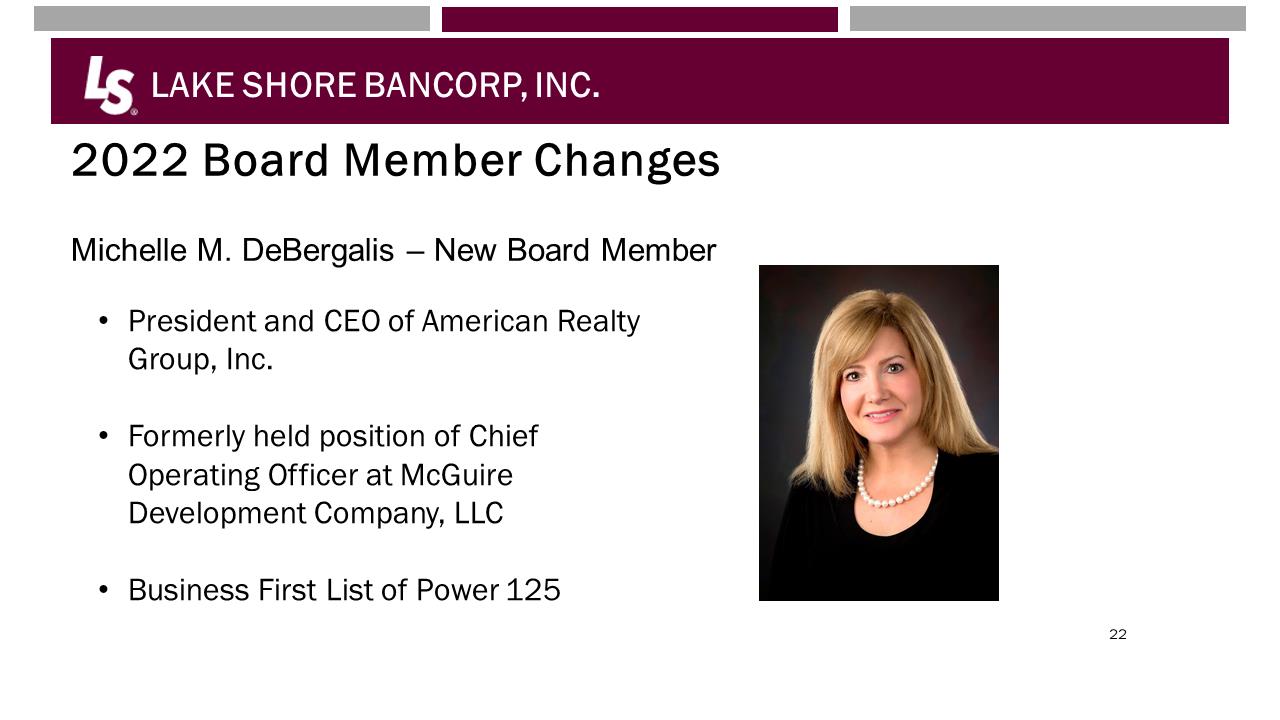 LAKE SHORE BANCORP, INC.2022 Board Member ChangesMichelle M. DeBergalis –New Board Member•President and CEO of American Realty Group, Inc.•Formerly held position of Chief Operating Officer at McGuire Development Company, LLC•Business First List of Power 125A person with blonde hair
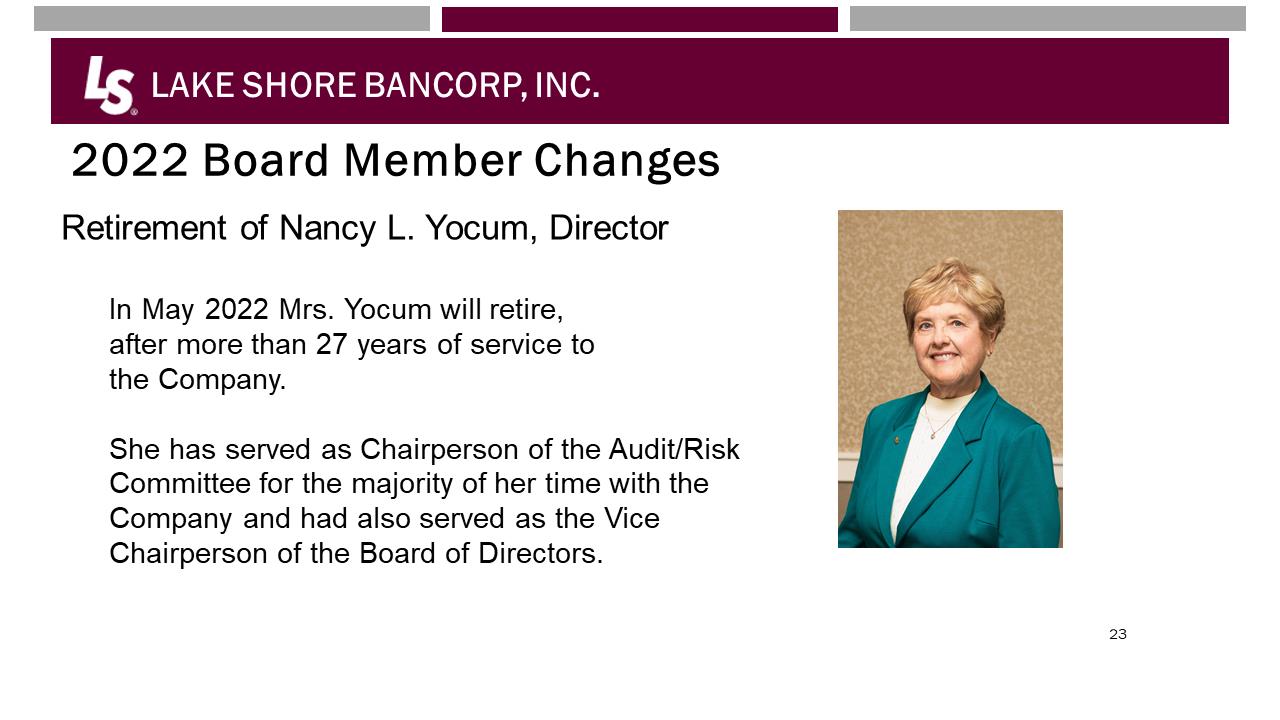 LAKE SHORE BANCORP, INC.2022 Board Member ChangesRetirement of Nancy L. Yocum, DirectorIn May 2022 Mrs. Yocum will retire, after more than 27 years of service to the Company.She has served as Chairperson of the Audit/Risk Committee for the majority of her time with theCompany and had also served as the Vice Chairperson of the Board of Directors. A picture containing person, indoor
 LAKE SHORE BANCORP, INC.Corporate Governance•The Board of Directors and Management remain focused on governance over the Company.•We expect the new core system efficiencies will lay the foundation for the growth of the organization.
 Lake Shore Bancorp, Inc. Summary After 131 years in business, we continue to be a local bank that cares about its customers and communities. At Lake Shore Savings, that has always meant “Putting People First”. We will continue to put our customers, communities and shareholders “First”, as we adopt new technology, products and services to meet the future needs of our customers.
 LAKE SHORE BANCORP, INC.Financial HighlightsRachel A. Foley,Chief Financial Officer and Treasurer
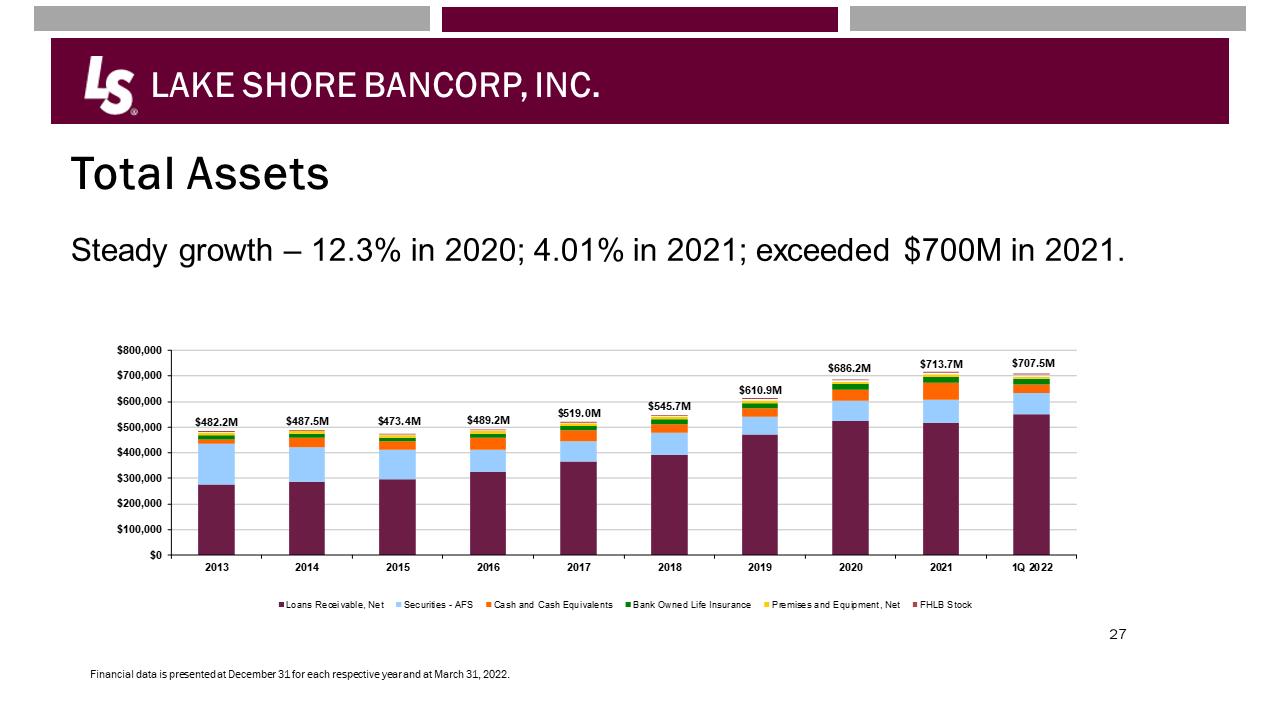 LAKE SHORE BANCORP, INC.Total AssetsSteady growth –12.3% in 2020; 4.01%in 2021; exceeded $700M in 2021.Financial data is presented at December 31 for each respective year and at March 31, 2022.$482.2M$487.5M$473.4M$489.2M$519.0M$545.7M$610.9M$686.2M$713.7M$707.5M$0$100,000$200,000$300,000$400,000$500,000$600,000$700,000$800,0002013201420152016201720182019202020211Q 2022Loans Receivable, Net Securities – AFS Cash and Cash Equivalents Bank Owned Life Insurance Premises and Equipment, Net FHLB Stock
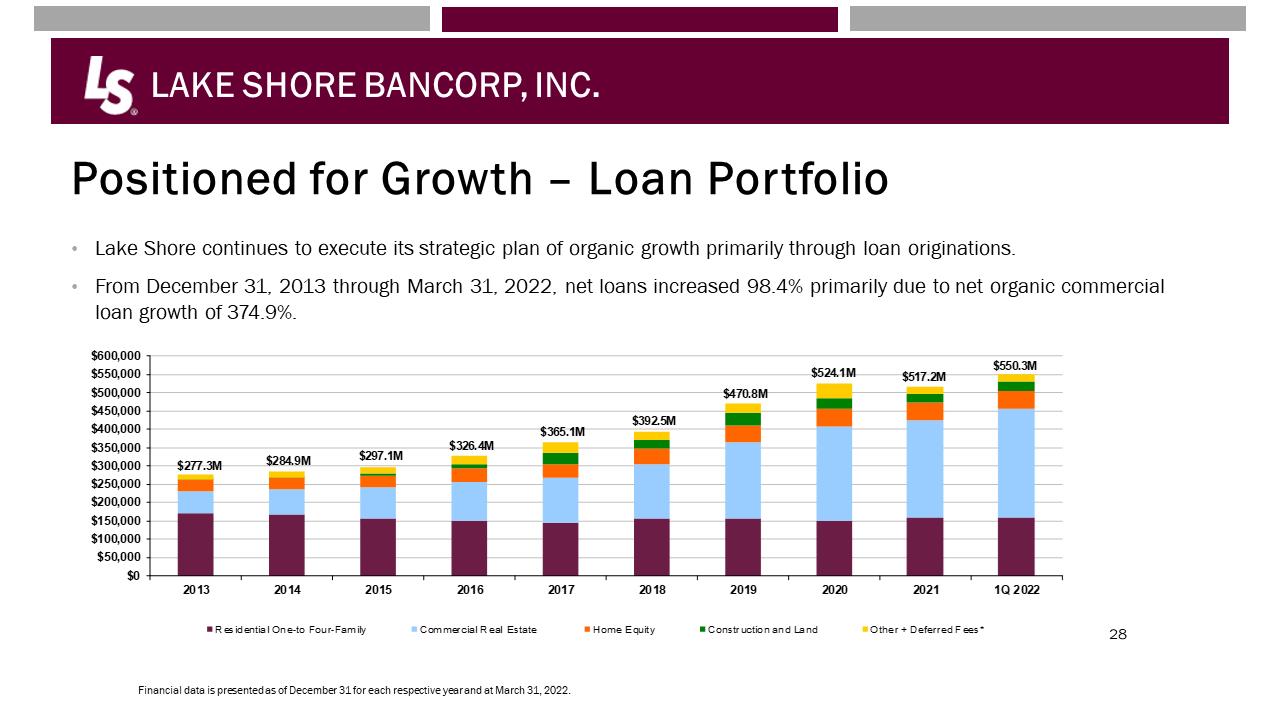 LAKE SHORE BANCORP, INC.Positioned for Growth –Loan Portfolio•Lake Shore continues to execute its strategic plan of organic growth primarily through loan originations. •From December 31, 2013 through March 31, 2022, net loans increased 98.4% primarily due to net organic commercial loan growth of 374.9%.Financial data is presented as of December 31 for each respective year and at March 31, 2022.$277.3M$284.9M$297.1M$326.4M$365.1M$392.5M$470.8M$524.1M$517.2M$550.3M$0$50,000$100,000$150,000$200,000$250,000$300,000$350,000$400,000$450,000$500,000$550,000$600,0002013201420152016201720182019202020211Q 2022Residential One-to Four-Family Commercial Real Estate Home Equity Construction and Land Other + Deferred Fees*
 LAKE SHORE BANCORP, INC.Loan OriginationsDollars in millions2.2% Increase for the Year ended December 31, 2021, excluding PPP Loans Loan Origination data is presented for Lake Shore’s Fiscal Year Ended December 31 for each respective year and for the three months ended March 31, 2022.New Loans20152016201720182019202020213/31/2022Residential Mortgage - New & Modified$21.37$16.48$18.65$28.58$21.53$55.27$53.96$8.48Commercial Mortgage - New & Modified27.5539.0649.6460.6870.1769.3675.3742.44PPP Loans-----26.8811.420.00Commercial Loans11.697.2814.638.3712.974.242.792.28Home Equity Loans6.4011.4515.5416.2516.1220.0620.463.37Consumer Loans0.330.360.450.680.770.870.520.13Total New Loans$67.34$74.63$98.91$114.56$121.57$176.68$164.52$56.70
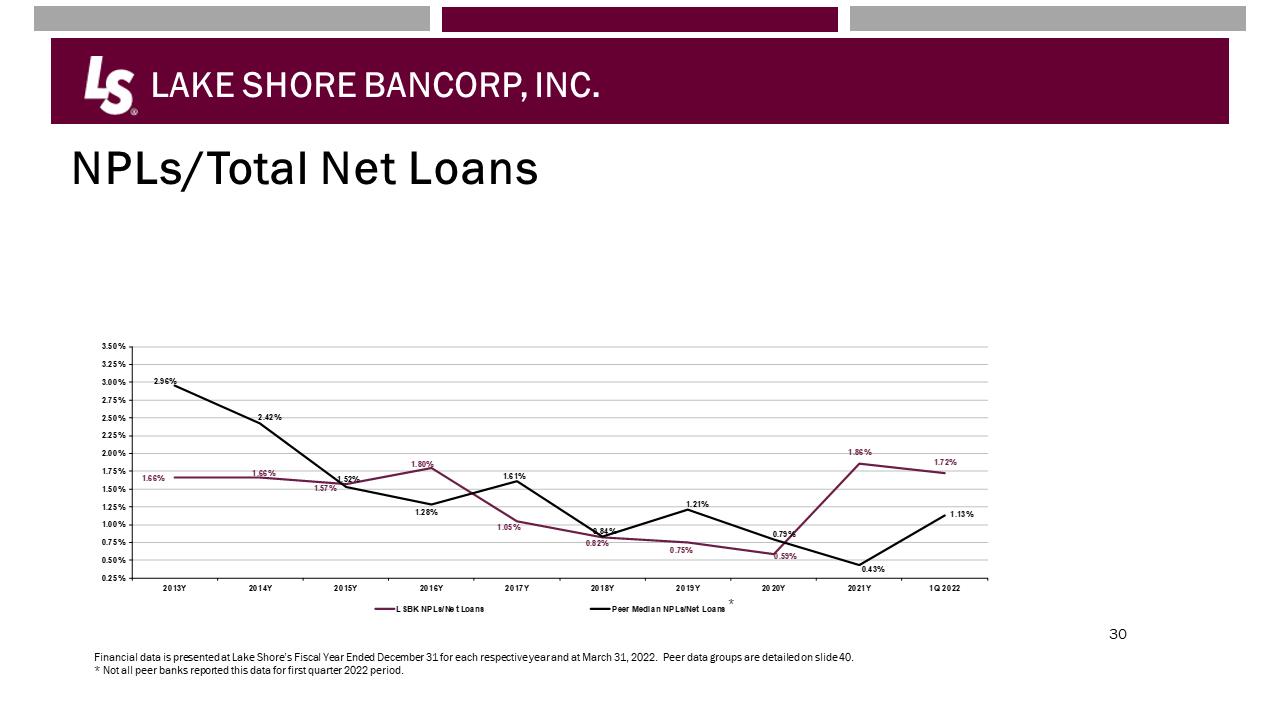 LAKE SHORE BANCORP, INC.NPLs/Total Net LoansFinancial data is presented at Lake Shore’s Fiscal Year Ended December 31 for each respective year and at March 31, 2022. Peer data groups are detailed on slide 40.* Not all peer banks reported this data for first quarter 2022 period.1.66%1.66%1.57%1.80%1.05%0.82%0.75%0.59%1.86%1.72%2.96%2.42%1.52%1.28%1.61%0.84%1.21%0.79%0.43%1.13%0.25%0.50%0.75%1.00%1.25%1.50%1.75%2.00%2.25%2.50%2.75%3.00%3.25%3.50%2013Y2014Y2015Y2016Y2017Y2018Y2019Y2020Y2021Y1Q 2022LSBK NPLs/Net Loans Peer Median NPLs/Net Loans*
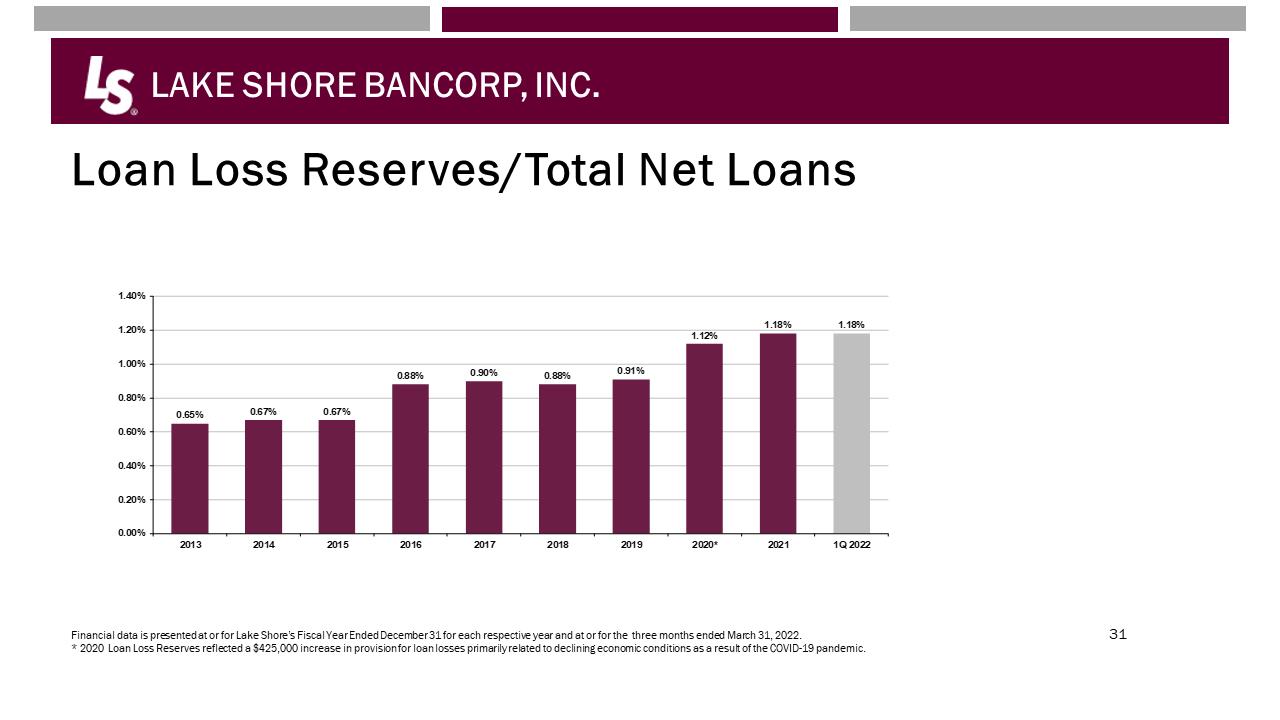 LAKE SHORE BANCORP, INC.Loan Loss Reserves/Total Net LoansFinancial data is presented at or for Lake Shore’s Fiscal Year Ended December 31 for each respective year and at or for the three months ended March 31, 2022.* 2020 Loan Loss Reserves reflected a $425,000 increase in provision for loan losses primarily related to declining economic conditions as a result of the COVID-19 pandemic. 0.65%0.67%0.67%0.88%0.90%0.88%0.91%1.12%1.18%1.18%0.00%0.20%0.40%0.60%0.80%1.00%1.20%1.40%20132014201520162017201820192020*20211Q 2022
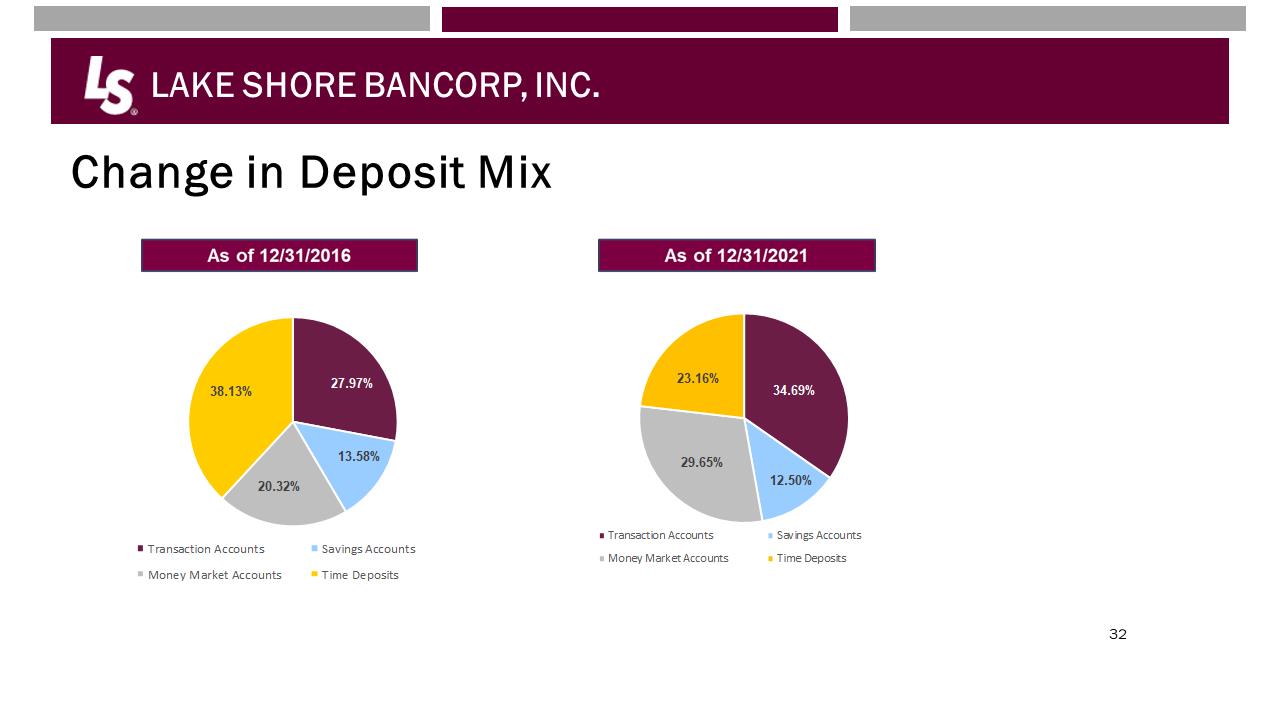 LAKE SHORE BANCORP, INC.Change in Deposit Mix27.97%13.58%20.32%38.13%Transaction Accounts Savings Accounts Money Market Accounts Time Deposits34.69%12.50%29.65%23.16%Transaction Accounts Savings Accounts Money Market Accounts Time Deposits
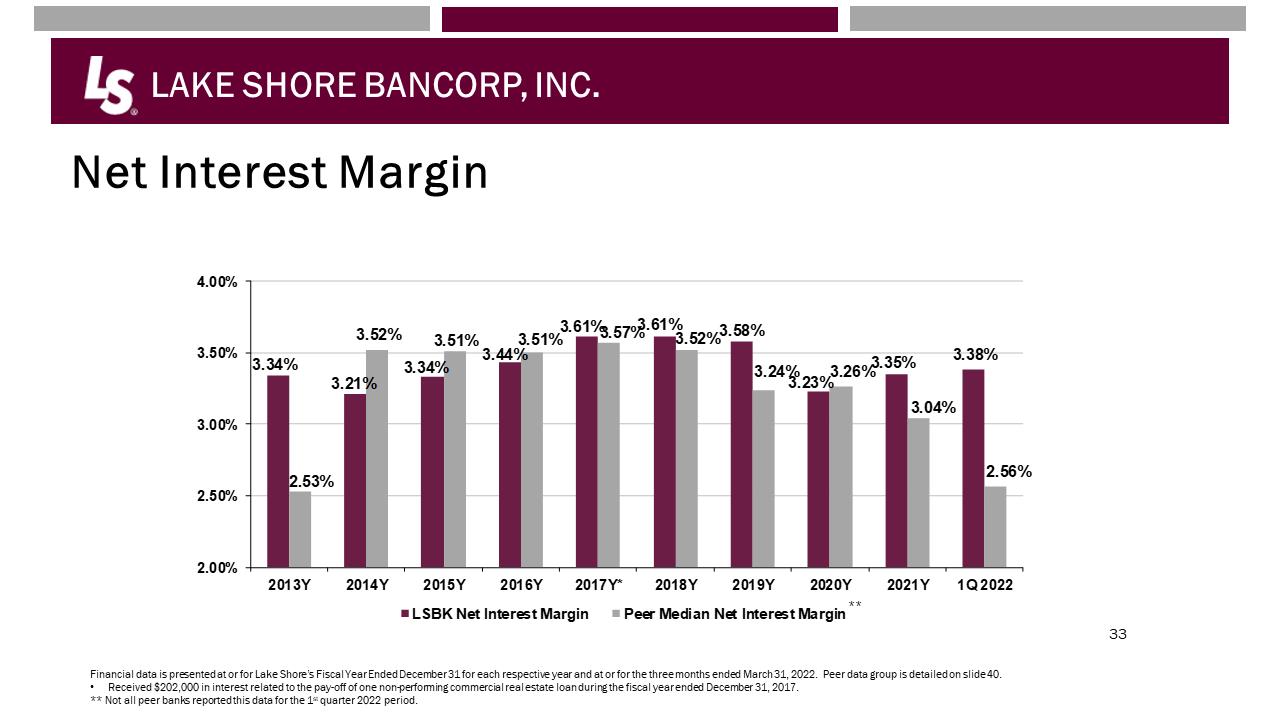 LAKE SHORE BANCORP, INC.Net Interest MarginFinancial data is presented at or for Lake Shore’s Fiscal Year Ended December 31 for each respective year and at or for the three months ended March 31, 2022. Peer data group is detailed on slide 40.•Received $202,000 in interest related to the pay-off of one non-performing commercial real estate loan during the fiscal year ended December 31, 2017.** Not all peer banks reported this data for the 1stquarter 2022 period.3.34%3.21%3.34%3.44%3.61%3.61%3.58%3.23%3.35%3.38%2.53%3.52%3.51%3.51%3.57%3.52%3.24%3.26%3.04%2.56%2.00%2.50%3.00%3.50%4.00%2013Y2014Y2015Y2016Y2017Y*2018Y2019Y2020Y2021Y1Q 2022LSBK Net Interest Margin Peer Median Net Interest Margin**
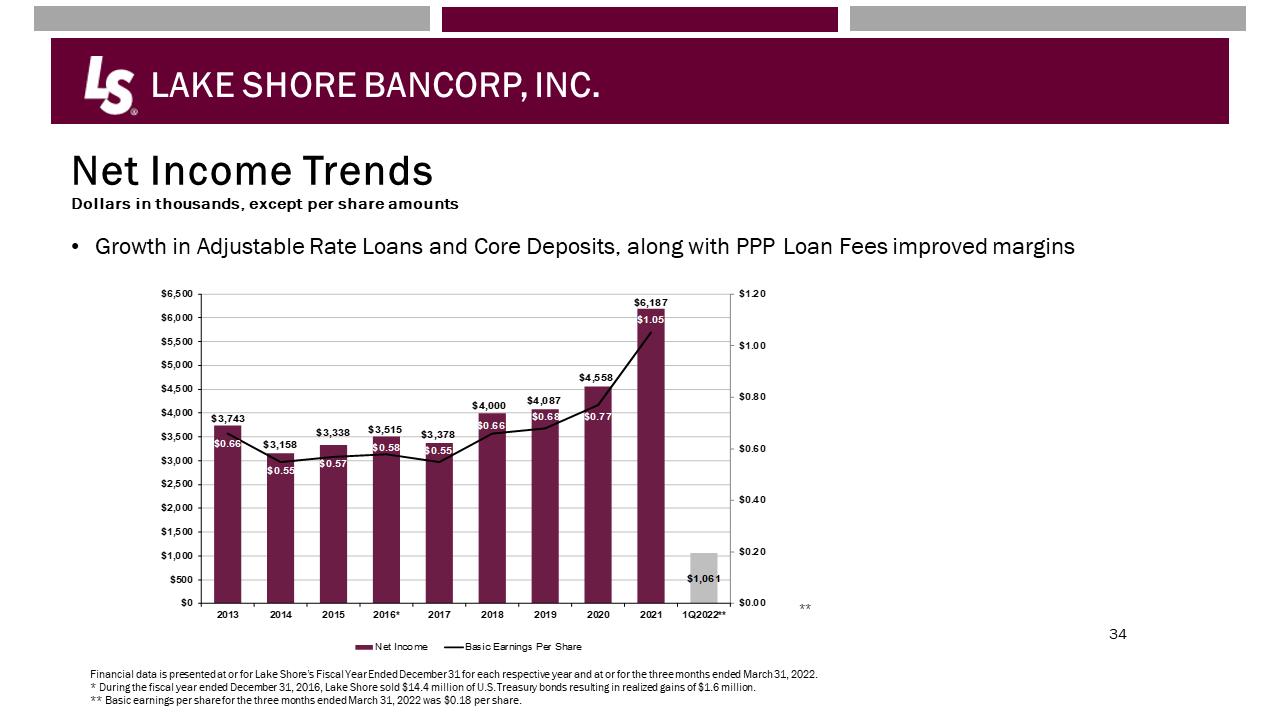 LAKE SHORE BANCORP, INC.Net Income TrendsDollars in thousands, except per share amounts•Growth in Adjustable Rate Loans and Core Deposits, along with PPP Loan Fees improved marginsFinancial data is presented at or for Lake Shore’s Fiscal Year Ended December 31 for each respective year and at or for the three months ended March 31, 2022. * During the fiscal year ended December 31, 2016, Lake Shore sold $14.4 million of U.S. Treasury bonds resulting in realized gains of $1.6 million. ** Basic earnings per share for the three months ended March 31, 2022 was $0.18 per share.**$3,743$3,158$3,338$3,515$3,378$4,000$4,087$4,558$6,187$1,061$0.66$0.55$0.57$0.58$0.55$0.66$0.68$0.77$1.05$0.00$0.20$0.40$0.60$0.80$1.00$1.20$0$500$1,000$1,500$2,000$2,500$3,000$3,500$4,000$4,500$5,000$5,500$6,000$6,5002013201420152016*201720182019202020211Q2022**Net Income Basic Earnings Per Share
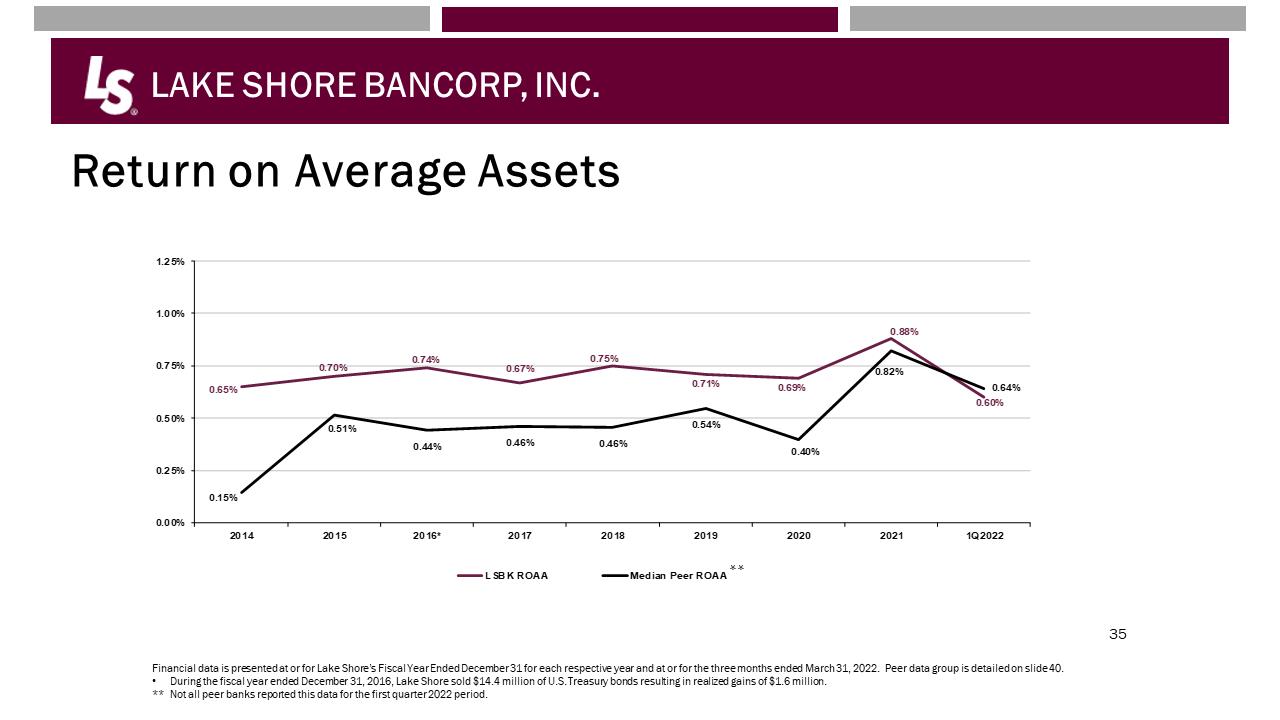 LAKE SHORE BANCORP, INC.Return on Average AssetsFinancial data is presented at or for Lake Shore’s Fiscal Year Ended December 31 for each respective year and at or for the three months ended March 31, 2022. Peer data group is detailed on slide 40.•During the fiscal year ended December 31, 2016, Lake Shore sold $14.4 million of U.S. Treasury bonds resulting in realized gains of $1.6 million.** Not all peer banks reported this data for the first quarter 2022 period.0.65%0.70%0.74%0.67%0.75%0.71%0.69%0.88%0.60%0.15%0.51%0.44%0.46%0.46%0.54%0.40%0.82%0.64%0.00%0.25%0.50%0.75%1.00%1.25%201420152016*201720182019202020211Q2022LSBK ROAA Median Peer ROAA**
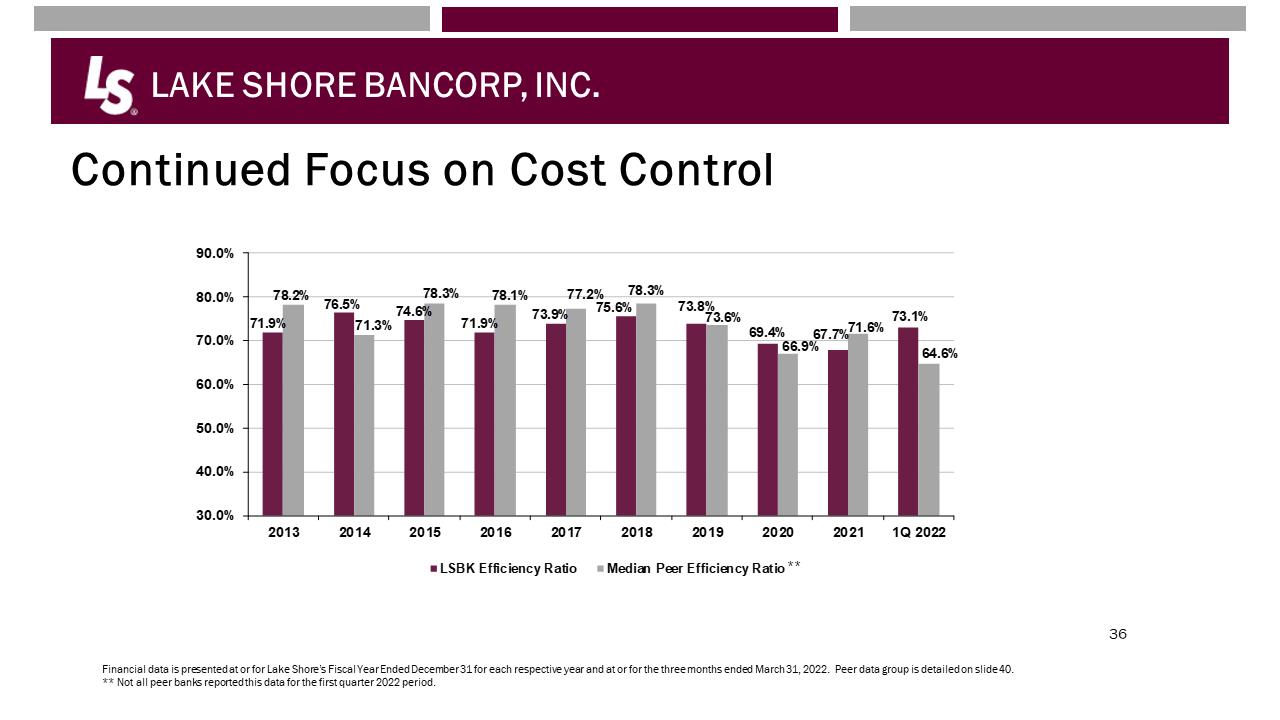 LAKE SHORE BANCORP, INC.Continued Focus on Cost ControlFinancial data is presented at or for Lake Shore’s Fiscal Year Ended December 31 for each respective year and at or for the three months ended March 31, 2022. Peer data group is detailed on slide 40.** Not all peer banks reported this data for the first quarter 2022 period.71.9%76.5%74.6%71.9%73.9%75.6%73.8%69.4%67.7%73.1%78.2%71.3%78.3%78.1%77.2%78.3%73.6%66.9%71.6%64.6%30.0%40.0%50.0%60.0%70.0%80.0%90.0%2013201420152016201720182019202020211Q 2022LSBK Efficiency RatioMedian Peer Efficiency Ratio**
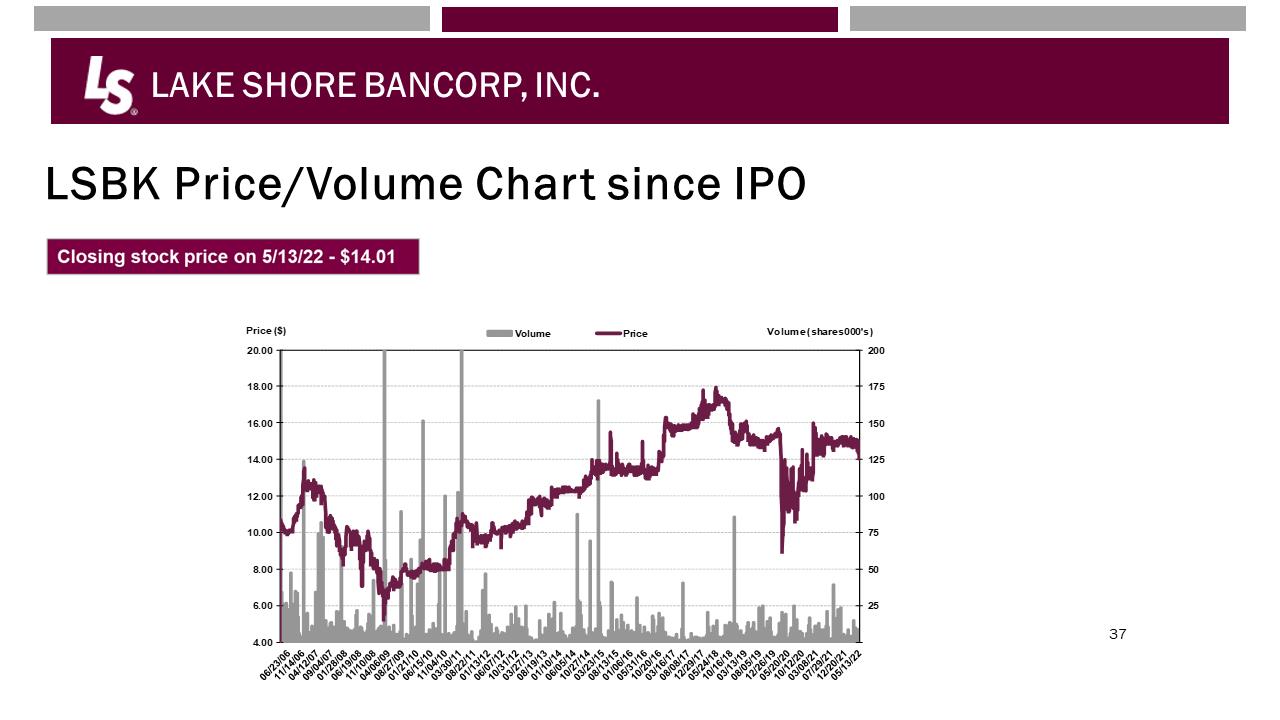 LAKE SHORE BANCORP, INC.LSBK Price/Volume Chart since IPO4.006.008.0010.0012.0014.0016.0018.0020.00255075100125150175200Price ($)Volume (shares 000's)VolumePriceLAKE SHORE BANCORP, INC.
 LAKE SHORE BANCORP, INC.Questions and Answers
 LAKE SHORE BANCORP, INC.Vote ReportAdjournment of Annual Shareholders’ Meeting
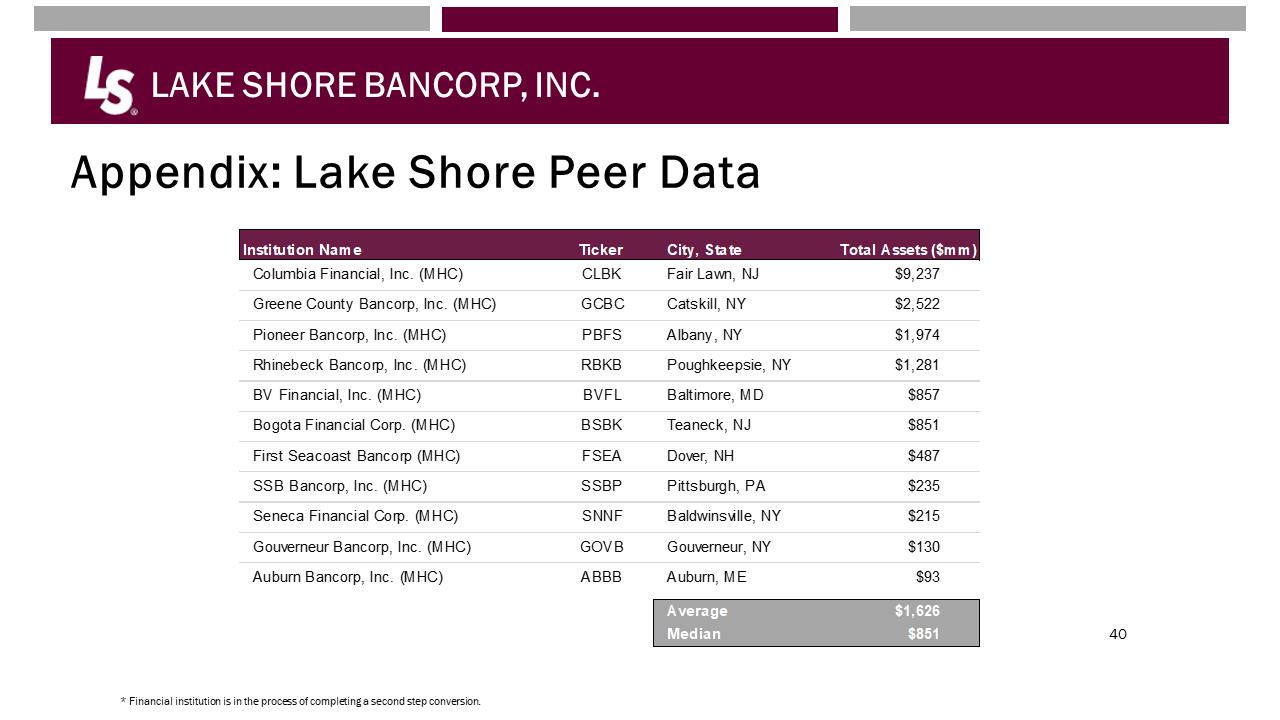 LAKE SHORE BANCORP, INC.Appendix: Lake Shore Peer Data* Financial institution is in the process of completing a second step conversion. Institution Name Ticker City, State Total Assets ($mm)Columbia Financial, Inc. (MHC)CLBKFair Lawn, NJ$9,237Greene County Bancorp, Inc. (MHC)GCBCCatskill, NY$2,522Pioneer Bancorp, Inc. (MHC)PBFSAlbany, NY$1,974Rhinebeck Bancorp, Inc. (MHC)RBKBPoughkeepsie, NY$1,281BV Financial, Inc. (MHC)BVFLBaltimore, MD$857Bogota Financial Corp. (MHC)BSBKTeaneck, NJ$851First Seacoast Bancorp (MHC)FSEADover, NH$487SSB Bancorp, Inc. (MHC)SSBPPittsburgh, PA$235Seneca Financial Corp. (MHC)SNNFBaldwinsville, NY$215Gouverneur Bancorp, Inc. (MHC)GOVBGouverneur, NY$130Auburn Bancorp, Inc. (MHC)ABBBAuburn, ME$93Average$1,626Median$851
 LAKE SHORE BANCORP, INC.Lake Shore, MHCAnnual Meeting of MembersCall to OrderIntroduction of Proposal to Elect DirectorsTabulation of VotesAdjournment