Annual Meeting of Shareholders May 23, 2012 Lake Shore Bancorp, Inc. Copyright 2012 Lake Shore Bancorp, Inc. 1
Safe Harbor Statement This presentation includes "forward looking statements" within the meaning of the Private Securities Litigation Reform Act of 1995. We intend such forward - looking statements to be covered by the Safe Harbor Provision and are including this statement for the purpose of such Safe Harbor Provision of the Private Securities Litigation Reform Act of 1995. Such forward - looking statements include, but are not limited to, statements concerning future business, revenue and earnings. These statements are not historical facts or guarantees of future performance, events or results. There are risks, uncertainties and other factors that could cause the actual results of the Company to differ materially from the results expressed or implied by such forward - looking statements. Information on factors that could affect the Company's business and results is discussed in the Company's periodic reports filed with the Securities and Exchange Commission. Forward looking statements speak only as of the date they are made. The Company undertakes no obligation to publicly update or revise forward looking information, whether as a result of new, updated information, future events or otherwise. 2 Lake Shore Bancorp, Inc. Copyright 2012
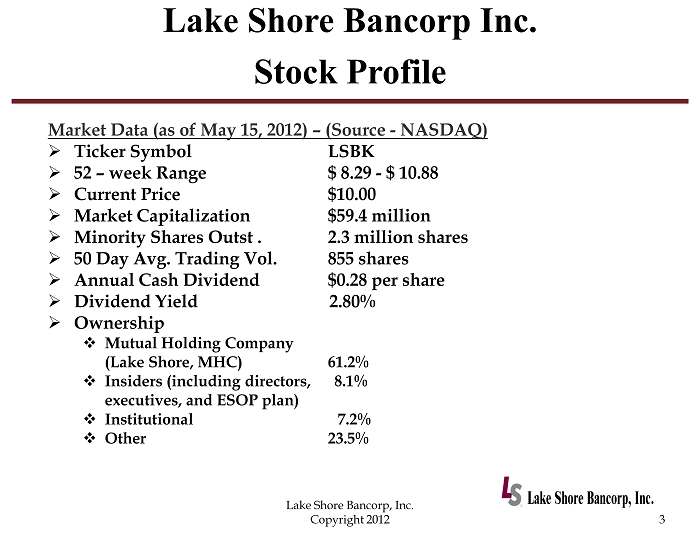
Lake Shore Bancorp Inc. Stock Profile 3 Lake Shore Bancorp, Inc. Copyright 2012 Market Data (as of May 15, 2012) – (Source - NASDAQ) » Ticker Symbol LSBK » 52 – week Range $ 8.29 - $ 10.88 » Current Price $10.00 » Market Capitalization $59.4 million » Minority Shares Outst . 2.3 million shares » 50 Day Avg. Trading Vol. 855 shares » Annual Cash Dividend $0.28 per share » Dividend Yield 2.80% » Ownership □ Mutual Holding Company (Lake Shore, MHC) 61.2% □ Insiders (including directors, 8.1% executives, and ESOP plan) □ Institutional 7.2% □ Other 23.5%
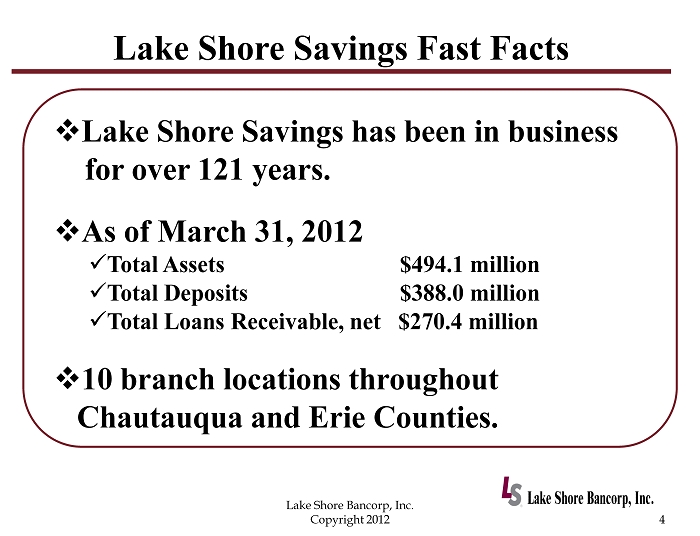
Lake Shore Savings Fast Facts 4 Lake Shore Bancorp, Inc. Copyright 2012 □ Lake Shore Savings has been in business for over 121 years. □ As of March 31, 2012 x Total Assets $494.1 million x Total Deposits $388.0 million x Total Loans Receivable, net $270.4 million □ 10 branch locations throughout Chautauqua and Erie Counties.
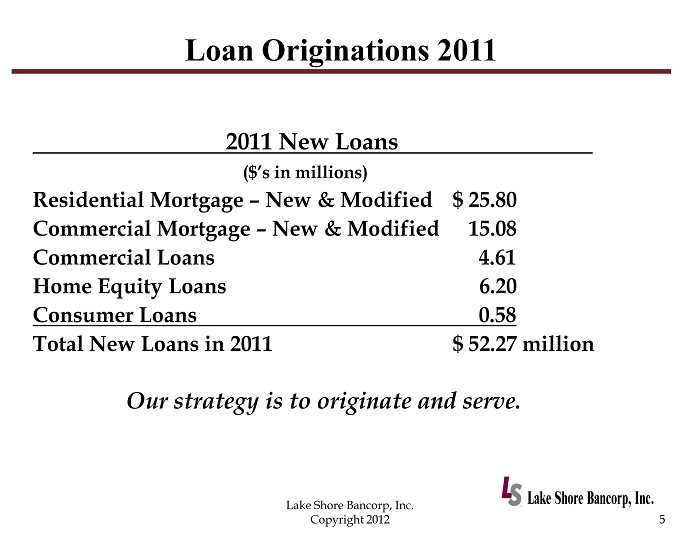
Loan Originations 2011 2011 New Loans ($’s in millions) Residential Mortgage – New & Modified $ 25.80 Commercial Mortgage – New & Modified 15.08 Commercial Loans 4.61 Home Equity Loans 6.20 Consumer Loans 0.58 Total New Loans in 2011 $ 52.27 million Our strategy is to originate and serve. 5 Lake Shore Bancorp, Inc. Copyright 2012
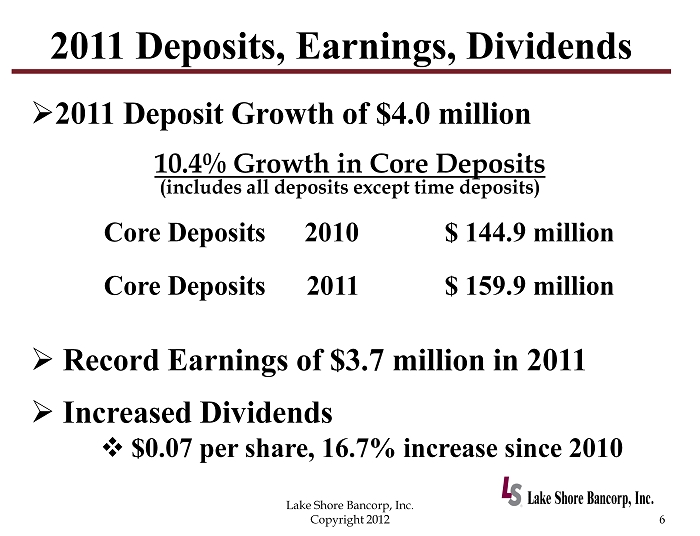
2011 Deposits, Earnings, Dividends 6 Lake Shore Bancorp, Inc. Copyright 2012 10.4% Growth in Core Deposits (includes all deposits except time deposits) Core Deposits 2010 $ 144.9 million Core Deposits 2011 $ 159.9 million » 2011 Deposit Growth of $4.0 million » Record Earnings of $3.7 million in 2011 » Increased Dividends □ $0.07 per share, 16.7% increase since 2010

Operational and Strategic Review 7 Lake Shore Bancorp, Inc. Copyright 2012 » Regulatory Oversight Transition from the OTS to OCC and Federal Reserve. » Enterprise Risk Management. » 2011 Operational Highlights. » 2012 Goals and Objectives. » 2012 Equity Incentive Plan.
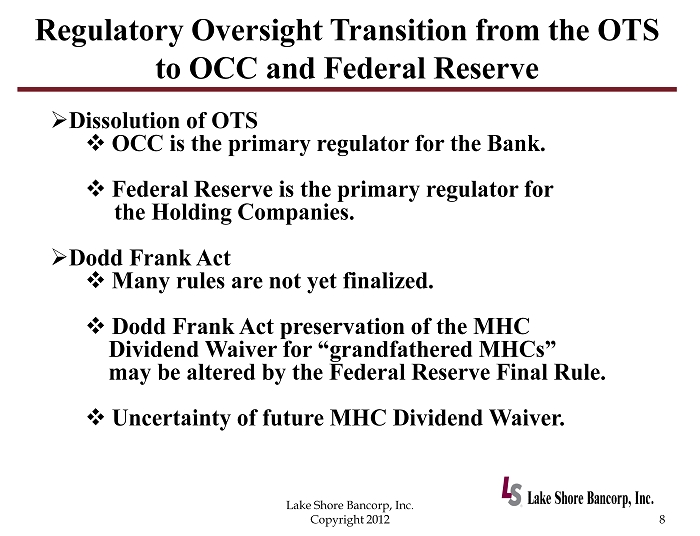
Regulatory Oversight Transition from the OTS to OCC and Federal Reserve » Dissolution of OTS □ OCC is the primary regulator for the Bank. □ Federal Reserve is the primary regulator for the Holding Companies. » Dodd Frank Act □ Many rules are not yet finalized. □ Dodd Frank Act preservation of the MHC Dividend Waiver for “grandfathered MHCs” may be altered by the Federal Reserve Final Rule. □ Uncertainty of future MHC Dividend Waiver. 8 Lake Shore Bancorp, Inc. Copyright 2012
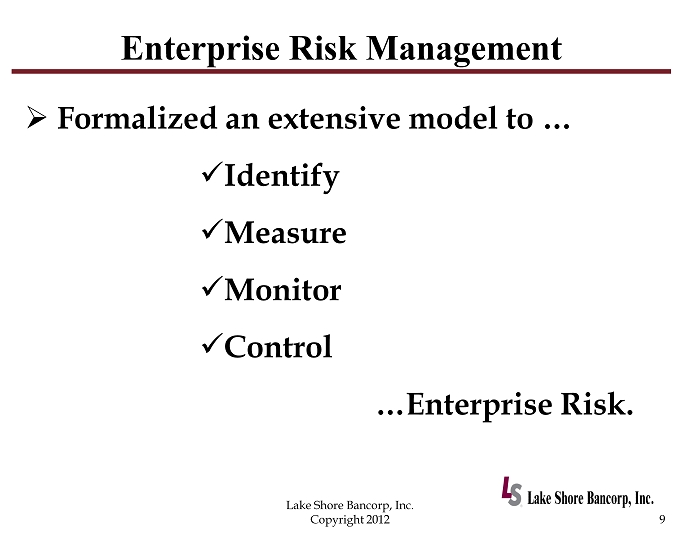
Enterprise Risk Management 9 Lake Shore Bancorp, Inc. Copyright 2012 » Formalized an extensive model to … x Identify x Measure x Monitor x Control …Enterprise Risk.
2011 Operational Highlights 10 Lake Shore Bancorp, Inc. Copyright 2012 » Evaluate potential branch locations: □ Opportunities from First Niagara’s acquisition of local HSBC branches. □ Develop customer base with new advertising campaign, “Discover the Bank You Have Always Wanted!” □ Clicks instead of Bricks. » Leadership Training Skills Development. » Extensive Training and Certification Programs: □ Branch Managers and Personal Bankers.
2011 Operational Highlights (cont.) 11 Lake Shore Bancorp, Inc. Copyright 2012 » Implemented formal procedures to evaluate new products. » 5 Year Comprehensive Technology Plan □ Incorporate into our Strategic Business Plan. » Research software for Human Resource Information System, Vendor Compliance and AML/BSA Automation. » Begin implementation of internal Asset - Liability modeling.
2012 Goals and Objectives 12 Lake Shore Bancorp, Inc. Copyright 2012 » Systems Implementation – Operational Efficiencies. » Digital Interaction Customer Relationship. » Commercial Division Activities. » Continued Leadership Development.
Operational Efficiencies 13 Lake Shore Bancorp, Inc. Copyright 2012 » Implementation of … x Human Resource Information System x Vendor Compliance Software x AML/BSA Tracking Software x Asset Liability Model Creating efficiencies in these processes and establishing a digital foundation to leverage the efficiencies as we grow the Bank.
Digital Interaction – Customer Relationship 14 Lake Shore Bancorp, Inc. Copyright 2012 » Clicks instead of bricks. » Considering the experience our customers want. » Energize the Lake Shore Savings Bank Electronic Banking Experience.
Digital Interaction – Customer Relationship (cont.) 15 Lake Shore Bancorp, Inc. Copyright 2012 » Digital experience may include … □ Various Components of Mobile Banking □ Website Upgrade: • Desktop • Tablets • Smart Phones □ Online Account Opening □ Person to Person Payment Systems □ Social Media Strategy
Commercial Division Activities 16 Lake Shore Bancorp, Inc. Copyright 2012 » Small Business relationship banking □ Flexibility created by Dodd Frank Act. » Growth of our commercial lending portfolio □ The right kind of interest!
2012 Equity Incentive Plan 17 Lake Shore Bancorp, Inc. Copyright 2012 » Promote the long term financial success of the organization. » Attract, retain and reward individuals who contribute to the success of our organization and align their interest with those of the Company’s shareholders.
Financial Presentation Rachel Foley Chief Financial Officer Lake Shore Bancorp, Inc. Copyright 2012 Lake Shore Bancorp, Inc. 18
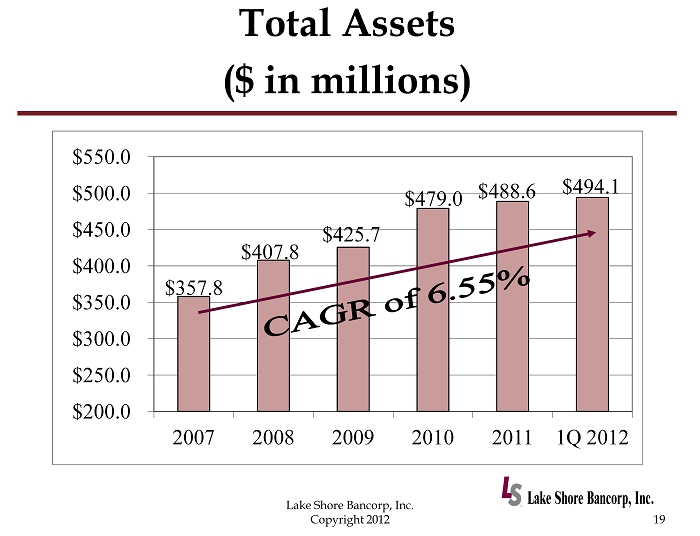
Total Assets ($ in millions) 19 Lake Shore Bancorp, Inc. Copyright 2012 $357.8 $407.8 $425.7 $479.0 $488.6 $494.1 $200.0 $250.0 $300.0 $350.0 $400.0 $450.0 $500.0 $550.0 2007 2008 2009 2010 2011 1Q 2012
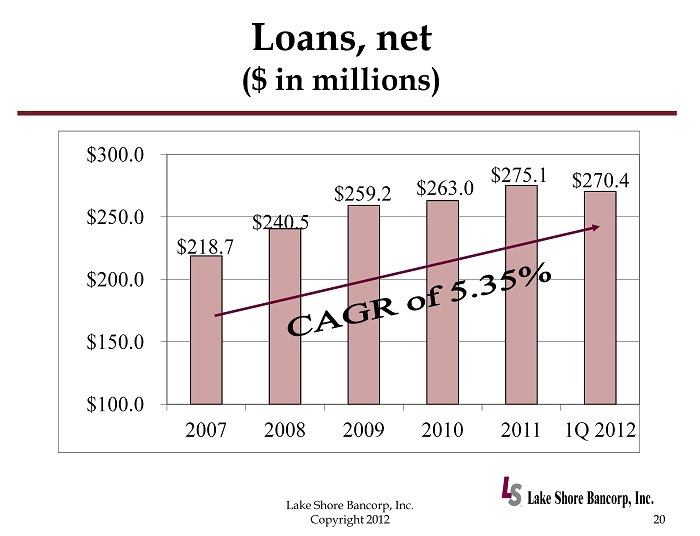
Loans, net ($ in millions) 20 Lake Shore Bancorp, Inc. Copyright 2012 $218.7 $240.5 $259.2 $263.0 $275.1 $270.4 $100.0 $150.0 $200.0 $250.0 $300.0 2007 2008 2009 2010 2011 1Q 2012
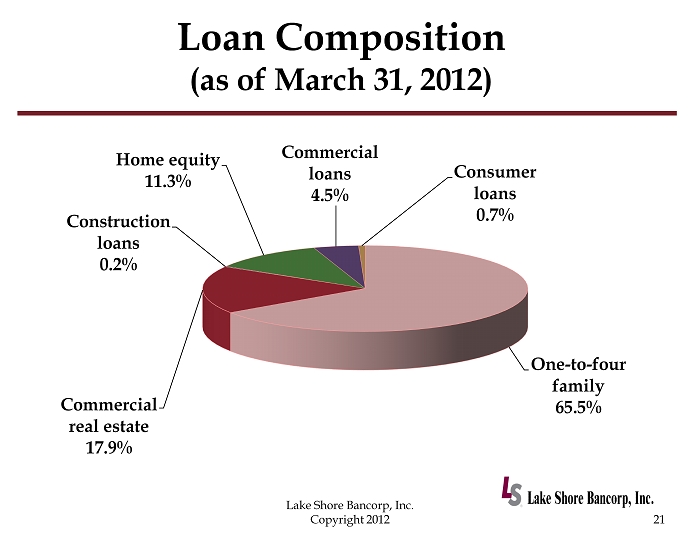
Loan Composition (as of March 31, 2012) 21 Lake Shore Bancorp, Inc. Copyright 2012 One - to - four family 65.5% Commercial real estate 17.9% Construction loans 0.2% Home equity 11.3% Commercial loans 4.5% Consumer loans 0.7%
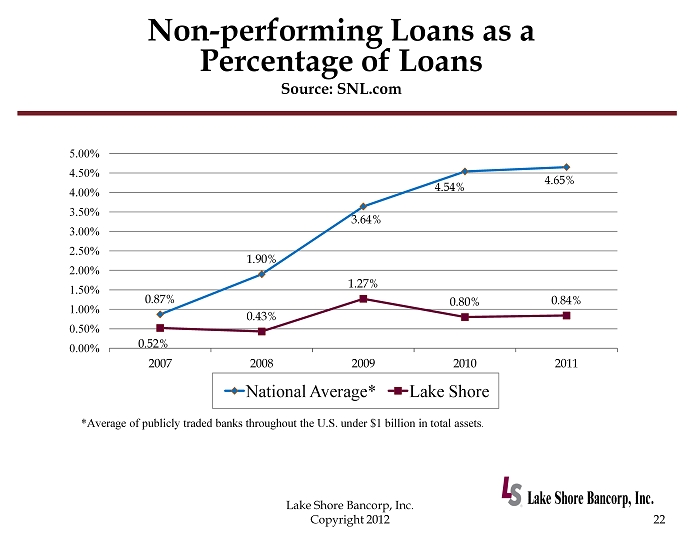
Non - performing Loans as a Percentage of Loans Source: SNL.com 22 Lake Shore Bancorp, Inc. Copyright 2012 0.87% 1.90% 3.64% 4.54% 4.65% 0.52% 0.43% 1.27% 0.80% 0.84% 0.00% 0.50% 1.00% 1.50% 2.00% 2.50% 3.00% 3.50% 4.00% 4.50% 5.00% 2007 2008 2009 2010 2011 National Average* Lake Shore *Average of publicly traded banks throughout the U.S. under $1 billion in total assets .
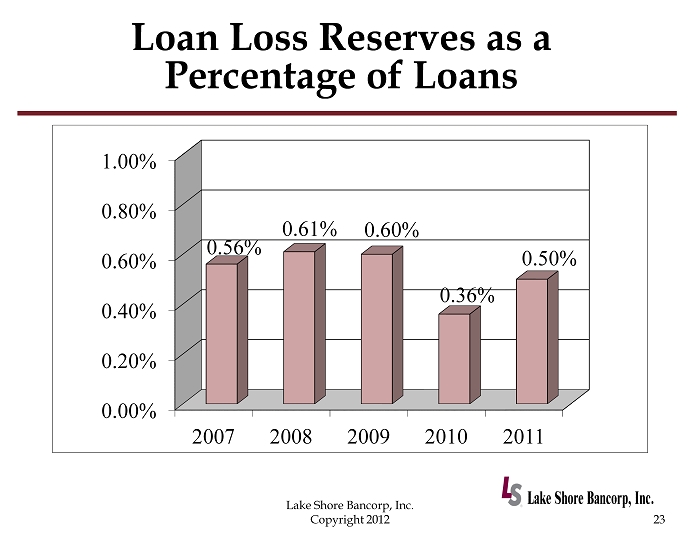
Loan Loss Reserves as a Percentage of Loans 23 Lake Shore Bancorp, Inc. Copyright 2012 0.00% 0.20% 0.40% 0.60% 0.80% 1.00% 2007 2008 2009 2010 2011 0.56% 0.61% 0.60% 0.36% 0.50%
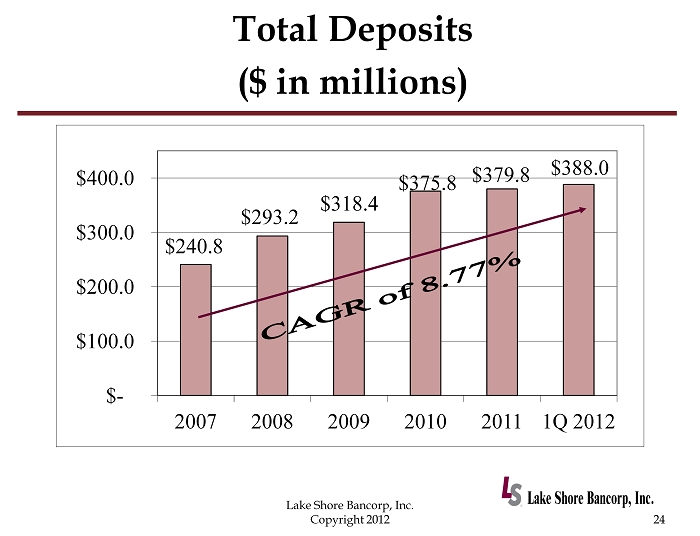
Total Deposits ($ in millions) 24 Lake Shore Bancorp, Inc. Copyright 2012 $240.8 $293.2 $318.4 $375.8 $379.8 $388.0 $ - $100.0 $200.0 $300.0 $400.0 2007 2008 2009 2010 2011 1Q 2012
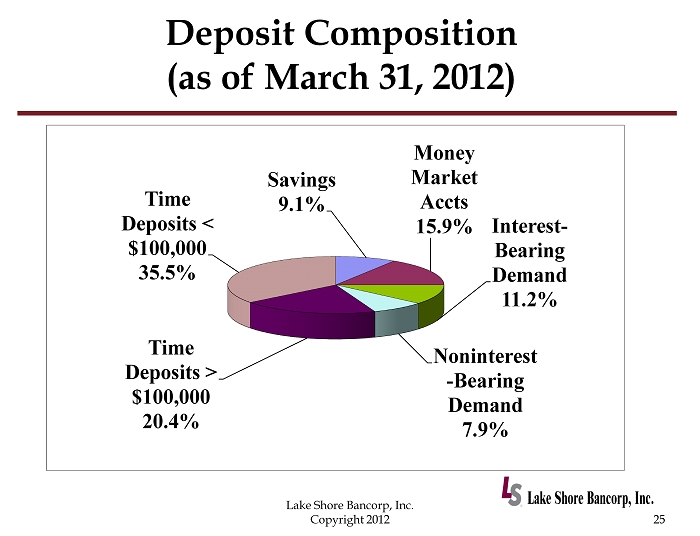
Deposit Composition (as of March 31, 2012) 25 Lake Shore Bancorp, Inc. Copyright 2012 Savings 9.1% Money Market Accts 15.9% Interest - Bearing Demand 11.2% Noninterest - Bearing Demand 7.9% Time Deposits > $100,000 20.4% Time Deposits < $100,000 35.5%
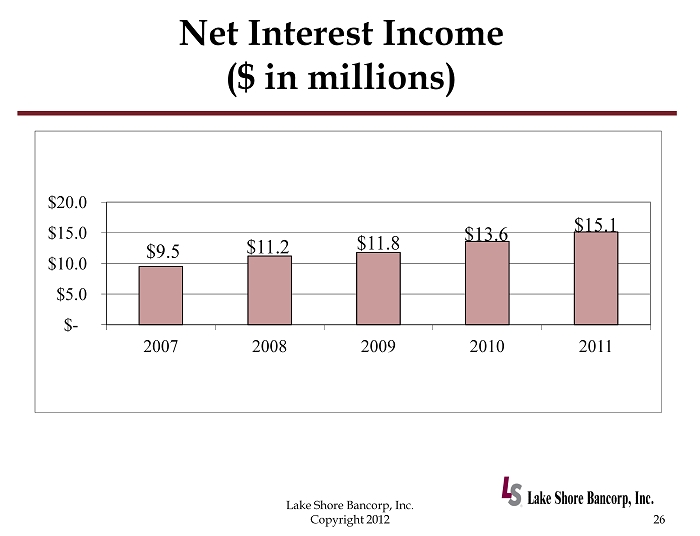
Net Interest Income ($ in millions) 26 Lake Shore Bancorp, Inc. Copyright 2012 $9.5 $11.2 $11.8 $13.6 $15.1 $ - $5.0 $10.0 $15.0 $20.0 2007 2008 2009 2010 2011
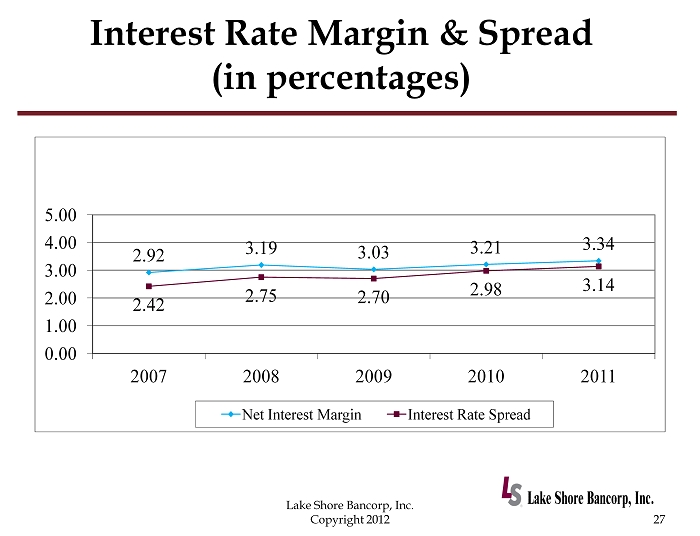
Interest Rate Margin & Spread (in percentages) 27 Lake Shore Bancorp, Inc. Copyright 2012 2.92 3.19 3.03 3.21 3.34 2.42 2.75 2.70 2.98 3.14 0.00 1.00 2.00 3.00 4.00 5.00 2007 2008 2009 2010 2011 Net Interest Margin Interest Rate Spread
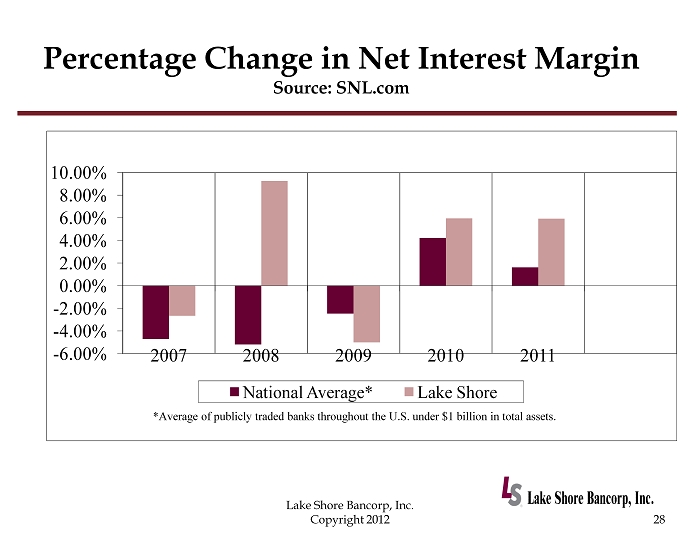
Percentage Change in Net Interest Margin Source: SNL.com 28 Lake Shore Bancorp, Inc. Copyright 2012 - 6.00% - 4.00% - 2.00% 0.00% 2.00% 4.00% 6.00% 8.00% 10.00% 2007 2008 2009 2010 2011 National Average* Lake Shore *Average of publicly traded banks throughout the U.S. under $1 billion in total assets.
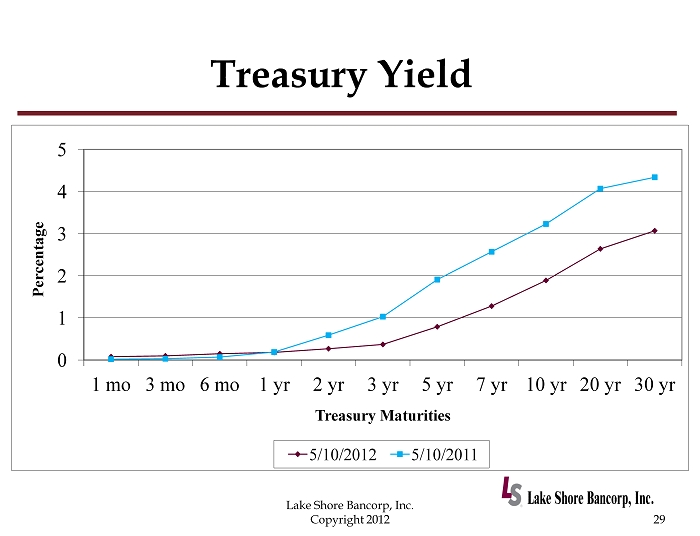
Treasury Yield 29 Lake Shore Bancorp, Inc. Copyright 2012 0 1 2 3 4 5 1 mo 3 mo 6 mo 1 yr 2 yr 3 yr 5 yr 7 yr 10 yr 20 yr 30 yr Percentage Treasury Maturities 5/10/2012 5/10/2011
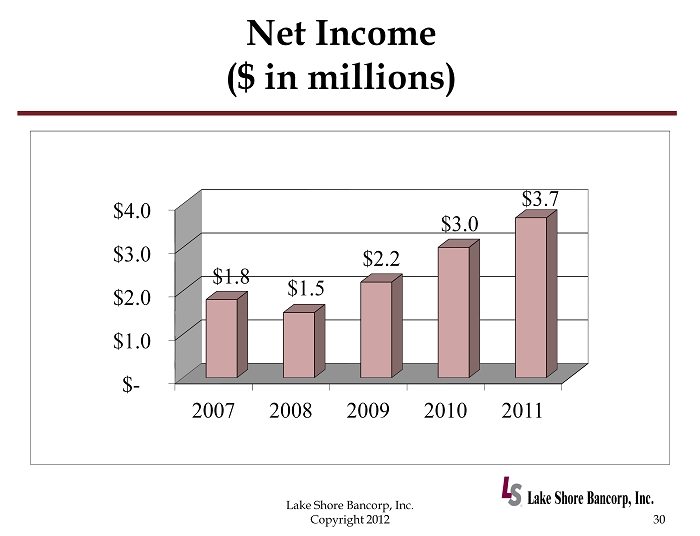
Net Income ($ in millions) 30 Lake Shore Bancorp, Inc. Copyright 2012 $ - $1.0 $2.0 $3.0 $4.0 2007 2008 2009 2010 2011 $1.8 $1.5 $2.2 $3.0 $3.7

Efficiency Ratio Source: SNL.com (in percentages) 31 Lake Shore Bancorp, Inc. Copyright 2012 80.84% 82.32% 81.36% 77.95% 77.72% 79.38% 69.92% 76.80% 72.74% 65.78% 60.00% 65.00% 70.00% 75.00% 80.00% 85.00% 90.00% 2007 2008 2009 2010 2011 National Average* Lake Shore *Average of publicly traded banks throughout the U.S. under $1 billion in total assets .
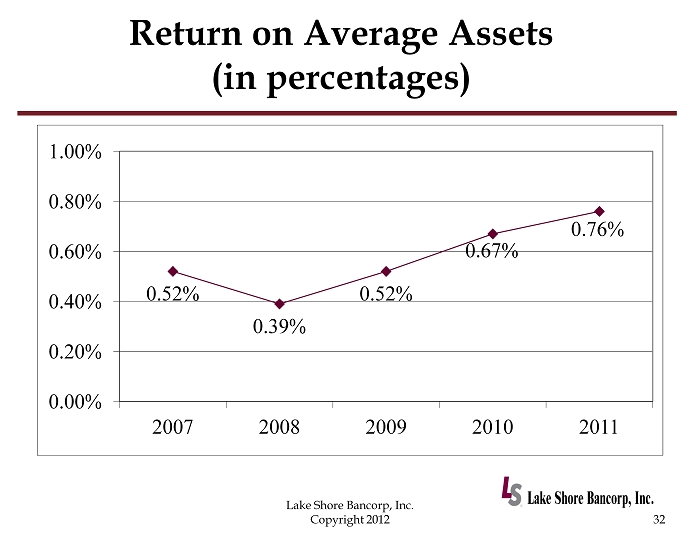
Return on Average Assets (in percentages) 32 Lake Shore Bancorp, Inc. Copyright 2012 0.52% 0.39% 0.52% 0.67% 0.76% 0.00% 0.20% 0.40% 0.60% 0.80% 1.00% 2007 2008 2009 2010 2011
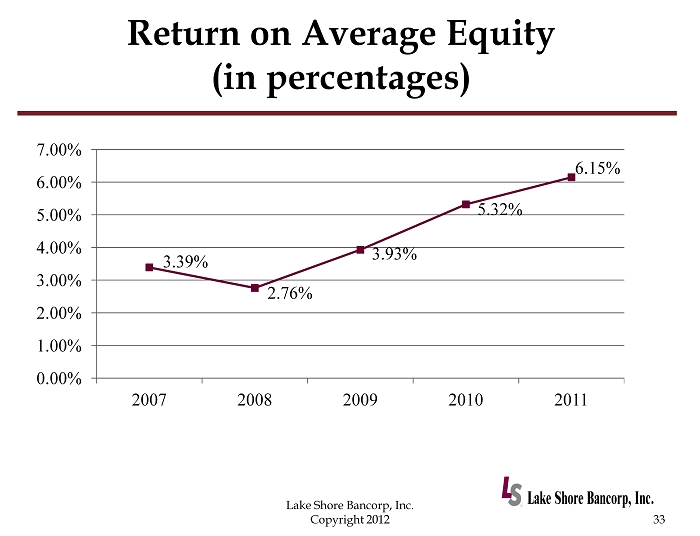
Return on Average Equity (in percentages) 33 Lake Shore Bancorp, Inc. Copyright 2012 3.39% 2.76% 3.93% 5.32% 6.15% 0.00% 1.00% 2.00% 3.00% 4.00% 5.00% 6.00% 7.00% 2007 2008 2009 2010 2011
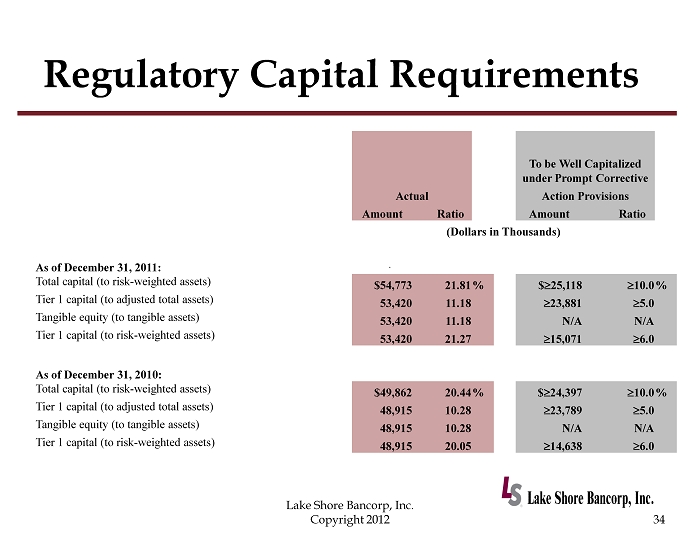
Regulatory Capital Requirements 34 Lake Shore Bancorp, Inc. Copyright 2012 To be Well Capitalized under Prompt Corrective Actual Action Provisions Amount Ratio Amount Ratio (Dollars in Thousands) As of December 31, 2011: Total capital (to risk - weighted assets) $54,773 21.81 % $ ≥ 25,118 ≥ 10.0 % Tier 1 capital (to adjusted total assets) 53,420 11.18 ≥ 23,881 ≥ 5.0 Tangible equity (to tangible assets) 53,420 11.18 N/A N/A Tier 1 capital (to risk - weighted assets) 53,420 21.27 ≥ 15,071 ≥ 6.0 As of December 31, 2010: Total capital (to risk - weighted assets) $49,862 20.44 % $ ≥ 24,397 ≥ 10.0 % Tier 1 capital (to adjusted total assets) 48,915 10.28 ≥ 23,789 ≥ 5.0 Tangible equity (to tangible assets) 48,915 10.28 N/A N/A Tier 1 capital (to risk - weighted assets) 48,915 20.05 ≥ 14,638 ≥ 6.0
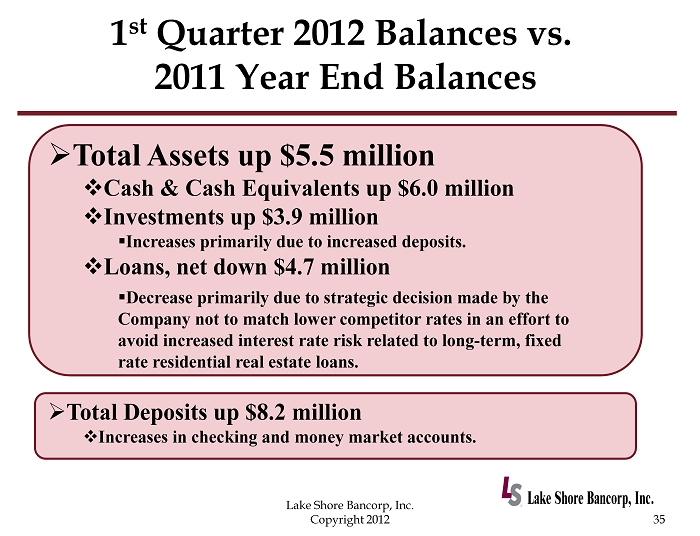
1 st Quarter 2012 Balances vs. 2011 Year End Balances 35 Lake Shore Bancorp, Inc. Copyright 2012 » Total Assets up $5.5 million □ Cash & Cash Equivalents up $6.0 million □ Investments up $3.9 million ▪ Increases primarily due to increased deposits. □ Loans, net down $4.7 million ▪ Decrease primarily due to strategic decision made by the Company not to match lower competitor rates in an effort to avoid increased interest rate risk related to long - term, fixed rate residential real estate loans. » Total Deposits up $8.2 million □ Increases in checking and money market accounts.
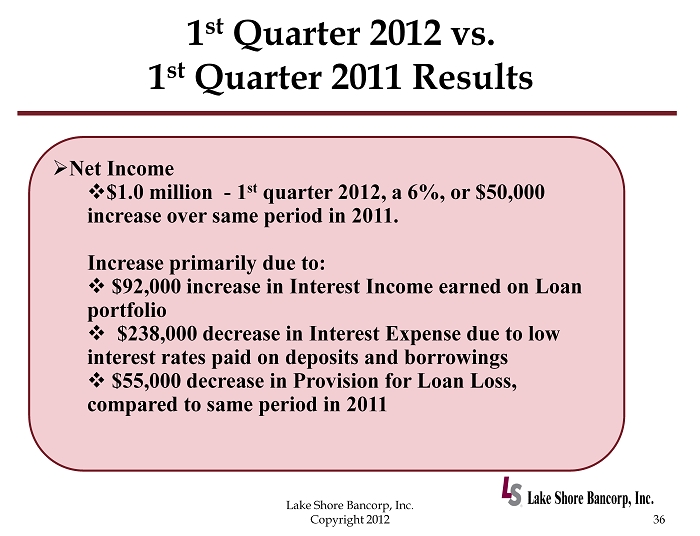
1 st Quarter 2012 vs. 1 st Quarter 2011 Results 36 Lake Shore Bancorp, Inc. Copyright 2012 » Net Income □ $1.0 million - 1 st quarter 2012, a 6%, or $50,000 increase over same period in 2011. Increase primarily due to: □ $92,000 increase in Interest Income earned on Loan portfolio □ $238,000 decrease in Interest Expense due to low interest rates paid on deposits and borrowings □ $55,000 decrease in Provision for Loan Loss, compared to same period in 2011
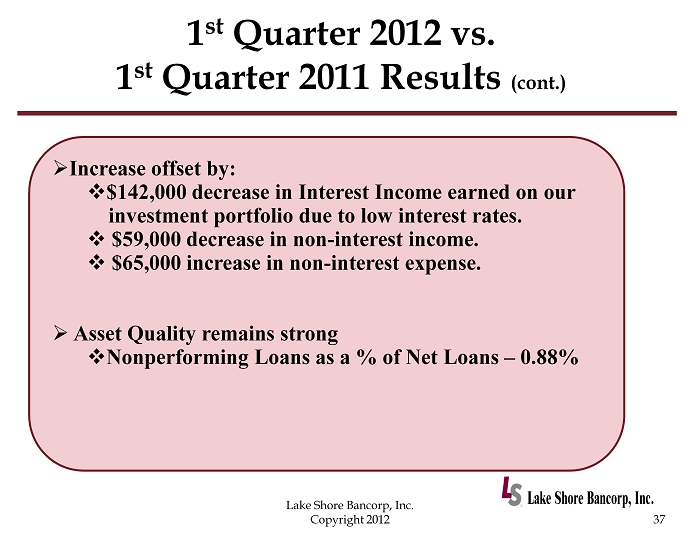
1 st Quarter 2012 vs. 1 st Quarter 2011 Results (cont.) 37 Lake Shore Bancorp, Inc. Copyright 2012 » Increase offset by: □ $142,000 decrease in Interest Income earned on our investment portfolio due to low interest rates. □ $59,000 decrease in non - interest income. □ $65,000 increase in non - interest expense. » Asset Quality remains strong □ Nonperforming Loans as a % of Net Loans – 0.88%
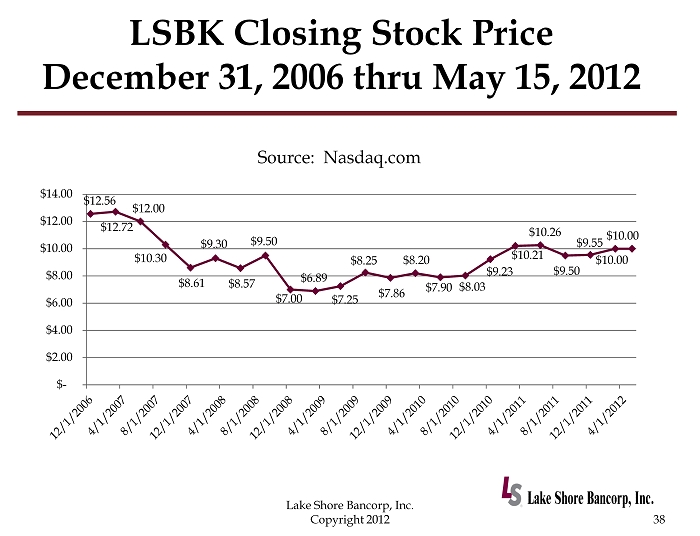
LSBK Closing Stock Price December 31, 2006 thru May 15, 2012 38 Lake Shore Bancorp, Inc. Copyright 2012 $12.56 $12.72 $12.00 $10.30 $8.61 $9.30 $8.57 $9.50 $7.00 $6.89 $7.25 $8.25 $7.86 $8.20 $7.90 $8.03 $9.23 $10.21 $10.26 $9.50 $9.55 $10.00 $10.00 $ - $2.00 $4.00 $6.00 $8.00 $10.00 $12.00 $14.00 Source: Nasdaq.com
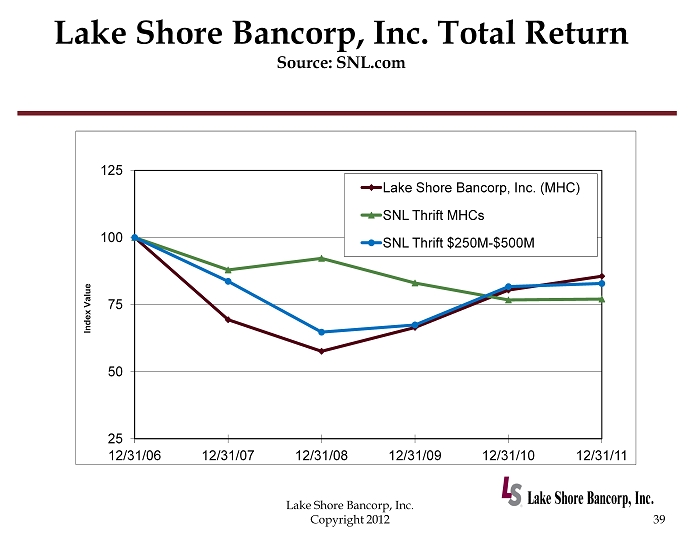
Lake Shore Bancorp, Inc. Total Return Source: SNL.com 39 Lake Shore Bancorp, Inc. Copyright 2012 25 50 75 100 125 12/31/06 12/31/07 12/31/08 12/31/09 12/31/10 12/31/11 Index Value Lake Shore Bancorp, Inc. (MHC) SNL Thrift MHCs SNL Thrift $250M - $500M
Conclusion 40 Lake Shore Bancorp, Inc. Copyright 2012 Questions? Thank you for your continued confidence in Lake Shore Bancorp, Inc.!