 2016-03-14 Project Roosevelt Valuation Presentation_v19.pptx\14 MAR 2016\2:34 PM\1 Project Roosevelt Presentation to the Board of Directors March 14, 2016 Exhibit (c)(2) Strictly Confidential |
 Strictly Confidential Table of Contents Project Roosevelt 2 2016-03-14 Project Roosevelt Valuation Presentation_v19.pptx\14 MAR 2016\2:34 PM\2 Section 1 Monroe Selected Information Section 2 Lodging Capital Markets Observations Section 3 Monroe Valuation Section 4 Third-Party Alternatives Appendix A Additional Information |
 Strictly Confidential Project Roosevelt 3 Section 1 Monroe Selected Information 2016-03-14 Project Roosevelt Valuation Presentation_v19.pptx\14 MAR 2016\2:34 PM\3 |
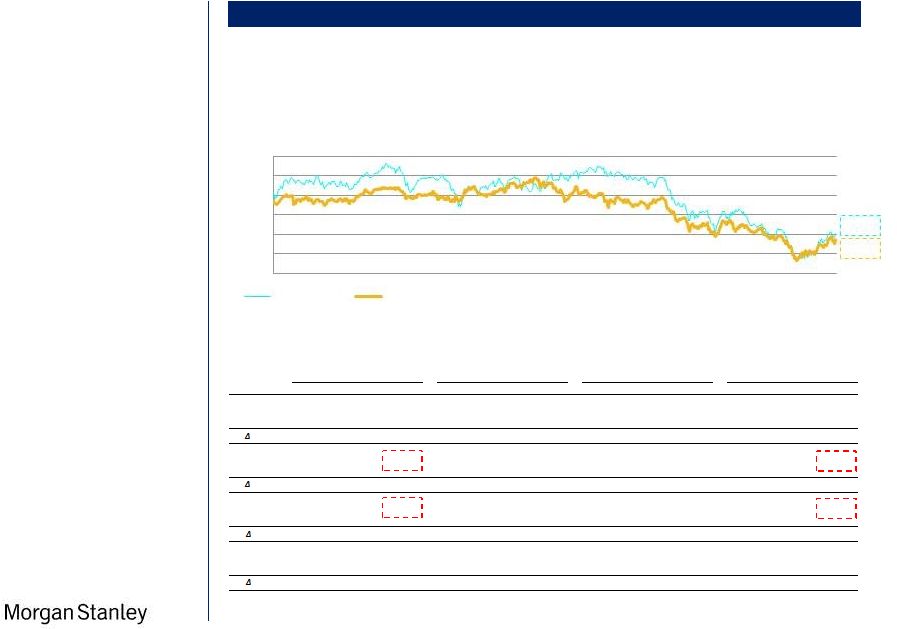
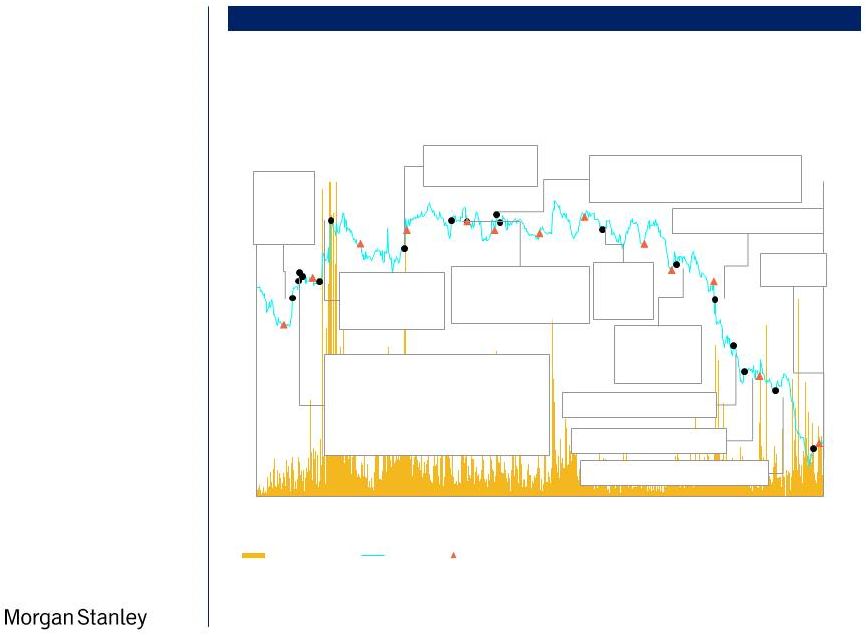 Strictly Confidential Project Roosevelt MONROE SELECTED INFORMATION 4 2016-03-14 Project Roosevelt Valuation Presentation_v19.pptx\14 MAR 2016\2:34 PM\4 Price Movement Over Time Historical Share Price / Volume Traded - Monroe As of 3/11/2016 Share Price ($) Source CapIQ Nov. 1, 2013 Unsolicited proposal from the Yucaipa Companies at $8.00 per share Feb. 10, 2014 Monroe refinances debt secured by Hudson and Delano South Beach Mar. 13, 2014 Announces restructuring plan Dec. 16, 2014 Announces sale of The Light Group for $36MM to Hakkasan May 13, 2014 Announces retention of MS to review Strategic Alternatives May 20, 2014 Results of election of the Board of Directors Apr. 1, 2013 Signs deal with Yucaipa to cut debt, preferred stock in exchange for Delano South Beach, The Light Group and other interests Apr. 2, 2013 Jason T. Kalisman files lawsuit to block Yucaipa transaction Apr. 9, 2013 Monroe voluntarily delays Yucaipa transaction May 14, 2013 Court issues ruling compelling restoration of record date Jun. 5, 2013 Monroe's slate of director nominees announces its intention to explore full range of strategic alternatives including sale of company Sep. 14, 2015 WSJ article reporting on Rambleside offer $1.63 May 19, 2015 Interim CEO Jason Kalisman resigns; Howard Lorber named Chairman and Ken Cruse named Director Mar. 18, 2013 OTK Announces plan to nominate seven Candidates to the Monroe Board Oct. 7, 2015 WSJ article reporting on SLS Las Vegas Aug. 6, 2015 WSJ article reporting on rumored merger Feb. 20, 2016 COO Josh Fluhr resigns Dec. 7, 2016 Company announces HWE plan to monetize assets • Monroe’s stock has declined substantially since mid-2015 0.0 0.5 1.0 1.5 0 1 2 3 4 5 6 7 8 9 Jan -13 Apr-13 Jul -13 Sep-13 Dec-13 Mar-14 Jun -14 Sep-14 Dec-14 Mar-15 Jun -15 Sep-15 Dec-15 Mar-16 Volume Traded (MM) Share Price Earnings Release |
 Strictly Confidential Monroe Today – Issues & Considerations MONROE SELECTED INFORMATION Scale Liquidity / Cash Availability • Undersized relative to peers • High G&A load as compared to asset base • Not enough liquidity for large investors to buy / sell without materially impacting share price • Monroe is projected to have $14MM of cash as of 6/30/2016 (1) , down from $46MM at year-end • Cash generation projected to be negative in 2016 / 2017, leaving limited dry powder to build pipeline and operate the business • Owned assets are fully levered • Yucaipa preferred securities’ coupon rate rising from 10% to 20% on October 15, 2016 • Lack of capital to de-lever from sector high leverage Project Roosevelt Leverage • High leverage relative to peers • Current debt / LTM EBITDA in excess of 16x (2) versus sector average of 3.6x • Debt / total market capitalization of approximately 76% versus Tier 1 comp average of ~23% Management Team / Board • Instability of management team (interim CEO) • Is the existing team able to run the business appropriately post-downsizing in 2014? Do they have capacity to invest in current client relationships? Hiring a permanent CEO could help drive growth by attracting new contracts and third-party capital, but it may not be required in a standalone scenario 5 Negative Sentiment / Confusion • Uncertainty surrounding near term and long term strategy • Negative press around Monroe • Burkle consent rights • Difficulty attracting new contracts in the US • Several key positions have been recently vacated, potential for increased employee turnover • Narrow research analyst coverage limits investor access to independent perspectives • Monroe has a number of key structural factors to consider when assessing valuation and a range of actionable alternatives • Specific challenges include: – CEO, development team and other roles not currently filled – Funding required by debt- yield covenant maintenance payments on the owned hotel mortgage through maturity – Preferred equity rate ratchet to 20% in Oct 2016 – Difficulty transitioning to an asset-light model given relatively small size of management platform Notes 1. Per management standalone projection model; includes impact of yield maintenance payment ($28.2MM) and termination fees received from Mondrian SB and Shore Club ($3.9MM) 2. Pro forma for $28.2MM loan paydown that occurred in Feb. 2016 |
 Strictly Confidential Project Roosevelt MONROE SELECTED INFORMATION 6 2016-03-14 Project Roosevelt Valuation Presentation_v19.pptx\14 MAR 2016\2:34 PM\6 Management Company Financials Source Management Projections Key Assumptions Q2 – Q4 2016 • Q2 2016 – No longer manage Shore Club starting Q2 2016 and receive $2.9MM termination fee • Q2 2016 – No longer manage Mondrian South Beach and received $1.0MM termination fee. Only receive licensing fees going forward • Q3 2016 – No longer manage Morgans starting Q3 2016 and receive $3.5MM termination fee • Q4 2016 – No longer manage Royalton starting Q4 2016 and receive $3.5MM termination fee Management Company Financials - By Contract (000s) 2015A 2016E 2017E 2018E 2019E Hudson 2,423 2,551 2,629 2,743 2,845 Delano 1,389 1,447 1,481 1,525 1,572 Owned Hotel Contracts 3,811 3,998 4,110 4,268 4,417 Clift 2,963 3,116 3,249 3,335 3,364 Leased Hotel Contracts 2,963 3,116 3,249 3,335 3,364 Mondrian LA 2,255 2,447 2,465 2,553 2,576 St Martins Lane 1,786 2,178 2,272 2,371 2,473 Sanderson 1,592 1,691 1,765 1,842 1,922 Mondrian South Beach (Licensing Fee Only Commencing 2016) 2,118 600 600 600 600 Mondrian London - Sea Containers 2,560 2,861 2,980 3,104 3,233 Delano Vegas 538 500 500 500 500 10 Karakoy - Istanbul 105 120 126 132 139 In-Place Current Contracts 10,953 10,397 10,708 11,101 11,444 Total Revenue from Current Contracts 17,727 17,511 18,067 18,704 19,225 Management Company G&A (excluded Public Company Costs) (15,667) (14,108) (15,731) (16,203) (16,689) EBITDA from Current Contracts 2,060 3,403 2,336 2,501 2,536 Mondrian Doha -- -- 2,160 2,268 2,336 Delano Dubai -- -- -- 1,121 1,480 Mondrian Dubai -- -- -- -- 3,006 Signed Pipeline Contracts -- -- 2,160 3,389 6,823 Revenue including Pipeline 17,727 17,511 20,227 22,092 26,047 EBITDA including Pipeline 2,060 3,403 4,496 5,890 9,358 Total Revenue from Food & Beverage 32,492 24,903 25,650 26,419 27,212 Food & Beverage Operating Expenses (29,508) (21,865) (22,396) (23,027) (23,676) Public Company Expenses (4,233) (3,022) (3,113) (3,206) (3,302) Total EBITDA including Pipeline, F&B 3,908 3,419 4,637 6,076 9,592 Additional Information Morgans 259 121 -- -- -- Royalton 522 381 -- -- -- Shore Club 1,774 658 -- -- -- Mondrian SoHo 543 -- -- -- -- Mondrian South Beach (2016 contribution In Excess of Licensing Fee) -- 594 -- -- -- Lost Contracts 3,098 1,754 -- -- -- Shore Club -- 2,882 -- -- -- Mondrian South Beach -- 1,000 -- -- -- Morgans -- 3,500 -- -- -- Royalton -- 3,500 -- -- -- Termination Fees (Excluded from EBITDA) -- 10,882 -- -- -- |
 Strictly Confidential Project Roosevelt MONROE SELECTED INFORMATION 7 2016-03-14 Project Roosevelt Valuation Presentation_v19.pptx\14 MAR 2016\2:34 PM\7 Financial Estimates and Key Assumptions Source Management Projections Key Assumptions Q1 2016 • Retire $28.2MM of mortgage debt on Hudson and Delano to meet 7.5% debt yield requirement Q2 – Q4 2016 • Q2 2016 – No longer manage Shore Club starting Q2 2016 and receive $2.9MM termination fees • Q2 2016 – No longer manage Mondrian South Beach and received $1.0MM termination fee. Only receive licensing fees going forward • Q3 2016 – No longer manage Morgans starting Q3 2016 and receive $3.5MM termination fees • Q4 2016 – No longer manage Royalton starting Q4 2016 and receive $3.5MM termination fees Q4 2016 • The current preferred dividend rate of 10% increases to 20% in October 2016 Q1 2017 • Retire $28.5MM of mortgage debt on Hudson and Delano to meet 7.75% debt yield requirement 1Q 2019 • Refinance $393MM of mortgage on Hudson and Delano at 2% transaction cost Notes 1. Includes management fees on owned assets 2. Excludes termination fees 3. Extension fees associated with the Hudson and Delano mortgage, 0.25% of outstanding balance. 2019 represents refinancing the $393MM outstanding loan balance at 2% cost Monroe - Key Financials ($MM, unless otherwise noted) 2015A 2016E 2017E 2018E 2019E '15-19 CAGR Revenue Hudson 80.8 84.5 87.6 91.4 94.8 4.1% Delano 47.7 48.2 49.4 50.8 52.4 2.4% Clift 45.6 47.9 50.0 51.3 51.8 3.2% Owned Hotels Revenue 174.0 180.6 187.0 193.6 199.0 3.4% Food & Beverage (MB Vegas, Sanderson, St Martins Lane FB) 32.5 24.9 25.6 26.4 27.2 (4.3%) Total Revenue from Current Contracts 17.8 17.5 18.1 18.7 19.2 2.0% Signed Pipeline Contracts -- -- 2.2 3.4 6.8 Lost Contracts (Mgmt & Termination Fees) (Excluded from EBITDA Starting 2016) 3.1 12.6 -- -- -- Less: Intercompany Payment (1) (7.0) (7.3) (7.6) (7.8) (8.0) Total Revenue 220.4 228.3 225.3 234.2 244.2 2.6% Growth - % (2.0%) 3.6% (1.3%) 4.0% 4.3% Major Expense Line Items - Does not represent all expenses of Monroe Operating Expenses at Owned Hotels (132.7) (139.8) (143.1) (146.9) (150.5) 3.2% Food & Beverage (MB Vegas, Sanderson, St Martins Lane FB) (29.5) (21.9) (22.4) (23.0) (23.7) (5.4%) Management Company G&A (15.7) (14.1) (15.7) (16.2) (16.7) 1.6% Public Company G&A (4.2) (3.0) (3.1) (3.2) (3.3) (6.0%) EBITDAR Hudson 16.3 16.3 18.2 20.3 22.1 7.9% Delano 17.9 17.5 17.8 18.3 18.9 1.4% Clift - EBITDAR 7.2 7.1 7.9 8.0 7.5 1.0% Owned Hotels EBITDAR 41.3 40.9 43.9 46.6 48.5 4.0% Clift Rent (7.6) (7.6) (7.6) (7.6) (7.8) 0.6% Hudson Lease Rent (0.5) (0.5) (0.5) (0.5) (0.5) Owned Hotel EBITDA 33.3 32.8 35.8 38.6 40.2 4.8% Food & Beverage - After MB Rent & Profit Sharing 3.0 3.0 3.3 3.4 3.5 4.3% Management Company EBITDA Incl. Pipeline 5.2 3.4 4.5 5.9 9.4 16.1% Corporate G&A (4.2) (3.0) (3.1) (3.2) (3.3) (6.0%) Adj. EBITDA (2) 37.2 36.2 40.5 44.6 49.8 7.6% Margin - % 17% 16% 18% 19% 20% Adj. EBITDAR 45.3 44.3 48.6 52.7 58.0 6.4% Adj. EBITDA 37.2 36.2 40.5 44.6 49.8 7.6% Plus: Lost Contracts (Mgmt & Termination Fees) -- 12.6 -- -- -- Less Interest (31.3) (29.5) (26.1) (26.1) (26.1) Less Capex (7.1) (6.4) (6.6) (6.8) (7.0) Plus TLG Sale 30.8 (1.0) -- -- -- Debt Yield Payments -- (28.2) (28.5) -- -- Debt Extension Fees & Loan Costs (3) -- (1.4) (1.1) (1.0) (7.9) Restructuring, Development and Disposal costs (7.2) (1.0) (1.0) (1.0) (1.0) Plus / (Less) Other Cash Flows 10.2 (5.3) (2.8) (2.8) (2.1) Levered Cash Flow 32.4 (23.8) (25.6) 7.0 5.7 |
 Strictly Confidential Project Roosevelt MONROE SELECTED INFORMATION 8 2016-03-14 Project Roosevelt Valuation Presentation_v19.pptx\14 MAR 2016\2:34 PM\8 Financial Estimates and Key Assumptions (Cont’d) Note 1. Extension fees associated with the Hudson and Delano mortgage, 0.25% of outstanding balance 2. Source Monroe Management Projections Key Assumptions Q1 2016 • Retire $28.2MM of mortgage debt on Hudson and Delano to meet 7.5% debt yield requirement Q2 – Q4 2016 • Q2 2016 – No longer manage Shore Club starting Q2 2016 and receive $2.9MM termination fees • Q2 2016 – No longer manage Mondrian South Beach and received $1.0MM termination fee. Only receive licensing fees going forward • Q3 2016 – No longer manage Morgans starting Q3 2016 and receive $3.5MM termination fees • Q4 2016 – No longer manage Royalton starting Q4 2016 and receive $3.5MM termination fees Q4 2016 • The current preferred dividend rate of 10% increases to 20% in October 2016 Q1 2017 • Retire $28.5MM of mortgage debt on Hudson and Delano to meet 7.75% debt yield requirement Monroe - Cash Flows Analysis Debt Yield Maintenance Covenant Test 2016 2017 1Q16 2Q16 3Q16 4Q16 1Q17 2Q17 3Q17 4Q17 Net cash provided by operating activities (A) (1.1) 2.9 3.6 8.1 (1.8) 4.5 1.7 7.3 Capex (1.5) (1.6) (1.6) (1.7) (1.5) (1.7) (1.6) (1.8) Dispositions (1.0) -- -- -- -- -- -- -- in Restricted Cash 0.6 -- -- -- -- -- -- -- Net cash provided by investing activities (B) (1.8) (1.6) (1.6) (1.7) (1.5) (1.7) (1.6) (1.8) Proceeds from / (Payments of) LT Debt, Revolver, and Lease Notes (0.2) (0.3) (0.3) (0.3) (0.3) (0.3) (0.3) (0.3) Debt Yield Payments (28.2) -- -- -- (28.5) -- -- -- Debt Extension Fees (1) (1.4) -- -- -- (1.1) -- -- -- Net cash used in financing (C) (29.8) (0.3) (0.3) (0.3) (29.8) (0.3) (0.3) (0.3) Net change in cash and cash equivalents (A+B+C) (32.7) 1.1 1.7 6.1 (33.1) 2.5 (0.2) 5.2 Cash and cash equivalents, Beginning 45.9 13.2 14.3 16.0 22.1 (10.9) (8.4) (8.6) Cash and cash equivalents, Ending 13.2 14.3 16.0 22.1 (10.9) (8.4) (8.6) (3.5) Year-End $MM 2016 2017 Delano NOI 15.6 15.8 Hudson NOI 12.9 14.7 Bill Back (2) 2.0 2.0 NOI for Test 30.5 32.5 Required Yield 7.75% 8.00% Required Balance 393.3 406.5 Beginning Debt Balance 421.8 393.3 Repayment Required 28.5 NA Ending Debt Balance 393.3 393.3 Per guidance from Monroe Interim CEO on 3/13/2016, reflects bill back expenses from corporate that Monroe is allowed to add back to NOI for debt yield maintenance test calculation |
 Strictly Confidential Project Roosevelt 9 Section 2 Lodging Capital Markets Observations 2016-03-14 Project Roosevelt Valuation Presentation_v19.pptx\14 MAR 2016\2:34 PM\9 |
 Strictly Confidential 2016E as of 3Q 2014 as of 1Q 2015 as of 3Q 2015 as of 4Q 2015 ADR Occ RevPAR ADR Occ RevPAR ADR Occ RevPAR ADR Occ RevPAR U.S. 5.9% -0.1% 5.8% 6.3% 0.2% 6.5% 5.9% 0.4% 6.3% 6.5% -0.5% 5.9% to 3Q 2014 0.4% 0.3% 0.7% 0.0% 0.5% 0.5% 0.6% (0.4%) 0.1% New York 4.6% 0.9% 5.6% 3.5% -0.3% 3.2% 2.1% -1.7% 0.3% 3.5% -1.0% 2.5% to 3Q 2014 (1.1%) (1.2%) (2.4%) (2.5%) (2.6%) (5.3%) (1.1%) (1.9%) (3.1%) Miami 6.6% -0.4% 6.2% 5.5% 0.0% 5.5% 3.2% -2.8% 0.3% 3.5% -2.5% 0.8% to 3Q 2014 (1.1%) 0.4% (0.7%) (3.4%) (2.4%) (5.9%) (3.1%) (2.1%) (5.4%) LA 5.4% 0.5% 6.0% 5.3% 0.1% 5.4% 5.9% 0.4% 6.3% 7.0% 1.0% 8.1% to 3Q 2014 (0.1%) (0.4%) (0.6%) 0.5% (0.1%) 0.3% 1.6% 0.5% 2.1% PKF Growth Forecasts Lodging Sector Recent Performance / Outlook Project Roosevelt LODGING CAPITAL MARKETS OBSERVATIONS 10 2016-03-14 Project Roosevelt Valuation Presentation_v19.pptx\14 MAR 2016\2:34 PM\10 Source PKF Hospitality Research • “After uneven results throughout the year, performance of Manhattan hotels notably declined in November and December, resulting in a revenue per available room (“RevPAR”) decrease of 3.0 percent in the fourth quarter. For the year, Manhattan’s RevPAR declined for the first time since 2009.” • “While average daily rates (“ADR”) increased marginally in October, minor declines in occupancy levels offset these gains. In November and December, both ADR and occupancy levels decreased, compared to year-ago levels, resulting in sizeable RevPAR declines. ADR was the primary factor contributing to declining RevPAR performance in the fourth quarter, declining 3.3 and 3.7 percent in November and December, respectively. Overall, Manhattan hotels experienced both decreasing occupancy and ADR in 2015, resulting in a RevPAR decline of 2.3 percent for the year.” – PWC Manhattan Lodging Index 4Q15 Source Capital IQ 11.0x 10.7x 9.0x 10.0x 11.0x 12.0x 13.0x 14.0x 15.0x Feb-14 Mar-14 May-14 Jul -14 Sep-14 Oct-14 Dec-14 Feb-15 Apr-15 Jun -15 Jul -15 Sep-15 Nov -15 Jan -16 Mar-16 Avg TIER 1 Avg Lodging REIT Tier 1 Comps / REIT Peers AV / NTM EBITDA |
 Strictly Confidential Tier 1 C- Corp Comps 15.5x 11.7x 11.7x 10.1x 11 2016-03-14 Project Roosevelt Valuation Presentation_v19.pptx\14 MAR 2016\2:34 PM\11 Notes 1. Includes BEL, H, HOT, HLT, IHG, and MAR 2. Includes AHP, AHT, BEE, CHSP, CLDT, DRH, FCH, HT, HPT, HST, INN, LHO, PEB, RHP, RLJ and SHO 3. Consensus estimates from CapIQ Project Roosevelt • Since 2009, Monroe has been valued at a premium to its peers as a multiple of EBITDA • Monroe’s multiple has been more volatile than the peers over the last six months – Consensus estimates for Monroe only comprised of one analyst’s estimates and are materially different from Company estimates • Current AV / Consensus EBITDA multiples are lower than the 3-year and 7-year average multiples LODGING CAPITAL MARKETS OBSERVATIONS Historical Lodging Valuation Average: Monroe: 15.0x Comps: 12.4x (1) (1) (2) Average: C-Corps: 12.4x REITs: 12.3x Source Capital IQ Source Capital IQ AV / NTM EBITDA Tier 1 C-Corp Comps 0 5 10 15 20 25 30 2006 2007 2008 2008 2009 2010 2011 2012 2013 2014 2015 2016 0 5 10 15 20 25 2006 2007 2008 2009 2010 2011 2012 2013 2014 2015 2016 Lodging REITs AV / NTM Consensus EBITDA (3) Consensus NTM Since Monroe IPO (2/14/2006) – As of 3/11/2016 AV / NTM Consensus EBITDA (3) August 2006 – March 2016 Monroe Averages Tier 1 C.Corps REITs Monroe LTM 12.7x 11.5x 16.1x Last 3 Yrs 13.0x 12.5x 16.4x Last 5 Yrs 12.4x 12.4x 16.8x Last 7 Yrs 12.8x 12.8x 16.8x |
 Strictly Confidential Project Roosevelt 12 Section 3 Monroe Valuation 2016-03-14 Project Roosevelt Valuation Presentation_v19.pptx\14 MAR 2016\2:34 PM\12 |
 Strictly Confidential Hudson Valuation Project Roosevelt MONROE VALUATION 13 2016-03-14 Project Roosevelt Valuation Presentation_v19.pptx\14 MAR 2016\2:34 PM\13 1 Notes 1. View of Monroe interim CEO shared with Morgan Stanley on March 11, 2016 that Hudson will likely meet but not exceed 2015 performance in 2016 (3/11/16 Diligence Session) 2. 4% FF&E reserve deducted from management’s asset EBITDA in all years; maintenance capex of 3% of revenue assumed in all years 3. Hudson’s 878 rooms include 72 former single room dwelling (“SROs”) units that have been converted to hotel rooms since 2009; the 878 room count excludes 60 SROs which remain and provide upside potential at Hudson; cost of conversion of to $200K per unit 4. Based on average of multiple valuation methodologies; management fees of 3.0% of total revenues 5. Based on projected performance and capitalized NOI; management fees of 2.0% of total revenues 6. 5-year NPV valuation; includes midpoint values for retail of $17.5MM (57 street) and $4.3MM (58 street); metrics net of $2.4MM capex; management fees of 3.0% of total revenues 7. Discount rates per IRR Viewpoint 2016; Terminal value calculated by applying stated cap rate to 2020 NOI. NOI projected to grow 3% from 2019 to 2020 Key Stats Ownership Type Fee Simple (condominium) Keys 878 (938 including SROs) 2016E ADR $225 2016E Occupancy 88% 2016E RevPAR $197 2016E Revenue $85.2MM 2016E EBITDA $16.3MM # Restaurants / Nightclubs etc. 6 Meeting Space (sqft) 5,599 Debt $280MM Peak EBITDA (2007) $36.7MM LOW (AVERAGE) HIGH • The property includes 3,500 SF at-grade and 25,000 SF below-grade of potential retail space currently unutilized by the Company – DCF is based on in-place cash flows and exclude the valuation of the retail component whereas the BOVs and expected level of proposals do include it $MM Illustrative Value 2016E 2017E 275 4.7% 5.4% 300 4.3% 4.9% Hudson Implied Forward Cap Rates $MM 2013A 2014A 2015E 2016E 2017E 2018E 2019E # of Rooms 866 878 878 878 888 898 908 Revenue 81.5 85.2 80.8 85.2 87.6 91.4 94.8 (-) Departmental Expenses (36.4) (38.9) (38.6) (40.7) (41.2) (42.2) (43.1) (-) Undistributed Expenses (16.7) (16.9) (15.7) (16.9) (17.3) (17.6) (18.0) (-) Management Fees (2.5) (2.6) (2.4) (2.6) (2.6) (2.7) (2.8) (-) Fixed Charges (7.4) (7.5) (7.8) (7.9) (8.3) (8.5) (8.8) (=) EBITDA 18.6 19.3 16.3 17.1 18.2 20.3 22.1 (-) Recent Property Performance Adj. (1) -- -- -- (0.8) -- -- -- (=) EBITDA After Adj. 18.6 19.3 16.3 16.3 18.2 20.3 22.1 (-) FF&E / Capex Reserve (2) (3.3) (3.4) (3.2) (3.4) (3.5) (3.7) (3.8) (=) Net Operating Income 15.3 15.9 13.1 12.9 14.7 16.7 18.3 (-) SRO Conversion (3) -- (1.4) -- -- -- -- -- (-) Maintenance Capex (2) (2.4) (2.6) (2.4) (2.5) (2.6) (2.7) (2.8) (=) Cash Flow 12.9 11.9 10.6 10.4 12.1 13.9 15.5 Hudson Cash Flow Projections $MM 2016E 2017E 2018E 2019E PV of CF Present Value of Cash Flows High (@ 7.0%) 9.7 10.6 11.4 11.8 43.5 Low (@ 9.0%) 9.5 10.2 10.8 11.0 41.4 Terminal Value at Stated Exit Cap Rates Cap Rate 5.50% 6.00% 6.50% 7.00% High (@ 7.0%) 244.5 224.1 206.9 192.1 Low (@ 9.0%) 222.9 204.3 188.6 175.1 Total Value at Stated Exit Cap Rates Cap Rate 5.50% 6.00% 6.50% 7.00% High (@ 7.0%) 287.9 267.6 250.3 235.5 Low (@ 9.0%) 264.3 245.7 230.0 216.5 Hudson Discounted Cash Flow Valuation (7) (1) th th Unencumbered Values $MM Implied Encum. 2016E Metrics 2016E Broker Value EBITDAx Cap Rate EBITDA NOI JLL (4) 340.7 12.0x 7.1% 28.5 24.3 HWE (5) 327.5 14.5x 5.7% 22.5 18.7 Eastdil (6) 294.1 14.9x 5.5% 21.2 17.4 Avg 320.8 13.8x 6.1% 24.1 20.1 Broker Opinions of Values |
 Strictly Confidential Delano Valuation Project Roosevelt MONROE VALUATION 14 2016-03-14 Project Roosevelt Valuation Presentation_v19.pptx\14 MAR 2016\2:34 PM\14 1 Notes 1. 4% FF&E reserve deducted from management’s asset EBITDA in all years; maintenance capex of 3% of revenue assumed in all years 2. Discount rates per IRR Viewpoint 2016; Terminal value calculated by applying stated cap rate to 2020 NOI. NOI assumed to grow 3% from 2019 to 2020 Key Stats Ownership Type Fee Simple Keys 194 2016E ADR $488 2016E Occupancy 69% 2016E RevPAR $349 2016E Revenue $48.2MM 2016E EBITDA $17.5MM # Restaurants / Nightclubs etc. 5 Meeting Space (sqft) 1,633 Debt $170MM Peak EBITDA (2008) $21.8MM HIGH LOW (AVERAGE) $MM 2013A 2014A 2015E 2016E 2017E 2018E 2019E # of Rooms 194 194 194 194 194 194 194 Revenue 47.5 48.8 47.7 48.2 49.4 50.8 52.4 (-) Departmental Expenses (19.3) (18.6) (17.7) (18.1) (18.6) (19.1) (19.7) (-) Undistributed Expenses (10.0) (8.2) (8.3) (8.7) (9.0) (9.2) (9.5) (-) Management Fees (2.0) (0.6) (1.4) (1.4) (1.5) (1.5) (1.6) (-) Fixed Charges (3.8) (3.5) (2.4) (2.5) (2.6) (2.7) (2.7) (=) EBITDA 12.5 17.9 17.9 17.5 17.8 18.3 18.9 (-) FF&E / Capex Reserve (1) (1.9) (2.0) (1.9) (1.9) (2.0) (2.0) (2.1) (=) Net Operating Income 10.6 16.0 15.9 15.6 15.8 16.3 16.8 (-) Renovation (0.2) -- -- -- -- -- -- (-) Maintenance Capex (1) (1.4) (1.5) (1.4) (1.4) (1.5) (1.5) (1.6) (=) Cash Flow 8.9 14.5 14.5 14.1 14.3 14.7 15.2 Delano Cash Flow Projections $MM 2016E NOI $15.6MM $15.6MM Cap Rate 6.5% 7.0% Gross Value 239 222 Delano Forward Cap Rate Valuation $MM Asset Bids Related 11/14/14 175 Rambleside 9/14/15 194 Hyatt 5/28/15 220 LaSalle 10/24/14 250 Delano Valuation Reference Points $MM 2016E 2017E 2018E 2019E PV of CF Present Value of Cash Flows High (@ 7.0%) 13.2 12.5 12.0 11.6 49.3 Low (@ 9.0%) 12.9 12.1 11.4 10.8 47.2 Terminal Value at Stated Exit Cap Rates Cap Rate 6.00% 6.50% 7.00% 7.50% High (@ 7.0%) 205.3 189.5 176.0 164.3 Low (@ 9.0%) 187.2 172.8 160.4 149.7 Total Value at Stated Exit Cap Rates Cap Rate 6.00% 6.50% 7.00% 7.50% High (@ 7.0%) 254.7 238.9 225.3 213.6 Low (@ 9.0%) 234.3 219.9 207.6 196.9 Delano Discounted Cash Flow Valuation (2) |
 Strictly Confidential Clift Valuation Project Roosevelt MONROE VALUATION 15 1 Notes 1. 4% FF&E reserve deducted from managements asset EBITDA projections 2. Discount rates per IRR Viewpoint 2016; Terminal value calculated by applying stated cap rate to 2020 NOI. NOI assumed to grow 3% from 2019 to 2020. Cap rates increased by 25 bps to reflect increased risk of ground lease 3. Net Value to Monroe reflects fee simple ownership interest less capital lease obligation plus value of Hotel Management Agreement 4. Value of Clift contract shown at a range of 9.4x-12.1x 2016E Fees based on the current range of 2016E EBITDA multiples of HLT, H, MAR, and HOT Key Stats Ownership Type 99-Yr Lease Keys 372 2016E ADR $279 2016E Occupancy 93% 2016E RevPAR $259 2016E Revenue $47.9MM 2016E EBITDA $7.1MM # Restaurants / Nightclubs etc. 4 Meeting Space (sqft) 4,209 Capitalized Lease Obligation (As of 12/31/2015) $94.7MM (12/31/15) RANGE • Reported conversations with Highgate Hotels suggest they would be willing to buy the leasehold interest unencumbered for $5MM to $10MM • As compared to previous model (October 16, 2015) anticipated approximate EBITDA margins have decreased 2% to 5% per year for 2016E-2019E $MM 2013E 2014E 2015E 2016E 2017E 2018E 2019E # of Rooms 372 372 372 372 372 372 372 Revenue 42.1 44.1 45.6 47.9 50.0 51.3 51.8 (-) Departmental Expenses (22.6) (23.5) (22.3) (23.7) (24.4) (25.1) (25.7) (-) Undistributed Expenses (11.9) (12.0) (12.4) (13.2) (13.6) (14.0) (14.3) (-) Management Fees (1.7) (1.8) (1.8) (1.9) (2.0) (2.1) (2.1) (-) Fixed Charges (2.0) (2.1) (1.9) (2.0) (2.1) (2.1) (2.2) (=) EBITDA 4.0 4.6 7.2 7.1 7.9 8.0 7.5 (-) FF&E / Capex Reserve (1) (1.7) (1.8) (1.8) (1.9) (2.0) (2.1) (2.1) (=) Net Operating Income 2.3 2.9 5.4 5.2 5.9 5.9 5.4 (-) Ground Rent Payment (6.0) (6.4) (7.6) (7.6) (7.6) (7.6) (7.8) (=) Cash Flow (3.6) (3.5) (2.2) (2.4) (1.7) (1.7) (2.4) Clift Cash Flow Projections $MM 2016E 2017E 2018E 2019E PV of CF Present Value of Cash Flows High (@ 7.0%) 4.8 5.2 4.8 4.1 19.0 Low (@ 9.0%) 4.7 5.0 4.6 3.8 18.1 Terminal Value at Stated Exit Cap Rates Cap Rate 6.25% 6.75% 7.25% 7.75% High (@ 7.0%) 63.6 58.9 54.8 51.3 Low (@ 9.0%) 57.9 53.6 49.9 46.7 Total Value at Stated Exit Cap Rates Cap Rate 6.25% 6.75% 7.25% 7.75% High (@ 7.0%) 82.5 77.8 73.8 70.2 Low (@ 9.0%) 76.1 71.8 68.1 64.9 Clift Discounted Cash Flow Valuation (2) $MM High Low Fee Simple Ownership 73.8 68.1 Capital Lease Obligation (94.7) (94.7) Implied Value of Leasehold (21.0) (26.6) Value of Contract (4) 37.7 29.4 Net Value to Monroe 16.7 2.7 Net Clift Valuation (3) |
 Strictly Confidential Net Operating Loss Valuation Project Roosevelt MONROE VALUATION 16 2016-03-14 Project Roosevelt Valuation Presentation_v19.pptx\14 MAR 2016\2:34 PM\16 Utilization Assuming Status Quo Case 1 Assumptions • 43% Corporate Tax Rate • Taxable Income per management projections through 2019, grown at designated growth rate thereafter Disclaimer: Morgan Stanley does not provide tax, accounting or legal advice and the information contained herein does not constitute such advice or any other form of advice for the recipient. • Since 2008, Monroe has accumulated an NOL balance of ~$433MM as of 12/31/15 • Management projects positive taxable income in 2016 (mainly due to termination fee income) and consistent positive taxable income starting in 2018 • If taxable income remains positive after 2018, all NOLs must be utilized (or expire) by 2038 • Tax savings from NOLs discounted at Monroe’s weighted average cost of capital with an applied 43% tax rate to estimate present value – Weighted average cost of capital used as discount rate includes tax-affected cost of debt Additional Notes • A buyer’s value for any NOLs would be based on utilization in any given year collared by the projected year’s taxable income and the maximum amount allowable under the IRS code section 382 • In a change of control transaction, use of NOLs will generally be limited to an annual amount equal to the product of the purchase price paid for the target equity multiplied by a rate published monthly by the IRS (most recent rate is 2.65%); most NOLs have a 20-year life • Asset sales in the first five years post-acquisition will generally be treated as exceptions to the 382 limitation $MM Taxable Income Growth After 2019 0.0% 2.5% 5.0% 7.5% 10.0% 8.1% 49.0 56.8 65.6 69.2 72.1 8.7% 46.6 53.8 61.8 65.4 68.3 9.3% 44.3 51.0 58.4 61.9 64.7 NOL Value Sensitivity Monroe Taxable Income $000s 2007A 2008A 2009A 2010A 2011A 2012A 2013A 2014A 2015A 2016E 2017E 2018E 2019E 678 (11,144) (19,078) (102,151) (87,514) (55,808) (43,589) (48,563) (28,143) 14,803 (2,285) 5,887 12,662 |
 Strictly Confidential ($MM, except per share metrics) Low Mid High Real Estate Value of Owned Properties Hudson Value 248 284 321 DCF - Low Mid Point BOV - High Delano Value 211 230 250 DCF - Low Mid Point Asset Bids Gross Clift Value 68 71 74 Value of Clift Lease Obligation (95) (95) (95) Implied Value of Clift Leasehold -- -- -- Gross Real Estate Value 459 515 571 Less: Existing Property Debt of Owned Properties Delano South Beach (159) (159) (159) Hudson (263) (263) (263) Hudson Capital Lease (6) (6) (6) Total Property Level Debt (428) (428) (428) Net Real Estate Value (1) 31 87 143 Management Company Value 2016E Management Co. EBITDA less G&A (2) 3.4 3.4 3.4 2016 EBITDA Multiple (Tier 1 Peers) 9.4x 11.1x 12.6x Net Management Company Value 32 38 43 Other Assets PV of Pipeline Under Construction (3) 8 9 10 PV of Lost Contracts (Termination & Mgmt Fees) 12 12 12 MB Vegas Lease 5 5 5 NOLs (4) -- 23 47 Cash 18 18 18 Other Liabilities Liability to Subsidiary Trust (50) (50) (50) MB Vegas Lease (5) (5) (5) Preferred & Accrued Dividends (5) (133) (133) (133) Sasson / Masi Default Interest (3) (3) (3) Sum-of-the-Parts Valuation (86) 0 85 (÷) Fully Diluted Number of Shares 35.9 35.9 35.9 (=) Sum-of-the-Parts Valuation per Share ($2.39) $0.01 $2.37 (=) Sum-of-the-Parts Valuation per Share (w/ Clift Leasehold at Negative Value) ($3.13) ($0.66) $1.79 (=) Sum-of-the-Parts Valuation per Share (w/o NOLs) ($2.39) ($0.64) $1.08 Monroe - Value of Business and Selected Trading Statistics MONROE VALUATION 17 Sum-of-the-Parts Analysis Project Roosevelt Source Company Information 1 Notes 1. Company has written down equity value in JV interest of Mondrian South Beach to $0. JV interest and associated debt excluded from this analysis 2. Management company EBITDA shown includes F&B EBITDA, is net of public company G&A, and excludes $1.8MM of fees from terminated contracts 3. Value of Pipeline Under Construction based on cash flows through stabilization discounted to 12/31/2015 at the company’s WACC; terminal value of the recurring management EBITDA calculated by applying a margin to stabilized fees and discounting back to 12/31/2015 at the company’s WACC 4. NOL asset valued as 0% (low), 50% (mid-point) and 100% (high) of the total present value of Monroe accumulated NOLs as of 12/31/2015 given likelihood of an asset sale which absorbs much of the NOL in any scenario 5. Preferred stock accrued dividends as of 3/31/2016 • Owned assets valued at a range of bids received to high end of DCF range – High end of bids from bidders with known capital sources – DCF at discount rate range of 7.0%-9.0% – Exit cap rate at 7.0% • Management business, including F&B business, net of public company costs, is valued at the current trading range of the Tier 1 peers: 9.4x-12.6x • The lower practical limit for common equity value would be $0, so in cases where the number shown is negative, and assuming the asset or entity values estimated, other portions of the capital structure would experience value impairments so as to reflect a zero or nominal positive value for the common equity |
 Strictly Confidential Closing Prices as of March 11, 2016 % of Debt/ Share 52-Week Equity Aggregate EBITDAx 2015 EPS Dividend Trailing Debt/Total Price High Value Value 2016 2017 Payout Yield EBITDA Market Cap Tier 1 Peers $21.26 67.3% 21,082 31,232 10.1x 9.5x 29% 1.3% 3.7x 34% $47.23 78.3% 6,455 7,377 9.4x 8.9x 0% 0.0% 1.8x 18% $39.50 88.3% 9,327 9,866 12.6x 11.6x 81% 2.8% 2.2x 15% $68.89 81.0% 17,650 21,661 11.2x 10.4x 27% 1.5% 2.6x 19% $9.48 71.5% 961 1,408 11.4x 10.7x 0% 0.0% 5.1x 38% $70.42 80.0% 12,043 13,543 12.1x 11.6x 52% 2.1% 2.0x 17% Average Tier 1 11.1x 10.4x 31% 1.3% 2.9x 23% Min Tier 1 9.4x 8.9x 0% 0.0% 1.8x 15% Max Tier 1 12.6x 11.6x 81% 2.8% 5.1x 38% Tier 2 Peers $52.11 79.8% 2,973 3,593 14.2x 13.4x 35% 1.6% 3.4x 21% $15.13 68.8% 3,111 5,500 9.0x 8.5x 74% 4.5% 4.6x 47% $11.56 46.4% 1,445 3,073 8.3x 8.0x 0% 0.0% 4.3x 54% $76.52 82.6% 8,756 13,796 10.0x 9.5x 35% 2.6% 3.8x 37% Average Tier 2 10.4x 9.9x 36% 2.2% 4.0x 40% Min Tier 2 8.3x 8.0x 0% 0.0% 3.4x 21% Max Tier 2 14.2x 13.4x 74% 4.5% 4.6x 54% Average 10.8x 10.2x 33% 1.6% 3.4x 30% Hotel C-Corp Peers MONROE VALUATION 18 Trading Comparables Analysis Source SNL Financial, Capital IQ, Morgan Stanley and Company reports Project Roosevelt 2 • The tier one peers’ 2016E EBITDA multiple range is 9.4x to 12.6x |
 Strictly Confidential $MM, as of 12/31/2015 2016 2017 Low Mid High Low Mid High EBITDAR 44.3 44.3 44.3 48.6 48.6 48.6 Clift and Hudson Rent (8.1) (8.1) (8.1) (8.1) (8.1) (8.1) Adj. EBITDA (1) 36.2 36.2 36.2 40.5 40.5 40.5 Peers' Multiple 9.4x 11.1x 12.6x 8.9x 10.4x 11.6x Implied Value 341 403 455 359 422 469 Plus: NOLs (2) -- 23 47 -- 23 47 Plus: PV of Lost Contracts (Termination & Mgmt Fees) 12 12 12 12 12 12 Plus: Cash 18 18 18 18 18 18 Implied Gross Value 371 456 531 389 475 545 Less: Property Debt (422) (422) (422) (422) (422) (422) Less: Liability to Subsidiary Trust (50) (50) (50) (50) (50) (50) Less: Restaurant Lease Note (5) (5) (5) (5) (5) (5) Less: Preferred Stock (75) (75) (75) (75) (75) (75) Less: Preferred Stock Accrued Dividends (3) (58) (58) (58) (58) (58) (58) Less: Sasson / Masi Default Interest (3) (3) (3) (3) (3) (3) Total Debt + Preferred (4) (613) (613) (613) (613) (613) (613) Net Value (242) (158) (82) (224) (139) (68) Diluted Shares 35.9 35.9 35.9 35.9 35.9 35.9 $ / Share ($6.74) ($4.38) ($2.29) ($6.25) ($3.85) ($1.90) Incremental EBITDA to Achieve 3/11/16 Share Price of $1.63 $19.4MM $18.9MM $ / Share (w/o NOLs) ($6.74) ($5.03) ($3.59) ($6.25) ($4.50) ($3.20) Implied Monroe Valuation MONROE VALUATION 19 Trading Comparables Analysis Project Roosevelt 2 Source SNL Financial, Capital IQ, Morgan Stanley and Company reports Notes 1. EBITDA represents management projections, excludes $1.8MM of fees from lost contracts 2. NOL asset valued as 0% (low), 50% (mid) and 100% (high) of the total present value of Monroe accumulated NOLs as of 12/31/2015 3. Preferred stock accrued dividends as of 3/31/2016 4. Total Debt and Preferred excludes capital leases at Clift and Hudson; EBITDA is net of rent expense for both leases; Company has written down equity value in JV interest of Mondrian South Beach to $0. JV interest and associated debt excluded from this analysis 5. Dilution from assumed exercise of 12.5MM warrants with $6.00 strike price (if in-the-money) Monroe trades at 14.7x aggregate value / consensus 2016E EBITDA. Consensus EBITDA of $44.5MM is 23% above management’s projected $36.2MM EBITDA. Monroe’s multiple implied by management’s EBITDA estimate is 18.1x • Application of peer EBITDA multiples assumes comparable reduction for rent in computing EBITDA from EBITDAR • The lower practical limit for common equity value would be $0, so in cases where the number shown is negative, and assuming the asset or entity values estimated, other portions of the capital structure would experience value impairments so as to reflect a zero or nominal positive value for the common equity Common Stock 34.7 LTIP Units 0.9 Membership Units 0.1 Restricted Stock 0.2 Dilution from Stock Options -- Dilution from Warrants Dependent on Price Shares Before Warrants 35.9 Warrant Dilution at Current Share Price Share Price as of 03/11/16 $1.63 Warrants 12.5 Exercise Price $6.00 Dilution (5) -- Total Shares Outstanding 35.9 Fully Diluted Share Count |
 Strictly Confidential MONROE VALUATION 20 Discounted Unlevered Cash Flow Analysis - Inputs Project Roosevelt Notes 1. Represents average remaining term of managements contracts for Monroe; yield of 15-year treasury obtained by interpolating the geometric midpoint of the spot rate between the 10-year and 20-year treasury 2. Per Capital IQ (Long-Term US Predicted Beta) 3. Company capital structure at 3/31/2016 adjusting for debt yield maintenance paydown in Feb. 2016 Weighted Average Cost of Capital • Cost of equity “floor” in Mid and High WACC estimates based on cost of preferred equity • Unquantified execution risks – Assumes 20% preferred equity can be refinanced at between 10% (low WACC) and 15% (high WACC) for forecast period • Monroe’s weighted average cost of capital not adjusted to tax-affect the cost of debt due to NOL tax shield Monroe WACC Analysis: CAPM Method 3(a) Assumption Notes Low Mid High Risk Free Rate (R f ) Interpolated 15-year risk free rate (1) 2.1% Predicted Beta U.S. Local Predicted Beta per Barra (2) 1.62 Market Risk Premium (MRP) Morgan Stanley estimated market risk premium 6.0% Cost of Equity (K E ) Calculated using the Capital Asset Pricing Model 11.8% 12.5% 15.0% Pre-tax Cost of Debt (KD) Blended rate based expected current capital structure (3) 5.8% 5.8% 5.8% Post-tax Cost of Debt (K D ) 5.8% 5.8% 5.8% Cost of Preferred (K P ) 10.0% 12.5% 15.0% Debt / Total Capitalization Based on expected capital structure (3) 91.3% 91.3% 91.3% Weighted Average Cost of Capital (WACC) K E * E/(D+E+P) + K D * (1-t) * D/(D+E+P) + K P * (1-t) * D/(D+E+P) 7.2% 7.7% 8.5% |
 Strictly Confidential $MM, unless otherwise noted Low Mid High Total PV Unlevered Cash Flows 117 119 121 Plus: PV of Terminal Value 423 460 497 Gross Value 540 579 617 Less: Hudson Mortgage (263) (263) (263) Less: Delano Mortgage (159) (159) (159) Less: Liability to Subsidiary Trust (50) (50) (50) Less: Restaurant Lease Note (5) (5) (5) Less: Preferred Stock (75) (75) (75) Less: Accrued Unpaid Preferred Dividend (58) (58) (58) Plus: Cash 13 13 13 Plus: PVof NOLs (6) 9 18 29 Implied Equity Value (48) 0 49 # of Diluted Shares 35.9 35.9 35.9 Implied Price per Share ($1.33) $0.01 $1.38 Implied Price per Share (w/o NOLs) ($1.57) ($0.49) $0.57 1. Based on management estimates 2016 – 2019; 2020 based on 2019 grown at 3% (pipeline incentive fees grown at 6%) 2. Includes working capital changes, proceeds from asset sales (2016 only), and restructuring, development, and disposal costs 3. Management company EBITDA shown includes F&B EBITDA 4. Terminal value assumes going concern achieves more typical capital structure. Utilizes tier 1 lodging long term beta of 1.3, risk free rate of 2.1%, market risk premium at 6%, and weighting of 30% debt and 10% pref to total capitalization based on tier 1 lodging comps to calculate WACC 5. Preferred equity, cash, and mortgage balances shown as of 3/31/2016, present value summary assumes no terminal value for Clift leasehold or Mondrian SoHo termination fee / settlement 6. Represents present value of NOLs at the end of the projection period (Year 2019) discounted back to present (Year 2015) – value shown at 25%, 50%, and 75% in low, mid, and high case, respectively Present Value Summary (5) MONROE VALUATION 21 Notes Discounted Unlevered Cash Flow Analysis Project Roosevelt As of 12/31/2015 • Assumptions – Unlevered Discount Rate: 7.2%-8.5% (all terminal values discounted at 7.2%) – Exit EBITDA Multiple for Management Company and Owned Hotels of 11.5x – 13.5x – Reflects blended exit multiple of long term sector averages +/- 1.0x – Assumes going concern valuation: no transaction costs • Unquantified execution risks – Forecast period: assumes 20% preferred equity can be refinanced at between 10% (low WACC) and 15% (high WACC) – Assumes terminal period going concern achieves ability to attract preferred equity at a 10% cost of capital (4) 3(a) Monroe Unlevered Free Cash Flows (1) Terminal Values $MM, unless otherwise noted Low Mid High 2020E Multiple Multiple Multiple Owned Hotel EBITDA (After Rent) 41.4 11.5x 12.5x 13.5x Management Co.EBITDA (3) 13.4 11.5x 12.5x 13.5x Corporate G&A (3.4) 11.5x 12.5x 13.5x Terminal Value ex. Unidentified 590.5 641.8 693.2 PV of Terminal Value (4) 422.9 459.7 496.5 $MM, unless otherwise noted 2016E 2017E 2018E 2019E 2020E Owned Hotel EBITDA (After Rent) 32.8 35.8 38.6 40.2 41.4 Management Co. EBITDA 5.2 4.5 5.9 9.4 9.7 F&B EBITDA 3.0 3.3 3.4 3.5 3.6 Corporate G&A (3.0) (3.1) (3.2) (3.3) (3.4) Termination Fees 10.9 -- -- -- Capex (6.4) (6.6) (6.8) (7.0) Sason / Massi Default Interest (3.0) -- -- -- Other Cash Flow Adjustments (2) (3.2) (2.7) (2.6) (1.8) Monroe Unlevered Cash Flow 36.3 31.2 35.3 41.0 PV of Cash Flows - Low 33.5 26.5 27.7 29.7 117.3 PV of Cash Flows - Mid 33.7 26.9 28.2 30.5 119.2 PV of Cash Flows - High 33.9 27.2 28.6 31.1 120.8 |
  Strictly Confidential $MM, unless otherwise noted Low Mid High FV of Terminal Value 590 642 693 Plus: FV of NOLs (3) 12 24 38 FV of Gross Value 602 666 731 Less: Hudson Mortgage (245) (245) (245) Less: Delano Mortgage (149) (149) (149) Less: Liability to Subsidiary Trust (50) (50) (50) Less: Preferred Equity (4) (226) (209) (205) Less: Cash Balance 9 9 9 FV of Terminal Equity Value (58) 23 92 (x) PV Factor 57% 62% 64% PV of Terminal Equity Value (33) 14 59 Plus: PV of Levered Cash Flows (32) (33) (33) PV of Total Equity Value (66) (19) 26 # of Diluted Shares 35.9 35.9 35.9 Implied Price per Share ($1.82) ($0.52) $0.72 Implied Price per Share (w/o NOLs) ($2.01) ($0.94) $0.05 Terminal Value Summary (2) MONROE VALUATION 22 Discounted Levered Cash Flow Analysis Project Roosevelt As of 12/31/2015 • Assumptions – Preferred equity continues PIK with no cash component – Cost of Equity: 11.8%-15.0% – Exit EBITDA Multiple for Total EBITDA of 11.5x – 13.5x – Reflects blended exit multiple of long term sector averages +/- 1.0x – Assumes going concern valuation: no transaction costs • Unquantified execution risks – Forecast period: assumes 20% preferred equity can be refinanced at between 10% (low WACC) and 15% (high WACC) – Cost of equity floor set by preferred coupon – Terminal period: going concern achieves ability to attract preferred equity at a 10% cost of capital – Cost of equity then based on CAPM for Mid and CAPM+100bps for High $MM, unless otherwise noted 2016E 2017E 2018E 2019E 2020E Total EBITDA (After Rent) (1) 38.0 40.5 44.6 49.8 51.3 Interest Expense (29.5) (26.1) (26.1) (26.1) Capex (6.4) (6.6) (6.8) (7.0) Debt Yield Test & Lease Note Repayment (29.6) (29.5) (1.0) (7.9) Other Cash Flow Adjustments 3.6 (3.8) (3.8) (3.1) Monroe Levered Cash Flow (23.8) (25.6) 7.0 5.7 PV of Cash Flows - Low (20.7) (19.4) 4.6 3.2 (32.2) PV of Cash Flows - Mid (21.1) (20.2) 4.9 3.5 (32.9) PV of Cash Flows - High (21.3) (20.5) 5.0 3.6 (33.1) Monroe Levered Cash Flows 3(b) Notes 1. Based on management estimates 2016 – 2019; 2020 based on 2019 grown at 3% (pipeline incentive fees grown at 6%) 2. Terminal Value summary assumes no terminal value for Clift leasehold or Mondrian SoHo termination fee / settlement 3. Represents present value of NOLs at the end of the projection period (Year 2019) 4. Terminal balance calculated by growing the 9/30/2016 balance of preferred equity at the preferred cost assumption in the appropriate column’s WACC assumption |
 Strictly Confidential MONROE VALUATION Post-Asset Sale Standalone Monroe (cont’d) Cash Flows under various growth and G&A scenarios Project Roosevelt 23 • Analysis assumes that Yucaipa preferred equity is retired and Trust Preferred stays in-place – To fully redeem the Yucaipa preferred, total sale price for Hudson and Delano would have to be $555MM or higher (1) – Trust preferred ($50MM) has put rights for “sale of all or substantially all” of the Company’s assets; this analysis assumes that the servicer agrees to keep in place under current terms • Based on a standalone company model, near-term cash flows are negative for several years • Sources and costs of funding capital shortfalls are unclear for a sub-scale company with little to no EBITDA or levered cash flow through at least 2018 4 Sources & Uses Note 1. Includes estimated brokerage fees; does not include additional friction costs such as transfer taxes Equity Value of Standalone Company 12/31/2019 Trust Preferred (50) Yucaipa Preferred -- Cumulative CF (6) MBLV Lease (5) NOLs 6 Total Adjustments (54) Terminal Value Adjustment Management Projections 2016E 2017E 2018E 2019E 2020E Management Fees - Existing 16.6 13.1 13.5 14.0 14.4 Management Fees - Under Construction -- 2.2 3.4 6.8 7.4 Total Fees 16.6 15.2 16.9 20.8 21.8 Owned Operations 1.8 2.8 3.1 2.5 2.6 Total Revenues 18.3 18.0 20.0 23.3 24.3 Management Expenses (14.1) (15.7) (16.2) (16.7) (17.2) Public Company Expenses (3.0) (3.1) (3.2) (3.3) (3.4) EBITDA 1.2 (0.8) 0.6 3.3 3.7 Corporate Debt (3.7) (2.0) (2.1) (2.1) Levered Operating Cash Flow (2.5) (2.8) (1.5) 1.2 Total Net Cash Flow (2.5) (2.8) (1.5) 1.2 Ending Cash Balance (2.5) (5.3) (6.8) (5.6) Cash Flow - Sell Both Assets Sources Sale of Hudson 310 Sales of Delano 240 Return of Escrow 5 Termination Fees 10 Balance Sheet Cash 7 Total Sources 572 Uses Hudson Mortgage 263 Delano Mortgage 159 Selling Costs 17 Repayment of Preferred 133 Balance Sheet Cash -- Total Uses 572 Sell Both Assets 2016E 2017E 2018E 2019E Total Net Cash Flow (2.5) (2.8) (1.5) 1.2 Terminal Value (11.5x 2020 EBITDA) -- -- -- (11.2) Total Net Cash Flow (2.5) (2.8) (1.5) (10.0) Present Value of Cash Flows $/Sh Total PV @ 20.0% Cost of Equity (0.27) (9.7) (2.1) (1.9) (0.9) (4.8) PV @ 22.5% Cost of Equity (0.26) (9.2) (2.1) (1.8) (0.8) (4.5) PV @ 25.0% Cost of Equity (0.24) (8.7) (2.0) (1.8) (0.8) (4.1) |
 Strictly Confidential MONROE VALUATION Post-Asset Sale Standalone Monroe (cont’d) Cash Flows under various growth and G&A scenarios Project Roosevelt 24 • Selling the Hudson and Delano and retiring the Yucaipa preferred would likely leave Monroe with little to no cash – Assumes Hudson sold for $340MM unencumbered; pro forma preferred balance of $104MM at June 30, 2016 – This analysis assumes Yucaipa preferred is refinanced with a 15% coupon and current-pay / PIK split on interest • Based on a standalone company model, near-term cash flows are negative for several years • Sources and costs of funding capital shortfalls are unclear for a sub-scale company with little to no EBITDA or levered cash flow through at least 2018 4 Sources & Uses Cash Flow - Sell Only Hudson Equity Value of Standalone Company 12/31/2019 Trust Preferred (50) Preferred (136) Cumulative CF (7) Mortgage Balance (133) MBLV Lease (5) NOLs 42 Total Adjustments (289) Terminal Value Adjustment Management Projections 2016E 2017E 2018E 2019E 2020E Management Fees - Existing 16.6 13.1 13.5 14.0 14.4 Management Fees - Under Construction -- 2.2 3.4 6.8 7.4 Total Fees 16.6 15.2 16.9 20.8 21.8 Owned Operations 1.8 2.8 3.1 2.5 2.6 Delano EBITDA less FF&E / Capex 14.1 14.3 14.7 15.2 15.7 Total Revenues 32.4 32.4 34.7 38.5 40.0 Management Expenses (14.1) (15.7) (16.2) (16.7) (17.2) Public Company Expenses (3.0) (3.1) (3.2) (3.3) (3.4) EBITDA 15.3 13.5 15.3 18.5 19.4 Corporate Debt (3.7) (2.0) (2.1) (2.1) Interest on Remaining Mortgage (8.1) (8.1) (8.1) (8.1) Preferred Payment -- (8.4) (9.0) (9.7) Levered Operating Cash Flow 3.5 (4.9) (3.9) (1.5) Total Net Cash Flow 3.5 (4.9) (3.9) (1.5) Ending Cash Balance 3.5 (1.5) (5.4) (6.9) Sell Hudson 2016E 2017E 2018E 2019E Total Net Cash Flow 3.5 (4.9) (3.9) (1.5) Terminal Value (11.5x 2020 EBITDA) -- -- -- (66.1) Total Net Cash Flow 3.5 (4.9) (3.9) (67.5) Present Value of Cash Flows $/Sh Total PV @ 20.0% Cost of Equity (0.99) (35.4) 2.9 (3.4) (2.3) (32.6) PV @ 22.5% Cost of Equity (0.91) (32.6) 2.8 (3.3) (2.1) (30.0) PV @ 25.0% Cost of Equity (0.84) (30.1) 2.8 (3.2) (2.0) (27.7) Sources Sale of Hudson 310 Sales of Delano -- Return of Escrow 3 Termination Fees 10 Balance Sheet Cash 7 Total Sources 330 Uses Hudson Mortgage Paydown 263 Delano Mortgage Paydown 26 Selling Costs 12 Repayment of Preferred 29 Balance Sheet Cash -- Total Uses 330 |
 Strictly Confidential MONROE VALUATION Post-Asset Sale Standalone Monroe (cont’d) Cash Flows under various growth and G&A scenarios Project Roosevelt 25 • Selling the Hudson and Delano and retiring the Yucaipa preferred would likely leave Monroe with little to no cash – Assumes Delano sold for $240MM; pro forma preferred balance of $137MM at June 30, 2016 – This analysis assumes Yucaipa preferred is refinanced with a 15% coupon and current-pay / PIK split on interest • Based on a standalone company model, near-term cash flows are negative for several years • Sources and costs of funding capital shortfalls are unclear for a sub-scale company with little to no EBITDA or levered cash flow through at least 2018 4 Sources & Uses Management Projections 2016E 2017E 2018E 2019E 2020E Management Fees - Existing 19.1 15.7 16.3 16.8 17.3 Management Fees - Under Construction -- 2.2 3.4 6.8 7.4 Total Fees 19.1 17.9 19.7 23.6 24.7 Owned Operations 1.8 2.8 3.1 2.5 2.6 Hudson EBITDA less FF&E / Capex 10.4 12.1 13.9 15.5 15.9 Total Revenues 31.3 32.8 36.7 41.6 43.2 Management Expenses (14.1) (15.7) (16.2) (16.7) (17.2) Public Company Expenses (3.0) (3.1) (3.2) (3.3) (3.4) EBITDA 14.1 13.9 17.3 21.6 22.6 Corporate Debt (3.7) (2.0) (2.1) (2.1) Interest on Remaining Mortgage (11.1) (11.1) (11.1) (11.1) Preferred Payment -- (9.6) (10.3) (11.1) Levered Operating Cash Flow (0.7) (8.7) (6.2) (2.7) Total Net Cash Flow (0.7) (8.7) (6.2) (2.7) Ending Cash Balance (0.7) (9.4) (15.6) (18.3) Cash Flow - Sell Only Delano Value of Standalone Company (Sell Delano) 12/31/2019 Trust Preferred (50) Preferred (155) Cumulative CF (18) Mortgage Balance (182) MBLV Lease (5) NOLs 41 Total Adjustments (369) Terminal Value Adjustment Sell Delano 2016E 2017E 2018E 2019E Total Net Cash Flow (0.7) (8.7) (6.2) (2.7) Terminal Value (11.5x 2020 EBITDA) -- -- -- (109.2) Total Net Cash Flow (0.7) (8.7) (6.2) (111.9) Present Value of Cash Flows $/Sh Total PV @ 20.0% Cost of Equity (1.79) (64.2) (0.6) (6.0) (3.6) (54.0) PV @ 22.5% Cost of Equity (1.66) (59.4) (0.6) (5.8) (3.4) (49.7) PV @ 25.0% Cost of Equity (1.54) (55.1) (0.6) (5.6) (3.2) (45.8) $MM Sources Sales of Delano 240 Sale of Hudson -- Return of Escrow 2 Termination Fees 10 Balance Sheet Cash 7 Total Sources 259 Uses Delano Mortgage Paydown 159 Hudson Mortgage Paydown 32 Hudson Yield Maintenance Paydown (After Proceeds) 49 Selling Costs 5 Repayment of Preferred 14 Balance Sheet Cash -- Total Uses 259 |
 Strictly Confidential Price per Share, $ (1) MONROE VALUATION Preliminary Illustrative Summary Valuation 26 Current Price (3/12/16) $1.63 • One research analyst covers Monroe; $1.30 price target released the day after Company’s 4Q15 earnings call • Consensus 2016E EBITDA estimate of $44.5MM compared to management projected $36.2MM (23% delta) Project Roosevelt Monroe Equity Value Per Share (Standalone Case) SOTP (2)(3) • Owned asset valuations based on DCF and private market bids • Management Co. based on comps 2016E EBITDA Multiples Valuation Analysis: Market Reference: Trading Comps (2)(3) • 2016E EBITDA Multiples Methodology • Single broker with current estimates Broker Price Target DCF (Unlevered) • 4-year projected unlevered cash flows • Tier one comps 2016E EBITDA range of 9.4x to 12.6x – $36.2MM Proj. 2016 EBITDA • $23MM of NOL Value at the mid-point 2 1 • Owned asset valued at range of bids, DCF valuations, and BOVs – Discount Rate: 7.0%-9.0% – Exit Cap Rate: 7.0%, 7.25% for Clift – EBITDA multiple for Management Business, F&B, and public company costs: 9.4x-12.6x (tier one comps) • $23MM of NOL value at the mid-point • Discount Rate: 7.2%-8.5% • Exit EBITDA Multiple for Owned Hotels and Mgmt Business: 11.5x-13.5x DCF (Levered) • 4-year projected levered cash flows • Excludes Unidentified Contracts • Cost of Equity: 11.8%-15.0% • Exit Total EBITDA Multiple: 11.5x-13.5x Trousdale Offer $2.25 3(a) 3(b) Standalone Asset Sales • Selling one or both hotel assets 4 $1.30 $0.00 $0.00 $0.00 $0.00 $0.00 $2.37 -- $1.38 $0.72 -- 0.00 0.50 1.00 1.50 2.00 2.50 3.00 (4) Notes 1. Negative per share values curtailed at $0.00 2. Based on Tier 1 peers which include BEL, H, HLT, IHG, MAR and HOT 3. EBITDA used to determine going concern value does not include lost contracts or termination payments, instead the present value of these cash flows were included in the analysis to obtain a company per share value 4. Terminal value assumes going concern achieves more typical capital structure. Utilizes tier 1 lodging long term beta of 1.3, risk free rate of 2.1%, market risk premium of 6%, and weighting of 30% debt and 10% pref to total capitalization based on tier 1 lodging comps to calculate WACC |
 Strictly Confidential Project Roosevelt 27 Section 4 Third-Party Alternatives 2016-03-14 Project Roosevelt Valuation Presentation_v19.pptx\14 MAR 2016\2:34 PM\27 |
 Strictly Confidential Selected Outreach / “Market Checks” THIRD-PARTY ALTERNATIVES 28 Project Roosevelt • To gauge market interest in a potential transaction with Monroe, Morgan Stanley contacted a select list of potential investors previously engaged in the Monroe process Paris Inn Group • Submitted attractive bid in first round, but unable to provide certainty around financing • Remain interested in Monroe but current timeline not feasible from a diligence or financing perspective • Participated in previous process with interest in a merger or strategic partnership • Potentially interested in a WholeCo bid • Will discuss with partners and revert mid-week of March 14 Hyatt Hotels • Indicated previously submitted bid letter remains valid (asset deal to acquire Delano and OpCo for $200MM apiece) • Based on the implied revenue multiple (~7x) at the time the offer was made, the OpCo valuation would be closer to $125MM (1) based on current NTM revenue Blackstone • Involved in asset sale process so familiar with two major components of value • Digging in on where they might see wholeco value and will provide some feedback on March 14 KSL Capital • Submitted offer to merge with a KSL portfolio company that has since been sold • Familiar with components of value and the business • Will respond with updated feedback early week of March 14 Note 1. $200MM bid was on $28.0MM of revenue, implying ~7.1x multiple, but on current revenue of $17.5MM, a ~7.1x implies a value of $125MM. Assuming value of Delano at $200MM (per their offer) and Hudson at $310MM, share price is $0.98 • Select other outbound contacts have been made, with no substantive dialogue to date 21c Museum Hotels th th th |
 Strictly Confidential Submitted Proposal Summary Terms Trousdale WholeCo Acquisition Proposal THIRD-PARTY ALTERNATIVES 29 Project Roosevelt • Cash offer of $2.25 per share, submitted March 2nd – [Expiration extended to Wednesday, March 16th] • Requests exclusivity period of approx. four weeks • Diligence could be completed “expeditiously in a matter of days” • No stated financing contingency; Cain Hoy Enterprises identified as a possible financing source • Yucaipa reportedly to roll the principal amount of its preferred equity ($75MM balance) • If deal not signed by end of exclusivity period, Trousdale reimbursed accrued deal expenses of approx. $1.5MM • Break-up as previously negotiated • Requires certain shareholders must enter into voting support agreements for the acquisition – Vector, Yucaipa, Rambleside, Pine River, OTK and Hamamoto Carlton Strategic Ventures Structured Proposal • Structured proposal submitted on March 3rd by Carlton Strategic Ventures (‘CSV”) to acquire the Hudson and Delano South Beach for $540MM (both encumbered); proceeds to retire Yucaipa preferred equity • Monroe would receive: – HMA for Cap Juluca (CSV is currently under contract to acquire from Starwood Capital) for 2.5% fee on all hotel and F&B revenue (1) – Opportunity to purchase 3.5% 20 Times Square, an EDITION-brand Marriott hotel, for $12MM – Potential access to $20MM of key money funding through a fully accruing 2-year term loan at 10% coupon or acquiring shares of stock • CSV to receive: – Guest lists for each of Monroe’s properties for the past 10 years – 18MM warrants to purchase Monroe shares at a price of $1.25 per share (2) – Two board seats (Howard Michaels as Vice Chairman and David Tessier as Monroe CEO) – Veto rights on all capital event, asset, investment, personnel and other management decisions – 30-day exclusivity; breakup fee of $10MM; termination permissible only if asset sale price is $560MM or greater • No reference to diligence requirements or timing Notes 1. It its proposal, CSV estimates stabilized hotel revenue at over $35MM 2. The warrants may be exercised at any time and will expire at the end of a three year term. The warrants shall have standard anti-dilution adjustment provisions for stock splits, dividends etc. and below fair market stock issuances |
 Strictly Confidential Project Roosevelt 30 Appendix A Additional Information 2016-03-14 Project Roosevelt Valuation Presentation_v19.pptx\14 MAR 2016\2:34 PM\30 |
 Strictly Confidential Project Roosevelt Trading Statistics: Hotel C-Corp Comparables ADDITIONAL INFORMATION 31 Hotel C-Corp Comparables Notes: (1) Includes shares and operating partnership units (4) Consensus Estimates from SNL as of March 11, 2016, unless otherwise noted Sources: SNL Financial, Capital IQ, Green Street Advisors, Morgan Stanley and Company reports (3) Aggregate Value equals Total Market Capitalization less cash Trading Statistics as of March 11, 2016 (in $MM, except per share and multiple data) Total Aggregate Value / % of Equity Market Aggregate Price / EPS (4) EBITDA (4) 5-Yr. EPS Dividend 2016E EPS Company Name Ticker Price 52-Wk High Mkt. Cap. (1) Capitalization (2) Value (3) 2016E 2017E 2016E 2017E Growth Yield Payout Ratio (4) Belmond Ltd. BEL 9.48 71.5% 960.6 1,543.8 1,408.2 47.4x 38.2x 11.4x 10.7x 1.0% 0.0% 0.0% Choice Hotels International, Inc. CHH 52.11 79.8% 2,972.7 3,786.8 3,593.4 22.1x 20.2x 14.2x 13.4x 6.1% 1.6% 34.7% Hyatt Hotels Corporation H 47.23 78.3% 6,454.8 7,834.5 7,377.5 32.7x 27.4x 9.4x 8.9x 11.4% 0.0% 0.0% Hilton Worldwide Holdings Inc. HLT 21.26 67.3% 21,081.7 31,840.7 31,231.7 22.2x 18.8x 10.1x 9.5x 15.0% 1.3% 29.3% Starwood Hotels & Resorts Worldwide HOT 70.42 80.0% 12,042.6 14,590.6 13,542.6 24.5x 22.5x 12.1x 11.6x 5.3% 2.1% 52.2% InterContinental Hotels Group IHG 39.50 88.3% 9,326.6 11,002.6 9,865.6 29.0x 25.2x 12.6x 11.6x 11.0% 2.8% 80.8% La Quinta Holdings Inc. LQ 11.56 46.4% 1,444.6 3,159.6 3,072.8 21.6x 19.5x 8.3x 8.0x (1.0%) 0.0% 0.0% Marriott International, Inc. MAR 68.89 81.0% 17,649.9 21,756.9 21,660.9 18.4x 15.7x 11.2x 10.4x 15.0% 1.5% 26.7% Marcus Hotels and Resorts MCS 19.53 87.9% 546.5 817.9 812.2 17.6x 15.8x 7.9x 7.4x 11.4% 2.3% 40.4% Morgans Hotel Group Company MHGC 1.63 20.4% 58.6 788.8 775.6 NM NM 14.7x 12.9x - 0.0% 0.0% Extended Stay America, Inc. STAY 15.13 68.8% 3,110.5 5,872.9 5,499.7 16.4x 14.3x 9.0x 8.5x 6.3% 4.5% 73.7% Wyndham Worldwide WYN 76.52 82.6% 8,755.6 13,966.6 13,795.6 13.5x 12.2x 10.0x 9.5x 7.9% 2.6% 35.3% Mean: 71.0% 7,033.7 9,746.8 9,386.3 22.0x 19.0x 10.9x 10.2x 8.1% 1.6% 31.1% Median: 79.0% 4,782.6 6,853.7 6,438.6 21.8x 19.1x 10.6x 10.0x 7.9% 1.9% 37.6% Total: 84,404.6 116,961.7 112,635.8 (2) Equals the sum of equity market value, noncontrolling interest, preferred securities at liquidation preference, consolidated and company's share of unconsolidated debt |
 Strictly Confidential Project Roosevelt Credit Statistics: Hotel C-Corp Comparables ADDITIONAL INFORMATION 32 Hotel C-Corp Comparables Notes: (1) Includes shares and operating partnership units (3) Aggregate Value equals Total Market Capitalization less cash (4) Includes share of unconsolidated debt (5) Book capitalization equals the sum of debt outstanding and total equity Sources: SNL Financial, Capital IQ, Morgan Stanley and Company reports Credit Statistics as of March 11, 2016 (Including Share of Joint Ventures) (in $MM, except per share data) Total Secured Debt/ Variable Rate LTM Coverage Statistics Credit Ratings Equity Market Aggregate Debt-to-Market Debt-to-Book Total Debt Debt/Total Debt EBITDA/ Debt/ Net Debt/ EBITDA/ Company Name Ticker Price Mkt. Cap. (1) Capitalization (2) Value (3) Capitalization (4) Capitalization (4)(5) (Cons.) (Cons.) Interest EBITDA EBITDA FC S&P Moody's Fitch Belmond Ltd. BEL 9.48 960.6 1,543.8 1,408.2 37.8% 47.0% 94.7% 100.0% 3.6x 5.1x 3.9x 3.6x B+ - - Choice Hotels International, Inc. CHH 52.11 2,972.7 3,786.8 3,593.4 21.5% 194.7% 0.1% 19.2% NA 3.4x 2.6x NA BB+ Baa3 - Hyatt Hotels Corporation H 47.23 6,454.8 7,834.5 7,377.5 17.6% 25.6% 0.0% 0.0% NA 1.8x 1.2x NA BBB Baa2 - Hilton Worldwide Holdings Inc. HLT 21.26 21,081.7 31,840.7 31,231.7 33.9% 64.5% 85.3% 42.1% NA 3.7x 3.5x NA BB - - Starwood Hotels & Resorts Worldwide HOT 70.42 12,042.6 14,590.6 13,542.6 17.4% 66.2% 1.7% 29.2% 9.7x 2.0x 1.2x 9.2x BBB Baa2 BBB InterContinental Hotels Group IHG 39.50 9,326.6 11,002.6 9,865.6 15.1% 83.9% 13.4% 0.0% NA 2.2x 0.7x NA BBB - - La Quinta Holdings Inc. LQ 11.56 1,444.6 3,159.6 3,072.8 54.2% 69.6% 100.0% 50.4% 4.6x 4.3x 4.1x 4.6x BB- - - Marriott International, Inc. MAR 68.89 17,649.9 21,756.9 21,660.9 18.9% 794.4% 0.0% 22.8% 9.5x 2.6x 2.5x 9.0x BBB Baa2 BBB Marcus Hotels and Resorts MCS 19.53 546.5 817.9 812.2 33.0% 42.9% 6.3% NA 9.5x 3.0x 2.9x 9.5x - - - Morgans Hotel Group Company MHGC 1.63 58.6 788.8 775.6 75.7% 176.7% 73.0% 73.0% 0.8x 16.1x 15.7x 0.6x - - - Extended Stay America, Inc. STAY 15.13 3,110.5 5,872.9 5,499.7 47.0% 65.0% 69.2% 13.1% 4.4x 4.6x 4.0x 4.4x BB- - - Wyndham Worldwide WYN 76.52 8,755.6 13,966.6 13,795.6 37.3% 84.5% 43.8% 6.8% 6.9x 3.8x 3.7x 6.7x BBB- Baa3 BBB- Mean: 7,033.7 9,746.8 9,386.3 34.1% 142.9% 40.6% 32.4% 6.1x 4.4x 3.8x 5.9x Median: 4,782.6 6,853.7 6,438.6 33.4% 67.9% 28.6% 22.8% 5.7x 3.6x 3.2x 5.6x Total: 84,404.6 116,961.7 112,635.8 (2) Equals the sum of equity market value, noncontrolling interest, preferred securities at liquidation preference, consolidated and company's share of unconsolidated debt |
 Strictly Confidential Project Roosevelt Trading Statistics: Hotel REIT Comparables ADDITIONAL INFORMATION 33 Hotel REIT Comparables Trading Statistics as of March 11, 2016 (Including Share of Joint Ventures) (in $MM, except per share, per key ($k), and multiple data) Total Aggregate Value / % of UPREIT Equity Market Aggregate Agg Value / Price / FFO (5) Price/AFFO (5) EBITDA (4) Premium/ Dividend Company Name Ticker Price 52-Wk High Mkt. Cap. (1) Capitalization (2) Value (3) Key 2016E 2017E 2016E 2017E 2016E 2017E NAV (5) Yield Ashford Hospitality Trust Inc. AHT 5.86 56.8% 668.4 4,932.1 4,717.0 168.1 3.6x 3.4x 5.7x 5.2x 10.7x 10.3x (38.6%) 8.2% Ashford Hospitality Prime, Inc. AHP 10.44 60.3% 297.2 1,053.0 967.3 244.8 5.9x 5.6x 8.1x 6.4x 9.0x 8.6x (41.5%) 3.8% Apple Hospitality REIT, Inc. APLE 19.97 95.2% 3,481.7 4,479.8 4,479.8 195.1 11.5x 11.2x 13.6x 13.5x 13.0x 12.7x 13.1% 6.0% Chatham Lodging Trust CLDT 21.04 66.8% 806.6 1,414.5 1,393.5 76.7 8.3x 7.8x 9.6x 8.4x 0.0x 0.0x (31.8%) 6.3% Chesapeake Lodging Trust CHSP 26.30 74.8% 1,580.2 2,483.8 2,433.3 363.2 10.7x 10.4x 12.2x 12.3x 12.5x 12.4x (12.5%) 6.1% DiamondRock Hospitality Co DRH 9.54 62.9% 1,915.1 3,092.8 2,879.2 263.5 8.9x 8.4x 11.4x 11.1x 10.5x 10.2x (23.2%) 5.2% FelCor Lodging Trust, Inc. FCH 7.86 63.2% 1,101.9 2,871.1 2,811.3 225.0 8.0x 7.9x 12.1x 11.7x 11.2x 11.2x NA 3.1% Hersha Hospitality Trust HT 21.14 73.9% 980.2 2,338.1 2,310.2 263.6 7.8x 7.4x 9.2x 8.5x 11.9x 11.5x (17.8%) 5.3% Hospitality Properties Trust HPT 25.53 74.6% 3,869.0 7,446.5 7,432.8 162.1 6.6x 6.4x 7.9x 7.6x 9.5x 9.2x (21.7%) 7.8% Host Hotels & Resorts, Inc. HST 16.63 75.9% 12,666.7 17,048.7 16,809.7 261.2 9.9x 9.6x 13.4x 12.9x 11.6x 11.4x (12.8%) 4.8% LaSalle Hotel Properties LHO 25.09 61.0% 2,837.2 4,445.8 4,440.1 367.7 8.4x 8.4x 10.3x 10.6x 11.2x 11.1x (18.5%) 7.2% Pebblebrook Hotel Trust PEB 26.59 54.1% 1,886.1 3,572.4 3,546.1 361.1 9.6x 9.1x 12.1x 11.6x 12.8x 12.7x (19.7%) 4.7% RLJ Lodging Trust RLJ 22.26 67.7% 2,841.5 4,430.4 4,296.2 205.8 8.1x 7.9x 10.1x 9.9x 10.8x 10.7x (19.1%) 5.9% Ryman Hospitality Properties, Inc. RHP 50.12 77.1% 2,568.5 4,000.3 3,944.0 NA 9.4x 8.8x 9.7x 9.1x 11.4x 10.7x 2.3% 6.0% Summit Hotel Properties INN 11.81 80.8% 1,031.7 1,924.3 1,895.0 165.9 9.1x 8.5x 11.2x 10.4x 11.9x 11.5x (15.5%) 4.0% Sunstone Hotel Investors, Inc. SHO 13.59 77.9% 2,935.5 4,217.8 3,718.8 268.6 10.9x 10.2x 15.1x 13.7x 11.1x 10.5x (7.9%) 10.4% Xenia Hotels & Resorts, Inc. XHR 16.15 66.2% 1,758.9 2,869.4 2,747.3 201.1 6.3x 6.1x 7.0x NA 9.2x 8.4x NA 5.7% Mean: 70.0% 2,542.7 4,271.8 4,166.0 237.1 8.4x 8.1x 10.5x 10.2x 10.5x 10.2x (17.7%) 5.9% Median: 67.7% 1,886.1 3,572.4 3,546.1 234.9 8.4x 8.4x 10.3x 10.5x 11.2x 10.7x (18.5%) 5.9% Total: 43,226.5 72,620.8 70,821.3 Notes (1) Includes shares and operating partnership units (3) Aggregate Value equals Total Market Capitalization less cash (4) Aggregate Value / EBITDA (Including Share of JV Debt) (5) Consensus AFFO and NAV estimates from SNL Financial as of March 11, 2016, unless otherwise noted (6) Implied Cap Rates based on share prices as of March 11, 2016 Sources: SNL Financial, Capital IQ, Green Street Advisors, Morgan Stanley and Company reports (2) Equals the sum of equity market value, noncontrolling interest, preferred securities at liquidation preference, consolidated and company's share of unconsolidated debt |
 Strictly Confidential Project Roosevelt Credit Statistics: Hotel REIT Comparables ADDITIONAL INFORMATION 34 Hotel REIT Comparables Credit Statistics as of March 11, 2016 (Including Share of Joint Ventures) (in $MM, except per share data) Total LTM Coverage Statistics Credit Ratings UPREIT Equity Market Aggregate Debt-to-Market Debt-to-Book Secured Debt/ Variable Rate Debt/ EBITDA/ Debt/ Net Debt/ EBITDA/ Company Name Ticker Price Mkt. Cap. (1) Capitalization (2) Value (3) Capitalization (4) Capitalization (4)(5) Total Debt (Cons.) Total Debt (Cons.) Interest EBITDA EBITDA FC S&P Moody's Fitch Ashford Hospitality Trust Inc. AHT 5.86 668.4 4,932.1 4,717.0 78.4% 82.7% 100.0% 72.0% 2.2x 9.5x 9.0x 1.8x - - - Ashford Hospitality Prime, Inc. AHP 10.44 297.2 1,053.0 967.3 72.2% 68.7% 100.0% 45.5% 2.4x 8.5x 7.5x 2.3x - - - Apple Hospitality REIT, Inc. APLE 19.97 3,481.7 4,479.8 4,479.8 22.3% 27.4% 42.6% 57.9% 9.7x 3.1x 3.1x 9.7x - - - Chatham Lodging Trust CLDT 21.04 806.6 1,414.5 1,393.5 43.0% 46.6% 89.2% 10.8% NA 4.8x 4.6x NA - - - Chesapeake Lodging Trust CHSP 26.30 1,580.2 2,483.8 2,433.3 31.3% 39.1% 69.7% 30.3% 6.0x 4.1x 3.8x 4.6x - - - DiamondRock Hospitality Co DRH 9.54 1,915.1 3,092.8 2,879.2 38.1% 39.2% 100.0% 14.5% 5.0x 4.4x 3.6x 5.0x - - - FelCor Lodging Trust, Inc. FCH 7.86 1,101.9 2,871.1 2,811.3 50.1% 82.2% 47.5% 19.3% 2.9x 6.1x 5.9x 2.0x B B3 - Hersha Hospitality Trust HT 21.14 980.2 2,338.1 2,310.2 50.0% 63.3% 44.1% 57.0% 3.5x 6.6x 6.4x 2.6x - - - Hospitality Properties Trust HPT 25.53 3,869.0 7,446.5 7,432.8 44.1% 53.9% 0.0% 26.3% 4.7x 4.9x 4.9x 3.3x BBB- Baa2 - Host Hotels & Resorts, Inc. HST 16.63 12,666.7 17,048.7 16,809.7 25.6% 38.1% 8.7% 35.0% NA 3.1x 2.9x NA BB+ Baa2 BBB- LaSalle Hotel Properties LHO 25.09 2,837.2 4,445.8 4,440.1 32.2% 37.6% 35.8% 80.0% 7.1x 3.7x 3.7x 5.7x - - - Pebblebrook Hotel Trust PEB 26.59 1,886.1 3,572.4 3,546.1 37.3% 43.1% 28.7% 62.2% 5.4x 5.1x 5.0x 3.5x - - - RLJ Lodging Trust RLJ 22.26 2,841.5 4,430.4 4,296.2 35.7% 42.0% 25.8% 97.8% 6.9x 4.2x 3.8x 6.6x - - - Ryman Hospitality Properties, Inc. RHP 50.12 2,568.5 4,000.3 3,944.0 35.8% 79.0% 0.5% 48.0% 5.1x 4.4x 4.2x 5.1x B+ Ba3 - Summit Hotel Properties INN 11.81 1,031.7 1,924.3 1,895.0 35.2% 44.1% 54.2% 40.5% 5.0x 4.4x 4.2x 5.0x - - - Sunstone Hotel Investors, Inc. SHO 13.59 2,935.5 4,217.8 3,718.8 26.5% 32.7% 91.0% 20.2% 5.3x 3.2x 1.8x 4.6x - - - Xenia Hotels & Resorts, Inc. XHR 16.15 1,758.9 2,869.4 2,747.3 38.1% 38.6% 100.0% 53.3% 5.8x 3.7x 3.3x 5.8x - - - Mean: 2,542.7 4,271.8 4,166.0 40.9% 50.5% 55.2% 45.3% 5.1x 4.9x 4.6x 4.5x Median: 1,886.1 3,572.4 3,546.1 37.3% 43.1% 47.5% 45.5% 5.1x 4.4x 4.2x 4.6x Total: 43,226.5 72,620.8 70,821.3 Notes (1) Includes shares and operating partnership units (3) Aggregate Value equals Total Market Capitalization less cash (4) Includes share of unconsolidated debt (5) Book capitalization equals the sum of debt outstanding and total equity Sources: SNL Financial, Capital IQ, Morgan Stanley and Company reports (2) Equals the sum of equity market value, noncontrolling interest, preferred securities at liquidation preference, consolidated and company's share of unconsolidated debt |
 Strictly Confidential Disclaimer 2016-03-14 Project Roosevelt Valuation Presentation_v19.pptx\14 MAR 2016\2:34 PM\35 Project Roosevelt 35 © Morgan Stanley and/or certain of its affiliates. All rights reserved. We have prepared this document solely for informational purposes. You should not definitively rely upon it or use it to form the definitive basis for any decision, contract, commitment or action whatsoever, with respect to any proposed transaction or otherwise. You and your directors, officers, employees, agents and affiliates must hold this document and any oral information provided in connection with this document in strict confidence and may not communicate, reproduce, distribute or disclose it to any other person, or refer to it publicly, in whole or in part at any time except with our prior written consent. If you are not the intended recipient of this document, please delete and destroy all copies immediately. We have prepared this document and the analyses contained in it based, in part, on certain assumptions and information obtained by us from the recipient, its directors, officers, employees, agents, affiliates and/or from other sources. Our use of such assumptions and information does not imply that we have independently verified or necessarily agree with any of such assumptions or information, and we have assumed and relied upon the accuracy and completeness of such assumptions and information for purposes of this document. Neither we nor any of our affiliates, or our or their respective officers, employees or agents, make any representation or warranty, express or implied, in relation to the accuracy or completeness of the information contained in this document or any oral information provided in connection herewith, or any data it generates and accept no responsibility, obligation or liability (whether direct or indirect, in contract, tort or otherwise) in relation to any of such information. We and our affiliates and our and their respective officers, employees and agents expressly disclaim any and all liability which may be based on this document and any errors therein or omissions therefrom. Neither we nor any of our affiliates, or our or their respective officers, employees or agents, make any representation or warranty, express or implied, that any transaction has been or may be effected on the terms or in the manner stated in this document, or as to the achievement or reasonableness of future projections, management targets, estimates, prospects or returns, if any. Any views or terms contained herein are preliminary only, and are based on financial, economic, market and other conditions prevailing as of the date of this document and are therefore subject to change. We undertake no obligation or responsibility to update any of the information contained in this document. Past performance does not guarantee or predict future performance. This document and the information contained herein do not constitute an offer to sell or the solicitation of an offer to buy any security, commodity or instrument or related derivative, nor do they constitute an offer or commitment to lend, syndicate or arrange a financing, underwrite or purchase or act as an agent or advisor or in any other capacity with respect to any transaction, or commit capital, or to participate in any trading strategies, and do not constitute legal, regulatory, accounting or tax advice to the recipient. We recommend that the recipient seek independent third party legal, regulatory, accounting and tax advice regarding the contents of this document. This document does not constitute and should not be considered as any form of financial opinion or recommendation by us or any of our affiliates. This document is not a research report and was not prepared by the research department of Morgan Stanley or any of its affiliates. Notwithstanding anything herein to the contrary, each recipient hereof (and their employees, representatives, and other agents) may disclose to any and all persons, without limitation of any kind from the commencement of discussions, the U.S. federal and state income tax treatment and tax structure of the proposed transaction and all materials of any kind (including opinions or other tax analyses) that are provided relating to the tax treatment and tax structure. For this purpose, "tax structure" is limited to facts relevant to the U.S. federal and state income tax treatment of the proposed transaction and does not include information relating to the identity of the parties, their affiliates, agents or advisors. This document is provided by Morgan Stanley & Co. LLC and/or certain of its affiliates or other applicable entities, which may include Morgan Stanley Realty Incorporated, Morgan Stanley Senior Funding, Inc., Morgan Stanley Bank, N.A., Morgan Stanley & Co. International plc, Morgan Stanley Securities Limited, Morgan Stanley Bank AG, Morgan Stanley MUFG Securities Co., Ltd., Mitsubishi UFJ Morgan Stanley Securities Co., Ltd., Morgan Stanley Asia Limited, Morgan Stanley Australia Securities Limited, Morgan Stanley Australia Limited, Morgan Stanley Asia (Singapore) Pte., Morgan Stanley Services Limited, Morgan Stanley & Co. International plc Seoul Branch and/or Morgan Stanley Canada Limited Unless governing law permits otherwise, you must contact an authorized Morgan Stanley entity in your jurisdiction regarding this document or any of the information contained herein. |