 2016-05-07 Project Roosevelt Fairness Presentation_v26 (Post Committee).pptx\08 MAY 2016\1:19 AM\1 Project Roosevelt Fairness Opinion Presentation May 8, 2016 Exhibit (c)(3) Strictly Confidential |
 Strictly Confidential Table of Contents Project Roosevelt 2 2016-05-07 Project Roosevelt Fairness Presentation_v26 (Post Committee).pptx\08 MAY 2016\1:19 AM\2 Section 1 Situation Overview Section 2 Lodging Capital Markets Observations Section 3 Monroe Selected Information Section 4 Monroe Valuation Section 5 Third-Party Alternatives |
 Strictly Confidential Project Roosevelt 3 Section 1 Situation Overview 2016-05-07 Project Roosevelt Fairness Presentation_v26 (Post Committee).pptx\08 MAY 2016\1:19 AM\3 |
 Strictly Confidential Executive Summary SITUATION OVERVIEW 4 Project Roosevelt • From Mid-2014 through 2015, Monroe’s Board of Directors explored strategic alternatives, including an active solicitation for proposals on a sale of the entire business or parts thereof from approximately 180 parties (see next page for more details) – Discussions reached a point of active negotiation of a merger agreement in late 2015 with “Trousdale”, a private hotel/restaurant/nightlife branded operator founded, owned and headed by Sam Nazarian • Ultimately, negotiations with Trousdale ended and Monroe suspended the active solicitation; an asset marketing process was announced on December 7, 2015 • In March 2016, discussions with Trousdale re-commenced around an all-cash bid for purchase of Monroe’s outstanding common shares at an initial proposed value of $2.25 per share – Additional outreach was conducted by Monroe and its financial advisors with eleven parties judged to have sufficient potential interest in, and familiarity with, Monroe to respond quickly and credibly if they so desired • The Trousdale discussions resulted in a negotiated proposal for $2.40 per share and the decision by Monroe’s board to enter into a 4-week exclusivity period with Trousdale beginning on March 29, 2016 • Financial, legal, and tax diligence continued, including in-person meetings and asset tours – Parties agreed to extend exclusivity through May 3 (and again through May 6), 2016, primarily to allow Trousdale and its financing partners to complete the financing commitment process – On May 6, after completion of due diligence, Trousdale lowered their offer price to $2.10, citing deteriorating performance at the Hudson and the Delano and other factors as the rationale for such reduction – Negotiations continued through the weekend of May 7 – 8 (and included an increase in the offer price from $2.10 to $2.25 made late eastern time on May 8, which was characterized as the final offer) – A summary of the transaction structure is provided in the following pages, as well as an analysis of Monroe as a stand-alone going concern |
 Strictly Confidential Overview of Strategic Alternatives Process May 2014 to December 2015 Project Roosevelt SITUATION OVERVIEW 5 2016-05-07 Project Roosevelt Fairness Presentation_v26 (Post Committee).pptx\08 MAY 2016\1:19 AM\5 • In May 2014 the Company announced the retention of Morgan Stanley as financial advisor to assist the STC in its ongoing review of strategic alternatives • Morgan Stanley began engaging with potential interested parties in early September 2014. The initial process launch included global outreach to approximately 180 parties – 65 parties signed NDAs and 12 parties ultimately submitted transaction proposals – Based on discussions with potential investors and the judgment of the STC and its advisors, it was concluded that the disposition of The Light Group would potentially broaden the Company’s appeal to prospective counterparties – The Company announced the sale of The Light Group on December 16, 2014 • Interested parties that executed an NDA were provided with evaluation materials • Following the receipt of first round indications, parties approved by the STC were invited to participate in a subsequent round – These interested parties were given access to an electronic data room and permission to speak with financing sources • Based on a recommendation of the Special Transaction Committee, the Board dissolved the Special Transaction Committee in June 2015 and the process continued under the direction of the full board • Potential transaction partners were eventually narrowed to Trousdale, a private hotel/restaurant/nightlife branded operator founded and owned by Sam Nazarian – Over the course of a few months, terms were negotiated and agreed upon; however, no deal was consummated and the process was suspended in late 2015 – The Company announced its intention to market the owned hotel properties for sale through the real estate brokerage, Hodges Ward Elliott • As financial advisor to Monroe, Morgan Stanley has assisted the Company with extensive diligence related to the proposed transaction and assisted the Board of Directors in negotiating specific terms and reviewing alternatives |
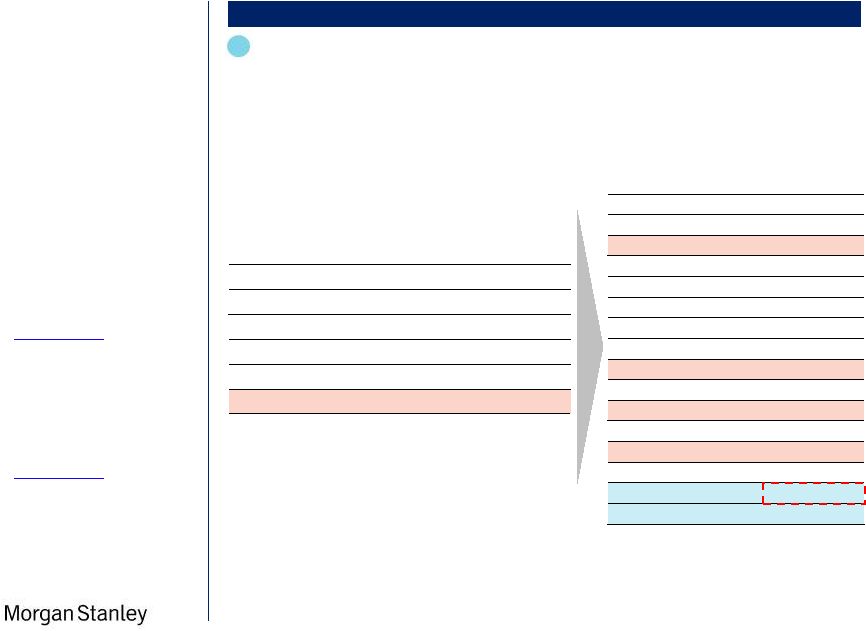
 Strictly Confidential Summary of Key Terms of Proposed Transaction Project Roosevelt SITUATION OVERVIEW 6 2016-05-07 Project Roosevelt Fairness Presentation_v26 (Post Committee).pptx\08 MAY 2016\1:19 AM\6 Structure Reverse triangular merger: SBEEG, Eldridge, Yucaipa form “New Holdco” to own 100% of sbe and acquire 100% of Monroe SBEEG and Eldridge will contribute 100% of sbe in exchange for 75% of the common equity in “New Holdco” Eldridge will contribute $75MM in cash in exchange for preferred equity in “New Holdco” (used to fund a portion of the Monroe acquisition) Yucaipa to exchange $75MM of principal and all accrued dividends ($65.1MM as of 9/30/2016) in Series A preferred equity and its common stock warrants for $75MM in new preferred in “New Holdco” and 25% of the common equity of “New Holdco” Post-closing assignment of leasehold interest in three restaurants at Mandalay Bay Las Vegas casino / hotel Consideration $2.25 per share in cash Voting Agreements [Voting Agreements signed in support of the transaction by the following shareholders (ownership % in Monroe): OTK (13%), Pine River (9%), Vector (7%)] Mortgage Assumption Buyer has expressed intention to assume or refinance mortgage; assumption could be automatic under the Mortgage Agreement if buyer is deemed a Qualified Transferee or through lender consents if not deemed a Qualified Transferee Lenders' counsel has indicated they expect lenders to agree that buyer meets Qualified Transferee requirements; formal lender acknowledgment of Qualified Transferee status unlikely before SPA signing Buyer has also indicated a potential desire to amend the mortgage agreement prior to assumption, which would require approval by lenders as well as transfer consent Termination Fees $6.5MM termination fee / $6.5MM reverse termination fee; to be received by Monroe: Buyer fails to close by the outside date and all conditions were satisfied or capable of being satisfied other than the mortgage condition; or The conditions are satisfied, the Company is ready willing and able to close but Buyer fails to close in breach of the agreement (and Buyer does not obtain specific performance) Financing Commitment $175MM term loan / $30MM RLOC commitment from Security Benefit Corporation $75MM preferred equity from Eldridge “Rollover” agreement with Yucaipa related to preferred and warrants |
 Strictly Confidential Summary of Key Terms of Proposed Transaction (Cont’d) Project Roosevelt SITUATION OVERVIEW 7 2016-05-07 Project Roosevelt Fairness Presentation_v26 (Post Committee).pptx\08 MAY 2016\1:19 AM\7 (6) Ownership & Capitalization Mortgage assumption $421.8MM Security Benefit Term Loan & LOC (1) $186.1MM Trust preferred & restaurant note (2) $54.1MM New Holdco preferred issued to Eldridge $75.0MM New Holdco preferred issued to Yucaipa $75.0MM New Holdco common issued to Yucaipa $65.1MM (3)(4) New Holdco common issued to SBEEG / Eldridge $195.4MM (4) Notes 1. Includes $11.1MM drawn on Security Benefit line of credit (full capacity of $30MM) 2. Includes $50.1MM trust preferred and $4.0MM restaurant note as of 9/30/16 3. Calculated as par value of accrued dividends on Yucaipa preferred equity in Monroe as of 9/30/2016; per the May 4, 2016 financing commitment, in exchange for $75MM in preferred securities in New Holdco and 25% of the New Holdco common equity, Yucaipa will retire its preferred equity (including accrued dividends) and common stock warrants in Monroe, as well as receive an assignment of leasehold interest in three restaurants at Mandalay Bay Las Vegas casino / hotel; value shown is for illustrative purposes only 4. Illustrative value implied by Yucaipa's 25% position being valued as the par value of the accrued dividends in Monroe preferred equity securities; see footnote 3 5. Reflects $2.25 per share and 36.2MM shares. See page 32 for details on share count 6. Includes legal and advisory estimated costs for Monroe and Trousdale (per respective management’s estimates); excludes any required consent / assumption fees on the mortgages or other financing fees which cannot be estimated at this time 7. Includes forecasted cash balances as of 9/30/16 of $2.7MM for Trousdale and $6.8MM for Monroe; Monroe management expects a minimum cash balance would be needed to run the business, which would result in additional draws on the RLOC $MM Sources & Uses for Proposed Acquisition of Monroe (4) Sources Eldridge preferred proceeds 75.0 Security Benefit RLOC Draw (1) 11.1 Existing Monroe / Trousdale cash (7) 9.5 Sub-Total Cash Sources 95.6 New Holdco preferred issued to Yucaipa 75.0 New Holdco common equity issued to Yucaipa (3) 65.1 Debt assumed 475.9 Total Sources 711.6 Uses Equity acquired (5) 81.6 Transaction costs 14.0 Sub-Total Cash Uses 95.6 Retire Monroe pref. & accrued held by Yucaipa 140.1 Assumed mortgage, trust preferred, rest. note (2) 475.9 Total Uses 711.6 |
 Strictly Confidential Project Roosevelt 8 Section 2 Lodging Capital Markets Observations 2016-05-07 Project Roosevelt Fairness Presentation_v26 (Post Committee).pptx\08 MAY 2016\1:19 AM\8 |
 Strictly Confidential Lodging Sector Recent Performance / Outlook Project Roosevelt LODGING CAPITAL MARKETS OBSERVATIONS 9 2016-05-07 Project Roosevelt Fairness Presentation_v26 (Post Committee).pptx\08 MAY 2016\1:19 AM\9 Source PKF Hospitality Research • “After uneven results throughout the year, performance of Manhattan hotels notably declined in November and December, resulting in a revenue per available room (“RevPAR”) decrease of 3.0 percent in the fourth quarter.” • “ADR was the primary factor contributing to declining RevPAR performance in the fourth quarter, declining 3.3 and 3.7 percent in November and December, respectively. Overall, Manhattan hotels experienced both decreasing occupancy and ADR in 2015, resulting in a RevPAR decline of 2.3 percent for the year.” – PWC Manhattan Lodging Index 4Q15 1Q16 Mid-Earnings Update • Operating fundamentals continue to decline • Lodging cycle is in the mature stage • Transaction activity has slowed, but signs point to lower values • Tough debt markets and “social issues” still impede M&A – Green Street Advisors, May 3 rd Source Capital IQ 10.7x 10.8x PKF Growth Forecasts Notes 1. Includes BEL, H, HLT, HOT, IHG, and MAR 2. Includes AHP, AHT, CHSP, CLDT, DRH, FCH, HPT, HST, HT, INN, LHO, PEB, RHP, RLJ, SHO Avg Tier 1 Avg Lodging REIT (1) (2) 2016E as of 3Q 2014 as of 1Q 2015 as of 3Q 2015 as of 4Q 2015 as of 1Q 2016 ADR Occ RevPAR ADR Occ RevPAR ADR Occ RevPAR ADR Occ RevPAR ADR Occ RevPAR U.S. 5.9% -0.1% 5.8% 6.3% 0.2% 6.5% 5.9% 0.4% 6.3% 6.5% -0.5% 5.9% 5.2% 0.3% 5.5% to 3Q 2014 0.4% 0.3% 0.7% 0.0% 0.5% 0.5% 0.6% (0.4%) 0.1% (0.7%) 0.4% (0.3%) New York 4.6% 0.9% 5.6% 3.5% -0.3% 3.2% 2.1% -1.7% 0.3% 3.5% -1.0% 2.5% 1.4% -1.0% 0.4% to 3Q 2014 (1.1%) (1.2%) (2.4%) (2.5%) (2.6%) (5.3%) (1.1%) (1.9%) (3.1%) (3.2%) (1.9%) (5.2%) Miami 6.6% -0.4% 6.2% 5.5% 0.0% 5.5% 3.2% -2.8% 0.3% 3.5% -2.5% 0.8% 4.0% -1.6% 2.3% to 3Q 2014 (1.1%) 0.4% (0.7%) (3.4%) (2.4%) (5.9%) (3.1%) (2.1%) (5.4%) (2.6%) (1.2%) (3.9%) LA 5.4% 0.5% 6.0% 5.3% 0.1% 5.4% 5.9% 0.4% 6.3% 7.0% 1.0% 8.1% 6.2% 1.3% 7.6% to 3Q 2014 (0.1%) (0.4%) (0.6%) 0.5% (0.1%) 0.3% 1.6% 0.5% 2.1% 0.8% 0.8% 1.6% 9.0x 10.0x 11.0x 12.0x 13.0x 14.0x 15.0x Feb -14 Mar - 14 May - 14 Jul -14 Sep - 14 Oct -14 Dec - 14 Feb - 15 Apr -15 Jun - 15 Jul - 15 Sep - 15 Nov - 15 Jan -16 Mar - 16 Apr - 16 Tier 1 Comps / REIT Peers AV / NTM EBITDA |
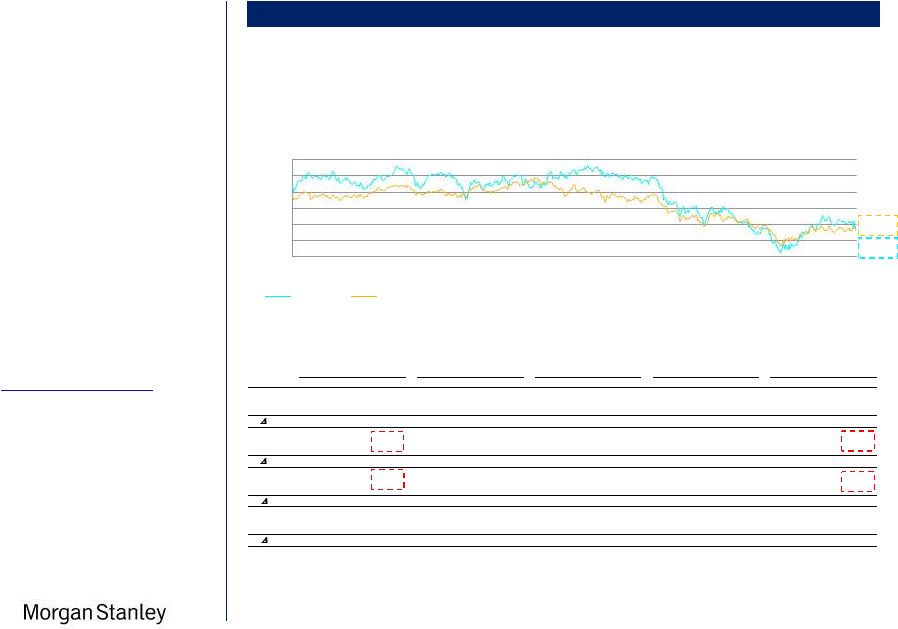
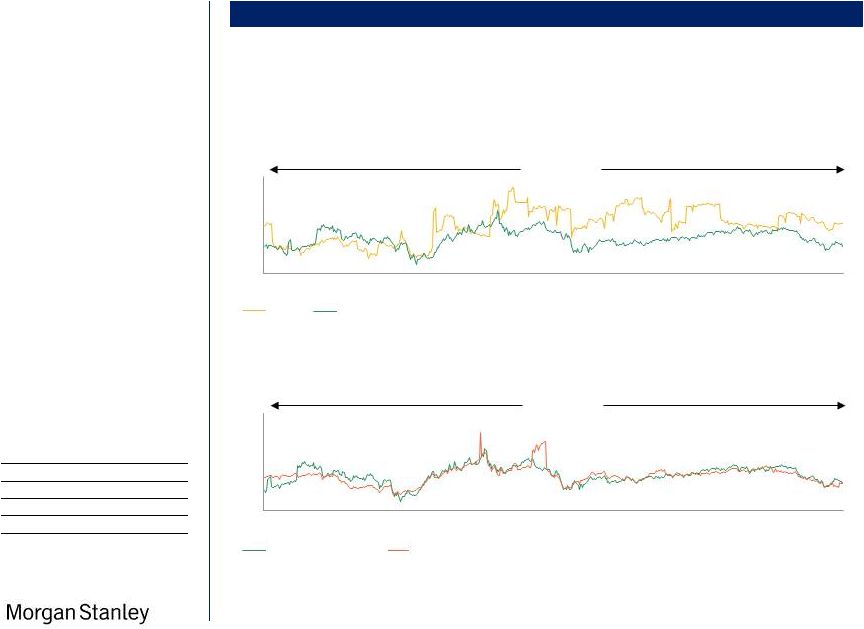 Strictly Confidential AV / NTM Consensus EBITDA (3) Consensus NTM Since Monroe IPO (2/14/2006) – As of 5/5/2016 15.2x 10.7x 10.7x 10.8x 10 2016-05-07 Project Roosevelt Fairness Presentation_v26 (Post Committee).pptx\08 MAY 2016\1:19 AM\10 Notes 1. Includes BEL, H, HOT, HLT, IHG, and MAR 2. Includes AHP, AHT, BEE, CHSP, CLDT, DRH, FCH, HT, HPT, HST, INN, LHO, PEB, RHP, RLJ and SHO 3. Consensus estimates from CapIQ Project Roosevelt • Since 2009, Monroe has been valued at a premium to its peers as a multiple of EBITDA • Monroe’s multiple has been more volatile than the peers over the last twelve months – Consensus estimates for Monroe only comprised of one analyst’s estimates and are materially different from Company estimates • Current AV / Consensus EBITDA multiples are lower than the 3-year and 7-year average multiples LODGING CAPITAL MARKETS OBSERVATIONS Historical Lodging Valuation Average: Monroe: 15.0x Comps: 12.3x (1) (1) (2) Average: C-Corps: 12.4x REITs: 12.3x Source Capital IQ Source Capital IQ AV / NTM EBITDA 5 10 15 20 25 2006 2007 2008 2008 2009 2010 2011 2012 2013 2014 2015 2016 AV / NTM Consensus EBITDA (3) August 2006 – May 2016 Lodging REITs Tier 1 C-Corp Comps 5 10 15 20 25 2006 2007 2008 2009 2010 2011 2012 2013 2014 2015 2016 Tier 1 C-Corp Comps Monroe Averages Tier 1 C.Corps REITs Monroe LTM 11.9x 11.4x 16.0x Last 3 Yrs 12.9x 12.5x 16.3x Last 5 Yrs 12.3x 12.2x 16.7x Last 7 Yrs 12.8x 12.8x 16.8x |
 Strictly Confidential Project Roosevelt 11 Section 3 Monroe Selected Information 2016-05-07 Project Roosevelt Fairness Presentation_v26 (Post Committee).pptx\08 MAY 2016\1:19 AM\11 |
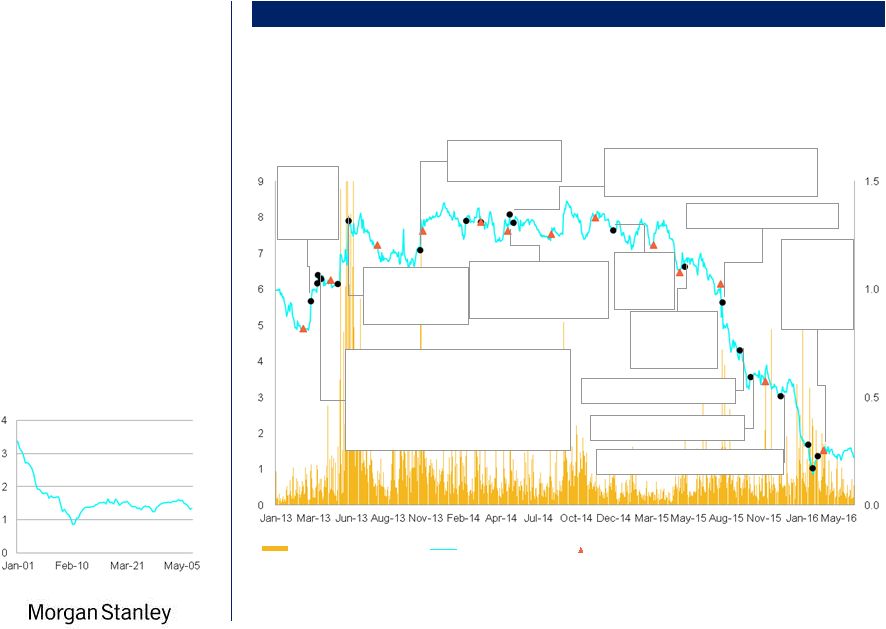 Strictly Confidential Historical Share Price / Volume Traded - Monroe As of 5/5/2016 Share Price ($) Shares (MM) Project Roosevelt MONROE SELECTED INFORMATION 12 2016-05-07 Project Roosevelt Fairness Presentation_v26 (Post Committee).pptx\08 MAY 2016\1:19 AM\12 Price Movement Over Time Source CapIQ Nov. 1, 2013 Unsolicited proposal from the Yucaipa Companies at $8.00 per share Feb. 10, 2014 Monroe refinances debt secured by Hudson and Delano South Beach Mar. 13, 2014 Announces restructuring plan Dec. 16, 2014 Announces sale of The Light Group for $36MM to Hakkasan May 13, 2014 Announces retention of MS to review Strategic Alternatives May 20, 2014 Results of election of the Board of Directors Apr. 1, 2013 Signs deal with Yucaipa to cut debt, preferred stock in exchange for Delano South Beach, The Light Group and other interests Apr. 2, 2013 Jason T. Kalisman files lawsuit to block Yucaipa transaction Apr. 9, 2013 Monroe voluntarily delays Yucaipa transaction May 14, 2013 Court issues ruling compelling restoration of record date Jun. 5, 2013 Monroe's slate of director nominees announces its intention to explore full range of strategic alternatives including sale of company Sep. 14, 2015 WSJ article reporting on Rambleside offer $1.33 May 19, 2015 Interim CEO Jason Kalisman resigns; Howard Lorber named Chairman and Ken Cruse named Director Mar. 18, 2013 OTK announces plan to nominate seven candidates to the Monroe Board Oct. 7, 2015 WSJ article reporting on SLS Las Vegas Aug. 6, 2015 WSJ article reporting on rumored merger Feb. 1, 2016 Rambleside letter Feb. 9, 2016 Monroe mortgage debt yield paydown Feb. 20, 2016 COO Josh Fluhr resigns Dec. 7, 2016 Company announces HWE plan to monetize assets • Monroe’s stock has declined substantially since mid-2015 and has generally hovered between $1.00 and $1.50 since early 2016 Monroe Price Performance YTD As of 5/5/2016 Share Price ($) $1.33 Volume Traded (MM) (RHS) Share Price ($) (LHS) Earnings Release |
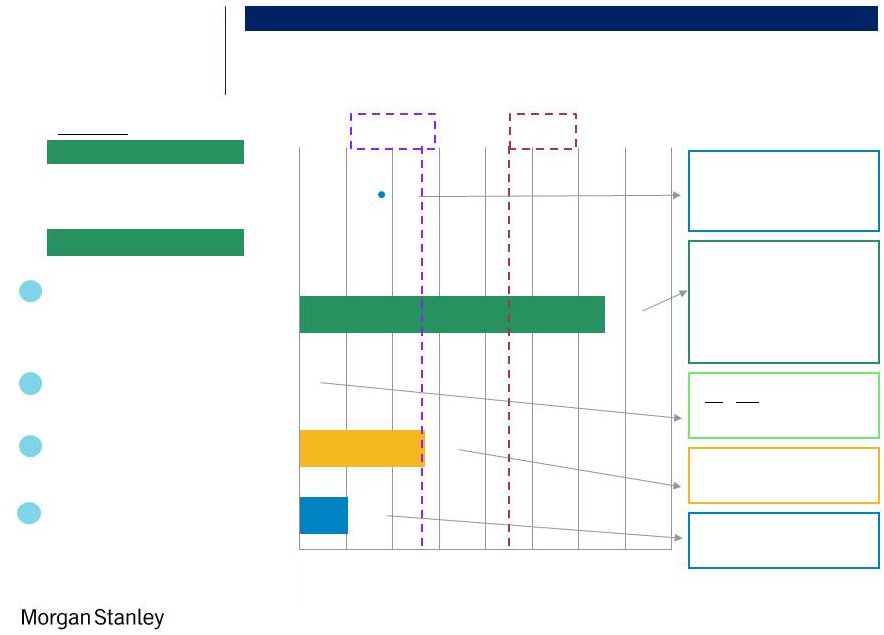
 Strictly Confidential Monroe – Issues and Considerations MONROE SELECTED INFORMATION Scale Liquidity / Cash Availability • Undersized relative to peers, with adverse implications for marketing breadth and expense margins, among other factors • High G&A load as compared to asset base • Not enough liquidity for large investors to buy / sell without materially impacting share price Project Roosevelt • Monroe has $11.9MM of cash as of 3/31/2016 and is projected to have $7.7MM of cash as of 6/30/2016 (1) , down from $46MM at year-end • Cash generation projected to be negative in 2016 / 2017, leaving limited dry powder to build pipeline and operate the business • Poor performance in the New York and Miami markets drives projected debt yield at the two owned assets below the required 7.75% debt yield, requiring a sizeable pay-down (currently estimated to be $53.9MM) of principal in early 2017 • Current projections indicate any excess cash flow from owned assets will be trapped by the lenders (2) • Owned assets are fully levered • Yucaipa preferred securities’ coupon rate rising from 10% to 20% on October 15, 2016 ($140.1MM estimated balance as of September 30, 2016, including accrued, unpaid dividends of $65.1MM) • Lack of capital to de-lever from sector high leverage Leverage • High leverage relative to peers – Current debt / LTM EBITDA in excess of 16x versus sector average of 4.1x – Debt / total market capitalization of approximately 74% versus Tier 1 comp average of ~25% Management Team / Board • Instability of management team (PEO / CFO and CRO / Interim COO) • Several other key positions remain vacant with no near-term intention to be filled 13 Negative Sentiment / Confusion • Uncertainty surrounding short-term and long-term strategy • Negative press around Monroe • Burkle consent rights • Difficulty attracting new contracts in the US • Narrow research analyst coverage limits investor access to independent perspectives Notes 1. Per management standalone projection model; includes termination fees received from Mondrian SB ($1.0MM) 2. A cash trap on the two assets would reduce cash generation by approximately $3MM through year-end • Monroe has a number of key structural factors to consider when assessing valuation and a range of actionable alternatives • Management has indicated that the risks and challenges facing Monroe are unlikely to improve in the near-term and/or are likely to worsen Source Management Projections |
 Strictly Confidential Project Roosevelt MONROE SELECTED INFORMATION 14 2016-05-07 Project Roosevelt Fairness Presentation_v26 (Post Committee).pptx\08 MAY 2016\1:19 AM\14 Management Company Financials Source Management Projections Key Assumptions Q2 – Q4 2016 • Q2 2016 – No longer manage Mondrian South Beach and receive $1.0MM termination fee. Receive licensing fees annually going forward • Q4 2016 – End management of Shore Club in Q3 and receive $2.9MM termination fee in Q4 • Q4 2016 – End management of Morgans and Royalton and receive $7.0MM in termination fees in Q4 Note 1. Decrease in 2016 G&A due to vacant positions (~$2.5MM impact), reduction in marketing, legal, and public company expenses (audit and tax filing fees due to the decrease in number of managed hotels), and no Hudson TCO renewal related costs Management Company Financials - By Contract (000s), projections as of May 5, 2016 2015A 2016E 2017E 2018E 2019E Hudson 2,423 2,339 2,389 2,465 2,537 Delano 1,389 1,379 1,424 1,472 1,516 Owned Hotel Contracts 3,811 3,718 3,813 3,937 4,053 Clift 2,963 3,121 3,291 3,412 3,438 Leased Hotel Contracts 2,963 3,121 3,291 3,412 3,438 Mondrian LA 2,255 2,443 2,436 2,505 2,545 St Martins Lane 1,786 2,128 2,257 2,354 2,456 Sanderson 1,592 1,653 1,763 1,839 1,919 Mondrian South Beach (Licensing Fee Only Commencing 2016) 2,118 600 600 600 600 Mondrian London - Sea Containers 2,560 2,824 2,968 3,092 3,221 Delano Vegas 538 513 500 600 675 10 Karakoy - Istanbul 105 103 108 113 119 In-Place Current Contracts 10,953 10,264 10,631 11,104 11,536 Total Revenue from Current Contracts 17,727 17,103 17,735 18,453 19,027 Management Company G&A (excluding Public Company Costs) (1) (15,815) (11,669) (11,953) (12,311) (12,681) EBITDA from Current Contracts 1,912 5,434 5,782 6,141 6,347 Mondrian Doha -- -- 2,160 2,268 2,336 Delano Dubai -- -- -- 1,121 1,480 Mondrian Dubai -- -- -- -- 3,006 Signed Pipeline Contracts -- -- 2,160 3,389 6,823 Revenue including Pipeline 17,727 17,103 19,895 21,841 25,850 EBITDA from Current Contracts including Pipeline 1,912 5,434 7,942 9,530 13,169 Total Revenue from Food & Beverage 32,492 24,547 25,284 26,042 26,823 Food & Beverage Operating Expenses (29,508) (21,553) (22,093) (22,715) (23,355) F&B EBITDA 2,984 2,994 3,190 3,327 3,469 Public Company Expenses (4,233) (3,074) (3,100) (3,193) (3,289) Subtotal EBITDA (Excluding Lost Contracts) 663 5,354 8,032 9,664 13,349 Additional Information Morgans 259 191 -- -- -- Royalton 522 378 -- -- -- Shore Club 1,774 835 -- -- -- Mondrian SoHo 543 -- -- -- -- Mondrian South Beach (2016 contribution In Excess of Licensing Fee) -- 464 -- -- -- Revenue Related to Lost Contracts 3,098 1,868 -- -- -- Shore Club -- 2,822 -- -- -- Mondrian South Beach -- 1,000 -- -- -- Morgans -- 3,500 -- -- -- Royalton -- 3,500 -- -- -- Termination Fees (Excluded from EBITDA) -- 10,822 -- -- -- |
 Strictly Confidential Project Roosevelt MONROE SELECTED INFORMATION 15 2016-05-07 Project Roosevelt Fairness Presentation_v26 (Post Committee).pptx\08 MAY 2016\1:19 AM\15 Financial Estimates and Key Assumptions Source Management Projections Notes 1. Includes management fees on owned assets 2. Extension fees associated with the Hudson and Delano mortgage, 0.25% of outstanding balance. 2019 represents refinancing the $368MM outstanding loan balance at 2% cost Excludes Lost Contracts as of Present Key Assumptions Q2 – Q4 2016 • Q2 2016 – Post $3.0MM bond in connection with Sasson / Masi Litigation • Q2 2016 – No longer manage Mondrian South Beach and receive $1.0MM termination fee. Receive licensing fees annually going forward • Q2 and Q4 – owned assets forecasted to fail 6.75% debt yield test and trigger cash lock box; $1MM excess cash flow trapped in Q2 and $3MM excess cash flow trapped in Q4 • Q4 2016 – End management of Shore Club in Q3 and receive $2.9MM termination fee in Q4 • Q4 2016 – End management of Morgans and Royalton and receive $7.0MM in termination fees in Q4 Q4 2016 • The current preferred dividend rate of 10% increases to 20% in October 2016 1Q 2019 • Refinance $368MM of mortgage on Hudson and Delano at 2% transaction cost Monroe - Key Financials ($MM), projections as of May 5, 2016 2015A 2016E 2017E 2018E 2019E '15-19 CAGR Hudson 80.8 78.1 79.6 82.2 84.6 1.2% Delano 47.7 46.0 47.5 49.1 50.5 1.4% Clift 45.6 48.0 50.6 52.5 52.9 3.8% Owned Hotel Total Revenue 174.0 172.1 177.7 183.7 188.0 1.9% Growth - % (2.3%) (1.1%) 3.3% 3.4% 2.3% Operating Expenses at Owned Hotels (Incl. Intercompany Payment) (1) (132.7) (132.9) (136.1) (139.7) (142.9) 1.9% EBITDAR Hudson 16.3 15.3 15.8 16.9 18.0 2.4% Delano 17.9 16.4 17.0 17.7 18.2 0.5% Clift - EBITDAR 7.2 7.5 8.8 9.4 8.9 5.5% Owned Hotels EBITDAR 41.3 39.1 41.6 44.0 45.0 2.2% Clift Rent (7.6) (7.6) (7.6) (7.6) (7.8) 0.6% Hudson Lease Rent (0.5) (0.5) (0.5) (0.5) (0.5) 0.0% Owned Hotels EBITDA 33.3 31.1 33.5 35.9 36.8 2.5% Management Company EBITDA Incl. Pipeline 1.9 5.4 7.9 9.5 13.2 62.0% F&B EBITDA 3.0 3.0 3.2 3.3 3.5 3.8% Adj. EBITDA (before Corporate G&A) 38.2 39.5 44.6 48.8 53.4 8.8% Corporate G&A (Public Company Expenses) (4.2) (3.1) (3.1) (3.2) (3.3) (6.1%) Adj. EBITDA 33.9 36.4 41.5 45.6 50.1 10.2% Adj. EBITDAR 42.0 44.5 49.6 53.7 58.4 8.6% Adj. EBITDA 33.9 36.4 41.5 45.6 50.1 10.2% Plus: Lost Contracts (Mgmt & Termination Fees) 3.1 12.7 -- -- -- Less: Interest (31.3) (29.5) (24.7) (24.5) (24.5) Less: Capex (7.1) (6.7) (9.8) (8.1) (8.3) Less: Trapped Cash -- (3.0) -- -- -- Plus: TLG Sale / SC London Agreement Conversion 30.8 (1.0) -- -- -- Less: Sasson / Masi Default Interest -- (3.0) -- -- -- Less: Debt Yield Payments -- (28.2) (53.9) -- -- Less: Debt Extension Fees & Loan Costs (2) -- (1.5) (1.1) (1.0) (8.1) Less: Restructuring, Development and Disposal costs (7.2) (1.0) (1.0) (1.0) (1.0) Plus / (Less): Other Cash Flows 10.3 (3.3) (1.8) (2.8) (2.1) Levered Cash Flow 32.4 (28.0) (50.8) 8.2 6.1 |
 Strictly Confidential Project Roosevelt MONROE SELECTED INFORMATION 16 2016-05-07 Project Roosevelt Fairness Presentation_v26 (Post Committee).pptx\08 MAY 2016\1:19 AM\16 Financial Estimates and Key Assumptions (Cont’d) Notes 1. 2. 3. Source Management Projections Key Assumptions Q2 – Q4 2016 • Q2 2016 – Post $3.0MM bond in connection with Sasson / Masi Litigation • Q2 2016 – No longer manage Mondrian South Beach and receive $1.0MM termination fee. Receive licensing fees annually going forward • Q2 and Q4 – owned assets forecasted to fail 6.75% debt yield test and trigger cash lock box; $1MM excess cash flow trapped in Q2 and $3MM excess cash flow trapped in Q4 • Q4 2016 – End management of Shore Club in Q3 and receive $2.9MM termination fee in Q4 • Q4 2016 – End management of Morgans and Royalton and receive $7.0MM in termination fees in Q4 Q4 2016 • The current preferred dividend rate of 10% increases to 20% in October 2016 1Q 2019 • Refinance $368MM of mortgage on Hudson and Delano at 2% transaction cost Monroe - Cash Flows Analysis Debt Yield Maintenance Test ($MM), projections as of May 5, 2016 2016 2017 1Q16 2Q16 3Q16 4Q16 1Q17 2Q17 3Q17 4Q17 Net cash provided by operating activities (A) (2.9) (0.1) 1.2 15.6 (1.3) 4.0 3.5 8.0 Capex (0.9) (1.9) (1.9) (2.1) (1.8) (1.9) (2.9) (3.2) SC London Agreement Conversion -- (1.0) -- -- -- -- -- -- Cash Trap -- (1.0) -- (2.0) -- -- -- -- in Restricted Cash (0.2) -- -- -- 1.0 -- -- -- Net cash provided by investing activities (B) (1.0) (3.8) (1.9) (4.1) (0.8) (1.9) (2.9) (3.2) Proceeds from / (Payments of) LT Debt, Revolver, and Lease Notes (0.4) (0.3) (0.3) (0.3) (0.3) (0.3) (0.3) (0.3) Debt Yield Payments (28.2) -- -- -- (53.9) -- -- -- Debt Extension Fees (1) (1.5) -- -- -- (1.1) -- -- -- Net cash used in financing (C) (30.0) (0.3) (0.3) (0.3) (55.3) (0.3) (0.3) (0.3) Net change in cash and cash equivalents (A+B+C) (34.0) (4.2) (0.9) 11.2 (57.4) 1.8 0.3 4.5 Cash and cash equivalents, Beginning 45.9 11.9 7.7 6.8 18.0 (39.5) (37.6) (37.4) Cash and cash equivalents, Ending 11.9 7.7 6.8 18.0 (39.5) (37.6) (37.4) (32.8) $MM Year-End 2016 2017 Delano NOI 14.6 15.1 Hudson NOI 12.2 12.6 Bill Back (2) 2.4 2.6 Ground Rent Payment (3) (0.6) (0.6) NOI for Test 28.5 29.7 Required Yield 7.75% 8.00% Required Balance 367.9 371.4 Beginning Debt Balance 421.8 367.9 Repayment Required 53.9 NA Ending Debt Balance 367.9 367.9 Extension fees associated with the Hudson and Delano mortgage, 0.25% of outstanding balance Per guidance from Monroe Interim CEO on 3/13/2016, reflects bill back expenses from corporate that Monroe is allowed to add back to NOI for debt yield maintenance test calculation. Updated bill back amounts received from Monroe 5/5/2016 Includes $100K of operating lease payment |
 Strictly Confidential Project Roosevelt MONROE SELECTED INFORMATION 17 2016-05-07 Project Roosevelt Fairness Presentation_v26 (Post Committee).pptx\08 MAY 2016\1:19 AM\17 Monthly Liquidity Analysis • Mortgage agreement establishes a lockbox for excess cash generated at Hudson and Delano – If debt yield falls below 6.75%, excess cash is swept – Current projections indicated $3MM of cash will be trapped in lock box controlled by the lender in 2016 – Assets must deliver two consecutive quarters of 7.0% debt yield before it is released Through Year-End 2016 Source Management Projections $MM Apr May Jun Jul Aug Sep Oct Nov Dec Cash Balances Beginning Cash Balance (1) 11.9 10.3 8.6 7.7 6.3 6.2 6.8 6.9 6.0 Change in Cash (2)(3) (1.6) (1.7) (0.9) (1.4) (0.1) 0.6 0.2 (0.9) 12.0 Ending Cash Balance 10.3 8.6 7.7 6.3 6.2 6.8 6.9 6.0 18.0 Monroe Pro Forma 2016 Cash Balances Notes 1. Includes approximately $3MM cash held at MBLV, London Management Co, and Clift 2. Includes termination fees for Mondrian SB 1Q16, bond posted for Sasson Masi litigation in 2Q16, and termination fees for Shore Club, Morgans, and Royalton in 4Q16 3. Cash flow sweep would not affect April receipts. Assumes cash shortfalls at the property level can be funded with lock-box cash balances |
 Strictly Confidential Project Roosevelt 18 Section 4 Monroe Valuation 2016-05-07 Project Roosevelt Fairness Presentation_v26 (Post Committee).pptx\08 MAY 2016\1:19 AM\18 |
 Strictly Confidential Hudson Valuation Project Roosevelt MONROE VALUATION 19 2016-05-07 Project Roosevelt Fairness Presentation_v26 (Post Committee).pptx\08 MAY 2016\1:19 AM\19 1 Key Stats Ownership Type Fee Simple (condominium) Keys 878 (938 including SROs) 2016E ADR $209 2016E Occupancy 89% 2016E RevPAR $187 # Restaurants / Nightclubs etc. 6 Meeting Space (sqft) 5,599 Debt $263MM Peak EBITDA (2007) $36.7MM LOW HIGH $MM Asset Bids Highgate / Carlton 3/31/16 280 London / Regional 3/31/16 320 Ashkenazy 3/31/16 325 Itafin 3/31/16 340 Hudson Valuation Reference Points (3) Operations Update • Q1 room rates soft and F&B down due to poor performance in banquets / meeting space • Management has implemented a contingency plan; steps taken have included not replacing departures and initiation of phase-out of banquet business & group sales, which are unprofitable • Manhattan remains challenged due to substantial supply; although Hudson performed slightly better than comps in March-April Due to the depth of Hudson’s deterioration in performance, direct capitalization and discounted cash flow valuation methods may be less relevant for valuation purposes than the bids submitted by interested buyers. Interested buyers are likely to implement a repositioning and renovation plan at the Hudson, making valuations based on Monroe projections less relevant. Recent New York Lodging Trades Hudson Implied Value at Various Cap Rates $MM Total Value at Stated Exit Cap Rates Cap Rate 3.75% 4.50% 5.25% 6.00% Implied Exit Value 400.2 333.5 285.9 250.1 High DCF PV (@ 7.0%) 321.7 274.1 240.2 214.7 Low DCF PV (@ 9.0%) 294.8 251.5 220.5 197.3 Hudson Discounted Cash Flow Valuation (4) $MM (Projections as of May 5, 2016) 2013A 2014A 2015E 2016E 2017E 2018E 2019E # of Rooms 866 878 878 878 878 878 878 Revenue 81.5 85.2 80.8 78.1 79.6 82.2 84.6 (-) Departmental Expenses (36.4) (38.9) (38.6) (36.8) (37.2) (37.9) (38.6) (-) Undistributed Expenses (16.7) (16.9) (15.7) (15.3) (15.6) (15.9) (16.3) (-) Management Fees (2.5) (2.6) (2.4) (2.3) (2.4) (2.5) (2.5) (-) Fixed Charges (7.4) (7.5) (7.8) (8.3) (8.7) (8.9) (9.2) (=) EBITDA 18.6 19.3 16.3 15.3 15.8 16.9 18.0 (-) FF&E / Capex Reserve (1) (3.3) (3.4) (3.2) (3.1) (3.2) (3.3) (3.4) (=) Net Operating Income 15.3 15.9 13.1 12.2 12.6 13.6 14.6 (-) SRO Conversion (2) -- (1.4) -- -- -- -- -- (-) Maintenance Capex (1) (2.4) (2.6) (2.4) (2.3) (2.4) (2.5) (2.5) (=) Cash Flow 12.9 11.9 10.6 9.8 10.2 11.2 12.0 Hudson Cash Flow Projections $MM Cap Rate Stat. 6.00% 5.25% 4.50% 3.75% 2016 NOI 12.2 202.6 231.5 270.1 324.1 2017 NOI 12.6 209.7 239.6 279.6 335.5 Per Real Capital Analytics Date Property Name Price ($MM) Rooms Cap Rate 16-Mar Sheraton Tribeca 158 369 6.8% 15-Dec Doubletree Times Square 540 468 3.4% 15-Feb Manhattan at Times Square 535 698 3.5% Average 4.6% Notes 1. 4% FF&E reserve deducted from management’s asset EBITDA in all years; maintenance capex of 3% of revenue assumed in all years 2. Hudson’s 878 rooms include 72 former single room dwelling (“SROs”) units that have been converted to hotel rooms since 2009; the 878 room count excludes 60 SROs which remain and provide upside potential at Hudson; cost of conversion of $200K per unit 3. London / Regional bid for Hudson unencumbered; other bids are silent on management. Per Monroe management, bids were not the result of a full process due to exclusivity 4. Discount rates per IRR Viewpoint 2016; Terminal value calculated by applying stated cap rate to 2020 NOI. NOI projected to grow 3% from 2019 to 2020 |
 Strictly Confidential Delano Valuation Project Roosevelt MONROE VALUATION 20 2016-05-07 Project Roosevelt Fairness Presentation_v26 (Post Committee).pptx\08 MAY 2016\1:19 AM\20 1 Key Stats Ownership Type Fee Simple 2016E ADR $464 2016E Occupancy 72% 2016E RevPAR $333 # Restaurants / Nightclubs etc. 5 Meeting Space (sqft) 1,633 Debt $159MM Peak EBITDA (2008) $21.8MM HIGH LOW (AVERAGE) Operations Update • RevPAR and F&B each down approximately 10% in March, trend worsening in April • F&B concepts (Bianca & FDR) require an overhaul • Management has implemented contingency plans: this has included not replacing certain positions, reducing headcount in the months ahead, ramping up hotel promotions, lowering menu prices at Bianca • Significant new supply in Miami; on a trailing-twelve-month basis, although Delano has performed slightly better than its comp set Delano Forward Cap Rate Valuation Delano Cash Flow Projections $MM Total Value at Stated Exit Cap Rates Cap Rate 6.00% 6.50% 7.00% 7.50% Implied Exit Value 277.8 256.4 238.1 222.2 High DCF PV (@ 7.0%) 245.1 229.9 216.8 205.5 Low DCF PV (@ 9.0%) 225.5 211.6 199.7 189.4 Delano Discounted Cash Flow Valuation (3) $MM Asset Bids Pacific Eagle 4/14/16 210 Carlton 4/14/16 240 Delano Valuation Reference Points (2) $MM 2016E NOI 14.6 14.6 Cap Rate 6.5% 7.0% Gross Value 224 208 $MM (Projections as of May 5, 2016) 2013A 2014A 2015E 2016E 2017E 2018E 2019E # of Rooms 194 194 194 194 194 194 194 Revenue 47.5 48.8 47.7 46.0 47.5 49.1 50.5 (-) Departmental Expenses (19.3) (18.6) (17.7) (17.3) (17.8) (18.4) (18.9) (-) Undistributed Expenses (10.0) (8.2) (8.3) (8.4) (8.7) (8.9) (9.2) (-) Management Fees (2.0) (0.6) (1.4) (1.4) (1.4) (1.5) (1.5) (-) Fixed Charges (3.8) (3.5) (2.4) (2.5) (2.6) (2.6) (2.7) (=) EBITDA 12.5 17.9 17.9 16.4 17.0 17.7 18.2 (-) FF&E / Capex Reserve (1) (1.9) (2.0) (1.9) (1.8) (1.9) (2.0) (2.0) (=) Net Operating Income 10.6 16.0 15.9 14.6 15.1 15.7 16.2 (-) Renovation (0.2) -- -- -- -- -- -- (-) Maintenance Capex (1) (1.4) (1.5) (1.4) (1.4) (1.4) (1.5) (1.5) (=) Cash Flow 8.9 14.5 14.5 13.2 13.7 14.2 14.7 Notes 1. 4% FF&E reserve deducted from management’s asset EBITDA in all years; maintenance capex of 3% of revenue assumed in all years 2. Per Monroe management, bids were not the result of a full process due to exclusivity 3. Discount rates per IRR Viewpoint 2016; Terminal value calculated by applying stated cap rate to 2020 NOI. NOI assumed to grow 3% from 2019 to 2020 |
 Strictly Confidential $MM Low High Pre-Ground Lease Ownership 83.8 96.0 Capital Lease Obligation (12/31/2015) (94.7) (94.7) Implied Value of Leasehold (10.9) 1.2 Value of Contract (4) 29.8 34.9 Net Value to Monroe 18.9 36.2 Net Clift Valuation (3) $MM Total Value at Stated Exit Cap Rates Cap Rate 6.25% 6.75% 7.25% 7.75% Implied Exit Value 111.6 103.3 96.2 90.0 High DCF PV (@ 7.0%) 101.9 96.0 90.9 86.5 Low DCF PV (@ 9.0%) 93.8 88.4 83.8 79.8 Clift Discounted Cash Flow Valuation (Pre-Ground Lease) (2) Clift Valuation Project Roosevelt MONROE VALUATION 21 1 Key Stats Ownership Type 99-Yr Lease 2016E ADR $278 2016E Occupancy 93% 2016E RevPAR $259 # Restaurants / Nightclubs etc. 4 Meeting Space (sqft) 4,209 Capitalized Lease Obligation (As of 12/31/2015) $94.7MM RANGE Market Check • Reported conversations with Highgate Hotels suggest they may be willing to buy the leasehold interest unencumbered for $5MM to $10MM Operations Update • Clift is exceeding forecasts and RevPAR up 8% in 1Q16, largely due to strong supply-demand dynamics; group sales are also strong • The asset is ageing and the rooms needs renovation, particularly the bathrooms • To reduce costs, restaurant service has been curtailed and is now only serving breakfast (dinner is served out of Redwood room) $MM (Projections as of May 5, 2016) 2013E 2014E 2015E 2016E 2017E 2018E 2019E # of Rooms 372 372 372 372 372 372 372 Revenue 42.1 44.1 45.6 48.0 50.6 52.5 52.9 (-) Departmental Expenses (22.6) (23.5) (22.3) (23.6) (24.3) (25.0) (25.6) (-) Undistributed Expenses (11.9) (12.0) (12.4) (13.2) (13.6) (14.0) (14.3) (-) Management Fees (1.7) (1.8) (1.8) (1.9) (2.0) (2.1) (2.1) (-) Fixed Charges (2.0) (2.1) (1.9) (1.9) (1.9) (2.0) (2.0) (=) EBITDA 4.0 4.6 7.2 7.5 8.8 9.4 8.9 (-) FF&E / Capex Reserve (1) (1.7) (1.8) (1.8) (1.9) (2.0) (2.1) (2.1) (=) Net Operating Income 2.3 2.9 5.4 5.5 6.8 7.3 6.8 (-) Ground Rent Payment (6.0) (6.4) (7.6) (7.6) (7.6) (7.6) (7.8) (=) Cash Flow (3.6) (3.5) (2.2) (2.0) (0.8) (0.3) (1.0) Clift Cash Flow Projections Notes 1. 4% FF&E reserve deducted from managements asset EBITDA projections 2. Discount rates per IRR Viewpoint 2016; Terminal value calculated by applying stated cap rate to 2020 NOI. NOI assumed to grow 3% from 2019 to 2020. Lower range of cap rates increased by 25-75 bps from Delano and Hudson valuation tables to reflect increased risk of ground lease 3. Net Value to Monroe reflects fee simple ownership interest less capital lease obligation plus value of Hotel Management Agreement 4. Value of Clift contract shown at a range of 9.6x-11.2x 2016E Fees based on the current range of 2016E EBITDA multiples of HLT, H, and MAR |
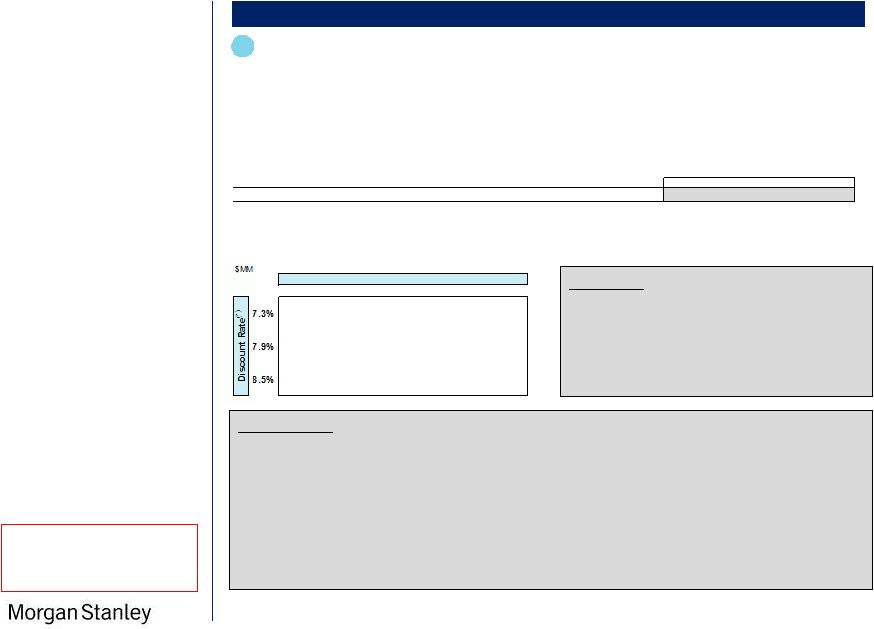 Strictly Confidential Net Operating Loss Valuation Project Roosevelt MONROE VALUATION 22 2016-05-07 Project Roosevelt Fairness Presentation_v26 (Post Committee).pptx\08 MAY 2016\1:19 AM\22 Utilization Assuming Status Quo Case 1 Assumptions • 43% Corporate Tax Rate • Taxable Income per management projections through 2019, grown at designated growth rate thereafter Disclaimer: Morgan Stanley does not provide tax, accounting or legal advice and the information contained herein does not constitute such advice or any other form of advice for the recipient. • Monroe has accumulated an NOL balance of ~$433MM as of 12/31/15 • Management projects positive taxable income beginning in 2016 (mainly due to termination fee income) and consistent taxable income starting in 2018 • All existing NOLs must be utilized (or expire) by 2038 • Tax savings from NOLs are discounted at Monroe’s going concern weighted average cost of capital with an applied 43% tax rate to estimate present value (1) – Weighted average cost of capital used as discount rate includes tax-affected cost of debt Additional Notes • A buyer’s value for any NOLs would be based on utilization in any given year collared by the projected year’s taxable income and the maximum amount allowable under the IRS code section 382 • In a change of control transaction, use of NOLs will generally be limited to an annual amount equal to the product of the purchase price paid for the target equity multiplied by a rate published monthly by the IRS (most recent rate is 2.27%); most NOLs have a 20-year life – At the current offer price of $2.25, the annual NOL limit each year to the buyer will be ~$2MM • Section 382 also provides the potential for certain exceptions to the NOL usage limitation in the first five years post- acquisition; exemptions include actual asset sales and an adjust to the exemption limit based on a hypothetical step-up in value of the acquired assets (mutually exclusive election) Note 1. Assumes going concern achieves more typical capital structure. Utilizes tier 1 lodging long term beta of 1.3, risk free rate of 2.0%, market risk premium at 6%, and weighting of 30% debt and 10% pref to total capitalization based on tier 1 lodging comps to calculate WACC Taxable Income Growth After 2019 0.0% 2.5% 5.0% 7.5% 10.0% 52.5 60.4 70.4 75.9 78.7 49.9 57.3 66.4 71.7 74.5 47.5 54.3 62.8 67.8 70.6 NOL Value Sensitivity Monroe Taxable Income $000s (Projections as of May 5, 2016) 2007A 2008A 2009A 2010A 2011A 2012A 2013A 2014A 2015A 2016E 2017E 2018E 2019E 678 (11,144) (19,078) (102,151) (87,514) (55,808) (43,589) (48,563) (28,143) 13,221 (131) 7,475 13,338 |
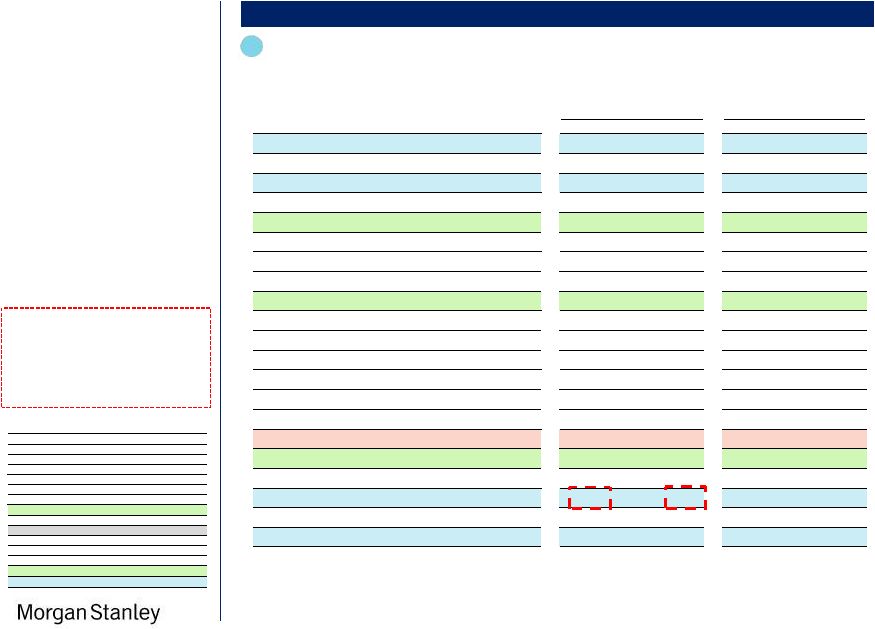
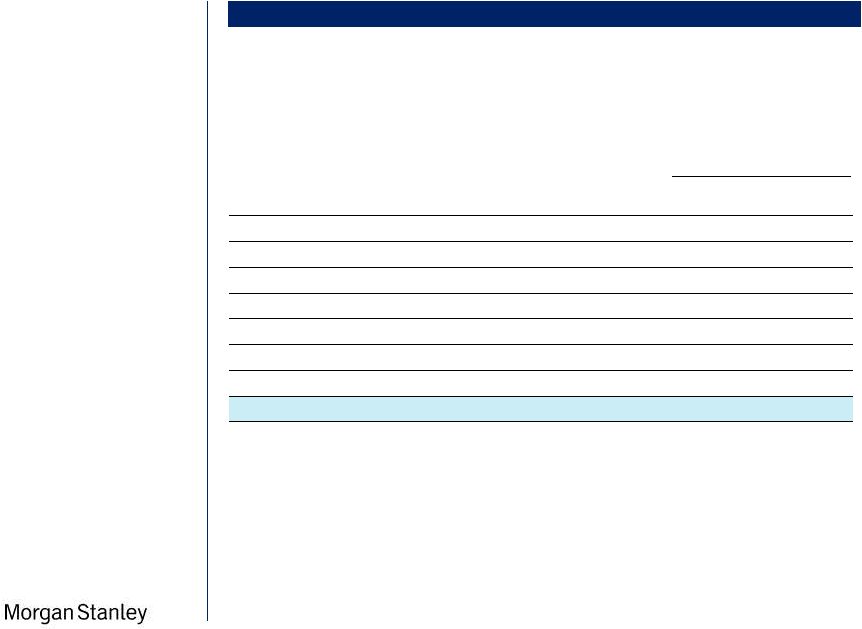
 Strictly Confidential ($MM, except per share metrics) Low Mid High Real Estate Value of Owned Properties Hudson Value 280 310 340 Asset Bids Mid Point Asset Bids Delano Value 203 221 240 DCF - Low Mid Point Asset Bids Gross Clift Value 84 90 96 Value of Clift Lease Obligation (95) (95) (95) Implied Value of Clift Leasehold (11) (5) 1 Gross Real Estate Value 472 527 582 Less: Existing Property Debt of Owned Properties Delano South Beach (159) (159) (159) Hudson (263) (263) (263) Hudson Capital Lease (6) (6) (6) Total Property Level Debt (428) (428) (428) Net Real Estate Value (1) 44 99 154 Management Company Value 2016E Management Co. EBITDA less G&A (2) 5.4 5.4 5.4 2016 EBITDA Multiple (Tier 1 Peers) 9.6x 10.9x 12.5x Net Management Company Value 51 58 67 Other Assets PV of Pipeline Under Construction (3) 5 5 6 PV of Lost Contracts (Termination & Mgmt Fees) 12 12 12 MB Vegas Lease 5 5 5 NOLs (4) -- 25 50 Cash 18 18 18 Other Liabilities Liability to Subsidiary Trust (50) (50) (50) MB Vegas Lease (5) (5) (5) Preferred & Accrued Dividends (5) (133) (133) (133) Sasson / Masi Default Interest (3) (3) (3) Sum-of-the-Parts Valuation (57) 30 119 ( ÷) Fully Diluted Number of Shares 36.4 36.4 36.4 (=) Sum-of-the-Parts Valuation per Share ($1.58) $0.83 $3.28 (=) Sum-of-the-Parts Valuation per Share (w/o NOLs) ($1.58) $0.14 $1.91 Monroe - Value of Business and Selected Trading Statistics MONROE VALUATION 23 Sum-of-the-Parts Analysis Project Roosevelt Source Company Information 1 Notes 1. Company has written down equity value in JV interest of Mondrian South Beach to $0. JV interest and associated debt excluded from this analysis 2. Management company EBITDA shown includes F&B EBITDA, is net of public company G&A, and excludes $1.9MM of fees from terminated contracts 3. Value of Pipeline Under Construction based on cash flows through stabilization discounted to 12/31/2015 at the company’s current WACC; terminal value of the recurring management EBITDA calculated by applying a margin to stabilized fees and discounting back to 12/31/2015 at the company’s going concern WACC which assumes the company is able to attract preferred equity at a 10% cost of capital 4. NOL asset valued as 0% (low), 50% (mid-point) and 100% (high) of the total present value of Monroe accumulated NOLs as of 12/31/2015 5. Preferred stock accrued dividends as of 3/31/2016 • Owned assets valued at a range of bids received to high end of DCF range – High end of bids from bidders with known capital sources – DCF at discount rate range of 7.0%-9.0% – Midpoint exit cap rates range from 7.0% to 7.25% • Management business, including F&B business, net of public company costs, is valued at the current trading range of the Tier 1 peers: 9.6x-12.5x • The lower practical limit for common equity value would be $0, so in cases where the number shown is negative, and assuming the asset or entity values estimated, other portions of the capital structure would experience value impairments so as to reflect a zero or nominal positive value for the common equity |
 Strictly Confidential Closing Prices as of May 5, 2016 % of Debt/ Share 52-Week Equity Aggregate EBITDAx 2015 EPS Dividend Trailing Debt/Total Price High Value Value 2016 2017 Payout Yield EBITDA Market Cap Tier 1 Peers $22.04 72.4% 21,855 32,005 10.3x 9.7x 29% 1.3% 3.7x 33% $48.94 81.6% 6,696 7,619 9.6x 9.0x 0% 0.0% 1.8x 17% $39.19 89.9% 9,253 9,792 12.5x 11.5x 83% 2.8% 2.2x 15% $69.27 84.9% 17,748 21,759 11.2x 10.4x 27% 1.4% 2.5x 19% $8.97 68.6% 908 1,356 10.8x 10.2x 0% 0.0% 5.1x 39% $81.36 92.8% 13,915 15,415 13.8x 13.4x 52% 1.8% 2.0x 15% Average Tier 1 (1) 10.9x 10.2x 28% 1.1% 3.1x 25% Min Tier 1 (1) 9.6x 9.0x 0% 0.0% 1.8x 15% Max Tier 1 (1) 12.5x 11.5x 83% 2.8% 5.1x 39% Tier 2 Peers $48.27 79.7% 2,747 3,368 13.2x 12.5x 35% 1.7% 3.4x 23% $15.21 73.2% 3,127 5,516 9.1x 8.6x 18% 1.1% 4.6x 47% $12.37 49.6% 1,546 3,174 8.6x 8.4x 0% 0.0% 4.3x 53% $70.48 79.8% 8,062 13,102 9.5x 9.0x 35% 2.8% 3.8x 39% Average Tier 2 10.1x 9.6x 22% 1.4% 4.0x 40% Min Tier 2 8.6x 8.4x 0% 0.0% 3.4x 23% Max Tier 2 13.2x 12.5x 35% 2.8% 4.6x 53% Average 10.5x 9.9x 25% 1.2% 3.5x 32% Hotel C-Corp Peers MONROE VALUATION 24 Trading Comparables Analysis Source SNL Financial, Capital IQ, Morgan Stanley and Company reports Project Roosevelt 2 • The tier one peers’ 2016E EBITDA multiple range is 9.6x to 12.5x • Starwood is the target of a potential merger with Marriott so its trading multiples are excluded from the ranges used in valuation (1) Note 1. Starwood excluded from average, min, and max statistics due to its pending merger with Marriott |
 Strictly Confidential $MM, as of 12/31/2015 2016 2017 Low Mid High Low Mid High EBITDAR 44.5 44.5 44.5 49.6 49.6 49.6 Clift and Hudson Rent (8.1) (8.1) (8.1) (8.1) (8.1) (8.1) Adj. EBITDA (1) 36.4 36.4 36.4 41.5 41.5 41.5 Peers' Multiple 9.6x 10.9x 12.5x 9.0x 10.2x 11.5x Implied Value 348 396 457 375 423 479 Plus: NOLs (2) -- 25 50 -- 25 50 Plus: PV of Lost Contracts (Termination & Mgmt Fees) 12 12 12 12 12 12 Plus: Cash 18 18 18 18 18 18 Implied Gross Value 378 450 536 404 477 559 Less: Property Debt (422) (422) (422) (422) (422) (422) Less: Liability to Subsidiary Trust (50) (50) (50) (50) (50) (50) Less: Restaurant Lease Note (5) (5) (5) (5) (5) (5) Less: Preferred Stock (75) (75) (75) (75) (75) (75) Less: Preferred Stock Accrued Dividends (3) (58) (58) (58) (58) (58) (58) Less: Sasson / Masi Default Interest (3) (3) (3) (3) (3) (3) Total Debt + Preferred (4) (613) (613) (613) (613) (613) (613) Net Value (235) (163) (77) (209) (136) (54) Diluted Shares 36.4 36.4 36.4 36.4 36.4 36.4 $ / Share ($6.47) ($4.47) ($2.11) ($5.73) ($3.74) ($1.49) Incremental EBITDA to Achieve 5/5/16 Share Price of $1.33 19.4 18.1 $ / Share (w/o NOLs) ($6.47) ($5.16) ($3.48) ($5.73) ($4.42) ($2.87) Implied Monroe Valuation MONROE VALUATION 25 Trading Comparables Analysis Project Roosevelt 2 Source SNL Financial, Capital IQ, Morgan Stanley and Company reports Monroe trades at 14.8x aggregate value / consensus 2016E EBITDA. Consensus EBITDA of $44.5MM is 22% above management’s projected $36.4MM EBITDA. Monroe’s multiple implied by management’s EBITDA estimate is 18.0x • Application of peer EBITDA multiples assumes comparable reduction for rent in computing EBITDA from EBITDAR • The lower practical limit for common equity value would be $0, so in cases where the number shown is negative, and assuming the asset or entity values estimated, other portions of the capital structure would experience value impairments so as to reflect a zero or nominal positive value for the common equity Common Stock 34.8 LTIP Units 0.9 Membership Units 0.1 Restricted Stock 0.1 Director Retainer Grants 0.5 Dilution from Stock Options -- Dilution from Warrants Dependent on Price Shares Before Warrants 36.4 Warrant Dilution at Current Share Price Share Price as of 05/05/16 $1.33 Warrants 12.5 Exercise Price $6.00 Dilution (5) -- Total Shares Outstanding 36.4 Fully Diluted Share Count Notes 1. EBITDA represents management projections, excludes $1.9MM of fees from lost contracts 2. NOL asset valued as 0% (low), 50% (mid) and 100% (high) of the total present value of Monroe accumulated NOLs as of 12/31/2015 3. Preferred stock accrued dividends as of 3/31/2016 4. Total Debt and Preferred excludes capital leases at Clift and Hudson; EBITDA is net of rent expense for both leases; Company has written down equity value in JV interest of Mondrian South Beach to $0. JV interest and associated debt excluded from this analysis 5. Dilution from assumed exercise of 12.5MM warrants with $6.00 strike price (if in-the-money) |
 Strictly Confidential MONROE VALUATION 26 Discounted Unlevered Cash Flow Analysis - Inputs Project Roosevelt Notes 1. Represents average remaining term of managements contracts for Monroe; yield of 15-year treasury obtained by interpolating the geometric midpoint of the spot rate between the 10-year and 20-year treasury 2. Per Capital IQ (Long-Term US Predicted Beta) 3. Company capital structure at 3/31/2016 composed of $48MM equity, $133MM preferred, and $483MM debt. Weighted Average Cost of Capital • Cost of equity “floor” in High WACC estimate based on estimated cost of preferred equity • Unquantified execution risks – Assumes 20% preferred equity can be refinanced at between 10% and 15% (high WACC) for forecast period • Monroe’s weighted average cost of capital not adjusted to tax-affect the cost of debt due to NOL tax shield 3(a) Monroe WACC Analysis: CAPM Method Assumption Notes Low Mid High Risk Free Rate (R f ) Interpolated 15-year risk free rate (1) 2.0% 2.0% Predicted Beta U.S. Local Predicted Beta per Barra (2) 1.87 1.87 Market Risk Premium (MRP) Morgan Stanley estimated market risk premium 6.0% 6.0% Sensitivity Adjustment +/- 0.0% from base (1.0%) Cost of Equity (K E ) Calculated using the Capital Asset Pricing Model 12.2% 13.2% 15.0% Pre-tax Cost of Debt (KD) Blended rate based expected current capital structure (3) 5.8% 5.8% 5.8% Post-tax Cost of Debt (K D ) 5.8% 5.8% 5.8% Cost of Preferred (K P ) 10.0% 12.5% 15.0% Debt + Pref / Total Capitalization Based on expected capital structure (3) 92.7% 92.7% 92.7% Weighted Average Cost of Capital (WACC) K E * E/(D+E+P) + K D * (1-t) * D/(D+E+P) + K P * (1-t) * D/(D+E+P) 7.1% 7.7% 8.4% |
 Strictly Confidential $MM, unless otherwise noted Low Mid High Total PV Unlevered Cash Flows 112 114 115 Plus: PV of Terminal Value (4) 427 464 502 Gross Value 539 578 617 Less: Hudson Mortgage (263) (263) (263) Less: Delano Mortgage (159) (159) (159) Less: Liability to Subsidiary Trust (50) (50) (50) Less: Restaurant Lease Note (5) (5) (5) Less: Preferred Stock (75) (75) (75) Less: Accrued Unpaid Preferred Dividend (58) (58) (58) Plus: Cash 12 12 12 Plus: PV of NOLs (6) 9 19 30 Implied Equity Value (49) (1) 49 # of Diluted Shares 36.4 36.4 36.4 Implied Price per Share ($1.36) ($0.02) $1.35 Implied Price per Share (w/o NOLs) ($1.61) ($0.54) $0.52 Present Value Summary (5) MONROE VALUATION 27 Discounted Unlevered Cash Flow Analysis Project Roosevelt As of 3/31/2016 • Assumptions – Unlevered Discount Rate: 7.1%-8.4% (all terminal values discounted at 8.7%) (4) – Exit EBITDA Multiple for Management Company and Owned Hotels of 11.5x – 13.5x – Reflects blended exit multiple of long term sector averages +/- 1.0x – Assumes going concern valuation: no transaction costs • Unquantified execution risks – Forecast period: assumes 20% preferred equity can be refinanced at between 10% and 15% (high WACC) – Terminal period: assumes going concern achieves ability to attract preferred equity at a 10% cost of capital (4) 3(a) $MM, unless otherwise noted 2016E 2017E 2018E 2019E 2020E Owned Hotel EBITDA (After Rent) 31.1 33.5 35.9 36.8 37.9 Management Co. EBITDA 7.3 7.9 9.5 13.2 13.6 F&B EBITDA 3.0 3.2 3.3 3.5 3.6 Corporate G&A (3.1) (3.1) (3.2) (3.3) (3.4) Total EBITDA 38.3 41.5 45.6 50.1 51.7 Termination Fees 10.8 -- -- -- Capex (6.7) (9.8) (8.1) (8.3) Sason / Massi Default Interest (3.0) -- -- -- Other Cash Flow Adjustments (2) (7.1) (1.6) (2.5) (1.7) Monroe Unlevered Cash Flow 32.3 30.1 35.0 40.1 Monroe Unlevered Free Cash Flows (1) $MM, unless otherwise noted Low Mid High 2020E Multiple Multiple Multiple Total EBITDA 51.7 11.5x 12.5x 13.5x Terminal Value 594.5 646.2 697.9 PV of Terminal Value (4) 427.2 464.4 501.5 Terminal Values Notes 1. Based on management estimates 2016 – 2019; 2020 based on 2019 grown at 3% (pipeline incentive fees grown at 6%) 2. Includes working capital changes, proceeds from asset sales (2016 only), and restructuring, development, and disposal costs 3. Management company EBITDA shown includes F&B EBITDA 4. Terminal value assumes going concern achieves more typical capital structure. Utilizes tier 1 lodging long term beta of 1.3, risk free rate of 2.0%, market risk premium at 6%, and weighting of 30% debt and 10% pref to total capitalization based on tier 1 lodging comps to calculate WACC 5. Preferred equity, cash, and mortgage balances shown as of 3/31/2016, present value summary assumes no terminal value for Clift leasehold or Mondrian SoHo termination fee / settlement 6. Represents present value of remaining NOLs at the end of the projection period (Year 2019) discounted back to present (Year 2015) – value shown at 25%, 50%, and 75% in low, mid, and high case, respectively |
 Strictly Confidential $MM, unless otherwise noted Low Mid High FV of Terminal Value 595 646 698 Plus: FV of NOLs (3) 12 26 40 FV of Gross Value 607 672 738 Less: Hudson Mortgage (229) (229) (229) Less: Delano Mortgage (139) (139) (139) Less: Liability to Subsidiary Trust (50) (50) (50) Less: Preferred Equity (4) (226) (209) (193) Less: Cash Balance (18) (18) (18) FV of Terminal Equity Value (56) 26 108 (x) PV Factor 69% 69% 69% PV of Terminal Equity Value (38) 18 75 Plus: PV of Levered Cash Flows (54) (55) (56) PV of Total Equity Value (92) (37) 19 # of Diluted Shares 36.4 36.4 36.4 Implied Price per Share ($2.53) ($1.01) $0.52 Implied Price per Share (w/o NOLs) ($2.77) ($1.49) ($0.23) Terminal Value Summary (2) MONROE VALUATION 28 Notes Discounted Levered Cash Flow Analysis Project Roosevelt As of 3/31/2016 • Assumptions – Preferred equity continues PIK with no cash component – Cost of Equity: 12.2%-15.0% – Exit EBITDA Multiple for Total EBITDA of 11.5x – 13.5x – Reflects blended exit multiple of long term sector averages +/- 1.0x – Assumes going concern valuation: no transaction costs • Unquantified execution risks – Forecast period: assumes preferred equity coupon increasing to 20% in 4Q 2016 can refinanced at between 10% (low WACC) and 15% (high WACC) – Cost of equity floor set by preferred coupon – Terminal period: assumes going concern achieves ability to attract preferred equity at a 10% cost of capital (4) $MM, unless otherwise noted 2016E 2017E 2018E 2019E 2020E Total EBITDA (1) 38.3 41.5 45.6 50.1 51.7 Interest Expense (29.5) (24.7) (24.5) (24.5) Capex (6.7) (9.8) (8.1) (8.3) Debt Yield Test & Lease Note Repayment (29.7) (55.0) (1.0) (8.1) Other Cash Flow Adjustments (0.5) (2.8) (3.8) (3.1) Monroe Levered Cash Flow (28.0) (50.8) 8.2 6.1 Monroe Levered Cash Flows 3(b) 1. Based on management estimates 2016 – 2019; 2020 based on 2019 grown at 3% (pipeline incentive fees grown at 6%) 2. Terminal Value summary assumes no terminal value for Clift leasehold or Mondrian SoHo termination fee / settlement 3. Represents present value of remaining NOLs at the end of the projection period (Year 2019) 4. Terminal value assumes going concern achieves more typical capital structure. Utilizes tier 1 lodging long term beta of 1.3, risk free rate of 2.0%, market risk premium at 6%, and weighting of 30% debt and 10% pref to total capitalization based on tier 1 lodging comps to calculate WACC |
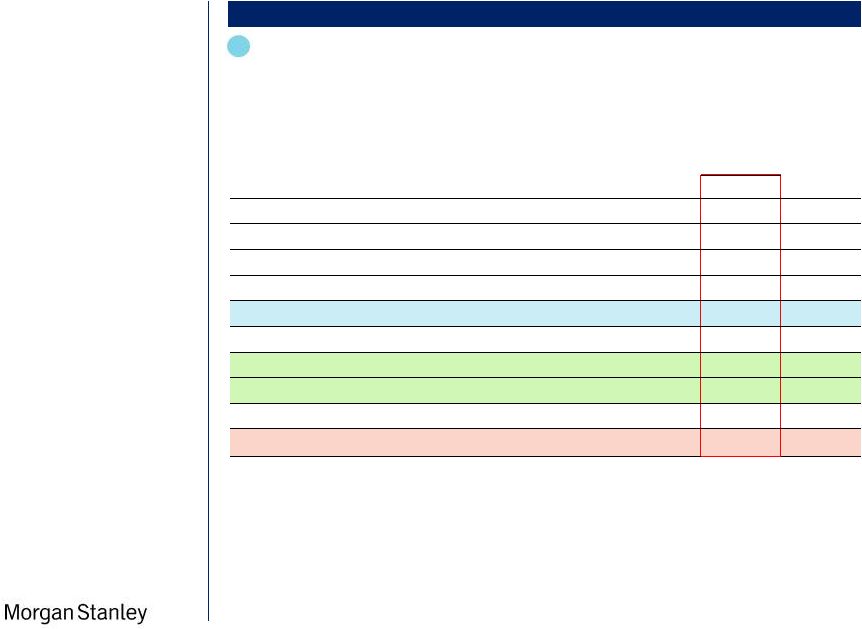
 Strictly Confidential Price per Share, $ (1) MONROE VALUATION Preliminary Illustrative Summary Valuation 29 Unaffected Price (5/5/16) $1.33 • One research analyst covers Monroe; $1.30 price target released the day after Company’s 4Q15 earnings call • Consensus 2016E EBITDA estimate of $44.5MM compared to management projected $36.4MM (22% delta) Project Roosevelt Notes 1. Negative per share values curtailed at $0.00 2. Based on Tier 1 peers which include BEL, H, HLT, IHG, and MAR 3. EBITDA used to determine going concern value does not include lost contracts or termination payments, instead the present value of these cash flows were included in the analysis to obtain a company per share value 4. Terminal value assumes going concern achieves more typical capital structure. Utilizes Tier 1 lodging long term beta of 1.3, risk free rate of 2.0%, market risk premium of 6%, and weighting of 30% debt and 10% pref to total capitalization based on Tier 1 lodging comps to calculate WACC Monroe Equity Value Per Share (Standalone Case) SOTP • Owned asset valuations based on DCF and private market bids • Management Co. based on comps 2016E EBITDA Multiples Valuation Analysis: Market Reference: Trading Comps • 2016E EBITDA Multiples Methodology • Single broker with current estimates Broker Price Target DCF (Unlevered) • 4-year projected unlevered cash flows • Tier one comps 2016E EBITDA range of 9.6x to 12.5x – $36.4MM Proj. 2016 EBITDA • $25MM of NOL Value at the mid-point 2 1 3(a) • Owned asset valued at range of bids, DCF valuations, and BOVs – Discount Rate: 7.0%-9.0% – Exit Cap Rate: 7.0%, 7.25% for Clift – EBITDA multiple for Management Business, F&B, and public company costs: 9.6x-12.5x (tier one comps) • $25MM of NOL value at the mid-point • Discount Rate: 7.1%-8.4% • Exit EBITDA Multiple for Owned Hotels and Mgmt Business: 11.5x-13.5x DCF (Levered) • 4-year projected levered cash flows • Excludes Unidentified Contracts 3(b) • Cost of Equity: 12.2%-15.0% • Exit Total EBITDA Multiple: 11.5x-13.5x Trousdale Offer $2.25 $1.30 $0.00 $0.00 $0.00 $0.00 $3.28 -- $1.35 $0.52 0.00 0.50 1.00 1.50 2.00 2.50 3.00 3.50 4.00 (2)(3) (2)(3) (4) |
 Strictly Confidential Project Roosevelt 30 Section 5 Third-Party Alternatives 2016-05-07 Project Roosevelt Fairness Presentation_v26 (Post Committee).pptx\08 MAY 2016\1:19 AM\30 |
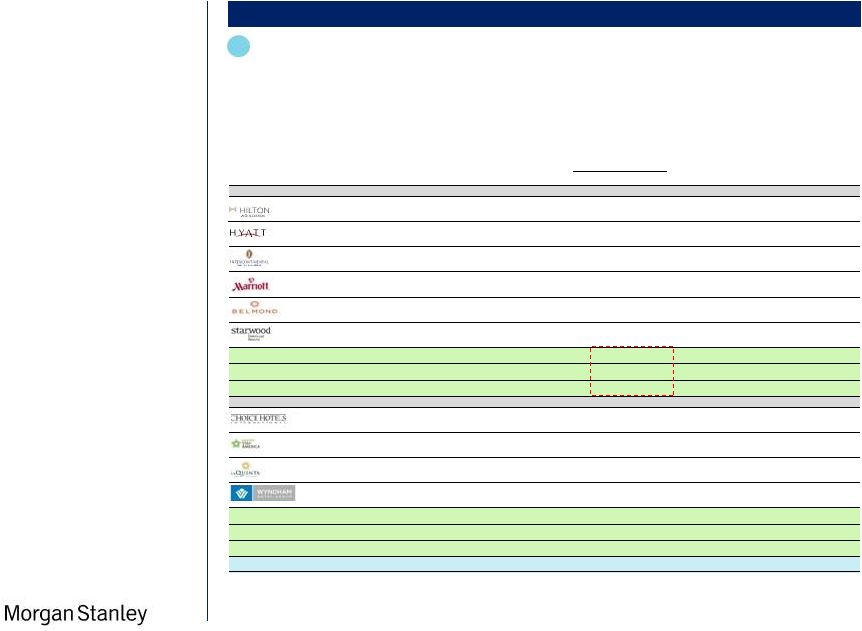
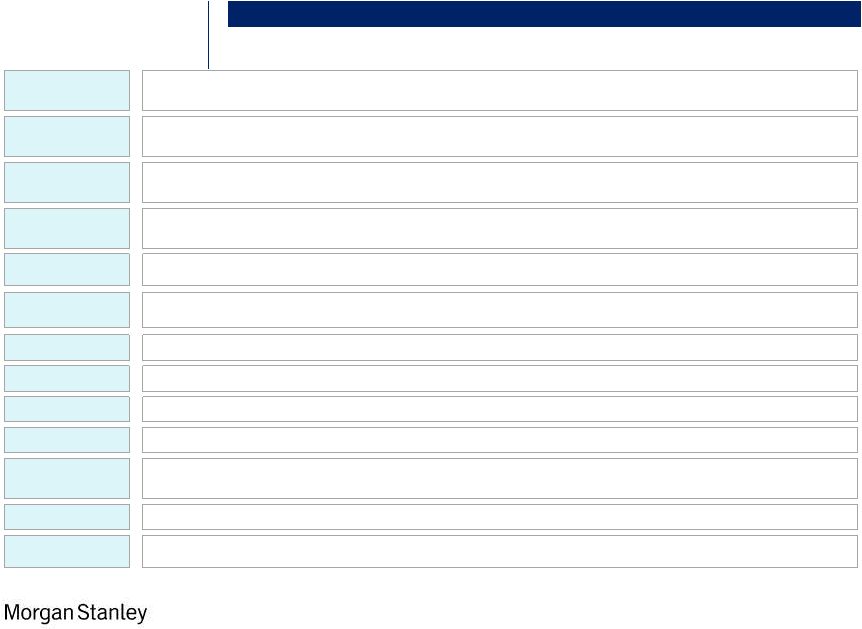 Strictly Confidential Selected Outreach / “Market Checks” THIRD-PARTY ALTERNATIVES 31 Project Roosevelt Accor • Potential interest in the management company but not the real estate • Little time to focus on this situation given Fairmont closing process and another shareholder situation Dogan Holdings • Unsolicited inbound received from Turkish conglomerate with “authorization” to “pay up to $90MM” for the common equity of the company (an implied per share value of approximately $2.50 per share), though no other detail provided (financing, diligence requirements, etc.) Hilton • Showed minimal interest in the platform Blackstone • Involved in asset sale process; familiar with two major components of value • On March 14, indicated they saw value of management company “around $50MM” and declined to move forward KSL Capital • Submitted offer to merge with a KSL portfolio company that has since been sold; familiar with components the business • Initial estimates in the $2/sh range Wyndham • Declined to participate based on timing and real estate component Hyatt Hotels • Indicated previously submitted offer (May 18, 2015) of $200MM for the management/license contracts remains valid • Previous bid revenue multiple on NTM revenue in place at time of bid implies OpCo value of approx. $130MM ($1.89/share ) • Did not sign NDA or otherwise engage Starwood Capital • Had conversation week of March 7 and understand timeline. Have not responded with updated valuation thoughts Marriott • Indicated that they are not interested 21c Museum Hotels • Participated in previous process with interest in a merger or strategic partnership; potentially interested in a WholeCo bid • Unclear on sources of capital Paris Inn Group • Submitted attractive bid in first round during 2015 process, but unable to provide certainty around financing • Remain interested in Monroe but current timeline not feasible from a diligence or financing perspective Carlton Strategic Ventures • Submitted bid for $540MM for Hudson and Delano (both encumbered); proceeds to retire preferred equity; full offer included several exchanges of rights and options Jin Jiang • Have shown little interest in this platform to date (1) (2) Notes 1. Under the terms in Carlton Strategic Ventures’s offer, Monroe would receive: HMA for Cap Juluca (CSV is currently under contract to acquire from Starwood Capital) for 2.5% fee on all hotel and F&B revenue(1), opportunity to purchase 3.5% 20 Times Square for $12MM, potential access to $20MM of key money funding through a fully accruing 2- year term loan at 10% coupon or acquiring shares of stock. CSV to receive: guest lists for each of Monroe’s properties for the past 10 years, 18MM warrants to purchase Monroe shares at a price of $1.25 per share(2), two board seats (Howard Michaels as Vice Chairman and David Tessier as Monroe CEO), veto rights on all capital event, asset, investment, personnel and other management decisions, 30-day exclusivity; breakup fee of $10MM; termination permissible only if asset sale price is $560MM or greater. No reference to diligence requirements or timing 2. At time of bid, assumed owned hotels sold for $560MM |
 Strictly Confidential 1. On May 13, 2016, approximately 106K Restricted Share Units (previously granted Director Retainer Grants) will vest, converting to Common Shares 2. Represents the annual director retention grants that will be issued on May 12, 2016. Each director will receive $100K in grants 3. There are currently nine Monroe board members, and the calculation assumes Brad Nugent and Adam Stein decline their grants per historical shareholder policy precedent set by the shareholders they represent (Yucaipa and Pine River, respectively) resulting in $700K of annual director retention grants issued; sources and uses estimate assumes grant price of $1.91 as of May 6, 2016 close Common Share Count Calculation Project Roosevelt Notes 2016-05-08 Project Roosevelt -Monroe Equity Capitalization v1.pptx\08 MAY 2016\2:17 PM\2 Source Monroe Management 32 As of May 7, 2016 (1) Applied Share Count Outstanding Strike Price In The Money? Standalone Valuation Sources and Uses Shares Estimate Common Shares 34,768,044 -- Yes 34,768,044 34,768,044 RSUs 123,987 -- Yes 123,987 123,987 LTIPs 913,423 -- Yes 913,423 913,423 Membership Units 75,446 -- Yes 75,446 75,446 Director Retainer Grants (2)(3) TBD ($100K per Director) -- Yes 526,316 366,492 Stock Options 208,015 $13.19 - $20.50 No -- -- Warrants 12,500,000 $6.00 No -- -- Common Share Equivalents 36,407,216 36,247,392 Monroe Equity Capitalization |
 Strictly Confidential Disclaimer 2016-05-07 Project Roosevelt Fairness Presentation_v26 (Post Committee).pptx\08 MAY 2016\1:19 AM\33 Project Roosevelt 33 © Morgan Stanley and/or certain of its affiliates. All rights reserved. We have prepared this document solely for informational purposes. You should not definitively rely upon it or use it to form the definitive basis for any decision, contract, commitment or action whatsoever, with respect to any proposed transaction or otherwise. You and your directors, officers, employees, agents and affiliates must hold this document and any oral information provided in connection with this document in strict confidence and may not communicate, reproduce, distribute or disclose it to any other person, or refer to it publicly, in whole or in part at any time except with our prior written consent. If you are not the intended recipient of this document, please delete and destroy all copies immediately. We have prepared this document and the analyses contained in it based, in part, on certain assumptions and information obtained by us from the recipient, its directors, officers, employees, agents, affiliates and/or from other sources. Our use of such assumptions and information does not imply that we have independently verified or necessarily agree with any of such assumptions or information, and we have assumed and relied upon the accuracy and completeness of such assumptions and information for purposes of this document. Neither we nor any of our affiliates, or our or their respective officers, employees or agents, make any representation or warranty, express or implied, in relation to the accuracy or completeness of the information contained in this document or any oral information provided in connection herewith, or any data it generates and accept no responsibility, obligation or liability (whether direct or indirect, in contract, tort or otherwise) in relation to any of such information. We and our affiliates and our and their respective officers, employees and agents expressly disclaim any and all liability which may be based on this document and any errors therein or omissions therefrom. Neither we nor any of our affiliates, or our or their respective officers, employees or agents, make any representation or warranty, express or implied, that any transaction has been or may be effected on the terms or in the manner stated in this document, or as to the achievement or reasonableness of future projections, management targets, estimates, prospects or returns, if any. Any views or terms contained herein are preliminary only, and are based on financial, economic, market and other conditions prevailing as of the date of this document and are therefore subject to change. We undertake no obligation or responsibility to update any of the information contained in this document. Past performance does not guarantee or predict future performance. This document and the information contained herein do not constitute an offer to sell or the solicitation of an offer to buy any security, commodity or instrument or related derivative, nor do they constitute an offer or commitment to lend, syndicate or arrange a financing, underwrite or purchase or act as an agent or advisor or in any other capacity with respect to any transaction, or commit capital, or to participate in any trading strategies, and do not constitute legal, regulatory, accounting or tax advice to the recipient. We recommend that the recipient seek independent third party legal, regulatory, accounting and tax advice regarding the contents of this document. This document does not constitute and should not be considered as any form of financial opinion or recommendation by us or any of our affiliates. This document is not a research report and was not prepared by the research department of Morgan Stanley or any of its affiliates. Notwithstanding anything herein to the contrary, each recipient hereof (and their employees, representatives, and other agents) may disclose to any and all persons, without limitation of any kind from the commencement of discussions, the U.S. federal and state income tax treatment and tax structure of the proposed transaction and all materials of any kind (including opinions or other tax analyses) that are provided relating to the tax treatment and tax structure. For this purpose, "tax structure" is limited to facts relevant to the U.S. federal and state income tax treatment of the proposed transaction and does not include information relating to the identity of the parties, their affiliates, agents or advisors. This document is provided by Morgan Stanley & Co. LLC and/or certain of its affiliates or other applicable entities, which may include Morgan Stanley Realty Incorporated, Morgan Stanley Senior Funding, Inc., Morgan Stanley Bank, N.A., Morgan Stanley & Co. International plc, Morgan Stanley Securities Limited, Morgan Stanley Bank AG, Morgan Stanley MUFG Securities Co., Ltd., Mitsubishi UFJ Morgan Stanley Securities Co., Ltd., Morgan Stanley Asia Limited, Morgan Stanley Australia Securities Limited, Morgan Stanley Australia Limited, Morgan Stanley Asia (Singapore) Pte., Morgan Stanley Services Limited, Morgan Stanley & Co. International plc Seoul Branch and/or Morgan Stanley Canada Limited Unless governing law permits otherwise, you must contact an authorized Morgan Stanley entity in your jurisdiction regarding this document or any of the information contained herein. |