UNITED STATES
SECURITIES AND EXCHANGE COMMISSION
Washington, D.C. 20549
FORM N-CSR
CERTIFIED SHAREHOLDER REPORT OF REGISTERED MANAGEMENT INVESTMENT COMPANIES
Investment Company Act file number: 811-21835
Name of Fund: BlackRock Long-Term Municipal Advantage Trust (BTA)
Fund Address: 100 Bellevue Parkway, Wilmington, DE 19809
Name and address of agent for service: John M. Perlowski, Chief Executive Officer, BlackRock Long-Term Municipal Advantage Trust, 55 East 52nd Street, New York, NY 10055
Registrant’s telephone number, including area code: (800) 882-0052, Option 4
Date of fiscal year end: 04/30/2014
Date of reporting period: 10/31/2013
Item 1 – Report to Stockholders
OCTOBER 31, 2013
| SEMI-ANNUAL REPORT (UNAUDITED) | |  |
BlackRock Investment Quality Municipal Trust Inc. (BKN)
BlackRock Long-Term Municipal Advantage Trust (BTA)
BlackRock Municipal 2020 Term Trust (BKK)
BlackRock Municipal Income Trust (BFK)
BlackRock Pennsylvania Strategic Municipal Trust (BPS)
BlackRock Strategic Municipal Trust (BSD)
Not FDIC Insured • May Lose Value • No Bank Guarantee |
Table of Contents
| | | | | Page | |
Dear Shareholder | | | | | 3 | |
Semi-Annual Report:
| | | | | | |
Municipal Market Overview | | | | | 4 | |
The Benefits and Risks of Leveraging | | | | | 5 | |
Derivative Financial Instruments | | | | | 5 | |
Trust Summaries | | | | | 6 | |
Financial Statements
| | | | | | |
Schedules of Investments | | | | | 18 | |
Statements of Assets and Liabilities | | | | | 50 | |
Statements of Operations | | | | | 51 | |
Statements of Changes in Net Assets | | | | | 52 | |
Statements of Cash Flows | | | | | 54 | |
Financial Highlights | | | | | 55 | |
Notes to Financial Statements | | | | | 61 | |
Disclosure of Investment Advisory Agreements and Sub-Advisory Agreements | | | | | 71 | |
Officers and Trustees | | | | | 75 | |
Additional Information | | | | | 76 | |
| 2 | SEMI-ANNUAL REPORT | OCTOBER 31, 2013
|
Financial markets were volatile as 2012 drew to a close, with investors growing increasingly concerned over the possible implementation of pre-mandated tax increases and spending cuts known as the “fiscal cliff.” However, a last-minute tax deal averted the potential crisis and allowed markets to get off to a strong start in 2013. Money that had been pulled to the sidelines amid year-end tax-rate uncertainty poured back into the markets in January. Key indicators signaling modest but broad-based improvements in the world’s major economies, coupled with the absence of negative headlines from Europe, fostered an aura of comfort for investors. Global equities surged, while rising US Treasury yields pressured high quality fixed income assets. (Bond prices fall when yields rise.)
Global economic momentum slowed in February, however, and the pace of the rally moderated. In the months that followed, US stocks outperformed international stocks, as America showed greater stability compared to most other regions. Slow, but positive, growth was sufficient to support corporate earnings, while uncomfortably high unemployment reinforced expectations that the Federal Reserve would keep its asset purchase program intact and interest rates low. International markets experienced higher levels of volatility given a resurgence of political instability in Italy, a severe banking crisis in Cyprus and a generally poor outlook for European economies, many of which were mired in recession. Emerging markets significantly lagged the rest of the world as growth in these economies, particularly in China and Brazil, fell short of expectations.
In May, the Fed Chairman commented on the possibility of beginning to gradually reduce — or “taper” — the central bank’s asset purchase program before the end of 2013. Investors around the world retreated from higher risk assets in response. Markets rebounded in late June when the tone of the US central bank turned more dovish, and improving economic indicators and better corporate earnings helped extend gains through July.
Markets slumped again in August as investors became wary of looming macro risks. Mixed economic data stirred worries about global growth and uncertainty about when and how much the Fed would scale back on stimulus. Also weighing on investors’ minds was the escalation of the revolution in Egypt and the civil war in Syria, both of which fueled higher oil prices, an additional headwind for global economic growth.
September was surprisingly positive for investors, thanks to the easing of several key risks. Most important, the Fed defied market expectations with its decision to delay tapering. Additionally, the more hawkish candidate to become the next Fed Chairman, Larry Summers, withdrew from the race. On the geopolitical front, turmoil in Egypt and Syria subsided. In Europe, the re-election of Angela Merkel as Chancellor of Germany was welcomed as a continuation of the status quo. High levels of volatility returned in late September when the Treasury Department warned that the US national debt would breach its statutory maximum soon after Oct. 17. Political brinksmanship led to a partial government shutdown, roiling global financial markets through the first half of October, but the rally quickly resumed with a last-minute compromise to reopen the government and extend the debt ceiling until early 2014.
Though periods of heightened uncertainty drove high levels of market volatility over the past year, riskier asset classes generally outperformed lower-risk investments. Developed market equities generated the highest returns for the 6- and 12-month periods ended Oct. 31, with particular strength coming from US small-cap stocks. Emerging markets posted smaller, albeit positive returns after struggling with slowing growth and weakening currencies in the first half of 2013. Rising interest rates resulted in poor performance for US Treasury bonds and other higher-quality sectors such as tax-exempt municipals and investment grade corporate bonds. High yield bonds, on the other hand, moved higher as income-oriented investors sought meaningful returns in the low-rate environment. Short-term interest rates remained near zero, keeping yields on money market securities near historical lows.
At BlackRock, we believe investors need to think globally and extend their scope across a broader array of asset classes and be prepared to move freely as market conditions change over time. We encourage you to talk with your financial advisor and visit www.blackrock.com for further insight about investing in today’s world.
Sincerely,
Rob Kapito
President, BlackRock Advisors, LLC
 |
| | “Though periods of heightened uncertainty drove high levels of market volatility over the past year, riskier asset classes generally outperformed lower-risk investments.” |
Rob Kapito
President, BlackRock Advisors, LLC
Total Returns as of October 31, 2013 | | | | 6-month | | 12-month |
US large cap equities (S&P 500® Index) | | | | | 11.14 | % | | | 27.18 | % |
US small cap equities (Russell 2000® Index) | | | | | 16.90 | | | | 36.28 | |
| International equities (MSCI Europe, Australasia, Far East Index) | | | | | 8.53 | | | | 26.88 | |
| Emerging market equities (MSCI Emerging Markets Index) | | | | | 1.18 | | | | 6.53 | |
| 3-month Treasury bill (BofA Merrill Lynch 3-Month US Treasury Bill Index) | | | | | 0.03 | | | | 0.09 | |
| US Treasury securities (BofA Merrill Lynch 10-Year US Treasury Index) | | | | | (6.07 | ) | | | (4.64 | ) |
| US investment grade bonds (Barclays US Aggregate Bond Index) | | | | | (1.97 | ) | | | (1.08 | ) |
| Tax-exempt municipal bonds (S&P Municipal Bond Index) | | | | �� | (3.63 | ) | | | (1.69 | ) |
| US high yield bonds (Barclays US Corporate High Yield 2% Issuer Capped Index) | | | | | 1.50 | | | | 8.86 | |
Past performance is no guarantee of future results. Index performance is shown for illustrative purposes only. You cannot invest directly in an index.
THIS PAGE NOT PART OF YOUR FUND REPORT
| 3 |
| |
| Municipal Market Overview |
|
For the Reporting Period Ended October 31, 2013
Municipal Market Conditions
Toward the end of 2012, municipal bond supply was met with robust demand as investors were starved for yield in the low-rate, low-return environment and uncertainty around the Presidential election and fiscal policy decisions highlighted the appeal of the relatively stable asset class. Investors poured into municipal bond mutual funds, favoring long-duration and high-yield funds as they tend to provide higher levels of income.
S&P Municipal Bond Index
Total Returns as of October 31, 2013
6 months: (3.63)%
12 months: (1.69)% |
However, market conditions turned less favorable in May when the US Federal Reserve alluded to the possible scaling back of its bond-buying stimulus program. Municipal bond funds saw strong outflows in the last six months of the period, resulting in net outflows of approximately $38 billion for the 12-month period as a whole (based on data from the Investment Company Institute). Further signals from the Fed suggesting a retrenchment of asset purchases led to rising interest rates and waning demand in June. (Bond prices fall as rates rise.) High levels of interest rate volatility resulted in a sharp curtailment of tax-exempt issuance in May through period end. However, from a historical perspective, total new issuance for the 12 months ended October 31, 2013 remained relatively strong at $345 billion (down modestly from the $378 billion issued in the prior 12-month period). A significant portion of new supply during this period (roughly 50%) was attributable to refinancing activity as issuers took advantage of lower interest rates to reduce their borrowing costs. Total new supply was also supported by recent activity in the taxable market, where taxable-municipal issuance was up 19% year-over-year.
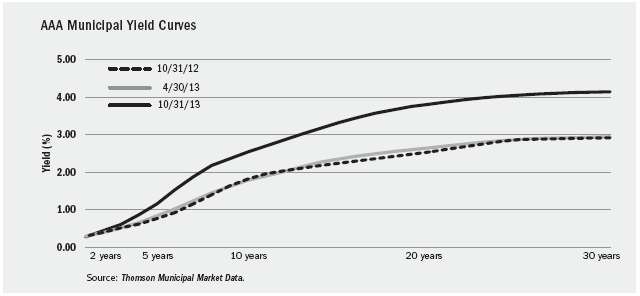
From October 31, 2012 to October 31, 2013, muni yields increased by 122 basis points (“bps”) from 2.82% to 4.04% on AAA-rated 30-year municipal bonds, while increasing 72 bps from 1.72% to 2.44% on 10-year bonds and rising another 39 bps from 0.67% to 1.06% on 5-year issues (as measured by Thomson Municipal Market Data). Overall, the municipal yield curve remained relatively steep over the 12-month period as the spread between 2- and 30-year maturities widened by 118 bps and the spread between 2- and 10-year maturities widened by 68 bps.
During the same time period, US Treasury rates rose by 78 bps on 30-year and 87 bps on 10-year bonds, while moving up 61 bps in 5-years. Accordingly, tax-exempt municipal bonds underperformed Treasuries on the long end of the yield curve as investors sought to reduce risk later in the period. On the short end of the curve, moderate outperformance versus Treasuries was driven largely by a supply/demand imbalance within the municipal market and a rotation from long-duration assets into short- and intermediate-duration investments. As higher US tax rates began to appear imminent late in 2012, municipal bonds benefited from the increased appeal of tax-exempt investing. The municipal asset class is known for its lower relative volatility and preservation of principal with an emphasis on income as tax rates rise. The municipal market continues to be an attractive avenue for investors seeking yield in today’s environment, particularly as the recent correction has restored value in the market and placed yields at levels not obtainable since early 2011. However, opportunities are not as broad-based as in 2011 and 2012, warranting a more tactical approach going forward.
Financial Conditions of Municipal Issuers Continue to Improve
Following an extended period of nation-wide austerity and de-leveraging as states sought to balance their budgets, 14 consecutive quarters of positive revenue growth coupled with the elimination of more than 750,000 jobs in recent years have put state and local governments in a better financial position. Many local municipalities, however, continue to face increased health care and pension costs passed down from the state level. BlackRock maintains the view that municipal bond defaults will be minimal and remain in the periphery, and that the overall market is fundamentally sound. We continue to recognize that careful credit research, appropriate structure and security selection remain imperative amid uncertainty in this fragile economic environment.
Past performance is no guarantee of future results. Index performance is shown for illustrative purposes only. You cannot invest directly in an index.
| 4 | SEMI-ANNUAL REPORT | OCTOBER 31, 2013
|
| |
| The Benefits and Risks of Leveraging |
|
The Trusts may utilize leverage to seek to enhance the yield and net asset value (“NAV”) of their common shares (“Common Shares”). However, these objectives cannot be achieved in all interest rate environments.
To obtain leverage, the Trusts, except for BTA, issue Auction Market Preferred Shares (“AMPS”), Variable Rate Demand Preferred Shares (“VRDP Shares”) or Variable Rate Muni Term Preferred Shares (“VMTP Shares”) (collectively, “Preferred Shares”). Preferred Shares pay dividends at prevailing short-term interest rates, and the Trusts invest the proceeds in long-term municipal bonds. In general, the concept of leveraging is based on the premise that the financing cost of assets to be obtained from leverage, which will be based on short-term interest rates, will normally be lower than the income earned by each Trust on its longer-term portfolio investments. To the extent that the total assets of each Trust (including the assets obtained from leverage) are invested in higher-yielding portfolio investments, each Trust’s shareholders will benefit from the incremental net income.
The interest earned on securities purchased with the proceeds from leverage is paid to shareholders in the form of dividends, and the value of these portfolio holdings is reflected in the per share NAV. However, in order to benefit shareholders, the yield curve must be positively sloped; that is, short-term interest rates must be lower than long-term interest rates. If the yield curve becomes negatively sloped, meaning short-term interest rates exceed long-term interest rates, income to shareholders will be lower than if the Trusts had not used leverage.
To illustrate these concepts, assume a Trust’s Common Shares capitalization is $100 million and it issues Preferred Shares for an additional $50 million, creating a total value of $150 million available for investment in long-term municipal bonds. If prevailing short-term interest rates are 3% and long-term interest rates are 6%, the yield curve has a strongly positive slope. In this case, the Trust pays dividends on the $50 million of Preferred Shares based on the lower short-term interest rates. At the same time, the securities purchased by the Trust with assets received from Preferred Shares issuance earn income based on long-term interest rates. In this case, the dividends paid to holders of Preferred Shares (“Preferred Shareholders”) are significantly lower than the income earned on the Trust’s long-term investments, and therefore the holders of Common Shares (“Common Shareholders”) are the beneficiaries of the incremental net income.
If short-term interest rates rise, narrowing the differential between short-term and long-term interest rates, the incremental net income pickup will be reduced or eliminated completely. Furthermore, if prevailing short-term interest rates rise above long-term interest rates, the yield curve has a negative slope. In this case, the Trust pays higher short-term interest rates whereas the Trust’s total portfolio earns income based on lower long-term interest rates.
Furthermore, the value of the Trusts’ portfolio investments generally varies inversely with the direction of long-term interest rates, although other factors can influence the value of portfolio investments. In contrast, the redemption value of the Trusts’ Preferred Shares and/or debt securities does not fluctuate in relation to interest rates. As a result, changes in interest rates can influence the Trusts’ NAVs positively or negatively in addition to the impact on Trust performance from leverage from Preferred Shares discussed above.
The Trusts may also leverage their assets through the use of tender option bond trusts (“TOBs”), as described in Note 3 of the Notes to Financial Statements. TOB investments generally will provide the Trusts with economic benefits in periods of declining short-term interest rates, but expose the Trusts to risks during periods of rising short-term interest rates similar to those associated with Preferred Shares issued by the Trusts, as described above. Additionally, fluctuations in the market value of municipal bonds deposited into the TOB trust may adversely affect each Trust’s NAV per share.
The use of leverage may enhance opportunities for increased income to the Trusts and Common Shareholders, but as described above, it also creates risks as short- or long-term interest rates fluctuate. Leverage also will generally cause greater changes in the Trusts’ NAVs, market prices and dividend rates than comparable portfolios without leverage. If the income derived from securities purchased with assets received from leverage exceeds the cost of leverage, the Trusts’ net income will be greater than if leverage had not been used. Conversely, if the income from the securities purchased is not sufficient to cover the cost of leverage, each Trust’s net income will be less than if leverage had not been used, and therefore the amount available for distribution to Common Shareholders will be reduced. Each Trust may be required to sell portfolio securities at inopportune times or at distressed values in order to comply with regulatory requirements applicable to the use of leverage or as required by the terms of leverage instruments, which may cause a Trust to incur losses. The use of leverage may limit each Trust’s ability to invest in certain types of securities or use certain types of hedging strategies, such as in the case of certain restrictions imposed by rating agencies that rate the Preferred Shares issued by the Trusts. Each Trust will incur expenses in connection with the use of leverage, all of which are borne by Common Shareholders and may reduce income to the Common Shares.
Under the Investment Company Act of 1940, as amended (the “1940 Act”), the Trusts are permitted to issue senior securities in the form of equity securities (e.g., Preferred Shares) up to 50% of their total managed assets (each Trust’s total assets less its total accrued liabilities). In addition, each Trust voluntarily limits its economic leverage to 50% of its total managed assets, while each Trust with VRDP Shares or VMTP Shares outstanding limits its economic leverage to 45% of its total managed assets. As of October 31, 2013, the Trusts had economic leverage from Preferred Shares and/or TOBs as a percentage of their total managed assets as follows:
|
|
|
| Percent of
Economic
Leverage
|
BKN | | | | | 38% | |
BTA | | | | | 35% | |
BKK | | | | | 26% | |
BFK | | | | | 40% | |
BPS | | | | | 38% | |
BSD | | | | | 40% | |
Derivative Financial Instruments
The Trusts may invest in various derivative financial instruments, including financial futures contracts, as specified in Note 4 of the Notes to Financial Statements, which may constitute forms of economic leverage. Such derivative financial instruments are used to obtain exposure to a market without owning or taking physical custody of securities or to hedge market, interest rate and/or other risks. Derivative financial instruments involve risks, including the imperfect correlation between the value of a derivative financial instrument and the underlying asset, possible default of the counterparty to the transaction or illiquidity of the derivative financial instrument. The Trusts’ ability to use a derivative financial instrument successfully depends on the investment advisor’s ability to predict pertinent market movements accurately, which cannot be assured. The use of derivative financial instruments may result in losses greater than if they had not been used, may require a Trust to sell or purchase portfolio investments at inopportune times or for distressed values, may limit the amount of appreciation a Trust can realize on an investment, may result in lower dividends paid to shareholders or may cause a Trust to hold an investment that it might otherwise sell. The Trusts’ investments in these instruments are discussed in detail in the Notes to Financial Statements.
| SEMI-ANNUAL REPORT | OCTOBER 31, 2013 | 5
|
| |
| Trust Summary as of October 31, 2013 | BlackRock Investment Quality Municipal Trust Inc.
|
Trust Overview
BlackRock Investment Quality Municipal Trust Inc.’s (BKN) (the “Trust”) investment objective is to provide high current income exempt from regular federal income tax consistent with the preservation of capital. The Trust seeks to achieve its investment objective by investing at least 80% of its assets in municipal obligations exempt from federal income taxes (except that the interest may be subject to the federal alternative minimum tax). Under normal market conditions, the Trust invests at least 80% of its assets in securities rated investment grade at the time of investment. The Trust may invest directly in such securities or synthetically through the use of derivatives.
No assurance can be given that the Trust’s investment objective will be achieved.
Performance
• | | For the six-month period ended October 31, 2013, the Trust returned (8.15)% based on market price and (9.63)% based on NAV. For the same period, the closed-end Lipper General & Insured Municipal Debt Funds (Leveraged) category posted an average return of (13.60)% based on market price and (9.18)% based on NAV. All returns reflect reinvestment of dividends. The Trust moved from a discount to NAV to a premium by period end, which accounts for the difference between performance based on price and performance based on NAV. The following discussion relates to performance based on NAV. |
• | | As tax-exempt municipal rates increased over the six-month period, the Trust’s duration exposure (sensitivity to interest rate movements) had a negative impact on performance. (Bond prices fall when rates rise.) Concentrated exposure on the long-end of the yield curve was detrimental as rates increased more in the long-end than in the short-end of the curve. Leverage on the Trust’s assets amplified the negative effect of rising rates on the Trust’s performance. The Trust’s modest exposure to Puerto Rico Sales Tax Revenue Bonds also detracted from results as credit spreads on most of Puerto Rico’s debt widened materially during the period due to investors’ lack of confidence and a weak local economy. The Trust’s holdings of zero-coupon bonds, which have longer durations for their respective maturities, hurt returns for the period. |
The views expressed reflect the opinions of BlackRock as of the date of this report and are subject to change based on changes in market, economic or other conditions. These views are not intended to be a forecast of future events and are no guarantee of future results.
Trust Information
Symbol on New York Stock Exchange (“NYSE”) | | | | BKN |
Initial Offering Date | | | | February 19, 1993 |
Yield on Closing Market Price as of October 31, 2013 ($14.30)1 | | | | 6.71% |
Tax Equivalent Yield2 | | | | 11.86% |
Current Monthly Distribution per Common Share3 | | | | $0.08 |
Current Annualized Distribution per Common Share3 | | | | $0.96 |
Economic Leverage as of October 31, 20134 | | | | 38% |
| 1 | | Yield on closing market price is calculated by dividing the current annualized distribution per share by the closing market price. Past performance does not guarantee future results. |
| 2 | | Tax equivalent yield assumes the maximum marginal federal tax rate of 43.4%, which includes the 3.8% Medicare tax. Actual tax rates will vary based on income, exemptions and deductions. Lower taxes will result in lower tax equivalent yields. |
| 3 | | The distribution rate is not constant and is subject to change. |
| 4 | | Represents VMTP Shares and TOBs as a percentage of total managed assets, which is the total assets of the Trust, including any assets attributable to VMTP Shares and TOBs, minus the sum of accrued liabilities. For a discussion of leveraging techniques utilized by the Trust, please see The Benefits and Risks of Leveraging on page 5. |
| 6 | SEMI-ANNUAL REPORT | OCTOBER 31, 2013
|
| |
| | BlackRock Investment Quality Municipal Trust Inc.
|
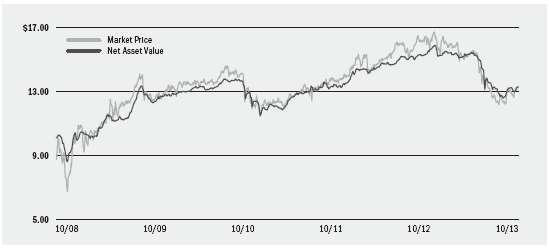
Market Price and Net Asset Value Per Share Summary
|
|
|
| 10/31/13
|
| 4/30/13
|
| Change
|
| High
|
| Low
|
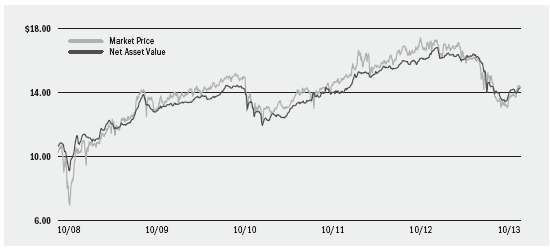
Market Price | | | | $ | 14.30 | | | $ | 16.11 | | | | (11.24 | )% | | $ | 16.24 | | | $ | 12.99 | |
Net Asset Value | | | | $ | 14.28 | | | $ | 16.35 | | | | (12.66 | )% | | $ | 16.41 | | | $ | 13.41 | |
Market Price and Net Asset Value History For the Past Five Years
Overview of the Trust’s Long-Term Investments
Sector Allocation
|
|
|
| 10/31/13
|
| 4/30/13
|
Health | | | | | 27 | % | | | 27 | % |
County/City/Special District/School District | | | | | 18 | | | | 20 | |
Transportation | | | | | 13 | | | | 12 | |
Utilities | | | | | 12 | | | | 11 | |
Education | | | | | 10 | | | | 11 | |
State | | | | | 10 | | | | 11 | |
Corporate | | | | | 6 | | | | 4 | |
Tobacco | | | | | 2 | | | | 2 | |
Housing | | | | | 2 | | | | 2 | |
Credit Quality Allocation1
|
|
|
| 10/31/13
|
| 4/30/13
|
AAA/Aaa | | | | | 3 | % | | | 3 | % |
AA/Aa | | | | | 35 | | | | 35 | |
A | | | | | 41 | | | | 36 | |
BBB/Baa | | | | | 12 | | | | 17 | |
BB/Ba | | | | | 2 | | | | 2 | |
Not Rated2 | | | | | 7 | | | | 7 | |
| 1 | | Using the higher of Standard & Poor’s (“S&P’s”) or Moody’s Investors Service (“Moody’s”) ratings. |
| 2 | | The investment advisor has deemed certain of these non-rated securities to be of investment grade quality. As of October 31, 2013 and April 30, 2013, the market value of these securities was $12,935,137, representing 3%, and $18,641,489, representing 4%, respectively, of the Trust’s long-term investments. |
|
|
Call/Maturity Schedule3
|
|
Calendar Year Ended December 31,
| | | | | | |
2013 | | | | | 4 | % |
2014 | | | | | 4 | |
2015 | | | | | 5 | |
2016 | | | | | 5 | |
2017 | | | | | 3 | |
| 3 | | Scheduled maturity dates and/or bonds that are subject to potential calls by issuers over the next five years. |
| SEMI-ANNUAL REPORT | OCTOBER 31, 2013 | 7
|
| |
| Trust Summary as of October 31, 2013 | BlackRock Long-Term Municipal Advantage Trust
|
Trust Overview
BlackRock Long-Term Municipal Advantage Trust’s (BTA) (the “Trust”) investment objective is to provide current income exempt from regular federal income tax. The Trust seeks to achieve its investment objective by investing, under normal market conditions, at least 80% of its assets in municipal obligations and derivative instruments with exposure to such municipal obligations, in each case that are exempt from federal income tax (except that the interest may be subject to the federal alternative minimum tax). The Trust invests, under normal market conditions, primarily in long-term municipal bonds with a maturity of more than ten years at the time of investment and, under normal market conditions, the Trust’s municipal bond portfolio will have a dollar-weighted average maturity of greater than 10 years. The Trust may invest directly in such securities or synthetically through the use of derivatives.
No assurance can be given that the Trust’s investment objective will be achieved.
Performance
• | | For the six-month period ended October 31, 2013, the Trust returned (14.01)% based on market price and (8.78)% based on NAV. For the same period, the closed-end Lipper General & Insured Municipal Debt Funds (Leveraged) category posted an average return of (13.60)% based on market price and (9.18)% based on NAV. All returns reflect reinvestment of dividends. The Trust’s discount to NAV, which widened during the period, accounts for the difference between performance based on price and performance based on NAV. The following discussion relates to performance based on NAV. |
• | | As tax-exempt municipal rates increased over the six-month period, the Trust’s duration exposure (sensitivity to interest rate movements) had a negative impact on performance. (Bond prices fall when rates rise.) Exposure to bonds with long maturities was detrimental as rates increased more in the long-end than in the short-end of the curve. Leverage on the Trust’s assets amplified the negative effect of rising rates on the Trust’s performance. Holdings of bonds rated low-quality investment grade and non-investment grade posted significant losses. The Trust’s modest exposure to Puerto Rico Sales Tax Revenue Bonds also detracted from results as credit spreads on most of Puerto Rico’s debt widened materially during the period due to investors’ lack of confidence and a weak local economy. Modest exposure to tobacco bonds was another notable source of negative performance. |
The views expressed reflect the opinions of BlackRock as of the date of this report and are subject to change based on changes in market, economic or other conditions. These views are not intended to be a forecast of future events and are no guarantee of future results.
Trust Information
Symbol on NYSE | | | | BTA |
Initial Offering Date | | | | February 28, 2006 |
Yield on Closing Market Price as of October 31, 2013 ($10.38)1 | | | | 7.17% |
Tax Equivalent Yield2 | | | | 12.67% |
Current Monthly Distribution per Common Share3 | | | | $0.062 |
Current Annualized Distribution per Common Share3 | | | | $0.744 |
Economic Leverage as of October 31, 20134 | | | | 35% |
| 1 | | Yield on closing market price is calculated by dividing the current annualized distribution per share by the closing market price. Past performance does not guarantee future results. |
| 2 | | Tax equivalent yield assumes the maximum marginal federal tax rate of 43.4%, which includes the 3.8% Medicare tax. Actual tax rates will vary based on income, exemptions and deductions. Lower taxes will result in lower tax equivalent yields. |
| 3 | | The distribution rate is not constant and is subject to change. |
| 4 | | Represents TOBs as a percentage of total managed assets, which is the total assets of the Trust, including any assets attributable to TOBs, minus the sum of accrued liabilities. For a discussion of leveraging techniques utilized by the Trust, please see The Benefits and Risks of Leveraging on page 5. |
| 8 | SEMI-ANNUAL REPORT | OCTOBER 31, 2013
|
| |
| | BlackRock Long-Term Municipal Advantage Trust
|
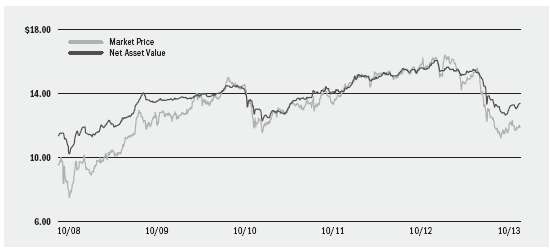
Market Price and Net Asset Value Per Share Summary
|
|
|
| 10/31/13
|
| 4/30/13
|
| Change
|
| High
|
| Low
|
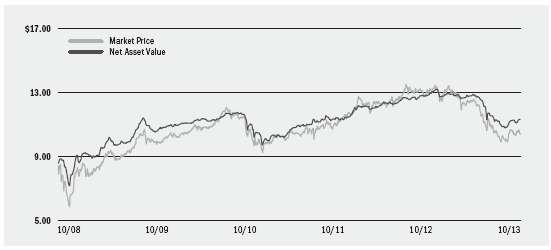
Market Price | | | | $ | 10.38 | | | $ | 12.50 | | | | (16.96 | )% | | $ | 12.55 | | | $ | 9.86 | |
Net Asset Value | | | | $ | 11.32 | | | $ | 12.85 | | | | (11.91 | )% | | $ | 12.88 | | | $ | 10.77 | |
Market Price and Net Asset Value History For the Past Five Years
Overview of the Trust’s Long-Term Investments
Sector Allocation
|
|
|
| 10/31/13
|
| 4/30/13
|
Health | | | | | 27 | % | | | 17 | % |
Transportation | | | | | 17 | | | | 16 | |
Education | | | | | 16 | | | | 19 | |
Utilities | | | | | 15 | | | | 17 | |
County/City/Special District/School District | | | | | 8 | | | | 14 | |
State | | | | | 6 | | | | 7 | |
Corporate | | | | | 6 | | | | 4 | |
Housing | | | | | 3 | | | | 3 | |
Tobacco | | | | | 2 | | | | 3 | |
Credit Quality Allocation1
|
|
|
| 10/31/13
|
| 4/30/13
|
AAA/Aaa | | | | | 19 | % | | | 21 | % |
AA/Aa | | | | | 44 | | | | 48 | |
A | | | | | 20 | | | | 17 | |
BBB/Baa | | | | | 7 | | | | 7 | |
BB/Ba | | | | | 3 | | | | 1 | |
B | | | | | 1 | | | | 1 | |
Not Rated2 | | | | | 6 | | | | 5 | |
| 1 | | Using the higher of S&P’s or Moody’s ratings. |
| 2 | | The investment advisor has deemed certain of these non-rated securities to be of investment grade quality. As of October 31, 2013 and April 30, 2013, the market value of these securities was $1,092,462 and $1,277,033, each representing less than 1%, respectively, of the Trust’s long-term investments. |
|
|
Call/Maturity Schedule3
|
|
Calendar Year Ended December 31,
| | | | | | |
2013 | | | | | 2 | % |
2014 | | | | | 2 | |
2015 | | | | | 8 | |
2016 | | | | | 17 | |
2017 | | | | | 3 | |
| 3 | | Scheduled maturity dates and/or bonds that are subject to potential calls by issuers over the next five years. |
| SEMI-ANNUAL REPORT | OCTOBER 31, 2013 | 9
|
| |
| Trust Summary as of October 31, 2013 | BlackRock Municipal 2020 Term Trust
|
Trust Overview
BlackRock Municipal 2020 Term Trust’s (BKK) (the “Trust”) investment objectives are to provide current income exempt from regular federal income tax and to return $15 per Common Share (the initial offering price per Common Share) to holders of Common Shares on or about December 31, 2020. The Trust seeks to achieve its investment objectives by investing, under normal market conditions, at least 80% of its assets in municipal bonds exempt from federal income taxes (except that the interest may be subject to the federal alternative minimum tax). The Trust invests, under normal market conditions, at least 80% of its assets in municipal bonds that are investment grade quality at the time of investment. The Trust may invest directly in such securities or synthetically through the use of derivatives.
No assurance can be given that the Trust’s investment objectives will be achieved.
Performance
• | | For the six-month period ended October 31, 2013, the Trust returned (0.73)% based on market price and (2.52)% based on NAV. For the same period, the closed-end Lipper Intermediate Municipal Debt Funds category posted an average return of (8.41)% based on market price and (5.21)% based on NAV. All returns reflect reinvestment of dividends. The Trust moved from a discount to NAV to a premium by period end, which accounts for the difference between performance based on price and performance based on NAV. The following discussion relates to performance based on NAV. |
• | | As tax-exempt municipal rates increased over the six-month period, the Trust’s duration exposure (sensitivity to interest rate movements) had a negative impact on performance. (Bond prices fall when rates rise.) Leverage on the Trust’s assets amplified the negative effect of rising rates on the Trust’s performance. The Trust’s modest exposure to Puerto Rico Sales Tax Revenue Bonds also detracted from results as credit spreads on most of Puerto Rico’s debt widened materially during the period due to investors’ lack of confidence and a weak local economy. |
The views expressed reflect the opinions of BlackRock as of the date of this report and are subject to change based on changes in market, economic or other conditions. These views are not intended to be a forecast of future events and are no guarantee of future results.
Trust Information
Symbol on NYSE | | | | BKK |
Initial Offering Date | | | | September 30, 2003 |
Termination Date (on or about) | | | | December 31, 2020 |
Yield on Closing Market Price as of October 31, 2013 ($16.14)1 | | | | 4.63% |
Tax Equivalent Yield2 | | | | 8.18% |
Current Monthly Distribution per Common Share3 | | | | $0.06225 |
Current Annualized Distribution per Common Share3 | | | | $0.74700 |
Economic Leverage as of October 31, 20134 | | | | 26% |
| 1 | | Yield on closing market price is calculated by dividing the current annualized distribution per share by the closing market price. Past performance does not guarantee future results. |
| 2 | | Tax equivalent yield assumes the maximum marginal federal tax rate of 43.4%, which includes the 3.8% Medicare tax. Actual tax rates will vary based on income, exemptions and deductions. Lower taxes will result in lower tax equivalent yields. |
| 3 | | The distribution rate is not constant and is subject to change. |
| 4 | | Represents AMPS and TOBs as a percentage of total managed assets, which is the total assets of the Trust, including any assets attributable to AMPS and TOBs, minus the sum of accrued liabilities. For a discussion of leveraging techniques utilized by the Trust, please see The Benefits and Risks of Leveraging on page 5. |
| 10 | SEMI-ANNUAL REPORT | OCTOBER 31, 2013
|
| |
| | BlackRock Municipal 2020 Term Trust
|
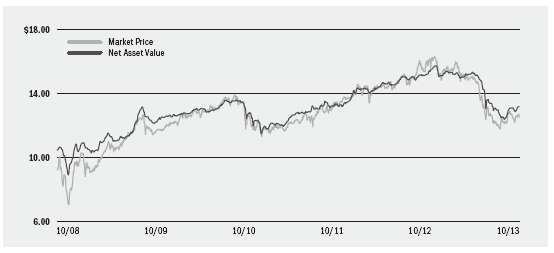
Market Price and Net Asset Value Per Share Summary
|
|
|
| 10/31/13
|
| 4/30/13
|
| Change
|
| High
|
| Low
|
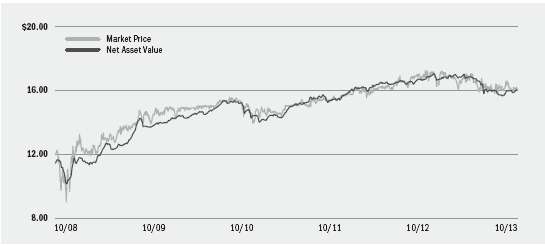
Market Price | | | | $ | 16.14 | | | $ | 16.64 | | | | (3.00 | )% | | $ | 17.08 | | | $ | 15.75 | |
Net Asset Value | | | | $ | 16.05 | | | $ | 16.85 | | | | (4.75 | )% | | $ | 16.87 | | | $ | 15.65 | |
Market Price and Net Asset Value History For the Past Five Years
Overview of the Trust’s Long-Term Investments
Sector Allocation
|
|
|
| 10/31/13
|
| 4/30/13
|
Transportation | | | | | 19 | % | | | 16 | % |
State | | | | | 17 | | | | 14 | |
Utilities | | | | | 14 | | | | 15 | |
Corporate | | | | | 14 | | | | 12 | |
Health | | | | | 10 | | | | 14 | |
County/City/Special District/School District | | | | | 10 | | | | 13 | |
Education | | | | | 7 | | | | 5 | |
Housing | | | | | 5 | | | | 5 | |
Tobacco | | | | | 4 | | | | 6 | |
Credit Quality Allocation1
|
|
|
| 10/31/13
|
| 4/30/13
|
AAA/Aaa | | | | | 11 | % | | | 11 | % |
AA/Aa | | | | | 20 | | | | 23 | |
A | | | | | 43 | | | | 37 | |
BBB/Baa | | | | | 18 | | | | 18 | |
BB/Ba | | | | | 1 | | | | 1 | |
Not Rated2 | | | | | 7 | | | | 10 | |
| 1 | | Using the higher of S&P’s or Moody’s ratings. |
| 2 | | The investment advisor has deemed certain of these non-rated securities to be of investment grade quality. As of October 31, 2013 and April 30, 2013, the market value of these securities was $5,031,665, representing 1%, and $19,936,315, representing 4%, respectively, of the Trust’s long-term investments. |
|
|
Call/Maturity Schedule3
|
|
Calendar Year Ended December 31,
| | | | | | |
2013 | | | | | 10 | % |
2014 | | | | | 5 | |
2015 | | | | | 4 | |
2016 | | | | | 10 | |
2017 | | | | | 4 | |
| 3 | | Scheduled maturity dates and/or bonds that are subject to potential calls by issuers over the next five years. |
| SEMI-ANNUAL REPORT | OCTOBER 31, 2013 | 11
|
| |
| Trust Summary as of October 31, 2013 | BlackRock Municipal Income Trust
|
Trust Overview
BlackRock Municipal Income Trust’s (BFK) (the “Trust”) investment objective is to provide current income exempt from regular federal income tax. The Trust seeks to achieve its investment objective by investing primarily in municipal bonds exempt from federal income taxes (except that the interest may be subject to the federal alternative minimum tax). The Trust invests, under normal market conditions, at least 80% of its assets in municipal bonds that are investment grade quality at the time of investment. The Trust may invest directly in such securities or synthetically through the use of derivatives.
No assurance can be given that the Trust’s investment objective will be achieved.
Performance
• | | For the six-month period ended October 31, 2013, the Trust returned (10.87)% based on market price and (10.73)% based on NAV. For the same period, the closed-end Lipper General & Insured Municipal Debt Funds (Leveraged) category posted an average return of (13.60)% based on market price and (9.18)% based on NAV. All returns reflect reinvestment of dividends. The Trust began the period trading at neither a premium to NAV nor a discount and moved to discount by period end, which accounts for the difference between performance based on price and performance based on NAV. The following discussion relates to performance based on NAV. |
• | | As tax-exempt municipal rates increased over the six-month period, the Trust’s duration exposure (sensitivity to interest rate movements) had a negative impact on performance. (Bond prices fall when rates rise.) Exposure to bonds with long maturities was detrimental as rates increased more in the long-end than in the short-end of the curve. Leverage on the Trust’s assets amplified the negative effect of rising rates on the Trust’s performance. Holdings of bonds rated low-quality investment grade and non-investment grade posted significant losses. The Trust’s modest exposure to Puerto Rico Sales Tax Revenue Bonds also detracted from results as credit spreads on most of Puerto Rico’s debt widened materially during the period due to investors’ lack of confidence and a weak local economy. Modest exposure to tobacco bonds was another notable source of negative performance. |
The views expressed reflect the opinions of BlackRock as of the date of this report and are subject to change based on changes in market, economic or other conditions. These views are not intended to be a forecast of future events and are no guarantee of future results.
Trust Information
Symbol on NYSE | | | | BFK |
Initial Offering Date | | | | July 27, 2001 |
Yield on Closing Market Price as of October 31, 2013 ($13.26)1 | | | | 6.80% |
Tax Equivalent Yield2 | | | | 12.01% |
Current Monthly Distribution per Common Share3 | | | | $0.0751 |
Current Annualized Distribution per Common Share3 | | | | $0.9012 |
Economic Leverage as of October 31, 20134 | | | | 40% |
| 1 | | Yield on closing market price is calculated by dividing the current annualized distribution per share by the closing market price. Past performance does not guarantee future results. |
| 2 | | Tax equivalent yield assumes the maximum marginal federal tax rate of 43.4%, which includes the 3.8% Medicare tax. Actual tax rates will vary based on income, exemptions and deductions. Lower taxes will result in lower tax equivalent yields. |
| 3 | | The distribution rate is not constant and is subject to change. |
| 4 | | Represents VMTP Shares and TOBs as a percentage of total managed assets, which is the total assets of the Trust, including any assets attributable to VMTP Shares and TOBs, minus the sum of accrued liabilities. For a discussion of leveraging techniques utilized by the Trust, please see The Benefits and Risks of Leveraging on page 5. |
| 12 | SEMI-ANNUAL REPORT | OCTOBER 31, 2013
|
| |
| | BlackRock Municipal Income Trust
|
Market Price and Net Asset Value Per Share Summary
|
|
|
| 10/31/13
|
| 4/30/13
|
| Change
|
| High
|
| Low
|
Market Price | | | | $ | 13.26 | | | $ | 15.40 | | | | (13.90 | )% | | $ | 15.58 | | | $ | 12.13 | |
Net Asset Value | | | | $ | 13.28 | | | $ | 15.40 | | | | (13.77 | )% | | $ | 15.44 | | | $ | 12.58 | |
Market Price and Net Asset Value History For the Past Five Years
Overview of the Trust’s Long-Term Investments
Sector Allocation
|
|
|
| 10/31/13
|
| 4/30/13
|
Transportation | | | | | 22 | % | | | 22 | % |
Health | | | | | 17 | | | | 19 | |
Utilities | | | | | 17 | | | | 15 | |
County/City/Special District/School District | | | | | 11 | | | | 11 | |
Corporate | | | | | 10 | | | | 9 | |
State | | | | | 9 | | | | 12 | |
Education | | | | | 8 | | | | 7 | |
Tobacco | | | | | 4 | | | | 3 | |
Housing | | | | | 2 | | | | 2 | |
Credit Quality Allocation1
|
|
|
| 10/31/13
|
| 4/30/13
|
AAA/Aaa | | | | | 10 | % | | | 10 | % |
AA/Aa | | | | | 35 | | | | 35 | |
A | | | | | 29 | | | | 27 | |
BBB/Baa | | | | | 14 | | | | 17 | |
BB/Ba | | | | | 3 | | | | 1 | |
B | | | | | 2 | | | | 2 | |
Not Rated2 | | | | | 7 | | | | 8 | |
| 1 | | Using the higher of S&P’s or Moody’s ratings. |
| 2 | | The investment advisor has deemed certain of these non-rated securities to be of investment grade quality. As of October 31, 2013 and April 30, 2013, the market value of these securities was $12,804,330, representing 1%, and $31,712,268, representing 3%, respectively, of the Trust’s long-term investments. |
|
|
Call/Maturity Schedule3
|
|
Calendar Year Ended December 31,
| | | | | | |
2013 | | | | | 7 | % |
2014 | | | | | 2 | |
2015 | | | | | 2 | |
2016 | | | | | 7 | |
2017 | | | | | 4 | |
| 3 | | Scheduled maturity dates and/or bonds that are subject to potential calls by issuers over the next five years. |
| SEMI-ANNUAL REPORT | OCTOBER 31, 2013 | 13
|
| |
| Trust Summary as of October 31, 2013 | BlackRock Pennsylvania Strategic Municipal Trust
|
Trust Overview
BlackRock Pennsylvania Strategic Municipal Trust’s (BPS) (the “Trust”) investment objectives are to provide current income that is exempt from regular federal and Pennsylvania income taxes and to invest in municipal bonds that over time will perform better than the broader Pennsylvania municipal bond market. The Trust seeks to achieve its investment objectives by investing, under normal market conditions, primarily in municipal bonds exempt from federal income taxes (except that the interest may be subject to the federal alternative minimum tax) and Pennsylvania income taxes. The Trust invests, under normal market conditions, at least 80% of its assets in municipal bonds that are investment grade quality at the time of investment. The Trust may invest directly in such securities or synthetically through the use of derivatives.
No assurance can be given that the Trust’s investment objectives will be achieved.
Performance
• | | For the six-month period ended October 31, 2013, the Trust returned (18.59)% based on market price and (10.65)% based on NAV. For the same period, the closed-end Lipper Pennsylvania Municipal Debt Funds category posted an average return of (13.66)% based on market price and (8.29)% based on NAV. All returns reflect reinvestment of dividends. The Trust’s discount to NAV, which widened during the period, accounts for the difference between performance based on price and performance based on NAV. The following discussion relates to performance based on NAV. |
• | | As tax-exempt municipal rates increased over the six-month period, the Trust’s duration exposure (sensitivity to interest rate movements) had a negative impact on performance. (Bond prices fall when rates rise.) Exposure to the long-end of the yield curve was detrimental as rates increased more in the long-end than in the short-end of the curve. Leverage on the Trust’s assets amplified the negative effect of rising rates on the Trust’s performance. The Trust’s modest exposure to Puerto Rico Sales Tax Revenue Bonds also detracted from results as credit spreads on most of Puerto Rico’s debt widened materially during the period due to investors’ lack of confidence and a weak local economy. |
• | | Short positions in US Treasury futures contracts, as a hedge against rising interest rates, had a positive impact on the Trust’s performance for the period. |
The views expressed reflect the opinions of BlackRock as of the date of this report and are subject to change based on changes in market, economic or other conditions. These views are not intended to be a forecast of future events and are no guarantee of future results.
Trust Information
Symbol on NYSE MKT | | | | BPS |
Initial Offering Date | | | | August 25, 1999 |
Yield on Closing Market Price as of October 31, 2013 ($11.86)1 | | | | 6.58% |
Tax Equivalent Yield2 | | | | 11.99% |
Current Monthly Distribution per Common Share3 | | | | $0.065 |
Current Annualized Distribution per Common Share3 | | | | $0.780 |
Economic Leverage as of October 31, 20134 | | | | 38% |
| 1 | | Yield on closing market price is calculated by dividing the current annualized distribution per share by the closing market price. Past performance does not guarantee future results. |
| 2 | | Tax equivalent yield assumes the maximum marginal federal and state tax rate of 45.14%, which includes the 3.8% Medicare tax. Actual tax rates will vary based on income, exemptions and deductions. Lower taxes will result in lower tax equivalent yields. |
| 3 | | The distribution rate is not constant and is subject to change. |
| 4 | | Represents VRDP Shares and TOBs as a percentage of total managed assets, which is the total assets of the Trust, including any assets attributable to VRDP Shares and TOBs, minus the sum of accrued liabilities. For a discussion of leveraging techniques utilized by the Trust, please see The Benefits and Risks of Leveraging on page 5. |
| 14 | SEMI-ANNUAL REPORT | OCTOBER 31, 2013
|
| |
| | BlackRock Pennsylvania Strategic Municipal Trust
|
Market Price and Net Asset Value Per Share Summary
|
|
|
| 10/31/13
|
| 4/30/13
|
| Change
|
| High
|
| Low
|
Market Price | | | | $ | 11.86 | | | $ | 15.04 | | | | (21.14 | )% | | $ | 15.69 | | | $ | 11.13 | |
Net Asset Value | | | | $ | 13.37 | | | $ | 15.45 | | | | (13.46 | )% | | $ | 15.51 | | | $ | 12.64 | |
Market Price and Net Asset Value History For the Past Five Years
Overview of the Trust’s Long-Term Investments
Sector Allocation
|
|
|
| 10/31/13
|
| 4/30/13
|
Health | | | | | 27 | % | | | 29 | % |
Education | | | | | 18 | | | | 16 | |
State | | | | | 16 | | | | 17 | |
Transportation | | | | | 13 | | | | 13 | |
Housing | | | | | 10 | | | | 10 | |
County/City/Special District/School District | | | | | 10 | | | | 7 | |
Corporate | | | | | 4 | | | | 3 | |
Utilities | | | | | 2 | | | | 5 | |
Credit Quality Allocation1
|
|
|
| 10/31/13
|
| 4/30/13
|
AAA/Aaa | | | | | 2 | % | | | 1 | % |
AA/Aa | | | | | 64 | | | | 62 | |
A | | | | | 25 | | | | 27 | |
BBB/Baa | | | | | 8 | | | | 8 | |
Not Rated2 | | | | | 1 | | | | 2 | |
| 1 | | Using the higher of S&P’s or Moody’s ratings. |
| 2 | | The investment advisor has deemed certain of these non-rated securities to be of investment grade quality. As of October 31, 2013 and April 30, 2013, the market value of these securities was $527,561 and $561,020, each representing 1%, respectively, of the Trust’s long-term investments. |
|
|
Call/Maturity Schedule3
|
|
Calendar Year Ended December 31,
| | | | | | |
2013 | | | | | — | |
2014 | | | | | 2 | % |
2015 | | | | | 3 | |
2016 | | | | | 5 | |
2017 | | | | | 3 | |
| 3 | | Scheduled maturity dates and/or bonds that are subject to potential calls by issuers over the next five years. |
| SEMI-ANNUAL REPORT | OCTOBER 31, 2013 | 15
|
| |
| Trust Summary as of October 31, 2013 | BlackRock Strategic Municipal Trust
|
Trust Overview
BlackRock Strategic Municipal Trust’s (BSD) (the “Trust”) investment objectives are to provide current income that is exempt from regular federal income tax and to invest in municipal bonds that over time will perform better than the broader municipal bond market. The Trust seeks to achieve its investment objective by investing, under normal market conditions, at least 80% of its assets in investments exempt from federal income taxes (except that the interest may be subject to the federal alternative minimum tax). The Trust invests at least 80% of its assets in investment grade quality securities at the time of investment and, under normal market conditions, primarily invests in municipal bonds with long-term maturities in order to maintain a weighted average maturity of 15 years or more. The Trust may invest directly in such securities or synthetically through the use of derivatives.
No assurance can be given that the Trust’s investment objectives will be achieved.
Performance
• | | For the six-month period ended October 31, 2013, the Trust returned (13.59)% based on market price and (10.73)% based on NAV. For the same period, the closed-end Lipper General & Insured Municipal Debt Funds (Leveraged) category posted an average return of (13.60)% based on market price and (9.18)% based on NAV. All returns reflect reinvestment of dividends. The Trust’s discount to NAV, which widened during the period, accounts for the difference between performance based on price and performance based on NAV. The following discussion relates to performance based on NAV. |
• | | As tax-exempt municipal rates increased over the six-month period, the Trust’s duration exposure (sensitivity to interest rate movements) had a negative impact on performance. (Bond prices fall when rates rise.) Exposure to bonds with long maturities was detrimental as rates increased more in the long-end than in the short-end of the curve. Leverage on the Trust’s assets amplified the negative effect of rising rates on the Trust’s performance. Holdings of bonds rated low-quality investment grade and non-investment grade posted significant losses. The Trust’s modest exposure to Puerto Rico Sales Tax Revenue Bonds also detracted from results as credit spreads on most of Puerto Rico’s debt widened materially during the period due to investors’ lack of confidence and a weak local economy. Modest exposure to tobacco bonds was another notable source of negative performance. |
The views expressed reflect the opinions of BlackRock as of the date of this report and are subject to change based on changes in market, economic or other conditions. These views are not intended to be a forecast of future events and are no guarantee of future results.
Trust Information
Symbol on NYSE | | | | BSD |
Initial Offering Date | | | | August 25, 1999 |
Yield on Closing Market Price as of October 31, 2013 ($12.49)1 | | | | 7.11% |
Tax Equivalent Yield2 | | | | 12.56% |
Current Monthly Distribution per Common Share3 | | | | $0.074 |
Current Annualized Distribution per Common Share3 | | | | $0.888 |
Economic Leverage as of October 31, 20134 | | | | 40% |
| 1 | | Yield on closing market price is calculated by dividing the current annualized distribution per share by the closing market price. Past performance does not guarantee future results. |
| 2 | | Tax equivalent yield assumes the maximum marginal federal tax rate of 43.4%, which includes the 3.8% Medicare tax. Actual tax rates will vary based on income, exemptions and deductions. Lower taxes will result in lower tax equivalent yields. |
| 3 | | The distribution rate is not constant and is subject to change. |
| 4 | | Represents VMTP Shares and TOBs as a percentage of total managed assets, which is the total assets of the Trust, including any assets attributable to VMTP Shares and TOBs, minus the sum of accrued liabilities. For a discussion of leveraging techniques utilized by the Trust, please see The Benefits and Risks of Leveraging on page 5. |
| 16 | SEMI-ANNUAL REPORT | OCTOBER 31, 2013
|
| |
| | BlackRock Strategic Municipal Trust
|
Market Price and Net Asset Value Per Share Summary
|
|
|
| 10/31/13
|
| 4/30/13
|
| Change
|
| High
|
| Low
|
Market Price | | | | $ | 12.49 | | | $ | 14.97 | | | | (16.57 | )% | | $ | 15.08 | | | $ | 11.66 | |
Net Asset Value | | | | $ | 13.17 | | | $ | 15.28 | | | | (13.81 | )% | | $ | 15.33 | | | $ | 12.38 | |
Market Price and Net Asset Value History For the Past Five Years
Overview of the Trust’s Long-Term Investments
Sector Allocation
|
|
|
| 10/31/13
|
| 4/30/13
|
Transportation | | | | | 23 | % | | | 23 | % |
Health | | | | | 21 | | | | 22 | |
Utilities | | | | | 14 | | | | 12 | |
County/City/Special District/School District | | | | | 11 | | | | 11 | |
State | | | | | 10 | | | | 13 | |
Education | | | | | 10 | | | | 9 | |
Corporate | | | | | 8 | | | | 8 | |
Tobacco | | | | | 3 | | | | 2 | |
Credit Quality Allocation1
|
|
|
| 10/31/13
|
| 4/30/13
|
AAA/Aaa | | | | | 13 | % | | | 13 | % |
AA/Aa | | | | | 34 | | | | 37 | |
A | | | | | 29 | | | | 24 | |
BBB/Baa | | | | | 11 | | | | 16 | |
BB/Ba | | | | | 4 | | | | 2 | |
B | | | | | 2 | | | | 1 | |
Not Rated2 | | | | | 7 | | | | 7 | |
| 1 | | Using the higher of S&P’s or Moody’s ratings. |
| 2 | | The investment advisor has deemed certain of these non-rated securities to be of investment grade quality. As of October 31, 2013 and April 30, 2013, the market value of these securities was $4,360,833 and $5,654,223, each representing 3%, respectively, of the Trust’s long-term investments. |
|
|
Call/Maturity Schedule3
|
|
Calendar Year Ended December 31,
| | | | | | |
2013 | | | | | 3 | % |
2014 | | | | | 2 | |
2015 | | | | | 3 | |
2016 | | | | | 5 | |
2017 | | | | | 1 | |
| 3 | | Scheduled maturity dates and/or bonds that are subject to potential calls by issuers over the next five years. |
| SEMI-ANNUAL REPORT | OCTOBER 31, 2013 | 17
|
| |
| Schedule of Investments October 31, 2013 (Unaudited) | BlackRock Investment Quality Municipal Trust, Inc. (BKN)
(Percentages shown are based on Net Assets)
|
| Municipal Bonds | | | | Par
(000) | | Value |
Alabama — 2.2% | | | | | | | | | | |
City of Birmingham Alabama Special Care Facilities Financing Authority, RB, Children’s Hospital (AGC): | | | | | | | | | | |
6.00%, 6/01/34 | | | | $ | 1,745 | | | $ | 1,958,746 | |
6.00%, 6/01/39 | | | | | 500 | | | | 561,245 | |
City of Hoover Alabama Board of Education, Refunding, Special Tax, Capital Outlay Warrants, 4.25%, 2/15/40 | | | | | 3,050 | | | | 2,951,241 | |
| | | | | | | | | 5,471,232 | |
Arizona — 7.9% | | | | | | | | | | |
Arizona Board of Regents, RB, Arizona State University, Series C, 5.50%, 7/01/26 | | | | | 475 | | | | 541,329 | |
Arizona Health Facilities Authority, Refunding RB, Phoenix Children’s Hospital, Series A, 5.00%, 2/01/42 | | | | | 3,300 | | | | 3,024,780 | |
County of Pima Arizona IDA, Refunding, IDRB, Tucson Electric Power Co. Project, Remarketing, Series B, 5.75%, 9/01/29 | | | | | 1,375 | | | | 1,401,152 | |
County of Pinal Electric District No. 3, Refunding RB, Electric System, 4.75%, 7/01/31 | | | | | 3,750 | | | | 3,788,175 | |
Salt Verde Financial Corp., RB, Senior: | | | | | | | | | | |
5.00%, 12/01/32 | | | | | 1,035 | | | | 1,045,133 | |
5.00%, 12/01/37 | | | | | 4,585 | | | | 4,603,982 | |
San Luis Facility Development Corp., RB, Senior Lien Project, Regional Detention Center Project: | | | | | | | | | | |
6.25%, 5/01/15 | | | | | 210 | | | | 204,845 | |
7.00%, 5/01/20 | | | | | 490 | | | | 445,415 | |
7.25%, 5/01/27 | | | | | 980 | | | | 787,606 | |
State of Arizona, COP, Department of Administration, Series A (AGM), 5.00%, 10/01/29 | | | | | 1,100 | | | | 1,155,044 | |
University Medical Center Corp. Arizona, RB, 6.50%, 7/01/39 | | | | | 750 | | | | 807,150 | |
University Medical Center Corp. Arizona, Refunding RB, 6.00%, 7/01/39 | | | | | 1,600 | | | | 1,657,440 | |
| | | | | | | | | 19,462,051 | |
California — 24.5% | | | | | | | | | | |
California County Tobacco Securitization Agency, RB, CAB, Stanislaus, Sub-Series C, 12.13%, 6/01/55 (a) | | | | | 7,090 | | | | 52,962 | |
California Health Facilities Financing Authority, RB, Sutter Health, Series B, 5.88%, 8/15/31 | | | | | 2,300 | | | | 2,617,170 | |
Carlsbad California Unified School District, GO, Election of 2006, Series B, 0.00%, 5/01/34 (b) | | | | | 1,500 | | | | 1,161,405 | |
City of Manteca California, Refunding RB, Sewer System, 4.00%, 12/01/33 | | | | | 1,000 | | | | 957,290 | |
City of San Jose California, Refunding ARB, Series A-1, AMT, 5.75%, 3/01/34 | | | | | 3,000 | | | | 3,179,910 | |
Dinuba California Unified School District, GO, Election of 2006 (AGM): | | | | | | | | | | |
5.63%, 8/01/31 | | | | | 250 | | | | 265,520 | |
5.75%, 8/01/33 | | | | | 535 | | | | 567,672 | |
| | | | | | | | | | | |
| Municipal Bonds | | | | Par
(000) | | Value |
California (concluded) | | | | | | | | | | |
Foothill-Eastern Transportation Corridor Agency, Refunding RB: | | | | | | | | | | |
5.75%, 1/15/40 | | | | $ | 3,495 | | | $ | 3,402,452 | |
CAB, 5.88%, 1/15/28 | | | | | 7,000 | | | | 7,034,440 | |
Hartnell Community College District California, GO, CAB, Election of 2002, Series D, 0.00%, 8/01/34 (b) | | | | | 2,475 | | | | 1,690,202 | |
Norwalk-La Mirada Unified School District, GO, Refunding, CAB, Election of 2002, Series E (AGC), 5.85%, 8/01/38 (a) | | | | | 12,000 | | | | 2,893,920 | |
Palomar Community College District, GO, CAB, Election of 2006, Series B: | | | | | | | | | | |
5.19%, 8/01/30 (a) | | | | | 2,270 | | | | 962,276 | |
5.85%, 8/01/33 (a) | | | | | 4,250 | | | | 1,361,403 | |
0.00%, 8/01/39 (b) | | | | | 3,000 | | | | 1,620,600 | |
Sacramento County California, ARB, Senior Series A, 5.00%, 7/01/41 | | | | | 2,100 | | | | 2,121,924 | |
San Diego Community College District, GO, CAB, Election of 2002, 0.00%, 8/01/33 (b) | | | | | 4,200 | | | | 3,272,808 | |
San Jose California Evergreen Community College District, GO, Election of 2010, Series B, 3.50%, 8/01/32 | | | | | 1,800 | | | | 1,581,498 | |
State of California, GO, Refunding, Various Purpose: | | | | | | | | | | |
5.00%, 2/01/38 | | | | | 2,000 | | | | 2,061,100 | |
(NPFGC), 5.00%, 6/01/37 | | | | | 5,000 | | | | 5,134,950 | |
State of California, GO, Various Purpose: | | | | | | | | | | |
5.75%, 4/01/31 | | | | | 3,000 | | | | 3,352,290 | |
6.00%, 3/01/33 | | | | | 2,270 | | | | 2,654,334 | |
6.50%, 4/01/33 | | | | | 2,900 | | | | 3,453,378 | |
5.50%, 3/01/40 | | | | | 3,650 | | | | 3,955,542 | |
(CIFG), 5.00%, 3/01/33 | | | | | 4,485 | | | | 4,647,133 | |
| | | | | | | | | 60,002,179 | |
Colorado — 0.3% | | | | | | | | | | |
Park Creek Metropolitan District, Refunding RB, Senior Limited Property Tax (AGM), 6.00%, 12/01/38 | | | | | 750 | | | | 801,615 | |
Connecticut — 0.8% | | | | | | | | | | |
Connecticut State Health & Educational Facility Authority, Refunding RB: | | | | | | | | | | |
Hartford Healthcare, Series A, 5.00%, 7/01/32 | | | | | 1,000 | | | | 1,004,360 | |
Lawrence & Memorial Hospital, Series F, 5.00%, 7/01/36 | | | | | 950 | | | | 963,224 | |
| | | | | | | | | 1,967,584 | |
Delaware — 0.8% | | | | | | | | | | |
County of Sussex Delaware, RB, NRG Energy, Inc., Indian River Project, 6.00%, 10/01/40 | | | | | 1,800 | | | | 1,851,174 | |
Florida — 12.4% | | | | | | | | | | |
County of Hillsborough Florida IDA, RB, National Gypsum Co., AMT, Series A, 7.13%, 4/01/30 | | | | | 3,700 | | | | 3,710,471 | |
Portfolio Abbreviations
| To simplify the listings of portfolio holdings in the Schedules of Investments, the names and descriptions of many of the securities have been abbreviated according to the following list: | AGC | Assured Guarantee Corp. | HFA | Housing Finance Agency |
AGM | Assured Guaranty Municipal Corp. | HRB | Housing Revenue Bonds |
AMBAC | American Municipal Bond Assurance Corp. | IDA | Industrial Development Authority |
AMT | Alternative Minimum Tax (subject to) | IDB | Industrial Development Board |
ARB | Airport Revenue Bonds | IDRB | Industrial Development Revenue Bonds |
CAB | Capital Appreciation Bonds | ISD | Independent School District |
CIFG | CDC IXIS Financial Guaranty | LOC | Letter of Credit |
COP | Certificates of Participation | M/F | Multi-Family |
EDA | Economic Development Authority | NPFGC | National Public Finance Guarantee Corp. |
EDC | Economic Development Corp. | PILOT | Payment in Lieu of Taxes |
ERB | Education Revenue Bonds | RB | Revenue Bonds |
GARB | General Airport Revenue Bonds | S/F | Single-Family |
GO | General Obligation Bonds | SAN | State Aid Notes |
HDA | Housing Development Authority | VRDN | Variable Rate Demand Notes |
See Notes to Financial Statements.
| 18 | SEMI-ANNUAL REPORT | OCTOBER 31, 2013
|
| |
| Schedule of Investments (continued) | BlackRock Investment Quality Municipal Trust, Inc. (BKN)
(Percentages shown are based on Net Assets)
|
| Municipal Bonds | | | | Par
(000) | | Value |
Florida (concluded) | | | | | | | | | | |
County of Lee Florida, Refunding ARB, Series A, AMT (AGM), 5.00%, 10/01/28 | | | | $ | 3,000 | | | $ | 3,085,530 | |
County of Miami-Dade, RB (a): | | | | | | | | | | |
CAB, Sub-Series A (NPFGC), 5.51%, 10/01/32 | | | | | 4,225 | | | | 1,511,071 | |
CAB, Sub-Series A (NPFGC), 5.55%, 10/01/33 | | | | | 4,000 | | | | 1,344,440 | |
CAB, Sub-Series A (NPFGC), 5.59%, 10/01/34 | | | | | 4,580 | | | | 1,445,585 | |
CAB, Sub-Series A (NPFGC), 5.62%, 10/01/35 | | | | | 5,000 | | | | 1,483,950 | |
CAB, Subordinate Special Obligation, 5.80%, 10/01/32 | | | | | 5,000 | | | | 1,695,350 | |
CAB, Subordinate Special Obligation, 5.85%, 10/01/33 | | | | | 15,375 | | | | 4,876,028 | |
Series B, AMT, 6.00%, 10/01/32 | | | | | 3,000 | | | | 3,172,050 | |
Orange County Florida Tourist Development Tax Revenue, Refunding RB, 4.75%, 10/01/32 | | | | | 5,000 | | | | 5,018,700 | |
Orange County Health Facilities Authority, Refunding RB, Mayflower Retirement Center, 5.00%, 6/01/32 | | | | | 200 | | | | 195,030 | |
Sumter Landing Community Development District Florida, RB, Sub-Series B, 5.70%, 10/01/38 | | | | | 3,405 | | | | 2,796,867 | |
| | | | | | | | | 30,335,072 | |
Georgia — 0.6% | | | | | | | | | | |
Milledgeville & Baldwin County Development Authority, RB, Georgia College & State University Foundation, 6.00%, 9/01/14 (c) | | | | | 1,500 | | | | 1,587,675 | |
Hawaii — 0.2% | | | | | | | | | | |
Hawaii State Department of Budget & Finance, Refunding RB, Special Purpose, Senior Living, Kahala Nui, 5.25%, 11/15/37 | | | | | 600 | | | | 602,130 | |
Idaho — 1.2% | | | | | | | | | | |
Idaho Health Facilities Authority, Refunding RB, Trinity Health Group, Series B, 6.25%, 12/01/33 | | | | | 2,500 | | | | 2,836,725 | |
Illinois — 11.9% | | | | | | | | | | |
Chicago Illinois Transit Authority, RB, Sales Tax Receipts, 5.25%, 12/01/40 | | | | | 1,000 | | | | 1,016,410 | |
Chicago Public Building Commission, RB, Series A (NPFGC), 7.00%, 1/01/20 (d) | | | | | 5,000 | | | | 6,392,800 | |
City of Chicago Illinois O’Hare International Airport, Refunding ARB, Passenger Facility Charge, Series B, AMT, 4.00%, 1/01/29 | | | | | 6,000 | | | | 5,390,760 | |
Illinois Finance Authority, RB: | | | | | | | | | | |
Northwestern Memorial Hospital, Series A, 5.50%, 8/15/14 (c) | | | | | 3,000 | | | | 3,125,700 | |
Rush University Medical Center, Series C, 6.63%, 11/01/39 | | | | | 1,200 | | | | 1,330,416 | |
Illinois Finance Authority, Refunding RB: | | | | | | | | | | |
Friendship Village Schaumburg, Series A, 5.63%, 2/15/37 | | | | | 345 | | | | 303,559 | |
OSF Healthcare System, Series A, 6.00%, 5/15/39 | | | | | 1,490 | | | | 1,610,988 | |
Roosevelt University Project, 6.50%, 4/01/44 | | | | | 1,500 | | | | 1,550,340 | |
Railsplitter Tobacco Settlement Authority, RB: | | | | | | | | | | |
6.25%, 6/01/24 | | | | | 6,000 | | | | 6,511,980 | |
6.00%, 6/01/28 | | | | | 1,700 | | | | 1,822,740 | |
| | | | | | | | | 29,055,693 | |
Indiana — 0.5% | | | | | | | | | | |
Indiana Finance Authority, Refunding RB, US Steel Corp. Project, 6.00%, 12/01/26 | | | | | 1,350 | | | | 1,314,185 | |
Iowa — 1.6% | | | | | | | | | | |
Iowa Higher Education Loan Authority, RB, Private College Facility, Buena Vista University Project, 5.00%, 4/01/31 | | | | | 1,355 | | | | 1,401,585 | |
Iowa Higher Education Loan Authority, Refunding RB, Private College Facility, Upper Iowa University Project: | | | | | | | | | | |
5.75%, 9/01/30 | | | | | 965 | | | | 1,008,657 | |
6.00%, 9/01/39 | | | | | 1,500 | | | | 1,559,700 | |
| | | | | | | | | 3,969,942 | |
| | | | | | | | | | | |
| Municipal Bonds | | | | Par
(000) | | Value |
Kansas — 0.5% | | | | | | | | | | |
Kansas Development Finance Authority, Refunding RB, Sisters of Leavenworth, Series A, 5.00%, 1/01/28 | | | | $ | 1,155 | | | $ | 1,211,075 | |
Kentucky — 4.5% | | | | | | | | | | |
Kentucky Economic Development Finance Authority, RB, 5.38%, 1/01/40 (e) | | | | | 2,750 | | | | 2,776,537 | |
Kentucky Economic Development Finance Authority, Refunding RB, Norton Healthcare, Inc., Series B (NPFGC), 4.26%, 10/01/23 (a) | | | | | 8,500 | | | | 5,597,335 | |
Louisville & Jefferson County Metropolitan Government, Refunding RB, Jewish Hospital & St. Mary’s Healthcare, 6.13%, 2/01/18 (c) | | | | | 2,250 | | | | 2,733,975 | |
| | | | | | | | | 11,107,847 | |
Louisiana — 2.3% | | | | | | | | | | |
Lafayette Public Trust Financing Authority, Refunding RB, Ragin’ Cajun Facilities, Inc. Project (AGM), 3.75%, 10/01/32 | | | | | 530 | | | | 477,710 | |
Louisiana Local Government Environmental Facilities & Community Development Authority, RB: | | | | | | | | | | |
Parish of Plaquemines Project (AGM), 4.00%, 9/01/42 | | | | | 395 | | | | 335,853 | |
Westlake Chemical Corp. Projects, Series A-1, 6.50%, 11/01/35 | | | | | 1,565 | | | | 1,685,004 | |
Louisiana Public Facilities Authority, RB: | | | | | | | | | | |
Belle Chasse Educational Foundation Project, 6.50%, 5/01/31 | | | | | 600 | | | | 640,266 | |
Cleco Power LLC Project, Series B, 4.25%, 12/01/38 | | | | | 2,100 | | | | 1,867,950 | |
Terrebonne Levee & Conservation District, RB, Sales Tax, 4.25%, 7/01/32 | | | | | 575 | | | | 558,164 | |
| | | | | | | | | 5,564,947 | |
Maryland — 2.0% | | | | | | | | | | |
Maryland EDC, Refunding RB, CNX Marine Terminals, Inc., 5.75%, 9/01/25 | | | | | 895 | | | | 931,283 | |
Maryland Health & Higher Educational Facilities Authority, Refunding RB, Doctor’s Community Hospital, 5.63%, 7/01/30 | | | | | 4,100 | | | | 4,012,916 | |
| | | | | | | | | 4,944,199 | |
Michigan — 4.9% | | | | | | | | | | |
Michigan State Building Authority, Refunding RB, Facilities Program, Series I, 6.25%, 10/15/38 | | | | | 1,875 | | | | 2,124,150 | |
Michigan State Hospital Finance Authority, Refunding RB, Trinity Health Credit Group, Series C, 4.00%, 12/01/32 | | | | | 5,250 | | | | 4,650,923 | |
Michigan Technological University, Refunding RB, General, Series A, 4.00%, 10/01/30 | | | | | 1,930 | | | | 1,827,459 | |
Royal Oak Hospital Finance Authority, Refunding RB, William Beaumont Hospital, 8.25%, 9/01/39 | | | | | 2,750 | | | | 3,307,920 | |
| | | | | | | | | 11,910,452 | |
Minnesota — 1.5% | | | | | | | | | | |
City of Minneapolis Minnesota, Refunding RB, Fairview Health Services, Series B (AGC), 6.50%, 11/15/38 | | | | | 2,250 | | | | 2,579,018 | |
University of Minnesota, RB, Biomedical Science Research Facilities, Series C: | | | | | | | | | | |
4.00%, 8/01/31 | | | | | 520 | | | | 514,706 | |
4.13%, 8/01/32 | | | | | 480 | | | | 480,182 | |
| | | | | | | | | 3,573,906 | |
Mississippi — 3.5% | | | | | | | | | | |
County of Warren Mississippi, RB, Gulf Opportunity Zone Bonds, International Paper Co. Project, Series A, 5.38%, 12/01/35 | | | | | 600 | | | | 586,476 | |
Mississippi Development Bank, RB, Special Obligation: | | | | | | | | | | |
CAB, Hinds Community College District (AGM), 5.00%, 4/01/36 | | | | | 1,910 | | | | 1,957,483 | |
Jackson County Limited Tax Note (AGC), 5.50%, 7/01/32 | | | | | 2,655 | | | | 2,817,672 | |
See Notes to Financial Statements.
| SEMI-ANNUAL REPORT | OCTOBER 31, 2013 | 19
|
| |
| Schedule of Investments (continued) | BlackRock Investment Quality Municipal Trust, Inc. (BKN)
(Percentages shown are based on Net Assets)
|
| Municipal Bonds | | | | Par
(000) | | Value |
Mississippi (concluded) | | | | | | | | | | |
University of Southern Mississippi, RB, Campus Facilities Improvements Project, 5.38%, 9/01/36 | | | | $ | 3,150 | | | $ | 3,319,564 | |
| | | | | | | | | 8,681,195 | |
Missouri — 2.8% | | | | | | | | | | |
Missouri Development Finance Board, RB: | | | | | | | | | | |
Annual Appropriation Sewer System, Series B, 5.00%, 11/01/41 | | | | | 1,350 | | | | 1,352,646 | |
St. Joseph Sewage System Improvements, Series E, 5.25%, 5/01/31 | | | | | 620 | | | | 626,113 | |
Missouri Development Finance Board, Refunding RB, Electric System Projects, Series F, 4.00%, 6/01/32 | | | | | 2,000 | | | | 1,827,700 | |
Missouri State Health & Educational Facilities Authority, RB: | | | | | | | | | | |
A.T. Still University of Health Sciences, 5.25%, 10/01/31 | | | | | 500 | | | | 524,725 | |
Heartland Regional Medical Center, 4.13%, 2/15/43 | | | | | 1,530 | | | | 1,291,014 | |
Missouri State Health & Educational Facilities Authority, Refunding RB, CoxHealth, Series A, 5.00%, 11/15/38 | | | | | 1,200 | | | | 1,205,616 | |
| | | | | | | | | 6,827,814 | |
Montana — 0.3% | | | | | | | | | | |
Montana Facility Finance Authority, Refunding RB, Sisters of Charity of Leavenworth Health System, Series A, 4.75%, 1/01/40 | | | | | 700 | | | | 701,813 | |
Nebraska — 3.3% | | | | | | | | | | |
Central Plains Energy Project Nebraska, RB, Gas Project No. 3, 5.00%, 9/01/42 | | | | | 900 | | | | 879,777 | |
City of Omaha Nebraska, RB, Sanitary Sewerage System, 4.00%, 11/15/42 | | | | | 3,300 | | | | 3,023,988 | |
Nebraska Public Power District, Refunding RB, Series A: | | | | | | | | | | |
5.00%, 1/01/32 | | | | | 2,535 | | | | 2,706,366 | |
5.00%, 1/01/33 | | | | | 750 | | | | 784,215 | |
5.00%, 1/01/34 | | | | | 600 | | | | 624,438 | |
| | | | | | | | | 8,018,784 | |
Nevada — 0.4% | | | | | | | | | | |
County of Clark Nevada, Refunding RB, Alexander Dawson School Nevada Project, 5.00%, 5/15/29 | | | | | 1,065 | | | | 1,103,510 | |
New Jersey — 5.0% | | | | | | | | | | |
Middlesex County Improvement Authority, RB, Subordinate, Heldrich Center Hotel, Sub-Series B, 6.25%, 1/01/37 (f)(g) | | | | | 1,510 | | | | 105,504 | |
New Jersey EDA, RB: | | | | | | | | | | |
Cigarette Tax, 5.75%, 6/15/14 (c) | | | | | 3,000 | | | | 3,104,250 | |
Continental Airlines, Inc. Project, AMT, 5.25%, 9/15/29 | | | | | 1,335 | | | | 1,226,918 | |
Rutgers University, College Avenue Redevelopment Project, 5.00%, 6/15/38 | | | | | 670 | | | | 711,493 | |
New Jersey Educational Facilities Authority, Refunding RB, University of Medicine & Dentistry, Series B (c): | | | | | | | | | | |
7.13%, 6/01/19 | | | | | 950 | | | | 1,236,966 | |
7.50%, 6/01/19 | | | | | 1,225 | | | | 1,619,572 | |
New Jersey Health Care Facilities Financing Authority, Refunding RB, Barnabas Health, Series A: | | | | | | | | | | |
4.63%, 7/01/23 | | | | | 770 | | | | 810,564 | |
5.00%, 7/01/25 | | | | | 500 | | | | 531,020 | |
5.63%, 7/01/37 | | | | | 2,560 | | | | 2,634,394 | |
New Jersey State Housing & Mortgage Finance Agency, RB, S/F Housing, Series AA, 6.50%, 10/01/38 | | | | | 400 | | | | 407,188 | |
| | | | | | | | | 12,387,869 | |
New Mexico — 0.3% | | | | | | | | | | |
New Mexico State University, Refunding RB, Series A, 3.50%, 4/01/33 | | | | | 780 | | | | 667,454 | |
| | | | | | | | | | | |
| Municipal Bonds | | | | Par
(000) | | Value |
New York — 7.5% | | | | | | | | | | |
Albany Industrial Development Agency, RB, New Covenant Charter School Project, Series A, 7.00%, 5/01/35 (f)(g) | | | | $ | 725 | | | $ | 123,265 | |
City of New York New York, GO, Fiscal 2014, Sub-Series A-1: | | | | | | | | | | |
5.00%, 8/01/29 | | | | | 600 | | | | 659,196 | |
5.00%, 8/01/35 | | | | | 2,380 | | | | 2,526,989 | |
County of Westchester New York Healthcare Corp., Refunding RB, Senior Lien, Series A, Remarketing, 5.00%, 11/01/30 | | | | | 1,600 | | | | 1,638,128 | |
Hudson New York Yards Infrastructure Corp., RB, Series A: | | | | | | | | | | |
(AGM), 5.00%, 2/15/47 | | | | | 1,250 | | | | 1,260,625 | |
(NPFGC), 5.00%, 2/15/47 | | | | | 500 | | | | 500,735 | |
Long Island Power Authority, Refunding RB, Electric System, Series A, 5.75%, 4/01/39 | | | | | 2,475 | | | | 2,676,663 | |
New York City Industrial Development Agency, ARB, American Airlines, Inc., JFK International Airport, AMT, 7.63%, 8/01/25 (h) | | | | | 2,600 | | | | 2,817,646 | |
New York City Industrial Development Agency, RB, PILOT Queens Baseball Stadium: | | | | | | | | | | |
(AGC), 6.50%, 1/01/46 | | | | | 300 | | | | 327,075 | |
(AMBAC), 5.00%, 1/01/39 | | | | | 1,900 | | | | 1,643,671 | |
New York Liberty Development Corp., Refunding RB, Second Priority, Bank of America Tower at One Bryant Park Project, Class 3, 6.38%, 7/15/49 | | | | | 1,250 | | | | 1,324,212 | |
New York State Dormitory Authority, Refunding RB, State University Dormitory Facilities, Series A, 5.00%, 7/01/42 | | | | | 1,195 | | | | 1,233,945 | |
Niagara Area Development Corp., Refunding RB, Solid Waste Disposal Facility, Covanta Energy Project, Series A, AMT, 5.25%, 11/01/42 | | | | | 600 | | | | 528,822 | |
Onondaga Civic Development Corp., Refunding RB, St. Joseph’s Hospital Health Center Project, 4.50%, 7/01/32 | | | | | 1,420 | | | | 1,203,890 | |
| | | | | | | | | 18,464,862 | |
North Carolina — 3.9% | | | | | | | | | | |
Gaston County Industrial Facilities & Pollution Control Financing Authority, RB, Exempt Facilities, National Gypsum Co. Project, AMT, 5.75%, 8/01/35 | | | | | 2,175 | | | | 2,012,375 | |
North Carolina Medical Care Commission, Refunding RB: | | | | | | | | | | |
Health Care Facilities, Novant Health Obligated Group, Series A, 4.00%, 11/01/46 | | | | | 5,600 | | | | 4,567,864 | |
Southeastern Regional Medical Center, 5.00%, 6/01/32 | | | | | 985 | | | | 999,381 | |
University Health System, Series D, 6.25%, 12/01/33 | | | | | 1,750 | | | | 1,961,383 | |
| | | | | | | | | 9,541,003 | |
North Dakota — 1.1% | | | | | | | | | | |
City of Fargo North Dakota, Refunding RB, University Facilities Development Foundation Project, 3.00%, 12/01/30 | | | | | 600 | | | | 501,198 | |
City of Grand Forks North Dakota, Refunding RB, Altru Health System Obligated Group, 5.00%, 12/01/32 | | | | | 2,120 | | | | 2,124,092 | |
| | | | | | | | | 2,625,290 | |
Oklahoma — 0.5% | | | | | | | | | | |
Oklahoma Municipal Power Authority, RB, Power Supply System, Series A, 4.00%, 1/01/38 | | | | | 1,500 | | | | 1,325,460 | |
Oregon — 2.6% | | | | | | | | | | |
City of Madras Oregon, GO, Refunding, 4.00%, 2/15/33 | | | | | 600 | | | | 514,908 | |
County of Clackamas Housing Authority, HRB, M/F, Easton Ridge Apartments Project, Series A: | | | | | | | | | | |
3.50%, 9/01/33 | | | | | 760 | | | | 630,200 | |
4.00%, 9/01/43 | | | | | 660 | | | | 564,577 | |
4.00%, 9/01/49 | | | | | 825 | | | | 681,458 | |
See Notes to Financial Statements.
| 20 | SEMI-ANNUAL REPORT | OCTOBER 31, 2013
|
| |
| Schedule of Investments (continued) | BlackRock Investment Quality Municipal Trust, Inc. (BKN)
(Percentages shown are based on Net Assets)
|
| Municipal Bonds | | | | Par
(000) | | Value |
Oregon (concluded) | | | | | | | | | | |
County of Klamath School District, GO, 4.00%, 6/15/33 | | | | $ | 630 | | | $ | 618,206 | |
Oregon Health & Science University, RB, Series A, 5.75%, 7/01/39 | | | | | 1,250 | | | | 1,365,475 | |
Oregon Health & Science University, Refunding RB: | | | | | | | | | | |
Series A, 3.00%, 7/01/24 | | | | | 900 | | | | 878,256 | |
Series E, 5.00%, 7/01/32 | | | | | 500 | | | | 526,180 | |
Oregon State Facilities Authority, Refunding RB, Linfield College Project, Series A, 5.25%, 10/01/40 | | | | | 500 | | | | 502,565 | |
| | | | | | | | | 6,281,825 | |
Pennsylvania — 2.7% | | | | | | | | | | |
County of Allegheny Pennsylvania IDA, Refunding RB, US Steel Corp. Project, 6.55%, 12/01/27 | | | | | 2,535 | | | | 2,600,276 | |
Delaware River Port Authority, RB, Series D (AGM), 5.00%, 1/01/40 | | | | | 3,640 | | | | 3,752,658 | |
Mckeesport Area School District, GO, CAB, Refunding (NPFGC), 3.96%, 10/01/31 (a)(d) | | | | | 500 | | | | 247,655 | |
| | | | | | | | | 6,600,589 | |
Rhode Island — 2.7% | | | | | | | | | | |
Rhode Island Health & Educational Building Corp., RB: | | | | | | | | | | |
City of Newport Issue, Series C, 4.00%, 5/15/33 | | | | | 1,850 | | | | 1,822,324 | |
Hospital Financing, LifeSpan Obligation, Series A (AGC), 7.00%, 5/15/39 | | | | | 3,000 | | | | 3,335,490 | |
State of Rhode Island, COP, School for the Deaf Project, Series C (AGC), 5.38%, 4/01/28 | | | | | 1,330 | | | | 1,420,227 | |
| | | | | | | | | 6,578,041 | |
South Carolina — 1.5% | | | | | | | | | | |
South Carolina State Housing Finance & Development Authority, Refunding RB, Series A-2, AMT (AMBAC), 5.15%, 7/01/37 | | | | | 3,540 | | | | 3,681,317 | |
Tennessee — 2.6% | | | | | | | | | | |
Chattanooga Health Educational & Housing Facility Board, RB, 5.25%, 1/01/40 (e) | | | | | 2,945 | | | | 2,953,275 | |
Johnson City Health & Educational Facilities Board, RB, Mountain States Health, Series A, 5.00%, 8/15/42 | | | | | 1,200 | | | | 1,162,536 | |
Memphis-Shelby County Sports Authority, Inc., Refunding RB, Memphis Arena Project, Series A: | | | | | | | | | | |
5.25%, 11/01/27 | | | | | 1,135 | | | | 1,210,852 | |
5.38%, 11/01/28 | | | | | 1,000 | | | | 1,063,930 | |
| | | | | | | | | 6,390,593 | |
Texas — 12.9% | | | | | | | | | | |
City of San Antonio Texas Public Service Board, RB, Electric & Gas Systems, Junior Lien, 5.00%, 2/01/43 | | | | | 2,370 | | | | 2,473,285 | |
County of Matagorda Texas Navigation District No. 1, Refunding RB, Central Power & Light Co. Project, Series A, 6.30%, 11/01/29 | | | | | 2,200 | | | | 2,445,388 | |
Harris County Cultural Education Facilities Finance Corp., Refunding RB, Young Men’s Christian Association of the Greater Houston Area, Series A, 5.00%, 6/01/38 | | | | | 345 | | | | 326,774 | |
Harris County Health Facilities Development Corp., Refunding RB, Memorial Hermann Healthcare System, Series B (c): | | | | | | | | | | |
7.13%, 12/01/18 | | | | | 1,000 | | | | 1,294,650 | |
7.25%, 12/01/18 | | | | | 2,650 | | | | 3,447,146 | |
Harris County-Houston Sports Authority, Refunding RB, CAB, Senior Lien, Series A (NPFGC), 6.46%, 11/15/38 (a) | | | | | 5,000 | | | | 1,017,650 | |
Love Field Airport Modernization Corp., RB, Southwest Airlines Co. Project, 5.25%, 11/01/40 | | | | | 1,545 | | | | 1,518,735 | |
Midland County Fresh Water Supply District No. 1, RB, CAB, City of Midland Project, Series A (a): | | | | | | | | | | |
5.01%, 9/15/36 | | | | | 7,640 | | | | 2,461,150 | |
5.15%, 9/15/38 | | | | | 16,780 | | | | 4,737,329 | |
Midland County Fresh Water Supply District No. 1, Refunding RB, City of Midland Project, 3.38%, 9/15/32 | | | | | 2,425 | | | | 2,098,328 | |
| | | | | | | | | | | |
| Municipal Bonds | | | | Par
(000) | �� | Value |
Texas (concluded) | | | | | | | | | | |
Red River Education Financing Corp., RB, Texas Christian University Project, 5.25%, 3/15/38 | | | | $ | 1,140 | | | $ | 1,233,731 | |
Texas Private Activity Bond Surface Transportation Corp., RB, Senior Lien, LBJ Infrastructure Group LLC, LBJ Freeway Managed Lanes Project, 7.00%, 6/30/40 | | | | | 3,000 | | | | 3,274,200 | |
Texas State Turnpike Authority, RB, CAB (AMBAC), 6.05%, 8/15/31 (a) | | | | | 15,000 | | | | 5,195,550 | |
| | | | | | | | | 31,523,916 | |
Vermont — 2.8% | | | | | | | | | | |
University of Vermont & State Agricultural College, Refunding RB, Series A, 4.00%, 10/01/38 | | | | | 1,800 | | | | 1,610,262 | |
Vermont Educational & Health Buildings Financing Agency, RB, Fletcher Allen Health Hospital, Series A, 4.75%, 12/01/36 | | | | | 1,495 | | | | 1,478,406 | |
Vermont Educational & Health Buildings Financing Agency, Refunding RB, 5.00%, 12/01/34 | | | | | 3,640 | | | | 3,678,438 | |
| | | | | | | | | 6,767,106 | |
Virginia — 1.7% | | | | | | | | | | |
County of Prince William Virginia IDA, Refunding RB, Novant Health Obligation Group, Series B, 4.00%, 11/01/46 | | | | | 2,800 | | | | 2,303,000 | |
Virginia Small Business Financing Authority, RB, Senior Lien, Elizabeth River Crossings LLC Project, AMT, 6.00%, 1/01/37 | | | | | 1,755 | | | | 1,817,145 | |
| | | | | | | | | 4,120,145 | |
Washington — 0.9% | | | | | | | | | | |
Washington Health Care Facilities Authority, RB, MultiCare Health System, Series B (AGC), 6.00%, 8/15/39 | | | | | 2,100 | | | | 2,250,381 | |
West Virginia — 1.2% | | | | | | | | | | |
City of Wheeling West Virginia Waterworks & Sewerage System, RB, 5.00%, 6/01/38 | | | | | 3,000 | | | | 3,047,850 | |
Wyoming — 0.8% | | | | | | | | | | |
County of Sweetwater Wyoming, Refunding RB, Idaho Power Co. Project, Remarketing, 5.25%, 7/15/26 | | | | | 1,800 | | | | 1,939,518 | |
Total Municipal Bonds — 141.6% | | 347,096,018 | |
|
Municipal Bonds Transferred to
Tender Option Bond Trusts (i)
|
Colorado — 2.2% | | | | | | | | | | |
Colorado Health Facilities Authority, RB, Catholic Health, Series C-7 (AGM), 5.00%, 9/01/36 | | | | | 5,250 | | | | 5,283,600 | |
Massachusetts — 1.3% | | | | | | | | | | |
Massachusetts Water Resources Authority, Refunding RB, General, Series A, 5.00%, 8/01/41 | | | | | 3,070 | | | | 3,211,742 | |
New Jersey — 1.2% | | | | | | | | | | |
New Jersey Transportation Trust Fund Authority, RB, Transportation System, Series B, 5.25%, 6/15/36 (j) | | | | | 2,861 | | | | 3,007,035 | |
New York — 9.2% | | | | | | | | | | |
Hudson Yards Infrastructure Corp., RB, Senior, Series A, 5.75%, 2/15/47 (j) | | | | | 1,750 | | | | 1,853,610 | |
New York City Municipal Water Finance Authority, RB, Water & Sewer System, Fiscal 2009, Series A, 5.75%, 6/15/40 | | | | | 690 | | | | 767,265 | |
New York City Municipal Water Finance Authority, Refunding RB, Water & Sewer System: | | | | | | | | | | |
Second General Resolution, Series CC, 5.00%, 6/15/47 | | | | | 4,000 | | | | 4,153,640 | |
Second General Resolution, Series FF-2, 5.50%, 6/15/40 | | | | | 810 | | | | 867,099 | |
See Notes to Financial Statements.
| SEMI-ANNUAL REPORT | OCTOBER 31, 2013 | 21
|
| |
| Schedule of Investments (continued) | BlackRock Investment Quality Municipal Trust, Inc. (BKN)
(Percentages shown are based on Net Assets)
|
Municipal Bonds Transferred to
Tender Option Bond Trusts (l) | | | | Par
(000) | | Value |
New York (concluded) | | | | | | | | | | |
New York City Municipal Water Finance Authority, Refunding RB, Water & Sewer System (concluded): | | | | | | | | | | |
Series A, 4.75%, 6/15/30 | | | | $ | 4,000 | | | $ | 4,182,920 | |
New York Liberty Development Corp., RB, 1 World Trade Center Port Authority Construction, 5.25%, 12/15/43 | | | | | 4,500 | | | | 4,696,155 | |
New York State Dormitory Authority, RB, New York University, Series A, 5.00%, 7/01/38 | | | | | 3,359 | | | | 3,530,335 | |
New York State Thruway Authority, Refunding RB, Transportation, Personal Income Tax, Series A, 5.00%, 3/15/31 | | | | | 2,360 | | | | 2,542,711 | |
| | | | | | | | | 22,593,735 | |
Ohio — 1.8% | | | | | | | | | | |
County of Montgomery Ohio, RB, Catholic Health, Series C-1 (AGM), 5.00%, 10/01/41 | | | | | 1,740 | | | | 1,747,621 | |
Ohio Higher Educational Facility Commission, RB, Cleveland Clinic Health, Series A, 5.25%, 1/01/33 | | | | | 2,600 | | | | 2,692,144 | |
| | | | | | | | | 4,439,765 | |
Total Municipal Bonds Transferred to
Tender Option Bond Trusts — 15.7% | | 38,535,877 | |
Total Long-Term Investments
(Cost — $376,908,214) — 157.3% | | | | | | | | | 385,631,895 | |
| | | | | | | | | | | |
| Short-Term Securities | | | |
Shares | | Value |
FFI Institutional Tax-Exempt Fund, 0.03% (k)(l) | | | | | 11,390,265 | | | $ | 11,390,265 | |
Total Short-Term Securities
(Cost — $11,390,265) — 4.7% | | | | | | | | | 11,390,265 | |
Total Investments (Cost — $388,298,479) — 162.0% | | | | | | | | | 397,022,160 | |
Liabilities in Excess of Other Assets — (1.7)% | | | | | | | | | (4,226,985 | ) |
Liability for TOB Trust Certificates, Including Interest Expense and Fees Payable — (8.9%) | | | | | | | | | (21,803,284 | ) |
VMTP Shares, at Liquidation Value — (51.4%) | | | | | | | | | (125,900,000 | ) |
Net Assets Applicable to Common Shares — 100.0% | | | | | | | | $ | 245,091,891 | |
Notes to Schedule of Investments
| (a) | | | | Represents a zero-coupon bond. Rate shown reflects the current yield as of report date. |
| (b) | | | | Represents a step-up bond that pays an initial coupon rate for the first period and then a higher coupon rate for the following periods. Rate shown is as of report date. |
| (c) | | | | US government securities, held in escrow, are used to pay interest on this security, as well as to retire the bond in full at the date indicated, typically at a premium to par. |
| (d) | | | | Security is collateralized by municipal or US Treasury obligations. |
| (e) | | | | When-issued security. Unsettled when-issued transactions were as follows: |
| Counterparty | | | | Value | | Unrealized
Appreciation |
D. A. Davidson & Co. | | | | $ | 145,407 | | | $ | 1,685 | |
JP Morgan Chase Bank | | | | $ | 706,755 | | | $ | 6,038 | |
Merrill Lynch, Pierce, Fenner & Smith Inc. | | | | $ | 1,303,653 | | | $ | 15,103 | |
Morgan Stanley & Co. Inc. | | | | $ | 3,573,997 | | | $ | 35,108 | |
| (f) | | | | Non-income producing security. |
| (g) | | | | Issuer filed for bankruptcy and/or is in default of principal and/or interest payments. |
| (h) | | | | Variable rate security. Rate shown is as of report date. |
| (i) | | | | Represent bonds transferred to a TOB. In exchange the Trust acquired residual interest certificates. These bonds serve as collateral in a financing transaction. See Note 3 of the Notes to Financial Statements for details of municipal bonds transferred to TOBs. |
| (j) | | | | All or a portion of security is subject to a recourse agreement, which may require the Trust to pay the liquidity provider in the event there is a shortfall between the TOB trust certificates and proceeds received from the sale of the security contributed to the TOB trust. In the case of a shortfall, the aggregate maximum potential amount the Trust could ultimately be required to pay under the agreement, which expires from February 15, 2019 to June 15, 2019, is $3,149,396. |
| (k) | | | | Investments in issuers considered to be an affiliate of the Trust during the six months ended October 31, 2013, for purposes of Section 2(a)(3) of the 1940 Act, were as follows: |
Affiliate
|
|
|
| Shares
Held at
April 30, 2013
|
| Net
Activity
|
| Shares
Held at
October 31, 2013
|
| Income
|
FFI Institutional Tax-Exempt Fund | | | | 4,475,537 | | 6,914,728 | | 11,390,265 | | $789 |
| (l) | | | | Represents the current yield as of report date. |
| • | | | | Financial futures contracts as of October 31, 2013 were as follows: |
Contracts
Sold
|
|
|
| Issue
|
| Exchange
|
| Expiration
|
| Notional
Value
|
| Unrealized
Depreciation
|
| (100) | | | | 10-Year US Treasury Note | | Chicago Board of Trade | | December 2013 | | $12,735,938 | | $(7,922) |
See Notes to Financial Statements.
| 22 | SEMI-ANNUAL REPORT | OCTOBER 31, 2013
|
| |
| Schedule of Investments (concluded) | BlackRock Investment Quality Municipal Trust, Inc. (BKN) |
| • | | | | Fair Value Measurements — Various inputs are used in determining the fair value of investments and derivative financial instruments. These inputs to valuation techniques are categorized into a disclosure hierarchy consisting of three broad levels for financial statement purposes as follows: |
| • | | | | Level 1 — unadjusted price quotations in active markets/exchanges for identical assets or liabilities that the Trust has the ability to access |
| • | | | | Level 2 — other observable inputs (including, but not limited to, quoted prices for similar assets or liabilities in markets that are active, quoted prices for identical or similar assets or liabilities in markets that are not active, inputs other than quoted prices that are observable for the assets or liabilities (such as interest rates, yield curves, volatilities, prepayment speeds, loss severities, credit risks and default rates) or other market-corroborated inputs) |
| • | | | | Level 3 — unobservable inputs based on the best information available in the circumstances, to the extent observable inputs are not available (including the Trust’s own assumptions used in determining the fair value of investments and derivative financial instruments) |
| | | | | The hierarchy gives the highest priority to unadjusted quoted prices in active markets for identical assets or liabilities (Level 1 measurements) and the lowest priority to unobservable inputs (Level 3 measurements). Accordingly, the degree of judgment exercised in determining fair value is greatest for instruments categorized in Level 3. The inputs used to measure fair value may fall into different levels of the fair value hierarchy. In such cases, for disclosure purposes, the fair value hierarchy classification is determined based on the lowest level input that is significant to the fair value measurement in its entirety.
|
| | | | | Changes in valuation techniques may result in transfers into or out of an assigned level within the disclosure hierarchy. In accordance with the Trust’s policy, transfers between different levels of the fair value disclosure hierarchy are deemed to have occurred as of the beginning of the reporting period. The categorization of a value determined for investments and derivative financial instruments is based on the pricing transparency of the investment and derivative financial instrument and is not necessarily an indication of the risks associated with investing in those securities. For information about the Trust’s policy regarding valuation of investments and derivative financial instruments, please refer to Note 2 of the Notes to Financial Statements. |
| | | | | The following tables summarize the Trust’s investments and derivative financial instruments categorized in the disclosure hierarchy as of October 31, 2013: |
|
|
|
| Level 1
|
| Level 2
|
| Level 3
|
| Total
|
Assets:
| | | | | | | | | | | | | | | | | | |
Investments:
| | | | | | | | | | | | | | | | | | |
Long-Term Investments1 | | | | | — | | | $ | 385,631,895 | | | | — | | | $ | 385,631,895 | |
Short-Term Securities | | | | $ | 11,390,265 | | | | — | | | | — | | | | 11,390,265 | |
Total
| | | | $ | 11,390,265 | | | $ | 385,631,895 | | | | — | | | $ | 397,022,160 | |
| 1 | See above Schedule of Investments for values in each state or political subdivision. |
|
|
|
| Level 1
|
| Level 2
|
| Level 3
|
| Total
|
Derivative Financial Instruments2
| | | | | | | | | | | | | | | | | | |
Liabilities:
| | | | | | | | | | | | | | | | | | |
Interest rate contracts | | | | $ | (7,922 | ) | | | — | | | | — | | | $ | (7,922 | ) |
| 2 | Derivative financial instruments are financial futures contracts, which are valued at the unrealized appreciation/depreciation on the instrument. |
Certain of the Trust’s assets and/or liabilities are held at carrying amount, which approximates fair value for financial statement purposes. As of October 31, 2013, such assets and/or liabilities are categorized within the disclosure hierarchy as follows:
| | | | | Level 1 | | Level 2 | | Level 3 | | Total |
Assets:
| | | | | | | | | | | | | | | | | | |
Cash | | | | $ | 115,415 | | | | — | | | | — | | | $ | 115,415 | |
Cash pledged for financial futures contracts | | | | | 177,000 | | | | — | | | | — | | | | 177,000 | |
Liabilities:
| | | | | | | | | | | | | | | | | | |
TOB trust certificates | | | | | — | | | $ | (21,799,254 | ) | | | — | | | | (21,799,254 | ) |
VMTP Shares | | | | | — | | | | (125,900,000 | ) | | | — | | | | (125,900,000 | ) |
Total
| | | | $ | 292,415 | | | $ | (147,699,254 | ) | | | — | | | $ | (147,406,839 | ) |
There were no transfers between levels during the six months ended October 31, 2013.
See Notes to Financial Statements.
| SEMI-ANNUAL REPORT | OCTOBER 31, 2013 | 23
|
| |
| Schedule of Investments October 31, 2013 (Unaudited) | BlackRock Long-Term Municipal Advantage Trust (BTA)
(Percentages shown are based on Net Assets)
|
| Municipal Bonds | | | | Par
(000) | | Value |
Alabama — 0.3% | | | | | | | | | | |
County of Jefferson Alabama, RB, Limited Obligation School, Series A, 5.25%, 1/01/19 | | | | $ | 515 | | | $ | 511,333 | |
Arizona — 1.0% | | | | | | | | | | |
Salt Verde Financial Corp., RB, Senior, 5.00%, 12/01/37 | | | | | 1,590 | | | | 1,596,583 | |
California — 7.1% | | | | | | | | | | |
California Health Facilities Financing Authority, RB: | | | | | | | | | | |
St. Joseph Health System, Series A, 5.75%, 7/01/39 | | | | | 385 | | | | 428,008 | |
Sutter Health, Series B, 6.00%, 8/15/42 | | | | | 1,040 | | | | 1,199,474 | |
California Health Facilities Financing Authority, Refunding RB, Series A: | | | | | | | | | | |
Catholic Healthcare West, 6.00%, 7/01/39 | | | | | 680 | | | | 741,112 | |
St. Joseph Health System, 5.00%, 7/01/33 | | | | | 435 | | | | 448,085 | |
California HFA, RB, S/F, Home Mortgage, Series K, AMT, 5.50%, 2/01/42 | | | | | 320 | | | | 328,874 | |
California Pollution Control Financing Authority, RB: | | | | | | | | | | |
Poseidon Resources (Channel Side) LP Desalination Project, AMT, 5.00%, 7/01/37 | | | | | 360 | | | | 317,671 | |
San Diego County Water Authority Desalination Project Pipeline, 5.00%, 11/21/45 | | | | | 440 | | | | 390,746 | |
California State Public Works Board, RB, Various Capital Projects, Sub-Series I-1, 6.38%, 11/01/34 | | | | | 400 | | | | 460,544 | |
California Statewide Communities Development Authority, Refunding RB, Episcopal Communities & Services: | | | | | | | | | | |
5.00%, 5/15/42 | | | | | 250 | | | | 224,818 | |
5.00%, 5/15/47 | | | | | 125 | | | | 110,233 | |
City of Los Angeles California Department of Airports, Refunding RB, Los Angeles International Airport, Series A: | | | | | | | | | | |
5.25%, 5/15/39 | | | | | 270 | | | | 288,182 | |
5.00%, 5/15/40 | | | | | 2,045 | | | | 2,084,918 | |
San Diego Community College District, GO, Election of 2006, 5.00%, 8/01/43 | | | | | 375 | | | | 396,007 | |
San Marcos Unified School District, GO, CAB, SAN, Election of 2010, Series B, 5.59%, 8/01/38 (a) | | | | | 3,725 | | | | 951,737 | |
State of California, GO, Various Purposes, 6.50%, 4/01/33 | | | | | 2,000 | | | | 2,381,640 | |
| | | | | | | | | 10,752,049 | |
Colorado — 1.2% | | | | | | | | | | |
Colorado Health Facilities Authority, Refunding RB, Evangelical Lutheran Good Samaritan Society Project, 5.00%, 12/01/42 | | | | | 315 | | | | 293,120 | |
Colorado State Board of Governors, Refunding RB, State University System Enterprise, Series A, 5.00%, 3/01/43 | | | | | 415 | | | | 437,414 | |
North Range Metropolitan District No. 2, GO, Limited Tax, 5.50%, 12/15/37 | | | | | 1,200 | | | | 1,076,196 | |
| | | | | | | | | 1,806,730 | |
Delaware — 1.1% | | | | | | | | | | |
County of Sussex Delaware, RB, NRG Energy, Inc., Indian River Project, 6.00%, 10/01/40 | | | | | 750 | | | | 771,322 | |
Delaware State EDA, RB, Exempt Facilities, Indian River Power, 5.38%, 10/01/45 | | | | | 940 | | | | 891,308 | |
| | | | | | | | | 1,662,630 | |
District of Columbia — 3.9% | | | | | | | | | | |
District of Columbia, RB, Methodist Home District of Columbia, Series A: | | | | | | | | | | |
7.38%, 1/01/30 | | | | | 550 | | | | 539,511 | |
7.50%, 1/01/39 | | | | | 500 | | | | 484,025 | |
District of Columbia, Refunding RB, Kipp Charter School, Series A, 6.00%, 7/01/43 | | | | | 260 | | | | 270,416 | |
District of Columbia, Tax Allocation Bonds, City Market at O Street Project, 5.13%, 6/01/41 | | | | | 750 | | | | 751,132 | |
| | | | | | | | | | | |
| Municipal Bonds | | | | Par
(000) | | Value |
District of Columbia (concluded) | | | | | | | | | | |
District of Columbia Tobacco Settlement Financing Corp., Refunding RB, Asset Backed, 6.25%, 5/15/24 | | | | $ | 2,675 | | | $ | 2,688,295 | |
Metropolitan Washington Airports Authority, Refunding RB, First Senior Lien, Series A: | | | | | | | | | | |
5.25%, 10/01/44 | | | | | 1,000 | | | | 1,012,620 | |
5.00%, 10/01/39 | | | | | 170 | | | | 170,252 | |
| | | | | | | | | 5,916,251 | |
Florida — 4.4% | | | | | | | | | | |
County of Tampa-Hillsborough Florida Expressway Authority, Refunding RB: | | | | | | | | | | |
Series A, 5.00%, 7/01/37 | | | | | 765 | | | | 781,134 | |
Series B, 5.00%, 7/01/42 | | | | | 640 | | | | 647,136 | |
Mid-Bay Bridge Authority, RB, Springing Lien, Series A, 7.25%, 10/01/40 | | | | | 1,080 | | | | 1,187,557 | |
Sumter Landing Community Development District Florida, RB, Sub-Series B, 5.70%, 10/01/38 | | | | | 1,330 | | | | 1,092,462 | |
Tolomato Community Development District, Refunding, Special Assessment Bonds, CAB: | | | | | | | | | | |
Series A-1, 6.65%, 5/01/40 | | | | | 355 | | | | 347,478 | |
Series A-2, 7.14%, 5/01/39 (b) | | | | | 95 | | | | 69,961 | |
Series A-3, 7.55%, 5/01/40 (b) | | | | | 225 | | | | 135,086 | |
Series A-4, 8.02%, 5/01/40 (b) | | | | | 120 | | | | 53,352 | |
Tolomato Community Development District, Special Assessment Bonds (c)(d): | | | | | | | | | | |
Series 1, 6.65%, 5/01/40 | | | | | 15 | | | | 14,603 | |
Series 2, 6.65%, 5/01/40 | | | | | 815 | | | | 450,939 | |
Series 3, 6.65%, 5/01/40 | | | | | 275 | | | | 3 | |
Village Community Development District No. 10, Special Assessment Bonds, 5.13%, 5/01/43 | | | | | 880 | | | | 799,999 | |
Watergrass Community Development District, Special Assessment Bonds, Series A, 5.38%, 5/01/39 | | | | | 1,755 | | | | 1,129,167 | |
| | | | | | | | | 6,708,877 | |
Guam — 0.1% | | | | | | | | | | |
Territory of Guam, GO, Series A, 6.00%, 11/15/19 | | | | | 200 | | | | 207,254 | |
Illinois — 8.4% | | | | | | | | | | |
City of Chicago Illinois, GARB, O’Hare International Airport, Third Lien, Series A, 5.75%, 1/01/39 | | | | | 2,500 | | | | 2,603,950 | |
City of Chicago Illinois, GO, Project, Series A, 5.00%, 1/01/34 | | | | | 1,570 | | | | 1,474,936 | |
City of Chicago Illinois, Refunding RB, Sales Tax Revenue, Series A, 5.25%, 1/01/38 | | | | | 280 | | | | 292,256 | |
City of Chicago Illinois Transit Authority, RB, Sales Tax Receipts, 5.25%, 12/01/40 | | | | | 360 | | | | 365,908 | |
City of Chicago Illinois Waterworks, Refunding RB, Second Lien, Water Project, 5.00%, 11/01/42 | | | | | 2,000 | | | | 1,978,860 | |
County of Cook Illinois Community College District No. 508, GO, City College of Chicago, 5.50%, 12/01/38 | | | | | 350 | | | | 367,388 | |
Illinois Finance Authority, RB, Advocate Health Care, Series C, 5.38%, 4/01/44 | | | | | 1,845 | | | | 1,888,819 | |
Illinois Finance Authority, Refunding RB: | | | | | | | | | | |
Ascension Health, Series A, 5.00%, 11/15/37 | | | | | 335 | | | | 336,755 | |
Central Dupage Health, Series B, 5.50%, 11/01/39 | | | | | 550 | | | | 580,674 | |
Illinois State Toll Highway Authority, RB, Series A, 5.00%, 1/01/38 | | | | | 815 | | | | 816,728 | |
Metropolitan Pier & Exposition Authority, Refunding RB, McCormick Place Expansion Project: | | | | | | | | | | |
Series B (AGM), 5.00%, 6/15/50 | | | | | 1,095 | | | | 1,075,881 | |
Series B-2, 5.00%, 6/15/50 | | | | | 600 | | | | 576,618 | |
Railsplitter Tobacco Settlement Authority, RB, 5.50%, 6/01/23 | | | | | 180 | | | | 197,930 | |
State of Illinois, RB, Build Illinois, Series B, 5.25%, 6/15/34 | | | | | 215 | | | | 222,488 | |
| | | | | | | | | 12,779,191 | |
See Notes to Financial Statements.
| 24 | SEMI-ANNUAL REPORT | OCTOBER 31, 2013
|
| |
| Schedule of Investments (continued) | BlackRock Long-Term Municipal Advantage Trust (BTA)
(Percentages shown are based on Net Assets)
|
| Municipal Bonds | | | | Par
(000) | | Value |
Indiana — 3.4% | | | | | | | | | | |
Carmel Redevelopment Authority, Refunding RB, Multipurpose, Series A: | | | | | | | | | | |
4.00%, 8/01/35 | | | | $ | 400 | | | $ | 374,000 | |
4.00%, 2/01/38 | | | | | 645 | | | | 586,124 | |
Indiana Finance Authority, RB, Series A: | | | | | | | | | | |
Private Activity Bond, Ohio River Bridges East End Crossing Project, AMT, 5.00%, 7/01/44 | | | | | 160 | | | | 142,787 | |
Private Activity Bond, Ohio River Bridges East End Crossing Project, AMT, 5.00%, 7/01/48 | | | | | 520 | | | | 458,115 | |
Sisters of St. Francis Health, 5.25%, 11/01/39 | | | | | 290 | | | | 295,977 | |
Wastewater Utility (CWA Authority Project), First Lien, 5.25%, 10/01/38 | | | | | 1,285 | | | | 1,330,361 | |
Indiana Finance Authority, Refunding RB, Series A: | | | | | | | | | | |
Community Health Network Project, 5.00%, 5/01/42 | | | | | 340 | | | | 331,429 | |
Parkview Health System, 5.75%, 5/01/31 | | | | | 600 | | | | 635,586 | |
Indiana Municipal Power Agency, RB, Series B, 6.00%, 1/01/39 | | | | | 350 | | | | 388,738 | |
Indianapolis Local Public Improvement Bond Bank, RB, Series A: | | | | | | | | | | |
5.00%, 1/15/36 | | | | | 140 | | | | 146,185 | |
5.00%, 1/15/40 | | | | | 445 | | | | 459,894 | |
| | | | | | | | | 5,149,196 | |
Iowa — 1.7% | | | | | | | | | | |
Iowa Finance Authority, Refunding RB, Midwestern Disaster Area, Iowa Fertilizer Co. Project: | | | | | | | | | | |
5.00%, 12/01/19 | | | | | 340 | | | | 329,589 | |
5.50%, 12/01/22 | | | | | 830 | | | | 793,388 | |
5.25%, 12/01/25 | | | | | 660 | | | | 602,468 | |
Iowa Student Loan Liquidity Corp., Refunding RB, Student Loan, Senior Series A-1, AMT, 5.15%, 12/01/22 | | | | | 885 | | | | 917,515 | |
| | | | | | | | | 2,642,960 | |
Kentucky — 0.3% | | | | | | | | | | |
Kentucky Economic Development Finance Authority, RB, Catholic Health Initiatives, Series A, 5.25%, 1/01/45 (e) | | | | | 440 | | | | 437,958 | |
Louisiana — 3.8% | | | | | | | | | | |
Louisiana Local Government Environmental Facilities & Community Development Authority, RB, Westlake Chemical Corp. Projects: | | | | | | | | | | |
6.75%, 11/01/32 | | | | | 2,000 | | | | 2,130,700 | |
Series A-1, 6.50%, 11/01/35 | | | | | 1,135 | | | | 1,222,032 | |
Terrebonne Levee & Conservation District, RB, Sales Tax, 4.25%, 7/01/32 | | | | | 85 | | | | 82,511 | |
Tobacco Settlement Financing Corp., Refunding RB, Asset-Backed, Series A: | | | | | | | | | | |
5.50%, 5/15/30 | | | | | 350 | | | | 356,720 | |
5.25%, 5/15/31 | | | | | 300 | | | | 298,293 | |
5.25%, 5/15/32 | | | | | 380 | | | | 375,999 | |
5.25%, 5/15/33 | | | | | 415 | | | | 409,007 | |
5.25%, 5/15/35 | | | | | 945 | | | | 927,054 | |
| | | | | | | | | 5,802,316 | |
Maine — 0.9% | | | | | | | | | | |
Maine Health & Higher Educational Facilities Authority, RB, Maine General Medical Center, 6.75%, 7/01/41 | | | | | 970 | | | | 1,020,770 | |
Maine Turnpike Authority, RB, Series A, 5.00%, 7/01/42 | | | | | 310 | | | | 323,491 | |
| | | | | | | | | 1,344,261 | |
Maryland — 2.3% | | | | | | | | | | |
Maryland EDC, RB, Transportation Facilities Project, Series A, 5.75%, 6/01/35 | | | | | 970 | | | | 982,280 | |
Maryland EDC, Refunding RB, CNX Marine Terminals, Inc., 5.75%, 9/01/25 | | | | | 1,000 | | | | 1,040,540 | |
| | | | | | | | | | | |
| Municipal Bonds | | | | Par
(000) | | Value |
Maryland (concluded) | | | | | | | | | | |
Maryland Health & Higher Educational Facilities Authority, RB, Ascension Health Alliance, Series B, 5.00%, 11/15/51 | | | | $ | 1,420 | | | $ | 1,420,895 | |
| | | | | | | | | 3,443,715 | |
Massachusetts — 1.2% | | | | | | | | | | |
Massachusetts Development Finance Agency, RB, Wellesley College, Series J, 5.00%, 7/01/42 | | | | | 630 | | | | 662,987 | |
Massachusetts Health & Educational Facilities Authority, Refunding RB, Partners Healthcare System, Series J1, 5.00%, 7/01/39 | | | | | 615 | | | | 624,963 | |
Massachusetts School Building Authority, RB, Dedicated Sales Tax, Senior Series A, 5.00%, 5/15/43 | | | | | 495 | | | | 520,680 | |
| | | | | | | | | 1,808,630 | |
Michigan — 3.0% | | | | | | | | | | |
City of Detroit Michigan, Sewage Disposal System, Refunding RB: | | | | | | | | | | |
Second Lien, Series B (AGM), 7.50% 7/01/33 | | | | | 560 | | | | 601,171 | |
Senior Lien, Series A, 5.00%, 7/01/32 | | | | | 545 | | | | 493,907 | |
Senior Lien, Series A, 5.25%, 7/01/39 | | | | | 1,970 | | | | 1,811,336 | |
Royal Oak Hospital Finance Authority, Refunding RB, William Beaumont Hospital, 8.25%, 9/01/39 | | | | | 1,400 | | | | 1,684,032 | |
| | | | | | | | | 4,590,446 | |
Missouri — 0.1% | | | | | | | | | | |
Bi-State Development Agency of the Missouri-Illinois Metropolitan District, Refunding RB, Combined Lien, Series A, 5.00%, 10/01/44 | | | | | 85 | | | | 87,901 | |
Nebraska — 0.2% | | | | | | | | | | |
Central Plains Energy Project Nebraska, RB, Gas Project No. 3, 5.25%, 9/01/37 | | | | | 285 | | | | 293,097 | |
New Jersey — 2.5% | | | | | | | | | | |
New Jersey EDA, RB, Continental Airlines, Inc. Project, AMT, 5.13%, 9/15/23 | | | | | 1,410 | | | | 1,344,223 | |
New Jersey EDA, Refunding, Special Assessment Kapkowski Road Landfill Project, 5.75%, 4/01/31 | | | | | 785 | | | | 772,244 | |
New Jersey State Turnpike Authority, RB, Series A, 5.00%, 1/01/38 | | | | | 455 | | | | 472,144 | |
New Jersey Transportation Trust Fund Authority, RB, Transportation System, Series B, 5.25%, 6/15/36 | | | | | 845 | | | | 888,247 | |
Rutgers The State University of New Jersey, Refunding RB, Series L: | | | | | | | | | | |
5.00%, 5/01/38 | | | | | 175 | | | | 185,733 | |
5.00%, 5/01/43 | | | | | 185 | | | | 194,424 | |
| | | | | | | | | 3,857,015 | |
New York — 5.8% | | | | | | | | | | |
City of New York IDA, RB, British Airways PLC Project, AMT, 7.63%, 12/01/32 | | | | | 1,000 | | | | 1,004,700 | |
New York City Industrial Development Agency, ARB, American Airlines, Inc., JFK International Airport, AMT, 7.63%, 8/01/25 (f) | | | | | 4,000 | | | | 4,334,840 | |
New York Liberty Development Corp., Refunding RB, Second Priority, Bank of America Tower at One Bryant Park Project, Class 3, 6.38%, 7/15/49 | | | | | 420 | | | | 444,935 | |
New York State Dormitory Authority, RB: | | | | | | | | | | |
New York University, Series A, 5.25%, 7/01/48 | | | | | 1,000 | | | | 1,067,620 | |
Series F, 5.00%, 3/15/35 | | | | | 530 | | | | 547,639 | |
Oneida County Local Development Corp., RB, Hamilton College Project, 4.00%, 7/01/38 | | | | | 600 | | | | 567,006 | |
Port Authority of New York & New Jersey, ARB, Special Project, JFK International Air Terminal LLC Project, Series 8, 6.00%, 12/01/42 | | | | | 730 | | | | 782,947 | |
| | | | | | | | | 8,749,687 | |
See Notes to Financial Statements.
| SEMI-ANNUAL REPORT | OCTOBER 31, 2013 | 25
|
| |
| Schedule of Investments (continued) | BlackRock Long-Term Municipal Advantage Trust (BTA)
(Percentages shown are based on Net Assets)
|
| Municipal Bonds | | | | Par
(000) | | Value |
North Carolina — 0.5% | | | | | | | | | | |
North Carolina Medical Care Commission, RB, Health Care Facilities, Duke University Health System, Series A, 5.00%, 6/01/42 | | | | $ | 480 | | | $ | 486,979 | |
North Carolina Medical Care Commission, Refunding RB, Retirement Facilities, First Mortgage, Whitestone Project, Series A, 7.75%, 3/01/41 | | | | | 260 | | | | 274,350 | |
| | | | | | | | | 761,329 | |
Ohio — 3.6% | | | | | | | | | | |
Buckeye Tobacco Settlement Financing Authority, RB, Asset-Backed Bonds, Series A-2, 5.75%, 6/01/34 | | | | | 2,295 | | | | 1,787,346 | |
County of Allen Ohio, Refunding RB, Hospital Facilities, Catholic Healthcare Partners, Series A, 5.25%, 6/01/38 | | | | | 2,650 | | | | 2,700,058 | |
State of Ohio, RB, Ford Motor Co. Project, AMT, 5.75%, 4/01/35 | | | | | 1,000 | | | | 1,009,270 | |
| | | | | | | | | 5,496,674 | |
Oregon — 0.1% | | | | | | | | | | |
City of Tigard Oregon, Refunding RB, Water System, 5.00%, 8/01/37 | | | | | 90 | | | | 94,414 | |
Puerto Rico — 0.1% | | | | | | | | | | |
Puerto Rico Sales Tax Financing Corp., Refunding RB, CAB, First Sub-Series C, 7.85%, 8/01/38 (a) | | | | | 1,490 | | | | 221,593 | |
Tennessee — 0.4% | | | | | | | | | | |
City of Chattanooga Tennessee Health Educational & Housing Facility Board, RB, Catholic Health Initiatives, Series A, 5.25%, 1/01/45 (e) | | | | | 615 | | | | 612,146 | |
County of Rutherford Tennessee Health & Educational Facilities Board, RB, Ascension Health, Series C, 5.00%, 11/15/47 | | | | | 75 | | | | 76,190 | |
| | | | | | | | | 688,336 | |
Texas — 7.8% | | | | | | | | | | |
Brazos River Authority, RB, TXU Electric, Series A, AMT, 8.25%, 10/01/30 (d) | | | | | 1,500 | | | | 22,485 | |
Central Texas Regional Mobility Authority, Refunding RB: | | | | | | | | | | |
Senior Lien, 6.25%, 1/01/46 | | | | | 730 | | | | 746,396 | |
Senior Lien, Series A, 5.00%, 1/01/33 | | | | | 35 | | | | 33,948 | |
Sub-Lien, 5.00%, 1/01/33 | | | | | 125 | | | | 113,378 | |
Sub-Lien, 5.00%, 1/01/42 | | | | | 110 | | | | 94,993 | |
City of Dallas Texas Waterworks & Sewer System, Refunding RB, 5.00%, 10/01/35 | | | | | 525 | | | | 554,158 | |
City of Houston Texas Airport System, Refunding ARB, Senior Lien, Series A, 5.50%, 7/01/39 | | | | | 250 | | | | 274,448 | |
City of Houston Texas Higher Education Finance Corp., RB, Cosmos Foundation, Inc., Series A, 6.88%, 5/15/41 | | | | | 200 | | | | 222,222 | |
City of San Antonio Texas Public Service Board, RB, Electric & Gas Systems, Junior Lien, 5.00%, 2/01/43 | | | | | 1,000 | | | | 1,043,580 | |
County of Matagorda Texas Navigation District No. 1, Refunding RB, Central Power & Light Co. Project, Series A, 6.30%, 11/01/29 | | | | | 700 | | | | 778,078 | |
County of Midland Texas Fresh Water Supply District No. 1, RB, CAB, City of Midland Projects, Series A, 5.01%, 9/15/37 (a) | | | | | 5,200 | | | | 1,595,828 | |
County of Tarrant Texas Cultural Education Facilities Finance Corp., RB, Scott & White Healthcare, 6.00%, 8/15/45 | | | | | 1,390 | | | | 1,583,279 | |
County of Tarrant Texas Cultural Education Facilities Finance Corp., Refunding RB, Scott & White Healthcare, Series A, 5.00%, 8/15/43 | | | | | 125 | | | | 125,183 | |
HFDC of Central Texas, Inc., RB, Village at Gleannloch Farms, Series A, 5.50%, 2/15/27 | | | | | 1,150 | | | | 1,061,082 | |
North Texas Tollway Authority, Refunding RB, Second Tier System, Series F, 6.13%, 1/01/31 | | | | | 2,290 | | | | 2,447,895 | |
| | | | | | | | | | | |
| Municipal Bonds | | | | Par
(000) | | Value |
Texas (concluded) | | | | | | | | | | |
Texas Private Activity Bond Surface Transportation Corp., RB, Senior Lien, LBJ Infrastructure Group LLC, LBJ Freeway Managed Lanes Project, 7.00%, 6/30/40 | | | | $ | 1,000 | | | $ | 1,091,400 | |
| | | | | | | | | 11,788,353 | |
Utah — 0.7% | | | | | | | | | | |
University of Utah, RB, General, Series A, 5.00%, 8/01/43 | | | | | 220 | | | | 230,360 | |
Utah State Charter School Finance Authority, RB, Ogden Preparatory Academy, Series A: | | | | | | | | | | |
3.25%, 10/15/36 | | | | | 700 | | | | 526,603 | |
3.25%, 10/15/42 | | | | | 425 | | | | 303,042 | |
| | | | | | | | | 1,060,005 | |
Virginia — 2.9% | | | | | | | | | | |
Peninsula Ports Authority, Refunding RB, Virginia Baptist Homes, Series C, 5.38%, 12/01/26 | | | | | 1,600 | | | | 1,415,168 | |
Virginia HDA, RB, Rental Housing, Series F, 5.00%, 4/01/45 | | | | | 1,000 | | | | 1,011,700 | |
Virginia Small Business Financing Authority, RB, Senior Lien, Elizabeth River Crossings LLC Project, AMT, 6.00%, 1/01/37 | | | | | 1,875 | | | | 1,941,394 | |
| | | | | | | | | 4,368,262 | |
Washington — 0.7% | | | | | | | | | | |
Washington Health Care Facilities Authority, RB, Catholic Health Initiatives, Series A, 5.75%, 1/01/45 (e) | | | | | 1,020 | | | | 1,067,226 | |
Wisconsin — 0.8% | | | | | | | | | | |
WPPI Energy Wisconsin, Refunding RB, Power Supply System, Series A: | | | | | | | | | | |
5.00%, 7/01/29 | | | | | 135 | | | | 145,055 | |
5.00%, 7/01/30 | | | | | 170 | | | | 180,982 | |
5.00%, 7/01/31 | | | | | 365 | | | | 386,495 | |
5.00%, 7/01/37 | | | | | 445 | | | | 456,641 | |
| | | | | | | | | 1,169,173 | |
Wyoming — 0.1% | | | | | | | | | | |
Wyoming Municipal Power Agency, Inc., RB, Series A, 5.00%, 1/01/42 | | | | | 100 | | | | 100,581 | |
Total Municipal Bonds — 70.4% | | | | | | | | | 106,964,026 | |
|
Municipal Bonds Transferred to
Tender Option Bond Trusts (g)
|
California — 4.0% | | | | | | | | | | |
Bay Area Toll Authority, Refunding RB, San Francisco Bay Area, Series F-1, 5.63%, 4/01/44 | | | | | 1,090 | | | | 1,171,802 | |
California Educational Facilities Authority, RB, University of Southern California, Series B, 5.25%, 10/01/39 (h) | | | | | 840 | | | | 899,581 | |
City & County of San Francisco California Public Utilities Commission, RB, Water Revenue, Series B, 5.00%, 11/01/39 | | | | | 3,225 | | | | 3,369,351 | |
San Diego Community College District California, GO, Election of 2002, 5.25%, 8/01/33 | | | | | 553 | | | | 617,150 | |
| | | | | | | | | 6,057,884 | |
Colorado — 3.1% | | | | | | | | | | |
Colorado Health Facilities Authority, Refunding RB, Series A: | | | | | | | | | | |
Catholic Health Initiatives, 5.50%, 7/01/34 (h) | | | | | 740 | | | | 810,252 | |
Sisters of Leavenworth Health System, 5.00%, 1/01/40 | | | | | 3,930 | | | | 3,946,270 | |
| | | | | | | | | 4,756,522 | |
Florida — 1.3% | | | | | | | | | | |
County of Miami-Dade Florida, RB, Water & Sewer System, 5.00%, 10/01/34 | | | | | 1,950 | | | | 2,022,288 | |
See Notes to Financial Statements.
| 26 | SEMI-ANNUAL REPORT | OCTOBER 31, 2013
|
| |
| Schedule of Investments (continued) | BlackRock Long-Term Municipal Advantage Trust (BTA)
(Percentages shown are based on Net Assets)
|
Municipal Bonds Transferred to
Tender Option Bond Trusts (g) | | | | Par
(000) | | Value |
Illinois — 4.9% | | | | | | | | | | |
City of Chicago Illinois, GARB, O’Hare International Airport, 3rd Lien, Series A (NPFGC), 5.00%, 1/01/33 (h) | | | | $ | 4,995 | | | $ | 5,005,839 | |
Illinois Finance Authority, RB, The Carle Foundation, Series A (AGM), 6.00%, 8/15/41 | | | | | 2,340 | | | | 2,506,374 | |
| | | | | | | | | 7,512,213 | |
Indiana — 8.1% | | | | | | | | | | |
Carmel Redevelopment Authority, RB, Performing Arts Center: | | | | | | | | | | |
4.75%, 2/01/33 | | | | | 5,365 | | | | 5,446,065 | |
5.00%, 2/01/33 | | | | | 6,580 | | | | 6,921,963 | |
| | | | | | | | | 12,368,028 | |
Massachusetts — 6.6% | | | | | | | | | | |
Massachusetts HFA, Refunding, HRB, Series D, AMT, 5.45%, 6/01/37 | | | | | 5,090 | | | | 5,097,980 | |
Massachusetts School Building Authority, RB, Senior Dedicated Sales Tax, Series B, 5.00%, 10/15/41 | | | | | 4,711 | | | | 4,921,518 | |
| | | | | | | | | 10,019,498 | |
Nebraska — 3.3% | | | | | | | | | | |
Omaha Public Power District, RB, Sub-Series B (NPFGC), 4.75%, 2/01/36 (h) | | | | | 5,000 | | | | 5,014,450 | |
New Hampshire — 0.5% | | | | | | | | | | |
New Hampshire Health & Education Facilities Authority, RB, Dartmouth College, 5.25%, 6/01/39 (h) | | | | | 660 | | | | 717,471 | |
New York — 24.2% | | | | | | | | | | |
Hudson Yards Infrastructure Corp., RB, Senior, Series A, 5.75%, 2/15/47 (h) | | | | | 6,509 | | | | 6,895,428 | |
New York City Municipal Water Finance Authority, Refunding RB, Water & Sewer System, Second General Resolution: | | | | | | | | | | |
Series CC, 5.00%, 6/15/47 | | | | | 4,780 | | | | 4,963,600 | |
Series FF-2, 5.50%, 6/15/40 | | | | | 495 | | | | 529,894 | |
Series HH, 5.00%, 6/15/31 (h) | | | | | 2,835 | | | | 3,038,425 | |
New York Liberty Development Corp., RB, 1 World Trade Center Port Authority Construction, 5.25%, 12/15/43 | | | | | 6,135 | | | | 6,402,425 | |
New York Liberty Development Corp., Refunding RB, 4 World Trade Center Project, 5.75%, 11/15/51 (h) | | | | | 2,220 | | | | 2,369,917 | |
New York State Dormitory Authority, ERB, Series B, 5.75%, 3/15/36 | | | | | 11,240 | | | | 12,596,780 | |
| | | | | | | | | 36,796,469 | |
North Carolina — 10.4% | | | | | | | | | | |
University of North Carolina at Chapel Hill, Refunding RB, Series A, 4.75%, 12/01/34 | | | | | 15,170 | | | | 15,745,547 | |
| | | | | | | | | | | |
Municipal Bonds Transferred to
Tender Option Bond Trusts (g) | | | | Par
(000) | | Value |
Ohio — 3.3% | | | | | | | | | | |
State of Ohio, Refunding RB, Cleveland Clinic Health System Obligated Group, Series A, 5.50%, 1/01/39 | | | | $ | 4,634 | | | $ | 5,061,973 | |
South Carolina — 1.5% | | | | | | | | | | |
South Carolina State Housing Finance & Development Authority, Refunding RB, Series B-1, 5.55%, 7/01/39 | | | | | 2,203 | | | | 2,266,225 | |
Texas — 10.2% | | | | | | | | | | |
County of Harris Texas, RB, Senior Lien, Toll Road, Series A, 5.00%, 8/15/38 (h) | | | | | 2,122 | | | | 2,279,099 | |
County of Harris Texas Metropolitan Transit Authority, Refunding RB, Series A, 5.00%, 11/01/41 | | | | | 1,170 | | | | 1,210,529 | |
New Caney ISD, GO, School Building, 5.00%, 2/15/35 (h) | | | | | 9,150 | | | | 9,701,471 | |
University of Texas System, Refunding RB, Series B, 5.00%, 8/15/43 | | | | | 2,175 | | | | 2,303,748 | |
| | | | | | | | | 15,494,847 | |
Utah — 0.6% | | | | | | | | | | |
City of Riverton Utah, RB, IHC Health Services, Inc., 5.00%, 8/15/41 | | | | | 960 | | | | 972,685 | |
Virginia — 0.7% | | | | | | | | | | |
Virginia Small Business Financing Authority, Refunding RB, Sentara Healthcare, 5.00%, 11/01/40 | | | | | 1,000 | | | | 1,011,936 | |
Wisconsin — 1.4% | | | | | | | | | | |
Wisconsin Health & Educational Facilities Authority, Refunding RB, Froedtert & Community Health, Inc., Series C, 5.25%, 4/01/39 (h) | | | | | 1,989 | | | | 2,042,025 | |
Total Municipal Bonds Transferred to
Tender Option Bond Trusts — 84.1%
| | | | | | | | | 127,860,061 | |
Total Long-Term Investments
(Cost — $234,466,942) — 154.5% | | | | | | | | | 234,824,087 | |
|
Short-Term Securities | | | | | Shares | | | | | |
FFI Institutional Tax-Exempt Fund, 0.03% (i) (j) | | | | | 2,906,749 | | | | 2,906,749 | |
Total Short-Term Securities
(Cost — $2,906,749) — 1.9% | | | | | | | | | 2,906,749 | |
Total Investments (Cost — $237,373,691) — 156.4% | | | | | | | | | 237,730,836 | |
Liabilities in Excess of Other Assets — (1.8)% | | | | | | | | | (2,732,621 | ) |
Liability for TOB Trust Certificates, Including Interest Expense and Fees Payable — (54.6%) | | | | | | | | | (83,025,334 | ) |
Net Assets — 100.0% | | | | | | | | $ | 151,972,881 | |
Notes to Schedule of Investments
| (a) | | | | Represents a zero-coupon bond. Rate shown reflects the current yield as of report date. |
| (b) | | | | Represents a step-up bond that pays an initial coupon rate for the first period and then a higher coupon rate for the following periods. Rate shown is of report date. |
| (c) | | | | Non-income producing security. |
| (d) | | | | Issuer filed for bankruptcy and/or is in default of principal and/or interest payments. |
| (e) | | | | When-issued security. Unsettled when-issued transactions were as follows: |
Counterparty
|
|
|
| Value
|
| Unrealized
Appreciation
|
Morgan Stanley & Co. LLC | | | | $ | 2,117,330 | | | $ | 42,444 | |
| (f) | | | | Variable rate security. Rate shown is as of report date. |
| (g) | | | | Represent bonds transferred to a TOB. In exchange the Trust acquired residual interest certificates. These bonds serve as collateral in a financing transaction. See Note 3 of the Notes to Financial Statements for details of municipal bonds transferred to TOBs. |
See Notes to Financial Statements.
| SEMI-ANNUAL REPORT | OCTOBER 31, 2013 | 27
|
| |
| Schedule of Investments (concluded) | BlackRock Long-Term Municipal Advantage Trust (BTA)
|
| (h) | | | | All or a portion of security is subject to a recourse agreement, which may require the Trust to pay the liquidity provider in the event there is a shortfall between the TOB trust certificates and proceeds received from the sale of the security contributed to the TOB trust. In the case of a shortfall, the aggregate maximum potential amount the Trust could ultimately be required to pay under the agreements, which expire from February 1, 2014 to February 15, 2031 is $24,690,502. |
| (i) | | | | Investments in issuers considered to be an affiliate of the Trust during the six months ended October 31, 2013, for purposes of Section 2(a)(3) of the 1940 Act, were as follows: |
Affiliate
|
|
|
| Shares
Held at
April 30, 2013
|
| Net
Activity
|
| Shares
Held at
October 31, 2013
|
| Income
|
FFI Institutional Tax-Exempt Fund | | | | 920,424 | | 1,986,325 | | 2,906,749 | | $292 |
| (j) | | | | Represents the current yield as of report date. |
| • | | | | Fair Value Measurements — Various inputs are used in determining the fair value of investments. These inputs to valuation techniques are categorized into a disclosure hierarchy consisting of three broad levels for financial statement purposes as follows: |
| • | | | | Level 1 — unadjusted price quotations in active markets/exchanges for identical assets or liabilities that the Trust has the ability to access |
| • | | | | Level 2 — other observable inputs (including, but not limited to, quoted prices for similar assets or liabilities in markets that are active, quoted prices for identical or similar assets or liabilities in markets that are not active, inputs other than quoted prices that are observable for the assets or liabilities (such as interest rates, yield curves, volatilities, prepayment speeds, loss severities, credit risks and default rates) or other market-corroborated inputs) |
| • | | | | Level 3 — unobservable inputs based on the best information available in the circumstances, to the extent observable inputs are not available (including the Trust’s own assumptions used in determining the fair value of investments) |
| | | | | The hierarchy gives the highest priority to unadjusted quoted prices in active markets for identical assets or liabilities (Level 1 measurements) and the lowest priority to unobservable inputs (Level 3 measurements). Accordingly, the degree of judgment exercised in determining fair value is greatest for instruments categorized in Level 3. The inputs used to measure fair value may fall into different levels of the fair value hierarchy. In such cases, for disclosure purposes, the fair value hierarchy classification is determined based on the lowest level input that is significant to the fair value measurement in its entirety. |
| | | | | Changes in valuation techniques may result in transfers into or out of an assigned level within the disclosure hierarchy. In accordance with the Trust’s policy, transfers between different levels of the fair value disclosure hierarchy are deemed to have occurred as of the beginning of the reporting period. The categorization of a value determined for investments is based on the pricing transparency of the investment and is not necessarily an indication of the risks associated with investing in those securities. For information about the Trust’s policy regarding valuation of investments, please refer to Note 2 of the Notes to Financial Statements. |
| | | | | The following table summarizes the Trust’s investments categorized in the disclosure hierarchy as of October 31, 2013: |
|
|
|
| Level 1
|
| Level 2
|
| Level 3
|
| Total
|
Assets:
| | | | | | | | | | | | | | | | | | |
Investments:
| | | | | | | | | | | | | | | | | | |
Long-Term Investments1 | | | | | — | | | $ | 234,824,087 | | | | — | | | $ | 234,824,087 | |
Short-Term Securities | | | | $ | 2,906,749 | | | | — | | | | — | | | | 2,906,749 | |
Total
| | | | $ | 2,906,749 | | | $ | 234,824,087 | | | | — | | | $ | 237,730,836 | |
| 1 | See above Schedule of Investments for values in each state or political subdivision. |
| Certain of the Trust’s liabilities are held at carrying amount, which approximates fair value for financial statement purposes. As of October 31, 2013, TOB trust certificates of $82,982,165 is categorized as Level 2 within the disclosure hierarchy. |
| There were no transfers between levels during the six months ended October 31, 2013. |
See Notes to Financial Statements.
| 28 | SEMI-ANNUAL REPORT | OCTOBER 31, 2013
|
| |
| Schedule of Investments October 31, 2013 (Unaudited) | BlackRock Municipal 2020 Term Trust (BKK)
(Percentages shown are based on Net Assets)
|
| Municipal Bonds | | | | Par
(000) | | Value |
Alabama — 0.7% | | | | | | | | | | |
Alabama 21st Century Authority Tobacco Settlement, Refunding RB, Series A, 5.00%, 6/01/20 | | | | $ | 1,000 | | | $ | 1,136,350 | |
Courtland Alabama IDB, Refunding RB, International Paper Co. Projects, Series A, 4.75%, 5/01/17 | | | | | 1,165 | | | | 1,195,977 | |
| | | | | | | | | 2,332,327 | |
Alaska — 2.0% | | | | | | | | | | |
City of Valdez Alaska, Refunding RB, BP Pipelines Project: | | | | | | | | | | |
Series B, 5.00%, 1/01/21 | | | | | 3,200 | | | | 3,687,808 | |
Series C, 5.00%, 1/01/21 | | | | | 2,500 | | | | 2,881,100 | |
| | | | | | | | | 6,568,908 | |
Arizona — 3.3% | | | | | | | | | | |
Phoenix Civic Improvement Corp., RB, Junior Lien, Series A: | | | | | | | | | | |
5.00%, 7/01/20 | | | | | 1,300 | | | | 1,526,317 | |
5.00%, 7/01/21 | | | | | 5,585 | | | | 6,508,647 | |
Salt Verde Financial Corp., RB, Senior: | | | | | | | | | | |
5.00%, 12/01/18 | | | | | 1,500 | | | | 1,670,445 | |
5.25%, 12/01/20 | | | | | 1,000 | | | | 1,122,290 | |
| | | | | | | | | 10,827,699 | |
California — 16.7% | | | | | | | | | | |
California Health Facilities Financing Authority, RB, Sutter Health, Series B, 5.00%, 8/15/22 | | | | | 815 | | | | 920,836 | |
California Statewide Communities Development Authority, RB, John Muir Health, Series A, 5.00%, 8/15/22 | | | | | 5,000 | | | | 5,452,950 | |
County of Riverside Asset Leasing Corp. California, RB, Riverside County Hospital Project (NPFGC), 5.36%, 6/01/25 (a) | | | | | 6,865 | | | | 3,722,203 | |
Foothill Eastern Transportation Corridor Agency California, Refunding RB, CAB (a): | | | | | | | | | | |
6.07%, 1/15/21 | | | | | 12,500 | | | | 8,124,250 | |
6.17%, 1/15/22 | | | | | 10,000 | | | | 6,073,600 | |
Los Angeles Regional Airports Improvement Corp. Facilities Lease, Refunding RB, LAXFuel Corp., Los Angeles International Airport: | | | | | | | | | | |
5.00%, 1/01/19 | | | | | 540 | | | | 614,579 | |
5.00%, 1/01/20 | | | | | 550 | | | | 623,403 | |
Los Angeles Unified School District California, GO, Series I, 5.00%, 7/01/20 | | | | | 3,750 | | | | 4,447,013 | |
San Manuel Entertainment Authority, Series 04-C, 4.50%, 12/01/16 (b) | | | | | 4,000 | | | | 4,083,320 | |
State of California, GO, Refunding, Various Purpose, 5.25%, 10/01/22 | | | | | 1,000 | | | | 1,198,220 | |
State of California, GO, Various Purpose, 5.00%, 11/01/13 (c) | | | | | 7,050 | | | | 7,050,000 | |
State of California Department of Water Resources, Refunding RB, Series L, 5.00%, 5/01/20 | | | | | 10,000 | | | | 12,029,600 | |
| | | | | | | | | 54,339,974 | |
Colorado — 1.3% | | | | | | | | | | |
Colorado Health Facilities Authority, Refunding RB, Evangelical Lutheran Good Samaritan Society Project: | | | | | | | | | | |
4.00%, 12/01/19 | | | | | 555 | | | | 589,077 | |
4.00%, 12/01/20 | | | | | 580 | | | | 607,620 | |
E-470 Public Highway Authority Colorado, RB, CAB, Senior Series B (NPFGC), 4.22%, 9/01/22 (a) | | | | | 4,500 | | | | 3,111,750 | |
| | | | | | | | | 4,308,447 | |
District of Columbia — 1.6% | | | | | | | | | | |
Metropolitan Washington Airports Authority, Refunding RB, Series C-2, AMT (AGM), 5.00%, 10/01/24 | | | | | 5,000 | | | | 5,147,150 | |
| | | | | | | | | | | |
| Municipal Bonds | | | | Par
(000) | | Value |
Florida — 7.3% | | | | | | | | | | |
City of Jacksonville Florida, RB, Better Jacksonville, 5.00%, 10/01/22 | | | | $ | 5,160 | | | $ | 5,868,674 | |
County of Broward Florida Airport System, Refunding RB, Series P-1, AMT, 4.00%, 10/01/19 | | | | | 1,750 | | | | 1,901,795 | |
County of Broward Florida School Board, COP, Series A (AGM), 5.25%, 7/01/22 | | | | | 1,250 | | | | 1,418,050 | |
County of Miami-Dade Florida, Refunding RB, Series A, AMT, 5.00%, 10/01/20 | | | | | 1,375 | | | | 1,565,822 | |
County of Miami-Dade Florida Expressway Authority, Refunding RB, Toll System, Series A, 5.00%, 7/01/20 | | | | | 500 | | | | 581,985 | |
Habitat Community Development District, Special Assessment Bonds, 5.80%, 5/01/25 | | | | | 1,720 | | | | 1,746,041 | |
Miami Beach Health Facilities Authority, RB, Mount Sinai Medical Center Florida, 6.75%, 11/15/21 | | | | | 1,840 | | | | 1,935,864 | |
Pine Island Community Development District, RB, 5.30%, 11/01/10 (d)(e) | | | | | 250 | | | | 97,648 | |
State of Florida Board of Education, GO, Refunding, Capital Outlay, Series B, 5.00%, 6/01/20 | | | | | 5,000 | | | | 5,986,500 | |
Stevens Plantation Community Development District, Special Assessment Bonds, Series B, 1.00%, 12/31/49 (d)(e) | | | | | 3,530 | | | | 2,627,097 | |
| | | | | | | | | 23,729,476 | |
Georgia — 2.4% | | | | | | | | | | |
Gainesville & Hall County Development Authority, Refunding RB, ACTS Retirement — Life Communities, Inc. Obligated Group, 5.00%, 11/15/22 | | | | | 6,915 | | | | 7,695,289 | |
Guam — 0.4% | | | | | | | | | | |
Guam Power Authority, Refunding RB, Series A (AGM), 5.00%, 10/01/20 | | | | | 1,190 | | | | 1,378,675 | |
Hawaii — 0.9% | | | | | | | | | | |
State of Hawaii Department of Budget & Finance, Refunding RB, Special Purpose Senior Living, Kahala Nui: | | | | | | | | | | |
5.00%, 11/15/19 | | | | | 1,275 | | | | 1,406,274 | |
5.00%, 11/15/20 | | | | | 1,440 | | | | 1,574,899 | |
| | | | | | | | | 2,981,173 | |
Illinois — 15.5% | | | | | | | | | | |
City of Chicago Illinois, O’Hare International Airport, GARB, Third Lien, Series A (AMBAC): | | | | | | | | | | |
5.00%, 1/01/21 | | | | | 5,000 | | | | 5,351,650 | |
5.00%, 1/01/22 | | | | | 7,000 | | | | 7,531,160 | |
Illinois Finance Authority, RB, Northwestern University, 5.00%, 12/01/21 | | | | | 4,800 | | | | 4,819,440 | |
Lake Cook-Dane & McHenry Counties Community Unit School District 220 Illinois, GO, Refunding (AGM), 5.25%, 12/01/20 | | | | | 1,000 | | | | 1,199,550 | |
Metropolitan Pier & Exposition Authority Illinois, Refunding RB, CAB, McCormick, Series A (NPFGC), 4.19%, 6/15/22 (a) | | | | | 13,455 | | | | 9,407,602 | |
Railsplitter Tobacco Settlement Authority, RB, 5.25%, 6/01/20 | | | | | 10,000 | | | | 11,409,700 | |
State of Illinois, GO, 5.00%, 7/01/20 | | | | | 5,255 | | | | 5,772,407 | |
State of Illinois, RB, Series B: | | | | | | | | | | |
5.00%, 6/15/19 (c) | | | | | 515 | | | | 613,705 | |
5.00%, 6/15/20 | | | | | 1,485 | | | | 1,692,677 | |
State of Illinois Toll Highway Authority, RB, Senior Priority, Series A (AGM), 5.00%, 7/01/15 (c) | | | | | 2,250 | | | | 2,425,680 | |
| | | | | | | | | 50,223,571 | |
Indiana — 5.1% | | | | | | | | | | |
City of Vincennes Indiana, Refunding RB, Southwest Indiana Regional Youth Village, 6.25%, 1/01/24 | | | | | 3,765 | | | | 2,204,257 | |
Indiana Finance Authority, RB, Ohio River Bridges East End Crossing Project, Series B, AMT, 5.00%, 1/01/19 | | | | | 2,465 | | | | 2,615,069 | |
See Notes to Financial Statements.
| SEMI-ANNUAL REPORT | OCTOBER 31, 2013 | 29
|
| |
| Schedule of Investments (continued) | BlackRock Municipal 2020 Term Trust (BKK)
(Percentages shown are based on Net Assets)
|
| Municipal Bonds | | | | Par
(000) | | Value |
Indiana (concluded) | | | | | | | | | | |
Indiana Municipal Power Agency, Refunding RB, Series A, 5.00%, 1/01/21 | | | | $ | 600 | | | $ | 699,552 | |
Indianapolis Airport Authority, Refunding RB, Special Facilities, FedEx Corp. Project, AMT, 5.10%, 1/15/17 | | | | | 10,000 | | | | 11,082,500 | |
| | | | | | | | | 16,601,378 | |
Iowa — 1.6% | | | | | | | | | | |
Iowa Finance Authority, Refunding RB, Midwestern Disaster Area, Iowa Fertilizer Co. Project, 5.00%, 12/01/19 | | | | | 5,320 | | | | 5,157,102 | |
Kansas — 2.4% | | | | | | | | | | |
County of Wyandotte Kansas, Kansas City Unified Government, RB, Kansas International Speedway (NPFGC), 4.02%, 12/01/20 (a) | | | | | 6,440 | | | | 4,857,821 | |
Kansas Development Finance Authority, Refunding RB, Adventist Health, 5.25%, 11/15/20 | | | | | 2,500 | | | | 2,892,800 | |
| | | | | | | | | 7,750,621 | |
Kentucky — 1.8% | | | | | | | | | | |
Kentucky Housing Corp., RB, Series C, AMT, 4.63%, 7/01/22 | | | | | 2,000 | | | | 2,048,280 | |
Louisville & Jefferson County, Refunding RB, Catholic Health Initiatives, Series A: | | | | | | | | | | |
3.50%, 12/01/20 | | | | | 2,115 | | | | 2,225,932 | |
5.00%, 12/01/20 | | | | | 1,430 | | | | 1,642,541 | |
| | | | | | | | | 5,916,753 | |
Louisiana — 0.6% | | | | | | | | | | |
Parish of DeSoto Louisiana, RB, Series A, AMT, 5.85%, 11/01/27 | | | | | 2,000 | | | | 1,999,960 | |
Maryland — 2.1% | | | | | | | | | | |
Anne Arundel County Consolidated, Special Taxing District, Refunding, Special Tax Bonds, The Villages of Dorchester and Farmington Village Project: | | | | | | | | | | |
4.00%, 7/01/19 | | | | | 285 | | | | 313,152 | |
5.00%, 7/01/20 | | | | | 500 | | | | 575,980 | |
Maryland EDC, RB, Transportation Facilities Project, Series A, 5.13%, 6/01/20 | | | | | 1,250 | | | | 1,313,663 | |
Maryland Health & Higher Educational Facilities Authority, Refunding RB: | | | | | | | | | | |
Charlestown Community, 5.50%, 1/01/21 | | | | | 1,335 | | | | 1,466,484 | |
University of Maryland, Medical System, 5.00%, 7/01/19 | | | | | 670 | | | | 768,269 | |
Maryland State and Local Facilities Loan, GO, Series B, 5.00%, 3/15/20 | | | | | 2,000 | | | | 2,405,980 | |
| | | | | | | | | 6,843,528 | |
Massachusetts — 1.5% | | | | | | | | | | |
Massachusetts Development Finance Agency, RB, Waste Management, Inc. Project, AMT, 5.45%, 6/01/14 | | | | | 4,500 | | | | 4,622,580 | |
State of Massachusetts Water Pollution Abatement Trust, Refunding RB, MWRA Program, Sub-Series A, 6.00%, 8/01/23 | | | | | 140 | | | | 140,666 | |
| | | | | | | | | 4,763,246 | |
Michigan — 2.5% | | | | | | | | | | |
Kalamazoo Hospital Finance Authority, Refunding RB, Bronson Methodist Hospital, 5.00%, 5/15/20 | | | | | 1,585 | | | | 1,746,511 | |
Lansing Board of Water & Light Utilities, RB, Series A, 3.50%, 7/01/20 | | | | | 1,000 | | | | 1,066,120 | |
State of Michigan, Refunding RB: | | | | | | | | | | |
5.00%, 11/01/20 | | | | | 1,000 | | | | 1,152,400 | |
5.00%, 11/01/21 | | | | | 2,000 | | | | 2,268,800 | |
State of Michigan Building Authority, Refunding RB, Facilities Program: | | | | | | | | | | |
Series 1-A, 5.00%, 10/15/20 | | | | | 325 | | | | 373,939 | |
Series 2-A, 4.00%, 10/15/20 | | | | | 1,205 | | | | 1,308,678 | |
| | | | | | | | | 7,916,448 | |
| | | | | | | | | | | |
| Municipal Bonds | | | | Par
(000) | | Value |
Minnesota — 4.1% | | | | | | | | | | |
Minnesota Higher Education Facilities Authority, RB, University of St. Thomas, Series 5-Y, 5.00%, 10/01/24 | | | | $ | 1,250 | | | $ | 1,301,587 | |
State of Michigan Trunk Highway, GO, Series B, 5.00%, 10/01/20 | | | | | 10,000 | | | | 12,066,700 | |
| | | | | | | | | 13,368,287 | |
Missouri — 4.6% | | | | | | | | | | |
City of Kansas City Missouri Airport, Refunding RB, Series A, AMT, 5.00%, 9/01/20 | | | | | 3,000 | | | | 3,415,050 | |
Missouri Development Finance Board, RB, Branson Landing Project, Series A, 5.50%, 6/01/14 (c) | | | | | 5,000 | | | | 5,155,350 | |
State of Missouri Health & Educational Facilities Authority, Refunding RB, Series A: | | | | | | | | | | |
BJC Health System, 5.00%, 5/15/20 | | | | | 5,500 | | | | 5,863,550 | |
Coxhealth, 5.00%, 11/15/20 | | | | | 500 | | | | 576,125 | |
| | | | | | | | | 15,010,075 | |
Multi-State — 3.4% | | | | | | | | | | |
Centerline Equity Issuer Trust (b)(f): | | | | | | | | | | |
Series A-4-1, 5.75%, 5/15/15 | | | | | 1,000 | | | | 1,064,600 | |
Series A-4-2, 6.00%, 5/15/19 | | | | | 2,500 | | | | 2,876,425 | |
Series B-3-1, 6.00%, 5/15/15 | | | | | 4,000 | | | | 4,259,400 | |
Series B-3-2, 6.30%, 5/15/19 | | | | | 2,500 | | | | 2,910,175 | |
| | | | | | | | | 11,110,600 | |
Nebraska — 1.2% | | | | | | | | | | |
Central Plains Energy Project, RB, Gas Project No. 3, 5.00%, 9/01/20 | | | | | 3,500 | | | | 3,879,540 | |
Nevada — 2.7% | | | | | | | | | | |
County of Clark Nevada, Refunding ARB, Las Vegas McCarran International Airport, Series B: | | | | | | | | | | |
5.00%, 7/01/19 | | | | | 500 | | | | 577,955 | |
5.00%, 7/01/20 | | | | | 1,000 | | | | 1,154,620 | |
County of Clark Nevada, Refunding RB, Alexander Dawson School Nevada Project, 5.00%, 5/15/20 | | | | | 5,000 | | | | 5,406,900 | |
County of Clark Nevada, Refunding, Special Assessment Bonds, Special Improvement District No. 142, 5.00%, 8/01/20 | | | | | 1,510 | | | | 1,534,613 | |
| | | | | | | | | 8,674,088 | |
New Hampshire — 1.4% | | | | | | | | | | |
New Hampshire Business Finance Authority, Refunding RB, Public Service Co. of New Hampshire Project, Series B, AMT (NPFGC), 4.75%, 5/01/21 | | | | | 4,350 | | | | 4,437,435 | |
New Jersey — 4.3% | | | | | | | | | | |
Middlesex County Improvement Authority, RB, George Street Student Housing Project, Series A, 5.00%, 8/15/14 (c) | | | | | 1,000 | | | | 1,038,060 | |
New Jersey EDA, Refunding RB: | | | | | | | | | | |
Cigarette Tax, 5.00%, 6/15/20 | | | | | 2,500 | | | | 2,782,150 | |
First Mortgage, Winchester, Series A, 4.80%, 11/01/13 | | | | | 265 | | | | 265,000 | |
School Facilities, Series GG, 5.00%, 9/01/22 | | | | | 2,000 | | | | 2,281,240 | |
New Jersey Educational Facilities Authority, Refunding RB: | | | | | | | | | | |
Seton Hall University, Series D, 5.00%, 7/01/19 | | | | | 1,060 | | | | 1,226,494 | |
Seton Hall University, Series D, 5.00%, 7/01/20 | | | | | 650 | | | | 750,067 | |
University of Medicine & Dentistry, Series B, 6.25%, 12/01/18 (g) | | | | | 2,500 | | | | 3,114,900 | |
New Jersey Health Care Facilities Financing Authority, Refunding RB, AtlantiCare Regional Medical Center, 5.00%, 7/01/20 | | | | | 2,110 | | | | 2,297,537 | |
| | | | | | | | | 13,755,448 | |
See Notes to Financial Statements.
| 30 | SEMI-ANNUAL REPORT | OCTOBER 31, 2013
|
| |
| Schedule of Investments (continued) | BlackRock Municipal 2020 Term Trust (BKK)
(Percentages shown are based on Net Assets)
|
| Municipal Bonds | | | | Par
(000) | | Value |
New York — 9.3% | | | | | | | | | | |
New York City Industrial Development Agency, ARB, American Airlines, Inc., JFK International Airport, AMT (h): | | | | | | | | | | |
7.63%, 8/01/25 | | | | $ | 3,885 | | | $ | 4,210,213 | |
7.75%, 8/01/31 | | | | | 5,000 | | | | 5,418,550 | |
New York Mortgage Agency, Refunding RB, 35th Series, AMT, 4.50%, 10/01/20 | | | | | 4,000 | | | | 4,078,760 | |
New York State Energy Research & Development Authority, Refunding RB, Brooklyn Union Gas/Keyspan, Series A, AMT (NPFGC), 4.70%, 2/01/24 | | | | | 8,500 | | | | 8,821,045 | |
New York State Thruway Authority, Refunding RB, General, Series I, 5.00%, 1/01/20 | | | | | 875 | | | | 1,025,999 | |
Port Authority of New York & New Jersey, ARB, JFK International Air Terminal LLC Project, 5.00%, 12/01/20 | | | | | 1,525 | | | | 1,631,796 | |
Tobacco Settlement Financing Corp. New York, RB, Asset-Backed, Series B-1C, 5.50%, 6/01/20 | | | | | 5,000 | | | | 5,021,950 | |
| | | | | | | | | 30,208,313 | |
North Carolina — 2.3% | | | | | | | | | | |
North Carolina Eastern Municipal Power Agency, Refunding RB, Series B, 5.00%, 1/01/21 | | | | | 1,550 | | | | 1,749,500 | |
North Carolina Municipal Power Agency No. 1, Refunding RB, Series B, 5.00%, 1/01/20 | | | | | 5,000 | | | | 5,815,600 | |
| | | | | | | | | 7,565,100 | |
Oklahoma — 1.0% | | | | | | | | | | |
Canadian County Educational Facilities Authority, RB, Mustang Public Schools Project, 4.50%, 9/01/20 | | | | | 1,500 | | | | 1,668,690 | |
County of Oklahoma Finance Authority, Refunding RB, Epworth Villa Project, Series A: | | | | | | | | | | |
2.25%, 4/01/14 | | | | | 225 | | | | 223,792 | |
2.50%, 4/01/15 | | | | | 225 | | | | 220,939 | |
County of Tulsa Oklahoma Industrial Authority, Education Facilities, RB, Broken Arrow Public School, 4.00%, 9/01/22 | | | | | 1,100 | | | | 1,169,520 | |
| | | | | | | | | 3,282,941 | |
Pennsylvania — 4.5% | | | | | | | | | | |
East Hempfield Township IDA, RB, Student Services, Inc., Student Housing Project: | | | | | | | | | | |
4.00%, 7/01/19 | | | | | 360 | | | | 367,308 | |
4.00%, 7/01/20 | | | | | 465 | | | | 467,144 | |
Pennsylvania Economic Development Financing Authority, Refunding RB, Amtrak Project, Series A, AMT, 4.00%, 11/01/20 | | | | | 2,175 | | | | 2,304,760 | |
Pennsylvania Higher Educational Facilities Authority, RB, Shippensburg University Student Services: | | | | | | | | | | |
4.00%, 10/01/19 | | | | | 1,165 | | | | 1,200,265 | |
4.00%, 10/01/20 | | | | | 1,210 | | | | 1,229,723 | |
Pennsylvania Higher Educational Facilities Authority, Refunding RB, Series A: | | | | | | | | | | |
5.00%, 7/15/20 (i) | | | | | 600 | | | | 657,972 | |
Drexel University, 5.00%, 5/01/20 | | | | | 1,575 | | | | 1,821,503 | |
Pennsylvania Housing Finance Agency, Refunding RB, S/F Mortgage, Series 115A, AMT: | | | | | | | | | | |
2.30%, 10/01/19 | | | | | 460 | | | | 449,503 | |
2.55%, 4/01/20 | | | | | 850 | | | | 829,931 | |
2.65%, 10/01/20 | | | | | 865 | | | | 841,463 | |
Pennsylvania IDA, Refunding RB, Economic Development, 5.00%, 7/01/20 | | | | | 1,500 | | | | 1,744,950 | |
Pennsylvania Turnpike Commission, RB, Sub-Series A (AGC), 5.00%, 6/01/22 | | | | | 1,000 | | | | 1,099,660 | |
| | | | | | | | | | | |
| Municipal Bonds | | | | Par
(000) | | Value |
Pennsylvania (concluded) | | | | | | | | | | |
State Public School Building Authority, RB, Community College Allegheny County Project (AGM), 5.00%, 7/15/20 | | | | $ | 995 | | | $ | 1,143,295 | |
Swarthmore Borough Authority, Refunding RB, Swarthmore College Project, 5.00%, 9/15/20 | | | | | 350 | | | | 418,877 | |
| | | | | | | | | 14,576,354 | |
Rhode Island — 0.7% | | | | | | | | | | |
Rhode Island Student Loan Authority, RB, Student Loan Program, Senior Series A, AMT, 5.00%, 12/01/20 | | | | | 2,000 | | | | 2,162,460 | |
South Carolina — 0.7% | | | | | | | | | | |
South Carolina State Ports Authority, RB, 5.00%, 7/01/20 | | | | | 2,000 | | | | 2,330,620 | |
Texas — 12.8% | | | | | | | | | | |
Central Texas Regional Mobility Authority, Refunding RB, Senior Lien: | | | | | | | | | | |
5.75%, 1/01/19 | | | | | 800 | | | | 881,184 | |
5.75%, 1/01/20 | | | | | 1,140 | | | | 1,249,303 | |
City of Dallas Texas, Refunding RB, Civic Center Convention Complex (AGC), 5.00%, 8/15/21 | | | | | 2,500 | | | | 2,795,950 | |
City of Frisco Texas, GO, Refunding, 3.00%, 2/15/20 | | | | | 2,250 | | | | 2,406,240 | |
City of Houston Texas, Refunding RB, Subordinate Lien, Series B, 5.00%, 7/01/20 | | | | | 250 | | | | 290,992 | |
Love Field Airport Modernization Corp., RB, Southwest Airlines Co., Love Field Modernization Program Project, 5.00%, 11/01/20 | | | | | 3,715 | | | | 3,949,194 | |
Lower Colorado River Authority, Refunding RB, LCRA Transmission Corp. Project, Series B, 5.00%, 5/15/20 | | | | | 5,000 | | | | 5,767,950 | |
New Hope Cultural Education Facilities Corp., RB, Tarleton State University Project, Series A: | | | | | | | | | | |
4.00%, 4/01/19 | | | | | 345 | | | | 352,580 | |
4.00%, 4/01/20 | | | | | 415 | | | | 416,855 | |
North Texas Tollway Authority, Refunding RB, Series C: | | | | | | | | | | |
5.25%, 1/01/20 | | | | | 1,000 | | | | 1,128,860 | |
5.38%, 1/01/21 | | | | | 5,000 | | | | 5,744,800 | |
Texas Municipal Gas Acquisition & Supply Corp. III, RB, 5.00%, 12/15/20 | | | | | 5,000 | | | | 5,488,300 | |
Texas State Turnpike Authority, RB, CAB, 1st Tier, Series A (AMBAC) (a): | | | | | | | | | | |
4.06%, 8/15/21 | | | | | 7,990 | | | | 5,842,608 | |
4.69%, 8/15/24 | | | | | 8,450 | | | | 5,124,502 | |
| | | | | | | | | 41,439,318 | |
US Virgin Islands — 0.3% | | | | | | | | | | |
Virgin Islands Public Finance Authority, RB, Senior Lien, Matching Fund Loan Note, Series A, 5.25%, 10/01/14 (c) | | | | | 1,000 | | | | 1,046,410 | |
Virginia — 5.2% | | | | | | | | | | |
Charles City County EDA, RB, Waste Management, Inc. Project, Mandatory Put Bonds, AMT, 5.13%, 8/01/27 (h) | | | | | 10,000 | | | | 10,202,700 | |
Hanover County EDA, Refunding RB, Covenant Woods, Series A, 3.00%, 7/01/15 | | | | | 465 | | | | 456,239 | |
Norfolk Virginia Water Revenue, Refunding RB, 5.00%, 11/01/20 | | | | | 2,000 | | | | 2,399,440 | |
Roanoke EDA, Refunding RB, Carilion Clinic Obligation Group, 5.00%, 7/01/20 | | | | | 1,500 | | | | 1,725,945 | |
Russell County IDA, Refunding RB, Appalachian Power, Series K, 4.63%, 11/01/21 | | | | | 2,000 | | | | 2,128,680 | |
| | | | | | | | | 16,913,004 | |
See Notes to Financial Statements.
| SEMI-ANNUAL REPORT | OCTOBER 31, 2013 | 31
|
| |
| Schedule of Investments (continued) | BlackRock Municipal 2020 Term Trust (BKK)
(Percentages shown are based on Net Assets)
|
| Municipal Bonds | | | | Par
(000) | | Value |
Washington — 1.5% | | | | | | | | | | |
Washington Health Care Facilities Authority, Refunding RB, Providence Health & Services, Series B: | | | | | | | | | | |
5.00%, 10/01/20 | | | | $ | 250 | | | $ | 293,235 | |
5.00%, 10/01/42 (h) | | | | | 4,000 | | | | 4,553,120 | |
| | | | | | | | | 4,846,355 | |
Wisconsin — 0.9% | | | | | | | | | | |
State of Wisconsin, Refunding RB, Series A, 5.25%, 5/01/20 | | | | | 1,000 | | | | 1,178,310 | |
Wisconsin Health & Educational Facilities Authority, Refunding RB, Froedtert & Community Health, Inc., 5.00%, 4/01/20 | | | | | 1,515 | | | | 1,727,358 | |
| | | | | | | | | 2,905,668 | |
Total Municipal Bonds — 130.6% | | 423,993,741 | |
|
Municipal Bonds Transferred to
Tender Option Bond Trusts (j) — 1.7% | | | | | | | | | | |
Illinois — 1.7% | | | | | | | | | | |
City of Chicago Illinois Waterworks, Refunding RB, Second Lien (AGM), 5.00%, 11/01/20 | | | | | 5,000 | | | | 5,518,000 | |
Total Long-Term Investments
(Cost — $411,916,483) — 132.3% | | 429,511,741 | |
| | | | |
Short-Term Securities | | | | Shares | | Value |
Money Market Funds — 1.5% | | | | | | | | | | |
FFI Institutional Tax-Exempt Fund, 0.03% (k)(l) | | | | | 4,891,505 | | | $ | 4,891,505 | |
| | | | | Par
(000 | ) | |
|
New York — 0.1% | | | | | | | | | | |
New York City Water & Sewer System, Refunding RB, VRDN (Mizuho Corporate Bank), 0.04%, 11/01/13 (m) | | | | $ | 300 | | | | 300,000 | |
Total Short-Term Securities
(Cost — $5,191,505) — 1.6% | | | | | | | | | 5,191,505 | |
Total Investments (Cost — $417,107,988) — 133.9% | | | | | | | | | 434,703,246 | |
Other Assets Less Liabilities — 1.2% | | | | | | | | | 3,860,276 | |
Liability for TOB Trust Certificates, Including Interest Expense and Fees Payable — (1.2%) | | | | | | | | | (3,754,158 | ) |
AMPS, at Redemption Value — (33.9%) | | | | | | | | | (110,100,000 | ) |
Net Assets Applicable to Common Shares — 100.0% | | | | | | | | $ | 324,709,364 | |
Notes to Schedule of Investments
| (a) | | | | Represents a zero-coupon bond. Rate shown reflects the current yield as of report date. |
| (b) | | | | Security exempt from registration pursuant to Rule 144A under the Securities Act of 1933, as amended. These securities may be resold in transactions exempt from registration to qualified institutional investors. |
| (c) | | | | US government securities, held in escrow, are used to pay interest on this security, as well as to retire the bond in full at the date indicated, typically at a premium to par. |
| (d) | | | | Non-income producing security. |
| (e) | | | | Issuer filed for bankruptcy and/or is in default of principal and/or interest payments. |
| (f) | | | | Security represents a beneficial interest in a trust. The collateral deposited into the trust is federally tax-exempt revenue bonds issued by various state or local governments, or their respective agencies or authorities. The security is subject to remarketing prior to its stated maturity. |
| (g) | | | | Security is collateralized by municipal or US Treasury obligations. |
| (h) | | | | Variable rate security. Rate shown is as of report date. |
| (i) | | | | When-issued security. Unsettled when-issued transactions were as follows: |
Counterparty
|
|
|
| Value
|
| Unrealized
Appreciation
|
Merrill Lynch, Pierce, Fenner & Smith Inc. | | | | $ | 657,972 | | | $ | 3,996 | |
| (j) | | | | Represent bonds transferred to a TOB. In exchange the Trust acquired residual interest certificates. These bonds serve as collateral in a financing transaction. See Note 3 of the Notes to Financial Statements for details of municipal bonds transferred to TOBs. |
| (k) | | | | Investments in issuers considered to be an affiliate of the Trust during the six months ended October 31, 2013, for purposes of Section 2(a)(3) of the 1940 Act, as amended, were as follows: |
Affiliate
|
|
|
| Shares
Held at
April 30, 2013
|
| Net
Activity
|
| Shares
Held at
October 31, 2013
|
| Income
|
FFI Institutional Tax-Exempt Fund | | | | 1,959,251 | | 2,932,254 | | 4,891,505 | | $1,540 |
See Notes to Financial Statements.
| 32 | SEMI-ANNUAL REPORT | OCTOBER 31, 2013
|
| |
| Schedule of Investments (concluded) | BlackRock Municipal 2020 Term Trust (BKK)
|
| (l) | | | | Represents the current yield as of report date. |
| (m) | | | | Variable rate security. Rate shown is as of report date and maturity shown is the date the principal owed can be recovered through demand. |
| • | | | | Fair Value Measurements — Various inputs are used in determining the fair value of investments. These inputs to valuation techniques are categorized into a disclosure hierarchy consisting of three broad levels for financial statement purposes as follows: |
| • | | | | Level 1 — unadjusted price quotations in active markets/exchanges for identical assets or liabilities that the Trust has the ability to access |
| • | | | | Level 2 — other observable inputs (including, but not limited to, quoted prices for similar assets or liabilities in markets that are active, quoted prices for identical or similar assets or liabilities in markets that are not active, inputs other than quoted prices that are observable for the assets or liabilities (such as interest rates, yield curves, volatilities, prepayment speeds, loss severities, credit risks and default rates) or other market-corroborated inputs) |
| • | | | | Level 3 — unobservable inputs based on the best information available in the circumstances, to the extent observable inputs are not available (including the Trust’s own assumptions used in determining the fair value of investments) |
| | | | | The hierarchy gives the highest priority to unadjusted quoted prices in active markets for identical assets or liabilities (Level 1 measurements) and the lowest priority to unobservable inputs (Level 3 measurements). Accordingly, the degree of judgment exercised in determining fair value is greatest for instruments categorized in Level 3. The inputs used to measure fair value may fall into different levels of the fair value hierarchy. In such cases, for disclosure purposes, the fair value hierarchy classification is determined based on the lowest level input that is significant to the fair value measurement in its entirety.
|
| | | | | Changes in valuation techniques may result in transfers into or out of an assigned level within the disclosure hierarchy. In accordance with the Trust’s policy, transfers between different levels of the fair value disclosure hierarchy are deemed to have occurred as of the beginning of the reporting period. The categorization of a value determined for investments is based on the pricing transparency of the investment and is not necessarily an indication of the risks associated with investing in those securities. For information about the Trust’s policy regarding valuation of investments, please refer to Note 2 of the Notes to Financial Statements.
|
| | | | | The following table summarizes the Trust’s investments categorized in the disclosure hierarchy as of October 31, 2013: |
|
| Level 1
|
| Level 2
|
| Level 3
|
| Total
|
Assets: | | | | | | | | | | | |
Investments:
| | | | | | | | | | | |
Long-Term Investments1 | | | — | | $ | 429,511,741 | | — | | $ | 429,511,741 |
Short-Term Securities | | $ | 4,891,505 | | | 300,000 | | — | | | 5,191,505 |
Total | | $ | 4,891,505 | | $ | 429,811,741 | | — | | $ | 434,703,246 |
| 1 | See above Schedule of Investments for values in each state or political subdivision. |
| Certain of the Trust’s liabilities are held at carrying amount, which approximates fair value for financial statement purposes. As of October 31, 2013, TOB trust certificates of $3,750,000 are categorized as Level 2 within the disclosure hierarchy. |
| There were no transfers between levels during the six months ended October 31, 2013. |
See Notes to Financial Statements.
| SEMI-ANNUAL REPORT | OCTOBER 31, 2013 | 33
|
| |
| Schedule of Investments October 31, 2013 (Unaudited) | BlackRock Municipal Income Trust (BFK)
(Percentages shown are based on Net Assets)
|
| Municipal Bonds | | | | Par
(000) | | Value |
Alabama — 1.2% | | | | | | | | | | |
Alabama State Docks Department, Refunding RB, 6.00%, 10/01/40 | | | | $ | 4,080 | | | $ | 4,542,591 | |
County of Jefferson Alabama, RB, Limited Obligation School, Series A, 5.25%, 1/01/19 | | | | | 2,910 | | | | 2,889,281 | |
| | | | | | | | | 7,431,872 | |
Arizona — 3.0% | | | | | | | | | | |
Salt Verde Financial Corp., RB, Senior: | | | | | | | | | | |
5.00%, 12/01/32 | | | | | 10,030 | | | | 10,128,194 | |
5.00%, 12/01/37 | | | | | 7,460 | | | | 7,490,884 | |
| | | | | | | | | 17,619,078 | |
California — 17.5% | | | | | | | | | | |
Bay Area Toll Authority, Refunding RB, San Francisco Bay Area Toll Bridge, Series F-1, 5.63%, 4/01/44 | | | | | 4,445 | | | | 4,777,797 | |
California County Tobacco Securitization Agency, RB, CAB, Stanislaus, Sub-Series C, 12.13%, 6/01/55 (a) | | | | | 17,855 | | | | 133,377 | |
California Health Facilities Financing Authority, RB, Sutter Health, Series B, 6.00%, 8/15/42 | | | | | 6,230 | | | | 7,185,308 | |
California Health Facilities Financing Authority, Refunding RB, St. Joseph Health System, Series A, 5.00%, 7/01/33 | | | | | 2,465 | | | | 2,539,147 | |
California Pollution Control Financing Authority, RB: | | | | | | | | | | |
Poseidon Resources (Channel Side) LP Desalination Project, AMT, 5.00%, 7/01/37 (b) | | | | | 2,015 | | | | 1,778,076 | |
Poseidon Resources (Channel Side) LP Desalination Project, AMT, 5.00%, 11/21/45 (b) | | | | | 5,035 | | | | 4,222,250 | |
San Diego County Water Authority Desalination Project Pipeline, 5.00%, 11/21/45 | | | | | 2,415 | | | | 2,144,665 | |
California State Public Works Board, RB, Various Capital Projects, Sub-Series I-1, 6.38%, 11/01/34 | | | | | 2,315 | | | | 2,665,399 | |
California Statewide Communities Development Authority, Refunding RB, Episcopal Communities & Services: | | | | | | | | | | |
5.00%, 5/15/42 | | | | | 830 | | | | 746,394 | |
5.00%, 5/15/47 | | | | | 705 | | | | 621,711 | |
City of Los Angeles California Department of Airports, Refunding RB, Los Angeles International Airport, Senior Series A: | | | | | | | | | | |
5.25%, 5/15/39 | | | | | 1,560 | | | | 1,665,051 | |
5.00%, 5/15/40 | | | | | 11,690 | | | | 11,918,189 | |
Foothill Eastern Transportation Corridor Agency California, Refunding RB, CAB, 6.97%, 1/15/38 (a) | | | | | 75,000 | | | | 14,283,000 | |
Foothill-De Anza Community College District, GO, Election of 2006, Series C, 5.00%, 8/01/40 | | | | | 7,000 | | | | 7,352,590 | |
Murrieta Community Facilities District Special Tax California, Special Tax Bonds, District No. 2, The Oaks Improvement Area A, 6.00%, 9/01/34 | | | | | 5,000 | | | | 4,952,600 | |
Riverside County Transportation Commission, RB, CAB, Senior Lien, Series B (a): | | | | | | | | | | |
6.64%, 6/01/41 | | | | | 5,000 | | | | 825,600 | |
6.66%, 6/01/42 | | | | | 6,000 | | | | 923,400 | |
6.67%, 6/01/43 | | | | | 5,000 | | | | 718,700 | |
San Diego Community College District, GO, Election of 2006, 5.00%, 8/01/43 | | | | | 2,115 | | | | 2,233,482 | |
San Marcos Unified School District, GO, CAB, Election of 2010, Series B (a): | | | | | | | | | | |
5.44%, 8/01/34 | | | | | 3,500 | | | | 1,149,155 | |
5.51%, 8/01/36 | | | | | 4,000 | | | | 1,161,520 | |
State of California, GO, Various Purpose: | | | | | | | | | | |
6.00%, 3/01/33 | | | | | 4,970 | | | | 5,811,471 | |
6.50%, 4/01/33 | | | | | 20,410 | | | | 24,304,636 | |
| | | | | | | | | 104,113,518 | |
Colorado — 2.2% | | | | | | | | | | |
Colorado Health Facilities Authority, Refunding RB: | | | | | | | | | | |
Catholic Health Initiative, Series A, 5.50%, 7/01/34 | | | | | 4,205 | | | | 4,605,316 | |
Evangelical Lutheran Good Samaritan Society Project, 5.00%, 12/01/42 | | | | | 3,450 | | | | 3,210,363 | |
| | | | | | | | | | | |
| Municipal Bonds | | | | Par
(000) | | Value |
Colorado (concluded) | | | | | | | | | | |
Colorado State Board of Governors, Refunding RB, State University System Enterprise, Series A, 5.00%, 3/01/43 | | | | $ | 2,310 | | | $ | 2,434,763 | |
Park Creek Metropolitan District, Refunding RB, Senior Limited Property Tax, 5.50%, 12/01/37 | | | | | 2,530 | | | | 2,586,520 | |
| | | | | | | | | 12,836,962 | |
Connecticut — 0.5% | | | | | | | | | | |
Connecticut State Health & Educational Facility Authority, RB, Ascension Health Senior Credit, Series A, 5.00%, 11/15/40 | | | | | 2,710 | | | | 2,780,894 | |
Delaware — 1.6% | | | | | | | | | | |
County of Sussex Delaware, RB, NRG Energy, Inc., Indian River Project, 6.00%, 10/01/40 | | | | | 2,225 | | | | 2,288,257 | |
Delaware State EDA, RB, Exempt Facilities, Indian River Power, 5.38%, 10/01/45 | | | | | 7,950 | | | | 7,538,190 | |
| | | | | | | | | 9,826,447 | |
District of Columbia — 4.7% | | | | | | | | | | |
District of Columbia, Refunding RB, Kipp Charter School, Series A, 6.00%, 7/01/43 | | | | | 1,480 | | | | 1,539,289 | |
District of Columbia Tobacco Settlement Financing Corp., Refunding RB, Asset-Backed, 6.75%, 5/15/40 | | | | | 23,035 | | | | 23,149,484 | |
Metropolitan Washington Airports Authority, Refunding RB, First Senior Lien, Series A: | | | | | | | | | | |
5.00%, 10/01/39 | | | | | 990 | | | | 991,465 | |
5.25%, 10/01/44 | | | | | 2,465 | | | | 2,496,108 | |
| | | | | | | | | 28,176,346 | |
Florida — 4.9% | | | | | | | | | | |
County of Miami-Dade Florida Aviation, Refunding ARB, Miami International Airport, Series A-1, 5.38%, 10/01/41 | | | | | 2,280 | | | | 2,356,289 | |
County of Orange Florida Health Facilities Authority, Refunding RB, Mayflower Retirement Center: | | | | | | | | | | |
5.00%, 6/01/32 | | | | | 600 | | | | 585,090 | |
5.00%, 6/01/36 | | | | | 125 | | | | 119,931 | |
5.13%, 6/01/42 | | | | | 1,925 | | | | 1,850,964 | |
County of Tampa-Hillsborough Florida Expressway Authority, Refunding RB: | | | | | | | | | | |
Series A, 5.00%, 7/01/37 | | | | | 3,920 | | | | 4,002,673 | |
Series B, 5.00%, 7/01/42 | | | | | 4,925 | | | | 4,979,914 | |
Miami Beach Health Facilities Authority, RB, Mount Sinai Medical Center Florida, 6.75%, 11/15/21 | | | | | 5,570 | | | | 5,860,197 | |
Mid-Bay Bridge Authority, RB, Springing Lien, Series A, 7.25%, 10/01/40 | | | | | 5,885 | | | | 6,471,087 | |
Stevens Plantation Community Development District, Special Assessment, Series A, 7.10%, 5/01/35 (c)(d) | | | | | 3,590 | | | | 2,674,335 | |
| | | | | | | | | 28,900,480 | |
Georgia — 1.8% | | | | | | | | | | |
DeKalb Private Hospital Authority, Refunding RB, Children’s Healthcare, 5.25%, 11/15/39 | | | | | 1,650 | | | | 1,686,762 | |
Metropolitan Atlanta Rapid Transit Authority, RB, Sale Tax, Third Indenture, Series A, 5.00%, 7/01/39 | | | | | 5,000 | | | | 5,168,850 | |
Richmond County Development Authority, Refunding RB, International Paper Co. Project, Series A, AMT, 6.00%, 2/01/25 | | | | | 4,000 | | | | 4,000,440 | |
| | | | | | | | | 10,856,052 | |
Hawaii — 0.5% | | | | | | | | | | |
State of Hawaii Harbor System, RB, Series A, 5.25%, 7/01/30 | | | | | 2,660 | | | | 2,860,803 | |
Illinois — 12.0% | | | | | | | | | | |
Chicago Illinois Transit Authority, RB, Sales Tax Receipts, 5.25%, 12/01/40 | | | | | 2,055 | | | | 2,088,722 | |
City of Chicago Illinois, GARB, O’Hare International Airport, Third Lien, Series C, 6.50%, 1/01/41 | | | | | 11,385 | | | | 12,802,888 | |
See Notes to Financial Statements.
| 34 | SEMI-ANNUAL REPORT | OCTOBER 31, 2013
|
| |
| Schedule of Investments (continued) | BlackRock Municipal Income Trust (BFK)
(Percentages shown are based on Net Assets)
|
| Municipal Bonds | | | | Par
(000) | | Value |
Illinois (concluded) | | | | | | | | | | |
City of Chicago Illinois, GO, Project, Series A: | | | | | | | | | | |
5.00%, 1/01/33 | | | | $ | 4,435 | | | $ | 4,189,035 | |
5.00%, 1/01/34 | | | | | 4,430 | | | | 4,161,763 | |
City of Chicago Illinois, Refunding RB, Sales Tax, Series A, 5.25%, 1/01/38 | | | | | 1,605 | | | | 1,675,251 | |
City of Chicago Illinois Waterworks Revenue, Refunding RB, Second Lien Project, 5.00%, 11/01/42 | | | | | 5,625 | | | | 5,565,544 | |
County of Cook Illinois Community College District No. 508, GO, City College of Chicago, 5.50%, 12/01/38 | | | | | 1,525 | | | | 1,600,762 | |
Illinois Finance Authority, RB, Advocate Health Care, Series C, 5.38%, 4/01/44 | | | | | 10,630 | | | | 10,882,462 | |
Illinois Finance Authority, Refunding RB: | | | | | | | | | | |
Ascension Health, Series A, 5.00%, 11/15/37 | | | | | 1,895 | | | | 1,904,930 | |
Ascension Health, Series A, 5.00%, 11/15/42 | | | | | 3,450 | | | | 3,444,687 | |
Central Dupage Health, Series B, 5.50%, 11/01/39 | | | | | 3,160 | | | | 3,336,233 | |
Friendship Village Schaumburg, Series A, 5.63%, 2/15/37 | | | | | 470 | | | | 413,544 | |
Illinois State Toll Highway Authority, RB, Series A, 5.00%, 1/01/38 | | | | | 4,550 | | | | 4,559,646 | |
Metropolitan Pier & Exposition Authority, Refunding RB, McCormick Place Expansion Project: | | | | | | | | | | |
Series B (AGM), 5.00%, 6/15/50 | | | | | 6,155 | | | | 6,047,534 | |
Series B-2, 5.00%, 6/15/50 | | | | | 3,905 | | | | 3,752,822 | |
Railsplitter Tobacco Settlement Authority, RB: | | | | | | | | | | |
5.50%, 6/01/23 | | | | | 885 | | | | 973,155 | |
6.00%, 6/01/28 | | | | | 2,245 | | | | 2,407,089 | |
State of Illinois, RB, Build Illinois, Series B, 5.25%, 6/15/34 | | | | | 1,240 | | | | 1,283,189 | |
| | | | | | | | | 71,089,256 | |
Indiana — 4.6% | | | | | | | | | | |
Carmel Redevelopment Authority, Refunding RB, Multipurpose, Series A: | | | | | | | | | | |
4.00%, 8/01/35 | | | | | 2,215 | | | | 2,071,025 | |
4.00%, 2/01/38 | | | | | 3,555 | | | | 3,230,500 | |
City of Vincennes Indiana, Refunding RB, Southwest Indiana Regional Youth Village, 6.25%, 1/01/24 | | | | | 1,815 | | | | 1,062,610 | |
Indiana Finance Authority, RB, Series A: | | | | | | | | | | |
Private Activity Bond, Ohio River Bridges East End Crossing Project, AMT, 5.00%, 7/01/44 | | | | | 880 | | | | 785,330 | |
Private Activity Bond, Ohio River Bridges East End Crossing Project, AMT, 5.00%, 7/01/48 | | | | | 2,905 | | | | 2,559,276 | |
Sisters of St. Francis Health, 5.25%, 11/01/39 | | | | | 1,655 | | | | 1,689,110 | |
Wastewater Utility (CWA Authority Project), First Lien, 5.25%, 10/01/38 | | | | | 6,305 | | | | 6,527,566 | |
Indiana Finance Authority, Refunding RB, Community Health Network Project, Series A, 5.00%, 5/01/42 | | | | | 3,695 | | | | 3,601,849 | |
Indiana Municipal Power Agency, RB, Series B, 6.00%, 1/01/39 | | | | | 2,150 | | | | 2,387,962 | |
Indianapolis Local Public Improvement Bond Bank, RB, Series A: | | | | | | | | | | |
5.00%, 1/15/36 | | | | | 780 | | | | 814,460 | |
5.00%, 1/15/40 | | | | | 2,490 | | | | 2,573,340 | |
| | | | | | | | | 27,303,028 | |
Iowa — 2.3% | | | | | | | | | | |
Iowa Finance Authority, RB, Midwestern Disaster Area, Alcoa, Inc. Project, 4.75%, 8/01/42 | | | | | 2,265 | | | | 1,911,773 | |
Iowa Finance Authority, Refunding RB, Midwestern Disaster Area, Iowa Fertilizer Co. Project: | | | | | | | | | | |
5.00%, 12/01/19 | | | | | 1,880 | | | | 1,822,434 | |
5.50%, 12/01/22 | | | | | 4,595 | | | | 4,392,315 | |
5.25%, 12/01/25 | | | | | 2,125 | | | | 1,939,764 | |
Iowa Student Loan Liquidity Corp., Refunding RB, Student Loan, Senior Series A-1, AMT, 5.15%, 12/01/22 | | | | | 3,465 | | | | 3,592,304 | |
| | | | | | | | | 13,658,590 | |
| | | | | | | | | | | |
| Municipal Bonds | | | | Par
(000) | | Value |
Kentucky — 0.5% | | | | | | | | | | |
Kentucky Economic Development Finance Authority, RB, Series A: | | | | | | | | | | |
Catholic Health Initiatives, 5.25%, 1/01/45 (e) | | | | $ | 1,915 | | | $ | 1,906,115 | |
Owensboro Medical Health System, 6.38%, 6/01/40 | | | | | 920 | | | | 969,919 | |
| | | | | | | | | 2,876,034 | |
Louisiana — 3.3% | | | | | | | | | | |
Louisiana Local Government Environmental Facilities & Community Development Authority, RB, Westlake Chemical Corp. Projects, Series A-1, 6.50%, 11/01/35 | | | | | 6,535 | | | | 7,036,104 | |
State of Louisiana Gasoline & Fuels Tax, RB, Second Lien, Series B, 5.00%, 5/01/45 | | | | | 3,550 | | | | 3,667,256 | |
Tobacco Settlement Financing Corp., Refunding RB, Asset-Backed, Series A: | | | | | | | | | | |
5.50%, 5/15/30 | | | | | 1,980 | | | | 2,018,016 | |
5.25%, 5/15/31 | | | | | 1,690 | | | | 1,680,384 | |
5.25%, 5/15/32 | | | | | 2,160 | | | | 2,137,255 | |
5.25%, 5/15/33 | | | | | 2,345 | | | | 2,311,138 | |
5.25%, 5/15/35 | | | | | 985 | | | | 966,295 | |
| | | | | | | | | 19,816,448 | |
Maine — 0.3% | | | | | | | | | | |
Maine Turnpike Authority, RB, Series A, 5.00%, 7/01/42 | | | | | 1,715 | | | | 1,789,637 | |
Maryland — 2.7% | | | | | | | | | | |
Maryland EDC, RB, Transportation Facilities Project, Series A, 5.75%, 6/01/35 | | | | | 855 | | | | 865,824 | |
Maryland EDC, Refunding RB, CNX Marine Terminals, Inc., 5.75%, 9/01/25 | | | | | 2,235 | | | | 2,325,607 | |
Maryland Health & Higher Educational Facilities Authority, RB, Ascension Health Alliance, Series B, 5.00%, 11/15/51 | | | | | 7,865 | | | | 7,869,955 | |
Maryland Health & Higher Educational Facilities Authority, Refunding RB, Charlestown Community Project, 6.25%, 1/01/41 | | | | | 4,295 | | | | 4,511,812 | |
Montgomery County Housing Opportunities Commission, RB, Series D, AMT, 5.50%, 1/01/38 | | | | | 510 | | | | 518,389 | |
| | | | | | | | | 16,091,587 | |
Massachusetts — 1.1% | | | | | | | | | | |
Massachusetts Health & Educational Facilities Authority, Refunding RB, Partners Healthcare System, Series J1, 5.00%, 7/01/39 | | | | | 3,535 | | | | 3,592,267 | |
Massachusetts School Building Authority, RB, Dedicated Sales Tax, Senior Series A, 5.00%, 5/15/43 | | | | | 2,780 | | | | 2,924,226 | |
| | | | | | | | | 6,516,493 | |
Michigan — 3.5% | | | | | | | | | | |
City of Detroit Michigan Sewage Disposal System, Refunding RB, Senior Lien, Series A: | | | | | | | | | | |
5.00%, 7/01/32 | | | | | 3,065 | | | | 2,777,656 | |
5.25%, 7/01/39 | | | | | 8,665 | | | | 7,967,121 | |
City of Lansing Michigan, RB, Board of Water & Light, Series A, 5.50%, 7/01/41 | | | | | 2,870 | | | | 3,077,243 | |
Kalamazoo Hospital Finance Authority, Refunding RB, Bronson Methodist Hospital, 5.50%, 5/15/36 | | | | | 2,700 | | | | 2,756,349 | |
Michigan State Hospital Finance Authority, Refunding RB, Henry Ford Health System, Series A, 5.25%, 11/15/46 | | | | | 4,230 | | | | 4,093,286 | |
| | | | | | | | | 20,671,655 | |
Mississippi — 2.4% | | | | | | | | | | |
City of Gulfport Mississippi, RB, Memorial Hospital at Gulfport Project, Series A, 5.75%, 7/01/31 | | | | | 14,025 | | | | 14,032,153 | |
See Notes to Financial Statements.
| SEMI-ANNUAL REPORT | OCTOBER 31, 2013 | 35
|
| |
| Schedule of Investments (continued) | BlackRock Municipal Income Trust (BFK)
(Percentages shown are based on Net Assets)
|
| Municipal Bonds | | | | Par
(000) | | Value |
Missouri — 0.4% | | | | | | | | | | |
Bi-State Development Agency of the Missouri-Illinois Metropolitan District, Refunding RB, Combined Lien, Series A, 5.00%, 10/01/44 | | | | $ | 495 | | | $ | 511,895 | |
Missouri State Health & Educational Facilities Authority, RB, Senior Living Facilities, Lutheran Senior Services, 5.50%, 2/01/42 | | | | | 2,035 | | | | 2,036,933 | |
| | | | | | | | | 2,548,828 | |
Multi-State — 2.8% | | | | | | | | | | |
Centerline Equity Issuer Trust, 6.80%, 11/15/14 (b)(f) | | | | | 16,000 | | | | 16,857,280 | |
Nebraska — 1.4% | | | | | | | | | | |
Central Plains Energy Project Nebraska, RB, Gas Project No. 3: | | | | | | | | | | |
5.25%, 9/01/37 | | | | | 1,610 | | | | 1,655,740 | |
5.00%, 9/01/42 | | | | | 2,815 | | | | 2,751,747 | |
County of Douglas Nebraska Hospital Authority No. 2, Refunding RB, Health Facilities, Immanuel Obligation Group, 5.63%, 1/01/40 | | | | | 3,280 | | | | 3,392,668 | |
County of Lancaster Nebraska Hospital Authority No. 1, Refunding RB, Immanuel Obligation Group, Health Facilities, 5.63%, 1/01/40 | | | | | 600 | | | | 620,610 | |
| | | | | | | | | 8,420,765 | |
Nevada — 0.8% | | | | | | | | | | |
County of Clark Nevada, Refunding RB, Alexander Dawson School Nevada Project, 5.00%, 5/15/29 | | | | | 4,550 | | | | 4,714,528 | |
New Jersey — 9.5% | | | | | | | | | | |
Middlesex County Improvement Authority, RB, Subordinate, Heldrich Center Hotel, Sub-Series B, 6.25%, 1/01/37 (c)(d) | | | | | 3,680 | | | | 257,122 | |
New Jersey EDA, RB, Continental Airlines, Inc. Project, AMT: | | | | | | | | | | |
5.25%, 9/15/29 | | | | | 3,830 | | | | 3,519,923 | |
7.00%, 11/15/30 (g) | | | | | 15,410 | | | | 15,409,075 | |
New Jersey EDA, Refunding, Special Assessment, Kapkowski Road Landfill Project, 6.50%, 4/01/28 | | | | | 8,000 | | | | 8,582,160 | |
New Jersey State Turnpike Authority, RB, Series A: | | | | | | | | | | |
5.00%, 1/01/38 | | | | | 2,535 | | | | 2,630,519 | |
5.00%, 1/01/43 | | | | | 8,150 | | | | 8,339,406 | |
New Jersey Transportation Trust Fund Authority, RB, Transportation System: | | | | | | | | | | |
Series A, 5.50%, 6/15/41 | | | | | 8,000 | | | | 8,421,280 | |
Series B, 5.25%, 6/15/36 | | | | | 4,810 | | | | 5,056,176 | |
Rutgers The State University of New Jersey, Refunding RB, Series L: | | | | | | | | | | |
5.00%, 5/01/38 | | | | | 985 | | | | 1,045,410 | |
5.00%, 5/01/43 | | | | | 1,030 | | | | 1,082,468 | |
Tobacco Settlement Financing Corp. New Jersey, Refunding RB, Series 1A, 4.50%, 6/01/23 | | | | | 2,165 | | | | 2,002,712 | |
| | | | | | | | | 56,346,251 | |
New York — 8.5% | | | | | | | | | | |
Albany Industrial Development Agency, RB, New Covenant Charter School Project, Series A, 7.00%, 5/01/35 (c)(d) | | | | | 1,820 | | | | 309,436 | |
New York City Industrial Development Agency, RB, American Airlines, Inc., JFK International Airport, AMT (g): | | | | | | | | | | |
8.00%, 8/01/28 | | | | | 5,000 | | | | 5,464,450 | |
7.75%, 8/01/31 | | | | | 22,140 | | | | 23,993,339 | |
New York City Transitional Finance Authority Future Tax Secured Bonds, RB, Fiscal 2012, Sub-Series E-1, 5.00%, 2/01/42 | | | | | 4,805 | | | | 5,036,217 | |
New York Liberty Development Corp., Refunding RB, Second Priority, Bank of America Tower at One Bryant Park Project, Class 3, 6.38%, 7/15/49 | | | | | 2,400 | | | | 2,542,488 | |
New York State Dormitory Authority, RB, Series F, 5.00%, 3/15/35 | | | | | 4,775 | | | | 4,933,912 | |
| | | | | | | | | | | |
| Municipal Bonds | | | | Par
(000) | | Value |
New York (concluded) | | | | | | | | | | |
New York State Thruway Authority, Refunding RB, General, Series I, 5.00%, 1/01/42 | | | | $ | 3,465 | | | $ | 3,546,393 | |
Port Authority of New York & New Jersey, ARB, Special Project, JFK International Air Terminal LLC Project, Series 8: | | | | | | | | | | |
6.00%, 12/01/36 | | | | | 2,525 | | | | 2,723,869 | |
6.00%, 12/01/42 | | | | | 1,960 | | | | 2,102,159 | |
| | | | | | | | | 50,652,263 | |
North Carolina — 4.4% | | | | | | | | | | |
Gaston County Industrial Facilities & Pollution Control Financing Authority, RB, Exempt Facilities, National Gypsum Co. Project, AMT, 5.75%, 8/01/35 | | | | | 12,130 | | | | 11,223,040 | |
North Carolina Capital Facilities Finance Agency, Refunding RB, Duke University Project, Series B, 5.00%, 10/01/38 | | | | | 10,000 | | | | 10,728,500 | |
North Carolina Medical Care Commission, RB, Health Care Facilities, Duke University Health System, Series A, 5.00%, 6/01/42 | | | | | 2,750 | | | | 2,789,985 | |
North Carolina Medical Care Commission, Refunding RB, Retirement Facilities, First Mortgage, Whitestone Project, Series A, 7.75%, 3/01/41 | | | | | 1,130 | | | | 1,192,365 | |
| | | | | | | | | 25,933,890 | |
Ohio — 2.9% | | | | | | | | | | |
County of Allen Ohio, Refunding RB, Hospital Facilities, Catholic Healthcare Partners, Series A, 5.25%, 6/01/38 | | | | | 6,125 | | | | 6,240,701 | |
County of Hamilton Ohio, RB, Christ Hospital Project, 5.00%, 6/01/42 | | | | | 2,475 | | | | 2,362,709 | |
County of Montgomery Ohio, Refunding RB, Catholic Health, Series A, 5.00%, 5/01/39 | | | | | 5,450 | | | | 5,342,254 | |
Pinnacle Community Infrastructure Financing Authority, RB, Facilities, Series A, 6.25%, 12/01/36 | | | | | 3,760 | | | | 3,562,374 | |
| | | | | | | | | 17,508,038 | |
Oregon — 0.1% | | | | | | | | | | |
City of Tigard Oregon, Refunding RB, Water System, 5.00%, 8/01/37 | | | | | 495 | | | | 519,280 | |
Pennsylvania — 0.6% | | | | | | | | | | |
Pennsylvania Economic Development Financing Authority, RB, Aqua Pennsylvania, Inc. Project, 5.00%, 11/15/40 | | | | | 3,725 | | | | 3,792,869 | |
Puerto Rico — 1.2% | | | | | | | | | | |
Puerto Rico Sales Tax Financing Corp., RB, CAB, Series A, 7.85%, 8/01/36 (a) | | | | | 40,000 | | | | 6,939,200 | |
South Carolina — 1.1% | | | | | | | | | | |
South Carolina State Ports Authority, RB, 5.25%, 7/01/40 | | | | | 6,455 | | | | 6,704,421 | |
Tennessee — 0.5% | | | | | | | | | | |
City of Chattanooga Tennessee Health Educational & Housing Facility Board, RB, Catholic Health Initiatives, Series A, 5.25%, 1/01/45 (e) | | | | | 2,660 | | | | 2,647,658 | |
County of Rutherford Tennessee Health & Educational Facilities Board, RB, Ascension Health, Series C, 5.00%, 11/15/47 | | | | | 415 | | | | 421,582 | |
| | | | | | | | | 3,069,240 | |
Texas — 17.3% | | | | | | | | | | |
Brazos River Authority, RB, TXU Electric, Series A, AMT, 8.25%, 10/01/30 (c)(d) | | | | | 4,370 | | | | 65,506 | |
Central Texas Regional Mobility Authority, Refunding RB: | | | | | | | | | | |
Senior Lien, 6.25%, 1/01/46 | | | | | 4,210 | | | | 4,304,557 | |
Senior Lien, Series A, 5.00%, 1/01/33 | | | | | 195 | | | | 189,140 | |
Sub-Lien, 5.00%, 1/01/33 | | | | | 700 | | | | 634,914 | |
Sub-Lien, 5.00%, 1/01/42 | | | | | 620 | | | | 535,413 | |
City of Dallas Texas Waterworks & Sewer System, Refunding RB, 5.00%, 10/01/35 | | | | | 2,970 | | | | 3,134,954 | |
See Notes to Financial Statements.
| 36 | SEMI-ANNUAL REPORT | OCTOBER 31, 2013
|
| |
| Schedule of Investments (continued) | BlackRock Municipal Income Trust (BFK)
(Percentages shown are based on Net Assets)
|
| Municipal Bonds | | | | Par
(000) | | Value |
Texas (concluded) | | | | | | | | | | |
City of Houston Texas Airport System, Refunding ARB, Senior Lien, Series A, 5.50%, 7/01/39 | | | | $ | 3,000 | | | $ | 3,293,370 | |
City of Houston Texas Utility System, Refunding RB, Combined First Lien, Series A (AGC), 6.00%, 11/15/35 | | | | | 16,425 | | | | 18,672,104 | |
City of San Antonio Texas Public Service Board, RB, Electric & Gas Systems, Junior Lien, 5.00%, 2/01/43 | | | | | 4,895 | | | | 5,108,324 | |
County of Tarrant Texas Cultural Education Facilities Finance Corp., RB, Scott & White Healthcare, 6.00%, 8/15/45 | | | | | 7,930 | | | | 9,032,666 | |
County of Tarrant Texas Cultural Education Facilities Finance Corp., Refunding RB, Scott & White Healthcare, Series A, 5.00%, 8/15/43 | | | | | 705 | | | | 706,029 | |
Dallas-Fort Worth International Airport, Refunding ARB, Joint Improvement, Series E, AMT, 5.00%, 11/01/35 | | | | | 3,535 | | | | 3,461,119 | |
Fort Bend County Industrial Development Corp., RB, NRG Energy Project, Series B, 4.75%, 11/01/42 | | | | | 2,045 | | | | 1,768,373 | |
Harris County-Houston Sports Authority, Refunding RB (NPFGC) (a): | | | | | | | | | | |
CAB, Junior Lien, Series H, 6.87%, 11/15/35 | | | | | 5,000 | | | | 1,128,400 | |
CAB, Senior Lien, Series A, 6.46%, 11/15/38 | | | | | 12,580 | | | | 2,560,407 | |
Third Lien, Series A-3, 6.97%, 11/15/37 | | | | | 26,120 | | | | 5,031,496 | |
Matagorda County Navigation District No. 1, Refunding RB, AEP Texas Central Co. Project, Series 1, 4.00%, 6/01/30 | | | | | 2,120 | | | | 1,900,559 | |
Midland County Fresh Water Supply District No. 1, RB, CAB, City of Midland Project, Series A (a): | | | | | | | | | | |
5.27%, 9/15/40 | | | | | 9,780 | | | | 2,414,682 | |
5.38%, 9/15/41 | | | | | 5,420 | | | | 1,234,839 | |
North Texas Tollway Authority, Refunding RB, Second Tier System, Series F, 6.13%, 1/01/31 | | | | | 12,180 | | | | 13,019,811 | |
San Antonio Energy Acquisition Public Facility Corp., RB, Gas Supply, 5.50%, 8/01/25 | | | | | 6,540 | | | | 7,257,634 | |
Texas Municipal Gas Acquisition & Supply Corp. III, RB: | | | | | | | | | | |
5.00%, 12/15/29 | | | | | 865 | | | | 851,783 | |
5.00%, 12/15/32 | | | | | 2,835 | | | | 2,743,288 | |
Texas Private Activity Bond Surface Transportation Corp., RB, Senior Lien: | | | | | | | | | | |
LBJ Infrastructure Group LLC, LBJ Freeway Managed Lanes Project, 7.00%, 6/30/40 | | | | | 6,000 | | | | 6,548,400 | |
NTE Mobility Partners LLC, North Tarrant Express Managed Lanes Project, 6.88%, 12/31/39 | | | | | 6,500 | | | | 7,014,215 | |
| | | | | | | | | 102,611,983 | |
Utah — 1.5% | | | | | | | | | | |
County of Utah Utah, RB, IHC Health Services, Inc., 5.00%, 5/15/43 | | | | | 3,940 | | | | 4,036,845 | |
University of Utah, RB, General, Series A, 5.00%, 8/01/43 | | | | | 1,235 | | | | 1,293,156 | |
Utah State Charter School Finance Authority, RB, Ogden Preparatory Academy, Series A: | | | | | | | | | | |
3.25%, 10/15/36 | | | | | 1,940 | | | | 1,459,443 | |
3.25%, 10/15/42 | | | | | 3,010 | | | | 2,146,250 | |
| | | | | | | | | 8,935,694 | |
Virginia — 1.9% | | | | | | | | | | |
City of Norfolk Virginia Parking System, Refunding RB, Series B (AMBAC), 5.50%, 2/01/31 | | | | | 2,240 | | | | 2,242,307 | |
Virginia Small Business Financing Authority, RB, Senior Lien, Elizabeth River Crossings OpCo LLC Project, AMT: | | | | | | | | | | |
5.25%, 1/01/32 | | | | | 3,155 | | | | 3,121,999 | |
6.00%, 1/01/37 | | | | | 5,695 | | | | 5,896,660 | |
| | | | | | | | | 11,260,966 | |
Washington — 0.8% | | | | | | | | | | |
Washington Health Care Facilities Authority, RB, Catholic Health Initiatives, Series A, 5.75%, 1/01/45 (e) | | | | | 4,420 | | | | 4,624,646 | |
| | | | | | | | | | | |
| Municipal Bonds | | | | Par
(000) | | Value |
Wisconsin — 1.4% | | | | | | | | | | |
Wisconsin Health & Educational Facilities Authority, RB, Ascension Health Senior Care Group, 5.00%, 11/15/33 | | | | $ | 1,640 | | | $ | 1,713,767 | |
WPPI Energy Wisconsin, Refunding RB, Power Supply System, Series A: | | | | | | | | | | |
5.00%, 7/01/29 | | | | | 740 | | | | 795,115 | |
5.00%, 7/01/30 | | | | | 935 | | | | 995,401 | |
5.00%, 7/01/31 | | | | | 2,035 | | | | 2,154,841 | |
5.00%, 7/01/37 | | | | | 2,470 | | | | 2,534,616 | |
| | | | | | | | | 8,193,740 | |
Total Municipal Bonds — 127.7% | | 758,881,215 | |
|
Municipal Bonds Transferred to
Tender Option Bond Trusts (h) |
Alabama — 0.8% | | | | | | | | | | |
City of Birmingham Alabama Special Care Facilities Financing Authority, Refunding RB, Ascension Health, Senior Credit Series C-2, 5.00%, 11/15/36 | | | | | 4,548 | | | | 4,579,918 | |
California — 5.6% | | | | | | | | | | |
California Educational Facilities Authority, RB, University of Southern California, Series B, 5.25%, 10/01/39 (i) | | | | | 5,115 | | | | 5,477,807 | |
City & County of San Francisco California Public Utilities Commission, RB, Water Revenue, Series B, 5.00%, 11/01/39 | | | | | 18,540 | | | | 19,369,850 | |
Los Angeles Community College District California, GO, Election of 2001, Series A (AGM), 5.00%, 8/01/32 | | | | | 4,500 | | | | 4,747,455 | |
San Diego Community College District California, GO, Election of 2002, 5.25%, 8/01/33 | | | | | 3,260 | | | | 3,636,178 | |
| | | | | | | | | 33,231,290 | |
Colorado — 2.1% | | | | | | | | | | |
Colorado Health Facilities Authority, RB, Catholic Health (AGM): | | | | | | | | | | |
Series C-3, 5.10%, 10/01/41 | | | | | 7,600 | | | | 7,639,368 | |
Series C-7, 5.00%, 9/01/36 | | | | | 4,860 | | | | 4,891,104 | |
| | | | | | | | | 12,530,472 | |
Connecticut — 3.3% | | | | | | | | | | |
Connecticut State Health & Educational Facility Authority, RB, Yale University: | | | | | | | | | | |
Series T-1, 4.70%, 7/01/29 | | | | | 9,397 | | | | 9,804,651 | |
Series X-3, 4.85%, 7/01/37 | | | | | 9,366 | | | | 9,806,255 | |
| | | | | | | | | 19,610,906 | |
Florida — 1.2% | | | | | | | �� | | | |
County of Miami-Dade Florida, RB, Water & Sewer System, 5.00%, 10/01/34 | | | | | 6,629 | | | | 6,875,781 | |
Massachusetts — 2.0% | | | | | | | | | | |
Massachusetts School Building Authority, RB, Senior Dedicated Sales Tax, Series B, 5.00%, 10/15/41 | | | | | 4,426 | | | | 4,623,719 | |
Massachusetts Water Resources Authority, Refunding RB, General, Series A, 5.00%, 8/01/41 | | | | | 6,770 | | | | 7,082,571 | |
| | | | | | | | | 11,706,290 | |
New Hampshire — 0.7% | | | | | | | | | | |
New Hampshire Health & Education Facilities Authority, RB, Dartmouth College, 5.25%, 6/01/39 (i) | | | | | 3,988 | | | | 4,337,436 | |
See Notes to Financial Statements.
| SEMI-ANNUAL REPORT | OCTOBER 31, 2013 | 37
|
| |
| Schedule of Investments (continued) | BlackRock Municipal Income Trust (BFK)
(Percentages shown are based on Net Assets)
|
| | | | | | | |
Municipal Bonds Transferred to
Tender Option Bond Trusts (h) | | | | Par
(000) | | Value |
New York — 10.0% | | | | | | | | | | |
Hudson Yards Infrastructure Corp., RB, Senior, Series A, 5.75%, 2/15/47 (i) | | | | $ | 3,130 | | | $ | 3,315,313 | |
New York City Municipal Water Finance Authority, Refunding RB, Water & Sewer System, Second General Resolution: | | | | | | | | | | |
Series FF-2, 5.50%, 6/15/40 | | | | | 3,075 | | | | 3,291,766 | |
Series HH, 5.00%, 6/15/31 (i) | | | | | 16,393 | | | | 17,571,423 | |
New York Liberty Development Corp., RB, 1 World Trade Center Port Authority Construction, 5.25%, 12/15/43 | | | | | 20,865 | | | | 21,774,506 | |
New York Liberty Development Corp., Refunding RB, 4 World Trade Center Project, 5.75%, 11/15/51 (i) | | | | | 12,610 | | | | 13,461,553 | |
| | | | | | | | | 59,414,561 | |
Texas — 2.2% | | | | | | | | | | |
County of Harris Texas Metropolitan Transit Authority, Refunding RB, Series A, 5.00%, 11/01/41 | | | | | 6,650 | | | | 6,880,356 | |
University of Texas System, Refunding RB, Series B, 5.00%, 8/15/43 | | | | | 6,001 | | | | 6,355,168 | |
| | | | | | | | | 13,235,524 | |
Utah — 1.2% | | | | | | | | | | |
City of Riverton Utah, RB, IHC Health Services, Inc., 5.00%, 8/15/41 | | | | | 7,153 | | | | 7,249,541 | |
Virginia — 1.9% | | | | | | | | | | |
University of Virginia, Refunding RB, General, 5.00%, 6/01/40 | | | | | 10,767 | | | | 11,544,629 | |
| | | | | | | | | | | |
Municipal Bonds Transferred to
Tender Option Bond Trusts (h) | | | | Par
(000) | | Value |
Washington — 3.6% | | | | | | | | | | |
Central Puget Sound Regional Transit Authority, RB, Series A (AGM), 5.00%, 11/01/32 | | | | $ | 5,459 | | | $ | 5,747,789 | |
State of Washington, GO, Various Purposes, Series E, 5.00%, 2/01/34 | | | | | 14,487 | | | | 15,602,977 | |
| | | | | | | | | 21,350,766 | |
Total Municipal Bonds Transferred to
Tender Option Bond Trusts — 34.6% | | 205,667,114 | |
Total Long-Term Investments
(Cost — $966,921,318) — 162.3% | | | | | | | | | 964,548,329 | |
|
Short-Term Securities | | | | | Shares | | |
|
| FFI Institutional Tax-Exempt Fund, 0.03% (j)(k) | | | | | 19,167,561 | | | | 19,167,561 | |
Total Short-Term Securities
(Cost — $19,167,561) — 3.2% | | | | | | | | | 19,167,561 | |
Total Investments (Cost — $986,088,879) — 165.5% | | | | | | | | | 983,715,890 | |
Other Assets Less Liabilities — 0.7% | | | | | | | | | 3,750,054 | |
Liability for TOB Trust Certificates, Including Interest Expense and Fees Payable — (20.6%) | | | | | | | | | (122,424,869 | ) |
VMTP Shares, at Liquidation Value — (45.6%) | | | | | | | | | (270,800,000 | ) |
Net Assets Applicable to Common Shares — 100.0% | | | | | | | | $ | 594,241,075 | |
Notes to Schedule of Investments
| (a) | | | | Represents a zero-coupon bond. Rate shown reflects the current yield as of report date. |
| (b) | | | | Security exempt from registration pursuant to Rule 144A under the Securities Act of 1933, as amended. These securities may be resold in transactions exempt from registration to qualified institutional investors. |
| (c) | | | | Non-income producing security. |
| (d) | | | | Issuer filed for bankruptcy and/or is in default of principal and/or interest payments. |
| (e) | | | | When-issued security. Unsettled when-issued transactions were as follows: |
Counterparty
|
|
|
| Value
|
| Unrealized
Appreciation
|
Morgan Stanley & Co. LLC | | | | $ | 9,178,419 | | | $ | 184,020 | |
| (f) | | | | Security represents a beneficial interest in a trust. The collateral deposited into the trust is federally tax-exempt revenue bonds issued by various state or local governments, or their respective agencies or authorities. The security is subject to remarketing prior to its stated maturity. |
| (g) | | | | Variable rate security. Rate shown is as of report date. |
| (h) | | | | Represent bonds transferred to a TOB. In exchange the Trust acquired residual interest certificates. These bonds serve as collateral in a financing transaction. See Note 3 of the Notes to Financial Statements for details of municipal bonds transferred to TOBs. |
| (i) | | | | All or a portion of security is subject to a recourse agreement, which may require the Trust to pay the liquidity provider in the event there is a shortfall between the TOB trust certificates and proceeds received from the sale of the security contributed to the TOB trust. In the case of a shortfall, the aggregate maximum potential amount the Trust could ultimately be required to pay under the agreements, which expire from October 1, 2016 to November 15, 2019, is $25,997,578. |
| (j) | | | | Investments in issuers considered to be an affiliate of the Trust during the six months ended October 31, 2013, for purposes of Section 2(a)(3) of the 1940 Act, were as follows: |
Affiliate
|
|
|
| Shares
Held at
April 30, 2013
|
| Net
Activity
|
| Shares
Held at
October 31, 2013
|
| Income
|
FFI Institutional Tax-Exempt Fund | | | | 2,673,310 | | 16,494,251 | | 19,167,561 | | $1,811 |
| (k) | | | | Represents the current yield as of report date. |
| • | | | | Financial futures contracts as of October 31, 2013 were as follows: |
Contracts
Sold
|
| Issue
|
| Exchange
|
| Expiration
|
| Notional
Value
|
| Unrealized
Depreciation
|
| (182) | | 10-Year US Treasury Note | | Chicago Board of Trade | | December
2013 | | $23,179,406 | | $(14,417) |
See Notes to Financial Statements.
| 38 | SEMI-ANNUAL REPORT | OCTOBER 31, 2013
|
| |
| Schedule of Investments (concluded) | BlackRock Municipal Income Trust (BFK)
|
| • | | | | Fair Value Measurements — Various inputs are used in determining the fair value of investments and derivative financial instruments. These inputs to valuation techniques are categorized into a disclosure hierarchy consisting of three broad levels for financial statement purposes as follows: |
| • | | | | Level 1 — unadjusted price quotations in active markets/exchanges for identical assets or liabilities that the Trust has the ability to access |
| • | | | | Level 2 — other observable inputs (including, but not limited to, quoted prices for similar assets or liabilities in markets that are active, quoted prices for identical or similar assets or liabilities in markets that are not active, inputs other than quoted prices that are observable for the assets or liabilities (such as interest rates, yield curves, volatilities, prepayment speeds, loss severities, credit risks and default rates) or other market-corroborated inputs) |
| • | | | | Level 3 — unobservable inputs based on the best information available in the circumstances, to the extent observable inputs are not available (including the Trust’s own assumptions used in determining the fair value of investments and derivative financial instruments) |
| | | | | The hierarchy gives the highest priority to unadjusted quoted prices in active markets for identical assets or liabilities (Level 1 measurements) and the lowest priority to unobservable inputs (Level 3 measurements). Accordingly, the degree of judgment exercised in determining fair value is greatest for instruments categorized in Level 3. The inputs used to measure fair value may fall into different levels of the fair value hierarchy. In such cases, for disclosure purposes, the fair value hierarchy classification is determined based on the lowest level input that is significant to the fair value measurement in its entirety. |
| | | | | Changes in valuation techniques may result in transfers into or out of an assigned level within the disclosure hierarchy. In accordance with the Trust’s policy, transfers between different levels of the fair value disclosure hierarchy are deemed to have occurred as of the beginning of the reporting period. The categorization of a value determined for investments and derivative financial instruments is based on the pricing transparency of the investment and derivative financial instrument and is not necessarily an indication of the risks associated with investing in those securities. For information about the Trust’s policy regarding valuation of investments and derivative financial instruments, please refer to Note 2 of the Notes to Financial Statements. |
| | | | | The following tables summarize the Trust’s investments and derivative financial instruments categorized in the disclosure hierarchy as of October 31, 2013: |
|
| Level 1
|
| Level 2
|
| Level 3
|
| Total
|
Assets: | | | | | | | | | | | |
Investments:
| | | | | | | | | | | |
Long-Term Investments1 | | | — | | $ | 964,548,329 | | — | | $ | 964,548,329 |
Short-Term Securities | | $ | 19,167,561 | | | — | | — | | | 19,167,561 |
Total | | $ | 19,167,561 | | $ | 964,548,329 | | — | | $ | 983,715,890 |
| 1 | See above Schedule of Investments for values in each state or political subdivision. |
|
| Level 1
|
| Level 2
|
| Level 3
|
| Total
|
Derivative Financial Instruments2
| | | | | | | | | | | | |
Liabilities: | | | | | | | | | | | | |
Interest rate contracts | | $ | (14,417 | ) | | — | | — | | $ | (14,417 | ) |
| 2 | Derivative financial instruments are financial futures contracts, which are valued at the unrealized appreciation/depreciation on the instrument. |
Certain of the Trust’s assets and/or liabilities are held at carrying amount, which approximates fair value for financial statement purposes. As of October 31, 2013, such assets and/or liabilities are categorized within the disclosure hierarchy as follows: |
|
| Level 1
|
| Level 2
|
| Level 3
|
| Total
|
Assets: | | | | | | | | | | | | | |
Cash | | $ | 248,246 | | | — | | | — | | $ | 248,246 | |
Cash pledged for financial futures contracts | | | 323,000 | | | — | | | — | | | 323,000 | |
Liabilities: | | | | | | | | | | | | | |
TOB trust certificates | | | — | | $ | (122,400,226 | ) | | — | | | (122,400,226 | ) |
VMTP Shares | | | — | | | (270,800,000 | ) | | — | | | (270,800,000 | ) |
Total | | $ | 571,246 | | $ | (393,200,226 | ) | | — | | $ | (392,628,980 | ) |
| There were no transfers between levels during the six months ended October 31, 2013. |
See Notes to Financial Statements.
| SEMI-ANNUAL REPORT | OCTOBER 31, 2013 | 39
|
| |
| Schedule of Investments October 31, 2013 (Unaudited) | BlackRock Pennsylvania Strategic Municipal Trust (BPS)
(Percentages shown are based on Net Assets)
|
| Municipal Bonds | | | | Par
(000) | | Value |
Pennsylvania — 154.6% |
Corporate — 5.5% |
County of Beaver IDA, Refunding RB, First Energy, Nuclear Energy Corp. Project, Mandatory Put Bonds, Series A, 3.38%, 1/01/35 (a) | | | | $ | 200 | | | $ | 203,360 | |
Pennsylvania Economic Development Financing Authority, RB: | | | | | | | | | | |
American Water Co. Project, 6.20%, 4/01/39 | | | | | 210 | | | | 228,602 | |
Aqua Pennsylvania, Inc. Project, Series A, AMT, 6.75%, 10/01/18 | | | | | 600 | | | | 733,914 | |
Pennsylvania Economic Development Financing Authority, Refunding RB, Series A AMT: | | | | | | | | | | |
Amtrak Project, 5.00%, 11/01/41 | | | | | 160 | | | | 153,037 | |
Aqua Pennsylvania, Inc. Project, 5.00%, 12/01/34 | | | | | 180 | | | | 186,172 | |
| | | | | | | | | 1,505,085 | |
County/City/Special District/School District — 15.7% | | | | | | | | | | |
Allentown Neighborhood Improvement Zone Development Authority, Refunding RB, Series A: | | | | | | | | | | |
5.00%, 5/01/35 | | | | | 190 | | | | 175,629 | |
5.00%, 5/01/42 | | | | | 450 | | | | 402,395 | |
City of Philadelphia Pennsylvania, GO, Refunding, Series A (AGC), 5.00%, 8/01/24 | | | | | 370 | | | | 398,094 | |
City of Pittsburgh Pennsylvania, GO, Series B, 5.00%, 9/01/26 | | | | | 125 | | | | 137,076 | |
County of Lycoming Pennsylvania, GO, Series A (AGM): | | | | | | | | | | |
4.00%, 8/15/38 | | | | | 160 | | | | 142,910 | |
4.00%, 8/15/42 | | | | | 100 | | | | 87,950 | |
County of Lycoming Pennsylvania Water & Sewer Authority, RB (AGM), 5.00%, 11/15/41 | | | | | 100 | | | | 100,567 | |
County of York Pennsylvania, GO, Refunding, 5.00%, 3/01/36 | | | | | 100 | | | | 103,204 | |
Falls Township Authority, RB, Water & Sewer Authority, 5.00%, 12/01/37 | | | | | 200 | | | | 206,570 | |
Marple Newtown School District, GO (AGM), 5.00%, 6/01/31 | | | | | 600 | | | | 646,794 | |
Owen J. Roberts School District, GO, 4.75%, 11/15/25 | | | | | 700 | | | | 767,046 | |
Philadelphia School District, GO, Series E, 6.00%, 9/01/38 | | | | | 100 | | | | 107,341 | |
Philipsburg-Osceola Pennsylvania Area School District, GO (AGM): | | | | | | | | | | |
5.00%, 4/01/41 | | | | | 155 | | | | 156,710 | |
Series A, 4.00%, 4/01/35 | | | | | 150 | | | | 136,293 | |
Series A, 4.00%, 4/01/38 | | | | | 110 | | | | 94,306 | |
Series A, 4.00%, 4/01/41 | | | | | 40 | | | | 34,170 | |
State Public School Building Authority, RB, Community College, Allegheny County Project (AGM), 5.00%, 7/15/34 | | | | | 310 | | | | 320,999 | |
State Public School Building Authority, Refunding RB, Harrisburg School District Project, Series A (AGC), 5.00%, 11/15/33 | | | | | 250 | | | | 256,680 | |
| | | | | | | | | 4,274,734 | |
Education — 25.4% | | | | | | | | | | |
County of Adams Pennsylvania IDA, Refunding RB, Gettysburg College: | | | | | | | | | | |
5.00%, 8/15/24 | | | | | 100 | | | | 109,672 | |
5.00%, 8/15/25 | | | | | 100 | | | | 108,347 | |
County of Cumberland Pennsylvania Municipal Authority, RB, AICUP Financing Program, Dickinson College Project, 5.00%, 11/01/39 | | | | | 200 | | | | 205,418 | |
County of Delaware Pennsylvania Authority, Refunding RB: | | | | | | | | | | |
Haverford College, 5.00%, 11/15/35 | | | | | 415 | | | | 436,958 | |
Villanova University, 5.25%, 12/01/31 | | | | | 100 | | | | 106,243 | |
East Hempfield Township IDA, RB, Student Services, Inc., Student Housing Project at Millersville University of Pennsylvania, 5.00%, 7/01/35 | | | | | 100 | | | | 92,871 | |
| | | | | | | | | | | |
| Municipal Bonds | | | | Par
(000) | | Value |
Pennsylvania (continued) |
Education (concluded) | | | | | | | | | | |
Pennsylvania Higher Educational Facilities Authority, RB: | | | | | | | | | | |
Drexel University, Series A (NPFGC), 5.00%, 5/01/37 | | | | $ | 150 | | | $ | 151,452 | |
Shippensburg University Student Services, Student Housing, 5.00%, 10/01/44 | | | | | 265 | | | | 239,947 | |
Thomas Jefferson University, 5.00%, 3/01/40 | | | | | 1,000 | | | | 1,025,570 | |
Pennsylvania Higher Educational Facilities Authority, Refunding RB: | | | | | | | | | | |
Drexel University, Series A, 5.25%, 5/01/41 | | | | | 1,180 | | | | 1,223,648 | |
La Salle University, 5.00%, 5/01/37 | | | | | 140 | | | | 134,212 | |
State System of Higher Education, Series AL, 5.00%, 6/15/35 | | | | | 100 | | | | 103,992 | |
Thomas Jefferson University, 4.00%, 3/01/37 | | | | | 70 | | | | 62,273 | |
Thomas Jefferson University, 5.00%, 3/01/42 | | | | | 60 | | | | 60,895 | |
Trustees of The University of Pennsylvania, Series C, 4.75%, 7/15/35 | | | | | 500 | | | | 501,265 | |
Widener University, Series A, 5.25%, 7/15/33 (b) | | | | | 220 | | | | 217,182 | |
Widener University, Series A, 5.50%, 7/15/38 (b) | | | | | 165 | | | | 162,575 | |
Pennsylvania State University, RB, 5.00%, 3/01/40 | | | | | 1,000 | | | | 1,046,530 | |
Swarthmore Borough Authority, Refunding RB, Swarthmore College Project, 5.00%, 9/15/38 | | | | | 215 | | | | 227,348 | |
University of Pittsburgh Pennsylvania, RB, Capital Project, Series B, 5.00%, 9/15/28 | | | | | 610 | | | | 673,519 | |
| | | | | | | | | 6,889,917 | |
Health — 41.7% | | | | | | | | | | |
Berks County Municipal Authority, Refunding RB, Reading Hospital & Medical Center Project, Series A3, 5.50%, 11/01/31 | | | | | 500 | | | | 551,940 | |
Centre County Hospital Authority, RB, Mount Nittany Medical Center Project, 7.00%, 11/15/46 | | | | | 390 | | | | 443,594 | |
County of Cumberland Pennsylvania Municipal Authority, Refunding RB: | | | | | | | | | | |
Asbury Pennsylvania Obligated Group, 5.25%, 1/01/41 | | | | | 210 | | | | 183,557 | |
Diakon Lutheran, 6.38%, 1/01/39 | | | | | 500 | | | | 527,435 | |
County of Montgomery Pennsylvania IDA, RB, Acts Retirement-Life Community, Series A, 4.50%, 11/15/36 | | | | | 375 | | | | 320,239 | |
County of Montgomery Pennsylvania IDA, Refunding RB, Acts Retirement-Life Communities: | | | | | | | | | | |
5.00%, 11/15/27 | | | | | 175 | | | | 175,268 | |
5.00%, 11/15/28 | | | | | 110 | | | | 108,512 | |
5.00%, 11/15/29 | | | | | 100 | | | | 98,053 | |
Dauphin County General Authority, Refunding RB, Pinnacle Health System Project, Series A, 6.00%, 6/01/29 | | | | | 500 | | | | 544,620 | |
Franklin County IDA Pennsylvania, Refunding RB, Chambersburg Hospital Project, 5.38%, 7/01/42 | | | | | 415 | | | | 418,785 | |
Geisinger Authority Pennsylvania, RB, Health system Obligated Group: | | | | | | | | | | |
Series A, 5.25%, 6/01/39 | | | | | 1,000 | | | | 1,025,210 | |
Series A-1, 5.13%, 6/01/41 | | | | | 1,160 | | | | 1,182,945 | |
Pennsylvania Higher Educational Facilities Authority, RB, University of Pennsylvania Health System, Series A, 4.00%, 8/15/39 | | | | | 215 | | | | 180,995 | |
Pennsylvania Higher Educational Facilities Authority, Refunding RB, University of Pittsburgh Medical Center, Series E, 5.00%, 5/15/31 | | | | | 1,000 | | | | 1,020,650 | |
Philadelphia Hospitals & Higher Education Facilities Authority, RB, The Children’s Hospital of Philadelphia Project, Series C, 5.00%, 7/01/41 | | | | | 940 | | | | 956,102 | |
Philadelphia Hospitals & Higher Education Facilities Authority, Refunding RB, Jefferson Health System of Chester Philadelphia, Series B, 5.00%, 5/15/40 | | | | | 1,000 | | | | 1,002,740 | |
See Notes to Financial Statements.
| 40 | SEMI-ANNUAL REPORT | OCTOBER 31, 2013
|
| |
| Schedule of Investments (continued) | BlackRock Pennsylvania Strategic Municipal Trust (BPS)
(Percentages shown are based on Net Assets)
|
| Municipal Bonds | | | | Par
(000) | | Value |
Pennsylvania (continued) |
Health (concluded) | | | | | | | | | | |
Saint Mary Hospital Authority, Refunding RB, Catholic Health East, Series A: | | | | | | | | | | |
5.00%, 11/15/26 | | | | $ | 250 | | | $ | 264,735 | |
5.00%, 11/15/27 | | | | | 175 | | | | 183,951 | |
South Fork Municipal Authority, Refunding RB, Conemaugh Valley Memorial Hospital, Series B (AGC), 5.38%, 7/01/35 | | | | | 245 | | | | 252,656 | |
Southcentral General Authority, Refunding RB, Wellspan Health Obligation Group, Series A, 6.00%, 6/01/29 | | | | | 1,250 | | | | 1,382,700 | |
Union County Hospital Authority, Refunding RB, Evangelical Community Hospital Project, 7.00%, 8/01/41 | | | | | 460 | | | | 517,205 | |
| | | | | | | | | 11,341,892 | |
Housing — 16.4% | | | | | | | | | | |
Pennsylvania HFA, RB, S/F Mortgage, Series 114-C: | | | | | | | | | | |
3.65%, 10/01/37 | | | | | 390 | | | | 320,798 | |
3.70%, 10/01/42 | | | | | 640 | | | | 519,187 | |
Pennsylvania HFA, Refunding RB, S/F Mortgage: | | | | | | | | | | |
Series 92-A, AMT, 4.75%, 4/01/31 | | | | | 90 | | | | 90,095 | |
Series 96-A, AMT, 4.70%, 10/01/37 | | | | | 450 | | | | 431,271 | |
Series 97-A, AMT, 4.65%, 10/01/31 | | | | | 1,300 | | | | 1,301,352 | |
Series 99-A, AMT, 5.15%, 4/01/38 | | | | | 210 | | | | 214,704 | |
Series 110-B, 4.75%, 10/01/39 | | | | | 130 | | | | 133,570 | |
Series 113, 4.85%, 10/01/37 | | | | | 775 | | | | 766,312 | |
Series 115-A, AMT, 4.20%, 10/01/33 | | | | | 750 | | | | 676,605 | |
| | | | | | | | | 4,453,894 | |
State — 24.5% | | | | | | | | | | |
Commonwealth of Pennsylvania, GO, First Series: | | | | | | | | | | |
5.00%, 3/15/28 | | | | | 825 | | | | 926,029 | |
5.00%, 6/01/28 | | | | | 2,160 | | | | 2,410,236 | |
5.00%, 3/15/29 | | | | | 275 | | | | 307,684 | |
Water Utility & Sewer Improvements, 5.00%, 11/15/24 | | | | | 1,000 | | | | 1,159,920 | |
Water Utility & Sewer Improvements, 5.00%, 4/01/26 | | | | | 245 | | | | 282,980 | |
Pennsylvania Economic Development Financing Authority, Refunding RB, Unemployment Compensation, Series B, 5.00%, 7/01/23 | | | | | 500 | | | | 531,470 | |
Pennsylvania Turnpike Commission, RB, Oil Franchise Tax, Remarketing, Series C (NPFGC), 5.00%, 12/01/32 | | | | | 1,000 | | | | 1,034,930 | |
| | | | | | | | | 6,653,249 | |
Transportation — 21.6% | | | | | | | | | | |
City of Philadelphia Pennsylvania, ARB, Series A: | | | | | | | | | | |
5.00%, 6/15/40 | | | | | 1,325 | | | | 1,330,856 | |
AMT (AGM), 5.00%, 6/15/37 | | | | | 855 | | | | 850,255 | |
Delaware River Port Authority, RB, Series D, 5.00%, 1/01/40 | | | | | 750 | | | | 773,212 | |
Pennsylvania Turnpike Commission, RB: | | | | | | | | | | |
Motor License Fund, Enhanced Turnpike, Special Sub-Series A, 5.00%, 12/01/37 | | | | | 140 | | | | 143,835 | |
Motor License Fund, Enhanced Turnpike, Special Sub-Series A, 5.00%, 12/01/42 | | | | | 215 | | | | 219,287 | |
Senior Lien, Series A, 5.00%, 12/01/42 | | | | | 470 | | | | 478,220 | |
Series A (AMBAC), 5.25%, 12/01/32 | | | | | 870 | | | | 877,795 | |
Sub-Series A, 5.13%, 12/01/26 | | | | | 100 | | | | 107,824 | |
Sub-Series A, 6.00%, 12/01/41 | | | | | 100 | | | | 108,433 | |
Pennsylvania Turnpike Commission, Refunding RB, Sub-Series B, 5.25%, 6/01/24 | | | | | 250 | | | | 272,958 | |
Southeastern Pennsylvania Transportation Authority, RB, Capital Grant Receipts: | | | | | | | | | | |
5.00%, 6/01/28 | | | | | 290 | | | | 306,275 | |
5.00%, 6/01/29 | | | | | 385 | | | | 403,030 | |
| | | | | | | | | 5,871,980 | |
| | | | | | | | | | | |
| Municipal Bonds | | �� | | Par
(000) | | Value |
Pennsylvania (concluded) |
Utilities — 3.8% | | | | | | | | | | |
City of Philadelphia Pennsylvania Gas Works, RB, Ninth Series, 5.25%, 8/01/40 | | | | $ | 270 | | | $ | 271,347 | |
City of Philadelphia Pennsylvania Water & Wastewater, RB: | | | | | | | | | | |
Series A, 5.25%, 1/01/36 | | | | | 100 | | | | 104,873 | |
Series C (AGM), 5.00%, 8/01/40 | | | | | 350 | | | | 355,989 | |
County of Bucks Pennsylvania Water & Sewer Authority, RB, Water System (AGM), 5.00%, 12/01/41 | | | | | 30 | | | | 30,965 | |
Delaware County Regional Water Quality Control Authority, RB, Sewer Improvements, 5.00%, 5/01/33 | | | | | 70 | | | | 73,844 | |
Pennsylvania Economic Development Financing Authority, RB, Philadelphia Biosolids Facility, 6.25%, 1/01/32 | | | | | 185 | | | | 184,602 | |
| | | | | | | | | 1,021,620 | |
Total Municipal Bonds in Pennsylvania — 154.6% | | 42,012,371 | |
|
Guam — 0.6% |
State — 0.6% | | | | | | | | | | |
Territory of Guam, RB, Section 30, Series A, 5.63%, 12/01/29 | | | | | 150 | | | | 157,019 | |
Total Municipal Bonds — 155.2% | | 42,169,390 | |
|
Municipal Bonds Transferred to
Tender Option Bond Trusts (c) | | | | | | | | | | |
Pennsylvania — 5.2% |
Education — 3.3% | | | | | | | | | | |
Pennsylvania Higher Educational Facilities Authority, RB, University of Pennsylvania Health System, Series A, 5.75%, 8/15/41 | | | | | 850 | | | | 900,762 | |
Health — 1.9% | | | | | | | | | | |
Geisinger Authority Pennsylvania, RB, Health System, Series A, 5.13%, 6/01/34 | | | | | 500 | | | | 512,530 | |
Total Municipal Bonds Transferred to
Tender Option Bond Trusts in Pennsylvania — 5.2% | | 1,413,292 | |
Total Long-Term Investments
(Cost — $42,948,313) — 160.4% | | | | | | | | | 43,582,682 | |
|
Short-Term Securities | | | | | Shares | | | | | |
BIF Pennsylvania Municipal Money Fund, 0.00% (d)(e) | | | | | 294,385 | | | | 294,385 | |
Total Short-Term Securities
(Cost — $294,385) — 1.1% | | | | | | | | | 294,385 | |
Total Investments (Cost — $43,242,698) — 161.5% | | | | | | | | | 43,877,067 | |
Other Assets Less Liabilities — 1.0% | | | | | | | | | 274,362 | |
Liability for TOB Trust Certificates, Including Interest Expense and Fees Payable — (2.5%) | | | | | | | | | (675,118 | ) |
VRDP Shares, at Liquidation Value — (60.0%) | | | | | | | | | (16,300,000 | ) |
Net Assets Applicable to Common Shares — 100.0% | | | | | | | | $ | 27,176,311 | |
See Notes to Financial Statements.
| SEMI-ANNUAL REPORT | OCTOBER 31, 2013 | 41
|
| |
| Schedule of Investments (continued) | BlackRock Pennsylvania Strategic Municipal Trust (BPS)
|
Notes to Schedule of Investments
| (a) | | | | Variable rate security. Rate shown is as of report date. |
| (b) | | | | When-issued security. Unsettled when-issued transactions were as follows: |
Counterparty
|
|
|
| Value
|
| Unrealized
Appreciation
|
Merrill Lynch, Pierce, Fenner & Smith Inc. | | | | $ | 379,757 | | | $ | 2,467 | |
| (c) | | | | Represent bonds transferred to a TOB. In exchange the Trust acquired residual interest certificates. These bonds serve as collateral in a financing transaction. See Note 3 of the Notes to Financial Statements for details of municipal bonds transferred to TOBs. |
| (d) | | | | Investments in issuers considered to be an affiliate of the Trust during the six months ended October 31, 2013, for purposes of Section 2(a)(3) of the 1940 Act, were as follows: |
Affiliate
|
|
|
| Shares
Held at
April 30, 2013
|
| Net
Activity
|
| Shares
Held at
October 31, 2013
|
| Income
|
BIF Pennsylvania Municipal Money Fund | | | | 1,396,790 | | (1,102,405) | | 294,385 | | — |
| (e) | | | | Represents the current yield as of report date. |
| • | | | | Financial futures contracts as of October 31, 2013 were as follows: |
Contracts
Sold
|
| Issue
|
| Exchange
|
| Expiration
|
| Notional
Value
|
| Unrealized
Depreciation
|
| (14) | | 10-Year US Treasury Note | | Chicago Board of Trade | | December 2013 | | $1,783,031 | | $(2,093) |
| • | | | | For Trust compliance purposes, the Trust’s sector classifications refer to any one or more of the sector sub-classifications used by one or more widely recognized market indexes or rating group indexes and/or as defined by Trust management. These definitions may not apply for purposes of this report, which may combine such sector sub-classifications for reporting ease. |
| • | | | | Fair Value Measurements — Various inputs are used in determining the fair value of investments and derivative financial instruments. These inputs to valuation techniques are categorized into a disclosure hierarchy consisting of three broad levels for financial statement purposes as follows: |
| • | | | | Level 1 — unadjusted price quotations in active markets/exchanges for identical assets or liabilities that the Trust has the ability to access |
| • | | | | Level 2 — other observable inputs (including, but not limited to, quoted prices for similar assets or liabilities in markets that are active, quoted prices for identical or similar assets or liabilities in markets that are not active, inputs other than quoted prices that are observable for the assets or liabilities (such as interest rates, yield curves, volatilities, prepayment speeds, loss severities, credit risks and default rates) or other market-corroborated inputs) |
| • | | | | Level 3 — unobservable inputs based on the best information available in the circumstances, to the extent observable inputs are not available (including the Trust’s own assumptions used in determining the fair value of investments and derivative financial instruments) |
| | | | | The hierarchy gives the highest priority to unadjusted quoted prices in active markets for identical assets or liabilities (Level 1 measurements) and the lowest priority to unobservable inputs (Level 3 measurements). Accordingly, the degree of judgment exercised in determining fair value is greatest for instruments categorized in Level 3. The inputs used to measure fair value may fall into different levels of the fair value hierarchy. In such cases, for disclosure purposes, the fair value hierarchy classification is determined based on the lowest level input that is significant to the fair value measurement in its entirety. |
| | | | | Changes in valuation techniques may result in transfers into or out of an assigned level within the disclosure hierarchy. In accordance with the Trust’s policy, transfers between different levels of the fair value disclosure hierarchy are deemed to have occurred as of the beginning of the reporting period. The categorization of a value determined for investments and derivative financial instruments is based on the pricing transparency of the investment and derivative financial instrument and is not necessarily an indication of the risks associated with investing in those securities. For information about the Trust’s policy regarding valuation of investments and derivative financial instruments, please refer to Note 2 of the Notes to Financial Statements. |
See Notes to Financial Statements.
| 42 | SEMI-ANNUAL REPORT | OCTOBER 31, 2013
|
| |
| Schedule of Investments (concluded) | BlackRock Pennsylvania Strategic Municipal Trust (BPS)
|
The following tables summarize the Trust’s investments and derivative financial instruments categorized in the disclosure hierarchy as of October 31, 2013: |
|
| Level 1
|
| Level 2
|
| Level 3
|
| Total
|
Assets: | | | | | | | | | | | | | | | | |
Investments:
| | | | | | | | | | | | | | | | |
Long-Term Investments1 | | | — | | | $ | 43,582,682 | | | | — | | | $ | 43,582,682 | |
Short-Term Securities | | $ | 294,385 | | | | — | | | | — | | | | 294,385 | |
Total | | $ | 294,385 | | | $ | 43,582,682 | | | | — | | | $ | 43,877,067 | |
| 1 | See above Schedule of Investments for values in each sector. |
|
| Level 1
|
| Level 2
|
| Level 3
|
| Total
|
Derivative Financial Instruments2
| | | | | | | | | | | | | | | | |
Liabilities: | | | | | | | | | | | | | | | | |
Interest rate contracts | | $ | (2,093 | ) | | | — | | | | — | | | $ | (2,093 | ) |
| 2 | Derivative financial instruments are financial futures contracts, which are valued at the unrealized appreciation/depreciation on the instrument. |
Certain of the Trust’s assets and/or liabilities are held at carrying amount, which approximates fair value for financial statement purposes. As of October 31, 2013, such assets and/or liabilities are categorized within the disclosure hierarchy as follows: |
|
| Level 1
|
| Level 2
|
| Level 3
|
| Total
|
Assets: | | | | | | | | | | | | | | | | |
Cash | | $ | 14,251 | | | | — | | | | — | | | $ | 14,251 | |
Cash pledged for financial futures contracts | | | 25,000 | | | | — | | | | — | | | | 25,000 | |
Liabilities: | | | | | | | | | | | | | | | | |
TOB trust certificates | | | — | | | $ | (675,000 | ) | | | — | | | | (675,000 | ) |
VRDP Shares | | | — | | | | (16,300,000 | ) | | | — | | | | (16,300,000 | ) |
Total | | $ | 39,251 | | | $ | (16,975,000 | ) | | | — | | | $ | (16,935,749 | ) |
| There were no transfers between levels during the six months ended October 31, 2013. |
See Notes to Financial Statements.
| SEMI-ANNUAL REPORT | OCTOBER 31, 2013 | 43
|
| |
| Schedule of Investments October 31, 2013 (Unaudited) | BlackRock Strategic Municipal Trust (BSD)
(Percentages shown are based on Net Assets)
|
| Municipal Bonds | | | | Par
(000) | | Value |
Alabama — 1.2% | | | | | | | | | | |
Alabama State Docks Department, Refunding RB, 6.00%, 10/01/40 | | | | $ | 655 | | | $ | 729,263 | |
County of Jefferson Alabama, RB, Limited Obligation School, Series A, 5.25%, 1/01/19 | | | | | 465 | | | | 461,689 | |
| | | | | | | | | 1,190,952 | |
Alaska — 1.0% | | | | | | | | | | |
Northern Tobacco Securitization Corp., Refunding RB, Tobacco Settlement, Asset-Backed, Series A: | | | | | | | | | | |
4.63%, 6/01/23 | | | | | 660 | | | | 620,209 | |
5.00%, 6/01/46 | | | | | 530 | | | | 364,603 | |
| | | | | | | | | 984,812 | |
Arizona — 1.7% | | | | | | | | | | |
Salt Verde Financial Corp., RB, Senior, 5.00%, 12/01/37 | | | | | 1,000 | | | | 1,004,140 | |
San Luis Facility Development Corp., RB, Senior Lien Project, Regional Detention Center Project: | | | | | | | | | | |
6.25%, 5/01/15 | | | | | 90 | | | | 87,790 | |
7.00%, 5/01/20 | | | | | 210 | | | | 190,892 | |
7.25%, 5/01/27 | | | | | 420 | | | | 337,546 | |
| | | | | | | | | 1,620,368 | |
California — 9.7% | | | | | | | | | | |
Bay Area Toll Authority, Refunding RB, San Francisco Bay Area Toll Bridge, Series F-1, 5.63%, 4/01/44 | | | | | 720 | | | | 773,906 | |
California County Tobacco Securitization Agency, RB, CAB, Stanislaus, Sub-Series C, 12.13%, 6/01/55 (a) | | | | | 3,095 | | | | 23,120 | |
California Health Facilities Financing Authority, RB, Sutter Health, Series B, 6.00%, 8/15/42 | | | | | 1,010 | | | | 1,164,873 | �� |
California Health Facilities Financing Authority, Refunding RB, St. Joseph Health System, Series A, 5.00%, 7/01/33 | | | | | 400 | | | | 412,032 | |
California Pollution Control Financing Authority, RB: | | | | | | | | | | |
Poseidon Resources (Channel Side) LP Desalination Project, AMT, 5.00%, 7/01/37 (b) | | | | | 325 | | | | 286,787 | |
Poseidon Resources (Channel Side) LP Desalination Project, AMT, 5.00%, 11/21/45 (b) | | | | | 810 | | | | 679,250 | |
San Diego County Water Authority Desalination Project Pipeline, 5.00%, 11/21/45 | | | | | 390 | | | | 346,343 | |
California State Public Works Board, RB: | | | | | | | | | | |
Department of Corrections and Rehabilitation, Series F, 5.25%, 9/01/33 | | | | | 915 | | | | 968,985 | |
Various Capital Projects, Sub-Series I-1, 6.38%, 11/01/34 | | | | | 375 | | | | 431,760 | |
City of Los Angeles California Department of Airports, Refunding RB, Los Angeles International Airport, Series A: | | | | | | | | | | |
5.25%, 5/15/39 | | | | | 250 | | | | 266,835 | |
Senior, 5.00%, 5/15/40 | | | | | 1,875 | | | | 1,911,600 | |
San Diego Community College District, GO, Election of 2006, 5.00%, 8/01/43 | | | | | 340 | | | | 359,047 | |
State of California, GO, Various Purpose: | | | | | | | | | | |
6.00%, 3/01/33 | | | | | 800 | | | | 935,448 | |
6.50%, 4/01/33 | | | | | 650 | | | | 774,033 | |
| | | | | | | | | 9,334,019 | |
Colorado — 2.0% | | | | | | | | | | |
Colorado Health Facilities Authority, Refunding RB, Catholic Health Initiative, Series A, 5.50%, 7/01/34 | | | | | 680 | | | | 744,736 | |
Colorado State Board of Governors, Refunding RB, State University System Enterprise, Series A, 5.00%, 3/01/43 | | | | | 370 | | | | 389,984 | |
Park Creek Metropolitan District, Refunding RB, Senior, Limited Property Tax, 5.50%, 12/01/37 | | | | | 440 | | | | 449,829 | |
Regional Transportation District, COP, Refunding, Series A, 5.38%, 6/01/31 | | | | | 320 | | | | 339,811 | |
| | | | | | | | | 1,924,360 | |
| | | | | | | | | | | |
| Municipal Bonds | | | | Par
(000) | | Value |
Delaware — 2.1% | | | | | | | | | | |
County of Sussex Delaware, RB, NRG Energy, Inc., Indian River Project, 6.00%, 10/01/40 | | | | $ | 820 | | | $ | 843,313 | |
Delaware State EDA, RB, Exempt Facilities, Indian River Power, 5.38%, 10/01/45 | | | | | 1,280 | | | | 1,213,696 | |
| | | | | | | | | 2,057,009 | |
District of Columbia — 1.9% | | | | | | | | | | |
District of Columbia, Tax Allocation Bonds, City Market at O Street Project, 5.13%, 6/01/41 | | | | | 690 | | | | 691,042 | |
Metropolitan Washington Airports Authority, Refunding RB, 1st Senior Lien, Series A: | | | | | | | | | | |
5.00%, 10/01/39 | | | | | 160 | | | | 160,237 | |
5.25%, 10/01/44 | | | | | 1,000 | | | | 1,012,620 | |
| | | | | | | | | 1,863,899 | |
Florida — 7.2% | | | | | | | | | | |
County of Hillsborough Florida IDA, RB, National Gypsum Co., AMT, Series A, 7.13%, 4/01/30 | | | | | 1,500 | | | | 1,504,245 | |
County of Tampa-Hillsborough Florida Expressway Authority, Refunding RB: | | | | | | | | | | |
Series A, 5.00%, 7/01/37 | | | | | 630 | | | | 643,287 | |
Series B, 5.00%, 7/01/42 | | | | | 790 | | | | 798,809 | |
Miami Beach Health Facilities Authority, RB, Mount Sinai Medical Center Florida, 6.75%, 11/15/21 | | | | | 925 | | | | 973,192 | |
Mid-Bay Bridge Authority, RB, Springing Lien, Series A, 7.25%, 10/01/40 | | | | | 950 | | | | 1,044,610 | |
Sumter Landing Community Development District Florida, RB, Sub-Series B, 5.70%, 10/01/38 | | | | | 1,465 | | | | 1,203,351 | |
Village Community Development District No. 10, Special Assessment Bonds, 5.13%, 5/01/43 | | | | | 785 | | | | 713,636 | |
| | | | | | | | | 6,881,130 | |
Georgia — 1.5% | | | | | | | | | | |
DeKalb Private Hospital Authority, Refunding RB, Children’s Healthcare, 5.25%, 11/15/39 | | | | | 265 | | | | 270,904 | |
Metropolitan Atlanta Rapid Transit Authority, RB, Sale Tax, Third Indenture, Series A, 5.00%, 7/01/39 | | | | | 1,095 | | | | 1,131,978 | |
| | | | | | | | | 1,402,882 | |
Hawaii — 0.5% | | | | | | | | | | |
State of Hawaii Harbor System, RB, Series A, 5.25%, 7/01/30 | | | | | 425 | | | | 457,083 | |
Illinois — 15.6% | | | | | | | | | | |
Chicago Illinois Transit Authority, RB, Sales Tax Receipts, 5.25%, 12/01/40 | | | | | 330 | | | | 335,415 | |
City of Chicago Illinois, GARB, O’Hare International Airport Third Lien: | | | | | | | | | | |
Series A, 5.63%, 1/01/35 | | | | | 800 | | | | 830,232 | |
Series A, 5.75%, 1/01/39 | | | | | 1,500 | | | | 1,562,370 | |
Series C, 6.50%, 1/01/41 | | | | | 1,855 | | | | 2,086,022 | |
City of Chicago Illinois, GO, Project, Series A, 5.00%, 1/01/34 | | | | | 1,430 | | | | 1,343,413 | |
City of Chicago Illinois, Refunding RB, Sales Tax, Series A, 5.25%, 1/01/38 | | | | | 260 | | | | 271,380 | |
City of Chicago Illinois Waterworks Revenue, Refunding RB, Second Lien Project, 5.00%, 11/01/42 | | | | | 915 | | | | 905,328 | |
County of Cook Illinois Community College District No. 508, GO, City College of Chicago, 5.50%, 12/01/38 | | | | | 245 | | | | 257,172 | |
Illinois Finance Authority, Refunding RB: | | | | | | | | | | |
Ascension Health, Series A, 5.00%, 11/15/37 | | | | | 305 | | | | 306,598 | |
Central Dupage Health, Series B, 5.50%, 11/01/39 | | | | | 2,500 | | | | 2,639,425 | |
Friendship Village Schaumburg, Series A, 5.63%, 2/15/37 | | | | | 145 | | | | 127,583 | |
Illinois State Toll Highway Authority, RB, Series A, 5.00%, 1/01/38 | | | | | 730 | | | | 731,548 | |
Metropolitan Pier & Exposition Authority, Refunding RB, McCormick Place Expansion Project: | | | | | | | | | | |
CAB, Series B (AGM), 6.05%, 6/15/44 (a) | | | | | 2,980 | | | | 480,346 | |
Series B (AGM), 5.00%, 6/15/50 | | | | | 990 | | | | 972,715 | |
See Notes to Financial Statements.
| 44 | SEMI-ANNUAL REPORT | OCTOBER 31, 2013
|
| |
| Schedule of Investments (continued) | BlackRock Strategic Municipal Trust (BSD)
(Percentages shown are based on Net Assets)
|
| Municipal Bonds | | | | Par
(000) | | Value |
Illinois (concluded) | | | | | | | | | | |
Metropolitan Pier & Exposition Authority, Refunding RB, McCormick Place Expansion Project (concluded): | | | | | | | | | | |
Series B-2, 5.00%, 6/15/50 | | | | $ | 785 | | | $ | 754,408 | |
Railsplitter Tobacco Settlement Authority, RB: | | | | | | | | | | |
5.50%, 6/01/23 | | | | | 175 | | | | 192,432 | |
6.00%, 6/01/28 | | | | | 940 | | | | 1,007,868 | |
State of Illinois, RB, Build Illinois, Series B, 5.25%, 6/15/34 | | | | | 200 | | | | 206,966 | |
| | | | | | | | | 15,011,221 | |
Indiana — 5.5% | | | | | | | | | | |
Carmel Redevelopment Authority, Refunding RB, Multipurpose, Series A: | | | | | | | | | | |
4.00%, 8/01/35 | | | | | 355 | | | | 331,925 | |
4.00%, 2/01/38 | | | | | 570 | | | | 517,970 | |
Indiana Finance Authority, RB, Series A: | | | | | | | | | | |
Private Activity Bond, Ohio River Bridges East End Crossing Project, AMT, 5.00%, 7/01/44 | | | | | 140 | | | | 124,939 | |
Private Activity Bond, Ohio River Bridges East End Crossing Project, AMT, 5.00%, 7/01/48 | | | | | 465 | | | | 409,660 | |
Sisters of St. Francis Health, 5.25%, 11/01/39 | | | | | 270 | | | | 275,565 | |
Wastewater Utility (CWA Authority Project), First Lien, 5.25%, 10/01/38 | | | | | 1,020 | | | | 1,056,006 | |
Indiana Finance Authority, Refunding RB, Community Health Network Project, Series A, 5.00%, 5/01/42 | | | | | 595 | | | | 580,000 | |
Indiana Health Facility Financing Authority, Refunding RB, Methodist Hospital, Inc., 5.38%, 9/15/22 | | | | | 1,060 | | | | 1,061,283 | |
Indiana Municipal Power Agency, RB, Series B, 6.00%, 1/01/39 | | | | | 350 | | | | 388,738 | |
Indianapolis Local Public Improvement Bond Bank, RB, Series A: | | | | | | | | | | |
5.00%, 1/15/36 | | | | | 125 | | | | 130,522 | |
5.00%, 1/15/40 | | | | | 400 | | | | 413,388 | |
| | | | | | | | | 5,289,996 | |
Iowa — 2.1% | | | | | | | | | | |
Iowa Finance Authority, RB, Midwestern Disaster Area, Alcoa, Inc. Project, 4.75%, 8/01/42 | | | | | 365 | | | | 308,078 | |
Iowa Finance Authority, Refunding RB, Midwestern Disaster Area, Iowa Fertilizer Co. Project: | | | | | | | | | | |
5.00%, 12/01/19 | | | | | 300 | | | | 290,814 | |
5.50%, 12/01/22 | | | | | 730 | | | | 697,800 | |
5.25%, 12/01/25 | | | | | 145 | | | | 132,360 | |
Iowa Student Loan Liquidity Corp., Refunding RB, Student Loan, Senior Series A-1, AMT, 5.15%, 12/01/22 | | | | | 565 | | | | 585,758 | |
| | | | | | | | | 2,014,810 | |
Kentucky — 3.7% | | | | | | | | | | |
Kentucky Economic Development Finance Authority, RB, Series A: | | | | | | | | | | |
Catholic Health Initiatives, 5.25%, 1/01/45 (c) | | | | | 310 | | | | 308,562 | |
Owensboro Medical Health System, 6.38%, 6/01/40 | | | | | 200 | | | | 210,852 | |
Kentucky Economic Development Finance Authority, Refunding RB, Norton Healthcare, Inc., Series B (NPFGC), 4.53%, 10/01/24 (a) | | | | | 5,000 | | | | 3,066,150 | |
| | | | | | | | | 3,585,564 | |
Louisiana — 3.3% | | | | | | | | | | |
Louisiana Local Government Environmental Facilities & Community Development Authority, RB, Westlake Chemical Corp. Projects, Series A-1, 6.50%, 11/01/35 | | | | | 1,055 | | | | 1,135,897 | |
State of Louisiana Gasoline & Fuels Tax Revenue, RB, Second Lien, Series B, 5.00%, 5/01/45 | | | | | 575 | | | | 593,992 | |
Tobacco Settlement Financing Corp., Refunding RB, Asset-Backed, Series A: | | | | | | | | | | |
5.50%, 5/15/30 | | | | | 320 | | | | 326,144 | |
| | | | | | | | | | | |
| Municipal Bonds | | | | Par
(000) | | Value |
Louisiana (concluded) | | | | | | | | | | |
Tobacco Settlement Financing Corp., Refunding RB, Asset-Backed, Series A (concluded): | | | | | | | | | | |
5.25%, 5/15/31 | | | | $ | 270 | | | $ | 268,464 | |
5.25%, 5/15/32 | | | | | 345 | | | | 341,367 | |
5.25%, 5/15/33 | | | | | 375 | | | | 369,585 | |
5.25%, 5/15/35 | | | | | 160 | | | | 156,962 | |
| | | | | | | | | 3,192,411 | |
Maine — 1.1% | | | | | | | | | | |
Maine Turnpike Authority, RB, Series A, 5.00%, 7/01/42 | | | | | 1,000 | | | | 1,043,520 | |
Maryland — 3.2% | | | | | | | | | | |
Maryland EDC, RB, Transportation Facilities Project, Series A, 5.75%, 6/01/35 | | | | | 135 | | | | 136,709 | |
Maryland EDC, Refunding RB, CNX Marine Terminals, Inc., 5.75%, 9/01/25 | | | | | 1,000 | | | | 1,040,540 | |
Maryland Health & Higher Educational Facilities Authority, RB, Ascension Health Alliance, Series B, 5.00%, 11/15/51 | | | | | 1,185 | | | | 1,185,747 | |
Maryland Health & Higher Educational Facilities Authority, Refunding RB, Charlestown Community Project, 6.25%, 1/01/41 | | | | | 690 | | | | 724,831 | |
| | | | | | | | | 3,087,827 | |
Massachusetts — 1.7% | | | | | | | | | | |
Massachusetts Development Finance Agency, RB, Wellesley College, Series J, 5.00%, 7/01/42 | | | | | 570 | | | | 599,845 | |
Massachusetts Health & Educational Facilities Authority, Refunding RB, Partners Healthcare System, Series J1, 5.00%, 7/01/39 | | | | | 570 | | | | 579,234 | |
Massachusetts School Building Authority, RB, Dedicated Sales Tax, Senior Series A, 5.00%, 5/15/43 | | | | | 445 | | | | 468,087 | |
| | | | | | | | | 1,647,166 | |
Michigan — 5.0% | | | | | | | | | | |
City of Detroit Michigan Sewage Disposal System, Refunding RB, Senior Lien, Series A: | | | | | | | | | | |
5.00%, 7/01/32 | | | | | 495 | | | | 448,594 | |
5.25%, 7/01/39 | | | | | 1,925 | | | | 1,769,960 | |
City of Lansing Michigan, RB, Board of Water & Light, Series A, 5.50%, 7/01/41 | | | | | 465 | | | | 498,578 | |
Kalamazoo Hospital Finance Authority, Refunding RB, Bronson Methodist Hospital, 5.50%, 5/15/36 | | | | | 435 | | | | 444,078 | |
Michigan State Hospital Finance Authority, Refunding RB, Henry Ford Health System, Series A, 5.25%, 11/15/46 | | | | | 500 | | | | 483,840 | |
Royal Oak Hospital Finance Authority, Refunding RB, William Beaumont Hospital, 8.25%, 9/01/39 | | | | | 1,000 | | | | 1,202,880 | |
| | | | | | | | | 4,847,930 | |
Missouri — 0.4% | | | | | | | | | | |
Bi-State Development Agency of the Missouri-Illinois Metropolitan District, Refunding RB, Combined Lien, Series A, 5.00%, 10/01/44 | | | | | 80 | | | | 82,730 | |
Missouri State Health & Educational Facilities Authority, RB, Senior Living Facilities, Lutheran Senior Services, 5.50%, 2/01/42 | | | | | 330 | | | | 330,314 | |
| | | | | | | | | 413,044 | |
Nebraska — 1.5% | | | | | | | | | | |
Central Plains Energy Project Nebraska, RB, Gas Project No. 3: | | | | | | | | | | |
5.25%, 9/01/37 | | | | | 260 | | | | 267,387 | |
5.00%, 9/01/42 | | | | | 455 | | | | 444,776 | |
Douglas County Hospital Authority No. 2, Refunding RB, Health Facilities, Immanuel Obligation Group, 5.63%, 1/01/40 | | | | | 720 | | | | 744,732 | |
| | | | | | | | | 1,456,895 | |
Nevada — 1.0% | | | | | | | | | | |
County of Clark Nevada, Refunding RB, Alexander Dawson School Nevada Project, 5.00%, 5/15/29 | | | | | 880 | | | | 911,821 | |
See Notes to Financial Statements.
| SEMI-ANNUAL REPORT | OCTOBER 31, 2013 | 45
|
| |
| Schedule of Investments (continued) | BlackRock Strategic Municipal Trust (BSD)
(Percentages shown are based on Net Assets)
|
| Municipal Bonds | | | | Par
(000) | | Value |
New Jersey — 8.0% | | | | | | | | | | |
Middlesex County Improvement Authority, RB, Subordinate, Heldrich Center Hotel, Sub-Series B, 6.25%, 1/01/37 (d)(e) | | | | $ | 645 | | | $ | 45,066 | |
New Jersey EDA, RB, Continental Airlines, Inc. Project, AMT: | | | | | | | | | | |
5.13%, 9/15/23 | | | | | 1,090 | | | | 1,039,151 | |
5.25%, 9/15/29 | | | | | 145 | | | | 133,261 | |
New Jersey EDA, Refunding, Special Assessment Kapkowski Road Landfill Project, 5.75%, 4/01/31 | | | | | 705 | | | | 693,544 | |
New Jersey State Turnpike Authority, RB: | | | | | | | | | | |
Series A, 5.00%, 1/01/38 | | | | | 410 | | | | 425,449 | |
Series A, 5.00%, 1/01/43 | | | | | 1,625 | | | | 1,662,765 | |
Series E, 5.25%, 1/01/40 | | | | | 1,355 | | | | 1,422,316 | |
New Jersey Transportation Trust Fund Authority, RB, Transportation System: | | | | | | | | | | |
Series A, 5.50%, 6/15/41 | | | | | 575 | | | | 605,280 | |
Series B, 5.25%, 6/15/36 | | | | | 775 | | | | 814,664 | |
Rutgers The State University of New Jersey, Refunding RB, Series L: | | | | | | | | | | |
5.00%, 5/01/38 | | | | | 160 | | | | 169,813 | |
5.00%, 5/01/43 | | | | | 165 | | | | 173,405 | |
Tobacco Settlement Financing Corp. New Jersey, Refunding RB, Series 1A, 4.50%, 6/01/23 | | | | | 540 | | | | 499,522 | |
| | | | | | | | | 7,684,236 | |
New York — 9.6% | | | | | | | | | | |
Albany Industrial Development Agency, RB, New Covenant Charter School Project, Series A, 7.00%, 5/01/35 (d)(e) | | | | | 315 | | | | 53,556 | |
City of New York New York IDA, RB, British Airways PLC Project, AMT, 7.63%, 12/01/32 | | | | | 1,000 | | | | 1,004,700 | |
New York City Industrial Development Agency, RB, American Airlines, Inc., JFK International Airport, AMT, 7.75%, 8/01/31 (f) | | | | | 3,000 | | | | 3,251,130 | |
New York City Transitional Finance Authority Future Tax Secured, RB, Fiscal 2012, Sub-Series E-1, 5.00%, 2/01/42 | | | | | 770 | | | | 807,052 | |
New York Liberty Development Corp., Refunding RB, Second Priority, Bank of America Tower at One Bryant Park Project, Class 3, 6.38%, 7/15/49 | | | | | 385 | | | | 407,857 | |
New York State Dormitory Authority, RB, Series F, 5.00%, 3/15/35 | | | | | 2,145 | | | | 2,216,386 | |
New York State Dormitory Authority, Refunding RB, General Purpose, Series A, 5.00%, 6/15/31 | | | | | 560 | | | | 606,878 | |
Port Authority of New York & New Jersey, ARB, Special Project, JFK International Air Terminal LLC Project, Series 8: | | | | | | | | | | |
6.00%, 12/01/36 | | | | | 410 | | | | 442,292 | |
6.00%, 12/01/42 | | | | | 395 | | | | 423,649 | |
| | | | | | | | | 9,213,500 | |
North Carolina — 0.7% | | | | | | | | | | |
North Carolina Medical Care Commission, RB, Health Care Facilities, Duke University Health System, Series A, 5.00%, 6/01/42 | | | | | 440 | | | | 446,398 | |
North Carolina Medical Care Commission, Refunding RB, Retirement Facilities, First Mortgage, Whitestone Project, Series A, 7.75%, 3/01/41 | | | | | 185 | | | | 195,210 | |
| | | | | | | | | 641,608 | |
Ohio — 2.0% | | | | | | | | | | |
County of Montgomery Ohio, Refunding RB, Catholic Health, Series A, 5.00%, 5/01/39 | | | | | 885 | | | | 867,504 | |
State of Ohio, RB, Ford Motor Co. Project, AMT, 5.75%, 4/01/35 | | | | | 1,000 | | | | 1,009,270 | |
| | | | | | | | | 1,876,774 | |
| | | | | | | | | | | |
| Municipal Bonds | | | | Par
(000) | | Value |
Oregon — 0.8% | | | | | | | | | | |
City of Tigard Oregon, Refunding RB, Water System, 5.00%, 8/01/37 | | | | $ | 80 | | | $ | 83,924 | |
Oregon State Facilities Authority, RB, 5.00%, 7/01/44 | | | | | 715 | | | | 720,455 | |
| | | | | | | | | 804,379 | |
Pennsylvania — 0.6% | | | | | | | | | | |
Pennsylvania Economic Development Financing Authority, RB, Aqua Pennsylvania, Inc. Project, 5.00%, 11/15/40 | | | | | 600 | | | | 610,932 | |
South Carolina — 1.1% | | | | | | | | | | |
South Carolina State Ports Authority, RB, 5.25%, 7/01/40 | | | | | 1,040 | | | | 1,080,186 | |
Tennessee — 0.5% | | | | | | | | | | |
City of Chattanooga Tennessee Health Educational & Housing Facility Board, RB, Catholic Health Initiatives, Series A, 5.25%, 1/01/45 (c) | | | | | 430 | | | | 428,005 | |
County of Rutherford Tennessee Health & Educational Facilities Board, RB, Ascension Health, Series C, 5.00%, 11/15/47 | | | | | 65 | | | | 66,031 | |
| | | | | | | | | 494,036 | |
Texas — 16.9% | | | | | | | | | | |
Brazos River Authority, RB, TXU Electric, Series A, AMT, 8.25%, 10/01/30 (d)(e) | | | | | 730 | | | | 10,943 | |
Central Texas Regional Mobility Authority, Refunding RB: | | | | | | | | | | |
Senior Lien, 6.25%, 1/01/46 | | | | | 680 | | | | 695,273 | |
Senior Lien, Series A, 5.00%, 1/01/33 | | | | | 30 | | | | 29,099 | |
Sub-Lien, 5.00%, 1/01/33 | | | | | 115 | | | | 104,307 | |
Sub-Lien, 5.00%, 1/01/42 | | | | | 100 | | | | 86,357 | |
City of Dallas Texas Waterworks & Sewer System, Refunding RB, 5.00%, 10/01/35 | | | | | 475 | | | | 501,382 | |
City of Houston Texas Airport System, Refunding ARB, Senior Lien, Series A, 5.50%, 7/01/39 | | | | | 485 | | | | 532,428 | |
City of Houston Texas Utility System, Refunding RB, Combined First Lien, Series A (AGC), 6.00%, 11/15/35 | | | | | 2,730 | | | | 3,103,491 | |
City of San Antonio Texas Public Service Board, RB, Electric & Gas Systems, Junior Lien, 5.00%, 2/01/43 | | | | | 785 | | | | 819,210 | |
Clifton Higher Education Finance Corp., RB, Series B, 6.00%, 8/15/43 | | | | | 230 | | | | 238,593 | |
County of Midland Texas Fresh Water Supply District No. 1, RB, CAB, City of Midland Projects, Series A, 5.01%, 9/15/37 (a) | | | | | 4,935 | | | | 1,514,502 | |
County of Tarrant Texas Cultural Education Facilities Finance Corp., RB, Scott & White Healthcare, 6.00%, 8/15/45 | | | | | 1,270 | | | | 1,446,593 | |
County of Tarrant Texas Cultural Education Facilities Finance Corp., Refunding RB, Scott & White Healthcare, Series A, 5.00%, 8/15/43 | | | | | 115 | | | | 115,168 | |
Dallas-Fort Worth International Airport, Refunding ARB, Joint Improvement, Series E, AMT, 5.00%, 11/01/35 | | | | | 565 | | | | 553,191 | |
Fort Bend County Industrial Development Corp., RB, NRG Energy Project, Series B, 4.75%, 11/01/42 | | | | | 465 | | | | 402,099 | |
Harris County-Houston Sports Authority, Refunding RB, CAB, Senior Lien, Series A (NPFGC), 6.46%, 11/15/38 (a) | | | | | 4,750 | | | | 966,767 | |
La Joya Independent School District, GO, Refunding, 4.00%, 2/15/32 | | | | | 1,400 | | | | 1,401,988 | |
La Vernia Higher Education Finance Corp., RB, Kipp, Inc., Series A, 6.38%, 8/15/44 | | | | | 500 | | | | 532,590 | |
Matagorda County Navigation District No. 1, Refunding RB, AEP Texas Central Co. Project, 4.00%, 6/01/30 | | | | | 340 | | | | 304,807 | |
North Texas Tollway Authority, RB, CAB, Special Project System, Series B, 6.04%, 9/01/37 (a) | | | | | 640 | | | | 154,970 | |
North Texas Tollway Authority, Refunding RB, Second Tier System, Series F, 6.13%, 1/01/31 | | | | | 1,025 | | | | 1,095,674 | |
See Notes to Financial Statements.
| 46 | SEMI-ANNUAL REPORT | OCTOBER 31, 2013
|
| |
| Schedule of Investments (continued) | BlackRock Strategic Municipal Trust (BSD)
(Percentages shown are based on Net Assets)
|
| Municipal Bonds | | | | Par
(000) | | Value |
Texas (concluded) | | | | | | | | | | |
Texas Private Activity Bond Surface Transportation Corp., RB, Senior Lien: | | | | | | | | | | |
LBJ Infrastructure Group LLC, LBJ Freeway Managed Lanes Project, 7.00%, 6/30/40 | | | | $ | 1,000 | | | $ | 1,091,400 | |
NTE Mobility Partners LLC, North Tarrant Express Managed Lanes Project, 6.88%, 12/31/39 | | | | | 500 | | | | 539,555 | |
| | | | | | | | | 16,240,387 | |
Utah — 0.9% | | | | | | | | | | |
County of Utah Utah, RB, IHC Health Services, Inc., 5.00%, 5/15/43 | | | | | 635 | | | | 650,608 | |
University of Utah, RB, General, Series A, 5.00%, 8/01/43 | | | | | 195 | | | | 204,183 | |
| | | | | | | | | 854,791 | |
Virginia — 6.4% | | | | | | | | | | |
City of Norfolk Virginia Parking System, Refunding RB, Series B (AMBAC), 5.50%, 2/01/31 | | | | | 355 | | | | 355,366 | |
County of Fairfax Virginia EDA, Refunding RB, Goodwin House, Inc., 5.13%, 10/01/42 | | | | | 1,000 | | | | 1,002,240 | |
University of Virginia, Refunding RB, 5.00%, 6/01/40 | | | | | 2,500 | | | | 2,680,425 | |
Virginia Small Business Financing Authority, RB, Senior Lien, Elizabeth River Crossings LLC Project, AMT: | | | | | | | | | | |
5.25%, 1/01/32 | | | | | 250 | | | | 247,385 | |
6.00%, 1/01/37 | | | | | 1,845 | | | | 1,910,331 | |
| | | | | | | | | 6,195,747 | |
Washington — 0.8% | | | | | | | | | | |
Washington Health Care Facilities Authority, RB, Catholic Health Initiatives, Series A, 5.75%, 1/01/45 (c) | | | | | 715 | | | | 748,105 | |
Wisconsin — 3.3% | | | | | | | | | | |
Wisconsin Health & Educational Facilities Authority, Ascension Health Credit Group, Series A, 5.00%, 11/15/31 | | | | | 2,000 | | | | 2,120,060 | |
WPPI Energy Wisconsin, Refunding RB, Power Supply System, Series A: | | | | | | | | | | |
5.00%, 7/01/29 | | | | | 120 | | | | 128,937 | |
5.00%, 7/01/30 | | | | | 150 | | | | 159,690 | |
5.00%, 7/01/31 | | | | | 330 | | | | 349,434 | |
5.00%, 7/01/37 | | | | | 395 | | | | 405,333 | |
| | | | | | | | | 3,163,454 | |
Wyoming — 1.7% | | | | | | | | | | |
County of Sweetwater Wyoming, Refunding RB, Idaho Power Co. Project, Remarketing, 5.25%, 7/15/26 | | | | | 975 | | | | 1,050,572 | |
Wyoming Municipal Power Agency, Inc., RB, Series A: | | | | | | | | | | |
5.00%, 1/01/42 | | | | | 95 | | | | 95,552 | |
5.38%, 1/01/42 | | | | | 500 | | | | 532,855 | |
| | | | | | | | | 1,678,979 | |
Total Municipal Bonds — 126.2% | | | | | | | | | 121,505,833 | |
|
Municipal Bonds Transferred to
Tender Option Bond Trusts (g) |
Alabama — 0.8% | | | | | | | | | | |
City of Birmingham Alabama Special Care Facilities Financing Authority, Refunding RB, Ascension Health, Senior Credit Series C-2, 5.00%, 11/15/36 | | | | | 760 | | | | 764,997 | |
California — 5.6% | | | | | | | | | | |
California Educational Facilities Authority, RB, University of Southern California, Series B, 5.25%, 10/01/39 (h) | | | | | 855 | | | | 915,645 | |
City & County of San Francisco California Public Utilities Commission, RB, Water Revenue, Series B, 5.00%, 11/01/39 | | | | | 2,970 | | | | 3,102,937 | |
| | | | | | | | | | | |
Municipal Bonds Transferred to
Tender Option Bond Trusts (g) | | | | Par
(000) | | Value |
California (concluded) | | | | | | | | | | |
Los Angeles Community College District California, GO, Election of 2001, Series A (AGM), 5.00%, 8/01/32 | | | | $ | 740 | | | $ | 780,693 | |
San Diego Community College District California, GO, Election of 2002, 5.25%, 8/01/33 | | | | | 553 | | | | 617,149 | |
| | | | | | | | | 5,416,424 | |
Colorado — 2.1% | | | | | | | | | | |
Colorado Health Facilities Authority, RB, Catholic Health (AGM): | | | | | | | | | | |
Series C-3, 5.10%, 10/01/41 | | | | | 1,210 | | | | 1,216,268 | |
Series C-7, 5.00%, 9/01/36 | | | | | 780 | | | | 784,992 | |
| | | | | | | | | 2,001,260 | |
Connecticut — 3.4% | | | | | | | | | | |
Connecticut State Health & Educational Facility Authority, RB, Yale University: | | | | | | | | | | |
Series T-1, 4.70%, 7/01/29 | | | | | 1,580 | | | | 1,648,016 | |
Series X-3, 4.85%, 7/01/37 | | | | | 1,541 | | | | 1,613,422 | |
| | | | | | | | | 3,261,438 | |
Massachusetts — 3.0% | | | | | | | | | | |
Massachusetts School Building Authority, RB, Senior Dedicated Sales Tax, Series B, 5.00%, 10/15/41 | | | | | 720 | | | | 752,334 | |
Massachusetts Water Resources Authority, Refunding RB, General, Series A, 5.00%, 8/01/41 | | | | | 1,980 | | | | 2,071,417 | |
| | | | | | | | | 2,823,751 | |
New Hampshire — 0.7% | | | | | | | | | | |
New Hampshire Health & Education Facilities Authority, RB, Dartmouth College, 5.25%, 6/01/39 (h) | | | | | 645 | | | | 701,164 | |
New York — 7.0% | | | | | | | | | | |
Hudson Yards Infrastructure Corp., RB, Senior, Series A, 5.75%, 2/15/47 (h) | | | | | 500 | | | | 529,603 | |
New York City Municipal Water Finance Authority, Refunding RB, Water & Sewer System, Second General Resolution, Series FF-2, 5.50%, 6/15/40 | | | | | 510 | | | | 545,951 | |
New York Liberty Development Corp., RB, 1 World Trade Center Port Authority Construction, 5.25%, 12/15/43 | | | | | 3,375 | | | | 3,522,116 | |
New York Liberty Development Corp., Refunding RB, 4 World Trade Center Project, 5.75%, 11/15/51 (h) | | | | | 2,030 | | | | 2,167,086 | |
| | | | | | | | | 6,764,756 | |
Tennessee — 1.4% | | | | | | | | | | |
County of Shelby Tennessee Health Educational & Housing Facilities Board, Refunding RB, St. Jude’s Children’s Research Hospital, 5.00%, 7/01/31 | | | | | 1,280 | | | | 1,357,427 | |
Texas — 4.6% | | | | | | | | | | |
County of Harris Texas, RB, Senior Lien, Toll Road, Series A, 5.00%, 8/15/38 (h) | | | | | 2,142 | | | | 2,300,600 | |
County of Harris Texas Metropolitan Transit Authority, Refunding RB, Series A, 5.00%, 11/01/41 | | | | | 1,080 | | | | 1,117,411 | |
University of Texas System, Refunding RB, Series B, 5.00%, 8/15/43 | | | | | 975 | | | | 1,032,715 | |
| | | | | | | | | 4,450,726 | |
Utah — 1.2% | | | | | | | | | | �� |
City of Riverton Utah, RB, IHC Health Services, Inc., 5.00%, 8/15/41 | | | | | 1,155 | | | | 1,170,262 | |
Virginia — 2.0% | | | | | | | | | | |
University of Virginia, Refunding RB, General, 5.00%, 6/01/40 | | | | | 1,785 | | | | 1,913,386 | |
See Notes to Financial Statements.
| SEMI-ANNUAL REPORT | OCTOBER 31, 2013 | 47
|
| |
| Schedule of Investments (continued) | BlackRock Strategic Municipal Trust (BSD)
(Percentages shown are based on Net Assets)
|
| | | | | | | |
Municipal Bonds Transferred to
Tender Option Bond Trusts (g) | | | | Par
(000) | | Value |
Washington — 3.7% | | | | | | | | | | |
Central Puget Sound Regional Transit Authority, RB, Series A (AGM), 5.00%, 11/01/32 | | | | $ | 900 | | | $ | 947,438 | |
State of Washington, GO, Various Purposes, Series E, 5.00%, 2/01/34 | | | | | 2,400 | | | | 2,584,344 | |
| | | | | | | | | 3,531,782 | |
Total Municipal Bonds Transferred to
Tender Option Bond Trusts — 35.5% | | 34,157,373 | |
Total Long-Term Investments
(Cost — $154,612,358) — 161.7% | | 155,663,206 | |
Short-Term Securities | | | | Shares | | Value |
Money Market Funds — 3.7% | | | | | | | | | | |
FFI Institutional Tax-Exempt Fund, 0.03% (i)(j) | | | | | 3,535,488 | | | $ | 3,535,488 | |
| | | | Par
(000) | | | | |
Pennsylvania — 0.2% | | | | | | | | | | |
Beaver County IDA, Refunding RB, VRDN, Pennsylvania Electric Co. Project, Series B (UBS LOC), 0.05%, 11/01/13 (k) | | | | $ | 200 | | | | 200,000 | |
Total Short-Term Securities
(Cost — $3,735,488) — 3.9% | | | | | | | | | 3,735,488 | |
Total Investments (Cost — $158,347,846) — 165.6% | | | | | | | | | 159,398,694 | |
Other Assets Less Liabilities — 0.2% | | | | | | | | | 87,055 | |
Liability for TOB Trust Certificates, Including Interest Expense and Fees Payable — (21.2%) | | | | | | | | | (20,358,635 | ) |
VMTP Shares, at Liquidation Value — (44.6%) | | | | | | | | | (42,900,000 | ) |
Net Assets Applicable to Common Shares — 100.0% | | | | | | | | $ | 96,227,114 | |
Notes to Schedule of Investments
| (a) | | | | Represents a zero-coupon bond. Rate shown reflects the current yield as of report date. |
| (b) | | | | Security exempt from registration pursuant to Rule 144A under the Securities Act of 1933, as amended. These securities may be resold in transactions exempt from registration to qualified institutional investors. |
| (c) | | | | When-issued security. Unsettled when-issued transactions were as follows: |
|
Counterparty
|
|
|
| Value
|
| Unrealized
Appreciation
|
Morgan Stanley & Co. LLC | | | | $ | 1,484,671 | | | $ | 29,767 | |
| (d) | | | | Non-income producing security. |
| (e) | | | | Issuer filed for bankruptcy and/or is in default of principal and/or interest payments. |
| (f) | | | | Variable rate security. Rate shown is as of report date. |
| (g) | | | | Represent bonds transferred to a TOB. In exchange the Trust acquired residual interest certificates. These bonds serve as collateral in a financing transaction. See Note 3 of the Notes to Financial Statements for details of municipal bonds transferred to TOBs. |
| (h) | | | | All or a portion of security is subject to a recourse agreement, which may require the Trust to pay the liquidity provider in the event there is a shortfall between the TOB trust certificates and proceeds received from the sale of the security contributed to the TOB trust. In the case of a shortfall, the aggregate maximum potential amount the Trust could ultimately be required to pay under the agreements, which expire from October 1, 2016 to February 15, 2031 is $4,041,631. |
| (i) | | | | Investments in issuers considered to be an affiliate of the Trust during the six months ended October 31, 2013, for purposes of Section 2(a)(3) of the 1940 Act, were as follows: |
| |
Affiliate
|
|
|
| Shares Held at
April 30, 2013
|
| Net
Activity
|
| Shares Held at
October 31, 2013
|
| Income
|
FFI Institutional Tax-Exempt Fund | | | | 2,349,913 | | 1,185,575 | | 3,535,488 | | $284 |
| (j) | | | | Represents the current yield as of report date. |
| (k) | | | | Variable rate security. Rate shown is as of report date and maturity shown is the date the principal owed can be recovered through demand. |
| • | | | | Financial futures contracts as of October 31, 2013 were as follows: |
Contracts
Sold
|
| Issue
|
| Exchange
|
| Expiration
|
| Notional
Value
|
| Unrealized
Depreciation
|
| (29) | | 10-Year US Treasury Note | | Chicago Board of Trade | | December 2013 | | $3,693,422 | | $(2,297) |
| • | | | | Fair Value Measurements—Various inputs are used in determining the fair value of investments and derivative financial instruments. These inputs to valuation techniques are categorized into a disclosure hierarchy consisting of three broad levels for financial statement purposes as follows: |
| • | | | | Level 1 — unadjusted price quotations in active markets/exchanges for identical assets or liabilities that the Trust has the ability to access |
| • | | | | Level 2 — other observable inputs (including, but not limited to, quoted prices for similar assets or liabilities in markets that are active, quoted prices for identical or similar assets or liabilities in markets that are not active, inputs other than quoted prices that are observable for the assets or liabilities (such as interest rates, yield curves, volatilities, prepayment speeds, loss severities, credit risks and default rates) or other market-corroborated inputs) |
| • | | | | Level 3 — unobservable inputs based on the best information available in the circumstances, to the extent observable inputs are not available (including the Trust’s own assumptions used in determining the fair value of investments and derivative financial instruments) |
| | | | | The hierarchy gives the highest priority to unadjusted quoted prices in active markets for identical assets or liabilities (Level 1 measurements) and the lowest priority to unobservable inputs (Level 3 measurements). Accordingly, the degree of judgment exercised in determining fair value is greatest for instruments categorized in Level 3. The inputs used to measure fair value may fall into different levels of the fair value hierarchy. In such cases, for disclosure purposes, the fair value hierarchy classification is determined based on the lowest level input that is significant to the fair value measurement in its entirety. |
See Notes to Financial Statements.
| 48 | SEMI-ANNUAL REPORT | OCTOBER 31, 2013
|
| |
| Schedule of Investments (concluded) | BlackRock Strategic Municipal Trust (BSD)
|
Changes in valuation techniques may result in transfers into or out of an assigned level within the disclosure hierarchy. In accordance with the Trust’s policy, transfers between different levels of the fair value disclosure hierarchy are deemed to have occurred as of the beginning of the reporting period. The categorization of a value determined for investments and derivative financial instruments is based on the pricing transparency of the investment and derivative financial instrument and is not necessarily an indication of the risks associated with investing in those securities. For information about the Trust’s policy regarding valuation of investments and derivative financial instruments, please refer to Note 2 of the Notes to Financial Statements. |
The following tables summarize the Trust’s investments and derivative financial instruments categorized in the disclosure hierarchy as of October 31, 2013: |
|
| Level 1
|
| Level 2
|
| Level 3
|
| Total
|
Assets: | | | | | | | | | | | | | | | | |
Investments:
| | | | | | | | | | | | | | | | |
Long-Term Investments1 | | | — | | | $ | 155,663,206 | | | | — | | | $ | 155,663,206 | |
Short-Term Securities | | $ | 3,535,488 | | | | 200,000 | | | | — | | | | 3,735,488 | |
Total | | $ | 3,535,488 | | | $ | 155,863,206 | | | | — | | | $ | 159,398,694 | |
| 1 | See above Schedule of Investments for values in each state or political subdivision. |
|
| Level 1
|
| Level 2
|
| Level 3
|
| Total
|
Derivative Financial Instruments2
| | | | | | | | | | | | | | | | |
Liabilities: | | | | | | | | | | | | | | | | |
Interest rate contracts | | $ | (2,297 | ) | | | — | | | | — | | | $ | (2,297 | ) |
| 2 | Derivative financial instruments are financial futures contracts, which are valued at the unrealized appreciation/depreciation on the instrument. |
Certain of the Trust’s assets and/or liabilities are held at carrying amount, which approximates fair value for financial statement purposes. As of October 31, 2013, such assets and/or liabilities are categorized within the disclosure hierarchy as follows: |
|
| Level 1
|
| Level 2
|
| Level 3
|
| Total
|
Assets: | | | | | | | | | | | | | | | | |
Cash | | $ | 39,328 | | | | — | | | | — | | | $ | 39,328 | |
Cash pledged for financial futures contracts | | | 52,000 | | | | — | | | | — | | | | 52,000 | |
Liabilities: | | | | | | | | | | | | | | | | |
TOB trust certificates | | | — | | | $ | (20,353,920 | ) | | | — | | | | (20,353,920 | ) |
VMTP Shares | | | — | | | | (42,900,000 | ) | | | — | | | | (42,900,000 | ) |
Total | | $ | 91,328 | | | $ | (63,253,920 | ) | | | — | | | $ | (63,162,592 | ) |
There were no transfers between levels during the six months ended October 31, 2013. |
See Notes to Financial Statements.
| SEMI-ANNUAL REPORT | OCTOBER 31, 2013 | 49
|
| |
| Statements of Assets and Liabilities |
|
October 31, 2013
(Unaudited)
| | | | BlackRock
Investment
Quality Municipal
Trust Inc.
(BKN) | | BlackRock
Long-Term
Municipal
Advantage Trust
(BTA) | | BlackRock
Municipal
2020
Term Trust
(BKK) | | BlackRock
Municipal
Income Trust
(BFK) | | BlackRock
Pennsylvania
Strategic
Municipal Trust
(BPS) | | BlackRock
Strategic
Municipal Trust
(BSD) |
| |
Assets
|
Investments at value — unaffiliated1 | | | | $ | 385,631,895 | | | $ | 234,824,087 | | | $ | 429,811,741 | | | $ | 964,548,329 | | | $ | 43,582,682 | | | $ | 155,863,206 | |
Investments at value — affiliated2 | | | | | 11,390,265 | | | | 2,906,749 | | | | 4,891,505 | | | | 19,167,561 | | | | 294,385 | | | | 3,535,488 | |
| Cash | | | | | 115,415 | | | | — | | | | — | | | | 248,246 | | | | 14,251 | | | | 39,328 | |
| Cash pledged for financial futures contracts | | | | | 177,000 | | | | — | | | | — | | | | 323,000 | | | | 25,000 | | | | 52,000 | |
| Interest receivable | | | | | 5,124,166 | | | | 3,536,963 | | | | 5,877,083 | | | | 15,334,013 | | | | 695,940 | | | | 2,434,721 | |
| Investments sold receivable | | | | | 3,062,670 | | | | 521,145 | | | | 165,000 | | | | 1,364,020 | | | | — | | | | 219,500 | |
| Variation margin receivable on financial futures contracts | | | | | 15,625 | | | | — | | | | — | | | | 28,438 | | | | 2,188 | | | | 4,531 | |
| Deferred offering costs | | | | | 88,198 | | | | — | | | | — | | | | 167,205 | | | | 103,065 | | | | 52,637 | |
| TOB trust receivable | | | | | — | | | | 2,500,000 | | | | — | | | | — | | | | — | | | | — | |
| Prepaid expenses | | | | | 6,445 | | | | 6,688 | | | | 16,541 | | | | 16,973 | | | | 2,906 | | | | 3,537 | |
| Total assets | | | | | 405,611,679 | | | | 244,295,632 | | | | 440,761,870 | | | | 1,001,197,785 | | | | 44,720,417 | | | | 162,204,948 | |
| |
Accrued Liabilities
|
| Investments purchased payable | | | | | 11,160,902 | | | | 8,283,529 | | | | 653,976 | | | | 9,493,367 | | | | 377,290 | | | | 2,050,319 | |
| Income dividends payable — Common Shares | | | | | 1,372,766 | | | | 832,179 | | | | 1,259,730 | | | | 3,360,154 | | | | 132,087 | | | | 540,563 | |
| Investment advisory fees payable | | | | | 115,772 | | | | 115,046 | | | | 186,103 | | | | 496,341 | | | | 22,337 | | | | 79,903 | |
| Officer’s and Trustees’ fees payable | | | | | 58,609 | | | | 17,904 | | | | 44,312 | | | | 233,342 | | | | 7,106 | | | | 13,174 | |
| Interest expense and fees payable | | | | | 4,030 | | | | 43,169 | | | | 4,158 | | | | 24,643 | | | | 118 | | | | 4,715 | |
| Administration fees payable | | | | | 49,689 | | | | — | | | | — | | | | — | | | | — | | | | — | |
| Other accrued expenses payable | | | | | 58,766 | | | | 48,759 | | | | 52,908 | | | | 148,637 | | | | 30,168 | | | | 35,240 | |
| Total accrued liabilities | | | | | 12,820,534 | | | | 9,340,586 | | | | 2,201,187 | | | | 13,756,484 | | | | 569,106 | | | | 2,723,914 | |
| |
Other Liabilities
|
| TOB trust certificates | | | | | 21,799,254 | | | | 82,982,165 | | | | 3,750,000 | | | | 122,400,226 | | | | 675,000 | | | | 20,353,920 | |
VRDP Shares, at liquidation value of $100,000 per share3,4,5 | | | | | — | | | | — | | | | — | | | | — | | | | 16,300,000 | | | | — | |
VMTP Shares, at liquidation value of $100,000 per share3,4,5 | | | | | 125,900,000 | | | | — | | | | — | | | | 270,800,000 | | | | — | | | | 42,900,000 | |
| Total other liabilities | | | | | 147,699,254 | | | | 82,982,165 | | | | 3,750,000 | | | | 393,200,226 | | | | 16,975,000 | | | | 63,253,920 | |
| Total liabilities | | | | | 160,519,788 | | | | 92,322,751 | | | | 5,951,187 | | | | 406,956,710 | | | | 17,544,106 | | | | 65,977,834 | |
| |
AMPS at Redemption Value
|
$25,000 per share liquidation preference, plus unpaid dividends3,4,5 | | | | | — | | | | — | | | | 110,101,319 | | | | — | | | | — | | | | — | |
Net Assets Applicable to Common Shareholders | | | | $ | 245,091,891 | | | $ | 151,972,881 | | | $ | 324,709,364 | | | $ | 594,241,075 | | | $ | 27,176,311 | | | $ | 96,227,114 | |
| |
Net Assets Applicable to Common Shareholders Consist of
|
Paid-in capital5,6,7 | | | | $ | 238,431,531 | | | $ | 191,705,313 | | | $ | 291,109,576 | | | $ | 607,702,270 | | | $ | 28,549,623 | | | $ | 103,518,599 | |
| Undistributed net investment income | | | | | 3,119,921 | | | | 1,866,312 | | | | 17,121,140 | | | | 10,651,265 | | | | 433,700 | | | | 1,473,369 | |
| Accumulated net realized loss | | | | | (5,147,995 | ) | | | (41,955,889 | ) | | | (1,116,610 | ) | | | (21,725,054 | ) | | | (2,439,288 | ) | | | (9,813,405 | ) |
| Net unrealized appreciation/depreciation | | | | | 8,688,434 | | | | 357,145 | | | | 17,595,258 | | | | (2,387,406 | ) | | | 632,276 | | | | 1,048,551 | |
Net Assets Applicable to Common Shareholders | | | | $ | 245,091,891 | | | $ | 151,972,881 | | | $ | 324,709,364 | | | $ | 594,241,075 | | | $ | 27,176,311 | | | $ | 96,227,114 | |
| Net asset value per Common Share | | | | $ | 14.28 | | | $ | 11.32 | | | $ | 16.05 | | | $ | 13.28 | | | $ | 13.37 | | | $ | 13.17 | |
1 Investments at cost — unaffiliated | | | | $ | 376,908,214 | | | $ | 234,466,942 | | | $ | 412,216,483 | | | $ | 966,921,318 | | | $ | 42,948,313 | | | $ | 154,812,358 | |
2 Investments at cost — affiliated | | | | $ | 11,390,265 | | | $ | 2,906,749 | | | $ | 4,891,505 | | | $ | 19,167,561 | | | $ | 294,385 | | | $ | 3,535,488 | |
3 Preferred Shares outstanding | | | | | 1,259 | | | | — | | | | 4,404 | | | | 2,708 | | | | 163 | | | | 429 | |
4 Preferred Shares authorized, including Auction Market Preferred Shares (“AMPS”) | | | | | 7,121 | | | | — | | | | unlimited | | | | unlimited | | | | unlimited | | | | unlimited | |
5 Par value per Preferred Share and Common Share | | | | $ | 0.01 | | | $ | 0.001 | | | $ | 0.001 | | | $ | 0.001 | | | $ | 0.001 | | | $ | 0.001 | |
6 Common Shares outstanding | | | | | 17,159,580 | | | | 13,422,247 | | | | 20,236,628 | | | | 44,742,403 | | | | 2,032,115 | | | | 7,304,904 | |
7 Common Shares authorized | | | | | 200 million | | | | unlimited | | | | unlimited | | | | unlimited | | | | unlimited | | | | unlimited | |
See Notes to Financial Statements.
| 50 | SEMI-ANNUAL REPORT | OCTOBER 31, 2013
|
Six Months Ended October 31, 2013 (Unaudited)
| | | | BlackRock
Investment
Quality Municipal
Trust Inc.
(BKN) | | BlackRock
Long-Term
Municipal
Advantage Trust
(BTA) | | BlackRock
Municipal
2020
Term Trust
(BKK) | | BlackRock
Municipal
Income Trust
(BFK) | | BlackRock
Pennsylvania
Strategic
Municipal Trust
(BPS) | | BlackRock
Strategic
Municipal Trust
(BSD) |
| |
Investment Income
|
| Interest | | | | $ | 10,018,219 | | | $ | 5,927,721 | | | $ | 9,665,385 | | | $ | 26,890,923 | | | $ | 1,051,735 | | | $ | 4,149,954 | |
| Income — affiliated | | | | | 789 | | | | 292 | | | | 1,540 | | | | 1,811 | | | | — | | | | 284 | |
| Total income | | | | | 10,019,008 | | | | 5,928,013 | | | | 9,666,925 | | | | 26,892,734 | | | | 1,051,735 | | | | 4,150,238 | |
| |
Expenses
|
| Investment advisory | | | | | 705,675 | | | | 784,558 | | | | 1,180,188 | | | | 3,119,351 | | | | 145,094 | | | | 501,211 | |
| Administration | | | | | 302,432 | | | | — | | | | — | | | | — | | | | — | | | | — | |
| Professional | | | | | 35,107 | | | | 29,126 | | | | 43,977 | | | | 29,025 | | | | 21,302 | | | | 27,809 | |
| Accounting services | | | | | 30,179 | | | | 10,062 | | | | 27,737 | | | | 37,807 | | | | 5,303 | | | | 15,836 | |
| Remarketing fees on Preferred Shares | | | | | — | | | | — | | | | 102,448 | | | | — | | | | — | | | | — | |
| Transfer agent | | | | | 16,482 | | | | 11,254 | | | | 26,886 | | | | 26,518 | | | | 8,175 | | | | 10,781 | |
| Officer and Trustees | | | | | 14,215 | | | | 8,562 | | | | 17,409 | | | | 35,917 | | | | 1,555 | | | | 5,589 | |
| Custodian | | | | | 13,115 | | | | 6,247 | | | | 14,797 | | | | 24,163 | | | | 3,249 | | | | 6,869 | |
| Printing | | | | | 6,664 | | | | 4,388 | | | | 7,531 | | | | 11,692 | | | | 3,184 | | | | 4,243 | |
| Registration | | | | | 4,638 | | | | 4,629 | | | | 4,586 | | | | 7,794 | | | | 437 | | | | 4,577 | |
| Miscellaneous | | | | | 38,388 | | | | 16,588 | | | | 35,648 | | | | 53,070 | | | | 26,247 | | | | 34,004 | |
| Total expenses excluding interest expense, fees and amortization of offering costs | | | | | 1,166,895 | | | | 875,414 | | | | 1,461,207 | | | | 3,345,337 | | | | 214,546 | | | | 610,919 | |
Interest expense, fees and amortization of offering costs1 | | | | | 806,248 | | | | 318,207 | | | | 11,099 | | | | 2,044,054 | | | | 98,455 | | | | 336,790 | |
| Total expenses | | | | | 1,973,143 | | | | 1,193,621 | | | | 1,472,306 | | | | 5,389,391 | | | | 313,001 | | | | 947,709 | |
| Less fees waived by Manager | | | | | (757 | ) | | | (78,848 | ) | | | (1,781 | ) | | | (2,123 | ) | | | (34 | ) | | | (313 | ) |
| Total expenses after fees waived | | | | | 1,972,386 | | | | 1,114,773 | | | | 1,470,525 | | | | 5,387,268 | | | | 312,967 | | | | 947,396 | |
| Net investment income | | | | | 8,046,622 | | | | 4,813,240 | | | | 8,196,400 | | | | 21,505,466 | | | | 738,768 | | | | 3,202,842 | |
| |
Realized and Unrealized Gain (Loss)
|
Net realized gain (loss) from:
| | | | | | | | | | | | | | | | | | | | | | | | | | |
| Investments | | | | | (1,733,297 | ) | | | (1,315,673 | ) | | | 385,470 | | | | (1,244,750 | ) | | | (575,293 | ) | | | (425,846 | ) |
| Financial futures contracts | | | | | 250,288 | | | | — | | | | — | | | | 421,443 | | | | 31,964 | | | | 84,150 | |
| | | | | | (1,483,009 | ) | | | (1,315,673 | ) | | | 385,470 | | | | (823,307 | ) | | | (543,329 | ) | | | (341,696 | ) |
Net change in unrealized appreciation/depreciation on:
| | | | | | | | | | | | | | | | | | | | | | | | | | |
| Investments | | | | | (34,060,896 | ) | | | (18,959,516 | ) | | | (17,192,974 | ) | | | (95,509,812 | ) | | | (3,665,085 | ) | | | (15,118,576 | ) |
| Financial futures contracts | | | | | 263,748 | | | | — | | | | — | | | | 564,353 | | | | 54,289 | | | | 124,541 | |
| | | | | | (33,797,148 | ) | | | (18,959,516 | ) | | | (17,192,974 | ) | | | (94,945,459 | ) | | | (3,610,796 | ) | | | (14,994,035 | ) |
| Total realized and unrealized loss | | | | | (35,280,157 | ) | | | (20,275,189 | ) | | | (16,807,504 | ) | | | (95,768,766 | ) | | | (4,154,125 | ) | | | (15,335,731 | ) |
| |
Dividends to AMPS shareholders from
|
| Net investment income | | | | | — | | | | — | | | | (111,390 | ) | | | — | | | | — | | | | — | |
Net Decrease in Net Assets Applicable to Common Shareholders Resulting from Operations | | | | $ | (27,233,535 | ) | | $ | (15,461,949 | ) | | $ | (8,722,494 | ) | | $ | (74,263,300 | ) | | $ | (3,415,357 | ) | | $ | (12,132,889 | ) |
| 1 | | Related to TOBs, VRDP Shares and/or VMTP Shares. |
See Notes to Financial Statements.
| SEMI-ANNUAL REPORT | OCTOBER 31, 2013 | 51
|
| |
| Statements of Changes in Net Assets |
|
| | | | BlackRock Investment Quality
Municipal Trust Inc. (BKN)
|
| | | BlackRock Long-Term
Municipal Advantage Trust (BTA)
|
Increase (Decrease) in Net Assets
Applicable to Common Shareholders:
| | | | Six Months Ended
October 31,
2013
(Unaudited) | | Year
Ended
April 30,
2013 | | | | Six Months
Ended
October 31,
2013
(Unaudited) | | Year
Ended
April 30,
2013 |
Operations
|
| Net investment income | | | | $ | 8,046,622 | | | $ | 16,140,893 | | | | | | | $ | 4,813,240 | | | $ | 9,872,508 | |
| Net realized gain (loss) | | | | | (1,483,009 | ) | | | 4,950,889 | | | | | | | | (1,315,673 | ) | | | 1,133,269 | |
| Net change in unrealized appreciation/depreciation | | | | | (33,797,148 | ) | | | 12,247,650 | | | | | | | | (18,959,516 | ) | | | 8,097,727 | |
| Net increase (decrease) in net assets applicable to Common Shareholders resulting from operations | | | | | (27,233,535 | ) | | | 33,339,432 | | | | | | | | (15,461,949 | ) | | | 19,103,504 | |
| |
Dividends to Common Shareholders From
|
| Net investment income | | | | | (8,236,096 | ) | | | (16,870,941 | )1 | | | | | | | (4,993,076 | ) | | | (10,248,277 | )1 |
| |
Capital Share Transactions
|
| Reinvestment of common dividends | | | | | 47,723 | | | | 670,480 | | | | | | | | — | | | | 357,617 | |
| |
Net Assets Applicable to Common Shareholders
|
| Total increase (decrease) in net assets applicable to Common Shareholders | | | | | (35,421,908 | ) | | | 17,138,971 | | | | | | | | (20,455,025 | ) | | | 9,212,844 | |
| Beginning of period | | | | | 280,513,799 | | | | 263,374,828 | | | | | | | | 172,427,906 | | | | 163,215,062 | |
| End of period | | | | $ | 245,091,891 | | | $ | 280,513,799 | | | | | | | $ | 151,972,881 | | | $ | 172,427,906 | |
| Undistributed net investment income, end of period | | | | $ | 3,119,921 | | | $ | 3,309,395 | | | | | | | $ | 1,866,312 | | | $ | 2,046,148 | |
| | | | BlackRock Municipal 2020
Term Trust (BKK)
|
| | | BlackRock Municipal
Income Trust (BFK)
|
Increase (Decrease) in Net Assets
Applicable to Common Shareholders:
| | | | Six Months Ended
October 31,
2013
(Unaudited) | | Year
Ended
April 30,
2013 | | | | Six Months
Ended
October 31,
2013
(Unaudited) | | Year
Ended
April 30,
2013 |
| |
Operations
|
| Net investment income | | | | $ | 8,196,400 | | | $ | 18,164,482 | | | | | | | $ | 21,505,466 | | | $ | 41,559,480 | |
| Net realized gain (loss) | | | | | 385,470 | | | | 402,157 | | | | | | | | (823,307 | ) | | | 3,460,265 | |
| Net change in unrealized appreciation/depreciation | | | | | (17,192,974 | ) | | | 10,245,492 | | | | | | | | (94,945,459 | ) | | | 36,798,026 | |
| Dividends to AMPS shareholders from net investment income | | | | | (111,390 | ) | | | (424,074 | ) | | | | | | | — | | | | — | |
| Net increase (decrease) in net assets applicable to Common Shareholders resulting from operations | | | | | (8,722,494 | ) | | | 28,388,057 | | | | | | | | (74,263,300 | ) | | | 81,817,771 | |
| |
Dividends to Common Shareholders From
|
| Net investment income | | | | | (7,558,381 | ) | | | (18,455,805 | )1 | | | | | | | (20,383,425 | ) | | | (43,007,944 | )1 |
| |
Capital Share Transactions
|
| Reinvestment of common dividends | | | | | — | | | | — | | | | | | | | 180,644 | | | | 1,400,760 | |
| |
Net Assets Applicable to Common Shareholders
|
| Total increase (decrease) in net assets applicable to Common Shareholders | | | | | (16,280,875 | ) | | | 9,932,252 | | | | | | | | (94,466,081 | ) | | | 40,210,587 | |
| Beginning of period | | | | | 340,990,239 | | | | 331,057,987 | | �� | | | | | | 688,707,156 | | | | 648,496,569 | |
| End of period | | | | $ | 324,709,364 | | | $ | 340,990,239 | | | | | | | $ | 594,241,075 | | | $ | 688,707,156 | |
| Undistributed net investment income, end of period | | | | $ | 17,121,140 | | | $ | 16,594,511 | | | | | | | $ | 10,651,265 | | | $ | 9,529,224 | |
| 1 | | Determined in accordance with federal income tax regulations. |
See Notes to Financial Statements.
| 52 | SEMI-ANNUAL REPORT | OCTOBER 31, 2013
|
| |
| Statements of Changes in Net Assets (concluded) |
|
| | | | BlackRock Pennsylvania
Strategic Municipal Trust (BPS)
|
| | | BlackRock Strategic
Municipal Trust (BSD)
|
Increase (Decrease) in Net Assets
Applicable to Common Shareholders:
| | | | Six Months Ended
October 31,
2013
(Unaudited) | | Year
Ended
April 30,
2013 | | | | Six Months
Ended
October 31,
2013
(Unaudited) | | Year
Ended
April 30,
2013 |
| |
Operations
|
| Net investment income | | | | $ | 738,768 | | | $ | 1,617,126 | | | | | | | $ | 3,202,842 | | | $ | 6,238,936 | |
| Net realized gain (loss) | | | | | (543,329 | ) | | | 174,030 | | | | | | | | (341,696 | ) | | | 605,942 | |
| Net change in unrealized appreciation/depreciation | | | | | (3,610,796 | ) | | | 744,830 | | | | | | | | (14,994,035 | ) | | | 5,852,341 | |
| Dividends to AMPS shareholders from net investment income | | | | | — | | | | (8,984 | ) | | | | | | | — | | | | — | |
| Net increase (decrease) in net assets applicable to Common Shareholders resulting from operations | | | | | (3,415,357 | ) | | | 2,527,002 | | | | | | | | (12,132,889 | ) | | | 12,697,219 | |
| |
Dividends to Common Shareholders From
|
| Net investment income | | | | | (804,718 | ) | | | (1,764,339 | )1 | | | | | | | (3,243,392 | ) | | | (6,484,152 | )1 |
| |
Capital Share Transactions
|
| Reinvestment of common dividends | | | | | — | | | | 54,903 | | | | | | | | — | | | | 81,826 | |
| |
Net Assets Applicable to Common Shareholders
|
| Total increase (decrease) in net assets applicable to Common Shareholders | | | | | (4,220,075 | ) | | | 817,566 | | | | | | | | (15,376,281 | ) | | | 6,294,893 | |
| Beginning of period | | | | | 31,396,386 | | | | 30,578,820 | | | | | | | | 111,603,395 | | | | 105,308,502 | |
| End of period | | | | $ | 27,176,311 | | | $ | 31,396,386 | | | | | | | $ | 96,227,114 | | | $ | 111,603,395 | |
| Undistributed net investment income, end of period | | | | $ | 433,700 | | | $ | 499,650 | | | | | | | $ | 1,473,369 | | | $ | 1,513,919 | |
| 1 | | Determined in accordance with federal income tax regulations. |
See Notes to Financial Statements.
| SEMI-ANNUAL REPORT | OCTOBER 31, 2013 | 53
|
Six Months Ended October 31, 2013 (Unaudited)
| | | | BlackRock
Investment
Quality Municipal
Trust Inc.
(BKN) | | BlackRock
Long-Term
Municipal
Advantage Trust
(BTA) | | BlackRock
Municipal
Income Trust
(BFK) | | BlackRock
Pennsylvania
Strategic
Municipal Trust
(BPS) | | BlackRock
Strategic
Municipal
Trust
(BSD) |
| |
Cash Provided by Operating Activities
| | |
| Net decrease in net assets resulting from operations, excluding dividends to AMPS shareholders | | | | $ | (27,233,535 | ) | | $ | (15,461,949 | ) | | | $ (74,263,300 | ) | | $ | (3,415,357 | ) | | $ | (12,132,889 | ) |
Adjustments to reconcile net decrease in net assets resulting from operations to net cash provided by operating activities:
| | | | | | | | | | | | | | | | | | | | | | |
| (Increase) decrease in interest receivable | | | | | 46,337 | | | | 266,869 | | | | (78,045 | ) | | | 61,744 | | | | 7,471 | |
| Decrease in cash pledged for financial futures contracts | | | | | 29,000 | | | | — | | | | 105,000 | | | | 11,000 | | | | 37,000 | |
| (Increase) decrease in prepaid expenses | | | | | 41,361 | | | | 2,992 | | | | 18,894 | | | | (1,291 | ) | | | 2,038 | |
| (Increase) decrease in variation margin receivable on financial futures contracts | | | | | (719 | ) | | | — | | | | 2,031 | | | | 437 | | | | 1,750 | |
| Decrease in investment advisory fees payable | | | | | (8,101 | ) | | | (11,664 | ) | | | (57,233 | ) | | | (3,887 | ) | | | (9,208 | ) |
| Decrease in interest expense and fees payable | | | | | (8,882 | ) | | | (48,003 | ) | | | (75,492 | ) | | | (2,610 | ) | | | (10,719 | ) |
| Decrease in other accrued expenses payable | | | | | (15,850 | ) | | | (18,629 | ) | | | (64,552 | ) | | | (8,947 | ) | | | (15,208 | ) |
| Increase in Officers and Trustees’ fees payable | | | | | 1,877 | | | | 1,014 | | | | 5,668 | | | | 174 | | | | 707 | |
| Decrease in administration fees payable | | | | | (3,511 | ) | | | — | | | | — | | | | — | | | | — | |
| Net realized and unrealized loss on investments | | | | | 35,794,193 | | | | 20,275,189 | | | | 96,754,562 | | | | 4,240,378 | | | | 15,544,422 | |
| Amortization of premium and accretion of discount on investments | | | | | (1,033,472 | ) | | | 216,890 | | | | (545,378 | ) | | | 91,476 | | | | (8,108 | ) |
| Amortization of deferred offering costs | | | | | 1,751 | | | | — | | | | 68,338 | | | | 1,836 | | | | 22,560 | |
| Proceeds from sales of long-term investments | | | | | 60,479,376 | | | | 47,937,348 | | | | 143,682,351 | | | | 8,043,620 | | | | 22,824,582 | |
| Purchases of long-term investments | | | | | (47,472,444 | ) | | | (25,805,026 | ) | | | (84,183,744 | ) | | | (4,240,555 | ) | | | (15,362,665 | ) |
| Net proceeds from sales (purchases) of short-term securities | | | | | (6,914,728 | ) | | | (1,986,325 | ) | | | (16,494,251 | ) | | | 1,102,405 | | | | (1,185,575 | ) |
| Cash provided by operating activities | | | | | 13,702,653 | | | | 25,368,706 | | | | 64,874,849 | | | | 5,880,423 | | | | 9,716,158 | |
| |
Cash Used for Financing Activities
| | |
| Cash receipts from TOB trust certificates | | | | | — | | | | 9,200,455 | | | | 16,731,022 | | | | — | | | | 3,226,147 | |
| Cash payments for TOB trust certificates | | | | | (5,399,127 | ) | | | (30,231,160 | ) | | | (64,593,810 | ) | | | (5,049,261 | ) | | | (10,247,466 | ) |
| Cash dividends paid to Common Shareholders | | | | | (8,188,111 | ) | | | (4,993,076 | ) | | | (20,425,486 | ) | | | (816,911 | ) | | | (3,243,392 | ) |
| Cash used for financing activities | | | | | (13,587,238 | ) | | | (26,023,781 | ) | | | (68,288,274 | ) | | | (5,866,172 | ) | | | (10,264,711 | ) |
| |
Cash
| | |
| Net increase (decrease) in cash | | | | | 115,415 | | | | (655,075 | ) | | | (3,413,425 | ) | | | 14,251 | | | | (548,553 | ) |
| Cash at beginning of period | | | | | — | | | | 655,075 | | | | 3,661,671 | | | | — | | | | 587,881 | |
| Cash at end of period | | | | $ | 115,415 | | | | — | | | $ | 248,246 | | | $ | 14,251 | | | $ | 39,328 | |
| |
Cash Flow Information
| | |
| Cash paid during the period for interest and fees | | | | $ | 813,379 | | | $ | 366,210 | | | $ | 2,051,208 | | | $ | 99,229 | | | $ | 324,949 | |
| |
Non-cash Financing Activities
|
| Capital shares issued in reinvestment of dividends paid to Common Shareholders | | | | $ | 47,723 | | | | — | | | $ | 180,644 | | | | — | | | | — | |
See Notes to Financial Statements.
| 54 | SEMI-ANNUAL REPORT | OCTOBER 31, 2013
|
| |
| Financial Highlights | BlackRock Investment Quality Municipal Trust Inc. (BKN)
|
| | | | Six Months
Ended
October 31,
2013
(Unaudited) | | Year Ended April 30,
| | Period
November 1,
2008 to
April 30,
2009 | | Year Ended
October 31,
2008 |
| | | | | 2013 | | 2012 | | 2011 | | 2010 | | | |
| |
Per Share Operating Performance
|
| Net asset value, beginning of period | | | | $ | 16.35 | | | $ | 15.39 | | | $ | 12.75 | | | $ | 13.68 | | | $ | 11.63 | | | $ | 10.64 | | | $ | 14.73 | |
Net investment income1 | | | | | 0.47 | | | | 0.94 | | | | 0.98 | | | | 1.04 | | | | 1.07 | | | | 0.50 | | | | 1.08 | |
| Net realized and unrealized gain (loss) | | | | | (2.06 | ) | | | 1.00 | | | | 2.68 | | | | (0.93 | ) | | | 1.96 | | | | 0.94 | | | | (3.97 | ) |
| Dividends to AMPS Shareholders from net investment income | | | | | — | | | | — | | | | (0.01 | ) | | | (0.03 | ) | | | (0.03 | ) | | | (0.05 | ) | | | (0.31 | ) |
| Net increase (decrease) from investment operations | | | | | (1.59 | ) | | | 1.94 | | | | 3.65 | | | | 0.08 | | | | 3.00 | | | | 1.39 | | | | (3.20 | ) |
| Dividends to Common Shareholders from net investment income | | | | | (0.48 | ) | | | (0.98 | )2 | | | (1.01 | )2 | | | (1.01 | )2 | | | (0.95 | )2 | | | (0.40 | )2 | | | (0.89 | )2 |
| Net asset value, end of period | | | | $ | 14.28 | | | $ | 16.35 | | | $ | 15.39 | | | $ | 12.75 | | | $ | 13.68 | | | $ | 11.63 | | | $ | 10.64 | |
| Market price, end of period | | | | $ | 14.30 | | | $ | 16.11 | | | $ | 15.75 | | | $ | 13.08 | | | $ | 14.19 | | | $ | 11.35 | | | $ | 10.25 | |
| |
Total Investment Return Applicable to Common Shareholders3
|
| Based on net asset value | | | | | (9.63)% | 4 | | | 12.89% | | | | 29.46% | | | | 0.49% | | | | 26.55% | | | | 13.63% | 4 | | | (22.93)% | |
| Based on market price | | | | | (8.15)% | 4 | | | 8.69% | | | | 29.15% | | | | (0.61)% | | | | 34.50% | | | | 15.12% | 4 | | | (33.11)% | |
| |
Ratios to Average Net Assets Applicable to Common Shareholders
|
Total expenses5 | | | | | 1.57% | 6 | | | 1.48% | | | | 1.26% | | | | 1.08% | | | | 1.10% | | | | 1.29% | 6 | | | 1.19% | |
Total expenses after fees waived and paid indirectly5 | | | | | 1.57% | 6 | | | 1.48% | | | | 1.26% | | | | 1.08% | | | | 1.10% | | | | 1.28% | 6 | | | 1.17% | |
Total expenses after fees waived and paid indirectly and excluding interest expense, fees and amortization of offering cost5,7 | | | | | 0.93% | 6 | | | 0.87% | | | | 0.99% | 8 | | | 1.04% | | | | 1.06% | | | | 1.20% | 6 | | | 1.07% | |
Net investment income5 | | | | | 6.39% | 6 | | | 5.87% | | | | 6.94% | | | | 7.83% | | | | 8.29% | | | | 9.53% | 6 | | | 7.84% | |
| Dividends to AMPS Shareholders | | | | | — | | | | — | | | | 0.09% | | | | 0.23% | | | | 0.26% | | | | 0.87% | 6 | | | 2.28% | |
| Net investment income to Common Shareholders | | | | | 6.39% | 6 | | | 5.87% | | | | 6.85% | | | | 7.60% | | | | 8.03% | | | | 8.66% | 6 | | | 5.56% | |
| |
Supplemental Data
|
| Net assets applicable to Common Shareholders, end of period (000) | | | | $ | 245,092 | | | $ | 280,514 | | | $ | 263,375 | | | $ | 217,541 | | | $ | 232,471 | | | $ | 196,811 | | | $ | 180,188 | |
| AMPS outstanding at $25,000 liquidation preference, end of period (000) | | | | | — | | | | — | | | | — | | | $ | 125,950 | | | $ | 125,950 | | | $ | 126,950 | | | $ | 126,950 | |
| VMTP Shares outstanding at $100,000 liquidation value, end of period (000) | | | | $ | 125,900 | | | $ | 125,900 | | | $ | 125,900 | | | | — | | | | — | | | | — | | | | — | |
| Portfolio turnover | | | | | 13% | | | | 33% | | | | 47% | | | | 38% | | | | 43% | | | | 26% | | | | 26% | |
| Asset coverage per AMPS at $25,000 liquidation preference, end of period | | | | | — | | | | — | | | | — | | | $ | 68,183 | | | $ | 71,147 | | | $ | 63,762 | | | $ | 60,495 | |
| Asset coverage per VMTP Shares at $100,000 liquidation value, end of period | | | | $ | 294,672 | | | $ | 322,807 | | | $ | 309,194 | | | | — | | | | — | | | | — | | | | — | |
| 1 | | Based on average Common Shares outstanding. |
| 2 | | Determined in accordance with federal income tax regulations. |
| 3 | | Total investment returns based on market price, which can be significantly greater or less than the net asset value, may result in substantially different returns. Where applicable, excludes the effects of any sales charges and assumes the reinvestment of dividends and distributions. |
| 4 | | Aggregate total investment return. |
| 5 | | Does not reflect the effect of dividends to AMPS Shareholders. |
| 7 | | Interest expense, fees and amortization of offering costs relate to TOBs and/or VMTP Shares. See Note 3 and Note 9 of the Notes to Financial Statements for details of municipal bonds transferred to TOBs and VMTP Shares, respectively. |
| 8 | | For the year ended April 30, 2012, the total expense ratio after fees waived and paid indirectly and excluding interest expense, fees, amortization of offering costs and remarketing fees was 0.94%. |
See Notes to Financial Statements.
| SEMI-ANNUAL REPORT | OCTOBER 31, 2013 | 55
|
| |
| Financial Highlights | BlackRock Long-Term Municipal Advantage Trust (BTA)
|
|
| | | | Six Months
Ended
October 31,
2013
(Unaudited) | | Year Ended April 30,
| | Period
November 1,
2008 to
April 30,
2009 | | Year Ended
October 31,
2008 |
| | | | | 2013 | | 2012 | | 2011 | | 2010 | | | |
Per Share Operating Performance
|
| Net asset value, beginning of period | | | | $ | 12.85 | | | $ | 12.19 | | | $ | 10.51 | | | $ | 11.27 | | | $ | 9.52 | | | $ | 8.57 | | | $ | 13.72 | |
Net investment income1 | | | | | 0.36 | | | | 0.74 | | | | 0.75 | | | | 0.76 | | | | 0.75 | | | | 0.34 | | | | 0.81 | |
| Net realized and unrealized gain (loss) | | | | | (1.52 | ) | | | 0.68 | | | | 1.70 | | | | (0.79 | ) | | | 1.69 | | | | 0.94 | | | | (5.30 | ) |
| Net increase (decrease) from investment operations | | | | | (1.16 | ) | | | 1.42 | | | | 2.45 | | | | (0.03 | ) | | | 2.44 | | | | 1.28 | | | | (4.49 | ) |
| Dividends to Common Shareholders from net investment income | | | | | (0.37 | ) | | | (0.76 | )2 | | | (0.77 | )2 | | | (0.73 | )2 | | | (0.69 | )2 | | | (0.33 | )2 | | | (0.66 | )2 |
| Net asset value, end of period | | | | $ | 11.32 | | | $ | 12.85 | | | $ | 12.19 | | | $ | 10.51 | | | $ | 11.27 | | | $ | 9.52 | | | $ | 8.57 | |
| Market price, end of period | | | | $ | 10.38 | | | $ | 12.50 | | | $ | 12.27 | | | $ | 10.20 | | | $ | 10.77 | | | $ | 8.79 | | | $ | 8.40 | |
| |
Total Investment Return Applicable to Common Shareholders3
|
| Based on net asset value | | | | | (8.78)% | 4 | | | 11.95% | | | | 24.09% | | | | (0.18)% | | | | 26.81% | | | | 15.78% | 4 | | | (33.64)% | |
| Based on market price | | | | | (14.01)% | 4 | | | 8.19% | | | | 28.70% | | | | 1.37% | | | | 31.25% | | | | 9.06% | 4 | | | (26.49)% | |
| |
Ratios to Average Net Assets Applicable to Common Shareholders
|
| Total expenses | | | | | 1.52% | 5 | | | 1.55% | | | | 1.69% | | | | 1.81% | | | | 1.80% | | | | 2.95% | 5 | | | 4.00% | |
| Total expenses after fees waived and before fees paid indirectly | | | | | 1.42% | 5 | | | 1.37% | | | | 1.42% | | | | 1.43% | | | | 1.40% | | | | 2.55% | 5 | | | 3.60% | |
| Total expenses after fees waived and paid indirectly | | | | | 1.42% | 5 | | | 1.37% | | | | 1.42% | | | | 1.43% | | | | 1.40% | | | | 2.55% | 5 | | | 3.60% | |
Total expenses after fees waived and paid indirectly and excluding interest expense and fees6 | | | | | 1.02% | 5 | | | 0.92% | | | | 0.86% | | | | 0.78% | | | | 0.75% | | | | 0.82% | 5 | | | 0.83% | |
| Net investment income | | | | | 6.13% | 5 | | | 5.80% | | | | 6.60% | | | | 6.97% | | | | 7.07% | | | | 7.88% | 5 | | | 6.56% | |
| |
Supplemental Data
|
| Net assets applicable to Common Shareholders, end of period (000) | | | | $ | 151,973 | | | $ | 172,428 | | | $ | 163,215 | | | $ | 140,510 | | | $ | 150,357 | | | $ | 127,079 | | | $ | 114,382 | |
| Portfolio turnover | | | | | 13% | | | | 16% | | | | 26% | | | | 12% | | | | 30% | | | | 15% | | | | 16% | |
| 1 | | Based on average shares outstanding. |
| 2 | | Determined in accordance with federal income tax regulations. |
| 3 | | Total investment returns based on market price, which can be significantly greater or less than the net asset value, may result in substantially different returns. Where applicable, excludes the effects of any sales charges and assumes the reinvestment of dividends and distributions. |
| 4 | | Aggregate total investment return. |
| 6 | | Interest expense and fees relate to TOBs. See Note 3 of the Notes to Financial Statements for details of municipal bonds transferred to TOBs. |
See Notes to Financial Statements.
| 56 | SEMI-ANNUAL REPORT | OCTOBER 31, 2013
|
| |
| Financial Highlights | BlackRock Municipal 2020 Term Trust (BKK)
|
| | | | Six Months
Ended
October 31,
2013
(Unaudited) | | Year Ended April 30,
| | Period
January 1,
2009 to
April 30,
2009 | | Year Ended
December 31,
2008 |
| | | | | 2013 | | 2012 | | 2011 | | 2010 | | | |
Per Share Operating Performance
| | Net asset value, beginning of period | | | | $ | 16.85 | | | $ | 16.36 | | | $ | 14.63 | | | $ | 14.51 | | | $ | 12.04 | | | $ | 10.55 | | | $ | 14.79 | |
Net investment income1 | | | | | 0.41 | | | | 0.90 | | | | 1.02 | | | | 1.06 | | | | 1.10 | | | | 0.35 | | | | 1.09 | |
| Net realized and unrealized gain (loss) | | | | | (0.83 | ) | | | 0.52 | | | | 1.48 | | | | (0.15 | ) | | | 2.16 | | | | 1.41 | | | | (4.28 | ) |
| Dividends to AMPS shareholders from net investment income | | | | | (0.01 | ) | | | (0.02 | ) | | | (0.02 | ) | | | (0.04 | ) | | | (0.04 | ) | | | (0.02 | ) | | | (0.30 | ) |
| Net increase (decrease) from investment operations | | | | | (0.43 | ) | | | 1.40 | | | | 2.48 | | | | 0.87 | | | | 3.22 | | | | 1.74 | | | | (3.49 | ) |
| Dividends to Common Shareholders from net investment income | | | | | (0.37 | ) | | | (0.91 | )2 | | | (0.75 | )2 | | | (0.75 | )2 | | | (0.75 | )2 | | | (0.25 | )2 | | | (0.75 | )2 |
| Net asset value, end of period | | | | $ | 16.05 | | | $ | 16.85 | | | $ | 16.36 | | | $ | 14.63 | | | $ | 14.51 | | | $ | 12.04 | | | $ | 10.55 | |
| Market price, end of period | | | | $ | 16.14 | | | $ | 16.64 | | | $ | 16.06 | | | $ | 15.06 | | | $ | 14.89 | | | $ | 12.70 | | | $ | 10.57 | |
| |
Total Investment Return Applicable to Common Shareholders3
|
| Based on net asset value | | | | | (2.52)% | 4 | | | 8.72% | | | | 17.27% | | | | 5.96% | | | | 26.97% | | | | 16.39% | 4 | | | (24.57)% | |
| Based on market price | | | | | (0.73)% | 4 | | | 9.37% | | | | 11.83% | | | | 6.29% | | | | 23.52% | | | | 22.54% | 4 | | | (17.81)% | |
| |
Ratios to Average Net Assets Applicable to Common Shareholders
|
Total expenses5 | | | | | 0.89% | 6 | | | 0.94% | | | | 0.99% | | | | 1.03% | | | | 1.06% | | | | 1.23% | 6 | | | 1.12% | |
Total expenses after fees waived and paid indirectly5 | | | | | 0.89% | 6 | | | 0.94% | | | | 0.99% | | | | 1.03% | | | | 1.06% | | | | 1.23% | 6 | | | 1.12% | |
Total expenses after fees waived and paid indirectly and excluding interest expense, fees and income tax5,7 | | | | | 0.89% | 6 | | | 0.93% | | | | 0.98% | 8 | | | 1.02% | | | | 1.05% | | | | 1.21% | 6 | | | 1.10% | |
Net investment income5 | | | | | 4.98% | 6 | | | 5.38% | | | | 6.57% | | | | 7.26% | | | | 8.08% | | | | 9.28% | 6 | | | 8.01% | |
| Dividends to AMPS shareholders | | | | | 0.07% | 6 | | | 0.13% | | | | 0.13% | | | | 0.24% | | | | 0.28% | | | | 0.59% | 6 | | | 2.18% | |
| Net investment income to Common Shareholders | | | | | 4.91% | 6 | | | 5.25% | | | | 6.44% | | | | 7.02% | | | | 7.80% | | | | 8.69% | 6 | | | 5.83% | |
| |
Supplemental Data
|
Net assets applicable to Common Shareholders,
end of period (000) | | | | $ | 324,709 | | | $ | 340,990 | | | $ | 331,058 | | | $ | 296,082 | | | $ | 293,549 | | | $ | 243,571 | | | $ | 213,472 | |
AMPS outstanding at $25,000 liquidation preference,
end of period (000) | | | | $ | 110,100 | | | $ | 161,250 | | | $ | 173,850 | | | $ | 173,850 | | | $ | 173,850 | | | $ | 173,850 | | | $ | 173,850 | |
| Portfolio turnover | | | | | 4% | | | | 14% | | | | 18% | | | | 9% | | | | 6% | | | | 1% | | | | 5% | |
| Asset coverage per AMPS at $25,000 liquidation preference, end of period | | | | $ | 98,731 | | | $ | 77,867 | | | $ | 72,607 | | | $ | 67,579 | | | $ | 67,215 | | | $ | 60,027 | | | $ | 55,703 | |
| 1 | | Based on average Common Shares outstanding. |
| 2 | | Determined in accordance with federal income tax regulations. |
| 3 | | Total investment returns based on market price, which can be significantly greater or less than the net asset value, may result in substantially different returns. Where applicable, excludes the effects of any sales charges and assumes the reinvestment of dividends and distributions. |
| 4 | | Aggregate total investment return. |
| 5 | | Does not reflect the effect of dividends to AMPS shareholders. |
| 7 | | Interest expense and fees related to TOBs. See Note 3 of the Notes to Financial Statements for details of municipal bonds transferred to TOBs. |
| 8 | | For the period ended October 31, 2013 and the years ended April 30, 2013 and April 30, 2012, the total expense ratio after fees waived and excluding interest expense, fees and remarketing fees was 0.82%, 0.85% and 0.90% respectively. |
See Notes to Financial Statements.
| SEMI-ANNUAL REPORT | OCTOBER 31, 2013 | 57
|
| |
| Financial Highlights | BlackRock Municipal Income Trust (BFK)
|
| | | | Six Months
Ended
October 31,
2013
(Unaudited) | | Year Ended April 30,
| | Period
November 1,
2008 to
April 30,
2009 | | Year Ended
October 31,
2008 |
| | | | | 2013 | | 2012 | | 2011 | | 2010 | | | |
Per Share Operating Performance
|
| Net asset value, beginning of period | | | | $ | 15.40 | | | $ | 14.53 | | | $ | 12.16 | | | $ | 13.23 | | | $ | 10.74 | | | $ | 10.08 | | | $ | 14.55 | |
Net investment income1 | | | | | 0.48 | | | | 0.93 | | | | 0.95 | | | | 1.01 | | | | 1.03 | | | | 0.52 | | | | 1.12 | |
| Net realized and unrealized gain (loss) | | | | | (2.14 | ) | | | 0.90 | | | | 2.39 | | | | (1.11 | ) | | | 2.42 | | | | 0.58 | | | | (4.38 | ) |
| Dividends to AMPS shareholders from net investment income | | | | | — | | | | — | | | | (0.01 | ) | | | (0.02 | ) | | | (0.03 | ) | | | (0.03 | ) | | | (0.30 | ) |
| Net increase (decrease) from investment operations | | | | | (1.66 | ) | | | 1.83 | | | | 3.33 | | | | (0.12 | ) | | | 3.42 | | | | 1.07 | | | | (3.56 | ) |
| Dividends to Common Shareholders from net investment income | | | | | (0.46 | ) | | | (0.96 | )2 | | | (0.96 | )2 | | | (0.95 | )2 | | | (0.93 | )2 | | | (0.41 | )2 | | | (0.91 | )2 |
| Net asset value, end of period | | | | $ | 13.28 | | | $ | 15.40 | | | $ | 14.53 | | | $ | 12.16 | | | $ | 13.23 | | | $ | 10.74 | | | $ | 10.08 | |
| Market price, end of period | | | | $ | 13.26 | | | $ | 15.40 | | | $ | 14.83 | | | $ | 12.35 | | | $ | 13.44 | | | $ | 11.10 | | | $ | 8.75 | |
| |
Total Investment Return Applicable to Common Shareholders3
|
| Based on net asset value | | | | | (10.73)% | 4 | | | 12.84% | | | | 28.24% | | | | (1.04)% | | | | 32.75% | | | | 11.15% | 4 | | | (25.69)% | |
| Based on market price | | | | | (10.87)% | 4 | | | 10.55% | | | | 28.87% | | | | (1.07)% | | | | 30.49% | | | | 32.34% | 4 | | | (41.05)% | |
| |
Ratios to Average Net Assets Applicable to Common Shareholders
|
| Total expenses | | | | | 1.75% | 6 | | | 1.71% | | | | 1.45% | 5 | | | 1.26% | 5 | | | 1.26% | 5 | | | 1.44% | 5,6 | | | 1.38% | 5 |
| Total expenses after fees waived and paid indirectly | | | | | 1.75% | 6 | | | 1.71% | | | | 1.45% | 5 | | | 1.24% | 5 | | | 1.15% | 5 | | | 1.26% | 5,6 | | | 1.15% | 5 |
Total expenses after fees waived and paid indirectly and excluding interest expense, fees and amortization of offering costs7 | | | | | 1.08% | 6 | | | 1.05% | | | | 1.14% | 5,8 | | | 1.145 | | | | 1.07% | 5 | | | 1.15% | 5,6 | | | 0.98% | 5 |
| Net investment income | | | | | 6.97% | 6 | | | 6.13% | | | | 7.06% | 5 | | | 7.84% | 5 | | | 8.37% | 5 | | | 10.48% | 5,6 | | | 8.34% | 5 |
| Dividends to AMPS shareholders | | | | | — | | | | — | | | | 0.07% | | | | 0.20% | | | | 0.23% | | | | 0.70% | 6 | | | 2.19% | |
| Net investment income to Common Shareholders | | | | | 6.97% | 6 | | | 6.13% | | | | 6.99% | | | | 7.64% | | | | 8.14% | | | | 9.78% | 6 | | | 6.15% | |
| |
Supplemental Data
|
| Net assets applicable to Common Shareholders, end of period (000) | | | | $ | 594,241 | | | $ | 688,707 | | | $ | 648,497 | | | $ | 541,097 | | | $ | 587,250 | | | $ | 474,814 | | | $ | 445,289 | |
| AMPS outstanding at $25,000 liquidation preference, end of period (000) | | | | | — | | | | — | | | | — | | | $ | 270,875 | | | $ | 270,875 | | | $ | 293,125 | | | $ | 293,125 | |
| VMTP Shares outstanding at $100,000 liquidation value, end of period (000) | | | | $ | 270,800 | | | $ | 270,800 | | | $ | 270,800 | | | | — | | | | — | | | | — | | | | — | |
| Portfolio turnover | | | | | 8% | | | | 13% | | | | 17% | | | | 18% | | | | 32% | | | | 11% | | | | 13% | |
| Asset coverage per AMPS at $25,000 liquidation preference, end of period | | | | | — | | | | — | | | | — | | | $ | 74,941 | | | $ | 79,201 | | | $ | 65,498 | | | $ | 62,989 | |
| Asset coverage per VMTP Shares at $100,000 liquidation value, end of period | | | | $ | 319,439 | | | $ | 354,323 | | | $ | 339,474 | | | | — | | | | — | | | | — | | | | — | |
| 1 | | Based on average Common Shares outstanding. |
| 2 | | Determined in accordance with federal income tax regulations. |
| 3 | | Total investment returns based on market price, which can be significantly greater or less than the net asset value, may result in substantially different returns. Where applicable, excludes the effects of any sales charges and assumes the reinvestment of dividends and distributions. |
| 4 | | Aggregate total investment return. |
| 5 | | Does not reflect the effect of dividends to AMPS shareholders. |
| 7 | | Interest expense, fees and amortization of offering costs relate to TOBs and/or VMTP Shares. See Note 3 and Note 9 of the Notes to Financial Statements for details of municipal bonds transferred to TOBs and VMTP Shares, respectively. |
| 8 | | For the year ended April 30, 2012, the total expense ratio after fees waived and paid indirectly and excluding interest expense, fees, amortization of offering costs and remarketing fees was 1.10%. |
See Notes to Financial Statements.
| 58 | SEMI-ANNUAL REPORT | OCTOBER 31, 2013
|
| |
| Financial Highlights | BlackRock Pennsylvania Strategic Municipal Trust (BPS)
|
| | | | Six Months
Ended
October 31,
2013
(Unaudited) | | Year Ended April 30,
| | Period
January 1,
2009 to
April 30,
2009 | | Year Ended
December 31,
2008 |
| | | | | 2013 | | 2012 | | 2011 | | 2010 | | | |
Per Share Operating Performance
|
| Net asset value, beginning of period | | | | $ | 15.45 | | | $ | 15.07 | | | $ | 13.11 | | | $ | 13.86 | | | $ | 11.87 | | | $ | 10.77 | | | $ | 14.12 | |
Net investment income1 | | | | | 0.36 | | | | 0.80 | | | | 0.90 | | | | 0.98 | | | | 0.92 | | | | 0.27 | | | | 0.89 | |
| Net realized and unrealized gain (loss) | | | | | (2.04 | ) | | | 0.45 | | | | 1.99 | | | | (0.81 | ) | | | 1.83 | | | | 1.03 | | | | (3.36 | ) |
| Dividends to AMPS shareholders from net investment income | | | | | — | | | | (0.00 | )2 | | | (0.02 | ) | | | (0.03 | ) | | | (0.04 | ) | | | (0.02 | ) | | | (0.26 | ) |
| Net increase (decrease) from investment operations | | | | | (1.68 | ) | | | 1.25 | | | | 2.87 | | | | 0.14 | | | | 2.71 | | | | 1.28 | | | | (2.73 | ) |
| Dividends to Common Shareholders from net investment income | | | | | (0.40 | ) | | | (0.87 | )3 | | | (0.91 | )3 | | | (0.89 | )3 | | | (0.72 | )3 | | | (0.18 | )3 | | | (0.62 | )3 |
| Net asset value, end of period | | | | $ | 13.37 | | | $ | 15.45 | | | $ | 15.07 | | | $ | 13.11 | | | $ | 13.86 | | | $ | 11.87 | | | $ | 10.77 | |
| Market price, end of period | | | | $ | 11.86 | | | $ | 15.04 | | | $ | 15.27 | | | $ | 12.99 | | | $ | 13.88 | | | $ | 9.85 | | | $ | 8.42 | |
| |
Total Investment Return Applicable to Common Shareholders4
|
| Based on net asset value | | | | | (10.65)% | 5 | | | 8.45% | | | | 22.57% | | | | 1.07% | | | | 23.80% | | | | 12.28% | 5 | | | (19.63)% | |
| Based on market price | | | | | (18.59)% | 5 | | | 4.19% | | | | 25.34% | | | | 0.00% | | | | 49.41% | | | | 19.18% | 5 | | | (34.53)% | |
| |
Ratios to Average Net Assets Applicable to Common Shareholders
|
| Total expenses | | | | | 2.22% | 6 | | | 2.09% | 7 | | | 1.72% | 7 | | | 1.56% | 7 | | | 1.60% | 7 | | | 1.63% | 6,7 | | | 1.61% | 7 |
| Total expenses after fees waived and paid indirectly | | | | | 2.22% | 6 | | | 2.09% | 7 | | | 1.71% | 7 | | | 1.55% | 7 | | | 1.59% | 7 | | | 1.61% | 6,7 | | | 1.45% | 7 |
Total expenses after fees waived and paid indirectly and excluding interest expense, fees and amortization of offering costs8 | | | | | 1.52% | 6 | | | 1.44% | 7,9 | | | 1.58% | 7,9 | | | 1.43% | 7 | | | 1.57% | 7 | | | 1.61% | 6,7 | | | 1.42% | 7 |
| Net investment income | | | | | 5.25% | 6 | | | 5.16% | 7 | | | 6.30% | 7 | | | 7.28% | 7 | | | 6.94% | 7 | | | 7.38% | 6,7 | | | 6.82% | 7 |
| Dividends to AMPS shareholders | | | | | — | | | | 0.03% | | | | 0.13% | | | | 0.25% | | | | 0.28% | | | | 0.56% | | | | 2.17% | |
| Net investment income to Common Shareholders | | | | | 5.25% | 6 | | | 5.13% | | | | 6.17% | | | | 7.03% | | | | 6.66% | | | | 6.82% | 6 | | | 4.65% | |
| |
Supplemental Data
|
Net assets applicable to Common Shareholders,
end of period (000) | | | | $ | 27,176 | | | $ | 31,396 | | | $ | 30,579 | | | $ | 26,574 | | | $ | 28,038 | | | $ | 24,023 | | | $ | 21,799 | |
AMPS outstanding at $25,000 liquidation preference,
end of period (000) | | | | | — | | | | — | | | $ | 16,325 | | | $ | 16,325 | | | $ | 16,325 | | | $ | 16,825 | | | $ | 16,825 | |
VRDP Shares outstanding at $100,000 liquidation value,
end of period (000) | | | | $ | 16,300 | | | $ | 16,300 | | | | — | | | | — | | | | — | | | | — | | | | — | |
| Portfolio turnover | | | | | 8% | | | | 14% | | | | 34% | | | | 17% | | | | 19% | | | | 8% | | | | 45% | |
| Asset coverage per AMPS at $25,000 liquidation preference, end of period | | | | | — | | | | — | | | $ | 71,828 | | | $ | 65,697 | | | $ | 67,939 | | | $ | 60,696 | | | $ | 57,399 | |
| Asset coverage per VRDP Shares at $100,000 liquidation value, end of period | | | | $ | 266,726 | | | $ | 292,616 | | | | — | | | | — | | | | — | | | | — | | | | — | |
| 1 | | Based on average Common Shares outstanding. |
| 2 | | Amount is greater than $(0.005) per share. |
| 3 | | Determined in accordance with federal income tax regulations. |
| 4 | | Total investment returns based on market price, which can be significantly greater or less than the net asset value, may result in substantially different returns. Where applicable, excludes the effects of any sales charges and assumes the reinvestment of dividends and distributions. |
| 5 | | Aggregate total investment return. |
| 6 | | Annualized. Certain expenses incurred during the period January 1, 2009 to April 30, 2009 have been included in the ratio but not annualized. If these expenses were annualized, the annualized ratio of total expenses, total expenses after fees waived and paid indirectly, total expenses after fees waived and paid indirectly and excluding interest expense, fees and amortization of offering costs, net investment income and net investment income to Common Shareholders would have been 1.91%, 1.89%, 1.89%, 7.09% and 6.53%, respectively. |
| 7 | | Does not reflect the effect of dividends to AMPS shareholders. |
| 8 | | Interest expense, fees and amortization of offering costs relate to TOBs and/or VRDP Shares. See Note 3 and Note 9 of the Notes to Financial Statements for details of municipal bonds transferred to TOBs and VRDP Shares, respectively. |
| 9 | | For the years ended April 30, 2013 and April 30, 2012, the total expense ratio after fees waived and paid indirectly and excluding interest expense, fees, amortization of offering costs and remarketing fees was 1.43% and 1.52%, respectively. |
See Notes to Financial Statements.
| SEMI-ANNUAL REPORT | OCTOBER 31, 2013 | 59
|
| |
| Financial Highlights | BlackRock Strategic Municipal Trust (BSD)
|
| | | | Six Months
Ended
October 31,
2013
(Unaudited) | | Year Ended April 30,
| | Period
January 1,
2009 to
April 30,
2009 | | Year Ended
December 31,
2008 |
| | | | | 2013 | | 2012 | | 2011 | | 2010 | | | |
Per Share Operating Performance
|
| Net asset value, beginning of period | | | | $ | 15.28 | | | $ | 14.43 | | | $ | 12.27 | | | $ | 13.00 | | | $ | 10.95 | | | $ | 9.90 | | | $ | 14.27 | |
Net investment income1 | | | | | 0.44 | | | | 0.85 | | | | 0.89 | | | | 0.94 | | | | 0.96 | | | | 0.32 | | | | 1.02 | |
| Net realized and unrealized gain (loss) | | | | | (2.11 | ) | | | 0.89 | | | | 2.17 | | | | (0.77 | ) | | | 1.96 | | | | 1.00 | | | | (4.32 | ) |
| Dividends to AMPS shareholders from net investment income | | | | | — | | | | — | | | | (0.01 | ) | | | (0.02 | ) | | | (0.03 | ) | | | (0.02 | ) | | | (0.26 | ) |
| Net increase (decrease) from investment operations | | | | | (1.67 | ) | | | 1.74 | | | | 3.05 | | | | 0.15 | | | | 2.89 | | | | 1.30 | | | | (3.56 | ) |
| Dividends to Common Shareholders from net investment income | | | | | (0.44 | ) | | | (0.89 | )2 | | | (0.89 | )2 | | | (0.88 | )2 | | | (0.84 | )2 | | | (0.25 | )2 | | | (0.81 | )2 |
| Net asset value, end of period | | | | $ | 13.17 | | | $ | 15.28 | | | $ | 14.43 | | | $ | 12.27 | | | $ | 13.00 | | | $ | 10.95 | | | $ | 9.90 | |
| Market price, end of period | | | | $ | 12.49 | | | $ | 14.97 | | | $ | 14.38 | | | $ | 11.88 | | | $ | 12.95 | | | $ | 10.15 | | | $ | 8.19 | |
| |
Total Investment Return Applicable to Common Shareholders3
|
| Based on net asset value | | | | | (10.73)% | 4 | | | 12.29% | | | | 25.65% | | | | 1.19% | | | | 27.36% | | | | 13.44% | 4 | | | (25.70)% | |
| Based on market price | | | | | (13.59)% | 4 | | | 10.40% | | | | 29.32% | | | | (1.65)% | | | | 36.87% | | | | 27.11% | 4 | | | (37.17)% | |
| |
Ratios to Average Net Assets Applicable to Common Shareholders
|
| Total expenses | | | | | 1.90% | 5 | | | 1.84% | | | | 1.55% | 6 | | | 1.39% | 6 | | | 1.36% | 6 | | | 1.49% | 5,6 | | | 1.54% | 6 |
| Total expenses after fees waived and paid indirectly | | | | | 1.90% | 5 | | | 1.84% | | | | 1.55% | 6 | | | 1.39% | 6 | | | 1.36% | 6 | | | 1.48% | 5,6 | | | 1.45% | 6 |
Total expenses after fees waived and paid indirectly and excluding interest expense, fees, and amortization of offering costs7 | | | | | 1.23% | 5 | | | 1.17% | | | | 1.23% | 6,8 | | | 1.28% | 6 | | | 1.26% | 6 | | | 1.40% | 5,6 | | | 1.23% | 6 |
| Net investment income | | | | | 6.43% | 5 | | | 5.68% | | | | 6.64% | 6 | | | 7.38% | 6 | | | 7.91% | 6 | | | 9.48% | 6 | | | 8.04% | 6 |
| Dividends to AMPS shareholders | | | | | — | | | | — | | | | 0.07% | | | | 0.19% | | | | 0.22% | | | | 0.49% | | | | 2.02% | |
| Net investment income to Common Shareholders | | | | | 6.43% | 5 | | | 5.68% | | | | 6.57% | | | | 7.19% | | | | 7.69% | | | | 8.99% | 5 | | | 6.02% | |
| |
Supplemental Data
|
Net assets applicable to Common Shareholders,
end of period (000) | | | | $ | 96,227 | | | $ | 111,603 | | | $ | 105,309 | | | $ | 89,481 | | | $ | 94,736 | | | $ | 79,820 | | | $ | 72,188 | |
AMPS outstanding at $25,000 liquidation preference,
end of period (000) | | | | | — | | | | — | | | | — | | | $ | 42,975 | | | $ | 42,975 | | | $ | 47,750 | | | $ | 47,750 | |
VMTP Shares outstanding at $100,000 liquidation value,
end of period (000) | | | | $ | 42,900 | | | $ | 42,900 | | | $ | 42,900 | | | | — | | | | — | | | | — | | | | — | |
| Portfolio turnover | | | | | 10% | | | | 18% | | | | 30% | | | | 20% | | | | 32% | | | | 6% | | | | 17% | |
| Asset coverage per AMPS at $25,000 liquidation preference, end of period | | | | | — | | | | — | | | | — | | | $ | 77,055 | | | $ | 80,113 | | | $ | 66,791 | | | $ | 62,803 | |
| Asset coverage per VMTP Shares at $100,000 liquidation value, end of period | | | | $ | 324,306 | | | $ | 360,148 | | | $ | 345,474 | | | | — | | | | — | | | | — | | | | — | |
| 1 | | Based on average Common Shares outstanding. |
| 2 | | Determined in accordance with federal income tax regulations. |
| 3 | | Total investment returns based on market price, which can be significantly greater or less than the net asset value, may result in substantially different returns. Where applicable, excludes the effects of any sales charges and assumes the reinvestment of dividends and distributions. |
| 4 | | Aggregate total investment return. |
| 5 | | Annualized. Certain expenses incurred during the period January 1, 2009 to April 30, 2009 have been included in the ratio but not annualized. If these expenses were annualized, the annualized ratio of total expenses, total expenses after fees waived and paid indirectly, total expenses after fees waived and paid indirectly and excluding interest expense, fees and amortization of offering costs, net investment income and net investment income to Common Shareholders would have been 1.91%, 1.89%, 1.89%, 7.09% and 6.53%, respectively. |
| 6 | | Does not reflect the effect of dividends to AMPS shareholders. |
| 7 | | Interest expense, fees and amortization of offering costs relate to TOBs and/or VMTP Shares. See Note 3 and Note 9 of the Notes to Financial Statements for details of municipal bonds transferred to TOBs and VMTP Shares, respectively. |
| 8 | | For the year ended April 30, 2012, the total expense ratio after fees waived and paid indirectly and excluding interest expense, fees, amortization of offering costs and remarketing fees was 1.19%. |
See Notes to Financial Statements.
| 60 | SEMI-ANNUAL REPORT | OCTOBER 31, 2013
|
| |
| Notes to Financial Statements (Unaudited) |
|
1. Organization:
BlackRock Investment Quality Municipal Trust Inc. (“BKN”) is organized as a Maryland corporation. BlackRock Long-Term Municipal Advantage Trust (“BTA”), BlackRock Municipal 2020 Term Trust (“BKK”), BlackRock Municipal Income Trust (“BFK”), BlackRock Pennsylvania Strategic Municipal Trust (“BPS”) and BlackRock Strategic Municipal Trust (“BSD”) (collectively, together with BKN, the “Trusts” or individually as the “Trust”) are organized as Delaware statutory trusts. BKN, BKK, BFK and BSD are registered under the 1940 Act, as amended (the “1940 Act”), as diversified, closed-end management investment companies. BTA and BPS are registered under the 1940 Act as non-diversified, closed-end management investment companies. The Board of Directors and the Boards of Trustees of the Trusts are collectively referred to throughout this report as the “Board of Trustees” or the “Board” and the directors/trustees thereof are collectively referred to throughout this report as “Trustees”. The Trusts determine, and make available for publication the NAVs of their Common Shares on a daily basis.
2. Significant Accounting Policies:
The Trusts’ financial statements are prepared in conformity with accounting principles generally accepted in the United States of America (“US GAAP”), which may require management to make estimates and assumptions that affect the reported amounts of assets and liabilities in the financial statements and the reported amounts of increases and decreases in net assets from operations during the reporting period. Actual results could differ from those estimates. The following is a summary of significant accounting policies followed by the Trusts:
Valuation: US GAAP defines fair value as the price the Trusts would receive to sell an asset or pay to transfer a liability in an orderly transaction between market participants at the measurement date. The Trusts determine the fair value of their financial instruments at market value using independent dealers or pricing services under policies approved by each Trust’s Board. The BlackRock Global Valuation Methodologies Committee (the “Global Valuation Committee”) is the committee formed by management to develop global pricing policies and procedures and to provide oversight of the pricing function for the Trusts for all financial instruments.
Municipal investments (including commitments to purchase such investments on a “when-issued” basis) are valued on the basis of prices provided by dealers or pricing services. In determining the value of a particular investment, pricing services may use certain information with respect to transactions in such investments, quotations from dealers, pricing matrixes, market transactions in comparable investments and information with respect to various relationships between investments. Financial futures contracts traded on exchanges are valued at their last sale price. Investments in open-end registered investment companies are valued at NAV each business day. Short-term securities with remaining maturities of 60 days or less may be valued at amortized cost, which approximates fair value.
In the event that application of these methods of valuation results in a price for an investment that is deemed not to be representative of the market value of such investment, or if a price is not available, the investment will be valued by the Global Valuation Committee, or its delegate, in accordance with a policy approved by the Board as reflecting fair value (“Fair Value Assets”). When determining the price for Fair Value Assets, the Global Valuation Committee, or its delegate, seeks to determine the price that each Trust might reasonably expect to receive from the current sale of that asset in an arm’s-length transaction. Fair value determinations shall be based upon all available factors that the Global Valuation Committee, or its delegate, deem relevant consistent with the principles of fair value measurement which include the market approach, income approach and/or in the case of recent investments, the cost approach, as appropriate. A market approach generally consists of using comparable market transactions. The income approach generally is used to discount future cash flows to present value and adjusted for liquidity as appropriate. These factors include but are not limited to: (i) attributes specific to the investment or asset; (ii) the principal market for the investment or asset; (iii) the customary participants in the principal market for the investment or asset; (iv) data assumptions by market participants for the investment or asset, if reasonably available; (v) quoted prices for similar investments or assets in active markets; and (vi) other factors, such as future cash flows, interest rates, yield curves, volatilities, prepayment speeds, loss severities, credit risks, recovery rates, liquidation amounts and/or default rates. Due to the inherent uncertainty of valuations of such investments, the fair values may differ from the values that would have been used had an active market existed. The Global Valuation Committee, or its delegate, employs various methods for calibrating valuation approaches for investments where an active market does not exist, including regular due diligence of each Trusts’ pricing vendors, a regular review of key inputs and assumptions, transactional back-testing or disposition analysis to compare unrealized gains and losses to realized gains and losses, reviews of missing or stale prices and large movements in market values and reviews of any market related activity. The pricing of all Fair Value Assets is subsequently reported to the Board or a committee thereof on a quarterly basis.
Segregation and Collateralization: In cases in which the 1940 Act and the interpretive positions of the Securities and Exchange Commission (“SEC”) require that each Trust either deliver collateral or segregate assets in connection with certain investments (e.g., TOBs and/or financial futures contracts), each Trust will, consistent with SEC rules and/or certain interpretive letters issued by the SEC, segregate collateral or designate on its books and records cash or liquid securities having a market value at least equal to the amount that would otherwise be required to be physically segregated. Furthermore, based on requirements and agreements with certain exchanges and third party broker-dealers, a Trust engaging in such transactions may have requirements to deliver/deposit securities to/with an exchange or broker-dealer as collateral for certain investments.
Investment Transactions and Investment Income: For financial reporting purposes, investment transactions are recorded on the dates the transactions are entered into (the trade dates). Realized gains and losses on investment transactions are determined on the identified cost basis. Dividend income is recorded on the ex-dividend dates. Interest income, including amortization and accretion of premiums and discounts on debt securities, is recognized on the accrual basis.
| SEMI-ANNUAL REPORT | OCTOBER 31, 2013 | 61
|
| |
| Notes to Financial Statements (continued) |
|
Dividends and Distributions: Dividends from net investment income are declared and paid monthly. Distributions of capital gains are recorded on the ex-dividend dates. The character and timing of dividends and distributions are determined in accordance with federal income tax regulations, which may differ from US GAAP. Dividends and distributions to Preferred Shareholders are accrued and determined as described in Note 9.
Income Taxes: It is the Trusts’ policy to comply with the requirements of the Internal Revenue Code of 1986, as amended, applicable to regulated investment companies and to distribute substantially all of their taxable income to their shareholders. Therefore, no federal income tax provision is required.
Each Trust files US federal and various state and local tax returns. No income tax returns are currently under examination. The statute of limitations on the Trusts’ US federal tax returns remains open for each of the four years ended April 30, 2013. The statutes of limitations on each Trust’s state and local tax returns may remain open for an additional year depending upon the jurisdiction. Management does not believe there are any uncertain tax positions that require recognition of a tax liability.
Deferred Compensation Plan: Under the deferred compensation plan (the “Plan”) approved by each Trust’s Board, the independent Trustees (“Independent Trustees”) may defer a portion of their annual complex-wide compensation. Deferred amounts earn an approximate return as though equivalent dollar amounts had been invested in common shares of certain other BlackRock Closed-End Funds selected by the Independent Trustees. This has the same economic effect for the Independent Trustees as if the Independent Trustees had invested the deferred amounts directly in certain other BlackRock Closed-End Funds.
The Plan is not funded and obligations thereunder represent general unsecured claims against the general assets of each Trust. Deferred compensation liabilities are included in Officer’s and Trustees’ fees payable in the Statements of Assets and Liabilities and will remain as a liability of the Trusts until such amounts are distributed in accordance with the Plan.
Other: Expenses directly related to a Trust are charged to that Trust. Other operating expenses shared by several funds are pro rated among those funds on the basis of relative net assets or other appropriate methods.
The Trusts have an arrangement with the custodian whereby fees may be reduced by credits earned on uninvested cash balances, which, if applicable, are shown as fees paid indirectly in the Statements of Operations. The custodian imposes fees on overdrawn cash balances, which can be offset by accumulated credits earned or may result in additional custody charges.
3. Securities and Other Investments:
Zero-Coupon Bonds: The Trusts may invest in zero-coupon bonds, which are normally issued at a significant discount from face value and do not provide for periodic interest payments. Zero-coupon bonds may experience greater volatility in market value than similar maturity debt obligations which provide for regular interest payments.
Forward Commitments and When-Issued Delayed Delivery Securities: The Trusts may purchase securities on a when-issued basis and may purchase or sell securities on a forward commitment basis. Settlement of such transactions normally occurs within a month or more after the purchase or sale commitment is made. The Trusts may purchase securities under such conditions with the intention of actually acquiring them, but may enter into a separate agreement to sell the securities before the settlement date. Since the value of securities purchased may fluctuate prior to settlement, the Trusts may be required to pay more at settlement than the security is worth. In addition, the Trusts are not entitled to any of the interest earned prior to settlement. When purchasing a security on a delayed delivery basis, the Trusts assume the rights and risks of ownership of the security, including the risk of price and yield fluctuations. In the event of default by the counterparty, the Trusts’ maximum amount of loss is the unrealized appreciation of unsettled when-issued transactions, which is shown in the Schedules of Investments.
Municipal Bonds Transferred to TOBs: The Trusts leverage their assets through the use of TOBs. A TOB is a special purpose entity established by a third party sponsor, into which a trust, or an agent on behalf of a trust, transfers municipal bonds into a trust (“TOB Trust”). Other trusts managed by the investment advisor may also contribute municipal bonds to a TOB into which a Trust has contributed bonds. A TOB typically issues two classes of beneficial interests: short-term floating rate certificates, (“TOB Trust Certificates”), which are sold to third party investors, and residual certificates (“TOB Residuals”), which are generally issued to the participating funds that contributed the municipal bonds to the TOB Trust. If multiple Trusts participate in the same TOB, the rights and obligations under the TOB Residual will be shared among the Trusts ratably in proportion to their participation.
The TOB Residuals held by a Trust include the right of a Trust (1) to cause the holders of a proportional share of the TOB Trust certificates to tender their certificates at par plus accrued interest upon the occurrence of certain mandatory tender events defined in the TOB agreements, and (2) to transfer, subject to a specified number of days’ prior notice, a corresponding share of the municipal bonds from the TOB to a Trust. The TOB may also be collapsed without the consent of a Trust, as the TOB Residual holder, upon the occurrence of certain termination events as defined in the TOB agreements. Such termination events may include the bankruptcy or default of the municipal bond, a substantial downgrade in credit quality of the municipal bond, the inability of the TOB to obtain renewal of the liquidity support agreement, a substantial decline in market value of the municipal bond and a judgment or ruling that interest on the municipal bond is subject to federal income taxation. Upon the occurrence of a termination event, the TOB would generally be liquidated in full with the proceeds typically applied first to any accrued fees owed to the trustee, remarketing agent and liquidity provider, and then to the holders of the TOB Trust Certificates up to par plus accrued interest owed on the TOB Trust Certificates, with the balance paid out to the TOB Residual holder. During the six months ended October 31, 2013, no TOBs in which the Trusts participated were terminated without the consent of the Trusts.
| 62 | SEMI-ANNUAL REPORT | OCTOBER 31, 2013
|
| |
| Notes to Financial Statements (continued) |
|
The cash received by the TOB from the sale of the TOB Trust Certificates, less transaction expenses, is paid to a Trust. The Trust typically invests the cash received in additional municipal bonds. Each Trust’s transfer of the municipal bonds to a TOB Trust is accounted for as a secured borrowing; therefore, the municipal bonds deposited into a TOB are presented in the Trusts’ Schedules of Investments and the TOB Trust Certificates are shown in other liabilities in the Statements of Assets and Liabilities. The carrying amount of the Trust’s payable to the holder of the TOB Trust Certificates, as reported in Statements of Assets and Liabilities as TOB Trust Certificates, approximates its fair value.
The Trusts may invest in TOBs on either a non-recourse or recourse basis. TOB Trusts are typically supported by a liquidity facility provided by a bank or other financial institution (the “Liquidity Provider”) that allows the holders of the TOB Trust Certificates to tender their certificates in exchange for payment from the Liquidity Provider of par plus accrued interest on any business day prior to the occurrence of the termination events described above. When a Trust invests in TOBS on a non-recourse basis, and the Liquidity Provider is required to make a payment under the liquidity facility due to a termination event, the Liquidity Provider will typically liquidate all or a portion of the municipal securities held in the TOB Trust and then fund, on a net basis, the balance, if any, of the amount owed under the liquidity facility over the liquidation proceeds (the “Liquidation Shortfall”). If a Trust invests in a TOB on a recourse basis, the Trust will typically enter into a reimbursement agreement with the Liquidity Provider where the Trust is required to repay the Liquidity Provider the amount of any Liquidation Shortfall. As a result, a Trust investing in a recourse TOB will bear the risk of loss with respect to any Liquidation Shortfall. If multiple Trusts participate in any such TOB, these losses will be shared ratably, including the maximum potential amounts owed by the Trusts at October 31, 2013, in proportion to their participation. The recourse TOB Trusts, if any, are identified in the Schedules of Investments including the maximum potential amounts owed by the Trusts at October 31, 2013.
Interest income, including amortization and accretion of premiums and discounts, from the underlying municipal bonds is recorded by the Trusts on an accrual basis. Interest expense incurred on the secured borrowing and other expenses related to remarketing, administration and trustee services to a TOB are shown as interest expense, fees and amortization of offering costs in the Statements of Operations. The TOB Trust Certificates have interest rates that generally reset weekly and their holders have the option to tender such certificates to the TOB for redemption at par at each reset date. At October 31, 2013, the aggregate value of the underlying municipal bonds transferred to TOBs, the related liability for TOB Trust Certificates and the range of interest rates on the liability for TOB Trust Certificates were as follows:
| Underlying
Municipal
Bonds
Transferred
to TOBs
|
| Liability for
TOB Trust
Certificates
|
| Range of
Interest
Rates
|
| BKN | $ | 38,535,877 | | $ | 21,799,254 | | 0.08 — | 0.35% |
| BTA | $ | 127,860,061 | | $ | 82,982,165 | | 0.08 — | 0.22% |
| BKK | $ | 5,518,000 | | $ | 3,750,000 | | | 0.30% |
| BFK | $ | 205,667,114 | | $ | 122,400,226 | | 0.08 — | 0.33% |
| BPS | $ | 1,413,292 | | $ | 675,000 | | 0.09 — | 0.11% |
| BSD | $ | 34,157,373 | | $ | 20,353,920 | | 0.08 — | 0.33% |
For the six months ended October 31, 2013, the Trusts’ average TOB Trust Certificates outstanding and the daily weighted average interest rate, including fees, were as follows:
|
|
|
| Average
TOB Trust
Certificates
Outstanding
|
| Daily
Weighted
Average
Interest
Rate
|
|
|
BKN | | | | $ 24,038,020 | | 0.66% |
BTA | | | | $ 83,211,830 | | 0.55% |
BKK | | | | $ 3,750,000 | | 0.59% |
BFK | | | | $148,075,526 | | 0.66% |
BPS | | | | $ 3,731,696 | | 0.62% |
BSD | | | | $ 23,945,966 | | 0.65% |
Should short-term interest rates rise, the Trusts’ investments in TOBs may adversely affect the Trusts’ net investment income and dividends to Common Shareholders. Also, fluctuations in the market value of municipal bonds deposited into the TOB Trust may adversely affect the Trusts’ NAVs per share.
4. Derivative Financial Instruments:
The Trusts engage in various portfolio investment strategies using derivative contracts both to increase the returns of the Trusts and/or to economically hedge their exposure to certain risks such as interest rate risk. These contracts may be transacted on an exchange.
Financial Futures Contracts: The Trusts purchase and/or sell financial futures contracts to gain exposure to, or economically hedge against, changes in interest rates (interest rate risk). Financial futures contracts are agreements between the Trusts and a counterparty to buy or sell a specific quantity of an underlying instrument at a specified price and at a specified date. Depending on the terms of the particular contract, financial futures contracts are settled either through physical delivery of the underlying instrument on the settlement date or by payment of a cash settlement amount on the settlement date. Upon entering into a financial futures contract, the Trusts are required to deposit initial margin with the broker in the form of cash or securities in an amount that varies depending on a contract’s size and risk profile. The initial margin deposit must then be maintained at an established level over the life of the contract. Securities deposited as initial margin are designated on the Schedules of Investments and cash deposited is recorded on the Statements of Assets and Liabilities as cash pledged for financial futures contracts. Pursuant to the contract, the Trusts agree to receive from or pay to the broker an amount of cash equal to the daily fluctuation in value of the contract. Such receipts or payments are known as variation margin and are recorded by the Trusts as unrealized appreciation or depreciation. When the contract is closed, the Trusts record a realized gain or loss equal to the difference between the value of the contract at the time it was opened and the value at the time it was closed. The use of financial futures contracts involves the risk of an imperfect correlation in the movements in the price of financial futures contracts, interest rates and the underlying assets.
| SEMI-ANNUAL REPORT | OCTOBER 31, 2013 | 63
|
| |
| Notes to Financial Statements (continued) |
|
The following is a summary of the Trusts’ derivative financial instruments categorized by risk exposure:
Fair Values of Derivative Financial Instruments as of October 31, 2013
|
|
| | Derivative Liabilities
|
|
| |
|
| BKN
|
| BFK
|
| BPS
|
| BSD
|
|
|
| Statements of Assets and
Liabilities Location
|
|
|
|
|
|
|
|
|
|
Interest rate contracts:
| | | | | | | | | | | | | | | | | | | | | |
Financial futures contracts | | Net unrealized depreciation1 | | | $(7,922 | ) | | $(14,417) | | $(2,093) | | $(2,297) | |
| 1 | | Includes cumulative appreciation/depreciation on financial futures contracts as reported in the Schedules of Investments. Only current day’s variation margin is reported within the Statements of Assets and Liabilities. |
The Effect of Derivative Financial Instruments in the Statements of Operations Six Months Ended October 31, 2013
|
|
Net Realized Gain From
|
|
|
| BKN
|
| BFK
|
| BPS
|
| BSD
|
Interest rate contracts:
| | | | | | | | | | | | | | | | | | |
Financial futures contracts | | | | $ | 250,288 | | | $ | 421,443 | | | $ | 31,964 | | | $ | 84,150 | |
| | | | Net Change in Unrealized Appreciation/Depreciation on
|
|
| | | | BKN
|
| BFK
|
| BPS
|
| BSD
|
|
Interest rate contracts:
| | | | | | | | | | | | | | | | | | | |
Financial futures contracts | | | | $ | 263,748 | | | $ | 564,353 | | | $ | 54,289 | | | $ | 124,541 | | |
For the six months ended October 31, 2013, the average quarterly balances of outstanding derivative financial instruments were as follows:
| | | | BKN
|
| BFK
|
| BPS
|
| BSD
|
Financial futures contracts:
| | | | | | | | | | | | | | | | | | |
Average number of contracts sold | | | | | 50 | | | | 91 | | | | 7 | | | | 15 | |
Average notional value of contracts sold | | | | $ | 6,367,969 | | | $ | 11,589,703 | | | $ | 891,516 | | | $ | 1,846,711 | |
Counterparty Credit Risk: A derivative contract may suffer a mark to market loss if the value of the contract decreases due to an unfavorable change in the market rates or values of the underlying instrument. Losses can also occur if the counterparty does not perform under the contract.
With exchange traded futures, there is less counterparty credit risk to the Trusts since the exchange or clearinghouse, as counterparty to such instruments, guarantees against a possible default. The clearinghouse stands between the buyer and the seller of the contract; therefore, credit risk is limited to failure of the clearinghouse. While offset rights may exist under applicable law, the Trusts do not have a contractual right of offset against a clearing broker or clearinghouse in the event of a default (including the bankruptcy or insolvency) of the clearing broker or clearinghouse. Additionally, credit risk still exists in exchange traded futures with respect to initial and variation margin that is held in a clearing broker’s customer accounts. While clearing brokers are required to segregate customer margin from their own assets, in the event that a clearing broker becomes insolvent or goes into bankruptcy and at that time there is a shortfall in the aggregate amount of margin held by the clearing broker for all its clients, typically the shortfall would be allocate on a pro rata basis across all the clearing broker’s customers, potentially resulting in losses to the Trusts.
For financial reporting purposes, the Trusts do not offset derivative assets and derivative liabilities that are subject to netting arrangements in the Statements of Assets and Liabilities.
5. Investment Advisory Agreement and Other Transactions with Affiliates:
The PNC Financial Services Group, Inc. is the largest stockholder and an affiliate, for 1940 Act purposes, of BlackRock, Inc. (“BlackRock”).
Each Trust entered into an Investment Advisory Agreement with BlackRock Advisors, LLC (the “Manager”), the Trusts’ investment advisor, an indirect, wholly owned subsidiary of BlackRock, to provide investment advisory and administration services. The Manager is responsible for the management of each Trust’s portfolio and provides the necessary personnel, facilities, equipment and certain other services necessary to the operations of each Trust. For such services, each Trust pays the Manager a monthly fee based on a percentage of each Trust’s average weekly net assets at the following annual rates:
BKN | | | | | 0.35 | % |
BTA | | | | | 1.00 | % |
BKK | | | | | 0.50 | % |
BFK | | | | | 0.60 | % |
BPS | | | | | 0.60 | % |
BSD | | | | | 0.60 | % |
Average weekly net assets for all of the Trusts, except BTA, is the average weekly value of each Trust’s total assets minus its total accrued liabilities. For BTA, average weekly net assets is the average weekly value of the Trust’s total assets minus its total liabilities.
| 64 | SEMI-ANNUAL REPORT | OCTOBER 31, 2013
|
| |
| Notes to Financial Statements (continued) |
|
The Manager entered into a sub-advisory agreement with BlackRock Financial Management, LLC (“BFM”), an affiliate of the Manager. The Manager pays BFM, for services it provides, a monthly fee that is a percentage of the investment advisory fees paid by each Trust to the Manager.
The Manager voluntarily agreed to waive a portion of the investment advisory fees or other expenses as a percentage of its average daily net assets as follows:
|
|
|
| Through
|
| Rate
|
BTA | | | | January 31, 2014 | | 0.10% |
For the six months ended October 31, 2013, the Manager waived the following amounts, which are included in fees waived by advisor in the Statements of Operations:
BKN has an Administration Agreement with the Manager. The Administration fee paid to the manager is computed at an annual rate of 0.15% of the Trust’s average weekly net assets including proceeds from the issuance of Preferred Shares and TOBs.
The Manager voluntarily agreed to waive its investment advisory fees by the amount of investment advisory fees each Trust pays to the Manager indirectly through its investment in affiliated money market funds. However, the Manager does not waive its investment advisory fees by the amount of investment advisory fees paid in connection with each Trust’s investment in other affiliated investment companies, if any. These amounts are included in fees waived by Manager in the Statements of Operations. For the six months ended October 31, 2013, the amounts waived were as follows:
BKN | | | | $ | 757 | |
BTA | | | | $ | 392 | |
BKK | | | | $ | 1,781 | |
BFK | | | | $ | 2,123 | |
BPS | | | | $ | 34 | |
BSD | | | | $ | 313 | |
Certain officers and/or Trustees of the Trusts are officers and/or directors of BlackRock or its affiliates. The Trusts reimburse the Manager for a portion of the compensation paid to the Trusts’ Chief Compliance officer, which is included in Officer and Trustees in the Statements of Operations.
The Trusts may purchase securities from, or sell securities to, an affiliated fund provided the affiliation is solely due to having a common investment adviser, common officers, or common trustees. For the six months ended October 31, 2013, the purchase and sale transactions for BKN with an affiliated fund in compliance with Rule 17a-7 under the 1940 Act were $0 and $2,059,002, respectively.
6. Purchases and Sales:
Purchases and sales of investments excluding short-term securities for the six months ended October 31, 2013 were as follows:
|
|
|
| Purchases
|
| Sales
|
BKN | | | | $ | 50,061,003 | | | $ | 63,037,046 | |
BTA | | | | $ | 32,171,459 | | | $ | 48,368,493 | |
BKK | | | | $ | 19,246,277 | | | $ | 72,476,955 | |
BFK | | | | $ | 82,959,725 | | | $ | 144,656,371 | |
BPS | | | | $ | 3,867,845 | | | $ | 8,043,620 | |
BSD | | | | $ | 15,689,613 | | | $ | 22,999,082 | |
7. Income Tax Information:
As of April 30, 2013, the Trusts had capital loss carryforwards available to offset future realized capital gains through the indicated expiration dates as follows:
Expires April 30,
|
|
|
| BKN
|
| BTA
|
| BKK
|
| BFK
|
| BPS
|
| BSD
|
| | | | | | | | | | | | | | | | | | | | | | | | | | |
2014 | | | | | — | | | $ | 701,315 | | | | — | | | $ | 2,574,427 | | | | — | | | | — | |
2015 | | | | | — | | | | — | | | | — | | | | 606,017 | | | | — | | | | — | |
2016 | | | | | — | | | | 22,052,642 | | | | — | | | | 10,207,532 | | | $ | 127,957 | | | | — | |
2017 | | | | $ | 2,716,981 | | | | 6,882,935 | | | | — | | | | 2,065,704 | | | | 929,529 | | | $ | 3,887,588 | |
2018 | | | | | 1,174,679 | | | | 4,821,726 | | | $ | 354,058 | | | | 2,455,638 | | | | 586,549 | | | | 2,381,683 | |
2019 | | | | | — | | | | 951,237 | | | | 1,090,371 | | | | — | | | | — | | | | 2,978,126 | |
No expiration date1 | | | | | — | | | | 4,257,308 | | | | — | | | | — | | | | 189,377 | | | | — | |
Total
| | | | $ | 3,891,660 | | | $ | 39,667,163 | | | $ | 1,444,429 | | | $ | 17,909,318 | | | $ | 1,833,412 | | | $ | 9,247,397 | |
| 1 | | Must be utilized prior to losses subject to expiration. |
| SEMI-ANNUAL REPORT | OCTOBER 31, 2013 | 65
|
| |
| Notes to Financial Statements (continued) |
|
As of October 31, 2013, gross unrealized appreciation and depreciation based on cost for federal income tax purposes were as follows:
|
|
|
| BKN
|
| BTA
|
| BKK
|
| BFK
|
| BPS
|
| BSD
|
| | | | | | | | | | | | | | | | | | | | | | | | | | | |
| Tax cost | | | | $ | 366,429,627 | | | $ | 155,544,353 | | | $ | 413,402,081 | | | $ | 866,194,826 | | | $ | 42,643,034 | | | $ | 138,330,869 | |
| Gross unrealized appreciation | | | | $ | 20,533,336 | | | $ | 7,179,214 | | | $ | 21,540,561 | | | $ | 35,316,991 | | | $ | 1,401,172 | | | $ | 5,823,071 | |
| Gross unrealized depreciation | | | | | (11,740,057 | ) | | | (7,974,893 | ) | | | (3,989,396 | ) | | | (40,196,153 | ) | | | (842,139 | ) | | | (5,109,166 | ) |
| Net unrealized appreciation/depreciation | | | | $ | 8,793,279 | | | $ | (795,679 | ) | | $ | 17,551,165 | | | $ | (4,879,162 | ) | | $ | 559,033 | | | $ | 713,905 | |
| | | | | | | | | | | | | | | | | | | | | | | | | | | |
8. Concentration, Market and Credit Risk:
The Trusts invest a substantial amount of their assets in issuers located in a single state or limited number of states. Please see the Schedules of Investments for concentrations in specific states of US territories.
Many municipalities insure repayment of their bonds, which may reduce the potential for loss due to credit risk. The market value of these bonds may fluctuate for other reasons, including market perception of the value of such insurance, and there is no guarantee that the insurer will meet its obligation.
In the normal course of business, the Trusts invest in securities and enter into transactions where risks exist due to fluctuations in the market (market risk) or failure of the issuer of a security to meet all its obligations (issuer credit risk). The value of securities held by the Trusts may decline in response to certain events, including those directly involving the issuers whose securities are owned by the Trusts; conditions affecting the general economy; overall market changes; local, regional or global political, social or economic instability; and currency and interest rate and price fluctuations. Similar to issuer credit risk, the Trusts may be exposed to counterparty credit risk, or the risk that an entity with which the Trusts have unsettled or open transactions may fail to or be unable to perform on its commitments. The Trusts manage counterparty credit risk by entering into transactions only with counterparties that they believe have the financial resources to honor their obligations and by monitoring the financial stability of those counterparties. Financial assets, which potentially expose the Trusts to market, issuer and counterparty credit risks, consist principally of financial instruments and receivables due from counterparties. The extent of the Trusts’ exposure to market, issuer and counterparty credit risks with respect to these financial assets is generally approximated by their value recorded in the Statements of Assets and Liabilities, less any collateral held by the Trusts.
As of October 31, 2013, BKN, BTA, BPS and BSD invested a significant portion of their assets in securities in the health sector. BFK and BSD invested a significant portion of their assets in securities in the transportation sector. Changes in economic conditions affecting the health or transportation would have a greater impact on the Trusts and could affect the value, income and/or liquidity of positions in such securities.
The Trusts may hold a significant amount of bonds subject to calls by the issuers at defined dates and prices. When bonds are called by issuers and the Trusts reinvest the proceeds received, such investments may be in securities with lower yields than the bonds originally held, and correspondingly, could adversely impact the yield and total return performance of a Trust.
9. Capital Share Transactions:
BKK, BFK, BPS and BSD are authorized to issue an unlimited number of shares, including Preferred Shares, par value $0.001 per share, all of which were initially classified as Common Shares. BKN is authorized to issue 200 million shares including Preferred Shares, all of which were initially classified as Common Shares, par value $0.01 per share. BTA is authorized to issue an unlimited number of Common Shares, par value $0.001 per share. BTA is also allowed to issue Preferred Shares but has not done so. The Board is authorized, however, to reclassify any unissued Common Shares to Preferred Shares without approval of Common Shareholders.
Common Shares
For the period shown, shares issued and outstanding increased by the following amounts as a result of dividend reinvestment:
|
|
|
| Six Months
Ended
October 31,
2013
|
|
Year
Ended
April 30,
2013
|
BKN | | | | | 3,264 | | | | 41,693 | |
BTA | | | | | — | | | | 28,270 | |
BFK | | | | | 12,577 | | | | 91,781 | |
BPS | | | | | — | | | | 3,536 | |
BSD | | | | | — | | | | 5,389 | |
Shares issued and outstanding remained constant for BKK for the six months ended October 31, 2013 and the year ended April 30, 2013.
Preferred Shares
Each Trust’s Preferred Shares rank prior to the Trust’s Common Shares as to the payment of dividends by the Trust and distribution of assets upon dissolution or liquidation of the Trust. The 1940 Act prohibits the declaration of any dividend on the Trust’s Common Shares or the repurchase of the Trust’s Common Shares if the Trust fails to maintain the asset coverage of at least 200% of the liquidation preference of the outstanding Preferred Shares. In addition, pursuant to the Preferred Shares’ governing instrument, the Trust is restricted from declaring and paying dividends on classes of shares ranking junior to or on parity with the Preferred Shares or repurchasing such shares if the Trust fails to declare and pay dividends on the Preferred Shares, redeem any Preferred Shares required to be redeemed under the Preferred Shares governing instrument or comply with the basic maintenance amount requirement of the rating agencies then rating the Preferred Shares.
| 66 | SEMI-ANNUAL REPORT | OCTOBER 31, 2013
|
| |
| Notes to Financial Statements (continued) |
|
The holders of Preferred Shares have voting rights equal to the holders of Common Shares (one vote per share) and will vote together with holders of Common Shares (one vote per share) as a single class. However, the holders of Preferred Shares, voting as a separate class, are also entitled to elect two Trustees for each Trust. In addition, the 1940 Act requires that along with approval by shareholders that might otherwise be required, the approval of the holders of a majority of any outstanding Preferred Shares, voting separately as a class would be required to (a) adopt any plan of reorganization that would adversely affect the Preferred Shares, (b) change a Trust’s sub-classification as a closed-end investment company or change its fundamental investment restrictions or (c) change its business so as to cease to be an investment company.
VRDP Shares
BPS has issued Series W-7 VRDP Shares, $100,000 liquidation value per share, in a privately negotiated offering. The VRDP Shares were offered to qualified institutional buyers as defined pursuant to Rule 144A under the Securities Act of 1933, as amended, (the “Securities Act”) and include a liquidity feature, pursuant to a liquidity agreement, that allows the holders of VRDP Shares to have their shares purchased by the liquidity provider in the event of a failed remarketing. BPS is required to redeem the VRDP Shares owned by the liquidity provider after six months of continuous, unsuccessful remarketing. Upon the occurrence of the first unsuccessful remarketing, BPS is required to segregate liquid assets to fund the redemption. The VRDP Shares are subject to certain restrictions on transfer.
The VRDP Shares outstanding as of the six months ended October 31, 2013 were as follows:
|
|
|
| Issue Date
|
| Shares
Issued
|
| Aggregate
Principal
|
| Maturity
Date
|
BPS | | | | | 6/14/12 | | | 163
| | $ | 16,300,000 | | | | 7/01/42 | |
BPS entered into a fee agreement with the liquidity provider that may require a per annum liquidity fee payable to the liquidity provider. These fees, if applicable, are shown as liquidity fees in the Statements of Operations.
The fee agreement between the BPS and the liquidity provider is scheduled to expire on July 9, 2015 unless renewed or terminated in advance. In the event the fee agreement is not renewed or is terminated in advance, and BPS does not enter into a fee agreement with an alternate liquidity provider, the VRDP Shares will be subject to mandatory purchase by the liquidity provider prior to the termination of the fee agreement. BPS is required to redeem any VRDP Shares purchased by the liquidity provider six months after the purchase date. Immediately after the purchase of any VRDP Shares by the liquidity provider, BPS is required to begin to segregate liquid assets with the Trust’s custodian to fund the redemption. There is no assurance BPS will replace such redeemed VRDP Shares with any other preferred shares or other form of leverage.
BPS is required to redeem its VRDP Shares on the maturity date, unless earlier redeemed or repurchased. Six months prior to the maturity date, BPS is required to begin to segregate liquid assets with the Trust’s custodian to fund the redemption. In addition, BPS is required to redeem certain of its outstanding VRDP Shares if it fails to maintain certain asset coverage, basic maintenance amount or leverage requirements.
Subject to certain conditions, the VRDP Shares may be redeemed, in whole or in part, at any time at the option of BPS. The redemption price per VRDP Share is equal to the liquidation value per share plus any outstanding unpaid dividends. In the event of an optional redemption of the VRDP Shares prior to the initial termination date of the fee agreement, BPS must pay the respective liquidity provider fees on such redeemed VRDP Shares for the remaining term of the fee agreement up to the initial termination date.
Dividends on the VRDP Shares are payable monthly at a variable rate set weekly by the remarketing agent. Such dividend rates are generally based upon a spread over a base rate and cannot exceed a maximum rate. In the event of a failed remarketing, the dividend rate of the VRDP Shares will be reset to a maximum rate. The maximum rate is determined based on, among other things, the long-term preferred share rating assigned to the VRDP Shares and the length of time that the VRDP Shares fail to be remarketed. At the date of issuance, the VRDP Shares were assigned a long-term rating of Aaa from Moody’s and AAA from Fitch. Subsequent to the issuance of the VRDP Shares, Moody’s completed a review of its methodology for rating securities issued by registered closed-end funds. As of October 31, 2013 the VRDP Shares were assigned a long-term rating of Aa1 from Moody’s under its new ratings methodology. The VRDP Shares continue to be assigned a long-term rating of AAA from Fitch.
For financial reporting purposes, the VRDP Shares are considered debt of the issuer; therefore, the liquidation value, which approximates fair value, of the VRDP Shares is recorded as a liability in the Statements of Assets and Liabilities. Unpaid dividends are included in interest expense and fees payable in the Statements of Assets and Liabilities, and the dividends accrued and paid on the VRDP Shares are included as a component of interest expense, fees and amortization of offering costs in the Statements of Operations. The VRDP Shares are treated as equity for tax purposes. Dividends paid to holders of the VRDP Shares are generally classified as tax-exempt income for tax-reporting purposes.
BPS may incur remarketing fees of 0.10% on the aggregate principal amount of all the VRDP Shares, which, if any, are included in remarketing fees on Preferred Shares in the Statements of Operations. None of BPS’s VRDP Shares were tendered for remarketing during the six months ended October 31, 2013.
The annualized dividend rates for the VRDP Shares for the six months ended October 31, 2013 were as follows:
| SEMI-ANNUAL REPORT | OCTOBER 31, 2013 | 67
|
| |
| Notes to Financial Statements (continued) |
|
Upon issuance of the VRDP Shares on June 14, 2012, BPS announced a special rate period for an approximate three-year term ending June 24, 2015 with respect to its VRDP Shares. The liquidity and fee agreements remain in effect for the duration of the special rate period; however, the VRDP Shares will not be remarketed or subject to optional or mandatory tender events during such time. During the special rate period, BPS is required to maintain the same asset coverage, basic maintenance amount and leverage requirements for the VRDP Shares. During the three-year term of the special rate period, BPS will not pay any liquidity and remarketing fees and instead will pay dividends monthly based on the sum of Securities Industries and Financial Market Association Municipal Swap Index (“SIFMA”) and a percentage per annum based on the long-term ratings assigned to the VRDP Shares.
If BPS redeems the VRDP Shares on a date that is one year or more before the end of the special rate period and the VRDP Shares are rated above A1/A by Moody’s and Fitch respectively, then such redemption is subject to a redemption premium payable to the holder of the VRDP Shares based on the time remaining in the special rate period, subject to certain exceptions for redemptions that are required to maintain minimum asset coverage requirements. After June 24, 2015, the holder of the VRDP Shares and BPS may mutually agree to extend the special rate period. If the special rate period is not extended, the VRDP Shares will revert back to remarketable securities and will be remarketed and available for purchase by qualified institutional investors. No short-term ratings were assigned by Moody’s, Fitch and/or S&P at issuance but will be assigned upon termination of the special rate period when the VRDP Shares revert to remarketable securities.
VMTP Shares
BKN, BFK and BSD (collectively, the “VMTP Trusts”), have issued Series W-7 VMTP Shares, $100,000 liquidation value per share, in a privately negotiated offering and sale of VMTP Shares exempt from registration under the Securities Act.
The VMTP Shares outstanding as of the six months ended October 31, 2013 were as follows:
|
|
|
| Issue Date
|
| Shares
Issued
|
| Aggregate
Principal
|
| Term
Date
|
BKN | | | | | 12/16/11 | | | | 1,259 | | | $ | 125,900,000 | | | | 1/02/15 | |
BFK | | | | | 12/16/11 | | | | 2,708 | | | $ | 270,800,000 | | | | 1/02/15 | |
BSD | | | | | 12/16/11 | | | | 429 | | | $ | 42,900,000 | | | | 1/02/15 | |
Each VMTP Trust is required to redeem its VMTP Shares on the term date, unless earlier redeemed or repurchased or unless extended. There is no assurance that the term of the Trusts’ VMTP Shares will be extended or that a Trusts’ VMTP Shares will be replaced with any other preferred shares or other form of leverage upon the redemption or repurchase of the VMTP Shares. Six months prior to term date, each VMTP Trust is required to begin to segregate liquid assets with the Trusts’ custodian to fund the redemption. In addition, each VMTP Trust is required to redeem certain of its outstanding VMTP Shares if it fails to maintain certain asset coverage, basic maintenance amount or leverage requirements.
Subject to certain conditions, each Trust’s VMTP Shares may be redeemed, in whole or in part, at any time at the option of the Trust. The redemption price per VMTP Share is equal to the liquidation value per share plus any outstanding unpaid dividends and applicable redemption premium. If the Trusts redeem the VMTP Shares on a date that is one year or more prior to the term date and the VMTP Shares are rated above A1/A+ by Moody’s and Fitch, respectively, then such redemption is subject to a prescribed redemption premium (up to 3% of the liquidation preference) payable to the holder of the VMTP Shares based on the time remaining to the term date, subject to certain exceptions for redemptions that are required to maintain minimum asset coverage requirements. The VMTP Shares are subject to certain restrictions on transfer, and the Trust may also be required to register the VMTP Shares for sale under the Securities Act under certain circumstances. In addition, amendments to the VMTP governing document generally require the consent of the holders of VMTP Shares.
Dividends on the VMTP Shares are declared daily and payable monthly at a variable rate set weekly at a fixed rate spread to the SIFMA Municipal Swap Index. The fixed spread is determined based on the long-term preferred share rating assigned to the VMTP Shares by Moody’s and Fitch. At the date of issuance, the VMTP Shares were assigned long-term ratings of Aaa from Moody’s and AAA from Fitch. Subsequent to the issuance of the VMTP Shares, Moody’s completed a review of its methodology for rating securities issued by registered closed-end funds. As of October 31, 2013, the VMTP Shares were assigned long-term ratings of Aaa from Moody’s under its new rating methodology. The VMTP Shares continue to be assigned a long-term rating of AAA from Fitch. The dividend rate on the VMTP Shares is subject to a step-up spread if the Trust fails to comply with certain provisions, including, among other things, the timely payment of dividends, redemptions or gross-up payments, and maintaining certain asset coverage and leverage requirements.
The average annualized dividend rates for the VMTP Shares for the six months ended October 31, 2013 were as follows:
|
|
|
| Rate
|
BKN | | | | | 1.08 | % |
BFK | | | | | 1.08 | % |
BSD | | | | | 1.08 | % |
For financial reporting purposes, the VMTP Shares are considered debt of the issuer; therefore the liquidation value, which approximates fair value, of the VMTP Shares is recorded as a liability in the Statements of Assets and Liabilities. Unpaid dividends are included in interest expense and fees payable in the Statements of Assets and Liabilities, and the dividends accrued and paid on the VMTP Shares are included as a component of interest expense, fees and amortization of offering costs in the Statements of Operations. The VMTP Shares are treated as equity for tax purposes. Dividends paid to holders of the VMTP Shares are generally classified as tax-exempt income for tax-reporting purposes.
| 68 | SEMI-ANNUAL REPORT | OCTOBER 31, 2013
|
| |
| Notes to Financial Statements (continued) |
|
Offering Costs: Certain Trusts incurred costs in connection with the issuance of VRDP Shares and/or VMTP Shares. For VRDP Shares, these costs were recorded as a deferred charge and will be amortized over the 30-year life of the VRDP Shares. For VMTP Shares, these costs were recorded as a deferred charge and will be amortized over the 3-year life of the VMTP Shares. Amortization of these costs is included in interest expense, fees and amortization of offering costs in the Statements of Operations.
AMPS
The AMPS are redeemable at the option of BKK in whole or in part, on any dividend payment date at their liquidation preference per share plus any accumulated and unpaid dividends whether or not declared. The AMPS are also subject to mandatory redemption at their liquidation preference plus any accumulated and unpaid dividends, whether or not declared, if certain requirements relating to the composition of the assets and liabilities of BKK, as set forth in BKK’s Statement of Preferences (the “Governing Instrument”) are not satisfied.
From time to time in the future, BKK may effect repurchases of its AMPS at prices below their liquidation preference as agreed upon by the Trust and seller. BKK also may redeem its AMPS from time to time as provided in the applicable Governing Instrument. BKK intends to effect such redemptions and/or repurchases to the extent necessary to maintain applicable asset coverage requirements or for such other reasons as the Board may determine.
The AMPS outstanding as of the six months ended October 31, 2013 were as follows:
|
|
|
| Series
|
| AMPS
|
| Effective
Yield
|
| Reset
Frequency
Days
|
| Moody’s
Rating
|
BKK | | | | | M-7 | | | | 1,468 | | | | 0.16 | % | | | 7 | | | | Aa1 | |
| | | | | W-7 | | | | 1,468 | | | | 0.16 | % | | | 7 | | | | Aa1 | |
| | | | | F-7 | | | | 1,468 | | | | 0.16 | % | | | 7 | | | | Aa1 | |
Dividends on BKK’s AMPS are cumulative at a rate, which is reset every seven days, based on the results of an auction. If the AMPS fail to clear the auction on an auction date, BKK is required to pay the maximum applicable rate on the AMPS to holders of such shares for successive dividend periods until such time as the shares are successfully auctioned. The maximum applicable rate on the AMPS is footnoted in the table below. The low, high and average dividend rates on the AMPS for BKK and BPS for the period were as follows:
|
|
|
| Series
|
| Low
|
| High
|
| Average
|
BKK | | | | | M-7 | | | | 0.08 | % | | | 0.36 | % | | | 0.16 | % |
| | | | | W-7 | | | | 0.08 | % | | | 0.38 | % | | | 0.16 | % |
| | | | | F-7 | | | | 0.08 | % | | | 0.36 | % | | | 0.15 | % |
BPS | | | | | W-7 | | | | 0.24 | % | | | 0.38 | % | | | 0.31 | % |
Since February 13, 2008, the AMPS of BKK and BPS failed to clear any of its auctions. As a result, the AMPS dividend rates were reset to the maximum applicable rate, which ranged from 0.08% to 0.38% for the six months ended October 31, 2013. A failed auction is not an event of default for the Trust but it has a negative impact on the liquidity of AMPS. A failed auction occurs when there are more sellers of the Trust’s AMPS than buyers. A successful auction for the Trusts’ AMPS may not occur for some time, if ever, and even if liquidity does resume, holders of AMPS may not have the ability to sell the AMPS at their liquidation preference.
BKK and BPS paid commissions of 0.15% on the aggregate principal amount of all shares that fail to clear their auctions and 0.25% on the aggregate principal amount of all shares that successfully clear their auctions. Certain broker dealers have individually agreed to reduce commissions for failed auctions. The commissions paid to these broker dealers are included in remarketing fees on Preferred Shares in the Statements of Operations.
During the six months ended October 31, 2013, BKK announced the following redemptions of AMPS at a price of $25,000 per share plus any accrued and unpaid dividends through the redemption date:
|
|
|
| Series
|
| Redemption
Date
|
| Shares
Redeemed
|
| Aggregate
Principal
|
BKK | | | | | F-7 | | | | 5/28/13 | | | | 82 | | | $ | 2,050,000 | |
| | | | | M-7 | | | | 5/28/13 | | | | 82 | | | $ | 2,050,000 | |
| | | | | W-7 | | | | 5/23/13 | | | | 82 | | | $ | 2,050,000 | |
| | | | | F-7 | | | | 8/05/13 | | | | 413 | | | $ | 10,325,000 | |
| | | | | M-7 | | | | 8/06/13 | | | | 413 | | | $ | 10,325,000 | |
| | | | | W-7 | | | | 8/01/13 | | | | 413 | | | $ | 10,325,000 | |
| | | | | F-7 | | | | 9/09/13 | | | | 98 | | | $ | 2,450,000 | |
| | | | | M-7 | | | | 9/10/13 | | | | 98 | | | $ | 2,450,000 | |
| | | | | W-7 | | | | 9/12/13 | | | | 98 | | | $ | 2,450,000 | |
| | | | | F-7 | | | | 10/07/13 | | | | 89 | | | $ | 2,225,000 | |
| | | | | M-7 | | | | 10/08/13 | | | | 89 | | | $ | 2,225,000 | |
| | | | | W-7 | | | | 10/10/13 | | | | 89 | | | $ | 2,225,000 | |
During the year ended April 30, 2013, BKK and BPS announced the following redemptions of AMPS at a price of $25,000 per share plus any accrued and unpaid dividends through the redemption date:
|
|
|
| Series
|
| Redemption
Date
|
| Shares
Redeemed
|
| Aggregate
Principal
|
BKK | | | | | F-7 | | | | 1/22/13 | | | | 142 | | | $ | 3,550,000 | |
| | | | | M-7 | | | | 1/22/13 | | | | 142 | | | $ | 3,550,000 | |
| | | | �� | W-7 | | | | 1/24/13 | | | | 142 | | | $ | 3,550,000 | |
| | | | | F-7 | | | | 1/28/13 | | | | 26 | | | $ | 650,000 | |
| | | | | M-7 | | | | 1/29/13 | | | | 26 | | | $ | 650,000 | |
| | | | | W-7 | | | | 1/31/13 | | | | 26 | | | $ | 650,000 | |
BPS | | | | | W-7 | | | | 7/05/12 | | | | 653 | | | $ | 16,325,000 | |
As of April 30, 2013, there were no AMPS outstanding on BPS.
| SEMI-ANNUAL REPORT | OCTOBER 31, 2013 | 69
|
| |
| Notes to Financial Statements (concluded) |
|
10. Subsequent Events:
Management’s evaluation of the impact of all subsequent events on the Trusts’ financial statements was completed through the date the financial statements were issued and the following items were noted:
The Trusts paid a net investment income dividend in the following amounts per share on December 2, 2013 to shareholders of record on November 15, 2013 as follows:
|
| Common
Dividend
Per Share
|
BKN | | $ | 0.08000 | |
BTA | | $ | 0.06200 | |
BKK | | $ | 0.06225 | |
BFK | | $ | 0.07510 | |
BPS | | $ | 0.06500 | |
BSD | | $ | 0.07400 | |
Additionally, the Trusts declared dividends on December 2, 2013 payable to Common Shareholders of record on December 13, 2013 as follows:
| | Per Common Share
|
|
| Tax-Exempt
Dividends
Declared
|
| Ordinary
Dividends
Declared
|
BKN | | $ | 0.08000 | | — |
BTA | | $ | 0.06200 | | — |
BKK | | $ | 0.06225 | | — |
BFK | | $ | 0.07510 | | $0.000310 |
BPS | | $ | 0.06500 | | $0.001408 |
BSD | | $ | 0.07400 | | $0.001161 |
The dividends declared on AMPS, VRDP or VMTP Shares for the period November 1, 2013 to November 30, 2013 were as follows:
|
|
|
| Series
|
| AMPS/VRDP/VMTP
Dividends Declared
|
| BKN | | | | | W-7 | | | $ | 109,999 | |
| BKK | | | | | M-7 | | | $ | 3,578 | |
| | | | | | W-7 | | | $ | 3,582 | |
| | | | | | F-7 | | | $ | 3,425 | |
| BFK | | | | | W-7 | | | $ | 236,598 | |
| BPS | | | | | W-7 | | | $ | 13,571 | |
| BSD | | | | | W-7 | | | $ | 37,482 | |
On November 7, 2013, BKK announced the following redemption of AMPS at a price of $25,000 per share plus any accrued and unpaid dividends through the redemption date.
|
|
|
| Series
|
| Redemption
Date
|
| Shares
Redeemed
|
| Aggregate
Principal
|
BKK | | | | | F-7 | | | | 12/02/13 | | | | 132 | | | $ | 3,300,000 | |
| | | | | M-7 | | | | 12/03/13 | | | | 132 | | | $ | 3,300,000 | |
| | | | | W-7 | | | | 11/29/13 | | | | 132 | | | $ | 3,300,000 | |
On December 10, 2013, regulators published final rules implementing section 619 of the Dodd-Frank Wall Street Reform and Consumer Protection Act (the “Volcker Rule”), which prohibit banking entities from engaging in proprietary trading of certain instruments and limit such entities’ investments in, and relationships with, “covered funds, as defined in the rules.” Banking entities subject to the rules are required to fully comply by July 21, 2015. These rules may preclude banking entities and their affiliates from (i) sponsoring TOB trust programs (as such programs are presently structured) and (ii) continuing relationships with or services for existing TOB trust programs. As a result, TOB trusts may need to be restructured or unwound. There can be no assurances that TOB trusts can be restructured, that new sponsors of TOB trusts will develop, or that alternative forms of leverage will be available to the Trusts. Any alternative forms of leverage may be more or less advantageous to the Trusts than existing TOB leverage.
TOB transactions constitute an important component of the municipal bond market. Accordingly, implementation of the Volcker Rule may adversely impact the municipal market, including through reduced demand for and liquidity of municipal bonds and increased financing costs for municipal issuers. Any such developments could adversely affect the Trusts. The ultimate impact of these rules on the TOB market and the overall municipal market is not yet certain.
| 70 | SEMI-ANNUAL REPORT | OCTOBER 31, 2013
|
| |
| Disclosure of Investment Advisory Agreements and Sub-Advisory Agreements |
|
The Board of Directors or Trustees, as applicable (each, a “Board,” collectively, the “Boards,” and the members of which are referred to as “Board Members”) of BlackRock Investment Quality Municipal Trust Inc. (“BKN”), BlackRock Long-Term Municipal Advantage Trust (“BTA”), BlackRock Municipal 2020 Term Trust (“BKK”), BlackRock Municipal Income Trust (“BFK”), BlackRock Pennsylvania Strategic Municipal Trust (“BPS”) and BlackRock Strategic Municipal Trust (“BSD” and together with BKN, BTA, BKK, BFK and BPS, each a “Fund,” and, collectively, the “Funds”) met in person on April 18, 2013 (the “April Meeting”) and June 4-5, 2013 (the “June Meeting”) to consider the approval of each Fund’s investment advisory agreement (each, an “Advisory Agreement”) with BlackRock Advisors, LLC (the “Manager”), each Fund’s investment advisor. The Board of each Fund also considered the approval of the sub-advisory agreement (each, a “Sub-Advisory Agreement”) among the Manager, BlackRock Financial Management, Inc. (the “Sub-Advisor”), and its Fund. The Manager and the Sub-Advisor are referred to herein as “BlackRock.” The Advisory Agreements and the Sub-Advisory Agreements are referred to herein as the “Agreements.”
Activities and Composition of the Board
Each Board consists of eleven individuals, nine of whom are not “interested persons” of such Fund as defined in the Investment Company Act of 1940 (the “1940 Act”) (the “Independent Board Members”). The Board Members are responsible for the oversight of the operations of the Funds and perform the various duties imposed on the directors of investment companies by the 1940 Act. The Independent Board Members have retained independent legal counsel to assist them in connection with their duties. The Chairman of each Board is an Independent Board Member. Each Board has established six standing committees: an Audit Committee, a Governance and Nominating Committee, a Compliance Committee, a Performance Oversight Committee, an Executive Committee, and a Leverage Committee, each of which is chaired by an Independent Board Member and composed of Independent Board Members (except for the Executive Committee and the Leverage Committee, each of which also has one interested Board Member).
The Agreements
Pursuant to the 1940 Act, the Boards are required to consider the continuation of the Agreements on an annual basis. The Boards have four quarterly meetings per year, each extending over two days, and a fifth one-day meeting to consider specific information surrounding the consideration of renewing the Agreements. In connection with this process, the Boards assessed, among other things, the nature, scope and quality of the services provided to the Funds by BlackRock, its personnel and its affiliates, including investment management, administrative and shareholder services, oversight of fund accounting and custody, marketing services, risk oversight, compliance and assistance in meeting applicable legal and regulatory requirements.
The Boards, acting directly and through their respective committees, considered at each of their meetings, and from time to time as appropriate, factors that are relevant to their annual consideration of the renewal of the Agreements, including the services and support provided by BlackRock to the Funds and their shareholders. Among the matters the Boards considered were: (a) investment performance for one-year, three-year, five-year and/or since inception periods, as applicable, against peer funds, and applicable benchmarks, if any, as well as senior management’s and portfolio managers’ analysis of the reasons for any over-performance or underperformance against their peers and/or benchmark, as applicable; (b) fees, including advisory, administration, if applicable, and other amounts paid to BlackRock and its affiliates by the Funds for services such as call center; (c) Fund operating expenses and how BlackRock allocates expenses to the Funds; (d) the resources devoted to, risk oversight of, and compliance reports relating to, implementation of the Funds’ investment objectives, policies and restrictions; (e) the Funds’ compliance with their Code of Ethics and other compliance policies and procedures; (f) the nature, cost and character of non-investment management services provided by BlackRock and its affiliates; (g) BlackRock’s and other service providers’ internal controls and risk and compliance oversight mechanisms; (h) BlackRock’s implementation of the proxy voting policies approved by the Boards; (i) execution quality of portfolio transactions; (j) BlackRock’s implementation of the Funds’ valuation and liquidity procedures; (k) an analysis of management fees for products with similar investment objectives across the open-end fund, closed-end fund and institutional account product channels, as applicable; (l) BlackRock’s compensation methodology for its investment professionals and the incentives it creates; and (m) periodic updates on BlackRock’s business.
The Boards have engaged in an ongoing strategic review with BlackRock of opportunities to consolidate funds and of BlackRock’s commitment to investment performance. In addition, the Boards requested and BlackRock provided an analysis of fair valuation and stale pricing policies. BlackRock also furnished information to the Boards in response to specific questions. These questions covered issues such as BlackRock’s profitability, investment performance and management fee levels. The Boards further considered the importance of: (i) organizational and structural variables to investment performance; (ii) rates of portfolio turnover; (iii) BlackRock’s performance accountability for portfolio managers; (iv) marketing support for the funds; (v) services provided to the Funds by BlackRock affiliates; and (vi) BlackRock’s oversight of relationships with third party service providers.
The Board of each of BKN, BKK, BFK, BPS and BSD considered BlackRock’s efforts during the past year with regard to refinancing outstanding AMPS, as well as ongoing time and resources devoted to other forms of preferred shares and alternative leverage. As of the date of this report, each of BKN, BFK, BPS and BSD has redeemed 100% of its outstanding AMPS and BKK has redeemed 43.6% of its outstanding AMPS.
Board Considerations in Approving the Agreements
The Approval Process: Prior to the April Meeting, the Boards requested and received materials specifically relating to the Agreements. The Boards are engaged in a process with its independent legal counsel and BlackRock to review the nature and scope of the information provided to better assist their deliberations. The materials provided in connection with the April Meeting included (a) information independently compiled and prepared by Lipper, Inc. (“Lipper”) on Fund fees and expenses as compared with a peer group of funds as determined by Lipper (“Expense
| SEMI-ANNUAL REPORT | OCTOBER 31, 2013 | 71
|
| |
| Disclosure of Investment Advisory Agreements and Sub-Advisory Agreements (continued) |
|
Peers”) and the investment performance of the Funds as compared with a peer group of funds as determined by Lipper1 and, with respect to BKN, BTA, BFK, BPS and BSD, a customized peer group selected by BlackRock; (b) information on the profits realized by BlackRock and its affiliates pursuant to the Agreements and a discussion of fall-out benefits to BlackRock and its affiliates; (c) a general analysis provided by BlackRock concerning investment management fees charged to other clients, such as institutional clients and open-end funds, under similar investment mandates, as applicable; (d) review of non-management fees; (e) the existence, impact and sharing of potential economies of scale; (f) a summary of aggregate amounts paid by each Fund to BlackRock and (g) if applicable, a comparison of management fees to similar BlackRock closed-end funds, as classified by Lipper.
At the April Meeting, the Boards reviewed materials relating to their consideration of the Agreements. As a result of the discussions that occurred during the April Meeting, and as a culmination of the Boards’ year-long deliberative process, the Boards presented BlackRock with questions and requests for additional information. BlackRock responded to these requests with additional written information in advance of the June Meeting.
At the June Meeting, each Board, including the Independent Board Members, unanimously approved the continuation of the Advisory Agreement between the Manager and its Fund, and the Sub-Advisory Agreement among the Manager, the Sub-Advisor, and its Fund, each for a one-year term ending June 30, 2014. In approving the continuation of the Agreements, the Boards considered: (a) the nature, extent and quality of the services provided by BlackRock; (b) the investment performance of the Funds and BlackRock; (c) the advisory fee and the cost of the services and profits to be realized by BlackRock and its affiliates from their relationship with the Funds; (d) the Funds’ costs to investors compared to the costs of Expense Peers and performance compared to the relevant performance comparison as previously discussed; (e) economies of scale; (f) fall-out benefits to BlackRock as a result of its relationship with the Funds; and (g) other factors deemed relevant by the Board Members.
The Boards also considered other matters they deemed important to the approval process, such as payments made to BlackRock or its affiliates relating to securities lending, services related to the valuation and pricing of Fund portfolio holdings, direct and indirect benefits to BlackRock and its affiliates from their relationship with the Funds and advice from independent legal counsel with respect to the review process and materials submitted for the Boards’ review. The Boards noted the willingness of BlackRock personnel to engage in open, candid discussions with the Boards. The Boards did not identify any particular information as determinative, and each Board Member may have attributed different weights to the various items considered.
A. Nature, Extent and Quality of the Services Provided by BlackRock: The Boards, including the Independent Board Members, reviewed the nature, extent and quality of services provided by BlackRock, including the investment advisory services and the resulting performance of the Funds.
Throughout the year, the Boards compared Fund performance to the performance of a comparable group of closed-end funds and/or the performance of a relevant benchmark, if any. The Boards met with BlackRock’s senior management personnel responsible for investment operations, including the senior investment officers. Each Board also reviewed the materials provided by its Fund’s portfolio management team discussing the Fund’s performance and the Fund’s investment objective, strategies and outlook.
The Boards considered, among other factors, with respect to BlackRock: the number, education and experience of investment personnel generally and their Funds’ portfolio management teams; investments by portfolio managers in the funds they manage; portfolio trading capabilities; use of technology; commitment to compliance; credit analysis capabilities; risk analysis and oversight capabilities; and the approach to training and retaining portfolio managers and other research, advisory and management personnel. The Boards engaged in a review of BlackRock’s compensation structure with respect to their Funds’ portfolio management teams and BlackRock’s ability to attract and retain high-quality talent and create performance incentives.
In addition to advisory services, the Boards considered the quality of the administrative and other non-investment advisory services provided to the Funds. BlackRock and its affiliates provide the Funds with certain services (in addition to any such services provided to the Funds by third parties) and officers and other personnel as are necessary for the operations of the Funds. In particular, BlackRock and its affiliates provide the Funds with the following administrative services including, among others: (i) preparing disclosure documents, such as the prospectus, the summary prospectus (as applicable) and the statement of additional information in connection with the initial public offering and periodic shareholder reports; (ii) preparing communications with analysts to support secondary market trading of the Funds; (iii) assisting with daily accounting and pricing; (iv) preparing periodic filings with regulators and stock exchanges; (v) overseeing and coordinating the activities of other service providers; (vi) organizing Board meetings and preparing the materials for such Board meetings; (vii) providing legal and compliance support; (viii) furnishing analytical and other support to assist the Boards in their consideration of strategic issues such as the merger or consolidation of certain closed-end funds; and (ix) performing other administrative functions necessary for the operation of the Funds, such as tax reporting, fulfilling regulatory filing requirements and call center services. The Boards reviewed the structure and duties of BlackRock’s fund administration, shareholder services, legal and compliance departments and considered BlackRock’s policies and procedures for assuring compliance with applicable laws and regulations.
B. The Investment Performance of the Funds and BlackRock: Each Board, including the Independent Board Members, also reviewed and considered the performance history of its Funds. In preparation for the April Meeting, the Boards worked with its independent legal counsel, BlackRock and Lipper to develop a template for, and were provided with reports independently prepared by Lipper, which included a comprehensive analysis of each Fund’s performance. The Boards also reviewed a narrative and statistical analysis of the Lipper data that was prepared by BlackRock, which analyzed various factors that affect Lipper’s rankings. In connection
| 1 | | Lipper ranks funds in quartiles, ranging from first to fourth, where first is the most desirable quartile position and fourth is the least desirable. |
| 72 | SEMI-ANNUAL REPORT | OCTOBER 31, 2013
|
| |
| Disclosure of Investment Advisory Agreements and Sub-Advisory Agreements (continued) |
|
with their review, each Board received and reviewed information regarding the investment performance, based on net asset value (NAV), of its Fund as compared to other funds in its applicable Lipper category and, with respect to BKN, BTA, BFK, BPS and BSD, the customized peer group selected by BlackRock. The Boards were provided with a description of the methodology used by Lipper to select peer funds and periodically meets with Lipper representatives to review their methodology. Each Board and its Performance Oversight Committee regularly review, and meet with Fund management to discuss, the performance of its Fund throughout the year.
The Board of each of BKN, BFK and BPS noted that its respective Fund ranked in the first quartile against its Customized Lipper Peer Group Composite for each of the one-, three- and five-year periods reported.
The Board of BTA noted that BTA ranked in the second, second and fourth quartiles against its Customized Lipper Peer Group Composite for the one-, three- and five-year periods reported, respectively.
The Board of BSD noted that BSD ranked in the second quartile against its Customized Lipper Peer Group Composite for each of the one-, three- and five-year periods reported.
BlackRock believes that the Customized Lipper Peer Group Composite is an appropriate performance metric for BKN, BTA, BFK, BPS and BSD in that it measures a blend of total return and yield.
The Board of BKK noted that BKK ranked in the fourth quartile against its Lipper Performance Universe Composite for each of the one-, three- and five-year periods reported. BlackRock believes that the Lipper Performance Universe Composite is an appropriate performance metric for BKK in that it measures a blend of total return and yield. The Board of BKK and BlackRock reviewed and discussed the reasons for BKK’s underperformance during these periods compared to its Lipper Performance Universe Composite. BKK’s Board was informed that, among other things, BKK has a targeted maturity, and as such is managed to achieve the specific maturity goal.
The Boards noted that BlackRock has recently made, and continues to make, changes to the organization of BlackRock’s overall portfolio management structure designed to result in strengthened leadership teams.
C. Consideration of the Advisory/Management Fees and the Cost of the Services and Profits to be Realized by BlackRock and its Affiliates from their Relationship with the Funds: Each Board, including the Independent Board Members, reviewed its Fund’s contractual management fee rate compared with the other funds in its Lipper category. The contractual management fee rate represents a combination of the advisory fee and any administrative fees, before taking into account any reimbursements or fee waivers. Each Board also compared its Fund’s total net operating expense ratio, as well as actual management fee rate, to those of other funds in its Lipper category. The total net operating expense ratio and actual management fee rate both give effect to any expense reimbursements or fee waivers that benefit the funds. The Boards considered the services provided and the fees charged by BlackRock to other types of clients with similar investment mandates, including institutional accounts.
The Boards received and reviewed statements relating to BlackRock’s financial condition. The Boards were also provided with a profitability analysis that detailed the revenues earned and the expenses incurred by BlackRock for services provided to the Funds. The Boards reviewed BlackRock’s profitability with respect to the Funds and other funds the Boards currently oversee for the year ended December 31, 2012 compared to available aggregate profitability data provided for the prior two years. The Boards reviewed BlackRock’s profitability with respect to certain other fund complexes managed by the Manager and/or its affiliates. The Boards reviewed BlackRock’s assumptions and methodology of allocating expenses in the profitability analysis, noting the inherent limitations in allocating costs among various advisory products. The Boards recognized that profitability may be affected by numerous factors including, among other things, fee waivers and expense reimbursements by the Manager, the types of funds managed, precision of expense allocations and business mix. As a result, comparing profitability is difficult.
The Boards noted that, in general, individual fund or product line profitability of other advisors is not publicly available. The Boards reviewed BlackRock’s overall operating margin, in general, compared to that of certain other publicly-traded asset management firms. The Boards considered the differences between BlackRock and these other firms, including the contribution of technology at BlackRock, BlackRock’s expense management, and the relative product mix.
In addition, the Boards considered the cost of the services provided to the Funds by BlackRock, and BlackRock’s and its affiliates’ profits relating to the management of the Funds and the other funds advised by BlackRock and its affiliates. As part of its analysis, the Boards reviewed BlackRock’s methodology in allocating its costs to the management of the Funds. The Boards also considered whether BlackRock has the financial resources necessary to attract and retain high quality investment management personnel to perform its obligations under the Agreements and to continue to provide the high quality of services that is expected by the Boards.
The Board of each of BKN and BKK noted that its respective Fund’s contractual management fee rate ranked in the first quartile relative to the Fund’s Expense Peers.
The Board of each of BFK, BPS and BSD noted that its respective Fund’s contractual management fee rate ranked in the second quartile relative to the Fund’s Expense Peers.
The Board of BTA noted that BTA’s contractual management fee rate ranked in the fourth quartile relative to BTA’s Expense Peers. The Board of BTA also noted that BTA’s actual management fee rate ranked in the first quartile relative to BTA’s Expense Peers.
D. Economies of Scale: Each Board, including the Independent Board Members, considered the extent to which economies of scale might be realized as the assets of its Fund increase. Each Board also considered the extent to which its Fund benefits from such economies and whether there should be changes in the advisory fee rate or breakpoint structure in order
| SEMI-ANNUAL REPORT | OCTOBER 31, 2013 | 73
|
| |
| Disclosure of Investment Advisory Agreements and Sub-Advisory Agreements (concluded) |
|
to enable the Fund to participate in these economies of scale, for example through the use of breakpoints in the advisory fee based upon the asset level of the Fund.
Based on the Boards’ review and consideration of the issue, the Boards concluded that most closed-end funds do not have fund level breakpoints because closed-end funds generally do not experience substantial growth after the initial public offering. They are typically priced at scale at a fund’s inception. The Boards noted that only one closed-end fund in the Fund Complex has breakpoints in its advisory fee structure.
E. Other Factors Deemed Relevant by the Board Members: The Boards, including the Independent Board Members, also took into account other ancillary or “fall-out” benefits that BlackRock or its affiliates may derive from their respective relationships with the Funds, both tangible and intangible, such as BlackRock’s ability to leverage its investment professionals who manage other portfolios and risk management personnel, an increase in BlackRock’s profile in the investment advisory community, and the engagement of BlackRock’s affiliates as service providers to the Funds, including securities lending and cash management services. The Boards also considered BlackRock’s overall operations and its efforts to expand the scale of, and improve the quality of, its operations. The Boards also noted that BlackRock may use and benefit from third party research obtained by soft dollars generated by certain registered fund transactions to assist in managing all or a number of its other client accounts. The Boards further noted that they had considered the investment by BlackRock’s funds in exchange traded funds (i.e., ETFs) without any offset against the management fees payable by the funds to BlackRock.
In connection with its consideration of the Agreements, the Boards also received information regarding BlackRock’s brokerage and soft dollar practices. The Boards received reports from BlackRock which included information on brokerage commissions and trade execution practices throughout the year.
The Boards noted the competitive nature of the closed-end fund marketplace, and that shareholders are able to sell their Fund shares in the secondary market if they believe that the Fund’s fees and expenses are too high or if they are dissatisfied with the performance of the Fund.
The Boards also considered the various notable initiatives and projects BlackRock performed in connection with its closed-end fund product line. These initiatives included the completion of the refinancing of auction rate preferred securities for BKN, BFK, BPS and BSD; efforts to eliminate product overlap with fund mergers; ongoing services to manage leverage that has become increasingly complex; share repurchases and other support initiatives for certain BlackRock funds; and continued communications efforts with shareholders, fund analysts and financial advisers. With respect to the latter, the Independent Board Members noted BlackRock’s continued commitment to supporting the secondary market for the common shares of its closed-end funds through a comprehensive secondary market communication program designed to raise investor and analyst awareness and understanding of closed-end funds. BlackRock’s support services included, among other things: continuing communications concerning the refinancing efforts related to auction rate preferred securities; sponsoring and participating in conferences; communicating with closed-end fund analysts covering the BlackRock funds throughout the year; providing marketing and product updates for the closed-end funds; and maintaining and enhancing its closed-end fund website.
Conclusion
Each Board, including the Independent Board Members, unanimously approved the continuation of the Advisory Agreement between the Manager and its Fund for a one-year term ending June 30, 2014, and the Sub-Advisory Agreement among the Manager, the Sub-Advisor, and its Fund for a one-year term ending June 30, 2014. Based upon its evaluation of all of the aforementioned factors in their totality, the Boards, including the Independent Board Members, were satisfied that the terms of the Agreements were fair and reasonable and in the best interest of the Funds and their shareholders. In arriving at their decision to approve the Agreements, the Boards did not identify any single factor or group of factors as all-important or controlling, but considered all factors together, and different Board Members may have attributed different weights to the various factors considered. The Independent Board Members were also assisted by the advice of independent legal counsel in making these determinations. The contractual fee arrangements for the Funds reflect the results of several years of review by the Board Members and predecessor Board Members, and discussions between such Board Members (and predecessor Board Members) and BlackRock. As a result, the Board Members’ conclusions may be based in part on their consideration of these arrangements in prior years.
| 74 | SEMI-ANNUAL REPORT | OCTOBER 31, 2013
|
Richard E. Cavanagh, Chairman of the Board and Trustee
Karen P. Robards, Vice Chairperson of the Board, Chairperson of the Audit Committee and Trustee
Paul L. Audet, Trustee
Michael J. Castellano, Trustee and Member of the Audit Committee
Frank J. Fabozzi, Trustee and Member of the Audit Committee
Kathleen F. Feldstein, Trustee
James T. Flynn, Trustee and Member of the Audit Committee
Henry Gabbay, Trustee
Jerrold B. Harris, Trustee
R. Glenn Hubbard, Trustee
W. Carl Kester, Trustee and Member of the Audit Committee
John M. Perlowski, President and Chief Executive Officer
Brendan Kyne, Vice President
Robert W. Crothers, Vice President
Neal Andrews, Chief Financial Officer
Jay Fife, Treasurer
Brian Kindelan, Chief Compliance Officer and
Anti-Money Laundering Officer
Janey Ahn, Secretary
Investment Advisor
BlackRock Advisors, LLC
Wilmington, DE 19809
Sub-Advisor
BlackRock Financial Management, Inc.
New York, NY 10022
Custodian and Accounting Agent
State Street Bank and Trust Company
Boston, MA 02110
Transfer Agent
Common Shares:
Computershare Trust Company, N.A.
Canton, MA 02021
AMPS Auction Agent
The Bank of New York Mellon
New York, NY 10286
VRDP Tender and Paying Agent and
VMTP Redemption and Paying Agent
The Bank of New York Mellon
New York, NY 10289
VRDP Liquidity Provider
Citibank, N.A.
New York, NY 10179
VRDP Remarketing Agent
CitiGroup Global Markets, Inc.
New York, NY 10179
Independent Registered Public Accounting Firm
Deloitte & Touche LLP
Boston, MA 02116
Legal Counsel
Skadden, Arps, Slate, Meagher & Flom LLP
New York, NY 10036
Address of the Trusts
100 Bellevue Parkway
Wilmington, DE 19809
| SEMI-ANNUAL REPORT | OCTOBER 31, 2013 | 75
|
Proxy Results
The Annual Meeting of Shareholders was held on July 30, 2013 for shareholders of record on June 3, 2013 to elect trustee nominees for each Trust. There were no broker non-votes with regard to any of the Trusts.
Approved the Class III Trustees as follows:
| Richard E. Cavanagh
|
| Kathleen F. Feldstein
|
| Henry Gabbay
|
|
| Votes For
|
| Votes
Withheld
|
| Abstain
|
| Votes For
|
| Votes
Withheld
|
| Abstain
|
| Votes For
|
| Votes
Withheld
|
| Abstain
|
BKN | | 15,022,243 | | | | 529,801 | | | | 0 | | | | 14,918,472 | | | | 633,573 | | | | 0 | | | | 14,990,007 | | | | 562,037 | | | | 0 | |
BTA | | 9,241,771 | | | | 329,845 | | | | 0 | | | | 9,228,728 | | | | 342,888 | | | | 0 | | | | 9,243,147 | | | | 328,469 | | | | 0 | |
BKK | | 18,769,812 | | | | 358,099 | | | | 0 | | | | 18,699,191 | | | | 428,720 | | | | 0 | | | | 18,750,568 | | | | 377,343 | | | | 0 | |
BFK | | 36,029,890 | | | | 1,011,749 | | | | 0 | | | | 35,993,152 | | | | 1,048,487 | | | | 0 | | | | 36,020,887 | | | | 1,020,752 | | | | 0 | |
BPS | | 1,798,986 | | | | 32,085 | | | | 0 | | | | 1,791,266 | | | | 39,805 | | | | 0 | | | | 1,798,986 | | | | 32,085 | | | | 0 | |
BSD | | 5,708,253 | | | | 290,171 | | | | 0 | | | | 5,696,440 | | | | 301,984 | | | | 0 | | | | 5,709,008 | | | | 289,416 | | | | 0 | |
| | | | | | | | | | | | | | | | | | | | | | | | | | | | | | | | | | | | | |
| | | | | | | | | | | | | | | | |
| | | | Jerrold B. Harris
|
|
|
|
|
| Votes For
|
| Votes
Withheld
|
| Abstain
|
BKN | | | | | 15,016,879 | | | | 535,165 | | | | 0 | |
BTA | | | | | 9,242,514 | | | | 329,102 | | | | 0 | |
BKK | | | | | 18,726,328 | | | | 401,583 | | | | 0 | |
BFK | | | | | 35,948,277 | | | | 1,093,362 | | | | 0 | |
BPS | | | | | 1,797,041 | | | | 34,030 | | | | 0 | |
BSD | | | | | 5,709,008 | | | | 289,416 | | | | 0 | |
For the Trusts listed above, Trustees whose term of office continued after the Annual Meeting of Shareholders because they were not up for election are Paul L. Audet, Michael J. Castellano, Frank J. Fabozzi, James T. Flynn, R. Glenn Hubbard, W. Carl Kester and Karen P. Robards.
Regulation Regarding Derivatives
Effective December 31, 2012, the Commodity Futures Trading Commission (“CFTC”) adopted certain regulatory changes that subject registered investment companies and advisers to registered investment companies to regulation by the CFTC if a fund invests more than a prescribed level of its net assets in CFTC-regulated futures, options and swaps (“CFTC Derivatives”), or if a fund markets itself as providing investment exposure to such instruments. To the extent a Trust uses CFTC-regulated futures, options and swaps, it intends to do so below such prescribed levels and will not market itself as a “commodity pool” or a vehicle for trading such instruments. Accordingly, BlackRock Advisors, LLC has claimed an exclusion from the definition of the term “commodity pool operator” under the Commodity Exchange Act (“CEA”) pursuant to Rule 4.5 under the CEA. BlackRock Advisors, LLC is not, therefore, subject to registration or regulation as a “commodity pool operator” under the CEA in respect to each Trust.
Dividend Policy
Each Trust’s dividend policy is to distribute all or a portion of its net investment income to its shareholders on a monthly basis. In order to provide shareholders with a more stable level of dividend distributions, the Trusts may at times pay out less than the entire amount of net investment income earned in any particular month and may at times in any particular month pay out such accumulated but undistributed income in addition to net investment income earned in that month. As a result, the dividends paid by the Trusts for any particular month may be more or less than the amount of net investment income earned by the Trusts during such month. The Trusts’ current accumulated but undistributed net investment income, if any, is disclosed in the Statements of Assets and Liabilities, which comprises part of the financial information included in this report.
General Information
On July 29, 2010, the Manager announced that a derivative complaint had been filed by shareholders of BSD and BFK, on July 27, 2010 in the Supreme Court of the State of New York, New York County. The complaint names the Manager, BlackRock, Inc. and certain of the trustees, officers and portfolio managers of BSD and BFK (collectively, the “Defendants”) as defendants. The complaint alleges, among other things, that the Defendants breached fiduciary duties owed to BSD and BFK and each of their Common Shareholders by redeeming AMPS at their liquidation preference. The complaint sought, among other things, unspecified damages for losses purportedly suffered by BSD and BFK as a result of the
| 76 | SEMI-ANNUAL REPORT | OCTOBER 31, 2013
|
| |
| Additional Information (continued) |
|
General Information (concluded)
prior redemptions and injunctive relief preventing BSD and BFK from redeeming AMPS at their liquidation preference in the future. On March 15, 2012, the Supreme Court of the State of New York, New York County, entered an order consolidating the above-referenced derivative action with another derivative case pending in the same court which asserted essentially the same claims. On the same date, the court also authorized plaintiffs to file an amended consolidated complaint, which they filed on April 16, 2012, asserting substantially the same claims alleged in their original complaints. Defendants filed a motion to dismiss the Consolidated Shareholder Derivative Complaint (the “Consolidated Complaint”) on July 20, 2012. On September 14, 2012, plaintiffs filed an application to hold the Defendants’ motion in abeyance and allow plaintiffs to conduct limited discovery before responding to the motion. After the parties agreed to proceed with limited discovery, plaintiffs advised Defendants they would withdraw their action and, on June 10, 2013, the parties filed a stipulation dismissing the Consolidated Complaint without prejudice, subject to approval of the court. The court dismissed the case without prejudice on June 17, 2013.
The Trusts do not make available copies of their Statements of Additional Information because the Trusts’ shares are not continuously offered, which means that the Statement of Additional Information of each Trust has not been updated after completion of the respective Trust’s offerings and the information contained in each Trust’s Statement of Additional Information may have become outdated.
During the period, other than as described above, there were no material changes in the Trusts’ investment objectives or policies or to the Trusts’ charters or by-laws that would delay or prevent a change of control of the Trusts that were not approved by the shareholders or in the principal risk factors associated with investment in the Trusts. There have been no changes in the persons who are primarily responsible for the day-to-day management of the Trusts’ portfolios.
Quarterly performance, semi-annual and annual reports, current net asset value and other information regarding the Trusts may be found on BlackRock’s website, which can be accessed at http://www.blackrock.com. This reference to BlackRock’s website is intended to allow investors public access to information regarding the Trusts and does not, and is not intended to, incorporate BlackRock’s website in this report.
Electronic Delivery
Electronic copies of most financial reports are available on the Trusts’ web-site or shareholders can sign up for e-mail notifications of quarterly statements, annual and semi-annual reports by enrolling in the Trusts’ electronic delivery program.
Shareholders Who Hold Accounts with Investment Advisors, Banks or Brokerages:
Please contact your financial advisor to enroll. Please note that not all investment advisors, banks or brokerages may offer this service.
Householding
The Trusts will mail only one copy of shareholder documents, including annual and semi-annual reports and proxy statements, to shareholders with multiple accounts at the same address. This practice is commonly called “householding” and is intended to reduce expenses and eliminate duplicate mailings of shareholder documents. Mailings of your shareholder documents may be householded indefinitely unless you instruct us otherwise. If you do not want the mailing of these documents to be combined with those for other members of your household, please call the Trusts at (800) 882-0052.
Availability of Quarterly Schedule of Investments
The Trusts file their complete schedule of portfolio holdings with the SEC for the first and third quarters of each fiscal year on Form N-Q. The Trusts’ Forms N-Q are available on the SEC’s website at http://www.sec.gov and may also be reviewed and copied at the SEC’s Public Reference Room in Washington, DC. Information on how to access documents on the SEC’s website without charge may be obtained by calling (800) SEC-0330. The Trusts’ Forms N-Q may also be obtained upon request and without charge by calling (800) 882-0052.
Availability of Proxy Voting Policies and Procedures
A description of the policies and procedures that the Trusts use to determine how to vote proxies relating to portfolio securities is available (1) without charge, upon request, by calling (800) 882-0052; (2) at http://www.blackrock.com; and (3) on the SEC’s website at http://www.sec.gov.
Availability of Proxy Voting Record
Information about how the Trusts voted proxies relating to securities held in the Trusts’ portfolios during the most recent 12-month period ended June 30 is available upon request and without charge (1) at http://www.blackrock.com or by calling (800) 882-0052 and (2) on the SEC’s website at http://www.sec.gov.
Availability of Trust Updates
BlackRock will update performance and certain other data for the Trusts on a monthly basis on its website in the “Closed-end Funds” section of http://www.blackrock.com as well as certain other material information as necessary from time to time. Investors and others are advised to periodically check the website for updated performance information and the release of other material information about the Trusts. This reference to BlackRock’s website is intended to allow investors public access to information regarding the Trusts and does not, and is not intended to, incorporate BlackRock’s website in this report.
| SEMI-ANNUAL REPORT | OCTOBER 31, 2013 | 77
|
| |
| Additional Information (concluded) |
|
BlackRock Privacy Principles
BlackRock is committed to maintaining the privacy of its current and former fund investors and individual clients (collectively, “Clients”) and to safeguarding their non-public personal information. The following information is provided to help you understand what personal information BlackRock collects, how we protect that information and why in certain cases we share such information with select parties.
If you are located in a jurisdiction where specific laws, rules or regulations require BlackRock to provide you with additional or different privacy-related rights beyond what is set forth below, then BlackRock will comply with those specific laws, rules or regulations.
BlackRock obtains or verifies personal non-public information from and about you from different sources, including the following: (i) information we receive from you or, if applicable, your financial intermediary, on applications, forms or other documents; (ii) information about your transactions with us, our affiliates, or others; (iii) information we receive from a consumer reporting agency; and (iv) from visits to our websites.
BlackRock does not sell or disclose to non-affiliated third parties any non-public personal information about its Clients, except as permitted by law or as is necessary to respond to regulatory requests or to service Client accounts. These non-affiliated third parties are required to protect the confidentiality and security of this information and to use it only for its intended purpose.
We may share information with our affiliates to service your account or to provide you with information about other BlackRock products or services that may be of interest to you. In addition, BlackRock restricts access to non-public personal information about its Clients to those BlackRock employees with a legitimate business need for the information. BlackRock maintains physical, electronic and procedural safeguards that are designed to protect the non-public personal information of its Clients, including procedures relating to the proper storage and disposal of such information.
| 78 | SEMI-ANNUAL REPORT | OCTOBER 31, 2013
|
[THIS PAGE INTENTIONALLY LEFT BLANK]
This report is transmitted to shareholders only. It is not a prospectus. Past performance results shown in this report should not be considered a representation of future performance. Certain Trusts have leveraged their Common Shares, which creates risks for Common Shareholders, including the likelihood of greater volatility of net asset value and market price of the Common Shares, and the risk that fluctuations in the dividend rates of the Preferred Shares, including AMPS, which are currently set at the maximum reset rate as a result of failed auctions, may reduce the Common Shares’ yield. Statements and other information herein are as dated and are subject to change.
CEMUNI6-10/13-SAR | | | | | 
| |
Item 2 – Code of Ethics – Not Applicable to this semi-annual report
Item 3 – Audit Committee Financial Expert – Not Applicable to this semi-annual report
Item 4 – Principal Accountant Fees and Services – Not Applicable to this semi-annual report
Item 5 – Audit Committee of Listed Registrants – Not Applicable to this semi-annual report
Item 6 – Investments
(a) The registrant’s Schedule of Investments is included as part of the Report to Stockholders filed under Item 1 of this Form.
(b) Not Applicable due to no such divestments during the semi-annual period covered since the previous Form N-CSR filing.
Item 7 – Disclosure of Proxy Voting Policies and Procedures for Closed-End Management Investment Companies – Not Applicable to this semi-annual report
Item 8 – Portfolio Managers of Closed-End Management Investment Companies
| (a) | Not Applicable to this semi-annual report |
| (b) | As of the date of this filing, there have been no changes in any of the portfolio managers identified in the most recent annual report on Form N-CSR. |
Item 9 – Purchases of Equity Securities by Closed-End Management Investment Company and Affiliated Purchasers – Not Applicable
Item 10 – Submission of Matters to a Vote of Security Holders – There have been no material changes to these procedures.
Item 11 – Controls and Procedures
(a) – The registrant’s principal executive and principal financial officers, or persons performing similar functions, have concluded that the registrant’s disclosure controls and procedures (as defined in Rule 30a-3(c) under the Investment Company Act of 1940, as amended (the “1940 Act”)) are effective as of a date within 90 days of the filing of this report based on the evaluation of these controls and procedures required by Rule 30a-3(b) under the 1940 Act and Rule 13a-15(b) under the Securities Exchange Act of 1934, as amended.
(b) – There were no changes in the registrant’s internal control over financial reporting (as defined in Rule 30a-3(d) under the 1940 Act) that occurred during the second fiscal quarter of the period covered by this report that have materially affected, or are reasonably likely to materially affect, the registrant’s internal control over financial reporting.
Item 12 – Exhibits attached hereto
| | (a)(1) – Code of Ethics – Not Applicable to this semi-annual report |
| | (a)(2) – Certifications – Attached hereto |
(a)(3) – Not Applicable
(b) – Certifications – Attached hereto
Pursuant to the requirements of the Securities Exchange Act of 1934 and the Investment Company Act of 1940, the registrant has duly caused this report to be signed on its behalf by the undersigned, thereunto duly authorized.
BlackRock Long-Term Municipal Advantage Trust
By: /s/ John M. Perlowski
John M. Perlowski
Chief Executive Officer (principal executive officer) of
BlackRock Long-Term Municipal Advantage Trust
Date: January 2, 2014
Pursuant to the requirements of the Securities Exchange Act of 1934 and the Investment Company Act of 1940, this report has been signed below by the following persons on behalf of the registrant and in the capacities and on the dates indicated.
By: /s/ John M. Perlowski
John M. Perlowski
Chief Executive Officer (principal executive officer) of
BlackRock Long-Term Municipal Advantage Trust
Date: January 2, 2014
By: /s/ Neal J. Andrews
Neal J. Andrews
Chief Financial Officer (principal financial officer) of
BlackRock Long-Term Municipal Advantage Trust
Date: January 2, 2014