UNITED STATES
SECURITIES AND EXCHANGE COMMISSION
Washington, D.C. 20549
FORM N-CSR
CERTIFIED SHAREHOLDER REPORT OF REGISTERED MANAGEMENT
INVESTMENT COMPANIES
Investment Company Act File Number 811-21836
Giant 5 Funds
(Exact name of registrant as specified in charter)
128 South Tejon, Suite 150
Colorado Springs, CO 80903
(Address of principal executive offices)
Michael G. Willis
The Willis Group
128 South Tejon, Suite 150
Colorado Springs, CO 80903________
(Name and address of agent for service)
Registrant's telephone number, including area code: (719) 884-7500
Date of fiscal year end: March 31
Date of reporting period: September 30, 2010
Item 1. Reports to Stockholders
The following is a copy of the report transmitted to shareholders pursuant to Rule 30e-1 under the Investment Company Act of 1940 (17 CFR 270.30e-1).
Giant 5 Funds
Investor Shares
Semi-Annual Report
September 30, 2010
Giant 5 Total Investment System (FIVEX)
20+ Underlying Mutual Funds
Giant 5 Total Index System (INDEX)
20+ Underlying Index Funds and ETFs
Invest in the Essentials
Invest for Life™
Investors should carefully read and consider the Funds’ investment objectives, risks, charges and expenses before investing or sending money. This and other important information is contained in the Prospectus, which can be obtained by calling 1-888-5Giant5 (1-888-544-2685) or downloaded on www.Giant5.com. Funds distributed by UMB Distribution Services, LLC.
| | |
| | |
| | |
| | Semi-Annual Report |
| Table of Contents | September 30, 2010 (Unaudited) |
| | |
| Letter to Shareholders | 2 |
| | |
| Giant 5 Total Investment System | |
| Schedule of Portfolio Investments | 3 |
| Financial Statements | 4 |
| Financial Highlights | 6 |
| | |
| Giant 5 Total Index System | |
| Schedule of Portfolio Investments | 7 |
| Financial Statements | 8 |
| Financial Highlights | 10 |
| | |
| Notes to the Financial Statements | 11 |
| Supplemental Information | 16 |
Statement Regarding Availability of Quarterly Portfolio Schedule. (Unaudited)
The Giant 5 Funds file complete schedules of portfolio holdings for each Fund with the Securities and Exchange Commission (the “Commission”) for the first and third quarters of each fiscal year on Form N-Q. The Funds’ Forms N-Q are available on the Commission’s website at http://www.sec.gov. The Funds’ Form N-Q may be reviewed and copied at the Commission’s Public Reference Room in Washington, D.C., and information on the operation of the Public Reference Room may be obtained by calling 1-800-SEC-0330; and the Funds make the information on Form N-Q available upon request without charge.
Statement Regarding Availability of Proxy Voting Policies and Procedures and Proxy Voting Record. (Unaudited)
A description of the policies and procedures the Funds use to determine how to vote proxies relating to the portfolio securities is available without charge, upon request, by calling 1-800-788-5680 or on the Commission’s website at http://www.sec.gov. A copy of the Funds’ voting record for the most recent 12-month period ended June 30 is also available at the SEC’s website at http://www.sec.gov.
October 31, 2010
Dear Shareholders,
A new global era has arrived. Wall Street is no longer the center of the financial universe, and the United States and Europe appear to be losing the political and economic dominance they have held over the rest of the world for the past 200 years. We believe the “Rise of the Rest” (those living outside of the United States and Europe), combined with the one global language and economy of the Internet, will be the two most significant factors driving the financial course of the next decade.
The new global economy and rapid advancements in technology seem to be changing the fundamentals of investing at a rate the industry has never seen before. There are roughly seven times as many people living outside of the United States and Europe as compared to those living within. The growth and consumption behavior of this huge demographic will likely drive prices sharply higher during the next decade.
If this last decade is any indication, it appears that governments in general cannot control their spending and debt. Instead of being fiscally responsible by spending less than they take in, governments use their ability to print money to make up the difference. As a result, we believe this will ultimately lead to a devaluing of all currencies that are not backed by hard assets such as gold. As these fiat currencies diminish in value, we believe that core commodities will increase in value and become a better global “currency”.
We believe that global consumption is key to investing in the new global economy. Not coincidentally, core commodities represent a large percentage of the average investor’s annual budget. Therefore, our independent Fund of Funds structure which utilizes a “best of” approach for both indexes and managers, combined with a focus on the 5 core themes of Energy, Raw Materials, Capital Markets, Bonds, and Real Estate, represents a comprehensive investment process for investors who desire to focus on consumption.
Our investment process, Consumption-Based Fundamental Asset Allocation (CFAA), introduces a new generation of asset management methodologies which use fundamental attributes of the Investor, not the investment, as the primary determinant for all asset allocation decisions. Our “Invest Where You Spend” strategy is designed to invest in the areas our Investors spend the majority of their money. By designing the portfolio around consumption and global spending patterns, our goal is to give Investors the capability to meet their future spending needs on the budget items they spend most of their money. This, we believe, is the primary purpose of investing.
Since our inception almost 5 years ago, both of our Funds have outperformed their benchmark, the S&P 500® Index (see performance chart below). In addition, both Funds also outperformed their benchmark during the past 1-year, 2-year, and 3-year periods. The primary reason that we outperformed our benchmark during the most recent period was due to an increase in prices among some of the core commodities that we overweight compared to the S&P 500® Index. We overweight these sectors compared to our benchmark because they represent a large portion of Investor’s spending. Looking forward, we believe the price of real estate, oil, metals, foo d and other raw materials will continue to move higher, and our portfolios should benefit as a result.
Thank you for your continued trust as shareholders of Giant 5 Funds. We appreciate our Investors and will continue strive to place you first in all that we do.
Invest in the Essentials. Invest for Life.
Michael G. Willis
President
| Performance as of October 31, 2010 | | | | | | 2-Year | | 3-Year | Average Annual Since |
| | | 3-Months | | 1-Year | | Average | | Average | Inception (May 1, 2006) |
| Total Investment System (FIVEX) | | | +10.11% | | | +17.06% | | | +20.89% | | | -4.25% | | | +2.66% | |
| Total Index System (INDEX) | | | +10.08% | | | +16.65% | | | +18.73% | | | -4.61% | | | +1.08% | |
S&P 500® Index | | | +7.96% | | | +16.52% | | | +13.11% | | | -6.49% | | | -0.14% | |
The performance data quoted here represents past performance and past performance is not a guarantee of future results. Investment return and principal value will fluctuate, so that an investor's shares, when redeemed, may be worth more or less than their original cost. Current performance may be lower or higher than the performance information quoted. To obtain performance information current to the most recent month-end, please call 1-888-5GIANT5. Total Annual Fund Operating Expenses of the Total Investment System and Total Index System were 2.51% and 2.32%, respectively.
The S&P Index is an unmanaged index of stocks, bonds or mutual funds. It is not possible to invest directly in an index.
| | |
| Schedule of Portfolio Investments | Giant 5 Total Investment System September 30, 2010 (Unaudited) |
| | | | | | | |
| | | | | | Fair | |
| Security Description | | Shares | | | Value | |
| INVESTMENT COMPANIES - 99.7% | | | | | | |
| BlackRock Energy | | | | | | |
| & Resources Portfolio, Class I* | | | 41,033 | | | $ | 1,434,517 | |
| Cohen & Steers Asia Pacific | | | | | | | | |
| Realty Shares, Inc., Class I | | | 49,096 | | | | 449,718 | |
| E.I.I. International Property | | | | | | | | |
| Fund, Class I | | | 90,499 | | | | 1,582,823 | |
| Fidelity Select Materials Portfolio | | | 57,074 | | | | 3,262,339 | |
| First American Real Estate | | | | | | | | |
| Securities Fund, Class Y | | | 89,231 | | | | 1,512,457 | |
| First Eagle Global Fund, Class I | | | 20,061 | | | | 868,461 | |
| First Eagle Overseas Fund, Class I | | | 37,412 | | | | 809,966 | |
| Franklin Mutual European Fund, Class Z | | | 8,464 | | | | 175,791 | |
| ICON Materials Fund | | | 50,069 | | | | 503,694 | |
| Ivy Global Natural Resources | | | | | | | | |
| Fund, Class I* | | | 1,597 | | | | 28,947 | |
| JPMorgan Small Cap Equity | | | | | | | | |
| Fund, Class S | | | 1,000 | | | | 33,070 | |
| Matthews China Fund | | | 38,630 | | | | 1,134,560 | |
| Matthews India Fund | | | 21,815 | | | | 471,640 | |
| Metzler/Payden European | | | | | | | | |
| Emerging Markets Fund* | | | 7,831 | | | | 210,422 | |
| Morgan Stanley Institutional | | | | | | | | |
| Fund, Inc., International Real Estate | | | | | | | | |
| Portfolio, Class I | | | 17,256 | | | | 323,212 | |
| Morgan Stanley Institutional | | | | | | | | |
| Fund, Inc., U.S. Real Estate | | | | | | | | |
| Portfolio, Class I | | | 7,474 | | | | 99,483 | |
| Oppenheimer International | | | | | | | | |
| Bond Fund, Class Y | | | 80,031 | | | | 544,209 | |
| T. Rowe Price Latin America Fund | | | 3,272 | | | | 173,685 | |
| Vanguard Energy Fund, Admiral Shares | | | 19,866 | | | | 2,146,949 | |
| Vanguard Inflation-Protected | | | | | | | | |
| Securities Fund, Admiral Shares | | | 84,463 | | | | 2,201,942 | |
| Total Investment Companies | | | | | | | | |
| (Cost $15,603,948) | | | | | | | 17,967,885 | |
| | | | | | | | | |
| SHORT-TERM INVESTMENTS - 0.4% | | | | | | | | |
| | | | | | | | | |
| Fidelity Institutional Treasury Portfolio, | | | | | | | | |
Class I, 0.033%, 10/1/2010(a) | | | 74,136 | | | | 74,136 | |
| Total Short-Term Investments | | | | | | | | |
| (Cost $74,136) | | | | | | | 74,136 | |
| Total Investments - 100.1% | | | | | | | | |
| (Cost $15,678,084) | | | | | | | 18,042,021 | |
| Other Liabilities in | | | | | | | | |
| Excess of Assets - (0.1)% | | | | | | | (19,069 | ) |
| NET ASSETS - 100.0% | | | | | | $ | 18,022,952 | |
| (a) | Variable rate security; the rate shown represents the rate at September 30, 2010.
|
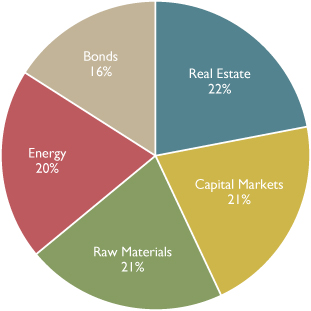
Giant 5 Total Investment System
Sector Breakdown
(Based on Total Investments) (Unaudited)
See Notes to the Financial Statements.
| Financial Statements | Giant 5 Total Investment System |
| STATEMENT OF ASSETS AND LIABILITIES | | | |
| September 30, 2010 (Unaudited) | | | |
| | | | |
| Assets: | | | |
| Investment securities at fair value | | | |
| (cost $15,678,084) | | $ | 18,042,021 | |
| Interest and dividends receivable | | | 1,874 | |
| Prepaid expenses | | | 18,109 | |
| Total Assets | | | 18,062,004 | |
| | | | | |
| Liabilities: | | | | |
| Payable to Adviser | | | 9,711 | |
| Payable for 12b-1 fees | | | 2,464 | |
| Other payables | | | 26,877 | |
| Total Liabilities | | | 39,052 | |
| | | | | |
| Net Assets | | $ | 18,022,952 | |
| | | | | |
| Net assets consist of: | | | | |
| Paid-in-capital | | $ | 22,383,494 | |
| Undistributed net investment loss | | | (72,890 | ) |
| Accumulated undistributed net realized losses | | | (6,651,589 | ) |
| Net unrealized appreciation on investments | | | 2,363,937 | |
| | | | | |
| Net Assets | | $ | 18,022,952 | |
| | | | | |
| Capital Shares: | | | | |
| Investor Shares Outstanding (no par value, | | | | |
| unlimited number of shares authorized) | | | 1,315,298 | |
| | | | | |
| Net Asset Value, Offering Price and | | | | |
| Redemption Price Per Share | | $ | 13.70 | |
| | | | | |
| STATEMENT OF OPERATIONS | | | | |
| For the period ended September 30, 2010 (Unaudited) | | | | |
| | | | | |
| Investment Income: | | | | |
| Dividends | | $ | 47,195 | |
| Interest income | | | 68 | |
| Total Investment Income | | | 47,263 | |
| | | | | |
| Expenses: | | | | |
| Investment advisory fees | | | 59,349 | |
| Fund administration fees | | | 33,174 | |
| Transfer Agency fees | | | 25,681 | |
| 12b-1 fees | | | 15,059 | |
| Blue Sky fees | | | 10,538 | |
| Audit fees | | | 7,088 | |
| Custody fees | | | 6,084 | |
| Insurance | | | 4,541 | |
| CCO fees | | | 2,711 | |
| Printing fees | | | 2,306 | |
| Legal fees | | | 2,064 | |
| Pricing fees | | | 1,367 | |
| Directors fees | | | 307 | |
| Miscellaneous fees | | | 504 | |
| Total Expenses | | | 170,773 | |
| | | | | |
| Net Investment Loss | | | (123,510 | ) |
| | | | | |
| Net Realized and Unrealized | | | | |
| Gains/(Losses) on Investments: | | | | |
| Net realized losses from investment transactions | | | (232,658 | ) |
| Net realized gain distributions from underlying funds | | | 1,766 | |
| Change in unrealized appreciation/(depreciation) | | | | |
| on investments | | | 862,047 | |
| Net realized and unrealized gains on investments | | | 631,155 | |
| | | | | |
| Change in net assets resulting from operations | | $ | 507,645 | |
See Notes to the Financial Statements.
| Financial Statements | Giant 5 Total Investment System |
| | | Period Ended | | | | |
| | September 30, 2010 | | Year Ended | |
| | | (Unaudited) | | | March 31, 2010 | |
| STATEMENTS OF CHANGES IN NET ASSETS | | | | | | |
| | | | | | | |
| Increase in Net Assets from Operations | | | | | | |
| Net investment income/(loss) | | $ | (123,510 | ) | | $ | 42,013 | |
| Net realized losses from investment transactions | | | (232,658 | ) | | | (315,998 | ) |
| Net realized gain distributions from underlying funds | | | 1,766 | | | | 31,580 | |
| Change in unrealized appreciation/(depreciation) on investments | | | 862,047 | | | | 7,050,618 | |
| Change in net assets resulting from operations | | | 507,645 | | | | 6,808,213 | |
| | | | | | | | | |
| Capital Share Transactions | | | | | | | | |
| Proceeds from sale of shares | | | 485,610 | | | | 1,689,470 | |
| Cost of shares redeemed | | | (1,786,339 | ) | | | (2,878,157 | ) |
| Change in net assets resulting from capital share transactions | | | (1,300,729 | ) | | | (1,188,687 | ) |
| Net increase/(decrease) in net assets | | | (793,084 | ) | | | 5,619,526 | |
| | | | | | | | | |
| Net Assets | | | | | | | | |
| Beginning of period | | | 18,816,036 | | | | 13,196,510 | |
| End of period | | $ | 18,022,952 | | | $ | 18,816,036 | |
| Accumulated undistributed net investment income/(loss) at end of period | | | (72,890 | ) | | | 50,620 | |
| | | | | | | | | |
| Share Information | | | | | | | | |
| Shares sold | | | 38,346 | | | | 145,686 | |
| Shares redeemed | | | (139,884 | ) | | | (248,405 | ) |
| Net change resulting from share transactions | | | (101,538 | ) | | | (102,719 | ) |
See Notes to the Financial Statements.
| Financial Highlights | Giant 5 Total Investment System |
| The table below sets forth financial | | Period Ended | | | | | | | | | | | | |
| data for a share outstanding in the Fund | | September 30, 2010 | | Year Ended | | Year Ended | | Year Ended | | Period Ended |
| throughout each period presented: | | (Unaudited) | | March 31, 2010 | | March 31, 2009 | | March 31, 2008 | | March 31, 2007(a) |
| | | | | | | | | | | | | | | | |
| Per share data: | | | | | | | | | | | | | | | |
| Net Asset Value - Beginning of Period | | $ | 13.28 | | | $ | 8.68 | | | $ | 15.64 | | | $ | 16.27 | | | $ | 15.00 | |
| | | | | | | | | | | | | | | | | | | | | |
| Income/(loss) from | | | | | | | | | | | | | | | | | | | | |
| Investment Operations: | | | | | | | | | | | | | | | | | | | | |
| Net investment income/(loss) | | | (0.09 | ) | | | 0.03 | | | | (0.03 | ) | | | 0.65 | | | | 0.26 | |
| Net realized and unrealized | | | | | | | | | | | | | | | | | | | | |
| gains/(losses) on investments | | | 0.51 | | | | 4.57 | | | | (6.35 | ) | | | 0.13 | (b) | | | 1.41 | |
| Total from investment operations | | | 0.42 | | | | 4.60 | | | | (6.38 | ) | | | 0.78 | | | | 1.67 | |
| | | | | | | | | | | | | | | | | | | | | |
| Less Distributions | | | | | | | | | | | | | | | | | | | | |
| Declared to Shareholders: | | | | | | | | | | | | | | | | | | | | |
| Net investment income | | | — | | | | — | | | | — | | | | (0.65 | ) | | | (0.26 | ) |
| Net realized gains | | | — | | | | — | | | | (0.58 | ) | | | (0.76 | ) | | | (0.14 | ) |
| Total distributions | | | — | | | | — | | | | (0.58 | ) | | | (1.41 | ) | | | (0.40 | ) |
| Paid-in capital from redemption fees | | | — | (c) | | | — | (c) | | | — | (c) | | | — | (d) | | | — | (d) |
| | | | | | | | | | | | | | | | | | | | | |
| Net Asset Value - End of Period | | $ | 13.70 | | | $ | 13.28 | | | $ | 8.68 | | | $ | 15.64 | | | $ | 16.27 | |
| | | | | | | | | | | | | | | | | | | | | |
Total Return(e) | | | 3.16 | % | | | 53.00 | % | | | (41.06 | )% | | | 4.39 | % | | | 11.27 | %(f) |
| | | | | | | | | | | | | | | | | | | | | |
| Ratios (to average net assets) | | | | | | | | | | | | | | | | | | | | |
| Supplemental Data: | | | | | | | | | | | | | | | | | | | | |
| Net assets at end of period (000s) | | $ | 18,023 | | | $ | 18,816 | | | $ | 13,197 | | | $ | 30,374 | | | $ | 29,970 | |
Ratio of expenses to average net assets(g) | | | 1.93 | %(h) | | | 1.89 | % | | | 1.64 | % | | | 1.37 | %(i) | | | 1.91 | %(h) |
| Net investment income/(loss) | | | | | | | | | | | | | | | | | | | | |
to average net assets(j) | | | (1.39 | )%(h) | | | 0.24 | % | | | (0.18 | )% | | | 3.94 | % | | | 1.96 | %(h) |
| Portfolio turnover | | | 0 | %(f) | | | 8.84 | % | | | 58.81 | % | | | 51.90 | % | | | 22.20 | %(f) |
| | | | | | | | | | | | | | | | | | | | | |
| (a) | Fund commenced operations on May 1, 2006. |
| (b) | Realized and unrealized gains and losses per share in this caption are balancing amounts necessary to reconcile the change in net asset value per share in the period. It does not agree to the aggregate gains and losses in the Statement of Operations due to the fluctuation in share transactions for the period. |
| (c) | Effective September 14, 2007, the Fund no longer imposed a redemption fee for sales of shares done within 180 days of purchase. |
| (e) | Total return in the above table represents the rate of return that the investor would have earned or lost on an investment in the Fund assuming the reinvestment of dividends. |
| (g) | This ratio excludes the impact of expenses of the registered investment companies and exchange-traded funds in which the Fund invests. |
| (i) | For the period July 1, 2007 through March 31, 2008, the expense ratio of the Fund was capped at 1.35%. There were no reimbursements required to be made by the Adviser for that period. |
| (j) | Recognition of the net investment income by the Fund is affected by the timing of the declaration of dividends by the underlying investment companies and exchange-traded funds in which the Fund invests. |
See Notes to the Financial Statements.
| Schedule of Portfolio Investments | Giant 5 Total Index System September 30, 2010 (Unaudited) |
| | | | | | | |
| | | Shares or | | | | |
| | | Principal | | | Fair | |
| Security Description | | Amount | | | Value | |
| EXCHANGE TRADED FUNDS - 97.4% | | | | | | |
| | | | | | | | | |
| Energy Select Sector SPDR Fund | | | 14,133 | | | $ | 792,296 | |
| First Trust ISE Chindia Index Fund | | | 39,000 | | | | 969,930 | |
| Guggenheim China Real Estate ETF | | | 10,000 | | | | 196,399 | |
| iShares Barclays 1-3 Year | | | | | | | | |
| Treasury Bond Fund | | | 100 | | | | 8,437 | |
| iShares Barclays TIPS Bond Fund | | | 15,300 | | | | 1,668,159 | |
| iShares S&P Europe 350 Index Fund | | | 10,584 | | | | 400,605 | |
| iShares S&P Global Energy | | | | | | | | |
| Sector Index Fund | | | 4,185 | | | | 141,704 | |
| Materials Select Sector SPDR Fund | | | 27,000 | | | | 885,060 | |
| PowerShares FTSE RAFI | | | | | | | | |
| U.S. 1000 Portfolio | | | 11,855 | | | | 596,662 | |
| PowerShares FTSE RAFI U.S. 1500 | | | | | | | | |
| Small-Mid Portfolio | | | 7,370 | | | | 408,740 | |
| PowerShares Golden Dragon | | | | | | | | |
| Halter USX China Portfolio | | | 10,000 | | | | 262,600 | |
| PowerShares WilderHill | | | | | | | | |
| Clean Energy Portfolio* | | | 4,000 | | | | 39,520 | |
| SPDR Barclays Capital International | | | | | | | | |
| Treasury Bond ETF | | | 434 | | | | 26,023 | |
| SPDR Barclays Capital TIPS ETF | | | 5,000 | | | | 269,900 | |
| SPDR DB International Government | | | | | | | | |
| Inflation-Protected Bond ETF | | | 10,000 | | | | 587,600 | |
| SPDR Dow Jones International | | | | | | | | |
| Real Estate ETF | | | 26,500 | | | | 1,019,985 | |
| SPDR Dow Jones REIT ETF | | | 983 | | | | 56,365 | |
| SPDR S&P Oil & Gas | | | | | | | | |
| Equipment & Services ETF | | | 6,000 | | | | 178,020 | |
| SPDR S&P Oil & Gas | | | | | | | | |
| Exploration & Production ETF | | | 4,000 | | | | 169,040 | |
| Vanguard Energy ETF | | | 14,200 | | | | 1,174,766 | |
| Vanguard Information Technology ETF | | | 5,000 | | | | 278,000 | |
| Vanguard Materials ETF | | | 10,524 | | | | 746,152 | |
| Vanguard REIT ETF | | | 27,500 | | | | 1,432,200 | |
| WisdomTree International | | | | | | | | |
| Basic Materials Sector Fund | | | 50,650 | | | | 1,405,026 | |
| WisdomTree International | | | | | | | | |
| Energy Sector Fund | | | 17,993 | | | | 431,472 | |
| WisdomTree International | | | | | | | | |
| MidCap Dividend Fund | | | 4,000 | | | | 196,480 | |
| WisdomTree International | | | | | | | | |
| Real Estate Fund | | | 20,000 | | | | 575,200 | |
| WisdomTree International | | | | | | | | |
| SmallCap Dividend Fund | | | 3,500 | | | | 165,970 | |
| Total Exchange Traded Funds | | | | | | | | |
| (Cost $16,145,780) | | | | | | | 15,082,311 | |
| | | | | | | | | |
| SHORT-TERM INVESTMENTS - 2.7% | | | | | | | | |
| | | | | | | | | |
| Fidelity Institutional Treasury | | | | | | | | |
Portfolio, Class I, 0.033%, 10/1/2010(a) | | $ | 425,511 | | | | 425,511 | |
| Total Short-Term Investments | | | | | | | | |
| (Cost $425,511) | | | | | | | 425,511 | |
| Total Investments - 100.1% | | | | | | | | |
| (Cost $16,571,291) | | | | | | | 15,507,822 | |
| Other Liabilities in | | | | | | | | |
| Excess of Assets - (0.1)% | | | | | | | (15,441 | ) |
| NET ASSETS - 100.0% | | | | | | $ | 15,492,381 | |
| (a) | Variable rate security; the rate shown represents the rate at September 30, 2010.
|
Giant 5 Total Index System
Sector Breakdown
(Based on Total Investments) (Unaudited)
See Notes to the Financial Statements.
| Financial Statements | Giant 5 Total Index System |
| STATEMENT OF ASSETS AND LIABILITIES | | | |
| September 30, 2010 (Unaudited) | | | |
| | | | |
| Assets: | | | |
| Investment securities at fair value | | | |
| (cost $16,571,291) | | $ | 15,507,822 | |
| Interest and dividends receivable | | | 10 | |
| Prepaid expenses | | | 17,189 | |
| Total Assets | | | 15,525,021 | |
| | | | | |
| Liabilities: | | | | |
| Payable to Adviser | | | 8,330 | |
| Payable for 12b-1 fees | | | 2,113 | |
| Other payables | | | 22,197 | |
| Total Liabilities | | | 32,640 | |
| | | | | |
| Net Assets | | $ | 15,492,381 | |
| | | | | |
| Net assets consist of: | | | | |
| Paid-in-capital | | $ | 19,242,727 | |
| Undistributed net investment income | | | 23,926 | |
| Accumulated undistributed net realized losses | | | (2,710,803 | ) |
| Net unrealized depreciation on investments | | | (1,063,469 | ) |
| | | | | |
| Net Assets | | $ | 15,492,381 | |
| | | | | |
| Capital Shares: | | | | |
| Investor Shares Outstanding (no par value, | | | | |
| unlimited number of shares authorized) | | | 1,155,942 | |
| | | | | |
| Net Asset Value, Offering Price | | | | |
| and Redemption Price Per Share | | $ | 13.40 | |
| | | | | |
| STATEMENT OF OPERATIONS | | | | |
| For the period ended September 30, 2010 (Unaudited) | | | | |
| | | | | |
| Investment Income: | | | | |
| Dividends | | $ | 168,649 | |
| Interest income | | | 114 | |
| Total Investment Income | | | 168,763 | |
| | | | | |
| Expenses: | | | | |
| Investment advisory fees | | | 50,410 | |
| Fund administration fees | | | 28,203 | |
| Transfer Agency fees | | | 21,727 | |
| 12b-1 fees | | | 12,790 | |
| Blue Sky fees | | | 10,641 | |
| Audit fees | | | 7,088 | |
| Custody fees | | | 5,840 | |
| Insurance | | | 3,833 | |
| CCO fees | | | 2,303 | |
| Printing fees | | | 1,957 | |
| Legal fees | | | 1,781 | |
| Pricing fees | | | 1,514 | |
| Directors fees | | | 255 | |
| Miscellaneous fees | | | 695 | |
| Total Expenses | | | 149,037 | |
| | | | | |
| Net Investment Income | | | 19,726 | |
| | | | | |
| Net Realized and Unrealized | | | | |
| Gains/(Losses) on Investments: | | | | |
| Net realized losses from investment transactions | | | (37,700 | ) |
| Change in unrealized appreciation/(depreciation) | | | | |
| on investments | | | 366,494 | |
| Net realized and unrealized gains on investments | | | 328,794 | |
| | | | | |
| Change in net assets resulting from operations | | $ | 348,520 | |
See Notes to the Financial Statements.
| Financial Statements | Giant 5 Total Index System |
| | Period Ended | | | |
| | September 30, 2010 | Year Ended |
| | (Unaudited) | March 31, 2010 |
| STATEMENTS OF CHANGES IN NET ASSETS | | | | | | |
| Increase in Net Assets from Operations | | | | | | |
| Net investment income | | $ | 19,726 | | | $ | 82,384 | |
| Net realized losses from investment transactions | | | (37,700 | ) | | | (591,616 | ) |
| Net realized gain distributions from underlying funds | | | — | | | | 58 | |
| Change in unrealized appreciation/(depreciation) on investments | | | 366,494 | | | | 6,172,150 | |
| Change in net assets resulting from operations | | | 348,520 | | | | 5,662,976 | |
| | | | | | | | | |
| Distributions to Shareholders | | | | | | | | |
| Net investment income | | | — | | | | (97,247 | ) |
| Change in net assets resulting from distributions to shareholders | | | — | | | | (97,247 | ) |
| | | | | | | | | |
| Capital Share Transactions | | | | | | | | |
| Proceeds from sale of shares | | | 341,930 | | | | 593,115 | |
| Distributions reinvested | | | — | | | | 96,003 | |
| Cost of shares redeemed | | | (719,522 | ) | | | (1,690,183 | ) |
| Change in net assets resulting from capital share transactions | | | (377,592 | ) | | | (1,001,065 | ) |
| Net increase/(decrease) in net assets | | | (29,072 | ) | | | 4,564,664 | |
| | | | | | | | | |
| Net Assets | | | | | | | | |
| Beginning of period | | | 15,521,453 | | | | 10,956,789 | |
| End of period | | $ | 15,492,381 | | | $ | 15,521,453 | |
| Accumulated undistributed net investment income at end of period | | | 23,926 | | | | 4,200 | |
| | | | | | | | | |
| Share Information | | | | | | | | |
| Shares sold | | | 26,692 | | | | 53,461 | |
| Distributions reinvested | | | — | | | | 7,506 | |
| Shares redeemed | | | (57,449 | ) | | | (144,804 | ) |
| Net change resulting from share transactions | | | (30,757 | ) | | | (83,837 | ) |
See Notes to the Financial Statements.
| Financial Highlights | Giant 5 Total Index System |
| The table below sets forth financial | Period Ended | | | | | | | | | | | | |
| data for a share outstanding in the Fund | September 30, 2010 | Year Ended | Year Ended | Year Ended | Period Ended |
| throughout each period presented: | (Unaudited) | March 31, 2010 | March 31, 2009 | March 31, 2008 | March 31, 2007(a) |
| | | | | | | | | | | | | | | | |
| Per share data: | | | | | | | | | | | | | | | |
| Net Asset Value - Beginning of Period | | $ | 13.08 | | | $ | 8.62 | | | $ | 15.36 | | | $ | 16.24 | | | $ | 15.00 | |
| | | | | | | | | | | | | | | | | | | | | |
| Income/(loss) from | | | | | | | | | | | | | | | | | | | | |
| Investment Operations: | | | | | | | | | | | | | | | | | | | | |
| Net investment income | | | 0.02 | | | | 0.07 | | | | 0.20 | | | | 0.18 | | | | 0.15 | |
| Net realized and unrealized | | | | | | | | | | | | | | | | | | | | |
| gains/(losses) on investments | | | 0.30 | | | | 4.47 | | | | (6.57 | )(b) | | | 0.01 | (b) | | | 1.25 | |
| Total from investment operations | | | 0.32 | | | | 4.54 | | | | (6.37 | ) | | | 0.19 | | | | 1.40 | |
| | | | | | | | | | | | | | | | | | | | | |
| Less Distributions | | | | | | | | | | | | | | | | | | | | |
| Declared to Shareholders: | | | | | | | | | | | | | | | | | | | | |
| Net investment income | | | — | | | | (0.08 | ) | | | (0.18 | ) | | | (0.18 | ) | | | (0.15 | ) |
| Net realized gains | | | — | | | | — | | | | (0.19 | ) | | | (0.89 | ) | | | — | (d) |
| Return of capital | | | — | | | | — | | | | — | | | | — | | | | (0.01 | ) |
| Total distributions | | | — | | | | (0.08 | ) | | | (0.37 | ) | | | (1.07 | ) | | | (0.16 | ) |
| Paid-in capital from redemption fees | | | — | (c) | | | — | (c) | | | — | (c) | | | — | (d) | | | — | (d) |
| | | | | | | | | | | | | | | | | | | | | |
| Net Asset Value - End of Period | | $ | 13.40 | | | $ | 13.08 | | | $ | 8.62 | | | $ | 15.36 | | | $ | 16.24 | |
| | | | | | | | | | | | | | | | | | | | | |
Total Return(e) | | | 2.45 | %(f) | | | 52.70 | % | | | (41.75 | )% | | | 0.91 | % | | | 9.38 | %(f) |
| | | | | | | | | | | | | | | | | | | | | |
| Ratios (to average net assets) | | | | | | | | | | | | | | | | | | | | |
| Supplemental Data: | | | | | | | | | | | | | | | | | | | | |
| Net assets at end of period (000s) | | $ | 15,492 | | | $ | 15,521 | | | $ | 10,957 | | | $ | 20,395 | | | $ | 22,388 | |
Ratio of expenses to average net assets(g) | | | 1.98 | %(h) | | | 1.94 | % | | | 1.74 | % | | | 1.42 | %(i) | | | 1.90 | %(h) |
| Net investment income | | | | | | | | | | | | | | | | | | | | |
to average net assets(j) | | | 0.26 | %(h) | | | 0.57 | % | | | 1.44 | % | | | 1.20 | % | | | 1.00 | %(h) |
| Portfolio turnover | | | 0 | %(f) | | | 11.14 | % | | | 66.67 | % | | | 110.31 | % | | | 5 | .35%(f) |
| (a) | Fund commenced operations on May 1, 2006. |
| (b) | Realized and unrealized gains and losses per share in this caption are balancing amounts necessary to reconcile the change in net asset value per share in the period. It does not agree to the aggregate gains and losses in the Statement of Operations due to the fluctuation in share transactions in the period. |
| (c) | Effective September 14, 2007, the Fund no longer imposed a redemption fee for sales of shares done within 180 days of purchase. |
| (e) | Total return in the above table represents the rate of return that the investor would have earned or lost on an investment in the Fund assuming the reinvestment of dividends. |
| (g) | This ratio excludes the impact of expenses of the registered investment companies and exchange traded funds in which the Fund invests. |
| (i) | For the period July 1, 2007 through March 31, 2008, the expense ratio of the Fund was capped at 1.35%. There were no reimbursements required to be made by the Adviser for that period. |
| (j) | Recognition of the net investment income by the Fund is affected by the timing of the declaration of dividends by the underlying investment companies and exchange traded funds in which the Fund invests. |
See Notes to the Financial Statements.
| Notes to the Financial Statements | Giant 5 Funds September 30, 2010 (Unaudited) |
1.Organization
| | Giant 5 Funds (the “Trust”) was organized as a trust under the laws of the State of Delaware on November 9, 2005. The Trust is an open-end investment company registered under the Investment Company Act of 1940, as amended (the “1940 Act”). The Trust is authorized to issue an unlimited number of shares, which are units of beneficial interest with no par value. The Trust currently offers shares of two series, each of which has different and distinct strategies and policies: the Giant 5 Total Investment System and the Giant 5 Total Index System (individually a “Fund,” collectively the “Funds”). Each of the Funds commenced operations on May 1, 2006. |
| | The investment objective for each Fund is to seek total return. To pursue its investment objective, the Giant 5 Total Investment System will make investments primarily in other mutual funds that are not affiliated with the Fund. To pursue its investment objective, the Giant 5 Total Index System will primarily invest in unaffiliated index funds and exchange traded funds. |
| | Each Fund is non-diversified, as that term is defined in the 1940 Act, and each Fund is a “fund of funds,” which means that each Fund invests in other mutual funds and exchange traded funds (“Underlying Funds”). The Trust has established two classes of shares: Investor Shares and Institutional Shares. While the Institutional Shares became effective during the year ended March 31, 2009, only Investor Shares have been offered and issued to date. |
2.Significant Accounting Policies
| | The following is a summary of significant accounting policies followed by the Trust in the preparation of its financial statements. These policies are in conformity with accounting principles generally accepted in the United States of America (“GAAP”). |
| | The value of assets in a Fund’s portfolio is determined on the basis of their fair value, or where market quotations are not readily available or are deemed unreliable due to a significant event or otherwise, determined in good faith in accordance with the procedures established by, and under the general supervision of, the Funds’ Board of Trustees (the “Board”). The Funds may invest in securities that are primarily listed on foreign exchanges that trade on weekends or other days when the Funds do not price their shares. The value of portfolio securities held by the Funds may change on days when shareholders will not be able to purchase or redeem shares. |
| | Additionally, each of the Underlying Funds will be registered investment companies, therefore their net asset value per share (“NAV”) will be calculated as set forth in their prospectuses. As noted above, each Fund is a fund of funds, primarily invested in mutual funds and exchange traded funds that have their own internal fair pricing and valuation procedures. Due to this structure, the Underlying Funds’ policies will be used in the daily calculation of their NAV, which will, in turn, be used in calculating the Funds’ NAV. If for any reason, a mutual fund held by the Funds’ does not provide its NAV to the Fund in a timely fashion for the Funds’ NAV calculation, for valuation purposes, the last available NAV for the mutual fund will be adjusted by the percentage a predetermined benchmark rose or declined on that particular trading day. |
| | A Fund will fair value price its securities when market quotations are not readily available. Generally, this would include securities for which trading has been halted, securities whose value has been materially affected by the occurrence of a significant event (as defined below), securities whose price has become stale (i.e., the market price has remained unchanged for five business days), and other securities where a market price is not available from either a national pricing service or a broker. In addition, the Pricing Committee will review exception priced securities (i.e., securities for which the market value is provided by a quote from a single broker rather than a national pricing service) on a quarterly basis. In these situations, the Pricing Committee will employ certain Board-approved methodologies to determine a fair value for the securities. Fair valuations will be reviewed by the Board of Trustees on a quarterly basis. Fair value pricing should result in a more accurate determination of a Fund’s net asset value price, which should eliminate the potential for stale pricing |
Continued
| Notes to the Financial Statements | Giant 5 Funds September 30, 2010 (Unaudited) |
| | arbitrage opportunities in a Fund. However, fair value pricing involves the risk that the values used by a Fund to price its investments may be different from those used by other investment companies and investors to price the same investments. |
| | A “significant event” is one that occurred prior to a Fund’s valuation time, is not reflected in the most recent market price of a security, and materially affects the value of a security. Generally, such “significant events” relate to developments in foreign securities that occur after the close of trading in their respective markets. The Funds’ accounting agent may obtain fair value prices of foreign securities through utilization of a Fair Value Pricing Service previously approved by the Board where a movement in the U.S. equities market is sufficiently large to constitute a trigger established by the Pricing Committee. |
| | GAAP establishes a hierarchy that prioritizes the various inputs used in determining the value of a Fund’s investments. The three broad levels of the hierarchy are described below: |
| | • | Level 1 – | quoted prices for active markets for identical securities. |
| | • | Level 2 – | other significant observable inputs (including quoted prices for similar securities, interest rates, prepayment speeds, credit risk, etc.). |
| | • | Level 3 – | significant unobservable inputs, including the Funds’ own assumptions in determining the fair value of investments. |
| | The inputs or methodology used for valuing securities are not necessarily an indication of the risk associated with investing in those securities. The following is a summary of the inputs used to value the Funds’ investments as of September 30, 2010. |
| | Giant 5 Total Investment System |
| | | | Level 2 – | Level 3 – | |
| | | Level 1 – | Other Significant | Significan | |
| | | Quoted Prices | Observable Inputs | Unobservable Inputs | Total |
| | Investment Companies | $17,967,885 | $ — | $ — | $17,967,885 |
| | Short-Term Investments | 74,136 | — | — | 74,136 |
| | Total | $18,042,021 | $ — | $ — | $18,042, 021 |
| | Giant 5 Total Index System |
| | | | Level 2 – | Level 3 – | |
| | | Level 1 – | Other Significant | Significant | |
| | | Quoted Prices | Observable Inputs | Unobservable Inputs | Total |
| | Exchange Traded Funds | $15,082,311 | $ — | $ — | $15,082,311 |
| | Short-Term Investments | 425,511 | — | — | 425,511 |
| | Total | $15,507,822 | $ — | $ — | $15,507,822 |
| | The Funds did not hold any Level 2 or Level 3 securities during the period ended September 30, 2010. |
| | Investment Transactions and Related Income: |
| | Investment transactions are recorded on a trade date for financial reporting purposes. Dividend income is recorded on the ex-dividend date. Securities gains and losses are calculated based on highest cost, long-term holdings, and where not applicable, the first-in, first-out method. Interest income is recognized on the accrual basis and includes, where applicable, the amortization or accretion of premium or discount. |
Continued
| Notes to the Financial Statements | Giant 5 Funds September 30, 2010 (Unaudited) |
| | Expenses directly attributable to a Fund are charged directly to the Fund. Expenses relating to the Trust are allocated proportionately to each Fund within the Trust according to the relative net assets of each Fund or on another reasonable basis. |
| | Distributions to Shareholders: |
| | Dividends from net investment income, if any, are declared and distributed semi-annually for each Fund. Dividends from net realized gains, if any, are declared and distributed annually for each Fund. |
| | The amounts of dividends from net investment income and of distributions from net realized gains, if any, are determined in accordance with federal income tax regulations and are recorded on the ex-dividend date. They may differ from GAAP. These “book/tax” differences are either considered temporary or permanent in nature. To the extent these differences are permanent in nature, such amounts are reclassified within the composition of net assets based on their federal tax-basis treatment; temporary differences do not require reclassification. As of March 31, 2010, permanent book to tax differences were as follows: |
| | | | Undistributed Net | Accumulated Undistributed |
| | Fund | Paid-in-Capital | Investment Income | Net Realized Losses |
| | Giant 5 Total Investment System | $ — | $8,607 | $(8,607) |
| | Giant 5 Total Index System | (207) | 342 | (135) |
| | Each Fund intends to qualify as a regulated investment company by complying with the provisions available to certain investment companies, as defined in Subchapter M of the Internal Revenue Code, and to make distributions from net investment income and from net realized capital gains sufficient to relieve it from all, or substantially all, federal income and excise taxes. Therefore, no federal or excise tax provision is recorded. |
| | As of and during the year ended March 31, 2010, the Funds did not have a liability for any unrecognized tax benefits. The Funds recognize interest and penalties, if any, related to unrecognized tax benefits as income tax expense in the Statement of Operations. During the year, the Funds did not incur any interest or penalties. The Funds are subject to examination by U.S. federal tax authorities for all tax years since the commencement of operations. |
| | The preparation of financial statements in conformity with GAAP requires management to make estimates and assumptions that affect the reported amounts of assets and liabilities, and the disclosure of contingent assets and liabilities at the date of the financial statements, and the reported amounts of increases and decreases in net assets from operations during the reporting period. Actual results could differ from those estimates. |
| | In preparing these financial statements, management has evaluated events and transactions for potential recognition or disclosure through the date these financial statements were issued. |
| | Recent Accounting Pronouncements: |
| | In January 2010, the Financial Accounting Standards Board (“FASB”) issued Accounting Standards UpdateImproving Disclosures about Fair Value Measurements that requires additional disclosures regarding fair value measurements. Certain required disclosures are effective for interim and annual reporting periods beginning after December 15, 2009, and other required disclosures are effective for fiscal years beginning after December 15, 2010, and for interim periods within those fiscal years. Management is currently evaluating the impact it will have on its financial statement disclosures. |
Continued
| Notes to the Financial Statements | Giant 5 Funds September 30, 2010 (Unaudited) |
| 3. | Related Party Transactions: |
| | The Willis Group, Inc. (the “Adviser”) serves as the investment adviser to each Fund. Under the terms of the investment advisory agreement, the Adviser is entitled to receive fees computed daily and paid monthly at an annual rate of 0.67% of average net assets of each Fund. The Adviser makes the investment decisions for each of the Funds and continuously reviews, supervises and administers the investment program of each Fund, subject to the supervision of, and policies established by the Board. The amounts charged to the Funds for investment advisory services are reported within the Statement of Operations. |
| | Certain trustees and officers of the Trust are also officers of the Adviser. |
| | Each Fund has adopted a Distribution Plan, pursuant to Rule 12b-1 under the 1940 Act (the “Distribution Plan”) with respect to its Investor Shares. Pursuant to the Distribution Plan, the Giant 5 Total Investment System and the Giant 5 Total Index System each will pay 0.17% of its average daily net assets attributable to its Investor Shares. The Distribution Plan provides that the Funds pay the Distributor and other organizations for distributing shares, advertising and marketing and for providing certain services to shareholders of the Investor Shares. The 12b-1 expenses incurred by the Funds are reported within the Statement of Operations. |
| 4. | Purchases and Sales of Securities: |
| | Purchases and sales of investment securities, excluding short-term securities for the period ended September 30, 2010, totaled: |
| | | Giant 5 Total | Giant 5 Total |
| | | Investment System | Index System |
| | Purchases | $ — | |
| | Sales | 105,558 | 860,505 |
| | There were no purchases or sales of U.S. government securities for the period. |
| 5. | Federal Tax Information: |
| | At September 30, 2010, the cost, gross unrealized appreciation and gross unrealized depreciation on securities, for federal income tax purposes, were as follows: |
| | | Giant 5 Total | Giant 5 Total |
| | | Investment System | Index System |
| | Tax Cost | $15,691,237 | $16,585,329 |
| | Tax Unrealized Appreciation | 2,932,867 | 1,564,872 |
| | Tax Unrealized (Depreciation) | (582,083) | (2,642,371) |
| | Net Unrealized Appreciation/(Depreciation) | 2,350,784 | (1,077,499) |
| | The tax character of distributions paid during the fiscal years ended March 31, 2010 and March 31, 2009 were as follows: |
| | | Giant 5 Total | Giant 5 Total |
| | | Investment System | Index System |
| | | 2010 | 2009 | 2010 | 2009 |
| | Distributions Paid from Ordinary Income | $ — | $ — | $97,247 | $296,843 |
| | Distributions Paid from Net Long Term Capital Gains | — | 843,959 | — | 170,672 |
| | Total Taxable Distributions | — | 843,959 | $97,247 | 467,515 |
| | Return of Capital Distributions | — | — | — | — |
| | Total Distributions Paid | — | 843,959 | $97,247 | 467,515 |
Continued
| Notes to the Financial Statements | Giant 5 Funds September 30, 2010 (Unaudited) |
| | As of March 31, 2010, the components of accumulated earnings on a tax basis were as follows: |
| | | | Giant 5 Total | | | Giant 5 Total | |
| | | Investment System | | Index System | |
| | Undistributed Ordinary Income | | $ | 50,620 | | | $ | 4,542 | |
| | Undistributed Long Term Capital Gains | | | — | | | | — | |
| | Accumulated Earnings | | | 50,620 | | | | 4,542 | |
| | Distributions Payable | | | — | | | | — | |
| | Accumulated Capital and Other Losses | | | (6,407,544 | ) | | | (2,659,200 | ) |
| | Unrealized Appreciation/(Depreciation) | | | 1,488,737 | | | | (1,444,001 | ) |
| | Total Accumulated Earnings/(Deficit) | | | (4,868,187 | ) | | | (4,098,659 | ) |
| | The difference between book basis and tax-basis unrealized appreciation/(depreciation) is attributable primarily to the tax deferral of losses on wash sales and other temporary differences. |
| | At March 31, 2010, the Funds had capital loss carryforwards, which reduce the Funds’ taxable income arising from future net realized gains on investments, if any, to the extent permitted by the Code, and thus will reduce the amount of distributions to shareholders which would otherwise be necessary to relieve the Funds of any liability for federal tax. Pursuant to the Code, such capital loss carryforwards will expire as follows: |
| | | Capital Loss Carryforward to Expire In: |
| | Fund | 2017 | 2018 | Total |
| | Giant 5 Total Investment System | $796,004 | $5,437,353 | $6,233,357 |
| | Giant 5 Total Index System | 29,840 | 2,509,989 | 2,539,829 |
| | As of March 31, 2010, the Giant 5 Total Investment System and the Giant 5 Total Index System had $174,187 and $119,371, respectively, of post-October losses, which have been elected to be deferred until April 1, 2010 for tax purposes. Net capital losses incurred after October 31, and within the taxable year are deemed to arise on the first day of the Fund’s next taxable year. |
| | The beneficial ownership, either directly or indirectly, of more than 25% of the voting securities creates a presumption of control of the Funds, under Section 2(a)(9) of the 1940 Act. As of September 30, 2010, TD Ameritrade Clearing, Inc. had ownership in the Giant 5 Total Investment System and the Giant 5 Total Index System in the amounts of 63.9% and 68.2%, respectively. |
| Supplemental Information | Giant 5 Funds September 30, 2010 (Unaudited) |
Expense Example
As a shareholder of the Giant 5 Funds, you incur two types of costs: (1) transaction costs, including exchange fees; and (2) ongoing costs, including investment Advisory fees, distribution (12b-1) fees, and other Fund expenses. The Examples below are intended to help you understand your ongoing costs (in dollars) of investing in the Funds and to compare these costs with the ongoing costs of investing in other mutual funds.
Each is based on an investment of $1,000 invested at the beginning of the period and held for the entire period from April 1, 2010 through September 30, 2010.
Actual Expenses
The table below provides information about actual account values and actual expenses. You may use the information below, together with the amount you invested, to estimate the expenses you paid over the period. Simply divide your account value by $1,000 (for example, an $8,600 account value divided by $1,000 = 8.6), then multiply the result by the number in the table under the heading entitled “Expenses Paid During Period” to estimate the expenses you paid on your account during the period.
| | | | Expenses paid | Expense Ratio |
| | Beginning account | Ending account | during period | during period |
| | value 4/1/10 | value 9/30/10 | 4/1/10-9/30/10(1) | 4/1/10-9/30/10(1) |
| Giant 5 Total Investment System | $1,000.00 | $1,031.60 | $9.82 | 1.93% |
| Giant 5 Total Index System | $1,000.00 | $1,024.50 | $10.05 | 1.98% |
Hypothetical Example for Comparison Purposes
The table below provides information about hypothetical account values and hypothetical expenses based on the Giant 5 Funds’ actual expense ratios and an assumed rate of return of 5% per year before expenses, which is not the Funds’ actual return. The hypothetical account values and expenses may not be used to estimate the actual ending account balance or expenses you paid for the period. However, you may use this information to compare this 5% hypothetical example with the 5% hypothetical examples that appear in the shareholder reports of the other funds.
Please note that the expenses shown in the table are meant to highlight your ongoing costs only and do not reflect any transactional costs, such as sales charges (loads) or exchange fees, if applicable. Therefore, the table is useful in comparing the ongoing costs only, and will not help you determine the relative total costs of owning different funds. In addition, if these transactional costs were included, your costs would have been higher.
| | | | Expenses paid | Expense Ratio |
| | Beginning account | Ending account | during period | during period |
| | value 4/1/10 | value 9/30/10 | 4/1/10-9/30/10(1) | 4/1/10-9/30/10(1) |
| Giant 5 Total Investment System | $1,000.00 | $1,015.33 | $9.74 | 1.93% |
| Giant 5 Total Index System | $1,000.00 | $1,015.07 | $10.01 | 1.98% |
| (1) | Expenses are equal to the average account value times the annualized expense ratio of the Giant 5 Total Investment System and the Giant 5 Total Index System of 1.93% and 1.98%, respectively, multiplied by the number of days in the period (183), divided by the number of days in the fiscal year (365). |
(This Page Intentionally Left Blank.)
Invest in the Essentials. Invest for Life.
| | | | |
| Capital Markets | Real Estate | Bonds | Energy | Raw Materials |
Funds distributed by UMB Distribution Services, LLC
© 2010 Giant 5 Funds, Colorado
Item 2. Code of Ethics
Not applicable to semi-annual reports.
Item 3. Audit Committee Financial Expert
Not applicable to semi-annual reports.
Item 4. Principal Accountant Fees and Services
Not applicable to semi-annual reports.
Item 5. Audit Committee of Listed Registrants
Not applicable.
Item 6. Schedule of Investments
Schedule of Investments is included as part of the report to shareholders filed under item 1 of this Form N-CSR
Item 7. Disclosure of Proxy Voting Policies and Procedures for Closed-End Management Investment Companies
Not applicable.
Item 8. Portfolio Managers of Closed-End Management Investment Companies
Not applicable.
Item 9. Purchases of Equity Securities by Closed-End Management Investment Company and Affiliated Purchasers
Not applicable.
Item 10. Submission of Matters to a Vote of Security Holders
There were no material changes to the procedures by which shareholders may recommend nominees to the registrant’s Board of Trustees.
Item 11. Controls and Procedures
| (a) | Based on an evaluation of the disclosure controls and procedures (as defined in Rule 30a-3(c) under the Investment Company Act of 1940, as amended, the “Disclosure Controls”) as of a date within 90 days of the filing date (the “Filing Date”) of this Form N-CSR (the “Report”), the registrant’s principal executive officer and principal financial officer have concluded that the Disclosure Controls are effectively designed to ensure that information that is required to be disclosed by the registrant in the Report is recorded, processed, summarized and reported within the time periods specified in the Securities and Exchange Commission’s rules and forms, including ensuring that information required to be disclosed in the Report is accumulated and communicated to the registrant’s manage ment, including the registrant’s principal executive officer and principal financial officer, as appropriate to allow timely decisions regarding required disclosures. |
| (b) | There were no changes in the registrant’s internal controls over financial reporting (as defined in Rule 30 a-3(d) under the Investment Company Act of 1940) that occurred during the second fiscal quarter of the period covered by this report that have materially affected, or are reasonably likely to materially affect, the registrant’s internal control over financial reporting. |
Item 12. Exhibits
| | (2)Certifications for each principal executive and principal financial officer as required by Rule 30a-2(a) under the Investment Company Act of 1940, as amended, (17 CFR 270.30a-2(a)) are filed herewith. |
| (b) | Certifications required by Rule 30a-2 (b) under the Investment Company Act of 1940, as amended, (17 CFR 270.30a-2 (b)) are filed herewith. |
SIGNATURES
Pursuant to the requirements of the Securities Exchange Act of 1934 and the Investment Company Act of 1940, the registrant has duly caused this report to be signed on its behalf by the undersigned, thereunto duly authorized.
Giant 5 Funds
/s/ Michael G. Willis
Michael G. Willis
President
(Principal Executive Officer and Principal Financial Officer)
Date December 7, 2010
Pursuant to the requirements of the Securities Exchange Act of 1934 and the Investment Company Act of 1940, this report has been signed below by the following person on behalf of the registrant and in the capacities and on the dates indicated.
/s/ Michael G. Willis
Michael G. Willis
President
(Principal Executive Officer)
Date December 7, 2010
/s/ Michael G. Willis
Michael G. Willis
(Principal Financial Officer)
Date December 7, 2010