UNITED STATES
SECURITIES AND EXCHANGE COMMISSION
Washington, D.C. 20549
FORM N-CSR
CERTIFIED SHAREHOLDER REPORT OF REGISTERED MANAGEMENT INVESTMENT COMPANIES
Investment Company Act File Number 811-21836
Giant 5 Funds
(Exact name of registrant as specified in charter)
128 South Tejon, Suite 150
Colorado Springs, CO 80903
(Address of principal executive offices)
Michael G. Willis
The Willis Group
128 South Tejon, Suite 150
Colorado Springs, CO 80903
(Name and address of agent for service)
Registrant's telephone number, including area code: (719) 884-7500
Date of fiscal year end: March 31
Date of reporting period: September 30, 2008
Item 1. Reports to Stockholders
The following is a copy of the report transmitted to shareholders pursuant to Rule 30e-1 under the Investment Company Act of 1940 (17 CFR 270.30e-1).
Giant 5 Funds Investor Shares Semi-Annual Report September 30, 2008 |
Giant 5 Total Investment System (FIVEX) 20+ Underlying Mutual Funds Giant 5 Total Index System (INDEX) 20+ Underlying Index Funds and ETFs |
|
| |
Investors should carefully read and consider the Funds’ investment objectives, risks, charges and expenses before investing or sending money. This and other important information is contained in the Prospectus, which can be obtained by calling 1-888-5Giant5 (1-888-544-2685) or downloaded on www.Giant5.com. Funds distributed by UMB Distribution Services, LLC. |
| |
| Semi-Annual Report |
| Table of Contents | September 30, 2008(Unaudited) |
Letter to Shareholders | 2 |
| | |
| Giant 5 Total Investment System | |
Schedule of Portfolio Investments | 3 |
Financial Statements | 4 |
Financial Highlights | 6 |
| | |
| Giant 5 Total Index System | |
Schedule of Portfolio Investments | 7 |
Financial Statements | 8 |
Financial Highlights | 10 |
| | |
Notes to the Financial Statements | 11 |
Supplemental Information | 16 |
| | |
| Statement Regarding Availability of Quarterly Portfolio Schedule. (Unaudited) |
| The Giant 5 Funds file complete schedules of portfolio holdings for each Fund with the Securities and Exchange Commission (the “Commission”) for the first and third quarters of each fiscal year on Form N-Q. The Funds’ Forms N-Q are available on the Commission’s website at http://www.sec.gov. The Funds’ Form N-Q may be reviewed and copied at the Commission’s Public Reference Room in Washington, D.C., and information on the operation of the Public Reference Room may be obtained by calling 1-800-SEC-0330; and the Funds make the information on Form N-Q available upon request without charge. |
| | |
| Statement Regarding Availability of Proxy Voting Policies and Procedures and Proxy Voting Record. (Unaudited) |
A description of the policies and procedures the Funds use to determine how to vote proxies relating to the portfolio securities is available without charge, upon request, by calling 1-800-788-5680 or on the Commission’s website at http://www.sec.gov. A copy of the Funds’ voting record for the most recent 12-month period ended June 30 is also available at the SEC’s website at http://www.sec.gov. |
| | |
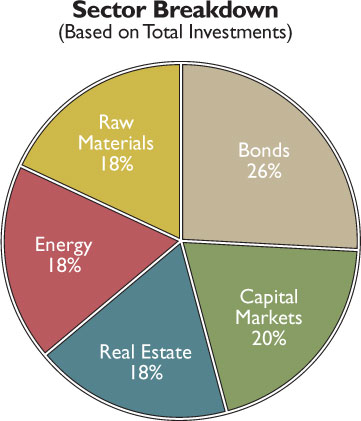
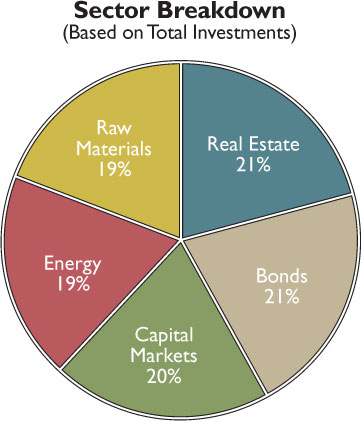
 | Dear Shareholders, As you are all aware, the financial markets have experienced a sharp pullback during the past several months. Contributing factors include: the US mortgage crisis, the increased use of leverage by Wall Street’s largest institutions and plain old-fashioned greed. During the past quarter we underperformed our primary benchmark, the S&P 500 Index. This underperformance was due in large part to the overweight Energy, Raw Materials, Real Estate, and International holdings in our Invest Where You Spend portfolios. Each of these categories experienced sharp declines during this quarter. These periods of economic uncertainty and market volatility can cause investors to consider altering sound long-term investment strategies in response to short-term fears. During extreme periods for the market, investors often make decisions that can undermine their ability to build long-term wealth. I understand that all of you have witnessed the effect of this extreme volatility on the value of your investments and are looking for answers and guidance. Alan Greenspan recently told Congress that the current global financial crisis is a “once in a century credit tsunami” that policymakers did not anticipate. This collapse has caused many investors to go to cash. Warren Buffett recently was quoted as saying, “Today people who hold cash equivalents feel comfortable. They shouldn’t. They have opted for a terrible long-term asset, one that pays virtually nothing and is certain to depreciate in value. Indeed, the policies that government will follow in its efforts to alleviate the current crisis will probably prove inflationary and therefore accelerate declines in the real value of cash accounts.” We cannot know what each of you is going through, but I would urge you to focus on the long-term and not the short-term. In my experience, long-term proactive strategies are the most rewarding, but always the most difficult to implement because emotions have to be managed. Some words of wisdom and thoughts to consider while navigating difficult times: 1) Avoid self-destructive investor behavior; 2) Understand that crises are inevitable; 3) Don’t attempt to time the market; 4) Be Patient; 5) Don’t let emotions guide your investment decisions; 6) Recognize that short-term underperformance is sometimes inevitable; and 7) Disregard short-term forecasts and predictions. “Far more money has been lost by investors preparing for corrections or trying to anticipate corrections than has been lost in the corrections themselves.” Peter Lynch, Well-Known Investor and Author “I will tell you how to become rich. Be fearful when others are greedy. Be greedy when others are fearful.” Warren Buffett, Chairman of Berkshire Hathaway We continue to believe that the primary reason people invest is to give them the capability of spending this money in the future. Therefore, we utilize an Invest Where You Spend strategy that allocates our portfolios into 5 primary categories of spending and consumption: Energy, Raw Materials, Capital Markets, Bonds, and Real Estate. Giant 5 Funds does not leverage or short the portfolios’ holdings. Thank you for your continued confidence in your long-term investment strategy and in Giant 5 Funds. President |
| | Performance Comparison | | | | | | | Inception | | | |
| | As of September 30, 2008 | | | 1-Year | | | Annualized* | | | |
| | Giant 5 Total Investment System (FIVEX) | | -21.79% | | | | -1.60% | | | | |
| | Giant 5 Total Index System (INDEX) | | -20.44% | | | | -2.72% | | | | |
| | | | | -21.98% | | | | -2.64% | | | | |
| | | | | -14.48% | | | | -3.36% | | | | |
| | Dow Jones Industrial Average | | | -19.85% | | | | 0.58% | | | | |
| | NASDAQ | | | -21.92% | | | | -3.48% | | | | |
| | * Inception Date: May 1, 2006 | | | | | | | | | | | |
 | Performance data quoted here represents past performance which is not predictive of future results. The investment return and net asset value per share will fluctuate, so that an investor’s shares, when redeemed, may be worth more or less than the original cost. Current performance may be higher or lower than the performance information quoted. To obtain performance information current to the most recent month end, please call 1-888-5GIANT5. Gross expenses of the Total Investment System and Total Index System are 2.23% and 1.90%, respectively. Gross expenses are reflective of information quoted in the Funds’ Prospectus dated July 9, 2008 and may differ from the expense ratios disclosed in this report. |
| Giant 5 Total Investment System |
| Schedule of Portfolio Investments | September 30, 2008 (Unaudited) |
| Security Description | | Shares | | | Value | |
| INVESTMENT COMPANIES - 93.8% |
| | | | | | | | |
| Alpine International | | | | | | |
| | Real Estate Equity Fund, Class Y | | | 10,970 | | | $ | 213,800 | |
| | | | | | | | | |
| BlackRock Global | | | | | | | | |
| | Resources Fund, Class I | | | 32,696 | | | | 1,679,577 | |
| | | | | | | | | |
| Cohen & Steers Asia Pacific | | | | | | | | |
| | Realty Shares, Inc., Class I | | | 81,367 | | | | 703,824 | |
| | | | | | | | | |
| E.I.I. International Property | | | | | | | | |
| | Fund, Class I | | | 81,152 | | | | 1,084,194 | |
| | | | | | | | | |
| Fidelity Select Industrials | | | | | | | | |
| | Materials Portfolio | | | 41,627 | | | | 1,827,436 | |
| | | | | | | | | |
| First American Real Estate | | | | | | | | |
| | Securities Fund, Class Y | | | 28,588 | | | | 520,583 | |
| | | | | | | | | |
| First Eagle Global | | | | | | | | |
| | Fund, Class I | | | 26,445 | | | | 1,054,114 | |
| | | | | | | | | |
| First Eagle Overseas | | | | | | | | |
| | Fund, Class I | | | 50,202 | | | | 1,000,033 | |
| | | | | | | | | |
| Franklin Mutual | | | | | | | | |
| | European Fund, Class Z | | | 17,375 | | | | 346,453 | |
| | | | | | | | | |
| ICON Materials Fund | | | 109,198 | | | | 1,071,229 | |
| | | | | | | | | | |
| Ivy European Opportunities | | | | | | | | |
| | Fund, Class I | | | 3,008 | | | | 77,669 | |
| | | | | | | | | |
| Ivy Global Natural | | | | | | | | |
| | Resources Fund, Class I | | | 85,597 | | | | 2,199,833 | |
| | | | | | | | | |
| JPMorgan Small Cap | | | | | | | | |
| | Equity Fund, Class S | | | 1,000 | | | | 28,120 | |
| | | | | | | | | |
| Loomis Sayles Fixed | | | | | | | | |
| | Income Fund, Class I | | | 181,950 | | | | 2,210,689 | |
| | | | | | | | | |
| Matthews China Fund | | | 44,661 | | | | 1,088,395 | |
| | | | | | | | | |
| Matthews India Fund | | | 21,815 | | | | 291,885 | |
| | | | | | | | | |
| Metzler/Payden European | | | | | | | | |
| | Emerging Markets Fund | | | 11,823 | | | | 275,952 | |
| | | | | | | | | |
| Morgan Stanley Institutional | | | | | | | | |
| | Fund, Inc., International Real | | | | | | | | |
| | Estate Portfolio, Class I | | | 7,096 | | | | 131,480 | |
| | | | | | | | |
| Morgan Stanley Institutional Fund, Inc., | | | | | | | |
| | U.S. Real Estate Portfolio, Class I | | | 102,652 | | | | 1,479,215 | |
| | | | | | | | | |
| Oppenheimer International | | | | | | | | |
| | Bond Fund, Class Y | | | 345,988 | | | | 2,062,089 | |
| | | | | | | | | |
| T. Rowe Price | | | | | | | | |
| | Latin America Fund | | | 3,272 | | | | 122,738 | |
| | | | | | | | |
| U.S. Global Investors Accolade Funds, | | | | | | | |
| | Eastern European Fund | | | 13,213 | | | | 130,282 | |
| | | | | | | | | |
| Vanguard Energy Fund, | | | | | | | | |
| | Admiral Shares | | | 10,371 | | | $ | 1,243,345 | |
| | | | | | | | | |
| Vanguard Short-Term Investment | | | | | | | | |
| | Grade Fund, Admiral Shares | | | 9,953 | | | | 99,826 | |
| | | | | | | | | |
| Total Investment Companies | | | | | | | | |
| | (Cost $25,915,246) | | | | | | | 20,942,761 | |
| | | | | | | | | | |
| SHORT-TERM INVESTMENTS - 6.3% |
| | | | | | | | | | |
| UMB Bank Money Market Fiduciary, | | | | | | | | |
| | 1.020%, 10/1/2008(a) | | $ | 1,415,827 | | | $ | 1,415,827 | |
| | | | | | | | | |
| Total Short-Term Investments | | | | | | | | |
| | (Cost $1,415,827) | | | | | | | 1,415,827 | |
| | | | | | | | | |
| Total Investments – 100.1% | | | | | | | | |
| | (Cost $27,331,073) | | | | | | | 22,358,588 | |
| | | | | | | | | |
| Other Liabilities in Excess | | | | | | | | |
| | of Assets - (0.1)% | | | | | | | (17,221 | ) |
| | | | | | | | | |
| NET ASSETS - 100.0% | | | | | | $ | 22,341,367 | |
| | | | | | | | | | |
| | | | | | | | | | |
 |
| | | | | | | | | | |
| | | | | | | | | | |
(a) Variable rate security; the rate shown represents the rate at September 30, 2008. | | | | | |
| | | | | | | | | | |
See Notes to the Financial Statements.
| Giant 5 Total Investment System |
| Financial Statements | |
| STATEMENT OF ASSETS AND LIABILITIES | | | |
| | | | |
| September 30, 2008 (Unaudited) | | | |
| | | | |
| Assets: | | | |
| Investment securities at market value (cost $27,331,073) | | $ | 22,358,588 | |
| Interest and dividends receivable | | | 10,394 | |
| Prepaid expenses | | | 20,110 | |
| Total Assets | | | 22,389,092 | |
| | | | | |
| Liabilities: | | | | |
| Payable to Investment Adviser | | | 14,538 | |
| Payable for 12b -1 fees | | | 3,689 | |
| Other payables | | | 29,498 | |
| Total Liabilities | | | 47,725 | |
| | | | | |
| Net Assets | | $ | 22,341,367 | |
| | | | | |
| Net assets consist of: | | | | |
| Paid-in capital | | $ | 26,942,188 | |
| Undistributed net investment loss | | | (121,865 | ) |
| Accumulated undistributed net realized gains | | | 493,529 | |
| Net unrealized depreciation on investments | | | (4,972,485 | ) |
| | | | | |
| Net Assets | | $ | 22,341,367 | |
| | | | | |
| Capital Shares: | | | | |
| Investor Shares Outstanding (no par value, unlimited number of shares authorized) | | | 1,725,127 | |
| | | | | |
| Net Asset Value, Offering Price and Redemption Price Per Share | | $ | 12.95 | |
| STATEMENT OF OPERATIONS | | | |
| | | | |
| For the six months ended September 30, 2008 (Unaudited) | | | |
| | | | |
| Investment Income: | | | |
| Dividends | | $ | 95,594 | |
| Interest income | | | 3,280 | |
| Total Investment Income | | | 98,874 | |
| | | | | |
| Expenses: | | | | |
| Investment advisory fees | | | 105,200 | |
| 12b-1 fees | | | 26,693 | |
| Fund administration fees | | | 25,585 | |
| Transfer Agency fees | | | 24,158 | |
| Blue Sky fees | | | 8,357 | |
| Audit fees | | | 7,866 | |
| Custody fees | | | 5,969 | |
| Insurance | | | 5,302 | |
| Legal fees | | | 4,944 | |
| CCO fees | | | 2,946 | |
| Printing fees | | | 1,768 | |
| Pricing fees | | | 1,164 | |
| Directors fees | | | 525 | |
| Miscellaneous fees | | | 170 | |
| SEC fees | | | 92 | |
| Total Expenses | | | 220,739 | |
| | | | | |
| Net Investment Loss | | | (121,865 | ) |
| | | | | |
Net Realized and Unrealized Gains/(Losses) on Investments | | | | |
| Net realized losses from investment transactions | | | (474,333 | ) |
| Net realized gain distributions from underlying funds | | | 137,104 | |
| Change in unrealized appreciation/(depreciation) on investments | | | (4,958,438 | ) |
| Net realized and unrealized losses on investments | | | (5,295,667 | ) |
| Change in net assets resulting from operations | | $ | (5,417,532 | ) |
See Notes to the Financial Statements.
| Giant 5 Total Investment System |
| Financial Statements | |
| | | Six Months Ended | | | | |
| | | September 30, 2008 | | | Year Ended | |
| | | (Unaudited) | | | March 31, 2008 | |
| STATEMENTS OF CHANGES IN NET ASSETS | | | | | | |
| | | | | | | |
| Increase in Net Assets from Operations | | | | | | |
| Net investment income/(loss) | | $ | (121,865 | ) | | $ | 1,275,712 | |
| Net realized losses from investment transactions | | | (474,333 | ) | | | (7,037 | ) |
| Net realized gain distributions from underlying funds | | | 137,104 | | | | 1,707,066 | |
| Change in unrealized appreciation/(depreciation) on investments | | | (4,958,438 | ) | | | (1,750,102 | ) |
| Change in net assets resulting from operations | | | (5,417,532 | ) | | | 1,225,639 | |
| | | | | | | | | |
| Distributions to Shareholders | | | | | | | | |
| Net investment income | | | — | | | | (1,294,776 | ) |
| Net realized gains | | | — | | | | (1,513,557 | ) |
| Change in net assets resulting from distributions to shareholders | | | — | | | | (2,808,333 | ) |
| | | | | | | | | |
| Capital Share Transactions | | | | | | | | |
| Proceeds from sale of shares | | | 6,176,665 | | | | 9,875,426 | |
| Distributions reinvested | | | — | | | | 2,779,151 | |
| Cost of shares redeemed | | | (8,791,675 | ) | | | (10,670,068 | ) |
| Redemption fees | | | — | | | | 1,769 | |
| Change in net assets resulting from capital share transactions | | | (2,615,010 | ) | | | 1,986,278 | |
| Net increase/(decrease) in net assets | | | (8,032,542 | ) | | | 403,584 | |
| | | | | | | | | |
| Net Assets | | | | | | | | |
| Beginning of period | | | 30,373,909 | | | | 29,970,325 | |
| End of period | | $ | 22,341,367 | | | $ | 30,373,909 | |
| Accumulated undistributed net investment income at end of period | | | (121,865 | ) | | | — | |
| | | | | | | | | |
| Share Information | | | | | | | | |
| Shares sold | | | 375,873 | | | | 558,271 | |
| Distributions reinvested | | | — | | | | 169,254 | |
| Shares redeemed | | | (592,195 | ) | | | (628,148 | ) |
| Net change resulting from share transactions | | | (216,322 | ) | | | 99,377 | |
| | | | | | | | | |
| | | | | | | | | |
See Notes to the Financial Statements.
| Giant 5 Total Investment System |
| Financial Highlights | |
The table below sets forth financial data for a share outstanding in the Fund throughout each period presented: | | Six Months Ended September 30, 2008 | | | | | | Period Ended March 31, 2007(a) | |
| | | | | | | | | | |
| Per share data: | | | | | | | | | |
| Net Asset Value - Beginning of Period | | $ | 15.64 | | | $ | 16.27 | | | $ | 15.00 | |
| | | | | | | | | | | | | |
| Income from Investment Operations: | | | | | | | | | | | | |
| Net investment income (loss) | | | (0.07 | ) | | | 0.65 | | | | 0.26 | |
| Net realized and unrealized gains/(losses) on investments | | | (2.62 | ) (b) | | | 0.13 | (b) | | | 1.41 | |
| Total from investment operations | | | (2.69 | ) | | | 0.78 | | | | 1.67 | |
| | | | | | | | | | | | | |
| Less Distributions Declared to Shareholders: | | | | | | | | | | | | |
| Net investment income | | | — | | | | (0.65 | ) | | | (0.26 | ) |
| Net realized gains | | | — | | | | (0.76 | ) | | | (0.14 | ) |
| Total distributions | | | — | | | | (1.41 | ) | | | (0.40 | ) |
| Paid-in capital from redemption fees | | | — | (c) | | | — | (d) | | | — | (d) |
| | | | | | | | | | | | | |
| Net Asset Value - End of Period | | $ | 12.95 | | | $ | 15.64 | | | $ | 16.27 | |
| | | | | | | | | | | | | |
Total Return(e) | | | (17.20 | )%(f) | | | 4.39 | % | | | 11.27 | %(f) |
| | | | | | | | | | | | | |
| Ratios (to average net assets) Supplemental Data: | | | | | | | | | | | | |
| Net assets at end of period (000s) | | $ | 22,341 | | | $ | 30,374 | | | $ | 29,970 | |
Ratio of expenses to average net assets(g) | | | 1.41 | %(h) | | | 1.37 | %(i) | | | 1.91 | %(h) |
Net investment income to average net assets(j) | | | (0.78 | )%(h) | | | 3.94 | % | | | 1.96 | %(h) |
| Portfolio turnover | | | 20.42 | %(f) | | | 51.90 | % | | | 22.20 | %(f) |
| | | | | | | | | | | | | |
| | | | | | | | | | | | | |
| | | | | | | | | | | | | |
(a) Fund commenced operations on May 1, 2006. | | | | | | | | | | | | |
(b) Realized and unrealized gains and losses per share in this caption are balancing amounts necessary to reconcile the change in net asset value per share in the period. It does not agree to the aggregate gains and losses in the Statement of Operations due to the fluctuation in share transactions in the period. | |
(c) Effective September 14, 2007, the Fund no longer imposed a redemption fee for sales of shares done within 180 days of purchase. | |
(d) Less than $0.005. | | | | | | | | | | | | |
(e) Total return in the above table represents the rate of return that the investor would have earned or lost on an investment in the Fund assuming the reinvestment of dividends. | |
(f) Not annualized. | | | | | | | | | | | | |
(g) This ratio excludes the impact of expenses of the registered investment companies and exchange-traded funds in which the Fund invests. | |
(h) Annualized. | | | | | | | | | | | | |
(i) Effective July 1, 2007 through March 31, 2008, the expense ratio of the Fund was capped at 1.35%. During that period, there were no reimbursements required to be made by the Adviser. | |
(j) Recognition of the net investment income by the Fund is affected by the timing of the declaration of dividends by the underlying investment companies and exchange-traded funds in which the Fund invests. | |
See Notes to the Financial Statements.
| Giant 5 Total Index System |
| Schedule of Portfolio Investments | September 30, 2008 (Unaudited) |
| Security Description | | Shares | | | Value | |
| EXCHANGE TRADED FUNDS - 99.4% | | | | | | |
| | | | | | | | |
| Claymore/AlphaShares | | | | | | |
| | China Real Estate ETF* | | | 10,000 | | | $ | 118,000 | |
| | | | | | | | | |
| Energy Select Sector SPDR Fund | | | 11,133 | | | | 704,719 | |
| | | | | | | | | |
| First Trust ISE Chindia Index Fund | | | 39,000 | | | | 628,680 | |
| | | | | | | | | |
| iShares Dow Jones U.S. Basic | | | | | | | | |
| | Materials Sector Index Fund | | | 6,776 | | | | 386,435 | |
| | | | | | | | | |
| iShares Lehman 1-3 Year | | | | | | | | |
| | Treasury Bond Fund | | | 1,000 | | | | 83,560 | |
| | | | | | | | | |
| iShares MSCI EMU Index Fund | | | 1,520 | | | | 60,374 | |
| | | | | | | | |
| iShares S&P Europe 350 Index Fund | | 13,584 | | | | 541,458 | |
| | | | | | | | | |
| iShares S&P Global | | | | | | | | |
| | Energy Sector Index Fund | | | 34,185 | | | | 1,289,116 | |
| | | | | | | | | |
| PowerShares FTSE RAFI Basic | | | | | | | | |
| | Materials Sector Portfolio | | | 7,900 | | | | 399,266 | |
| | | | | | | | |
| PowerShares FTSE RAFI Developed | | | | | | | |
| | Markets ex-U.S. Portfolio | | | 3,000 | | | | 106,890 | |
| | | | | | | | | |
| PowerShares FTSE RAFI Energy | | | | | | | | |
| | Sector Portfolio | | | 4,240 | | | | 264,534 | |
| | | | | | | | | |
| PowerShares FTSE RAFI | | | | | | | | |
| | U.S. 1000 Portfolio | | | 17,955 | | | | 814,798 | |
| | | | | | | | | |
| PowerShares FTSE RAFI U.S. | | | | | | | | |
| | 1500 Small-Mid Portfolio | | | 12,070 | | | | 549,427 | |
| | | | | | | | |
| PowerShares Golden Dragon Halter | | | | | | | |
| | USX China Portfolio | | | 10,000 | | | | 190,500 | |
| | | | | | | | | |
| PowerShares WilderHill Clean | | | | | | | | |
| | Energy Portfolio | | | 4,000 | | | | 59,440 | |
| | | | | | | | | |
| SPDR DJ Wilshire International | | | | | | | | |
| | Real Estate ETF | | | 26,500 | | | | 1,010,975 | |
| | | | | | | | | |
| SPDR DJ Wilshire REIT ETF | | | 11,483 | | | | 775,906 | |
| | | | | | | | | |
| SPDR Lehman International | | | | | | | | |
| | Treasury Bond ETF | | | 42,503 | | | | 2,205,481 | |
| | | | | | | | | |
| SPDR S&P Oil & Gas | | | | | | | | |
| | Equipment & Services ETF | | | 6,000 | | | | 195,360 | |
| | | | | | | | | |
| SPDR S&P Oil & Gas | | | | | | | | |
| | Exploration & Production ETF | | | 4,000 | | | | 179,640 | |
| | | | | | | | | |
| Vanguard Information | | | | | | | | |
| | Technology Index ETF | | | 10,000 | | | | 464,000 | |
| | | | | | | | | |
| Vanguard Long-Term Bond ETF | | | 7,000 | | | | 499,660 | |
| | | | | | | | | |
| Vanguard Materials ETF | | | 15,524 | | | | 1,060,289 | |
| | | | | | | | | |
| Vanguard REIT ETF | | | 23,000 | | | | 1,397,710 | |
| | | | | | | | | |
| Vanguard Total Bond | | | | | | | | |
| | Market ETF | | | 11,800 | | | | 892,316 | |
| | | | | | | | | |
| WisdomTree International | | | | | | | | |
| | Basic Materials Sector Fund | | | 57,750 | | | $ | 1,524,023 | |
| | | | | | | | | |
| WisdomTree International | | | | | | | | |
| | Energy Sector Fund | | | 30,500 | | | | 825,330 | |
| | | | | | | | | |
| WisdomTree International | | | | | | | | |
| | MidCap Dividend Fund | | | 4,000 | | | | 194,160 | |
| | | | | | | | | |
| WisdomTree International | | | | | | | | |
| | Real Estate Fund | | | 20,000 | | | | 585,800 | |
| | | | | | | | | |
| WisdomTree International | | | | | | | | |
| | SmallCap Dividend Fund | | | 3,500 | | | | 160,370 | |
| | | | | | | | | |
| Total Exchange Traded Funds | | | | | | | | |
| | (Cost $22,213,284) | | | | | | | 18,168,217 | |
| | | | | | | | | |
| SHORT-TERM INVESTMENTS - 0.6% | | | | | | | | |
| | | | | | | | | |
| UMB Bank Money Market | | | | | | | | |
| | Fiduciary, 1.020%, 10/1/2008(a) | | $ | 104,540 | | | $ | 104,540 | |
| | | | | | | | | |
| Total Short-Term Investments | | | | | | | | |
| | (Cost $104,540) | | | | | | | 104,540 | |
| | | | | | | | | |
| Total Investments - 100.0% | | | | | | | | |
| | (Cost $22,317,824) | | | | | | | 18,272,757 | |
| | | | | | | | | |
| Other Assets less Liabilities – 0.0% | | | | | | | 5,107 | |
| | | | | | | | | |
| NET ASSETS - 100.0% | | | | | | $ | 18,277,864 | |
| | | | | | | | | | |
| | | | | | | | | | |
 |
| | | | | | | | | | |
| | | | | | | | | | |
| | | | | | | | | | |
| * Non-income producing. | | | | | | | | |
| | | | | | | | | | |
(a) Variable rate security; the rate shown represents the rate at September 30, 2008. |
| | | | | | | | | | |
See Notes to the Financial Statements.
| Giant 5 Total Index System |
| Financial Statements | |
| STATEMENT OF ASSETS AND LIABILITIES | | | |
| | | | |
| September 30, 2008 (Unaudited) | | | |
| | | | |
| Assets: | | | |
| Investment securities at market value (cost $22,317,824) | | $ | 18,272,757 | |
| Interest and dividends receivable | | | 24,932 | |
| Prepaid expenses | | | 18,067 | |
| Total Assets | | | 18,315,756 | |
| | | | | |
| Liabilities: | | | | |
| Payable for fund shares redeemed | | | 1,000 | |
| Payable to Investment Adviser | | | 10,736 | |
| Payable for 12b -1 fees | | | 2,724 | |
| Other payables | | | 23,432 | |
| Total Liabilities | | | 37,892 | |
| | | | | |
| Net Assets | | $ | 18,277,864 | |
| | | | | |
| Net assets consist of: | | | | |
| Paid-in capital | | $ | 21,835,746 | |
| Undistributed net investment income | | | 66,426 | |
| Accumulated undistributed net realized gain | | | 420,759 | |
| Net unrealized depreciation on investments | | | (4,045,067 | ) |
| | | | | |
| Net Assets | | $ | 18,277,864 | |
| | | | | |
| Capital Shares: | | | | |
| Investor Shares Outstanding (no par value, unlimited number of shares authorized) | | | 1,404,166 | |
| | | | | |
| Net Asset Value, Offering Price and Redemption Price Per Share | | $ | 13.02 | |
| STATEMENT OF OPERATIONS | | | |
| | | | |
| For the six months ended September 30, 2008 (Unaudited) | | | |
| | | | |
| Investment Income: | | | |
| Dividends | | $ | 228,081 | |
| Interest income | | | 1,795 | |
| Total Investment Income | | | 229,876 | |
| | | | | |
| Expenses: | | | | |
| Investment advisory fees | | | 73,829 | |
| 12b-1 fees | | | 18,733 | |
| Fund administration fees | | | 17,965 | |
| Transfer Agency fees | | | 17,519 | |
| Blue Sky fees | | | 8,292 | |
| Audit fees | | | 7,866 | |
| Custody fees | | | 4,183 | |
| Legal fees | | | 4,063 | |
| Insurance | | | 3,663 | |
| CCO fees | | | 2,068 | |
| Miscellaneous fees | | | 1,809 | |
| Pricing fees | | | 1,535 | |
| Printing fees | | | 1,289 | |
| Directors fees | | | 371 | |
| SEC fees | | | 265 | |
| Total Expenses | | | 163,450 | |
| | | | | |
| Net Investment Income | | | 66,426 | |
| | | | | |
Net Realized and Unrealized Gains/(Losses) on Investments | | | | |
| Net realized gain from investment transactions | | | 181,428 | |
| Change in unrealized appreciation/(depreciation) on investments | | | (3,738,082 | ) |
| Net realized and unrealized losses on investments | | | (3,556,654 | ) |
| Change in net assets resulting from operations | | $ | (3,490,228 | ) |
| | | | | |
See Notes to the Financial Statements.
Giant 5 Total Index System |
| Financial Statements | |
| | | Six Months Ended | | | | |
| | | September 30, 2008 | | | Year Ended | |
| | | (Unaudited) | | | March 31, 2008 | |
| | | | | | | |
| STATEMENTS OF CHANGES IN NET ASSETS | | | | | | |
| | | | | | | |
| Increase/(Decrease) in Net Assets from Operations | | | | | | |
| Net investment income | | $ | 66,426 | | | $ | 307,469 | |
| Net realized gain from investment transactions | | | 181,428 | | | | 1,687,565 | |
| Change in unrealized appreciation/(depreciation) on investments | | | (3,738,082 | ) | | | (2,156,261 | ) |
| Change in net assets resulting from operations | | | (3,490,228 | ) | | | (161,227 | ) |
| | | | | | | | | |
| Distributions to Shareholders | | | | | | | | |
| Net investment income | | | — | | | | (293,654 | ) |
| Net realized gains | | | — | | | | (1,465,156 | ) |
| Change in net assets resulting from distributions to shareholders | | | — | | | | (1,758,810 | ) |
| | | | | | | | | |
| Capital Share Transactions | | | | | | | | |
| Proceeds from sale of shares | | | 4,123,923 | | | | 6,646,890 | |
| Distributions reinvested | | | — | | | | 1,731,706 | |
| Cost of shares redeemed | | | (2,750,935 | ) | | | (8,452,981 | ) |
| Redemption fees | | | — | | | | 1,128 | |
| Change in net assets resulting from capital share transactions | | | 1,372,988 | | | | (73,257 | ) |
| Net decrease in net assets | | | (2,117,240 | ) | | | (1,993,294 | ) |
| | | | | | | | | |
| Net Assets | | | | | | | | |
| Beginning of period | | | 20,395,104 | | | | 22,388,398 | |
| End of period | | $ | 18,277,864 | | | $ | 20,395,104 | |
| Accumulated undistributed net investment income at end of period | | | 66,426 | | | | — | |
| | | | | | | | | |
| Share Information | | | | | | | | |
| Shares sold | | | 253,303 | | | | 396,587 | |
| Distributions reinvested | | | — | | | | 107,894 | |
| Shares redeemed | | | (177,001 | ) | | | (554,943 | ) |
| Net change resulting from share transactions | | | 76,302 | | | | (50,462 | ) |
| | | | | | | | | |
See Notes to the Financial Statements.
| Giant 5 Total Index System |
| Financial Highlights | |
| | | | | | | |
| | | | | | | | | | |
The table below sets forth financial data for a share outstanding in the Fund throughout each period presented: | | Six Months Ended September 30, 2008 | | | | | | Period Ended March 31, 2007(a) | |
| | | | | | | | | | |
| | | | | | | | | | |
| Per share data: | | | | | | | | | |
| Net Asset Value - Beginning of Period | | $ | 15.36 | | | $ | 16.24 | | | $ | 15.00 | |
| | | | | | | | | | | | | |
| Income from Investment Operations: | | | | | | | | | | | | |
| Net investment income | | | 0.05 | | | | 0.18 | | | | 0.15 | |
| Net realized and unrealized gains/(losses) on investments | | | (2.39 | )(b) | | | 0.01 | (b) | | | 1.25 | |
| Total from investment operations | | | (2.34 | ) | | | 0.19 | | | | 1.40 | |
| | | | | | | | | | | | | |
| Less Distributions Declared to Shareholders: | | | | | | | | | | | | |
| Net investment income | | | — | | | | (0.18 | ) | | | (0.15 | ) |
| Net realized gains | | | — | | | | (0.89 | ) | | | — | (c) |
| Return of capital | | | — | | | | — | | | | (0.01 | ) |
| Total distributions | | | — | | | | (1.07 | ) | | | (0.16 | ) |
| Paid-in capital from redemption fees | | | — | (d) | | | — | (c) | | | — | (c) |
| | | | | | | | | | | | | |
| Net Asset Value - End of Period | | $ | 13.02 | | | $ | 15.36 | | | $ | 16.24 | |
| | | | | | | | | | | | | |
Total Return (e) | | | (15.23 | )%(f) | | | 0.91 | % | | | 9.38 | %(f) |
| | | | | | | | | | | | | |
| Ratios (to average net assets) Supplemental Data: | | | | | | | | | | | | |
| Net assets at end of period (000s) | | $ | 18,278 | | | $ | 20,395 | | | $ | 22,388 | |
Ratio of expenses to average net assets (g) | | | 1.48 | % (h) | | | 1.42 | %(i) | | | 1.90 | %(h) |
Net investment income to average net assets (j) | | | 0.60 | %(h) | | | 1.20 | % | | | 1.00 | %(h) |
| Portfolio turnover | | | 11.91 | %(f) | | | 110.31 | % | | | 5.35 | %(f) |
| | | | | | | | | | | | | |
| | | | | | | | | | | | | |
(a) Fund commenced operations on May 1, 2006. | | | | | | | | | | | | |
(b) Realized and unrealized gains and losses per share in this caption are balancing amounts necessary to reconcile the change in net asset value per share in the period. It does not agree to the aggregate gains and losses in the Statement of Operations due to the fluctuation in share transactions in the period. | |
(c) Less than $0.005. | | | | | | | | | | | | |
(d) Effective September 14, 2007, the Fund no longer imposed a redemption fee for sales of shares done within 180 days of purchase. | |
(e) Total return in the above table represents the rate of return that the investor would have earned or lost on an investment in the Fund assuming the reinvestment of dividends. | |
(f) Not annualized. | | | | | | | | | | | | |
(g) This ratio excludes the impact of expenses of the registered investment companies and exchange-traded funds in which the Fund invests. | |
(h) Annualized. | | | | | | | | | | | | |
(i) Effective July 1, 2007 through March 31, 2008, the expense ratio of the Fund was capped at 1.35%. During that period, there were no reimbursements required to be made by the Adviser. | |
(j) Recognition of the net investment income by the Fund is affected by the timing of the declaration of dividends by the underlying investment companies and exchange-traded funds in which the Fund invests. | |
See Notes to the Financial Statements.
| Giant 5 Funds |
| Notes to the Financial Statements | September 30, 2008 (Unaudited) |
1. | Organization |
| | |
| | Giant 5 Funds (the “Trust”) was organized as a trust under the laws of the State of Delaware on November 9, 2005. The Trust is an open-end investment company registered under the Investment Company Act of 1940, as amended (the “1940 Act”). The Trust is authorized to issue an unlimited number of shares, which are units of beneficial interest with no par value. The Trust currently offers shares of two series, each of which has different and distinct investment objectives and policies: the Giant 5 Total Investment System and the Giant 5 Total Index System (Individually a “Fund”, collectively the “Funds”). Each of the Funds commenced operations on May 1, 2006. The investment objective for each Fund is to seek total return. To pursue its investment objective, the Giant 5 Total Investment System will make investments primarily in other mutual funds that are not affiliated with the Fund. To pursue its investment objective, the Giant 5 Total Index System will primarily invest in unaffiliated index funds and exchange traded funds. Each Fund is non-diversified, as that term is defined in the 1940 Act, and each Fund is a “fund of funds”, which means that each Fund invests in other mutual funds and exchange traded funds (“Underlying Funds”). The Trust has established two classes of shares: Investor Shares and Institutional Shares. As of September 30, 2008, only Investor Shares have been offered and issued. |
2. | Significant Accounting Policies |
| | |
| | The following is a summary of significant accounting policies followed by the Trust in the preparation of its financial statements. These policies are in conformity with accounting principles generally accepted in the United States of America (“GAAP”). Security Valuation: The value of assets in a Fund’s portfolio is determined on the basis of their market value, or where market quotations are not readily available or are deemed unreliable due to a significant event or otherwise, based on fair value as determined in good faith in accordance with the procedures established by, and under the general supervision of, the Funds’ Board of Trustees (the “Board”). The Funds may invest in securities that are primarily listed on foreign exchanges that trade on weekends or other days when the Funds do not price their shares. The value of portfolio securities held by the Funds may change on days when shareholders will not be able to purchase or redeem shares. Additionally, each of the Underlying Funds will be registered investment companies, therefore their net asset value per share (“NAV”) will be calculated as set forth in their prospectuses. As noted above, each Fund is a fund of funds, primarily invested in Underlying Funds that have their own internal fair pricing and valuation procedures. Due to this structure, the Underlying Funds’ policies will be used in the daily calculation of their NAV, which will, in turn, be used in calculating the Funds’ NAVs. If for any reason, an Underlying Fund does not provide its NAV to the Fund in a timely fashion for the Fund’s NAV calculation, for valuation purposes, the last available NAV for the Underlying Fund will be adjusted by the percentage a predetermined benchmark rose or declined on that particular trading day. A Fund will fair value price its securities when market quotations are not readily available. Generally, this would include securities for which trading has been halted, securities whose value has been materially affected by the occurrence of a significant event (as defined below), securities whose price has become stale (i.e., the market price has remained unchanged for five business days), and other securities where a market price is not available from either a national pricing service or a broker. In addition, the Pricing Committee will review exception priced securities (i.e., securities for which the market value is provided by a quote from a single broker rather than a national pricing service) on a quarterly basis. In these situations, the Pricing Committee will employ certain Board-approved methodologies to determine a fair value for the securities. Fair valuations will be reviewed by the Board of Trustees on a quarterly basis. Fair value pricing should result in a more accurate determination of a Fund’s net asset value price, which should eliminate the potential for stale pricing arbitrage opportunities in a Fund. However, fair value pricing involves the risk that the values used by a Fund to price its investments may be different from those used by other investment companies and investors to price the same investments. |
Continued
Giant 5 Funds |
| Notes to the Financial Statements | September 30, 2008 (Unaudited) |
| | |
| | A “significant event” is one that occurred prior to a Fund’s valuation time, is not reflected in the most recent market price of a security, and materially affects the value of a security. Generally, such “significant events” relate to developments in foreign securities that occur after the close of trading in their respective markets. The Fund’s accounting agent may obtain fair value prices of foreign securities through utilization of a Fair Value Pricing Service previously approved by the Board where a movement in the U.S. equities market is sufficiently large to constitute a trigger established by the Pricing Committee. Investment Transactions and Related Income: Investment transactions are recorded on a trade date plus one basis, except for the last day of the fiscal quarter end, when they are recorded on trade date. Dividend income is recorded on the ex-dividend date. Securities gains and losses are calculated based on the costs of the specific security (also known as identified cost basis). Interest income is recognized on the accrual basis and includes, where applicable, the amortization or accretion of premium or discount. Expenses: Expenses directly attributable to a Fund are charged directly to the Fund. Expenses relating to the Trust are allocated proportionately to each Fund within the Trust according to the relative net assets of each Fund or on another reasonable basis. Distributions to Shareholders: Dividends from net investment income, if any, are declared and distributed semi-annually for all Funds. Dividends from net realized gains, if any, are declared and distributed annually for all Funds. The amounts of dividends from net investment income and of distributions from net realized gains, if any, are determined in accordance with federal income tax regulations and are recorded on the ex-dividend date. They may differ from GAAP. These “book/tax” differences are either considered temporary or permanent in nature. To the extent these differences are permanent in nature, such amounts are reclassified within the composition of net assets based on their federal tax-basis treatment; temporary differences do not require reclassification. As of March 31, 2008, distributions in excess of net investment income and other permanent book to tax differences of $19,064 and $13,815 were reclassified to accumulated undistributed net realized gains and paid-in capital for the Giant 5 Total Investment System and the Giant 5 Total Index System, respectively. Federal Income Taxes: Each Fund intends to qualify as a regulated investment company by complying with the provisions available to certain investment companies, as defined in Subchapter M of the Internal Revenue Code, and to make distributions from net investment income and from net realized capital gains sufficient to relieve it from all, or substantially all, federal income and excise taxes. Therefore, no federal or excise tax provision is recorded. Use of Estimates: The preparation of financial statements in conformity with accounting principals generally accepted in the United States of America requires management to make estimates and assumptions that affect the reported amounts of assets and liabilities, and the disclosure of contingent assets and liabilities at the date of the financial statements, and the reported amounts of increases and decreases in net assets from operations during the reporting period. Actual results could differ from those estimates. Recent Accounting Pronouncements: In September 2006, the FASB issued Statement on Financial Accounting Standards (“SFAS”) No. 157, “Fair Value Measurements”. This standard establishes a single authoritative definition of fair value, sets out a framework for measuring fair value and requires additional disclosures about fair value measurements. SFAS No. 157 applies to fair value measurements already required or permitted by existing standards. SFAS No. 157 is effective for financial statements issued for fiscal years beginning after November 15, 2007 and interim periods within those fiscal years. The changes to current generally accepted accounting principles from the application of this Statement relate to the definition of fair value, the methods used to measure fair value, and the expanded disclosures about fair value measurements. The Funds commenced complying with SFAS No. 157 in fiscal year 2008. SFAS No. 157 establishes a hierarchy that prioritizes the various inputs used in determining the value of a fund’s investments. The three broad levels of the hierarchy are described below: |
Continued
Giant 5 Funds |
Notes to the Financial Statements | September 30, 2008 (Unaudited) |
| | | |
| • | | Level 1 – quoted prices for active markets for identical securities. An active market for the security is a market in which transactions occur with sufficient frequency and volume to provide pricing information on an ongoing basis. A quoted price in an active market provides the most reliable evidence of fair value. |
| | | |
| • | | Level 2 – other significant observable inputs (including quoted prices for similar securities, interest rates, prepayment speeds, credit risk, etc.) Quoted prices for identical or similar assets in markets that are not active. Inputs that are derived principally from or corroborated by observable market data. An adjustment to any observable input that is significant to the fair value may render the measurement a Level 3 measurement. |
| | | |
| • | | Level 3 – significant unobservable inputs, including the Fund’s own assumptions in determining the fair value of investments. The inputs or methodology used for valuing securities are not necessarily an indication of the risk associated with investing in those securities. The following is a summary of the inputs used to value the Fund’s net assets as of September 30, 2008: |
| | GIANT 5 TOTAL INVESTMENT SYSTEM | | |
| | Valuation Inputs | Investment in Securities | Other Financial Instruments* |
| | Level 1 – Quoted Prices | $33,579,416 | — |
| | Level 2 – Other Significant Observable Inputs | — | — |
| | Level 3 – Significant Unobservable Inputs | — | — |
| | Total | $33,579,416 | — |
| | | | |
| | GIANT 5 TOTAL INDEX SYSTEM | | |
| | Valuation Inputs | Investment in Securities | Other Financial Instruments* |
| | Level 1 – Quoted Prices | $22,900,119 | — |
| | Level 2 – Other Significant Observable Inputs | — | — |
| | Level 3 – Significant Unobservable Inputs | — | — |
| | Total | $22,900,119 | — |
| | | | |
| | * Other financial instruments are derivatives instruments not reflected in the Schedule of Investments, such as futures, forwards and swap contracts, which are valued at the unrealized appreciation/depreciation on the investment. |
| | Effective September 28, 2007 the Funds adopted Financial Accounting Standards Board (FASB) Interpretation No. 48 (FIN 48), “Accounting for Uncertainty in Income Taxes”, a clarification of FASB Statement No. 109, “Accounting for Income Taxes”. FIN 48 establishes financial reporting rules regarding recognition and measurement of tax positions taken or expected to be taken on a tax return. FIN 48 was applied to all open tax years as of the effective date. The adoption of FIN 48 had no impact on the Fund’s net assets or results of operations. As of and during the period ended March 31, 2008, the Funds did not have a liability for any unrecognized tax benefits. The Funds recognize interest and penalties, if any, related to unrecognized tax benefits as income tax expense in the Statement of Operations. During the period, the Fund did not incur any interest or penalties. The Funds are not subject to examination by U.S. federal tax authorities for tax years before 2007. In March 2008, the FASB issued SFAS No. 161, Disclosures about Derivative Instruments and Hedging Activities. The provisions are effective for fiscal years beginning after November 15, 2008. SFAS 161 is intended to improve financial reporting for derivative instruments by requiring enhanced disclosure that enables investors to understand how and why an entity uses derivatives, how derivatives are accounted for, and how derivative instruments affect an entity’s results of operations and financial position. Management is currently evaluating the implications of SFAS 161. The impact on the Fund’s financial statement disclosures, if any, is currently being assessed. |
| | |
Continued
| Giant 5 Funds |
| Notes to the Financial Statements | September 30, 2008 (Unaudited) |
3. | Related Party Transactions |
| | |
| | Certain trustees and officers of the Trust are also officers of The Willis Group, Inc. (the “Adviser”). Investment Adviser: The Adviser serves as the investment adviser to each Fund. Under the terms of the investment advisory agreement, the Adviser is entitled to receive fees computed daily and paid monthly at an annual rate of 0.67% of average net assets of each Fund. The Adviser makes the investment decisions for each of the Funds and continuously reviews, supervises and administers the investment program of each Fund, subject to the supervision of, and policies established by the Board. The amounts charged to the Funds for investment advisory services are reported within the Statement of Operations. Administrator: UMB Fund Services, Inc. (“UMBFS”), is the Administrator, Fund Accountant and Transfer Agent for the Trust. UMB Bank, N.A. (“UMB Bank”) is the Custodian for the Trust. For its services, UMBFS and UMB Bank are paid a fee by the Funds at an annual rate equal to 0.09% on the first $500 Million in combined assets, 0.07% on the next $500 Million in combined assets, 0.05% on the next $500 Million in combined assets, and 0.03% on the combined assets over $1.5 Billion. UMBFS and UMB Bank fees are subject to an annual minimum of $135,000 in year one, $175,000 in year two, $200,000 in year three and $225,000 in year four. Distributor: UMB Distribution Services, LLC is the Distributor of the Funds. Fees for such distribution services are paid to the Distributor by the Adviser. Distribution Plan: Each Fund has adopted a Distribution Plan, pursuant to Rule 12b-1 under the 1940 Act (the “Distribution Plan”) with respect to its Investor Shares. Pursuant to the Distribution Plan, the Giant 5 Total Investment System and the Giant 5 Total Index System each will pay 0.17% of its average daily net assets attributable to its Investor Shares. The Distribution Plan provides that the Funds pay the Distributor and other organizations for distributing shares, advertising and marketing and for providing certain services to shareholders of the Investor Shares. For the period ended September 30, 2008, Giant 5 Total Investment System and Giant 5 Total Index System incurred 12b-1 expenses of $26,693 and $18,733, respectively, for Investor Shares. |
4. | Purchases and Sales of Securities | | | | | | |
| | | | | | | | |
| | Purchases and sales of investment securities, excluding short-term securities for the year ended September 30, 2008, totaled: | |
| | | | | | | | |
| | | Giant 5 Total
Investment System | | Giant 5 Total
Index System | |
| | Purchases | $6,100,000 | | | $4,260,387 | | |
| | Sales | 9,825,453 | | | 2,535,291 | | |
| | | | | | | | |
| | There were no purchases or sales of U.S. government securities for the period. | |
| | | | | | | | |
5. | Contingencies and Commitments | | | | | | |
| | | | | | | | |
| | In the normal course of business, the Funds enter into contracts that contain various representations and warranties and provide general indemnifications. The Funds’ maximum exposure under these arrangements is dependent on future claims against the Funds and is presently unknown. However, based on experience, the Funds consider risk of loss from such potential claims to be remote. | |
Continued
| Giant 5 Funds |
| Notes to the Financial Statements | September 30, 2008 (Unaudited) |
| | | | | | | | |
6. | Federal Tax Information | | | | | | |
| | | | | | | | |
| | At September 30, 2008, the cost, gross unrealized appreciation and gross unrealized depreciation on securities, for federal income tax purposes, were as follows: | |
| | | | | | | | |
| | | Giant 5 Total
Investment System | | Giant 5 Total
Index System | |
| | Tax Cost | $ 27,344,226 | | | $ 22,313,910 | | |
| | Tax Unrealized Appreciation | 113,342 | | | 237,194 | | |
| | Tax Unrealized (Depreciation) | (5,908,980 | ) | | (4,278,347 | ) | |
| | Net Unrealized (Depreciation) | (4,985,638 | ) | | (4,041,153 | ) | |
| | | | | | | | |
| | The tax character of distributions paid during the fiscal periods ended March 31, 2008 and March 31, 2007 were as follows: |
| | | Giant 5 Total Investment System | Giant 5 Total Index System |
| | | 2008 | 2007 | 2008 | 2007 |
| | Distributions Paid from Ordinary Income | $ 1,294,776 | $ 461,110 | $ 361,622 | $ 216,286 |
| | Distributions Paid from Net Long Term Capital Gains | 1,513,557 | 238,738 | 1,397,188 | 4,131 |
| | Total Taxable Distributions | 2,808,333 | 699,848 | 1,758,810 | 220,417 |
| | Return of Capital Distributions | — | — | — | 6,502 |
| Total Distributions Paid | 2,808,333 | 699,848 | 1,758,810 | 226,919 |
| As of March 31, 2008, the components of accumulated earnings/(deficit) on a tax basis were as follows: |
| | | | Giant 5 Total
Investment System | | Giant 5 Total
Index System |
| | | | | | | | |
| | Undistributed Ordinary Income | | $ | — | | | $ | 70,108 | |
| | Undistributed Long Term Capital Gains | | | 843,911 | | | | 170,576 | |
| | Accumulated Earnings | | | 843,911 | | | | 240,684 | |
| | Distributions Payable | | | — | | | | — | |
| | Accumulated Capital and Other Losses | | | — | | | | — | |
| | Unrealized (Depreciation) | | | (27,200 | ) | | | (308,338 | ) |
| | Total Accumulated Earnings/(Deficit) | | | 816,711 | | | | (67,654 | ) |
| | The difference between books basis and tax-basis unrealized depreciation is attributable primarily to the tax deferral of losses on wash sales and other temporary differences. |
7. | Control Ownership |
| | |
| | The beneficial ownership, either directly or indirectly, of more than 25% of the voting securities creates a presumption of control of the Funds, under Section 2(a)(9) of the 1940 Act. As of September 30, 2008, the Andrea S. Swanson Santa Fe Trust had ownership in the Giant 5 Total Investment System and the Giant 5 Total Index System in the amounts of 26.7% and 31.5%, respectively. As of September 30, 2008, the Jann Simmons Patigian Trust and the Scheryle Jann Simmons Descendants’ Trust had combined ownership in the Giant 5 Total Investment System and the Giant 5 Total Index System in the amounts of 26.6% and 31.5%, respectively. |
| Giant 5 Funds |
| Supplemental Information | September 30, 2008 (Unaudited) |
| Expense Example |
As a shareholder of the Giant 5 Funds, you incur two types of costs: (1) transaction costs, including exchange fees; and (2) ongoing costs, including investment advisory fees, distribution (12b-1) fees, and other fund expenses. The Examples below are intended to help you understand your ongoing costs (in dollars) of investing in the Funds and to compare these costs with the ongoing costs of investing in other mutual funds. Each is based on an investment of $1,000 invested at the beginning of the period and held for the entire period from April 1, 2008 through September 30, 2008. |
| |
|
The table below provides information about actual account values and actual expenses. You may use the information below, together with the amount you invested, to estimate the expenses you paid over the period. Simply divide your account value by $1,000 (for example, an $8,600 account value divided by $1,000 = 8.6), then multiply the result by the number in the table under the heading entitled “Expenses Paid During Period” to estimate the expenses you paid on your account during the period. |
| | Beginning account
value 4/1/08 | Ending account
value 9/30/08 | Expenses paid
during period
4/1/08-9/30/08(1) | Expense Ratio
during period
4/1/08-9/30/08(1) |
| Giant 5 Total Investment System | $1,000.00 | $828.00 | $6.45 | 1.41% |
| Giant 5 Total Index System | $1,000.00 | $847.70 | $6.87 | 1.48% |
| Hypothetical Example for Comparison Purposes |
The table below provides information about hypothetical account values and hypothetical expenses based on the Giant 5 Funds’ actual expense ratios and an assumed rate of return of 5% per year before expenses, which is not the Funds’ actual return. The hypothetical account values and expenses may not be used to estimate the actual ending account balance or expenses you paid for the period. However, you may use this information to compare this 5% hypothetical example with the 5% hypothetical examples that appear in the shareholder reports of the other funds. Please note that the expenses shown in the table are meant to highlight your ongoing costs only and do not reflect any transactional costs, such as sales charges (loads) or exchange fees, if applicable. Therefore, the table is useful in comparing the ongoing costs only, and will not help you determine the relative total costs of owning different funds. In addition, if these transactional costs were included, your costs would have been higher. |
| | Beginning account
value 4/1/08 | Ending account
value 9/30/08 | Expenses paid
during period
4/1/08-9/30/08(1) | Expense Ratio
during period
4/1/08-9/30/08(1) |
| Giant 5 Total Investment System | $1,000.00 | $1,017.94 | $7.12 | 1.41% |
| Giant 5 Total Index System | $1,000.00 | $1,017.56 | $7.50 | 1.48% |
| (1) | Expenses are equal to the average account value times the annualized expense ratio of the Giant 5 Total Investment System and the Giant 5 Total Index System of 1.41% and 1.48%, respectively, multiplied by the number of days in the period (183), divided by the number of days in the fiscal year (365). |
This page intentionally left blank.

Item 2. Code of Ethics
Not applicable to semi-annual reports.
Item 3. Audit Committee Financial Expert
Not applicable to semi-annual reports.
Item 4. Principal Accountant Fees and Services
Not applicable to semi-annual reports.
Item 5. Audit Committee of Listed Registrants
Not applicable.
Item 6. Schedule of Investments
| (a) | Schedule of Investments is included as part of the report to shareholders filed under item 1 of this Form N-CSR |
| (b) | The registrant did not need to divest itself of securities in accordance with Section 13(c) of the Investment Company Act of 1940, as amended (the “1940 Act”), following the filing of its last report of Form N-CSR and before the filing of the current report. |
Item 7. Disclosure of Proxy Voting Policies and Procedures for Closed-End Management Investment Companies
Not applicable.
Item 8. Portfolio Managers of Closed-End Management Investment Companies
Not applicable.
Item 9. Purchases of Equity Securities by Closed-End Management Investment Company and Affiliated Purchasers
Not applicable.
Item 10. Submission of Matters to a Vote of Security Holders
There were no material changes to the procedures by which shareholders may recommend nominees to the registrant’s Board of Trustees.
Item 11. Controls and Procedures
| (a) | Based on an evaluation of the disclosure controls and procedures (as defined in Rule 30a-3(c) under the Investment Company Act of 1940, as amended, the “Disclosure Controls”) as of a date within 90 days of the filing date (the “Filing Date”) of this Form N-CSR (the “Report”), the registrant’s principal executive officer and principal financial officer have concluded that the Disclosure Controls are effectively designed to ensure that information that is required to be disclosed by the registrant in the Report is recorded, processed, summarized and reported within the time periods specified in the Securities and Exchange Commission’s rules and forms, including ensuring that information required to be disclosed in the Report is accumulated and communicated to the registrant’s management, including the registrant’s principal executive officer and principal financial officer, as appropriate to allow timely decisions regarding required disclosures. |
| (b) | There were no changes in the registrant’s internal controls over financial reporting (as defined in Rule 30 a-3(d) under the Investment Company Act of 1940) that occurred during the second fiscal quarter of the period covered by this report that have materially affected, or are reasonably likely to materially affect, the registrant’s internal control over financial reporting. |
Item 12. Exhibits
| (a) | (1) | Not applicable. |
| | (2) | Certifications for each principal executive and principal financial officer as required by Rule 30a-2(a) under the Investment Company Act of 1940, as amended, (17 CFR 270.30a-2(a)) are filed herewith. |
| | (3) | Not applicable. |
| | | |
| (b) | Certifications required by Rule 30a-2 (b) under the Investment Company Act of 1940, as amended, (17 CFR 270.30a-2 (b)) are filed herewith. |
SIGNATURES
Pursuant to the requirements of the Securities Exchange Act of 1934 and the Investment Company Act of 1940, the registrant has duly caused this report to be signed on its behalf by the undersigned, thereunto duly authorized.
Giant 5 Funds
/s/ Michael G. Willis
Michael G. Willis
President
Pursuant to the requirements of the Securities Exchange Act of 1934 and the Investment Company Act of 1940, this report has been signed below by the following persons on behalf of the registrant and in the capacities and on the dates indicated.
/s/ Michael G. Willis
Michael G. Willis
President
(Principal Executive Officer)
/s/ Paul D. Myers
Paul D. Myers
Treasurer
(Principal Financial Officer)
