CODI Investor Day Presentation December 9, 2021 Exhibit 99.2
Legal Disclaimer This presentation contains certain forward-looking statements within the meaning of the federal securities laws. These statements may be made a part of this presentation or by reference to other documents we file with the SEC. Some of the forward-looking statements can be identified by the use of forward-looking words. Statements that are not historical in nature, including the words “anticipate,” “may,” “estimate,” “should,” “seek,” “expect,” “plan,” “believe,” “intend,” and similar words, or the negatives of those words, are intended to identify forward-looking statements. Certain statements regarding the following particularly are forward-looking in nature: future financial performance and goals, 2021 guidance, ESG initiatives, market forecasts or projections, projected capital expenditures; and our business and acquisition strategy. All forward-looking statements are based on our management’s beliefs, assumptions and expectations of our future economic performance, taking into account the information currently available to it. These statements are not statements of historical fact. Forward-looking statements are subject to a number of factors, risks and uncertainties, some of which are not currently known to us, that may cause our actual results, performance or financial condition to be materially different from the expectations of future results, performance or financial position. Our actual results may differ materially from the results discussed in forward-looking statements. Factors that might cause such a difference include but are not limited to the risks set forth in “Risk Factors” included in our SEC filings. In addition, our discussion may include references to Adjusted EBITDA, EBITDA, cash flow, CAD or other non-GAAP measures. A reconciliation of the most directly comparable GAAP financial measures to such non-GAAP financial measures is included in our annual and quarterly reports in Forms 10-K and 10-Q filed with the SEC as well as the attached Appendix. In reliance on the unreasonable efforts exception provided under Regulation G and Item 10(e)(1)(i)(B) of Regulation S-K, we have not reconciled 2021 Adjusted EBITDA or 2021 Payout Ratio (which requires an estimate of 2021 CAD) to their comparable GAAP measure because we do not provide guidance on Net Income (Loss), Cash Flow Provided by Operating Activities or the applicable reconciling items as a result of the uncertainty regarding, and the potential variability of, these items. For the same reasons, we are unable to address the probable significance of the unavailable information, which could be material to future results.
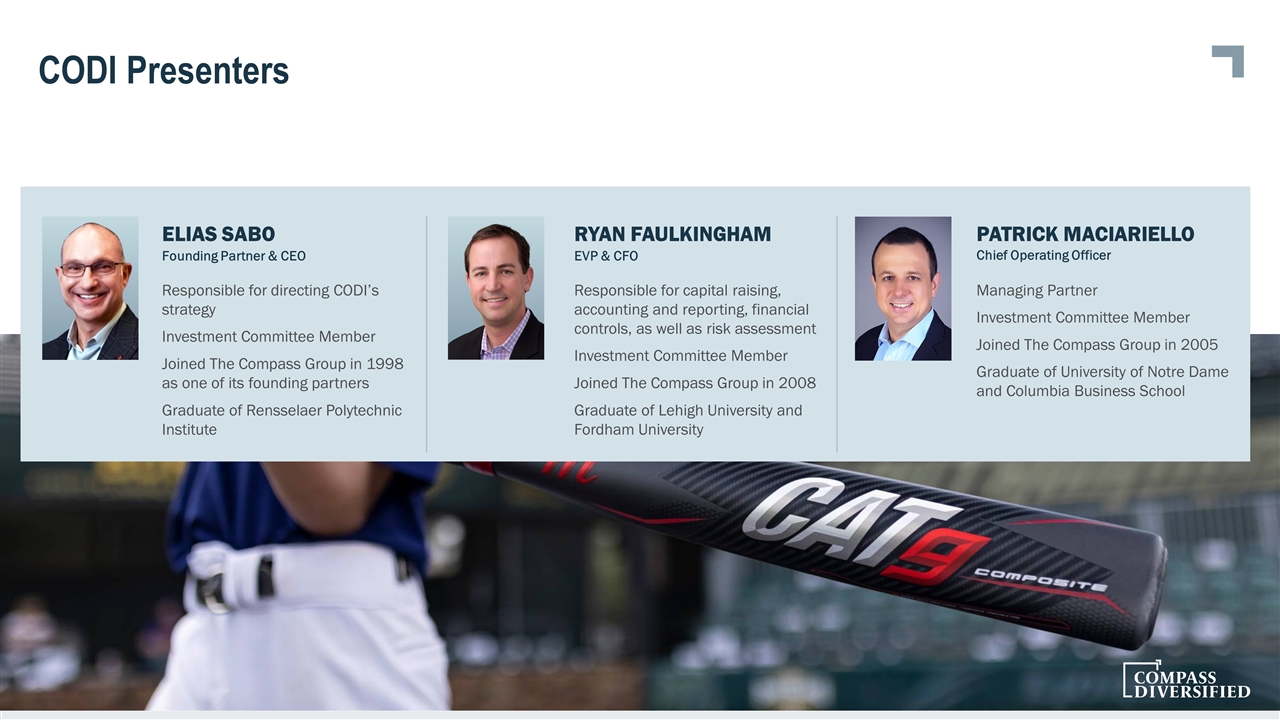
CODI Presenters Elias Sabo Founding Partner & CEO Responsible for directing CODI’s strategy Investment Committee Member Joined The Compass Group in 1998 as one of its founding partners Graduate of Rensselaer Polytechnic Institute Ryan Faulkingham EVP & CFO Responsible for capital raising, accounting and reporting, financial controls, as well as risk assessment Investment Committee Member Joined The Compass Group in 2008 Graduate of Lehigh University and Fordham University Patrick Maciariello Chief Operating Officer Managing Partner Investment Committee Member Joined The Compass Group in 2005 Graduate of University of Notre Dame and Columbia Business School
Agenda 1 Introduction — Elias Sabo 2 Marucci Sports Presentation — Kurt Ainsworth 3 Marucci Sports Q&A — Kurt Ainsworth 4 CODI Remarks — Elias Sabo 5 CODI Subsidiary Update — Pat Maciariello 6 CODI Financial Review — Ryan Faulkingham 7 CODI Q&A — Elias Sabo, Ryan Faulkingham & Pat Maciariello 8 Closing Remarks — Elias Sabo
Compass Diversified (NYSE: CODI) Overview 6
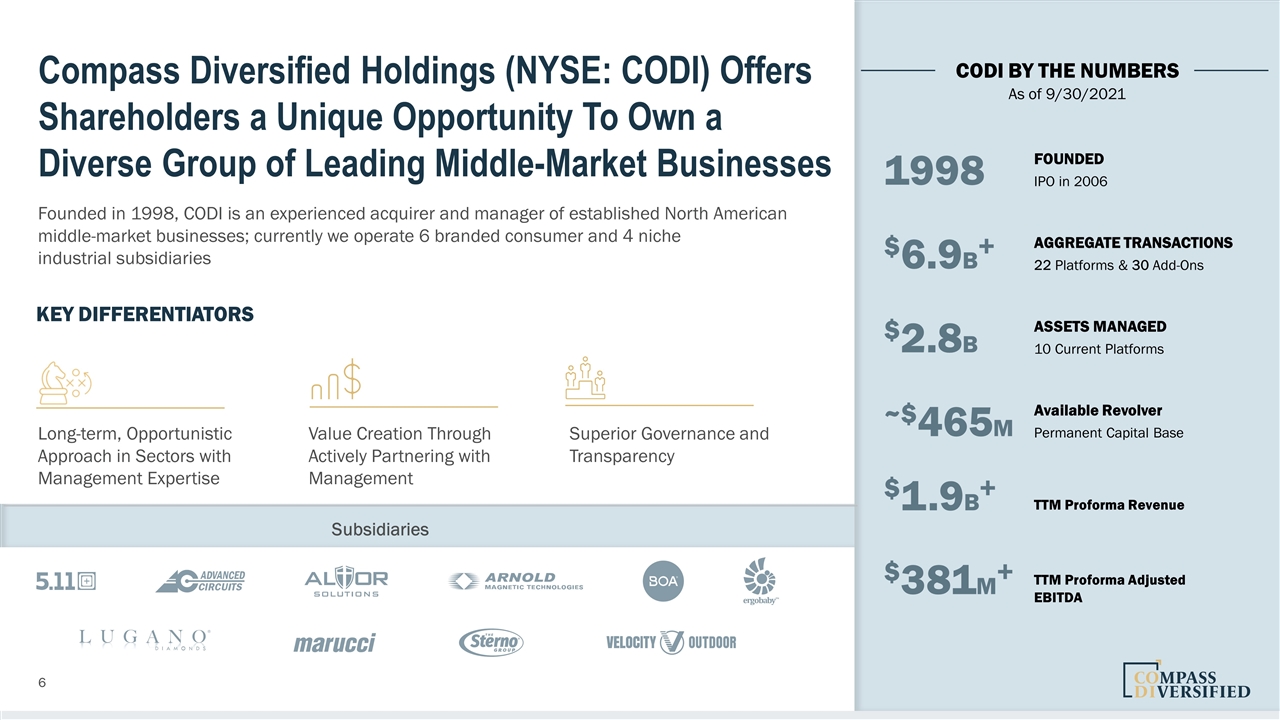
CODI BY THE NUMBERS As of 9/30/2021 Compass Diversified Holdings (NYSE: CODI) Offers Shareholders a Unique Opportunity To Own a Diverse Group of Leading Middle-Market Businesses Founded in 1998, CODI is an experienced acquirer and manager of established North American middle-market businesses; currently we operate 6 branded consumer and 4 niche industrial subsidiaries Key Differentiators Long-term, Opportunistic Approach in Sectors with Management Expertise Value Creation Through Actively Partnering with Management Superior Governance and Transparency 1998 FOUNDED IPO in 2006 $6.9B+ AGGREGATE TRANSACTIONS 22 Platforms & 30 Add-Ons $2.8B ASSETS MANAGED 10 Current Platforms ~$465M Available Revolver Permanent Capital Base $1.9B+ TTM Proforma Revenue $381M+ TTM Proforma Adjusted EBITDA Subsidiaries
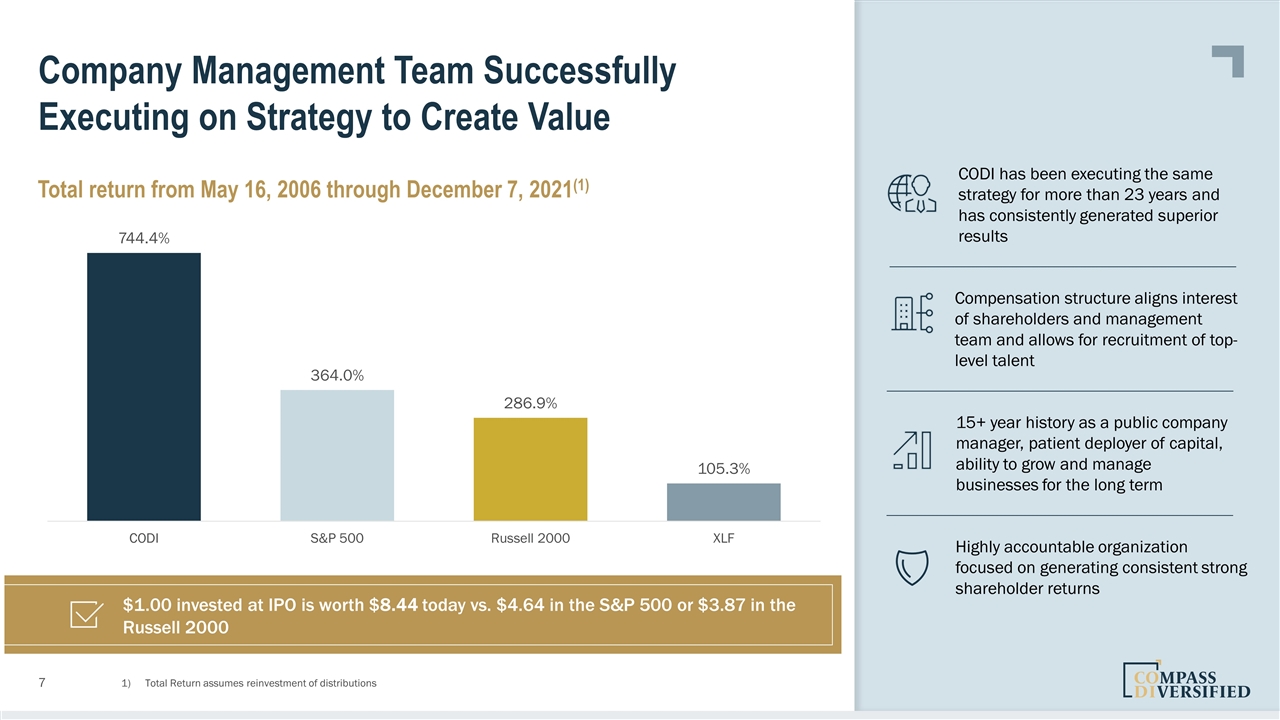
Highly accountable organization focused on generating consistent strong shareholder returns 15+ year history as a public company manager, patient deployer of capital, ability to grow and manage businesses for the long term Compensation structure aligns interest of shareholders and management team and allows for recruitment of top-level talent CODI has been executing the same strategy for more than 23 years and has consistently generated superior results Company Management Team Successfully Executing on Strategy to Create Value Total Return assumes reinvestment of distributions Total return from May 16, 2006 through December 7, 2021(1) $1.00 invested at IPO is worth $8.44 today vs. $4.64 in the S&P 500 or $3.87 in the Russell 2000
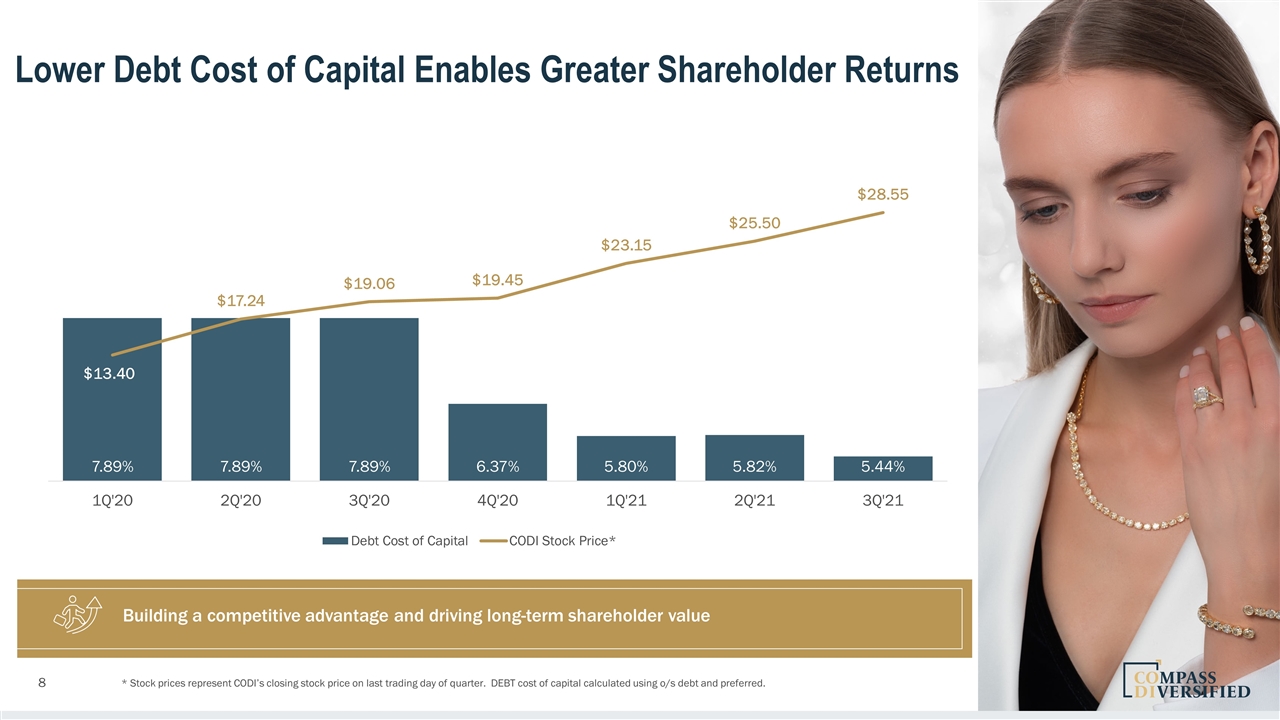
Lower Debt Cost of Capital Enables Greater Shareholder Returns * Stock prices represent CODI’s closing stock price on last trading day of quarter. DEBT cost of capital calculated using o/s debt and preferred. Building a competitive advantage and driving long-term shareholder value
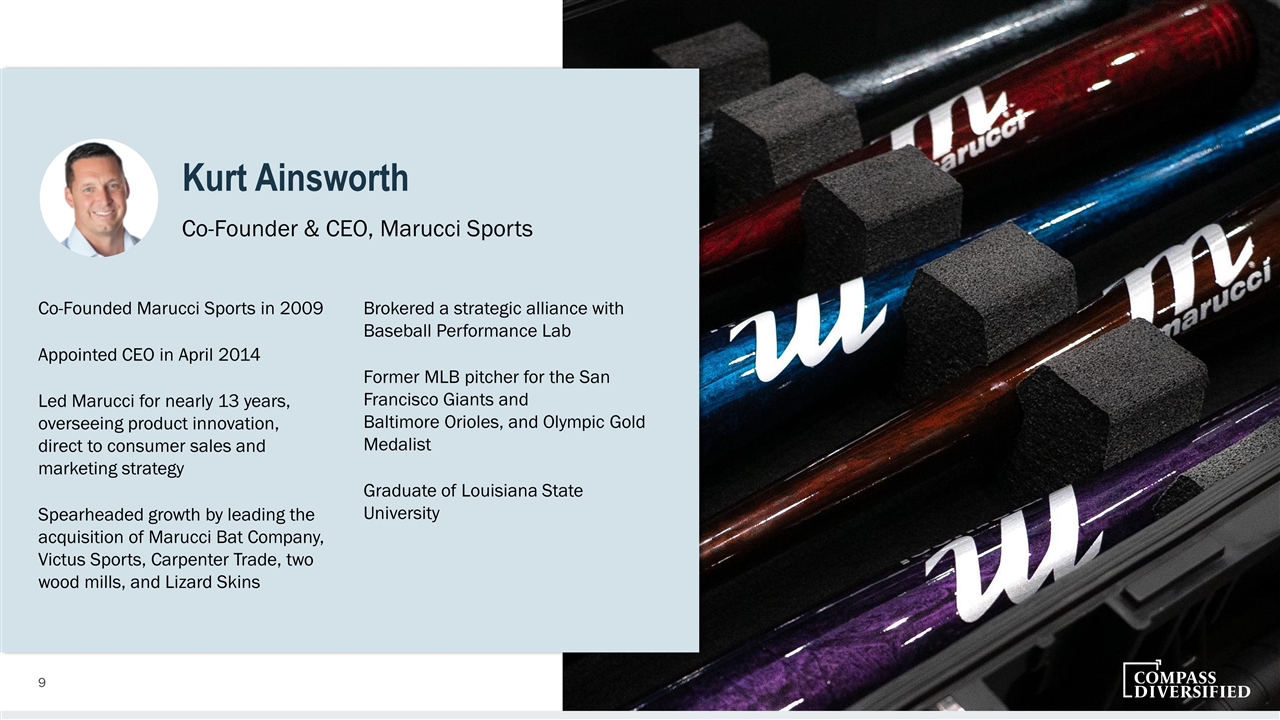
Kurt Ainsworth Co-Founder & CEO, Marucci Sports Co-Founded Marucci Sports in 2009 Appointed CEO in April 2014 Led Marucci for nearly 13 years, overseeing product innovation, direct to consumer sales and marketing strategy Spearheaded growth by leading the acquisition of Marucci Bat Company, Victus Sports, Carpenter Trade, two wood mills, and Lizard Skins Brokered a strategic alliance with Baseball Performance Lab Former MLB pitcher for the San Francisco Giants and Baltimore Orioles, and Olympic Gold Medalist Graduate of Louisiana State University

Long-Term Strategic Vision for CODI
6 Our Goal: $1 Billion of EBITDA in 5 – 7 Years
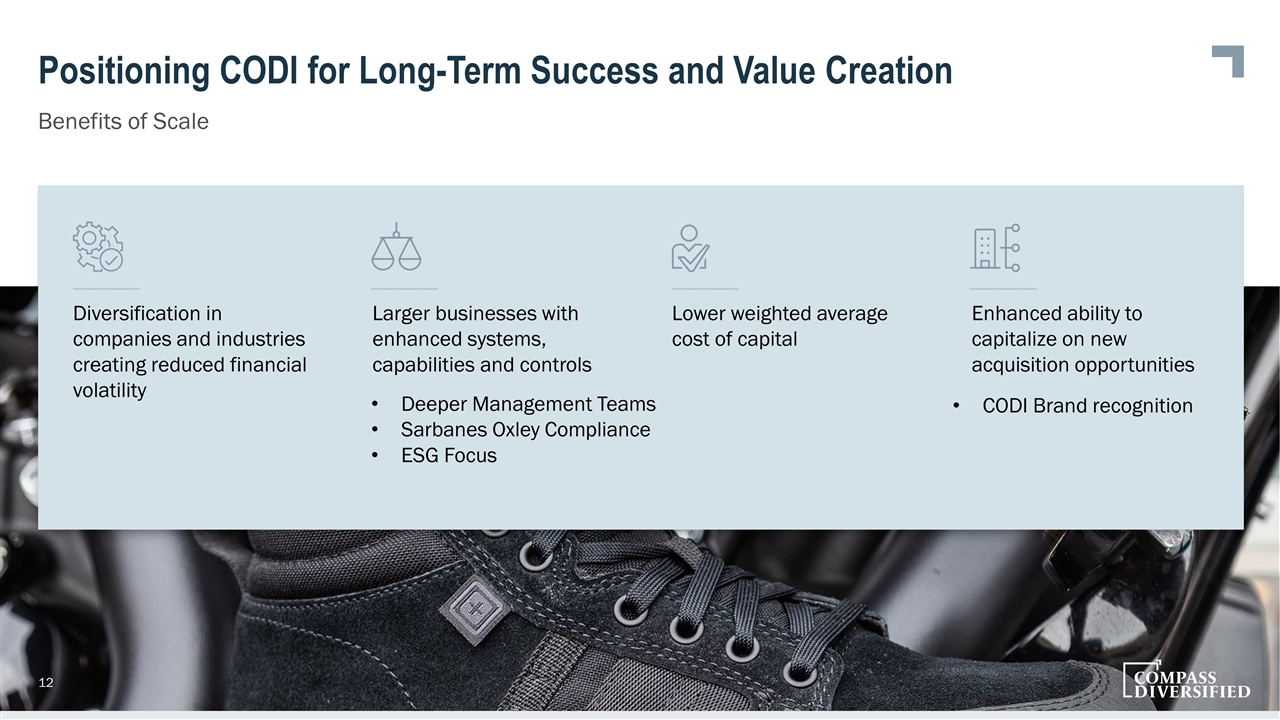
Positioning CODI for Long-Term Success and Value Creation Benefits of Scale Diversification in companies and industries creating reduced financial volatility Larger businesses with enhanced systems, capabilities and controls Lower weighted average cost of capital Enhanced ability to capitalize on new acquisition opportunities Deeper Management Teams Sarbanes Oxley Compliance ESG Focus CODI Brand recognition
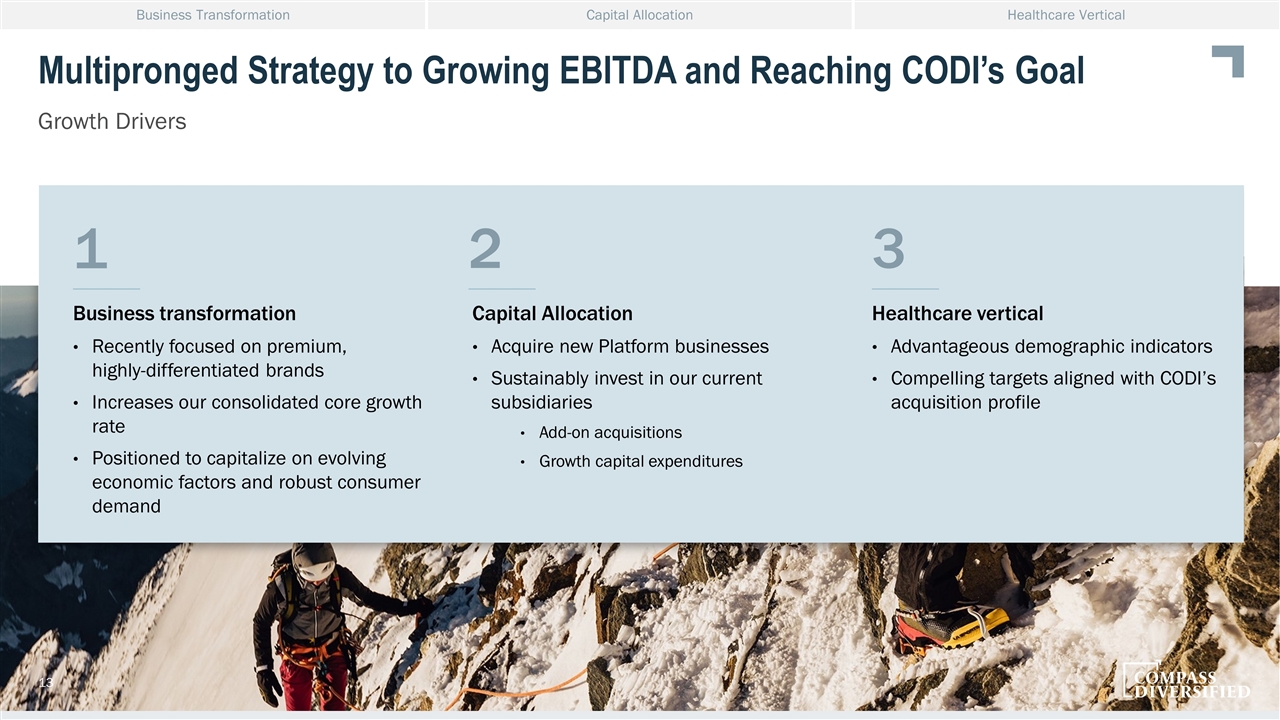
Multipronged Strategy to Growing EBITDA and Reaching CODI’s Goal Growth Drivers Business transformation Recently focused on premium, highly-differentiated brands Increases our consolidated core growth rate Positioned to capitalize on evolving economic factors and robust consumer demand Capital Allocation Acquire new Platform businesses Sustainably invest in our current subsidiaries Add-on acquisitions Growth capital expenditures Healthcare vertical Advantageous demographic indicators Compelling targets aligned with CODI’s acquisition profile 1 2 3 Business Transformation Capital Allocation Healthcare Vertical
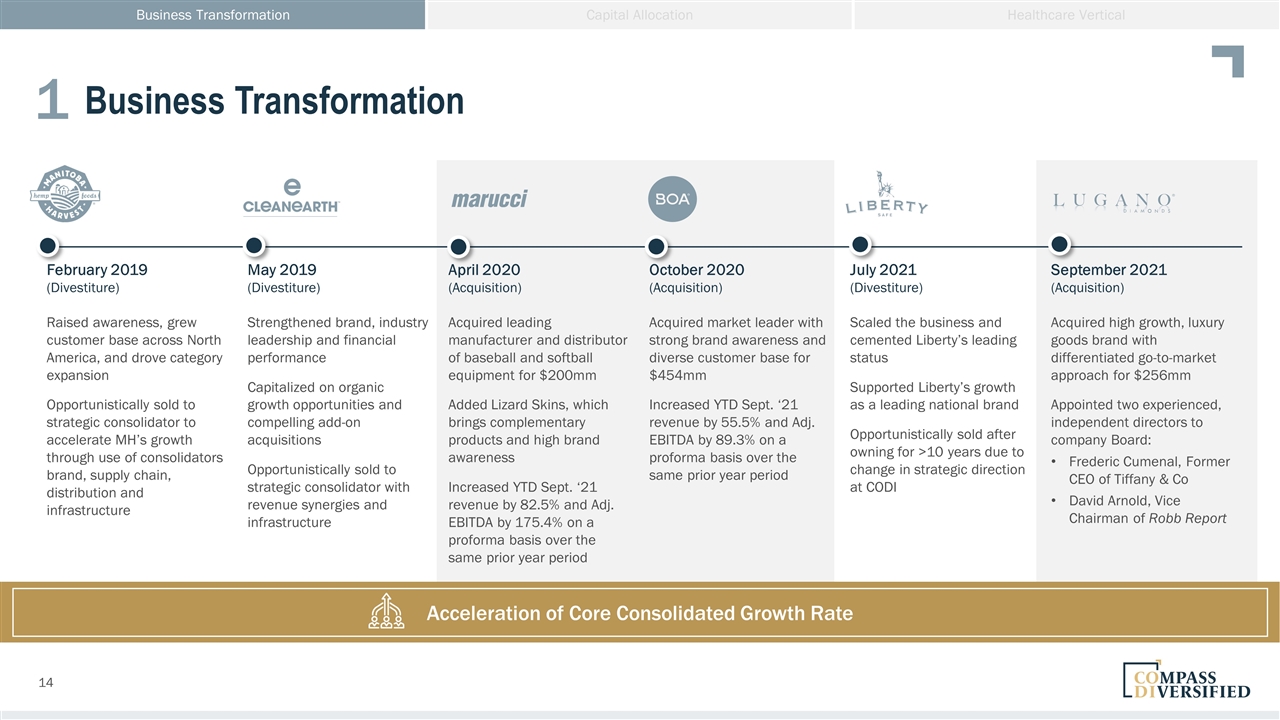
Business Transformation February 2019 (Divestiture) May 2019 (Divestiture) April 2020 (Acquisition) October 2020 (Acquisition) July 2021 (Divestiture) September 2021 (Acquisition) Raised awareness, grew customer base across North America, and drove category expansion Opportunistically sold to strategic consolidator to accelerate MH’s growth through use of consolidators brand, supply chain, distribution and infrastructure Strengthened brand, industry leadership and financial performance Capitalized on organic growth opportunities and compelling add-on acquisitions Opportunistically sold to strategic consolidator with revenue synergies and infrastructure Acquired leading manufacturer and distributor of baseball and softball equipment for $200mm Added Lizard Skins, which brings complementary products and high brand awareness Increased YTD Sept. ‘21 revenue by 82.5% and Adj. EBITDA by 175.4% on a proforma basis over the same prior year period Acquired market leader with strong brand awareness and diverse customer base for $454mm Increased YTD Sept. ‘21 revenue by 55.5% and Adj. EBITDA by 89.3% on a proforma basis over the same prior year period Scaled the business and cemented Liberty’s leading status Supported Liberty’s growth as a leading national brand Opportunistically sold after owning for >10 years due to change in strategic direction at CODI Acquired high growth, luxury goods brand with differentiated go-to-market approach for $256mm Appointed two experienced, independent directors to company Board: Frederic Cumenal, Former CEO of Tiffany & Co David Arnold, Vice Chairman of Robb Report Business Transformation Capital Allocation Healthcare Vertical 1 Acceleration of Core Consolidated Growth Rate
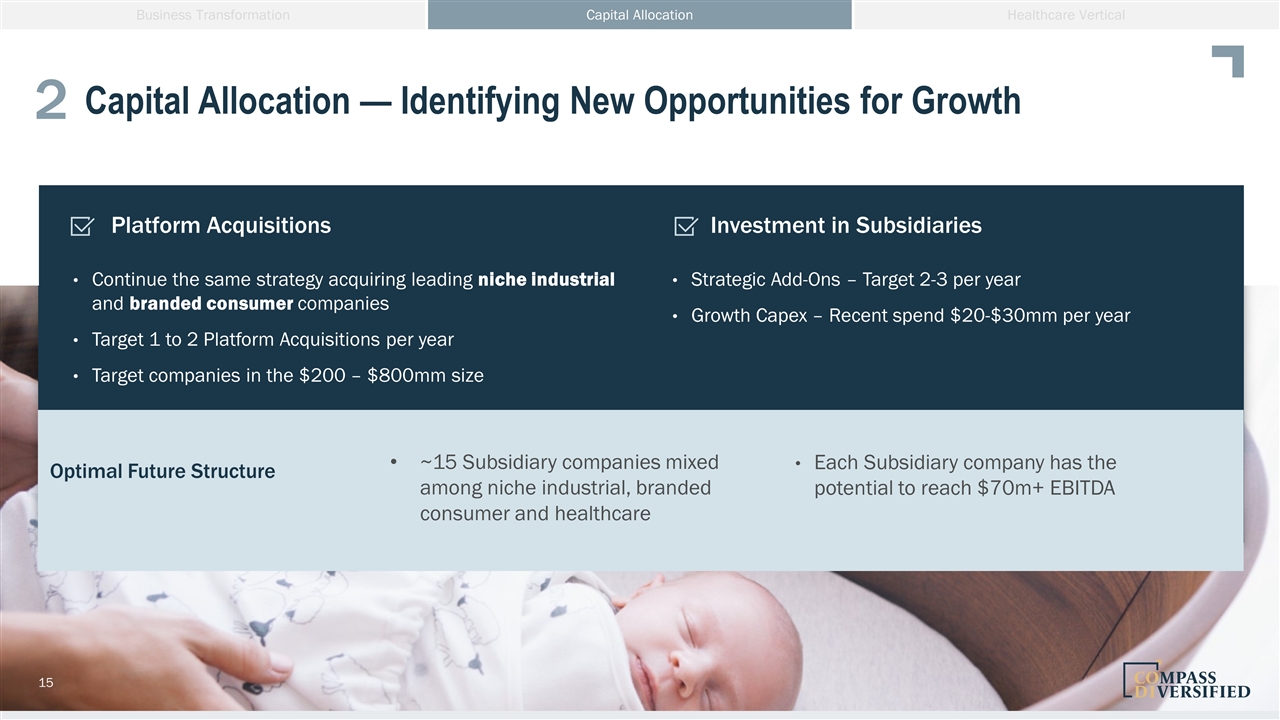
Capital Allocation — Identifying New Opportunities for Growth Business Transformation Capital Allocation Healthcare Vertical 2 Platform Acquisitions Continue the same strategy acquiring leading niche industrial and branded consumer companies Target 1 to 2 Platform Acquisitions per year Target companies in the $200 – $800mm size Investment in Subsidiaries Strategic Add-Ons – Target 2-3 per year Growth Capex – Recent spend $20-$30mm per year Optimal Future Structure ~15 Subsidiary companies mixed among niche industrial, branded consumer and healthcare Each Subsidiary company has the potential to reach $70m+ EBITDA
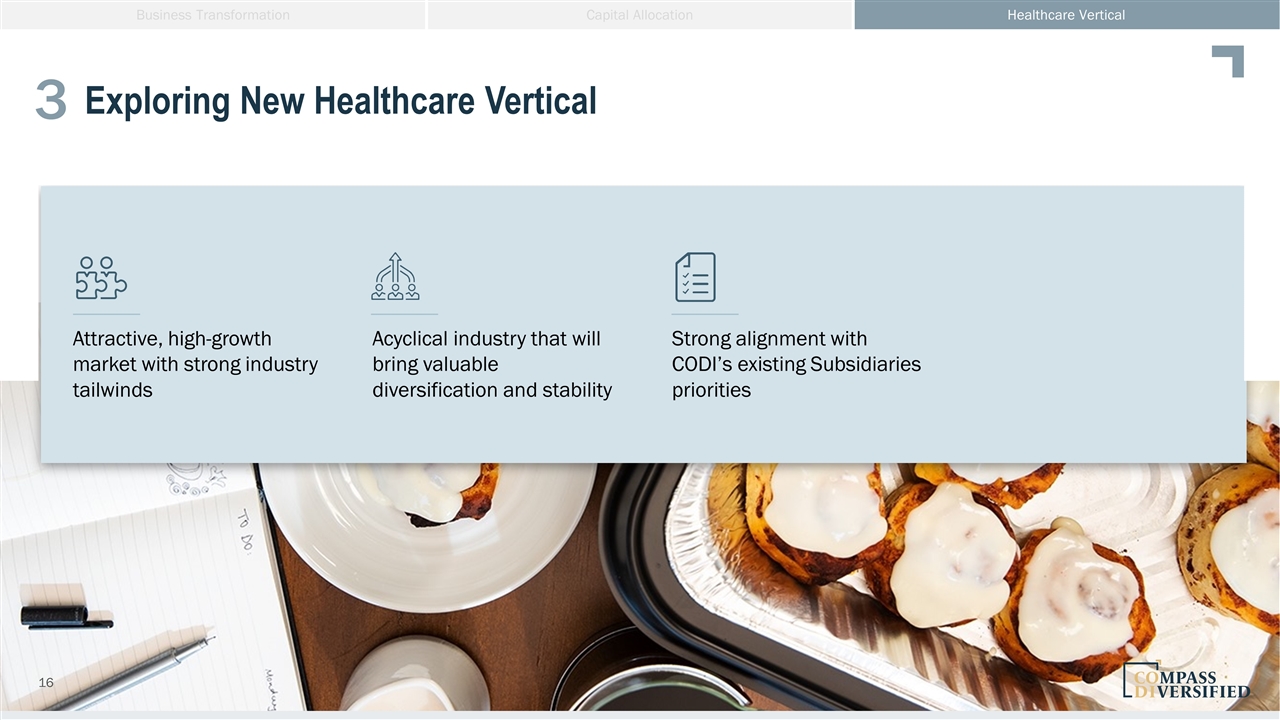
Exploring New Healthcare Vertical Business Transformation Capital Allocation Healthcare Vertical 3 Attractive, high-growth market with strong industry tailwinds Acyclical industry that will bring valuable diversification and stability Strong alignment with CODI’s existing Subsidiaries priorities
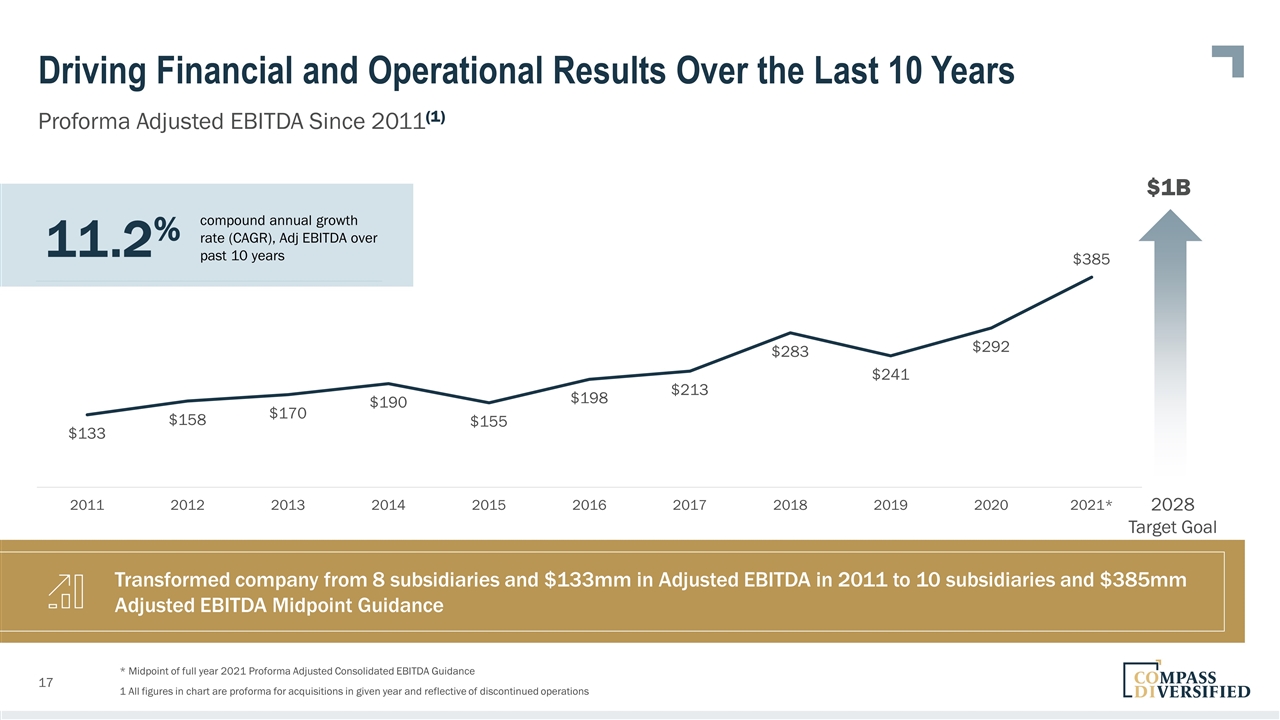
Driving Financial and Operational Results Over the Last 10 Years Proforma Adjusted EBITDA Since 2011(1) * Midpoint of full year 2021 Proforma Adjusted Consolidated EBITDA Guidance Transformed company from 8 subsidiaries and $133mm in Adjusted EBITDA in 2011 to 10 subsidiaries and $385mm Adjusted EBITDA Midpoint Guidance 11.2% compound annual growth rate (CAGR), Adj EBITDA over past 10 years $1B 1 All figures in chart are proforma for acquisitions in given year and reflective of discontinued operations 2028 Target Goal
6 CODI’s Corporate Values
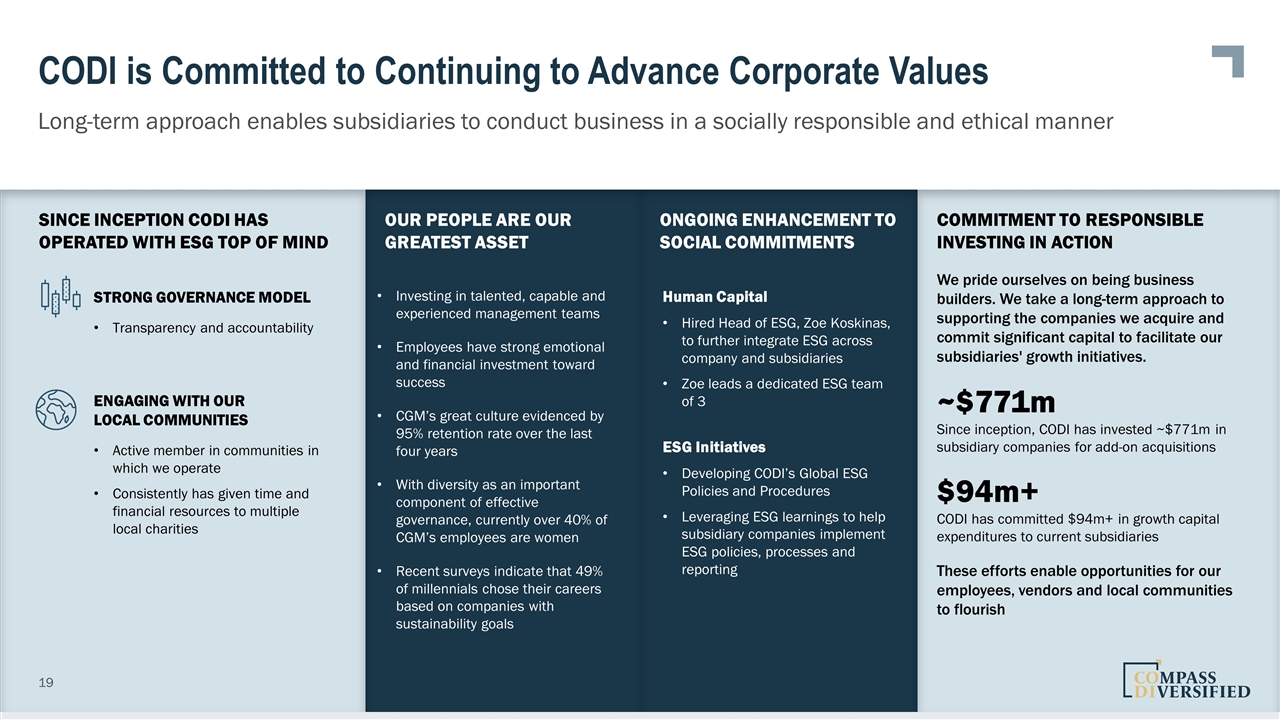
Since inception CODI has operated with Esg top of mind Ongoing enhancement to social commitments Our People are our Greatest Asset Commitment to Responsible Investing in action CODI is Committed to Continuing to Advance Corporate Values Long-term approach enables subsidiaries to conduct business in a socially responsible and ethical manner STRONG GOVERNANCE MODEL Transparency and accountability ENGAGING WITH OUR LOCAL COMMUNITIES Active member in communities in which we operate Consistently has given time and financial resources to multiple local charities Human Capital Hired Head of ESG, Zoe Koskinas, to further integrate ESG across company and subsidiaries Zoe leads a dedicated ESG team of 3 ESG Initiatives Developing CODI’s Global ESG Policies and Procedures Leveraging ESG learnings to help subsidiary companies implement ESG policies, processes and reporting We pride ourselves on being business builders. We take a long-term approach to supporting the companies we acquire and commit significant capital to facilitate our subsidiaries' growth initiatives. ~$771m Since inception, CODI has invested ~$771m in subsidiary companies for add-on acquisitions $94m+ CODI has committed $94m+ in growth capital expenditures to current subsidiaries These efforts enable opportunities for our employees, vendors and local communities to flourish Investing in talented, capable and experienced management teams Employees have strong emotional and financial investment toward success CGM’s great culture evidenced by 95% retention rate over the last four years With diversity as an important component of effective governance, currently over 40% of CGM’s employees are women Recent surveys indicate that 49% of millennials chose their careers based on companies with sustainability goals
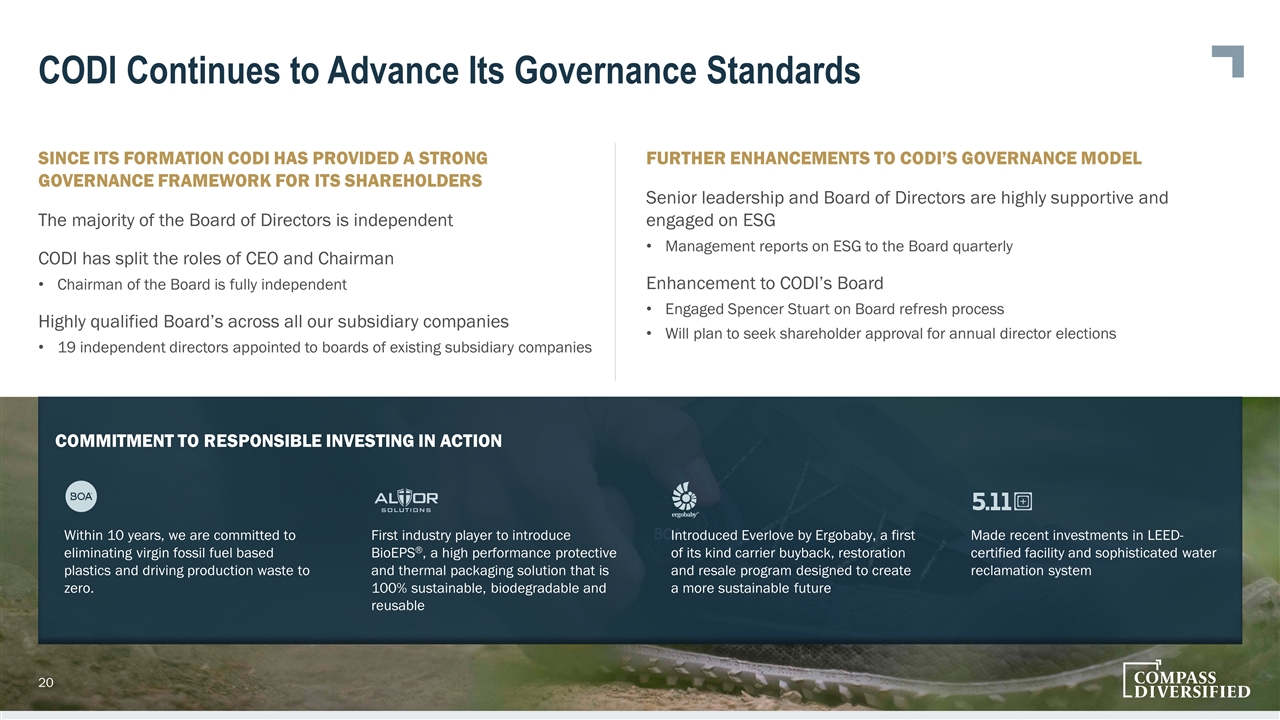
Since its formation CODI has provided a strong governance framework for its shareholders The majority of the Board of Directors is independent CODI has split the roles of CEO and Chairman Chairman of the Board is fully independent Highly qualified Board’s across all our subsidiary companies 19 independent directors appointed to boards of existing subsidiary companies Further enhancements to CODI’S governance model Senior leadership and Board of Directors are highly supportive and engaged on ESG Management reports on ESG to the Board quarterly Enhancement to CODI’s Board Engaged Spencer Stuart on Board refresh process Will plan to seek shareholder approval for annual director elections CODI Continues to Advance Its Governance Standards Commitment to Responsible Investing in action Within 10 years, we are committed to eliminating virgin fossil fuel based plastics and driving production waste to zero. First industry player to introduce BioEPS®, a high performance protective and thermal packaging solution that is 100% sustainable, biodegradable and reusable Introduced Everlove by Ergobaby, a first of its kind carrier buyback, restoration and resale program designed to create a more sustainable future Made recent investments in LEED-certified facility and sophisticated water reclamation system
Subsidiary Update 6
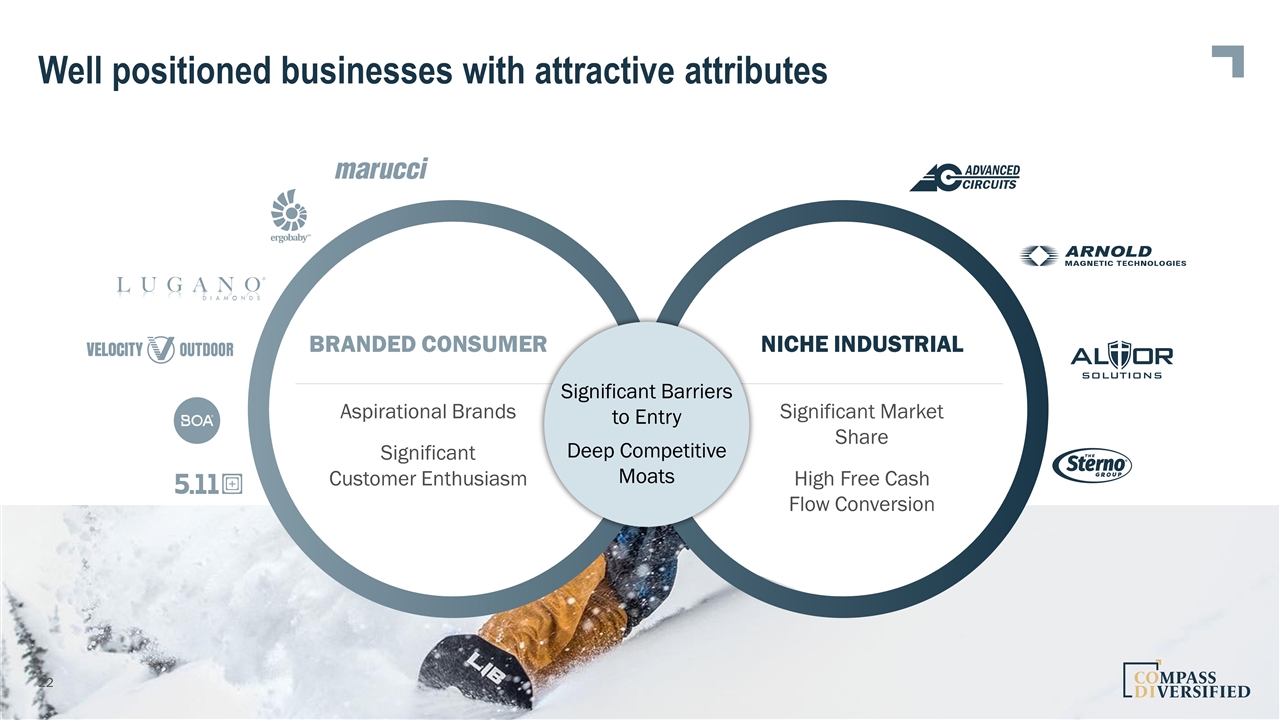
Well positioned businesses with attractive attributes Niche Industrial Significant Market Share High Free Cash Flow Conversion Branded Consumer Aspirational Brands Significant Customer Enthusiasm Significant Barriers to Entry Deep Competitive Moats
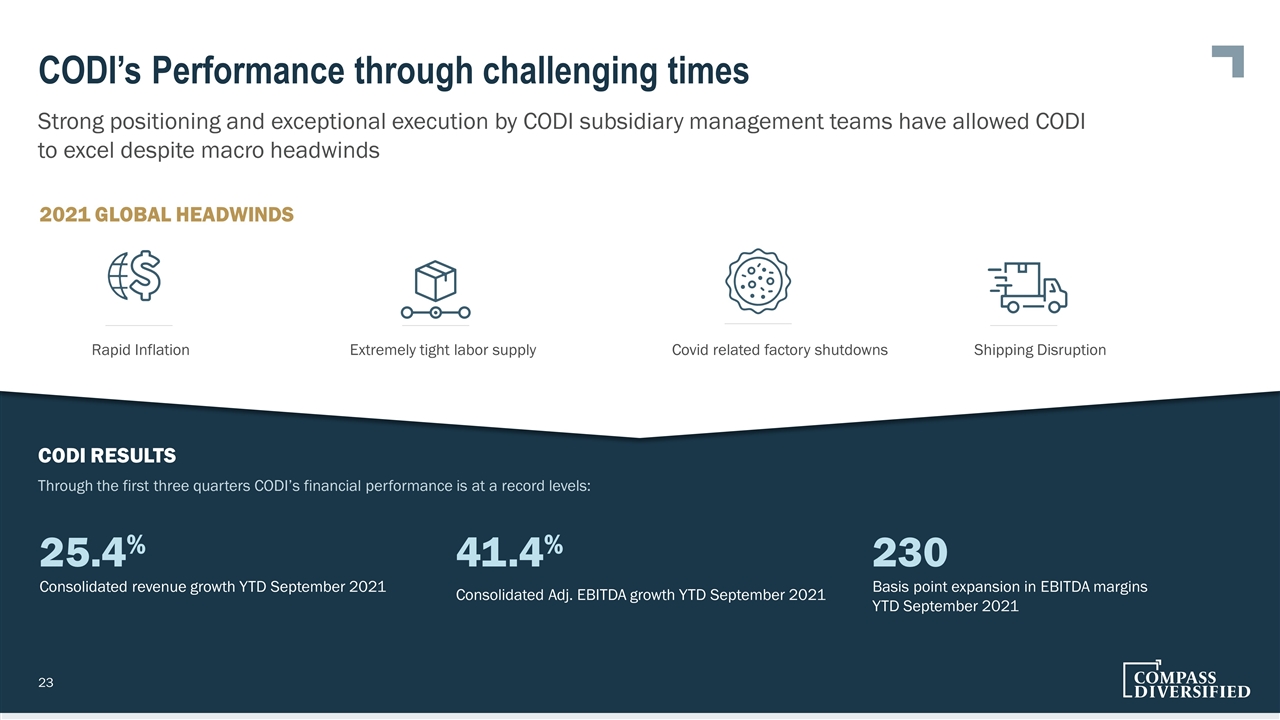
CODI’s Performance through challenging times Strong positioning and exceptional execution by CODI subsidiary management teams have allowed CODI to excel despite macro headwinds Rapid Inflation Extremely tight labor supply Covid related factory shutdowns Shipping Disruption 2021 Global Headwinds 25.4% Consolidated revenue growth YTD September 2021 41.4% Consolidated Adj. EBITDA growth YTD September 2021 230 Basis point expansion in EBITDA margins YTD September 2021 CODI Results Through the first three quarters CODI’s financial performance is at a record levels:
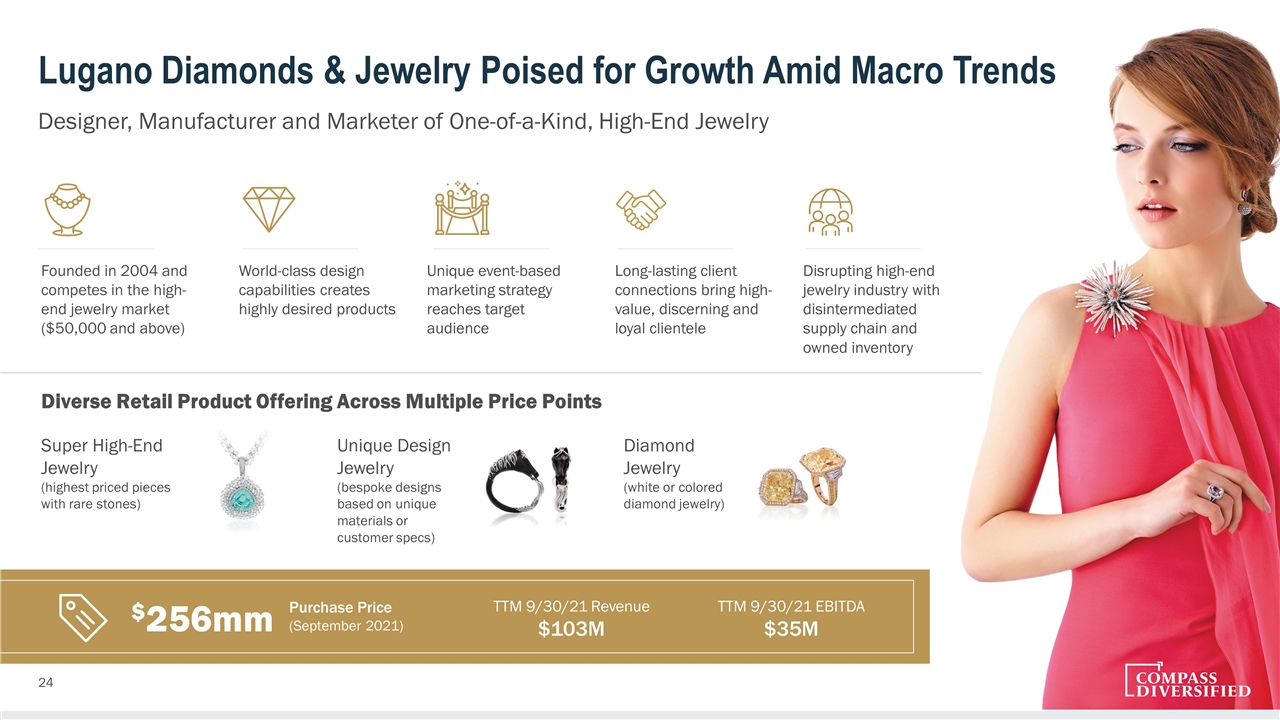
Lugano Diamonds & Jewelry Poised for Growth Amid Macro Trends Designer, Manufacturer and Marketer of One-of-a-Kind, High-End Jewelry Diverse Retail Product Offering Across Multiple Price Points Super High-End Jewelry (highest priced pieces with rare stones) Unique Design Jewelry (bespoke designs based on unique materials or customer specs) Diamond Jewelry (white or colored diamond jewelry) Founded in 2004 and competes in the high-end jewelry market ($50,000 and above) World-class design capabilities creates highly desired products Unique event-based marketing strategy reaches target audience Long-lasting client connections bring high-value, discerning and loyal clientele Disrupting high-end jewelry industry with disintermediated supply chain and owned inventory Purchase Price (September 2021) $256mm TTM 9/30/21 Revenue $103M TTM 9/30/21 EBITDA $35M
Lugano is Ideally Positioned to Benefit From CODI’s Resources and Capital Well-positioned to emerge as a leading domestic and international luxury brand by leveraging CODI’s strong experience building consumer brands Additional capital flexibility will enable Lugano to opportunistically procure rare stones, expand its internal manufacturing capabilities, and accelerate its retail salon deployment Company works with Kimberley Process certified suppliers, CODI working with Company to further enhance social compliance efforts Strong existing management team with plans to significantly grow headcount and infrastructure to support growth
Financial Review 6
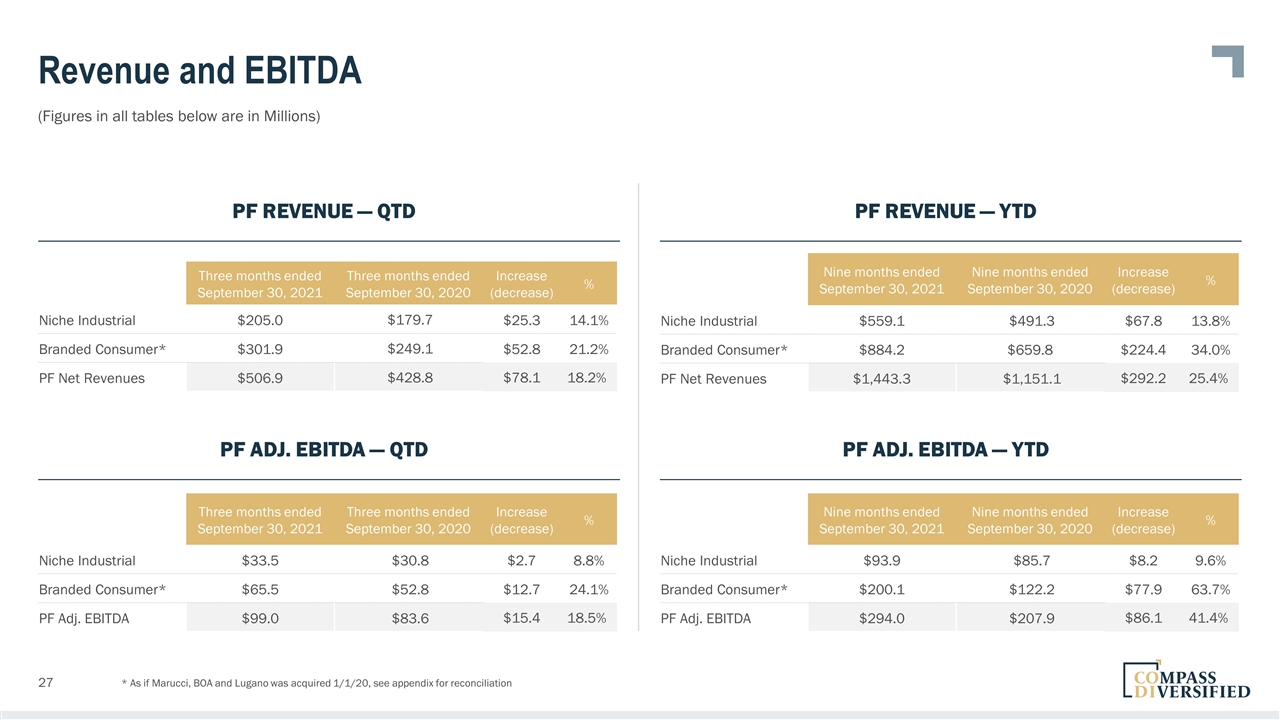
Revenue and EBITDA (Figures in all tables below are in Millions) * As if Marucci, BOA and Lugano was acquired 1/1/20, see appendix for reconciliation PF Revenue — QTD PF Revenue — YTD PF Adj. EBITDA — QTD PF Adj. EBITDA — YTD Three months ended September 30, 2021 Three months ended September 30, 2020 Increase (decrease) % Niche Industrial $33.5 $30.8 $2.7 8.8% Branded Consumer* $65.5 $52.8 $12.7 24.1% PF Adj. EBITDA $99.0 $83.6 $15.4 18.5% Nine months ended September 30, 2021 Nine months ended September 30, 2020 Increase (decrease) % Niche Industrial $559.1 $491.3 $67.8 13.8% Branded Consumer* $884.2 $659.8 $224.4 34.0% PF Net Revenues $1,443.3 $1,151.1 $292.2 25.4% Nine months ended September 30, 2021 Nine months ended September 30, 2020 Increase (decrease) % Niche Industrial $93.9 $85.7 $8.2 9.6% Branded Consumer* $200.1 $122.2 $77.9 63.7% PF Adj. EBITDA $294.0 $207.9 $86.1 41.4% ($ Three months ended September 30, 2021 Three months ended September 30, 2020 Increase (decrease) % Niche Industrial $205.0 $179.7 $25.3 14.1% Branded Consumer* $301.9 $249.1 $52.8 21.2% PF Net Revenues $506.9 $428.8 $78.1 18.2%
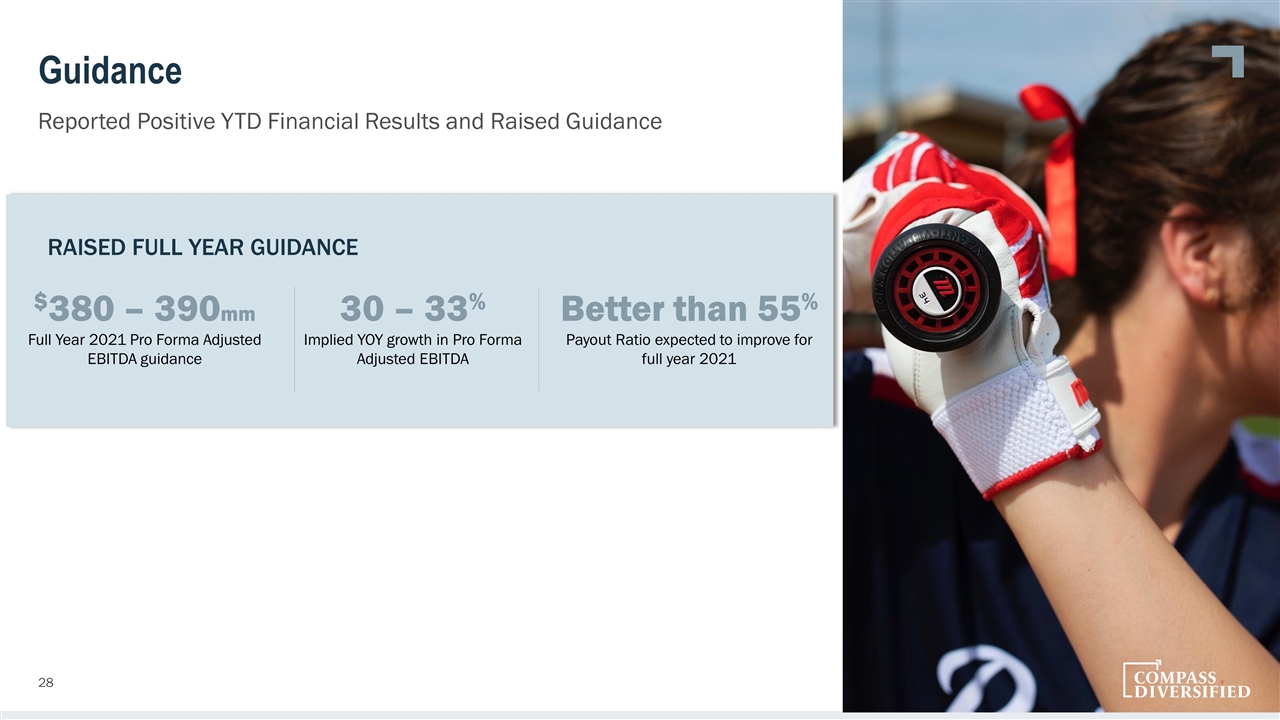
Guidance Reported Positive YTD Financial Results and Raised Guidance $380 – 390mm Full Year 2021 Pro Forma Adjusted EBITDA guidance 30 – 33% Implied YOY growth in Pro Forma Adjusted EBITDA Better than 55% Payout Ratio expected to improve for full year 2021 RAISED FULL YEAR GUIDANCE

CODI’s Strengthened Capital Structure Dec 2011 SEPT 2021 5.44% Rate On Debt and Preferreds* * Rate drops to 4.56% if revolver is fully funded Pursuit of a Lower WACC Lowering our WACC strengthens our competitive advantage and drives shareholder returns ~5.5 Years Tenor on debt 4% Cost OID Since 2018 8.0% Senior Unsecured 8-Year Bond Due 2026 $400 million in March 2018 + $200 million May 2020 7.785% Preferred Equity Issuances $215 million in March 2018 and November 2019 Redeemed Senior Unsecured Bond Due 2026 5.25% Senior Unsecured Bond due 2029 $1 billion in March 2021 Complete Simplification of Tax Structure September 2021 5.0% Senior Unsecured 10-Year Bond Due 2032 $300 million in November 2021 8.8% Rate On Debt ~9.5 Years Tenor on debt 0% Cost OID Consistent Financial Policy: Leverage 3.0 to 3.5 times
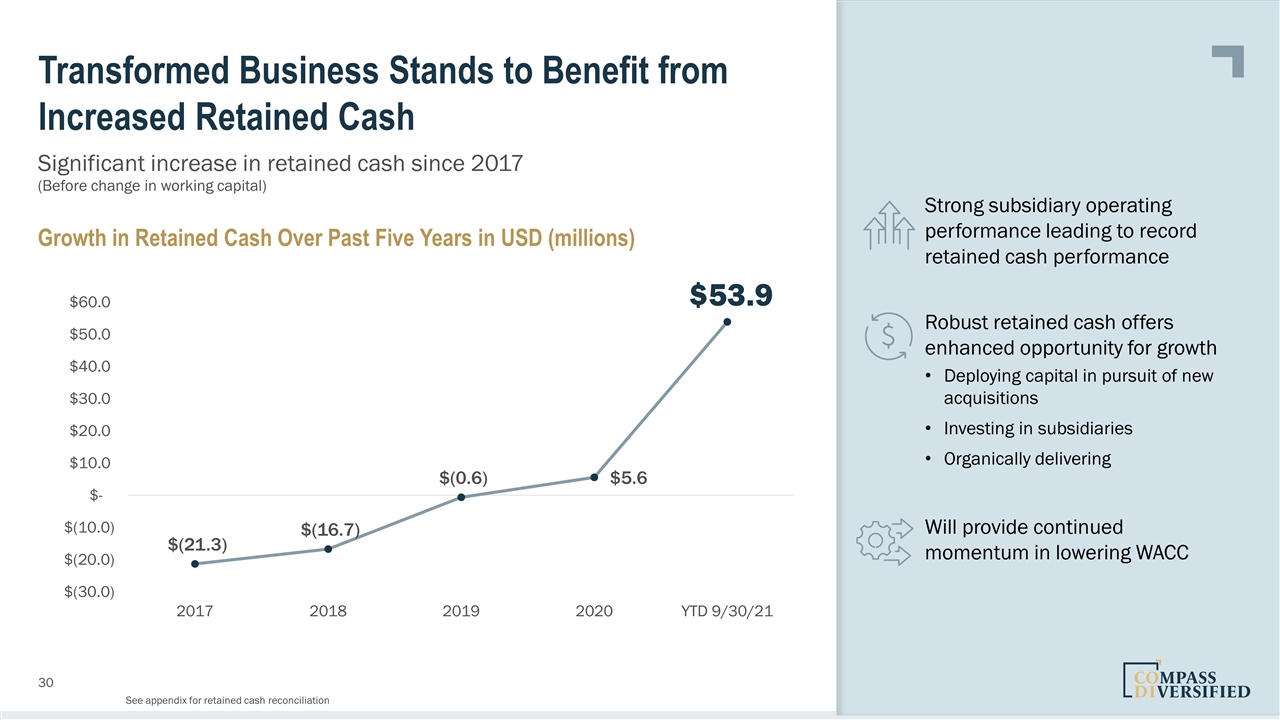
Transformed Business Stands to Benefit from Increased Retained Cash Significant increase in retained cash since 2017 Strong subsidiary operating performance leading to record retained cash performance Robust retained cash offers enhanced opportunity for growth Deploying capital in pursuit of new acquisitions Investing in subsidiaries Organically delivering Will provide continued momentum in lowering WACC Growth in Retained Cash Over Past Five Years in USD (millions) See appendix for retained cash reconciliation (Before change in working capital)

Q&A 6
Appendix
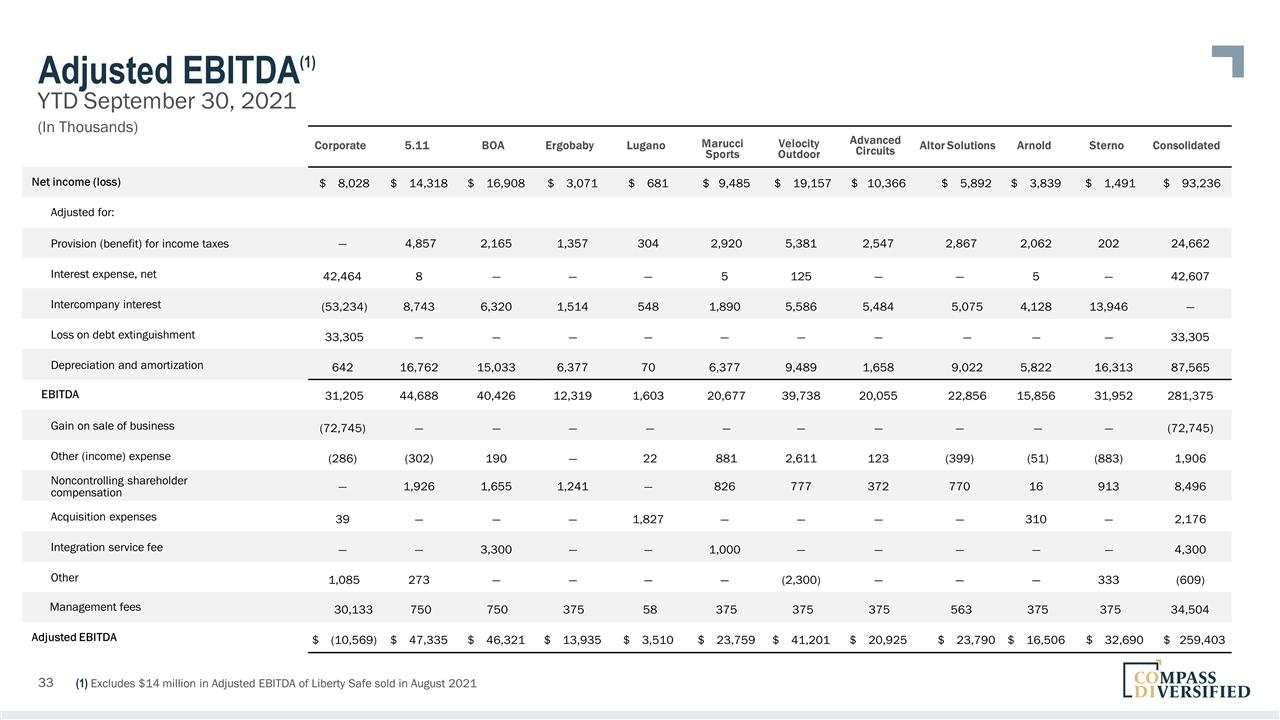
Adjusted EBITDA YTD September 30, 2021 Corporate 5.11 BOA Ergobaby Lugano Marucci Sports Velocity Outdoor Advanced Circuits Altor Solutions Arnold Sterno Consolidated Net income (loss) $ 8,028 $ 14,318 $ 16,908 $ 3,071 $ 681 $ 9,485 $ 19,157 $ 10,366 $ 5,892 $ 3,839 $ 1,491 $ 93,236 Adjusted for: Provision (benefit) for income taxes — 4,857 2,165 1,357 304 2,920 5,381 2,547 2,867 2,062 202 24,662 Interest expense, net 42,464 8 — — — 5 125 — — 5 — 42,607 Intercompany interest (53,234) 8,743 6,320 1,514 548 1,890 5,586 5,484 5,075 4,128 13,946 — Loss on debt extinguishment 33,305 — — — — — — — — — — 33,305 Depreciation and amortization 642 16,762 15,033 6,377 70 6,377 9,489 1,658 9,022 5,822 16,313 87,565 EBITDA 31,205 44,688 40,426 12,319 1,603 20,677 39,738 20,055 22,856 15,856 31,952 281,375 Gain on sale of business (72,745) — — — — — — — — — — (72,745) Other (income) expense (286) (302) 190 — 22 881 2,611 123 (399) (51) (883) 1,906 Noncontrolling shareholder compensation — 1,926 1,655 1,241 — 826 777 372 770 16 913 8,496 Acquisition expenses 39 — — — 1,827 — — — — 310 — 2,176 Integration service fee — — 3,300 — — 1,000 — — — — — 4,300 Other 1,085 273 — — — — (2,300) — — — 333 (609) Management fees 30,133 750 750 375 58 375 375 375 563 375 375 34,504 Adjusted EBITDA $ (10,569) $ 47,335 $ 46,321 $ 13,935 $ 3,510 $ 23,759 $ 41,201 $ 20,925 $ 23,790 $ 16,506 $ 32,690 $ 259,403 (1) Excludes $14 million in Adjusted EBITDA of Liberty Safe sold in August 2021 (1) (In Thousands)
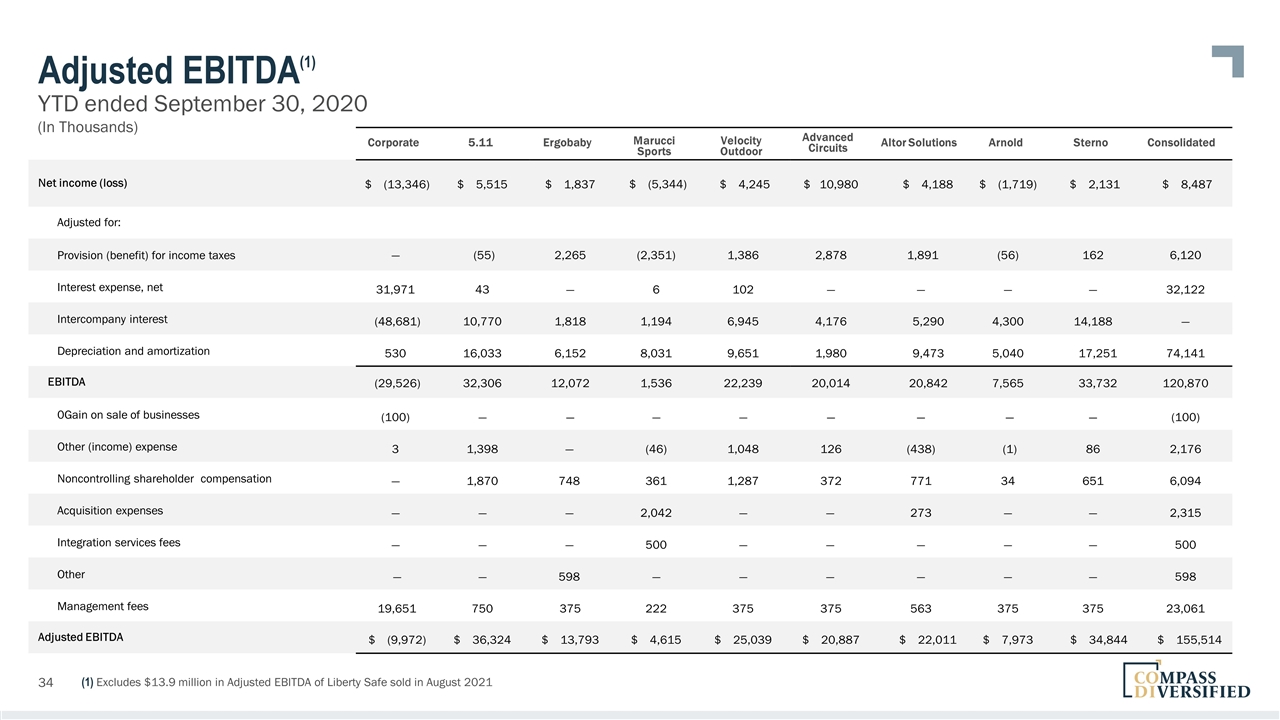
Adjusted EBITDA YTD ended September 30, 2020 Corporate 5.11 Ergobaby Marucci Sports Velocity Outdoor Advanced Circuits Altor Solutions Arnold Sterno Consolidated Net income (loss) $ (13,346) $ 5,515 $ 1,837 $ (5,344) $ 4,245 $ 10,980 $ 4,188 $ (1,719) $ 2,131 $ 8,487 Adjusted for: Provision (benefit) for income taxes — (55) 2,265 (2,351) 1,386 2,878 1,891 (56) 162 6,120 Interest expense, net 31,971 43 — 6 102 — — — — 32,122 Intercompany interest (48,681) 10,770 1,818 1,194 6,945 4,176 5,290 4,300 14,188 — Depreciation and amortization 530 16,033 6,152 8,031 9,651 1,980 9,473 5,040 17,251 74,141 EBITDA (29,526) 32,306 12,072 1,536 22,239 20,014 20,842 7,565 33,732 120,870 0Gain on sale of businesses (100) — — — — — — — — (100) Other (income) expense 3 1,398 — (46) 1,048 126 (438) (1) 86 2,176 Noncontrolling shareholder compensation — 1,870 748 361 1,287 372 771 34 651 6,094 Acquisition expenses — — — 2,042 — — 273 — — 2,315 Integration services fees — — — 500 — — — — — 500 Other — — 598 — — — — — — 598 Management fees 19,651 750 375 222 375 375 563 375 375 23,061 Adjusted EBITDA $ (9,972) $ 36,324 $ 13,793 $ 4,615 $ 25,039 $ 20,887 $ 22,011 $ 7,973 $ 34,844 $ 155,514 (1) Excludes $13.9 million in Adjusted EBITDA of Liberty Safe sold in August 2021 (1) (In Thousands)
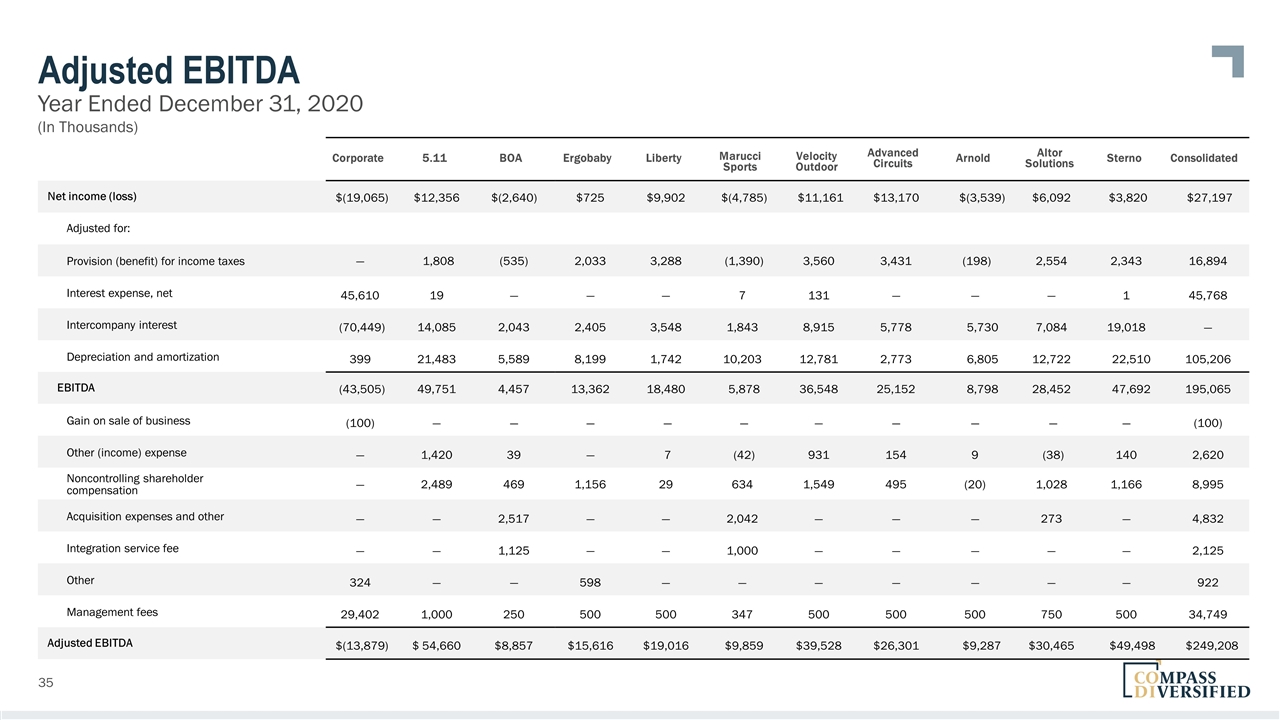
Adjusted EBITDA Year Ended December 31, 2020 Corporate 5.11 BOA Ergobaby Liberty Marucci Sports Velocity Outdoor Advanced Circuits Arnold Altor Solutions Sterno Consolidated Net income (loss) $(19,065) $12,356 $(2,640) $725 $9,902 $(4,785) $11,161 $13,170 $(3,539) $6,092 $3,820 $27,197 Adjusted for: Provision (benefit) for income taxes — 1,808 (535) 2,033 3,288 (1,390) 3,560 3,431 (198) 2,554 2,343 16,894 Interest expense, net 45,610 19 — — — 7 131 — — — 1 45,768 Intercompany interest (70,449) 14,085 2,043 2,405 3,548 1,843 8,915 5,778 5,730 7,084 19,018 — Depreciation and amortization 399 21,483 5,589 8,199 1,742 10,203 12,781 2,773 6,805 12,722 22,510 105,206 EBITDA (43,505) 49,751 4,457 13,362 18,480 5,878 36,548 25,152 8,798 28,452 47,692 195,065 Gain on sale of business (100) — — — — — — — — — — (100) Other (income) expense — 1,420 39 — 7 (42) 931 154 9 (38) 140 2,620 Noncontrolling shareholder compensation — 2,489 469 1,156 29 634 1,549 495 (20) 1,028 1,166 8,995 Acquisition expenses and other — — 2,517 — — 2,042 — — — 273 — 4,832 Integration service fee — — 1,125 — — 1,000 — — — — — 2,125 Other 324 — — 598 — — — — — — — 922 Management fees 29,402 1,000 250 500 500 347 500 500 500 750 500 34,749 Adjusted EBITDA $(13,879) $ 54,660 $8,857 $15,616 $19,016 $9,859 $39,528 $26,301 $9,287 $30,465 $49,498 $249,208 (In Thousands)
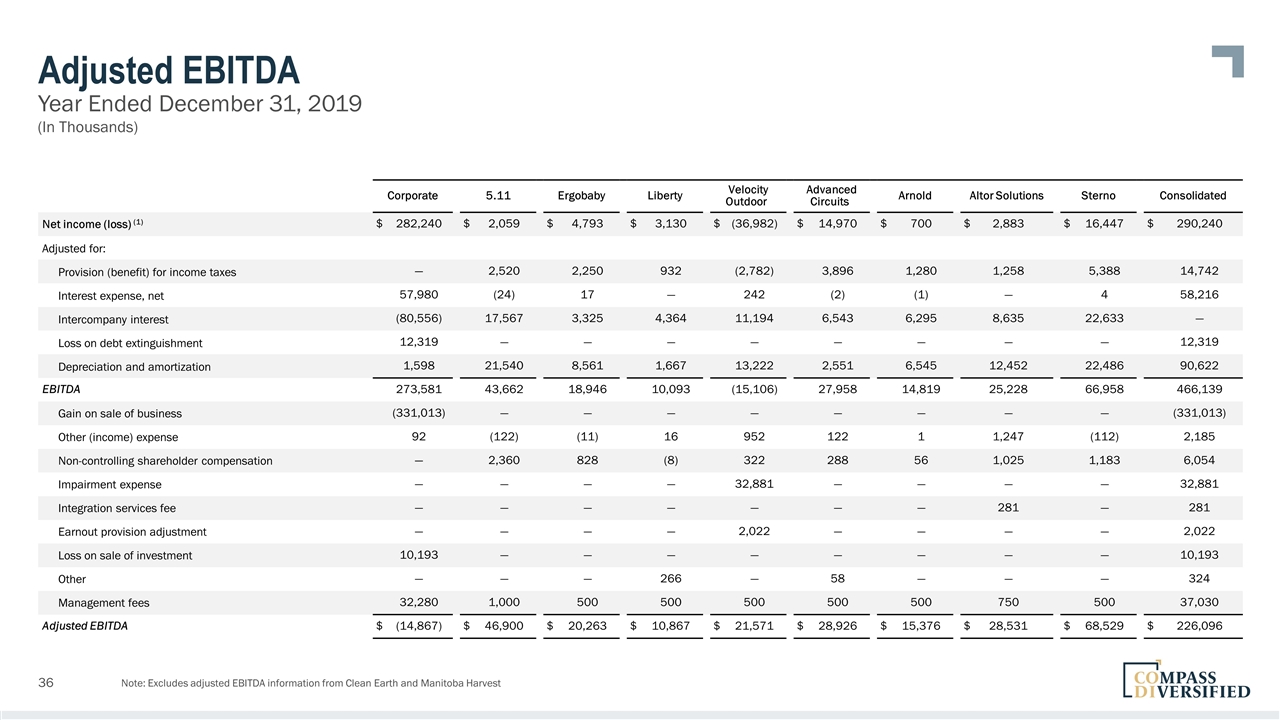
Adjusted EBITDA Year Ended December 31, 2019 Note: Excludes adjusted EBITDA information from Clean Earth and Manitoba Harvest Corporate Corporate 5.11 5.11 Ergobaby Ergobaby Liberty Liberty Velocity Outdoor Velocity Outdoor Advanced Circuits AdvancedCircuits Arnold Arnold Altor Solutions Foam Fabricators Sterno Sterno Consolidated Consolidated Net income (loss) (1) $ 282,240 $ 2,059 $ 4,793 $ 3,130 $ (36,982) $ 14,970 $ 700 $ 2,883 $ 16,447 $ 290,240 Adjusted for: Provision (benefit) for income taxes — 2,520 2,250 932 (2,782) 3,896 1,280 1,258 5,388 14,742 Interest expense, net 57,980 (24) 17 — 242 (2) (1) — 4 58,216 Intercompany interest (80,556) 17,567 3,325 4,364 11,194 6,543 6,295 8,635 22,633 — Loss on debt extinguishment 12,319 — — — — — — — — 12,319 Depreciation and amortization 1,598 21,540 8,561 1,667 13,222 2,551 6,545 12,452 22,486 90,622 EBITDA 273,581 43,662 18,946 10,093 (15,106) 27,958 14,819 25,228 66,958 466,139 Gain on sale of business (331,013) — — — — — — — — (331,013) Other (income) expense 92 (122) (11) 16 952 122 1 1,247 (112) 2,185 Non-controlling shareholder compensation — 2,360 828 (8) 322 288 56 1,025 1,183 6,054 Impairment expense — — — — 32,881 — — — — 32,881 Integration services fee — — — — — — — 281 — 281 Earnout provision adjustment — — — — 2,022 — — — — 2,022 Loss on sale of investment 10,193 — — — — — — — — 10,193 Other — — — 266 — 58 — — — 324 Management fees 32,280 1,000 500 500 500 500 500 750 500 37,030 Adjusted EBITDA $ (14,867) $ 46,900 $ 20,263 $ 10,867 $ 21,571 $ 28,926 $ 15,376 $ 28,531 $ 68,529 $ 226,096 (In Thousands)
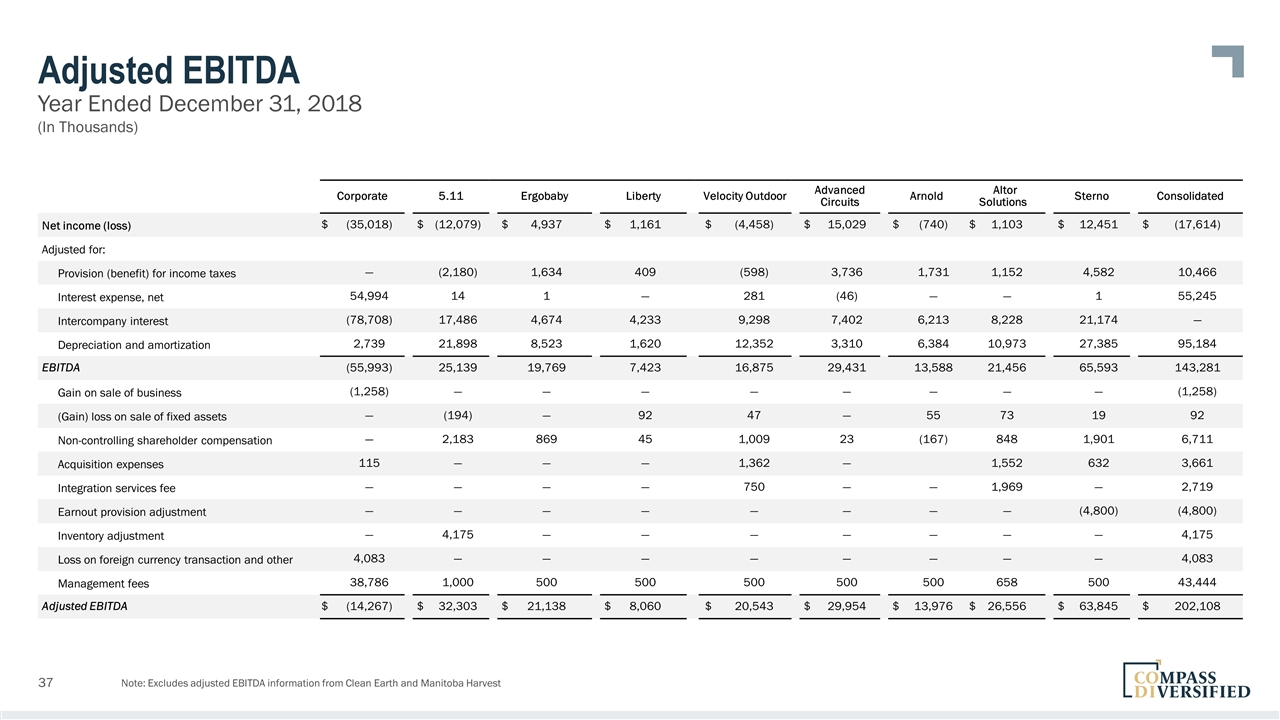
Adjusted EBITDA Year Ended December 31, 2018 Note: Excludes adjusted EBITDA information from Clean Earth and Manitoba Harvest Corporate Corporate 5.11 5.11 Ergobaby Ergobaby Liberty Liberty Velocity Outdoor Velocity Outdoor AdvancedCircuits AdvancedCircuits Arnold Arnold Altor Solutions Foam Sterno Sterno Consolidated Consolidated Net income (loss) $ (35,018) $ (12,079) $ 4,937 $ 1,161 $ (4,458) $ 15,029 $ (740) $ 1,103 $ 12,451 $ (17,614) Adjusted for: Provision (benefit) for income taxes — (2,180) 1,634 409 (598) 3,736 1,731 1,152 4,582 10,466 Interest expense, net 54,994 14 1 — 281 (46) — — 1 55,245 Intercompany interest (78,708) 17,486 4,674 4,233 9,298 7,402 6,213 8,228 21,174 — Depreciation and amortization 2,739 21,898 8,523 1,620 12,352 3,310 6,384 10,973 27,385 95,184 EBITDA (55,993) 25,139 19,769 7,423 16,875 29,431 13,588 21,456 65,593 143,281 Gain on sale of business (1,258) — — — — — — — — (1,258) (Gain) loss on sale of fixed assets — (194) — 92 47 — 55 73 19 92 Non-controlling shareholder compensation — 2,183 869 45 1,009 23 (167) 848 1,901 6,711 Acquisition expenses 115 — — — 1,362 — 1,552 632 3,661 Integration services fee — — — — 750 — — 1,969 — 2,719 Earnout provision adjustment — — — — — — — — (4,800) (4,800) Inventory adjustment — 4,175 — — — — — — — 4,175 Loss on foreign currency transaction and other 4,083 — — — — — — — — 4,083 Management fees 38,786 1,000 500 500 500 500 500 658 500 43,444 Adjusted EBITDA $ (14,267) $ 32,303 $ 21,138 $ 8,060 $ 20,543 $ 29,954 $ 13,976 $ 26,556 $ 63,845 $ 202,108 (In Thousands)
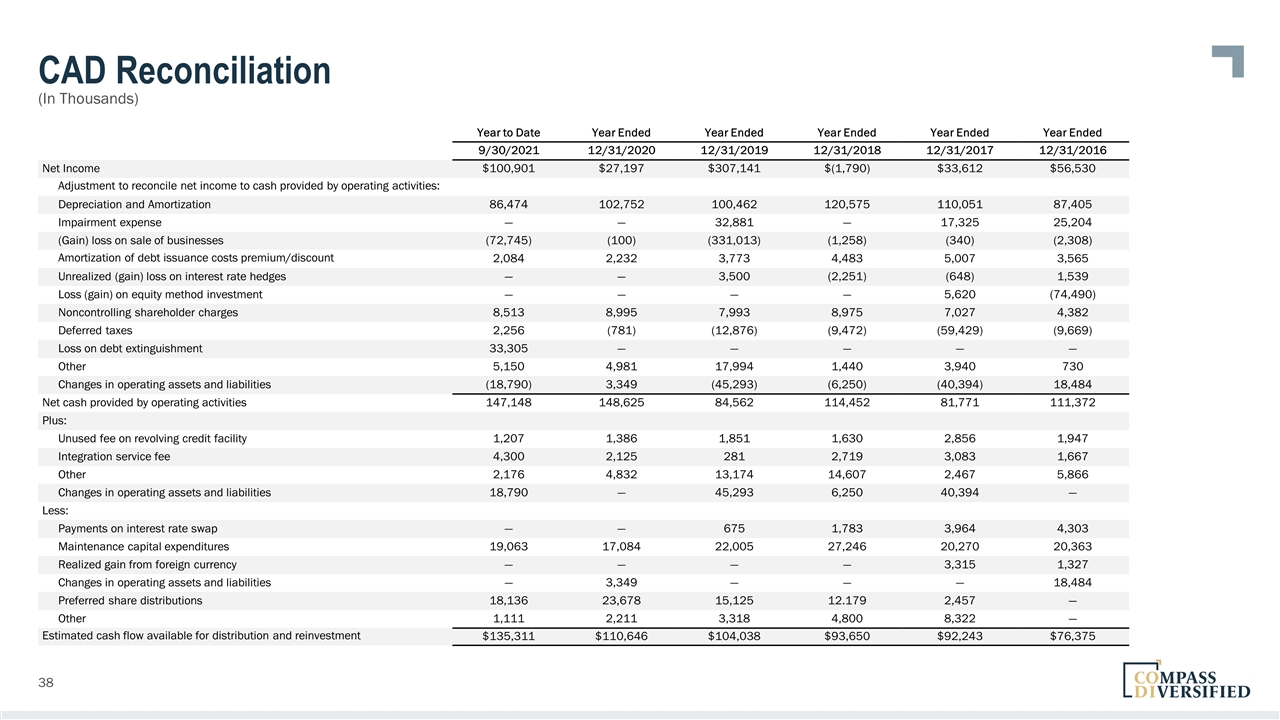
CAD Reconciliation Year to Date Year Ended Year Ended Year Ended Year Ended Year Ended 9/30/2021 12/31/2020 12/31/2019 12/31/2018 12/31/2017 12/31/2016 Net Income $100,901 $27,197 $307,141 $(1,790) $33,612 $56,530 Adjustment to reconcile net income to cash provided by operating activities: Depreciation and Amortization 86,474 102,752 100,462 120,575 110,051 87,405 Impairment expense — — 32,881 — 17,325 25,204 (Gain) loss on sale of businesses (72,745) (100) (331,013) (1,258) (340) (2,308) Amortization of debt issuance costs premium/discount 2,084 2,232 3,773 4,483 5,007 3,565 Unrealized (gain) loss on interest rate hedges — — 3,500 (2,251) (648) 1,539 Loss (gain) on equity method investment — — — — 5,620 (74,490) Noncontrolling shareholder charges 8,513 8,995 7,993 8,975 7,027 4,382 Deferred taxes 2,256 (781) (12,876) (9,472) (59,429) (9,669) Loss on debt extinguishment 33,305 — — — — — Other 5,150 4,981 17,994 1,440 3,940 730 Changes in operating assets and liabilities (18,790) 3,349 (45,293) (6,250) (40,394) 18,484 Net cash provided by operating activities 147,148 148,625 84,562 114,452 81,771 111,372 Plus: Unused fee on revolving credit facility 1,207 1,386 1,851 1,630 2,856 1,947 Integration service fee 4,300 2,125 281 2,719 3,083 1,667 Other 2,176 4,832 13,174 14,607 2,467 5,866 Changes in operating assets and liabilities 18,790 — 45,293 6,250 40,394 — Less: Payments on interest rate swap — — 675 1,783 3,964 4,303 Maintenance capital expenditures 19,063 17,084 22,005 27,246 20,270 20,363 Realized gain from foreign currency — — — — 3,315 1,327 Changes in operating assets and liabilities — 3,349 — — — 18,484 Preferred share distributions 18,136 23,678 15,125 12.179 2,457 — Other 1,111 2,211 3,318 4,800 8,322 — Estimated cash flow available for distribution and reinvestment $135,311 $110,646 $104,038 $93,650 $92,243 $76,375 (In Thousands)
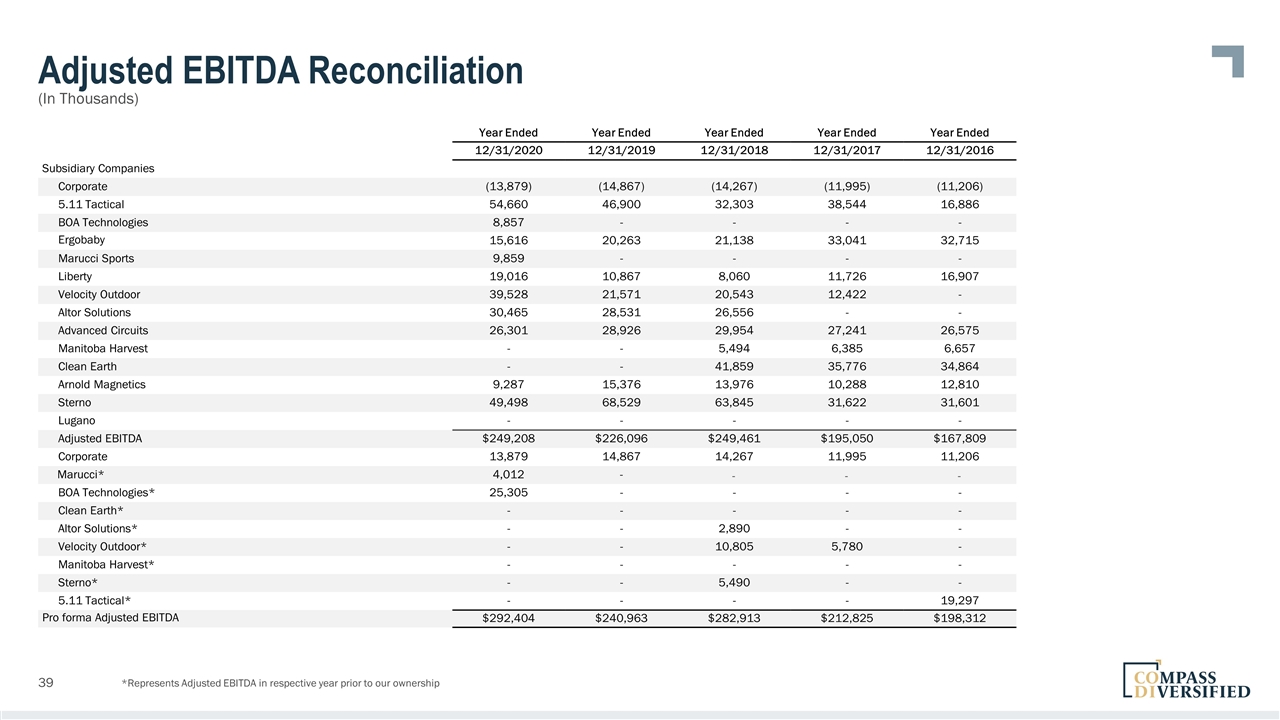
Adjusted EBITDA Reconciliation Year Ended Year Ended Year Ended Year Ended Year Ended 12/31/2020 12/31/2019 12/31/2018 12/31/2017 12/31/2016 Subsidiary Companies Corporate (13,879) (14,867) (14,267) (11,995) (11,206) 5.11 Tactical 54,660 46,900 32,303 38,544 16,886 BOA Technologies 8,857 - - - - Ergobaby 15,616 20,263 21,138 33,041 32,715 Marucci Sports 9,859 - - - - Liberty 19,016 10,867 8,060 11,726 16,907 Velocity Outdoor 39,528 21,571 20,543 12,422 - Altor Solutions 30,465 28,531 26,556 - - Advanced Circuits 26,301 28,926 29,954 27,241 26,575 Manitoba Harvest - - 5,494 6,385 6,657 Clean Earth - - 41,859 35,776 34,864 Arnold Magnetics 9,287 15,376 13,976 10,288 12,810 Sterno 49,498 68,529 63,845 31,622 31,601 Lugano - - - - - Adjusted EBITDA $249,208 $226,096 $249,461 $195,050 $167,809 Corporate 13,879 14,867 14,267 11,995 11,206 Marucci* 4,012 - - - - BOA Technologies* 25,305 - - - - Clean Earth* - - - - - Altor Solutions* - - 2,890 - - Velocity Outdoor* - - 10,805 5,780 - Manitoba Harvest* - - - - - Sterno* - - 5,490 - - 5.11 Tactical* - - - - 19,297 Pro forma Adjusted EBITDA $292,404 $240,963 $282,913 $212,825 $198,312 (In Thousands) *Represents Adjusted EBITDA in respective year prior to our ownership
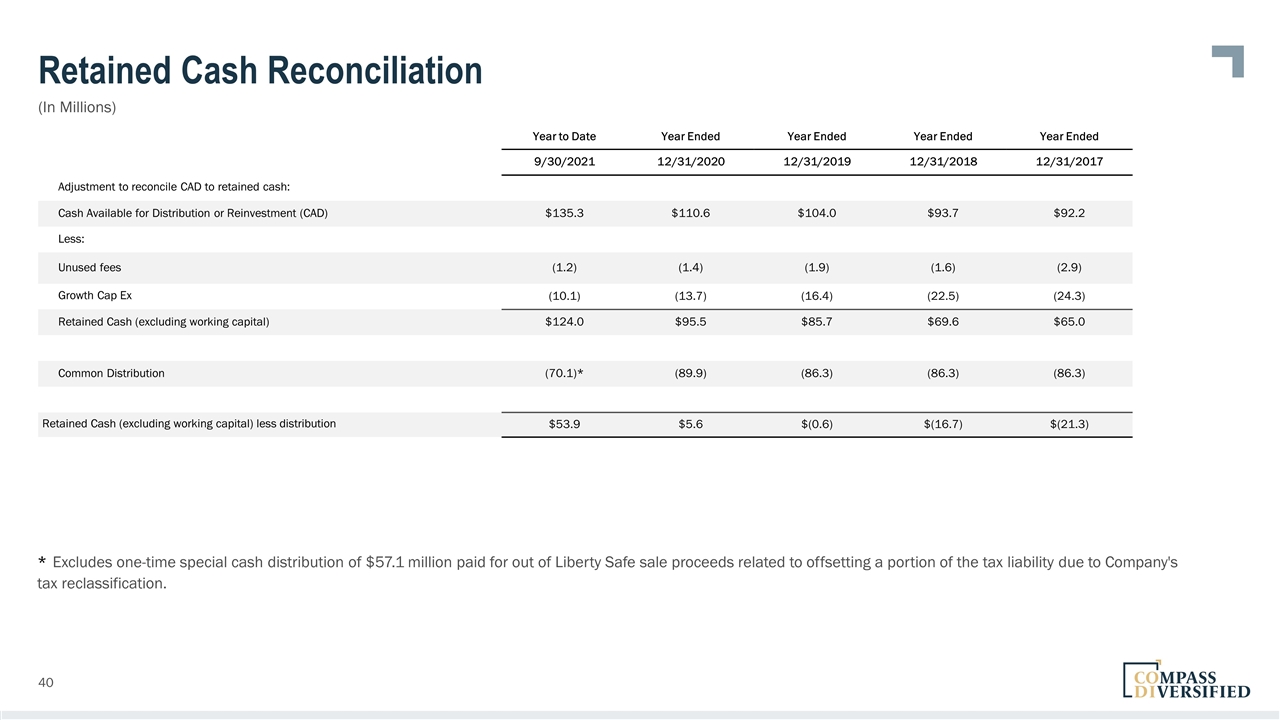
Retained Cash Reconciliation Year to Date Year Ended Year Ended Year Ended Year Ended 9/30/2021 12/31/2020 12/31/2019 12/31/2018 12/31/2017 Adjustment to reconcile CAD to retained cash: Cash Available for Distribution or Reinvestment (CAD) $135.3 $110.6 $104.0 $93.7 $92.2 Less: Unused fees (1.2) (1.4) (1.9) (1.6) (2.9) Growth Cap Ex (10.1) (13.7) (16.4) (22.5) (24.3) Retained Cash (excluding working capital) $124.0 $95.5 $85.7 $69.6 $65.0 Common Distribution (70.1)* (89.9) (86.3) (86.3) (86.3) Retained Cash (excluding working capital) less distribution $53.9 $5.6 $(0.6) $(16.7) $(21.3) * Excludes one-time special cash distribution of $57.1 million paid for out of Liberty Safe sale proceeds related to offsetting a portion of the tax liability due to Company's tax reclassification. (In Millions)
Thank you 6


