UNITED STATES
SECURITIES AND EXCHANGE COMMISSION
Washington, D.C. 20549
SCHEDULE 14A INFORMATION
Proxy Statement Pursuant to Section 14(a) of the Securities
Exchange Act of 1934
(Amendment No. )
Filed by the Registranto Filed by a Party other than the Registrantþ
Check the appropriate box:
o Preliminary Proxy Statement
o Confidential, for Use of the Commission Only (as permitted by Rule 14a-6(e)(2))
o Definitive Proxy Statement
þ Definitive Additional Materials
o Soliciting Material Pursuant to §240.14a -12
EMAGEON INC.
(Name of the Registrant as Specified In Its Charter)
OLIVER PRESS PARTNERS, LLC
OLIVER PRESS INVESTORS, LLC
AUGUSTUS K. OLIVER
CLIFFORD PRESS
DAVENPORT PARTNERS, L.P.
JE PARTNERS, L.P.
OLIVER PRESS MASTER FUND, L.P.
BENNER A. ULRICH
(Name(s) of Person(s) Filing Proxy Statement, if other than the Registrant)
Payment of Filing Fee (Check the appropriate box):
| þ | No fee required. |
| |
| o | Fee computed on table below per Exchange Act Rules 14a-6(i)(4) and 0-11. |
| |
| | (1) | Title of each class of securities to which transaction applies: N/A |
| | (2) | Aggregate number of securities to which transaction applies: N/A |
| | (3) | Per unit price or other underlying value of transaction computed pursuant to Exchange Act Rule 0-11 (Set forth the amount on which the filing fee is calculated and state how it was determined): N/A |
| | (4) | Proposed maximum aggregate value of transaction: N/A |
| | (5) | Total fee paid: N/A |
| |
| o | Fee paid previously with preliminary materials. |
| |
| o | Check box if any part of the fee is offset as provided by Exchange Act Rule 0-11(a)(2) and identify the |
| filing for which the offsetting fee was paid previously. Identify the previous filing by registration statement number, or the Form or Schedule and the date of its filing. |
| | | |
| | (1) | Amount Previously Paid: N/A |
| | (2) | Form. Schedule or Registration Statement No.: N/A |
| | (3) | Filing Party: N/A |
| | (4) | Date Filed: N/A |
| |

OPP Presentation to Risk Metrics/ISS
Emageon, Inc
11 June, 2008

Oliver Press Partners, LLC
Oliver Press Partners, LLC is an investment management firm based in New York City. OPP serves as
investment manager for several investment partnerships, including Davenport Partners, L.P., Oliver Press
Master Fund, L.P., and JE Partners, L.P. Under the direction of OPP principals Augustus K. Oliver and
Clifford Press, the partnerships invest in companies that the principals believe are undervalued and that
have available strategic options to enhance value for shareholders. Between them, Messrs. Oliver and Press
have almost 60 years of experience in investment management and the financial and legal aspects of
merger and acquisition transactions.
1

Reasons for this Solicitation

Background of this Solicitation
The partnerships under OPP’s management initially purchased approximately 12% of the outstanding shares of
Emageon in the summer of 2007 because OPP believed them to be undervalued and that Emageon was at an
inflection point as an independent public company.
In August 2007 we commenced discussions with Emageon’s management and directors about the desirability of
restoring an ownership perspective to the Board. This appeared to coincide with the Board’s own judgment that
the Company needed to explore its strategic alternatives in order to unlock the value in the business.
The Company’s initial response was to start a review process of shareholder representation that we were led to
believe would result in an invitation to us and possibly one or more other large shareholders to join the Board.
In November 2007 the Company announced third quarter results and sales guidelines that were not well received.
Immediately following this announcement, the market capitalization of the Company was cut in half bringing the
share price decline for the year to 74%. Subsequent to this price decline, OPP increased its position to 16.6%.
Despite numerous attempts by us to negotiate meaningful shareholder representation to the Board, the Company
has renominated all incumbents for the 2011 class at the 2008 Annual Meeting. In the absence of any
representation by us or any other significant shareholder, we commenced this solicitation for our nominees.
3
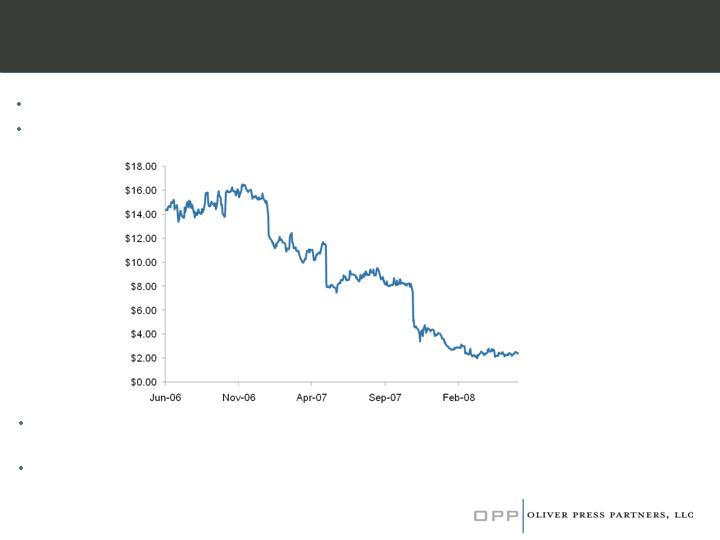
Dramatic Decline in Share Price and Valuation
EMAG shares have declined 72% in the LTM from $8.53 to $2.40
In the prior calendar year, EMAG shares declined 40% from $13.84 to $8.26
EMAG shares are currently trading at an extreme discount valuation when compared to
enterprise software trading levels (see Appendix 1)
As a multiple of maintenance revenue, the stock is trading at 0.4 times, a substantial drop
from a multiple of 3.1 times one year ago
4

Board Share Ownership – Actions Speak Louder Than Words
The current board owns less than 1.0% of the common stock
At the time of the IPO in February 2005, Emageon had a Board that collectively
owned 22% of the outstanding shares. The largest holder on the Board, Chris
Horgan was the beneficial owner of 3,079,160 shares. He distributed this entire
position during 2005 and left the Board in 2007
The continuing directors, who collectively owned more than 6.0% of the outstanding
shares at the IPO, have divested the overwhelming majority of their position as
demonstrated on the following slides
5

Unsuccessful Sales Process
“In April 2007 our Board of Directors began a comprehensive investigation to explore the possibility of a strategic transaction. The
Board appointed a Strategic Committee to lead the investigation. The committee consisted of Hugh H. Williamson, III, Fred C. Goad,
Jr. and Roddy J.H. Clark, with Mr. Williamson serving as the committee’s chairman. The committee engaged SunTrust Robinson
Humphrey as its financial advisor, and Bass, Berry & Sims PLC as its legal counsel. In conducting its investigation, the committee
considered all alternatives, including a sale of the company, a merger of equals, smaller acquisitions, recapitalizations and share
repurchases. The investigation concluded in April 2008. The Committee did not identify a viable prospect for a strategic transaction
at this time, and recommended to the Board of Directors that the Company continue as an independent company and focus on
improving its core products and services.”
Source: EMAG Form 10K/A filed 04/29/08
6
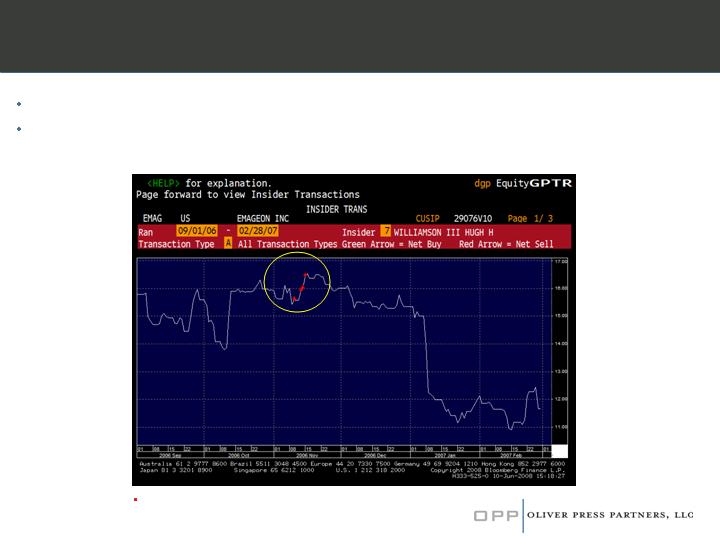
Insider Sales – Hugh Williamson
(Lead Director and Special Committee member)
Hugh Williamson sells 138,544 shares between September 06 and February 07
Hugh Williamson owned 192,805 shares at the IPO and owns 9,560 shares today, having
reduced his ownership position by 95%
Source: Bloomberg
7
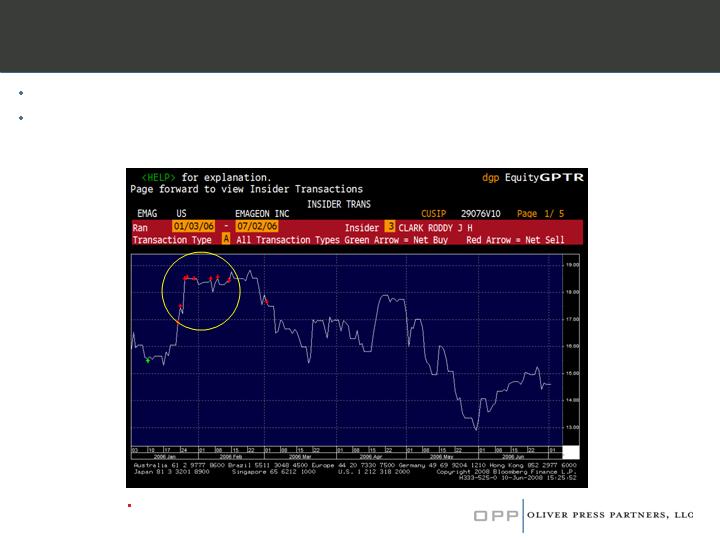
Insider Sales – Roddy Clark (Special Committee member)
Roddy Clark divested 245,347 shares between January 06 and June 06
Roddy Clark owned 595,421 shares at the IPO and owns 2,000 shares today, having reduced
his ownership position by 99%
Source: Bloomberg
8
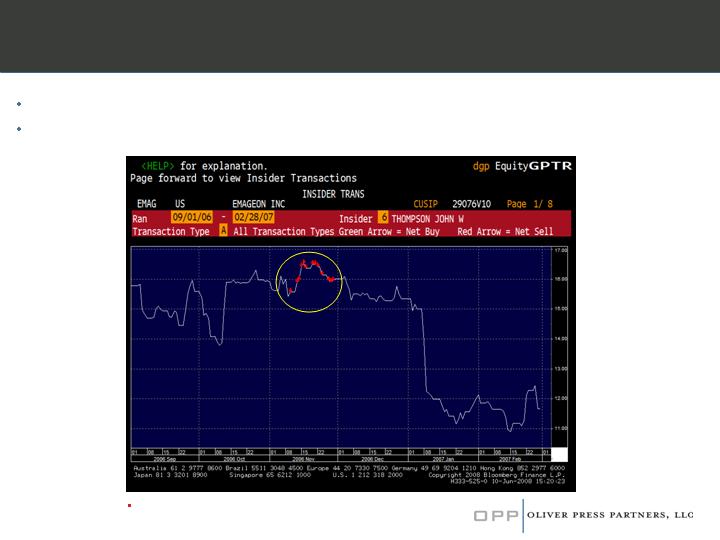
Insider Sales – John Thompson
John Thompson divested 273,700 shares between September 06 and February 07
John Thompson owned 290,090 shares at the IPO and owns 120,353 shares today
Source: Bloomberg
9
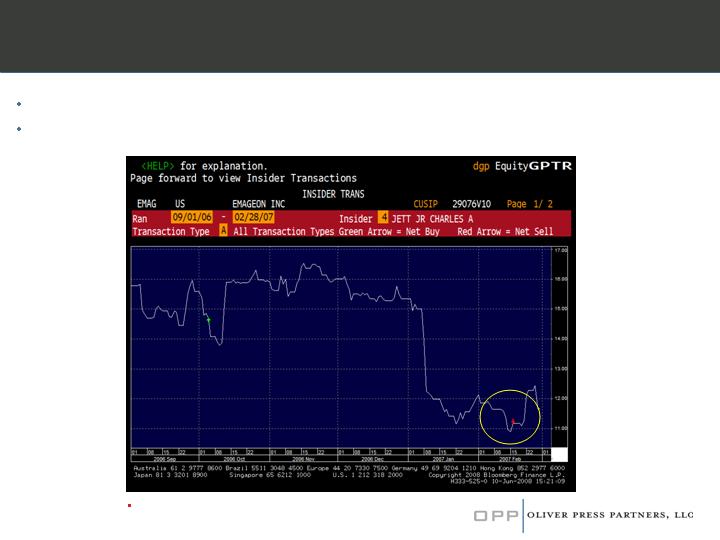
Insider Sales – Charles Jett
Charles Jett divested 175,000 shares between September 06 and February 07
Charles Jett owned 108,948 shares at the IPO and owns 64,620 shares today
Source: Bloomberg
10

“Emageon 2.0”
We believe this is an opportunistic response, filed late in the proxy
contest – no explanation provided to shareholders, lacks articulated
targets and objectives
No information is disclosed to shareholders about proposed sources
of financing, or dilutive effects on existing holders
11

The OPP Platform
OPP believes that Shareholders need urgent representation:
Loss of confidence in current Board by investors, as evidenced by the discounted valuation
The failure by the current management and Board to articulate any vision for the Company’s
future suggests they are either unwilling or unable to address the strategic issues that now
demand resolution.
Continued ‘pay for failure’ – after he presided over an 84% decline in market value in the
preceding year, the Board granted Charles Jett 100,000 options (and 25,000 RSU’s) in
February 2008
After a full year of discussing shareholder representation with us, the current Board has re-
nominated all incumbents
Although they will only occupy a minority of the Board, if elected, the OPP nominees
possess the ownership interest and motivation to single-mindedly pursue the best
outcome for the Company, its customers and employees above any other agenda
12

OPP Benefits to shareholders
Immediate benefits to shareholders by restoring direct shareholder representation and
credibility
Demonstrated record of Board participation and an established history for negotiating
shareholder Board representations
CMVT – Comverse Technologies, Inc.
Gus Oliver is a director of this $3.8 billion market capitalization provider of telecommunications software and
services.
OPP has 1,693,307 shares (1% position)
COHR – Coherent, Inc.
Clifford Press is a director of this $770 million market capitalization manufacturer of laser based photonic products.
OPP has 2,604,089 shares (11% position)
PNX – Phoenix Companies
Gus Oliver is a director of this $1.1 billion provider of life insurance annuities and investment products.
OPP has 5,688,206 shares (5% position)
In our view, direct shareholder representation on the Emageon Board will be a significant improvement:
13

OPP Nominees
Gus Oliver - Gus is a graduate of Yale University and American University Law School. He began his career as a lawyer
with Skadden, Arps, Slate, Meagher & Flom, becoming a partner in 1983. In 1984, he became a partner of the investment firm
Gollust, Tierney and Oliver and its principal investment partnership, Coniston Partners, which engaged in the same investment
strategy as Oliver Press. Since 1999, he has been a partner of WaterView Advisors, the investment manager for two
companion private equity investment partnerships. Gus is currently a director of Scholastic Corp., Comverse Technology, Inc.
and The Phoenix Companies, Inc. He is also a director of Lincoln Center Theater
Clifford Press - Clifford has been a managing member of Oliver Press Partners, LLC, an investment advisory firm, since
March 2005. Prior to 1986 he was employed as an investment banker at Morgan Stanley & Co., Incorporated. From 1986 to
March 2003, Clifford was a General Partner of Hyde Park Holdings, Inc., a private equity investment firm ("HPH"). Clifford is
currently a director of Coherent, Inc., and a director of GM Network Ltd., a private holding company. Clifford received his MA
degree from Oxford University and an MBA degree from Harvard Business School.
Benner Ulrich - Benner has been a Principal and director of research of Oliver Press Partners, LLC, an investment
advisory firm, since March 2007. He has over 7 years of analytical experience focused on various healthcare sectors. From
2000 to 2007, Benner worked at UBS Investment Bank in the healthcare group, most recently as a director covering medical
technology companies. Benner is a graduate of Lehigh University.
14

Appendix 1
15
| |  | | SOFTWARE |
| |
| | | | Bear, Stearns & Co. Inc. – U.S. Equity Research |
| | May 30, 2008 | | |
| | | | | |
| | Sector | Rating | | | Software Sector Consolidation Weekly Refresh (Week 22 - 2008):
What Price Is Right? SOFTWARE SECTOR CONSOLIDATION LIKELY TO CONTINUE. We believe that consolidation within the software industry will continue at an accelerated rate. The primary goal of this note is to identify likely financial (versus strategic) acquisitions in the software sector and their respective takeout values. We have focused on the value of maintenance revenue and organic, federal NOLs. THIS WEEKLY NOTE FOLLOWS A SERIES OF PREVIOUS NOTES ON SOFTWARE CONSOLIDATION (the first published March 22, 2005 and a full report dated August 2007) and provides investors with the latest updated values for maintenance revenue and enterprise values for 103 software companies. For financial acquisitions, we calculate implied logical take-out multiples at 3.5x-5.1x on an adjusted EV/Maintenance basis. The following companies fall within or below this range, have over $150M market cap, and have an average trading volume of greater than 200,000: VIGN, LAVA, OPTV, ENTU, INTV, ITWO, NOVL, CHRD, SNWL, CDNS, ACIW, MSCS, VTAL, MENT, ACTU, JDAS, IWOV, JKHY, SPRT, PFWD, TLEO, PMTC, ININ, LWSN, WIND, SNPS, RNOW, EPIC, SPSS, QSFT, CA, MSTR, and CPWR. CHANGES FROM LAST WEEK: ARBA was deleted because it appreciated above the 3.5-5.1x EV/Maintenance. WE CURRENTLY RATE THE SOFTWARE SECTOR MARKET WEIGHT. However, we believe that a consolidation play at the low end may be a logical long strategy at this time.
|
| | Software | Market Weight | | |
| | | | | | |
| | Companies Covered | | |
| | Company | Cl. Price | Rtg | | |
| | ANSYS, Inc. | $47.30 | O | | |
| | Autodesk, Inc. | $41.16 | O | | |
| | BMC Software | $40.10 | U | | |
| | CA Inc. | $26.54 | P | | |
| | Citrix Systems Inc. | $34.23 | P | | |
| | McAfee, Inc. | $36.25 | O | | |
| | Microsoft Corp. | $28.32 | P | | |
| | Oracle Corporation | $22.84 | O | | |
| | Parametric Technology | $18.78 | O | | |
| | Corp. | | | | |
| | Symantec Corp. | $21.73 | P | | |
| | Tibco Software, Inc. | $7.72 | P | | |
| | VMware Inc. | $68.67 | O | | |
| | O=Outperform; P=Peer Perform; U=Underperform | |
| | Securities in this report priced as of: | |
| | May 30, 2008 16:00ET | |
| | | | | | |
| | | | | | |
| | | | | | |
| | | | | | | |
| | | | | | | |
| | | | | | | |
| | | | | | | |
| | | | | | | |
| | | | | | | |
| | | | | | | |
| | | | | | | |
| | | | | | | |
| | | | | | | |
| | | | | | | |
| | | | | |
| | Equity Research Analyst(s) | | | | | |
| | | | | | |
| | John DiFucci | | | | | |
| | 212-272-0171 | | | | | |
| | jdifucci@bear.com | | | | | |
| | Andrew Matorin | | | | | |
| | 212-272-5998 | | | | | |
| | amatorin@bear.com | | | | | |
| | Nathan Zhou | | | | | |
| | 212-272-9412 | | | | | |
| | nzhou@bear.com | | | | | |
| | | | | | | |
| | | | | | | |
| | | | | | | |
| | | | | | | |
† All numbers are after stock-based compensation expense, normalized consistent with BSC option expense policy.
Bear Stearns does and seeks to do business with companies covered in its research reports. As a result investors should be aware that the firm may have a conflict of interest that could affect the objectivity of this report. Customers of Bear Stearns in the United States can receive independent, third-party research on the company or companies covered in this report, at no cost to them, where such research is available. Customers can access this independent research at www.bearstearns.com/independentresearch or can call (800) 517-2327 to request a copy of this research. Investors should consider this report as only a single factor in making their investment decision.
PLEASE REFER TO PAGE 8 OF THIS REPORT FOR IMPORTANT DISCLOSURES AND ANALYST CERTIFICATION
BEAR, STEARNS & CO. INC. 383 MADISON AVENUE NEW YORK, NY 10179 (212) 272-2000 WWW.BEARSTEARNS.COM
| Exhibit 1. “Adjusted” Maintenance Valuation Matrix for Software Companies, Sorted According to EV/Adjusted Maintenance (LTM) |
| | | | | | | | | | Price | | | Software | | | Shares | | | Market | | | 52Wk. | | | Ent | | | NPV of "Organic" | | Adjusted Ent | | Revenue* | | | EV/Revenue | | | Mtn | | | EV/Mtn | | | Adj. EV/Mtn |
| | Company | | Symbol | | | Rating | | | 05/30/08 | | | Segment | | | Outstg | | | Cap | | | Avg. Vol. | | | Value | | | NOLs | | Value | | LTM+ | | | 2008E | | | LTM+ | | | LTM+ | | | LTM+ | | | LTM+ |
| | ActivIdentity | | ACTI | | | NR | | | $ | 2.84 | | | Security | | | 45.8 | | | 130.0 | | | 0.103 | | | 13.3 | | | 16.2 | | (2.9) | | 59.1 | | | 64.7 | | | 0.2 | | | 20.7 | | | 0.6 | | | (0.1 | ) |
| | Merge Technologies 2, 20 | MRGE | | NR | | $ | 0.69 | | Health Care | | 33.9 | | 23.4 | | 0.263 | | 7.1 | | 3.7 | 3.5 | 57.4 | | 56.6 | | 0.1 | | 22.5 | | 0.3 | | 0.2 | |
| | Emageon 2 | EMAG | | NR | | $ | 2.30 | | Health Care | | 21.5 | | 49.3 | | 0.219 | | 31.1 | | 7.7 | 23.4 | 96.5 | | 83.5 | | 0.3 | | 53.0 | | 0.6 | | 0.4 | |
| | Borland | BORL | | NR | | $ | 1.41 | | App / Infra Dev | | 72.8 | | 102.6 | | 0.784 | | 111.5 | | 16.1 | 95.4 | 256.1 | | 221.7 | | 0.4 | | 100.2 | | 1.1 | | 1.0 | |
| | SoftBrands | SBN | | NR | | $ | 1.12 | | Application | | 41.8 | | 46.8 | | 0.051 | | 58.3 | | 5.1 | 53.2 | 92.9 | | 103.4 | | 0.6 | | 54.9 | | 1.1 | | 1.0 | |
| | Kana Software 11 | KANA | | NR | | $ | 1.50 | | Application | | 41.2 | | 61.8 | | 0.105 | | 59.1 | | 9.7 | 49.4 | 66.0 | | 72.1 | | 0.9 | | 45.9 | | 1.3 | | 1.1 | |
| | Vignette | VIGN | | NR | | $ | 12.95 | | Content Management | | 24.4 | | 315.6 | | 0.243 | | 141.2 | | 49.4 | 91.8 | 189.0 | | 192.7 | | 0.7 | | 83.3 | | 1.7 | | 1.1 | |
| | Tumbleweed Communications 2 | TMWD | | NR | | $ | 1.85 | | Messaging & Comm | | 51.2 | | 94.6 | | 0.136 | | 66.1 | | 14.8 | 51.3 | 57.7 | | 61.5 | | 1.1 | | 32.7 | | 2.0 | | 1.6 | |
| | QAD 19 | QADI | | NR | | $ | 7.66 | | Application | | 31.9 | | 244.3 | | 0.066 | | 216.0 | | 1.9 | 214.1 | 262.7 | | 280.0 | | 0.8 | | 133.2 | | 1.6 | | 1.6 | |
| | Magma Design Automation 6 | LAVA | | NR | | $ | 7.55 | | Engineering | | 42.3 | | 319.1 | | 0.542 | | 315.3 | | 26.4 | 288.9 | 198.9 | | 219.8 | | 1.6 | | 174.6 | | 1.8 | | 1.7 | |
| | SumTotal Systems 1,5 | SUMT | | NR | | $ | 4.65 | | Education & Training | | 32.5 | | 151.0 | | 0.146 | | 109.2 | | NA | 109.2 | 128.9 | | 135.4 | | 0.8 | | 64.1 | | 1.7 | | 1.7 | |
| | OpenTV 2 | OPTV | | NR | | $ | 1.47 | | Messaging & Comm | | 140.5 | | 206.5 | | 0.688 | | 110.5 | | 32.3 | 78.2 | 118.7 | | 111.5 | | 0.9 | | 41.9 | | 2.6 | | 1.9 | |
| | Retalix 5, 10 | RTLX | | NR | | $ | 15.20 | | Supply Chain | | 20.1 | | 305.6 | | 0.030 | | 272.2 | | 3.1 | 269.1 | 222.6 | | 229.8 | | 1.2 | | 144.0 | | 1.9 | | 1.9 | |
| | Entrust 17 | ENTU | | NR | | $ | 2.80 | | Security | | 61.2 | | 171.3 | | 0.364 | | 148.3 | | 26.8 | 121.5 | 100.9 | | 108.1 | | 1.5 | | 64.0 | | 2.3 | | 1.9 | |
| | IONA | IONA | | NR | | $ | 3.62 | | Integration | | 36.6 | | 132.6 | | 0.118 | | 77.6 | | 12.1 | 65.5 | 78.5 | | 78.1 | | 1.0 | | 32.9 | | 2.4 | | 2.0 | |
| | Intervoice 5 | INTV | | NR | | $ | 6.46 | | Messaging & Comm | | 39.4 | | 254.6 | | 0.322 | | 215.9 | | 0.5 | 215.5 | 202.4 | | 217.8 | | 1.1 | | 105.5 | | 2.0 | | 2.0 | |
| | Bottomline Technologies 5 | EPAY | | NR | | $ | 9.95 | | Fin / Legal / Gov't | | 23.9 | | 238.1 | | 0.149 | | 161.1 | | NA | 161.1 | 127.6 | | 140.0 | | 1.3 | | 78.7 | | 2.0 | | 2.0 | |
| | Kintera | KNTA | | NR | | $ | 1.08 | | Application | | 40.2 | | 43.5 | | 0.048 | | 41.0 | | NA | 41.0 | 43.1 | | 43.1 | | 1.0 | | 19.6 | | 2.1 | | 2.1 | |
| | Saba Software | SABA | | NR | | $ | 3.82 | | Education & Training | | 29.4 | | 112.2 | | 0.096 | | 98.5 | | 17.6 | 81.0 | 105.2 | | 113.3 | | 0.9 | | 34.6 | | 2.8 | | 2.3 | |
| | Unica | UNCA | | NR | | $ | 8.40 | | Application | | 20.4 | | 171.4 | | 0.092 | | 130.3 | | 0.0 | 130.3 | 111.4 | | 128.1 | | 1.2 | | 54.9 | | 2.4 | | 2.4 | |
| | i2 Technologies | ITWO | | NR | | $ | 12.00 | | Supply Chain | | 26.4 | | 317.3 | | 0.247 | | 270.3 | | 49.7 | 220.6 | 257.3 | | 254.4 | | 1.1 | | 88.5 | | 3.1 | | 2.5 | |
| | Novell | NOVL | | NR | | $ | 7.08 | | Operating Systems | | 354.3 | | 2,508.4 | | 4.505 | | 1,514.9 | | 23.9 | 1,491.0 | 948.3 | | 968.3 | | 1.6 | | 552.4 | | 2.7 | | 2.7 | |
| | Chordiant Software 2, 22 | CHRD | | NR | | $ | 6.42 | | Application | | 33.1 | | 212.3 | | 0.566 | | 143.5 | | 25.2 | 118.3 | 122.7 | | 114.6 | | 1.2 | | 40.5 | | 3.5 | | 2.9 | |
| | Sonicwall 5 | SNWL | | NR | | $ | 8.00 | | Security | | 61.0 | | 487.9 | | 0.678 | | 285.4 | | 0.6 | 284.7 | 209.4 | | 228.9 | | 1.4 | | 97.4 | | 2.9 | | 2.9 | |
| | Cadence Design Systems 13 | CDNS | | NR | | $ | 11.62 | | Engineering | | 262.8 | | 3,054.0 | | 4.319 | | 2,947.7 | | 4.7 | 2,943.0 | 1,537.0 | | 1,505.8 | | 1.9 | | 1,002.0 | | 2.9 | | 2.9 | |
| | Opnet | OPNT | | NR | | $ | 9.45 | | NSM | | 20.2 | | 190.9 | | 0.080 | | 105.1 | | NA | 105.1 | 101.3 | | 115.3 | | 1.0 | | 34.8 | | 3.0 | | 3.0 | |
| | ACI Worldwide 5 | ACIW | | NR | | $ | 17.41 | | Fin / Legal / Gov't | | 35.2 | | 612.2 | | 0.488 | | 578.6 | | 1.0 | 577.6 | 376.9 | | 401.6 | | 1.5 | | 190.7 | | 3.0 | | 3.0 | |
| | MSC.Software | MSCS | | NR | | $ | 12.37 | | Engineering | | 44.8 | | 553.6 | | 0.256 | | 412.5 | | 6.9 | 405.6 | 250.2 | | 258.1 | | 1.6 | | 125.9 | | 3.3 | | 3.2 | |
| | Vital Images 8 | VTAL | | NR | | $ | 15.45 | | Health Care | | 17.1 | | 263.8 | | 0.344 | | 84.9 | | 5.6 | 79.3 | 66.7 | | 69.0 | | 1.3 | | 23.5 | | 3.6 | | 3.4 | |
| | Mentor Graphics 2 | MENT | | NR | | $ | 11.65 | | Engineering | | 90.8 | | 1,057.2 | | 1.586 | | 1,126.5 | | 14.2 | 1,112.2 | 864.4 | | 902.3 | | 1.3 | | 324.4 | | 3.5 | | 3.4 | |
| | American Software | AMSWA | | NR | | $ | 6.54 | | Supply Chain | | 26.4 | | 173.0 | | 0.139 | | 98.1 | | 1.2 | 96.9 | 89.9 | | 95.6 | | 1.1 | | 27.8 | | 3.5 | | 3.5 | |
| | Actuate | ACTU | | NR | | $ | 4.96 | | Business Intelligence | | 67.3 | | 333.7 | | 0.599 | | 260.9 | | NA | 260.9 | 138.2 | | 137.7 | | 1.9 | | 72.9 | | 3.6 | | 3.6 | |
| | JDA Software | JDAS | | NR | | $ | 20.40 | | Supply Chain | | 35.1 | | 715.7 | | 0.390 | | 699.9 | | NA | 699.9 | 376.7 | | 384.5 | | 1.9 | | 179.5 | | 3.9 | | 3.9 | |
| | Interwoven | IWOV | | NR | | $ | 13.41 | | Content Management | | 46.7 | | 626.5 | | 0.411 | | 453.1 | | 61.9 | 391.3 | 234.4 | | 257.1 | | 1.9 | | 99.2 | | 4.6 | | 3.9 | |
| | Jack Henry & Associates 2,4 | JKHY | | NR | | $ | 23.80 | | Fin / Legal / Gov't | | 88.9 | | 2,116.0 | | 0.742 | | 2,159.6 | | 0.0 | 2,159.6 | 736.8 | | 791.9 | | 2.9 | | 547.2 | | 3.9 | | 3.9 | |
| | SupportSoft | SPRT | | NR | | $ | 3.73 | | NSM | | 46.2 | | 172.1 | | 0.201 | | 64.8 | | NA | 64.8 | 49.0 | | 50.7 | | 1.3 | | 16.2 | | 4.0 | | 4.0 | |
| | Progress | PRGS | | NR | | $ | 31.14 | | App / Infra Dev | | 44.2 | | 1,375.6 | | 0.274 | | 1,057.8 | | 10.2 | 1,047.6 | 499.8 | | 525.0 | | 2.1 | | 258.3 | | 4.1 | | 4.1 | |
| | Phase Forward 5 | PFWD | | NR | | $ | 17.34 | | Content Management | | 43.7 | | 758.4 | | 0.429 | | 559.2 | | 18.0 | 541.2 | 142.2 | | 168.3 | | 3.9 | | 129.2 | | 4.3 | | 4.2 | |
| | Taleo 3 | TLEO | | NR | | $ | 19.79 | | HR & Workforce Mgmt | | 28.9 | | 571.9 | | 0.330 | | 480.3 | | 9.6 | 470.6 | 136.5 | | 157.6 | | 3.5 | | 111.6 | | 4.3 | | 4.2 | |
| | PTC 21 | PMTC | | O | | $ | 18.78 | | Engineering | | 117.2 | | 2,201.9 | | 1.804 | | 2,107.4 | | 70.9 | 2,036.5 | 1,042.3 | | 1,089.9 | | 2.0 | | 481.1 | | 4.4 | | 4.2 | |
| | Interactive Intelligence 9 | ININ | | NR | | $ | 13.03 | | Messaging & Comm | | 19.2 | | 250.4 | | 0.229 | | 200.9 | | 12.5 | 188.4 | 115.1 | | 132.3 | | 1.7 | | 43.9 | | 4.6 | | 4.3 | |
| | Lawson Software | LWSN | | NR | | $ | 8.72 | | Application | | 178.8 | | 1,559.2 | | 2.351 | | 1,421.0 | | NA | 1,421.0 | 810.1 | | 879.2 | | 1.8 | | 325.6 | | 4.4 | | 4.4 | |
| | Wind River Systems 3 | WIND | | NR | | $ | 10.82 | | Operating Systems | | 87.4 | | 945.7 | | 0.885 | | 701.5 | | 21.2 | 680.4 | 328.6 | | 375.4 | | 2.1 | | 155.7 | | 4.5 | | 4.4 | |
| | Synopsys, Inc 13 | SNPS | | NR | | $ | 26.35 | | Engineering | | 145.3 | | 3,827.9 | | 1.274 | | 3,010.4 | | 26.0 | 2,984.4 | 1,259.3 | | 1,369.7 | | 2.4 | | 680.4 | | 4.4 | | 4.4 | |
| | RightNow Technologies 1 | RNOW | | NR | | $ | 14.86 | | Application | | 33.5 | | 498.3 | | 0.284 | | 399.4 | | NA | 399.4 | 119.3 | | 139.8 | | 3.3 | | 90.5 | | 4.4 | | 4.4 | |
| | Callidus Software 5 | CALD | | NR | | $ | 6.08 | | HR & Workforce Mgmt | | 29.8 | | 180.9 | | 0.169 | | 138.7 | | NA | 138.7 | 104.9 | | 117.6 | | 1.3 | | 30.8 | | 4.5 | | 4.5 | |
| | Epicor Software | EPIC | | NR | | $ | 8.58 | | Application | | 57.9 | | 496.8 | | 0.754 | | 781.0 | | 19.7 | 761.2 | 456.1 | | 536.1 | | 1.7 | | 167.4 | | 4.7 | | 4.5 | |
| | SPSS | SPSS | | NR | | $ | 39.37 | | Business Intelligence | | 19.2 | | 755.2 | | 0.294 | | 610.6 | | 28.4 | 582.1 | 299.1 | | 315.9 | | 2.0 | | 121.5 | | 5.0 | | 4.8 | |
| | Quest Software | QSFT | | NR | | $ | 17.01 | | NSM | | 106.0 | | 1,803.9 | | 1.020 | | 1,420.4 | | 5.3 | 1,415.1 | 654.0 | | 720.3 | | 2.2 | | 294.5 | | 4.8 | | 4.8 | |
| | CA 1,14 | CA | | P | | $ | 26.54 | | NSM | | 537.0 | | 14,252.0 | | 3.251 | | 14,289.0 | | 157.4 | 14,131.6 | 4,277.0 | | 4,463.4 | | 3.3 | | 2,902.6 | | 4.9 | | 4.9 | |
| | MicroStrategy | MSTR | | NR | | $ | 79.61 | | Business Intelligence | | 12.4 | | 985.7 | | 0.300 | | 885.8 | | 46.0 | 839.8 | 364.9 | | 362.9 | | 2.4 | | 171.3 | | 5.2 | | 4.9 | |
| | Jacada | JCDA | | NR | | $ | 3.71 | | Integration | | 20.6 | | 76.3 | | 0.026 | | 42.5 | | 3.2 | 39.2 | 13.3 | | NA | | 3.2 | | 7.8 | | 5.5 | | 5.0 | |
| | Compuware | | CPWR | | | NR | | | $ | 10.19 | | | App / Infra Dev | | | 268.7 | | | 2,738.4 | | | 4.009 | | | 2,452.0 | | | 0.9 | | 2,451.1 | | 1,229.6 | | | 1,271.8 | | | 2.0 | | | 476.4 | | | 5.1 | | | 5.1 | |
| |
| | Ariba1 | | ARBA | | | NR | | | $ | 14.84 | | | Supply Chain | | | 77.6 | | | 1,152.3 | | | 1.027 | | | 1,057.7 | | | 180.4 | | 877.3 | | 308.6 | | | 345.8 | | | 3.4 | | | 160.9 | | | 6.6 | | | 5.5 | |
| | Open Text | | OTEX | | | NR | | | $ | 35.91 | | | Content Management | | | 52.8 | | | 1,895.7 | | | 0.579 | | | 1,988.3 | | | 45.6 | | 1,942.8 | | 700.5 | | | 739.1 | | | 2.8 | | | 350.7 | | | 5.7 | | | 5.5 | |
| | Tyler | TYL | | NR | | $ | 13.96 | | Fin / Legal / Gov't | | 39.5 | | 551.8 | | 0.256 | | 510.8 | | 0.0 | 510.8 | 228.8 | | 259.7 | | 2.2 | | 90.3 | | 5.7 | | 5.7 | |
| | Deltek | PROJ | | NR | | $ | 10.04 | | Application | | 44.4 | | 445.8 | | 0.133 | | 603.8 | | NA | 603.8 | 280.4 | | 308.3 | | 2.2 | | 106.3 | | 5.7 | | 5.7 | |
| | Sybase | SY | | NR | | $ | 32.02 | | Integration | | 90.8 | | 2,906.7 | | 1.365 | | 2,529.1 | | NA | 2,529.1 | 1,055.6 | | 1,095.8 | | 2.4 | | 432.1 | | 5.9 | | 5.9 | |
| | TIBCO | TIBX | | P | | $ | 7.72 | | Integration | | 190.1 | | 1,467.3 | | 3.416 | | 1,226.8 | | NA | 1,226.8 | 598.3 | | 660.6 | | 2.1 | | 206.9 | | 5.9 | | 5.9 | |
| | Blackboard 5 | BBBB | | NR | | $ | 37.88 | | Education & Training | | 30.2 | | 1,145.8 | | 0.381 | | 1,245.4 | | 12.7 | 1,232.7 | 252.6 | | 313.9 | | 4.9 | | 194.6 | | 6.4 | | 6.3 | |
| | Advent Software 1 | ADVS | | NR | | $ | 42.97 | | Fin / Legal / Gov't | | 28.1 | | 1,206.6 | | 0.326 | | 1,148.6 | | NA | 1,148.6 | 228.8 | | 254.3 | | 5.0 | | 178.1 | | 6.4 | | 6.4 | |
| | The TriZetto Group 5 | TZIX | | NR | | $ | 21.47 | | Health Care | | 60.2 | | 1,293.1 | | 0.755 | | 1,461.2 | | 10.7 | 1,450.5 | 445.1 | | 497.7 | | 3.3 | | 223.5 | | 6.5 | | 6.5 | |
| | BMC Software | BMC | | U | | $ | 40.10 | | NSM | | 194.8 | | 7,811.5 | | 2.312 | | 6,336.3 | | 0.0 | 6,336.3 | 1,731.6 | | 1,883.9 | | 3.7 | | 967.7 | | 6.5 | | 6.5 | |
| | S1 | SONE | | NR | | $ | 6.54 | | Fin / Legal / Gov't | | 57.1 | | 373.4 | | 0.447 | | 311.9 | | NA | 311.9 | 212.0 | | 223.9 | | 1.5 | | 46.8 | | 6.7 | | 6.7 | |
| | Intuit 2 | INTU | | NR | | $ | 28.96 | | Consumer Software | | 333.4 | | 9,656.3 | | 3.495 | | 9,461.9 | | 0.0 | 9,461.9 | 3,025.5 | | 3,170.3 | | 3.1 | | 1,410.6 | | 6.7 | | 6.7 | |
Source: Bear, Stearns & Co. Inc.; FactSet Research Systems Inc.; SEC filings.
| BEAR, STEARNS & CO. INC. 383 MADISON AVENUE NEW YORK, NY 10179 (212) 272-2000 WWW.BEARSTEARNS.COM | | 3 |
| Exhibit 1 (cont’d). “Adjusted” Maintenance Valuation Matrix for Software Companies, Sorted According to EV/Adjusted Maintenance (LTM) |
| | | | | | | | | | Price | | | Software | | | Shares | | | Market | | | 52Wk. | | | Ent | | | NPV of "Organic" | | Adjusted Ent | | Revenue* | | | EV/Revenue | | | Mtn | | | EV/Mtn | | | Adj. EV/Mtn |
| | Company | | Symbol | | | Rating | | | 05/30/08 | | | Segment | | | Outstg | | | Cap | | | Avg. Vol. | | | Value | | | NOLs | | Value | | LTM+ | | | 2008E | | | LTM+ | | | LTM+ | | | LTM+ | | | LTM+ |
| | Moldflow 10 | | MFLO | | | NR | | | $ | 22.01 | | | Engineering | | | 12.1 | | | 265.2 | | | 0.109 | | | 174.7 | | | 0.5 | | 174.2 | | 61.3 | | | NA | | | 2.8 | | | 25.4 | | | 6.9 | | | 6.8 | |
| | McAfee | MFE | | O | | $ | 36.25 | | Security | | 164.9 | | 5,976.4 | | 1.638 | | 4,682.8 | | 0.0 | 4,682.8 | 1,363.0 | | 1,507.8 | | 3.4 | | 660.2 | | 7.1 | | 7.1 | |
| | Aspen Technology | AZPN.PK | | NR | | $ | 14.40 | | Engineering | | 89.0 | | 1,281.5 | | NA | | 1,335.6 | | 44.6 | 1,291.0 | 341.7 | | 379.7 | | 3.9 | | 180.8 | | 7.4 | | 7.1 | |
| | Citrix 18 | CTXS | | P | | $ | 34.23 | | Integration | | 190.0 | | 6,503.3 | | 3.442 | | 5,719.5 | | 3.5 | 5,716.0 | 1,460.9 | | 1,625.8 | | 3.9 | | 792.4 | | 7.2 | | 7.2 | |
| | Symantec | SYMC | | P | | $ | 21.73 | | Security | | 856.7 | | 18,617.1 | | 13.761 | | 18,490.2 | | 0.0 | 18,490.2 | 5,937.2 | | 6,257.2 | | 3.1 | | 2,518.3 | | 7.3 | | 7.3 | |
| | Double-Take Software | DBTK | | NR | | $ | 13.04 | | Storage | | 23.1 | | 301.4 | | 0.288 | | 231.6 | | NA | 231.6 | 87.8 | | 103.0 | | 2.6 | | 31.5 | | 7.3 | | 7.3 | |
| | Commvault 2 | CVLT | | NR | | $ | 17.51 | | Storage | | 45.5 | | 797.5 | | 0.428 | | 705.8 | | 23.3 | 682.5 | 198.3 | | 233.8 | | 3.6 | | 89.3 | | 7.9 | | 7.6 | |
| | Manhattan Associates | MANH | | NR | | $ | 25.40 | | Supply Chain | | 24.9 | | 632.2 | | 0.273 | | 567.8 | | 0.0 | 567.8 | 347.5 | | 375.4 | | 1.6 | | 69.2 | | 8.2 | | 8.2 | |
| | MICROS Systems 4 | MCRS | | NR | | $ | 32.97 | | Business Intelligence | | 83.2 | | 2,742.2 | | 0.843 | | 2,298.8 | | NA | 2,298.8 | 919.2 | | 997.9 | | 2.5 | | 279.1 | | 8.2 | | 8.2 | |
| | Blackbaud 3 | BLKB | | NR | | $ | 23.66 | | Fin / Legal / Gov't | | 44.7 | | 1,056.7 | | 0.349 | | 1,057.0 | | 0.2 | 1,056.9 | 271.3 | | 297.5 | | 3.9 | | 127.0 | | 8.3 | | 8.3 | |
| | Macrovision 2 | MVSND | | NR | | $ | 13.53 | | Content Management | | 54.1 | | 731.7 | | 1.085 | | 526.1 | | NA | 526.1 | 151.3 | | 610.8 | | 3.5 | | 63.1 | | 8.3 | | 8.3 | |
| | Avid Technology 7 | AVID | | NR | | $ | 21.46 | | Multimedia | | 39.4 | | 844.7 | | 0.547 | | 694.3 | | 39.2 | 655.1 | 908.9 | | 881.1 | | 0.8 | | 76.3 | | 9.1 | | 8.6 | |
| | Cerner 3 | CERN | | P | | $ | 45.37 | | Health Care | | 83.5 | | 3,789.7 | | 0.743 | | 3,629.4 | | 0.0 | 3,629.4 | 1,539.1 | | 1,660.8 | | 2.4 | | 411.7 | | 8.8 | | 8.8 | |
| | Pegasystems | PEGA | | NR | | $ | 12.32 | | Application | | 37.3 | | 459.7 | | 0.087 | | 298.8 | | 3.5 | 295.3 | 172.9 | | NA | | 1.7 | | 33.0 | | 9.1 | | 9.0 | |
| | CheckPoint 16 | CHKP | | NR | | $ | 24.83 | | Security | | 219.4 | | 5,447.5 | | 1.770 | | 4,128.8 | | 214.6 | 3,914.3 | 758.5 | | 803.0 | | 5.4 | | 419.9 | | 9.8 | | 9.3 | |
| | Art Technology Group | ARTG | | NR | | $ | 3.75 | | App / Infra Dev | | 128.4 | | 481.6 | | 1.201 | | 434.7 | | 37.5 | 397.1 | 144.4 | | 161.8 | | 3.0 | | 42.5 | | 10.2 | | 9.3 | |
| | Infomatica | INFA | | NR | | $ | 18.00 | | Business Intelligence | | 103.7 | | 1,867.1 | | 1.430 | | 1,571.3 | | 6.9 | 1,564.5 | 407.9 | | 458.3 | | 3.9 | | 158.0 | | 9.9 | | 9.9 | |
| | The Ultimate Software Group 5 | ULTI | | NR | | $ | 37.83 | | HR & Workforce Mgmt | | 26.5 | | 1,001.0 | | 0.226 | | 971.8 | | 23.7 | 948.0 | 158.4 | | 189.3 | | 6.1 | | 93.2 | | 10.4 | | 10.2 | |
| | Red Hat 1,3 | RHT | | NR | | $ | 24.36 | | Operating Systems | | 220.4 | | 5,367.9 | | 2.326 | | 4,606.0 | | NA | 4,606.0 | 523.0 | | 630.1 | | 8.8 | | 449.8 | | 10.2 | | 10.2 | |
| | SAP | SAP | | NR | | $ | 54.60 | | Application | | 1,197.0 | | 65,356.2 | | 2.376 | | 61,407.8 | | 0.0 | 61,407.8 | 14,180.8 | | 18,743.5 | | 4.3 | | 5,955.9 | | 10.3 | | 10.3 | |
| | Concur Technologies 1,3 | CNQR | | NR | | $ | 36.67 | | Application | | 47.3 | | 1,736.3 | | 0.640 | | 1,751.1 | | 78.8 | 1,672.2 | 172.0 | | 222.2 | | 10.2 | | 160.0 | | 10.9 | | 10.5 | |
| | Salesforce.com 1,3 | CRM | | NR | | $ | 72.31 | | Application | | 124.4 | | 8,996.4 | | 1.836 | | 8,245.7 | | 47.9 | 8,197.9 | 833.9 | | 1,074.0 | | 9.9 | | 758.2 | | 10.9 | | 10.8 | |
| | Oracle | ORCL | | O | | $ | 22.84 | | App / Infra Dev | | 5,235.0 | | 119,567.4 | | 36.528 | | 115,299.4 | | NA | 115,299.4 | 21,211.0 | | 23,483.8 | | 5.4 | | 9,962.0 | | 11.6 | | 11.6 | |
| | Guidance Software | GUID | | NR | | $ | 9.99 | | Fin / Legal / Gov't | | 23.1 | | 230.6 | | 0.075 | | 195.0 | | 0.1 | 194.9 | 83.0 | | 97.6 | | 2.4 | | 14.6 | | 13.3 | | 13.3 | |
| | ANSYS 1 | ANSS | | O | | $ | 47.30 | | Engineering | | 81.6 | | 3,861.7 | | 0.774 | | 3,708.7 | | 10.2 | 3,698.5 | 407.0 | | 459.0 | | 9.1 | | 271.4 | | 13.7 | | 13.6 | |
| | Autodesk | ADSK | | O | | $ | 41.16 | | Engineering | | 232.6 | | 9,573.8 | | 3.453 | | 8,663.5 | | 127.7 | 8,535.8 | 2,262.1 | | 2,481.5 | | 3.8 | | 594.6 | | 14.6 | | 14.4 | |
| | F5 Networks 10 | FFIV | | NR | | $ | 30.05 | | Networking | | 83.8 | | 2,518.3 | | 2.549 | | 2,068.6 | | 3.7 | 2,064.9 | 591.4 | | 664.2 | | 3.5 | | 139.6 | | 14.8 | | 14.8 | |
| | Quality Systems | QSII | | NR | | $ | 32.93 | | Health Care | | 27.7 | | 912.0 | | 0.339 | | 833.6 | | 0.0 | 833.6 | 180.4 | | 214.1 | | 4.6 | | 52.7 | | 15.8 | | 15.8 | |
| | Ansoft 2 | ANST | | NR | | $ | 36.48 | | Engineering | | 25.0 | | 913.3 | | 0.286 | | 838.1 | | 0.4 | 837.7 | 103.4 | | 111.8 | | 8.1 | | 42.2 | | 19.9 | | 19.9 | |
| | Falconstor | FALC | | NR | | $ | 8.94 | | Storage | | 51.7 | | 462.1 | | 0.509 | | 405.3 | | 7.0 | 398.3 | 82.9 | | 103.1 | | 4.9 | | 19.4 | | 20.9 | | 20.5 | |
| | Riverbed Technology 2 | RVBD | | NR | | $ | 17.95 | | Networking | | 74.0 | | 1,327.6 | | 2.063 | | 1,058.5 | | 10.0 | 1,048.5 | 266.6 | | 321.3 | | 4.0 | | 46.7 | | 22.7 | | 22.4 | |
| | Nuance Communications | NUAN | | NR | | $ | 19.72 | | Messaging & Comm | | 206.3 | | 4,069.2 | | 3.042 | | 4,619.0 | | NA | 4,619.0 | 734.8 | | 975.3 | | 6.3 | | 137.5 | | 33.6 | | 33.6 | |
| | ANTs Software | ANTS | | NR | | $ | 1.10 | | App / Infra Dev | | 57.8 | | 63.6 | | 0.032 | | 70.7 | | 8.4 | 62.2 | 0.3 | | NA | | NM | | 0.1 | | NM | | NM | |
| | Adobe | ADBE | | NR | | $ | 44.06 | | Consumer Software | | 571.3 | | 25,169.7 | | 7.554 | | 23,697.2 | | 0.0 | 23,697.2 | 3,398.9 | | 3,587.9 | | 7.0 | | NA | | NA | | NM | |
| | Microsoft | MSFT | | P | | $ | 28.32 | | Operating Systems | | 9,428.0 | | 267,001.0 | | 71.337 | | 240,660.0 | | 0.0 | 240,660.0 | 57,954.0 | | 63,524.3 | | 4.2 | | NA | | NA | | NM | |
| | Secure Computing | SCUR | | NR | | $ | 5.33 | | Security | | 67.4 | | 359.3 | | 0.813 | | 377.2 | | 37.5 | 339.7 | 244.8 | | 273.6 | | 1.5 | | NA | | NA | | NM | |
| | Verisign | VRSN | | NR | | $ | 40.04 | | Security | | 210.5 | | 8,427.3 | | 4.436 | | 9,233.5 | | 67.0 | 9,166.5 | 1,522.1 | | 946.4 | | 6.1 | | NA | | NA | | NM | |
| | VMware 20 | VMW | | O | | $ | 68.67 | | NSM | | 398.1 | | 27,335.0 | | 3.395 | | 26,479.0 | | 0.0 | 26,479.0 | 1,505.3 | | 1,997.1 | | 17.6 | | 374.5 | | NM | | NM | |
Ratings Key: O=Outperform, P=Peer Perform, U=Underperform, NR=Not Rated.
* Calendarized Revenue and EPS Estimates
+ LTM numbers as of calendar first quarter of 2008, where available
1. Maintenance includes license component
2. Maintenance includes prof. services component
3. Maintenance included in license revenue due to subscription model
4. Includes maintenance on hardware
5. Maintenance includes all recurring revenue
6. Maintenance revenue is taken from backlog revenue
7. Maintenance estimated at 60% of combined services revenue
8. Maintenance estimated at 72% of combined maintenance and services revenue
9. Maintenance estimated at 80% of combined services revenue
10. Maintenance estimated at 85% of combined services revenue
11. Maintenance estimated at 87% of combined services revenue
12. Maintenance includes 50% of license revenue to account for term licenses
13. Maintenance includes 60% of license revenue to account for term licenses
14. Maintenance for CA assumes 75% of subscription revenue is maintenance (25% the equivalent of license revenue)
15. Company is not current in its filings with the SEC. Numbers based on most recent available data.
16. Maintenance includes 100% of software subscriptions and an estimated 90% of support, training, and consulting is renewable support contracts.
17. Recurring revenue estimated at 66% of services line for maintenance contracts and $12M LTM revenue for renewable ssl license revenue
18. Includes 50% of Technical Services & 100% of Online Services
19. Includes 3% of license revenue which represents estimated renewable software subscriptions
20. Maintenance estimated at 75% of the combined service revenue
21. PTC LTM revenue and LTM maintenance revenue numbers are normalized to account for the CoCreate acquisition.
22. Maintenance estimated at 50% of combined services revenue
Source: Bear, Stearns & Co. Inc.; SEC filings; FactSet Research Systems Inc.; Bloomberg.
| BEAR, STEARNS & CO. INC. 383 MADISON AVENUE NEW YORK, NY 10179 (212) 272-2000 WWW.BEARSTEARNS.COM | | 4 |