Confidential
Presentation to the
Board of Directors Regarding
Project MELODY
Strategic Alternatives Analysis
December, 2011
Confidential Important Information
Important Information
Confidential Material Presented to the Special Committee of the Board of Directors of MELODY
The following pages contain material that was prepared by William Blair & Company, L.L.C. (“William Blair”) and provided to the Special Committee of the Board of Directors of MELODY (the “Company”) in connection with their consideration of a potential business combination between the Company and an affiliate to Mr. Yingjie Gao and certain members of the management. The accompanying material was compiled or prepared on a confidential basis for use by the Special Committee of the Board of Directors and not with a view toward public disclosure. The information utilized in preparing this presentation was obtained from the Company and other public sources. Any estimates and projections for the Company contained herein have been prepared by or approved by senior management, or based upon such estimates and projections, and involve numerous and significant subjective determination, which may or may not prove to be correct. No representation or warranty, express or implied, is made as to the accuracy or completeness of such information and nothing contained herein is, or shall be relied upon as, a representation, whether as to the past or the future. Because this material was prepared for use in the context of an oral presentation to the Special Committee of the Board of Directors, which is familiar with the business and affairs of the Company, neither the Company nor William Blair nor any of their respective legal or financial advisors or accountants take any responsibility for the accuracy or completeness of any of the material if used by persons other than the Special Committee of the Board of Directors of the Company. Neither the Company nor William Blair undertakes any obligation to update or otherwise revise the accompanying materials. This presentation does not constitute an opinion and William Blair’s only opinion is the opinion that is to be rendered to the Special Committee of the Board of Directors of the Company.
1
Confidential Table of Contents
Table of Contents
I. Executive Summary
II. MELODY Business Overview III. MELODY Situation Overview IV. Valuation Analysis A. Summary of Transaction
B. Selected Public Companies Analysis C. Selected M&A Transactions Analysis D. Discounted Cash Flow Analysis E. Leveraged Buyout Analysis
F. Premiums Paid Analysis Appendix A. Supporting Financial Schedules
2
Confidential
Executive Summary
Confidential Executive Summary
Background
William Blair has been retained by the Special Committee of the Board of Directors of MELODY to provide certain analysis (the “Analysis”). This Analysis includes a review of the following:
Financial review of the Company: Historical financial performance Forecasted financial performance Preliminary valuation parameters
2
Confidential Executive Summary
Scope of Review and Analysis
In connection with this Analysis, Blair familiarized itself, to the extent it deemed appropriate, with the business, operations, financial condition and prospects of the Company Blair examined and relied upon information from several sources: Visited the Company’s headquarters in Shenzhen, Peoples Republic of China; Discussions with senior management regarding the Company’s historical financial results, current business operations and forecasted financial performance; Certain audited historical financial statements of the Company for the fiscal years ended December 2005 through December 2010; The unaudited financial statements of the Company for the nine months ended September 2010 and September 2011; Certain internal business, operating and financial information and forecasts for the years ended December 2011 through December 2016 (the “Forecasts”), prepared by the senior management of the Company; Financial terms of certain other transactions we deemed relevant and who’s information is publicly available; The financial position and operating results of the Company compared with those of certain other publicly traded companies we deemed relevant; Selected industry research and market analysis; Current and historical market prices and trading volumes of the Company common stock; and Certain other publicly available information relating to the Company Blair relied on the information furnished by the Company (and information available from public sources and other sources deemed reliable by Blair) without assuming any duty of independent verification thereof or independent appraisal of any of the assets of the Company Blair does not assume responsibility for the accuracy or completeness of the information or any other information regarding the Company Blair expressed no opinion with respect to the Company’s Forecasts or the estimates and judgments on which they are based
3
Confidential Executive Summary
Key Assumptions Underlying Our Review and Analysis
All information made available to Blair by the Company with respect to the Analysis was complete and correct in all material respects and that any projections, forecasts or other information provided by the Company to Blair was prepared in good faith and based upon reasonable assumptions The Forecasts examined by us have been reasonably prepared on bases reflecting the best currently available estimates and judgments of the senior management of MELODY, and we have assumed, with your consent, that the Forecasts will be achieved in the amounts and at the times contemplated thereby
4
Confidential Executive Summary
Summary of Valuation Analysis
Blair performed several analyses to assist in the development of its strategic alternatives analysis
Selected Public Companies Analysis
Trading multiple analysis based on companies that William Blair considered relevant
Selected Transaction Analysis
Transaction multiple analysis based on transactions that William Blair considered relevant
Discounted Cash Flow Analysis
Utilized MELODY’s forecasts to derive free cash flows for the Company for 2011E – 2016E. Employed a 11.0% –15.0% range of discount rates to determine the present values of such cash flows. Estimated a terminal value by utilizing 2016E EBITDA exit multiples of 5.3x – 6.3x
Leveraged Acquisition Analysis
Analyzed the purchase prices at which a leveraged acquisition of MELODY could occur based on a target IRR range of 20.0% – 30.0% and 2016E EBITDA exit multiples of 5.3x – 6.3x
M&A Premiums Paid Analysis
Reviewed the premiums derived by comparing the per share equity consideration paid to the trailing one day, one week, one month and 90 days trading prices for 728 public targets with 100% of target equity acquired for all cash and from $25M to $250M in deal size since January 1, 2006
5
Confidential Executive Summary
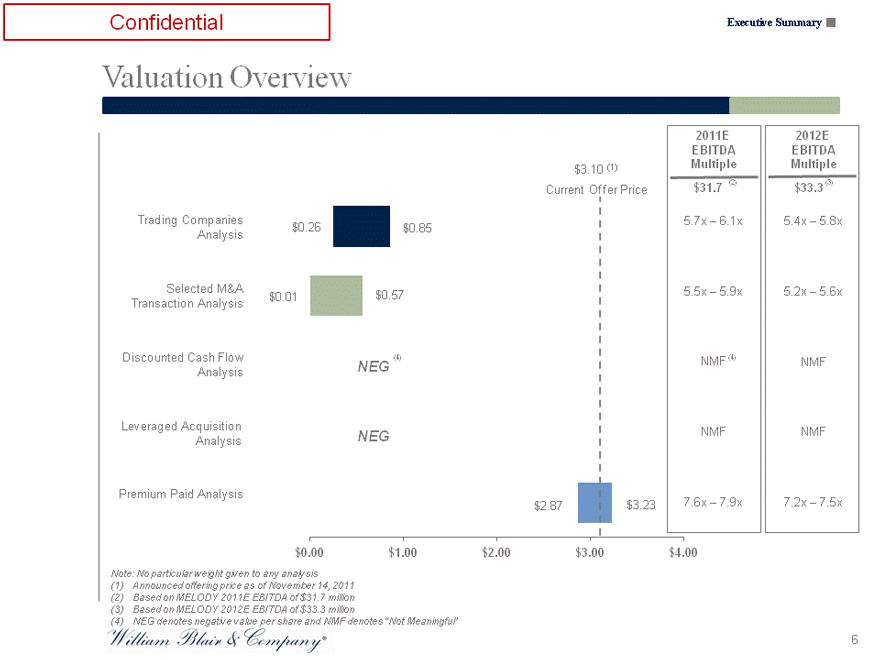
Valuation Overview
Trading Companies
Analysis
Selected M&A
Transaction Analysis
Discounted Cash Flow
Analysis
Leveraged Acquisition
Analysis
Premium Paid Analysis
$0.26
$0.01
$0.85
$0.57
(4)
NEG
NEG
$3.10 (1) Current Offer Price
2011E EBITDA Multiple $31.7 (2)
5.7x – 6.1x 5.5x – 5.9x NMF(4) NMF
2012E EBITDA Multiple
$33.3(3)
5.4x – 5.8x
5.2x – 5.6x NMF
NMF
$2.87 $3.23 7.6x – 7.9x 7.2x – 7.5x
$0.00 $1.00 $2.00 $3.00 $4.00
Note: No particular weight given to any analysis
(1) Announced offering price as of November 14, 2011 (2) Based on MELODY 2011E EBITDA of $31.7 million (3) Based on MELODY 2012E EBITDA of $33.3 million
(4) NEG denotes negative value per share and NMF denotes “Not Meaningful”
6

Confidential
MELODY Business Overview
Confidential
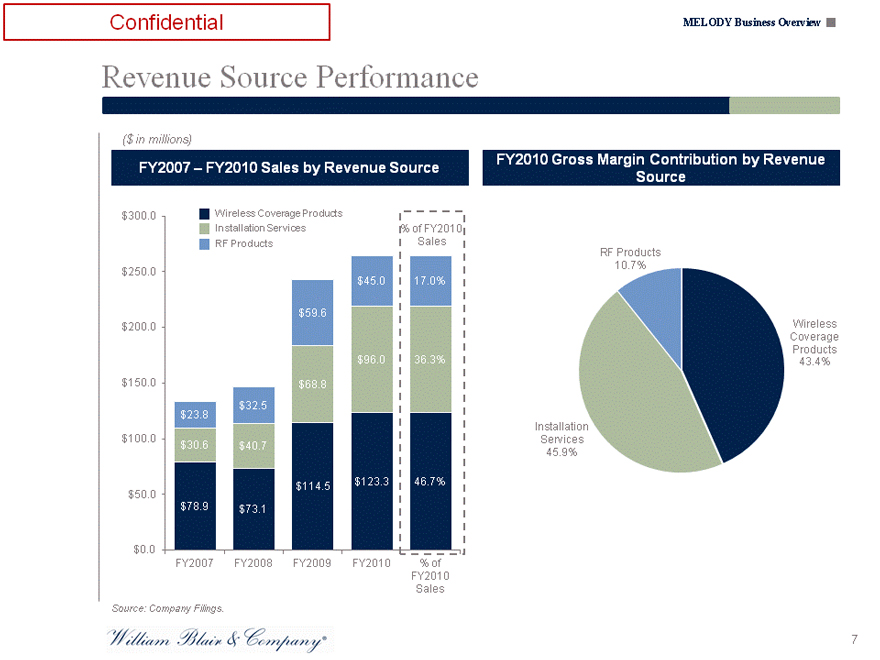
Revenue Source Performance
MELODY Business Overview
($ in millions)
FY2007 – FY2010 Sales by Revenue Source
$300.0 $250.0 $200.0 $150.0 $100.0 $50.0 $0.0
Wireless Coverage Products Installation Services RF Products
$45.0 17.0%
$59.6
$96.0 36.3%
$68.8
$23.8 $32.5
$30.6 $40.7
$114.5 $123.3 46.7%
$78.9 $73.1
% of FY2010 Sales
FY2007 FY2008 FY2009 FY2010 % of FY2010 Sales
Source: Company Filings.
FY2010 Gross Margin Contribution by Revenue Source
RF Products 10.7%
Installation Services 45.9%
Wireless Coverage Products 43.4%
7
Confidential MELODY Business Overview
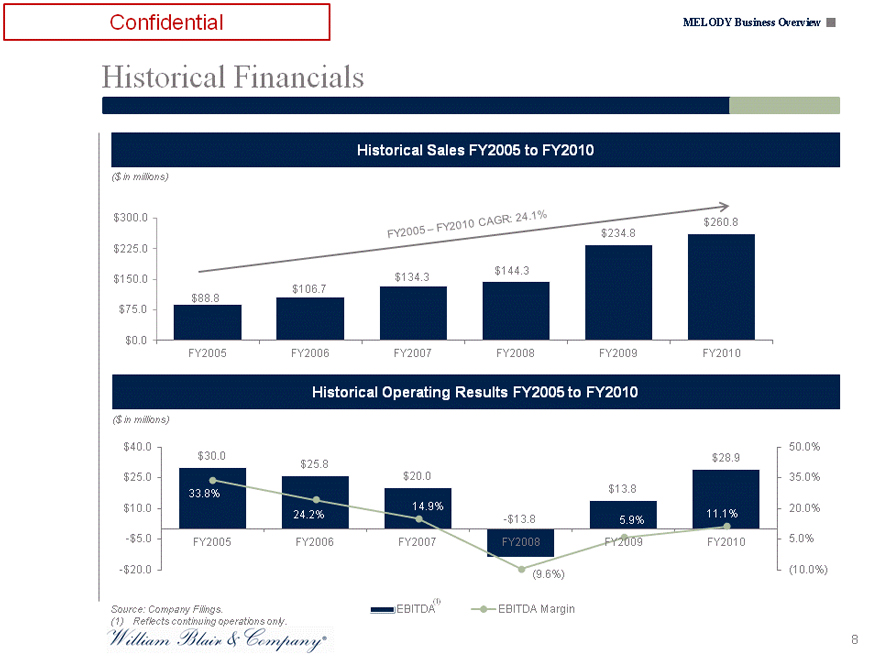
Historical Financials
Historical Sales FY2005 to FY2010
($ in millions)
$300.0 $225.0 $150.0 $75.0 $0.0
$260.8 $234.8
$144.3 $134.3 $106.7
$88.8
FY2005 FY2006 FY2007 FY2008 FY2009 FY2010
Historical Operating Results FY2005 to FY2010
($ in millions)
$40.0 $25.0 $10.0
-$5.0
-$20.0
$30.0 $28.9
$25.8
$20.0
$13.8
33.8%
14.9%
24.2% 11.1%
-$13.8 5.9%
FY2005 FY2006 FY2007 FY2008 FY2009 FY2010
(9.6%)
50.0% 35.0% 20.0% 5.0% (10.0%)
EBITDA (1) EBITDA Margin
Source: Company Filings.
(1) Reflects continuing operations only.
8
Confidential
MELODY Situation Overview
Confidential MELODY Situation Overview
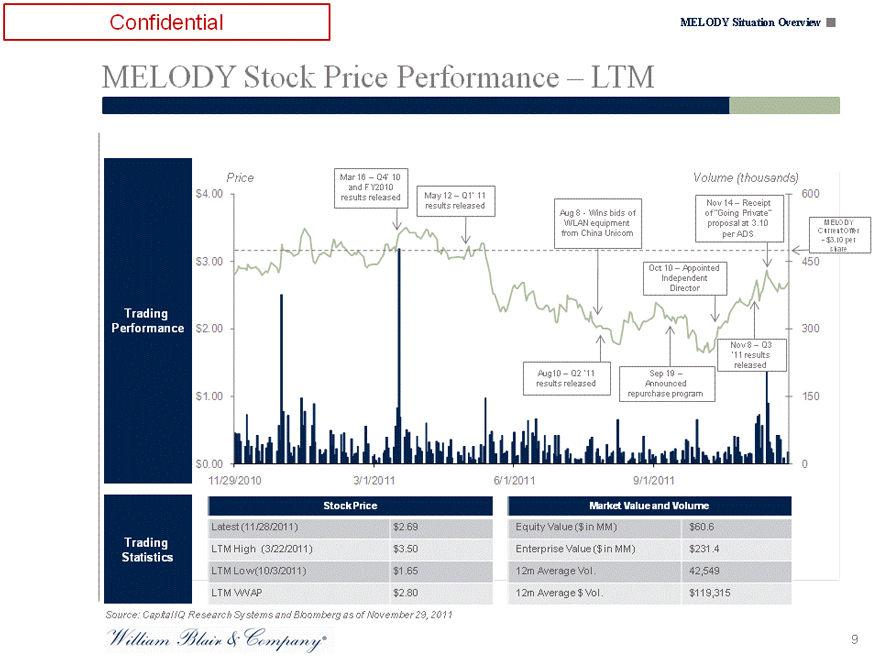
MELODY Stock Price Performance – LTM
Trading Performance
Trading Statistics
Price
Mar 16 – Q4’ 10 Volume (thousands)
and FY2010 results released May 12 – Q1’ 11 600 results released Nov 14 – Receipt Aug 8—Wins bids of of “Going Private”
WLAN equipment proposal at 3.10 MELODY from China Unicom per ADS Current Offer
- $3.10 per share
Oct 10 – Appointed Independent Director
Nov 8 – Q3 ‘11 results Aug10 – Q2 ‘11 Sep 19 – released results released Announced repurchase program
450 300 150
0
11/29/2010 3/1/2011 6/1/2011 9/1/2011
Trading Statistics
11/29/2010 3/1/2011 6/1/2011 9/1/2011
0
Stock Price
Latest (11/28/2011) $2.69 LTM High (3/22/2011) $3.50 LTM Low (10/3/2011) $1.65 LTM VWAP $2.80
Market Value and Volume
Equity Value ($ in MM) $60.6 Enterprise Value ($ in MM) $231.4 12m Average Vol. 42,549 12m Average $ Vol. $119,315
Source: Capital IQ Research Systems and Bloomberg as of November 29, 2011
9
Confidential MELODY Situation Overview
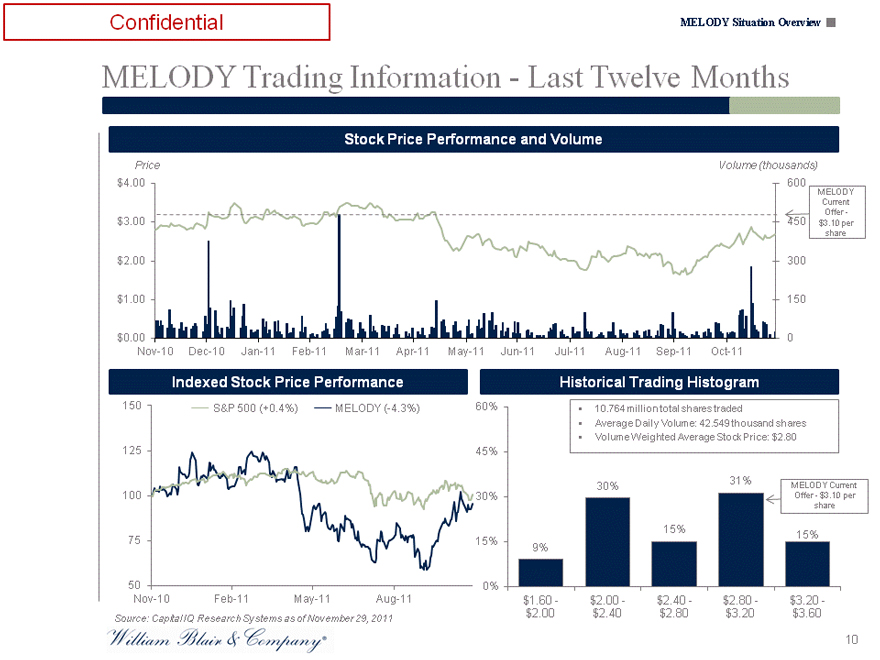
MELODY Trading Information—Last Twelve Months
Stock Price Performance and Volume
Price Volume (thousands)
$4.00 $3.00 $2.00 $1.00 $0.00
600 MELODY Current Offer -450 $3.10 per share
300 150 0
Nov-10 Dec-10 Jan-11 Feb-11 Mar-11 Apr-11 May-11 Jun-11 Jul-11 Aug-11 Sep-11 Oct-11
Indexed Stock Price Performance
150 125 100 75 50
S&P 500 (+0.4%) MELODY (-4.3%)
Nov-10 Feb-11 May-11 Aug-11
60% 45% 30% 15% 0%
Historical Trading Histogram
10.764 million total shares traded
Average Daily Volume: 42.549 thousand shares Volume Weighted Average Stock Price: $2.80
30% 31% MELODY Current Offer—$3.10 per share
15%
15% 9%
$1.60—$2.00—$2.40—$2.80—$3.20 -$2.00 $2.40 $2.80 $3.20 $3.60
Source: Capital IQ Research Systems as of November 29, 2011
10
Confidential MELODY Situation Overview
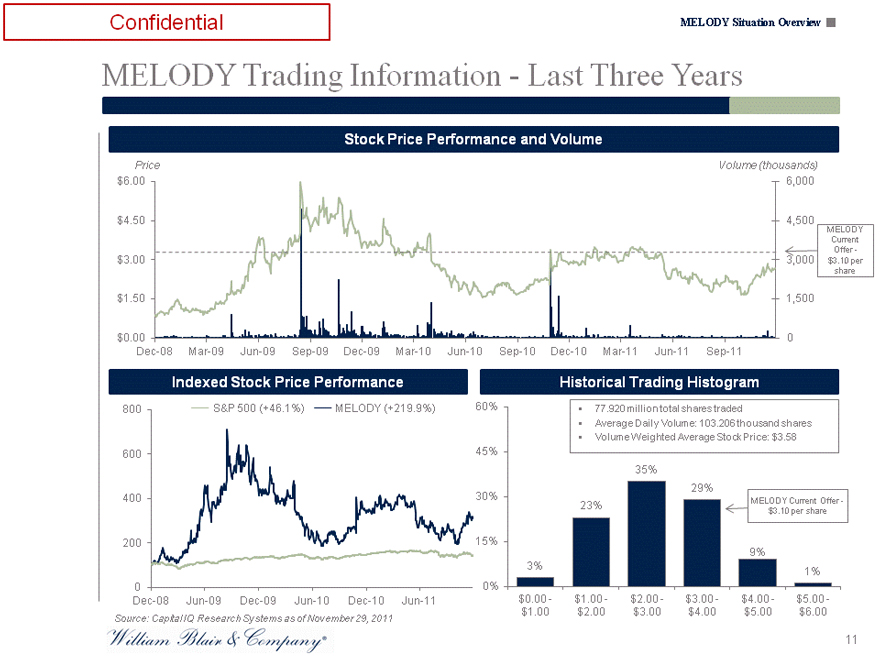
MELODY Trading Information—Last Three Years
Stock Price Performance and Volume
Price Volume (thousands)
$6.00 6,000
$4.50 4,500
MELODY
Current
Offer -
$3.00 3,000 $3.10 per
share
$1.50 1,500
$0.00 0
Dec-08 Mar-09 Jun-09 Sep-09 Dec-09 Mar-10 Jun-10 Sep-10 Dec-10 Mar-11 Jun-11 Sep-11
Indexed Stock Price Performance
800 S&P 500 (+46.1%) MELODY (+219.9%)
600
400
200
0
Dec-08 Jun-09 Dec-09 Jun-10 Dec-10 Jun-11
Historical Trading Histogram
60% 77.920 million total shares traded
Average Daily Volume: 103.206 thousand shares
Volume Weighted Average Stock Price: $3.58
45%
35%
29%
30% MELODY Current Offer -
23% $3.10 per share
15%
9%
3% 1%
0%
$0.00— $1.00— $2.00— $3.00— $4.00— $5.00 -
$1.00 $2.00 $3.00 $4.00 $5.00 $6.00
Source: Capital IQ Research Systems as of November 29, 2011
11
Confidential MELODY Situation Overview
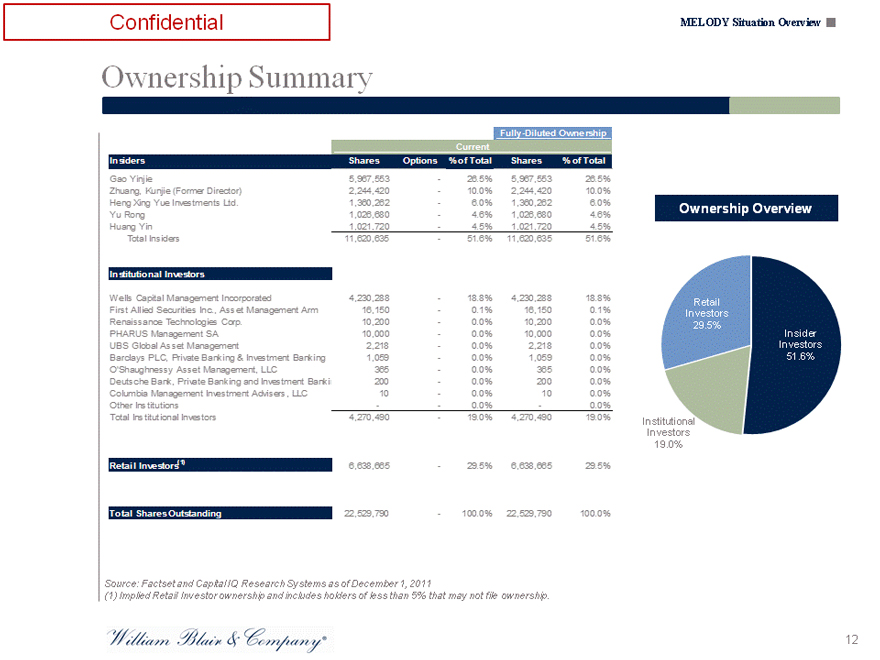
Ownership Summary
Fully-Diluted Ownership
Current
Insiders Shares Options % of Total Shares % of Total
Gao Yinjie 5,967,553 — 26.5% 5,967,553 26.5%
Zhuang, Kunjie (Former Director) 2,244,420 — 10.0% 2,244,420 10.0%
Heng Xing Yue Investments Ltd. 1,360,262 — 6.0% 1,360,262 6.0%
Yu Rong 1,026,680 — 4.6% 1,026,680 4.6%
Huang Yin 1,021,720 — 4.5% 1,021,720 4.5%
Total Insiders 11,620,635 — 51.6% 11,620,635 51.6%
Institutional Investors
Wells Capital Management Incorporated 4,230,288 — 18.8% 4,230,288 18.8%
First Allied Securities Inc., Asset Management Arm 16,150 — 0.1% 16,150 0.1%
Renaissance Technologies Corp. 10,200 — 0.0% 10,200 0.0%
PHARUS Management SA 10,000 — 0.0% 10,000 0.0%
UBS Global Asset Management 2,218 — 0.0% 2,218 0.0%
Barclays PLC, Private Banking & Investment Banking 1,059 — 0.0% 1,059 0.0%
O’Shaughnessy Asset Management, LLC 365 — 0.0% 365 0.0%
Deutsche Bank, Private Banking and Investment Bankin 200 — 0.0% 200 0.0%
Columbia Management Investment Advisers, LLC 10 — 0.0% 10 0.0%
Other Institutions —— 0.0% — 0.0%
Total Institutional Investors 4,270,490 — 19.0% 4,270,490 19.0%
Retail Investors(1) 6,638,665 — 29.5% 6,638,665 29.5%
Total Shares Outstanding 22,529,790 — 100.0% 22,529,790 100.0%
Source: Factset and Capital IQ Research Systems as of December 1, 2011
(1) Implied Retail Investor ownership and includes holders of less than 5% that may not file ownership.
Ownership Overview
Retail Investors 29.5% (1)
Insider Investors 51.6%
Institutional Investors
19.0%
12
Confidential MELODY Situation Overview
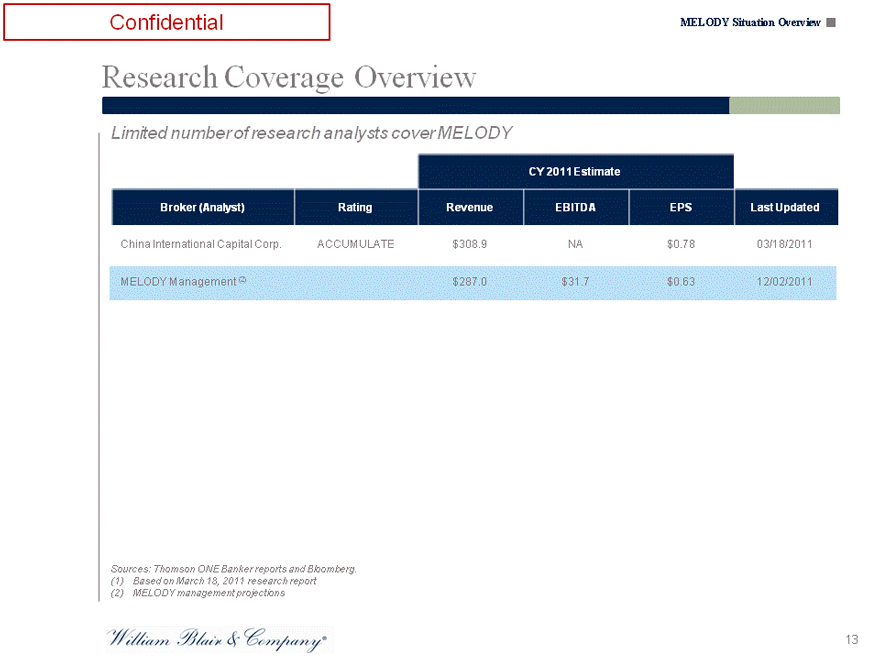
Research Coverage Overview
Limited number of research analysts cover MELODY
($ in millions) CY 2011 Estimate
Broker (Analyst) Rating Revenue EBITDA EPS Last Updated
China International Capital Corp. ACCUMULATE $308.9 NA $0.78 03/18/2011
MELODY Management (2) $287.0 $31.7 $0.63 12/02/2011
Sources: Thomson ONE Banker reports and Bloomberg. (1) Based on March 18, 2011 research report (2) MELODY management projections
13
Confidential MELODY Situation Overview
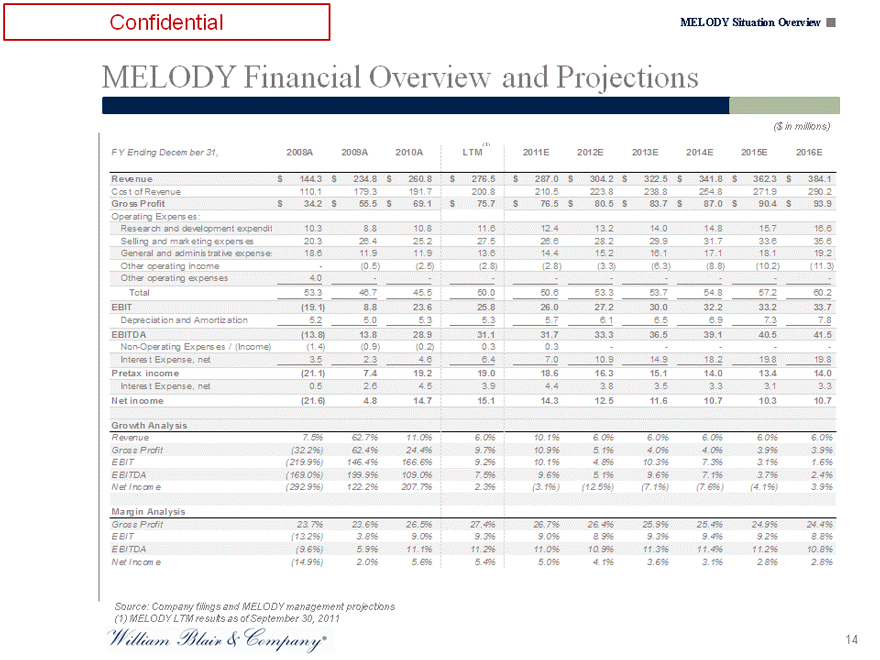
MELODY Financial Overview and Projections
($ in millions)
FY Ending December 31, 2008A 2009A 2010A LTM(1) 2011E 2012E 2013E 2014E 2015E 2016E
Revenue $ 144.3 $ 234.8 $ 260.8 $ 276.5 $ 287.0 $ 304.2 $ 322.5 $ 341.8 $ 362.3 $ 384.1
Cost of Revenue 110.1 179.3 191.7 200.8 210.5 223.8 238.8 254.8 271.9 290.2
Gross Profit $ 34.2 $ 55.5 $ 69.1 $ 75.7 $ 76.5 $ 80.5 $ 83.7 $ 87.0 $ 90.4 $ 93.9
Operating Expenses:
Research and development expendit 10.3 8.8 10.8 11.6 12.4 13.2 14.0 14.8 15.7 16.6
Selling and marketing expenses 20.3 26.4 25.2 27.5 26.6 28.2 29.9 31.7 33.6 35.6
General and administrative expenses 18.6 11.9 11.9 13.6 14.4 15.2 16.1 17.1 18.1 19.2
Other operating income — (0.5) (2.5) (2.8) (2.8) (3.3) (6.3) (8.8) (10.2) (11.3)
Other operating expenses 4.0 — ——— — — — — -
Total 53.3 46.7 45.5 50.0 50.6 53.3 53.7 54.8 57.2 60.2
EBIT (19.1) 8.8 23.6 25.8 26.0 27.2 30.0 32.2 33.2 33.7
Depreciation and Amortization 5.2 5.0 5.3 5.3 5.7 6.1 6.5 6.9 7.3 7.8
EBITDA (13.8) 13.8 28.9 31.1 31.7 33.3 36.5 39.1 40.5 41.5
Non-Operating Expenses / (Income) (1.4) (0.9) (0.2) 0.3 0.3 — — — — -
Interest Expense, net 3.5 2.3 4.6 6.4 7.0 10.9 14.9 18.2 19.8 19.8
Pretax income (21.1) 7.4 19.2 19.0 18.6 16.3 15.1 14.0 13.4 14.0
Interest Expense, net 0.5 2.6 4.5 3.9 4.4 3.8 3.5 3.3 3.1 3.3
Net income (21.6) 4.8 14.7 15.1 14.3 12.5 11.6 10.7 10.3 10.7
Growth Analysis
Revenue 7.5% 62.7% 11.0% 6.0% 10.1% 6.0% 6.0% 6.0% 6.0% 6.0%
Gross Profit (32.2%) 62.4% 24.4% 9.7% 10.9% 5.1% 4.0% 4.0% 3.9% 3.9%
EBIT (219.9%) 146.4% 166.6% 9.2% 10.1% 4.8% 10.3% 7.3% 3.1% 1.6%
EBITDA (169.0%) 199.9% 109.0% 7.5% 9.6% 5.1% 9.6% 7.1% 3.7% 2.4%
Net Income (292.9%) 122.2% 207.7% 2.3% (3.1%) (12.5%) (7.1%) (7.6%) (4.1%) 3.9%
Margin Analysis
Gross Profit 23.7% 23.6% 26.5% 27.4% 26.7% 26.4% 25.9% 25.4% 24.9% 24.4%
EBIT (13.2%) 3.8% 9.0% 9.3% 9.0% 8.9% 9.3% 9.4% 9.2% 8.8%
EBITDA (9.6%) 5.9% 11.1% 11.2% 11.0% 10.9% 11.3% 11.4% 11.2% 10.8%
Net Income (14.9%) 2.0% 5.6% 5.4% 5.0% 4.1% 3.6% 3.1% 2.8% 2.8%
Source: Company filings and MELODY management projections (1) MELODY LTM results as of September 30, 2011
14
Confidential MELODY Situation Overview
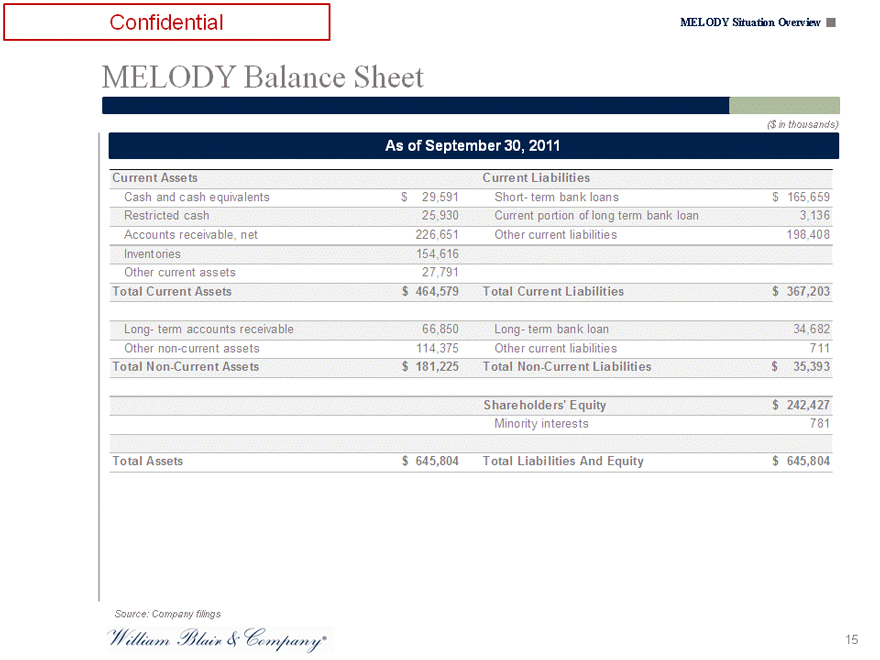
MELODY Balance Sheet
($ in thousands)
As of September 30, 2011
Current Assets Current Liabilities
Cash and cash equivalents $ 29,591 Short- term bank loans $ 165,659
Restricted cash 25,930 Current portion of long term bank loan 3,136
Accounts receivable, net 226,651 Other current liabilities 198,408
Inventories 154,616
Other current assets 27,791
Total Current Assets $ 464,579 Total Current Liabilities $ 367,203
Long- term accounts receivable 66,850 Long- term bank loan 34,682
Other non-current assets 114,375 Other current liabilities 711
Total Non-Current Assets $ 181,225 Total Non-Current Liabilities $ 35,393
Shareholders’ Equity $ 242,427
Minority interests 781
Total Assets $ 645,804 Total Liabilities And Equity $ 645,804
Source: Company filings
15
Confidential
Valuation Analysis

Confidential
Summary of Transaction
Confidential Summary of Transaction
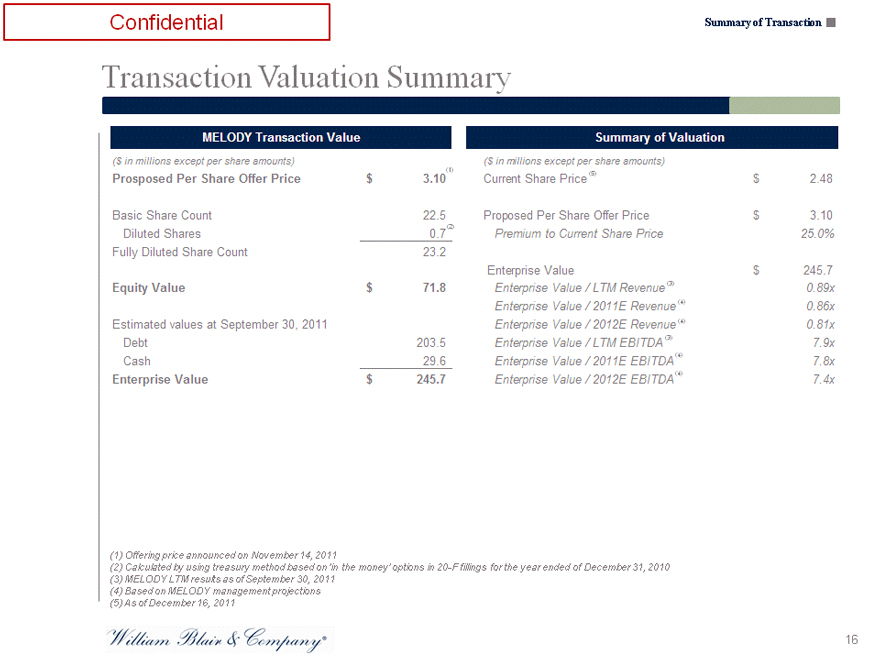
Transaction Valuation Summary
MELODY Transaction Value
($ in millions except per share amounts)
Prosposed Per Share Offer Price $ 3.10(1)
Basic Share Count 22.5
Diluted Shares 0.7 (2)
Fully Diluted Share Count 23.2
Equity Value $ 71.8
Estimated values at September 30, 2011
Debt 203.5
Cash 29.6
Enterprise Value $ 245.7
Summary of Valuation
($ in millions except per share amounts)
Current Share Price (5) $ 2.48
Proposed Per Share Offer Price $ 3.10
Premium to Current Share Price 25.0%
Enterprise Value $ 245.7
Enterprise Value / LTM Revenue (3) 0.89x
Enterprise Value / 2011E Revenue (4) 0.86x
Enterprise Value / 2012E Revenue (4) 0.81x
Enterprise Value / LTM EBITDA (3) 7.9x
Enterprise Value / 2011E EBITDA (4) 7.8x
Enterprise Value / 2012E EBITDA (4) 7.4x
(1) Offering price announced on November 14, 2011
(2) Calculated by using treasury method based on ‘in the money’ options in 20-F fillings for the year ended of December 31, 2010
(3) MELODY LTM results as of September 30, 2011 (4) Based on MELODY management projections (5) As of December 16, 2011
16

Confidential
Selected Public Companies Analysis
Confidential Selected Public Companies Analysis
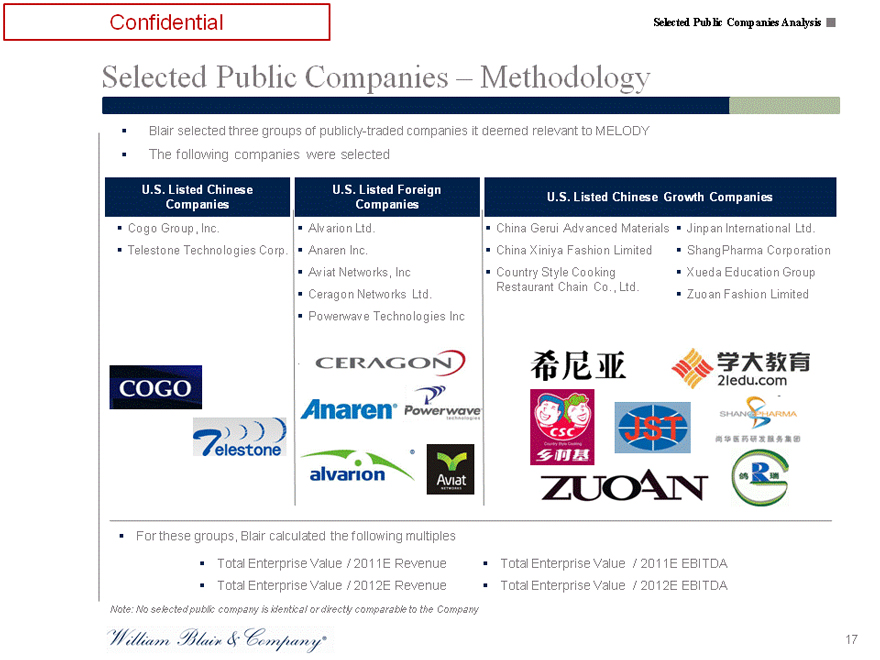
Selected Public Companies – Methodology
Blair selected three groups of publicly-traded companies it deemed relevant to MELODY The following companies were selected
U.S. Listed Chinese U.S. Listed Foreign U.S. Listed Chinese Growth Companies
Companies Companies
Cogo Group, Inc. Alvarion Ltd. China Gerui Advanced Materials Jinpan International Ltd.
Telestone Technologies Corp. Anaren Inc. China Xiniya Fashion Limited ShangPharma Corporation
Aviat Networks, Inc Country Style Cooking Xueda Education Group
Restaurant Chain Co., Ltd.
Ceragon Networks Ltd. Zuoan Fashion Limited
Powerwave Technologies Inc
.
For these groups, Blair calculated the following multiples
Total Enterprise Value / 2011E Revenue Total Enterprise Value / 2011E EBITDA
Total Enterprise Value / 2012E Revenue Total Enterprise Value / 2012E EBITDA
Note: No selected public company is identical or directly comparable to the Company
17
Confidential Selected Public Companies Analysis
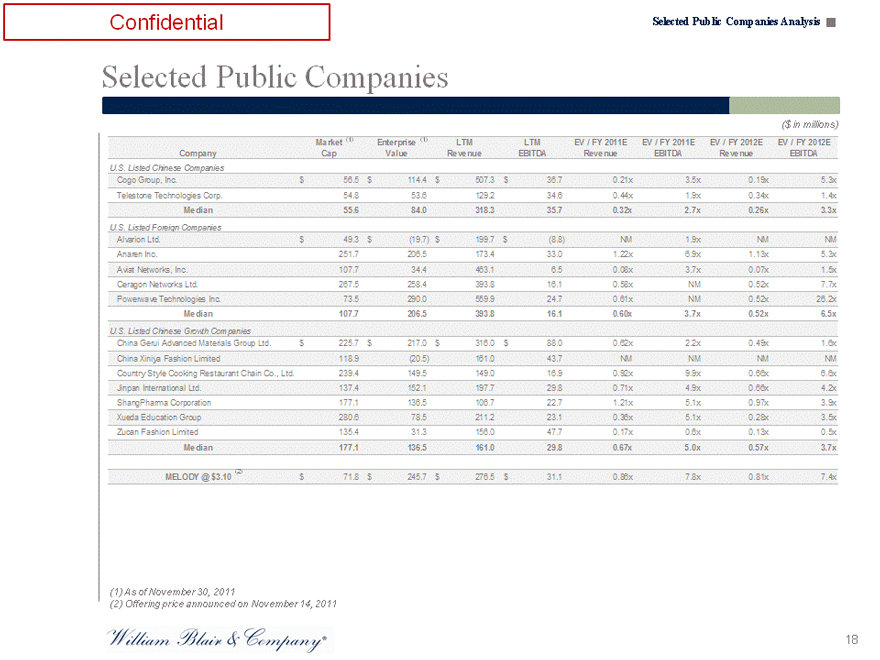
Selected Public Companies
($ in millions)
Market (1) Enterprise (1) LTM LTM EV / FY 2011E EV / FY 2011E EV / FY 2012E EV / FY 2012E
Company Cap Value Revenue EBITDA Revenue EBITDA Revenue EBITDA
U.S. Listed Chinese Companies
Cogo Group, Inc. $ 56.5 $ 114.4 $ 507.3 $ 36.7 0.21x 3.5x 0.19x 5.3x
Telestone Technologies Corp. 54.8 53.6 129.2 34.6 0.44x 1.9x 0.34x 1.4x
Median 55.6 84.0 318.3 35.7 0.32x 2.7x 0.26x 3.3x
U.S. Listed Foreign Companies
Alvarion Ltd. $ 49.3 $ (19.7) $ 199.7 $ (8.8) NM 1.9x NM NM
Anaren Inc. 251.7 206.5 173.4 33.0 1.22x 6.9x 1.13x 5.3x
Aviat Networks, Inc. 107.7 34.4 463.1 6.5 0.08x 3.7x 0.07x 1.5x
Ceragon Networks Ltd. 267.5 258.4 393.8 16.1 0.58x NM 0.52x 7.7x
Powerwave Technologies Inc. 73.5 290.0 559.9 24.7 0.61x NM 0.52x 26.2x
Median 107.7 206.5 393.8 16.1 0.60x 3.7x 0.52x 6.5x
U.S. Listed Chinese Growth Companies
China Gerui Advanced Materials Group Ltd. $ 225.7 $ 217.0 $ 316.0 $ 88.0 0.62x 2.2x 0.49x 1.6x
China Xiniya Fashion Limited 118.9 (20.5) 161.0 43.7 NM NM NM NM
Country Style Cooking Restaurant Chain Co., Ltd. 239.4 149.5 149.0 16.9 0.92x 9.9x 0.66x 6.6x
Jinpan International Ltd. 137.4 152.1 197.7 29.8 0.71x 4.9x 0.66x 4.2x
ShangPharma Corporation 177.1 136.5 106.7 22.7 1.21x 5.1x 0.97x 3.9x
Xueda Education Group 280.6 78.5 211.2 23.1 0.36x 5.1x 0.28x 3.5x
Zuoan Fashion Limited 135.4 31.3 156.0 47.7 0.17x 0.6x 0.13x 0.5x
Median 177.1 136.5 161.0 29.8 0.67x 5.0x 0.57x 3.7x
MELODY @ $3.10 (2) $ 71.8 $ 245.7 $ 276.5 $ 31.1 0.86x 7.8x 0.81x 7.4x
(1) | | As of November 30, 2011 |
(2) | | Offering price announced on November 14, 2011 |
18
Confidential Selected Public Companies Analysis
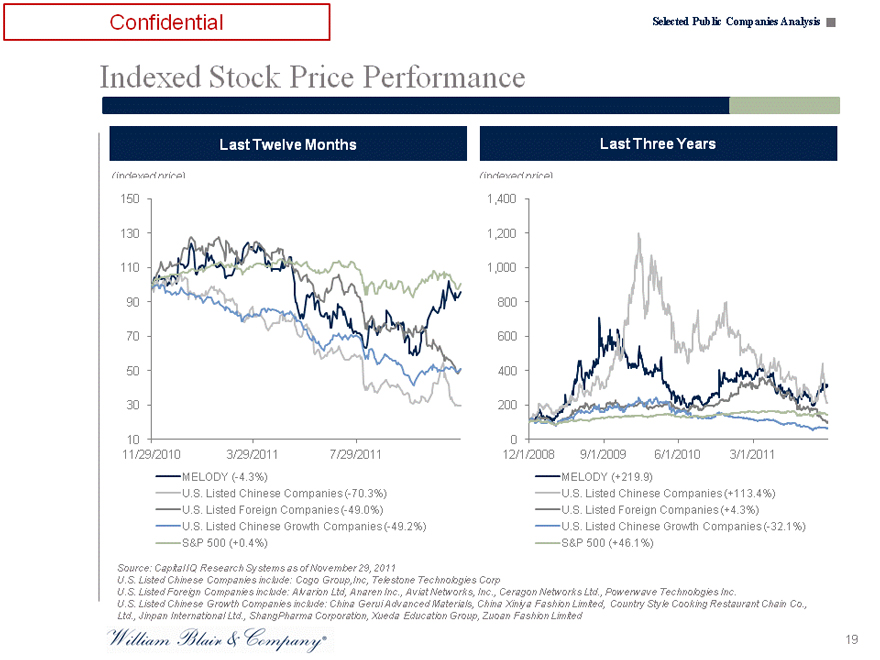
Indexed Stock Price Performance
Last Twelve Months
(indexed price)
150
130
110
90
70
50
30
10
11/29/2010 3/29/2011 7/29/2011
MELODY (-4.3%)
U.S. Listed Chinese Companies (-70.3%)
U.S. Listed Foreign Companies (-49.0%)
U.S. Listed Chinese Growth Companies (-49.2%) S&P 500 (+0.4%)
Last Three Years
(indexed price)
1,400
1,200
1,000
800
600
400
200
0
12/1/2008 9/1/2009 6/1/2010 3/1/2011
MELODY (+219.9)
U.S. Listed Chinese Companies (+113.4%)
U.S. Listed Foreign Companies (+4.3%)
U.S. Listed Chinese Growth Companies (-32.1%) S&P 500 (+46.1%)
Source: Capital IQ Research Systems as of November 29, 2011
U.S. Listed Chinese Companies include: Cogo Group,Inc, Telestone Technologies Corp
U.S. Listed Foreign Companies include: Alvarion Ltd, Anaren Inc., Aviat Networks, Inc., Ceragon Networks Ltd., Powerwave Technologies Inc.
U.S. Listed Chinese Growth Companies include: China Gerui Advanced Materials, China Xiniya Fashion Limited, Country Style Cooking Restaurant Chain Co., Ltd., Jinpan International Ltd., ShangPharma Corporation, Xueda Education Group, Zuoan Fashion Limited
Confidential Selected Public Companies Analysis
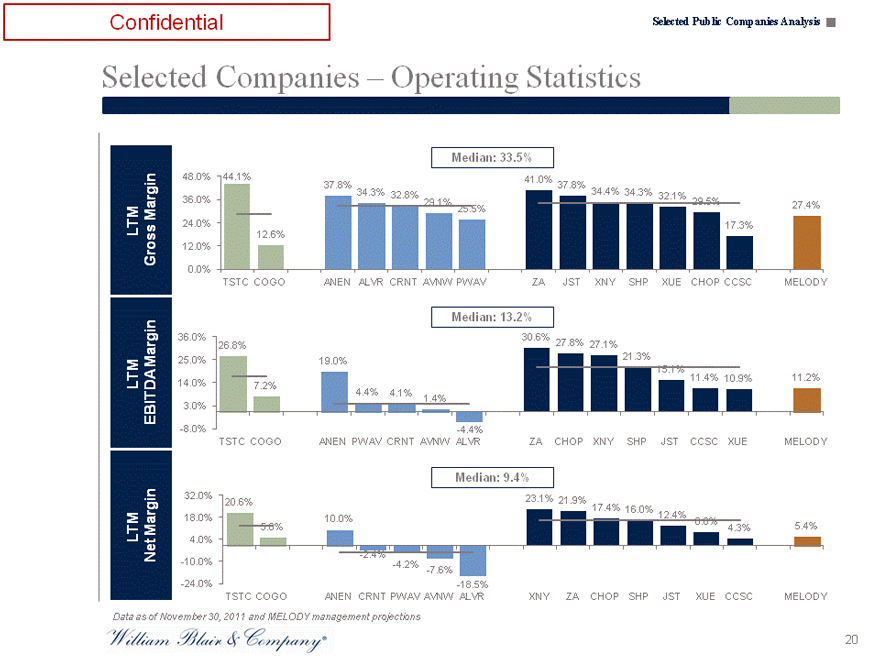
Selected Companies – Operating Statistics
Median: 33.5%
LTM Gross Margin
48.0% 44.1% 41.0%
37.8% 37.8%
34.3% 32.8% 34.4% 34.3% 32.1%
36.0% 29.1% 29.5% 27.4%
25.5%
24.0% 17.3%
12.6%
12.0%
0.0%
TSTC COGO ANEN ALVR CRNT AVNW PWAV ZA JST XNY SHP XUE CHOP CCSC MELODY
Median: 13.2%
LTM EBITDA Margin
36.0% 30.6%
26.8% 27.8% 27.1%
25.0% 19.0% 21.3%
15.1% 11.4% 10.9% 11.2%
14.0% 7.2%
4.4% 4.1% 1.4%
3.0%
-8.0% -4.4%
TSTC COGO ANEN PWAV CRNT AVNW ALVR ZA CHOP XNY SHP JST CCSC XUE MELODY
Median: 9.4%
LTM Net Margin
32.0% 20.6% 23.1% 21.9%
17.4% 16.0% 12.4%
18.0% 10.0% 8.8%
5.0% 4.3% 5.4%
4.0%
-2.4%
-10.0% -4.2% -7.6%
-24.0% -18.5%
TSTC COGO ANEN CRNT PWAV AVNW ALVR XNY ZA CHOP SHP JST XUE CCSC MELODY
Data as of November 30, 2011 and MELODY management projections
20
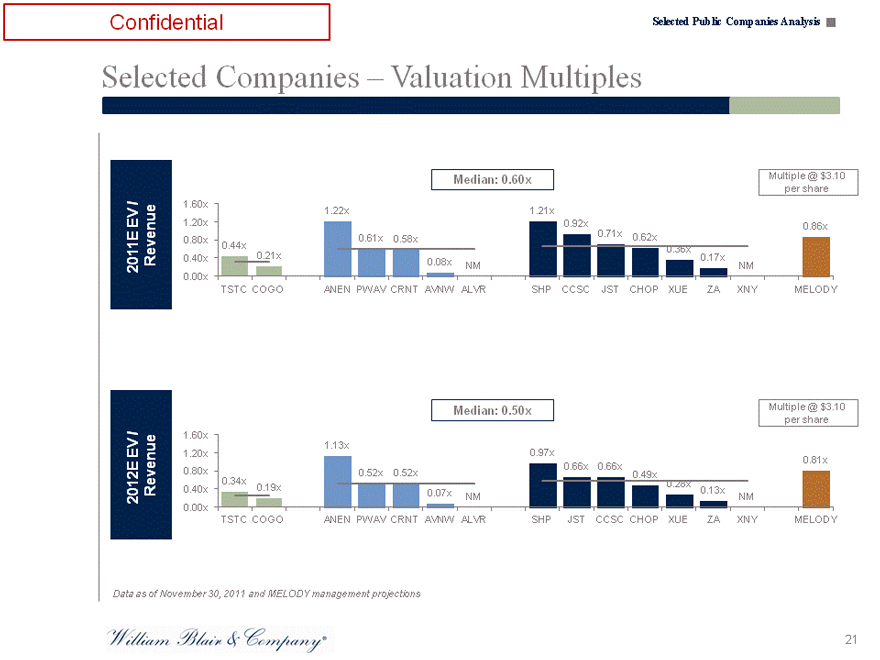
Confidential Selected Public Companies Analysis
Selected Companies – Valuation Multiples
2011E EV / Revenue
2012E EV / Revenue
Median: 0.60x
Multiple @ $3.10 per share
1.60x 1.20x 0.80x 0.40x 0.00x
0.44x 0.21x
1.22x
0.61x 0.58x
0.08x NM
1.21x
0.92x 0.71x
0.62x
0.36x
0.17x NM
0.86x
TSTC COGO ANEN PWAV CRNT AVNW ALVR SHP CCSC JST CHOP XUE ZA XNY MELODY
Median: 0.50x
Multiple @ $3.10 per share
1.60x 1.20x 0.80x 0.40x 0.00x
0.34x 0.19x
1.13x
0.52x 0.52x
0.07x NM
0.97x
0.66x 0.66x
0.49x 0.28x
0.13x NM
0.81x
TSTC COGO ANEN PWAV CRNT AVNW ALVR SHP JST CCSC CHOP XUE ZA XNY MELODY
Data as of November 30, 2011 and MELODY management projections
21
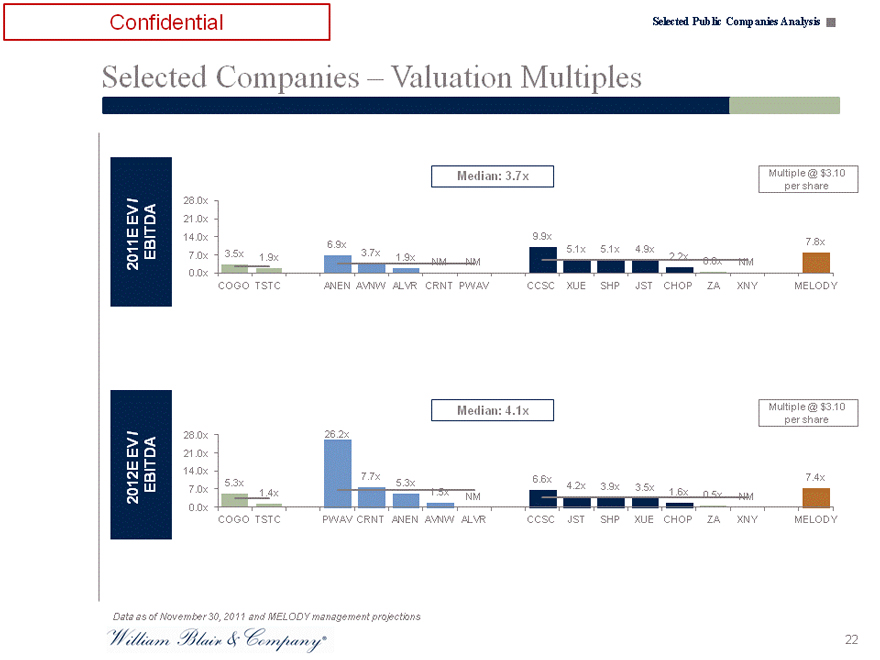
Confidential Selected Public Companies Analysis
Selected Companies – Valuation Multiples
2011E EV / EBITDA
2012E EV / EBITDA
Median: 3.7x
Multiple @ $3.10 per share
28.0x 21.0x 14.0x 7.0x 0.0x
6.9x
3.5x 1.9x 3.7x 1.9x NM NM
9.9x
5.1x 5.1x 4.9x
2.2x 0.6x NM
7.8x
COGO TSTC ANEN AVNW ALVR CRNT PWAV CCSC XUE SHP JST CHOP ZA XNY MELODY
Median: 4.1x
Multiple @ $3.10 per share
28.0x 21.0x 14.0x 7.0x 0.0x
5.3x 1.4x
26.2x
7.7x
5.3x 1.5x NM
6.6x
4.2x 3.9x 3.5x
1.6x 0.5x NM
7.4x
COGO TSTC PWAV CRNT ANEN AVNW ALVR CCSC JST SHP XUE CHOP ZA XNY MELODY
Data as of November 30, 2011 and MELODY management projections
22
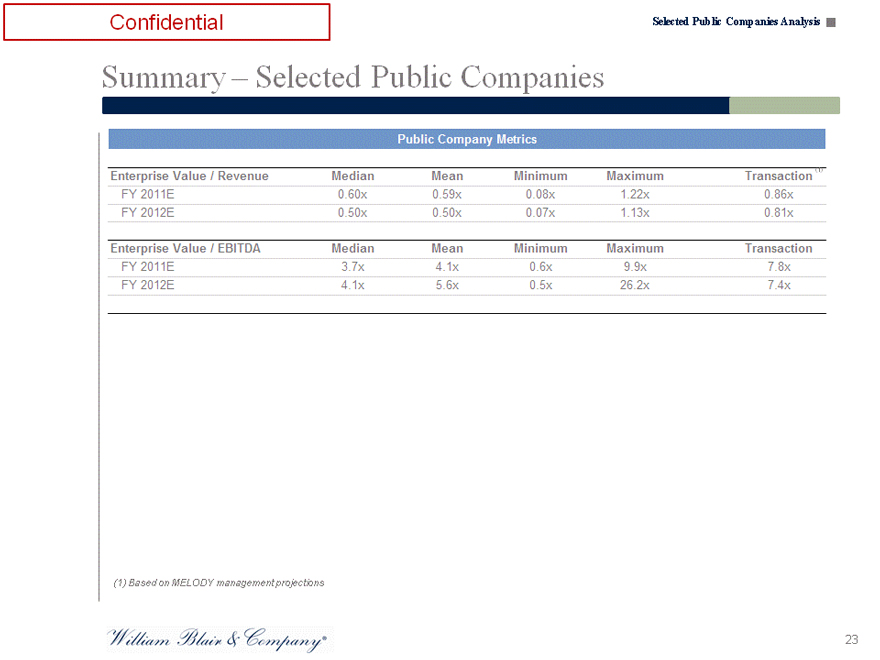
Confidential Selected Public Companies Analysis
Summary – Selected Public Companies
Public Company Metrics
Enterprise Value / Revenue Median Mean Minimum Maximum Transaction (1)
FY 2011E 0.60x 0.59x 0.08x 1.22x 0.86x
FY 2012E 0.50x 0.50x 0.07x 1.13x 0.81x
Enterprise Value / EBITDA Median Mean Minimum Maximum Transaction
FY 2011E 3.7x 4.1x 0.6x 9.9x 7.8x
FY 2012E 4.1x 5.6x 0.5x 26.2x 7.4x
(1) | | Based on MELODY management projections |
23

Confidential
Selected M&A Transactions Analysis
Confidential Selected M&A Transactions Analysis
Summary – Selected M&A Transactions
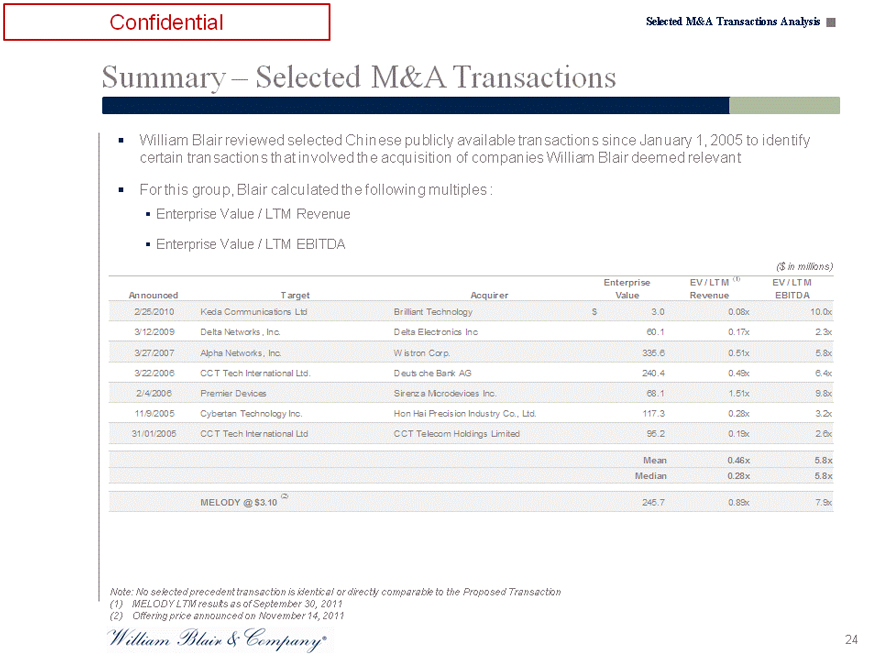
William Blair reviewed selected Chinese publicly available transactions since January 1, 2005 to identify certain transactions that involved the acquisition of companies William Blair deemed relevant
For this group, Blair calculated the following multiples : Enterprise Value / LTM Revenue
Enterprise Value / LTM EBITDA
($ in millions)
Enterprise EV / LTM (1) EV / LTM
Announced Target Acquirer Value Revenue EBITDA
2/25/2010 Keda Communications Ltd Brilliant Technology $ 3.0 0.08x 10.0x
3/12/2009 Delta Networks, Inc. Delta Electronics Inc 60.1 0.17x 2.3x
3/27/2007 Alpha Networks, Inc. Wistron Corp. 335.6 0.51x 5.8x
3/22/2006 CCT Tech International Ltd. Deutsche Bank AG 240.4 0.49x 6.4x
2/4/2006 Premier Devices Sirenza Microdevices Inc. 68.1 1.51x 9.8x
11/9/2005 Cybertan Technology Inc. Hon Hai Precision Industry Co., Ltd. 117.3 0.28x 3.2x
31/01/2005 CCT Tech International Ltd CCT Telecom Holdings Limited 95.2 0.19x 2.6x
Mean 0.46x 5.8x
Median 0.28x 5.8x
MELODY @ $3.10 (2) 245.7 0.89x 7.9x
Note: No selected precedent transaction is identical or directly comparable to the Proposed Transaction (1) MELODY LTM results as of September 30, 2011 (2) Offering price announced on November 14, 2011
24
Confidential Selected M&A Transactions Analysis
Selected Transaction Summary
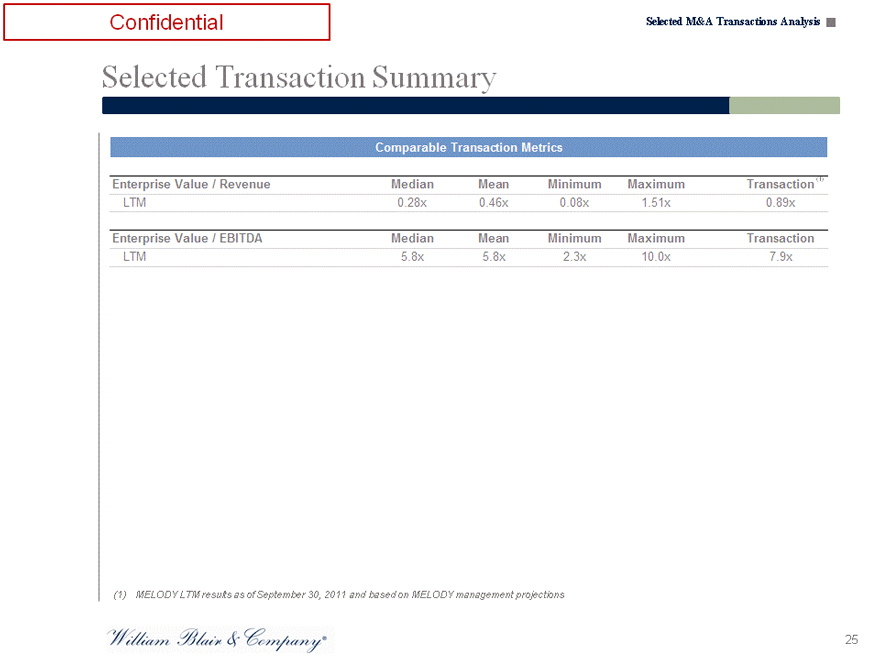
Comparable Transaction Metrics
Enterprise Value / Revenue Median Mean Minimum Maximum Transaction (1)
LTM 0.28x 0.46x 0.08x 1.51x 0.89x
Enterprise Value / EBITDA Median Mean Minimum Maximum Transaction
LTM 5.8x 5.8x 2.3x 10.0x 7.9x
(1) MELODY LTM results as of September 30, 2011 and based on MELODY management projections
25

Confidential
Discounted Cash Flow Analysis
Confidential Discounted Cash Flow Analysis
Discounted Cash Flow Analysis
Parameters
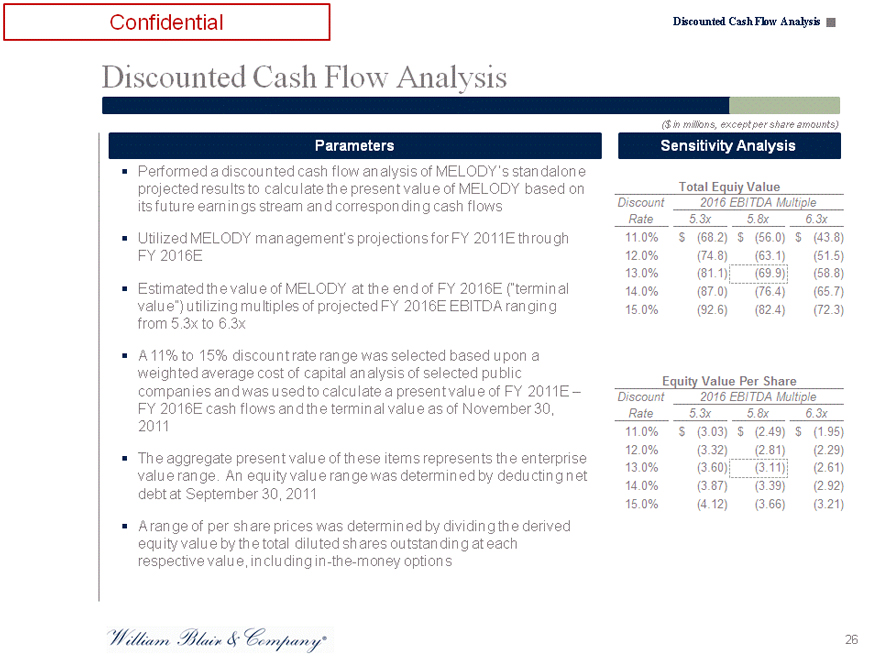
Performed a discounted cash flow analysis of MELODY’s standalone projected results to calculate the present value of MELODY based on its future earnings stream and corresponding cash flows
Utilized MELODY management’s projections for FY 2011E through FY 2016E
Estimated the value of MELODY at the end of FY 2016E (“terminal value”) utilizing multiples of projected FY 2016E EBITDA ranging from 5.3x to 6.3x
A 11% to 15% discount rate range was selected based upon a weighted average cost of capital analysis of selected public companies and was used to calculate a present value of FY 2011E –
FY 2016E cash flows and the terminal value as of November 30, 2011
The aggregate present value of these items represents the enterprise value range. An equity value range was determined by deducting net debt at September 30, 2011
A range of per share prices was determined by dividing the derived equity value by the total diluted shares outstanding at each respective value, including in-the-money options
($ in millions, except per share amounts)
Sensitivity Analysis
Total Equiy Value
Discount 2016 EBITDA Multiple
Rate 5.3x 5.8x 6.3x
11.0% $ (68.2) $ (56.0) $ (43.8)
12.0% (74.8) (63.1) (51.5)
13.0% (81.1) (69.9) (58.8)
14.0% (87.0) (76.4) (65.7)
15.0% (92.6) (82.4) (72.3)
Equity Value Per Share
Discount 2016 EBITDA Multiple
Rate 5.3x 5.8x 6.3x
11.0% $ (3.03) $ (2.49) $ (1.95)
12.0% (3.32) (2.81) (2.29)
13.0% (3.60) (3.11) (2.61)
14.0% (3.87) (3.39) (2.92)
15.0% (4.12) (3.66) (3.21)
26
Confidential
Leveraged Buyout Analysis
Confidential Leveraged Buyout Analysis
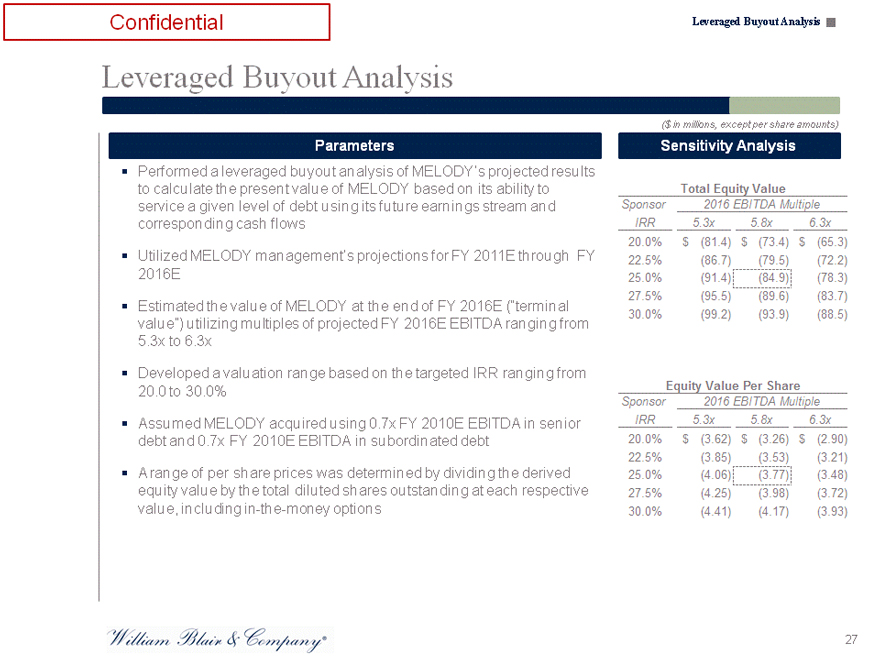
Leveraged Buyout Analysis
Parameters
Performed a leveraged buyout analysis of MELODY’s projected results to calculate the present value of MELODY based on its ability to service a given level of debt using its future earnings stream and corresponding cash flows
Utilized MELODY management’s projections for FY 2011E through FY 2016E
Estimated the value of MELODY at the end of FY 2016E (“terminal value”) utilizing multiples of projected FY 2016E EBITDA ranging from 5.3x to 6.3x
Developed a valuation range based on the targeted IRR ranging from 20.0 to 30.0%
Assumed MELODY acquired using 0.7x FY 2010E EBITDA in senior debt and 0.7x FY 2010E EBITDA in subordinated debt
A range of per share prices was determined by dividing the derived equity value by the total diluted shares outstanding at each respective value, including in-the-money options
($ in millions, except per share amounts)
Sensitivity Analysis
Total Equity Value
Sponsor 2016 EBITDA Multiple
IRR 5.3x 5.8x 6.3x
20.0% $ (81.4) $ (73.4) $ (65.3)
22.5% (86.7) (79.5) (72.2)
25.0% (91.4) (84.9) (78.3)
27.5% (95.5) (89.6) (83.7)
30.0% (99.2) (93.9) (88.5)
Equity Value Per Share
Sponsor 2016 EBITDA Multiple
IRR 5.3x 5.8x 6.3x
20.0% $ (3.62) $ (3.26) $ (2.90)
22.5% (3.85) (3.53) (3.21)
25.0% (4.06) (3.77) (3.48)
27.5% (4.25) (3.98) (3.72)
30.0% (4.41) (4.17) (3.93)
27

Confidential
Premiums Paid Analysis
Confidential Preliminary Paid Analysis
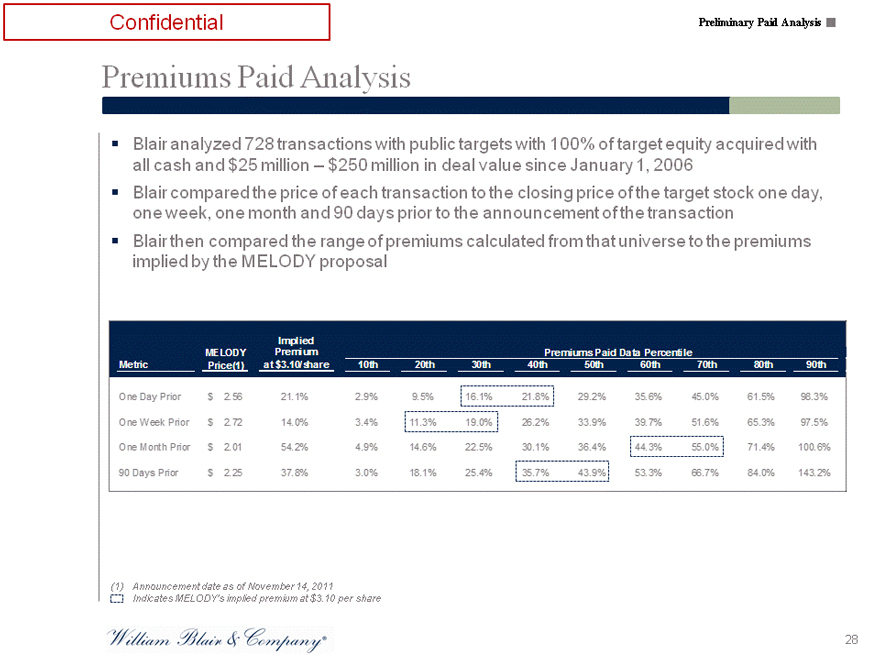
Premiums Paid Analysis
Blair analyzed 728 transactions with public targets with 100% of target equity acquired with all cash and $25 million – $250 million in deal value since January 1, 2006
Blair compared the price of each transaction to the closing price of the target stock one day, one week, one month and 90 days prior to the announcement of the transaction Blair then compared the range of premiums calculated from that universe to the premiums implied by the MELODY proposal
Implied
MELODY Premium Premiums Paid Data Percentile
Metric Price(1) at $3.10/share 10th 20th 30th 40th 50th 60th 70th 80th 90th
One Day Prior $ 2.56 21.1% 2.9% 9.5% 16.1% 21.8% 29.2% 35.6% 45.0% 61.5% 98.3%
One Week Prior $ 2.72 14.0% 3.4% 11.3% 19.0% 26.2% 33.9% 39.7% 51.6% 65.3% 97.5%
One Month Prior $ 2.01 54.2% 4.9% 14.6% 22.5% 30.1% 36.4% 44.3% 55.0% 71.4% 100.6%
90 Days Prior $ 2.25 37.8% 3.0% 18.1% 25.4% 35.7% 43.9% 53.3% 66.7% 84.0% 143.2%
(1) Announcement date as of November 14, 2011
Indicates MELODY’s implied premium at $3.10 per share
28
Confidential
Supporting Financial Schedules
Confidential Supporting Financial Schedules
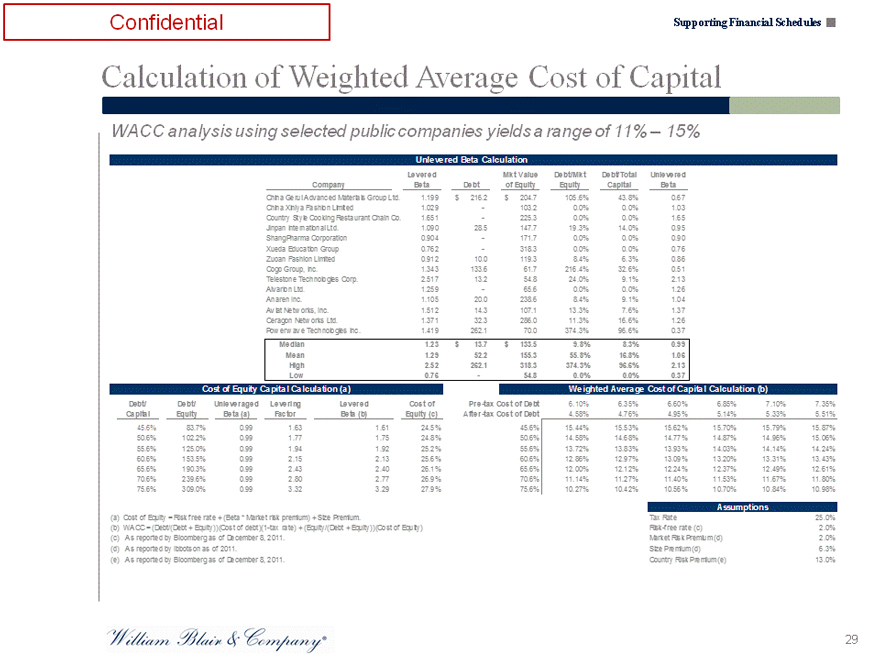
Calculation of Weighted Average Cost of Capital
WACC analysis using selected public companies yields a range of 11% – 15%
Unlevered Beta Calculation
Levered Mkt Value Debt/Mkt Debt/Total Unlevered
Company Beta Debt of Equity Equity Capital Beta
China Gerui Advanced Materials Group Ltd. 1.199 $ 216.2 $ 204.7 105.6% 43.8% 0.67
China Xiniya Fashion Limited 1.029 — 103.2 0.0% 0.0% 1.03
Country Style Cooking Restaurant Chain Co. 1.651 — 225.3 0.0% 0.0% 1.65
Jinpan International Ltd. 1.090 28.5 147.7 19.3% 14.0% 0.95
ShangPharma Corporation 0.904 — 171.7 0.0% 0.0% 0.90
Xueda Education Group 0.762 — 318.3 0.0% 0.0% 0.76
Zuoan Fashion Limited 0.912 10.0 119.3 8.4% 6.3% 0.86
Cogo Group, Inc. 1.343 133.6 61.7 216.4% 32.6% 0.51
Telestone Technologies Corp. 2.517 13.2 54.8 24.0% 9.1% 2.13
Alvarion Ltd. 1.259 — 65.6 0.0% 0.0% 1.26
Anaren Inc. 1.105 20.0 238.6 8.4% 9.1% 1.04
Aviat Netw orks, Inc. 1.512 14.3 107.1 13.3% 7.6% 1.37
Ceragon Netw orks Ltd. 1.371 32.3 286.0 11.3% 16.6% 1.26
Pow erw ave Technologies Inc. 1.419 262.1 70.0 374.3% 96.6% 0.37
Median 1.23 $ 13.7 $ 133.5 9.8% 8.3% 0.99
Mean 1.29 52.2 155.3 55.8% 16.8% 1.06
High 2.52 262.1 318.3 374.3% 96.6% 2.13
Low 0.76 — 54.8 0.0% 0.0% 0.37
Cost of Equity Capital Calculation (a)
Debt/ Debt/ Unleveraged Levering Levered Cost of
Capital Equity Beta (a) Factor Beta (b) Equity (c)
45.6% 83.7% 0.99 1.63 1.61 24.5%
50.6% 102.2% 0.99 1.77 1.75 24.8%
55.6% 125.0% 0.99 1.94 1.92 25.2%
60.6% 153.5% 0.99 2.15 2.13 25.6%
65.6% 190.3% 0.99 2.43 2.40 26.1%
70.6% 239.6% 0.99 2.80 2.77 26.9%
75.6% 309.0% 0.99 3.32 3.29 27.9%
Weighted Average Cost of Capital Calculation (b)
Pre-tax Cost of Debt 6.10% 6.35% 6.60% 6.85% 7.10% 7.35%
After-tax Cost of Debt 4.58% 4.76% 4.95% 5.14% 5.33% 5.51%
45.6% 15.44% 15.53% 15.62% 15.70% 15.79% 15.87%
50.6% 14.58% 14.68% 14.77% 14.87% 14.96% 15.06%
55.6% 13.72% 13.83% 13.93% 14.03% 14.14% 14.24%
60.6% 12.86% 12.97% 13.09% 13.20% 13.31% 13.43%
65.6% 12.00% 12.12% 12.24% 12.37% 12.49% 12.61%
70.6% 11.14% 11.27% 11.40% 11.53% 11.67% 11.80%
75.6% 10.27% 10.42% 10.56% 10.70% 10.84% 10.98%
(a) Cost of Equity = Risk free rate + (Beta * Market risk premium) + Size Premium.
(b) WACC = (Debt/(Debt + Equity))(Cost of debt)(1-tax rate) + (Equity/(Debt + Equity))(Cost of Equity)
(c) As reported by Bloomberg as of December 8, 2011.
(d) As reported by Ibbotson as of 2011.
(e) As reported by Bloomberg as of December 8, 2011.
Assumptions
Tax Rate 25.0%
Risk-free rate (c) 2.0%
Market Risk Premium (d) 2.0%
Size Premium (d) 6.3%
Country Risk Premium (e) 13.0%
29