The Company has filed with the SEC the certification of its Chief Executive Officer and Chief Financial Officer required by Section 302 of the Sarbanes-Oxley Act.
Generally, the Company does not receive any non-public personal information relating to its stockholders, although certain non-public personal information of its stockholders may become available to them. The Company does not disclose any non-public personal information about its stockholders or a former stockholder to anyone, except as required by law or as is necessary in order to service stockholder accounts (for example, to a transfer agent).
The Company restricts access to non-public personal information about its stockholders to employees of its Adviser with a legitimate business need for the information. The Company maintains physical, electronic and procedural safeguards designed to protect the non-public personal information of its stockholders.
ITEM 2. MANAGEMENT’S DISCUSSION AND ANALYSIS OF FINANCIAL CONDITION AND RESULTS OF OPERATIONS
All statements contained herein, other than historical facts, constitute “forward-looking statements.” These statements may relate to, among other things, future events or our future performance or financial condition. In some cases, you can identify forward-looking statements by terminology such as “may,” “might,” “believe,” “will,” “provided,” “anticipate,” “future,” “could,” “growth,” “plan,” “intend,” “expect,” “should,” “would,” “if,” “seek,” “possible,” “potential,” “likely” or the negative of such terms or comparable terminology. These forward-looking statements involve known and unknown risks, uncertainties and other factors that may cause our actual results, levels of activity, performance or achievements to be materially different from any anticipated results, levels of activity, performance or achievements expressed or implied by such forward-looking statements. For a discussion of factors that could cause our actual results to differ from forward-looking statements contained herein, please see the discussion under the heading “Risk Factors” in Part I, Item 1A. of our most recent Annual Report filed on Form 10-K.
We may experience fluctuations in our operating results due to a number of factors, including the return on our equity investments, the interest rates payable on our debt investments, the default rates on such investments, the level of our expenses, variations in and the timing of the recognition of realized and unrealized gains or losses, the degree to which we encounter competition in our markets and general economic conditions. As a result of these factors, results for any period should not be relied upon as being indicative of performance in future periods.
Overview
We have elected to be regulated as a BDC and we are classified as a non-diversified closed-end management investment company under the 1940 Act. As a BDC, we are subject to numerous regulations and restrictions. Unlike most investment companies, we are, and intend to continue to be, taxed as a general business corporation under the Code.
We invest in companies operating in the U.S. energy infrastructure sector, primarily in privately-held and micro-cap public companies focused on the midstream and downstream segments, and to a lesser extent the upstream segment. Companies in the midstream segment of the energy infrastructure sector engage in the business of transporting, processing or storing natural gas, natural gas liquids, crude oil, refined petroleum products and renewable energy resources. Companies in the downstream segment of the energy infrastructure sector engage in distributing or marketing such commodities, and companies in the upstream segment of the energy infrastructure sector engage in exploring, developing, managing or producing such commodities. The energy infrastructure sector also includes producers and processors of coal and aggregates, two business segments that also are eligible for MLP status. We seek to invest in companies in the energy infrastructure sector that generally produce stable cash flows as a result of their fee-based revenues and proactive hedging programs which help to limit direct commodity price risk. Our goal is to provide our stockholders with a high level of total return, with an emphasis on distributions and distribution growth. We invest primarily in equity securities of companies that we expect to pay us distributions on a current basis and provide us distribution growth.
Performance Review and Portfolio Outlook
The first quarter of 2009 reflected mixed results as the MLP sector continued to manage through the global economic recession and the related credit crisis, and recover from significant deleveraging by certain hedge funds and other MLP investors in late 2008. While, in our view, midstream long-haul pipeline company fundamentals remain intact, falling commodity prices have caused some upstream companies to elect to conserve capital by curtailing drilling and/or production. In the midstream segment, gatherers and processors, particularly those whose revenues are based on make-whole or percent-of-proceeds contracts, were negatively impacted by lower prices and or volumes, and downstream companies have seen lower prices for NGLs as a result of increased inventory for the hurricane season and diminished demand. These challenges were manifest in the distribution decisions of certain MLPs, as some chose to reduce distribution growth, hold distributions steady or, in a few cases, reduce distributions.
For the three months ended February 28, 2009, the Wachovia MLP Total Return Index reflected a total return based on market value, assuming reinvestment of quarterly distributions, of 6.1 percent. Our total return for the three months ended February 28, 2009 based on market value, assuming reinvestment of quarterly distributions was 28.3 percent. Our total assets decreased from $112,321,057 as of November 30, 2008 to $103,518,043 as of February 28, 2009. Our net asset value as of February 28, 2009 was $8.67 compared to $9.96 at November 30, 2008. Presently, the total cost basis of our investments for financial statement reporting purposes exceeds the fair value we are reflecting on our Statement of Assets and Liabilities. That, combined with our operating losses, results in a deferred tax asset of $9,277,868 (net of a $4,026,458 valuation allowance), or approximately $1.04 per share. We do not include the deferred tax asset in the calculation of the management fee due to the Adviser.
Market values of MLPs, along with the values of our comparable private companies, have experienced substantial declines. As a result, we have selectively liquidated some of our public investments and used the proceeds to reduce our leverage. While this has improved our asset coverage ratios, it will likely reduce future distributable cash flow available to stockholders.
We recently announced a 90-day extension to our credit facility. We are continuing to work toward a longer-term arrangement; however, we acknowledge that these are uncertain credit markets. We reduced the facility to $25,000,000, and through the extension period at least half of any proceeds from the liquidation of public investments and all of the proceeds from the liquidation of private investments will be used to further reduce the facility. As mentioned above, subsequent to the end of the quarter, we liquidated a portion of our public investments and used the proceeds to reduce the amount outstanding on the credit facility to $19,300,000 as of April 8, 2009. On April 3, 2009 Legacy Reserves, LP announced that a private equity firm made a proposal to acquire all of the outstanding units of their company. If the sale is achieved at the stated price, the proceeds would further reduce our credit facility by approximately $3.0 million. Combined with the recent sales of public investments, this would result in a level of asset coverage that we feel is appropriate given the current market volatility.
We expect to see a continued divergence in subsector performance, with fee-based long-haul pipeline companies outperforming commodity sensitive companies. Despite significant headwinds, we believe gathering and processing companies with strategic operational assets, sufficient coverage, strong hedging programs and adequate liquidity will prevail. In our view, E&P companies will continue to experience pressure resulting from falling prices and rising operating costs reported during the second half of 2008. That said, we believe operating costs will fall in 2009 and 2010 as a result of price competition due to the overcapacity in a lower-priced commodity environment. In addition, we may see some companies begin to explore strategic alternatives such as joint ventures and acquisitions. We expect this year to be challenging; however, we continue to believe our companies play a critical role in producing, processing, transporting and storing energy in response to consumer demand.
Investment Review
Following is a summary of our investment activity during the three months ended February 28, 2009:
Mowood, LLC (“Mowood”) – Follow-on Investment
On December 5, 2008 we invested $515,000 in Mowood in the form of a promissory note with a fixed annual interest rate equal to 9.0 percent. The proceeds were used by Mowood for working capital purposes. On December 8, 2008, we entered into an agreement with Mowood to amend and combine the existing subordinated debt and multiple promissory notes into a single new promissory note with a principal balance of $8,800,000. The new note has an annual interest rate of 9.0 percent and a maturity date of December 31, 2009. Due to the start-up nature of Timberline (subsidiary of Mowood) and the delays encountered in completing its first three landfill gas to energy projects, we deemed it prudent to reduce the interest rate charged on Mowood’s debt and distributions on invested equity to 9.0 percent to provide Mowood more operational flexibility and growth capital.
In order to count portfolio securities as qualifying assets, a BDC must either control the issuer of the securities or must offer to make available to the issuer of the securities (other than small and solvent companies described above) significant managerial assistance. Making available significant managerial assistance means, among other things, any arrangement whereby a BDC, through its directors, officers or employees, offers to provide, and, if accepted, does so provide, significant guidance and counsel concerning the management, operations or business objectives and policies of a portfolio company through monitoring of portfolio company operations, selective participation in board and management meetings, consulting with and advising a portfolio company’s officers, or other organizational or financial guidance. As of December 1, 2008, we began charging Mowood $5,000 per month to cover our expenses related to the managerial assistance we are providing to them.
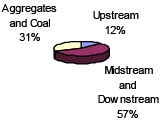
As of February 28, 2009, the value of our investment portfolio (excluding short-term investments) was $91,046,870 including equity investments of $82,246,870 and debt investments of $8,800,000 across the following segments of the energy infrastructure sector:
| | | | | | | | | | | | | Current |
| | | | | | | | | | | | | Yield on |
| Name of Portfolio | | Nature of its | | Securities | | Amount Invested | | Fair Value(in | | Amount |
| Company (Segment) | | Principal Business | | Held by Us | | (in millions) | | millions)(1) | | Invested(2) |
Abraxas Energy Partners, L.P.
(Upstream) | | Natural gas and oil exploitation and development in the Delaware and Gulf Coast Basins of Texas, Rockies and Mid-Continent region of the U.S. | | Common Units | | $ | 7.5 | | $ | 2.0 | | 9.0% |
| | | | | | | | | | | | | |
Eagle Rock Energy Partners,
L.P. (Upstream/Midstream) | | Gatherer and processor of natural gas in north and east Texas and Louisiana and producer and developer of upstream and mineral assets located in 17 states | | Common Units
(Registered and
Unregistered) | | | 19.8 | | | 5.6 | | 10.3 |
| | | | | | | | | | | | | |
EV Energy Partners, L.P.
(Upstream) | | Acquirer, producer and developer of oil and gas properties in the Appalachian Basin, the Monroe field in Louisiana, Michigan, the Austin Chalk, South Central Texas, the Permian Basin, the San Juan Basin and the Mid-continent area. | | Common Units | | | 7.5 | | | 3.2 | | 8.7 |
| | | | | | | | | | | | | |
High Sierra Energy, LP
(Midstream) | | Marketer, processor, storer and transporter of hydrocarbons and processor and disposer of oilfield produced water with operations primarily in Colorado, Wyoming, Oklahoma and Florida | | Common Units | | | 24.8 | | | 19.5 | | 10.2 |
| | | | | | | | | | | | | |
High Sierra Energy GP, LLC
(Midstream)(3) | | General Partner of High Sierra Energy, LP | | Equity Interest | | | 2.0 | | | 1.9 | | 2.2 |
| | | | | | | | | | | | | |
International Resource
Partners LP (Coal) | | Operator of both metallurgical and steam coal mines in Central Appalachia | | Class A Units | | | 10.0 | | | 8.5 | | 8.0 |
| | | | | | | | | | | | | |
Legacy Reserves LP
(Upstream) | | Oil and natural gas exploitation and development primarily in the Permian Basin | | Limited Partner
Units | | | 4.5 | | | 2.8 | | 12.2 |
| | | | | | | | | | | | | |
LONESTAR Midstream
Partners, LP (Midstream)(4) | | LONESTAR Midstream Partners, LP sold its assets to Penn Virginia Resource Partners, L.P (PVR) in July 2008. LONESTAR has no continuing operations, but currently holds rights to receive future payments from PVR relative to the sale. | | Class A Units | | | 3.7 | | | 3.6 | | N/A |
| | | | | | | | | | | | | |
| LSMP GP, LP (Midstream)(4) | | Indirectly owns General Partner of LONESTAR Midstream Partners, LP | | GP LP Units | | | 0.2 | | | 0.5 | | N/A |
| | | | | | | | | | | | | |
Mowood, LLC
(Midstream/Downstream)(5) | | Natural gas distribution in central Missouri and landfill gas to energy projects | | Equity interest | | | 5.0 | | | 5.5 | | 9.0 |
| | | | | | | | | | | | | |
| | | | Subordinated
Debt | | | 8.8 | | | 8.8 | | 9.0 |
| | | | | | | | | | | | | |
Penn Virginia Resource
Partners, L.P.
(Midstream/Coal) | | Operator of a midstream natural gas gathering and processing business and manager of coal properties and related assets | | Unregistered
Common Units | | | 11.3 | | | 5.9 | | 8.4 |
| | | | | | | | | | | | | |
Penn Virginia GP Holdings,
L.P. (Midstream/Coal) | | Owns the general partner interest, incentive distribution rights and a portion of the limited partner interests in Penn Virginia Resource Partners, L.P. | | Unregistered
Common Units | | | 1.7 | | | 0.7 | | 5.6 |
| | | | | | | | | | | | | |
Quest Midstream Partners,
L.P. (Midstream)(6) | | Operator of natural gas gathering pipelines in the Cherokee Basin and interstate natural gas transmission pipelines in Oklahoma, Kansas and Missouri | | Common Units | | | 22.2 | | | 6.5 | | 0.0 |
| | | | | | | | | | | | | |
VantaCore Partners LP
(Aggregates) | | Acquirer and operator of aggregate companies, with quarry and asphalt operations in Clarksville, Tennessee and sand and gravel operations located near Baton Rouge, Louisiana | | Common Units
and
Incentive
Distribution
Rights | | | 18.4 | | | 16.0 | | 10.1 |
| | | | | | | | | | | | | |
| | | | | | $ | 147.4 | | $ | 91.0 | | |
| (1) | | Fair value as of February 28, 2009. |
| (2) | | The current yield has been calculated by annualizing the most recent distribution during the period and dividing by the amount invested in the underlying security. Actual distributions to us are based on each company’s available cash flow and are subject to change. |
| (3) | | Includes original purchase of 3 percent equity interest, sale of 0.6274 percent equity interest in July 2007 and subsequent capital calls. |
| (4) | | LONESTAR Midstream Partners, LP sold its assets to Penn Virginia Resource Partners, L.P in July 2008. LONESTAR has no continuing operations, but currently holds rights to receive future payments from PVR relative to the sale. The cost basis and the fair value of the LONESTAR and LSMP GP, LP units as of February 28, 2009 are related to the potential receipt of those future payments. Since this investment is not deemed to be “active”, the yield is not meaningful and we have excluded it from our weighted average yield to cost on investments as described below in Results of Operations. |
| (5) | | Current yield represents an equity distribution on the previous quarter fair value of our invested capital, including the effect of the management incentive plan, divided by the amount invested. We expect that, pending cash availability, such equity distributions will recur on a quarterly basis at or above such yield. |
| (6) | | Currently non-income producing. |
Portfolio Company Profiles
Abraxas Energy Partners, L.P. (“Abraxas”)
Abraxas is a private company that operates long-lived, low-decline natural gas and oil reserves located primarily in the Delaware and Gulf Coast Basins of Texas, Rocky Mountains and Mid-Continent regions of the U.S. Abraxas was formed by Abraxas Petroleum Corporation, an independent publicly-traded energy company engaged in the exploration and production of natural gas and crude oil. We hold one of six seats on Abraxas’ board of directors. Abraxas’ principal office is located at 18803 Meisner Drive, San Antonio, TX 78258.
Eagle Rock Energy Partners, L.P. (“Eagle Rock Energy”)
Eagle Rock Energy (NASDAQ: EROC) is a publicly traded master limited partnership with midstream assets located primarily in Texas and Louisiana and upstream assets, including mineral and royalty interests, in seventeen states. Eagle Rock Energy’s principal office is located at 16701 Greenspoint Park Drive, Suite 200, Houston, TX 77060.
EV Energy Partners, L.P. (“EV”)
EV (NASDAQ: EVEP) is a publicly traded master limited partnership engaged in acquiring, producing and developing oil and gas properties. EV’s current properties are located in the Appalachian Basin, the Monroe Field in Louisiana, the Austin Chalk, South Central Texas, the Permian Basin, the San Juan Basin and the Mid-Continent area. EV’s principal office is located at 1001 Fannin Street, Suite 800, Houston, TX 77002.
High Sierra Energy, LP (“High Sierra”)
High Sierra is a holding company with diversified midstream energy assets focused on the processing, transportation, storage and marketing of hydrocarbons. The company’s businesses include a natural gas liquids logistics and transportation business in Colorado, natural gas gathering and processing operations in Louisiana, a natural gas storage facility in Mississippi, an ethanol terminal in Nevada, crude and natural gas liquids trucking businesses in Kansas and Colorado, businesses providing crude oil gathering, transportation and marketing services, primarily focused in the Mid-Continent, Western and Gulf Coast regions, water treatment transportation and disposal businesses serving oil and gas producers in Wyoming and Oklahoma, and two asphalt processing, packaging and distribution terminals in Florida. We hold board of director observation rights for High Sierra. High Sierra’s principal office is located at 3773 Cherry Creek Drive North, Suite 655, Denver, CO 80209.
High Sierra Energy GP, LLC (“High Sierra GP”)
High Sierra GP is the general partner of High Sierra. High Sierra GP’s principal office is located at 3773 Cherry Creek Drive North, Suite 655, Denver, CO 80209.
International Resource Partners LP (“IRP”)
IRP has surface and underground coal mine operations in southern West Virginia comprised of metallurgical and steam coal reserves, a coal washing and preparation plant, rail load-out facilities and a sales and marketing subsidiary. IRP’s principal office is located at 725 5th Avenue, New York, NY 10022.
Legacy Reserves LP (“Legacy”)
Legacy (NASDAQ: LGCY) is a publicly traded master limited partnership focused on the acquisition and development of long-lived oil and natural gas properties primarily located in the Permian Basin and Mid-Continent regions of the United States. Legacy’s principal office is located at 303 West Wall, Suite 1400, Midland, TX 79701.
LONESTAR Midstream Partners, LP (“LONESTAR”)
LONESTAR Midstream Partners, LP sold its assets to Penn Virginia Resource Partners, L.P in July 2008. LONESTAR has no continuing operations, but currently holds rights to receive future payments from PVR relative to the sale. We hold one of four seats on LONESTAR’s board of directors. LONESTAR’s principal office is located at 300 E. John Carpenter Freeway, Suite 800, Irving, TX 75062.
LSMP GP, LP (“LSMP GP”)
LSMP GP indirectly owns the general partner of LONESTAR. LSMP GP’s principal office is located at 300 E. John Carpenter Freeway, Suite 800, Irving, TX 75062.
Mowood, LLC (“Mowood”)
Mowood is a holding company whose assets include Omega Pipeline, LLC (“Omega”) and Timberline Energy, LLC (“Timberline”). Omega is a natural gas local distribution company located on the Fort Leonard Wood army base in south central Missouri. Omega serves the natural gas and propane needs of Fort Leonard Wood and other customers in the surrounding area. Timberline is an owner and developer of projects that convert landfill gas to energy. We currently hold one of two seats on Mowood’s board of directors. Mowood’s principal office is located at 14694 Orchard Parkway, Suite 200, Westminster, CO 80020.
Penn Virginia Resource Partners, L.P. (“PVR”)
Penn Virginia Resource Partners, L.P. (NYSE: PVR) is a publicly traded master limited partnership formed by Penn Virginia Corporation (NYSE: PVA). PVR operates a midstream natural gas gathering and processing business and manages coal properties and related assets. PVR’s principal office is located at Three Radnor Corporate Center, Suite 300, 100 Matsonford Road, Radnor, PA 19087.
Penn Virginia GP Holdings, L.P. (“PVG”)
Penn Virginia GP Holdings, L.P. (NYSE: PVG) is a publicly traded master limited partnership formed to own the general partner interest, all of the incentive distribution rights and a portion of the limited partner interests in PVR. PVG’s principal office is located at Three Radnor Corporate Center, Suite 300, 100 Matsonford Road, Radnor, PA 19087.
Quest Midstream Partners, L.P. (“Quest”)
Quest was formed by the spin-off of Quest Resource Corporation’s midstream coal bed methane natural gas gathering assets in the Cherokee Basin. Quest owns more than 1,800 miles of natural gas gathering pipelines (primarily serving Quest Energy Partners, L.P., an affiliate) and over 1,100 miles of interstate natural gas transmission pipelines in Oklahoma, Kansas and Missouri. We hold one of seven seats on Quest’s board of directors. Quest’s principal office is located at 210 Park Avenue, Suite 2750, Oklahoma City, OK 73102.
VantaCore Partners LP (“VantaCore”)
VantaCore was formed to acquire companies in the aggregate industry and currently owns a quarry and asphalt plant in Clarksville, Tennessee and sand and gravel operations located near Baton Rouge, Louisiana. We hold one of four seats on VantaCore’s Board of Directors. VantaCore’s principal office is located at 666 Fifth Avenue, 26th Floor, New York, NY 10103.
Portfolio Company Monitoring
Our Adviser monitors each portfolio company to determine progress relative to meeting the company’s business plan and to assess the company’s strategic and tactical courses of action. This monitoring may be accomplished by attendance at Board of Directors meetings, ad hoc communications with company management, the review of periodic operating reports and financial reports, an analysis of relevant reserve information and capital expenditure plans, and periodic consultations with engineers, geologists, and other experts. The performance of each portfolio company is also periodically compared to performance of similarly sized companies with comparable assets and businesses to assess performance relative to peers. Our Adviser’s monitoring activities are expected to provide it with the necessary access to monitor compliance with existing covenants, to enhance our ability to make qualified valuation decisions, and to assist our evaluation of the nature of the risks involved in each individual investment. In addition, these monitoring activities should enable our Adviser to diagnose and manage the common risk factors held by our total portfolio, such as sector concentration, exposure to a single financial sponsor, or sensitivity to a particular geography.
As part of the monitoring process, our Adviser continually assesses the risk profile of each of our investments and rates them on a scale of (1) to (3) based on the following:
| | (1) | | The portfolio company is performing at or above expectations and the trends and risk factors are generally favorable to neutral. |
| (2) | | The portfolio company is performing below expectations and the investment’s risk has increased materially since origination. The portfolio company is generally out of compliance with various covenants; however, payments are generally not more than 120 days past due. |
| |
| | (3) | | The portfolio company is performing materially below expectations and the investment risk has substantially increased since origination. Most or all of the covenants are out of compliance and payments are substantially delinquent. Investment is not expected to provide a full repayment of the amount invested. |
As of February 28, 2009, all of our portfolio companies have a rating of (1), with the exception of Quest Midstream Partners, L.P., which has a rating of (3).
High Sierra Energy, L.P. (“High Sierra”) experienced tightening of its transactional trade finance credit line, made more difficult by its exposure to a voluntary petition for reorganization under Chapter 11 of the U.S. Bankruptcy Code filed by SemGroup, L.P. and certain of its subsidiaries in July 2008. In response to these challenges, High Sierra utilized cash generated from operations to reduce borrowings and to support its marketing businesses. High Sierra elected to distribute additional common units in lieu of a cash distribution to its common unit holders during our fiscal quarters ended August 31, 2008 and November 30, 2008, and therefore we had assigned it a rating of (2) as of November 30, 2008. Most recently, during our fiscal quarter ended February 28, 2009, the board of directors for High Sierra elected to pay a cash distribution of $0.61 per unit to all common unit holders. Primarily as a result of the return to payment of a cash distribution, High Sierra was upgraded to a rating of (1) as of February 28, 2009.
Quest Midstream Partners, L.P. (“Quest Midstream”) continues to face challenges as a result of the August 2008 alleged misappropriation of funds by Jerry Cash, former CEO and Chairman of Quest Resource Corporation (NASDAQ: QRCP), Quest Energy Partners, L.P. (NASDAQ: QELP) and Quest Midstream. Quest Midstream suspended distributions to its common unit holders during our quarter ended November 30, 2008, and accordingly, we assigned the company a rating of (2) as of November 30, 2008. During our fiscal quarter ended February 28, 2009, Quest Midstream again did not pay a distribution to its common unit holders. The company is currently in compliance, and expects to remain in compliance, with its bank covenants. Quest Midstream could resume distributions to common unit holders, subject to debt covenant requirements; however, since the company anticipates a reduction in its gathering rate beginning in 2010, we do not expect to receive any distributions in 2009. Further, our fair value for Quest Midstream has declined substantially this quarter and it appears that the investment will not likely provide a full repayment of the amount invested. Accordingly, Quest Midstream has been downgraded to a rating of (3) as of February 28, 2009.
Results of Operations
Set forth below are the results of operations for the three months ended February 28, 2009 as compared to February 29, 2008.
Investment Income:Investment income decreased $21,834 for the three months ended February 28, 2009 as compared to the three months ended February 29, 2008; however, total distributions from investments increased $99,056 in comparison to the prior fiscal year. The decrease in investment income is generally due to less interest income received from debt investments subsequent to the VantaCore debt redemption. The increase in total distributions from investments is attributable to follow-on investments and distribution increases from several of our portfolio companies.
The weighted average yield (to cost) on our investment portfolio (excluding short-term investments) as of February 28, 2009 was 7.8 percent as compared to 8.8 percent at February 29, 2008. The decrease in the weighted average yield to cost is related to slightly lower yields on securities received from our two realization events last fiscal year, as well as Quest’s non-payment of a distribution during the current quarter.
Net Expenses: Net expenses decreased $246,120 during the three months ended February 28, 2009 as compared to the three months ended February 29, 2008. The decrease is primarily attributable to less base management fees payable to the Adviser as a result of the decreased value of the investment portfolio.
Distributable Cash Flow:Our portfolio generates cash flow to us from which we pay distributions to stockholders. When our Board of Directors determines the amount of any distribution we expect to pay our stockholders, it will review distributable cash flow (“DCF”). DCF is distributions received from investments less our total expenses. The total distributions received from our investments include the amount received by us as cash distributions from equity investments, paid-in-kind distributions, and dividend and interest payments. Total expenses include current or anticipated operating expenses, leverage costs and current income taxes on our operating income. Total expenses do not include deferred income taxes or accrued capital gain incentive fees. We do not include in distributable cash flow the value of distributions received from portfolio companies which are paid in stock as a result of credit constraints, market dislocation or other similar issues.
We disclose DCF in order to provide supplemental information regarding our results of operations and to enhance our investors’ overall understanding of our core financial performance and our prospects for the future. We believe that our investors benefit from seeing the results of DCF in addition to U.S. generally accepted accounting principles (“GAAP”) information. This non-GAAP information facilitates management’s comparison of current results with historical results of operations and with those of our peers. This information is not in accordance with, or an alternative to, GAAP and may not be comparable to similarly titled measures reported by other companies.
The following table represents DCF for the three months ended February 28, 2009 as compared to the three months ended February 29, 2008:
| | | For the three months ended | | For the three months ended |
| Distributable Cash Flow | | February 28, 2009 | | February 29, 2008 |
| Total from Investments | | | | | | | | |
| Distributions from investments | | $ | 2,691,635 | | | $ | 2,620,715 | |
| Distributions paid in stock(1) | | | - | | | | 453,520 | |
| Interest income from investments | | | 201,598 | | | | 313,409 | |
| Dividends from money market mutual funds | | | 725 | | | | 2,310 | |
| Other income | | | 15,000 | | | | 28,987 | |
| Total from Investments | | | 2,908,958 | | | | 3,418,941 | |
| |
| Operating Expenses Before Leverage Costs | | | | | | | | |
| Advisory fees (net of expense reimbursement by Adviser) | | | 327,308 | | | | 493,606 | |
| Other operating expenses (excluding capital gain incentive fees) | | | 217,582 | | | | 250,281 | |
| Total Operating Expenses | | | 544,890 | | | | 743,887 | |
| Distributable cash flow before leverage costs | | | 2,364,068 | | | | 2,675,054 | |
| Leverage Costs | | | 171,116 | | | | 497,904 | |
| Distributable Cash Flow | | $ | 2,192,952 | | | $ | 2,177,150 | |
| |
| Distributions paid on common stock | | $ | 2,061,294 | | | $ | 2,214,587 | |
| |
| Payout percentage for period (2) | | | 94 | % | | | 102 | % |
| |
| DCF/GAAP Reconciliation | | | | | | | | |
| Distributable Cash Flow | | $ | 2,192,952 | | | $ | 2,177,150 | |
| Adjustments to reconcile to Net Investment Income, before Income Taxes | | | | | | | | |
| Distributions paid in stock(1) | | | 28,136 | | | | (453,520 | ) |
| Return of capital on distributions received from equity investments | | | (1,853,248 | ) | | | (1,859,741 | ) |
| Capital gain incentive fees | | | - | | | | 279,665 | |
| Net Investment Income, before Income Taxes | | $ | 367,840 | | | $ | 143,554 | |
| (1) | | The only distributions paid in stock for the three months ended February 28, 2009 were from Abraxas Energy Partners, L.P. which were paid in stock as a result of credit constraints and therefore were not included in DCF. Distributions paid in stock for the three months ended February 29, 2008 represent paid-in-kind distributions from LONESTAR Midstream Partners, LP |
| (2) | | Distributions paid as a percentage of Distributable Cash Flow. |
Distributions:The following table sets forth distributions for the three months ended February 28, 2009 as compared to the three months ended February 29, 2008.
| Record Date | | Payment Date | | Amount |
| February 23, 2009 | | March 2, 2009 | | $ | 0.2300 |
| February 21, 2008 | | March 3, 2008 | | $ | 0.2500 |
Net Investment Income:Net investment income for the three months ended February 28, 2009 was $266,657 as compared to $89,003 for the three months ended February 29, 2008. The increase in net investment income is primarily related to the decrease in net expenses described above.
Net Realized and Unrealized Loss:We had unrealized depreciation of $9,376,241 (after deferred taxes) as compared to $2,137,578 (after deferred taxes) for the three months ended February 29, 2008. We had realized losses for the three months ended February 28, 2009 of $362,331 (after deferred taxes) as compared to no realized gains or losses for the three months ended February 29, 2008. The realized losses for the current period are attributable to the Millennium realization event as described in Note 9 to the financial statements.
Recent Developments
On March 2, 2009, the Company paid a distribution in the amount of $0.23 per common share, for a total of $2,061,294. Of this total, the dividend reinvestment amounted to $231,375.
Liquidity and Capital Resources
We expect to raise additional capital to support our future growth through equity offerings, rights offerings, and issuances of senior securities or future borrowings to the extent permitted by the 1940 Act and our current credit facility and subject to market conditions. We generally may not issue additional common shares at a price below our net asset value (net of any sales load (underwriting discount)) without first obtaining approval of our stockholders and Board of Directors. We are restricted in our ability to incur additional debt by the terms of our credit facility. We have filed a shelf registration statement with the Securities and Exchange Commission which, when effective, will facilitate raising additional capital.
Borrowings
Total leverage outstanding on our credit facility at February 28, 2009 was $23,100,000, representing approximately 22 percent of total assets, including our deferred tax asset. We are, and intend to remain, in compliance with our asset coverage ratios under the Investment Company Act of 1940 and our basic maintenance covenants under our credit facility.
For the three months ended February 28, 2009, the average principal balance and interest rate for the period during which the credit facility was utilized were $23,068,889 and 2.38 percent, respectively. As of February 28, 2009, the principal balance outstanding was $23,100,000 at a rate of 2.25 percent.
On March 21, 2008, we secured an extension to our revolving credit facility and on March 28, 2008, amended the credit agreement to exclude Bank of Oklahoma and include Wells Fargo as a lender, and to increase the total credit facility to $50,000,000. The revolving credit facility has a variable annual interest rate equal to the one-month LIBOR plus 1.75 percent, a non-usage fee equal to an annual rate of 0.375 percent of the difference between the total credit facility commitment and the average outstanding balance at the end of each day for the preceding fiscal quarter, and is secured with all our assets. The credit facility contains a covenant precluding us from incurring additional debt. The credit facility has a maturity date of March 20, 2009. See discussion below regarding extension of the credit facility.
On March 20, 2009, we entered into a 90-day extension of its amended credit facility. Terms of the extension provide for a secured revolving credit facility of up to $25,000,000. As of April 8, 2009, we had $19,300,000 outstanding on our credit facility. The credit agreement, as extended, terminates on June 20, 2009. The amended credit facility includes a provision requiring us to apply 100% of the proceeds from any private investment liquidation and 50% of the proceeds from the sale of any publicly traded portfolio assets to the outstanding balance of the facility. In addition, each prepayment of principal of the loans under the amended credit facility will permanently reduce the maximum amount of the loans under the amended credit agreement to an amount equal to the outstanding principal balance of the loans under the amended credit agreement immediately following the prepayment. During the extension, outstanding balances generally will accrue interest at a variable rate equal to the greater of (i) the one-month LIBOR plus 3.00 percent or (ii) 5.50 percent, with a fee of 0.50 percent on any unused balance of the facility. We anticipate arranging a more permanent lending arrangement in the near-term.
Contractual Obligations
The following table summarizes our significant contractual payment obligations as of February 28, 2009.
| | | Payments due by period |
| | | | | Less than 1 year | | 1-3 years | | 3-5 years | | More than 5 years |
| | | Total | | | | | | | | |
| Secured revolving credit facility(1) | | $23,100,000 | | $23,100,000 | | - | | - | | - |
| | | $23,100,000 | | $23,100,000 | | - | | - | | - |
| (1) | | At February 28, 2009, the outstanding balance under the credit facility was $23,100,000, with a maturity date of March 20, 2009. |
Off-Balance Sheet Arrangements
We do not have any off-balance sheet arrangements that have or are reasonably likely to have a current or future effect on our financial condition, changes in financial condition, revenues or expenses, results of operations, liquidity, capital expenditures, or capital resources.
Critical Accounting Policies
The financial statements included in this report are based on the selection and application of critical accounting policies, which require management to make significant estimates and assumptions. Critical accounting policies are those that are both important to the presentation of our financial condition and results of operations and require management’s most difficult, complex or subjective judgments. While our critical accounting policies are discussed below, Note 2 in the Notes to Financial Statements included in this report provides more detailed disclosure of all of our significant accounting policies.
Valuation of Portfolio Investments
We invest primarily in illiquid securities including debt and equity securities of privately-held companies. These investments generally are subject to restrictions on resale, have no established trading market and are fair valued on a quarterly basis. Because of the inherent uncertainty of valuation, the fair values of such investments, which are determined in accordance with procedures approved by our Board of Directors, may differ materially from the values that would have been used had a ready market existed for the investments.
Securities Transactions and Investment Income Recognition
Securities transactions are accounted for on the date the securities are purchased or sold (trade date). Realized gains and losses are reported on an identified cost basis. Distributions received from our equity investments generally are comprised of ordinary income, capital gains and return of capital from the portfolio company. We record investment income and returns of capital based on estimates made at the time such distributions are received. Such estimates are based on information available from each portfolio company and/or other industry sources. These estimates may subsequently be revised based on information received from the portfolio companies after their tax reporting periods are concluded, as the actual character of these distributions are not known until after our fiscal year end.
Federal and State Income Taxation
We, as a corporation, are obligated to pay federal and state income tax on our taxable income. Our tax expense or benefit is included in the Statement of Operations based on the component of income or gains (losses) to which such expense or benefit relates. Deferred income taxes reflect the net tax effects of temporary differences between the carrying amounts of assets and liabilities for financial reporting purposes and the amounts used for income tax purposes.
ITEM 3. QUANTITIATIVE AND QUALITATIVE DISCLOSURES ABOUT MARKET RISK
Our business activities contain elements of market risk. We consider fluctuations in the value of our equity securities and the cost of capital under our credit facility to be our principal market risk.
We carry our investments at fair value, as determined by our Board of Directors. The fair value of securities is determined using readily available market quotations from the principal market if available. The fair value of securities that are not publicly traded or whose market price is not readily available is determined in good faith by our Board of Directors. Because there are no readily available market quotations for most of the investments in our portfolio, we value substantially all of our portfolio investments at fair value as determined in good faith by our Board of Directors under a valuation policy and a consistently applied valuation process. Due to the inherent uncertainty of determining the fair value of investments that do not have readily available market quotations, the fair value of our investments may differ significantly from the fair values that would have been used had a ready market quotation existed for such investments, and these differences could be material.
As of February 28, 2009, the fair value of our investment portfolio (excluding short-term investments) totaled $91,046,870. We estimate that the impact of a 10 percent increase or decrease in the fair value of these investments, net of capital gain incentive fees and related deferred taxes, would increase or decrease net assets applicable to common stockholders by approximately $5,644,906.
As of February 28, 2009, our revolving credit facility has a variable annual interest rate equal to the one-month LIBOR plus 1.75 percent. We estimate that a one percentage point interest rate movement in the average market interest rates (either higher or lower) for the three month period during which the credit facility was utilized would either increase or decrease net investment income by approximately $57,672.
Debt investments in our portfolio may be based on floating or fixed rates. Loans bearing a floating interest rate are usually based on LIBOR and, in most cases, a spread consisting of additional basis points. The interest rates for these debt instruments typically have one to six-month durations and reset at the current market interest rates. As of February 28, 2009, we had no floating rate debt investments outstanding.
We consider the management of risk essential to conducting our businesses. Accordingly, our risk management systems and procedures are designed to identify and analyze our risks, to set appropriate policies and limits and to continually monitor these risks and limits by means of reliable administrative and information systems and other policies and programs.
ITEM 4. CONTROLS AND PROCEDURES
Our management, with the participation of our Chief Executive Officer and Chief Financial Officer, has evaluated the effectiveness of our disclosure controls and procedures (as defined in Rules 13a-15(e) or 15d-15(e) of the Securities Exchange Act of 1934) as of the end of the period covered by this report. Based upon such evaluation, our Chief Executive Officer and Chief Financial Officer concluded that our disclosure controls and procedures were effective and provided reasonable assurance that information required to be disclosed by us in the reports we file or submit under the Securities Exchange Act of 1934 is recorded, processed, summarized and reported within the time periods specified in the SEC rules and forms, and that such information is accumulated and communicated to our management, including our Chief Executive Officer and Chief Financial Officer, as appropriate, to allow timely decisions regarding required disclosure.
There have been no changes in our internal control over financial reporting (as defined in Rules 13a-15(f) or 15d-15(f) of the Securities Exchange Act of 1934) during the fiscal quarter ended February 28, 2009, that have materially affected, or are reasonably likely to materially affect, our internal control over financial reporting.
PART II—OTHER INFORMATION
ITEM 1. LEGAL PROCEEDINGS
We are not currently subject to any material legal proceeding, nor, to our knowledge, is any material legal proceeding threatened against us.
ITEM 1A. RISK FACTORS
In addition to the other information set forth in this report, you should carefully consider the factors discussed in Part I, “Item 1A. Risk Factors” in our Annual Report on Form 10-K for the fiscal year ended November 30, 2008, which could materially affect our business, financial condition or operating results. The risks described in our Annual Report on Form 10-K are not the only risks facing our Company. Additional risks and uncertainties not currently known to us or that we currently deem to be immaterial also may materially adversely affect our business, financial condition and/or operating results.
ITEM 2. UNREGISTERED SALES OF EQUITY SECURITIES AND USE OF PROCEEDS
We did not sell any securities during the three months ended February 28, 2009 that were not registered under the Securities Act of 1933.
We did not repurchase any of our common shares during the three months ended February 28, 2009.
ITEM 3. DEFAULTS UPON SENIOR SECURITIES
Not applicable.
ITEM 4. SUBMISSION OF MATTERS TO A VOTE OF SECURITY HOLDERS
Not applicable.
ITEM 5. OTHER INFORMATION
Not applicable.
ITEM 6. EXHIBITS
| Exhibit | | Description |
| 10.1 | | Fifth Amendment to Credit Agreement dated as of March 20, 2009 by and among Tortoise Capital Resources Corporation, U.S. Bank National Association and First National Bank of Kansas, which is attached as Exhibit 10.1to the Form 8-K filed on March 26, 2009, is hereby incorporated by reference as Exhibit 10.1 |
| |
| 31.1 | | Certification by Chief Executive Officer pursuant to Exchange Act Rule 13a-14(a), as adopted pursuant to Section 302of the Sarbanes-Oxley Act of 2002, is filed herewith |
| |
| 31.2 | | Certification by Chief Financial Officer pursuant to Exchange Act Rule 13a-14(a), as adopted pursuant to Section 302of the Sarbanes-Oxley Act of 2002, is filed herewith |
| |
| 32.1 | | Certification by Chief Executive Officer and Chief Financial Officer pursuant to 18 U.S.C. Section 1350, as adopted pursuant to Section 906 of the Sarbanes-Oxley Act of 2002, is furnished herewith |
All other exhibits for which provision is made in the applicable regulations of the Securities and Exchange Commission are not required under the related instruction or are inapplicable and therefore have been omitted.
SIGNATURE
Pursuant to the requirements of the Securities Exchange Act of 1934, the registrant has duly caused this report to be signed on its behalf by the undersigned thereunto duly authorized.
| |
| TORTOISE CAPITAL RESOURCES |
| | CORPORATION |
| |
| By: | /s/ Terry Matlack |
| |
| Terry Matlack |
| Chief Financial Officer |
| (Principal Financial Officer) |
Date: April 8, 2009