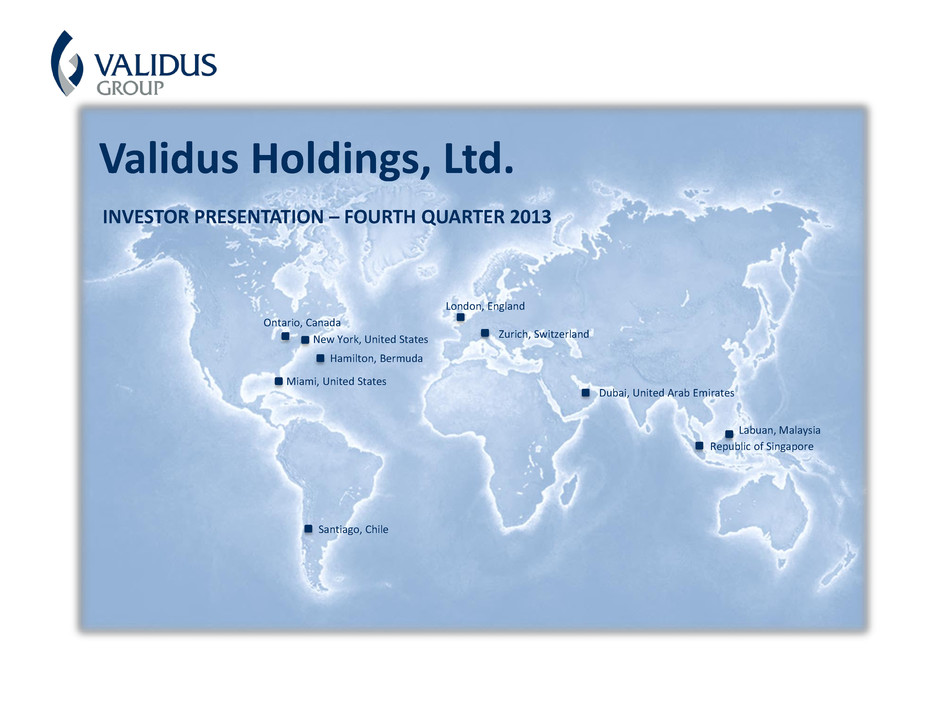
Ontario, Canada New York, United States Hamilton, Bermuda Miami, United States Santiago, Chile London, England Dubai, United Arab Emirates Republic of Singapore Labuan, Malaysia Zurich, Switzerland INVESTOR PRESENTATION – FOURTH QUARTER 2013 Validus Holdings, Ltd.

2 This presentation may include forward-looking statements, both with respect to us and our industry, that reflect our current views with respect to future events and financial performance. Statements that include the words “expect,” “intend,” “plan,” “believe,” “project,” “anticipate,” “will,” “may” and similar statements of a future or forward-looking nature identify forward-looking statements. All forward-looking statements address matters that involve risks and uncertainties. Accordingly, there are or will be important factors that could cause actual results to differ materially from those indicated in such statements and, therefore, you should not place undue reliance on any such statements. We believe that these factors include, but are not limited to, the following: 1) unpredictability and severity of catastrophic events; 2) rating agency actions; 3) adequacy of Validus’ risk management and loss limitation methods; 4) cyclicality of demand and pricing in the insurance and reinsurance markets; 5) statutory or regulatory developments including tax policy, reinsurance and other regulatory matters; 6) Validus’ ability to implement its business strategy during “soft” as well as “hard” markets; 7) adequacy of Validus’ loss reserves; 8) continued availability of capital and financing; 9) retention of key personnel; 10) competition; 11) potential loss of business from one or more major insurance or reinsurance brokers; 12) Validus’ ability to implement, successfully and on a timely basis, complex infrastructure, distribution capabilities, systems, procedures and internal controls, and to develop accurate actuarial data to support the business and regulatory and reporting requirements; 13) general economic and market conditions (including inflation, volatility in the credit and capital markets, interest rates and foreign currency exchange rates); 14) the integration of businesses Validus may acquire or new business ventures Validus may start; 15) the effect on Validus’ investment portfolios of changing financial market conditions including inflation, interest rates, liquidity and other factors; 16) acts of terrorism or outbreak of war; and 17) availability of reinsurance and retrocessional coverage, as well as management’s response to any of the aforementioned factors. The foregoing review of important factors should not be construed as exhaustive and should be read in conjunction with the other cautionary statements that are included herein and elsewhere, including the Risk Factors included in our most recent reports on Form 10-K/A and Form 10-Q and other documents on file with the Securities and Exchange Commission. Any forward-looking statements made in this presentation are qualified by these cautionary statements, and there can be no assurance that the actual results or developments anticipated by us will be realized or, even if substantially realized, that they will have the expected consequences to, or effects on, us or our business or operations. We undertake no obligation to update publicly or revise any forward-looking statement, whether as a result of new information, future developments or otherwise. Cautionary Note Regarding Forward-looking Statements
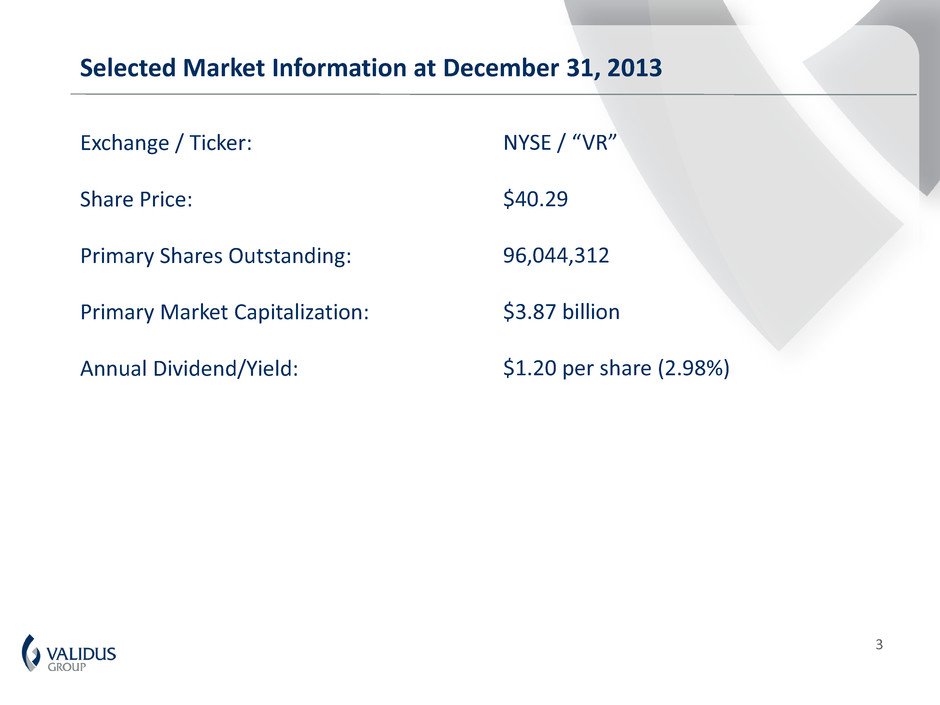
3 Selected Market Information at December 31, 2013 Exchange / Ticker: Share Price: Primary Shares Outstanding: Primary Market Capitalization: Annual Dividend/Yield: NYSE / “VR” $40.29 96,044,312 $3.87 billion $1.20 per share (2.98%)
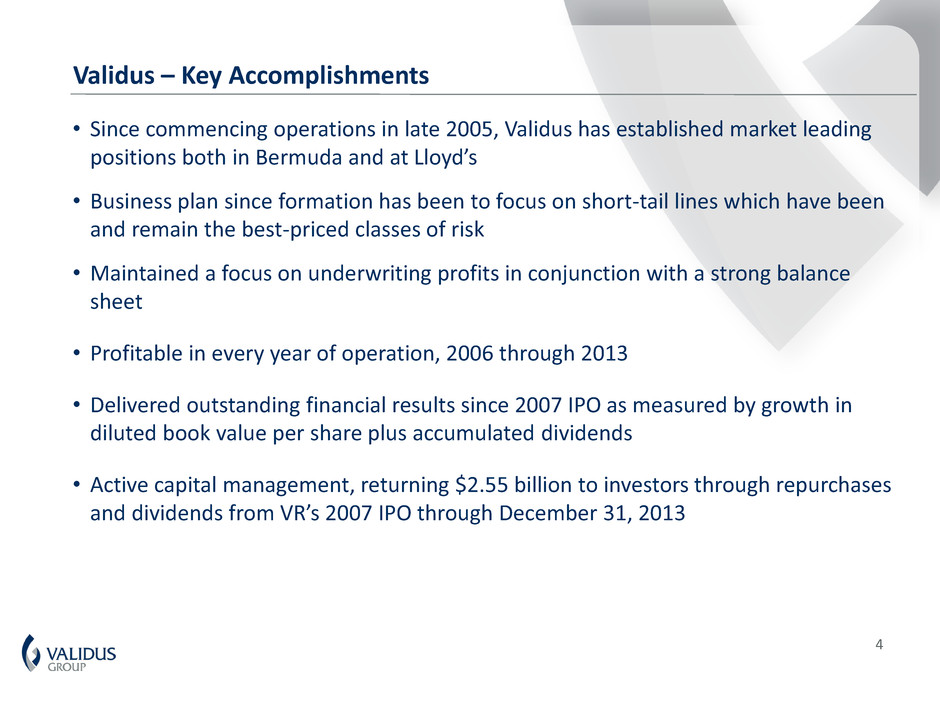
4 • Since commencing operations in late 2005, Validus has established market leading positions both in Bermuda and at Lloyd’s • Business plan since formation has been to focus on short-tail lines which have been and remain the best-priced classes of risk • Maintained a focus on underwriting profits in conjunction with a strong balance sheet • Profitable in every year of operation, 2006 through 2013 • Delivered outstanding financial results since 2007 IPO as measured by growth in diluted book value per share plus accumulated dividends • Active capital management, returning $2.55 billion to investors through repurchases and dividends from VR’s 2007 IPO through December 31, 2013 Validus – Key Accomplishments
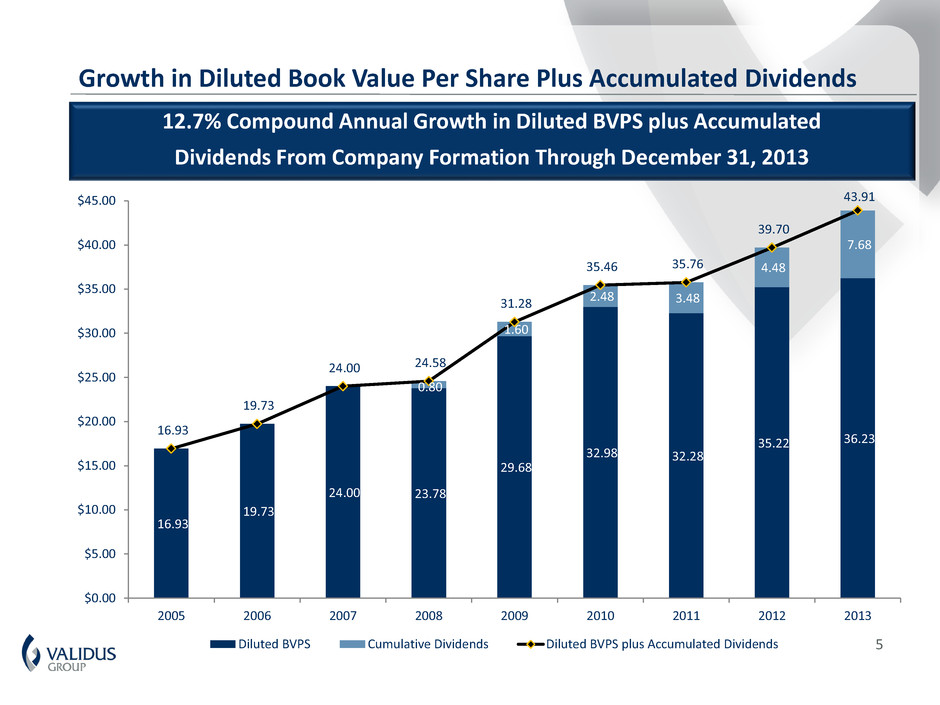
5 12.7% Compound Annual Growth in Diluted BVPS plus Accumulated Dividends From Company Formation Through December 31, 2013 Growth in Diluted Book Value Per Share Plus Accumulated Dividends 16.93 19.73 24.00 23.78 29.68 32.98 32.28 35.22 36.23 0.80 1.60 2.48 3.48 4.48 7.68 16.93 19.73 24.00 24.58 31.28 35.46 35.76 39.70 43.91 $0.00 $5.00 $10.00 $15.00 $20.00 $25.00 $30.00 $35.00 $40.00 $45.00 2005 2006 2007 2008 2009 2010 2011 2012 2013 Diluted BVPS Cumulative Dividends Diluted BVPS plus Accumulated Dividends
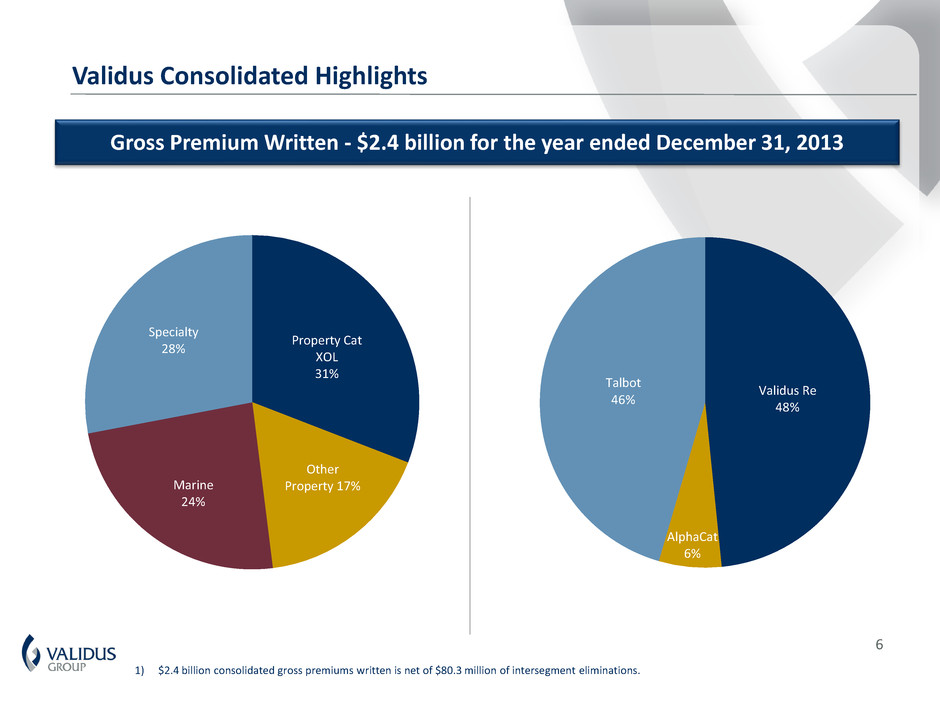
6 Validus Consolidated Highlights Gross Premium Written - $2.4 billion for the year ended December 31, 2013 1) $2.4 billion consolidated gross premiums written is net of $80.3 million of intersegment eliminations. Property Cat XOL 31% Other Property 17% Marine 24% Specialty 28% Validus Re 48% AlphaCat 6% Talbot 46%
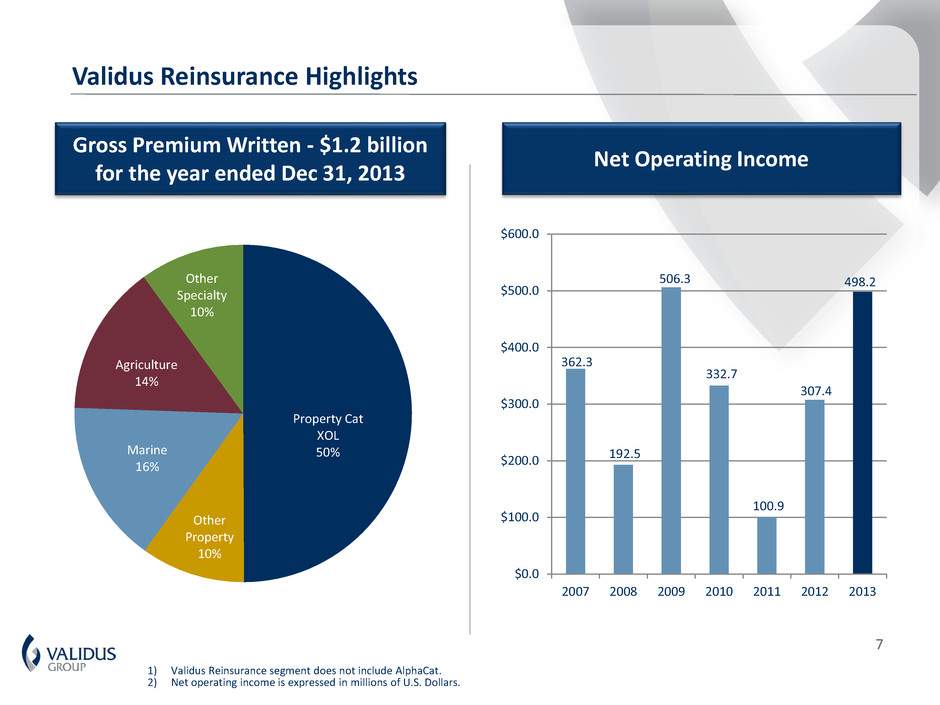
7 Validus Reinsurance Highlights Gross Premium Written - $1.2 billion for the year ended Dec 31, 2013 Net Operating Income 1) Validus Reinsurance segment does not include AlphaCat. 2) Net operating income is expressed in millions of U.S. Dollars. Property Cat XOL 50% Other Property 10% Marine 16% Agriculture 14% Other Specialty 10% 362.3 192.5 506.3 332.7 100.9 307.4 498.2 $0.0 $100.0 $200.0 $300.0 $400.0 $500.0 $600.0 2007 2008 2009 2010 2011 2012 2013

8 U.S. Property Catastrophe Rate on Line Index Property Catastrophe Rate Environment 1) Source: Guy Carpenter. 2) Index value of 100 in 1990. 3) All data points as of January 1. 111% 133% 152% 173% 154% 145% 255% 233% 195% 215% 190% 184% 202% 210% 179% 100% 125% 150% 175% 200% 225% 250% 275% 2000 2001 2002 2003 2004 2005 2006 2007 2008 2009 2010 2011 2012 2013 2014
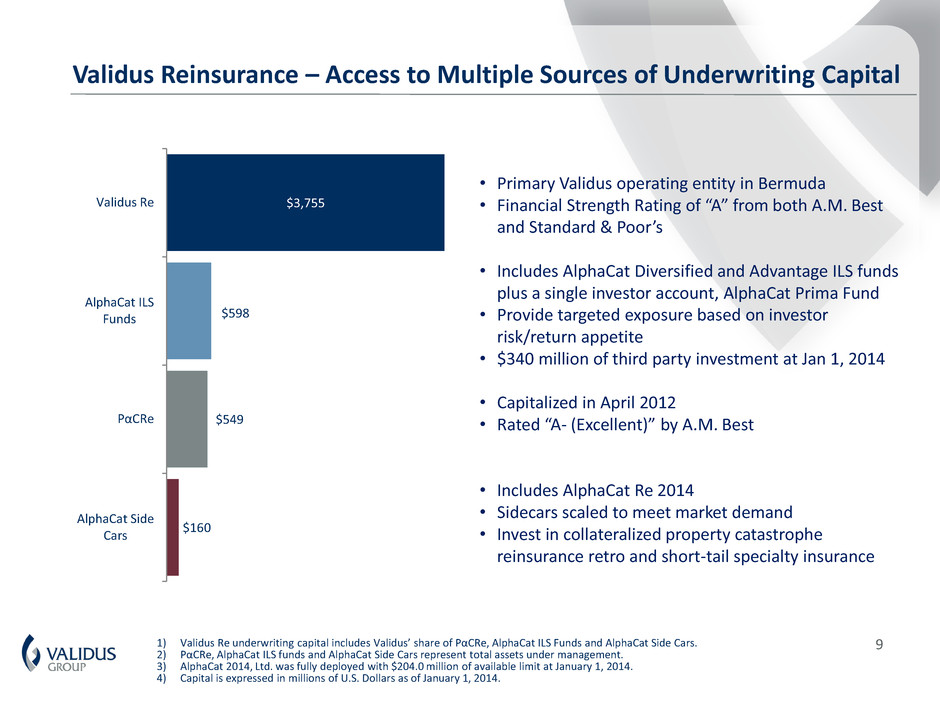
9 Validus Reinsurance – Access to Multiple Sources of Underwriting Capital • Primary Validus operating entity in Bermuda • Financial Strength Rating of “A” from both A.M. Best and Standard & Poor’s • Includes AlphaCat Diversified and Advantage ILS funds plus a single investor account, AlphaCat Prima Fund • Provide targeted exposure based on investor risk/return appetite • $340 million of third party investment at Jan 1, 2014 • Capitalized in April 2012 • Rated “A- (Excellent)” by A.M. Best • Includes AlphaCat Re 2014 • Sidecars scaled to meet market demand • Invest in collateralized property catastrophe reinsurance retro and short-tail specialty insurance 1) Validus Re underwriting capital includes Validus’ share of PαCRe, AlphaCat ILS Funds and AlphaCat Side Cars. 2) PαCRe, AlphaCat ILS funds and AlphaCat Side Cars represent total assets under management. 3) AlphaCat 2014, Ltd. was fully deployed with $204.0 million of available limit at January 1, 2014. 4) Capital is expressed in millions of U.S. Dollars as of January 1, 2014. $160 $549 $598 $3,755 AlphaCat Side Cars PαCRe AlphaCat ILS Funds Validus Re

10 AlphaCat Highlights Gross Premium Written - $147 million for the year ended Dec 31, 2013 Net Operating Income Cat Bonds 4% ILWs 1% Parametric Contract 1% Reinsurance 94% 1) Gross premium written includes reinsurance, ILWs, and parametric contracts, but does not include cat bonds. 2) Net operating income is expressed in millions of U.S. Dollars. 3) Net operating income excludes non-controlling interest. 4) AlphaCat began operations in 2008, and became a stand alone segment in 2011. 26.2 43.1 45.2 $0.0 $5.0 $10.0 $15.0 $20.0 $25.0 $30.0 $35.0 $40.0 $45.0 $50.0 2011 2012 2013

11 3.9 15.7 16.6 1.5 6.7 9.8 $0 $5 $10 $15 $20 $25 $30 2011 2012 2013 Third Party Related Party AlphaCat Income 1) Management fee income and Validus share of 2013 net income are expressed in millions of U.S. Dollars. Management Fee Income Validus Share of 2013 Net Income $44.3 million 22.4 26.4 5.4 • Management fees of $16.6 million • Income from Operating Affiliates of $14.3 million • Income of $25.9 million • Realized and Unrealized Losses on PaCRe Investments of $(0.2) million • Expenses incurred by AlphaCat Managers of $(12.3) million

12 AlphaCat - Over $1 billion in Assets Under Management As of January 1, 2014 1) “Expected Loss” represents the average annual loss over the set of simulation scenarios as calculated by Validus’ VCAPS divided by the total limit plus cash. “Loss Free Yield” equal to premiums less commissions divided by collateral required to fund contracts at inception plus cash. 2) Bubble size represents capital of vehicle available to support reinsurance capacity. Commingled Funds Managed Account Sidecar Rated Vehicle AlphaCat Diversified Fund PαCRe AlphaCat Advantage Fund AlphaCat Prima Fund AlphaCat 2014 Lo ss F re e Yiel d Expected Loss
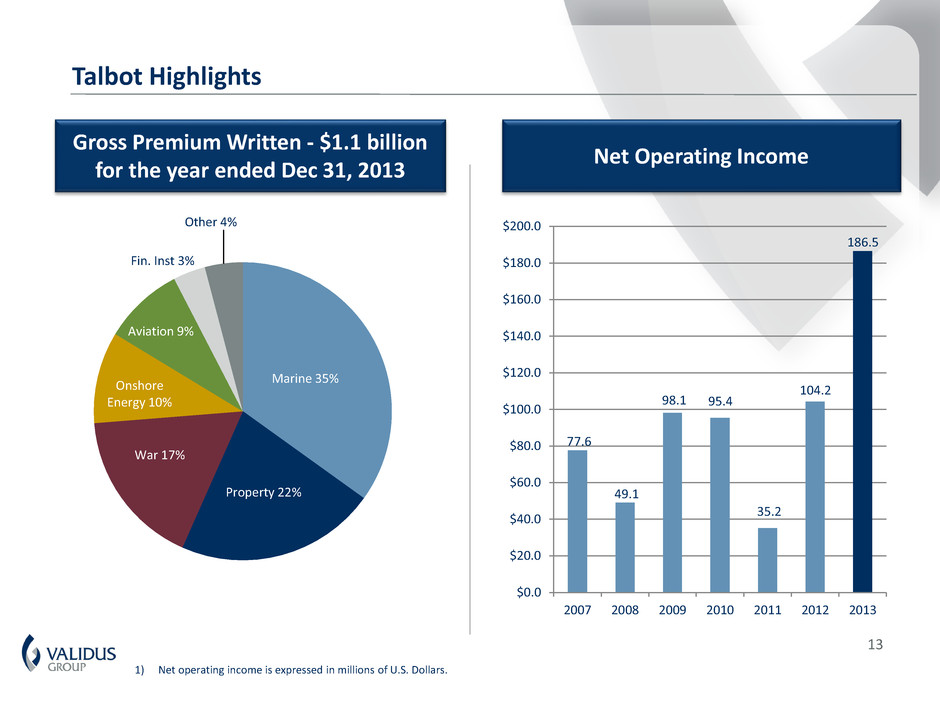
13 Talbot Highlights Gross Premium Written - $1.1 billion for the year ended Dec 31, 2013 Net Operating Income 1) Net operating income is expressed in millions of U.S. Dollars. Marine 35% Property 22% War 17% Onshore Energy 10% Aviation 9% Fin. Inst 3% Other 4% 77.6 49.1 98.1 95.4 35.2 104.2 186.5 $0.0 $20.0 $40.0 $60.0 $80.0 $100.0 $120.0 $140.0 $160.0 $180.0 $200.0 2007 2008 2009 2010 2011 2012 2013

14 1) Rate index reflects the whole account rate change, as adjusted for changes in exposure, inflation, attachment point and terms and conditions. Talbot Composite Rate Index – The Benefits of Cycle Management 100% 126% 187% 208% 206% 204% 218% 207% 197% 210% 209% 215% 221% 221% 75% 100% 125% 150% 175% 200% 225% 2000 2001 2002 2003 2004 2005 2006 2007 2008 2009 2010 2011 2012 2013
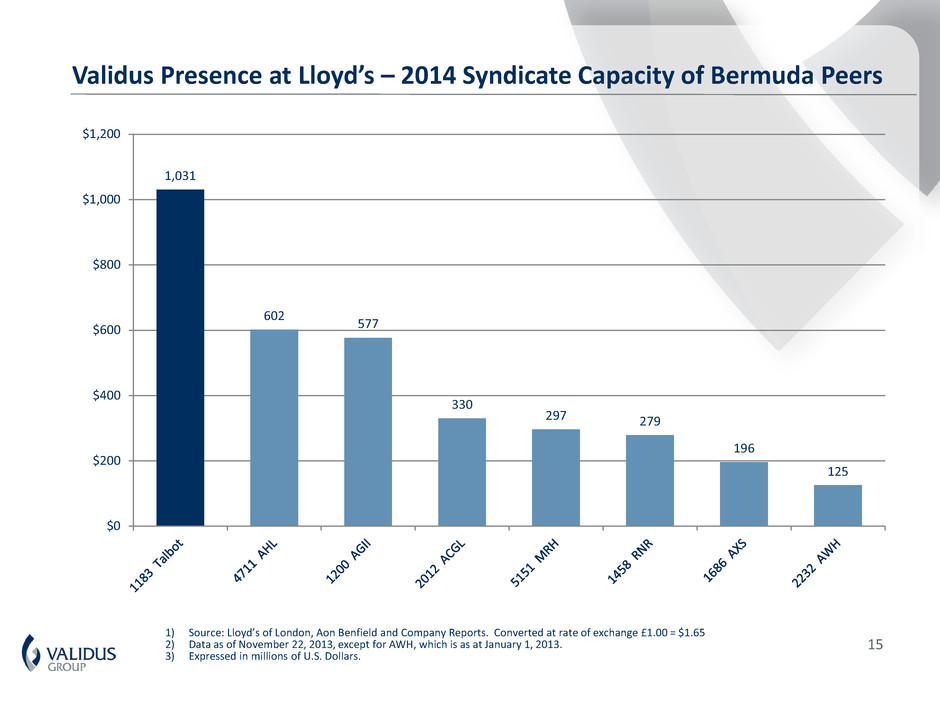
15 1) Source: Lloyd’s of London, Aon Benfield and Company Reports. Converted at rate of exchange £1.00 = $1.65 2) Data as of November 22, 2013, except for AWH, which is as at January 1, 2013. 3) Expressed in millions of U.S. Dollars. Validus Presence at Lloyd’s – 2014 Syndicate Capacity of Bermuda Peers 1,031 602 577 330 297 279 196 125 $0 $200 $400 $600 $800 $1,000 $1,200

16 Validus - Agricultural Reinsurance Initiative • For the year ended December 31, 2013 Validus wrote $179.5 million of crop reinsurance on a gross basis – Primarily quota share Multi Peril Crop Insurance (“MPCI”) • Premiums written are earned on a pro-rata basis over the terms of the underlying policies • The significant growth during 2013 in this class of business reflects the opportunity to attract skilled underwriting talent and mature books of business • Attractions of crop reinsurance to Validus: – Short tail, event driven exposure profile – Data intensive class of business well suited for Validus’ sophisticated analytics – A foundation for further growth as crop insurance is a growing global class of business
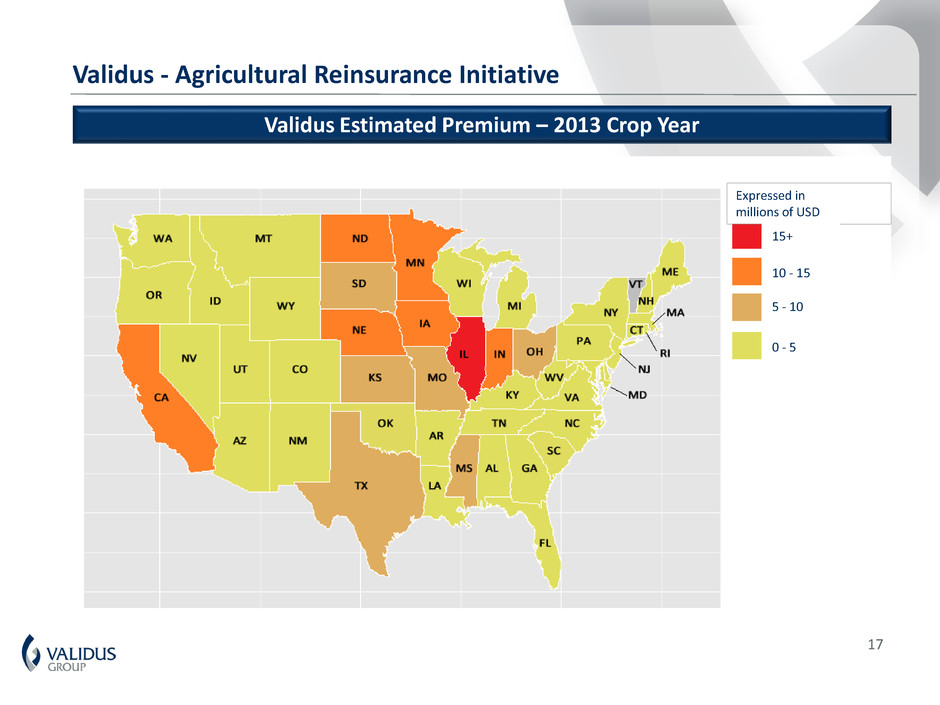
17 Validus - Agricultural Reinsurance Initiative Validus Estimated Premium – 2013 Crop Year Expressed in millions of USD 15+ 10 - 15 5 - 10 0 - 5
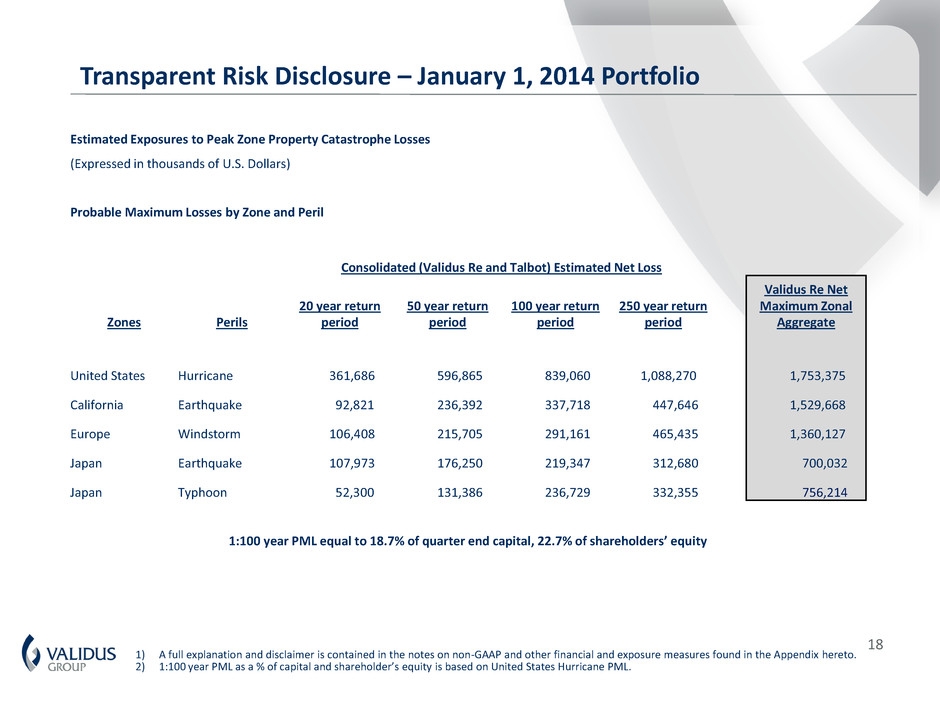
18 1) A full explanation and disclaimer is contained in the notes on non-GAAP and other financial and exposure measures found in the Appendix hereto. 2) 1:100 year PML as a % of capital and shareholder’s equity is based on United States Hurricane PML. Transparent Risk Disclosure – January 1, 2014 Portfolio Estimated Exposures to Peak Zone Property Catastrophe Losses (Expressed in thousands of U.S. Dollars) Probable Maximum Losses by Zone and Peril Consolidated (Validus Re and Talbot) Estimated Net Loss Zones Perils 20 year return period 50 year return period 100 year return period 250 year return period Validus Re Net Maximum Zonal Aggregate United States Hurricane 361,686 596,865 839,060 1,088,270 1,753,375 California Earthquake 92,821 236,392 337,718 447,646 1,529,668 Europe Windstorm 106,408 215,705 291,161 465,435 1,360,127 Japan Earthquake 107,973 176,250 219,347 312,680 700,032 Japan Typhoon 52,300 131,386 236,729 332,355 756,214 1:100 year PML equal to 18.7% of quarter end capital, 22.7% of shareholders’ equity
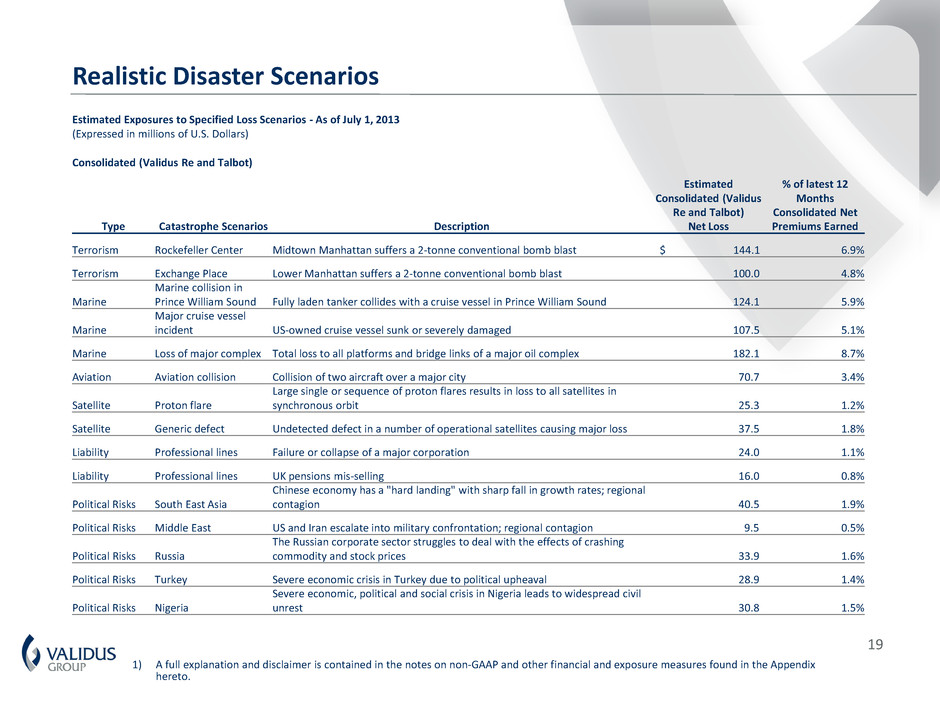
19 1) A full explanation and disclaimer is contained in the notes on non-GAAP and other financial and exposure measures found in the Appendix hereto. Realistic Disaster Scenarios Estimated Exposures to Specified Loss Scenarios - As of July 1, 2013 (Expressed in millions of U.S. Dollars) Consolidated (Validus Re and Talbot) Type Catastrophe Scenarios Description Estimated Consolidated (Validus Re and Talbot) Net Loss % of latest 12 Months Consolidated Net Premiums Earned Terrorism Rockefeller Center Midtown Manhattan suffers a 2-tonne conventional bomb blast $ 144.1 6.9% Terrorism Exchange Place Lower Manhattan suffers a 2-tonne conventional bomb blast 100.0 4.8% Marine Marine collision in Prince William Sound Fully laden tanker collides with a cruise vessel in Prince William Sound 124.1 5.9% Marine Major cruise vessel incident US-owned cruise vessel sunk or severely damaged 107.5 5.1% Marine Loss of major complex Total loss to all platforms and bridge links of a major oil complex 182.1 8.7% Aviation Aviation collision Collision of two aircraft over a major city 70.7 3.4% Satellite Proton flare Large single or sequence of proton flares results in loss to all satellites in synchronous orbit 25.3 1.2% Satellite Generic defect Undetected defect in a number of operational satellites causing major loss 37.5 1.8% Liability Professional lines Failure or collapse of a major corporation 24.0 1.1% Liability Professional lines UK pensions mis-selling 16.0 0.8% Political Risks South East Asia Chinese economy has a "hard landing" with sharp fall in growth rates; regional contagion 40.5 1.9% Political Risks Middle East US and Iran escalate into military confrontation; regional contagion 9.5 0.5% Political Risks Russia The Russian corporate sector struggles to deal with the effects of crashing commodity and stock prices 33.9 1.6% Political Risks Turkey Severe economic crisis in Turkey due to political upheaval 28.9 1.4% Political Risks Nigeria Severe economic, political and social crisis in Nigeria leads to widespread civil unrest 30.8 1.5%
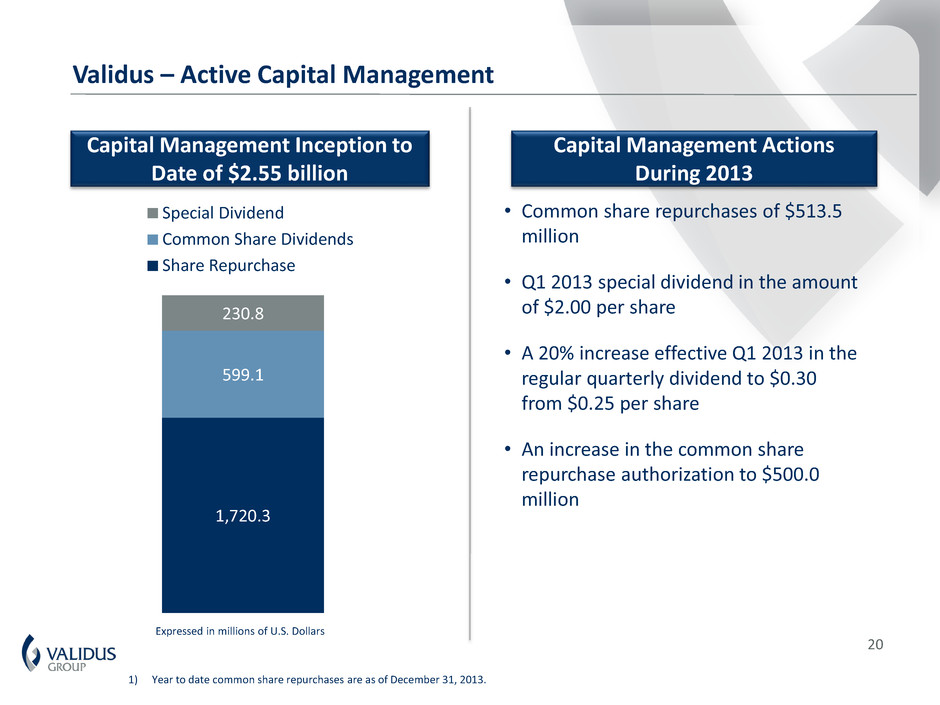
20 Validus – Active Capital Management • Common share repurchases of $513.5 million • Q1 2013 special dividend in the amount of $2.00 per share • A 20% increase effective Q1 2013 in the regular quarterly dividend to $0.30 from $0.25 per share • An increase in the common share repurchase authorization to $500.0 million Capital Management Actions During 2013 Expressed in millions of U.S. Dollars 1) Year to date common share repurchases are as of December 31, 2013. 1,720.3 599.1 230.8 Special Dividend Common Share Dividends Share Repurchase Capital Management Inception to Date of $2.55 billion
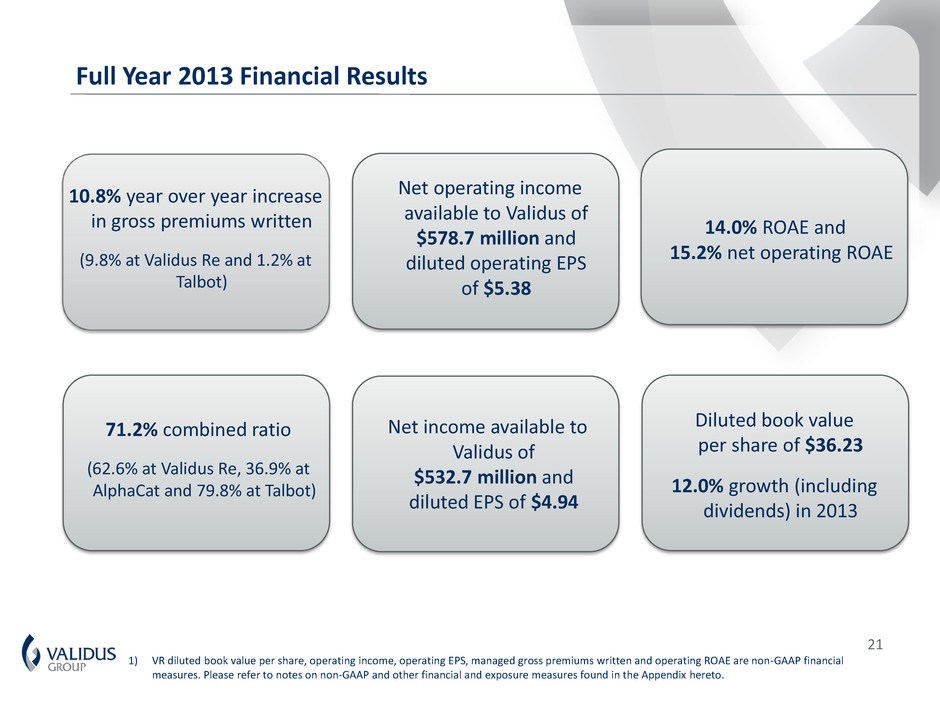
21 10.8% year over year increase in gross premiums written (9.8% at Validus Re and 1.2% at Talbot) 14.0% ROAE and 15.2% net operating ROAE 1) VR diluted book value per share, operating income, operating EPS, managed gross premiums written and operating ROAE are non-GAAP financial measures. Please refer to notes on non-GAAP and other financial and exposure measures found in the Appendix hereto. 71.2% combined ratio (62.6% at Validus Re, 36.9% at AlphaCat and 79.8% at Talbot) Net income available to Validus of $532.7 million and diluted EPS of $4.94 Diluted book value per share of $36.23 12.0% growth (including dividends) in 2013 Full Year 2013 Financial Results Net operating income available to Validus of $578.7 million and diluted operating EPS of $5.38
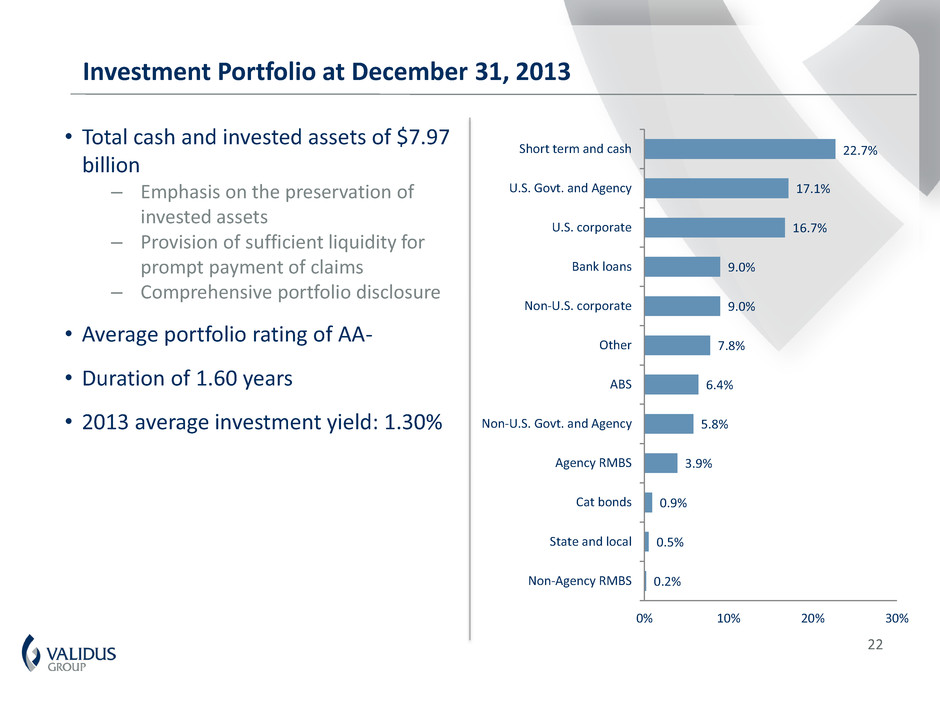
22 Investment Portfolio at December 31, 2013 • Total cash and invested assets of $7.97 billion – Emphasis on the preservation of invested assets – Provision of sufficient liquidity for prompt payment of claims – Comprehensive portfolio disclosure • Average portfolio rating of AA- • Duration of 1.60 years • 2013 average investment yield: 1.30% 22.7% 17.1% 16.7% 9.0% 9.0% 7.8% 6.4% 5.8% 3.9% 0.9% 0.5% 0.2% Short term and cash U.S. Govt. and Agency U.S. corporate Bank loans Non-U.S. corporate Other ABS Non-U.S. Govt. and Agency Agency RMBS Cat bonds State and local Non-Agency RMBS 0% 10% 20% 30%

23 Gross Loss Reserves at December 31, 2013 • Gross reserves for losses and loss expenses of $3.03 billion: – $2.66 billion net of reinsurance • IBNR represents 49.3% of reserves • No notable losses in Q4 2013 • Favorable reserve development during Q4 2013: – Talbot favorable development of $37.0 million – Validus Re adverse development of $3.4 million Favorable Reserve Development Validus Gross Reserve Mix 1) Favorable reserve development is expressed in millions of U.S. Dollars. Case Reserves 50.7% IBNR Reserves 49.3% 156.1 175.0 205.4 65.8 41.0 65.1 33.6 $0.0 $50.0 $100.0 $150.0 $200.0 $250.0 2011 2012 2013 Q1 2013 Q2 2013 Q3 2013 Q4 2013
24 • International reinsurance and insurance business • Size and scale to compete effectively • Active capital management • Three distinct yet complementary operating segments • Focused on short-tail classes of reinsurance and insurance • Leadership position in property catastrophe reinsurance • Able to expand market profile through use of third party capital • Profitable in every year since inception • Short duration, highly liquid, conservative balance sheet • Transparent risk disclosure Conclusion – Continue to be Well Positioned for 2014 and Beyond

APPENDIX Investor Presentation

26 Abbreviated Balance Sheets 1) A full explanation and disclaimer is contained in the note on non-GAAP financial and other measures found in the Appendix hereto. (Expressed in thousands of U.S. Dollars) December 31, 2010 December 31, 2011 December 31, 2012 December 31, 2013 Assets Fixed maturities $ 4,823,867 $ 4,894,145 $ 5,085,334 $ 5,542,258 Short-term investments 273,514 280,191 1,114,250 751,778 Other investments 21,478 16,787 564,448 618,316 Cash and cash equivalents 620,740 832,844 1,219,379 1,056,346 Total investments and cash 5,739,599 6,023,967 7,983,411 7,968,698 Goodwill and Intangible assets 139,286 135,124 130,962 126,800 Other assets 1,181,993 1,459,380 1,905,891 1,750,934 Total assets $ 7,060,878 $ 7,618,471 $ 10,020,264 $ 9,846,432 Liabilities Reserve for losses and loss expenses $ 2,035,973 $ 2,631,143 $ 3,517,573 $ 3,030,399 Unearned premiums 728,516 772,382 894,362 824,496 Other liabilities 254,884 229,739 365,423 475,388 Notes payable to operating affiliates - - - 439,272 Senior notes payable 246,874 246,982 247,090 247,198 Debentures payable 289,800 289,800 540,709 541,416 Total liabilities $ 3,556,047 $ 4,170,046 $ 5,565,157 $ 5,558,169 Redeemable noncontrolling interest - - - 86,512 Shareholders' equity Capital $ 1,872,656 $ 1,904,696 $ 2,176,411 $ 1,694,085 Retained earnings 1,632,175 1,543,729 1,844,416 2,010,009 Total shareholders' equity available to Validus 3,504,831 3,448,425 4,020,827 3,704,094 Noncontrolling interest - - 434,280 497,657 Total shareholders' equity 3,504,831 3,448,425 4,455,107 4,201,751 Total liabilities, noncontrolling interests and shareholders' equity $ 7,060,878 $ 7,618,471 $ 10,020,264 $ 9,846,432 Debt to capital ratio 6.1% 6.2% 4.7% 4.9% Debt and hybrid to capital ratio 13.3% 13.5% 15.0% 15.5% Investments and cash to equity 163.8% 174.7% 179.2% 189.7%
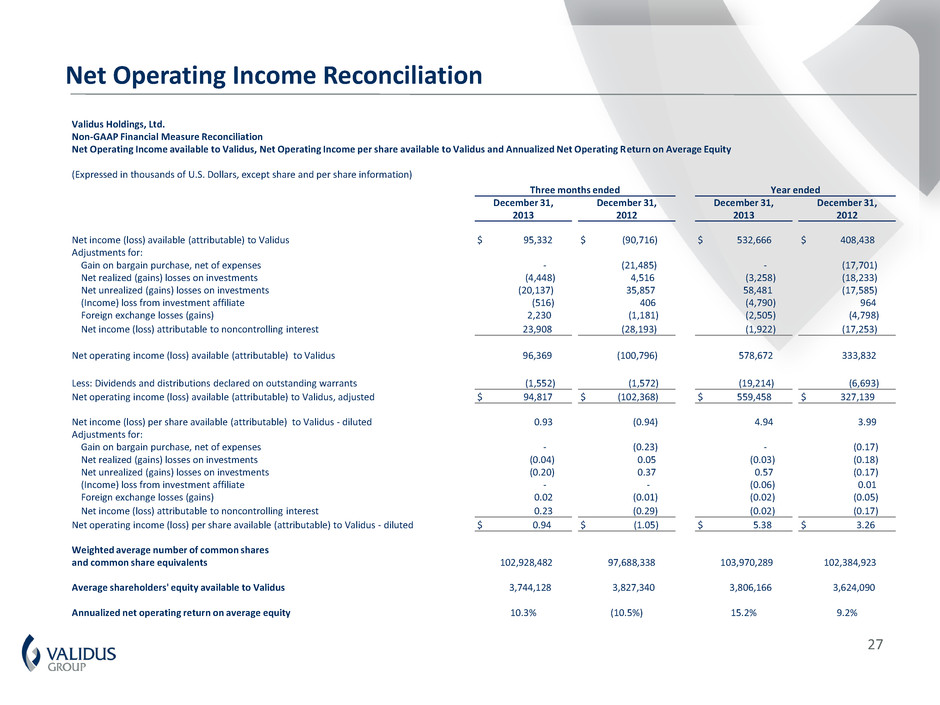
27 Net Operating Income Reconciliation Validus Holdings, Ltd. Non-GAAP Financial Measure Reconciliation Net Operating Income available to Validus, Net Operating Income per share available to Validus and Annualized Net Operating Return on Average Equity (Expressed in thousands of U.S. Dollars, except share and per share information) Three months ended Year ended December 31, 2013 December 31, 2012 December 31, 2013 December 31, 2012 Net income (loss) available (attributable) to Validus $ 95,332 $ (90,716) $ 532,666 $ 408,438 Adjustments for: Gain on bargain purchase, net of expenses - (21,485) - (17,701) Net realized (gains) losses on investments (4,448) 4,516 (3,258) (18,233) Net unrealized (gains) losses on investments (20,137) 35,857 58,481 (17,585) (Income) loss from investment affiliate (516) 406 (4,790) 964 Foreign exchange losses (gains) 2,230 (1,181) (2,505) (4,798) Net income (loss) attributable to noncontrolling interest 23,908 (28,193) (1,922) (17,253) Net operating income (loss) available (attributable) to Validus 96,369 (100,796) 578,672 333,832 Less: Dividends and distributions declared on outstanding warrants (1,552) (1,572) (19,214) (6,693) Net operating income (loss) available (attributable) to Validus, adjusted $ 94,817 $ (102,368) $ 559,458 $ 327,139 Net income (loss) per share available (attributable) to Validus - diluted 0.93 (0.94) 4.94 3.99 Adjustments for: Gain on bargain purchase, net of expenses - (0.23) - (0.17) Net realized (gains) losses on investments (0.04) 0.05 (0.03) (0.18) Net unrealized (gains) losses on investments (0.20) 0.37 0.57 (0.17) (Income) loss from investment affiliate - - (0.06) 0.01 Foreign exchange losses (gains) 0.02 (0.01) (0.02) (0.05) Net income (loss) attributable to noncontrolling interest 0.23 (0.29) (0.02) (0.17) Net operating income (loss) per share available (attributable) to Validus - diluted $ 0.94 $ (1.05) $ 5.38 $ 3.26 Weighted average number of common shares and common share equivalents 102,928,482 97,688,338 103,970,289 102,384,923 Average shareholders' equity available to Validus 3,744,128 3,827,340 3,806,166 3,624,090 Annualized net operating return on average equity 10.3% (10.5%) 15.2% 9.2%
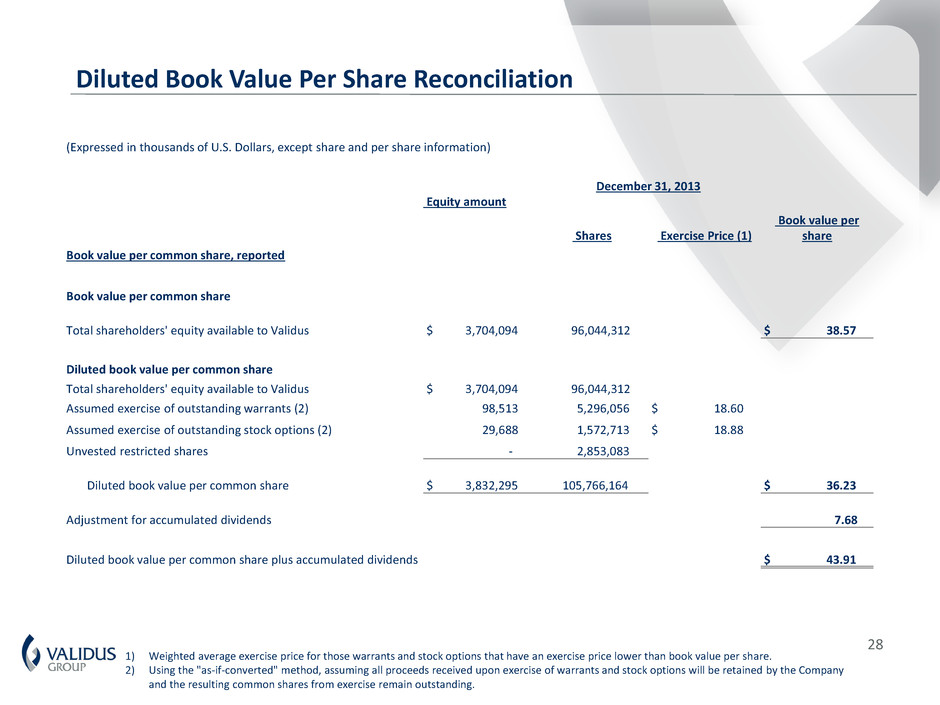
28 1) Weighted average exercise price for those warrants and stock options that have an exercise price lower than book value per share. 2) Using the "as-if-converted" method, assuming all proceeds received upon exercise of warrants and stock options will be retained by the Company and the resulting common shares from exercise remain outstanding. Diluted Book Value Per Share Reconciliation (Expressed in thousands of U.S. Dollars, except share and per share information) December 31, 2013 Equity amount Shares Exercise Price (1) Book value per share Book value per common share, reported Book value per common share Total shareholders' equity available to Validus $ 3,704,094 96,044,312 $ 38.57 Diluted book value per common share Total shareholders' equity available to Validus $ 3,704,094 96,044,312 Assumed exercise of outstanding warrants (2) 98,513 5,296,056 $ 18.60 Assumed exercise of outstanding stock options (2) 29,688 1,572,713 $ 18.88 Unvested restricted shares - 2,853,083 Diluted book value per common share $ 3,832,295 105,766,164 $ 36.23 Adjustment for accumulated dividends 7.68 Diluted book value per common share plus accumulated dividends $ 43.91
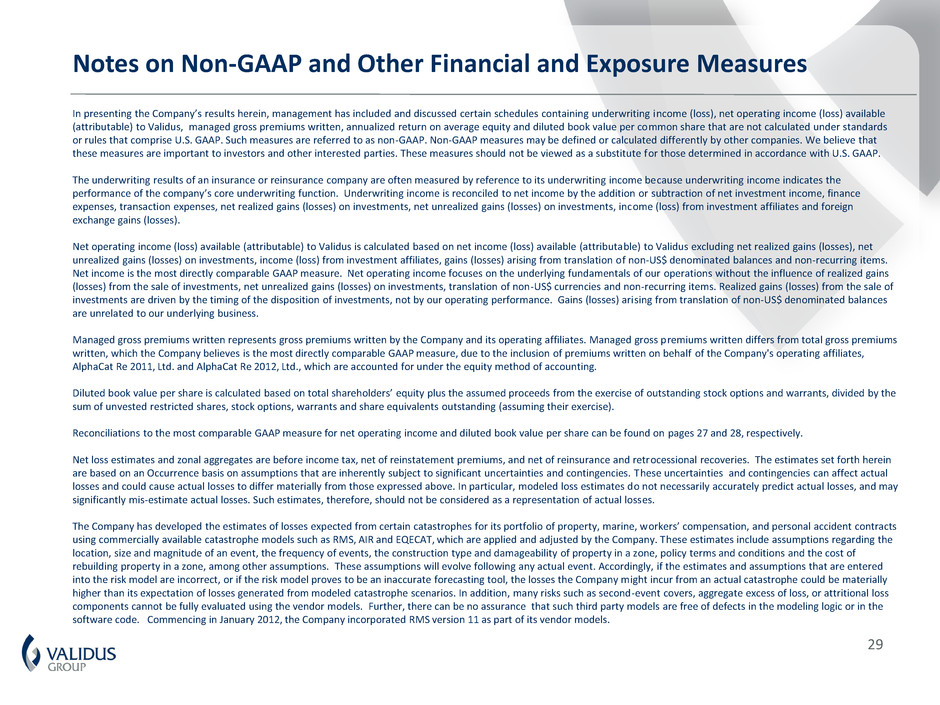
29 In presenting the Company’s results herein, management has included and discussed certain schedules containing underwriting income (loss), net operating income (loss) available (attributable) to Validus, managed gross premiums written, annualized return on average equity and diluted book value per common share that are not calculated under standards or rules that comprise U.S. GAAP. Such measures are referred to as non-GAAP. Non-GAAP measures may be defined or calculated differently by other companies. We believe that these measures are important to investors and other interested parties. These measures should not be viewed as a substitute for those determined in accordance with U.S. GAAP. The underwriting results of an insurance or reinsurance company are often measured by reference to its underwriting income because underwriting income indicates the performance of the company’s core underwriting function. Underwriting income is reconciled to net income by the addition or subtraction of net investment income, finance expenses, transaction expenses, net realized gains (losses) on investments, net unrealized gains (losses) on investments, income (loss) from investment affiliates and foreign exchange gains (losses). Net operating income (loss) available (attributable) to Validus is calculated based on net income (loss) available (attributable) to Validus excluding net realized gains (losses), net unrealized gains (losses) on investments, income (loss) from investment affiliates, gains (losses) arising from translation of non-US$ denominated balances and non-recurring items. Net income is the most directly comparable GAAP measure. Net operating income focuses on the underlying fundamentals of our operations without the influence of realized gains (losses) from the sale of investments, net unrealized gains (losses) on investments, translation of non-US$ currencies and non-recurring items. Realized gains (losses) from the sale of investments are driven by the timing of the disposition of investments, not by our operating performance. Gains (losses) arising from translation of non-US$ denominated balances are unrelated to our underlying business. Managed gross premiums written represents gross premiums written by the Company and its operating affiliates. Managed gross premiums written differs from total gross premiums written, which the Company believes is the most directly comparable GAAP measure, due to the inclusion of premiums written on behalf of the Company's operating affiliates, AlphaCat Re 2011, Ltd. and AlphaCat Re 2012, Ltd., which are accounted for under the equity method of accounting. Diluted book value per share is calculated based on total shareholders’ equity plus the assumed proceeds from the exercise of outstanding stock options and warrants, divided by the sum of unvested restricted shares, stock options, warrants and share equivalents outstanding (assuming their exercise). Reconciliations to the most comparable GAAP measure for net operating income and diluted book value per share can be found on pages 27 and 28, respectively. Net loss estimates and zonal aggregates are before income tax, net of reinstatement premiums, and net of reinsurance and retrocessional recoveries. The estimates set forth herein are based on an Occurrence basis on assumptions that are inherently subject to significant uncertainties and contingencies. These uncertainties and contingencies can affect actual losses and could cause actual losses to differ materially from those expressed above. In particular, modeled loss estimates do not necessarily accurately predict actual losses, and may significantly mis-estimate actual losses. Such estimates, therefore, should not be considered as a representation of actual losses. The Company has developed the estimates of losses expected from certain catastrophes for its portfolio of property, marine, workers’ compensation, and personal accident contracts using commercially available catastrophe models such as RMS, AIR and EQECAT, which are applied and adjusted by the Company. These estimates include assumptions regarding the location, size and magnitude of an event, the frequency of events, the construction type and damageability of property in a zone, policy terms and conditions and the cost of rebuilding property in a zone, among other assumptions. These assumptions will evolve following any actual event. Accordingly, if the estimates and assumptions that are entered into the risk model are incorrect, or if the risk model proves to be an inaccurate forecasting tool, the losses the Company might incur from an actual catastrophe could be materially higher than its expectation of losses generated from modeled catastrophe scenarios. In addition, many risks such as second-event covers, aggregate excess of loss, or attritional loss components cannot be fully evaluated using the vendor models. Further, there can be no assurance that such third party models are free of defects in the modeling logic or in the software code. Commencing in January 2012, the Company incorporated RMS version 11 as part of its vendor models. Notes on Non-GAAP and Other Financial and Exposure Measures
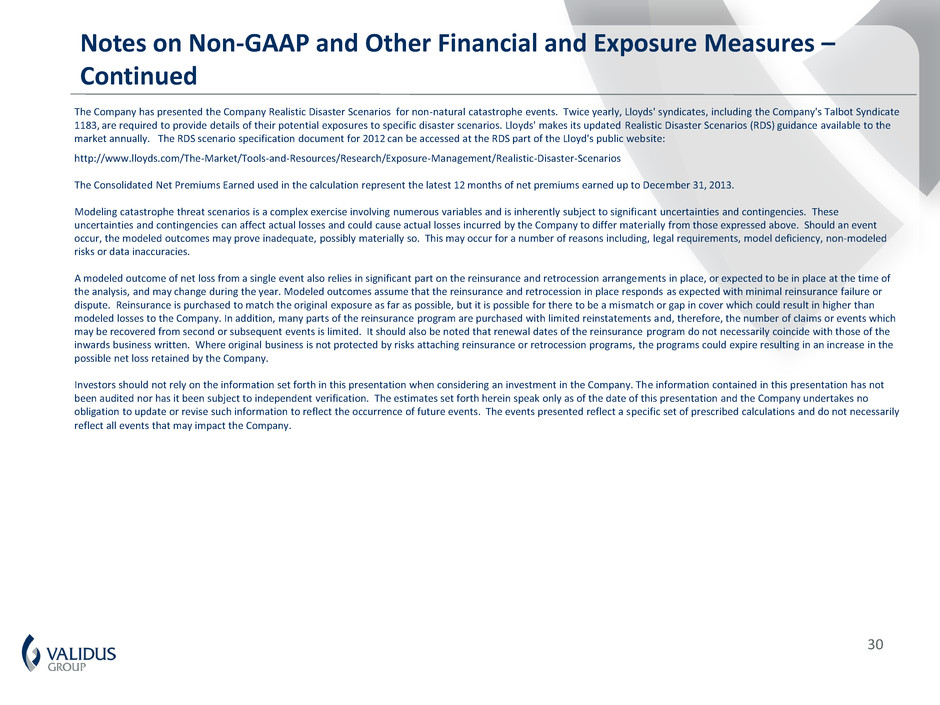
30 The Company has presented the Company Realistic Disaster Scenarios for non-natural catastrophe events. Twice yearly, Lloyds' syndicates, including the Company's Talbot Syndicate 1183, are required to provide details of their potential exposures to specific disaster scenarios. Lloyds' makes its updated Realistic Disaster Scenarios (RDS) guidance available to the market annually. The RDS scenario specification document for 2012 can be accessed at the RDS part of the Lloyd's public website: http://www.lloyds.com/The-Market/Tools-and-Resources/Research/Exposure-Management/Realistic-Disaster-Scenarios The Consolidated Net Premiums Earned used in the calculation represent the latest 12 months of net premiums earned up to December 31, 2013. Modeling catastrophe threat scenarios is a complex exercise involving numerous variables and is inherently subject to significant uncertainties and contingencies. These uncertainties and contingencies can affect actual losses and could cause actual losses incurred by the Company to differ materially from those expressed above. Should an event occur, the modeled outcomes may prove inadequate, possibly materially so. This may occur for a number of reasons including, legal requirements, model deficiency, non-modeled risks or data inaccuracies. A modeled outcome of net loss from a single event also relies in significant part on the reinsurance and retrocession arrangements in place, or expected to be in place at the time of the analysis, and may change during the year. Modeled outcomes assume that the reinsurance and retrocession in place responds as expected with minimal reinsurance failure or dispute. Reinsurance is purchased to match the original exposure as far as possible, but it is possible for there to be a mismatch or gap in cover which could result in higher than modeled losses to the Company. In addition, many parts of the reinsurance program are purchased with limited reinstatements and, therefore, the number of claims or events which may be recovered from second or subsequent events is limited. It should also be noted that renewal dates of the reinsurance program do not necessarily coincide with those of the inwards business written. Where original business is not protected by risks attaching reinsurance or retrocession programs, the programs could expire resulting in an increase in the possible net loss retained by the Company. Investors should not rely on the information set forth in this presentation when considering an investment in the Company. The information contained in this presentation has not been audited nor has it been subject to independent verification. The estimates set forth herein speak only as of the date of this presentation and the Company undertakes no obligation to update or revise such information to reflect the occurrence of future events. The events presented reflect a specific set of prescribed calculations and do not necessarily reflect all events that may impact the Company. Notes on Non-GAAP and Other Financial and Exposure Measures – Continued

Street Address: 29 Richmond Road Pembroke, Bermuda Mailing Address: Suite 1790 48 Par-la-Ville Road Hamilton, Bermuda HM 11 Telephone: +1-441-278-9000 Email: investor.relations@validusholdings.com For more information on our company, products and management team please visit our website at: www.validusholdings.com


