SandRidge Energy Merger with Arena Resources Investor Presentation—Supplemental Materials July 2010 Filed by SandRidge Energy, Inc. pursuant to Rule 425 under the Securities Act of 1933, as amended, and deemed filed pursuant to Rule 14a-6 under the Securities Exchange Act of 1934, as amended Subject Company: Arena Resources, Inc. Commission File No.: 001-31657 |
 2 Important Additional Information Filed with the SEC This presentation is being made in respect of the proposed business combination involving SandRidge Energy, Inc. (“SandRidge”) and Arena Resources, Inc. (“Arena”). In connection with the proposed transaction, SandRidge filed with the SEC a Registration Statement on Form S-4, as amended, on April 30, 2010 containing a joint proxy statement/prospectus, and a supplement to the joint proxy statement/prospectus on June 14, 2010, and each of SandRidge and Arena may file with the SEC other documents regarding the proposed transaction. The definitive joint proxy statement/prospectus was first mailed to stockholders of SandRidge and Arena on or about May 7, 2010, and the supplement to the joint proxy statement/prospectus was first mailed to stockholders on June 17, 2010. Investors and security holders of SandRidge and Arena are urged to read the joint proxy statement/prospectus, the supplement and other documents filed with the SEC carefully in their entirety because they contain important information about the proposed transaction. Investors and security holders may obtain free copies of the Registration Statement and the joint proxy statement/prospectus, the supplement and other documents filed with the SEC by SandRidge and Arena through the web site maintained by the SEC at www.sec.gov. Free copies of the Registration Statement and the joint proxy statement/prospectus, supplement and other documents filed with the SEC may also be obtained by directing a request to SandRidge Energy, Inc., 123 Robert S. Kerr Avenue, Oklahoma City, Oklahoma 73102, Attention: Investor Relations, or by directing a request to Arena Resources, Inc., 6555 South Lewis Avenue, Tulsa, Oklahoma 74136, Attention: Investor Relations. SandRidge, Arena and their respective directors and executive officers and other persons may be deemed to be participants in the solicitation of proxies in respect of the proposed transaction. Information regarding SandRidge's directors and executive officers is available in SandRidge's Annual Report on Form 10-K for the year ended December 31, 2009, which was filed with the SEC on March 1, 2010, and SandRidge's proxy statement for its 2010 annual meeting of stockholders, which was filed with the SEC on April 26, 2010. Information regarding Arena's directors and executive officers is available in Arena's Annual Report on Form 10- K for the year ended December 31, 2009, which was filed with the SEC on March 1, 2010, as amended by the Annual Report on Form 10-K/A for the year ended December 31, 2009, which was filed with the SEC on April 30, 2010, and Arena's proxy statement for its 2009 annual meeting of stockholders, which was filed with the SEC on October 29, 2009. Other information regarding the participants in the proxy solicitation and a description of their direct and indirect interests, by security holdings or otherwise, is contained in the joint proxy statement/prospectus, the supplement and other relevant materials filed with the SEC. Safe Harbor Language on Forward Looking Statements: This presentation includes "forward-looking statements" within the meaning of Section 27A of the Securities Act of 1933, as amended, and Section 21E of the Securities Exchange Act of 1934, as amended. These statements express a belief, expectation or intention and are generally accompanied by words that convey projected future events or outcomes. We have based these forward-looking statements on our current expectations and assumptions and analyses made by us in light of our experience and our perception of historical trends, current conditions and expected future developments, as well as other factors we believe are appropriate under the circumstances. However, whether actual results and developments will conform with our expectations and predictions is subject to a number of risks and uncertainties, including the ability to obtain governmental approvals of the merger on the proposed terms and schedule, the failure of SandRidge or Arena stockholders to approve the merger, the risk that the businesses will not be integrated successfully, credit conditions of global capital markets, changes in economic conditions, regulatory changes, and other factors, many of which are beyond our control. We refer you to the discussion of risk factors in Part I, Item 1A - "Risk Factors" of the Annual Report on Form 10-K filed by SandRidge with the SEC on March 1, 2010; Part II, Item 1A – "Risk Factors" of the Quarterly Report on Form 10-Q for the quarter ended March 31, 2010 filed by SandRidge with the SEC on May 7, 2010; and Part I, Item Safe Harbor Language on Forward Looking Statements: 1A -"Risk Factors" of the Annual Report on Form 10-K filed by Arena with the SEC on March 1, 2010. All of the forward-looking statements made in this communication are qualified by these cautionary statements. The actual results or developments anticipated may not be realized or, even if substantially realized, they may not have the expected consequences to or effects on our company or our business or operations. Such statements are not guarantees of future performance and actual results or developments may differ materially from those projected in the forward-looking statements. We undertake no obligation to update or revise any forward-looking statements. |
 $33.90 $34.74 $26.82 $25.66 $28.45 $18.29 $21.81 $- $10.00 $20.00 $30.00 $40.00 2010E EBITDA 2011E EBITDA 2010E Cash Flow 2011E Cash Flow Prvd Reserves (Boe) Prvd Dev Reserves (Boe) Daily Production (Boe/d) Arena Market Comparables (a) Denbury adjusted for Encore Acquisition, which closed March 9, 2010 as well as for $900MM asset divestiture that closed May 14, 2010 (b) Whiting adjusted for convertible preferred stock that was in-the-money as of 07/02/2010 Source: Capital IQ, Thomson One, Company filings Implied Stock Price Based on Peer Median Multiples Current Price: $32.19 Multiples: 7.8x 6.2x 6.5x 5.0x $15.56 $26.04 $98,990 Trading Levels Market Market Enterprise YE'09 1Q'10 Price Cap Value EV / EBITDA P / CF Pvd Res Prod. % R / P EV / Company Name 7/2/2010 ($MMs) ($MMs) 2010E 2011E 2010E 2011E (MMBoe) (MBoe/d) Oil Ratio Pvd Boe Pvd Dev Daily Prod Arena Comps Pioneer Natural Resources Co. $57.26 $6,638 $9,364 6.8x 5.5x 6.0x 4.7x 898.6 115.0 54% 21.4 $10.42 $17.87 $81,425 Denbury Resources Inc. (a) 14.29 5,705 8,780 8.8x 7.1x 7.0x 5.2x 373.8 73.6 79% 13.9 23.49 33.07 119,329 Continental Resources Inc. 43.49 7,392 7,873 10.2x 7.8x 10.3x 8.1x 257.3 37.7 67% 18.7 30.59 74.62 209,012 Whiting Petroleum Corp. (b) 76.04 4,516 5,222 5.0x 4.3x 4.8x 4.0x 275.0 59.8 81% 12.6 18.99 29.67 87,278 Berry Petroleum Co. 25.63 1,357 2,270 6.2x 5.1x 4.8x 4.1x 235.3 29.3 55% 22.0 9.65 18.10 77,402 Resolute Energy Corporation 12.20 669 782 9.6x 6.9x 8.5x 6.5x 64.4 7.1 41% 25.0 12.14 22.40 110,703 MEAN $4,379 $5,715 7.8x 6.1x 6.9x 5.4x 350.7 53.7 63% 18.9 $17.55 $32.62 $114,191 MEDIAN $5,110 $6,547 7.8x 6.2x 6.5x 5.0x 266.2 48.8 61% 20.1 $15.56 $26.04 $98,990 Arena Resources Inc. $32.19 $1,282 $1,227 7.4x 5.7x 7.8x 6.2x 69.3 8.2 86% 23.1 $17.72 $47.44 $149,309 3 |
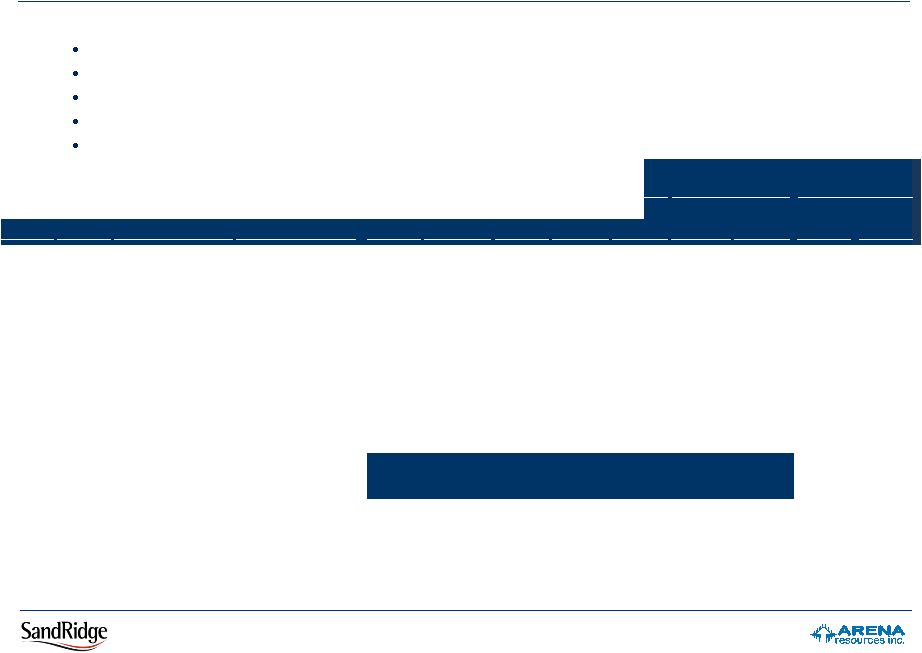
  The precedent transactions below were selected using the following criteria: Public to public company transactions in the last five years across all industries; United States headquartered targets and buyers; Transactions greater than $1 billion in enterprise value; Consideration offered is greater than 50% stock; New shares account for greater than 50% of the existing shares. Precedent Transactions – Relative Performance Versus the S&P 500 4 60-Days Post-Announce. Performance (vs. S&P 500) MergeCo Post-Close Performance (vs. S&P 500) Recommendation Ann. Date Close Date Buyer Target Buyer Target 30-Days Post- Close 60-Days Post- Close RiskMetrics Glass Lewis 12/09/05 07/17/06 Windstream Corporation Valor Communications Group Inc. $2,004 100.0% 99.3% (4.7%) (4.7%) 6.7% 4.2% - For 04/20/06 07/12/06 Petrohawk Energy Corporation KCS Energy Inc. 1,938 72.3% 105.1% (17.3%) (3.4%) (17.9%) (18.1%) For For 11/01/06 03/22/07 CVS Corp. Caremark Rx Inc. 24,936 87.5% 93.4% 2.6% 13.8% (1.5%) 3.9% For (a) Against (a) 02/20/07 07/29/08 Sirius Satellite Radio XM Satellite Radio Holdings Inc. ( b) 6,353 100.0% 95.6% (30.0%) (29.2%) NM NM For For 03/03/09 09/30/09 Magellan Midstream Partners LP Magellan Midstream Holdings 3,424 100.0% 60.6% (15.6%) 4.9% 5.3% 5.7% - For 03/08/09 11/03/09 Merck & Co. Inc. Schering-Plough Corporation 47,366 55.5% 50.3% (19.1%) (22.7%) 14.7% 12.3% For For 05/11/09 07/31/09 Alpha Natural Resources, Inc. Foundation Coal Holdings Inc. 1,993 100.0% 71.0% (13.1%) 14.4% (6.4%) (0.7%) For For 10/31/09 03/09/10 Denbury Resources Inc. Encore Acquisition Co. 4,341 70.0% 59.5% 10.8% 0.7% 12.4% 10.7% For For 11/02/09 03/12/10 Stanley Works The Black & Decker Corporation 4,406 100.0% 98.0% 8.1% 31.5% 0.3% 5.7% For For 04/03/10 - SandRidge Energy, Inc. Arena Resources Inc. 1,293 86.6% 72.1% (2.1%) 4.1% - - Against Against 04/11/10 - RRI Energy, Inc. Mirant Corporation 2,087 100.0% 101.7% 3.9% 3.4% - - - - 04/21/10 - CenturyLink, Inc. Qwest Communications Int. 22,240 100.0% 97.2% 4.2% 11.3% - - - - 05/02/10 - UAL Corporation Continental Airlines, Inc. 6,142 100.0% 85.4% (1.0%) 2.9% - - - - 06/02/10 - SandRidge Energy, Inc. (Revised) Arena Resources Inc. (Revised) ( c) 1,230 86.3% 83.4% 0.3% 2.1% - - - - Mean 90.1% 83.8% (5.6%) 2.1% 1.7% 2.9% Median 100.0% 93.4% (2.1%) 3.4% 2.8% 4.9% High 100.0% 105.1% 10.8% 31.5% 14.7% 12.3% Low 55.5% 50.3% (30.0%) (29.2%) (17.9%) (18.1%) Enterprise Value ($MM) % Stock Consideration Stock Offered as a % of Buyer's Market Cap Note: Permission to cite the reports from RiskMetrics Group, Inc, and Glass Lewis & Co. was neither sought nor obtained (a) RiskMetrics’ “for” recommendation was on the revised deal terms; Glass Lewis’ “against” recommendation was on the initial deal terms (b) Post-close performance statistics were not meaningful due to the equity offering associated with the transaction. The combined company stock performance 30 days post- close was negative 16.9%. The combined company stock performance 60 days post-close was negative 48.3%. (c) Relative stock performance for the revised Arena-SandRidge deal as of 7/2/2010 is excluded from the summary calculations Source: Capital IQ |
  The precedent transactions below were selected using the following criteria: Public to public company transactions in the last five years across all industries; United States headquartered targets and buyers; Transactions greater than $1 billion in enterprise value; Consideration offered is greater than 50% stock; New shares account for greater than 50% of the existing shares. Precedent Transactions – Relative Performance Versus Industry Indexes Note: Permission to cite the reports from RiskMetrics Group, Inc, and Glass Lewis & Co. was neither sought nor obtained Proxy for the relative industry is the appropriate S&P Select Industry Index (Telecom: Valor/Windstream, Qwest/CenturyLink; Oil & Gas Exploration & Production: KCS/Petrohawk, Magellan/Magellan, Encor e/Denbury, Arena/SandRidge; Heath Care Services: Caremark/CVS; Pharmaceuticals: Schering- Plough/Merck; Metals and Mining: Foundation Coal/Alpha Natural; Retail: Black & Decker/Stanley; Oil & Gas Equipment & Services: Mirant/RRI; Transportation: Continental/UAL) (a) RiskMetrics’ “for” recommendation was on the revised deal terms; Glass Lewis’ “against” recommendation was on the initial deal terms (b) Post-close performance statistics were not meaningful due to the equity offering associated with the transaction. The combined company stock performance 30 days post- close was negative 13.4%. The combined company stock performance 60 days post-close was negative 36.4% (c) Relative stock performance for the revised Arena-SandRidge deal as of 7/2/2010 is excluded from the summary calculations Source: Capital IQ 5 60-day Post-Announce. Performance (vs. Relevant S&P Industry Index) MergeCo Post-Close Performance (vs. Relevant S&P Industry Index) Recommendation Ann. Date Close Date Buyer Target Buyer Target 30-Days Post- Close 60-Days Post- Close RiskMetrics Glass Lewis 12/09/05 07/17/06 Windstream Corporation Valor Communications Group Inc. $2,004 100.0% 99.3% (7.6%) (7.6%) 5.0% (1.0%) - For 04/20/06 07/12/06 Petrohawk Energy Corporation KCS Energy Inc. 1,938 72.3% 105.1% (4.8%) 9.1% (20.7%) (7.1%) For For 11/01/06 03/22/07 CVS Corp. Caremark Rx Inc. 24,936 87.5% 93.4% 0.4% 11.6% (0.8%) 6.9% For (a) Against (a) 02/20/07 07/29/08 Sirius Satellite Radio XM Satellite Radio Holdings Inc. ( b) 6,353 100.0% 95.6% (27.8%) (27.0%) NM NM For For 03/03/09 09/30/09 Magellan Midstream Partners LP Magellan Midstream Holdings 3,424 100.0% 60.6% (29.2%) (8.7%) 4.0% 10.2% - For 03/08/09 11/03/09 Merck & Co. Inc. Schering-Plough Corporation 47,366 55.5% 50.3% 2.7% (1.0%) 11.6% 7.0% For For 05/11/09 07/31/09 Alpha Natural Resources, Inc. Foundation Coal Holdings Inc. 1,993 100.0% 71.0% (9.8%) 17.7% (4.9%) (9.1%) For For 10/31/09 03/09/10 Denbury Resources Inc. Encore Acquisition Co. 4,341 70.0% 59.5% 7.3% (2.8%) 14.1% 12.6% For For 11/02/09 03/12/10 Stanley Works The Black & Decker Corporation 4,406 100.0% 98.0% 10.5% 33.9% (2.0%) 1.1% For For 04/03/10 - SandRidge Energy, Inc. Arena Resources Inc. 1,293 86.6% 72.1% (4.4%) 1.8% - - Against Against 04/11/10 - RRI Energy, Inc. Mirant Corporation 2,087 100.0% 101.7% 8.6% 8.1% - - - - 04/21/10 - CenturyLink, Inc. Qwest Communications Int. 22,240 100.0% 97.2% 3.3% 10.3% - - - - 05/02/10 - UAL Corporation Continental Airlines, Inc. 6,142 100.0% 85.4% 1.3% 5.2% - - - - 06/02/10 - SandRidge Energy, Inc. (Revised) Arena Resources Inc. (Revised) ( c) 1,230 86.3% 83.4% 1.7% 3.5% - - - - Mean 90.1% 83.8% (3.8%) 3.9% 0.8% 2.6% Median 100.0% 93.4% 0.4% 5.2% 1.6% 4.0% High 100.0% 105.1% 10.5% 33.9% 14.1% 12.6% Low 55.5% 50.3% (29.2%) (27.0%) (20.7%) (9.1%) Enterprise Value ($MM) % Stock Consideration Stock Offered as a % of Buyer's Market Cap |
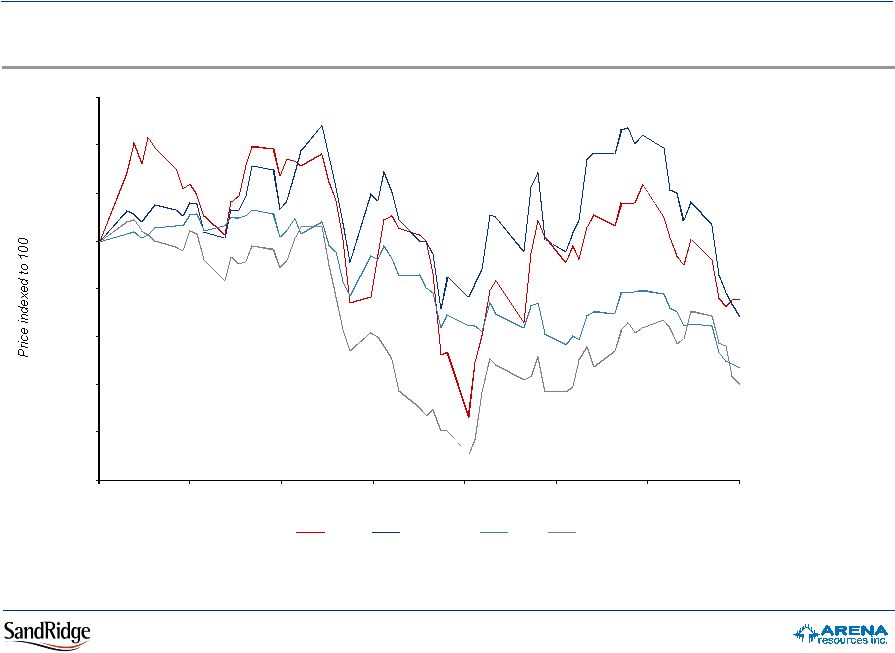 Price Performance Since Initial Announcement Arena vs. Peers, S&P and NYMEX 12-Month Strip Oil 6 75 80 85 90 95 100 105 110 115 1-Apr 14-Apr 27-Apr 10-May 23-May 5-Jun 18-Jun 2-Jul Arena Arena peers S&P WTI S&P (13%) WTI (15%) Arena peers (8%) Arena (6%) Note: ARD peers include BRY, CLR, DNR, PXD, REN & WLL. Peers indexed on a market cap weighted basis. Source: Capital IQ, Bloomberg |