UNITED STATES
SECURITIES AND EXCHANGE COMMISSION
Washington, D.C. 20549
FORM N-CSR
CERTIFIED SHAREHOLDER REPORT OF REGISTERED MANAGEMENT
INVESTMENT COMPANIES
Investment Company Act file number 811-21940
EIP Investment Trust
(Exact name of registrant as specified in charter)
c/o Energy Income Partners, LLC
49 Riverside Avenue
Westport, CT 06880
(Address of principal executive offices) (Zip code)
Linda Longville
c/o Energy Income Partners, LLC
49 Riverside Avenue
Westport, CT 06880
(Name and address of agent for service)
registrant’s telephone number, including area code: 203-349-8232
Date of fiscal year end: December 31
Date of reporting period: December 31, 2012
Form N-CSR is to be used by management investment companies to file reports with the Commission not later than 10 days after the transmission to stockholders of any report that is required to be transmitted to stockholders under Rule 30e-1 under the Investment Company Act of 1940 (17 CFR 270.30e-1). The Commission may use the information provided on Form N-CSR in its regulatory, disclosure review, inspection, and policymaking roles.
A registrant is required to disclose the information specified by Form N-CSR, and the Commission will make this information public. A registrant is not required to respond to the collection of information contained in Form N-CSR unless the Form displays a currently valid Office of Management and Budget (“OMB”) control number. Please direct comments concerning the accuracy of the information collection burden estimate and any suggestions for reducing the burden to Secretary, Securities and Exchange Commission, 100 F Street, NE, Washington, DC 20549. The OMB has reviewed this collection of information under the clearance requirements of 44 U.S.C. § 3507.
Item 1. Reports to Stockholders.
The Report to Shareholders is attached herewith.
EIP Growth and Income Fund
December 31, 2012 Annual Report
EIP Growth and Income Fund
You should carefully consider the investment objectives, risks, charges, and expenses of the Fund before making an investment decision. The private placement memorandum contains this and other information - please read it carefully before investing or sending money. Except as noted, numbers in the private placement memorandum are unaudited. To obtain a copy of the private placement memorandum, please call (203) 349-8232.
EIP Growth and Income Fund
To Our Shareholders:
I am pleased to submit this Annual Report for the EIP Growth and Income Fund for the period ended December 31, 2012. For the year ended December 31, 2012, the Fund’s total return was +7.03%. For the year ended December 31, 2011, the Fund’s total return was +21.62%.
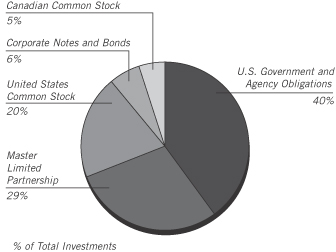
The Fund’s primary strategy is investing in publicly traded energy infrastructure companies with high dividend payouts that offer attractive yields and have the opportunity to grow. A large portion of our equity investment opportunities are publicly traded partnerships known as Master Limited Partnerships (“MLPs”). These securities represent just under 25% of the Fund’s assets, which is the maximum allowable for mutual funds. On average, about 25% of our assets are invested in securities with similar characteristics to the energy-related MLPs, such as MLP affiliates, Canadian income equities (formerly income trusts) in Canada and infrastructure and utility companies many of which have MLP or subsidiaries. We typically invest the remainder of the portfolio in high-quality corporate and agency bonds with a weighted average maturity of 18 months or less or a coupon that floats with prevailing interest rates. All of our corporate bonds must have an AA rating or better, or an equivalent rating from Moody’s or, if unrated, have been determined by Energy Income Partners, LLC to be of similar quality, at the time they are put into the portfolio unless they are issued by an energy company, in which case the bond must have an investment grade rating or higher. While the bond portfolio may generate a significant amount of income, the large allocation to bonds with short duration is expected over time to have a large dampening effect on the portfolio’s volatility. We employ leverage in an attempt to enhance the portfolio’s returns.
Benchmarks:
We believe the following benchmarks provide appropriate comparisons of the Fund’s performance:
| | | | |
| | | Total Return
1/1/12-
12/31/12 | |
| Wells Fargo Midstream MLP Index | | | 6.77% | |
| Barclays Capital Aggregate U.S. Credit Index (1-3 year) | | | 3.69% | |
| | | | |
| | | Total Return
1/1/11-
12/31/11 | |
| Wells Fargo Midstream MLP Index | | | 18.44% | |
| Barclays Capital Aggregate U.S. Credit Index (1-3 year) | | | 1.75% | |
Wells Fargo Midstream MLP Index. We believe the portion of our portfolio invested in MLPs, Canadian income equities and other energy equities may be compared to the Wells Fargo Midstream MLP Index. We use this index rather than a broader MLP index as our investment style tends to focus the portfolio in MLPs involved in pipeline transportation, storage, terminaling and processing of petroleum and natural gas. These activities are commonly known as “midstream” as opposed to oil and gas production (“upstream”) and refining and marketing (“downstream”). The upstream and downstream parts of the energy industry are the customers of the midstream companies. And while much of the equity portion of the portfolio is not invested in midstream MLPs per se, their business characteristics are similar: a heavy weighting in North American midstream operations and a high payout ratio.
Barclays Capital Aggregate U.S. Credit Index. The Barclays Capital Aggregate U.S. Credit Index (1-3 year) is an index of corporate bonds with an average duration of about 1.9 years and an average credit quality between Moody’s assigned A1 to A2 ratings (Source: Barclays Capital Inc.). While slightly longer in duration and lower in credit quality, we believe that over time, this index is the best benchmark for how we run the bond portion of our portfolio.
MLPs and Other Equities
As measured by the Wells Fargo Midstream MLP Index, the total return for MLPs over the year ended December 31, 2012 was about 6.77%. This return reflects an initial yield of about 5.5% and share appreciation of about 1.3%. While in the short-term, share price performance can be volatile, and subject to macro factors such as credit spreads, interest rates and overall market sentiment, we believe that over the long-term, share performance will approximate growth in per-share quarterly cash distributions paid by MLPs. Over the last 12 months, the average growth in per-share cash distributions of energy-related MLPs has grown about 6.6%. This compares to a ten-year average of about 6.8% (Source: Alerian Capital Management). MLPs and other portfolio companies engaged in infrastructure businesses such as pipelines,
terminals and storage receive fees and
Results of a Hypothetical $10,000 Investment

The Wells Fargo Midstream MLP Index consists of 35 energy MLPs and represents the Midstream sub-sector of the Wells Fargo MLP Composite Index. The index is calculated by S&P using a float-adjusted market capitalization methodology. Unlike the Fund, the index does not incur fees and expenses.
The Barclays Capital Aggregate U.S. Credit Index (1-3 year) is an index of corporate bonds with an average duration of about 1.9 years and an average credit quality of between Moody’s assigned A1 to A2 ratings. Unlike the Fund, the index does not incur fees and expenses.
EIP Growth and Income Fund
RETURNS FOR YEAR ENDED 12/31/12
Average Annual Total Returns
| | | | |
| One Year | | | 7.03% | |
| Five Years | | | 14.21% | |
| Since Inception | | | 13.71% | |
Inception Date 08/22/06
The performance data quoted represents past performance and does not guarantee future results. The performance stated may have been due to extraordinary market conditions, which may not be duplicated in the future. Current performance may be lower or higher than the performance data quoted. The investment return and principal value of the fund will fluctuate so that an investor’s shares, when sold, may be worth more or less than the original cost. Calculations do not reflect the deduction in taxes that a shareholder would pay on fund distributions or the redemption of shares. Calculations assume reinvestment of dividends and capital gain distributions. To obtain more recent performance data, please contact the Energy Income Partners Information Center at 1-203-349-8232.
EIP Growth and Income Fund
tariffs that are generally not directly related to commodity prices. Growth for these companies is driven by changes in demand for petroleum and natural gas, inflation-related escalations to their fees and tariffs and the accretion from new projects and acquisitions. We believe that the growth rate of the dividend stream from MLPs in these true infrastructure businesses is supported by the fundamentals of their underlying businesses.
Fixed Income
The Fund’s bond portfolio continues to provide income and stability to our overall portfolio returns. Bond performance was up about 99 basis points for the year. On average, the bonds are trading near par.
Our bond portfolio is made up entirely of corporate issues and US agency bonds. We do not hold any collateralized debt obligations or mortgage-backed securities or any other types of fixed income derivatives. In addition, our strategy is a “buy and hold” approach. So while the mark-to-market value of some of our bonds may experience volatility, we believe that if we hold them to maturity and there are no events of default, we should realize 100 cents on the dollar for these bonds as they mature. None of the bonds we have held have ever defaulted in their payments to the Fund. Of course, although not currently anticipated, if we sell these bonds before maturity, we may not realize 100 cents on the dollar for these bonds.
Outlook
Year-to-date through December 31, 2012, there have been 13 MLP IPOs which raised $3.3 billion of gross proceeds. There has also been a healthy level of secondary financing activity for MLPs during the reporting period as they continue to fund their ongoing investments in new pipelines, processing and storage facilities. In 2012, there have been 67 secondary equity offerings for MLPs that raised $25.0 billion. This compares to $14.2 billion raised in 2011. In the public debt market, $18.2 billion has been raised during the same time period. This compares to $15.6 billion in 2011 (Source: Barclays Capital).
In our opinion, the better positioned MLPs have non-cyclical cash flows, conservative balance sheets, modest and/or flexible organic growth commitments and liquidity on their revolving lines of credit. Cyclical cash flows will always be unpredictable in our view, making them a poorer fit with a steady dividend obligation. Over the last few years, the majority of MLP IPOs were companies whose primary business is the production of oil and gas, shipping, refining or natural gas gathering. While some of these MLPs have quality assets, competent management teams and the potential for higher growth, they have more risk associated with the cyclical nature of their businesses. We have written about the dangers of this trend in the past, and remain vigilant about limiting our exposure to MLPs with cyclical cash flows.
The total return proposition of owning energy-related infrastructure MLPs has been and continues to be their yield plus their growth. The yield of the MLPs, weighted by market capitalization, on December 31, 2012, was 6.6% based on the Alerian Index. The growth in the quarterly cash distributions that make up this yield has averaged between 6% and 7% annually over the last ten years (Source: Alerian Capital Management). For true infrastructure MLPs, we still expect dividend growth rates to average in the mid-single digits over the next few years. We believe this growth will continue to be driven by modest increases in underlying demand as the economy recovers, inflation and cost escalators in pipeline tariffs and contracts and accretion from profitable capital projects and acquisitions. The capital projects continue to be related to growth in areas such as the new natural gas shale resources, the need for more infrastructure related to bio fuels and other environmental requirements, and Canadian oil sands. Thus far, we believe the MLPs as a group have done a great job capitalizing on these opportunities.
Sincerely,
James Murchie
President
EIP Growth and Income Fund
The views expressed in this commentary reflect those of the Fund’s portfolio management team as of December 31, 2012. Any such views are subject to change at any time based on market or other conditions, and the Fund disclaims any responsibility to update such views. These views are not intended to be a forecast of future events, a guarantee of future results or advice. Because investment decisions for the Fund are based on numerous factors, these views may not be relied upon as an indication of trading intent on behalf of the Fund. The information contained herein has been prepared from sources believed to be reliable, but is not guaranteed by the Fund as to its accuracy or completeness. Past performance is not indicative of future results. Performance information provided above assumes the reinvestment of interest, dividends and other earnings. There is no assurance that the Fund’s investment objectives will be achieved.
EIP Growth and Income Fund
December 31, 2012
Schedule of Investments
| | | | | | | | |
Par Value | | | | | Fair
Value | |
| | | | | | | | |
|
| | CORPORATE NOTES AND BONDS – 7.31%† | |
| | | | Credit - Miscellaneous Business – 7.31%† | |
| $ | 3,000,000 | | | General Electric Capital Corp., MTN | | | | |
| | | | 0.551%, 01/08/16 (a) (b) | | $ | 2,967,453 | |
| | | | | | | | |
| | | | Total Corporate Notes and Bonds | | | | |
| | | | (Cost $3,001,420) | | | 2,967,453 | |
| | | | | | | | |
|
| | U.S. GOVERNMENT AND AGENCY OBLIGATIONS – 53.02%† | |
| | | | Federal Farm Credit Bank – 12.33%† | |
| | 5,000,000 | | | Federal Farm Credit Bank | | | | |
| | | | 0.230%, 10/03/13 (a) | | | 5,002,820 | |
| | | | | | | | |
| | | | Federal Home Loan Bank – 19.74%† | |
| | 7,000,000 | | | Federal Home Loan Bank | | | | |
| | | | 0.270%, 01/23/14 (a) | | | 7,007,861 | |
| | 1,000,000 | | | Federal Home Loan Bank | | | | |
| | | | 1.625%, 03/20/13 (a) | | | 1,003,313 | |
| | | | | | | | |
| | | | | | | 8,011,174 | |
| | | | | | | | |
| | | | Federal Home Loan Mortgage – 20.95%† | |
| | 8,500,000 | | | Federal Home Loan Mortgage | | | | |
| | | | 0.165%, 02/04/13 (a) (b) | | | 8,500,102 | |
| | | | | | | | |
| | | | Total U.S. Government and Agency Obligations | |
| | | | (Cost $21,504,162) | | | 21,514,096 | |
| | | | | | | | |
| | | | | | | | |
|
| | MASTER LIMITED PARTNERSHIPS – 38.53%† | |
| | | | Consumer Cyclicals – 1.69%† | |
| | 17,700 | | | AmeriGas Partners, LP | | $ | 685,698 | |
| | | | | | | | |
| | | | Energy – 33.08%† | |
| | 6,000 | | | Access Midstream Partners, LP | | | 201,240 | |
| | 11,400 | | | Alliance Holdings GP, LP | | | 542,412 | |
| | 18,100 | | | Alliance Resource Partners, LP | | | 1,051,067 | |
| | 7,400 | | | El Paso Pipeline Partners, LP | | | 273,578 | |
| | 20,100 | | | Energy Transfer Equity, LP | | | 914,148 | |
| | 52,469 | | | Enterprise Products Partners, LP | | | 2,627,648 | |
| | 8,800 | | | EQT Midstream Partners, LP | | | 274,120 | |
| | 12,779 | | | Holly Energy Partners, LP | | | 840,603 | |
| | 1,000 | | | Magellan Midstream Partners, LP | | | 43,190 | |
| | 15,400 | | | MPLX, LP (c) | | | 480,326 | |
| | 25,750 | | | NuStar Energy, LP | | | 1,093,860 | |
| | 22,900 | | | NuStar GP Holdings, LLC | | | 634,101 | |
| | 5,700 | | | Oiltanking Partners, LP | | | 215,802 | |
| | 23,086 | | | ONEOK Partners, LP | | | 1,246,413 | |
| | 30,000 | | | Spectra Energy Partners, LP | | | 936,900 | |
| | 20,000 | | | Suburban Propane Partners, LP | | | 777,200 | |
| | 17,609 | | | TC Pipelines, LP | | | 710,699 | |
| | 10,900 | | | Transmontaigne Partners, LP | | | 413,873 | |
| | 3,000 | | | Williams Partners, LP | | | 145,980 | |
| | | | | | | | |
| | | | | | | 13,423,160 | |
| | | | | | | | |
| | | | Industrial – 2.24%† | |
| | 24,000 | | | Teekay LNG Partners, LP | | | 906,720 | |
| | | | | | | | |
| | | | Utilities – 1.52%† | |
| | 9,000 | | | Brookfield Renewable Energy Partners, LP | | | 265,829 | |
| | 15,000 | | | NGL Energy Partners, LP | | | 349,800 | |
| | | | | | | | |
| | | | | | | 615,629 | |
| | | | | | | | |
| | | | Total Master Limited Partnerships | |
| | | | (Cost $12,645,988) | | | 15,631,207 | |
| | | | | | | | |
|
| | UNITED STATES COMMON STOCKS – 25.59%† | |
| | | | Energy – 14.05%† | |
| | 83,773 | | | Enbridge Energy Management, LLC (c) | | | 2,420,202 | |
| | 19,782 | | | Kinder Morgan Management, LLC (c) | | | 1,492,750 | |
| | 34,961 | | | Kinder Morgan, Inc. | | | 1,235,172 | |
| | 15,000 | | | Wisconsin Energy Corp. | | | 552,750 | |
| | | | | | | | |
| | | | | | | 5,700,874 | |
| | | | | | | | |
| | | | Financial – 0.17%† | |
| | 11,500 | | | CorEnergy Infrastructure Trust | | | 69,345 | |
| | | | | | | | |
| | | | Utilities – 11.37%† | |
| | 10,000 | | | Dominion Resources, Inc. | | | 518,000 | |
| | 5,000 | | | Exelon Corp. | | | 148,700 | |
| | 1,000 | | | ITC Holdings Corp. | | | 76,910 | |
| | 15,000 | | | National Grid PLC, Sponsored ADR | | | 861,600 | |
| | 7,000 | | | NextEra Energy, Inc. | | | 484,330 | |
| | 10,000 | | | NiSource, Inc. | | | 248,900 | |
| | 4,000 | | | Northeast Utilities | | | 156,320 | |
| | 38,000 | | | Southern Co. | | | 1,626,780 | |
| | 15,000 | | | UGI Corp. | | | 490,650 | |
| | | | | | | | |
| | | | | | | 4,612,190 | |
| | | | | | | | |
| | | | Total United States Common Stocks | |
| | | | (Cost $9,392,981) | | | 10,382,409 | |
| | | | | | | | |
See accompanying Notes to Financial Statements.
3
EIP Growth and Income Fund
December 31, 2012
Schedule of Investments – continued
| | | | | | | | |
Shares | | | | | Fair
Value | |
| | | | | | | | |
|
| | CANADIAN COMMON STOCKS – 6.67%† | |
| | | | Energy – 0.78%† | |
| | 11,000 | | | Pembina Pipeline Corp. | | $ | 314,728 | |
| | | | | | | | |
| | | | Utilities – 5.89%† | |
| | 11,000 | | | Atco Ltd Canada, Class I | | | 892,651 | |
| | 8,000 | | | Emera, Inc. | | | 279,401 | |
| | 15,500 | | | Enbridge Income Fund Holdings, Inc. | | | 376,008 | |
| | 17,000 | | | Keyera Corp. | | | 841,369 | |
| | | | | | | | |
| | | | | | | 2,389,429 | |
| | | | | | | | |
| | | | Total Canadian Common Stocks | |
| | | | (Cost $1,947,267) | | | 2,704,157 | |
| | | | | | | | |
|
| | WARRANTS – 0.04%† | |
| | | | Energy – 0.04%† | |
| | 4,480 | | | Kinder Morgan, Inc., Strike Price $40.00, Exp. 05/25/17 (c) | | | 16,934 | |
| | | | | | | | |
| | | | Total Warrants | | | | |
| | | | (Cost $8,534) | | | 16,934 | |
| | | | | | | | |
| Total Investments – 131.16%† | | | | |
| (Cost $48,500,352)* | | | 53,216,256 | |
| | | | | | | | |
| | |
Principal | | | | | | |
|
| | REVERSE REPURCHASE AGREEMENTS (d) – (56.01)%† | |
| $ | (4,700,000) | | | With Credit Suisse for Federal Farm Credit Bank, 0.30% dated 12/31/12, to be repurchased at $4,700,078 on 01/02/13 | | | (4,700,000 | ) |
| | (6,600,000) | | | With Credit Suisse for Federal Home Loan Bank, 0.30% dated 12/31/12, to be repurchased at $6,600,110 on 01/02/13 | | | (6,600,000 | ) |
| | (950,000) | | | With Credit Suisse for Federal Home Loan Bank, 0.30% dated 12/31/12, to be repurchased at $950,016 on 01/02/13 | | | (950,000 | ) |
| | (8,073,652) | | | With Credit Suisse for Federal Home Loan Mortgage, 0.30% dated 12/31/12, to be repurchased at $8,073,787 on 01/02/13 | | | (8,073,652 | ) |
| | (2,400,000) | | | With Credit Suisse for General Electric Capital Corp., MTN, 0.75% dated 12/31/12, to be repurchased at $2,400,100 on 01/02/13 | | | (2,400,000 | ) |
| | | | | | | | |
| | | | Total Reverse Repurchase Agreements | | | | |
| | | | (Cost $(22,723,652)) | | | (22,723,652 | ) |
| | | | | | | | |
| Total Investments and Reverse Repurchase Agreements – 75.15%† | |
| (Cost $25,776,700) | | | 30,492,604 | |
| | | | | | | | |
| Other Assets in excess of Liabilities – 24.85%† | | | 10,081,505 | |
| | | | | | | | |
| Net Assets – 100.00%† | | $ | 40,574,109 | |
| | | | | | | | |
| | † | | Percentages are calculated based on net assets, inclusive of reverse repurchase agreements. |
| | * | | Aggregate cost for federal tax purposes is $48,936,152 |
| | (a) | | Segregated as collateral for Reverse Repurchase Agreements as of December 31, 2012. |
| | (b) | | Floating rate note. The interest rate shown reflects the rate in effect at December 31, 2012. |
| | (c) | | Non-income producing security. |
| | (d) | | A reverse repurchase agreement, although structured as a sale and repurchase obligation, acts as a financing transaction under which the Fund will effectively pledge certain assets as collateral to secure a short-term loan. Generally the other party to the agreement makes the loan in an amount equal to a percentage of the market value of the pledged collateral. At the maturity of the reverse repurchase agreement, the Fund will be required to repay the loan and interest and correspondingly receive back its collateral. While used as collateral, the assets continue to pay principal and interest which are for the benefit of the Fund. |
| | ADR | | American Depositary Receipt |
The amount of $118,538 in cash was segregated with the broker, Credit Suisse, to cover margin requirements for the following open futures contracts as of December 31, 2012:
| | | | | | | | | | |
Short Futures
Outstanding | | Number of
Contracts | | Notional
Amount** | | | Unrealized
Appreciation | |
| Canadian Dollar (03/13) | | 58 | | $ | 5,862,350 | | | $ | 40,658 | |
| | ** | | The notional amount represents the U.S. value of the contract as of the day of the opening of the transaction or latest contract reset date. |
The amount of $4,882,259 in cash was segregated with the custodian to cover the following total return swaps outstanding at December 31, 2012:
| | | | | | | | | | | | | | |
Long Total
Return Equity Swaps | | Pay
Rate | | Expiration
Date | | | Notional
Amount** | | | Unrealized
Appreciation
(Depreciation) | |
| Inter Pipeline Fund (Canada)*** | | 1 month
LIBOR + 40
basis points | | | 3/20/13 | | | $ | 1,483,976 | | | ($ | 25,608 | ) |
| El Paso Pipeline Partners, LP*** | | 1 month
LIBOR + 90
basis points | | | 12/24/13 | | | | 932,250 | | | | (8,345 | ) |
| Kinder Morgan Management, LLC*** | | 1 month
LIBOR + 50
basis points | | | 12/24/13 | | | | 1,390,954 | | | | 16,650 | |
| Magellan Midstream Partners*** | | 1 month
LIBOR + 56
basis points | | | 12/24/13 | | | | 1,495,650 | | | | 32,892 | |
| Plains All American Pipeline, LP*** | | 1 month
LIBOR + 50
basis points | | | 12/24/13 | | | | 893,200 | | | | 11,389 | |
| Williams Pipeline Partners, LP*** | | 1 month
LIBOR + 100
basis points | | | 12/24/13 | | | | 323,988 | | | | 14,554 | |
| Centerpoint Energy inc.*** | | 1 month
LIBOR + 35
basis points | | | 1/21/14 | | | | 297,600 | | | | (8,906 | ) |
| Dominion Resources, Inc.*** | | 1 month
LIBOR + 35
basis points | | | 1/21/14 | | | | 857,340 | | | | 5,904 | |
| Duke Energy Co.*** | | 1 month
LIBOR + 35
basis points | | | 1/21/14 | | | | 194,280 | | | | (2,916 | ) |
See accompanying Notes to Financial Statements.
4
EIP Growth and Income Fund
December 31, 2012
Schedule of Investments – continued
| | | | | | | | | | | | | | |
Long Total
Return Equity Swaps | | Pay
Rate | | Expiration
Date | | | Notional
Amount** | | | Unrealized
Appreciation
(Depreciation) | |
Enbridge, Inc.
(Canada)*** | | 1 month
LIBOR + 36
basis points | | | 1/21/14 | | | $ | 891,488 | | | $ | 9,400 | |
| Exelon Corp.*** | | 1 month
LIBOR + 35
basis points | | | 1/21/14 | | | | 389,090 | | | | (2,543 | ) |
| ITC Holdings Corp.*** | | 1 month
LIBOR + 35
basis points | | | 1/21/14 | | | | 1,013,740 | | | | (14,099 | ) |
| Nextera Energy, Inc.*** | | 1 month
LIBOR + 35
basis points | | | 1/21/14 | | | | 909,708 | | | | (17,327 | ) |
| Nisource Inc.*** | | 1 month
LIBOR + 35
basis points | | | 1/21/14 | | | | 1,123,320 | | | | 21,410 | |
| Northeast Utilities*** | | 1 month
LIBOR + 35
basis points | | | 1/21/14 | | | | 471,240 | | | | 1,748 | |
| Questar Corp.*** | | 1 month
LIBOR + 35
basis points | | | 1/21/14 | | | | 813,850 | | | | (3,842 | ) |
| Sempra Energy*** | | 1 month
LIBOR + 35
basis points | | | 1/21/14 | | | | 640,112 | | | | (10,680 | ) |
| Southern Co.*** | | 1 month
LIBOR + 35
basis points | | | 1/21/14 | | | | 83,106 | | | | (1,782 | ) |
TransCanada Corp.
(Canada)*** | | 1 month
LIBOR + 35
basis points | | | 1/21/14 | | | | 624,574 | | | | 15,311 | |
| UGI Corp.*** | | 1 month
LIBOR + 35
basis points | | | 1/21/14 | | | | 1,011,357 | | | | 7,536 | |
| Williams Companies, Inc.*** | | 1 month
LIBOR + 35
basis points | | | 1/21/14 | | | | 1,441,428 | | | | 52,841 | |
| Wisconsin Energy Corp.*** | | 1 month
LIBOR + 34
basis points | | | 1/21/14 | | | | 263,690 | | | | (5,788 | ) |
| | | | | | | | | | | | | | |
| | | | | | | | $ | 17,545,941 | | | $ | 87,799 | |
| | | | | | | | | | | | | | |
| | | | |
Short Total
Return Equity Swaps | | Pay
Rate | | Expiration
Date | | | Notional
Amount** | | | Unrealized
Depreciation | |
| Copano Energy, LLC*** | | 1 month
Libor - 300
basis points | | | 1/18/13 | | | $ | 455,850 | | | ($ | 19,024 | ) |
| Markwest Energy Partners, LP*** | | 1 month
Libor - 275
basis points | | | 1/18/13 | | | | 244,600 | | | | (10,657 | ) |
| | | | | | | | | | | | | | |
| | | | | | | | $ | 700,450 | | | ($ | 29,681 | ) |
| | | | | | | | | | | | | | |
| | ** | | The notional amount represents the U.S. value of the contract as of the day of the opening of the transaction. |
| | *** | | Credit Suisse is the counterparty to the above total return swaps. |
See accompanying Notes to Financial Statements.
5
EIP Growth and Income Fund
December 31, 2012
Statement of Assets and Liabilities
| | | | |
| |
ASSETS: | | | | |
Investments, at value (Cost $48,500,352) | | $ | 53,216,256 | |
Cash and cash equivalents | | | 4,227,099 | |
Restricted cash | | | 5,000,797 | |
Swaps (premium paid $0) | | | 189,635 | |
Foreign currency (Cost $3,078) | | | 3,078 | |
Receivables: | | | | |
Investments sold | | | 950,120 | |
Dividends and interest | | | 50,526 | |
Due from broker—variation margin on futures contracts | | | 40,658 | |
Prepaid expenses | | | 53,253 | |
| | | | |
Total assets | | | 63,731,422 | |
| | | | |
| |
LIABILITIES: | | | | |
Reverse repurchase agreements | | | 22,723,652 | |
Swaps (premium received $0) | | | 131,517 | |
Payables: | | | | |
Interest expense | | | 35,660 | |
Investments purchased | | | 3,084 | |
Professional fees | | | 182,999 | |
Investment advisory fees (Note 3) | | | 35,350 | |
Accounting and administration fees (Note 3) | | | 17,255 | |
Transfer agent fees | | | 5,217 | |
Custodian fees | | | 3,836 | |
Printing expense | | | 8,316 | |
Trustee fees and related expenses (Note 3) | | | 1,181 | |
Other payables | | | 9,246 | |
| | | | |
Total liabilities | | | 23,157,313 | |
| | | | |
NET ASSETS | | $ | 40,574,109 | |
| | | | |
| |
NET ASSETS CONSIST OF: | | | | |
Par value ($0.01 per share) | | $ | 27,963 | |
Paid in capital | | | 60,383,808 | |
Accumulated undistributed net investment loss | | | (545,984 | ) |
Accumulated net realized loss on investments, swap transactions, futures contracts and foreign currency transactions | | | (24,106,355 | ) |
Net unrealized appreciation on investments, swap transactions, futures contracts and foreign currency transactions | | | 4,814,677 | |
| | | | |
| | $ | 40,574,109 | |
| | | | |
Shares outstanding (unlimited number of shares authorized) | | | 2,796,344 | |
| | | | |
Net Asset Value, offering and redemption price per share (net assets/shares outstanding) | | $ | 14.51 | |
| | | | |
See accompanying Notes to Financial Statements.
6
EIP Growth and Income Fund
For the Year Ended December 31, 2012
Statement of Operations
| | | | |
| |
INVESTMENT INCOME: | | | | |
Dividends | | $ | 328,195 | |
Less: foreign taxes withheld | | | (16,675 | ) |
Interest | | | 90,250 | |
| | | | |
Total investment income | | | 401,770 | |
| | | | |
| |
EXPENSES: | | | | |
Interest expense (Note 2) | | | 81,596 | |
Investment advisory fees (Note 3) | | | 435,148 | |
Professional fees | | | 320,978 | |
Accounting and administration fees (Note 3) | | | 173,811 | |
Trustee fees and related expenses (Note 3) | | | 53,119 | |
Transfer agent fees (Note 3) | | | 58,682 | |
Custodian fees | | | 20,752 | |
Printing expenses | | | 14,212 | |
Other expenses | | | 79,540 | |
| | | | |
Total expenses | | | 1,237,838 | |
| | | | |
NET INVESTMENT LOSS | | | (836,068 | ) |
| | | | |
NET REALIZED AND UNREALIZED GAIN/(LOSS) ON INVESTMENTS: | | | | |
NET REALIZED GAIN/(LOSS) ON: | | | | |
Investments | | | 3,356,640 | |
Swap transactions | | | 2,895,036 | |
Futures contracts | | | (206,460 | ) |
Foreign currency transactions | | | (5,126 | ) |
| | | | |
Net realized gain | | | 6,040,090 | |
| | | | |
| |
NET CHANGE IN UNREALIZED APPRECIATION/(DEPRECIATION) ON: | | | | |
Investments | | | (2,089,768 | ) |
Swap transactions | | | (371,619 | ) |
Futures contracts | | | 80,618 | |
Foreign currency transactions | | | (54 | ) |
| | | | |
Net change in unrealized depreciation | | | (2,380,823 | ) |
| | | | |
NET REALIZED AND UNREALIZED GAIN ON INVESTMENTS | | | 3,659,267 | |
| | | | |
| |
NET INCREASE IN NET ASSETS FROM OPERATIONS | | $ | 2,823,199 | |
| | | | |
See accompanying Notes to Financial Statements.
7
EIP Growth and Income Fund
Statement of Changes in Net Assets
| | | | | | | | |
| | | Year ended
December 31,
2012 | | | Year ended
December 31,
2011 | |
OPERATIONS: | | | | | | | | |
Net investment loss | | $ | (836,068 | ) | | $ | (859,987 | ) |
Net realized gain on investments, swaps, futures and foreign currency transactions | | | 6,040,090 | | | | 10,679,310 | |
Net change in unrealized depreciation on investments, swaps, futures and foreign currency transactions | | | (2,380,823 | ) | | | (2,034,063 | ) |
| | | | | | | | |
Net increase in net assets from operations | | | 2,823,199 | | | | 7,785,260 | |
| | | | | | | | |
| | |
Distributions to shareholders from: | | | | | | | | |
Net investment income | | | (2,492,987 | ) | | | (3,560,382 | ) |
| | | | | | | | |
Total distributions | | | (2,492,987 | ) | | | (3,560,382 | ) |
| | | | | | | | |
| | |
Capital share transactions: | | | | | | | | |
Proceeds from sales of shares | | | 4,881,000 | | | | 64,000 | |
Proceeds from reinvestment of distributions | | | 2,272,955 | | | | 3,163,017 | |
Cost of shares redeemed | | | (8,346,970 | ) | | | (4,335,000 | ) |
| | | | | | | | |
Net decrease in net assets from capital share transactions | | | (1,193,015 | ) | | | (1,107,983 | ) |
| | | | | | | | |
Total increase/(decrease) in net assets | | | (862,803 | ) | | | 3,116,895 | |
| | | | | | | | |
| | |
NET ASSETS: | | | | | | | | |
Beginning of year | | | 41,436,912 | | | | 38,320,017 | |
End of year | | $ | 40,574,109 | | | $ | 41,436,912 | |
| | | | | | | | |
Undistributed net investment loss | | $ | (545,984 | ) | | $ | (541,083 | ) |
| | | | | | | | |
See accompanying Notes to Financial Statements.
8
EIP Growth and Income Fund
For the Year Ended December 31, 2012
Statement of Cash Flows
| | | | |
| |
Operating Activities | | | | |
Net increase in net assets from operations | | $ | 2,823,199 | |
| |
Adjustments to Net Increase in Net Assets from Operations | | | | |
Purchase of investment securities | | | (27,626,662 | ) |
Proceeds from disposition of investment securities | | | 30,091,816 | |
Net proceeds of short-term investment transactions | | | 2,500,000 | |
Net realized gain on investments | | | (3,356,640 | ) |
Net change in unrealized depreciation on investments | | | 2,089,768 | |
Net accretion of premium on bonds | | | 17,257 | |
Return of capital received from investments in MLPs | | | 974,080 | |
Increase in investments sold receivable | | | (864,965 | ) |
Decrease in investments purchased payable | | | (104,967 | ) |
Net increase in due from broker-variation margin on futures contracts | | | (80,618 | ) |
Net change in swap appreciation | | | 371,619 | |
Increase in professional fees payable | | | 7,832 | |
Increase in printing expense payable | | | 1,898 | |
Increase in investment advisory fees payable | | | 1,673 | |
Increase in transfer agent fees payable | | | 1,240 | |
Decrease in trustee fees and related expenses payable | | | (319 | ) |
Decrease in accounting and administration fees payable | | | (1,368 | ) |
Decrease in custodian fees payable | | | (1,969 | ) |
Increase in prepaid expenses | | | (2,908 | ) |
Decrease in interest expense payable | | | (6,378 | ) |
Decrease in other payables | | | (7,690 | ) |
Increase in dividends and interest receivable | | | (13,131 | ) |
Increase in restricted cash | | | (258,540 | ) |
| | | | |
Net cash provided by operating activities | | | 6,554,227 | |
| | | | |
| |
Cash Flows From Financing Activities | | | | |
Net decrease in reverse repurchase agreements | | | (6,480,000 | ) |
Proceeds from shares sold | | | 4,901,000 | |
Payment of shares redeemed | | | (8,346,970 | ) |
Cash distributions to shareholders | | | (220,032 | ) |
| | | | |
Net cash used in financing activities | | | (10,146,002 | ) |
| | | | |
Net decrease in unrestricted cash and foreign currency | | | (3,591,775 | ) |
Beginning of Year (1) | | $ | 7,821,952 | |
| | | | |
End of Year (1) | | $ | 4,230,177 | |
| | | | |
| |
Supplemental Disclosures: | | | | |
Cash paid for interest expense | | $ | 87,974 | |
| | | | |
| (1) | The amount represents an investment in a money market fund which is included in cash and cash equivalents, and foreign currency, if any, on the Statement of Assets and Liabilities. |
See accompanying Notes to Financial Statements.
9
EIP Growth and Income Fund
The financial highlights table is intended to help you understand the Fund’s financial performance for the periods shown of the Fund’s operations. Certain information reflects financial results for a share outstanding throughout each year. The total returns in the table represent the rate that an investor would have earned (or lost) on an investment in the Fund (assuming reinvestment of all dividends and distributions).
| | | | | | | | | | | | | | | | | | | | |
| | | Year
Ended
12/31/12 | | | Year
Ended
12/31/11 | | | Year
Ended
12/31/10 | | | Year
Ended
12/31/09 | | | Year
Ended
12/31/08 | |
| | | | | | | | | | | | | | | | | | | | |
Net asset value, beginning of year | | $ | 14.43 | | | $ | 13.04 | | | $ | 11.43 | | | $ | 6.71 | | | $ | 11.22 | |
| | | | | | | | | | | | | | | | | | | | |
| | | | | |
Income from investment operations: | | | | | | | | | | | | | | | | | | | | |
Net investment income/(loss)(a) | | | (0.29 | ) | | | (0.31 | ) | | | (0.29 | ) | | | (0.16 | ) | | | 0.05 | |
Net realized and unrealized gain/(loss)
on investments | | | 1.29 | | | | 3.05 | | | | 3.78 | | | | 4.88 | | | | (3.75 | ) |
| | | | | | | | | | | | | | | | | | | | |
Total from investment operations | | | 1.00 | | | | 2.74 | | | | 3.49 | | | | 4.72 | | | | (3.70 | ) |
| | | | | | | | | | | | | | | | | | | | |
| | | | | |
Distributions paid to shareholders from: | | | | | | | | | | | | | | | | | | | | |
Net investment income | | | (0.92 | ) | | | (1.35 | ) | | | (1.88 | ) | | | — | | | | (0.19 | ) |
Net realized gain on investments | | | — | | | | — | | | | — | | | | — | | | | (0.62 | ) |
| | | | | | | | | | | | | | | | | | | | |
Total from distributions | | | (0.92 | ) | | | (1.35 | ) | | | (1.88 | ) | | | — | | | | (0.81 | ) |
| | | | | | | | | | | | | | | | | | | | |
Net increase/(decrease) in net asset value | | | 0.08 | | | | 1.39 | | | | 1.61 | | | | 4.72 | | | | (4.51 | ) |
| | | | | | | | | | | | | | | | | | | | |
Net asset value, end of year | | $ | 14.51 | | | $ | 14.43 | | | $ | 13.04 | | | $ | 11.43 | | | $ | 6.71 | |
| | | | | | | | | | | | | | | | | | | | |
Total return | | | 7.03 | % | | | 21.62 | % | | | 30.88 | % | | | 70.34 | % | | | (33.04 | )% |
| | | | | | | | | | | | | | | | | | | | |
| | | | | |
Ratios/Supplemental Data: | | | | | | | | | | | | | | | | | | | | |
Net assets, end of year (in 000’s) | | $ | 40,574 | | | $ | 41,437 | | | $ | 38,320 | | | $ | 58,983 | | | $ | 87,747 | |
Ratios of expenses to average net assets: | | | | | | | | | | | | | | | | | | | | |
Operating expenses excluding interest
expense | | | 2.66 | % | | | 2.90 | % | | | 2.98 | % | | | 2.57 | % | | | 1.54 | % |
Operating expenses including interest
expense | | | 2.84 | % | | | 3.17 | % | | | 3.30 | % | | | 3.77 | % | | | 4.30 | % |
Ratios of net investment income/(loss) to
average net assets | | | (1.92 | )% | | | (2.21 | )% | | | (2.27 | )% | | | (1.89 | )% | | | 0.52 | % |
Portfolio turnover rate | | | 51 | % | | | 69 | % | | | 68 | % | | | 93 | % | | | 42 | % |
| (a) | Per share investment income has been calculated using the average shares method. |
See accompanying Notes to Financial Statements.
10
EIP Growth and Income Fund
December 31, 2012
Notes to Financial Statements
1. ORGANIZATION
EIP Growth and Income Fund (the “Fund”) is a diversified, open-end management investment company. The Fund commenced operations on August 22, 2006. The Fund is currently the sole series of EIP Investment Trust (the “Trust”), a Delaware statutory trust. The Fund is managed by Energy Income Partners, LLC (the “Manager”). At this time, the Fund does not intend to publicly offer its shares. Fund shares are available only to certain unregistered investment companies through a “master/feeder” arrangement pursuant to Section 12(d)(1)(E) of the Investment Company Act of 1940, as amended (the “1940 Act”) and certain other accredited investors.
The Fund’s primary investment objective is to seek a high level of total shareholder return that is balanced between current income and growth. As a secondary objective, the Fund will seek low volatility. Under normal market conditions, the Fund’s investments will be concentrated in the securities of one or more issuers conducting their principal business activities in the Energy Industry. The Energy Industry is defined as enterprises connected to the exploration, development, production, gathering, transportation, processing, storing, refining, distribution, mining or marketing of natural gas, natural gas liquids (including propane), crude oil, refined petroleum products, electricity, coal or other energy sources.
2. SIGNIFICANT ACCOUNTING POLICIES
The following is a summary of significant accounting policies followed by the Fund in the preparation of its financial statements and which are in conformity with accounting principles generally accepted in the United States of America (“U.S. GAAP”) for investment companies. The preparation of financial statements in conformity with U.S. GAAP requires management to make estimates and assumptions that affect the reported amounts and disclosures in the financial statements. Actual results could differ from those estimates.
Security Valuation: For purposes of valuing investment securities, readily marketable portfolio securities listed on any exchange or the National Association of Securities Dealers Automated Quotation System (“NASDAQ”) Global Market are valued, except as indicated below, at the last sale price or the NASDAQ official closing price as determined by NASDAQ on the business day as of which such value is being determined. If there has been no sale on such day, the securities are valued at the mean between the most recent bid and asked price on such day. Portfolio securities traded on more than one securities exchange are valued at the last sale price on the business day of which such value is being determined at the close of the exchange representing the principal market for such securities. Investments initially valued in currencies other than the U.S. dollar are converted to U.S. dollars using exchange rates obtained from independent pricing services. As a result, the net asset value (“NAV”) of the Fund’s shares may be affected by changes in the value of currencies in relation to the U.S. dollar. The value of securities traded in markets outside of the United States or denominated in currencies other than the U.S. dollar may be affected significantly on a day that the New York Stock Exchange (“NYSE”) is closed and an investor is not able to purchase or redeem shares.
Equity securities traded in the over-the-counter (“OTC”) market, but excluding securities trading on the NASDAQ Global Market, are valued at the closing bid prices, if held long, or at the closing asked prices, if held short. Debt securities are priced based upon valuations provided by independent, third-party pricing agents. These third-party pricing agents may employ methodologies that utilize actual market transactions, broker-dealer supplied valuation, or other electronic data processing techniques. Such techniques generally consider such factors as security prices, yields, maturities, call features, ratings and developments relating to specific securities in arriving at valuations. If reliable market quotations are not readily available with respect to a portfolio security held by the Fund, including any illiquid securities, or if a valuation is deemed inappropriate, the fair value of such security will be determined under procedures adopted by the Board of Trustees of the Trust (the “Board”) in a manner that most fairly reflects market value of the security on the valuation date as described below.
The use of fair value pricing by the Fund indicates that a readily available market quotation is unavailable (such as when the exchange on which a security trades does not open for the day due to extraordinary circumstances and no other market prices are available or when events occur after the close of a relevant market and prior to the close of the NYSE that materially affect the value of an asset) and in such situations the Board (or the Manager, acting at the Board’s direction) will estimate the value of a security using available information. In such situations, the values assigned to such securities may not necessarily represent the amounts which might be realized upon their sale. The use of fair value pricing by the Fund will be governed by valuation procedures adopted by the Trust’s Board, and in accordance with the provisions of the 1940 Act. At December 31, 2012, there were no fair valued securities.
11
EIP Growth and Income Fund
December 31, 2012
Notes to Financial Statements – continued
Financial futures contracts traded on exchanges are valued at their last sale price. Swap agreements are valued utilizing quotes received daily by the Fund’s pricing service.
Fair Value Measurement: The inputs and valuation techniques used to measure fair value of the Fund’s net assets are summarized into three levels as described in the hierarchy below:
| | • Level 1 – | unadjusted quoted prices in active markets for identical assets or liabilities |
| | • Level 2 – | other significant observable inputs (including quoted prices for similar securities, interest rates, prepayment speeds, credit risk, evaluation pricing, etc.) |
| | • Level 3 – | significant unobservable inputs (including the Fund’s own assumptions in determining the fair value of investments) |
The inputs or methodology used for valuing securities are not necessarily an indication of the risk associated with investing in those securities. Transfers in and out of levels are recognized at market value at the end of the period. A summary of the values of each investment in each level as of December 31, 2012 is as follows:
| | | | | | | | | | | | | | | | |
| | | Total Fair
Value at
12/31/12 | | | Level 1
Quoted
Prices | | | Level 2
Significant
Observable
Inputs | | | Level 3
Significant
Unobservable
Inputs | |
ASSETS | | | | | | | | | | | | | | | | |
Corporate Notes and Bonds | | $ | 2,967,453 | | | $ | — | | | $ | 2,967,453 | | | $ | — | |
U.S. Government and Agency Obligations | | | 21,514,096 | | | | — | | | | 21,514,096 | | | | — | |
Master Limited Partnerships* | | | 15,631,207 | | | | 15,631,207 | | | | — | | | | — | |
United States Common Stocks* | | | 10,382,409 | | | | 10,382,409 | | | | — | | | | — | |
Canadian Common Stocks* | | | 2,704,157 | | | | 2,704,157 | | | | — | | | | — | |
Cash Equivalents | | | 4,227,099 | | | | 4,227,099 | | | | — | | | | — | |
Warrants | | | 16,934 | | | | 16,934 | | | | — | | | | — | |
Derivatives | | | | | | | | | | | | | | | | |
Equity Contracts | | | 189,635 | | | | — | | | | 189,635 | | | | — | |
Foreign Currency Exchange Contracts | | | 40,658 | | | | 40,658 | | | | — | | | | — | |
Total | | | 57,673,648 | | | | 33,002,464 | | | | 24,671,184 | | | | — | |
LIABILITIES | | | | | | | | | | | | | | | | |
Derivatives | | | | | | | | | | | | | | | | |
Equity Contracts | | | 131,517 | | | | — | | | | 131,517 | | | | — | |
Total | | $ | 131,517 | | | $ | — | | | $ | 131,517 | | | $ | — | |
| * | See Schedule of Investments detail for industry breakout. |
The Fund did not have any transfers in and out of Level 1 and Level 2 during the year.
The Fund held no securities or financial instruments during 2012, which were measured at fair value using Level 3 inputs.
At the end of each calendar quarter, management evaluates the Level 2 and 3 assets and liabilities, if applicable, for changes in liquidity, including but not limited to: whether a broker is willing to execute at the quoted price, the depth and consistency of prices from third party services, and the existence of contemporaneous, observable trades in the market. Additionally, management evaluates the Level 1 and 2 assets and liabilities on a quarterly basis for changes in listings or delistings on national exchanges. Due to the inherent uncertainty of determining the fair value of investments that do not have a readily available market value, the fair value of the Fund’s investments may fluctuate from period to period.
Additionally, the fair value of investments may differ significantly from the values that would have been used had a ready market existed for such investments and may differ materially from the values the Fund may ultimately realize. Further, such investments may be subject to legal and other restrictions on resale or otherwise less liquid than publicly traded securities.
The fair value of the Fund’s reverse repurchase agreements, which qualify as financial instruments under FASB Accounting Standards Codification (“ASC”) 820 “Disclosures about Fair Values of Financial Instruments”, approximates the carrying amounts presented in the Schedule of Investments and Statement of Assets and Liabilities.
MLP Common Units: Master Limited Partnership (“MLP”) common units represent limited partnership interests in the MLP. Common units are generally listed and traded on U.S. securities exchanges or OTC with their value fluctuating predominantly based on the success of the
12
EIP Growth and Income Fund
December 31, 2012
Notes to Financial Statements – continued
MLP. Unlike owners of common stock of a corporation, owners of MLP common units have limited voting rights. MLPs generally distribute all available cash flow (cash flow from operations less maintenance capital expenditures) in the form of quarterly distributions. Common unit holders have first priority to receive quarterly cash distributions up to the minimum quarterly distribution and have arrearage rights. In the event of liquidation, common unit holders have preference over subordinated units, but not debt holders or preferred unit holders, to the remaining assets of the MLP.
Cash and Cash Equivalents: The Fund maintains cash in a bank deposit account that, at times, may exceed federally insured limits. The Fund has not experienced any losses in such accounts and does not believe it is exposed to any significant credit risk on such bank deposits. The Fund considers investments in money market funds and short-term highly liquid investments with maturities of 90 days or less (when acquired) to be cash equivalents. Cash equivalents are carried at cost. As of December 31, 2012, the Fund held $4,227,099 of PNC Bank Money Market included in cash and cash equivalents on the Statement of Assets and Liabilities.
Restricted Cash: Restricted cash includes amounts required to be segregated with the Fund’s custodian or brokers as collateral for the Fund’s derivatives as shown on the Schedule of Investments.
Reverse Repurchase Agreements: One method by which the Fund currently incurs leverage is through the use of reverse repurchase agreements. In a reverse repurchase agreement, the Fund sells securities to a bank, securities dealer or one of their respective affiliates and agrees to repurchase such securities on demand or on a specified future date and at a specified price, including an implied interest payment. During the period between the sale and the forward purchase, the Fund will continue to receive principal and interest payments on the securities sold and also have the opportunity to earn a return on the securities furnished by the counterparty. Reverse repurchase agreements involve the risk that the buyer of the securities sold by the Fund might be unable to deliver them when the Fund seeks to repurchase such securities. If the buyer of the securities under the reverse repurchase agreement files for bankruptcy or becomes insolvent, the buyer or a trustee or receiver may receive an extension of time to determine whether to enforce the Fund’s obligation to repurchase the securities, and the Fund’s use of the proceeds of the reverse repurchase agreement may effectively be restricted pending that decision. The Fund will segregate on its books assets in an amount at least equal to its obligations, marked to market daily, under any reverse repurchase agreement or take other permissible actions to cover its obligations. The use of leverage involves risks of increased volatility of the Fund’s investment portfolio, among others. In certain cases, the Fund may be required to sell securities with a value significantly in excess of the cash received by the Fund from the buyer. In certain reverse repurchase agreements, the buyer may require excess cover of the Fund’s obligation. If the buyer files for bankruptcy or becomes insolvent, the Fund may lose the value of the securities in excess of the cash received. In addition, many reverse repurchase agreements are short-term in duration (often overnight), and the counterparty may refuse to “roll over” the agreement to the next period, in which case the Fund may temporarily lose the ability to incur leverage through the use of reverse repurchase agreements and may need to dispose of a significant portion of its assets in a short time period.
| | | | |
| |
Maximum amount outstanding during the period | | $ | 29,203,652 | |
| |
Average amount outstanding during the period* | | $ | 26,093,871 | |
| |
Average shares outstanding during the period | | | 2,900,988 | |
| |
Average debt per share outstanding during the period | | | $8.99 | |
| * | The average amount outstanding during the period was calculated by adding the cash received under reverse repurchase agreements at the end of each day and dividing the sum by the number of days in the year ended December 31, 2012. |
The reverse repurchase agreements are executed daily based on the previous day’s terms. The accrued interest and maturity amounts are payable at the time the reverse repurchase agreement is not renewed or the terms of the agreement are renegotiated. Interest accrues on a daily basis from the initial opening date or last interest payment date, if an interest payment has been made for the respective repurchase agreement.
Interest rates ranged from 0.18% to 0.75% during the year ended December 31, 2012, on cash received under reverse repurchase agreements. Interest expense for the year ended December 31, 2012 aggregated $81,596, which is included in the Statement of Operations under “Interest Expense”.
Short Sales of Securities: The Fund may enter into short sale transactions. A short sale is a transaction in which the Fund sells securities it does not own (but has or may have borrowed) in anticipation of a decline in the market price of the securities. To complete a short sale, the Fund may arrange through a broker to borrow the securities to be delivered to the buyer. The proceeds received by the Fund for the short sale are retained by the broker until the Fund replaces the borrowed securities. In borrowing the securities to be delivered to the buyer, the Fund becomes obligated to replace the securities borrowed at their market price at the time of replacement, whatever that price may be. The Fund did not enter into any short sale transactions during the year ended December 31, 2012.
13
EIP Growth and Income Fund
December 31, 2012
Notes to Financial Statements – continued
Disclosures about Derivative Instruments and Hedging Activities: The following is a table summarizing the fair value of derivatives held at December 31, 2012 by primary risk exposure:
| | | | | | | | | | | | |
| | | Asset Derivatives | | | Liability Derivatives | |
Derivatives not accounted for
as hedging instruments | | | | | | | | | | | | |
| | | Statement of Assets
and Liabilities Location | | Fair Value | | | Statement of Assets
and Liabilities Location | | Fair Value | |
| Foreign Currency Exchange Contracts | | Due from broker- variation margin on futures contracts | | $ | 40,658 | | | — | | $ | — | |
| | | | |
Equity Contracts | | Swaps | | | 189,635 | | | Swaps | | | 131,517 | |
| | | | | | | | | | | | |
| | | | |
Total | | | | $ | 230,293 | | | | | $ | 131,517 | |
| | | | | | | | | | | | |
The Effect of Derivative Instruments on the Statement of Operations for the year ended December 31, 2012:
| | | | | | | | | | |
Derivatives not accounted for
as hedging instruments | | Location of Gain/(Loss)
on Derivatives
Recognized in Income | | Net Realized Gain/
(Loss) on Derivatives
Recognized in Income | | | Net Change in Unrealized
Appreciation/
(Depreciation) on
Derivatives
Recognized in Income | |
| | | |
Foreign Currency Exchange Contracts | | Net realized gain/(loss) on futures contracts/Net change in unrealized appreciation/(depreciation) on futures contracts | | $ | (206,460 | ) | | $ | 80,618 | |
| | | |
Equity Contracts | | Net realized gain/(loss) on swap transactions/Net change in unrealized appreciation/(depreciation) on swap transactions | | | 2,895,036 | | | | (371,619 | ) |
| | | | | | | | | | |
| | | |
Total | | | | $ | 2,688,576 | | | $ | (291,001 | ) |
| | | | | | | | | | |
Futures Contracts: The Fund is subject to foreign currency exchange rate risk in the normal course of pursuing its investment objectives. The Fund may purchase or sell futures contracts to hedge against foreign currency exchange risk or for any other purpose permitted by applicable law. The purchase of futures contracts may be more efficient or cost effective than actually buying the underlying securities or assets. A futures contract is an agreement between two parties to buy and sell an instrument at a set price on a future date and is exchange-traded. Upon entering into a futures contract, the Fund is required to pledge to the broker an amount of cash, U.S. Government securities or other high-quality debt securities equal to the minimum “initial margin” requirements of the exchange or the broker. Pursuant to a contract entered into with a futures commission merchant, the Fund agrees to receive from or pay to the firm an amount of cash equal to the cumulative daily fluctuation in the value of the contract. Such receipts or payments are known as “variation margin” and are recorded by the Fund as unrealized gains or losses. When the contract is closed, the Fund records a gain or loss equal to the difference between the value of the contract at the time it was opened and the value at the time it was closed. The Fund will cover its current obligations under futures contracts by the segregation of liquid assets or by entering into offsetting transactions or owning positions covering its obligations. The risks of entering into futures contracts include the possibility that there may be an illiquid market and that a change in the value of the contracts may not correlate with changes in the value of the underlying securities or assets. The Fund’s maximum foreign currency exchange rate risk on those futures contracts where the underlying currency is long is an amount equal to the notional amount of the related contracts. During the year ended December 31, 2012, the Fund held no futures contracts where the underlying currency is long. The Fund’s maximum foreign currency exchange rate risk on those futures contracts where the underlying currency is short is theoretically unlimited. However, if effectively hedged, any loss would be offset in unrealized foreign currency gains of securities denominated in the same currency. For the year ended December 31, 2012, the Fund’s average volume of futures activity was $5,543,730 based on the quarterly notional amount. The notional amount represents the U.S. value of the contracts as of the day of the opening of the transaction.
14
EIP Growth and Income Fund
December 31, 2012
Notes to Financial Statements – continued
Currency Hedging Transactions: The Fund may engage in certain transactions intended to hedge the Fund’s exposure to currency risks, including without limitation buying or selling options or futures, entering into forward foreign currency contracts, currency swaps or options on currency and currency futures and other derivative transactions. Hedging transactions can be expensive and have risks, including the imperfect correlation between the value of such instruments and the underlying assets, the possible default of the other party to the transaction or illiquidity of the derivatives instruments.
Foreign Currency Translations: The accounting records of the Fund are maintained in U.S. dollars. The Fund may purchase securities that are denominated in foreign currencies. Investment securities and other assets and liabilities denominated in foreign currency are translated into U.S. dollars at the current exchange rates. Purchases and sales of securities, income and expenses are translated into U.S. dollars at the exchange rates on the dates of the respective transactions.
Although the net assets of the Fund are calculated using the foreign exchange rates and market values at the close of the period, the Fund does not isolate that portion of the results of operations arising as a result of changes in the foreign exchange rates from the fluctuations arising from changes in the market prices of long-term securities held at the end of the period. Similarly, the Fund does not isolate the effect of changes in foreign exchange rates from the fluctuations arising from changes in the market prices of long-term portfolio securities sold during the period. Accordingly, these foreign exchange gains or losses are included in the reported net realized and unrealized gain/(loss) on investments shown on the Statement of Operations.
Net realized gains or losses on foreign currency transactions represent net foreign exchange gains or losses from the holding of foreign currencies, currency gains or losses realized between the trade date and settlement date on securities transactions, and the difference between the amounts of dividends, interest and foreign withholding taxes recorded on the Funds’ books and the U.S. dollar equivalent amounts actually received or paid. Net unrealized currency gains or losses from valuing foreign currency denominated assets and liabilities (other than investments) at period end exchange rates are reflected as a component of net change in unrealized appreciation/(depreciation) on foreign currency transactions shown on the Statement of Operations.
Swap Agreements: The Fund is subject to equity price risk in the normal course of pursuing its investment objectives. The Fund may enter into swap agreements as a substitute for purchasing equity securities of issuers in the Energy Industry as defined in Note 1 above, to achieve the same exposure as it would by engaging in short sales transactions of energy securities, to hedge its currency exposure or for any other purpose permitted by applicable law. A swap is a financial instrument that typically involves the exchange of cash flows between two parties on specified dates (settlement dates) where the cash flows are based on agreed-upon prices, rates, etc. In a typical equity swap agreement, one party agrees to pay another party the return on a security or basket of securities in return for a specified interest rate. By entering into swaps, the Fund can gain exposure to a security without actually purchasing the underlying asset. Swap agreements involve both the risk associated with the investment in the security as well as the risk that the performance of the security, including any dividends, will not exceed the interest that the Fund will be committed to pay under the swap. Swaps are individually negotiated. Swap agreements may increase or decrease the overall volatility of the investments of the Fund. The performance of swap agreements may be affected by a change in the specific interest rate, security, currency, or other factors that determine the amounts of payments due to and from the Fund. The Fund will cover its current obligations under swap agreements by the segregation of liquid assets or by entering into offsetting transactions or owning positions covering its obligations. A swap agreement would expose the Fund to the same equity price risk as it would have if the underlying equity securities were purchased. The regulation of swaps and futures transactions in the United States is a rapidly changing area of law and is subject to modification by government and judicial action. The effect of any future regulatory change on the Fund is impossible to predict, but could be substantial and adverse.
The Fund’s maximum equity price risk to meet its future payments under long swap agreements outstanding as of December 31, 2012 is equal to the total notional amount as shown on the Schedule of Investments. The Fund’s maximum equity price risk to meet its future payments under short swap agreements outstanding is theoretically unlimited. For the year ended December 31, 2012, the average volume of long Total Return Equity Swaps was $17,761,235 based on the quarterly notional amount. The average volume of short Total Return Equity Swaps for the year ended December 31, 2012, was $748,130 based on the quarterly notional amount. The notional amount represents the U.S. value of the contracts as of the day of the opening of the transaction or latest contract reset date.
Options Contracts: The Fund is subject to equity price risk in the normal course of pursuing its investment objectives. The Fund may enter into option contracts in order to hedge against potential adverse price movements
15
EIP Growth and Income Fund
December 31, 2012
Notes to Financial Statements – continued
in the value of portfolio assets, as a temporary substitute for selling selected investments, to lock in the purchase price of a security or currency which it expects to purchase in the near future, as a temporary substitute for purchasing selected investments, to enhance potential gain, and for any other purpose permitted by applicable law. An option contract is a contract in which the writer of the option grants the buyer of the option the right to purchase from (call option), or sell to (put option), the writer a designated instrument at a specified price within a specified period of time. Certain options, including options on indices, would require cash settlement by the Fund if the option is exercised.
The liability representing the Fund’s obligation under an exchange-traded written option or investment in a purchased option is valued at the last sale price or, in the absence of a sale on such day, the mean between the closing bid and ask prices on such day or at the most recent asked price (bid for purchased options) if no bid and asked prices are available. OTC written or purchased options are valued using dealer supplied quotations. Gain or loss is recognized when the option contract expires or is closed.
If the Fund writes a covered call option, the Fund forgoes, in exchange for the premium, the opportunity to profit during the option period from an increase in the market value of the underlying security above the exercise price. If the Fund writes a put option it accepts the risk of a decline in the market value of the underlying security below the exercise price. OTC options have the risk of the potential inability of counterparties to meet the terms of their contracts. The Fund’s maximum equity price risk for purchased options is limited to the premium initially paid. In addition, certain risks may arise upon entering into option contracts including the risk that an illiquid secondary market will limit the Fund’s ability to close out an option contract prior to the expiration date and that a change in the value of the option contract may not correlate exactly with changes in the value of the securities or currencies hedged. For the year ended December 31, 2012, the Fund did not hold any option contracts.
Securities Transactions and Investment Income: Securities transactions are recorded on a trade date basis. Realized gain and loss from securities transactions are recorded on the specific identified cost basis. Dividend income is recognized on the ex-dividend date. Dividend income on foreign securities is recognized as soon as the Fund is informed of the ex-dividend date. Distributions received in excess of income are recorded as a reduction of cost of investments and/or as a realized gain. Interest income is recognized on the accrual basis. All discounts/premiums are accreted/amortized using the effective yield method.
Dividends and Distributions: At least annually, the Fund intends to distribute all or substantially all of its investment company taxable income (computed without regard to the deduction for dividends paid), if any, and net capital gain, if any. The tax treatment and characterization of the Fund’s distributions may vary significantly from time to time because of the varied nature of the Fund’s investments. The Fund will reinvest distributions in additional shares of the Fund unless a shareholder has written to request distributions, in whole or in part, in cash.
The tax character of distributions paid during the calendar year ended December 31, 2012 was as follows:
| | | | |
Ordinary Income | | $ | 2,492,987 | |
Long-Term Capital Gains | | $ | 0 | |
The tax character of distributions paid during the calendar year ended December 31, 2011 was as follows:
| | | | |
Ordinary Income | | $ | 3,560,382 | |
Long-Term Capital Gains | | $ | 0 | |
The Fund is considered a nonpublicly offered regulated investment company (“RIC”) under the Internal Revenue Code of 1986, as amended (the “Code”). Thus, certain expenses of the Fund, including the investment advisory fee, are subject to special rules that can affect certain shareholders of the Fund (generally individuals and entities that compute their taxable income in the same manner as an individual). In particular, such a shareholder’s pro rata portion of the affected expenses for the calendar year (but generally reduced by the Fund’s net operating loss, if any, for its tax year ending within the calendar year), will be taxable to such shareholder as an additional dividend and such shareholder will be treated as having paid its pro rata share of the affected expenses itself. If such a shareholder itemizes its deductions, it generally should be entitled to take an offsetting deduction for its share of the affected expenses, subject, however, to the 2% “floor” on miscellaneous itemized deductions. These expenses will not be deductible for the purposes of calculating alternative minimum tax.
The Fund has a tax year end of June 30. As of June 30, 2012, the components of distributable earnings on a tax basis and other tax attributes were as follows:
| | | | |
Undistributed Ordinary Income | | $ | 2,492,901 | |
Capital Loss Carryforward | | $ | 26,848,682 | |
Post October Loss – Capital & Foreign Currency | | $ | 0 | |
Taxable income and capital gains are determined in accordance with U.S. federal income tax rules, which may differ from accounting principles generally accepted in the United States of America. These differences are primarily due to differing treatments of income and gains on various investment securities held by the Fund, timing
16
EIP Growth and Income Fund
December 31, 2012
Notes to Financial Statements – continued
differences and differing characterization of distributions made by the Fund.
Permanent book and tax accounting differences relating to the tax year ended June 30, 2012 have been reclassified to reflect an increase in undistributed net investment income of $3,324,154, an increase in accumulated net realized loss on investments of $3,908,146 and an increase in paid-in-capital of $583,992. These differences are primarily due to passive loss limitations, pass through taxable income from investments and swap character reclasses. Net assets were not affected by this reclassification.
Capital Loss Carryforward: As of June 30, 2012, the following capital loss carryforwards are available to reduce taxable income arising from future net realized gains on investments, if any, to the extent permitted by the Internal Revenue Code:
| | | | | | | | |
| Year of Expiration | | | | | | |
| | |
2017 | | 2018 | | | Total | |
| $7,205,915 | | $ | 19,642,767 | | | $ | 26,848,682 | |
During the tax year ended June 30, 2012, the Fund utilized $2,967,852 of capital loss carryforwards expiring in 2017.
Federal Income Tax: The Fund intends to qualify each year for taxation as a RIC eligible for treatment under the provisions of Subchapter M of the Code. If the Fund so qualifies and satisfies certain distribution requirements, the Fund will not be subject to federal income tax on income and gains distributed in a timely manner to its shareholders in the form of dividends or capital gain dividends.
As of December 31, 2012, the cost of securities and gross unrealized appreciation and depreciation for all securities on a tax basis was as follows:
| | | | |
Total Cost of Investments | | $ | 48,936,152 | |
| | | | |
Gross Unrealized Appreciation
on Investments | | $ | 4,782,241 | |
Gross Unrealized Depreciation
on Investments | | $ | (502,137 | ) |
| | | | |
Net Unrealized Appreciation
on Investments | | $ | 4,280,104 | |
| | | | |
Management has analyzed the Fund’s tax positions taken on federal income tax returns for all open tax years and has concluded that no provision for federal income tax is required in the Fund’s financial statements.
The Fund files U.S. federal and Connecticut state tax returns. No income tax returns are currently under examination. The Fund’s U.S. federal tax returns and Connecticut state tax returns remain open for examination for the tax years ended June 30, 2012, June 30, 2011, June 30, 2010 and June 30, 2009.
Expenses: The Fund will pay all of its own expenses incurred in its operations.
Recently Issued Accounting Standards: In December 2011, the Financial Accounting Standards Board (“FASB”) issued Accounting Standards Update (“ASU”) No. 2011-11, “Disclosures about Offsetting Assets and Liabilities”. ASU 2011-11 requires disclosures to make financial statements that are prepared under U.S. GAAP more comparable to those prepared under International Financial Reporting Standards. The new disclosure requirements mandate that entities disclose both gross and net information about instruments and transactions eligible for offset in the statement of assets and liabilities as well as instruments and transactions subject to an agreement similar to a master netting arrangement. In addition, ASU 2011-11 requires disclosure of collateral received and posted in connection with master netting agreements or similar arrangements. New disclosures are required for annual reporting periods beginning on or after January 1, 2013, and interim periods within those annual periods. Management is evaluating the impact of ASU 2011-11 on the financial statements and disclosures.
3. INVESTMENT ADVISORY FEE, ADMINISTRATION FEE AND
OTHER RELATED PARTY TRANSACTIONS
Pursuant to an investment advisory agreement, Energy Income Partners, LLC, serves as the Fund’s investment manager with responsibility for the management of the Fund’s investment portfolio, subject to the supervision of the Board of Trustees of the Trust. For providing such services, the Fund pays to the Manager a fee, computed and paid monthly at the annual rate of 1% of the average daily net assets of the Fund.
The Bank of New York Mellon serves as custodian for the Fund and has custody of all securities and cash of the Fund and attends to the collection of principal and income and payment for and collection of proceeds of securities bought and sold by the Fund.
BNY Mellon Investment Servicing (US) Inc. (“BNY Mellon”) serves as the transfer agent, registrar, dividend disbursing agent and shareholder servicing agent for the Fund and provides certain clerical, bookkeeping, shareholder servicing and administrative services necessary for the operation of the Fund and maintenance of shareholder accounts.
BNY Mellon also provides certain accounting and administrative services to the Fund pursuant to an Administration and Accounting Services Agreement. For administrative and accounting services, the Fund pays BNY Mellon a fee equal to 0.07% of the Fund’s first
17
EIP Growth and Income Fund
December 31, 2012
Notes to Financial Statements – continued
$250 million of average gross assets, 0.05% of the Fund’s next $200 million of average gross assets and 0.03% of the Fund’s average gross assets in excess of $450 million, on a monthly basis, in addition to certain out-of-pocket expenses. The Fund is currently paying the minimum fee of $100,000/year ($8,333/month). For regulatory administration services, the Fund pays BNY Mellon a fee equal to 0.03% of the Fund’s first $250 million of average gross assets and 0.02% of the Fund’s average gross assets in excess of $250 million, on a monthly basis, in addition to certain other fees and expenses. The Fund is currently paying the minimum fee of $50,000/year ($4,167/month).
The Fund does not charge any sales load or fees pursuant to Rule 12b-1 of the 1940 Act. Currently, the Fund offers only a single class of shares. The Fund is self-distributed and does not have a principal underwriter or private placement agent.
The Fund pays each member of the Board of Trustees who is not an “interested person” as defined in Section 2(a)(19) of the 1940 Act (“Disinterested Trustees”) an annual retainer fee of $25,000 which includes compensation for all regular quarterly board meetings and regular committee meetings. Additional fees of $1,250 and $400 are paid to Independent Trustees for special in-person board or non-regular committee meetings and special telephonic board or non-regular committee meetings, respectively.
4. PURCHASES AND SALES
The aggregate amounts of purchases and sales of the Fund’s investment securities, other than short-term securities for the year ended December 31, 2012 were as follows:
| | | | | | | | |
| | | Purchases | | | Sales | |
U.S. Government Securities | | $ | 12,003,220 | | | $ | 16,300,000 | |
Other Investment Securities | | | 15,623,442 | | | | 13,791,816 | |
5. SHARES OF BENEFICIAL INTEREST
The Trust has authorized capital of unlimited shares of beneficial interest with a par value of $0.01 which may be issued in more than one class or series. Currently, the Fund is the only series of the Trust and the Fund currently offers one class of shares.
Share transactions were as follows:
| | | | | | | | |
| | | Year Ended
December 31, 2012 | |
| | | Shares | | | Amount | |
Shares sold | | | 314,671 | | | $ | 4,881,000 | |
Shares issued as reinvestment of distribution | | | 158,837 | | | | 2,272,955 | |
Shares redeemed | | | (548,910 | ) | | | (8,346,970 | ) |
| | | | | | | | |
Total net decrease from Fund share transactions | | | (75,402 | ) | | $ | (1,193,015 | ) |
| | | | | | | | |
| | | | | | | | |
| | | Year Ended
December 31, 2011 | |
| | | Shares | | | Amount | |
Shares sold | | | 4,563 | | | $ | 64,000 | |
Shares issued as reinvestment of distribution | | | 232,063 | | | | 3,163,017 | |
Shares redeemed | | | (303,984 | ) | | | (4,335,000 | ) |
| | | | | | | | |
Total net decrease from Fund share transactions | | | (67,358 | ) | | $ | (1,107,983 | ) |
| | | | | | | | |
6. INDUSTRY CONCENTRATION AND OTHER RISK FACTORS
The Fund’s investments are concentrated in the Energy Industry and are likely to present more risks than a fund that is broadly invested in a number of different industries.
The Fund may invest in securities denominated or quoted in foreign currencies and therefore changes in the exchange rate between the U.S. dollar and such foreign currencies will affect the U.S. dollar value of these securities and the unrealized appreciation or depreciation of these investments. The Fund may hedge against certain currency risk by, among other techniques, buying or selling options or futures or entering into other foreign currency transactions including forward foreign currency contracts, currency swaps or options on currency and currency futures and other derivatives transactions. The use of hedging transactions has risks and may result in losses greater than if they had not been used, may require the Fund to sell or purchase portfolio securities at inopportune times or for prices other than current market values, may limit the amount of appreciation the Fund can realize on an investment, or may cause the Fund to hold a security that it might otherwise sell.
The Fund may transact in various financial instruments including futures contracts, swap contracts and options. With these financial instruments, the Fund is exposed to market risk in excess of the amounts recorded in the statement of assets and liabilities. Further, the Fund is exposed to credit risk from potential counterparty non-performance. At the Statement of Assets and Liabilities date, credit risk is limited to amounts recorded in the Statement of Assets and Liabilities.
Foreign security and currency transactions may involve certain considerations and risks not typically associated with those of domestic origin as a result of, among other factors, the possibility of political and economic instability or the level of governmental supervision and regulation of foreign securities markets.
Counterparty Risk
Some of the markets in which the Fund effects its transactions are “over-the-counter” markets. The participants in such markets are typically not subject to credit evaluation and regulatory oversight as are members
18
EIP Growth and Income Fund
December 31, 2012
Notes to Financial Statements – continued
of “exchange based” markets. This exposes the Fund to the risk that a counterparty will not settle a transaction in accordance with its terms and conditions because of a dispute over the terms of the contract or because of a credit or liquidity problem, thus causing the Fund to suffer a loss. Such “counterparty risk” is accentuated for contracts with longer maturities where events may intervene to prevent settlement, or where the Fund has concentrated its transactions with a single or small group of counterparties. The Manager is not restricted from concentrating any or all of its transactions with one counterparty. The ability of the Fund to transact business with any one or number of counterparties, the lack of any meaningful and independent evaluation of such counterparties’ financial capabilities, and the absence of a regulated market to facilitate settlement may increase the potential for losses by the Fund.
Please see the Private Placement Memorandum and the Statement of Additional Information of the Fund for further information.
7. SUBSEQUENT EVENTS
Management has evaluated the impact of all subsequent events on the Fund through the date the financial statements were issued, and has determined that there were no subsequent events.
19
EIP Growth and Income Fund
Report of Independent Registered Public Accounting Firm
To the Board of Trustees and Shareholders of EIP Growth and Income Fund:
We have audited the accompanying statement of assets and liabilities, including the schedule of investments, of EIP Growth and Income Fund (the “Fund”), the sole series of EIP Investment Trust, as of December 31, 2012, and the related statements of operations and cash flows for the year then ended, the statements of changes in net assets for each of the two years in the period then ended, and the financial highlights for each of the five years in the period then ended. These financial statements and financial highlights are the responsibility of the Fund’s management. Our responsibility is to express an opinion on these financial statements and financial highlights based on our audits.
We conducted our audits in accordance with the standards of the Public Company Accounting Oversight Board (United States). Those standards require that we plan and perform the audit to obtain reasonable assurance about whether the financial statements and financial highlights are free of material misstatement. The Fund is not required to have, nor were we engaged to perform, an audit of its internal control over financial reporting. Our audits included consideration of internal control over financial reporting as a basis for designing audit procedures that are appropriate in the circumstances, but not for the purpose of expressing an opinion on the effectiveness of the Fund’s internal control over financial reporting. Accordingly, we express no such opinion. An audit also includes examining, on a test basis, evidence supporting the amounts and disclosures in the financial statements, assessing the accounting principles used and significant estimates made by management, as well as evaluating the overall financial statement presentation. Our procedures included confirmation of securities owned as of December 31, 2012, by correspondence with the custodian and brokers. We believe that our audits provide a reasonable basis for our opinion.
In our opinion, the financial statements and financial highlights referred to above present fairly, in all material respects, the financial position of EIP Growth and Income Fund, the sole series of the EIP Investment Trust, as of December 31, 2012, the results of its operations and its cash flows for the year then ended, the changes in its net assets for each of the two years in the period then ended, and the financial highlights for each of the five years in the period then ended, in conformity with accounting principles generally accepted in the United States of America.
DELOITTE & TOUCHE LLP
Philadelphia, Pennsylvania
February 25, 2013
20
EIP Growth and Income Fund
December 31, 2012
Additional Information (unaudited)
Form N-Q: The Trust files complete Portfolio of Investments for the Fund with the SEC for the Trust’s first and third quarters of each fiscal year on Form N-Q. The Trust’s Forms N-Q are available on the SEC’s website at www.sec.gov and are available for review and copying at the SEC’s Public Reference Room in Washington, D.C. Information on the operations of the Public Reference Room may be obtained by calling the SEC at 1-202-942-8090.
Proxy Voting: The Fund’s Proxy Voting Policies and Procedures, used to determine how to vote proxies relating to portfolio securities, are included in the Trust’s Statement of Additional Information, and are also available (i) upon request, without charge, by calling collect 1-203-349-8323 or (ii) on the SEC’s website at www.sec.gov.
The Fund’s Proxy Voting Record for the most recent twelve month period ended June 30 (which is filed by August 31 of each year) is available (i) upon request, without charge, by calling collect 1-203-349-8323 or (ii) on the SEC’s website at www.sec.gov.
Tax Information: The Fund hereby designates as eligible for the corporate dividends received deduction available to corporate shareholders 4.58% of the distributions made by the Fund during the calendar year ended December 31, 2012.
The Fund hereby designates as qualified dividend income distributions 10.69% of the distributions made by the Fund during the calendar year ended December 31, 2012.
The Fund hereby designates as qualifying interest related dividends 3.41% of the distributions made by the Fund during the calendar year ended December 31, 2012.
No distributions made by the Fund during the calendar year ended December 31, 2012 are designated as capital gain dividends.
For each of the foregoing items, it is the intention of the Fund to designate, if greater than the percentage or amount set forth above, the maximum amount permitted under the Internal Revenue Code and the regulations thereunder. Fund shareholders must meet additional requirements (including any applicable holding period requirements) in order to receive favorable tax treatment with respect to the foregoing items, and should consult their tax advisors in this regard.
Disclosure of Fund Expenses
We believe it is important for you to understand the impact of fees regarding your investment. All mutual funds have operating expenses. As a shareholder of a mutual fund, you incur ongoing costs, which include costs for portfolio management, administrative services, and shareholder reports (like this one), among others. Operating expenses, which are deducted from a fund’s gross income, directly reduce the investment return of the fund. A fund’s expenses are expressed as a percentage of its average net assets. This figure is known as the expense ratio. The following examples are intended to help you understand the ongoing fees (in dollars) of investing in the Fund and to compare these costs with those of other mutual funds. The examples are based on an investment of $1,000 made at the beginning of the period shown and held for the entire period.
This table illustrates the Fund’s costs in two ways:
Actual Fund Return: This section helps you to estimate the actual expenses, after any applicable fee waivers, which you paid over the period. The “Ending Account Value” shown is derived from the Fund’s actual return for the past six month period, the “Expense Ratio” column shows the period’s annualized expense ratio, and the “Expenses Incurred During Period” column shows the dollar amount that would have been paid by an investor who started with $1,000 in the Fund at the beginning of the period.
You may use the information here, together with your account value, to estimate the expenses that you paid over the period. To do so, simply divide your account value by $1,000 (for example, an $8,600 account value divided by $1,000 = 8.6), then multiply the result by the number given in the first line under the heading entitled “Expenses Incurred During Period.”
Hypothetical 5% Return: This section is intended to help you compare your Fund’s costs with those of other mutual funds. It assumes that the Fund had an annual return of 5% before expenses, but that the expense ratio is unchanged. In this case, because the return used is not the Fund’s actual return, the results do not apply to your investment. This example is useful in making comparisons to other mutual funds because the SEC requires all mutual funds to calculate expenses based on an assumed 5% annual return. You can assess your Fund’s costs by comparing this hypothetical example with the hypothetical examples that appear in shareholder reports of other funds.
Please note that the expenses shown in the table are meant to highlight and help you compare your ongoing costs only and do not reflect any transactional costs such as sales charges (loads) and redemption fees. The Fund does not charge any sales loads or redemption fees but these may be present in other funds to which you compare this data. Therefore, the hypothetical portions of the table are useful in comparing ongoing costs only, and will
21
EIP Growth and Income Fund
December 31, 2012
Additional Information (unaudited) – continued
not help you determine the relative total costs of owning different funds.
| | | | | | | | | | | | | | | | |
| | | Beginning
Account
Value 07/01/12 | | | Ending
Account
Value
12/31/12 | | | Expense
Ratio(1)(2)
Including
Interest
Expense | | | Expenses
Incurred
During
Period(3) | |
Actual Fund Return | | $ | 1,000.00 | | | $ | 1,047.80 | | | | 2.74 | % | | $ | 14.10 | |
Hypothetical 5% Return | | $ | 1,000.00 | | | $ | 1,011.36 | | | | 2.74 | % | | $ | 13.85 | |
| (1) | Annualized, based on the Fund’s most recent fiscal expenses. |
| (2) | Expense ratio includes interest expense. If interest expense were not included, the Fund’s expense ratio would be 2.56%, and would result in the following expenses: |
| | | | | | | | | | | | | | | | |
| | | Beginning
Account
Value 07/01/12 | | | Ending
Account
Value
12/31/12 | | | Expense
Ratio(4)
Excluding
Interest
Expense | | | Expenses
Incurred
During
Period(3) | |
Actual Fund Return | | $ | 1,000.00 | | | $ | 1,047.80 | | | | 2.56 | % | | $ | 13.18 | |
Hypothetical 5% Return | | $ | 1,000.00 | | | $ | 1,012.27 | | | | 2.56 | % | | $ | 12.95 | |
| (3) | Expenses are equal to the Fund’s annualized expense ratio, as indicated, multiplied by the average account value over the period, multiplied by 184 days in the most recent fiscal half-year or appli- cable period, then divided by 366. |
| (4) | Annualized, based on the Fund’s most recent fiscal expenses, excluding interest expense. |
22
EIP Growth and Income Fund
December 31, 2012
Additional Information (unaudited) – continued
TRUSTEES AND OFFICERS OF THE TRUST
Under Delaware law, the business and affairs of the Trust are managed under the direction of the Board of Trustees. Information pertaining to the Trustees and Executive Officers of the Trust is set forth below. The term “officer” means the president, vice president, secretary, treasurer, controller or any other officer who performs a policy making function.
| | | | | | | | |
Name, Address, Age and
Position(s) with Trust | | Term of
Office(1) and
Length of
Time Served | | Principal Occupation(s)
During Past Five Years | | Number of
Portfolios in
Fund Complex
Overseen by
Trustee | | Other Trusteeships/
Directorships
Held by Trustee |
| | | | |
INDEPENDENT TRUSTEES | | | | | | | | |
| | | | |
Kenneth I. Rosenblum
DOB: 04/27/41 c/o EIP Investment Trust 49 Riverside Avenue
Westport, CT 06880 Trustee | | Since December 2005 | | Independent Consultant (since January 1990); Trustee of McMorgan Funds (6 funds) (1994-2008). | | One | | None |
| | | | |
Salvatore Faia DOB: 12/25/62 c/o EIP Investment Trust 49 Riverside Avenue Westport, CT 06880 Trustee | | Since December 2005 | | President, Vigilant Compliance Services (mutual fund and investment adviser compliance company) (since August 2004). | | One | | None |
| | | | |
INTERESTED TRUSTEES | | | | | | | | |
| | | | |
James J. Murchie(2) DOB: 11/14/57 c/o EIP Investment Trust 49 Riverside Avenue Westport, CT 06880 Trustee and President | | Since July 2006 | | Principal, Energy Income Partners, LLC (since 2006). | | One | | None |
| | | | |
OFFICERS WHO ARE NOT TRUSTEES | | | | | | | | |
| | | | |
Linda Longville DOB: 07/26/58 c/o EIP Investment Trust 49 Riverside Avenue Westport, CT 06880 Treasurer and Principal Financial and Accounting Officer | | Since July 2006 | | Principal, Energy Income Partners, LLC (since 2006). | | N/A | | N/A |
| | | | |
Eva Pao DOB: 04/18/74 c/o EIP Investment Trust 49 Riverside Avenue Westport, CT 06880 Chief Legal Officer(3), Chief Compliance Officer and Anti-Money Laundering Compliance Officer | | Since July 2006 | | Principal, Energy Income Partners, LLC (since 2006). | | N/A | | N/A |
23
EIP Growth and Income Fund
December 31, 2012
Additional Information (unaudited) – continued
| | | | | | | | |
Name, Address, Age and
Position(s) with Trust | | Term of
Office(1) and
Length of
Time Served | | Principal Occupation(s)
During Past Five Years | | Number of
Portfolios in
Fund Complex
Overseen by
Trustee | | Other Trusteeships/
Directorships
Held by Trustee |
| | | | |
OFFICERS WHO ARE NOT TRUSTEES | | | | | | | | |
| | | | |
Jennifer Rogers DOB: 07/28/74 C/O BNY Mellon Investment Servicing (US) Inc. 301 Bellevue Parkway 2nd Floor Wilmington, DE 19809 Secretary | | Since February 2009 | | Managing Director and Senior Counsel, BNY Mellon Investment Servicing (US) Inc. (Since 2007). | | N/A | | N/A |
| (1) | Each Trustee serves during the continued lifetime of the Trust until he or she dies, resigns or is removed, or, if sooner, until the next meeting of shareholders called for the purpose of electing Trustees and until the election and qualification of his or her successor. Except as otherwise provided by law, the Trust’s Declaration of Trust or Bylaws, the President and the Treasurer hold office until his or her resignation has been accepted by the Trustees or until his or her respective successor has been duly elected and qualified, or in each case until he or she sooner dies, resigns, is removed or becomes disqualified. All other officers hold office at the pleasure of the Trustees. |
| (2) | Mr. Murchie is deemed an “interested person” of the Fund due to his positions of Principal of the Manager and President of the Fund and due to his beneficial ownership of interests in the Manager. |
| (3) | Ms. Pao is not a licensed attorney. |
The Fund’s Statement of Additional Information includes additional information about the Fund’s trustees and is available, without charge, upon request by calling collect 1-203-349-8232.
24
EIP Growth and Income Fund
ADVISER
Energy Income Partners, LLC
49 Riverside Avenue
Westport, CT 06880
SHAREHOLDER SERVICES
BNY Mellon Investment Servicing (US) Inc.
760 Moore Road
King of Prussia, PA 19406
CUSTODIAN
The Bank of New York Mellon
One Wall Street
New York, NY 10286
LEGAL COUNSEL
Ropes & Gray LLP
Prudential Tower, 800 Boylston Street
Boston, MA 02199-3600
INDEPENDENT REGISTERED
PUBLIC ACCOUNTING FIRM
Deloitte & Touche LLP
1700 Market Street
Philadelphia, PA 19103

EIP Growth and Income Fund
49 Riverside Avenue
Westport, CT 06880
203.349.8232
Item 2. Code of Ethics.
| | (a) | The registrant, as of the end of the period covered by this report, has adopted a code of ethics that applies to the registrant’s principal executive officer, principal financial officer, principal accounting officer or controller, or persons performing similar functions, regardless of whether these individuals are employed by the registrant or a third party. |
| | (c) | There have been no amendments, during the period covered by this report, to a provision of the code of ethics that applies to the registrant’s principal executive officer, principal financial officer, principal accounting officer or controller, or persons performing similar functions, regardless of whether these individuals are employed by the registrant or a third party, and that relates to any element of the code of ethics definition enumerated in paragraph (b) of Item 2. |
| | (d) | The registrant has not granted any waivers, including an implicit waiver, from a provision of the code of ethics, during the period covered by this report, to the registrant’s principal executive officer, principal financial officer, principal accounting officer or controller, or persons performing similar functions, regardless of whether these individuals are employed by the registrant or a third party, that relates to one or more of the items set forth in paragraph (b) of this item’s instructions. |
Item 3. Audit Committee Financial Expert.
The board of trustees of the registrant has determined that Mr. Salvatore Faia qualifies as an “audit committee financial expert” (as such term has been defined by the Regulations) based on its review of his pertinent experience, knowledge and education. Mr. Faia is “independent,” as defined by this Item 3. The SEC has stated that the designation or identification of a person as an audit committee financial expert pursuant to this Item 3 of Form N-CSR does not impose on such person any duties, obligations or liability that are greater than the duties, obligations and liability imposed on such person as a member of the audit committee and the board of trustees in absence of such designation or identification.
Item 4. Principal Accountant Fees and Services.
Audit Fees
| | (a) | The aggregate fees billed for each of the last two fiscal years for professional services rendered by the principal accountant for the audit of the registrant’s annual financial statements or services that are normally provided by the accountant in connection with statutory and regulatory filings or engagements for those fiscal years are $58,000 for the fiscal year ended December 31, 2011 and $58,000 for the fiscal year ended December 31, 2012. |
Audit-Related Fees
| | (b) | The aggregate fees billed in each of the last two fiscal years for assurance and related services by the principal accountant that are reasonably related to the performance of the audit of the registrant’s financial statements and are not reported under paragraph (a) of this Item are $0 for the fiscal year ended December 31, 2011 and $0 for the fiscal year ended December 31, 2012. |
Tax Fees
| | (c) | The aggregate fees billed in each of the last two fiscal years for professional services rendered by the principal accountant for tax compliance, tax advice, and tax planning are $28,000 for the fiscal year ended December 31, 2011 and $29,500 for the fiscal year ended December 31, 2012. The nature of these services was to prepare Form 1120-RIC, along with applicable state income/franchise tax returns as well as Form 8613, Return of Excise Tax on Undistributed Income of Regulated Investment companies. |
All Other Fees
| | (d) | The aggregate fees billed in each of the last two fiscal years for products and services provided by the principal accountant, other than the services reported in paragraphs (a) through (c) of this Item are $0 for the fiscal year ended December 31, 2011 and $0 for the fiscal year ended December 31, 2012. |
| | (e)(1) | The audit committee’s pre-approval policies and procedures described in paragraph (c)(7) of Rule 2-01 of Regulation S-X are as follows: |
Pursuant to its charter, the Registrant’s Audit Committee (the “Committee”) annually reviews and, if the Committee so determines, pre-approves the scope of the audit of EIP Growth and Income Fund (the “Fund”) and proposed audit fees and permitted non-audit (including audit-related) services that are proposed to be performed by the Fund’s independent accountants for the Fund as well as for the Fund’s investment adviser (Energy Income Partners, LLC, (“EIP”)) or any entity controlling, controlled by or under common control with EIP that provides ongoing services to the Fund (“Applicable Service Providers”), if the engagement relates directly to the operations and financial reporting of the Fund.
In addition to the Committee’s pre-approval of services, the engagement of the independent accounting firm for any permitted non-audit service provided to the Fund also requires the separate pre-approval of the President, Treasurer or Assistant Treasurer of the Fund, who may only grant such approval if he or she believes that the accounting firm’s engagement will not adversely affect the firm’s independence.
Individual (i) audit services, (ii) audit-related services, (iii) tax services, and (iv) services that are not audit, audit-related, or tax services that are not presented to the Committee as part of the annual pre-approval process may be pre-approved, if deemed consistent with the accounting firm’s independence, by the Committee at any regular or special meeting (whether in-person or telephonic). Such services may also be pre-approved by the Committee Chair (or any other Committee member who is a
disinterested trustee under the Investment Company Act to whom this responsibility has been delegated) so long as the estimated fee for the particular service for which pre-approval is sought does not exceed $75,000 for audit services or $100,000 for all other permitted services. Any pre-approval by a Committee member shall be reported to the full Committee at its next regularly scheduled meeting.
* * * * *
| | (e)(2) | The percentage of services described in each of paragraphs (b) through (d) of this Item that were approved by the audit committee pursuant to paragraph (c)(7)(i)(C) of Rule 2-01 of Regulation S-X are as follows: |
| | (g) | The aggregate non-audit fees billed by the registrant’s accountant for services rendered to the registrant, and rendered to the registrant’s investment adviser (not including any sub-adviser whose role is primarily portfolio management and is subcontracted with or overseen by another investment adviser), and any entity controlling, controlled by, or under common control with the adviser that provides ongoing services to the registrant for each of the last two fiscal years of the registrant was $135,000 for the fiscal year ended December 31, 2011 and $141,000 for the fiscal year ended December 31, 2012. |
| | (h) | The registrant’s audit committee of the board of directors has considered whether the provision of non-audit services that were rendered to the registrant’s investment adviser (not including any sub-adviser whose role is primarily portfolio management and is subcontracted with or overseen by another investment adviser), and any entity controlling, controlled by, or under common control with the investment adviser that provides ongoing services to the registrant that were not pre-approved pursuant to paragraph (c)(7)(ii) of Rule 2-01 of Regulation S-X is compatible with maintaining the principal accountant’s independence. |
Item 5. Audit Committee of Listed registrants.
Not applicable.
Item 6. Investments.
| (a) | Schedule of Investments in securities of unaffiliated issuers as of the close of the reporting period is included as part of the report to shareholders filed under Item 1 of this form. |
| | Item 7. | Disclosure of Proxy Voting Policies and Procedures for Closed-End Management Investment Companies. |
Not applicable.
| | Item 8. | Portfolio Managers of Closed-End Management Investment Companies. |
Not applicable.
| | Item 9. | Purchases of Equity Securities by Closed-End Management Investment Company and Affiliated Purchasers. |
Not applicable.
| | Item 10. | Submission of Matters to a Vote of Security Holders. |
There have been no material changes to the procedures by which the shareholders may recommend nominees to the registrant’s board of trustees, where those changes were implemented after the registrant last provided disclosure in response to the requirements of Item 407(c)(2)(iv) of Regulation S-K (17 CFR 229.407) (as required by Item 22(b)(15) of Schedule 14A (17 CFR 240.14a-101)), or this Item.
| | Item 11. | Controls and Procedures. |
| | (a) | EIP Investment Trust’s (the “Registrant”) principal executive and principal financial officers have concluded, based on their evaluation of the effectiveness of the Registrant’s disclosure controls and procedures as of a date within 90 days of the filing date of this report, that the Registrant’s disclosure controls and procedures are reasonably designed to provide reasonable assurance that information required to be disclosed by the Registrant on Form N-CSR is recorded, processed, summarized and reported within the required time periods and that information required to be disclosed by the Registrant in the reports that it files or submits on Form N-CSR is accumulated and communicated to the Registrant’s management, including its principal executive and principal financial officers, as appropriate to allow timely decisions regarding required disclosure. |
| | (b) | There were no changes in the Registrant’s internal control over financial reporting during the Registrant’s last fiscal quarter that have materially affected, or are reasonably likely to materially affect, the internal control over financial reporting. |
Item 12. Exhibits.
| | (a)(1) | Code of ethics, or any amendment thereto, that is the subject of disclosure required by Item 2 is attached hereto. |
| | (a)(2) | Certifications pursuant to Rule 30a-2(a) under the 1940 Act and Section 302 of the Sarbanes-Oxley Act of 2002 are attached hereto. |
SIGNATURES
Pursuant to the requirements of the Securities Exchange Act of 1934 and the Investment Company Act of 1940, the registrant has duly caused this report to be signed on its behalf by the undersigned, thereunto duly authorized.
| | |
| (registrant) | | EIP Investment Trust |
| | |
By (Signature and Title) | | /s/ James Murchie |
| | James Murchie, President |
| | (principal executive officer) |
Pursuant to the requirements of the Securities Exchange Act of 1934 and the Investment Company Act of 1940, this report has been signed below by the following persons on behalf of the registrant and in the capacities and on the dates indicated.
| | |
By (Signature and Title) | | /s/ James Murchie |
| | James Murchie, President |
| | (principal executive officer) |
| | | | | | |
By (Signature and Title) | | /s/ Linda Longville | | | | |
| | Linda Longville, Treasurer and Principal Financial and Accounting Officer |
| | (principal financial officer) | | | | |